UNITED STATES SECURITIES AND EXCHANGE COMMISSION
Washington, D.C. 20549
FORM N-CSR
CERTIFIED SHAREHOLDER REPORT
OF REGISTERED MANAGEMENT INVESTMENT COMPANIES
Investment Company Act file number 811-03462
Meeder Funds Trust
6125 Memorial Drive
Dublin, OH 43017
Bruce McKibben
c/o Meeder Funds Trust
6125 Memorial Drive
Dublin, OH 43017
Registrant’s telephone number, including area code: 800-325-3539
Date of fiscal year end: December 31, 2022
Date of reporting period: December 31, 2022
Item 1. Report to Stockholders.
TABLE OF CONTENTS
| | |
Letter to Shareholders | 1 |
Fund Summaries (Unaudited) | |
Muirfield Fund | 3 |
Spectrum Fund | 5 |
Global Allocation Fund | 7 |
Balanced Fund | 9 |
Moderate Allocation Fund | 11 |
Conservative Allocation Fund | 13 |
Dynamic Allocation Fund | 15 |
Quantex Fund | 17 |
Tactical Income Fund | 19 |
Institutional Prime Money Market Fund | 21 |
Financial Statements | |
Schedules of Investments | 24 |
Statements of Assets and Liabilities | 74 |
Statements of Operations | 76 |
Statements of Changes in Net Assets | 78 |
Financial Highlights | 82 |
Notes to Financial Statements | 92 |
Report of Independent Registered Public Accounting Firm | 110 |
Shareholder Expense Analysis | 111 |
Management of the Trust | 113 |
Other Items | 114 |
This Annual Report is prepared and distributed for the general information of the shareholders of the Funds. This material is not authorized for distribution to prospective investors unless preceded or accompanied by a prospectus. Investors are advised to consider carefully the investment objectives, risks, charges and expenses of the Fund before investing. The prospectus contains this and other information about the Funds.
Meeder Funds are distributed by Meeder Distribution Services, Inc. (Member FINRA), an affiliate of Meeder Investment Management. An affiliated registered investment adviser, Meeder Asset Management, Inc., serves as the investment adviser to Meeder Funds and is paid a fee for its services.
Letter to Shareholders
December 31, 2022
A Very Difficult Year for Stocks and Bonds
The term “historic” is frequently used and often misplaced for anyone who is a regular reader of financial news. Patterns and events may sometimes feel unique after reading eye-catching headlines and articles, intended only to capture a reader’s attention. While acknowledging the overuse of this term, I feel confident in stating that 2022 was a historic year for capital markets.
Over the long term, stocks and bonds are typically thought of as uncorrelated assets that are a complement for each other in a portfolio. When bonds aren’t earning significant income, stocks will be there to provide growth. When stocks have a tough year, income from bonds will cushion the fall. It’s a perfect duo. And while this may often be the case, 2022 showed us that uncorrelated is very different than never correlated.
2022 marked the worst performance by U.S. investment-grade bonds since 1931, with investment-grade corporate bonds down –14.5%. Stocks fared worse, with the S&P 500 Index finishing at a loss of -18.0%, experiencing a maximum drawdown of -22.7% at its October 2022 low. In the past 94 years, there have only been two years, 1931 and 1969, that the total return of both stocks and bonds finished negative in the same calendar year.
Inflation also reached its highest level since 1981, with the Consumer Price Index (CPI) 12-month growth peaking at 9.1% in June. While inflation began rearing its head in 2021, the Federal Reserve (the “Fed”) did not respond until 2022...and did they respond. The Fed increased the Fed Funds rate seven times during the year, from an upper bound of 0.25% at the start of the year to 4.50% at their last meeting in December. It was the fastest rate hike cycle since 1974, leaving investors with few places to hide.
Navigating 2022 with Meeder’s Tactical Funds
Meeder’s tactical approach allowed most of our Funds to outperform their respective benchmarks. Our cautious approach entering 2022, which led to a significant defensive position throughout the year, was a significant contributor to the relative outperformance of many of our funds that utilize the Defensive Equity strategy. Many of our funds also favored value-oriented equities within our U.S. stock selection strategy, which also positively contributed to several of our Fund’s strong performance. With respect to fixed income, having a shorter duration than many of our benchmarks allowed several Meeder Funds to be positioned well during a challenging interest rate environment.
Meeder’s Investment Philosophy
At Meeder, we manage our funds using a systematic approach that guides us in our allocation decisions. A systematic, quantitative process allows for a repeatable and efficient method to achieve long-term appreciation while avoiding common emotional biases. We also apply a holistic approach to investing;analyzing fundamental, technical, macroeconomic, and sentiment factors.
Many of our funds utilize our time-tested Defensive Equity strategy, which follows a rules-based and data-driven approach, based on the Meeder Investment Positioning (IPS) model. This model is used to determine the reward relative to the risk of the stock market and identifies when a respective fund should be increasing or decreasing its equity allocation relative to other asset classes. In addition to our Defensive Equity strategy, we also provide active management for shareholders through global allocation, individual equity selection, and fixed income exposure.
The Coast is Not Clear
One of the enduring goals throughout Meeder’s history has been to improve investor outcomes by helping investors remain committed to their investment strategy through a full market cycle. While most of our Funds performed well in 2022 relative to their respective benchmarks, we want to highlight the notable longer-term performance of one of our oldest funds. Per the 10-year rankings as of December 31, 2022, the Muirfield Fund ranked in the top 2 percent of open-ended mutual funds among the 163 strategies ranked in the Tactical Allocation category, according to Morningstar.
As we turn the corner to 2023, we maintain our commitment to continually improving our investment strategies and always maintaining a focus on serving our shareholders. Our investment team never stops looking for ways to improve our investment decision-making process.
While a new year brings new challenges; including the highest interest rates since 2007, lingering inflation, and the looming threat of an economic recession, we remain committed to our tactical approach. The direction of the winds may change, but our philosophy remains firmly planted in the ground. We feel optimistic that our approach, rooted in minimizing behavioral biases and leaning on history as a guide, will help us navigate the coming years ahead.
Sincerely,

Robert S. Meeder
President & CEO
Data Source: Bloomberg, as of May 31, 2022. Notes: The return of bonds are based on the annual return of Bloomberg U.S. Aggregate Bond Index from 1976 to 2022. Prior to 1976, the returns are based on the 10-year U.S. Treasury Bond. Stocks are represented by the S&P 500 Index from 1957 to 2022. Prior to 1957, the returns are based on the price changes in the S&P Composite Index. Index performance shown for illustrative purposes only. You cannot invest into an index. Past performance is no guarantee of future results.
2022 Annual Report | December 31, 2022 | Page 1 |
2022 Annual Report
Fund Summaries
Muirfield Fund
The Meeder Muirfield Fund Institutional Class returned –10.93% for the year ended December 31, 2022, compared to the Morningstar Moderate Target Risk Index benchmark return of –14.77%.
This fund uses Meeder’s Defensive Equity strategy, which follows a rules-based and data-driven approach to using the Meeder Investment Positioning (IPS) model. This model is used to determine the reward relative to the risk of the stock market and identifies when a respective fund should be increasing or decreasing its equity allocation.
Muirfield achieved positive performance relative to its benchmark in 2022, primarily driven by the Defensive Equity Strategy and its underweight to equities and overweight to cash throughout the year. The Defensive Equity Strategy entered the year with a significant defensive position of 33% cash and a 67% allocation to equities. The Fund remained defensive for the entirety of the year, averaging only a 50% allocation to equity throughout 2022 and ending the year with a 51% equity allocation.
Our global equity allocation was a negative contributor to performance this year. The fund allocates to different regions of the global equity markets, including U.S., Developed International ex-US., and Emerging Markets. Within Muirfield’s equity allocation, it maintained an overweight to U.S. and underweight to both Developed International ex-U.S. and Emerging Markets equities relative to its benchmark. Given the outperformance of international equities in 2022 compared to their U.S. counterparts, the fund’s global equity allocation detracted from performance.
The performance of our stock selection strategy was very positive in 2022. Within the U.S. portion of Muirfield’s equity allocation, we use a proprietary equity selection model that selects stocks based on value, momentum, quality, stability, and sentiment factors. In general, we favor companies that display positive momentum relative to their peers, strong balance sheets, consistent earnings growth, along with attractive valuations and positive near-term sentiment. Our overweight to value stocks, along with our overweight to company’s displaying strong profitability, positively contributed to performance. From a sector perspective, the overweight to the Health Care and Energy sectors positively contributed to performance throughout the year, while the underweight to interest-rate sensitive sectors like Utilities and REITs also benefited performance.
In the fund, we will often use equity index derivatives, such as stock index futures, to efficiently equitize our cash positions as well as manage the equity exposure of the portfolio. Regarding equitizing cash positions, these derivatives are designed to track their respective stock index, so there was no discernible impact on the fund’s relative performance. The use of equity index futures to reduce equity exposure in the fund’s Defensive Equity exposure was additive to performance relative to the benchmark in 2022.
Investment Objective
The investment objective of the Fund is to provide long-term capital appreciation.
Average Annual Total Returns
as of December 31, 2022
| 1
Year | 5
Year | 10
Year | Share Class
Inception
Date |
Muirfield Fund Retail Class | -11.19% | 4.03% | 7.92% | 8/10/88 |
Muirfield Fund Institutional Class | -10.93% | 4.40% | 8.15% | 10/31/16 |
Muirfield Fund Adviser Class | -10.85% | 4.35% | 8.11% | 10/31/16 |
Morningstar Moderate Target Risk Index | -14.77% | 3.73% | 5.82% | — |
Top 10 Holdings
as of December 31, 2022
1. | Apple, Inc. | 3.0% |
2. | Microsoft Corp. | 2.8% |
3. | Chevron Corp. | 1.7% |
4. | Exxon Mobil Corp. | 1.7% |
5. | Alphabet, Inc. | 1.3% |
6. | Berkshire Hathaway, Inc. | 1.2% |
7. | UnitedHealth Group, Inc. | 1.1% |
8. | Johnson & Johnson | 1.0% |
9. | Eli Lilly & Co. | 0.8% |
10. | NVIDIA Corp. | 0.8% |
As a percentage of total net assets. Holdings exclude short-term investments and derivatives.
2022 Annual Report | December 31, 2022 | Page 3 |
Growth of $10,000
as of December 31, 2022
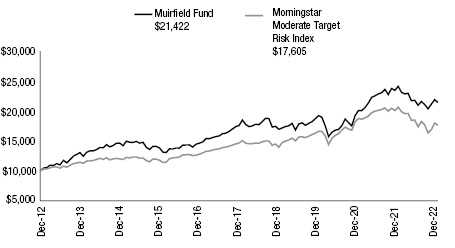
The Growth of $10,000 chart compares the performance of the Fund’s Retail Share Class over the period shown with dividends and capital gains reinvested to the Fund’s benchmark. Benchmark indices are unmanaged and do not reflect the deduction of expenses associated with a mutual fund, such as investment management and accounting fees.
Investment performance assumes reinvestment of all dividend and capital gain distributions. The results do not reflect the effect of taxes a shareholder would pay on Fund distributions or on the redemption of Fund shares. Historical performance attributed to the Institutional and Adviser Share Classes prior to their inception dates is based on the performance of the Retail Share Class. No adjustment has been made to reflect class-specific distribution or servicing fees. Returns may reflect the effect of voluntary fee waivers or expense reimbursements over the period shown. Without these waivers, performance would have been lower.
The performance data shown represents past performance, which does not guarantee future results. The investment return and principal value of an investment will fluctuate so that an investor’s shares, when redeemed, may be worth more or less than their original cost. Current performance may be lower or higher than the performance data quoted. For current month-end performance data, please visit our website at www.meederfunds.com.
Common Stock Sector Concentration
as of December 31, 2022
Information Technology | 26.0% |
Healthcare | 16.3% |
Energy | 14.4% |
Consumer Discretionary | 13.4% |
Financials | 8.7% |
Industrials | 8.4% |
Consumer Staples | 4.4% |
Communication Services | 3.8% |
Materials | 3.6% |
Utilities | 0.9% |
Real Estate Investment Trust | 0.1% |
Total | 100.0% |
As a percentage of total common stocks. Concentrations are subject to change.
Asset Allocation
as of December 31, 2022
Common Stocks (United States) | 57.2% |
Money Market Registered Investment Companies | 42.6% |
Bank Obligations | 0.1% |
Other Assets/Liabilities (Net) | 0.1% |
Total | 100.0% |
As a percentage of total net assets. The Fund has invested in stock index futures contracts in order to equitize cash balances it holds in a proprietary money market fund.
Page 4 | 2022 Annual Report | December 31, 2022 |
Spectrum Fund
The Meeder Spectrum Fund Institutional Class returned –11.19% for the year ended December 31, 2022, compared to the Morningstar Moderate Target Risk Index benchmark return of –14.77%.
This fund uses our Defensive Equity strategy, which follows a rules-based and data-driven approach to using the Meeder Investment Positioning (IPS) model. This model is used to determine the reward relative to the risk of the stock market and identifies when a respective fund should be increasing or decreasing its equity allocation.
Spectrum achieved positive performance relative to its benchmark in 2022, primarily driven by the Defensive Equity Strategy and its underweight to equities and overweight to cash throughout the year. The Defensive Equity Strategy entered the year with a significant defensive position of 33% cash and a 67% allocation to equities. The Fund remained defensive for the entirety of the year, averaging only a 50% allocation to equity throughout 2022 and ending the year with a 51% equity allocation.
Global equity allocation was a negative contributor to performance in 2022. The fund allocates to different regions of the global equity markets, including U.S., Developed International ex-US., and Emerging Markets. Within Spectrum’s equity allocation, it maintained an overweight to U.S. and underweight to both Developed International ex-U.S. and Emerging Markets equities relative to its benchmark. Given the outperformance of international equities in 2022 compared to their U.S. counterparts, the fund’s global equity allocation detracted from performance.
The performance of our stock selection strategy was very positive in 2022. Within the U.S. portion of Spectrum’s equity allocation, we use a proprietary equity selection model that selects stocks based on value, momentum, quality, stability, and sentiment factors. In general, we favor companies that display positive momentum relative to their peers, strong balance sheets, consistent earnings growth, along with attractive valuations and positive near-term sentiment. Our overweight to value stocks, along with our overweight to company’s displaying strong profitability, positively contributed to performance. From a sector perspective, the overweight to the Health Care and Energy sectors positively contributed to performance throughout the year, while the underweight to interest-rate sensitive sectors like Utilities and REITs also benefited performance.
In the fund, we will often use equity index derivatives, such as stock index futures, to efficiently equitize our cash positions as well as manage the equity exposure of the portfolio. Regarding equitizing cash positions, these derivatives are designed to track their respective stock index, so there was no discernible impact on the fund’s relative performance. The use of equity index futures to reduce equity exposure in the fund’s Defensive Equity exposure was additive to performance relative to the benchmark in 2022.
Investment Objective
The investment objective of the Fund is to provide long-term capital appreciation.
Average Annual Total Returns
as of December 31, 2022
| 1
Year | 5
Year | Since
Inception | Share Class
Inception
Date |
Spectrum Fund Retail Class | -11.52% | 2.93% | 4.82% | 1/2/15 |
Spectrum Fund Institutional Class | -11.19% | 3.35% | 5.15% | 10/31/16 |
Spectrum Fund Adviser Class | -11.08% | 3.29% | 5.09% | 10/31/16 |
Morningstar Moderate Target Risk Index | -14.77% | 3.73% | 4.93% | — |
Top 10 Holdings
as of December 31, 2022
1. | Microsoft Corp. | 3.8% |
2. | Apple, Inc. | 2.1% |
3. | Berkshire Hathaway, Inc. | 1.6% |
4. | Johnson & Johnson | 1.1% |
5. | UnitedHealth Group, Inc. | 1.1% |
6. | Copart, Inc. | 1.0% |
7. | Exxon Mobil Corp. | 0.9% |
8. | Chevron Corp. | 0.9% |
9. | Eli Lilly & Co. | 0.8% |
10. | Mastercard, Inc. | 0.7% |
As a percentage of total net assets. Holdings exclude short-term investments and derivatives.
2022 Annual Report | December 31, 2022 | Page 5 |
Growth of $10,000
as of December 31, 2022
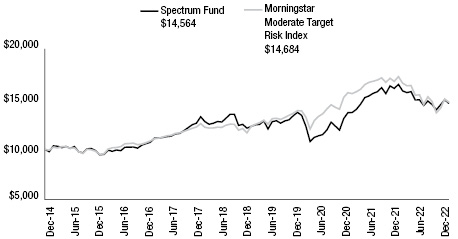
The Growth of $10,000 chart compares the performance of the Fund’s Retail Share Class over the period shown with dividends and capital gains reinvested to the Fund’s benchmark. Benchmark indices are unmanaged and do not reflect the deduction of expenses associated with a mutual fund, such as investment management and accounting fees.
Investment performance assumes reinvestment of all dividend and capital gain distributions. The results do not reflect the effect of taxes a shareholder would pay on Fund distributions or on the redemption of Fund shares. Historical performance attributed to the Institutional and Adviser Share Classes prior to their inception dates is based on the performance of the Retail Share Class. No adjustment has been made to reflect class-specific distribution or servicing fees. Returns may reflect the effect of voluntary fee waivers or expense reimbursements over the period shown. Without these waivers, performance would have been lower.
The performance data shown represents past performance, which does not guarantee future results. The investment return and principal value of an investment will fluctuate so that an investor’s shares, when redeemed, may be worth more or less than their original cost. Current performance may be lower or higher than the performance data quoted. For current month-end performance data, please visit our website at www.meederfunds.com.
Common Stock Sector Concentration
as of December 31, 2022
Information Technology | 29.4% |
Healthcare | 15.9% |
Consumer Discretionary | 13.1% |
Financials | 11.5% |
Industrials | 9.3% |
Energy | 7.7% |
Materials | 6.0% |
Communication Services | 3.4% |
Consumer Staples | 3.0% |
Utilities | 0.6% |
Real Estate Investment Trust | 0.1% |
Total | 100.0% |
As a percentage of total common stocks. Concentrations are subject to change.
Asset Allocation
as of December 31, 2022
Common Stocks (United States) | 47.8% |
Money Market Registered Investment Companies | 52.7% |
Other Assets/Liabilities (Net) | -0.5% |
Total | 100.0% |
As a percentage of total net assets. The Fund has invested in stock index futures contracts in order to equitize cash balances it holds in a proprietary money market fund.
Page 6 | 2022 Annual Report | December 31, 2022 |
Global Allocation Fund
The Meeder Global Allocation Fund Institutional Class returned –12.56% for the year ended December 31, 2022, compared to the Morningstar Global Allocation Index benchmark return of –17.10%.
A portion (90%) of the Fund uses our Defensive Equity strategy, which follows a rules-based and data-driven approach to using the Meeder Investment Positioning (IPS) model. This model is used to determine the reward relative to the risk of the stock market and identifies when a respective fund should be increasing or decreasing its equity allocation. The remaining portion (10%) of the fund is allocated to fixed income securities.
The Meeder Global Allocation Fund achieved positive performance relative to its benchmark in 2022, primarily driven by the Defensive Equity Strategy and its underweight to equities and overweight to cash throughout the year. The Defensive Equity Strategy entered the year with a significant defensive position of 33% cash and a 67% allocation to equities. The Fund remained defensive for the entirety of the year.
Our global equity allocation was a detractor to performance this year. The fund allocates to different regions of the global equity markets, including U.S., Developed International ex-US., and Emerging Markets. Within the Global Allocation Fund’s equity holdings, it maintained an overweight to U.S. and underweight to both Developed International ex-U.S. and Emerging Markets equities relative to its benchmark. Given the outperformance of international equities in 2022 compared to their U.S. counterparts, the fund’s global equity allocation detracted from performance.
The performance of our stock selection strategy was also strong in 2022. Within the U.S. portion of the Global Allocation Fund’s equity allocation, we use a proprietary equity selection model that selects stocks based on value, momentum, quality, stability, and sentiment factors. In general, we favor companies that display positive momentum relative to their peers, strong balance sheets, consistent earnings growth, along with attractive valuations and positive near-term sentiment. Our overweight to common stocks displaying strong momentum and profitability were the two primary drivers of positive performance. From a sector perspective, the overweight to Information Technology and Healthcare sectors positively contributed to performance throughout the year, while the increase in allocation to Energy and Financial stocks in the second half of the year also generated positive returns.
While fixed income returns were negative, the Global Allocation Fund’s fixed income allocation outperformed the fixed income portion of the benchmark. The fund’s allocation to fixed income tactically shifts portfolio exposure utilizing quantitative models designed to actively manage credit quality, emerging market bond exposure, and duration of its holdings. In 2022, the Federal Reserve increased interest rates at its fastest rate in more than four decades. The historic rise in rates led to negative returns throughout the fixed income asset class. Despite the challenging environment, tactical shifts in the emerging market sector were a positive contributor to its outperformance. Relative to the benchmark, exposure to shorter duration bonds primarily benefited performance too.
In the fund, we will often use equity index derivatives, such as stock index futures, to efficiently equitize our cash positions as well as manage the equity exposure of the portfolio. Regarding equitizing cash positions, these derivatives are designed to track their respective stock index, so there was no discernible impact on the fund’s relative performance. The use of equity index futures to reduce equity exposure in the fund’s Defensive Equity exposure was additive to performance relative to the benchmark in 2022.
Investment Objective
The investment objective of the Fund is to provide long-term capital appreciation.
Average Annual Total Returns
as of December 31, 2022
| 1
Year | 5
Year | 10
Year | Share Class
Inception
Date |
Global Allocation Fund Retail Class | -12.94% | 1.23% | 5.06% | 1/31/06 |
Global Allocation Fund Institutional Class | -12.56% | 1.66% | 5.35% | 10/31/16 |
Global Allocation Fund Adviser Class | -12.52% | 1.55% | 5.28% | 10/31/16 |
Morningstar Global Allocation Index | -17.10% | 2.86% | 5.20% | — |
Top 10 Holdings
as of December 31, 2022
1. | iShares Core MSCI EAFE ETF | 8.2% |
2. | iShares Core MSCI Emerging Markets ETF | 1.8% |
3. | Apple, Inc. | 1.7% |
4. | Berkshire Hathaway, Inc. | 1.7% |
5. | Chevron Corp. | 1.6% |
6. | Microsoft Corp. | 1.5% |
7. | iShares Core U.S. Aggregate Bond ETF | 1.5% |
8. | iShares JP Morgan USD Emerging Markets Bond ETF | 1.2% |
9. | SPDR Bloomberg High Yield Bond ETF | 1.1% |
10. | Copart, Inc. | 0.8% |
As a percentage of total net assets. Holdings exclude short-term investments and derivatives.
2022 Annual Report | December 31, 2022 | Page 7 |
Growth of $10,000
as of December 31, 2022
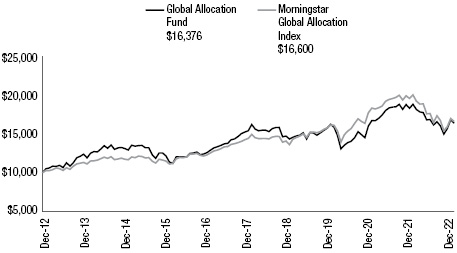
The Growth of $10,000 chart compares the performance of the Fund’s Retail Share Class over the period shown with dividends and capital gains reinvested to the Fund’s benchmark. Benchmark indices are unmanaged and do not reflect the deduction of expenses associated with a mutual fund, such as investment management and accounting fees.
Investment performance assumes reinvestment of all dividend and capital gain distributions. The results do not reflect the effect of taxes a shareholder would pay on Fund distributions or on the redemption of Fund shares. Historical performance attributed to the Institutional and Adviser Share Classes prior to their inception dates is based on the performance of the Retail Share Class. No adjustment has been made to reflect class-specific distribution or servicing fees. Returns may reflect the effect of voluntary fee waivers or expense reimbursements over the period shown. Without these waivers, performance would have been lower.
The performance data shown represents past performance, which does not guarantee future results. The investment return and principal value of an investment will fluctuate so that an investor’s shares, when redeemed, may be worth more or less than their original cost. Current performance may be lower or higher than the performance data quoted. For current month-end performance data, please visit our website at www.meederfunds.com.
Common Stock Sector Concentration
as of December 31, 2022
Information Technology | 25.6% |
Healthcare | 17.6% |
Energy | 14.4% |
Financials | 13.7% |
Consumer Discretionary | 10.4% |
Industrials | 8.6% |
Consumer Staples | 4.0% |
Communication Services | 2.7% |
Materials | 2.6% |
Utilities | 0.3% |
Real Estate Investment Trust | 0.1% |
Total | 100.0% |
As a percentage of total common stocks. Concentrations are subject to change.
Registered Investment Company Geographic Concentration
as of December 31, 2022
U.S. Fixed Income | 34.2% |
International Fixed Income | 6.7% |
International Equity | 59.1% |
Total | 100.0% |
As a percentage of total registered investment companies. Concentrations are subject to change.
Asset Allocation
as of December 31, 2022
Common Stocks (United States) | 26.3% |
Equity Registered Investment Companies | 10.1% |
Fixed Income Registered Investment Companies | 6.9% |
Money Market Registered Investment Companies | 52.7% |
Bank Obligations | 1.6% |
Other Assets/Liabilities (Net) | 2.4% |
Total | 100.0% |
As a percentage of total net assets. The Fund has invested in stock index futures contracts in order to equitize cash balances it holds in a proprietary money market fund.
Page 8 | 2022 Annual Report | December 31, 2022 |
Balanced Fund
The Meeder Balanced Fund Institutional Class returned –10.80% for the year ended December 31, 2022, compared to the Morningstar Moderate Target Risk Index benchmark return of –14.77%.
A portion (70%) of the fund uses our Defensive Equity strategy, which follows a rules-based and data-driven approach to using the Meeder Investment Positioning (IPS) model. This model is used to determine the reward relative to the risk of the stock market and identifies when a respective fund should be increasing or decreasing its equity allocation. The remaining portion (30%) of the fund is allocated to fixed income securities.
The Balanced Fund achieved positive performance relative to its benchmark in 2022, primarily driven by the Defensive Equity Strategy and its underweight to equities and overweight to cash throughout the year. The Defensive Equity Strategy entered the year with a significant defensive position of 23% cash and a 47% allocation to equities. The Fund remained defensive for the entirety of the year, averaging only a 35% allocation to equity throughout 2022 and ending the year with a 36% equity allocation.
Our global equity allocation was a detractor to performance this year. The fund allocates to different regions of the global equity markets, including U.S., Developed International ex-US., and Emerging Markets. Within the Balanced Fund’s equity allocation, it maintained an overweight to U.S. and underweight to both Developed International ex-U.S. and Emerging Markets equities relative to its benchmark. Given the outperformance of international equities in 2022 compared to their U.S. counterparts, the fund’s global equity allocation detracted from performance.
The performance of our stock selection strategy was very positive in 2022. Within the U.S. portion of the Balanced Fund’s equity allocation, we use a proprietary equity selection model that selects stocks based on value, momentum, quality, stability, and sentiment factors. In general, we favor companies that display positive momentum relative to their peers, strong balance sheets, consistent earnings growth, along with attractive valuations and positive near-term sentiment. Our overweight to value stocks, along with our overweight to company’s displaying strong profitability, positively contributed to performance. From a sector perspective, the overweight to the Health Care and Energy sectors positively contributed to performance throughout the year, while the underweight to interest-rate sensitive sectors like Utilities and REITs also benefited performance.
While fixed income returns were negative, the Balanced Fund’s fixed income allocation outperformed the fixed income portion of the benchmark. The fund’s allocation to fixed income tactically shifts portfolio exposure utilizing quantitative models designed to actively manage credit quality, emerging market bond exposure, and duration of its holdings. In 2022, the Federal Reserve increased interest rates at its fastest rate in more than four decades. The historic rise in rates led to negative returns throughout the fixed income asset class. Despite the challenging environment, tactical shifts in the emerging market sector were a positive contributor to its outperformance. Relative to the benchmark, exposure to shorter duration bonds primarily benefited performance too.
In the fund, we will often use equity index derivatives, such as stock index futures, to efficiently equitize our cash positions as well as manage the equity exposure of the portfolio. Regarding equitizing cash positions, these derivatives are designed to track their respective stock index, so there was no discernible impact on the fund’s relative performance. The use of equity index futures to gain equity exposure in the fund’s Defensive Equity exposure was additive to performance relative to the benchmark in 2022.
Investment Objective
The investment objective of the Fund is to provide income and long-term capital appreciation.
Average Annual Total Returns
as of December 31, 2022
| 1
Year | 5
Year | 10
Year | Share Class
Inception
Date |
Balanced Fund Retail Class | -11.09% | 2.86% | 5.58% | 1/31/06 |
Balanced Fund Institutional Class | -10.80% | 3.27% | 5.85% | 10/31/16 |
Balanced Fund Adviser Class | -10.77% | 3.21% | 5.80% | 10/31/16 |
Morningstar Moderate Target Risk Index | -14.77% | 3.73% | 5.82% | — |
Top 10 Holdings
as of December 31, 2022
1. | iShares Core U.S. Aggregate Bond ETF | 4.5% |
2. | iShares JP Morgan USD Emerging Markets Bond ETF | 3.6% |
3. | SPDR Bloomberg High Yield Bond ETF | 3.5% |
4. | Apple, Inc. | 2.7% |
5. | Microsoft Corp. | 2.4% |
6. | Berkshire Hathaway, Inc. | 1.7% |
7. | Diamond Hill Short Duration Securitized Bond Fund - Class Y | 1.5% |
8. | PGIM Short-Term Corporate Bond Fund - Class Q | 1.5% |
9. | Chevron Corp. | 1.4% |
10. | Copart, Inc. | 1.1% |
As a percentage of total net assets. Holdings exclude short-term investments and derivatives.
2022 Annual Report | December 31, 2022 | Page 9 |
Growth of $10,000
as of December 31, 2022
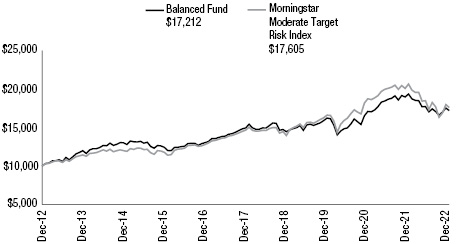
The Growth of $10,000 chart compares the performance of the Fund’s Retail Share Class over the period shown with dividends and capital gains reinvested to the Fund’s benchmark. Benchmark indices are unmanaged and do not reflect the deduction of expenses associated with a mutual fund, such as investment management and accounting fees.
Investment performance assumes reinvestment of all dividend and capital gain distributions. The results do not reflect the effect of taxes a shareholder would pay on Fund distributions or on the redemption of Fund shares. Historical performance attributed to the Institutional and Adviser Share Classes prior to their inception dates is based on the performance of the Retail Share Class. No adjustment has been made to reflect class-specific distribution or servicing fees. Returns may reflect the effect of voluntary fee waivers or expense reimbursements over the period shown. Without these waivers, performance would have been lower.
The performance data shown represents past performance, which does not guarantee future results. The investment return and principal value of an investment will fluctuate so that an investor’s shares, when redeemed, may be worth more or less than their original cost. Current performance may be lower or higher than the performance data quoted. For current month-end performance data, please visit our website at www.meederfunds.com.
Common Stock Sector Concentration
as of December 31, 2022
Information Technology | 27.1% |
Healthcare | 17.1% |
Consumer Discretionary | 12.9% |
Financials | 12.1% |
Energy | 11.9% |
Industrials | 9.9% |
Materials | 3.3% |
Communication Services | 2.8% |
Consumer Staples | 2.5% |
Utilities | 0.3% |
Real Estate Investment Trust | 0.1% |
Total | 100.0% |
As a percentage of total common stocks. Concentrations are subject to change.
Registered Investment Company Geographic Concentration
as of December 31, 2022
U.S. Fixed Income | 82.6% |
International Fixed Income | 17.4% |
Total | 100.0% |
As a percentage of total registered investment companies. Concentrations are subject to change.
Asset Allocation
as of December 31, 2022
Common Stocks (United States) | 41.7% |
Equity Registered Investment Companies | 3.6% |
Fixed Income Registered Investment Companies | 16.9% |
Money Market Registered Investment Companies | 37.4% |
Bank Obligations | 0.1% |
Other Assets/Liabilities (Net) | 0.3% |
Total | 100.0% |
As a percentage of total net assets. The Fund has invested in stock index futures contracts in order to equitize cash balances it holds in a proprietary money market fund.
Page 10 | 2022 Annual Report | December 31, 2022 |
Moderate Allocation Fund
The Meeder Moderate Allocation Fund Institutional Class returned –10.39% for the year ended December 31, 2022, compared to the Morningstar Moderately Conservative Target Risk Index benchmark return of –13.85%.
A portion (50%) of the fund uses our Defensive Equity strategy, which follows a rules-based and data-driven approach to using the Meeder Investment Positioning (IPS) model. This model is used to determine the reward relative to the risk of the stock market and identifies when a respective fund should be increasing or decreasing its equity allocation. The remaining portion (50%) of the fund is allocated to fixed income securities.
The Meeder Moderate Allocation Fund achieved positive performance relative to its benchmark in 2022, primarily driven by the Defensive Equity Strategy and its underweight to equities and overweight to cash throughout the year. The Defensive Equity Strategy entered the year with a significant defensive position of 16% cash and a 34% allocation to equities. The Fund remained defensive for the entirety of the year, averaging only a 25% allocation to equity throughout 2022 and ending the year with a 26% equity allocation.
Our global equity allocation was a detractor to performance this year. The fund allocates to different regions of the global equity markets, including U.S., Developed International ex-US., and Emerging Markets. Within Moderate Allocation’s equity holdings, it maintained an overweight to U.S. and underweight to both Developed International ex-U.S. and Emerging Markets equities relative to its benchmark. Given the outperformance of international equities in 2022 compared to their U.S. counterparts, the fund’s global equity allocation detracted from performance.
The performance of our stock selection strategy was very positive in 2022. Within the U.S. portion of Moderate Allocation’s equity holdings, we use a proprietary equity selection model that selects stocks based on value, momentum, quality, stability, and sentiment factors. In general, we favor companies that display positive momentum relative to their peers, strong balance sheets, consistent earnings growth, along with attractive valuations and positive near-term sentiment. Our overweight to value stocks, along with our overweight to company’s displaying strong profitability, positively contributed to performance. From a sector perspective, the overweight to the Health Care and Energy sectors positively contributed to performance throughout the year, while the underweight to interest-rate sensitive sectors like Utilities and REITs also benefited performance.
While fixed income returns were negative, the Moderate Allocation Fund’s fixed income allocation outperformed the fixed income portion of the benchmark. The fund’s allocation to fixed income tactically shifts portfolio exposure utilizing quantitative models designed to actively manage credit quality, emerging market bond exposure, and duration of its holdings. In 2022, the Federal Reserve increased interest rates at its fastest rate in more than four decades. The historic rise in rates led to negative returns throughout the fixed income asset class. Despite the challenging environment, tactical shifts in the emerging market sector were a positive contributor to its outperformance. Relative to the benchmark, exposure to shorter duration bonds primarily benefited performance too.
In the fund, we will often use equity index derivatives, such as stock index futures, to efficiently equitize our cash positions as well as manage the equity exposure of the portfolio. Regarding equitizing cash positions, these derivatives are designed to track their respective stock index, so there was no discernible impact on the fund’s relative performance. The use of equity index futures to reduce equity exposure in the fund’s Defensive Equity exposure was additive to performance relative to the benchmark in 2022.
Investment Objective
The investment objective of the Fund is to provide total return, including capital appreciation, and current income.
Average Annual Total Returns
as of December 31, 2022
| 1
Year | 5
Year | Since
Inception | Share Class
Inception
Date |
Moderate Allocation Fund Retail Class | -10.75% | 2.09% | 4.40% | 6/30/15 |
Moderate Allocation Fund Institutional Class | -10.39% | 2.47% | 4.74% | 10/31/16 |
Moderate Allocation Fund Adviser Class | -10.39% | 2.43% | 4.69% | 10/31/16 |
Morningstar Moderately Conservative Target Risk Index | -13.85% | 2.79% | 3.92% | — |
Top 10 Holdings
as of December 31, 2022
1. | iShares Core U.S. Aggregate Bond ETF | 7.5% |
2. | iShares JP Morgan USD Emerging Markets Bond ETF | 5.9% |
3. | SPDR Bloomberg High Yield Bond ETF | 5.9% |
4. | Diamond Hill Short Duration Securitized Bond Fund - Class Y | 2.5% |
5. | PGIM Short-Term Corporate Bond Fund - Class Q | 2.5% |
6. | Segall Bryant & Hamill Plus Bond Fund - Class I | 1.8% |
7. | DoubleLine Total Return Bond Fund - Class I | 1.7% |
8. | Xtrackers USD High Yield Corporate Bond ETF | 1.5% |
9. | Baird Core Plus Bond Fund - Class I | 1.5% |
10. | Berkshire Hathaway, Inc. | 1.3% |
As a percentage of total net assets. Holdings exclude short-term investments and derivatives.
2022 Annual Report | December 31, 2022 | Page 11 |
Growth of $10,000
as of December 31, 2022

The Growth of $10,000 chart compares the performance of the Fund’s Retail Share Class over the period shown with dividends and capital gains reinvested to the Fund’s benchmark. Benchmark indices are unmanaged and do not reflect the deduction of expenses associated with a mutual fund, such as investment management and accounting fees.
Investment performance assumes reinvestment of all dividend and capital gain distributions. The results do not reflect the effect of taxes a shareholder would pay on Fund distributions or on the redemption of Fund shares. Historical performance attributed to the Institutional and Adviser Share Classes prior to their inception dates is based on the performance of the Retail Share Class. No adjustment has been made to reflect class-specific distribution or servicing fees. Returns may reflect the effect of voluntary fee waivers or expense reimbursements over the period shown. Without these waivers, performance would have been lower.
The performance data shown represents past performance, which does not guarantee future results. The investment return and principal value of an investment will fluctuate so that an investor’s shares, when redeemed, may be worth more or less than their original cost. Current performance may be lower or higher than the performance data quoted. For current month-end performance data, please visit our website at www.meederfunds.com.
Common Stock Sector Concentration
as of December 31, 2022
Information Technology | 25.6% |
Healthcare | 17.4% |
Financials | 14.5% |
Energy | 12.7% |
Consumer Discretionary | 11.2% |
Industrials | 8.6% |
Consumer Staples | 4.6% |
Materials | 2.9% |
Communication Services | 2.1% |
Utilities | 0.3% |
Real Estate Investment Trust | 0.1% |
Total | 100.0% |
As a percentage of total common stocks. Concentrations are subject to change.
Registered Investment Company Geographic Concentration
as of December 31, 2022
U.S. Fixed Income | 82.6% |
International Fixed Income | 17.4% |
Total | 100.0% |
As a percentage of total registered investment companies. Concentrations are subject to change.
Asset Allocation
as of December 31, 2022
Common Stocks (United States) | 21.6% |
Equity Registered Investment Companies | 5.9% |
Fixed Income Registered Investment Companies | 28.1% |
Money Market Registered Investment Companies | 44.2% |
Bank Obligations | 0.2% |
Other Assets/Liabilities (Net) | 0.0% |
Total | 100.0% |
As a percentage of total net assets. The Fund has invested in stock index futures contracts in order to equitize cash balances it holds in a proprietary money market fund.
Page 12 | 2022 Annual Report | December 31, 2022 |
Conservative Allocation Fund
The Meeder Conservative Allocation Fund Institutional Class returned –10.00% for the year ended December 31, 2022, compared to the Morningstar Conservative Target Risk Index benchmark return of –13.15%.
A portion (30%) of the fund uses our Defensive Equity strategy, which follows a rules-based and data-driven approach to using the Meeder Investment Positioning (IPS) model. This model is used to determine the reward relative to the risk of the stock market and identifies when a respective fund should be increasing or decreasing its equity allocation. The remaining portion (70%) of the fund is allocated to fixed income securities.
The Meeder Conservative Allocation Fund achieved positive performance relative to its benchmark in 2022, partially driven by the Defensive Equity Strategy and its underweight to equities and overweight to cash throughout the year. The Defensive Equity Strategy entered the year with a significant defensive position of 10% cash and a 20% allocation to equities. The Fund remained defensive for the entirety of the year, averaging only a 15% allocation to equity throughout 2022 and ending the year with a 15% equity allocation.
Our global equity allocation was a negative contributor to performance this year. The fund allocates to different regions of the global equity markets, including U.S., Developed International ex-US., and Emerging Markets. Within Conservative Allocation’s equity holdings, it maintained an overweight to U.S. and underweight to both Developed International ex-U.S. and Emerging Markets equities relative to its benchmark. Given the outperformance of international equities in 2022 compared to their U.S. counterparts, the fund’s global equity allocation detracted from performance.
The performance of our stock selection strategy was very positive in 2022. Within the U.S. portion of Conservative Allocation’s equity holdings, we use a proprietary equity selection model that selects stocks based on value, momentum, quality, stability, and sentiment factors. In general, we favor companies that display positive momentum relative to their peers, strong balance sheets, consistent earnings growth, along with attractive valuations and positive near-term sentiment. Our overweight to value stocks, along with our overweight to company’s displaying strong profitability, positively contributed to performance. From a sector perspective, the overweight to the Health Care and Energy sectors positively contributed to performance throughout the year, while the underweight to interest-rate sensitive sectors like Utilities and REITs also benefited performance.
While fixed income returns were negative, the Conservative Allocation Fund’s fixed income allocation outperformed the fixed income portion of the benchmark. The fund’s allocation to fixed income tactically shifts portfolio exposure utilizing quantitative models designed to actively manage credit quality, emerging market bond exposure, and duration of its holdings. In 2022, the Federal Reserve increased interest rates at its fastest rate in more than four decades. The historic rise in rates led to negative returns throughout the fixed income asset class. Despite the challenging environment, tactical shifts in the emerging market sector were a positive contributor to its outperformance. Relative to the benchmark, exposure to shorter duration bonds primarily benefited performance too.
In the fund, we will often use equity index derivatives, such as stock index futures, to efficiently equitize our cash positions as well as manage the equity exposure of the portfolio. Regarding equitizing cash positions, these derivatives are designed to track their respective stock index, so there was no discernible impact on the fund’s relative performance. The use of equity index futures to reduce equity exposure in the fund’s Defensive Equity exposure was additive to performance relative to the benchmark in 2022.
Investment Objective
The investment objective of the Fund is to provide income and long-term capital appreciation.
Average Annual Total Returns
as of December 31, 2022
| 1
Year | 5
Year | 10
Year | Share Class
Inception
Date |
Conservative Allocation Fund Retail Class | -10.24% | 1.39% | 4.95% | 6/21/95 |
Conservative Allocation Fund Institutional Class | -10.00% | 1.72% | 5.17% | 10/31/16 |
Conservative Allocation Fund Adviser Class | -9.94% | 1.69% | 5.15% | 10/31/16 |
Morningstar Conservative Target Risk Index | -13.15% | 1.38% | 2.38% | — |
Top 10 Holdings
as of December 31, 2022
1. | iShares Core U.S. Aggregate Bond ETF | 10.5% |
2. | iShares JP Morgan USD Emerging Markets Bond ETF | 8.4% |
3. | SPDR Bloomberg High Yield Bond ETF | 8.3% |
4. | Diamond Hill Short Duration Securitized Bond Fund - Class Y | 3.5% |
5. | PGIM Short-Term Corporate Bond Fund - Class Q | 3.4% |
6. | Segall Bryant & Hamill Plus Bond Fund - Class I | 2.5% |
7. | DoubleLine Total Return Bond Fund - Class I | 2.4% |
8. | Xtrackers USD High Yield Corporate Bond ETF | 2.1% |
9. | Baird Core Plus Bond Fund - Class I | 2.1% |
10. | Frost Total Return Bond Fund - Class I | 1.4% |
As a percentage of total net assets. Holdings exclude short-term investments and derivatives.
2022 Annual Report | December 31, 2022 | Page 13 |
Growth of $10,000
as of December 31, 2022

The Growth of $10,000 chart compares the performance of the Fund’s Retail Share Class over the period shown with dividends and capital gains reinvested to the Fund’s benchmark. Benchmark indices are unmanaged and do not reflect the deduction of expenses associated with a mutual fund, such as investment management and accounting fees.
Investment performance assumes reinvestment of all dividend and capital gain distributions. The results do not reflect the effect of taxes a shareholder would pay on Fund distributions or on the redemption of Fund shares. Historical performance attributed to the Institutional and Adviser Share Classes prior to their inception dates is based on the performance of the Retail Share Class. No adjustment has been made to reflect class-specific distribution or servicing fees. Returns may reflect the effect of voluntary fee waivers or expense reimbursements over the period shown. Without these waivers, performance would have been lower.
The performance data shown represents past performance, which does not guarantee future results. The investment return and principal value of an investment will fluctuate so that an investor’s shares, when redeemed, may be worth more or less than their original cost. Current performance may be lower or higher than the performance data quoted. For current month-end performance data, please visit our website at www.meederfunds.com.
Common Stock Sector Concentration
as of December 31, 2022
Information Technology | 21.1% |
Healthcare | 18.8% |
Energy | 16.1% |
Financials | 11.2% |
Consumer Discretionary | 11.1% |
Industrials | 10.3% |
Consumer Staples | 4.5% |
Communication Services | 3.8% |
Materials | 2.5% |
Utilities | 0.5% |
Real Estate Investment Trust | 0.1% |
Total | 100.0% |
As a percentage of total common stocks. Concentrations are subject to change.
Registered Investment Company Geographic Concentration
as of December 31, 2022
U.S. Fixed Income | 82.6% |
International Fixed Income | 17.4% |
Total | 100.0% |
As a percentage of total registered investment companies. Concentrations are subject to change.
Asset Allocation
as of December 31, 2022
Common Stocks (United States) | 14.7% |
Equity Registered Investment Companies | 8.3% |
Fixed Income Registered Investment Companies | 39.7% |
Money Market Registered Investment Companies | 37.0% |
Other Assets/Liabilities (Net) | 0.3% |
Total | 100.0% |
As a percentage of total net assets. The Fund has invested in stock index futures contracts in order to equitize cash balances it holds in a proprietary money market fund.
Page 14 | 2022 Annual Report | December 31, 2022 |
Dynamic Allocation Fund
The Meeder Dynamic Allocation Fund Institutional Class returned –15.26% for the year ended December 31, 2022, compared to the Morningstar Aggressive Target Risk Index benchmark return of –15.93%.
The Dynamic Allocation Fund maintains a more aggressive objective and remains nearly fully invested (95%) in the stock market. Our global equity allocation was a detractor to performance this year. The fund allocates to different regions of the global equity markets, including U.S., Developed International ex-US., and Emerging Markets. Within the Dynamic Allocation Fund’s equity holdings, it maintained an overweight to U.S. and underweight to both Developed International ex-U.S. and Emerging Markets equities relative to its benchmark. Given the outperformance of international equities in 2022 compared to their U.S. counterparts, the fund’s global equity allocation detracted from performance.
The performance of our stock selection strategy was very positive in 2022. Within the U.S. portion of the Dynamic Allocation Fund’s equity allocation, we use a proprietary equity selection model that selects stocks based on value, momentum, quality, stability, and sentiment factors. In general, we favor companies that display positive momentum relative to their peers, strong balance sheets, consistent earnings growth, along with attractive valuations and positive near-term sentiment. Our overweight to value stocks, along with our overweight to company’s displaying strong profitability, positively contributed to performance. From a sector perspective, the overweight to the Health Care and Energy sectors positively contributed to performance throughout the year, while the underweight to interest-rate sensitive sectors like Utilities and REITs also benefited performance.
A small portion of the fund (5%) is allocated to fixed income. While fixed income returns were negative, the Dynamic Allocation Fund’s fixed income allocation outperformed the fixed income portion of the benchmark. The fund’s allocation to fixed income tactically shifts portfolio exposure utilizing quantitative models designed to actively manage credit quality, emerging market bond exposure, and duration of its holdings. In 2022, the Federal Reserve increased interest rates at its fastest rate in more than four decades. The historic rise in rates led to negative returns throughout the fixed income asset class. Despite the challenging environment, tactical shifts in the emerging market sector were a positive contributor to its outperformance. Relative to the benchmark, exposure to shorter duration bonds primarily benefited performance too.
In the fund, we will often use equity index derivatives, such as stock index futures, to efficiently equitize our cash positions as well as manage the equity exposure of the portfolio. Regarding equitizing cash positions, these derivatives are designed to track their respective stock index, so there was no discernible impact on the fund’s relative performance.
Investment Objective
The investment objective of the Fund is to provide long-term capital appreciation.
Average Annual Total Returns
as of December 31, 2022
| 1
Year | 5
Year | 10
Year | Share Class
Inception
Date |
Dynamic Allocation Fund Retail Class | -15.53% | 5.70% | 9.22% | 2/29/00 |
Dynamic Allocation Fund Institutional Class | -15.26% | 6.11% | 9.47% | 10/31/16 |
Dynamic Allocation Fund Adviser Class | -15.23% | 6.04% | 9.42% | 10/31/16 |
Morningstar Aggressive Target Risk Index | -15.93% | 5.25% | 8.38% | — |
Top 10 Holdings
as of December 31, 2022
1. | Apple, Inc. | 4.2% |
2. | Microsoft Corp. | 3.9% |
3. | Berkshire Hathaway, Inc. | 3.6% |
4. | iShares Core U.S. Aggregate Bond ETF | 1.8% |
5. | Copart, Inc. | 1.6% |
6. | UnitedHealth Group, Inc. | 1.6% |
7. | Exxon Mobil Corp. | 1.4% |
8. | Johnson & Johnson | 1.3% |
9. | Chevron Corp. | 1.3% |
10. | Costco Wholesale Corp. | 1.1% |
As a percentage of total net assets. Holdings exclude short-term investments and derivatives.
2022 Annual Report | December 31, 2022 | Page 15 |
Growth of $10,000
as of December 31, 2022

The Growth of $10,000 chart compares the performance of the Fund’s Retail Share Class over the period shown with dividends and capital gains reinvested to the Fund’s benchmark. Benchmark indices are unmanaged and do not reflect the deduction of expenses associated with a mutual fund, such as investment management and accounting fees.
Investment performance assumes reinvestment of all dividend and capital gain distributions. The results do not reflect the effect of taxes a shareholder would pay on Fund distributions or on the redemption of Fund shares. Historical performance attributed to the Institutional and Adviser Share Classes prior to their inception dates is based on the performance of the Retail Share Class. No adjustment has been made to reflect class-specific distribution or servicing fees. Returns may reflect the effect of voluntary fee waivers or expense reimbursements over the period shown. Without these waivers, performance would have been lower.
The performance data shown represents past performance, which does not guarantee future results. The investment return and principal value of an investment will fluctuate so that an investor’s shares, when redeemed, may be worth more or less than their original cost. Current performance may be lower or higher than the performance data quoted. For current month-end performance data, please visit our website at www.meederfunds.com.
Common Stock Sector Concentration
as of December 31, 2022
Information Technology | 26.4% |
Healthcare | 18.2% |
Consumer Discretionary | 13.8% |
Financials | 13.0% |
Industrials | 9.2% |
Energy | 9.2% |
Consumer Staples | 4.0% |
Materials | 3.5% |
Communication Services | 2.2% |
Utilities | 0.4% |
Real Estate Investment Trust | 0.1% |
Total | 100.0% |
As a percentage of total common stocks. Concentrations are subject to change.
Registered Investment Company Geographic Concentration
as of December 31, 2022
U.S. Fixed Income | 71.6% |
International Fixed Income | 15.6% |
International Equity | 12.8% |
Total | 100.0% |
As a percentage of total registered investment companies. Concentrations are subject to change.
Asset Allocation
as of December 31, 2022
Common Stocks (United States) | 70.1% |
Fixed Income Registered Investment Companies | 2.4% |
Equity Registered Investment Companies | 1.1% |
Money Market Registered Investment Companies | 25.4% |
Bank Obligations | 0.2% |
Other Assets/Liabilities (Net) | 0.8% |
Total | 100.0% |
As a percentage of total net assets. The Fund has invested in stock index futures contracts in order to equitize cash balances it holds in a proprietary money market fund.
Page 16 | 2022 Annual Report | December 31, 2022 |
Quantex Fund
The Meeder Quantex Fund Institutional Class returned –13.58% for the year ended December 31, 2022, compared to the S&P MidCap 400 Index benchmark return of –13.06%.
The fund maintains a more aggressive objective and remains fully invested (100%) in the U.S. stock market, primarily in U.S. midcap stocks. While the fund utilizes a quantitative strategy to identify small- and mid-cap stocks that have significant growth potential, it can also tactically allocate up to 40% of the portfolio to U.S. large-cap equities based on our expectations of market cap segments.
The performance of our stock selection strategy for this fund was favorable in 2022, allowing the fund to outperform its benchmark. With value stocks outperforming, the fund’s holdings in the Energy sector were profitable, including positions in ConocoPhillips, Marathon Oil, and APA Corp. Our underweight to Software and Equity REITs also positively contributed to performance. Travel stocks, including Wynn Resorts and Norwegian Cruise Line Holdings were among the largest detractors during the year. The Fund’s tactical allocation to U.S. large-cap equities during the year detracted from performance. This was primarily related to a strong year from U.S. mid-cap equities, which outpaced both their U.S. large- and small-cap peers.
In the fund, we will often use equity index derivatives, such as stock index futures, to efficiently equitize our cash positions as well as manage the equity exposure of the portfolio. Regarding equitizing cash positions, these derivatives are designed to track their respective stock index, so there was no discernible impact on the fund’s relative performance.
Investment Objective
The investment objective of the Fund is to provide long-term capital appreciation.
Average Annual Total Returns
as of December 31, 2022
| 1
Year | 5
Year | 10
Year | Share Class
Inception
Date |
Quantex Fund Retail Class | -13.75% | 1.54% | 7.90% | 3/20/85 |
Quantex Fund Institutional Class | -13.58% | 1.78% | 8.08% | 10/31/16 |
Quantex Fund Adviser Class | -13.55% | 1.72% | 8.03% | 10/31/16 |
S&P MidCap 400 Index | -13.06% | 6.71% | 10.78% | — |
Russell 2000 Index | -20.44% | 4.13% | 9.01% | — |
Top 10 Holdings
as of December 31, 2022
1. | Quanta Services, Inc. | 1.0% |
2. | AES Corp./The | 0.9% |
3. | Howmet Aerospace, Inc. | 0.9% |
4. | Lamb Weston Holdings, Inc. | 0.9% |
5. | Leidos Holdings, Inc. | 0.9% |
6. | FMC Corp. | 0.9% |
7. | Huntington Ingalls Industries, Inc. | 0.9% |
8. | Cardinal Health, Inc. | 0.9% |
9. | Rollins, Inc. | 0.9% |
10. | Mosaic Co./The | 0.9% |
As a percentage of total net assets. Holdings exclude short-term investments and derivatives.
2022 Annual Report | December 31, 2022 | Page 17 |
Growth of $10,000
as of December 31, 2022
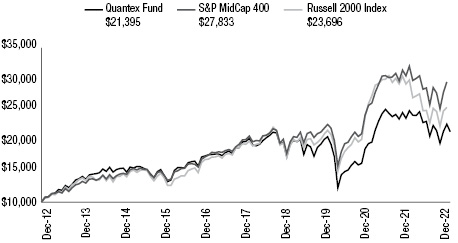
The Growth of $10,000 chart compares the performance of the Fund’s Retail Share Class over the period shown with dividends and capital gains reinvested to the Fund’s benchmarks. Benchmark indices are unmanaged and do not reflect the deduction of expenses associated with a mutual fund, such as investment management and accounting fees.
Investment performance assumes reinvestment of all dividend and capital gain distributions. The results do not reflect the effect of taxes a shareholder would pay on Fund distributions or on the redemption of Fund shares. Historical performance attributed to the Institutional and Adviser Share Classes prior to their inception dates is based on the performance of the Retail Share Class. No adjustment has been made to reflect class-specific distribution or servicing fees. Returns may reflect the effect of voluntary fee waivers or expense reimbursements over the period shown. Without these waivers, performance would have been lower.
The performance data shown represents past performance, which does not guarantee future results. The investment return and principal value of an investment will fluctuate so that an investor’s shares, when redeemed, may be worth more or less than their original cost. Current performance may be lower or higher than the performance data quoted. For current month-end performance data, please visit our website at www.meederfunds.com.
Common Stock Sector Concentration
as of December 31, 2022
Industrials | 18.0% |
Financials | 13.3% |
Consumer Discretionary | 12.3% |
Information Technology | 11.4% |
Utilities | 8.4% |
Materials | 8.1% |
Healthcare | 7.4% |
Real Estate Investment Trust | 6.5% |
Consumer Staples | 5.4% |
Communication Services | 5.1% |
Energy | 4.1% |
Total | 100.0% |
As a percentage of total common stocks. Concentrations are subject to change.
Asset Allocation
as of December 31, 2022
Common Stocks (United States) | 61.0% |
Money Market Registered Investment Companies | 37.1% |
Other Assets/Liabilities (Net) | 1.9% |
Total | 100.0% |
As a percentage of total net assets. The Fund has invested in stock index futures contracts in order to equitize cash balances it holds in a proprietary money market fund.
Page 18 | 2022 Annual Report | December 31, 2022 |
Tactical Income Fund
The Meeder Tactical Income Institutional Class returned –5.70% for the year ended December 31, 2022, compared to the Bloomberg U.S. Treasury Bill 1-3 Month Index benchmark return of 1.52%.
This fund tactically shifts portfolio exposure utilizing quantitative models designed to actively manage the credit quality, emerging market bond exposure, and duration of U.S. Treasury holdings. In 2022, the Federal Reserve increased interest rates at its fastest rate in more than four decades. The historic rise in rates led to negative returns throughout the fixed income asset class. While the Fund performed favorable relative to its peer group average, relative to the Bloomberg U.S. Treasury Bill 1-3 Month Index benchmark, exposure to longer duration securities, high yield and emerging markets sectors detracted from performance.
Investment Objective
The investment objective of the Fund is to provide long-term total return and income.
Average Annual Total Returns
as of December 31, 2022
| 1
Year | 5
Year | 10
Year | Share Class
Inception
Date |
Tactical Income Fund Retail Class | -5.99% | 0.86% | 1.16% | 6/30/11 |
Tactical Income Fund Institutional Class | -5.70% | 1.25% | 1.41% | 10/31/16 |
Tactical Income Fund Adviser Class | -5.65% | 1.20% | 1.37% | 10/31/16 |
Bloomberg U.S. Treasury Bill 1-3 Month Total Return Index | 1.52% | 1.22% | 0.73% | — |
Top 10 Holdings
as of December 31, 2022
1. | iShares Core 1-5 Year USD Bond ETF | 19.7% |
2. | iShares JP Morgan USD Emerging Markets Bond ETF | 11.9% |
3. | SPDR Bloomberg High Yield Bond ETF | 11.9% |
4. | BBH Limited Duration Fund - Class I | 7.0% |
5. | iShares Trust iShares 1-5 Year Investment Grade Corporate Bond ETF | 5.8% |
6. | Diamond Hill Short Duration Securitized Bond Fund - Class Y | 3.1% |
7. | Xtrackers USD High Yield Corporate Bond ETF | 3.0% |
8. | Frost Total Return Bond Fund - Class I | 2.5% |
9. | iShares Core U.S. Aggregate Bond ETF | 2.0% |
10. | PGIM Short-Term Corporate Bond Fund - Class Q | 1.4% |
As a percentage of total net assets. Holdings exclude short-term investments and derivatives.
2022 Annual Report | December 31, 2022 | Page 19 |
Growth of $10,000
as of December 31, 2022
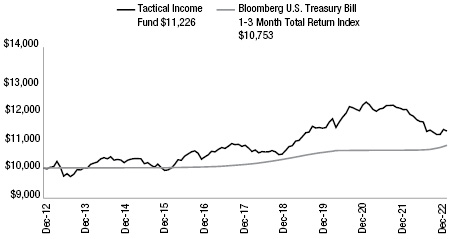
The Growth of $10,000 chart compares the performance of the Fund’s Retail Share Class over the period shown with dividends and capital gains reinvested to the Fund’s benchmark. Benchmark indices are unmanaged and do not reflect the deduction of expenses associated with a mutual fund, such as investment management and accounting fees.
Investment performance assumes reinvestment of all dividend and capital gain distributions. The results do not reflect the effect of taxes a shareholder would pay on Fund distributions or on the redemption of Fund shares. Historical performance attributed to the Institutional and Adviser Share Classes prior to their inception dates is based on the performance of the Retail Share Class. No adjustment has been made to reflect class-specific distribution or servicing fees. Returns may reflect the effect of voluntary fee waivers or expense reimbursements over the period shown. Without these waivers, performance would have been lower.
The performance data shown represents past performance, which does not guarantee future results. The investment return and principal value of an investment will fluctuate so that an investor’s shares, when redeemed, may be worth more or less than their original cost. Current performance may be lower or higher than the performance data quoted. For current month-end performance data, please visit our website at www.meederfunds.com.
Fixed Income Sector Concentration
as of December 31, 2022
Investment Grade | 68.3% |
Cash & Equivalents | 31.7% |
Total | 100.0% |
As a percentage of total fixed income securities. Concentrations are subject to change.
Page 20 | 2022 Annual Report | December 31, 2022 |
Institutional Prime Money Market Fund
The Meeder Institutional Prime Money Market Fund (the Fund) reported a 7-day net yield of 4.36% as of December 31, 2022. The total return for the Fund was 1.63% for the full year period.
The Fund offers a floating net asset value (FNAV). A FNAV fund is characterized by a net asset value which could vary incrementally above or below $1.0000 per share. The objective of this fund is to maintain a FNAV near $1.0000 per share while offering a safe investment vehicle and competitive returns to shareholders. A FNAV was reported at year-end 2022 as $1.0000. The advisor to the Fund accomplished the objective by investing in short-term, high-quality money market debt obligations. Money market debt obligations may be offered by the U.S. Government and its agencies but may also include obligations of fundamentally sound corporate issuers.
Over the years, investors have demonstrated confidence in the money market fund industry because of two key features. Safety and liquidity are at the core of money fund investment strategy. Safety is expressed through the selection of investments which are anticipated to provide minimal principal volatility. While liquidity is generated by maintaining high quality investments and ample funds to accommodate investor requests to redeem shares. These attributes proved important once again as the industry faced a long-awaited shift in the Federal Open Market Committee’s (FOMC) interest rate policy. Early in 2022 the FOMC embarked on an aggressive restrictive monetary policy stance to combat accelerating inflation.
Throughout 2022, the FOMC increased its target interest rate 4.25% over the course of nine months. To accommodate the shift in policy, the advisor adopted a strategy to increase investments with shorter average maturities. This was additive to performance and supported the objective of minimizing downward pressure on the FNAV. Prior to the FOMC meeting in March 2022, the Fund reported a 7-day net yield of 0.05% versus a year end rate of 4.36%. In similar fashion, the Fund’s FNAV was $0.9993 prior to the FOMC’s March movement while ending the year at $1.0000. The shorter average maturity of the fund allowed faster reinvestment of maturing proceeds in order to take advantage of base interest rates moving higher. The average maturity of the Fund was managed down from 35 days to 15 days.
The advisor addressed fund safety directly through a strategy focused on exceeding required liquidity limits and investing in securities which historically perform favorably in the aforementioned interest rate environment. The Fund maintained daily liquid assets of nearly 30% and weekly liquid assets of almost 50%. This far exceed required levels of 10% and 30%, respectively. Investments which added value to the portfolio were purchased with shorter average maturities.
As we move forward, our efforts will be focused on any supplementary monetary adjustments by the FOMC and the resulting impact of these actions may have on the economy. The strategies implemented in 2022, we believe, were prudent and provided shareholders with exceptional safety as interest rates moved higher. Currently, we believe the Fund should be positioned to maintain stability through 2023. In the event our view changes, we will review our strategy relative to market opportunities and act in the best interest of our shareholders.
Investment Objective
The investment objective of the Fund is to provide current income consistent with liquidity and the preservation of capital.
Average Annual Total Returns
as of December 31, 2022
| 1
Year | 5
Year | 10
Year |
Institutional Prime Money Market Fund | 1.63% | 1.29% | 0.81% |
Yields
as of December 31, 2022
| | 7-Day
Subsidized
Yield | 7-Day
Unsubsidized
Yield |
Institutional Prime Money Market Fund | 4.36% | 4.09% |
Top 10 Holdings
as of December 31, 2022
1. | Federated Hermes Government Obligations Fund, 4.15% | 10.6% |
2. | StoneX Repo, 4.48%, due 1/3/2023 | 7.2% |
3. | Truist Repo, 4.34%, due 1/3/2023 | 7.2% |
4. | South Street Repo, 4.33%, due 1/3/2023 | 6.5% |
5. | Halkin Finance, LLC, 4.31%, 1/3/2023 | 2.9% |
6. | Anglesea Funding, 4.37%, 2/1/2023 | 2.6% |
7. | Anglesea Funding, 4.43%, 2/7/2023 | 2.4% |
8. | South Street Repo, 4.28%, due 1/3/2023 | 2.2% |
9. | Halkin Finance, LLC, 4.32%, 1/5/2023 | 2.2% |
10. | ANZ New Zealand Int’l, LTD, 4.88%, 1/5/2023 | 1.8% |
As a percentage of total net assets.
2022 Annual Report | December 31, 2022 | Page 21 |
Investment performance assumes reinvestment of all dividend and capital gain distributions. The results do not reflect the effect of taxes a shareholder would pay on Fund distributions or on the redemption of Fund shares. The Fund’s performance prior to October 7, 2016 reflects the performance of a predecessor fund, the Institutional Class of the Meeder Prime Money Market Fund, which was distributed and transferred to the Institutional Prime Money Market Fund upon its inception. The subsidized 7-day current yield is the current annualized net yield of the Fund. The unsubsidized 7-day current yield does not reflect the effect of any fee waivers or expense reimbursements made by the Fund’s investment adviser. The 7-day current yield more closely reflects the current earnings of the Fund than total return.
You could lose money by investing in the Fund. Because the share price of the Fund will fluctuate, when you sell your shares they may be worth more or less than what you originally paid for them. The Fund may impose a fee upon sale of your shares or may temporarily suspend your ability to sell shares if the Fund’s liquidity falls below required minimums because of market conditions or other factors. An investment in the Fund is not insured or guaranteed by the Federal Deposit Insurance Corporation or any other government agency. The Fund’s sponsor has no legal obligation to provide financial support to the Fund, and you should not expect that the sponsor will provide financial support to the Fund at any time.
Sector Concentration
as of December 31, 2022
Commercial Paper | 31.8% |
Certificates of Deposit | 31.6% |
Repurchase Agreements | 23.1% |
Money Market Registered Investment Companies | 10.6% |
Corporate Obligations | 2.2% |
Variable Rate Demand Notes | 0.9% |
Other Assets/Liabilities (Net) | -0.2% |
Total | 100.0% |
As a percentage of total net assets. Concentrations are subject to change.
Page 22 | 2022 Annual Report | December 31, 2022 |
2022 Annual Report
Fund Holdings & Financial Statements
Schedules of Investments
December 31, 2022
Muirfield Fund |
Security Description | | Shares,
Contracts
or Principal
Amount ($) | | | Fair
Value ($) | |
Common Stocks (United States) — 57.2% |
Communication Services — 2.2% | | | | | | | | |
Alphabet, Inc. (1) | | | 89,979 | | | | 7,983,837 | |
AT&T, Inc. | | | 192 | | | | 3,535 | |
Cable One, Inc. | | | 136 | | | | 96,813 | |
Comcast Corp. | | | 14,624 | | | | 511,401 | |
Entravision Communications Corp. | | | 1,883 | | | | 9,038 | |
IDT Corp. (1) | | | 16,073 | | | | 452,776 | |
Liberty TripAdvisor Holdings, Inc. (1) | | | 8,364 | | | | 5,601 | |
Meta Platforms, Inc. (1) | | | 8,412 | | | | 1,012,300 | |
Netflix, Inc. (1) | | | 283 | | | | 83,451 | |
Roku, Inc. (1) | | | 5,846 | | | | 237,932 | |
Telephone and Data Systems, Inc. | | | 3,121 | | | | 32,739 | |
T-Mobile US, Inc. (1) | | | 21,221 | | | | 2,970,940 | |
Trade Desk, Inc./The (1) | | | 8,551 | | | | 383,341 | |
Verizon Communications, Inc. | | | 802 | | | | 31,599 | |
| | | | | | | | 13,815,303 | |
| | | | | | | | | |
Consumer Discretionary — 7.7% | | | | | | | | |
ADT, Inc. | | | 769 | | | | 6,975 | |
Amazon.com, Inc. (1) | | | 5,647 | | | | 474,348 | |
AutoZone, Inc. (1) | | | 559 | | | | 1,378,595 | |
Best Buy Co., Inc. | | | 29,266 | | | | 2,347,426 | |
Bloomin’ Brands, Inc. | | | 2,397 | | | | 48,228 | |
Booking Holdings, Inc. (1) | | | 817 | | | | 1,646,484 | |
BorgWarner, Inc. | | | 32,732 | | | | 1,317,463 | |
Buckle, Inc./The | | | 1,116 | | | | 50,611 | |
Burlington Stores, Inc. (1) | | | 4,763 | | | | 965,746 | |
Cavco Industries, Inc. (1) | | | 160 | | | | 36,200 | |
Chegg, Inc. (1) | | | 15,741 | | | | 397,775 | |
Citi Trends, Inc. (1) | | | 732 | | | | 19,383 | |
Dana, Inc. | | | 3,684 | | | | 55,739 | |
Dillard’s, Inc. | | | 11 | | | | 3,555 | |
DR Horton, Inc. | | | 24,027 | | | | 2,141,767 | |
Everi Holdings, Inc. (1) | | | 566 | | | | 8,122 | |
Frontdoor, Inc. (1) | | | 3,994 | | | | 83,075 | |
Garmin, Ltd. | | | 12,011 | | | | 1,108,495 | |
Gentex Corp. | | | 1,391 | | | | 37,933 | |
Genuine Parts Co. | | | 94 | | | | 16,310 | |
Goodyear Tire & Rubber Co./The (1) | | | 9,741 | | | | 98,871 | |
Grand Canyon Education, Inc. (1) | | | 15,214 | | | | 1,607,511 | |
Green Brick Partners, Inc. (1) | | | 453 | | | | 10,976 | |
Helen of Troy, Ltd. (1) | | | 97 | | | | 10,758 | |
Home Depot, Inc./The | | | 7,236 | | | | 2,285,563 | |
La-Z-Boy, Inc. | | | 288 | | | | 6,572 | |
Lear Corp. | | | 133 | | | | 16,495 | |
Lennar Corp. | | | 25,161 | | | | 2,277,071 | |
Muirfield Fund |
Security Description | | Shares,
Contracts
or Principal
Amount ($) | | | Fair
Value ($) | |
Common Stocks (United States) — continued |
Lions Gate Entertainment Corp. (1) | | | 496 | | | | 2,698 | |
Lithia Motors, Inc. | | | 328 | | | | 67,155 | |
LKQ Corp. | | | 9,583 | | | | 511,828 | |
Lowe’s Cos., Inc. | | | 4,388 | | | | 874,265 | |
Lululemon Athletica, Inc. (1) | | | 7,862 | | | | 2,518,828 | |
M/I Homes, Inc. (1) | | | 16,719 | | | | 772,083 | |
Macy’s, Inc. | | | 94,043 | | | | 1,941,988 | |
Malibu Boats, Inc. (1) | | | 63 | | | | 3,358 | |
MasterCraft Boat Holdings, Inc. (1) | | | 1,033 | | | | 26,724 | |
McDonald’s Corp. | | | 3,447 | | | | 908,388 | |
MDC Holdings, Inc. | | | 123 | | | | 3,887 | |
Meritage Homes Corp. (1) | | | 1,677 | | | | 154,619 | |
Mohawk Industries, Inc. (1) | | | 9,216 | | | | 942,060 | |
National Vision Holdings, Inc. (1) | | | 907 | | | | 35,155 | |
Newell Brands, Inc. | | | 428 | | | | 5,598 | |
NVR, Inc. (1) | | | 102 | | | | 470,483 | |
ONE Group Hospitality, Inc./The (1) | | | 3,356 | | | | 21,143 | |
O’Reilly Automotive, Inc. (1) | | | 2,583 | | | | 2,180,129 | |
Patrick Industries, Inc. | | | 375 | | | | 22,725 | |
PulteGroup, Inc. | | | 7,378 | | | | 335,920 | |
PVH Corp. | | | 8,357 | | | | 589,921 | |
Qurate Retail, Inc. (1) | | | 7,934 | | | | 12,932 | |
Red Rock Resorts, Inc. | | | 177 | | | | 7,082 | |
Rent-A-Center, Inc./TX | | | 533 | | | | 12,019 | |
Ross Stores, Inc. | | | 6,699 | | | | 777,553 | |
Skyline Champion Corp. (1) | | | 26,489 | | | | 1,364,448 | |
Sleep Number Corp. (1) | | | 2,013 | | | | 52,298 | |
Smith & Wesson Brands, Inc. | | | 9,621 | | | | 83,510 | |
Starbucks Corp. | | | 24,903 | | | | 2,470,378 | |
Tapestry, Inc. | | | 6,717 | | | | 255,783 | |
Target Corp. | | | 3,187 | | | | 474,990 | |
Tempur Sealy International, Inc. | | | 7,965 | | | | 273,438 | |
Texas Roadhouse, Inc. | | | 9,406 | | | | 855,476 | |
TJX Cos., Inc./The | | | 37,014 | | | | 2,946,314 | |
Toll Brothers, Inc. | | | 8,169 | | | | 407,796 | |
Town Sports International Holdings, Inc. (1)(5) | | | 4,613 | | | | 0 | |
Tractor Supply Co. | | | 2,478 | | | | 557,476 | |
TravelCenters of America, Inc. (1) | | | 138 | | | | 6,180 | |
Tupperware Brands Corp. (1) | | | 19,775 | | | | 81,869 | |
Ulta Beauty, Inc. (1) | | | 5,773 | | | | 2,707,941 | |
Universal Electronics, Inc. (1) | | | 328 | | | | 6,826 | |
Whirlpool Corp. | | | 14,881 | | | | 2,105,066 | |
Wingstop, Inc. | | | 1,410 | | | | 194,044 | |
Yum! Brands, Inc. | | | 18,166 | | | | 2,326,701 | |
Zumiez, Inc. (1) | | | 432 | | | | 9,392 | |
| | | | | | | | 48,836,514 | |
The accompanying notes are an integral part of these financial statements.
Page 24 | 2022 Annual Report | December 31, 2022 |
Schedules of Investments
December 31, 2022
Muirfield Fund |
Security Description | | Shares,
Contracts
or Principal
Amount ($) | | | Fair
Value ($) | |
Common Stocks (United States) — continued |
Consumer Staples — 2.5% | | | | | | | | |
Archer-Daniels-Midland Co. | | | 26,252 | | | | 2,437,498 | |
Bunge, Ltd. | | | 11,407 | | | | 1,138,076 | |
Calavo Growers, Inc. | | | 200 | | | | 5,880 | |
Casey’s General Stores, Inc. | | | 979 | | | | 219,639 | |
Coca-Cola Co./The | | | 32,556 | | | | 2,070,887 | |
Coca-Cola Consolidated, Inc. | | | 16 | | | | 8,198 | |
Costco Wholesale Corp. | | | 1,666 | | | | 760,529 | |
Flowers Foods, Inc. | | | 1,313 | | | | 37,736 | |
General Mills, Inc. | | | 21,255 | | | | 1,782,232 | |
Ingles Markets, Inc. | | | 204 | | | | 19,678 | |
Ingredion, Inc. | | | 3,637 | | | | 356,171 | |
John B Sanfilippo & Son, Inc. | | | 47 | | | | 3,822 | |
Kimberly-Clark Corp. | | | 2,564 | | | | 348,063 | |
Kraft Heinz Co./The | | | 394 | | | | 16,040 | |
Kroger Co./The | | | 953 | | | | 42,485 | |
Lamb Weston Holdings, Inc. | | | 4,625 | | | | 413,290 | |
Molson Coors Beverage Co. | | | 2,574 | | | | 132,612 | |
Mondelez International, Inc. | | | 13,544 | | | | 902,708 | |
PepsiCo, Inc. | | | 17,205 | | | | 3,108,255 | |
Pilgrim’s Pride Corp. (1) | | | 934 | | | | 22,164 | |
Simply Good Foods Co./The (1) | | | 1,304 | | | | 49,591 | |
Tyson Foods, Inc. | | | 19,769 | | | | 1,230,620 | |
Walmart, Inc. | | | 6,873 | | | | 974,523 | |
| | | | | | | | 16,080,697 | |
| | | | | | | | | |
Energy — 8.3% | | | | | | | | |
Alto Ingredients, Inc. (1) | | | 1,605 | | | | 4,622 | |
Antero Midstream Corp. | | | 784 | | | | 8,459 | |
Antero Resources Corp. (1) | | | 394 | | | | 12,210 | |
APA Corp. | | | 9,056 | | | | 422,734 | |
Arch Resources, Inc. | | | 194 | | | | 27,701 | |
Baker Hughes Co. | | | 297 | | | | 8,770 | |
Berry Corp. | | | 2,368 | | | | 18,944 | |
Bristow Group, Inc. (1) | | | 2,574 | | | | 69,833 | |
California Resources Corp. | | | 2,985 | | | | 129,877 | |
Callon Petroleum Co. (1) | | | 251 | | | | 9,310 | |
Centrus Energy Corp. (1) | | | 5,482 | | | | 178,055 | |
ChampionX Corp. | | | 337 | | | | 9,770 | |
Cheniere Energy, Inc. | | | 11,704 | | | | 1,755,132 | |
Chesapeake Energy Corp. | | | 5,074 | | | | 478,833 | |
Chevron Corp. | | | 61,056 | | | | 10,958,941 | |
Chord Energy Corp. | | | 169 | | | | 23,121 | |
Civitas Resources, Inc. | | | 998 | | | | 57,814 | |
Comstock Resources, Inc. | | | 433 | | | | 5,936 | |
ConocoPhillips | | | 28,530 | | | | 3,366,540 | |
Muirfield Fund |
Security Description | | Shares,
Contracts
or Principal
Amount ($) | | | Fair
Value ($) | |
Common Stocks (United States) — continued |
Coterra Energy, Inc. | | | 886 | | | | 21,769 | |
CVR Energy, Inc. | | | 470 | | | | 14,730 | |
Delek US Holdings, Inc. | | | 915 | | | | 24,705 | |
Denbury, Inc. (1) | | | 434 | | | | 37,767 | |
Devon Energy Corp. | | | 3,663 | | | | 225,311 | |
Diamondback Energy, Inc. | | | 2,954 | | | | 404,048 | |
Dorian LPG, Ltd. | | | 270 | | | | 5,117 | |
DT Midstream, Inc. | | | 7,021 | | | | 387,980 | |
EOG Resources, Inc. | | | 21,993 | | | | 2,848,533 | |
EQT Corp. | | | 6,771 | | | | 229,063 | |
Exxon Mobil Corp. | | | 98,130 | | | | 10,823,739 | |
FLEX LNG, Ltd. | | | 588 | | | | 19,222 | |
Golar LNG, Ltd. (1) | | | 826 | | | | 18,825 | |
Halliburton Co. | | | 311 | | | | 12,238 | |
Hess Corp. | | | 3,825 | | | | 542,462 | |
HF Sinclair Corp. | | | 1,857 | | | | 96,360 | |
International Seaways, Inc. | | | 155 | | | | 5,738 | |
Kinder Morgan, Inc. | | | 1,272 | | | | 22,998 | |
Kinetik Holdings, Inc. | | | 209 | | | | 6,914 | |
Laredo Petroleum, Inc. (1) | | | 429 | | | | 22,059 | |
Magnolia Oil & Gas Corp. | | | 936 | | | | 21,949 | |
Marathon Oil Corp. | | | 337 | | | | 9,123 | |
Marathon Petroleum Corp. | | | 32,363 | | | | 3,766,730 | |
Matador Resources Co. | | | 2,210 | | | | 126,500 | |
Murphy Oil Corp. | | | 425 | | | | 18,279 | |
New Fortress Energy, Inc. | | | 6,752 | | | | 286,420 | |
Northern Oil and Gas, Inc. | | | 388 | | | | 11,958 | |
Occidental Petroleum Corp. | | | 8,886 | | | | 559,729 | |
ONEOK, Inc. | | | 41,184 | | | | 2,705,789 | |
Ovintiv, Inc. | | | 9,397 | | | | 476,522 | |
Par Pacific Holdings, Inc. (1) | | | 190 | | | | 4,418 | |
PBF Energy, Inc. | | | 416 | | | | 16,964 | |
Peabody Energy Corp. (1) | | | 502 | | | | 13,263 | |
Phillips 66 | | | 29,982 | | | | 3,120,527 | |
Pioneer Natural Resources Co. | | | 12,789 | | | | 2,920,880 | |
ProPetro Holding Corp. (1) | | | 746 | | | | 7,736 | |
Range Resources Corp. | | | 1,068 | | | | 26,721 | |
REX American Resources Corp. (1) | | | 273 | | | | 8,698 | |
SandRidge Energy, Inc. (1) | | | 406 | | | | 6,914 | |
Schlumberger, Ltd. | | | 23,934 | | | | 1,279,512 | |
Scorpio Tankers, Inc. | | | 404 | | | | 21,723 | |
SilverBow Resources, Inc. (1) | | | 447 | | | | 12,641 | |
Sitio Royalties Corp. | | | 454 | | | | 13,098 | |
SM Energy Co. | | | 1,906 | | | | 66,386 | |
Targa Resources Corp. | | | 11,739 | | | | 862,817 | |
The accompanying notes are an integral part of these financial statements.
2022 Annual Report | December 31, 2022 | Page 25 |
Schedules of Investments
December 31, 2022
Muirfield Fund |
Security Description | | Shares,
Contracts
or Principal
Amount ($) | | | Fair
Value ($) | |
Common Stocks (United States) — continued |
Teekay Corp. (1) | | | 3,592 | | | | 16,308 | |
Valero Energy Corp. | | | 20,992 | | | | 2,663,045 | |
Williams Cos., Inc./The | | | 1,636 | | | | 53,824 | |
World Fuel Services Corp. | | | 2,737 | | | | 74,802 | |
| | | | | | | | 52,489,456 | |
| | | | | | | | | |
Financials — 5.0% | | | | | | | | |
Affiliated Managers Group, Inc. | | | 483 | | | | 76,522 | |
Aflac, Inc. | | | 3,120 | | | | 224,453 | |
Ally Financial, Inc. | | | 2,068 | | | | 50,563 | |
American Equity Investment Life Holding Co. | | | 13,196 | | | | 602,002 | |
American Financial Group, Inc./OH | | | 2,404 | | | | 330,021 | |
American International Group, Inc. | | | 15,666 | | | | 990,718 | |
Aon PLC | | | 26 | | | | 7,804 | |
Apollo Global Management, Inc. | | | 16,737 | | | | 1,067,653 | |
Axis Capital Holdings, Ltd. | | | 380 | | | | 20,585 | |
Bank of New York Mellon Corp./The | | | 16,526 | | | | 752,264 | |
Bank OZK | | | 1,494 | | | | 59,850 | |
Berkshire Hathaway, Inc. (1) | | | 23,961 | | | | 7,401,553 | |
Capital One Financial Corp. | | | 10,800 | | | | 1,003,968 | |
Charles Schwab Corp./The | | | 41,324 | | | | 3,440,636 | |
Chubb, Ltd. | | | 3,213 | | | | 708,788 | |
East West Bancorp, Inc. | | | 15,251 | | | | 1,005,041 | |
Essent Group, Ltd. | | | 15,187 | | | | 590,471 | |
Evercore, Inc. | | | 239 | | | | 26,070 | |
F&G Annuities & Life, Inc. | | | 1,684 | | | | 33,697 | |
Fidelity National Financial, Inc. | | | 24,779 | | | | 932,186 | |
First American Financial Corp. | | | 376 | | | | 19,680 | |
Green Dot Corp. (1) | | | 1,999 | | | | 31,624 | |
Hartford Financial Services Group, Inc./The | | | 5,375 | | | | 407,586 | |
Huntington Bancshares, Inc./OH | | | 531 | | | | 7,487 | |
Independent Bank Corp. | | | 47 | | | | 3,968 | |
Jackson Financial, Inc. | | | 1,574 | | | | 54,759 | |
LendingTree, Inc. (1) | | | 4,438 | | | | 94,663 | |
Loews Corp. | | | 447 | | | | 26,074 | |
LPL Financial Holdings, Inc. | | | 3,756 | | | | 811,935 | |
MarketAxess Holdings, Inc. | | | 14 | | | | 3,904 | |
Marsh & McLennan Cos., Inc. | | | 19,167 | | | | 3,171,755 | |
Medley Management, Inc. (1)(5) | | | 235 | | | | 0 | |
Moelis & Co. | | | 4,017 | | | | 154,132 | |
Mr Cooper Group, Inc. (1) | | | 1,315 | | | | 52,771 | |
New York Community Bancorp, Inc. | | | 3,878 | | | | 33,351 | |
NMI Holdings, Inc. (1) | | | 4,033 | | | | 84,290 | |
Northern Trust Corp. | | | 1,552 | | | | 137,336 | |
OFG Bancorp | | | 257 | | | | 7,083 | |
Muirfield Fund |
Security Description | | Shares,
Contracts
or Principal
Amount ($) | | | Fair
Value ($) | |
Common Stocks (United States) — continued |
Old Republic International Corp. | | | 3,598 | | | | 86,892 | |
Pathward Financial, Inc. | | | 6,010 | | | | 258,731 | |
Radian Group, Inc. | | | 1,227 | | | | 23,399 | |
Regions Financial Corp. | | | 12,226 | | | | 263,593 | |
Reinsurance Group of America, Inc. | | | 1,834 | | | | 260,593 | |
RLI Corp. | | | 53 | | | | 6,957 | |
SEI Investments Co. | | | 705 | | | | 41,102 | |
State Street Corp. | | | 8,972 | | | | 695,958 | |
Stewart Information Services Corp. | | | 15,866 | | | | 677,954 | |
Synchrony Financial | | | 38,982 | | | | 1,280,949 | |
Unum Group | | | 406 | | | | 16,658 | |
Valley National Bancorp | | | 320 | | | | 3,619 | |
Virtus Investment Partners, Inc. | | | 42 | | | | 8,040 | |
W R Berkley Corp. | | | 4,183 | | | | 303,560 | |
Walker & Dunlop, Inc. | | | 6,233 | | | | 489,166 | |
Waterstone Financial, Inc. | | | 418 | | | | 7,206 | |
Willis Towers Watson PLC | | | 11,421 | | | | 2,793,348 | |
WSFS Financial Corp. | | | 156 | | | | 7,073 | |
Zions Bancorp NA | | | 3,518 | | | | 172,945 | |
| | | | | | | | 31,824,986 | |
| | | | | | | | | |
Healthcare — 9.4% | | | | | | | | |
Abbott Laboratories | | | 4,591 | | | | 504,046 | |
AbbVie, Inc. | | | 27,218 | | | | 4,398,701 | |
AmerisourceBergen Corp. | | | 1,541 | | | | 255,359 | |
Amgen, Inc. | | | 3,697 | | | | 970,980 | |
Assertio Holdings, Inc. (1) | | | 3,562 | | | | 15,317 | |
Avalo Therapeutics, Inc. (1) | | | 1,445 | | | | 7,283 | |
Biogen, Inc. (1) | | | 4,091 | | | | 1,132,880 | |
Bristol-Myers Squibb Co. | | | 22,329 | | | | 1,606,572 | |
Bruker Corp. | | | 1,470 | | | | 100,475 | |
Cardinal Health, Inc. | | | 1,154 | | | | 88,708 | |
Catalent, Inc. (1) | | | 10,641 | | | | 478,951 | |
Centene Corp. (1) | | | 9,825 | | | | 805,748 | |
Chemed Corp. | | | 33 | | | | 16,844 | |
Cigna Corp. | | | 6,455 | | | | 2,138,800 | |
CVS Health Corp. | | | 6,516 | | | | 607,226 | |
Elevance Health, Inc. | | | 3,689 | | | | 1,892,346 | |
Eli Lilly & Co. | | | 14,262 | | | | 5,217,610 | |
Embecta Corp. | | | 990 | | | | 25,037 | |
Enhabit, Inc. (1) | | | 1,243 | | | | 16,358 | |
Ensign Group, Inc./The | | | 76 | | | | 7,190 | |
Fulgent Genetics, Inc. (1) | | | 17,453 | | | | 519,750 | |
Galectin Therapeutics, Inc. (1) | | | 3,817 | | | | 4,313 | |
Genprex, Inc. (1) | | | 4,483 | | | | 6,500 | |
Gilead Sciences, Inc. | | | 39,703 | | | | 3,408,503 | |
The accompanying notes are an integral part of these financial statements.
Page 26 | 2022 Annual Report | December 31, 2022 |
Schedules of Investments
December 31, 2022
Muirfield Fund |
Security Description | | Shares,
Contracts
or Principal
Amount ($) | | | Fair
Value ($) | |
Common Stocks (United States) — continued |
HCA Healthcare, Inc. | | | 16 | | | | 3,839 | |
Humana, Inc. | | | 2,777 | | | | 1,422,352 | |
IDEXX Laboratories, Inc. (1) | | | 653 | | | | 266,398 | |
ImmunityBio, Inc. (1) | | | 9,835 | | | | 49,863 | |
Intuitive Surgical, Inc. (1) | | | 2,053 | | | | 544,764 | |
Johnson & Johnson | | | 37,306 | | | | 6,590,105 | |
Joint Corp./The (1) | | | 424 | | | | 5,928 | |
Laboratory Corp. of America Holdings | | | 307 | | | | 72,292 | |
Lantheus Holdings, Inc. (1) | | | 112 | | | | 5,708 | |
McKesson Corp. | | | 2,971 | | | | 1,114,482 | |
Merck & Co., Inc. | | | 38,345 | | | | 4,254,378 | |
Moderna, Inc. (1) | | | 16,231 | | | | 2,915,412 | |
Molina Healthcare, Inc. (1) | | | 141 | | | | 46,561 | |
Neurocrine Biosciences, Inc. (1) | | | 1,127 | | | | 134,609 | |
Organon & Co. | | | 666 | | | | 18,601 | |
Perrigo Co. PLC | | | 1 | | | | 34 | |
Pfizer, Inc. | | | 62,933 | | | | 3,224,687 | |
Quest Diagnostics, Inc. | | | 1,893 | | | | 296,141 | |
Regeneron Pharmaceuticals, Inc. (1) | | | 2,533 | | | | 1,827,534 | |
Syneos Health, Inc. (1) | | | 2,487 | | | | 91,223 | |
Teleflex, Inc. | | | 908 | | | | 226,664 | |
Tenet Healthcare Corp. (1) | | | 118 | | | | 5,757 | |
Twist Bioscience Corp. (1) | | | 25,656 | | | | 610,869 | |
UnitedHealth Group, Inc. | | | 12,834 | | | | 6,804,330 | |
Universal Health Services, Inc. | | | 983 | | | | 138,495 | |
Veracyte, Inc. (1) | | | 10,272 | | | | 243,755 | |
Vertex Pharmaceuticals, Inc. (1) | | | 3,110 | | | | 898,106 | |
Viatris, Inc. | | | 29,587 | | | | 329,303 | |
Vir Biotechnology, Inc. (1) | | | 3,575 | | | | 90,483 | |
West Pharmaceutical Services, Inc. | | | 1,386 | | | | 326,195 | |
Zoetis, Inc. | | | 18,583 | | | | 2,723,339 | |
| | | | | | | | 59,507,704 | |
| | | | | | | | | |
Industrials — 4.8% | | | | | | | | |
AAR Corp. (1) | | | 154 | | | | 6,915 | |
Acuity Brands, Inc. | | | 22 | | | | 3,643 | |
AECOM | | | 208 | | | | 17,665 | |
AGCO Corp. | | | 994 | | | | 137,858 | |
Alaska Air Group, Inc. (1) | | | 308 | | | | 13,226 | |
AMETEK, Inc. | | | 422 | | | | 58,962 | |
Applied Industrial Technologies, Inc. | | | 38 | | | | 4,789 | |
Argan, Inc. | | | 752 | | | | 27,734 | |
Astec Industries, Inc. | | | 95 | | | | 3,863 | |
Atkore, Inc. (1) | | | 9,917 | | | | 1,124,786 | |
BlueLinx Holdings, Inc. (1) | | | 1,082 | | | | 76,941 | |
Boise Cascade Co. | | | 11,244 | | | | 772,125 | |
Muirfield Fund |
Security Description | | Shares,
Contracts
or Principal
Amount ($) | | | Fair
Value ($) | |
Common Stocks (United States) — continued |
Booz Allen Hamilton Holding Corp. | | | 2,089 | | | | 218,342 | |
Brady Corp. | | | 335 | | | | 15,779 | |
Builders FirstSource, Inc. (1) | | | 27,400 | | | | 1,777,712 | |
BWX Technologies, Inc. | | | 276 | | | | 16,030 | |
Comfort Systems USA, Inc. | | | 140 | | | | 16,111 | |
Copart, Inc. (1) | | | 42,553 | | | | 2,591,052 | |
Costamare, Inc. | | | 524 | | | | 4,863 | |
CoStar Group, Inc. (1) | | | 1,643 | | | | 126,971 | |
Donaldson Co., Inc. | | | 261 | | | | 15,365 | |
Dover Corp. | | | 469 | | | | 63,507 | |
Eaton Corp. PLC | | | 79 | | | | 12,399 | |
EMCOR Group, Inc. | | | 10,061 | | | | 1,490,135 | |
Emerson Electric Co. | | | 176 | | | | 16,907 | |
Enovix Corp. (1) | | | 8,172 | | | | 101,660 | |
Equifax, Inc. | | | 1,494 | | | | 290,374 | |
Expeditors International of Washington, Inc. | | | 6,478 | | | | 673,194 | |
Fastenal Co. | | | 227 | | | | 10,742 | |
Federal Signal Corp. | | | 168 | | | | 7,807 | |
Fortune Brands Innovations, Inc. | | | 16,897 | | | | 964,988 | |
Genco Shipping & Trading, Ltd. | | | 3,389 | | | | 52,055 | |
General Dynamics Corp. | | | 8,669 | | | | 2,150,866 | |
Graco, Inc. | | | 10,030 | | | | 674,618 | |
H&E Equipment Services, Inc. | | | 275 | | | | 12,485 | |
Heidrick & Struggles International, Inc. | | | 1,275 | | | | 35,662 | |
Hub Group, Inc. (1) | | | 85 | | | | 6,757 | |
Hubbell, Inc. | | | 2,389 | | | | 560,651 | |
Huntington Ingalls Industries, Inc. | | | 96 | | | | 22,145 | |
ITT, Inc. | | | 1,132 | | | | 91,805 | |
Karat Packaging, Inc. | | | 307 | | | | 4,412 | |
Kforce, Inc. | | | 120 | | | | 6,580 | |
Leidos Holdings, Inc. | | | 4,126 | | | | 434,014 | |
Lockheed Martin Corp. | | | 1,819 | | | | 884,925 | |
ManpowerGroup, Inc. | | | 3,714 | | | | 309,042 | |
Masterbrand, Inc. (1) | | | 11,748 | | | | 88,697 | |
Matson, Inc. | | | 6,541 | | | | 408,878 | |
McGrath RentCorp | | | 171 | | | | 16,885 | |
MDU Resources Group, Inc. | | | 115 | | | | 3,489 | |
Moog, Inc. (1) | | | 280 | | | | 24,573 | |
MSC Industrial Direct Co., Inc. | | | 93 | | | | 7,598 | |
Mueller Industries, Inc. | | | 5,666 | | | | 334,294 | |
Nordson Corp. | | | 1,666 | | | | 396,042 | |
Northrop Grumman Corp. | | | 5,298 | | | | 2,890,642 | |
nVent Electric PLC | | | 2,601 | | | | 100,060 | |
Owens Corning | | | 1,537 | | | | 131,106 | |
PACCAR, Inc. | | | 16,327 | | | | 1,615,883 | |
The accompanying notes are an integral part of these financial statements.
2022 Annual Report | December 31, 2022 | Page 27 |
Schedules of Investments
December 31, 2022
Muirfield Fund |
Security Description | | Shares,
Contracts
or Principal
Amount ($) | | | Fair
Value ($) | |
Common Stocks (United States) — continued |
Primoris Services Corp. | | | 2,062 | | | | 45,240 | |
Raytheon Technologies Corp. | | | 25,913 | | | | 2,615,140 | |
Regal Rexnord Corp. | | | 2,864 | | | | 343,623 | |
Republic Services, Inc. | | | 257 | | | | 33,150 | |
Ryder System, Inc. | | | 438 | | | | 36,604 | |
Sensata Technologies Holding PLC | | | 1,049 | | | | 42,359 | |
SkyWest, Inc. (1) | | | 1,125 | | | | 18,574 | |
Southwest Airlines Co. | | | 24,759 | | | | 833,636 | |
Sterling Infrastructure, Inc. (1) | | | 322 | | | | 10,562 | |
Tennant Co. | | | 116 | | | | 7,142 | |
Textron, Inc. | | | 5,747 | | | | 406,888 | |
TrueBlue, Inc. (1) | | | 505 | | | | 9,888 | |
UFP Industries, Inc. | | | 498 | | | | 39,467 | |
United Parcel Service, Inc. | | | 1,301 | | | | 226,166 | |
United Rentals, Inc. (1) | | | 1,320 | | | | 469,154 | |
Univar Solutions, Inc. (1) | | | 845 | | | | 26,871 | |
Valmont Industries, Inc. | | | 140 | | | | 46,294 | |
Verisk Analytics, Inc. | | | 6,703 | | | | 1,182,543 | |
Vicor Corp. (1) | | | 8,440 | | | | 453,650 | |
Waste Management, Inc. | | | 5,917 | | | | 928,259 | |
WW Grainger, Inc. | | | 1,526 | | | | 848,838 | |
Xylem, Inc./NY | | | 1,502 | | | | 166,076 | |
| | | | | | | | 30,716,733 | |
| | | | | | | | | |
Information Technology — 14.8% | | | | | | | | |
Adobe, Inc. (1) | | | 8,721 | | | | 2,934,878 | |
Alpha & Omega Semiconductor, Ltd. (1) | | | 4,895 | | | | 139,850 | |
Amkor Technology, Inc. | | | 12,790 | | | | 306,704 | |
ANSYS, Inc. (1) | | | 2,764 | | | | 667,755 | |
Apple, Inc. | | | 145,849 | | | | 18,950,161 | |
Applied Materials, Inc. | | | 7,902 | | | | 769,497 | |
Arista Networks, Inc. (1) | | | 383 | | | | 46,477 | |
Arrow Electronics, Inc. (1) | | | 9,145 | | | | 956,293 | |
Atlassian Corp. (1) | | | 152 | | | | 19,559 | |
Autodesk, Inc. (1) | | | 7,845 | | | | 1,465,995 | |
Avnet, Inc. | | | 8,301 | | | | 345,156 | |
Belden, Inc. | | | 267 | | | | 19,197 | |
Block, Inc. (1) | | | 1,063 | | | | 66,799 | |
Broadcom, Inc. | | | 49 | | | | 27,397 | |
Calix, Inc. (1) | | | 1,697 | | | | 116,126 | |
Cisco Systems, Inc. | | | 79,035 | | | | 3,765,227 | |
Cloudflare, Inc. (1) | | | 18,025 | | | | 814,910 | |
Cognex Corp. | | | 2,610 | | | | 122,957 | |
Cognizant Technology Solutions Corp. | | | 18,450 | | | | 1,055,156 | |
Dell Technologies, Inc. | | | 2,140 | | | | 86,071 | |
Digital Turbine, Inc. (1) | | | 35,998 | | | | 548,610 | |
Muirfield Fund |
Security Description | | Shares,
Contracts
or Principal
Amount ($) | | | Fair
Value ($) | |
Common Stocks (United States) — continued |
DocuSign, Inc. (1) | | | 18,711 | | | | 1,036,964 | |
DXC Technology Co. (1) | | | 136 | | | | 3,604 | |
EPAM Systems, Inc. (1) | | | 4,464 | | | | 1,463,031 | |
Euronet Worldwide, Inc. (1) | | | 1,575 | | | | 148,649 | |
Extreme Networks, Inc. (1) | | | 779 | | | | 14,263 | |
Fabrinet (1) | | | 344 | | | | 44,108 | |
Fair Isaac Corp. (1) | | | 514 | | | | 307,670 | |
Intel Corp. | | | 56,232 | | | | 1,486,212 | |
Intuit, Inc. | | | 8,510 | | | | 3,312,262 | |
Jabil, Inc. | | | 36,607 | | | | 2,496,597 | |
Juniper Networks, Inc. | | | 346 | | | | 11,058 | |
Keysight Technologies, Inc. (1) | | | 24 | | | | 4,106 | |
Lam Research Corp. | | | 4,748 | | | | 1,995,584 | |
Lattice Semiconductor Corp. (1) | | | 3,706 | | | | 240,445 | |
Manhattan Associates, Inc. (1) | | | 22,482 | | | | 2,729,315 | |
Mastercard, Inc. | | | 10,899 | | | | 3,789,909 | |
Microchip Technology, Inc. | | | 6,902 | | | | 484,866 | |
Microsoft Corp. | | | 75,410 | | | | 18,084,813 | |
Monolithic Power Systems, Inc. | | | 1,208 | | | | 427,161 | |
National Instruments Corp. | | | 3,756 | | | | 138,596 | |
NVIDIA Corp. | | | 33,114 | | | | 4,839,280 | |
Oracle Corp. | | | 34,203 | | | | 2,795,753 | |
Pure Storage, Inc. (1) | | | 11,718 | | | | 313,574 | |
QUALCOMM, Inc. | | | 20,695 | | | | 2,275,208 | |
Skyworks Solutions, Inc. | | | 28,195 | | | | 2,569,410 | |
StarTek, Inc. (1) | | | 2,934 | | | | 11,003 | |
Synopsys, Inc. (1) | | | 5,192 | | | | 1,657,754 | |
TD SYNNEX Corp. | | | 114 | | | | 10,797 | |
Teradyne, Inc. | | | 22,852 | | | | 1,996,122 | |
Texas Instruments, Inc. | | | 22,556 | | | | 3,726,702 | |
Vishay Intertechnology, Inc. | | | 330 | | | | 7,118 | |
WEX, Inc. (1) | | | 2,541 | | | | 415,835 | |
Zebra Technologies Corp. (1) | | | 6,966 | | | | 1,786,152 | |
Zoom Video Communications, Inc. (1) | | | 14,063 | | | | 952,628 | |
| | | | | | | | 94,801,324 | |
| | | | | | | | | |
Materials — 2.0% | | | | | | | | |
AdvanSix, Inc. | | | 1,479 | | | | 56,232 | |
Air Products and Chemicals, Inc. | | | 60 | | | | 18,496 | |
Alcoa Corp. | | | 48,938 | | | | 2,225,211 | |
Alpha Metallurgical Resources, Inc. | | | 278 | | | | 40,696 | |
Avery Dennison Corp. | | | 6,193 | | | | 1,120,933 | |
CF Industries Holdings, Inc. | | | 1,130 | | | | 96,276 | |
Clearwater Paper Corp. (1) | | | 293 | | | | 11,078 | |
Dow, Inc. | | | 18,186 | | | | 916,393 | |
The accompanying notes are an integral part of these financial statements.
Page 28 | 2022 Annual Report | December 31, 2022 |
Schedules of Investments
December 31, 2022
Muirfield Fund |
Security Description | | Shares,
Contracts
or Principal
Amount ($) | | | Fair
Value ($) | |
Common Stocks (United States) — continued |
Eagle Materials, Inc. | | | 5,176 | | | | 687,632 | |
Freeport-McMoRan, Inc. | | | 13,260 | | | | 503,880 | |
Huntsman Corp. | | | 257 | | | | 7,062 | |
International Paper Co. | | | 8,415 | | | | 291,411 | |
Linde PLC | | | 14 | | | | 4,567 | |
Louisiana-Pacific Corp. | | | 34,643 | | | | 2,050,866 | |
LyondellBasell Industries NV | | | 16,782 | | | | 1,393,409 | |
Mosaic Co./The | | | 70 | | | | 3,071 | |
MP Materials Corp. (1) | | | 4,955 | | | | 120,307 | |
Newmont Corp. | | | 4,613 | | | | 217,734 | |
Nucor Corp. | | | 8,327 | | | | 1,097,582 | |
Olin Corp. | | | 1,955 | | | | 103,498 | |
Packaging Corp. of America | | | 3,481 | | | | 445,255 | |
Reliance Steel & Aluminum Co. | | | 239 | | | | 48,383 | |
Ryerson Holding Corp. | | | 1,645 | | | | 49,778 | |
Schnitzer Steel Industries, Inc. | | | 1,053 | | | | 32,274 | |
Southern Copper Corp. | | | 3,742 | | | | 225,979 | |
Steel Dynamics, Inc. | | | 7,745 | | | | 756,687 | |
Sylvamo Corp. | | | 1,976 | | | | 96,014 | |
Tronox Holdings PLC | | | 453 | | | | 6,211 | |
United States Steel Corp. | | | 10,827 | | | | 271,216 | |
Warrior Met Coal, Inc. | | | 619 | | | | 21,442 | |
Westrock Co. | | | 1,291 | | | | 45,392 | |
| | | | | | | | 12,964,965 | |
| | | | | | | | | |
Real Estate Investment Trust — 0.0% | | | | | | | | |
CorEnergy Infrastructure Trust, Inc. | | | 13,458 | | | | 28,127 | |
Spirit MTA REIT Liquidating Trust (1)(5) | | | 9,151 | | | | 0 | |
| | | | | | | | 28,127 | |
| | | | | | | | | |
Utilities — 0.5% | | | | | | | | |
Alliant Energy Corp. | | | 2,897 | | | | 159,943 | |
American Water Works Co., Inc. | | | 1,250 | | | | 190,525 | |
Brookfield Renewable Corp. | | | 1,151 | | | | 31,699 | |
CenterPoint Energy, Inc. | | | 240 | | | | 7,198 | |
Clearway Energy, Inc. | | | 1,377 | | | | 43,885 | |
FirstEnergy Corp. | | | 5,896 | | | | 247,278 | |
National Fuel Gas Co. | | | 2,556 | | | | 161,795 | |
NRG Energy, Inc. | | | 24,850 | | | | 790,727 | |
OGE Energy Corp. | | | 984 | | | | 38,917 | |
UGI Corp. | | | 39,723 | | | | 1,472,532 | |
| | | | | | | | 3,144,499 | |
| | | | | | | | | |
Total Common Stocks (United States) (Cost $301,772,505) | | | | | | | 364,210,308 | |
Muirfield Fund |
Security Description | | Shares,
Contracts
or Principal
Amount ($) | | | Fair
Value ($) | |
Preferred Stock (United States) — 0.0% |
WESCO International, Inc. Series A Variable Preferred, 9.7% (6) | | | 2,612 | | | | 68,957 | |
Total Preferred Stock (United States) (Cost $65,288) | | | | | | | 68,957 | |
| | | | | | | | | |
Warrants (United States) — 0.0% |
Chaparral Energy, Inc. A Warrants, Expiration Date 10/14/2024 (1)(5) | | | 7 | | | | 0 | |
Chaparral Energy, Inc. B Warrants, Expiration Date 10/14/2025 (1)(5) | | | 7 | | | | 0 | |
Civitas Solutions, Inc. A Warrants, Expiration Date 1/20/2025 (1)(5) | | | 57 | | | | 0 | |
Civitas Solutions, Inc. B Warrants, Expiration Date 1/20/2026 (1)(5) | | | 28 | | | | 0 | |
Hertz Global Holdings, Inc. Warrants, Expiration Date 6/30/2051 (1) | | | 349 | | | | 2,602 | |
Nabors Industries, Ltd. Warrants, Expiration Date 6/11/2026 (1) | | | 122 | | | | 4,014 | |
Oasis Petroleum, Inc. Warrants, Expiration Date 11/19/2024 (1)(5) | | | 23 | | | | 0 | |
Whiting Petroleum Corp. A Warrants, Expiration Date 9/1/2024 (1) | | | 128 | | | | 2,610 | |
Whiting Petroleum Corp. B Warrants, Expiration Date 9/1/2025 (1) | | | 63 | | | | 1,146 | |
Total Warrants (United States) (Cost $8,512) | | | | | | | 10,372 | |
| | | | | | | | | |
Money Market Registered Investment Companies — 42.6% |
Meeder Institutional Prime Money Market Fund, 4.36% (2) | | | 270,676,198 | | | | 270,676,198 | |
Total Money Market Registered Investment Companies (Cost $270,564,643) | | | | | | | 270,676,198 | |
| | | | | | | | | |
Bank Obligations — 0.1% |
First Merchants Bank Deposit Account, 1.60%, 1/3/2023 (3) | | | 249,081 | | | | 249,081 | |
Metro City Bank Deposit Account, 0.94%, 1/3/2023 (3) | | | 249,337 | | | | 249,337 | |
Total Bank Obligations (Cost $498,418) | | | | | | | 498,418 | |
Total Investments — 99.9% (Cost $572,909,366) | | | | | | | 635,464,253 | |
Other Assets less Liabilities — 0.1% | | | | | | | 612,913 | |
Total Net Assets — 100.0% | | | | | | | 636,077,166 | |
| | | | | | | | | |
The accompanying notes are an integral part of these financial statements.
2022 Annual Report | December 31, 2022 | Page 29 |
Schedules of Investments
December 31, 2022
Muirfield Fund |
Security Description | | Shares,
Contracts
or Principal
Amount ($) | | | Fair
Value ($) | |
Trustee Deferred Compensation (4) |
Meeder Balanced Fund - Retail Class | | | 5,549 | | | | 63,814 | |
Meeder Dynamic Allocation Fund - Retail Class | | | 14,699 | | | | 166,981 | |
Meeder Muirfield Fund - Retail Class | | | 10,252 | | | | 84,476 | |
Meeder Conservative Allocation Fund - Retail Class | | | 1,622 | | | | 33,819 | |
Total Trustee Deferred Compensation (Cost $343,850) | | | | | | | 349,090 | |
Muirfield Fund |
| | | Long
(Short)
Contracts | | | Expiration
Date | | | Notional
Value of
Contracts
($) | | | Value and
Unrealized
Appreciation
(Depreciation)
($) | |
Futures Contracts |
Index Futures | | | | | | | | | | | | | | | | |
E-mini Standard & Poors MidCap 400 Futures | | | (220 | ) | | | 3/17/2023 | | | | (53,737,200 | ) | | | 1,507,547 | |
Mini MSCI EAFE Index Futures | | | 458 | | | | 3/17/2023 | | | | 44,641,260 | | | | (1,755,897 | ) |
Mini MSCI Emerging Markets Index Futures | | | 200 | | | | 3/17/2023 | | | | 9,594,000 | | | | (247,594 | ) |
Russell 2000 Mini Index Futures | | | 235 | | | | 3/17/2023 | | | | 20,808,075 | | | | (848,860 | ) |
Standard & Poors 500 Mini Futures | | | (314 | ) | | | 3/17/2023 | | | | (60,617,700 | ) | | | 1,883,719 | |
Total Futures Contracts | | | 359 | | | | | | | | (39,311,565 | ) | | | 538,915 | |
(1) | Represents non-income producing securities. |
(2) | Investment in affiliate. The yield shown represents the 7-day yield in effect at December 31, 2022. |
(3) | Variable rate security. Securities payable at par including accrued interest (usually within seven days notice) and unconditionally secured as to principal and interest by letters of credit or other credit support agreements from major banks. The interest rates are adjustable and are not based on a published reference rate and spread but are determined by the issuer or agent and are based on current market conditions. These securities do not indicate a reference rate and spread in their description above. The rate shown represents the rate in effect at December 31, 2022. The maturity date shown, if applicable, reflects the earlier of the next demand date or stated maturity date. |
(4) | Assets of affiliates to the Muirfield Fund held for the benefit of the Fund’s Trustees in connection with the Trustee Deferred Compensation Plan. |
(5) | Fair valued security deemed a Level 3 security. Security is not part of the investment strategy of the Fund. |
The accompanying notes are an integral part of these financial statements.
Page 30 | 2022 Annual Report | December 31, 2022 |
Schedules of Investments
December 31, 2022
Spectrum Fund |
Security Description | | Shares or
Principal
Amount ($) | | | Fair
Value ($) | |
Common Stocks (United States) - Long — 47.8% |
Communication Services — 1.6% | | | | | | | | |
Alphabet, Inc. - Class C (1) | | | 12,812 | | | | 1,136,809 | |
Alphabet, Inc. - Class A (1) | | | 6,115 | | | | 539,526 | |
Altice USA, Inc. (1) | | | 1,192 | | | | 5,483 | |
AMC Entertainment Holdings, Inc. (1) | | | 888 | | | | 3,614 | |
AMC Networks, Inc. (1) | | | 2,171 | | | | 34,020 | |
Cable One, Inc. | | | 20 | | | | 14,237 | |
Comcast Corp. | | | 7,311 | | | | 255,666 | |
Entravision Communications Corp. | | | 3,381 | | | | 16,229 | |
IDT Corp. (1) | | | 1,101 | | | | 31,015 | |
Magnite, Inc. (1) | | | 3,987 | | | | 42,222 | |
Meta Platforms, Inc. (1) | | | 5,332 | | | | 641,653 | |
Roku, Inc. (1) | | | 639 | | | | 26,007 | |
Skillz, Inc. (1) | | | 138,445 | | | | 70,122 | |
Trade Desk, Inc./The (1) | | | 4,338 | | | | 194,473 | |
| | | | | | | | 3,011,076 | |
| | | | | | | | | |
Consumer Discretionary — 6.3% | | | | | | | | |
Amazon.com, Inc. (1) | | | 10,935 | | | | 918,540 | |
AutoZone, Inc. (1) | | | 159 | | | | 392,123 | |
Beachbody Co., Inc./The (1) | | | 14,976 | | | | 7,877 | |
Beazer Homes USA, Inc. (1) | | | 772 | | | | 9,851 | |
Best Buy Co., Inc. | | | 1,491 | | | | 119,593 | |
Booking Holdings, Inc. (1) | | | 153 | | | | 308,338 | |
BorgWarner, Inc. | | | 7,262 | | | | 292,296 | |
Bright Horizons Family Solutions, Inc. (1) | | | 198 | | | | 12,494 | |
Burlington Stores, Inc. (1) | | | 1,710 | | | | 346,720 | |
Carvana Co. (1) | | | 8,511 | | | | 40,342 | |
Century Communities, Inc. | | | 2,882 | | | | 144,129 | |
Chegg, Inc. (1) | | | 3,821 | | | | 96,557 | |
ContextLogic, Inc. (1) | | | 47,462 | | | | 23,147 | |
DR Horton, Inc. | | | 582 | | | | 51,879 | |
Ethan Allen Interiors, Inc. | | | 206 | | | | 5,443 | |
Expedia Group, Inc. (1) | | | 3,190 | | | | 279,444 | |
Frontdoor, Inc. (1) | | | 1,128 | | | | 23,462 | |
Garmin, Ltd. | | | 581 | | | | 53,620 | |
Goodyear Tire & Rubber Co./The (1) | | | 10,493 | | | | 106,504 | |
Grand Canyon Education, Inc. (1) | | | 5,269 | | | | 556,723 | |
Green Brick Partners, Inc. (1) | | | 1,974 | | | | 47,830 | |
H&R Block, Inc. | | | 145 | | | | 5,294 | |
Helen of Troy, Ltd. (1) | | | 2,444 | | | | 271,064 | |
Home Depot, Inc./The | | | 248 | | | | 78,333 | |
Hovnanian Enterprises, Inc. (1) | | | 1,552 | | | | 65,308 | |
Lennar Corp. | | | 647 | | | | 58,554 | |
LGI Homes, Inc. (1) | | | 4,159 | | | | 385,123 | |
LKQ Corp. | | | 453 | | | | 24,195 | |
Lovesac Co./The (1) | | | 7,501 | | | | 165,097 | |
Spectrum Fund |
Security Description | | Shares or
Principal
Amount ($) | | | Fair
Value ($) | |
Common Stocks (United States) - Long — continued |
Lowe’s Cos., Inc. | | | 2,351 | | | | 468,413 | |
Lululemon Athletica, Inc. (1) | | | 2,217 | | | | 710,282 | |
M/I Homes, Inc. (1) | | | 5,932 | | | | 273,940 | |
Macy’s, Inc. | | | 6,654 | | | | 137,405 | |
Mohawk Industries, Inc. (1) | | | 7,956 | | | | 813,262 | |
National Vision Holdings, Inc. (1) | | | 2,518 | | | | 97,598 | |
O’Reilly Automotive, Inc. (1) | | | 388 | | | | 327,484 | |
Patrick Industries, Inc. | | | 953 | | | | 57,752 | |
PVH Corp. | | | 3,807 | | | | 268,736 | |
Qurate Retail, Inc. (1) | | | 6,600 | | | | 10,758 | |
RealReal, Inc./The (1) | | | 2,878 | | | | 3,598 | |
Rent-A-Center, Inc./TX | | | 2,185 | | | | 49,272 | |
Ross Stores, Inc. | | | 1,735 | | | | 201,381 | |
Skyline Champion Corp. (1) | | | 6,131 | | | | 315,808 | |
Sleep Number Corp. (1) | | | 4,823 | | | | 125,302 | |
Smith & Wesson Brands, Inc. | | | 396 | | | | 3,437 | |
Starbucks Corp. | | | 1,062 | | | | 105,350 | |
Tapestry, Inc. | | | 2,247 | | | | 85,566 | |
Target Corp. | | | 690 | | | | 102,838 | |
Tempur Sealy International, Inc. | | | 571 | | | | 19,602 | |
TJX Cos., Inc./The | | | 5,290 | | | | 421,084 | |
Toll Brothers, Inc. | | | 2,214 | | | | 110,523 | |
Tractor Supply Co. | | | 297 | | | | 66,816 | |
Tupperware Brands Corp. (1) | | | 12,407 | | | | 51,365 | |
Ulta Beauty, Inc. (1) | | | 1,966 | | | | 922,192 | |
Volta, Inc. (1) | | | 16,179 | | | | 5,750 | |
Whirlpool Corp. | | | 3,734 | | | | 528,212 | |
Wingstop, Inc. | | | 371 | | | | 51,057 | |
Yum! Brands, Inc. | | | 2,210 | | | | 283,057 | |
Zumiez, Inc. (1) | | | 780 | | | | 16,957 | |
| | | | | | | | 11,524,677 | |
| | | | | | | | | |
Consumer Staples — 1.4% | | | | | | | | |
Archer-Daniels-Midland Co. | | | 7,038 | | | | 653,478 | |
Bunge, Ltd. | | | 3,331 | | | | 332,334 | |
Casey’s General Stores, Inc. | | | 981 | | | | 220,087 | |
Coca-Cola Co./The | | | 415 | | | | 26,398 | |
Costco Wholesale Corp. | | | 773 | | | | 352,875 | |
General Mills, Inc. | | | 6,845 | | | | 573,953 | |
Kimberly-Clark Corp. | | | 37 | | | | 5,023 | |
Kroger Co./The | | | 456 | | | | 20,328 | |
PepsiCo, Inc. | | | 1,976 | | | | 356,984 | |
Tyson Foods, Inc. | | | 474 | | | | 29,507 | |
Walmart, Inc. | | | 485 | | | | 68,768 | |
| | | | | | | | 2,639,735 | |
| | | | | | | | | |
The accompanying notes are an integral part of these financial statements.
2022 Annual Report | December 31, 2022 | Page 31 |
Schedules of Investments
December 31, 2022
Spectrum Fund |
Security Description | | Shares or
Principal
Amount ($) | | | Fair
Value ($) | |
Common Stocks (United States) - Long — continued |
Energy — 3.7% | | | | | | | | |
Aemetis, Inc. (1) | | | 19,947 | | | | 78,990 | |
Berry Corp. | | | 842 | | | | 6,736 | |
Bristow Group, Inc. (1) | | | 676 | | | | 18,340 | |
Centrus Energy Corp. (1) | | | 2,818 | | | | 91,529 | |
Cheniere Energy, Inc. | | | 1,616 | | | | 242,335 | |
Chevron Corp. | | | 8,904 | | | | 1,598,179 | |
Civitas Resources, Inc. | | | 117 | | | | 6,778 | |
ConocoPhillips | | | 4,322 | | | | 509,996 | |
Diamondback Energy, Inc. | | | 501 | | | | 68,527 | |
DMC Global, Inc. (1) | | | 7,095 | | | | 137,927 | |
DT Midstream, Inc. | | | 2,203 | | | | 121,738 | |
Enviva, Inc. | | | 2,341 | | | | 124,003 | |
EOG Resources, Inc. | | | 2,411 | | | | 312,273 | |
Exxon Mobil Corp. | | | 15,198 | | | | 1,676,339 | |
Green Plains, Inc. (1) | | | 3,877 | | | | 118,249 | |
Hess Corp. | | | 561 | | | | 79,561 | |
Laredo Petroleum, Inc. (1) | | | 2,129 | | | | 109,473 | |
Marathon Petroleum Corp. | | | 771 | | | | 89,737 | |
Ovintiv, Inc. | | | 682 | | | | 34,584 | |
Phillips 66 | | | 2,135 | | | | 222,211 | |
Pioneer Natural Resources Co. | | | 980 | | | | 223,822 | |
Schlumberger, Ltd. | | | 5,639 | | | | 301,461 | |
SilverBow Resources, Inc. (1) | | | 6,760 | | | | 191,173 | |
Targa Resources Corp. | | | 1,347 | | | | 99,005 | |
Teekay Corp. (1) | | | 1,555 | | | | 7,060 | |
Valero Energy Corp. | | | 2,133 | | | | 270,592 | |
World Fuel Services Corp. | | | 312 | | | | 8,527 | |
| | | | | | | | 6,749,145 | |
| | | | | | | | | |
Financials — 5.5% | | | | | | | | |
Berkshire Hathaway, Inc. (1) | | | 9,264 | | | | 2,861,650 | |
Affiliated Managers Group, Inc. | | | 490 | | | | 77,631 | |
American Equity Investment Life Holding Co. | | | 3,778 | | | | 172,352 | |
American International Group, Inc. | | | 12,807 | | | | 809,915 | |
Bank of New York Mellon Corp./The | | | 1,673 | | | | 76,155 | |
Cannae Holdings, Inc. (1) | | | 34,198 | | | | 706,189 | |
Capital BanCorp., Inc. | | | 485 | | | | 11,417 | |
Capital One Financial Corp. | | | 1,867 | | | | 173,556 | |
Charles Schwab Corp./The | | | 11,571 | | | | 963,401 | |
Chubb, Ltd. | | | 2,298 | | | | 506,939 | |
Compass Diversified Holdings | | | 3,111 | | | | 56,714 | |
East West BanCorp., Inc. | | | 3,768 | | | | 248,311 | |
Essent Group, Ltd. | | | 2,896 | | | | 112,596 | |
F&G Annuities & Life, Inc. | | | 147 | | | | 2,941 | |
Fidelity National Financial, Inc. | | | 2,165 | | | | 81,447 | |
Spectrum Fund |
Security Description | | Shares or
Principal
Amount ($) | | | Fair
Value ($) | |
Common Stocks (United States) - Long — continued |
First American Financial Corp. | | | 3,379 | | | | 176,857 | |
First Internet BanCorp. | | | 616 | | | | 14,956 | |
Focus Financial Partners, Inc. (1) | | | 3,340 | | | | 124,482 | |
Goosehead Insurance, Inc. (1) | | | 951 | | | | 32,657 | |
Hartford Financial Services Group, Inc./The | | | 1,798 | | | | 136,342 | |
Investors Title Co. | | | 43 | | | | 6,345 | |
Jackson Financial, Inc. | | | 19,065 | | | | 663,271 | |
Lemonade, Inc. (1) | | | 12,856 | | | | 175,870 | |
LendingTree, Inc. (1) | | | 4,639 | | | | 98,950 | |
Marsh & McLennan Cos., Inc. | | | 1,346 | | | | 222,736 | |
Moelis & Co. | | | 445 | | | | 17,075 | |
Mr Cooper Group, Inc. (1) | | | 629 | | | | 25,242 | |
New York Community BanCorp., Inc. | | | 2,818 | | | | 24,235 | |
Northern Trust Corp. | | | 1,203 | | | | 106,453 | |
Pathward Financial, Inc. | | | 2,117 | | | | 91,137 | |
Root, Inc./OH (1) | | | 13,630 | | | | 61,199 | |
SEI Investments Co. | | | 3,923 | | | | 228,711 | |
State Street Corp. | | | 456 | | | | 35,372 | |
Stewart Information Services Corp. | | | 2,427 | | | | 103,706 | |
Synchrony Financial | | | 5,040 | | | | 165,614 | |
Trupanion, Inc. (1) | | | 3,165 | | | | 150,432 | |
W R Berkley Corp. | | | 92 | | | | 6,676 | |
Walker & Dunlop, Inc. | | | 296 | | | | 23,230 | |
Willis Towers Watson PLC | | | 2,059 | | | | 503,590 | |
| | | | | | | | 10,056,352 | |
| | | | | | | | | |
Healthcare — 7.6% | | | | | | | | |
10X Genomics, Inc. (1) | | | 586 | | | | 21,354 | |
AbbVie, Inc. | | | 505 | | | | 81,613 | |
Adaptive Biotechnologies Corp. (1) | | | 5,632 | | | | 43,028 | |
Amgen, Inc. | | | 1,537 | | | | 403,678 | |
Biogen, Inc. (1) | | | 786 | | | | 217,659 | |
Bristol-Myers Squibb Co. | | | 3,404 | | | | 244,918 | |
Cardinal Health, Inc. | | | 1,860 | | | | 142,978 | |
Catalent, Inc. (1) | | | 1,499 | | | | 67,470 | |
Centene Corp. (1) | | | 1,840 | | | | 150,898 | |
Cigna Corp. | | | 3,246 | | | | 1,075,530 | |
CVS Health Corp. | | | 6,544 | | | | 609,835 | |
Eli Lilly & Co. | | | 3,933 | | | | 1,438,849 | |
Embecta Corp. | | | 1,550 | | | | 39,200 | |
Emergent BioSolutions, Inc. (1) | | | 384 | | | | 4,535 | |
Fulgent Genetics, Inc. (1) | | | 918 | | | | 27,338 | |
Gilead Sciences, Inc. | | | 8,067 | | | | 692,552 | |
HCA Healthcare, Inc. | | | 274 | | | | 65,749 | |
Humana, Inc. | | | 944 | | | | 483,507 | |
IDEXX Laboratories, Inc. (1) | | | 10 | | | | 4,080 | |
ImmunityBio, Inc. (1) | | | 1,360 | | | | 6,895 | |
The accompanying notes are an integral part of these financial statements.
Page 32 | 2022 Annual Report | December 31, 2022 |
Schedules of Investments
December 31, 2022
Spectrum Fund |
Security Description | | Shares or
Principal
Amount ($) | | | Fair
Value ($) | |
Common Stocks (United States) - Long — continued |
Intuitive Surgical, Inc. (1) | | | 405 | | | | 107,467 | |
Invitae Corp. (1) | | | 79,888 | | | | 148,592 | |
Johnson & Johnson | | | 11,865 | | | | 2,095,952 | |
McKesson Corp. | | | 2,375 | | | | 890,910 | |
Merck & Co., Inc. | | | 10,689 | | | | 1,185,945 | |
Moderna, Inc. (1) | | | 253 | | | | 45,444 | |
NanoString Technologies, Inc. (1) | | | 9,361 | | | | 74,607 | |
Pfizer, Inc. | | | 16,502 | | | | 845,562 | |
Regeneron Pharmaceuticals, Inc. (1) | | | 48 | | | | 34,632 | |
ResMed, Inc. | | | 289 | | | | 60,150 | |
Twist Bioscience Corp. (1) | | | 3,856 | | | | 91,811 | |
UnitedHealth Group, Inc. | | | 3,927 | | | | 2,082,017 | |
Universal Health Services, Inc. | | | 771 | | | | 108,626 | |
Viatris, Inc. | | | 664 | | | | 7,390 | |
West Pharmaceutical Services, Inc. | | | 880 | | | | 207,108 | |
Zimmer Biomet Holdings, Inc. | | | 66 | | | | 8,415 | |
Zoetis, Inc. | | | 1,004 | | | | 147,136 | |
| | | | | | | | 13,963,430 | |
| | | | | | | | | |
Industrials — 4.5% | | | | | | | | |
AeroVironment, Inc. (1) | | | 1,186 | | | | 101,593 | |
Atkore, Inc. (1) | | | 3,810 | | | | 432,130 | |
BlueLinx Holdings, Inc. (1) | | | 553 | | | | 39,324 | |
Boise Cascade Co. | | | 1,218 | | | | 83,640 | |
Builders FirstSource, Inc. (1) | | | 3,736 | | | | 242,392 | |
Cintas Corp. | | | 41 | | | | 18,516 | |
Copart, Inc. (1) | | | 28,678 | | | | 1,746,203 | |
CoStar Group, Inc. (1) | | | 6,368 | | | | 492,119 | |
Dover Corp. | | | 494 | | | | 66,893 | |
EMCOR Group, Inc. | | | 1,800 | | | | 266,598 | |
Enovix Corp. (1) | | | 10,963 | | | | 136,380 | |
Fortune Brands Innovations, Inc. | | | 10,827 | | | | 618,330 | |
General Dynamics Corp. | | | 499 | | | | 123,807 | |
Graco, Inc. | | | 2,491 | | | | 167,545 | |
H&E Equipment Services, Inc. | | | 512 | | | | 23,245 | |
Hudson Technologies, Inc. (1) | | | 2,565 | | | | 25,958 | |
ITT, Inc. | | | 618 | | | | 50,120 | |
Karat Packaging, Inc. | | | 140 | | | | 2,012 | |
Kirby Corp. (1) | | | 1,929 | | | | 124,131 | |
Leidos Holdings, Inc. | | | 2,114 | | | | 222,372 | |
Lockheed Martin Corp. | | | 1,473 | | | | 716,600 | |
ManpowerGroup, Inc. | | | 353 | | | | 29,373 | |
Masterbrand, Inc. (1) | | | 10,827 | | | | 81,744 | |
Matson, Inc. | | | 2,948 | | | | 184,279 | |
Mueller Industries, Inc. | | | 2,411 | | | | 142,249 | |
Northrop Grumman Corp. | | | 1,146 | | | | 625,269 | |
Raytheon Technologies Corp. | | | 1,073 | | | | 108,287 | |
Spectrum Fund |
Security Description | | Shares or
Principal
Amount ($) | | | Fair
Value ($) | |
Common Stocks (United States) - Long — continued |
SiteOne Landscape Supply, Inc. (1) | | | 91 | | | | 10,676 | |
SkyWest, Inc. (1) | | | 1,646 | | | | 27,175 | |
Southwest Airlines Co. | | | 5,617 | | | | 189,124 | |
United Airlines Holdings, Inc. (1) | | | 2,406 | | | | 90,706 | |
Verisk Analytics, Inc. | | | 1,454 | | | | 256,515 | |
Vicor Corp. (1) | | | 1,018 | | | | 54,718 | |
Waste Management, Inc. | | | 3,159 | | | | 495,584 | |
WW Grainger, Inc. | | | 200 | | | | 111,250 | |
Xylem, Inc./NY | | | 875 | | | | 96,749 | |
| | | | | | | | 8,203,606 | |
| | | | | | | | | |
Information Technology — 14.0% | | | | | | | | |
8x8, Inc. (1) | | | 10,360 | | | | 44,755 | |
Affirm Holdings, Inc. (1) | | | 25,136 | | | | 243,065 | |
Alpha & Omega Semiconductor, Ltd. (1) | | | 100 | | | | 2,857 | |
Amkor Technology, Inc. | | | 260 | | | | 6,235 | |
ANSYS, Inc. (1) | | | 1,367 | | | | 330,254 | |
Apple, Inc. (6) | | | 29,663 | | | | 3,854,114 | |
Applied Materials, Inc. | | | 4,657 | | | | 453,499 | |
AppLovin Corp. (1) | | | 5,971 | | | | 62,875 | |
Arrow Electronics, Inc. (1) | | | 1,361 | | | | 142,320 | |
Asana, Inc. (1) | | | 8,389 | | | | 115,517 | |
Autodesk, Inc. (1) | | | 1,254 | | | | 234,335 | |
Avnet, Inc. | | | 4,145 | | | | 172,349 | |
Bill.com Holdings, Inc. (1) | | | 589 | | | | 64,177 | |
Block, Inc. (1) | | | 2,497 | | | | 156,911 | |
Broadridge Financial Solutions, Inc. | | | 976 | | | | 130,911 | |
Calix, Inc. (1) | | | 3,102 | | | | 212,270 | |
Cisco Systems, Inc. | | | 3,301 | | | | 157,260 | |
Cleanspark, Inc. (1) | | | 3,489 | | | | 7,118 | |
Cloudflare, Inc. (1) | | | 6,329 | | | | 286,134 | |
Cognex Corp. | | | 2,621 | | | | 123,475 | |
Cognizant Technology Solutions Corp. | | | 3,772 | | | | 215,721 | |
Cohu, Inc. (1) | | | 1,057 | | | | 33,877 | |
Coupa Software, Inc. (1) | | | 886 | | | | 70,145 | |
CS Disco, Inc. (1) | | | 459 | | | | 2,901 | |
Dell Technologies, Inc. | | | 644 | | | | 25,902 | |
Digital Turbine, Inc. (1) | | | 48,169 | | | | 734,096 | |
Diodes, Inc. (1) | | | 1,067 | | | | 81,241 | |
DocuSign, Inc. (1) | | | 3,156 | | | | 174,906 | |
EPAM Systems, Inc. (1) | | | 710 | | | | 232,695 | |
Euronet Worldwide, Inc. (1) | | | 1,092 | | | | 103,063 | |
Extreme Networks, Inc. (1) | | | 567 | | | | 10,382 | |
Fair Isaac Corp. (1) | | | 16 | | | | 9,577 | |
Fastly, Inc. (1) | | | 3,647 | | | | 29,869 | |
Greenidge Generation Holdings, Inc. (1) | | | 5,463 | | | | 1,579 | |
HubSpot, Inc. (1) | | | 1,170 | | | | 338,282 | |
The accompanying notes are an integral part of these financial statements.
2022 Annual Report | December 31, 2022 | Page 33 |
Schedules of Investments
December 31, 2022
Spectrum Fund |
Security Description | | Shares or
Principal
Amount ($) | | | Fair
Value ($) | |
Common Stocks (United States) - Long — continued |
Inseego Corp. (1) | | | 7,282 | | | | 6,135 | |
Intel Corp. | | | 11,800 | | | | 311,874 | |
Intuit, Inc. | | | 2,339 | | | | 910,386 | |
Jabil, Inc. | | | 9,460 | | | | 645,172 | |
Lattice Semiconductor Corp. (1) | | | 2,519 | | | | 163,433 | |
Manhattan Associates, Inc. (1) | | | 5,688 | | | | 690,523 | |
Mastercard, Inc. | | | 3,523 | | | | 1,225,053 | |
Matterport, Inc. (1) | | | 86,982 | | | | 243,550 | |
Microchip Technology, Inc. | | | 3,641 | | | | 255,780 | |
Microsoft Corp. | | | 28,853 | | | | 6,919,520 | |
National Instruments Corp. | | | 1,271 | | | | 46,900 | |
NVIDIA Corp. | | | 4,666 | | | | 681,889 | |
Oracle Corp. | | | 8,024 | | | | 655,882 | |
Paysafe, Ltd. (1) | | | 2,581 | | | | 35,850 | |
Power Integrations, Inc. | | | 1,105 | | | | 79,251 | |
QUALCOMM, Inc. | | | 2,568 | | | | 282,326 | |
RingCentral, Inc. (1) | | | 7,382 | | | | 261,323 | |
Skyworks Solutions, Inc. | | | 12,512 | | | | 1,140,219 | |
Snowflake, Inc. (1) | | | 134 | | | | 19,234 | |
StarTek, Inc. (1) | | | 2,176 | | | | 8,160 | |
Synopsys, Inc. (1) | | | 2,201 | | | | 702,757 | |
Teradyne, Inc. | | | 5,047 | | | | 440,855 | |
Texas Instruments, Inc. | | | 3,076 | | | | 508,217 | |
Thoughtworks Holding, Inc. (1) | | | 295 | | | | 3,006 | |
Unity Software, Inc. (1) | | | 5,920 | | | | 169,253 | |
Veritone, Inc. (1) | | | 7,055 | | | | 37,392 | |
Zebra Technologies Corp. (1) | | | 1,767 | | | | 453,076 | |
Zoom Video Communications, Inc. (1) | | | 2,091 | | | | 141,644 | |
| | | | | | | | 25,903,327 | |
| | | | | | | | | |
Materials — 2.9% | | | | | | | | |
5E Advanced Materials, Inc. (1) | | | 18,536 | | | | 146,064 | |
AdvanSix, Inc. | | | 118 | | | | 4,486 | |
Alcoa Corp. | | | 17,599 | | | | 800,227 | |
Avery Dennison Corp. | | | 1,240 | | | | 224,440 | |
Carpenter Technology Corp. | | | 621 | | | | 22,940 | |
Century Aluminum Co. (1) | | | 13,108 | | | | 107,223 | |
Compass Minerals International, Inc. | | | 3,677 | | | | 150,757 | |
Dow, Inc. | | | 2,883 | | | | 145,274 | |
Eagle Materials, Inc. | | | 1,440 | | | | 191,304 | |
Freeport-McMoRan, Inc. | | | 5,943 | | | | 225,834 | |
Kaiser Aluminum Corp. | | | 5,038 | | | | 382,686 | |
Louisiana-Pacific Corp. | | | 10,815 | | | | 640,248 | |
LyondellBasell Industries NV | | | 1,840 | | | | 152,775 | |
MP Materials Corp. (1) | | | 21,450 | | | | 520,806 | |
Spectrum Fund |
Security Description | | Shares or
Principal
Amount ($) | | | Fair
Value ($) | |
Common Stocks (United States) - Long — continued |
Newmont Corp. | | | 642 | | | | 30,302 | |
Nucor Corp. | | | 1,456 | | | | 191,915 | |
Piedmont Lithium, Inc. (1) | | | 17,593 | | | | 774,444 | |
Reliance Steel & Aluminum Co. | | | 168 | | | | 34,010 | |
Royal Gold, Inc. | | | 248 | | | | 27,955 | |
Ryerson Holding Corp. | | | 765 | | | | 23,149 | |
Schnitzer Steel Industries, Inc. | | | 4,382 | | | | 134,308 | |
Steel Dynamics, Inc. | | | 1,915 | | | | 187,096 | |
Sylvamo Corp. | | | 905 | | | | 43,974 | |
TimkenSteel Corp. (1) | | | 1,164 | | | | 21,150 | |
United States Steel Corp. | | | 4,797 | | | | 120,165 | |
Westrock Co. | | | 433 | | | | 15,224 | |
| | | | | | | | 5,318,756 | |
| | | | | | | | | |
Real Estate Investment Trust — 0.0% | | | | | | | | |
CorEnergy Infrastructure Trust, Inc. | | | 4,564 | | | | 9,539 | |
RE/MAX Holdings, Inc. | | | 712 | | | | 13,272 | |
WeWork, Inc. (1) | | | 4,047 | | | | 5,787 | |
| | | | | | | | 28,598 | |
| | | | | | | | | |
Utilities — 0.3% | | | | | | | | |
FirstEnergy Corp. | | | 2,271 | | | | 95,246 | |
NRG Energy, Inc. | | | 8,155 | | | | 259,492 | |
OGE Energy Corp. | | | 2,614 | | | | 103,384 | |
UGI Corp. | | | 2,794 | | | | 103,574 | |
| | | | | | | | 561,696 | |
| | | | | | | | | |
Total Common Stocks (United States) - Long (Cost $69,725,010) | | | | | | | 87,960,398 | |
| | | | | | | | | |
Preferred Stock (United States) — 0.0% |
WESCO International, Inc. Series A Variable Preferred (5) | | | 198 | | | | 5,227 | |
Total Preferred Stock (United States) (Cost $4,949) | | | | | | | 5,227 | |
| | | | | | | | | |
Warrants (United States) — 0.0% |
Chaparral Energy, Inc. A Warrants, Expiration Date 10/14/2024 (1)(4) | | | 1 | | | | 0 | |
Chaparral Energy, Inc. B Warrants, Expiration Date 10/14/2025 (1)(4) | | | 1 | | | | 0 | |
Civitas Solutions, Inc. A Warrants, Expiration Date 1/20/2025 (1)(4) | | | 13 | | | | 0 | |
Civitas Solutions, Inc. B Warrants, Expiration Date 1/20/2026 (1)(4) | | | 6 | | | | 0 | |
The accompanying notes are an integral part of these financial statements.
Page 34 | 2022 Annual Report | December 31, 2022 |
Schedules of Investments
December 31, 2022
Spectrum Fund |
Security Description | | Shares or
Principal
Amount ($) | | | Fair
Value ($) | |
Warrants (United States) — continued |
Hertz Global Holdings, Inc. Warrants, Expiration Date 6/30/2051 (1) | | | 86 | | | | 641 | |
Nabors Industries, Ltd. Warrants, Expiration Date 6/11/2026 (1) | | | 29 | | | | 954 | |
Oasis Petroleum, Inc. Warrants, Expiration Date 11/19/2024 (1)(4) | | | 7 | | | | 0 | |
Whiting Petroleum Corp. A Warrants, Expiration Date 9/1/2024 (1) | | | 47 | | | | 958 | |
Whiting Petroleum Corp. B Warrants, Expiration Date 9/1/2025 (1) | | | 23 | | | | 418 | |
Total Warrants (United States) (Cost $2,899) | | | | | | | 2,971 | |
| | | | | | | | | |
Money Market Registered Investment Companies — 52.7% |
Meeder Institutional Prime Money Market Fund, 4.36% (2) | | | 97,085,841 | | | | 97,085,841 | |
Total Money Market Registered Investment Companies (Cost 97,044,533) | | | | | | | 97,085,841 | |
Total Investments — Long - 100.5% (Cost $166,777,391) | | | | | | | 185,054,437 | |
Liabilities less Other Assets — (0.5%) | | | | | | | (895,952 | ) |
Total Net Assets — 100.0% | | | | | | | 184,158,485 | |
| | | | | | | | | |
Trustee Deferred Compensation (3) |
Meeder Balanced Fund - Retail Class | | | 868 | | | | 9,982 | |
Meeder Dynamic Allocation Fund - Retail Class | | | 2,143 | | | | 24,344 | |
Meeder Muirfield Fund - Retail Class | | | 2,463 | | | | 20,295 | |
Meeder Conservative Allocation Fund - Retail Class | | | 266 | | | | 5,546 | |
Total Trustee Deferred Compensation (Cost $62,330) | | | | | | | 60,167 | |
Spectrum Fund |
| | | Long
(Short)
Contracts | | | Expiration
Date | | | Notional
Value of
Contracts
($) | | | Value and
Unrealized
Appreciation
(Depreciation)
($) | |
Futures Contracts |
Index Futures | | | | | | | | | | | | | | | | |
E-mini Standard & Poors MidCap 400 Futures | | | (52 | ) | | | 3/17/2023 | | | | (12,701,520 | ) | | | 197,143 | |
Mini MSCI EAFE Index Futures | | | 133 | | | | 3/17/2023 | | | | 12,963,510 | | | | (509,900 | ) |
Mini MSCI Emerging Markets Index Futures | | | 58 | | | | 3/17/2023 | | | | 2,782,260 | | | | (71,802 | ) |
Russell 2000 Mini Index Futures | | | 16 | | | | 3/17/2023 | | | | 1,416,720 | | | | (61,580 | ) |
Standard & Poors 500 Mini Futures | | | 7 | | | | 3/17/2023 | | | | 1,351,350 | | | | 11,017 | |
Total Futures Contracts | | | 162 | | | | | | | | 5,812,320 | | | | (435,122 | ) |
(1) | Represents non-income producing securities. |
(2) | Investment in affiliate. The yield shown represents the 7-day yield in effect at December 31, 2022. |
(3) | Assets of affiliates to the Spectrum Fund held for the benefit of the Fund’s Trustees in connection with the Trustee Deferred Compensation Plan. |
(4) | Fair valued security deemed a Level 3 security. Security is not part of the investment strategy of the Fund. |
(6) | 29,332 shares pledged as collateral for potential short positions (fair value $3,811,107). |
The accompanying notes are an integral part of these financial statements.
2022 Annual Report | December 31, 2022 | Page 35 |
Schedules of Investments
December 31, 2022
Global Allocation Fund |
Security Description | | Shares or
Principal
Amount ($) | | | Fair
Value ($) | |
Common Stocks (United States) — 26.3% |
Communication Services — 0.7% | | | | | | | | |
Alphabet, Inc. (1) | | | 1,760 | | | | 156,165 | |
Entravision Communications Corp. | | | 144 | | | | 691 | |
IDT Corp. (1) | | | 437 | | | | 12,310 | |
Liberty TripAdvisor Holdings, Inc. (1) | | | 262 | | | | 175 | |
Meta Platforms, Inc. (1) | | | 305 | | | | 36,704 | |
Netflix, Inc. (1) | | | 25 | | | | 7,372 | |
Roku, Inc. (1) | | | 67 | | | | 2,727 | |
T-Mobile US, Inc. (1) | | | 52 | | | | 7,280 | |
Trade Desk, Inc./The (1) | | | 60 | | | | 2,690 | |
| | | | | | | | 226,114 | |
| | | | | | | | | |
Consumer Discretionary — 2.7% | | | | | | | | |
Amazon.com, Inc. (1) | | | 1,048 | | | | 88,032 | |
AutoZone, Inc. (1) | | | 11 | | | | 27,128 | |
Best Buy Co., Inc. | | | 307 | | | | 24,624 | |
Bloomin’ Brands, Inc. | | | 223 | | | | 4,487 | |
Booking Holdings, Inc. (1) | | | 23 | | | | 46,351 | |
BorgWarner, Inc. | | | 640 | | | | 25,760 | |
Buckle, Inc./The | | | 9 | | | | 408 | |
Burlington Stores, Inc. (1) | | | 135 | | | | 27,373 | |
Cavco Industries, Inc. (1) | | | 2 | | | | 453 | |
Chegg, Inc. (1) | | | 438 | | | | 11,068 | |
Chico’s FAS, Inc. (1) | | | 42 | | | | 207 | |
DR Horton, Inc. | | | 92 | | | | 8,201 | |
Ethan Allen Interiors, Inc. | | | 10 | | | | 264 | |
Expedia Group, Inc. (1) | | | 332 | | | | 29,083 | |
Frontdoor, Inc. (1) | | | 38 | | | | 790 | |
Garmin, Ltd. | | | 24 | | | | 2,215 | |
Gentex Corp. | | | 24 | | | | 654 | |
Goodyear Tire & Rubber Co./The (1) | | | 836 | | | | 8,485 | |
Grand Canyon Education, Inc. (1) | | | 258 | | | | 27,260 | |
Green Brick Partners, Inc. (1) | | | 14 | | | | 339 | |
Home Depot, Inc./The | | | 206 | | | | 65,067 | |
Lear Corp. | | | 2 | | | | 248 | |
Lennar Corp. | | | 4 | | | | 362 | |
LKQ Corp. | | | 63 | | | | 3,365 | |
Lowe’s Cos., Inc. | | | 297 | | | | 59,174 | |
Lululemon Athletica, Inc. (1) | | | 245 | | | | 78,493 | |
M/I Homes, Inc. (1) | | | 131 | | | | 6,050 | |
Macy’s, Inc. | | | 1,941 | | | | 40,082 | |
MasterCraft Boat Holdings, Inc. (1) | | | 19 | | | | 492 | |
Mohawk Industries, Inc. (1) | | | 198 | | | | 20,240 | |
National Vision Holdings, Inc. (1) | | | 232 | | | | 8,992 | |
O’Reilly Automotive, Inc. (1) | | | 20 | | | | 16,881 | |
PVH Corp. | | | 582 | | | | 41,083 | |
Qurate Retail, Inc. (1) | | | 315 | | | | 513 | |
Global Allocation Fund |
Security Description | | Shares or
Principal
Amount ($) | | | Fair
Value ($) | |
Common Stocks (United States) — continued |
Ross Stores, Inc. | | | 102 | | | | 11,839 | |
Skyline Champion Corp. (1) | | | 359 | | | | 18,492 | |
Smith & Wesson Brands, Inc. | | | 111 | | | | 963 | |
Tapestry, Inc. | | | 235 | | | | 8,949 | |
Target Corp. | | | 55 | | | | 8,197 | |
TJX Cos., Inc./The | | | 448 | | | | 35,661 | |
Town Sports International Holdings, Inc. (1)(5) | | | 378 | | | | 0 | |
Tractor Supply Co. | | | 104 | | | | 23,397 | |
Tupperware Brands Corp. (1) | | | 118 | | | | 489 | |
Ulta Beauty, Inc. (1) | | | 83 | | | | 38,933 | |
Whirlpool Corp. | | | 103 | | | | 14,570 | |
Wingstop, Inc. | | | 31 | | | | 4,266 | |
Yum! Brands, Inc. | | | 212 | | | | 27,153 | |
Zumiez, Inc. (1) | | | 11 | | | | 239 | |
| | | | | | | | 867,372 | |
| | | | | | | | | |
Consumer Staples — 1.1% | | | | | | | | |
Archer-Daniels-Midland Co. | | | 342 | | | | 31,755 | |
Bunge, Ltd. | | | 30 | | | | 2,993 | |
Casey’s General Stores, Inc. | | | 7 | | | | 1,570 | |
Coca-Cola Co./The | | | 188 | | | | 11,959 | |
Costco Wholesale Corp. | | | 224 | | | | 102,256 | |
General Mills, Inc. | | | 1,070 | | | | 89,720 | |
Ingredion, Inc. | | | 18 | | | | 1,763 | |
Kraft Heinz Co./The | | | 5 | | | | 204 | |
Kroger Co./The | | | 59 | | | | 2,630 | |
PepsiCo, Inc. | | | 344 | | | | 62,147 | |
Pilgrim’s Pride Corp. (1) | | | 13 | | | | 308 | |
Walmart, Inc. | | | 177 | | | | 25,097 | |
| | | | | | | | 332,402 | |
| | | | | | | | | |
Energy — 3.8% | | | | | | | | |
APA Corp. | | | 342 | | | | 15,965 | |
Berry Corp. | | | 67 | | | | 536 | |
Bristow Group, Inc. (1) | | | 60 | | | | 1,628 | |
California Resources Corp. | | | 13 | | | | 566 | |
Centrus Energy Corp. (1) | | | 111 | | | | 3,605 | |
Cheniere Energy, Inc. | | | 74 | | | | 11,097 | |
Chevron Corp. | | | 2,754 | | | | 494,315 | |
Civitas Resources, Inc. | | | 7 | | | | 406 | |
ConocoPhillips | | | 367 | | | | 43,306 | |
Denbury, Inc. (1) | | | 2 | | | | 174 | |
Devon Energy Corp. | | | 9 | | | | 554 | |
Diamondback Energy, Inc. | | | 43 | | | | 5,882 | |
DT Midstream, Inc. | | | 30 | | | | 1,658 | |
EOG Resources, Inc. | | | 166 | | | | 21,500 | |
EQT Corp. | | | 19 | | | | 643 | |
The accompanying notes are an integral part of these financial statements.
Page 36 | 2022 Annual Report | December 31, 2022 |
Schedules of Investments
December 31, 2022
Global Allocation Fund |
Security Description | | Shares or
Principal
Amount ($) | | | Fair
Value ($) | |
Common Stocks (United States) — continued |
Exxon Mobil Corp. | | | 1,491 | | | | 164,457 | |
Halliburton Co. | | | 417 | | | | 16,409 | |
Hess Corp. | | | 47 | | | | 6,666 | |
HF Sinclair Corp. | | | 6 | | | | 311 | |
Laredo Petroleum, Inc. (1) | | | 6 | | | | 309 | |
Marathon Petroleum Corp. | | | 793 | | | | 92,297 | |
Matador Resources Co. | | | 3 | | | | 172 | |
Occidental Petroleum Corp. | | | 32 | | | | 2,016 | |
ONEOK, Inc. | | | 2,673 | | | | 175,616 | |
Ovintiv, Inc. | | | 269 | | | | 13,641 | |
PDC Energy, Inc. | | | 32 | | | | 2,031 | |
Phillips 66 | | | 261 | | | | 27,165 | |
Pioneer Natural Resources Co. | | | 55 | | | | 12,561 | |
Schlumberger, Ltd. | | | 651 | | | | 34,802 | |
SM Energy Co. | | | 10 | | | | 348 | |
Targa Resources Corp. | | | 188 | | | | 13,818 | |
Teekay Corp. (1) | | | 121 | | | | 549 | |
Valero Energy Corp. | | | 257 | | | | 32,603 | |
Westmoreland Coal Co. (1)(5) | | | 539 | | | | 0 | |
Williams Cos., Inc./The | | | 10 | | | | 329 | |
World Fuel Services Corp. | | | 20 | | | | 547 | |
| | | | | | | | 1,198,482 | |
| | | | | | | | | |
Financials — 3.6% | | | | | | | | |
Berkshire Hathaway, Inc. (1) | | | 1,704 | | | | 526,366 | |
American Equity Investment Life Holding Co. | | | 60 | | | | 2,737 | |
American Financial Group, Inc./OH | | | 41 | | | | 5,628 | |
American International Group, Inc. | | | 117 | | | | 7,399 | |
Bank of New York Mellon Corp./The | | | 1,039 | | | | 47,295 | |
Charles Schwab Corp./The | | | 137 | | | | 11,407 | |
Chubb, Ltd. | | | 139 | | | | 30,663 | |
East West Bancorp, Inc. | | | 738 | | | | 48,634 | |
Essent Group, Ltd. | | | 88 | | | | 3,421 | |
F&G Annuities & Life, Inc. | | | 22 | | | | 440 | |
Fidelity National Financial, Inc. | | | 331 | | | | 12,452 | |
First American Financial Corp. | | | 28 | | | | 1,466 | |
Focus Financial Partners, Inc. (1) | | | 60 | | | | 2,236 | |
Hartford Financial Services Group, Inc./The | | | 189 | | | | 14,332 | |
Jackson Financial, Inc. | | | 9 | | | | 313 | |
Loews Corp. | | | 6 | | | | 350 | |
LPL Financial Holdings, Inc. | | | 24 | | | | 5,188 | |
Marsh & McLennan Cos., Inc. | | | 1,308 | | | | 216,448 | |
Medley Management, Inc. (1)(5) | | | 21 | | | | 0 | |
Moelis & Co. | | | 145 | | | | 5,564 | |
NMI Holdings, Inc. (1) | | | 35 | | | | 732 | |
Northern Trust Corp. | | | 92 | | | | 8,141 | |
Global Allocation Fund |
Security Description | | Shares or
Principal
Amount ($) | | | Fair
Value ($) | |
Common Stocks (United States) — continued |
Old Republic International Corp. | | | 14 | | | | 338 | |
Pathward Financial, Inc. | | | 124 | | | | 5,338 | |
SEI Investments Co. | | | 128 | | | | 7,462 | |
State Street Corp. | | | 199 | | | | 15,436 | |
Stewart Information Services Corp. | | | 410 | | | | 17,519 | |
Synchrony Financial | | | 78 | | | | 2,563 | |
W R Berkley Corp. | | | 25 | | | | 1,814 | |
Walker & Dunlop, Inc. | | | 15 | | | | 1,177 | |
Willis Towers Watson PLC | | | 567 | | | | 138,677 | |
| | | | | | | | 1,141,536 | |
| | | | | | | | | |
Healthcare — 4.7% | | | | | | | | |
AbbVie, Inc. | | | 366 | | | | 59,149 | |
Alaunos Therapeutics, Inc. (1) | | | 620 | | | | 402 | |
AmerisourceBergen Corp. | | | 9 | | | | 1,491 | |
Amgen, Inc. | | | 365 | | | | 95,864 | |
Assertio Holdings, Inc. (1) | | | 132 | | | | 568 | |
Avanos Medical, Inc. (1) | | | 7 | | | | 189 | |
Biogen, Inc. (1) | | | 49 | | | | 13,569 | |
Bristol-Myers Squibb Co. | | | 655 | | | | 47,127 | |
Cardinal Health, Inc. | | | 625 | | | | 48,044 | |
Catalent, Inc. (1) | | | 254 | | | | 11,433 | |
Centene Corp. (1) | | | 238 | | | | 19,518 | |
Cigna Corp. | | | 143 | | | | 47,382 | |
CVS Health Corp. | | | 213 | | | | 19,849 | |
Dexcom, Inc. (1) | | | 44 | | | | 4,983 | |
Eli Lilly & Co. | | | 227 | | | | 83,046 | |
Embecta Corp. | | | 79 | | | | 1,998 | |
Endo International PLC (1) | | | 1,889 | | | | 134 | |
Ensign Group, Inc./The | | | 10 | | | | 946 | |
Exact Sciences Corp. (1) | | | 119 | | | | 5,892 | |
Fulgent Genetics, Inc. (1) | | | 820 | | | | 24,420 | |
Genprex, Inc. (1) | | | 180 | | | | 261 | |
Gilead Sciences, Inc. | | | 1,358 | | | | 116,584 | |
Haemonetics Corp. (1) | | | 4 | | | | 315 | |
HCA Healthcare, Inc. | | | 36 | | | | 8,639 | |
Humana, Inc. | | | 37 | | | | 18,951 | |
IDEXX Laboratories, Inc. (1) | | | 18 | | | | 7,343 | |
Inspire Medical Systems, Inc. (1) | | | 15 | | | | 3,778 | |
Intuitive Surgical, Inc. (1) | | | 107 | | | | 28,392 | |
IQVIA Holdings, Inc. (1) | | | 53 | | | | 10,859 | |
Johnson & Johnson | | | 1,144 | | | | 202,088 | |
Laboratory Corp. of America Holdings | | | 26 | | | | 6,122 | |
McKesson Corp. | | | 95 | | | | 35,636 | |
Merck & Co., Inc. | | | 885 | | | | 98,191 | |
Moderna, Inc. (1) | | | 257 | | | | 46,162 | |
Myriad Genetics, Inc. (1) | | | 47 | | | | 682 | |
The accompanying notes are an integral part of these financial statements.
2022 Annual Report | December 31, 2022 | Page 37 |
Schedules of Investments
December 31, 2022
Global Allocation Fund |
Security Description | | Shares or
Principal
Amount ($) | | | Fair
Value ($) | |
Common Stocks (United States) — continued |
Pfizer, Inc. | | | 887 | | | | 45,450 | |
Quest Diagnostics, Inc. | | | 5 | | | | 782 | |
Regeneron Pharmaceuticals, Inc. (1) | | | 16 | | | | 11,544 | |
ResMed, Inc. | | | 33 | | | | 6,868 | |
Twist Bioscience Corp. (1) | | | 757 | | | | 18,024 | |
UnitedHealth Group, Inc. | | | 308 | | | | 163,295 | |
Universal Health Services, Inc. | | | 53 | | | | 7,467 | |
Vertex Pharmaceuticals, Inc. (1) | | | 127 | | | | 36,675 | |
Viatris, Inc. | | | 1,031 | | | | 11,475 | |
Vir Biotechnology, Inc. (1) | | | 7 | | | | 177 | |
West Pharmaceutical Services, Inc. | | | 48 | | | | 11,297 | |
Zimmer Biomet Holdings, Inc. | | | 3 | | | | 383 | |
Zoetis, Inc. | | | 621 | | | | 91,008 | |
| | | | | | | | 1,474,452 | |
| | | | | | | | | |
Industrials — 2.3% | | | | | | | | |
AAR Corp. (1) | | | 4 | | | | 180 | |
AeroVironment, Inc. (1) | | | 113 | | | | 9,680 | |
AGCO Corp. | | | 4 | | | | 555 | |
Alaska Air Group, Inc. (1) | | | 7 | | | | 301 | |
Atkore, Inc. (1) | | | 118 | | | | 13,384 | |
BlueLinx Holdings, Inc. (1) | | | 9 | | | | 640 | |
Boise Cascade Co. | | | 13 | | | | 893 | |
Brady Corp. | | | 4 | | | | 188 | |
Builders FirstSource, Inc. (1) | | | 530 | | | | 34,386 | |
Comfort Systems USA, Inc. | | | 2 | | | | 230 | |
Copart, Inc. (1) | | | 4,006 | | | | 243,925 | |
CoStar Group, Inc. (1) | | | 222 | | | | 17,156 | |
Crane Holdings Co. | | | 2 | | | | 201 | |
Donaldson Co., Inc. | | | 3 | | | | 177 | |
EMCOR Group, Inc. | | | 270 | | | | 39,990 | |
Emerson Electric Co. | | | 93 | | | | 8,934 | |
Enovix Corp. (1) | | | 327 | | | | 4,068 | |
Equifax, Inc. | | | 1 | | | | 194 | |
Expeditors International of Washington, Inc. | | | 25 | | | | 2,598 | |
Fortune Brands Innovations, Inc. | | | 939 | | | | 53,626 | |
General Dynamics Corp. | | | 300 | | | | 74,433 | |
Graco, Inc. | | | 392 | | | | 26,366 | |
Hub Group, Inc. (1) | | | 2 | | | | 159 | |
ITT, Inc. | | | 5 | | | | 406 | |
Karat Packaging, Inc. | | | 15 | | | | 216 | |
Leidos Holdings, Inc. | | | 70 | | | | 7,363 | |
Lockheed Martin Corp. | | | 92 | | | | 44,757 | |
ManpowerGroup, Inc. | | | 3 | | | | 250 | |
Masterbrand, Inc. (1) | | | 399 | | | | 3,012 | |
Matson, Inc. | | | 47 | | | | 2,938 | |
MDU Resources Group, Inc. | | | 11 | | | | 334 | |
Global Allocation Fund |
Security Description | | Shares or
Principal
Amount ($) | | | Fair
Value ($) | |
Common Stocks (United States) — continued |
Mueller Industries, Inc. | | | 110 | | | | 6,490 | |
Northrop Grumman Corp. | | | 31 | | | | 16,914 | |
nVent Electric PLC | | | 215 | | | | 8,271 | |
PACCAR, Inc. | | | 18 | | | | 1,781 | |
Primoris Services Corp. | | | 15 | | | | 329 | |
Regal Rexnord Corp. | | | 2 | | | | 240 | |
Sensata Technologies Holding PLC | | | 7 | | | | 283 | |
SkyWest, Inc. (1) | | | 269 | | | | 4,441 | |
Southwest Airlines Co. | | | 918 | | | | 30,909 | |
Terex Corp. | | | 4 | | | | 171 | |
United Airlines Holdings, Inc. (1) | | | 329 | | | | 12,403 | |
Univar Solutions, Inc. (1) | | | 6 | | | | 191 | |
Verisk Analytics, Inc. | | | 139 | | | | 24,522 | |
Vicor Corp. (1) | | | 215 | | | | 11,556 | |
Waste Management, Inc. | | | 15 | | | | 2,353 | |
WW Grainger, Inc. | | | 3 | | | | 1,669 | |
| | | | | | | | 714,063 | |
| | | | | | | | | |
Information Technology — 6.6% | | | | | | | | |
Adobe, Inc. (1) | | | 166 | | | | 55,864 | |
ANSYS, Inc. (1) | | | 36 | | | | 8,697 | |
Apple, Inc. | | | 4,142 | | | | 538,170 | |
Applied Materials, Inc. | | | 295 | | | | 28,727 | |
Arrow Electronics, Inc. (1) | | | 349 | | | | 36,495 | |
Avnet, Inc. | | | 503 | | | | 20,915 | |
Calix, Inc. (1) | | | 124 | | | | 8,485 | |
Cisco Systems, Inc. | | | 598 | | | | 28,489 | |
Cloudflare, Inc. (1) | | | 334 | | | | 15,100 | |
Cognizant Technology Solutions Corp. | | | 290 | | | | 16,585 | |
Dell Technologies, Inc. | | | 9 | | | | 362 | |
Digital Turbine, Inc. (1) | | | 847 | | | | 12,908 | |
DocuSign, Inc. (1) | | | 280 | | | | 15,518 | |
EPAM Systems, Inc. (1) | | | 27 | | | | 8,849 | |
Intel Corp. | | | 313 | | | | 8,273 | |
Intuit, Inc. | | | 146 | | | | 56,826 | |
Jabil, Inc. | | | 143 | | | | 9,753 | |
Lam Research Corp. | | | 82 | | | | 34,465 | |
Lattice Semiconductor Corp. (1) | | | 477 | | | | 30,948 | |
Manhattan Associates, Inc. (1) | | | 568 | | | | 68,955 | |
Mastercard, Inc. | | | 203 | | | | 70,589 | |
Microchip Technology, Inc. | | | 264 | | | | 18,546 | |
Microsoft Corp. | | | 2,027 | | | | 486,115 | |
National Instruments Corp. | | | 254 | | | | 9,373 | |
NVIDIA Corp. | | | 302 | | | | 44,134 | |
Oracle Corp. | | | 672 | | | | 54,929 | |
Power Integrations, Inc. | | | 3 | | | | 215 | |
QUALCOMM, Inc. | | | 563 | | | | 61,896 | |
The accompanying notes are an integral part of these financial statements.
Page 38 | 2022 Annual Report | December 31, 2022 |
Schedules of Investments
December 31, 2022
Global Allocation Fund |
Security Description | | Shares or
Principal
Amount ($) | | | Fair
Value ($) | |
Common Stocks (United States) — continued |
Skyworks Solutions, Inc. | | | 1,163 | | | | 105,984 | |
StarTek, Inc. (1) | | | 131 | | | | 491 | |
Synopsys, Inc. (1) | | | 176 | | | | 56,195 | |
Teradyne, Inc. | | | 591 | | | | 51,624 | |
Texas Instruments, Inc. | | | 586 | | | | 96,819 | |
TTM Technologies, Inc. (1) | | | 12 | | | | 181 | |
Vishay Intertechnology, Inc. | | | 8 | | | | 173 | |
Zebra Technologies Corp. (1) | | | 198 | | | | 50,769 | |
Zoom Video Communications, Inc. (1) | | | 320 | | | | 21,677 | |
| | | | | | | | 2,134,094 | |
| | | | | | | | | |
Materials — 0.7% | | | | | | | | |
Alcoa Corp. | | | 732 | | | | 33,284 | |
Avery Dennison Corp. | | | 81 | | | | 14,661 | |
CF Industries Holdings, Inc. | | | 5 | | | | 426 | |
Dow, Inc. | | | 309 | | | | 15,571 | |
Eagle Materials, Inc. | | | 99 | | | | 13,152 | |
Flotek Industries, Inc. (1) | | | 208 | | | | 233 | |
Freeport-McMoRan, Inc. | | | 666 | | | | 25,308 | |
Louisiana-Pacific Corp. | | | 668 | | | | 39,546 | |
LyondellBasell Industries NV | | | 213 | | | | 17,685 | |
Newmont Corp. | | | 38 | | | | 1,794 | |
Nucor Corp. | | | 170 | | | | 22,408 | |
Olin Corp. | | | 49 | | | | 2,594 | |
Packaging Corp. of America | | | 3 | | | | 384 | |
Reliance Steel & Aluminum Co. | | | 2 | | | | 405 | |
Ryerson Holding Corp. | | | 40 | | | | 1,210 | |
Schnitzer Steel Industries, Inc. | | | 52 | | | | 1,594 | |
Southern Copper Corp. | | | 106 | | | | 6,401 | |
Steel Dynamics, Inc. | | | 132 | | | | 12,896 | |
United States Steel Corp. | | | 366 | | | | 9,168 | |
Westrock Co. | | | 24 | | | | 844 | |
| | | | | | | | 219,564 | |
| | | | | | | | | |
Real Estate Investment Trust — 0.0% | | | | | | | | |
CorEnergy Infrastructure Trust, Inc. | | | 583 | | | | 1,218 | |
RAIT Financial Trust (1)(5) | | | 287 | | | | 0 | |
Spirit MTA REIT Liquidating Trust (1)(5) | | | 385 | | | | 0 | |
| | | | | | | | 1,218 | |
| | | | | | | | | |
Utilities — 0.1% | | | | | | | | |
American Water Works Co., Inc. | | | 5 | | | | 762 | |
Brookfield Renewable Corp. | | | 13 | | | | 358 | |
National Fuel Gas Co. | | | 19 | | | | 1,203 | |
NRG Energy, Inc. | | | 12 | | | | 382 | |
Global Allocation Fund |
Security Description | | Shares or
Principal
Amount ($) | | | Fair
Value ($) | |
Common Stocks (United States) — continued |
UGI Corp. | | | 697 | | | | 25,839 | |
| | | | | | | | 28,544 | |
| | | | | | | | | |
Total Common Stocks (United States) (Cost $6,802,042) | | | | | | | 8,337,841 | |
| | | | | | | | | |
Preferred Stock (United States) — 0.0% |
WESCO International, Inc. Series A Variable Preferred, 9.7% (6) | | | 81 | | | | 2,138 | |
Total Preferred Stock (United States) (Cost $2,025) | | | | | | | 2,138 | |
| | | | | | | | | |
Warrants (United States) — 0.0% |
Civitas Solutions, Inc. A Warrants, Expiration Date 1/20/2025 (1)(5) | | | 2 | | | | 0 | |
Civitas Solutions, Inc. B Warrants, Expiration Date 1/20/2026 (1)(5) | | | 1 | | | | 0 | |
Hertz Global Holdings, Inc. Warrants, Expiration Date 6/30/2051 (1) | | | 11 | | | | 82 | |
Nabors Industries, Ltd. Warrants, Expiration Date 6/11/2026 (1) | | | 4 | | | | 132 | |
Whiting Petroleum Corp. A Warrants, Expiration Date 9/1/2024 (1) | | | 12 | | | | 245 | |
Whiting Petroleum Corp. B Warrants, Expiration Date 9/1/2025 (1) | | | 9 | | | | 164 | |
Total Warrants (United States) (Cost $93) | | | | | | | 623 | |
| | | | | | | | | |
Registered Investment Companies — 17.0% |
U.S. Fixed Income — 5.8% | | | | | | | | |
Baird Core Plus Bond Fund - Class I | | | 9,182 | | | | 90,627 | |
BBH Limited Duration Fund - Class I | | | 5,078 | | | | 50,578 | |
Diamond Hill Short Duration Securitized Bond Fund - Class Y | | | 18,104 | | | | 170,536 | |
DoubleLine Total Return Bond Fund - Class I | | | 14,068 | | | | 123,373 | |
Frost Total Return Bond Fund - Class I | | | 7,807 | | | | 72,840 | |
Guggenheim- Total Return Bond Fund - Class I | | | 2,205 | | | | 51,159 | |
iShares Core U.S. Aggregate Bond ETF (7) | | | 4,811 | | | | 466,619 | |
PGIM Short-Term Corporate Bond Fund - Class Q | | | 16,705 | | | | 170,055 | |
Pioneer Bond Fund - Class K | | | 8,807 | | | | 71,513 | |
Segall Bryant & Hamill Plus Bond Fund - Class I | | | 14,317 | | | | 129,566 | |
SPDR Bloomberg High Yield Bond ETF (7) | | | 3,977 | | | | 357,930 | |
The accompanying notes are an integral part of these financial statements.
2022 Annual Report | December 31, 2022 | Page 39 |
Schedules of Investments
December 31, 2022
Global Allocation Fund |
Security Description | | Shares or
Principal
Amount ($) | | | Fair
Value ($) | |
Registered Investment Companies — continued |
Xtrackers USD High Yield Corporate Bond ETF (7) | | | 2,730 | | | | 92,028 | |
| | | | | | | | 1,846,824 | |
| | | | | | | | | |
International Fixed Income — 1.1% | | | | | | | | |
iShares JP Morgan USD Emerging Markets Bond ETF (7) | | | 4,299 | | | | 363,652 | |
| | | | | | | | 363,652 | |
| | | | | | | | | |
International Equity — 10.1% | | | | | | | | |
iShares Core MSCI EAFE ETF (7) | | | 42,298 | | | | 2,607,249 | |
iShares Core MSCI Emerging Markets ETF (7) | | | 12,312 | | | | 574,970 | |
| | | | | | | | 3,182,219 | |
| | | | | | | | | |
Total Registered Investment Companies (Cost $5,036,582) | | | | | | | 5,392,695 | |
| | | | | | | | | |
Money Market Registered Investment Companies — 52.7% |
Federated Hermes Government Obligations Fund, 4.15% | | | 621,000 | | | | 621,000 | |
Meeder Institutional Prime Money Market Fund, 4.36% (2) | | | 16,061,419 | | | | 16,061,419 | |
Total Money Market Registered Investment Companies (Cost $16,676,545) | | | | | | | 16,682,419 | |
| | | | | | | | | |
Bank Obligations — 1.6% |
First Merchants Bank Deposit Account, 1.60%, 1/3/2023 (3) | | | 249,081 | | | | 249,081 | |
Metro City Bank Deposit Account, 0.94%, 1/3/2023 (3) | | | 249,337 | | | | 249,337 | |
Total Bank Obligations (Cost $498,418) | | | | | | | 498,418 | |
Total Investments — 97.6% (Cost $29,015,705) | | | | | | | 30,914,134 | |
Other Assets less Liabilities — 2.4% | | | | | | | 747,384 | |
Total Net Assets — 100.0% | | | | | | | 31,661,518 | |
Global Allocation Fund |
Security Description | | Shares or
Principal
Amount ($) | | | Fair
Value ($) | |
Trustee Deferred Compensation (4) |
Meeder Balanced Fund - Retail Class | | | 2,048 | | | | 23,552 | |
Meeder Dynamic Allocation Fund - Retail Class | | | 5,560 | | | | 63,162 | |
Meeder Muirfield Fund - Retail Class | | | 2,378 | | | | 19,595 | |
Meeder Conservative Allocation Fund - Retail Class | | | 571 | | | | 11,905 | |
Total Trustee Deferred Compensation (Cost $112,523) | | | | | | | 118,214 | |
| | | | | | | | | |
| | | Long
(Short)
Contracts | | | Expiration
Date | | | Notional
Value of
Contracts
($) | | | Value and
Unrealized
Appreciation
(Depreciation)
($) | |
Futures Contracts |
Index Futures | | | | | | | | | | | | | | | | |
E-mini Standard & Poors MidCap 400 Futures | | | (1 | ) | | | 3/17/2023 | | | | (244,260 | ) | | | (2,039 | ) |
Mini MSCI EAFE Index Futures | | | 82 | | | | 3/17/2023 | | | | 7,992,540 | | | | (314,375 | ) |
Mini MSCI Emerging Markets Index Futures | | | 39 | | | | 3/17/2023 | | | | 1,870,830 | | | | (47,285 | ) |
Russell 2000 Mini Index Futures | | | 10 | | | | 3/17/2023 | | | | 885,450 | | | | (31,075 | ) |
Standard & Poors 500 Mini Futures | | | 10 | | | | 3/17/2023 | | | | 1,930,500 | | | | (89,608 | ) |
Total Futures Contracts | | | 140 | | | | | | | | 12,435,060 | | | | (484,382 | ) |
(1) | Represents non-income producing securities. |
(2) | Investment in affiliate. The yield shown represents the 7-day yield in effect at December 31, 2022. |
(3) | Variable rate security. Securities payable at par including accrued interest (usually within seven days notice) and unconditionally secured as to principal and interest by letters of credit or other credit support agreements from major banks. The interest rates are adjustable and are not based on a published reference rate and spread but are determined by the issuer or agent and are based on current market conditions. These securities do not indicate a reference rate and spread in their description above. The rate shown represents the rate in effect at December 31, 2022. The maturity date shown, if applicable, reflects the earlier of the next demand date or stated maturity date. |
(4) | Assets of affiliates to the Global Allocation Fund held for the benefit of the Fund’s Trustees in connection with the Trustee Deferred Compensation Plan. |
(5) | Fair valued security deemed a Level 3 security. Security is not part of the investment strategy of the Fund. |
The accompanying notes are an integral part of these financial statements.
Page 40 | 2022 Annual Report | December 31, 2022 |
Schedules of Investments
December 31, 2022
Balanced Fund |
Security Description | | Shares,
Contracts
or Principal
Amount ($) | | | Fair
Value ($) | |
Common Stocks (United States) — 41.7% |
Communication Services — 1.2% | | | | | | | | |
Alphabet, Inc. (1) | | | 28,288 | | | | 2,509,994 | |
Cable One, Inc. | | | 8 | | | | 5,695 | |
Entravision Communications Corp. | | | 1,386 | | | | 6,653 | |
IDT Corp. (1) | | | 5,933 | | | | 167,133 | |
Liberty TripAdvisor Holdings, Inc. (1) | | | 4,043 | | | | 2,707 | |
Meta Platforms, Inc. (1) | | | 4,538 | | | | 546,103 | |
Netflix, Inc. (1) | | | 418 | | | | 123,260 | |
Roku, Inc. (1) | | | 2,372 | | | | 96,540 | |
Telephone and Data Systems, Inc. | | | 447 | | | | 4,689 | |
T-Mobile US, Inc. (1) | | | 3,087 | | | | 432,180 | |
Trade Desk, Inc./The (1) | | | 3,389 | | | | 151,929 | |
Verizon Communications, Inc. | | | 198 | | | | 7,801 | |
| | | | | | | | 4,054,684 | |
| | | | | | | | | |
Consumer Discretionary — 5.4% | | | | | | | | |
Amazon.com, Inc. (1) | | | 8,898 | | | | 747,432 | |
AutoZone, Inc. (1) | | | 13 | | | | 32,060 | |
Best Buy Co., Inc. | | | 4,277 | | | | 343,058 | |
Bloomin’ Brands, Inc. | | | 1,365 | | | | 27,464 | |
Booking Holdings, Inc. (1) | | | 339 | | | | 683,180 | |
BorgWarner, Inc. | | | 10,796 | | | | 434,539 | |
Buckle, Inc./The | | | 504 | | | | 22,856 | |
Burlington Stores, Inc. (1) | | | 967 | | | | 196,069 | |
Cavco Industries, Inc. (1) | | | 84 | | | | 19,005 | |
Chegg, Inc. (1) | | | 7,542 | | | | 190,586 | |
Citi Trends, Inc. (1) | | | 1,270 | | | | 33,630 | |
Dillard’s, Inc. | | | 10 | | | | 3,232 | |
DR Horton, Inc. | | | 12,139 | | | | 1,082,070 | |
Ethan Allen Interiors, Inc. | | | 151 | | | | 3,989 | |
Expedia Group, Inc. (1) | | | 6,564 | | | | 575,006 | |
Frontdoor, Inc. (1) | | | 498 | | | | 10,358 | |
Garmin, Ltd. | | | 6,071 | | | | 560,293 | |
Gentex Corp. | | | 423 | | | | 11,535 | |
Goodyear Tire & Rubber Co./The (1) | | | 5,610 | | | | 56,942 | |
Grand Canyon Education, Inc. (1) | | | 5,339 | | | | 564,119 | |
Green Brick Partners, Inc. (1) | | | 1,860 | | | | 45,068 | |
La-Z-Boy, Inc. | | | 10 | | | | 228 | |
Lear Corp. | | | 42 | | | | 5,209 | |
Lennar Corp. | | | 9,278 | | | | 839,659 | |
LKQ Corp. | | | 3,626 | | | | 193,665 | |
Lowe’s Cos., Inc. | | | 4,446 | | | | 885,821 | |
Lululemon Athletica, Inc. (1) | | | 6,228 | | | | 1,995,327 | |
M/I Homes, Inc. (1) | | | 4,804 | | | | 221,849 | |
Macy’s, Inc. | | | 35,115 | | | | 725,125 | |
MasterCraft Boat Holdings, Inc. (1) | | | 383 | | | | 9,908 | |
Balanced Fund |
Security Description | | Shares,
Contracts
or Principal
Amount ($) | | | Fair
Value ($) | |
Common Stocks (United States) — continued |
Mohawk Industries, Inc. (1) | | | 9,097 | | | | 929,895 | |
National Vision Holdings, Inc. (1) | | | 3,666 | | | | 142,094 | |
Newell Brands, Inc. | | | 346 | | | | 4,526 | |
NVR, Inc. (1) | | | 27 | | | | 124,540 | |
ONE Group Hospitality, Inc./The (1) | | | 1,514 | | | | 9,538 | |
O’Reilly Automotive, Inc. (1) | | | 784 | | | | 661,720 | |
Patrick Industries, Inc. | | | 293 | | | | 17,756 | |
PulteGroup, Inc. | | | 4,844 | | | | 220,547 | |
PVH Corp. | | | 4,185 | | | | 295,419 | |
Qurate Retail, Inc. (1) | | | 4,274 | | | | 6,967 | |
Red Rock Resorts, Inc. | | | 135 | | | | 5,401 | |
Rent-A-Center, Inc./TX | | | 295 | | | | 6,652 | |
Ross Stores, Inc. | | | 3,396 | | | | 394,174 | |
Skyline Champion Corp. (1) | | | 8,506 | | | | 438,144 | |
Sleep Number Corp. (1) | | | 2,001 | | | | 51,986 | |
Smith & Wesson Brands, Inc. | | | 4,867 | | | | 42,246 | |
Tapestry, Inc. | | | 2,980 | | | | 113,478 | |
Target Corp. | | | 802 | | | | 119,530 | |
Tempur Sealy International, Inc. | | | 4,501 | | | | 154,519 | |
TJX Cos., Inc./The | | | 10,029 | | | | 798,308 | |
Toll Brothers, Inc. | | | 4,203 | | | | 209,814 | |
Town Sports International Holdings, Inc. (1)(5) | | | 1,777 | | | | 0 | |
Tractor Supply Co. | | | 1,565 | | | | 352,078 | |
Tupperware Brands Corp. (1) | | | 5,977 | | | | 24,745 | |
Ulta Beauty, Inc. (1) | | | 1,757 | | | | 824,156 | |
Urban Outfitters, Inc. (1) | | | 227 | | | | 5,414 | |
Whirlpool Corp. | | | 7,954 | | | | 1,125,173 | |
Wingstop, Inc. | | | 826 | | | | 113,674 | |
Yum! Brands, Inc. | | | 6,148 | | | | 787,436 | |
Zumiez, Inc. (1) | | | 780 | | | | 16,957 | |
| | | | | | | | 18,516,169 | |
| | | | | | | | | |
Consumer Staples — 1.0% | | | | | | | | |
Archer-Daniels-Midland Co. | | | 9,443 | | | | 876,783 | |
Bunge, Ltd. | | | 2,201 | | | | 219,594 | |
Casey’s General Stores, Inc. | | | 100 | | | | 22,435 | |
Coca-Cola Co./The | | | 4,056 | | | | 258,002 | |
Costco Wholesale Corp. | | | 1,643 | | | | 750,030 | |
Flowers Foods, Inc. | | | 250 | | | | 7,185 | |
General Mills, Inc. | | | 8,383 | | | | 702,915 | |
Ingles Markets, Inc. | | | 61 | | | | 5,884 | |
Ingredion, Inc. | | | 1,260 | | | | 123,392 | |
Kraft Heinz Co./The | | | 152 | | | | 6,188 | |
Kroger Co./The | | | 267 | | | | 11,903 | |
Molson Coors Beverage Co. | | | 175 | | | | 9,016 | |
PepsiCo, Inc. | | | 1,570 | | | | 283,636 | |
The accompanying notes are an integral part of these financial statements.
2022 Annual Report | December 31, 2022 | Page 41 |
Schedules of Investments
December 31, 2022
Balanced Fund |
Security Description | | Shares,
Contracts
or Principal
Amount ($) | | | Fair
Value ($) | |
Common Stocks (United States) — continued |
Pilgrim’s Pride Corp. (1) | | | 240 | | | | 5,695 | |
Sysco Corp. | | | 1 | | | | 76 | |
Walmart, Inc. | | | 2,258 | | | | 320,162 | |
| | | | | | | | 3,602,896 | |
| | | | | | | | | |
Energy — 5.0% | | | | | | | | |
APA Corp. | | | 3,728 | | | | 174,023 | |
Arch Resources, Inc. | | | 27 | | | | 3,855 | |
Bristow Group, Inc. (1) | | | 747 | | | | 20,266 | |
California Resources Corp. | | | 220 | | | | 9,572 | |
Callon Petroleum Co. (1) | | | 1,160 | | | | 43,024 | |
Centrus Energy Corp. (1) | | | 3,577 | | | | 116,181 | |
Cheniere Energy, Inc. | | | 2,192 | | | | 328,712 | |
Chesapeake Energy Corp. | | | 4,008 | | | | 378,235 | |
Chevron Corp. | | | 26,218 | | | | 4,705,869 | |
Chord Energy Corp. | | | 23 | | | | 3,147 | |
Civitas Resources, Inc. | | | 438 | | | | 25,373 | |
ConocoPhillips | | | 7,878 | | | | 929,604 | |
Coterra Energy, Inc. | | | 180 | | | | 4,423 | |
Denbury, Inc. (1) | | | 109 | | | | 9,485 | |
Devon Energy Corp. | | | 1,759 | | | | 108,196 | |
Diamondback Energy, Inc. | | | 802 | | | | 109,698 | |
DT Midstream, Inc. | | | 780 | | | | 43,103 | |
EOG Resources, Inc. | | | 7,426 | | | | 961,816 | |
EQT Corp. | | | 228 | | | | 7,713 | |
Exxon Mobil Corp. | | | 34,681 | | | | 3,825,314 | |
FLEX LNG, Ltd. | | | 172 | | | | 5,623 | |
Hess Corp. | | | 899 | | | | 127,496 | |
HF Sinclair Corp. | | | 465 | | | | 24,129 | |
Laredo Petroleum, Inc. (1) | | | 36 | | | | 1,851 | |
Marathon Oil Corp. | | | 482 | | | | 13,048 | |
Marathon Petroleum Corp. | | | 12,932 | | | | 1,505,155 | |
Matador Resources Co. | | | 106 | | | | 6,067 | |
Murphy Oil Corp. | | | 87 | | | | 3,742 | |
Occidental Petroleum Corp. | | | 285 | | | | 17,952 | |
ONEOK, Inc. | | | 8,963 | | | | 588,869 | |
Ovintiv, Inc. | | | 2,633 | | | | 133,519 | |
PBF Energy, Inc. | | | 163 | | | | 6,647 | |
Phillips 66 | | | 4,563 | | | | 474,917 | |
Pioneer Natural Resources Co. | | | 4,529 | | | | 1,034,378 | |
Range Resources Corp. | | | 232 | | | | 5,805 | |
Schlumberger, Ltd. | | | 5,895 | | | | 315,147 | |
Scorpio Tankers, Inc. | | | 111 | | | | 5,968 | |
SilverBow Resources, Inc. (1) | | | 469 | | | | 13,263 | |
SM Energy Co. | | | 226 | | | | 7,872 | |
Targa Resources Corp. | | | 4,776 | | | | 351,036 | |
Balanced Fund |
Security Description | | Shares,
Contracts
or Principal
Amount ($) | | | Fair
Value ($) | |
Common Stocks (United States) — continued |
Teekay Corp. (1) | | | 1,515 | | | | 6,878 | |
Valero Energy Corp. | | | 5,129 | | | | 650,665 | |
Williams Cos., Inc./The | | | 383 | | | | 12,601 | |
World Fuel Services Corp. | | | 641 | | | | 17,519 | |
| | | | | | | | 17,137,756 | |
| | | | | | | | | |
Financials — 5.0% | | | | | | | | |
American Equity Investment Life Holding Co. | | | 4,384 | | | | 199,998 | |
American Financial Group, Inc./OH | | | 1,052 | | | | 144,419 | |
American International Group, Inc. | | | 5,090 | | | | 321,892 | |
Apollo Global Management, Inc. | | | 11,024 | | | | 703,221 | |
Axis Capital Holdings, Ltd. | | | 103 | | | | 5,580 | |
Bank of New York Mellon Corp./The | | | 10,738 | | | | 488,794 | |
Berkshire Hathaway, Inc. (1) | | | 18,554 | | | | 5,731,331 | |
Cadence Bank | | | 4 | | | | 99 | |
Charles Schwab Corp./The | | | 13,114 | | | | 1,091,872 | |
Chubb, Ltd. | | | 4,619 | | | | 1,018,951 | |
Customers Bancorp, Inc. (1) | | | 181 | | | | 5,130 | |
East West Bancorp, Inc. | | | 6,078 | | | | 400,540 | |
Essent Group, Ltd. | | | 5,396 | | | | 209,796 | |
F&G Annuities & Life, Inc. | | | 678 | | | | 13,567 | |
Fidelity National Financial, Inc. | | | 9,985 | | | | 375,636 | |
First American Financial Corp. | | | 2,684 | | | | 140,481 | |
Focus Financial Partners, Inc. (1) | | | 1,740 | | | | 64,850 | |
Hartford Financial Services Group, Inc./The | | | 2,606 | | | | 197,613 | |
Jackson Financial, Inc. | | | 1,495 | | | | 52,011 | |
Loews Corp. | | | 146 | | | | 8,516 | |
MarketAxess Holdings, Inc. | | | 12 | | | | 3,347 | |
Marsh & McLennan Cos., Inc. | | | 11,097 | | | | 1,836,332 | |
Medley Management, Inc. (1)(5) | | | 101 | | | | 0 | |
Moelis & Co. | | | 427 | | | | 16,384 | |
Morningstar, Inc. | | | 152 | | | | 32,922 | |
Mr Cooper Group, Inc. (1) | | | 1,437 | | | | 57,667 | |
New York Community Bancorp, Inc. | | | 6,452 | | | | 55,487 | |
NMI Holdings, Inc. (1) | | | 1,375 | | | | 28,738 | |
Northern Trust Corp. | | | 86 | | | | 7,610 | |
Old Republic International Corp. | | | 554 | | | | 13,379 | |
OneMain Holdings, Inc. | | | 375 | | | | 12,491 | |
PacWest Bancorp | | | 579 | | | | 13,288 | |
Pathward Financial, Inc. | | | 2,409 | | | | 103,707 | |
SEI Investments Co. | | | 4,390 | | | | 255,937 | |
State Street Corp. | | | 3,034 | | | | 235,347 | |
Stewart Information Services Corp. | | | 6,217 | | | | 265,652 | |
Synchrony Financial | | | 10,648 | | | | 349,893 | |
W R Berkley Corp. | | | 114 | | | | 8,273 | |
The accompanying notes are an integral part of these financial statements.
Page 42 | 2022 Annual Report | December 31, 2022 |
Schedules of Investments
December 31, 2022
Balanced Fund |
Security Description | | Shares,
Contracts
or Principal
Amount ($) | | | Fair
Value ($) | |
Common Stocks (United States) — continued |
Walker & Dunlop, Inc. | | | 1,766 | | | | 138,596 | |
Willis Towers Watson PLC | | | 11,252 | | | | 2,752,014 | |
WSFS Financial Corp. | | | 117 | | | | 5,305 | |
Zions Bancorp NA | | | 101 | | | | 4,965 | |
| | | | | | | | 17,371,631 | |
| | | | | | | | | |
Healthcare — 7.2% | | | | | | | | |
Abbott Laboratories | | | 51 | | | | 5,599 | |
AbbVie, Inc. | | | 12,999 | | | | 2,100,768 | |
Alaunos Therapeutics, Inc. (1) | | | 5,102 | | | | 3,312 | |
AmerisourceBergen Corp. | | | 109 | | | | 18,062 | |
Amgen, Inc. | | | 5,829 | | | | 1,530,929 | |
Biogen, Inc. (1) | | | 767 | | | | 212,398 | |
Bristol-Myers Squibb Co. | | | 7,289 | | | | 524,444 | |
Catalent, Inc. (1) | | | 5,388 | | | | 242,514 | |
Centene Corp. (1) | | | 4,448 | | | | 364,780 | |
Chemed Corp. | | | 15 | | | | 7,656 | |
Cigna Corp. | | | 3,106 | | | | 1,029,142 | |
CVS Health Corp. | | | 7,695 | | | | 717,097 | |
Dexcom, Inc. (1) | | | 112 | | | | 12,683 | |
Elevance Health, Inc. | | | 329 | | | | 168,767 | |
Eli Lilly & Co. | | | 4,259 | | | | 1,558,113 | |
Embecta Corp. | | | 1,536 | | | | 38,845 | |
Emergent BioSolutions, Inc. (1) | | | 945 | | | | 11,160 | |
Enhabit, Inc. (1) | | | 486 | | | | 6,396 | |
Fulgent Genetics, Inc. (1) | | | 8,739 | | | | 260,247 | |
Genprex, Inc. (1) | | | 2,209 | | | | 3,203 | |
Gilead Sciences, Inc. | | | 18,158 | | | | 1,558,864 | |
HCA Healthcare, Inc. | | | 119 | | | | 28,555 | |
Humana, Inc. | | | 249 | | | | 127,535 | |
IDEXX Laboratories, Inc. (1) | | | 203 | | | | 82,816 | |
ImmunityBio, Inc. (1) | | | 2,407 | | | | 12,203 | |
Intuitive Surgical, Inc. (1) | | | 292 | | | | 77,482 | |
IQVIA Holdings, Inc. (1) | | | 437 | | | | 89,537 | |
Johnson & Johnson | | | 15,445 | | | | 2,728,359 | |
Joint Corp./The (1) | | | 332 | | | | 4,641 | |
Laboratory Corp. of America Holdings | | | 80 | | | | 18,838 | |
McKesson Corp. | | | 1,847 | | | | 692,847 | |
Merck & Co., Inc. | | | 15,616 | | | | 1,732,595 | |
Moderna, Inc. (1) | | | 5,724 | | | | 1,028,145 | |
Molina Healthcare, Inc. (1) | | | 54 | | | | 17,832 | |
Organon & Co. | | | 113 | | | | 3,156 | |
Pfizer, Inc. | | | 21,305 | | | | 1,091,668 | |
Quest Diagnostics, Inc. | | | 562 | | | | 87,919 | |
Regeneron Pharmaceuticals, Inc. (1) | | | 856 | | | | 617,595 | |
SIGA Technologies, Inc. | | | 2,406 | | | | 17,708 | |
Balanced Fund |
Security Description | | Shares,
Contracts
or Principal
Amount ($) | | | Fair
Value ($) | |
Common Stocks (United States) — continued |
Twist Bioscience Corp. (1) | | | 13,422 | | | | 319,578 | |
UnitedHealth Group, Inc. | | | 6,150 | | | | 3,260,607 | |
Universal Health Services, Inc. | | | 88 | | | | 12,398 | |
Veracyte, Inc. (1) | | | 1,568 | | | | 37,209 | |
Vertex Pharmaceuticals, Inc. (1) | | | 2,952 | | | | 852,479 | |
Viatris, Inc. | | | 5,057 | | | | 56,284 | |
Vir Biotechnology, Inc. (1) | | | 843 | | | | 21,336 | |
West Pharmaceutical Services, Inc. | | | 1,700 | | | | 400,095 | |
Zimmer Biomet Holdings, Inc. | | | 1,573 | | | | 200,558 | |
Zoetis, Inc. | | | 4,950 | | | | 725,423 | |
| | | | | | | | 24,720,377 | |
| | | | | | | | | |
Industrials — 4.1% | | | | | | | | |
AECOM | | | 79 | | | | 6,709 | |
AeroVironment, Inc. (1) | | | 1,793 | | | | 153,588 | |
AGCO Corp. | | | 69 | | | | 9,570 | |
Alaska Air Group, Inc. (1) | | | 189 | | | | 8,116 | |
AMETEK, Inc. | | | 122 | | | | 17,046 | |
Argan, Inc. | | | 199 | | | | 7,339 | |
Atkore, Inc. (1) | | | 3,090 | | | | 350,468 | |
BlueLinx Holdings, Inc. (1) | | | 466 | | | | 33,137 | |
Boise Cascade Co. | | | 2,273 | | | | 156,087 | |
Booz Allen Hamilton Holding Corp. | | | 2,043 | | | | 213,534 | |
Builders FirstSource, Inc. (1) | | | 8,562 | | | | 555,503 | |
Cintas Corp. | | | 295 | | | | 133,228 | |
Copart, Inc. (1) | | | 64,828 | | | | 3,947,377 | |
CoStar Group, Inc. (1) | | | 4,509 | | | | 348,456 | |
Crane Holdings Co. | | | 27 | | | | 2,712 | |
Dover Corp. | | | 201 | | | | 27,217 | |
Eaton Corp. PLC | | | 30 | | | | 4,709 | |
EMCOR Group, Inc. | | | 2,846 | | | | 421,521 | |
Emerson Electric Co. | | | 66 | | | | 6,340 | |
Enovix Corp. (1) | | | 8,576 | | | | 106,685 | |
Equifax, Inc. | | | 18 | | | | 3,498 | |
Expeditors International of Washington, Inc. | | | 1,285 | | | | 133,537 | |
Federal Signal Corp. | | | 64 | | | | 2,974 | |
Fortune Brands Innovations, Inc. | | | 15,915 | | | | 908,906 | |
Genco Shipping & Trading, Ltd. | | | 330 | | | | 5,069 | |
General Dynamics Corp. | | | 5,188 | | | | 1,287,195 | |
Graco, Inc. | | | 7,105 | | | | 477,882 | |
H&E Equipment Services, Inc. | | | 183 | | | | 8,308 | |
Heidrick & Struggles International, Inc. | | | 232 | | | | 6,489 | |
ITT, Inc. | | | 1,132 | | | | 91,805 | |
Leidos Holdings, Inc. | | | 2,282 | | | | 240,044 | |
Lockheed Martin Corp. | | | 2,632 | | | | 1,280,442 | |
ManpowerGroup, Inc. | | | 2,195 | | | | 182,646 | |
The accompanying notes are an integral part of these financial statements.
2022 Annual Report | December 31, 2022 | Page 43 |
Schedules of Investments
December 31, 2022
Balanced Fund |
Security Description | | Shares,
Contracts
or Principal
Amount ($) | | | Fair
Value ($) | |
Common Stocks (United States) — continued |
Masterbrand, Inc. (1) | | | 12,892 | | | | 97,335 | |
Matson, Inc. | | | 2,174 | | | | 135,897 | |
MDU Resources Group, Inc. | | | 92 | | | | 2,791 | |
Mueller Industries, Inc. | | | 2,696 | | | | 159,064 | |
Northrop Grumman Corp. | | | 1,369 | | | | 746,940 | |
nVent Electric PLC | | | 1,655 | | | | 63,668 | |
PACCAR, Inc. | | | 2,399 | | | | 237,429 | |
Primoris Services Corp. | | | 500 | | | | 10,970 | |
Raytheon Technologies Corp. | | | 40 | | | | 4,037 | |
Regal Rexnord Corp. | | | 297 | | | | 35,634 | |
Republic Services, Inc. | | | 63 | | | | 8,126 | |
Ryder System, Inc. | | | 145 | | | | 12,118 | |
Sensata Technologies Holding PLC | | | 460 | | | | 18,575 | |
SkyWest, Inc. (1) | | | 1,033 | | | | 17,055 | |
Southwest Airlines Co. | | | 11,304 | | | | 380,606 | |
Sterling Infrastructure, Inc. (1) | | | 229 | | | | 7,511 | |
UFP Industries, Inc. | | | 83 | | | | 6,578 | |
Univar Solutions, Inc. (1) | | | 213 | | | | 6,773 | |
Valmont Industries, Inc. | | | 34 | | | | 11,243 | |
Verisk Analytics, Inc. | | | 4,019 | | | | 709,032 | |
Vicor Corp. (1) | | | 4,457 | | | | 239,564 | |
Waste Management, Inc. | | | 1,565 | | | | 245,517 | |
WW Grainger, Inc. | | | 51 | | | | 28,369 | |
| | | | | | | | 14,322,969 | |
| | | | | | | | | |
Information Technology — 11.3% | | | | | | | | |
Adobe, Inc. (1) | | | 2,641 | | | | 888,776 | |
Alpha & Omega Semiconductor, Ltd. (1) | | | 27 | | | | 771 | |
Amkor Technology, Inc. | | | 231 | | | | 5,539 | |
ANSYS, Inc. (1) | | | 1,211 | | | | 292,565 | |
Apple, Inc. | | | 71,803 | | | | 9,329,364 | |
Applied Materials, Inc. | | | 3,670 | | | | 357,385 | |
Arrow Electronics, Inc. (1) | | | 3,762 | | | | 393,392 | |
Atlassian Corp. (1) | | | 92 | | | | 11,839 | |
Autodesk, Inc. (1) | | | 72 | | | | 13,455 | |
Avnet, Inc. | | | 7,482 | | | | 311,102 | |
Block, Inc. (1) | | | 253 | | | | 15,899 | |
Broadcom, Inc. | | | 234 | | | | 130,836 | |
Calix, Inc. (1) | | | 1,844 | | | | 126,185 | |
Cisco Systems, Inc. | | | 17,823 | | | | 849,088 | |
Cloudflare, Inc. (1) | | | 7,232 | | | | 326,959 | |
Cognex Corp. | | | 916 | | | | 43,153 | |
Cognizant Technology Solutions Corp. | | | 6,956 | | | | 397,814 | |
Dell Technologies, Inc. | | | 904 | | | | 36,359 | |
Digital Turbine, Inc. (1) | | | 15,833 | | | | 241,295 | |
DocuSign, Inc. (1) | | | 6,933 | | | | 384,227 | |
Balanced Fund |
Security Description | | Shares,
Contracts
or Principal
Amount ($) | | | Fair
Value ($) | |
Common Stocks (United States) — continued |
EPAM Systems, Inc. (1) | | | 864 | | | | 283,167 | |
Euronet Worldwide, Inc. (1) | | | 1,093 | | | | 103,157 | |
Extreme Networks, Inc. (1) | | | 367 | | | | 6,720 | |
Fabrinet (1) | | | 50 | | | | 6,411 | |
Intel Corp. | | | 21,642 | | | | 571,998 | |
International Money Express, Inc. (1) | | | 216 | | | | 5,264 | |
Intuit, Inc. | | | 894 | | | | 347,963 | |
Jabil, Inc. | | | 17,867 | | | | 1,218,529 | |
Juniper Networks, Inc. | | | 96 | | | | 3,068 | |
Lam Research Corp. | | | 1,746 | | | | 733,844 | |
Lattice Semiconductor Corp. (1) | | | 5,538 | | | | 359,305 | |
Manhattan Associates, Inc. (1) | | | 11,509 | | | | 1,397,193 | |
Mastercard, Inc. | | | 4,436 | | | | 1,542,530 | |
Microchip Technology, Inc. | | | 4,808 | | | | 337,762 | |
Microsoft Corp. | | | 34,989 | | | | 8,391,059 | |
National Instruments Corp. | | | 1,993 | | | | 73,542 | |
NVIDIA Corp. | | | 7,732 | | | | 1,129,954 | |
Oracle Corp. | | | 10,962 | | | | 896,034 | |
QUALCOMM, Inc. | | | 5,449 | | | | 599,063 | |
Skyworks Solutions, Inc. | | | 20,267 | | | | 1,846,932 | |
StarTek, Inc. (1) | | | 1,281 | | | | 4,804 | |
Synopsys, Inc. (1) | | | 2,765 | | | | 882,837 | |
TD SYNNEX Corp. | | | 31 | | | | 2,936 | |
Teradyne, Inc. | | | 12,294 | | | | 1,073,881 | |
Texas Instruments, Inc. | | | 11,034 | | | | 1,823,037 | |
Zebra Technologies Corp. (1) | | | 3,166 | | | | 811,794 | |
Zoom Video Communications, Inc. (1) | | | 7,561 | | | | 512,182 | |
| | | | | | | | 39,120,969 | |
| | | | | | | | | |
Materials — 1.4% | | | | | | | | |
AdvanSix, Inc. | | | 148 | | | | 5,627 | |
Air Products and Chemicals, Inc. | | | 24 | | | | 7,398 | |
Alcoa Corp. | | | 24,860 | | | | 1,130,384 | |
Alpha Metallurgical Resources, Inc. | | | 55 | | | | 8,051 | |
Avery Dennison Corp. | | | 2,266 | | | | 410,146 | |
CF Industries Holdings, Inc. | | | 124 | | | | 10,565 | |
Dow, Inc. | | | 5,476 | | | | 275,936 | |
Eagle Materials, Inc. | | | 2,335 | | | | 310,205 | |
Freeport-McMoRan, Inc. | | | 7,980 | | | | 303,240 | |
Louisiana-Pacific Corp. | | | 13,962 | | | | 826,550 | |
LyondellBasell Industries NV | | | 2,795 | | | | 232,069 | |
MP Materials Corp. (1) | | | 6,692 | | | | 162,482 | |
Newmont Corp. | | | 535 | | | | 25,252 | |
Nucor Corp. | | | 3,419 | | | | 450,658 | |
Reliance Steel & Aluminum Co. | | | 56 | | | | 11,337 | |
Ryerson Holding Corp. | | | 557 | | | | 16,855 | |
The accompanying notes are an integral part of these financial statements.
Page 44 | 2022 Annual Report | December 31, 2022 |
Schedules of Investments
December 31, 2022
Balanced Fund |
Security Description | | Shares,
Contracts
or Principal
Amount ($) | | | Fair
Value ($) | |
Common Stocks (United States) — continued |
Schnitzer Steel Industries, Inc. | | | 681 | | | | 20,873 | |
Southern Copper Corp. | | | 1,377 | | | | 83,157 | |
Steel Dynamics, Inc. | | | 2,978 | | | | 290,951 | |
Sylvamo Corp. | | | 230 | | | | 11,176 | |
United States Steel Corp. | | | 7,330 | | | | 183,617 | |
Westrock Co. | | | 508 | | | | 17,861 | |
| | | | | | | | 4,794,390 | |
| | | | | | | | | |
Real Estate Investment Trust — 0.0% | | | | | | | | |
CorEnergy Infrastructure Trust, Inc. | | | 5,403 | | | | 11,292 | |
Spirit MTA REIT Liquidating Trust (1)(5) | | | 3,461 | | | | 0 | |
| | | | | | | | 11,292 | |
Utilities — 0.1% | | | | | | | | |
American Water Works Co., Inc. | | | 165 | | | | 25,149 | |
Brookfield Renewable Corp. | | | 428 | | | | 11,787 | |
Clearway Energy, Inc. | | | 555 | | | | 17,688 | |
National Fuel Gas Co. | | | 400 | | | | 25,320 | |
UGI Corp. | | | 8,522 | | | | 315,807 | |
| | | | | | | | 395,751 | |
| | | | | | | | | |
Total Common Stocks (United States) (Cost $116,444,222) | | | | | | | 144,048,884 | |
| | | | | | | | | |
Preferred Stock (United States) — 0.0% |
WESCO International, Inc. Series A Variable Preferred, 9.7% (6) | | | 994 | | | | 26,242 | |
Total Preferred Stock (United States) (Cost $24,845) | | | | | | | 26,242 | |
| | | | | | | | | |
Warrants (United States) — 0.0% |
Chaparral Energy, Inc. A Warrants, Expiration Date 10/14/2024 (1)(5) | | | 3 | | | | 0 | |
Chaparral Energy, Inc. B Warrants, Expiration Date 10/14/2025 (1)(5) | | | 3 | | | | 0 | |
Civitas Solutions, Inc. A Warrants, Expiration Date 1/20/2025 (1)(5) | | | 22 | | | | 0 | |
Civitas Solutions, Inc. B Warrants, Expiration Date 1/20/2026 (1)(5) | | | 12 | | | | 0 | |
Hertz Global Holdings, Inc. Warrants, Expiration Date 6/30/2051 (1) | | | 157 | | | | 1,170 | |
Nabors Industries, Ltd. Warrants, Expiration Date 6/11/2026 (1) | | | 57 | | | | 1,875 | |
Oasis Petroleum, Inc. Warrants, Expiration Date 11/19/2024 (1)(5) | | | 9 | | | | 0 | |
Whiting Petroleum Corp. A Warrants, Expiration Date 9/1/2024 (1) | | | 56 | | | | 1,142 | |
Balanced Fund |
Security Description | | Shares,
Contracts
or Principal
Amount ($) | | | Fair
Value ($) | |
Warrants (United States) — continued |
Whiting Petroleum Corp. B Warrants, Expiration Date 9/1/2025 (1) | | | 28 | | | | 509 | |
Total Warrants (United States) (Cost $3,304) | | | | | | | 4,696 | |
| | | | | | | | | |
Registered Investment Companies — 20.5% |
U.S. Fixed Income — 16.9% | | | | | | | | |
Baird Core Plus Bond Fund - Class I | | | 314,870 | | | | 3,107,772 | |
BBH Limited Duration Fund - Class I | | | 152,342 | | | | 1,517,327 | |
Diamond Hill Short Duration Securitized Bond Fund - Class Y | | | 532,461 | | | | 5,015,779 | |
DoubleLine Total Return Bond Fund - Class I | | | 399,792 | | | | 3,506,172 | |
Frost Total Return Bond Fund - Class I | | | 226,493 | | | | 2,113,175 | |
Guggenheim- Total Return Bond Fund - Class I | | | 65,058 | | | | 1,509,336 | |
iShares Core U.S. Aggregate Bond ETF (7) | | | 160,566 | | | | 15,573,297 | |
PGIM Short-Term Corporate Bond Fund - Class Q | | | 491,321 | | | | 5,001,650 | |
Pioneer Bond Fund - Class K | | | 250,747 | | | | 2,036,065 | |
Segall Bryant & Hamill Plus Bond Fund - Class I | | | 403,346 | | | | 3,650,278 | |
SPDR Bloomberg High Yield Bond ETF (7) | | | 135,816 | | | | 12,223,440 | |
Xtrackers USD High Yield Corporate Bond ETF (7) | | | 91,019 | | | | 3,068,250 | |
| | | | | | | | 58,322,541 | |
| | | | | | | | | |
International Fixed Income — 3.6% | | | | | | | | |
iShares JP Morgan USD Emerging Markets Bond ETF (7) | | | 145,301 | | | | 12,291,012 | |
| | | | | | | | 12,291,012 | |
| | | | | | | | | |
Total Registered Investment Companies (Cost $73,208,549) | | | | | | | 70,613,553 | |
| | | | | | | | | |
Money Market Registered Investment Companies — 37.4% |
Federated Hermes Government Obligations Fund, 4.15% | | | 20,970,000 | | | | 20,970,000 | |
Meeder Institutional Prime Money Market Fund, 4.36% (2) | | | 108,408,697 | | | | 108,408,697 | |
Total Money Market Registered Investment Companies (Cost $129,325,978) | | | | | | | 129,378,697 | |
| | | | | | | | | |
The accompanying notes are an integral part of these financial statements.
2022 Annual Report | December 31, 2022 | Page 45 |
Schedules of Investments
December 31, 2022
Balanced Fund |
Security Description | | Shares,
Contracts
or Principal
Amount ($) | | | Fair
Value ($) | |
Bank Obligations — 0.1% |
First Merchants Bank Deposit Account, 1.60%, 1/3/2023 (3) | | | 249,081 | | | | 249,081 | |
Metro City Bank Deposit Account, 0.94%, 1/3/2023 (3) | | | 249,337 | | | | 249,337 | |
Total Bank Obligations (Cost $498,418) | | | | | | | 498,418 | |
Total Investments — 99.7% (Cost $319,505,316) | | | | | | | 344,570,490 | |
Other Assets less Liabilities — 0.3% | | | | | | | 1,142,990 | |
Total Net Assets — 100.0% | | | | | | | 345,713,480 | |
| | | | | | | | | |
Trustee Deferred Compensation (4) |
Meeder Balanced Fund - Retail Class | | | 3,594 | | | | 41,331 | |
Meeder Dynamic Allocation Fund - Retail Class | | | 9,460 | | | | 107,466 | |
Meeder Muirfield Fund - Retail Class | | | 6,419 | | | | 52,893 | |
Meeder Conservative Allocation Fund - Retail Class | | | 1,039 | | | | 21,663 | |
Total Trustee Deferred Compensation (Cost $220,154) | | | | | | | 223,353 | |
| | | | | | | | | |
Balanced Fund |
| | | Net Long
(Short)
Contracts | | | Expiration
Date | | | Notional
Value of
Contracts
($) | | | Value and
Unrealized
Appreciation
(Depreciation)
($) | |
Futures Contracts |
Index Futures | | | | | | | | | | | | | | | | |
E-mini Standard & Poors MidCap 400 Futures | | | (96 | ) | | | 3/17/2023 | | | | (23,448,960 | ) | | | 585,087 | |
Mini MSCI EAFE Index Futures | | | 174 | | | | 3/17/2023 | | | | 16,959,780 | | | | (667,087 | ) |
Mini MSCI Emerging Markets Index Futures | | | 76 | | | | 3/17/2023 | | | | 3,645,720 | | | | (94,086 | ) |
Russell 2000 Mini Index Futures | | | 85 | | | | 3/17/2023 | | | | 7,526,325 | | | | (327,141 | ) |
Standard & Poors 500 Mini Futures | | | (131 | ) | | | 3/17/2023 | | | | (25,289,550 | ) | | | 915,576 | |
Total Futures Contracts | | | 108 | | | | | | | | (20,606,685 | ) | | | 412,349 | |
(1) | Represents non-income producing securities. |
(2) | Investment in affiliate. The yield shown represents the 7-day yield in effect at December 31, 2022. |
(3) | Variable rate security. Securities payable at par including accrued interest (usually within seven days notice) and unconditionally secured as to principal and interest by letters of credit or other credit support agreements from major banks. The interest rates are adjustable and are not based on a published reference rate and spread but are determined by the issuer or agent and are based on current market conditions. These securities do not indicate a reference rate and spread in their description above. The rate shown represents the rate in effect at December 31, 2022. The maturity date shown, if applicable, reflects the earlier of the next demand date or stated maturity date. |
(4) | Assets of affiliates to the Balanced Fund held for the benefit of the Fund’s Trustees in connection with the Trustee Deferred Compensation Plan. |
(5) | Fair valued security deemed a Level 3 security. Security is not part of the investment strategy of the Fund. |
The accompanying notes are an integral part of these financial statements.
Page 46 | 2022 Annual Report | December 31, 2022 |
Schedules of Investments
December 31, 2022
Moderate Allocation Fund |
Security Description | | Shares or
Principal
Amount ($) | | | Fair
Value ($) | |
Common Stocks (United States) — 21.6% |
Communication Services — 0.5% | | | | | | | | |
Alphabet, Inc. (1) | | | 6,621 | | | | 587,481 | |
Cable One, Inc. | | | 1 | | | | 712 | |
Cumulus Media, Inc. (1) | | | 133 | | | | 826 | |
Entravision Communications Corp. | | | 537 | | | | 2,578 | |
IDT Corp. (1) | | | 1,500 | | | | 42,255 | |
Liberty TripAdvisor Holdings, Inc. (1) | | | 971 | | | | 650 | |
Netflix, Inc. (1) | | | 103 | | | | 30,373 | |
Roku, Inc. (1) | | | 203 | | | | 8,262 | |
Telephone and Data Systems, Inc. | | | 76 | | | | 797 | |
T-Mobile US, Inc. (1) | | | 268 | | | | 37,520 | |
Trade Desk, Inc./The (1) | | | 131 | | | | 5,873 | |
Verizon Communications, Inc. | | | 27 | | | | 1,064 | |
| | | | | | | | 718,391 | |
| | | | | | | | | |
Consumer Discretionary — 2.4% | | | | | | | | |
Amazon.com, Inc. (1) | | | 3,551 | | | | 298,284 | |
AutoZone, Inc. (1) | | | 29 | | | | 71,519 | |
Best Buy Co., Inc. | | | 1,372 | | | | 110,048 | |
Bloomin’ Brands, Inc. | | | 1,232 | | | | 24,788 | |
Booking Holdings, Inc. (1) | | | 57 | | | | 114,871 | |
BorgWarner, Inc. | | | 2,233 | | | | 89,878 | |
Buckle, Inc./The | | | 109 | | | | 4,943 | |
Burlington Stores, Inc. (1) | | | 493 | | | | 99,961 | |
Cavco Industries, Inc. (1) | | | 9 | | | | 2,036 | |
Chegg, Inc. (1) | | | 1,838 | | | | 46,446 | |
Dillard’s, Inc. | | | 4 | | | | 1,293 | |
DR Horton, Inc. | | | 2,213 | | | | 197,267 | |
Expedia Group, Inc. (1) | | | 1,404 | | | | 122,990 | |
Frontdoor, Inc. (1) | | | 58 | | | | 1,206 | |
Garmin, Ltd. | | | 118 | | | | 10,890 | |
Gentex Corp. | | | 70 | | | | 1,909 | |
Goodyear Tire & Rubber Co./The (1) | | | 3,947 | | | | 40,062 | |
Grand Canyon Education, Inc. (1) | | | 831 | | | | 87,803 | |
Green Brick Partners, Inc. (1) | | | 362 | | | | 8,771 | |
Home Depot, Inc./The | | | 1,257 | | | | 397,036 | |
Lear Corp. | | | 9 | | | | 1,116 | |
Lennar Corp. | | | 1,074 | | | | 97,197 | |
LKQ Corp. | | | 178 | | | | 9,507 | |
Lululemon Athletica, Inc. (1) | | | 1,140 | | | | 365,233 | |
M/I Homes, Inc. (1) | | | 607 | | | | 28,031 | |
Macy’s, Inc. | | | 8,024 | | | | 165,696 | |
Mohawk Industries, Inc. (1) | | | 1,888 | | | | 192,991 | |
National Vision Holdings, Inc. (1) | | | 957 | | | | 37,093 | |
O’Reilly Automotive, Inc. (1) | | | 190 | | | | 160,366 | |
Patrick Industries, Inc. | | | 26 | | | | 1,576 | |
PVH Corp. | | | 3,128 | | | | 220,806 | |
Moderate Allocation Fund |
Security Description | | Shares or
Principal
Amount ($) | | | Fair
Value ($) | |
Common Stocks (United States) — continued |
Qurate Retail, Inc. (1) | | | 1,113 | | | | 1,814 | |
Ross Stores, Inc. | | | 763 | | | | 88,561 | |
Skyline Champion Corp. (1) | | | 1,278 | | | | 65,830 | |
Smith & Wesson Brands, Inc. | | | 723 | | | | 6,276 | |
Tapestry, Inc. | | | 846 | | | | 32,216 | |
Target Corp. | | | 201 | | | | 29,957 | |
TJX Cos., Inc./The | | | 2,366 | | | | 188,334 | |
Town Sports International Holdings, Inc. (1)(5) | | | 961 | | | | 0 | |
Tractor Supply Co. | | | 357 | | | | 80,314 | |
TravelCenters of America, Inc. (1) | | | 22 | | | | 985 | |
Tupperware Brands Corp. (1) | | | 190 | | | | 787 | |
Ulta Beauty, Inc. (1) | | | 288 | | | | 135,092 | |
Whirlpool Corp. | | | 546 | | | | 77,237 | |
Wingstop, Inc. | | | 105 | | | | 14,450 | |
Yum! Brands, Inc. | | | 673 | | | | 86,198 | |
| | | | | | | | 3,819,664 | |
| | | | | | | | | |
Consumer Staples — 1.0% | | | | | | | | |
Archer-Daniels-Midland Co. | | | 2,012 | | | | 186,814 | |
Bunge, Ltd. | | | 7 | | | | 698 | |
Casey’s General Stores, Inc. | | | 21 | | | | 4,711 | |
Coca-Cola Consolidated, Inc. | | | 2 | | | | 1,025 | |
Costco Wholesale Corp. | | | 873 | | | | 398,525 | |
Flowers Foods, Inc. | | | 66 | | | | 1,897 | |
General Mills, Inc. | | | 3,326 | | | | 278,885 | |
Ingredion, Inc. | | | 39 | | | | 3,819 | |
Kroger Co./The | | | 159 | | | | 7,088 | |
Molson Coors Beverage Co. | | | 29 | | | | 1,494 | |
PepsiCo, Inc. | | | 3,284 | | | | 593,287 | |
Pilgrim’s Pride Corp. (1) | | | 54 | | | | 1,281 | |
Walmart, Inc. | | | 636 | | | | 90,178 | |
| | | | | | | | 1,569,702 | |
| | | | | | | | | |
Energy — 2.7% | | | | | | | | |
APA Corp. | | | 1,297 | | | | 60,544 | |
Arch Resources, Inc. | | | 11 | | | | 1,571 | |
Baker Hughes Co. | | | 62 | | | | 1,831 | |
Berry Corp. | | | 301 | | | | 2,408 | |
Bristow Group, Inc. (1) | | | 305 | | | | 8,275 | |
California Resources Corp. | | | 129 | | | | 5,613 | |
Callon Petroleum Co. (1) | | | 21 | | | | 779 | |
Centrus Energy Corp. (1) | | | 369 | | | | 11,985 | |
ChampionX Corp. | | | 156 | | | | 4,522 | |
Cheniere Energy, Inc. | | | 149 | | | | 22,344 | |
Chesapeake Energy Corp. | | | 481 | | | | 45,392 | |
Chevron Corp. | | | 10,285 | | | | 1,846,055 | |
Chord Energy Corp. | | | 13 | | | | 1,779 | |
The accompanying notes are an integral part of these financial statements.
2022 Annual Report | December 31, 2022 | Page 47 |
Schedules of Investments
December 31, 2022
Moderate Allocation Fund |
Security Description | | Shares or
Principal
Amount ($) | | | Fair
Value ($) | |
Common Stocks (United States) — continued |
Civitas Resources, Inc. | | | 93 | | | | 5,387 | |
Comstock Resources, Inc. | | | 114 | | | | 1,563 | |
ConocoPhillips | | | 1,122 | | | | 132,396 | |
Coterra Energy, Inc. | | | 54 | | | | 1,327 | |
CVR Energy, Inc. | | | 38 | | | | 1,191 | |
Delek US Holdings, Inc. | | | 57 | | | | 1,539 | |
Denbury, Inc. (1) | | | 48 | | | | 4,177 | |
Devon Energy Corp. | | | 61 | | | | 3,752 | |
Diamondback Energy, Inc. | | | 88 | | | | 12,037 | |
Dorian LPG, Ltd. | | | 81 | | | | 1,535 | |
DT Midstream, Inc. | | | 167 | | | | 9,228 | |
EOG Resources, Inc. | | | 691 | | | | 89,498 | |
EQT Corp. | | | 118 | | | | 3,992 | |
Excelerate Energy, Inc. | | | 26 | | | | 651 | |
Exxon Mobil Corp. | | | 5,305 | | | | 585,142 | |
FLEX LNG, Ltd. | | | 75 | | | | 2,452 | |
Golar LNG, Ltd. (1) | | | 93 | | | | 2,119 | |
Gulfport Energy Corp. (1) | | | 10 | | | | 736 | |
Halliburton Co. | | | 953 | | | | 37,501 | |
Hess Corp. | | | 263 | | | | 37,299 | |
HF Sinclair Corp. | | | 123 | | | | 6,382 | |
International Seaways, Inc. | | | 33 | | | | 1,222 | |
Kinder Morgan, Inc. | | | 68 | | | | 1,229 | |
Kinetik Holdings, Inc. | | | 25 | | | | 827 | |
Laredo Petroleum, Inc. (1) | | | 30 | | | | 1,543 | |
Magnolia Oil & Gas Corp. | | | 67 | | | | 1,571 | |
Marathon Oil Corp. | | | 67 | | | | 1,814 | |
Marathon Petroleum Corp. | | | 3,265 | | | | 380,013 | |
Matador Resources Co. | | | 60 | | | | 3,434 | |
Murphy Oil Corp. | | | 54 | | | | 2,323 | |
Northern Oil and Gas, Inc. | | | 43 | | | | 1,325 | |
Occidental Petroleum Corp. | | | 153 | | | | 9,637 | |
ONEOK, Inc. | | | 6,825 | | | | 448,403 | |
Ovintiv, Inc. | | | 898 | | | | 45,538 | |
PBF Energy, Inc. | | | 55 | | | | 2,243 | |
PDC Energy, Inc. | | | 48 | | | | 3,047 | |
Peabody Energy Corp. (1) | | | 56 | | | | 1,480 | |
Phillips 66 | | | 1,026 | | | | 106,786 | |
Pioneer Natural Resources Co. | | | 185 | | | | 42,252 | |
Range Resources Corp. | | | 75 | | | | 1,877 | |
SandRidge Energy, Inc. (1) | | | 69 | | | | 1,175 | |
Schlumberger, Ltd. | | | 2,483 | | | | 132,741 | |
Scorpio Tankers, Inc. | | | 54 | | | | 2,904 | |
SilverBow Resources, Inc. (1) | | | 45 | | | | 1,273 | |
SM Energy Co. | | | 52 | | | | 1,811 | |
Talos Energy, Inc. (1) | | | 74 | | | | 1,397 | |
Targa Resources Corp. | | | 1,176 | | | | 86,436 | |
Moderate Allocation Fund |
Security Description | | Shares or
Principal
Amount ($) | | | Fair
Value ($) | |
Common Stocks (United States) — continued |
Teekay Corp. (1) | | | 502 | | | | 2,279 | |
Teekay Tankers, Ltd. (1) | | | 38 | | | | 1,171 | |
Valero Energy Corp. | | | 843 | | | | 106,943 | |
Westmoreland Coal Co. (1)(5) | | | 773 | | | | 0 | |
Williams Cos., Inc./The | | | 109 | | | | 3,586 | |
World Fuel Services Corp. | | | 154 | | | | 4,209 | |
| | | | | | | | 4,355,491 | |
| | | | | | | | | |
Financials — 3.1% | | | | | | | | |
American Equity Investment Life Holding Co. | | | 345 | | | | 15,739 | |
American Financial Group, Inc./OH | | | 277 | | | | 38,027 | |
American International Group, Inc. | | | 3,601 | | | | 227,727 | |
Axis Capital Holdings, Ltd. | | | 12 | | | | 650 | |
Bank of New York Mellon Corp./The | | | 3,980 | | | | 181,170 | |
Bank OZK | | | 80 | | | | 3,205 | |
Berkshire Hathaway, Inc. (1) | | | 6,686 | | | | 2,065,305 | |
Charles Schwab Corp./The | | | 3,158 | | | | 262,935 | |
Chubb, Ltd. | | | 368 | | | | 81,181 | |
East West Bancorp, Inc. | | | 2,802 | | | | 184,652 | |
Essent Group, Ltd. | | | 517 | | | | 20,101 | |
Evercore, Inc. | | | 25 | | | | 2,727 | |
F&G Annuities & Life, Inc. | | | 82 | | | | 1,641 | |
Fidelity National Financial, Inc. | | | 1,207 | | | | 45,407 | |
First American Financial Corp. | | | 24 | | | | 1,256 | |
Hartford Financial Services Group, Inc./The | | | 773 | | | | 58,617 | |
Loews Corp. | | | 55 | | | | 3,208 | |
LPL Financial Holdings, Inc. | | | 183 | | | | 39,559 | |
Marsh & McLennan Cos., Inc. | | | 5,172 | | | | 855,863 | |
Medley Management, Inc. (1)(5) | | | 27 | | | | 0 | |
Moelis & Co. | | | 583 | | | | 22,370 | |
Mr Cooper Group, Inc. (1) | | | 178 | | | | 7,143 | |
NMI Holdings, Inc. (1) | | | 209 | | | | 4,368 | |
Northern Trust Corp. | | | 1,285 | | | | 113,710 | |
Old Republic International Corp. | | | 118 | | | | 2,850 | |
PacWest Bancorp | | | 27 | | | | 620 | |
Pathward Financial, Inc. | | | 582 | | | | 25,055 | |
SEI Investments Co. | | | 529 | | | | 30,841 | |
State Street Corp. | | | 789 | | | | 61,203 | |
Stewart Information Services Corp. | | | 1,904 | | | | 81,358 | |
Synchrony Financial | | | 1,644 | | | | 54,022 | |
TrustCo Bank Corp. NY | | | 36 | | | | 1,353 | |
W R Berkley Corp. | | | 89 | | | | 6,459 | |
Walker & Dunlop, Inc. | | | 90 | | | | 7,063 | |
Willis Towers Watson PLC | | | 1,881 | | | | 460,055 | |
| | | | | | | | 4,967,440 | |
| | | | | | | | | |
The accompanying notes are an integral part of these financial statements.
Page 48 | 2022 Annual Report | December 31, 2022 |
Schedules of Investments
December 31, 2022
Moderate Allocation Fund |
Security Description | | Shares or
Principal
Amount ($) | | | Fair
Value ($) | |
Common Stocks (United States) — continued |
Healthcare — 3.8% | | | | | | | | |
Abbott Laboratories | | | 9 | | | | 988 | |
AbbVie, Inc. | | | 1,837 | | | | 296,878 | |
AmerisourceBergen Corp. | | | 25 | | | | 4,143 | |
Amgen, Inc. | | | 1,321 | | | | 346,947 | |
Assertio Holdings, Inc. (1) | | | 531 | | | | 2,283 | |
Avanos Medical, Inc. (1) | | | 27 | | | | 731 | |
Biogen, Inc. (1) | | | 183 | | | | 50,676 | |
Bristol-Myers Squibb Co. | | | 3,008 | | | | 216,426 | |
Cardinal Health, Inc. | | | 1,879 | | | | 144,439 | |
Catalent, Inc. (1) | | | 1,156 | | | | 52,032 | |
Centene Corp. (1) | | | 1,080 | | | | 88,571 | |
Chemed Corp. | | | 2 | | | | 1,021 | |
Cigna Corp. | | | 323 | | | | 107,023 | |
CVS Health Corp. | | | 454 | | | | 42,308 | |
Dexcom, Inc. (1) | | | 275 | | | | 31,141 | |
Dynavax Technologies Corp. (1) | | | 97 | | | | 1,032 | |
Eli Lilly & Co. | | | 959 | | | | 350,841 | |
Emergent BioSolutions, Inc. (1) | | | 6 | | | | 71 | |
Enhabit, Inc. (1) | | | 103 | | | | 1,355 | |
Ensign Group, Inc./The | | | 29 | | | | 2,744 | |
Exact Sciences Corp. (1) | | | 289 | | | | 14,308 | |
Fulgent Genetics, Inc. (1) | | | 2,626 | | | | 78,202 | |
Genprex, Inc. (1) | | | 631 | | | | 915 | |
Gilead Sciences, Inc. | | | 5,138 | | | | 441,097 | |
Haemonetics Corp. (1) | | | 15 | | | | 1,180 | |
HCA Healthcare, Inc. | | | 40 | | | | 9,598 | |
Humana, Inc. | | | 158 | | | | 80,926 | |
IDEXX Laboratories, Inc. (1) | | | 177 | | | | 72,209 | |
Incyte Corp. (1) | | | 9 | | | | 723 | |
Inspire Medical Systems, Inc. (1) | | | 144 | | | | 36,271 | |
Intuitive Surgical, Inc. (1) | | | 72 | | | | 19,105 | |
IQVIA Holdings, Inc. (1) | | | 248 | | | | 50,813 | |
Johnson & Johnson | | | 5,675 | | | | 1,002,489 | |
Laboratory Corp. of America Holdings | | | 138 | | | | 32,496 | |
McKesson Corp. | | | 298 | | | | 111,786 | |
Merck & Co., Inc. | | | 3,381 | | | | 375,122 | |
Moderna, Inc. (1) | | | 941 | | | | 169,022 | |
Molina Healthcare, Inc. (1) | | | 66 | | | | 21,795 | |
Myriad Genetics, Inc. (1) | | | 796 | | | | 11,550 | |
Organon & Co. | | | 48 | | | | 1,341 | |
Pfizer, Inc. | | | 3,577 | | | | 183,285 | |
Quest Diagnostics, Inc. | | | 47 | | | | 7,353 | |
Regeneron Pharmaceuticals, Inc. (1) | | | 212 | | | | 152,956 | |
SIGA Technologies, Inc. | | | 86 | | | | 633 | |
Twist Bioscience Corp. (1) | | | 3,803 | | | | 90,549 | |
UnitedHealth Group, Inc. | | | 1,196 | | | | 634,095 | |
Moderate Allocation Fund |
Security Description | | Shares or
Principal
Amount ($) | | | Fair
Value ($) | |
Common Stocks (United States) — continued |
Universal Health Services, Inc. | | | 89 | | | | 12,539 | |
Vertex Pharmaceuticals, Inc. (1) | | | 520 | | | | 150,166 | |
Viatris, Inc. | | | 3,418 | | | | 38,042 | |
Vir Biotechnology, Inc. (1) | | | 173 | | | | 4,379 | |
West Pharmaceutical Services, Inc. | | | 268 | | | | 63,074 | |
Zimmer Biomet Holdings, Inc. | | | 201 | | | | 25,628 | |
Zoetis, Inc. | | | 2,527 | | | | 370,332 | |
| | | | | | | | 6,005,629 | |
| | | | | | | | | |
Industrials — 1.9% | | | | | | | | |
AECOM | | | 9 | | | | 764 | |
AeroVironment, Inc. (1) | | | 350 | | | | 29,981 | |
AGCO Corp. | | | 11 | | | | 1,526 | |
Alaska Air Group, Inc. (1) | | | 27 | | | | 1,159 | |
AMETEK, Inc. | | | 19 | | | | 2,655 | |
Argan, Inc. | | | 41 | | | | 1,512 | |
Atkore, Inc. (1) | | | 450 | | | | 51,039 | |
BlueLinx Holdings, Inc. (1) | | | 77 | | | | 5,475 | |
Boise Cascade Co. | | | 147 | | | | 10,094 | |
Brady Corp. | | | 41 | | | | 1,931 | |
Builders FirstSource, Inc. (1) | | | 1,870 | | | | 121,326 | |
Comfort Systems USA, Inc. | | | 12 | | | | 1,381 | |
Copart, Inc. (1) | | | 15,834 | | | | 964,132 | |
CoStar Group, Inc. (1) | | | 268 | | | | 20,711 | |
Crane Holdings Co. | | | 12 | | | | 1,205 | |
Distribution Solutions Group, Inc. (1) | | | 42 | | | | 1,548 | |
Eaton Corp. PLC | | | 9 | | | | 1,413 | |
EMCOR Group, Inc. | | | 1,027 | | | | 152,109 | |
Emerson Electric Co. | | | 13 | | | | 1,249 | |
Enovix Corp. (1) | | | 1,413 | | | | 17,578 | |
Equifax, Inc. | | | 4 | | | | 777 | |
Expeditors International of Washington, Inc. | | | 530 | | | | 55,078 | |
Fortune Brands Innovations, Inc. | | | 2,246 | | | | 128,269 | |
Genco Shipping & Trading, Ltd. | | | 138 | | | | 2,120 | |
General Dynamics Corp. | | | 1,216 | | | | 301,702 | |
Graco, Inc. | | | 1,436 | | | | 96,585 | |
GrafTech International, Ltd. | | | 186 | | | | 885 | |
Heidrick & Struggles International, Inc. | | | 70 | | | | 1,958 | |
Huntington Ingalls Industries, Inc. | | | 5 | | | | 1,153 | |
ITT, Inc. | | | 449 | | | | 36,414 | |
Karat Packaging, Inc. | | | 58 | | | | 833 | |
Leidos Holdings, Inc. | | | 260 | | | | 27,349 | |
Lockheed Martin Corp. | | | 499 | | | | 242,759 | |
ManpowerGroup, Inc. | | | 171 | | | | 14,229 | |
Masterbrand, Inc. (1) | | | 2,246 | | | | 16,957 | |
Matson, Inc. | | | 349 | | | | 21,816 | |
McGrath RentCorp | | | 23 | | | | 2,271 | |
The accompanying notes are an integral part of these financial statements.
2022 Annual Report | December 31, 2022 | Page 49 |
Schedules of Investments
December 31, 2022
Moderate Allocation Fund |
Security Description | | Shares or
Principal
Amount ($) | | | Fair
Value ($) | |
Common Stocks (United States) — continued |
MSC Industrial Direct Co., Inc. | | | 8 | | | | 654 | |
Mueller Industries, Inc. | | | 563 | | | | 33,217 | |
Northrop Grumman Corp. | | | 335 | | | | 182,779 | |
nVent Electric PLC | | | 1,004 | | | | 38,624 | |
PACCAR, Inc. | | | 308 | | | | 30,483 | |
Primoris Services Corp. | | | 117 | | | | 2,567 | |
Raytheon Technologies Corp. | | | 7 | | | | 706 | |
Regal Rexnord Corp. | | | 15 | | | | 1,800 | |
Republic Services, Inc. | | | 11 | | | | 1,419 | |
Ryder System, Inc. | | | 25 | | | | 2,089 | |
Sensata Technologies Holding PLC | | | 35 | | | | 1,413 | |
SkyWest, Inc. (1) | | | 1,114 | | | | 18,392 | |
Southwest Airlines Co. | | | 3,701 | | | | 124,613 | |
Trex Co., Inc. (1) | | | 227 | | | | 9,609 | |
TrueBlue, Inc. (1) | | | 5 | | | | 98 | |
UFP Industries, Inc. | | | 41 | | | | 3,249 | |
United Airlines Holdings, Inc. (1) | | | 1,139 | | | | 42,940 | |
Univar Solutions, Inc. (1) | | | 48 | | | | 1,526 | |
V2X, Inc. (1) | | | 18 | | | | 743 | |
Valmont Industries, Inc. | | | 13 | | | | 4,299 | |
Verisk Analytics, Inc. | | | 248 | | | | 43,752 | |
Vicor Corp. (1) | | | 1,135 | | | | 61,006 | |
Waste Management, Inc. | | | 12 | | | | 1,883 | |
WW Grainger, Inc. | | | 7 | | | | 3,894 | |
| | | | | | | | 2,951,698 | |
| | | | | | | | | |
Information Technology — 5.5% | | | | | | | | |
Adobe, Inc. (1) | | | 821 | | | | 276,291 | |
Amkor Technology, Inc. | | | 562 | | | | 13,477 | |
Amphenol Corp. | | | 9 | | | | 685 | |
ANSYS, Inc. (1) | | | 148 | | | | 35,755 | |
Apple, Inc. | | | 15,888 | | | | 2,064,328 | |
Applied Materials, Inc. | | | 1,419 | | | | 138,182 | |
Arrow Electronics, Inc. (1) | | | 1,130 | | | | 118,164 | |
Avnet, Inc. | | | 2,163 | | | | 89,938 | |
Calix, Inc. (1) | | | 421 | | | | 28,809 | |
Cisco Systems, Inc. | | | 1,908 | | | | 90,897 | |
Cloudflare, Inc. (1) | | | 1,085 | | | | 49,053 | |
Cognizant Technology Solutions Corp. | | | 1,809 | | | | 103,457 | |
Dell Technologies, Inc. | | | 101 | | | | 4,062 | |
Digital Turbine, Inc. (1) | | | 3,001 | | | | 45,735 | |
DocuSign, Inc. (1) | | | 1,190 | | | | 65,950 | |
EPAM Systems, Inc. (1) | | | 110 | | | | 36,051 | |
Extreme Networks, Inc. (1) | | | 45 | | | | 824 | |
Fabrinet (1) | | | 7 | | | | 898 | |
Intel Corp. | | | 1,855 | | | | 49,028 | |
International Money Express, Inc. (1) | | | 35 | | | | 853 | |
Moderate Allocation Fund |
Security Description | | Shares or
Principal
Amount ($) | | | Fair
Value ($) | |
Common Stocks (United States) — continued |
Intuit, Inc. | | | 555 | | | | 216,017 | |
Jabil, Inc. | | | 2,433 | | | | 165,931 | |
Lam Research Corp. | | | 368 | | | | 154,670 | |
Lattice Semiconductor Corp. (1) | | | 2,025 | | | | 131,382 | |
Manhattan Associates, Inc. (1) | | | 2,585 | | | | 313,819 | |
Mastercard, Inc. | | | 596 | | | | 207,247 | |
Microchip Technology, Inc. | | | 909 | | | | 63,857 | |
Microsoft Corp. | | | 8,110 | | | | 1,944,937 | |
National Instruments Corp. | | | 1,271 | | | | 46,900 | |
NVIDIA Corp. | | | 1,549 | | | | 226,371 | |
Oracle Corp. | | | 2,670 | | | | 218,246 | |
QUALCOMM, Inc. | | | 3,021 | | | | 332,129 | |
Skyworks Solutions, Inc. | | | 4,332 | | | | 394,775 | |
StarTek, Inc. (1) | | | 631 | | | | 2,366 | |
Synopsys, Inc. (1) | | | 695 | | | | 221,907 | |
Teradyne, Inc. | | | 2,194 | | | | 191,646 | |
Texas Instruments, Inc. | | | 2,572 | | | | 424,946 | |
Zebra Technologies Corp. (1) | | | 844 | | | | 216,410 | |
Zoom Video Communications, Inc. (1) | | | 1,024 | | | | 69,366 | |
| | | | | | | | 8,755,359 | |
| | | | | | | | | |
Materials — 0.6% | | | | | | | | |
AdvanSix, Inc. | | | 57 | | | | 2,167 | |
Air Products and Chemicals, Inc. | | | 5 | | | | 1,541 | |
Alcoa Corp. | | | 4,452 | | | | 202,432 | |
Alpha Metallurgical Resources, Inc. | | | 31 | | | | 4,538 | |
Arconic Corp. (1) | | | 35 | | | | 741 | |
Avery Dennison Corp. | | | 333 | | | | 60,273 | |
CF Industries Holdings, Inc. | | | 53 | | | | 4,516 | |
Clearwater Paper Corp. (1) | | | 22 | | | | 832 | |
Dow, Inc. | | | 1,242 | | | | 62,584 | |
Eagle Materials, Inc. | | | 11 | | | | 1,461 | |
Flotek Industries, Inc. (1) | | | 676 | | | | 757 | |
Freeport-McMoRan, Inc. | | | 3,121 | | | | 118,598 | |
Louisiana-Pacific Corp. | | | 3,774 | | | | 223,421 | |
LyondellBasell Industries NV | | | 816 | | | | 67,752 | |
Mosaic Co./The | | | 33 | | | | 1,448 | |
Newmont Corp. | | | 118 | | | | 5,570 | |
Nucor Corp. | | | 736 | | | | 97,012 | |
Olin Corp. | | | 69 | | | | 3,653 | |
Packaging Corp. of America | | | 10 | | | | 1,279 | |
Reliance Steel & Aluminum Co. | | | 14 | | | | 2,834 | |
Ryerson Holding Corp. | | | 105 | | | | 3,177 | |
Schnitzer Steel Industries, Inc. | | | 157 | | | | 4,812 | |
Southern Copper Corp. | | | 457 | | | | 27,598 | |
Steel Dynamics, Inc. | | | 461 | | | | 45,040 | |
SunCoke Energy, Inc. | | | 184 | | | | 1,588 | |
The accompanying notes are an integral part of these financial statements.
Page 50 | 2022 Annual Report | December 31, 2022 |
Schedules of Investments
December 31, 2022
Moderate Allocation Fund |
Security Description | | Shares or
Principal
Amount ($) | | | Fair
Value ($) | |
Common Stocks (United States) — continued |
Sylvamo Corp. | | | 48 | | | | 2,332 | |
United States Steel Corp. | | | 1,705 | | | | 42,710 | |
Warrior Met Coal, Inc. | | | 39 | | | | 1,351 | |
Westrock Co. | | | 99 | | | | 3,481 | |
| | | | | | | | 995,498 | |
| | | | | | | | | |
Real Estate Investment Trust — 0.0% | | | | | | | | |
CorEnergy Infrastructure Trust, Inc. | | | 2,011 | | | | 4,203 | |
Rafael Holdings, Inc. (1) | | | 530 | | | | 991 | |
RAIT Financial Trust (1)(5) | | | 751 | | | | 0 | |
Spirit MTA REIT Liquidating Trust (1)(5) | | | 1,024 | | | | 0 | |
| | | | | | | | 5,194 | |
| | | | | | | | | |
Utilities — 0.1% | | | | | | | | |
American Water Works Co., Inc. | | | 18 | | | | 2,744 | |
Brookfield Renewable Corp. | | | 108 | | | | 2,974 | |
Clearway Energy, Inc. | | | 103 | | | | 3,283 | |
National Fuel Gas Co. | | | 86 | | | | 5,444 | |
UGI Corp. | | | 2,556 | | | | 94,750 | |
| | | | | | | | 109,195 | |
| | | | | | | | | |
Total Common Stocks (United States) (Cost $28,654,408) | | | | | | | 34,253,261 | |
| | | | | | | | | |
Preferred Stock (United States) — 0.0% |
WESCO International, Inc. Series A Variable Preferred, 9.7% (6) | | | 252 | | | | 6,653 | |
Total Preferred Stock (United States) (Cost $6,299) | | | | | | | 6,653 | |
| | | | | | | | | |
Warrants (United States) — 0.0% |
Chaparral Energy, Inc. A Warrants, Expiration Date 10/14/2024 (1)(5) | | | 1 | | | | 0 | |
Chaparral Energy, Inc. B Warrants, Expiration Date 10/14/2025 (1)(5) | | | 1 | | | | 0 | |
Civitas Solutions, Inc. A Warrants, Expiration Date 1/20/2025 (1)(5) | | | 7 | | | | 0 | |
Civitas Solutions, Inc. B Warrants, Expiration Date 1/20/2026 (1)(5) | | | 3 | | | | 0 | |
Hertz Global Holdings, Inc. Warrants, Expiration Date 6/30/2051 (1) | | | 48 | | | | 358 | |
Nabors Industries, Ltd. Warrants, Expiration Date 6/11/2026 (1) | | | 15 | | | | 494 | |
Oasis Petroleum, Inc. Warrants, Expiration Date 11/19/2024 (1)(5) | | | 3 | | | | 0 | |
Whiting Petroleum Corp. A Warrants, Expiration Date 9/1/2024 (1) | | | 26 | | | | 530 | |
Moderate Allocation Fund |
Security Description | | Shares or
Principal
Amount ($) | | | Fair
Value ($) | |
Warrants (United States) — continued |
Whiting Petroleum Corp. B Warrants, Expiration Date 9/1/2025 (1) | | | 13 | | | | 236 | |
Total Warrants (United States) (Cost $941) | | | | | | | 1,618 | |
| | | | | | | | | |
Registered Investment Companies — 34.0% |
U.S. Fixed Income — 28.1% | | | | | | | | |
Baird Core Plus Bond Fund - Class I | | | 237,126 | | | | 2,340,435 | |
BBH Limited Duration Fund - Class I | | | 111,718 | | | | 1,112,707 | |
Diamond Hill Short Duration Securitized Bond Fund - Class Y | | | 415,139 | | | | 3,910,609 | |
DoubleLine Total Return Bond Fund - Class I | | | 303,482 | | | | 2,661,538 | |
Frost Total Return Bond Fund - Class I | | | 169,936 | | | | 1,585,507 | |
Guggenheim- Total Return Bond Fund - Class I | | | 49,552 | | | | 1,149,599 | |
iShares Core U.S. Aggregate Bond ETF (7) | | | 122,581 | | | | 11,889,132 | |
PGIM Short-Term Corporate Bond Fund - Class Q | | | 382,143 | | | | 3,890,214 | |
Pioneer Bond Fund - Class K | | | 188,070 | | | | 1,527,129 | |
Segall Bryant & Hamill Plus Bond Fund - Class I | | | 307,798 | | | | 2,785,571 | |
SPDR Bloomberg High Yield Bond ETF (7) | | | 104,083 | | | | 9,367,470 | |
Xtrackers USD High Yield Corporate Bond ETF (7) | | | 69,781 | | | | 2,352,318 | |
| | | | | | | | 44,572,229 | |
| | | | | | | | | |
International Fixed Income — 5.9% | | | | | | | | |
iShares JP Morgan USD Emerging Markets Bond ETF (7) | | | 111,279 | | | | 9,413,091 | |
| | | | | | | | 9,413,091 | |
| | | | | | | | | |
Total Registered Investment Companies (Cost $55,984,869) | | | | | | | 53,985,320 | |
| | | | | | | | | |
Money Market Registered Investment Companies — 44.2% |
Federated Hermes Government Obligations Fund, 4.15% | | | 16,090,000 | | | | 16,090,000 | |
Meeder Institutional Prime Money Market Fund, 4.36% (2) | | | 53,903,745 | | | | 53,903,745 | |
Total Money Market Registered Investment Companies (Cost $69,967,247) | | | | | | | 69,993,745 | |
| | | | | | | | | |
The accompanying notes are an integral part of these financial statements.
2022 Annual Report | December 31, 2022 | Page 51 |
Schedules of Investments
December 31, 2022
Moderate Allocation Fund |
Security Description | | Shares or
Principal
Amount ($) | | | Fair
Value ($) | |
Bank Obligations — 0.2% |
Metro City Bank Deposit Account, 0.94%, 1/3/2023 (3) | | | 249,338 | | | | 249,338 | |
Total Bank Obligations (Cost 249,338) | | | | | | | 249,338 | |
Total Investments — 100.0% (Cost $154,863,102) | | | | | | | 158,489,935 | |
Other Assets less Liabilities — 0.0% | | | | | | | 32,233 | |
Total Net Assets — 100.0% | | | | | | | 158,522,168 | |
| | | | | | | | | |
Trustee Deferred Compensation (4) |
Meeder Balanced Fund - Retail Class | | | 625 | | | | 7,188 | |
Meeder Dynamic Allocation Fund - Retail Class | | | 1,538 | | | | 17,472 | |
Meeder Muirfield Fund - Retail Class | | | 2,023 | | | | 16,670 | |
Meeder Conservative Allocation Fund - Retail Class | | | 194 | | | | 4,045 | |
Total Trustee Deferred Compensation (Cost $47,304) | | | | | | | 45,375 | |
| | | | | | | | | |
| | | Long
(Short)
Contracts | | | Expiration
Date | | | Notional
Value of
Contracts
($) | | | Value and
Unrealized
Appreciation
(Depreciation)
($) | |
Futures Contracts |
Index Futures | | | | | | | | | | | | | | | | |
E-mini Standard & Poors MidCap 400 Futures | | | (14 | ) | | | 3/17/2023 | | | | (3,419,640 | ) | | | 77,180 | |
Mini MSCI EAFE Index Futures | | | 57 | | | | 3/17/2023 | | | | 5,555,790 | | | | (202,439 | ) |
Mini MSCI Emerging Markets Index Futures | | | 25 | | | | 3/17/2023 | | | | 1,199,250 | | | | (30,949 | ) |
Russell 2000 Mini Index Futures | | | 29 | | | | 3/17/2023 | | | | 2,567,805 | | | | (111,613 | ) |
Total Futures Contracts | | | 97 | | | | | | | | 5,903,205 | | | | (267,821 | ) |
(1) | Represents non-income producing securities. |
(2) | Investment in affiliate. The yield shown represents the 7-day yield in effect at December 31, 2022. |
(3) | Variable rate security. Securities payable at par including accrued interest (usually within seven days notice) and unconditionally secured as to principal and interest by letters of credit or other credit support agreements from major banks. The interest rates are adjustable and are not based on a published reference rate and spread but are determined by the issuer or agent and are based on current market conditions. These securities do not indicate a reference rate and spread in their description above. The rate shown represents the rate in effect at December 31, 2022. The maturity date shown, if applicable, reflects the earlier of the next demand date or stated maturity date. |
(4) | Assets of affiliates to the Moderate Allocation Fund held for the benefit of the Fund’s Trustees in connection with the Trustee Deferred Compensation Plan. |
(5) | Fair valued security deemed a Level 3 security. Security is not part of the investment strategy of the Fund. |
The accompanying notes are an integral part of these financial statements.
Page 52 | 2022 Annual Report | December 31, 2022 |
Schedules of Investments
December 31, 2022
Conservative Allocation |
Security Description | | Shares or
Principal
Amount ($) | | | Fair
Value ($) | |
Common Stocks (United States) — 14.7% |
Communication Services — 0.6% | | | | | | | | |
Alphabet, Inc. - Class C (1) | | | 3,360 | | | | 298,133 | |
Alphabet, Inc. - Class A (1) | | | 12 | | | | 1,059 | |
Comcast Corp. | | | 2,269 | | | | 79,347 | |
Entravision Communications Corp. | | | 172 | | | | 826 | |
IDT Corp. (1) | | | 32 | | | | 901 | |
Interpublic Group of Cos., Inc./The | | | 582 | | | | 19,386 | |
Liberty Broadband Corp. - Class A (1) | | | 4 | | | | 303 | |
Liberty Broadband Corp. - Class C (1) | | | 3 | | | | 229 | |
Meta Platforms, Inc. (1) | | | 382 | | | | 45,970 | |
Netflix, Inc. (1) | | | 229 | | | | 67,528 | |
T-Mobile US, Inc. (1) | | | 1,122 | | | | 157,080 | |
Verizon Communications, Inc. | | | 93 | | | | 3,664 | |
| | | | | | | | 674,426 | |
| | | | | | | | | |
Consumer Discretionary — 1.5% | | | | | | | | |
Adtalem Global Education, Inc. (1) | | | 8 | | | | 284 | |
Amazon.com, Inc. (1) | | | 502 | | | | 42,168 | |
AutoNation, Inc. (1) | | | 3 | | | | 322 | |
AutoZone, Inc. (1) | | | 7 | | | | 17,263 | |
Best Buy Co., Inc. | | | 845 | | | | 67,777 | |
Bloomin’ Brands, Inc. | | | 307 | | | | 6,177 | |
Booking Holdings, Inc. (1) | | | 80 | | | | 161,222 | |
BorgWarner, Inc. | | | 1,092 | | | | 43,953 | |
Bright Horizons Family Solutions, Inc. (1) | | | 13 | | | | 820 | |
Buckle, Inc./The | | | 36 | | | | 1,633 | |
Burlington Stores, Inc. (1) | | | 232 | | | | 47,040 | |
Cavco Industries, Inc. (1) | | | 3 | | | | 679 | |
Chegg, Inc. (1) | | | 627 | | | | 15,844 | |
Chico’s FAS, Inc. (1) | | | 62 | | | | 305 | |
Churchill Downs, Inc. | | | 1 | | | | 211 | |
ContextLogic, Inc. (1) | | | 134 | | | | 65 | |
Coursera, Inc. (1) | | | 18 | | | | 213 | |
Dillard’s, Inc. | | | 2 | | | | 646 | |
Expedia Group, Inc. (1) | | | 4 | | | | 350 | |
Frontdoor, Inc. (1) | | | 18 | | | | 374 | |
Garmin, Ltd. | | | 20 | | | | 1,846 | |
Gentex Corp. | | | 53 | | | | 1,445 | |
Goodyear Tire & Rubber Co./The (1) | | | 1,583 | | | | 16,067 | |
Grand Canyon Education, Inc. (1) | | | 220 | | | | 23,245 | |
H&R Block, Inc. | | | 35 | | | | 1,278 | |
Home Depot, Inc./The | | | 849 | | | | 268,165 | |
La-Z-Boy, Inc. | | | 25 | | | | 571 | |
Lennar Corp. | | | 733 | | | | 66,337 | |
Lithia Motors, Inc. | | | 2 | | | | 409 | |
LKQ Corp. | | | 1,141 | | | | 60,941 | |
Lowe’s Cos., Inc. | | | 2 | | | | 398 | |
Conservative Allocation |
Security Description | | Shares or
Principal
Amount ($) | | | Fair
Value ($) | |
Common Stocks (United States) — continued |
Lululemon Athletica, Inc. (1) | | | 400 | | | | 128,152 | |
M/I Homes, Inc. (1) | | | 41 | | | | 1,893 | |
Macy’s, Inc. | | | 1,283 | | | | 26,494 | |
McDonald’s Corp. | | | 722 | | | | 190,269 | |
National Vision Holdings, Inc. (1) | | | 61 | | | | 2,364 | |
NIKE, Inc. | | | 1,663 | | | | 194,588 | |
O’Reilly Automotive, Inc. (1) | | | 81 | | | | 68,366 | |
Patrick Industries, Inc. | | | 7 | | | | 424 | |
PVH Corp. | | | 18 | | | | 1,271 | |
Qurate Retail, Inc. (1) | | | 409 | | | | 667 | |
Ross Stores, Inc. | | | 283 | | | | 32,848 | |
Skechers USA, Inc. (1) | | | 592 | | | | 24,834 | |
Skyline Champion Corp. (1) | | | 35 | | | | 1,803 | |
Starbucks Corp. | | | 101 | | | | 10,019 | |
Sturm Ruger & Co., Inc. | | | 6 | | | | 304 | |
Target Corp. | | | 9 | | | | 1,341 | |
Tempur Sealy International, Inc. | | | 8 | | | | 275 | |
Texas Roadhouse, Inc. | | | 454 | | | | 41,291 | |
TJX Cos., Inc./The | | | 1,341 | | | | 106,744 | |
Town Sports International Holdings, Inc. (1)(4) | | | 464 | | | | 0 | |
Tractor Supply Co. | | | 1 | | | | 225 | |
Tupperware Brands Corp. (1) | | | 120 | | | | 497 | |
Ulta Beauty, Inc. (1) | | | 201 | | | | 94,283 | |
Urban Outfitters, Inc. (1) | | | 13 | | | | 310 | |
Whirlpool Corp. | | | 332 | | | | 46,965 | |
Yum! Brands, Inc. | | | 1,081 | | | | 138,454 | |
Zumiez, Inc. (1) | | | 9 | | | | 196 | |
| | | | | | | | 1,962,925 | |
| | | | | | | | | |
Consumer Staples — 0.7% | | | | | | | | |
Archer-Daniels-Midland Co. | | | 14 | | | | 1,300 | |
Cal-Maine Foods, Inc. | | | 16 | | | | 871 | |
Casey’s General Stores, Inc. | | | 13 | | | | 2,917 | |
Coca-Cola Co./The | | | 1,234 | | | | 78,495 | |
Costco Wholesale Corp. | | | 99 | | | | 45,194 | |
Flowers Foods, Inc. | | | 10 | | | | 287 | |
General Mills, Inc. | | | 21 | | | | 1,761 | |
Hershey Co./The | | | 600 | | | | 138,942 | |
Hostess Brands, Inc. (1) | | | 18 | | | | 404 | |
Ingles Markets, Inc. | | | 4 | | | | 386 | |
John B Sanfilippo & Son, Inc. | | | 2 | | | | 163 | |
Kimberly-Clark Corp. | | | 1,083 | | | | 147,017 | |
Kraft Heinz Co./The | | | 10 | | | | 407 | |
Kroger Co./The | | | 97 | | | | 4,324 | |
Lamb Weston Holdings, Inc. | | | 179 | | | | 15,995 | |
Lancaster Colony Corp. | | | 3 | | | | 592 | |
Molson Coors Beverage Co. | | | 7 | | | | 361 | |
The accompanying notes are an integral part of these financial statements.
2022 Annual Report | December 31, 2022 | Page 53 |
Schedules of Investments
December 31, 2022
Conservative Allocation |
Security Description | | Shares or
Principal
Amount ($) | | | Fair
Value ($) | |
Common Stocks (United States) — continued |
PepsiCo, Inc. | | | 1,178 | | | | 212,817 | |
Philip Morris International, Inc. | | | 2 | | | | 202 | |
Pilgrim’s Pride Corp. (1) | | | 64 | | | | 1,519 | |
Procter & Gamble Co./The | | | 25 | | | | 3,789 | |
TreeHouse Foods, Inc. (1) | | | 7 | | | | 346 | |
Walmart, Inc. | | | 1,025 | | | | 145,335 | |
| | | | | | | | 803,424 | |
| | | | | | | | | |
Energy — 2.4% | | | | | | | | |
Antero Resources Corp. (1) | | | 41 | | | | 1,271 | |
APA Corp. | | | 157 | | | | 7,329 | |
Arch Resources, Inc. | | | 11 | | | | 1,571 | |
Baker Hughes Co. | | | 29 | | | | 856 | |
California Resources Corp. | | | 69 | | | | 3,002 | |
Callon Petroleum Co. (1) | | | 45 | | | | 1,669 | |
Centrus Energy Corp. (1) | | | 283 | | | | 9,192 | |
ChampionX Corp. | | | 26 | | | | 754 | |
Cheniere Energy, Inc. | | | 465 | | | | 69,731 | |
Chesapeake Energy Corp. | | | 3 | | | | 283 | |
Chevron Corp. | | | 6,863 | | | | 1,231,840 | |
Chord Energy Corp. | | | 11 | | | | 1,505 | |
Civitas Resources, Inc. | | | 52 | | | | 3,012 | |
Comstock Resources, Inc. | | | 12 | | | | 165 | |
ConocoPhillips | | | 1,247 | | | | 147,146 | |
Coterra Energy, Inc. | | | 55 | | | | 1,351 | |
CVR Energy, Inc. | | | 18 | | | | 564 | |
Delek US Holdings, Inc. | | | 13 | | | | 351 | |
Denbury, Inc. (1) | | | 9 | | | | 783 | |
Devon Energy Corp. | | | 72 | | | | 4,429 | |
Diamondback Energy, Inc. | | | 171 | | | | 23,389 | |
DT Midstream, Inc. | | | 137 | | | | 7,571 | |
EOG Resources, Inc. | | | 1,291 | | | | 167,210 | |
EQT Corp. | | | 120 | | | | 4,060 | |
Exxon Mobil Corp. | | | 4,741 | | | | 522,932 | |
FLEX LNG, Ltd. | | | 39 | | | | 1,275 | |
Golar LNG, Ltd. (1) | | | 75 | | | | 1,709 | |
Halliburton Co. | | | 12 | | | | 472 | |
Hess Corp. | | | 151 | | | | 21,415 | |
HF Sinclair Corp. | | | 73 | | | | 3,788 | |
Kinder Morgan, Inc. | | | 10 | | | | 181 | |
Laredo Petroleum, Inc. (1) | | | 25 | | | | 1,286 | |
Magnolia Oil & Gas Corp. | | | 24 | | | | 563 | |
Marathon Oil Corp. | | | 19 | | | | 514 | |
Marathon Petroleum Corp. | | | 1,390 | | | | 161,782 | |
Matador Resources Co. | | | 40 | | | | 2,290 | |
Murphy Oil Corp. | | | 23 | | | | 989 | |
Northern Oil and Gas, Inc. | | | 13 | | | | 401 | |
Conservative Allocation |
Security Description | | Shares or
Principal
Amount ($) | | | Fair
Value ($) | |
Common Stocks (United States) — continued |
Occidental Petroleum Corp. | | | 472 | | | | 29,731 | |
ONEOK, Inc. | | | 2,022 | | | | 132,845 | |
Ovintiv, Inc. | | | 500 | | | | 25,355 | |
Par Pacific Holdings, Inc. (1) | | | 54 | | | | 1,256 | |
PBF Energy, Inc. | | | 56 | | | | 2,284 | |
PDC Energy, Inc. | | | 16 | | | | 1,016 | |
Phillips 66 | | | 877 | | | | 91,278 | |
Pioneer Natural Resources Co. | | | 308 | | | | 70,344 | |
Range Resources Corp. | | | 88 | | | | 2,202 | |
SandRidge Energy, Inc. (1) | | | 18 | | | | 307 | |
Schlumberger, Ltd. | | | 163 | | | | 8,714 | |
Scorpio Tankers, Inc. | | | 144 | | | | 7,743 | |
SilverBow Resources, Inc. (1) | | | 10 | | | | 283 | |
Sitio Royalties Corp. | | | 13 | | | | 375 | |
SM Energy Co. | | | 80 | | | | 2,786 | |
Talos Energy, Inc. (1) | | | 23 | | | | 434 | |
Targa Resources Corp. | | | 334 | | | | 24,549 | |
Teekay Corp. (1) | | | 65 | | | | 295 | |
Teekay Tankers, Ltd. (1) | | | 57 | | | | 1,756 | |
Tidewater, Inc. (1) | | | 90 | | | | 3,317 | |
Valero Energy Corp. | | | 327 | | | | 41,483 | |
Westmoreland Coal Co. (1)(4) | | | 410 | | | | 0 | |
Williams Cos., Inc./The | | | 39 | | | | 1,283 | |
World Fuel Services Corp. | | | 33 | | | | 902 | |
| | | | | | | | 2,859,169 | |
| | | | | | | | | |
Financials — 1.6% | | | | | | | | |
Affiliated Managers Group, Inc. | | | 33 | | | | 5,228 | |
Aflac, Inc. | | | 116 | | | | 8,345 | |
Ally Financial, Inc. | | | 1,124 | | | | 27,482 | |
American Equity Investment Life Holding Co. | | | 200 | | | | 9,124 | |
American Financial Group, Inc./OH | | | 11 | | | | 1,510 | |
American International Group, Inc. | | | 2,384 | | | | 150,764 | |
Argo Group International Holdings, Ltd. | | | 33 | | | | 853 | |
Axis Capital Holdings, Ltd. | | | 2 | | | | 108 | |
Bank of New York Mellon Corp./The | | | 992 | | | | 45,156 | |
Bank OZK | | | 44 | | | | 1,763 | |
Berkshire Hathaway, Inc. (1) | | | 2,621 | | | | 809,627 | |
Cadence Bank | | | 3 | | | | 74 | |
Capital One Financial Corp. | | | 116 | | | | 10,783 | |
Cathay General Bancorp | | | 7 | | | | 286 | |
Charles Schwab Corp./The | | | 1,191 | | | | 99,163 | |
Chubb, Ltd. | | | 80 | | | | 17,648 | |
Citigroup, Inc. | | | 1 | | | | 45 | |
East West Bancorp, Inc. | | | 1,950 | | | | 128,505 | |
Erie Indemnity Co. | | | 1 | | | | 249 | |
The accompanying notes are an integral part of these financial statements.
Page 54 | 2022 Annual Report | December 31, 2022 |
Schedules of Investments
December 31, 2022
Conservative Allocation |
Security Description | | Shares or
Principal
Amount ($) | | | Fair
Value ($) | |
Common Stocks (United States) — continued |
Essent Group, Ltd. | | | 152 | | | | 5,910 | |
F&G Annuities & Life, Inc. | | | 53 | | | | 1,061 | |
Fidelity National Financial, Inc. | | | 782 | | | | 29,419 | |
First American Financial Corp. | | | 43 | | | | 2,251 | |
Hancock Whitney Corp. | | | 215 | | | | 10,404 | |
Hartford Financial Services Group, Inc./The | | | 354 | | | | 26,844 | |
Loews Corp. | | | 644 | | | | 37,565 | |
LPL Financial Holdings, Inc. | | | 185 | | | | 39,991 | |
Marsh & McLennan Cos., Inc. | | | 236 | | | | 39,053 | |
Medley Management, Inc. (1)(4) | | | 25 | | | | 0 | |
New York Community Bancorp, Inc. | | | 1,220 | | | | 10,492 | |
NMI Holdings, Inc. (1) | | | 111 | | �� | | 2,320 | |
Northern Trust Corp. | | | 1,431 | | | | 126,629 | |
Old Republic International Corp. | | | 23 | | | | 555 | |
Pathward Financial, Inc. | | | 69 | | | | 2,970 | |
Prosperity Bancshares, Inc. | | | 203 | | | | 14,754 | |
Radian Group, Inc. | | | 55 | | | | 1,049 | |
Reinsurance Group of America, Inc. | | | 58 | | | | 8,241 | |
SLM Corp. | | | 19 | | | | 315 | |
State Street Corp. | | | 5 | | | | 388 | |
Stewart Information Services Corp. | | | 220 | | | | 9,401 | |
Synchrony Financial | | | 1,427 | | | | 46,891 | |
Unum Group | | | 46 | | | | 1,887 | |
Virtu Financial, Inc. | | | 14 | | | | 286 | |
W R Berkley Corp. | | | 249 | | | | 18,070 | |
Walker & Dunlop, Inc. | | | 27 | | | | 2,119 | |
Wells Fargo & Co. | | | 63 | | | | 2,601 | |
Willis Towers Watson PLC | | | 898 | | | | 219,633 | |
WSFS Financial Corp. | | | 13 | | | | 589 | |
Zions Bancorp NA | | | 7 | | | | 344 | |
| | | | | | | | 1,978,745 | |
| | | | | | | | | |
Healthcare — 2.8% | | | | | | | | |
Abbott Laboratories | | | 90 | | | | 9,881 | |
AbbVie, Inc. | | | 1,544 | | | | 249,526 | |
Acadia Healthcare Co., Inc. (1) | | | 388 | | | | 31,940 | |
AmerisourceBergen Corp. | | | 108 | | | | 17,897 | |
Amgen, Inc. | | | 648 | | | | 170,191 | |
AMN Healthcare Services, Inc. (1) | | | 16 | | | | 1,645 | |
Amneal Pharmaceuticals, Inc. (1) | | | 442 | | | | 880 | |
Avalo Therapeutics, Inc. (1) | | | 62 | | | | 312 | |
Avanos Medical, Inc. (1) | | | 14 | | | | 379 | |
Axogen, Inc. (1) | | | 198 | | | | 1,976 | |
Biogen, Inc. (1) | | | 414 | | | | 114,645 | |
BioMarin Pharmaceutical, Inc. (1) | | | 4 | | | | 414 | |
Bristol-Myers Squibb Co. | | | 1,491 | | | | 107,277 | |
Cardinal Health, Inc. | | | 722 | | | | 55,500 | |
Conservative Allocation |
Security Description | | Shares or
Principal
Amount ($) | | | Fair
Value ($) | |
Common Stocks (United States) — continued |
Catalent, Inc. (1) | | | 1,112 | | | | 50,051 | |
Catalyst Pharmaceuticals, Inc. (1) | | | 22 | | | | 409 | |
Centene Corp. (1) | | | 644 | | | | 52,814 | |
Centogene NV (1) | | | 138 | | | | 128 | |
Cigna Corp. | | | 32 | | | | 10,603 | |
Cross Country Healthcare, Inc. (1) | | | 10 | | | | 266 | |
CVS Health Corp. | | | 1,814 | | | | 169,047 | |
Danaher Corp. | | | 313 | | | | 83,076 | |
Dexcom, Inc. (1) | | | 205 | | | | 23,214 | |
Edwards Lifesciences Corp. (1) | | | 3 | | | | 224 | |
Elevance Health, Inc. | | | 271 | | | | 139,015 | |
Eli Lilly & Co. | | | 716 | | | | 261,941 | |
Eloxx Pharmaceuticals, Inc. (1) | | | 15 | | | | 27 | |
Embecta Corp. | | | 30 | | | | 759 | |
Emergent BioSolutions, Inc. (1) | | | 46 | | | | 543 | |
Enhabit, Inc. (1) | | | 21 | | | | 276 | |
Ensign Group, Inc./The | | | 103 | | | | 9,745 | |
Fulgent Genetics, Inc. (1) | | | 649 | | | | 19,327 | |
Genprex, Inc. (1) | | | 271 | | | | 393 | |
Gilead Sciences, Inc. | | | 1,984 | | | | 170,326 | |
Haemonetics Corp. (1) | | | 323 | | | | 25,404 | |
HCA Healthcare, Inc. | | | 171 | | | | 41,033 | |
Humana, Inc. | | | 180 | | | | 92,194 | |
Incyte Corp. (1) | | | 119 | | | | 9,558 | |
Intuitive Surgical, Inc. (1) | | | 623 | | | | 165,313 | |
IQVIA Holdings, Inc. (1) | | | 185 | | | | 37,905 | |
Johnson & Johnson | | | 1,864 | | | | 329,276 | |
McKesson Corp. | | | 78 | | | | 29,259 | |
Medtronic PLC | | | 20 | | | | 1,554 | |
Merck & Co., Inc. | | | 332 | | | | 36,835 | |
Merit Medical Systems, Inc. (1) | | | 350 | | | | 24,717 | |
MiMedx Group, Inc. (1) | | | 22 | | | | 61 | |
Moderna, Inc. (1) | | | 562 | | | | 100,946 | |
Molina Healthcare, Inc. (1) | | | 62 | | | | 20,474 | |
Neurocrine Biosciences, Inc. (1) | | | 100 | | | | 11,944 | |
Oncocyte Corp. (1) | | | 195 | | | | 63 | |
Organon & Co. | | | 36 | | | | 1,005 | |
Orthofix Medical, Inc. (1) | | | 33 | | | | 677 | |
Palatin Technologies, Inc. (1) | | | 34 | | | | 87 | |
Pfizer, Inc. | | | 163 | | | | 8,352 | |
Premier, Inc. | | | 43 | | | | 1,504 | |
Quest Diagnostics, Inc. | | | 69 | | | | 10,794 | |
Regeneron Pharmaceuticals, Inc. (1) | | | 45 | | | | 32,467 | |
SIGA Technologies, Inc. | | | 9 | | | | 66 | |
Twist Bioscience Corp. (1) | | | 94 | | | | 2,238 | |
UnitedHealth Group, Inc. | | | 641 | | | | 339,845 | |
Universal Health Services, Inc. | | | 145 | | | | 20,429 | |
The accompanying notes are an integral part of these financial statements.
2022 Annual Report | December 31, 2022 | Page 55 |
Schedules of Investments
December 31, 2022
Conservative Allocation |
Security Description | | Shares or
Principal
Amount ($) | | | Fair
Value ($) | |
Common Stocks (United States) — continued |
Veracyte, Inc. (1) | | | 136 | | | | 3,227 | |
Vertex Pharmaceuticals, Inc. (1) | | | 430 | | | | 124,175 | |
Viatris, Inc. | | | 1,051 | | | | 11,698 | |
Vir Biotechnology, Inc. (1) | | | 83 | | | | 2,101 | |
West Pharmaceutical Services, Inc. | | | 139 | | | | 32,714 | |
Zimmer Biomet Holdings, Inc. | | | 263 | | | | 33,533 | |
Zoetis, Inc. | | | 245 | | | | 35,905 | |
| | | | | | | | 3,342,000 | |
| | | | | | | | | |
Industrials — 1.5% | | | | | | | | |
Acuity Brands, Inc. | | | 4 | | | | 662 | |
AGCO Corp. | | | 6 | | | | 832 | |
Alaska Air Group, Inc. (1) | | | 7 | | | | 301 | |
Allison Transmission Holdings, Inc. | | | 23 | | | | 957 | |
AMETEK, Inc. | | | 6 | | | | 838 | |
Argan, Inc. | | | 14 | | | | 516 | |
Atkore, Inc. (1) | | | 59 | | | | 6,692 | |
Axon Enterprise, Inc. (1) | | | 109 | | | | 18,086 | |
BlueLinx Holdings, Inc. (1) | | | 22 | | | | 1,564 | |
Boise Cascade Co. | | | 47 | | | | 3,227 | |
Booz Allen Hamilton Holding Corp. | | | 30 | | | | 3,136 | |
Brady Corp. | | | 14 | | | | 659 | |
Builders FirstSource, Inc. (1) | | | 1,032 | | | | 66,956 | |
BWX Technologies, Inc. | | | 11 | | | | 639 | |
Casella Waste Systems, Inc. (1) | | | 8 | | | | 634 | |
Comfort Systems USA, Inc. | | | 9 | | | | 1,036 | |
Copart, Inc. (1) | | | 5,626 | | | | 342,567 | |
Crane Holdings Co. | | | 6 | | | | 603 | |
Deere & Co. | | | 409 | | | | 175,363 | |
Delta Air Lines, Inc. (1) | | | 3 | | | | 99 | |
Donaldson Co., Inc. | | | 12 | | | | 706 | |
Dover Corp. | | | 105 | | | | 14,218 | |
EMCOR Group, Inc. | | | 253 | | | | 37,472 | |
Encore Wire Corp. | | | 4 | | | | 550 | |
Enovix Corp. (1) | | | 509 | | | | 6,332 | |
Equifax, Inc. | | | 2 | | | | 389 | |
Fastenal Co. | | | 7 | | | | 331 | |
Federal Signal Corp. | | | 14 | | | | 651 | |
Fortune Brands Innovations, Inc. | | | 2,181 | | | | 124,557 | |
Genco Shipping & Trading, Ltd. | | | 7 | | | | 108 | |
Graco, Inc. | | | 1,136 | | | | 76,407 | |
H&E Equipment Services, Inc. | | | 10 | | | | 454 | |
Heidrick & Struggles International, Inc. | | | 15 | | | | 420 | |
Hub Group, Inc. (1) | | | 4 | | | | 318 | |
Hubbell, Inc. | | | 104 | | | | 24,407 | |
Huntington Ingalls Industries, Inc. | | | 6 | | | | 1,384 | |
ITT, Inc. | | | 6 | | | | 487 | |
Conservative Allocation |
Security Description | | Shares or
Principal
Amount ($) | | | Fair
Value ($) | |
Common Stocks (United States) — continued |
Kforce, Inc. | | | 5 | | | | 274 | |
Leidos Holdings, Inc. | | | 255 | | | | 26,823 | |
Lockheed Martin Corp. | | | 32 | | | | 15,568 | |
Masterbrand, Inc. (1) | | | 1,857 | | | | 14,020 | |
Matson, Inc. | | | 107 | | | | 6,689 | |
MDU Resources Group, Inc. | | | 58 | | | | 1,760 | |
Moog, Inc. (1) | | | 4 | | | | 351 | |
Mueller Industries, Inc. | | | 56 | | | | 3,304 | |
MYR Group, Inc. (1) | | | 4 | | | | 368 | |
Nordson Corp. | | | 104 | | | | 24,723 | |
Northrop Grumman Corp. | | | 13 | | | | 7,093 | |
PACCAR, Inc. | | | 1,153 | | | | 114,112 | |
Primoris Services Corp. | | | 63 | | | | 1,382 | |
Regal Rexnord Corp. | | | 4 | | | | 480 | |
Republic Services, Inc. | | | 2 | | | | 258 | |
Sensata Technologies Holding PLC | | | 10 | | | | 404 | |
SkyWest, Inc. (1) | | | 473 | | | | 7,809 | |
Southwest Airlines Co. | | | 1,669 | | | | 56,195 | |
Tetra Tech, Inc. | | | 242 | | | | 35,136 | |
UFP Industries, Inc. | | | 6 | | | | 476 | |
United Airlines Holdings, Inc. (1) | | | 593 | | | | 22,356 | |
United Parcel Service, Inc. | | | 552 | | | | 95,960 | |
United Rentals, Inc. (1) | | | 367 | | | | 130,439 | |
Univar Solutions, Inc. (1) | | | 4 | | | | 127 | |
V2X, Inc. (1) | | | 40 | | | | 1,652 | |
Valmont Industries, Inc. | | | 3 | | | | 992 | |
Verisk Analytics, Inc. | | | 771 | | | | 136,020 | |
Vicor Corp. (1) | | | 397 | | | | 21,339 | |
Waste Management, Inc. | | | 945 | | | | 148,252 | |
WW Grainger, Inc. | | | 28 | | | | 15,575 | |
Xylem, Inc./NY | | | 275 | | | | 30,407 | |
| | | | | | | | 1,834,902 | |
| | | | | | | | | |
Information Technology — 3.1% | | | | | | | | |
Adobe, Inc. (1) | | | 13 | | | | 4,375 | |
Amkor Technology, Inc. | | | 516 | | | | 12,374 | |
Apple, Inc. | | | 7,197 | | | | 935,106 | |
Arista Networks, Inc. (1) | | | 650 | | | | 78,878 | |
Autodesk, Inc. (1) | | | 399 | | | | 74,561 | |
Avnet, Inc. | | | 2 | | | | 83 | |
Broadcom, Inc. | | | 19 | | | | 10,623 | |
Cadence Design Systems, Inc. (1) | | | 498 | | | | 79,999 | |
Calix, Inc. (1) | | | 68 | | | | 4,653 | |
Cantaloupe, Inc. (1) | | | 83 | | | | 361 | |
CDW Corp./DE | | | 355 | | | | 63,396 | |
Cisco Systems, Inc. | | | 1,315 | | | | 62,647 | |
Dell Technologies, Inc. | | | 38 | | | | 1,528 | |
The accompanying notes are an integral part of these financial statements.
Page 56 | 2022 Annual Report | December 31, 2022 |
Schedules of Investments
December 31, 2022
Conservative Allocation |
Security Description | | Shares or
Principal
Amount ($) | | | Fair
Value ($) | |
Common Stocks (United States) — continued |
DocuSign, Inc. (1) | | | 251 | | | | 13,910 | |
EPAM Systems, Inc. (1) | | | 126 | | | | 41,295 | |
Euronet Worldwide, Inc. (1) | | | 55 | | | | 5,191 | |
Extreme Networks, Inc. (1) | | | 23 | | | | 421 | |
Intel Corp. | | | 1,900 | | | | 50,217 | |
International Money Express, Inc. (1) | | | 5 | | | | 122 | |
Intuit, Inc. | | | 21 | | | | 8,174 | |
Jabil, Inc. | | | 1,156 | | | | 78,839 | |
Juniper Networks, Inc. | | | 11 | | | | 352 | |
Lam Research Corp. | | | 85 | | | | 35,726 | |
Manhattan Associates, Inc. (1) | | | 721 | | | | 87,529 | |
Mastercard, Inc. | | | 395 | | | | 137,353 | |
Microchip Technology, Inc. | | | 528 | | | | 37,092 | |
Microsoft Corp. | | | 1,588 | | | | 380,837 | |
Monolithic Power Systems, Inc. | | | 79 | | | | 27,935 | |
National Instruments Corp. | | | 101 | | | | 3,727 | |
NVIDIA Corp. | | | 1,141 | | | | 166,746 | |
Oracle Corp. | | | 951 | | | | 77,735 | |
Paycom Software, Inc. (1) | | | 75 | | | | 23,273 | |
Pure Storage, Inc. (1) | | | 992 | | | | 26,546 | |
QUALCOMM, Inc. | | | 1,123 | | | | 123,463 | |
Roper Technologies, Inc. | | | 436 | | | | 188,391 | |
Sanmina Corp. (1) | | | 24 | | | | 1,375 | |
Skyworks Solutions, Inc. | | | 2,022 | | | | 184,265 | |
Synopsys, Inc. (1) | | | 447 | | | | 142,723 | |
Teradyne, Inc. | | | 360 | | | | 31,446 | |
TESSCO Technologies, Inc. (1) | | | 44 | | | | 216 | |
Texas Instruments, Inc. | | | 2,696 | | | | 445,433 | |
VeriSign, Inc. (1) | | | 14 | | | | 2,876 | |
Vishay Intertechnology, Inc. | | | 15 | | | | 324 | |
WEX, Inc. (1) | | | 246 | | | | 40,258 | |
Zebra Technologies Corp. (1) | | | 21 | | | | 5,385 | |
Zoom Video Communications, Inc. (1) | | | 741 | | | | 50,195 | |
| | | | | | | | 3,747,954 | |
| | | | | | | | | |
Materials — 0.4% | | | | | | | | |
AdvanSix, Inc. | | | 12 | | | | 456 | |
Alcoa Corp. | | | 1,080 | | | | 49,108 | |
Alpha Metallurgical Resources, Inc. | | | 24 | | | | 3,513 | |
Avery Dennison Corp. | | | 113 | | | | 20,453 | |
CF Industries Holdings, Inc. | | | 132 | | | | 11,246 | |
Dow, Inc. | | | 323 | | | | 16,276 | |
Eagle Materials, Inc. | | | 81 | | | | 10,761 | |
Freeport-McMoRan, Inc. | | | 688 | | | | 26,144 | |
Huntsman Corp. | | | 12 | | | | 330 | |
International Paper Co. | | | 2 | | | | 69 | |
Louisiana-Pacific Corp. | | | 532 | | | | 31,494 | |
Conservative Allocation |
Security Description | | Shares or
Principal
Amount ($) | | | Fair
Value ($) | |
Common Stocks (United States) — continued |
LyondellBasell Industries NV | | | 957 | | | | 79,460 | |
Mosaic Co./The | | | 6 | | | | 263 | |
Newmont Corp. | | | 345 | | | | 16,284 | |
Nucor Corp. | | | 475 | | | | 62,610 | |
Olin Corp. | | | 291 | | | | 15,406 | |
Packaging Corp. of America | | | 5 | | | | 640 | |
Reliance Steel & Aluminum Co. | | | 4 | | | | 810 | |
Ryerson Holding Corp. | | | 41 | | | | 1,241 | |
Sherwin-Williams Co./The | | | 3 | | | | 712 | |
Southern Copper Corp. | | | 122 | | | | 7,368 | |
Steel Dynamics, Inc. | | | 739 | | | | 72,200 | |
Sylvamo Corp. | | | 24 | | | | 1,166 | |
United States Steel Corp. | | | 810 | | | | 20,291 | |
Warrior Met Coal, Inc. | | | 17 | | | | 589 | |
Westrock Co. | | | 64 | | | | 2,250 | |
| | | | | | | | 451,140 | |
| | | | | | | | | |
Real Estate Investment Trust — 0.0% | | | | | | | | |
Hudson Pacific Properties, Inc. | | | 63 | | | | 613 | |
RAIT Financial Trust (1)(4) | | | 368 | | | | 0 | |
Spirit MTA REIT Liquidating Trust (1)(4) | | | 477 | | | | 0 | |
| | | | | | | | 613 | |
| | | | | | | | | |
Utilities — 0.1% | | | | | | | | |
Brookfield Renewable Corp. | | | 97 | | | | 2,671 | |
CenterPoint Energy, Inc. | | | 614 | | | | 18,414 | |
Clearway Energy, Inc. | | | 22 | | | | 701 | |
CMS Energy Corp. | | | 137 | | | | 8,676 | |
Evergy, Inc. | | | 8 | | | | 503 | |
National Fuel Gas Co. | | | 178 | | | | 11,267 | |
NRG Energy, Inc. | | | 153 | | | | 4,868 | |
OGE Energy Corp. | | | 272 | | | | 10,758 | |
ONE Gas, Inc. | | | 12 | | | | 909 | |
UGI Corp. | | | 746 | | | | 27,652 | |
| | | | | | | | 86,419 | |
| | | | | | | | | |
Total Common Stocks (United States) (Cost $17,607,221) | | | | | | | 17,741,717 | |
| | | | | | | | | |
The accompanying notes are an integral part of these financial statements.
2022 Annual Report | December 31, 2022 | Page 57 |
Schedules of Investments
December 31, 2022
Conservative Allocation |
Security Description | | Shares or
Principal
Amount ($) | | | Fair
Value ($) | |
Preferred Stock (United States) — 0.0% |
WESCO International, Inc. Series A Variable Preferred, 9.7% (5) | | | 153 | | | | 4,039 | |
Total Preferred Stock (United States) (Cost $3,824) | | | | | | | 4,039 | |
| | | | | | | | | |
Warrants (United States) — 0.0% |
Civitas Solutions, Inc. A Warrants, Expiration Date 1/20/2025 (1)(4) | | | 4 | | | | 0 | |
Civitas Solutions, Inc. B Warrants, Expiration Date 1/20/2026 (1)(4) | | | 1 | | | | 0 | |
Hertz Global Holdings, Inc. Warrants, Expiration Date 6/30/2051 (1) | | | 21 | | | | 157 | |
Nabors Industries, Ltd. Warrants, Expiration Date 6/11/2026 (1) | | | 6 | | | | 197 | |
Oasis Petroleum, Inc. Warrants, Expiration Date 11/19/2024 (1)(4) | | | 1 | | | | 0 | |
Whiting Petroleum Corp. A Warrants, Expiration Date 9/1/2024 (1) | | | 8 | | | | 163 | |
Whiting Petroleum Corp. B Warrants, Expiration Date 9/1/2025 (1) | | | 2 | | | | 36 | |
Total Warrants (United States) (Cost $374) | | | | | | | 553 | |
| | | | | | | | | |
Registered Investment Companies — 48.0% |
U.S. Fixed Income — 39.7% | | | | | | | | |
Baird Core Plus Bond Fund - Class I | | | 256,113 | | | | 2,527,837 | |
BBH Limited Duration Fund - Class I | | | 126,828 | | | | 1,263,210 | |
Diamond Hill Short Duration Securitized Bond Fund - Class Y | | | 441,897 | | | | 4,162,672 | |
DoubleLine Total Return Bond Fund - Class I | | | 327,373 | | | | 2,871,061 | |
Frost Total Return Bond Fund - Class I | | | 183,247 | | | | 1,709,695 | |
Guggenheim- Total Return Bond Fund - Class I | | | 53,415 | | | | 1,239,219 | |
iShares Core U.S. Aggregate Bond ETF (6) | | | 130,818 | | | | 12,688,038 | |
PGIM Short-Term Corporate Bond Fund - Class Q | | | 402,881 | | | | 4,101,329 | |
Pioneer Bond Fund - Class K | | | 202,559 | | | | 1,644,778 | |
Segall Bryant & Hamill Plus Bond Fund - Class I | | | 331,846 | | | | 3,003,203 | |
SPDR Bloomberg High Yield Bond ETF (6) | | | 111,053 | | | | 9,994,770 | |
Xtrackers USD High Yield Corporate Bond ETF (6) | | | 75,849 | | | | 2,556,870 | |
| | | | | | | | 47,762,682 | |
| | | | | | | | | |
Conservative Allocation |
Security Description | | Shares or
Principal
Amount ($) | | | Fair
Value ($) | |
Registered Investment Companies — continued |
International Fixed Income — 8.3% | | | | | | | | |
iShares JP Morgan USD Emerging Markets Bond ETF (6) | | | 118,802 | | | | 10,049,461 | |
| | | | | | | | 10,049,461 | |
| | | | | | | | | |
Total Registered Investment Companies (Cost $59,935,548) | | | | | | | 57,812,143 | |
| | | | | | | | | |
Money Market Registered Investment Companies — 37.0% |
Federated Hermes Government Obligations Fund, 4.15% | | | 17,165,000 | | | | 17,165,000 | |
Meeder Institutional Prime Money Market Fund, 4.36% (2) | | | 27,330,467 | | | | 27,330,467 | |
Total Money Market Registered Investment Companies (Cost $44,480,360) | | | | | | | 44,495,467 | |
Total Investments — 99.7% (Cost $122,027,327) | | | | | | | 120,053,919 | |
Other Assets less Liabilities — 0.3% | | | | | | | 352,404 | |
Total Net Assets — 100.0% | | | | | | | 120,406,323 | |
| | | | | | | | | |
Trustee Deferred Compensation (3) |
Meeder Balanced Fund - Retail Class | | | 1,444 | | | | 16,606 | |
Meeder Dynamic Allocation Fund - Retail Class | | | 3,865 | | | | 43,906 | |
Meeder Muirfield Fund - Retail Class | | | 2,466 | | | | 20,320 | |
Meeder Conservative Allocation Fund - Retail Class | | | 415 | | | | 8,653 | |
Total Trustee Deferred Compensation (Cost $86,954) | | | | | | | 89,485 | |
| | | | | | | | | |
The accompanying notes are an integral part of these financial statements.
Page 58 | 2022 Annual Report | December 31, 2022 |
Schedules of Investments
December 31, 2022
Conservative Allocation |
| | | Long
(Short)
Contracts | | | Expiration
Date | | | Notional
Value of
Contracts
($) | | | Value and
Unrealized
Appreciation
(Depreciation)
($) | |
Futures Contracts |
Index Futures | | | | | | | | | | | | | | | | |
E-mini Standard & Poors MidCap 400 Futures | | | (8 | ) | | | 3/17/2023 | | | | (1,954,080 | ) | | | 50,773 | |
Mini MSCI EAFE Index Futures | | | 27 | | | | 3/17/2023 | | | | 2,631,690 | | | | (99,491 | ) |
Mini MSCI Emerging Markets Index Futures | | | 12 | | | | 3/17/2023 | | | | 575,640 | | | | (12,620 | ) |
Russell 2000 Mini Index Futures | | | 15 | | | | 3/17/2023 | | | | 1,328,175 | | | | (54,025 | ) |
Standard & Poors 500 Mini Futures | | | (12 | ) | | | 3/17/2023 | | | | (2,316,600 | ) | | | 59,943 | |
Total Futures Contracts | | | 34 | | | | | | | | 264,825 | | | | (55,420 | ) |
(1) | Represents non-income producing securities. |
(2) | Investment in affiliate. The yield shown represents the 7-day yield in effect at December 31, 2022. |
(3) | Assets of affiliates to the Conservative Allocation Fund held for the benefit of the Fund’s Trustees in connection with the Trustees Deferred Compensation Plan. |
(4) | Fair valued security deemed a Level 3 security. Security is not part of the investment strategy of the Fund. |
The accompanying notes are an integral part of these financial statements.
2022 Annual Report | December 31, 2022 | Page 59 |
Schedules of Investments
December 31, 2022
Dynamic Allocation Fund |
Security Description | | Shares or
Principal
Amount ($) | | | Fair
Value ($) | |
Common Stocks (United States) — 70.1% |
Communication Services — 1.6% | | | | | | | | |
Alphabet, Inc. (1) | | | 19,550 | | | | 1,734,672 | |
Cable One, Inc. | | | 14 | | | | 9,966 | |
Entravision Communications Corp. | | | 1,214 | | | | 5,827 | |
IDT Corp. (1) | | | 5,644 | | | | 158,991 | |
Meta Platforms, Inc. (1) | | | 7,797 | | | | 938,291 | |
Netflix, Inc. (1) | | | 458 | | | | 135,055 | |
News Corp. | | | 572 | | | | 10,410 | |
Roku, Inc. (1) | | | 2,154 | | | | 87,668 | |
T-Mobile US, Inc. (1) | | | 1,427 | | | | 199,780 | |
Trade Desk, Inc./The (1) | | | 1,418 | | | | 63,569 | |
Verizon Communications, Inc. | | | 524 | | | | 20,646 | |
| | | | | | | | 3,364,875 | |
| | | | | | | | | |
Consumer Discretionary — 9.7% | | | | | | | | |
Amazon.com, Inc. (1) | | | 8,403 | | | | 705,852 | |
AutoZone, Inc. (1) | | | 51 | | | | 125,775 | |
Best Buy Co., Inc. | | | 5,288 | | | | 424,150 | |
Bloomin’ Brands, Inc. | | | 481 | | | | 9,678 | |
Booking Holdings, Inc. (1) | | | 372 | | | | 749,684 | |
BorgWarner, Inc. | | | 13,172 | | | | 530,173 | |
Burlington Stores, Inc. (1) | | | 1,785 | | | | 361,927 | |
Chegg, Inc. (1) | | | 7,421 | | | | 187,529 | |
Chico’s FAS, Inc. (1) | | | 743 | | | | 3,656 | |
DR Horton, Inc. | | | 11,602 | | | | 1,034,202 | |
Expedia Group, Inc. (1) | | | 6,672 | | | | 584,467 | |
Frontdoor, Inc. (1) | | | 1,100 | | | | 22,880 | |
Garmin, Ltd. | | | 4,714 | | | | 435,055 | |
Goodyear Tire & Rubber Co./The (1) | | | 7,559 | | | | 76,724 | |
Grand Canyon Education, Inc. (1) | | | 6,427 | | | | 679,077 | |
Helen of Troy, Ltd. (1) | | | 944 | | | | 104,699 | |
Home Depot, Inc./The | | | 4,081 | | | | 1,289,025 | |
Lennar Corp. (1) | | | 35 | | | | 2,625 | |
Lennar Corp. | | | 7,856 | | | | 710,968 | |
LKQ Corp. | | | 1,902 | | | | 101,586 | |
Lowe’s Cos., Inc. | | | 3,887 | | | | 774,446 | |
Lululemon Athletica, Inc. (1) | | | 6,035 | | | | 1,933,493 | |
M/I Homes, Inc. (1) | | | 4,603 | | | | 212,567 | |
Macy’s, Inc. | | | 26,609 | | | | 549,476 | |
Mohawk Industries, Inc. (1) | | | 15,247 | | | | 1,558,548 | |
National Vision Holdings, Inc. (1) | | | 2,692 | | | | 104,342 | |
NVR, Inc. (1) | | | 7 | | | | 32,288 | |
O’Reilly Automotive, Inc. (1) | | | 731 | | | | 616,986 | |
PulteGroup, Inc. | | | 4,844 | | | | 220,547 | |
PVH Corp. | | | 6,020 | | | | 424,952 | |
Qurate Retail, Inc. (1) | | | 2,330 | | | | 3,798 | |
Ross Stores, Inc. | | | 2,909 | | | | 337,648 | |
Dynamic Allocation Fund |
Security Description | | Shares or
Principal
Amount ($) | | | Fair
Value ($) | |
Common Stocks (United States) — continued |
Skyline Champion Corp. (1) | | | 7,804 | | | | 401,984 | |
Sleep Number Corp. (1) | | | 4,356 | | | | 113,169 | |
Tapestry, Inc. | | | 2,344 | | | | 89,260 | |
Target Corp. | | | 660 | | | | 98,366 | |
Tempur Sealy International, Inc. | | | 7,035 | | | | 241,512 | |
TJX Cos., Inc./The | | | 11,571 | | | | 921,052 | |
Toll Brothers, Inc. | | | 4,640 | | | | 231,629 | |
Town Sports International Holdings, Inc. (1)(5) | | | 2,090 | | | | 0 | |
Tractor Supply Co. | | | 1,069 | | | | 240,493 | |
Tupperware Brands Corp. (1) | | | 13,119 | | | | 54,313 | |
Ulta Beauty, Inc. (1) | | | 2,133 | | | | 1,000,526 | |
Whirlpool Corp. | | | 11,018 | | | | 1,558,606 | |
Wingstop, Inc. | | | 754 | | | | 103,765 | |
Yum! Brands, Inc. | | | 6,200 | | | | 794,096 | |
| | | | | | | | 20,757,594 | |
| | | | | | | | | |
Consumer Staples — 2.8% | | | | | | | | |
Archer-Daniels-Midland Co. | | | 11,486 | | | | 1,066,475 | |
Bunge, Ltd. | | | 5,318 | | | | 530,577 | |
Coca-Cola Co./The | | | 5,510 | | | | 350,491 | |
Costco Wholesale Corp. | | | 5,390 | | | | 2,460,535 | |
Flowers Foods, Inc. | | | 107 | | | | 3,075 | |
General Mills, Inc. | | | 9,632 | | | | 807,643 | |
Ingredion, Inc. | | | 153 | | | | 14,983 | |
Kroger Co./The | | | 295 | | | | 13,151 | |
PepsiCo, Inc. | | | 2,536 | | | | 458,154 | |
Walmart, Inc. | | | 2,307 | | | | 327,110 | |
| | | | | | | | 6,032,194 | |
| | | | | | | | | |
Energy — 6.5% | | | | | | | | |
APA Corp. | | | 3,465 | | | | 161,746 | |
Ardmore Shipping Corp. (1) | | | 6,127 | | | | 88,290 | |
Berry Corp. | | | 1,448 | | | | 11,584 | |
Bristow Group, Inc. (1) | | | 2,480 | | | | 67,282 | |
Callon Petroleum Co. (1) | | | 4,721 | | | | 175,102 | |
Centrus Energy Corp. (1) | | | 2,964 | | | | 96,271 | |
ChampionX Corp. | | | 616 | | | | 17,858 | |
Cheniere Energy, Inc. | | | 1,552 | | | | 232,738 | |
Chevron Corp. | | | 15,999 | | | | 2,871,661 | |
Civitas Resources, Inc. | | | 84 | | | | 4,866 | |
Comstock Resources, Inc. | | | 272 | | | | 3,729 | |
ConocoPhillips | | | 8,323 | | | | 982,114 | |
Coterra Energy, Inc. | | | 75 | | | | 1,843 | |
CVR Energy, Inc. | | | 1,034 | | | | 32,406 | |
Delek US Holdings, Inc. | | | 1,146 | | | | 30,942 | |
Devon Energy Corp. | | | 4,369 | | | | 268,737 | |
Diamondback Energy, Inc. | | | 886 | | | | 121,187 | |
The accompanying notes are an integral part of these financial statements.
Page 60 | 2022 Annual Report | December 31, 2022 |
Schedules of Investments
December 31, 2022
Dynamic Allocation Fund |
Security Description | | Shares or
Principal
Amount ($) | | | Fair
Value ($) | |
Common Stocks (United States) — continued |
Dorian LPG, Ltd. | | | 1,525 | | | | 28,899 | |
DT Midstream, Inc. | | | 4,022 | | | | 222,256 | |
EOG Resources, Inc. | | | 3,293 | | | | 426,509 | |
EQT Corp. | | | 1,928 | | | | 65,224 | |
Exxon Mobil Corp. | | | 26,869 | | | | 2,963,651 | |
Golar LNG, Ltd. (1) | | | 2,829 | | | | 64,473 | |
Green Plains, Inc. (1) | | | 4,799 | | | | 146,370 | |
Halliburton Co. | | | 2,664 | | | | 104,828 | |
Hess Corp. | | | 624 | | | | 88,496 | |
Laredo Petroleum, Inc. (1) | | | 55 | | | | 2,828 | |
Marathon Oil Corp. | | | 331 | | | | 8,960 | |
Marathon Petroleum Corp. | | | 16,082 | | | | 1,871,784 | |
NexTier Oilfield Solutions, Inc. (1) | | | 3,682 | | | | 34,022 | |
ONEOK, Inc. | | | 10,228 | | | | 671,980 | |
Ovintiv, Inc. | | | 2,155 | | | | 109,280 | |
Phillips 66 | | | 3,526 | | | | 366,986 | |
Pioneer Natural Resources Co. | | | 2,495 | | | | 569,833 | |
Schlumberger, Ltd. | | | 5,701 | | | | 304,775 | |
SilverBow Resources, Inc. (1) | | | 1,127 | | | | 31,872 | |
SM Energy Co. | | | 465 | | | | 16,196 | |
Solaris Oilfield Infrastructure, Inc. | | | 279 | | | | 2,770 | |
Targa Resources Corp. | | | 2,436 | | | | 179,046 | |
Teekay Corp. (1) | | | 1,128 | | | | 5,121 | |
Teekay Tankers, Ltd. (1) | | | 1,665 | | | | 51,299 | |
Valero Energy Corp. | | | 3,397 | | | | 430,943 | |
World Fuel Services Corp. | | | 258 | | | | 7,051 | |
| | | | | | | | 13,943,808 | |
| | | | | | | | | |
Financials — 9.1% | | | | | | | | |
Affiliated Managers Group, Inc. | | | 384 | | | | 60,837 | |
Aflac, Inc. | | | 1,461 | | | | 105,104 | |
American Equity Investment Life Holding Co. | | | 4,141 | | | | 188,912 | |
American Financial Group, Inc./OH | | | 577 | | | | 79,211 | |
Apollo Global Management, Inc. | | | 21,349 | | | | 1,361,853 | |
Argo Group International Holdings, Ltd. | | | 521 | | | | 13,468 | |
Bank of New York Mellon Corp./The | | | 15,170 | | | | 690,538 | |
Bank OZK | | | 862 | | | | 34,532 | |
Berkshire Hathaway, Inc. (1) | | | 24,919 | | | | 7,697,479 | |
Cannae Holdings, Inc. (1) | | | 2,478 | | | | 51,171 | |
Charles Schwab Corp./The | | | 13,543 | | | | 1,127,590 | |
Chubb, Ltd. | | | 4,940 | | | | 1,089,764 | |
Donegal Group, Inc. | | | 1,569 | | | | 22,280 | |
East West Bancorp, Inc. | | | 7,420 | | | | 488,978 | |
Essent Group, Ltd. | | | 7,148 | | | | 277,914 | |
F&G Annuities & Life, Inc. | | | 487 | | | | 9,745 | |
Fidelity National Financial, Inc. | | | 7,169 | | | | 269,698 | |
Dynamic Allocation Fund |
Security Description | | Shares or
Principal
Amount ($) | | | Fair
Value ($) | |
Common Stocks (United States) — continued |
First American Financial Corp. | | | 2,834 | | | | 148,332 | |
Focus Financial Partners, Inc. (1) | | | 263 | | | | 9,802 | |
Hartford Financial Services Group, Inc./The | | | 1,450 | | | | 109,954 | |
Jackson Financial, Inc. | | | 3,161 | | | | 109,971 | |
LPL Financial Holdings, Inc. | | | 1,525 | | | | 329,659 | |
Marsh & McLennan Cos., Inc. | | | 12,086 | | | | 1,999,991 | |
Moelis & Co. | | | 187 | | | | 7,175 | |
Mr Cooper Group, Inc. (1) | | | 1,322 | | | | 53,052 | |
New York Community Bancorp, Inc. | | | 4,448 | | | | 38,253 | |
Old Republic International Corp. | | | 241 | | | | 5,820 | |
OneMain Holdings, Inc. | | | 1,297 | | | | 43,203 | |
PacWest Bancorp | | | 1,120 | | | | 25,704 | |
Pathward Financial, Inc. | | | 1,175 | | | | 50,584 | |
SEI Investments Co. | | | 2,385 | | | | 139,046 | |
State Street Corp. | | | 2,125 | | | | 164,836 | |
Stewart Information Services Corp. | | | 4,581 | | | | 195,746 | |
Synchrony Financial | | | 3,910 | | | | 128,483 | |
W R Berkley Corp. | | | 509 | | | | 36,938 | |
Walker & Dunlop, Inc. | | | 1,770 | | | | 138,910 | |
Willis Towers Watson PLC | | | 9,214 | | | | 2,253,560 | |
| | | | | | | | 19,558,093 | |
| | | | | | | | | |
Healthcare — 12.7% | | | | | | | | |
AbbVie, Inc. | | | 7,645 | | | | 1,235,508 | |
Agilent Technologies, Inc. | | | 224 | | | | 33,522 | |
Alaunos Therapeutics, Inc. (1) | | | 4,281 | | | | 2,779 | |
Amgen, Inc. | | | 7,438 | | | | 1,953,516 | |
Avanos Medical, Inc. (1) | | | 1,863 | | | | 50,413 | |
Biogen, Inc. (1) | | | 1,425 | | | | 394,611 | |
Bristol-Myers Squibb Co. | | | 8,463 | | | | 608,913 | |
Cardinal Health, Inc. | | | 13,693 | | | | 1,052,581 | |
CareDx, Inc. (1) | | | 3,297 | | | | 37,619 | |
Catalent, Inc. (1) | | | 5,878 | | | | 264,569 | |
Centene Corp. (1) | | | 7,170 | | | | 588,012 | |
Cigna Corp. | | | 2,398 | | | | 794,553 | |
CVS Health Corp. | | | 9,000 | | | | 838,710 | |
Dexcom, Inc. (1) | | | 207 | | | | 23,441 | |
Elevance Health, Inc. | | | 1,538 | | | | 788,948 | |
Eli Lilly & Co. | | | 4,302 | | | | 1,573,844 | |
Embecta Corp. | | | 928 | | | | 23,469 | |
Emergent BioSolutions, Inc. (1) | | | 981 | | | | 11,586 | |
Enhabit, Inc. (1) | | | 719 | | | | 9,462 | |
Fulgent Genetics, Inc. (1) | | | 7,681 | | | | 228,740 | |
Genprex, Inc. (1) | | | 1,400 | | | | 2,030 | |
Gilead Sciences, Inc. | | | 15,525 | | | | 1,332,821 | |
HCA Healthcare, Inc. | | | 1,521 | | | | 364,979 | |
Humana, Inc. | | | 216 | | | | 110,633 | |
The accompanying notes are an integral part of these financial statements.
2022 Annual Report | December 31, 2022 | Page 61 |
Schedules of Investments
December 31, 2022
Dynamic Allocation Fund |
Security Description | | Shares or
Principal
Amount ($) | | | Fair
Value ($) | |
Common Stocks (United States) — continued |
IDEXX Laboratories, Inc. (1) | | | 341 | | | | 139,114 | |
ImmunityBio, Inc. (1) | | | 5,750 | | | | 29,153 | |
Intuitive Surgical, Inc. (1) | | | 894 | | | | 237,223 | |
IQVIA Holdings, Inc. (1) | | | 1,084 | | | | 222,101 | |
Johnson & Johnson | | | 16,319 | | | | 2,882,751 | |
Joint Corp./The (1) | | | 200 | | | | 2,796 | |
Laboratory Corp. of America Holdings | | | 266 | | | | 62,638 | |
McKesson Corp. | | | 2,301 | | | | 863,151 | |
Merck & Co., Inc. | | | 8,941 | | | | 992,004 | |
Merit Medical Systems, Inc. (1) | | | 21 | | | | 1,483 | |
Moderna, Inc. (1) | | | 5,834 | | | | 1,047,903 | |
Molina Healthcare, Inc. (1) | | | 19 | | | | 6,274 | |
Pfizer, Inc. | | | 16,915 | | | | 866,725 | |
Quest Diagnostics, Inc. | | | 2,750 | | | | 430,210 | |
Regeneron Pharmaceuticals, Inc. (1) | | | 1,150 | | | | 829,714 | |
SIGA Technologies, Inc. | | | 449 | | | | 3,305 | |
Twist Bioscience Corp. (1) | | | 18,302 | | | | 435,771 | |
UnitedHealth Group, Inc. | | | 6,280 | | | | 3,329,530 | |
Universal Health Services, Inc. | | | 1,432 | | | | 201,754 | |
Veracyte, Inc. (1) | | | 998 | | | | 23,683 | |
Vertex Pharmaceuticals, Inc. (1) | | | 2,221 | | | | 641,380 | |
Viatris, Inc. | | | 7,721 | | | | 85,935 | |
Vir Biotechnology, Inc. (1) | | | 1,204 | | | | 30,473 | |
West Pharmaceutical Services, Inc. | | | 3,305 | | | | 777,832 | |
Zoetis, Inc. | | | 7,744 | | | | 1,134,883 | |
| | | | | | | | 27,603,045 | |
| | | | | | | | | |
Industrials — 6.5% | | | | | | | | |
AeroVironment, Inc. (1) | | | 617 | | | | 52,852 | |
Atkore, Inc. (1) | | | 2,898 | | | | 328,691 | |
Boise Cascade Co. | | | 1,198 | | | | 82,267 | |
Builders FirstSource, Inc. (1) | | | 9,010 | | | | 584,569 | |
Comfort Systems USA, Inc. | | | 200 | | | | 23,016 | |
Copart, Inc. (1) | | | 56,054 | | | | 3,413,128 | |
CoStar Group, Inc. (1) | | | 5,483 | | | | 423,726 | |
EMCOR Group, Inc. | | | 1,844 | | | | 273,115 | |
Enovix Corp. (1) | | | 46,291 | | | | 575,860 | |
Expeditors International of Washington, Inc. | | | 2,554 | | | | 265,412 | |
Fortune Brands Innovations, Inc. | | | 16,131 | | | | 921,241 | |
General Dynamics Corp. | | | 3,337 | | | | 827,943 | |
Graco, Inc. | | | 6,520 | | | | 438,535 | |
ITT, Inc. | | | 1,132 | | | | 91,805 | |
Karat Packaging, Inc. | | | 223 | | | | 3,205 | |
Leidos Holdings, Inc. | | | 2,433 | | | | 255,927 | |
Lockheed Martin Corp. | | | 2,596 | | | | 1,262,928 | |
ManpowerGroup, Inc. | | | 1,994 | | | | 165,921 | |
Masterbrand, Inc. (1) | | | 16,131 | | | | 121,789 | |
Dynamic Allocation Fund |
Security Description | | Shares or
Principal
Amount ($) | | | Fair
Value ($) | |
Common Stocks (United States) — continued |
Matson, Inc. | | | 2,940 | | | | 183,779 | |
Mueller Industries, Inc. | | | 1,455 | | | | 85,845 | |
Northrop Grumman Corp. | | | 1,410 | | | | 769,310 | |
nVent Electric PLC | | | 338 | | | | 13,003 | |
Owens Corning | | | 1,537 | | | | 131,106 | |
PACCAR, Inc. | | | 5,134 | | | | 508,112 | |
SkyWest, Inc. (1) | | | 2,652 | | | | 43,785 | |
Southwest Airlines Co. | | | 12,523 | | | | 421,649 | |
Trex Co., Inc. (1) | | | 1,261 | | | | 53,378 | |
United Airlines Holdings, Inc. (1) | | | 1,744 | | | | 65,749 | |
Verisk Analytics, Inc. | | | 3,536 | | | | 623,821 | |
Vicor Corp. (1) | | | 2,794 | | | | 150,178 | |
Waste Management, Inc. | | | 4,704 | | | | 737,964 | |
| | | | | | | | 13,899,609 | |
| | | | | | | | | |
Information Technology — 18.4% | | | | | | | | |
Adobe, Inc. (1) | | | 3,228 | | | | 1,086,319 | |
Amkor Technology, Inc. | | | 1,102 | | | | 26,426 | |
ANSYS, Inc. (1) | | | 844 | | | | 203,902 | |
Apple, Inc. | | | 69,144 | | | | 8,983,880 | |
Applied Materials, Inc. | | | 3,341 | | | | 325,347 | |
Arrow Electronics, Inc. (1) | | | 2,707 | | | | 283,071 | |
Avnet, Inc. | | | 4,923 | | | | 204,698 | |
Block, Inc. (1) | | | 288 | | | | 18,098 | |
Broadcom, Inc. | | | 226 | | | | 126,363 | |
Calix, Inc. (1) | | | 2,175 | | | | 148,835 | |
Cisco Systems, Inc. | | | 13,890 | | | | 661,720 | |
Cloudflare, Inc. (1) | | | 6,542 | | | | 295,764 | |
Cognizant Technology Solutions Corp. | | | 8,934 | | | | 510,935 | |
Digital Turbine, Inc. (1) | | | 26,090 | | | | 397,612 | |
DocuSign, Inc. (1) | | | 12,678 | | | | 702,615 | |
EPAM Systems, Inc. (1) | | | 745 | | | | 244,166 | |
Euronet Worldwide, Inc. (1) | | | 1,960 | | | | 184,985 | |
Intel Corp. | | | 22,902 | | | | 605,300 | |
Intuit, Inc. | | | 1,130 | | | | 439,819 | |
Jabil, Inc. | | | 9,880 | | | | 673,816 | |
Lam Research Corp. | | | 1,139 | | | | 478,722 | |
Lattice Semiconductor Corp. (1) | | | 5,583 | | | | 362,225 | |
Manhattan Associates, Inc. (1) | | | 13,089 | | | | 1,589,005 | |
Mastercard, Inc. | | | 4,625 | | | | 1,608,251 | |
Microchip Technology, Inc. | | | 5,551 | | | | 389,958 | |
Microsoft Corp. | | | 35,115 | | | | 8,421,272 | |
MongoDB, Inc. (1) | | | 94 | | | | 18,503 | |
National Instruments Corp. | | | 1,897 | | | | 69,999 | |
NVIDIA Corp. | | | 8,106 | | | | 1,184,611 | |
Oracle Corp. | | | 3,904 | | | | 319,113 | |
QUALCOMM, Inc. | | | 15,694 | | | | 1,725,398 | |
The accompanying notes are an integral part of these financial statements.
Page 62 | 2022 Annual Report | December 31, 2022 |
Schedules of Investments
December 31, 2022
Dynamic Allocation Fund |
Security Description | | Shares or
Principal
Amount ($) | | | Fair
Value ($) | |
Common Stocks (United States) — continued |
Skyworks Solutions, Inc. | | | 20,897 | | | | 1,904,344 | |
StarTek, Inc. (1) | | | 1,629 | | | | 6,109 | |
Synopsys, Inc. (1) | | | 2,929 | | | | 935,200 | |
Teradyne, Inc. | | | 12,574 | | | | 1,098,339 | |
Texas Instruments, Inc. | | | 12,501 | | | | 2,065,415 | |
Zebra Technologies Corp. (1) | | | 3,037 | | | | 778,717 | |
Zoom Video Communications, Inc. (1) | | | 10,075 | | | | 682,481 | |
| | | | | | | | 39,761,333 | |
| | | | | | | | | |
Materials — 2.5% | | | | | | | | |
AdvanSix, Inc. | | | 88 | | | | 3,346 | |
Alcoa Corp. | | | 32,145 | | | | 1,461,633 | |
Alpha Metallurgical Resources, Inc. | | | 112 | | | | 16,396 | |
Avery Dennison Corp. | | | 2,471 | | | | 447,251 | |
Dow, Inc. | | | 5,102 | | | | 257,090 | |
Eagle Materials, Inc. | | | 680 | | | | 90,338 | |
Freeport-McMoRan, Inc. | | | 6,565 | | | | 249,470 | |
Louisiana-Pacific Corp. | | | 16,886 | | | | 999,651 | |
LyondellBasell Industries NV | | | 4,940 | | | | 410,168 | |
MP Materials Corp. (1) | | | 12,179 | | | | 295,706 | |
Newmont Corp. | | | 43 | | | | 2,030 | |
Nucor Corp. | | | 2,957 | | | | 389,762 | |
Olin Corp. | | | 241 | | | | 12,759 | |
Ryerson Holding Corp. | | | 140 | | | | 4,236 | |
Schnitzer Steel Industries, Inc. | | | 981 | | | | 30,068 | |
Southern Copper Corp. | | | 1,298 | | | | 78,386 | |
Steel Dynamics, Inc. | | | 4,039 | | | | 394,610 | |
United States Steel Corp. | | | 5,138 | | | | 128,707 | |
Warrior Met Coal, Inc. | | | 2,016 | | | | 69,834 | |
| | | | | | | | 5,341,441 | |
| | | | | | | | | |
Real Estate Investment Trust — 0.0% | | | | | | | | |
CorEnergy Infrastructure Trust, Inc. | | | 5,320 | | | | 11,119 | |
Rafael Holdings, Inc. (1) | | | 1,612 | | | | 3,014 | |
Spirit MTA REIT Liquidating Trust (1)(5) | | | 3,134 | | | | 0 | |
| | | | | | | | 14,133 | |
| | | | | | | | | |
Utilities — 0.3% | | | | | | | | |
Brookfield Renewable Corp. | | | 854 | | | | 23,519 | |
OGE Energy Corp. | | | 2,254 | | | | 89,146 | |
UGI Corp. | | | 13,620 | | | | 504,892 | |
| | | | | | | | 617,557 | |
| | | | | | | | | |
Total Common Stocks (United States) (Cost $131,311,555) | | | | | | | 150,893,682 | |
| | | | | | | | | |
Dynamic Allocation Fund |
Security Description | | Shares or
Principal
Amount ($) | | | Fair
Value ($) | |
Preferred Stock (United States) — 0.0% |
WESCO International, Inc. Series A Variable Preferred, 9.7% (6) | | | 610 | | | | 16,104 | |
Total Preferred Stock (United States) (Cost $15,247) | | | | | | | 16,104 | |
| | | | | | | | | |
Warrants (United States) — 0.0% |
Chaparral Energy, Inc. A Warrants, Expiration Date 10/14/2024 (1)(5) | | | 2 | | | | 0 | |
Chaparral Energy, Inc. B Warrants, Expiration Date 10/14/2025 (1)(5) | | | 2 | | | | 0 | |
Civitas Solutions, Inc. A Warrants, Expiration Date 1/20/2025 (1)(5) | | | 15 | | | | 0 | |
Civitas Solutions, Inc. B Warrants, Expiration Date 1/20/2026 (1)(5) | | | 8 | | | | 0 | |
Hertz Global Holdings Inc. Warrants, Expiration Date 6/30/2051 (1) | | | 89 | | | | 664 | |
Nabors Industries, Ltd. Warrants, Expiration Date 6/11/2026 (1) | | | 27 | | | | 888 | |
Oasis Petroleum, Inc. Warrants, Expiration Date 11/19/2024 (1)(5) | | | 7 | | | | 0 | |
Whiting Petroleum Corp. A Warrants, Expiration Date 9/1/2024 (1) | | | 45 | | | | 918 | |
Whiting Petroleum Corp. B Warrants, Expiration Date 9/1/2025 (1) | | | 22 | | | | 400 | |
Total Warrants (United States) (Cost $2,715) | | | | | | | 2,870 | |
| | | | | | | | | |
Registered Investment Companies — 3.5% |
U.S. Fixed Income — 2.4% | | | | | | | | |
iShares Core U.S. Aggregate Bond ETF (7) | | | 40,834 | | | | 3,960,490 | |
SPDR Bloomberg High Yield Bond ETF (7) | | | 13,084 | | | | 1,177,560 | |
Xtrackers USD High Yield Corporate Bond ETF (7) | | | 8,495 | | | | 286,366 | |
| | | | | | | | 5,424,416 | |
| | | | | | | | | |
International Fixed Income — 0.6% | | | | | | | | |
iShares JP Morgan USD Emerging Markets Bond ETF (7) | | | 14,005 | | | | 1,184,683 | |
| | | | | | | | 1,184,683 | |
| | | | | | | | | |
International Equity — 0.5% | | | | | | | | |
iShares Core MSCI EAFE ETF (7) | | | 15,725 | | | | 969,289 | |
| | | | | | | | 969,289 | |
| | | | | | | | | |
Total Registered Investment Companies (Cost $7,722,733) | | | | | | | 7,578,388 | |
| | | | | | | | | |
The accompanying notes are an integral part of these financial statements.
2022 Annual Report | December 31, 2022 | Page 63 |
Schedules of Investments
December 31, 2022
Dynamic Allocation Fund |
Security Description | | Shares or
Principal
Amount ($) | | | Fair
Value ($) | |
Money Market Registered Investment Companies — 25.4% |
Federated Hermes Government Obligations Fund, 4.15% | | | 2,035,000 | | | | 2,035,000 | |
Meeder Institutional Prime Money Market Fund, 4.36% (2) | | | 52,503,793 | | | | 52,503,793 | |
Total Money Market Registered Investment Companies (Cost $54,513,477) | | | | | | | 54,538,793 | |
| | | | | | | | | |
Bank Obligations — 0.2% |
First Merchants Bank Deposit Account, 1.60%, 1/3/2023 (3) | | | 249,081 | | | | 249,081 | |
Metro City Bank Deposit Account, 0.94%, 1/3/2023 (3) | | | 249,337 | | | | 249,337 | |
Total Bank Obligations (Cost $498,418) | | | | | | | 498,418 | |
Total Investments — 99.2% (Cost $194,064,145) | | | | | | | 213,528,255 | |
Other Assets less Liabilities — 0.8% | | | | | | | 1,487,940 | |
Total Net Assets — 100.0% | | | | | | | 215,016,195 | |
| | | | | | | | | |
Trustee Deferred Compensation (4) |
Meeder Balanced Fund - Retail Class | | | 4,194 | | | | 48,231 | |
Meeder Dynamic Allocation Fund - Retail Class | | | 11,475 | | | | 130,356 | |
Meeder Muirfield Fund - Retail Class | | | 5,537 | | | | 45,625 | |
Meeder Conservative Allocation Fund - Retail Class | | | 1,195 | | | | 24,916 | |
Total Trustee Deferred Compensation (Cost $237,194) | | | | | | | 249,128 | |
| | | | | | | | | |
Dynamic Allocation Fund |
| | | Long
(Short)
Contracts | | | Expiration
Date | | | Notional
Value of
Contracts
($) | | | Value and
Unrealized
Appreciation
(Depreciation)
($) | |
Futures Contracts |
Index Futures | | | | | | | | | | | | | | | | |
E-mini Standard & Poors MidCap 400 Futures | | | (82 | ) | | | 3/17/2023 | | | | (20,029,320 | ) | | | 437,784 | |
Mini MSCI EAFE Index Futures | | | 469 | | | | 3/17/2023 | | | | 45,713,430 | | | | (1,754,168 | ) |
Mini MSCI Emerging Markets Index Futures | | | 208 | | | | 3/17/2023 | | | | 9,977,760 | | | | (257,498 | ) |
Russell 2000 Mini Index Futures | | | 132 | | | | 3/17/2023 | | | | 11,687,940 | | | | (499,561 | ) |
Standard & Poors 500 Mini Futures | | | 23 | | | | 3/17/2023 | | | | 4,440,150 | | | | 7,617 | |
Total Futures Contracts | | | 750 | | | | | | | | 51,789,960 | | | | (2,065,826 | ) |
(1) | Represents non-income producing securities. |
(2) | Investment in affiliate. The yield shown represents the 7-day yield in effect at December 31, 2022. |
(3) | Variable rate security. Securities payable at par including accrued interest (usually within seven days notice) and unconditionally secured as to principal and interest by letters of credit or other credit support agreements from major banks. The interest rates are adjustable and are not based on a published reference rate and spread but are determined by the issuer or agent and are based on current market conditions. These securities do not indicate a reference rate and spread in their description above. The rate shown represents the rate in effect at December 31, 2022. The maturity date shown, if applicable, reflects the earlier of the next demand date or stated maturity date. |
(4) | Assets of affiliates to the Dynamic Allocation Fund held for the benefit of the Fund’s Trustees in connection with the Trustee Deferred Compensation Plan. |
(5) | Fair valued security deemed a Level 3 security. Security is not part of the investment strategy of the Fund. |
The accompanying notes are an integral part of these financial statements.
Page 64 | 2022 Annual Report | December 31, 2022 |
Schedules of Investments
December 31, 2022
Quantex Fund |
Security Description | | Shares or
Principal
Amount ($) | | | Fair
Value ($) | |
Common Stocks (United States) — 61.0% |
Communication Services — 3.1% | | | | | | | | |
DISH Network Corp. (1) | | | 13,099 | | | | 183,910 | |
Interpublic Group of Cos., Inc./The | | | 6,033 | | | | 200,959 | |
News Corp. - Class B | | | 10,626 | | | | 195,943 | |
News Corp. - Class A | | | 10,760 | | | | 195,832 | |
Omnicom Group, Inc. | | | 2,771 | | | | 226,030 | |
| | | | | | | | 1,002,674 | |
| | | | | | | | | |
Consumer Discretionary — 7.5% | | | | | | | | |
Bath & Body Works, Inc. | | | 4,877 | | | | 205,517 | |
BorgWarner, Inc. | | | 5,333 | | | | 214,653 | |
Caesars Entertainment, Inc. (1) | | | 4,636 | | | | 192,858 | |
CarMax, Inc. (1) | | | 3,596 | | | | 218,960 | |
Hasbro, Inc. | | | 3,277 | | | | 199,930 | |
Mohawk Industries, Inc. (1) | | | 2,018 | | | | 206,280 | |
Norwegian Cruise Line Holdings, Ltd. (1) | | | 12,527 | | | | 153,330 | |
PulteGroup, Inc. | | | 4,492 | | | | 204,521 | |
Ralph Lauren Corp. | | | 1,810 | | | | 191,263 | |
Tapestry, Inc. | | | 5,967 | | | | 227,223 | |
Whirlpool Corp. | | | 1,422 | | | | 201,156 | |
Wynn Resorts, Ltd. (1) | | | 2,426 | | | | 200,072 | |
| | | | | | | | 2,415,763 | |
| | | | | | | | | |
Consumer Staples — 3.3% | | | | | | | | |
Campbell Soup Co. | | | 4,209 | | | | 238,861 | |
Conagra Brands, Inc. | | | 5,942 | | | | 229,955 | |
J M Smucker Co./The | | | 578 | | | | 91,590 | |
Lamb Weston Holdings, Inc. | | | 3,358 | | | | 300,071 | |
Molson Coors Beverage Co. | | | 3,793 | | | | 195,415 | |
| | | | | | | | 1,055,892 | |
| | | | | | | | | |
Energy — 2.5% | | | | | | | | |
APA Corp. | | | 4,699 | | | | 219,349 | |
ConocoPhillips | | | 2,083 | | | | 245,794 | |
Coterra Energy, Inc. | | | 6,434 | | | | 158,083 | |
Marathon Oil Corp. | | | 7,027 | | | | 190,221 | |
| | | | | | | | 813,447 | |
| | | | | | | | | |
Financials — 8.1% | | | | | | | | |
Assurant, Inc. | | | 1,620 | | | | 202,597 | |
Cboe Global Markets, Inc. | | | 1,943 | | | | 243,788 | |
Comerica, Inc. | | | 3,055 | | | | 204,227 | |
Everest Re Group, Ltd. | | | 780 | | | | 258,391 | |
Globe Life, Inc. | | | 2,253 | | | | 271,599 | |
Invesco, Ltd. | | | 10,838 | | | | 194,976 | |
Lincoln National Corp. | | | 6,683 | | | | 205,302 | |
Quantex Fund |
Security Description | | Shares or
Principal
Amount ($) | | | Fair
Value ($) | |
Common Stocks (United States) — continued |
Loews Corp. | | | 3,641 | | | | 212,380 | |
M&T Bank Corp. | | | 1,228 | | | | 178,134 | |
Signature Bank/New York NY | | | 1,755 | | | | 202,211 | |
W R Berkley Corp. | | | 3,161 | | | | 229,394 | |
Zions Bancorp NA | | | 3,994 | | | | 196,345 | |
| | | | | | | | 2,599,344 | |
| | | | | | | | | |
Healthcare — 4.5% | | | | | | | | |
Cardinal Health, Inc. | | | 3,698 | | | | 284,265 | |
Catalent, Inc. (1) | | | 4,598 | | | | 206,956 | |
Henry Schein, Inc. (1) | | | 2,540 | | | | 202,870 | |
Incyte Corp. (1) | | | 2,854 | | | | 229,233 | |
Organon & Co. | | | 7,750 | | | | 216,458 | |
Universal Health Services, Inc. | | | 1,393 | | | | 196,260 | |
Viatris, Inc. | | | 11,014 | | | | 122,586 | |
| | | | | | | | 1,458,628 | |
| | | | | | | | | |
Industrials — 11.1% | | | | | | | | |
A O Smith Corp. | | | 3,009 | | | | 172,235 | |
Alaska Air Group, Inc. (1) | | | 4,559 | | | | 195,763 | |
Allegion plc | | | 1,886 | | | | 198,520 | |
American Airlines Group, Inc. (1) | | | 15,425 | | | | 196,206 | |
CH Robinson Worldwide, Inc. | | | 2,316 | | | | 212,053 | |
Fortune Brands Innovations, Inc. | | | 3,249 | | | | 185,550 | |
Generac Holdings, Inc. (1) | | | 1,987 | | | | 200,011 | |
Howmet Aerospace, Inc. | | | 7,623 | | | | 300,424 | |
Huntington Ingalls Industries, Inc. | | | 1,243 | | | | 286,735 | |
Leidos Holdings, Inc. | | | 2,781 | | | | 292,533 | |
Masterbrand, Inc. (1) | | | 3,249 | | | | 24,530 | |
Pentair PLC | | | 4,462 | | | | 200,701 | |
Quanta Services, Inc. | | | 2,201 | | | | 313,643 | |
Robert Half International, Inc. | | | 2,730 | | | | 201,556 | |
Rollins, Inc. | | | 7,605 | | | | 277,887 | |
Snap-on, Inc. | | | 1,158 | | | | 264,591 | |
| | | | | | | | 3,522,938 | |
| | | | | | | | | |
Information Technology — 6.9% | | | | | | | | |
Ceridian HCM Holding, Inc. (1) | | | 3,166 | | | | 203,099 | |
DXC Technology Co. (1) | | | 7,068 | | | | 187,302 | |
F5, Inc. (1) | | | 1,066 | | | | 152,982 | |
FleetCor Technologies, Inc. (1) | | | 1,079 | | | | 198,191 | |
Gen Digital, Inc. | | | 8,850 | | | | 189,656 | |
IPG Photonics Corp. (1) | | | 115 | | | | 10,887 | |
Jack Henry & Associates, Inc. | | | 1,179 | | | | 206,985 | |
Juniper Networks, Inc. | | | 6,685 | | | | 213,653 | |
PTC, Inc. (1) | | | 1,953 | | | | 234,438 | |
The accompanying notes are an integral part of these financial statements.
2022 Annual Report | December 31, 2022 | Page 65 |
Schedules of Investments
December 31, 2022
Quantex Fund |
Security Description | | Shares or
Principal
Amount ($) | | | Fair
Value ($) | |
Common Stocks (United States) — continued |
Qorvo, Inc. (1) | | | 2,185 | | | | 198,048 | |
SolarEdge Technologies, Inc. (1) | | | 927 | | | | 262,591 | |
Trimble, Inc. (1) | | | 3,376 | | | | 170,691 | |
| | | | | | | | 2,228,523 | |
| | | | | | | | | |
Materials — 5.0% | | | | | | | | |
CF Industries Holdings, Inc. | | | 2,985 | | | | 254,322 | |
Eastman Chemical Co. | | | 2,438 | | | | 198,551 | |
FMC Corp. | | | 2,298 | | | | 286,790 | |
Mosaic Co./The | | | 6,312 | | | | 276,907 | |
Packaging Corp. of America | | | 1,608 | | | | 205,679 | |
Sealed Air Corp. | | | 3,486 | | | | 173,882 | |
Westrock Co. | | | 5,647 | | | | 198,549 | |
| | | | | | | | 1,594,680 | |
| | | | | | | | | |
Real Estate Investment Trust — 3.9% | | | | | | | | |
Federal Realty Investment Trust | | | 1,834 | | | | 185,307 | |
Host Hotels & Resorts, Inc. | | | 14,395 | | | | 231,040 | |
Iron Mountain, Inc. | | | 5,037 | | | | 251,094 | |
Kimco Realty Corp. | | | 10,131 | | | | 214,575 | |
Regency Centers Corp. | | | 3,283 | | | | 205,188 | |
SL Green Realty Corp. | | | 128 | | | | 4,316 | |
Vornado Realty Trust | | | 8,445 | | | | 175,740 | |
| | | | | | | | 1,267,260 | |
| | | | | | | | | |
Utilities — 5.1% | | | | | | | | |
AES Corp./The | | | 10,453 | | | | 300,628 | |
Alliant Energy Corp. | | | 4,210 | | | | 232,434 | |
Atmos Energy Corp. | | | 2,406 | | | | 269,640 | |
Evergy, Inc. | | | 3,706 | | | | 233,219 | |
NiSource, Inc. | | | 8,248 | | | | 226,160 | |
NRG Energy, Inc. | | | 5,997 | | | | 190,825 | |
Pinnacle West Capital Corp. | | | 2,636 | | | | 200,442 | |
| | | | | | | | 1,653,348 | |
| | | | | | | | | |
Total Common Stocks (United States) (Cost $16,458,227) | | | | | | | 19,612,497 | |
| | | | | | | | | |
Quantex Fund |
Security Description | | Shares or
Principal
Amount ($) | | | Fair
Value ($) | |
Preferred Stock (United States) — 0.0% |
Wells Fargo & Co. Preferred (5) | | | 1 | | | | 0 | |
Total Preferred Stock (United States) (Cost 0) | | | | | | | 0 | |
| | | | | | | | | |
Money Market Registered Investment Companies — 37.1% |
Meeder Institutional Prime Money Market Fund, 4.36% (2) | | | 11,930,714 | | | | 11,930,714 | |
Total Money Market Registered Investment Companies (Cost $11,927,919) | | | | | | | 11,930,714 | |
| | | | | | | | | |
Bank Obligations — 0.0% |
First Merchants Bank Deposit Account, 1.60%, 1/3/2023 (3) | | | 3 | | | | 3 | |
Total Bank Obligations (Cost 3) | | | | | | | 3 | |
Total Investments — 98.1% (Cost $28,386,149) | | | | | | | 31,543,214 | |
Other Assets less Liabilities — 1.9% | | | | | | | 624,085 | |
Total Net Assets — 100.0% | | | | | | | 32,167,299 | |
| | | | | | | | | |
Trustee Deferred Compensation (4) |
Meeder Balanced Fund - Retail Class | | | 1,220 | | | | 14,030 | |
Meeder Dynamic Allocation Fund - Retail Class | | | 3,282 | | | | 37,284 | |
Meeder Muirfield Fund - Retail Class | | | 1,669 | | | | 13,753 | |
Meeder Conservative Allocation Fund - Retail Class | | | 347 | | | | 7,235 | |
Total Trustee Deferred Compensation (Cost $69,553) | | | | | | | 72,302 | |
| | | | | | | | | |
The accompanying notes are an integral part of these financial statements.
Page 66 | 2022 Annual Report | December 31, 2022 |
Schedules of Investments
December 31, 2022
Quantex Fund |
| | | Long
(Short)
Contracts | | | Expiration
Date | | | Notional
Value of
Contracts
($) | | | Value and
Unrealized
Appreciation
(Depreciation)
($) | |
Futures Contracts |
Index Futures | | | | | | | | | | | | | | | | |
E-mini Standard & Poors MidCap 400 Futures | | | 41 | | | | 3/17/2023 | | | | 10,014,660 | | | | (290,819 | ) |
Standard & Poors 500 Mini Futures | | | 12 | | | | 3/17/2023 | | | | 2,316,600 | | | | (107,682 | ) |
Total Futures Contracts | | | 53 | | | | | | | | 12,331,260 | | | | (398,501 | ) |
(1) | Represents non-income producing securities. |
(2) | Investment in affiliate. The yield shown represents the 7-day yield in effect at December 31, 2022. |
(3) | Variable rate security. Securities payable at par including accrued interest (usually within seven days notice) and unconditionally secured as to principal and interest by letters of credit or other credit support agreements from major banks. The interest rates are adjustable and are not based on a published reference rate and spread but are determined by the issuer or agent and are based on current market conditions. These securities do not indicate a reference rate and spread in their description above. The rate shown represents the rate in effect at December 31, 2022. The maturity date shown, if applicable, reflects the earlier of the next demand date or stated maturity date. |
(4) | Assets of affiliates to the Quantex Fund held for the benefit of the Fund’s Trustees in connection with the Trustee Deferred Compensation Plan. |
(5) | Fair valued security deemed a Level 3 security. Security is not part of the investment strategy of the Fund. |
The accompanying notes are an integral part of these financial statements.
2022 Annual Report | December 31, 2022 | Page 67 |
Schedules of Investments
December 31, 2022
Tactical Income Fund |
Security Description | | Shares or
Principal
Amount ($) | | | Fair
Value ($) | |
Commercial Paper — 14.8% |
American Honda Finance Co, 5.06, due 1/11/2023 | | | 10,000,000 | | | | 9,984,527 | |
Total Commercial Paper (Cost $9,987,222) | | | | | | | 9,984,527 | |
| | | | | | | | | |
Registered Investment Companies — 68.3% |
U.S. Fixed Income — 56.4% | | | | | | | | |
BBH Limited Duration Fund - Class I | | | 473,714 | | | | 4,718,194 | |
Diamond Hill Short Duration Securitized Bond Fund - Class Y | | | 218,467 | | | | 2,057,956 | |
Frost Total Return Bond Fund - Class I | | | 180,104 | | | | 1,680,375 | |
iShares Core 1-5 Year USD Bond ETF (3) | | | 284,895 | | | | 13,230,524 | |
iShares Core U.S. Aggregate Bond ETF (3) | | | 13,924 | | | | 1,350,489 | |
iShares Trust iShares 1-5 Year Investment Grade Corporate Bond ETF (3) | | | 78,102 | | | | 3,891,042 | |
PGIM Short-Term Corporate Bond Fund - Class Q | | | 91,980 | | | | 936,357 | |
SPDR Bloomberg High Yield Bond ETF (3) | | | 88,756 | | | | 7,988,040 | |
Xtrackers USD High Yield Corporate Bond ETF (3) | | | 60,679 | | | | 2,045,489 | |
| | | | | | | | 37,898,466 | |
| | | | | | | | | |
International Fixed Income — 11.9% | | | | | | | | |
iShares JP Morgan USD Emerging Markets Bond ETF (3) | | | 95,033 | | | | 8,038,841 | |
| | | | | | | | 8,038,841 | |
| | | | | | | | | |
Total Registered Investment Companies (Cost $47,319,046) | | | | | | | 45,937,307 | |
| | | | | | | | | |
Money Market Registered Investment Companies — 16.8% |
Meeder Institutional Prime Money Market Fund, 4.36% (1) | | | 11,331,750 | | | | 11,331,750 | |
Total Money Market Registered Investment Companies (Cost $11,327,917) | | | | | | | 11,331,750 | |
| | | | | | | | | |
U.S. Government Obligations — 0.1% |
Government National Mortgage Association, 6.50%, due 7/20/2038 | | | 62,053 | | | | 70,588 | |
Total U.S. Government Obligations (Cost $66,145) | | | | | | | 70,588 | |
Total Investments — 100.0% (Cost $68,700,330) | | | | | | | 67,324,172 | |
Other Assets less Liabilities — 0.0% | | | | | | | 2,439 | |
Total Net Assets — 100.0% | | | | | | | 67,326,611 | |
Tactical Income Fund |
Security Description | | Shares or
Principal
Amount ($) | | | Fair
Value ($) | |
Trustee Deferred Compensation (2) |
Meeder Balanced Fund - Retail Class | | | 1,403 | | | | 16,135 | |
Meeder Dynamic Allocation Fund - Retail Class | | | 3,675 | | | | 41,748 | |
Meeder Muirfield Fund - Retail Class | | | 2,028 | | | | 16,711 | |
Meeder Conservative Allocation Fund - Retail Class | | | 406 | | | | 8,465 | |
Total Trustee Deferred Compensation (Cost $83,110) | | | | | | | 83,059 | |
| | | | | | | | | |
(1) | Investment in affiliate. The yield shown represents the 7-day yield in effect at December 31, 2022. |
(2) | Assets of affiliates to the Tactical Income Fund held for the benefit of the Fund’s Trustees in connection with the Trustee Deferred Compensation Plan. |
The accompanying notes are an integral part of these financial statements.
Page 68 | 2022 Annual Report | December 31, 2022 |
Schedules of Investments
December 31, 2022
Institutional Prime Money Market Fund |
Security Description | | Coupon/
Yield | | | Maturity/
Demand
Date | | | Principal
Amount ($)
or Shares | | | Fair
Value ($) | |
Certificates of Deposit — 31.6% |
Banco Santander NY Yankee CD (Secured Overnight Financing Rate + 0.62%) | | | 4.92 | %(2) | | | 01/18/23 | | | | 300,000 | | | | 300,079 | |
Banco Santander NY Yankee CD (Secured Overnight Financing Rate + 0.68%) | | | 4.98 | %(2) | | | 02/22/23 | | | | 10,000,000 | | | | 10,000,700 | |
Bank of Montreal Chicago Yankee CD | | | 5.00 | % | | | 10/06/23 | | | | 5,000,000 | | | | 4,986,110 | |
Bank of Montreal Chicago (Secured Overnight Financing Rate + 0.61%) | | | 4.91 | %(2) | | | 01/23/23 | | | | 10,000,000 | | | | 10,007,480 | |
Bank of Nova Scotia (Secured Overnight Financing Rate + 0.48%) | | | 4.78 | %(2) | | | 03/30/23 | | | | 10,000,000 | | | | 10,004,700 | |
Barclays Bank PLC NY (Secured Overnight Financing Rate + 0.30%) | | | 4.60 | %(2) | | | 01/02/23 | | | | 5,000,000 | | | | 5,000,490 | |
Barclays Bank PLC NY (Secured Overnight Financing Rate + 0.29%) | | | 4.59 | %(2) | | | 01/16/23 | | | | 5,000,000 | | | | 5,000,060 | |
BNP Paribas NY (Secured Overnight Financing Rate + 0.50%) | | | 4.80 | %(2) | | | 01/18/23 | | | | 10,000,000 | | | | 10,004,170 | |
Canadian Imperial Holdings, Inc. (Secured Overnight Financing Rate + 0.30%) | | | 4.60 | %(2) | | | 01/06/23 | | | | 5,000,000 | | | | 5,000,210 | |
Canadian Imperial Holdings, Inc. (Secured Overnight Financing Rate + 0.25%) | | | 4.55 | %(2) | | | 01/10/23 | | | | 6,000,000 | | | | 6,000,174 | |
Canadian Imperial Holdings, Inc. (Secured Overnight Financing Rate + 0.25%) | | | 4.55 | %(2) | | | 01/17/23 | | | | 5,000,000 | | | | 4,999,975 | |
Canadian Imperial Holdings, Inc. (Secured Overnight Financing Rate + 0.28%) | | | 4.58 | %(2) | | | 01/05/23 | | | | 3,000,000 | | | | 3,000,000 | |
Institutional Prime Money Market Fund |
Security Description | | Coupon/
Yield | | | Maturity/
Demand
Date | | | Principal
Amount ($)
or Shares | | | Fair
Value ($) | |
Certificates of Deposit — continued |
Canadian Imperial Holdings, Inc. (Secured Overnight Financing Rate + 0.30%) | | | 4.60 | %(2) | | | 01/05/23 | | | | 10,000,000 | | | | 10,000,370 | |
Cooperatieve Rabobank (Secured Overnight Financing Rate + 0.49%) | | | 4.79 | %(2) | | | 01/10/23 | | | | 10,000,000 | | | | 10,002,990 | |
Lloyds Bank Corp. Mkts/NY (Secured Overnight Financing Rate + 0.28%) | | | 4.58 | %(2) | | | 02/13/23 | | | | 5,000,000 | | | | 5,000,085 | |
Mitsubishi UFJ Trust & Banking Corp. (Secured Overnight Financing Rate + 0.60%) | | | 4.90 | %(2) | | | 01/03/23 | | | | 10,000,000 | | | | 10,012,560 | |
Mizuho Bank, Ltd./NY Yankee CD (Secured Overnight Financing Rate + 0.54%) | | | 4.84 | %(2) | | | 01/09/23 | | | | 5,925,000 | | | | 5,925,729 | |
Mizuho Bank, Ltd./NY Yankee CD (Secured Overnight Financing Rate + 0.36%) | | | 4.66 | %(2) | | | 01/03/23 | | | | 10,000,000 | | | | 10,001,890 | |
Mizuho Bank, Ltd./NY Yankee CD (Secured Overnight Financing Rate + 0.54%) | | | 4.84 | %(2) | | | 01/09/23 | | | | 10,000,000 | | | | 10,004,310 | |
Mizuho Bank, Ltd./NY (Secured Overnight Financing Rate + 0.73%) | | | 5.03 | %(2) | | | 01/04/23 | | | | 5,000,000 | | | | 5,007,930 | |
MUFG Bank, Ltd./New York, NY (Secured Overnight Financing Rate + 0.56%) | | | 4.86 | %(2) | | | 01/17/23 | | | | 5,000,000 | | | | 5,000,935 | |
Nordea Bank ABP/New York, NY (Secured Overnight Financing Rate + 0.55%) | | | 4.85 | %(2) | | | 01/21/23 | | | | 2,000,000 | | | | 2,000,884 | |
Nordea Bank ABP/New York, NY (Secured Overnight Financing Rate + 0.50%) | | | 4.80 | %(2) | | | 01/12/23 | | | | 12,600,000 | | | | 12,605,670 | |
Sumitomo Mitsui Banking Corp./NY (Secured Overnight Financing Rate + 0.60%) | | | 4.90 | %(2) | | | 01/03/23 | | | | 10,000,000 | | | | 10,008,680 | |
The accompanying notes are an integral part of these financial statements.
2022 Annual Report | December 31, 2022 | Page 69 |
Schedules of Investments
December 31, 2022
Institutional Prime Money Market Fund |
Security Description | | Coupon/
Yield | | | Maturity/
Demand
Date | | | Principal
Amount ($)
or Shares | | | Fair
Value ($) | |
Certificates of Deposit — continued |
Sumitomo Mitsui Banking Corp./NY (Secured Overnight Financing Rate + 0.27%) | | | 4.57 | %(2) | | | 01/19/23 | | | | 8,000,000 | | | | 7,999,760 | |
Sumitomo Mitsui Banking Corp./NY (Secured Overnight Financing Rate + 0.28%) | | | 4.58 | %(2) | | | 01/23/23 | | | | 3,000,000 | | | | 2,999,781 | |
Sumitomo Mitsui Banking Corp./NY (Secured Overnight Financing Rate + 0.50%) | | | 4.80 | %(2) | | | 01/30/23 | | | | 2,500,000 | | | | 2,501,065 | |
Sumitomo Mitsui Banking Corp./NY (Secured Overnight Financing Rate + 0.92%) | | | 5.22 | %(2) | | | 01/21/23 | | | | 560,000 | | | | 561,488 | |
Sumitomo Mitsui Banking Corp./NY (Secured Overnight Financing Rate + 0.50%) | | | 4.80 | %(2) | | | 01/10/23 | | | | 10,000,000 | | | | 9,998,660 | |
Toronto Dominion Bank/New York, NY (Secured Overnight Financing Rate + 0.23%) | | | 4.53 | %(2) | | | 02/08/23 | | | | 5,000,000 | | | | 5,000,000 | |
Toronto Dominion Bank/New York, NY Yankee CD | | | 2.40 | % | | | 05/11/23 | | | | 5,000,000 | | | | 4,954,780 | |
Toronto Dominion Bank/New York, NY Yankee CD | | | 3.00 | % | | | 07/03/23 | | | | 5,000,000 | | | | 4,945,250 | |
Westpac Banking Corp. (Secured Overnight Financing Rate + 0.45%) | | | 4.75 | %(2) | | | 01/23/23 | | | | 10,000,000 | | | | 10,002,420 | |
Total Certificates of Deposit (Cost $218,875,475) | | | 218,839,385 | |
| | | | | |
Commercial Paper — 31.8% |
American Honda Finance Corp. | | | 4.46 | % | | | 01/06/23 | | | | 6,000,000 | | | | 5,994,612 | |
American Honda Finance Corp. | | | 4.62 | % | | | 01/18/23 | | | | 2,500,000 | | | | 2,493,835 | |
Anglesea Funding | | | 4.37 | % | | | 02/01/23 | | | | 18,000,000 | | | | 17,928,090 | |
Anglesea Funding | | | 4.43 | % | | | 02/07/23 | | | | 17,000,000 | | | | 16,919,080 | |
Aquitaine Funding | | | 4.35 | % | | | 01/04/23 | | | | 5,000,000 | | | | 4,996,995 | |
Institutional Prime Money Market Fund |
Security Description | | Coupon/
Yield | | | Maturity/
Demand
Date | | | Principal
Amount ($)
or Shares | | | Fair
Value ($) | |
Commercial Paper — continued |
ANZ New Zealand Int’l, LTD (Secured Overnight Financing Rate + 0.58%) | | | 4.88 | %(2) | | | 01/05/23 | | | | 12,600,000 | | | | 12,608,039 | |
ANZ New Zealand Int’l, LTD (Secured Overnight Financing Rate + 0.32%) | | | 4.62 | %(2) | | | 01/05/23 | | | | 250,000 | | | | 250,034 | |
Banco Santander | | | 4.93 | % | | | 04/17/23 | | | | 10,000,000 | | | | 9,856,300 | |
Bank of America Corp. | | | 4.66 | % | | | 06/01/23 | | | | 5,400,000 | | | | 5,288,144 | |
Bank of Nova Scotia (Secured Overnight Financing Rate + 0.53%) | | | 4.83 | %(2) | | | 01/05/23 | | | | 10,000,000 | | | | 10,008,080 | |
Bank of Nova Scotia (Secured Overnight Financing Rate + 0.58%) | | | 4.88 | %(2) | | | 01/01/23 | | | | 5,000,000 | | | | 5,005,520 | |
Barclays Capital, Inc. | | | 2.50 | % | | | 01/05/23 | | | | 5,000,000 | | | | 4,996,385 | |
Barclays Capital, Inc. | | | 4.32 | % | | | 01/06/23 | | | | 1,000,000 | | | | 999,156 | |
Bedford Row Funding | | | 3.06 | % | | | 01/03/23 | | | | 10,000,000 | | | | 9,995,200 | |
Collateralized Commercial Paper V Co. | | | 2.65 | % | | | 02/24/23 | | | | 2,700,000 | | | | 2,681,000 | |
General Mills, Inc. | | | 4.48 | % | | | 01/03/23 | | | | 5,000,000 | | | | 4,997,475 | |
General Mills, Inc. | | | 4.48 | % | | | 01/05/23 | | | | 2,000,000 | | | | 1,998,480 | |
General Mills, Inc. | | | 4.46 | % | | | 01/12/23 | | | | 12,500,000 | | | | 12,479,200 | |
Halkin Finance, LLC | | | 4.31 | % | | | 01/03/23 | | | | 20,000,000 | | | | 19,990,380 | |
Halkin Finance, LLC | | | 4.32 | % | | | 01/05/23 | | | | 15,000,000 | | | | 14,989,185 | |
HSBC USA, Inc. | | | 5.22 | % | | | 08/01/23 | | | | 900,000 | | | | 872,517 | |
Liberty Street Funds | | | 4.88 | % | | | 04/12/23 | | | | 10,000,000 | | | | 9,865,180 | |
Macquarie Bank LTD/Australia (Secured Overnight Financing Rate + 0.32%) | | | 4.62 | %(2) | | | 01/02/23 | | | | 6,000,000 | | | | 6,001,152 | |
National Bank of Canada (Secured Overnight Financing Rate + 0.25%) | | | 4.55 | %(2) | | | 02/10/23 | | | | 10,000,000 | | | | 10,000,020 | |
National Australia Bank, Ltd. (Secured Overnight Financing Rate + 0.50%) | | | 4.80 | %(2) | | | 01/08/23 | | | | 3,000,000 | | | | 3,000,987 | |
Royal Bank of Canada (Secured Overnight Financing Rate + 0.25%) | | | 4.55 | %(2) | | | 02/24/23 | | | | 5,000,000 | | | | 4,999,470 | |
Royal Bank of Canada (Secured Overnight Financing Rate + 0.43%) | | | 4.73 | %(2) | | | 03/01/23 | | | | 1,500,000 | | | | 1,500,113 | |
The accompanying notes are an integral part of these financial statements.
Page 70 | 2022 Annual Report | December 31, 2022 |
Schedules of Investments
December 31, 2022
Institutional Prime Money Market Fund |
Security Description | | Coupon/
Yield | | | Maturity/
Demand
Date | | | Principal
Amount ($)
or Shares | | | Fair
Value ($) | |
Commercial Paper — continued |
Skandinaviska Enskilda Banken AB (Secured Overnight Financing Rate + 0.69%) | | | 4.99 | %(2) | | | 01/29/23 | | | | 10,000,000 | | | | 10,008,180 | |
Skandinaviska Enskilda Banken AB (Secured Overnight Financing Rate + 0.67%) | | | 4.97 | %(2) | | | 01/27/23 | | | | 5,000,000 | | | | 5,004,938 | |
Westpac Banking Corp. (Secured Overnight Financing Rate + 0.50%) | | | 4.80 | %(2) | | | 01/20/23 | | | | 5,000,000 | | | | 5,001,890 | |
Total Commercial Paper (Cost $220,757,768) | | | 220,729,636 | |
| | | | | |
Corporate Obligations — 2.2% |
Bank of Montreal (Bloomberg 1Month Short Term Bank Yield Index (USD) + 0.42%) | | | 4.74 | %(2) | | | 01/03/23 | | | | 10,000,000 | | | | 10,000,000 | |
Citigroup Global Markets, Inc. | | | 3.80 | % | | | 01/30/23 | | | | 5,000,000 | | | | 4,936,700 | |
Total Corporate Obligations (Cost $15,000,000) | | | 14,936,700 | |
| | | | | |
Repurchase Agreements — 23.1% |
StoneX (Collateralized by $54,951,631 (principal) various Corporate Bonds and FMACs, 0.52% - 9.25%, due 1/11/23 - 12/31/99, fair value $51,532,606)(proceeds $50,018,667) purchase date 12/30/22 | | | 4.48 | % | | | 01/03/23 | | | | 50,000,000 | | | | 50,000,000 | |
South Street (Collateralized by $16,647,976 (principal) various FMACs, FHLBs, FNMAs, and FCSBs, 1.63% - 6.00%, due 4/1/25 - 8/1/53, fair value $15,300,000)(proceeds $15,005,350), purchase date 12/30/22 | | | 4.28 | % | | | 01/03/23 | | | | 15,000,000 | | | | 15,000,000 | |
Institutional Prime Money Market Fund |
Security Description | | Coupon/
Yield | | | Maturity/
Demand
Date | | | Principal
Amount ($)
or Shares | | | Fair
Value ($) | |
Repurchase Agreements — continued |
South Street (Collateralized by $43,600,449 (principal) various FMACs, GNMAs, FNMAs, FHLBs, and SBAs, 1.63% - 7.66%, due 12/8/23 - 9/1/52, fair value $46,208,088)(proceeds $45,016,238), purchase date 12/30/22 | | | 4.33 | % | | | 01/03/23 | | | | 45,000,000 | | | | 45,000,000 | |
Truist (Collateralized by $49,670,000 (principal) various Corporate Bonds, 3.55% - 5.50%, due 8/15/30 - 10/1/53, fair value $51,001,615)(proceeds $50,018,083), purchase date 12/30/22 | | | 4.34 | % | | | 01/03/23 | | | | 50,000,000 | | | | 50,000,000 | |
Total Repurchase Agreements (Cost $160,000,000) | | | 160,000,000 | |
| | | | | |
Variable Rate Demand Notes — 0.9% |
Michigan State Finance Authority Revenue | | | 4.38 | %(1) | | | 01/05/23 | | | | 4,500,000 | | | | 4,500,000 | |
Pittsburgh & Allegheny County PA Sports & Exhibition Authority | | | 4.40 | %(1) | | | 01/05/23 | | | | 1,715,000 | | | | 1,715,000 | |
Total Variable Rate Demand Notes (Cost $6,215,000) | | | 6,215,000 | |
| | | | | |
Money Market Registered Investment Companies — 10.6% |
Federated Hermes Government Obligations Fund, 4.15% (3) | | | 73,405,458 | | | | 73,405,458 | |
Total Money Market Registered Investment Companies (Cost $73,405,458) | | | 73,405,458 | |
Total Investments — 100.2% (Cost $694,253,701) | | | 694,126,179 | |
Liabilities less Other Assets — (0.2%) | | | (1,043,633 | ) |
Total Net Assets — 100.0% | | | 693,082,546 | |
The accompanying notes are an integral part of these financial statements.
2022 Annual Report | December 31, 2022 | Page 71 |
Schedules of Investments
December 31, 2022
| Institutional Prime Money Market Fund |
| Security Description | | Principal
Amount ($)
or Shares | | | Fair
Value ($) | |
Trustee Deferred Compensation (4) |
| Meeder Balanced Fund - Retail Class | | | 99 | | | | 1,139 | |
| Meeder Dynamic Allocation Fund - Retail Class | | | 242 | | | | 2,749 | |
| Meeder Muirfield Fund - Retail Class | | | 321 | | | | 2,645 | |
| Meeder Conservative Allocation Fund - Retail Class | | | 30 | | | | 626 | |
| Total Trustee Deferred Compensation (Cost $7,479) | | | | | | | 7,159 | |
(1) | Variable rate security. Securities payable at par including accrued interest (usually within seven days notice) and unconditionally secured as to principal and interest by letters of credit or other credit support agreements from major banks. The interest rates are adjustable and are not based on a published reference rate and spread but are determined by the issuer or agent and are based on current market conditions. These securities do not indicate a reference rate and spread in their description above. The rate shown represents the rate in effect at December 31, 2022. The maturity date shown, if applicable, reflects the earlier of the next demand date or stated maturity date. |
(2) | Floating rate security. Interest rates reset periodically. The reference rate and spread are indicated in the description above. The rate shown represents the rate in effect at December 31, 2022. The maturity date shown reflects the earlier of the next demand date or stated maturity date. |
(3) | 7-day yield as of December 31, 2022. The Fund may invest a significant portion of its assets in shares of one or more investment companies, including money market mutual funds. The Fund will incur additional indirect expenses (acquired fund fees and expenses) to the extent it invests in shares of other investment companies. |
(4) | Assets of affiliates to the Institutional Prime Money Market Fund held for the benefit of the Fund’s Trustees in connection with the Trustee Deferred Compensation Plan. |
The accompanying notes are an integral part of these financial statements.
Page 72 | 2022 Annual Report | December 31, 2022 |
[This page intentionally left blank]
Statements of Assets and Liabilities
December 31, 2022 | |
| | | Muirfield
Fund | | | Spectrum
Fund | |
Assets | | | | | | | | |
Investments, at fair value (1)(2) | | $ | 364,788,055 | | | $ | 87,968,596 | |
Repurchase agreements, at fair value (1) | | | — | | | | — | |
Investments in affiliates, at fair value (1) | | | 270,676,198 | | | | 97,085,841 | |
Trustee deferred compensation investments, at fair value | | | 349,090 | | | | 60,167 | |
Deposits at broker for futures contracts (3) | | | 8,555,026 | | | | 1,437,596 | |
Receivable for securities sold | | | 7,456 | | | | 84,351 | |
Receivable for capital stock issued | | | 645,210 | | | | 70,004 | |
Interest and dividend receivable | | | 1,231,672 | | | | 383,306 | |
Prepaid expenses/other assets | | | 88,176 | | | | 26,536 | |
Total Assets | | | 646,340,883 | | | | 187,116,397 | |
| | | | | | | | | |
Liabilities | | | | | | | | |
Payable for securities purchased | | | 9,231,438 | | | | 2,670,744 | |
Payable for Trustee Deferred Compensation Plan | | | 349,090 | | | | 60,167 | |
Payable for capital stock redeemed | | | 80,932 | | | | 10,861 | |
Dividends payable | | | — | | | | — | |
Payable to investment adviser | | | 343,628 | | | | 115,704 | |
Accrued distribution plan (12b-1) and shareholder service plan fees | | | 102,272 | | | | 22,907 | |
Accrued transfer agent, fund accounting, CCO, and administration fees and expenses | | | 100,913 | | | | 37,590 | |
Other accrued liabilities | | | 55,444 | | | | 39,939 | |
Total Liabilities | | | 10,263,717 | | | | 2,957,912 | |
| | | | | | | | | |
Net Assets | | $ | 636,077,166 | | | $ | 184,158,485 | |
| | | | | | | | | |
Net Assets | | | | | | | | |
Capital | | $ | 570,152,931 | | | $ | 162,251,177 | |
Distributable Earnings (Accumulated Deficit) | | | 65,924,235 | | | | 21,907,308 | |
Total Net Assets | | $ | 636,077,166 | | | $ | 184,158,485 | |
| | | | | | | | | |
Net Asset Value Per Share | | | | | | | | |
Retail Class | | | | | | | | |
Net Assets | | $ | 38,205,875 | | | $ | 1,715,144 | |
Shares Outstanding | | | 4,636,336 | | | | 143,470 | |
Net Asset Value, Offering and Redemption Price Per Share | | $ | 8.24 | | | $ | 11.95 | |
| | | | | | | | | |
Adviser Class | | | | | | | | |
Net Assets | | $ | 94,281,937 | | | $ | 33,535,873 | |
Shares Outstanding | | | 11,280,350 | | | | 2,775,844 | |
Net Asset Value, Offering and Redemption Price Per Share | | $ | 8.36 | | | $ | 12.08 | |
| | | | | | | | | |
Institutional Class | | | | | | | | |
Net Assets | | $ | 503,589,354 | | | $ | 148,907,468 | |
Shares Outstanding | | | 60,177,188 | | | | 12,293,705 | |
Net Asset Value, Offering and Redemption Price Per Share | | $ | 8.37 | | | $ | 12.11 | |
| | | | | | | | | |
Net Asset Value Per Share - Money Market Fund | | | | | | | | |
Net Assets | | | | | | | | |
Shares Outstanding | | | | | | | | |
Net Asset Value, Offering and Redemption Price Per Share | | | | | | | | |
| | | | | | | | | |
(1) Investments and affiliated investments at cost (See Note #4) | | $ | 572,909,366 | | | $ | 166,777,391 | |
(2) Fair value of securities loaned included in investments at fair value (See Note #2, Note #3, and Note #5) | | $ | — | | | $ | — | |
(3) Required margin held as collateral for futures contracts | | $ | 8,354,871 | | | $ | 1,401,847 | |
The accompanying notes are an integral part of these financial statements.
Page 74 | 2022 Annual Report | December 31, 2022 |
| | Global
Allocation
Fund | | | Balanced
Fund | | | Moderate
Allocation
Fund | | | Conservative
Allocation
Fund | | | Dynamic
Allocation
Fund | | | Quantex
Fund | | | Tactical
Income Fund | | | Institutional
Prime Money
Market Fund | |
| | | | | | | | | | | | | | | | | | | | | | | | | | | | | | | | |
| | $ | 14,852,715 | | | $ | 236,161,793 | | | $ | 104,586,190 | | | $ | 92,723,452 | | | $ | 161,024,462 | | | $ | 19,612,500 | | | $ | 55,992,422 | | | $ | 534,126,179 | |
| | | — | | | | — | | | | — | | | | — | | | | — | | | | — | | | | — | | | | 160,000,000 | |
| | | 16,061,419 | | | | 108,408,697 | | | | 53,903,745 | | | | 27,330,467 | | | | 52,503,793 | | | | 11,930,714 | | | | 11,331,750 | | | | — | |
| | | 118,214 | | | | 223,353 | | | | 45,375 | | | | 89,485 | | | | 249,128 | | | | 72,302 | | | | 83,059 | | | | 7,159 | |
| | | 855,188 | | | | 3,955,439 | | | | 594,225 | | | | 379,947 | | | | 4,018,565 | | | | 947,746 | | | | — | | | | — | |
| | | — | | | | 129,334 | | | | 10,779 | | | | 241,270 | | | | 571,128 | | | | — | | | | — | | | | — | |
| | | 50,770 | | | | 213,332 | | | | 20,152 | | | | 17,316 | | | | 280,733 | | | | 29,540 | | | | 531 | | | | — | |
| | | 64,288 | | | | 587,080 | | | | 305,905 | | | | 213,309 | | | | 284,610 | | | | 77,196 | | | | 65,399 | | | | 1,414,654 | |
| | | 15,751 | | | | 163,019 | | | | 18,799 | | | | 16,196 | | | | 24,240 | | | | 10,655 | | | | 13,556 | | | | 38,146 | |
| | | 32,018,345 | | | | 349,842,047 | | | | 159,485,170 | | | | 121,011,442 | | | | 218,956,659 | | | | 32,680,653 | | | | 67,486,717 | | | | 695,586,138 | |
| | | | | | | | | | | | | | | | | | | | | | | | | | | | | | | | |
| | | | | | | | | | | | | | | | | | | | | | | | | | | | | | | | |
| | | 181,931 | | | | 3,451,003 | | | | 733,228 | | | | 368,083 | | | | 3,427,133 | | | | — | | | | — | | | | — | |
| | | 118,214 | | | | 223,353 | | | | 45,375 | | | | 89,485 | | | | 249,128 | | | | 72,302 | | | | 83,059 | | | | 7,159 | |
| | | 16 | | | | 99,754 | | | | 20,934 | | | | 20,355 | | | | 40,120 | | | | 378,285 | | | | 8,878 | | | | — | |
| | | — | | | | — | | | | — | | | | — | | | | — | | | | — | | | | — | | | | 2,368,234 | |
| | | 19,907 | | | | 199,150 | | | | 79,683 | | | | 50,594 | | | | 117,097 | | | | 20,619 | | | | 16,381 | | | | — | |
| | | 3,484 | | | | 44,626 | | | | 17,985 | | | | 17,744 | | | | 28,521 | | | | 7,960 | | | | 9,472 | | | | 53 | |
| | | 10,016 | | | | 66,119 | | | | 33,055 | | | | 26,416 | | | | 43,264 | | | | 10,262 | | | | 14,665 | | | | 91,517 | |
| | | 23,259 | | | | 44,562 | | | | 32,742 | | | | 32,442 | | | | 35,201 | | | | 23,926 | | | | 27,651 | | | | 36,629 | |
| | | 356,827 | | | | 4,128,567 | | | | 963,002 | | | | 605,119 | | | | 3,940,464 | | | | 513,354 | | | | 160,106 | | | | 2,503,592 | |
| | | | | | | | | | | | | | | | | | | | | | | | | | | | | | | | |
| | $ | 31,661,518 | | | $ | 345,713,480 | | | $ | 158,522,168 | | | $ | 120,406,323 | | | $ | 215,016,195 | | | $ | 32,167,299 | | | $ | 67,326,611 | | | $ | 693,082,546 | |
| | | | | | | | | | | | | | | | | | | | | | | | | | | | | | | | |
| | | | | | | | | | | | | | | | | | | | | | | | | | | | | | | | |
| | $ | 31,681,371 | | | $ | 327,356,779 | | | $ | 160,704,018 | | | $ | 127,442,005 | | | $ | 207,425,619 | | | $ | 30,526,525 | | | $ | 81,634,468 | | | $ | 693,210,933 | |
| | | (19,853 | ) | | | 18,356,701 | | | | (2,181,850 | ) | | | (7,035,682 | ) | | | 7,590,576 | | | | 1,640,774 | | | | (14,307,857 | ) | | | (128,387 | ) |
| | $ | 31,661,518 | | | $ | 345,713,480 | | | $ | 158,522,168 | | | $ | 120,406,323 | | | $ | 215,016,195 | | | $ | 32,167,299 | | | $ | 67,326,611 | | | $ | 693,082,546 | |
| | | | | | | | | | | | | | | | | | | | | | | | | | | | | | | | |
| | | | | | | | | | | | | | | | | | | | | | | | | | | | | | | | |
| | | | | | | | | | | | | | | | | | | | | | | | | | | | | | | | |
| | $ | 2,398,517 | | | $ | 6,117,280 | | | $ | 1,033,358 | | | $ | 5,328,426 | | | $ | 7,767,047 | | | $ | 12,476,724 | | | $ | 2,246,935 | | | | | |
| | | 240,434 | | | | 532,043 | | | | 94,216 | | | | 255,566 | | | | 683,862 | | | | 382,950 | | | | 251,592 | | | | | |
| | $ | 9.98 | | | $ | 11.50 | | | $ | 10.97 | | | $ | 20.85 | | | $ | 11.36 | | | $ | 32.58 | | | $ | 8.93 | | | | | |
| | | | | | | | | | | | | | | | | | | | | | | | | | | | | | | | |
| | | | | | | | | | | | | | | | | | | | | | | | | | | | | | | | |
| | $ | 4,088,308 | | | $ | 65,668,003 | | | $ | 30,879,205 | | | $ | 21,188,700 | | | $ | 23,048,460 | | | $ | 3,645,795 | | | $ | 10,624,931 | | | | | |
| | | 405,775 | | | | 5,652,770 | | | | 2,804,264 | | | | 1,003,899 | | | | 2,001,397 | | | | 110,894 | | | | 1,188,190 | | | | | |
| | $ | 10.08 | | | $ | 11.62 | | | $ | 11.01 | | | $ | 21.11 | | | $ | 11.52 | | | $ | 32.88 | | | $ | 8.94 | | | | | |
| | | | | | | | | | | | | | | | | | | | | | | | | | | | | | | | |
| | | | | | | | | | | | | | | | | | | | | | | | | | | | | | | | |
| | $ | 25,174,693 | | | $ | 273,928,197 | | | $ | 126,609,605 | | | $ | 93,889,197 | | | $ | 184,200,688 | | | $ | 16,044,780 | | | $ | 54,454,745 | | | | | |
| | | 2,506,085 | | | | 23,533,521 | | | | 11,481,387 | | | | 4,438,956 | | | | 16,032,118 | | | | 489,106 | | | | 6,094,218 | | | | | |
| | $ | 10.05 | | | $ | 11.64 | | | $ | 11.03 | | | $ | 21.15 | | | $ | 11.49 | | | $ | 32.80 | | | $ | 8.94 | | | | | |
| | | | | | | | | | | | | | | | | | | | | | | | | | | | | | | | |
| | | | | | | | | | | | | | | | | | | | | | | | | | | | | | | | |
| | | | | | | | | | | | | | | | | | | | | | | | | | | | | | $ | 693,082,546 | |
| | | | | | | | | | | | | | | | | | | | | | | | | | | | | | | 693,116,793 | |
| | | | | | | | | | | | | | | | | | | | | | | | | | | | | | $ | 1.0000 | |
| | | | | | | | | | | | | | | | | | | | | | | | | | | | | | | | |
| | $ | 29,015,705 | | | $ | 319,505,316 | | | $ | 154,863,102 | | | $ | 122,027,327 | | | $ | 194,064,145 | | | $ | 28,386,149 | | | $ | 68,700,330 | | | $ | 694,253,701 | |
| | $ | — | | | $ | — | | | $ | — | | | $ | — | | | $ | — | | | $ | — | | | $ | — | | | $ | — | |
| | $ | 609,354 | | | $ | 3,474,347 | | | $ | 476,106 | | | $ | 354,622 | | | $ | 3,516,816 | | | $ | 680,700 | | | $ | — | | | $ | — | |
The accompanying notes are an integral part of these financial statements.
2022 Annual Report | December 31, 2022 | Page 75 |
Statements of Operations
For the Year Ended December 31, 2022 | |
| | | Muirfield
Fund | | | Spectrum
Fund | |
Investment Income | | | | | | | | |
Interest | | $ | 11,600 | | | $ | 3,214 | |
Income from affiliates | | | 4,484,889 | | | | 1,258,244 | |
Dividends | | | 6,039,649 | | | | 1,862,845 | |
Total Investment Income | | | 10,536,138 | | | | 3,124,303 | |
| | | | | | | | | |
Fund Expenses | | | | | | | | |
Investment advisory fees | | | 4,286,868 | | | | 1,432,743 | |
Transfer agent fees and expenses - Retail Class | | | 37,046 | | | | 2,364 | |
Transfer agent fees and expenses - Adviser Class | | | 87,592 | | | | 41,620 | |
Transfer agent fees and expenses - Institutional Class | | | 525,954 | | | | 185,493 | |
Transfer agent fees and expenses - Money Market Fund | | | | | | | | |
Fund accounting fees | | | 103,864 | | | | 56,123 | |
Administration fees | | | 460,593 | | | | 162,984 | |
Trustee fees | | | 26,075 | | | | 7,500 | |
Audit fees | | | 17,304 | | | | 17,303 | |
Legal fees | | | 5,223 | | | | 5,223 | |
Custody fees | | | 66,675 | | | | 18,821 | |
Printing expenses | | | 15,822 | | | | 7,935 | |
Distribution plan (12b-1) fees - Retail Class (1) | | | 81,137 | | | | 4,924 | |
Shareholder service plan fees - Retail Class | | | 53,835 | | | | 3,939 | |
Shareholder service plan fees - Adviser Class | | | 1,362 | | | | 152 | |
Shareholder service plan fees - Institutional Class | | | 424,528 | | | | 111,177 | |
Postage expenses | | | 24,282 | | | | 13,960 | |
Registration fees | | | 70,187 | | | | 54,421 | |
Insurance expenses | | | 34,643 | | | | 10,935 | |
Chief Compliance Officer fees | | | 7,584 | | | | 7,598 | |
Other expenses | | | 53,632 | | | | 32,671 | |
Total Expenses Before Reductions | | | 6,384,207 | | | | 2,177,886 | |
| | | | | | | | | |
Expenses voluntarily reimbursed/waived by investment adviser (See Note #5) | | | — | | | | — | |
Expenses contractually reimbursed/waived by investment adviser (See Note #5) | | | — | | | | — | |
Securities lending credit (See Note #5) | | | (234 | ) | | | — | |
Transfer agent expenses voluntarily waived (See Note #5) | | | (40,000 | ) | | | — | |
| | | | | | | | |
Net Expenses | | | 6,343,973 | | | | 2,177,886 | |
| | | | | | | | | |
Net Investment Income (Loss) | | | 4,192,165 | | | | 946,417 | |
| | | | | | | | | |
Net Realized and Unrealized Gain (Loss) from Investments | | | | | | | | |
Net realized gains (losses) from unaffiliated investments | | | 22,933,526 | | | | 7,297,509 | |
Net realized gains (losses) from affiliated investments | | | (91,133 | ) | | | (25,148 | ) |
Net realized gains (losses) from futures contracts | | | (12,194,934 | ) | | | (1,072,338 | ) |
Distributions of long-term realized gains by other investment companies | | | — | | | | — | |
Net Realized Gains (Losses) from Investment Transactions, Futures Contracts, and Distributions of Long-term Realized Gains by Other Investment Companies | | | 10,647,459 | | | | 6,200,023 | |
| | | | | | | | | |
Net change in unrealized appreciation (depreciation) of unaffiliated investments | | | (97,114,948 | ) | | | (30,482,693 | ) |
Net change in unrealized appreciation (depreciation) of affiliated investments | | | 111,809 | | | | 39,064 | |
Net change in unrealized appreciation (depreciation) of futures contracts | | | 150,017 | | | | (257,650 | ) |
Net Change in Unrealized Appreciation (Depreciation) of Investment Transactions and Futures Contracts | | | (96,853,122 | ) | | | (30,701,279 | ) |
| | | | | | | | | |
Net Realized and Unrealized Gain (Loss) from Investments | | | (86,205,663 | ) | | | (24,501,256 | ) |
| | | | | | | | | |
Net Change in Net Assets Resulting from Operations | | $ | (82,013,498 | ) | | $ | (23,554,839 | ) |
(1) | Only the Retail Class of shares has adopted a Rule 12b-1 Plan. See #5 of the Notes to Financial Statements. |
The accompanying notes are an integral part of these financial statements.
Page 76 | 2022 Annual Report | December 31, 2022 |
| | Global
Allocation
Fund | | | Balanced
Fund | | | Moderate
Allocation
Fund | | | Conservative
Allocation
Fund | | | Dynamic
Allocation
Fund | | | Quantex
Fund | | | Tactical
Income Fund | | | Institutional
Prime Money
Market Fund | |
| | | | | | | | | | | | | | | | | | | | | | | | | | | | | | | | |
| | $ | 24,647 | | | $ | 668,912 | | | $ | 505,539 | | | $ | 542,628 | | | $ | 42,899 | | | $ | 296 | | | $ | 431,200 | | | $ | 12,652,625 | |
| | | 286,861 | | | | 1,878,603 | | | | 951,306 | | | | 575,657 | | | | 919,517 | | | | 209,219 | | | | 188,419 | | | | — | |
| | | 293,496 | | | | 4,083,911 | | | | 1,948,496 | | | | 1,700,635 | | | | 2,412,200 | | | | 415,642 | | | | 1,033,380 | | | | — | |
| | | 605,004 | | | | 6,631,426 | | | | 3,405,341 | | | | 2,818,920 | | | | 3,374,616 | | | | 625,157 | | | | 1,652,999 | | | | 12,652,625 | |
| | | | | | | | | | | | | | | | | | | | | | | | | | | | | | | | |
| | | | | | | | | | | | | | | | | | | | | | | | | | | | | | | | |
| | | 279,004 | | | | 2,446,139 | | | | 974,268 | | | | 623,501 | | | | 1,609,070 | | | | 268,410 | | | | 271,410 | | | | 1,867,334 | |
| | | 3,378 | | | | 5,682 | | | | 1,314 | | | | 7,278 | | | | 9,656 | | | | 17,168 | | | | 1,973 | | | | | |
| | | 5,291 | | | | 56,177 | | | | 37,226 | | | | 25,944 | | | | 29,078 | | | | 4,766 | | | | 7,936 | | | | | |
| | | 35,972 | | | | 367,370 | | | | 156,314 | | | | 116,419 | | | | 223,098 | | | | 21,012 | | | | 44,374 | | | | | |
| | | | | | | | | | | | | | | | | | | | | | | | | | | | | | | 456,080 | |
| | | 36,418 | | | | 72,769 | | | | 53,238 | | | | 49,470 | | | | 58,819 | | | | 36,157 | | | | 42,570 | | | | 105,693 | |
| | | 37,200 | | | | 296,152 | | | | 139,903 | | | | 109,760 | | | | 184,555 | | | | 35,788 | | | | 64,282 | | | | 466,080 | |
| | | 1,662 | | | | 12,899 | | | | 6,448 | | | | 5,020 | | | | 8,722 | | | | 1,722 | | | | 3,189 | | | | 1,126 | |
| | | 15,394 | | | | 17,303 | | | | 15,398 | | | | 15,398 | | | | 15,398 | | | | 15,395 | | | | 15,799 | | | | 14,822 | |
| | | 5,224 | | | | 5,223 | | | | 5,223 | | | | 5,223 | | | | 5,223 | | | | 5,224 | | | | 5,223 | | | | 5,281 | |
| | | 3,651 | | | | 34,446 | | | | 15,951 | | | | 12,133 | | | | 21,289 | | | | 3,483 | | | | 6,805 | | | | 54,998 | |
| | | 436 | | | | 10,172 | | | | 5,281 | | | | 5,336 | | | | 7,215 | | | | 746 | | | | 2,205 | | | | 1,682 | |
| | | 7,038 | | | | 16,867 | | | | 2,737 | | | | 15,162 | | | | 20,117 | | | | 28,613 | | | | 6,165 | | | | | |
| | | 5,573 | | | | 11,157 | | | | 1,936 | | | | 5,872 | | | | 8,602 | | | | 3,177 | | | | 3,677 | | | | | |
| | | 35 | | | | 272 | | | | 57 | | | | 63 | | | | 139 | | | | 38 | | | | 43 | | | | | |
| | | 3,885 | | | | 201,444 | | | | 89,668 | | | | 68,576 | | | | 110,701 | | | | 4,204 | | | | 38,230 | | | | | |
| | | 299 | | | | 16,858 | | | | 8,831 | | | | 9,055 | | | | 11,621 | | | | 1,321 | | | | 3,885 | | | | 1,690 | |
| | | 47,101 | | | | 59,689 | | | | 51,494 | | | | 51,659 | | | | 58,926 | | | | 47,291 | | | | 50,497 | | | | 11,505 | |
| | | 2,554 | | | | 22,596 | | | | 9,673 | | | | 7,698 | | | | 11,670 | | | | 2,308 | | | | 3,767 | | | | 20,926 | |
| | | 7,575 | | | | 7,575 | | | | 7,580 | | | | 7,575 | | | | 7,580 | | | | 7,582 | | | | 7,570 | | | | 7,586 | |
| | | 25,636 | | | | 41,600 | | | | 31,674 | | | | 30,160 | | | | 33,497 | | | | 25,523 | | | | 27,003 | | | | 67,845 | |
| | | 523,326 | | | | 3,702,389 | | | | 1,614,214 | | | | 1,171,301 | | | | 2,434,976 | | | | 529,928 | | | | 606,602 | | | | 3,082,648 | |
| | | | | | | | | | | | | | | | | | | | | | | | | | | | | | | | |
| | | — | | | | — | | | | — | | | | — | | | | (134,795 | ) | | | — | | | | (49,819 | ) | | | (1,906,269 | ) |
| | | — | | | | — | | | | — | | | | — | | | | (65,205 | ) | | | — | | | | (24,819 | ) | | | — | |
| | | (150 | ) | | | (5,979 | ) | | | (3,673 | ) | | | (2,854 | ) | | | (1,913 | ) | | | — | | | | — | | | | — | |
| | | — | | | | (128,000 | ) | | | — | | | | — | | | | — | | | | — | | | | — | | | | — | |
| | | | | | | | | | | | | | | | | | | | | | | | | | | | | | | | |
| | | 523,176 | | | | 3,568,410 | | | | 1,610,541 | | | | 1,168,447 | | | | 2,233,063 | | | | 529,928 | | | | 531,964 | | | | 1,176,379 | |
| | | | | | | | | | | | | | | | | | | | | | | | | | | | | | | | |
| | | 81,828 | | | | 3,063,016 | | | | 1,794,800 | | | | 1,650,473 | | | | 1,141,553 | | | | 95,229 | | | | 1,121,035 | | | | 11,476,246 | |
| | | | | | | | | | | | | | | | | | | | | | | | | | | | | | | | |
| | | | | | | | | | | | | | | | | | | | | | | | | | | | | | | | |
| | | 777,543 | | | | (2,176,326 | ) | | | (3,155,709 | ) | | | (3,874,403 | ) | | | 2,020,572 | | | | 1,426,359 | | | | (3,413,739 | ) | | | 757 | |
| | | (5,712 | ) | | | (55,061 | ) | | | (32,727 | ) | | | (28,520 | ) | | | (25,888 | ) | | | (5,345 | ) | | | (9,235 | ) | | | — | |
| | | (1,680,805 | ) | | | (3,241,539 | ) | | | (1,724,406 | ) | | | (651,607 | ) | | | (9,138,942 | ) | | | (2,222,162 | ) | | | — | | | | — | |
| | | 17 | | | | 593 | | | | 446 | | | | 482 | | | | — | | | | — | | | | 594 | | | | — | |
| | | (908,957 | ) | | | (5,472,333 | ) | | | (4,912,396 | ) | | | (4,554,048 | ) | | | (7,144,258 | ) | | | (801,148 | ) | | | (3,422,380 | ) | | | 757 | |
| | | | | | | | | | | | | | | | | | | | | | | | | | | | | | | | |
| | | (4,146,028 | ) | | | (40,234,169 | ) | | | (14,888,405 | ) | | | (10,423,829 | ) | | | (28,119,734 | ) | | | (4,165,936 | ) | | | (1,708,897 | ) | | | (93,978 | ) |
| | | 3,371 | | | | 39,360 | | | | 20,695 | | | | 11,952 | | | | 24,963 | | | | 4,094 | | | | 3,317 | | | | — | |
| | | (758,848 | ) | | | 410,442 | | | | (307,452 | ) | | | (131,848 | ) | | | (3,284,944 | ) | | | (631,316 | ) | | | — | | | | — | |
| | | (4,901,505 | ) | | | (39,784,367 | ) | | | (15,175,162 | ) | | | (10,543,725 | ) | | | (31,379,715 | ) | | | (4,793,158 | ) | | | (1,705,580 | ) | | | (93,978 | ) |
| | | | | | | | | | | | | | | | | | | | | | | | | | | | | | | | |
| | | (5,810,462 | ) | | | (45,256,700 | ) | | | (20,087,558 | ) | | | (15,097,773 | ) | | | (38,523,973 | ) | | | (5,594,306 | ) | | | (5,127,960 | ) | | | (93,221 | ) |
| | | | | | | | | | | | | | | | | | | | | | | | | | | | | | | | |
| | $ | (5,728,634 | ) | | $ | (42,193,684 | ) | | $ | (18,292,758 | ) | | $ | (13,447,300 | ) | | $ | (37,382,420 | ) | | $ | (5,499,077 | ) | | $ | (4,006,925 | ) | | $ | 11,383,025 | |
The accompanying notes are an integral part of these financial statements.
2022 Annual Report | December 31, 2022 | Page 77 |
Statements of Changes in Net Assets
For the Years Ended December 31, | |
| | | Muirfield Fund | | | Spectrum Fund | |
| | | 2022 | | | 2021 | | | 2022 | | | 2021 | |
Operations | | | | | | | | | | | | | | | | |
Net investment income (loss) | | $ | 4,192,165 | | | $ | 1,595,623 | | | $ | 946,417 | | | $ | 94,333 | |
Net realized gains (losses) from investment transactions, futures contracts, and distributions of long-term realized gains by other investment companies | | | 10,647,459 | | | | 89,463,110 | | | | 6,200,023 | | | | 32,449,569 | |
Net change in unrealized appreciation (depreciation) of investment transactions and futures contracts | | | (96,853,122 | ) | | | 22,186,089 | | | | (30,701,279 | ) | | | 4,551,153 | |
Net change in net assets resulting from operations | | | (82,013,498 | ) | | | 113,244,822 | | | | (23,554,839 | ) | | | 37,095,055 | |
| | | | | | | | | | | | | | | | | |
Distributions to Shareholders | | | | | | | | | | | | | | | | |
Retail Class | | | (1,037,037 | ) | | | (1,428,738 | ) | | | (48,367 | ) | | | (133,412 | ) |
Adviser Class | | | (2,518,745 | ) | | | (3,472,675 | ) | | | (916,716 | ) | | | (2,008,809 | ) |
Institutional Class | | | (13,506,315 | ) | | | (18,608,096 | ) | | | (4,076,838 | ) | | | (8,934,801 | ) |
Money Market Fund | | | | | | | | | | | | | | | | |
Change in net assets resulting from distributions | | | (17,062,097 | ) | | | (23,509,509 | ) | | | (5,041,921 | ) | | | (11,077,022 | ) |
| | | | | | | | | | | | | | | | | |
Capital Transactions: | | | | | | | | | | | | | | | | |
Issued | | | 173,001,385 | | | | 317,995,936 | | | | 34,617,151 | | | | 81,698,993 | |
Reinvested | | | 16,522,225 | | | | 22,813,672 | | | | 5,015,633 | | | | 11,042,182 | |
Redeemed | | | (174,842,415 | ) | | | (283,898,369 | ) | | | (37,981,293 | ) | | | (92,934,007 | ) |
Net change in net assets resulting from capital transactions | | | 14,681,195 | | | | 56,911,239 | | | | 1,651,491 | | | | (192,832 | ) |
| | | | | | | | | | | | | | | | | |
Total Change in Net Assets | | | (84,394,400 | ) | | | 146,646,552 | | | | (26,945,269 | ) | | | 25,825,201 | |
| | | | | | | | | | | | | | | | | |
Net Assets - Beginning of Year | | | 720,471,566 | | | | 573,825,014 | | | | 211,103,754 | | | | 185,278,553 | |
| | | | | | | | | | | | | | | | | |
Net Assets - End of Year | | $ | 636,077,166 | | | $ | 720,471,566 | | | $ | 184,158,485 | | | $ | 211,103,754 | |
| | | | | | | | | | | | | | | | | |
Share Transactions: | | | | | | | | | | | | | | | | |
Issued | | | 19,687,102 | | | | 35,009,621 | | | | 2,699,636 | | | | 6,207,988 | |
Reinvested | | | 1,938,275 | | | | 2,375,480 | | | | 406,298 | | | | 787,831 | |
Redeemed | | | (20,301,814 | ) | | | (32,086,333 | ) | | | (2,977,091 | ) | | | (7,098,087 | ) |
Net change in shares | | | 1,323,563 | | | | 5,298,768 | | | | 128,843 | | | | (102,268 | ) |
The accompanying notes are an integral part of these financial statements.
Page 78 | 2022 Annual Report | December 31, 2022 |
| | Global
Allocation Fund | | | Balanced Fund | | | Moderate
Allocation Fund | | | Conservative
Allocation Fund | |
| | 2022 | | | 2021 | | | 2022 | | | 2021 | | | 2022 | | | 2021 | | | 2022 | | | 2021 | |
| | | | | | | | | | | | | | | | | | | | | | | | | | | | | | | | |
| | $ | 81,828 | | | $ | (91,989 | ) | | $ | 3,063,016 | | | $ | 2,769,005 | | | $ | 1,794,800 | | | $ | 1,760,910 | | | $ | 1,650,473 | | | $ | 1,975,878 | |
| | | (908,957 | ) | | | 6,197,305 | | | | (5,472,333 | ) | | | 57,143,370 | | | | (4,912,396 | ) | | | 18,503,263 | | | | (4,554,048 | ) | | | 11,326,073 | |
| | | (4,901,505 | ) | | | (425,582 | ) | | | (39,784,367 | ) | | | (7,453,233 | ) | | | (15,175,162 | ) | | | (4,917,333 | ) | | | (10,543,725 | ) | | | (6,463,745 | ) |
| | | (5,728,634 | ) | | | 5,679,734 | | | | (42,193,684 | ) | | | 52,459,142 | | | | (18,292,758 | ) | | | 15,346,840 | | | | (13,447,300 | ) | | | 6,838,206 | |
| | | | | | | | | | | | | | | | | | | | | | | | | | | | | | | | |
| | | | | | | | | | | | | | | | | | | | | | | | | | | | | | | | |
| | | (18,338 | ) | | | (355,386 | ) | | | (235,650 | ) | | | (539,513 | ) | | | (29,590 | ) | | | (71,385 | ) | | | (97,079 | ) | | | (378,811 | ) |
| | | (31,247 | ) | | | (507,971 | ) | | | (2,483,575 | ) | | | (5,644,094 | ) | | | (913,063 | ) | | | (1,909,611 | ) | | | (418,971 | ) | | | (1,342,034 | ) |
| | | (190,868 | ) | | | (3,659,013 | ) | | | (10,529,353 | ) | | | (24,757,476 | ) | | | (3,734,734 | ) | | | (9,206,005 | ) | | | (1,819,093 | ) | | | (6,369,177 | ) |
| | | | | | | | | | | | | | | | | | | | | | | | | | | | | | | | |
| | | (240,453 | ) | | | (4,522,370 | ) | | | (13,248,578 | ) | | | (30,941,083 | ) | | | (4,677,387 | ) | | | (11,187,001 | ) | | | (2,335,143 | ) | | | (8,090,022 | ) |
| | | | | | | | | | | | | | | | | | | | | | | | | | | | | | | | |
| | | | | | | | | | | | | | | | | | | | | | | | | | | | | | | | |
| | | 4,937,882 | | | | 11,805,911 | | | | 72,790,300 | | | | 153,194,019 | | | | 32,951,993 | | | | 66,121,514 | | | | 26,477,489 | | | | 54,257,997 | |
| | | 239,130 | | | | 4,521,300 | | | | 13,138,981 | | | | 30,784,411 | | | | 4,649,341 | | | | 11,120,325 | | | | 2,320,415 | | | | 8,047,628 | |
| | | (12,802,206 | ) | | | (17,810,709 | ) | | | (72,023,363 | ) | | | (214,744,638 | ) | | | (29,867,265 | ) | | | (83,908,176 | ) | | | (27,078,721 | ) | | | (68,102,776 | ) |
| | | (7,625,194 | ) | | | (1,483,498 | ) | | | 13,905,918 | | | | (30,766,208 | ) | | | 7,734,069 | | | | (6,666,337 | ) | | | 1,719,183 | | | | (5,797,151 | ) |
| | | | | | | | | | | | | | | | | | | | | | | | | | | | | | | | |
| | | (13,594,281 | ) | | | (326,134 | ) | | | (41,536,344 | ) | | | (9,248,149 | ) | | | (15,236,076 | ) | | | (2,506,498 | ) | | | (14,063,260 | ) | | | (7,048,967 | ) |
| | | | | | | | | | | | | | | | | | | | | | | | | | | | | | | | |
| | | 45,255,799 | | | | 45,581,933 | | | | 387,249,824 | | | | 396,497,973 | | | | 173,758,244 | | | | 176,264,742 | | | | 134,469,583 | | | | 141,518,550 | |
| | | | | | | | | | | | | | | | | | | | | | | | | | | | | | | | |
| | $ | 31,661,518 | | | $ | 45,255,799 | | | $ | 345,713,480 | | | $ | 387,249,824 | | | $ | 158,522,168 | | | $ | 173,758,244 | | | $ | 120,406,323 | | | $ | 134,469,583 | |
| | | | | | | | | | | | | | | | | | | | | | | | | | | | | | | | |
| | | | | | | | | | | | | | | | | | | | | | | | | | | | | | | | |
| | | 476,289 | | | | 982,056 | | | | 5,868,495 | | | | 11,296,376 | | | | 2,818,277 | | | | 5,159,224 | | | | 1,191,691 | | | | 2,206,952 | |
| | | 23,319 | | | | 390,033 | | | | 1,115,552 | | | | 2,261,914 | | | | 419,117 | | | | 873,520 | | | | 109,084 | | | | 333,814 | |
| | | (1,255,187 | ) | | | (1,467,025 | ) | | | (5,847,014 | ) | | | (15,681,027 | ) | | | (2,563,757 | ) | | | (6,532,488 | ) | | | (1,220,358 | ) | | | (2,774,610 | ) |
| | | (755,579 | ) | | | (94,936 | ) | | | 1,137,033 | | | | (2,122,737 | ) | | | 673,637 | | | | (499,744 | ) | | | 80,417 | | | | (233,844 | ) |
The accompanying notes are an integral part of these financial statements.
2022 Annual Report | December 31, 2022 | Page 79 |
Statements of Changes in Net Assets
For the Years Ended December 31, | |
| | | Dynamic
Allocation Fund | |
| | | 2022 | | | 2021 | |
Operations | | | | | | | | |
Net investment income (loss) | | $ | 1,141,553 | | | $ | 405,885 | |
Net realized gains (losses) from investment transactions, futures contracts, and distributions of long-term realized gains by other investment companies | | | (7,144,258 | ) | | | 33,126,774 | |
Net change in unrealized appreciation (depreciation) of investment transactions and futures contracts | | | (31,379,715 | ) | | | 4,297,387 | |
Net change in net assets resulting from operations | | | (37,382,420 | ) | | | 37,830,046 | |
| | | | | | | | | |
Distributions to Shareholders | | | | | | | | |
Retail Class | | | (277,373 | ) | | | (1,288,985 | ) |
Adviser Class | | | (821,467 | ) | | | (3,644,420 | ) |
Institutional Class | | | (6,547,141 | ) | | | (25,897,027 | ) |
Money Market Fund | | | | | | | | |
Change in net assets resulting from distributions | | | (7,645,981 | ) | | | (30,830,432 | ) |
| | | | | | | | | |
Capital Transactions: | | | | | | | | |
Issued | | | 59,839,928 | | | | 108,187,090 | |
Reinvested | | | 7,577,815 | | | | 30,789,232 | |
Redeemed | | | (45,104,562 | ) | | | (107,524,267 | ) |
Net change in net assets resulting from capital transactions | | | 22,313,181 | | | | 31,452,055 | |
| | | | | | | | | |
Total Change in Net Assets | | | (22,715,220 | ) | | | 38,451,669 | |
| | | | | | | | | |
Net Assets - Beginning of Year | | | 237,731,415 | | | | 199,279,746 | |
| | | | | | | | | |
Net Assets - End of Year | | $ | 215,016,195 | | | $ | 237,731,415 | |
| | | | | | | | | |
Share Transactions: | | | | | | | | |
Issued | | | 4,841,994 | | | | 7,360,966 | |
Reinvested | | | 633,922 | | | | 2,185,338 | |
Redeemed | | | (3,687,590 | ) | | | (7,446,963 | ) |
Net change in shares | | | 1,788,326 | | | | 2,099,341 | |
The accompanying notes are an integral part of these financial statements.
Page 80 | 2022 Annual Report | December 31, 2022 |
| | Quantex Fund | | | Tactical
Income Fund | | | Institutional
Prime
Money Market
Fund | |
| | 2022 | | | 2021 | | | 2022 | | | 2021 | | | 2022 | | | 2021 | |
| | | | | | | | | | | | | | | | | | | | | | | | |
| | $ | 95,229 | | | $ | 49,174 | | | $ | 1,121,035 | | | $ | 1,269,628 | | | $ | 11,476,246 | | | $ | 193,476 | |
| | | (801,148 | ) | | | 10,644,111 | | | | (3,422,380 | ) | | | 2,061,332 | | | | 757 | | | | 229 | |
| | | (4,793,158 | ) | | | (213,812 | ) | | | (1,705,580 | ) | | | (4,500,178 | ) | | | (93,978 | ) | | | (67,755 | ) |
| | | (5,499,077 | ) | | | 10,479,473 | | | | (4,006,925 | ) | | | (1,169,218 | ) | | | 11,383,025 | | | | 125,950 | |
| | | | | | | | | | | | | | | | | | | | | | | | |
| | | | | | | | | | | | | | | | | | | | | | | | |
| | | (354,444 | ) | | | (2,350,162 | ) | | | (32,054 | ) | | | (40,103 | ) | | | | | | | | |
| | | (96,619 | ) | | | (649,230 | ) | | | (175,671 | ) | | | (185,140 | ) | | | | | | | | |
| | | (426,957 | ) | | | (3,059,421 | ) | | | (917,046 | ) | | | (1,070,555 | ) | | | | | | | | |
| | | | | | | | | | | | | | | | | | | (11,475,492 | ) | | | (193,478 | ) |
| | | (878,020 | ) | | | (6,058,813 | ) | | | (1,124,771 | ) | | | (1,295,798 | ) | | | (11,475,492 | ) | | | (193,478 | ) |
| | | | | | | | | | | | | | | | | | | | | | | | |
| | | | | | | | | | | | | | | | | | | | | | | | |
| | | 3,580,398 | | | | 16,768,435 | | | | 18,954,073 | | | | 36,170,527 | | | | 1,037,794,871 | | | | 1,011,642,367 | |
| | | 869,434 | | | | 6,046,958 | | | | 1,122,527 | | | | 1,288,487 | | | | 685,718 | | | | 35,042 | |
| | | (7,932,328 | ) | | | (25,302,418 | ) | | | (16,959,409 | ) | | | (33,757,101 | ) | | | (972,298,987 | ) | | | (721,061,508 | ) |
| | | (3,482,496 | ) | | | (2,487,025 | ) | | | 3,117,191 | | | | 3,701,913 | | | | 66,181,602 | | | | 290,615,901 | |
| | | | | | | | | | | | | | | | | | | | | | | | |
| | | (9,859,593 | ) | | | 1,933,635 | | | | (2,014,505 | ) | | | 1,236,897 | | | | 66,089,135 | | | | 290,548,373 | |
| | | | | | | | | | | | | | | | | | | | | | | | |
| | | 42,026,892 | | | | 40,093,257 | | | | 69,341,116 | | | | 68,104,219 | | | | 626,993,411 | | | | 336,445,038 | |
| | | | | | | | | | | | | | | | | | | | | | | | |
| | $ | 32,167,299 | | | $ | 42,026,892 | | | $ | 67,326,611 | | | $ | 69,341,116 | | | $ | 693,082,546 | | | $ | 626,993,411 | |
| | | | | | | | | | | | | | | | | | | | | | | | |
| | | | | | | | | | | | | | | | | | | | | | | | |
| | | 102,272 | | | | 415,083 | | | | 2,059,279 | | | | 3,681,061 | | | | 1,038,099,219 | | | | 1,011,455,624 | |
| | | 28,783 | | | | 154,992 | | | | 124,210 | | | | 132,173 | | | | 685,953 | | | | 35,036 | |
| | | (225,437 | ) | | | (616,603 | ) | | | (1,845,711 | ) | | | (3,434,958 | ) | | | (972,566,847 | ) | | | (720,922,007 | ) |
| | | (94,382 | ) | | | (46,528 | ) | | | 337,778 | | | | 378,276 | | | | 66,218,325 | | | | 290,568,653 | |
The accompanying notes are an integral part of these financial statements.
2022 Annual Report | December 31, 2022 | Page 81 |
Financial Highlights
For the Years Ended December 31, | |
| | | | | | | Income
from
Investment Operations | | | Less
Distributions | |
| | Net Asset
Value,
Beginning
of Period | | | Net
Investment
Income
(Loss) (3) | | | Net gains (losses)
on securities and
futures (both realized
and unrealized) | | | Total from
Investment
Operations | | | From Net
Investment
Income | | | From Net
Capital
Gains | | | From
Return of
Capital | | | Total
Distributions | |
Muirfield Fund - Retail Class (1)(2) |
2022 | | $ | 9.53 | | | | 0.03 | | | | (1.09 | ) | | | (1.06 | ) | | | (0.06 | ) | | | (0.17 | ) | | | 0.00 | | | | (0.23 | ) |
2021 | | $ | 8.20 | | | | (0.01 | ) | | | 1.66 | | | | 1.65 | | | | (0.07 | ) | | | (0.25 | ) | | | 0.00 | | | | (0.32 | ) |
2020 | | $ | 7.91 | | | | 0.03 | | | | 0.31 | | | | 0.34 | | | | (0.05 | ) | | | 0.00 | | | | 0.00 | | | | (0.05 | ) |
2019 | | $ | 7.16 | | | | 0.07 | | | | 0.89 | | | | 0.96 | | | | (0.03 | ) | | | (0.18 | ) | | | 0.00 | | | | (0.21 | ) |
2018 | | $ | 7.54 | | | | 0.04 | | | | (0.31 | ) | | | (0.27 | ) | | | (0.04 | ) | | | (0.07 | ) | | | 0.00 | | | | (0.11 | ) |
Muirfield Fund - Adviser Class (1)(2) |
2022 | | $ | 9.63 | | | | 0.06 | | | | (1.10 | ) | | | (1.04 | ) | | | (0.06 | ) | | | (0.17 | ) | | | 0.00 | | | | (0.23 | ) |
2021 | | $ | 8.26 | | | | 0.03 | | | | 1.67 | | | | 1.70 | | | | (0.08 | ) | | | (0.25 | ) | | | 0.00 | | | | (0.33 | ) |
2020 | | $ | 7.97 | | | | 0.05 | | | | 0.31 | | | | 0.36 | | | | (0.07 | ) | | | 0.00 | | | | 0.00 | | | | (0.07 | ) |
2019 | | $ | 7.20 | | | | 0.09 | | | | 0.90 | | | | 0.99 | | | | (0.04 | ) | | | (0.18 | ) | | | 0.00 | | | | (0.22 | ) |
2018 | | $ | 7.57 | | | | 0.06 | | | | (0.31 | ) | | | (0.25 | ) | | | (0.05 | ) | | | (0.07 | ) | | | 0.00 | | | | (0.12 | ) |
Muirfield Fund - Institutional Class (1)(2) |
2022 | | $ | 9.65 | | | | 0.06 | | | | (1.11 | ) | | | (1.05 | ) | | | (0.06 | ) | | | (0.17 | ) | | | 0.00 | | | | (0.23 | ) |
2021 | | $ | 8.28 | | | | 0.03 | | | | 1.66 | | | | 1.69 | | | | (0.07 | ) | | | (0.25 | ) | | | 0.00 | | | | (0.32 | ) |
2020 | | $ | 7.99 | | | | 0.05 | | | | 0.31 | | | | 0.36 | | | | (0.07 | ) | | | 0.00 | | | | 0.00 | | | | (0.07 | ) |
2019 | | $ | 7.21 | | | | 0.10 | | | | 0.90 | | | | 1.00 | | | | (0.04 | ) | | | (0.18 | ) | | | 0.00 | | | | (0.22 | ) |
2018 | | $ | 7.57 | | | | 0.08 | | | | (0.31 | ) | | | (0.23 | ) | | | (0.06 | ) | | | (0.07 | ) | | | 0.00 | | | | (0.13 | ) |
Spectrum Fund - Retail Class (1)(2) |
2022 | | $ | 13.88 | | | | 0.01 | | | | (1.61 | ) | | | (1.60 | ) | | | (0.09 | ) | | | (0.24 | ) | | | 0.00 | | | | (0.33 | ) |
2021 | | $ | 12.15 | | | | (0.06 | ) | | | 2.56 | | | | 2.50 | | | | (0.03 | ) | | | (0.74 | ) | | | 0.00 | | | | (0.77 | ) |
2020 | | $ | 12.19 | | | | (0.00 | ) | | | (0.03 | ) | | | (0.03 | ) | | | (0.01 | ) | | | 0.00 | | | | 0.00 | | | | (0.01 | ) |
2019 | | $ | 10.89 | | | | 0.04 | | | | 1.38 | | | | 1.42 | | | | (0.01 | ) | | | (0.11 | ) | | | 0.00 | | | | (0.12 | ) |
2018 | | $ | 11.48 | | | | 0.03 | | | | (0.49 | ) | | | (0.46 | ) | | | 0.00 | | | | (0.13 | ) | | | 0.00 | | | | (0.13 | ) |
Spectrum Fund - Adviser Class (1)(2) |
2022 | | $ | 13.96 | | | | 0.07 | | | | (1.62 | ) | | | (1.55 | ) | | | (0.09 | ) | | | (0.24 | ) | | | 0.00 | | | | (0.33 | ) |
2021 | | $ | 12.17 | | | | 0.02 | | | | 2.54 | | | | 2.56 | | | | (0.03 | ) | | | (0.74 | ) | | | 0.00 | | | | (0.77 | ) |
2020 | | $ | 12.27 | | | | 0.03 | | | | (0.02 | ) | | | 0.01 | | | | (0.11 | ) | | | 0.00 | | | | 0.00 | | | | (0.11 | ) |
2019 | | $ | 10.95 | | | | 0.07 | | | | 1.37 | | | | 1.44 | | | | (0.01 | ) | | | (0.11 | ) | | | 0.00 | | | | (0.12 | ) |
2018 | | $ | 11.53 | | | | 0.06 | | | | (0.48 | ) | | | (0.42 | ) | | | (0.03 | ) | | | (0.13 | ) | | | 0.00 | | | | (0.16 | ) |
Spectrum Fund - Institutional Class (1)(2) |
2022 | | $ | 14.01 | | | | 0.06 | | | | (1.62 | ) | | | (1.56 | ) | | | (0.10 | ) | | | (0.24 | ) | | | 0.00 | | | | (0.34 | ) |
2021 | | $ | 12.22 | | | | 0.01 | | | | 2.55 | | | | 2.56 | | | | (0.03 | ) | | | (0.74 | ) | | | 0.00 | | | | (0.77 | ) |
2020 | | $ | 12.31 | | | | 0.04 | | | | (0.02 | ) | | | 0.02 | | | | (0.11 | ) | | | 0.00 | | | | 0.00 | | | | (0.11 | ) |
2019 | | $ | 10.96 | | | | 0.09 | | | | 1.38 | | | | 1.47 | | | | (0.01 | ) | | | (0.11 | ) | | | 0.00 | | | | (0.12 | ) |
2018 | | $ | 11.54 | | | | 0.08 | | | | (0.49 | ) | | | (0.41 | ) | | | (0.04 | ) | | | (0.13 | ) | | | 0.00 | | | | (0.17 | ) |
|
See footnotes on pages 90 and 91.
The accompanying notes are an integral part of these financial statements.
Page 82 | 2022 Annual Report | December 31, 2022 |
| | | | | | | | | | Ratios/
Supplemental
Data | |
| | Net Asset
Value, End
of Period | | | Total Return
(Assumes
Reinvestment of
Distributions) | | | Net Assets,
End of Period
($000) | | | Ratio of Net
Investment
Income (Loss)
to Average
Net Assets | | | Ratio of Expenses to
Average Net Assets
After Fee Reductions (4) | | | Ratio of Expenses
to Average Net
Assets Before Fee
Reductions (5) | | | Portfolio
Turnover
Rate | |
| | | | |
| | $ | 8.24 | | | | (11.19 | %) | | $ | 38,206 | | | | 0.37 | % | | | 1.20 | % | | | 1.20 | % | | | 267 | % |
| | $ | 9.53 | | | | 20.20 | % | | $ | 43,353 | | | | (0.06 | %) | | | 1.21 | % | | | 1.21 | % | | | 197 | % |
| | $ | 8.20 | | | | 4.36 | % | | $ | 134,240 | | | | 0.35 | % | | | 1.28 | % | | | 1.28 | % | | | 225 | % |
| | $ | 7.91 | | | | 13.53 | % | | $ | 189,105 | | | | 0.94 | % | | | 1.28 | % | | | 1.28 | % | | | 222 | % |
| | $ | 7.16 | | | | (3.66 | %) | | $ | 203,287 | | | | 0.54 | % | | | 1.32 | % | | | 1.32 | % | | | 225 | % |
| | | |
| | $ | 8.36 | | | | (10.85 | %) | | $ | 94,282 | | | | 0.71 | % | | | 0.87 | % | | | 0.87 | % | | | 267 | % |
| | $ | 9.63 | | | | 20.61 | % | | $ | 104,300 | | | | 0.33 | % | | | 0.90 | % | | | 0.90 | % | | | 197 | % |
| | $ | 8.26 | | | | 4.67 | % | | $ | 48,953 | | | | 0.64 | % | | | 0.98 | % | | | 0.98 | % | | | 225 | % |
| | $ | 7.97 | | | | 13.81 | % | | $ | 60,024 | | | | 1.14 | % | | | 1.09 | % | | | 1.09 | % | | | 222 | % |
| | $ | 7.20 | | | | (3.39 | %) | | $ | 61,159 | | | | 0.79 | % | | | 1.10 | % | | | 1.17 | % | | | 225 | % |
| | | |
| | $ | 8.37 | | | | (10.93 | %) | | $ | 503,589 | | | | 0.63 | % | | | 0.94 | % | | | 0.95 | % | | | 267 | % |
| | $ | 9.65 | | | | 20.55 | % | | $ | 572,819 | | | | 0.27 | % | | | 0.94 | % | | | 0.95 | % | | | 197 | % |
| | $ | 8.28 | | | | 4.66 | % | | $ | 390,632 | | | | 0.73 | % | | | 0.88 | % | | | 0.97 | % | | | 225 | % |
| | $ | 7.99 | | | | 14.01 | % | | $ | 432,299 | | | | 1.35 | % | | | 0.87 | % | | | 0.98 | % | | | 222 | % |
| | $ | 7.21 | | | | (3.17 | %) | | $ | 346,563 | | | | 1.00 | % | | | 0.90 | % | | | 0.98 | % | | | 225 | % |
| | | |
| | $ | 11.95 | | | | (11.52 | %) | | $ | 1,715 | | | | 0.08 | % | | | 1.52 | % | | | 1.52 | % | | | 289 | % |
| | $ | 13.88 | | | | 20.58 | % | | $ | 2,526 | | | | (0.43 | %) | | | 1.49 | % | | | 1.49 | % | | | 200 | % |
| | $ | 12.15 | | | | (0.23 | %) | | $ | 36,604 | | | | (0.04 | %) | | | 1.73 | % | | | 1.73 | % | | | 182 | % |
| | $ | 12.19 | | | | 13.03 | % | | $ | 51,060 | | | | 0.37 | % | | | 1.77 | % | | | 1.77 | % | | | 74 | % |
| | $ | 10.89 | | | | (3.97 | %) | | $ | 51,083 | | | | 0.26 | % | | | 1.89 | % | | | 1.89 | % | | | 97 | % |
| | | |
| | $ | 12.08 | | | | (11.08 | %) | | $ | 33,536 | | | | 0.56 | % | | | 1.08 | % | | | 1.08 | % | | | 289 | % |
| | $ | 13.96 | | | | 21.07 | % | | $ | 38,190 | | | | 0.11 | % | | | 1.09 | % | | | 1.09 | % | | | 200 | % |
| | $ | 12.17 | | | | 0.18 | % | | $ | 12,475 | | | | 0.32 | % | | | 1.36 | % | | | 1.36 | % | | | 182 | % |
| | $ | 12.27 | | | | 13.17 | % | | $ | 15,564 | | | | 0.63 | % | | | 1.51 | % | | | 1.51 | % | | | 74 | % |
| | $ | 10.95 | | | | (3.67 | %) | | $ | 14,486 | | | | 0.49 | % | | | 1.70 | % | | | 1.70 | % | | | 97 | % |
| | | |
| | $ | 12.11 | | | | (11.19 | %) | | $ | 148,907 | | | | 0.49 | % | | | 1.15 | % | | | 1.15 | % | | | 289 | % |
| | $ | 14.01 | | | | 20.98 | % | | $ | 170,388 | | | | 0.05 | % | | | 1.13 | % | | | 1.13 | % | | | 200 | % |
| | $ | 12.22 | | | | 0.25 | % | | $ | 136,200 | | | | 0.33 | % | | | 1.32 | % | | | 1.33 | % | | | 182 | % |
| | $ | 12.31 | | | | 13.44 | % | | $ | 146,443 | | | | 0.77 | % | | | 1.38 | % | | | 1.40 | % | | | 74 | % |
| | $ | 10.96 | | | | (3.51 | %) | | $ | 117,166 | | | | 0.71 | % | | | 1.50 | % | | | 1.50 | % | | | 97 | % |
| | | |
See footnotes on pages 90 and 91.
The accompanying notes are an integral part of these financial statements.
2022 Annual Report | December 31, 2022 | Page 83 |
Financial Highlights
For the Years Ended December 31, | |
| | | | | | | Income
from
Investment Operations | | | Less
Distributions | |
| | Net Asset
Value,
Beginning
of Period | | | Net
Investment
Income
(Loss) (3) | | | Net gains (losses)
on securities and
futures (both realized
and unrealized) | | | Total from
Investment
Operations | | | From Net
Investment
Income | | | From Net
Capital
Gains | | | From
Return of
Capital | | | Total
Distributions | |
Global Allocation Fund - Retail Class (1)(2) |
2022 | | $ | 11.55 | | | | (0.02 | ) | | | (1.47 | ) | | | (1.49 | ) | | | (0.03 | ) | | | (0.05 | ) | | | 0.00 | | | | (0.08 | ) |
2021 | | $ | 11.40 | | | | (0.08 | ) | | | 1.52 | | | | 1.44 | | | | 0.00 | | | | (1.29 | ) | | | 0.00 | | | | (1.29 | ) |
2020 | | $ | 11.32 | | | | (0.02 | ) | | | 0.35 | | | | 0.33 | | | | 0.00 | | | | (0.25 | ) | | | 0.00 | | | | (0.25 | ) |
2019 | | $ | 10.22 | | | | 0.08 | | | | 1.26 | | | | 1.34 | | | | (0.04 | ) | | | (0.20 | ) | | | 0.00 | | | | (0.24 | ) |
2018 | | $ | 11.53 | | | | 0.05 | | | | (0.85 | ) | | | (0.80 | ) | | | (0.06 | ) | | | (0.45 | ) | | | 0.00 | | | | (0.51 | ) |
Global Allocation Fund - Adviser Class (1)(2) |
2022 | | $ | 11.61 | | | | 0.03 | | | | (1.48 | ) | | | (1.45 | ) | | | (0.03 | ) | | | (0.05 | ) | | | 0.00 | | | | (0.08 | ) |
2021 | | $ | 11.42 | | | | (0.02 | ) | | | 1.50 | | | | 1.48 | | | | 0.00 | | | | (1.29 | ) | | | 0.00 | | | | (1.29 | ) |
2020 | | $ | 11.35 | | | | 0.01 | | | | 0.37 | | | | 0.38 | | | | (0.06 | ) | | | (0.25 | ) | | | 0.00 | | | | (0.31 | ) |
2019 | | $ | 10.24 | | | | 0.11 | | | | 1.25 | | | | 1.36 | | | | (0.05 | ) | | | (0.20 | ) | | | 0.00 | | | | (0.25 | ) |
2018 | | $ | 11.54 | | | | 0.09 | | | | (0.86 | ) | | | (0.77 | ) | | | (0.08 | ) | | | (0.45 | ) | | | 0.00 | | | | (0.53 | ) |
Global Allocation Fund - Institutional Class (1)(2) |
2022 | | $ | 11.58 | | | | 0.03 | | | | (1.48 | ) | | | (1.45 | ) | | | (0.03 | ) | | | (0.05 | ) | | | 0.00 | | | | (0.08 | ) |
2021 | | $ | 11.38 | | | | (0.02 | ) | | | 1.51 | | | | 1.49 | | | | 0.00 | | | | (1.29 | ) | | | 0.00 | | | | (1.29 | ) |
2020 | | $ | 11.36 | | | | 0.02 | | | | 0.35 | | | | 0.37 | | | | (0.10 | ) | | | (0.25 | ) | | | 0.00 | | | | (0.35 | ) |
2019 | | $ | 10.24 | | | | 0.13 | | | | 1.26 | | | | 1.39 | | | | (0.07 | ) | | | (0.20 | ) | | | 0.00 | | | | (0.27 | ) |
2018 | | $ | 11.55 | | | | 0.11 | | | | (0.86 | ) | | | (0.75 | ) | | | (0.11 | ) | | | (0.45 | ) | | | 0.00 | | | | (0.56 | ) |
Balanced Fund - Retail Class (1)(2) |
2022 | | $ | 13.42 | | | | 0.06 | | | | (1.55 | ) | | | (1.49 | ) | | | (0.23 | ) | | | (0.20 | ) | | | 0.00 | | | | (0.43 | ) |
2021 | | $ | 12.82 | | | | (0.01 | ) | | | 1.71 | | | | 1.70 | | | | (0.16 | ) | | | (0.94 | ) | | | 0.00 | | | | (1.10 | ) |
2020 | | $ | 12.26 | | | | 0.08 | | | | 0.56 | | | | 0.64 | | | | (0.08 | ) | | | 0.00 | | | | 0.00 | | | | (0.08 | ) |
2019 | | $ | 11.08 | | | | 0.16 | | | | 1.20 | | | | 1.36 | | | | (0.09 | ) | | | (0.09 | ) | | | 0.00 | | | | (0.18 | ) |
2018 | | $ | 11.61 | | | | 0.12 | | | | (0.49 | ) | | | (0.37 | ) | | | (0.10 | ) | | | (0.06 | ) | | | 0.00 | | | | (0.16 | ) |
Balanced Fund - Adviser Class (1)(2) |
2022 | | $ | 13.53 | | | | 0.11 | | | | (1.57 | ) | | | (1.46 | ) | | | (0.25 | ) | | | (0.20 | ) | | | 0.00 | | | | (0.45 | ) |
2021 | | $ | 12.92 | | | | 0.11 | | | | 1.66 | | | | 1.77 | | | | (0.22 | ) | | | (0.94 | ) | | | 0.00 | | | | (1.16 | ) |
2020 | | $ | 12.35 | | | | 0.13 | | | | 0.56 | | | | 0.69 | | | | (0.12 | ) | | | 0.00 | | | | 0.00 | | | | (0.12 | ) |
2019 | | $ | 11.15 | | | | 0.19 | | | | 1.21 | | | | 1.40 | | | | (0.11 | ) | | | (0.09 | ) | | | 0.00 | | | | (0.20 | ) |
2018 | | $ | 11.68 | | | | 0.15 | | | | (0.49 | ) | | | (0.34 | ) | | | (0.13 | ) | | | (0.06 | ) | | | 0.00 | | | | (0.19 | ) |
Balanced Fund - Institutional Class (1)(2) |
2022 | | $ | 13.56 | | | | 0.11 | | | | (1.58 | ) | | | (1.47 | ) | | | (0.25 | ) | | | (0.20 | ) | | | 0.00 | | | | (0.45 | ) |
2021 | | $ | 12.94 | | | | 0.10 | | | | 1.67 | | | | 1.77 | | | | (0.21 | ) | | | (0.94 | ) | | | 0.00 | | | | (1.15 | ) |
2020 | | $ | 12.36 | | | | 0.14 | | | | 0.55 | | | | 0.69 | | | | (0.11 | ) | | | 0.00 | | | | 0.00 | | | | (0.11 | ) |
2019 | | $ | 11.15 | | | | 0.21 | | | | 1.21 | | | | 1.42 | | | | (0.12 | ) | | | (0.09 | ) | | | 0.00 | | | | (0.21 | ) |
2018 | | $ | 11.68 | | | | 0.18 | | | | (0.51 | ) | | | (0.33 | ) | | | (0.14 | ) | | | (0.06 | ) | | | 0.00 | | | | (0.20 | ) |
|
See footnotes on pages 90 and 91.
The accompanying notes are an integral part of these financial statements.
Page 84 | 2022 Annual Report | December 31, 2022 |
| | | | | | | | | | Ratios/
Supplemental
Data | |
| | Net Asset
Value, End
of Period | | | Total Return
(Assumes
Reinvestment of
Distributions) | | | Net Assets,
End of Period
($000) | | | Ratio of Net
Investment
Income (Loss)
to Average
Net Assets | | | Ratio of Expenses to
Average Net Assets
After Fee Reductions (4) | | | Ratio of Expenses
to Average Net
Assets Before Fee
Reductions (5) | | | Portfolio
Turnover
Rate | |
| | | |
| | $ | 9.98 | | | | (12.94 | %) | | $ | 2,399 | | | | (0.18 | %) | | | 1.81 | % | | | 1.81 | % | | | 243 | % |
| | $ | 11.55 | | | | 12.58 | % | | $ | 3,567 | | | | (0.63 | %) | | | 1.72 | % | | | 1.72 | % | | | 173 | % |
| | $ | 11.40 | | | | 2.96 | % | | $ | 9,001 | | | | (0.25 | %) | | | 1.74 | % | | | 1.74 | % | | | 179 | % |
| | $ | 11.32 | | | | 13.17 | % | | $ | 11,154 | | | | 0.76 | % | | | 1.68 | % | | | 1.68 | % | | | 185 | % |
| | $ | 10.22 | | | | (6.94 | %) | | $ | 13,810 | | | | 0.47 | % | | | 1.63 | % | | | 1.63 | % | | | 163 | % |
| | | |
| | $ | 10.08 | | | | (12.52 | %) | | $ | 4,088 | | | | 0.28 | % | | | 1.37 | % | | | 1.37 | % | | | 243 | % |
| | $ | 11.61 | | | | 12.90 | % | | $ | 5,099 | | | | (0.14 | %) | | | 1.31 | % | | | 1.31 | % | | | 173 | % |
| | $ | 11.42 | | | | 3.42 | % | | $ | 1,740 | | | | 0.09 | % | | | 1.40 | % | | | 1.40 | % | | | 179 | % |
| | $ | 11.35 | | | | 13.34 | % | | $ | 1,772 | | | | 1.01 | % | | | 1.45 | % | | | 1.45 | % | | | 185 | % |
| | $ | 10.24 | | | | (6.73 | %) | | $ | 1,624 | | | | 0.75 | % | | | 1.44 | % | | | 1.44 | % | | | 163 | % |
| | | |
| | $ | 10.05 | | | | (12.56 | %) | | $ | 25,175 | | | | 0.25 | % | | | 1.37 | % | | | 1.37 | % | | | 243 | % |
| | $ | 11.58 | | | | 13.05 | % | | $ | 36,590 | | | | (0.16 | %) | | | 1.30 | % | | | 1.30 | % | | | 173 | % |
| | $ | 11.38 | | | | 3.43 | % | | $ | 34,841 | | | | 0.17 | % | | | 1.31 | % | | | 1.31 | % | | | 179 | % |
| | $ | 11.36 | | | | 13.66 | % | | $ | 38,497 | | | | 1.19 | % | | | 1.25 | % | | | 1.25 | % | | | 185 | % |
| | $ | 10.24 | | | | (6.57 | %) | | $ | 42,976 | | | | 0.94 | % | | | 1.20 | % | | | 1.20 | % | | | 163 | % |
| | | |
| | $ | 11.50 | | | | (11.09 | %) | | $ | 6,117 | | | | 0.48 | % | | | 1.39 | % | | | 1.39 | % | | | 365 | % |
| | $ | 13.42 | | | | 13.23 | % | | $ | 7,086 | | | | (0.09 | %) | | | 1.36 | % | | | 1.36 | % | | | 205 | % |
| | $ | 12.82 | | | | 5.27 | % | | $ | 75,449 | | | | 0.65 | % | | | 1.41 | % | | | 1.41 | % | | | 189 | % |
| | $ | 12.26 | | | | 12.29 | % | | $ | 92,815 | | | | 1.34 | % | | | 1.41 | % | | | 1.41 | % | | | 180 | % |
| | $ | 11.08 | | | | (3.25 | %) | | $ | 90,133 | | | | 1.06 | % | | | 1.43 | % | | | 1.43 | % | | | 218 | % |
| | | |
| | $ | 11.62 | | | | (10.77 | %) | | $ | 65,668 | | | | 0.89 | % | | | 0.97 | % | | | 0.97 | % | | | 365 | % |
| | $ | 13.53 | | | | 13.71 | % | | $ | 71,034 | | | | 0.78 | % | | | 0.97 | % | | | 0.97 | % | | | 205 | % |
| | $ | 12.92 | | | | 5.66 | % | | $ | 18,699 | | | | 1.03 | % | | | 1.04 | % | | | 1.04 | % | | | 189 | % |
| | $ | 12.35 | | | | 12.59 | % | | $ | 20,182 | | | | 1.61 | % | | | 1.14 | % | | | 1.14 | % | | | 180 | % |
| | $ | 11.15 | | | | (2.99 | %) | | $ | 19,301 | | | | 1.31 | % | | | 1.21 | % | | | 1.23 | % | | | 218 | % |
| | | |
| | $ | 11.64 | | | | (10.80 | %) | | $ | 273,928 | | | | 0.86 | % | | | 1.00 | % | | | 1.05 | % | | | 365 | % |
| | $ | 13.56 | | | | 13.71 | % | | $ | 309,130 | | | | 0.69 | % | | | 1.00 | % | | | 1.02 | % | | | 205 | % |
| | $ | 12.94 | | | | 5.71 | % | | $ | 302,350 | | | | 1.09 | % | | | 0.98 | % | | | 1.03 | % | | | 189 | % |
| | $ | 12.36 | | | | 12.77 | % | | $ | 295,200 | | | | 1.79 | % | | | 0.96 | % | | | 1.04 | % | | | 180 | % |
| | $ | 11.15 | | | | (2.85 | %) | | $ | 239,375 | | | | 1.51 | % | | | 1.02 | % | | | 1.05 | % | | | 218 | % |
| | | |
See footnotes on pages 90 and 91.
The accompanying notes are an integral part of these financial statements.
2022 Annual Report | December 31, 2022 | Page 85 |
Financial Highlights
For the Years Ended December 31, | |
| | | | | | | Income
from
Investment Operations | | | Less
Distributions | |
| | Net Asset
Value,
Beginning
of Period | | | Net
Investment
Income
(Loss) (3) | | | Net gains (losses)
on securities and
futures (both realized
and unrealized) | | | Total from
Investment
Operations | | | From Net
Investment
Income | | | From Net
Capital
Gains | | | From
Return of
Capital | | | Total
Distributions | |
Moderate Allocation Fund - Retail Class (1)(2) |
2022 | | $ | 12.64 | | | | 0.08 | | | | (1.43 | ) | | | (1.35 | ) | | | (0.24 | ) | | | (0.08 | ) | | | 0.00 | | | | (0.32 | ) |
2021 | | $ | 12.37 | | | | (0.02 | ) | | | 1.10 | | | | 1.08 | | | | (0.05 | ) | | | (0.76 | ) | | | 0.00 | | | | (0.81 | ) |
2020 | | $ | 11.85 | | | | 0.13 | | | | 0.52 | | | | 0.65 | | | | (0.13 | ) | | | 0.00 | | | | 0.00 | | | | (0.13 | ) |
2019 | | $ | 10.84 | | | | 0.20 | | | | 1.00 | | | | 1.20 | | | | (0.19 | ) | | | 0.00 | | | | 0.00 | | | | (0.19 | ) |
2018 | | $ | 11.66 | | | | 0.18 | | | | (0.48 | ) | | | (0.30 | ) | | | (0.16 | ) | | | (0.36 | ) | | | 0.00 | | | | (0.52 | ) |
Moderate Allocation Fund - Adviser Class (1)(2) |
2022 | | $ | 12.66 | | | | 0.14 | | | | (1.45 | ) | | | (1.31 | ) | | | (0.26 | ) | | | (0.08 | ) | | | 0.00 | | | | (0.34 | ) |
2021 | | $ | 12.39 | | | | 0.16 | | | | 0.97 | | | | 1.13 | | | | (0.10 | ) | | | (0.76 | ) | | | 0.00 | | | | (0.86 | ) |
2020 | | $ | 11.86 | | | | 0.17 | | | | 0.53 | | | | 0.70 | | | | (0.17 | ) | | | 0.00 | | | | 0.00 | | | | (0.17 | ) |
2019 | | $ | 10.85 | | | | 0.24 | | | | 1.00 | | | | 1.24 | | | | (0.23 | ) | | | 0.00 | | | | 0.00 | | | | (0.23 | ) |
2018 | | $ | 11.66 | | | | 0.21 | | | | (0.49 | ) | | | (0.28 | ) | | | (0.17 | ) | | | (0.36 | ) | | | 0.00 | | | | (0.53 | ) |
Moderate Allocation Fund - Institutional Class (1)(2) |
2022 | | $ | 12.68 | | | | 0.13 | | | | (1.44 | ) | | | (1.31 | ) | | | (0.26 | ) | | | (0.08 | ) | | | 0.00 | | | | (0.34 | ) |
2021 | | $ | 12.42 | | | | 0.14 | | | | 0.98 | | | | 1.12 | | | | (0.10 | ) | | | (0.76 | ) | | | 0.00 | | | | (0.86 | ) |
2020 | | $ | 11.89 | | | | 0.17 | | | | 0.53 | | | | 0.70 | | | | (0.17 | ) | | | 0.00 | | | | 0.00 | | | | (0.17 | ) |
2019 | | $ | 10.88 | | | | 0.25 | | | | 1.00 | | | | 1.25 | | | | (0.24 | ) | | | 0.00 | | | | 0.00 | | | | (0.24 | ) |
2018 | | $ | 11.68 | | | | 0.23 | | | | (0.48 | ) | | | (0.25 | ) | | | (0.19 | ) | | | (0.36 | ) | | | 0.00 | | | | (0.55 | ) |
Conservative Allocation Fund - Retail Class (1)(2) |
2022 | | $ | 23.64 | | | | 0.22 | | | | (2.64 | ) | | | (2.42 | ) | | | (0.25 | ) | | | (0.12 | ) | | | 0.00 | | | | (0.37 | ) |
2021 | | $ | 23.91 | | | | 0.22 | | | | 0.89 | | | | 1.11 | | | | (0.24 | ) | | | (1.14 | ) | | | 0.00 | | | | (1.38 | ) |
2020 | | $ | 22.85 | | | | 0.37 | | | | 1.04 | | | | 1.41 | | | | (0.35 | ) | | | 0.00 | | | | 0.00 | | | | (0.35 | ) |
2019 | | $ | 21.18 | | | | 0.51 | | | | 1.65 | | | | 2.16 | | | | (0.49 | ) | | | 0.00 | | | | 0.00 | | | | (0.49 | ) |
2018 | | $ | 22.54 | | | | 0.46 | | | | (1.04 | ) | | | (0.58 | ) | | | (0.40 | ) | | | (0.38 | ) | | | 0.00 | | | | (0.78 | ) |
Conservative Allocation Fund - Adviser Class (1)(2) |
2022 | | $ | 23.91 | | | | 0.31 | | | | (2.69 | ) | | | (2.38 | ) | | | (0.30 | ) | | | (0.12 | ) | | | 0.00 | | | | (0.42 | ) |
2021 | | $ | 24.21 | | | | 0.41 | | | | 0.81 | | | | 1.22 | | | | (0.38 | ) | | | (1.14 | ) | | | 0.00 | | | | (1.52 | ) |
2020 | | $ | 23.13 | | | | 0.46 | | | | 1.06 | | | | 1.52 | | | | (0.44 | ) | | | 0.00 | | | | 0.00 | | | | (0.44 | ) |
2019 | | $ | 21.44 | | | | 0.57 | | | | 1.67 | | | | 2.24 | | | | (0.55 | ) | | | 0.00 | | | | 0.00 | | | | (0.55 | ) |
2018 | | $ | 22.82 | | | | 0.52 | | | | (1.08 | ) | | | (0.56 | ) | | | (0.44 | ) | | | (0.38 | ) | | | 0.00 | | | | (0.82 | ) |
Conservative Allocation Fund - Institutional Class (1)(2) |
2022 | | $ | 23.96 | | | | 0.29 | | | | (2.69 | ) | | | (2.40 | ) | | | (0.29 | ) | | | (0.12 | ) | | | 0.00 | | | | (0.41 | ) |
2021 | | $ | 24.26 | | | | 0.38 | | | | 0.81 | | | | 1.19 | | | | (0.35 | ) | | | (1.14 | ) | | | 0.00 | | | | (1.49 | ) |
2020 | | $ | 23.18 | | | | 0.46 | | | | 1.06 | | | | 1.52 | | | | (0.44 | ) | | | 0.00 | | | | 0.00 | | | | (0.44 | ) |
2019 | | $ | 21.49 | | | | 0.59 | | | | 1.68 | | | | 2.27 | | | | (0.58 | ) | | | 0.00 | | | | 0.00 | | | | (0.58 | ) |
2018 | | $ | 22.85 | | | | 0.56 | | | | (1.07 | ) | | | (0.51 | ) | | | (0.47 | ) | | | (0.38 | ) | | | 0.00 | | | | (0.85 | ) |
|
See footnotes on pages 90 and 91.
The accompanying notes are an integral part of these financial statements.
Page 86 | 2022 Annual Report | December 31, 2022 |
| | | | | | | | | | Ratios/
Supplemental
Data | |
| | Net Asset
Value, End
of Period | | | Total Return
(Assumes
Reinvestment of
Distributions) | | | Net Assets,
End of Period
($000) | | | Ratio of Net
Investment
Income (Loss)
to Average
Net Assets | | | Ratio of Expenses to
Average Net Assets
After Fee Reductions (4) | | | Ratio of Expenses
to Average Net
Assets Before Fee
Reductions (5) | | | Portfolio
Turnover
Rate | |
| | | |
| | $ | 10.97 | | | | (10.75 | %) | | $ | 1,033 | | | | 0.73 | % | | | 1.36 | % | | | 1.36 | % | | | 446 | % |
| | $ | 12.64 | | | | 8.74 | % | | $ | 1,190 | | | | (0.22 | %) | | | 1.34 | % | | | 1.34 | % | | | 211 | % |
| | $ | 12.37 | | | | 5.55 | % | | $ | 30,930 | | | | 1.00 | % | | | 1.38 | % | | | 1.38 | % | | | 160 | % |
| | $ | 11.85 | | | | 11.13 | % | | $ | 35,460 | | | | 1.73 | % | | | 1.38 | % | | | 1.38 | % | | | 155 | % |
| | $ | 10.84 | | | | (2.60 | %) | | $ | 32,502 | | | | 1.51 | % | | | 1.39 | % | | | 1.44 | % | | | 213 | % |
| | | |
| | $ | 11.01 | | | | (10.39 | %) | | $ | 30,879 | | | | 1.18 | % | | | 0.94 | % | | | 0.94 | % | | | 446 | % |
| | $ | 12.66 | | | | 9.15 | % | | $ | 29,781 | | | | 1.13 | % | | | 0.94 | % | | | 0.94 | % | | | 211 | % |
| | $ | 12.39 | | | | 6.04 | % | | $ | 9,823 | | | | 1.39 | % | | | 1.00 | % | | | 1.00 | % | | | 160 | % |
| | $ | 11.86 | | | | 11.45 | % | | $ | 10,080 | | | | 2.00 | % | | | 1.11 | % | | | 1.11 | % | | | 155 | % |
| | $ | 10.85 | | | | (2.47 | %) | | $ | 9,480 | | | | 1.78 | % | | | 1.19 | % | | | 1.24 | % | | | 213 | % |
| | | |
| | $ | 11.03 | | | | (10.39 | %) | | $ | 126,610 | | | | 1.09 | % | | | 1.00 | % | | | 1.00 | % | | | 446 | % |
| | $ | 12.68 | | | | 9.05 | % | | $ | 142,788 | | | | 1.01 | % | | | 0.99 | % | | | 0.99 | % | | | 211 | % |
| | $ | 12.42 | | | | 6.02 | % | | $ | 135,512 | | | | 1.40 | % | | | 0.99 | % | | | 0.99 | % | | | 160 | % |
| | $ | 11.89 | | | | 11.52 | % | | $ | 132,500 | | | | 2.10 | % | | | 1.01 | % | | | 1.01 | % | | | 155 | % |
| | $ | 10.88 | | | | (2.20 | %) | | $ | 119,881 | | | | 1.97 | % | | | 1.01 | % | | | 1.05 | % | | | 213 | % |
| | | |
| | $ | 20.85 | | | | (10.24 | %) | | $ | 5,328 | | | | 1.01 | % | | | 1.21 | % | | | 1.21 | % | | | 543 | % |
| | $ | 23.64 | | | | 4.64 | % | | $ | 6,879 | | | | 0.78 | % | | | 1.22 | % | | | 1.23 | % | | | 210 | % |
| | $ | 23.91 | | | | 6.28 | % | | $ | 29,034 | | | | 1.46 | % | | | 1.28 | % | | | 1.28 | % | | | 139 | % |
| | $ | 22.85 | | | | 10.25 | % | | $ | 31,688 | | | | 2.19 | % | | | 1.28 | % | | | 1.28 | % | | | 136 | % |
| | $ | 21.18 | | | | (2.62 | %) | | $ | 30,759 | | | | 2.09 | % | | | 1.27 | % | | | 1.38 | % | | | 185 | % |
| | | |
| | $ | 21.11 | | | | (9.94 | %) | | $ | 21,189 | | | | 1.40 | % | | | 0.87 | % | | | 0.87 | % | | | 543 | % |
| | $ | 23.91 | | | | 5.04 | % | | $ | 22,283 | | | | 1.56 | % | | | 0.87 | % | | | 0.88 | % | | | 210 | % |
| | $ | 24.21 | | | | 6.69 | % | | $ | 7,082 | | | | 1.85 | % | | | 0.92 | % | | | 0.92 | % | | | 139 | % |
| | $ | 23.13 | | | | 10.51 | % | | $ | 6,787 | | | | 2.44 | % | | | 1.04 | % | | | 1.04 | % | | | 136 | % |
| | $ | 21.44 | | | | (2.50 | %) | | $ | 6,110 | | | | 2.29 | % | | | 1.12 | % | | | 1.22 | % | | | 185 | % |
| | | |
| | $ | 21.15 | | | | (10.00 | %) | | $ | 93,889 | | | | 1.33 | % | | | 0.94 | % | | | 0.94 | % | | | 543 | % |
| | $ | 23.96 | | | | 4.94 | % | | $ | 105,307 | | | | 1.42 | % | | | 0.92 | % | | | 0.93 | % | | | 210 | % |
| | $ | 24.26 | | | | 6.68 | % | | $ | 105,403 | | | | 1.87 | % | | | 0.92 | % | | | 0.92 | % | | | 139 | % |
| | $ | 23.18 | | | | 10.61 | % | | $ | 99,456 | | | | 2.54 | % | | | 0.94 | % | | | 0.94 | % | | | 136 | % |
| | $ | 21.49 | | | | (2.28 | %) | | $ | 92,412 | | | | 2.50 | % | | | 0.92 | % | | | 1.04 | % | | | 185 | % |
| | | |
See footnotes on pages 90 and 91.
The accompanying notes are an integral part of these financial statements.
2022 Annual Report | December 31, 2022 | Page 87 |
Financial Highlights
For the Years Ended December 31, | |
| | | | | | | Income
from
Investment Operations | | | Less
Distributions | |
| | Net Asset
Value,
Beginning
of Period | | | Net
Investment
Income
(Loss) (3) | | | Net gains (losses)
on securities and
futures (both realized
and unrealized) | | | Total from
Investment
Operations | | | From Net
Investment
Income | | | From Net
Capital
Gains | | | From
Return of
Capital | | | Total
Distributions | |
Dynamic Allocation Fund - Retail Class (1)(2) |
2022 | | $ | 13.93 | | | | 0.03 | | | | (2.18 | ) | | | (2.15 | ) | | | (0.06 | ) | | | (0.36 | ) | | | 0.00 | | | | (0.42 | ) |
2021 | | $ | 13.39 | | | | (0.03 | ) | | | 2.65 | | | | 2.62 | | | | (0.08 | ) | | | (2.00 | ) | | | 0.00 | | | | (2.08 | ) |
2020 | | $ | 11.87 | | | | 0.03 | | | | 1.79 | | | | 1.82 | | | | (0.03 | ) | | | (0.27 | ) | | | 0.00 | | | | (0.30 | ) |
2019 | | $ | 9.79 | | | | 0.11 | | | | 2.23 | | | | 2.34 | | | | (0.08 | ) | | | (0.18 | ) | | | 0.00 | | | | (0.26 | ) |
2018 | | $ | 10.85 | | | | 0.07 | | | | (1.00 | ) | | | (0.93 | ) | | | (0.06 | ) | | | (0.07 | ) | | | 0.00 | | | | (0.13 | ) |
Dynamic Allocation Fund - Adviser Class (1)(2) |
2022 | | $ | 14.07 | | | | 0.07 | | | | (2.20 | ) | | | (2.13 | ) | | | (0.06 | ) | | | (0.36 | ) | | | 0.00 | | | | (0.42 | ) |
2021 | | $ | 13.46 | | | | 0.04 | | | | 2.65 | | | | 2.69 | | | | (0.08 | ) | | | (2.00 | ) | | | 0.00 | | | | (2.08 | ) |
2020 | | $ | 11.91 | | | | 0.07 | | | | 1.81 | | | | 1.88 | | | | (0.06 | ) | | | (0.27 | ) | | | 0.00 | | | | (0.33 | ) |
2019 | | $ | 9.82 | | | | 0.13 | | | | 2.24 | | | | 2.37 | | | | (0.10 | ) | | | (0.18 | ) | | | 0.00 | | | | (0.28 | ) |
2018 | | $ | 10.88 | | | | 0.09 | | | | (1.00 | ) | | | (0.91 | ) | | | (0.08 | ) | | | (0.07 | ) | | | 0.00 | | | | (0.15 | ) |
Dynamic Allocation Fund - Institutional Class (1)(2) |
2022 | | $ | 14.04 | | | | 0.06 | | | | (2.19 | ) | | | (2.13 | ) | | | (0.06 | ) | | | (0.36 | ) | | | 0.00 | | | | (0.42 | ) |
2021 | | $ | 13.45 | | | | 0.03 | | | | 2.64 | | | | 2.67 | | | | (0.08 | ) | | | (2.00 | ) | | | 0.00 | | | | (2.08 | ) |
2020 | | $ | 11.90 | | | | 0.08 | | | | 1.80 | | | | 1.88 | | | | (0.06 | ) | | | (0.27 | ) | | | 0.00 | | | | (0.33 | ) |
2019 | | $ | 9.82 | | | | 0.15 | | | | 2.23 | | | | 2.38 | | | | (0.12 | ) | | | (0.18 | ) | | | 0.00 | | | | (0.30 | ) |
2018 | | $ | 10.86 | | | | 0.12 | | | | (1.00 | ) | | | (0.88 | ) | | | (0.09 | ) | | | (0.07 | ) | | | 0.00 | | | | (0.16 | ) |
Quantex Fund - Retail Class (1)(2) |
2022 | | $ | 38.89 | | | | 0.05 | | | | (5.47 | ) | | | (5.42 | ) | | | (0.89 | ) | | | 0.00 | | | | 0.00 | | | | (0.89 | ) |
2021 | | $ | 35.64 | | | | (0.02 | ) | | | 9.77 | | | | 9.75 | | | | (0.02 | ) | | | (6.48 | ) | | | 0.00 | | | | (6.50 | ) |
2020 | | $ | 37.91 | | | | 0.20 | | | | (2.28 | ) | | | (2.08 | ) | | | (0.19 | ) | | | 0.00 | | | | 0.00 | | | | (0.19 | ) |
2019 | | $ | 32.22 | | | | 0.19 | | | | 5.75 | | | | 5.94 | | | | (0.25 | ) | | | 0.00 | | | | 0.00 | | | | (0.25 | ) |
2018 | | $ | 36.76 | | | | (0.01 | ) | | | (4.53 | ) | | | (4.54 | ) | | | 0.00 | | | | 0.00 | | | | 0.00 | | | | 0.00 | |
Quantex Fund - Adviser Class (1)(2) |
2022 | | $ | 39.15 | | | | 0.13 | | | | (5.51 | ) | | | (5.38 | ) | | | (0.89 | ) | | | 0.00 | | | | 0.00 | | | | (0.89 | ) |
2021 | | $ | 35.75 | | | | 0.13 | | | | 9.77 | | | | 9.90 | | | | (0.02 | ) | | | (6.48 | ) | | | 0.00 | | | | (6.50 | ) |
2020 | | $ | 38.01 | | | | 0.23 | | | | (2.28 | ) | | | (2.05 | ) | | | (0.21 | ) | | | 0.00 | | | | 0.00 | | | | (0.21 | ) |
2019 | | $ | 32.28 | | | | 0.24 | | | | 5.76 | | | | 6.00 | | | | (0.27 | ) | | | 0.00 | | | | 0.00 | | | | (0.27 | ) |
2018 | | $ | 36.78 | | | | 0.10 | | | | (4.60 | ) | | | (4.50 | ) | | | 0.00 | | | | 0.00 | | | | 0.00 | | | | 0.00 | |
Quantex - Institutional Class (1)(2) |
2022 | | $ | 39.07 | | | | 0.12 | | | | (5.50 | ) | | | (5.38 | ) | | | (0.89 | ) | | | 0.00 | | | | 0.00 | | | | (0.89 | ) |
2021 | | $ | 35.70 | | | | 0.09 | | | | 9.78 | | | | 9.87 | | | | (0.02 | ) | | | (6.48 | ) | | | 0.00 | | | | (6.50 | ) |
2020 | | $ | 38.01 | | | | 0.26 | | | | (2.31 | ) | | | (2.05 | ) | | | (0.26 | ) | | | 0.00 | | | | 0.00 | | | | (0.26 | ) |
2019 | | $ | 32.29 | | | | 0.29 | | | | 5.77 | | | | 6.06 | | | | (0.34 | ) | | | 0.00 | | | | 0.00 | | | | (0.34 | ) |
2018 | | $ | 36.77 | | | | 0.20 | | | | (4.62 | ) | | | (4.42 | ) | | | (0.06 | ) | | | 0.00 | | | | 0.00 | | | | (0.06 | ) |
|
See footnotes on pages 90 and 91.
The accompanying notes are an integral part of these financial statements.
Page 88 | 2022 Annual Report | December 31, 2022 |
| | | | | | | | | | Ratios/
Supplemental
Data | |
| | Net Asset
Value, End
of Period | | | Total Return
(Assumes
Reinvestment of
Distributions) | | | Net Assets,
End of Period
($000) | | | Ratio of Net
Investment
Income (Loss)
to Average
Net Assets | | | Ratio of Expenses to
Average Net Assets
After Fee Reductions (4) | | | Ratio of Expenses
to Average Net
Assets Before Fee
Reductions (5) | | | Portfolio
Turnover
Rate | |
| | | | |
| | $ | 11.36 | | | | (15.53 | %) | | $ | 7,767 | | | | 0.22 | % | | | 1.32 | % | | | 1.41 | % | | | 295 | % |
| | $ | 13.93 | | | | 19.54 | % | | $ | 9,850 | | | | (0.21 | %) | | | 1.34 | % | | | 1.43 | % | | | 213 | % |
| | $ | 13.39 | | | | 15.37 | % | | $ | 37,392 | | | | 0.27 | % | | | 1.41 | % | | | 1.51 | % | | | 236 | % |
| | $ | 11.87 | | | | 24.00 | % | | $ | 40,977 | | | | 0.97 | % | | | 1.41 | % | | | 1.51 | % | | | 265 | % |
| | $ | 9.79 | | | | (8.66 | %) | | $ | 40,732 | | | | 0.62 | % | | | 1.45 | % | | | 1.55 | % | | | 273 | % |
| | | |
| | $ | 11.52 | | | | (15.23 | %) | | $ | 23,048 | | | | 0.57 | % | | | 0.96 | % | | | 1.05 | % | | | 295 | % |
| | $ | 14.07 | | | | 20.02 | % | | $ | 28,129 | | | | 0.25 | % | | | 0.98 | % | | | 1.07 | % | | | 213 | % |
| | $ | 13.46 | | | | 15.85 | % | | $ | 13,322 | | | | 0.61 | % | | | 1.06 | % | | | 1.16 | % | | | 236 | % |
| | $ | 11.91 | | | | 24.29 | % | | $ | 13,137 | | | | 1.20 | % | | | 1.18 | % | | | 1.28 | % | | | 265 | % |
| | $ | 9.82 | | | | (8.49 | %) | | $ | 11,198 | | | | 0.84 | % | | | 1.23 | % | | | 1.33 | % | | | 273 | % |
| | | |
| | $ | 11.49 | | | | (15.26 | %) | | $ | 184,201 | | | | 0.53 | % | | | 1.02 | % | | | 1.11 | % | | | 295 | % |
| | $ | 14.04 | | | | 19.88 | % | | $ | 199,753 | | | | 0.21 | % | | | 1.00 | % | | | 1.09 | % | | | 213 | % |
| | $ | 13.45 | | | | 15.94 | % | | $ | 148,566 | | | | 0.67 | % | | | 1.01 | % | | | 1.11 | % | | | 236 | % |
| | $ | 11.90 | | | | 24.40 | % | | $ | 146,119 | | | | 1.38 | % | | | 1.00 | % | | | 1.10 | % | | | 265 | % |
| | $ | 9.82 | | | | (8.18 | %) | | $ | 121,965 | | | | 1.08 | % | | | 1.01 | % | | | 1.11 | % | | | 273 | % |
| | | |
| | $ | 32.58 | | | | (13.75 | %) | | $ | 12,477 | | | | 0.15 | % | | | 1.60 | % | | | 1.60 | % | | | 56 | % |
| | $ | 38.89 | | | | 27.34 | % | | $ | 16,406 | | | | (0.05 | %) | | | 1.60 | % | | | 1.60 | % | | | 64 | % |
| | $ | 35.64 | | | | (5.36 | %) | | $ | 18,352 | | | | 0.65 | % | | | 1.53 | % | | | 1.53 | % | | | 88 | % |
| | $ | 37.91 | | | | 18.48 | % | | $ | 24,979 | | | | 0.52 | % | | | 1.53 | % | | | 1.53 | % | | | 82 | % |
| | $ | 32.22 | | | | (12.35 | %) | | $ | 28,319 | | | | (0.03 | %) | | | 1.57 | % | | | 1.62 | % | | | 116 | % |
| | | |
| | $ | 32.88 | | | | (13.55 | %) | | $ | 3,646 | | | | 0.36 | % | | | 1.38 | % | | | 1.38 | % | | | 56 | % |
| | $ | 39.15 | | | | 27.68 | % | | $ | 4,575 | | | | 0.31 | % | | | 1.33 | % | | | 1.33 | % | | | 64 | % |
| | $ | 35.75 | | | | (5.25 | %) | | $ | 986 | | | | 0.77 | % | | | 1.41 | % | | | 1.41 | % | | | 88 | % |
| | $ | 38.01 | | | | 18.63 | % | | $ | 1,113 | | | | 0.67 | % | | | 1.41 | % | | | 1.41 | % | | | 82 | % |
| | $ | 32.28 | | | | (12.22 | %) | | $ | 923 | | | | 0.28 | % | | | 1.42 | % | | | 1.47 | % | | | 116 | % |
| | | |
| | $ | 32.80 | | | | (13.58 | %) | | $ | 16,045 | | | | 0.34 | % | | | 1.40 | % | | | 1.40 | % | | | 56 | % |
| | $ | 39.07 | | | | 27.63 | % | | $ | 21,046 | | | | 0.20 | % | | | 1.36 | % | | | 1.36 | % | | | 64 | % |
| | $ | 35.70 | | | | (5.22 | %) | | $ | 20,756 | | | | 0.85 | % | | | 1.37 | % | | | 1.37 | % | | | 88 | % |
| | $ | 38.01 | | | | 18.81 | % | | $ | 36,646 | | | | 0.82 | % | | | 1.25 | % | | | 1.25 | % | | | 82 | % |
| | $ | 32.29 | | | | (12.05 | %) | | $ | 35,414 | | | | 0.54 | % | | | 1.21 | % | | | 1.26 | % | | | 116 | % |
| | | |
See footnotes on pages 90 and 91.
The accompanying notes are an integral part of these financial statements.
2022 Annual Report | December 31, 2022 | Page 89 |
Financial Highlights
For the Years Ended December 31, | |
| | | | | | | Income
from
Investment Operations | | | Less
Distributions | |
| | Net Asset
Value,
Beginning
of Period | | | Net
Investment
Income
(Loss) (3) | | | Net gains (losses)
on securities and
futures (both realized
and unrealized) | | | Total from
Investment
Operations | | | From Net
Investment
Income | | | From Net
Capital
Gains | | | From
Return of
Capital | | | Total
Distributions | |
Tactical Income Fund - Retail Class (1)(2) |
2022 | | $ | 9.63 | | | | 0.12 | | | | (0.70 | ) | | | (0.58 | ) | | | (0.12 | ) | | | 0.00 | | | | 0.00 | | | | (0.12 | ) |
2021 | | $ | 9.98 | | | | 0.13 | | | | (0.33 | ) | | | (0.20 | ) | | | (0.15 | ) | | | 0.00 | | | | 0.00 | | | | (0.15 | ) |
2020 | | $ | 9.46 | | | | 0.21 | | | | 0.49 | | | | 0.70 | | | | (0.18 | ) | | | 0.00 | | | | 0.00 | | | | (0.18 | ) |
2019 | | $ | 9.03 | | | | 0.23 | | | | 0.42 | | | | 0.65 | | | | (0.22 | ) | | | 0.00 | | | | 0.00 | | | | (0.22 | ) |
2018 | | $ | 9.37 | | | | 0.17 | | | | (0.33 | ) | | | (0.16 | ) | | | (0.18 | ) | | | 0.00 | | | | 0.00 | | | | (0.18 | ) |
Tactical Income Fund - Adviser Class (1)(2) |
2022 | | $ | 9.64 | | | | 0.16 | | | | (0.70 | ) | | | (0.54 | ) | | | (0.16 | ) | | | 0.00 | | | | 0.00 | | | | (0.16 | ) |
2021 | | $ | 9.99 | | | | 0.21 | | | | (0.37 | ) | | | (0.16 | ) | | | (0.19 | ) | | | 0.00 | | | | 0.00 | | | | (0.19 | ) |
2020 | | $ | 9.47 | | | | 0.25 | | | | 0.49 | | | | 0.74 | | | | (0.22 | ) | | | 0.00 | | | | 0.00 | | | | (0.22 | ) |
2019 | | $ | 9.04 | | | | 0.26 | | | | 0.42 | | | | 0.68 | | | | (0.25 | ) | | | 0.00 | | | | 0.00 | | | | (0.25 | ) |
2018 | | $ | 9.38 | | | | 0.21 | | | | (0.35 | ) | | | (0.14 | ) | | | (0.20 | ) | | | 0.00 | | | | 0.00 | | | | (0.20 | ) |
Tactical Income Fund - Institutional Class (1)(2) |
2022 | | $ | 9.64 | | | | 0.15 | | | | (0.70 | ) | | | (0.55 | ) | | | (0.15 | ) | | | 0.00 | | | | 0.00 | | | | (0.15 | ) |
2021 | | $ | 9.99 | | | | 0.20 | | | | (0.36 | ) | | | (0.16 | ) | | | (0.19 | ) | | | 0.00 | | | | 0.00 | | | | (0.19 | ) |
2020 | | $ | 9.47 | | | | 0.24 | | | | 0.50 | | | | 0.74 | | | | (0.22 | ) | | | 0.00 | | | | 0.00 | | | | (0.22 | ) |
2019 | | $ | 9.04 | | | | 0.27 | | | | 0.42 | | | | 0.69 | | | | (0.26 | ) | | | 0.00 | | | | 0.00 | | | | (0.26 | ) |
2018 | | $ | 9.38 | | | | 0.23 | | | | (0.35 | ) | | | (0.12 | ) | | | (0.22 | ) | | | 0.00 | | | | 0.00 | | | | (0.22 | ) |
Institutional Prime Money Market Fund (1)(2) |
2022 | | $ | 1.0001 | | | | 0.0167 | | | | (0.0008 | ) | | | 0.0159 | | | | (0.0160 | ) | | | 0.0000 | | | | 0.0000 | | | | (0.0160 | ) |
2021 | | $ | 1.0003 | | | | 0.0005 | | | | 0.0003 | | | | 0.0008 | | | | (0.0010 | ) | | | 0.0000 | | | | 0.0000 | | | | (0.0010 | ) |
2020 | | $ | 1.0000 | | | | 0.0058 | | | | (0.0005 | ) | | | 0.0053 | | | | (0.0050 | ) | | | 0.0000 | | | | 0.0000 | | | | (0.0050 | ) |
2019 | | $ | 0.9999 | | | | 0.0231 | | | | 0.0000 | | | | 0.0231 | | | | (0.0230 | ) | | | 0.0000 | | | | 0.0000 | | | | (0.0230 | ) |
2018 | | $ | 0.9999 | | | | 0.0190 | | | | 0.0000 | | | | 0.0190 | | | | (0.0190 | ) | | | 0.0000 | | | | 0.0000 | | | | (0.0190 | ) |
|
1 | Ratio of net investment income (loss) to average net assets, ratio of expenses to average net assets after fee reductions, and ratio of expenses to average net assets before fee reductions do not include impact of expenses of the underlying security holdings as represented in the schedule of investments. |
2 | Recognition of net investment income by the Fund is affected by the timing of the declaration of dividends by the underlying investment companies in which the Fund invests. |
3 | Except for the Money Market Fund, net investment income per share is based on average shares outstanding during the period. |
The accompanying notes are an integral part of these financial statements.
Page 90 | 2022 Annual Report | December 31, 2022 |
| | | | | | | | | | Ratios/
Supplemental
Data | |
| | Net Asset
Value, End
of Period | | | Total Return
(Assumes
Reinvestment of
Distributions) | | | Net Assets,
End of Period
($000) | | | Ratio of Net
Investment
Income (Loss)
to Average
Net Assets | | | Ratio of Expenses to
Average Net Assets
After Fee Reductions (4) | | | Ratio of Expenses
to Average Net
Assets Before Fee
Reductions (5) | | | Portfolio
Turnover
Rate | |
| | | | |
| | $ | 8.93 | | | | (5.99 | %) | | $ | 2,247 | | | | 1.27 | % | | | 1.11 | % | | | 1.22 | % | | | 514 | % |
| | $ | 9.63 | | | | (2.01 | %) | | $ | 2,721 | | | | 1.10 | % | | | 1.14 | % | | | 1.25 | % | | | 250 | % |
| | $ | 9.98 | | | | 7.46 | % | | $ | 12,231 | | | | 1.87 | % | | | 1.15 | % | | | 1.26 | % | | | 69 | % |
| | $ | 9.46 | | | | 7.24 | % | | $ | 11,137 | | | | 2.27 | % | | | 1.14 | % | | | 1.25 | % | | | 95 | % |
| | $ | 9.03 | | | | (1.67 | %) | | $ | 14,932 | | | | 1.88 | % | | | 1.15 | % | | | 1.26 | % | | | 102 | % |
| | | |
| | $ | 8.94 | | | | (5.65 | %) | | $ | 10,625 | | | | 1.77 | % | | | 0.71 | % | | | 0.82 | % | | | 514 | % |
| | $ | 9.64 | | | | (1.60 | %) | | $ | 8,982 | | | | 1.98 | % | | | 0.75 | % | | | 0.86 | % | | | 250 | % |
| | $ | 9.99 | | | | 7.86 | % | | $ | 5,463 | | | | 2.28 | % | | | 0.79 | % | | | 0.90 | % | | | 69 | % |
| | $ | 9.47 | | | | 7.54 | % | | $ | 4,205 | | | | 2.64 | % | | | 0.88 | % | | | 0.99 | % | | | 95 | % |
| | $ | 9.04 | | | | (1.45 | %) | | $ | 3,570 | | | | 2.33 | % | | | 0.95 | % | | | 1.06 | % | | | 102 | % |
| | | |
| | $ | 8.94 | | | | (5.70 | %) | | $ | 54,455 | | | | 1.65 | % | | | 0.78 | % | | | 0.89 | % | | | 514 | % |
| | $ | 9.64 | | | | (1.62 | %) | | $ | 57,638 | | | | 1.90 | % | | | 0.79 | % | | | 0.90 | % | | | 250 | % |
| | $ | 9.99 | | | | 7.86 | % | | $ | 50,410 | | | | 2.25 | % | | | 0.77 | % | | | 0.88 | % | | | 69 | % |
| | $ | 9.47 | | | | 7.67 | % | | $ | 46,490 | | | | 2.72 | % | | | 0.76 | % | | | 0.87 | % | | | 95 | % |
| | $ | 9.04 | | | | (1.22 | %) | | $ | 48,437 | | | | 2.50 | % | | | 0.76 | % | | | 0.87 | % | | | 102 | % |
| | | |
| | $ | 1.0000 | | | | 1.63 | % | | $ | 693,083 | | | | 1.67 | % | | | 0.17 | % | | | 0.45 | % | | | N/A | |
| | $ | 1.0001 | | | | 0.03 | % | | $ | 626,993 | | | | 0.05 | % | | | 0.11 | % | | | 0.50 | % | | | N/A | |
| | $ | 1.0003 | | | | 0.57 | % | | $ | 336,445 | | | | 0.57 | % | | | 0.15 | % | | | 0.52 | % | | | N/A | |
| | $ | 1.0000 | | | | 2.31 | % | | $ | 370,120 | | | | 2.30 | % | | | 0.13 | % | | | 0.50 | % | | | N/A | |
| | $ | 0.9999 | | | | 1.90 | % | | $ | 471,603 | | | | 1.90 | % | | | 0.16 | % | | | 0.51 | % | | | N/A | |
| | | |
4 | Ratio of expenses to average net assets after fee reductions reflects contractual or voluntary waivers and reimbursements of expenses by the investment adviser and transfer agent. |
5 | Ratio of expenses to average net assets before fee reductions reflects the total expenses before reductions reported in the statements of operations. |
* | Actual amounts were less than one-half of a cent per share |
The accompanying notes are an integral part of these financial statements.
2022 Annual Report | December 31, 2022 | Page 91 |
Notes to Financial Statements
December 31, 2022
1. Organization
Meeder Funds (the Trust) is organized as a Massachusetts business trust and is registered under the Investment Company Act of 1940, as amended (the 1940 Act), as a diversified, open-end management investment company. The Trust offers ten separate series, all of which are included in this report: Muirfield Fund (Muirfield), Spectrum Fund (Spectrum), Global Allocation Fund (Global), Balanced Fund (Balanced), Moderate Allocation Fund (Moderate), Conservative Allocation Fund (Conservative), Dynamic Allocation Fund (Dynamic), Quantex Fund (Quantex), Tactical Income Fund (Income), and Institutional Prime Money Market Fund (Money Market)(the Funds).
Each Fund, except Money Market, offers three classes of shares: Retail Class, Adviser Class, and Institutional Class. Money Market offers only one class of shares. The share classes differ with respect to distribution fees, service fees, and other expenses allocated to each class. Eligibility to purchase Adviser and Institutional Class shares is generally limited to customers of financial intermediaries who enter into special arrangements with the Funds or who meet certain initial investment minimums.
Money Market operates as an institutional money market fund open to all forms of investors. Its net asset value fluctuates based upon changes in the value of its investments and the value of its shares is calculated daily to four decimal places. Money Market has adopted policies and procedures to impose liquidity fees on redemptions or temporary redemption gates in the event that the Fund’s weekly liquid assets fall below designated thresholds and the Board of Trustees determines that such liquidity fees or redemption gates are in the best interests of the Fund.
For more information regarding the Funds’ objectives, strategies, and differences in share classes, please refer to the Funds’ prospectus.
2. Significant Accounting Policies
The Funds’ financial statements are prepared in conformity with accounting principles generally accepted in the United States of America (GAAP), which require management to make certain estimates and assumptions that affect the reported amounts of assets and liabilities and disclosure of contingent assets and liabilities at the date of the financial statements. The Trust is an investment company and applies the accounting and reporting guidance of the Financial Accounting Standards Board (FASB) Accounting Standards Codification Topic 946 Financial Services Companies. The following summarizes the significant accounting policies of the Trust and the Funds:
Repurchase agreements. Each Fund may engage in repurchase agreement transactions whereby the Fund takes possession of an underlying debt instrument subject to an obligation of the seller to repurchase the instrument from the Fund and an obligation of the Fund to resell the instrument at an agreed upon price and term. At all times, the Fund maintains the fair value of collateral, including accrued interest, of at least 100% of the amount of the repurchase agreement, plus accrued interest. If the seller defaults or the fair value of the collateral declines, realization of the collateral by the Fund may be delayed or limited.
Short sales. Spectrum may enter into short sales as part of its overall portfolio management strategy or to offset a potential decline in value of a security. The Fund may engage in short sales with respect to various types of securities, including ETFs. A short sale involves the sale of a security that is borrowed from a broker or other institution to complete the sale. The Fund may engage in short sales with respect to securities it owns, as well as securities that it does not own. Short sales expose the Fund to the risk that it will be required to acquire, convert, or exchange securities to replace the borrowed securities (also known as “covering” the short position) at a time when the securities sold short have appreciated in value, thus resulting in a loss to the Fund. The Fund’s investment performance may also suffer if the Fund is required to close out a short position earlier than it had intended. The Fund must segregate assets determined to be liquid in accordance with procedures established by the Board, or otherwise cover its position in a permissible manner. The Fund will be required to pledge its liquid assets to the broker in order to secure its performance on short sales. As a result, the assets pledged may not be available to meet the Fund’s needs for immediate cash or other liquidity. In addition, the Fund may be subject to expenses related to short sales that are not typically associated with investing in securities directly, such as costs of borrowing and margin account maintenance costs associated with the Fund’s open short positions. These types of short sales expenses are sometimes referred to as the “negative cost of carry,” and will tend to cause the Fund to lose money on a short sale even in instances where the price of the underlying security sold short does not change over the duration of the short sale. Dividend expenses on securities sold short and borrowing costs will be borne by the Fund and are reflected in the Statements of Operations.
Futures & options. Each Fund, except Money Market, may engage in transactions in financial futures contracts and options contracts in order to manage the risk of unanticipated changes in market values of securities held in the Fund, or which it intends to purchase. The futures and options contracts are adjusted by the daily exchange rate of the underlying currency, or index, and any gains or losses are recorded for financial statement purposes as unrealized gains or losses in the Statements of Assets and Liabilities and the Statements of Operations until the contract settlement date, at which time amounts are reflected as realized gains and losses in the Statements of Operations.
To the extent that a Fund enters into futures contracts on an index or group of securities, the Fund exposes itself to an indeterminate liability and will be required to pay or receive a sum of money measured by the change in the fair value of the index. Upon entering into a futures contract, the Fund is required to deposit an initial margin, which is either cash or securities (disclosed as pledged as collateral on the Schedules of Investments) in an amount equal to a certain percentage of the contract value. Subsequently, margin movements, which are equal to changes in the daily price or last sale price on the exchanges where futures contracts trade, are recorded as unrealized gains or losses until the contract is closed. When the contract
Page 92 | 2022 Annual Report | December 31, 2022 |
is closed, the Fund records a realized gain or loss equal to the difference between the proceeds from (or cost of) the closing transaction and the Fund’s basis in the contract. Should market conditions move unexpectedly, the Fund may not achieve the anticipated benefits of the futures contract and may realize a loss. The use of futures transactions involves the risk of imperfect correlation in movements in the price of futures contracts, interest rates, and the underlying hedged assets. With futures, there is minimal counterparty credit risk to the Fund since futures are exchange traded and the exchange’s clearinghouse, as counterparty to all exchange traded futures, guarantees the futures against default. Except for Money Market, it is normal practice for each Fund to invest in futures contracts on a daily basis. The Funds, except for Income and Money Market, typically utilize equity index futures contracts to equitize cash positions or adjust targeted stock market exposure. Except for Money Market, the fixed income portion of any Fund can utilize Treasury futures contracts in order to adjust duration.
Call and put option contracts involve the payment of a premium for the right to purchase or sell an individual security or index aggregate at a specified price until the expiration of the contract. Such transactions expose the Fund to the loss of the premium paid if the Fund does not sell or exercise the contract prior to the expiration date. In the case of a call option, sufficient cash or money market instruments will be segregated to complete the purchase. Options are fair valued on the basis of the daily settlement price or last sale on the exchanges where they trade and the changes in fair value are recorded as unrealized appreciation or depreciation until closed, exercised or expired. For the year ended December 31, 2022, there were no call or put options transacted for any of the Funds.
The Funds may write covered call or put options for which premiums received are recorded as liabilities and are subsequently adjusted to the current value of the options written. When written options are closed or exercised, premiums received are offset against the proceeds paid, and the Fund records realized gains or losses for the difference. When written options expire, the liability is eliminated, and the Fund records realized gains for the entire amount of premiums received. Although permitted, it is currently not normal practice for the Funds to write call and put options and none were written during the year ended December 31, 2022.
The fair value of derivative instruments, not accounted for as hedging instruments, as reported within the Statements of Assets and Liabilities as of December 31, 2022 was as follows:
Amount of Deposits at Broker and Unrealized Appreciation (Depreciation) on Derivatives |
| | Type of
Derivative/
Risk | Statements of Assets & Liabilities Location | | Fair Value of
Deposits at
Broker for Futures
Contracts | | | Value of
Unrealized
Appreciation
(Depreciation) | |
Muirfield | Equity contracts | Assets, Deposits at broker for futures contracts; Net Assets, Distributable Earnings (Accumulated Deficit) | | $ | 8,555,026 | | | $ | 538,915 | |
Spectrum | Equity contracts | Assets, Deposits at broker for futures contracts; Net Assets, Distributable Earnings (Accumulated Deficit) | | | 1,437,596 | | | | (435,122 | ) |
Global | Equity contracts | Assets, Deposits at broker for futures contracts; Net Assets, Distributable Earnings (Accumulated Deficit) | | | 855,188 | | | | (484,382 | ) |
Balanced | Equity contracts | Assets, Deposits at broker for futures contracts; Net Assets, Distributable Earnings (Accumulated Deficit) | | | 3,955,439 | | | | 412,349 | |
Moderate | Equity contracts | Assets, Deposits at broker for futures contracts; Net Assets, Distributable Earnings (Accumulated Deficit) | | | 594,225 | | | | (267,821 | ) |
Conservative | Equity contracts | Assets, Deposits at broker for futures contracts; Net Assets, Distributable Earnings (Accumulated Deficit) | | | 379,947 | | | | (55,420 | ) |
Dynamic | Equity contracts | Assets, Deposits at broker for futures contracts; Net Assets, Distributable Earnings (Accumulated Deficit) | | | 4,018,565 | | | | (2,065,826 | ) |
Quantex | Equity contracts | Assets, Deposits at broker for futures contracts; Net Assets, Distributable Earnings (Accumulated Deficit) | | | 947,746 | | | | (398,501 | ) |
2022 Annual Report | December 31, 2022 | Page 93 |
The effect of derivative instruments on the Statements of Operations for the year ended December 31, 2022 and related activity was as follows:
Amount of Realized Gain (Loss) on Derivatives Recognized in Income |
| | Type of
Derivative/
Risk | | Net Long
Contracts as of
December 31,
2021 | | | Long and
Short
Contracts
Opened
During the
Period | | | Long and
Short
Contracts
Closed/
Expired
During the
Period | | | Net Long
Contracts as of
December 31,
2022 | | Statement of Operations
Location | | For the
Year Ended
December 31,
2022 | |
Muirfield | Equity contracts | | | 361 | | | | 13,002 | | | | 13,004 | | | | 359 | | Net realized gains (losses) from futures contracts | | $ | (12,194,934 | ) |
Spectrum | Equity contracts | | | 63 | | | | 4,097 | | | | 3,998 | | | | 162 | | Net realized gains (losses) from futures contracts | | | (1,072,338 | ) |
Global | Equity contracts | | | 110 | | | | 1,085 | | | | 1,055 | | | | 140 | | Net realized gains (losses) from futures contracts | | | (1,680,805 | ) |
Balanced | Equity contracts | | | 117 | | | | 4,907 | | | | 4,916 | | | | 108 | | Net realized gains (losses) from futures contracts | | | (3,241,539 | ) |
Moderate | Equity contracts | | | 39 | | | | 1,386 | | | | 1,328 | | | | 97 | | Net realized gains (losses) from futures contracts | | | (1,724,406 | ) |
Conservative | Equity contracts | | | 29 | | | | 747 | | | | 742 | | | | 34 | | Net realized gains (losses) from futures contracts | | | (651,607 | ) |
Dynamic | Equity contracts | | | 448 | | | | 6,035 | | | | 5,733 | | | | 750 | | Net realized gains (losses) from futures contracts | | | (9,138,942 | ) |
Quantex | Equity contracts | | | 43 | | | | 688 | | | | 678 | | | | 53 | | Net realized gains (losses) from futures contracts | | | (2,222,162 | ) |
Change in Unrealized Gain or (Loss) on Derivatives Recognized in Income |
| | Type of
Derivative/ Risk | Statement of Operations Location | | For the
Year Ended
December 31, 2022 | |
Muirfield | Equity contracts | Net change in unrealized appreciation (depreciation) of futures contracts | | $ | 150,017 | |
Spectrum | Equity contracts | Net change in unrealized appreciation (depreciation) of futures contracts | | | (257,650 | ) |
Global | Equity contracts | Net change in unrealized appreciation (depreciation) of futures contracts | | | (758,848 | ) |
Balanced | Equity contracts | Net change in unrealized appreciation (depreciation) of futures contracts | | | 410,442 | |
Moderate | Equity contracts | Net change in unrealized appreciation (depreciation) of futures contracts | | | (307,452 | ) |
Conservative | Equity contracts | Net change in unrealized appreciation (depreciation) of futures contracts | | | (131,848 | ) |
Dynamic | Equity contracts | Net change in unrealized appreciation (depreciation) of futures contracts | | | (3,284,944 | ) |
Quantex | Equity contracts | Net change in unrealized appreciation (depreciation) of futures contracts | | | (631,316 | ) |
Federal income taxes. It is each Fund’s policy to continue to comply with the requirements of Subchapter M of the Internal Revenue Code applicable to regulated investment companies and to distribute substantially all of its taxable income and net capital gains to its shareholders. Therefore, no federal income tax provision is required. The Funds recognize the tax benefits or expenses of uncertain tax positions only where the position is “more likely than not” to be sustained assuming examination by tax authorities. Management has reviewed tax positions taken on Federal income tax returns for all open tax years (tax years ended December 31, 2019 through December 31, 2022) and has concluded that no provision for unrecognized tax benefits or expenses is required in these financial statements. Each Fund identifies its major tax jurisdictions as U.S. Federal and certain State tax authorities; however the Funds are not aware of any tax positions for which it is reasonably possible that the total amounts of unrecognized tax benefits will change materially in the next twelve months. The Funds recognize interest and penalties, if any, related to unrecognized tax benefits as income tax expense in the Statements of Operations as incurred. During the year ended December 31, 2022, the Funds did not incur any material interest or penalties.
Distributions to shareholders. Distributions to shareholders are recorded on the ex-dividend date. Muirfield, Spectrum, Global, Balanced, Moderate, Conservative, Dynamic, and Quantex declare and pay dividends from net investment income, if any, on a quarterly basis. Income declares and pays dividends from net investment income on a monthly basis. Money Market declares dividends from net investment income on a daily basis and pays such dividends on a monthly basis. Each Fund distributes net capital gains, if any, on an annual basis.
Page 94 | 2022 Annual Report | December 31, 2022 |
Distributions from net investment income and from net capital gains are determined in accordance with income tax regulations, which may differ from GAAP. Permanent differences relate to redemptions treated as distributions for tax purposes (i.e. equalization). Accordingly, timing differences relating to shareholder distributions are reflected in the components of net assets and permanent book and tax differences have been reclassified within the components of net assets based on their ultimate characterization for federal income tax purposes. For the year ended December 31, 2022, the Funds made the following reclassifications to increase/(decrease) the components of net assets:
| | | Capital | | | Distributable Earnings
(Accumulated Deficit) | |
Muirfield | | $ | 3,579,913 | | | $ | (3,579,913 | ) |
Spectrum | | | 1,100,385 | | | | (1,100,385 | ) |
Investment income & expenses allocation. For all Funds, except Money Market, income and expenses (other than expenses attributable to a specific class) are allocated to each class of shares based on its relative net assets. Expenses incurred by the Trust that do not specifically relate to an individual Fund of the Trust are allocated to the Funds based on each Fund’s relative net assets or other appropriate basis.
Capital Share Transactions. All Funds are authorized to issue an unlimited number of shares. Transactions in the capital shares of the Funds for the year ended December 31, 2022 and the year ended December 31, 2021 were as follows:
| | | Issued | | | Reinvested | |
Share Class | | Amount | | | Shares | | | Amount | | | Shares | |
Year Ended December 31, 2022 | | | | | | | | | | | | | | | | |
Muirfield - Retail | | $ | 10,367,547 | | | | 1,196,225 | | | $ | 979,107 | | | | 116,491 | |
Muirfield - Adviser | | | 15,179,589 | | | | 1,706,964 | | | | 2,505,775 | | | | 293,990 | |
Muirfield - Institutional | | | 147,454,249 | | | | 16,783,913 | | | | 13,037,343 | | | | 1,527,794 | |
Spectrum - Retail | | | 339,270 | | | | 26,671 | | | | 48,366 | | | | 3,966 | |
Spectrum - Adviser | | | 4,736,600 | | | | 364,858 | | | | 910,490 | | | | 73,892 | |
Spectrum - Institutional | | | 29,541,281 | | | | 2,308,107 | | | | 4,056,777 | | | | 328,440 | |
Global - Retail | | | 461,718 | | | | 45,302 | | | | 18,332 | | | | 1,800 | |
Global - Adviser | | | 504,831 | | | | 45,774 | | | | 31,246 | | | | 3,038 | |
Global - Institutional | | | 3,971,333 | | | | 385,213 | | | | 189,552 | | | | 18,481 | |
Balanced - Retail | | | 2,251,109 | | | | 187,078 | | | | 234,363 | | | | 20,124 | |
Balanced - Adviser | | | 11,960,964 | | | | 952,401 | | | | 2,472,129 | | | | 210,136 | |
Balanced - Institutional | | | 58,578,227 | | | | 4,729,016 | | | | 10,432,489 | | | | 885,292 | |
Moderate - Retail | | | 371,399 | | | | 32,399 | | | | 28,570 | | | | 2,590 | |
Moderate - Adviser | | | 8,553,108 | | | | 714,051 | | | | 910,055 | | | | 82,141 | |
Moderate - Institutional | | | 24,027,486 | | | | 2,071,827 | | | | 3,710,716 | | | | 334,386 | |
Conservative - Retail | | | 420,026 | | | | 19,355 | | | | 96,843 | | | | 4,612 | |
Conservative - Adviser | | | 4,219,912 | | | | 187,079 | | | | 417,614 | | | | 19,655 | |
Conservative - Institutional | | | 21,837,551 | | | | 985,257 | | | | 1,805,958 | | | | 84,817 | |
Dynamic - Retail | | | 1,300,362 | | | | 109,675 | | | | 239,533 | | | | 20,280 | |
Dynamic - Adviser | | | 3,065,143 | | | | 239,717 | | | | 803,118 | | | | 67,012 | |
Dynamic - Institutional | | | 55,474,423 | | | | 4,492,602 | | | | 6,535,164 | | | | 546,630 | |
Quantex - Retail | | | 643,824 | | | | 19,080 | | | | 347,726 | | | | 11,571 | |
Quantex - Adviser | | | 377,374 | | | | 10,236 | | | | 94,910 | | | | 3,125 | |
Quantex - Institutional | | | 2,559,200 | | | | 72,956 | | | | 426,798 | | | | 14,087 | |
Income - Retail | | | 251,290 | | | | 27,068 | | | | 31,953 | | | | 3,546 | |
Income - Adviser | | | 3,585,479 | | | | 388,928 | | | | 175,491 | | | | 19,417 | |
Income - Institutional | | | 15,117,304 | | | | 1,643,283 | | | | 915,083 | | | | 101,247 | |
Money Market | | | 1,037,794,871 | | | | 1,038,099,219 | | | | 685,718 | | | | 685,953 | |
2022 Annual Report | December 31, 2022 | Page 95 |
| | | Issued | | | Reinvested | |
Share Class | | Amount | | | Shares | | | Amount | | | Shares | |
| | | | | | | | | | | | | | | | | |
Year Ended December 31, 2021 | | | | | | | | | | | | | | | | |
Muirfield - Retail | | $ | 6,469,284 | | | | 694,953 | | | $ | 1,389,369 | | | | 146,318 | |
Muirfield - Adviser | | | 105,372,752 | | | | 12,157,906 | | | | 3,472,316 | | | | 362,120 | |
Muirfield - Institutional | | | 206,153,900 | | | | 22,156,762 | | | | 17,951,987 | | | | 1,867,042 | |
Spectrum - Retail | | | 812,426 | | | | 62,421 | | | | 133,412 | | | | 9,600 | |
Spectrum - Adviser | | | 38,585,700 | | | | 3,016,241 | | | | 2,008,738 | | | | 143,722 | |
Spectrum - Institutional | | | 42,300,867 | | | | 3,129,326 | | | | 8,900,032 | | | | 634,509 | |
Global - Retail | | | 464,829 | | | | 37,814 | | | | 355,386 | | | | 30,743 | |
Global - Adviser | | | 5,718,573 | | | | 480,145 | | | | 507,971 | | | | 43,678 | |
Global - Institutional | | | 5,622,509 | | | | 464,097 | | | | 3,657,943 | | | | 315,612 | |
Balanced - Retail | | | 1,419,522 | | | | 103,666 | | | | 536,279 | | | | 39,803 | |
Balanced - Adviser | | | 75,167,324 | | | | 5,639,400 | | | | 5,644,455 | | | | 415,494 | |
Balanced - Institutional | | | 76,607,173 | | | | 5,553,310 | | | | 24,603,677 | | | | 1,806,617 | |
Moderate - Retail | | | 243,792 | | | | 19,203 | | | | 68,964 | | | | 5,442 | |
Moderate - Adviser | | | 32,545,012 | | | | 2,569,740 | | | | 1,909,210 | | | | 150,181 | |
Moderate - Institutional | | | 33,332,710 | | | | 2,570,281 | | | | 9,142,151 | | | | 717,897 | |
Conservative - Retail | | | 834,351 | | | | 34,357 | | | | 373,133 | | | | 15,690 | |
Conservative - Adviser | | | 24,966,663 | | | | 1,019,612 | | | | 1,341,555 | | | | 55,711 | |
Conservative - Institutional | | | 28,456,983 | | | | 1,152,983 | | | | 6,332,940 | | | | 262,413 | |
Dynamic - Retail | | | 826,784 | | | | 56,185 | | | | 1,280,969 | | | | 91,616 | |
Dynamic - Adviser | | | 30,927,011 | | | | 2,198,166 | | | | 3,644,409 | | | | 258,053 | |
Dynamic - Institutional | | | 76,433,295 | | | | 5,106,615 | | | | 25,863,854 | | | | 1,835,669 | |
Quantex - Retail | | | 4,529,307 | | | | 104,989 | | | | 2,342,181 | | | | 60,226 | |
Quantex - Adviser | | | 4,794,010 | | | | 125,606 | | | | 649,231 | | | | 16,579 | |
Quantex - Institutional | | | 7,445,118 | | | | 184,488 | | | | 3,055,546 | | | | 78,187 | |
Income - Retail | | | 573,050 | | | | 58,803 | | | | 39,594 | | | | 4,065 | |
Income - Adviser | | | 10,993,038 | | | | 1,108,656 | | | | 185,116 | | | | 18,972 | |
Income - Institutional | | | 24,604,439 | | | | 2,513,602 | | | | 1,063,777 | | | | 109,136 | |
Money Market | | | 1,011,642,367 | | | | 1,011,455,624 | | | | 35,042 | | | | 35,036 | |
| | | Redeemed | | | Net Increase (Decrease) | |
Share Class | | Amount | | | Shares | | | Amount | | | Shares | |
Year Ended December 31, 2022 | | | | | | | | | | | | | | | | |
Muirfield - Retail | | $ | (10,392,577 | ) | | | (1,227,021 | ) | | $ | 954,077 | | | | 85,695 | |
Muirfield - Adviser | | | (13,699,847 | ) | | | (1,554,998 | ) | | | 3,985,517 | | | | 445,956 | |
Muirfield - Institutional | | | (150,749,991 | ) | | | (17,519,795 | ) | | | 9,741,601 | | | | 791,912 | |
Spectrum - Retail | | | (877,124 | ) | | | (69,156 | ) | | | (489,488 | ) | | | (38,519 | ) |
Spectrum - Adviser | | | (5,121,441 | ) | | | (398,943 | ) | | | 525,649 | | | | 39,807 | |
Spectrum - Institutional | | | (31,982,728 | ) | | | (2,508,992 | ) | | | 1,615,330 | | | | 127,555 | |
Global - Retail | | | (1,183,450 | ) | | | (115,504 | ) | | | (703,400 | ) | | | (68,402 | ) |
Global - Adviser | | | (861,702 | ) | | | (82,102 | ) | | | (325,625 | ) | | | (33,290 | ) |
Global - Institutional | | | (10,757,054 | ) | | | (1,057,581 | ) | | | (6,596,169 | ) | | | (653,887 | ) |
Balanced - Retail | | | (2,421,578 | ) | | | (202,999 | ) | | | 63,894 | | | | 4,203 | |
Balanced - Adviser | | | (9,478,358 | ) | | | (761,567 | ) | | | 4,954,735 | | | | 400,970 | |
Balanced - Institutional | | | (60,123,427 | ) | | | (4,882,448 | ) | | | 8,887,289 | | | | 731,860 | |
Moderate - Retail | | | (400,784 | ) | | | (34,930 | ) | | | (815 | ) | | | 59 | |
Moderate - Adviser | | | (4,030,289 | ) | | | (344,725 | ) | | | 5,432,874 | | | | 451,467 | |
Moderate - Institutional | | | (25,436,192 | ) | | | (2,184,102 | ) | | | 2,302,010 | | | | 222,111 | |
Conservative - Retail | | | (1,283,281 | ) | | | (59,368 | ) | | | (766,412 | ) | | | (35,401 | ) |
Conservative - Adviser | | | (3,005,162 | ) | | | (134,934 | ) | | | 1,632,364 | | | | 71,800 | |
Conservative - Institutional | | | (22,790,278 | ) | | | (1,026,056 | ) | | | 853,231 | | | | 44,018 | |
Dynamic - Retail | | | (1,862,469 | ) | | | (153,154 | ) | | | (322,574 | ) | | | (23,199 | ) |
Dynamic - Adviser | | | (3,808,817 | ) | | | (304,891 | ) | | | 59,444 | | | | 1,838 | |
Dynamic - Institutional | | | (39,433,276 | ) | | | (3,229,545 | ) | | | 22,576,311 | | | | 1,809,687 | |
Page 96 | 2022 Annual Report | December 31, 2022 |
| | | Redeemed | | | Net Increase (Decrease) | |
Share Class | | Amount | | | Shares | | | Amount | | | Shares | |
Quantex - Retail | | $ | (2,362,224 | ) | | | (69,565 | ) | | $ | (1,370,674 | ) | | | (38,914 | ) |
Quantex - Adviser | | | (700,448 | ) | | | (19,309 | ) | | | (228,164 | ) | | | (5,948 | ) |
Quantex - Institutional | | | (4,869,656 | ) | | | (136,563 | ) | | | (1,883,658 | ) | | | (49,520 | ) |
Income - Retail | | | (565,332 | ) | | | (61,447 | ) | | | (282,089 | ) | | | (30,833 | ) |
Income - Adviser | | | (1,394,981 | ) | | | (151,845 | ) | | | 2,365,989 | | | | 256,500 | |
Income - Institutional | | | (14,999,096 | ) | | | (1,632,419 | ) | | | 1,033,291 | | | | 112,111 | |
Money Market | | | (972,298,987 | ) | | | (972,566,847 | ) | | | 66,181,602 | | | | 66,218,325 | |
| | | | | | | | | | | | | | | | | |
Year Ended December 31, 2021 | | | | | | | | | | | | | | | | |
Muirfield - Retail | | $ | (108,680,649 | ) | | | (12,662,814 | ) | | $ | (100,821,996 | ) | | | (11,821,543 | ) |
Muirfield - Adviser | | | (66,608,139 | ) | | | (7,612,443 | ) | | | 42,236,929 | | | | 4,907,583 | |
Muirfield - Institutional | | | (108,609,581 | ) | | | (11,811,076 | ) | | | 115,496,306 | | | | 12,212,728 | |
Spectrum - Retail | | | (36,841,554 | ) | | | (2,901,721 | ) | | | (35,895,716 | ) | | | (2,829,700 | ) |
Spectrum - Adviser | | | (18,737,374 | ) | | | (1,448,581 | ) | | | 21,857,064 | | | | 1,711,382 | |
Spectrum - Institutional | | | (37,355,079 | ) | | | (2,747,785 | ) | | | 13,845,820 | | | | 1,016,050 | |
Global - Retail | | | (6,568,484 | ) | | | (548,993 | ) | | | (5,748,269 | ) | | | (480,436 | ) |
Global - Adviser | | | (2,862,018 | ) | | | (237,195 | ) | | | 3,364,526 | | | | 286,628 | |
Global - Institutional | | | (8,380,207 | ) | | | (680,837 | ) | | | 900,245 | | | | 98,872 | |
Balanced - Retail | | | (72,534,298 | ) | | | (5,502,556 | ) | | | (70,578,497 | ) | | | (5,359,087 | ) |
Balanced - Adviser | | | (30,358,104 | ) | | | (2,250,733 | ) | | | 50,453,675 | | | | 3,804,161 | |
Balanced - Institutional | | | (111,852,236 | ) | | | (7,927,738 | ) | | | (10,641,386 | ) | | | (567,811 | ) |
Moderate - Retail | | | (30,629,325 | ) | | | (2,430,279 | ) | | | (30,316,569 | ) | | | (2,405,634 | ) |
Moderate - Adviser | | | (14,748,469 | ) | | | (1,159,942 | ) | | | 19,705,753 | | | | 1,559,979 | |
Moderate - Institutional | | | (38,530,382 | ) | | | (2,942,267 | ) | | | 3,944,479 | | | | 345,911 | |
Conservative - Retail | | | (23,494,226 | ) | | | (973,256 | ) | | | (22,286,742 | ) | | | (923,209 | ) |
Conservative - Adviser | | | (10,649,934 | ) | | | (435,766 | ) | | | 15,658,284 | | | | 639,557 | |
Conservative - Institutional | | | (33,958,616 | ) | | | (1,365,588 | ) | | | 831,307 | | | | 49,808 | |
Dynamic - Retail | | | (31,238,886 | ) | | | (2,232,902 | ) | | | (29,131,133 | ) | | | (2,085,101 | ) |
Dynamic - Adviser | | | (20,640,401 | ) | | | (1,446,686 | ) | | | 13,931,019 | | | | 1,009,533 | |
Dynamic - Institutional | | | (55,644,980 | ) | | | (3,767,375 | ) | | | 46,652,169 | | | | 3,174,909 | |
Quantex - Retail | | | (10,498,344 | ) | | | (258,266 | ) | | | (3,626,856 | ) | | | (93,051 | ) |
Quantex - Adviser | | | (2,204,605 | ) | | | (52,908 | ) | | | 3,238,636 | | | | 89,277 | |
Quantex - Institutional | | | (12,599,469 | ) | | | (305,429 | ) | | | (2,098,805 | ) | | | (42,754 | ) |
Income - Retail | | | (9,978,652 | ) | | | (1,005,571 | ) | | | (9,366,008 | ) | | | (942,703 | ) |
Income - Adviser | | | (7,285,187 | ) | | | (742,788 | ) | | | 3,892,967 | | | | 384,840 | |
Income - Institutional | | | (16,493,262 | ) | | | (1,686,599 | ) | | | 9,174,954 | | | | 936,139 | |
Money Market | | | (721,061,508 | ) | | | (720,922,007 | ) | | | 290,615,901 | | | | 290,568,653 | |
2022 Annual Report | December 31, 2022 | Page 97 |
Offsetting Assets & Liabilities. The Funds are party to enforceable master netting arrangements between counter parties, such as the securities lending agreement, which provides for the right of offset under certain circumstances, such as the event of default. The securities lending transactions have an overnight and continuous contractual maturity. Risks arise from the possible inability of counterparties to meet the terms of their contracts. The table below reflects the offsetting assets and liabilities relating to securities lending, futures contracts, and repurchase agreements shown on the Statements of Assets and Liabilities at December 31, 2022.
| | | | | | | | | | | | | | | Gross Amounts Not Offset in the
Statements of Assets and Liabilities | | | | | |
Description/ Fund (1) | | Gross Amounts
of Recognized
Assets/
Liabilities | | | Gross Amounts
Offset in the
Statements
of Assets and
Liabilities | | | Net Amounts
Presented in
the Statements
of Assets and
Liabilities | | | Financial
Instruments (2) | | | Collateral
Pledged
(Received) (2) | | | Net Amount | |
Assets: | | | | | | | | | | | | | | | | | | | | | | | | |
Futures Contracts | | | | | | | | | | | | | | | | | | | | | | | | |
Muirfield | | $ | 3,391,266 | | | $ | (2,852,351 | ) | | $ | 538,915 | | | $ | — | | | $ | — | | | $ | 538,915 | |
Balanced | | | 1,500,663 | | | | (1,088,314 | ) | | | 412,349 | | | | — | | | | — | | | | 412,349 | |
| | | | | | | | | | | | | | | | | | | | | | | | | |
Repurchase Agreements | | | | | | | | | | | | | | | | | | | | | | | | |
Money Market | | $ | 160,000,000 | | | $ | — | | | $ | 160,000,000 | | | $ | (160,000,000 | ) | | $ | — | | | $ | — | |
| | | | | | | | | | | | | | | | | | | | | | | | | |
Liabilities: | | | | | | | | | | | | | | | | | | | | | | | | |
Futures Contracts | | | | | | | | | | | | | | | | | | | | | | | | |
Spectrum | | $ | (643,281 | ) | | $ | 208,159 | | | $ | (435,122 | ) | | $ | — | | | $ | 435,122 | | | $ | — | |
Global | | | (484,382 | ) | | | — | | | | (484,382 | ) | | | — | | | | 484,382 | | | | — | |
Moderate | | | (345,001 | ) | | | 77,180 | | | | (267,821 | ) | | | — | | | | 267,821 | | | | — | |
Conservative | | | (166,137 | ) | | | 110,717 | | | | (55,420 | ) | | | — | | | | 55,420 | | | | — | |
Dynamic | | | (2,511,226 | ) | | | 445,400 | | | | (2,065,826 | ) | | | — | | | | 2,065,826 | | | | — | |
Quantex | | | (398,501 | ) | | | — | | | | (398,501 | ) | | | — | | | | 398,501 | | | | — | |
| | | | | | | | | | | | | | | | | | | | | | | | | |
(1) There were no securities on loan as of December 31, 2022.
(2) The amount is limited to the net amounts of financial assets and liabilities and accordingly does not include excess collateral pledged.
Other. The Funds record security transactions on the trade date. Securities purchased or sold on a when-issued or delayed-delivery basis may be settled 15 days or more after the trade date. Gains and losses realized from the sale of securities are determined on the specific identification basis. Dividend income and dividend expenses are recognized on the ex-dividend date and interest income (including amortization of premium and accretion of discount) is recognized as earned. Short-term capital gain distributions from underlying funds are classified as dividend income for financial reporting purposes. Long-term capital gains distributions are separately stated. Discounts and premiums are amortized using the effective yield over the lives of the respective securities. Distributions received from partnerships are recorded as return of capital distributions. Withholding taxes on foreign dividends, if applicable, have been provided for in accordance with the Funds’ understanding of the applicable country’s tax rules and rates.
A Fund may purchase securities on a forward commitment or when-issued basis. A Fund records a when-issued transaction on the trade date and will segregate assets in an amount at least equal in value to the Fund’s commitment to purchase when-issued securities. Securities purchased on a when-issued basis are marked-to-market daily and the Fund begins earning interest on the settlement date. Losses may arise due to changes in the market value of the underlying securities or if the counterparty does not perform under the contract.
Certain Funds may purchase or sell securities on a delayed-delivery basis. These transactions involve a commitment by a Fund to purchase or sell securities for a predetermined price or yield, with payment and delivery taking place beyond the customary settlement period. When delayed-delivery transactions are outstanding, a Fund will designate or receive as collateral liquid assets in an amount sufficient to meet the purchase price or respective obligations. When purchasing a security on a delayed-delivery basis, a Fund assumes the rights and risks of ownership of the security, including the risk of price and yield fluctuations, and takes such fluctuations into account when determining its NAV. A Fund may dispose of or renegotiate a delayed-delivery transaction after it is entered into which may result in a realized gain or loss. When a Fund has sold a security on a delayed-delivery basis, the Fund does not participate in future gains and losses with respect to the security.
Distributions received from the Funds’ investments in real estate investment trusts (“REITs”) may be characterized as ordinary income, net capital gain, or return of capital. The proper characterization of REIT distributions is generally not known until after the end of each calendar year. As such, the Funds must use estimates in reporting the character of their income and distributions for financial statement purposes. The actual character of distributions to the Funds’ shareholders will be reflected on the Form 1099 received by shareholders after the end of the calendar year. Due to the nature of REIT investments, a portion of the distributions received by the Funds’ shareholders may represent a return of capital.
Page 98 | 2022 Annual Report | December 31, 2022 |
3. Securities Valuations
The Funds utilize various methods to calculate the Net Asset Value (NAV) of the Funds on a recurring basis. GAAP establishes a hierarchy that prioritizes inputs to valuation methods. The three levels of inputs are as follows:
Level 1 – Unadjusted quoted prices in active markets for identical assets or liabilities that the Funds have the ability to access.
Level 2 – Observable inputs other than quoted prices included in level 1 that are observable for the asset or liability, either directly or indirectly. These inputs may include quoted prices for the identical instrument on an inactive market, prices for similar instruments, interest rates, prepayment speeds, credit risk, yield curves, default rates and similar data.
Level 3 – Significant unobservable inputs for the asset or liability, to the extent relevant observable inputs are not available, representing the Funds’ own assumptions about the assumptions a market participant would use in valuing the asset or liability, and would be based on the best information available.
The availability of observable inputs can vary from security to security and is affected by a wide variety of factors, including, for example, the type of security, whether the security is new and not yet established in the marketplace, the liquidity of markets, and other characteristics particular to the security. To the extent that valuation is based on models or inputs that are less observable or unobservable in the market, the determination of fair value requires more judgment. Accordingly, the degree of judgment exercised in determining fair value is greatest for instruments categorized in level 3.
The inputs used to measure fair value may fall into different levels of the fair value hierarchy. In such cases, for disclosure purposes, the level in the fair value hierarchy within which the fair value measurement falls in its entirety, is determined based on the lowest level input that is significant to the fair value measurement in its entirety.
A description of the valuation techniques applied to the Funds’ major categories of assets and liabilities measured at fair value on a recurring basis follows.
Equity securities (including publicly traded partnerships, real estate investment trusts, American depositary receipts, exchange traded funds, and common stock). Securities traded on a national securities exchange (or reported on the NASDAQ national market) are stated at the last reported sales price on the day of valuation and are categorized in level 1 of the fair value hierarchy.
Investments in registered open-end investment companies, including money market funds, are valued at the daily redemption net asset value as reported by the underlying fund and are categorized in level 1 of the fair value hierarchy.
Short-term notes (including bank obligations, commercial paper, corporate obligations, repurchase agreements, U.S. government agency obligations, and floating rate demand notes). Short-term notes held in the Funds maturing more than sixty days after the valuation date, are valued at the last sales price as of the close of business on the day of valuation, or, lacking any sales, at the most recent bid price or yield equivalent as obtained from dealers that make markets in such securities. When valued at last sales price, the securities will be categorized as level 1. When using bid prices or yield equivalents, they will be categorized as level 2. When such securities are valued within sixty days or less to maturity, the difference between the valuation existing on the sixty-first day before maturity and maturity value is amortized on a straight-line basis to maturity, which approximates fair value, and will be categorized as level 2.
Certificates of deposit. Except for Money Market, certificates of deposit are valued at acquisition cost, which approximates fair value, and will be categorized as level 2. For Money Market, certificates of deposit are normally valued using a model that incorporates market observable data such as reported sales of similar securities, broker quotes, yields, bids, offers, and reference data, and will be categorized as level 2.
U.S. government obligations. U.S. government obligations are normally valued using a model that incorporates market observable data such as reported sales of similar securities, broker quotes, yields, bids, offers, and reference data. Certain securities are valued principally using dealer quotations. In either case, these securities will be categorized as level 2.
Restricted securities (equity and debt). Restricted securities for which quotations are not readily available are valued at fair value as determined by the Trustees. Depending on the relative significance of valuation inputs, these instruments may be classified in either level 2 or level 3 of the fair value hierarchy.
Derivative instruments (futures contracts). Listed derivative instruments that are actively traded, including futures contracts, are valued based on quoted prices from the exchange and are categorized in level 1 of the fair value hierarchy.
In the event market quotations or evaluated prices obtained from a pricing service are not readily available when the NAV is calculated, the Funds will utilize the fair value of the investment. This may occur in the event the Funds cannot obtain current market quotations for a security, cannot obtain current evaluated prices from a pricing service, or the price furnished is not deemed reliable and representative of the fair value of the security. In these cases, the Valuation & Pricing Committee, established and designated by the Board of Trustees as its valuation designee pursuant to Rule 2a-5 under the 1940 Act, determines the fair value of the security in accordance with procedures adopted by the Adviser. Depending on the method used to determine fair value, valuations for these securities may be classified as Level 2 or Level 3 as appropriate in the fair value hierarchy.
2022 Annual Report | December 31, 2022 | Page 99 |
The Valuation & Pricing Committee is responsible for determining the fair value of investments for which market quotations are not readily available. The Valuation & Pricing Committee is also authorized to select and retain pricing services to provide fair value evaluations of the current value of certain investments for which market quotations are not readily available. The Valuation & Pricing Committee supervises various methods used to review market quotations and evaluated prices for reliability, including the resolution of price challenges by the Adviser to evaluated prices for a given security. In the event market quotations or evaluated prices are not readily available for an investment, the Valuation & Pricing Committee will determine the fair value of the investment in accordance with its procedures. Fair valuations are periodically reviewed by the Board of Trustees, which maintains oversight of the Adviser’s fair valuation policy and procedures.
For the year ended December 31, 2022, the Funds did not hold any assets at any time in which significant unobservable inputs were used in determining fair value. Therefore, no reconciliation of level 3 securities is provided. However, the Funds have disclosed holding level 3 securities with fair valuations of zero. The following table summarizes the inputs used to value the Funds’ assets and liabilities measured at fair value as of December 31, 2022.
Muirfield - Assets/(Liabilities) | | Level 1 | | | Level 2 | | | Level 3 | | | Total | |
Common stocks* | | $ | 364,210,308 | | | $ | — | | | $ | — | | | $ | 364,210,308 | |
Preferred stocks | | | 68,957 | | | | — | | | | — | | | | 68,957 | |
Warrants | | | 10,372 | | | | — | | | | — | | | | 10,372 | |
Money market registered investment companies | | | 270,676,198 | | | | — | | | | — | | | | 270,676,198 | |
Bank obligations | | | — | | | | 498,418 | | | | — | | | | 498,418 | |
Total | | $ | 634,965,835 | | | $ | 498,418 | | | $ | — | | | $ | 635,464,253 | |
Trustee deferred compensation*** | | $ | 349,090 | | | $ | — | | | $ | — | | | $ | 349,090 | |
Futures contracts** | | $ | 538,915 | | | $ | — | | | $ | — | | | $ | 538,915 | |
Spectrum - Assets/(Liabilities) | | Level 1 | | | Level 2 | | | Level 3 | | | Total | |
Common stocks* | | $ | 87,960,398 | | | $ | — | | | $ | — | | | $ | 87,960,398 | |
Preferred stocks | | | 5,227 | | | | — | | | | — | | | | 5,227 | |
Warrants | | | 2,971 | | | | — | | | | — | | | | 2,971 | |
Money market registered investment companies | | | 97,085,841 | | | | — | | | | — | | | | 97,085,841 | |
Total | | $ | 185,054,437 | | | $ | — | | | $ | — | | | $ | 185,054,437 | |
Trustee deferred compensation*** | | $ | 60,167 | | | $ | — | | | $ | — | | | $ | 60,167 | |
Futures contracts** | | $ | (435,122 | ) | | $ | — | | | $ | — | | | $ | (435,122 | ) |
Global - Assets/(Liabilities) | | Level 1 | | | Level 2 | | | Level 3 | | | Total | |
Common stocks* | | $ | 8,337,841 | | | $ | — | | | $ | — | | | $ | 8,337,841 | |
Preferred stocks | | | 2,138 | | | | — | | | | — | | | | 2,138 | |
Warrants | | | 623 | | | | — | | | | — | | | | 623 | |
Registered investment companies | | | 5,392,695 | | | | — | | | | — | | | | 5,392,695 | |
Money market registered investment companies | | | 16,682,419 | | | | — | | | | — | | | | 16,682,419 | |
Bank obligations | | | — | | | | 498,418 | | | | — | | | | 498,418 | |
Total | | $ | 30,415,716 | | | $ | 498,418 | | | $ | — | | | $ | 30,914,134 | |
Trustee deferred compensation*** | | $ | 118,214 | | | $ | — | | | $ | — | | | $ | 118,214 | |
Futures contracts** | | $ | (484,382 | ) | | $ | — | | | $ | — | | | $ | (484,382 | ) |
Balanced - Assets/(Liabilities) | | Level 1 | | | Level 2 | | | Level 3 | | | Total | |
Common stocks* | | $ | 144,048,884 | | | $ | — | | | $ | — | | | $ | 144,048,884 | |
Preferred stocks | | | 26,242 | | | | — | | | | — | | | | 26,242 | |
Warrants | | | 4,696 | | | | — | | | | — | | | | 4,696 | |
Registered investment companies | | | 70,613,553 | | | | — | | | | — | | | | 70,613,553 | |
Money market registered investment companies | | | 129,378,697 | | | | — | | | | — | | | | 129,378,697 | |
Bank obligations | | | — | | | | 498,418 | | | | — | | | | 498,418 | |
Total | | $ | 344,072,072 | | | $ | 498,418 | | | $ | — | | | $ | 344,570,490 | |
Trustee deferred compensation*** | | $ | 223,353 | | | $ | — | | | $ | — | | | $ | 223,353 | |
Futures contracts** | | $ | 412,349 | | | $ | — | | | $ | — | | | $ | 412,349 | |
Page 100 | 2022 Annual Report | December 31, 2022 |
Moderate - Assets/(Liabilities) | | Level 1 | | | Level 2 | | | Level 3 | | | Total | |
Common stocks* | | $ | 34,253,261 | | | $ | — | | | $ | — | | | $ | 34,253,261 | |
Preferred stocks | | | 6,653 | | | | — | | | | — | | | | 6,653 | |
Warrants | | | 1,618 | | | | — | | | | — | | | | 1,618 | |
Registered investment companies | | | 53,985,320 | | | | — | | | | — | | | | 53,985,320 | |
Money market registered investment companies | | | 69,993,745 | | | | — | | | | — | | | | 69,993,745 | |
Bank obligations | | | — | | | | 249,338 | | | | — | | | | 249,338 | |
Total | | $ | 158,240,597 | | | $ | 249,338 | | | $ | — | | | $ | 158,489,935 | |
Trustee deferred compensation*** | | $ | 45,375 | | | $ | — | | | $ | — | | | $ | 45,375 | |
Futures contracts** | | $ | (267,821 | ) | | $ | — | | | $ | — | | | $ | (267,821 | ) |
Conservative - Assets/(Liabilities) | | Level 1 | | | Level 2 | | | Level 3 | | | Total | |
Common stocks* | | $ | 17,741,717 | | | $ | — | | | $ | — | | | $ | 17,741,717 | |
Preferred stocks | | | 4,039 | | | | — | | | | — | | | | 4,039 | |
Warrants | | | 553 | | | | — | | | | — | | | | 553 | |
Registered investment companies | | | 57,812,143 | | | | — | | | | — | | | | 57,812,143 | |
Money market registered investment companies | | | 44,495,467 | | | | — | | | | — | | | | 44,495,467 | |
Total | | $ | 120,053,919 | | | $ | — | | | $ | — | | | $ | 120,053,919 | |
Trustee deferred compensation*** | | $ | 89,485 | | | $ | — | | | $ | — | | | $ | 89,485 | |
Futures contracts** | | $ | (55,420 | ) | | $ | — | | | $ | — | | | $ | (55,420 | ) |
Dynamic - Assets/(Liabilities) | | Level 1 | | | Level 2 | | | Level 3 | | | Total | |
Common stocks* | | $ | 150,893,682 | | | $ | — | | | $ | — | | | $ | 150,893,682 | |
Preferred stocks | | | 16,104 | | | | — | | | | — | | | | 16,104 | |
Warrants | | | 2,870 | | | | — | | | | — | | | | 2,870 | |
Registered investment companies | | | 7,578,388 | | | | — | | | | — | | | | 7,578,388 | |
Money market registered investment companies | | | 54,538,793 | | | | — | | | | — | | | | 54,538,793 | |
Bank obligations | | | — | | | | 498,418 | | | | — | | | | 498,418 | |
Total | | $ | 213,029,837 | | | $ | 498,418 | | | $ | — | | | $ | 213,528,255 | |
Trustee deferred compensation*** | | $ | 249,128 | | | $ | — | | | $ | — | | | $ | 249,128 | |
Futures contracts** | | $ | (2,065,826 | ) | | $ | — | | | $ | — | | | $ | (2,065,826 | ) |
Quantex - Assets/(Liabilities) | | Level 1 | | | Level 2 | | | Level 3 | | | Total | |
Common stocks* | | $ | 19,612,497 | | | $ | — | | | $ | — | | | $ | 19,612,497 | |
Money market registered investment companies | | | 11,930,714 | | | | — | | | | — | | | | 11,930,714 | |
Bank obligations | | | — | | | | 3 | | | | — | | | | 3 | |
Total | | $ | 31,543,211 | | | $ | 3 | | | $ | — | | | $ | 31,543,214 | |
Trustee deferred compensation*** | | $ | 72,302 | | | $ | — | | | $ | — | | | $ | 72,302 | |
Futures contracts** | | $ | (398,501 | ) | | $ | — | | | $ | — | | | $ | (398,501 | ) |
Income - Assets/(Liabilities) | | Level 1 | | | Level 2 | | | Level 3 | | | Total | |
Commercial paper | | $ | — | | | $ | 9,984,527 | | | $ | — | | | $ | 9,984,527 | |
Registered investment companies | | | 45,937,307 | | | | — | | | | — | | | | 45,937,307 | |
Money market registered investment companies | | | 11,331,750 | | | | — | | | | — | | | | 11,331,750 | |
U.S. government obligations | | | — | | | | 70,588 | | | | — | | | | 70,588 | |
Total | | $ | 57,269,057 | | | $ | 10,055,115 | | | $ | — | | | $ | 67,324,172 | |
Trustee deferred compensation*** | | $ | 83,059 | | | $ | — | | | $ | — | | | $ | 83,059 | |
2022 Annual Report | December 31, 2022 | Page 101 |
Money Market - Assets/(Liabilities) | | Level 1 | | | Level 2 | | | Level 3 | | | Total | |
Certificates of deposit | | $ | — | | | $ | 218,839,385 | | | $ | — | | | $ | 218,839,385 | |
Commercial paper | | | — | | | | 220,729,636 | | | | — | | | | 220,729,636 | |
Corporate obligations | | | — | | | | 14,936,700 | | | | — | | | | 14,936,700 | |
Repurchase agreements | | | — | | | | 160,000,000 | | | | — | | | | 160,000,000 | |
Variable rate demand notes | | | — | | | | 6,215,000 | | | | — | | | | 6,215,000 | |
Money market registered investment companies | | | 73,405,458 | | | | — | | | | — | | | | 73,405,458 | |
Total | | $ | 73,405,458 | | | $ | 620,720,721 | | | $ | — | | | $ | 694,126,179 | |
Trustee deferred compensation*** | | $ | 7,159 | | | $ | — | | | $ | — | | | $ | 7,159 | |
* | See schedules of investments for industry classifications. |
** | Futures contracts include unrealized gain/loss on contracts open at December 31, 2022. |
*** | A corresponding liability exists that is marked to market and is considered Level 1 in the fair value hierarchy. |
4. Investment Transactions
For the year ended December 31, 2022, the cost of purchases and proceeds from sales or maturities of long-term investments for the Funds, excluding U.S. Government investments and short positions, were as follows:
| | | Purchases | | | Sales | |
Muirfield | | $ | 1,042,982,143 | | | $ | 1,085,844,764 | |
Spectrum | | | 352,287,175 | | | | 394,411,932 | |
Global | | | 32,916,435 | | | | 38,920,408 | |
Balanced | | | 622,907,085 | | | | 651,578,406 | |
Moderate | | | 264,586,211 | | | | 290,418,094 | |
Conservative | | | 228,576,219 | | | | 243,719,791 | |
Dynamic | | | 467,069,748 | | | | 453,567,640 | |
Quantex | | | 11,683,364 | | | | 16,191,118 | |
Income | | | 117,925,833 | | | | 123,079,110 | |
For the year ended December 31, 2022, the cost of purchases and proceeds from sales or maturities of long-term U.S. Government investments for the Funds are as follows:
| | | Purchases | | | Sales | |
Global | | $ | 6,250,142 | | | $ | 6,178,983 | |
Balanced | | | 175,494,852 | | | | 173,503,690 | |
Moderate | | | 133,121,858 | | | | 131,606,539 | |
Conservative | | | 144,193,945 | | | | 142,551,691 | |
Income | | | 108,242,274 | | | | 94,335,015 | |
Page 102 | 2022 Annual Report | December 31, 2022 |
5. Investment Advisory Fees and Other Transactions with Affiliates and Non-Affiliates
Meeder Asset Management, Inc. (“MAM”), a wholly-owned subsidiary of Meeder Investment Management, Inc. (“Meeder”), provides the Funds with investment management, research, statistical and advisory services pursuant to the terms of an Investment Advisory Agreement. The services of MAM will terminate automatically if assigned and may be terminated without penalty at any time upon 60 days prior written notice by majority vote of the Fund, by the Trustees of the Fund, or by MAM. For such services the Funds pay a monthly fee at the following annual rates:
| | Percentage of Average
Daily Net Assets up to
$50 Million | Percentage of Average
Daily Net Assets
Exceeding $50 Million up
to $100 Million | Percentage of Average
Daily Net Assets
Exceeding $100 Million
up to $200 Million | Percentage of Average
Daily Net Assets
Exceeding $200 Million |
Muirfield | 1.00% | 0.75% | 0.60% | 0.60% |
Spectrum | 0.75% | 0.75% | 0.75% | 0.60% |
Global | 0.75% | 0.75% | 0.75% | 0.60% |
Balanced | 0.75% | 0.75% | 0.75% | 0.60% |
Moderate | 0.60% | 0.60% | 0.60% | 0.60% |
Conservative | 0.50% | 0.50% | 0.50% | 0.50% |
Dynamic | 0.75% | 0.75% | 0.75% | 0.60% |
Quantex | 0.75% | 0.75% | 0.60% | 0.60% |
Income | 0.40% | 0.40% | 0.20% | 0.20% |
Money Market | 0.40% | 0.40% | 0.25% | 0.25% |
Fee Waivers & Expense Limitation Agreements. MAM can contractually agree to reduce its advisory fees or limit total annual ordinary fund operating expenses for certain Funds pursuant to written agreements that may only be amended or terminated with the approval of the Board. The sums waived or reimbursed under these agreements would not be subject to recoupment.
For the period January 1, 2022 through April 29, 2022, MAM contractually agreed to reduce its investment advisory fee by 0.10% for Dynamic for average daily net assets up to $200 million. Effective April 30, 2022, MAM voluntarily agreed to reduce this fee by 0.10% for average daily net assets up to $200 million. During the year ended December 31, 2022, $65,205 of investment advisory fees were contractually waived in Dynamic, while $134,795 of investment advisory fees were voluntarily waived.
For the period January 1, 2022 through April 29, 2022, MAM contractually agreed to reduce its investment advisory fee by 0.11% for Income for average daily net assets up to $100 million. Effective April 30, 2022, MAM voluntarily agreed to reduce this fee by 0.11% for average daily net assets up to $100 million. During the year ended December 31, 2022, $24,819 of investment advisory fees were contractually waived in Income, while $49,819 of investment advisory fees were voluntarily waived.
Mutual Funds Service Co. (“MFSCo”), a wholly-owned subsidiary of Meeder, serves as stock transfer, dividend disbursing and shareholder services agent for each Fund. In compensation for such services, each Fund pays MFSCo a monthly fee at an annual rate equal to the greater of the following:
| | | Minimum Fee | | | Percentage of Average
Daily Net Assets up to
$500 Million | | | Percentage of Average
Daily Net Assets
Exceeding $500
Million | |
Muirfield | | $ | 4,000 | | | | 0.12 | % | | | 0.03 | % |
Spectrum | | | 4,000 | | | | 0.12 | % | | | 0.03 | % |
Global | | | 4,000 | | | | 0.12 | % | | | 0.03 | % |
Balanced | | | 4,000 | | | | 0.12 | % | | | 0.03 | % |
Moderate | | | 4,000 | | | | 0.12 | % | | | 0.03 | % |
Conservative | | | 4,000 | | | | 0.12 | % | | | 0.03 | % |
Dynamic | | | 4,000 | | | | 0.12 | % | | | 0.03 | % |
Quantex | | | 4,000 | | | | 0.12 | % | | | 0.03 | % |
Income | | | 4,000 | | | | 0.08 | % | | | 0.03 | % |
Money Market | | | 4,000 | | | | 0.08 | % | | | 0.03 | % |
2022 Annual Report | December 31, 2022 | Page 103 |
Management may voluntarily waive fees for any Fund. During the year ended December 31, 2022, MFSCo waived the following transfer agent fees:
| | | Voluntary
Transfer Agent Fees
Reimbursements | | | Impact of Voluntary
Transfer
Agent Fees
Reimbursements to
Average Net Assets
- Retail Class | | | Impact of Voluntary
Transfer
Agent Fees
Reimbursements to
Average Net Assets
- Adviser Class | | | Impact of Voluntary
Transfer
Agent Fees
Reimbursements to
Average Net Assets
- Institutional Class | | | Impact of Voluntary
Transfer
Agent Fees
Reimbursements to
Average Net Assets
- Money Market
Funds | |
Muirfield | | $ | 40,000 | | | | N/A | | | | N/A | | | | 0.01 | % | | | N/A | |
Spectrum | | | — | | | | N/A | | | | N/A | | | | N/A | | | | N/A | |
Global | | | — | | | | N/A | | | | N/A | | | | N/A | | | | N/A | |
Balanced | | | 128,000 | | | | N/A | | | | N/A | | | | 0.05 | % | | | N/A | |
Moderate | | | — | | | | N/A | | | | N/A | | | | N/A | | | | N/A | |
Conservative | | | — | | | | N/A | | | | N/A | | | | N/A | | | | N/A | |
Dynamic | | | — | | | | N/A | | | | N/A | | | | N/A | | | | N/A | |
Quantex | | | — | | | | N/A | | | | N/A | | | | N/A | | | | N/A | |
Income | | | — | | | | N/A | | | | N/A | | | | N/A | | | | N/A | |
Money Market | | | — | | | | N/A | | | | N/A | | | | N/A | | | | N/A | |
MFSCo provides the Trust with certain administrative services. In compensation for such services, each Fund pays MFSCo a monthly fee at the following annual rates:
| | | Percentage of
Average Daily Net
Assets up to $50
Million | | | Percentage of
Average Daily Net
Assets Exceeding
$50 Million up to
$500 Million | | | Percentage of
Average Daily Net
Assets Exceeding
$500 Million | |
Muirfield | | | 0.10 | % | | | 0.08 | % | | | 0.03 | % |
Spectrum | | | 0.10 | % | | | 0.08 | % | | | 0.03 | % |
Global | | | 0.10 | % | | | 0.08 | % | | | 0.03 | % |
Balanced | | | 0.10 | % | | | 0.08 | % | | | 0.03 | % |
Moderate | | | 0.10 | % | | | 0.08 | % | | | 0.03 | % |
Conservative | | | 0.10 | % | | | 0.08 | % | | | 0.03 | % |
Dynamic | | | 0.10 | % | | | 0.08 | % | | | 0.03 | % |
Quantex | | | 0.10 | % | | | 0.08 | % | | | 0.03 | % |
Income | | | 0.10 | % | | | 0.08 | % | | | 0.03 | % |
Money Market | | | 0.10 | % | | | 0.08 | % | | | 0.03 | % |
MFSCo serves as accounting services agent for each Fund. In compensation for such services, each Fund pays MFSCo a monthly fee at an annual rate equal to the greater of a minimum fee or at a rate based on the percentage of average daily net assets. The annual rates are as follows:
| | | Minimum Fee | | | Percentage of
Average Daily Net
Assets up to $10
Million | | | Percentage of
Average Daily Net
Assets Exceeding
$10 Million up to
$30 Million | | | Percentage of
Average Daily Net
Assets Exceeding
$30 Million up to
$80 Million | | | Percentage of
Average Daily Net
Assets Exceeding
$80 Million | |
Muirfield | | $ | 7,500 | | | | 0.15 | % | | | 0.10 | % | | | 0.02 | % | | | 0.01 | % |
Spectrum | | | 7,500 | | | | 0.15 | % | | | 0.10 | % | | | 0.02 | % | | | 0.01 | % |
Global | | | 7,500 | | | | 0.15 | % | | | 0.10 | % | | | 0.02 | % | | | 0.01 | % |
Balanced | | | 7,500 | | | | 0.15 | % | | | 0.10 | % | | | 0.02 | % | | | 0.01 | % |
Moderate | | | 7,500 | | | | 0.15 | % | | | 0.10 | % | | | 0.02 | % | | | 0.01 | % |
Conservative | | | 7,500 | | | | 0.15 | % | | | 0.10 | % | | | 0.02 | % | | | 0.01 | % |
Dynamic | | | 7,500 | | | | 0.15 | % | | | 0.10 | % | | | 0.02 | % | | | 0.01 | % |
Quantex | | | 7,500 | | | | 0.15 | % | | | 0.10 | % | | | 0.02 | % | | | 0.01 | % |
Income | | | 7,500 | | | | 0.15 | % | | | 0.10 | % | | | 0.02 | % | | | 0.01 | % |
Money Market | | | 30,000 | | | | 0.15 | % | | | 0.10 | % | | | 0.02 | % | | | 0.01 | % |
Page 104 | 2022 Annual Report | December 31, 2022 |
For the year ended December 31, 2022, MAM agreed to voluntarily waive and/or reimburse investment advisory fees. The amounts voluntarily waived and/or reimbursed and the impact to the net expense ratio (excluding brokerage fees and commissions, taxes, interest, and extraordinary or non-recurring expenses) for each Fund are as follows:
| | | Voluntary
Investment
Advisory Fee
Waivers and/or
Reimbursements | | | Impact of Voluntary
Investment
Advisory Fee
Waivers and/or
Reimbursements to
Average Net Assets | | | Impact of Voluntary
Investment
Advisory Fee
Waivers and/or
Reimbursements to
Average Net Assets
- Retail Class | | | Impact of Voluntary
Investment
Advisory Fee
Waivers and/or
Reimbursements to
Average Net Assets
- Adviser Class | | | Impact of Voluntary
Investment
Advisory Fee
Waivers and/or
Reimbursements to
Average Net Assets
- Institutional Class | |
Muirfield | | $ | — | | | | N/A | | | | N/A | | | | N/A | | | | N/A | |
Spectrum | | | — | | | | N/A | | | | N/A | | | | N/A | | | | N/A | |
Global | | | — | | | | N/A | | | | N/A | | | | N/A | | | | N/A | |
Balanced | | | — | | | | N/A | | | | N/A | | | | N/A | | | | N/A | |
Moderate | | | — | | | | N/A | | | | N/A | | | | N/A | | | | N/A | |
Conservative | | | — | | | | N/A | | | | N/A | | | | N/A | | | | N/A | |
Dynamic | | | 134,795 | | | | N/A | | | | 0.06 | % | | | 0.06 | % | | | 0.06 | % |
Quantex | | | — | | | | N/A | | | | N/A | | | | N/A | | | | N/A | |
Income | | | 49,819 | | | | N/A | | | | 0.07 | % | | | 0.07 | % | | | 0.07 | % |
Money Market | | | 1,906,269 | | | | 0.28 | % | | | N/A | | | | N/A | | | | N/A | |
Certain Funds have entered into securities lending arrangements with Huntington National Bank (“HNB”). Under the terms of the agreement, HNB is authorized to loan securities on behalf of the Funds to approved brokers. In exchange, under normal market conditions, the Funds receive cash collateral in the amount of at least 102% of the value of securities loaned. The cash collateral is invested in short term instruments as disclosed in the Schedules of Investments. Although risk is mitigated by the collateral, the Funds could experience a delay in recovering their securities and possible loss of income or value if the borrower fails to return the borrowed securities. In addition, the Funds bear the risk of loss associated with the investment of cash collateral received. After predetermined rebates to brokers, a percentage of the net securities lending revenue is credited to the Funds to be used as an offset against charges incurred by the Funds. HNB is paid a fee for administering the securities lending program for the Funds, equal to the remaining percentage of the net securities lending revenues generated under the agreement. As of December 31, 2022, there were no securities being loaned by any of the Funds. For the year ended December 31, 2022, income earned through securities lending arrangements was as follows:
| | | Amount Received
to Reduce Gross
Expenses | |
Muirfield | | $ | 234 | |
Global | | | 150 | |
Balanced | | | 5,979 | |
Moderate | | | 3,673 | |
Conservative | | | 2,854 | |
Dynamic | | | 1,913 | |
2022 Annual Report | December 31, 2022 | Page 105 |
The Funds have adopted a written plan pursuant to Rule 12b-1 of the 1940 Act that allows the Funds to pay fees for the sale and distribution of Fund shares and for services provided to Fund shareholders. 12b-1 fees are paid by the Funds to financial intermediaries, securities brokers, investment advisers, and other persons, including affiliates of MAM. For the year ended December 31, 2022, total 12b-1 plan expense payments made to the Funds’ affiliated distributor was $79,777. The Funds’ affiliated distributor did not receive any brokerage commissions from executed trades from the Funds. The annual adopted 12b-1 plan maximum limitations for the year ended December 31, 2022, are as follows:
| | Maximum Annual
12b-1 Plan Expense
as a Percentage of
Average Daily Net
Assets | Maximum Annual
12b-1 Plan Expense
as a Percentage of
Average Daily Net
Assets - Retail Class | Maximum Annual
12b-1 Plan Expense
as a Percentage of
Average Daily Net
Assets - Adviser
Class | Maximum Annual
12b-1 Plan Expense
as a Percentage of
Average Daily Net
Assets - Institutional
Class | 12b-1 Plan Expense
Payments Made to
Affiliates |
Muirfield | N/A | 0.20% | N/A | N/A | $ 34,247 |
Spectrum | N/A | 0.25% | N/A | N/A | 1,060 |
Global | N/A | 0.25% | N/A | N/A | 1,625 |
Balanced | N/A | 0.25% | N/A | N/A | 4,402 |
Moderate | N/A | 0.25% | N/A | N/A | 558 |
Conservative | N/A | 0.25% | N/A | N/A | 7,567 |
Dynamic | N/A | 0.25% | N/A | N/A | 9,659 |
Quantex | N/A | 0.20% | N/A | N/A | 18,938 |
Income | N/A | 0.25% | N/A | N/A | 1,721 |
Money Market | 0.20% | N/A | N/A | N/A | N/A |
The Funds (other than Money Market) have adopted a shareholder services plan that allows the Funds to pay financial intermediaries and other persons, including “platforms,” for providing shareholder and administrative services to Fund shareholders and maintaining shareholder accounts. The annual adopted shareholder services plan maximum limitations for the year ended December 31, 2022 are as follows:
| | Maximum Annual
Shareholder Services
Plan Expense as a
Percentage of Average
Daily Net Assets - Retail
Class | Maximum Annual
Shareholder Services
Plan Expense as a
Percentage of Average
Daily Net Assets -
Adviser Class | Maximum Annual
Shareholder Services
Plan Expense as a
Percentage of Average
Daily Net Assets -
Institutional Class |
Muirfield | 0.20% | 0.25% | 0.10% |
Spectrum | 0.20% | 0.25% | 0.10% |
Global | 0.20% | 0.25% | 0.10% |
Balanced | 0.20% | 0.25% | 0.10% |
Moderate | 0.20% | 0.25% | 0.10% |
Conservative | 0.20% | 0.25% | 0.10% |
Dynamic | 0.20% | 0.25% | 0.10% |
Quantex | 0.20% | 0.25% | 0.10% |
Income | 0.20% | 0.25% | 0.10% |
Page 106 | 2022 Annual Report | December 31, 2022 |
The Funds have adopted a Deferred Compensation Plan (the “Plan”) for the independent Trustees. Under the Plan, each eligible Trustee is permitted to defer all or a portion of the trustees fees payable by any of the Funds as an investment into any combination of Funds until a specified point of time. The investment into the Funds is recorded as an asset however an offsetting liability is also recorded for the deferred payment. Amounts deferred under the Plan may be distributed in a lump sum or generally equal annual installments over a period of up to ten (10) years to the eligible Trustee(s). The Funds may terminate this Plan at any time.
Certain Trustees and officers of the Funds are also officers or directors of Meeder, MAM, and MFSCo.
During the year ended December 31, 2022, several of the Funds invested in the Institutional Prime Money Market Fund, an affiliate, as described in Section 2(a)(3) of the Investment Company Act of 1940. The purchases/sales amounts in the following table are presented on a gross basis, while the statement of changes in net assets shows subscriptions and redemptions into and out of the Institutional Prime Money Market Fund on a net basis. The Funds’ investments in the Institutional Prime Money Market Fund, which had a 7-day yield of 4.36% on December 31, 2022, were as follows:
| | | 12/31/21
Fair Value | | | Purchases | | | Sales | | | Realized
Gains
(Losses) | | | 12/31/22 Cost | | | Change in
Unrealized | | | Income | | | 12/31/22
Fair Value | |
Muirfield | | $ | 227,883,637 | | | $ | 251,933,598 | | | $ | (209,161,713 | ) | | $ | (91,133 | ) | | $ | 270,564,643 | | | $ | 111,809 | | | $ | 4,484,889 | | | $ | 270,676,198 | |
Spectrum | | | 54,068,333 | | | | 118,176,257 | | | | (75,172,665 | ) | | | (25,148 | ) | | | 97,044,533 | | | | 39,064 | | | | 1,258,244 | | | | 97,085,841 | |
Global | | | 19,823,051 | | | | 17,055,207 | | | | (20,814,498 | ) | | | (5,712 | ) | | | 16,055,545 | | | | 3,371 | | | | 286,861 | | | | 16,061,419 | |
Balanced | | | 98,243,827 | | | | 209,296,645 | | | | (199,116,074 | ) | | | (55,061 | ) | | | 108,355,978 | | | | 39,360 | | | | 1,878,603 | | | | 108,408,697 | |
Moderate | | | 41,085,154 | | | | 132,960,642 | | | | (120,130,019 | ) | | | (32,727 | ) | | | 53,877,247 | | | | 20,695 | | | | 951,306 | | | | 53,903,745 | |
Conservative | | | 30,120,101 | | | | 131,686,982 | | | | (134,460,048 | ) | | | (28,520 | ) | | | 27,315,360 | | | | 11,952 | | | | 575,657 | | | | 27,330,467 | |
Dynamic | | | 58,149,681 | | | | 82,925,519 | | | | (88,570,482 | ) | | | (25,888 | ) | | | 52,478,477 | | | | 24,963 | | | | 919,517 | | | | 52,503,793 | |
Quantex | | | 13,687,909 | | | | 13,039,119 | | | | (14,795,063 | ) | | | (5,345 | ) | | | 11,927,919 | | | | 4,094 | | | | 209,219 | | | | 11,930,714 | |
Income | | | 13,584,663 | | | | 123,047,318 | | | | (125,294,313 | ) | | | (9,235 | ) | | | 11,327,917 | | | | 3,317 | | | | 188,419 | | | | 11,331,750 | |
6. Federal Tax Information
The following information is computed on a tax basis for each item as of December 31, 2022:
| | | Tax Cost of
Portfolio
Investments | | | Gross Unrealized
Appreciation | | | Gross Unrealized
Depreciation | | | Net Unrealized
Appreciation/
Depreciation | |
| | | | | | | | | | | | | | | | | |
Muirfield | | $ | 578,775,324 | | | $ | 77,233,960 | | | $ | (20,545,031 | ) | | $ | 56,688,929 | |
Spectrum | | | 167,909,090 | | | | 20,498,091 | | | | (3,352,744 | ) | | | 17,145,347 | |
Global | | | 29,188,296 | | | | 2,320,562 | | | | (594,724 | ) | | | 1,725,838 | |
Balanced | | | 322,436,320 | | | | 33,541,605 | | | | (11,407,435 | ) | | | 22,134,170 | |
Moderate | | | 156,073,730 | | | | 7,204,505 | | | | (4,788,300 | ) | | | 2,416,205 | |
Conservative | | | 123,043,148 | | | | 1,278,096 | | | | (4,267,325 | ) | | | (2,989,229 | ) |
Dynamic | | | 196,277,195 | | | | 27,731,097 | | | | (10,480,037 | ) | | | 17,251,060 | |
Quantex | | | 28,502,608 | | | | 3,641,207 | | | | (600,601 | ) | | | 3,040,606 | |
Income | | | 68,725,364 | | | | 129,934 | | | | (1,531,126 | ) | | | (1,401,192 | ) |
Money Market | | | 694,253,701 | | | | 106,249 | | | | (233,771 | ) | | | (127,522 | ) |
The tax characteristics of dividends paid by the Funds during the year ended December 31, 2022 were as follows:
| | | Ordinary Income | | | Net Short-Term
Capital Gains | | | Net Long-Term
Capital Gains | | | Total Dividends
Paid* | |
Muirfield | | $ | 4,249,878 | | | $ | — | | | $ | 12,812,219 | | | $ | 17,062,097 | |
Spectrum | | | 958,594 | | | | 471,996 | | | | 3,611,331 | | | | 5,041,921 | |
Global | | | 82,102 | | | | — | | | | 158,351 | | | | 240,453 | |
Balanced | | | 3,501,995 | | | | 3,906,305 | | | | 5,840,278 | | | | 13,248,578 | |
Moderate | | | 2,235,676 | | | | 1,370,093 | | | | 1,071,618 | | | | 4,677,387 | |
Conservative | | | 1,641,226 | | | | — | | | | 693,917 | | | | 2,335,143 | |
Dynamic | | | 1,144,644 | | | | — | | | | 6,501,337 | | | | 7,645,981 | |
Quantex | | | 132,707 | | | | 745,313 | | | | — | | | | 878,020 | |
Income | | | 1,124,771 | | | | — | | | | — | | | | 1,124,771 | |
Money Market | | | 11,475,492 | | | | — | | | | — | | | | 11,475,492 | |
2022 Annual Report | December 31, 2022 | Page 107 |
The tax characteristics of dividends paid by the Funds during the year ended December 31, 2021 were as follows:
| | | Ordinary Income | | | Net Short Term
Capital Gains | | | Net Long Term
Capital Gains | | | Total Dividends
Paid* | |
Muirfield | | $ | 5,065,877 | | | $ | — | | | $ | 18,443,632 | | | $ | 23,509,509 | |
Spectrum | | | 452,969 | | | | 4,113,237 | | | | 6,510,816 | | | | 11,077,022 | |
Global | | | — | | | | 1,360,991 | | | | 3,161,379 | | | | 4,522,370 | |
Balanced | | | 6,001,952 | | | | 1,250,419 | | | | 23,688,712 | | | | 30,941,083 | |
Moderate | | | 1,372,700 | | | | — | | | | 9,814,301 | | | | 11,187,001 | |
Conservative | | | 2,100,379 | | | | — | | | | 5,989,643 | | | | 8,090,022 | |
Dynamic | | | 1,183,701 | | | | 13,748,460 | | | | 15,898,271 | | | | 30,830,432 | |
Quantex | | | 18,344 | | | | 449,273 | | | | 5,591,196 | | | | 6,058,813 | |
Income | | | 1,295,798 | | | | — | | | | — | | | | 1,295,798 | |
Money Market | | | 193,478 | | | | — | | | | — | | | | 193,478 | |
As of December 31, 2022, the components of distributable earnings/(accumulated deficit) on a tax basis for the Funds were as follows:
| | | Undistributed
Ordinary Income | | | Undistributed
Long-Term
Capital Gain | | | Accumulated
Capital and Other
Gains and (Losses) | | | Unrealized
Appreciation/
(Depreciation)** | | | Total Distributable
Earnings/
(Accumulated
Deficit) | |
Muirfield | | $ | 3,941 | | | $ | 9,575,215 | | | $ | (343,850 | ) | | $ | 56,688,929 | | | $ | 65,924,235 | |
Spectrum | | | 856 | | | | 4,823,435 | | | | (62,330 | ) | | | 17,145,347 | | | | 21,907,308 | |
Global | | | 5,777 | | | | — | | | | (1,751,468 | ) | | | 1,725,838 | | | | (19,853 | ) |
Balanced | | | 16,998 | | | | — | | | | (3,794,467 | ) | | | 22,134,170 | | | | 18,356,701 | |
Moderate | | | 11,859 | | | | — | | | | (4,609,914 | ) | | | 2,416,205 | | | | (2,181,850 | ) |
Conservative | | | 18,243 | | | | — | | | | (4,064,696 | ) | | | (2,989,229 | ) | | | (7,035,682 | ) |
Dynamic | | | 15,175 | | | | — | | | | (9,675,659 | ) | | | 17,251,060 | | | | 7,590,576 | |
Quantex | | | 8,276 | | | | — | | | | (1,408,108 | ) | | | 3,040,606 | | | | 1,640,774 | |
Income | | | 6,744 | | | | — | | | | (12,913,409 | ) | | | (1,401,192 | ) | | | (14,307,857 | ) |
Money Market | | | 8,335 | | | | — | | | | (9,200 | ) | | | (127,522 | ) | | | (128,387 | ) |
* | Total dividends paid may differ from the amount reported in the Statements of Changes in Net Assets because for tax purposes dividends are recognized when actually paid. Short-term capital gains distributions are taxed as ordinary income. |
** | The differences between book- and tax-basis unrealized appreciation/(depreciation) are attributable primarily to: wash sales and the realization for tax purposes of unrealized gains/(losses) on certain derivative instruments. |
For federal income tax purposes, the following Funds have capital loss carryforwards as of December 31, 2022, which are not subject to expiration and are available to offset future capital gains, if any. To the extent that these carryforwards are used to offset future capital gains, it is probable that the gains that are offset will not be distributed to shareholders:
| | | Short-Term Capital
Loss Carryforward | | | Long-Term Capital
Loss Carryforward | | | Capital Loss
Carryforward Utilized | |
Muirfield | | $ | — | | | $ | — | | | $ | — | |
Spectrum | | | — | | | | — | | | | — | |
Global | | | 1,638,945 | | | | — | | | | — | |
Balanced | | | 3,574,313 | | | | — | | | | — | |
Moderate | | | 4,562,609 | | | | — | | | | — | |
Conservative | | | 3,977,742 | | | | — | | | | — | |
Dynamic | | | 9,438,465 | | | | — | | | | — | |
Quantex | | | 1,338,555 | | | | — | | | | — | |
Income | | | 12,355,351 | | | | 474,948 | | | | — | |
Money Market | | | — | | | | 1,721 | | | | 757 | |
Page 108 | 2022 Annual Report | December 31, 2022 |
7. Control Ownership
The beneficial ownership, either directly or indirectly, of more than 25% of the voting securities of a fund creates a presumption of control of the fund under Section 2(a)(9) of the 1940 Act. As of December 31, 2022, beneficial owners that held more than 25% of the voting securities of the Funds and may be deemed to control the Funds are as follows:
Fund | Beneficial Owner | Percent of Voting
Securities |
Money Market | Muirfield | 39% |
8. Contingencies and Commitments
The Funds indemnify the Trust’s officers and Trustees for certain liabilities that might arise from their performance of their duties to the Funds. Additionally, in the normal course of business the Funds enter into contracts that contain a variety of representations and warranties and which provide general indemnifications. The Funds’ maximum exposure under these arrangements is unknown, as this would involve future claims that may be made against the Funds that have not yet occurred. However, based on experience, the Funds expect the risk of loss to be remote.
9. Subsequent Events
Management evaluated subsequent events through the date these financial statements were issued and concluded no subsequent events required recognition or disclosure in these financial statements.
2022 Annual Report | December 31, 2022 | Page 109 |
Report of Independent Registered Public Accounting Firm
To the Shareholders and Board of Trustees of
Meeder Funds
Opinion on the Financial Statements
We have audited the accompanying statements of assets and liabilities, including the schedules of investments, of Meeder Funds comprising Muirfield Fund, Spectrum Fund, Global Allocation Fund, Balanced Fund, Moderate Allocation Fund, Conservative Allocation Fund, Dynamic Allocation Fund, Quantex Fund, Tactical Income Fund, and Institutional Prime Money Market Fund (the “Funds”) as of December 31, 2022, the related statements of operations for the year then ended, the statements of changes in net assets for each of the two years in the period then ended, the related notes, and the financial highlights for each of the five years in the period then ended (collectively referred to as the “financial statements”). In our opinion, the financial statements present fairly, in all material respects, the financial position of each of the Funds as of December 31, 2022, the results of their operations for the year then ended, the changes in net assets for each of the two years in the period then ended, and the financial highlights for each of the five years in the period then ended, in conformity with accounting principles generally accepted in the United States of America.
Basis for Opinion
These financial statements are the responsibility of the Funds’ management. Our responsibility is to express an opinion on the Funds’ financial statements based on our audits. We are a public accounting firm registered with the Public Company Accounting Oversight Board (United States) (“PCAOB”) and are required to be independent with respect to the Funds in accordance with the U.S. federal securities laws and the applicable rules and regulations of the Securities and Exchange Commission and the PCAOB.
We conducted our audits in accordance with the standards of the PCAOB. Those standards require that we plan and perform the audit to obtain reasonable assurance about whether the financial statements are free of material misstatement whether due to error or fraud.
Our audits included performing procedures to assess the risks of material misstatement of the financial statements, whether due to error or fraud, and performing procedures that respond to those risks. Such procedures included examining, on a test basis, evidence regarding the amounts and disclosures in the financial statements. Our procedures included confirmation of securities owned as of December 31, 2022, by correspondence with the custodian and brokers. Our audits also included evaluating the accounting principles used and significant estimates made by management, as well as evaluating the overall presentation of the financial statements. We believe that our audits provide a reasonable basis for our opinion.
We have served as the Funds’ auditor since 2004.

COHEN & COMPANY, LTD.
Milwaukee, Wisconsin
February 27, 2023
Page 110 | 2022 Annual Report | December 31, 2022 |
Shareholder Expense Analysis (unaudited)
Shareholders of mutual funds pay ongoing expenses, such as advisory fees, distribution and service fees and other fund operating expenses. The following examples are intended to help you understand your ongoing costs (in dollars) of investing in the Funds and to compare these costs with the ongoing costs of investing in other mutual funds. The examples are based on an investment of $1,000 invested for the period of time indicated in the table below.
The Actual Expense example provides information about actual account values and actual expenses. You may use the information in this line, together with the amount you invested, to estimate the expenses that you paid over the period. Simply divide your account value by $1,000 (e.g.: an $8,600 account value divided by $1,000 = 8.6), then multiply the result by the number in the line under the heading “Expenses Paid During the Period” to estimate the expenses you paid on your account during this period.
The Hypothetical Expense example provides information about hypothetical account values and hypothetical expenses based on each Fund’s actual expense ratio and an assumed rate of return of 5% per year before expenses, which is not the actual return of any Fund. The hypothetical account values and expenses may not be used to estimate the actual ending account balance or expenses you paid for the period. You may use this information to compare the ongoing costs of investing in the Funds to other funds. To do so, compare this 5% hypothetical example with the 5% hypothetical examples that appear in the shareholder reports of the other funds.
| | Beginning Account Value
July 1, 2022 | | | Ending Account Value
December 31, 2022 | | | Expenses Paid
During Period1 | | | Net Expense
Ratio2 | |
| | | Actual | | | Hypothetical | | | Actual | | | Hypothetical | | | Actual | | | Hypothetical | | | Actual | |
Muirfield Fund | | | | | | | | | | | | | | | | | | | | | | | | | | | | |
Retail Class | | $ | 1,000.00 | | | $ | 1,000.00 | | | $ | 1,022.20 | | | $ | 1,018.90 | | | $ | 6.37 | | | $ | 6.36 | | | | 1.25 | % |
Adviser Class | | | 1,000.00 | | | | 1,000.00 | | | | 1,024.40 | | | | 1,020.77 | | | | 4.49 | | | | 4.48 | | | | 0.88 | % |
Institutional Class | | | 1,000.00 | | | | 1,000.00 | | | | 1,023.20 | | | | 1,020.57 | | | | 4.69 | | | | 4.69 | | | | 0.92 | % |
Spectrum Fund | | | | | | | | | | | | | | | | | | | | | | | | | | | | |
Retail Class | | | 1,000.00 | | | | 1,000.00 | | | | 1,013.20 | | | | 1,017.59 | | | | 7.66 | | | | 7.68 | | | | 1.51 | % |
Adviser Class | | | 1,000.00 | | | | 1,000.00 | | | | 1,015.80 | | | | 1,019.76 | | | | 5.49 | | | | 5.50 | | | | 1.08 | % |
Institutional Class | | | 1,000.00 | | | | 1,000.00 | | | | 1,015.70 | | | | 1,019.41 | | | | 5.84 | | | | 5.85 | | | | 1.15 | % |
Global Allocation Fund | | | | | | | | | | | | | | | | | | | | | | | | | | | | |
Retail Class | | | 1,000.00 | | | | 1,000.00 | | | | 1,013.60 | | | | 1,016.18 | | | | 9.08 | | | | 9.10 | | | | 1.79 | % |
Adviser Class | | | 1,000.00 | | | | 1,000.00 | | | | 1,015.60 | | | | 1,018.20 | | | | 7.06 | | | | 7.07 | | | | 1.39 | % |
Institutional Class | | | 1,000.00 | | | | 1,000.00 | | | | 1,015.60 | | | | 1,018.25 | | | | 7.01 | | | | 7.02 | | | | 1.38 | % |
Balanced Fund | | | | | | | | | | | | | | | | | | | | | | | | | | | | |
Retail Class | | | 1,000.00 | | | | 1,000.00 | | | | 1,010.30 | | | | 1,017.90 | | | | 7.35 | | | | 7.37 | | | | 1.45 | % |
Adviser Class | | | 1,000.00 | | | | 1,000.00 | | | | 1,012.80 | | | | 1,020.32 | | | | 4.92 | | | | 4.94 | | | | 0.97 | % |
Institutional Class | | | 1,000.00 | | | | 1,000.00 | | | | 1,013.00 | | | | 1,020.47 | | | | 4.77 | | | | 4.79 | | | | 0.94 | % |
Moderate Allocation Fund | | | | | | | | | | | | | | | | | | | | | | | | | | | | |
Retail Class | | | 1,000.00 | | | | 1,000.00 | | | | 1,002.80 | | | | 1,018.50 | | | | 6.71 | | | | 6.77 | | | | 1.33 | % |
Adviser Class | | | 1,000.00 | | | | 1,000.00 | | | | 1,004.80 | | | | 1,020.47 | | | | 4.75 | | | | 4.79 | | | | 0.94 | % |
Institutional Class | | | 1,000.00 | | | | 1,000.00 | | | | 1,004.70 | | | | 1,020.32 | | | | 4.90 | | | | 4.94 | | | | 0.97 | % |
Conservative Allocation Fund | | | | | | | | | | | | | | | | | | | | | | | | | | | | |
Retail Class | | | 1,000.00 | | | | 1,000.00 | | | | 999.00 | | | | 1,018.65 | | | | 6.55 | | | | 6.61 | | | | 1.30 | % |
Adviser Class | | | 1,000.00 | | | | 1,000.00 | | | | 1,001.60 | | | | 1,020.82 | | | | 4.39 | | | | 4.43 | | | | 0.87 | % |
Institutional Class | | | 1,000.00 | | | | 1,000.00 | | | | 1,001.10 | | | | 1,020.57 | | | | 4.64 | | | | 4.69 | | | | 0.92 | % |
Dynamic Allocation Fund | | | | | | | | | | | | | | | | | | | | | | | | | | | | |
Retail Class | | | 1,000.00 | | | | 1,000.00 | | | | 1,046.90 | | | | 1,018.45 | | | | 6.91 | | | | 6.82 | | | | 1.34 | % |
Adviser Class | | | 1,000.00 | | | | 1,000.00 | | | | 1,049.00 | | | | 1,020.37 | | | | 4.96 | | | | 4.89 | | | | 0.96 | % |
Institutional Class | | | 1,000.00 | | | | 1,000.00 | | | | 1,048.20 | | | | 1,019.91 | | | | 5.42 | | | | 5.35 | | | | 1.05 | % |
2022 Annual Report | December 31, 2022 | Page 111 |
| | Beginning Account Value
July 1, 2022 | | | Ending Account Value
December 31, 2022 | | | Expenses Paid
During Period1 | | | Net Expense
Ratio2 | |
| | | Actual | | | Hypothetical | | | Actual | | | Hypothetical | | | Actual | | | Hypothetical | | | Actual | |
Quantex Fund | | | | | | | | | | | | | | | | | | | | | | | | | | | | |
Retail Class | | $ | 1,000.00 | | | $ | 1,000.00 | | | $ | 1,034.70 | | | $ | 1,017.80 | | | $ | 7.54 | | | $ | 7.48 | | | | 1.47 | % |
Adviser Class | | | 1,000.00 | | | | 1,000.00 | | | | 1,035.10 | | | | 1,018.15 | | | | 7.18 | | | | 7.12 | | | | 1.40 | % |
Institutional Class | | | 1,000.00 | | | | 1,000.00 | | | | 1,034.70 | | | | 1,017.95 | | | | 7.39 | | | | 7.32 | | | | 1.44 | % |
Tactical Income Fund | | | | | | | | | | | | | | | | | | | | | | | | | | | | |
Retail Class | | | 1,000.00 | | | | 1,000.00 | | | | 1,001.00 | | | | 1,019.86 | | | | 5.35 | | | | 5.40 | | | | 1.06 | % |
Adviser Class | | | 1,000.00 | | | | 1,000.00 | | | | 1,002.60 | | | | 1,021.73 | | | | 3.48 | | | | 3.52 | | | | 0.69 | % |
Institutional Class | | | 1,000.00 | | | | 1,000.00 | | | | 1,002.20 | | | | 1,021.37 | | | | 3.84 | | | | 3.87 | | | | 0.76 | % |
Institutional Prime Money Market Fund | | | 1,000.00 | | | | 1,000.00 | | | | 1,015.00 | | | | 1,024.35 | | | | 0.86 | | | | 0.87 | | | | 0.17 | % |
Please note that the expenses shown in the tables are meant to highlight your ongoing costs only and do not reflect any transactional costs, such as redemption fees or exchange fees. Therefore, hypothetical information is useful in comparing ongoing costs only, and will not help you determine the relative total costs of owning different funds. In addition, if any transactional costs were included, your costs would have been higher.
1 | Expenses are equal to each Fund’s annualized net expense ratio, multiplied by the average account value over the period, multiplied by 184/365 (to reflect the total number of days in the six-month period). |
2 | Annualized net expense ratio reflects contractual or voluntary waivers and reimbursements of expenses by the investment adviser and transfer agent. |
Page 112 | 2022 Annual Report | December 31, 2022 |
Trustees and Officers (unaudited)
Certain trustees and officers of the Funds are also officers or directors of Meeder, MAM, and MFSCo. The Trustees oversee the management of the Trust and elect its officers. The officers are responsible for the Funds’ day-to-day operations. The Trustees’ and officers’ names, addresses, years of birth, positions held with the Trust, and length of service with the Meeder Funds, are listed below. Also included is each Board member’s principal occupation during, at least, the past five years. Except as indicated, each individual has held the office shown or other offices in the same company for the last five years. Those Trustees who are “interested persons”, as defined in the 1940 Act, by virtue of their affiliation with the Trust, are indicated by an asterisk (*).
Name, Address1,
and Year of Birth | Year First Elected a
Trustee or Officer of
the Trust | Position and Number
of Funds Overseen2 | Principal Occupation During
Past Five Years and Other
Directorships Held |
Robert S. Meeder, Jr.*
Year of Birth: 1961 | 1992 | Trustee and President | President, Meeder Investment Management, Inc. |
Stuart M. Allen**
Year of Birth: 1961 | 2006 | Trustee | President of Gardiner Allen DeRoberts Insurance LLC, an insurance agency. |
Anthony V. D’Angelo**
Year of Birth: 1959 | 2006 | Trustee | General Manager, WSYX ABC 6 /WTTE-TV Fox 28 /WWHO television stations, Columbus, Ohio, operated by Sinclair Broadcast Group (2014 – present); Director of Sales (2004 – 2014); Lead Trustee of the Trust. |
Jeffrey R. Provence**
Year of Birth: 1969 | 2017 | Trustee | CEO, Premier Fund Solutions, Inc. (2001 – present); General Partner & Portfolio Manager, Value Trend Capital Management, L.P. (1995 – present); Director, Blue Chip Investor Funds; Director, PFS Funds; Chairman of the Trust’s Audit Committee. |
Douglas R. Jennings
Year of Birth: 1962 | 2017 | Chief Compliance Officer | Chief Compliance Officer, Meeder Investment Management, Inc. (2016 – present); Assistant General Counsel; Partner, Carlile Patchen & Murphy, LLP (2010 – 2016). |
Bruce E. McKibben
Year of Birth: 1969 | 2002 | Treasurer | Director of Fund Accounting, Mutual Funds Service Co. (1997 – present). |
Alaina Salonsky
Year of Birth: 1967 | 2017 | Secretary | Compliance Specialist, Meeder Investment Management, Inc. (2017 – present); Teacher, Big Walnut School District, Sunbury, Ohio (2013 – 2017). |
1 | The address of each Trustee is 6125 Memorial Drive, Dublin, OH 43017. |
2 | Each Trustee serves for an indefinite term, until his or her resignation, death, or removal. Each Trustee oversees all ten Funds in the Trust. |
* | Robert S. Meeder, Jr. is deemed an “interested person” of the Trust by virtue of his position as President of Meeder Asset Management, Inc., the Adviser of the Trust. |
** | Each independent Trustee is a member of the Trust’s Audit Committee, Compensation Committee, and Nominating Committee. |
The Statement of Additional Information includes additional information about each Trustee and is available without charge. To obtain a copy of the Statement of Additional Information, please contact your financial representative or call toll free 1-800-325-3539.
2022 Annual Report | December 31, 2022 | Page 113 |
Board Review and Approval of Investment Advisory Agreement (unaudited)
At a meeting held September 22, 2022, the Board of Trustees (“Board”), including all of the Trustees who are not “interested persons,” as that term is defined in the Investment Company Act of 1940 (“Independent Trustees”), met to consider the renewal of the investment advisory agreement (“Agreement”) between the Funds and Meeder Asset Management, Inc. (“Adviser”).
Approval Process. Pursuant to the Investment Company Act of 1940 (“1940 Act”), the Board is required to consider the continuation of the Funds’ investment advisory agreement on an annual basis. It is the duty of the Board to request as much information as is reasonably necessary to evaluate the terms of the Agreement to determine whether the Agreement is fair to each Fund and its shareholders. Prior to the meeting, the Board requested, and the Adviser provided, both written and oral reports containing information and data related to the following: (i) the nature, extent, and quality of the services provided by the Adviser to the Funds; (ii) the investment performance of the Funds and the Adviser; (iii) the costs of the services to be provided and the profits to be realized by the Adviser from the relationship with the Funds; (iv) the extent to which economies of scale will be realized as a Fund grows; and (v) whether the fee level reflects these economies of scale to the benefit of the Funds’ shareholders. In reaching the decision to renew the Agreement, the Board also took into account information furnished throughout the year at regular Board meetings. Information furnished and discussed throughout the year included investment performance reports and related financial information for the Funds, as well as periodic reports on shareholder services, legal compliance, pricing, brokerage commissions, execution and other services provided by the Adviser and its affiliates. Information furnished specifically in connection with the renewal process included a report for the Funds prepared by Broadridge Financial Solutions, Ltd. (“Broadridge”), an independent organization, as well as the Funds’ profitability analysis prepared by the Adviser. The Broadridge report compared each Fund’s advisory fees and expenses with those of other mutual funds deemed comparable to the Fund. The Funds’ profitability analysis discussed the profitability to the Adviser and Mutual Funds Service Co., an affiliate of the Adviser, from the overall Funds’ operations, as well as an analysis based on the profitability resulting from the operation of each individual Fund, utilizing expense allocation methodologies deemed reasonable by the Adviser. In considering such materials, the Independent Trustees also received assistance and advice from and met separately with the Funds’ Independent Legal Counsel and the Chief Compliance Officer prior to the meeting. In their deliberations, the Board considered the terms of the existing Agreement between the Funds and the Adviser. While attention was given to all of the information furnished, the Board made the following specific findings in connection with its decision to renew the Agreement:
Nature, Extent and Quality of Services. The Board considered the nature, extent and quality of the services provided by the Adviser and its affiliates, including the reputation, qualifications, experience and capabilities of the personnel performing these services. The Board considered the qualifications of the investment management team and the resources committed to maintaining and improving the Adviser’s quantitative models. The Board noted that the Adviser and its affiliates provide a series of additional administrative services for the Funds, including fund accounting, transfer agency and compliance services, and recognized the continuing expenditures made to support and improve the scope of those services. Consideration was also given to the Adviser’s compliance resources and policies, including the periodic reporting provided to the Board. In making its judgment, the Board also considered the Adviser’s continual management of investment, operational, enterprise, legal and regulatory risk as it relates to the Funds as well as the manner in which the Adviser addressed new regulatory burdens that became effective during the preceding year. The Board concluded that the nature, extent and quality of the services provided by the Adviser have benefited and should continue to benefit each Fund and its shareholders.
Investment Performance. The Board placed emphasis on the investment performance of each Fund in view of its importance to shareholders. While consideration was given to performance reports and discussions with portfolio managers at Board meetings during the year, particular attention in assessing performance was given to the Broadridge reports furnished for the Agreement renewal. The Broadridge report prepared for each Fund showed the investment performance of each Fund for the one-, three-, five-, and ten-year periods, as applicable, ended June 30, 2022, in comparison with its benchmark and a performance universe similar to each Fund’s investment objectives. The Board evaluated performance in light of the investment strategy pursued by the Adviser, measures of investment risk, and steps taken by the Adviser to mitigate risk through active management of the portfolio. The Board noted both the equity markets and bond markets were generally down for the one-year period ended June 30, 2022. They also noted each Fund was down less than its benchmark index during the one-year period ended June 30, 2022, with the exception of the Quantex Fund. The Board was satisfied with the Adviser’s explanation of the factors that contributed to both the short-term and long-term performance of each Fund. The Board noted the Adviser’s continued efforts to improve performance and improve the quantitative models. The Board concluded that the Funds’ investment results have been satisfactory for renewal of the Agreement and that the Adviser’s record in managing the Funds indicated that its continued management should benefit the Funds and their shareholders.
Costs of Services. Consideration was given to a comparative analysis of the advisory fees and expense ratios of each Fund compared with those of a group of other relevant funds. The Board observed that the Funds’ advisory fees and expenses were within the range of those of other similar funds included in the comparable reports. The Board also considered an analysis comparing the Funds’ advisory fees with the fees charged by the Adviser to private clients, but noted the significant investment, operational, regulatory, and market differences between advising the Funds and advising private clients. The Board was satisfied with the Adviser’s continued efforts to reduce fees and expenses. The Board concluded that the Funds’ cost structures were fair and reasonable in relation to the services provided, and that the Funds’ shareholders receive reasonable value in return for the advisory fees and other amounts paid to the Adviser by the Funds.
Management Profitability. The Board also considered the level of profits realized by the Adviser and its affiliates in connection with the operation of the Funds. In this respect, the Board reviewed the Funds’ profitability analysis that addresses the overall profitability of the Meeder Funds’ business as well as the profitability resulting from the operation of each Fund. The Board also took into account management’s expenditures in improving shareholder services provided to the Funds, as well as the need to meet additional regulatory and compliance requirements resulting from recent SEC requirements. The Board determined that the level of profits realized by the Adviser under its Agreement with the Funds was not excessive in view of the nature, quality and extent of services provided.
Page 114 | 2022 Annual Report | December 31, 2022 |
Economies of Scale. The Board also considered whether economies of scale are realized as the Funds grow larger and the extent to which this is reflected in the level of advisory fees charged. While recognizing that any precise determination is inherently subjective, the Board noted that economies of scale may develop for certain Funds as their assets increase, and their Fund level expenses decline as a percentage of assets. The Board also considered whether the advisory fee rate is reasonable in relation to the asset size of each Fund and any economies of scale that may exist. The Board acknowledged that the advisory fee structure for each Fund is reasonable and in most instances is tiered by assets under management, allowing the shareholders to benefit from economies of scale as the Funds grow in size. The Board expressed continued satisfaction with each Fund’s fee structure under its Agreement.
Ancillary Benefits. The Board also considered ancillary benefits received by the Adviser as a result of its relationship with the Trust, including its access to research that benefits other clients and the service of its affiliates as transfer agent, administrator and distributor for the Funds. The fees for these services were considered separately in the profitability analysis and the Board considered the revenue and expenses incurred by the Adviser and its affiliates in providing these services. The Board also took into consideration additional contractual breakpoints in certain affiliated service agreements. The Board also considered the benefits derived by the Adviser from soft dollar arrangements, noting that these arrangements are subject to regular reporting and oversight. The Board took the ancillary benefits into account in evaluating the reasonableness of the advisory fees and other amounts paid to the Adviser by the Funds.
Conclusion. Based upon the foregoing findings as well as all of the information provided by the Adviser, the Board, including all of its Independent Trustees, was satisfied that the terms of the Agreement, including the existing advisory fee structure, are fair and reasonable and in the best interest of the Funds and their shareholders. The Board, including all of its Independent Trustees, therefore approved the continuation of the Agreement effective for a one-year term ending September 30, 2023.
Statement Regarding Liquidity Risk Management Program (unaudited)
In accordance with Rule 22e-4 (“Liquidity Rule”) under the 1940 Act, the Funds have adopted and implemented a liquidity risk management program (“Program”). The purpose of the Program is to outline the techniques, tools and arrangements employed for the management of liquidity risk within the Funds, and the terms, contents and frequency of reporting and escalation of any issues to the Board of Trustees. Liquidity is managed taking account of the investment strategy, liquidity profile, and redemption history, with the objective of maintaining a level of liquidity that is appropriate in light of the Funds’ obligations to the Funds’ shareholders. The Program assesses liquidity risk under both normal and stressed market conditions.
The Board of Trustees reviewed the Program during the Funds’ most recent fiscal half-year, including a written report prepared by the Program Administrator. The report reviewed the terms and operation of the Program, investment strategy and liquidity of the Funds, cash flow projections, shareholder concentration and holdings of cash and cash equivalents. The Adviser utilizes quantitative tools that provide daily evaluation of the liquidity of nearly all Funds’ securities. The Program Administrator was satisfied with the design, operation and effectiveness of the Program and reported that there were no liquidity events that materially affected the performance of the Funds or the Funds’ ability to meet their redemption obligations under normal and reasonably foreseeable stressed conditions without dilution to existing shareholders.
The report confirmed that the Funds’ investment strategies utilize highly liquid securities and do not maintain concentrated positions. The Funds also maintain significant holdings of cash and cash equivalents, which were judged suitable to meet redemption needs under ordinary and reasonably stressed market conditions. During the reporting period, the Funds maintained a high level of liquidity and primarily held assets in securities judged highly liquid under the Liquidity Rule. As a result, the Funds see no reason to, and therefore have not adopted a “Highly Liquid Investment Minimum,” as defined under the Liquidity Rule.
There can be no assurance that the Program will achieve its objectives in the future. Further information on liquidity risks of the Funds can be found in the Funds’ prospectus.
Other Information (unaudited)
The Trust files a complete schedule of portfolio holdings for the first and third quarters of each fiscal year on Form N-PORT. In addition, Money Market files its complete schedule of portfolio holdings with the SEC each month on Form N-MFP. Forms N-PORT and N-MFP are available on the SEC’s website at www.sec.gov. Information regarding Fund holdings is also available at www.meederinvestment.com.
The investment adviser is responsible for exercising the voting rights associated with the securities purchased or held by the Funds. A description of the policies and procedures that the adviser uses in fulfilling this responsibility and information regarding how those proxies were voted during the most recent 12-month period ending June 30 are available, without charge, by calling 1-800-325-3539 or on the SEC’s website at www.sec.gov.
2022 Annual Report | December 31, 2022 | Page 115 |

Privacy Policy
Meeder Investment Management and the Meeder Funds are committed to maintaining the financial privacy of our current, former and prospective customers. This policy explains how we protect the security and confidentiality of our customer’s information.
PERSONAL INFORMATION WE COLLECT
We may collect information about Meeder customers from a variety of sources, including:
| | ● | Information provided by you or your representative on applications or forms, such as your name, address, date of birth, social security number and investment objectives; |
| | ● | Information about the transactions in your account, such as your account balance and transaction history; and |
| | ● | Information we obtain from third parties regarding you, to verify your identity or transfer your account. |
INFORMATION WE SHARE WITH OUR AFFILIATES
Our affiliates are financial service providers that offer transfer agency, customer accounting, customer servicing, investment advisory, and other financial services. We share information with our affiliates to service your account. In addition, we may also share information with our affiliates to alert you to other products or services offered by Meeder to the extent provided by law. Information collected from customers whose accounts are opened through investment professionals is not shared with Meeder affiliates for marketing purposes.
INFORMATION WE SHARE WITH THIRD PARTIES
On occasion, we share information we collect about you with unaffiliated third parties to perform services in connection with your account, such as processing transactions, preparing and mailing account statements, and other forms of customer servicing. Information provided to third parties may not be used for any other purpose and Meeder does not permit unaffiliated third parties to use customer information to market their products or services.
HOW WE PROTECT INFORMATION ABOUT YOU
We maintain policies, and require all unaffiliated third parties to maintain policies, to safeguard customer information. We restrict access to nonpublic personal information about you to those persons who need to know that information in order to provide products and services to you. We also maintain physical, electronic, and procedural safeguards to guard your nonpublic personal information.
WHO THIS POLICY APPLIES TO
This policy applies to customers who open relationships directly with Meeder. It applies to Meeder Funds and Meeder’s affiliated companies, including Meeder Asset Management, Meeder Advisory Services, Meeder Public Funds, Meeder Distribution Services and Mutual Funds Service Company.
QUESTIONS
Contact us at 800-325-3539 or visit us online at www.meederinvestment.com
Privacy Policy – MIM 001 (4/21/22)
Page 116 | 2022 Annual Report | December 31, 2022 |
Manager and Investment Adviser
Meeder Asset Management, Inc.
6125 Memorial Drive
P.O. Box 7177
Dublin, Ohio 43017
Board of Trustees
Stuart M. Allen
Anthony V. D’Angelo
Robert S. Meeder, Jr.
Jeffrey R. Provence
Custodian
The Huntington National Bank
Columbus, Ohio 43215
Transfer Agent & Dividend Disbursing Agent
Mutual Funds Service Co.
6125 Memorial Drive
Dublin, Ohio 43017
Distributor
Meeder Distribution Services, Inc.
6125 Memorial Drive
Dublin, Ohio 43017
Independent Registered Public Accounting Firm
Cohen & Company, Ltd.
342 North Water Street, Suite 830
Milwaukee, Wisconsin 53202

Item 2. Code of Ethics.
The registrant has adopted a code of ethics that applies to the registrant’s principal executive officer, principal financial officer, comptroller or principal accounting officer, and any person who performs a similar function. There were no amendments made to, or waivers granted from, the code of ethics during the fiscal year.
Item 3. Audit Committee Financial Expert.
The Board of Trustees of the Trust has determined that Jeffrey R. Provence is an audit committee financial expert, as defined in Item 3 of Form N-CSR. Mr. Provence is independent for purposes of Item 3 of Form N-CSR.
Item 4. Principal Accountant Fees and Services.
(a) – (d) Aggregate fees billed to the registrant for the last two fiscal years for professional services rendered by the registrant’s principal accountant were as follows:
| | | 2022 | | | 2021 | |
| Audit Fees | | $ | 108,000 | | | $ | 119,400 | |
| Audit-Related Fees | | | 0 | | | | 0 | |
| Tax Fees | | | 50,500 | | | | 41,000 | |
| All Other Fees | | | 2,250 | | | | 2,250 | |
Audit fees include amounts related to the audit of the registrant’s annual financial statements and services normally provided by the accountant in connection with statutory and regulatory filings. Audit-related fees include amounts reasonably related to the performance of the audit of the registrant’s financial statements, including, but not limited to, mileage, lodging, and meals. Tax fees include amounts related to tax compliance, tax planning, and tax advice, including the review and preparation of the Funds’ income tax returns, the review and preparation of the Funds’ excise tax returns, the review of supporting schedules and documentation provided by management, the review and recalculation of the Funds’ estimated distribution calculations, and the review of wash sales for reasonableness. All other fees include amounts related to the registrant’s annual filing of Form N1A.
(e)(1) A purpose of the Audit Committee is to approve the engagement of the registrant’s independent auditors (i) to render audit and non-audit services for the registrant in accordance with Rule 2-01(c)(7)(i) of Regulation S-X, subject to the waiver provisions set forth in Rule 2-01(c)(7)(i)(C) of Regulation S-X, and (ii) to render non-audit services for the registrant’s investment advisors (other than a sub-advisor whose role is primarily portfolio management and is subcontracted or overseen by another investment advisor) and any other entity controlling by, or under common control with the investment advisor that provides ongoing services to the registrant, in each case under (ii) if the engagement relates directly to the operations and financial reporting of the registrant, in accordance with Rule 2-01(c)(7)(ii) of Regulation S-X, subject to waiver provisions set forth in Rule 2-01(c)(7)(ii) of Regulation S-X.
(e)(2) 0% of services included in (b) – (d) above were approved pursuant to Rule 2-01(c)(7)(i)(C) of Regulation S-X.
(f) Not applicable.
(g) The aggregate fees billed for the most recent fiscal year and the preceding fiscal year by the registrant’s principal accountant for non-audit services rendered to the registrant, its investment advisor, and any entity controlling, controlled by, or under common control with the investment advisor that provides ongoing services to the registrant were $92,200 and $40,600 respectively.
(h) The registrant’s audit committee of the board of directors has considered whether the provision of non-audit services that were rendered to the registrant’s investment adviser (not including any sub-adviser whose role is primarily portfolio management and is subcontracted with or overseen by another investment adviser), and any entity controlling, controlled by, or under common control with the investment adviser that provides ongoing services to the registrant that were not pre-approved pursuant to paragraph (c)(7)(ii) of Rule 2-01 of Regulation S-X is compatible with maintaining the principal accountant’s independence.
Items 5. Audit Committee of Listed Registrants.
Not applicable.
Item 6. Schedule of Investments.
Not applicable.
Item 7. Disclosure of Proxy Voting Policies and Procedures for Closed-End Management Investment Companies.
Not applicable.
Item 8. Portfolio Managers of Closed-End Management Investment Companies.
Not applicable.
Item 9. Purchases of Equity Securities by Closed-End Management Investment Company and Affiliated Purchasers.
Not applicable.
Item 10. Submission of Matters to a Vote of Security Holders.
Not applicable.
Item 11. Controls and Procedures.
(a) Based on our evaluation conducted within 90 days of the filing date, hereof, the design and operation of the registrant's disclosure controls and procedures are effective to ensure that material information relating to the registrant is made known to the certifying officers by others within the appropriate entities, particularly during the period in which Forms N-CSR are being prepared, and the registrant's disclosure controls and procedures allow timely preparation and review of the information for the registrant's Form N-CSR and the officer certifications of such Form N-CSR.
(b) There were no significant changes in the registrant's internal controls or in other factors that could significantly affect these controls subsequent to the date of their evaluation, including any corrective actions with regard to significant deficiencies and material weaknesses.
Item 12. Disclosure of Securities Lending Activities for Closed-End Management Investment Companies.
Not applicable.
Item 13. Exhibits.
(a)(1) Code of Ethics filed herewith as EX-99.CODE ETH.
(a)(2) A separate certification for each principal executive and principal financial officer of the registrant as required by Rule 30a-2(a) under the Act(17 CFR270.30a-2(a)). Filed herewith as EX-99.CERT.
(b) Certifications of principal executive officer and principal financial officer, under Section 906 of the Sarbanes-Oxley Act of 2002, and 18 U.S.C. ss.1350. Filed herewith as EX-99.906 CERT.
SIGNATURES
Pursuant to the requirements of the Securities Exchange Act of 1934 and the Investment Company Act of 1940, the registrant has duly caused this report to be signed on its behalf by the undersigned, thereunto duly authorized.
Meeder Funds
| By: | /s/ Bruce E. McKibben | |
| | Bruce E. McKibben, Treasurer | |
| | |
| Date: | March 8, 2023 | |
Pursuant to the requirements of the Securities Exchange Act of 1934 and the Investment Company Act of 1940, this report has been signed below by the following persons on behalf of the registrant and in the capacities and on the dates indicated.
| By: | /s/ Bruce E. McKibben | |
| | Bruce E. McKibben, Treasurer | |
| | |
| Date: | March 8, 2023 | |
| | | |
| By: | /s/ Robert S. Meeder, Jr. | |
| | Robert S. Meeder, Jr., President | |
| | | |
Date: | March 8, 2023 | |