UNITED STATES SECURITIES AND EXCHANGE COMMISSION
Washington, D.C. 20549
FORM N-CSR
CERTIFIED SHAREHOLDER REPORT
OF REGISTERED MANAGEMENT INVESTMENT COMPANIES
Investment Company Act file number 811-03462
Meeder Funds Trust
6125 Memorial Drive
Dublin, OH 43017
Bruce McKibben
c/o Meeder Funds Trust
6125 Memorial Drive
Dublin, OH 43017
Registrant’s telephone number, including area code: 800-325-3539
Date of fiscal year end: December 31, 2020
Date of reporting period: December 31, 2020
Item 1. Report to Stockholders.
Beginning on January 1, 2021, as permitted by regulations adopted by the U.S. Securities and Exchange Commission, paper copies of the Funds’ annual and semiannual shareholder reports will no longer be sent by mail, unless you specifically request paper copies of the reports. Instead, the reports will be made available on the Funds’ website (www.meederinvestment.com), and you will be notified by mail each time a report is posted and provided with a website link to access the report.
If you already elected to receive shareholder reports electronically, you will not be affected by this change and you need not take any action. You may elect to receive shareholder reports and other communications from a Fund electronically anytime by contacting your financial intermediary (such as a broker-dealer or bank) or, if you are a direct investor, by calling 1-800-325-3539 or by sending an email request to meederfunds@meederinvestment.com.
You may elect to receive all future reports in paper free of charge. If you invest through a financial intermediary, you can contact your financial intermediary to request that you continue to receive paper copies of your shareholder reports. If you invest directly with a Fund, you can call 1-800-325-3539 or send an email request to meederfunds@meederinvestment.com to let the Fund know you wish to continue receiving paper copies of your shareholder reports. Your election to receive reports in paper will apply to all Funds held in your account if you invest through your financial intermediary or all Funds held with the Fund complex if you invest directly with a Fund.
TABLE OF CONTENTS
| | |
Letter to Shareholders | 1 |
Fund Summaries (Unaudited) | |
Muirfield Fund | 4 |
Spectrum Fund | 6 |
Global Allocation Fund | 8 |
Balanced Fund | 10 |
Moderate Allocation Fund | 12 |
Conservative Allocation Fund | 14 |
Dynamic Allocation Fund | 16 |
Quantex Fund | 18 |
Total Return Bond Fund | 20 |
Prime Money Market Fund | 22 |
Institutional Prime Money Market Fund | 24 |
Financial Statements | |
Schedules of Investments | 27 |
Statements of Assets & Liabilities | 118 |
Statements of Operations | 120 |
Statements of Changes in Net Assets | 122 |
Financial Highlights | 126 |
Notes to Financial Statements | 136 |
Report of Independent Registered Public Accounting Firm | 155 |
Shareholder Expense Analysis | 156 |
Management of the Trust | 158 |
Other Items | 159 |
This Annual Report is prepared and distributed for the general information of the shareholders of the Funds. This material is not authorized for distribution to prospective investors unless preceded or accompanied by a prospectus. Investors are advised to consider carefully the investment objectives, risks, charges and expenses of the Fund before investing. The prospectus contains this and other information about the Funds.
Meeder Funds are distributed by Meeder Distribution Services, Inc. (f.k.a. Adviser Dealer Services, Inc.) (Member FINRA), an affiliate of Meeder Investment Management. An affiliated registered investment adviser, Meeder Asset Management, Inc., serves as the investment adviser to Meeder Funds and is paid a fee for its services.
Letter to Shareholders December 31, 2020
CAPITAL MARKETS UPDATE: Q4: 2020
For many, the year 2020 could not end quickly enough. The U.S. election and quest to find a COVID-19 vaccine dominated the headlines throughout the year. As scientists learned more about the transmission of the virus, state governments formulated various strategies and companies across the U.S. gradually reopened. Positive news on vaccine advances helped GDP in the 3rd quarter rebound by more than +33%, up from its worst-ever drop of -31.4% in the prior quarter. At the end of December, the FDA approved two different COVID-19 vaccines for emergency use. These events provided a renewed hope that the global economy could reopen sooner than previously expected and helped the Dow Jones Industrial Average, S&P 500, and Russell 2000 Indices reach new all-time highs. Small-cap stocks were the best performing U.S, market cap index for the quarter, followed by mid and large-caps, respectively. WTI oil also reached a 9-month high of $50 a barrel as the world reached another step closer to the global economy reopening.
While it seemed like things were moving back to normal economically, the disconnect between strong stock market performance and a weak economic recovery continues as significant economic problems remain The U.S. unemployment rate remains stagnant at 6.7% as many workers still attempt to regain their footing after being displaced due to the pandemic. Unfortunately, U.S. Non-farm payrolls lost 140,000 jobs in December, making it the first loss since the economy shed almost an unthinkable 21 million jobs in April alone. The continued trend of slowing growth even compelled Congress to pass a stimulus relief bill for those impacted the most by the pandemic. The new administration is also considering an additional stimulus bill for Americans early in 2021.
COVID-19
The FDA approved a COVID-19 vaccine for emergency use developed through a collaboration between Pfizer and BioNTech. The U.S. government provided resources to vaccine manufacturers to begin proactively producing vaccine candidates. Thus, manufacturers created an inventory and began shipping the premade doses around the U.S. within hours of the FDA’s formal approval. The next day, medical facilities received and began administering the vaccine to front-line workers and those in assisted living facilities. Ironically, on the first day of vaccinations, the U.S. crossed 300,000 fatalities from COVID-19, as the country averages roughly 200,000 new contractions each day. On a positive note, Moderna’s COVID-19 vaccine was the second to be approved for emergency use by the FDA. This vaccination provides an efficacy rate of up to 95%. Oxford-AstraZeneca’s vaccine candidate may delay submission for FDA review in the spring of 2021, but is currently being used in the U.K. These vaccines will help provide the medical community with a portfolio of available medicines that fight the virus differently. To date, the virus is responsible for the deaths of more than 368,000 Americans and 1,900,000 lives worldwide.
FEDERAL RESERVE
The Federal Open Market Committee held its meeting in December and kept interest rates near zero. The committee also committed to purchasing a minimum of $120 billion of bonds each month until the economy reaches full employment and inflation expectations. They issued a statement saying, “these asset purchases help foster smooth market functioning and accommodative financial conditions, thereby supporting the flow of credit to households and businesses.” The Federal Reserve (Fed) stated that they would consider many items when determining their outlook, including the global pandemic, labor markets, inflation, and international events. As it stands, a survey of Fed officials revealed the group is committed to keeping rates near zero through 2023.
ELECTION 2020
Joe Biden will be inaugurated as the 46th President of the United States as the electoral college officially certified their votes, providing him with more than the 270 votes needed. Democrats will maintain control of the House of Representatives, but their majority decreased from 38 seats to 10. On January 5, Democrats won both of Georgia’s runoff races. These seats now split the Senate in a 50-50 tie between both parties but gives the incoming Democratic Vice President the tie-breaking majority. Stock market returns have historically been higher with a split Congress, which usually leads to less sweeping policy changes. However, performance of the S&P 500 Index when Democrats have maintained control of the White House and Congress are still above average.
There was a record amount of money spent during this election cycle. The nonpartisan Center of Responsive Politics estimates that the Congressional and Presidential campaigns for the November 2020 elections spent $10.8 billion. Campaigns allocated more than $1 billion to television campaign ads, with $882 million of the total directed to six key battleground states. Despite the record amounts spent by both campaigns, expected market volatility followed a somewhat similar pattern to past elections and rose significantly. This year, the CBOE Volatility Index (VIX) spiked more than 50% during the three months ahead of the election.
BREXIT TRADE DEAL OFFICIAL
In 2016, citizens of Great Britain voted to leave the European Union. Since then, details and logistics of the move prevented this transition from occurring. The event was officially ratified on January 31, 2020; however, Britain agreed to adhere to the E.U.’s terms to finalize the agreement until December 31, 2020. Citizens of Great Britain who travel to the European Union will now need to provide similar documentation as Americans. From a business perspective, the most critical detail in the agreement is that the two entities established a trade deal with no tariffs and no quotas. Thankfully, this resolution is one less thing that investors need to worry about in 2021.
2020 Annual Report | December 31, 2020 | Page 1 |
HOW IS THIS IMPACTING PORTFOLIOS?
At Meeder, we manage investment solutions across different risk profiles and time horizons. Meeder manages strategies using a systematic approach that guides us in the allocation of our portfolios. Many of these solutions employ one or more of our core investment strategies: Growth, Defensive Equity and Fixed Income.
GROWTH
Investment portfolios comprised of the Growth Strategy maintain a more aggressive objective and typically remain invested in the stock market. In the fourth quarter, investors got significantly more clarity about the future. Certified election results provided investors with a better idea of what they might expect regarding future policy shifts. At the end of December, the FDA approved two different COVID-19 vaccines for emergency use. This renewed hope that the global economy might be reopening sooner than previously expected helped major indices like the Dow Jones, S&P 500, and Russell 2000 Indices reach new all-time highs. Small-cap stocks were the best performing market cap for the quarter, followed by mid and large-caps, respectively. Those investors that remained invested in the Growth Strategy portfolios, despite the market volatility in the fourth quarter, received the highest returns of all our risk-based portfolios.
DEFENSIVE EQUITY
Portfolios that utilize the Defensive Equity Strategy follow a rules-based and data-driven approach using the Meeder Investment Positioning System (IPS) model. This model is used to determine the risk relative to reward in the marketplace and identifies when we should be increasing or decreasing the portfolio’s target equity exposure.
At the beginning of the fourth quarter, the IPS model indicated that we should have an equity target exposure of 86%. Short-term trends were robust as many stocks participated in the stock market rally. The IPS guided us to gradually increase our target equity exposure to 100% by the middle of October. As the U.S. election drew near, the stock market’s expected volatility climbed to its highest level since early June. During higher periods of volatility, historically, there are increased odds of equity drawdowns and this is one reason the IPS guided us to reduce the target equity exposure to 88%. After the U.S. election occurred, market risk declined significantly as investors gained clarity about potential future policy shifts.
The long-term model’s score continued to improve as the broad strength of the underlying trend of many sectors and industries. This caused us to gradually increase our target equity exposure to 100% in the middle of November. In December, bullish option activity was extremely high and was near an optimistic extreme. Since we view this from a contrarian perspective, this was a detractor from the intermediate-term model score. The IPS also identified a decline in the percentage of world markets in uptrends, but neither of these events was significant enough to reduce our equity exposure. The Defensive Equity strategy remained 100% invested through the end of 2020.
FIXED INCOME
The Meeder Fixed Income Strategy tactically shifts portfolio exposure utilizing our proprietary investment models. These models are designed to actively monitor factors to guide us in determining the credit quality, emerging market debt exposure, and the portfolio’s U.S. Treasury duration. Our quantitative model signaled strength in momentum, volatility, and macroeconomic factors in high-yield and emerging market debt sectors in the fourth quarter. This risk-on signal led us to increase the allocation and ultimately overweight these sectors while underweighting investment-grade bonds and U.S. Treasuries for the majority of the quarter. High-yield bonds led the risk-on rally to substantially outperform their investment-grade peers, as yields reached a record low of 4.18% at the end of the year. The overweight allocation to emerging market bonds also contributed to portfolio performance, as the sector benefited from the U.S. dollar’s weakness in December. The Meeder fixed income strategy maintained a duration in line with its benchmark, the Bloomberg Barclays U.S. Aggregate Bond Index.
A NEW YEAR
The events of 2020 made history for our country and in the markets that we will likely not forget. Despite all the twists and turns, I want to take a moment to congratulate everyone for navigating through one of the most turbulent market environments ever. It is essential to reflect on what an historic year it has been and all that we have accomplished together in such an unusual time. On behalf of all of us at Meeder Investment Management, I would like to wish each of you a happy, healthy, and prosperous new year.
Sincerely,

Robert S. Meeder
President & CEO
Meeder Asset Management, Inc.
Page 2 | 2020 Annual Report | December 31, 2020 |
2020 Annual Report
Fund Summaries
Muirfield Fund
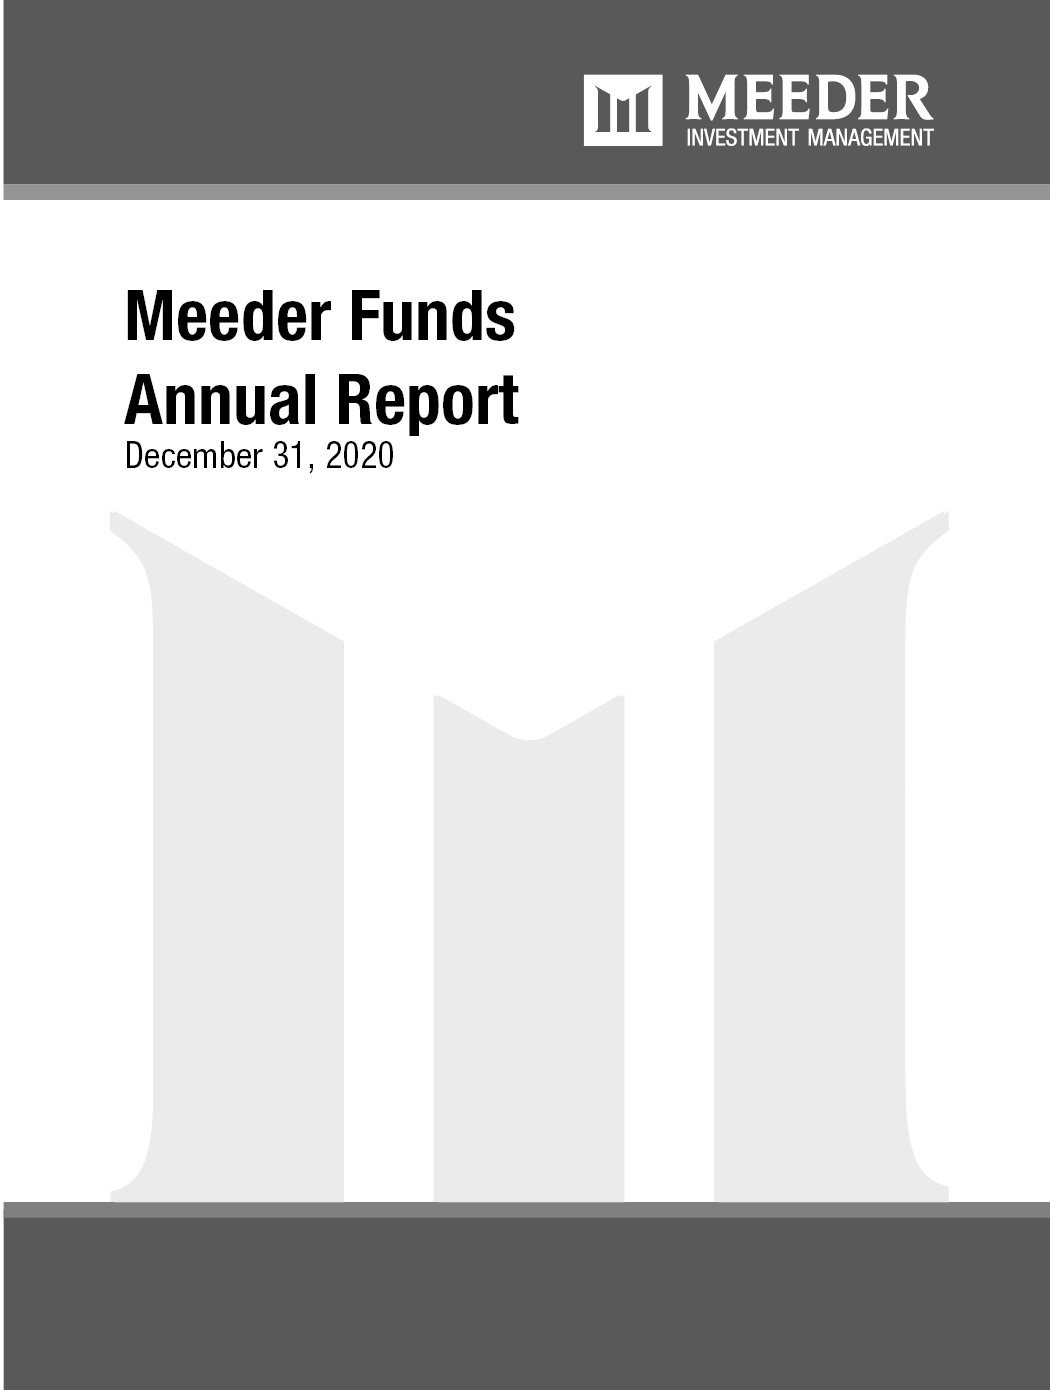
The Meeder Muirfield Fund Institutional Class returned 4.66% for the year ended December 31, 2020, compared to the Morningstar Moderate Target Risk Index benchmark return of 12.82%. This fund maintains exposure to the Meeder Defensive Equity Strategy.
The Meeder Defensive Equity Strategy follows a rules-based and data-driven approach using the Meeder Investment Positioning System (IPS) model. This model is used to determine the risk relative to reward in the marketplace and identifies when we should be increasing or decreasing the portfolio’s target equity exposure. The Defensive Equity tactical portfolio began the first quarter with a target of 100% exposure to the stock market since our investment model’s reward value was higher than the risk value. The S&P 500 Index plummeted -34% from its high on February 19th, to its low on March 23rd. The economic impact of the COVID-19 pandemic rocked the stock market as initial jobless claims spiked as high as 6.8 million in just one week, before gradually trending lower. A sharp increase in market risk identified by our IPS models indicated that we should have a target exposure of 30% at the end of March. The percentage of world markets trading above their 50-day moving average increased in the long-term model. Markets remained rangebound until the May non-farm payroll report showed that the U.S. added a record-high 2.5 million jobs when it was expected to lose more than -8.3 million. This led us to increase the target exposure to the stock market to 62%. The intermediate-term model improved, as significant fund flow activity demonstrated an increase in institutional demand causing us to increase our equity target to as high as 91%. With the Fed remaining extremely accommodative and stating they will keep interest rates near zero until at least 2023, the long-term model score significantly improved this quarter. Institutional demand factors in our intermediate-term model continued to show a lack of significant fund flow activity during September. After the U.S. election in November, market risk declined significantly as investors gained clarity about potential future policy shifts. The long-term model’s score continued to improve as the broad strength of the underlying trend of many sectors and industries. This caused us to gradually increase our target equity exposure to 100% in mid-November and remained there through the end of 2020.
Our shifts within equity markets include international versus domestic holdings, as well as allocating among market capitalization ranges in addition to sector overweight and/or underweight positions. Due primarily to relative momentum factors, our exposure to international holdings among both developed international and emerging market securities was underweight relative to the benchmark. Our underweight exposure to international markets contributed to performance relative to the benchmark in 2020.
Within our stock selection process, we attempt to gain exposure to companies with strong profitability that are priced at reasonable valuations relative to their industry peers and are trading with positive price momentum. For the year ending 2020, securities with strong fundamentals, such as strong profitability, contributed to performance. In addition, the fund’s investment in companies with low leverage also contributed to performance. The fund’s exposure to companies with low valuations detracted from performance in 2020.
In the portfolio, we will often use equity index derivatives in the fund, such as stock index futures, to efficiently equitize our cash positions as well as manage the equity exposure of the fund. Regarding equitizing cash positions, these derivatives are designed to track their respective stock index, so there was no discernible impact to the fund’s relative performance. The use of stock index futures to manage equity exposure of the fund had a negative impact on the performance of the fund relative to the benchmark index during 2020.
Investment Objective
The investment objective of the Fund is to provide long-term capital appreciation.
Average Annual Total Returns
as of December 31, 2020
| 1
Year | 5
Year | 10
Year | Share Class
Inception
Date |
Muirfield Fund Retail Class | 4.36% | 7.74% | 7.62% | 8/10/88 |
Muirfield Fund Institutional Class | 4.66% | 8.09% | 7.80% | 10/31/16 |
Muirfield Fund Adviser Class | 4.67% | 7.98% | 7.74% | 10/31/16 |
Morningstar Moderate Target Risk Index | 12.82% | 9.75% | 7.77% | — |
Blended Index | 11.77% | 9.69% | 8.62% | — |
Top 10 Holdings
as of December 31, 2020
1. | Apple, Inc. | 4.8% |
2. | Microsoft Corp. | 4.1% |
3. | Amazon.com, Inc. | 2.8% |
4. | Facebook, Inc. | 1.6% |
5. | Berkshire Hathaway, Inc. - Class B | 1.5% |
6. | Johnson & Johnson | 1.5% |
7. | Alphabet, Inc. - Class C | 1.4% |
8. | Tesla, Inc. | 1.2% |
9. | Merck & Co., Inc. | 0.9% |
10. | Alphabet, Inc. - Class A | 0.9% |
As a percentage of total net assets. Holdings exclude short-term investments and derivatives.
Page 4 | 2020 Annual Report | December 31, 2020 |
Growth of $10,000
as of December 31, 2020
The Growth of $10,000 chart compares the performance of the Fund’s Retail Share Class over the period shown with dividends and capital gains reinvested to the Fund’s benchmarks. Benchmark indices are unmanaged and do not reflect the deduction of expenses associated with a mutual fund, such as investment management and accounting fees.
Investment performance assumes reinvestment of all dividend and capital gain distributions. The results do not reflect the effect of taxes a shareholder would pay on Fund distributions or on the redemption of Fund shares. Historical performance attributed to the Institutional and Adviser Share Classes prior to their inception dates is based on the performance of the Retail Share Class. No adjustment has been made to reflect class-specific distribution or servicing fees. Returns may reflect the effect of voluntary fee waivers or expense reimbursements over the period shown. Without these waivers, performance would have been lower.
The performance data shown represents past performance, which does not guarantee future results. The investment return and principal value of an investment will fluctuate so that an investor’s shares, when redeemed, may be worth more or less than their original cost. Current performance may be lower or higher than the performance data quoted. For current month-end performance data, please visit our website at www.meederfunds.com.
Sector Concentration
as of December 31, 2020
Information Technology | 28.7% |
Healthcare | 18.9% |
Consumer Discretionary | 12.7% |
Communication Services | 10.1% |
Financials | 8.9% |
Industrials | 8.7% |
Real Estate Investment Trust | 3.1% |
Materials | 3.0% |
Consumer Staples | 2.7% |
Utilities | 2.2% |
Energy | 1.0% |
Total | 100.0% |
As a percentage of total common stocks. Concentrations are subject to change.
Asset Allocation
as of December 31, 2020
Common Stocks | 79.9% |
Money Market Registered Investment Companies | 18.1% |
Bank Obligations | 0.1% |
Other Assets/Liabilities (Net) | 1.9% |
Total | 100.0% |
As a percentage of total net assets. The Fund has invested in stock index futures contracts in order to equitize cash balances held in the Fund.
The Blended Index is comprised 60% of the S&P 500 Index and 40% of 90-day T-bills.
2020 Annual Report | December 31, 2020 | Page 5 |
Spectrum Fund
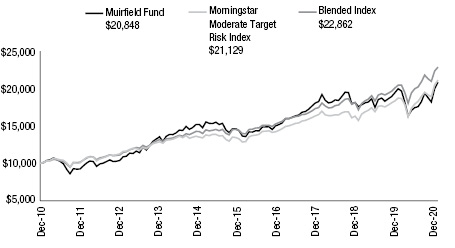
The Meeder Spectrum Fund Institutional Class returned 0.25% for the year ended December 31, 2020, compared to the Morningstar Moderate Target Risk Index benchmark return of 12.82%. This fund maintains exposure to the Meeder Defensive Equity Strategy.
The Meeder Defensive Equity Strategy follows a rules-based and data-driven approach using the Meeder Investment Positioning System (IPS) model. This model is used to determine the risk relative to reward in the marketplace and identifies when we should be increasing or decreasing the portfolio’s target equity exposure. The Defensive Equity tactical portfolio began the first quarter with a target of 100% exposure to the stock market since our investment model’s reward value was higher than the risk value. The S&P 500 Index plummeted -34% from its high on February 19th, to its low on March 23rd. The economic impact of the COVID-19 pandemic rocked the stock market as initial jobless claims spiked as high as 6.8 million in just one week, before gradually trending lower. A sharp increase in market risk identified by our IPS models indicated that we should have a target exposure of 30% at the end of March. The percentage of world markets trading above their 50-day moving average increased in the long-term model. Markets remained rangebound until the May non-farm payroll report showed that the U.S. added a record-high 2.5 million jobs when it was expected to lose more than -8.3 million. This led us to increase the target exposure to the stock market to 62%. The intermediate-term model improved, as significant fund flow activity demonstrated an increase in institutional demand causing us to increase our equity target to as high as 91%. With the Fed remaining extremely accommodative and stating they will keep interest rates near zero until at least 2023, the long-term model score significantly improved this quarter. Institutional demand factors in our intermediate-term model continued to show a lack of significant fund flow activity during September. After the U.S. election in November, market risk declined significantly as investors gained clarity about potential future policy shifts. The long-term model’s score continued to improve as the broad strength of the underlying trend of many sectors and industries. This caused us to gradually increase our target equity exposure to 100% in mid-November and remained there through the end of 2020.
Our shifts within equity markets include international versus domestic holdings, as well as allocating among market capitalization ranges in addition to sector overweight and/or underweight positions. Due primarily to relative momentum factors, our exposure to international holdings among both developed international and emerging market securities was underweight relative to the benchmark. Our underweight exposure to international markets contributed to performance relative to the benchmark in 2020.
Within our stock selection process, we attempt to gain exposure to companies with strong profitability that are priced at reasonable valuations relative to their industry peers and are trading with positive price momentum. For the year ending 2020, securities with strong fundamentals, such as strong profitability, contributed to performance. In addition, the fund’s investment in companies with low leverage also contributed to performance. The fund’s exposure to companies with low valuations detracted from performance in 2020.
In the portfolio, we will often use equity index derivatives in the fund, such as stock index futures, to efficiently equitize our cash positions as well as manage the equity exposure of the fund. Regarding equitizing cash positions, these derivatives are designed to track their respective stock index, so there was no discernible impact to the fund’s relative performance. The use of stock index futures to manage equity exposure of the fund had a negative impact on the performance of the fund relative to the benchmark index during 2020.
Investment Objective
The investment objective of the Fund is to provide long-term capital appreciation.
Average Annual Total Returns
as of December 31, 2020
| 1
Year | 5
Year | Since
Inception | Share Class
Inception
Date |
Spectrum Fund Retail Class | -0.23% | 6.68% | 5.33% | 1/1/15 |
Spectrum Fund Institutional Class | 0.25% | 7.07% | 5.65% | 10/31/16 |
Spectrum Fund Adviser Class | 0.18% | 6.94% | 5.54% | 10/31/16 |
Morningstar Moderate Target Risk Index | 12.82% | 9.75% | 7.75% | — |
Blended Index | 11.77% | 9.69% | 8.21% | — |
Top 10 Holdings
as of December 31, 2020
1. | Apple, Inc. | 5.5% |
2. | Microsoft Corp. | 4.7% |
3. | Amazon.com, Inc. | 2.8% |
4. | Johnson & Johnson | 1.9% |
5. | Facebook, Inc. | 1.7% |
6. | Berkshire Hathaway, Inc. - Class B | 1.5% |
7. | Alphabet, Inc. - Class C | 1.4% |
8. | Tesla, Inc. | 1.3% |
9. | Merck & Co., Inc. | 1.3% |
10. | Intuit, Inc. | 1.2% |
As a percentage of total net assets. Holdings exclude short-term investments and derivatives.
Page 6 | 2020 Annual Report | December 31, 2020 |
Growth of $10,000
as of December 31, 2020
The Growth of $10,000 chart compares the performance of the Fund’s Retail Share Class over the period shown with dividends and capital gains reinvested to the Fund’s benchmarks. Benchmark indices are unmanaged and do not reflect the deduction of expenses associated with a mutual fund, such as investment management and accounting fees.
Investment performance assumes reinvestment of all dividend and capital gain distributions. The results do not reflect the effect of taxes a shareholder would pay on Fund distributions or on the redemption of Fund shares. Historical performance attributed to the Institutional and Adviser Share Classes prior to their inception dates is based on the performance of the Retail Share Class. No adjustment has been made to reflect class-specific distribution or servicing fees. Returns may reflect the effect of voluntary fee waivers or expense reimbursements over the period shown. Without these waivers, performance would have been lower.
The performance data shown represents past performance, which does not guarantee future results. The investment return and principal value of an investment will fluctuate so that an investor’s shares, when redeemed, may be worth more or less than their original cost. Current performance may be lower or higher than the performance data quoted. For current month-end performance data, please visit our website at www.meederfunds.com.
Sector Concentration
as of December 31, 2020
Information Technology | 30.7% |
Healthcare | 19.3% |
Consumer Discretionary | 12.5% |
Communication Services | 9.6% |
Financials | 8.6% |
Industrials | 7.9% |
Real Estate Investment Trust | 3.1% |
Materials | 3.0% |
Consumer Staples | 2.9% |
Utilities | 1.5% |
Energy | 0.9% |
Total | 100.0% |
As a percentage of total common stocks. Concentrations are subject to change.
Asset Allocation
as of December 31, 2020
Common Stocks | 81.6% |
Money Market Registered Investment Companies | 15.8% |
Other Assets/Liabilities (Net) | 2.6% |
Total | 100.0% |
As a percentage of total net assets. The Fund has invested in stock index futures contracts in order to equitize cash balances held in the Fund.
The Blended Index is comprised 60% of the S&P 500 Index and 40% of 90-day T-bills.
2020 Annual Report | December 31, 2020 | Page 7 |
Global Allocation Fund
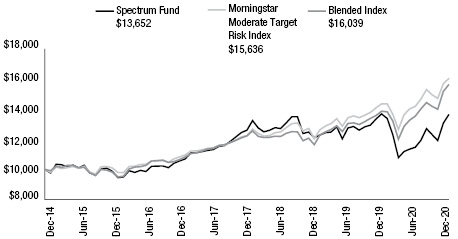
The Meeder Global Allocation Fund Institutional Class returned 3.43% for the year ended December 31, 2020, compared to the Morningstar Global Allocation Index benchmark return of 13.55%. This fund maintains exposure to both the Meeder Defensive Equity Strategy and to the Meeder Fixed Income Strategy. It invests in domestic equity markets but will generally hold securities in emerging market and developed international equities as well. We alter the allocation to the international markets based on indications from our quantitative models. Additionally, the strategy can reduce equity exposure when it is deemed to be a high-risk market environment.
The Meeder Defensive Equity Strategy follows a rules-based and data-driven approach using the Meeder Investment Positioning System (IPS) model. This model is used to determine the risk relative to reward in the marketplace and identifies when we should be increasing or decreasing the portfolio’s target equity exposure. The Defensive Equity tactical portfolio began the first quarter with a target of 100% exposure to the stock market since our investment model’s reward value was higher than the risk value. The S&P 500 Index plummeted -34% from its high on February 19th, to its low on March 23rd. The economic impact of the COVID-19 pandemic rocked the stock market as initial jobless claims spiked as high as 6.8 million in just one week, before gradually trending lower. A sharp increase in market risk identified by our IPS models indicated that we should have a target exposure of 30% at the end of March. The percentage of world markets trading above their 50-day moving average increased in the long-term model. Markets remained rangebound until the May non-farm payroll report showed that the U.S. added a record-high 2.5 million jobs when it was expected to lose more than -8.3 million. This led us to increase the target exposure to the stock market to 62%. The intermediate-term model improved, as significant fund flow activity demonstrated an increase in institutional demand causing us to increase our equity target to as high as 91%. With the Fed remaining extremely accommodative and stating they will keep interest rates near zero until at least 2023, the long-term model score significantly improved this quarter. Institutional demand factors in our intermediate-term model continued to show a lack of significant fund flow activity during September. After the U.S. election in November, market risk declined significantly as investors gained clarity about potential future policy shifts. The long-term model’s score continued to improve as the broad strength of the underlying trend of many sectors and industries. This caused us to gradually increase our target equity exposure to 100% in mid-November and remained there through the end of 2020.
Our shifts within equity markets include international versus domestic holdings, as well as allocating among market capitalization ranges in addition to sector overweight and/or underweight positions. Due primarily to relative momentum factors, our exposure to international holdings among both developed international and emerging market securities was underweight relative to the benchmark. Our underweight exposure to international markets contributed to performance relative to the benchmark in 2020.
The Meeder Fixed Income Strategy tactically shifts portfolio exposure utilizing quantitative models designed to actively monitor the credit quality, emerging market bond exposure, and the U.S. Treasury duration of the portfolio. Our fixed income models added significant value during the coronavirus-driven drawdown. Volatility and macroeconomic factors in our models turned uniformly negative in the middle of March, while momentum factors turned negative toward the end of the first quarter. This caused us to reduce our high-yield and emerging market exposure before the market meltdown in March. The Federal Reserve stepped in to provide liquidity by reducing short-term interest rates to zero, as well as providing other quantitative easing measures to calm fixed income markets. During this period, our portfolio maintained a high-quality bias, which contributed to its overall performance during this market volatility. In early April, momentum and volatility factors showed strength in high-yield bonds, while macroeconomic factors signaled potential weakness. All model factors related to emerging market bonds were uniformly positive. In response to our models signaling an improvement in market conditions, we increased exposure to high-yield bonds and emerging market bonds in our tactical portfolio over the first few weeks of the second quarter. This risk-on signal led us to ultimately overweight these sectors while reducing exposure to U.S. investment-grade bonds and U.S. Treasuries. Since then, high-yield bonds led the risk-on rally to substantially outperform their investment-grade peers. The overweight allocation to emerging market bonds also contributed to portfolio performance, as the sector benefited from the U.S. dollar’s weakness. At the end of the year, the Meeder fixed income strategy maintained a duration in line with its benchmark, the Bloomberg Barclays U.S. Aggregate Bond Index.
Within our stock selection process, we attempt to gain exposure to companies with strong profitability that are priced at reasonable valuations relative to their industry peers and are trading with positive price momentum. For the year ending 2020, securities with strong fundamentals, such as strong profitability, contributed to performance. In addition, the fund’s investment in companies with low leverage also contributed to performance. The fund’s exposure to companies with low valuations detracted from performance in 2020.
In the portfolio, we will often use equity index derivatives in the fund, such as stock index futures, to efficiently equitize our cash positions as well as manage the equity exposure of the fund. Regarding equitizing cash positions, these derivatives are designed to track their respective stock index, so there was no discernible impact to the fund’s relative performance. The use of stock index futures to manage equity exposure of the fund had a negative impact on the performance of the fund relative to the benchmark index during 2020.
Page 8 | 2020 Annual Report | December 31, 2020 |
Investment Objective
The investment objective of the Fund is to provide long-term capital appreciation.
Average Annual Total Returns
as of December 31, 2020
| 1
Year | 5
Year | 10
Year | Share Class
Inception
Date |
Global Allocation Fund Retail Class | 2.96% | 6.55% | 5.65% | 1/31/06 |
Global Allocation Fund Institutional Class | 3.43% | 6.98% | 5.86% | 10/31/16 |
Global Allocation Fund Adviser Class | 3.42% | 6.84% | 5.79% | 10/31/16 |
Morningstar Global Allocation Index | 13.55% | 9.76% | 7.22% | — |
Blended Index | 10.29% | 7.67% | 5.73% | — |
Growth of $10,000
as of December 31, 2020
The Growth of $10,000 chart compares the performance of the Fund’s Retail Share Class over the period shown with dividends and capital gains reinvested to the Fund’s benchmarks. Benchmark indices are unmanaged and do not reflect the deduction of expenses associated with a mutual fund, such as investment management and accounting fees.
Investment performance assumes reinvestment of all dividend and capital gain distributions. The results do not reflect the effect of taxes a shareholder would pay on Fund distributions or on the redemption of Fund shares. Historical performance attributed to the Institutional and Adviser Share Classes prior to their inception dates is based on the performance of the Retail Share Class. No adjustment has been made to reflect class-specific distribution or servicing fees. Returns may reflect the effect of voluntary fee waivers or expense reimbursements over the period shown. Without these waivers, performance would have been lower.
The performance data shown represents past performance, which does not guarantee future results. The investment return and principal value of an investment will fluctuate so that an investor’s shares, when redeemed, may be worth more or less than their original cost. Current performance may be lower or higher than the performance data quoted. For current month-end performance data, please visit our website at www.meederfunds.com.
Top 10 Holdings
as of December 31, 2020
1. | iShares Core MSCI EAFE ETF | 6.4% |
2. | Apple, Inc. | 2.4% |
3. | Microsoft Corp. | 2.0% |
4. | iShares Core MSCI Emerging Markets ETF | 1.7% |
5. | Amazon.com, Inc. | 1.4% |
6. | iShares JP Morgan USD Emerging Markets Bond ETF | 1.4% |
7. | Xtrackers USD High Yield Corporate Bond ETF | 1.3% |
8. | SPDR Bloomberg Barclays High Yield Bond ETF | 1.0% |
9. | Facebook, Inc. | 0.9% |
10. | Alphabet, Inc. - Class C | 0.8% |
As a percentage of total net assets. Holdings exclude short-term investments and derivatives.
Sector Concentration
as of December 31, 2020
Information Technology | 28.9% |
Healthcare | 18.7% |
Consumer Discretionary | 12.8% |
Communication Services | 10.8% |
Financials | 8.6% |
Industrials | 8.6% |
Real Estate Investment Trust | 3.1% |
Materials | 3.0% |
Consumer Staples | 2.9% |
Utilities | 1.7% |
Energy | 0.9% |
Total | 100.0% |
As a percentage of total common stocks. Concentrations are subject to change.
Asset Allocation
as of December 31, 2020
Common Stocks | 39.9% |
Equity Registered Investment Companies | 8.1% |
Fixed Income Registered Investment Companies | 9.5% |
Money Market Registered Investment Companies | 34.4% |
Bank Obligations | 1.6% |
Other Assets/Liabilities (Net) | 6.5% |
Total | 100.0% |
As a percentage of total net assets. The Fund has invested in stock index futures contracts in order to equitize cash balances held in the Fund.
The Blended Index is comprised of 54% MSCI ACWI, 36% of 90 day T-Bills and 10% Bloomberg Barclays US Aggregate Bond Index.
2020 Annual Report | December 31, 2020 | Page 9 |
Balanced Fund
The Meeder Balanced Fund Institutional Class returned 5.71% for the year ended December 31, 2020, compared to the Morningstar Moderate Target Risk Index benchmark return of 12.82%. This fund maintains exposure to both the Meeder Defensive Equity Strategy and to the Meeder Fixed Income Strategy.
The Meeder Defensive Equity Strategy follows a rules-based and data-driven approach using the Meeder Investment Positioning System (IPS) model. This model is used to determine the risk relative to reward in the marketplace and identifies when we should be increasing or decreasing the portfolio’s target equity exposure. The Defensive Equity tactical portfolio began the first quarter with a target of 100% exposure to the stock market since our investment model’s reward value was higher than the risk value. The S&P 500 Index plummeted -34% from its high on February 19th, to its low on March 23rd. The economic impact of the COVID-19 pandemic rocked the stock market as initial jobless claims spiked as high as 6.8 million in just one week, before gradually trending lower. A sharp increase in market risk identified by our IPS models indicated that we should have a target exposure of 30% at the end of March. The percentage of world markets trading above their 50-day moving average increased in the long-term model. Markets remained rangebound until the May non-farm payroll report showed that the U.S. added a record-high 2.5 million jobs when it was expected to lose more than -8.3 million. This led us to increase the target exposure to the stock market to 62%. The intermediate-term model improved, as significant fund flow activity demonstrated an increase in institutional demand causing us to increase our equity target to as high as 91%. With the Fed remaining extremely accommodative and stating they will keep interest rates near zero until at least 2023, the long-term model score significantly improved this quarter. Institutional demand factors in our intermediate-term model continued to show a lack of significant fund flow activity during September. After the U.S. election in November, market risk declined significantly as investors gained clarity about potential future policy shifts. The long-term model’s score continued to improve as the broad strength of the underlying trend of many sectors and industries. This caused us to gradually increase our target equity exposure to 100% in mid-November and remained there through the end of 2020.
Our shifts within equity markets include international versus domestic holdings, as well as allocating among market capitalization ranges in addition to sector overweight and/or underweight positions. Due primarily to relative momentum factors, our exposure to international holdings among both developed international and emerging market securities was underweight relative to the benchmark. Our underweight exposure to international markets contributed to performance relative to the benchmark in 2020.
The Meeder Fixed Income Strategy tactically shifts portfolio exposure utilizing quantitative models designed to actively monitor the credit quality, emerging market bond exposure, and the U.S. Treasury duration of the portfolio. Our fixed income models added significant value during the coronavirus-driven drawdown. Volatility and macroeconomic factors in our models turned uniformly negative in the middle of March, while momentum factors turned negative toward the end of the first quarter. This caused us to reduce our high-yield and emerging market exposure before the market meltdown in March. The Federal Reserve stepped in to provide liquidity by reducing short-term interest rates to zero, as well as providing other quantitative easing measures to calm fixed income markets. During this period, our portfolio maintained a high-quality bias, which contributed to its overall performance during this market volatility. In early April, momentum and volatility factors showed strength in high-yield bonds, while macroeconomic factors signaled potential weakness. All model factors related to emerging market bonds were uniformly positive. In response to our models signaling an improvement in market conditions, we increased exposure to high-yield bonds and emerging market bonds in our tactical portfolio over the first few weeks of the second quarter. This risk-on signal led us to ultimately overweight these sectors while reducing exposure to U.S. investment-grade bonds and U.S. Treasuries. Since then, high-yield bonds led the risk-on rally to substantially outperform their investment-grade peers. The overweight allocation to emerging market bonds also contributed to portfolio performance, as the sector benefited from the U.S. dollar’s weakness. At the end of the year, the Meeder fixed income strategy maintained a duration in line with its benchmark, the Bloomberg Barclays U.S. Aggregate Bond Index.
Within our stock selection process, we attempt to gain exposure to companies with strong profitability that are priced at reasonable valuations relative to their industry peers and are trading with positive price momentum. For the year ending 2020, securities with strong fundamentals, such as strong profitability, contributed to performance. In addition, the fund’s investment in companies with low leverage also contributed to performance. The fund’s exposure to companies with low valuations detracted from performance in 2020.
In the portfolio, we will often use equity index derivatives in the fund, such as stock index futures, to efficiently equitize our cash positions as well as manage the equity exposure of the fund. Regarding equitizing cash positions, these derivatives are designed to track their respective stock index, so there was no discernible impact to the fund’s relative performance. The use of stock index futures to manage equity exposure of the fund had a negative impact on the performance of the fund relative to the benchmark index during 2020.
Page 10 | 2020 Annual Report | December 31, 2020 |
Investment Objective
The investment objective of the Fund is to provide income and long-term capital appreciation.
Average Annual Total Returns
as of December 31, 2020
| 1
Year | 5
Year | 10
Year | Share Class
Inception
Date |
Balanced Fund Retail Class | 5.27% | 6.59% | 6.07% | 1/31/06 |
Balanced Fund Institutional Class | 5.71% | 6.97% | 6.26% | 10/31/16 |
Balanced Fund Adviser Class | 5.66% | 6.87% | 6.21% | 10/31/16 |
Morningstar Moderate Target Risk Index | 12.82% | 9.75% | 7.77% | — |
Blended Index | 10.66% | 8.20% | 7.26% | — |
Growth of $10,000
as of December 31, 2020
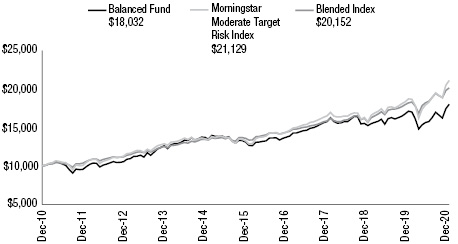
The Growth of $10,000 chart compares the performance of the Fund’s Retail Share Class over the period shown with dividends and capital gains reinvested to the Fund’s benchmarks. Benchmark indices are unmanaged and do not reflect the deduction of expenses associated with a mutual fund, such as investment management and accounting fees.
Investment performance assumes reinvestment of all dividend and capital gain distributions. The results do not reflect the effect of taxes a shareholder would pay on Fund distributions or on the redemption of Fund shares. Historical performance attributed to the Institutional and Adviser Share Classes prior to their inception dates is based on the performance of the Retail Share Class. No adjustment has been made to reflect class-specific distribution or servicing fees. Returns may reflect the effect of voluntary fee waivers or expense reimbursements over the period shown. Without these waivers, performance would have been lower.
The performance data shown represents past performance, which does not guarantee future results. The investment return and principal value of an investment will fluctuate so that an investor’s shares, when redeemed, may be worth more or less than their original cost. Current performance may be lower or higher than the performance data quoted. For current month-end performance data, please visit our website at www.meederfunds.com.
Top 10 Holdings
as of December 31, 2020
1. | iShares JP Morgan USD Emerging Markets Bond ETF | 4.4% |
2. | Xtrackers USD High Yield Corporate Bond ETF | 4.2% |
3. | Apple, Inc. | 3.3% |
4. | SPDR Bloomberg Barclays High Yield Bond ETF | 3.0% |
5. | Microsoft Corp. | 2.8% |
6. | iShares Core U.S. Aggregate Bond ETF | 2.6% |
7. | Vanguard Total Bond Market ETF | 2.2% |
8. | Amazon.com, Inc. | 2.0% |
9. | Baird Core Plus Bond Fund - Class I | 1.9% |
10. | Lord Abbett High Yield Fund - Class I | 1.8% |
As a percentage of total net assets. Holdings exclude short-term investments and derivatives.
Sector Concentration
as of December 31, 2020
Information Technology | 28.4% |
Healthcare | 18.9% |
Consumer Discretionary | 12.9% |
Communication Services | 10.0% |
Financials | 8.8% |
Industrials | 8.8% |
Real Estate Investment Trust | 3.1% |
Materials | 3.0% |
Consumer Staples | 2.9% |
Utilities | 2.1% |
Energy | 1.1% |
Total | 100.0% |
As a percentage of total common stocks. Concentrations are subject to change.
Asset Allocation
as of December 31, 2020
Common Stocks | 55.3% |
Fixed Income Registered Investment Companies | 29.6% |
Money Market Registered Investment Companies | 13.0% |
Bank Obligations | 0.2% |
Other Assets/Liabilities (Net) | 1.9% |
Total | 100.0% |
As a percentage of total net assets. The Fund has invested in stock index futures contracts in order to equitize cash balances held in the Fund.
The Blended Index is comprised 42% of the S&P 500 Index, 28% of the average 90-day T-bills, and 30% of the Bloomberg Barclays US Aggregate Bond Index.
2020 Annual Report | December 31, 2020 | Page 11 |
Moderate Allocation Fund
The Meeder Moderate Allocation Fund Institutional Class returned 6.02% compared to the Morningstar Moderate Conservative Target Risk Index benchmark return of 11.86%. This fund maintains exposure to the Meeder Defensive Equity Strategy and to the Meeder Fixed Income Strategy.
The Meeder Defensive Equity Strategy follows a rules-based and data-driven approach using the Meeder Investment Positioning System (IPS) model. This model is used to determine the risk relative to reward in the marketplace and identifies when we should be increasing or decreasing the portfolio’s target equity exposure. The Defensive Equity tactical portfolio began the first quarter with a target of 100% exposure to the stock market since our investment model’s reward value was higher than the risk value. The S&P 500 Index plummeted -34% from its high on February 19th, to its low on March 23rd. The economic impact of the COVID-19 pandemic rocked the stock market as initial jobless claims spiked as high as 6.8 million in just one week, before gradually trending lower. A sharp increase in market risk identified by our IPS models indicated that we should have a target exposure of 30% at the end of March. The percentage of world markets trading above their 50-day moving average increased in the long-term model. Markets remained rangebound until the May non-farm payroll report showed that the U.S. added a record-high 2.5 million jobs when it was expected to lose more than -8.3 million. This led us to increase the target exposure to the stock market to 62%. The intermediate-term model improved, as significant fund flow activity demonstrated an increase in institutional demand causing us to increase our equity target to as high as 91%. With the Fed remaining extremely accommodative and stating they will keep interest rates near zero until at least 2023, the long-term model score significantly improved this quarter. Institutional demand factors in our intermediate-term model continued to show a lack of significant fund flow activity during September. After the U.S. election in November, market risk declined significantly as investors gained clarity about potential future policy shifts. The long-term model’s score continued to improve as the broad strength of the underlying trend of many sectors and industries. This caused us to gradually increase our target equity exposure to 100% in mid-November and remained there through the end of 2020.
Our shifts within equity markets include international versus domestic holdings, as well as allocating among market capitalization ranges in addition to sector overweight and/or underweight positions. Due primarily to relative momentum factors, our exposure to international holdings among both developed international and emerging market securities was underweight relative to the benchmark. Our underweight exposure to international markets contributed to performance relative to the benchmark in 2020.
The Meeder Fixed Income Strategy tactically shifts portfolio exposure utilizing quantitative models designed to actively monitor the credit quality, emerging market bond exposure, and the U.S. Treasury duration of the portfolio. Our fixed income models added significant value during the coronavirus-driven drawdown. Volatility and macroeconomic factors in our models turned uniformly negative in the middle of March, while momentum factors turned negative toward the end of the first quarter. This caused us to reduce our high-yield and emerging market exposure before the market meltdown in March. The Federal Reserve stepped in to provide liquidity by reducing short-term interest rates to zero, as well as providing other quantitative easing measures to calm fixed income markets. During this period, our portfolio maintained a high-quality bias, which contributed to its overall performance during this market volatility. In early April, momentum and volatility factors showed strength in high-yield bonds, while macroeconomic factors signaled potential weakness. All model factors related to emerging market bonds were uniformly positive. In response to our models signaling an improvement in market conditions, we increased exposure to high-yield bonds and emerging market bonds in our tactical portfolio over the first few weeks of the second quarter. This risk-on signal led us to ultimately overweight these sectors while reducing exposure to U.S. investment-grade bonds and U.S. Treasuries. Since then, high-yield bonds led the risk-on rally to substantially outperform their investment-grade peers. The overweight allocation to emerging market bonds also contributed to portfolio performance, as the sector benefited from the U.S. dollar’s weakness. At the end of the year, the Meeder fixed income strategy maintained a duration in line with its benchmark, the Bloomberg Barclays U.S. Aggregate Bond Index.
Within our stock selection process, we attempt to gain exposure to companies with strong profitability that are priced at reasonable valuations relative to their industry peers and are trading with positive price momentum. For the year ending 2020, securities with strong fundamentals, such as strong profitability, contributed to performance. In addition, the fund’s investment in companies with low leverage also contributed to performance. The fund’s exposure to companies with low valuations detracted from performance in 2020.
In the portfolio, we will often use equity index derivatives in the fund, such as stock index futures, to efficiently equitize our cash positions as well as manage the equity exposure of the fund. Regarding equitizing cash positions, these derivatives are designed to track their respective stock index, so there was no discernible impact to the fund’s relative performance. The use of stock index futures to manage equity exposure of the fund had a negative impact on the performance of the fund relative to the benchmark index during 2020.
Page 12 | 2020 Annual Report | December 31, 2020 |
Investment Objective
The investment objective of the Fund is to provide total return, including capital appreciation, and current income.
Average Annual Total Returns
as of December 31, 2020
| 1
Year | 5
Year | Since
Inception | Share Class
Inception
Date |
Moderate Allocation Fund Retail Class | 5.55% | 8.23% | 6.62% | 6/30/15 |
Moderate Allocation Fund Institutional Class | 6.02% | 8.61% | 6.96% | 10/31/16 |
Moderate Allocation Fund Adviser Class | 6.04% | 8.51% | 6.88% | 10/31/16 |
Morningstar Moderate Conservative Target Risk Index | 11.86% | 8.17% | 7.07% | — |
Blended Index | 9.86% | 7.16% | 6.58% | — |
Growth of $10,000
as of December 31, 2020
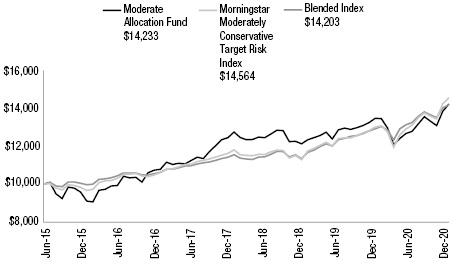
The Growth of $10,000 chart compares the performance of the Fund’s Retail Share Class over the period shown with dividends and capital gains reinvested to the Fund’s benchmarks. Benchmark indices are unmanaged and do not reflect the deduction of expenses associated with a mutual fund, such as investment management and accounting fees.
Investment performance assumes reinvestment of all dividend and capital gain distributions. The results do not reflect the effect of taxes a shareholder would pay on Fund distributions or on the redemption of Fund shares. Historical performance attributed to the Institutional and Adviser Share Classes prior to their inception dates is based on the performance of the Retail Share Class. No adjustment has been made to reflect class-specific distribution or servicing fees. Returns may reflect the effect of voluntary fee waivers or expense reimbursements over the period shown. Without these waivers, performance would have been lower.
The performance data shown represents past performance, which does not guarantee future results. The investment return and principal value of an investment will fluctuate so that an investor’s shares, when redeemed, may be worth more or less than their original cost. Current performance may be lower or higher than the performance data quoted. For current month-end performance data, please visit our website at www.meederfunds.com.
Top 10 Holdings
as of December 31, 2020
1. | iShares JP Morgan USD Emerging Markets Bond ETF | 7.3% |
2. | Xtrackers USD High Yield Corporate Bond ETF | 7.0% |
3. | SPDR Bloomberg Barclays High Yield Bond ETF | 4.9% |
4. | iShares Core U.S. Aggregate Bond ETF | 4.2% |
5. | Vanguard Total Bond Market ETF | 3.6% |
6. | Baird Core Plus Bond Fund - Class I | 3.1% |
7. | Lord Abbett High Yield Fund - Class I | 3.0% |
8. | PGIM Total Return Bond Fund - Class R6 | 2.6% |
9. | Dodge & Cox Income Fund | 2.6% |
10. | Segall Bryant & Hamill Plus Bond Fund - Class I | 2.2% |
As a percentage of total net assets. Holdings exclude short-term investments and derivatives.
Sector Concentration
as of December 31, 2020
Information Technology | 29.0% |
Healthcare | 18.7% |
Consumer Discretionary | 13.1% |
Communication Services | 10.3% |
Industrials | 8.9% |
Financials | 8.3% |
Real Estate Investment Trust | 3.1% |
Materials | 3.0% |
Consumer Staples | 3.0% |
Utilities | 1.7% |
Energy | 0.9% |
Total | 100.0% |
As a percentage of total common stocks. Concentrations are subject to change.
Asset Allocation
as of December 31, 2020
Common Stocks | 36.4% |
Fixed Income Registered Investment Companies | 49.3% |
Money Market Registered Investment Companies | 12.3% |
Bank Obligations | 0.1% |
Other Assets/Liabilities (Net) | 1.9% |
Total | 100.0% |
As a percentage of total net assets. The Fund has invested in stock index futures contracts in order to equitize cash balances held in the Fund.
The Blended Index is comprised 30% of the S&P 500 Index, 20% of the average 90-day T-bills, and 50% of the Bloomberg Barclays US Aggregate Bond Index.
2020 Annual Report | December 31, 2020 | Page 13 |
Conservative Allocation Fund
The Meeder Conservative Allocation Fund Institutional Class returned 6.68% compared to the Morningstar Conservative Target Risk Index return of 9.75%. This fund maintains exposure to the Meeder Defensive Equity Strategy and to the Meeder Fixed Income Strategy.
The Meeder Defensive Equity Strategy follows a rules-based and data-driven approach using the Meeder Investment Positioning System (IPS) model. This model is used to determine the risk relative to reward in the marketplace and identifies when we should be increasing or decreasing the portfolio’s target equity exposure. The Defensive Equity tactical portfolio began the first quarter with a target of 100% exposure to the stock market since our investment model’s reward value was higher than the risk value. The S&P 500 Index plummeted -34% from its high on February 19th, to its low on March 23rd. The economic impact of the COVID-19 pandemic rocked the stock market as initial jobless claims spiked as high as 6.8 million in just one week, before gradually trending lower. A sharp increase in market risk identified by our IPS models indicated that we should have a target exposure of 30% at the end of March. The percentage of world markets trading above their 50-day moving average increased in the long-term model. Markets remained rangebound until the May non-farm payroll report showed that the U.S. added a record-high 2.5 million jobs when it was expected to lose more than -8.3 million. This led us to increase the target exposure to the stock market to 62%. The intermediate-term model improved, as significant fund flow activity demonstrated an increase in institutional demand causing us to increase our equity target to as high as 91%. With the Fed remaining extremely accommodative and stating they will keep interest rates near zero until at least 2023, the long-term model score significantly improved this quarter. Institutional demand factors in our intermediate-term model continued to show a lack of significant fund flow activity during September. After the U.S. election in November, market risk declined significantly as investors gained clarity about potential future policy shifts. The long-term model’s score continued to improve as the broad strength of the underlying trend of many sectors and industries. This caused us to gradually increase our target equity exposure to 100% in mid-November and remained there through the end of 2020.
Our shifts within equity markets include international versus domestic holdings, as well as allocating among market capitalization ranges in addition to sector overweight and/or underweight positions. Due primarily to relative momentum factors, our exposure to international holdings among both developed international and emerging market securities was underweight relative to the benchmark. Our underweight exposure to international markets contributed to performance relative to the benchmark in 2020.
The Meeder Fixed Income Strategy tactically shifts portfolio exposure utilizing quantitative models designed to actively monitor the credit quality, emerging market bond exposure, and the U.S. Treasury duration of the portfolio. Our fixed income models added significant value during the coronavirus-driven drawdown. Volatility and macroeconomic factors in our models turned uniformly negative in the middle of March, while momentum factors turned negative toward the end of the first quarter. This caused us to reduce our high-yield and emerging market exposure before the market meltdown in March. The Federal Reserve stepped in to provide liquidity by reducing short-term interest rates to zero, as well as providing other quantitative easing measures to calm fixed income markets. During this period, our portfolio maintained a high-quality bias, which contributed to its overall performance during this market volatility. In early April, momentum and volatility factors showed strength in high-yield bonds, while macroeconomic factors signaled potential weakness. All model factors related to emerging market bonds were uniformly positive. In response to our models signaling an improvement in market conditions, we increased exposure to high-yield bonds and emerging market bonds in our tactical portfolio over the first few weeks of the second quarter. This risk-on signal led us to ultimately overweight these sectors while reducing exposure to U.S. investment-grade bonds and U.S. Treasuries. Since then, high-yield bonds led the risk-on rally to substantially outperform their investment-grade peers. The overweight allocation to emerging market bonds also contributed to portfolio performance, as the sector benefited from the U.S. dollar’s weakness. At the end of the year, the Meeder fixed income strategy maintained a duration in line with its benchmark, the Bloomberg Barclays U.S. Aggregate Bond Index.
Within our stock selection process, we attempt to gain exposure to companies with strong profitability that are priced at reasonable valuations relative to their industry peers and are trading with positive price momentum. For the year ending 2020, securities with strong fundamentals, such as strong profitability, contributed to performance. In addition, the fund’s investment in companies with low leverage also contributed to performance. The fund’s exposure to companies with low valuations detracted from performance in 2020.
In the portfolio, we will often use equity index derivatives in the fund, such as stock index futures, to efficiently equitize our cash positions as well as manage the equity exposure of the fund. Regarding equitizing cash positions, these derivatives are designed to track their respective stock index, so there was no discernible impact to the fund’s relative performance. The use of stock index futures to manage equity exposure of the fund had a negative impact on the performance of the fund relative to the benchmark index during 2020.
Page 14 | 2020 Annual Report | December 31, 2020 |
Investment Objective
The investment objective of the Fund is to provide income and long-term capital appreciation.
Average Annual Total Returns
as of December 31, 2020
| 1
Year | 5
Year | 10
Year | Share Class
Inception
Date |
Conservative Allocation Fund Retail Class | 6.28% | 8.04% | 6.18% | 6/21/95 |
Conservative Allocation Fund Institutional Class | 6.68% | 8.38% | 6.34% | 10/31/16 |
Conservative Allocation Fund Adviser Class | 6.69% | 8.29% | 6.30% | 10/31/16 |
Morningstar Conservative Target Risk Index | 9.75% | 6.20% | 4.79% | — |
Blended Index | 8.98% | 6.09% | 5.34% | — |
Growth of $10,000
as of December 31, 2020
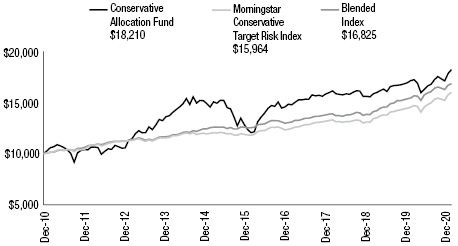
The Growth of $10,000 chart compares the performance of the Fund’s Retail Share Class over the period shown with dividends and capital gains reinvested to the Fund’s benchmarks. Benchmark indices are unmanaged and do not reflect the deduction of expenses associated with a mutual fund, such as investment management and accounting fees.
Investment performance assumes reinvestment of all dividend and capital gain distributions. The results do not reflect the effect of taxes a shareholder would pay on Fund distributions or on the redemption of Fund shares. Historical performance attributed to the Institutional and Adviser Share Classes prior to their inception dates is based on the performance of the Retail Share Class. No adjustment has been made to reflect class-specific distribution or servicing fees. Returns may reflect the effect of voluntary fee waivers or expense reimbursements over the period shown. Without these waivers, performance would have been lower.
The performance data shown represents past performance, which does not guarantee future results. The investment return and principal value of an investment will fluctuate so that an investor’s shares, when redeemed, may be worth more or less than their original cost. Current performance may be lower or higher than the performance data quoted. For current month-end performance data, please visit our website at www.meederfunds.com.
Top 10 Holdings
as of December 31, 2020
1. | iShares JP Morgan USD Emerging Markets Bond ETF | 10.2% |
2. | Xtrackers USD High Yield Corporate Bond ETF | 9.7% |
3. | SPDR Bloomberg Barclays High Yield Bond ETF | 6.9% |
4. | iShares Core U.S. Aggregate Bond ETF | 5.9% |
5. | Vanguard Total Bond Market ETF | 5.0% |
6. | Baird Core Plus Bond Fund - Class I | 4.3% |
7. | Lord Abbett High Yield Fund - Class I | 4.3% |
8. | PGIM Total Return Bond Fund - Class R6 | 3.7% |
9. | Dodge & Cox Income Fund | 3.6% |
10. | Segall Bryant & Hamill Plus Bond Fund - Class I | 3.1% |
As a percentage of total net assets. Holdings exclude short-term investments and derivatives.
Sector Concentration
as of December 31, 2020
Information Technology | 28.9% |
Healthcare | 18.6% |
Consumer Discretionary | 12.8% |
Communication Services | 10.7% |
Industrials | 8.9% |
Financials | 8.5% |
Real Estate Investment Trust | 3.1% |
Materials | 3.0% |
Consumer Staples | 2.9% |
Utilities | 1.7% |
Energy | 0.9% |
Total | 100.0% |
As a percentage of total common stocks. Concentrations are subject to change.
Asset Allocation
as of December 31, 2020
Common Stocks | 22.1% |
Fixed Income Registered Investment Companies | 69.2% |
Money Market Registered Investment Companies | 7.4% |
Other Assets/Liabilities (Net) | 1.3% |
Total | 100.0% |
As a percentage of total net assets. The Fund has invested in stock index futures contracts in order to equitize cash balances held in the Fund.
The Blended Index is comprised 18% of the S&P 500 Index, 12% of the average 90-day T-bills, and 70% of the Bloomberg Barclays US Aggregate Bond Index.
2020 Annual Report | December 31, 2020 | Page 15 |
Dynamic Allocation Fund
The Meeder Dynamic Allocation Fund Institutional Class returned 15.94% for the year ended December 31, 2020, compared to the Morningstar Aggressive Target Risk Index benchmark return of 13.26%. This fund maintains exposure to both the Meeder Growth Strategy and to the Meeder Fixed Income Strategy.
The Meeder Growth Strategy maintains a more aggressive objective and typically remains invested in the stock market. Therefore, investors experienced significant volatility as the market declined from its all-time high on February 19th. The S&P 500 experienced more than a 30% decline before the end of the first quarter. The stock market reversed course from the lows experienced on March 23rd and moved higher to capture significant gains, ultimately reaching a new all-time high in August. Certified election results provided investors with a better idea of what they might expect regarding future policy shifts. At the end of December, the FDA approved two different COVID-19 vaccines for emergency use. The renewed hope that the global economy might be reopening sooner than previously expected helped major indices like the Dow Jones, S&P 500, and Russell 2000 Indices reach new all-time highs. Investors that remained invested in the Growth Strategy despite the market volatility, received the highest returns of all our risk-based portfolios.
Our shifts within equity markets include international versus domestic holdings, as well as allocating among market capitalization ranges in addition to sector overweight and/or underweight positions. Due primarily to relative momentum factors, our exposure to international holdings among both developed international and emerging market securities was underweight relative to the benchmark. Our underweight exposure to international markets contributed to performance relative to the benchmark in 2020.
We maintain at least a 5% allocation to the Meeder Fixed Income Strategy in the fund. The Meeder Fixed Income Strategy tactically shifts portfolio exposure utilizing quantitative models designed to actively monitor the credit quality, emerging market bond exposure, and the U.S. Treasury duration of the portfolio. Our fixed income models added significant value during the coronavirus-driven drawdown. Volatility and macroeconomic factors in our models turned uniformly negative in the middle of March, while momentum factors turned negative toward the end of the first quarter. This caused us to reduce our high-yield and emerging market exposure before the market meltdown in March. The Federal Reserve stepped in to provide liquidity by reducing short-term interest rates to zero, as well as providing other quantitative easing measures to calm fixed income markets. During this period, our portfolio maintained a high-quality bias, which contributed to its overall performance during this market volatility. In early April, momentum and volatility factors showed strength in high-yield bonds, while macroeconomic factors signaled potential weakness. All model factors related to emerging market bonds were uniformly positive. In response to our models signaling an improvement in market conditions, we increased exposure to high-yield bonds and emerging market bonds in our tactical portfolio over the first few weeks of the second quarter. This risk-on signal led us to ultimately overweight these sectors while reducing exposure to U.S. investment-grade bonds and U.S. Treasuries. Since then, high-yield bonds led the risk-on rally to substantially outperform their investment-grade peers. The overweight allocation to emerging market bonds also contributed to portfolio performance, as the sector benefited from the U.S. dollar’s weakness. At the end of the year, the Meeder fixed income strategy maintained a duration in line with its benchmark, the Bloomberg Barclays U.S. Aggregate Bond Index.
Within our stock selection process, we attempt to gain exposure to companies with strong profitability that are priced at reasonable valuations relative to their industry peers and are trading with positive price momentum. For the year ending 2020, securities with strong fundamentals, such as strong profitability, contributed to performance. In addition, the fund’s investment in companies with low leverage also contributed to performance. The fund’s exposure to companies with low valuations detracted from performance in 2020.
In the portfolio, we will often use equity index derivatives in the fund, such as stock index futures, to efficiently equitize our cash positions. Regarding equitizing cash positions, these derivatives are designed to track their respective stock index, so there was no discernible impact to the fund’s relative performance.
Investment Objective
The investment objective of the Fund is to provide long-term capital appreciation.
Average Annual Total Returns
as of December 31, 2020
| 1
Year | 5
Year | 10
Year | Share Class
Inception
Date |
Dynamic Allocation Fund Retail Class | 15.37% | 10.79% | 9.97% | 2/29/00 |
Dynamic Allocation Fund Institutional Class | 15.94% | 11.16% | 10.15% | 10/31/16 |
Dynamic Allocation Fund Adviser Class | 15.85% | 11.04% | 10.09% | 10/31/16 |
Morningstar Aggressive Target Risk Index | 13.26% | 12.20% | 9.76% | — |
Blended Index | 16.08% | 13.17% | 11.17% | — |
Top 10 Holdings
as of December 31, 2020
1. | Apple, Inc. | 4.7% |
2. | Microsoft Corp. | 3.8% |
3. | Amazon.com, Inc. | 2.6% |
4. | iShares JP Morgan USD Emerging Markets Bond ETF | 2.3% |
5. | Xtrackers USD High Yield Corporate Bond ETF | 2.3% |
6. | Facebook, Inc. | 1.5% |
7. | Alphabet, Inc. - Class C | 1.4% |
8. | Berkshire Hathaway, Inc. - Class B | 1.4% |
9. | Johnson & Johnson | 1.4% |
10. | Tesla, Inc. | 1.2% |
As a percentage of total net assets. Holdings exclude short-term investments and derivatives.
Page 16 | 2020 Annual Report | December 31, 2020 |
Sector Concentration
as of December 31, 2020
Information Technology | 29.5% |
Healthcare | 18.9% |
Consumer Discretionary | 12.9% |
Communication Services | 10.0% |
Financials | 8.5% |
Industrials | 8.4% |
Real Estate Investment Trust | 3.1% |
Consumer Staples | 3.1% |
Materials | 2.9% |
Utilities | 1.8% |
Energy | 0.9% |
Total | 100.0% |
As a percentage of total common stocks. Concentrations are subject to change.
Asset Allocation
as of December 31, 2020
Common Stocks | 74.1% |
Money Market Registered Investment Companies | 18.4% |
Fixed Income Registered Investment Companies | 4.6% |
Equity Registered Investment Companies | 0.6% |
Bank Obligations | 0.4% |
Other Assets/Liabilities (Net) | 1.9% |
Total | 100.0% |
As a percentage of total net assets. The Fund has invested in stock index futures contracts in order to equitize cash balances held in the Fund.
Growth of $10,000
as of December 31, 2020
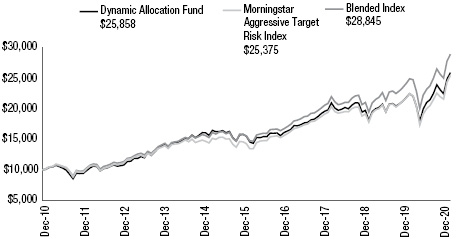
The Growth of $10,000 chart compares the performance of the Fund’s Retail Share Class over the period shown with dividends and capital gains reinvested to the Fund’s benchmarks. Benchmark indices are unmanaged and do not reflect the deduction of expenses associated with a mutual fund, such as investment management and accounting fees.
Investment performance assumes reinvestment of all dividend and capital gain distributions. The results do not reflect the effect of taxes a shareholder would pay on Fund distributions or on the redemption of Fund shares. Historical performance attributed to the Institutional and Adviser Share Classes prior to their inception dates is based on the performance of the Retail Share Class. No adjustment has been made to reflect class-specific distribution or servicing fees. Returns may reflect the effect of voluntary fee waivers or expense reimbursements over the period shown. Without these waivers, performance would have been lower.
The performance data shown represents past performance, which does not guarantee future results. The investment return and principal value of an investment will fluctuate so that an investor’s shares, when redeemed, may be worth more or less than their original cost. Current performance may be lower or higher than the performance data quoted. For current month-end performance data, please visit our website at www.meederfunds.com.
The Blended Index is comprised of 70% S&P 500 Index, 25% MSCI ACWI ex USA Index, and 5% Bloomberg Barclays US Aggregate Bond Index.
2020 Annual Report | December 31, 2020 | Page 17 |
Quantex Fund
The Meeder Quantex Fund Institutional Class returned -5.22% for the year ended December 31, 2020, compared to the benchmark return of the S&P Mid-Cap 400 Index 13.66% and the Russell 2000 Index return of 19.96%.
We use a quantitative model to identify the capitalization ranges that incorporate our ideal portfolio of small- and mid-capitalization companies with strong growth potential each calendar year. Individual securities for the portfolio are equally weighted at the beginning of the year. Securities are then monitored on an ongoing basis and screened based on various momentum, profitability, and value characteristics.
The portfolio’s performance was driven by a combination of sector selection and individual security selection. Consumer Discretionary, Health Care, and Materials were the largest overweight sectors relative to the benchmark, while our largest underweights relative to the benchmark were in Financials, Utilities, and Real Estate. The largest sector contributors were Health Care and Financials, while the biggest individual contributors to performance were L Brands, Abiomed, and Green Dot. Noble Energy, Dilliards, and Patterson-Uti Energy were the largest individual detractors to performance.
In the portfolio, we will often use equity index derivatives in the fund, such as stock index futures, to efficiently equitize our cash. Regarding equitizing cash positions, these derivatives are designed to track their respective stock index, so there was no discernible impact to the fund’s relative performance.
Investment Objective
The investment objective of the Fund is to provide long-term capital appreciation.
Average Annual Total Returns
as of December 31, 2020
| 1
Year | 5
Year | 10
Year | Share Class
Inception
Date |
Quantex Fund Retail Class | -5.36% | 6.37% | 8.13% | 3/20/85 |
Quantex Fund Institutional Class | -5.22% | 6.63% | 8.26% | 10/31/16 |
Quantex Fund Adviser Class | -5.25% | 6.51% | 8.21% | 10/31/16 |
S&P MidCap 400 Index | 13.66% | 12.35% | 11.51% | — |
Russell 2000 Index | 19.96% | 13.26% | 11.20% | — |
Blended Index | 16.82% | 12.83% | 11.39% | — |
Top 10 Holdings
as of December 31, 2020
1. | Quanta Services, Inc. | 2.3% |
2. | DaVita, Inc. | 2.1% |
3. | PerkinElmer, Inc. | 1.9% |
4. | Allscripts Healthcare Solutions, Inc. | 1.8% |
5. | ABIOMED, Inc. | 1.7% |
6. | Fortune Brands Home & Security, Inc. | 1.6% |
7. | Nu Skin Enterprises, Inc. | 1.6% |
8. | Eastman Chemical Co. | 1.6% |
9. | Whirlpool Corp. | 1.5% |
10. | Avery Dennison Corp. | 1.5% |
As a percentage of total net assets. Holdings exclude short-term investments and derivatives.
Page 18 | 2020 Annual Report | December 31, 2020 |
Growth of $10,000
as of December 31, 2020
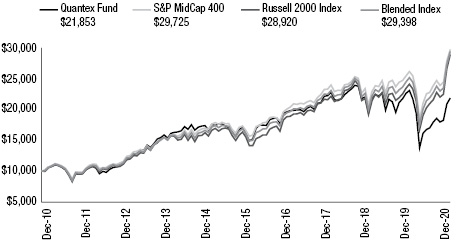
The Growth of $10,000 chart compares the performance of the Fund’s Retail Share Class over the period shown with dividends and capital gains reinvested to the Fund’s benchmarks. Benchmark indices are unmanaged and do not reflect the deduction of expenses associated with a mutual fund, such as investment management and accounting fees.
Investment performance assumes reinvestment of all dividend and capital gain distributions. The results do not reflect the effect of taxes a shareholder would pay on Fund distributions or on the redemption of Fund shares. Historical performance attributed to the Institutional and Adviser Share Classes prior to their inception dates is based on the performance of the Retail Share Class. No adjustment has been made to reflect class-specific distribution or servicing fees. Returns may reflect the effect of voluntary fee waivers or expense reimbursements over the period shown. Without these waivers, performance would have been lower.
The performance data shown represents past performance, which does not guarantee future results. The investment return and principal value of an investment will fluctuate so that an investor’s shares, when redeemed, may be worth more or less than their original cost. Current performance may be lower or higher than the performance data quoted. For current month-end performance data, please visit our website at www.meederfunds.com.
Sector Concentration
as of December 31, 2020
Consumer Discretionary | 20.3% |
Industrials | 19.3% |
Healthcare | 13.9% |
Materials | 12.2% |
Information Technology | 10.2% |
Financials | 9.0% |
Communication Services | 4.3% |
Consumer Staples | 3.7% |
Utilities | 2.8% |
Energy | 2.4% |
Real Estate Investment Trust | 1.9% |
Total | 100.0% |
As a percentage of total common stocks. Concentrations are subject to change.
Asset Allocation
as of December 31, 2020
Common Stocks | 90.4% |
Money Market Registered Investment Companies | 2.2% |
Other Assets/Liabilities (Net) | 7.4% |
Total | 100.0% |
As a percentage of total net assets. The Fund has invested in stock index futures contracts in order to equitize cash balances held in the Fund.
The Blended Index consists of 50% of the Russell 2000 Index and 50% of the S&P MidCap 400 Index.
2020 Annual Report | December 31, 2020 | Page 19 |
Total Return Bond Fund
The Meeder Total Return Bond Fund Institutional Class return was 7.86% for the year compared to the Bloomberg Barclays U.S. Aggregate Bond Index benchmark return of 7.51%. This fund maintains exposure to the Meeder Fixed Income Strategy.
The Meeder Fixed Income Strategy tactically shifts portfolio exposure utilizing quantitative models designed to actively monitor the credit quality, emerging market bond exposure, and the U.S. Treasury duration of the portfolio. Our fixed income models added significant value during the coronavirus-driven drawdown. Volatility and macroeconomic factors in our models turned uniformly negative in the middle of March, while momentum factors turned negative toward the end of the first quarter. This caused us to reduce our high-yield and emerging market exposure before the market meltdown in March. The Federal Reserve stepped in to provide liquidity by reducing short-term interest rates to zero, as well as providing other quantitative easing measures to calm fixed income markets. During this period, our portfolio maintained a high-quality bias, which contributed to its overall performance during this market volatility. In early April, momentum and volatility factors showed strength in high-yield bonds, while macroeconomic factors signaled potential weakness. All model factors related to emerging market bonds were uniformly positive. In response to our models signaling an improvement in market conditions, we increased exposure to high-yield bonds and emerging market bonds in our tactical portfolio over the first few weeks of the second quarter. This risk-on signal led us to ultimately overweight these sectors while reducing exposure to U.S. investment-grade bonds and U.S. Treasuries. Since then, high-yield bonds led the risk-on rally to substantially outperform their investment-grade peers. The overweight allocation to emerging market bonds also contributed to portfolio performance, as the sector benefited from the U.S. dollar’s weakness. At the end of the year, the Meeder fixed income strategy maintained a duration in line with its benchmark, the Bloomberg Barclays U.S. Aggregate Bond Index.
Investment Objective
The investment objective of the Fund is to provide total return, consisting of income and capital growth, consistent with minimizing the risk of loss of capital.
Average Annual Total Returns
as of December 31, 2020
| 1
Year | 5
Year | Since
Inception | Share Class
Inception
Date |
Total Return Bond Fund Retail Class | 7.46% | 4.20% | 2.96% | 6/30/11 |
Total Return Bond Fund Institutional Class | 7.86% | 4.56% | 3.15% | 10/31/16 |
Total Return Bond Fund Adviser Class | 7.86% | 4.47% | 3.10% | 10/31/16 |
Bloomberg Barclays U.S. Aggregate Bond Index | 7.51% | 4.44% | 3.75% | — |
Top 10 Holdings
as of December 31, 2020
1. | iShares JP Morgan USD Emerging Markets Bond ETF | 10.5% |
2. | iShares Core U.S. Aggregate Bond ETF | 9.8% |
3. | Vanguard Total Bond Market ETF | 8.4% |
4. | Baird Core Plus Bond Fund - Class I | 7.1% |
5. | Xtrackers USD High Yield Corporate Bond ETF | 7.0% |
6. | Dodge & Cox Income Fund | 6.0% |
7. | PGIM Total Return Bond Fund - Class R6 | 6.0% |
8. | Segall Bryant & Hamill Plus Bond Fund - Class I | 5.2% |
9. | SPDR Bloomberg Barclays High Yield Bond ETF | 5.0% |
10. | Pioneer Bond Fund - Class Y | 4.5% |
As a percentage of total net assets. Holdings exclude short-term investments and derivatives.
Page 20 | 2020 Annual Report | December 31, 2020 |
Growth of $10,000
as of December 31, 2020
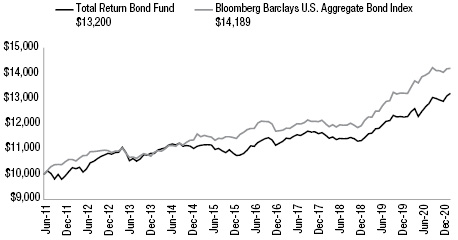
The Growth of $10,000 chart compares the performance of the Fund’s Retail Share Class over the period shown with dividends and capital gains reinvested to the Fund’s benchmarks. Benchmark indices are unmanaged and do not reflect the deduction of expenses associated with a mutual fund, such as investment management and accounting fees.
Investment performance assumes reinvestment of all dividend and capital gain distributions. The results do not reflect the effect of taxes a shareholder would pay on Fund distributions or on the redemption of Fund shares. Historical performance attributed to the Institutional and Adviser Share Classes prior to their inception dates is based on the performance of the Retail Share Class. No adjustment has been made to reflect class-specific distribution or servicing fees. Returns may reflect the effect of voluntary fee waivers or expense reimbursements over the period shown. Without these waivers, performance would have been lower.
The performance data shown represents past performance, which does not guarantee future results. The investment return and principal value of an investment will fluctuate so that an investor’s shares, when redeemed, may be worth more or less than their original cost. Current performance may be lower or higher than the performance data quoted. For current month-end performance data, please visit our website at www.meederfunds.com.
Fixed Income Sector Concentration
as of December 31, 2020
Core Intermediate-Term | 60.1% |
High-Yield | 15.6% |
Emerging Markets Debt | 14.1% |
U.S. Government | 10.2% |
Total | 100.0% |
As a percentage of total fixed income securities. Concentrations are subject to change.
2020 Annual Report | December 31, 2020 | Page 21 |
Prime Money Market Fund
The Meeder Prime Money Market Fund is a constant net asset value (CNAV) fund offered only to natural persons. The objective of this fund is to maintain a CNAV at $1.00 per share while offering a competitive return to shareholders. The adviser to the Fund accomplishes the objective by investing in short-term, high-quality money market debt obligations. Money market debt obligations may be offered by the U.S. Government and its agencies but may also include obligations of fundamentally sound corporate issuers.
Over the years, investors have demonstrated confidence in the money market funds industry because of a couple key features. Safety and liquidity are at the core of money fund investment strategy. Safety is expressed through the selection of investments which are anticipated to provide minimal principal volatility, while liquidity is generated by maintaining ample funds to accommodate investor requests to redeem shares.
Fund providers have faced many obstacles challenging this philosophy. Zero bound interest rates, regulatory changes and financial crisis have all confronted fund providers. Regardless of the event, money fund managers analyzed the environment before them and marched ahead.
The past year started out as a rather normal year. Interest rates in the fixed income markets were respectable. Speculation of a domestic economic slowdown was debated but market participants remained optimistic growth would persist. However, as the year unfolded, 2020 would be remembered for a new challenge to the industry. The Covid-19 pandemic invaded the U.S. throughout the year causing unanticipated headwinds. From capital market disarray to a race for a vaccine, participants in every sector of the capital markets waged a battle not faced before.
The year began with the Federal Open Market Committee (FOMC) in a less restrictive stance versus the previous year. However, discussions surrounding global trade and economic instability emerged with the onset of a complex virus. By the beginning of March ramifications of a global pause prompted FOMC Chairperson, Jerome Powell, to act in favor of supporting domestic growth. An agreement to lower the target rate by 0.50% to a range of 1.00% to 1.25% was enacted to support employment and price stability goals. Needless to say, this would be insufficient. In less than two weeks the committee would meet again to discuss escalation of the virus to the point of pandemic. Fearing destruction of the global economy would eventually infiltrate the U.S. economy, the FOMC acted again. This time the committee took the target rate to a range of 0.00% to 0.25% in hopes of mitigating economic calamity.
Factoring in data at hand and weighing expectations for the year that lay ahead, the advisor fine-tuned tactical strategy targeting investment opportunities which may outperform in a zero bound interest rate environment. Government securities and high-quality corporate obligations warranted priority in an unstable environment. The Fund was also structured to bolster liquidity which enhanced portfolio safety. Investments which were short-term, including but not limited to collateralized investment, provided the necessary portfolio stability. Eventually in the second half of the year, when markets stabilized, liquid resources were ample to deploy in longer dated investments. As expectations escalated that short-term interest rates may stagnate at the lower bound, the team engaged more corporate obligations in an effort support shareholder value. During the year, the portfolio management team targeted a weighted average maturity that accommodated the divergent environment. This strategy allowed the management team opportunity to alter investments as conditions changed.
Currently, we believe the FOMC will continue to remain vigilant to aid economic resurgence. We expect the committee will maintain its current rate stance well into next year. We do anticipate the following interest rate cycle may also be elongated with potentially several meetings to pass with no action. Our sector allocation favors an overweight to high-quality liquid investments. Depending on market opportunities we will continue to explore investment alternatives in short-term, high-quality corporate debt products without adding undo risk.
As we completed 2020, our belief is that the Fund should be positioned to maintain strong performance into 2021. In the event FOMC policy changes, we believe the portfolio is positioned to perform in the resulting environment. We will continuously monitor strategy relative to market opportunities and act in the best interest of our shareholders.
Investment Objective
The investment objective of the Fund is to provide current income while maintaining a stable share price of $1.00.
Average Annual Total Returns
as of December 31, 2020
| 1
Year | 5
Year | 10
Year |
Prime Money Market Fund | 0.45% | 1.01% | 0.55% |
Yields
as of December 31, 2020
| | 7-Day
Subsidized
Yield | 7-Day
Unsubsidized
Yield |
Prime Money Market Fund | 0.03% | -0.65% |
Top 10 Holdings
as of December 31, 2020
1. | South Street Repo, 0.10%, due 1/4/2021 | 14.5% |
2. | Federated Hermes Government Obligations Fund, 0.01% | 9.8% |
3. | INTL FCStone Repo, 0.23%, due 1/4/2021 | 5.8% |
4. | Caterpillar Financial Power Investment Floating Rate Demand Note, 0.30% | 5.1% |
5. | Anglesea Funding, 0.22%, 1/19/2021 | 2.9% |
6. | Banque et Caisse d’Epargne de l’Etat, 0.23%, 3/4/2021 | 1.5% |
7. | Federal Agricultural Mortgage Corp., 0.18%, 2/10/2021 | 1.4% |
8. | Federal Home Loan Bank, 0.32%, 4/13/2021 | 1.4% |
9. | Sumitomo Mitsui Trust Bank LTD/New York, NY, 0.23%, 3/25/2021 | 1.4% |
10. | Toronto Dominion Bank/New York, NY, 0.35%, 8/31/2021 | 1.4% |
As a percentage of total net assets.
Page 22 | 2020 Annual Report | December 31, 2020 |
The Fund operates as a retail money market fund and is limited to accounts beneficially owned by natural persons. Investment performance assumes reinvestment of all dividend and capital gain distributions. The results do not reflect the effect of taxes a shareholder would pay on Fund distributions or on the redemption of Fund shares. The subsidized 7-day current yield is the current annualized net yield of the Fund. The unsubsidized 7-day current yield does not reflect the effect of any fee waivers or expense reimbursements made by the Fund’s investment adviser. The 7-day current yield more closely reflects the current earnings of the Fund than total return.
You could lose money by investing in the Fund. Because the share price of the Fund will fluctuate, when you sell your shares they may be worth more or less than what you originally paid for them. The Fund may impose a fee upon sale of your shares or may temporarily suspend your ability to sell shares if the Fund’s liquidity falls below required minimums because of market conditions or other factors. An investment in the Fund is not insured or guaranteed by the Federal Deposit Insurance Corporation or any other government agency. The Fund’s sponsor has no legal obligation to provide financial support to the Fund, and you should not expect that the sponsor will provide financial support to the Fund at any time.
Sector Concentration
as of December 31, 2020
Commercial Paper | 28.6% |
Repurchase Agreements | 20.2% |
Variable Rate Demand Notes | 14.2% |
Certificates of Deposit | 10.7% |
Money Market Registered Investment Companies | 9.8% |
Corporate Obligations | 6.4% |
U.S. Government and Agency Obligations | 5.8% |
Bank Obligations | 4.3% |
Total | 100.0% |
As a percentage of total net assets. Concentrations are subject to change.
2020 Annual Report | December 31, 2020 | Page 23 |
Institutional Prime Money Market Fund
The Meeder Institutional Prime Money Market Fund offers a floating net asset value (FNAV). An FNAV fund is characterized by a net asset value which could vary incrementally above or below $1.00 per share. The objective of this fund is to maintain a FNAV near $1.00 per share while offering a competitive return to shareholders. The adviser to the Fund accomplishes the objective by investing in short-term, high-quality money market debt obligations. Money market debt obligations may be offered by the U.S. Government and its agencies but may also include obligations of fundamentally sound corporate issuers.
Over the years, investors have demonstrated confidence in the money market funds industry because of a couple key features. Safety and liquidity are at the core of money fund investment strategy. Safety is expressed through the selection of investments which are anticipated to provide minimal principal volatility, while liquidity is generated by maintaining ample funds to accommodate investor requests to redeem shares.
Fund providers have faced many obstacles challenging this philosophy. Zero bound interest rates, regulatory changes and financial crisis have all confronted fund providers. Regardless of the event, money fund managers analyzed the environment before them and marched ahead.
The past year started out as a rather normal year. Interest rates in the fixed income markets were respectable. Speculation of a domestic economic slowdown was debated but market participants remained optimistic growth would persist. However, as the year unfolded, 2020 would be remembered for a new challenge to the industry. The Covid-19 pandemic invaded the U.S. throughout the year causing unanticipated headwinds. From capital market disarray to a race for a vaccine, participants in every sector of the capital markets waged a battle not faced before.
The year began with the Federal Open Market Committee (FOMC) in a less restrictive stance versus the previous year. However, discussions surrounding global trade and economic instability emerged with the onset of a complex virus. By the beginning of March ramifications of a global pause prompted FOMC Chairperson, Jerome Powell, to act in favor of supporting domestic growth. An agreement to lower the target rate by 0.50% to a range of 1.00% to 1.25% was enacted to support employment and price stability goals. Needless to say, this would be insufficient. In less than two weeks the committee would meet again to discuss escalation of the virus to the point of pandemic. Fearing destruction of the global economy would eventually infiltrate the U.S. economy, the FOMC acted again. This time the committee took the target rate to a range of 0.00% to 0.25% in hopes of mitigating economic calamity.
Factoring in data at hand and weighing expectations for the year that lay ahead, the advisor fine-tuned tactical strategy targeting investment opportunities which may outperform in a zero bound interest rate environment. Government securities and high-quality corporate obligations warranted priority in an unstable environment. The Fund was also structured to bolster liquidity which enhanced portfolio safety. Investments which were short-term, including but not limited to collateralized investment, provided the necessary portfolio stability. Eventually in the second half of the year, when markets stabilized, liquid resources were ample to deploy in longer dated investments. As expectations escalated that short-term interest rates may stagnate at the lower bound, the team engaged more corporate obligations in an effort support shareholder value. During the year, the portfolio management team targeted a weighted average maturity that accommodated the divergent environment. This strategy allowed the management team opportunity to alter investments as conditions changed.
Currently, we believe the FOMC will continue to remain vigilant to aid economic resurgence. We expect the committee will maintain its current rate stance well into next year. We do anticipate the following interest rate cycle may also be elongated with potentially several meetings to pass with no action. Our sector allocation favors an overweight to high-quality liquid investments. Depending on market opportunities we will continue to explore investment alternatives in short-term, high-quality corporate debt products without adding undo risk.
As we completed 2020, our belief is that the Fund should be positioned to maintain strong performance into 2021. In the event FOMC policy changes, we believe the portfolio is positioned to perform in the resulting environment. We will continuously monitor strategy relative to market opportunities and act in the best interest of our shareholders.
Investment Objective
The investment objective of the Fund is to provide current income consistent with liquidity and the preservation of capital.
Average Annual Total Returns
as of December 31, 2020
| 1
Year | 5
Year | 10
Year |
Institutional Prime Money Market Fund | 0.57% | 1.22% | 0.68% |
Yields
as of December 31, 2020
| | 7-Day
Subsidized
Yield | 7-Day
Unsubsidized
Yield |
Institutional Prime Money Market Fund | 0.08% | -0.28% |
Top 10 Holdings
as of December 31, 2020
1. | South Street Repo, 0.08%, due 1/4/2021 | 11.9% |
2. | INTL FCStone Repo, 0.23%, due 1/4/2021 | 8.9% |
3. | Caterpillar Financial Power Investment Floating Rate Demand Note, 0.30% | 4.5% |
4. | Federated Hermes Government Obligations Fund, 0.01% | 4.2% |
5. | South Street Repo, 0.10%, due 1/4/2021 | 3.0% |
6. | Anglesea Funding, 0.21%, 2/1/2021 | 2.2% |
7. | Metropolitan Transportation Authority of New York, 0.04%, 1/7/2021 | 1.6% |
8. | Ohio State Department of Rehabilitation & Correction, 0.09%, 1/6/2021 | 1.6% |
9. | State of California, 0.07%, 1/7/2021 | 1.6% |
10. | State of Wisconsin, 0.09%, 1/7/2021 | 1.6% |
As a percentage of total net assets.
Page 24 | 2020 Annual Report | December 31, 2020 |
Investment performance assumes reinvestment of all dividend and capital gain distributions. The results do not reflect the effect of taxes a shareholder would pay on Fund distributions or on the redemption of Fund shares. The Fund’s performance prior to October 7, 2016 reflects the performance of a predecessor fund, the Institutional Class of the Meeder Prime Money Market Fund, which was distributed and transferred to the Institutional Prime Money Market Fund upon its inception. The subsidized 7-day current yield is the current annualized net yield of the Fund. The unsubsidized 7-day current yield does not reflect the effect of any fee waivers or expense reimbursements made by the Fund’s investment adviser. The 7-day current yield more closely reflects the current earnings of the Fund than total return.
You could lose money by investing in the Fund. Because the share price of the Fund will fluctuate, when you sell your shares they may be worth more or less than what you originally paid for them. The Fund may impose a fee upon sale of your shares or may temporarily suspend your ability to sell shares if the Fund’s liquidity falls below required minimums because of market conditions or other factors. An investment in the Fund is not insured or guaranteed by the Federal Deposit Insurance Corporation or any other government agency. The Fund’s sponsor has no legal obligation to provide financial support to the Fund, and you should not expect that the sponsor will provide financial support to the Fund at any time.
Sector Concentration
as of December 31, 2020
Commercial Paper | 38.6% |
Repurchase Agreements | 23.8% |
Variable Rate Demand Notes | 14.3% |
Corporate Obligations | 8.1% |
U.S. Government and Agency Obligations | 5.9% |
Certificates of Deposit | 4.7% |
Money Market Registered Investment Companies | 4.2% |
Bank Obligations | 0.4% |
Total | 100.0% |
As a percentage of total net assets. Concentrations are subject to change.
2020 Annual Report | December 31, 2020 | Page 25 |
2020 Annual Report
Fund Holdings & Financial Statements
Schedule of Investments
December 31, 2020
Muirfield Fund |
Security Description | | Shares,
Contracts
or Principal
Amount ($) | | | Fair
Value ($) | |
Common Stocks — 79.9% |
Communication Services — 8.1% | | | | | | | | |
Activision Blizzard, Inc. | | | 17,490 | | | | 1,623,947 | |
Alphabet, Inc. - Class A (1) | | | 3,076 | | | | 5,391,121 | |
Alphabet, Inc. - Class C (1) | | | 4,662 | | | | 8,167,265 | |
AMC Entertainment Holdings, Inc. - Class A (2) | | | 2,647 | | | | 5,612 | |
AT&T, Inc. | | | 12,829 | | | | 368,962 | |
Cable One, Inc. | | | 49 | | | | 109,158 | |
Cinemark Holdings, Inc. | | | 1,662 | | | | 28,935 | |
Comcast Corp. - Class A | | | 86,159 | | | | 4,514,732 | |
DISH Network Corp. (1) | | | 3,717 | | | | 120,208 | |
Electronic Arts, Inc. | | | 12,880 | | | | 1,849,568 | |
EW Scripps Co./The | | | 355 | | | | 5,428 | |
Facebook, Inc. (1) | | | 34,277 | | | | 9,363,105 | |
Fluent, Inc. (1) | | | 1,228 | | | | 6,521 | |
Frontier Communications Corp. (1) | | | 13,822 | | | | 1,237 | |
Glu Mobile, Inc. (1) | | | 3,604 | | | | 32,472 | |
Gogo, Inc. (1) | | | 1,165 | | | | 11,219 | |
Gray Television, Inc. (1) | | | 4,944 | | | | 88,448 | |
IDT Corp. - Class B (1) | | | 1,445 | | | | 17,860 | |
Interpublic Group of Cos., Inc./The | | | 52,835 | | | | 1,242,679 | |
Lee Enterprises, Inc. (1) | | | 8,976 | | | | 11,310 | |
Liberty TripAdvisor Holdings, Inc. (1) | | | 1,759 | | | | 7,634 | |
Lions Gate Entertainment Corp. - Class A (1) | | | 3,800 | | | | 43,206 | |
Meredith Corp. | | | 1,069 | | | | 20,525 | |
Netflix, Inc. (1) | | | 5,254 | | | | 2,840,995 | |
News Corp. | | | 8,727 | | | | 156,824 | |
Nexstar Media Group, Inc. | | | 2,480 | | | | 270,791 | |
Omnicom Group, Inc. | | | 15,239 | | | | 950,456 | |
Pinterest, Inc. - Class A (1) | | | 5,542 | | | | 365,218 | |
Roku, Inc. - Class A (1) | | | 1,885 | | | | 625,858 | |
Spotify Technology SA (1) | | | 2,492 | | | | 784,133 | |
Take-Two Interactive Software, Inc. (1) | | | 367 | | | | 76,259 | |
TechTarget, Inc. (1) | | | 2,131 | | | | 125,963 | |
TEGNA, Inc. | | | 4,778 | | | | 66,653 | |
Telephone and Data Systems, Inc. | | | 4,926 | | | | 91,476 | |
Tribune Publishing Co. | | | 804 | | | | 11,015 | |
Twitter, Inc. (1) | | | 2,844 | | | | 154,003 | |
Verizon Communications, Inc. | | | 87,131 | | | | 5,118,946 | |
Walt Disney Co./The | | | 8,215 | | | | 1,488,394 | |
World Wrestling Entertainment, Inc. - Class A | | | 3,856 | | | | 185,281 | |
Yelp, Inc. (1) | | | 670 | | | | 21,889 | |
| | | | | | | | 46,365,306 | |
| | | | | | | | | |
Muirfield Fund |
Security Description | | Shares,
Contracts
or Principal
Amount ($) | | | Fair
Value ($) | |
Common Stocks — continued |
Consumer Discretionary — 10.1% | | | | | | | | |
Abercrombie & Fitch Co. | | | 418 | | | | 8,510 | |
Amazon.com, Inc. (1) | | | 4,956 | | | | 16,141,345 | |
Aramark | | | 2,599 | | | | 100,010 | |
At Home Group, Inc. (1) | | | 990 | | | | 15,305 | |
AutoNation, Inc. (1) | | | 676 | | | | 47,178 | |
Best Buy Co., Inc. | | | 11,872 | | | | 1,184,707 | |
Big Lots, Inc. | | | 736 | | | | 31,596 | |
BorgWarner, Inc. | | | 3,923 | | | | 151,585 | |
Boyd Gaming Corp. | | | 1,786 | | | | 76,655 | |
Brinker International, Inc. | | | 1,347 | | | | 76,200 | |
Brunswick Corp./DE | | | 1,664 | | | | 126,863 | |
Buckle, Inc./The | | | 680 | | | | 19,856 | |
Caleres, Inc. | | | 1,414 | | | | 22,129 | |
Camping World Holdings, Inc. | | | 5,426 | | | | 141,347 | |
Capri Holdings, Ltd. (1) | | | 1,861 | | | | 78,162 | |
CarParts.com, Inc. (1) | | | 2,952 | | | | 36,575 | |
Carvana Co. (1) | | | 110 | | | | 26,349 | |
Chipotle Mexican Grill, Inc. (1) | | | 1,259 | | | | 1,745,868 | |
Churchill Downs, Inc. | | | 322 | | | | 62,722 | |
Container Store Group, Inc./The (1) | | | 738 | | | | 7,041 | |
Cooper Tire & Rubber Co. | | | 690 | | | | 27,945 | |
Cracker Barrel Old Country Store, Inc. | | | 1,947 | | | | 256,848 | |
Crocs, Inc. (1) | | | 9,979 | | | | 625,284 | |
Dana, Inc. | | | 4,437 | | | | 86,610 | |
Darden Restaurants, Inc. | | | 3,124 | | | | 372,131 | |
Dave & Buster’s Entertainment, Inc. | | | 375 | | | | 11,258 | |
Deckers Outdoor Corp. (1) | | | 329 | | | | 94,351 | |
Del Taco Restaurants, Inc. | | | 4,503 | | | | 40,797 | |
Designer Brands, Inc. - Class A | | | 1,643 | | | | 12,569 | |
Dillard’s, Inc. - Class A | | | 121 | | | | 7,629 | |
Dollar Tree, Inc. (1) | | | 3,406 | | | | 367,984 | |
Domino’s Pizza, Inc. | | | 1,074 | | | | 411,836 | |
DR Horton, Inc. | | | 10,420 | | | | 718,146 | |
Duluth Holdings, Inc. - Class B (1) | | | 502 | | | | 5,301 | |
eBay, Inc. | | | 9,323 | | | | 468,481 | |
Etsy, Inc. (1) | | | 1,291 | | | | 229,682 | |
Everi Holdings, Inc. (1) | | | 611 | | | | 8,438 | |
Extended Stay America, Inc. | | | 7,524 | | | | 111,430 | |
Fiesta Restaurant Group, Inc. (1) | | | 945 | | | | 10,773 | |
Ford Motor Co. | | | 1 | | | | 9 | |
Fossil Group, Inc. (1) | | | 1,273 | | | | 11,037 | |
Fox Factory Holding Corp. (1) | | | 192 | | | | 20,296 | |
Franchise Group, Inc. | | | 622 | | | | 18,940 | |
Gap, Inc./The | | | 80 | | | | 1,615 | |
General Motors Co. | | | 33,730 | | | | 1,404,517 | |
The accompanying notes are an integral part of these financial statements
2020 Annual Report | December 31, 2020 | Page 27 |
Schedule of Investments
December 31, 2020
Muirfield Fund |
Security Description | | Shares,
Contracts
or Principal
Amount ($) | | | Fair
Value ($) | |
Common Stocks — continued |
Genesco, Inc. (1) | | | 449 | | | | 13,510 | |
GoPro, Inc. (1) | | | 406 | | | | 3,362 | |
Greenlane Holdings, Inc. (1) | | | 963 | | | | 3,813 | |
Group 1 Automotive, Inc. | | | 345 | | | | 45,243 | |
GrowGeneration Corp. (1) | | | 1,120 | | | | 45,046 | |
Guess?, Inc. | | | 682 | | | | 15,427 | |
Hanesbrands, Inc. | | | 3,606 | | | | 52,575 | |
Harley-Davidson, Inc. | | | 4,813 | | | | 176,637 | |
Hibbett Sports, Inc. (1) | | | 1,585 | | | | 73,195 | |
Houghton Mifflin Harcourt Co. (1) | | | 1,829 | | | | 6,091 | |
International Game Technology PLC | | | 3,633 | | | | 61,543 | |
Kohl’s Corp. | | | 2,663 | | | | 108,357 | |
L Brands, Inc. | | | 3,094 | | | | 115,066 | |
Lakeland Industries, Inc. (1) | | | 3,065 | | | | 83,521 | |
Lands’ End, Inc. (1) | | | 667 | | | | 14,387 | |
Las Vegas Sands Corp. | | | 2,882 | | | | 171,767 | |
LCI Industries | | | 826 | | | | 107,116 | |
Lear Corp. | | | 822 | | | | 130,723 | |
Lennar Corp. - Class A | | | 3,816 | | | | 290,894 | |
Liquidity Services, Inc. (1) | | | 210 | | | | 3,341 | |
Lovesac Co./The (1) | | | 159 | | | | 6,851 | |
Lowe’s Cos., Inc. | | | 25,316 | | | | 4,063,471 | |
Lululemon Athletica, Inc. (1) | | | 1,627 | | | | 566,245 | |
Lumber Liquidators Holdings, Inc. (1) | | | 949 | | | | 29,172 | |
M/I Homes, Inc. (1) | | | 2,310 | | | | 102,310 | |
Malibu Boats, Inc. (1) | | | 3,195 | | | | 199,496 | |
Marriott International, Inc./MD | | | 1,882 | | | | 248,273 | |
McDonald’s Corp. | | | 20,078 | | | | 4,308,337 | |
Meritage Homes Corp. (1) | | | 2,039 | | | | 168,870 | |
MGM Resorts International | | | 84 | | | | 2,647 | |
Modine Manufacturing Co. (1) | | | 3,203 | | | | 40,230 | |
Nautilus, Inc. (1) | | | 1,078 | | | | 19,555 | |
NIKE, Inc. - Class B | | | 15,988 | | | | 2,261,822 | |
Nordstrom, Inc. | | | 237 | | | | 7,397 | |
ODP Corp./The | | | 1,801 | | | | 52,769 | |
Overstock.com, Inc. (1) | | | 631 | | | | 30,269 | |
Party City Holdco, Inc. (1) | | | 1,959 | | | | 12,048 | |
Penn National Gaming, Inc. (1) | | | 2,502 | | | | 216,098 | |
Polaris, Inc. | | | 1,148 | | | | 109,381 | |
Pool Corp. | | | 836 | | | | 311,410 | |
PulteGroup, Inc. | | | 29,363 | | | | 1,266,133 | |
Purple Innovation, Inc. (1) | | | 3,074 | | | | 101,258 | |
Qurate Retail, Inc. - Class A | | | 10,394 | | | | 114,022 | |
Red Rock Resorts, Inc. | | | 1,905 | | | | 47,701 | |
Rent-A-Center, Inc./TX | | | 26,665 | | | | 1,021,003 | |
Scientific Games Corp. (1) | | | 1,216 | | | | 50,452 | |
Muirfield Fund |
Security Description | | Shares,
Contracts
or Principal
Amount ($) | | | Fair
Value ($) | |
Common Stocks — continued |
Sleep Number Corp. (1) | | | 485 | | | | 39,702 | |
Sonic Automotive, Inc. | | | 2,822 | | | | 108,845 | |
Starbucks Corp. | | | 23,199 | | | | 2,481,829 | |
Tapestry, Inc. | | | 1,789 | | | | 55,602 | |
Target Corp. | | | 9,553 | | | | 1,686,391 | |
Tesla, Inc. (1) | | | 9,950 | | | | 7,021,417 | |
Texas Roadhouse, Inc. | | | 1,771 | | | | 138,421 | |
Thor Industries, Inc. | | | 2,774 | | | | 257,954 | |
Tilly’s, Inc. - Class A | | | 748 | | | | 6,104 | |
TopBuild Corp. (1) | | | 398 | | | | 73,264 | |
Town Sports International Holdings, Inc. (1) | | | 4,612 | | | | 1,153 | |
Tupperware Brands Corp. (1) | | | 590 | | | | 19,110 | |
Urban Outfitters, Inc. (1) | | | 945 | | | | 24,192 | |
Vista Outdoor, Inc. (1) | | | 738 | | | | 17,535 | |
VOXX International Corp. (1) | | | 998 | | | | 12,734 | |
Waitr Holdings, Inc. (1) | | | 1,473 | | | | 4,095 | |
Wayfair, Inc. (1) | | | 147 | | | | 33,194 | |
Wendy’s Co./The | | | 2,796 | | | | 61,288 | |
Williams-Sonoma, Inc. | | | 890 | | | | 90,638 | |
Wingstop, Inc. | | | 1,250 | | | | 165,688 | |
Winnebago Industries, Inc. | | | 10,390 | | | | 622,777 | |
Wyndham Destinations, Inc. | | | 9,380 | | | | 420,787 | |
Yum China Holdings, Inc. | | | 3,849 | | | | 219,739 | |
Yum! Brands, Inc. | | | 20,505 | | | | 2,226,023 | |
Zumiez, Inc. (1) | | | 1 | | | | 37 | |
| | | | | | | | 58,091,263 | |
| | | | | | | | | |
Consumer Staples — 2.2% | | | | | | | | |
Andersons, Inc./The | | | 1,307 | | | | 32,035 | |
BJ’s Wholesale Club Holdings, Inc. (1) | | | 870 | | | | 32,434 | |
Bunge, Ltd. | | | 18,974 | | | | 1,244,315 | |
Conagra Brands, Inc. | | | 10,350 | | | | 375,291 | |
Costco Wholesale Corp. | | | 354 | | | | 133,380 | |
Darling Ingredients, Inc. (1) | | | 15,851 | | | | 914,286 | |
General Mills, Inc. | | | 51,057 | | | | 3,002,152 | |
Ingredion, Inc. | | | 125 | | | | 9,834 | |
Kroger Co./The | | | 16,967 | | | | 538,872 | |
Molson Coors Beverage Co. - Class B | | | 15,790 | | | | 713,550 | |
Natural Grocers by Vitamin Cottage, Inc. | | | 743 | | | | 10,209 | |
Nu Skin Enterprises, Inc. | | | 420 | | | | 22,945 | |
PepsiCo, Inc. | | | 15,604 | | | | 2,314,073 | |
Performance Food Group Co. (1) | | | 2,057 | | | | 97,934 | |
Rite Aid Corp. (1) | | | 870 | | | | 13,772 | |
SpartanNash Co. | | | 1,545 | | | | 26,898 | |
Tyson Foods, Inc. | | | 4,786 | | | | 308,410 | |
United Natural Foods, Inc. (1) | | | 1,376 | | | | 21,975 | |
The accompanying notes are an integral part of these financial statements
Page 28 | 2020 Annual Report | December 31, 2020 |
Schedule of Investments
December 31, 2020
Muirfield Fund |
Security Description | | Shares,
Contracts
or Principal
Amount ($) | | | Fair
Value ($) | |
Common Stocks — continued |
Walgreens Boots Alliance, Inc. | | | 1,002 | | | | 39,960 | |
Walmart, Inc. | | | 17,390 | | | | 2,506,769 | |
| | | | | | | | 12,359,094 | |
| | | | | | | | | |
Energy — 0.8% | | | | | | | | |
Amplify Energy Corp. | | | 7,061 | | | | 9,250 | |
Antero Resources Corp. (1) | | | 8,096 | | | | 44,123 | |
Apache Corp. | | | 3,496 | | | | 49,608 | |
Archrock, Inc. | | | 4,408 | | | | 38,173 | |
Ardmore Shipping Corp. | | | 3,596 | | | | 11,759 | |
Aspen Aerogels, Inc. (1) | | | 1,900 | | | | 31,711 | |
Bonanza Creek Energy, Inc. (1) | | | 1,656 | | | | 32,010 | |
Brigham Minerals, Inc. | | | 2,883 | | | | 31,684 | |
Cabot Oil & Gas Corp. | | | 8,982 | | | | 146,227 | |
Cactus, Inc. - Class A | | | 3,705 | | | | 96,589 | |
Centennial Resource Development, Inc./DE - Class A (1) | | | 7,019 | | | | 10,529 | |
Chaparral Energy, Inc. A Warrants (1)(7) | | | 7 | | | | 0 | |
Chaparral Energy, Inc. B Warrants (1)(7) | | | 7 | | | | 0 | |
Chesapeake Energy Corp. (1) | | | 778 | | | | 1,183 | |
Chevron Corp. | | | 4,716 | | | | 398,266 | |
Cimarex Energy Co. | | | 6,865 | | | | 257,506 | |
Clean Energy Fuels Corp. (1) | | | 5,277 | | | | 41,477 | |
CNX Resources Corp. (1) | | | 2,623 | | | | 28,328 | |
Concho Resources, Inc. | | | 5,945 | | | | 346,891 | |
ConocoPhillips | | | 22,076 | | | | 882,819 | |
CONSOL Energy, Inc. (1) | | | 746 | | | | 5,379 | |
Continental Resources, Inc./OK | | | 1,691 | | | | 27,563 | |
Delek US Holdings, Inc. | | | 577 | | | | 9,272 | |
DHT Holdings, Inc. | | | 2,432 | | | | 12,719 | |
Diamondback Energy, Inc. | | | 832 | | | | 40,269 | |
DMC Global, Inc. | | | 47 | | | | 2,033 | |
Dorian LPG, Ltd. (1) | | | 2,050 | | | | 24,990 | |
Earthstone Energy, Inc. - Class A (1) | | | 1,433 | | | | 7,638 | |
EOG Resources, Inc. | | | 10,182 | | | | 507,776 | |
EQT Corp. | | | 6,023 | | | | 76,552 | |
Exterran Corp. (1) | | | 409 | | | | 1,808 | |
Extraction Oil & Gas, Inc. (1) | | | 4,625 | | | | 131 | |
Frank’s International NV (1) | | | 5,882 | | | | 16,117 | |
Golar LNG, Ltd. | | | 502 | | | | 4,839 | |
Hallador Energy Co. | | | 6,197 | | | | 9,110 | |
Hess Corp. | | | 1,132 | | | | 59,758 | |
International Seaways, Inc. | | | 1,840 | | | | 30,047 | |
Laredo Petroleum, Inc. (1) | | | 2,192 | | | | 43,182 | |
Liberty Oilfield Services, Inc. - Class A | | | 4,321 | | | | 44,550 | |
Matador Resources Co. (1) | | | 3,384 | | | | 40,811 | |
Muirfield Fund |
Security Description | | Shares,
Contracts
or Principal
Amount ($) | | | Fair
Value ($) | |
Common Stocks — continued |
Nabors Industries, Ltd. | | | 485 | | | | 28,242 | |
NextDecade Corp. (1) | | | 1,106 | | | | 2,312 | |
NexTier Oilfield Solutions, Inc. (1) | | | 4,369 | | | | 15,029 | |
Nine Energy Service, Inc. (1) | | | 3,274 | | | | 8,905 | |
Nordic American Tankers, Ltd. | | | 1,043 | | | | 3,077 | |
NOV, Inc. (1) | | | 3,676 | | | | 50,471 | |
Oasis Petroleum, Inc. Warrants (1)(7) | | | 23 | | | | 0 | |
Oceaneering International, Inc. (1) | | | 4,673 | | | | 37,150 | |
Parsley Energy, Inc. | | | 3,406 | | | | 48,365 | |
Patterson-UTI Energy, Inc. | | | 2,712 | | | | 14,265 | |
PDC Energy, Inc. (1) | | | 2,776 | | | | 56,991 | |
Peabody Energy Corp. | | | 2,730 | | | | 6,579 | |
Penn Virginia Corp. (1) | | | 1 | | | | 10 | |
Phillips 66 | | | 2,772 | | | | 193,874 | |
Pioneer Natural Resources Co. | | | 2,337 | | | | 266,161 | |
Profire Energy, Inc. (1) | | | 100 | | | | 85 | |
ProPetro Holding Corp. (1) | | | 11,987 | | | | 88,584 | |
Range Resources Corp. | | | 4,098 | | | | 27,457 | |
Renewable Energy Group, Inc. (1) | | | 924 | | | | 65,438 | |
Schlumberger NV | | | 5,766 | | | | 125,872 | |
Scorpio Tankers, Inc. | | | 321 | | | | 3,592 | |
Southwestern Energy Co. (1) | | | 11,421 | | | | 34,035 | |
Superior Energy Services, Inc. (1) | | | 1,242 | | | | 57 | |
Talos Energy, Inc. (1) | | | 301 | | | | 2,480 | |
Teekay Corp. (1) | | | 3,537 | | | | 7,605 | |
W&T Offshore, Inc. (1) | | | 5,610 | | | | 12,174 | |
Whiting Petroleum Corp. (1) | | | 260 | | | | 6,500 | |
Whiting Petroleum Corporation A Warrants (1) | | | 127 | | | | 222 | |
Whiting Petroleum Corporation B Warrants (1)(2) | | | 63 | | | | 120 | |
World Fuel Services Corp. | | | 3,727 | | | | 116,133 | |
WPX Energy, Inc. (1) | | | 3,447 | | | | 28,093 | |
| | | | | | | | 4,672,555 | |
| | | | | | | | | |
Financials — 7.1% | | | | | | | | |
AGNC Investment Corp. | | | 23,051 | | | | 359,596 | |
Allstate Corp./The | | | 3,156 | | | | 346,939 | |
Ally Financial, Inc. | | | 24,356 | | | | 868,535 | |
American Equity Investment Life Holding Co. | | | 3,328 | | | | 92,052 | |
American Express Co. | | | 3,050 | | | | 368,776 | |
Ameriprise Financial, Inc. | | | 1,900 | | | | 369,227 | |
Ameris Bancorp | | | 5,511 | | | | 209,804 | |
Apollo Commercial Real Estate Finance, Inc. | | | 199 | | | | 2,223 | |
Arbor Realty Trust, Inc. | | | 1,979 | | | | 28,062 | |
The accompanying notes are an integral part of these financial statements
2020 Annual Report | December 31, 2020 | Page 29 |
Schedule of Investments
December 31, 2020
Muirfield Fund |
Security Description | | Shares,
Contracts
or Principal
Amount ($) | | | Fair
Value ($) | |
Common Stocks — continued |
Artisan Partners Asset Management, Inc. - Class A | | | 7,959 | | | | 400,656 | |
Associated Banc-Corp | | | 15,405 | | | | 262,655 | |
Axos Financial, Inc. (1) | | | 2,296 | | | | 86,169 | |
BancorpSouth Bank | | | 4,700 | | | | 128,968 | |
Bank of America Corp. | | | 116,786 | | | | 3,539,784 | |
Bank of NT Butterfield & Son, Ltd./The | | | 3,350 | | | | 104,386 | |
BankUnited, Inc. | | | 6,256 | | | | 217,584 | |
Banner Corp. | | | 215 | | | | 10,017 | |
Bar Harbor Bankshares | | | 306 | | | | 6,913 | |
Berkshire Hathaway, Inc. - Class B (1) | | | 36,159 | | | | 8,384,187 | |
Capital Bancorp, Inc. (1) | | | 236 | | | | 3,287 | |
Charles Schwab Corp./The | | | 2,479 | | | | 131,486 | |
Chimera Investment Corp. | | | 235 | | | | 2,409 | |
Citigroup, Inc. | | | 16,541 | | | | 1,019,918 | |
Citizens Financial Group, Inc. | | | 10,591 | | | | 378,734 | |
Civista Bancshares, Inc. | | | 1,421 | | | | 24,910 | |
CNO Financial Group, Inc. | | | 9,588 | | | | 213,141 | |
Columbia Banking System, Inc. | | | 893 | | | | 32,059 | |
Comerica, Inc. | | | 472 | | | | 26,366 | |
Cowen, Inc. | | | 1,502 | | | | 39,037 | |
Curo Group Holdings Corp. | | | 6,958 | | | | 99,708 | |
Customers Bancorp, Inc. (1) | | | 3,475 | | | | 63,176 | |
East West Bancorp, Inc. | | | 5,243 | | | | 265,873 | |
Eaton Vance Corp. | | | 2,421 | | | | 164,459 | |
Ellington Residential Mortgage REIT | | | 1,608 | | | | 20,968 | |
Enova International, Inc. (1) | | | 3,004 | | | | 74,409 | |
Esquire Financial Holdings, Inc. (1) | | | 21 | | | | 403 | |
Evercore, Inc. - Class A | | | 2,358 | | | | 258,531 | |
Farmers National Banc Corp. | | | 298 | | | | 3,954 | |
Fifth Third Bancorp | | | 32,307 | | | | 890,704 | |
First Citizens BancShares, Inc./NC - Class A | | | 277 | | | | 159,073 | |
First Financial Bancorp | | | 4,016 | | | | 70,400 | |
First Financial Corp./IN | | | 1,848 | | | | 71,795 | |
First Foundation, Inc. | | | 1,176 | | | | 23,520 | |
First Horizon Corp. | | | 1,367 | | | | 17,443 | |
First Interstate BancSystem, Inc. | | | 735 | | | | 29,966 | |
First Republic Bank/CA | | | 4,265 | | | | 626,656 | |
FNCB Bancorp, Inc. | | | 134 | | | | 858 | |
Goosehead Insurance, Inc. | | | 1,424 | | | | 177,658 | |
Great Ajax Corp. | | | 4,942 | | | | 51,693 | |
GWG Holdings, Inc. (1) | | | 358 | | | | 2,502 | |
Hartford Financial Services Group, Inc./The | | | 1,977 | | | | 96,833 | |
HBT Financial, Inc. | | | 2,869 | | | | 43,465 | |
Heartland Financial USA, Inc. | | | 2,418 | | | | 97,615 | |
Hilltop Holdings, Inc. | | | 9,563 | | | | 263,078 | |
Houlihan Lokey, Inc. - Class A | | | 1,121 | | | | 75,365 | |
Muirfield Fund |
Security Description | | Shares,
Contracts
or Principal
Amount ($) | | | Fair
Value ($) | |
Common Stocks — continued |
Huntington Bancshares, Inc./OH | | | 15,004 | | | | 189,501 | |
Independent Bank Group, Inc. | | | 178 | | | | 11,129 | |
James River Group Holdings, Ltd. | | | 2,746 | | | | 134,966 | |
JPMorgan Chase & Co. | | | 24,011 | | | | 3,051,078 | |
KeyCorp | | | 6,693 | | | | 109,832 | |
Kinsale Capital Group, Inc. | | | 2,121 | | | | 424,476 | |
Lakeland Financial Corp. | | | 555 | | | | 29,737 | |
LPL Financial Holdings, Inc. | | | 1,127 | | | | 117,456 | |
M&T Bank Corp. | | | 1,272 | | | | 161,926 | |
Marsh & McLennan Cos., Inc. | | | 1,612 | | | | 188,604 | |
Medley Management, Inc. | | | 234 | | | | 1,870 | |
Meta Financial Group, Inc. | | | 767 | | | | 28,042 | |
MetLife, Inc. | | | 16,901 | | | | 793,502 | |
Metrocity Bankshares, Inc. | | | 3,706 | | | | 53,441 | |
MMA Capital Holdings, Inc. (1) | | | 353 | | | | 8,684 | |
Morgan Stanley | | | 24,148 | | | | 1,654,862 | |
Mr Cooper Group, Inc. (1) | | | 5,005 | | | | 155,305 | |
Northrim BanCorp, Inc. | | | 3,133 | | | | 106,365 | |
Old Republic International Corp. | | | 6,399 | | | | 126,124 | |
OneMain Holdings, Inc. | | | 3,230 | | | | 155,557 | |
Oppenheimer Holdings, Inc. | | | 3,852 | | | | 121,068 | |
PennyMac Financial Services, Inc. | | | 9,995 | | | | 655,872 | |
PennyMac Mortgage Investment Trust | | | 4,152 | | | | 73,034 | |
People’s United Financial, Inc. | | | 5,521 | | | | 71,387 | |
Pinnacle Financial Partners, Inc. | | | 461 | | | | 29,688 | |
PJT Partners, Inc. | | | 6,534 | | | | 491,684 | |
PNC Financial Services Group, Inc./The | | | 4,837 | | | | 720,713 | |
Popular, Inc. | | | 2,656 | | | | 149,586 | |
Progressive Corp./The | | | 8,207 | | | | 811,508 | |
Prudential Financial, Inc. | | | 8,339 | | | | 651,026 | |
Pzena Investment Management, Inc. - Class A | | | 8,002 | | | | 58,415 | |
QCR Holdings, Inc. | | | 1,569 | | | | 62,117 | |
RBB Bancorp | | | 9,372 | | | | 144,141 | |
Ready Capital Corp. | | | 5,253 | | | | 65,400 | |
Regions Financial Corp. | | | 38,503 | | | | 620,668 | |
Sandy Spring Bancorp, Inc. | | | 477 | | | | 15,355 | |
Shore Bancshares, Inc. | | | 251 | | | | 3,665 | |
Siebert Financial Corp. (1) | | | 626 | | | | 2,629 | |
Signature Bank/New York NY | | | 1,673 | | | | 226,340 | |
Silvercrest Asset Management Group, Inc. | | | 155 | | | | 2,153 | |
Simmons First National Corp. | | | 759 | | | | 16,387 | |
SLM Corp. | | | 6,257 | | | | 77,524 | |
South State Corp. | | | 410 | | | | 29,643 | |
State Street Corp. | | | 10,099 | | | | 735,005 | |
Stewart Information Services Corp. | | | 13,933 | | | | 673,800 | |
The accompanying notes are an integral part of these financial statements
Page 30 | 2020 Annual Report | December 31, 2020 |
Schedule of Investments
December 31, 2020
Muirfield Fund |
Security Description | | Shares,
Contracts
or Principal
Amount ($) | | | Fair
Value ($) | |
Common Stocks — continued |
StoneX Group, Inc. (1) | | | 893 | | | | 51,705 | |
Summit Financial Group, Inc. | | | 567 | | | | 12,519 | |
SVB Financial Group (1) | | | 1,200 | | | | 465,396 | |
Synchrony Financial | | | 48,877 | | | | 1,696,521 | |
Synovus Financial Corp. | | | 921 | | | | 29,813 | |
Truist Financial Corp. | | | 24,211 | | | | 1,160,433 | |
UMB Financial Corp. | | | 3,228 | | | | 222,700 | |
United Community Banks, Inc./GA | | | 4,757 | | | | 135,289 | |
Unum Group | | | 9,347 | | | | 214,420 | |
Valley National Bancorp | | | 8,559 | | | | 83,450 | |
Veritex Holdings, Inc. | | | 1,697 | | | | 43,545 | |
Virtu Financial, Inc. | | | 7,529 | | | | 189,505 | |
Virtus Investment Partners, Inc. | | | 1,265 | | | | 274,505 | |
Walker & Dunlop, Inc. | | | 2,942 | | | | 270,723 | |
Wells Fargo & Co. | | | 5,631 | | | | 169,944 | |
Western Alliance Bancorp | | | 3,833 | | | | 229,788 | |
WSFS Financial Corp. | | | 483 | | | | 21,677 | |
| | | | | | | | 40,591,183 | |
| | | | | | | | | |
Healthcare — 15.1% | | | | | | | | |
89bio, Inc. (1) | | | 138 | | | | 3,363 | |
Abbott Laboratories | | | 16,344 | | | | 1,789,505 | |
AbbVie, Inc. | | | 45,997 | | | | 4,928,579 | |
AcelRx Pharmaceuticals, Inc. (1) | | | 9,000 | | | | 11,160 | |
Affimed NV (1) | | | 4,733 | | | | 27,546 | |
Agilent Technologies, Inc. | | | 15,306 | | | | 1,813,608 | |
Albireo Pharma, Inc. (1) | | | 104 | | | | 3,901 | |
Alexion Pharmaceuticals, Inc. (1) | | | 7,095 | | | | 1,108,523 | |
Align Technology, Inc. (1) | | | 1,273 | | | | 680,266 | |
Alkermes PLC (1) | | | 8,387 | | | | 167,321 | |
Allakos, Inc. (1) | | | 458 | | | | 64,120 | |
Allscripts Healthcare Solutions, Inc. (1) | | | 2,593 | | | | 37,443 | |
Alnylam Pharmaceuticals, Inc. (1) | | | 1,199 | | | | 155,834 | |
AmerisourceBergen Corp. | | | 1,273 | | | | 124,448 | |
Amgen, Inc. | | | 14,081 | | | | 3,237,504 | |
Amicus Therapeutics, Inc. (1) | | | 1,028 | | | | 23,737 | |
Amneal Pharmaceuticals, Inc. - Class A (1) | | | 7,549 | | | | 34,499 | |
Anthem, Inc. | | | 500 | | | | 160,545 | |
Apellis Pharmaceuticals, Inc. (1) | | | 906 | | | | 51,823 | |
Applied Therapeutics, Inc. (1) | | | 213 | | | | 4,688 | |
Arcturus Therapeutics Holdings, Inc. (1) | | | 247 | | | | 10,715 | |
Arcutis Biotherapeutics, Inc. (1) | | | 516 | | | | 14,515 | |
Arena Pharmaceuticals, Inc. (1) | | | 1,157 | | | | 88,892 | |
Arrowhead Pharmaceuticals, Inc. (1) | | | 1,361 | | | | 104,430 | |
Assembly Biosciences, Inc. (1) | | | 783 | | | | 4,737 | |
Assertio Holdings, Inc. (1) | | | 14,489 | | | | 5,181 | |
Muirfield Fund |
Security Description | | Shares,
Contracts
or Principal
Amount ($) | | | Fair
Value ($) | |
Common Stocks — continued |
Atara Biotherapeutics, Inc. (1) | | | 965 | | | | 18,943 | |
Avantor, Inc. (1) | | | 3,368 | | | | 94,809 | |
Axsome Therapeutics, Inc. (1) | | | 271 | | | | 22,078 | |
Baxter International, Inc. | | | 1,258 | | | | 100,942 | |
Beam Therapeutics, Inc. (1) | | | 820 | | | | 66,945 | |
Becton Dickinson and Co. | | | 2,626 | | | | 657,078 | |
Beyondspring, Inc. (1) | | | 251 | | | | 3,062 | |
BioDelivery Sciences International, Inc. (1) | | | 8,214 | | | | 34,499 | |
Bio-Rad Laboratories, Inc. (1) | | | 595 | | | | 346,849 | |
Bioxcel Therapeutics, Inc. (1) | | | 865 | | | | 39,963 | |
Blueprint Medicines Corp. (1) | | | 1,053 | | | | 118,094 | |
Bridgebio Pharma, Inc. (1) | | | 700 | | | | 49,777 | |
Bristol-Myers Squibb Co. | | | 63,774 | | | | 3,955,901 | |
Calyxt, Inc. (1) | | | 374 | | | | 1,578 | |
Cardinal Health, Inc. | | | 18,719 | | | | 1,002,590 | |
CareDx, Inc. (1) | | | 1,149 | | | | 83,245 | |
CASI Pharmaceuticals, Inc. (1) | | | 1,514 | | | | 4,466 | |
Castle Biosciences, Inc. (1) | | | 706 | | | | 47,408 | |
Catalent, Inc. (1) | | | 5,069 | | | | 527,531 | |
Catalyst Pharmaceuticals, Inc. (1) | | | 8,336 | | | | 27,842 | |
Celcuity, Inc. (1) | | | 720 | | | | 6,595 | |
Centene Corp. (1) | | | 6,349 | | | | 381,130 | |
Centogene NV (1) | | | 818 | | | | 8,818 | |
Cerecor, Inc. (1) | | | 1,721 | | | | 4,543 | |
Cerner Corp. | | | 28,215 | | | | 2,214,313 | |
Charles River Laboratories International, Inc. (1) | | | 1,151 | | | | 287,589 | |
Chemed Corp. | | | 920 | | | | 490,001 | |
ChemoCentryx, Inc. (1) | | | 1,729 | | | | 107,060 | |
Co-Diagnostics, Inc. (1) | | | 547 | | | | 5,087 | |
Community Health Systems, Inc. (1) | | | 3,818 | | | | 28,368 | |
Constellation Pharmaceuticals, Inc. (1) | | | 554 | | | | 15,955 | |
Corcept Therapeutics, Inc. (1) | | | 1,162 | | | | 30,398 | |
Cross Country Healthcare, Inc. (1) | | | 576 | | | | 5,109 | |
CVS Health Corp. | | | 25,310 | | | | 1,728,673 | |
Cymabay Therapeutics, Inc. (1) | | | 4,427 | | | | 25,411 | |
Danaher Corp. | | | 4,014 | | | | 891,670 | |
Deciphera Pharmaceuticals, Inc. (1) | | | 594 | | | | 33,900 | |
Denali Therapeutics, Inc. (1) | | | 966 | | | | 80,912 | |
DENTSPLY SIRONA, Inc. | | | 6,862 | | | | 359,294 | |
Editas Medicine, Inc. (1) | | | 612 | | | | 42,907 | |
Edwards Lifesciences Corp. (1) | | | 7,900 | | | | 720,717 | |
Eidos Therapeutics, Inc. (1) | | | 208 | | | | 27,369 | |
Elanco Animal Health, Inc. Contingent Value Rights (1)(7) | | | 3,328 | | | | 0 | |
Eli Lilly and Co. | | | 13,528 | | | | 2,284,068 | |
The accompanying notes are an integral part of these financial statements
2020 Annual Report | December 31, 2020 | Page 31 |
Schedule of Investments
December 31, 2020
Muirfield Fund |
Security Description | | Shares,
Contracts
or Principal
Amount ($) | | | Fair
Value ($) | |
Common Stocks — continued |
Eloxx Pharmaceuticals, Inc. (1) | | | 1,370 | | | | 5,453 | |
Emergent BioSolutions, Inc. (1) | | | 1,331 | | | | 119,258 | |
Endo International PLC (1) | | | 9,873 | | | | 70,888 | |
Enochian Biosciences, Inc. (1) | | | 367 | | | | 1,083 | |
Ensign Group, Inc./The | | | 916 | | | | 66,795 | |
Evelo Biosciences, Inc. (1) | | | 772 | | | | 9,333 | |
Exact Sciences Corp. (1) | | | 1,895 | | | | 251,069 | |
Exelixis, Inc. (1) | | | 8,117 | | | | 162,908 | |
Fate Therapeutics, Inc. (1) | | | 1,157 | | | | 105,206 | |
Five Prime Therapeutics, Inc. (1) | | | 1,125 | | | | 19,136 | |
Fulgent Genetics, Inc. (1) | | | 345 | | | | 17,975 | |
Gilead Sciences, Inc. | | | 32,568 | | | | 1,897,412 | |
Globus Medical, Inc. (1) | | | 1,144 | | | | 74,612 | |
HCA Healthcare, Inc. | | | 3,131 | | | | 514,924 | |
Hill-Rom Holdings, Inc. | | | 2,308 | | | | 226,115 | |
Hologic, Inc. (1) | | | 2,384 | | | | 173,627 | |
Horizon Therapeutics Plc (1) | | | 6,527 | | | | 477,450 | |
Humana, Inc. | | | 3,361 | | | | 1,378,917 | |
IGM Biosciences, Inc. (1) | | | 114 | | | | 10,065 | |
Illumina, Inc. (1) | | | 1,153 | | | | 426,610 | |
ImmunoGen, Inc. (1) | | | 4,087 | | | | 26,361 | |
Immunovant, Inc. (1) | | | 113 | | | | 5,219 | |
Inogen, Inc. (1) | | | 337 | | | | 15,057 | |
Inovio Pharmaceuticals, Inc. (1) | | | 1,746 | | | | 15,452 | |
Insmed, Inc. (1) | | | 1,220 | | | | 40,614 | |
Insulet Corp. (1) | | | 502 | | | | 128,326 | |
Intellia Therapeutics, Inc. (1) | | | 1,211 | | | | 65,878 | |
Intersect ENT, Inc. (1) | | | 1,135 | | | | 25,992 | |
Intra-Cellular Therapies, Inc. (1) | | | 117 | | | | 3,721 | |
Invitae Corp. (1) | | | 1,536 | | | | 64,220 | |
Iovance Biotherapeutics, Inc. (1) | | | 2,594 | | | | 120,362 | |
iRhythm Technologies, Inc. (1) | | | 310 | | | | 73,535 | |
Johnson & Johnson | | | 53,046 | | | | 8,348,379 | |
Jounce Therapeutics, Inc. (1) | | | 809 | | | | 5,663 | |
Kodiak Sciences, Inc. (1) | | | 603 | | | | 88,587 | |
Kura Oncology, Inc. (1) | | | 2,121 | | | | 69,272 | |
LHC Group, Inc. (1) | | | 28 | | | | 5,973 | |
MacroGenics, Inc. (1) | | | 1,916 | | | | 43,800 | |
Marinus Pharmaceuticals, Inc. (1) | | | 782 | | | | 9,540 | |
McKesson Corp. | | | 5,118 | | | | 890,123 | |
Medtronic PLC | | | 43,760 | | | | 5,126,046 | |
Merck & Co., Inc. | | | 66,113 | | | | 5,408,043 | |
Mersana Therapeutics, Inc. (1) | | | 3,775 | | | | 100,453 | |
Mettler-Toledo International, Inc. (1) | | | 21 | | | | 23,933 | |
Mirati Therapeutics, Inc. (1) | | | 744 | | | | 163,412 | |
Moderna, Inc. (1) | | | 4,964 | | | | 518,589 | |
Muirfield Fund |
Security Description | | Shares,
Contracts
or Principal
Amount ($) | | | Fair
Value ($) | |
Common Stocks — continued |
ModivCare, Inc. (1) | | | 58 | | | | 8,041 | |
Morphic Holding, Inc. (1) | | | 485 | | | | 16,272 | |
Myriad Genetics, Inc. (1) | | | 68 | | | | 1,345 | |
NantKwest, Inc. (1) | | | 2,019 | | | | 26,913 | |
Natera, Inc. (1) | | | 1,230 | | | | 122,410 | |
National HealthCare Corp. | | | 169 | | | | 11,223 | |
Neurocrine Biosciences, Inc. (1) | | | 855 | | | | 81,952 | |
NextGen Healthcare, Inc. (1) | | | 4,937 | | | | 90,051 | |
Novavax, Inc. (1) | | | 867 | | | | 96,679 | |
Novocure, Ltd. (1) | | | 126 | | | | 21,803 | |
Ocular Therapeutix, Inc. (1) | | | 3,598 | | | | 74,479 | |
Oncocyte Corp. (1) | | | 1,734 | | | | 4,144 | |
Organogenesis Holdings, Inc. (1) | | | 1,572 | | | | 11,837 | |
Osmotica Pharmaceuticals PLC (1) | | | 5,073 | | | | 20,901 | |
Owens & Minor, Inc. | | | 1,976 | | | | 53,451 | |
Pacific Biosciences of California, Inc. (1) | | | 2,998 | | | | 77,768 | |
Palatin Technologies, Inc. (1) | | | 15,630 | | | | 10,563 | |
PerkinElmer, Inc. | | | 2,072 | | | | 297,332 | |
Perrigo Co. PLC | | | 12,650 | | | | 565,708 | |
Pfizer, Inc. | | | 99,536 | | | | 3,663,920 | |
Phreesia, Inc. (1) | | | 202 | | | | 10,961 | |
PRA Health Sciences, Inc. (1) | | | 2,015 | | | | 252,762 | |
Precigen, Inc. (1)(2) | | | 1,826 | | | | 18,625 | |
Quest Diagnostics, Inc. | | | 35 | | | | 4,171 | |
Quidel Corp. (1) | | | 272 | | | | 48,865 | |
Regeneron Pharmaceuticals, Inc. (1) | | | 3,093 | | | | 1,494,259 | |
Replimune Group, Inc. (1) | | | 608 | | | | 23,195 | |
ResMed, Inc. | | | 1,292 | | | | 274,628 | |
REVOLUTION Medicines, Inc. (1) | | | 557 | | | | 22,052 | |
Rhythm Pharmaceuticals, Inc. (1) | | | 2,288 | | | | 68,022 | |
Rigel Pharmaceuticals, Inc. (1) | | | 1,164 | | | | 4,074 | |
Rocket Pharmaceuticals, Inc. (1) | | | 795 | | | | 43,598 | |
Sangamo Therapeutics, Inc. (1) | | | 2,194 | | | | 34,237 | |
Scholar Rock Holding Corp. (1) | | | 581 | | | | 28,196 | |
Seagen, Inc. (1) | | | 2,323 | | | | 406,850 | |
Seres Therapeutics, Inc. (1) | | | 1,083 | | | | 26,534 | |
SIGA Technologies, Inc. (1) | | | 496 | | | | 3,606 | |
Simulations Plus, Inc. | | | 143 | | | | 10,285 | |
Solid Biosciences, Inc. (1) | | | 1,261 | | | | 9,558 | |
Sorrento Therapeutics, Inc. (1) | | | 3,427 | | | | 23,389 | |
Spectrum Pharmaceuticals, Inc. (1) | | | 877 | | | | 2,991 | |
SpringWorks Therapeutics, Inc. (1) | | | 317 | | | | 22,989 | |
STERIS PLC | | | 6,433 | | | | 1,219,311 | |
Stryker Corp. | | | 7,906 | | | | 1,937,286 | |
Supernus Pharmaceuticals, Inc. (1) | | | 1,208 | | | | 30,393 | |
Surgery Partners, Inc. (1) | | | 600 | | | | 17,406 | |
The accompanying notes are an integral part of these financial statements
Page 32 | 2020 Annual Report | December 31, 2020 |
Schedule of Investments
December 31, 2020
Muirfield Fund |
Security Description | | Shares,
Contracts
or Principal
Amount ($) | | | Fair
Value ($) | |
Common Stocks — continued |
Sutro Biopharma, Inc. (1) | | | 798 | | | | 17,325 | |
Syros Pharmaceuticals, Inc. (1) | | | 2,752 | | | | 29,859 | |
Teladoc Health, Inc. (1) | | | 946 | | | | 189,162 | |
Tenet Healthcare Corp. (1) | | | 2,578 | | | | 102,940 | |
TG Therapeutics, Inc. (1) | | | 1,999 | | | | 103,988 | |
Thermo Fisher Scientific, Inc. | | | 5,032 | | | | 2,343,805 | |
Translate Bio, Inc. (1) | | | 1,167 | | | | 21,508 | |
Travere Therapeutics, Inc. (1) | | | 383 | | | | 10,439 | |
Turning Point Therapeutics, Inc. (1) | | | 932 | | | | 113,564 | |
Twist Bioscience Corp. (1) | | | 808 | | | | 114,162 | |
Ultragenyx Pharmaceutical, Inc. (1) | | | 774 | | | | 107,145 | |
United Therapeutics Corp. (1) | | | 3,674 | | | | 557,676 | |
UnitedHealth Group, Inc. | | | 13,107 | | | | 4,596,363 | |
Universal Health Services, Inc. - Class B | | | 1,872 | | | | 257,400 | |
Vanda Pharmaceuticals, Inc. (1) | | | 2,852 | | | | 37,475 | |
Veeva Systems, Inc. (1) | | | 2,406 | | | | 655,034 | |
Veracyte, Inc. (1) | | | 1,880 | | | | 92,007 | |
Vertex Pharmaceuticals, Inc. (1) | | | 5,616 | | | | 1,327,285 | |
Viatris, Inc. (1) | | | 17,586 | | | | 329,562 | |
Viela Bio, Inc. (1) | | | 68 | | | | 2,446 | |
Viemed Healthcare, Inc. (1) | | | 302 | | | | 2,344 | |
West Pharmaceutical Services, Inc. | | | 2,427 | | | | 687,593 | |
XBiotech, Inc. (1) | | | 2,832 | | | | 44,321 | |
Xencor, Inc. (1) | | | 948 | | | | 41,361 | |
Zimmer Biomet Holdings, Inc. | | | 10,795 | | | | 1,663,402 | |
ZIOPHARM Oncology, Inc. (1) | | | 3,797 | | | | 9,568 | |
Zoetis, Inc. - Class A | | | 17,735 | | | | 2,935,143 | |
| | | | | | | | 86,723,668 | |
| | | | | | | | | |
Industrials — 6.9% | | | | | | | | |
3M Co. | | | 12,601 | | | | 2,202,529 | |
ABM Industries, Inc. | | | 965 | | | | 36,516 | |
AGCO Corp. | | | 3,497 | | | | 360,506 | |
Allegiant Travel Co. | | | 2,818 | | | | 533,278 | |
Allison Transmission Holdings, Inc. | | | 72 | | | | 3,105 | |
Alpha Pro Tech, Ltd. (1) | | | 1,555 | | | | 17,338 | |
Altra Industrial Motion Corp. | | | 1,402 | | | | 77,713 | |
ArcBest Corp. | | | 2,806 | | | | 119,732 | |
Arcosa, Inc. | | | 5,985 | | | | 328,756 | |
Argan, Inc. | | | 654 | | | | 29,096 | |
ASGN, Inc. (1) | | | 884 | | | | 73,841 | |
Astec Industries, Inc. | | | 1,019 | | | | 58,980 | |
Atkore International Group, Inc. (1) | | | 5,601 | | | | 230,257 | |
Atlas Air Worldwide Holdings, Inc. (1) | | | 370 | | | | 20,180 | |
Axon Enterprise, Inc. (1) | | | 720 | | | | 88,222 | |
AZZ, Inc. | | | 1,216 | | | | 57,687 | |
Muirfield Fund |
Security Description | | Shares,
Contracts
or Principal
Amount ($) | | | Fair
Value ($) | |
Common Stocks — continued |
BG Staffing, Inc. | | | 348 | | | | 4,695 | |
BMC Stock Holdings, Inc. (1) | | | 2,862 | | | | 153,632 | |
Boise Cascade Co. | | | 8,578 | | | | 410,028 | |
CAI International, Inc. | | | 203 | | | | 6,342 | |
Caterpillar, Inc. | | | 4,874 | | | | 887,165 | |
Chart Industries, Inc. (1) | | | 42 | | | | 4,947 | |
Cintas Corp. | | | 3,555 | | | | 1,256,550 | |
Comfort Systems USA, Inc. | | | 3,839 | | | | 202,162 | |
Copart, Inc. (1) | | | 8,135 | | | | 1,035,179 | |
CoreCivic, Inc. | | | 8,652 | | | | 56,671 | |
CoreLogic, Inc./United States | | | 3,827 | | | | 295,904 | |
Costamare, Inc. | | | 396 | | | | 3,279 | |
Covenant Logistics Group, Inc. (1) | | | 1,527 | | | | 22,615 | |
CSX Corp. | | | 4,811 | | | | 436,598 | |
Cummins, Inc. | | | 15,888 | | | | 3,608,165 | |
Deere & Co. | | | 5,518 | | | | 1,484,618 | |
Eaton Corp. PLC | | | 10,598 | | | | 1,273,244 | |
EMCOR Group, Inc. | | | 1,185 | | | | 108,380 | |
Emerson Electric Co. | | | 4,754 | | | | 382,079 | |
EnerSys | | | 832 | | | | 69,106 | |
Fastenal Co. | | | 8,474 | | | | 413,785 | |
FedEx Corp. | | | 3,026 | | | | 785,610 | |
FuelCell Energy, Inc. (1) | | | 631 | | | | 7,048 | |
Generac Holdings, Inc. (1) | | | 656 | | | | 149,181 | |
General Electric Co. | | | 14,004 | | | | 151,243 | |
GrafTech International, Ltd. | | | 6,054 | | | | 64,536 | |
H&E Equipment Services, Inc. | | | 1,510 | | | | 45,013 | |
HEICO Corp. | | | 1,340 | | | | 177,416 | |
Herc Holdings, Inc. (1) | | | 771 | | | | 51,202 | |
Herman Miller, Inc. | | | 1,548 | | | | 52,322 | |
Hertz Global Holdings, Inc. (1) | | | 3,055 | | | | 3,910 | |
HNI Corp. | | | 1,610 | | | | 55,481 | |
Hubbell, Inc. | | | 3,328 | | | | 521,797 | |
Huntington Ingalls Industries, Inc. | | | 1,473 | | | | 251,117 | |
JB Hunt Transport Services, Inc. | | | 519 | | | | 70,921 | |
Kelly Services, Inc. - Class A | | | 2,420 | | | | 49,779 | |
Kforce, Inc. | | | 810 | | | | 34,093 | |
Kimball International, Inc. - Class B | | | 3,107 | | | | 37,129 | |
L B Foster Co. - Class A (1) | | | 446 | | | | 6,712 | |
Lawson Products, Inc./DE (1) | | | 67 | | | | 3,411 | |
Lockheed Martin Corp. | | | 10,323 | | | | 3,664,459 | |
LSC Communications, Inc. (1) | | | 11,648 | | | | 233 | |
Manitowoc Co., Inc./The (1) | | | 529 | | | | 7,041 | |
ManpowerGroup, Inc. | | | 15,805 | | | | 1,425,295 | |
Matson, Inc. | | | 2,018 | | | | 114,965 | |
Maxar Technologies, Inc. | | | 1,354 | | | | 52,251 | |
The accompanying notes are an integral part of these financial statements
2020 Annual Report | December 31, 2020 | Page 33 |
Schedule of Investments
December 31, 2020
Muirfield Fund |
Security Description | | Shares,
Contracts
or Principal
Amount ($) | | | Fair
Value ($) | |
Common Stocks — continued |
McGrath RentCorp | | | 351 | | | | 23,552 | |
Meritor, Inc. (1) | | | 920 | | | | 25,677 | |
Miller Industries, Inc./TN | | | 4,972 | | | | 189,035 | |
Moog, Inc. | | | 4,024 | | | | 319,103 | |
MSC Industrial Direct Co., Inc. | | | 3,883 | | | | 327,686 | |
Mueller Industries, Inc. | | | 2,663 | | | | 93,498 | |
MYR Group, Inc. (1) | | | 759 | | | | 45,616 | |
National Presto Industries, Inc. | | | 162 | | | | 14,326 | |
NL Industries, Inc. | | | 280 | | | | 1,338 | |
Norfolk Southern Corp. | | | 157 | | | | 37,305 | |
Old Dominion Freight Line, Inc. | | | 2,815 | | | | 549,432 | |
PACCAR, Inc. | | | 35,665 | | | | 3,077,176 | |
PAE, Inc. (1) | | | 2,378 | | | | 21,830 | |
Parker-Hannifin Corp. | | | 5,319 | | | | 1,448,949 | |
Plug Power, Inc. (1) | | | 5,867 | | | | 198,950 | |
Primoris Services Corp. | | | 8,021 | | | | 221,460 | |
Quanta Services, Inc. | | | 22,986 | | | | 1,655,452 | |
Regal Beloit Corp. | | | 3,567 | | | | 438,063 | |
Resideo Technologies, Inc. (1) | | | 3,376 | | | | 71,774 | |
Rexnord Corp. | | | 1,902 | | | | 75,110 | |
RR Donnelley & Sons Co. | | | 14,233 | | | | 32,167 | |
Rush Enterprises, Inc. | | | 7,174 | | | | 297,147 | |
Ryder System, Inc. | | | 2,402 | | | | 148,348 | |
Safe Bulkers, Inc. (1) | | | 7,327 | | | | 9,525 | |
Saia, Inc. (1) | | | 1,273 | | | | 230,158 | |
Shyft Group, Inc./The | | | 2,019 | | | | 57,299 | |
SkyWest, Inc. | | | 290 | | | | 11,690 | |
Steelcase, Inc. | | | 3,832 | | | | 51,924 | |
Textainer Group Holdings, Ltd. (1) | | | 3,130 | | | | 60,033 | |
Timken Co./The | | | 5,153 | | | | 398,636 | |
Titan Machinery, Inc. (1) | | | 442 | | | | 8,641 | |
TPI Composites, Inc. (1) | | | 991 | | | | 52,305 | |
Triton International, Ltd./Bermuda | | | 8,040 | | | | 390,020 | |
Tutor Perini Corp. (1) | | | 197 | | | | 2,551 | |
Uber Technologies, Inc. (1) | | | 9,837 | | | | 501,687 | |
United Parcel Service, Inc. - Class B | | | 8,716 | | | | 1,467,774 | |
Vectrus, Inc. (1) | | | 1,259 | | | | 62,597 | |
Veritiv Corp. (1) | | | 968 | | | | 20,125 | |
Waste Management, Inc. | | | 21,764 | | | | 2,566,629 | |
Watsco, Inc. | | | 392 | | | | 88,808 | |
WESCO International, Inc. (1) | | | 2,277 | | | | 178,745 | |
WESCO International, Inc. Series A Variable Preferred (8) | | | 2,612 | | | | 81,625 | |
| | | | | | | | 39,688,811 | |
| | | | | | | | | |
Muirfield Fund |
Security Description | | Shares,
Contracts
or Principal
Amount ($) | | | Fair
Value ($) | |
Common Stocks — continued |
Information Technology — 22.9% | | | | | | | | |
8x8, Inc. (1) | | | 800 | | | | 27,576 | |
Accenture PLC - Class A | | | 2,982 | | | | 778,928 | |
ACI Worldwide, Inc. (1) | | | 4,022 | | | | 154,565 | |
Adobe, Inc. (1) | | | 7,689 | | | | 3,845,423 | |
ADTRAN, Inc. | | | 1 | | | | 15 | |
Advanced Micro Devices, Inc. (1) | | | 16,194 | | | | 1,485,152 | |
Alarm.com Holdings, Inc. (1) | | | 442 | | | | 45,725 | |
Alliance Data Systems Corp. | | | 1,174 | | | | 86,993 | |
Amkor Technology, Inc. | | | 9,469 | | | | 142,793 | |
Amphenol Corp. | | | 1,243 | | | | 162,547 | |
Apple, Inc. | | | 205,891 | | | | 27,319,677 | |
Applied Materials, Inc. | | | 20,396 | | | | 1,760,175 | |
Arrow Electronics, Inc. (1) | | | 9,080 | | | | 883,484 | |
AstroNova, Inc. | | | 1,469 | | | | 15,645 | |
Autodesk, Inc. (1) | | | 4,151 | | | | 1,267,466 | |
Automatic Data Processing, Inc. | | | 12 | | | | 2,114 | |
Avaya Holdings Corp. (1) | | | 3,631 | | | | 69,534 | |
Avid Technology, Inc. (1) | | | 3,156 | | | | 50,086 | |
Avnet, Inc. | | | 15,671 | | | | 550,209 | |
Bill.com Holdings, Inc. (1) | | | 321 | | | | 43,817 | |
Broadcom, Inc. | | | 4,693 | | | | 2,054,830 | |
CACI International, Inc. - Class A (1) | | | 2,967 | | | | 739,762 | |
Cadence Design Systems, Inc. (1) | | | 21,461 | | | | 2,927,924 | |
Calix, Inc. (1) | | | 10,373 | | | | 308,700 | |
Cambium Networks Corp. (1) | | | 790 | | | | 19,813 | |
CDK Global, Inc. | | | 15,405 | | | | 798,441 | |
CDW Corp./DE | | | 7,483 | | | | 986,185 | |
Cerence, Inc. (1) | | | 1,210 | | | | 121,581 | |
ChannelAdvisor Corp. (1) | | | 6,248 | | | | 99,843 | |
Ciena Corp. (1) | | | 1,702 | | | | 89,951 | |
Cisco Systems, Inc. | | | 61,354 | | | | 2,745,592 | |
Cloudera, Inc. (1) | | | 1,097 | | | | 15,259 | |
Cloudflare, Inc. (1) | | | 3,096 | | | | 235,265 | |
Cognex Corp. | | | 2,017 | | | | 161,935 | |
Cognizant Technology Solutions Corp. | | | 14,670 | | | | 1,202,207 | |
Concentrix Corp. (1) | | | 4,427 | | | | 436,945 | |
Conduent, Inc. (1) | | | 10,760 | | | | 51,648 | |
Corning, Inc. | | | 14,909 | | | | 536,724 | |
Coupa Software, Inc. (1) | | | 659 | | | | 223,342 | |
Crowdstrike Holdings, Inc. (1) | | | 2,043 | | | | 432,748 | |
Dell Technologies, Inc. - Class C (1) | | | 1,852 | | | | 135,733 | |
Diebold Nixdorf, Inc. (1) | | | 2,052 | | | | 21,874 | |
Digital Turbine, Inc. (1) | | | 3,651 | | | | 206,501 | |
DocuSign, Inc. (1) | | | 2,836 | | | | 630,443 | |
Dolby Laboratories, Inc. | | | 1,290 | | | | 125,298 | |
The accompanying notes are an integral part of these financial statements
Page 34 | 2020 Annual Report | December 31, 2020 |
Schedule of Investments
December 31, 2020
Muirfield Fund |
Security Description | | Shares,
Contracts
or Principal
Amount ($) | | | Fair
Value ($) | |
Common Stocks — continued |
Dropbox, Inc. - Class A (1) | | | 2,358 | | | | 52,324 | |
DXC Technology Co. | | | 8,511 | | | | 219,158 | |
Eastman Kodak Co. (1) | | | 794 | | | | 6,463 | |
Ebix, Inc. | | | 1,619 | | | | 61,473 | |
Elastic NV (1) | | | 42 | | | | 6,137 | |
Enphase Energy, Inc. (1) | | | 1,546 | | | | 271,277 | |
F5 Networks, Inc. (1) | | | 537 | | | | 94,480 | |
Fastly, Inc. (1) | | | 726 | | | | 63,431 | |
FormFactor, Inc. (1) | | | 1,001 | | | | 43,063 | |
Fortinet, Inc. (1) | | | 1,215 | | | | 180,464 | |
Hewlett Packard Enterprise Co. | | | 40,388 | | | | 478,598 | |
HP, Inc. | | | 47,689 | | | | 1,172,673 | |
HubSpot, Inc. (1) | | | 656 | | | | 260,065 | |
II-VI, Inc. (1) | | | 751 | | | | 57,046 | |
Insight Enterprises, Inc. (1) | | | 1,280 | | | | 97,395 | |
Intel Corp. | | | 65,271 | | | | 3,251,801 | |
International Business Machines Corp. | | | 3,105 | | | | 390,857 | |
Intuit, Inc. | | | 11,908 | | | | 4,523,254 | |
Jabil, Inc. | | | 11,753 | | | | 499,855 | |
KBR, Inc. | | | 3,125 | | | | 96,656 | |
KLA Corp. | | | 3,124 | | | | 808,835 | |
Lam Research Corp. | | | 3,719 | | | | 1,756,372 | |
Littelfuse, Inc. | | | 132 | | | | 33,615 | |
Marvell Technology Group, Ltd. | | | 1 | | | | 48 | |
Mastercard, Inc. | | | 8,051 | | | | 2,873,724 | |
Maxim Integrated Products, Inc. | | | 2,663 | | | | 236,075 | |
Methode Electronics, Inc. | | | 2,873 | | | | 109,978 | |
Microchip Technology, Inc. | | | 325 | | | | 44,886 | |
Micron Technology, Inc. (1) | | | 9,645 | | | | 725,111 | |
Microsoft Corp. | | | 105,462 | | | | 23,456,858 | |
MicroStrategy, Inc. (1) | | | 953 | | | | 370,288 | |
MKS Instruments, Inc. | | | 969 | | | | 145,786 | |
MoneyGram International, Inc. (1) | | | 3,700 | | | | 20,221 | |
Monolithic Power Systems, Inc. | | | 307 | | | | 112,433 | |
NCR Corp. (1) | | | 3,201 | | | | 120,262 | |
NETGEAR, Inc. (1) | | | 151 | | | | 6,135 | |
NortonLifeLock, Inc. | | | 21,365 | | | | 443,965 | |
NVIDIA Corp. | | | 7,606 | | | | 3,971,853 | |
ON Semiconductor Corp. (1) | | | 1,115 | | | | 36,494 | |
Oracle Corp. | | | 52,545 | | | | 3,399,136 | |
PagerDuty, Inc. (1) | | | 505 | | | | 21,059 | |
Palo Alto Networks, Inc. (1) | | | 676 | | | | 240,244 | |
Paychex, Inc. | | | 680 | | | | 63,362 | |
Paycom Software, Inc. (1) | | | 613 | | | | 277,229 | |
PayPal Holdings, Inc. (1) | | | 327 | | | | 76,583 | |
Photronics, Inc. (1) | | | 5,043 | | | | 56,280 | |
Muirfield Fund |
Security Description | | Shares,
Contracts
or Principal
Amount ($) | | | Fair
Value ($) | |
Common Stocks — continued |
Plantronics, Inc. | | | 655 | | | | 17,705 | |
Priority Technology Holdings, Inc. (1) | | | 1,600 | | | | 11,264 | |
Progress Software Corp. | | | 9,307 | | | | 420,583 | |
Qorvo, Inc. (1) | | | 3,261 | | | | 542,206 | |
QUALCOMM, Inc. | | | 27,959 | | | | 4,259,274 | |
Rimini Street, Inc. (1) | | | 778 | | | | 3,447 | |
RingCentral, Inc. - Class A (1) | | | 649 | | | | 245,952 | |
salesforce.com, Inc. (1) | | | 10,795 | | | | 2,402,211 | |
Sanmina Corp. (1) | | | 3,381 | | | | 107,820 | |
Sapiens International Corp. NV | | | 2,199 | | | | 67,311 | |
ServiceNow, Inc. (1) | | | 1,106 | | | | 608,776 | |
Skyworks Solutions, Inc. | | | 3,746 | | | | 572,688 | |
Slack Technologies, Inc. - Class A (1) | | | 726 | | | | 30,666 | |
Smartsheet, Inc. (1) | | | 584 | | | | 40,465 | |
SolarEdge Technologies, Inc. (1) | | | 49 | | | | 15,637 | |
SPS Commerce, Inc. (1) | | | 3,200 | | | | 347,488 | |
Square, Inc. - Class A (1) | | | 7,404 | | | | 1,611,407 | |
SS&C Technologies Holdings, Inc. | | | 38,960 | | | | 2,834,340 | |
StarTek, Inc. (1) | | | 1 | | | | 8 | |
StoneCo, Ltd. (1) | | | 2,058 | | | | 172,707 | |
Stratasys, Ltd. (1) | | | 1,740 | | | | 36,053 | |
Sykes Enterprises, Inc. (1) | | | 3,260 | | | | 122,804 | |
SYNNEX Corp. | | | 4,458 | | | | 363,060 | |
Tenable Holdings, Inc. (1) | | | 2,794 | | | | 146,014 | |
Teradyne, Inc. | | | 5,642 | | | | 676,419 | |
Texas Instruments, Inc. | | | 13,867 | | | | 2,275,991 | |
Trade Desk, Inc./The (1) | | | 637 | | | | 510,237 | |
Trimble, Inc. (1) | | | 8,895 | | | | 593,919 | |
TTEC Holdings, Inc. | | | 1,489 | | | | 108,593 | |
Twilio, Inc. - Class A (1) | | | 1,779 | | | | 602,192 | |
Ultra Clean Holdings, Inc. (1) | | | 1,206 | | | | 37,567 | |
Verint Systems, Inc. (1) | | | 3,082 | | | | 207,049 | |
Veritone, Inc. (1) | | | 310 | | | | 8,820 | |
VirnetX Holding Corp. (2) | | | 10,134 | | | | 51,075 | |
Visa, Inc. | | | 13,160 | | | | 2,878,487 | |
Vishay Intertechnology, Inc. | | | 9,661 | | | | 200,079 | |
Vontier Corp. (1) | | | 1,162 | | | | 38,811 | |
Xerox Holdings Corp. | | | 20,795 | | | | 482,236 | |
Xilinx, Inc. | | | 4,061 | | | | 575,728 | |
Xperi Holding Corp. | | | 7,679 | | | | 160,491 | |
Zebra Technologies Corp. - Class A (1) | | | 1,599 | | | | 614,544 | |
Zoom Video Communications, Inc.- Class A (1) | | | 2,249 | | | | 758,633 | |
Zscaler, Inc. (1) | | | 865 | | | | 172,749 | |
| | | | | | | | 131,167,276 | |
| | | | | | | | | |
The accompanying notes are an integral part of these financial statements
2020 Annual Report | December 31, 2020 | Page 35 |
Schedule of Investments
December 31, 2020
Muirfield Fund |
Security Description | | Shares,
Contracts
or Principal
Amount ($) | | | Fair
Value ($) | |
Common Stocks — continued |
Materials — 2.4% | | | | | | | | |
Avery Dennison Corp. | | | 2,940 | | | | 456,023 | |
Avient Corp. | | | 627 | | | | 25,256 | |
Cabot Corp. | | | 83 | | | | 3,725 | |
Caledonia Mining Corp. PLC | | | 2,451 | | | | 38,922 | |
Celanese Corp. | | | 873 | | | | 113,438 | |
Chemours Co./The | | | 684 | | | | 16,956 | |
Coeur Mining, Inc. (1) | | | 500 | | | | 5,175 | |
Commercial Metals Co. | | | 2,002 | | | | 41,121 | |
Corteva, Inc. | | | 9,534 | | | | 369,156 | |
Dow, Inc. | | | 9,658 | | | | 536,019 | |
Eastman Chemical Co. | | | 10,096 | | | | 1,012,427 | |
Freeport-McMoRan, Inc. - Class B | | | 19,639 | | | | 511,007 | |
Hawkins, Inc. | | | 331 | | | | 17,315 | |
Huntsman Corp. | | | 16,340 | | | | 410,788 | |
Koppers Holdings, Inc. (1) | | | 763 | | | | 23,775 | |
Linde PLC | | | 5,133 | | | | 1,352,597 | |
Louisiana-Pacific Corp. | | | 7,671 | | | | 285,131 | |
LyondellBasell Industries NV - Class A | | | 4,748 | | | | 435,202 | |
Minerals Technologies, Inc. | | | 209 | | | | 12,983 | |
Mosaic Co./The | | | 1,746 | | | | 40,175 | |
Newmont Corp. | | | 34,523 | | | | 2,067,582 | |
Nucor Corp. | | | 5,744 | | | | 305,523 | |
O-I Glass, Inc. | | | 4,048 | | | | 48,171 | |
Olin Corp. | | | 827 | | | | 20,311 | |
Olympic Steel, Inc. | | | 1,341 | | | | 17,876 | |
Packaging Corp. of America | | | 2,562 | | | | 353,325 | |
PPG Industries, Inc. | | | 7,081 | | | | 1,021,222 | |
Ramaco Resources, Inc. (1) | | | 1,378 | | | | 3,969 | |
Rayonier Advanced Materials, Inc. (1) | | | 2,611 | | | | 17,024 | |
Reliance Steel & Aluminum Co. | | | 8,305 | | | | 994,524 | |
Royal Gold, Inc. | | | 1 | | | | 106 | |
Ryerson Holding Corp. (1) | | | 2,904 | | | | 39,611 | |
Scotts Miracle-Gro Co./The | | | 7,227 | | | | 1,439,185 | |
Sherwin-Williams Co./The | | | 1,788 | | | | 1,314,019 | |
Steel Dynamics, Inc. | | | 4,213 | | | | 155,333 | |
Stepan Co. | | | 1,058 | | | | 126,241 | |
SunCoke Energy, Inc. | | | 961 | | | | 4,180 | |
Tredegar Corp. | | | 2,649 | | | | 44,238 | |
Trinseo SA | | | 218 | | | | 11,164 | |
Tronox Holdings PLC | | | 2,351 | | | | 34,372 | |
Westlake Chemical Corp. | | | 1,413 | | | | 115,301 | |
Westrock Co. | | | 2,118 | | | | 92,197 | |
| | | | | | | | 13,932,665 | |
| | | | | | | | | |
Muirfield Fund |
Security Description | | Shares,
Contracts
or Principal
Amount ($) | | | Fair
Value ($) | |
Common Stocks — continued |
Real Estate Investment Trust — 2.5% | | | | | | | | |
Altisource Portfolio Solutions SA (1) | | | 2,089 | | | | 26,906 | |
American Homes 4 Rent - Class A | | | 11,868 | | | | 356,040 | |
American Tower Corp. | | | 8,451 | | | | 1,896,911 | |
Ashford Hospitality Trust, Inc. | | | 2,131 | | | | 5,519 | |
AvalonBay Communities, Inc. | | | 796 | | | | 127,702 | |
Camden Property Trust | | | 107 | | | | 10,691 | |
CareTrust REIT, Inc. | | | 2,448 | | | | 54,297 | |
CatchMark Timber Trust, Inc. | | | 1,689 | | | | 15,809 | |
CBL & Associates Properties, Inc. (1)(2) | | | 19,529 | | | | 810 | |
Columbia Property Trust, Inc. | | | 9,023 | | | | 129,390 | |
CorEnergy Infrastructure Trust, Inc. | | | 4,118 | | | | 28,208 | |
Corporate Office Properties Trust | | | 8,820 | | | | 230,026 | |
CubeSmart | | | 17,651 | | | | 593,250 | |
DiamondRock Hospitality Co. | | | 1,437 | | | | 11,855 | |
EastGroup Properties, Inc. | | | 415 | | | | 57,295 | |
Equinix, Inc. | | | 954 | | | | 681,328 | |
Essex Property Trust, Inc. | | | 2,599 | | | | 617,055 | |
Extra Space Storage, Inc. | | | 8,349 | | | | 967,315 | |
Gaming and Leisure Properties, Inc. | | | 13,353 | | | | 566,167 | |
Getty Realty Corp. | | | 2,529 | | | | 69,649 | |
Gladstone Commercial Corp. | | | 1,484 | | | | 26,712 | |
Healthcare Realty Trust, Inc. | | | 15,836 | | | | 468,746 | |
Healthcare Trust of America, Inc. - Class A | | | 11,864 | | | | 326,735 | |
Hersha Hospitality Trust | | | 25 | | | | 197 | |
Highwoods Properties, Inc. | | | 3,475 | | | | 137,714 | |
Host Hotels & Resorts, Inc. | | | 4,342 | | | | 63,523 | |
Iron Mountain, Inc. | | | 7,001 | | | | 206,389 | |
Lamar Advertising Co. - Class A | | | 15,544 | | | | 1,293,572 | |
Life Storage, Inc. | | | 464 | | | | 55,397 | |
LTC Properties, Inc. | | | 22,302 | | | | 867,771 | |
National Health Investors, Inc. | | | 4,314 | | | | 298,399 | |
National Storage Affiliates Trust | | | 2,751 | | | | 99,119 | |
Newmark Group, Inc. | | | 2,216 | | | | 16,155 | |
Omega Healthcare Investors, Inc. | | | 4,478 | | | | 162,641 | |
Paramount Group, Inc. | | | 22 | | | | 199 | |
Park Hotels & Resorts, Inc. | | | 3,628 | | | | 62,220 | |
Piedmont Office Realty Trust, Inc. | | | 15,878 | | | | 257,700 | |
PotlatchDeltic Corp. | | | 1,491 | | | | 74,580 | |
PS Business Parks, Inc. | | | 2,510 | | | | 333,504 | |
Public Storage | | | 4,143 | | | | 956,743 | |
Retail Opportunity Investments Corp. | | | 6,562 | | | | 87,865 | |
Ryman Hospitality Properties, Inc. | | | 88 | | | | 5,963 | |
Sabra Health Care REIT, Inc. | | | 2,023 | | | | 35,140 | |
SBA Communications Corp. | | | 793 | | | | 223,729 | |
Service Properties Trust | | | 17,033 | | | | 195,709 | |
The accompanying notes are an integral part of these financial statements
Page 36 | 2020 Annual Report | December 31, 2020 |
Schedule of Investments
December 31, 2020
Muirfield Fund |
Security Description | | Shares,
Contracts
or Principal
Amount ($) | | | Fair
Value ($) | |
Common Stocks — continued |
Simon Property Group, Inc. | | | 14,325 | | | | 1,221,636 | |
Spirit MTA REIT Liquidating Trust (1)(7) | | | 9,151 | | | | 0 | |
Tanger Factory Outlet Centers, Inc. (2) | | | 4,113 | | | | 40,965 | |
Universal Health Realty Income Trust | | | 29 | | | | 1,864 | |
Urstadt Biddle Properties, Inc. - Class A | | | 809 | | | | 11,431 | |
Welltower, Inc. | | | 4,232 | | | | 273,472 | |
| | | | | | | | 14,252,013 | |
| | | | | | | | | |
Utilities — 1.8% | | | | | | | | |
Alliant Energy Corp. | | | 1,725 | | | | 88,889 | |
American Water Works Co., Inc. | | | 8,325 | | | | 1,277,638 | |
Eversource Energy | | | 2,864 | | | | 247,765 | |
MDU Resources Group, Inc. | | | 46,004 | | | | 1,211,745 | |
NextEra Energy, Inc. | | | 35,113 | | | | 2,708,969 | |
NorthWestern Corp. | | | 4,407 | | | | 256,972 | |
NRG Energy, Inc. | | | 15,560 | | | | 584,278 | |
Public Service Enterprise Group, Inc. | | | 22,064 | | | | 1,286,331 | |
Southwest Gas Holdings, Inc. | | | 3,083 | | | | 187,292 | |
UGI Corp. | | | 16,493 | | | | 576,595 | |
Vistra Corp. | | | 10,110 | | | | 198,763 | |
WEC Energy Group, Inc. | | | 5,304 | | | | 488,127 | |
Xcel Energy, Inc. | | | 17,763 | | | | 1,184,246 | |
| | | | | | | | 10,297,610 | |
| | | | | | | | | |
Total Common Stocks (Cost $323,196,508) | | | | | | | 458,141,444 | |
| | | | | | | | | |
Money Market Registered Investment Companies — 18.1% |
Meeder Institutional Prime Money Market Fund, 0.08% (4) | | | 103,857,223 | | | | 103,888,380 | |
Morgan Stanley Government Institutional Fund, 0.03% (3) | | | 94,106 | | | | 94,106 | |
Total Money Market Registered Investment Companies (Cost $103,958,116) | | | | | | | 103,982,486 | |
Muirfield Fund |
Security Description | | Shares,
Contracts
or Principal
Amount ($) | | | Fair
Value ($) | |
Bank Obligations — 0.1% |
First Merchants Bank Deposit Account, 0.75%, 1/4/2021 (5) | | | 248,088 | | | | 248,088 | |
Metro City Bank Deposit Account, 0.10%, 1/4/2021 (5) | | | 248,220 | | | | 248,220 | |
Pacific Mercantile Bank Deposit Account, 0.10%, 1/4/2021 (5) | | | 246,825 | | | | 246,825 | |
Total Bank Obligations (Cost $743,133) | | | | | | | 743,133 | |
Total Investments — 98.1% (Cost $427,897,757) | | | | | | | 562,867,063 | |
Other Assets less Liabilities — 1.9% | | | | | | | 10,957,951 | |
Total Net Assets — 100.0% | | | | | | | 573,825,014 | |
| | | | | | | | | |
Trustee Deferred Compensation (6) |
Meeder Balanced Fund - Retail Class | | | 4,194 | | | | 53,767 | |
Meeder Dynamic Allocation Fund - Retail Class | | | 10,647 | | | | 142,563 | |
Meeder Muirfield Fund - Retail Class | | | 7,212 | | | | 59,138 | |
Meeder Conservative Allocation Fund - Retail Class | | | 1,257 | | | | 30,055 | |
Total Trustee Deferred Compensation (Cost $235,611) | | | | | | | 285,523 | |
| | | | | | | | | |
The accompanying notes are an integral part of these financial statements
2020 Annual Report | December 31, 2020 | Page 37 |
Schedule of Investments
December 31, 2020
| | | Long
(Short)
Contracts | | | Expiration
Date | | | Notional
Value of
Contracts
($) | | | Value and
Unrealized
Appreciation
(Depreciation)
($) | |
Futures Contracts |
Index Futures | | | | | | | | | | | | | | | | |
Mini MSCI EAFE Index Futures | | | 482 | | | | 3/19/2021 | | | | 51,352,280 | | | | 832,931 | |
Mini MSCI Emerging Markets Index Futures | | | 223 | | | | 3/19/2021 | | | | 14,363,430 | | | | 449,588 | |
Russell 2000 Mini Index Futures | | | 46 | | | | 3/19/2021 | | | | 4,542,040 | | | | 128,519 | |
Standard & Poors 500 Mini Futures | | | 198 | | | | 3/19/2021 | | | | 37,113,120 | | | | 1,082,140 | |
E-mini Standard & Poors MidCap 400 Futures | | | 42 | | | | 3/19/2021 | | | | 9,674,700 | | | | 298,351 | |
Total Futures Contracts | | | 991 | | | | | | | | 117,045,570 | | | | 2,791,529 | |
(1) | Represents non-income producing securities. |
(2) | All or a portion of this security is on loan. |
(3) | Investment purchased with cash received as securities lending collateral. The yield shown represents the 7-day yield in effect at December 31, 2020. |
(4) | Investment in affiliate. The yield shown represents the 7-day yield in effect at December 31, 2020. |
(5) | Variable rate security. Securities payable at par including accrued interest (usually within seven days notice) and unconditionally secured as to principal and interest by letters of credit or other credit support agreements from major banks. The interest rates are adjustable and are not based on a published reference rate and spread but are determined by the issuer or agent and are based on current market conditions. These securities do not indicate a reference rate and spread in their description above. The rate shown represents the rate in effect at December 31, 2020. The maturity date shown, if applicable, reflects the earlier of the next demand date or stated maturity date. |
(6) | Assets of affiliates to the Muirfield Fund held for the benefit of the Fund’s Trustees in connection with the Trustee Deferred Compensation Plan. |
(7) | Fair valued security deemed as Level 3 security. |
The accompanying notes are an integral part of these financial statements
Page 38 | 2020 Annual Report | December 31, 2020 |
Schedule of Investments
December 31, 2020
Spectrum Fund |
Security Description | | Shares or
Principal
Amount ($) | | | Fair
Value ($) | |
Common Stocks - Long — 81.6% |
Communication Services — 7.8% | | | | | | | | |
Activision Blizzard, Inc. | | | 8,171 | | | | 758,677 | |
Alphabet, Inc. - Class A (1) | | | 1,045 | | | | 1,831,509 | |
Alphabet, Inc. - Class C (1) | | | 1,511 | | | | 2,647,091 | |
AMC Entertainment Holdings, Inc. - Class A (2) | | | 864 | | | | 1,832 | |
Cable One, Inc. | | | 215 | | | | 478,960 | |
CenturyLink, Inc. | | | 10,285 | | | | 100,279 | |
Cinemark Holdings, Inc. | | | 529 | | | | 9,210 | |
Comcast Corp. - Class A | | | 27,386 | | | | 1,435,026 | |
Cumulus Media, Inc. (1) | | | 3,754 | | | | 32,735 | |
DHI Group, Inc. (1) | | | 1,719 | | | | 3,816 | |
DISH Network Corp. (1) | | | 1,057 | | | | 34,183 | |
Electronic Arts, Inc. | | | 1,934 | | | | 277,722 | |
Entravision Communications Corp. | | | 5,597 | | | | 15,392 | |
EW Scripps Co./The | | | 96 | | | | 1,468 | |
Facebook, Inc. (1) | | | 11,613 | | | | 3,172,207 | |
Fluent, Inc. (1) | | | 2,081 | | | | 11,050 | |
Glu Mobile, Inc. (1) | | | 885 | | | | 7,974 | |
Gogo, Inc. (1) | | | 316 | | | | 3,043 | |
Gray Television, Inc. (1) | | | 1,608 | | | | 28,767 | |
IDT Corp. - Class B (1) | | | 388 | | | | 4,796 | |
Interpublic Group of Cos., Inc./The | | | 7,457 | | | | 175,389 | |
Liberty TripAdvisor Holdings, Inc. (1) | | | 518 | | | | 2,248 | |
Lions Gate Entertainment Corp. - Class A (1) | | | 1,256 | | | | 14,281 | |
Netflix, Inc. (1) | | | 1,785 | | | | 965,203 | |
News Corp. | | | 2,394 | | | | 43,020 | |
Nexstar Media Group, Inc. | | | 914 | | | | 99,800 | |
Omnicom Group, Inc. | | | 5,143 | | | | 320,769 | |
Pinterest, Inc. - Class A (1) | | | 1,728 | | | | 113,875 | |
Roku, Inc. - Class A (1) | | | 638 | | | | 211,829 | |
Spotify Technology SA (1) | | | 845 | | | | 265,888 | |
Take-Two Interactive Software, Inc. (1) | | | 226 | | | | 46,961 | |
TechTarget, Inc. (1) | | | 674 | | | | 39,840 | |
TEGNA, Inc. | | | 1,525 | | | | 21,274 | |
Tribune Publishing Co. | | | 1,171 | | | | 16,043 | |
Twitter, Inc. (1) | | | 936 | | | | 50,684 | |
Verizon Communications, Inc. | | | 20,424 | | | | 1,199,910 | |
WideOpenWest, Inc. (1) | | | 501 | | | | 5,346 | |
World Wrestling Entertainment, Inc. - Class A | | | 1,122 | | | | 53,912 | |
Yelp, Inc. (1) | | | 182 | | | | 5,946 | |
| | | | | | | | 14,507,955 | |
| | | | | | | | | |
Consumer Discretionary — 10.2% | | | | | | | | |
Abercrombie & Fitch Co. | | | 118 | | | | 2,402 | |
Adient PLC (1) | | | 61 | | | | 2,121 | |
Spectrum Fund |
Security Description | | Shares or
Principal
Amount ($) | | | Fair
Value ($) | |
Common Stocks - Long — continued |
Amazon.com, Inc. (1) | | | 1,594 | | | | 5,191,546 | |
American Eagle Outfitters, Inc. | | | 105 | | | | 2,107 | |
Aramark | | | 941 | | | | 36,210 | |
At Home Group, Inc. (1) | | | 364 | | | | 5,627 | |
Barnes & Noble Education, Inc. (1) | | | 1,061 | | | | 4,934 | |
Best Buy Co., Inc. | | | 6,414 | | | | 640,053 | |
Big Lots, Inc. | | | 248 | | | | 10,647 | |
Biglari Holdings, Inc. - Class B (1) | | | 2 | | | | 222 | |
BorgWarner, Inc. | | | 1,172 | | | | 45,286 | |
Boyd Gaming Corp. | | | 709 | | | | 30,430 | |
Brinker International, Inc. | | | 393 | | | | 22,232 | |
Buckle, Inc./The | | | 181 | | | | 5,285 | |
Caleres, Inc. | | | 545 | | | | 8,529 | |
Camping World Holdings, Inc. | | | 2,926 | | | | 76,222 | |
Capri Holdings, Ltd. (1) | | | 583 | | | | 24,486 | |
CarParts.com, Inc. (1) | | | 3,354 | | | | 41,556 | |
Carvana Co. (1) | | | 25 | | | | 5,989 | |
Chipotle Mexican Grill, Inc. (1) | | | 497 | | | | 689,195 | |
Churchill Downs, Inc. | | | 50 | | | | 9,740 | |
Container Store Group, Inc./The (1) | | | 260 | | | | 2,480 | |
Cooper Tire & Rubber Co. | | | 409 | | | | 16,565 | |
Core-Mark Holding Co., Inc. | | | 77 | | | | 2,261 | |
Cracker Barrel Old Country Store, Inc. | | | 363 | | | | 47,887 | |
Crocs, Inc. (1) | | | 1,322 | | | | 82,837 | |
Dana, Inc. | | | 1,277 | | | | 24,927 | |
Darden Restaurants, Inc. | | | 618 | | | | 73,616 | |
Dave & Buster’s Entertainment, Inc. | | | 128 | | | | 3,843 | |
Del Taco Restaurants, Inc. | | | 80 | | | | 725 | |
Designer Brands, Inc. - Class A | | | 716 | | | | 5,477 | |
Dillard’s, Inc. - Class A | | | 63 | | | | 3,972 | |
Dollar Tree, Inc. (1) | | | 1,107 | | | | 119,600 | |
Domino’s Pizza, Inc. | | | 331 | | | | 126,925 | |
DR Horton, Inc. | | | 4,651 | | | | 320,547 | |
Duluth Holdings, Inc. - Class B (1) | | | 44 | | | | 465 | |
eBay, Inc. | | | 3,078 | | | | 154,670 | |
Etsy, Inc. (1) | | | 398 | | | | 70,808 | |
Everi Holdings, Inc. (1) | | | 223 | | | | 3,080 | |
Extended Stay America, Inc. | | | 6,187 | | | | 91,629 | |
Fiesta Restaurant Group, Inc. (1) | | | 259 | | | | 2,953 | |
Fossil Group, Inc. (1) | | | 470 | | | | 4,075 | |
Fox Factory Holding Corp. (1) | | | 96 | | | | 10,148 | |
Franchise Group, Inc. | | | 201 | | | | 6,120 | |
Gap, Inc./The | | | 323 | | | | 6,521 | |
General Motors Co. | | | 10,171 | | | | 423,520 | |
Genesco, Inc. (1) | | | 138 | | | | 4,152 | |
GoPro, Inc. (1) | | | 452 | | | | 3,743 | |
Greenlane Holdings, Inc. (1) | | | 412 | | | | 1,632 | |
The accompanying notes are an integral part of these financial statements
2020 Annual Report | December 31, 2020 | Page 39 |
Schedule of Investments
December 31, 2020
Spectrum Fund |
Security Description | | Shares or
Principal
Amount ($) | | | Fair
Value ($) | |
Common Stocks - Long — continued |
Group 1 Automotive, Inc. | | | 131 | | | | 17,179 | |
GrowGeneration Corp. (1) | | | 401 | | | | 16,128 | |
Guess?, Inc. | | | 191 | | | | 4,320 | |
Hanesbrands, Inc. | | | 1,282 | | | | 18,692 | |
Harley-Davidson, Inc. | | | 714 | | | | 26,204 | |
Hibbett Sports, Inc. (1) | | | 518 | | | | 23,921 | |
Houghton Mifflin Harcourt Co. (1) | | | 523 | | | | 1,742 | |
International Game Technology PLC | | | 1,099 | | | | 18,617 | |
Kohl’s Corp. | | | 1,015 | | | | 41,300 | |
L Brands, Inc. | | | 941 | | | | 34,996 | |
Lakeland Industries, Inc. (1) | | | 905 | | | | 24,661 | |
Lands’ End, Inc. (1) | | | 231 | | | | 4,983 | |
Las Vegas Sands Corp. | | | 938 | | | | 55,905 | |
Lear Corp. | | | 290 | | | | 46,119 | |
Lennar Corp. - Class A | | | 1,296 | | | | 98,794 | |
Lovesac Co./The (1) | | | 51 | | | | 2,198 | |
Lowe’s Cos., Inc. | | | 11,422 | | | | 1,833,345 | |
Lululemon Athletica, Inc. (1) | | | 541 | | | | 188,284 | |
Lumber Liquidators Holdings, Inc. (1) | | | 492 | | | | 15,124 | |
M/I Homes, Inc. (1) | | | 246 | | | | 10,895 | |
Malibu Boats, Inc. (1) | | | 347 | | | | 21,667 | |
MarineMax, Inc. (1) | | | 211 | | | | 7,391 | |
Marriott International, Inc./MD | | | 506 | | | | 66,752 | |
McDonald’s Corp. | | | 5,663 | | | | 1,215,167 | |
Meritage Homes Corp. (1) | | | 377 | | | | 31,223 | |
Modine Manufacturing Co. (1) | | | 708 | | | | 8,892 | |
Nathan’s Famous, Inc. | | | 42 | | | | 2,319 | |
Nautilus, Inc. (1) | | | 322 | | | | 5,841 | |
NIKE, Inc. - Class B | | | 4,136 | | | | 585,120 | |
Nordstrom, Inc. | | | 181 | | | | 5,649 | |
ODP Corp./The | | | 623 | | | | 18,254 | |
OneWater Marine, Inc. (1) | | | 865 | | | | 25,163 | |
Overstock.com, Inc. (1) | | | 213 | | | | 10,218 | |
Penn National Gaming, Inc. (1) | | | 791 | | | | 68,319 | |
Polaris, Inc. | | | 291 | | | | 27,726 | |
Pool Corp. | | | 28 | | | | 10,430 | |
PulteGroup, Inc. | | | 10,864 | | | | 468,456 | |
Purple Innovation, Inc. (1) | | | 87 | | | | 2,866 | |
Qurate Retail, Inc. - Class A | | | 5,475 | | | | 60,061 | |
Red Rock Resorts, Inc. | | | 626 | | | | 15,675 | |
Rent-A-Center, Inc./TX | | | 4,373 | | | | 167,442 | |
Scientific Games Corp. (1) | | | 337 | | | | 13,982 | |
Select Interior Concepts, Inc. (1) | | | 13 | | | | 93 | |
Sleep Number Corp. (1) | | | 166 | | | | 13,589 | |
Smith & Wesson Brands, Inc. | | | 320 | | | | 5,680 | |
Starbucks Corp. | | | 7,399 | | | | 791,545 | |
Sturm Ruger & Co., Inc. | | | 30 | | | | 1,952 | |
Spectrum Fund |
Security Description | | Shares or
Principal
Amount ($) | | | Fair
Value ($) | |
Common Stocks - Long — continued |
Tapestry, Inc. | | | 985 | | | | 30,614 | |
Target Corp. | | | 2,988 | | | | 527,472 | |
Tesla, Inc. (1) | | | 3,532 | | | | 2,492,426 | |
Texas Roadhouse, Inc. | | | 477 | | | | 37,282 | |
Thor Industries, Inc. | | | 1,741 | | | | 161,896 | |
TopBuild Corp. (1) | | | 140 | | | | 25,771 | |
Tupperware Brands Corp. (1) | | | 195 | | | | 6,316 | |
Urban Outfitters, Inc. (1) | | | 307 | | | | 7,859 | |
Vista Outdoor, Inc. (1) | | | 76 | | | | 1,806 | |
VOXX International Corp. (1) | | | 321 | | | | 4,096 | |
Waitr Holdings, Inc. (1) | | | 412 | | | | 1,145 | |
Wayfair, Inc. (1) | | | 53 | | | | 11,968 | |
Wendy’s Co./The | | | 837 | | | | 18,347 | |
Williams-Sonoma, Inc. | | | 246 | | | | 25,053 | |
Wingstop, Inc. | | | 683 | | | | 90,532 | |
Winnebago Industries, Inc. | | | 3,347 | | | | 200,619 | |
Wyndham Destinations, Inc. | | | 2,383 | | | | 106,901 | |
Yum China Holdings, Inc. | | | 2,966 | | | | 169,329 | |
Yum! Brands, Inc. | | | 3,281 | | | | 356,185 | |
| | | | | | | | 18,880,493 | |
| | | | | | | | | |
Consumer Staples — 2.3% | | | | | | | | |
Andersons, Inc./The | | | 361 | | | | 8,848 | |
BJ’s Wholesale Club Holdings, Inc. (1) | | | 400 | | | | 14,912 | |
Bunge, Ltd. | | | 10,217 | | | | 670,031 | |
Conagra Brands, Inc. | | | 3,148 | | | | 114,146 | |
Costco Wholesale Corp. | | | 283 | | | | 106,629 | |
Darling Ingredients, Inc. (1) | | | 5,668 | | | | 326,930 | |
Flowers Foods, Inc. | | | 5,883 | | | | 133,132 | |
General Mills, Inc. | | | 17,541 | | | | 1,031,411 | |
Kroger Co./The | | | 7,807 | | | | 247,950 | |
Natural Grocers by Vitamin Cottage, Inc. | | | 82 | | | | 1,127 | |
Nature’s Sunshine Products, Inc. (1) | | | 247 | | | | 3,693 | |
Nu Skin Enterprises, Inc. | | | 164 | | | | 8,959 | |
PepsiCo, Inc. | | | 4,412 | | | | 654,300 | |
Performance Food Group Co. (1) | | | 642 | | | | 30,566 | |
Rite Aid Corp. (1) | | | 346 | | | | 5,477 | |
SpartanNash Co. | | | 495 | | | | 8,618 | |
Tyson Foods, Inc. | | | 1,483 | | | | 95,565 | |
United Natural Foods, Inc. (1) | | | 404 | | | | 6,452 | |
Walgreens Boots Alliance, Inc. | | | 385 | | | | 15,354 | |
Walmart, Inc. | | | 5,951 | | | | 857,837 | |
| | | | | | | | 4,341,937 | |
| | | | | | | | | |
Energy — 0.7% | | | | | | | | |
Antero Resources Corp. (1) | | | 2,755 | | | | 15,015 | |
Apache Corp. | | | 1,130 | | | | 16,035 | |
The accompanying notes are an integral part of these financial statements
Page 40 | 2020 Annual Report | December 31, 2020 |
Schedule of Investments
December 31, 2020
Spectrum Fund |
Security Description | | Shares or
Principal
Amount ($) | | | Fair
Value ($) | |
Common Stocks - Long — continued |
Archrock, Inc. | | | 1,641 | | | | 14,211 | |
Ardmore Shipping Corp. | | | 2,318 | | | | 7,580 | |
Aspen Aerogels, Inc. (1) | | | 802 | | | | 13,385 | |
Bonanza Creek Energy, Inc. (1) | | | 584 | | | | 11,289 | |
Cabot Oil & Gas Corp. | | | 1,772 | | | | 28,848 | |
Cactus, Inc. - Class A | | | 1,144 | | | | 29,824 | |
Centennial Resource Development, Inc./DE - Class A (1) | | | 2,480 | | | | 3,720 | |
Chaparral Energy, Inc. A Warrants (1)(7) | | | 1 | | | | 0 | |
Chaparral Energy, Inc. B Warrants (1)(7) | | | 1 | | | | 0 | |
Chesapeake Energy Corp. (1) | | | 197 | | | | 299 | |
Cimarex Energy Co. | | | 2,046 | | | | 76,745 | |
Clean Energy Fuels Corp. (1) | | | 1,859 | | | | 14,612 | |
CNX Resources Corp. (1) | | | 987 | | | | 10,660 | |
Concho Resources, Inc. | | | 1,678 | | | | 97,911 | |
ConocoPhillips | | | 5,758 | | | | 230,262 | |
CONSOL Energy, Inc. (1) | | | 474 | | | | 3,418 | |
Contango Oil & Gas Co. (1) | | | 1,528 | | | | 3,499 | |
Continental Resources, Inc./OK | | | 644 | | | | 10,497 | |
Delek US Holdings, Inc. | | | 328 | | | | 5,271 | |
DHT Holdings, Inc. | | | 584 | | | | 3,054 | |
Diamondback Energy, Inc. | | | 394 | | | | 19,070 | |
DMC Global, Inc. | | | 12 | | | | 519 | |
Earthstone Energy, Inc. - Class A (1) | | | 611 | | | | 3,257 | |
EOG Resources, Inc. | | | 3,340 | | | | 166,566 | |
EQT Corp. | | | 1,852 | | | | 23,539 | |
Exterran Corp. (1) | | | 230 | | | | 1,017 | |
Extraction Oil & Gas, Inc. (1) | | | 1,049 | | | | 30 | |
Frank’s International NV (1) | | | 734 | | | | 2,011 | |
Golar LNG, Ltd. | | | 319 | | | | 3,075 | |
Hess Corp. | | | 644 | | | | 33,997 | |
International Seaways, Inc. | | | 423 | | | | 6,908 | |
ION Geophysical Corp. (1) | | | 2,321 | | | | 5,640 | |
Laredo Petroleum, Inc. (1) | | | 702 | | | | 13,829 | |
Liberty Oilfield Services, Inc. - Class A | | | 1,305 | | | | 13,455 | |
Marathon Oil Corp. | | | 11,014 | | | | 73,463 | |
Matador Resources Co. (1) | | | 987 | | | | 11,903 | |
Nabors Industries, Ltd. | | | 159 | | | | 9,259 | |
NextDecade Corp. (1) | | | 423 | | | | 884 | |
NexTier Oilfield Solutions, Inc. (1) | | | 4,037 | | | | 13,887 | |
Nine Energy Service, Inc. (1) | | | 1,098 | | | | 2,987 | |
Nordic American Tankers, Ltd. | | | 1,435 | | | | 4,233 | |
NOV, Inc. (1) | | | 1,743 | | | | 23,931 | |
Oasis Petroleum, Inc. Warrants (1)(7) | | | 7 | | | | 0 | |
Oceaneering International, Inc. (1) | | | 1,457 | | | | 11,583 | |
Overseas Shipholding Group, Inc. (1) | | | 720 | | | | 1,541 | |
Parsley Energy, Inc. | | | 1,258 | | | | 17,864 | |
Spectrum Fund |
Security Description | | Shares or
Principal
Amount ($) | | | Fair
Value ($) | |
Common Stocks - Long — continued |
Patterson-UTI Energy, Inc. | | | 315 | | | | 1,657 | |
PDC Energy, Inc. (1) | | | 981 | | | | 20,140 | |
Peabody Energy Corp. | | | 1,910 | | | | 4,603 | |
Penn Virginia Corp. (1) | | | 34 | | | | 345 | |
Phillips 66 | | | 302 | | | | 21,122 | |
Pioneer Natural Resources Co. | | | 814 | | | | 92,706 | |
ProPetro Holding Corp. (1) | | | 3,917 | | | | 28,947 | |
Range Resources Corp. | | | 1,372 | | | | 9,192 | |
Renewable Energy Group, Inc. (1) | | | 274 | | | | 19,405 | |
Schlumberger NV | | | 2,004 | | | | 43,747 | |
Scorpio Tankers, Inc. | | | 378 | | | | 4,230 | |
SilverBow Resources, Inc. (1) | | | 448 | | | | 2,379 | |
Southwestern Energy Co. (1) | | | 4,016 | | | | 11,968 | |
Talos Energy, Inc. (1) | | | 255 | | | | 2,101 | |
Teekay Corp. (1) | | | 1,555 | | | | 3,343 | |
W&T Offshore, Inc. (1) | | | 2,465 | | | | 5,349 | |
Whiting Petroleum Corp. (1) | | | 80 | | | | 2,000 | |
Whiting Petroleum Corporation A Warrants (1)(2) | | | 47 | | | | 82 | |
Whiting Petroleum Corporation B Warrants (1)(2) | | | 23 | | | | 44 | |
World Fuel Services Corp. | | | 1,244 | | | | 38,763 | |
WPX Energy, Inc. (1) | | | 1,626 | | | | 13,252 | |
| | | | | | | | 1,385,958 | |
| | | | | | | | | |
Financials — 7.0% | | | | | | | | |
AGNC Investment Corp. | | | 7,902 | | | | 123,271 | |
Ally Financial, Inc. | | | 7,657 | | | | 273,049 | |
American Equity Investment Life Holding Co. | | | 845 | | | | 23,373 | |
American Express Co. | | | 1,089 | | | | 131,671 | |
Ameriprise Financial, Inc. | | | 581 | | | | 112,906 | |
Ameris Bancorp | | | 1,816 | | | | 69,135 | |
Artisan Partners Asset Management, Inc. - Class A | | | 2,120 | | | | 106,721 | |
Associated Banc-Corp | | | 6,299 | | | | 107,398 | |
Axos Financial, Inc. (1) | | | 671 | | | | 25,183 | |
BancorpSouth Bank | | | 1,808 | | | | 49,612 | |
Bank of America Corp. | | | 38,600 | | | | 1,169,966 | |
Bank of Commerce Holdings | | | 1,918 | | | | 18,988 | |
Bank of NT Butterfield & Son, Ltd./The | | | 888 | | | | 27,670 | |
BankUnited, Inc. | | | 2,026 | | | | 70,464 | |
Bar Harbor Bankshares | | | 152 | | | | 3,434 | |
Berkshire Hathaway, Inc. - Class B (1) | | | 11,904 | | | | 2,760,180 | |
Capital Bancorp, Inc. (1) | | | 1,243 | | | | 17,315 | |
Capstead Mortgage Corp. | | | 511 | | | | 2,969 | |
Chimera Investment Corp. | | | 144 | | | | 1,476 | |
The accompanying notes are an integral part of these financial statements
2020 Annual Report | December 31, 2020 | Page 41 |
Schedule of Investments
December 31, 2020
Spectrum Fund |
Security Description | | Shares or
Principal
Amount ($) | | | Fair
Value ($) | |
Common Stocks - Long — continued |
Citigroup, Inc. | | | 5,521 | | | | 340,425 | |
Citizens Financial Group, Inc. | | | 3,625 | | | | 129,630 | |
Civista Bancshares, Inc. | | | 1,856 | | | | 32,536 | |
CNO Financial Group, Inc. | | | 1,271 | | | | 28,254 | |
Coastal Financial Corp./WA (1) | | | 143 | | | | 3,003 | |
Columbia Banking System, Inc. | | | 91 | | | | 3,267 | |
Comerica, Inc. | | | 133 | | | | 7,429 | |
Crawford & Co. - Class B | | | 890 | | | | 6,408 | |
Curo Group Holdings Corp. | | | 3,891 | | | | 55,758 | |
Customers Bancorp, Inc. (1) | | | 1,235 | | | | 22,452 | |
East West Bancorp, Inc. | | | 1,807 | | | | 91,633 | |
Eaton Vance Corp. | | | 861 | | | | 58,488 | |
Ellington Residential Mortgage REIT | | | 2,219 | | | | 28,936 | |
Enova International, Inc. (1) | | | 925 | | | | 22,912 | |
Esquire Financial Holdings, Inc. (1) | | | 283 | | | | 5,431 | |
Evercore, Inc. - Class A | | | 286 | | | | 31,357 | |
Farmers National Banc Corp. | | | 259 | | | | 3,437 | |
Fifth Third Bancorp | | | 10,124 | | | | 279,119 | |
First Business Financial Services, Inc. | | | 1,414 | | | | 26,032 | |
First Choice Bancorp | | | 157 | | | | 2,903 | |
First Citizens BancShares, Inc./NC - Class A | | | 89 | | | | 51,110 | |
First Financial Bancorp | | | 2,463 | | | | 43,176 | |
First Financial Corp./IN | | | 1,045 | | | | 40,598 | |
First Foundation, Inc. | | | 206 | | | | 4,120 | |
First Horizon Corp. | | | 600 | | | | 7,656 | |
First Republic Bank/CA | | | 908 | | | | 133,412 | |
FNCB Bancorp, Inc. | | | 221 | | | | 1,414 | |
Franklin Financial Services Corp. | | | 95 | | | | 2,568 | |
Goosehead Insurance, Inc. | | | 234 | | | | 29,194 | |
Great Ajax Corp. | | | 1,384 | | | | 14,477 | |
GWG Holdings, Inc. (1)(2) | | | 935 | | | | 6,536 | |
Hartford Financial Services Group, Inc./The | | | 1,350 | | | | 66,123 | |
HBT Financial, Inc. | | | 3,805 | | | | 57,646 | |
Heartland Financial USA, Inc. | | | 1,029 | | | | 41,541 | |
Hilltop Holdings, Inc. | | | 2,684 | | | | 73,837 | |
Houlihan Lokey, Inc. - Class A | | | 1,846 | | | | 124,107 | |
Huntington Bancshares, Inc./OH | | | 3,500 | | | | 44,205 | |
Independent Bank Corp./MI | | | 63 | | | | 1,164 | |
Invesco, Ltd. | | | 114 | | | | 1,987 | |
Investors Title Co. | | | 43 | | | | 6,579 | |
James River Group Holdings, Ltd. | | | 712 | | | | 34,995 | |
JPMorgan Chase & Co. | | | 7,660 | | | | 973,356 | |
KeyCorp | | | 2,158 | | | | 35,413 | |
Kinsale Capital Group, Inc. | | | 529 | | | | 105,869 | |
Lakeland Financial Corp. | | | 52 | | | | 2,786 | |
LendingClub Corp. (1) | | | 295 | | | | 3,115 | |
M&T Bank Corp. | | | 329 | | | | 41,882 | |
Spectrum Fund |
Security Description | | Shares or
Principal
Amount ($) | | | Fair
Value ($) | |
Common Stocks - Long — continued |
Mackinac Financial Corp. | | | 1,005 | | | | 12,824 | |
Meta Financial Group, Inc. | | | 289 | | | | 10,566 | |
MetLife, Inc. | | | 1,496 | | | | 70,237 | |
Metrocity Bankshares, Inc. | | | 391 | | | | 5,638 | |
Mid Penn Bancorp, Inc. | | | 74 | | | | 1,621 | |
MMA Capital Holdings, Inc. (1) | | | 697 | | | | 17,146 | |
Morgan Stanley | | | 7,022 | | | | 481,218 | |
Mr Cooper Group, Inc. (1) | | | 1,593 | | | | 49,431 | |
MVB Financial Corp. | | | 1,668 | | | | 37,830 | |
NewStar Financial Contingent Value Rights (1)(7) | | | 95 | | | | 0 | |
Northrim BanCorp, Inc. | | | 1,376 | | | | 46,715 | |
OneMain Holdings, Inc. | | | 1,192 | | | | 57,407 | |
OP Bancorp | | | 662 | | | | 5,097 | |
Oppenheimer Holdings, Inc. | | | 1,655 | | | | 52,017 | |
PennyMac Financial Services, Inc. | | | 1,580 | | | | 103,680 | |
PennyMac Mortgage Investment Trust | | | 260 | | | | 4,573 | |
People’s United Financial, Inc. | | | 1,827 | | | | 23,623 | |
Pinnacle Financial Partners, Inc. | | | 61 | | | | 3,928 | |
PJT Partners, Inc. | | | 1,297 | | | | 97,599 | |
PNC Financial Services Group, Inc./The | | | 1,605 | | | | 239,145 | |
Premier Financial Bancorp, Inc. | | | 677 | | | | 8,997 | |
Progressive Corp./The | | | 9,026 | | | | 892,491 | |
ProSight Global, Inc. (1) | | | 8 | | | | 103 | |
Prudential Financial, Inc. | | | 1,925 | | | | 150,285 | |
Pzena Investment Management, Inc. - Class A | | | 3,069 | | | | 22,404 | |
QCR Holdings, Inc. | | | 625 | | | | 24,744 | |
RBB Bancorp | | | 4,073 | | | | 62,643 | |
Ready Capital Corp. | | | 1,775 | | | | 22,099 | |
Regions Financial Corp. | | | 12,340 | | | | 198,921 | |
SB Financial Group, Inc. | | | 568 | | | | 10,383 | |
Shore Bancshares, Inc. | | | 1,196 | | | | 17,462 | |
Siebert Financial Corp. (1) | | | 214 | | | | 899 | |
Signature Bank/New York NY | | | 513 | | | | 69,404 | |
Silvercrest Asset Management Group, Inc. | | | 233 | | | | 3,236 | |
Simmons First National Corp. | | | 253 | | | | 5,462 | |
SLM Corp. | | | 2,151 | | | | 26,651 | |
South State Corp. | | | 154 | | | | 11,134 | |
State Street Corp. | | | 2,447 | | | | 178,093 | |
Stewart Information Services Corp. | | | 2,427 | | | | 117,370 | |
StoneX Group, Inc. (1) | | | 279 | | | | 16,154 | |
Summit Financial Group, Inc. | | | 224 | | | | 4,946 | |
SVB Financial Group (1) | | | 390 | | | | 151,254 | |
Synchrony Financial | | | 14,195 | | | | 492,708 | |
Synovus Financial Corp. | | | 395 | | | | 12,786 | |
Triumph Bancorp, Inc. (1) | | | 85 | | | | 4,127 | |
The accompanying notes are an integral part of these financial statements
Page 42 | 2020 Annual Report | December 31, 2020 |
Schedule of Investments
December 31, 2020
Spectrum Fund |
Security Description | | Shares or
Principal
Amount ($) | | | Fair
Value ($) | |
Common Stocks - Long — continued |
Truist Financial Corp. | | | 7,638 | | | | 366,089 | |
UMB Financial Corp. | | | 1,117 | | | | 77,062 | |
United Community Banks, Inc./GA | | | 1,595 | | | | 45,362 | |
Unum Group | | | 5,847 | | | | 134,130 | |
Valley National Bancorp | | | 2,764 | | | | 26,949 | |
Veritex Holdings, Inc. | | | 972 | | | | 24,942 | |
Virtu Financial, Inc. | | | 2,134 | | | | 53,713 | |
Virtus Investment Partners, Inc. | | | 335 | | | | 72,695 | |
Walker & Dunlop, Inc. | | | 253 | | | | 23,281 | |
Wells Fargo & Co. | | | 1,504 | | | | 45,391 | |
Western Alliance Bancorp | | | 1,264 | | | | 75,777 | |
| | | | | | | | 12,993,499 | |
| | | | | | | | | |
Healthcare — 15.8% | | | | | | | | |
89bio, Inc. (1) | | | 37 | | | | 902 | |
Abbott Laboratories | | | 4,724 | | | | 517,231 | |
AbbVie, Inc. | | | 13,025 | | | | 1,395,629 | |
Affimed NV (1) | | | 1,150 | | | | 6,693 | |
Agilent Technologies, Inc. | | | 2,495 | | | | 295,633 | |
Akebia Therapeutics, Inc. (1) | | | 655 | | | | 1,834 | |
Akero Therapeutics, Inc. (1) | | | 22 | | | | 568 | |
Albireo Pharma, Inc. (1) | | | 41 | | | | 1,538 | |
Alexion Pharmaceuticals, Inc. (1) | | | 2,313 | | | | 361,383 | |
Align Technology, Inc. (1) | | | 393 | | | | 210,011 | |
Alkermes PLC (1) | | | 882 | | | | 17,596 | |
Allakos, Inc. (1) | | | 157 | | | | 21,980 | |
Allscripts Healthcare Solutions, Inc. (1) | | | 632 | | | | 9,126 | |
Alnylam Pharmaceuticals, Inc. (1) | | | 558 | | | | 72,523 | |
Amedisys, Inc. (1) | | | 15 | | | | 4,400 | |
Amgen, Inc. | | | 4,678 | | | | 1,075,566 | |
Amicus Therapeutics, Inc. (1) | | | 222 | | | | 5,126 | |
Amneal Pharmaceuticals, Inc. - Class A (1) | | | 2,196 | | | | 10,036 | |
Anthem, Inc. | | | 816 | | | | 262,009 | |
Apellis Pharmaceuticals, Inc. (1) | | | 345 | | | | 19,734 | |
Applied Therapeutics, Inc. (1) | | | 43 | | | | 946 | |
Arcturus Therapeutics Holdings, Inc. (1) | | | 127 | | | | 5,509 | |
Arcutis Biotherapeutics, Inc. (1) | | | 160 | | | | 4,501 | |
Arena Pharmaceuticals, Inc. (1) | | | 422 | | | | 32,422 | |
Arrowhead Pharmaceuticals, Inc. (1) | | | 441 | | | | 33,838 | |
Assembly Biosciences, Inc. (1) | | | 51 | | | | 309 | |
Atara Biotherapeutics, Inc. (1) | | | 310 | | | | 6,085 | |
Avantor, Inc. (1) | | | 1,346 | | | | 37,890 | |
Axsome Therapeutics, Inc. (1) | | | 74 | | | | 6,029 | |
Baxter International, Inc. | | | 429 | | | | 34,423 | |
Beam Therapeutics, Inc. (1) | | | 260 | | | | 21,226 | |
Becton Dickinson and Co. | | | 1 | | | | 250 | |
Beyondspring, Inc. (1) | | | 221 | | | | 2,696 | |
Spectrum Fund |
Security Description | | Shares or
Principal
Amount ($) | | | Fair
Value ($) | |
Common Stocks - Long — continued |
BioDelivery Sciences International, Inc. (1) | | | 1,345 | | | | 5,649 | |
Bio-Rad Laboratories, Inc. (1) | | | 160 | | | | 93,270 | |
Bio-Techne Corp. | | | 575 | | | | 182,591 | |
Bioxcel Therapeutics, Inc. (1) | | | 1,345 | | | | 62,139 | |
Blueprint Medicines Corp. (1) | | | 326 | | | | 36,561 | |
Bridgebio Pharma, Inc. (1) | | | 226 | | | | 16,071 | |
Bristol-Myers Squibb Co. | | | 16,365 | | | | 1,015,121 | |
Calyxt, Inc. (1) | | | 26 | | | | 110 | |
Cardinal Health, Inc. | | | 9,562 | | | | 512,141 | |
CareDx, Inc. (1) | | | 338 | | | | 24,488 | |
CASI Pharmaceuticals, Inc. (1) | | | 1,242 | | | | 3,664 | |
Castle Biosciences, Inc. (1) | | | 3 | | | | 201 | |
Catalent, Inc. (1) | | | 1,473 | | | | 153,295 | |
Catalyst Pharmaceuticals, Inc. (1) | | | 2,184 | | | | 7,295 | |
Centene Corp. (1) | | | 3,317 | | | | 199,120 | |
Centogene NV (1) | | | 120 | | | | 1,294 | |
Cerecor, Inc. (1) | | | 1,799 | | | | 4,749 | |
Cerner Corp. | | | 9,319 | | | | 731,355 | |
Charles River Laboratories International, Inc. (1) | | | 499 | | | | 124,680 | |
Checkpoint Therapeutics, Inc. (1) | | | 915 | | | | 2,425 | |
Chemed Corp. | | | 250 | | | | 133,153 | |
ChemoCentryx, Inc. (1) | | | 532 | | | | 32,941 | |
Co-Diagnostics, Inc. (1) | | | 182 | | | | 1,693 | |
Community Health Systems, Inc. (1) | | | 1,040 | | | | 7,727 | |
Computer Programs and Systems, Inc. | | | 797 | | | | 21,391 | |
Concert Pharmaceuticals, Inc. (1) | | | 24 | | | | 303 | |
Constellation Pharmaceuticals, Inc. (1) | | | 131 | | | | 3,773 | |
Corcept Therapeutics, Inc. (1) | | | 181 | | | | 4,735 | |
Corvus Pharmaceuticals, Inc. (1) | | | 645 | | | | 2,296 | |
Cross Country Healthcare, Inc. (1) | | | 166 | | | | 1,472 | |
CVS Health Corp. | | | 6,274 | | | | 428,514 | |
Cymabay Therapeutics, Inc. (1) | | | 1,196 | | | | 6,865 | |
Danaher Corp. | | | 2,331 | | | | 517,808 | |
Deciphera Pharmaceuticals, Inc. (1) | | | 92 | | | | 5,250 | |
Denali Therapeutics, Inc. (1) | | | 275 | | | | 23,034 | |
DENTSPLY SIRONA, Inc. | | | 1,152 | | | | 60,319 | |
Editas Medicine, Inc. (1) | | | 311 | | | | 21,804 | |
Edwards Lifesciences Corp. (1) | | | 864 | | | | 78,823 | |
Eidos Therapeutics, Inc. (1) | | | 66 | | | | 8,684 | |
Elanco Animal Health, Inc. Contingent Value Rights (1)(7) | | | 2,012 | | | | 0 | |
Eli Lilly and Co. | | | 4,192 | | | | 707,777 | |
Eloxx Pharmaceuticals, Inc. (1) | | | 481 | | | | 1,914 | |
Emergent BioSolutions, Inc. (1) | | | 694 | | | | 62,182 | |
Endo International PLC (1) | | | 3,626 | | | | 26,035 | |
Ensign Group, Inc./The | | | 299 | | | | 21,803 | |
The accompanying notes are an integral part of these financial statements
2020 Annual Report | December 31, 2020 | Page 43 |
Schedule of Investments
December 31, 2020
Spectrum Fund |
Security Description | | Shares or
Principal
Amount ($) | | | Fair
Value ($) | |
Common Stocks - Long — continued |
Evelo Biosciences, Inc. (1) | | | 297 | | | | 3,591 | |
Exact Sciences Corp. (1) | | | 633 | | | | 83,866 | |
Exelixis, Inc. (1) | | | 2,522 | | | | 50,617 | |
Fate Therapeutics, Inc. (1) | | | 377 | | | | 34,281 | |
Five Prime Therapeutics, Inc. (1) | | | 284 | | | | 4,831 | |
Five Star Senior Living, Inc. (1) | | | 1,043 | | | | 7,197 | |
Fulgent Genetics, Inc. (1) | | | 66 | | | | 3,439 | |
Gilead Sciences, Inc. | | | 8,279 | | | | 482,335 | |
Globus Medical, Inc. (1) | | | 428 | | | | 27,914 | |
HCA Healthcare, Inc. | | | 1,029 | | | | 169,229 | |
Hill-Rom Holdings, Inc. | | | 1,919 | | | | 188,004 | |
Hologic, Inc. (1) | | | 1,412 | | | | 102,836 | |
Horizon Therapeutics Plc (1) | | | 5,689 | | | | 416,150 | |
Humana, Inc. | | | 907 | | | | 372,115 | |
ICU Medical, Inc. (1) | | | 4 | | | | 858 | |
Idera Pharmaceuticals, Inc. (1) | | | 2,510 | | | | 9,212 | |
IDEXX Laboratories, Inc. (1) | | | 74 | | | | 36,990 | |
IGM Biosciences, Inc. (1) | | | 32 | | | | 2,825 | |
Illumina, Inc. (1) | | | 322 | | | | 119,140 | |
ImmunoGen, Inc. (1) | | | 1,338 | | | | 8,630 | |
InfuSystem Holdings, Inc. (1) | | | 1,886 | | | | 35,419 | |
Inogen, Inc. (1) | | | 183 | | | | 8,176 | |
Inovio Pharmaceuticals, Inc. (1) | | | 567 | | | | 5,018 | |
Insmed, Inc. (1) | | | 435 | | | | 14,481 | |
Insulet Corp. (1) | | | 169 | | | | 43,201 | |
Intellia Therapeutics, Inc. (1) | | | 393 | | | | 21,379 | |
Intersect ENT, Inc. (1) | | | 332 | | | | 7,603 | |
Invitae Corp. (1) | | | 495 | | | | 20,696 | |
Iovance Biotherapeutics, Inc. (1) | | | 833 | | | | 38,651 | |
iRhythm Technologies, Inc. (1) | | | 107 | | | | 25,381 | |
Ironwood Pharmaceuticals, Inc. (1) | | | 1,332 | | | | 15,171 | |
Johnson & Johnson | | | 22,348 | | | | 3,517,128 | |
Jounce Therapeutics, Inc. (1) | | | 358 | | | | 2,506 | |
Karuna Therapeutics, Inc. (1) | | | 3 | | | | 305 | |
Kodiak Sciences, Inc. (1) | | | 193 | | | | 28,354 | |
Kura Oncology, Inc. (1) | | | 698 | | | | 22,797 | |
LHC Group, Inc. (1) | | | 50 | | | | 10,666 | |
Lumos Pharma, Inc. (1) | | | 119 | | | | 4,249 | |
MacroGenics, Inc. (1) | | | 447 | | | | 10,218 | |
Mallinckrodt PLC (1) | | | 2,967 | | | | 596 | |
Marinus Pharmaceuticals, Inc. (1) | | | 235 | | | | 2,867 | |
McKesson Corp. | | | 1,618 | | | | 281,403 | |
Medtronic PLC | | | 12,952 | | | | 1,517,197 | |
Merck & Co., Inc. | | | 29,145 | | | | 2,384,061 | |
Mersana Therapeutics, Inc. (1) | | | 2,139 | | | | 56,919 | |
Mettler-Toledo International, Inc. (1) | | | 50 | | | | 56,984 | |
Mirati Therapeutics, Inc. (1) | | | 217 | | | | 47,662 | |
Spectrum Fund |
Security Description | | Shares or
Principal
Amount ($) | | | Fair
Value ($) | |
Common Stocks - Long — continued |
Moderna, Inc. (1) | | | 2,133 | | | | 222,835 | |
Molina Healthcare, Inc. (1) | | | 266 | | | | 56,573 | |
Myriad Genetics, Inc. (1) | | | 396 | | | | 7,831 | |
NantKwest, Inc. (1) | | | 664 | | | | 8,851 | |
Natera, Inc. (1) | | | 396 | | | | 39,410 | |
National HealthCare Corp. | | | 64 | | | | 4,250 | |
Neurocrine Biosciences, Inc. (1) | | | 270 | | | | 25,880 | |
NextGen Healthcare, Inc. (1) | | | 1,247 | | | | 22,745 | |
Novavax, Inc. (1) | | | 286 | | | | 31,892 | |
Novocure, Ltd. (1) | | | 129 | | | | 22,322 | |
Ocular Therapeutix, Inc. (1) | | | 1,319 | | | | 27,303 | |
Oncocyte Corp. (1) | | | 905 | | | | 2,163 | |
Osmotica Pharmaceuticals PLC (1) | | | 1,812 | | | | 7,465 | |
Otonomy, Inc. (1) | | | 2,774 | | | | 17,948 | |
Owens & Minor, Inc. | | | 734 | | | | 19,855 | |
Pacific Biosciences of California, Inc. (1) | | | 1,045 | | | | 27,107 | |
PerkinElmer, Inc. | | | 621 | | | | 89,114 | |
Perrigo Co. PLC | | | 3,660 | | | | 163,675 | |
Pfizer, Inc. | | | 32,875 | | | | 1,210,129 | |
PRA Health Sciences, Inc. (1) | | | 550 | | | | 68,992 | |
Precigen, Inc. (1)(2) | | | 620 | | | | 6,324 | |
Quest Diagnostics, Inc. | | | 42 | | | | 5,005 | |
Quidel Corp. (1) | | | 137 | | | | 24,612 | |
Regeneron Pharmaceuticals, Inc. (1) | | | 1,345 | | | | 649,783 | |
Replimune Group, Inc. (1) | | | 237 | | | | 9,042 | |
ResMed, Inc. | | | 409 | | | | 86,937 | |
REVOLUTION Medicines, Inc. (1) | | | 177 | | | | 7,007 | |
Rhythm Pharmaceuticals, Inc. (1) | | | 684 | | | | 20,335 | |
Rigel Pharmaceuticals, Inc. (1) | | | 1,848 | | | | 6,468 | |
Rocket Pharmaceuticals, Inc. (1) | | | 249 | | | | 13,655 | |
Sangamo Therapeutics, Inc. (1) | | | 779 | | | | 12,156 | |
Scholar Rock Holding Corp. (1) | | | 109 | | | | 5,290 | |
Seagen, Inc. (1) | | | 670 | | | | 117,344 | |
Seres Therapeutics, Inc. (1) | | | 333 | | | | 8,159 | |
Solid Biosciences, Inc. (1) | | | 433 | | | | 3,282 | |
Sorrento Therapeutics, Inc. (1) | | | 1,034 | | | | 7,057 | |
Spectrum Pharmaceuticals, Inc. (1) | | | 1,247 | | | | 4,252 | |
SpringWorks Therapeutics, Inc. (1) | | | 110 | | | | 7,977 | |
STERIS PLC | | | 707 | | | | 134,005 | |
Stryker Corp. | | | 2,954 | | | | 723,848 | |
Supernus Pharmaceuticals, Inc. (1) | | | 525 | | | | 13,209 | |
Surgery Partners, Inc. (1) | | | 168 | | | | 4,874 | |
Sutro Biopharma, Inc. (1) | | | 252 | | | | 5,471 | |
Syros Pharmaceuticals, Inc. (1) | | | 969 | | | | 10,514 | |
Teladoc Health, Inc. (1) | | | 322 | | | | 64,387 | |
Tenet Healthcare Corp. (1) | | | 788 | | | | 31,465 | |
TG Therapeutics, Inc. (1) | | | 675 | | | | 35,114 | |
The accompanying notes are an integral part of these financial statements
Page 44 | 2020 Annual Report | December 31, 2020 |
Schedule of Investments
December 31, 2020
Spectrum Fund |
Security Description | | Shares or
Principal
Amount ($) | | | Fair
Value ($) | |
Common Stocks - Long — continued |
Thermo Fisher Scientific, Inc. | | | 1,774 | | | | 826,294 | |
Translate Bio, Inc. (1) | | | 349 | | | | 6,432 | |
Travere Therapeutics, Inc. (1) | | | 96 | | | | 2,616 | |
Turning Point Therapeutics, Inc. (1) | | | 325 | | | | 39,601 | |
Twist Bioscience Corp. (1) | | | 280 | | | | 39,561 | |
Ultragenyx Pharmaceutical, Inc. (1) | | | 227 | | | | 31,424 | |
United Therapeutics Corp. (1) | | | 1,150 | | | | 174,559 | |
UnitedHealth Group, Inc. | | | 4,231 | | | | 1,483,727 | |
Universal Health Services, Inc. - Class B | | | 519 | | | | 71,363 | |
Utah Medical Products, Inc. | | | 16 | | | | 1,349 | |
Vanda Pharmaceuticals, Inc. (1) | | | 1,314 | | | | 17,266 | |
Veeva Systems, Inc. (1) | | | 852 | | | | 231,957 | |
Veracyte, Inc. (1) | | | 635 | | | | 31,077 | |
Vertex Pharmaceuticals, Inc. (1) | | | 2,471 | | | | 583,996 | |
Viatris, Inc. (1) | | | 6,481 | | | | 121,454 | |
Viemed Healthcare, Inc. (1) | | | 26 | | | | 202 | |
West Pharmaceutical Services, Inc. | | | 235 | | | | 66,578 | |
Xencor, Inc. (1) | | | 294 | | | | 12,827 | |
Zimmer Biomet Holdings, Inc. | | | 3,184 | | | | 490,623 | |
Zoetis, Inc. - Class A | | | 4,432 | | | | 733,496 | |
| | | | | | | | 29,195,619 | |
| | | | | | | | | |
Industrials — 6.4% | | | | | | | | |
3M Co. | | | 3,788 | | | | 662,105 | |
AGCO Corp. | | | 1,048 | | | | 108,038 | |
Allegiant Travel Co. | | | 462 | | | | 87,429 | |
Alpha Pro Tech, Ltd. (1) | | | 506 | | | | 5,642 | |
Altra Industrial Motion Corp. | | | 448 | | | | 24,833 | |
ArcBest Corp. | | | 856 | | | | 36,526 | |
Arcosa, Inc. | | | 486 | | | | 26,696 | |
Argan, Inc. | | | 174 | | | | 7,741 | |
ASGN, Inc. (1) | | | 224 | | | | 18,711 | |
Astec Industries, Inc. | | | 132 | | | | 7,640 | |
Atkore International Group, Inc. (1) | | | 1,745 | | | | 71,737 | |
Atlas Air Worldwide Holdings, Inc. (1) | | | 45 | | | | 2,454 | |
Axon Enterprise, Inc. (1) | | | 233 | | | | 28,549 | |
AZZ, Inc. | | | 892 | | | | 42,316 | |
BG Staffing, Inc. | | | 73 | | | | 985 | |
BMC Stock Holdings, Inc. (1) | | | 925 | | | | 49,654 | |
Boise Cascade Co. | | | 1,389 | | | | 66,394 | |
CAI International, Inc. | | | 94 | | | | 2,937 | |
Caterpillar, Inc. | | | 1,814 | | | | 330,184 | |
Cintas Corp. | | | 647 | | | | 228,689 | |
Comfort Systems USA, Inc. | | | 733 | | | | 38,600 | |
Commercial Vehicle Group, Inc. (1) | | | 1,206 | | | | 10,432 | |
CompX International, Inc. - Class A | | | 200 | | | | 2,846 | |
Copart, Inc. (1) | | | 2,418 | | | | 307,691 | |
Spectrum Fund |
Security Description | | Shares or
Principal
Amount ($) | | | Fair
Value ($) | |
Common Stocks - Long — continued |
CoreCivic, Inc. | | | 933 | | | | 6,111 | |
CoreLogic, Inc./United States | | | 1,067 | | | | 82,500 | |
Covenant Logistics Group, Inc. (1) | | | 725 | | | | 10,737 | |
CSX Corp. | | | 1,690 | | | | 153,368 | |
Cummins, Inc. | | | 8,661 | | | | 1,966,913 | |
Deere & Co. | | | 887 | | | | 238,647 | |
Eaton Corp. PLC | | | 2,186 | | | | 262,626 | |
Emerson Electric Co. | | | 3,218 | | | | 258,631 | |
EnerSys | | | 256 | | | | 21,263 | |
Fastenal Co. | | | 3,296 | | | | 160,944 | |
FedEx Corp. | | | 1,021 | | | | 265,072 | |
FuelCell Energy, Inc. (1) | | | 262 | | | | 2,927 | |
Generac Holdings, Inc. (1) | | | 311 | | | | 70,725 | |
General Electric Co. | | | 6,781 | | | | 73,235 | |
GrafTech International, Ltd. | | | 1,620 | | | | 17,269 | |
Greenbrier Cos., Inc./The | | | 60 | | | | 2,183 | |
HEICO Corp. | | | 294 | | | | 38,926 | |
Herc Holdings, Inc. (1) | | | 248 | | | | 16,470 | |
Herman Miller, Inc. | | | 421 | | | | 14,230 | |
Hertz Global Holdings, Inc. (1) | | | 1,132 | | | | 1,449 | |
HNI Corp. | | | 554 | | | | 19,091 | |
Huntington Ingalls Industries, Inc. | | | 444 | | | | 75,693 | |
JB Hunt Transport Services, Inc. | | | 166 | | | | 22,684 | |
Kelly Services, Inc. - Class A | | | 747 | | | | 15,366 | |
Kforce, Inc. | | | 231 | | | | 9,723 | |
Kimball International, Inc. - Class B | | | 2,417 | | | | 28,883 | |
L B Foster Co. - Class A (1) | | | 291 | | | | 4,380 | |
Lawson Products, Inc./DE (1) | | | 83 | | | | 4,226 | |
Lockheed Martin Corp. | | | 2,477 | | | | 879,285 | |
Manitowoc Co., Inc./The (1) | | | 192 | | | | 2,556 | |
ManpowerGroup, Inc. | | | 2,999 | | | | 270,450 | |
Matson, Inc. | | | 625 | | | | 35,606 | |
Maxar Technologies, Inc. | | | 419 | | | | 16,169 | |
Meritor, Inc. (1) | | | 558 | | | | 15,574 | |
Miller Industries, Inc./TN | | | 2,261 | | | | 85,963 | |
Moog, Inc. | | | 908 | | | | 72,004 | |
MSC Industrial Direct Co., Inc. | | | 3,800 | | | | 320,682 | |
Mueller Industries, Inc. | | | 1,746 | | | | 61,302 | |
MYR Group, Inc. (1) | | | 138 | | | | 8,294 | |
NL Industries, Inc. | | | 1,691 | | | | 8,083 | |
Norfolk Southern Corp. | | | 49 | | | | 11,643 | |
Old Dominion Freight Line, Inc. | | | 973 | | | | 189,910 | |
PACCAR, Inc. | | | 9,186 | | | | 792,568 | |
PAE, Inc. (1) | | | 745 | | | | 6,839 | |
Parker-Hannifin Corp. | | | 1,205 | | | | 328,254 | |
Plug Power, Inc. (1) | | | 1,809 | | | | 61,343 | |
Primoris Services Corp. | | | 1,690 | | | | 46,661 | |
The accompanying notes are an integral part of these financial statements
2020 Annual Report | December 31, 2020 | Page 45 |
Schedule of Investments
December 31, 2020
Spectrum Fund |
Security Description | | Shares or
Principal
Amount ($) | | | Fair
Value ($) | |
Common Stocks - Long — continued |
Quad/Graphics, Inc. - Class A | | | 365 | | | | 1,394 | |
Quanta Services, Inc. | | | 8,098 | | | | 583,218 | |
Regal Beloit Corp. | | | 1,428 | | | | 175,373 | |
Resideo Technologies, Inc. (1) | | | 1,129 | | | | 24,003 | |
Rexnord Corp. | | | 648 | | | | 25,590 | |
RR Donnelley & Sons Co. | | | 3,957 | | | | 8,943 | |
Ryder System, Inc. | | | 720 | | | | 44,467 | |
Saia, Inc. (1) | | | 350 | | | | 63,280 | |
Shyft Group, Inc./The | | | 544 | | | | 15,439 | |
SkyWest, Inc. | | | 124 | | | | 4,998 | |
Steelcase, Inc. | | | 799 | | | | 10,826 | |
Textainer Group Holdings, Ltd. (1) | | | 856 | | | | 16,418 | |
Timken Co./The | | | 2,200 | | | | 170,192 | |
TPI Composites, Inc. (1) | | | 415 | | | | 21,904 | |
Triton International, Ltd./Bermuda | | | 2,475 | | | | 120,062 | |
Tutor Perini Corp. (1) | | | 208 | | | | 2,694 | |
Uber Technologies, Inc. (1) | | | 3,561 | | | | 181,611 | |
United Parcel Service, Inc. - Class B | | | 2,930 | | | | 493,412 | |
United Rentals, Inc. (1) | | | 51 | | | | 11,827 | |
Vectrus, Inc. (1) | | | 1,322 | | | | 65,730 | |
Veritiv Corp. (1) | | | 377 | | | | 7,838 | |
Waste Management, Inc. | | | 4,573 | | | | 539,294 | |
WESCO International, Inc. (1) | | | 1,106 | | | | 86,821 | |
WESCO International, Inc. Series A Variable Preferred (8) | | | 198 | | | | 6,188 | |
YRC Worldwide, Inc. (1) | | | 553 | | | | 2,450 | |
| | | | | | | | 11,910,259 | |
| | | | | | | | | |
Information Technology — 25.1% | | | | | | | | |
8x8, Inc. (1) | | | 304 | | | | 10,479 | |
Accenture PLC - Class A | | | 557 | | | | 145,494 | |
ACI Worldwide, Inc. (1) | | | 1,250 | | | | 48,038 | |
Adobe, Inc. (1) | | | 2,582 | | | | 1,291,310 | |
ADTRAN, Inc. | | | 205 | | | | 3,028 | |
Advanced Micro Devices, Inc. (1) | | | 5,109 | | | | 468,546 | |
Alarm.com Holdings, Inc. (1) | | | 98 | | | | 10,138 | |
Alliance Data Systems Corp. | | | 325 | | | | 24,083 | |
Amkor Technology, Inc. | | | 2,819 | | | | 42,511 | |
Apple, Inc. (4) | | | 77,412 | | | | 10,271,798 | |
Applied Materials, Inc. | | | 7,958 | | | | 686,775 | |
Arista Networks, Inc. (1) | | | 67 | | | | 19,468 | |
Arrow Electronics, Inc. (1) | | | 2,715 | | | | 264,170 | |
AstroNova, Inc. | | | 530 | | | | 5,645 | |
Autodesk, Inc. (1) | | | 1,250 | | | | 381,675 | |
Avaya Holdings Corp. (1) | | | 958 | | | | 18,346 | |
Avnet, Inc. | | | 4,145 | | | | 145,531 | |
Bill.com Holdings, Inc. (1) | | | 129 | | | | 17,609 | |
Spectrum Fund |
Security Description | | Shares or
Principal
Amount ($) | | | Fair
Value ($) | |
Common Stocks - Long — continued |
Broadcom, Inc. | | | 1,945 | | | | 851,618 | |
CACI International, Inc. - Class A (1) | | | 1,170 | | | | 291,716 | |
Cadence Design Systems, Inc. (1) | | | 13,835 | | | | 1,887,509 | |
Calix, Inc. (1) | | | 4,472 | | | | 133,087 | |
Cambium Networks Corp. (1) | | | 232 | | | | 5,819 | |
CDK Global, Inc. | | | 2,563 | | | | 132,840 | |
CDW Corp./DE | | | 1,576 | | | | 207,701 | |
Cerence, Inc. (1) | | | 342 | | | | 34,364 | |
ChannelAdvisor Corp. (1) | | | 1,646 | | | | 26,303 | |
Ciena Corp. (1) | | | 524 | | | | 27,693 | |
Cisco Systems, Inc. | | | 20,253 | | | | 906,322 | |
Cloudera, Inc. (1) | | | 40 | | | | 556 | |
Cloudflare, Inc. (1) | | | 786 | | | | 59,728 | |
Cognex Corp. | | | 540 | | | | 43,354 | |
Cognizant Technology Solutions Corp. | | | 4,449 | | | | 364,596 | |
Concentrix Corp. (1) | | | 967 | | | | 95,443 | |
Conduent, Inc. (1) | | | 3,442 | | | | 16,522 | |
Corning, Inc. | | | 4,723 | | | | 170,028 | |
Coupa Software, Inc. (1) | | | 207 | | | | 70,154 | |
Crowdstrike Holdings, Inc. (1) | | | 694 | | | | 147,003 | |
Diebold Nixdorf, Inc. (1) | | | 588 | | | | 6,268 | |
Digital Turbine, Inc. (1) | | | 1,500 | | | | 84,840 | |
DocuSign, Inc. (1) | | | 914 | | | | 203,182 | |
Dropbox, Inc. - Class A (1) | | | 1,149 | | | | 25,496 | |
DXC Technology Co. | | | 2,832 | | | | 72,924 | |
Eastman Kodak Co. (1) | | | 275 | | | | 2,239 | |
Ebix, Inc. | | | 539 | | | | 20,466 | |
Elastic NV (1) | | | 46 | | | | 6,722 | |
Enphase Energy, Inc. (1) | | | 482 | | | | 84,577 | |
F5 Networks, Inc. (1) | | | 206 | | | | 36,244 | |
Fabrinet (1) | | | 1,103 | | | | 85,582 | |
Fastly, Inc. (1) | | | 279 | | | | 24,376 | |
FormFactor, Inc. (1) | | | 1 | | | | 43 | |
Fortinet, Inc. (1) | | | 336 | | | | 49,906 | |
Hewlett Packard Enterprise Co. | | | 4,115 | | | | 48,763 | |
HP, Inc. | | | 24,417 | | | | 600,414 | |
HubSpot, Inc. (1) | | | 176 | | | | 69,773 | |
II-VI, Inc. (1) | | | 308 | | | | 23,396 | |
Information Services Group, Inc. (1) | | | 3,086 | | | | 10,122 | |
Insight Enterprises, Inc. (1) | | | 261 | | | | 19,859 | |
Intel Corp. | | | 23,006 | | | | 1,146,159 | |
Intevac, Inc. (1) | | | 316 | | | | 2,278 | |
Intuit, Inc. | | | 6,089 | | | | 2,312,907 | |
Jabil, Inc. | | | 3,864 | | | | 164,336 | |
KBR, Inc. | | | 1,100 | | | | 34,023 | |
Kimball Electronics, Inc. (1) | | | 750 | | | | 11,993 | |
KLA Corp. | | | 1,701 | | | | 440,406 | |
The accompanying notes are an integral part of these financial statements
Page 46 | 2020 Annual Report | December 31, 2020 |
Schedule of Investments
December 31, 2020
Spectrum Fund |
Security Description | | Shares or
Principal
Amount ($) | | | Fair
Value ($) | |
Common Stocks - Long — continued |
Lam Research Corp. | | | 1,140 | | | | 538,388 | |
Littelfuse, Inc. | | | 21 | | | | 5,348 | |
Mastercard, Inc. | | | 2,736 | | | | 976,588 | |
Maxim Integrated Products, Inc. | | | 775 | | | | 68,704 | |
Methode Electronics, Inc. | | | 211 | | | | 8,077 | |
Microchip Technology, Inc. | | | 66 | | | | 9,115 | |
Micron Technology, Inc. (1) | | | 3,081 | | | | 231,630 | |
Microsoft Corp. | | | 38,945 | | | | 8,662,147 | |
MicroStrategy, Inc. (1) | | | 417 | | | | 162,025 | |
MKS Instruments, Inc. | | | 431 | | | | 64,844 | |
MoneyGram International, Inc. (1) | | | 993 | | | | 5,427 | |
Monolithic Power Systems, Inc. | | | 60 | | | | 21,974 | |
NCR Corp. (1) | | | 999 | | | | 37,532 | |
NETGEAR, Inc. (1) | | | 130 | | | | 5,282 | |
NIC, Inc. | | | 24 | | | | 620 | |
NortonLifeLock, Inc. | | | 7,276 | | | | 151,195 | |
NVIDIA Corp. | | | 2,446 | | | | 1,277,301 | |
ON Semiconductor Corp. (1) | | | 271 | | | | 8,870 | |
Oracle Corp. | | | 15,975 | | | | 1,033,423 | |
PagerDuty, Inc. (1) | | | 175 | | | | 7,298 | |
Palo Alto Networks, Inc. (1) | | | 118 | | | | 41,936 | |
Paycom Software, Inc. (1) | | | 224 | | | | 101,304 | |
Photronics, Inc. (1) | | | 3,361 | | | | 37,509 | |
Plantronics, Inc. | | | 216 | | | | 5,838 | |
Priority Technology Holdings, Inc. (1) | | | 739 | | | | 5,203 | |
Progress Software Corp. | | | 1,823 | | | | 82,381 | |
Qorvo, Inc. (1) | | | 778 | | | | 129,358 | |
QUALCOMM, Inc. | | | 9,926 | | | | 1,512,127 | |
Rimini Street, Inc. (1) | | | 790 | | | | 3,500 | |
RingCentral, Inc. - Class A (1) | | | 199 | | | | 75,415 | |
salesforce.com, Inc. (1) | | | 3,562 | | | | 792,652 | |
Sanmina Corp. (1) | | | 1,208 | | | | 38,523 | |
Skyworks Solutions, Inc. | | | 1,283 | | | | 196,145 | |
Slack Technologies, Inc. - Class A (1) | | | 156 | | | | 6,589 | |
Smartsheet, Inc. (1) | | | 225 | | | | 15,590 | |
SPS Commerce, Inc. (1) | | | 950 | | | | 103,161 | |
Square, Inc. - Class A (1) | | | 1,739 | | | | 378,476 | |
SS&C Technologies Holdings, Inc. | | | 13,107 | | | | 953,534 | |
StarTek, Inc. (1) | | | 410 | | | | 3,083 | |
StoneCo, Ltd. (1) | | | 688 | | | | 57,737 | |
Sykes Enterprises, Inc. (1) | | | 808 | | | | 30,437 | |
SYNNEX Corp. | | | 1,425 | | | | 116,052 | |
Tenable Holdings, Inc. (1) | | | 1,065 | | | | 55,657 | |
Teradyne, Inc. | | | 1,994 | | | | 239,061 | |
Texas Instruments, Inc. | | | 3,937 | | | | 646,180 | |
Trade Desk, Inc./The (1) | | | 207 | | | | 165,807 | |
Trimble, Inc. (1) | | | 2,757 | | | | 184,085 | |
Spectrum Fund |
Security Description | | Shares or
Principal
Amount ($) | | | Fair
Value ($) | |
Common Stocks - Long — continued |
TTEC Holdings, Inc. | | | 435 | | | | 31,725 | |
Twilio, Inc. - Class A (1) | | | 602 | | | | 203,777 | |
Ultra Clean Holdings, Inc. (1) | | | 180 | | | | 5,607 | |
Verint Systems, Inc. (1) | | | 593 | | | | 39,838 | |
Veritone, Inc. (1) | | | 141 | | | | 4,011 | |
VirnetX Holding Corp. | | | 2,266 | | | | 11,421 | |
Visa, Inc. | | | 4,641 | | | | 1,015,126 | |
Vishay Intertechnology, Inc. | | | 2,050 | | | | 42,456 | |
Vontier Corp. (1) | | | 338 | | | | 11,289 | |
Xerox Holdings Corp. | | | 5,936 | | | | 137,656 | |
Xilinx, Inc. | | | 1,239 | | | | 175,653 | |
Xperi Holding Corp. | | | 2,138 | | | | 44,684 | |
Zebra Technologies Corp. - Class A (1) | | | 504 | | | | 193,702 | |
Zoom Video Communications, Inc.- Class A (1) | | | 724 | | | | 244,220 | |
Zscaler, Inc. (1) | | | 276 | | | | 55,120 | |
| | | | | | | | 46,383,707 | |
| | | | | | | | | |
Materials — 2.4% | | | | | | | | |
Avery Dennison Corp. | | | 1,729 | | | | 268,185 | |
Avient Corp. | | | 402 | | | | 16,193 | |
Caledonia Mining Corp. PLC | | | 834 | | | | 13,244 | |
Celanese Corp. | | | 276 | | | | 35,863 | |
Chemours Co./The | | | 332 | | | | 8,230 | |
Coeur Mining, Inc. (1) | | | 729 | | | | 7,545 | |
Commercial Metals Co. | | | 478 | | | | 9,818 | |
Corteva, Inc. | | | 3,365 | | | | 130,293 | |
Dow, Inc. | | | 3,156 | | | | 175,158 | |
Eastman Chemical Co. | | | 2,760 | | | | 276,773 | |
Ferroglobe PLC Contingent Value Rights (1)(7)(9) | | | (2,326 | ) | | | 0 | |
Freeport-McMoRan, Inc. - Class B | | | 6,190 | | | | 161,064 | |
FutureFuel Corp. | | | 1,446 | | | | 18,364 | |
Hawkins, Inc. | | | 116 | | | | 6,068 | |
Huntsman Corp. | | | 5,331 | | | | 134,021 | |
Koppers Holdings, Inc. (1) | | | 167 | | | | 5,204 | |
Louisiana-Pacific Corp. | | | 3,394 | | | | 126,155 | |
LyondellBasell Industries NV - Class A | | | 1,478 | | | | 135,473 | |
Minerals Technologies, Inc. | | | 107 | | | | 6,647 | |
Mosaic Co./The | | | 655 | | | | 15,072 | |
Newmont Corp. | | | 11,678 | | | | 699,395 | |
Nucor Corp. | | | 1,665 | | | | 88,561 | |
O-I Glass, Inc. | | | 1,524 | | | | 18,136 | |
Olin Corp. | | | 444 | | | | 10,905 | |
Olympic Steel, Inc. | | | 261 | | | | 3,479 | |
Packaging Corp. of America | | | 290 | | | | 39,994 | |
PPG Industries, Inc. | | | 2,406 | | | | 346,993 | |
The accompanying notes are an integral part of these financial statements
2020 Annual Report | December 31, 2020 | Page 47 |
Schedule of Investments
December 31, 2020
Spectrum Fund |
Security Description | | Shares or
Principal
Amount ($) | | | Fair
Value ($) | |
Common Stocks - Long — continued |
Ramaco Resources, Inc. (1) | | | 996 | | | | 2,868 | |
Rayonier Advanced Materials, Inc. (1) | | | 879 | | | | 5,731 | |
Reliance Steel & Aluminum Co. | | | 2,359 | | | | 282,490 | |
Royal Gold, Inc. | | | 117 | | | | 12,444 | |
Ryerson Holding Corp. (1) | | | 729 | | | | 9,944 | |
Scotts Miracle-Gro Co./The | | | 3,425 | | | | 682,055 | |
Sherwin-Williams Co./The | | | 602 | | | | 442,416 | |
Steel Dynamics, Inc. | | | 1,526 | | | | 56,264 | |
Stepan Co. | | | 876 | | | | 104,524 | |
SunCoke Energy, Inc. | | | 1,442 | | | | 6,273 | |
Tredegar Corp. | | | 1,414 | | | | 23,614 | |
Trinseo SA | | | 126 | | | | 6,452 | |
Tronox Holdings PLC | | | 1,113 | | | | 16,272 | |
United States Lime & Minerals, Inc. | | | 243 | | | | 27,702 | |
Westlake Chemical Corp. | | | 519 | | | | 42,350 | |
Westrock Co. | | | 778 | | | | 33,866 | |
| | | | | | | | 4,512,098 | |
| | | | | | | | | |
Real Estate Investment Trust — 2.6% | | | | | | | | |
Altisource Portfolio Solutions SA (1) | | | 1,218 | | | | 15,688 | |
American Homes 4 Rent - Class A | | | 3,301 | | | | 99,030 | |
American Tower Corp. | | | 3,228 | | | | 724,557 | |
CareTrust REIT, Inc. | | | 863 | | | | 19,141 | |
CatchMark Timber Trust, Inc. | | | 5,866 | | | | 54,906 | |
Clipper Realty, Inc. | | | 2,259 | | | | 15,926 | |
Columbia Property Trust, Inc. | | | 2,155 | | | | 30,903 | |
CorEnergy Infrastructure Trust, Inc. | | | 1,477 | | | | 10,117 | |
CorePoint Lodging, Inc. | | | 283 | | | | 1,947 | |
Corporate Office Properties Trust | | | 2,587 | | | | 67,469 | |
CubeSmart | | | 7,290 | | | | 245,017 | |
CyrusOne, Inc. | | | 305 | | | | 22,311 | |
DiamondRock Hospitality Co. | | | 680 | | | | 5,610 | |
Diversified Healthcare Trust | | | 2,608 | | | | 10,745 | |
EastGroup Properties, Inc. | | | 339 | | | | 46,802 | |
Equinix, Inc. | | | 502 | | | | 358,518 | |
Essex Property Trust, Inc. | | | 562 | | | | 133,430 | |
Extra Space Storage, Inc. | | | 3,204 | | | | 371,215 | |
Gaming and Leisure Properties, Inc. | | | 33 | | | | 1,399 | |
GEO Group, Inc./The | | | 1,082 | | | | 9,587 | |
Healthcare Realty Trust, Inc. | | | 9,436 | | | | 279,306 | |
Healthcare Trust of America, Inc. - Class A | | | 5,604 | | | | 154,334 | |
Host Hotels & Resorts, Inc. | | | 1,662 | | | | 24,315 | |
Spectrum Fund |
Security Description | | Shares or
Principal
Amount ($) | | | Fair
Value ($) | |
Common Stocks - Long — continued |
Iron Mountain, Inc. | | | 342 | | | | 10,082 | |
Lamar Advertising Co. - Class A | | | 3,905 | | | | 324,974 | |
Life Storage, Inc. | | | 168 | | | | 20,058 | |
LTC Properties, Inc. | | | 1,573 | | | | 61,205 | |
Maui Land & Pineapple Co., Inc. (1) | | | 559 | | | | 6,445 | |
National Health Investors, Inc. | | | 1,489 | | | | 102,994 | |
National Storage Affiliates Trust | | | 67 | | | | 2,414 | |
New Senior Investment Group, Inc. | | | 328 | | | | 1,699 | |
Newmark Group, Inc. | | | 1,327 | | | | 9,674 | |
Omega Healthcare Investors, Inc. | | | 1,926 | | | | 69,952 | |
Park Hotels & Resorts, Inc. | | | 1,790 | | | | 30,699 | |
Piedmont Office Realty Trust, Inc. | | | 7,550 | | | | 122,537 | |
PotlatchDeltic Corp. | | | 593 | | | | 29,662 | |
PS Business Parks, Inc. | | | 1,163 | | | | 154,528 | |
Public Storage | | | 1,697 | | | | 391,888 | |
Rafael Holdings, Inc. - Class B (1) | | | 1,213 | | | | 28,287 | |
Realogy Holdings Corp. (1) | | | 510 | | | | 6,691 | |
Retail Opportunity Investments Corp. | | | 2,070 | | | | 27,717 | |
Retail Properties of America, Inc. - Class A | | | 1,969 | | | | 16,855 | |
Ryman Hospitality Properties, Inc. | | | 76 | | | | 5,150 | |
Sabra Health Care REIT, Inc. | | | 1,370 | | | | 23,797 | |
SBA Communications Corp. | | | 453 | | | | 127,805 | |
Service Properties Trust | | | 4,217 | | | | 48,453 | |
Simon Property Group, Inc. | | | 3,264 | | | | 278,354 | |
Tanger Factory Outlet Centers, Inc. (2) | | | 1,609 | | | | 16,026 | |
Trinity Place Holdings, Inc. (1) | | | 3,358 | | | | 4,198 | |
Urstadt Biddle Properties, Inc. - Class A | | | 103 | | | | 1,455 | |
Welltower, Inc. | | | 1,548 | | | | 100,032 | |
| | | | | | | | 4,725,904 | |
Utilities — 1.3% | | | | | | | | |
American Water Works Co., Inc. | | | 2,362 | | | | 362,496 | |
Atlantic Power Corp. (1) | | | 8,848 | | | | 18,581 | |
MDU Resources Group, Inc. | | | 4,942 | | | | 130,172 | |
NextEra Energy, Inc. | | | 9,189 | | | | 708,931 | |
Public Service Enterprise Group, Inc. | | | 6,270 | | | | 365,541 | |
UGI Corp. | | | 2,014 | | | | 70,409 | |
Vistra Corp. | | | 4,696 | | | | 92,323 | |
WEC Energy Group, Inc. | | | 1,570 | | | | 144,487 | |
Xcel Energy, Inc. | | | 6,664 | | | | 444,276 | |
| | | | | | | | 2,337,216 | |
| | | | | | | | | |
Total Common Stocks - Long (Cost $107,992,193) | | | | | | | 151,174,645 | |
The accompanying notes are an integral part of these financial statements
Page 48 | 2020 Annual Report | December 31, 2020 |
Schedule of Investments
December 31, 2020
Spectrum Fund |
Security Description | | Shares or
Principal
Amount ($) | | | Fair
Value ($) | |
Money Market Registered Investment Companies — 15.8% |
Meeder Institutional Prime Money Market Fund, 0.08% (5) | | | 29,275,431 | | | | 29,284,214 | |
Morgan Stanley Government Institutional Fund, 0.03% (3) | | | 22,605 | | | | 22,605 | |
Total Money Market Registered Investment Companies (Cost $29,298,014) | | | | | | | 29,306,819 | |
Total Investments - Long — 97.4% (Cost $137,290,207) | | | | | | | 180,481,464 | |
Other Assets less Liabilities — 2.6% | | | | | | | 4,797,089 | |
Total Net Assets — 100.0% | | | | | | | 185,278,553 | |
| | | | | | | | | |
Trustee Deferred Compensation (6) |
Meeder Balanced Fund - Retail Class | | | 540 | | | | 6,923 | |
Meeder Dynamic Allocation Fund - Retail Class | | | 1,273 | | | | 17,045 | |
Meeder Muirfield Fund - Retail Class | | | 1,558 | | | | 12,776 | |
Meeder Conservative Allocation Fund - Retail Class | | | 169 | | | | 4,041 | |
Total Trustee Deferred Compensation (Cost $35,882) | | | | | | | 40,785 | |
| | | | | | | | | |
| | | Long
(Short)
Contracts | | | Expiration
Date | | | Notional
Value of
Contracts
($) | | | Value and
Unrealized
Appreciation
(Depreciation)
($) | |
Futures Contracts |
Index Futures | | | | | | | | | | | | | | | | |
Mini MSCI EAFE Index Futures | | | 155 | | | | 3/19/2021 | | | | 16,513,700 | | | | 268,851 | |
Mini MSCI Emerging Markets Index Futures | | | 72 | | | | 3/19/2021 | | | | 4,637,520 | | | | 145,158 | |
Russell 2000 Mini Index Futures | | | 11 | | | | 3/19/2021 | | | | 1,086,140 | | | | 35,377 | |
Standard & Poors 500 Mini Futures | | | 50 | | | | 3/19/2021 | | | | 9,372,000 | | | | 273,268 | |
E-mini Standard & Poors MidCap 400 Futures | | | 11 | | | | 3/19/2021 | | | | 2,533,850 | | | | 78,139 | |
Total Futures Contracts | | | 299 | | | | | | | | 34,143,210 | | | | 800,793 | |
(1) | Represents non-income producing securities. |
(2) | All or a portion of the security is on loan. |
(3) | Investment purchased with cash received as securities lending collateral. The yield shown represents the 7-day yield in effect at December 31, 2020. |
(4) | All or a portion of the security is held as collateral for securities sold short. The total fair value of this collateral on December 31, 2020 was $8,536,213. |
(5) | Investment in affiliate. The yield shown represents the 7-day yield in effect at December 31, 2020. |
(6) | Assets of affiliates to the Spectrum Fund held for the benefit of the Fund’s Trustees in connection with the Trustee Deferred Compensation Plan. |
(7) | Fair valued security deemed as Level 3 security. |
The accompanying notes are an integral part of these financial statements
2020 Annual Report | December 31, 2020 | Page 49 |
Schedule of Investments
December 31, 2020
Global Allocation Fund |
Security Description | | Shares or
Principal
Amount ($) | | | Fair
Value ($) | |
Common Stocks — 39.9% |
Communication Services — 4.3% | | | | | | | | |
Activision Blizzard, Inc. | | | 1,356 | | | | 125,905 | |
Alphabet, Inc. - Class A (1) | | | 94 | | | | 164,748 | |
Alphabet, Inc. - Class C (1) | | | 213 | | | | 373,150 | |
AMC Entertainment Holdings, Inc. - Class A (2) | | | 106 | | | | 225 | |
Cable One, Inc. | | | 1 | | | | 2,228 | |
Cinemark Holdings, Inc. | | | 62 | | | | 1,079 | |
Comcast Corp. - Class A | | | 3,388 | | | | 177,531 | |
Cumulus Media, Inc. (1) | | | 93 | | | | 811 | |
DISH Network Corp. (1) | | | 124 | | | | 4,010 | |
Electronic Arts, Inc. | | | 506 | | | | 72,662 | |
EW Scripps Co./The | | | 17 | | | | 260 | |
Facebook, Inc. (1) | | | 1,412 | | | | 385,702 | |
Fluent, Inc. (1) | | | 29 | | | | 154 | |
Frontier Communications Corp. (1) | | | 547 | | | | 49 | |
Glu Mobile, Inc. (1) | | | 167 | | | | 1,505 | |
Gogo, Inc. (1) | | | 43 | | | | 414 | |
Gray Television, Inc. (1) | | | 217 | | | | 3,882 | |
IDT Corp. - Class B (1) | | | 48 | | | | 593 | |
Interpublic Group of Cos., Inc./The | | | 3,842 | | | | 90,364 | |
Lee Enterprises, Inc. (1) | | | 235 | | | | 296 | |
Liberty TripAdvisor Holdings, Inc. (1) | | | 84 | | | | 365 | |
Lions Gate Entertainment Corp. - Class A (1) | | | 183 | | | | 2,081 | |
Meredith Corp. | | | 12 | | | | 230 | |
Netflix, Inc. (1) | | | 211 | | | | 114,094 | |
News Corp. | | | 266 | | | | 4,780 | |
Nexstar Media Group, Inc. | | | 127 | | | | 13,867 | |
Omnicom Group, Inc. | | | 1,999 | | | | 124,678 | |
Pinterest, Inc. - Class A (1) | | | 217 | | | | 14,300 | |
Roku, Inc. - Class A (1) | | | 75 | | | | 24,902 | |
Spotify Technology SA (1) | | | 92 | | | | 28,949 | |
Take-Two Interactive Software, Inc. (1) | | | 62 | | | | 12,883 | |
TechTarget, Inc. (1) | | | 98 | | | | 5,793 | |
TEGNA, Inc. | | | 196 | | | | 2,734 | |
Telephone and Data Systems, Inc. | | | 207 | | | | 3,844 | |
Tribune Publishing Co. | | | 13 | | | | 178 | |
Twitter, Inc. (1) | | | 119 | | | | 6,444 | |
Verizon Communications, Inc. | | | 3,385 | | | | 198,869 | |
World Wrestling Entertainment, Inc. - Class A | | | 122 | | | | 5,862 | |
Yelp, Inc. (1) | | | 33 | | | | 1,078 | |
| | | | | | | | 1,971,499 | |
| | | | | | | | | |
Consumer Discretionary — 5.1% | | | | | | | | |
Adient PLC (1) | | | 12 | | | | 417 | |
Amazon.com, Inc. (1) | | | 199 | | | | 648,129 | |
Global Allocation Fund |
Security Description | | Shares or
Principal
Amount ($) | | | Fair
Value ($) | |
Common Stocks — continued |
American Public Education, Inc. (1) | | | 2 | | | | 61 | |
Aramark | | | 106 | | | | 4,079 | |
At Home Group, Inc. (1) | | | 37 | | | | 572 | |
Best Buy Co., Inc. | | | 723 | | | | 72,148 | |
Big Lots, Inc. | | | 22 | | | | 944 | |
BorgWarner, Inc. | | | 115 | | | | 4,444 | |
Boyd Gaming Corp. | | | 66 | | | | 2,833 | |
Brinker International, Inc. | | | 48 | | | | 2,715 | |
Buckle, Inc./The | | | 25 | | | | 730 | |
Caleres, Inc. | | | 64 | | | | 1,002 | |
Camping World Holdings, Inc. | | | 188 | | | | 4,897 | |
Capri Holdings, Ltd. (1) | | | 80 | | | | 3,360 | |
CarParts.com, Inc. (1) | | | 292 | | | | 3,618 | |
Carvana Co. (1) | | | 4 | | | | 958 | |
Chipotle Mexican Grill, Inc. (1) | | | 67 | | | | 92,910 | |
Churchill Downs, Inc. | | | 12 | | | | 2,337 | |
Container Store Group, Inc./The (1) | | | 25 | | | | 239 | |
Cooper Tire & Rubber Co. | | | 32 | | | | 1,296 | |
Cracker Barrel Old Country Store, Inc. | | | 62 | | | | 8,179 | |
Crocs, Inc. (1) | | | 209 | | | | 13,096 | |
Dana, Inc. | | | 142 | | | | 2,772 | |
Darden Restaurants, Inc. | | | 98 | | | | 11,674 | |
Dave & Buster’s Entertainment, Inc. | | | 15 | | | | 450 | |
Del Taco Restaurants, Inc. | | | 36 | | | | 326 | |
Designer Brands, Inc. - Class A | | | 84 | | | | 643 | |
Dillard’s, Inc. - Class A | | | 7 | | | | 441 | |
Dollar General Corp. | | | 100 | | | | 21,030 | |
Dollar Tree, Inc. (1) | | | 134 | | | | 14,477 | |
Domino’s Pizza, Inc. | | | 42 | | | | 16,105 | |
DR Horton, Inc. | | | 624 | | | | 43,006 | |
Duluth Holdings, Inc. - Class B (1) | | | 4 | | | | 42 | |
eBay, Inc. | | | 417 | | | | 20,954 | |
Etsy, Inc. (1) | | | 55 | | | | 9,785 | |
Everi Holdings, Inc. (1) | | | 23 | | | | 318 | |
Extended Stay America, Inc. | | | 228 | | | | 3,377 | |
Fiesta Restaurant Group, Inc. (1) | | | 35 | | | | 399 | |
Fossil Group, Inc. (1) | | | 51 | | | | 442 | |
Fox Factory Holding Corp. (1) | | | 13 | | | | 1,374 | |
Franchise Group, Inc. | | | 19 | | | | 579 | |
Gap, Inc./The | | | 11 | | | | 222 | |
General Motors Co. | | | 1,317 | | | | 54,840 | |
Genesco, Inc. (1) | | | 15 | | | | 451 | |
GoPro, Inc. (1) | | | 23 | | | | 190 | |
Greenlane Holdings, Inc. (1) | | | 49 | | | | 194 | |
Group 1 Automotive, Inc. | | | 15 | | | | 1,967 | |
GrowGeneration Corp. (1) | | | 37 | | | | 1,488 | |
Guess?, Inc. | | | 26 | | | | 588 | |
The accompanying notes are an integral part of these financial statements
Page 50 | 2020 Annual Report | December 31, 2020 |
Schedule of Investments
December 31, 2020
Global Allocation Fund |
Security Description | | Shares or
Principal
Amount ($) | | | Fair
Value ($) | |
Common Stocks — continued |
Hanesbrands, Inc. | | | 143 | | | | 2,085 | |
Harley-Davidson, Inc. | | | 128 | | | | 4,698 | |
Hibbett Sports, Inc. (1) | | | 62 | | | | 2,863 | |
Houghton Mifflin Harcourt Co. (1) | | | 73 | | | | 243 | |
International Game Technology PLC | | | 129 | | | | 2,185 | |
Kohl’s Corp. | | | 92 | | | | 3,743 | |
L Brands, Inc. | | | 122 | | | | 4,537 | |
Lakeland Industries, Inc. (1) | | | 126 | | | | 3,434 | |
Lands’ End, Inc. (1) | | | 24 | | | | 518 | |
Las Vegas Sands Corp. | | | 129 | | | | 7,688 | |
Lear Corp. | | | 34 | | | | 5,407 | |
Lennar Corp. - Class A | | | 131 | | | | 9,986 | |
Lovesac Co./The (1) | | | 5 | | | | 215 | |
Lowe’s Cos., Inc. | | | 1,091 | | | | 175,116 | |
Lululemon Athletica, Inc. (1) | | | 67 | | | | 23,318 | |
Lumber Liquidators Holdings, Inc. (1) | | | 47 | | | | 1,445 | |
M/I Homes, Inc. (1) | | | 70 | | | | 3,100 | |
Malibu Boats, Inc. (1) | | | 35 | | | | 2,185 | |
MarineMax, Inc. (1) | | | 6 | | | | 210 | |
Marriott International, Inc./MD | | | 8 | | | | 1,055 | |
McDonald’s Corp. | | | 723 | | | | 155,141 | |
Meritage Homes Corp. (1) | | | 81 | | | | 6,708 | |
MGM Resorts International | | | 27 | | | | 851 | |
Modine Manufacturing Co. (1) | | | 77 | | | | 967 | |
Nautilus, Inc. (1) | | | 40 | | | | 726 | |
NIKE, Inc. - Class B | | | 545 | | | | 77,101 | |
Nordstrom, Inc. | | | 18 | | | | 562 | |
ODP Corp./The | | | 70 | | | | 2,051 | |
OneWater Marine, Inc. (1) | | | 11 | | | | 320 | |
Overstock.com, Inc. (1) | | | 24 | | | | 1,151 | |
Party City Holdco, Inc. (1) | | | 69 | | | | 424 | |
Penn National Gaming, Inc. (1) | | | 93 | | | | 8,032 | |
Polaris, Inc. | | | 33 | | | | 3,144 | |
Pool Corp. | | | 19 | | | | 7,078 | |
PulteGroup, Inc. | | | 1,435 | | | | 61,877 | |
Purple Innovation, Inc. (1) | | | 42 | | | | 1,383 | |
Qurate Retail, Inc. - Class A | | | 480 | | | | 5,266 | |
Red Rock Resorts, Inc. | | | 74 | | | | 1,853 | |
Rent-A-Center, Inc./TX | | | 1,141 | | | | 43,689 | |
Scientific Games Corp. (1) | | | 46 | | | | 1,909 | |
Sleep Number Corp. (1) | | | 19 | | | | 1,555 | |
Sonic Automotive, Inc. | | | 88 | | | | 3,394 | |
Starbucks Corp. | | | 894 | | | | 95,640 | |
Sturm Ruger & Co., Inc. | | | 20 | | | | 1,301 | |
Tapestry, Inc. | | | 64 | | | | 1,989 | |
Target Corp. | | | 363 | | | | 64,080 | |
Tesla, Inc. (1) | | | 398 | | | | 280,857 | |
Global Allocation Fund |
Security Description | | Shares or
Principal
Amount ($) | | | Fair
Value ($) | |
Common Stocks — continued |
Texas Roadhouse, Inc. | | | 62 | | | | 4,846 | |
Thor Industries, Inc. | | | 220 | | | | 20,458 | |
Tilly’s, Inc. - Class A | | | 34 | | | | 277 | |
TopBuild Corp. (1) | | | 10 | | | | 1,841 | |
Town Sports International Holdings, Inc. (1) | | | 378 | | | | 95 | |
Tractor Supply Co. | | | 5 | | | | 703 | |
Tupperware Brands Corp. (1) | | | 24 | | | | 777 | |
Urban Outfitters, Inc. (1) | | | 31 | | | | 794 | |
VOXX International Corp. (1) | | | 44 | | | | 561 | |
Waitr Holdings, Inc. (1) | | | 53 | | | | 147 | |
Wayfair, Inc. (1) | | | 8 | | | | 1,806 | |
Wendy’s Co./The | | | 106 | | | | 2,324 | |
Williams-Sonoma, Inc. | | | 36 | | | | 3,666 | |
Wingstop, Inc. | | | 73 | | | | 9,676 | |
Winnebago Industries, Inc. | | | 516 | | | | 30,929 | |
Wyndham Destinations, Inc. | | | 372 | | | | 16,688 | |
XPEL, Inc. (1) | | | 20 | | | | 1,031 | |
Yum China Holdings, Inc. | | | 256 | | | | 14,615 | |
Yum! Brands, Inc. | | | 452 | | | | 49,069 | |
| | | | | | | | 2,320,481 | |
| | | | | | | | | |
Consumer Staples — 1.1% | | | | | | | | |
Andersons, Inc./The | | | 48 | | | | 1,176 | |
BJ’s Wholesale Club Holdings, Inc. (1) | | | 45 | | | | 1,678 | |
Bunge, Ltd. | | | 1,670 | | | | 109,519 | |
Conagra Brands, Inc. | | | 471 | | | | 17,078 | |
Costco Wholesale Corp. | | | 14 | | | | 5,275 | |
Darling Ingredients, Inc. (1) | | | 617 | | | | 35,589 | |
General Mills, Inc. | | | 1,954 | | | | 114,895 | |
Ingredion, Inc. | | | 40 | | | | 3,147 | |
Kroger Co./The | | | 907 | | | | 28,806 | |
Natural Grocers by Vitamin Cottage, Inc. | | | 13 | | | | 179 | |
Nu Skin Enterprises, Inc. | | | 33 | | | | 1,803 | |
PepsiCo, Inc. | | | 538 | | | | 79,785 | |
Performance Food Group Co. (1) | | | 83 | | | | 3,952 | |
Rite Aid Corp. (1) | | | 44 | | | | 697 | |
SpartanNash Co. | | | 65 | | | | 1,132 | |
Tyson Foods, Inc. | | | 183 | | | | 11,793 | |
United Natural Foods, Inc. (1) | | | 46 | | | | 735 | |
Walgreens Boots Alliance, Inc. | | | 26 | | | | 1,037 | |
Walmart, Inc. | | | 702 | | | | 101,193 | |
| | | | | | | | 519,469 | |
| | | | | | | | | |
Energy — 0.4% | | | | | | | | |
Amplify Energy Corp. | | | 338 | | | | 443 | |
Antero Resources Corp. (1) | | | 335 | | | | 1,826 | |
Apache Corp. | | | 126 | | | | 1,788 | |
The accompanying notes are an integral part of these financial statements
2020 Annual Report | December 31, 2020 | Page 51 |
Schedule of Investments
December 31, 2020
Global Allocation Fund |
Security Description | | Shares or
Principal
Amount ($) | | | Fair
Value ($) | |
Common Stocks — continued |
Archrock, Inc. | | | 185 | | | | 1,602 | |
Ardmore Shipping Corp. | | | 143 | | | | 468 | |
Aspen Aerogels, Inc. (1) | | | 122 | | | | 2,036 | |
Bonanza Creek Energy, Inc. (1) | | | 74 | | | | 1,430 | |
Cabot Oil & Gas Corp. | | | 291 | | | | 4,737 | |
Cactus, Inc. - Class A | | | 141 | | | | 3,676 | |
Centennial Resource Development, Inc./DE - Class A (1) | | | 312 | | | | 468 | |
Chesapeake Energy Corp. (1) | | | 17 | | | | 26 | |
Cimarex Energy Co. | | | 252 | | | | 9,453 | |
Clean Energy Fuels Corp. (1) | | | 221 | | | | 1,737 | |
CNX Resources Corp. (1) | | | 92 | | | | 994 | |
Concho Resources, Inc. | | | 244 | | | | 14,237 | |
ConocoPhillips | | | 744 | | | | 29,753 | |
CONSOL Energy, Inc. (1) | | | 42 | | | | 303 | |
Continental Resources, Inc./OK | | | 85 | | | | 1,386 | |
Delek US Holdings, Inc. | | | 32 | | | | 514 | |
DHT Holdings, Inc. | | | 174 | | | | 910 | |
Diamondback Energy, Inc. | | | 41 | | | | 1,984 | |
DMC Global, Inc. | | | 7 | | | | 303 | |
Dorian LPG, Ltd. (1) | | | 13 | | | | 158 | |
Earthstone Energy, Inc. - Class A (1) | | | 44 | | | | 235 | |
EOG Resources, Inc. | | | 402 | | | | 20,048 | |
EQT Corp. | | | 235 | | | | 2,987 | |
Exterran Corp. (1) | | | 25 | | | | 111 | |
Extraction Oil & Gas, Inc. (1) | | | 166 | | | | 5 | |
Frank’s International NV (1) | | | 113 | | | | 310 | |
Golar LNG, Ltd. | | | 46 | | | | 443 | |
Hess Corp. | | | 67 | | | | 3,537 | |
International Seaways, Inc. | | | 14 | | | | 229 | |
Laredo Petroleum, Inc. (1) | | | 87 | | | | 1,714 | |
Liberty Oilfield Services, Inc. - Class A | | | 188 | | | | 1,938 | |
Matador Resources Co. (1) | | | 136 | | | | 1,640 | |
Nabors Industries, Ltd. | | | 20 | | | | 1,165 | |
NextDecade Corp. (1) | | | 48 | | | | 100 | |
NexTier Oilfield Solutions, Inc. (1) | | | 189 | | | | 650 | |
Nine Energy Service, Inc. (1) | | | 131 | | | | 356 | |
Nordic American Tankers, Ltd. | | | 118 | | | | 348 | |
NOV, Inc. (1) | | | 213 | | | | 2,924 | |
Oceaneering International, Inc. (1) | | | 216 | | | | 1,717 | |
Pacific Ethanol,, Inc. (1) | | | 1 | | | | 5 | |
Parsley Energy, Inc. | | | 253 | | | | 3,593 | |
Patterson-UTI Energy, Inc. | | | 82 | | | | 431 | |
PDC Energy, Inc. (1) | | | 119 | | | | 2,443 | |
Peabody Energy Corp. | | | 118 | | | | 284 | |
Phillips 66 | | | 74 | | �� | | 5,176 | |
Pioneer Natural Resources Co. | | | 105 | | | | 11,958 | |
Global Allocation Fund |
Security Description | | Shares or
Principal
Amount ($) | | | Fair
Value ($) | |
Common Stocks — continued |
ProPetro Holding Corp. (1) | | | 448 | | | | 3,311 | |
Range Resources Corp. | | | 159 | | | | 1,065 | |
Renewable Energy Group, Inc. (1) | | | 29 | | | | 2,054 | |
Schlumberger NV | | | 180 | | | | 3,929 | |
Scorpio Tankers, Inc. | | | 27 | | | | 302 | |
SilverBow Resources, Inc. (1) | | | 55 | | | | 292 | |
Southwestern Energy Co. (1) | | | 444 | | | | 1,323 | |
Superior Energy Services, Inc. (1) | | | 47 | | | | 2 | |
Talos Energy, Inc. (1) | | | 33 | | | | 272 | |
Teekay Corp. (1) | | | 121 | | | | 260 | |
TETRA Technologies, Inc. (1) | | | 91 | | | | 78 | |
W&T Offshore, Inc. (1) | | | 311 | | | | 675 | |
Westmoreland Coal Co. (1)(7) | | | 539 | | | | 0 | |
Whiting Petroleum Corp. (1) | | | 10 | | | | 250 | |
Whiting Petroleum Corporation A Warrants (1) | | | 9 | | | | 16 | |
Whiting Petroleum Corporation B Warrants (1) | | | 7 | | | | 13 | |
World Fuel Services Corp. | | | 147 | | | | 4,581 | |
WPX Energy, Inc. (1) | | | 227 | | | | 1,850 | |
| | | | | | | | 164,852 | |
| | | | | | | | | |
Financials — 3.4% | | | | | | | | |
AGNC Investment Corp. | | | 756 | | | | 11,794 | |
Allstate Corp./The | | | 88 | | | | 9,674 | |
Ally Financial, Inc. | | | 878 | | | | 31,309 | |
American Equity Investment Life Holding Co. | | | 87 | | | | 2,406 | |
American Express Co. | | | 128 | | | | 15,476 | |
Ameriprise Financial, Inc. | | | 77 | | | | 14,963 | |
Ameris Bancorp | | | 223 | | | | 8,490 | |
Arbor Realty Trust, Inc. | | | 74 | | | | 1,049 | |
Artisan Partners Asset Management, Inc. - Class A | | | 282 | | | | 14,196 | |
Associated Banc-Corp | | | 766 | | | | 13,060 | |
Axos Financial, Inc. (1) | | | 69 | | | | 2,590 | |
BancorpSouth Bank | | | 213 | | | | 5,845 | |
Bank of America Corp. | | | 4,645 | | | | 140,790 | |
Bank of NT Butterfield & Son, Ltd./The | | | 113 | | | | 3,521 | |
BankUnited, Inc. | | | 236 | | | | 8,208 | |
Bar Harbor Bankshares | | | 7 | | | | 158 | |
Berkshire Hathaway, Inc. - Class B (1) | | | 1,431 | | | | 331,806 | |
Charles Schwab Corp./The | | | 17 | | | | 902 | |
Chimera Investment Corp. | | | 40 | | | | 410 | |
Citigroup, Inc. | | | 703 | | | | 43,347 | |
Citizens Financial Group, Inc. | | | 443 | | | | 15,842 | |
Civista Bancshares, Inc. | | | 147 | | | | 2,577 | |
The accompanying notes are an integral part of these financial statements
Page 52 | 2020 Annual Report | December 31, 2020 |
Schedule of Investments
December 31, 2020
Global Allocation Fund |
Security Description | | Shares or
Principal
Amount ($) | | | Fair
Value ($) | |
Common Stocks — continued |
CNO Financial Group, Inc. | | | 488 | | | | 10,848 | |
Columbia Banking System, Inc. | | | 55 | | | | 1,975 | |
Comerica, Inc. | | | 18 | | | | 1,005 | |
Cowen, Inc. | | | 3 | | | | 78 | |
Curo Group Holdings Corp. | | | 52 | | | | 745 | |
Customers Bancorp, Inc. (1) | | | 131 | | | | 2,382 | |
East West Bancorp, Inc. | | | 213 | | | | 10,801 | |
Eaton Vance Corp. | | | 77 | | | | 5,231 | |
Elevate Credit, Inc. (1) | | | 248 | | | | 990 | |
Ellington Residential Mortgage REIT | | | 183 | | | | 2,386 | |
Enova International, Inc. (1) | | | 111 | | | | 2,749 | |
Esquire Financial Holdings, Inc. (1) | | | 8 | | | | 154 | |
Evercore, Inc. - Class A | | | 74 | | | | 8,113 | |
Farmers National Banc Corp. | | | 43 | | | | 571 | |
Fifth Third Bancorp | | | 1,226 | | | | 33,801 | |
First Citizens BancShares, Inc./NC - Class A | | | 10 | | | | 5,743 | |
First Financial Bancorp | | | 332 | | | | 5,820 | |
First Horizon Corp. | | | 70 | | | | 893 | |
First Interstate BancSystem, Inc. | | | 19 | | | | 775 | |
First Republic Bank/CA | | | 138 | | | | 20,276 | |
FNCB Bancorp, Inc. | | | 3 | | | | 19 | |
Goosehead Insurance, Inc. | | | 46 | | | | 5,739 | |
Great Ajax Corp. | | | 518 | | | | 5,418 | |
Hartford Financial Services Group, Inc./The | | | 92 | | | | 4,506 | |
HBT Financial, Inc. | | | 64 | | | | 970 | |
Heartland Financial USA, Inc. | | | 135 | | | | 5,450 | |
Hilltop Holdings, Inc. | | | 277 | | | | 7,620 | |
Houlihan Lokey, Inc. - Class A | | | 118 | | | | 7,933 | |
Huntington Bancshares, Inc./OH | | | 358 | | | | 4,522 | |
JPMorgan Chase & Co. | | | 948 | | | | 120,462 | |
KeyCorp | | | 407 | | | | 6,679 | |
Kinsale Capital Group, Inc. | | | 65 | | | | 13,008 | |
Lakeland Financial Corp. | | | 13 | | | | 697 | |
LendingClub Corp. (1) | | | 17 | | | | 180 | |
LPL Financial Holdings, Inc. | | | 62 | | | | 6,462 | |
M&T Bank Corp. | | | 33 | | | | 4,201 | |
Medley Management, Inc. | | | 14 | | | | 112 | |
Meta Financial Group, Inc. | | | 34 | | | | 1,243 | |
MetLife, Inc. | | | 10 | | | | 470 | |
Metrocity Bankshares, Inc. | | | 33 | | | | 476 | |
MMA Capital Holdings, Inc. (1) | | | 61 | | | | 1,501 | |
Morgan Stanley | | | 814 | | | | 55,783 | |
Mr Cooper Group, Inc. (1) | | | 271 | | | | 8,409 | |
NewStar Financial Contingent Value Rights (1)(7) | | | 34 | | | | 0 | |
Northrim BanCorp, Inc. | | | 125 | | | | 4,244 | |
OneMain Holdings, Inc. | | | 113 | | | | 5,442 | |
Global Allocation Fund |
Security Description | | Shares or
Principal
Amount ($) | | | Fair
Value ($) | |
Common Stocks — continued |
Oppenheimer Holdings, Inc. | | | 260 | | | | 8,172 | |
PennyMac Financial Services, Inc. | | | 279 | | | | 18,308 | |
PennyMac Mortgage Investment Trust | | | 50 | | | | 880 | |
People’s United Financial, Inc. | | | 191 | | | | 2,470 | |
Pinnacle Financial Partners, Inc. | | | 45 | | | | 2,898 | |
PJT Partners, Inc. | | | 45 | | | | 3,386 | |
PNC Financial Services Group, Inc./The | | | 198 | | | | 29,502 | |
Popular, Inc. | | | 90 | | | | 5,069 | |
Progressive Corp./The | | | 991 | | | | 97,990 | |
Prudential Financial, Inc. | | | 316 | | | | 24,670 | |
Pzena Investment Management, Inc. - Class A | | | 268 | | | | 1,956 | |
QCR Holdings, Inc. | | | 91 | | | | 3,603 | |
RBB Bancorp | | | 257 | | | | 3,953 | |
Ready Capital Corp. | | | 249 | | | | 3,100 | |
Regions Financial Corp. | | | 1,393 | | | | 22,455 | |
Sandy Spring Bancorp, Inc. | | | 17 | | | | 547 | |
Siebert Financial Corp. (1) | | | 33 | | | | 139 | |
Signature Bank/New York NY | | | 65 | | | | 8,794 | |
Silvercrest Asset Management Group, Inc. | | | 74 | | | | 1,028 | |
Simmons First National Corp. | | | 34 | | | | 734 | |
SLM Corp. | | | 233 | | | | 2,887 | |
South State Corp. | | | 16 | | | | 1,157 | |
State Street Corp. | | | 368 | | | | 26,783 | |
Stewart Information Services Corp. | | | 407 | | | | 19,683 | |
StoneX Group, Inc. (1) | | | 36 | | | | 2,084 | |
SVB Financial Group (1) | | | 45 | | | | 17,452 | |
Synchrony Financial | | | 2,215 | | | | 76,883 | |
Synovus Financial Corp. | | | 30 | | | | 971 | |
Triumph Bancorp, Inc. (1) | | | 5 | | | | 243 | |
Truist Financial Corp. | | | 915 | | | | 43,856 | |
UMB Financial Corp. | | | 115 | | | | 7,934 | |
United Community Banks, Inc./GA | | | 198 | | | | 5,631 | |
Valley National Bancorp | | | 390 | | | | 3,803 | |
Veritex Holdings, Inc. | | | 2 | | | | 51 | |
Virtu Financial, Inc. | | | 356 | | | | 8,961 | |
Virtus Investment Partners, Inc. | | | 41 | | | | 8,897 | |
Walker & Dunlop, Inc. | | | 175 | | | | 16,104 | |
Wells Fargo & Co. | | | 284 | | | | 8,571 | |
Western Alliance Bancorp | | | 147 | | | | 8,813 | |
Wins Finance Holdings, Inc. (1) | | | 37 | | | | 222 | |
WSFS Financial Corp. | | | 6 | | | | 269 | |
| | | | | | | | 1,566,204 | |
| | | | | | | | | |
Healthcare — 7.5% | | | | | | | | |
89bio, Inc. (1) | | | 5 | | | | 122 | |
Abbott Laboratories | | | 456 | | | | 49,927 | |
The accompanying notes are an integral part of these financial statements
2020 Annual Report | December 31, 2020 | Page 53 |
Schedule of Investments
December 31, 2020
Global Allocation Fund |
Security Description | | Shares or
Principal
Amount ($) | | | Fair
Value ($) | |
Common Stocks — continued |
AbbVie, Inc. | | | 1,907 | | | | 204,335 | |
Abeona Therapeutics, Inc. (1) | | | 8 | | | | 13 | |
AcelRx Pharmaceuticals, Inc. (1) | | | 414 | | | | 513 | |
Affimed NV (1) | | | 182 | | | | 1,059 | |
AgeX Therapeutics, Inc. (1) | | | 13 | | | | 20 | |
Agilent Technologies, Inc. | | | 723 | | | | 85,668 | |
Akebia Therapeutics, Inc. (1) | | | 4 | | | | 11 | |
Alexion Pharmaceuticals, Inc. (1) | | | 293 | | | | 45,778 | |
Align Technology, Inc. (1) | | | 50 | | | | 26,719 | |
Alkermes PLC (1) | | | 338 | | | | 6,743 | |
Allakos, Inc. (1) | | | 19 | | | | 2,660 | |
Allscripts Healthcare Solutions, Inc. (1) | | | 120 | | | | 1,733 | |
Alnylam Pharmaceuticals, Inc. (1) | | | 58 | | | | 7,538 | |
AmerisourceBergen Corp. | | | 77 | | | | 7,528 | |
Amgen, Inc. | | | 608 | | | | 139,791 | |
Amicus Therapeutics, Inc. (1) | | | 43 | | | | 993 | |
Amneal Pharmaceuticals, Inc. - Class A (1) | | | 288 | | | | 1,316 | |
Apellis Pharmaceuticals, Inc. (1) | | | 40 | | | | 2,288 | |
Applied Therapeutics, Inc. (1) | | | 11 | | | | 242 | |
Arcturus Therapeutics Holdings, Inc. (1) | | | 17 | | | | 737 | |
Arcutis Biotherapeutics, Inc. (1) | | | 21 | | | | 591 | |
Arena Pharmaceuticals, Inc. (1) | | | 28 | | | | 2,151 | |
Arrowhead Pharmaceuticals, Inc. (1) | | | 54 | | | | 4,143 | |
Assembly Biosciences, Inc. (1) | | | 26 | | | | 157 | |
Assertio Holdings, Inc. (1) | | | 530 | | | | 190 | |
Atara Biotherapeutics, Inc. (1) | | | 40 | | | | 785 | |
Avantor, Inc. (1) | | | 146 | | | | 4,110 | |
Axsome Therapeutics, Inc. (1) | | | 13 | | | | 1,059 | |
Baxter International, Inc. | | | 45 | | | | 3,611 | |
Beam Therapeutics, Inc. (1) | | | 34 | | | | 2,776 | |
Beyondspring, Inc. (1) | | | 3 | | | | 37 | |
BioDelivery Sciences International, Inc. (1) | | | 595 | | | | 2,499 | |
Bio-Rad Laboratories, Inc. (1) | | | 22 | | | | 12,825 | |
Bio-Techne Corp. | | | 24 | | | | 7,621 | |
Bioxcel Therapeutics, Inc. (1) | | | 33 | | | | 1,525 | |
Blueprint Medicines Corp. (1) | | | 40 | | | | 4,486 | |
Bridgebio Pharma, Inc. (1) | | | 27 | | | | 1,920 | |
Bristol-Myers Squibb Co. | | | 2,289 | | | | 141,987 | |
Calyxt, Inc. (1) | | | 9 | | | | 38 | |
Cardinal Health, Inc. | | | 829 | | | | 44,401 | |
CareDx, Inc. (1) | | | 46 | | | | 3,333 | |
CASI Pharmaceuticals, Inc. (1) | | | 17 | | | | 50 | |
Castle Biosciences, Inc. (1) | | | 21 | | | | 1,410 | |
Catalent, Inc. (1) | | | 199 | | | | 20,710 | |
Catalyst Pharmaceuticals, Inc. (1) | | | 308 | | | | 1,029 | |
cbdMD, Inc. (1) | | | 7 | | | | 21 | |
Celcuity, Inc. (1) | | | 1 | | | | 9 | |
Global Allocation Fund |
Security Description | | Shares or
Principal
Amount ($) | | | Fair
Value ($) | |
Common Stocks — continued |
Centene Corp. (1) | | | 240 | | | | 14,407 | |
Centogene NV (1) | | | 27 | | | | 291 | |
Cerecor, Inc. (1) | | | 100 | | | | 264 | |
Cerner Corp. | | | 1,034 | | | | 81,148 | |
Charles River Laboratories International, Inc. (1) | | | 51 | | | | 12,743 | |
Chemed Corp. | | | 7 | | | | 3,728 | |
ChemoCentryx, Inc. (1) | | | 67 | | | | 4,149 | |
Co-Diagnostics, Inc. (1) | | | 23 | | | | 214 | |
Community Health Systems, Inc. (1) | | | 132 | | | | 981 | |
Computer Programs and Systems, Inc. | | | 34 | | | | 913 | |
Concert Pharmaceuticals, Inc. (1) | | | 6 | | | | 76 | |
Conformis, Inc. (1) | | | 10 | | | | 7 | |
Constellation Pharmaceuticals, Inc. (1) | | | 18 | | | | 518 | |
Corcept Therapeutics, Inc. (1) | | | 54 | | | | 1,413 | |
Cortexyme, Inc. (1) | | | 1 | | | | 28 | |
Cross Country Healthcare, Inc. (1) | | | 27 | | | | 239 | |
CVS Health Corp. | | | 737 | | | | 50,337 | |
Cymabay Therapeutics, Inc. (1) | | | 157 | | | | 901 | |
Danaher Corp. | | | 251 | | | | 55,757 | |
Deciphera Pharmaceuticals, Inc. (1) | | | 21 | | | | 1,198 | |
Denali Therapeutics, Inc. (1) | | | 38 | | | | 3,183 | |
DENTSPLY SIRONA, Inc. | | | 149 | | | | 7,802 | |
Editas Medicine, Inc. (1) | | | 38 | | | | 2,664 | |
Edwards Lifesciences Corp. (1) | | | 276 | | | | 25,179 | |
Eidos Therapeutics, Inc. (1) | | | 11 | | | | 1,447 | |
Elanco Animal Health, Inc. Contingent Value Rights (1)(7) | | | 99 | | | | 0 | |
Eli Lilly and Co. | | | 524 | | | | 88,472 | |
Eloxx Pharmaceuticals, Inc. (1) | | | 75 | | | | 299 | |
Emergent BioSolutions, Inc. (1) | | | 96 | | | | 8,602 | |
Endo International PLC (1) | | | 422 | | | | 3,030 | |
Ensign Group, Inc./The | | | 35 | | | | 2,552 | |
Evelo Biosciences, Inc. (1) | | | 38 | | | | 459 | |
Exact Sciences Corp. (1) | | | 76 | | | | 10,069 | |
Exelixis, Inc. (1) | | | 322 | | | | 6,463 | |
Fate Therapeutics, Inc. (1) | | | 46 | | | | 4,183 | |
Five Prime Therapeutics, Inc. (1) | | | 36 | | | | 612 | |
Fulgent Genetics, Inc. (1) | | | 8 | | | | 417 | |
Gilead Sciences, Inc. | | | 1,261 | | | | 73,466 | |
Globus Medical, Inc. (1) | | | 55 | | | | 3,587 | |
HCA Healthcare, Inc. | | | 122 | | | | 20,064 | |
Hill-Rom Holdings, Inc. | | | 198 | | | | 19,398 | |
Hologic, Inc. (1) | | | 50 | | | | 3,642 | |
Horizon Therapeutics Plc (1) | | | 525 | | | | 38,404 | |
Humana, Inc. | | | 111 | | | | 45,540 | |
ICU Medical, Inc. (1) | | | 2 | | | | 429 | |
The accompanying notes are an integral part of these financial statements
Page 54 | 2020 Annual Report | December 31, 2020 |
Schedule of Investments
December 31, 2020
Global Allocation Fund |
Security Description | | Shares or
Principal
Amount ($) | | | Fair
Value ($) | |
Common Stocks — continued |
IGM Biosciences, Inc. (1) | | | 4 | | | | 353 | |
Illumina, Inc. (1) | | | 51 | | | | 18,870 | |
ImmunoGen, Inc. (1) | | | 121 | | | | 780 | |
Immunovant, Inc. (1) | | | 3 | | | | 139 | |
Inogen, Inc. (1) | | | 20 | | | | 894 | |
Inovio Pharmaceuticals, Inc. (1) | | | 67 | | | | 593 | |
Insmed, Inc. (1) | | | 34 | | | | 1,132 | |
Insulet Corp. (1) | | | 15 | | | | 3,834 | |
Intellia Therapeutics, Inc. (1) | | | 49 | | | | 2,666 | |
Intersect ENT, Inc. (1) | | | 12 | | | | 275 | |
Invitae Corp. (1) | | | 57 | | | | 2,383 | |
Iovance Biotherapeutics, Inc. (1) | | | 102 | | | | 4,733 | |
iRhythm Technologies, Inc. (1) | | | 12 | | | | 2,847 | |
Jazz Pharmaceuticals PLC (1) | | | 52 | | | | 8,583 | |
Johnson & Johnson | | | 2,102 | | | | 330,813 | |
Jounce Therapeutics, Inc. (1) | | | 24 | | | | 168 | |
Kodiak Sciences, Inc. (1) | | | 24 | | | | 3,526 | |
Kura Oncology, Inc. (1) | | | 86 | | | | 2,809 | |
LHC Group, Inc. (1) | | | 5 | | | | 1,067 | |
MacroGenics, Inc. (1) | | | 51 | | | | 1,166 | |
Mallinckrodt PLC (1)(2) | | | 22 | | | | 4 | |
Marinus Pharmaceuticals, Inc. (1) | | | 29 | | | | 354 | |
McKesson Corp. | | | 173 | | | | 30,088 | |
Medtronic PLC | | | 1,681 | | | | 196,912 | |
MEI Pharma, Inc. (1) | | | 76 | | | | 201 | |
Merck & Co., Inc. | | | 2,769 | | | | 226,504 | |
Mersana Therapeutics, Inc. (1) | | | 163 | | | | 4,337 | |
Mettler-Toledo International, Inc. (1) | | | 1 | | | | 1,140 | |
Mirati Therapeutics, Inc. (1) | | | 25 | | | | 5,491 | |
Moderna, Inc. (1) | | | 216 | | | | 22,566 | |
ModivCare, Inc. (1) | | | 4 | | | | 555 | |
Molina Healthcare, Inc. (1) | | | 14 | | | | 2,978 | |
Morphic Holding, Inc. (1) | | | 38 | | | | 1,275 | |
Myriad Genetics, Inc. (1) | | | 39 | | | | 771 | |
NantKwest, Inc. (1) | | | 85 | | | | 1,133 | |
Natera, Inc. (1) | | | 51 | | | | 5,076 | |
National HealthCare Corp. | | | 10 | | | | 664 | |
Neurocrine Biosciences, Inc. (1) | | | 28 | | | | 2,684 | |
NextGen Healthcare, Inc. (1) | | | 164 | | | | 2,991 | |
Novavax, Inc. (1) | | | 34 | | | | 3,791 | |
Novocure, Ltd. (1) | | | 10 | | | | 1,730 | |
Ocular Therapeutix, Inc. (1) | | | 163 | | | | 3,374 | |
Oncocyte Corp. (1) | | | 95 | | | | 227 | |
Organogenesis Holdings, Inc. (1) | | | 70 | | | | 527 | |
Osmotica Pharmaceuticals PLC (1) | | | 152 | | | | 626 | |
Owens & Minor, Inc. | | | 71 | | | | 1,921 | |
Pacific Biosciences of California, Inc. (1) | | | 115 | | | | 2,983 | |
Global Allocation Fund |
Security Description | | Shares or
Principal
Amount ($) | | | Fair
Value ($) | |
Common Stocks — continued |
Palatin Technologies, Inc. (1) | | | 689 | | | | 466 | |
PerkinElmer, Inc. | | | 85 | | | | 12,198 | |
Perrigo Co. PLC | | | 540 | | | | 24,149 | |
Pfizer, Inc. | | | 3,860 | | | | 142,087 | |
Phreesia, Inc. (1) | | | 7 | | | | 380 | |
PolarityTE, Inc. (1) | | | 3 | | | | 2 | |
PRA Health Sciences, Inc. (1) | | | 29 | | | | 3,638 | |
Precigen, Inc. (1) | | | 76 | | | | 775 | |
Quest Diagnostics, Inc. | | | 26 | | | | 3,098 | |
Quidel Corp. (1) | | | 3 | | | | 539 | |
Regeneron Pharmaceuticals, Inc. (1) | | | 112 | | | | 54,108 | |
Replimune Group, Inc. (1) | | | 19 | | | | 725 | |
ResMed, Inc. | | | 50 | | | | 10,628 | |
REVOLUTION Medicines, Inc. (1) | | | 21 | | | | 831 | |
Rhythm Pharmaceuticals, Inc. (1) | | | 97 | | | | 2,884 | |
Rocket Pharmaceuticals, Inc. (1) | | | 32 | | | | 1,755 | |
Sangamo Therapeutics, Inc. (1) | | | 93 | | | | 1,451 | |
Scholar Rock Holding Corp. (1) | | | 21 | | | | 1,019 | |
Seagen, Inc. (1) | | | 93 | | | | 16,288 | |
Seres Therapeutics, Inc. (1) | | | 41 | | | | 1,005 | |
SIGA Technologies, Inc. (1) | | | 57 | | | | 414 | |
Simulations Plus, Inc. | | | 68 | | | | 4,891 | |
Solid Biosciences, Inc. (1) | | | 54 | | | | 409 | |
Sorrento Therapeutics, Inc. (1) | | | 133 | | | | 908 | |
Spectrum Pharmaceuticals, Inc. (1) | | | 133 | | | | 454 | |
SpringWorks Therapeutics, Inc. (1) | | | 12 | | | | 870 | |
STERIS PLC | | | 237 | | | | 44,921 | |
Stryker Corp. | | | 305 | | | | 74,737 | |
Supernus Pharmaceuticals, Inc. (1) | | | 76 | | | | 1,912 | |
Surgery Partners, Inc. (1) | | | 22 | | | | 638 | |
Sutro Biopharma, Inc. (1) | | | 30 | | | | 651 | |
Syros Pharmaceuticals, Inc. (1) | | | 119 | | | | 1,291 | |
Teladoc Health, Inc. (1) | | | 36 | | | | 7,199 | |
Tenet Healthcare Corp. (1) | | | 100 | | | | 3,993 | |
TG Therapeutics, Inc. (1) | | | 80 | | | | 4,162 | |
Thermo Fisher Scientific, Inc. | | | 134 | | | | 62,415 | |
Translate Bio, Inc. (1) | | | 46 | | | | 848 | |
Travere Therapeutics, Inc. (1) | | | 2 | | | | 55 | |
Turning Point Therapeutics, Inc. (1) | | | 39 | | | | 4,752 | |
Twist Bioscience Corp. (1) | | | 32 | | | | 4,521 | |
Ultragenyx Pharmaceutical, Inc. (1) | | | 27 | | | | 3,738 | |
United Therapeutics Corp. (1) | | | 132 | | | | 20,036 | |
UnitedHealth Group, Inc. | | | 534 | | | | 187,263 | |
Universal Health Services, Inc. - Class B | | | 81 | | | | 11,138 | |
Vanda Pharmaceuticals, Inc. (1) | | | 157 | | | | 2,063 | |
Veeva Systems, Inc. (1) | | | 78 | | | | 21,236 | |
Veracyte, Inc. (1) | | | 79 | | | | 3,866 | |
The accompanying notes are an integral part of these financial statements
2020 Annual Report | December 31, 2020 | Page 55 |
Schedule of Investments
December 31, 2020
Global Allocation Fund |
Security Description | | Shares or
Principal
Amount ($) | | | Fair
Value ($) | |
Common Stocks — continued |
Vertex Pharmaceuticals, Inc. (1) | | | 226 | | | | 53,413 | |
Viatris, Inc. (1) | | | 721 | | | | 13,512 | |
Viela Bio, Inc. (1) | | | 3 | | | | 108 | |
West Pharmaceutical Services, Inc. | | | 88 | | | | 24,931 | |
XBiotech, Inc. (1) | | | 101 | | | | 1,581 | |
Xencor, Inc. (1) | | | 38 | | | | 1,658 | |
Zimmer Biomet Holdings, Inc. | | | 355 | | | | 54,702 | |
ZIOPHARM Oncology, Inc. (1) | | | 150 | | | | 378 | |
Zoetis, Inc. - Class A | | | 854 | | | | 141,337 | |
| | | | | | | | 3,396,044 | |
| | | | | | | | | |
Industrials — 3.5% | | | | | | | | |
3M Co. | | | 503 | | | | 87,919 | |
AGCO Corp. | | | 124 | | | | 12,783 | |
Allegiant Travel Co. | | | 38 | | | | 7,191 | |
Alpha Pro Tech, Ltd. (1) | | | 66 | | | | 736 | |
Altra Industrial Motion Corp. | | | 53 | | | | 2,938 | |
ArcBest Corp. | | | 104 | | | | 4,438 | |
Arcosa, Inc. | | | 96 | | | | 5,273 | |
Argan, Inc. | | | 22 | | | | 979 | |
ASGN, Inc. (1) | | | 40 | | | | 3,341 | |
Astec Industries, Inc. | | | 31 | | | | 1,794 | |
Atkore International Group, Inc. (1) | | | 222 | | | | 9,126 | |
Atlas Air Worldwide Holdings, Inc. (1) | | | 8 | | | | 436 | |
Axon Enterprise, Inc. (1) | | | 31 | | | | 3,798 | |
AZZ, Inc. | | | 76 | | | | 3,605 | |
BG Staffing, Inc. | | | 18 | | | | 243 | |
BMC Stock Holdings, Inc. (1) | | | 115 | | | | 6,173 | |
Boise Cascade Co. | | | 204 | | | | 9,751 | |
CAI International, Inc. | | | 9 | | | | 281 | |
Caterpillar, Inc. | | | 215 | | | | 39,134 | |
Cintas Corp. | | | 116 | | | | 41,001 | |
Comfort Systems USA, Inc. | | | 187 | | | | 9,847 | |
Commercial Vehicle Group, Inc. (1) | | | 149 | | | | 1,289 | |
Construction Partners, Inc. (1) | | | 5 | | | | 146 | |
Copart, Inc. (1) | | | 317 | | | | 40,338 | |
CoreCivic, Inc. | | | 111 | | | | 727 | |
CoreLogic, Inc./United States | | | 148 | | | | 11,443 | |
Costamare, Inc. | | | 25 | | | | 207 | |
Covenant Logistics Group, Inc. (1) | | | 49 | | | | 726 | |
CSX Corp. | | | 230 | | | | 20,873 | |
Cummins, Inc. | | | 662 | | | | 150,340 | |
Deere & Co. | | | 53 | | | | 14,260 | |
Eaton Corp. PLC | | | 489 | | | | 58,748 | |
EMCOR Group, Inc. | | | 269 | | | | 24,603 | |
Emerson Electric Co. | | | 154 | | | | 12,377 | |
EnerSys | | | 23 | | | | 1,910 | |
Global Allocation Fund |
Security Description | | Shares or
Principal
Amount ($) | | | Fair
Value ($) | |
Common Stocks — continued |
Fastenal Co. | | | 394 | | | | 19,239 | |
FedEx Corp. | | | 121 | | | | 31,414 | |
FuelCell Energy, Inc. (1) | | | 20 | | | | 223 | |
Generac Holdings, Inc. (1) | | | 26 | | | | 5,913 | |
General Electric Co. | | | 758 | | | | 8,186 | |
GrafTech International, Ltd. | | | 191 | | | | 2,036 | |
HEICO Corp. | | | 59 | | | | 7,812 | |
Herc Holdings, Inc. (1) | | | 33 | | | | 2,192 | |
Herman Miller, Inc. | | | 62 | | | | 2,096 | |
Hertz Global Holdings, Inc. (1) | | | 141 | | | | 180 | |
HNI Corp. | | | 66 | | | | 2,274 | |
Hubbell, Inc. | | | 101 | | | | 15,836 | |
Huntington Ingalls Industries, Inc. | | | 66 | | | | 11,252 | |
JB Hunt Transport Services, Inc. | | | 28 | | | | 3,826 | |
Kelly Services, Inc. - Class A | | | 93 | | | | 1,913 | |
Kforce, Inc. | | | 31 | | | | 1,305 | |
Kimball International, Inc. - Class B | | | 179 | | | | 2,139 | |
L B Foster Co. - Class A (1) | | | 39 | | | | 587 | |
Lawson Products, Inc./DE (1) | | | 6 | | | | 305 | |
Lockheed Martin Corp. | | | 388 | | | | 137,732 | |
LSC Communications, Inc. (1) | | | 522 | | | | 10 | |
ManpowerGroup, Inc. | | | 470 | | | | 42,385 | |
Matson, Inc. | | | 77 | | | | 4,387 | |
Maxar Technologies, Inc. | | | 57 | | | | 2,200 | |
Meritor, Inc. (1) | | | 36 | | | | 1,005 | |
Miller Industries, Inc./TN | | | 254 | | | | 9,657 | |
Moog, Inc. | | | 115 | | | | 9,120 | |
MSC Industrial Direct Co., Inc. | | | 164 | | | | 13,840 | |
Mueller Industries, Inc. | | | 173 | | | | 6,074 | |
MYR Group, Inc. (1) | | | 38 | | | | 2,284 | |
National Presto Industries, Inc. | | | 6 | | | | 531 | |
Norfolk Southern Corp. | | | 6 | | | | 1,426 | |
Old Dominion Freight Line, Inc. | | | 121 | | | | 23,617 | |
PACCAR, Inc. | | | 1,486 | | | | 128,212 | |
PAE, Inc. (1) | | | 139 | | | | 1,276 | |
Parker-Hannifin Corp. | | | 170 | | | | 46,310 | |
Plug Power, Inc. (1) | | | 227 | | | | 7,698 | |
Primoris Services Corp. | | | 614 | | | | 16,953 | |
Quad/Graphics, Inc. - Class A | | | 29 | | | | 111 | |
Quanta Services, Inc. | | | 1,185 | | | | 85,344 | |
Regal Beloit Corp. | | | 180 | | | | 22,106 | |
Resideo Technologies, Inc. (1) | | | 136 | | | | 2,891 | |
Rexnord Corp. | | | 43 | | | | 1,698 | |
RR Donnelley & Sons Co. | | | 416 | | | | 940 | |
Rush Enterprises, Inc. | | | 196 | | | | 8,118 | |
Ryder System, Inc. | | | 80 | | | | 4,941 | |
Safe Bulkers, Inc. (1) | | | 239 | | | | 311 | |
The accompanying notes are an integral part of these financial statements
Page 56 | 2020 Annual Report | December 31, 2020 |
Schedule of Investments
December 31, 2020
Global Allocation Fund |
Security Description | | Shares or
Principal
Amount ($) | | | Fair
Value ($) | |
Common Stocks — continued |
Saia, Inc. (1) | | | 42 | | | | 7,594 | |
Shyft Group, Inc./The | | | 78 | | | | 2,214 | |
SkyWest, Inc. | | | 20 | | | | 806 | |
Steelcase, Inc. | | | 132 | | | | 1,789 | |
Textainer Group Holdings, Ltd. (1) | | | 122 | | | | 2,340 | |
Timken Co./The | | | 286 | | | | 22,125 | |
TPI Composites, Inc. (1) | | | 48 | | | | 2,533 | |
Triton International, Ltd./Bermuda | | | 337 | | | | 16,348 | |
Tutor Perini Corp. (1) | | | 10 | | | | 130 | |
Uber Technologies, Inc. (1) | | | 413 | | | | 21,063 | |
United Parcel Service, Inc. - Class B | | | 352 | | | | 59,277 | |
United Rentals, Inc. (1) | | | 5 | | | | 1,160 | |
Vectrus, Inc. (1) | | | 46 | | | | 2,287 | |
Veritiv Corp. (1) | | | 43 | | | | 894 | |
Waste Management, Inc. | | | 1,116 | | | | 131,610 | |
WESCO International, Inc. (1) | | | 129 | | | | 10,127 | |
WESCO International, Inc. Series A Variable Preferred (9) | | | 81 | | | | 2,531 | |
| | | | | | | | 1,573,507 | |
| | | | | | | | | |
Information Technology — 11.5% | | | | | | | | |
8x8, Inc. (1) | | | 36 | | | | 1,241 | |
Accenture PLC - Class A | | | 99 | | | | 25,860 | |
ACI Worldwide, Inc. (1) | | | 170 | | | | 6,533 | |
Adobe, Inc. (1) | | | 312 | | | | 156,037 | |
ADTRAN, Inc. | | | 41 | | | | 606 | |
Advanced Micro Devices, Inc. (1) | | | 696 | | | | 63,830 | |
Alarm.com Holdings, Inc. (1) | | | 26 | | | | 2,690 | |
Alliance Data Systems Corp. | | | 49 | | | | 3,631 | |
Amkor Technology, Inc. | | | 316 | | | | 4,765 | |
Apple, Inc. | | | 8,375 | | | | 1,111,279 | |
Applied Materials, Inc. | | | 756 | | | | 65,243 | |
Arista Networks, Inc. (1) | | | 8 | | | | 2,325 | |
Arrow Electronics, Inc. (1) | | | 349 | | | | 33,958 | |
AstroNova, Inc. | | | 32 | | | | 341 | |
Autodesk, Inc. (1) | | | 157 | | | | 47,938 | |
Avaya Holdings Corp. (1) | | | 134 | | | | 2,566 | |
Avnet, Inc. | | | 649 | | | | 22,786 | |
Bill.com Holdings, Inc. (1) | | | 16 | | | | 2,184 | |
Broadcom, Inc. | | | 169 | | | | 73,997 | |
CACI International, Inc. - Class A (1) | | | 92 | | | | 22,938 | |
Cadence Design Systems, Inc. (1) | | | 1,136 | | | | 154,984 | |
Calix, Inc. (1) | | | 297 | | | | 8,839 | |
Cambium Networks Corp. (1) | | | 34 | | | | 853 | |
CDK Global, Inc. | | | 775 | | | | 40,168 | |
CDW Corp./DE | | | 241 | | | | 31,761 | |
Cerence, Inc. (1) | | | 47 | | | | 4,723 | |
Global Allocation Fund |
Security Description | | Shares or
Principal
Amount ($) | | | Fair
Value ($) | |
Common Stocks — continued |
ChannelAdvisor Corp. (1) | | | 219 | | | | 3,500 | |
Ciena Corp. (1) | | | 119 | | | | 6,289 | |
Cisco Systems, Inc. | | | 2,450 | | | | 109,638 | |
Cloudera, Inc. (1) | | | 2 | | | | 28 | |
Cloudflare, Inc. (1) | | | 94 | | | | 7,143 | |
Cognex Corp. | | | 82 | | | | 6,583 | |
Cognizant Technology Solutions Corp. | | | 590 | | | | 48,351 | |
Concentrix Corp. (1) | | | 133 | | | | 13,127 | |
Conduent, Inc. (1) | | | 476 | | | | 2,285 | |
Corning, Inc. | | | 592 | | | | 21,312 | |
Coupa Software, Inc. (1) | | | 26 | | | | 8,812 | |
Crowdstrike Holdings, Inc. (1) | | | 84 | | | | 17,793 | |
Dell Technologies, Inc. - Class C (1) | | | 42 | | | | 3,078 | |
Diebold Nixdorf, Inc. (1) | | | 82 | | | | 874 | |
Digital Turbine, Inc. (1) | | | 164 | | | | 9,276 | |
DocuSign, Inc. (1) | | | 125 | | | | 27,788 | |
Dolby Laboratories, Inc. | | | 12 | | | | 1,166 | |
Dropbox, Inc. - Class A (1) | | | 73 | | | | 1,620 | |
DXC Technology Co. | | | 344 | | | | 8,858 | |
Eastman Kodak Co. (1) | | | 15 | | | | 122 | |
Ebix, Inc. | | | 65 | | | | 2,468 | |
Elastic NV (1) | | | 8 | | | | 1,169 | |
Enphase Energy, Inc. (1) | | | 67 | | | | 11,756 | |
F5 Networks, Inc. (1) | | | 25 | | | | 4,399 | |
Fair Isaac Corp. (1) | | | 11 | | | | 5,621 | |
Fastly, Inc. (1) | | | 30 | | | | 2,621 | |
FormFactor, Inc. (1) | | | 36 | | | | 1,549 | |
Fortinet, Inc. (1) | | | 68 | | | | 10,100 | |
Hewlett Packard Enterprise Co. | | | 1,561 | | | | 18,498 | |
HP, Inc. | | | 1,674 | | | | 41,164 | |
HubSpot, Inc. (1) | | | 23 | | | | 9,118 | |
II-VI, Inc. (1) | | | 33 | | | | 2,507 | |
Information Services Group, Inc. (1) | | | 45 | | | | 148 | |
Insight Enterprises, Inc. (1) | | | 33 | | | | 2,511 | |
Intel Corp. | | | 2,837 | | | | 141,339 | |
Intuit, Inc. | | | 472 | | | | 179,289 | |
Jabil, Inc. | | | 611 | | | | 25,986 | |
KBR, Inc. | | | 125 | | | | 3,866 | |
Kimball Electronics, Inc. (1) | | | 9 | | | | 144 | |
KLA Corp. | | | 119 | | | | 30,810 | |
Lam Research Corp. | | | 168 | | | | 79,341 | |
Mastercard, Inc. | | | 347 | | | | 123,858 | |
Maxim Integrated Products, Inc. | | | 94 | | | | 8,333 | |
Methode Electronics, Inc. | | | 80 | | | | 3,062 | |
Microchip Technology, Inc. | | | 17 | | | | 2,348 | |
Micron Technology, Inc. (1) | | | 365 | | | | 27,441 | |
Microsoft Corp. | | | 4,190 | | | | 931,940 | |
The accompanying notes are an integral part of these financial statements
2020 Annual Report | December 31, 2020 | Page 57 |
Schedule of Investments
December 31, 2020
Global Allocation Fund |
Security Description | | Shares or
Principal
Amount ($) | | | Fair
Value ($) | |
Common Stocks — continued |
MicroStrategy, Inc. (1) | | | 41 | | | | 15,931 | |
MKS Instruments, Inc. | | | 42 | | | | 6,319 | |
MoneyGram International, Inc. (1) | | | 193 | | | | 1,055 | |
Monolithic Power Systems, Inc. | | | 4 | | | | 1,465 | |
NCR Corp. (1) | | | 145 | | | | 5,448 | |
NETGEAR, Inc. (1) | | | 14 | | | | 569 | |
NortonLifeLock, Inc. | | | 714 | | | | 14,837 | |
NVIDIA Corp. | | | 302 | | | | 157,704 | |
ON Semiconductor Corp. (1) | | | 67 | | | | 2,193 | |
Oracle Corp. | | | 2,005 | | | | 129,703 | |
PagerDuty, Inc. (1) | | | 19 | | | | 792 | |
Palo Alto Networks, Inc. (1) | | | 2 | | | | 711 | |
Paycom Software, Inc. (1) | | | 28 | | | | 12,663 | |
PayPal Holdings, Inc. (1) | | | 19 | | | | 4,450 | |
Photronics, Inc. (1) | | | 190 | | | | 2,120 | |
Plantronics, Inc. | | | 24 | | | | 649 | |
Priority Technology Holdings, Inc. (1) | | | 60 | | | | 422 | |
Progress Software Corp. | | | 260 | | | | 11,749 | |
Qorvo, Inc. (1) | | | 132 | | | | 21,948 | |
QUALCOMM, Inc. | | | 1,311 | | | | 199,718 | |
Rimini Street, Inc. (1) | | | 42 | | | | 186 | |
RingCentral, Inc. - Class A (1) | | | 28 | | | | 10,611 | |
salesforce.com, Inc. (1) | | | 431 | | | | 95,910 | |
Sanmina Corp. (1) | | | 149 | | | | 4,752 | |
ServiceNow, Inc. (1) | | | 17 | | | | 9,357 | |
Skyworks Solutions, Inc. | | | 148 | | | | 22,626 | |
Slack Technologies, Inc. - Class A (1) | | | 23 | | | | 972 | |
Smartsheet, Inc. (1) | | | 36 | | | | 2,494 | |
SolarEdge Technologies, Inc. (1) | | | 11 | | | | 3,510 | |
Sonim Technologies, Inc. (1) | | | 194 | | | | 140 | |
SPS Commerce, Inc. (1) | | | 36 | | | | 3,909 | |
Square, Inc. - Class A (1) | | | 195 | | | | 42,440 | |
SS&C Technologies Holdings, Inc. | | | 1,873 | | | | 136,261 | |
StoneCo, Ltd. (1) | | | 81 | | | | 6,798 | |
Stratasys, Ltd. (1) | | | 62 | | | | 1,285 | |
Sykes Enterprises, Inc. (1) | | | 124 | | | | 4,671 | |
SYNNEX Corp. | | | 154 | | | | 12,542 | |
Tenable Holdings, Inc. (1) | | | 125 | | | | 6,533 | |
Teradyne, Inc. | | | 201 | | | | 24,098 | |
TESSCO Technologies, Inc. | | | 26 | | | | 162 | |
Texas Instruments, Inc. | | | 536 | | | | 87,974 | |
Trade Desk, Inc./The (1) | | | 25 | | | | 20,025 | |
Trimble, Inc. (1) | | | 344 | | | | 22,969 | |
TTEC Holdings, Inc. | | | 71 | | | | 5,178 | |
Twilio, Inc. - Class A (1) | | | 72 | | | | 24,372 | |
Ultra Clean Holdings, Inc. (1) | | | 12 | | | | 374 | |
Verint Systems, Inc. (1) | | | 74 | | | | 4,971 | |
Global Allocation Fund |
Security Description | | Shares or
Principal
Amount ($) | | | Fair
Value ($) | |
Common Stocks — continued |
Veritone, Inc. (1) | | | 17 | | | | 484 | |
VirnetX Holding Corp. (2) | | | 349 | | | | 1,759 | |
Visa, Inc. | | | 561 | | | | 122,708 | |
Vishay Intertechnology, Inc. | | | 402 | | | | 8,325 | |
Vontier Corp. (1) | | | 37 | | | | 1,236 | |
Xerox Holdings Corp. | | | 844 | | | | 19,572 | |
Xilinx, Inc. | | | 158 | | | | 22,400 | |
Xperi Holding Corp. | | | 268 | | | | 5,601 | |
Zebra Technologies Corp. - Class A (1) | | | 63 | | | | 24,213 | |
Zoom Video Communications, Inc.- Class A (1) | | | 91 | | | | 30,696 | |
Zscaler, Inc. (1) | | | 36 | | | | 7,190 | |
| | | | | | | | 5,250,855 | |
| | | | | | | | | |
Materials — 1.2% | | | | | | | | |
Avery Dennison Corp. | | | 194 | | | | 30,091 | |
Avient Corp. | | | 49 | | | | 1,974 | |
Caledonia Mining Corp. PLC | | | 104 | | | | 1,652 | |
Celanese Corp. | | | 20 | | | | 2,599 | |
Chemours Co./The | | | 49 | | | | 1,215 | |
Commercial Metals Co. | | | 92 | | | | 1,890 | |
Corteva, Inc. | | | 421 | | | | 16,301 | |
Dow, Inc. | | | 382 | | | | 21,201 | |
Eastman Chemical Co. | | | 377 | | | | 37,806 | |
Flotek Industries, Inc. (1) | | | 182 | | | | 384 | |
Freeport-McMoRan, Inc. - Class B | | | 757 | | | | 19,697 | |
Hawkins, Inc. | | | 1 | | | | 52 | |
Huntsman Corp. | | | 696 | | | | 17,497 | |
Koppers Holdings, Inc. (1) | | | 40 | | | | 1,246 | |
Louisiana-Pacific Corp. | | | 362 | | | | 13,456 | |
LyondellBasell Industries NV - Class A | | | 185 | | | | 16,957 | |
Minerals Technologies, Inc. | | | 25 | | | | 1,553 | |
Mosaic Co./The | | | 70 | | | | 1,611 | |
Newmont Corp. | | | 1,433 | | | | 85,822 | |
Nucor Corp. | | | 232 | | | | 12,340 | |
O-I Glass, Inc. | | | 186 | | | | 2,213 | |
Olin Corp. | | | 57 | | | | 1,400 | |
Olympic Steel, Inc. | | | 11 | | | | 147 | |
Packaging Corp. of America | | | 30 | | | | 4,137 | |
PPG Industries, Inc. | | | 290 | | | | 41,824 | |
Rayonier Advanced Materials, Inc. (1) | | | 107 | | | | 698 | |
Reliance Steel & Aluminum Co. | | | 315 | | | | 37,721 | |
Royal Gold, Inc. | | | 13 | | | | 1,383 | |
Ryerson Holding Corp. (1) | | | 177 | | | | 2,414 | |
Scotts Miracle-Gro Co./The | | | 444 | | | | 88,418 | |
Sherwin-Williams Co./The | | | 83 | | | | 60,998 | |
Steel Dynamics, Inc. | | | 182 | | | | 6,710 | |
The accompanying notes are an integral part of these financial statements
Page 58 | 2020 Annual Report | December 31, 2020 |
Schedule of Investments
December 31, 2020
Global Allocation Fund |
Security Description | | Shares or
Principal
Amount ($) | | | Fair
Value ($) | |
Common Stocks — continued |
Stepan Co. | | | 23 | | | | 2,744 | |
SunCoke Energy, Inc. | | | 59 | | | | 257 | |
Tredegar Corp. | | | 64 | | | | 1,069 | |
Trinseo SA | | | 13 | | | | 666 | |
Tronox Holdings PLC | | | 133 | | | | 1,944 | |
Westlake Chemical Corp. | | | 63 | | | | 5,141 | |
Westrock Co. | | | 100 | | | | 4,353 | |
| | | | | | | | 549,581 | |
| | | | | | | | | |
Real Estate Investment Trust — 1.2% | | | | | | | | |
Altisource Portfolio Solutions SA (1) | | | 101 | | | | 1,301 | |
American Homes 4 Rent - Class A | | | 421 | | | | 12,630 | |
American Tower Corp. | | | 423 | | | | 94,947 | |
Ashford Hospitality Trust, Inc. | | | 79 | | | | 205 | |
CareTrust REIT, Inc. | | | 77 | | | | 1,708 | |
CatchMark Timber Trust, Inc. | | | 163 | | | | 1,526 | |
CBL & Associates Properties, Inc. (1)(2) | | | 792 | | | | 33 | |
Clipper Realty, Inc. | | | 91 | | | | 642 | |
Columbia Property Trust, Inc. | | | 492 | | | | 7,055 | |
CorEnergy Infrastructure Trust, Inc. | | | 164 | | | | 1,123 | |
Corporate Office Properties Trust | | | 352 | | | | 9,180 | |
CubeSmart | | | 668 | | | | 22,451 | |
CyrusOne, Inc. | | | 33 | | | | 2,414 | |
DiamondRock Hospitality Co. | | | 81 | | | | 668 | |
EastGroup Properties, Inc. | | | 58 | | | | 8,007 | |
Equinix, Inc. | | | 62 | | | | 44,279 | |
Essex Property Trust, Inc. | | | 64 | | | | 15,195 | |
Extra Space Storage, Inc. | | | 289 | | | | 33,484 | |
Gaming and Leisure Properties, Inc. | | | 556 | | | | 23,574 | |
Getty Realty Corp. | | | 87 | | | | 2,396 | |
Healthcare Realty Trust, Inc. | | | 484 | | | | 14,326 | |
Healthcare Trust of America, Inc. - Class A | | | 356 | | | | 9,804 | |
Hersha Hospitality Trust | | | 25 | | | | 197 | |
Host Hotels & Resorts, Inc. | | | 135 | | | | 1,975 | |
Iron Mountain, Inc. | | | 605 | | | | 17,835 | |
Lamar Advertising Co. - Class A | | | 578 | | | | 48,101 | |
Life Storage, Inc. | | | 18 | | | | 2,149 | |
LTC Properties, Inc. | | | 501 | | | | 19,494 | |
Maui Land & Pineapple Co., Inc. (1) | | | 8 | | | | 92 | |
National Health Investors, Inc. | | | 14 | | | | 968 | |
National Storage Affiliates Trust | | | 162 | | | | 5,837 | |
Newmark Group, Inc. | | | 125 | | | | 911 | |
Omega Healthcare Investors, Inc. | | | 179 | | | | 6,501 | |
Park Hotels & Resorts, Inc. | | | 157 | | | | 2,693 | |
Piedmont Office Realty Trust, Inc. | | | 542 | | | | 8,797 | |
PotlatchDeltic Corp. | | | 51 | | | | 2,551 | |
PS Business Parks, Inc. | | | 163 | | | | 21,658 | |
Global Allocation Fund |
Security Description | | Shares or
Principal
Amount ($) | | | Fair
Value ($) | |
Common Stocks — continued |
Public Storage | | | 159 | | | | 36,718 | |
RAIT Financial Trust (1)(7) | | | 287 | | | | 0 | |
Ryman Hospitality Properties, Inc. | | | 10 | | | | 678 | |
Sabra Health Care REIT, Inc. | | | 98 | | | | 1,702 | |
SBA Communications Corp. | | | 59 | | | | 16,646 | |
Service Properties Trust | | | 615 | | | | 7,066 | |
Simon Property Group, Inc. | | | 551 | | | | 46,989 | |
Spirit MTA REIT Liquidating Trust (1)(7) | | | 385 | | | | 0 | |
Tanger Factory Outlet Centers, Inc. (2) | | | 157 | | | | 1,564 | |
Trinity Place Holdings, Inc. (1) | | | 331 | | | | 414 | |
Welltower, Inc. | | | 156 | | | | 10,081 | |
| | | | | | | | 568,565 | |
| | | | | | | | | |
Utilities — 0.7% | | | | | | | | |
Alliant Energy Corp. | | | 92 | | | | 4,741 | |
American Water Works Co., Inc. | | | 300 | | | | 46,040 | |
Atlantic Power Corp. (1) | | | 432 | | | | 907 | |
MDU Resources Group, Inc. | | | 944 | | | | 24,865 | |
NextEra Energy, Inc. | | | 1,263 | | | | 97,440 | |
NRG Energy, Inc. | | | 286 | | | | 10,739 | |
Public Service Enterprise Group, Inc. | | | 806 | | | | 46,990 | |
UGI Corp. | | | 462 | | | | 16,152 | |
WEC Energy Group, Inc. | | | 218 | | | | 20,063 | |
Xcel Energy, Inc. | | | 670 | | | | 44,654 | |
| | | | | | | | 312,591 | |
| | | | | | | | | |
Total Common Stocks (Cost $13,079,046) | | | | | | | 18,193,648 | |
| | | | | | | | | |
Registered Investment Companies — 17.6% |
Baird Core Plus Bond Fund - Class I | | | 22,245 | | | | 270,052 | |
Dodge & Cox Income Fund | | | 15,635 | | | | 229,046 | |
DoubleLine Total Return Bond Fund - Class I | | | 14,505 | | | | 155,199 | |
Guggenheim Total Return Bond Fund - Class I | | | 3,574 | | | | 106,134 | |
iShares Core MSCI EAFE ETF (8) | | | 42,298 | | | | 2,922,369 | |
iShares Core MSCI Emerging Markets ETF (8) | | | 12,312 | | | | 763,836 | |
iShares Core U.S. Aggregate Bond ETF (8) | | | 3,136 | | | | 370,644 | |
iShares JP Morgan USD Emerging Markets Bond ETF (8) | | | 5,483 | | | | 635,535 | |
Lord Abbett High Yield Fund - Class I | | | 34,859 | | | | 259,696 | |
Payden Emerging Markets Bond Fund - Class I | | | 4,771 | | | | 66,273 | |
PGIM Total Return Bond Fund - Class R6 | | | 15,499 | | | | 234,189 | |
Pioneer Bond Fund - Class Y | | | 17,257 | | | | 174,812 | |
The accompanying notes are an integral part of these financial statements
2020 Annual Report | December 31, 2020 | Page 59 |
Schedule of Investments
December 31, 2020
Global Allocation Fund |
Security Description | | Shares or
Principal
Amount ($) | | | Fair
Value ($) | |
Registered Investment Companies — continued |
Segall Bryant & Hamill Plus Bond Fund - Class I | | | 17,195 | | | | 191,549 | |
SPDR Bloomberg Barclays High Yield Bond ETF (8) | | | 3,990 | | | | 434,671 | |
TCW Emerging Markets Income Fund - Class I | | | 13,926 | | | | 118,507 | |
Vanguard Intermediate-Term Corporate Bond ETF (8) | | | 1,625 | | | | 157,853 | |
Vanguard Total Bond Market ETF (8) | | | 3,555 | | | | 313,515 | |
Xtrackers USD High Yield Corporate Bond ETF (8) | | | 12,001 | | | | 601,128 | |
Total Registered Investment Companies (Cost $6,767,177) | | | | | | | 8,005,008 | |
| | | | | | | | | |
Money Market Registered Investment Companies — 34.4% |
Meeder Institutional Prime Money Market Fund, 0.08% (4) | | | 15,659,121 | | | | 15,663,819 | |
Morgan Stanley Government Institutional Fund, 0.03% (3) | | | 1,024 | | | | 1,024 | |
Total Money Market Registered Investment Companies (Cost $15,659,621) | | | | | | | 15,664,843 | |
| | | | | | | | | |
Bank Obligations — 1.6% |
First Merchants Bank Deposit Account, 0.75%, 1/4/2021 (5) | | | 248,088 | | | | 248,088 | |
Metro City Bank Deposit Account, 0.10%, 1/4/2021 (5) | | | 248,220 | | | | 248,220 | |
Pacific Mercantile Bank Deposit Account, 0.10%, 1/4/2021 (5) | | | 246,825 | | | | 246,825 | |
Total Bank Obligations (Cost $743,133) | | | | | | | 743,133 | |
Total Investments — 93.5% (Cost $36,248,977) | | | | | | | 42,606,632 | |
Other Assets less Liabilities — 6.5% | | | | | | | 2,975,301 | |
Total Net Assets — 100.0% | | | | | | | 45,581,933 | |
| | | | | | | | | |
Trustee Deferred Compensation (6) |
Meeder Balanced Fund - Retail Class | | | 1,765 | | | | 22,627 | |
Meeder Dynamic Allocation Fund - Retail Class | | | 4,535 | | | | 60,724 | |
Meeder Muirfield Fund - Retail Class | | | 2,043 | | | | 16,753 | |
Meeder Conservative Allocation Fund - Retail Class | | | 510 | | | | 12,194 | |
Total Trustee Deferred Compensation (Cost $90,572) | | | | | | | 112,298 | |
| | | | | | | | | |
Global Allocation Fund |
| | | Long
(Short)
Contracts | | | Expiration
Date | | | Notional
Value of
Contracts
($) | | | Value and
Unrealized
Appreciation
(Depreciation)
($) | |
Futures Contracts |
Index Futures | | | | | | | | | | | | | | | | |
Mini MSCI EAFE Index Futures | | | 120 | | | | 3/19/2021 | | | | 12,784,800 | | | | 195,325 | |
Mini MSCI Emerging Markets Index Futures | | | 52 | | | | 3/19/2021 | | | | 3,349,320 | | | | 99,500 | |
Russell 2000 Mini Index Futures | | | 3 | | | | 3/19/2021 | | | | 296,220 | | | | 7,224 | |
Standard & Poors 500 Mini Futures | | | 11 | | | | 3/19/2021 | | | | 2,061,840 | | | | 60,119 | |
E-mini Standard & Poors MidCap 400 Futures | | | 3 | | | | 3/19/2021 | | | | 691,050 | | | | 21,311 | |
Total Futures Contracts | | | 189 | | | | | | | | 19,183,230 | | | | 383,479 | |
(1) | Represents non-income producing securities. |
(2) | All or a portion of this security is on loan. |
(3) | Investment purchased with cash received as securities lending collateral. The yield shown represents the 7-day yield in effect at December 31, 2020. |
(4) | Investment in affiliate. The yield shown represents the 7-day yield in effect at December 31, 2020. |
(5) | Variable rate security. Securities payable at par including accrued interest (usually within seven days notice) and unconditionally secured as to principal and interest by letters of credit or other credit support agreements from major banks. The interest rates are adjustable and are not based on a published reference rate and spread but are determined by the issuer or agent and are based on current market conditions. These securities do not indicate a reference rate and spread in their description above. The rate shown represents the rate in effect at December 31, 2020. The maturity date shown, if applicable, reflects the earlier of the next demand date or stated maturity date. |
(6) | Assets of affiliates to the Global Allocation Fund held for the benefit of the Fund’s Trustees in connection with the Trustee Deferred Compensation Plan. |
(7) | Fair valued security deemed as Level 3 security. |
The accompanying notes are an integral part of these financial statements
Page 60 | 2020 Annual Report | December 31, 2020 |
Schedule of Investments
December 31, 2020
Balanced Fund |
Security Description | | Shares,
Contracts
or Principal
Amount ($) | | | Fair
Value ($) | |
Common Stocks — 55.3% |
Communication Services — 5.5% | | | | | | | | |
Activision Blizzard, Inc. | | | 7,824 | | | | 726,458 | |
Alphabet, Inc. - Class A (1) | | | 1,132 | | | | 1,983,988 | |
Alphabet, Inc. - Class C (1) | | | 2,571 | | | | 4,504,083 | |
AMC Entertainment Holdings, Inc. - Class A (2) | | | 1,174 | | | | 2,489 | |
AT&T, Inc. | | | 3,767 | | | | 108,339 | |
Cable One, Inc. | | | 8 | | | | 17,822 | |
Cinemark Holdings, Inc. | | | 767 | | | | 13,353 | |
Comcast Corp. - Class A | | | 40,782 | | | | 2,136,977 | |
Cumulus Media, Inc. (1) | | | 115 | | | | 1,003 | |
DISH Network Corp. (1) | | | 1,572 | | | | 50,838 | |
Electronic Arts, Inc. | | | 5,419 | | | | 778,168 | |
Entravision Communications Corp. | | | 948 | | | | 2,607 | |
EW Scripps Co./The | | | 76 | | | | 1,162 | |
Facebook, Inc. (1) | | | 16,613 | | | | 4,538,007 | |
Fluent, Inc. (1) | | | 460 | | | | 2,443 | |
Frontier Communications Corp. (1) | | | 4,619 | | | | 413 | |
Glu Mobile, Inc. (1) | | | 1,417 | | | | 12,767 | |
Gogo, Inc. (1) | | | 559 | | | | 5,383 | |
Gray Television, Inc. (1) | | | 2,246 | | | | 40,181 | |
IDT Corp. - Class B (1) | | | 729 | | | | 9,010 | |
Interpublic Group of Cos., Inc./The | | | 30,179 | | | | 709,810 | |
Lee Enterprises, Inc. (1) | | | 366 | | | | 461 | |
Liberty TripAdvisor Holdings, Inc. (1) | | | 705 | | | | 3,060 | |
Lions Gate Entertainment Corp. - Class A (1) | | | 1,943 | | | | 22,092 | |
Meredith Corp. | | | 465 | | | | 8,928 | |
Netflix, Inc. (1) | | | 2,550 | | | | 1,378,862 | |
News Corp. | | | 4,606 | | | | 82,770 | |
Nexstar Media Group, Inc. | | | 1,495 | | | | 163,239 | |
Omnicom Group, Inc. | | | 10,209 | | | | 636,735 | |
Pinterest, Inc. - Class A (1) | | | 2,660 | | | | 175,294 | |
Roku, Inc. - Class A (1) | | | 885 | | | | 293,838 | |
Spotify Technology SA (1) | | | 1,221 | | | | 384,200 | |
Take-Two Interactive Software, Inc. (1) | | | 114 | | | | 23,688 | |
TechTarget, Inc. (1) | | | 1,501 | | | | 88,724 | |
TEGNA, Inc. | | | 2,365 | | | | 32,992 | |
Telephone and Data Systems, Inc. | | | 3,397 | | | | 63,082 | |
Tribune Publishing Co. | | | 373 | | | | 5,110 | |
Twitter, Inc. (1) | | | 1,244 | | | | 67,363 | |
Verizon Communications, Inc. | | | 35,205 | | | | 2,068,294 | |
Walt Disney Co./The | | | 3,181 | | | | 576,334 | |
World Wrestling Entertainment, Inc. - Class A | | | 1,782 | | | | 85,625 | |
Yelp, Inc. (1) | | | 319 | | | | 10,422 | |
| | | | | | | | 21,816,414 | |
Balanced Fund |
Security Description | | Shares,
Contracts
or Principal
Amount ($) | | | Fair
Value ($) | |
Common Stocks — continued |
Consumer Discretionary — 7.1% | | | | | | | | |
Abercrombie & Fitch Co. | | | 86 | | | | 1,751 | |
Amazon.com, Inc. (1) | | | 2,371 | | | | 7,722,181 | |
American Eagle Outfitters, Inc. | | | 94 | | | | 1,887 | |
Aramark | | | 1,196 | | | | 46,022 | |
At Home Group, Inc. (1) | | | 478 | | | | 7,390 | |
AutoNation, Inc. (1) | | | 458 | | | | 31,964 | |
Best Buy Co., Inc. | | | 5,522 | | | | 551,040 | |
Big Lots, Inc. | | | 367 | | | | 15,755 | |
BorgWarner, Inc. | | | 2,333 | | | | 90,147 | |
Boyd Gaming Corp. | | | 733 | | | | 31,460 | |
Brinker International, Inc. | | | 643 | | | | 36,375 | |
Brunswick Corp./DE | | | 444 | | | | 33,851 | |
Buckle, Inc./The | | | 323 | | | | 9,432 | |
Caleres, Inc. | | | 654 | | | | 10,235 | |
Camping World Holdings, Inc. | | | 3,479 | | | | 90,628 | |
Capri Holdings, Ltd. (1) | | | 884 | | | | 37,128 | |
CarParts.com, Inc. (1) | | | 542 | | | | 6,715 | |
Carvana Co. (1) | | | 46 | | | | 11,019 | |
Chipotle Mexican Grill, Inc. (1) | | | 595 | | | | 825,092 | |
Churchill Downs, Inc. | | | 147 | | | | 28,634 | |
Container Store Group, Inc./The (1) | | | 382 | | | | 3,644 | |
Cooper Tire & Rubber Co. | | | 269 | | | | 10,895 | |
Cracker Barrel Old Country Store, Inc. | | | 873 | | | | 115,166 | |
Crocs, Inc. (1) | | | 4,215 | | | | 264,112 | |
Dana, Inc. | | | 1,980 | | | | 38,650 | |
Darden Restaurants, Inc. | | | 1,307 | | | | 155,690 | |
Dave & Buster’s Entertainment, Inc. | | | 180 | | | | 5,404 | |
Deckers Outdoor Corp. (1) | | | 29 | | | | 8,317 | |
Del Taco Restaurants, Inc. | | | 1,134 | | | | 10,274 | |
Designer Brands, Inc. - Class A | | | 646 | | | | 4,942 | |
Dillard’s, Inc. - Class A | | | 46 | | | | 2,900 | |
Dollar General Corp. | | | 3,072 | | | | 646,042 | |
Dollar Tree, Inc. (1) | | | 1,632 | | | | 176,321 | |
Domino’s Pizza, Inc. | | | 487 | | | | 186,745 | |
DR Horton, Inc. | | | 5,873 | | | | 404,767 | |
Duluth Holdings, Inc. - Class B (1) | | | 197 | | | | 2,080 | |
eBay, Inc. | | | 4,477 | | | | 224,969 | |
Etsy, Inc. (1) | | | 721 | | | | 128,273 | |
Everi Holdings, Inc. (1) | | | 254 | | | | 3,508 | |
Extended Stay America, Inc. | | | 4,362 | | | | 64,601 | |
Fiesta Restaurant Group, Inc. (1) | | | 456 | | | | 5,198 | |
Fossil Group, Inc. (1) | | | 581 | | | | 5,037 | |
Fox Factory Holding Corp. (1) | | | 101 | | | | 10,677 | |
Franchise Group, Inc. | | | 212 | | | | 6,455 | |
General Motors Co. | | | 15,927 | | | | 663,200 | |
The accompanying notes are an integral part of these financial statements
2020 Annual Report | December 31, 2020 | Page 61 |
Schedule of Investments
December 31, 2020
Balanced Fund |
Security Description | | Shares,
Contracts
or Principal
Amount ($) | | | Fair
Value ($) | |
Common Stocks — continued |
Genesco, Inc. (1) | | | 170 | | | | 5,115 | |
GoPro, Inc. (1) | | | 106 | | | | 878 | |
Greenlane Holdings, Inc. (1) | | | 449 | | | | 1,778 | |
Group 1 Automotive, Inc. | | | 161 | | | | 21,114 | |
GrowGeneration Corp. (1) | | | 473 | | | | 19,024 | |
Guess?, Inc. | | | 295 | | | | 6,673 | |
Hanesbrands, Inc. | | | 1,617 | | | | 23,576 | |
Harley-Davidson, Inc. | | | 1,992 | | | | 73,106 | |
Hibbett Sports, Inc. (1) | | | 794 | | | | 36,667 | |
Houghton Mifflin Harcourt Co. (1) | | | 797 | | | | 2,654 | |
International Game Technology PLC | | | 1,521 | | | | 25,766 | |
Kohl’s Corp. | | | 1,488 | | | | 60,547 | |
L Brands, Inc. | | | 1,460 | | | | 54,297 | |
Lakeland Industries, Inc. (1) | | | 1,410 | | | | 38,423 | |
Lands’ End, Inc. (1) | | | 308 | | | | 6,644 | |
Las Vegas Sands Corp. | | | 1,474 | | | | 87,850 | |
LCI Industries | | | 505 | | | | 65,488 | |
Lear Corp. | | | 448 | | | | 71,245 | |
Lennar Corp. - Class A | | | 1,923 | | | | 146,590 | |
Liquidity Services, Inc. (1) | | | 200 | | | | 3,182 | |
Lovesac Co./The (1) | | | 73 | | | | 3,146 | |
Lowe’s Cos., Inc. | | | 12,821 | | | | 2,057,899 | |
Lululemon Athletica, Inc. (1) | | | 757 | | | | 263,459 | |
Lumber Liquidators Holdings, Inc. (1) | | | 520 | | | | 15,985 | |
M/I Homes, Inc. (1) | | | 613 | | | | 27,150 | |
Malibu Boats, Inc. (1) | | | 1,704 | | | | 106,398 | |
MarineMax, Inc. (1) | | | 187 | | | | 6,551 | |
Marriott International, Inc./MD | | | 866 | | | | 114,243 | |
McDonald’s Corp. | | | 9,714 | | | | 2,084,430 | |
Meritage Homes Corp. (1) | | | 846 | | | | 70,066 | |
Modine Manufacturing Co. (1) | | | 1,348 | | | | 16,931 | |
Nautilus, Inc. (1) | | | 537 | | | | 9,741 | |
NIKE, Inc. - Class B | | | 7,517 | | | | 1,063,430 | |
Nordstrom, Inc. | | | 125 | | | | 3,901 | |
ODP Corp./The | | | 824 | | | | 24,143 | |
Overstock.com, Inc. (1) | | | 344 | | | | 16,502 | |
Party City Holdco, Inc. (1) | | | 922 | | | | 5,670 | |
Penn National Gaming, Inc. (1) | | | 1,218 | | | | 105,199 | |
Polaris, Inc. | | | 476 | | | | 45,353 | |
Pool Corp. | | | 333 | | | | 124,043 | |
PulteGroup, Inc. | | | 10,055 | | | | 433,572 | |
Purple Innovation, Inc. (1) | | | 1,539 | | | | 50,695 | |
Qurate Retail, Inc. - Class A | | | 4,824 | | | | 52,919 | |
Red Rock Resorts, Inc. | | | 858 | | | | 21,484 | |
Rent-A-Center, Inc./TX | | | 11,458 | | | | 438,727 | |
Scientific Games Corp. (1) | | | 594 | | | | 24,645 | |
Balanced Fund |
Security Description | | Shares,
Contracts
or Principal
Amount ($) | | | Fair
Value ($) | |
Common Stocks — continued |
Sleep Number Corp. (1) | | | 225 | | | | 18,419 | |
Smith & Wesson Brands, Inc. | | | 106 | | | | 1,882 | |
Sonic Automotive, Inc. | | | 1,324 | | | | 51,067 | |
Starbucks Corp. | | | 11,280 | | | | 1,206,734 | |
Sturm Ruger & Co., Inc. | | | 49 | | | | 3,188 | |
Tapestry, Inc. | | | 1,144 | | | | 35,556 | |
Target Corp. | | | 4,479 | | | | 790,678 | |
Tesla, Inc. (1) | | | 4,750 | | | | 3,351,933 | |
Texas Roadhouse, Inc. | | | 800 | | | | 62,528 | |
Thor Industries, Inc. | | | 1,445 | | | | 134,371 | |
Tilly’s, Inc. - Class A | | | 41 | | | | 335 | |
TopBuild Corp. (1) | | | 178 | | | | 32,766 | |
Town Sports International Holdings, Inc. (1) | | | 1,777 | | | | 444 | |
Tupperware Brands Corp. (1) | | | 292 | | | | 9,458 | |
Urban Outfitters, Inc. (1) | | | 381 | | | | 9,754 | |
Vista Outdoor, Inc. (1) | | | 443 | | | | 10,526 | |
VOXX International Corp. (1) | | | 352 | | | | 4,492 | |
Waitr Holdings, Inc. (1) | | | 695 | | | | 1,932 | |
Wayfair, Inc. (1) | | | 62 | | | | 14,000 | |
Wendy’s Co./The | | | 1,197 | | | | 26,238 | |
Williams-Sonoma, Inc. | | | 417 | | | | 42,467 | |
Wingstop, Inc. | | | 430 | | | | 56,997 | |
Winnebago Industries, Inc. | | | 3,834 | | | | 229,810 | |
Wyndham Destinations, Inc. | | | 5,365 | | | | 240,674 | |
Yum China Holdings, Inc. | | | 2,657 | | | | 151,688 | |
Yum! Brands, Inc. | | | 9,669 | | | | 1,049,667 | |
| | | | | | | | 28,211,076 | |
| | | | | | | | | |
Consumer Staples — 1.6% | | | | | | | | |
Andersons, Inc./The | | | 708 | | | | 17,353 | |
BJ’s Wholesale Club Holdings, Inc. (1) | | | 343 | | | | 12,787 | |
Bunge, Ltd. | | | 12,251 | | | | 803,421 | |
Conagra Brands, Inc. | | | 4,881 | | | | 176,985 | |
Costco Wholesale Corp. | | | 70 | | | | 26,375 | |
Darling Ingredients, Inc. (1) | | | 9,323 | | | | 537,751 | |
General Mills, Inc. | | | 26,625 | | | | 1,565,550 | |
Kroger Co./The | | | 7,863 | | | | 249,729 | |
Molson Coors Beverage Co. - Class B | | | 7,827 | | | | 353,702 | |
Natural Grocers by Vitamin Cottage, Inc. | | | 343 | | | | 4,713 | |
Nu Skin Enterprises, Inc. | | | 181 | | | | 9,888 | |
PepsiCo, Inc. | | | 7,732 | | | | 1,146,656 | |
Performance Food Group Co. (1) | | | 1,009 | | | | 48,038 | |
Rite Aid Corp. (1) | | | 509 | | | | 8,057 | |
SpartanNash Co. | | | 767 | | | | 13,353 | |
Tyson Foods, Inc. | | | 2,284 | | | | 147,181 | |
United Natural Foods, Inc. (1) | | | 661 | | | | 10,556 | |
The accompanying notes are an integral part of these financial statements
Page 62 | 2020 Annual Report | December 31, 2020 |
Schedule of Investments
December 31, 2020
Balanced Fund |
Security Description | | Shares,
Contracts
or Principal
Amount ($) | | | Fair
Value ($) | |
Common Stocks — continued |
Walgreens Boots Alliance, Inc. | | | 191 | | | | 7,617 | |
Walmart, Inc. | | | 8,649 | | | | 1,246,753 | |
| | | | | | | | 6,386,465 | |
| | | | | | | | | |
Energy — 0.6% | | | | | | | | |
Amplify Energy Corp. | | | 2,959 | | | | 3,876 | |
Antero Resources Corp. (1) | | | 4,003 | | | | 21,816 | |
Apache Corp. | | | 1,676 | | | | 23,782 | |
Archrock, Inc. | | | 2,249 | | | | 19,476 | |
Ardmore Shipping Corp. | | | 2,009 | | | | 6,569 | |
Aspen Aerogels, Inc. (1) | | | 1,109 | | | | 18,509 | |
Bonanza Creek Energy, Inc. (1) | | | 753 | | | | 14,555 | |
Brigham Minerals, Inc. | | | 633 | | | | 6,957 | |
Cabot Oil & Gas Corp. | | | 3,603 | | | | 58,657 | |
Cactus, Inc. - Class A | | | 1,885 | | | | 49,142 | |
Centennial Resource Development, Inc./DE - Class A (1) | | | 3,626 | | | | 5,439 | |
Chaparral Energy, Inc. A Warrants (1)(7) | | | 3 | | | | 0 | |
Chaparral Energy, Inc. B Warrants (1)(7) | | | 3 | | | | 0 | |
Chesapeake Energy Corp. (1) | | | 341 | | | | 518 | |
Chevron Corp. | | | 3,338 | | | | 281,894 | |
Cimarex Energy Co. | | | 3,261 | | | | 122,320 | |
Clean Energy Fuels Corp. (1) | | | 2,688 | | | | 21,128 | |
CNX Resources Corp. (1) | | | 1,270 | | | | 13,716 | |
Concho Resources, Inc. | | | 2,880 | | | | 168,048 | |
ConocoPhillips | | | 11,015 | | | | 440,490 | |
CONSOL Energy, Inc. (1) | | | 392 | | | | 2,826 | |
Continental Resources, Inc./OK | | | 820 | | | | 13,366 | |
Delek US Holdings, Inc. | | | 262 | | | | 4,210 | |
DHT Holdings, Inc. | | | 1,006 | | | | 5,261 | |
Diamondback Energy, Inc. | | | 442 | | | | 21,393 | |
Dorian LPG, Ltd. (1) | | | 610 | | | | 7,436 | |
Earthstone Energy, Inc. - Class A (1) | | | 592 | | | | 3,155 | |
EOG Resources, Inc. | | | 4,894 | | | | 244,064 | |
EQT Corp. | | | 2,861 | | | | 36,363 | |
Exterran Corp. (1) | | | 193 | | | | 853 | |
Extraction Oil & Gas, Inc. (1) | | | 1,822 | | | | 52 | |
Frank’s International NV (1) | | | 2,752 | | | | 7,540 | |
Golar LNG, Ltd. | | | 306 | | | | 2,950 | |
Hallador Energy Co. | | | 1,603 | | | | 2,356 | |
Hess Corp. | | | 576 | | | | 30,407 | |
International Seaways, Inc. | | | 864 | | | | 14,109 | |
Laredo Petroleum, Inc. (1) | | | 1,085 | | | | 21,375 | |
Liberty Oilfield Services, Inc. - Class A | | | 2,330 | | | | 24,022 | |
Matador Resources Co. (1) | | | 1,642 | | | | 19,803 | |
Nabors Industries, Ltd. | | | 239 | | | | 13,917 | |
Balanced Fund |
Security Description | | Shares,
Contracts
or Principal
Amount ($) | | | Fair
Value ($) | |
Common Stocks — continued |
NextDecade Corp. (1) | | | 575 | | | | 1,202 | |
NexTier Oilfield Solutions, Inc. (1) | | | 1,321 | | | | 4,544 | |
Nine Energy Service, Inc. (1) | | | 1,567 | | | | 4,262 | |
Nordic American Tankers, Ltd. | | | 354 | | | | 1,044 | |
NOV, Inc. (1) | | | 1,865 | | | | 25,606 | |
Oasis Petroleum, Inc. Warrants (1)(7) | | | 9 | | | | 0 | |
Oceaneering International, Inc. (1) | | | 2,179 | | | | 17,323 | |
Parsley Energy, Inc. | | | 1,631 | | | | 23,160 | |
PDC Energy, Inc. (1) | | | 1,435 | | | | 29,461 | |
Peabody Energy Corp. | | | 925 | | | | 2,229 | |
Phillips 66 | | | 1,050 | | | | 73,437 | |
Pioneer Natural Resources Co. | | | 1,147 | | | | 130,632 | |
ProPetro Holding Corp. (1) | | | 5,461 | | | | 40,357 | |
Range Resources Corp. | | | 2,001 | | | | 13,407 | |
Renewable Energy Group, Inc. (1) | | | 432 | | | | 30,594 | |
Schlumberger NV | | | 2,956 | | | | 64,529 | |
Scorpio Tankers, Inc. | | | 117 | | | | 1,309 | |
Southwestern Energy Co. (1) | | | 5,456 | | | | 16,259 | |
Superior Energy Services, Inc. (1) | | | 475 | | | | 22 | |
Talos Energy, Inc. (1) | | | 200 | | | | 1,648 | |
Teekay Corp. (1) | | | 1,504 | | | | 3,234 | |
W&T Offshore, Inc. (1) | | | 2,729 | | | | 5,922 | |
Whiting Petroleum Corp. (1) | | | 123 | | | | 3,075 | |
Whiting Petroleum Corporation A Warrants (1) | | | 56 | | | | 98 | |
Whiting Petroleum Corporation B Warrants (1)(2) | | | 27 | | | | 51 | |
World Fuel Services Corp. | | | 1,736 | | | | 54,094 | |
WPX Energy, Inc. (1) | | | 1,347 | | | | 10,978 | |
| | | | | | | | 2,310,827 | |
| | | | | | | | | |
Financials — 4.8% | | | | | | | | |
AGNC Investment Corp. | | | 10,765 | | | | 167,934 | |
Allstate Corp./The | | | 1,947 | | | | 214,034 | |
Ally Financial, Inc. | | | 11,328 | | | | 403,956 | |
American Equity Investment Life Holding Co. | | | 1,220 | | | | 33,745 | |
American Express Co. | | | 1,377 | | | | 166,493 | |
Ameriprise Financial, Inc. | | | 944 | | | | 183,448 | |
Ameris Bancorp | | | 2,801 | | | | 106,634 | |
Apollo Commercial Real Estate Finance, Inc. | | | 149 | | | | 1,664 | |
Arbor Realty Trust, Inc. | | | 1,990 | | | | 28,218 | |
Artisan Partners Asset Management, Inc. - Class A | | | 4,004 | | | | 201,561 | |
Associated Banc-Corp | | | 8,534 | | | | 145,505 | |
Axos Financial, Inc. (1) | | | 1,249 | | | | 46,875 | |
The accompanying notes are an integral part of these financial statements
2020 Annual Report | December 31, 2020 | Page 63 |
Schedule of Investments
December 31, 2020
Balanced Fund |
Security Description | | Shares,
Contracts
or Principal
Amount ($) | | | Fair
Value ($) | |
Common Stocks — continued |
BancorpSouth Bank | | | 2,170 | | | | 59,545 | |
Bank of America Corp. | | | 56,285 | | | | 1,705,998 | |
Bank of NT Butterfield & Son, Ltd./The | | | 2,903 | | | | 90,457 | |
BankUnited, Inc. | | | 3,220 | | | | 111,992 | |
Banner Corp. | | | 125 | | | | 5,824 | |
Bar Harbor Bankshares | | | 267 | | | | 6,032 | |
Berkshire Hathaway, Inc. - Class B (1) | | | 17,303 | | | | 4,012,047 | |
Capital Bancorp, Inc. (1) | | | 130 | | | | 1,811 | |
Charles Schwab Corp./The | | | 1,227 | | | | 65,080 | |
Chimera Investment Corp. | | | 1,042 | | | | 10,681 | |
Citigroup, Inc. | | | 8,025 | | | | 494,822 | |
Citizens Financial Group, Inc. | | | 5,004 | | | | 178,943 | |
Civista Bancshares, Inc. | | | 1,385 | | | | 24,279 | |
CNO Financial Group, Inc. | | | 4,940 | | | | 109,816 | |
Columbia Banking System, Inc. | | | 394 | | | | 14,145 | |
Comerica, Inc. | | | 5 | | | | 279 | |
Cowen, Inc. | | | 567 | | | | 14,736 | |
Curo Group Holdings Corp. | | | 3,701 | | | | 53,035 | |
Customers Bancorp, Inc. (1) | | | 1,609 | | | | 29,252 | |
East West Bancorp, Inc. | | | 2,602 | | | | 131,947 | |
Eaton Vance Corp. | | | 1,249 | | | | 84,845 | |
Ellington Residential Mortgage REIT | | | 923 | | | | 12,036 | |
Enova International, Inc. (1) | | | 1,454 | | | | 36,016 | |
Esquire Financial Holdings, Inc. (1) | | | 16 | | | | 307 | |
Evercore, Inc. - Class A | | | 1,141 | | | | 125,099 | |
Farmers National Banc Corp. | | | 255 | | | | 3,384 | |
Fifth Third Bancorp | | | 15,429 | | | | 425,378 | |
First American Financial Corp. | | | 2,298 | | | | 118,646 | |
First Choice Bancorp | | | 22 | | | | 407 | |
First Citizens BancShares, Inc./NC - Class A | | | 131 | | | | 75,229 | |
First Financial Bancorp | | | 2,122 | | | | 37,199 | |
First Foundation, Inc. | | | 841 | | | | 16,820 | |
First Horizon Corp. | | | 176 | | | | 2,246 | |
First Interstate BancSystem, Inc. | | | 166 | | | | 6,768 | |
First Republic Bank/CA | | | 2,101 | | | | 308,700 | |
FNCB Bancorp, Inc. | | | 298 | | | | 1,907 | |
Goosehead Insurance, Inc. | | | 384 | | | | 47,908 | |
Great Ajax Corp. | | | 2,240 | | | | 23,430 | |
GWG Holdings, Inc. (1) | | | 208 | | | | 1,454 | |
Hartford Financial Services Group, Inc./The | | | 1,009 | | | | 49,421 | |
HBT Financial, Inc. | | | 1,352 | | | | 20,483 | |
Heartland Financial USA, Inc. | | | 1,521 | | | | 61,403 | |
Hilltop Holdings, Inc. | | | 4,392 | | | | 120,824 | |
Houlihan Lokey, Inc. - Class A | | | 82 | | | | 5,513 | |
Huntington Bancshares, Inc./OH | | | 6,183 | | | | 78,091 | |
James River Group Holdings, Ltd. | | | 734 | | | | 36,076 | |
Balanced Fund |
Security Description | | Shares,
Contracts
or Principal
Amount ($) | | | Fair
Value ($) | |
Common Stocks — continued |
JPMorgan Chase & Co. | | | 10,757 | | | | 1,366,892 | |
KeyCorp | | | 2,665 | | | | 43,733 | |
Kinsale Capital Group, Inc. | | | 672 | | | | 134,487 | |
Lakeland Financial Corp. | | | 22 | | | | 1,179 | |
LPL Financial Holdings, Inc. | | | 700 | | | | 72,954 | |
M&T Bank Corp. | | | 425 | | | | 54,103 | |
Medley Management, Inc. | | | 101 | | | | 807 | |
Meta Financial Group, Inc. | | | 381 | | | | 13,929 | |
MetLife, Inc. | | | 6,095 | | | | 286,160 | |
Metrocity Bankshares, Inc. | | | 1,456 | | | | 20,996 | |
Mid Penn Bancorp, Inc. | | | 8 | | | | 175 | |
MMA Capital Holdings, Inc. (1) | | | 162 | | | | 3,985 | |
Morgan Stanley | | | 10,888 | | | | 746,155 | |
Mr Cooper Group, Inc. (1) | | | 2,498 | | | | 77,513 | |
Northrim BanCorp, Inc. | | | 1,346 | | | | 45,697 | |
Old Republic International Corp. | | | 3,496 | | | | 68,906 | |
OneMain Holdings, Inc. | | | 1,556 | | | | 74,937 | |
Oppenheimer Holdings, Inc. | | | 2,072 | | | | 65,123 | |
PennyMac Financial Services, Inc. | | | 4,688 | | | | 307,627 | |
PennyMac Mortgage Investment Trust | | | 2,154 | | | | 37,889 | |
People’s United Financial, Inc. | | | 2,024 | | | | 26,170 | |
Pinnacle Financial Partners, Inc. | | | 451 | | | | 29,044 | |
PJT Partners, Inc. | | | 2,411 | | | | 181,428 | |
PNC Financial Services Group, Inc./The | | | 2,327 | | | | 346,723 | |
Popular, Inc. | | | 1,341 | | | | 75,525 | |
Progressive Corp./The | | | 3,364 | | | | 332,632 | |
ProSight Global, Inc. (1) | | | 81 | | | | 1,039 | |
Prudential Financial, Inc. | | | 4,136 | | | | 322,898 | |
Pzena Investment Management, Inc. - Class A | | | 3,249 | | | | 23,718 | |
QCR Holdings, Inc. | | | 773 | | | | 30,603 | |
RBB Bancorp | | | 4,086 | | | | 62,843 | |
Ready Capital Corp. | | | 2,948 | | | | 36,703 | |
Regions Financial Corp. | | | 18,968 | | | | 305,764 | |
Sandy Spring Bancorp, Inc. | | | 402 | | | | 12,940 | |
Shore Bancshares, Inc. | | | 92 | | | | 1,343 | |
Siebert Financial Corp. (1) | | | 341 | | | | 1,432 | |
Signature Bank/New York NY | | | 817 | | | | 110,532 | |
Silvercrest Asset Management Group, Inc. | | | 283 | | | | 3,931 | |
Simmons First National Corp. | | | 500 | | | | 10,795 | |
SLM Corp. | | | 2,879 | | | | 35,671 | |
South State Corp. | | | 172 | | | | 12,436 | |
State Street Corp. | | | 4,787 | | | | 348,398 | |
Stewart Information Services Corp. | | | 6,018 | | | | 291,030 | |
StoneX Group, Inc. (1) | | | 365 | | | | 21,134 | |
Summit Financial Group, Inc. | | | 114 | | | | 2,517 | |
The accompanying notes are an integral part of these financial statements
Page 64 | 2020 Annual Report | December 31, 2020 |
Schedule of Investments
December 31, 2020
Balanced Fund |
Security Description | | Shares,
Contracts
or Principal
Amount ($) | | | Fair
Value ($) | |
Common Stocks — continued |
SVB Financial Group (1) | | | 567 | | | | 219,900 | |
Synchrony Financial | | | 25,050 | | | | 869,486 | |
Synovus Financial Corp. | | | 440 | | | | 14,243 | |
Truist Financial Corp. | | | 11,550 | | | | 553,592 | |
UMB Financial Corp. | | | 1,529 | | | | 105,486 | |
United Community Banks, Inc./GA | | | 2,683 | | | | 76,305 | |
Unum Group | | | 7,078 | | | | 162,369 | |
Valley National Bancorp | | | 4,768 | | | | 46,488 | |
Veritex Holdings, Inc. | | | 1,157 | | | | 29,689 | |
Virtu Financial, Inc. | | | 2,999 | | | | 75,485 | |
Virtus Investment Partners, Inc. | | | 571 | | | | 123,907 | |
W R Berkley Corp. | | | 1,031 | | | | 68,479 | |
Walker & Dunlop, Inc. | | | 725 | | | | 66,715 | |
Wells Fargo & Co. | | | 2,474 | | | | 74,665 | |
Western Alliance Bancorp | | | 1,864 | | | | 111,747 | |
WSFS Financial Corp. | | | 165 | | | | 7,405 | |
| | | | | | | | 19,176,835 | |
| | | | | | | | | |
Healthcare — 10.5% | | | | | | | | |
89bio, Inc. (1) | | | 47 | | | | 1,145 | |
Abbott Laboratories | | | 7,500 | | | | 821,175 | |
AbbVie, Inc. | | | 19,706 | | | | 2,111,498 | |
AcelRx Pharmaceuticals, Inc. (1) | | | 3,182 | | | | 3,946 | |
Affimed NV (1) | | | 2,019 | | | | 11,751 | |
Agilent Technologies, Inc. | | | 7,087 | | | | 839,739 | |
Albireo Pharma, Inc. (1) | | | 28 | | | | 1,050 | |
Alexion Pharmaceuticals, Inc. (1) | | | 3,427 | | | | 535,434 | |
Align Technology, Inc. (1) | | | 594 | | | | 317,422 | |
Alkermes PLC (1) | | | 2,906 | | | | 57,975 | |
Allakos, Inc. (1) | | | 225 | | | | 31,500 | |
Allscripts Healthcare Solutions, Inc. (1) | | | 1,340 | | | | 19,350 | |
Alnylam Pharmaceuticals, Inc. (1) | | | 826 | | | | 107,355 | |
AmerisourceBergen Corp. | | | 529 | | | | 51,715 | |
Amgen, Inc. | | | 7,165 | | | | 1,647,377 | |
Amicus Therapeutics, Inc. (1) | | | 599 | | | | 13,831 | |
Amneal Pharmaceuticals, Inc. - Class A (1) | | | 3,656 | | | | 16,708 | |
Anthem, Inc. | | | 1,116 | | | | 358,336 | |
Apellis Pharmaceuticals, Inc. (1) | | | 403 | | | | 23,052 | |
Applied Therapeutics, Inc. (1) | | | 103 | | | | 2,267 | |
Arcturus Therapeutics Holdings, Inc. (1) | | | 106 | | | | 4,598 | |
Arcutis Biotherapeutics, Inc. (1) | | | 254 | | | | 7,145 | |
Arena Pharmaceuticals, Inc. (1) | | | 540 | | | | 41,488 | |
Arrowhead Pharmaceuticals, Inc. (1) | | | 655 | | | | 50,258 | |
Assembly Biosciences, Inc. (1) | | | 2 | | | | 12 | |
Assertio Holdings, Inc. (1) | | | 2,907 | | | | 1,040 | |
Atara Biotherapeutics, Inc. (1) | | | 448 | | | | 8,794 | |
Balanced Fund |
Security Description | | Shares,
Contracts
or Principal
Amount ($) | | | Fair
Value ($) | |
Common Stocks — continued |
Avantor, Inc. (1) | | | 3,915 | | | | 110,207 | |
Axsome Therapeutics, Inc. (1) | | | 145 | | | | 11,813 | |
Baxter International, Inc. | | | 682 | | | | 54,724 | |
Beam Therapeutics, Inc. (1) | | | 416 | | | | 33,962 | |
Becton Dickinson and Co. | | | 1,088 | | | | 272,239 | |
BioDelivery Sciences International, Inc. (1) | | | 4,471 | | | | 18,778 | |
Bio-Rad Laboratories, Inc. (1) | | | 128 | | | | 74,616 | |
Bioxcel Therapeutics, Inc. (1) | | | 237 | | | | 10,949 | |
Blueprint Medicines Corp. (1) | | | 477 | | | | 53,496 | |
Bridgebio Pharma, Inc. (1) | | | 317 | | | | 22,542 | |
Bristol-Myers Squibb Co. | | | 23,449 | | | | 1,454,541 | |
Calyxt, Inc. (1) | | | 18 | | | | 76 | |
Cardinal Health, Inc. | | | 8,952 | | | | 479,469 | |
CareDx, Inc. (1) | | | 478 | | | | 34,631 | |
CASI Pharmaceuticals, Inc. (1) | | | 685 | | | | 2,021 | |
Castle Biosciences, Inc. (1) | | | 317 | | | | 21,287 | |
Catalent, Inc. (1) | | | 2,543 | | | | 264,650 | |
Catalyst Pharmaceuticals, Inc. (1) | | | 2,831 | | | | 9,456 | |
Celcuity, Inc. (1) | | | 180 | | | | 1,649 | |
Centene Corp. (1) | | | 3,588 | | | | 215,388 | |
Centogene NV (1) | | | 363 | | | | 3,913 | |
Cerecor, Inc. (1) | | | 511 | | | | 1,349 | |
Cerner Corp. | | | 11,664 | | | | 915,391 | |
Charles River Laboratories International, Inc. (1) | | | 578 | | | | 144,419 | |
Chemed Corp. | | | 597 | | | | 317,968 | |
ChemoCentryx, Inc. (1) | | | 771 | | | | 47,740 | |
Co-Diagnostics, Inc. (1) | | | 279 | | | | 2,595 | |
Community Health Systems, Inc. (1) | | | 1,808 | | | | 13,433 | |
Constellation Pharmaceuticals, Inc. (1) | | | 257 | | | | 7,402 | |
Corcept Therapeutics, Inc. (1) | | | 586 | | | | 15,330 | |
Cortexyme, Inc. (1) | | | 4 | | | | 111 | |
Cross Country Healthcare, Inc. (1) | | | 314 | | | | 2,785 | |
CVS Health Corp. | | | 12,280 | | | | 838,724 | |
Cymabay Therapeutics, Inc. (1) | | | 2,138 | | | | 12,272 | |
Danaher Corp. | | | 3,238 | | | | 719,289 | |
Deciphera Pharmaceuticals, Inc. (1) | | | 306 | | | | 17,463 | |
Denali Therapeutics, Inc. (1) | | | 462 | | | | 38,697 | |
DENTSPLY SIRONA, Inc. | | | 4,945 | | | | 258,920 | |
Editas Medicine, Inc. (1) | | | 248 | | | | 17,387 | |
Edwards Lifesciences Corp. (1) | | | 4,406 | | | | 401,959 | |
Eidos Therapeutics, Inc. (1) | | | 125 | | | | 16,448 | |
Elanco Animal Health, Inc. Contingent Value Rights (1)(7) | | | 1,792 | | | | 0 | |
Eli Lilly and Co. | | | 7,107 | | | | 1,199,946 | |
Eloxx Pharmaceuticals, Inc. (1) | | | 605 | | | | 2,408 | |
The accompanying notes are an integral part of these financial statements
2020 Annual Report | December 31, 2020 | Page 65 |
Schedule of Investments
December 31, 2020
Balanced Fund |
Security Description | | Shares,
Contracts
or Principal
Amount ($) | | | Fair
Value ($) | |
Common Stocks — continued |
Emergent BioSolutions, Inc. (1) | | | 677 | | | | 60,659 | |
Endo International PLC (1) | | | 4,683 | | | | 33,624 | |
Enochian Biosciences, Inc. (1) | | | 99 | | | | 292 | |
Ensign Group, Inc./The | | | 420 | | | | 30,626 | |
Evelo Biosciences, Inc. (1) | | | 353 | | | | 4,268 | |
Exact Sciences Corp. (1) | | | 903 | | | | 119,638 | |
Exelixis, Inc. (1) | | | 3,773 | | | | 75,724 | |
Fate Therapeutics, Inc. (1) | | | 553 | | | | 50,284 | |
Five Prime Therapeutics, Inc. (1) | | | 572 | | | | 9,730 | |
Fulgent Genetics, Inc. (1) | | | 168 | | | | 8,753 | |
Gilead Sciences, Inc. | | | 14,866 | | | | 866,093 | |
Globus Medical, Inc. (1) | | | 518 | | | | 33,784 | |
HCA Healthcare, Inc. | | | 1,394 | | | | 229,257 | |
Hill-Rom Holdings, Inc. | | | 1,607 | | | | 157,438 | |
Hologic, Inc. (1) | | | 1,003 | | | | 73,048 | |
Horizon Therapeutics Plc (1) | | | 2,831 | | | | 207,088 | |
Humana, Inc. | | | 1,688 | | | | 692,536 | |
IGM Biosciences, Inc. (1) | | | 68 | | | | 6,004 | |
Illumina, Inc. (1) | | | 571 | | | | 211,270 | |
ImmunoGen, Inc. (1) | | | 1,710 | | | | 11,030 | |
Immunovant, Inc. (1) | | | 120 | | | | 5,543 | |
Inogen, Inc. (1) | | | 161 | | | | 7,193 | |
Inovio Pharmaceuticals, Inc. (1) | | | 846 | | | | 7,487 | |
Insmed, Inc. (1) | | | 494 | | | | 16,445 | |
Insulet Corp. (1) | | | 201 | | | | 51,382 | |
Intellia Therapeutics, Inc. (1) | | | 580 | | | | 31,552 | |
Intersect ENT, Inc. (1) | | | 475 | | | | 10,878 | |
Intra-Cellular Therapies, Inc. (1) | | | 3 | | | | 95 | |
Invitae Corp. (1) | | | 702 | | | | 29,351 | |
Iovance Biotherapeutics, Inc. (1) | | | 1,227 | | | | 56,933 | |
iRhythm Technologies, Inc. (1) | | | 146 | | | | 34,633 | |
Johnson & Johnson | | | 25,338 | | | | 3,987,694 | |
Jounce Therapeutics, Inc. (1) | | | 495 | | | | 3,465 | |
Kodiak Sciences, Inc. (1) | | | 290 | | | | 42,604 | |
Kura Oncology, Inc. (1) | | | 943 | | | | 30,798 | |
LHC Group, Inc. (1) | | | 30 | | | | 6,400 | |
MacroGenics, Inc. (1) | | | 602 | | | | 13,762 | |
Marinus Pharmaceuticals, Inc. (1) | | | 360 | | | | 4,392 | |
McKesson Corp. | | | 2,284 | | | | 397,233 | |
Medtronic PLC | | | 20,914 | | | | 2,449,866 | |
Merck & Co., Inc. | | | 30,637 | | | | 2,506,107 | |
Mersana Therapeutics, Inc. (1) | | | 1,351 | | | | 35,950 | |
Mettler-Toledo International, Inc. (1) | | | 18 | | | | 20,514 | |
Mirati Therapeutics, Inc. (1) | | | 345 | | | | 75,776 | |
Moderna, Inc. (1) | | | 2,111 | | | | 220,536 | |
Molina Healthcare, Inc. (1) | | | 193 | | | | 41,047 | |
Balanced Fund |
Security Description | | Shares,
Contracts
or Principal
Amount ($) | | | Fair
Value ($) | |
Common Stocks — continued |
Morphic Holding, Inc. (1) | | | 177 | | | | 5,938 | |
NantKwest, Inc. (1) | | | 957 | | | | 12,757 | |
Natera, Inc. (1) | | | 558 | | | | 55,532 | |
National HealthCare Corp. | | | 151 | | | | 10,028 | |
Neurocrine Biosciences, Inc. (1) | | | 312 | | | | 29,905 | |
NextGen Healthcare, Inc. (1) | | | 2,087 | | | | 38,067 | |
Novavax, Inc. (1) | | | 411 | | | | 45,831 | |
Novocure, Ltd. (1) | | | 56 | | | | 9,690 | |
Ocular Therapeutix, Inc. (1) | | | 1,686 | | | | 34,900 | |
Oncocyte Corp. (1) | | | 328 | | | | 784 | |
Organogenesis Holdings, Inc. (1) | | | 529 | | | | 3,983 | |
Osmotica Pharmaceuticals PLC (1) | | | 2,064 | | | | 8,504 | |
Owens & Minor, Inc. | | | 1,059 | | | | 28,646 | |
Pacific Biosciences of California, Inc. (1) | | | 1,468 | | | | 38,080 | |
Palatin Technologies, Inc. (1) | | | 3,025 | | | | 2,044 | |
PerkinElmer, Inc. | | | 764 | | | | 109,634 | |
Perrigo Co. PLC | | | 5,856 | | | | 261,880 | |
Pfizer, Inc. | | | 45,082 | | | | 1,659,468 | |
Phreesia, Inc. (1) | | | 17 | | | | 922 | |
PRA Health Sciences, Inc. (1) | | | 616 | | | | 77,271 | |
Precigen, Inc. (1)(2) | | | 878 | | | | 8,956 | |
Quest Diagnostics, Inc. | | | 173 | | | | 20,616 | |
Quidel Corp. (1) | | | 163 | | | | 29,283 | |
Regeneron Pharmaceuticals, Inc. (1) | | | 1,173 | | | | 566,688 | |
Replimune Group, Inc. (1) | | | 398 | | | | 15,184 | |
ResMed, Inc. | | | 971 | | | | 206,396 | |
REVOLUTION Medicines, Inc. (1) | | | 249 | | | | 9,858 | |
Rhythm Pharmaceuticals, Inc. (1) | | | 1,155 | | | | 34,338 | |
Rigel Pharmaceuticals, Inc. (1) | | | 1,713 | | | | 5,996 | |
Rocket Pharmaceuticals, Inc. (1) | | | 396 | | | | 21,717 | |
Sangamo Therapeutics, Inc. (1) | | | 1,051 | | | | 16,401 | |
Scholar Rock Holding Corp. (1) | | | 266 | | | | 12,909 | |
Seagen, Inc. (1) | | | 1,205 | | | | 211,044 | |
Seres Therapeutics, Inc. (1) | | | 523 | | | | 12,814 | |
SIGA Technologies, Inc. (1) | | | 570 | | | | 4,144 | |
Simulations Plus, Inc. | | | 176 | | | | 12,658 | |
Solid Biosciences, Inc. (1) | | | 599 | | | | 4,540 | |
Sorrento Therapeutics, Inc. (1) | | | 1,599 | | | | 10,913 | |
Spectrum Pharmaceuticals, Inc. (1) | | | 47 | | | | 160 | |
SpringWorks Therapeutics, Inc. (1) | | | 146 | | | | 10,588 | |
STERIS PLC | | | 2,085 | | | | 395,191 | |
Stryker Corp. | | | 4,106 | | | | 1,006,134 | |
Supernus Pharmaceuticals, Inc. (1) | | | 668 | | | | 16,807 | |
Surgery Partners, Inc. (1) | | | 281 | | | | 8,152 | |
Sutro Biopharma, Inc. (1) | | | 367 | | | | 7,968 | |
Syros Pharmaceuticals, Inc. (1) | | | 1,184 | | | | 12,846 | |
The accompanying notes are an integral part of these financial statements
Page 66 | 2020 Annual Report | December 31, 2020 |
Schedule of Investments
December 31, 2020
Balanced Fund |
Security Description | | Shares,
Contracts
or Principal
Amount ($) | | | Fair
Value ($) | |
Common Stocks — continued |
Teladoc Health, Inc. (1) | | | 424 | | | | 84,783 | |
Tenet Healthcare Corp. (1) | | | 1,231 | | | | 49,154 | |
TG Therapeutics, Inc. (1) | | | 955 | | | | 49,679 | |
Thermo Fisher Scientific, Inc. | | | 2,152 | | | | 1,002,359 | |
Translate Bio, Inc. (1) | | | 557 | | | | 10,266 | |
Travere Therapeutics, Inc. (1) | | | 157 | | | | 4,279 | |
Turning Point Therapeutics, Inc. (1) | | | 425 | | | | 51,786 | |
Twist Bioscience Corp. (1) | | | 374 | | | | 52,842 | |
Ultragenyx Pharmaceutical, Inc. (1) | | | 346 | | | | 47,897 | |
United Therapeutics Corp. (1) | | | 2,101 | | | | 318,911 | |
UnitedHealth Group, Inc. | | | 6,657 | | | | 2,334,477 | |
Universal Health Services, Inc. - Class B | | | 922 | | | | 126,775 | |
Vanda Pharmaceuticals, Inc. (1) | | | 1,711 | | | | 22,483 | |
Veeva Systems, Inc. (1) | | | 1,073 | | | | 292,124 | |
Veracyte, Inc. (1) | | | 893 | | | | 43,703 | |
Vertex Pharmaceuticals, Inc. (1) | | | 2,570 | | | | 607,394 | |
Viatris, Inc. (1) | | | 8,305 | | | | 155,636 | |
Viela Bio, Inc. (1) | | | 21 | | | | 755 | |
Viemed Healthcare, Inc. (1) | | | 172 | | | | 1,335 | |
West Pharmaceutical Services, Inc. | | | 834 | | | | 236,281 | |
XBiotech, Inc. (1) | | | 1,196 | | | | 18,717 | |
Xencor, Inc. (1) | | | 416 | | | | 18,150 | |
Zimmer Biomet Holdings, Inc. | | | 5,162 | | | | 795,413 | |
ZIOPHARM Oncology, Inc. (1) | | | 1,965 | | | | 4,952 | |
Zoetis, Inc. - Class A | | | 10,196 | | | | 1,687,438 | |
| | | | | | | | 41,310,940 | |
| | | | | | | | | |
Industrials — 4.8% | | | | | | | | |
3M Co. | | | 5,958 | | | | 1,041,399 | |
ABM Industries, Inc. | | | 445 | | | | 16,839 | |
AGCO Corp. | | | 1,433 | | | | 147,728 | |
Allegiant Travel Co. | | | 1,681 | | | | 318,112 | |
Alpha Pro Tech, Ltd. (1) | | | 760 | | | | 8,474 | |
Altra Industrial Motion Corp. | | | 634 | | | | 35,143 | |
ArcBest Corp. | | | 1,331 | | | | 56,794 | |
Arcosa, Inc. | | | 1,911 | | | | 104,971 | |
Argan, Inc. | | | 298 | | | | 13,258 | |
ASGN, Inc. (1) | | | 459 | | | | 38,340 | |
Astec Industries, Inc. | | | 547 | | | | 31,660 | |
Atkore International Group, Inc. (1) | | | 2,910 | | | | 119,630 | |
Atlas Air Worldwide Holdings, Inc. (1) | | | 156 | | | | 8,508 | |
Axon Enterprise, Inc. (1) | | | 348 | | | | 42,640 | |
AZZ, Inc. | | | 790 | | | | 37,478 | |
BG Staffing, Inc. | | | 179 | | | | 2,415 | |
BMC Stock Holdings, Inc. (1) | | | 1,316 | | | | 70,643 | |
Boise Cascade Co. | | | 4,989 | | | | 238,474 | |
Balanced Fund |
Security Description | | Shares,
Contracts
or Principal
Amount ($) | | | Fair
Value ($) | |
Common Stocks — continued |
CAI International, Inc. | | | 65 | | | | 2,031 | |
Caterpillar, Inc. | | | 2,314 | | | | 421,194 | |
Chart Industries, Inc. (1) | | | 24 | | | | 2,827 | |
Cintas Corp. | | | 1,567 | | | | 553,872 | |
Comfort Systems USA, Inc. | | | 2,133 | | | | 112,324 | |
Copart, Inc. (1) | | | 3,911 | | | | 497,675 | |
CoreCivic, Inc. | | | 2,624 | | | | 17,187 | |
CoreLogic, Inc./United States | | | 1,868 | | | | 144,434 | |
Covenant Logistics Group, Inc. (1) | | | 701 | | | | 10,382 | |
CSX Corp. | | | 2,540 | | | | 230,505 | |
Cummins, Inc. | | | 7,985 | | | | 1,813,394 | |
Deere & Co. | | | 2,207 | | | | 593,793 | |
Eaton Corp. PLC | | | 5,235 | | | | 628,933 | |
EMCOR Group, Inc. | | | 1,562 | | | | 142,861 | |
Emerson Electric Co. | | | 1,995 | | | | 160,338 | |
EnerSys | | | 329 | | | | 27,327 | |
Fastenal Co. | | | 3,055 | | | | 149,176 | |
FedEx Corp. | | | 1,431 | | | | 371,516 | |
FuelCell Energy, Inc. (1) | | | 134 | | | | 1,497 | |
Generac Holdings, Inc. (1) | | | 258 | | | | 58,672 | |
General Electric Co. | | | 8,411 | | | | 90,839 | |
GrafTech International, Ltd. | | | 2,558 | | | | 27,268 | |
H&E Equipment Services, Inc. | | | 381 | | | | 11,358 | |
HEICO Corp. | | | 459 | | | | 60,772 | |
Herc Holdings, Inc. (1) | | | 264 | | | | 17,532 | |
Herman Miller, Inc. | | | 813 | | | | 27,479 | |
Hertz Global Holdings, Inc. (1) | | | 1,454 | | | | 1,861 | |
HNI Corp. | | | 788 | | | | 27,154 | |
Hubbell, Inc. | | | 1,550 | | | | 243,025 | |
Huntington Ingalls Industries, Inc. | | | 692 | | | | 117,972 | |
JB Hunt Transport Services, Inc. | | | 273 | | | | 37,305 | |
Kelly Services, Inc. - Class A | | | 1,139 | | | | 23,429 | |
Kforce, Inc. | | | 465 | | | | 19,572 | |
Kimball International, Inc. - Class B | | | 1,090 | | | | 13,026 | |
L B Foster Co. - Class A (1) | | | 119 | | | | 1,791 | |
Lawson Products, Inc./DE (1) | | | 11 | | | | 560 | |
Lockheed Martin Corp. | | | 4,120 | | | | 1,462,518 | |
LSC Communications, Inc. (1) | | | 4,516 | | | | 90 | |
Manitowoc Co., Inc./The (1) | | | 292 | | | | 3,887 | |
ManpowerGroup, Inc. | | | 6,874 | | | | 619,897 | |
Matson, Inc. | | | 1,002 | | | | 57,084 | |
Maxar Technologies, Inc. | | | 634 | | | | 24,466 | |
McGrath RentCorp | | | 288 | | | | 19,325 | |
Meritor, Inc. (1) | | | 249 | | | | 6,950 | |
Miller Industries, Inc./TN | | | 1,780 | | | | 67,676 | |
Moog, Inc. | | | 1,935 | | | | 153,446 | |
The accompanying notes are an integral part of these financial statements
2020 Annual Report | December 31, 2020 | Page 67 |
Schedule of Investments
December 31, 2020
Balanced Fund |
Security Description | | Shares,
Contracts
or Principal
Amount ($) | | | Fair
Value ($) | |
Common Stocks — continued |
MSC Industrial Direct Co., Inc. | | | 3,298 | | | | 278,318 | |
Mueller Industries, Inc. | | | 2,008 | | | | 70,501 | |
MYR Group, Inc. (1) | | | 422 | | | | 25,362 | |
National Presto Industries, Inc. | | | 70 | | | | 6,190 | |
NL Industries, Inc. | | | 197 | | | | 942 | |
Norfolk Southern Corp. | | | 82 | | | | 19,484 | |
Northrop Grumman Corp. | | | 101 | | | | 30,777 | |
Old Dominion Freight Line, Inc. | | | 1,379 | | | | 269,153 | |
PACCAR, Inc. | | | 17,888 | | | | 1,543,377 | |
PAE, Inc. (1) | | | 1,151 | | | | 10,566 | |
Parker-Hannifin Corp. | | | 2,564 | | | | 698,459 | |
Plug Power, Inc. (1) | | | 2,772 | | | | 93,999 | |
Primoris Services Corp. | | | 2,946 | | | | 81,339 | |
Quanta Services, Inc. | | | 10,522 | | | | 757,794 | |
Regal Beloit Corp. | | | 2,169 | | | | 266,375 | |
Resideo Technologies, Inc. (1) | | | 1,614 | | | | 34,314 | |
Rexnord Corp. | | | 625 | | | | 24,681 | |
RR Donnelley & Sons Co. | | | 5,502 | | | | 12,435 | |
Rush Enterprises, Inc. | | | 3,339 | | | | 138,301 | |
Ryder System, Inc. | | | 998 | | | | 61,636 | |
Safe Bulkers, Inc. (1) | | | 1,521 | | | | 1,977 | |
Saia, Inc. (1) | | | 585 | | | | 105,768 | |
Shyft Group, Inc./The | | | 983 | | | | 27,898 | |
SkyWest, Inc. | | | 53 | | | | 2,136 | |
Steelcase, Inc. | | | 1,270 | | | | 17,209 | |
Textainer Group Holdings, Ltd. (1) | | | 1,448 | | | | 27,773 | |
Timken Co./The | | | 2,848 | | | | 220,321 | |
Titan Machinery, Inc. (1) | | | 51 | | | | 997 | |
TPI Composites, Inc. (1) | | | 458 | | | | 24,173 | |
Triton International, Ltd./Bermuda | | | 4,705 | | | | 228,240 | |
Tutor Perini Corp. (1) | | | 89 | | | | 1,153 | |
Uber Technologies, Inc. (1) | | | 4,437 | | | | 226,287 | |
United Parcel Service, Inc. - Class B | | | 4,139 | | | | 697,008 | |
Vectrus, Inc. (1) | | | 631 | | | | 31,373 | |
Veritiv Corp. (1) | | | 451 | | | | 9,376 | |
Waste Management, Inc. | | | 13,233 | | | | 1,560,568 | |
Watsco, Inc. | | | 110 | | | | 24,921 | |
WESCO International, Inc. (1) | | | 1,285 | | | | 100,873 | |
WESCO International, Inc. Series A Variable Preferred (9) | | | 994 | | | | 31,063 | |
| | | | | | | | 19,171,843 | |
| | | | | | | | | |
Information Technology — 15.9% | | | | | | | | |
8x8, Inc. (1) | | | 395 | | | | 13,616 | |
Accenture PLC - Class A | | | 1,503 | | | | 392,599 | |
ACI Worldwide, Inc. (1) | | | 1,880 | | | | 72,248 | |
Balanced Fund |
Security Description | | Shares,
Contracts
or Principal
Amount ($) | | | Fair
Value ($) | |
Common Stocks — continued |
Adobe, Inc. (1) | | | 3,608 | | | | 1,804,433 | |
ADTRAN, Inc. | | | 1 | | | | 15 | |
Advanced Micro Devices, Inc. (1) | | | 8,066 | | | | 739,733 | |
Alarm.com Holdings, Inc. (1) | | | 262 | | | | 27,104 | |
Alliance Data Systems Corp. | | | 548 | | | | 40,607 | |
Amkor Technology, Inc. | | | 4,627 | | | | 69,775 | |
Amphenol Corp. | | | 226 | | | | 29,554 | |
Apple, Inc. | | | 99,250 | | | | 13,169,385 | |
Applied Materials, Inc. | | | 12,109 | | | | 1,045,007 | |
Arrow Electronics, Inc. (1) | | | 3,762 | | | | 366,043 | |
AstroNova, Inc. | | | 565 | | | | 6,017 | |
Autodesk, Inc. (1) | | | 1,934 | | | | 590,528 | |
Avaya Holdings Corp. (1) | | | 1,400 | | | | 26,810 | |
Avid Technology, Inc. (1) | | | 2,742 | | | | 43,516 | |
Avnet, Inc. | | | 7,484 | | | | 262,763 | |
Bill.com Holdings, Inc. (1) | | | 151 | | | | 20,612 | |
Broadcom, Inc. | | | 2,155 | | | | 943,567 | |
CACI International, Inc. - Class A (1) | | | 1,203 | | | | 299,944 | |
Cadence Design Systems, Inc. (1) | | | 11,162 | | | | 1,522,832 | |
Calix, Inc. (1) | | | 4,389 | | | | 130,617 | |
Cambium Networks Corp. (1) | | | 376 | | | | 9,430 | |
CDK Global, Inc. | | | 8,374 | | | | 434,024 | |
CDW Corp./DE | | | 3,085 | | | | 406,572 | |
Cerence, Inc. (1) | | | 564 | | | | 56,671 | |
ChannelAdvisor Corp. (1) | | | 2,956 | | | | 47,237 | |
Ciena Corp. (1) | | | 1,077 | | | | 56,919 | |
Cisco Systems, Inc. | | | 29,173 | | | | 1,305,492 | |
Cloudera, Inc. (1) | | | 335 | | | | 4,660 | |
Cloudflare, Inc. (1) | | | 1,494 | | | | 113,529 | |
Cognex Corp. | | | 1,004 | | | | 80,606 | |
Cognizant Technology Solutions Corp. | | | 6,932 | | | | 568,077 | |
Concentrix Corp. (1) | | | 1,724 | | | | 170,159 | |
Conduent, Inc. (1) | | | 5,154 | | | | 24,739 | |
Corning, Inc. | | | 7,272 | | | | 261,792 | |
Coupa Software, Inc. (1) | | | 296 | | | | 100,317 | |
Crowdstrike Holdings, Inc. (1) | | | 982 | | | | 208,007 | |
Dell Technologies, Inc. - Class C (1) | | | 783 | | | | 57,386 | |
Diebold Nixdorf, Inc. (1) | | | 981 | | | | 10,457 | |
Digital Turbine, Inc. (1) | | | 1,743 | | | | 98,584 | |
DocuSign, Inc. (1) | | | 1,344 | | | | 298,771 | |
Dolby Laboratories, Inc. | | | 1,290 | | | | 125,298 | |
Dropbox, Inc. - Class A (1) | | | 2,178 | | | | 48,330 | |
DXC Technology Co. | | | 4,139 | | | | 106,579 | |
Eastman Kodak Co. (1) | | | 370 | | | | 3,012 | |
Ebix, Inc. | | | 789 | | | | 29,958 | |
Elastic NV (1) | | | 17 | | | | 2,484 | |
The accompanying notes are an integral part of these financial statements
Page 68 | 2020 Annual Report | December 31, 2020 |
Schedule of Investments
December 31, 2020
Balanced Fund |
Security Description | | Shares,
Contracts
or Principal
Amount ($) | | | Fair
Value ($) | |
Common Stocks — continued |
Enphase Energy, Inc. (1) | | | 723 | | | | 126,865 | |
F5 Networks, Inc. (1) | | | 256 | | | | 45,041 | |
Fair Isaac Corp. (1) | | | 79 | | | | 40,372 | |
Fastly, Inc. (1) | | | 356 | | | | 31,104 | |
FormFactor, Inc. (1) | | | 561 | | | | 24,134 | |
Fortinet, Inc. (1) | | | 618 | | | | 91,792 | |
Hewlett Packard Enterprise Co. | | | 15,977 | | | | 189,327 | |
HP, Inc. | | | 19,818 | | | | 487,325 | |
HubSpot, Inc. (1) | | | 291 | | | | 115,364 | |
II-VI, Inc. (1) | | | 357 | | | | 27,118 | |
Insight Enterprises, Inc. (1) | | | 447 | | | | 34,012 | |
Intel Corp. | | | 30,777 | | | | 1,533,310 | |
Intuit, Inc. | | | 5,570 | | | | 2,115,765 | |
Jabil, Inc. | | | 6,659 | | | | 283,207 | |
KBR, Inc. | | | 1,935 | | | | 59,850 | |
KLA Corp. | | | 1,282 | | | | 331,923 | |
Lam Research Corp. | | | 1,797 | | | | 848,669 | |
Littelfuse, Inc. | | | 42 | | | | 10,696 | |
Marvell Technology Group, Ltd. | | | 55 | | | | 2,615 | |
Mastercard, Inc. | | | 3,849 | | | | 1,373,862 | |
Maxim Integrated Products, Inc. | | | 1,619 | | | | 143,524 | |
Methode Electronics, Inc. | | | 1,238 | | | | 47,391 | |
Microchip Technology, Inc. | | | 102 | | | | 14,087 | |
Micron Technology, Inc. (1) | | | 4,647 | | | | 349,361 | |
Microsoft Corp. | | | 50,418 | | | | 11,213,972 | |
MicroStrategy, Inc. (1) | | | 456 | | | | 177,179 | |
MKS Instruments, Inc. | | | 466 | | | | 70,110 | |
MoneyGram International, Inc. (1) | | | 1,732 | | | | 9,465 | |
Monolithic Power Systems, Inc. | | | 170 | | | | 62,259 | |
NCR Corp. (1) | | | 1,659 | | | | 62,329 | |
NETGEAR, Inc. (1) | | | 44 | | | | 1,788 | |
NIC, Inc. | | | 347 | | | | 8,963 | |
NortonLifeLock, Inc. | | | 12,103 | | | | 251,500 | |
NVIDIA Corp. | | | 3,619 | | | | 1,889,842 | |
ON Semiconductor Corp. (1) | | | 680 | | | | 22,256 | |
Oracle Corp. | | | 25,192 | | | | 1,629,670 | |
PagerDuty, Inc. (1) | | | 211 | | | | 8,799 | |
Palo Alto Networks, Inc. (1) | | | 257 | | | | 91,335 | |
Paycom Software, Inc. (1) | | | 286 | | | | 129,344 | |
PayPal Holdings, Inc. (1) | | | 580 | | | | 135,836 | |
Photronics, Inc. (1) | | | 2,536 | | | | 28,302 | |
Plantronics, Inc. | | | 303 | | | | 8,190 | |
Priority Technology Holdings, Inc. (1) | | | 944 | | | | 6,646 | |
Progress Software Corp. | | | 3,995 | | | | 180,534 | |
Qorvo, Inc. (1) | | | 1,430 | | | | 237,766 | |
QUALCOMM, Inc. | | | 13,551 | | | | 2,064,359 | |
Balanced Fund |
Security Description | | Shares,
Contracts
or Principal
Amount ($) | | | Fair
Value ($) | |
Common Stocks — continued |
Rimini Street, Inc. (1) | | | 430 | | | | 1,905 | |
RingCentral, Inc. - Class A (1) | | | 302 | | | | 114,449 | |
salesforce.com, Inc. (1) | | | 5,176 | | | | 1,151,815 | |
Sanmina Corp. (1) | | | 1,716 | | | | 54,723 | |
Sapiens International Corp. NV | | | 884 | | | | 27,059 | |
ServiceNow, Inc. (1) | | | 596 | | | | 328,056 | |
Skyworks Solutions, Inc. | | | 1,732 | | | | 264,788 | |
Slack Technologies, Inc. - Class A (1) | | | 307 | | | | 12,968 | |
Smartsheet, Inc. (1) | | | 269 | | | | 18,639 | |
SolarEdge Technologies, Inc. (1) | | | 67 | | | | 21,381 | |
SPS Commerce, Inc. (1) | | | 2,195 | | | | 238,355 | |
Square, Inc. - Class A (1) | | | 3,295 | | | | 717,124 | |
SS&C Technologies Holdings, Inc. | | | 18,271 | | | | 1,329,215 | |
StarTek, Inc. (1) | | | 4 | | | | 30 | |
StoneCo, Ltd. (1) | | | 947 | | | | 79,472 | |
Stratasys, Ltd. (1) | | | 819 | | | | 16,970 | |
Sykes Enterprises, Inc. (1) | | | 1,564 | | | | 58,916 | |
SYNNEX Corp. | | | 2,110 | | | | 171,838 | |
Tenable Holdings, Inc. (1) | | | 1,474 | | | | 77,031 | |
Teradyne, Inc. | | | 2,994 | | | | 358,951 | |
TESSCO Technologies, Inc. | | | 709 | | | | 4,424 | |
Texas Instruments, Inc. | | | 6,420 | | | | 1,053,715 | |
Trade Desk, Inc./The (1) | | | 299 | | | | 239,499 | |
Trimble, Inc. (1) | | | 4,204 | | | | 280,701 | |
TTEC Holdings, Inc. | | | 817 | | | | 59,584 | |
Twilio, Inc. - Class A (1) | | | 853 | | | | 288,741 | |
Ultra Clean Holdings, Inc. (1) | | | 418 | | | | 13,021 | |
Verint Systems, Inc. (1) | | | 1,223 | | | | 82,161 | |
Veritone, Inc. (1) | | | 140 | | | | 3,983 | |
VirnetX Holding Corp. (2) | | | 4,120 | | | | 20,765 | |
Visa, Inc. | | | 6,189 | | | | 1,353,720 | |
Vishay Intertechnology, Inc. | | | 4,560 | | | | 94,438 | |
Vontier Corp. (1) | | | 464 | | | | 15,498 | |
Xerox Holdings Corp. | | | 10,145 | | | | 235,263 | |
Xilinx, Inc. | | | 1,980 | | | | 280,705 | |
Xperi Holding Corp. | | | 3,666 | | | | 76,619 | |
Zebra Technologies Corp. - Class A (1) | | | 755 | | | | 290,169 | |
Zoom Video Communications, Inc.- Class A (1) | | | 1,062 | | | | 358,234 | |
Zscaler, Inc. (1) | | | 435 | | | | 86,874 | |
| | | | | | | | 62,745,372 | |
| | | | | | | | | |
Materials — 1.6% | | | | | | | | |
Avery Dennison Corp. | | | 2,107 | | | | 326,817 | |
Avient Corp. | | | 270 | | | | 10,876 | |
Caledonia Mining Corp. PLC | | | 985 | | | | 15,642 | |
The accompanying notes are an integral part of these financial statements
2020 Annual Report | December 31, 2020 | Page 69 |
Schedule of Investments
December 31, 2020
Balanced Fund |
Security Description | | Shares,
Contracts
or Principal
Amount ($) | | | Fair
Value ($) | |
Common Stocks — continued |
Celanese Corp. | | | 233 | | | | 30,276 | |
Chemours Co./The | | | 386 | | | | 9,569 | |
Coeur Mining, Inc. (1) | | | 365 | | | | 3,778 | |
Commercial Metals Co. | | | 281 | | | | 5,772 | |
Corteva, Inc. | | | 4,854 | | | | 187,947 | |
Dow, Inc. | | | 4,378 | | | | 242,979 | |
Eastman Chemical Co. | | | 4,983 | | | | 499,695 | |
Freeport-McMoRan, Inc. - Class B | | | 9,428 | | | | 245,317 | |
Hawkins, Inc. | | | 202 | | | | 10,567 | |
Huntsman Corp. | | | 7,534 | | | | 189,405 | |
Koppers Holdings, Inc. (1) | | | 285 | | | | 8,881 | |
Linde PLC | | | 2,225 | | | | 586,310 | |
Louisiana-Pacific Corp. | | | 4,503 | | | | 167,377 | |
LyondellBasell Industries NV - Class A | | | 2,281 | | | | 209,076 | |
Minerals Technologies, Inc. | | | 81 | | | | 5,032 | |
Mosaic Co./The | | | 580 | | | | 13,346 | |
Newmont Corp. | | | 15,691 | | | | 939,734 | |
Nucor Corp. | | | 2,818 | | | | 149,889 | |
O-I Glass, Inc. | | | 1,933 | | | | 23,003 | |
Olin Corp. | | | 360 | | | | 8,842 | |
Olympic Steel, Inc. | | | 732 | | | | 9,758 | |
Packaging Corp. of America | | | 1,369 | | | | 188,799 | |
PPG Industries, Inc. | | | 3,373 | | | | 486,454 | |
Ramaco Resources, Inc. (1) | | | 699 | | | | 2,013 | |
Rayonier Advanced Materials, Inc. (1) | | | 1,319 | | | | 8,600 | |
Reliance Steel & Aluminum Co. | | | 3,287 | | | | 393,618 | |
Ryerson Holding Corp. (1) | | | 1,955 | | | | 26,666 | |
Scotts Miracle-Gro Co./The | | | 2,999 | | | | 597,221 | |
Sherwin-Williams Co./The | | | 844 | | | | 620,264 | |
Steel Dynamics, Inc. | | | 2,302 | | | | 84,875 | |
Stepan Co. | | | 324 | | | | 38,660 | |
SunCoke Energy, Inc. | | | 327 | | | | 1,422 | |
Tredegar Corp. | | | 1,090 | | | | 18,203 | |
Trinseo SA | | | 105 | | | | 5,377 | |
Tronox Holdings PLC | | | 1,114 | | | | 16,287 | |
Westlake Chemical Corp. | | | 726 | | | | 59,242 | |
Westrock Co. | | | 999 | | | | 43,486 | |
| | | | | | | | 6,491,075 | |
| | | | | | | | | |
Real Estate Investment Trust — 1.7% | | | | | | | | |
Altisource Portfolio Solutions SA (1) | | | 1,011 | | | | 13,022 | |
American Homes 4 Rent - Class A | | | 4,867 | | | | 146,010 | |
American Tower Corp. | | | 4,213 | | | | 945,650 | |
Ashford Hospitality Trust, Inc. | | | 1,018 | | | | 2,637 | |
AvalonBay Communities, Inc. | | | 493 | | | | 79,092 | |
CareTrust REIT, Inc. | | | 1,332 | | | | 29,544 | |
Balanced Fund |
Security Description | | Shares,
Contracts
or Principal
Amount ($) | | | Fair
Value ($) | |
Common Stocks — continued |
CatchMark Timber Trust, Inc. | | | 529 | | | | 4,951 | |
CBL & Associates Properties, Inc. (1) | | | 7,569 | | | | 314 | |
Clipper Realty, Inc. | | | 61 | | | | 430 | |
Columbia Property Trust, Inc. | | | 5,462 | | | | 78,325 | |
Community Healthcare Trust, Inc. | | | 350 | | | | 16,489 | |
CorEnergy Infrastructure Trust, Inc. | | | 1,927 | | | | 13,200 | |
CorePoint Lodging, Inc. | | | 547 | | | | 3,763 | |
Corporate Office Properties Trust | | | 3,465 | | | | 90,367 | |
CubeSmart | | | 8,711 | | | | 292,777 | |
DiamondRock Hospitality Co. | | | 545 | | | | 4,496 | |
EastGroup Properties, Inc. | | | 476 | | | | 65,717 | |
Equinix, Inc. | | | 549 | | | | 392,085 | |
Essex Property Trust, Inc. | | | 1,135 | | | | 269,472 | |
Extra Space Storage, Inc. | | | 3,755 | | | | 435,054 | |
Gaming and Leisure Properties, Inc. | | | 3,525 | | | | 149,460 | |
Getty Realty Corp. | | | 1,105 | | | | 30,432 | |
Gladstone Commercial Corp. | | | 62 | | | | 1,116 | |
Healthcare Realty Trust, Inc. | | | 8,727 | | | | 258,319 | |
Healthcare Trust of America, Inc. - Class A | | | 5,435 | | | | 149,680 | |
Hersha Hospitality Trust | | | 1,175 | | | | 9,271 | |
Highwoods Properties, Inc. | | | 3,028 | | | | 120,000 | |
Host Hotels & Resorts, Inc. | | | 2,429 | | | | 35,536 | |
Iron Mountain, Inc. | | | 2,157 | | | | 63,588 | |
Lamar Advertising Co. - Class A | | | 6,366 | | | | 529,779 | |
Life Storage, Inc. | | | 240 | | | | 28,654 | |
LTC Properties, Inc. | | | 10,596 | | | | 412,290 | |
National Health Investors, Inc. | | | 2,560 | | | | 177,075 | |
National Storage Affiliates Trust | | | 837 | | | | 30,157 | |
Newmark Group, Inc. | | | 830 | | | | 6,051 | |
Omega Healthcare Investors, Inc. | | | 2,079 | | | | 75,509 | |
Paramount Group, Inc. | | | 207 | | | | 1,871 | |
Park Hotels & Resorts, Inc. | | | 2,596 | | | | 44,521 | |
Piedmont Office Realty Trust, Inc. | | | 7,090 | | | | 115,071 | |
PotlatchDeltic Corp. | | | 651 | | | | 32,563 | |
PS Business Parks, Inc. | | | 1,147 | | | | 152,402 | |
Public Storage | | | 1,899 | | | | 438,536 | |
Retail Opportunity Investments Corp. | | | 5,535 | | | | 74,114 | |
Ryman Hospitality Properties, Inc. | | | 114 | | | | 7,725 | |
Sabra Health Care REIT, Inc. | | | 892 | | | | 15,494 | |
SBA Communications Corp. | | | 405 | | | | 114,263 | |
Service Properties Trust | | | 8,279 | | | | 95,126 | |
Simon Property Group, Inc. | | | 7,151 | | | | 609,837 | |
Spirit MTA REIT Liquidating Trust (1)(7) | | | 3,461 | | | | 0 | |
Tanger Factory Outlet Centers, Inc. (2) | | | 1,830 | | | | 18,227 | |
Universal Health Realty Income Trust | | | 62 | | | | 3,985 | |
Urstadt Biddle Properties, Inc. - Class A | | | 1,152 | | | | 16,278 | |
The accompanying notes are an integral part of these financial statements
Page 70 | 2020 Annual Report | December 31, 2020 |
Schedule of Investments
December 31, 2020
Balanced Fund |
Security Description | | Shares,
Contracts
or Principal
Amount ($) | | | Fair
Value ($) | |
Common Stocks — continued |
Welltower, Inc. | | | 1,941 | | | | 125,427 | |
| | | | | | | | 6,825,752 | |
Utilities — 1.2% | | | | | | | | |
Alliant Energy Corp. | | | 850 | | | | 43,801 | |
American Water Works Co., Inc. | | | 3,787 | | | | 581,191 | |
Eversource Energy | | | 1,479 | | | | 127,948 | |
MDU Resources Group, Inc. | | | 17,427 | | | | 459,027 | |
NextEra Energy, Inc. | | | 16,950 | | | | 1,307,693 | |
NorthWestern Corp. | | | 1,149 | | | | 66,998 | |
NRG Energy, Inc. | | | 6,517 | | | | 244,713 | |
Public Service Enterprise Group, Inc. | | | 10,137 | | | | 590,987 | |
Southwest Gas Holdings, Inc. | | | 1,466 | | | | 89,060 | |
UGI Corp. | | | 8,228 | | | | 287,651 | |
Vistra Corp. | | | 3,912 | | | | 76,910 | |
WEC Energy Group, Inc. | | | 2,499 | | | | 229,983 | |
Xcel Energy, Inc. | | | 7,648 | | | | 509,865 | |
| | | | | | | | 4,615,827 | |
| | | | | | | | | |
Total Common Stocks (Cost $155,542,551) | | | | | | | 219,062,426 | |
| | | | | | | | | |
Registered Investment Companies — 29.6% |
Baird Core Plus Bond Fund - Class I | | | 603,061 | | | | 7,321,166 | |
Dodge & Cox Income Fund | | | 410,758 | | | | 6,017,609 | |
DoubleLine Total Return Bond Fund - Class I | | | 378,262 | | | | 4,047,401 | |
Guggenheim Total Return Bond Fund - Class I | | | 103,257 | | | | 3,066,728 | |
iShares Core U.S. Aggregate Bond ETF (8) | | | 85,529 | | | | 10,108,673 | |
iShares JP Morgan USD Emerging Markets Bond ETF (8) | | | 149,108 | | | | 17,283,108 | |
Lord Abbett High Yield Fund - Class I | | | 942,922 | | | | 7,024,770 | |
Payden Emerging Markets Bond Fund - Class I | | | 128,895 | | | | 1,790,352 | |
PGIM Total Return Bond Fund - Class R6 | | | 408,384 | | | | 6,170,681 | |
Pioneer Bond Fund - Class Y | | | 468,946 | | | | 4,750,421 | |
Segall Bryant & Hamill Plus Bond Fund - Class I | | | 468,317 | | | | 5,217,049 | |
SPDR Bloomberg Barclays High Yield Bond ETF (8) | | | 108,057 | | | | 11,771,730 | |
TCW Emerging Markets Income Fund - Class I | | | 388,820 | | | | 3,308,862 | |
Vanguard Intermediate-Term Corporate Bond ETF (8) | | | 44,109 | | | | 4,284,748 | |
Vanguard Total Bond Market ETF (8) | | | 98,676 | | | | 8,702,236 | |
Balanced Fund |
Security Description | | Shares,
Contracts
or Principal
Amount ($) | | | Fair
Value ($) | |
Registered Investment Companies — continued |
Xtrackers USD High Yield Corporate Bond ETF (8) | | | 328,677 | | | | 16,463,432 | |
Total Registered Investment Companies (Cost $109,536,724) | | | | | | | 117,328,966 | |
| | | | | | | | | |
Money Market Registered Investment Companies — 13.0% |
Meeder Institutional Prime Money Market Fund, 0.08% (4) | | | 51,618,916 | | | | 51,634,402 | |
Morgan Stanley Government Institutional Fund, 0.03% (3) | | | 33,506 | | | | 33,506 | |
Total Money Market Registered Investment Companies (Cost $51,641,272) | | | | | | | 51,667,908 | |
| | | | | | | | | |
Bank Obligations — 0.2% |
First Merchants Bank Deposit Account, 0.75%, 1/4/2021 (5) | | | 248,088 | | | | 248,088 | |
Metro City Bank Deposit Account, 0.10%, 1/4/2021 (5) | | | 248,220 | | | | 248,220 | |
Pacific Mercantile Bank Deposit Account, 0.10%, 1/4/2021 (5) | | | 246,825 | | | | 246,825 | |
Total Bank Obligations (Cost $743,133) | | | | | | | 743,133 | |
Total Investments — 98.1% (Cost $317,463,680) | | | | | | | 388,802,433 | |
Other Assets less Liabilities — 1.9% | | | | | | | 7,695,540 | |
Total Net Assets — 100.0% | | | | | | | 396,497,973 | |
| | | | | | | | | |
Trustee Deferred Compensation (6) |
Meeder Balanced Fund - Retail Class | | | 2,766 | | | | 35,460 | |
Meeder Dynamic Allocation Fund - Retail Class | | | 6,962 | | | | 93,221 | |
Meeder Muirfield Fund - Retail Class | | | 4,603 | | | | 37,745 | |
Meeder Conservative Allocation Fund - Retail Class | | | 819 | | | | 19,582 | |
Total Trustee Deferred Compensation (Cost $154,070) | | | | | | | 186,008 | |
The accompanying notes are an integral part of these financial statements
2020 Annual Report | December 31, 2020 | Page 71 |
Schedule of Investments
December 31, 2020
Balanced Fund |
| | | Net Long
(Short)
Contracts | | | Expiration
Date | | | Notional
Value of
Contracts
($) | | | Value and
Unrealized
Appreciation
(Depreciation)
($) | |
Futures Contracts |
Index Futures | | | | | | | | | | | | | | | | |
Mini MSCI EAFE Index Futures | | | 231 | | | | 3/19/2021 | | | | 24,610,740 | | | | 396,268 | |
Mini MSCI Emerging Markets Index Futures | | | 107 | | | | 3/19/2021 | | | | 6,891,870 | | | | 206,974 | |
Russell 2000 Mini Index Futures | | | 24 | | | | 3/19/2021 | | | | 2,369,760 | | | | 63,440 | |
Standard & Poors 500 Mini Futures | | | 103 | | | | 3/19/2021 | | | | 19,306,320 | | | | 553,409 | |
E-mini Standard & Poors MidCap 400 Futures | | | 22 | | | | 3/19/2021 | | | | 5,067,700 | | | | 156,279 | |
Total Futures Contracts | | | 487 | | | | | | | | 58,246,390 | | | | 1,376,370 | |
(1) | Represents non-income producing securities. |
(2) | All or a portion of this security is on loan. |
(3) | Investment purchased with cash received as securities lending collateral. The yield shown represents the 7-day yield in effect at December 31, 2020. |
(4) | Investment in affiliate. The yield shown represents the 7-day yield in effect at December 31, 2020. |
(5) | Variable rate security. Securities payable at par including accrued interest (usually within seven days notice) and unconditionally secured as to principal and interest by letters of credit or other credit support agreements from major banks. The interest rates are adjustable and are not based on a published reference rate and spread but are determined by the issuer or agent and are based on current market conditions. These securities do not indicate a reference rate and spread in their description above. The rate shown represents the rate in effect at December 31, 2020. The maturity date shown, if applicable, reflects the earlier of the next demand date or stated maturity date. |
(6) | Assets of affiliates to the Balanced Fund held for the benefit of the Fund’s Trustees in connection with the Trustee Deferred Compensation Plan. |
(7) | Fair valued security deemed as Level 3 security. |
The accompanying notes are an integral part of these financial statements
Page 72 | 2020 Annual Report | December 31, 2020 |
Schedule of Investments
December 31, 2020
Moderate Allocation Fund |
Security Description | | Shares or
Principal
Amount ($) | | | Fair
Value ($) | |
Common Stocks — 36.4% |
Communication Services — 3.7% | | | | | | | | |
Activision Blizzard, Inc. | | | 4,103 | | | | 380,964 | |
Alphabet, Inc. - Class A (1) | | | 286 | | | | 501,255 | |
Alphabet, Inc. - Class C (1) | | | 761 | | | | 1,333,181 | |
AMC Entertainment Holdings, Inc. - Class A (2) | | | 379 | | | | 803 | |
Cinemark Holdings, Inc. | | | 228 | | | | 3,969 | |
Comcast Corp. - Class A | | | 11,888 | | | | 622,931 | |
Cumulus Media, Inc. (1) | | | 12 | | | | 105 | |
DISH Network Corp. (1) | | | 460 | | | | 14,876 | |
Electronic Arts, Inc. | | | 1,607 | | | | 230,765 | |
EW Scripps Co./The | | | 43 | | | | 657 | |
Facebook, Inc. (1) | | | 5,017 | | | | 1,370,444 | |
Fluent, Inc. (1) | | | 66 | | | | 350 | |
Frontier Communications Corp. (1) | | | 1,310 | | | | 117 | |
Glu Mobile, Inc. (1) | | | 581 | | | | 5,235 | |
Gogo, Inc. (1) | | | 150 | | | | 1,445 | |
Gray Television, Inc. (1) | | | 754 | | | | 13,489 | |
IDT Corp. - Class B (1) | | | 184 | | | | 2,274 | |
Interpublic Group of Cos., Inc./The | | | 9,319 | | | | 219,183 | |
Lee Enterprises, Inc. (1) | | | 1,275 | | | | 1,607 | |
Liberty TripAdvisor Holdings, Inc. (1) | | | 300 | | | | 1,302 | |
Lions Gate Entertainment Corp. - Class A (1) | | | 684 | | | | 7,777 | |
Meredith Corp. | | | 97 | | | | 1,862 | |
Netflix, Inc. (1) | | | 760 | | | | 410,955 | |
News Corp. | | | 1,268 | | | | 22,786 | |
Nexstar Media Group, Inc. | | | 438 | | | | 47,825 | |
Omnicom Group, Inc. | | | 5,011 | | | | 312,536 | |
Pinterest, Inc. - Class A (1) | | | 761 | | | | 50,150 | |
Roku, Inc. - Class A (1) | | | 265 | | | | 87,985 | |
Spotify Technology SA (1) | | | 326 | | | | 102,579 | |
Take-Two Interactive Software, Inc. (1) | | | 160 | | | | 33,246 | |
TechTarget, Inc. (1) | | | 379 | | | | 22,403 | |
TEGNA, Inc. | | | 637 | | | | 8,886 | |
Telephone and Data Systems, Inc. | | | 718 | | | | 13,333 | |
Tribune Publishing Co. | | | 109 | | | | 1,493 | |
Twitter, Inc. (1) | | | 404 | | | | 21,877 | |
Verizon Communications, Inc. | | | 12,298 | | | | 722,508 | |
World Wrestling Entertainment, Inc. - Class A | | | 462 | | | | 22,199 | |
Yelp, Inc. (1) | | | 138 | | | | 4,508 | |
| | | | | | | | 6,599,860 | |
| | | | | | | | | |
Consumer Discretionary — 4.8% | | | | | | | | |
Abercrombie & Fitch Co. | | | 39 | | | | 794 | |
Adient PLC (1) | | | 27 | | | | 939 | |
Amazon.com, Inc. (1) | | | 691 | | | | 2,250,539 | |
Moderate Allocation Fund |
Security Description | | Shares or
Principal
Amount ($) | | | Fair
Value ($) | |
Common Stocks — continued |
American Public Education, Inc. (1) | | | 12 | | | | 366 | |
Aramark | | | 386 | | | | 14,853 | |
Aspen Group, Inc./CO (1) | | | 9 | | | | 100 | |
At Home Group, Inc. (1) | | | 138 | | | | 2,133 | |
AutoNation, Inc. (1) | | | 63 | | | | 4,397 | |
Best Buy Co., Inc. | | | 2,318 | | | | 231,313 | |
Big Lots, Inc. | | | 66 | | | | 2,833 | |
BorgWarner, Inc. | | | 357 | | | | 13,794 | |
Boyd Gaming Corp. | | | 259 | | | | 11,116 | |
Brinker International, Inc. | | | 173 | | | | 9,787 | |
Buckle, Inc./The | | | 85 | | | | 2,482 | |
Caleres, Inc. | | | 224 | | | | 3,506 | |
Camping World Holdings, Inc. | | | 689 | | | | 17,948 | |
Capri Holdings, Ltd. (1) | | | 289 | | | | 12,138 | |
CarParts.com, Inc. (1) | | | 832 | | | | 10,308 | |
Carvana Co. (1) | | | 12 | | | | 2,874 | |
Chipotle Mexican Grill, Inc. (1) | | | 230 | | | | 318,943 | |
Churchill Downs, Inc. | | | 51 | | | | 9,934 | |
Container Store Group, Inc./The (1) | | | 94 | | | | 897 | |
Cooper Tire & Rubber Co. | | | 99 | | | | 4,010 | |
Cracker Barrel Old Country Store, Inc. | | | 199 | | | | 26,252 | |
Crocs, Inc. (1) | | | 1,821 | | | | 114,104 | |
Dana, Inc. | | | 468 | | | | 9,135 | |
Darden Restaurants, Inc. | | | 240 | | | | 28,589 | |
Dave & Buster’s Entertainment, Inc. | | | 57 | | | | 1,711 | |
Del Taco Restaurants, Inc. | | | 111 | | | | 1,006 | |
Designer Brands, Inc. - Class A | | | 186 | | | | 1,423 | |
Dillard’s, Inc. - Class A | | | 27 | | | | 1,702 | |
Dollar General Corp. | | | 1,377 | | | | 289,583 | |
Dollar Tree, Inc. (1) | | | 481 | | | | 51,967 | |
Domino’s Pizza, Inc. | | | 146 | | | | 55,985 | |
DR Horton, Inc. | | | 2,355 | | | | 162,307 | |
eBay, Inc. | | | 1,525 | | | | 76,631 | |
Etsy, Inc. (1) | | | 198 | | | | 35,226 | |
Everi Holdings, Inc. (1) | | | 57 | | | | 787 | |
Extended Stay America, Inc. | | | 872 | | | | 12,914 | |
Fiesta Restaurant Group, Inc. (1) | | | 132 | | | | 1,505 | |
Fossil Group, Inc. (1) | | | 176 | | | | 1,526 | |
Fox Factory Holding Corp. (1) | | | 40 | | | | 4,228 | |
Franchise Group, Inc. | | | 63 | | | | 1,918 | |
Gap, Inc./The | | | 93 | | | | 1,878 | |
General Motors Co. | | | 4,910 | | | | 204,452 | |
Genesco, Inc. (1) | | | 38 | | | | 1,143 | |
GoPro, Inc. (1) | | | 84 | | | | 696 | |
Greenlane Holdings, Inc. (1) | | | 175 | | | | 693 | |
Group 1 Automotive, Inc. | | | 59 | | | | 7,737 | |
GrowGeneration Corp. (1) | | | 151 | | | | 6,073 | |
The accompanying notes are an integral part of these financial statements
2020 Annual Report | December 31, 2020 | Page 73 |
Schedule of Investments
December 31, 2020
Moderate Allocation Fund |
Security Description | | Shares or
Principal
Amount ($) | | | Fair
Value ($) | |
Common Stocks — continued |
Guess?, Inc. | | | 113 | | | | 2,556 | |
Hanesbrands, Inc. | | | 499 | | | | 7,275 | |
Harley-Davidson, Inc. | | | 339 | | | | 12,441 | |
Hibbett Sports, Inc. (1) | | | 242 | | | | 11,176 | |
Houghton Mifflin Harcourt Co. (1) | | | 245 | | | | 816 | |
International Game Technology PLC | | | 426 | | | | 7,216 | |
Kohl’s Corp. | | | 316 | | | | 12,858 | |
L Brands, Inc. | | | 420 | | | | 15,620 | |
Lakeland Industries, Inc. (1) | | | 409 | | | | 11,145 | |
Lands’ End, Inc. (1) | | | 100 | | | | 2,157 | |
Las Vegas Sands Corp. | | | 462 | | | | 27,535 | |
Lear Corp. | | | 156 | | | | 24,809 | |
Lennar Corp. - Class A | | | 336 | | | | 25,613 | |
Lovesac Co./The (1) | | | 23 | | | | 991 | |
Lowe’s Cos., Inc. | | | 3,857 | | | | 619,087 | |
Lululemon Athletica, Inc. (1) | | | 240 | | | | 83,527 | |
Lumber Liquidators Holdings, Inc. (1) | | | 201 | | | | 6,179 | |
M/I Homes, Inc. (1) | | | 198 | | | | 8,769 | |
Malibu Boats, Inc. (1) | | | 126 | | | | 7,867 | |
MarineMax, Inc. (1) | | | 84 | | | | 2,943 | |
Marriott International, Inc./MD | | | 31 | | | | 4,090 | |
McDonald’s Corp. | | | 2,701 | | | | 579,581 | |
Meritage Homes Corp. (1) | | | 290 | | | | 24,018 | |
MGM Resorts International | | | 240 | | | | 7,562 | |
Modine Manufacturing Co. (1) | | | 301 | | | | 3,781 | |
Nathan’s Famous, Inc. | | | 23 | | | | 1,270 | |
Nautilus, Inc. (1) | | | 144 | | | | 2,612 | |
NIKE, Inc. - Class B | | | 1,918 | | | | 271,339 | |
Nordstrom, Inc. | | | 57 | | | | 1,779 | |
ODP Corp./The | | | 249 | | | | 7,296 | |
Overstock.com, Inc. (1) | | | 84 | | | | 4,029 | |
Party City Holdco, Inc. (1) | | | 244 | | | | 1,501 | |
Penn National Gaming, Inc. (1) | | | 348 | | | | 30,057 | |
Polaris, Inc. | | | 112 | | | | 10,671 | |
Pool Corp. | | | 34 | | | | 12,665 | |
PulteGroup, Inc. | | | 3,964 | | | | 170,928 | |
Purple Innovation, Inc. (1) | | | 244 | | | | 8,037 | |
Qurate Retail, Inc. - Class A | | | 1,756 | | | | 19,263 | |
Red Rock Resorts, Inc. | | | 271 | | | | 6,786 | |
Rent-A-Center, Inc./TX | | | 3,572 | | | | 136,772 | |
RTW Retailwinds, Inc. (1) | | | 450 | | | | 6 | |
Scientific Games Corp. (1) | | | 156 | | | | 6,472 | |
Sleep Number Corp. (1) | | | 68 | | | | 5,566 | |
Sonic Automotive, Inc. | | | 171 | | | | 6,595 | |
Starbucks Corp. | | | 3,277 | | | | 350,573 | |
Sturm Ruger & Co., Inc. | | | 105 | | | | 6,832 | |
Superior Industries International, Inc. (1) | | | 416 | | | | 1,701 | |
Moderate Allocation Fund |
Security Description | | Shares or
Principal
Amount ($) | | | Fair
Value ($) | |
Common Stocks — continued |
Tapestry, Inc. | | | 236 | | | | 7,335 | |
Target Corp. | | | 1,207 | | | | 213,072 | |
Tesla, Inc. (1) | | | 1,399 | | | | 987,232 | |
Texas Roadhouse, Inc. | | | 204 | | | | 15,945 | |
Thor Industries, Inc. | | | 776 | | | | 72,160 | |
TopBuild Corp. (1) | | | 31 | | | | 5,706 | |
Town Sports International Holdings, Inc. (1) | | | 961 | | | | 240 | |
Tupperware Brands Corp. (1) | | | 91 | | | | 2,947 | |
Urban Outfitters, Inc. (1) | | | 114 | | | | 2,918 | |
Vista Outdoor, Inc. (1) | | | 59 | | | | 1,402 | |
VOXX International Corp. (1) | | | 110 | | | | 1,404 | |
Waitr Holdings, Inc. (1) | | | 190 | | | | 528 | |
Wayfair, Inc. (1) | | | 27 | | | | 6,097 | |
Wendy’s Co./The | | | 442 | | | | 9,689 | |
Williams-Sonoma, Inc. | | | 112 | | | | 11,406 | |
Wingstop, Inc. | | | 292 | | | | 38,705 | |
Winnebago Industries, Inc. | | | 1,618 | | | | 96,983 | |
Wyndham Destinations, Inc. | | | 1,121 | | | | 50,288 | |
XPEL, Inc. (1) | | | 68 | | | | 3,506 | |
Yum China Holdings, Inc. | | | 986 | | | | 56,291 | |
Yum! Brands, Inc. | | | 1,652 | | | | 179,341 | |
| | | | | | | | 8,362,732 | |
| | | | | | | | | |
Consumer Staples — 1.1% | | | | | | | | |
Andersons, Inc./The | | | 166 | | | | 4,069 | |
BJ’s Wholesale Club Holdings, Inc. (1) | | | 54 | | | | 2,013 | |
Bunge, Ltd. | | | 5,023 | | | | 329,408 | |
Conagra Brands, Inc. | | | 982 | | | | 35,607 | |
Costco Wholesale Corp. | | | 117 | | | | 44,083 | |
Darling Ingredients, Inc. (1) | | | 2,004 | | | | 115,591 | |
General Mills, Inc. | | | 6,879 | | | | 404,485 | |
Ingredion, Inc. | | | 111 | | | | 8,732 | |
Kroger Co./The | | | 2,338 | | | | 74,255 | |
Molson Coors Beverage Co. - Class B | | | 2,199 | | | | 99,373 | |
Natural Grocers by Vitamin Cottage, Inc. | | | 83 | | | | 1,140 | |
Nu Skin Enterprises, Inc. | | | 142 | | | | 7,757 | |
PepsiCo, Inc. | | | 2,103 | | | | 311,875 | |
Performance Food Group Co. (1) | | | 292 | | | | 13,902 | |
Rite Aid Corp. (1) | | | 156 | | | | 2,469 | |
SpartanNash Co. | | | 237 | | | | 4,126 | |
Tyson Foods, Inc. | | | 640 | | | | 41,242 | |
United Natural Foods, Inc. (1) | | | 169 | | | | 2,699 | |
Walgreens Boots Alliance, Inc. | | | 93 | | | | 3,709 | |
Walmart, Inc. | | | 2,766 | | | | 398,719 | |
| | | | | | | | 1,905,254 | |
| | | | | | | | | |
The accompanying notes are an integral part of these financial statements
Page 74 | 2020 Annual Report | December 31, 2020 |
Schedule of Investments
December 31, 2020
Moderate Allocation Fund |
Security Description | | Shares or
Principal
Amount ($) | | | Fair
Value ($) | |
Common Stocks — continued |
Energy — 0.3% | | | | | | | | |
Amplify Energy Corp. | | | 719 | | | | 942 | |
Antero Resources Corp. (1) | | | 1,230 | | | | 6,704 | |
Apache Corp. | | | 437 | | | | 6,201 | |
Archrock, Inc. | | | 672 | | | | 5,820 | |
Ardmore Shipping Corp. | | | 241 | | | | 788 | |
Aspen Aerogels, Inc. (1) | | | 282 | | | | 4,707 | |
Bonanza Creek Energy, Inc. (1) | | | 236 | | | | 4,562 | |
Brigham Minerals, Inc. | | | 325 | | | | 3,572 | |
Cabot Oil & Gas Corp. | | | 1,110 | | | | 18,071 | |
Cactus, Inc. - Class A | | | 502 | | | | 13,087 | |
Centennial Resource Development, Inc./DE - Class A (1) | | | 1,087 | | | | 1,631 | |
Chaparral Energy, Inc. A Warrants (1)(7) | | | 1 | | | | 0 | |
Chaparral Energy, Inc. B Warrants (1)(7) | | | 1 | | | | 0 | |
Chesapeake Energy Corp. (1) | | | 54 | | | | 82 | |
Cimarex Energy Co. | | | 896 | | | | 33,609 | |
Clean Energy Fuels Corp. (1) | | | 804 | | | | 6,319 | |
CNX Resources Corp. (1) | | | 340 | | | | 3,672 | |
Concho Resources, Inc. | | | 849 | | | | 49,539 | |
ConocoPhillips | | | 3,121 | | | | 124,809 | |
CONSOL Energy, Inc. (1) | | | 161 | | | | 1,161 | |
Continental Resources, Inc./OK | | | 284 | | | | 4,629 | |
Delek US Holdings, Inc. | | | 103 | | | | 1,655 | |
DHT Holdings, Inc. | | | 613 | | | | 3,206 | |
Diamondback Energy, Inc. | | | 140 | | | | 6,776 | |
DMC Global, Inc. | | | 20 | | | | 865 | |
Dorian LPG, Ltd. (1) | | | 320 | | | | 3,901 | |
Earthstone Energy, Inc. - Class A (1) | | | 40 | | | | 213 | |
EOG Resources, Inc. | | | 1,398 | | | | 69,718 | |
EQT Corp. | | | 889 | | | | 11,299 | |
Exterran Corp. (1) | | | 92 | | | | 407 | |
Extraction Oil & Gas, Inc. (1) | | | 568 | | | | 16 | |
Frank’s International NV (1) | | | 352 | | | | 964 | |
Golar LNG, Ltd. | | | 157 | | | | 1,513 | |
Gulfport Energy Corp. (1) | | | 53 | | | | 2 | |
Hallador Energy Co. | | | 121 | | | | 178 | |
Hess Corp. | | | 215 | | | | 11,350 | |
International Seaways, Inc. | | | 104 | | | | 1,698 | |
KLX Energy Services Holdings, Inc. (1) | | | 127 | | | | 820 | |
Laredo Petroleum, Inc. (1) | | | 304 | | | | 5,989 | |
Liberty Oilfield Services, Inc. - Class A | | | 717 | | | | 7,392 | |
Matador Resources Co. (1) | | | 444 | | | | 5,355 | |
Nabors Industries, Ltd. | | | 71 | | | | 4,134 | |
NextDecade Corp. (1) | | | 179 | | | | 374 | |
NexTier Oilfield Solutions, Inc. (1) | | | 354 | | | | 1,218 | |
Nine Energy Service, Inc. (1) | | | 483 | | | | 1,314 | |
Moderate Allocation Fund |
Security Description | | Shares or
Principal
Amount ($) | | | Fair
Value ($) | |
Common Stocks — continued |
Nordic American Tankers, Ltd. | | | 389 | | | | 1,148 | |
NOV, Inc. (1) | | | 722 | | | | 9,913 | |
Oasis Petroleum, Inc. Warrants (1)(7) | | | 3 | | | | 0 | |
Oceaneering International, Inc. (1) | | | 732 | | | | 5,819 | |
Pacific Ethanol,, Inc. (1) | | | 2 | | | | 11 | |
Parsley Energy, Inc. | | | 947 | | | | 13,447 | |
Patterson-UTI Energy, Inc. | | | 304 | | | | 1,599 | |
PDC Energy, Inc. (1) | | | 409 | | | | 8,397 | |
Peabody Energy Corp. | | | 408 | | | | 983 | |
Phillips 66 | | | 351 | | | | 24,549 | |
Pioneer Natural Resources Co. | | | 315 | | | | 35,875 | |
Profire Energy, Inc. (1) | | | 11 | | | | 9 | |
ProPetro Holding Corp. (1) | | | 1,536 | | | | 11,351 | |
Range Resources Corp. | | | 497 | | | | 3,330 | |
Renewable Energy Group, Inc. (1) | | | 104 | | | | 7,365 | |
Schlumberger NV | | | 724 | | | | 15,805 | |
Scorpio Tankers, Inc. | | | 57 | | | | 638 | |
SilverBow Resources, Inc. (1) | | | 218 | | | | 1,158 | |
Southwestern Energy Co. (1) | | | 1,586 | | | | 4,726 | |
Superior Energy Services, Inc. (1) | | | 64 | | | | 3 | |
Talos Energy, Inc. (1) | | | 63 | | | | 519 | |
Teekay Corp. (1) | | | 502 | | | | 1,079 | |
W&T Offshore, Inc. (1) | | | 1,085 | | | | 2,354 | |
Westmoreland Coal Co. (1)(7) | | | 773 | | | | 0 | |
Whiting Petroleum Corp. (1) | | | 35 | | | | 875 | |
Whiting Petroleum Corporation A Warrants (1) | | | 26 | | | | 46 | |
Whiting Petroleum Corporation B Warrants (1)(2) | | | 12 | | | | 23 | |
World Fuel Services Corp. | | | 500 | | | | 15,580 | |
WPX Energy, Inc. (1) | | | 794 | | | | 6,471 | |
| | | | | | | | 603,335 | |
| | | | | | | | | |
Financials — 3.0% | | | | | | | | |
AGNC Investment Corp. | | | 2,535 | | | | 39,546 | |
Allstate Corp./The | | | 138 | | | | 15,170 | |
Ally Financial, Inc. | | | 3,147 | | | | 112,222 | |
American Equity Investment Life Holding Co. | | | 220 | | | | 6,085 | |
American Express Co. | | | 429 | | | | 51,870 | |
Ameriprise Financial, Inc. | | | 274 | | | | 53,246 | |
Ameris Bancorp | | | 787 | | | | 29,961 | |
Arbor Realty Trust, Inc. | | | 246 | | | | 3,488 | |
Artisan Partners Asset Management, Inc. - Class A | | | 1,037 | | | | 52,203 | |
Associated Banc-Corp | | | 3,073 | | | | 52,395 | |
Axos Financial, Inc. (1) | | | 341 | | | | 12,798 | |
BancorpSouth Bank | | | 718 | | | | 19,702 | |
The accompanying notes are an integral part of these financial statements
2020 Annual Report | December 31, 2020 | Page 75 |
Schedule of Investments
December 31, 2020
Moderate Allocation Fund |
Security Description | | Shares or
Principal
Amount ($) | | | Fair
Value ($) | |
Common Stocks — continued |
Bank of America Corp. | | | 16,248 | | | | 492,477 | |
Bank of NT Butterfield & Son, Ltd./The | | | 492 | | | | 15,331 | |
BankUnited, Inc. | | | 846 | | | | 29,424 | |
Bar Harbor Bankshares | | | 24 | | | | 542 | |
Berkshire Hathaway, Inc. - Class B (1) | | | 5,127 | | | | 1,188,797 | |
Charles Schwab Corp./The | | | 201 | | | | 10,661 | |
Chimera Investment Corp. | | | 214 | | | | 2,194 | |
Citigroup, Inc. | | | 2,393 | | | | 147,552 | |
Citizens Financial Group, Inc. | | | 1,490 | | | | 53,282 | |
Civista Bancshares, Inc. | | | 499 | | | | 8,747 | |
CNO Financial Group, Inc. | | | 1,485 | | | | 33,012 | |
Columbia Banking System, Inc. | | | 144 | | | | 5,170 | |
Comerica, Inc. | | | 83 | | | | 4,636 | |
Curo Group Holdings Corp. | | | 950 | | | | 13,614 | |
Customers Bancorp, Inc. (1) | | | 478 | | | | 8,690 | |
East West Bancorp, Inc. | | | 779 | | | | 39,503 | |
Eaton Vance Corp. | | | 314 | | | | 21,330 | |
Elevate Credit, Inc. (1) | | | 771 | | | | 3,076 | |
Ellington Residential Mortgage REIT | | | 1,041 | | | | 13,575 | |
Enova International, Inc. (1) | | | 374 | | | | 9,264 | |
Esquire Financial Holdings, Inc. (1) | | | 69 | | | | 1,324 | |
Evercore, Inc. - Class A | | | 154 | | | | 16,885 | |
Farmers National Banc Corp. | | | 70 | | | | 929 | |
Fifth Third Bancorp | | | 4,349 | | | | 119,902 | |
First Citizens BancShares, Inc./NC - Class A | | | 37 | | | | 21,248 | |
First Financial Bancorp | | | 899 | | | | 15,759 | |
First Horizon Corp. | | | 187 | | | | 2,386 | |
First Republic Bank/CA | | | 442 | | | | 64,943 | |
FNCB Bancorp, Inc. | | | 124 | | | | 794 | |
Goosehead Insurance, Inc. | | | 148 | | | | 18,464 | |
Great Ajax Corp. | | | 1,645 | | | | 17,207 | |
Hartford Financial Services Group, Inc./The | | | 230 | | | | 11,265 | |
HBT Financial, Inc. | | | 215 | | | | 3,257 | |
Heartland Financial USA, Inc. | | | 452 | | | | 18,247 | |
Hilltop Holdings, Inc. | | | 1,114 | | | | 30,646 | |
Houlihan Lokey, Inc. - Class A | | | 441 | | | | 29,648 | |
Huntington Bancshares, Inc./OH | | | 1,477 | | | | 18,655 | |
JPMorgan Chase & Co. | | | 3,129 | | | | 397,602 | |
KeyCorp | | | 1,415 | | | | 23,220 | |
Kinsale Capital Group, Inc. | | | 264 | | | | 52,834 | |
Lakeland Financial Corp. | | | 3 | | | | 161 | |
LendingClub Corp. (1) | | | 85 | | | | 898 | |
LPL Financial Holdings, Inc. | | | 316 | | | | 32,934 | |
M&T Bank Corp. | | | 132 | | | | 16,804 | |
Medley Management, Inc. | | | 27 | | | | 216 | |
Meta Financial Group, Inc. | | | 127 | | | | 4,643 | |
MetLife, Inc. | | | 891 | | | | 41,832 | |
Moderate Allocation Fund |
Security Description | | Shares or
Principal
Amount ($) | | | Fair
Value ($) | |
Common Stocks — continued |
Metrocity Bankshares, Inc. | | | 317 | | | | 4,571 | |
Mid Penn Bancorp, Inc. | | | 3 | | | | 66 | |
Morgan Stanley | | | 2,781 | | | | 190,582 | |
Mr Cooper Group, Inc. (1) | | | 941 | | | | 29,199 | |
NewStar Financial Contingent Value Rights (1)(7) | | | 31 | | | | 0 | |
Northrim BanCorp, Inc. | | | 388 | | | | 13,173 | |
OneMain Holdings, Inc. | | | 426 | | | | 20,516 | |
Oppenheimer Holdings, Inc. | | | 851 | | | | 26,747 | |
PennyMac Financial Services, Inc. | | | 855 | | | | 56,105 | |
PennyMac Mortgage Investment Trust | | | 615 | | | | 10,818 | |
People’s United Financial, Inc. | | | 647 | | | | 8,366 | |
Pinnacle Financial Partners, Inc. | | | 163 | | | | 10,497 | |
PJT Partners, Inc. | | | 481 | | | | 36,195 | |
PNC Financial Services Group, Inc./The | | | 676 | | | | 100,724 | |
Popular, Inc. | | | 297 | | | | 16,727 | |
Progressive Corp./The | | | 1,622 | | | | 160,383 | |
ProSight Global, Inc. (1) | | | 16 | | | | 205 | |
Prudential Financial, Inc. | | | 1,119 | | | | 87,360 | |
Pzena Investment Management, Inc. - Class A | | | 929 | | | | 6,782 | |
QCR Holdings, Inc. | | | 252 | | | | 9,977 | |
RBB Bancorp | | | 509 | | | | 7,828 | |
Ready Capital Corp. | | | 750 | | | | 9,338 | |
Regions Financial Corp. | | | 6,024 | | | | 97,107 | |
Sandy Spring Bancorp, Inc. | | | 7 | | | | 225 | |
Siebert Financial Corp. (1) | | | 123 | | | | 517 | |
Signature Bank/New York NY | | | 234 | | | | 31,658 | |
Silvercrest Asset Management Group, Inc. | | | 99 | | | | 1,375 | |
Simmons First National Corp. | | | 159 | | | | 3,433 | |
SLM Corp. | | | 816 | | | | 10,110 | |
South State Corp. | | | 54 | | | | 3,904 | |
State Street Corp. | | | 1,271 | | | | 92,503 | |
Stewart Information Services Corp. | | | 1,873 | | | | 90,578 | |
StoneX Group, Inc. (1) | | | 110 | | | | 6,369 | |
SVB Financial Group (1) | | | 160 | | | | 62,053 | |
Synchrony Financial | | | 5,868 | | | | 203,678 | |
Synovus Financial Corp. | | | 62 | | | | 2,007 | |
Truist Financial Corp. | | | 3,229 | | | | 154,766 | |
UMB Financial Corp. | | | 412 | | | | 28,424 | |
United Community Banks, Inc./GA | | | 867 | | | | 24,657 | |
Valley National Bancorp | | | 1,343 | | | | 13,094 | |
Veritex Holdings, Inc. | | | 1 | | | | 26 | |
Virtu Financial, Inc. | | | 1,300 | | | | 32,721 | |
Virtus Investment Partners, Inc. | | | 145 | | | | 31,465 | |
Walker & Dunlop, Inc. | | | 611 | | | | 56,224 | |
Wells Fargo & Co. | | | 917 | | | | 27,675 | |
The accompanying notes are an integral part of these financial statements
Page 76 | 2020 Annual Report | December 31, 2020 |
Schedule of Investments
December 31, 2020
Moderate Allocation Fund |
Security Description | | Shares or
Principal
Amount ($) | | | Fair
Value ($) | |
Common Stocks — continued |
Western Alliance Bancorp | | | 530 | | | | 31,774 | |
| | | | | | | | 5,324,768 | |
| | | | | | | | | |
Healthcare — 6.9% | | | | | | | | |
89bio, Inc. (1) | | | 15 | | | | 366 | |
Abbott Laboratories | | | 2,091 | | | | 228,944 | |
AbbVie, Inc. | | | 6,814 | | | | 730,120 | |
AcelRx Pharmaceuticals, Inc. (1) | | | 2,706 | | | | 3,355 | |
Affimed NV (1) | | | 628 | | | | 3,655 | |
AgeX Therapeutics, Inc. (1) | | | 108 | | | | 164 | |
Agilent Technologies, Inc. | | | 1,739 | | | | 206,054 | |
Albireo Pharma, Inc. (1) | | | 2 | | | | 75 | |
Alexion Pharmaceuticals, Inc. (1) | | | 990 | | | | 154,678 | |
Align Technology, Inc. (1) | | | 176 | | | | 94,051 | |
Alkermes PLC (1) | | | 935 | | | | 18,653 | |
Allakos, Inc. (1) | | | 68 | | | | 9,520 | |
Allscripts Healthcare Solutions, Inc. (1) | | | 372 | | | | 5,372 | |
Alnylam Pharmaceuticals, Inc. (1) | | | 212 | | | | 27,554 | |
Amgen, Inc. | | | 2,164 | | | | 497,547 | |
Amicus Therapeutics, Inc. (1) | | | 224 | | | | 5,172 | |
Amneal Pharmaceuticals, Inc. - Class A (1) | | | 1,005 | | | | 4,593 | |
Anthem, Inc. | | | 510 | | | | 163,756 | |
Apellis Pharmaceuticals, Inc. (1) | | | 144 | | | | 8,237 | |
Applied Therapeutics, Inc. (1) | | | 42 | | | | 924 | |
Arcturus Therapeutics Holdings, Inc. (1) | | | 56 | | | | 2,429 | |
Arcutis Biotherapeutics, Inc. (1) | | | 77 | | | | 2,166 | |
Arena Pharmaceuticals, Inc. (1) | | | 118 | | | | 9,066 | |
Arrowhead Pharmaceuticals, Inc. (1) | | | 187 | | | | 14,349 | |
Assembly Biosciences, Inc. (1) | | | 161 | | | | 974 | |
Assertio Holdings, Inc. (1) | | | 874 | | | | 313 | |
Atara Biotherapeutics, Inc. (1) | | | 139 | | | | 2,729 | |
Avantor, Inc. (1) | | | 574 | | | | 16,158 | |
Axsome Therapeutics, Inc. (1) | | | 29 | | | | 2,363 | |
Baxter International, Inc. | | | 124 | | | | 9,950 | |
Beam Therapeutics, Inc. (1) | | | 121 | | | | 9,878 | |
Beyondspring, Inc. (1) | | | 32 | | | | 390 | |
BioDelivery Sciences International, Inc. (1) | | | 1,905 | | | | 8,001 | |
Biogen, Inc. (1) | | | 7 | | | | 1,714 | |
Bio-Rad Laboratories, Inc. (1) | | | 8 | | | | 4,664 | |
Bio-Techne Corp. | | | 100 | | | | 31,755 | |
Bioxcel Therapeutics, Inc. (1) | | | 83 | | | | 3,835 | |
Blueprint Medicines Corp. (1) | | | 128 | | | | 14,355 | |
Bridgebio Pharma, Inc. (1) | | | 99 | | | | 7,040 | |
Bristol-Myers Squibb Co. | | | 6,446 | | | | 399,845 | |
Calyxt, Inc. (1) | | | 27 | | | | 114 | |
Cardinal Health, Inc. | | | 2,988 | | | | 160,037 | |
CareDx, Inc. (1) | | | 153 | | | | 11,085 | |
Moderate Allocation Fund |
Security Description | | Shares or
Principal
Amount ($) | | | Fair
Value ($) | |
Common Stocks — continued |
CASI Pharmaceuticals, Inc. (1) | | | 102 | | | | 301 | |
Castle Biosciences, Inc. (1) | | | 69 | | | | 4,633 | |
Catalent, Inc. (1) | | | 645 | | | | 67,125 | |
Catalyst Pharmaceuticals, Inc. (1) | | | 1,537 | | | | 5,134 | |
cbdMD, Inc. (1) | | | 26 | | | | 77 | |
Celcuity, Inc. (1) | | | 82 | | | | 751 | |
Centene Corp. (1) | | | 751 | | | | 45,083 | |
Centogene NV (1) | | | 95 | | | | 1,024 | |
Cerecor, Inc. (1) | | | 197 | | | | 520 | |
Cerner Corp. | | | 3,008 | | | | 236,068 | |
Charles River Laboratories International, Inc. (1) | | | 215 | | | | 53,720 | |
Chemed Corp. | | | 114 | | | | 60,718 | |
ChemoCentryx, Inc. (1) | | | 237 | | | | 14,675 | |
Co-Diagnostics, Inc. (1) | | | 92 | | | | 856 | |
Community Health Systems, Inc. (1) | | | 451 | | | | 3,351 | |
Computer Programs and Systems, Inc. | | | 83 | | | | 2,228 | |
Concert Pharmaceuticals, Inc. (1) | | | 27 | | | | 341 | |
Conformis, Inc. (1) | | | 569 | | | | 376 | |
Constellation Pharmaceuticals, Inc. (1) | | | 75 | | | | 2,160 | |
Corcept Therapeutics, Inc. (1) | | | 146 | | | | 3,819 | |
Cross Country Healthcare, Inc. (1) | | | 64 | | | | 568 | |
CVS Health Corp. | | | 4,664 | | | | 318,551 | |
Cymabay Therapeutics, Inc. (1) | | | 649 | | | | 3,725 | |
Danaher Corp. | | | 954 | | | | 211,922 | |
Deciphera Pharmaceuticals, Inc. (1) | | | 107 | | | | 6,106 | |
Denali Therapeutics, Inc. (1) | | | 125 | | | | 10,470 | |
DENTSPLY SIRONA, Inc. | | | 961 | | | | 50,318 | |
Editas Medicine, Inc. (1) | | | 126 | | | | 8,834 | |
Edwards Lifesciences Corp. (1) | | | 1,372 | | | | 125,168 | |
Eidos Therapeutics, Inc. (1) | | | 39 | | | | 5,132 | |
Elanco Animal Health, Inc. Contingent Value Rights (1)(7) | | | 162 | | | | 0 | |
ElectroCore, Inc. (1) | | | 30 | | | | 47 | |
Eli Lilly and Co. | | | 1,846 | | | | 311,679 | |
Eloxx Pharmaceuticals, Inc. (1) | | | 121 | | | | 482 | |
Emergent BioSolutions, Inc. (1) | | | 341 | | | | 30,554 | |
Endo International PLC (1) | | | 1,274 | | | | 9,147 | |
Enochian Biosciences, Inc. (1) | | | 37 | | | | 109 | |
Ensign Group, Inc./The | | | 112 | | | | 8,167 | |
Evelo Biosciences, Inc. (1) | | | 103 | | | | 1,245 | |
Exact Sciences Corp. (1) | | | 264 | | | | 34,977 | |
Exelixis, Inc. (1) | | | 1,142 | | | | 22,920 | |
Fate Therapeutics, Inc. (1) | | | 160 | | | | 14,549 | |
Five Prime Therapeutics, Inc. (1) | | | 106 | | | | 1,803 | |
Fulgent Genetics, Inc. (1) | | | 24 | | | | 1,250 | |
Geron Corp. (1) | | | 381 | | | | 606 | |
The accompanying notes are an integral part of these financial statements
2020 Annual Report | December 31, 2020 | Page 77 |
Schedule of Investments
December 31, 2020
Moderate Allocation Fund |
Security Description | | Shares or
Principal
Amount ($) | | | Fair
Value ($) | |
Common Stocks — continued |
Gilead Sciences, Inc. | | | 4,062 | | | | 236,652 | |
Globus Medical, Inc. (1) | | | 180 | | | | 11,740 | |
HCA Healthcare, Inc. | | | 414 | | | | 68,086 | |
Hill-Rom Holdings, Inc. | | | 765 | | | | 74,947 | |
Horizon Therapeutics Plc (1) | | | 1,699 | | | | 124,282 | |
Humana, Inc. | | | 414 | | | | 169,852 | |
IGM Biosciences, Inc. (1) | | | 12 | | | | 1,059 | |
Illumina, Inc. (1) | | | 164 | | | | 60,680 | |
ImmunoGen, Inc. (1) | | | 407 | | | | 2,625 | |
Immunovant, Inc. (1) | | | 54 | | | | 2,494 | |
Inogen, Inc. (1) | | | 64 | | | | 2,860 | |
Inovio Pharmaceuticals, Inc. (1) | | | 215 | | | | 1,903 | |
Insmed, Inc. (1) | | | 112 | | | | 3,728 | |
Insulet Corp. (1) | | | 29 | | | | 7,413 | |
Intellia Therapeutics, Inc. (1) | | | 171 | | | | 9,302 | |
Intersect ENT, Inc. (1) | | | 16 | | | | 366 | |
Invitae Corp. (1) | | | 214 | | | | 8,947 | |
Iovance Biotherapeutics, Inc. (1) | | | 343 | | | | 15,915 | |
iRhythm Technologies, Inc. (1) | | | 42 | | | | 9,963 | |
Jazz Pharmaceuticals PLC (1) | | | 83 | | | | 13,699 | |
Johnson & Johnson | | | 7,381 | | | | 1,161,622 | |
Jounce Therapeutics, Inc. (1) | | | 107 | | | | 749 | |
Kodiak Sciences, Inc. (1) | | | 82 | | | | 12,047 | |
Kura Oncology, Inc. (1) | | | 331 | | | | 10,810 | |
LHC Group, Inc. (1) | | | 5 | | | | 1,067 | |
MacroGenics, Inc. (1) | | | 196 | | | | 4,481 | |
Mallinckrodt PLC (1)(2) | | | 30 | | | | 6 | |
MannKind Corp. (1) | | | 564 | | | | 1,765 | |
Marinus Pharmaceuticals, Inc. (1) | | | 99 | | | | 1,208 | |
McKesson Corp. | | | 571 | | | | 99,308 | |
Medtronic PLC | | | 5,903 | | | | 691,477 | |
MEI Pharma, Inc. (1) | | | 82 | | | | 216 | |
Merck & Co., Inc. | | | 9,640 | | | | 788,552 | |
Mersana Therapeutics, Inc. (1) | | | 667 | | | | 17,749 | |
Mettler-Toledo International, Inc. (1) | | | 11 | | | | 12,536 | |
Mirati Therapeutics, Inc. (1) | | | 99 | | | | 21,744 | |
Moderna, Inc. (1) | | | 595 | | | | 62,160 | |
Molina Healthcare, Inc. (1) | | | 29 | | | | 6,168 | |
Morphic Holding, Inc. (1) | | | 98 | | | | 3,288 | |
Myriad Genetics, Inc. (1) | | | 116 | | | | 2,294 | |
NantKwest, Inc. (1) | | | 307 | | | | 4,092 | |
Natera, Inc. (1) | | | 172 | | | | 17,117 | |
National HealthCare Corp. | | | 9 | | | | 598 | |
Neurocrine Biosciences, Inc. (1) | | | 104 | | | | 9,968 | |
NextGen Healthcare, Inc. (1) | | | 540 | | | | 9,850 | |
Novavax, Inc. (1) | | | 120 | | | | 13,381 | |
Novocure, Ltd. (1) | | | 41 | | | | 7,095 | |
Moderate Allocation Fund |
Security Description | | Shares or
Principal
Amount ($) | | | Fair
Value ($) | |
Common Stocks — continued |
Ocular Therapeutix, Inc. (1) | | | 551 | | | | 11,406 | |
Oncocyte Corp. (1) | | | 240 | | | | 574 | |
Organogenesis Holdings, Inc. (1) | | | 140 | | | | 1,054 | |
Osmotica Pharmaceuticals PLC (1) | | | 431 | | | | 1,776 | |
Owens & Minor, Inc. | | | 292 | | | | 7,899 | |
Pacific Biosciences of California, Inc. (1) | | | 394 | | | | 10,220 | |
Palatin Technologies, Inc. (1) | | | 1,854 | | | | 1,253 | |
PerkinElmer, Inc. | | | 348 | | | | 49,938 | |
Perrigo Co. PLC | | | 1,684 | | | | 75,308 | |
Pfizer, Inc. | | | 13,035 | | | | 479,818 | |
PolarityTE, Inc. (1) | | | 252 | | | | 171 | |
PRA Health Sciences, Inc. (1) | | | 189 | | | | 23,708 | |
Precigen, Inc. (1)(2) | | | 267 | | | | 2,723 | |
Quest Diagnostics, Inc. | | | 324 | | | | 38,611 | |
Quidel Corp. (1) | | | 5 | | | | 898 | |
Regeneron Pharmaceuticals, Inc. (1) | | | 458 | | | | 221,264 | |
Replimune Group, Inc. (1) | | | 73 | | | | 2,785 | |
ResMed, Inc. | | | 167 | | | | 35,498 | |
REVOLUTION Medicines, Inc. (1) | | | 48 | | | | 1,900 | |
Rhythm Pharmaceuticals, Inc. (1) | | | 323 | | | | 9,603 | |
Rocket Pharmaceuticals, Inc. (1) | | | 114 | | | | 6,252 | |
Sangamo Therapeutics, Inc. (1) | | | 327 | | | | 5,103 | |
Scholar Rock Holding Corp. (1) | | | 71 | | | | 3,446 | |
Seagen, Inc. (1) | | | 332 | | | | 58,146 | |
Senseonics Holdings, Inc. (1) | | | 145 | | | | 126 | |
Seres Therapeutics, Inc. (1) | | | 149 | | | | 3,651 | |
Solid Biosciences, Inc. (1) | | | 167 | | | | 1,266 | |
Sorrento Therapeutics, Inc. (1) | | | 459 | | | | 3,133 | |
Spectrum Pharmaceuticals, Inc. (1) | | | 378 | | | | 1,289 | |
SpringWorks Therapeutics, Inc. (1) | | | 42 | | | | 3,046 | |
STERIS PLC | | | 590 | | | | 111,829 | |
Stryker Corp. | | | 1,090 | | | | 267,094 | |
Supernus Pharmaceuticals, Inc. (1) | | | 246 | | | | 6,189 | |
Surgery Partners, Inc. (1) | | | 65 | | | | 1,886 | |
Sutro Biopharma, Inc. (1) | | | 105 | | | | 2,280 | |
Syros Pharmaceuticals, Inc. (1) | | | 365 | | | | 3,960 | |
Teladoc Health, Inc. (1) | | | 114 | | | | 22,795 | |
Tenet Healthcare Corp. (1) | | | 346 | | | | 13,816 | |
TG Therapeutics, Inc. (1) | | | 286 | | | | 14,878 | |
Thermo Fisher Scientific, Inc. | | | 433 | | | | 201,683 | |
TransEnterix, Inc. (1) | | | 359 | | | | 224 | |
Translate Bio, Inc. (1) | | | 163 | | | | 3,004 | |
Turning Point Therapeutics, Inc. (1) | | | 132 | | | | 16,084 | |
Twist Bioscience Corp. (1) | | | 111 | | | | 15,683 | |
Ultragenyx Pharmaceutical, Inc. (1) | | | 96 | | | | 13,289 | |
United Therapeutics Corp. (1) | | | 458 | | | | 69,520 | |
UnitedHealth Group, Inc. | | | 1,817 | | | | 637,186 | |
The accompanying notes are an integral part of these financial statements
Page 78 | 2020 Annual Report | December 31, 2020 |
Schedule of Investments
December 31, 2020
Moderate Allocation Fund |
Security Description | | Shares or
Principal
Amount ($) | | | Fair
Value ($) | |
Common Stocks — continued |
Universal Health Services, Inc. - Class B | | | 251 | | | | 34,513 | |
Vanda Pharmaceuticals, Inc. (1) | | | 600 | | | | 7,884 | |
Veeva Systems, Inc. (1) | | | 237 | | | | 64,523 | |
Veracyte, Inc. (1) | | | 263 | | | | 12,871 | |
Vertex Pharmaceuticals, Inc. (1) | | | 971 | | | | 229,486 | |
Viatris, Inc. (1) | | | 2,434 | | | | 45,613 | |
Viela Bio, Inc. (1) | | | 7 | | | | 252 | |
West Pharmaceutical Services, Inc. | | | 347 | | | | 98,309 | |
XBiotech, Inc. (1) | | | 378 | | | | 5,916 | |
Xencor, Inc. (1) | | | 131 | | | | 5,716 | |
Zimmer Biomet Holdings, Inc. | | | 1,312 | | | | 202,166 | |
ZIOPHARM Oncology, Inc. (1) | | | 370 | | | | 932 | |
Zoetis, Inc. - Class A | | | 2,745 | | | | 454,298 | |
| | | | | | | | 11,970,894 | |
| | | | | | | | | |
Industrials — 3.2% | | | | | | | | |
3M Co. | | | 1,839 | | | | 321,439 | |
AGCO Corp. | | | 429 | | | | 44,226 | |
Allegiant Travel Co. | | | 142 | | | | 26,872 | |
Alpha Pro Tech, Ltd. (1) | | | 231 | | | | 2,576 | |
Altra Industrial Motion Corp. | | | 202 | | | | 11,197 | |
ArcBest Corp. | | | 369 | | | | 15,745 | |
Arcosa, Inc. | | | 660 | | | | 36,254 | |
Argan, Inc. | | | 79 | | | | 3,515 | |
ASGN, Inc. (1) | | | 137 | | | | 11,444 | |
Astec Industries, Inc. | | | 105 | | | | 6,077 | |
Atkore International Group, Inc. (1) | | | 803 | | | | 33,011 | |
Atlas Air Worldwide Holdings, Inc. (1) | | | 21 | | | | 1,145 | |
Axon Enterprise, Inc. (1) | | | 108 | | | | 13,233 | |
AZZ, Inc. | | | 337 | | | | 15,987 | |
BG Staffing, Inc. | | | 65 | | | | 877 | |
BMC Stock Holdings, Inc. (1) | | | 387 | | | | 20,774 | |
Boise Cascade Co. | | | 919 | | | | 43,928 | |
CAI International, Inc. | | | 25 | | | | 781 | |
Caterpillar, Inc. | | | 764 | | | | 139,063 | |
Cintas Corp. | | | 412 | | | | 145,626 | |
Comfort Systems USA, Inc. | | | 538 | | | | 28,331 | |
Commercial Vehicle Group, Inc. (1) | | | 591 | | | | 5,112 | |
Copart, Inc. (1) | | | 1,120 | | | | 142,520 | |
CoreCivic, Inc. | | | 622 | | | | 4,074 | |
CoreLogic, Inc./United States | | | 531 | | | | 41,057 | |
Covenant Logistics Group, Inc. (1) | | | 194 | | | | 2,873 | |
CSX Corp. | | | 770 | | | | 69,878 | |
Cummins, Inc. | | | 2,329 | | | | 528,916 | |
Deere & Co. | | | 351 | | | | 94,437 | |
Eaton Corp. PLC | | | 1,175 | | | | 141,165 | |
EMCOR Group, Inc. | | | 957 | | | | 87,527 | |
Moderate Allocation Fund |
Security Description | | Shares or
Principal
Amount ($) | | | Fair
Value ($) | |
Common Stocks — continued |
Emerson Electric Co. | | | 659 | | | | 52,964 | |
EnerSys | | | 111 | | | | 9,220 | |
Fastenal Co. | | | 1,427 | | | | 69,680 | |
FedEx Corp. | | | 422 | | | | 109,560 | |
Generac Holdings, Inc. (1) | | | 103 | | | | 23,423 | |
General Electric Co. | | | 2,535 | | | | 27,378 | |
GrafTech International, Ltd. | | | 686 | | | | 7,313 | |
Greenbrier Cos., Inc./The | | | 11 | | | | 400 | |
HEICO Corp. | | | 147 | | | | 19,463 | |
Herc Holdings, Inc. (1) | | | 123 | | | | 8,168 | |
Herman Miller, Inc. | | | 216 | | | | 7,301 | |
Hertz Global Holdings, Inc. (1) | | | 407 | | | | 521 | |
HNI Corp. | | | 250 | | | | 8,615 | |
Huntington Ingalls Industries, Inc. | | | 234 | | | | 39,892 | |
JB Hunt Transport Services, Inc. | | | 74 | | | | 10,112 | |
Kelly Services, Inc. - Class A | | | 331 | | | | 6,809 | |
Kforce, Inc. | | | 86 | | | | 3,620 | |
Kimball International, Inc. - Class B | | | 536 | | | | 6,405 | |
L B Foster Co. - Class A (1) | | | 85 | | | | 1,279 | |
Lawson Products, Inc./DE (1) | | | 27 | | | | 1,375 | |
Lockheed Martin Corp. | | | 1,417 | | | | 503,007 | |
LSC Communications, Inc. (1) | | | 1,143 | | | | 23 | |
Manitowoc Co., Inc./The (1) | | | 18 | | | | 240 | |
ManpowerGroup, Inc. | | | 1,775 | | | | 160,070 | |
Matson, Inc. | | | 280 | | | | 15,952 | |
Maxar Technologies, Inc. | | | 192 | | | | 7,409 | |
McGrath RentCorp | | | 41 | | | | 2,751 | |
Meritor, Inc. (1) | | | 150 | | | | 4,187 | |
Miller Industries, Inc./TN | | | 443 | | | | 16,843 | |
Moog, Inc. | | | 530 | | | | 42,029 | |
MSC Industrial Direct Co., Inc. | | | 707 | | | | 59,664 | |
Mueller Industries, Inc. | | | 704 | | | | 24,717 | |
MYR Group, Inc. (1) | | | 132 | | | | 7,933 | |
National Presto Industries, Inc. | | | 30 | | | | 2,653 | |
Norfolk Southern Corp. | | | 22 | | | | 5,227 | |
Old Dominion Freight Line, Inc. | | | 420 | | | | 81,976 | |
PACCAR, Inc. | | | 5,218 | | | | 450,209 | |
PAE, Inc. (1) | | | 485 | | | | 4,452 | |
Parker-Hannifin Corp. | | | 616 | | | | 167,805 | |
Plug Power, Inc. (1) | | | 787 | | | | 26,687 | |
Primoris Services Corp. | | | 1,261 | | | | 34,816 | |
Quad/Graphics, Inc. - Class A | | | 153 | | | | 584 | |
Quanta Services, Inc. | | | 4,191 | | | | 301,836 | |
Regal Beloit Corp. | | | 704 | | | | 86,458 | |
Resideo Technologies, Inc. (1) | | | 490 | | | | 10,417 | |
Rexnord Corp. | | | 213 | | | | 8,411 | |
RR Donnelley & Sons Co. | | | 897 | | | | 2,027 | |
The accompanying notes are an integral part of these financial statements
2020 Annual Report | December 31, 2020 | Page 79 |
Schedule of Investments
December 31, 2020
Moderate Allocation Fund |
Security Description | | Shares or
Principal
Amount ($) | | | Fair
Value ($) | |
Common Stocks — continued |
Rush Enterprises, Inc. | | | 574 | | | | 23,775 | |
Ryder System, Inc. | | | 269 | | | | 16,613 | |
Safe Bulkers, Inc. (1) | | | 451 | | | | 586 | |
Saia, Inc. (1) | | | 140 | | | | 25,312 | |
Shyft Group, Inc./The | | | 196 | | | | 5,562 | |
SkyWest, Inc. | | | 75 | | | | 3,023 | |
Steelcase, Inc. | | | 429 | | | | 5,813 | |
Textainer Group Holdings, Ltd. (1) | | | 430 | | | | 8,247 | |
Timken Co./The | | | 930 | | | | 71,945 | |
TPI Composites, Inc. (1) | | | 155 | | | | 8,181 | |
Triton International, Ltd./Bermuda | | | 1,096 | | | | 53,167 | |
Tutor Perini Corp. (1) | | | 38 | | | | 492 | |
Uber Technologies, Inc. (1) | | | 1,426 | | | | 72,726 | |
United Parcel Service, Inc. - Class B | | | 1,231 | | | | 207,300 | |
Vectrus, Inc. (1) | | | 159 | | | | 7,905 | |
Verisk Analytics, Inc. | | | 513 | | | | 106,494 | |
Veritiv Corp. (1) | | | 147 | | | | 3,056 | |
Waste Management, Inc. | | | 4,643 | | | | 547,549 | |
Watsco, Inc. | | | 15 | | | | 3,398 | |
WESCO International, Inc. (1) | | | 397 | | | | 31,165 | |
WESCO International, Inc. Series A Variable Preferred (9) | | | 252 | | | | 7,875 | |
| | | | | | | | 5,691,725 | |
| | | | | | | | | |
Information Technology — 10.6% | | | | | | | | |
8x8, Inc. (1) | | | 126 | | | | 4,343 | |
Accenture PLC - Class A | | | 279 | | | | 72,878 | |
ACI Worldwide, Inc. (1) | | | 596 | | | | 22,904 | |
Adobe, Inc. (1) | | | 1,108 | | | | 554,133 | |
Advanced Micro Devices, Inc. (1) | | | 2,355 | | | | 215,977 | |
Alarm.com Holdings, Inc. (1) | | | 80 | | | | 8,276 | |
Alliance Data Systems Corp. | | | 171 | | | | 12,671 | |
Amkor Technology, Inc. | | | 1,095 | | | | 16,513 | |
Amphenol Corp. | | | 6 | | | | 785 | |
Apple, Inc. | | | 29,098 | | | | 3,861,014 | |
Applied Materials, Inc. | | | 2,977 | | | | 256,915 | |
Arista Networks, Inc. (1) | | | 33 | | | | 9,589 | |
Arrow Electronics, Inc. (1) | | | 1,165 | | | | 113,355 | |
AstroNova, Inc. | | | 279 | | | | 2,971 | |
Autodesk, Inc. (1) | | | 562 | | | | 171,601 | |
Avaya Holdings Corp. (1) | | | 488 | | | | 9,345 | |
Avnet, Inc. | | | 2,163 | | | | 75,943 | |
Bill.com Holdings, Inc. (1) | | | 47 | | | | 6,416 | |
Broadcom, Inc. | | | 597 | | | | 261,396 | |
CACI International, Inc. - Class A (1) | | | 409 | | | | 101,976 | |
Cadence Design Systems, Inc. (1) | | | 3,991 | | | | 544,492 | |
Calix, Inc. (1) | | | 1,236 | | | | 36,783 | |
Moderate Allocation Fund |
Security Description | | Shares or
Principal
Amount ($) | | | Fair
Value ($) | |
Common Stocks — continued |
Cambium Networks Corp. (1) | | | 123 | | | | 3,085 | |
CDK Global, Inc. | | | 2,437 | | | | 126,310 | |
CDW Corp./DE | | | 878 | | | | 115,712 | |
Cerence, Inc. (1) | | | 174 | | | | 17,484 | |
ChannelAdvisor Corp. (1) | | | 856 | | | | 13,679 | |
Ciena Corp. (1) | | | 353 | | | | 18,656 | |
Cisco Systems, Inc. | | | 8,427 | | | | 377,108 | |
Cloudera, Inc. (1) | | | 5 | | | | 70 | |
Cloudflare, Inc. (1) | | | 324 | | | | 24,621 | |
Cognex Corp. | | | 292 | | | | 23,443 | |
Cognizant Technology Solutions Corp. | | | 2,038 | | | | 167,014 | |
Concentrix Corp. (1) | | | 425 | | | | 41,948 | |
Conduent, Inc. (1) | | | 1,534 | | | | 7,363 | |
Corning, Inc. | | | 2,044 | | | | 73,584 | |
Coupa Software, Inc. (1) | | | 84 | | | | 28,468 | |
Crowdstrike Holdings, Inc. (1) | | | 294 | | | | 62,275 | |
Dell Technologies, Inc. - Class C (1) | | | 91 | | | | 6,669 | |
Diebold Nixdorf, Inc. (1) | | | 311 | | | | 3,315 | |
Digital Turbine, Inc. (1) | | | 564 | | | | 31,900 | |
DocuSign, Inc. (1) | | | 425 | | | | 94,478 | |
Dolby Laboratories, Inc. | | | 139 | | | | 13,501 | |
Dropbox, Inc. - Class A (1) | | | 288 | | | | 6,391 | |
DXC Technology Co. | | | 1,209 | | | | 31,132 | |
Eastman Kodak Co. (1) | | | 104 | | | | 847 | |
Ebix, Inc. | | | 236 | | | | 8,961 | |
Elastic NV (1) | | | 14 | | | | 2,046 | |
Enphase Energy, Inc. (1) | | | 233 | | | | 40,885 | |
F5 Networks, Inc. (1) | | | 59 | | | | 10,380 | |
Fair Isaac Corp. (1) | | | 102 | | | | 52,126 | |
Fastly, Inc. (1) | | | 107 | | | | 9,349 | |
FormFactor, Inc. (1) | | | 143 | | | | 6,152 | |
Fortinet, Inc. (1) | | | 223 | | | | 33,122 | |
Hewlett Packard Enterprise Co. | | | 5,174 | | | | 61,312 | |
HP, Inc. | | | 5,987 | | | | 147,220 | |
HubSpot, Inc. (1) | | | 75 | | | | 29,733 | |
II-VI, Inc. (1) | | | 121 | | | | 9,191 | |
Insight Enterprises, Inc. (1) | | | 111 | | | | 8,446 | |
Intel Corp. | | | 9,068 | | | | 451,768 | |
Intuit, Inc. | | | 1,659 | | | | 630,171 | |
Jabil, Inc. | | | 2,342 | | | | 99,605 | |
KBR, Inc. | | | 514 | | | | 15,898 | |
Kimball Electronics, Inc. (1) | | | 23 | | | | 368 | |
KLA Corp. | | | 687 | | | | 177,871 | |
Lam Research Corp. | | | 591 | | | | 279,112 | |
Mastercard, Inc. | | | 1,065 | | | | 380,141 | |
Maxim Integrated Products, Inc. | | | 474 | | | | 42,020 | |
Methode Electronics, Inc. | | | 266 | | | | 10,182 | |
The accompanying notes are an integral part of these financial statements
Page 80 | 2020 Annual Report | December 31, 2020 |
Schedule of Investments
December 31, 2020
Moderate Allocation Fund |
Security Description | | Shares or
Principal
Amount ($) | | | Fair
Value ($) | |
Common Stocks — continued |
Microchip Technology, Inc. | | | 67 | | | | 9,253 | |
Micron Technology, Inc. (1) | | | 1,344 | | | | 101,042 | |
Microsoft Corp. | | | 14,725 | | | | 3,275,135 | |
MicroStrategy, Inc. (1) | | | 168 | | | | 65,276 | |
MKS Instruments, Inc. | | | 162 | | | | 24,373 | |
MoneyGram International, Inc. (1) | | | 666 | | | | 3,640 | |
Monolithic Power Systems, Inc. | | | 47 | | | | 17,213 | |
NCR Corp. (1) | | | 524 | | | | 19,687 | |
NETGEAR, Inc. (1) | | | 77 | | | | 3,129 | |
NIC, Inc. | | | 18 | | | | 465 | |
NortonLifeLock, Inc. | | | 2,802 | | | | 58,226 | |
NVIDIA Corp. | | | 1,020 | | | | 532,644 | |
ON Semiconductor Corp. (1) | | | 249 | | | | 8,150 | |
Oracle Corp. | | | 6,601 | | | | 427,019 | |
PagerDuty, Inc. (1) | | | 76 | | | | 3,169 | |
Palo Alto Networks, Inc. (1) | | | 115 | | | | 40,870 | |
Paycom Software, Inc. (1) | | | 89 | | | | 40,250 | |
PayPal Holdings, Inc. (1) | | | 219 | | | | 51,290 | |
Photronics, Inc. (1) | | | 690 | | | | 7,700 | |
Plantronics, Inc. | | | 83 | | | | 2,243 | |
Power Integrations, Inc. | | | 9 | | | | 737 | |
Priority Technology Holdings, Inc. (1) | | | 198 | | | | 1,394 | |
Progress Software Corp. | | | 1,030 | | | | 46,546 | |
Qorvo, Inc. (1) | | | 481 | | | | 79,976 | |
QUALCOMM, Inc. | | | 4,394 | | | | 669,382 | |
RingCentral, Inc. - Class A (1) | | | 98 | | | | 37,139 | |
salesforce.com, Inc. (1) | | | 1,508 | | | | 335,575 | |
Sanmina Corp. (1) | | | 521 | | | | 16,615 | |
ServiceNow, Inc. (1) | | | 82 | | | | 45,135 | |
Skyworks Solutions, Inc. | | | 489 | | | | 74,758 | |
Slack Technologies, Inc. - Class A (1) | | | 90 | | | | 3,802 | |
Smartsheet, Inc. (1) | | | 82 | | | | 5,682 | |
Sonim Technologies, Inc. (1) | | | 372 | | | | 269 | |
SPS Commerce, Inc. (1) | | | 326 | | | | 35,400 | |
Square, Inc. - Class A (1) | | | 869 | | | | 189,129 | |
SS&C Technologies Holdings, Inc. | | | 5,836 | | | | 424,569 | |
StoneCo, Ltd. (1) | | | 285 | | | | 23,917 | |
Stratasys, Ltd. (1) | | | 204 | | | | 4,227 | |
Sykes Enterprises, Inc. (1) | | | 412 | | | | 15,520 | |
SYNNEX Corp. | | | 616 | | | | 50,167 | |
Tenable Holdings, Inc. (1) | | | 452 | | | | 23,622 | |
Teradyne, Inc. | | | 801 | | | | 96,032 | |
TESSCO Technologies, Inc. | | | 90 | | | | 562 | |
Texas Instruments, Inc. | | | 1,897 | | | | 311,355 | |
Trade Desk, Inc./The (1) | | | 90 | | | | 72,090 | |
Trimble, Inc. (1) | | | 1,213 | | | | 80,992 | |
TTEC Holdings, Inc. | | | 261 | | | | 19,035 | |
Moderate Allocation Fund |
Security Description | | Shares or
Principal
Amount ($) | | | Fair
Value ($) | |
Common Stocks — continued |
Twilio, Inc. - Class A (1) | | | 252 | | | | 85,302 | |
Ultra Clean Holdings, Inc. (1) | | | 110 | | | | 3,427 | |
Verint Systems, Inc. (1) | | | 296 | | | | 19,885 | |
Veritone, Inc. (1) | | | 45 | | | | 1,280 | |
VirnetX Holding Corp. (2) | | | 1,342 | | | | 6,764 | |
Visa, Inc. | | | 1,897 | | | | 414,931 | |
Vishay Intertechnology, Inc. | | | 1,342 | | | | 27,793 | |
Vontier Corp. (1) | | | 98 | | | | 3,273 | |
Xerox Holdings Corp. | | | 3,332 | | | | 77,269 | |
Xilinx, Inc. | | | 585 | | | | 82,935 | |
Xperi Holding Corp. | | | 963 | | | | 20,127 | |
Zebra Technologies Corp. - Class A (1) | | | 225 | | | | 86,474 | |
Zoom Video Communications, Inc.- Class A (1) | | | 322 | | | | 108,617 | |
Zscaler, Inc. (1) | | | 141 | | | | 28,159 | |
| | | | | | | | 18,476,025 | |
| | | | | | | | | |
Materials — 1.1% | | | | | | | | |
Avery Dennison Corp. | | | 688 | | | | 106,716 | |
Avient Corp. | | | 160 | | | | 6,445 | |
Caledonia Mining Corp. PLC | | | 374 | | | | 5,939 | |
Celanese Corp. | | | 51 | | | | 6,627 | |
Century Aluminum Co. (1) | | | 18 | | | | 199 | |
Chemours Co./The | | | 162 | | | | 4,016 | |
Commercial Metals Co. | | | 172 | | | | 3,533 | |
Corteva, Inc. | | | 1,431 | | | | 55,408 | |
Dow, Inc. | | | 1,285 | | | | 71,318 | |
Eastman Chemical Co. | | | 1,378 | | | | 138,186 | |
Flotek Industries, Inc. (1) | | | 592 | | | | 1,249 | |
Freeport-McMoRan, Inc. - Class B | | | 2,633 | | | | 68,511 | |
FutureFuel Corp. | | | 10 | | | | 127 | |
Hawkins, Inc. | | | 2 | | | | 105 | |
Huntsman Corp. | | | 2,144 | | | | 53,900 | |
Ingevity Corp. (1) | | | 38 | | | | 2,878 | |
Linde PLC | | | 75 | | | | 19,763 | |
Louisiana-Pacific Corp. | | | 1,194 | | | | 44,381 | |
LyondellBasell Industries NV - Class A | | | 688 | | | | 63,062 | |
Marrone Bio Innovations, Inc. (1) | | | 1,062 | | | | 1,328 | |
Minerals Technologies, Inc. | | | 88 | | | | 5,467 | |
Mosaic Co./The | | | 187 | | | | 4,303 | |
Newmont Corp. | | | 5,173 | | | | 309,811 | |
Nucor Corp. | | | 702 | | | | 37,339 | |
O-I Glass, Inc. | | | 658 | | | | 7,830 | |
Olin Corp. | | | 140 | | | | 3,438 | |
Olympic Steel, Inc. | | | 30 | | | | 400 | |
Packaging Corp. of America | | | 377 | | | | 51,992 | |
PPG Industries, Inc. | | | 988 | | | | 142,489 | |
The accompanying notes are an integral part of these financial statements
2020 Annual Report | December 31, 2020 | Page 81 |
Schedule of Investments
December 31, 2020
Moderate Allocation Fund |
Security Description | | Shares or
Principal
Amount ($) | | | Fair
Value ($) | |
Common Stocks — continued |
Rayonier Advanced Materials, Inc. (1) | | | 389 | | | | 2,536 | |
Reliance Steel & Aluminum Co. | | | 1,534 | | | | 183,697 | |
Royal Gold, Inc. | | | 101 | | | | 10,742 | |
Ryerson Holding Corp. (1) | | | 409 | | | | 5,579 | |
Scotts Miracle-Gro Co./The | | | 898 | | | | 178,828 | |
Sherwin-Williams Co./The | | | 304 | | | | 223,413 | |
Steel Dynamics, Inc. | | | 537 | | | | 19,799 | |
Stepan Co. | | | 58 | | | | 6,921 | |
SunCoke Energy, Inc. | | | 48 | | | | 209 | |
Tredegar Corp. | | | 192 | | | | 3,206 | |
Trinseo SA | | | 46 | | | | 2,356 | |
Tronox Holdings PLC | | | 399 | | | | 5,833 | |
Westlake Chemical Corp. | | | 231 | | | | 18,850 | |
Westrock Co. | | | 346 | | | | 15,061 | |
| | | | | | | | 1,893,790 | |
| | | | | | | | | |
Real Estate Investment Trust — 1.1% | | | | | | | | |
Altisource Portfolio Solutions SA (1) | | | 347 | | | | 4,469 | |
American Homes 4 Rent - Class A | | | 1,223 | | | | 36,690 | |
American Tower Corp. | | | 1,468 | | | | 329,507 | |
Ashford Hospitality Trust, Inc. | | | 280 | | | | 725 | |
Camden Property Trust | | | 8 | | | | 799 | |
CareTrust REIT, Inc. | | | 304 | | | | 6,743 | |
CatchMark Timber Trust, Inc. | | | 780 | | | | 7,301 | |
CBL & Associates Properties, Inc. (1)(2) | | | 1,741 | | | | 72 | |
Clipper Realty, Inc. | | | 189 | | | | 1,332 | |
Columbia Property Trust, Inc. | | | 1,888 | | | | 27,074 | |
Community Healthcare Trust, Inc. | | | 120 | | | | 5,653 | |
CorEnergy Infrastructure Trust, Inc. | | | 552 | | | | 3,781 | |
Corporate Office Properties Trust | | | 1,164 | | | | 30,357 | |
CubeSmart | | | 2,640 | | | | 88,730 | |
CyrusOne, Inc. | | | 51 | | | | 3,731 | |
DiamondRock Hospitality Co. | | | 328 | | | | 2,706 | |
EastGroup Properties, Inc. | | | 229 | | | | 31,616 | |
Equinix, Inc. | | | 185 | | | | 132,123 | |
Essential Properties Realty Trust, Inc. | | | 5 | | | | 106 | |
Essex Property Trust, Inc. | | | 233 | | | | 55,319 | |
Extra Space Storage, Inc. | | | 1,145 | | | | 132,660 | |
Gaming and Leisure Properties, Inc. | | | 1,225 | | | | 51,940 | |
Getty Realty Corp. | | | 739 | | | | 20,352 | |
Gladstone Commercial Corp. | | | 207 | | | | 3,726 | |
Healthcare Realty Trust, Inc. | | | 2,761 | | | | 81,726 | |
Healthcare Trust of America, Inc. - Class A | | | 1,990 | | | | 54,805 | |
Hersha Hospitality Trust | | | 286 | | | | 2,257 | |
Host Hotels & Resorts, Inc. | | | 660 | | | | 9,656 | |
Iron Mountain, Inc. | | | 1,074 | | | | 31,662 | |
Lamar Advertising Co. - Class A | | | 1,988 | | | | 165,441 | |
Moderate Allocation Fund |
Security Description | | Shares or
Principal
Amount ($) | | | Fair
Value ($) | |
Common Stocks — continued |
Life Storage, Inc. | | | 174 | | | | 20,774 | |
LTC Properties, Inc. | | | 1,454 | | | | 56,575 | |
National Health Investors, Inc. | | | 291 | | | | 20,128 | |
National Storage Affiliates Trust | | | 413 | | | | 14,880 | |
Newmark Group, Inc. | | | 534 | | | | 3,893 | |
Omega Healthcare Investors, Inc. | | | 650 | | | | 23,608 | |
Park Hotels & Resorts, Inc. | | | 480 | | | | 8,232 | |
Piedmont Office Realty Trust, Inc. | | | 2,163 | | | | 35,105 | |
PotlatchDeltic Corp. | | | 207 | | | | 10,354 | |
PS Business Parks, Inc. | | | 373 | | | | 49,561 | |
Public Storage | | | 609 | | | | 140,636 | |
RAIT Financial Trust (1)(2)(7) | | | 751 | | | | 0 | |
Retail Opportunity Investments Corp. | | | 23 | | | | 308 | |
Ryman Hospitality Properties, Inc. | | | 64 | | | | 4,337 | |
Sabra Health Care REIT, Inc. | | | 502 | | | | 8,720 | |
SBA Communications Corp. | | | 212 | | | | 59,812 | |
Service Properties Trust | | | 2,144 | | | | 24,635 | |
Simon Property Group, Inc. | | | 1,691 | | | | 144,208 | |
Spirit MTA REIT Liquidating Trust (1)(7) | | | 1,024 | | | | 0 | |
Tanger Factory Outlet Centers, Inc. (2) | | | 644 | | | | 6,414 | |
Trinity Place Holdings, Inc. (1) | | | 645 | | | | 806 | |
Welltower, Inc. | | | 627 | | | | 40,517 | |
| | | | | | | | 1,996,562 | |
| | | | | | | | | |
Utilities — 0.6% | | | | | | | | |
Alliant Energy Corp. | | | 322 | | | | 16,593 | |
American Water Works Co., Inc. | | | 1,073 | | | | 164,673 | |
Atlantic Power Corp. (1) | | | 810 | | | | 1,701 | |
Eversource Energy | | | 136 | | | | 11,765 | |
MDU Resources Group, Inc. | | | 2,810 | | | | 74,015 | |
NextEra Energy, Inc. | | | 4,809 | | | | 371,015 | |
NRG Energy, Inc. | | | 1,376 | | | | 51,669 | |
Public Service Enterprise Group, Inc. | | | 2,683 | | | | 156,419 | |
UGI Corp. | | | 1,525 | | | | 53,314 | |
Vistra Corp. | | | 264 | | | | 5,190 | |
WEC Energy Group, Inc. | | | 725 | | | | 66,722 | |
Xcel Energy, Inc. | | | 2,165 | | | | 144,345 | |
| | | | | | | | 1,117,421 | |
| | | | | | | | | |
Total Common Stocks (Cost $46,864,087) | | | | | | | 63,942,366 | |
| | | | | | | | | |
Registered Investment Companies — 49.3% |
Baird Core Plus Bond Fund - Class I | | | 449,427 | | | | 5,456,040 | |
Dodge & Cox Income Fund | | | 308,019 | | | | 4,512,480 | |
The accompanying notes are an integral part of these financial statements
Page 82 | 2020 Annual Report | December 31, 2020 |
Schedule of Investments
December 31, 2020
Moderate Allocation Fund |
Security Description | | Shares or
Principal
Amount ($) | | | Fair
Value ($) | |
Registered Investment Companies — continued |
DoubleLine Total Return Bond Fund - Class I | | | 282,200 | | | | 3,019,536 | |
Guggenheim Total Return Bond Fund - Class I | | | 77,896 | | | | 2,313,514 | |
iShares Core U.S. Aggregate Bond ETF (8) | | | 62,474 | | | | 7,383,802 | |
iShares JP Morgan USD Emerging Markets Bond ETF (8) | | | 110,486 | | | | 12,806,432 | |
Lord Abbett High Yield Fund - Class I | | | 703,327 | | | | 5,239,785 | |
Payden Emerging Markets Bond Fund - Class I | | | 96,183 | | | | 1,335,987 | |
PGIM Total Return Bond Fund - Class R6 | | | 304,631 | | | | 4,602,973 | |
Pioneer Bond Fund - Class Y | | | 351,699 | | | | 3,562,715 | |
Segall Bryant & Hamill Plus Bond Fund - Class I | | | 348,219 | | | | 3,879,156 | |
SPDR Bloomberg Barclays High Yield Bond ETF (8) | | | 79,662 | | | | 8,678,378 | |
TCW Emerging Markets Income Fund - Class I | | | 290,835 | | | | 2,475,010 | |
Vanguard Intermediate-Term Corporate Bond ETF (8) | | | 31,979 | | | | 3,106,440 | |
Vanguard Total Bond Market ETF (8) | | | 71,766 | | | | 6,329,044 | |
Xtrackers USD High Yield Corporate Bond ETF (8) | | | 245,095 | | | | 12,276,808 | |
Total Registered Investment Companies (Cost $81,215,895) | | | | | | | 86,978,100 | |
| | | | | | | | | |
Money Market Registered Investment Companies — 12.3% |
Meeder Institutional Prime Money Market Fund, 0.08% (4) | | | 21,690,617 | | | | 21,697,124 | |
Morgan Stanley Government Institutional Fund, 0.03% (3) | | | 9,746 | | | | 9,746 | |
Total Money Market Registered Investment Companies (Cost $21,696,235) | | | | | | | 21,706,870 | |
| | | | | | | | | |
Bank Obligations — 0.1% |
Metro City Bank Deposit Account, 0.10%, 1/4/2021 (5) | | | 248,220 | | | | 248,220 | |
Total Bank Obligations (Cost $248,220) | | | | | | | 248,220 | |
Total Investments — 98.1% (Cost $150,024,437) | | | | | | | 172,875,556 | |
Other Assets less Liabilities — 1.9% | | | | | | | 3,389,186 | |
Total Net Assets — 100.0% | | | | | | | 176,264,742 | |
| | | | | | | | | |
Moderate Allocation Fund |
Security Description | | Shares or
Principal
Amount ($) | | | Fair
Value ($) | |
Trustee Deferred Compensation (6) |
Meeder Balanced Fund - Retail Class | | | 354 | | | | 4,538 | |
Meeder Dynamic Allocation Fund - Retail Class | | | 835 | | | | 11,181 | |
Meeder Muirfield Fund - Retail Class | | | 1,238 | | | | 10,152 | |
Meeder Conservative Allocation Fund - Retail Class | | | 113 | | | | 2,702 | |
Total Trustee Deferred Compensation (Cost $25,290) | | | | | | | 28,573 | |
| | | | | | | | | |
| | | Long
(Short)
Contracts | | | Expiration
Date | | | Notional
Value of
Contracts
($) | | | Value and
Unrealized
Appreciation
(Depreciation)
($) | |
Futures Contracts |
Index Futures | | | | | | | | | | | | | | | | |
Mini MSCI EAFE Index Futures | | | 74 | | | | 3/19/2021 | | | | 7,883,960 | | | | 129,142 | |
Mini MSCI Emerging Markets Index Futures | | | 34 | | | | 3/19/2021 | | | | 2,189,940 | | | | 64,850 | |
Russell 2000 Mini Index Futures | | | 12 | | | | 3/19/2021 | | | | 1,184,880 | | | | 38,593 | |
Standard & Poors 500 Mini Futures | | | 53 | | | | 3/19/2021 | | | | 9,934,320 | | | | 289,664 | |
E-mini Standard & Poors MidCap 400 Futures | | | 11 | | | | 3/19/2021 | | | | 2,533,850 | | | | 78,139 | |
Total Futures Contracts | | | 184 | | | | | | | | 23,726,950 | | | | 600,388 | |
(1) | Represents non-income producing securities. |
(2) | All or a portion of this security is on loan. |
(3) | Investment purchased as securities lending collateral. The yield shown represents the 7-day yield in effect at December 31, 2020. |
(4) | Investment in affiliate. The yield shown represents the 7-day yield in effect at December 31, 2020. |
(5) | Variable rate security. Securities payable at par including accrued interest (usually within seven days notice) and unconditionally secured as to principal and interest by letters of credit or other credit support agreements from major banks. The interest rates are adjustable and are not based on a published reference rate and spread but are determined by the issuer or agent and are based on current market conditions. These securities do not indicate a reference rate and spread in their description above. The rate shown represents the rate in effect at December 31, 2020. The maturity date shown, if applicable, reflects the earlier of the next demand date or stated maturity date. |
The accompanying notes are an integral part of these financial statements
2020 Annual Report | December 31, 2020 | Page 83 |
Schedule of Investments
December 31, 2020
(6) | Assets of affiliates to the Moderate Allocation Fund held for the benefit of the Fund’s Trustees in connection with the Trustee Deferred Compensation Plan. |
(7) | Fair valued security deemed as Level 3 security. |
The accompanying notes are an integral part of these financial statements
Page 84 | 2020 Annual Report | December 31, 2020 |
Schedule of Investments
December 31, 2020
Conservative Allocation |
Security Description | | Shares or
Principal
Amount ($) | | | Fair
Value ($) | |
Common Stocks — 22.1% |
Communication Services — 2.4% | | | | | | | | |
Activision Blizzard, Inc. | | | 2,181 | | | | 202,506 | |
Alphabet, Inc. - Class A (1) | | | 185 | | | | 324,238 | |
Alphabet, Inc. - Class C (1) | | | 338 | | | | 592,135 | |
AMC Entertainment Holdings, Inc. - Class A (2) | | | 181 | | | | 384 | |
Cinemark Holdings, Inc. | | | 107 | | | | 1,863 | |
Comcast Corp. - Class A | | | 5,743 | | | | 300,933 | |
Cumulus Media, Inc. (1) | | | 188 | | | | 1,639 | |
DISH Network Corp. (1) | | | 203 | | | | 6,565 | |
Electronic Arts, Inc. | | | 712 | | | | 102,243 | |
EW Scripps Co./The | | | 28 | | | | 428 | |
Facebook, Inc. (1) | | | 2,548 | | | | 696,012 | |
Fluent, Inc. (1) | | | 93 | | | | 494 | |
Frontier Communications Corp. (1) | | | 606 | | | | 54 | |
Glu Mobile, Inc. (1) | | | 284 | | | | 2,559 | |
Gogo, Inc. (1) | | | 73 | | | | 703 | |
Gray Television, Inc. (1) | | | 365 | | | | 6,530 | |
IDT Corp. - Class B (1) | | | 85 | | | | 1,051 | |
Interpublic Group of Cos., Inc./The | | | 6,071 | | | | 142,790 | |
Lee Enterprises, Inc. (1) | | | 652 | | | | 822 | |
Liberty TripAdvisor Holdings, Inc. (1) | | | 141 | | | | 612 | |
Lions Gate Entertainment Corp. - Class A (1) | | | 324 | | | | 3,684 | |
Meredith Corp. | | | 19 | | | | 365 | |
Netflix, Inc. (1) | | | 364 | | | | 196,826 | |
News Corp. | | | 472 | | | | 8,482 | |
Nexstar Media Group, Inc. | | | 224 | | | | 24,459 | |
Omnicom Group, Inc. | | | 3,353 | | | | 209,127 | |
Pinterest, Inc. - Class A (1) | | | 370 | | | | 24,383 | |
Roku, Inc. - Class A (1) | | | 128 | | | | 42,499 | |
Spotify Technology SA (1) | | | 168 | | | | 52,863 | |
Take-Two Interactive Software, Inc. (1) | | | 50 | | | | 10,390 | |
TechTarget, Inc. (1) | | | 196 | | | | 11,586 | |
TEGNA, Inc. | | | 325 | | | | 4,534 | |
Telephone and Data Systems, Inc. | | | 358 | | | | 6,648 | |
Tribune Publishing Co. | | | 57 | | | | 781 | |
Twitter, Inc. (1) | | | 194 | | | | 10,505 | |
Verizon Communications, Inc. | | | 5,753 | | | | 337,989 | |
World Wrestling Entertainment, Inc. - Class A | | | 224 | | | | 10,763 | |
Yelp, Inc. (1) | | | 40 | | | | 1,307 | |
| | | | | | | | 3,341,752 | |
| | | | | | | | | |
Consumer Discretionary — 2.7% | | | | | | | | |
Abercrombie & Fitch Co. | | | 11 | | | | 224 | |
Adient PLC (1) | | | 14 | | | | 487 | |
Amazon.com, Inc. (1) | | | 338 | | | | 1,100,842 | |
Conservative Allocation |
Security Description | | Shares or
Principal
Amount ($) | | | Fair
Value ($) | |
Common Stocks — continued |
American Public Education, Inc. (1) | | | 13 | | | | 396 | |
Aramark | | | 182 | | | | 7,003 | |
At Home Group, Inc. (1) | | | 67 | | | | 1,036 | |
Best Buy Co., Inc. | | | 1,282 | | | | 127,931 | |
Big Lots, Inc. | | | 45 | | | | 1,932 | |
BorgWarner, Inc. | | | 194 | | | | 7,496 | |
Boyd Gaming Corp. | | | 115 | | | | 4,936 | |
Brinker International, Inc. | | | 83 | | | | 4,695 | |
Buckle, Inc./The | | | 41 | | | | 1,197 | |
Caleres, Inc. | | | 106 | | | | 1,659 | |
Camping World Holdings, Inc. | | | 309 | | | | 8,049 | |
Capri Holdings, Ltd. (1) | | | 138 | | | | 5,796 | |
CarParts.com, Inc. (1) | | | 439 | | | | 5,439 | |
Carvana Co. (1) | | | 7 | | | | 1,677 | |
Chipotle Mexican Grill, Inc. (1) | | | 110 | | | | 152,538 | |
Churchill Downs, Inc. | | | 20 | | | | 3,896 | |
Container Store Group, Inc./The (1) | | | 44 | | | | 420 | |
Cooper Tire & Rubber Co. | | | 34 | | | | 1,377 | |
Cracker Barrel Old Country Store, Inc. | | | 95 | | | | 12,532 | |
Crocs, Inc. (1) | | | 544 | | | | 34,087 | |
Dana, Inc. | | | 228 | | | | 4,451 | |
Darden Restaurants, Inc. | | | 120 | | | | 14,294 | |
Dave & Buster’s Entertainment, Inc. | | | 28 | | | | 841 | |
Del Taco Restaurants, Inc. | | | 49 | | | | 444 | |
Designer Brands, Inc. - Class A | | | 120 | | | | 918 | |
Dillard’s, Inc. - Class A | | | 11 | | | | 694 | |
Dollar General Corp. | | | 314 | | | | 66,034 | |
Dollar Tree, Inc. (1) | | | 232 | | | | 25,065 | |
Domino’s Pizza, Inc. | | | 65 | | | | 24,925 | |
DR Horton, Inc. | | | 1,069 | | | | 73,675 | |
Duluth Holdings, Inc. - Class B (1) | | | 9 | | | | 95 | |
eBay, Inc. | | | 715 | | | | 35,929 | |
Etsy, Inc. (1) | | | 93 | | | | 16,546 | |
Everi Holdings, Inc. (1) | | | 38 | | | | 525 | |
Extended Stay America, Inc. | | | 377 | | | | 5,583 | |
Fiesta Restaurant Group, Inc. (1) | | | 62 | | | | 707 | |
Fossil Group, Inc. (1) | | | 86 | | | | 746 | |
Fox Factory Holding Corp. (1) | | | 21 | | | | 2,220 | |
Franchise Group, Inc. | | | 22 | | | | 670 | |
General Motors Co. | | | 2,331 | | | | 97,063 | |
Genesco, Inc. (1) | | | 18 | | | | 542 | |
GoPro, Inc. (1) | | | 40 | | | | 331 | |
Greenlane Holdings, Inc. (1) | | | 82 | | | | 325 | |
Group 1 Automotive, Inc. | | | 25 | | | | 3,279 | |
GrowGeneration Corp. (1) | | | 58 | | | | 2,333 | |
Guess?, Inc. | | | 50 | | | | 1,131 | |
Hanesbrands, Inc. | | | 247 | | | | 3,601 | |
The accompanying notes are an integral part of these financial statements
2020 Annual Report | December 31, 2020 | Page 85 |
Schedule of Investments
December 31, 2020
Conservative Allocation |
Security Description | | Shares or
Principal
Amount ($) | | | Fair
Value ($) | |
Common Stocks — continued |
Harley-Davidson, Inc. | | | 166 | | | | 6,092 | |
Hibbett Sports, Inc. (1) | | | 108 | | | | 4,987 | |
Houghton Mifflin Harcourt Co. (1) | | | 128 | | | | 426 | |
International Game Technology PLC | | | 218 | | | | 3,693 | |
Kohl’s Corp. | | | 159 | | | | 6,470 | |
L Brands, Inc. | | | 207 | | | | 7,698 | |
Lakeland Industries, Inc. (1) | | | 194 | | | | 5,287 | |
Lands’ End, Inc. (1) | | | 42 | | | | 906 | |
Las Vegas Sands Corp. | | | 215 | | | | 12,814 | |
Lear Corp. | | | 79 | | | | 12,563 | |
Lennar Corp. - Class A | | | 192 | | | | 14,636 | |
Lovesac Co./The (1) | | | 10 | | | | 431 | |
Lowe’s Cos., Inc. | | | 1,885 | | | | 302,561 | |
Lululemon Athletica, Inc. (1) | | | 116 | | | | 40,371 | |
Lumber Liquidators Holdings, Inc. (1) | | | 91 | | | | 2,797 | |
M/I Homes, Inc. (1) | | | 98 | | | | 4,340 | |
Malibu Boats, Inc. (1) | | | 54 | | | | 3,372 | |
MarineMax, Inc. (1) | | | 29 | | | | 1,016 | |
Marriott International, Inc./MD | | | 14 | | | | 1,847 | |
McDonald’s Corp. | | | 1,303 | | | | 279,598 | |
Meritage Homes Corp. (1) | | | 153 | | | | 12,671 | |
MGM Resorts International | | | 37 | | | | 1,166 | |
Modine Manufacturing Co. (1) | | | 147 | | | | 1,846 | |
Nautilus, Inc. (1) | | | 69 | | | | 1,252 | |
NIKE, Inc. - Class B | | | 901 | | | | 127,464 | |
Nordstrom, Inc. | | | 28 | | | | 874 | |
ODP Corp./The | | | 118 | | | | 3,457 | |
OneWater Marine, Inc. (1) | | | 57 | | | | 1,658 | |
Overstock.com, Inc. (1) | | | 41 | | | | 1,967 | |
Party City Holdco, Inc. (1) | | | 120 | | | | 738 | |
Penn National Gaming, Inc. (1) | | | 165 | | | | 14,251 | |
Polaris, Inc. | | | 51 | | | | 4,859 | |
Pool Corp. | | | 42 | | | | 15,645 | |
PulteGroup, Inc. | | | 2,038 | | | | 87,879 | |
Purple Innovation, Inc. (1) | | | 93 | | | | 3,063 | |
Qurate Retail, Inc. - Class A | | | 849 | | | | 9,314 | |
Red Rock Resorts, Inc. | | | 127 | | | | 3,180 | |
Rent-A-Center, Inc./TX | | | 1,973 | | | | 75,546 | |
Scientific Games Corp. (1) | | | 77 | | | | 3,195 | |
Sleep Number Corp. (1) | | | 32 | | | | 2,620 | |
Sonic Automotive, Inc. | | | 139 | | | | 5,361 | |
Starbucks Corp. | | | 1,524 | | | | 163,038 | |
Sturm Ruger & Co., Inc. | | | 55 | | | | 3,579 | |
Tapestry, Inc. | | | 139 | | | | 4,320 | |
Target Corp. | | | 636 | | | | 112,273 | |
Tesla, Inc. (1) | | | 685 | | | | 483,384 | |
Texas Roadhouse, Inc. | | | 99 | | | | 7,738 | |
Conservative Allocation |
Security Description | | Shares or
Principal
Amount ($) | | | Fair
Value ($) | |
Common Stocks — continued |
Thor Industries, Inc. | | | 387 | | | | 35,987 | |
TopBuild Corp. (1) | | | 20 | | | | 3,682 | |
Town Sports International Holdings, Inc. (1) | | | 464 | | | | 116 | |
Tupperware Brands Corp. (1) | | | 40 | | | | 1,296 | |
Urban Outfitters, Inc. (1) | | | 50 | | | | 1,280 | |
VOXX International Corp. (1) | | | 50 | | | | 638 | |
Waitr Holdings, Inc. (1) | | | 94 | | | | 261 | |
Wayfair, Inc. (1) | | | 15 | | | | 3,387 | |
Wendy’s Co./The | | | 172 | | | | 3,770 | |
Williams-Sonoma, Inc. | | | 53 | | | | 5,398 | |
Wingstop, Inc. | | | 116 | | | | 15,376 | |
Winnebago Industries, Inc. | | | 738 | | | | 44,236 | |
Wyndham Destinations, Inc. | | | 724 | | | | 32,479 | |
XPEL, Inc. (1) | | | 54 | | | | 2,784 | |
Yum China Holdings, Inc. | | | 478 | | | | 27,289 | |
Yum! Brands, Inc. | | | 760 | | | | 82,506 | |
| | | | | | | | 3,993,340 | |
| | | | | | | | | |
Consumer Staples — 0.6% | | | | | | | | |
Andersons, Inc./The | | | 83 | | | | 2,034 | |
BJ’s Wholesale Club Holdings, Inc. (1) | | | 84 | | | | 3,132 | |
Bunge, Ltd. | | | 2,929 | | | | 192,084 | |
Conagra Brands, Inc. | | | 565 | | | | 20,487 | |
Costco Wholesale Corp. | | | 56 | | | | 21,100 | |
Darling Ingredients, Inc. (1) | | | 1,212 | | | | 69,908 | |
General Mills, Inc. | | | 3,239 | | | | 190,453 | |
Ingredion, Inc. | | | 8 | | | | 629 | |
Kroger Co./The | | | 1,119 | | | | 35,539 | |
Medifast, Inc. | | | 18 | | | | 3,534 | |
Natural Grocers by Vitamin Cottage, Inc. | | | 36 | | | | 495 | |
Nu Skin Enterprises, Inc. | | | 61 | | | | 3,332 | |
PepsiCo, Inc. | | | 951 | | | | 141,033 | |
Performance Food Group Co. (1) | | | 144 | | | | 6,856 | |
Rite Aid Corp. (1) | | | 83 | | | | 1,314 | |
SpartanNash Co. | | | 118 | | | | 2,054 | |
Tyson Foods, Inc. | | | 306 | | | | 19,719 | |
United Natural Foods, Inc. (1) | | | 82 | | | | 1,310 | |
Walgreens Boots Alliance, Inc. | | | 62 | | | | 2,473 | |
Walmart, Inc. | | | 1,216 | | | | 175,286 | |
| | | | | | | | 892,772 | |
| | | | | | | | | |
Energy — 0.2% | | | | | | | | |
Amplify Energy Corp. | | | 528 | | | | 692 | |
Antero Resources Corp. (1) | | | 580 | | | | 3,161 | |
Apache Corp. | | | 258 | | | | 3,661 | |
Archrock, Inc. | | | 323 | | | | 2,797 | |
Ardmore Shipping Corp. | | | 71 | | | | 232 | |
The accompanying notes are an integral part of these financial statements
Page 86 | 2020 Annual Report | December 31, 2020 |
Schedule of Investments
December 31, 2020
Conservative Allocation |
Security Description | | Shares or
Principal
Amount ($) | | | Fair
Value ($) | |
Common Stocks — continued |
Aspen Aerogels, Inc. (1) | | | 176 | | | | 2,937 | |
Berry Corp. | | | 98 | | | | 361 | |
Bonanza Creek Energy, Inc. (1) | | | 125 | | | | 2,416 | |
Brigham Minerals, Inc. | | | 226 | | | | 2,484 | |
Cabot Oil & Gas Corp. | | | 473 | | | | 7,700 | |
Cactus, Inc. - Class A | | | 241 | | | | 6,283 | |
Centennial Resource Development, Inc./DE - Class A (1) | | | 531 | | | | 797 | |
Chesapeake Energy Corp. (1) | | | 25 | | | | 38 | |
Cimarex Energy Co. | | | 431 | | | | 16,167 | |
Clean Energy Fuels Corp. (1) | | | 380 | | | | 2,987 | |
CNX Resources Corp. (1) | | | 159 | | | | 1,717 | |
Concho Resources, Inc. | | | 399 | | | | 23,282 | |
ConocoPhillips | | | 1,338 | | | | 53,507 | |
CONSOL Energy, Inc. (1) | | | 78 | | | | 562 | |
Continental Resources, Inc./OK | | | 138 | | | | 2,249 | |
Delek US Holdings, Inc. | | | 50 | | | | 804 | |
DHT Holdings, Inc. | | | 204 | | | | 1,067 | |
Diamondback Energy, Inc. | | | 74 | | | | 3,582 | |
DMC Global, Inc. | | | 9 | | | | 389 | |
Dorian LPG, Ltd. (1) | | | 247 | | | | 3,011 | |
Earthstone Energy, Inc. - Class A (1) | | | 102 | | | | 544 | |
EOG Resources, Inc. | | | 681 | | | | 33,961 | |
EQT Corp. | | | 415 | | | | 5,275 | |
Exterran Corp. (1) | | | 46 | | | | 203 | |
Extraction Oil & Gas, Inc. (1) | | | 275 | | | | 8 | |
Frank’s International NV (1) | | | 170 | | | | 466 | |
Golar LNG, Ltd. | | | 77 | | | | 742 | |
Hallador Energy Co. | | | 217 | | | | 319 | |
Hess Corp. | | | 114 | | | | 6,018 | |
International Seaways, Inc. | | | 46 | | | | 751 | |
KLX Energy Services Holdings, Inc. (1) | | | 65 | | | | 420 | |
Laredo Petroleum, Inc. (1) | | | 149 | | | | 2,935 | |
Liberty Oilfield Services, Inc. - Class A | | | 344 | | | | 3,547 | |
Matador Resources Co. (1) | | | 229 | | | | 2,762 | |
Nabors Industries, Ltd. | | | 34 | | | | 1,980 | |
NextDecade Corp. (1) | | | 85 | | | | 178 | |
NexTier Oilfield Solutions, Inc. (1) | | | 168 | | | | 578 | |
Nine Energy Service, Inc. (1) | | | 230 | | | | 626 | |
Nordic American Tankers, Ltd. | | | 184 | | | | 543 | |
NOV, Inc. (1) | | | 377 | | | | 5,176 | |
Oasis Petroleum, Inc. Warrants (1)(6) | | | 1 | | | | 0 | |
Oceaneering International, Inc. (1) | | | 350 | | | | 2,783 | |
Pacific Ethanol,, Inc. (1) | | | 5 | | | | 27 | |
Parsley Energy, Inc. | | | 452 | | | | 6,418 | |
Patterson-UTI Energy, Inc. | | | 323 | | | | 1,699 | |
PDC Energy, Inc. (1) | | | 209 | | | | 4,291 | |
Conservative Allocation |
Security Description | | Shares or
Principal
Amount ($) | | | Fair
Value ($) | |
Common Stocks — continued |
Peabody Energy Corp. | | | 186 | | | | 448 | |
Phillips 66 | | | 118 | | | | 8,253 | |
Pioneer Natural Resources Co. | | | 168 | | | | 19,134 | |
Profire Energy, Inc. (1) | | | 5 | | | | 4 | |
ProPetro Holding Corp. (1) | | | 779 | | | | 5,757 | |
Range Resources Corp. | | | 245 | | | | 1,642 | |
Renewable Energy Group, Inc. (1) | | | 50 | | | | 3,541 | |
Schlumberger NV | | | 339 | | | | 7,400 | |
Scorpio Tankers, Inc. | | | 31 | | | | 347 | |
SilverBow Resources, Inc. (1) | | | 101 | | | | 536 | |
Southwestern Energy Co. (1) | | | 763 | | | | 2,274 | |
Superior Energy Services, Inc. (1) | | | 65 | | | | 3 | |
Talos Energy, Inc. (1) | | | 43 | | | | 354 | |
Teekay Corp. (1) | | | 254 | | | | 546 | |
W&T Offshore, Inc. (1) | | | 530 | | | | 1,150 | |
Westmoreland Coal Co. (1) | | | 410 | | | | 0 | |
Whiting Petroleum Corp. (1) | | | 17 | | | | 425 | |
Whiting Petroleum Corporation A Warrants (1) | | | 12 | | | | 21 | |
Whiting Petroleum Corporation B Warrants (1)(2) | | | 6 | | | | 11 | |
World Fuel Services Corp. | | | 248 | | | | 7,728 | |
WPX Energy, Inc. (1) | | | 381 | | | | 3,105 | |
| | | | | | | | 287,812 | |
| | | | | | | | | |
Financials — 1.9% | | | | | | | | |
AGNC Investment Corp. | | | 1,327 | | | | 20,701 | |
Allstate Corp./The | | | 60 | | | | 6,596 | |
Ally Financial, Inc. | | | 1,585 | | | | 56,521 | |
American Equity Investment Life Holding Co. | | | 141 | | | | 3,900 | |
American Express Co. | | | 213 | | | | 25,754 | |
Ameriprise Financial, Inc. | | | 134 | | | | 26,040 | |
Ameris Bancorp | | | 386 | | | | 14,695 | |
Arbor Realty Trust, Inc. | | | 192 | | | | 2,723 | |
Artisan Partners Asset Management, Inc. - Class A | | | 516 | | | | 25,975 | |
Associated Banc-Corp | | | 1,295 | | | | 22,080 | |
Axos Financial, Inc. (1) | | | 140 | | | | 5,254 | |
BancorpSouth Bank | | | 343 | | | | 9,412 | |
Bank of America Corp. | | | 7,919 | | | | 240,025 | |
Bank of NT Butterfield & Son, Ltd./The | | | 233 | | | | 7,260 | |
BankUnited, Inc. | | | 414 | | | | 14,399 | |
Bar Harbor Bankshares | | | 12 | | | | 271 | |
Berkshire Hathaway, Inc. - Class B (1) | | | 2,462 | | | | 570,864 | |
Charles Schwab Corp./The | | | 56 | | | | 2,970 | |
Chimera Investment Corp. | | | 67 | | | | 687 | |
The accompanying notes are an integral part of these financial statements
2020 Annual Report | December 31, 2020 | Page 87 |
Schedule of Investments
December 31, 2020
Conservative Allocation |
Security Description | | Shares or
Principal
Amount ($) | | | Fair
Value ($) | |
Common Stocks — continued |
Citigroup, Inc. | | | 1,201 | | | | 74,054 | |
Citizens Financial Group, Inc. | | | 767 | | | | 27,428 | |
Civista Bancshares, Inc. | | | 238 | | | | 4,172 | |
CNO Financial Group, Inc. | | | 694 | | | | 15,428 | |
Columbia Banking System, Inc. | | | 86 | | | | 3,087 | |
Comerica, Inc. | | | 27 | | | | 1,508 | |
Curo Group Holdings Corp. | | | 456 | | | | 6,534 | |
Customers Bancorp, Inc. (1) | | | 241 | | | | 4,381 | |
East West Bancorp, Inc. | | | 380 | | | | 19,270 | |
Eaton Vance Corp. | | | 141 | | | | 9,578 | |
Elevate Credit, Inc. (1) | | | 596 | | | | 2,378 | |
Ellington Residential Mortgage REIT | | | 623 | | | | 8,124 | |
Enova International, Inc. (1) | | | 199 | | | | 4,929 | |
Esquire Financial Holdings, Inc. (1) | | | 40 | | | | 768 | |
Evercore, Inc. - Class A | | | 97 | | | | 10,635 | |
Farmers National Banc Corp. | | | 81 | | | | 1,075 | |
Fifth Third Bancorp | | | 2,087 | | | | 57,539 | |
First Choice Bancorp | | | 7 | | | | 129 | |
First Citizens BancShares, Inc./NC - Class A | | | 18 | | | | 10,337 | |
First Financial Bancorp | | | 572 | | | | 10,027 | |
First Horizon Corp. | | | 119 | | | | 1,518 | |
First Interstate BancSystem, Inc. | | | 31 | | | | 1,264 | |
First Republic Bank/CA | | | 239 | | | | 35,116 | |
Goosehead Insurance, Inc. | | | 73 | | | | 9,107 | |
Great Ajax Corp. | | | 771 | | | | 8,065 | |
Hartford Financial Services Group, Inc./The | | | 114 | | | | 5,584 | |
HBT Financial, Inc. | | | 110 | | | | 1,667 | |
Heartland Financial USA, Inc. | | | 245 | | | | 9,891 | |
Hilltop Holdings, Inc. | | | 495 | | | | 13,617 | |
Houlihan Lokey, Inc. - Class A | | | 191 | | | | 12,841 | |
Huntington Bancshares, Inc./OH | | | 701 | | | | 8,854 | |
Independent Bank Corp./MI | | | 19 | | | | 351 | |
JPMorgan Chase & Co. | | | 1,579 | | | | 200,644 | |
KeyCorp | | | 643 | | | | 10,552 | |
Kinsale Capital Group, Inc. | | | 117 | | | | 23,415 | |
Lakeland Financial Corp. | | | 9 | | | | 482 | |
LendingClub Corp. (1) | | | 41 | | | | 433 | |
LPL Financial Holdings, Inc. | | | 87 | | | | 9,067 | |
M&T Bank Corp. | | | 58 | | | | 7,383 | |
Medley Management, Inc. | | | 14 | | | | 112 | |
Meta Financial Group, Inc. | | | 60 | | | | 2,194 | |
MetLife, Inc. | | | 365 | | | | 17,137 | |
Metrocity Bankshares, Inc. | | | 134 | | | | 1,932 | |
MMA Capital Holdings, Inc. (1) | | | 66 | | | | 1,624 | |
Morgan Stanley | | | 1,309 | | | | 89,706 | |
Mr Cooper Group, Inc. (1) | | | 457 | | | | 14,181 | |
Conservative Allocation |
Security Description | | Shares or
Principal
Amount ($) | | | Fair
Value ($) | |
Common Stocks — continued |
NewStar Financial Contingent Value Rights (1)(6) | | | 8 | | | | 0 | |
Northrim BanCorp, Inc. | | | 202 | | | | 6,858 | |
OneMain Holdings, Inc. | | | 203 | | | | 9,776 | |
Oppenheimer Holdings, Inc. | | | 437 | | | | 13,735 | |
PennyMac Financial Services, Inc. | | | 600 | | | | 39,372 | |
PennyMac Mortgage Investment Trust | | | 120 | | | | 2,111 | |
People’s United Financial, Inc. | | | 322 | | | | 4,163 | |
Pinnacle Financial Partners, Inc. | | | 74 | | | | 4,766 | |
PJT Partners, Inc. | | | 179 | | | | 13,470 | |
PNC Financial Services Group, Inc./The | | | 343 | | | | 51,107 | |
Popular, Inc. | | | 219 | | | | 12,334 | |
Progressive Corp./The | | | 1,465 | | | | 144,859 | |
Prudential Financial, Inc. | | | 501 | | | | 39,113 | |
Pzena Investment Management, Inc. - Class A | | | 433 | | | | 3,161 | |
QCR Holdings, Inc. | | | 158 | | | | 6,255 | |
RBB Bancorp | | | 348 | | | | 5,352 | |
Ready Capital Corp. | | | 429 | | | | 5,341 | |
Regions Financial Corp. | | | 2,467 | | | | 39,768 | |
Sandy Spring Bancorp, Inc. | | | 30 | | | | 966 | |
Siebert Financial Corp. (1) | | | 66 | | | | 277 | |
Signature Bank/New York NY | | | 115 | | | | 15,558 | |
Silvercrest Asset Management Group, Inc. | | | 73 | | | | 1,014 | |
Simmons First National Corp. | | | 68 | | | | 1,468 | |
SLM Corp. | | | 344 | | | | 4,262 | |
South State Corp. | | | 28 | | | | 2,024 | |
State Street Corp. | | | 609 | | | | 44,323 | |
Stewart Information Services Corp. | | | 927 | | | | 44,830 | |
StoneX Group, Inc. (1) | | | 55 | | | | 3,185 | |
SVB Financial Group (1) | | | 77 | | | | 29,863 | |
Synchrony Financial | | | 3,136 | | | | 108,851 | |
Synovus Financial Corp. | | | 44 | | | | 1,424 | |
Triumph Bancorp, Inc. (1) | | | 12 | | | | 583 | |
Truist Financial Corp. | | | 1,570 | | | | 75,250 | |
UMB Financial Corp. | | | 197 | | | | 13,591 | |
United Community Banks, Inc./GA | | | 391 | | | | 11,120 | |
Valley National Bancorp | | | 622 | | | | 6,065 | |
Veritex Holdings, Inc. | | | 80 | | | | 2,053 | |
Virtu Financial, Inc. | | | 590 | | | | 14,850 | |
Virtus Investment Partners, Inc. | | | 70 | | | | 15,190 | |
Walker & Dunlop, Inc. | | | 296 | | | | 27,238 | |
Wells Fargo & Co. | | | 500 | | | | 15,090 | |
Western Alliance Bancorp | | | 255 | | | | 15,287 | |
WSFS Financial Corp. | | | 21 | | | | 942 | |
| | | | | | | | 2,671,090 | |
| | | | | | | | | |
The accompanying notes are an integral part of these financial statements
Page 88 | 2020 Annual Report | December 31, 2020 |
Schedule of Investments
December 31, 2020
Conservative Allocation |
Security Description | | Shares or
Principal
Amount ($) | | | Fair
Value ($) | |
Common Stocks — continued |
Healthcare — 4.1% | | | | | | | | |
89bio, Inc. (1) | | | 8 | | | | 195 | |
Abbott Laboratories | | | 415 | | | | 45,438 | |
AbbVie, Inc. | | | 3,550 | | | | 380,383 | |
AcelRx Pharmaceuticals, Inc. (1) | | | 549 | | | | 681 | |
Affimed NV (1) | | | 289 | | | | 1,682 | |
Agilent Technologies, Inc. | | | 799 | | | | 94,674 | |
Akero Therapeutics, Inc. (1) | | | 3 | | | | 77 | |
Alexion Pharmaceuticals, Inc. (1) | | | 493 | | | | 77,026 | |
Align Technology, Inc. (1) | | | 81 | | | | 43,285 | |
Alkermes PLC (1) | | | 429 | | | | 8,559 | |
Allakos, Inc. (1) | | | 32 | | | | 4,480 | |
Allscripts Healthcare Solutions, Inc. (1) | | | 174 | | | | 2,513 | |
Alnylam Pharmaceuticals, Inc. (1) | | | 117 | | | | 15,206 | |
AmerisourceBergen Corp. | | | 96 | | | | 9,385 | |
Amgen, Inc. | | | 1,044 | | | | 240,036 | |
Amicus Therapeutics, Inc. (1) | | | 65 | | | | 1,501 | |
Amneal Pharmaceuticals, Inc. - Class A (1) | | | 500 | | | | 2,285 | |
Apellis Pharmaceuticals, Inc. (1) | | | 70 | | | | 4,004 | |
Applied Therapeutics, Inc. (1) | | | 12 | | | | 264 | |
Arcturus Therapeutics Holdings, Inc. (1) | | | 31 | | | | 1,345 | |
Arcutis Biotherapeutics, Inc. (1) | | | 35 | | | | 985 | |
Arena Pharmaceuticals, Inc. (1) | | | 53 | | | | 4,072 | |
Arrowhead Pharmaceuticals, Inc. (1) | | | 92 | | | | 7,059 | |
Assembly Biosciences, Inc. (1) | | | 96 | | | | 581 | |
Assertio Holdings, Inc. (1) | | | 1,068 | | | | 382 | |
Atara Biotherapeutics, Inc. (1) | | | 67 | | | | 1,315 | |
Avantor, Inc. (1) | | | 339 | | | | 9,543 | |
Axsome Therapeutics, Inc. (1) | | | 19 | | | | 1,548 | |
Baxter International, Inc. | | | 67 | | | | 5,376 | |
Beam Therapeutics, Inc. (1) | | | 57 | | | | 4,653 | |
Beyondspring, Inc. (1) | | | 4 | | | | 49 | |
BioDelivery Sciences International, Inc. (1) | | | 970 | | | | 4,074 | |
Bio-Rad Laboratories, Inc. (1) | | | 23 | | | | 13,408 | |
Bio-Techne Corp. | | | 42 | | | | 13,337 | |
Bioxcel Therapeutics, Inc. (1) | | | 42 | | | | 1,940 | |
Blueprint Medicines Corp. (1) | | | 70 | | | | 7,851 | |
Bridgebio Pharma, Inc. (1) | | | 50 | | | | 3,556 | |
Bristol-Myers Squibb Co. | | | 3,000 | | | | 186,090 | |
Calyxt, Inc. (1) | | | 13 | | | | 55 | |
Cardinal Health, Inc. | | | 1,485 | | | | 79,537 | |
CareDx, Inc. (1) | | | 77 | | | | 5,579 | |
CASI Pharmaceuticals, Inc. (1) | | | 44 | | | | 130 | |
Castle Biosciences, Inc. (1) | | | 9 | | | | 604 | |
Catalent, Inc. (1) | | | 328 | | | | 34,135 | |
Catalyst Pharmaceuticals, Inc. (1) | | | 639 | | | | 2,134 | |
Celcuity, Inc. (1) | | | 35 | | | | 321 | |
Conservative Allocation |
Security Description | | Shares or
Principal
Amount ($) | | | Fair
Value ($) | |
Common Stocks — continued |
Centene Corp. (1) | | | 372 | | | | 22,331 | |
Centogene NV (1) | | | 40 | | | | 431 | |
Cerecor, Inc. (1) | | | 91 | | | | 240 | |
Cerner Corp. | | | 1,603 | | | | 125,803 | |
Charles River Laboratories International, Inc. (1) | | | 106 | | | | 26,485 | |
Chemed Corp. | | | 73 | | | | 38,881 | |
ChemoCentryx, Inc. (1) | | | 114 | | | | 7,059 | |
Co-Diagnostics, Inc. (1) | | | 45 | | | | 419 | |
Community Health Systems, Inc. (1) | | | 224 | | | | 1,664 | |
Computer Programs and Systems, Inc. | | | 110 | | | | 2,952 | |
Concert Pharmaceuticals, Inc. (1) | | | 4 | | | | 51 | |
Constellation Pharmaceuticals, Inc. (1) | | | 33 | | | | 950 | |
Corcept Therapeutics, Inc. (1) | | | 75 | | | | 1,962 | |
Cortexyme, Inc. (1) | | | 1 | | | | 28 | |
Cross Country Healthcare, Inc. (1) | | | 38 | | | | 337 | |
CVS Health Corp. | | | 1,387 | | | | 94,732 | |
Cymabay Therapeutics, Inc. (1) | | | 260 | | | | 1,492 | |
Danaher Corp. | | | 529 | | | | 117,512 | |
Deciphera Pharmaceuticals, Inc. (1) | | | 29 | | | | 1,655 | |
Denali Therapeutics, Inc. (1) | | | 64 | | | | 5,361 | |
DENTSPLY SIRONA, Inc. | | | 638 | | | | 33,406 | |
Editas Medicine, Inc. (1) | | | 55 | | | | 3,856 | |
Edwards Lifesciences Corp. (1) | | | 660 | | | | 60,212 | |
Eidos Therapeutics, Inc. (1) | | | 20 | | | | 2,632 | |
Elanco Animal Health, Inc. Contingent Value Rights (1)(6) | | | 32 | | | | 0 | |
Eli Lilly and Co. | | | 952 | | | | 160,736 | |
Eloxx Pharmaceuticals, Inc. (1) | | | 111 | | | | 442 | |
Emergent BioSolutions, Inc. (1) | | | 169 | | | | 15,142 | |
Endo International PLC (1) | | | 631 | | | | 4,531 | |
Enochian Biosciences, Inc. (1) | | | 7 | | | | 21 | |
Ensign Group, Inc./The | | | 56 | | | | 4,084 | |
Evelo Biosciences, Inc. (1) | | | 64 | | | | 774 | |
Exact Sciences Corp. (1) | | | 130 | | | | 17,224 | |
Exelixis, Inc. (1) | | | 557 | | | | 11,179 | |
Fate Therapeutics, Inc. (1) | | | 79 | | | | 7,183 | |
Five Prime Therapeutics, Inc. (1) | | | 61 | | | | 1,038 | |
Fulgent Genetics, Inc. (1) | | | 13 | | | | 677 | |
Gilead Sciences, Inc. | | | 2,324 | | | | 135,396 | |
Globus Medical, Inc. (1) | | | 82 | | | | 5,348 | |
HCA Healthcare, Inc. | | | 214 | | | | 35,194 | |
Hill-Rom Holdings, Inc. | | | 292 | | | | 28,607 | |
Hologic, Inc. (1) | | | 180 | | | | 13,109 | |
Horizon Therapeutics Plc (1) | | | 850 | | | | 62,178 | |
Humana, Inc. | | | 211 | | | | 86,567 | |
IDEXX Laboratories, Inc. (1) | | | 4 | | | | 1,999 | |
The accompanying notes are an integral part of these financial statements
2020 Annual Report | December 31, 2020 | Page 89 |
Schedule of Investments
December 31, 2020
Conservative Allocation |
Security Description | | Shares or
Principal
Amount ($) | | | Fair
Value ($) | |
Common Stocks — continued |
IGM Biosciences, Inc. (1) | | | 7 | | | | 618 | |
Illumina, Inc. (1) | | | 85 | | | | 31,450 | |
ImmunoGen, Inc. (1) | | | 202 | | | | 1,303 | |
Immunovant, Inc. (1) | | | 10 | | | | 462 | |
Inogen, Inc. (1) | | | 32 | | | | 1,430 | |
Inovio Pharmaceuticals, Inc. (1) | | | 114 | | | | 1,009 | |
Insmed, Inc. (1) | | | 82 | | | | 2,730 | |
Insulet Corp. (1) | | | 26 | | | | 6,646 | |
Intellia Therapeutics, Inc. (1) | | | 84 | | | | 4,570 | |
Intra-Cellular Therapies, Inc. (1) | | | 10 | | | | 318 | |
Invitae Corp. (1) | | | 107 | | | | 4,474 | |
Iovance Biotherapeutics, Inc. (1) | | | 171 | | | | 7,934 | |
iRhythm Technologies, Inc. (1) | | | 21 | | | | 4,981 | |
Jazz Pharmaceuticals PLC (1) | | | 43 | | | | 7,097 | |
Johnson & Johnson | | | 3,619 | | | | 569,558 | |
Jounce Therapeutics, Inc. (1) | | | 42 | | | | 294 | |
Kodiak Sciences, Inc. (1) | | | 40 | | | | 5,876 | |
Kura Oncology, Inc. (1) | | | 163 | | | | 5,324 | |
LHC Group, Inc. (1) | | | 3 | | | | 640 | |
MacroGenics, Inc. (1) | | | 91 | | | | 2,080 | |
Mallinckrodt PLC (1) | | | 20 | | | | 4 | |
Marinus Pharmaceuticals, Inc. (1) | | | 48 | | | | 586 | |
McKesson Corp. | | | 280 | | | | 48,698 | |
Medtronic PLC | | | 2,975 | | | | 348,492 | |
Merck & Co., Inc. | | | 4,762 | | | | 389,532 | |
Mersana Therapeutics, Inc. (1) | | | 316 | | | | 8,409 | |
Mettler-Toledo International, Inc. (1) | | | 4 | | | | 4,559 | |
Mirati Therapeutics, Inc. (1) | | | 46 | | | | 10,103 | |
Moderna, Inc. (1) | | | 295 | | | | 30,819 | |
ModivCare, Inc. (1) | | | 16 | | | | 2,218 | |
Molina Healthcare, Inc. (1) | | | 26 | | | | 5,530 | |
Morphic Holding, Inc. (1) | | | 24 | | | | 805 | |
Myriad Genetics, Inc. (1) | | | 57 | | | | 1,127 | |
NantKwest, Inc. (1) | | | 148 | | | | 1,973 | |
Natera, Inc. (1) | | | 85 | | | | 8,459 | |
National HealthCare Corp. | | | 12 | | | | 797 | |
Neurocrine Biosciences, Inc. (1) | | | 48 | | | | 4,601 | |
NextGen Healthcare, Inc. (1) | | | 251 | | | | 4,578 | |
Novavax, Inc. (1) | | | 59 | | | | 6,579 | |
Novocure, Ltd. (1) | | | 15 | | | | 2,596 | |
Ocular Therapeutix, Inc. (1) | | | 285 | | | | 5,900 | |
Oncocyte Corp. (1) | | | 100 | | | | 239 | |
Organogenesis Holdings, Inc. (1) | | | 64 | | | | 482 | |
Osmotica Pharmaceuticals PLC (1) | | | 285 | | | | 1,174 | |
Owens & Minor, Inc. | | | 145 | | | | 3,922 | |
Pacific Biosciences of California, Inc. (1) | | | 213 | | | | 5,525 | |
Palatin Technologies, Inc. (1) | | | 860 | | | | 581 | |
Conservative Allocation |
Security Description | | Shares or
Principal
Amount ($) | | | Fair
Value ($) | |
Common Stocks — continued |
PerkinElmer, Inc. | | | 153 | | | | 21,956 | |
Perrigo Co. PLC | | | 874 | | | | 39,085 | |
Pfizer, Inc. | | | 6,528 | | | | 240,296 | |
Phreesia, Inc. (1) | | | 3 | | | | 163 | |
PRA Health Sciences, Inc. (1) | | | 90 | | | | 11,290 | |
Precigen, Inc. (1)(2) | | | 130 | | | | 1,326 | |
Quest Diagnostics, Inc. | | | 69 | | | | 8,223 | |
Quidel Corp. (1) | | | 6 | | | | 1,078 | |
Regeneron Pharmaceuticals, Inc. (1) | | | 221 | | | | 106,767 | |
Replimune Group, Inc. (1) | | | 18 | | | | 687 | |
ResMed, Inc. | | | 122 | | | | 25,932 | |
REVOLUTION Medicines, Inc. (1) | | | 33 | | | | 1,306 | |
Rhythm Pharmaceuticals, Inc. (1) | | | 172 | | | | 5,114 | |
Rigel Pharmaceuticals, Inc. (1) | | | 237 | | | | 830 | |
Rocket Pharmaceuticals, Inc. (1) | | | 57 | | | | 3,126 | |
Sangamo Therapeutics, Inc. (1) | | | 159 | | | | 2,481 | |
Scholar Rock Holding Corp. (1) | | | 37 | | | | 1,796 | |
Seagen, Inc. (1) | | | 166 | | | | 29,073 | |
Seres Therapeutics, Inc. (1) | | | 70 | | | | 1,715 | |
SIGA Technologies, Inc. (1) | | | 115 | | | | 836 | |
Simulations Plus, Inc. | | | 180 | | | | 12,946 | |
Solid Biosciences, Inc. (1) | | | 92 | | | | 697 | |
Sorrento Therapeutics, Inc. (1) | | | 226 | | | | 1,542 | |
Spectrum Pharmaceuticals, Inc. (1) | | | 279 | | | | 951 | |
SpringWorks Therapeutics, Inc. (1) | | | 21 | | | | 1,523 | |
STERIS PLC | | | 269 | | | | 50,986 | |
Stryker Corp. | | | 534 | | | | 130,851 | |
Supernus Pharmaceuticals, Inc. (1) | | | 104 | | | | 2,617 | |
Surgery Partners, Inc. (1) | | | 34 | | | | 986 | |
Sutro Biopharma, Inc. (1) | | | 52 | | | | 1,129 | |
Syros Pharmaceuticals, Inc. (1) | | | 199 | | | | 2,159 | |
Teladoc Health, Inc. (1) | | | 62 | | | | 12,398 | |
Tenet Healthcare Corp. (1) | | | 170 | | | | 6,788 | |
TG Therapeutics, Inc. (1) | | | 140 | | | | 7,283 | |
Thermo Fisher Scientific, Inc. | | | 242 | | | | 112,719 | |
Translate Bio, Inc. (1) | | | 78 | | | | 1,438 | |
Turning Point Therapeutics, Inc. (1) | | | 66 | | | | 8,042 | |
Twist Bioscience Corp. (1) | | | 55 | | | | 7,771 | |
Ultragenyx Pharmaceutical, Inc. (1) | | | 49 | | | | 6,783 | |
United Therapeutics Corp. (1) | | | 236 | | | | 35,822 | |
UnitedHealth Group, Inc. | | | 926 | | | | 324,730 | |
Universal Health Services, Inc. - Class B | | | 135 | | | | 18,563 | |
Vanda Pharmaceuticals, Inc. (1) | | | 291 | | | | 3,824 | |
Veeva Systems, Inc. (1) | | | 125 | | | | 34,031 | |
Veracyte, Inc. (1) | | | 129 | | | | 6,313 | |
Vertex Pharmaceuticals, Inc. (1) | | | 447 | | | | 105,644 | |
Viatris, Inc. (1) | | | 1,185 | | | | 22,207 | |
The accompanying notes are an integral part of these financial statements
Page 90 | 2020 Annual Report | December 31, 2020 |
Schedule of Investments
December 31, 2020
Conservative Allocation |
Security Description | | Shares or
Principal
Amount ($) | | | Fair
Value ($) | |
Common Stocks — continued |
Viela Bio, Inc. (1) | | | 3 | | | | 108 | |
West Pharmaceutical Services, Inc. | | | 140 | | | | 39,663 | |
XBiotech, Inc. (1) | | | 186 | | | | 2,911 | |
Xencor, Inc. (1) | | | 60 | | | | 2,618 | |
Zimmer Biomet Holdings, Inc. | | | 579 | | | | 89,218 | |
ZIOPHARM Oncology, Inc. (1) | | | 228 | | | | 575 | |
Zoetis, Inc. - Class A | | | 1,350 | | | | 223,425 | |
| | | | | | | | 5,802,636 | |
| | | | | | | | | |
Industrials — 2.0% | | | | | | | | |
3M Co. | | | 868 | | | | 151,718 | |
AGCO Corp. | | | 198 | | | | 20,412 | |
Allegiant Travel Co. | | | 56 | | | | 10,597 | |
Alpha Pro Tech, Ltd. (1) | | | 110 | | | | 1,227 | |
Altra Industrial Motion Corp. | | | 98 | | | | 5,432 | |
ArcBest Corp. | | | 182 | | | | 7,766 | |
Arcosa, Inc. | | | 152 | | | | 8,349 | |
Argan, Inc. | | | 51 | | | | 2,269 | |
ASGN, Inc. (1) | | | 63 | | | | 5,262 | |
Astec Industries, Inc. | | | 52 | | | | 3,010 | |
Atkore International Group, Inc. (1) | | | 389 | | | | 15,992 | |
Atlas Air Worldwide Holdings, Inc. (1) | | | 11 | | | | 600 | |
Axon Enterprise, Inc. (1) | | | 52 | | | | 6,372 | |
AZZ, Inc. | | | 150 | | | | 7,116 | |
BG Staffing, Inc. | | | 30 | | | | 405 | |
BMC Stock Holdings, Inc. (1) | | | 199 | | | | 10,682 | |
Boise Cascade Co. | | | 313 | | | | 14,961 | |
CAI International, Inc. | | | 16 | | | | 500 | |
Caterpillar, Inc. | | | 368 | | | | 66,983 | |
Cintas Corp. | | | 208 | | | | 73,520 | |
Comfort Systems USA, Inc. | | | 328 | | | | 17,272 | |
Construction Partners, Inc. (1) | | | 3 | | | | 87 | |
Copart, Inc. (1) | | | 525 | | | | 66,806 | |
CoreCivic, Inc. | | | 43 | | | | 282 | |
CoreLogic, Inc./United States | | | 252 | | | | 19,485 | |
Covenant Logistics Group, Inc. (1) | | | 98 | | | | 1,451 | |
CSX Corp. | | | 385 | | | | 34,939 | |
Cummins, Inc. | | | 1,139 | | | | 258,667 | |
Deere & Co. | | | 217 | | | | 58,384 | |
Eaton Corp. PLC | | | 771 | | | | 92,628 | |
EMCOR Group, Inc. | | | 371 | | | | 33,932 | |
Emerson Electric Co. | | | 275 | | | | 22,102 | |
EnerSys | | | 41 | | | | 3,405 | |
Fastenal Co. | | | 520 | | | | 25,392 | |
FedEx Corp. | | | 207 | | | | 53,741 | |
FuelCell Energy, Inc. (1) | | | 19 | | | | 212 | |
Generac Holdings, Inc. (1) | | | 42 | | | | 9,551 | |
Conservative Allocation |
Security Description | | Shares or
Principal
Amount ($) | | | Fair
Value ($) | |
Common Stocks — continued |
General Electric Co. | | | 1,380 | | | | 14,904 | |
GrafTech International, Ltd. | | | 312 | | | | 3,326 | |
HEICO Corp. | | | 89 | | | | 11,784 | |
Herc Holdings, Inc. (1) | | | 66 | | | | 4,383 | |
Herman Miller, Inc. | | | 100 | | | | 3,380 | |
Hertz Global Holdings, Inc. (1) | | | 230 | | | | 294 | |
HNI Corp. | | | 122 | | | | 4,204 | |
Hubbell, Inc. | | | 103 | | | | 16,149 | |
Huntington Ingalls Industries, Inc. | | | 108 | | | | 18,412 | |
JB Hunt Transport Services, Inc. | | | 44 | | | | 6,013 | |
Kelly Services, Inc. - Class A | | | 151 | | | | 3,106 | |
Kforce, Inc. | | | 62 | | | | 2,610 | |
Kimball International, Inc. - Class B | | | 266 | | | | 3,179 | |
L B Foster Co. - Class A (1) | | | 50 | | | | 753 | |
Lawson Products, Inc./DE (1) | | | 11 | | | | 560 | |
Lockheed Martin Corp. | | | 672 | | | | 238,547 | |
LSC Communications, Inc. (1) | | | 641 | | | | 13 | |
Manitowoc Co., Inc./The (1) | | | 30 | | | | 399 | |
ManpowerGroup, Inc. | | | 809 | | | | 72,956 | |
Matson, Inc. | | | 132 | | | | 7,520 | |
Maxar Technologies, Inc. | | | 98 | | | | 3,782 | |
McGrath RentCorp | | | 56 | | | | 3,758 | |
Meritor, Inc. (1) | | | 66 | | | | 1,842 | |
Miller Industries, Inc./TN | | | 386 | | | | 14,676 | |
Moog, Inc. | | | 212 | | | | 16,812 | |
MSC Industrial Direct Co., Inc. | | | 612 | | | | 51,647 | |
Mueller Industries, Inc. | | | 313 | | | | 10,989 | |
MYR Group, Inc. (1) | | | 62 | | | | 3,726 | |
National Presto Industries, Inc. | | | 13 | | | | 1,150 | |
NL Industries, Inc. | | | 15 | | | | 72 | |
Norfolk Southern Corp. | | | 12 | | | | 2,851 | |
Old Dominion Freight Line, Inc. | | | 197 | | | | 38,450 | |
PACCAR, Inc. | | | 2,562 | | | | 221,049 | |
PAE, Inc. (1) | | | 236 | | | | 2,166 | |
Parker-Hannifin Corp. | | | 302 | | | | 82,268 | |
Plug Power, Inc. (1) | | | 391 | | | | 13,259 | |
Primoris Services Corp. | | | 858 | | | | 23,689 | |
Quad/Graphics, Inc. - Class A | | | 64 | | | | 244 | |
Quanta Services, Inc. | | | 2,085 | | | | 150,162 | |
Regal Beloit Corp. | | | 323 | | | | 39,668 | |
Resideo Technologies, Inc. (1) | | | 230 | | | | 4,890 | |
Rexnord Corp. | | | 73 | | | | 2,883 | |
RR Donnelley & Sons Co. | | | 696 | | | | 1,573 | |
Rush Enterprises, Inc. | | | 246 | | | | 10,189 | |
Ryder System, Inc. | | | 133 | | | | 8,214 | |
Safe Bulkers, Inc. (1) | | | 244 | | | | 317 | |
Saia, Inc. (1) | | | 70 | | | | 12,656 | |
The accompanying notes are an integral part of these financial statements
2020 Annual Report | December 31, 2020 | Page 91 |
Schedule of Investments
December 31, 2020
Conservative Allocation |
Security Description | | Shares or
Principal
Amount ($) | | | Fair
Value ($) | |
Common Stocks — continued |
Shyft Group, Inc./The | | | 107 | | | | 3,037 | |
SkyWest, Inc. | | | 33 | | | | 1,330 | |
Steelcase, Inc. | | | 216 | | | | 2,927 | |
Textainer Group Holdings, Ltd. (1) | | | 218 | | | | 4,181 | |
Timken Co./The | | | 514 | | | | 39,763 | |
TPI Composites, Inc. (1) | | | 85 | | | | 4,486 | |
Triton International, Ltd./Bermuda | | | 602 | | | | 29,203 | |
Tutor Perini Corp. (1) | | | 16 | | | | 207 | |
Uber Technologies, Inc. (1) | | | 720 | | | | 36,720 | |
United Parcel Service, Inc. - Class B | | | 601 | | | | 101,208 | |
Vectrus, Inc. (1) | | | 101 | | | | 5,022 | |
Veritiv Corp. (1) | | | 72 | | | | 1,497 | |
Waste Management, Inc. | | | 2,326 | | | | 274,305 | |
Watsco, Inc. | | | 35 | | | | 7,929 | |
WESCO International, Inc. (1) | | | 211 | | | | 16,564 | |
WESCO International, Inc. Series A Variable Preferred (8) | | | 153 | | | | 4,781 | |
| | | | | | | | 2,780,143 | |
| | | | | | | | | |
Information Technology — 6.4% | | | | | | | | |
8x8, Inc. (1) | | | 62 | | | | 2,137 | |
Accenture PLC - Class A | | | 150 | | | | 39,182 | |
ACI Worldwide, Inc. (1) | | | 288 | | | | 11,068 | |
Adobe, Inc. (1) | | | 533 | | | | 266,564 | |
ADTRAN, Inc. | | | 56 | | | | 827 | |
Advanced Micro Devices, Inc. (1) | | | 1,128 | | | | 103,449 | |
Alarm.com Holdings, Inc. (1) | | | 44 | | | | 4,552 | |
Alliance Data Systems Corp. | | | 81 | | | | 6,002 | |
Amkor Technology, Inc. | | | 517 | | | | 7,796 | |
Apple, Inc. | | | 14,313 | | | | 1,899,192 | |
Applied Materials, Inc. | | | 1,883 | | | | 162,503 | |
Arista Networks, Inc. (1) | | | 14 | | | | 4,068 | |
Arrow Electronics, Inc. (1) | | | 572 | | | | 55,656 | |
AstroNova, Inc. | | | 133 | | | | 1,416 | |
Autodesk, Inc. (1) | | | 267 | | | | 81,526 | |
Avaya Holdings Corp. (1) | | | 239 | | | | 4,577 | |
Avnet, Inc. | | | 975 | | | | 34,232 | |
Bill.com Holdings, Inc. (1) | | | 27 | | | | 3,686 | |
Broadcom, Inc. | | | 279 | | | | 122,160 | |
CACI International, Inc. - Class A (1) | | | 168 | | | | 41,887 | |
Cadence Design Systems, Inc. (1) | | | 1,951 | | | | 266,175 | |
Calix, Inc. (1) | | | 730 | | | | 21,725 | |
Cambium Networks Corp. (1) | | | 58 | | | | 1,455 | |
CDK Global, Inc. | | | 1,515 | | | | 78,522 | |
CDW Corp./DE | | | 403 | | | | 53,111 | |
Cerence, Inc. (1) | | | 85 | | | | 8,541 | |
ChannelAdvisor Corp. (1) | | | 415 | | | | 6,632 | |
Conservative Allocation |
Security Description | | Shares or
Principal
Amount ($) | | | Fair
Value ($) | |
Common Stocks — continued |
Ciena Corp. (1) | | | 195 | | | | 10,306 | |
Cisco Systems, Inc. | | | 4,194 | | | | 187,682 | |
Cloudera, Inc. (1) | | | 2 | | | | 28 | |
Cloudflare, Inc. (1) | | | 161 | | | | 12,234 | |
Cognex Corp. | | | 144 | | | | 11,561 | |
Cognizant Technology Solutions Corp. | | | 983 | | | | 80,557 | |
Concentrix Corp. (1) | | | 193 | | | | 19,049 | |
Conduent, Inc. (1) | | | 808 | | | | 3,878 | |
Corning, Inc. | | | 981 | | | | 35,316 | |
Coupa Software, Inc. (1) | | | 45 | | | | 15,251 | |
Crowdstrike Holdings, Inc. (1) | | | 144 | | | | 30,502 | |
Dell Technologies, Inc. - Class C (1) | | | 74 | | | | 5,423 | |
Diebold Nixdorf, Inc. (1) | | | 148 | | | | 1,578 | |
Digital Turbine, Inc. (1) | | | 262 | | | | 14,819 | |
DocuSign, Inc. (1) | | | 210 | | | | 46,683 | |
Dropbox, Inc. - Class A (1) | | | 135 | | | | 2,996 | |
DXC Technology Co. | | | 585 | | | | 15,064 | |
Eastman Kodak Co. (1) | | | 42 | | | | 342 | |
Ebix, Inc. | | | 109 | | | | 4,139 | |
Elastic NV (1) | | | 12 | | | | 1,754 | |
Enphase Energy, Inc. (1) | | | 106 | | | | 18,600 | |
F5 Networks, Inc. (1) | | | 41 | | | | 7,214 | |
Fastly, Inc. (1) | | | 50 | | | | 4,369 | |
FormFactor, Inc. (1) | | | 37 | | | | 1,592 | |
Fortinet, Inc. (1) | | | 108 | | | | 16,041 | |
Hewlett Packard Enterprise Co. | | | 2,497 | | | | 29,589 | |
HP, Inc. | | | 2,826 | | | | 69,491 | |
HubSpot, Inc. (1) | | | 38 | | | | 15,065 | |
II-VI, Inc. (1) | | | 60 | | | | 4,558 | |
Insight Enterprises, Inc. (1) | | | 55 | | | | 4,185 | |
Intel Corp. | | | 4,916 | | | | 244,915 | |
Intuit, Inc. | | | 814 | | | | 309,198 | |
Jabil, Inc. | | | 1,030 | | | | 43,806 | |
KBR, Inc. | | | 216 | | | | 6,681 | |
KLA Corp. | | | 348 | | | | 90,101 | |
Lam Research Corp. | | | 273 | | | | 128,930 | |
Mastercard, Inc. | | | 578 | | | | 206,311 | |
Maxim Integrated Products, Inc. | | | 208 | | | | 18,439 | |
Methode Electronics, Inc. | | | 137 | | | | 5,244 | |
Microchip Technology, Inc. | | | 25 | | | | 3,453 | |
Micron Technology, Inc. (1) | | | 618 | | | | 46,461 | |
Microsoft Corp. | | | 7,198 | | | | 1,600,979 | |
MicroStrategy, Inc. (1) | | | 71 | | | | 27,587 | |
MKS Instruments, Inc. | | | 67 | | | | 10,080 | |
MoneyGram International, Inc. (1) | | | 330 | | | | 1,803 | |
Monolithic Power Systems, Inc. | | | 8 | | | | 2,930 | |
NCR Corp. (1) | | | 254 | | | | 9,543 | |
The accompanying notes are an integral part of these financial statements
Page 92 | 2020 Annual Report | December 31, 2020 |
Schedule of Investments
December 31, 2020
Conservative Allocation |
Security Description | | Shares or
Principal
Amount ($) | | | Fair
Value ($) | |
Common Stocks — continued |
NETGEAR, Inc. (1) | | | 41 | | | | 1,666 | |
NortonLifeLock, Inc. | | | 1,549 | | | | 32,188 | |
NVIDIA Corp. | | | 515 | | | | 268,933 | |
ON Semiconductor Corp. (1) | | | 98 | | | | 3,208 | |
Oracle Corp. | | | 3,574 | | | | 231,202 | |
PagerDuty, Inc. (1) | | | 34 | | | | 1,418 | |
Palo Alto Networks, Inc. (1) | | | 4 | | | | 1,422 | |
Paycom Software, Inc. (1) | | | 46 | | | | 20,804 | |
PayPal Holdings, Inc. (1) | | | 89 | | | | 20,844 | |
Photronics, Inc. (1) | | | 364 | | | | 4,062 | |
Plantronics, Inc. | | | 42 | | | | 1,135 | |
Priority Technology Holdings, Inc. (1) | | | 171 | | | | 1,204 | |
Progress Software Corp. | | | 447 | | | | 20,200 | |
Qorvo, Inc. (1) | | | 211 | | | | 35,083 | |
QUALCOMM, Inc. | | | 2,198 | | | | 334,843 | |
Rimini Street, Inc. (1) | | | 83 | | | | 368 | |
RingCentral, Inc. - Class A (1) | | | 48 | | | | 18,191 | |
salesforce.com, Inc. (1) | | | 735 | | | | 163,560 | |
Sanmina Corp. (1) | | | 246 | | | | 7,845 | |
Sapiens International Corp. NV | | | 38 | | | | 1,163 | |
ServiceNow, Inc. (1) | | | 23 | | | | 12,660 | |
Skyworks Solutions, Inc. | | | 239 | | | | 36,538 | |
Slack Technologies, Inc. - Class A (1) | | | 38 | | | | 1,605 | |
Smartsheet, Inc. (1) | | | 55 | | | | 3,811 | |
SolarEdge Technologies, Inc. (1) | | | 8 | | | | 2,553 | |
Sonim Technologies, Inc. (1) | | | 265 | | | | 192 | |
SPS Commerce, Inc. (1) | | | 158 | | | | 17,157 | |
Square, Inc. - Class A (1) | | | 326 | | | | 70,951 | |
SS&C Technologies Holdings, Inc. | | | 2,769 | | | | 201,445 | |
StoneCo, Ltd. (1) | | | 143 | | | | 12,001 | |
Stratasys, Ltd. (1) | | | 125 | | | | 2,590 | |
Sykes Enterprises, Inc. (1) | | | 199 | | | | 7,496 | |
SYNNEX Corp. | | | 262 | | | | 21,337 | |
Tenable Holdings, Inc. (1) | | | 216 | | | | 11,288 | |
Teradyne, Inc. | | | 355 | | | | 42,561 | |
TESSCO Technologies, Inc. | | | 42 | | | | 262 | |
Texas Instruments, Inc. | | | 954 | | | | 156,580 | |
Trade Desk, Inc./The (1) | | | 43 | | | | 34,443 | |
Trimble, Inc. (1) | | | 588 | | | | 39,261 | |
TTEC Holdings, Inc. | | | 121 | | | | 8,825 | |
Twilio, Inc. - Class A (1) | | | 124 | | | | 41,974 | |
Ultra Clean Holdings, Inc. (1) | | | 30 | | | | 935 | |
Verint Systems, Inc. (1) | | | 128 | | | | 8,599 | |
Veritone, Inc. (1) | | | 28 | | | | 797 | |
VirnetX Holding Corp. (2) | | | 656 | | | | 3,306 | |
Visa, Inc. | | | 943 | | | | 206,262 | |
Vishay Intertechnology, Inc. | | | 633 | | | | 13,109 | |
Conservative Allocation |
Security Description | | Shares or
Principal
Amount ($) | | | Fair
Value ($) | |
Common Stocks — continued |
Vontier Corp. (1) | | | 71 | | | | 2,371 | |
Xerox Holdings Corp. | | | 1,476 | | | | 34,228 | |
Xilinx, Inc. | | | 270 | | | | 38,278 | |
Xperi Holding Corp. | | | 459 | | | | 9,593 | |
Zebra Technologies Corp. - Class A (1) | | | 106 | | | | 40,739 | |
Zoom Video Communications, Inc.- Class A (1) | | | 156 | | | | 52,622 | |
Zscaler, Inc. (1) | | | 63 | | | | 12,582 | |
| | | | | | | | 9,033,258 | |
| | | | | | | | | |
Materials — 0.7% | | | | | | | | |
Avery Dennison Corp. | | | 306 | | | | 47,464 | |
Avient Corp. | | | 76 | | | | 3,061 | |
Caledonia Mining Corp. PLC | | | 163 | | | | 2,588 | |
Celanese Corp. | | | 32 | | | | 4,158 | |
Century Aluminum Co. (1) | | | 12 | | | | 132 | |
Chemours Co./The | | | 88 | | | | 2,182 | |
Coeur Mining, Inc. (1) | | | 17 | | | | 176 | |
Commercial Metals Co. | | | 117 | | | | 2,403 | |
Corteva, Inc. | | | 716 | | | | 27,724 | |
Dow, Inc. | | | 651 | | | | 36,131 | |
Eastman Chemical Co. | | | 627 | | | | 62,876 | |
Freeport-McMoRan, Inc. - Class B | | | 1,344 | | | | 34,971 | |
Hawkins, Inc. | | | 34 | | | | 1,779 | |
Huntsman Corp. | | | 1,126 | | | | 28,308 | |
Koppers Holdings, Inc. (1) | | | 73 | | | | 2,275 | |
Linde PLC | | | 30 | | | | 7,905 | |
Louisiana-Pacific Corp. | | | 634 | | | | 23,566 | |
LyondellBasell Industries NV - Class A | | | 311 | | | | 28,506 | |
Minerals Technologies, Inc. | | | 40 | | | | 2,485 | |
Mosaic Co./The | | | 108 | | | | 2,485 | |
Newmont Corp. | | | 2,374 | | | | 142,179 | |
Nucor Corp. | | | 387 | | | | 20,585 | |
O-I Glass, Inc. | | | 317 | | | | 3,772 | |
Olin Corp. | | | 88 | | | | 2,161 | |
Olympic Steel, Inc. | | | 76 | | | | 1,013 | |
Packaging Corp. of America | | | 86 | | | | 11,860 | |
PPG Industries, Inc. | | | 489 | | | | 70,524 | |
Rayonier Advanced Materials, Inc. (1) | | | 189 | | | | 1,232 | |
Reliance Steel & Aluminum Co. | | | 466 | | | | 55,804 | |
Royal Gold, Inc. | | | 30 | | | | 3,191 | |
Ryerson Holding Corp. (1) | | | 338 | | | | 4,610 | |
Scotts Miracle-Gro Co./The | | | 703 | | | | 139,995 | |
Sherwin-Williams Co./The | | | 145 | | | | 106,562 | |
Steel Dynamics, Inc. | | | 327 | | | | 12,056 | |
Stepan Co. | | | 37 | | | | 4,415 | |
SunCoke Energy, Inc. | | | 84 | | | | 365 | |
The accompanying notes are an integral part of these financial statements
2020 Annual Report | December 31, 2020 | Page 93 |
Schedule of Investments
December 31, 2020
Conservative Allocation |
Security Description | | Shares or
Principal
Amount ($) | | | Fair
Value ($) | |
Common Stocks — continued |
Tredegar Corp. | | | 237 | | | | 3,958 | |
Trinseo SA | | | 24 | | | | 1,229 | |
Tronox Holdings PLC | | | 219 | | | | 3,202 | |
Westlake Chemical Corp. | | | 117 | | | | 9,547 | |
Westrock Co. | | | 167 | | | | 7,270 | |
| | | | | | | | 926,705 | |
| | | | | | | | | |
Real Estate Investment Trust — 0.7% | | | | | | | | |
Altisource Portfolio Solutions SA (1) | | | 205 | | | | 2,640 | |
American Homes 4 Rent - Class A | | | 752 | | | | 22,560 | |
American Tower Corp. | | | 679 | | | | 152,408 | |
Ashford Hospitality Trust, Inc. | | | 141 | | | | 365 | |
CareTrust REIT, Inc. | | | 142 | | | | 3,150 | |
CatchMark Timber Trust, Inc. | | | 380 | | | | 3,557 | |
CBL & Associates Properties, Inc. (1)(2) | | | 1,071 | | | | 44 | |
Clipper Realty, Inc. | | | 119 | | | | 839 | |
Columbia Property Trust, Inc. | | | 919 | | | | 13,178 | |
Community Healthcare Trust, Inc. | | | 32 | | | | 1,508 | |
CorEnergy Infrastructure Trust, Inc. | | | 277 | | | | 1,897 | |
CorePoint Lodging, Inc. | | | 268 | | | | 1,844 | |
Corporate Office Properties Trust | | | 580 | | | | 15,126 | |
CubeSmart | | | 1,179 | | | | 39,626 | |
CyrusOne, Inc. | | | 53 | | | | 3,877 | |
DiamondRock Hospitality Co. | | | 145 | | | | 1,196 | |
EastGroup Properties, Inc. | | | 107 | | | | 14,772 | |
Equinix, Inc. | | | 98 | | | | 69,990 | |
Essex Property Trust, Inc. | | | 131 | | | | 31,102 | |
Extra Space Storage, Inc. | | | 510 | | | | 59,089 | |
Gaming and Leisure Properties, Inc. | | | 776 | | | | 32,902 | |
Getty Realty Corp. | | | 277 | | | | 7,629 | |
Healthcare Realty Trust, Inc. | | | 895 | | | | 26,492 | |
Healthcare Trust of America, Inc. - Class A | | | 606 | | | | 16,689 | |
Hersha Hospitality Trust | | | 123 | | | | 970 | |
Highwoods Properties, Inc. | | | 24 | | | | 951 | |
Host Hotels & Resorts, Inc. | | | 349 | | | | 5,106 | |
Iron Mountain, Inc. | | | 1,432 | | | | 42,215 | |
Lamar Advertising Co. - Class A | | | 1,008 | | | | 83,886 | |
Life Storage, Inc. | | | 67 | | | | 7,999 | |
LTC Properties, Inc. | | | 673 | | | | 26,186 | |
Maui Land & Pineapple Co., Inc. (1) | | | 5 | | | | 58 | |
National Health Investors, Inc. | | | 77 | | | | 5,326 | |
National Storage Affiliates Trust | | | 338 | | | | 12,178 | |
Newmark Group, Inc. | | | 236 | | | | 1,720 | |
Omega Healthcare Investors, Inc. | | | 313 | | | | 11,368 | |
Park Hotels & Resorts, Inc. | | | 268 | | | | 4,596 | |
Piedmont Office Realty Trust, Inc. | | | 899 | | | | 14,591 | |
PotlatchDeltic Corp. | | | 91 | | | | 4,552 | |
Conservative Allocation |
Security Description | | Shares or
Principal
Amount ($) | | | Fair
Value ($) | |
Common Stocks — continued |
PS Business Parks, Inc. | | | 123 | | | | 16,343 | |
Public Storage | | | 283 | | | | 65,353 | |
RAIT Financial Trust (1)(6) | | | 368 | | | | 0 | |
Ryman Hospitality Properties, Inc. | | | 32 | | | | 2,168 | |
Sabra Health Care REIT, Inc. | | | 176 | | | | 3,057 | |
SBA Communications Corp. | | | 102 | | | | 28,777 | |
Service Properties Trust | | | 1,004 | | | | 11,536 | |
Simon Property Group, Inc. | | | 932 | | | | 79,481 | |
Spirit MTA REIT Liquidating Trust (1)(6) | | | 477 | | | | 0 | |
Tanger Factory Outlet Centers, Inc. (2) | | | 304 | | | | 3,028 | |
Trinity Place Holdings, Inc. (1) | | | 367 | | | | 459 | |
Urstadt Biddle Properties, Inc. - Class A | | | 376 | | | | 5,313 | |
Welltower, Inc. | | | 275 | | | | 17,771 | |
| | | | | | | | 977,468 | |
| | | | | | | | | |
Utilities — 0.4% | | | | | | | | |
Alliant Energy Corp. | | | 108 | | | | 5,565 | |
American Water Works Co., Inc. | | | 523 | | | | 80,265 | |
Atlantic Power Corp. (1) | | | 423 | | | | 888 | |
Eversource Energy | | | 19 | | | | 1,644 | |
MDU Resources Group, Inc. | | | 1,409 | | | | 37,113 | |
NextEra Energy, Inc. | | | 2,318 | | | | 178,831 | |
NRG Energy, Inc. | | | 678 | | | | 25,459 | |
Public Service Enterprise Group, Inc. | | | 1,374 | | | | 80,104 | |
UGI Corp. | | | 753 | | | | 26,325 | |
Vistra Corp. | | | 34 | | | | 668 | |
WEC Energy Group, Inc. | | | 364 | | | | 33,499 | |
Xcel Energy, Inc. | | | 1,093 | | | | 72,851 | |
| | | | | | | | 543,212 | |
| | | | | | | | | |
Total Common Stocks (Cost $23,056,620) | | | | | | | 31,250,188 | |
| | | | | | | | | |
Registered Investment Companies — 69.2% |
Baird Core Plus Bond Fund - Class I | | | 501,827 | | | | 6,092,177 | |
Dodge & Cox Income Fund | | | 350,828 | | | | 5,139,623 | |
DoubleLine Total Return Bond Fund - Class I | | | 320,390 | | | | 3,428,176 | |
Guggenheim Total Return Bond Fund - Class I | | | 87,805 | | | | 2,607,821 | |
iShares Core U.S. Aggregate Bond ETF (7) | | | 70,037 | | | | 8,277,673 | |
iShares JP Morgan USD Emerging Markets Bond ETF (7) | | | 124,818 | | | | 14,467,654 | |
Lord Abbett High Yield Fund - Class I | | | 807,499 | | | | 6,015,867 | |
Payden Emerging Markets Bond Fund - Class I | | | 108,674 | | | | 1,509,478 | |
PGIM Total Return Bond Fund - Class R6 | | | 346,631 | | | | 5,237,598 | |
The accompanying notes are an integral part of these financial statements
Page 94 | 2020 Annual Report | December 31, 2020 |
Schedule of Investments
December 31, 2020
Conservative Allocation |
Security Description | | Shares or
Principal
Amount ($) | | | Fair
Value ($) | |
Registered Investment Companies — continued |
Pioneer Bond Fund - Class Y | | | 394,545 | | | | 3,996,743 | |
Segall Bryant & Hamill Plus Bond Fund - Class I | | | 397,349 | | | | 4,426,469 | |
SPDR Bloomberg Barclays High Yield Bond ETF (7) | | | 90,085 | | | | 9,813,860 | |
TCW Emerging Markets Income Fund - Class I | | | 329,551 | | | | 2,804,481 | |
Vanguard Intermediate-Term Corporate Bond ETF (7) | | | 34,995 | | | | 3,399,414 | |
Vanguard Total Bond Market ETF (7) | | | 80,350 | | | | 7,086,067 | |
Xtrackers USD High Yield Corporate Bond ETF (7) | | | 274,322 | | | | 13,740,787 | |
Total Registered Investment Companies (Cost $91,532,633) | | | | | | | 98,043,888 | |
| | | | | | | | | |
Money Market Registered Investment Companies — 7.4% |
Meeder Institutional Prime Money Market Fund, 0.08% (4) | | | 10,425,301 | | | | 10,428,429 | |
Morgan Stanley Government Institutional Fund, 0.03% (3) | | | 4,870 | | | | 4,870 | |
Total Money Market Registered Investment Companies (Cost $10,426,324) | | | | | | | 10,433,299 | |
Total Investments — 98.7% (Cost $125,015,577) | | | | | | | 139,727,375 | |
Other Assets less Liabilities — 1.3% | | | | | | | 1,791,175 | |
Total Net Assets — 100.0% | | | | | | | 141,518,550 | |
| | | | | | | | | |
Trustee Deferred Compensation (5) |
Meeder Balanced Fund - Retail Class | | | 1,125 | | | | 14,423 | |
Meeder Dynamic Allocation Fund - Retail Class | | | 2,884 | | | | 38,617 | |
Meeder Muirfield Fund - Retail Class | | | 1,790 | | | | 14,678 | |
Meeder Conservative Allocation Fund - Retail Class | | | 332 | | | | 7,938 | |
Total Trustee Deferred Compensation (Cost $61,505) | | | | | | | 75,656 | |
| | | | | | | | | |
Conservative Allocation |
| | | Long
(Short)
Contracts | | | Expiration
Date | | | Notional
Value of
Contracts
($) | | | Value and
Unrealized
Appreciation
(Depreciation)
($) | |
Futures Contracts |
Index Futures | | | | | | | | | | | | | | | | |
Mini MSCI EAFE Index Futures | | | 35 | | | | 3/19/2021 | | | | 3,728,900 | | | | 59,330 | |
Mini MSCI Emerging Markets Index Futures | | | 16 | | | | 3/19/2021 | | | | 1,030,560 | | | | 32,257 | |
Russell 2000 Mini Index Futures | | | 7 | | | | 3/19/2021 | | | | 691,180 | | | | 14,035 | |
Standard & Poors 500 Mini Futures | | | 23 | | | | 3/19/2021 | | | | 4,311,120 | | | | 125,703 | |
E-mini Standard & Poors MidCap 400 Futures | | | 5 | | | | 3/19/2021 | | | | 1,151,750 | | | | 35,519 | |
Total Futures Contracts | | | 86 | | | | | | | | 10,913,510 | | | | 266,844 | |
(1) | Represents non-income producing securities. |
(2) | All or a portion of this security is on loan. |
(3) | Investment purchased with cash received as securities lending collateral. The yield shown represents the 7-day yield in effect at December 31, 2020. |
(4) | Investment in affiliate. The yield shown represents the 7-day yield in effect at December 31, 2020. |
(5) | Assets of affiliates to the Conservative Allocation Fund held for the benefit of the Fund’s Trustees in connection with the Trustees Deferred Compensation Plan. |
(6) | Fair valued security deemed as Level 3 security. |
The accompanying notes are an integral part of these financial statements
2020 Annual Report | December 31, 2020 | Page 95 |
Schedule of Investments
December 31, 2020
Dynamic Allocation Fund |
Security Description | | Shares or
Principal
Amount ($) | | | Fair
Value ($) | |
Common Stocks — 74.1% |
Communication Services — 7.4% | | | | | | | | |
Activision Blizzard, Inc. | | | 9,907 | | | | 919,865 | |
Alphabet, Inc. - Class A (1) | | | 915 | | | | 1,603,666 | |
Alphabet, Inc. - Class C (1) | | | 1,597 | | | | 2,797,752 | |
AMC Entertainment Holdings, Inc. - Class A (2) | | | 816 | | | | 1,730 | |
Cinemark Holdings, Inc. | | | 528 | | | | 9,192 | |
Comcast Corp. - Class A | | | 28,511 | | | | 1,493,976 | |
Cumulus Media, Inc. (1) | | | 785 | | | | 6,845 | |
DHI Group, Inc. (1) | | | 108 | | | | 240 | |
DISH Network Corp. (1) | | | 1,226 | | | | 39,649 | |
Electronic Arts, Inc. | | | 3,781 | | | | 542,952 | |
EW Scripps Co./The | | | 216 | | | | 3,303 | |
Facebook, Inc. (1) | | | 10,912 | | | | 2,980,722 | |
Fluent, Inc. (1) | | | 895 | | | | 4,752 | |
Frontier Communications Corp. (1) | | | 3,108 | | | | 278 | |
Glu Mobile, Inc. (1) | | | 1,144 | | | | 10,307 | |
Gogo, Inc. (1) | | | 330 | | | | 3,178 | |
Gray Television, Inc. (1) | | | 1,628 | | | | 29,125 | |
IDT Corp. - Class B (1) | | | 398 | | | | 4,919 | |
Interpublic Group of Cos., Inc./The | | | 12,842 | | | | 302,044 | |
Lee Enterprises, Inc. (1) | | | 2,570 | | | | 3,238 | |
Liberty TripAdvisor Holdings, Inc. (1) | | | 547 | | | | 2,374 | |
Lions Gate Entertainment Corp. - Class A (1) | | | 1,336 | | | | 15,190 | |
Meredith Corp. | | | 222 | | | | 4,262 | |
Netflix, Inc. (1) | | | 1,709 | | | | 924,108 | |
News Corp. | | | 3,084 | | | | 55,419 | |
Nexstar Media Group, Inc. | | | 997 | | | | 108,862 | |
Omnicom Group, Inc. | | | 4,641 | | | | 289,459 | |
Pinterest, Inc. - Class A (1) | | | 1,772 | | | | 116,775 | |
Roku, Inc. - Class A (1) | | | 623 | | | | 206,848 | |
Sinclair Broadcast Group, Inc. | | | 135 | | | | 4,300 | |
Spotify Technology SA (1) | | | 889 | | | | 279,733 | |
Take-Two Interactive Software, Inc. (1) | | | 343 | | | | 71,272 | |
TechTarget, Inc. (1) | | | 859 | | | | 50,775 | |
TEGNA, Inc. | | | 1,874 | | | | 26,142 | |
Telephone and Data Systems, Inc. | | | 1,239 | | | | 23,008 | |
Twitter, Inc. (1) | | | 976 | | | | 52,850 | |
Verizon Communications, Inc. | | | 28,619 | | | | 1,681,366 | |
World Wrestling Entertainment, Inc. - Class A | | | 1,217 | | | | 58,477 | |
Yelp, Inc. (1) | | | 64 | | | | 2,091 | |
| | | | | | | | 14,731,044 | |
| | | | | | | | | |
Consumer Discretionary — 9.5% | | | | | | | | |
Abercrombie & Fitch Co. | | | 53 | | | | 1,079 | |
Adient PLC (1) | | | 85 | | | | 2,955 | |
Dynamic Allocation Fund |
Security Description | | Shares or
Principal
Amount ($) | | | Fair
Value ($) | |
Common Stocks — continued |
Amazon.com, Inc. (1) | | | 1,607 | | | | 5,233,887 | |
American Eagle Outfitters, Inc. | | | 46 | | | | 923 | |
Aramark | | | 950 | | | | 36,556 | |
At Home Group, Inc. (1) | | | 296 | | | | 4,576 | |
AutoNation, Inc. (1) | | | 199 | | | | 13,888 | |
Best Buy Co., Inc. | | | 5,333 | | | | 532,180 | |
Big Lots, Inc. | | | 299 | | | | 12,836 | |
BorgWarner, Inc. | | | 832 | | | | 32,148 | |
Boyd Gaming Corp. | | | 623 | | | | 26,739 | |
Brinker International, Inc. | | | 394 | | | | 22,289 | |
Brunswick Corp./DE | | | 474 | | | | 36,138 | |
Buckle, Inc./The | | | 190 | | | | 5,548 | |
Caleres, Inc. | | | 481 | | | | 7,528 | |
Camping World Holdings, Inc. | | | 2,340 | | | | 60,957 | |
Capri Holdings, Ltd. (1) | | | 619 | | | | 25,998 | |
CarParts.com, Inc. (1) | | | 824 | | | | 10,209 | |
Carvana Co. (1) | | | 57 | | | | 13,654 | |
Chipotle Mexican Grill, Inc. (1) | | | 500 | | | | 693,355 | |
Churchill Downs, Inc. | | | 91 | | | | 17,726 | |
Container Store Group, Inc./The (1) | | | 212 | | | | 2,022 | |
Cooper Tire & Rubber Co. | | | 345 | | | | 13,973 | |
Cracker Barrel Old Country Store, Inc. | | | 501 | | | | 66,092 | |
Crocs, Inc. (1) | | | 3,358 | | | | 210,412 | |
Dana, Inc. | | | 1,295 | | | | 25,278 | |
Darden Restaurants, Inc. | | | 904 | | | | 107,684 | |
Dave & Buster’s Entertainment, Inc. | | | 127 | | | | 3,813 | |
Del Taco Restaurants, Inc. | | | 208 | | | | 1,884 | |
Designer Brands, Inc. - Class A | | | 505 | | | | 3,863 | |
Dillard’s, Inc. - Class A | | | 52 | | | | 3,279 | |
Dollar General Corp. | | | 2,574 | | | | 541,312 | |
Dollar Tree, Inc. (1) | | | 862 | | | | 93,130 | |
Domino’s Pizza, Inc. | | | 321 | | | | 123,091 | |
DR Horton, Inc. | | | 4,279 | | | | 294,909 | |
Duluth Holdings, Inc. - Class B (1) | | | 89 | | | | 940 | |
eBay, Inc. | | | 3,310 | | | | 166,328 | |
Etsy, Inc. (1) | | | 495 | | | | 88,065 | |
Everi Holdings, Inc. (1) | | | 257 | | | | 3,549 | |
Extended Stay America, Inc. | | | 1,752 | | | | 25,947 | |
Fiesta Restaurant Group, Inc. (1) | | | 265 | | | | 3,021 | |
Fossil Group, Inc. (1) | | | 413 | | | | 3,581 | |
Fox Factory Holding Corp. (1) | | | 99 | | | | 10,465 | |
Franchise Group, Inc. | | | 113 | | | | 3,441 | |
Gap, Inc./The | | | 198 | | | | 3,998 | |
General Motors Co. | | | 10,173 | | | | 423,604 | |
Genesco, Inc. (1) | | | 93 | | | | 2,798 | |
GoPro, Inc. (1) | | | 301 | | | | 2,492 | |
Greenlane Holdings, Inc. (1) | | | 370 | | | | 1,465 | |
The accompanying notes are an integral part of these financial statements
Page 96 | 2020 Annual Report | December 31, 2020 |
Schedule of Investments
December 31, 2020
Dynamic Allocation Fund |
Security Description | | Shares or
Principal
Amount ($) | | | Fair
Value ($) | |
Common Stocks — continued |
Group 1 Automotive, Inc. | | | 121 | | | | 15,868 | |
GrowGeneration Corp. (1) | | | 418 | | | | 16,812 | |
Guess?, Inc. | | | 225 | | | | 5,090 | |
Hanesbrands, Inc. | | | 1,124 | | | | 16,388 | |
Harley-Davidson, Inc. | | | 1,208 | | | | 44,334 | |
Hibbett Sports, Inc. (1) | | | 501 | | | | 23,136 | |
Houghton Mifflin Harcourt Co. (1) | | | 495 | | | | 1,648 | |
International Game Technology PLC | | | 1,113 | | | | 18,854 | |
Kohl’s Corp. | | | 1,009 | | | | 41,056 | |
L Brands, Inc. | | | 915 | | | | 34,029 | |
Lakeland Industries, Inc. (1) | | | 961 | | | | 26,187 | |
Lands’ End, Inc. (1) | | | 217 | | | | 4,681 | |
Las Vegas Sands Corp. | | | 1,010 | | | | 60,196 | |
Lear Corp. | | | 328 | | | | 52,162 | |
Lennar Corp. - Class A | | | 1,351 | | | | 102,987 | |
Lovesac Co./The (1) | | | 61 | | | | 2,628 | |
Lowe’s Cos., Inc. | | | 9,039 | | | | 1,450,850 | |
Lululemon Athletica, Inc. (1) | | | 542 | | | | 188,632 | |
Lumber Liquidators Holdings, Inc. (1) | | | 552 | | | | 16,968 | |
M/I Homes, Inc. (1) | | | 296 | | | | 13,110 | |
Malibu Boats, Inc. (1) | | | 226 | | | | 14,111 | |
MarineMax, Inc. (1) | | | 170 | | | | 5,955 | |
Marriott International, Inc./MD | | | 459 | | | | 60,551 | |
McDonald’s Corp. | | | 6,146 | | | | 1,318,809 | |
Meritage Homes Corp. (1) | | | 579 | | | | 47,953 | |
MGM Resorts International | | | 49 | | | | 1,544 | |
Modine Manufacturing Co. (1) | | | 908 | | | | 11,404 | |
Nautilus, Inc. (1) | | | 333 | | | | 6,041 | |
NIKE, Inc. - Class B | | | 4,443 | | | | 628,551 | |
Nordstrom, Inc. | | | 105 | | | | 3,277 | |
ODP Corp./The | | | 596 | | | | 17,463 | |
OneWater Marine, Inc. (1) | | | 315 | | | | 9,163 | |
Overstock.com, Inc. (1) | | | 218 | | | | 10,457 | |
Party City Holdco, Inc. (1) | | | 552 | | | | 3,395 | |
Penn National Gaming, Inc. (1) | | | 805 | | | | 69,528 | |
Polaris, Inc. | | | 283 | | | | 26,964 | |
Pool Corp. | | | 74 | | | | 27,565 | |
PulteGroup, Inc. | | | 9,151 | | | | 394,591 | |
Purple Innovation, Inc. (1) | | | 634 | | | | 20,884 | |
Qurate Retail, Inc. - Class A | | | 3,927 | | | | 43,079 | |
Red Rock Resorts, Inc. | | | 585 | | | | 14,648 | |
Rent-A-Center, Inc./TX | | | 7,429 | | | | 284,456 | |
Scientific Games Corp. (1) | | | 348 | | | | 14,439 | |
Select Interior Concepts, Inc. (1) | | | 2 | | | | 14 | |
Sleep Number Corp. (1) | | | 159 | | | | 13,016 | |
Smith & Wesson Brands, Inc. | | | 90 | | | | 1,598 | |
Sonic Automotive, Inc. | | | 487 | | | | 18,784 | |
Dynamic Allocation Fund |
Security Description | | Shares or
Principal
Amount ($) | | | Fair
Value ($) | |
Common Stocks — continued |
Starbucks Corp. | | | 6,451 | | | | 690,128 | |
Tapestry, Inc. | | | 790 | | | | 24,553 | |
Target Corp. | | | 3,094 | | | | 546,184 | |
Tesla, Inc. (1) | | | 3,288 | | | | 2,320,243 | |
Texas Roadhouse, Inc. | | | 503 | | | | 39,314 | |
Thor Industries, Inc. | | | 1,782 | | | | 165,708 | |
TopBuild Corp. (1) | | | 124 | | | | 22,826 | |
Town Sports International Holdings, Inc. (1) | | | 2,090 | | | | 523 | |
Tupperware Brands Corp. (1) | | | 179 | | | | 5,798 | |
Urban Outfitters, Inc. (1) | | | 258 | | | | 6,605 | |
Vista Outdoor, Inc. (1) | | | 144 | | | | 3,421 | |
VOXX International Corp. (1) | | | 212 | | | | 2,705 | |
Waitr Holdings, Inc. (1) | | | 351 | | | | 976 | |
Wayfair, Inc. (1) | | | 48 | | | | 10,839 | |
Wendy’s Co./The | | | 920 | | | | 20,166 | |
Williams-Sonoma, Inc. | | | 265 | | | | 26,988 | |
Wingstop, Inc. | | | 330 | | | | 43,742 | |
Winnebago Industries, Inc. | | | 2,421 | | | | 145,115 | |
Wyndham Destinations, Inc. | | | 2,925 | | | | 131,216 | |
Yum China Holdings, Inc. | | | 2,658 | | | | 151,745 | |
Yum! Brands, Inc. | | | 3,969 | | | | 430,875 | |
| | | | | | | | 19,015,131 | |
| | | | | | | | | |
Consumer Staples — 2.3% | | | | | | | | |
Andersons, Inc./The | | | 403 | | | | 9,878 | |
BJ’s Wholesale Club Holdings, Inc. (1) | | | 232 | | | | 8,649 | |
Bunge, Ltd. | | | 11,188 | | | | 733,709 | |
Conagra Brands, Inc. | | | 2,979 | | | | 108,019 | |
Costco Wholesale Corp. | | | 276 | | | | 103,991 | |
Darling Ingredients, Inc. (1) | | | 6,419 | | | | 370,248 | |
General Mills, Inc. | | | 16,731 | | | | 983,783 | |
Ingredion, Inc. | | | 150 | | | | 11,801 | |
Kroger Co./The | | | 4,980 | | | | 158,165 | |
Molson Coors Beverage Co. - Class B | | | 5,058 | | | | 228,571 | |
Natural Grocers by Vitamin Cottage, Inc. | | | 302 | | | | 4,149 | |
Nu Skin Enterprises, Inc. | | | 211 | | | | 11,527 | |
PepsiCo, Inc. | | | 5,712 | | | | 847,090 | |
Performance Food Group Co. (1) | | | 658 | | | | 31,327 | |
Rite Aid Corp. (1) | | | 358 | | | | 5,667 | |
SpartanNash Co. | | | 524 | | | | 9,123 | |
Tyson Foods, Inc. | | | 1,230 | | | | 79,261 | |
United Natural Foods, Inc. (1) | | | 394 | | | | 6,292 | |
Walgreens Boots Alliance, Inc. | | | 334 | | | | 13,320 | |
Walmart, Inc. | | | 6,321 | | | | 911,172 | |
| | | | | | | | 4,635,742 | |
The accompanying notes are an integral part of these financial statements
2020 Annual Report | December 31, 2020 | Page 97 |
Schedule of Investments
December 31, 2020
Dynamic Allocation Fund |
Security Description | | Shares or
Principal
Amount ($) | | | Fair
Value ($) | |
Common Stocks — continued |
Energy — 0.7% | | | | | | | | |
Amplify Energy Corp. | | | 2,487 | | | | 3,258 | |
Antero Resources Corp. (1) | | | 2,712 | | | | 14,780 | |
Apache Corp. | | | 1,048 | | | | 14,871 | |
Archrock, Inc. | | | 1,573 | | | | 13,622 | |
Ardmore Shipping Corp. | | | 1,930 | | | | 6,311 | |
Aspen Aerogels, Inc. (1) | | | 959 | | | | 16,006 | |
Berry Corp. | | | 370 | | | | 1,362 | |
Bonanza Creek Energy, Inc. (1) | | | 583 | | | | 11,269 | |
Brigham Minerals, Inc. | | | 209 | | | | 2,297 | |
Cabot Oil & Gas Corp. | | | 2,196 | | | | 35,751 | |
Cactus, Inc. - Class A | | | 1,243 | | | | 32,405 | |
Centennial Resource Development, Inc./DE - Class A (1) | | | 2,532 | | | | 3,798 | |
Chaparral Energy, Inc. A Warrants (1)(7) | | | 2 | | | | 0 | |
Chaparral Energy, Inc. B Warrants (1)(7) | | | 2 | | | | 0 | |
Chesapeake Energy Corp. (1) | | | 238 | | | | 362 | |
Cimarex Energy Co. | | | 2,105 | | | | 78,959 | |
Clean Energy Fuels Corp. (1) | | | 1,815 | | | | 14,266 | |
CNX Resources Corp. (1) | | | 836 | | | | 9,029 | |
Concho Resources, Inc. | | | 1,615 | | | | 94,235 | |
ConocoPhillips | | | 6,190 | | | | 247,538 | |
CONSOL Energy, Inc. (1) | | | 410 | | | | 2,956 | |
Continental Resources, Inc./OK | | | 708 | | | | 11,540 | |
Delek US Holdings, Inc. | | | 319 | | | | 5,126 | |
DHT Holdings, Inc. | | | 1,239 | | | | 6,480 | |
Diamondback Energy, Inc. | | | 387 | | | | 18,731 | |
DMC Global, Inc. | | | 70 | | | | 3,028 | |
Dorian LPG, Ltd. (1) | | | 509 | | | | 6,205 | |
Earthstone Energy, Inc. - Class A (1) | | | 897 | | | | 4,781 | |
EOG Resources, Inc. | | | 3,357 | | | | 167,414 | |
EQT Corp. | | | 1,991 | | | | 25,306 | |
Exterran Corp. (1) | | | 226 | | | | 999 | |
Extraction Oil & Gas, Inc. (1) | | | 1,270 | | | | 36 | |
Frank’s International NV (1) | | | 845 | | | | 2,315 | |
Golar LNG, Ltd. | | | 408 | | | | 3,933 | |
Gulfport Energy Corp. (1) | | | 750 | | | | 31 | |
Hallador Energy Co. | | | 131 | | | | 193 | |
Hess Corp. | | | 559 | | | | 29,510 | |
International Seaways, Inc. | | | 593 | | | | 9,684 | |
Laredo Petroleum, Inc. (1) | | | 790 | | | | 15,563 | |
Liberty Oilfield Services, Inc. - Class A | | | 1,572 | | | | 16,207 | |
Matador Resources Co. (1) | | | 979 | | | | 11,807 | |
Nabors Industries, Ltd. | | | 162 | | | | 9,433 | |
NextDecade Corp. (1) | | | 414 | | | | 865 | |
NexTier Oilfield Solutions, Inc. (1) | | | 1,356 | | | | 4,665 | |
Nine Energy Service, Inc. (1) | | | 1,075 | | | | 2,924 | |
Dynamic Allocation Fund |
Security Description | | Shares or
Principal
Amount ($) | | | Fair
Value ($) | |
Common Stocks — continued |
Nordic American Tankers, Ltd. | | | 861 | | | | 2,540 | |
NOV, Inc. (1) | | | 1,596 | | | | 21,913 | |
Oasis Petroleum, Inc. Warrants (1)(7) | | | 7 | | | | 0 | |
Oceaneering International, Inc. (1) | | | 1,320 | | | | 10,494 | |
Overseas Shipholding Group, Inc. (1) | | | 38 | | | | 81 | |
Parsley Energy, Inc. | | | 1,293 | | | | 18,361 | |
Patterson-UTI Energy, Inc. | | | 1,000 | | | | 5,260 | |
PDC Energy, Inc. (1) | | | 1,006 | | | | 20,653 | |
Peabody Energy Corp. | | | 1,125 | | | | 2,711 | |
Phillips 66 | | | 812 | | | | 56,791 | |
Pioneer Natural Resources Co. | | | 770 | | | | 87,695 | |
Profire Energy, Inc. (1) | | | 11 | | | | 9 | |
ProPetro Holding Corp. (1) | | | 3,756 | | | | 27,757 | |
Range Resources Corp. | | | 1,131 | | | | 7,578 | |
Renewable Energy Group, Inc. (1) | | | 254 | | | | 17,988 | |
Schlumberger NV | | | 2,017 | | | | 44,031 | |
SCorp.io Tankers, Inc. | | | 270 | | | | 3,021 | |
SilverBow Resources, Inc. (1)(2) | | | 506 | | | | 2,687 | |
Southwestern Energy Co. (1) | | | 3,758 | | | | 11,199 | |
Superior Energy Services, Inc. (1) | | | 323 | | | | 15 | |
Teekay Corp. (1) | | | 1,125 | | | | 2,419 | |
W&T Offshore, Inc. (1) | | | 2,639 | | | | 5,727 | |
Whiting Petroleum Corp. (1) | | | 82 | | | | 2,050 | |
Whiting Petroleum Corporation A Warrants (1) | | | 44 | | | | 77 | |
Whiting Petroleum Corporation B Warrants (1)(2) | | | 21 | | | | 40 | |
World Fuel Services Corp. | | | 1,128 | | | | 35,148 | |
WPX Energy, Inc. (1) | | | 1,709 | | | | 13,928 | |
| | | | | | | | 1,360,024 | |
| | | | | | | | | |
Financials — 6.3% | | | | | | | | |
AGNC Investment Corp. | | | 6,469 | | | | 100,916 | |
Allstate Corp./The | | | 265 | | | | 29,131 | |
Ally Financial, Inc. | | | 7,162 | | | | 255,397 | |
American Equity Investment Life Holding Co. | | | 594 | | | | 16,430 | |
American Express Co. | | | 1,088 | | | | 131,550 | |
Ameriprise Financial, Inc. | | | 584 | | | | 113,489 | |
Ameris BanCorp. | | | 1,883 | | | | 71,686 | |
Artisan Partners Asset Management, Inc. - Class A | | | 2,599 | | | | 130,834 | |
Associated Banc-Corp. | | | 6,476 | | | | 110,416 | |
Axos Financial, Inc. (1) | | | 489 | | | | 18,352 | |
BanCorp.South Bank | | | 1,770 | | | | 48,569 | |
Bank of America Corp. | | | 38,141 | | | | 1,156,054 | |
Bank of NT Butterfield & Son, Ltd./The | | | 987 | | | | 30,755 | |
The accompanying notes are an integral part of these financial statements
Page 98 | 2020 Annual Report | December 31, 2020 |
Schedule of Investments
December 31, 2020
Dynamic Allocation Fund |
Security Description | | Shares or
Principal
Amount ($) | | | Fair
Value ($) | |
Common Stocks — continued |
BankUnited, Inc. | | | 1,993 | | | | 69,317 | |
Bar Harbor Bankshares | | | 186 | | | | 4,202 | |
Berkshire Hathaway, Inc. - Class B (1) | | | 11,890 | | | | 2,756,934 | |
Brightsphere Investment Group, Inc. | | | 515 | | | | 9,929 | |
Charles Schwab Corp./The | | | 419 | | | | 22,224 | |
Chimera Investment Corp. | | | 288 | | | | 2,952 | |
Citigroup, Inc. | | | 5,628 | | | | 347,022 | |
Citizens Financial Group, Inc. | | | 3,481 | | | | 124,481 | |
Civista Bancshares, Inc. | | | 1,396 | | | | 24,472 | |
CNO Financial Group, Inc. | | | 3,103 | | | | 68,980 | |
Comerica, Inc. | | | 30 | | | | 1,676 | |
Curo Group Holdings Corp. | | | 1,458 | | | | 20,893 | |
Customers BanCorp., Inc. (1) | | | 1,222 | | | | 22,216 | |
East West BanCorp., Inc. | | | 1,618 | | | | 82,049 | |
Eaton Vance Corp. | | | 495 | | | | 33,625 | |
Elevate Credit, Inc. (1) | | | 2,328 | | | | 9,289 | |
Ellington Residential Mortgage REIT | | | 1,615 | | | | 21,060 | |
Enova International, Inc. (1) | | | 833 | | | | 20,633 | |
Esquire Financial Holdings, Inc. (1) | | | 113 | | | | 2,168 | |
Evercore, Inc. - Class A | | | 512 | | | | 56,136 | |
Farmers National Banc Corp. | | | 262 | | | | 3,477 | |
Fifth Third BanCorp. | | | 10,235 | | | | 282,179 | |
First Choice BanCorp. | | | 46 | | | | 851 | |
First Citizens BancShares, Inc./NC - Class A | | | 89 | | | | 51,110 | |
First Financial BanCorp. | | | 2,016 | | | | 35,340 | |
First Foundation, Inc. | | | 1,000 | | | | 20,000 | |
First Horizon Corp. | | | 362 | | | | 4,619 | |
First Interstate BancSystem, Inc. | | | 118 | | | | 4,811 | |
First Republic Bank/CA | | | 1,023 | | | | 150,309 | |
Goosehead Insurance, Inc. | | | 272 | | | | 33,935 | |
Great Ajax Corp. | | | 2,705 | | | | 28,294 | |
Hartford Financial Services Group, Inc./The | | | 571 | | | | 27,968 | |
HBT Financial, Inc. | | | 330 | | | | 5,000 | |
Heartland Financial USA, Inc. | | | 1,169 | | | | 47,193 | |
Hilltop Holdings, Inc. | | | 2,846 | | | | 78,293 | |
Houlihan Lokey, Inc. - Class A | | | 929 | | | | 62,457 | |
Huntington Bancshares, Inc./OH | | | 3,506 | | | | 44,281 | |
Independent Bank Corp./MI | | | 1 | | | | 18 | |
JPMorgan Chase & Co. | | | 7,740 | | | | 983,522 | |
KeyCorp. | | | 3,646 | | | | 59,831 | |
Kinsale Capital Group, Inc. | | | 539 | | | | 107,870 | |
Lakeland Financial Corp. | | | 130 | | | | 6,965 | |
LendingClub Corp. (1) | | | 129 | | | | 1,362 | |
M&T Bank Corp. | | | 334 | | | | 42,518 | |
Meta Financial Group, Inc. | | | 234 | | | | 8,555 | |
MetLife, Inc. | | | 4,256 | | | | 199,819 | |
Metrocity Bankshares, Inc. | | | 1,213 | | | | 17,491 | |
Dynamic Allocation Fund |
Security Description | | Shares or
Principal
Amount ($) | | | Fair
Value ($) | |
Common Stocks — continued |
Morgan Stanley | | | 7,115 | | | | 487,591 | |
Mr Cooper Group, Inc. (1) | | | 2,090 | | | | 64,853 | |
NewStar Financial Contingent Value Rights (1)(7) | | | 179 | | | | 0 | |
Northrim BanCorp., Inc. | | | 898 | | | | 30,487 | |
Old Republic International Corp. | | | 1,066 | | | | 21,011 | |
OneMain Holdings, Inc. | | | 1,029 | | | | 49,557 | |
Oppenheimer Holdings, Inc. | | | 1,860 | | | | 58,460 | |
PennyMac Financial Services, Inc. | | | 3,158 | | | | 207,228 | |
PennyMac Mortgage Investment Trust | | | 1,304 | | | | 22,937 | |
People’s United Financial, Inc. | | | 1,682 | | | | 21,748 | |
Pinnacle Financial Partners, Inc. | | | 213 | | | | 13,717 | |
PJT Partners, Inc. | | | 1,144 | | | | 86,086 | |
PNC Financial Services Group, Inc./The | | | 1,413 | | | | 210,537 | |
Popular, Inc. | | | 77 | | | | 4,337 | |
Progressive Corp./The | | | 1,586 | | | | 156,824 | |
ProSight Global, Inc. (1) | | | 20 | | | | 257 | |
Prudential Financial, Inc. | | | 2,464 | | | | 192,364 | |
Pzena Investment Management, Inc. - Class A | | | 2,462 | | | | 17,973 | |
QCR Holdings, Inc. | | | 630 | | | | 24,942 | |
RBB BanCorp. | | | 1,137 | | | | 17,487 | |
Ready Capital Corp. | | | 1,680 | | | | 20,916 | |
Regions Financial Corp. | | | 12,877 | | | | 207,577 | |
Sandy Spring BanCorp., Inc. | | | 277 | | | | 8,917 | |
Siebert Financial Corp. (1) | | | 226 | | | | 949 | |
Signature Bank/New York NY | | | 513 | | | | 69,404 | |
Simmons First National Corp. | | | 359 | | | | 7,751 | |
SLM Corp. | | | 1,779 | | | | 22,042 | |
South State Corp. | | | 134 | | | | 9,688 | |
State Street Corp. | | | 3,092 | | | | 225,036 | |
Stewart Information Services Corp. | | | 4,581 | | | | 221,537 | |
StoneX Group, Inc. (1) | | | 218 | | | | 12,622 | |
SVB Financial Group (1) | | | 384 | | | | 148,927 | |
Synchrony Financial | | | 18,067 | | | | 627,106 | |
Synovus Financial Corp. | | | 212 | | | | 6,862 | |
Triumph BanCorp., Inc. (1) | | | 30 | | | | 1,457 | |
Truist Financial Corp. | | | 7,802 | | | | 373,950 | |
UMB Financial Corp. | | | 1,045 | | | | 72,095 | |
United Community Banks, Inc./GA | | | 1,480 | | | | 42,091 | |
Unum Group | | | 6,502 | | | | 149,156 | |
Valley National BanCorp. | | | 2,879 | | | | 28,070 | |
Veritex Holdings, Inc. | | | 1,263 | | | | 32,409 | |
Virtu Financial, Inc. | | | 3,214 | | | | 80,896 | |
Virtus Investment Partners, Inc. | | | 335 | | | | 72,695 | |
Walker & Dunlop, Inc. | | | 1,084 | | | | 99,750 | |
Wells Fargo & Co. | | | 3,066 | | | | 92,532 | |
The accompanying notes are an integral part of these financial statements
2020 Annual Report | December 31, 2020 | Page 99 |
Schedule of Investments
December 31, 2020
Dynamic Allocation Fund |
Security Description | | Shares or
Principal
Amount ($) | | | Fair
Value ($) | |
Common Stocks — continued |
Western Alliance BanCorp. | | | 1,235 | | | | 74,038 | |
| | | | | | | | 12,618,774 | |
| | | | | | | | | |
Healthcare — 14.0% | | | | | | | | |
89bio, Inc. (1) | | | 38 | | | | 926 | |
Abbott Laboratories | | | 4,913 | | | | 537,924 | |
AbbVie, Inc. | | | 16,267 | | | | 1,743,009 | |
Abeona Therapeutics, Inc. (1) | | | 63 | | | | 99 | |
AcelRx Pharmaceuticals, Inc. (1) | | | 3,655 | | | | 4,532 | |
Affimed NV (1) | | | 1,311 | | | | 7,630 | |
Agilent Technologies, Inc. | | | 4,167 | | | | 493,748 | |
Akebia Therapeutics, Inc. (1) | | | 265 | | | | 742 | |
Albireo Pharma, Inc. (1) | | | 15 | | | | 563 | |
Alexion Pharmaceuticals, Inc. (1) | | | 2,027 | | | | 316,698 | |
Align Technology, Inc. (1) | | | 410 | | | | 219,096 | |
Alkermes PLC (1) | | | 1,911 | | | | 38,124 | |
Allakos, Inc. (1) | | | 154 | | | | 21,560 | |
Allscripts Healthcare Solutions, Inc. (1) | | | 733 | | | | 10,585 | |
Alnylam Pharmaceuticals, Inc. (1) | | | 604 | | | | 78,502 | |
Amedisys, Inc. (1) | | | 31 | | | | 9,093 | |
AmerisourceBergen Corp. | | | 28 | | | | 2,737 | |
Amgen, Inc. | | | 5,453 | | | | 1,253,754 | |
Amicus Therapeutics, Inc. (1) | | | 78 | | | | 1,801 | |
Amneal Pharmaceuticals, Inc. - Class A (1) | | | 2,422 | | | | 11,069 | |
Anthem, Inc. | | | 1,129 | | | | 362,511 | |
Apellis Pharmaceuticals, Inc. (1) | | | 326 | | | | 18,647 | |
Applied Therapeutics, Inc. (1) | | | 79 | | | | 1,739 | |
Arcturus Therapeutics Holdings, Inc. (1) | | | 125 | | | | 5,423 | |
Arcutis Biotherapeutics, Inc. (1) | | | 161 | | | | 4,529 | |
Arena Pharmaceuticals, Inc. (1) | | | 378 | | | | 29,042 | |
Arrowhead Pharmaceuticals, Inc. (1) | | | 447 | | | | 34,298 | |
Assembly Biosciences, Inc. (1) | | | 425 | | | | 2,571 | |
Assertio Holdings, Inc. (1) | | | 4,595 | | | | 1,643 | |
Atara Biotherapeutics, Inc. (1) | | | 309 | | | | 6,066 | |
Avantor, Inc. (1) | | | 1,405 | | | | 39,551 | |
Axsome Therapeutics, Inc. (1) | | | 62 | | | | 5,051 | |
Baxter International, Inc. | | | 378 | | | | 30,331 | |
Beam Therapeutics, Inc. (1) | | | 267 | | | | 21,798 | |
Beyondspring, Inc. (1) | | | 122 | | | | 1,488 | |
BioDelivery Sciences International, Inc. (1) | | | 4,109 | | | | 17,258 | |
Bio-Rad Laboratories, Inc. (1) | | | 65 | | | | 37,891 | |
Bio-Techne Corp. | | | 165 | | | | 52,396 | |
Bioxcel Therapeutics, Inc. (1) | | | 174 | | | | 8,039 | |
Blueprint Medicines Corp. (1) | | | 321 | | | | 36,000 | |
Bridgebio Pharma, Inc. (1) | | | 216 | | | | 15,360 | |
Bristol-Myers Squibb Co. | | | 13,502 | | | | 837,529 | |
Calyxt, Inc. (1) | | | 226 | | | | 954 | |
Dynamic Allocation Fund |
Security Description | | Shares or
Principal
Amount ($) | | | Fair
Value ($) | |
Common Stocks — continued |
Cardinal Health, Inc. | | | 6,549 | | | | 350,764 | |
CareDx, Inc. (1) | | | 336 | | | | 24,343 | |
CASI Pharmaceuticals, Inc. (1) | | | 468 | | | | 1,381 | |
Castle Biosciences, Inc. (1) | | | 169 | | | | 11,348 | |
Catalent, Inc. (1) | | | 1,573 | | | | 163,702 | |
Catalyst Pharmaceuticals, Inc. (1) | | | 2,747 | | | | 9,175 | |
Centene Corp. (1) | | | 2,247 | | | | 134,887 | |
Centogene NV (1) | | | 243 | | | | 2,620 | |
Cerecor, Inc. (1) | | | 444 | | | | 1,172 | |
Cerner Corp. | | | 8,242 | | | | 646,832 | |
Charles River Laboratories International, Inc. (1) | | | 420 | | | | 104,941 | |
Chemed Corp. | | | 285 | | | | 151,794 | |
ChemoCentryx, Inc. (1) | | | 423 | | | | 26,192 | |
Co-Diagnostics, Inc. (1) | | | 184 | | | | 1,711 | |
Community Health Systems, Inc. (1) | | | 1,047 | | | | 7,779 | |
Computer Programs and Systems, Inc. | | | 362 | | | | 9,716 | |
Concert Pharmaceuticals, Inc. (1) | | | 20 | | | | 253 | |
Constellation Pharmaceuticals, Inc. (1) | | | 183 | | | | 5,270 | |
Corcept Therapeutics, Inc. (1) | | | 200 | | | | 5,232 | |
Cross Country Healthcare, Inc. (1) | | | 254 | | | | 2,253 | |
CVS Health Corp. | | | 9,838 | | | | 671,935 | |
Cymabay Therapeutics, Inc. (1) | | | 1,271 | | | | 7,296 | |
Danaher Corp. | | | 1,782 | | | | 395,853 | |
Deciphera Pharmaceuticals, Inc. (1) | | | 82 | | | | 4,680 | |
Denali Therapeutics, Inc. (1) | | | 287 | | | | 24,039 | |
DENTSPLY SIRONA, Inc. | | | 2,341 | | | | 122,575 | |
Editas Medicine, Inc. (1) | | | 294 | | | | 20,612 | |
Edwards Lifesciences Corp. (1) | | | 2,745 | | | | 250,426 | |
Eidos Therapeutics, Inc. (1) | | | 83 | | | | 10,921 | |
Elanco Animal Health, Inc. Contingent Value Rights (1)(7) | | | 1,625 | | | | 0 | |
Eli Lilly and Co. | | | 4,698 | | | | 793,210 | |
Eloxx Pharmaceuticals, Inc. (1) | | | 355 | | | | 1,413 | |
Emergent BioSolutions, Inc. (1) | | | 599 | | | | 53,670 | |
Endo International PLC (1) | | | 3,202 | | | | 22,990 | |
Enochian Biosciences, Inc. (1) | | | 66 | | | | 195 | |
Ensign Group, Inc./The | | | 280 | | | | 20,418 | |
Evelo Biosciences, Inc. (1) | | | 248 | | | | 2,998 | |
Exact Sciences Corp. (1) | | | 617 | | | | 81,746 | |
Exelixis, Inc. (1) | | | 2,620 | | | | 52,583 | |
Fate Therapeutics, Inc. (1) | | | 369 | | | | 33,553 | |
Five Prime Therapeutics, Inc. (1) | | | 323 | | | | 5,494 | |
Fulgent Genetics, Inc. (1) | | | 60 | | | | 3,126 | |
Gilead Sciences, Inc. | | | 10,139 | | | | 590,698 | |
Globus Medical, Inc. (1) | | | 357 | | | | 23,284 | |
HCA Healthcare, Inc. | | | 962 | | | | 158,211 | |
The accompanying notes are an integral part of these financial statements
Page 100 | 2020 Annual Report | December 31, 2020 |
Schedule of Investments
December 31, 2020
Dynamic Allocation Fund |
Security Description | | Shares or
Principal
Amount ($) | | | Fair
Value ($) | |
Common Stocks — continued |
Hill-Rom Holdings, Inc. | | | 1,077 | | | | 105,514 | |
Hologic, Inc. (1) | | | 707 | | | | 51,491 | |
Horizon Therapeutics Plc (1) | | | 3,990 | | | | 291,869 | |
Humana, Inc. | | | 981 | | | | 402,475 | |
IDEXX Laboratories, Inc. (1) | | | 6 | | | | 2,999 | |
IGM Biosciences, Inc. (1) | | | 36 | | | | 3,178 | |
Illumina, Inc. (1) | | | 388 | | | | 143,560 | |
ImmunoGen, Inc. (1) | | | 1,235 | | | | 7,966 | |
Immunovant, Inc. (1) | | | 94 | | | | 4,342 | |
Inogen, Inc. (1) | | | 134 | | | | 5,987 | |
Inovio Pharmaceuticals, Inc. (1) | | | 498 | | | | 4,407 | |
Insmed, Inc. (1) | | | 403 | | | | 13,416 | |
Insulet Corp. (1) | | | 128 | | | | 32,721 | |
Intellia Therapeutics, Inc. (1) | | | 383 | | | | 20,835 | |
Intersect ENT, Inc. (1) | | | 298 | | | | 6,824 | |
Intra-Cellular Therapies, Inc. (1) | | | 1 | | | | 32 | |
Invitae Corp. (1) | | | 517 | | | | 21,616 | |
Iovance Biotherapeutics, Inc. (1) | | | 832 | | | | 38,605 | |
iRhythm Technologies, Inc. (1) | | | 104 | | | | 24,670 | |
Johnson & Johnson | | | 17,416 | | | | 2,740,930 | |
Jounce Therapeutics, Inc. (1) | | | 340 | | | | 2,380 | |
Kodiak Sciences, Inc. (1) | | | 188 | | | | 27,619 | |
Kura Oncology, Inc. (1) | | | 727 | | | | 23,744 | |
LHC Group, Inc. (1) | | | 2 | | | | 427 | |
MacroGenics, Inc. (1) | | | 404 | | | | 9,235 | |
Mallinckrodt PLC (1) | | | 92 | | | | 18 | |
Marinus Pharmaceuticals, Inc. (1) | | | 211 | | | | 2,574 | |
McKesson Corp. | | | 1,387 | | | | 241,227 | |
Medtronic PLC | | | 14,395 | | | | 1,686,230 | |
MEI Pharma, Inc. (1) | | | 1,169 | | | | 3,086 | |
Merck & Co., Inc. | | | 21,736 | | | | 1,778,005 | |
Mersana Therapeutics, Inc. (1) | | | 1,345 | | | | 35,790 | |
Mettler-Toledo International, Inc. (1) | | | 26 | | | | 29,632 | |
Mirati Therapeutics, Inc. (1) | | | 225 | | | | 49,419 | |
Moderna, Inc. (1) | | | 1,262 | | | | 131,841 | |
ModivCare, Inc. (1) | | | 80 | | | | 11,090 | |
Molina Healthcare, Inc. (1) | | | 154 | | | | 32,753 | |
Morphic Holding, Inc. (1) | | | 106 | | | | 3,556 | |
Myriad Genetics, Inc. (1) | | | 190 | | | | 3,757 | |
NantKwest, Inc. (1) | | | 638 | | | | 8,505 | |
Natera, Inc. (1) | | | 389 | | | | 38,713 | |
National HealthCare Corp. | | | 70 | | | | 4,649 | |
Neurocrine Biosciences, Inc. (1) | | | 263 | | | | 25,209 | |
NextGen Healthcare, Inc. (1) | | | 1,483 | | | | 27,050 | |
Novavax, Inc. (1) | | | 282 | | | | 31,446 | |
Novocure, Ltd. (1) | | | 81 | | | | 14,016 | |
Ocular Therapeutix, Inc. (1) | | | 1,294 | | | | 26,786 | |
Dynamic Allocation Fund |
Security Description | | Shares or
Principal
Amount ($) | | | Fair
Value ($) | |
Common Stocks — continued |
Oncocyte Corp. (1) | | | 312 | | | | 746 | |
Organogenesis Holdings, Inc. (1) | | | 353 | | | | 2,658 | |
Osmotica Pharmaceuticals PLC (1) | | | 1,397 | | | | 5,756 | |
Owens & Minor, Inc. | | | 598 | | | | 16,176 | |
Pacific Biosciences of California, Inc. (1) | | | 1,015 | | | | 26,329 | |
Palatin Technologies, Inc. (1) | | | 4,629 | | | | 3,128 | |
PerkinElmer, Inc. | | | 1,037 | | | | 148,810 | |
Perrigo Co. PLC | | | 3,795 | | | | 169,712 | |
Pfizer, Inc. | | | 30,864 | | | | 1,136,104 | |
PRA Health Sciences, Inc. (1) | | | 445 | | | | 55,821 | |
Precigen, Inc. (1)(2) | | | 558 | | | | 5,692 | |
Quest Diagnostics, Inc. | | | 691 | | | | 82,346 | |
Quidel Corp. (1) | | | 70 | | | | 12,576 | |
Regeneron Pharmaceuticals, Inc. (1) | | | 1,089 | | | | 526,107 | |
Replimune Group, Inc. (1) | | | 119 | | | | 4,540 | |
ResMed, Inc. | | | 647 | | | | 137,526 | |
REVOLUTION Medicines, Inc. (1) | | | 132 | | | | 5,226 | |
Rhythm Pharmaceuticals, Inc. (1) | | | 736 | | | | 21,881 | |
Rigel Pharmaceuticals, Inc. (1) | | | 559 | | | | 1,957 | |
Rocket Pharmaceuticals, Inc. (1) | | | 243 | | | | 13,326 | |
Sangamo Therapeutics, Inc. (1) | | | 751 | | | | 11,719 | |
Scholar Rock Holding Corp. (1) | | | 165 | | | | 8,007 | |
Seagen, Inc. (1) | | | 759 | | | | 132,931 | |
Seres Therapeutics, Inc. (1) | | | 341 | | | | 8,355 | |
Simulations Plus, Inc. | | | 866 | | | | 62,283 | |
Solid Biosciences, Inc. (1) | | | 395 | | | | 2,994 | |
Sorrento Therapeutics, Inc. (1) | | | 1,060 | | | | 7,235 | |
Spectrum Pharmaceuticals, Inc. (1) | | | 1,138 | | | | 3,881 | |
SpringWorks Therapeutics, Inc. (1) | | | 96 | | | | 6,962 | |
STERIS PLC | | | 1,636 | | | | 310,087 | |
Stryker Corp. | | | 2,709 | | | | 663,813 | |
Supernus Pharmaceuticals, Inc. (1) | | | 509 | | | | 12,806 | |
Surgery Partners, Inc. (1) | | | 174 | | | | 5,048 | |
Sutro Biopharma, Inc. (1) | | | 238 | | | | 5,167 | |
Syros Pharmaceuticals, Inc. (1) | | | 1,139 | | | | 12,358 | |
Teladoc Health, Inc. (1) | | | 309 | | | | 61,788 | |
Tenet Healthcare Corp. (1) | | | 810 | | | | 32,343 | |
TG Therapeutics, Inc. (1) | | | 671 | | | | 34,905 | |
Thermo Fisher Scientific, Inc. | | | 1,359 | | | | 632,995 | |
Translate Bio, Inc. (1) | | | 359 | | | | 6,616 | |
Travere Therapeutics, Inc. (1) | | | 90 | | | | 2,453 | |
Turning Point Therapeutics, Inc. (1) | | | 303 | | | | 36,921 | |
Twist Bioscience Corp. (1) | | | 259 | | | | 36,594 | |
Ultragenyx Pharmaceutical, Inc. (1) | | | 208 | | | | 28,793 | |
United Therapeutics Corp. (1) | | | 1,401 | | | | 212,658 | |
UnitedHealth Group, Inc. | | | 3,835 | | | | 1,344,858 | |
Universal Health Services, Inc. - Class B | | | 505 | | | | 69,438 | |
The accompanying notes are an integral part of these financial statements
2020 Annual Report | December 31, 2020 | Page 101 |
Schedule of Investments
December 31, 2020
Dynamic Allocation Fund |
Security Description | | Shares or
Principal
Amount ($) | | | Fair
Value ($) | |
Common Stocks — continued |
Vanda Pharmaceuticals, Inc. (1) | | | 1,576 | | | | 20,709 | |
Veeva Systems, Inc. (1) | | | 638 | | | | 173,696 | |
Veracyte, Inc. (1) | | | 686 | | | | 33,573 | |
Vertex Pharmaceuticals, Inc. (1) | | | 1,883 | | | | 445,028 | |
Viatris, Inc. (1) | | | 5,613 | | | | 105,188 | |
Viela Bio, Inc. (1) | | | 19 | | | | 683 | |
Viemed Healthcare, Inc. (1) | | | 158 | | | | 1,226 | |
West Pharmaceutical Services, Inc. | | | 741 | | | | 209,933 | |
XBiotech, Inc. (1) | | | 808 | | | | 12,645 | |
Xencor, Inc. (1) | | | 268 | | | | 11,693 | |
Zimmer Biomet Holdings, Inc. | | | 2,916 | | | | 449,326 | |
ZIOPHARM Oncology, Inc. (1) | | | 837 | | | | 2,109 | |
Zoetis, Inc. - Class A | | | 4,954 | | | | 819,887 | |
| | | | | | | | 27,923,913 | |
| | | | | | | | | |
Industrials — 6.3% | | | | | | | | |
3M Co. | | | 3,273 | | | | 572,088 | |
AGCO Corp. | | | 1,052 | | | | 108,451 | |
Allegiant Travel Co. | | | 1,025 | | | | 193,971 | |
Alpha Pro Tech, Ltd. (1) | | | 502 | | | | 5,597 | |
Altra Industrial Motion Corp. | | �� | 518 | | | | 28,713 | |
ArcBest Corp. | | | 836 | | | | 35,672 | |
Arcosa, Inc. | | | 868 | | | | 47,679 | |
Argan, Inc. | | | 187 | | | | 8,320 | |
ASGN, Inc. (1) | | | 152 | | | | 12,697 | |
Astec Industries, Inc. | | | 219 | | | | 12,676 | |
Atkore International Group, Inc. (1) | | | 1,856 | | | | 76,300 | |
Atlas Air Worldwide Holdings, Inc. (1) | | | 46 | | | | 2,509 | |
Axon Enterprise, Inc. (1) | | | 185 | | | | 22,668 | |
AZZ, Inc. | | | 634 | | | | 30,077 | |
BG Staffing, Inc. | | | 101 | | | | 1,362 | |
BMC Stock Holdings, Inc. (1) | | | 858 | | | | 46,057 | |
Boise Cascade Co. | | | 3,073 | | | | 146,889 | |
CAI International, Inc. | | | 51 | | | | 1,593 | |
Caterpillar, Inc. | | | 1,695 | | | | 308,524 | |
Charah Solutions, Inc. (1) | | | 139 | | | | 399 | |
Chart Industries, Inc. (1) | | | 4 | | | | 471 | |
Cintas Corp. | | | 774 | | | | 273,578 | |
Comfort Systems USA, Inc. | | | 1,201 | | | | 63,245 | |
Construction Partners, Inc. (1) | | | 20 | | | | 582 | |
Copart, Inc. (1) | | | 2,593 | | | | 329,959 | |
CoreCivic, Inc. | | | 3,074 | | | | 20,135 | |
CoreLogic, Inc./United States | | | 1,213 | | | | 93,789 | |
Costamare, Inc. | | | 7 | | | | 58 | |
Covenant Logistics Group, Inc. (1) | | | 659 | | | | 9,760 | |
CSX Corp. | | | 1,809 | | | | 164,167 | |
Cummins, Inc. | | | 5,425 | | | | 1,232,018 | |
Dynamic Allocation Fund |
Security Description | | Shares or
Principal
Amount ($) | | | Fair
Value ($) | |
Common Stocks — continued |
Deere & Co. | | | 1,397 | | | | 375,863 | |
Eaton Corp. PLC | | | 2,786 | | | | 334,710 | |
EMCOR Group, Inc. | | | 961 | | | | 87,893 | |
Emerson Electric Co. | | | 1,599 | | | | 128,512 | |
EnerSys | | | 69 | | | | 5,731 | |
Fastenal Co. | | | 3,382 | | | | 165,143 | |
FedEx Corp. | | | 981 | | | | 254,687 | |
FuelCell Energy, Inc. (1) | | | 235 | | | | 2,625 | |
Generac Holdings, Inc. (1) | | | 309 | | | | 70,270 | |
General Electric Co. | | | 6,621 | | | | 71,507 | |
GrafTech International, Ltd. | | | 1,703 | | | | 18,154 | |
Greenbrier Cos., Inc./The | | | 28 | | | | 1,019 | |
HEICO Corp. | | | 353 | | | | 46,737 | |
Herc Holdings, Inc. (1) | | | 230 | | | | 15,274 | |
Herman Miller, Inc. | | | 492 | | | | 16,630 | |
Hertz Global Holdings, Inc. (1) | | | 922 | | | | 1,180 | |
HNI Corp. | | | 539 | | | | 18,574 | |
Hubbell, Inc. | | | 265 | | | | 41,549 | |
Huntington Ingalls Industries, Inc. | | | 642 | | | | 109,448 | |
JB Hunt Transport Services, Inc. | | | 172 | | | | 23,504 | |
Kelly Services, Inc. - Class A | | | 763 | | | | 15,695 | |
Kforce, Inc. | | | 262 | | | | 11,028 | |
Kimball International, Inc. - Class B | | | 1,373 | | | | 16,407 | |
L B Foster Co. - Class A (1) | | | 301 | | | | 4,530 | |
Lawson Products, Inc./DE (1) | | | 79 | | | | 4,022 | |
Lincoln Electric Holdings, Inc. | | | 1 | | | | 116 | |
Lockheed Martin Corp. | | | 3,355 | | | | 1,190,958 | |
LSC Communications, Inc. (1) | | | 2,952 | | | | 59 | |
Manitowoc Co., Inc./The (1) | | | 275 | | | | 3,660 | |
ManpowerGroup, Inc. | | | 4,086 | | | | 368,475 | |
Matson, Inc. | | | 630 | | | | 35,891 | |
Maxar Technologies, Inc. | | | 450 | | | | 17,366 | |
McGrath RentCorp. | | | 115 | | | | 7,717 | |
Meritor, Inc. (1) | | | 354 | | | | 9,880 | |
Miller Industries, Inc./TN | | | 1,798 | | | | 68,360 | |
Moog, Inc. | | | 1,313 | | | | 104,121 | |
MSC Industrial Direct Co., Inc. | | | 3,099 | | | | 261,525 | |
Mueller Industries, Inc. | | | 1,648 | | | | 57,861 | |
MYR Group, Inc. (1) | | | 322 | | | | 19,352 | |
National Presto Industries, Inc. | | | 19 | | | | 1,680 | |
NL Industries, Inc. | | | 48 | | | | 229 | |
Norfolk Southern Corp. | | | 55 | | | | 13,069 | |
Old Dominion Freight Line, Inc. | | | 1,006 | | | | 196,351 | |
PACCAR, Inc. | | | 12,354 | | | | 1,065,903 | |
PAE, Inc. (1) | | | 744 | | | | 6,830 | |
Parker-Hannifin Corp. | | | 1,509 | | | | 411,067 | |
Plug Power, Inc. (1) | | | 1,800 | | | | 61,038 | |
The accompanying notes are an integral part of these financial statements
Page 102 | 2020 Annual Report | December 31, 2020 |
Schedule of Investments
December 31, 2020
Dynamic Allocation Fund |
Security Description | | Shares or
Principal
Amount ($) | | | Fair
Value ($) | |
Common Stocks — continued |
Primoris Services Corp. | | | 2,368 | | | | 65,380 | |
Quad/Graphics, Inc. - Class A | | | 417 | | | | 1,593 | |
Quanta Services, Inc. | | | 8,249 | | | | 594,093 | |
Regal Beloit Corp. | | | 1,510 | | | | 185,443 | |
Resideo Technologies, Inc. (1) | | | 1,157 | | | | 24,598 | |
Rexnord Corp. | | | 389 | | | | 15,362 | |
Rollins, Inc. | | | 918 | | | | 35,866 | |
RR Donnelley & Sons Co. | | | 3,258 | | | | 7,363 | |
Rush Enterprises, Inc. | | | 1,873 | | | | 77,580 | |
Ryder System, Inc. | | | 750 | | | | 46,320 | |
Safe Bulkers, Inc. (1) | | | 1,349 | | | | 1,754 | |
Saia, Inc. (1) | | | 342 | | | | 61,834 | |
Shyft Group, Inc./The | | | 668 | | | | 18,958 | |
SkyWest, Inc. | | | 133 | | | | 5,361 | |
Steelcase, Inc. | | | 1,115 | | | | 15,108 | |
Textainer Group Holdings, Ltd. (1) | | | 1,067 | | | | 20,465 | |
Timken Co./The | | | 1,925 | | | | 148,918 | |
TPI Composites, Inc. (1) | | | 380 | | | | 20,056 | |
Triton International, Ltd./Bermuda | | | 2,671 | | | | 129,570 | |
Tutor Perini Corp. (1) | | | 141 | | | | 1,826 | |
Uber Technologies, Inc. (1) | | | 3,352 | | | | 170,952 | |
United Parcel Service, Inc. - Class B | | | 2,833 | | | | 477,077 | |
Vectrus, Inc. (1) | | | 416 | | | | 20,684 | |
Veritiv Corp. (1) | | | 327 | | | | 6,798 | |
Waste Management, Inc. | | | 5,434 | | | | 640,832 | |
WESCO International, Inc. (1) | | | 976 | | | | 76,616 | |
WESCO International, Inc. Series A Variable Preferred (9) | | | 610 | | | | 19,063 | |
YRC Worldwide, Inc. (1) | | | 523 | | | | 2,317 | |
| | | | | | | | 12,483,991 | |
| | | | | | | | | |
Information Technology — 21.8% | | | | | | | | |
8x8, Inc. (1) | | | 343 | | | | 11,823 | |
Accenture PLC - Class A | | | 889 | | | | 232,216 | |
ACI Worldwide, Inc. (1) | | | 1,261 | | | | 48,460 | |
Adobe, Inc. (1) | | | 2,562 | | | | 1,281,307 | |
Advanced Micro Devices, Inc. (1) | | | 5,315 | | | | 487,439 | |
Alarm.com Holdings, Inc. (1) | | | 165 | | | | 17,069 | |
Alliance Data Systems Corp. | | | 360 | | | | 26,676 | |
Amkor Technology, Inc. | | | 2,763 | | | | 41,666 | |
Apple, Inc. | | | 70,328 | | | | 9,331,822 | |
Applied Materials, Inc. | | | 11,221 | | | | 968,372 | |
Arista Networks, Inc. (1) | | | 81 | | | | 23,536 | |
Arrow Electronics, Inc. (1) | | | 2,768 | | | | 269,326 | |
AstroNova, Inc. | | | 482 | | | | 5,133 | |
Autodesk, Inc. (1) | | | 1,363 | | | | 416,178 | |
Avaya Holdings Corp. (1) | | | 932 | | | | 17,848 | |
Dynamic Allocation Fund |
Security Description | | Shares or
Principal
Amount ($) | | | Fair
Value ($) | |
Common Stocks — continued |
Avid Technology, Inc. (1) | | | 614 | | | | 9,744 | |
Avnet, Inc. | | | 5,026 | | | | 176,463 | |
Bill.com Holdings, Inc. (1) | | | 105 | | | | 14,333 | |
Broadcom, Inc. | | | 1,367 | | | | 598,541 | |
CACI International, Inc. - Class A (1) | | | 1,007 | | | | 251,075 | |
Cadence Design Systems, Inc. (1) | | | 9,275 | | | | 1,265,388 | |
Calix, Inc. (1) | | | 3,414 | | | | 101,601 | |
Cambium Networks Corp. (1) | | | 267 | | | | 6,696 | |
CDK Global, Inc. | | | 4,484 | | | | 232,406 | |
CDW Corp./DE | | | 2,261 | | | | 297,977 | |
Cerence, Inc. (1) | | | 363 | | | | 36,474 | |
ChannelAdvisor Corp. (1) | | | 1,917 | | | | 30,634 | |
Ciena Corp. (1) | | | 745 | | | | 39,373 | |
Cisco Systems, Inc. | | | 19,615 | | | | 877,771 | |
Cloudera, Inc. (1) | | | 705 | | | | 9,807 | |
Cloudflare, Inc. (1) | | | 884 | | | | 67,175 | |
Cognex Corp. | | | 629 | | | | 50,499 | |
Cognizant Technology Solutions Corp. | | | 4,596 | | | | 376,642 | |
Concentrix Corp. (1) | | | 1,262 | | | | 124,559 | |
Conduent, Inc. (1) | | | 3,258 | | | | 15,638 | |
Corning, Inc. | | | 4,787 | | | | 172,332 | |
Coupa Software, Inc. (1) | | | 237 | | | | 80,322 | |
Crowdstrike Holdings, Inc. (1) | | | 681 | | | | 144,249 | |
Dell Technologies, Inc. - Class C (1) | | | 460 | | | | 33,713 | |
Diebold Nixdorf, Inc. (1) | | | 630 | | | | 6,716 | |
Digital Turbine, Inc. (1) | | | 1,652 | | | | 93,437 | |
DocuSign, Inc. (1) | | | 971 | | | | 215,853 | |
Dropbox, Inc. - Class A (1) | | | 1,440 | | | | 31,954 | |
DXC Technology Co. | | | 2,557 | | | | 65,843 | |
Dynatrace, Inc. (1) | | | 22 | | | | 952 | |
Eastman Kodak Co. (1) | | | 249 | | | | 2,027 | |
Ebix, Inc. | | | 494 | | | | 18,757 | |
Elastic NV (1) | | | 34 | | | | 4,968 | |
Enphase Energy, Inc. (1) | | | 520 | | | | 91,244 | |
F5 Networks, Inc. (1) | | | 34 | | | | 5,982 | |
Fastly, Inc. (1) | | | 252 | | | | 22,017 | |
FormFactor, Inc. (1) | | | 152 | | | | 6,539 | |
Fortinet, Inc. (1) | | | 450 | | | | 66,839 | |
Hewlett Packard Enterprise Co. | | | 12,778 | | | | 151,419 | |
HP, Inc. | | | 13,947 | | | | 342,957 | |
HubSpot, Inc. (1) | | | 160 | | | | 63,430 | |
II-VI, Inc. (1) | | | 196 | | | | 14,888 | |
Insight Enterprises, Inc. (1) | | | 289 | | | �� | 21,990 | |
Intel Corp. | | | 23,899 | | | | 1,190,648 | |
Intuit, Inc. | | | 3,864 | | | | 1,467,740 | |
Jabil, Inc. | | | 4,308 | | | | 183,219 | |
KBR, Inc. | | | 353 | | | | 10,918 | |
The accompanying notes are an integral part of these financial statements
2020 Annual Report | December 31, 2020 | Page 103 |
Schedule of Investments
December 31, 2020
Dynamic Allocation Fund |
Security Description | | Shares or
Principal
Amount ($) | | | Fair
Value ($) | |
Common Stocks — continued |
KLA Corp. | | | 1,837 | | | | 475,618 | |
Lam Research Corp. | | | 1,263 | | | | 596,477 | |
Mastercard, Inc. | | | 2,538 | | | | 905,914 | |
Maxim Integrated Products, Inc. | | | 1,114 | | | | 98,756 | |
Methode Electronics, Inc. | | | 495 | | | | 18,949 | |
Microchip Technology, Inc. | | | 80 | | | | 11,049 | |
Micron Technology, Inc. (1) | | | 3,023 | | | | 227,269 | |
Microsoft Corp. | | | 34,058 | | | | 7,575,180 | |
MicroStrategy, Inc. (1) | | | 405 | | | | 157,363 | |
MKS Instruments, Inc. | | | 285 | | | | 42,878 | |
MoneyGram International, Inc. (1) | | | 1,307 | | | | 7,143 | |
Monolithic Power Systems, Inc. | | | 83 | | | | 30,397 | |
NCR Corp. (1) | | | 1,102 | | | | 41,402 | |
NETGEAR, Inc. (1) | | | 148 | | | | 6,013 | |
NIC, Inc. | | | 469 | | | | 12,114 | |
NortonLifeLock, Inc. | | | 8,109 | | | | 168,505 | |
NVIDIA Corp. | | | 2,461 | | | | 1,285,134 | |
ON Semiconductor Corp. (1) | | | 53 | | | | 1,735 | |
Oracle Corp. | | | 18,033 | | | | 1,166,555 | |
PagerDuty, Inc. (1) | | | 182 | | | | 7,589 | |
Palo Alto Networks, Inc. (1) | | | 235 | | | | 83,517 | |
Paycom Software, Inc. (1) | | | 199 | | | | 89,998 | |
PayPal Holdings, Inc. (1) | | | 277 | | | | 64,873 | |
Photronics, Inc. (1) | | | 1,418 | | | | 15,825 | |
Plantronics, Inc. | | | 227 | | | | 6,136 | |
Priority Technology Holdings, Inc. (1) | | | 316 | | | | 2,225 | |
Progress Software Corp. | | | 2,765 | | | | 124,950 | |
Qorvo, Inc. (1) | | | 48 | | | | 7,981 | |
QUALCOMM, Inc. | | | 10,892 | | | | 1,659,287 | |
Rimini Street, Inc. (1) | | | 310 | | | | 1,373 | |
RingCentral, Inc. - Class A (1) | | | 207 | | | | 78,447 | |
salesforce.com, Inc. (1) | | | 3,569 | | | | 794,210 | |
Sanmina Corp. (1) | | | 1,196 | | | | 38,140 | |
Sapiens International Corp. NV | | | 190 | | | | 5,816 | |
Skyworks Solutions, Inc. | | | 1,005 | | | | 153,644 | |
Slack Technologies, Inc. - Class A (1) | | | 232 | | | | 9,800 | |
Smartsheet, Inc. (1) | | | 175 | | | | 12,126 | |
SPS Commerce, Inc. (1) | | | 933 | | | | 101,314 | |
Square, Inc. - Class A (1) | | | 1,863 | | | | 405,463 | |
SS&C Technologies Holdings, Inc. | | | 13,478 | | | | 980,525 | |
StarTek, Inc. (1) | | | 1 | | | | 8 | |
StoneCo, Ltd. (1) | | | 685 | | | | 57,485 | |
Stratasys, Ltd. (1) | | | 805 | | | | 16,680 | |
Sykes Enterprises, Inc. (1) | | | 928 | | | | 34,958 | |
SYNNEX Corp. | | | 1,462 | | | | 119,065 | |
Synopsys, Inc. (1) | | | 100 | | | | 25,924 | |
Tenable Holdings, Inc. (1) | | | 930 | | | | 48,602 | |
Dynamic Allocation Fund |
Security Description | | Shares or
Principal
Amount ($) | | | Fair
Value ($) | |
Common Stocks — continued |
Teradyne, Inc. | | | 1,905 | | | | 228,390 | |
TESSCO Technologies, Inc. | | | 237 | | | | 1,479 | |
Texas Instruments, Inc. | | | 3,967 | | | | 651,104 | |
Trade Desk, Inc./The (1) | | | 210 | | | | 168,210 | |
Trimble, Inc. (1) | | | 2,863 | | | | 191,163 | |
TTEC Holdings, Inc. | | | 487 | | | | 35,517 | |
Twilio, Inc. - Class A (1) | | | 588 | | | | 199,038 | |
Ultra Clean Holdings, Inc. (1) | | | 151 | | | | 4,704 | |
Verint Systems, Inc. (1) | | | 632 | | | | 42,458 | |
Veritone, Inc. (1) | | | 184 | | | | 5,235 | |
VirnetX Holding Corp. (2) | | | 2,874 | | | | 14,485 | |
Visa, Inc. | | | 4,483 | | | | 980,567 | |
Vishay Intertechnology, Inc. | | | 2,628 | | | | 54,426 | |
Vontier Corp. (1) | | | 256 | | | | 8,550 | |
Xerox Holdings Corp. | | | 6,943 | | | | 161,008 | |
Xilinx, Inc. | | | 1,308 | | | | 185,435 | |
Xperi Holding Corp. | | | 2,143 | | | | 44,789 | |
Zebra Technologies Corp. - Class A (1) | | | 524 | | | | 201,389 | |
Zoom Video Communications, Inc.- Class A (1) | | | 735 | | | | 247,930 | |
Zscaler, Inc. (1) | | | 263 | | | | 52,524 | |
| | | | | | | | 43,525,433 | |
| | | | | | | | | |
Materials — 2.2% | | | | | | | | |
Avery Dennison Corp. | | | 761 | | | | 118,039 | |
Avient Corp. | | | 324 | | | | 13,051 | |
Caledonia Mining Corp. PLC | | | 548 | | | | 8,702 | |
Celanese Corp. | | | 269 | | | | 34,954 | |
Chemours Co./The | | | 340 | | | | 8,429 | |
Coeur Mining, Inc. (1) | | | 478 | | | | 4,947 | |
Commercial Metals Co. | | | 621 | | | | 12,755 | |
Corteva, Inc. | | | 3,427 | | | | 132,693 | |
Dow, Inc. | | | 3,100 | | | | 172,050 | |
Eastman Chemical Co. | | | 3,284 | | | | 329,320 | |
Freeport-McMoRan, Inc. - Class B | | | 6,420 | | | | 167,048 | |
Hawkins, Inc. | | | 178 | | | | 9,311 | |
Huntsman Corp. | | | 4,987 | | | | 125,373 | |
Koppers Holdings, Inc. (1) | | | 250 | | | | 7,790 | |
Louisiana-Pacific Corp. | | | 3,035 | | | | 112,811 | |
LyondellBasell Industries NV - Class A | | | 1,566 | | | | 143,540 | |
Minerals Technologies, Inc. | | | 194 | | | | 12,051 | |
Mosaic Co./The | | | 546 | | | | 12,563 | |
Newmont Corp. | | | 12,781 | | | | 765,454 | |
Nucor Corp. | | | 2,006 | | | | 106,699 | |
O-I Glass, Inc. | | | 1,560 | | | | 18,564 | |
Olin Corp. | | | 313 | | | | 7,687 | |
Olympic Steel, Inc. | | | 442 | | | | 5,892 | |
The accompanying notes are an integral part of these financial statements
Page 104 | 2020 Annual Report | December 31, 2020 |
Schedule of Investments
December 31, 2020
Dynamic Allocation Fund |
Security Description | | Shares or
Principal
Amount ($) | | | Fair
Value ($) | |
Common Stocks — continued |
Packaging Corp. of America | | | 904 | | | | 124,671 | |
PPG Industries, Inc. | | | 2,405 | | | | 346,849 | |
Rayonier Advanced Materials, Inc. (1) | | | 875 | | | | 5,705 | |
Reliance Steel & Aluminum Co. | | | 2,149 | | | | 257,343 | |
Royal Gold, Inc. | | | 62 | | | | 6,594 | |
Ryerson Holding Corp. (1) | | | 1,193 | | | | 16,273 | |
Scotts Miracle-Gro Co./The | | | 3,128 | | | | 622,910 | |
Sherwin-Williams Co./The | | | 592 | | | | 435,067 | |
Steel Dynamics, Inc. | | | 1,490 | | | | 54,936 | |
Stepan Co. | | | 324 | | | | 38,660 | |
SunCoke Energy, Inc. | | | 388 | | | | 1,688 | |
Tredegar Corp. | | | 928 | | | | 15,498 | |
Trinseo SA | | | 120 | | | | 6,145 | |
Tronox Holdings PLC | | | 916 | | | | 13,392 | |
Westlake Chemical Corp. | | | 552 | | | | 45,043 | |
Westrock Co. | | | 843 | | | | 36,696 | |
Worthington Industries, Inc. | | | 11 | | | | 565 | |
| | | | | | | | 4,357,758 | |
| | | | | | | | | |
Real Estate Investment Trust — 2.3% | | | | | | | | |
Altisource Portfolio Solutions SA (1) | | | 1,173 | | | | 15,108 | |
American Homes 4 Rent - Class A | | | 2,914 | | | | 87,420 | |
American Tower Corp. | | | 3,279 | | | | 736,004 | |
AvalonBay Communities, Inc. | | | 47 | | | | 7,540 | |
Camden Property Trust | | | 78 | | | | 7,794 | |
CareTrust REIT, Inc. | | | 947 | | | | 21,004 | |
CatchMark Timber Trust, Inc. | | | 1,488 | | | | 13,928 | |
CBL & Associates Properties, Inc. (1)(2) | | | 5,143 | | | | 213 | |
Clipper Realty, Inc. | | | 439 | | | | 3,095 | |
Columbia Property Trust, Inc. | | | 2,635 | | | | 37,786 | |
Community Healthcare Trust, Inc. | | | 302 | | | | 14,227 | |
CorEnergy Infrastructure Trust, Inc. | | | 1,448 | | | | 9,919 | |
CorePoint Lodging, Inc. | | | 666 | | | | 4,582 | |
Corporate Office Properties Trust | | | 2,658 | | | | 69,321 | |
CubeSmart | | | 6,192 | | | | 208,113 | |
CyrusOne, Inc. | | | 152 | | | | 11,119 | |
DiamondRock Hospitality Co. | | | 777 | | | | 6,410 | |
EastGroup Properties, Inc. | | | 286 | | | | 39,485 | |
Equinix, Inc. | | | 439 | | | | 313,525 | |
Essential Properties Realty Trust, Inc. | | | 77 | | | | 1,632 | |
Essex Property Trust, Inc. | | | 750 | | | | 178,065 | |
Extra Space Storage, Inc. | | | 2,720 | | | | 315,139 | |
Gaming and Leisure Properties, Inc. | | | 4,347 | | | | 184,313 | |
Getty Realty Corp. | | | 501 | | | | 13,798 | |
Gladstone Commercial Corp. | | | 1,484 | | | | 26,712 | |
Healthcare Realty Trust, Inc. | | | 6,465 | | | | 191,364 | |
Healthcare Trust of America, Inc. - Class A | | | 3,432 | | | | 94,517 | |
Dynamic Allocation Fund |
Security Description | | Shares or
Principal
Amount ($) | | | Fair
Value ($) | |
Common Stocks — continued |
Host Hotels & Resorts, Inc. | | | 1,879 | | | | 27,490 | |
Iron Mountain, Inc. | | | 2,635 | | | | 77,680 | |
Lamar Advertising Co. - Class A | | | 6,191 | | | | 515,215 | |
Life Storage, Inc. | | | 406 | | | | 48,472 | |
LTC Properties, Inc. | | | 5,409 | | | | 210,464 | |
National Health Investors, Inc. | | | 811 | | | | 56,097 | |
National Storage Affiliates Trust | | | 2,350 | | | | 84,671 | |
Newmark Group, Inc. | | | 1,087 | | | | 7,924 | |
Omega Healthcare Investors, Inc. | | | 1,497 | | | | 54,371 | |
Paramount Group, Inc. | | | 756 | | | | 6,834 | |
Park Hotels & Resorts, Inc. | | | 2,334 | | | | 40,028 | |
Piedmont Office Realty Trust, Inc. | | | 3,201 | | | | 51,952 | |
PotlatchDeltic Corp. | | | 472 | | | | 23,609 | |
PS Business Parks, Inc. | | | 691 | | | | 91,813 | |
Public Storage | | | 1,478 | | | | 341,315 | |
Retail Opportunity Investments Corp. | | | 7,182 | | | | 96,167 | |
Retail Properties of America, Inc. - Class A | | | 607 | | | | 5,196 | |
Sabra Health Care REIT, Inc. | | | 1,281 | | | | 22,251 | |
SBA Communications Corp. | | | 221 | | | | 62,351 | |
Service Properties Trust | | | 3,129 | | | | 35,952 | |
Spirit MTA REIT Liquidating Trust (1)(7) | | | 3,134 | | | | 0 | |
Tanger Factory Outlet Centers, Inc. (2) | | | 1,879 | | | | 18,715 | |
Trinity Place Holdings, Inc. (1) | | | 97 | | | | 121 | |
Urstadt Biddle Properties, Inc. - Class A | | | 915 | | | | 12,929 | |
Welltower, Inc. | | | 1,543 | | | | 99,709 | |
| | | | | | | | 4,603,459 | |
| | | | | | | | | |
Utilities — 1.3% | | | | | | | | |
American Water Works Co., Inc. | | | 2,364 | | | | 362,803 | |
Duke Energy Corp. | | | 106 | | | | 9,705 | |
Eversource Energy | | | 447 | | | | 38,670 | |
MDU Resources Group, Inc. | | | 9,193 | | | | 242,144 | |
NextEra Energy, Inc. | | | 8,581 | | | | 662,024 | |
NRG Energy, Inc. | | | 3,178 | | | | 119,334 | |
Public Service Enterprise Group, Inc. | | | 6,699 | | | | 390,552 | |
UGI Corp. | | | 4,251 | | | | 148,615 | |
Vistra Corp. | | | 1,297 | | | | 25,499 | |
WEC Energy Group, Inc. | | | 1,707 | | | | 157,095 | |
Xcel Energy, Inc. | | | 6,760 | | | | 450,690 | |
| | | | | | | | 2,607,131 | |
| | | | | | | | | |
Total Common Stocks (Cost $105,137,285) | | | | | | | 147,862,400 | |
| | | | | | | | | |
The accompanying notes are an integral part of these financial statements
2020 Annual Report | December 31, 2020 | Page 105 |
Schedule of Investments
December 31, 2020
Dynamic Allocation Fund |
Security Description | | Shares or
Principal
Amount ($) | | | Fair
Value ($) | |
Registered Investment Companies — 5.2% |
iShares Core MSCI EAFE ETF (8) | | | 15,725 | | | | 1,086,440 | |
iShares JP Morgan USD Emerging Markets Bond ETF (8) | | | 39,690 | | | | 4,600,468 | |
Xtrackers USD High Yield Corporate Bond ETF (8) | | | 91,779 | | | | 4,597,210 | |
Total Registered Investment Companies (Cost $9,302,324) | | | | | | | 10,284,118 | |
| | | | | | | | | |
Money Market Registered Investment Companies — 18.4% |
Meeder Institutional Prime Money Market Fund, 0.08% (4) | | | 36,638,418 | | | | 36,649,409 | |
Morgan Stanley Government Institutional Fund, 0.03% (3) | | | 34,657 | | | | 34,657 | |
Total Money Market Registered Investment Companies (Cost $36,678,061) | | | | | | | 36,684,066 | |
| | | | | | | | | |
Bank Obligations — 0.4% |
First Merchants Bank Deposit Account, 0.75%, 1/4/2021 (5) | | | 248,088 | | | | 248,088 | |
Metro City Bank Deposit Account, 0.10%, 1/4/2021 (5) | | | 248,220 | | | | 248,220 | |
Pacific Mercantile Bank Deposit Account, 0.10%, 1/4/2021 (5) | | | 246,825 | | | | 246,825 | |
Total Bank Obligations (Cost $743,133) | | | | | | | 743,133 | |
Total Investments — 98.1% (Cost $151,860,803) | | | | | | | 195,573,717 | |
Other Assets less Liabilities — 1.9% | | | | | | | 3,706,029 | |
Total Net Assets — 100.0% | | | | | | | 199,279,746 | |
| | | | | | | | | |
Trustee Deferred Compensation (6) |
Meeder Balanced Fund - Retail Class | | | 3,479 | | | | 44,601 | |
Meeder Dynamic Allocation Fund - Retail Class | | | 9,056 | | | | 121,260 | |
Meeder Muirfield Fund - Retail Class | | | 4,373 | | | | 35,859 | |
Meeder Conservative Allocation Fund - Retail Class | | | 1,024 | | | | 24,484 | |
Total Trustee Deferred Compensation (Cost $180,790) | | | | | | | 226,204 | |
| | | | | �� | | | | |
Dynamic Allocation Fund |
| | | Long
(Short)
Contracts | | | Expiration
Date | | | Notional
Value of
Contracts
($) | | | Value and
Unrealized
Appreciation
(Depreciation)
($) | |
Futures Contracts |
Index Futures | | | | | | | | | | | | | | | | |
Mini MSCI EAFE Index Futures | | | 309 | | | | 3/19/2021 | | | | 32,920,860 | | | | 486,918 | |
Mini MSCI Emerging Markets Index Futures | | | 147 | | | | 3/19/2021 | | | | 9,468,270 | | | | 280,780 | |
Total Futures Contracts | | | 456 | | | | | | | | 42,389,130 | | | | 767,698 | |
(1) | Represents non-income producing securities. |
(2) | All or a portion of this security is on loan. |
(3) | Investment purchased with cash received as securities lending collateral. The yield shown represents the 7-day yield in effect at December 31, 2020. |
(4) | Investment in affiliate. The yield shown represents the 7-day yield in effect at December 31, 2020. |
(5) | Variable rate security. Securities payable at par including accrued interest (usually within seven days notice) and unconditionally secured as to principal and interest by letters of credit or other credit support agreements from major banks. The interest rates are adjustable and are not based on a published reference rate and spread but are determined by the issuer or agent and are based on current market conditions. These securities do not indicate a reference rate and spread in their description above. The rate shown represents the rate in effect at December 31, 2020. The maturity date shown, if applicable, reflects the earlier of the next demand date or stated maturity date. |
(6) | Assets of affiliates to the Dynamic Allocation Fund held for the benefit of the Fund’s Trustees in connection with the Trustee Deferred Compensation Plan. |
(7) | Fair valued security deemed as Level 3 security. |
The accompanying notes are an integral part of these financial statements
Page 106 | 2020 Annual Report | December 31, 2020 |
Schedule of Investments
December 31, 2020
Quantex Fund |
Security Description | | Shares or
Principal
Amount ($) | | | Fair
Value ($) | |
Common Stocks — 90.4% |
Communication Services — 3.9% | | | | | | | | |
AMC Networks, Inc. (1) | | | 12,565 | | | | 449,450 | |
Interpublic Group of Cos., Inc./The | | | 21,465 | | | | 504,857 | |
News Corp. | | | 34,041 | | | | 604,909 | |
| | | | | | | | 1,559,216 | |
| | | | | | | | | |
Consumer Discretionary — 18.5% | | | | | | | | |
Adtalem Global Education, Inc. (1) | | | 7,719 | | | | 262,060 | |
BorgWarner, Inc. | | | 10,083 | | | | 389,607 | |
Brinker International, Inc. | | | 10,267 | | | | 580,804 | |
Gap, Inc./The | | | 14,964 | | | | 302,123 | |
Hanesbrands, Inc. | | | 26,397 | | | | 384,868 | |
Harley-Davidson, Inc. | | | 12,656 | | | | 464,475 | |
Jack in the Box, Inc. | | | 4,325 | | | | 401,360 | |
Leggett & Platt, Inc. | | | 8,881 | | | | 393,428 | |
Mohawk Industries, Inc. (1) | | | 3,541 | | | | 499,104 | |
Newell Brands, Inc. | | | 23,970 | | | | 508,883 | |
Papa John’s International, Inc. | | | 5,621 | | | | 476,942 | |
PulteGroup, Inc. | | | 12,846 | | | | 553,920 | |
Tapestry, Inc. | | | 17,676 | | | | 549,370 | |
TRI Pointe Group, Inc. (1) | | | 31,908 | | | | 550,413 | |
Visteon Corp. (1) | | | 3,395 | | | | 426,140 | |
Whirlpool Corp. | | | 3,419 | | | | 617,095 | |
| | | | | | | | 7,360,592 | |
| | | | | | | | | |
Consumer Staples — 3.3% | | | | | | | | |
Edgewell Personal Care Co. | | | 10,566 | | | | 365,372 | |
Nu Skin Enterprises, Inc. | | | 12,008 | | | | 655,997 | |
Sprouts Farmers Market, Inc. (1) | | | 15,747 | | | | 316,515 | |
| | | | | | | | 1,337,884 | |
| | | | | | | | | |
Energy — 2.2% | | | | | | | | |
Cabot Oil & Gas Corp. | | | 16,129 | | | | 262,580 | |
CNX Resources Corp. (1) | | | 35,159 | | | | 379,717 | |
HollyFrontier Corp. | | | 9,482 | | | | 245,110 | |
| | | | | | | | 887,407 | |
| | | | | | | | | |
Financials — 8.1% | | | | | | | | |
Assurant, Inc. | | | 3,935 | | | | 536,026 | |
Green Dot Corp. (1) | | | 6,644 | | | | 370,735 | |
Invesco, Ltd. | | | 23,039 | | | | 401,570 | |
Morgan Stanley | | | 6,264 | | | | 429,272 | |
People’s United Financial, Inc. | | | 32,243 | | | | 416,902 | |
Trustmark Corp. | | | 11,900 | | | | 324,989 | |
Unum Group | | | 16,301 | | | | 373,945 | |
Wells Fargo & Co. (1)(7) | | | 1 | | | | 0 | |
Quantex Fund |
Security Description | | Shares or
Principal
Amount ($) | | | Fair
Value ($) | |
Common Stocks — continued |
Zions Bancorp NA | | | 9,370 | | | | 407,033 | |
| | | | | | | | 3,260,472 | |
| | | | | | | | | |
Healthcare — 12.6% | | | | | | | | |
ABIOMED, Inc. (1) | | | 2,144 | | | | 695,085 | |
Allscripts Healthcare Solutions, Inc. (1) | | | 50,019 | | | | 722,274 | |
Avanos Medical, Inc. (1) | | | 10,482 | | | | 480,914 | |
DaVita, Inc. (1) | | | 7,092 | | | | 832,601 | |
Henry Schein, Inc. (1) | | | 5,244 | | | | 350,614 | |
Ligand Pharmaceuticals, Inc. (1)(2) | | | 3,211 | | | | 319,334 | |
Patterson Cos., Inc. | | | 13,649 | | | | 404,420 | |
PerkinElmer, Inc. | | | 5,376 | | | | 771,456 | |
Perrigo Co. PLC | | | 10,276 | | | | 459,543 | |
| | | | | | | | 5,036,241 | |
| | | | | | | | | |
Industrials — 17.4% | | | | | | | | |
A O Smith Corp. | | | 7,578 | | | | 415,426 | |
Alaska Air Group, Inc. | | | 6,703 | | | | 348,556 | |
CH Robinson Worldwide, Inc. | | | 3,998 | | | | 375,292 | |
Dycom Industries, Inc. (1) | | | 3,935 | | | | 297,171 | |
Flowserve Corp. | | | 9,453 | | | | 348,343 | |
Fortune Brands Home & Security, Inc. | | | 7,664 | | | | 656,958 | |
Huntington Ingalls Industries, Inc. | | | 2,046 | | | | 348,802 | |
Pentair PLC | | | 10,942 | | | | 580,911 | |
Quanta Services, Inc. | | | 12,758 | | | | 918,831 | |
Resideo Technologies, Inc. (1) | | | 19,074 | | | | 405,513 | |
Robert Half International, Inc. | | | 7,754 | | | | 484,470 | |
Rollins, Inc. | | | 12,705 | | | | 496,384 | |
Snap-on, Inc. | | | 2,440 | | | | 417,582 | |
Terex Corp. | | | 11,370 | | | | 396,699 | |
Textron, Inc. | | | 10,205 | | | | 493,208 | |
| | | | | | | | 6,984,146 | |
| | | | | | | | | |
Information Technology — 9.2% | | | | | | | | |
CommVault Systems, Inc. (1) | | | 8,467 | | | | 468,818 | |
DXC Technology Co. | | | 11,663 | | | | 300,322 | |
F5 Networks, Inc. (1) | | | 2,392 | | | | 420,848 | |
FLIR Systems, Inc. | | | 5,620 | | | | 246,325 | |
InterDigital, Inc. | | | 5,311 | | | | 322,271 | |
IPG Photonics Corp. (1) | | | 2,035 | | | | 455,413 | |
Juniper Networks, Inc. | | | 17,824 | | | | 401,218 | |
NetScout Systems, Inc. (1) | | | 12,594 | | | | 345,327 | |
Synaptics, Inc. (1) | | | 4,591 | | | | 442,572 | |
Xerox Holdings Corp. | | | 12,661 | | | | 293,609 | |
| | | | | | | | 3,696,723 | |
| | | | | | | | | |
The accompanying notes are an integral part of these financial statements
2020 Annual Report | December 31, 2020 | Page 107 |
Schedule of Investments
December 31, 2020
Quantex Fund |
Security Description | | Shares or
Principal
Amount ($) | | | Fair
Value ($) | |
Common Stocks — continued |
Materials — 11.0% | | | | | | | | |
Avery Dennison Corp. | | | 3,945 | | | | 611,909 | |
CF Industries Holdings, Inc. | | | 10,202 | | | | 394,919 | |
Compass Minerals International, Inc. | | | 6,345 | | | | 391,613 | |
Eastman Chemical Co. | | | 6,356 | | | | 637,380 | |
Greif, Inc. - Class A | | | 8,865 | | | | 415,591 | |
Minerals Technologies, Inc. | | | 8,642 | | | | 536,841 | |
O-I Glass, Inc. | | | 35,326 | | | | 420,379 | |
Packaging Corp. of America | | | 2,946 | | | | 406,283 | |
Worthington Industries, Inc. | | | 11,473 | | | | 589,024 | |
| | | | | | | | 4,403,939 | |
| | | | | | | | | |
Real Estate Investment Trust — 1.7% | | | | | | | | |
Apartment Income REIT Corp. (1) | | | 1,835 | | | | 70,482 | |
Apartment Investment and Management Co. | | | 1,835 | | | | 9,689 | |
Kimco Realty Corp. | | | 21,509 | | | | 322,850 | |
Regency Centers Corp. | | | 6,230 | | | | 284,026 | |
| | | | | | | | 687,047 | |
| | | | | | | | | |
Utilities — 2.5% | | | | | | | | |
NiSource, Inc. | | | 11,328 | | | | 259,864 | |
NRG Energy, Inc. | | | 11,269 | | | | 423,151 | |
Pinnacle West Capital Corp. | | | 4,207 | | | | 336,352 | |
| | | | | | | | 1,019,367 | |
| | | | | | | | | |
Total Common Stocks (Cost $28,495,157) | | | | | | | 36,233,034 | |
| | | | | | | | | |
Money Market Registered Investment Companies — 2.2% |
Meeder Institutional Prime Money Market Fund, 0.08% (4) | | | 571,961 | | | | 572,132 | |
Morgan Stanley Government Institutional Fund, 0.03% (3) | | | 324,516 | | | | 324,516 | |
Total Money Market Registered Investment Companies (Cost $896,647) | | | | | | | 896,648 | |
| | | | | | | | | |
Bank Obligations — 0.0% |
First Merchants Bank Deposit Account, 0.75%, 1/4/2021 (5) | | | 8,000 | | | | 8,000 | |
Total Bank Obligations (Cost $8,000) | | | | | | | 8,000 | |
Total Investments — 92.6% (Cost $29,399,804) | | | | | | | 37,137,682 | |
Other Assets less Liabilities — 7.4% | | | | | | | 2,955,575 | |
Total Net Assets — 100.0% | | | | | | | 40,093,257 | |
Quantex Fund |
Security Description | | Shares or
Principal
Amount ($) | | | Fair
Value ($) | |
Trustee Deferred Compensation (6) |
Meeder Balanced Fund - Retail Class | | | 1,030 | | | | 13,205 | |
Meeder Dynamic Allocation Fund - Retail Class | | | 2,627 | | | | 35,176 | |
Meeder Muirfield Fund - Retail Class | | | 1,382 | | | | 11,332 | |
Meeder Conservative Allocation Fund - Retail Class | | | 302 | | | | 7,221 | |
Total Trustee Deferred Compensation (Cost $54,629) | | | | | | | 66,934 | |
| | | | | | | | | |
| | | Long
(Short)
Contracts | | | Expiration
Date | | | Notional
Value of
Contracts
($) | | | Value and
Unrealized
Appreciation
(Depreciation)
($) | |
Futures Contracts |
Index Futures | | | | | | | | | | | | | | | | |
E-mini Standard & Poors MidCap 400 Futures | | | 20 | | | | 3/19/2021 | | | | 4,607,000 | | | | 27,656 | |
Total Futures Contracts | | | 20 | | | | | | | | 4,607,000 | | | | 27,656 | |
(1) | Represents non-income producing securities. |
(2) | All or a portion of this security is on loan. |
(3) | Investment purchased with cash received as securities lending collateral. The yield shown represents the 7-day yield in effect at December 31, 2020. |
(4) | Investment in affiliate. The yield shown represents the 7-day yield in effect at December 31, 2020. |
(5) | Variable rate security. Securities payable at par including accrued interest (usually within seven days notice) and unconditionally secured as to principal and interest by letters of credit or other credit support agreements from major banks. The interest rates are adjustable and are not based on a published reference rate and spread but are determined by the issuer or agent and are based on current market conditions. These securities do not indicate a reference rate and spread in their description above. The rate shown represents the rate in effect at December 31, 2020. The maturity date shown, if applicable, reflects the earlier of the next demand date or stated maturity date. |
(6) | Assets of affiliates to the Quantex Fund held for the benefit of the Fund’s Trustees in connection with the Trustee Deferred Compensation Plan. |
(7) | Fair valued security deemed as Level 3 security. |
The accompanying notes are an integral part of these financial statements
Page 108 | 2020 Annual Report | December 31, 2020 |
Schedule of Investments
December 31, 2020
Total Return Bond Fund |
Security Description | | Shares or
Principal
Amount ($) | | | Fair
Value ($) | |
Registered Investment Companies — 86.5% |
Baird Core Plus Bond Fund - Class I | | | 400,394 | | | | 4,860,780 | |
Dodge & Cox Income Fund | | | 279,182 | | | | 4,090,021 | |
DoubleLine Total Return Bond Fund - Class I | | | 243,190 | | | | 2,602,130 | |
Guggenheim Total Return Bond Fund - Class I | | | 68,843 | | | | 2,044,649 | |
iShares Core U.S. Aggregate Bond ETF (3) | | | 56,600 | | | | 6,689,555 | |
iShares JP Morgan USD Emerging Markets Bond ETF (3) | | | 61,904 | | | | 7,175,293 | |
Lord Abbett High Yield Fund - Class I | | | 275,763 | | | | 2,054,432 | |
Payden Emerging Markets Bond Fund - Class I | | | 48,791 | | | | 677,713 | |
PGIM Total Return Bond Fund - Class R6 | | | 270,587 | | | | 4,088,564 | |
Pioneer Bond Fund - Class Y | | | 303,055 | | | | 3,069,949 | |
Segall Bryant & Hamill Plus Bond Fund - Class I | | | 317,231 | | | | 3,533,957 | |
SPDR Bloomberg Barclays High Yield Bond ETF (3) | | | 31,541 | | | | 3,436,077 | |
TCW Emerging Markets Income Fund - Class I | | | 164,517 | | | | 1,400,040 | |
Vanguard Intermediate-Term Corporate Bond ETF (3) | | | 28,025 | | | | 2,722,349 | |
Vanguard Total Bond Market ETF (3) | | | 64,937 | | | | 5,726,794 | |
Xtrackers USD High Yield Corporate Bond ETF (3) | | | 95,480 | | | | 4,782,593 | |
Total Registered Investment Companies (Cost $54,649,913) | | | | | | | 58,954,896 | |
| | | | | | | | | |
Money Market Registered Investment Companies — 3.7% |
Meeder Institutional Prime Money Market Fund, 0.08% (1) | | | 2,538,890 | | | | 2,539,651 | |
Total Money Market Registered Investment Companies (Cost $2,537,503) | | | | | | | 2,539,651 | |
| | | | | | | | | |
Total Return Bond Fund |
Security Description | | Shares or
Principal
Amount ($) | | | Fair
Value ($) | |
U.S. Government Obligations — 9.9% |
Government National Mortgage Association, 6.50%, due 7/20/2038 | | | 54,214 | | | | 71,889 | |
U.S. Treasury Note, 2.25%, due 1/31/2024 | | | 2,224,600 | | | | 2,366,766 | |
U.S. Treasury Note, 2.625%, due 2/15/2029 | | | 1,138,100 | | | | 1,306,503 | |
U.S. Treasury Note, 1.50%, due 8/15/2026 | | | 624,500 | | | | 661,263 | |
U.S. Treasury Note, 2.25%, due 11/15/2025 | | | 1,524,600 | | | | 1,664,911 | |
U.S. Treasury Note, 2.125%, due 12/31/2022 | | | 615,000 | | | | 639,479 | |
Total U.S. Government Obligations (Cost $6,188,342) | | | | | | | 6,710,811 | |
Total Investments — 100.1% (Cost $63,375,758) | | | | | | | 68,205,358 | |
Liabilities less Other Assets — (0.1%) | | | | | | | (101,139 | ) |
Total Net Assets — 100.0% | | | | | | | 68,104,219 | |
| | | | | | | | | |
Trustee Deferred Compensation (2) |
Meeder Balanced Fund - Retail Class | | | 1,160 | | | | 14,871 | |
Meeder Dynamic Allocation Fund - Retail Class | | | 2,884 | | | | 38,617 | |
Meeder Muirfield Fund - Retail Class | | | 1,611 | | | | 13,210 | |
Meeder Conservative Allocation Fund - Retail Class | | | 347 | | | | 8,297 | |
Total Trustee Deferred Compensation (Cost $64,166) | | | | | | | 74,995 | |
| | | | | | | | | |
(1) | Investment in affiliate. The yield shown represents the 7-day yield in effect at December 31, 2020. |
(2) | Assets of affiliates to the Total Return Bond Fund held for the benefit of the Fund’s Trustees in connection with the Trustee Deferred Compensation Plan. |
The accompanying notes are an integral part of these financial statements
2020 Annual Report | December 31, 2020 | Page 109 |
Schedule of Investments
December 31, 2020
Prime Money Market Fund |
Security Description | | Coupon/
Yield | | | Maturity/
Demand
Date | | | Principal
Amount ($)
or Shares | | | Fair
Value ($) | |
Bank Obligations — 4.3% |
Bank Midwest Deposit Account | | | 0.55 | %(1) | | | 01/04/21 | | | | 246,174 | | | | 246,174 | |
CIBC Bank Deposit Account | | | 0.20 | %(1) | | | 01/04/21 | | | | 245,338 | | | | 245,338 | |
First Merchants Bank Deposit Account | | | 0.75 | %(1) | | | 01/04/21 | | | | 248,088 | | | | 248,088 | |
Metro City Bank Deposit Account | | | 0.10 | %(1) | | | 01/04/21 | | | | 246,234 | | | | 246,234 | |
State Bank of India Deposit Account | | | 0.50 | %(1) | | | 01/04/21 | | | | 246,184 | | | | 246,184 | |
TIAA Bank Deposit Account | | | 0.05 | %(1) | | | 01/04/21 | | | | 245,611 | | | | 245,611 | |
Total Bank Obligations (Cost $1,477,629) | | | 1,477,629 | |
| | | | | |
Certificates of Deposit — 10.7% |
American Express National Bank | | | 0.95 | % | | | 03/24/21 | | | | 245,000 | | | | 244,986 | |
Bank Hapoalim BM NY | | | 0.90 | % | | | 02/22/21 | | | | 245,000 | | | | 245,000 | |
BMW Bank North America | | | 0.90 | % | | | 03/25/21 | | | | 245,000 | | | | 244,986 | |
Capital One N.A. | | | 0.90 | % | | | 03/25/21 | | | | 245,000 | | | | 244,986 | |
Capital One Bank USA N.A. | | | 0.90 | % | | | 03/25/21 | | | | 245,000 | | | | 244,986 | |
Discover Bank | | | 0.85 | % | | | 03/25/21 | | | | 245,000 | | | | 244,986 | |
Fifth Third Bank N.A. | | | 0.95 | % | | | 03/25/21 | | | | 245,000 | | | | 244,986 | |
Goldman Sachs Bank USA/New York | | | 0.90 | % | | | 03/25/21 | | | | 245,000 | | | | 244,986 | |
Lakeland Bank | | | 0.90 | % | | | 03/26/21 | | | | 245,000 | | | | 245,000 | |
Sumitomo Mitsui Trust Bank LTD/New York, NY | | | 0.23 | % | | | 03/25/21 | | | | 500,000 | | | | 500,000 | |
Toronto Dominion Bank/New York, NY | | | 0.40 | % | | | 07/19/21 | | | | 250,000 | | | | 250,000 | |
Toronto Dominion Bank/New York, NY | | | 0.35 | % | | | 08/31/21 | | | | 500,000 | | | | 500,000 | |
Townebank/Portsmouth, VA | | | 0.85 | % | | | 03/26/21 | | | | 245,000 | | | | 244,986 | |
Total Certificates of Deposit (Cost $3,699,888) | | | 3,699,888 | |
| | | | | |
Commercial Paper — 28.6% |
Anglesea Funding | | | 0.22 | % | | | 01/19/21 | | | | 1,000,000 | | | | 999,888 | |
Anglesea Funding | | | 0.21 | % | | | 02/01/21 | | | | 500,000 | | | | 499,910 | |
Banco Estado Chile | | | 0.30 | % | | | 01/08/21 | | | | 200,000 | | | | 199,988 | |
Banco Santander | | | 0.26 | % | | | 03/02/21 | | | | 250,000 | | | | 249,892 | |
Banco Santander | | | 0.25 | % | | | 04/01/21 | | | | 200,000 | | | | 199,885 | |
Bank of Montreal | | | 0.23 | % | | | 06/04/21 | | | | 500,000 | | | | 499,508 | |
Prime Money Market Fund |
Security Description | | Coupon/
Yield | | | Maturity/
Demand
Date | | | Principal
Amount ($)
or Shares | | | Fair
Value ($) | |
Commercial Paper — continued |
Bank of Nova Scotia | | | 0.22 | % | | | 06/01/21 | | | | 250,000 | | | | 249,769 | |
Banque et Caisse d’Epargne de l’Etat | | | 0.23 | % | | | 03/04/21 | | | | 525,000 | | | | 524,792 | |
BNP Paribas | | | 0.22 | % | | | 02/08/21 | | | | 250,000 | | | | 249,942 | |
BNP Paribas | | | 0.22 | % | | | 05/06/21 | | | | 500,000 | | | | 499,618 | |
Chesham Finance, LLC | | | 0.17 | % | | | 01/19/21 | | | | 250,000 | | | | 249,979 | |
Credit Suisse AG/New York, NY | | | 0.24 | % | | | 05/21/21 | | | | 250,000 | | | | 249,767 | |
Halkin Finance, LLC | | | 0.19 | % | | | 01/08/21 | | | | 250,000 | | | | 249,991 | |
JP Morgan Securities, LLC | | | 0.17 | % | | | 01/08/21 | | | | 250,000 | | | | 249,992 | |
JP Morgan Securities, LLC | | | 0.20 | % | | | 02/01/21 | | | | 200,000 | | | | 199,966 | |
JP Morgan Securities, LLC | | | 0.41 | % | | | 02/05/21 | | | | 250,000 | | | | 249,900 | |
Macquarie Bank LTD/Australia | | | 0.19 | % | | | 02/01/21 | | | | 250,000 | | | | 249,959 | |
Macquarie Bank LTD/Australia | | | 0.21 | % | | | 02/08/21 | | | | 250,000 | | | | 249,946 | |
Macquarie Bank LTD/Australia | | | 0.23 | % | | | 03/15/21 | | | | 250,000 | | | | 249,883 | |
Mitsubishi International Corp. | | | 0.21 | % | | | 01/27/21 | | | | 500,000 | | | | 499,924 | |
Mizuho Bank LTD/NY | | | 0.30 | % | | | 02/18/21 | | | | 250,000 | | | | 249,900 | |
MUFG Bank LTD/New York, NY | | | 0.28 | % | | | 01/05/21 | | | | 250,000 | | | | 249,992 | |
MUFG Bank LTD/New York, NY | | | 0.27 | % | | | 01/22/21 | | | | 250,000 | | | | 249,961 | |
MUFG Bank LTD/New York, NY | | | 0.32 | % | | | 04/12/21 | | | | 250,000 | | | | 249,776 | |
Royal Bank of Canada (Quarterly U.S. LIBOR + 0.03%) | | | 0.31 | %(2) | | | 01/08/21 | | | | 250,000 | | | | 249,993 | |
Royal Bank of Canada | | | 0.25 | % | | | 07/16/21 | | | | 250,000 | | | | 249,660 | |
Sumitomo Mitsui Trust Bank LTD/New York, NY | | | 0.21 | % | | | 01/20/21 | | | | 500,000 | | | | 499,947 | |
Toyota Motor Puerto Rico | | | 0.27 | % | | | 07/19/21 | | | | 250,000 | | | | 249,627 | |
Toyota Motor Puerto Rico | | | 0.26 | % | | | 08/27/21 | | | | 250,000 | | | | 249,570 | |
Westpac Banking Corp. | | | 0.15 | % | | | 01/11/21 | | | | 250,000 | | | | 249,990 | |
Westpac Banking Corp. | | | 0.20 | % | | | 03/31/21 | | | | 250,000 | | | | 249,875 | |
Total Commercial Paper (Cost $9,870,790) | | | 9,870,790 | |
| | | | | |
The accompanying notes are an integral part of these financial statements
Page 110 | 2020 Annual Report | December 31, 2020 |
Schedule of Investments
December 31, 2020
Prime Money Market Fund |
Security Description | | Coupon/
Yield | | | Maturity/
Demand
Date | | | Principal
Amount ($)
or Shares | | | Fair
Value ($) | |
Corporate Obligations — 6.4% |
Bank of Montreal | | | 3.10 | % | | | 04/13/21 | | | | 241,000 | | | | 242,853 | |
Mizuho Securities, LLC (Monthly U.S. LIBOR + 0.28%) | | | 0.43 | %(2) | | | 01/14/21 | | | | 500,000 | | | | 500,000 | |
Mizuho Securities, LLC | | | 0.26 | % | | | 03/17/21 | | | | 250,000 | | | | 250,000 | |
Toronto Dominion Bank/New York, NY | | | 2.13 | % | | | 04/07/21 | | | | 230,000 | | | | 230,575 | |
Toronto Dominion Bank/New York, NY (Quarterly U.S. LIBOR + 0.09%) | | | 0.32 | %(2) | | | 03/03/21 | | | | 250,000 | | | | 250,000 | |
Toyota Motor Credit Corp. (Quarterly U.S. LIBOR + 0.125%) | | | 0.38 | %(2) | | | 02/15/21 | | | | 250,000 | | | | 250,116 | |
Westpac Banking Corp. | | | 2.10 | % | | | 05/13/21 | | | | 250,000 | | | | 251,605 | |
Westpac Securities NZ LTD/London (Quarterly U.S. LIBOR + 0.01%) | | | 0.24 | %(2) | | | 01/05/21 | | | | 250,000 | | | | 250,001 | |
Total Corporate Obligations (Cost $2,225,150) | | | 2,225,150 | |
| | | | | |
Repurchase Agreements — 20.2% |
INTL FCStone (Collateralized by $1,897,770 Various FMACs, FNMAs, GNMAs, 2.50% - 3.00%, due 8/16/32 - 11/1/49, fair value $2,040,001) (proceeds $2,000,051), purchase date 12/31/20 | | | 0.23 | % | | | 01/04/21 | | | | 2,000,000 | | | | 2,000,000 | |
South Street (Collateralized by $4,916,218 various FMACs, FNMAs, and SBAs, 1.25% - 6.50%, due 3/1/24 - 3/1/48, fair value $5,126,578)(proceeds $5,000,056), purchase date 12/31/20 | | | 0.10 | % | | | 01/04/21 | | | | 5,000,000 | | | | 5,000,000 | |
Total Repurchase Agreements (Cost $7,000,000) | | | 7,000,000 | |
| | | | | |
Prime Money Market Fund |
Security Description | | Coupon/
Yield | | | Maturity/
Demand
Date | | | Principal
Amount ($)
or Shares | | | Fair
Value ($) | |
U.S. Government and Agency Obligations — 5.8% |
Federal Agricultural Mortgage Corp. (Secured Overnight Financing Rate + 0.09%) | | | 0.18 | %(2) | | | 02/10/21 | | | | 500,000 | | | | 500,000 | |
Federal Home Loan Bank (Secured Overnight Financing Rate + 0.05%) | | | 0.14 | %(2) | | | 01/22/21 | | | | 500,000 | | | | 499,997 | |
Federal Home Loan Bank (Secured Overnight Financing Rate + 0.23%) | | | 0.32 | %(2) | | | 01/13/21 | | | | 500,000 | | | | 500,000 | |
Federal Home Loan Mortgage Corp. (Secured Overnight Financing Rate + 0.03%) | | | 0.12 | %(2) | | | 02/05/21 | | | | 500,000 | | | | 499,986 | |
Total U.S. Government and Agency Obligations (Cost $1,999,983) | | | 1,999,983 | |
| | | | | |
Variable Rate Demand Notes — 14.2% |
Caterpillar Financial Power Investment Floating Rate Demand Note | | | 0.30 | %(1) | | | 01/04/21 | | | | 1,752,392 | | | | 1,752,392 | |
Cleveland Clinic Health System | | | 0.07 | %(1) | | | 01/06/21 | | | | 250,000 | | | | 250,000 | |
Metropolitan Transportation Authority of New York | | | 0.04 | %(1) | | | 01/07/21 | | | | 500,000 | | | | 500,000 | |
Michigan State Finance Authority Revenue | | | 0.14 | %(1) | | | 01/07/21 | | | | 500,000 | | | | 500,000 | |
Ohio State Parks & Recreation Capital | | | 0.07 | %(1) | | | 01/06/21 | | | | 250,000 | | | | 250,000 | |
Ohio State Department of Rehabilitation & Correction | | | 0.09 | %(1) | | | 01/06/21 | | | | 500,000 | | | | 500,000 | |
Sports & Exhibition Authority of Pittsburgh and Allegheny County | | | 0.18 | %(1) | | | 01/07/21 | | | | 155,000 | | | | 155,000 | |
State of California | | | 0.07 | %(1) | | | 01/07/21 | | | | 500,000 | | | | 500,000 | |
State of Wisconsin | | | 0.09 | %(1) | | | 01/07/21 | | | | 500,000 | | | | 500,000 | |
Total Variable Rate Demand Notes (Cost $4,907,392) | | | 4,907,392 | |
The accompanying notes are an integral part of these financial statements
2020 Annual Report | December 31, 2020 | Page 111 |
Schedule of Investments
December 31, 2020
Prime Money Market Fund |
Security Description | | Shares or
Principal
Amount ($) | | | Fair
Value ($) | |
Money Market Registered Investment Companies — 9.8% |
Federated Hermes Government Obligations Fund, 0.01% (3) | | | 3,381,806 | | | | 3,381,806 | |
Total Money Market Registered Investment Companies (Cost $3,381,806) | | | 3,381,806 | |
Total Investments — 100.0% (Cost $34,562,638) | | | 34,562,638 | |
Other Assets less Liabilities — 0.0% | | | 15,661 | |
Total Net Assets — 100.0% | | | 34,578,299 | |
| | | | | | | | | |
Trustee Deferred Compensation (4) |
Meeder Balanced Fund - Retail Class | | | 685 | | | | 8,782 | |
Meeder Dynamic Allocation Fund - Retail Class | | | 1,788 | | | | 23,941 | |
Meeder Muirfield Fund - Retail Class | | | 786 | | | | 6,445 | |
Meeder Conservative Allocation Fund - Retail Class | | | 199 | | | | 4,758 | |
Total Trustee Deferred Compensation (Cost $34,581) | | | 43,926 | |
(1) | Variable rate security. Securities payable at par including accrued interest (usually within seven days notice) and unconditionally secured as to principal and interest by letters of credit or other credit support agreements from major banks. The interest rates are adjustable and are not based on a published reference rate and spread but are determined by the issuer or agent and are based on current market conditions. These securities do not indicate a reference rate and spread in their description above. The rate shown represents the rate in effect at December 31, 2020. The maturity date shown, if applicable, reflects the earlier of the next demand date or stated maturity date. |
(2) | Floating rate security. Interest rates reset periodically. The reference rate and spread are indicated in the description above. The rate shown represents the rate in effect at December 31, 2020. The maturity date shown reflects the earlier of the next demand date or stated maturity date. |
(3) | 7-day yield as of December 31, 2020. The Fund may invest a significant portion of its assets in shares of one or more investment companies, including money market mutual funds. The Fund will incur additional indirect expenses (acquired fund fees and expenses) to the extent it invests in shares of other investment companies. |
(4) | Assets of affiliates to the Prime Money Market Fund held for the benefit of the Fund’s Trustees in connection with the Trustee Deferred Compensation Plan. |
The accompanying notes are an integral part of these financial statements
Page 112 | 2020 Annual Report | December 31, 2020 |
Schedule of Investments
December 31, 2020
Institutional Prime Money Market Fund |
Security Description | | Coupon/
Yield | | | Maturity/
Demand
Date | | | Principal
Amount ($)
or Shares | | | Fair
Value ($) | |
Bank Obligations — 0.4% |
Bank Midwest Deposit Account | | | 0.55 | %(1) | | | 01/04/21 | | | | 246,174 | | | | 246,174 | |
CIBC Bank Deposit Account | | | 0.20 | %(1) | | | 01/04/21 | | | | 245,338 | | | | 245,338 | |
First Merchants Bank Deposit Account | | | 0.75 | %(1) | | | 01/04/21 | | | | 248,088 | | | | 248,088 | |
Metro City Bank Deposit Account | | | 0.10 | %(1) | | | 01/04/21 | | | | 246,234 | | | | 246,234 | |
State Bank of India Deposit Account | | | 0.50 | %(1) | | | 01/04/21 | | | | 246,184 | | | | 246,184 | |
TIAA Bank Deposit Account | | | 0.05 | %(1) | | | 01/04/21 | | | | 245,611 | | | | 245,611 | |
Total Bank Obligations (Cost $1,477,629) | | | 1,477,629 | |
| | | | | |
Certificates of Deposit — 4.7% |
American Express National Bank | | | 0.95 | % | | | 03/24/21 | | | | 245,000 | | | | 245,509 | |
Anderson Brothers Bank | | | 0.95 | % | | | 01/22/21 | | | | 245,000 | | | | 245,134 | |
Bank Hapoalim BM NY | | | 0.90 | % | | | 02/22/21 | | | | 245,000 | | | | 245,306 | |
BMW Bank North America | | | 0.90 | % | | | 03/25/21 | | | | 245,000 | | | | 245,487 | |
Capital One N.A. | | | 0.90 | % | | | 03/25/21 | | | | 245,000 | | | | 245,487 | |
Capital One Bank USA N.A. | | | 0.90 | % | | | 03/25/21 | | | | 245,000 | | | | 245,487 | |
Cathay Bank/Los Angeles, CA | | | 1.10 | % | | | 04/16/21 | | | | 245,000 | | | | 245,760 | |
CresCom Bank | | | 1.10 | % | | | 04/15/21 | | | | 245,000 | | | | 245,753 | |
Discover Bank | | | 0.85 | % | | | 03/25/21 | | | | 245,000 | | | | 245,458 | |
Fifth Third Bank N.A. | | | 0.95 | % | | | 03/25/21 | | | | 245,000 | | | | 245,516 | |
Goldman Sachs Bank USA/New York | | | 0.90 | % | | | 03/25/21 | | | | 245,000 | | | | 245,487 | |
Lakeland Bank | | | 0.90 | % | | | 03/26/21 | | | | 245,000 | | | | 245,493 | |
MetaBank | | | 0.95 | % | | | 02/24/21 | | | | 245,000 | | | | 245,337 | |
Peoples Security Bank and Trust Company | | | 0.90 | % | | | 04/30/21 | | | | 245,000 | | | | 245,699 | |
Pinnacle Bank/Nashville, TN | | | 1.15 | % | | | 04/21/21 | | | | 245,000 | | | | 245,835 | |
PlainsCapital Bank | | | 0.95 | % | | | 01/15/21 | | | | 245,000 | | | | 245,092 | |
Sumitomo Mitsui Trust Bank LTD/New York, NY | | | 0.23 | % | | | 03/25/21 | | | | 1,500,000 | | | | 1,500,092 | |
TCF National Bank | | | 1.10 | % | | | 04/15/21 | | | | 245,000 | | | | 245,753 | |
Toronto Dominion Bank/New York, NY | | | 0.40 | % | | | 07/19/21 | | | | 3,000,000 | | | | 3,002,238 | |
Toronto Dominion Bank/New York, NY | | | 0.35 | % | | | 08/31/21 | | | | 5,000,000 | | | | 5,003,190 | |
Toronto Dominion Bank/New York, NY | | | 0.27 | % | | | 10/08/21 | | | | 2,000,000 | | | | 2,000,294 | |
Institutional Prime Money Market Fund |
Security Description | | Coupon/
Yield | | | Maturity/
Demand
Date | | | Principal
Amount ($)
or Shares | | | Fair
Value ($) | |
Certificates of Deposit — continued |
Townebank/Portsmouth, VA | | | 0.85 | % | | | 03/26/21 | | | | 245,000 | | | | 245,464 | |
Total Certificates of Deposit (Cost $15,909,889) | | | 15,924,871 | |
| | | | | |
Commercial Paper — 38.6% |
Anglesea Funding | | | 0.20 | % | | | 01/05/21 | | | | 2,000,000 | | | | 1,999,964 | |
Anglesea Funding | | | 0.22 | % | | | 01/19/21 | | | | 4,500,000 | | | | 4,499,613 | |
Anglesea Funding | | | 0.20 | % | | | 01/29/21 | | | | 2,000,000 | | | | 1,999,682 | |
Anglesea Funding | | | 0.21 | % | | | 02/01/21 | | | | 7,500,000 | | | | 7,498,650 | |
ANZ New Zealand Int’l LTD | | | 0.19 | % | | | 04/01/21 | | | | 2,000,000 | | | | 1,999,288 | |
Australia and New Zealand Banking Group | | | 0.21 | % | | | 05/24/21 | | | | 1,500,000 | | | | 1,498,944 | |
Australia and New Zealand Banking Group | | | 0.21 | % | | | 06/09/21 | | | | 3,000,000 | | | | 2,997,561 | |
Banco Estado Chile | | | 0.30 | % | | | 01/08/21 | | | | 1,400,000 | | | | 1,399,962 | |
Banco Santander | | | 0.26 | % | | | 03/02/21 | | | | 2,250,000 | | | | 2,249,384 | |
Banco Santander | | | 0.25 | % | | | 04/01/21 | | | | 3,000,000 | | | | 2,998,257 | |
Banco Santander | | | 0.26 | % | | | 04/27/21 | | | | 2,000,000 | | | | 1,998,446 | |
Banco Santander | | | 0.27 | % | | | 05/05/21 | | | | 2,000,000 | | | | 1,998,320 | |
Bank of Montreal | | | 0.23 | % | | | 06/04/21 | | | | 5,000,000 | | | | 4,994,575 | |
Bank of Nova Scotia | | | 0.22 | % | | | 06/01/21 | | | | 2,750,000 | | | | 2,747,528 | |
Bank of Nova Scotia | | | 0.22 | % | | | 06/23/21 | | | | 2,500,000 | | | | 2,497,075 | |
BNP Paribas | | | 0.22 | % | | | 02/08/21 | | | | 2,750,000 | | | | 2,749,667 | |
BNP Paribas | | | 0.20 | % | | | 03/08/21 | | | | 3,000,000 | | | | 2,999,169 | |
BNP Paribas | | | 0.22 | % | | | 05/06/21 | | | | 2,500,000 | | | | 2,498,478 | |
Chesham Finance, LLC | | | 0.17 | % | | | 01/19/21 | | | | 5,000,000 | | | | 4,999,570 | |
Credit Suisse AG/New York, NY | | | 0.24 | % | | | 05/21/21 | | | | 2,750,000 | | | | 2,747,663 | |
Ebury Finance, LLC | | | 0.10 | % | | | 01/04/21 | | | | 5,000,000 | | | | 4,999,930 | |
Exxon Mobil Corp. | | | 0.20 | % | | | 04/21/21 | | | | 2,000,000 | | | | 1,999,050 | |
Exxon Mobil Corp. | | | 0.20 | % | | | 05/28/21 | | | | 2,000,000 | | | | 1,998,528 | |
Exxon Mobil Corp. | | | 0.20 | % | | | 06/22/21 | | | | 2,000,000 | | | | 1,998,126 | |
Halkin Finance, LLC | | | 0.12 | % | | | 01/06/21 | | | | 2,000,000 | | | | 1,999,956 | |
Halkin Finance, LLC | | | 0.19 | % | | | 01/08/21 | | | | 1,000,000 | | | | 999,971 | |
JP Morgan Securities, LLC | | | 0.17 | % | | | 01/08/21 | | | | 3,000,000 | | | | 2,999,934 | |
JP Morgan Securities, LLC | | | 0.41 | % | | | 02/05/21 | | | | 1,000,000 | | | | 999,856 | |
JP Morgan Securities, LLC | | | 0.35 | % | | | 02/19/21 | | | | 2,000,000 | | | | 1,999,576 | |
Macquarie Bank LTD/Australia | | | 0.19 | % | | | 01/15/21 | | | | 3,000,000 | | | | 2,999,814 | |
Macquarie Bank LTD/Australia | | | 0.19 | % | | | 02/01/21 | | | | 2,000,000 | | | | 1,999,624 | |
The accompanying notes are an integral part of these financial statements
2020 Annual Report | December 31, 2020 | Page 113 |
Schedule of Investments
December 31, 2020
Institutional Prime Money Market Fund |
Security Description | | Coupon/
Yield | | | Maturity/
Demand
Date | | | Principal
Amount ($)
or Shares | | | Fair
Value ($) | |
Commercial Paper — continued |
Macquarie Bank LTD/Australia | | | 0.21 | % | | | 02/08/21 | | | | 2,000,000 | | | | 1,999,532 | |
Macquarie Bank LTD/Australia | | | 0.22 | % | | | 02/23/21 | | | | 2,000,000 | | | | 1,999,358 | |
Macquarie Bank LTD/Australia | | | 0.20 | % | | | 03/03/21 | | | | 2,000,000 | | | | 1,999,270 | |
Mitsubishi International Corp | | | 0.21 | % | | | 01/27/21 | | | | 1,000,000 | | | | 999,906 | |
Mizuho Bank LTD/NY | | | 0.17 | % | | | 01/05/21 | | | | 680,000 | | | | 679,990 | |
Mizuho Bank LTD/NY | | | 0.36 | % | | | 01/15/21 | | | | 1,000,000 | | | | 999,950 | |
Mizuho Bank LTD/NY | | | 0.30 | % | | | 02/18/21 | | | | 3,000,000 | | | | 2,999,352 | |
MUFG Bank LTD/New York, NY | | | 0.28 | % | | | 01/05/21 | | | | 3,000,000 | | | | 2,999,958 | |
MUFG Bank LTD/New York, NY | | | 0.27 | % | | | 01/22/21 | | | | 2,000,000 | | | | 1,999,886 | |
MUFG Bank LTD/New York, NY | | | 0.32 | % | | | 04/12/21 | | | | 3,000,000 | | | | 2,998,062 | |
National Rural Utilities | | | 0.14 | % | | | 02/03/21 | | | | 1,000,000 | | | | 999,865 | |
Royal Bank of Canada (Quarterly U.S. LIBOR + 0.03%) | | | 0.31 | %(2) | | | 01/08/21 | | | | 4,750,000 | | | | 4,750,038 | |
Royal Bank of Canada | | | 0.22 | % | | | 04/12/21 | | | | 100,000 | | | | 99,954 | |
Royal Bank of Canada | | | 0.25 | % | | | 07/16/21 | | | | 750,000 | | | | 749,258 | |
Sumitomo Mitsui Trust Bank LTD/New York, NY | | | 0.19 | % | | | 01/15/21 | | | | 2,000,000 | | | | 1,999,908 | |
Sumitomo Mitsui Trust Bank LTD/New York, NY | | | 0.21 | % | | | 01/20/21 | | | | 5,000,000 | | | | 4,999,675 | |
Sumitomo Mitsui Trust Bank LTD/New York, NY | | | 0.21 | % | | | 02/16/21 | | | | 250,000 | | | | 249,949 | |
Toronto Dominion Bank/New York, NY | | | 0.24 | % | | | 07/28/21 | | | | 2,000,000 | | | | 1,997,062 | |
Toyota Motor Puerto Rico | | | 0.27 | % | | | 07/19/21 | | | | 2,000,000 | | | | 1,997,812 | |
Toyota Motor Puerto Rico | | | 0.26 | % | | | 08/27/21 | | | | 3,000,000 | | | | 2,995,818 | |
Westpac Banking Corp. | | | 0.15 | % | | | 01/11/21 | | | | 2,000,000 | | | | 1,999,934 | |
Westpac Banking Corp. | | | 0.20 | % | | | 03/31/21 | | | | 2,750,000 | | | | 2,748,623 | |
Total Commercial Paper (Cost $129,621,831) | | | 129,629,321 | |
| | | | | |
Corporate Obligations — 8.1% |
Bank of Montreal | | | 3.10 | % | | | 04/13/21 | | | | 3,500,000 | | | | 3,528,203 | |
Mizuho Securities, LLC (Monthly U.S. LIBOR + 0.28%) | | | 0.43 | %(2) | | | 01/14/21 | | | | 5,000,000 | | | | 5,001,775 | |
Mizuho Securities, LLC | | | 0.26 | % | | | 03/17/21 | | | | 4,750,000 | | | | 4,750,166 | |
Institutional Prime Money Market Fund |
Security Description | | Coupon/
Yield | | | Maturity/
Demand
Date | | | Principal
Amount ($)
or Shares | | | Fair
Value ($) | |
Corporate Obligations — continued |
Toronto Dominion Bank/New York, NY | | | 2.13 | % | | | 04/07/21 | | | | 1,000,000 | | | | 1,004,930 | |
Toronto Dominion Bank/New York, NY (Quarterly U.S. LIBOR + 0.09%) | | | 0.32 | %(2) | | | 03/03/21 | | | | 2,250,000 | | | | 2,250,000 | |
Toyota Motor Credit Corp. (Quarterly U.S. LIBOR + 0.125%) | | | 0.38 | %(2) | | | 02/15/21 | | | | 4,750,000 | | | | 4,752,157 | |
Westpac Banking Corp. | | | 2.10 | % | | | 05/13/21 | | | | 3,000,000 | | | | 3,020,760 | |
Westpac Securities NZ LTD/London (Quarterly U.S. LIBOR + 0.01%) | | | 0.24 | %(2) | | | 01/05/21 | | | | 3,000,000 | | | | 3,000,939 | |
Total Corporate Obligations (Cost $27,300,886) | | | 27,308,930 | |
| | | | | |
Repurchase Agreements — 23.8% |
INTL FCStone (Collateralized by $60,945,293 various Corporate Bonds, FHLBs, FMACs, FNMAs, and GNMAs, 0.125% - 6.452%, due 8/24/21 - 7/16/62, fair value $30,679,599)(proceeds $30,000,767), purchase date 12/31/20 | | | 0.23 | % | | | 01/04/21 | | | | 30,000,000 | | | | 30,000,000 | |
South Street (Collateralized by $9,832,436 various FMACs, FNMAs, and SBAs, 1.25% - 6.50%, due 3/1/24 - 3/1/48, fair value $10,253,156)(proceeds $10,000,111), purchase date 12/31/20 | | | 0.10 | % | | | 01/04/21 | | | | 10,000,000 | | | | 10,000,000 | |
The accompanying notes are an integral part of these financial statements
Page 114 | 2020 Annual Report | December 31, 2020 |
Schedule of Investments
December 31, 2020
Institutional Prime Money Market Fund |
Security Description | | Coupon/
Yield | | | Maturity/
Demand
Date | | | Principal
Amount ($)
or Shares | | | Fair
Value ($) | |
Repurchase Agreements — continued |
South Street (Collateralized by $38,536,248 various FHLBs, FMACs, FNMAs, and U.S Treasury Notes, 1.779% - 4.049%, due 12/8/23 - 11/1/50, fair value $40,800,000)(proceeds $40,000,356), purchase date 12/31/20 | | | 0.08 | % | | | 01/04/21 | | | | 40,000,000 | | | | 40,000,000 | |
Total Repurchase Agreements (Cost $80,000,000) | | | 80,000,000 | |
| | | | | |
U.S. Government and Agency Obligations — 5.9% |
Federal Agricultural Mortgage Corp. (Secured Overnight Financing Rate + 0.09%) | | | 0.18 | %(2) | | | 02/10/21 | | | | 5,000,000 | | | | 5,000,370 | |
Federal Home Loan Bank (Secured Overnight Financing Rate + 0.05%) | | | 0.14 | %(2) | | | 01/22/21 | | | | 5,000,000 | | | | 5,000,075 | |
Federal Home Loan Bank (Secured Overnight Financing Rate + 0.23%) | | | 0.32 | %(2) | | | 01/13/21 | | | | 5,000,000 | | | | 5,003,020 | |
Federal Home Loan Mortgage Corp. (Secured Overnight Financing Rate + 0.03%) | | | 0.12 | %(2) | | | 02/05/21 | | | | 5,000,000 | | | | 5,000,055 | |
Total U.S. Government and Agency Obligations (Cost $19,999,825) | | | 20,003,520 | |
| | | | | |
Variable Rate Demand Notes — 14.3% |
Caterpillar Financial Power Investment Floating Rate Demand Note | | | 0.30 | %(1) | | | 01/04/21 | | | | 15,270,842 | | | | 15,270,842 | |
Cleveland Clinic Health System | | | 0.07 | %(1) | | | 01/06/21 | | | | 1,750,000 | | | | 1,750,000 | |
Metropolitan Transportation Authority of New York | | | 0.04 | %(1) | | | 01/07/21 | | | | 5,500,000 | | | | 5,500,000 | |
Michigan State Finance Authority Revenue | | | 0.14 | %(1) | | | 01/07/21 | | | | 4,500,000 | | | | 4,500,000 | |
Institutional Prime Money Market Fund |
Security Description | | Coupon/
Yield | | | Maturity/
Demand
Date | | | Principal
Amount ($)
or Shares | | | Fair
Value ($) | |
Variable Rate Demand Notes — continued |
Ohio State Parks & Recreation Capital | | | 0.07 | %(1) | | | 01/06/21 | | | | 2,750,000 | | | | 2,750,000 | |
Ohio State Department of Rehabilitation & Correction | | | 0.09 | %(1) | | | 01/06/21 | | | | 5,500,000 | | | | 5,500,000 | |
Sports & Exhibition Authority of Pittsburgh and Allegheny County | | | 0.18 | %(1) | | | 01/07/21 | | | | 1,810,000 | | | | 1,810,000 | |
State of California | | | 0.07 | %(1) | | | 01/07/21 | | | | 5,500,000 | | | | 5,500,000 | |
State of Wisconsin | | | 0.09 | %(1) | | | 01/07/21 | | | | 5,500,000 | | | | 5,500,000 | |
Total Variable Rate Demand Notes (Cost $48,080,842) | | | 48,080,842 | |
| | | | | |
Money Market Registered Investment Companies — 4.2% |
Federated Hermes Government Obligations Fund, 0.01% (3) | | | 13,985,963 | | | | 13,985,963 | |
Total Money Market Registered Investment Companies (Cost $13,985,963) | | | 13,985,963 | |
Total Investments — 100.0% (Cost $336,376,865) | | | 336,411,076 | |
Other Assets less Liabilities — 0.0% | | | 33,962 | |
Total Net Assets — 100.0% | | | 336,445,038 | |
| | | | | |
Trustee Deferred Compensation (4) |
Meeder Balanced Fund - Retail Class | | | 57 | | | | 731 | |
Meeder Dynamic Allocation Fund - Retail Class | | | 135 | | | | 1,808 | |
Meeder Muirfield Fund - Retail Class | | | 201 | | | | 1,648 | |
Meeder Conservative Allocation Fund - Retail Class | | | 18 | | | | 430 | |
Total Trustee Deferred Compensation (Cost $4,129) | | | 4,617 | |
| | | | | |
(1) | Variable rate security. Securities payable at par including accrued interest (usually within seven days notice) and unconditionally secured as to principal and interest by letters of credit or other credit support agreements from major banks. The interest rates are adjustable and are not based on a published reference rate and spread but are determined by the issuer or agent and are based on current market conditions. These securities do not indicate a reference rate and spread in their description above. The rate shown represents the rate in effect at December 31, 2020. The maturity date shown, if applicable, reflects the earlier of the next demand date or stated maturity date. |
(2) | Floating rate security. Interest rates reset periodically. The reference rate and spread are indicated in the description above. The rate shown represents the rate in effect at December 31, 2020. The maturity date shown reflects the earlier of the next demand date or stated maturity date. |
The accompanying notes are an integral part of these financial statements
2020 Annual Report | December 31, 2020 | Page 115 |
Schedule of Investments
December 31, 2020
(3) | 7-day yield as of December 31, 2020. The Fund may invest a significant portion of its assets in shares of one or more investment companies, including money market mutual funds. The Fund will incur additional indirect expenses (acquired fund fees and expenses) to the extent it invests in shares of other investment companies. |
(4) | Assets of affiliates to the Institutional Prime Money Market Fund held for the benefit of the Fund’s Trustees in connection with the Trustee Deferred Compensation Plan. |
The accompanying notes are an integral part of these financial statements
Page 116 | 2020 Annual Report | December 31, 2020 |
[This page intentionally left blank]
Statements of Assets & Liabilities
December 31, 2020 |
| | | Muirfield
Fund | | | Spectrum
Fund | | | Global
Allocation
Fund | |
Assets | | | | | | | | | | | | |
Investments, at fair value (1)(2) | | $ | 458,978,683 | | | $ | 151,197,250 | | | $ | 26,942,813 | |
Repurchase agreements, at fair value (1) | | | — | | | | — | | | | — | |
Investments in affiliates, at fair value (1) | | | 103,888,380 | | | | 29,284,214 | | | | 15,663,819 | |
Trustee deferred compensation investments, at fair value | | | 285,523 | | | | 40,785 | | | | 112,298 | |
Deposits at broker for futures contracts (3) | | | 13,355,386 | | | | 5,180,922 | | | | 3,176,695 | |
Cash held at broker for collateral on securities sold short | | | — | | | | 999 | | | | — | |
Receivable for securities sold | | | 4,563,727 | | | | 1,506,835 | | | | 181,266 | |
Receivable for capital stock issued | | | 112,420 | | | | 86,392 | | | | 33,969 | |
Receivable from investment adviser | | | — | | | | — | | | | — | |
Interest and dividend receivable | | | 383,009 | | | | 121,729 | | | | 16,128 | |
Prepaid expenses/other assets | | | 351,092 | | | | 30,197 | | | | 15,955 | |
Total Assets | | | 581,918,220 | | | | 187,449,323 | | | | 46,142,943 | |
| | | | | | | | | | | | | |
Liabilities | | | | | | | | | | | | |
Payable for securities purchased | | | 4,573,991 | | | | 1,508,659 | | | | 180,667 | |
Payable for collateral on securities loaned | | | 94,106 | | | | 22,605 | | | | 1,024 | |
Payable for Trustee Deferred Compensation Plan | | | 285,523 | | | | 40,785 | | | | 112,298 | |
Payable for capital stock redeemed | | | 2,481,230 | | | | 342,365 | | | | 187,262 | |
Dividends payable | | | — | | | | — | | | | — | |
Payable to investment adviser | | | 307,655 | | | | 115,548 | | | | 28,314 | |
Accrued distribution plan (12b-1) and shareholder service plan fees | | | 186,283 | | | | 61,581 | | | | 10,381 | |
Accrued transfer agent, fund accounting, CCO, and administrative fees | | | 96,602 | | | | 37,437 | | | | 12,615 | |
Accrued trustee fees | | | 1,256 | | | | 456 | | | | 91 | |
Other accrued liabilities | | | 66,560 | | | | 41,334 | | | | 28,358 | |
Total Liabilities | | | 8,093,206 | | | | 2,170,770 | | | | 561,010 | |
| | | | | | | | | | | | | |
Net Assets | | $ | 573,825,014 | | | $ | 185,278,553 | | | $ | 45,581,933 | |
| | | | | | | | | | | | | |
Net Assets | | | | | | | | | | | | |
Capital | | $ | 494,231,443 | | | $ | 159,185,895 | | | $ | 40,268,452 | |
Distributable Earnings (Accumulated Deficit) | | | 79,593,571 | | | | 26,092,658 | | | | 5,313,481 | |
Total Net Assets | | $ | 573,825,014 | | | $ | 185,278,553 | | | $ | 45,581,933 | |
| | | | | | | | | | | | | |
Net Asset Value Per Share | | | | | | | | | | | | |
Retail Class | | | | | | | | | | | | |
Net Assets | | $ | 134,240,130 | | | $ | 36,603,535 | | | $ | 9,000,757 | |
Shares Outstanding | | | 16,372,185 | | | | 3,011,689 | | | | 789,274 | |
Net Asset Value, Offering and Redemption Price Per Share | | $ | 8.20 | | | $ | 12.15 | | | $ | 11.40 | |
| | | | | | | | | | | | | |
Adviser Class | | | | | | | | | | | | |
Net Assets | | $ | 48,952,969 | | | $ | 12,475,041 | | | $ | 1,740,283 | |
Shares Outstanding | | | 5,926,811 | | | | 1,024,655 | | | | 152,437 | |
Net Asset Value, Offering and Redemption Price Per Share | | $ | 8.26 | | | $ | 12.17 | | | $ | 11.42 | |
| | | | | | | | | | | | | |
Institutional Class | | | | | | | | | | | | |
Net Assets | | $ | 390,631,915 | | | $ | 136,199,977 | | | $ | 34,840,893 | |
Shares Outstanding | | | 47,172,547 | | | | 11,150,100 | | | | 3,061,098 | |
Net Asset Value, Offering and Redemption Price Per Share | | $ | 8.28 | | | $ | 12.22 | | | $ | 11.38 | |
| | | | | | | | | | | | | |
Net Asset Value Per Share - Money Market Funds | | | | | | | | | | | | |
Net Assets | | | | | | | | | | | | |
Shares Outstanding | | | | | | | | | | | | |
Net Asset Value, Offering and Redemption Price Per Share | | | | | | | | | | | | |
| | | | | | | | | | | | | |
(1) Investments and affiliated investments at cost | | $ | 427,897,757 | | | $ | 137,290,207 | | | $ | 36,248,977 | |
(2) Fair value of securities loaned included in investments at fair value (See Note #2, Note #3, and Note #5) | | $ | 91,619 | | | $ | 22,136 | | | $ | 991 | |
(3) Required margin held as collateral for futures contracts | | $ | 7,902,150 | | | $ | 2,335,540 | | | $ | 1,377,940 | |
The accompanying notes are an integral part of these financial statements
Page 118 | 2020 Annual Report | December 31, 2020 |
| | | |
| | Balanced
Fund | | | Moderate
Allocation
Fund | | | Conservative
Allocation
Fund | | | Dynamic
Allocation
Fund | | | Quantex
Fund | | | Total Return
Bond Fund | | | Prime Money
Market Fund | | | Institutional
Prime Money
Market Fund | |
| | | | | | | | | | | | | | | | | | | | | | | | | | | | | | | | |
| | $ | 337,168,031 | | | $ | 151,178,432 | | | $ | 129,298,946 | | | | 158,924,308 | | | $ | 36,565,550 | | | $ | 65,665,707 | | | $ | 27,562,638 | | | $ | 256,411,076 | |
| | | — | | | | — | | | | — | | | | — | | | | — | | | | — | | | | 7,000,000 | | | | 80,000,000 | |
| | | 51,634,402 | | | | 21,697,124 | | | | 10,428,429 | | | | 36,649,409 | | | | 572,132 | | | | 2,539,651 | | | | — | | | | — | |
| | | 186,008 | | | | 28,573 | | | | 75,656 | | | | 226,204 | | | | 66,934 | | | | 74,995 | | | | 43,926 | | | | 4,617 | |
| | | 7,985,720 | | | | 3,387,359 | | | | 1,682,410 | | | | 6,346,484 | | | | 598,946 | | | | — | | | | — | | | | — | |
| | | — | | | | — | | | | — | | | | — | | | | — | | | | — | | | | — | | | | — | |
| | | 2,181,128 | | | | 862,063 | | | | 836,714 | | | | 1,472,875 | | | | 3,522,163 | | | | — | | | | — | | | | — | |
| | | 220,331 | | | | 105,844 | | | | 60,067 | | | | 107,086 | | | | 26,858 | | | | 216,129 | | | | — | | | | — | |
| | | — | | | | — | | | | — | | | | — | | | | — | | | | — | | | | 8,235 | | | | 20,537 | |
| | | 176,858 | | | | 52,800 | | | | 26,485 | | | | 113,838 | | | | 46,336 | | | | 47,515 | | | | 24,619 | | | | 104,102 | |
| | | 165,792 | | | | 17,796 | | | | 14,462 | | | | 20,725 | | | | 9,732 | | | | 15,029 | | | | 11,218 | | | | 12,065 | |
| | | 399,718,270 | | | | 177,329,991 | | | | 142,423,169 | | | | 203,860,929 | | | | 41,408,651 | | | | 68,559,026 | | | | 34,650,636 | | | | 336,552,397 | |
| | | | | | | | | | | | | | | | | | | | | | | | | | | | | | | | |
| | | | | | | | | | | | | | | | | | | | | | | | | | | | | | | | |
| | | 2,184,780 | | | | 638,401 | | | | 311,721 | | | | 1,475,406 | | | | — | | | | — | | | | — | | | | — | |
| | | 33,506 | | | | 9,746 | | | | 4,870 | | | | 34,657 | | | | 324,516 | | | | — | | | | — | | | | — | |
| | | 186,008 | | | | 28,573 | | | | 75,656 | | | | 226,204 | | | | 66,934 | | | | 74,995 | | | | 43,926 | | | | 4,617 | |
| | | 342,557 | | | | 175,225 | | | | 343,180 | | | | 2,604,826 | | | | 841,100 | | | | 300,806 | | | | — | | | | — | |
| | | — | | | | — | | | | — | | | | — | | | | — | | | | — | | | | 6 | | | | 17,303 | |
| | | 221,555 | | | | 87,257 | | | | 58,592 | | | | 109,258 | | | | 26,222 | | | | 16,294 | | | | — | | | | — | |
| | | 126,299 | | | | 53,585 | | | | 45,766 | | | | 52,736 | | | | 14,555 | | | | 20,583 | | | | 35 | | | | 53 | |
| | | 73,857 | | | | 35,595 | | | | 29,670 | | | | 40,391 | | | | 11,939 | | | | 14,514 | | | | 9,498 | | | | 50,431 | |
| | | 885 | | | | 430 | | | | 357 | | | | 192 | | | | 68 | | | | 221 | | | | 76 | | | | 75 | |
| | | 50,850 | | | | 36,437 | | | | 34,807 | | | | 37,513 | | | | 30,060 | | | | 27,394 | | | | 18,796 | | | | 34,880 | |
| | | 3,220,297 | | | | 1,065,249 | | | | 904,619 | | | | 4,581,183 | | | | 1,315,394 | | | | 454,807 | | | | 72,337 | | | | 107,359 | |
| | | | | | | | | | | | | | | | | | | | | | | | | | | | | | | | |
| | $ | 396,497,973 | | | $ | 176,264,742 | | | $ | 141,518,550 | | | $ | 199,279,746 | | | $ | 40,093,257 | | | $ | 68,104,219 | | | $ | 34,578,299 | | | $ | 336,445,038 | |
| | | | | | | | | | | | | | | | | | | | | | | | | | | | | | | | |
| | | | | | | | | | | | | | | | | | | | | | | | | | | | | | | | |
| | $ | 343,215,012 | | | $ | 159,095,417 | | | $ | 131,204,905 | | | $ | 149,829,052 | | | $ | 35,098,151 | | | $ | 74,815,364 | | | $ | 34,578,299 | | | $ | 336,413,430 | |
| | | 53,282,961 | | | | 17,169,325 | | | | 10,313,645 | | | | 49,450,694 | | | | 4,995,106 | | | | (6,711,145 | ) | | | — | | | | 31,608 | |
| | $ | 396,497,973 | | | $ | 176,264,742 | | | $ | 141,518,550 | | | $ | 199,279,746 | | | $ | 40,093,257 | | | $ | 68,104,219 | | | $ | 34,578,299 | | | $ | 336,445,038 | |
| | | | | | | | | | | | | | | | | | | | | | | | | | | | | | | | |
| | | | | | | | | | | | | | | | | | | | | | | | | | | | | | | | |
| | | | | | | | | | | | | | | | | | | | | | | | | | | | | | | | |
| | $ | 75,449,046 | | | $ | 30,929,976 | | | $ | 29,033,586 | | | $ | 37,391,653 | | | $ | 18,352,045 | | | $ | 12,230,958 | | | | | | | | | |
| | | 5,886,926 | | | | 2,499,791 | | | | 1,214,176 | | | | 2,792,160 | | | | 514,917 | | | | 1,225,127 | | | | | | | | | |
| | $ | 12.82 | | | $ | 12.37 | | | $ | 23.91 | | | $ | 13.39 | | | $ | 35.64 | | | $ | 9.98 | | | | | | | | | |
| | | | | | | | | | | | | | | | | | | | | | | | | | | | | | | | |
| | | | | | | | | | | | | | | | | | | | | | | | | | | | | | | | |
| | $ | 18,698,712 | | | $ | 9,823,006 | | | $ | 7,081,941 | | | $ | 13,322,129 | | | $ | 985,501 | | | $ | 5,463,335 | | | | | | | | | |
| | | 1,447,638 | | | | 792,818 | | | | 292,544 | | | | 990,027 | | | | 27,564 | | | | 546,850 | | | | | | | | | |
| | $ | 12.92 | | | $ | 12.39 | | | $ | 24.21 | | | $ | 13.46 | | | $ | 35.75 | | | $ | 9.99 | | | | | | | | | |
| | | | | | | | | | | | | | | | | | | | | | | | | | | | | | | | |
| | | | | | | | | | | | | | | | | | | | | | | | | | | | | | | | |
| | $ | 302,350,215 | | | $ | 135,511,760 | | | $ | 105,403,023 | | | $ | 148,565,964 | | | $ | 20,755,711 | | | $ | 50,409,926 | | | | | | | | | |
| | | 23,369,474 | | | | 10,913,365 | | | | 4,345,128 | | | | 11,047,523 | | | | 581,379 | | | | 5,045,969 | | | | | | | | | |
| | $ | 12.94 | | | $ | 12.42 | | | $ | 24.26 | | | $ | 13.45 | | | $ | 35.70 | | | $ | 9.99 | | | | | | | | | |
| | | | | | | | | | | | | | | | | | | | | | | | | | | | | | | | |
| | | | | | | | | | | | | | | | | | | | | | | | | | | | | | | | |
| | | | | | | | | | | | | | | | | | | | | | | | | | $ | 34,578,299 | | | $ | 336,445,038 | |
| | | | | | | | | | | | | | | | | | | | | | | | | | | 34,578,299 | | | | 336,354,315 | |
| | | | | | | | | | | | | | | | | | | | | | | | | | $ | 1.00 | | | $ | 1.0003 | |
| | | | | | | | | | | | | | | | | | | | | | | | | | | | | | | | |
| | $ | 317,463,680 | | | $ | 150,024,437 | | | $ | 125,015,577 | | | $ | 151,860,803 | | | $ | 29,399,804 | | | $ | 63,375,758 | | | $ | 34,562,638 | | | $ | 336,376,865 | |
| | $ | 32,745 | | | $ | 9,516 | | | $ | 4,753 | | | $ | 33,757 | | | $ | 308,295 | | | $ | — | | | $ | — | | | $ | — | |
| | $ | 3,913,910 | | | $ | 1,551,760 | | | $ | 716,020 | | | $ | 3,148,470 | | | $ | 270,000 | | | $ | — | | | $ | — | | | $ | — | |
The accompanying notes are an integral part of these financial statements
2020 Annual Report | December 31, 2020 | Page 119 |
Statements of Operations
For the Year Ended December 31, 2020 |
| | | Muirfield
Fund | | | Spectrum
Fund | | | Global
Allocation
Fund | |
Investment Income | | | | | | | | | | | | |
Interest | | $ | 6,159 | | | $ | — | | | $ | 17,277 | |
Income from affiliates | | | 622,634 | | | | 61,173 | | | | 89,179 | |
Dividends | | | 8,654,372 | | | | 2,970,204 | | | | 534,942 | |
Total Investment Income | | | 9,283,165 | | | | 3,031,377 | | | | 641,398 | |
| | | | | | | | | | | | | |
Fund Expenses | | | | | | | | | | | | |
Investment adviser | | | 3,725,575 | | | | 1,368,181 | | | | 323,059 | |
Transfer agent - Retail Class | | | 159,513 | | | | 47,277 | | | | 10,809 | |
Transfer agent - Adviser Class | | | 54,367 | | | | 15,393 | | | | 1,934 | |
Transfer agent - Institutional Class | | | 408,649 | | | | 156,750 | | | | 38,946 | |
Transfer agent - Money Market Funds | | | | | | | | | | | | |
Fund accounting | | | 94,510 | | | | 55,285 | | | | 37,615 | |
Administrative | | | 432,529 | | | | 156,280 | | | | 43,043 | |
Trustee | | | 30,475 | | | | 10,446 | | | | 2,761 | |
Audit and tax services | | | 14,231 | | | | 15,703 | | | | 16,730 | |
Legal | | | 4,390 | | | | 4,393 | | | | 4,392 | |
Custody | | | 54,695 | | | | 18,105 | | | | 3,781 | |
Printing | | | 12,095 | | | | 3,939 | | | | 870 | |
Distribution plan (12b-1) - Retail Class (1) | | | 294,718 | | | | 98,495 | | | | 22,519 | |
Distribution plan (12b-1) - Money Market Funds | | | | | | | | | | | | |
Shareholder service plan - Retail Class | | | 269,787 | | | | 78,796 | | | | 16,326 | |
Shareholder service plan - Adviser Class | | | 41,014 | | | | 11,076 | | | | 1,494 | |
Shareholder service plan - Institutional Class | | | 260,471 | | | | 85,374 | | | | 1,973 | |
Postage | | | 17,931 | | | | 11,389 | | | | 4 | |
Registration and filing | | | 68,675 | | | | 50,076 | | | | 46,019 | |
Insurance | | | 27,245 | | | | 8,526 | | | | 2,093 | |
Chief Compliance Officer | | | 6,819 | | | | 6,819 | | | | 6,819 | |
Dividend expense on securities sold short | | | — | | | | 357,680 | | | | — | |
Other | | | 41,450 | | | | 29,572 | | | | 24,881 | |
Total Expenses Before Reductions | | | 6,019,139 | | | | 2,589,555 | | | | 606,068 | |
| | | | | | | | | | | | | |
Expenses voluntarily reimbursed/waived by investment adviser (See Note #5) | | | — | | | | — | | | | — | |
Expenses contractually reimbursed/waived by investment adviser (See Note #5) | | | — | | | | — | | | | — | |
Securities lending credit (See Note #5) | | | (6,972 | ) | | | (5,000 | ) | | | (113 | ) |
Transfer agent expenses voluntarily waived (See Note #5) | | | (315,000 | ) | | | (7,000 | ) | | | — | |
| | | | | | | | | | | | | |
Net Expenses | | | 5,697,167 | | | | 2,577,555 | | | | 605,955 | |
| | | | | | | | | | | | | |
Net Investment Income (Loss) | | | 3,585,998 | | | | 453,822 | | | | 35,443 | |
| | | | | | | | | | | | | |
Net Realized and Unrealized Gain (Loss) from Investments | | | | | | | | | | | | |
Net realized gains (losses) from unaffiliated investments | | | 19,985,586 | | | | (1,274,330 | ) | | | 1,396,008 | |
Net realized gains (losses) from affiliated investments | | | (28,106 | ) | | | (4,299 | ) | | | 215 | |
Net realized gains (losses) from closed short positions | | | — | | | | 10,371,833 | | | | — | |
Net realized gains (losses) from futures contracts | | | (51,419,469 | ) | | | (17,738,861 | ) | | | (2,420,717 | ) |
Distributions of long-term realized gains by other investment companies | | | — | | | | — | | | | 8,791 | |
Net Realized Gains (Losses) from Investment Transactions, Futures Contracts, and Distributions of Long-term Realized Gains by Other Investment Companies | | | (31,461,989 | ) | | | (8,645,657 | ) | | | (1,015,703 | ) |
| | | | | | | | | | | | | |
Net change in unrealized appreciation (depreciation) of unaffiliated investments | | | 40,019,552 | | | | 4,014,723 | | | | 1,462,301 | |
Net change in unrealized appreciation (depreciation) of affiliated investments | | | 8,574 | | | | 8,798 | | | | 3,752 | |
Net change in unrealized appreciation (depreciation) of short positions | | | — | | | | 2,031,590 | | | | — | |
Net change in unrealized appreciation (depreciation) of futures contracts | | | 1,709,435 | | | | 88,102 | | | | 294,939 | |
Net Change in Unrealized Appreciation (Depreciation) of Investment Transactions and Futures Contracts | | | 41,737,561 | | | | 6,143,213 | | | | 1,760,992 | |
| | | | | | | | | | | | | |
Net Realized and Unrealized Gain (Loss) from Investments | | | 10,275,572 | | | | (2,502,444 | ) | | | 745,289 | |
| | | | | | | | | | | | | |
Net Change in Net Assets Resulting from Operations | | $ | 13,861,570 | | | $ | (2,048,622 | ) | | $ | 780,732 | |
(1) | Only the Retail Class of shares has adopted a Rule 12b-1 Plan. See #5 of the Notes to Financial Statements. |
The accompanying notes are an integral part of these financial statements
Page 120 | 2020 Annual Report | December 31, 2020 |
| | | |
| | Balanced
Fund | | | Moderate
Allocation
Fund | | | Conservative
Allocation
Fund | | | Dynamic
Allocation
Fund | | | Quantex
Fund | | | Total Return
Bond Fund | | | Prime Money
Market Fund | | | Institutional
Prime Money
Market Fund | |
| | | | | | | | | | | | | | | | | | | | | | | | | | | | | | | | |
| | $ | 291,963 | | | $ | 215,605 | | | $ | 237,472 | | | $ | 6,498 | | | $ | 4,708 | | | $ | 234,281 | | | $ | 261,742 | | | $ | 2,365,700 | |
| | | 346,120 | | | | 126,639 | | | | 58,795 | | | | 163,596 | | | | 10,119 | | | | 11,810 | | | | — | | | | — | |
| | | 7,159,368 | | | | 3,679,764 | | | | 3,458,935 | | | | 2,836,412 | | | | 902,597 | | | | 1,704,208 | | | | — | | | | — | |
| | | 7,797,451 | | | | 4,022,008 | | | | 3,755,202 | | | | 3,006,506 | | | | 917,424 | | | | 1,950,299 | | | | 261,742 | | | | 2,365,700 | |
| | | | | | | | | | | | | | | | | | | | | | | | | | | | | | | | |
| | | | | | | | | | | | | | | | | | | | | | | | | | | | | | | | |
| | | 2,565,048 | | | | 1,009,325 | | | | 676,591 | | | | 1,345,549 | | | | 314,797 | | | | 258,039 | | | | 142,989 | | | | 964,588 | |
| | | 95,181 | | | | 38,613 | | | | 36,282 | | | | 43,423 | | | | 21,211 | | | | 9,506 | | | | | | | | | |
| | | 22,121 | | | | 11,351 | | | | 8,293 | | | | 14,905 | | | | 1,054 | | | | 3,953 | | | | | | | | | |
| | | 335,708 | | | | 151,901 | | | | 117,807 | | | | 156,984 | | | | 28,102 | | | | 38,150 | | | | | | | | | |
| | | | | | | | | | | | | | | | | | | | | | | | | | | 28,598 | | | | 260,668 | |
| | | 74,751 | | | | 53,822 | | | | 50,532 | | | | 54,943 | | | | 37,395 | | | | 41,902 | | | | 36,149 | | | | 69,584 | |
| | | 312,006 | | | | 144,577 | | | | 118,254 | | | | 153,541 | | | | 41,620 | | | | 61,608 | | | | 35,747 | | | | 270,668 | |
| | | 20,733 | | | | 9,689 | | | | 7,851 | | | | 10,073 | | | | 2,435 | | | | 4,043 | | | | 1,454 | | | | 1,454 | |
| | | 14,199 | | | | 14,199 | | | | 14,200 | | | | 16,749 | | | | 14,230 | | | | 14,211 | | | | 13,221 | | | | 13,219 | |
| | | 4,391 | | | | 4,393 | | | | 4,393 | | | | 4,383 | | | | 4,392 | | | | 4,393 | | | | 4,399 | | | | 4,380 | |
| | | 36,644 | | | | 16,661 | | | | 13,355 | | | | 17,032 | | | | 3,757 | | | | 6,212 | | | | 3,001 | | | | 21,580 | |
| | | 8,481 | | | | 3,704 | | | | 2,967 | | | | 3,871 | | | | 1,061 | | | | 1,333 | | | | 735 | | | | 5,645 | |
| | | 198,294 | | | | 80,444 | | | | 75,588 | | | | 90,465 | | | | 35,353 | | | | 29,705 | | | | | | | | | |
| | | | | | | | | | | | | | | | | | | | | | | | | | | 99 | | | | — | |
| | | 158,635 | | | | 64,209 | | | | 55,220 | | | | 66,332 | | | | 1,578 | | | | 22,338 | | | | | | | | | |
| | | 14,520 | | | | 6,954 | | | | 5,261 | | | | 11,276 | | | | 775 | | | | 3,785 | | | | | | | | | |
| | | 200,692 | | | | 84,973 | | | | 66,277 | | | | 42,636 | | | | 13,576 | | | | 27,710 | | | | | | | | | |
| | | 12,940 | | | | 6,619 | | | | 6,646 | | | | 7,496 | | | | 1,834 | | | | 2,283 | | | | 439 | | | | 1,801 | |
| | | 57,378 | | | | 51,632 | | | | 50,330 | | | | 51,302 | | | | 45,892 | | | | 48,802 | | | | 21,512 | | | | 3,908 | |
| | | 16,733 | | | | 7,268 | | | | 5,424 | | | | 8,816 | | | | 2,304 | | | | 3,630 | | | | 1,303 | | | | 15,078 | |
| | | 6,819 | | | | 6,819 | | | | 6,819 | | | | 6,819 | | | | 6,819 | | | | 6,819 | | | | 6,819 | | | | 6,819 | |
| | | — | | | | — | | | | — | | | | — | | | | — | | | | — | | | | — | | | | — | |
| | | 33,919 | | | | 28,307 | | | | 27,626 | | | | 29,118 | | | | 25,970 | | | | 25,916 | | | | 27,055 | | | | 41,094 | |
| | | 4,189,193 | | | | 1,795,460 | | | | 1,349,716 | | | | 2,135,713 | | | | 604,155 | | | | 614,337 | | | | 323,520 | | | | 1,680,486 | |
| | | | | | | | | | | | | | | | | | | | | | | | | | | | | | | | |
| | | — | | | | — | | | | — | | | | — | | | | — | | | | — | | | | (222,816 | ) | | | (1,186,453 | ) |
| | | — | | | | — | | | | — | | | | (179,427 | ) | | | — | | | | (70,961 | ) | | | — | | | | — | |
| | | (3,103 | ) | | | (749 | ) | | | (270 | ) | | | (1,729 | ) | | | (7,453 | ) | | | — | | | | — | | | | — | |
| | | (132,000 | ) | | | — | | | | — | | | | — | | | | — | | | | — | | | | — | | | | — | |
| | | | | | | | | | | | | | | | | | | | | | | | | | | | | | | | |
| | | 4,054,090 | | | | 1,794,711 | | | | 1,349,446 | | | | 1,954,557 | | | | 596,702 | | | | 543,376 | | | | 100,704 | | | | 494,033 | |
| | | | | | | | | | | | | | | | | | | | | | | | | | | | | | | | |
| | | 3,743,361 | | | | 2,227,297 | | | | 2,405,756 | | | | 1,051,949 | | | | 320,722 | | | | 1,406,923 | | | | 161,038 | | | | 1,871,667 | |
| | | | | | | | | | | | | | | | | | | | | | | | | | | | | | | | |
| | | | | | | | | | | | | | | | | | | | | | | | | | | | | | | | |
| | | 5,418,452 | | | | 1,733,370 | | | | 606,797 | | | | 5,965,105 | | | | (3,354,528 | ) | | | 138,710 | | | | — | | | | 638 | |
| | | (18,173 | ) | | | (4,947 | ) | | | (3,227 | ) | | | (334 | ) | | | 1,713 | | | | (248 | ) | | | — | | | | — | |
| | | — | | | | — | | | | — | | | | — | | | | — | | | | — | | | | — | | | | — | |
| | | (20,163,080 | ) | | | (5,766,375 | ) | | | (2,636,207 | ) | | | 1,791,950 | | | | 725,562 | | | | — | | | | — | | | | — | |
| | | 241,002 | | | | 180,222 | | | | 204,113 | | | | — | | | | — | | | | 160,913 | | | | — | | | | — | |
| | | (14,521,799 | ) | | | (3,857,730 | ) | | | (1,828,524 | ) | | | 7,756,721 | | | | (2,627,253 | ) | | | 299,375 | | | | — | | | | 638 | |
| | | | | | | | | | | | | | | | | | | | | | | | | | | | | | | | |
| | | 30,267,196 | | | | 10,973,996 | | | | 8,032,826 | | | | 17,024,696 | | | | (5,086,523 | ) | | | 3,076,468 | | | | — | | | | 14,914 | |
| | | 18,404 | | | | 7,217 | | | | 5,682 | | | | 1,680 | | | | (6 | ) | | | 2,075 | | | | — | | | | — | |
| | | — | | | | — | | | | — | | | | — | | | | — | | | | — | | | | — | | | | — | |
| | | 793,361 | | | | 394,223 | | | | 188,032 | | | | 535,122 | | | | 11,959 | | | | — | | | | — | | | | — | |
| | | 31,078,961 | | | | 11,375,436 | | | | 8,226,540 | | | | 17,561,498 | | | | (5,074,570 | ) | | | 3,078,543 | | | | — | | | | 14,914 | |
| | | | | | | | | | | | | | | | | | | | | | | | | | | | | | | | |
| | | 16,557,162 | | | | 7,517,706 | | | | 6,398,016 | | | | 25,318,219 | | | | (7,701,823 | ) | | | 3,377,918 | | | | — | | | | 15,552 | |
| | | | | | | | | | | | | | | | | | | | | | | | | | | | | | | | |
| | $ | 20,300,523 | | | $ | 9,745,003 | | | $ | 8,803,772 | | | $ | 26,370,168 | | | $ | (7,381,101 | ) | | $ | 4,784,841 | | | $ | 161,038 | | | $ | 1,887,219 | |
The accompanying notes are an integral part of these financial statements
2020 Annual Report | December 31, 2020 | Page 121 |
Statements of Changes in Net Assets
For the Years Ended December 31, |
| | | Muirfield Fund | | | Spectrum Fund | |
| | | 2020 | | | 2019 | | | 2020 | | | 2019 | |
Operations | | | | | | | | | | | | | | | | |
Net investment income (loss) | | $ | 3,585,998 | | | $ | 8,058,700 | | | $ | 453,822 | | | $ | 1,334,747 | |
Net realized gain (loss) from investment transactions, futures contracts, and distributions of long-term realized gains by other investment companies | | | (31,461,989 | ) | | | (18,436,779 | ) | | | (8,645,657 | ) | | | (7,049,856 | ) |
Net change in unrealized appreciation (depreciation) of investment transactions and futures contracts | | | 41,737,561 | | | | 95,704,417 | | | | 6,143,213 | | | | 31,025,686 | |
Net change in net assets resulting from operations | | | 13,861,570 | | | | 85,326,338 | | | | (2,048,622 | ) | | | 25,310,577 | |
| | | | | | | | | | | | | | | | | |
Distributions to Shareholders | | | | | | | | | | | | | | | | |
Retail Class | | | (891,986 | ) | | | (5,010,444 | ) | | | (34,997 | ) | | | (488,471 | ) |
Adviser Class | | | (476,110 | ) | | | (1,635,066 | ) | | | (119,760 | ) | | | (151,230 | ) |
Institutional Class | | | (3,575,015 | ) | | | (11,891,386 | ) | | | (1,287,213 | ) | | | (1,431,158 | ) |
Money Market Funds | | | | | | | | | | | | | | | | |
Change in net assets resulting from distributions | | | (4,943,111 | ) | | | (18,536,896 | ) | | | (1,441,970 | ) | | | (2,070,859 | ) |
| | | | | | | | | | | | | | | | | |
Capital Transactions: | | | | | | | | | | | | | | | | |
Issued | | | 119,150,871 | | | | 197,324,991 | | | | 33,621,402 | | | | 51,986,998 | |
Reinvested | | | 4,887,303 | | | | 18,362,502 | | | | 1,436,609 | | | | 2,059,900 | |
Redeemed | | | (240,559,569 | ) | | | (212,058,081 | ) | | | (59,355,574 | ) | | | (46,954,317 | ) |
Net change in net assets resulting from capital transactions | | | (116,521,395 | ) | | | 3,629,412 | | | | (24,297,563 | ) | | | 7,092,581 | |
| | | | | | | | | | | | | | | | | |
Total Change in Net Assets | | | (107,602,936 | ) | | | 70,418,854 | | | | (27,788,155 | ) | | | 30,332,299 | |
| | | | | | | | | | | | | | | | | |
Net Assets - Beginning of Year | | | 681,427,950 | | | | 611,009,096 | | | | 213,066,708 | | | | 182,734,409 | |
| | | | | | | | | | | | | | | | | |
Net Assets - End of Year | | $ | 573,825,014 | | | $ | 681,427,950 | | | $ | 185,278,553 | | | $ | 213,066,708 | |
| | | | | | | | | | | | | | | | | |
Share Transactions: | | | | | | | | | | | | | | | | |
Issued | | | 16,391,709 | | | | 26,485,691 | | | | 3,112,011 | | | | 4,579,626 | |
Reinvested | | | 673,995 | | | | 2,358,583 | | | | 129,657 | | | | 170,107 | |
Redeemed | | | (33,137,060 | ) | | | (28,277,770 | ) | | | (5,408,355 | ) | | | (4,096,807 | ) |
Net change in shares | | | (16,071,356 | ) | | | 566,504 | | | | (2,166,687 | ) | | | 652,926 | |
The accompanying notes are an integral part of these financial statements
Page 122 | 2020 Annual Report | December 31, 2020 |
| | | |
| | Global
Allocation Fund | | | Balanced Fund | | | Moderate
Allocation Fund | | | Conservative
Allocation Fund | |
| | 2020 | | | 2019 | | | 2020 | | | 2019 | | | 2020 | | | 2019 | | | 2020 | | | 2019 | |
| | | | | | | | | | | | | | | | | | | | | | | | | | | | | | | | |
| | $ | 35,443 | | | $ | 605,735 | | | $ | 3,743,361 | | | $ | 6,528,092 | | | $ | 2,227,297 | | | $ | 3,541,144 | | | $ | 2,405,756 | | | $ | 3,401,214 | |
| | | (1,015,703 | ) | | | 1,226,376 | | | | (14,521,799 | ) | | | (3,526,175 | ) | | | (3,857,730 | ) | | | 261,456 | | | | (1,828,524 | ) | | | 544,887 | |
| | | 1,760,992 | | | | 4,928,037 | | | | 31,078,961 | | | | 43,330,190 | | | | 11,375,436 | | | | 15,068,833 | | | | 8,226,540 | | | | 9,805,783 | |
| | | 780,732 | | | | 6,760,148 | | | | 20,300,523 | | | | 46,332,107 | | | | 9,745,003 | | | | 18,871,433 | | | | 8,803,772 | | | | 13,751,884 | |
| | | | | | | | | | | | | | | | | | | | | | | | | | | | | | | | |
| | | | | | | | | | | | | | | | | | | | | | | | | | | | | | | | |
| | | (197,994 | ) | | | (242,208 | ) | | | (508,216 | ) | | | (1,368,254 | ) | | | (348,167 | ) | | | (571,424 | ) | | | (460,327 | ) | | | (689,225 | ) |
| | | (44,862 | ) | | | (38,283 | ) | | | (178,375 | ) | | | (326,176 | ) | | | (139,338 | ) | | | (194,767 | ) | | | (131,623 | ) | | | (160,298 | ) |
| | | (1,068,177 | ) | | | (940,057 | ) | | | (2,678,233 | ) | | | (4,882,547 | ) | | | (1,881,646 | ) | | | (2,678,105 | ) | | | (1,888,631 | ) | | | (2,525,999 | ) |
| | | | | | | | | | | | | | | | | | | | | | | | | | | | | | | | |
| | | (1,311,033 | ) | | | (1,220,548 | ) | | | (3,364,824 | ) | | | (6,576,977 | ) | | | (2,369,151 | ) | | | (3,444,296 | ) | | | (2,480,581 | ) | | | (3,375,522 | ) |
| | | | | | | | | | | | | | | | | | | | | | | | | | | | | | | | |
| | | | | | | | | | | | | | | | | | | | | | | | | | | | | | | | |
| | | 4,855,089 | | | | 7,060,084 | | | | 85,229,485 | | | | 104,242,588 | | | | 37,550,739 | | | | 39,833,668 | | | | 31,767,589 | | | | 32,486,841 | |
| | | 1,310,881 | | | | 1,220,307 | | | | 3,350,773 | | | | 6,544,647 | | | | 2,352,800 | | | | 3,422,617 | | | | 2,468,367 | | | | 3,357,881 | |
| | | (11,477,267 | ) | | | (20,806,165 | ) | | | (117,215,009 | ) | | | (91,154,144 | ) | | | (49,054,750 | ) | | | (42,505,891 | ) | | | (36,972,468 | ) | | | (37,570,100 | ) |
| | | (5,311,297 | ) | | | (12,525,774 | ) | | | (28,634,751 | ) | | | 19,633,091 | | | | (9,151,211 | ) | | | 750,394 | | | | (2,736,512 | ) | | | (1,725,378 | ) |
| | | | | | | | | | | | | | | | | | | | | | | | | | | | | | | | |
| | | (5,841,598 | ) | | | (6,986,174 | ) | | | (11,699,052 | ) | | | 59,388,221 | | | | (1,775,359 | ) | | | 16,177,531 | | | | 3,586,679 | | | | 8,650,984 | |
| | | | | | | | | | | | | | | | | | | | | | | | | | | | | | | | |
| | | 51,423,531 | | | | 58,409,705 | | | | 408,197,025 | | | | 348,808,804 | | | | 178,040,101 | | | | 161,862,570 | | | | 137,931,871 | | | | 129,280,887 | |
| | | | | | | | | | | | | | | | | | | | | | | | | | | | | | | | |
| | $ | 45,581,933 | | | $ | 51,423,531 | | | $ | 396,497,973 | | | $ | 408,197,025 | | | $ | 176,264,742 | | | $ | 178,040,101 | | | $ | 141,518,550 | | | $ | 137,931,871 | |
| | | | | | | | | | | | | | | | | | | | | | | | | | | | | | | | |
| | | | | | | | | | | | | | | | | | | | | | | | | | | | | | | | |
| | | 468,221 | | | | 662,661 | | | | 7,344,043 | | | | 9,007,314 | | | | 3,278,868 | | | | 3,527,952 | | | | 1,396,311 | | | | 1,456,459 | |
| | | 118,509 | | | | 110,294 | | | | 288,516 | | | | 549,529 | | | | 202,735 | | | | 295,525 | | | | 107,211 | | | | 147,638 | |
| | | (1,115,719 | ) | | | (1,946,833 | ) | | | (10,012,960 | ) | | | (7,799,068 | ) | | | (4,264,615 | ) | | | (3,730,284 | ) | | | (1,623,114 | ) | | | (1,669,810 | ) |
| | | (528,989 | ) | | | (1,173,878 | ) | | | (2,380,401 | ) | | | 1,757,775 | | | | (783,012 | ) | | | 93,193 | | | | (119,592 | ) | | | (65,713 | ) |
The accompanying notes are an integral part of these financial statements
2020 Annual Report | December 31, 2020 | Page 123 |
Statements of Changes in Net Assets
For the Years Ended December 31, |
| | | Dynamic
Allocation Fund | | | Quantex Fund | |
| | | 2020 | | | 2019 | | | 2020 | | | 2019 | |
Operations | | | | | | | | | | | | | | | | |
Net investment income (loss) | | $ | 1,051,949 | | | $ | 2,477,112 | | | $ | 320,722 | | | $ | 457,753 | |
Net realized gain (loss) from investment transactions, futures contracts, and distributions of long-term realized gains by other investment companies | | | 7,756,721 | | | | 10,767,864 | | | | (2,627,253 | ) | | | (6,200 | ) |
Net change in unrealized appreciation (depreciation) of investment transactions and futures contracts | | | 17,561,498 | | | | 28,083,219 | | | | (5,074,570 | ) | | | 10,276,756 | |
Net change in net assets resulting from operations | | | 26,370,168 | | | | 41,328,195 | | | | (7,381,101 | ) | | | 10,728,309 | |
| | | | | | | | | | | | | | | | | |
Distributions to Shareholders | | | | | | | | | | | | | | | | |
Retail Class | | | (825,448 | ) | | | (913,644 | ) | | | (107,170 | ) | | | (180,584 | ) |
Adviser Class | | | (322,349 | ) | | | (313,636 | ) | | | (5,977 | ) | | | (7,848 | ) |
Institutional Class | | | (3,697,919 | ) | | | (3,749,086 | ) | | | (179,516 | ) | | | (333,427 | ) |
Money Market Funds | | | | | | | | | | | | | | | | |
Change in net assets resulting from distributions | | | (4,845,716 | ) | | | (4,976,366 | ) | | | (292,663 | ) | | | (521,859 | ) |
| | | | | | | | | | | | | | | | | |
Capital Transactions: | | | | | | | | | | | | | | | | |
Issued | | | 39,358,423 | | | | 34,492,243 | | | | 7,663,727 | | | | 12,115,546 | |
Reinvested | | | 4,838,177 | | | | 4,969,211 | | | | 278,503 | | | | 409,937 | |
Redeemed | | | (66,674,299 | ) | | | (49,475,357 | ) | | | (22,913,934 | ) | | | (24,649,606 | ) |
Net change in net assets resulting from capital transactions | | | (22,477,699 | ) | | | (10,013,903 | ) | | | (14,971,704 | ) | | | (12,124,123 | ) |
| | | | | | | | | | | | | | | | | |
Total Change in Net Assets | | | (953,247 | ) | | | 26,337,926 | | | | (22,645,468 | ) | | | (1,917,673 | ) |
| | | | | | | | | | | | | | | | | |
Net Assets - Beginning of Year | | | 200,232,993 | | | | 173,895,067 | | | | 62,738,725 | | | | 64,656,398 | |
| | | | | | | | | | | | | | | | | |
Net Assets - End of Year | | $ | 199,279,746 | | | $ | 200,232,993 | | | $ | 40,093,257 | | | $ | 62,738,725 | |
| | | | | | | | | | | | | | | | | |
Share Transactions: | | | | | | | | | | | | | | | | |
Issued | | | 3,361,299 | | | | 3,147,990 | | | | 270,380 | | | | 338,751 | |
Reinvested | | | 374,002 | | | | 428,100 | | | | 9,772 | | | | 11,297 | |
Redeemed | | | (5,737,165 | ) | | | (4,466,355 | ) | | | (808,586 | ) | | | (702,095 | ) |
Net change in shares | | | (2,001,864 | ) | | | (890,265 | ) | | | (528,434 | ) | | | (352,047 | ) |
The accompanying notes are an integral part of these financial statements
Page 124 | 2020 Annual Report | December 31, 2020 |
| | | |
| | Total Return
Bond Fund | | | Prime Money
Market Fund | | | Institutional
Prime
Money Market
Fund | |
| | 2020 | | | 2019 | | | 2020 | | | 2019 | | | 2020 | | | 2019 | |
| | | | | | | | | | | | | | | | | | | | | | | | |
| | $ | 1,406,923 | | | $ | 1,740,487 | | | $ | 161,038 | | | $ | 725,101 | | | $ | 1,871,667 | | | $ | 9,951,805 | |
| | | 299,375 | | | | 556,683 | | | | — | | | | — | | | | 638 | | | | (20 | ) |
| | | 3,078,543 | | | | 2,627,781 | | | | — | | | | — | | | | 14,914 | | | | 73,938 | |
| | | 4,784,841 | | | | 4,924,951 | | | | 161,038 | | | | 725,101 | | | | 1,887,219 | | | | 10,025,723 | |
| | | | | | | | | | | | | | | | | | | | | | | | |
| | | | | | | | | | | | | | | | | | | | | | | | |
| | | (221,612 | ) | | | (318,972 | ) | | | | | | | | | | | | | | | | |
| | | (112,411 | ) | | | (105,786 | ) | | | | | | | | | | | | | | | | |
| | | (1,069,932 | ) | | | (1,325,202 | ) | | | | | | | | | | | | | | | | |
| | | | | | | | | | | (161,038 | ) | | | (725,101 | ) | | | (1,871,668 | ) | | | (9,951,803 | ) |
| | | (1,403,955 | ) | | | (1,749,960 | ) | | | (161,038 | ) | | | (725,101 | ) | | | (1,871,668 | ) | | | (9,951,803 | ) |
| | | | | | | | | | | | | | | | | | | | | | | | |
| | | | | | | | | | | | | | | | | | | | | | | | |
| | | 23,336,398 | | | | 16,660,352 | | | | 21,491,888 | | | | 21,752,554 | | | | 472,288,464 | | | | 337,972,181 | |
| | | 1,392,130 | | | | 1,737,187 | | | | 158,887 | | | | 686,595 | | | | 307,362 | | | | 1,149,955 | |
| | | (21,837,670 | ) | | | (26,679,180 | ) | | | (21,895,568 | ) | | | (28,496,871 | ) | | | (506,286,355 | ) | | | (440,678,548 | ) |
| | | 2,890,858 | | | | (8,281,641 | ) | | | (244,793 | ) | | | (6,057,722 | ) | | | (33,690,529 | ) | | | (101,556,412 | ) |
| | | | | | | | | | | | | | | | | | | | | | | | |
| | | 6,271,744 | | | | (5,106,650 | ) | | | (244,793 | ) | | | (6,057,722 | ) | | | (33,674,978 | ) | | | (101,482,492 | ) |
| | | | | | | | | | | | | | | | | | | | | | | | |
| | | 61,832,475 | | | | 66,939,125 | | | | 34,823,092 | | | | 40,880,814 | | | | 370,120,016 | | | | 471,602,508 | |
| | | | | | | | | | | | | | | | | | | | | | | | |
| | $ | 68,104,219 | | | $ | 61,832,475 | | | $ | 34,578,299 | | | $ | 34,823,092 | | | $ | 336,445,038 | | | $ | 370,120,016 | |
| | | | | | | | | | | | | | | | | | | | | | | | |
| | | | | | | | | | | | | | | | | | | | | | | | |
| | | 2,397,112 | | | | 1,785,878 | | | | 21,491,888 | | | | 21,752,554 | | | | 472,214,087 | | | | 337,937,146 | |
| | | 141,988 | | | | 185,122 | | | | 158,887 | | | | 686,595 | | | | 307,353 | | | | 1,149,805 | |
| | | (2,253,945 | ) | | | (2,847,058 | ) | | | (21,895,568 | ) | | | (28,496,871 | ) | | | (506,302,922 | ) | | | (440,622,456 | ) |
| | | 285,155 | | | | (876,058 | ) | | | (244,793 | ) | | | (6,057,722 | ) | | | (33,781,482 | ) | | | (101,535,505 | ) |
The accompanying notes are an integral part of these financial statements
2020 Annual Report | December 31, 2020 | Page 125 |
Financial Highlights
For the Periods Ended December 31, |
| | | | | | | Income
from
Investment Operations | | | Less
Distributions | |
| | Net Asset
Value,
Beginning
of Period | | | Net
Investment
Income
(Loss) (5) | | | Net gains (losses)
on securities and
futures (both realized
and unrealized) | | | Total from
Investment
Operations | | | From Net
Investment
Income | | | From Net
Capital
Gains | | | From
Return of
Capital | | | Total
Distributions | |
Muirfield Fund - Retail Class (1)(2)(3)(4) |
2020 | | $ | 7.91 | | | | 0.03 | | | | 0.31 | | | | 0.34 | | | | (0.05 | ) | | | 0.00 | | | | 0.00 | | | | (0.05 | ) |
2019 | | $ | 7.16 | | | | 0.07 | | | | 0.89 | | | | 0.96 | | | | (0.03 | ) | | | (0.18 | ) | | | 0.00 | | | | (0.21 | ) |
2018 | | $ | 7.54 | | | | 0.04 | | | | (0.31 | ) | | | (0.27 | ) | | | (0.04 | ) | | | (0.07 | ) | | | 0.00 | | | | (0.11 | ) |
2017 | | $ | 6.79 | | | | 0.04 | | | | 1.34 | | | | 1.38 | | | | (0.04 | ) | | | (0.59 | ) | | | 0.00 | | | | (0.63 | ) |
2016 | | $ | 6.47 | | | | 0.05 | | | | 0.32 | | | | 0.37 | | | | (0.05 | ) | | | 0.00 | | | | 0.00 | | | | (0.05 | ) |
Muirfield Fund - Adviser Class (1)(2)(3)(4) |
2020 | | $ | 7.97 | | | | 0.05 | | | | 0.31 | | | | 0.36 | | | | (0.07 | ) | | | 0.00 | | | | 0.00 | | | | (0.07 | ) |
2019 | | $ | 7.20 | | | | 0.09 | | | | 0.90 | | | | 0.99 | | | | (0.04 | ) | | | (0.18 | ) | | | 0.00 | | | | (0.22 | ) |
2018 | | $ | 7.57 | | | | 0.06 | | | | (0.31 | ) | | | (0.25 | ) | | | (0.05 | ) | | | (0.07 | ) | | | 0.00 | | | | (0.12 | ) |
2017 | | $ | 6.80 | | | | 0.05 | | | | 1.34 | | | | 1.39 | | | | (0.03 | ) | | | (0.59 | ) | | | 0.00 | | | | (0.62 | ) |
2016 (7) | | $ | 6.51 | | | | 0.01 | | | | 0.29 | | | | 0.30 | | | | (0.01 | ) | | | 0.00 | | | | 0.00 | | | | (0.01 | ) |
Muirfield Fund - Institutional Class (1)(2)(3)(4) |
2020 | | $ | 7.99 | | | | 0.05 | | | | 0.31 | | | | 0.36 | | | | (0.07 | ) | | | 0.00 | | | | 0.00 | | | | (0.07 | ) |
2019 | | $ | 7.21 | | | | 0.10 | | | | 0.90 | | | | 1.00 | | | | (0.04 | ) | | | (0.18 | ) | | | 0.00 | | | | (0.22 | ) |
2018 | | $ | 7.57 | | | | 0.08 | | | | (0.31 | ) | | | (0.23 | ) | | | (0.06 | ) | | | (0.07 | ) | | | 0.00 | | | | (0.13 | ) |
2017 | | $ | 6.80 | | | | 0.07 | | | | 1.33 | | | | 1.40 | | | | (0.04 | ) | | | (0.59 | ) | | | 0.00 | | | | (0.63 | ) |
2016 (7) | | $ | 6.51 | | | | 0.02 | | | | 0.29 | | | | 0.31 | | | | (0.02 | ) | | | 0.00 | | | | 0.00 | | | | (0.02 | ) |
Spectrum Fund - Retail Class (1)(2)(3)(4) |
2020 | | $ | 12.19 | | | | 0.00 | | | | (0.03 | ) | | | (0.03 | ) | | | (0.01 | ) | | | 0.00 | | | | 0.00 | | | | (0.01 | ) |
2019 | | $ | 10.89 | | | | 0.04 | | | | 1.38 | | | | 1.42 | | | | (0.01 | ) | | | (0.11 | ) | | | 0.00 | | | | (0.12 | ) |
2018 | | $ | 11.48 | | | | 0.03 | | | | (0.49 | ) | | | (0.46 | ) | | | 0.00 | | | | (0.13 | ) | | | 0.00 | | | | (0.13 | ) |
2017 | | $ | 10.28 | | | | (0.01 | ) | | | 1.99 | | | | 1.98 | | | | 0.00 | | | | (0.78 | ) | | | 0.00 | | | | (0.78 | ) |
2016 | | $ | 9.73 | | | | 0.02 | | | | 0.66 | | | | 0.68 | | | | (0.02 | ) | | | (0.11 | ) | | | 0.00 | | | | (0.13 | ) |
Spectrum Fund - Adviser Class (1)(2)(3)(4) |
2020 | | $ | 12.27 | | | | 0.03 | | | | (0.02 | ) | | | 0.01 | | | | (0.11 | ) | | | 0.00 | | | | 0.00 | | | | (0.11 | ) |
2019 | | $ | 10.95 | | | | 0.07 | | | | 1.37 | | | | 1.44 | | | | (0.01 | ) | | | (0.11 | ) | | | 0.00 | | | | (0.12 | ) |
2018 | | $ | 11.53 | | | | 0.06 | | | | (0.48 | ) | | | (0.42 | ) | | | (0.03 | ) | | | (0.13 | ) | | | 0.00 | | | | (0.16 | ) |
2017 | | $ | 10.29 | | | | 0.02 | | | | 2.00 | | | | 2.02 | | | | 0.00 | | | | (0.78 | ) | | | 0.00 | | | | (0.78 | ) |
2016 (7) | | $ | 9.97 | | | | 0.02 | | | | 0.43 | | | | 0.45 | | | | (0.02 | ) | | | (0.11 | ) | | | 0.00 | | | | (0.13 | ) |
Spectrum Fund - Institutional Class (1)(2)(3)(4) |
2020 | | $ | 12.31 | | | | 0.04 | | | | (0.02 | ) | | | 0.02 | | | | (0.11 | ) | | | 0.00 | | | | 0.00 | | | | (0.11 | ) |
2019 | | $ | 10.96 | | | | 0.09 | | | | 1.38 | | | | 1.47 | | | | (0.01 | ) | | | (0.11 | ) | | | 0.00 | | | | (0.12 | ) |
2018 | | $ | 11.54 | | | | 0.08 | | | | (0.49 | ) | | | (0.41 | ) | | | (0.04 | ) | | | (0.13 | ) | | | 0.00 | | | | (0.17 | ) |
2017 | | $ | 10.29 | | | | 0.05 | | | | 1.98 | | | | 2.03 | | | | 0.00 | | | | (0.78 | ) | | | 0.00 | | | | (0.78 | ) |
2016 (7) | | $ | 9.97 | | | | 0.02 | | | | 0.43 | | | | 0.45 | | | | (0.02 | ) | | | (0.11 | ) | | | 0.00 | | | | (0.13 | ) |
See footnotes on pages 134 and 135.
The accompanying notes are an integral part of these financial statements
Page 126 | 2020 Annual Report | December 31, 2020 |
| |
| |
| | | | | | | | | | Ratios/
Supplemental
Data | |
| | Net Asset
Value, End
of Period | | | Total Return
(Assumes
Reinvestment of
Distributions) | | | Net Assets,
End of Period
($000) | | | Ratio of Net
Investment
Income (Loss)
to Average
Net Assets | | | Ratio of Expenses to
Average Net Assets
After Fee Reductions (8) | | | Ratio of Expenses
to Average Net
Assets Before Fee
Reductions (9) | | | Portfolio
Turnover
Rate | |
| | | | | | | | | | | | | | | | | | | | | | | | | | | | |
| | $ | 8.20 | | | | 4.36 | % | | $ | 134,240 | | | | 0.35 | % | | | 1.28 | % | | | 1.28 | % | | | 225 | % |
| | $ | 7.91 | | | | 13.53 | % | | $ | 189,105 | | | | 0.94 | % | | | 1.28 | % | | | 1.28 | % | | | 222 | % |
| | $ | 7.16 | | | | (3.66 | %) | | $ | 203,287 | | | | 0.54 | % | | | 1.32 | % | | | 1.32 | % | | | 225 | % |
| | $ | 7.54 | | | | 20.29 | % | | $ | 250,322 | | | | 0.49 | % | | | 1.33 | % | | | 1.33 | % | | | 276 | % |
| | $ | 6.79 | | | | 5.72 | % | | $ | 390,817 | | | | 0.73 | % | | | 1.36 | % | | | 1.35 | % | | | 414 | % |
| | | |
| | $ | 8.26 | | | | 4.67 | % | | $ | 48,953 | | | | 0.64 | % | | | 0.98 | % | | | 0.98 | % | | | 225 | % |
| | $ | 7.97 | | | | 13.81 | % | | $ | 60,024 | | | | 1.14 | % | | | 1.09 | % | | | 1.09 | % | | | 222 | % |
| | $ | 7.20 | | | | (3.39 | %) | | $ | 61,159 | | | | 0.79 | % | | | 1.10 | % | | | 1.17 | % | | | 225 | % |
| | $ | 7.57 | | | | 20.50 | % | | $ | 41,440 | | | | 0.71 | % | | | 1.11 | % | | | 1.20 | % | | | 276 | % |
| | $ | 6.80 | | | | 4.68 | % | | $ | 154 | | | | 1.32 | % | | | 0.99 | % | | | 0.99 | % | | | 414 | % |
| | | |
| | $ | 8.28 | | | | 4.66 | % | | $ | 390,632 | | | | 0.73 | % | | | 0.88 | % | | | 0.97 | % | | | 225 | % |
| | $ | 7.99 | | | | 14.01 | % | | $ | 432,299 | | | | 1.35 | % | | | 0.87 | % | | | 0.98 | % | | | 222 | % |
| | $ | 7.21 | | | | (3.17 | %) | | $ | 346,563 | | | | 1.00 | % | | | 0.90 | % | | | 0.98 | % | | | 225 | % |
| | $ | 7.57 | | | | 20.60 | % | | $ | 186,200 | | | | 0.88 | % | | | 0.91 | % | | | 1.00 | % | | | 276 | % |
| | $ | 6.80 | | | | 4.72 | % | | $ | 845 | | | | 1.33 | % | | | 0.98 | % | | | 0.98 | % | | | 414 | % |
| | | |
| | $ | 12.15 | | | | (0.23 | %) | | $ | 36,604 | | | | (0.04 | %) | | | 1.73 | % | | | 1.73 | % | | | 182 | % |
| | $ | 12.19 | | | | 13.03 | % | | $ | 51,060 | | | | 0.37 | % | | | 1.77 | % | | | 1.77 | % | | | 74 | % |
| | $ | 10.89 | | | | (3.97 | %) | | $ | 51,083 | | | | 0.26 | % | | | 1.89 | % | | | 1.89 | % | | | 97 | % |
| | $ | 11.48 | | | | 19.28 | % | | $ | 59,441 | | | | (0.08 | %) | | | 2.16 | % | | | 2.16 | % | | | 120 | % |
| | $ | 10.28 | | | | 6.97 | % | | $ | 124,009 | | | | 0.16 | % | | | 1.99 | % | | | 1.99 | % | | | 235 | % |
| | | |
| | $ | 12.17 | | | | 0.18 | % | | $ | 12,475 | | | | 0.32 | % | | | 1.36 | % | | | 1.36 | % | | | 182 | % |
| | $ | 12.27 | | | | 13.17 | % | | $ | 15,564 | | | | 0.63 | % | | | 1.51 | % | | | 1.51 | % | | | 74 | % |
| | $ | 10.95 | | | | (3.67 | %) | | $ | 14,486 | | | | 0.49 | % | | | 1.70 | % | | | 1.70 | % | | | 97 | % |
| | $ | 11.53 | | | | 19.65 | % | | $ | 12,921 | | | | 0.21 | % | | | 1.89 | % | | | 2.01 | % | | | 120 | % |
| | $ | 10.29 | | | | 4.49 | % | | $ | 48 | | | | 1.07 | % | | | 1.88 | % | | | 1.88 | % | | | 235 | % |
| | | |
| | $ | 12.22 | | | | 0.25 | % | | $ | 136,200 | | | | 0.33 | % | | | 1.32 | % | | | 1.33 | % | | | 182 | % |
| | $ | 12.31 | | | | 13.44 | % | | $ | 146,443 | | | | 0.77 | % | | | 1.38 | % | | | 1.40 | % | | | 74 | % |
| | $ | 10.96 | | | | (3.51 | %) | | $ | 117,166 | | | | 0.71 | % | | | 1.50 | % | | | 1.50 | % | | | 97 | % |
| | $ | 11.54 | | | | 19.75 | % | | $ | 82,513 | | | | 0.45 | % | | | 1.70 | % | | | 1.82 | % | | | 120 | % |
| | $ | 10.29 | | | | 4.52 | % | | $ | 461 | | | | 1.07 | % | | | 1.87 | % | | | 1.87 | % | | | 235 | % |
See footnotes on pages 134 and 135.
The accompanying notes are an integral part of these financial statements
2020 Annual Report | December 31, 2020 | Page 127 |
Financial Highlights
For the Periods Ended December 31, |
| | | | | | | Income
from
Investment Operations | | | Less
Distributions | |
| | Net Asset
Value,
Beginning
of Period | | | Net
Investment
Income
(Loss) (5) | | | Net gains (losses)
on securities and
futures (both realized
and unrealized) | | | Total from
Investment
Operations | | | From Net
Investment
Income | | | From Net
Capital
Gains | | | From
Return of
Capital | | | Total
Distributions | |
Global Allocation Fund - Retail Class (1)(2)(3)(4) |
2020 | | $ | 11.32 | | | | (0.02 | ) | | | 0.35 | | | | 0.33 | | | | 0.00 | | | | (0.25 | ) | | | 0.00 | | | | (0.25 | ) |
2019 | | $ | 10.22 | | | | 0.08 | | | | 1.26 | | | | 1.34 | | | | (0.04 | ) | | | (0.20 | ) | | | 0.00 | | | | (0.24 | ) |
2018 | | $ | 11.53 | | | | 0.05 | | | | (0.85 | ) | | | (0.80 | ) | | | (0.06 | ) | | | (0.45 | ) | | | 0.00 | | | | (0.51 | ) |
2017 | | $ | 9.56 | | | | 0.04 | | | | 2.09 | | | | 2.13 | | | | (0.03 | ) | | | (0.13 | ) | | | 0.00 | | | | (0.16 | ) |
2016 | | $ | 9.34 | | | | 0.09 | | | | 0.24 | | | | 0.33 | | | | (0.11 | ) | | | 0.00 | | | | 0.00 | | | | (0.11 | ) |
Global Allocation Fund - Adviser Class (1)(2)(3)(4) |
2020 | | $ | 11.35 | | | | 0.01 | | | | 0.37 | | | | 0.38 | | | | (0.06 | ) | | | (0.25 | ) | | | 0.00 | | | | (0.31 | ) |
2019 | | $ | 10.24 | | | | 0.11 | | | | 1.25 | | | | 1.36 | | | | (0.05 | ) | | | (0.20 | ) | | | 0.00 | | | | (0.25 | ) |
2018 | | $ | 11.54 | | | | 0.09 | | | | (0.86 | ) | | | (0.77 | ) | | | (0.08 | ) | | | (0.45 | ) | | | 0.00 | | | | (0.53 | ) |
2017 | | $ | 9.57 | | | | 0.15 | | | | 2.03 | | | | 2.18 | | | | (0.08 | ) | | | (0.13 | ) | | | 0.00 | | | | (0.21 | ) |
2016 (7) | | $ | 9.41 | | | | 0.06 | | | | 0.16 | | | | 0.22 | | | | (0.06 | ) | | | 0.00 | | | | 0.00 | | | | (0.06 | ) |
Global Allocation Fund - Institutional Class (1)(2)(3)(4) |
2020 | | $ | 11.36 | | | | 0.02 | | | | 0.35 | | | | 0.37 | | | | (0.10 | ) | | | (0.25 | ) | | | 0.00 | | | | (0.35 | ) |
2019 | | $ | 10.24 | | | | 0.13 | | | | 1.26 | | | | 1.39 | | | | (0.07 | ) | | | (0.20 | ) | | | 0.00 | | | | (0.27 | ) |
2018 | | $ | 11.55 | | | | 0.11 | | | | (0.86 | ) | | | (0.75 | ) | | | (0.11 | ) | | | (0.45 | ) | | | 0.00 | | | | (0.56 | ) |
2017 | | $ | 9.58 | | | | 0.12 | | | | 2.09 | | | | 2.21 | | | | (0.11 | ) | | | (0.13 | ) | | | 0.00 | | | | (0.24 | ) |
2016 (7) | | $ | 9.41 | | | | 0.06 | | | | 0.16 | | | | 0.22 | | | | (0.05 | ) | | | 0.00 | | | | 0.00 | | | | (0.05 | ) |
Balanced Fund - Retail Class (1)(2)(3)(4) |
2020 | | $ | 12.26 | | | | 0.08 | | | | 0.56 | | | | 0.64 | | | | (0.08 | ) | | | 0.00 | | | | 0.00 | | | | (0.08 | ) |
2019 | | $ | 11.08 | | | | 0.16 | | | | 1.20 | | | | 1.36 | | | | (0.09 | ) | | | (0.09 | ) | | | 0.00 | | | | (0.18 | ) |
2018 | | $ | 11.61 | | | | 0.12 | | | | (0.49 | ) | | | (0.37 | ) | | | (0.10 | ) | | | (0.06 | ) | | | 0.00 | | | | (0.16 | ) |
2017 | | $ | 10.74 | | | | 0.09 | | | | 1.49 | | | | 1.58 | | | | (0.11 | ) | | | (0.60 | ) | | | 0.00 | | | | (0.71 | ) |
2016 | | $ | 10.36 | | | | 0.11 | | | | 0.39 | | | | 0.50 | | | | (0.12 | ) | | | 0.00 | | | | 0.00 | | | | (0.12 | ) |
Balanced Fund - Adviser Class (1)(2)(3)(4) |
2020 | | $ | 12.35 | | | | 0.13 | | | | 0.56 | | | | 0.69 | | | | (0.12 | ) | | | 0.00 | | | | 0.00 | | | | (0.12 | ) |
2019 | | $ | 11.15 | | | | 0.19 | | | | 1.21 | | | | 1.40 | | | | (0.11 | ) | | | (0.09 | ) | | | 0.00 | | | | (0.20 | ) |
2018 | | $ | 11.68 | | | | 0.15 | | | | (0.49 | ) | | | (0.34 | ) | | | (0.13 | ) | | | (0.06 | ) | | | 0.00 | | | | (0.19 | ) |
2017 | | $ | 10.74 | | | | 0.13 | | | | 1.50 | | | | 1.63 | | | | (0.09 | ) | | | (0.60 | ) | | | 0.00 | | | | (0.69 | ) |
2016 (7) | | $ | 10.49 | | | | 0.04 | | | | 0.25 | | | | 0.29 | | | | (0.04 | ) | | | 0.00 | | | | 0.00 | | | | (0.04 | ) |
Balanced Fund - Institutional Class (1)(2)(3)(4) |
2020 | | $ | 12.36 | | | | 0.14 | | | | 0.55 | | | | 0.69 | | | | (0.11 | ) | | | 0.00 | | | | 0.00 | | | | (0.11 | ) |
2019 | | $ | 11.15 | | | | 0.21 | | | | 1.21 | | | | 1.42 | | | | (0.12 | ) | | | (0.09 | ) | | | 0.00 | | | | (0.21 | ) |
2018 | | $ | 11.68 | | | | 0.18 | | | | (0.51 | ) | | | (0.33 | ) | | | (0.14 | ) | | | (0.06 | ) | | | 0.00 | | | | (0.20 | ) |
2017 | | $ | 10.75 | | | | 0.16 | | | | 1.47 | | | | 1.63 | | | | (0.10 | ) | | | (0.60 | ) | | | 0.00 | | | | (0.70 | ) |
2016 (7) | | $ | 10.49 | | | | 0.04 | | | | 0.26 | | | | 0.30 | | | | (0.04 | ) | | | 0.00 | | | | 0.00 | | | | (0.04 | ) |
See footnotes on pages 134 and 135.
The accompanying notes are an integral part of these financial statements
Page 128 | 2020 Annual Report | December 31, 2020 |
| |
| |
| | | | | | | | | | Ratios/
Supplemental
Data | |
| | Net Asset
Value, End
of Period | | | Total Return
(Assumes
Reinvestment of
Distributions) | | | Net Assets,
End of Period
($000) | | | Ratio of Net
Investment
Income (Loss)
to Average
Net Assets | | | Ratio of Expenses to
Average Net Assets
After Fee Reductions (8) | | | Ratio of Expenses
to Average Net
Assets Before Fee
Reductions (9) | | | Portfolio
Turnover
Rate | |
| | | |
| | $ | 11.40 | | | | 2.96 | % | | $ | 9,001 | | | | (0.25 | %) | | | 1.74 | % | | | 1.74 | % | | | 179 | % |
| | $ | 11.32 | | | | 13.17 | % | | $ | 11,154 | | | | 0.76 | % | | | 1.68 | % | | | 1.68 | % | | | 185 | % |
| | $ | 10.22 | | | | (6.94 | %) | | $ | 13,810 | | | | 0.47 | % | | | 1.63 | % | | | 1.63 | % | | | 163 | % |
| | $ | 11.53 | | | | 22.33 | % | | $ | 35,512 | | | | 0.35 | % | | | 1.63 | % | | | 1.63 | % | | | 179 | % |
| | $ | 9.56 | | | | 3.54 | % | | $ | 75,657 | | | | 1.00 | % | | | 1.41 | % | | | 1.54 | % | | | 169 | % |
| | | |
| | $ | 11.42 | | | | 3.42 | % | | $ | 1,740 | | | | 0.09 | % | | | 1.40 | % | | | 1.40 | % | | | 179 | % |
| | $ | 11.35 | | | | 13.34 | % | | $ | 1,772 | | | | 1.01 | % | | | 1.45 | % | | | 1.45 | % | | | 185 | % |
| | $ | 10.24 | | | | (6.73 | %) | | $ | 1,624 | | | | 0.75 | % | | | 1.44 | % | | | 1.44 | % | | | 163 | % |
| | $ | 11.54 | | | | 22.84 | % | | $ | 1,057 | | | | 1.38 | % | | | 1.33 | % | | | 1.44 | % | | | 179 | % |
| | $ | 9.57 | | | | 2.34 | % | | $ | 30 | | | | 3.79 | % | | | 1.17 | % | | | 1.17 | % | | | 169 | % |
| | | |
| | $ | 11.38 | | | | 3.43 | % | | $ | 34,841 | | | | 0.17 | % | | | 1.31 | % | | | 1.31 | % | | | 179 | % |
| | $ | 11.36 | | | | 13.66 | % | | $ | 38,497 | | | | 1.19 | % | | | 1.25 | % | | | 1.25 | % | | | 185 | % |
| | $ | 10.24 | | | | (6.57 | %) | | $ | 42,976 | | | | 0.94 | % | | | 1.20 | % | | | 1.20 | % | | | 163 | % |
| | $ | 11.55 | | | | 23.07 | % | | $ | 37,369 | | | | 1.13 | % | | | 1.10 | % | | | 1.21 | % | | | 179 | % |
| | $ | 9.58 | | | | 2.34 | % | | $ | 330 | | | | 3.76 | % | | | 1.18 | % | | | 1.18 | % | | | 169 | % |
| | | |
| | $ | 12.82 | | | | 5.27 | % | | $ | 75,449 | | | | 0.65 | % | | | 1.41 | % | | | 1.41 | % | | | 189 | % |
| | $ | 12.26 | | | | 12.29 | % | | $ | 92,815 | | | | 1.34 | % | | | 1.41 | % | | | 1.41 | % | | | 180 | % |
| | $ | 11.08 | | | | (3.25 | %) | | $ | 90,133 | | | | 1.06 | % | | | 1.43 | % | | | 1.43 | % | | | 218 | % |
| | $ | 11.61 | | | | 14.74 | % | | $ | 97,116 | | | | 0.81 | % | | | 1.49 | % | | | 1.49 | % | | | 226 | % |
| | $ | 10.74 | | | | 4.84 | % | | $ | 229,738 | | | | 1.02 | % | | | 1.46 | % | | | 1.46 | % | | | 322 | % |
| | | |
| | $ | 12.92 | | | | 5.66 | % | | $ | 18,699 | | | | 1.03 | % | | | 1.04 | % | | | 1.04 | % | | | 189 | % |
| | $ | 12.35 | | | | 12.59 | % | | $ | 20,182 | | | | 1.61 | % | | | 1.14 | % | | | 1.14 | % | | | 180 | % |
| | $ | 11.15 | | | | (2.99 | %) | | $ | 19,301 | | | | 1.31 | % | | | 1.21 | % | | | 1.23 | % | | | 218 | % |
| | $ | 11.68 | | | | 15.21 | % | | $ | 12,137 | | | | 1.13 | % | | | 1.21 | % | | | 1.30 | % | | | 226 | % |
| | $ | 10.74 | | | | 2.77 | % | | $ | 89 | | | | 2.42 | % | | | 1.06 | % | | | 1.06 | % | | | 322 | % |
| | | |
| | $ | 12.94 | | | | 5.71 | % | | $ | 302,350 | | | | 1.09 | % | | | 0.98 | % | | | 1.03 | % | | | 189 | % |
| | $ | 12.36 | | | | 12.77 | % | | $ | 295,200 | | | | 1.79 | % | | | 0.96 | % | | | 1.04 | % | | | 180 | % |
| | $ | 11.15 | | | | (2.85 | %) | | $ | 239,375 | | | | 1.51 | % | | | 1.02 | % | | | 1.05 | % | | | 218 | % |
| | $ | 11.68 | | | | 15.25 | % | | $ | 169,586 | | | | 1.35 | % | | | 1.02 | % | | | 1.11 | % | | | 226 | % |
| | $ | 10.75 | | | | 2.83 | % | | $ | 219 | | | | 2.42 | % | | | 1.07 | % | | | 1.07 | % | | | 322 | % |
See footnotes on pages 134 and 135.
The accompanying notes are an integral part of these financial statements
2020 Annual Report | December 31, 2020 | Page 129 |
Financial Highlights
For the Periods Ended December 31, |
| | | | | | | Income
from
Investment Operations | | | Less
Distributions | |
| | Net Asset
Value,
Beginning
of Period | | | Net
Investment
Income
(Loss) (5) | | | Net gains (losses)
on securities and
futures (both realized
and unrealized) | | | Total from
Investment
Operations | | | From Net
Investment
Income | | | From Net
Capital
Gains | | | From
Return of
Capital | | | Total
Distributions | |
Moderate Allocation Fund - Retail Class (1)(2)(3)(4) |
2020 | | $ | 11.85 | | | | 0.13 | | | | 0.52 | | | | 0.65 | | | | (0.13 | ) | | | 0.00 | | | | 0.00 | | | | (0.13 | ) |
2019 | | $ | 10.84 | | | | 0.20 | | | | 1.00 | | | | 1.20 | | | | (0.19 | ) | | | 0.00 | | | | 0.00 | | | | (0.19 | ) |
2018 | | $ | 11.66 | | | | 0.18 | | | | (0.48 | ) | | | (0.30 | ) | | | (0.16 | ) | | | (0.36 | ) | | | 0.00 | | | | (0.52 | ) |
2017 | | $ | 10.46 | | | | 0.07 | | | | 1.60 | | | | 1.67 | | | | (0.05 | ) | | | (0.42 | ) | | | 0.00 | | | | (0.47 | ) |
2016 | | $ | 9.50 | | | | 0.16 | | | | 0.97 | | | | 1.13 | | | | (0.17 | ) | | | 0.00 | | | | 0.00 | | | | (0.17 | ) |
Moderate Allocation Fund - Adviser Class (1)(2)(3)(4) |
2020 | | $ | 11.86 | | | | 0.17 | | | | 0.53 | | | | 0.70 | | | | (0.17 | ) | | | 0.00 | | | | 0.00 | | | | (0.17 | ) |
2019 | | $ | 10.85 | | | | 0.24 | | | | 1.00 | | | | 1.24 | | | | (0.23 | ) | | | 0.00 | | | | 0.00 | | | | (0.23 | ) |
2018 | | $ | 11.66 | | | | 0.21 | | | | (0.49 | ) | | | (0.28 | ) | | | (0.17 | ) | | | (0.36 | ) | | | 0.00 | | | | (0.53 | ) |
2017 | | $ | 10.46 | | | | 0.12 | | | | 1.59 | | | | 1.71 | | | | (0.09 | ) | | | (0.42 | ) | | | 0.00 | | | | (0.51 | ) |
2016 (7) | | $ | 9.87 | | | | 0.03 | | | | 0.59 | | | | 0.62 | | | | (0.03 | ) | | | 0.00 | | | | 0.00 | | | | (0.03 | ) |
Moderate Allocation Fund - Institutional Class (1)(2)(3)(4) |
2020 | | $ | 11.89 | | | | 0.17 | | | | 0.53 | | | | 0.70 | | | | (0.17 | ) | | | 0.00 | | | | 0.00 | | | | (0.17 | ) |
2019 | | $ | 10.88 | | | | 0.25 | | | | 1.00 | | | | 1.25 | | | | (0.24 | ) | | | 0.00 | | | | 0.00 | | | | (0.24 | ) |
2018 | | $ | 11.68 | | | | 0.23 | | | | (0.48 | ) | | | (0.25 | ) | | | (0.19 | ) | | | (0.36 | ) | | | 0.00 | | | | (0.55 | ) |
2017 | | $ | 10.47 | | | | 0.14 | | | | 1.59 | | | | 1.73 | | | | (0.10 | ) | | | (0.42 | ) | | | 0.00 | | | | (0.52 | ) |
2016 (7) | | $ | 9.87 | | | | 0.03 | | | | 0.59 | | | | 0.62 | | | | (0.02 | ) | | | 0.00 | | | | 0.00 | | | | (0.02 | ) |
Conservative Allocation Fund - Retail Class (1)(2)(3)(4) |
2020 | | $ | 22.85 | | | | 0.37 | | | | 1.04 | | | | 1.41 | | | | (0.35 | ) | | | 0.00 | | | | 0.00 | | | | (0.35 | ) |
2019 | | $ | 21.18 | | | | 0.51 | | | | 1.65 | | | | 2.16 | | | | (0.49 | ) | | | 0.00 | | | | 0.00 | | | | (0.49 | ) |
2018 | | $ | 22.54 | | | | 0.46 | | | | (1.04 | ) | | | (0.58 | ) | | | (0.40 | ) | | | (0.38 | ) | | | 0.00 | | | | (0.78 | ) |
2017 | | $ | 21.32 | | | | 0.27 | | | | 1.36 | | | | 1.63 | | | | (0.41 | ) | | | 0.00 | | | | 0.00 | | | | (0.41 | ) |
2016 | | $ | 18.17 | | | | 0.11 | | | | 3.48 | | | | 3.59 | | | | 0.00 | | | | (0.20 | ) | | | (0.24 | ) | | | (0.44 | ) |
Conservative Allocation Fund - Adviser Class (1)(2)(3)(4) |
2020 | | $ | 23.13 | | | | 0.46 | | | | 1.06 | | | | 1.52 | | | | (0.44 | ) | | | 0.00 | | | | 0.00 | | | | (0.44 | ) |
2019 | | $ | 21.44 | | | | 0.57 | | | | 1.67 | | | | 2.24 | | | | (0.55 | ) | | | 0.00 | | | | 0.00 | | | | (0.55 | ) |
2018 | | $ | 22.82 | | | | 0.52 | | | | (1.08 | ) | | | (0.56 | ) | | | (0.44 | ) | | | (0.38 | ) | | | 0.00 | | | | (0.82 | ) |
2017 | | $ | 21.34 | | | | 0.36 | | | | 1.35 | | | | 1.71 | | | | (0.23 | ) | | | 0.00 | | | | 0.00 | | | | (0.23 | ) |
2016 (7) | | $ | 21.02 | | | | 0.00 | * | | | 0.55 | | | | 0.55 | | | | 0.00 | | | | (0.20 | ) | | | (0.03 | ) | | | (0.23 | ) |
Conservative Allocation Fund - Institutional Class (1)(2)(3)(4) |
2020 | | $ | 23.18 | | | | 0.46 | | | | 1.06 | | | | 1.52 | | | | (0.44 | ) | | | 0.00 | | | | 0.00 | | | | (0.44 | ) |
2019 | | $ | 21.49 | | | | 0.59 | | | | 1.68 | | | | 2.27 | | | | (0.58 | ) | | | 0.00 | | | | 0.00 | | | | (0.58 | ) |
2018 | | $ | 22.85 | | | | 0.56 | | | | (1.07 | ) | | | (0.51 | ) | | | (0.47 | ) | | | (0.38 | ) | | | 0.00 | | | | (0.85 | ) |
2017 | | $ | 21.34 | | | | 0.59 | | | | 1.14 | | | | 1.73 | | | | (0.22 | ) | | | 0.00 | | | | 0.00 | | | | (0.22 | ) |
2016 (7) | | $ | 21.02 | | | | 0.00 | * | | | 0.55 | | | | 0.55 | | | | 0.00 | | | | (0.20 | ) | | | (0.03 | ) | | | (0.23 | ) |
See footnotes on pages 134 and 135.
The accompanying notes are an integral part of these financial statements
Page 130 | 2020 Annual Report | December 31, 2020 |
| |
| |
| | | | | | | | | | Ratios/
Supplemental
Data | |
| | Net Asset
Value, End
of Period | | | Total Return
(Assumes
Reinvestment of
Distributions) | | | Net Assets,
End of Period
($000) | | | Ratio of Net
Investment
Income (Loss)
to Average
Net Assets | | | Ratio of Expenses to
Average Net Assets
After Fee Reductions (8) | | | Ratio of Expenses
to Average Net
Assets Before Fee
Reductions (9) | | | Portfolio
Turnover
Rate | |
| | | |
| | $ | 12.37 | | | | 5.55 | % | | $ | 30,930 | | | | 1.00 | % | | | 1.38 | % | | | 1.38 | % | | | 160 | % |
| | $ | 11.85 | | | | 11.13 | % | | $ | 35,460 | | | | 1.73 | % | | | 1.38 | % | | | 1.38 | % | | | 155 | % |
| | $ | 10.84 | | | | (2.60 | %) | | $ | 32,502 | | | | 1.51 | % | | | 1.39 | % | | | 1.44 | % | | | 213 | % |
| | $ | 11.66 | | | | 15.99 | % | | $ | 24,635 | | | | 0.61 | % | | | 1.67 | % | | | 1.73 | % | | | 349 | % |
| | $ | 10.46 | | | | 12.06 | % | | $ | 56,744 | | | | 1.62 | % | | | 1.61 | % | | | 1.80 | % | | | 250 | % |
| | | |
| | $ | 12.39 | | | | 6.04 | % | | $ | 9,823 | | | | 1.39 | % | | | 1.00 | % | | | 1.00 | % | | | 160 | % |
| | $ | 11.86 | | | | 11.45 | % | | $ | 10,080 | | | | 2.00 | % | | | 1.11 | % | | | 1.11 | % | | | 155 | % |
| | $ | 10.85 | | | | (2.47 | %) | | $ | 9,480 | | | | 1.78 | % | | | 1.19 | % | | | 1.24 | % | | | 213 | % |
| | $ | 11.66 | | | | 16.40 | % | | $ | 3,538 | | | | 1.03 | % | | | 1.35 | % | | | 1.50 | % | | | 349 | % |
| | $ | 10.46 | | | | 6.32 | % | | $ | 22 | | | | 1.92 | % | | | 1.21 | % | | | 1.21 | % | | | 250 | % |
| | | |
| | $ | 12.42 | | | | 6.02 | % | | $ | 135,512 | | | | 1.40 | % | | | 0.99 | % | | | 0.99 | % | | | 160 | % |
| | $ | 11.89 | | | | 11.52 | % | | $ | 132,500 | | | | 2.10 | % | | | 1.01 | % | | | 1.01 | % | | | 155 | % |
| | $ | 10.88 | | | | (2.20 | %) | | $ | 119,881 | | | | 1.97 | % | | | 1.01 | % | | | 1.05 | % | | | 213 | % |
| | $ | 11.68 | | | | 16.55 | % | | $ | 37,945 | | | | 1.29 | % | | | 1.13 | % | | | 1.28 | % | | | 349 | % |
| | $ | 10.47 | | | | 6.31 | % | | $ | 229 | | | | 1.92 | % | | | 1.24 | % | | | 1.24 | % | | | 250 | % |
| | | |
| | $ | 23.91 | | | | 6.28 | % | | $ | 29,034 | | | | 1.46 | % | | | 1.28 | % | | | 1.28 | % | | | 139 | % |
| | $ | 22.85 | | | | 10.25 | % | | $ | 31,688 | | | | 2.19 | % | | | 1.28 | % | | | 1.28 | % | | | 136 | % |
| | $ | 21.18 | | | | (2.62 | %) | | $ | 30,759 | | | | 2.09 | % | | | 1.27 | % | | | 1.38 | % | | | 185 | % |
| | $ | 22.54 | | | | 7.64 | % | | $ | 12,545 | | | | 1.24 | % | | | 1.70 | % | | | 2.57 | % | | | 135 | % |
| | $ | 21.32 | | | | 19.87 | % | | $ | 20,450 | | | | 0.55 | % | | | 2.17 | % | | | 2.55 | % | | | 44 | % |
| | | |
| | $ | 24.21 | | | | 6.69 | % | | $ | 7,082 | | | | 1.85 | % | | | 0.92 | % | | | 0.92 | % | | | 139 | % |
| | $ | 23.13 | | | | 10.51 | % | | $ | 6,787 | | | | 2.44 | % | | | 1.04 | % | | | 1.04 | % | | | 136 | % |
| | $ | 21.44 | | | | (2.50 | %) | | $ | 6,110 | | | | 2.29 | % | | | 1.12 | % | | | 1.22 | % | | | 185 | % |
| | $ | 22.82 | | | | 8.01 | % | | $ | 682 | | | | 1.63 | % | | | 1.07 | % | | | 1.97 | % | | | 135 | % |
| | $ | 21.34 | | | | 2.64 | % | | $ | 7 | | | | 0.11 | % | | | 1.93 | % | | | 2.18 | % | | | 44 | % |
| | | |
| | $ | 24.26 | | | | 6.68 | % | | $ | 105,403 | | | | 1.87 | % | | | 0.92 | % | | | 0.92 | % | | | 139 | % |
| | $ | 23.18 | | | | 10.61 | % | | $ | 99,456 | | | | 2.54 | % | | | 0.94 | % | | | 0.94 | % | | | 136 | % |
| | $ | 21.49 | | | | (2.28 | %) | | $ | 92,412 | | | | 2.50 | % | | | 0.92 | % | | | 1.04 | % | | | 185 | % |
| | $ | 22.85 | | | | 8.10 | % | | $ | 11,739 | | | | 2.65 | % | | | 0.49 | % | | | 1.39 | % | | | 135 | % |
| | $ | 21.34 | | | | 2.62 | % | | $ | 305 | | | | 0.08 | % | | | 1.96 | % | | | 2.21 | % | | | 44 | % |
See footnotes on pages 134 and 135.
The accompanying notes are an integral part of these financial statements
2020 Annual Report | December 31, 2020 | Page 131 |
Financial Highlights
For the Periods Ended December 31, |
| | | | | | | Income
from
Investment Operations | | | Less
Distributions | |
| | Net Asset
Value,
Beginning
of Period | | | Net
Investment
Income
(Loss) (5) | | | Net gains (losses)
on securities and
futures (both realized
and unrealized) | | | Total from
Investment
Operations | | | From Net
Investment
Income | | | From Net
Capital
Gains | | | From
Return of
Capital | | | Total
Distributions | |
Dynamic Allocation Fund - Retail Class (1)(2)(3)(4) |
2020 | | $ | 11.87 | | | | 0.03 | | | | 1.79 | | | | 1.82 | | | | (0.03 | ) | | | (0.27 | ) | | | 0.00 | | | | (0.30 | ) |
2019 | | $ | 9.79 | | | | 0.11 | | | | 2.23 | | | | 2.34 | | | | (0.08 | ) | | | (0.18 | ) | | | 0.00 | | | | (0.26 | ) |
2018 | | $ | 10.85 | | | | 0.07 | | | | (1.00 | ) | | | (0.93 | ) | | | (0.06 | ) | | | (0.07 | ) | | | 0.00 | | | | (0.13 | ) |
2017 | | $ | 9.72 | | | | 0.06 | | | | 1.99 | | | | 2.05 | | | | (0.07 | ) | | | (0.85 | ) | | | 0.00 | | | | (0.92 | ) |
2016 | | $ | 9.36 | | | | 0.10 | | | | 0.40 | | | | 0.50 | | | | (0.09 | ) | | | (0.05 | ) | | | 0.00 | | | | (0.14 | ) |
Dynamic Allocation Fund - Adviser Class (1)(2)(3)(4) |
2020 | | $ | 11.91 | | | | 0.07 | | | | 1.81 | | | | 1.88 | | | | (0.06 | ) | | | (0.27 | ) | | | 0.00 | | | | (0.33 | ) |
2019 | | $ | 9.82 | | | | 0.13 | | | | 2.24 | | | | 2.37 | | | | (0.10 | ) | | | (0.18 | ) | | | 0.00 | | | | (0.28 | ) |
2018 | | $ | 10.88 | | | | 0.09 | | | | (1.00 | ) | | | (0.91 | ) | | | (0.08 | ) | | | (0.07 | ) | | | 0.00 | | | | (0.15 | ) |
2017 | | $ | 9.73 | | | | 0.10 | | | | 1.97 | | | | 2.07 | | | | (0.07 | ) | | | (0.85 | ) | | | 0.00 | | | | (0.92 | ) |
2016 (7) | | $ | 9.34 | | | | 0.02 | | | | 0.44 | | | | 0.46 | | | | (0.02 | ) | | | (0.05 | ) | | | 0.00 | | | | (0.07 | ) |
Dynamic Allocation Fund - Institutional Class (1)(2)(3)(4) |
2020 | | $ | 11.90 | | | | 0.08 | | | | 1.80 | | | | 1.88 | | | | (0.06 | ) | | | (0.27 | ) | | | 0.00 | | | | (0.33 | ) |
2019 | | $ | 9.82 | | | | 0.15 | | | | 2.23 | | | | 2.38 | | | | (0.12 | ) | | | (0.18 | ) | | | 0.00 | | | | (0.30 | ) |
2018 | | $ | 10.86 | | | | 0.12 | | | | (1.00 | ) | | | (0.88 | ) | | | (0.09 | ) | | | (0.07 | ) | | | 0.00 | | | | (0.16 | ) |
2017 | | $ | 9.72 | | | | 0.12 | | | | 1.97 | | | | 2.09 | | | | (0.10 | ) | | | (0.85 | ) | | | 0.00 | | | | (0.95 | ) |
2016 (7) | | $ | 9.34 | | | | 0.02 | | | | 0.43 | | | | 0.45 | | | | (0.02 | ) | | | (0.05 | ) | | | 0.00 | | | | (0.07 | ) |
Quantex Fund - Retail Class (1)(2)(3)(4) |
2020 | | $ | 37.91 | | | | 0.20 | | | | (2.28 | ) | | | (2.08 | ) | | | (0.19 | ) | | | 0.00 | | | | 0.00 | | | | (0.19 | ) |
2019 | | $ | 32.22 | | | | 0.19 | | | | 5.75 | | | | 5.94 | | | | (0.25 | ) | | | 0.00 | | | | 0.00 | | | | (0.25 | ) |
2018 | | $ | 36.76 | | | | (0.01 | ) | | | (4.53 | ) | | | (4.54 | ) | | | 0.00 | | | | 0.00 | | | | 0.00 | | | | 0.00 | |
2017 | | $ | 33.36 | | | | 0.09 | | | | 4.38 | | | | 4.47 | | | | (0.06 | ) | | | (1.01 | ) | | | 0.00 | | | | (1.07 | ) |
2016 | | $ | 27.84 | | | | 0.14 | | | | 6.02 | | | | 6.16 | | | | (0.16 | ) | | | (0.48 | ) | | | 0.00 | | | | (0.64 | ) |
Quantex Fund - Adviser Class (1)(2)(3)(4) |
2020 | | $ | 38.01 | | | | 0.23 | | | | (2.28 | ) | | | (2.05 | ) | | | (0.21 | ) | | | 0.00 | | | | 0.00 | | | | (0.21 | ) |
2019 | | $ | 32.28 | | | | 0.24 | | | | 5.76 | | | | 6.00 | | | | (0.27 | ) | | | 0.00 | | | | 0.00 | | | | (0.27 | ) |
2018 | | $ | 36.78 | | | | 0.10 | | | | (4.60 | ) | | | (4.50 | ) | | | 0.00 | | | | 0.00 | | | | 0.00 | | | | 0.00 | |
2017 | | $ | 33.37 | | | | 0.21 | | | | 4.35 | | | | 4.56 | | | | (0.14 | ) | | | (1.01 | ) | | | 0.00 | | | | (1.15 | ) |
2016 (7) | | $ | 30.67 | | | | 0.04 | | | | 3.18 | | | | 3.22 | | | | (0.04 | ) | | | (0.48 | ) | | | 0.00 | | | | (0.52 | ) |
Quantex - Institutional Class (1)(2)(3)(4) |
2020 | | $ | 38.01 | | | | 0.26 | | | | (2.31 | ) | | | (2.05 | ) | | | (0.26 | ) | | | 0.00 | | | | 0.00 | | | | (0.26 | ) |
2019 | | $ | 32.29 | | | | 0.29 | | | | 5.77 | | | | 6.06 | | | | (0.34 | ) | | | 0.00 | | | | 0.00 | | | | (0.34 | ) |
2018 | | $ | 36.77 | | | | 0.20 | | | | (4.62 | ) | | | (4.42 | ) | | | (0.06 | ) | | | 0.00 | | | | 0.00 | | | | (0.06 | ) |
2017 | | $ | 33.37 | | | | 0.26 | | | | 4.35 | | | | 4.61 | | | | (0.20 | ) | | | (1.01 | ) | | | 0.00 | | | | (1.21 | ) |
2016 (7) | | $ | 30.67 | | | | 0.04 | | | | 3.18 | | | | 3.22 | | | | (0.04 | ) | | | (0.48 | ) | | | 0.00 | | | | (0.52 | ) |
See footnotes on pages 134 and 135.
The accompanying notes are an integral part of these financial statements
Page 132 | 2020 Annual Report | December 31, 2020 |
| |
| |
| | | | | | | | | | Ratios/
Supplemental
Data | |
| | Net Asset
Value, End
of Period | | | Total Return
(Assumes
Reinvestment of
Distributions) | | | Net Assets,
End of Period
($000) | | | Ratio of Net
Investment
Income (Loss)
to Average
Net Assets | | | Ratio of Expenses to
Average Net Assets
After Fee Reductions (8) | | | Ratio of Expenses
to Average Net
Assets Before Fee
Reductions (9) | | | Portfolio
Turnover
Rate | |
| | | | | | | | | | | | | | | | | | | | | | | | | | | | |
| | $ | 13.39 | | | | 15.37 | % | | $ | 37,392 | | | | 0.27 | % | | | 1.41 | % | | | 1.51 | % | | | 236 | % |
| | $ | 11.87 | | | | 24.00 | % | | $ | 40,977 | | | | 0.97 | % | | | 1.41 | % | | | 1.51 | % | | | 265 | % |
| | $ | 9.79 | | | | (8.66 | %) | | $ | 40,732 | | | | 0.62 | % | | | 1.45 | % | | | 1.55 | % | | | 273 | % |
| | $ | 10.85 | | | | 21.20 | % | | $ | 50,570 | | | | 0.59 | % | | | 1.51 | % | | | 1.58 | % | | | 252 | % |
| | $ | 9.72 | | | | 5.37 | % | | $ | 118,293 | | | | 1.04 | % | | | 1.42 | % | | | 1.56 | % | | | 369 | % |
| | | |
| | $ | 13.46 | | | | 15.85 | % | | $ | 13,322 | | | | 0.61 | % | | | 1.06 | % | | | 1.16 | % | | | 236 | % |
| | $ | 11.91 | | | | 24.29 | % | | $ | 13,137 | | | | 1.20 | % | | | 1.18 | % | | | 1.28 | % | | | 265 | % |
| | $ | 9.82 | | | | (8.49 | %) | | $ | 11,198 | | | | 0.84 | % | | | 1.23 | % | | | 1.33 | % | | | 273 | % |
| | $ | 10.88 | | | | 21.42 | % | | $ | 10,140 | | | | 0.87 | % | | | 1.27 | % | | | 1.34 | % | | | 252 | % |
| | $ | 9.73 | | | | 4.89 | % | | $ | 48 | | | | 1.33 | % | | | 1.12 | % | | | 1.12 | % | | | 369 | % |
| | | |
| | $ | 13.45 | | | | 15.94 | % | | $ | 148,566 | | | | 0.67 | % | | | 1.01 | % | | | 1.11 | % | | | 236 | % |
| | $ | 11.90 | | | | 24.40 | % | | $ | 146,119 | | | | 1.38 | % | | | 1.00 | % | | | 1.10 | % | | | 265 | % |
| | $ | 9.82 | | | | (8.18 | %) | | $ | 121,965 | | | | 1.08 | % | | | 1.01 | % | | | 1.11 | % | | | 273 | % |
| | $ | 10.86 | | | | 21.61 | % | | $ | 70,187 | | | | 1.10 | % | | | 1.05 | % | | | 1.12 | % | | | 252 | % |
| | $ | 9.72 | | | | 4.80 | % | | $ | 592 | | | | 1.33 | % | | | 1.11 | % | | | 1.11 | % | | | 369 | % |
| | | |
| | $ | 35.64 | | | | (5.36 | %) | | $ | 18,352 | | | | 0.65 | % | | | 1.53 | % | | | 1.53 | % | | | 88 | % |
| | $ | 37.91 | | | | 18.48 | % | | $ | 24,979 | | | | 0.52 | % | | | 1.53 | % | | | 1.53 | % | | | 82 | % |
| | $ | 32.22 | | | | (12.35 | %) | | $ | 28,319 | | | | (0.03 | %) | | | 1.57 | % | | | 1.62 | % | | | 116 | % |
| | $ | 36.76 | | | | 13.42 | % | | $ | 60,161 | | | | 0.27 | % | | | 1.52 | % | | | 1.66 | % | | | 72 | % |
| | $ | 33.36 | | | | 22.14 | % | | $ | 85,235 | | | | 0.47 | % | | | 1.52 | % | | | 1.77 | % | | | 91 | % |
| | | |
| | $ | 35.75 | | | | (5.25 | %) | | $ | 986 | | | | 0.77 | % | | | 1.41 | % | | | 1.41 | % | | | 88 | % |
| | $ | 38.01 | | | | 18.63 | % | | $ | 1,113 | | | | 0.67 | % | | | 1.41 | % | | | 1.41 | % | | | 82 | % |
| | $ | 32.28 | | | | (12.22 | %) | | $ | 923 | | | | 0.28 | % | | | 1.42 | % | | | 1.47 | % | | | 116 | % |
| | $ | 36.78 | | | | 13.68 | % | | $ | 2,114 | | | | 0.59 | % | | | 1.39 | % | | | 1.56 | % | | | 72 | % |
| | $ | 33.37 | | | | 10.48 | % | | $ | 31 | | | | 0.75 | % | | | 1.15 | % | | | 1.40 | % | | | 91 | % |
| | | |
| | $ | 35.70 | | | | (5.22 | %) | | $ | 20,756 | | | | 0.85 | % | | | 1.37 | % | | | 1.37 | % | | | 88 | % |
| | $ | 38.01 | | | | 18.81 | % | | $ | 36,646 | | | | 0.82 | % | | | 1.25 | % | | | 1.25 | % | | | 82 | % |
| | $ | 32.29 | | | | (12.05 | %) | | $ | 35,414 | | | | 0.54 | % | | | 1.21 | % | | | 1.26 | % | | | 116 | % |
| | $ | 36.77 | | | | 13.84 | % | | $ | 32,489 | | | | 0.75 | % | | | 1.18 | % | | | 1.35 | % | | | 72 | % |
| | $ | 33.37 | | | | 10.48 | % | | $ | 951 | | | | 0.75 | % | | | 1.15 | % | | | 1.40 | % | | | 91 | % |
See footnotes on pages 134 and 135.
The accompanying notes are an integral part of these financial statements
2020 Annual Report | December 31, 2020 | Page 133 |
Financial Highlights
For the Periods Ended December 31, |
| | | | | | | Income
from
Investment Operations | | | Less
Distributions | |
| | Net Asset
Value,
Beginning
of Period | | | Net
Investment
Income
(Loss) (5) | | | Net gains (losses)
on securities and
futures (both realized
and unrealized) | | | Total from
Investment
Operations | | | From Net
Investment
Income | | | From Net
Capital
Gains | | | From
Return of
Capital | | | Total
Distributions | |
Total Return Bond Fund - Retail Class (1)(2)(3)(4) |
2020 | | $ | 9.46 | | | | 0.21 | | | | 0.49 | | | | 0.70 | | | | (0.18 | ) | | | 0.00 | | | | 0.00 | | | | (0.18 | ) |
2019 | | $ | 9.03 | | | | 0.23 | | | | 0.42 | | | | 0.65 | | | | (0.22 | ) | | | 0.00 | | | | 0.00 | | | | (0.22 | ) |
2018 | | $ | 9.37 | | | | 0.17 | | | | (0.33 | ) | | | (0.16 | ) | | | (0.18 | ) | | | 0.00 | | | | 0.00 | | | | (0.18 | ) |
2017 | | $ | 9.28 | | | | 0.24 | | | | 0.10 | | | | 0.34 | | | | (0.25 | ) | | | 0.00 | | | | 0.00 | | | | (0.25 | ) |
2016 | | $ | 9.14 | | | | 0.27 | | | | 0.14 | | | | 0.41 | | | | (0.27 | ) | | | 0.00 | | | | 0.00 | | | | (0.27 | ) |
Total Return Bond Fund - Adviser Class (1)(2)(3)(4) |
2020 | | $ | 9.47 | | | | 0.25 | | | | 0.49 | | | | 0.74 | | | | (0.22 | ) | | | 0.00 | | | | 0.00 | | | | (0.22 | ) |
2019 | | $ | 9.04 | | | | 0.26 | | | | 0.42 | | | | 0.68 | | | | (0.25 | ) | | | 0.00 | | | | 0.00 | | | | (0.25 | ) |
2018 | | $ | 9.38 | | | | 0.21 | | | | (0.35 | ) | | | (0.14 | ) | | | (0.20 | ) | | | 0.00 | | | | 0.00 | | | | (0.20 | ) |
2017 | | $ | 9.28 | | | | 0.28 | | | | 0.10 | | | | 0.38 | | | | (0.28 | ) | | | 0.00 | | | | 0.00 | | | | (0.28 | ) |
2016 (7) | | $ | 9.46 | | | | 0.09 | | | | (0.19 | ) | | | (0.10 | ) | | | (0.08 | ) | | | 0.00 | | | | 0.00 | | | | (0.08 | ) |
Total Return Bond Fund - Institutional Class (1)(2)(3)(4) |
2020 | | $ | 9.47 | | | | 0.24 | | | | 0.50 | | | | 0.74 | | | | (0.22 | ) | | | 0.00 | | | | 0.00 | | | | (0.22 | ) |
2019 | | $ | 9.04 | | | | 0.27 | | | | 0.42 | | | | 0.69 | | | | (0.26 | ) | | | 0.00 | | | | 0.00 | | | | (0.26 | ) |
2018 | | $ | 9.38 | | | | 0.23 | | | | (0.35 | ) | | | (0.12 | ) | | | (0.22 | ) | | | 0.00 | | | | 0.00 | | | | (0.22 | ) |
2017 | | $ | 9.28 | | | | 0.31 | | | | 0.08 | | | | 0.39 | | | | (0.29 | ) | | | 0.00 | | | | 0.00 | | | | (0.29 | ) |
2016 (7) | | $ | 9.46 | | | | 0.08 | | | | (0.18 | ) | | | (0.10 | ) | | | (0.08 | ) | | | 0.00 | | | | 0.00 | | | | (0.08 | ) |
Prime Money Market Fund (1)(2)(3)(4) |
2020 | | $ | 1.00 | | | | 0.005 | | | | N/A | | | | 0.005 | | | | (0.004 | ) | | | 0.000 | | | | 0.000 | | | | (0.004 | ) |
2019 | | $ | 1.00 | | | | 0.020 | | | | N/A | | | | 0.020 | | | | (0.020 | ) | | | 0.000 | | | | 0.000 | | | | (0.020 | ) |
2018 | | $ | 1.00 | | | | 0.016 | | | | N/A | | | | 0.016 | | | | (0.016 | ) | | | 0.000 | | | | 0.000 | | | | (0.016 | ) |
2017 | | $ | 1.00 | | | | 0.007 | | | | N/A | | | | 0.007 | | | | (0.007 | ) | | | 0.000 | | | | 0.000 | | | | (0.007 | ) |
2016 | | $ | 1.00 | | | | 0.003 | | | | N/A | | | | 0.003 | | | | (0.003 | ) | | | 0.000 | | | | 0.000 | | | | (0.003 | ) |
Institutional Prime Money Market Fund (1)(2)(3)(4) |
2020 | | $ | 1.0000 | | | | 0.0058 | | | | (0.0005 | ) | | | 0.0053 | | | | (0.0050 | ) | | | 0.0000 | | | | 0.0000 | | | | (0.0050 | ) |
2019 | | $ | 0.9999 | | | | 0.0231 | | | | 0.0000 | | | | 0.0231 | | | | (0.0230 | ) | | | 0.0000 | | | | 0.0000 | | | | (0.0230 | ) |
2018 | | $ | 0.9999 | | | | 0.0190 | | | | 0.0000 | | | | 0.0190 | | | | (0.0190 | ) | | | 0.0000 | | | | 0.0000 | | | | (0.0190 | ) |
2017 | | $ | 1.0001 | | | | 0.0101 | | | | (0.0003 | ) | | | 0.0098 | | | | (0.0100 | ) | | | 0.0000 | | | | 0.0000 | | | | (0.0100 | ) |
2016 (6) | | $ | 1.0000 | | | | 0.0010 | | | | 0.0001 | | | | 0.0011 | | | | (0.0010 | ) | | | 0.0000 | | | | 0.0000 | | | | (0.0010 | ) |
1 | Ratio of net investment income (loss) to average net assets, ratio of expenses to average net assets after fee reductions, and ratio of expenses to average net assets before fee reductions do not include impact of expenses of the underlying security holdings as represented in the schedule of investments. |
2 | Recognition of net investment income by the Fund is affected by the timing of the declaration of dividends by the underlying investment companies in which the Fund invests. |
3 | Total return and portfolio turnover rate are not annualized for periods of less than one full year. |
4 | Ratio of net investment income (loss) to average net assets, ratio of expenses to average net assets after fee reductions, and ratio of expenses to average net assets before fee reductions are annualized for periods of less than one full year. |
5 | Except for the Money Market Funds, net investment income per share is based on average shares outstanding during the period. |
The accompanying notes are an integral part of these financial statements
Page 134 | 2020 Annual Report | December 31, 2020 |
| |
| |
| | | | | | | | | | Ratios/
Supplemental
Data | |
| | Net Asset
Value, End
of Period | | | Total Return
(Assumes
Reinvestment of
Distributions) | | | Net Assets,
End of Period
($000) | | | Ratio of Net
Investment
Income (Loss)
to Average
Net Assets | | | Ratio of Expenses to
Average Net Assets
After Fee Reductions (8) | | | Ratio of Expenses
to Average Net
Assets Before Fee
Reductions (9) | | | Portfolio
Turnover
Rate | |
| | | | | | | | | | | | | | | | | | | | | | | | | | | | |
| | $ | 9.98 | | | | 7.46 | % | | $ | 12,231 | | | | 1.87 | % | | | 1.15 | % | | | 1.26 | % | | | 69 | % |
| | $ | 9.46 | | | | 7.24 | % | | $ | 11,137 | | | | 2.27 | % | | | 1.14 | % | | | 1.25 | % | | | 95 | % |
| | $ | 9.03 | | | | (1.67 | %) | | $ | 14,932 | | | | 1.88 | % | | | 1.15 | % | | | 1.26 | % | | | 102 | % |
| | $ | 9.37 | | | | 3.72 | % | | $ | 67,986 | | | | 2.59 | % | | | 1.02 | % | | | 1.03 | % | | | 133 | % |
| | $ | 9.28 | | | | 4.49 | % | | $ | 214,755 | | | | 2.87 | % | | | 0.98 | % | | | 1.00 | % | | | 217 | % |
| | | |
| | $ | 9.99 | | | | 7.86 | % | | $ | 5,463 | | | | 2.28 | % | | | 0.79 | % | | | 0.90 | % | | | 69 | % |
| | $ | 9.47 | | | | 7.54 | % | | $ | 4,205 | | | | 2.64 | % | | | 0.88 | % | | | 0.99 | % | | | 95 | % |
| | $ | 9.04 | | | | (1.45 | %) | | $ | 3,570 | | | | 2.33 | % | | | 0.95 | % | | | 1.06 | % | | | 102 | % |
| | $ | 9.38 | | | | 4.07 | % | | $ | 9,896 | | | | 2.95 | % | | | 0.83 | % | | | 0.84 | % | | | 133 | % |
| | $ | 9.28 | | | | (1.05 | %) | | $ | 84 | | | | 5.49 | % | | | 0.53 | % | | | 0.53 | % | | | 217 | % |
| | | |
| | $ | 9.99 | | | | 7.86 | % | | $ | 50,410 | | | | 2.25 | % | | | 0.77 | % | | | 0.88 | % | | | 69 | % |
| | $ | 9.47 | | | | 7.67 | % | | $ | 46,490 | | | | 2.72 | % | | | 0.76 | % | | | 0.87 | % | | | 95 | % |
| | $ | 9.04 | | | | (1.22 | %) | | $ | 48,437 | | | | 2.50 | % | | | 0.76 | % | | | 0.87 | % | | | 102 | % |
| | $ | 9.38 | | | | 4.20 | % | | $ | 110,674 | | | | 3.27 | % | | | 0.64 | % | | | 0.65 | % | | | 133 | % |
| | $ | 9.28 | | | | (1.08 | %) | | $ | 70 | | | | 5.35 | % | | | 0.53 | % | | | 0.53 | % | | | 217 | % |
| | | |
| | $ | 1.00 | | | | 0.45 | % | | $ | 34,578 | | | | 0.45 | % | | | 0.28 | % | | | 0.91 | % | | | N/A | |
| | $ | 1.00 | | | | 2.06 | % | | $ | 34,823 | | | | 2.05 | % | | | 0.36 | % | | | 0.95 | % | | | N/A | |
| | $ | 1.00 | | | | 1.59 | % | | $ | 40,881 | | | | 1.59 | % | | | 0.44 | % | | | 0.94 | % | | | N/A | |
| | $ | 1.00 | | | | 0.68 | % | | $ | 35,211 | | | | 0.67 | % | | | 0.47 | % | | | 1.00 | % | | | N/A | |
| | $ | 1.00 | | | | 0.29 | % | | $ | 36,666 | | | | 0.28 | % | | | 0.32 | % | | | 0.69 | % | | | N/A | |
| | | |
| | $ | 1.0003 | | | | 0.57 | % | | $ | 336,445 | | | | 0.57 | % | | | 0.15 | % | | | 0.52 | % | | | N/A | |
| | $ | 1.0000 | | | | 2.31 | % | | $ | 370,120 | | | | 2.30 | % | | | 0.13 | % | | | 0.50 | % | | | N/A | |
| | $ | 0.9999 | | | | 1.90 | % | | $ | 471,603 | | | | 1.90 | % | | | 0.16 | % | | | 0.51 | % | | | N/A | |
| | $ | 0.9999 | | | | 0.96 | % | | $ | 296,547 | | | | 1.01 | % | | | 0.17 | % | | | 0.56 | % | | | N/A | |
| | $ | 1.0001 | | | | 0.11 | % | | $ | 197,480 | | | | 0.43 | % | | | 0.24 | % | | | 0.62 | % | | | N/A | |
6 | Commenced operations on October 7, 2016. |
7 | Commenced operations on October 31, 2016. |
8 | Ratio of expenses to average net assets after fee reductions reflects contractual or voluntary waivers and reimbursements of expenses by the investment adviser and transfer agent. |
9 | Ratio of expenses to average net assets before fee reductions reflects the total expenses before reductions reported in the statements of operations. |
* | Actual amounts were less than one-half of a cent per share |
The accompanying notes are an integral part of these financial statements
2020 Annual Report | December 31, 2020 | Page 135 |
Notes to Financial Statements
December 31, 2020
1. Organization
Meeder Funds (the Trust) is organized as a Massachusetts business trust and is registered under the Investment Company Act of 1940, as amended (the 1940 Act), as a diversified, open-end management investment company. The Trust offers eleven separate series, all of which are included in this report: Muirfield Fund (Muirfield), Spectrum Fund (Spectrum), Global Allocation Fund (Global), Balanced Fund (Balanced), Moderate Allocation Fund (Moderate), Conservative Allocation Fund (Conservative), Dynamic Allocation Fund (Dynamic), Quantex Fund (Quantex), Total Return Bond Fund (Bond), Prime Money Market Fund (Prime Money Market), and Institutional Prime Money Market Fund (Institutional Prime Money Market)(the Funds).
Each Fund, except Prime Money Market and Institutional Prime Money Market, offers three classes of shares: Retail Class, Adviser Class, and Institutional Class. Prime Money Market and Institutional Prime Money Market offer only one class of shares. The share classes differ with respect to distribution fees, service fees, and other expenses allocated to each class. Eligibility to purchase Adviser and Institutional Class shares is generally limited to customers of financial intermediaries who enter into special arrangements with the Funds or who meet certain initial investment minimums.
Prime Money Market operates as a retail money market fund. The Fund maintains a stable net asset value of $1.00 and is only available for purchase in accounts beneficially owned by natural persons. Institutional Prime Money Market operates as an institutional money market fund open to all forms of investors. Its net asset value fluctuates based upon changes in the value of its investments and the value of its shares is calculated daily to four decimal places. Prime Money Market and Institutional Prime Money Market have adopted policies and procedures to impose liquidity fees on redemptions or temporary redemption gates in the event that the Funds’ weekly liquid assets fall below designated thresholds and the Board of Trustees determines that such liquidity fees or redemption gates are in the best interests of the Fund.
For more information regarding the Funds’ objectives, strategies, and differences in share classes, please refer to the Funds’ prospectus.
2. Significant Accounting Policies
The Funds’ financial statements are prepared in conformity with accounting principles generally accepted in the United States of America (GAAP), which require management to make certain estimates and assumptions that affect the reported amounts of assets and liabilities and disclosure of contingent assets and liabilities at the date of the financial statements. The Trust is an investment company and applies the accounting and reporting guidance of the Financial Accounting Standards Board (FASB) Accounting Standards Codification Topic 946 Financial Services Companies. The following summarizes the significant accounting policies of the Trust and the Funds:
Securities valuation. All investments in securities are recorded at their estimated fair value, as described in Note #3.
Repurchase agreements. Each Fund may engage in repurchase agreement transactions whereby the Fund takes possession of an underlying debt instrument subject to an obligation of the seller to repurchase the instrument from the Fund and an obligation of the Fund to resell the instrument at an agreed upon price and term. At all times, the Fund maintains the fair value of collateral, including accrued interest, of at least 100% of the amount of the repurchase agreement, plus accrued interest. If the seller defaults or the fair value of the collateral declines, realization of the collateral by the Fund may be delayed or limited.
Short sales. Spectrum may enter into short sales as part of its overall portfolio management strategy or to offset a potential decline in value of a security. The Fund may engage in short sales with respect to various types of securities, including ETFs. A short sale involves the sale of a security that is borrowed from a broker or other institution to complete the sale. The Fund may engage in short sales with respect to securities it owns, as well as securities that it does not own. Short sales expose the Fund to the risk that it will be required to acquire, convert, or exchange securities to replace the borrowed securities (also known as “covering” the short position) at a time when the securities sold short have appreciated in value, thus resulting in a loss to the Fund. The Fund’s investment performance may also suffer if the Fund is required to close out a short position earlier than it had intended. The Fund must segregate assets determined to be liquid in accordance with procedures established by the Board, or otherwise cover its position in a permissible manner. The Fund will be required to pledge its liquid assets to the broker in order to secure its performance on short sales. As a result, the assets pledged may not be available to meet the Fund’s needs for immediate cash or other liquidity. In addition, the Fund may be subject to expenses related to short sales that are not typically associated with investing in securities directly, such as costs of borrowing and margin account maintenance costs associated with the Fund’s open short positions. These types of short sales expenses are sometimes referred to as the “negative cost of carry,” and will tend to cause the Fund to lose money on a short sale even in instances where the price of the underlying security sold short does not change over the duration of the short sale. Dividend expenses on securities sold short and borrowing costs will be borne by the Fund and are reflected in the Statements of Operations.
Futures & options. Each Fund, except the Money Market Funds, may engage in transactions in financial futures contracts and options contracts in order to manage the risk of unanticipated changes in market values of securities held in the Fund, or which it intends to purchase. The futures and options contracts are adjusted by the daily exchange rate of the underlying currency, or index, and any gains or losses are recorded for financial statement purposes as unrealized gains or losses in the Statements of Assets and Liabilities and the Statements of Operations until the contract settlement date, at which time amounts are reflected as realized gains and losses in the Statements of Operations.
Page 136 | 2020 Annual Report | December 31, 2020 |
To the extent that a Fund enters into futures contracts on an index or group of securities, the Fund exposes itself to an indeterminate liability and will be required to pay or receive a sum of money measured by the change in the fair value of the index. Upon entering into a futures contract, the Fund is required to deposit an initial margin, which is either cash or securities (disclosed as pledged as collateral on the Schedules of Investments) in an amount equal to a certain percentage of the contract value. Subsequently, margin movements, which are equal to changes in the daily price or last sale price on the exchanges where futures contracts trade, are recorded as unrealized gains or losses until the contract is closed. When the contract is closed, the Fund records a realized gain or loss equal to the difference between the proceeds from (or cost of) the closing transaction and the Fund’s basis in the contract. Should market conditions move unexpectedly, the Fund may not achieve the anticipated benefits of the futures contract and may realize a loss. The use of futures transactions involves the risk of imperfect correlation in movements in the price of futures contracts, interest rates, and the underlying hedged assets. With futures, there is minimal counterparty credit risk to the Fund since futures are exchange traded and the exchange’s clearinghouse, as counterparty to all exchange traded futures, guarantees the futures against default. Except for the Money Market Funds, it is normal practice for each Fund to invest in futures contracts on a daily basis. The Funds, except for Bond and the Money Market Funds, typically utilize equity index futures contracts to equitize cash positions or adjust targeted stock market exposure. Except for the Money Market Funds, the fixed income portion of any Fund can utilize Treasury futures contracts in order to adjust duration.
Call and put option contracts involve the payment of a premium for the right to purchase or sell an individual security or index aggregate at a specified price until the expiration of the contract. Such transactions expose the Fund to the loss of the premium paid if the Fund does not sell or exercise the contract prior to the expiration date. In the case of a call option, sufficient cash or money market instruments will be segregated to complete the purchase. Options are fair valued on the basis of the daily settlement price or last sale on the exchanges where they trade and the changes in fair value are recorded as unrealized appreciation or depreciation until closed, exercised or expired. For the year ended December 31, 2020, there were no call or put options transacted for any of the Funds.
The Funds may write covered call or put options for which premiums received are recorded as liabilities and are subsequently adjusted to the current value of the options written. When written options are closed or exercised, premiums received are offset against the proceeds paid, and the Fund records realized gains or losses for the difference. When written options expire, the liability is eliminated, and the Fund records realized gains for the entire amount of premiums received. Although permitted, it is currently not normal practice for the Funds to write call and put options and none were written during the year ended December 31, 2020.
The fair value of derivative instruments, not accounted for as hedging instruments, as reported within the Statements of Assets and Liabilities as of December 31, 2020 was as follows:
Amount of Deposits at Broker and Unrealized Appreciation (Depreciation) on Derivatives |
| | Type of
Derivative/
Risk | Statements of Assets & Liabilities Location | | Fair Value of
Deposits at
Broker for Futures
Contracts | | | Value of
Unrealized
Appreciation
(Depreciation) | |
Muirfield | Equity contracts | Assets, Deposits at broker for futures contracts; Net Assets, Distributable Earnings (Accumulated Deficit) | | $ | 13,355,386 | | | $ | 2,791,529 | |
Spectrum | Equity contracts | Assets, Deposits at broker for futures contracts; Net Assets, Distributable Earnings (Accumulated Deficit) | | | 5,180,922 | | | | 800,793 | |
Global | Equity contracts | Assets, Deposits at broker for futures contracts; Net Assets, Distributable Earnings (Accumulated Deficit) | | | 3,176,695 | | | | 383,479 | |
Balanced | Equity contracts | Assets, Deposits at broker for futures contracts; Net Assets, Distributable Earnings (Accumulated Deficit) | | | 7,985,720 | | | | 1,376,370 | |
Moderate | Equity contracts | Assets, Deposits at broker for futures contracts; Net Assets, Distributable Earnings (Accumulated Deficit) | | | 3,387,359 | | | | 600,388 | |
Conservative | Equity contracts | Assets, Deposits at broker for futures contracts; Net Assets, Distributable Earnings (Accumulated Deficit) | | | 1,682,410 | | | | 266,844 | |
Dynamic | Equity contracts | Assets, Deposits at broker for futures contracts; Net Assets, Distributable Earnings (Accumulated Deficit) | | | 6,346,484 | | | | 767,698 | |
Quantex | Equity contracts | Assets, Deposits at broker for futures contracts; Net Assets, Distributable Earnings (Accumulated Deficit) | | | 598,946 | | | | 27,656 | |
2020 Annual Report | December 31, 2020 | Page 137 |
The effect of derivative instruments on the Statements of Operations for the year ended December 31, 2020 and related activity was as follows:
Amount of Realized Gain (Loss) on Derivatives Recognized in Income |
| | Type of
Derivative/
Risk | | Contracts as of
December 31,
2019 | | | Long and
Short
Contracts
Opened
During the
Period | | | Long and
Short
Contracts
Closed/
Expired
During the
Period | | | Contracts as of
December 31,
2020 | | Statement of Operations
Location | | For the
Year Ended
December 31,
2020 | |
Muirfield | Equity contracts | | | 1,234 | | | | 9,770 | | | | 10,013 | | | | 991 | | Net realized gains (losses) from futures contracts | | $ | (51,419,469 | ) |
Spectrum | Equity contracts | | | 752 | | | | 2,930 | | | | 3,383 | | | | 299 | | Net realized gains (losses) from futures contracts | | | (17,738,861 | ) |
Global | Equity contracts | | | 225 | | | | 1,094 | | | | 1,130 | | | | 189 | | Net realized gains (losses) from futures contracts | | | (2,420,717 | ) |
Balanced | Equity contracts | | | 592 | | | | 4,337 | | | | 4,442 | | | | 487 | | Net realized gains (losses) from futures contracts | | | (20,163,080 | ) |
Moderate | Equity contracts | | | 196 | | | | 1,439 | | | | 1,451 | | | | 184 | | Net realized gains (losses) from futures contracts | | | (5,766,375 | ) |
Conservative | Equity contracts | | | 81 | | | | 753 | | | | 748 | | | | 86 | | Net realized gains (losses) from futures contracts | | | (2,636,207 | ) |
Dynamic | Equity contracts | | | 462 | | | | 2,180 | | | | 2,186 | | | | 456 | | Net realized gains (losses) from futures contracts | | | 1,791,950 | |
Quantex | Equity contracts | | | 11 | | | | 136 | | | | 127 | | | | 20 | | Net realized gains (losses) from futures contracts | | | 725,562 | |
Change in Unrealized Gain or (Loss) on Derivatives Recognized in Income |
| | Type of
Derivative/ Risk | Statement of Operations Location | | For the
Year Ended
December 31, 2020 | |
Muirfield | Equity contracts | Net change in unrealized appreciation (depreciation) of futures contracts | | $ | 1,709,435 | |
Spectrum | Equity contracts | Net change in unrealized appreciation (depreciation) of futures contracts | | | 88,102 | |
Global | Equity contracts | Net change in unrealized appreciation (depreciation) of futures contracts | | | 294,939 | |
Balanced | Equity contracts | Net change in unrealized appreciation (depreciation) of futures contracts | | | 793,361 | |
Moderate | Equity contracts | Net change in unrealized appreciation (depreciation) of futures contracts | | | 394,223 | |
Conservative | Equity contracts | Net change in unrealized appreciation (depreciation) of futures contracts | | | 188,032 | |
Dynamic | Equity contracts | Net change in unrealized appreciation (depreciation) of futures contracts | | | 535,122 | |
Quantex | Equity contracts | Net change in unrealized appreciation (depreciation) of futures contracts | | | 11,959 | |
Federal income taxes. It is each Fund’s policy to continue to comply with the requirements of Subchapter M of the Internal Revenue Code applicable to regulated investment companies and to distribute substantially all of its taxable income and net capital gains to its shareholders. Therefore, no federal income tax provision is required. The Funds recognize the tax benefits or expenses of uncertain tax positions only where the position is “more likely than not” to be sustained assuming examination by tax authorities. Management has reviewed tax positions taken on Federal income tax returns for all open tax years (tax years ended December 31, 2017 through December 31, 2020) and has concluded that no provision for unrecognized tax benefits or expenses is required in these financial statements. Each Fund identifies its major tax jurisdictions as U.S. Federal and certain State tax authorities; however the Funds are not aware of any tax positions for which it is reasonably possible that the total amounts of unrecognized tax benefits will change materially in the next twelve months. The Funds recognize interest and penalties, if any, related to unrecognized tax benefits as income tax expense in the Statements of Operations as incurred. During the year ended December 31, 2020, the Funds did not incur any material interest or penalties.
Distributions to shareholders. Distributions to shareholders are recorded on the ex-dividend date. Muirfield, Spectrum, Global, Balanced, Moderate, Conservative, Dynamic, and Quantex declare and pay dividends from net investment income, if any, on a quarterly basis. Bond declares and pays dividends from net investment income on a monthly basis. The Money Market Funds declare dividends from net investment income on a daily basis and pay such dividends on a monthly basis. Each Fund distributes net capital gains, if any, on an annual basis.
Page 138 | 2020 Annual Report | December 31, 2020 |
Distributions from net investment income and from net capital gains are determined in accordance with income tax regulations, which may differ from GAAP. Permanent differences relate to redemptions treated as distributions for tax purposes (i.e. equalization). Accordingly, timing differences relating to shareholder distributions are reflected in the components of net assets and permanent book and tax differences have been reclassified within the components of net assets based on their ultimate characterization for federal income tax purposes. For the year ended December 31, 2020, the Funds made the following reclassifications to increase/(decrease) the components of net assets:
| | | Capital | | | Distributable Earnings
(Accumulated Deficit) | |
Muirfield | | $ | — | | | $ | — | |
Spectrum | | | — | | | | — | |
Global | | | — | | | | — | |
Balanced | | | — | | | | — | |
Moderate | | | — | | | | — | |
Conservative | | | — | | | | — | |
Dynamic | | | 1,347,314 | | | | (1,347,314 | ) |
Quantex | | | (354,086 | ) | | | 354,086 | |
Bond | | | — | | | | — | |
Investment income & expenses. For all Funds, except the Money Market Funds, income and expenses (other than expenses attributable to a specific class) are allocated to each class of shares based on its relative net assets. Expenses incurred by the Trust that do not specifically relate to an individual Fund of the Trust are allocated to the Funds based on each Fund’s relative net assets or other appropriate basis.
Capital Share Transactions. All Funds, except the Money Market Funds, are authorized to issue an unlimited number of shares in the Retail Class, the Adviser Class, and the Institutional Class. Transactions in the capital shares of the Funds for the year ended December 31, 2020 and the year ended December 31, 2019 were as follows:
| | | Issued | | | Reinvested | |
Share Class | | Amount | | | Shares | | | Amount | | | Shares | |
Year Ended December 31, 2020 | | | | | | | | | | | | | | | | |
Muirfield - Retail | | $ | 11,650,273 | | | | 1,616,852 | | | $ | 884,595 | | | | 122,946 | |
Muirfield - Adviser | | | 12,562,031 | | | | 1,731,428 | | | | 475,878 | | | | 65,587 | |
Muirfield - Institutional | | | 94,938,567 | | | | 13,043,429 | | | | 3,526,830 | | | | 485,462 | |
Spectrum - Retail | | | 3,339,517 | | | | 312,463 | | | | 34,980 | | | | 3,171 | |
Spectrum - Adviser | | | 2,993,068 | | | | 271,967 | | | | 119,760 | | | | 10,835 | |
Spectrum - Institutional | | | 27,288,817 | | | | 2,527,581 | | | | 1,281,869 | | | | 115,651 | |
Global - Retail | | | 1,166,292 | | | | 111,446 | | | | 197,994 | | | | 17,568 | |
Global - Adviser | | | 446,417 | | | | 43,133 | | | | 44,862 | | | | 4,032 | |
Global - Institutional | | | 3,242,380 | | | | 313,642 | | | | 1,068,025 | | | | 96,909 | |
Balanced - Retail | | | 7,397,073 | | | | 647,576 | | | | 507,680 | | | | 44,045 | |
Balanced - Adviser | | | 4,253,014 | | | | 362,514 | | | | 178,375 | | | | 15,347 | |
Balanced - Institutional | | | 73,579,398 | | | | 6,333,953 | | | | 2,664,718 | | | | 229,124 | |
Moderate - Retail | | | 3,670,705 | | | | 326,818 | | | | 347,588 | | | | 30,030 | |
Moderate - Adviser | | | 2,910,988 | | | | 254,996 | | | | 139,338 | | | | 12,040 | |
Moderate - Institutional | | | 30,969,046 | | | | 2,697,054 | | | | 1,865,874 | | | | 160,665 | |
Conservative - Retail | | | 3,996,383 | | | | 181,208 | | | | 458,804 | | | | 20,189 | |
Conservative - Adviser | | | 2,271,362 | | | | 99,923 | | | | 131,623 | | | | 5,705 | |
Conservative - Institutional | | | 25,499,844 | | | | 1,115,180 | | | | 1,877,940 | | | | 81,317 | |
Dynamic - Retail | | | 3,823,098 | | | | 347,512 | | | | 824,823 | | | | 63,418 | |
Dynamic - Adviser | | | 3,509,483 | | | | 301,817 | | | | 322,349 | | | | 24,972 | |
Dynamic - Institutional | | | 32,025,842 | | | | 2,711,970 | | | | 3,691,005 | | | | 285,612 | |
Quantex - Retail | | | 2,189,011 | | | | 80,196 | | | | 106,638 | | | | 3,742 | |
Quantex - Adviser | | | 276,382 | | | | 9,230 | | | | 5,977 | | | | 209 | |
Quantex - Institutional | | | 5,198,334 | | | | 180,954 | | | | 165,888 | | | | 5,821 | |
Bond - Retail | | | 3,539,918 | | | | 367,315 | | | | 219,807 | | | | 22,431 | |
Bond - Adviser | | | 4,032,049 | | | | 414,412 | | | | 112,411 | | | | 11,455 | |
Bond - Institutional | | | 15,764,431 | | | | 1,615,385 | | | | 1,059,912 | | | | 108,102 | |
Prime Money Market | | | 21,491,888 | | | | 21,491,888 | | | | 158,887 | | | | 158,887 | |
Institutional Prime Money Market | | | 472,288,464 | | | | 472,214,087 | | | | 307,362 | | | | 307,353 | |
| | | | | | | | | | | | | | | | | |
2020 Annual Report | December 31, 2020 | Page 139 |
| | | Issued | | | Reinvested | |
Share Class | | Amount | | | Shares | | | Amount | | | Shares | |
Year Ended December 31, 2019 | | | | | | | | | | | | | | | | |
Muirfield - Retail | | $ | 33,050,249 | | | | 4,442,733 | | | $ | 4,977,939 | | | | 642,781 | |
Muirfield - Adviser | | | 19,959,892 | | | | 2,672,639 | | | | 1,634,444 | | | | 209,658 | |
Muirfield - Institutional | | | 144,314,850 | | | | 19,370,319 | | | | 11,750,119 | | | | 1,506,144 | |
Spectrum - Retail | | | 7,469,577 | | | | 660,057 | | | | 487,763 | | | | 40,590 | |
Spectrum - Adviser | | | 3,597,497 | | | | 315,554 | | | | 151,231 | | | | 12,488 | |
Spectrum - Institutional | | | 40,919,924 | | | | 3,604,015 | | | | 1,420,906 | | | | 117,029 | |
Global - Retail | | | 1,332,331 | | | | 125,389 | | | | 242,185 | | | | 21,882 | |
Global - Adviser | | | 480,969 | | | | 44,348 | | | | 38,283 | | | | 3,449 | |
Global - Institutional | | | 5,246,784 | | | | 492,924 | | | | 939,839 | | | | 84,963 | |
Balanced - Retail | | | 14,149,512 | | | | 1,224,953 | | | | 1,366,611 | | | | 115,154 | |
Balanced - Adviser | | | 4,473,744 | | | | 385,634 | | | | 326,176 | | | | 27,354 | |
Balanced - Institutional | | | 85,619,332 | | | | 7,396,727 | | | | 4,851,860 | | | | 407,021 | |
Moderate - Retail | | | 6,078,494 | | | | 535,812 | | | | 569,700 | | | | 49,224 | |
Moderate - Adviser | | | 2,059,946 | | | | 182,460 | | | | 194,767 | | | | 16,811 | |
Moderate - Institutional | | | 31,695,228 | | | | 2,809,680 | | | | 2,658,150 | | | | 229,490 | |
Conservative - Retail | | | 4,494,757 | | | | 203,394 | | | | 685,421 | | | | 30,465 | |
Conservative - Adviser | | | 1,779,179 | | | | 79,442 | | | | 160,298 | | | | 7,037 | |
Conservative - Institutional | | | 26,212,905 | | | | 1,173,623 | | | | 2,512,162 | | | | 110,136 | |
Dynamic - Retail | | | 3,843,119 | | | | 351,639 | | | | 912,848 | | | | 78,711 | |
Dynamic - Adviser | | | 3,221,800 | | | | 289,708 | | | | 313,636 | | | | 26,922 | |
Dynamic - Institutional | | | 27,427,324 | | | | 2,506,643 | | | | 3,742,727 | | | | 322,467 | |
Quantex - Retail | | | 4,513,460 | | | | 124,634 | | | | 179,660 | | | | 4,955 | |
Quantex - Adviser | | | 358,998 | | | | 9,903 | | | | 7,848 | | | | 216 | |
Quantex - Institutional | | | 7,243,250 | | | | 204,214 | | | | 222,429 | | | | 6,126 | |
Bond - Retail | | | 1,961,968 | | | | 209,895 | | | | 315,086 | | | | 33,629 | |
Bond - Adviser | | | 1,552,225 | | | | 166,213 | | | | 105,786 | | | | 11,256 | |
Bond - Institutional | | | 13,146,159 | | | | 1,409,770 | | | | 1,316,315 | | | | 140,237 | |
Prime Money Market | | | 21,752,554 | | | | 21,752,554 | | | | 686,595 | | | | 686,595 | |
Institutional Prime Money Market | | | 337,972,181 | | | | 337,937,146 | | | | 1,149,955 | | | | 1,149,805 | |
| | | Redeemed | | | Net Increase (Decrease) | |
Share Class | | Amount | | | Shares | | | Amount | | | Shares | |
Year Ended December 31, 2020 | | | | | | | | | | | | | | | | |
Muirfield - Retail | | $ | (66,817,586 | ) | | | (9,261,883 | ) | | $ | (54,282,718 | ) | | | (7,522,085 | ) |
Muirfield - Adviser | | | (24,726,534 | ) | | | (3,396,916 | ) | | | (11,688,625 | ) | | | (1,599,901 | ) |
Muirfield - Institutional | | | (149,015,449 | ) | | | (20,478,261 | ) | | | (50,550,052 | ) | | | (6,949,370 | ) |
Spectrum - Retail | | | (16,054,832 | ) | | | (1,493,176 | ) | | | (12,680,335 | ) | | | (1,177,542 | ) |
Spectrum - Adviser | | | (5,661,594 | ) | | | (526,084 | ) | | | (2,548,766 | ) | | | (243,282 | ) |
Spectrum - Institutional | | | (37,639,148 | ) | | | (3,389,095 | ) | | | (9,068,462 | ) | | | (745,863 | ) |
Global - Retail | | | (3,342,556 | ) | | | (325,492 | ) | | | (1,978,270 | ) | | | (196,478 | ) |
Global - Adviser | | | (514,491 | ) | | | (50,884 | ) | | | (23,212 | ) | | | (3,719 | ) |
Global - Institutional | | | (7,620,220 | ) | | | (739,343 | ) | | | (3,309,815 | ) | | | (328,792 | ) |
Balanced - Retail | | | (27,794,588 | ) | | | (2,375,037 | ) | | | (19,889,835 | ) | | | (1,683,416 | ) |
Balanced - Adviser | | | (6,642,344 | ) | | | (564,264 | ) | | | (2,210,955 | ) | | | (186,403 | ) |
Balanced - Institutional | | | (82,778,077 | ) | | | (7,073,659 | ) | | | (6,533,961 | ) | | | (510,582 | ) |
Moderate - Retail | | | (9,844,841 | ) | | | (850,289 | ) | | | (5,826,548 | ) | | | (493,441 | ) |
Moderate - Adviser | | | (3,716,438 | ) | | | (323,871 | ) | | | (666,112 | ) | | | (56,835 | ) |
Moderate - Institutional | | | (35,493,471 | ) | | | (3,090,455 | ) | | | (2,658,551 | ) | | | (232,736 | ) |
Conservative - Retail | | | (8,490,522 | ) | | | (374,117 | ) | | | (4,035,335 | ) | | | (172,720 | ) |
Conservative - Adviser | | | (2,433,929 | ) | | | (106,506 | ) | | | (30,944 | ) | | | (878 | ) |
Conservative - Institutional | | | (26,048,017 | ) | | | (1,142,491 | ) | | | 1,329,767 | | | | 54,006 | |
Dynamic - Retail | | | (12,417,374 | ) | | | (1,072,111 | ) | | | (7,769,453 | ) | | | (661,181 | ) |
Dynamic - Adviser | | | (5,090,584 | ) | | | (439,774 | ) | | | (1,258,752 | ) | | | (112,985 | ) |
Page 140 | 2020 Annual Report | December 31, 2020 |
| | | Redeemed | | | Net Increase (Decrease) | |
Share Class | | Amount | | | Shares | | | Amount | | | Shares | |
Dynamic - Institutional | | $ | (49,166,341 | ) | | | (4,225,280 | ) | | $ | (13,449,494 | ) | | | (1,227,698 | ) |
Quantex - Retail | | | (6,470,912 | ) | | | (227,906 | ) | | | (4,175,263 | ) | | | (143,968 | ) |
Quantex - Adviser | | | (317,629 | ) | | | (11,169 | ) | | | (35,270 | ) | | | (1,730 | ) |
Quantex - Institutional | | | (16,125,393 | ) | | | (569,511 | ) | | | (10,761,171 | ) | | | (382,736 | ) |
Bond - Retail | | | (3,315,674 | ) | | | (341,917 | ) | | | 444,051 | | | | 47,829 | |
Bond - Adviser | | | (3,126,254 | ) | | | (323,216 | ) | | | 1,018,206 | | | | 102,651 | |
Bond - Institutional | | | (15,395,742 | ) | | | (1,588,812 | ) | | | 1,428,601 | | | | 134,675 | |
Prime Money Market | | | (21,895,568 | ) | | | (21,895,568 | ) | | | (244,793 | ) | | | (244,793 | ) |
Institutional Prime Money Market | | | (506,286,355 | ) | | | (506,302,922 | ) | | | (33,690,529 | ) | | | (33,781,482 | ) |
| | | | | | | | | | | | | | | | | |
Year Ended December 31, 2019 | | | | | | | | | | | | | | | | |
Muirfield - Retail | | $ | (70,868,511 | ) | | | (9,580,884 | ) | | $ | (32,840,323 | ) | | | (4,495,370 | ) |
Muirfield - Adviser | | | (28,851,525 | ) | | | (3,845,181 | ) | | | (7,257,189 | ) | | | (962,884 | ) |
Muirfield - Institutional | | | (112,338,045 | ) | | | (14,851,705 | ) | | | 43,726,924 | | | | 6,024,758 | |
Spectrum - Retail | | | (13,656,923 | ) | | | (1,200,248 | ) | | | (5,699,583 | ) | | | (499,601 | ) |
Spectrum - Adviser | | | (4,388,936 | ) | | | (383,545 | ) | | | (640,208 | ) | | | (55,503 | ) |
Spectrum - Institutional | | | (28,908,458 | ) | | | (2,513,014 | ) | | | 13,432,372 | | | | 1,208,030 | |
Global - Retail | | | (5,487,892 | ) | | | (512,715 | ) | | | (3,913,376 | ) | | | (365,444 | ) |
Global - Adviser | | | (540,172 | ) | | | (50,287 | ) | | | (20,920 | ) | | | (2,490 | ) |
Global - Institutional | | | (14,778,101 | ) | | | (1,383,831 | ) | | | (8,591,478 | ) | | | (805,944 | ) |
Balanced - Retail | | | (22,120,626 | ) | | | (1,902,554 | ) | | | (6,604,503 | ) | | | (562,447 | ) |
Balanced - Adviser | | | (5,953,857 | ) | | | (509,453 | ) | | | (1,153,937 | ) | | | (96,465 | ) |
Balanced - Institutional | | | (63,079,661 | ) | | | (5,387,061 | ) | | | 27,391,531 | | | | 2,416,687 | |
Moderate - Retail | | | (6,716,666 | ) | | | (591,069 | ) | | | (68,472 | ) | | | (6,033 | ) |
Moderate - Adviser | | | (2,538,479 | ) | | | (222,937 | ) | | | (283,766 | ) | | | (23,666 | ) |
Moderate - Institutional | | | (33,250,746 | ) | | | (2,916,278 | ) | | | 1,102,632 | | | | 122,892 | |
Conservative - Retail | | | (6,631,173 | ) | | | (298,972 | ) | | | (1,450,995 | ) | | | (65,113 | ) |
Conservative - Adviser | | | (1,757,987 | ) | | | (77,982 | ) | | | 181,490 | | | | 8,497 | |
Conservative - Institutional | | | (29,180,940 | ) | | | (1,292,856 | ) | | | (455,873 | ) | | | (9,097 | ) |
Dynamic - Retail | | | (12,530,345 | ) | | | (1,137,172 | ) | | | (7,774,378 | ) | | | (706,822 | ) |
Dynamic - Adviser | | | (3,913,271 | ) | | | (353,426 | ) | | | (377,835 | ) | | | (36,796 | ) |
Dynamic - Institutional | | | (33,031,741 | ) | | | (2,975,757 | ) | | | (1,861,690 | ) | | | (146,647 | ) |
Quantex - Retail | | | (12,066,011 | ) | | | (349,669 | ) | | | (7,372,891 | ) | | | (220,080 | ) |
Quantex - Adviser | | | (334,676 | ) | | | (9,427 | ) | | | 32,170 | | | | 692 | |
Quantex - Institutional | | | (12,248,919 | ) | | | (342,999 | ) | | | (4,783,240 | ) | | | (132,659 | ) |
Bond - Retail | | | (6,762,369 | ) | | | (720,141 | ) | | | (4,485,315 | ) | | | (476,617 | ) |
Bond - Adviser | | | (1,201,377 | ) | | | (128,206 | ) | | | 456,634 | | | | 49,263 | |
Bond - Institutional | | | (18,715,434 | ) | | | (1,998,711 | ) | | | (4,252,960 | ) | | | (448,704 | ) |
Prime Money Market | | | (28,496,871 | ) | | | (28,496,871 | ) | | | (6,057,722 | ) | | | (6,057,722 | ) |
Institutional Prime Money Market | | | (440,678,548 | ) | | | (440,622,456 | ) | | | (101,556,412 | ) | | | (101,535,505 | ) |
2020 Annual Report | December 31, 2020 | Page 141 |
Offsetting Assets & Liabilities. The Funds are party to enforceable master netting arrangements between counter parties, such as the securities lending agreement, which provides for the right of offset under certain circumstances, such as the event of default. The securities lending transactions have an overnight and continuous contractual maturity. Risks arise from the possible inability of counterparties to meet the terms of their contracts. The table below reflects the offsetting assets and liabilities relating to securities lending, futures contracts, and repurchase agreements shown on the Statements of Assets and Liabilities at December 31, 2020.
| | | | | | | | | | | | | | | Gross Amounts Not Offset in the
Statements of Assets and Liabilities | | | | | |
Description/ Fund | | Gross Amounts
of Recognized
Assets/
Liabilities | | | Gross Amounts
Offset in the
Statements
of Assets and
Liabilities | | | Net Amounts
Presented in
the Statements
of Assets and
Liabilities | | | Financial
Instruments* | | | Collateral
Pledged
(Received)* | | | Net Amount | |
Assets: | | | | | | | | | | | | | | | | | | | | | | | | |
Securities Loaned | | | | | | | | | | | | | | | | | | | | | | | | |
Muirfield | | $ | 91,619 | | | $ | — | | | $ | 91,619 | | | $ | — | | | $ | (91,619 | ) | | $ | — | |
Spectrum | | | 22,136 | | | | — | | | | 22,136 | | | | — | | | | (22,136 | ) | | | — | |
Global | | | 991 | | | | — | | | | 991 | | | | — | | | | (991 | ) | | | — | |
Balanced | | | 32,745 | | | | — | | | | 32,745 | | | | — | | | | (32,745 | ) | | | — | |
Moderate | | | 9,516 | | | | — | | | | 9,516 | | | | — | | | | (9,516 | ) | | | — | |
Conservative | | | 4,753 | | | | — | | | | 4,753 | | | | — | | | | (4,753 | ) | | | — | |
Dynamic | | | 33,757 | | | | — | | | | 33,757 | | | | — | | | | (33,757 | ) | | | — | |
Quantex | | | 308,295 | | | | — | | | | 308,295 | | | | — | | | | (308,295 | ) | | | — | |
| | | | | | | | | | | | | | | | | | | | | | | | | |
Futures Contracts | | | | | | | | | | | | | | | | | | | | | | | | |
Muirfield | | $ | 2,791,652 | | | $ | 123 | | | $ | 2,791,529 | | | $ | — | | | $ | — | | | $ | 2,791,529 | |
Spectrum | | | 800,793 | | | | — | | | | 800,793 | | | | — | | | | — | | | | 800,793 | |
Global | | | 385,903 | | | | 2,424 | | | | 383,479 | | | | — | | | | — | | | | 383,479 | |
Balanced | | | 1,377,623 | | | | 1,253 | | | | 1,376,370 | | | | — | | | | — | | | | 1,376,370 | |
Moderate | | | 600,388 | | | | — | | | | 600,388 | | | | — | | | | — | | | | 600,388 | |
Conservative | | | 268,220 | | | | 1,376 | | | | 266,844 | | | | — | | | | — | | | | 266,844 | |
Dynamic | | | 774,659 | | | | 6,961 | | | | 767,698 | | | | — | | | | — | | | | 767,698 | |
Quantex | | | 28,758 | | | | 1,102 | | | | 27,656 | | | | — | | | | — | | | | 27,656 | |
| | | | | | | | | | | | | | | | | | | | | | | | | |
Repurchase Agreements | | | | | | | | | | | | | | | | | | | | | | | | |
Prime Money Market | | $ | 7,000,000 | | | $ | — | | | $ | 7,000,000 | | | $ | (7,000,000 | ) | | $ | — | | | $ | — | |
Institutional Prime Money Market | | | 80,000,000 | | | | — | | | | 80,000,000 | | | | (80,000,000 | ) | | | — | | | | — | |
| | | | | | | | | | | | | | | | | | | | | | | | | |
Liabilities: | | | | | | | | | | | | | | | | | | | | | | | | |
N/A | | | N/A | | | | N/A | | | | N/A | | | | N/A | | | | N/A | | | | N/A | |
* | The amount is limited to the net amounts of financial assets and liabilities and accordingly does not include excess collateral pledged. |
Other. The Funds record security transactions on the trade date. Securities purchased or sold on a when-issued or delayed-delivery basis may be settled 15 days or more after the trade date. Gains and losses realized from the sale of securities are determined on the specific identification basis. Dividend income and dividend expenses are recognized on the ex-dividend date and interest income (including amortization of premium and accretion of discount) is recognized as earned. Short-term capital gain distributions from underlying funds are classified as dividend income for financial reporting purposes. Long-term capital gains distributions are separately stated. Discounts and premiums are amortized using the effective yield over the lives of the respective securities. Distributions received from partnerships are recorded as return of capital distributions. Withholding taxes on foreign dividends, if applicable, have been provided for in accordance with the Funds’ understanding of the applicable country’s tax rules and rates.
The Fund may purchase securities on a forward commitment or when-issued basis. The Fund records a when-issued transaction on the trade date and will segregate assets in an amount at least equal in value to the Fund’s commitment to purchase when-issued securities. Securities purchased on a when-issued basis are marked-to-market daily and the Fund begins earning interest on the settlement date. Losses may arise due to changes in the market value of the underlying securities or if the counterparty does not perform under the contract.
Certain Funds may purchase or sell securities on a delayed-delivery basis. These transactions involve a commitment by a Fund to purchase or sell securities for a predetermined price or yield, with payment and delivery taking place beyond the customary settlement period. When delayed-delivery transactions are outstanding, a Fund will designate or receive as collateral liquid assets in an amount sufficient to meet the purchase price
Page 142 | 2020 Annual Report | December 31, 2020 |
or respective obligations. When purchasing a security on a delayed-delivery basis, a Fund assumes the rights and risks of ownership of the security, including the risk of price and yield fluctuations, and takes such fluctuations into account when determining its NAV. A Fund may dispose of or renegotiate a delayed-delivery transaction after it is entered into which may result in a realized gain or loss. When a Fund has sold a security on a delayed-delivery basis, the Fund does not participate in future gains and losses with respect to the security.
Distributions received from the Funds’ investments in real estate investment trusts (“REITs”) may be characterized as ordinary income, net capital gain, or return of capital. The proper characterization of REIT distributions is generally not known until after the end of each calendar year. As such, the Funds must use estimates in reporting the character of their income and distributions for financial statement purposes. The actual character of distributions to the Funds’ shareholders will be reflected on the Form 1099 received by shareholders after the end of the calendar year. Due to the nature of REIT investments, a portion of the distributions received by the Funds’ shareholders may represent a return of capital.
3. Securities Valuations
The Funds utilize various methods to measure the fair value of their investments on a recurring basis. GAAP establishes a hierarchy that prioritizes inputs to valuation methods. The three levels of inputs are as follows:
Level 1 – Unadjusted quoted prices in active markets for identical assets or liabilities that the Funds have the ability to access.
Level 2 – Observable inputs other than quoted prices included in level 1 that are observable for the asset or liability, either directly or indirectly. These inputs may include quoted prices for the identical instrument on an inactive market, prices for similar instruments, interest rates, prepayment speeds, credit risk, yield curves, default rates and similar data.
Level 3 – Significant unobservable inputs for the asset or liability, to the extent relevant observable inputs are not available, representing the Funds’ own assumptions about the assumptions a market participant would use in valuing the asset or liability, and would be based on the best information available.
The availability of observable inputs can vary from security to security and is affected by a wide variety of factors, including, for example, the type of security, whether the security is new and not yet established in the marketplace, the liquidity of markets, and other characteristics particular to the security. To the extent that valuation is based on models or inputs that are less observable or unobservable in the market, the determination of fair value requires more judgment. Accordingly, the degree of judgment exercised in determining fair value is greatest for instruments categorized in level 3.
The inputs used to measure fair value may fall into different levels of the fair value hierarchy. In such cases, for disclosure purposes, the level in the fair value hierarchy within which the fair value measurement falls in its entirety, is determined based on the lowest level input that is significant to the fair value measurement in its entirety.
A description of the valuation techniques applied to the Funds’ major categories of assets and liabilities measured at fair value on a recurring basis follows.
Equity securities (including publicly traded partnerships, real estate investment trusts, American depositary receipts, exchange traded funds, and common stock). Securities traded on a national securities exchange (or reported on the NASDAQ national market) are stated at the last reported sales price on the day of valuation and are categorized in level 1 of the fair value hierarchy.
Investments in registered open-end investment companies, including money market funds, are valued at the daily redemption net asset value as reported by the underlying fund and are categorized in level 1 of the fair value hierarchy.
Short-term notes (including bank obligations, commercial paper, corporate obligations, repurchase agreements, U.S. government agency obligations, and floating rate demand notes). Short-term notes held in the Funds, except Prime Money Market, maturing more than sixty days after the valuation date, are valued at the last sales price as of the close of business on the day of valuation, or, lacking any sales, at the most recent bid price or yield equivalent as obtained from dealers that make markets in such securities. When valued at last sales price, the securities will be categorized as level 1. When using bid prices or yield equivalents, they will be categorized as level 2. When such securities are valued within sixty days or less to maturity, the difference between the valuation existing on the sixty-first day before maturity and maturity value is amortized on a straight-line basis to maturity and will be categorized as level 2.
All securities held in Prime Money Market, other than money market registered investment companies, are valued at amortized cost, which approximates fair value, and will be categorized as level 2.
Certificates of deposit. Except for Institutional Money Market, certificates of deposit are valued at acquisition cost, which approximates fair value, and will be categorized as level 2. For Institutional Money Market, certificates of deposit are normally valued using a model that incorporates market observable data such as reported sales of similar securities, broker quotes, yields, bids, offers, and reference data, and will be categorized as level 2.
U.S. government obligations. U.S. government obligations are normally valued using a model that incorporates market observable data such as reported sales of similar securities, broker quotes, yields, bids, offers, and reference data. Certain securities are valued principally using dealer quotations. In either case, these securities will be categorized as level 2.
2020 Annual Report | December 31, 2020 | Page 143 |
Restricted securities (equity and debt). Restricted securities for which quotations are not readily available are valued at fair value as determined by the Trustees. Depending on the relative significance of valuation inputs, these instruments may be classified in either level 2 or level 3 of the fair value hierarchy.
Derivative instruments (futures contracts). Listed derivative instruments that are actively traded, including futures contracts, are valued based on quoted prices from the exchange and are categorized in level 1 of the fair value hierarchy.
For the year ended December 31, 2020, the Funds did not hold any assets at any time in which significant unobservable inputs were used in determining fair value. Therefore, no reconciliation of level 3 securities is provided. The following table summarizes the inputs used to value the Funds’ assets and liabilities measured at fair value as of December 31, 2020.
Muirfield - Assets/(Liabilities) | | Level 1 | | | Level 2 | | | Level 3 | | | Total | |
Common stocks* | | $ | 458,141,444 | | | $ | — | | | $ | — | | | $ | 458,141,444 | |
Money market registered investment companies | | | 103,982,486 | | | | — | | | | — | | | | 103,982,486 | |
Bank obligations | | | — | | | | 743,133 | | | | — | | | | 743,133 | |
Total | | $ | 562,123,930 | | | $ | 743,133 | | | $ | — | | | $ | 562,867,063 | |
Trustee deferred compensation*** | | $ | 285,523 | | | $ | — | | | $ | — | | | $ | 285,523 | |
Futures contracts** | | $ | 2,791,529 | | | $ | — | | | $ | — | | | $ | 2,791,529 | |
Spectrum - Assets/(Liabilities) | | Level 1 | | | Level 2 | | | Level 3 | | | Total | |
Common stocks* | | $ | 151,174,645 | | | $ | — | | | $ | — | | | $ | 151,174,645 | |
Money market registered investment companies | | | 29,306,819 | | | | — | | | | — | | | | 29,306,819 | |
Total | | $ | 180,481,464 | | | $ | — | | | $ | — | | | $ | 180,481,464 | |
Trustee deferred compensation*** | | $ | 40,785 | | | $ | — | | | $ | — | | | $ | 40,785 | |
Futures contracts** | | $ | 800,793 | | | $ | — | | | $ | — | | | $ | 800,793 | |
Global - Assets/(Liabilities) | | Level 1 | | | Level 2 | | | Level 3 | | | Total | |
Common stocks* | | $ | 18,193,648 | | | $ | — | | | $ | — | | | $ | 18,193,648 | |
Registered investment companies | | | 8,005,008 | | | | — | | | | — | | | | 8,005,008 | |
Money market registered investment companies | | | 15,664,843 | | | | — | | | | — | | | | 15,664,843 | |
Bank obligations | | | — | | | | 743,133 | | | | — | | | | 743,133 | |
Total | | $ | 41,863,499 | | | $ | 743,133 | | | $ | — | | | $ | 42,606,632 | |
Trustee deferred compensation*** | | $ | 112,298 | | | $ | — | | | $ | — | | | $ | 112,298 | |
Futures contracts** | | $ | 383,479 | | | $ | — | | | $ | — | | | $ | 383,479 | |
Balanced - Assets/(Liabilities) | | Level 1 | | | Level 2 | | | Level 3 | | | Total | |
Common stocks* | | $ | 219,062,426 | | | $ | — | | | $ | — | | | $ | 219,062,426 | |
Registered investment companies | | | 117,328,966 | | | | — | | | | — | | | | 117,328,966 | |
Money market registered investment companies | | | 51,667,908 | | | | — | | | | — | | | | 51,667,908 | |
Bank obligations | | | — | | | | 743,133 | | | | — | | | | 743,133 | |
Total | | $ | 388,059,300 | | | $ | 743,133 | | | $ | — | | | $ | 388,802,433 | |
Trustee deferred compensation*** | | $ | 186,008 | | | $ | — | | | $ | — | | | $ | 186,008 | |
Futures contracts** | | $ | 1,376,370 | | | $ | — | | | $ | — | | | $ | 1,376,370 | |
Moderate - Assets/(Liabilities) | | Level 1 | | | Level 2 | | | Level 3 | | | Total | |
Common stocks* | | $ | 63,942,366 | | | $ | — | | | $ | — | | | $ | 63,942,366 | |
Registered investment companies | | | 86,978,100 | | | | — | | | | — | | | | 86,978,100 | |
Money market registered investment companies | | | 21,706,870 | | | | — | | | | — | | | | 21,706,870 | |
Bank obligations | | | — | | | | 248,220 | | | | — | | | | 248,220 | |
Total | | $ | 172,627,336 | | | $ | 248,220 | | | $ | — | | | $ | 172,875,556 | |
Trustee deferred compensation*** | | $ | 28,573 | | | $ | — | | | $ | — | | | $ | 28,573 | |
Futures contracts** | | $ | 600,388 | | | $ | — | | | $ | — | | | $ | 600,388 | |
Page 144 | 2020 Annual Report | December 31, 2020 |
Conservative - Assets/(Liabilities) | | Level 1 | | | Level 2 | | | Level 3 | | | Total | |
Common stocks* | | $ | 31,250,188 | | | $ | — | | | $ | — | | | $ | 31,250,188 | |
Registered investment companies | | | 98,043,888 | | | | — | | | | — | | | | 98,043,888 | |
Money market registered investment companies | | | 10,433,299 | | | | — | | | | — | | | | 10,433,299 | |
Total | | $ | 139,727,375 | | | $ | — | | | $ | — | | | $ | 139,727,375 | |
Trustee deferred compensation*** | | $ | 75,656 | | | $ | — | | | $ | — | | | $ | 75,656 | |
Futures contracts** | | $ | 266,844 | | | $ | — | | | $ | — | | | $ | 266,844 | |
Dynamic - Assets/(Liabilities) | | Level 1 | | | Level 2 | | | Level 3 | | | Total | |
Common stocks* | | $ | 147,862,400 | | | $ | — | | | $ | — | | | $ | 147,862,400 | |
Registered investment companies | | | 10,284,118 | | | | — | | | | — | | | | 10,284,118 | |
Money market registered investment companies | | | 36,684,066 | | | | — | | | | — | | | | 36,684,066 | |
Bank obligations | | | — | | | | 743,133 | | | | — | | | | 743,133 | |
Total | | $ | 194,830,584 | | | $ | 743,133 | | | $ | — | | | $ | 195,573,717 | |
Trustee deferred compensation*** | | $ | 226,204 | | | $ | — | | | $ | — | | | $ | 226,204 | |
Futures contracts** | | $ | 767,698 | | | $ | — | | | $ | — | | | $ | 767,698 | |
Quantex - Assets/(Liabilities) | | Level 1 | | | Level 2 | | | Level 3 | | | Total | |
Common stocks* | | $ | 36,233,034 | | | $ | — | | | $ | — | | | $ | 36,233,034 | |
Money market registered investment companies | | | 896,648 | | | | — | | | | — | | | | 896,648 | |
Bank obligations | | | — | | | | 8,000 | | | | — | | | | 8,000 | |
Total | | $ | 37,129,682 | | | $ | 8,000 | | | $ | — | | | $ | 37,137,682 | |
Trustee deferred compensation*** | | $ | 66,934 | | | $ | — | | | $ | — | | | $ | 66,934 | |
Futures contracts** | | $ | 27,656 | | | $ | — | | | $ | — | | | $ | 27,656 | |
Bond - Assets/(Liabilities) | | Level 1 | | | Level 2 | | | Level 3 | | | Total | |
Registered investment companies | | $ | 58,954,896 | | | $ | — | | | $ | — | | | $ | 58,954,896 | |
Money market registered investment companies | | | 2,539,651 | | | | — | | | | — | | | | 2,539,651 | |
U.S. government obligations | | | — | | | | 6,710,811 | | | | — | | | | 6,710,811 | |
Total | | $ | 61,494,547 | | | $ | 6,710,811 | | | $ | — | | | $ | 68,205,358 | |
Trustee deferred compensation*** | | $ | 74,995 | | | $ | — | | | $ | — | | | $ | 74,995 | |
Prime Money Market - Assets/(Liabilities) | | Level 1 | | | Level 2 | | | Level 3 | | | Total | |
Bank obligations | | $ | — | | | $ | 1,477,629 | | | $ | — | | | $ | 1,477,629 | |
Certificates of deposit | | | — | | | | 3,699,888 | | | | — | | | | 3,699,888 | |
Commercial paper | | | — | | | | 9,870,790 | | | | — | | | | 9,870,790 | |
Corporate obligations | | | — | | | | 2,225,150 | | | | — | | | | 2,225,150 | |
Repurchase agreements | | | — | | | | 7,000,000 | | | | — | | | | 7,000,000 | |
U.S. government and agency obligations | | | — | | | | 1,999,983 | | | | — | | | | 1,999,983 | |
Variable rate demand notes | | | — | | | | 4,907,392 | | | | — | | | | 4,907,392 | |
Money market registered investment companies | | | 3,381,806 | | | | — | | | | — | | | | 3,381,806 | |
Total | | $ | 3,381,806 | | | $ | 31,180,832 | | | $ | — | | | $ | 34,562,638 | |
Trustee deferred compensation*** | | $ | 43,926 | | | $ | — | | | $ | — | | | $ | 43,926 | |
2020 Annual Report | December 31, 2020 | Page 145 |
Institutional Prime Money Market - Assets/(Liabilities) | | Level 1 | | | Level 2 | | | Level 3 | | | Total | |
Bank obligations | | $ | — | | | $ | 1,477,629 | | | $ | — | | | $ | 1,477,629 | |
Certificates of deposit | | | — | | | | 15,924,871 | | | | — | | | | 15,924,871 | |
Commercial paper | | | — | | | | 129,629,321 | | | | — | | | | 129,629,321 | |
Corporate obligations | | | — | | | | 27,308,930 | | | | — | | | | 27,308,930 | |
Repurchase agreements | | | — | | | | 80,000,000 | | | | — | | | | 80,000,000 | |
U.S. government and agency obligations | | | — | | | | 20,003,520 | | | | — | | | | 20,003,520 | |
Variable rate demand notes | | | — | | | | 48,080,842 | | | | — | | | | 48,080,842 | |
Money market registered investment companies | | | 13,985,963 | | | | — | | | | — | | | | 13,985,963 | |
Total | | $ | 13,985,963 | | | $ | 322,425,113 | | | $ | — | | | $ | 336,411,076 | |
Trustee deferred compensation*** | | $ | 4,617 | | | $ | — | | | $ | — | | | $ | 4,617 | |
* | See schedules of investments for industry classifications. |
** | Futures contracts include unrealized gain/loss on contracts open at December 31, 2020. |
*** | A corresponding liability exists that is marked to market and is considered Level 1 in the fair value hierarchy. |
4. Investment Transactions
For the year ended December 31, 2020, the cost of purchases and proceeds from sales or maturities of long-term investments for the Funds, excluding U.S. Government investments and short positions, were as follows:
| | | Purchases | | | Sales | |
Muirfield | | $ | 987,670,435 | | | $ | 1,127,776,390 | |
Spectrum | | | 273,666,078 | | | | 334,481,824 | |
Global | | | 44,425,933 | | | | 51,850,338 | |
Balanced | | | 560,867,248 | | | | 578,800,539 | |
Moderate | | | 219,703,071 | | | | 221,894,940 | |
Conservative | | | 161,201,076 | | | | 154,673,818 | |
Dynamic | | | 330,004,130 | | | | 350,454,282 | |
Quantex | | | 34,456,957 | | | | 49,921,160 | |
Bond | | | 41,630,930 | | | | 36,108,823 | |
For the year ended December 31, 2020, the cost of purchases and proceeds from sales or maturities of long-term U.S. Government investments for the Funds are as follows:
| | | Purchases | | | Sales | |
Global | | $ | 292,591 | | | $ | 922,224 | |
Balanced | | | 8,923,824 | | | | 24,113,896 | |
Moderate | | | 5,951,094 | | | | 17,123,949 | |
Conservative | | | 7,249,497 | | | | 19,397,096 | |
Bond | | | 3,926,635 | | | | 6,607,647 | |
Page 146 | 2020 Annual Report | December 31, 2020 |
5. Investment Advisory Fees and Other Transactions with Affiliates and Non-Affiliates
Meeder Asset Management, Inc. (“MAM”), a wholly-owned subsidiary of Meeder Investment Management, Inc. (“Meeder”), provides the Funds with investment management, research, statistical and advisory services pursuant to the terms of an Investment Advisory Agreement. The services of MAM will terminate automatically if assigned and may be terminated without penalty at any time upon 60 days prior written notice by majority vote of the Fund, by the Trustees of the Fund, or by MAM. For such services the Funds pay a fee at the following annual rates:
| | Percentage of Average
Daily Net Assets up to
$50 Million | Percentage of Average
Daily Net Assets
Exceeding $50 Million up
to $100 Million | Percentage of Average
Daily Net Assets
Exceeding $100 Million
up to $200 Million | Percentage of Average
Daily Net Assets
Exceeding $200 Million |
Muirfield | 1.00% | 0.75% | 0.60% | 0.60% |
Spectrum | 0.75% | 0.75% | 0.75% | 0.60% |
Global | 0.75% | 0.75% | 0.75% | 0.60% |
Balanced | 0.75% | 0.75% | 0.75% | 0.60% |
Moderate | 0.60% | 0.60% | 0.60% | 0.60% |
Conservative | 0.50% | 0.50% | 0.50% | 0.50% |
Dynamic | 0.75% | 0.75% | 0.75% | 0.60% |
Quantex | 0.75% | 0.75% | 0.60% | 0.60% |
Bond | 0.40% | 0.40% | 0.20% | 0.20% |
Prime Money Market | 0.40% | 0.40% | 0.25% | 0.25% |
Institutional Prime Money Market | 0.40% | 0.40% | 0.25% | 0.25% |
Fee Waivers & Expense Limitation Agreements. MAM has contractually agreed to reduce its advisory fees or limit total annual ordinary fund operating expenses for certain Funds pursuant to written agreements that may only be amended or terminated with the approval of the board. The sums waived or reimbursed under these agreements are not subject to recoupment.
MAM contractually agreed to reduce its investment advisory fee by 0.10% for Dynamic for average daily net assets up to $200 million. During the year ended December 31, 2020, $179,427 of investment advisory fees were waived in Dynamic.
MAM contractually agreed to reduce its investment advisory fee by 0.11% for Bond for average daily net assets up to $100 million. During the year ended December 31, 2020, $70,961 of investment advisory fees were waived in Bond.
Mutual Funds Service Co. (“MFSCo”), a wholly-owned subsidiary of Meeder, serves as stock transfer, dividend disbursing and shareholder services agent for each Fund. In compensation for such services, each Fund pays MFSCo an annual fee equal to the greater of the following:
| | | Minimum Fee | | | Percentage of Average
Daily Net Assets up to
$500 Million | | | Percentage of Average
Daily Net Assets
Exceeding $500
Million | |
Muirfield | | $ | 4,000 | | | | 0.12 | % | | | 0.03 | % |
Spectrum | | | 4,000 | | | | 0.12 | % | | | 0.03 | % |
Global | | | 4,000 | | | | 0.12 | % | | | 0.03 | % |
Balanced | | | 4,000 | | | | 0.12 | % | | | 0.03 | % |
Moderate | | | 4,000 | | | | 0.12 | % | | | 0.03 | % |
Conservative | | | 4,000 | | | | 0.12 | % | | | 0.03 | % |
Dynamic | | | 4,000 | | | | 0.12 | % | | | 0.03 | % |
Quantex | | | 4,000 | | | | 0.12 | % | | | 0.03 | % |
Bond | | | 4,000 | | | | 0.08 | % | | | 0.03 | % |
Prime Money Market | | | 4,000 | | | | 0.08 | % | | | 0.03 | % |
Institutional Prime Money Market | | | 4,000 | | | | 0.08 | % | | | 0.03 | % |
2020 Annual Report | December 31, 2020 | Page 147 |
Prior to January 1, 2020, for fixed income Funds (Bond, Prime Money Market, and Institutional Prime Money Market) that were subject to an expense cap and which were above the expense cap, the basis point fee was reduced by 0.02%. Effective January 1, 2020 there is no such reduction. Management may voluntarily waive fees for any Fund. During the year ended December 31, 2020, MFSCo waived the following transfer agent fees:
| | | Voluntary Transfer
Agent Fees
Reimbursements | | | Impact of Voluntary
Transfer Agent Fees
Reimbursements to
Average Net Assets
- Retail Class | | | Impact of Voluntary
Transfer Agent Fees
Reimbursements to
Average Net Assets
- Adviser Class | | | Impact of Voluntary
Transfer Agent Fees
Reimbursements to
Average Net Assets
- Institutional Class | | | Impact of Voluntary
Transfer Agent Fees
Reimbursements to
Average Net Assets
- Money Market
Funds | |
Muirfield | | $ | 315,000 | | | | N/A | | | | N/A | | | | 0.08 | % | | | N/A | |
Spectrum | | | 7,000 | | | | N/A | | | | N/A | | | | 0.01 | % | | | N/A | |
Global | | | — | | | | N/A | | | | N/A | | | | N/A | | | | N/A | |
Balanced | | | 132,000 | | | | N/A | | | | N/A | | | | 0.05 | % | | | N/A | |
Moderate | | | — | | | | N/A | | | | N/A | | | | N/A | | | | N/A | |
Conservative | | | — | | | | N/A | | | | N/A | | | | N/A | | | | N/A | |
Dynamic | | | — | | | | N/A | | | | N/A | | | | N/A | | | | N/A | |
Quantex | | | — | | | | N/A | | | | N/A | | | | N/A | | | | N/A | |
Bond | | | — | | | | N/A | | | | N/A | | | | N/A | | | | N/A | |
Prime Money Market | | | — | | | | N/A | | | | N/A | | | | N/A | | | | N/A | |
Institutional Prime Money Market | | | — | | | | N/A | | | | N/A | | | | N/A | | | | N/A | |
MFSCo provides the Trust with certain administrative services. In compensation for such services, each Fund pays MFSCo at the following annual rates:
| | | Percentage of
Average Daily Net
Assets up to $50
Million | | | Percentage of
Average Daily Net
Assets Exceeding
$50 Million up to
$500 Million | | | Percentage of
Average Daily Net
Assets Exceeding
$500 Million | |
Muirfield | | | 0.10 | % | | | 0.08 | % | | | 0.03 | % |
Spectrum | | | 0.10 | % | | | 0.08 | % | | | 0.03 | % |
Global | | | 0.10 | % | | | 0.08 | % | | | 0.03 | % |
Balanced | | | 0.10 | % | | | 0.08 | % | | | 0.03 | % |
Moderate | | | 0.10 | % | | | 0.08 | % | | | 0.03 | % |
Conservative | | | 0.10 | % | | | 0.08 | % | | | 0.03 | % |
Dynamic | | | 0.10 | % | | | 0.08 | % | | | 0.03 | % |
Quantex | | | 0.10 | % | | | 0.08 | % | | | 0.03 | % |
Bond | | | 0.10 | % | | | 0.08 | % | | | 0.03 | % |
Prime Money Market | | | 0.10 | % | | | 0.08 | % | | | 0.03 | % |
Institutional Prime Money Market | | | 0.10 | % | | | 0.08 | % | | | 0.03 | % |
Page 148 | 2020 Annual Report | December 31, 2020 |
MFSCo serves as accounting services agent for each Fund. In compensation for such services, each Fund pays MFSCo an annual fee equal to the greater of a minimum fee or at a rate based on the percentage of average daily net assets. The annual rates are as follows:
| | | Minimum Fee | | | Percentage of
Average Daily Net
Assets up to $10
Million | | | Percentage of
Average Daily Net
Assets Exceeding
$10 Million up to
$30 Million | | | Percentage of
Average Daily Net
Assets Exceeding
$30 Million up to
$80 Million | | | Percentage of
Average Daily Net
Assets Exceeding
$80 Million | |
Muirfield | | $ | 7,500 | | | | 0.15 | % | | | 0.10 | % | | | 0.02 | % | | | 0.01 | % |
Spectrum | | | 7,500 | | | | 0.15 | % | | | 0.10 | % | | | 0.02 | % | | | 0.01 | % |
Global | | | 7,500 | | | | 0.15 | % | | | 0.10 | % | | | 0.02 | % | | | 0.01 | % |
Balanced | | | 7,500 | | | | 0.15 | % | | | 0.10 | % | | | 0.02 | % | | | 0.01 | % |
Moderate | | | 7,500 | | | | 0.15 | % | | | 0.10 | % | | | 0.02 | % | | | 0.01 | % |
Conservative | | | 7,500 | | | | 0.15 | % | | | 0.10 | % | | | 0.02 | % | | | 0.01 | % |
Dynamic | | | 7,500 | | | | 0.15 | % | | | 0.10 | % | | | 0.02 | % | | | 0.01 | % |
Quantex | | | 7,500 | | | | 0.15 | % | | | 0.10 | % | | | 0.02 | % | | | 0.01 | % |
Bond | | | 7,500 | | | | 0.15 | % | | | 0.10 | % | | | 0.02 | % | | | 0.01 | % |
Prime Money Market | | | 30,000 | | | | 0.15 | % | | | 0.10 | % | | | 0.02 | % | | | 0.01 | % |
Institutional Prime Money Market | | | 30,000 | | | | 0.15 | % | | | 0.10 | % | | | 0.02 | % | | | 0.01 | % |
For the year ended December 31, 2020, MAM agreed to voluntarily waive and/or reimburse investment advisory fees. The amounts voluntarily waived and/or reimbursed and the impact to the net expense ratio (excluding brokerage fees and commissions, taxes, interest, and extraordinary or non-recurring expenses) for each Fund are as follows:
| | | Voluntary
Investment
Advisory Fee
Reimbursements | | | Impact of Voluntary
Investment
Advisory Fee
Reimbursements to
Average Net Assets | | | Impact of Voluntary
Investment
Advisory Fee
Reimbursements to
Average Net Assets
- Retail Class | | | Impact of Voluntary
Investment
Advisory Fee
Reimbursements to
Average Net Assets
- Adviser Class | | | Impact of Voluntary
Investment
Advisory Fee
Reimbursements to
Average Net Assets
- Institutional Class | |
Muirfield | | $ | — | | | | N/A | | | | N/A | | | | N/A | | | | N/A | |
Spectrum | | | — | | | | N/A | | | | N/A | | | | N/A | | | | N/A | |
Global | | | — | | | | N/A | | | | N/A | | | | N/A | | | | N/A | |
Balanced | | | — | | | | N/A | | | | N/A | | | | N/A | | | | N/A | |
Moderate | | | — | | | | N/A | | | | N/A | | | | N/A | | | | N/A | |
Conservative | | | — | | | | N/A | | | | N/A | | | | N/A | | | | N/A | |
Dynamic | | | — | | | | N/A | | | | N/A | | | | N/A | | | | N/A | |
Quantex | | | — | | | | N/A | | | | N/A | | | | N/A | | | | N/A | |
Bond | | | — | | | | N/A | | | | N/A | | | | N/A | | | | N/A | |
Prime Money Market | | | 222,816 | | | | 0.63 | % | | | N/A | | | | N/A | | | | N/A | |
Institutional Prime Money Market | | | 1,186,453 | | | | 0.37 | % | | | N/A | | | | N/A | | | | N/A | |
Certain Funds have entered into securities lending arrangements with Huntington National Bank (“HNB”). Under the terms of the agreement, HNB is authorized to loan securities on behalf of the Funds to approved brokers. In exchange, under normal market conditions, the Funds receive cash collateral in the amount of at least 102% of the value of securities loaned. The cash collateral is invested in short term instruments as noted in the Schedules of Investments. Although risk is mitigated by the collateral, the Funds could experience a delay in recovering their securities and possible loss of income or value if the borrower fails to return the borrowed securities. In addition, the Funds bear the risk of loss associated with the investment of cash collateral received. After predetermined rebates to brokers, a percentage of the net securities lending revenue is credited to the Funds to be used as an offset against charges incurred by the Funds. HNB is paid a fee for administering the securities lending program for
2020 Annual Report | December 31, 2020 | Page 149 |
the Funds, equal to the remaining percentage of the net securities lending revenues generated under the agreement. As of December 31, 2020, Muirfield, Spectrum, Global, Balanced, Moderate, Conservative, Dynamic, and Quantex had loaned securities that were collateralized by cash. The cash collateral received was invested in securities as listed in each Fund’s Schedule of Investments. For the year ended December 31, 2020, income earned through securities lending arrangements was as follows:
| | | Amount Received
to Reduce Gross
Expenses | |
Muirfield | | $ | 6,972 | |
Spectrum | | | 5,000 | |
Global | | | 113 | |
Balanced | | | 3,103 | |
Moderate | | | 749 | |
Conservative | | | 270 | |
Dynamic | | | 1,729 | |
Quantex | | | 7,453 | |
The Funds have adopted a written plan pursuant to Rule 12b-1 of the 1940 Act that allows the Funds to pay fees for the sale and distribution of Fund shares and for services provided to Fund shareholders. 12b-1 fees are paid by the Funds to financial intermediaries, securities brokers, investment advisers, and other persons, including affiliates of MAM. For the year ended December 31, 2020, total 12b-1 plan expense payments made to the Funds’ affiliated distributor was $84,304. The annual adopted 12b-1 plan maximum limitations for the year ended December 31, 2020, are as follows:
| | Maximum Annual
12b-1 Plan Expense
as a Percentage of
Average Daily Net
Assets | Maximum Annual
12b-1 Plan Expense
as a Percentage of
Average Daily Net
Assets - Retail Class | Maximum Annual
12b-1 Plan Expense
as a Percentage of
Average Daily Net
Assets - Adviser
Class | Maximum Annual
12b-1 Plan Expense
as a Percentage of
Average Daily Net
Assets - Institutional
Class | 12b-1 Plan Expense
Payments Made to
Affiliates |
Muirfield | N/A | 0.20% | N/A | N/A | $38,895 |
Spectrum | N/A | 0.25% | N/A | N/A | 2,518 |
Global | N/A | 0.25% | N/A | N/A | 2,273 |
Balanced | N/A | 0.25% | N/A | N/A | 5,616 |
Moderate | N/A | 0.25% | N/A | N/A | 878 |
Conservative | N/A | 0.25% | N/A | N/A | 7,832 |
Dynamic | N/A | 0.25% | N/A | N/A | 8,849 |
Quantex | N/A | 0.20% | N/A | N/A | 15,191 |
Bond | N/A | 0.25% | N/A | N/A | 2,252 |
Prime Money Market | 0.20% | N/A | N/A | N/A | N/A |
Institutional Prime Money Market | 0.20% | N/A | N/A | N/A | N/A |
Page 150 | 2020 Annual Report | December 31, 2020 |
The Funds (other than the Money Market Funds) have adopted a shareholder services plan that allows the Funds to pay financial intermediaries and other persons, including “platforms,” for providing shareholder and administrative services to Fund shareholders and maintaining shareholder accounts. The annual adopted shareholder services plan maximum limitations for the year ended December 31, 2020 are as follows:
| | Maximum Annual
Shareholder Services
Plan Expense as a
Percentage of Average
Daily Net Assets - Retail
Class | Maximum Annual
Shareholder Services
Plan Expense as a
Percentage of Average
Daily Net Assets -
Adviser Class | Maximum Annual
Shareholder Services
Plan Expense as a
Percentage of Average
Daily Net Assets -
Institutional Class |
Muirfield | 0.20% | 0.25% | 0.10% |
Spectrum | 0.20% | 0.25% | 0.10% |
Global | 0.20% | 0.25% | 0.10% |
Balanced | 0.20% | 0.25% | 0.10% |
Moderate | 0.20% | 0.25% | 0.10% |
Conservative | 0.20% | 0.25% | 0.10% |
Dynamic | 0.20% | 0.25% | 0.10% |
Quantex | 0.20% | 0.25% | 0.10% |
Bond | 0.20% | 0.25% | 0.10% |
The Funds have adopted a Deferred Compensation Plan (the “Plan”) for the independent Trustees. Under the Plan, each eligible Trustee is permitted to defer all or a portion of the trustees fees payable by any of the Funds as an investment into any combination of Funds until a specified point of time. The investment into the Funds is recorded as an asset however an offsetting liability is also recorded for the deferred payment. Amounts deferred under the Plan may be distributed in a lump sum or generally equal annual installments over a period of up to ten (10) years to the eligible Trustee(s). The Funds may terminate this Plan at any time.
Certain Trustees and officers of the Funds are also officers or directors of Meeder, MAM, and MFSCo.
During the year ended December 31, 2020, several of the Funds invested in the Institutional Prime Money Market Fund, an affiliate, as described in Section 2(a)(3) of the Investment Company Act of 1940. The purchases/sales amounts in the following table are presented on a gross basis, while the statement of changes in net assets shows subscriptions and redemptions into and out of the Institutional Prime Money Market Fund on a net basis. The Funds’ investments in the Institutional Prime Money Market Fund, which had a 7-day yield of 0.08% on December 31, 2020, were as follows:
| | | 12/31/19
Fair Value | | | Purchases | | | Sales | | | Realized
Gains
(Losses) | | | 12/31/20 Cost | | | Change in
Unrealized | | | Income | | | 12/31/20
Fair Value | |
Muirfield | | $ | 131,391,282 | | | $ | 138,549,908 | | | $ | (166,033,278 | ) | | $ | (28,106 | ) | | $ | 103,864,010 | | | $ | 8,574 | | | $ | 622,634 | | | $ | 103,888,380 | |
Spectrum | | | 5,987,102 | | | | 81,891,670 | | | | (58,599,057 | ) | | | (4,299 | ) | | | 29,275,409 | | | | 8,798 | | | | 61,173 | | | | 29,284,214 | |
Global | | | 16,954,500 | | | | 12,010,102 | | | | (13,304,750 | ) | | | 215 | | | | 15,658,597 | | | | 3,752 | | | | 89,179 | | | | 15,663,819 | |
Balanced | | | 67,392,229 | | | | 93,526,058 | | | | (109,284,116 | ) | | | (18,173 | ) | | | 51,607,766 | | | | 18,404 | | | | 346,120 | | | | 51,634,402 | |
Moderate | | | 23,031,540 | | | | 51,463,304 | | | | (52,799,990 | ) | | | (4,947 | ) | | | 21,686,489 | | | | 7,217 | | | | 126,639 | | | | 21,697,124 | |
Conservative | | | 9,379,205 | | | | 46,052,545 | | | | (45,005,776 | ) | | | (3,227 | ) | | | 10,421,455 | | | | 5,682 | | | | 58,795 | | | | 10,428,429 | |
Dynamic | | | 40,107,913 | | | | 48,285,782 | | | | (51,745,632 | ) | | | (334 | ) | | | 36,643,404 | | | | 1,680 | | | | 163,596 | | | | 36,649,409 | |
Quantex | | | 1,503,598 | | | | 15,708,361 | | | | (16,641,534 | ) | | | 1,713 | | | | 572,131 | | | | (6 | ) | | | 10,119 | | | | 572,132 | |
Bond | | | 2,171,908 | | | | 24,104,078 | | | | (23,738,162 | ) | | | (248 | ) | | | 2,537,503 | | | | 2,075 | | | | 11,810 | | | | 2,539,651 | |
2020 Annual Report | December 31, 2020 | Page 151 |
6. Federal Tax Information
The following information is computed on a tax basis for each item as of December 31, 2020:
| | | Tax Cost of
Portfolio
Investments | | | Gross Unrealized
Appreciation | | | Gross Unrealized
Depreciation | | | Net Unrealized
Appreciation/
Depreciation | |
Muirfield | | $ | 434,992,782 | | | $ | 138,589,061 | | | $ | (10,714,780 | ) | | $ | 127,874,281 | |
Spectrum | | | 138,986,920 | | | | 44,896,495 | | | | (3,401,951 | ) | | | 41,494,544 | |
Global | | | 36,478,273 | | | | 6,534,121 | | | | (405,762 | ) | | | 6,128,359 | |
Balanced | | | 321,117,028 | | | | 73,141,498 | | | | (5,456,093 | ) | | | 67,685,405 | |
Moderate | | | 151,138,345 | | | | 23,402,689 | | | | (1,665,478 | ) | | | 21,737,211 | |
Conservative | | | 125,767,456 | | | | 15,002,810 | | | | (1,042,891 | ) | | | 13,959,919 | |
Dynamic | | | 153,815,769 | | | | 44,858,498 | | | | (3,100,550 | ) | | | 41,757,948 | |
Quantex | | | 29,401,285 | | | | 8,792,374 | | | | (1,055,977 | ) | | | 7,736,397 | |
Bond | | | 63,564,666 | | | | 4,833,732 | | | | (193,040 | ) | | | 4,640,692 | |
Prime Money Market | | | 34,562,638 | | | | — | | | | — | | | | — | |
Institutional Prime Money Market | | | 336,376,865 | | | | 35,427 | | | | (1,216 | ) | | | 34,211 | |
The tax characteristics of dividends paid by the Funds during the year ended December 31, 2020 were as follows:
| | | Ordinary Income | | | Net Short-Term
Capital Gains | | | Net Long-Term
Capital Gains | | | Total Dividends
Paid* | |
Muirfield | | $ | 4,943,111 | | | $ | — | | | $ | — | | | $ | 4,943,111 | |
Spectrum | | | 1,441,970 | | | | — | | | | — | | | | 1,441,970 | |
Global | | | 318,203 | | | | 303,373 | | | | 689,457 | | | | 1,311,033 | |
Balanced | | | 3,364,824 | | | | — | | | | — | | | | 3,364,824 | |
Moderate | | | 2,369,151 | | | | — | | | | — | | | | 2,369,151 | |
Conservative | | | 2,480,581 | | | | — | | | | — | | | | 2,480,581 | |
Dynamic | | | 835,596 | | | | 639,520 | | | | 3,370,600 | | | | 4,845,716 | |
Quantex | | | 292,663 | | | | — | | | | — | | | | 292,663 | |
Bond | | | 1,403,955 | | | | — | | | | — | | | | 1,403,955 | |
Prime Money Market | | | 161,501 | | | | — | | | | — | | | | 161,501 | |
Institutional Prime Money Market | | | 2,275,825 | | | | — | | | | — | | | | 2,275,825 | |
The tax characteristics of dividends paid by the Funds during the year ended December 31, 2019 were as follows:
| | | Ordinary Income | | | Net Short Term
Capital Gains | | | Net Long Term
Capital Gains | | | Total Dividends
Paid* | |
Muirfield | | $ | 3,218,545 | | | $ | — | | | $ | 15,318,351 | | | $ | 18,536,896 | |
Spectrum | | | 143,754 | | | | — | | | | 1,927,105 | | | | 2,070,859 | |
Global | | | 326,800 | | | | 279,432 | | | | 614,316 | | | | 1,220,548 | |
Balanced | | | 3,766,194 | | | | — | | | | 2,810,783 | | | | 6,576,977 | |
Moderate | | | 3,444,296 | | | | — | | | | — | | | | 3,444,296 | |
Conservative | | | 3,375,522 | | | | — | | | | — | | | | 3,375,522 | |
Dynamic | | | 1,941,019 | | | | — | | | | 3,035,347 | | | | 4,976,366 | |
Quantex | | | 521,859 | | | | — | | | | — | | | | 521,859 | |
Bond | | | 1,749,960 | | | | — | | | | — | | | | 1,749,960 | |
Prime Money Market | | | 725,101 | | | | — | | | | — | | | | 725,101 | |
Institutional Prime Money Market | | | 9,951,803 | | | | — | | | | — | | | | 9,951,803 | |
Page 152 | 2020 Annual Report | December 31, 2020 |
As of December 31, 2020, the components of distributable earnings/(accumulated deficit) on a tax basis for the Funds were as follows:
| | | Undistributed
Ordinary Income | | | Undistributed
Long-Term
Capital Gain | | | Accumulated
Capital and Other
Gains and (Losses) | | | Unrealized
Appreciation/
(Depreciation)** | | | Total
Distributable
Earnings/
(Accumulated
Deficit) | |
Muirfield | | $ | 3,491,212 | | | $ | — | | | $ | (51,771,922 | ) | | $ | 127,874,281 | | | $ | 79,593,571 | |
Spectrum | | | 375,632 | | | | — | | | | (15,777,518 | ) | | | 41,494,544 | | | | 26,092,658 | |
Global | | | 2,142 | | | | — | | | | (817,020 | ) | | | 6,128,359 | | | | 5,313,481 | |
Balanced | | | 3,650,774 | | | | — | | | | (18,053,218 | ) | | | 67,685,405 | | | | 53,282,961 | |
Moderate | | | 49,608 | | | | — | | | | (4,617,494 | ) | | | 21,737,211 | | | | 17,169,325 | |
Conservative | | | 112,005 | | | | — | | | | (3,758,279 | ) | | | 13,959,919 | | | | 10,313,645 | |
Dynamic | | | 1,214,054 | | | | 6,659,482 | | | | (180,790 | ) | | | 41,757,948 | | | | 49,450,694 | |
Quantex | | | 59,964 | | | | — | | | | (2,801,255 | ) | | | 7,736,397 | | | | 4,995,106 | |
Bond | | | 17,706 | | | | — | | | | (11,369,543 | ) | | | 4,640,692 | | | | (6,711,145 | ) |
Institutional Prime Money Market | | | 4,233 | | | | — | | | | (6,836 | ) | | | 34,211 | | | | 31,608 | |
* | Total dividends paid may differ from the amount reported in the Statements of Changes in Net Assets because for tax purposes dividends are recognized when actually paid. Short-term capital gains distributions are taxed as ordinary income. |
** | The differences between book- and tax-basis unrealized appreciation/(depreciation) are attributable primarily to: wash sales, return of capital adjustments, and the realization for tax purposes of unrealized gains/(losses) on certain derivative investments. |
For federal income tax purposes, the following Funds have capital loss carryforwards as of December 31, 2020, which are not subject to expiration and are available to offset future capital gains, if any. To the extent that these carryforwards are used to offset future capital gains, it is probable that the gains that are offset will not be distributed to shareholders:
| | | Short-Term Capital
Loss Carryforward | | | Long-Term Capital
Loss Carryforward | | | Capital Loss
Carryforward Utilized | |
Muirfield | | $ | 38,859,565 | | | $ | 12,676,746 | | | $ | — | |
Spectrum | | | 8,209,937 | | | | 7,488,535 | | | | — | |
Global | | | 726,448 | | | | — | | | | — | |
Balanced | | | 12,003,395 | | | | 5,895,753 | | | | — | |
Moderate | | | 3,969,072 | | | | 623,132 | | | | — | |
Conservative | | | 3,508,900 | | | | 187,874 | | | | — | |
Quantex | | | 2,746,626 | | | | — | | | | — | |
Bond | | | 8,949,457 | | | | 2,355,920 | | | | 333,274 | |
Institutional Prime Money Market | | | 1,203 | | | | 1,504 | | | | 638 | |
7. Control Ownership
The beneficial ownership, either directly or indirectly, of more than 25% of the voting securities of a fund creates a presumption of control of the fund under Section 2(a)(9) of the 1940 Act. As of December 31, 2020, beneficial owners that held more than 25% of the voting securities of the Funds and may be deemed to control the Funds are as follows:
Fund | Beneficial Owner | Percent of Voting
Securities |
Institutional Prime Money Market | Meeder Muirfield Fund | 31% |
8. Contingencies and Commitments
The Funds indemnify the Trust’s officers and Trustees for certain liabilities that might arise from their performance of their duties to the Funds. Additionally, in the normal course of business the Funds enter into contracts that contain a variety of representations and warranties and which provide general indemnifications. The Funds’ maximum exposure under these arrangements is unknown, as this would involve future claims that may be made against the Funds that have not yet occurred. However, based on experience, the Funds expect the risk of loss to be remote.
2020 Annual Report | December 31, 2020 | Page 153 |
9. Subsequent Events
On January 25, 2021, a broker/dealer initiated a significant capital share class exchange from the Retail Class of shares into the Adviser Class of shares. The exchange occurred in Muirfield, Spectrum, Global, Balanced, Moderate, Conservative, Dynamic, Quantex, and Bond Funds. As a result, total net assets of the Retail Classes of shares decreased, while the total net assets of the Adviser Classes of shares increased. There were no changes to each Fund’s total net assets as a result of the capital share class exchange.
At a meeting held on January 28, 2021, the Board of Trustees approved a revised principal investment strategy for the Total Return Bond Fund, as well as a change to the investment objective of the Fund. As a result, the name of the Fund will be changing from Total Return Bond Fund to Tactical Income Fund. These changes are expected to become effective on April 6, 2021. For more detailed information on the principal investment strategy change, the investment objective change, and the name change, please visit the Fund’s website at www.meederinvestment.com to obtain a copy of the prospectus.
At a meeting held on January 28, 2021, the Board of Trustees approved a revised principal investment strategy for the Quantex Fund. This change is expected to become effective on April 6, 2021. For more detailed information on the principal investment strategy change, please visit the Fund’s website at www.meederinvestment.com to obtain a copy of the prospectus.
Page 154 | 2020 Annual Report | December 31, 2020 |
Report of Independent Registered Public Accounting Firm
To the Shareholders and Board of Trustees of
Meeder Funds
Opinion on the Financial Statements
We have audited the accompanying statements of assets and liabilities, including the schedules of investments, of Meeder Funds comprising Muirfield Fund, Spectrum Fund, Global Allocation Fund, Balanced Fund, Moderate Allocation Fund, Conservative Allocation Fund, Dynamic Allocation Fund, Quantex Fund, Total Return Bond Fund, Prime Money Market Fund, and Institutional Prime Money Market Fund (the “Funds”) as of December 31, 2020, the related statements of operations for the year then ended, the statements of changes in net assets for each of the two years in the period then ended, the related notes, and the financial highlights for each of the five years or periods in the period then ended (collectively referred to as the “financial statements”). In our opinion, the financial statements present fairly, in all material respects, the financial position of each of the Funds as of December 31, 2020, the results of their operations for the year then ended, the changes in net assets for each of the two years in the period then ended, and the financial highlights for each of the five years or periods in the period then ended, in conformity with accounting principles generally accepted in the United States of America.
Basis for Opinion
These financial statements are the responsibility of the Funds’ management. Our responsibility is to express an opinion on the Funds’ financial statements based on our audits. We are a public accounting firm registered with the Public Company Accounting Oversight Board (United States) (“PCAOB”) and are required to be independent with respect to the Funds in accordance with the U.S. federal securities laws and the applicable rules and regulations of the Securities and Exchange Commission and the PCAOB.
We conducted our audits in accordance with the standards of the PCAOB. Those standards require that we plan and perform the audit to obtain reasonable assurance about whether the financial statements are free of material misstatement whether due to error or fraud.
Our audits included performing procedures to assess the risks of material misstatement of the financial statements, whether due to error or fraud, and performing procedures that respond to those risks. Such procedures included examining, on a test basis, evidence regarding the amounts and disclosures in the financial statements. Our procedures included confirmation of securities owned as of December 31, 2020, by correspondence with the custodian and brokers. Our audits also included evaluating the accounting principles used and significant estimates made by management, as well as evaluating the overall presentation of the financial statements. We believe that our audits provide a reasonable basis for our opinion.
We have served as the Funds’ auditor since 2004.
COHEN & COMPANY, LTD.
Cleveland, Ohio
February 24, 2021
2020 Annual Report | December 31, 2020 | Page 155 |
Shareholder Expense Analysis (unaudited)
Shareholders of mutual funds pay ongoing expenses, such as advisory fees, distribution and service fees and other fund operating expenses. The following examples are intended to help you understand your ongoing costs (in dollars) of investing in the Funds and to compare these costs with the ongoing costs of investing in other mutual funds. The examples are based on an investment of $1,000 invested for the period of time indicated in the table below.
The Actual Expense example provides information about actual account values and actual expenses. You may use the information in this line, together with the amount you invested, to estimate the expenses that you paid over the period. Simply divide your account value by $1,000 (e.g.: an $8,600 account value divided by $1,000 = 8.6), then multiply the result by the number in the line under the heading “Expenses Paid During the Period” to estimate the expenses you paid on your account during this period.
The Hypothetical Expense example provides information about hypothetical account values and hypothetical expenses based on each Fund’s actual expense ratio and an assumed rate of return of 5% per year before expenses, which is not the actual return of any Fund. The hypothetical account values and expenses may not be used to estimate the actual ending account balance or expenses you paid for the period. You may use this information to compare the ongoing costs of investing in the Funds to other funds. To do so, compare this 5% hypothetical example with the 5% hypothetical examples that appear in the shareholder reports of the other funds.
| | | Beginning Account Value
June 30, 2020 | | | Ending Account Value
December 31, 2020 | | | Expenses Paid
During Period1 | | | Net Expense
Ratio2 | |
| | | Actual | | | Hypothetical | | | Actual | | | Hypothetical | | | Actual | | | Hypothetical | | | Actual | |
Muirfield Fund | | | | | | | | | | | | | | | | | | | | | | | | | | | | |
Retail Class | | $ | 1,000.00 | | | $ | 1,000.00 | | | $ | 1,186.00 | | | $ | 1,018.70 | | | $ | 7.03 | | | $ | 6.50 | | | | 1.28 | % |
Adviser Class | | | 1,000.00 | | | | 1,000.00 | | | | 1,188.40 | | | | 1,020.21 | | | | 5.39 | | | | 4.98 | | | | 0.98 | % |
Institutional Class | | | 1,000.00 | | | | 1,000.00 | | | | 1,189.50 | | | | 1,021.11 | | | | 4.40 | | | | 4.06 | | | | 0.80 | % |
Spectrum Fund | | | | | | | | | | | | | | | | | | | | | | | | | | | | |
Retail Class | | | 1,000.00 | | | | 1,000.00 | | | | 1,190.00 | | | | 1,017.39 | | | | 8.48 | | | | 7.81 | | | | 1.54 | % |
Adviser Class | | | 1,000.00 | | | | 1,000.00 | | | | 1,192.20 | | | | 1,019.25 | | | | 6.45 | | | | 5.94 | | | | 1.17 | % |
Institutional Class | | | 1,000.00 | | | | 1,000.00 | | | | 1,193.50 | | | | 1,019.51 | | | | 6.18 | | | | 5.69 | | | | 1.12 | % |
Global Allocation Fund | | | | | | | | | | | | | | | | | | | | | | | | | | | | |
Retail Class | | | 1,000.00 | | | | 1,000.00 | | | | 1,189.30 | | | | 1,016.49 | | | | 9.47 | | | | 8.72 | | | | 1.72 | % |
Adviser Class | | | 1,000.00 | | | | 1,000.00 | | | | 1,192.90 | | | | 1,018.10 | | | | 7.72 | | | | 7.10 | | | | 1.40 | % |
Institutional Class | | | 1,000.00 | | | | 1,000.00 | | | | 1,192.80 | | | | 1,018.60 | | | | 7.17 | | | | 6.60 | | | | 1.30 | % |
Balanced Fund | | | | | | | | | | | | | | | | | | | | | | | | | | | | |
Retail Class | | | 1,000.00 | | | | 1,000.00 | | | | 1,143.10 | | | | 1,018.05 | | | | 7.60 | | | | 7.15 | | | | 1.41 | % |
Adviser Class | | | 1,000.00 | | | | 1,000.00 | | | | 1,144.70 | | | | 1,019.91 | | | | 5.61 | | | | 5.28 | | | | 1.04 | % |
Institutional Class | | | 1,000.00 | | | | 1,000.00 | | | | 1,145.10 | | | | 1,020.51 | | | | 4.96 | | | | 4.67 | | | | 0.92 | % |
Moderate Allocation Fund | | | | | | | | | | | | | | | | | | | | | | | | | | | | |
Retail Class | | | 1,000.00 | | | | 1,000.00 | | | | 1,112.70 | | | | 1,018.20 | | | | 7.33 | | | | 7.00 | | | | 1.38 | % |
Adviser Class | | | 1,000.00 | | | | 1,000.00 | | | | 1,115.80 | | | | 1,020.16 | | | | 5.27 | | | | 5.03 | | | | 0.99 | % |
Institutional Class | | | 1,000.00 | | | | 1,000.00 | | | | 1,115.40 | | | | 1,020.21 | | | | 5.21 | | | | 4.98 | | | | 0.98 | % |
Conservative Allocation Fund | | | | | | | | | | | | | | | | | | | | | | | | | | | | |
Retail Class | | | 1,000.00 | | | | 1,000.00 | | | | 1,085.40 | | | | 1,018.75 | | | | 6.66 | | | | 6.44 | | | | 1.27 | % |
Adviser Class | | | 1,000.00 | | | | 1,000.00 | | | | 1,087.40 | | | | 1,020.61 | | | | 4.72 | | | | 4.57 | | | | 0.90 | % |
Institutional Class | | | 1,000.00 | | | | 1,000.00 | | | | 1,087.70 | | | | 1,020.56 | | | | 4.78 | | | | 4.62 | | | | 0.91 | % |
Dynamic Allocation Fund | | | | | | | | | | | | | | | | | | | | | | | | | | | | |
Retail Class | | | 1,000.00 | | | | 1,000.00 | | | | 1,206.60 | | | | 1,018.15 | | | | 7.71 | | | | 7.05 | | | | 1.39 | % |
Adviser Class | | | 1,000.00 | | | | 1,000.00 | | | | 1,209.30 | | | | 1,019.86 | | | | 5.83 | | | | 5.33 | | | | 1.05 | % |
Institutional Class | | | 1,000.00 | | | | 1,000.00 | | | | 1,208.90 | | | | 1,020.06 | | | | 5.61 | | | | 5.13 | | | | 1.01 | % |
Page 156 | 2020 Annual Report | December 31, 2020 |
| | | Beginning Account Value
June 30, 2020 | | | Ending Account Value
December 31, 2020 | | | Expenses Paid
During Period1 | | | Net Expense
Ratio2 | |
| | | Actual | | | Hypothetical | | | Actual | | | Hypothetical | | | Actual | | | Hypothetical | | | Actual | |
Quantex Fund | | | | | | | | | | | | | | | | | | | | | | | | | | | | |
Retail Class | | $ | 1,000.00 | | | $ | 1,000.00 | | | $ | 1,282.70 | | | $ | 1,017.39 | | | $ | 8.84 | | | $ | 7.81 | | | | 1.54 | % |
Adviser Class | | | 1,000.00 | | | | 1,000.00 | | | | 1,283.40 | | | | 1,018.05 | | | | 8.09 | | | | 7.15 | | | | 1.41 | % |
Institutional Class | | | 1,000.00 | | | | 1,000.00 | | | | 1,283.40 | | | | 1,018.20 | | | | 7.92 | | | | 7.00 | | | | 1.38 | % |
Total Return Bond Fund | | | | | | | | | | | | | | | | | | | | | | | | | | | | |
Retail Class | | | 1,000.00 | | | | 1,000.00 | | | | 1,031.30 | | | | 1,019.46 | | | | 5.77 | | | | 5.74 | | | | 1.13 | % |
Adviser Class | | | 1,000.00 | | | | 1,000.00 | | | | 1,033.30 | | | | 1,021.17 | | | | 4.04 | | | | 4.01 | | | | 0.79 | % |
Institutional Class | | | 1,000.00 | | | | 1,000.00 | | | | 1,033.40 | | | | 1,021.32 | | | | 3.88 | | | | 3.86 | | | | 0.76 | % |
Prime Money Market Fund | | | 1,000.00 | | | | 1,000.00 | | | | 1,000.20 | | | | 1,023.78 | | | | 1.36 | | | | 1.37 | | | | 0.27 | % |
Institutional Prime Money Market Fund | | | 1,000.00 | | | | 1,000.00 | | | | 1,000.40 | | | | 1,024.38 | | | | 0.75 | | | | 0.76 | | | | 0.15 | % |
Please note that the expenses shown in the tables are meant to highlight your ongoing costs only and do not reflect any transactional costs, such as redemption fees or exchange fees. Therefore, hypothetical information is useful in comparing ongoing costs only, and will not help you determine the relative total costs of owning different funds. In addition, if any transactional costs were included, your costs would have been higher.
1 | Expenses are equal to each Fund’s annualized net expense ratio, multiplied by the average account value over the period, multiplied by the number of days in the most recent fiscal half-year, divided by the number of days in the fiscal year (to reflect the one-half year period). |
2 | Annualized net expense ratio reflects contractual or voluntary waivers and reimbursements of expenses by the investment adviser and transfer agent. |
2020 Annual Report | December 31, 2020 | Page 157 |
Trustees and Officers (unaudited)
Certain trustees and officers of the Funds are also officers or directors of Meeder, MAM, and MFSCo. The Trustees oversee the management of the Trust and elect its officers. The officers are responsible for the Funds’ day-to-day operations. The Trustees’ and officers’ names, addresses, years of birth, positions held with the Trust, and length of service with the Meeder Funds, are listed below. Also included is each Board member’s principal occupation during, at least, the past five years. Except as indicated, each individual has held the office shown or other offices in the same company for the last five years. Those Trustees who are “interested persons”, as defined in the 1940 Act, by virtue of their affiliation with the Trust, are indicated by an asterisk (*).
Name, Address1,
and Year of Birth | Year First Elected a
Trustee or Officer of
the Trust | Position and Number
of Funds Overseen2 | Principal Occupation During
Past Five Years and Other
Directorships Held |
Robert S. Meeder, Jr.*
Year of Birth: 1961 | 1992 | Trustee and President | President, Meeder Investment Management, Inc. |
Stuart M. Allen**
Year of Birth: 1961 | 2006 | Trustee | President of Gardiner Allen DeRoberts Insurance LLC, an insurance agency. |
Anthony V. D’Angelo**
Year of Birth: 1959 | 2006 | Trustee | General Manager, WSYX ABC 6 /WTTE-TV Fox 28 /WWHO television stations, Columbus, Ohio, operated by Sinclair Broadcast Group (2014 – present); Director of Sales (2004 – 2014); Lead Trustee of the Trust. |
Jeffrey R. Provence**
Year of Birth: 1969 | 2017 | Trustee | CEO, Premier Fund Solutions, Inc. (2001 – present); General Partner & Portfolio Manager, Value Trend Capital Management, L.P. (1995 – present); Director, Blue Chip Investor Funds; Director, PFS Funds; Chairman of the Trust’s Audit Committee. |
Douglas R. Jennings
Year of Birth: 1962 | 2017 | Chief Compliance Officer | Chief Compliance Officer, Meeder Investment Management, Inc. (2016 – present); Assistant General Counsel; Partner, Carlile Patchen & Murphy, LLP (2010 – 2016). |
Bruce E. McKibben
Year of Birth: 1969 | 2002 | Treasurer | Director of Fund Accounting, Mutual Funds Service Co. (1997 – present). |
Alaina Salonsky
Year of Birth: 1967 | 2017 | Secretary | Compliance Specialist, Meeder Investment Management, Inc. (2017 – present); Teacher, Big Walnut School District, Sunbury, Ohio (2013 – 2017). |
1 | The address of each Trustee is 6125 Memorial Drive, Dublin, OH 43017. |
2 | Each Trustee serves for an indefinite term, until his or her resignation, death, or removal. Each Trustee oversees all eleven Funds in the Trust. |
* | Robert S. Meeder, Jr. is deemed an “interested person” of the Trust by virtue of his position as President of Meeder Asset Management, Inc., the Adviser of the Trust. |
** | Each independent Trustee is a member of the Trust’s Audit Committee, Compensation Committee, and Nominating Committee. |
The Statement of Additional Information includes additional information about each Trustee and is available without charge. To obtain a copy of the Statement of Additional Information, please contact your financial representative or call toll free 1-800-325-3539.
Page 158 | 2020 Annual Report | December 31, 2020 |
Board Review and Approval of Investment Advisory Agreement (unaudited)
At a regularly scheduled meeting held September 17, 2020, the Board of Trustees met and considered a broad range of information provided by Meeder Asset Management, Inc. (“Adviser”) in connection with its review of the continuation of the investment advisory agreement between the Funds and the Adviser. By a unanimous vote, the Board and its Independent Trustees approved continuation of the investment advisory agreement.
Approval Process. In order to determine that continuation of the investment advisory agreement was in the best interest of the Funds and their shareholders, the Board requested that the Adviser provide information and data related to: (i) industry data comparing advisory fees and expense ratios with comparable funds; (ii) comparative investment performance information; (iii) information concerning the Adviser’s personnel, services and compliance programs; and (iv) information concerning the Adviser’s revenues, expenses and profitability. In addition, the Board took into account information furnished throughout the year at regular Board meetings, including periodic reports concerning investment performance and other services provided by the Adviser and its affiliates. While attention was given to all of the information furnished, the Board made the following specific findings in connection with its decision to renew the Agreement:
Nature, Extent and Quality of Services. The Board considered the nature, extent and quality of the services provided by the Adviser and its affiliates, including the reputation, qualifications, experience and capabilities of the personnel performing these services. The Board noted the qualifications of the investment management team and the efforts the Adviser expends on attracting and retaining talent. The Board also noted that the Adviser and its affiliates provide a series of additional administrative services for the Funds, including fund accounting, transfer agency, distribution and compliance services, and recognized the continuing expenditures made to support and improve the scope of those services. The Board concluded that the nature, extent and quality of the services provided by the Adviser and its affiliates have benefited and should continue to benefit each Fund and its shareholders.
Investment Performance. The Board reviewed the investment performance of each Fund relative to its benchmark and the Morningstar category performance furnished to the Board in the report prepared in conjunction with the Board’s review of the advisory contract. The Board evaluated performance in light of the investment strategy pursued by the Adviser and steps taken by the Adviser to mitigate risk through active management of the portfolio. The Board gave special consideration to the Funds’ stated objective of achieving performance over a full market cycle, noting that the Funds may underperform over the short-term in the pursuit of long term returns at lower risk. The Board noted the Adviser’s continued efforts to revise and improve the quantitative models used to select securities and manage short and long term risk for the Funds. The Board concluded that the overall performance of the Funds was satisfactory relative to Funds’ respective strategies and peer performance.
Costs of Services. The Board took into consideration a comprehensive report comparing each Fund’s advisory fees and expenses with those of other mutual funds deemed comparable to the Fund. The Board also considered the fees and expenses charged by the Adviser’s affiliates for administrative, transfer agency, accounting and compliance services. The Board noted that adjustments were made to the administrative and transfer agency agreements reducing overall costs to shareholders. The Board concluded that the Funds’ cost structures were fair and reasonable in relation to the services provided, and that the Funds’ shareholders receive reasonable value in return for the advisory fees and other amounts paid to the Adviser by the Funds.
Management Profitability. The Board also considered the level of profits realized by the Adviser and its affiliates in connection with the operation of the Funds. In this respect, the Board reviewed the Funds’ profitability analysis that addresses the overall profitability of the Meeder Funds’ business as well as the profitability resulting from the operation of each Fund. The Board also noted that the Adviser expends significant amounts on distribution services for the Funds and routinely waives a portion of advisory and other fees or expenses of the Funds in order to reduce net operating expenses. The Board determined that the level of profits realized by the Adviser under its Agreement with the Funds was not excessive in view of the nature, quality and extent of services provided.
Economies of Scale. The Board also considered whether economies of scale are realized as the Funds grow larger and the extent to which this is reflected in the level of advisory and other fees charged. The Board noted that several of the Funds had achieved reductions in advisory fees under applicable breakpoint schedules and that the administrative and transfer agency agreements had been amended to include breakpoints in their fee schedules. The Board expressed continued satisfaction with each Fund’s fee structure under its Agreement.
Ancillary Benefits. The Board also considered ancillary benefits received by the Adviser as a result of its relationship with the Funds, including its access to research that benefits other clients and the service of its affiliates as transfer agent, administrator and distributor for the Funds. The Board took the ancillary benefits into account in evaluating the reasonableness of the advisory fees and other amounts paid to the Adviser by the Funds, noting that these arrangements are subject to regular reporting and oversight.
Conclusion. Based upon the foregoing findings as well as all of the information provided by the Adviser, the Board and its Independent Trustees concluded that the compensation received by the Adviser from the funds was fair and reasonable and that continuation of the investment advisory agreement for the Funds was in the best interests of the Funds and their shareholders. The Board, including a majority of its Independent Trustees, therefore approved the continuation of the Agreement effective for a one-year term ending September 30, 2021.
2020 Annual Report | December 31, 2020 | Page 159 |
Statement Regarding Liquidity Risk Management Program (unaudited)
In accordance with Rule 22e-4 (“Liquidity Rule”) under the 1940 Act, the Funds have adopted and implemented a liquidity risk management program (“Program”). The purpose of the Program is to outline the techniques, tools and arrangements employed for the management of liquidity risk within the Funds, and the terms, contents and frequency of reporting and escalation of any issues to the Board of Trustees. Liquidity is managed taking account of the investment strategy, liquidity profile, and redemption history, with the objective of maintaining a level of liquidity that is appropriate in light of the Funds’ obligations to the Funds’ shareholders. The Program assesses liquidity risk under both normal and stressed market conditions.
The Board of Trustees reviewed the Program during the Funds’ most recent fiscal half-year, including a written report prepared by the Program Administrator. The report reviewed the terms and operation of the Program, investment strategy and liquidity of the Funds, cash flow projections, shareholder concentration and holdings of cash and cash equivalents. The Adviser utilizes quantitative tools that provide daily evaluation of the liquidity of nearly all Funds’ securities. The Program Administrator was satisfied with the design, operation and effectiveness of the Program and reported that there were no liquidity events that materially affected the performance of the Funds or the Funds’ ability to meet their redemption obligations under normal and reasonably foreseeable stressed conditions without dilution to existing shareholders.
The report confirmed that the Funds’ investment strategies utilize highly liquid securities and do not maintain concentrated positions. The Funds also maintain significant holdings of cash and cash equivalents, which were judged suitable to meet redemption needs under ordinary and reasonably stressed market conditions. During the reporting period, the Funds maintained a high level of liquidity and primarily held assets in securities judged highly liquid under the Liquidity Rule. As a result, the Funds see no reason to, and therefore have not adopted a “Highly Liquid Investment Minimum,” as defined under the Liquidity Rule.
There can be no assurance that the Program will achieve its objectives in the future. Further information on liquidity risks of the Funds can be found in the Funds’ prospectus.
Other Information (unaudited)
The Trust files a complete schedule of portfolio holdings for the first and third quarters of each fiscal year on Form N-PORT. In addition, Prime Money Market Fund and Institutional Prime Money Market Fund file their complete schedules of portfolio holdings with the SEC each month on Form N-MFP. Forms N-PORT and N-MFP are available on the SEC’s website at www.sec.gov. Information regarding Fund holdings is also available at www.meederinvestment.com.
The investment adviser is responsible for exercising the voting rights associated with the securities purchased or held by the Funds. A description of the policies and procedures that the adviser uses in fulfilling this responsibility and information regarding how those proxies were voted during the most recent 12-month period ending June 30 are available, without charge, by calling 1-800-325-3539 or on the SEC’s website at www.sec.gov.
Page 160 | 2020 Annual Report | December 31, 2020 |

Privacy Policy
Meeder Investment Management and the Meeder Funds are committed to maintaining the financial privacy of our current, former and prospective customers. This policy explains how we protect the security and confidentiality of our customer’s information.
PERSONAL INFORMATION WE COLLECT
We may collect information about Meeder customers from a variety of sources, including:
| | ● | Information provided by you or your representative on applications or forms, such as your name, address, date of birth, social security number and investment objectives; |
| | ● | Information about the transactions in your account, such as your account balance and transaction history; and |
| | ● | Information we obtain from third parties regarding you, to verify your identity or transfer your account. |
INFORMATION WE SHARE WITH OUR AFFILIATES
Our affiliates are financial service providers that offer transfer agency, customer accounting, customer servicing, investment advisory, and other financial services. We share information with our affiliates to service your account. In addition, we may also share information with our affiliates to alert you to other products or services offered by Meeder to the extent provided by law. Information collected from customers whose accounts are opened through investment professionals is not shared with Meeder affiliates for marketing purposes.
INFORMATION WE SHARE WITH THIRD PARTIES
On occasion, we share information we collect about you with unaffiliated third parties to perform services in connection with your account, such as processing transactions, preparing and mailing account statements, and other forms of customer servicing. Information provided to third parties may not be used for any other purpose and Meeder does not permit unaffiliated third parties to use customer information to market their products or services.
HOW WE PROTECT INFORMATION ABOUT YOU
We maintain policies, and require all unaffiliated third parties to maintain policies, to safeguard customer information. We restrict access to nonpublic personal information about you to those persons who need to know that information in order to provide products and services to you. We also maintain physical, electronic, and procedural safeguards to guard your nonpublic personal information.
WHO THIS POLICY APPLIES TO
This policy applies to customers who open relationships directly with Meeder. It applies to Meeder Funds and Meeder’s affiliated companies, including Meeder Asset Management, Meeder Advisory Services, Meeder Public Funds, Meeder Distribution Services, Inc. (f.k.a. Adviser Dealer Services, Inc.) and Mutual Funds Service Company.
QUESTIONS
Contact us at 800-325-3539 or visit us online at www.meederinvestment.com
2020 Annual Report | December 31, 2020 | Page 161 |
[This page intentionally left blank]
[This page intentionally left blank]
[This page intentionally left blank]
Manager and Investment Adviser
Meeder Asset Management, Inc.
6125 Memorial Drive
P.O. Box 7177
Dublin, Ohio 43017
Board of Trustees
Stuart M. Allen
Anthony V. D’Angelo
Robert S. Meeder, Jr.
Jeffrey R. Provence
Custodian
The Huntington National Bank
Columbus, Ohio 43215
Transfer Agent & Dividend Disbursing Agent
Mutual Funds Service Co.
6125 Memorial Drive
Dublin, Ohio 43017
Distributor
Meeder Distribution Services, Inc. (f.k.a. Adviser Dealer Services, Inc.)
6125 Memorial Drive
Dublin, Ohio 43017
Independent Registered Public Accounting Firm
Cohen & Company, Ltd.
1350 Euclid Ave., Suite 800
Cleveland, Ohio 44115

Item 2. Code of Ethics.
The registrant has adopted a code of ethics that applies to the registrant’s principal executive officer, principal financial officer, comptroller or principal accounting officer, and any person who performs a similar function. There were no amendments made to, or waivers granted from, the code of ethics during the fiscal year.
Item 3. Audit Committee Financial Expert.
The Board of Trustees of the Trust has determined that Jeffrey R. Provence is an audit committee financial expert, as defined in Item 3 of Form N-CSR. Mr. Provence is independent for purposes of Item 3 of Form N-CSR.
Item 4. Principal Accountant Fees and Services.
(a) – (d) Aggregate fees billed to the registrant for the last two fiscal years for professional services rendered by the registrant’s principal accountant were as follows:
| | 2020 | 2019 |
| Audit Fees | $119,400 | $123,400 |
| Audit-Related Fees | 0 | 300 |
| Tax Fees | 43,500 | 51,000 |
| All Other Fees | 2,239 | 1,971 |
Audit fees include amounts related to the audit of the registrant’s annual financial statements and services normally provided by the accountant in connection with statutory and regulatory filings. Audit-related fees include amounts reasonably related to the performance of the audit of the registrant’s financial statements, including, but not limited to, mileage, lodging, and meals. Tax fees include amounts related to tax compliance, tax planning, and tax advice, including the review and preparation of the Funds’ income tax returns, the review and preparation of the Funds’ excise tax returns, the review of supporting schedules and documentation provided by management, the review and recalculation of the Funds’ estimated distribution calculations, and the review of wash sales for reasonableness. All other fees include amounts related to the registrant’s annual filing of Form N1A.
(e)(1) A purpose of the Audit Committee is to approve the engagement of the registrant’s independent auditors (i) to render audit and non-audit services for the registrant in accordance with Rule 2-01(c)(7)(i) of Regulation S-X, subject to the waiver provisions set forth in Rule 2-01(c)(7)(i)(C) of Regulation S-X, and (ii) to render non-audit services for the registrant’s investment advisors (other than a sub-advisor whose role is primarily portfolio management and is subcontracted or overseen by another investment advisor) and any other entity controlling by, or under common control with the investment advisor that provides ongoing services to the registrant, in each case under (ii) if the engagement relates directly to the operations and financial reporting of the registrant, in accordance with Rule 2-01(c)(7)(ii) of Regulation S-X, subject to waiver provisions set forth in Rule 2-01(c)(7)(ii) of Regulation S-X.
(e)(2) 0% of services included in (b) – (d) above were approved pursuant to Rule 2-01(c)(7)(i)(C) of Regulation S-X.
(f) Not applicable.
(g) The aggregate fees billed for the most recent fiscal year and the preceding fiscal year by the registrant’s principal accountant for non-audit services rendered to the registrant, its investment advisor, and any entity controlling, controlled by, or under common control with the investment advisor that provides ongoing services to the registrant were $60,000 and $65,140 respectively.
(h) The registrant’s audit committee of the board of directors has considered whether the provision of non-audit services that were rendered to the registrant’s investment adviser (not including any sub-adviser whose role is primarily portfolio management and is subcontracted with or overseen by another investment adviser), and any entity controlling, controlled by, or under common control with the investment adviser that provides ongoing services to the registrant that were not pre-approved pursuant to paragraph (c)(7)(ii) of Rule 2-01 of Regulation S-X is compatible with maintaining the principal accountant’s independence.
Items 5. Audit Committee of Listed Registrants.
Not applicable.
Item 6. Schedule of Investments.
Not applicable.
Item 7. Disclosure of Proxy Voting Policies and Procedures for Closed-End Management Investment Companies.
Not applicable.
Item 8. Portfolio Managers of Closed-End Management Investment Companies.
Not applicable.
Item 9. Purchases of Equity Securities by Closed-End Management Investment Company and Affiliated Purchasers.
Not applicable.
Item 10. Submission of Matters to a Vote of Security Holders.
Not applicable.
Item 11. Controls and Procedures.
(a) Based on our evaluation conducted within 90 days of the filing date, hereof, the design and operation of the registrant's disclosure controls and procedures are effective to ensure that material information relating to the registrant is made known to the certifying officers by others within the appropriate entities, particularly during the period in which Forms N-CSR are being prepared, and the registrant's disclosure controls and procedures allow timely preparation and review of the information for the registrant's Form N-CSR and the officer certifications of such Form N-CSR.
(b) There were no significant changes in the registrant's internal controls or in other factors that could significantly affect these controls subsequent to the date of their evaluation, including any corrective actions with regard to significant deficiencies and material weaknesses.
Item 12. Disclosure of Securities Lending Activities for Closed-End Management Investment Companies.
Not applicable.
Item 13. Exhibits.
(a)(1) Code of Ethics filed herewith as EX-99.CODE ETH.
(a)(2) A separate certification for each principal executive and principal financial officer of the registrant as required by Rule 30a-2(a) under the Act(17 CFR270.30a-2(a)). Filed herewith as EX-99.CERT.
(b) Certifications of principal executive officer and principal financial officer, under Section 906 of the Sarbanes-Oxley Act of 2002, and 18 U.S.C. ss.1350. Filed herewith as EX-99.906 CERT.
SIGNATURES
Pursuant to the requirements of the Securities Exchange Act of 1934 and the Investment Company Act of 1940, the registrant has duly caused this report to be signed on its behalf by the undersigned, thereunto duly authorized.
Meeder Funds
Bruce E. McKibben, Treasurer
Pursuant to the requirements of the Securities Exchange Act of 1934 and the Investment Company Act of 1940, this report has been signed below by the following persons on behalf of the registrant and in the capacities and on the dates indicated.
Bruce E. McKibben, Treasurer
| By: | /s/ Robert S. Meeder, Jr. |
Robert S. Meeder, Jr., President