UNITED STATES SECURITIES AND EXCHANGE COMMISSION
Washington, D.C. 20549
FORM N-CSR
CERTIFIED SHAREHOLDER REPORT
OF REGISTERED MANAGEMENT INVESTMENT COMPANIES
Investment Company Act file number 811-03462
Meeder Funds Trust
6125 Memorial Drive
Dublin, OH 43017
Bruce McKibben
c/o Meeder Funds Trust
6125 Memorial Drive
Dublin, OH 43017
Registrant’s telephone number, including area code: 800-325-3539
Date of fiscal year end: December 31, 2019
Date of reporting period: December 31, 2019
Item 1. Report to Stockholders.
Beginning on January 1, 2021, as permitted by regulations adopted by the U.S. Securities and Exchange Commission, paper copies of the Funds’ annual and semiannual shareholder reports will no longer be sent by mail, unless you specifically request paper copies of the reports. Instead, the reports will be made available on the Funds’ website (www.meederinvestment.com), and you will be notified by mail each time a report is posted and provided with a website link to access the report.
If you already elected to receive shareholder reports electronically, you will not be affected by this change and you need not take any action. You may elect to receive shareholder reports and other communications from a Fund electronically anytime by contacting your financial intermediary (such as a broker-dealer or bank) or, if you are a direct investor, by calling 1-800-325-3539 or by sending an email request tomeederfunds@meederinvestment.com.
Beginning on January 1, 2019, you may elect to receive all future reports in paper free of charge. If you invest through a financial intermediary, you can contact your financial intermediary to request that you continue to receive paper copies of your shareholder reports. If you invest directly with a Fund, you can call 1-800-325-3539 or send an email request tomeederfunds@meederinvestment.com to let the Fund know you wish to continue receiving paper copies of your shareholder reports. Your election to receive reports in paper will apply to all Funds held in your account if you invest through your financial intermediary or all Funds held with the Fund complex if you invest directly with a Fund.
TABLE OF CONTENTS
| | |
Letter to Shareholders | 1 |
Fund Summaries (Unaudited) | |
Muirfield Fund | 4 |
Spectrum Fund | 6 |
Global Allocation Fund | 8 |
Balanced Fund | 10 |
Moderate Allocation Fund | 12 |
Conservative Allocation Fund | 14 |
Dynamic Allocation Fund | 16 |
Quantex Fund | 18 |
Total Return Bond Fund | 20 |
Prime Money Market Fund | 22 |
Institutional Prime Money Market Fund | 24 |
Financial Statements | |
Schedules of Investments | 27 |
Statements of Assets & Liabilities | 114 |
Statements of Operations | 116 |
Statements of Changes in Net Assets | 118 |
Financial Highlights | 122 |
Notes to Financial Statements | 130 |
Report of Independent Registered Public Accounting Firm | 149 |
Shareholder Expense Analysis | 150 |
Management of the Trust | 152 |
Other Items | 153 |
This Annual Report is prepared and distributed for the general information of the shareholders of the Funds. This material is not authorized for distribution to prospective investors unless preceded or accompanied by a prospectus. Investors are advised to consider carefully the investment objectives, risks, charges and expenses of the Fund before investing. The prospectus contains this and other information about the Funds.
Meeder Funds are distributed by Adviser Dealer Services, Inc. (Member FINRA), an affiliate of Meeder Investment Management. An affiliated registered investment adviser, Meeder Asset Management, Inc., serves as the investment adviser to Meeder Funds and is paid a fee for its services.
Letter to Shareholders December 31, 2019
As we enter a new decade, it is important to take a moment and reflect on what has occurred and learn from the past. In the last 100 years, 2010-2019 was the first decade in which the U.S. economy did not experience a recession. It was also a decade where the stock market did not close 20% below its all-time high. The only other decade in the last 100 years that the S&P 500 Index (“S&P 500”) did not experience a drawdown of this magnitude was 1990-1999. Why is this important? A famous quote states that “History does not repeat itself, but it often rhymes.” Therefore, let’s not forget what happened in the decade that followed the 1990’s. In the 2000’s, there were two separate market declines of more than 45%! While we are not predicting another decline of this magnitude, we feel it is important for clients to not ignore the past and have investment managers with the flexibility to navigate this type of volatility.
After a decade of strong returns and economic growth, many investors have become complacent in this current “Goldilocks Economy.” It may not be too hot, or too cold and seems to be “just right.” At Meeder, we believe that the one thing you can always count on is change. We want you to know that we will continue to navigate the market utilizing our data-driven investment models, which eliminate emotion from the investment decision making process.
S&P REACHES NEW HIGH DESPITE IMPEACHMENT
The S&P 500 Index climbed more than 9% in the 4th quarter alone and helped propel the index’s 2019 total return to over 31%. The S&P 500 achieved a total of 35 record highs in 2019, as the trend of growth stocks outperforming their value peers extended throughout the year. During the year, small-cap stocks remained the weakest performing market cap of U.S. equities. Despite their underperformance, the Russell 2000 Index still rose 25%. When comparing individual sectors in 2019, technology leaped far above the others by rising over 50%.
The biggest news of the fourth quarter occurred on December 18th, as the U.S. House of Representatives voted to formally impeach President Trump on two articles – abuse of power and obstruction of Congress. The impeachment process moves to the Senate next, where Supreme Court Chief Justice John Roberts will preside over the case. The Senate will hold a trial and determine if the President is guilty of these charges. If a two-thirds majority of the Senate votes that he is guilty, he would be removed from office.
The only other U.S. Presidents to be formally impeached are President Bill Clinton and President Andrew Johnson, both of which were not convicted or removed from office. Richard Nixon is widely thought to have been impeached but resigned from office before the official impeachment inquiry began. Since the official inquiry was launched against President Trump on October 31, the S&P 500 has risen over 6%.
ECONOMIC DATA REMAINS MIXED
GDP for the third quarter grew 2.1%. A very strong jobs report showed the U.S. created 266,000 jobs compared to the consensus estimates of 187,000 for November, while December showed results of 145,000 below expectations of 160,000. Among the largest sector contributors, Health Care, Social Work, and Manufacturers provided the biggest employment gains. The Leading Economic Index increased by 0.1% in November, exceeding expectations and broke the streak of three consecutive monthly declines. This index is widely followed because it uses 10 leading economic indicators to try and identify peaks and troughs in the business cycle.
While the economy continues to expand, the rate of growth is much slower than it has previously been during this business cycle. Signs of weakness are also starting to show in certain parts of the economy, especially manufacturing. The ISM Manufacturing PMI Index in the U.S. reported levels of 47.2 for December compared to expectations of 49. This was the fifth consecutive month below 50 and was the lowest level since June 2009. A reading below 50 traditionally indicates a contraction in the manufacturing sector.
Data from the Energy Information Administration released this quarter showed that the U.S. is one step closer to becoming energy independent. The U.S. has a long history of being dependent on foreign energy producers. In recent years, the U.S. has increased its energy production, mainly because of an increase in hydraulic fracking. In December, for the first time ever, the U.S. was a net exporter of crude oil and petroleum products for a full month. For perspective, in August 2006, the U.S. was a net importer of more than 13.4 million barrels per day.
CHINA
The world’s second largest economy, China, is feeling the impact of the existing trade environment, as their measure of economic growth recently fell to a 30-year low. On the bright side, the U.S. & China trade negotiations took a positive turn near the end of 2019, as media reports stated both parties have agreed in principle to a Phase 1 trade deal. Details around this deal are still unclear, but early reports state that both sides will suspend future tariffs. This is seen as a good first step by both parties. News of this progress helped bolster market sentiment, but it is important to understand that a complete resolution appears to be far off. Returns for emerging markets have been impacted by this trade dispute, lagging their developed international counterparts in 2019. While the MSCI EAFE Index, which tracks companies within developed international regions, posted returns of 22%, the MSCI Emerging Markets Index only increased by 18%.
FEDERAL RESERVE
In October, the Federal Reserve (“Fed”) met and again cut rates by 0.25%, bringing the overnight lending rate between banks to a range of 1.50% - 1.75%. It was the third 0.25% cut in 2019. This reduction helped provide a tailwind to the performance of bonds, as the Bloomberg Barclays Aggregate Index increased to a total return of 8.7% for the year. The Fed met again in December but left the overnight lending range unchanged. This was expected, as Fed Chairman Jerome Powell stated the board is “strongly committed” to maintaining a 2% inflation level for growth. Until the economy persistently outpaces this level, it is unlikely investors will see any rate hikes from the Federal Open Market Committee. One key measure that is essential to achieving higher inflation is strong consumer spending. It represents over 70% of the U.S. economy and
2019 Annual Report | December 31, 2019 | Page 1 |
continues to be healthy. Consumer confidence also remains high, which was certainly evident during the start of the holiday shopping season. The National Retail Federation estimated there were nearly 190 million shoppers in the U.S. between Black Friday and Cyber Monday, an increase of 14% over last year’s 165.8 million. Data from Adobe Analytics showed that Black Friday online shopping reached a record $7.4 billion.
MEEDER PORTFOLIOS
At Meeder, we manage investment solutions across different risk profiles and time horizons. These strategies utilize a multi-discipline/multi-factor approach that guide us in the allocation of our portfolios. Many of these solutions employ one or more of our core investment strategies; Growth, Defensive Equity and Fixed Income.
GROWTH
Portfolios comprised of the Growth Strategy are more aggressive in their objective and typically remain invested in the stock market. These portfolios captured significant gains during the fourth quarter, as many stock market indices reached new all-time highs. Investors in the Growth Strategy experienced more market volatility than less aggressive portfolios; however, they were rewarded with larger returns, as the stock market grinded substantially higher.
DEFENSIVE EQUITY
Portfolios comprised of the Defensive Equity Strategy utilize investment models that assess the risk/reward relationship of the stock market. The goal is to reduce exposure to the market when that relationship is deemed unfavorable and ultimately, decrease participation in more severe market declines.
The tactical portfolios began the fourth quarter with a target of 100% exposure to the stock market. In October, market risk increased due to concerns over slowing global growth and increased trade tensions between the U.S. and China. As risk increased, short-term trends also turned negative. Our model guided us to reduce the equity exposure to 85%. The Fed then reduced short-term interest rates, by 0.25%, for the third time in 2019. The stock market responded favorably as short- and long-term trends improved, and market risk gradually fell. This led us to steadily increase our exposure back to 100% before the end of November.
In addition to strong momentum in December, there was an improvement in market breadth. As a reminder, market breadth gauges how many industries and stocks are participating in a trend. The number of advancing securities significantly exceeded the number of declining securities in the latter part of December, which is typically a positive sign for the continuation of an uptrend.
FIXED INCOME
The Meeder Fixed Income Strategy tactically shifts portfolio exposure utilizing investment models designed to actively monitor the credit quality, emerging market debt exposure and the U.S. Treasury duration of the portfolio. Our investment models guided us to start the fourth quarter with smaller allocations to emerging market and high yield bonds, primarily due to a deterioration in momentum, volatility and macro factors. Much of this turmoil was likely due to the U.S. Presidential impeachment process combined with uncertainty around the trade war between the U.S. & China. In the middle of October, the U.S. and China reached a partial trade deal, calling it “Phase 1” of the overall trade negotiations and related market volatility subsided. Our investment models then guided us to reduce our holdings in investment-grade and U.S. Treasury holdings and use those proceeds to increase our holdings in both emerging market and high yield bonds. Our investment models continued to favor increased exposure to the two sectors for remainder of the year and the portfolio benefitted from the tailwinds that were produced from the market’s optimism in the U.S. and global economic strength. The U.S. Treasury curve inversion ended during the quarter and it steepened as rates dropped across the front end of the yield curve and the longer-dated treasury yields moved higher.
OUR COMMITTMENT
As we begin a new year, it is important to remember our goal. We are dedicated to keeping clients committed to their investment strategy throughout a full market cycle. We believe that investors often make the biggest mistakes when they become emotional, rather than utilizing data when making investment decisions. Therefore, we continue to utilize and refine our data-driven investment models to make fact-based decisions when allocating our portfolios. We believe a systematic approach, based on the highest probability outcomes, will generate a better risk-adjusted return for investors over a full market cycle. We believe this focus helps clients stay committed to their investment strategy and ultimately reach their investment destination. Thank you once again for giving us the opportunity to be part of your investment journey.

Robert S. Meeder
President and CEO
Meeder Asset Management, Inc.
Page 2 | 2019 Annual Report | December 31, 2019 |
2019 Annual Report
Fund Summaries
Muirfield Fund
The Meeder Muirfield Fund Institutional Class returned 14.01% compared to the Morningstar Moderate Target Risk Index return of 19.03%.
After market volatility spiked and our model scores weakened at the end of 2018, we began the year with a 15% target exposure to the stock market. During the first quarter, our model identified institutional demand for stocks increasing and both short-term and long-term trends had turned positive. We increased our target equity exposure to 69% by the end of March. Our measure of market volatility continued to fall and was the primary driver for the steady increase in equity exposure, which reached as high as 98% in early May. Poor economic data released throughout May confirmed the U.S. economy’s rate of growth was slowing. By the start of June, we had reduced exposure to the stock market to 81%. In mid-June, our models identified a significant increase in the demand for stocks, causing us to gradually increase our exposure until reaching 100% near the end of June.
The ongoing trade war between U.S. and China escalated further, causing our internal measure of market risk to elevate and short-term trend factors to turn negative. We decreased our model portfolio’s target exposure to equities to a low of 79% toward the end of August. By mid-September, the S&P 500 broke out of its short-term trading range and the number of advancing securities relative to declining securities also reached an extremely high level. This positive market breadth improved the score of the short-term model and was one reason why we increased our exposure to 100% by the middle of September. In October, market risk increased due to concerns over slowing global growth and increased trade tensions between the U.S. and China. As risk increased, short-term trends also turned negative. Our model guided us to reduce the equity exposure to 85%. The Federal Reserve then reduced short-term interest rates, by 0.25%, for the third time in 2019. The stock market responded favorably as short- and long-term trends improved, and market risk gradually fell. This led us to steadily increase our exposure back to 100% before the end of November, and we remained fully invested through the end of the year.
Our shifts within equity markets include international versus domestic holdings, as well as allocating among market capitalization ranges in addition to sector overweight and/or underweight positions. Due primarily to relative momentum factors, our exposure to international holdings among both developed international and emerging market securities was underweight relative to the benchmark. Our underweight exposure to international markets contributed to performance relative to the benchmark in 2019.
Within our stock selection process, we attempt to gain exposure to companies with strong profitability that are priced at reasonable valuations relative to their industry peers and are trading with positive price momentum. For the year ending 2019, securities with exposure to short-term momentum and value characteristics, such as low book-to-price, contributed to performance. Companies with strong profitability detracted from performance.
In the portfolio, we will often use equity index derivatives in the Fund, such as stock index futures, to efficiently equitize our cash positions as well as manage the equity exposure of the Fund. In regard to equitizing cash positions, these derivatives are designed to track their respective stock index, so there was no discernible impact to the Fund’s relative performance. The use of stock index futures to manage equity exposure of the Fund had a positive impact on the performance of the Fund relative to the benchmark index during 2019.
Investment Objective
The investment objective of the Fund is to provide long-term capital appreciation.
Average Annual Total Returns
as of December 31, 2019
| 1
Year | 5
Year | 10
Year | Share Class
Inception
Date |
Muirfield Fund Retail Class | 13.53% | 5.62% | 8.45% | 8/10/88 |
Muirfield Fund Institutional Class | 14.01% | 5.91% | 8.60% | 10/31/16 |
Muirfield Fund Adviser Class | 13.81% | 5.79% | 8.54% | 10/31/16 |
Morningstar Moderate Target Risk Index | 19.03% | 6.75% | 7.72% | — |
Blended Index | 19.17% | 7.50% | 8.38% | — |
Top 10 Holdings
as of December 31, 2019
1. | Apple, Inc. | 3.5% |
2. | Microsoft Corp. | 3.2% |
3. | Amazon.com, Inc. | 1.8% |
4. | Alphabet, Inc. - Class C | 1.6% |
5. | Berkshire Hathaway, Inc. - Class B | 1.4% |
6. | MasterCard, Inc. | 1.3% |
7. | Facebook, Inc. | 1.1% |
8. | PepsiCo, Inc. | 1.1% |
9. | Verizon Communications, Inc. | 1.0% |
10. | Citigroup, Inc. | 1.0% |
As a percentage of total net assets. Holdings exclude short-term investments and derivatives.
Page 4 | 2019 Annual Report | December 31, 2019 |
Growth of $10,000
as of December 31, 2019

The Growth of $10,000 chart compares the performance of the Fund’s Retail Share Class over the period shown with dividends and capital gains reinvested to the Fund’s benchmarks. Benchmark indices are unmanaged and do not reflect the deduction of expenses associated with a mutual fund, such as investment management and accounting fees.
Investment performance assumes reinvestment of all dividend and capital gain distributions. The results do not reflect the effect of taxes a shareholder would pay on Fund distributions or on the redemption of Fund shares. Historical performance attributed to the Institutional and Adviser Share Classes prior to their inception dates is based on the performance of the Retail Share Class. No adjustment has been made to reflect class-specific distribution or servicing fees. Returns may reflect the effect of voluntary fee waivers or expense reimbursements over the period shown. Without these waivers, performance would have been lower.
The performance data shown represents past performance, which does not guarantee future results. The investment return and principal value of an investment will fluctuate so that an investor’s shares, when redeemed, may be worth more or less than their original cost. Current performance may be lower or higher than the performance data quoted. For current month-end performance data, please visit our website atwww.meederfunds.com.
Sector Concentration
as of December 31, 2019
Information Technology | 27.5% |
Healthcare | 19.2% |
Financials | 11.5% |
Consumer Discretionary | 10.7% |
Communication Services | 8.7% |
Industrials | 6.2% |
Consumer Staples | 5.6% |
Real Estate Investment Trust | 3.9% |
Energy | 3.7% |
Materials | 1.9% |
Utilities | 1.1% |
Total | 100.0% |
As a percentage of total common stocks. Concentrations are subject to change.
Asset Allocation
as of December 31, 2019
Common Stocks | 79.1% |
Money Market Registered Investment Companies | 19.3% |
Bank Obligations | 0.1% |
Other Assets/Liabilities (Net) | 1.5% |
Total | 100.0% |
As a percentage of total net assets. The Fund has invested in stock index futures contracts in order to equitize cash balances held in the Fund.
The Blended Index is comprised 60% of the S&P 500 Index and 40% of 90-day T-bills.
2019 Annual Report | December 31, 2019 | Page 5 |
Spectrum Fund
The Meeder Spectrum Fund Institutional Class returned 13.44% for the year ended December 31, 2019, compared to the Morningstar Moderate Target Risk Index return of 19.03%.
After market volatility spiked and our model scores weakened at the end of 2018, we began the year with a 15% target exposure to the stock market. During the first quarter, our model identified institutional demand for stocks increasing and both short-term and long-term trends had turned positive. We increased our target equity exposure to 69% by the end of March. Our measure of market volatility continued to fall and was the primary driver for the steady increase in equity exposure, which reached as high as 98% in early May. Poor economic data released throughout May confirmed the U.S. economy’s rate of growth was slowing. By the start of June, we had reduced exposure to the stock market to 81%. In mid-June, our models identified a significant increase in the demand for stocks, causing us to gradually increase our exposure until reaching 100% near the end of June.
The ongoing trade war between U.S. and China escalated further, causing our internal measure of market risk to elevate and short-term trend factors to turn negative. We decreased our model portfolio’s target exposure to equities to a low of 79% toward the end of August. By mid-September, the S&P 500 broke out of its short-term trading range and the number of advancing securities relative to declining securities also reached an extremely high level. This positive market breadth improved the score of the short-term model and was one reason why we increased our exposure to 100% by the middle of September. In October, market risk increased due to concerns over slowing global growth and increased trade tensions between the U.S. and China. As risk increased, short-term trends also turned negative. Our model guided us to reduce the equity exposure to 85%. The Federal Reserve then reduced short-term interest rates, by 0.25%, for the third time in 2019. The stock market responded favorably as short- and long-term trends improved, and market risk gradually fell. This led us to steadily increase our exposure back to 100% before the end of November, and we remained fully invested through the end of the year.
Our shifts within equity markets include international versus domestic holdings, as well as allocating among market capitalization ranges in addition to sector overweight and/or underweight positions. Due primarily to relative momentum factors, our exposure to international holdings among both developed international and emerging market securities was underweight relative to the benchmark. Our underweight exposure to international markets contributed to performance relative to the benchmark in 2019.
Within our stock selection process, we attempt to gain exposure to companies with strong profitability that are priced at reasonable valuations relative to their industry peers and are trading with positive price momentum. For the year ending 2019, securities with exposure to short-term momentum and value characteristics, such as low book-to-price, contributed to performance. Companies with strong profitability detracted from performance.
In the portfolio, we will often use equity index derivatives in the Fund, such as stock index futures, to efficiently equitize our cash positions as well as manage the equity exposure of the Fund. In regard to equitizing cash positions, these derivatives are designed to track their respective stock index, so there was no discernible impact to the Fund’s relative performance. The use of stock index futures to manage equity exposure of the Fund had a positive impact on the performance of the Fund relative to the benchmark index during 2019.
Investment Objective
The investment objective of the Fund is to provide long-term capital appreciation.
Average Annual Total Returns
as of December 31, 2019
| 1
Year | Since
Inception | Share Class
Inception
Date |
Spectrum Fund Retail Class | 13.03% | 6.48% | 1/1/15 |
Spectrum Fund Institutional Class | 13.44% | 6.77% | 10/31/16 |
Spectrum Fund Adviser Class | 13.17% | 6.66% | 10/31/16 |
Morningstar Moderate Target Risk Index | 19.03% | 6.76% | — |
Blended Index | 19.17% | 7.51% | — |
Top 10 Holdings
as of December 31, 2019
1. | Apple, Inc. | 2.8% |
2. | Microsoft Corp. | 2.5% |
3. | Amazon.com, Inc. | 1.5% |
4. | Alphabet, Inc. - Class C | 1.3% |
5. | Berkshire Hathaway, Inc. - Class B | 1.0% |
6. | Facebook, Inc. | 0.9% |
7. | MasterCard, Inc. | 0.8% |
8. | Verizon Communications, Inc. | 0.8% |
9. | Johnson & Johnson | 0.8% |
10. | Bank of America Corp. | 0.8% |
As a percentage of total net assets. Holdings exclude short-term investments and derivatives.
Page 6 | 2019 Annual Report | December 31, 2019 |
Growth of $10,000
as of December 31, 2019

The Growth of $10,000 chart compares the performance of the Fund’s Retail Share Class over the period shown with dividends and capital gains reinvested to the Fund’s benchmarks. Benchmark indices are unmanaged and do not reflect the deduction of expenses associated with a mutual fund, such as investment management and accounting fees.
Investment performance assumes reinvestment of all dividend and capital gain distributions. The results do not reflect the effect of taxes a shareholder would pay on Fund distributions or on the redemption of Fund shares. Historical performance attributed to the Institutional and Adviser Share Classes prior to their inception dates is based on the performance of the Retail Share Class. No adjustment has been made to reflect class-specific distribution or servicing fees. Returns may reflect the effect of voluntary fee waivers or expense reimbursements over the period shown. Without these waivers, performance would have been lower.
The performance data shown represents past performance, which does not guarantee future results. The investment return and principal value of an investment will fluctuate so that an investor’s shares, when redeemed, may be worth more or less than their original cost. Current performance may be lower or higher than the performance data quoted. For current month-end performance data, please visit our website atwww.meederfunds.com.
Sector Concentration
as of December 31, 2019
Long Positions | |
Financials | 19.8% |
Information Technology | 19.6% |
Healthcare | 12.9% |
Industrials | 11.6% |
Consumer Discretionary | 9.1% |
Communication Services | 7.0% |
Consumer Staples | 5.0% |
Utilities | 4.4% |
Energy | 3.8% |
Real Estate Investment Trust | 3.6% |
Materials | 3.2% |
Total Long | 100.0% |
Short Positions | |
Financials | 38.1% |
Industrials | 18.6% |
Utilities | 13.0% |
Information Technology | 8.1% |
Materials | 6.3% |
Consumer Discretionary | 5.1% |
Consumer Staples | 3.1% |
Real Estate Investment Trust | 2.7% |
Healthcare | 2.1% |
Communication Services | 1.8% |
Energy | 1.1% |
Total Short | 100.0% |
Total long as a percentage of total long common stocks. Total short as a percentage of total short common stocks. Concentrations are subject to change.
Asset Allocation
as of December 31, 2019
Long Common Stocks | 98.3% |
Short Common Stocks | (33.5)% |
Money Market Registered Investment Companies | 2.8% |
Other Assets/Liabilities (Net) | 32.4% |
Total | 100.0% |
As a percentage of total net assets. The Fund has invested in stock index futures contracts in order to equitize cash balances held in the Fund.
The Blended Index is comprised 60% of the S&P 500 Index and 40% of 90-day T-bills.
2019 Annual Report | December 31, 2019 | Page 7 |
Global Allocation Fund
The Meeder Global Allocation Fund Institutional Class returned 13.66% compared to the Morningstar Global Allocation Index benchmark return of 18.53%.
The Fund invests in domestic equity markets but will generally hold securities in emerging market and developed international equities as well. We alter the allocation to the international markets based on indications from our quantitative models. Additionally, the strategy can reduce equity exposure when it is deemed to be a high-risk market environment.
After market volatility spiked and our model scores weakened at the end of 2018, we began the year with a 15% target exposure to the stock market. During the first quarter, our model identified institutional demand for stocks increasing and both short-term and long-term trends had turned positive. We increased our target equity exposure to 69% by the end of March. Our measure of market volatility continued to fall and was the primary driver for the steady increase in equity exposure, which reached as high as 98% in early May. Poor economic data released throughout May confirmed the U.S. economy’s rate of growth was slowing. By the start of June, we had reduced exposure to the stock market to 81%. In mid-June, our models identified a significant increase in the demand for stocks, causing us to gradually increase our exposure until reaching 100% near the end of June.
The ongoing trade war between U.S. and China escalated further, causing our internal measure of market risk to elevate and short-term trend factors to turn negative. We decreased our model portfolio’s target exposure to equities to a low of 79% toward the end of August. By mid-September, the S&P 500 broke out of its short-term trading range and the number of advancing securities relative to declining securities also reached an extremely high level. This positive market breadth improved the score of the short-term model and was one reason why we increased our exposure to 100% by the middle of September. In October, market risk increased due to concerns over slowing global growth and increased trade tensions between the U.S. and China. As risk increased, short-term trends also turned negative. Our model guided us to reduce the equity exposure to 85%. The Federal Reserve then reduced short-term interest rates, by 0.25%, for the third time in 2019. The stock market responded favorably as short- and long-term trends improved, and market risk gradually fell. This led us to steadily increase our exposure back to 100% before the end of November, and we remained fully invested through the end of the year.
Our shifts within equity markets include international versus domestic holdings, as well as allocating among market capitalization ranges in addition to sector overweight and/or underweight positions. Due primarily to relative momentum factors, our exposure to international holdings among both developed international and emerging market securities was underweight relative to the benchmark. Our underweight exposure to international markets detracted from performance relative to the benchmark in 2019.
Early in January, momentum factors improved in our fixed income models and we increased the portfolio’s allocation to high yield and emerging markets debt sectors. Roughly two-thirds of the portfolio remained allocated to more conservative U.S. Government securities and investment-grade bonds. The Fed took a dovish pivot in mid-March, announcing that it was “unlikely” there would be rate hikes in 2019. This reversed their earlier forecast of two rate increases. After the statement, Treasury prices increased as yields declined across the U.S. yield curve and portions of the yield curve inverted, as the 10-Year Treasury yield fell below the 3-month Treasury yield. The Fed maintained a dovish stance in the 2nd quarter due to mixed economic data and continued low inflation, eventually cutting overnight rates by 0.25% on the final day of July, as the U.S. and China trade negotiations continued to add to market uncertainty.
In the middle of August, a potential recessionary warning signal flashed as the 10-year U.S. Treasury yield fell below the 2-year U.S. Treasury, followed by an inversion of the U.S. Treasury yield curve for the first time since 2007. Our models signaled a change in sector positioning and we reallocated the portfolio to a more conservative position with a reduction in high yield and emerging market debt and an increase in investment-grade securities and U.S. Treasuries. In September, the Fed cut the policy rate for the second time this year by 0.25%. However, market concerns started to ease in the middle of October as the U.S. and China reached a partial trade deal, calling it “Phase 1” of the overall trade negotiations, causing related market volatility to subside.
Our investment models then guided us to reduce our holdings in investment-grade and U.S. Treasury holdings and use those proceeds to increase our holdings in both emerging market and high yield bonds. Our investment models continued to favor increased exposure to the two sectors for remainder of the year and the portfolio benefitted from the tailwinds that were produced from the market’s optimism in the U.S. and global economic strength. The U.S. Treasury curve inversion ended during the quarter and it steepened as rates dropped across the front end of the yield curve and the longer-dated treasury yields moved higher. The portfolio’s treasury allocation’s duration was slightly higher than the benchmark during the second and third quarter and remained below the benchmark during the first and the fourth quarter. Portfolio duration remained slightly shorter than the benchmark throughout the year.
Within our stock selection process, we attempt to gain exposure to companies with strong profitability that are priced at reasonable valuations relative to their industry peers and are trading with positive price momentum. For the year ending 2019, securities with exposure to short-term momentum and value characteristics, such as low book-to-price, contributed to performance. Companies with strong profitability detracted from performance.
In the portfolio, we will often use equity index derivatives in the Fund, such as stock index futures, to efficiently equitize our cash positions as well as manage the equity exposure of the Fund. In regard to equitizing cash positions, these derivatives are designed to track their respective stock index, so there was no discernible impact to the Fund’s relative performance. The use of stock index futures to manage equity exposure of the Fund had a positive impact on the performance of the Fund relative to the benchmark index during 2019.
Page 8 | 2019 Annual Report | December 31, 2019 |
Investment Objective
The investment objective of the Fund is to provide long-term capital appreciation.
Average Annual Total Returns
as of December 31, 2019
| 1
Year | 5
Year | 10
Year | Share Class
Inception
Date |
Global Allocation Fund Retail Class | 13.17% | 4.36% | 7.28% | 1/31/06 |
Global Allocation Fund Institutional Class | 13.66% | 4.68% | 7.44% | 10/31/16 |
Global Allocation Fund Adviser Class | 13.34% | 4.55% | 7.38% | 10/31/16 |
Morningstar Global Allocation Index | 18.53% | 6.58% | 7.08% | — |
Blended Index | 15.69% | 5.37% | 5.50% | — |
Growth of $10,000
as of December 31, 2019

The Growth of $10,000 chart compares the performance of the Fund’s Retail Share Class over the period shown with dividends and capital gains reinvested to the Fund’s benchmarks. Benchmark indices are unmanaged and do not reflect the deduction of expenses associated with a mutual fund, such as investment management and accounting fees.
Investment performance assumes reinvestment of all dividend and capital gain distributions. The results do not reflect the effect of taxes a shareholder would pay on Fund distributions or on the redemption of Fund shares. Historical performance attributed to the Institutional and Adviser Share Classes prior to their inception dates is based on the performance of the Retail Share Class. No adjustment has been made to reflect class-specific distribution or servicing fees. Returns may reflect the effect of voluntary fee waivers or expense reimbursements over the period shown. Without these waivers, performance would have been lower.
The performance data shown represents past performance, which does not guarantee future results. The investment return and principal value of an investment will fluctuate so that an investor’s shares, when redeemed, may be worth more or less than their original cost. Current performance may be lower or higher than the performance data quoted. For current month-end performance data, please visit our website at www.meederfunds.com.
Top 10 Holdings
as of December 31, 2019
1. | iShares Core MSCI EAFE ETF | 5.4% |
2. | Apple, Inc. | 2.0% |
3. | Microsoft Corp. | 2.0% |
4. | iShares Core MSCI Emerging Markets ETF | 1.3% |
5. | Amazon.com, Inc. | 1.1% |
6. | Berkshire Hathaway, Inc. - Class B | 1.0% |
7. | Vanguard Total Bond Market ETF | 1.0% |
8. | iShares Core U.S. Aggregate Bond ETF | 1.0% |
9. | Alphabet, Inc. - Class C | 0.9% |
10. | Verizon Communications, Inc. | 0.7% |
As a percentage of total net assets. Holdings exclude short-term investments and derivatives.
Sector Concentration
as of December 31, 2019
Information Technology | 27.3% |
Healthcare | 19.2% |
Financials | 12.5% |
Communication Services | 9.1% |
Consumer Discretionary | 8.9% |
Industrials | 6.8% |
Consumer Staples | 5.4% |
Real Estate Investment Trust | 3.9% |
Energy | 3.7% |
Materials | 1.9% |
Utilities | 1.3% |
Total | 100.0% |
As a percentage of total common stocks. Concentrations are subject to change.
Asset Allocation
as of December 31, 2019
Common Stocks | 44.8% |
Equity Registered Investment Companies | 6.7% |
Fixed Income Registered Investment Companies | 8.4% |
Money Market Registered Investment Companies | 33.0% |
Bank Obligations | 1.5% |
U.S. Government Obligations | 1.1% |
Other Assets/Liabilities (Net) | 4.5% |
Total | 100.0% |
As a percentage of total net assets. The Fund has invested in stock index futures contracts in order to equitize cash balances held in the Fund.
The Blended Index is comprised of 54% MSCI ACWI, 36% of 90 day T-Bills and 10% Bloomberg Barclays US Aggregate Bond Index.
2019 Annual Report | December 31, 2019 | Page 9 |
Balanced Fund
The Meeder Balanced Fund Institutional Class returned 12.77% for the year compared to the Morningstar Moderate Target Risk Index return of 19.03%. The Fund maintains exposure to both equity and fixed income.
After market volatility spiked and our model scores weakened at the end of 2018, we began the year with a 15% target exposure to the stock market. During the first quarter, our model identified institutional demand for stocks increasing and both short-term and long-term trends had turned positive. We increased our target equity exposure to 69% by the end of March. Our measure of market volatility continued to fall and was the primary driver for the steady increase in equity exposure, which reached as high as 98% in early May. Poor economic data released throughout May confirmed the U.S. economy’s rate of growth was slowing. By the start of June, we had reduced exposure to the stock market to 81%. In mid-June, our models identified a significant increase in the demand for stocks, causing us to gradually increase our exposure until reaching 100% near the end of June.
The ongoing trade war between U.S. and China escalated further, causing our internal measure of market risk to elevate and short-term trend factors to turn negative. We decreased our model portfolio’s target exposure to equities to a low of 79% toward the end of August. By mid-September, the S&P 500 broke out of its short-term trading range and the number of advancing securities relative to declining securities also reached an extremely high level. This positive market breadth improved the score of the short-term model and was one reason why we increased our exposure to 100% by the middle of September. In October, market risk increased due to concerns over slowing global growth and increased trade tensions between the U.S. and China. As risk increased, short-term trends also turned negative. Our model guided us to reduce the equity exposure to 85%. The Federal Reserve then reduced short-term interest rates, by 0.25%, for the third time in 2019. The stock market responded favorably as short- and long-term trends improved, and market risk gradually fell. This led us to steadily increase our exposure back to 100% before the end of November, and we remained fully invested through the end of the year.
Our shifts within equity markets include international versus domestic holdings, as well as allocating among market capitalization ranges in addition to sector overweight and/or underweight positions. Due primarily to relative momentum factors, our exposure to international holdings among both developed international and emerging market securities was underweight relative to the benchmark. Our underweight exposure to international markets contributed to performance relative to the benchmark in 2019.
Early in January, momentum factors improved in our fixed income models and we increased the portfolio’s allocation to high yield and emerging markets debt sectors. Roughly two-thirds of the portfolio remained allocated to more conservative U.S. Government securities and investment-grade bonds. The Fed took a dovish pivot in mid-March, announcing that it was “unlikely” there would be rate hikes in 2019. This reversed their earlier forecast of two rate increases. After the statement, Treasury prices increased as yields declined across the U.S. yield curve and portions of the yield curve inverted, as the 10-Year Treasury yield fell below the 3-month Treasury yield. The Fed maintained a dovish stance in the 2nd quarter due to mixed economic data and continued low inflation, eventually cutting overnight rates by 0.25% on the final day of July, as the U.S. and China trade negotiations continued to add to market uncertainty.
In the middle of August, a potential recessionary warning signal flashed as the 10-year U.S. Treasury yield fell below the 2-year U.S. Treasury, followed by an inversion of the U.S. Treasury yield curve for the first time since 2007. Our models signaled a change in sector positioning and we reallocated the portfolio to a more conservative position with a reduction in high yield and emerging market debt and an increase in investment-grade securities and U.S. Treasuries. In September, the Fed cut the policy rate for the second time this year by 0.25%. However, market concerns started to ease in the middle of October as the U.S. and China reached a partial trade deal, calling it “Phase 1” of the overall trade negotiations, causing related market volatility to subside. Our investment models then guided us to reduce our holdings in investment-grade and U.S. Treasury holdings and use those proceeds to increase our holdings in both emerging market and high yield bonds.
Our investment models continued to favor increased exposure to the two sectors for remainder of the year and the portfolio benefitted from the tailwinds that were produced from the market’s optimism in the U.S. and global economic strength. The U.S. Treasury curve inversion ended during the quarter and it steepened as rates dropped across the front end of the yield curve and the longer-dated treasury yields moved higher. The portfolio’s treasury allocation’s duration was slightly higher than the benchmark during the second and third quarter and remained below the benchmark during the first and the fourth quarter. Portfolio duration remained slightly shorter than the benchmark throughout the year.
Within our stock selection process, we attempt to gain exposure to companies with strong profitability that are priced at reasonable valuations relative to their industry peers and are trading with positive price momentum. For the year ending 2019, securities with exposure to short-term momentum and value characteristics, such as low book-to-price, contributed to performance. Companies with strong profitability detracted from performance.
In the portfolio, we will often use equity index derivatives in the Fund, such as stock index futures, to efficiently equitize our cash positions as well as manage the equity exposure of the Fund. In regard to equitizing cash positions, these derivatives are designed to track their respective stock index, so there was no discernible impact to the Fund’s relative performance. The use of stock index futures to manage equity exposure of the Fund had a positive impact on the performance of the Fund relative to the benchmark index during 2019.
Page 10 | 2019 Annual Report | December 31, 2019 |
Investment Objective
The investment objective of the Fund is to provide income and long-term capital appreciation.
Average Annual Total Returns
as of December 31, 2019
| 1
Year | 5
Year | 10
Year | Share Class
Inception
Date |
Balanced Fund Retail Class | 12.29% | 4.54% | 6.52% | 1/31/06 |
Balanced Fund Institutional Class | 12.77% | 4.82% | 6.66% | 10/31/16 |
Balanced Fund Adviser Class | 12.59% | 4.74% | 6.62% | 10/31/16 |
Morningstar Moderate Target Risk Index | 19.03% | 6.75% | 7.72% | — |
Blended Index | 16.03% | 6.24% | 7.06% | — |
Growth of $10,000
as of December 31, 2019
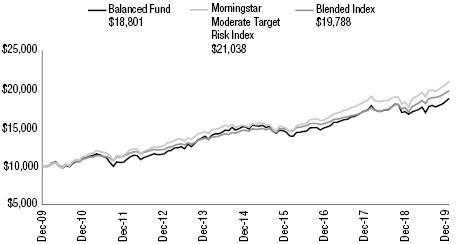
The Growth of $10,000 chart compares the performance of the Fund’s Retail Share Class over the period shown with dividends and capital gains reinvested to the Fund’s benchmarks. Benchmark indices are unmanaged and do not reflect the deduction of expenses associated with a mutual fund, such as investment management and accounting fees.
Investment performance assumes reinvestment of all dividend and capital gain distributions. The results do not reflect the effect of taxes a shareholder would pay on Fund distributions or on the redemption of Fund shares. Historical performance attributed to the Institutional and Adviser Share Classes prior to their inception dates is based on the performance of the Retail Share Class. No adjustment has been made to reflect class-specific distribution or servicing fees. Returns may reflect the effect of voluntary fee waivers or expense reimbursements over the period shown. Without these waivers, performance would have been lower.
The performance data shown represents past performance, which does not guarantee future results. The investment return and principal value of an investment will fluctuate so that an investor’s shares, when redeemed, may be worth more or less than their original cost. Current performance may be lower or higher than the performance data quoted. For current month-end performance data, please visit our website atwww.meederfunds.com.
Top 10 Holdings
as of December 31, 2019
1. | Vanguard Total Bond Market ETF | 3.0% |
2. | iShares Core U.S. Aggregate Bond ETF | 2.9% |
3. | Apple, Inc. | 2.3% |
4. | Microsoft Corp. | 2.1% |
5. | Xtrackers USD High Yield Corporate Bond ETF | 2.1% |
6. | Dodge & Cox Income Fund | 1.8% |
7. | Baird Core Plus Bond Fund - Class I | 1.6% |
8. | PGIM Total Return Bond Fund - Class R6 | 1.5% |
9. | Pioneer Bond Fund - Class Y | 1.5% |
10. | Lord Abbett High Yield Fund - Class I | 1.3% |
As a percentage of total net assets. Holdings exclude short-term investments and derivatives.
Sector Concentration
as of December 31, 2019
Information Technology | 27.5% |
Healthcare | 19.2% |
Financials | 11.5% |
Consumer Discretionary | 10.5% |
Communication Services | 8.6% |
Industrials | 6.1% |
Consumer Staples | 5.9% |
Real Estate Investment Trust | 3.9% |
Energy | 3.8% |
Materials | 1.9% |
Utilities | 1.1% |
Total | 100.0% |
As a percentage of total common stocks. Concentrations are subject to change.
Asset Allocation
as of December 31, 2019
Common Stocks | 52.3% |
Fixed Income Registered Investment Companies | 26.0% |
Money Market Registered Investment Companies | 16.5% |
Bank Obligations | 0.2% |
U.S. Government Obligations | 3.5% |
Other Assets/Liabilities (Net) | 1.5% |
Total | 100.0% |
As a percentage of total net assets. The Fund has invested in stock index futures contracts in order to equitize cash balances held in the Fund.
The Blended Index is comprised 42% of the S&P 500 Index, 28% of the average 90-day T-bills, and 30% of the Bloomberg Barclays US Aggregate Bond Index.
2019 Annual Report | December 31, 2019 | Page 11 |
Moderate Allocation Fund
The Meeder Moderate Allocation Fund Institutional Class returned 11.52% compared to the Morningstar Moderate Conservative Target Risk Index return of 15.25%.
After market volatility spiked and our model scores weakened at the end of 2018, we began the year with a 15% target exposure to the stock market. During the first quarter, our model identified institutional demand for stocks increasing and both short-term and long-term trends had turned positive. We increased our target equity exposure to 69% by the end of March. Our measure of market volatility continued to fall and was the primary driver for the steady increase in equity exposure, which reached as high as 98% in early May. Poor economic data released throughout May confirmed the U.S. economy’s rate of growth was slowing. By the start of June, we had reduced exposure to the stock market to 81%. In mid-June, our models identified a significant increase in the demand for stocks, causing us to gradually increase our exposure until reaching 100% near the end of June.
The ongoing trade war between U.S. and China escalated further, causing our internal measure of market risk to elevate and short-term trend factors to turn negative. We decreased our model portfolio’s target exposure to equities to a low of 79% toward the end of August. By mid-September, the S&P 500 broke out of its short-term trading range and the number of advancing securities relative to declining securities also reached an extremely high level. This positive market breadth improved the score of the short-term model and was one reason why we increased our exposure to 100% by the middle of September. In October, market risk increased due to concerns over slowing global growth and increased trade tensions between the U.S. and China. As risk increased, short-term trends also turned negative. Our model guided us to reduce the equity exposure to 85%. The Federal Reserve then reduced short-term interest rates, by 0.25%, for the third time in 2019. The stock market responded favorably as short- and long-term trends improved, and market risk gradually fell. This led us to steadily increase our exposure back to 100% before the end of November, and we remained fully invested through the end of the year.
Our shifts within equity markets include international versus domestic holdings, as well as allocating among market capitalization ranges in addition to sector overweight and/or underweight positions. Due primarily to relative momentum factors, our exposure to international holdings among both developed international and emerging market securities was underweight relative to the benchmark. Our underweight exposure to international markets contributed to performance relative to the benchmark in 2019.
Early in January, momentum factors improved in our fixed income models and we increased the portfolio’s allocation to high yield and emerging markets debt sectors. Roughly two-thirds of the portfolio remained allocated to more conservative U.S. Government securities and investment-grade bonds. The Fed took a dovish pivot in mid-March, announcing that it was “unlikely” there would be rate hikes in 2019. This reversed their earlier forecast of two rate increases. After the statement, Treasury prices increased as yields declined across the U.S. yield curve and portions of the yield curve inverted, as the 10-Year Treasury yield fell below the 3-month Treasury yield. The Fed maintained a dovish stance in the 2nd quarter due to mixed economic data and continued low inflation, eventually cutting overnight rates by 0.25% on the final day of July, as the U.S. and China trade negotiations continued to add to market uncertainty.
In the middle of August, a potential recessionary warning signal flashed as the 10-year U.S. Treasury yield fell below the 2-year U.S. Treasury, followed by an inversion of the U.S. Treasury yield curve for the first time since 2007. Our models signaled a change in sector positioning and we reallocated the portfolio to a more conservative position with a reduction in high yield and emerging market debt and an increase in investment-grade securities and U.S. Treasuries. In September, the Fed cut the policy rate for the second time this year by 0.25%. However, market concerns started to ease in the middle of October as the U.S. and China reached a partial trade deal, calling it “Phase 1” of the overall trade negotiations, causing related market volatility to subside. Our investment models then guided us to reduce our holdings in investment-grade and U.S. Treasury holdings and use those proceeds to increase our holdings in both emerging market and high yield bonds.
Our investment models continued to favor increased exposure to the two sectors for remainder of the year and the portfolio benefitted from the tailwinds that were produced from the market’s optimism in the U.S. and global economic strength. The U.S. Treasury curve inversion ended during the quarter and it steepened as rates dropped across the front end of the yield curve and the longer-dated treasury yields moved higher. The portfolio’s treasury allocation’s duration was slightly higher than the benchmark during the second and third quarter and remained below the benchmark during the first and the fourth quarter. Portfolio duration remained slightly shorter than the benchmark throughout the year.
Within our stock selection process, we attempt to gain exposure to companies with strong profitability that are priced at reasonable valuations relative to their industry peers and are trading with positive price momentum. For the year ending 2019, securities with exposure to short-term momentum and value characteristics, such as low book-to-price, contributed to performance. Companies with strong profitability detracted from performance.
In the portfolio, we will often use equity index derivatives in the Fund, such as stock index futures, to efficiently equitize our cash positions as well as manage the equity exposure of the Fund. In regard to equitizing cash positions, these derivatives are designed to track their respective stock index, so there was no discernible impact to the Fund’s relative performance. The use of stock index futures to manage equity exposure of the Fund had a positive impact on the performance of the Fund relative to the benchmark index during 2019.
Page 12 | 2019 Annual Report | December 31, 2019 |
Investment Objective
The investment objective of the Fund is to provide total return, including capital appreciation, and current income.
Average Annual Total Returns
as of December 31, 2019
| 1
Year | Since
Inception | Share Class
Inception
Date |
Moderate Allocation Fund Retail Class | 11.13% | 6.86% | 6/30/15 |
Moderate Allocation Fund Institutional Class | 11.52% | 7.18% | 10/31/16 |
Moderate Allocation Fund Adviser Class | 11.45% | 7.06% | 10/31/16 |
Morningstar Moderate Conservative Target Risk Index | 15.25% | 6.03% | — |
Blended Index | 13.94% | 5.87% | — |
Growth of $10,000
as of December 31, 2019

The Growth of $10,000 chart compares the performance of the Fund’s Retail Share Class over the period shown with dividends and capital gains reinvested to the Fund’s benchmarks. Benchmark indices are unmanaged and do not reflect the deduction of expenses associated with a mutual fund, such as investment management and accounting fees.
Investment performance assumes reinvestment of all dividend and capital gain distributions. The results do not reflect the effect of taxes a shareholder would pay on Fund distributions or on the redemption of Fund shares. Historical performance attributed to the Institutional and Adviser Share Classes prior to their inception dates is based on the performance of the Retail Share Class. No adjustment has been made to reflect class-specific distribution or servicing fees. Returns may reflect the effect of voluntary fee waivers or expense reimbursements over the period shown. Without these waivers, performance would have been lower.
The performance data shown represents past performance, which does not guarantee future results. The investment return and principal value of an investment will fluctuate so that an investor’s shares, when redeemed, may be worth more or less than their original cost. Current performance may be lower or higher than the performance data quoted. For current month-end performance data, please visit our website atwww.meederfunds.com.
Top 10 Holdings
as of December 31, 2019
1. | Vanguard Total Bond Market ETF | 4.9% |
2. | iShares Core U.S. Aggregate Bond ETF | 4.9% |
3. | Xtrackers USD High Yield Corporate Bond ETF | 3.5% |
4. | Dodge & Cox Income Fund | 3.0% |
5. | Baird Core Plus Bond Fund - Class I | 2.6% |
6. | PGIM Total Return Bond Fund - Class R6 | 2.6% |
7. | Pioneer Bond Fund - Class Y | 2.6% |
8. | iShares JP Morgan USD Emerging Markets Bond ETF | 2.2% |
9. | Lord Abbett High Yield Fund - Class I | 2.2% |
10. | Segall Bryant & Hamill Plus Bond Fund - Class I | 2.2% |
As a percentage of total net assets. Holdings exclude short-term investments and derivatives.
Sector Concentration
as of December 31, 2019
Information Technology | 27.7% |
Healthcare | 19.0% |
Financials | 11.7% |
Consumer Discretionary | 10.3% |
Communication Services | 8.3% |
Consumer Staples | 6.2% |
Industrials | 6.0% |
Real Estate Investment Trust | 3.9% |
Energy | 3.6% |
Materials | 2.1% |
Utilities | 1.2% |
Total | 100.0% |
As a percentage of total common stocks. Concentrations are subject to change.
Asset Allocation
as of December 31, 2019
Common Stocks | 35.9% |
Fixed Income Registered Investment Companies | 43.4% |
Money Market Registered Investment Companies | 13.0% |
Bank Obligations | 0.1% |
U.S. Government Obligations | 5.9% |
Other Assets/Liabilities (Net) | 1.7% |
Total | 100.0% |
As a percentage of total net assets. The Fund has invested in stock index futures contracts in order to equitize cash balances held in the Fund.
The Blended Index is comprised 30% of the S&P 500 Index, 20% of the average 90-day T-bills, and 50% of the Bloomberg Barclays US Aggregate Bond Index.
2019 Annual Report | December 31, 2019 | Page 13 |
Conservative Allocation Fund
The Meeder Conservative Allocation Fund Institutional Class returned 10.61% compared to the Morningstar Conservative Target Risk Index return of 11.22%.
After market volatility spiked and our model scores weakened at the end of 2018, we began the year with a 15% target exposure to the stock market. During the first quarter, our model identified institutional demand for stocks increasing and both short-term and long-term trends had turned positive. We increased our target equity exposure to 69% by the end of March. Our measure of market volatility continued to fall and was the primary driver for the steady increase in equity exposure, which reached as high as 98% in early May. Poor economic data released throughout May confirmed the U.S. economy’s rate of growth was slowing. By the start of June, we had reduced exposure to the stock market to 81%. In mid-June, our models identified a significant increase in the demand for stocks, causing us to gradually increase our exposure until reaching 100% near the end of June.
The ongoing trade war between U.S. and China escalated further, causing our internal measure of market risk to elevate and short-term trend factors to turn negative. We decreased our model portfolio’s target exposure to equities to a low of 79% toward the end of August. By mid-September, the S&P 500 broke out of its short-term trading range and the number of advancing securities relative to declining securities also reached an extremely high level. This positive market breadth improved the score of the short-term model and was one reason why we increased our exposure to 100% by the middle of September. In October, market risk increased due to concerns over slowing global growth and increased trade tensions between the U.S. and China. As risk increased, short-term trends also turned negative. Our model guided us to reduce the equity exposure to 85%. The Federal Reserve then reduced short-term interest rates, by 0.25%, for the third time in 2019. The stock market responded favorably as short- and long-term trends improved, and market risk gradually fell. This led us to steadily increase our exposure back to 100% before the end of November, and we remained fully invested through the end of the year.
Our shifts within equity markets include international versus domestic holdings, as well as allocating among market capitalization ranges in addition to sector overweight and/or underweight positions. Due primarily to relative momentum factors, our exposure to international holdings among both developed international and emerging market securities was underweight relative to the benchmark. Our underweight exposure to international markets contributed to performance relative to the benchmark in 2019.
Early in January, momentum factors improved in our fixed income models and we increased the portfolio’s allocation to high yield and emerging markets debt sectors. Roughly two-thirds of the portfolio remained allocated to more conservative U.S. Government securities and investment-grade bonds. The Fed took a dovish pivot in mid-March, announcing that it was “unlikely” there would be rate hikes in 2019. This reversed their earlier forecast of two rate increases. After the statement, Treasury prices increased as yields declined across the U.S. yield curve and portions of the yield curve inverted, as the 10-Year Treasury yield fell below the 3-month Treasury yield. The Fed maintained a dovish stance in the 2nd quarter due to mixed economic data and continued low inflation, eventually cutting overnight rates by 0.25% on the final day of July, as the U.S. and China trade negotiations continued to add to market uncertainty.
In the middle of August, a potential recessionary warning signal flashed as the 10-year U.S. Treasury yield fell below the 2-year U.S. Treasury, followed by an inversion of the U.S. Treasury yield curve for the first time since 2007. Our models signaled a change in sector positioning and we reallocated the portfolio to a more conservative position with a reduction in high yield and emerging market debt and an increase in investment-grade securities and U.S. Treasuries. In September, the Fed cut the policy rate for the second time this year by 0.25%. However, market concerns started to ease in the middle of October as the U.S. and China reached a partial trade deal, calling it “Phase 1” of the overall trade negotiations, causing related market volatility to subside.
Our investment models then guided us to reduce our holdings in investment-grade and U.S. Treasury holdings and use those proceeds to increase our holdings in both emerging market and high yield bonds. Our investment models continued to favor increased exposure to the two sectors for remainder of the year and the portfolio benefitted from the tailwinds that were produced from the market’s optimism in the U.S. and global economic strength. The U.S. Treasury curve inversion ended during the quarter and it steepened as rates dropped across the front end of the yield curve and the longer-dated treasury yields moved higher. The portfolio’s treasury allocation’s duration was slightly higher than the benchmark during the second and third quarter and remained below the benchmark during the first and the fourth quarter. Portfolio duration remained slightly shorter than the benchmark throughout the year.
Within our stock selection process, we attempt to gain exposure to companies with strong profitability that are priced at reasonable valuations relative to their industry peers and are trading with positive price momentum. For the year ending 2019, securities with exposure to short-term momentum and value characteristics, such as low book-to-price, contributed to performance. Companies with strong profitability detracted from performance.
In the portfolio, we will often use equity index derivatives in the Fund, such as stock index futures, to efficiently equitize our cash positions as well as manage the equity exposure of the Fund. In regard to equitizing cash positions, these derivatives are designed to track their respective stock index, so there was no discernible impact to the Fund’s relative performance. The use of stock index futures to manage equity exposure of the Fund had a positive impact on the performance of the Fund relative to the benchmark index during 2019.
Page 14 | 2019 Annual Report | December 31, 2019 |
Investment Objective
The investment objective of the Fund is to provide income and long-term capital appreciation.
Average Annual Total Returns
as of December 31, 2019
| 1
Year | 5
Year | 10
Year | Share Class
Inception
Date |
Conservative Allocation Fund Retail Class | 10.25% | 2.85% | 6.93% | 6/21/95 |
Conservative Allocation Fund Institutional Class | 10.61% | 3.09% | 7.06% | 10/31/16 |
Conservative Allocation Fund Adviser Class | 10.51% | 3.01% | 7.02% | 10/31/16 |
Morningstar Conservative Target Risk Index | 11.22% | 4.05% | 4.53% | — |
Blended Index | 11.85% | 4.45% | 5.20% | — |
Growth of $10,000
as of December 31, 2019
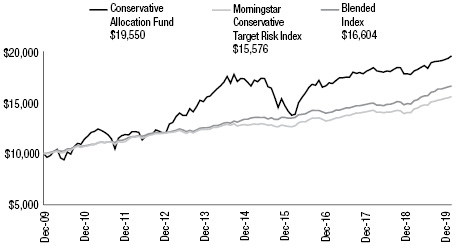
The Growth of $10,000 chart compares the performance of the Fund’s Retail Share Class over the period shown with dividends and capital gains reinvested to the Fund’s benchmarks. Benchmark indices are unmanaged and do not reflect the deduction of expenses associated with a mutual fund, such as investment management and accounting fees.
Investment performance assumes reinvestment of all dividend and capital gain distributions. The results do not reflect the effect of taxes a shareholder would pay on Fund distributions or on the redemption of Fund shares. Historical performance attributed to the Institutional and Adviser Share Classes prior to their inception dates is based on the performance of the Retail Share Class. No adjustment has been made to reflect class-specific distribution or servicing fees. Returns may reflect the effect of voluntary fee waivers or expense reimbursements over the period shown. Without these waivers, performance would have been lower.
The performance data shown represents past performance, which does not guarantee future results. The investment return and principal value of an investment will fluctuate so that an investor’s shares, when redeemed, may be worth more or less than their original cost. Current performance may be lower or higher than the performance data quoted. For current month-end performance data, please visit our website atwww.meederfunds.com.
Top 10 Holdings
as of December 31, 2019
1. | Vanguard Total Bond Market ETF | 6.9% |
2. | iShares Core U.S. Aggregate Bond ETF | 6.9% |
3. | Xtrackers USD High Yield Corporate Bond ETF | 4.8% |
4. | Dodge & Cox Income Fund | 4.1% |
5. | Baird Core Plus Bond Fund - Class I | 3.7% |
6. | PGIM Total Return Bond Fund - Class R6 | 3.6% |
7. | Pioneer Bond Fund - Class Y | 3.6% |
8. | iShares JP Morgan USD Emerging Markets Bond ETF | 3.1% |
9. | Lord Abbett High Yield Fund - Class I | 3.1% |
10. | Frost Total Return Bond Fund - Class I | 3.1% |
As a percentage of total net assets. Holdings exclude short-term investments and derivatives.
Sector Concentration
as of December 31, 2019
Information Technology | 27.3% |
Healthcare | 18.8% |
Financials | 11.8% |
Consumer Discretionary | 10.4% |
Communication Services | 8.3% |
Industrials | 6.3% |
Consumer Staples | 6.3% |
Real Estate Investment Trust | 3.9% |
Energy | 3.6% |
Materials | 2.1% |
Utilities | 1.2% |
Total | 100.0% |
As a percentage of total common stocks. Concentrations are subject to change.
Asset Allocation
as of December 31, 2019
Common Stocks | 22.6% |
Fixed Income Registered Investment Companies | 60.8% |
Money Market Registered Investment Companies | 6.8% |
U.S. Government Obligations | 8.2% |
Other Assets/Liabilities (Net) | 1.6% |
Total | 100.0% |
As a percentage of total net assets. The Fund has invested in stock index futures contracts in order to equitize cash balances held in the Fund.
The Blended Index is comprised 18% of the S&P 500 Index, 12% of the average 90-day T-bills, and 70% of the Bloomberg Barclays US Aggregate Bond Index.
2019 Annual Report | December 31, 2019 | Page 15 |
Dynamic Allocation Fund
The Meeder Dynamic Allocation Fund Institutional Class returned 24.40% compared to the Morningstar Aggressive Target Risk Index return of 25.91%.
Our shifts within equity markets include international versus domestic holdings, as well as allocating among market capitalization ranges in addition to sector overweight and/or underweight positions. Due primarily to relative momentum factors, our exposure to international holdings among both developed international and emerging market securities was underweight relative to the benchmark. Our underweight exposure to international markets contributed to performance relative to the benchmark in 2019.
We maintain at least a 5% allocation to fixed income in the Fund. During 2019, this allocation was actively managed among investment-grade, high yield, and emerging market debt sectors. These allocation changes are driven by our tactical fixed income models. These models assess various factors including momentum, volatility, and macroeconomic metrics and signal sector rotations. Although sector rotation among credit sectors added value within fixed income allocation in 2019, overall fixed income exposure slightly detracted from the Fund’s performance as equity markets rallied significantly relative to fixed income during the year.
Within our stock selection process, we attempt to gain exposure to companies with strong profitability that are priced at reasonable valuations relative to their industry peers and are trading with positive price momentum. For the year ending 2019, securities with exposure to short-term momentum and value characteristics, such as low book-to-price, contributed to performance. Companies with strong profitability detracted from performance.
We utilized equity index derivatives in the Fund, such as stock index futures, to equitize cash positions. Since these derivatives are designed to track a respective stock index, there was no discernable impact to the Fund’s relative performance in 2019.
Investment Objective
The investment objective of the Fund is to provide long-term capital appreciation.
Average Annual Total Returns
as of December 31, 2019
| 1
Year | 5
Year | 10
Year | Share Class
Inception
Date |
Dynamic Allocation Fund Retail Class | 24.00% | 6.91% | 9.98% | 2/29/00 |
Dynamic Allocation Fund Institutional Class | 24.40% | 7.16% | 10.11% | 10/31/16 |
Dynamic Allocation Fund Adviser Class | 24.29% | 7.06% | 10.06% | 10/31/16 |
Morningstar Aggressive Target Risk Index | 25.91% | 8.85% | 10.09% | — |
Blended Index | 27.79% | 9.77% | 10.96% | — |
Top 10 Holdings
as of December 31, 2019
1. | Apple, Inc. | 3.2% |
2. | Microsoft Corp. | 3.0% |
3. | iShares JP Morgan USD Emerging Markets Bond ETF | 2.3% |
4. | SPDR Bloomberg Barclays High Yield Bond ETF | 2.3% |
5. | Amazon.com, Inc. | 1.6% |
6. | Berkshire Hathaway, Inc. - Class B | 1.5% |
7. | Alphabet, Inc. - Class C | 1.5% |
8. | MasterCard, Inc. | 1.1% |
9. | Verizon Communications, Inc. | 1.1% |
10. | Facebook, Inc. | 1.0% |
As a percentage of total net assets. Holdings exclude short-term investments and derivatives.
Page 16 | 2019 Annual Report | December 31, 2019 |
Growth of $10,000
as of December 31, 2019
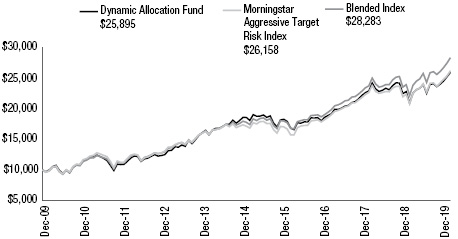
The Growth of $10,000 chart compares the performance of the Fund’s Retail Share Class over the period shown with dividends and capital gains reinvested to the Fund’s benchmarks. Benchmark indices are unmanaged and do not reflect the deduction of expenses associated with a mutual fund, such as investment management and accounting fees.
Investment performance assumes reinvestment of all dividend and capital gain distributions. The results do not reflect the effect of taxes a shareholder would pay on Fund distributions or on the redemption of Fund shares. Historical performance attributed to the Institutional and Adviser Share Classes prior to their inception dates is based on the performance of the Retail Share Class. No adjustment has been made to reflect class-specific distribution or servicing fees. Returns may reflect the effect of voluntary fee waivers or expense reimbursements over the period shown. Without these waivers, performance would have been lower.
The performance data shown represents past performance, which does not guarantee future results. The investment return and principal value of an investment will fluctuate so that an investor’s shares, when redeemed, may be worth more or less than their original cost. Current performance may be lower or higher than the performance data quoted. For current month-end performance data, please visit our website atwww.meederfunds.com.
Sector Concentration
as of December 31, 2019
Information Technology | 27.5% |
Healthcare | 19.2% |
Financials | 11.9% |
Consumer Discretionary | 10.1% |
Communication Services | 8.7% |
Industrials | 6.3% |
Consumer Staples | 5.8% |
Real Estate Investment Trust | 3.9% |
Energy | 3.6% |
Materials | 1.9% |
Utilities | 1.1% |
Total | 100.0% |
As a percentage of total common stocks. Concentrations are subject to change.
Asset Allocation
as of December 31, 2019
Common Stocks | 72.6% |
Money Market Registered Investment Companies | 20.1% |
Fixed Income Registered Investment Companies | 4.6% |
Equity Registered Investment Companies | 0.5% |
Bank Obligations | 0.4% |
Other Assets/Liabilities (Net) | 1.8% |
Total | 100.0% |
As a percentage of total net assets. The Fund has invested in stock index futures contracts in order to equitize cash balances held in the Fund.
The Blended Index is comprised of 70% S&P 500 Index, 25% MSCI ACWI ex USA Index, and 5% Bloomberg Barclays US Aggregate Bond Index.
2019 Annual Report | December 31, 2019 | Page 17 |
Quantex Fund
For the year ended December 31, 2019, the Meeder Quantex Fund Institutional Class returned 18.81% compared to the benchmark’s return of the S&P MidCap 400 Index of 26.20% and the Russell 2000 Index return of 25.52%.
We use a quantitative model to identify the capitalization ranges that incorporate our ideal portfolio of small- and mid-capitalization companies with strong growth potential each calendar year. Individual securities for the portfolio are equally weighted at the beginning of the year. Securities are then monitored on an ongoing basis and screened based on various momentum, profitability and value characteristics.
The portfolio’s performance was driven by a combination of sector selection and individual security selection. Consumer Discretionary, Industrials, and Energy were the largest overweight sectors relative to the benchmark, while our largest underweights relative to the benchmark were in Information Technology and Utilities. The largest sector contributors were Materials and Utilities, while the biggest individual contributors to performance were World Fuel Services and Tenet Healthcare. Mallinckrodt PLC, Tupperware Brands, and Chesapeake Energy were the largest individual detractors to performance.
We utilized equity index derivatives in the Fund, such as stock index futures, to equitize cash positions. Since these derivatives are designed to track a respective stock index, there was no discernable impact to the Fund’s relative performance in 2019.
Investment Objective
The investment objective of the Fund is to provide long-term capital appreciation.
Average Annual Total Returns
as of December 31, 2019
| 1
Year | 5
Year | 10
Year | Share Class
Inception
Date |
Quantex Fund Retail Class | 18.48% | 5.84% | 11.02% | 3/20/85 |
Quantex Fund Institutional Class | 18.81% | 6.07% | 11.14% | 10/31/16 |
Quantex Fund Adviser Class | 18.63% | 5.96% | 11.09% | 10/31/16 |
S&P MidCap 400 Index | 26.20% | 9.03% | 12.72% | — |
Russell 2000 Index | 25.52% | 8.23% | 11.83% | — |
Blended Index | 25.88% | 8.65% | 12.30% | — |
Top 10 Holdings
as of December 31, 2019
1. | World Fuel Services Corp. | 2.0% |
2. | Xerox Holdings Corp. | 1.8% |
3. | Fortune Brands Home & Security, Inc. | 1.8% |
4. | Qorvo, Inc. | 1.6% |
5. | Allegion PLC | 1.6% |
6. | Arconic, Inc. | 1.6% |
7. | KB Home | 1.5% |
8. | Western Union Co./The | 1.5% |
9. | Jacobs Engineering Group, Inc. | 1.5% |
10. | PulteGroup, Inc. | 1.5% |
As a percentage of total net assets. Holdings exclude short-term investments and derivatives.
Page 18 | 2019 Annual Report | December 31, 2019 |
Growth of $10,000
as of December 31, 2019
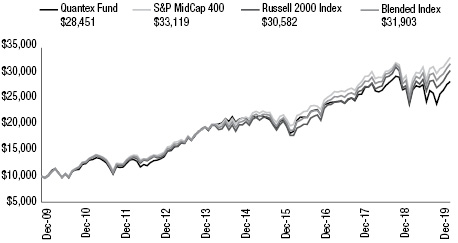
The Growth of $10,000 chart compares the performance of the Fund’s Retail Share Class over the period shown with dividends and capital gains reinvested to the Fund’s benchmarks. Benchmark indices are unmanaged and do not reflect the deduction of expenses associated with a mutual fund, such as investment management and accounting fees.
Investment performance assumes reinvestment of all dividend and capital gain distributions. The results do not reflect the effect of taxes a shareholder would pay on Fund distributions or on the redemption of Fund shares. Historical performance attributed to the Institutional and Adviser Share Classes prior to their inception dates is based on the performance of the Retail Share Class. No adjustment has been made to reflect class-specific distribution or servicing fees. Returns may reflect the effect of voluntary fee waivers or expense reimbursements over the period shown. Without these waivers, performance would have been lower.
The performance data shown represents past performance, which does not guarantee future results. The investment return and principal value of an investment will fluctuate so that an investor’s shares, when redeemed, may be worth more or less than their original cost. Current performance may be lower or higher than the performance data quoted. For current month-end performance data, please visit our website atwww.meederfunds.com.
Sector Concentration
as of December 31, 2019
Consumer Discretionary | 24.0% |
Industrials | 21.9% |
Information Technology | 11.4% |
Financials | 9.3% |
Healthcare | 8.9% |
Materials | 8.7% |
Energy | 5.8% |
Real Estate Investment Trust | 5.2% |
Communication Services | 3.4% |
Consumer Staples | 1.2% |
Utilities | 0.2% |
Total | 100.0% |
As a percentage of total common stocks. Concentrations are subject to change.
Asset Allocation
as of December 31, 2019
Common Stocks | 95.9% |
Money Market Registered Investment Companies | 4.5% |
Bank Obligations | 1.2% |
Other Assets/Liabilities (Net) | (1.6)% |
Total | 100.0% |
As a percentage of total net assets. The Fund has invested in stock index futures contracts in order to equitize cash balances held in the Fund.
The Blended Index consists of 50% of the Russell 2000 Index and 50% of the S&P MidCap 400 Index.
2019 Annual Report | December 31, 2019 | Page 19 |
Total Return Bond Fund
The Meeder Total Return Bond Fund Institutional Class return was 7.67% for the year compared to the Bloomberg Barclays U.S. Aggregate Bond Index which returned 8.72%.
Early in January, momentum factors improved in our fixed income models and we increased the portfolio’s allocation to high yield and emerging markets debt sectors. Roughly two-thirds of the portfolio remained allocated to more conservative U.S. Government securities and investment-grade bonds. The Fed took a dovish pivot in mid-March, announcing that it was “unlikely” there would be rate hikes in 2019. This reversed their earlier forecast of two rate increases. After the statement, Treasury prices increased as yields declined across the U.S. yield curve and portions of the yield curve inverted, as the 10-Year Treasury yield fell below the 3-month Treasury yield. The Fed maintained a dovish stance in the 2nd quarter due to mixed economic data and continued low inflation, eventually cutting overnight rates by 0.25% on the final day of July, as the U.S. and China trade negotiations continued to add to market uncertainty. In the middle of August, a potential recessionary warning signal flashed as the 10-year U.S. Treasury yield fell below the 2-year U.S. Treasury, followed by an inversion of the U.S. Treasury yield curve for the first time since 2007. Our models signaled a change in sector positioning and we reallocated the portfolio to a more conservative position with a reduction in high yield and emerging market debt and an increase in investment-grade securities and U.S. Treasuries. In September, the Fed cut the policy rate for the second time this year by 0.25%. However, market concerns started to ease in the middle of October as the U.S. and China reached a partial trade deal, calling it “Phase 1” of the overall trade negotiations, causing related market volatility to subside. Our investment models then guided us to reduce our holdings in investment-grade and U.S. Treasury holdings and use those proceeds to increase our holdings in both emerging market and high yield bonds. Our investment models continued to favor increased exposure to the two sectors for remainder of the year and the portfolio benefitted from the tailwinds that were produced from the market’s optimism in the U.S. and global economic strength. The U.S. Treasury curve inversion ended during the quarter and it steepened as rates dropped across the front end of the yield curve and the longer-dated treasury yields moved higher. The portfolio’s treasury allocation’s duration was slightly higher than the benchmark during the second and third quarter and remained below the benchmark during the first and the fourth quarter. Portfolio duration remained slightly shorter than the benchmark throughout the year.
Investment Objective
The investment objective of the Fund is to provide total return, consisting of income and capital growth, consistent with minimizing the risk of loss of capital.
Average Annual Total Returns
as of December 31, 2019
| 1
Year | 5
Year | Since
Inception | Share Class
Inception
Date |
Total Return Bond Fund Retail Class | 7.24% | 2.19% | 2.45% | 6/30/11 |
Total Return Bond Fund Institutional Class | 7.67% | 2.47% | 2.61% | 10/31/16 |
Total Return Bond Fund Adviser Class | 7.54% | 2.38% | 2.56% | 10/31/16 |
Bloomberg Barclays U.S. Aggregate Bond Index | 8.72% | 3.05% | 3.32% | — |
Top 10 Holdings
as of December 31, 2019
1. | Vanguard Total Bond Market ETF | 10.9% |
2. | iShares Core U.S. Aggregate Bond ETF | 10.9% |
3. | Dodge & Cox Income Fund | 7.1% |
4. | Baird Core Plus Bond Fund - Class I | 6.2% |
5. | Pioneer Bond Fund - Class Y | 6.0% |
6. | PGIM Total Return Bond Fund - Class R6 | 6.0% |
7. | Segall Bryant & Hamill Plus Bond Fund - Class I | 5.2% |
8. | Frost Total Return Bond Fund - Class I | 5.0% |
9. | U.S. Treasury Note, 2.25%, due 11/15/2025 | 4.9% |
10. | DoubleLine Total Return Bond Fund - Class I | 4.0% |
As a percentage of total net assets. Holdings exclude short-term investments and derivatives.
Page 20 | 2019 Annual Report | December 31, 2019 |
Growth of $10,000
as of December 31, 2019
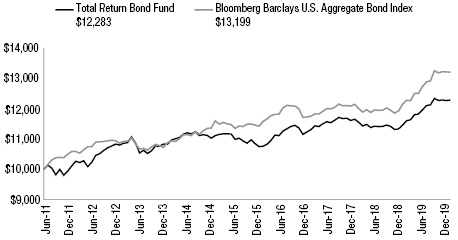
The Growth of $10,000 chart compares the performance of the Fund’s Retail Share Class over the period shown with dividends and capital gains reinvested to the Fund’s benchmarks. Benchmark indices are unmanaged and do not reflect the deduction of expenses associated with a mutual fund, such as investment management and accounting fees.
Investment performance assumes reinvestment of all dividend and capital gain distributions. The results do not reflect the effect of taxes a shareholder would pay on Fund distributions or on the redemption of Fund shares. Historical performance attributed to the Institutional and Adviser Share Classes prior to their inception dates is based on the performance of the Retail Share Class. No adjustment has been made to reflect class-specific distribution or servicing fees. Returns may reflect the effect of voluntary fee waivers or expense reimbursements over the period shown. Without these waivers, performance would have been lower.
The performance data shown represents past performance, which does not guarantee future results. The investment return and principal value of an investment will fluctuate so that an investor’s shares, when redeemed, may be worth more or less than their original cost. Current performance may be lower or higher than the performance data quoted. For current month-end performance data, please visit our website atwww.meederfunds.com.
Fixed Income Sector Concentration
as of December 31, 2019
Core Intermediate-Term | 71.2% |
U.S. Government | 14.8% |
Emerging Markets Debt | 9.3% |
High-Yield | 4.7% |
Total | 100.0% |
As a percentage of total fixed income securities.
Concentrations are subject to change.
2019 Annual Report | December 31, 2019 | Page 21 |
Prime Money Market Fund
The Meeder Prime Money Market Fund is a constant net asset value (CNAV) fund offered only to natural persons. The objective of this fund is to maintain a CNAV at $1.00 per share while offering a competitive return to shareholders. The adviser to the Fund accomplishes the objective by investing in short-term, high-quality money market debt obligations. Money market debt obligations may be offered by the U.S. Government and its agencies but may also include obligations of fundamentally sound corporate issuers.
Over the past several years the Money Market Fund industry has been faced with challenges from zero bound interest rates to regulatory changes. Regardless of the event, money fund managers digested what was put before them and marched ahead. In time, perseverance was rewarded with higher interest rates. From the end of 2015 to the end of 2018, the Federal Open Market Committee (FOMC) increased its benchmark interest rate nine times ending at a target range of 2.25% to 2.50%. However, in the ever-changing world known as “capital markets” even these advantageous interest rates could be short-lived.
The New Year, 2019, started with several potential obstacles posing challenges to global sentiment and circulated speculation about the global growth path moving forward. Discussions surrounding global trade, while simmering in the background over the last couple of years, became a steady headline throughout the year. FOMC Chairperson, Jerome Powell, and cohorts in the committee stressed vigilance in the first half on 2019 vowing to consider all scenarios and ramifications for the domestic economy. As a result, the benchmark range for interest rates was unchanged through June. Amid the news that the U.S. economy was stable relative to that of its peers, intermittent cracks began to appear. Developed economies outside the U.S. continued to languish as seen through manufacturing sentiment gauges. Eventually, this filtered through to the U.S. economy by mid-2019. In an effort to mitigate structural economic drag, the FOMC embarked on a series of benchmark interest rate cuts. By the end of October, the target range had decreased three times to a range of 1.50% to 1.75%.
Factoring in data at hand and weighing expectations for the year that lay ahead, the adviser fine-tuned tactical strategy to targeting investment opportunities which may outperform in a potentially flat interest rate environment. Historically, the Fund has maintained ample liquidity in an effort to provide portfolio safety. Liquidity had also been a solid tool for taking advantage of investment opportunities when they arise. With expectations that a stable target interest rate environment may be on the horizon for 2019, the portfolio management team adjusted strategy to accommodate investment options while securing value for shareholders. As the FOMC adjusted its stance to potentially move its benchmark interest rate lower later in the year, the team again altered its strategy. The strategy employed favored extending the weighted average maturity of the portfolio to guard against declining interest rates. This investment strategy was maintained for the remainder of the year.
For 2019 the portfolio management team targeted a longer weighted average maturity. This strategy allowed the management team opportunity to alter investments as the environment changed. Currently, we believe the FOMC will continue to contemplate its benchmark interest rate strategy. We believe the committee may again be more receptive to altering its rate path lower given economic uncertainties. We do anticipate any further interest rate actions to remain drawn out versus historical interest rate cycles. Our sector allocation favors an overweight to high-quality liquid investments. Depending on investment opportunities we will continue to explore investment alternatives in short-term, high-quality corporate debt product without adding undo risk.
As we completed 2019, our belief was that the Fund should be positioned to maintain strong performance into 2020. In the event FOMC policy changes, we believe the portfolio is positioned to perform in the resulting environment. We will continuously monitor strategy relative to market opportunities and act in the best interest of our shareholders.
Investment Objective
The investment objective of the Fund is to provide current income while maintaining a stable share price of $1.00.
Average Annual Total Returns
as of December 31, 2019
| 1
Year | 5
Year | 10
Year |
Prime Money Market Fund | 2.06% | 0.94% | 0.52% |
Yields
as of December 31, 2019
| | 7-Day
Subsidized
Yield | 7-Day
Unsubsidized
Yield |
Prime Money Market Fund | 1.55% | 0.91% |
Top 10 Holdings
as of December 31, 2019
1. | South Street Repo, 1.55%, due 1/2/2020 | 14.4% |
2. | Morgan Stanley Institutional Liquidity Government Fund, 1.51% | 8.5% |
3. | INTL FCStone Repo, 1.65%, due 1/2/2020 | 4.3% |
4. | Westpac Banking Corp., 1.94%, due 3/13/2020 | 2.2% |
5. | JP Morgan Securities, 1.87%, due 6/15/2020 | 2.1% |
6. | JP Morgan Securities, 2.43%, due 1/3/2020 | 1.7% |
7. | UBS AG Stamford, CT, 2.76%, due 6/1/2020 | 1.4% |
8. | Toyota Motor Credit Corp., 1.94%, due 10/23/2020 | 1.4% |
9. | Wells Fargo Bank N.A., 1.96%, due 7/15/2020 | 1.4% |
10. | Toyota Motor Credit Corp., 2.30%, due 2/13/2020 | 1.4% |
As a percentage of total net assets.
Page 22 | 2019 Annual Report | December 31, 2019 |
The Fund operates as a retail money market fund and is limited to accounts beneficially owned by natural persons. Investment performance assumes reinvestment of all dividend and capital gain distributions. The results do not reflect the effect of taxes a shareholder would pay on Fund distributions or on the redemption of Fund shares. The subsidized 7-day current yield is the current annualized net yield of the Fund. The unsubsidized 7-day current yield does not reflect the effect of any fee waivers or expense reimbursements made by the Fund’s investment adviser. The 7-day current yield more closely reflects the current earnings of the Fund than total return.
You could lose money by investing in the Fund. Because the share price of the Fund will fluctuate, when you sell your shares they may be worth more or less than what you originally paid for them. The Fund may impose a fee upon sale of your shares or may temporarily suspend your ability to sell shares if the Fund’s liquidity falls below required minimums because of market conditions or other factors. An investment in the Fund is not insured or guaranteed by the Federal Deposit Insurance Corporation or any other government agency. The Fund’s sponsor has no legal obligation to provide financial support to the Fund, and you should not expect that the sponsor will provide financial support to the Fund at any time.
Sector Concentration
as of December 31, 2019
Commercial Paper | 31.5% |
Repurchase Agreements | 18.7% |
Certificates of Deposit | 16.5% |
Corporate Obligations | 15.1% |
Money Market Registered Investment Companies | 8.8% |
U.S. Government and Agency Obligations | 7.9% |
Bank Obligations | 1.4% |
Other Assets/Liabilities (Net) | 0.1% |
Total | 100.0% |
As a percentage of total net assets. Concentrations are subject to change.
2019 Annual Report | December 31, 2019 | Page 23 |
Institutional Prime Money Market Fund
The Meeder Institutional Prime Money Market Fund offers a floating net asset value (FNAV). An FNAV fund is characterized by a net asset value which could vary incrementally above or below $1.00 per share. The objective of this fund is to maintain a FNAV near $1.00 per share while offering a competitive return to shareholders. The adviser to the Fund accomplishes the objective by investing in short-term, high-quality money market debt obligations. Money market debt obligations may be offered by the U.S. Government and its agencies but may also include obligations of fundamentally sound corporate issuers.
Over the past several years the Money Market Fund industry has been faced with challenges from zero bound interest rates to regulatory changes. Regardless of the event, money fund managers digested what was put before them and marched ahead. In time, perseverance was rewarded with higher interest rates. From the end of 2015 to the end of 2018, the Federal Open Market Committee (FOMC) increased its benchmark interest rate nine times ending at a target range of 2.25% to 2.50%. However, in the ever-changing world known as “capital markets” even these advantageous interest rates could be short-lived.
The New Year, 2019, started with several potential obstacles posing challenges to global sentiment and circulated speculation about the global growth path moving forward. Discussions surrounding global trade, while simmering in the background over the last couple of years, became a steady headline throughout the year. FOMC Chairperson, Jerome Powell, and cohorts in the committee stressed vigilance in the first half on 2019 vowing to consider all scenarios and ramifications for the domestic economy. As a result, the benchmark range for interest rates was unchanged through June. Amid the news that the U.S. economy was stable relative to that of its peers, intermittent cracks began to appear. Developed economies outside the U.S. continued to languish as seen through manufacturing sentiment gauges. Eventually, this filtered through to the U.S. economy by mid-2019. In an effort to mitigate structural economic drag, the FOMC embarked on series of benchmark interest rate cuts. By the end of October, the target range had decreased three times to a range of 1.50% to 1.75%.
Factoring in data at hand and weighing expectations for the year that lay ahead, the adviser fine-tuned tactical strategy to targeting investment opportunities which may outperform in a potentially flat interest rate environment. Historically, the Fund has maintained ample liquidity in an effort to provide portfolio safety. Liquidity had also been a solid tool for taking advantage of investment opportunities when they arise. With expectations that a stable target interest rate environment may be on the horizon for 2019, the portfolio management team adjusted strategy to accommodate investment options while securing value for shareholders. As the FOMC adjusted its stance to potentially move its benchmark interest rate lower later in the year, the team again altered its strategy. The strategy employed favored extending the weighted average maturity of the portfolio to guard against declining interest rates. This investment strategy was maintained for the remainder of the year.
For 2019 the portfolio management team targeted a longer weighted average maturity. This strategy allowed the management team opportunity to alter investments as the environment changed. Currently, we believe the FOMC will continue to contemplate its benchmark interest rate strategy. We believe the committee may again be more receptive to altering its rate path lower given economic uncertainties. We do anticipate any further interest rate actions to remain drawn out versus historical interest rate cycles. Our sector allocation favors an overweight to high-quality liquid investments. Depending on investment opportunities we will continue to explore investment alternatives in short-term, high-quality corporate debt product without adding undo risk.
As we completed 2019, our belief was that the Fund should be positioned to maintain strong performance into 2020. In the event FOMC policy changes, we believe the portfolio is positioned to perform in the resulting environment. We will continuously monitor strategy relative to market opportunities and act in the best interest of our shareholders.
Investment Objective
The investment objective of the Fund is to provide current income consistent with liquidity and the preservation of capital.
Average Annual Total Returns
as of December 31, 2019
| 1
Year | 5
Year | 10
Year |
Institutional Prime Money Market Fund | 2.31% | 1.13% | 0.65% |
Yields
as of December 31, 2019
| | 7-Day
Subsidized
Yield | 7-Day
Unsubsidized
Yield |
Institutional Prime Money Market Fund | 1.75% | 1.35% |
Top 10 Holdings
as of December 31, 2019
1. | South Street Repo, 1.50%, due 1/2/2020 | 10.8% |
2. | Morgan Stanley Institutional Liquidity Government Fund, 1.51% | 7.7% |
3. | Guggenheim Securities Repo, 1.57%, due 1/2/2020 | 5.4% |
4. | South Street Repo, 1.55%, due 1/2/2020 | 5.4% |
5. | INTL FCStone Repo, 1.65%, due 1/2/2020 | 5.4% |
6. | Credit Suisse NY, 1.84%, due 9/8/2020 | 2.6% |
7. | Walt Disney Company, 2.03%, due 3/4/2020 | 2.1% |
8. | Westpac Banking Corp., 1.94%, due 3/13/2020 | 2.0% |
9. | Toyota Motor Credit Corp., 1.94%, due 10/23/2020 | 1.8% |
10. | Toyota Motor Credit Corp., 2.30%, due 2/13/2020 | 1.6% |
As a percentage of total net assets.
Page 24 | 2019 Annual Report | December 31, 2019 |
Investment performance assumes reinvestment of all dividend and capital gain distributions. The results do not reflect the effect of taxes a shareholder would pay on Fund distributions or on the redemption of Fund shares. The Fund’s performance prior to October 7, 2016 reflects the performance of a predecessor fund, the Institutional Class of the Meeder Prime Money Market Fund, which was distributed and transferred to the Institutional Prime Money Market Fund upon its inception. The subsidized 7-day current yield is the current annualized net yield of the Fund. The unsubsidized 7-day current yield does not reflect the effect of any fee waivers or expense reimbursements made by the Fund’s investment adviser. The 7-day current yield more closely reflects the current earnings of the Fund than total return.
You could lose money by investing in the Fund. Because the share price of the Fund will fluctuate, when you sell your shares they may be worth more or less than what you originally paid for them. The Fund may impose a fee upon sale of your shares or may temporarily suspend your ability to sell shares if the Fund’s liquidity falls below required minimums because of market conditions or other factors. An investment in the Fund is not insured or guaranteed by the Federal Deposit Insurance Corporation or any other government agency. The Fund’s sponsor has no legal obligation to provide financial support to the Fund, and you should not expect that the sponsor will provide financial support to the Fund at any time.
Sector Concentration
as of December 31, 2019
Repurchase Agreements | 27.0% |
Corporate Obligations | 21.5% |
Certificates of Deposit | 18.5% |
Commercial Paper | 18.2% |
Money Market Registered Investment Companies | 7.7% |
U.S. Government and Agency Obligations | 7.0% |
Bank Obligations | 0.1% |
Total | 100.0% |
As a percentage of total net assets. Concentrations are subject to change.
2019 Annual Report | December 31, 2019 | Page 25 |
2019 Annual Report
Fund Holdings &Financial Statements
Schedule of Investments
December 31, 2019
Muirfield Fund |
Security Description | | Shares,
Contracts
or Principal
Amount ($) | | | Fair
Value ($) | |
Common Stocks — 79.1% |
Communication Services — 6.9% | | | | | | | | |
Alphabet, Inc. - Class A(1) | | | 1,718 | | | | 2,301,072 | |
Alphabet, Inc. - Class C(1) | | | 8,089 | | | | 10,815,155 | |
Altice USA, Inc.(1) | | | 6,124 | | | | 167,430 | |
AT&T, Inc. | | | 149,380 | | | | 5,837,770 | |
Beasley Broadcast Group, Inc. | | | 373 | | | | 1,153 | |
Cinemark Holdings, Inc. | | | 2,516 | | | | 85,167 | |
Cogent Communications Holdings, Inc. | | | 2,444 | | | | 160,840 | |
Comcast Corp. - Class A | | | 105,544 | | | | 4,746,314 | |
Cumulus Media, Inc.(1) | | | 4,334 | | | | 76,148 | |
Electronic Arts, Inc.(1) | | | 5,346 | | | | 574,748 | |
Facebook, Inc.(1) | | | 35,938 | | | | 7,376,275 | |
Frontier Communications Corp.(1) | | | 13,822 | | | | 12,296 | |
Gannett Co., Inc. | | | 2,676 | | | | 17,073 | |
IDT Corp. - Class B(1) | | | 8,904 | | | | 64,198 | |
John Wiley & Sons, Inc. | | | 2,031 | | | | 98,544 | |
Lee Enterprises, Inc.(1) | | | 9,860 | | | | 14,001 | |
Liberty Latin America, Ltd. - Class A(1) | | | 5,341 | | | | 103,081 | |
Liberty TripAdvisor Holdings, Inc.(1) | | | 20,043 | | | | 147,316 | |
Live Nation Entertainment, Inc.(1) | | | 1,241 | | | | 88,694 | |
Marcus Corp./The | | | 5,318 | | | | 168,953 | |
MDC Partners, Inc.(1) | | | 4,984 | | | | 13,856 | |
National CineMedia, Inc. | | | 4,420 | | | | 32,222 | |
Roku, Inc.(1) | | | 1,866 | | | | 249,857 | |
Take-Two Interactive Software, Inc.(1) | | | 7,593 | | | | 929,611 | |
TechTarget, Inc.(1) | | | 1,051 | | | | 27,431 | |
Telephone & Data Systems, Inc. | | | 16,921 | | | | 430,301 | |
T-Mobile US, Inc.(1) | | | 56,773 | | | | 4,452,139 | |
Travelzoo(1) | | | 410 | | | | 4,387 | |
Verizon Communications, Inc. | | | 114,971 | | | | 7,059,219 | |
Walt Disney Co./The | | | 5,936 | | | | 858,524 | |
Yelp, Inc.(1) | | | 4,124 | | | | 143,639 | |
| | | | | | | | 47,057,414 | |
| | | | | | | | | |
Consumer Discretionary — 8.4% | | | | | | | | |
Aaron’s, Inc. | | | 1,141 | | | | 65,163 | |
Acushnet Holdings Corp. | | | 3,639 | | | | 118,268 | |
Amazon.com, Inc.(1) | | | 6,643 | | | | 12,275,201 | |
American Public Education, Inc.(1) | | | 1,680 | | | | 46,015 | |
Aramark | | | 7,663 | | | | 332,574 | |
AutoZone, Inc.(1) | | | 2,164 | | | | 2,577,995 | |
Bassett Furniture Industries, Inc. | | | 4,997 | | | | 83,350 | |
BBX Capital Corp. | | | 1,149 | | | | 5,481 | |
Best Buy Co., Inc. | | | 11,203 | | | | 983,623 | |
Biglari Holdings, Inc. - Class B(1) | | | 712 | | | | 81,467 | |
Bloomin’ Brands, Inc. | | | 10,961 | | | | 241,909 | |
Muirfield Fund |
Security Description | | Shares,
Contracts
or Principal
Amount ($) | | | Fair
Value ($) | |
Common Stocks — continued |
Booking Holdings, Inc.(1) | | | 413 | | | | 848,190 | |
BorgWarner, Inc. | | | 3,021 | | | | 131,051 | |
Cato Corp./The | | | 332 | | | | 5,777 | |
Cavco Industries, Inc.(1) | | | 10 | | | | 1,954 | |
Citi Trends, Inc. | | | 1,670 | | | | 38,610 | |
Crocs, Inc.(1) | | | 6,028 | | | | 252,513 | |
Dana, Inc. | | | 5,393 | | | | 98,153 | |
Darden Restaurants, Inc. | | | 2,002 | | | | 218,238 | |
Dollar General Corp. | | | 12,704 | | | | 1,981,570 | |
eBay, Inc. | | | 51,385 | | | | 1,855,512 | |
Everi Holdings, Inc.(1) | | | 6,298 | | | | 84,582 | |
Extended Stay America, Inc. | | | 7,711 | | | | 114,585 | |
Ford Motor Co. | | | 3 | | | | 28 | |
Garmin, Ltd. | | | 2,664 | | | | 259,900 | |
General Motors Co. | | | 3,246 | | | | 118,804 | |
Gentex Corp. | | | 12,307 | | | | 356,657 | |
GNC Holdings, Inc.(1) | | | 844 | | | | 2,279 | |
Golden Entertainment, Inc.(1) | | | 431 | | | | 8,284 | |
H&R Block, Inc. | | | 4,980 | | | | 116,930 | |
Home Depot, Inc./The | | | 6,257 | | | | 1,366,404 | |
Hudson, Ltd.(1) | | | 2,143 | | | | 32,874 | |
J Alexander’s Holdings, Inc.(1) | | | 10,064 | | | | 96,212 | |
KB Home | | | 2,924 | | | | 100,205 | |
Kirkland’s, Inc.(1) | | | 11,436 | | | | 14,181 | |
Kohl’s Corp. | | | 1,227 | | | | 62,516 | |
LCI Industries | | | 203 | | | | 21,747 | |
Lear Corp. | | | 6,414 | | | | 880,001 | |
Lennar Corp. | | | 16,119 | | | | 899,279 | |
LKQ Corp.(1) | | | 16,085 | | | | 574,235 | |
Lululemon Athletica, Inc.(1) | | | 12,689 | | | | 2,939,661 | |
M/I Homes, Inc.(1) | | | 3,420 | | | | 134,577 | |
Malibu Boats, Inc.(1) | | | 2,634 | | | | 107,862 | |
MasterCraft Boat Holdings, Inc.(1) | | | 4,056 | | | | 63,882 | |
MDC Holdings, Inc. | | | 675 | | | | 25,758 | |
Meritage Homes Corp.(1) | | | 4,029 | | | | 246,212 | |
MGM Resorts International | | | 53,206 | | | | 1,770,164 | |
Murphy USA, Inc.(1) | | | 1,154 | | | | 135,018 | |
NIKE, Inc. - Class B | | | 60,876 | | | | 6,167,348 | |
NVR, Inc.(1) | | | 158 | | | | 601,729 | |
Office Depot, Inc. | | | 21,764 | | | | 59,633 | |
Polaris, Inc. | | | 4,477 | | | | 455,311 | |
PulteGroup, Inc. | | | 13,203 | | | | 512,276 | |
Purple Innovation, Inc.(1) | | | 2,670 | | | | 23,256 | |
Ralph Lauren Corp. | | | 642 | | | | 75,255 | |
Rent-A-Center, Inc./TX | | | 1,771 | | | | 51,076 | |
Rocky Brands, Inc. | | | 926 | | | | 27,252 | |
The accompanying notes are an integral part of these financial statements
2019 Annual Report | December 31, 2019 | Page 27 |
Schedule of Investments
December 31, 2019
Muirfield Fund |
Security Description | | Shares,
Contracts
or Principal
Amount ($) | | | Fair
Value ($) | |
Common Stocks — continued |
Ross Stores, Inc. | | | 10,042 | | | | 1,169,090 | |
Rubicon Project, Inc./The(1) | | | 1,659 | | | | 13,537 | |
Skechers U.S.A., Inc.(1) | | | 3,204 | | | | 138,381 | |
Sportsman’s Warehouse Holdings, Inc.(1) | | | 4,893 | | | | 39,291 | |
Starbucks Corp. | | | 53,357 | | | | 4,691,147 | |
Steven Madden, Ltd. | | | 4,158 | | | | 178,836 | |
Stoneridge, Inc.(1) | | | 2,286 | | | | 67,026 | |
Superior Industries International, Inc. | | | 600 | | | | 2,214 | |
Tailored Brands, Inc. | | | 4,557 | | | | 18,866 | |
Target Corp. | | | 39,701 | | | | 5,090,065 | |
Tile Shop Holdings, Inc. | | | 4,409 | | | | 7,451 | |
Tilly’s, Inc. - Class A | | | 3,327 | | | | 40,756 | |
TJX Cos., Inc./The | | | 68,524 | | | | 4,184,075 | |
Toll Brothers, Inc. | | | 7,873 | | | | 311,062 | |
TopBuild Corp.(1) | | | 27 | | | | 2,783 | |
Town Sports International Holdings, Inc.(1) | | | 8,388 | | | | 14,343 | |
Tupperware Brands Corp. | | | 7,057 | | | | 60,549 | |
Whirlpool Corp. | | | 1,424 | | | | 210,083 | |
Winnebago Industries, Inc. | | | 2,249 | | | | 119,152 | |
Wyndham Destinations, Inc. | | | 3,761 | | | | 194,406 | |
Yum China Holdings, Inc. | | | 4,176 | | | | 200,490 | |
| | | | | | | | 57,502,190 | |
| | | | | | | | | |
Consumer Staples — 4.4% | | | | | | | | |
BellRing Brands, Inc.(1) | | | 2,925 | | | | 62,273 | |
Casey’s General Stores, Inc. | | | 4,439 | | | | 705,757 | |
Coca-Cola Consolidated, Inc. | | | 54 | | | | 15,339 | |
Costco Wholesale Corp. | | | 8,406 | | | | 2,470,692 | |
Flowers Foods, Inc. | | | 4,960 | | | | 107,830 | |
General Mills, Inc. | | | 71,331 | | | | 3,820,488 | |
Hershey Co./The | | | 12,049 | | | | 1,770,962 | |
Ingles Markets, Inc. | | | 534 | | | | 25,370 | |
Kroger Co./The | | | 13,269 | | | | 384,668 | |
Lifevantage Corp.(1) | | | 1,560 | | | | 24,352 | |
Molson Coors Beverage Co. | | | 27,973 | | | | 1,507,745 | |
Mondelez International, Inc. | | | 2,317 | | | | 127,620 | |
PepsiCo, Inc. | | | 52,416 | | | | 7,163,695 | |
Performance Food Group Co.(1) | | | 9,887 | | | | 508,983 | |
Philip Morris International, Inc. | | | 7,505 | | | | 638,600 | |
Pilgrim’s Pride Corp.(1) | | | 2,031 | | | | 66,444 | |
Post Holdings, Inc.(1) | | | 361 | | | | 39,385 | |
Procter & Gamble Co./The | | | 2,315 | | | | 289,144 | |
SpartanNash Co. | | | 4,550 | | | | 64,792 | |
Sysco Corp. | | | 36,204 | | | | 3,096,890 | |
Tyson Foods, Inc. | | | 34,789 | | | | 3,167,191 | |
Muirfield Fund |
Security Description | | Shares,
Contracts
or Principal
Amount ($) | | | Fair
Value ($) | |
Common Stocks — continued |
Walmart, Inc. | | | 34,827 | | | | 4,138,841 | |
| | | | | | | | 30,197,061 | |
| | | | | | | | | |
Energy — 3.0% | | | | | | | | |
Amplify Energy Corp. | | | 6,412 | | | | 42,383 | |
Archrock, Inc. | | | 9,581 | | | | 96,193 | |
Ardmore Shipping Corp.(1) | | | 360 | | | | 3,258 | |
Baker Hughes Co. | | | 13,897 | | | | 356,180 | |
Berry Petroleum Corp. | | | 3,012 | | | | 28,403 | |
Brigham Minerals, Inc. | | | 780 | | | | 16,723 | |
Cactus, Inc. | | | 9,312 | | | | 319,588 | |
Chevron Corp. | | | 35,680 | | | | 4,299,797 | |
ConocoPhillips | | | 44,600 | | | | 2,900,338 | |
Contura Energy, Inc.(1) | | | 3,593 | | | | 32,517 | |
CVR Energy, Inc. | | | 593 | | | | 23,975 | |
Delek US Holdings, Inc. | | | 6,252 | | | | 209,630 | |
DHT Holdings, Inc. | | | 3,933 | | | | 32,565 | |
Dorian LPG, Ltd.(1) | | | 3,288 | | | | 50,898 | |
Exterran Corp.(1) | | | 7,315 | | | | 57,276 | |
Hallador Energy Co. | | | 6,197 | | | | 18,405 | |
Independence Contract Drilling, Inc.(1) | | | 1,536 | | | | 1,531 | |
International Seaways, Inc.(1) | | | 726 | | | | 21,606 | |
Liberty Oilfield Services, Inc. | | | 3,182 | | | | 35,384 | |
Marathon Petroleum Corp. | | | 39,866 | | | | 2,401,927 | |
Matrix Service Co.(1) | | | 2,446 | | | | 55,964 | |
NexTier Oilfield Solutions, Inc.(1) | | | 2,651 | | | | 17,762 | |
Nordic American Tankers, Ltd. | | | 6,567 | | | | 32,310 | |
Oceaneering International, Inc.(1) | | | 3,939 | | | | 58,730 | |
PBF Energy, Inc. | | | 4,704 | | | | 147,564 | |
Peabody Energy Corp. | | | 7,086 | | | | 64,624 | |
Phillips 66 | | | 44,100 | | | | 4,913,181 | |
Profire Energy, Inc.(1) | | | 100 | | | | 145 | |
Renewable Energy Group, Inc.(1) | | | 3,073 | | | | 82,817 | |
Rosehill Resources, Inc.(1) | | | 1,800 | | | | 2,304 | |
SEACOR Holdings, Inc.(1) | | | 1,792 | | | | 77,325 | |
SilverBow Resources, Inc.(1) | | | 1,399 | | | | 13,850 | |
Superior Energy Services, Inc.(1) | | | 1,160 | | | | 5,812 | |
Talos Energy, Inc.(1) | | | 187 | | | | 5,638 | |
Teekay Tankers, Ltd.(1) | | | 571 | | | | 13,687 | |
Valero Energy Corp. | | | 38,501 | | | | 3,605,619 | |
W&T Offshore, Inc.(1) | | | 588 | | | | 3,269 | |
World Fuel Services Corp. | | | 2,146 | | | | 93,179 | |
| | | | | | | | 20,142,357 | |
| | | | | | | | | |
The accompanying notes are an integral part of these financial statements
Page 28 | 2019 Annual Report | December 31, 2019 |
Schedule of Investments
December 31, 2019
Muirfield Fund |
Security Description | | Shares,
Contracts
or Principal
Amount ($) | | | Fair
Value ($) | |
Common Stocks — continued |
Financials — 9.1% | | | | | | | | |
Ally Financial, Inc. | | | 36,838 | | | | 1,125,769 | |
Artisan Partners Asset Management, Inc. | | | 12,149 | | | | 392,656 | |
Ashford, Inc.(1) | | | 280 | | | | 6,608 | |
BancFirst Corp. | | | 969 | | | | 60,504 | |
Bank of America Corp. | | | 132,759 | | | | 4,675,772 | |
Bank OZK | | | 363 | | | | 11,073 | |
BankFinancial Corp. | | | 648 | | | | 8,476 | |
Berkshire Hathaway, Inc. - Class B(1) | | | 43,386 | | | | 9,826,929 | |
Bridgewater Bancshares, Inc.(1) | | | 319 | | | | 4,396 | |
Brighthouse Financial, Inc.(1) | | | 6,673 | | | | 261,782 | |
Brightsphere Investment Group, Inc. | | | 216 | | | | 2,208 | |
Cannae Holdings, Inc.(1) | | | 3,089 | | | | 114,880 | |
Citigroup, Inc. | | | 87,663 | | | | 7,003,397 | |
Citizens Financial Group, Inc. | | | 21,097 | | | | 856,749 | |
Curo Group Holdings Corp.(1) | | | 6,590 | | | | 80,266 | |
Diamond Hill Investment Group, Inc. | | | 333 | | | | 46,773 | |
Elevate Credit, Inc.(1) | | | 9,477 | | | | 42,173 | |
Ellington Financial, Inc. | | | 20,115 | | | | 368,708 | |
Esquire Financial Holdings, Inc.(1) | | | 21 | | | | 547 | |
ESSA Bancorp, Inc. | | | 87 | | | | 1,475 | |
Essent Group, Ltd. | | | 16,818 | | | | 874,368 | |
Farmers National Banc Corp. | | | 328 | | | | 5,353 | |
Fidelity National Financial, Inc. | | | 39,495 | | | | 1,791,098 | |
Fifth Third Bancorp | | | 143,139 | | | | 4,400,093 | |
First American Financial Corp. | | | 17,033 | | | | 993,365 | |
First BanCorp/Puerto Rico | | | 27,282 | | | | 288,916 | |
First Horizon National Corp. | | | 44,648 | | | | 739,371 | |
GAMCO Investors, Inc. | | | 69 | | | | 1,345 | |
Great Ajax Corp. | | | 9,959 | | | | 147,493 | |
Hallmark Financial Services, Inc.(1) | | | 575 | | | | 10,103 | |
Hartford Financial Services Group, Inc./The | | | 1,151 | | | | 69,946 | |
HBT Financial, Inc.(1) | | | 571 | | | | 10,843 | |
Heritage Commerce Corp. | | | 14,008 | | | | 179,723 | |
Hilltop Holdings, Inc. | | | 20,179 | | | | 503,062 | |
Horizon Bancorp, Inc./IN | | | 184 | | | | 3,496 | |
Independent Bank Corp./MI | | | 1,457 | | | | 33,001 | |
International Bancshares Corp. | | | 4,427 | | | | 190,671 | |
JPMorgan Chase & Co. | | | 39,250 | | | | 5,471,450 | |
KeyCorp | | | 17,333 | | | | 350,820 | |
Medley Management, Inc. | | | 2,343 | | | | 6,935 | |
MGIC Investment Corp. | | | 53,228 | | | | 754,241 | |
Nicolet Bankshares, Inc.(1) | | | 975 | | | | 72,004 | |
NMI Holdings, Inc. - Class A(1) | | | 8,262 | | | | 274,133 | |
Northeast Bank | | | 1,451 | | | | 31,907 | |
Northrim BanCorp, Inc. | | | 2,547 | | | | 97,550 | |
Muirfield Fund |
Security Description | | Shares,
Contracts
or Principal
Amount ($) | | | Fair
Value ($) | |
Common Stocks — continued |
Old Republic International Corp. | | | 33,803 | | | | 756,173 | |
OneMain Holdings, Inc. | | | 4,345 | | | | 183,142 | |
Oppenheimer Holdings, Inc. | | | 12,917 | | | | 354,959 | |
Parke Bancorp, Inc. | | | 303 | | | | 7,693 | |
PCB Bancorp | | | 173 | | | | 2,989 | |
Peapack Gladstone Financial Corp. | | | 548 | | | | 16,933 | |
PennyMac Financial Services, Inc. | | | 2,585 | | | | 87,993 | |
Piper Sandler Cos. | | | 5,952 | | | | 475,803 | |
PNC Financial Services Group, Inc./The | | | 32,580 | | | | 5,200,745 | |
Popular, Inc. | | | 33,296 | | | | 1,956,140 | |
ProSight Global, Inc.(1) | | | 2,490 | | | | 40,164 | |
Prudential Financial, Inc. | | | 18,155 | | | | 1,701,850 | |
Pzena Investment Management, Inc. | | | 8,585 | | | | 74,003 | |
Radian Group, Inc. | | | 35,489 | | | | 892,903 | |
RBB Bancorp | | | 495 | | | | 10,479 | |
Ready Capital Corp. | | | 7,509 | | | | 115,789 | |
Regions Financial Corp. | | | 97,631 | | | | 1,675,348 | |
Renasant Corp. | | | 4,192 | | | | 148,481 | |
Shore Bancshares, Inc. | | | 1,088 | | | | 18,888 | |
Silvercrest Asset Management Group, Inc. | | | 157 | | | | 1,975 | |
Stewart Information Services Corp. | | | 5,588 | | | | 227,935 | |
Summit Financial Group, Inc. | | | 1,258 | | | | 34,079 | |
Synchrony Financial | | | 73,911 | | | | 2,661,535 | |
TPG RE Finance Trust, Inc. | | | 8,943 | | | | 181,275 | |
United Community Banks, Inc./GA | | | 615 | | | | 18,991 | |
Unity Bancorp, Inc. | | | 43 | | | | 971 | |
Univest Financial Corp. | | | 3,257 | | | | 87,222 | |
US Bancorp | | | 21,908 | | | | 1,298,925 | |
Valley National Bancorp | | | 49,250 | | | | 563,913 | |
Walker & Dunlop, Inc. | | | 3,198 | | | | 206,847 | |
Waterstone Financial, Inc. | | | 200 | | | | 3,806 | |
WR Berkley Corp. | | | 9,876 | | | | 682,432 | |
| | | | | | | | 61,882,809 | |
| | | | | | | | | |
Healthcare — 15.2% | | | | | | | | |
Abbott Laboratories | | | 18,508 | | | | 1,607,605 | |
AbbVie, Inc. | | | 38,449 | | | | 3,404,274 | |
ACADIA Pharmaceuticals, Inc.(1) | | | 2,988 | | | | 127,827 | |
Adverum Biotechnologies, Inc.(1) | | | 568 | | | | 6,543 | |
Aeglea BioTherapeutics, Inc.(1) | | | 1 | | | | 8 | |
Affimed NV(1) | | | 11,278 | | | | 30,902 | |
Agenus, Inc.(1) | | | 14,977 | | | | 60,956 | |
Agilent Technologies, Inc. | | | 15,306 | | | | 1,305,755 | |
Akebia Therapeutics, Inc.(1) | | | 1,618 | | | | 10,226 | |
Aldeyra Therapeutics, Inc.(1) | | | 2,690 | | | | 15,629 | |
Alexion Pharmaceuticals, Inc.(1) | | | 13,939 | | | | 1,507,503 | |
The accompanying notes are an integral part of these financial statements
2019 Annual Report | December 31, 2019 | Page 29 |
Schedule of Investments
December 31, 2019
Muirfield Fund |
Security Description | | Shares,
Contracts
or Principal
Amount ($) | | | Fair
Value ($) | |
Common Stocks — continued |
Alkermes PLC(1) | | | 8,387 | | | | 171,095 | |
Allergan PLC | | | 6,223 | | | | 1,189,651 | |
Alnylam Pharmaceuticals, Inc.(1) | | | 6,491 | | | | 747,568 | |
AmerisourceBergen Corp. | | | 7,924 | | | | 673,698 | |
Amgen, Inc. | | | 22,487 | | | | 5,420,941 | |
Amneal Pharmaceuticals, Inc.(1) | | | 5,548 | | | | 26,741 | |
AngioDynamics, Inc.(1) | | | 1,739 | | | | 27,841 | |
ANI Pharmaceuticals, Inc.(1) | | | 965 | | | | 59,512 | |
Anika Therapeutics, Inc.(1) | | | 196 | | | | 10,163 | |
Apellis Pharmaceuticals, Inc.(1) | | | 1,825 | | | | 55,882 | |
Ardelyx, Inc.(1) | | | 3,464 | | | | 25,997 | |
Arena Pharmaceuticals, Inc.(1) | | | 5,257 | | | | 238,773 | |
Arrowhead Pharmaceuticals, Inc.(1) | | | 1,517 | | | | 96,223 | |
Arvinas, Inc.(1) | | | 562 | | | | 23,093 | |
Assembly Biosciences, Inc.(1) | | | 310 | | | | 6,343 | |
Assertio Therapeutics, Inc.(1) | | | 22,298 | | | | 27,873 | |
Avantor, Inc.(1) | | | 17,714 | | | | 321,509 | |
Avid Bioservices, Inc.(1) | | | 4,581 | | | | 35,136 | |
Avrobio, Inc.(1) | | | 828 | | | | 16,668 | |
Axsome Therapeutics, Inc.(1) | | | 678 | | | | 70,078 | |
Baudax Bio, Inc.(1) | | | 2,282 | | | | 15,791 | |
Beyondspring, Inc.(1) | | | 1,971 | | | | 30,551 | |
BioDelivery Sciences International, Inc.(1) | | | 17,183 | | | | 108,597 | |
Biogen, Inc.(1) | | | 12,686 | | | | 3,764,317 | |
Bio-Rad Laboratories, Inc.(1) | | | 292 | | | | 108,049 | |
BioSpecifics Technologies Corp.(1) | | | 678 | | | | 38,605 | |
Bristol-Myers Squibb Co. | | | 59,366 | | | | 3,810,704 | |
Bruker Corp. | | | 4,930 | | | | 251,282 | |
Calithera Biosciences, Inc.(1) | | | 3,400 | | | | 19,414 | |
Cardinal Health, Inc. | | | 4,022 | | | | 203,433 | |
CareDx, Inc.(1) | | | 281 | | | | 6,061 | |
Catalent, Inc.(1) | | | 5,708 | | | | 321,360 | |
Catalyst Pharmaceuticals, Inc.(1) | | | 3,256 | | | | 12,210 | |
Celcuity, Inc.(1) | | | 720 | | | | 7,661 | |
Cellular Biomedicine Group, Inc.(1) | | | 1,468 | | | | 23,840 | |
Cerecor, Inc.(1) | | | 1,721 | | | | 9,276 | |
Cerner Corp. | | | 28,943 | | | | 2,124,127 | |
Chemed Corp. | | | 1,494 | | | | 656,254 | |
Coherus Biosciences, Inc.(1) | | | 1,019 | | | | 18,347 | �� |
Collegium Pharmaceutical, Inc.(1) | | | 2,003 | | | | 41,222 | |
Computer Programs & Systems, Inc. | | | 2,723 | | | | 71,887 | |
CONMED Corp. | | | 1,106 | | | | 123,684 | |
Constellation Pharmaceuticals, Inc.(1) | | | 394 | | | | 18,561 | |
Corium International Contingent Value Rights(1)(7) | | | 409 | | | | — | |
Cross Country Healthcare, Inc.(1) | | | 2,475 | | | | 28,760 | |
Muirfield Fund |
Security Description | | Shares,
Contracts
or Principal
Amount ($) | | | Fair
Value ($) | |
Common Stocks — continued |
Cutera, Inc.(1) | | | 590 | | | | 21,128 | |
CVS Health Corp. | | | 8,656 | | | | 643,054 | |
CytomX Therapeutics, Inc.(1) | | | 312 | | | | 2,593 | |
Deciphera Pharmaceuticals, Inc.(1) | | | 1,165 | | | | 72,510 | |
DENTSPLY SIRONA, Inc. | | | 7,095 | | | | 401,506 | |
DexCom, Inc.(1) | | | 2,114 | | | | 462,416 | |
Dicerna Pharmaceuticals, Inc.(1) | | | 2,011 | | | | 44,302 | |
Eagle Pharmaceuticals, Inc./DE(1) | | | 537 | | | | 32,263 | |
Edwards Lifesciences Corp.(1) | | | 1,610 | | | | 375,597 | |
Elanco Animal Health, Inc. Contingent Value Rights(1)(7) | | | 3,328 | | | | — | |
Eli Lilly & Co. | | | 38,457 | | | | 5,054,404 | |
Eloxx Pharmaceuticals, Inc.(1) | | | 243 | | | | 1,788 | |
Emergent BioSolutions, Inc.(1) | | | 1,612 | | | | 86,967 | |
Encompass Health Corp. | | | 4,446 | | | | 307,974 | |
Endo International PLC(1) | | | 12,492 | | | | 58,587 | |
Enochian Biosciences, Inc.(1) | | | 367 | | | | 1,842 | |
Exact Sciences Corp.(1) | | | 3,701 | | | | 342,268 | |
Exelixis, Inc.(1) | | | 18,834 | | | | 331,855 | |
Fate Therapeutics, Inc.(1) | | | 1,297 | | | | 25,382 | |
Fennec Pharmaceuticals, Inc.(1) | | | 5,296 | | | | 34,371 | |
Forty Seven, Inc.(1) | | | 819 | | | | 32,244 | |
Gilead Sciences, Inc. | | | 83,665 | | | | 5,436,552 | |
Haemonetics Corp.(1) | | | 155 | | | | 17,810 | |
Harvard Bioscience, Inc.(1) | | | 156 | | | | 476 | |
HealthStream, Inc.(1) | | | 1,279 | | | | 34,789 | |
Hill-Rom Holdings, Inc. | | | 8,178 | | | | 928,448 | |
Horizon Therapeutics Plc(1) | | | 2,291 | | | | 82,934 | |
Humana, Inc. | | | 8,023 | | | | 2,940,590 | |
ImmunoGen, Inc.(1) | | | 6,580 | | | | 33,591 | |
Incyte Corp.(1) | | | 12,822 | | | | 1,119,617 | |
Insulet Corp.(1) | | | 477 | | | | 81,662 | |
Intersect ENT, Inc.(1) | | | 1,609 | | | | 40,064 | |
Intra-Cellular Therapies, Inc.(1) | | | 263 | | | | 9,024 | |
Ionis Pharmaceuticals, Inc.(1) | | | 1,990 | | | | 120,216 | |
Iovance Biotherapeutics, Inc.(1) | | | 3,669 | | | | 101,558 | |
IQVIA Holdings, Inc.(1) | | | 2,840 | | | | 438,808 | |
Jazz Pharmaceuticals PLC(1) | | | 1,190 | | | | 177,643 | |
Johnson & Johnson | | | 47,731 | | | | 6,962,521 | |
Jounce Therapeutics, Inc.(1) | | | 6,003 | | | | 52,406 | |
Kadmon Holdings, Inc.(1) | | | 7,186 | | | | 32,553 | |
Karyopharm Therapeutics, Inc.(1) | | | 1,067 | | | | 20,454 | |
Kindred Biosciences, Inc.(1) | | | 230 | | | | 1,950 | |
Kodiak Sciences, Inc.(1) | | | 540 | | | | 38,853 | |
Krystal Biotech, Inc.(1) | | | 882 | | | | 48,845 | |
Kura Oncology, Inc.(1) | | | 1,105 | | | | 15,194 | |
The accompanying notes are an integral part of these financial statements
Page 30 | 2019 Annual Report | December 31, 2019 |
Schedule of Investments
December 31, 2019
Muirfield Fund |
Security Description | | Shares,
Contracts
or Principal
Amount ($) | | | Fair
Value ($) | |
Common Stocks — continued |
Lannett Co., Inc.(1) | | | 1,423 | | | | 12,551 | |
Lantheus Holdings, Inc.(1) | | | 1,343 | | | | 27,545 | |
Lexicon Pharmaceuticals, Inc.(1) | | | 5,053 | | | | 20,970 | |
Mallinckrodt PLC(1) | | | 10,859 | | | | 37,898 | |
Masimo Corp.(1) | | | 2,984 | | | | 471,651 | |
McKesson Corp. | | | 7,936 | | | | 1,097,708 | |
Medtronic PLC | | | 54,250 | | | | 6,154,663 | |
MEI Pharma, Inc.(1) | | | 2,704 | | | | 6,706 | |
MeiraGTx Holdings plc(1) | | | 991 | | | | 19,840 | |
Merck & Co., Inc. | | | 73,181 | | | | 6,655,812 | |
Meridian Bioscience, Inc. | | | 2,206 | | | | 21,553 | |
Mersana Therapeutics, Inc.(1) | | | 163 | | | | 934 | |
Mirati Therapeutics, Inc.(1) | | | 208 | | | | 26,803 | |
Misonix, Inc.(1) | | | 1,043 | | | | 19,410 | |
Molecular Templates, Inc.(1) | | | 2,205 | | | | 30,837 | |
Momenta Pharmaceuticals, Inc.(1) | | | 905 | | | | 17,856 | |
Morphic Holding, Inc.(1) | | | 517 | | | | 8,872 | |
Myriad Genetics, Inc.(1) | | | 71 | | | | 1,933 | |
Natera, Inc.(1) | | | 3,072 | | | | 103,496 | |
Natus Medical, Inc.(1) | | | 1,760 | | | | 58,062 | |
Neurocrine Biosciences, Inc.(1) | | | 2,583 | | | | 277,647 | |
Nevro Corp.(1) | | | 130 | | | | 15,280 | |
NextCure, Inc.(1) | | | 21 | | | | 1,183 | |
NextGen Healthcare, Inc.(1) | | | 2,192 | | | | 35,225 | |
Novocure, Ltd.(1) | | | 846 | | | | 71,292 | |
Odonate Therapeutics, Inc.(1) | | | 787 | | | | 25,538 | |
Oncternal Therapeutics, Inc.(1) | | | 2,145 | | | | 8,473 | |
OPKO Health, Inc.(1) | | | 39,407 | | | | 57,928 | |
Organogenesis Holdings, Inc.(1) | | | 1,572 | | | | 7,561 | |
Orthofix Medical, Inc.(1) | | | 1,674 | | | | 77,305 | |
Osmotica Pharmaceuticals PLC(1) | | | 3,067 | | | | 21,438 | |
Owens & Minor, Inc. | | | 211 | | | | 1,091 | |
Pacira BioSciences, Inc.(1) | | | 5,435 | | | | 246,206 | |
Palatin Technologies, Inc.(1) | | | 30,983 | | | | 24,235 | |
PDL BioPharma, Inc.(1) | | | 11,158 | | | | 36,208 | |
Pennant Group, Inc./The(1) | | | 2,918 | | | | 96,498 | |
Perrigo Co. PLC | | | 8,386 | | | | 433,221 | |
Pfenex, Inc.(1) | | | 4,718 | | | | 51,804 | |
Pfizer, Inc. | | | 139,734 | | | | 5,474,778 | |
Phibro Animal Health Corp. | | | 5,906 | | | | 146,646 | |
Pieris Pharmaceuticals, Inc.(1) | | | 5,741 | | | | 20,782 | |
PRA Health Sciences, Inc.(1) | | | 7,728 | | | | 858,967 | |
Precision BioSciences, Inc.(1) | | | 95 | | | | 1,320 | |
Principia Biopharma, Inc.(1) | | | 1,448 | | | | 79,321 | |
Progenics Pharmaceuticals, Inc.(1) | | | 6,792 | | | | 34,571 | |
Protagonist Therapeutics, Inc.(1) | | | 507 | | | | 3,574 | |
Muirfield Fund |
Security Description | | Shares,
Contracts
or Principal
Amount ($) | | | Fair
Value ($) | |
Common Stocks — continued |
PTC Therapeutics, Inc.(1) | | | 2,293 | | | | 110,133 | |
Puma Biotechnology, Inc.(1) | | | 2,284 | | | | 19,985 | |
Reata Pharmaceuticals, Inc.(1) | | | 464 | | | | 94,856 | |
Recro Pharma, Inc.(1) | | | 4,509 | | | | 82,650 | |
Regeneron Pharmaceuticals, Inc.(1) | | | 5,511 | | | | 2,069,270 | |
Replimune Group, Inc.(1) | | | 2,806 | | | | 40,266 | |
ResMed, Inc. | | | 3,033 | | | | 470,024 | |
Rigel Pharmaceuticals, Inc.(1) | | | 28,104 | | | | 60,143 | |
Savara, Inc.(1) | | | 1,706 | | | | 7,643 | |
Seattle Genetics, Inc.(1) | | | 3,953 | | | | 451,670 | |
SIGA Technologies, Inc.(1) | | | 4,142 | | | | 19,757 | |
STERIS PLC | | | 4,662 | | | | 710,582 | |
Stryker Corp. | | | 22,716 | | | | 4,768,997 | |
Syndax Pharmaceuticals, Inc.(1) | | | 251 | | | | 2,204 | |
Syros Pharmaceuticals, Inc.(1) | | | 563 | | | | 3,890 | |
Thermo Fisher Scientific, Inc. | | | 1,202 | | | | 390,494 | |
Tocagen, Inc.(1) | | | 3,104 | | | | 1,655 | |
Tricida, Inc.(1) | | | 135 | | | | 5,095 | |
United Therapeutics Corp.(1) | | | 3,416 | | | | 300,881 | |
UnitedHealth Group, Inc. | | | 6,841 | | | | 2,011,117 | |
Vanda Pharmaceuticals, Inc.(1) | | | 5,251 | | | | 86,169 | |
Veeva Systems, Inc.(1) | | | 5,712 | | | | 803,450 | |
Veracyte, Inc.(1) | | | 2,566 | | | | 71,643 | |
Vericel Corp.(1) | | | 6,121 | | | | 106,505 | |
Verrica Pharmaceuticals, Inc.(1) | | | 2,271 | | | | 36,086 | |
Vertex Pharmaceuticals, Inc.(1) | | | 22,665 | | | | 4,962,502 | |
West Pharmaceutical Services, Inc. | | | 942 | | | | 141,611 | |
XBiotech, Inc.(1) | | | 1,130 | | | | 21,091 | |
Xencor, Inc.(1) | | | 2,760 | | | | 94,916 | |
Y-mAbs Therapeutics, Inc.(1) | | | 3,014 | | | | 94,188 | |
Zimmer Biomet Holdings, Inc. | | | 17,104 | | | | 2,560,127 | |
Zoetis, Inc. | | | 26,094 | | | | 3,453,541 | |
| | | | | | | | 103,161,948 | |
| | | | | | | | | |
Industrials — 4.9% | | | | | | | | |
AGCO Corp. | | | 5,116 | | | | 395,211 | |
Alamo Group, Inc. | | | 16 | | | | 2,009 | |
Allison Transmission Holdings, Inc. | | | 41,298 | | | | 1,995,519 | |
Arconic, Inc. | | | 1,182 | | | | 36,370 | |
Atkore International Group, Inc.(1) | | | 6,696 | | | | 270,920 | |
Barrett Business Services, Inc. | | | 308 | | | | 27,862 | |
BG Staffing, Inc. | | | 702 | | | | 15,367 | |
Blue Bird Corp.(1) | | | 1,183 | | | | 27,114 | |
BMC Stock Holdings, Inc.(1) | | | 711 | | | | 20,399 | |
Builders FirstSource, Inc.(1) | | | 10,654 | | | | 270,718 | |
Caterpillar, Inc. | | | 8,840 | | | | 1,305,491 | |
The accompanying notes are an integral part of these financial statements
2019 Annual Report | December 31, 2019 | Page 31 |
Schedule of Investments
December 31, 2019
Muirfield Fund |
Security Description | | Shares,
Contracts
or Principal
Amount ($) | | | Fair
Value ($) | |
Common Stocks — continued |
CBIZ, Inc.(1) | | | 1,237 | | | | 33,350 | |
Cintas Corp. | | | 900 | | | | 242,172 | |
Comfort Systems USA, Inc. | | | 1,619 | | | | 80,707 | |
Commercial Vehicle Group, Inc.(1) | | | 10,841 | | | | 68,840 | |
Copart, Inc.(1) | | | 16,176 | | | | 1,471,045 | |
Costamare, Inc. | | | 395 | | | | 3,764 | |
Cummins, Inc. | | | 24,938 | | | | 4,462,904 | |
Delta Air Lines, Inc. | | | 10,918 | | | | 638,485 | |
Douglas Dynamics, Inc. | | | 443 | | | | 24,365 | |
Eaton Corp. PLC | | | 1,059 | | | | 100,308 | |
EMCOR Group, Inc. | | | 11,231 | | | | 969,235 | |
Federal Signal Corp. | | | 1,505 | | | | 48,536 | |
Fortune Brands Home & Security, Inc. | | | 6,888 | | | | 450,062 | |
Foundation Building Materials, Inc.(1) | | | 1,117 | | | | 21,614 | |
Generac Holdings, Inc.(1) | | | 2,856 | | | | 287,285 | |
GMS, Inc.(1) | | | 1,710 | | | | 46,307 | |
H&E Equipment Services, Inc. | | | 368 | | | | 12,302 | |
Heidrick & Struggles International, Inc. | | | 657 | | | | 21,353 | |
Herman Miller, Inc. | | | 1,701 | | | | 70,847 | |
Hubbell, Inc. | | | 3,382 | | | | 499,927 | |
Huntington Ingalls Industries, Inc. | | | 2,712 | | | | 680,387 | |
Illinois Tool Works, Inc. | | | 5,727 | | | | 1,028,741 | |
Ingersoll-Rand PLC | | | 2,317 | | | | 307,976 | |
Jacobs Engineering Group, Inc. | | | 2,551 | | | | 229,156 | |
Johnson Controls International plc | | | 20,538 | | | | 836,102 | |
Kelly Services, Inc. - Class A | | | 261 | | | | 5,893 | |
Kimball International, Inc. - Class B | | | 9,445 | | | | 195,228 | |
Knoll, Inc. | | | 1,471 | | | | 37,157 | |
Lockheed Martin Corp. | | | 5,875 | | | | 2,287,608 | |
LSC Communications, Inc. | | | 11,648 | | | | 2,399 | |
ManpowerGroup, Inc. | | | 9,221 | | | | 895,359 | |
Marten Transport, Ltd. | | | 1,730 | | | | 37,178 | |
Matson, Inc. | | | 4,996 | | | | 203,837 | |
Meritor, Inc.(1) | | | 2,351 | | | | 61,573 | |
Miller Industries, Inc./TN | | | 2,535 | | | | 94,125 | |
Northrop Grumman Corp. | | | 3,175 | | | | 1,092,105 | |
Northwest Pipe Co.(1) | | | 587 | | | | 19,553 | |
Old Dominion Freight Line, Inc. | | | 378 | | | | 71,737 | |
Oshkosh Corp. | | | 10,231 | | | | 968,364 | |
PACCAR, Inc. | | | 43,158 | | | | 3,413,798 | |
Parker-Hannifin Corp. | | | 11,090 | | | | 2,282,544 | |
Park-Ohio Holdings Corp. | | | 611 | | | | 20,560 | |
Powell Industries, Inc. | | | 675 | | | | 33,068 | |
Primoris Services Corp. | | | 1,656 | | | | 36,829 | |
Quanex Building Products Corp. | | | 3,631 | | | | 62,017 | |
Quanta Services, Inc. | | | 7,407 | | | | 301,539 | |
Muirfield Fund |
Security Description | | Shares,
Contracts
or Principal
Amount ($) | | | Fair
Value ($) | |
Common Stocks — continued |
Regal Beloit Corp. | | | 15 | | | | 1,284 | |
Resources Connection, Inc. | | | 798 | | | | 13,031 | |
Rush Enterprises, Inc. | | | 2,225 | | | | 103,463 | |
Safe Bulkers, Inc.(1) | | | 7,327 | | | | 12,456 | |
Saia, Inc.(1) | | | 695 | | | | 64,718 | |
SPX Corp.(1) | | | 396 | | | | 20,148 | |
Standex International Corp. | | | 1,184 | | | | 93,950 | |
Steelcase, Inc. - Class A | | | 3,832 | | | | 78,403 | |
Thermon Group Holdings, Inc.(1) | | | 779 | | | | 20,877 | |
Timken Co./The | | | 8,991 | | | | 506,283 | |
Triton International, Ltd./Bermuda | | | 12,723 | | | | 511,465 | |
TrueBlue, Inc.(1) | | | 3,025 | | | | 72,782 | |
UniFirst Corp./MA | | | 432 | | | | 87,255 | |
Union Pacific Corp. | | | 191 | | | | 34,531 | |
Universal Logistics Holdings, Inc. | | | 105 | | | | 1,991 | |
Valmont Industries, Inc. | | | 1,627 | | | | 243,692 | |
Vectrus, Inc.(1) | | | 1,413 | | | | 72,430 | |
Wabash National Corp. | | | 6,664 | | | | 97,894 | |
WESCO International, Inc.(1) | | | 10,447 | | | | 620,447 | |
WW Grainger, Inc. | | | 4,942 | | | | 1,672,966 | |
| | | | | | | | 33,455,287 | |
| | | | | | | | | |
Information Technology — 21.7% | | | | | | | | |
A10 Networks, Inc.(1) | | | 2,658 | | | | 18,260 | |
Adobe, Inc.(1) | | | 7,945 | | | | 2,620,340 | |
Alliance Data Systems Corp. | | | 491 | | | | 55,090 | |
Amkor Technology, Inc.(1) | | | 16,781 | | | | 218,153 | |
ANSYS, Inc.(1) | | | 5,575 | | | | 1,435,061 | |
Apple, Inc. | | | 80,918 | | | | 23,761,571 | |
Applied Materials, Inc. | | | 81,742 | | | | 4,989,532 | |
Aspen Technology, Inc.(1) | | | 6,010 | | | | 726,789 | |
AstroNova, Inc. | | | 2,322 | | | | 31,858 | |
Avnet, Inc. | | | 17,863 | | | | 758,106 | |
Benchmark Electronics, Inc. | | | 16,472 | | | | 565,978 | |
Booz Allen Hamilton Holding Corp. | | | 9,524 | | | | 677,442 | |
Broadcom, Inc. | | | 16,012 | | | | 5,060,112 | |
Cadence Design Systems, Inc.(1) | | | 25,547 | | | | 1,771,940 | |
Cambium Networks Corp.(1) | | | 8,022 | | | | 70,112 | |
CDK Global, Inc. | | | 9,683 | | | | 529,466 | |
CDW Corp./DE | | | 7,615 | | | | 1,087,727 | |
ChannelAdvisor Corp.(1) | | | 2,325 | | | | 21,018 | |
Cirrus Logic, Inc.(1) | | | 487 | | | | 40,134 | |
Cisco Systems, Inc. | | | 60,969 | | | | 2,924,073 | |
Citrix Systems, Inc. | | | 23,598 | | | | 2,617,018 | |
CommVault Systems, Inc.(1) | | | 3,952 | | | | 176,417 | |
Comtech Telecommunications Corp. | | | 3,840 | | | | 136,282 | |
The accompanying notes are an integral part of these financial statements
Page 32 | 2019 Annual Report | December 31, 2019 |
Schedule of Investments
December 31, 2019
Muirfield Fund |
Security Description | | Shares,
Contracts
or Principal
Amount ($) | | | Fair
Value ($) | |
Common Stocks — continued |
Dell Technologies, Inc. - Class C(1) | | | 14,857 | | | | 763,501 | |
Digi International, Inc.(1) | | | 4,257 | | | | 75,434 | |
Dolby Laboratories, Inc. | | | 3,864 | | | | 265,843 | |
Dynatrace, Inc.(1) | | | 20,913 | | | | 529,099 | |
Entegris, Inc. | | | 2,129 | | | | 106,642 | |
FormFactor, Inc.(1) | | | 140 | | | | 3,636 | |
Fortinet, Inc.(1) | | | 4,528 | | | | 483,409 | |
Hewlett Packard Enterprise Co. | | | 108,872 | | | | 1,726,710 | |
HP, Inc. | | | 13,889 | | | | 285,419 | |
Intel Corp. | | | 114,166 | | | | 6,832,835 | |
International Business Machines Corp. | | | 30,862 | | | | 4,136,742 | |
Intuit, Inc. | | | 19,545 | | | | 5,119,422 | |
j2 Global, Inc. | | | 6,414 | | | | 601,056 | |
Jabil, Inc. | | | 13,418 | | | | 554,566 | |
KBR, Inc. | | | 5,622 | | | | 171,471 | |
Keysight Technologies, Inc.(1) | | | 893 | | | | 91,649 | |
Kimball Electronics, Inc.(1) | | | 96 | | | | 1,685 | |
KLA Corp. | | | 19,503 | | | | 3,474,850 | |
Lam Research Corp. | | | 14,824 | | | | 4,334,538 | |
Majesco(1) | | | 115 | | | | 949 | |
Manhattan Associates, Inc.(1) | | | 2,191 | | | | 174,732 | |
Mastercard, Inc. | | | 28,527 | | | | 8,517,877 | |
Maxim Integrated Products, Inc. | | | 28,260 | | | | 1,738,273 | |
Methode Electronics, Inc. | | | 3,521 | | | | 138,551 | |
Micron Technology, Inc.(1) | | | 94,307 | | | | 5,071,830 | |
Microsoft Corp. | | | 138,498 | | | | 21,841,135 | |
MicroStrategy, Inc.(1) | | | 590 | | | | 84,152 | |
Mitek Systems, Inc.(1) | | | 1,086 | | | | 8,308 | |
Motorola Solutions, Inc. | | | 6,301 | | | | 1,015,343 | |
MTS Systems Corp. | | | 1,566 | | | | 75,215 | |
NCR Corp.(1) | | | 6,938 | | | | 243,940 | |
NortonLifeLock, Inc. | | | 33,015 | | | | 842,543 | |
NVIDIA Corp. | | | 4,919 | | | | 1,157,441 | |
OneSpan, Inc.(1) | | | 1,697 | | | | 29,053 | |
Oracle Corp. | | | 107,848 | | | | 5,713,787 | |
Paycom Software, Inc.(1) | | | 2,098 | | | | 555,466 | |
PC Connection, Inc. | | | 1,832 | | | | 90,977 | |
Perspecta, Inc. | | | 2,242 | | | | 59,278 | |
Photronics, Inc.(1) | | | 6,049 | | | | 95,332 | |
Progress Software Corp. | | | 9,670 | | | | 401,789 | |
Qorvo, Inc.(1) | | | 4,816 | | | | 559,764 | |
QUALCOMM, Inc. | | | 64,917 | | | | 5,727,627 | |
RingCentral, Inc. - Class A(1) | | | 1,184 | | | | 199,705 | |
Sanmina Corp.(1) | | | 4,776 | | | | 163,530 | |
ScanSource, Inc.(1) | | | 2,593 | | | | 95,811 | |
Skyworks Solutions, Inc. | | | 10,496 | | | | 1,268,756 | |
Muirfield Fund |
Security Description | | Shares,
Contracts
or Principal
Amount ($) | | | Fair
Value ($) | |
Common Stocks — continued |
SMART Global Holdings, Inc.(1) | | | 3,349 | | | | 127,061 | |
Sonim Technologies, Inc.(1) | | | 1,986 | | | | 7,209 | |
SPS Commerce, Inc.(1) | | | 652 | | | | 36,134 | |
SS&C Technologies Holdings, Inc. | | | 13,656 | | | | 838,478 | |
Synaptics, Inc.(1) | | | 802 | | | | 52,748 | |
SYNNEX Corp. | | | 3,290 | | | | 423,752 | |
Synopsys, Inc.(1) | | | 17,366 | | | | 2,417,347 | |
Teradyne, Inc. | | | 6,767 | | | | 461,442 | |
TESSCO Technologies, Inc. | | | 2,008 | | | | 22,530 | |
Texas Instruments, Inc. | | | 47,377 | | | | 6,077,995 | |
TiVo Corp. | | | 14,358 | | | | 121,756 | |
Ultra Clean Holdings, Inc.(1) | | | 1,446 | | | | 33,938 | |
Verint Systems, Inc.(1) | | | 160 | | | | 8,858 | |
Xerox Holdings Corp. | | | 24,017 | | | | 885,507 | |
Xperi Corp. | | | 6,615 | | | | 122,378 | |
Zebra Technologies Corp. - Class A(1) | | | 1,347 | | | | 344,078 | |
| | | | | | | | 147,703,361 | |
| | | | | | | | | |
Materials — 1.5% | | | | | | | | |
Air Products & Chemicals, Inc. | | | 5,382 | | | | 1,264,716 | |
AK Steel Holding Corp.(1) | | | 11,131 | | | | 36,621 | |
Cabot Corp. | | | 83 | | | | 3,944 | |
Celanese Corp. | | | 9,048 | | | | 1,113,990 | |
CF Industries Holdings, Inc. | | | 292 | | | | 13,940 | |
Eastman Chemical Co. | | | 200 | | | | 15,852 | |
Hawkins, Inc. | | | 183 | | | | 8,383 | |
Huntsman Corp. | | | 4,406 | | | | 106,449 | |
Innospec, Inc. | | | 1,236 | | | | 127,852 | |
Koppers Holdings, Inc.(1) | | | 1,313 | | | | 50,183 | |
LyondellBasell Industries NV | | | 42,533 | | | | 4,018,518 | |
Nucor Corp. | | | 6,829 | | | | 384,336 | |
Olympic Steel, Inc. | | | 5,083 | | | | 91,087 | |
Rayonier Advanced Materials, Inc. | | | 4,713 | | | | 18,098 | |
Reliance Steel & Aluminum Co. | | | 8,581 | | | | 1,027,661 | |
Royal Gold, Inc. | | | 914 | | | | 111,737 | |
RPM International, Inc. | | | 8,403 | | | | 645,014 | |
Ryerson Holding Corp.(1) | | | 10,047 | | | | 118,856 | |
Steel Dynamics, Inc. | | | 12,651 | | | | 430,640 | |
Stepan Co. | | | 647 | | | | 66,279 | |
Tredegar Corp. | | | 2,765 | | | | 61,798 | |
Valvoline, Inc. | | | 7,627 | | | | 163,294 | |
Warrior Met Coal, Inc. | | | 7,602 | | | | 160,630 | |
| | | | | | | | 10,039,878 | |
| | | | | | | | | |
The accompanying notes are an integral part of these financial statements
2019 Annual Report | December 31, 2019 | Page 33 |
Schedule of Investments
December 31, 2019
Muirfield Fund |
Security Description | | Shares,
Contracts
or Principal
Amount ($) | | | Fair
Value ($) | |
Common Stocks — continued |
Real Estate Investment Trust — 3.1% | | | | | | | | |
American Homes 4 Rent | | | 17,441 | | | | 457,129 | |
American Tower Corp. | | | 14,341 | | | | 3,295,849 | |
Apple Hospitality REIT, Inc. | | | 47,950 | | | | 779,188 | |
Ashford Hospitality Trust, Inc. | | | 15,880 | | | | 44,305 | |
AvalonBay Communities, Inc. | | | 5,629 | | | | 1,180,401 | |
CatchMark Timber Trust, Inc. | | | 5,093 | | | | 58,417 | |
CBL & Associates Properties, Inc. | | | 19,529 | | | | 20,505 | |
Clipper Realty, Inc. | | | 2,408 | | | | 25,525 | |
Colony Capital, Inc. | | | 3,141 | | | | 14,920 | |
CorEnergy Infrastructure Trust, Inc. | | | 4,315 | | | | 192,924 | |
CorePoint Lodging, Inc. | | | 12,967 | | | | 138,488 | |
Corporate Office Properties Trust | | | 5,072 | | | | 149,015 | |
CyrusOne, Inc. | | | 1,766 | | | | 115,549 | |
Essex Property Trust, Inc. | | | 12,524 | | | | 3,767,971 | |
Gaming and Leisure Properties, Inc. | | | 15,848 | | | | 682,256 | |
Healthcare Realty Trust, Inc. | | | 2,128 | | | | 71,011 | |
Healthcare Trust of America, Inc. - Class A | | | 792 | | | | 23,982 | |
Lamar Advertising Co. | | | 9,492 | | | | 847,256 | |
Mid-America Apartment Communities, Inc. | | | 5,341 | | | | 704,264 | |
National Health Investors, Inc. | | | 304 | | | | 24,770 | |
National Storage Affiliates Trust | | | 12,390 | | | | 416,552 | |
Office Properties Income Trust | | | 7,721 | | | | 248,153 | |
Pennsylvania Real Estate Investment Trust | | | 3,084 | | | | 16,438 | |
PS Business Parks, Inc. | | | 3,974 | | | | 655,193 | |
Realogy Holdings Corp. | | | 3,476 | | | | 33,648 | |
Regency Centers Corp. | | | 1,222 | | | | 77,096 | |
Service Properties Trust | | | 41,159 | | | | 1,001,398 | |
Simon Property Group, Inc. | | | 32,500 | | | | 4,841,200 | |
Spirit MTA REIT | | | 9,151 | | | | 7,024 | |
Summit Hotel Properties, Inc. | | | 10,330 | | | | 127,472 | |
Tanger Factory Outlet Centers, Inc.(2) | | | 37,775 | | | | 556,426 | |
UDR, Inc. | | | 602 | | | | 28,113 | |
Uniti Group, Inc. | | | 1,254 | | | | 10,295 | |
Urstadt Biddle Properties, Inc. | | | 7,196 | | | | 178,749 | |
Xenia Hotels & Resorts, Inc. | | | 19,782 | | | | 427,489 | |
| | | | | | | | 21,218,971 | |
| | | | | | | | | |
Utilities — 0.9% | | | | | | | | |
American Water Works Co., Inc. | | | 33,114 | | | | 4,068,055 | |
Consolidated Water Co., Ltd. | | | 1,299 | | | | 21,174 | |
MDU Resources Group, Inc. | | | 47,552 | | | | 1,412,770 | |
NorthWestern Corp. | | | 1,694 | | | | 121,409 | |
Portland General Electric Co. | | | 785 | | | | 43,795 | |
PPL Corp. | | | 5,895 | | | | 211,513 | |
Spark Energy, Inc. - Class A | | | 3,888 | | | | 35,886 | |
Muirfield Fund |
Security Description | | Shares,
Contracts
or Principal
Amount ($) | | | Fair
Value ($) | |
Common Stocks — continued |
Unitil Corp. | | | 2,259 | | | | 139,648 | |
| | | | | | | | 6,054,250 | |
| | | | | | | | | |
Total Common Stocks (Cost $443,490,142) | | | | | | | 538,415,526 | |
| | | | | | | | | |
Money Market Registered Investment Companies — 19.3% |
Meeder Institutional Prime Money Market Fund, 1.75%(4) | | | 131,391,282 | | | | 131,391,282 | |
Morgan Stanley Government Institutional Fund, 1.51%(3) | | | 316,373 | | | | 316,373 | |
Total Money Market Registered Investment Companies (Cost $131,691,859) | | | | | | | 131,707,655 | |
| | | | | | | | | |
Bank Obligations — 0.1% |
First Merchants Bank Deposit Account, 2.10%, 1/2/2020(5) | | | 249,236 | | | | 249,236 | |
Metro City Bank Deposit Account, 2.35%, 1/2/2020(5) | | | 249,416 | | | | 249,416 | |
Pacific Mercantile Bank Deposit Account, 1.55%, 1/2/2020(5) | | | 248,972 | | | | 248,972 | |
Total Bank Obligations (Cost $747,624) | | | | | | | 747,624 | |
Total Investments — 98.5% (Cost $575,929,625) | | | | | | | 670,870,805 | |
Other Assets less Liabilities — 1.5% | | | | | | | 10,557,145 | |
Total Net Assets — 100.0% | | | | | | | 681,427,950 | |
| | | | | | | | | |
Trustee Deferred Compensation(6) |
Meeder Balanced Fund | | | 3,883 | | | | 47,606 | |
Meeder Dynamic Allocation Fund | | | 9,773 | | | | 116,006 | |
Meeder Muirfield Fund | | | 5,894 | | | | 46,622 | |
Meeder Conservative Allocation Fund | | | 1,148 | | | | 26,232 | |
Total Trustee Deferred Compensation (Cost $209,643) | | | | | | | 236,466 | |
The accompanying notes are an integral part of these financial statements
Page 34 | 2019 Annual Report | December 31, 2019 |
Schedule of Investments
December 31, 2019
Muirfield Fund |
| | | Long
(Short)
Contracts | | | Expiration
Date | | | Notional
Value of
Contracts
($) | | | Value and
Unrealized
Appreciation
(Depreciation)
($) | |
Futures Contracts |
Index Futures | | | | | | | | | | | | | | | | |
Mini MSCI EAFE Index Futures | | | 534 | | | | 3/20/2020 | | | | 54,374,550 | | | | 181,073 | |
Mini MSCI Emerging Markets Index Futures | | | 244 | | | | 3/20/2020 | | | | 13,666,440 | | | | 136,254 | |
Russell 2000 Mini Index Futures | | | 45 | | | | 3/20/2020 | | | | 3,758,850 | | | | 33,003 | |
Standard & Poors 500 Mini Futures | | | 341 | | | | 3/20/2020 | | | | 55,090,255 | | | | 573,443 | |
E-mini Standard & Poors MidCap 400 Futures | | | 70 | | | | 3/20/2020 | | | | 14,453,600 | | | | 158,321 | |
Total Futures Contracts | | | 1,234 | | | | | | | | 141,343,695 | | | | 1,082,094 | |
(1) | Represents non-income producing securities. |
(2) | All or a portion of this security is on loan. |
(3) | Investment purchased with cash received as securities lending collateral. The yield shown represents the 7-day yield in effect at December 31, 2019. |
(4) | Investment in affiliate. The yield shown represents the 7-day yield in effect at December 31, 2019. |
(5) | Variable rate security. Securities payable at par including accrued interest (usually within seven days notice) and unconditionally secured as to principal and interest by letters of credit or other credit support agreements from major banks. The interest rates are adjustable and are not based on a published reference rate and spread but are determined by the issuer or agent and are based on current market conditions. These securities do not indicate a reference rate and spread in their description above. The rate shown represents the rate in effect at December 31, 2019. The maturity date shown, if applicable, reflects the earlier of the next demand date or stated maturity date. |
(6) | Assets of affiliates to the Muirfield Fund held for the benefit of the Fund’s Trustees in connection with the Trustee Deferred Compensation Plan. |
(7) | Fair valued security deemed as Level 3 security. |
The accompanying notes are an integral part of these financial statements
2019 Annual Report | December 31, 2019 | Page 35 |
Schedule of Investments
December 31, 2019
Spectrum Fund |
Security Description | �� | Shares or
Principal
Amount ($) | | | Fair
Value ($) | |
Common Stocks - Long — 98.3% |
Communication Services — 6.9% | | | | | | | | |
Alphabet, Inc. - Class A(1)(4) | | | 517 | | | | 692,465 | |
Alphabet, Inc. - Class C(1)(4) | | | 2,131 | | | | 2,849,190 | |
Altice USA, Inc.(1) | | | 3,032 | | | | 82,895 | |
AMC Entertainment Holdings, Inc.(2) | | | 3,580 | | | | 25,919 | |
AT&T, Inc.(4) | | | 30,664 | | | | 1,198,349 | |
ATN International, Inc. | | | 456 | | | | 25,258 | |
AutoWeb, Inc.(1) | | | 1,945 | | | | 4,804 | |
Beasley Broadcast Group, Inc. | | | 1,207 | | | | 3,730 | |
Cable One, Inc. | | | 215 | | | | 320,021 | |
Cinemark Holdings, Inc. | | | 3,766 | | | | 127,479 | |
Cogent Communications Holdings, Inc. | | | 625 | | | | 41,131 | |
Comcast Corp. - Class A(4) | | | 21,174 | | | | 952,195 | |
comScore, Inc.(1) | | | 1,123 | | | | 5,548 | |
Consolidated Communications Holdings, Inc. | | | 2,158 | | | | 8,373 | |
Cumulus Media, Inc.(1) | | | 380 | | | | 6,677 | |
Electronic Arts, Inc.(1) | | | 998 | | | | 107,295 | |
Entravision Communications Corp. | | | 859 | | | | 2,251 | |
Eros International PLC(1) | | | 1,369 | | | | 4,641 | |
Facebook, Inc.(1)(4) | | | 9,734 | | | | 1,997,904 | |
Fluent, Inc.(1) | | | 3,244 | | | | 8,110 | |
Fox Corp. - Class A | | | 581 | | | | 21,538 | |
Gannett Co., Inc. | | | 3,251 | | | | 20,741 | |
Gray Television, Inc.(1) | | | 1,427 | | | | 30,595 | |
Hemisphere Media Group, Inc.(1) | | | 108 | | | | 1,604 | |
IAC/InterActiveCorp(1) | | | 324 | | | | 80,712 | |
IDT Corp. - Class B(1) | | | 1,237 | | | | 8,919 | |
IMAX Corp.(1) | | | 67 | | | | 1,369 | |
Intelsat SA(1) | | | 994 | | | | 6,988 | |
Iridium Communications, Inc.(1) | | | 308 | | | | 7,589 | |
John Wiley & Sons, Inc. | | | 2,137 | | | | 103,687 | |
Lee Enterprises, Inc.(1) | | | 3,195 | | | | 4,537 | |
Liberty Broadband Corp. - Class A(1) | | | 631 | | | | 78,597 | |
Liberty Latin America, Ltd. - Class A(1) | | | 4,162 | | | | 80,327 | |
Liberty Latin America, Ltd. - Class C(1) | | | 1,919 | | | | 37,344 | |
Liberty Media Corp.-Liberty SiriusXM(1) | | | 4,367 | | | | 210,227 | |
Liberty TripAdvisor Holdings, Inc.(1) | | | 7,013 | | | | 51,546 | |
Lions Gate Entertainment Corp. - Class A(1) | | | 1,354 | | | | 14,434 | |
Live Nation Entertainment, Inc.(1) | | | 984 | | | | 70,326 | |
LiveXLive Media, Inc.(1) | | | 1,370 | | | | 2,117 | |
Marcus Corp./The | | | 1,611 | | | | 51,181 | |
MDC Partners, Inc.(1) | | | 6,064 | | | | 16,858 | |
Meet Group, Inc./The(1) | | | 1,292 | | | | 6,473 | |
National CineMedia, Inc. | | | 592 | | | | 4,316 | |
News Corp. | | | 5,062 | | | | 71,577 | |
Ooma, Inc.(1) | | | 391 | | | | 5,173 | |
Spectrum Fund |
Security Description | | Shares or
Principal
Amount ($) | | | Fair
Value ($) | |
Common Stocks - Long — continued |
ORBCOMM, Inc.(1) | | | 3,410 | | | | 14,356 | |
QuinStreet, Inc.(1) | | | 352 | | | | 5,389 | |
Roku, Inc.(1) | | | 340 | | | | 45,526 | |
Scholastic Corp. | | | 159 | | | | 6,114 | |
Take-Two Interactive Software, Inc.(1) | | | 2,077 | | | | 254,287 | |
TEGNA, Inc. | | | 1,931 | | | | 32,228 | |
Telephone & Data Systems, Inc. | | | 3,090 | | | | 78,579 | |
T-Mobile US, Inc.(1) | | | 14,226 | | | | 1,115,603 | |
Tribune Publishing Co. | | | 1,171 | | | | 15,410 | |
United States Cellular Corp.(1) | | | 918 | | | | 33,259 | |
Verizon Communications, Inc.(4) | | | 28,205 | | | | 1,731,787 | |
ViacomCBS, Inc. | | | 7,817 | | | | 328,079 | |
Walt Disney Co./The(4) | | | 10,576 | | | | 1,529,607 | |
WideOpenWest, Inc.(1) | | | 2,360 | | | | 17,511 | |
Yelp, Inc.(1) | | | 2,403 | | | | 83,696 | |
| | | | | | | | 14,744,441 | |
| | | | | | | | | |
Consumer Discretionary — 8.9% | | | | | | | | |
Aaron’s, Inc. | | | 389 | | | | 22,216 | |
Abercrombie & Fitch Co. | | | 614 | | | | 10,616 | |
Acushnet Holdings Corp. | | | 1,506 | | | | 48,945 | |
Amazon.com, Inc.(1)(4) | | | 1,750 | | | | 3,233,720 | |
American Axle & Manufacturing Holdings, Inc.(1) | | | 1,622 | | | | 17,453 | |
American Eagle Outfitters, Inc. | | | 1,157 | | | | 17,008 | |
American Public Education, Inc.(1) | | | 1,479 | | | | 40,510 | |
America’s Car-Mart, Inc./TX(1) | | | 24 | | | | 2,632 | |
Aramark | | | 3,264 | | | | 141,658 | |
Ascena Retail Group, Inc.(1) | | | 180 | | | | 1,380 | |
AutoZone, Inc.(1) | | | 130 | | | | 154,870 | |
Barnes & Noble Education, Inc.(1) | | | 1,146 | | | | 4,893 | |
Bassett Furniture Industries, Inc. | | | 1,216 | | | | 20,283 | |
BBX Capital Corp. | | | 5,353 | | | | 25,534 | |
Beazer Homes USA, Inc.(1) | | | 766 | | | | 10,824 | |
Bed Bath & Beyond, Inc. | | | 350 | | | | 6,055 | |
Best Buy Co., Inc. | | | 1,177 | | | | 103,341 | |
Big Lots, Inc. | | | 330 | | | | 9,478 | |
Biglari Holdings, Inc. - Class B(1) | | | 146 | | | | 16,705 | |
Bloomin’ Brands, Inc. | | | 2,656 | | | | 58,618 | |
Booking Holdings, Inc.(1)(4) | | | 443 | | | | 909,802 | |
BorgWarner, Inc. | | | 1,445 | | | | 62,684 | |
Brinker International, Inc. | | | 776 | | | | 32,592 | |
Brunswick Corp./DE | | | 1,001 | | | | 60,040 | |
Buckle, Inc./The | | | 177 | | | | 4,786 | |
Cavco Industries, Inc.(1) | | | 117 | | | | 22,859 | |
Centric Brands, Inc.(1) | | | 1,604 | | | | 3,481 | |
Chipotle Mexican Grill, Inc.(1) | | | 144 | | | | 120,544 | |
The accompanying notes are an integral part of these financial statements
Page 36 | 2019 Annual Report | December 31, 2019 |
Schedule of Investments
December 31, 2019
Spectrum Fund |
Security Description | | Shares or
Principal
Amount ($) | | | Fair
Value ($) | |
Common Stocks - Long — continued |
Citi Trends, Inc. | | | 387 | | | | 8,947 | |
Clarus Corp. | | | 456 | | | | 6,183 | |
Columbia Sportswear Co. | | | 1,159 | | | | 116,120 | |
Core-Mark Holding Co., Inc. | | | 307 | | | | 8,347 | |
Cracker Barrel Old Country Store, Inc. | | | 250 | | | | 38,435 | |
Crocs, Inc.(1) | | | 1,748 | | | | 73,224 | |
Dana, Inc. | | | 710 | | | | 12,922 | |
Darden Restaurants, Inc. | | | 508 | | | | 55,377 | |
Deckers Outdoor Corp.(1) | | | 719 | | | | 121,410 | |
Denny’s Corp.(1) | | | 1,810 | | | | 35,983 | |
Destination XL Group, Inc.(1) | | | 1,654 | | | | 2,117 | |
Dollar General Corp. | | | 4,610 | | | | 719,068 | |
Dollar Tree, Inc.(1) | | | 63 | | | | 5,925 | |
DR Horton, Inc. | | | 1,600 | | | | 84,400 | |
eBay, Inc. | | | 12,861 | | | | 464,411 | |
Ethan Allen Interiors, Inc. | | | 309 | | | | 5,890 | |
Everi Holdings, Inc.(1) | | | 1,835 | | | | 24,644 | |
Expedia Group, Inc. | | | 515 | | | | 55,692 | |
Express, Inc.(1) | | | 767 | | | | 3,735 | |
Extended Stay America, Inc. | | | 4,585 | | | | 68,133 | |
Flexsteel Industries, Inc. | | | 352 | | | | 7,012 | |
Foot Locker, Inc. | | | 1,286 | | | | 50,141 | |
Ford Motor Co. | | | 76,489 | | | | 711,348 | |
GameStop Corp.(2) | | | 3,541 | | | | 21,529 | |
General Motors Co. | | | 26,266 | | | | 961,336 | |
Genesco, Inc.(1) | | | 499 | | | | 23,912 | |
Gentex Corp. | | | 4,985 | | | | 144,465 | |
GNC Holdings, Inc.(1) | | | 518 | | | | 1,399 | |
Golden Entertainment, Inc.(1) | | | 1,500 | | | | 28,830 | |
Graham Holdings Co. | | | 143 | | | | 91,376 | |
H&R Block, Inc. | | | 4,577 | | | | 107,468 | |
Hamilton Beach Brands Holding Co. - Class A | | | 306 | | | | 5,845 | |
Hasbro, Inc. | | | 590 | | | | 62,310 | |
Helen of Troy, Ltd.(1) | | | 201 | | | | 36,138 | |
Hilton Grand Vacations, Inc.(1) | | | 1,903 | | | | 65,444 | |
Home Depot, Inc./The(4) | | | 2,960 | | | | 646,405 | |
Hooker Furniture Corp. | | | 526 | | | | 13,513 | |
Houghton Mifflin Harcourt Co.(1) | | | 986 | | | | 6,163 | |
Hudson, Ltd.(1) | | | 1,712 | | | | 26,262 | |
Inspired Entertainment, Inc.(1) | | | 818 | | | | 5,522 | |
International Game Technology PLC | | | 252 | | | | 3,772 | |
J Alexander’s Holdings, Inc.(1) | | | 1,406 | | | | 13,441 | |
JC Penney Co., Inc.(1) | | | 3,524 | | | | 3,947 | |
Johnson Outdoors, Inc. | | | 318 | | | | 24,391 | |
K12, Inc.(1) | | | 952 | | | | 19,373 | |
Kirkland’s, Inc.(1) | | | 6,196 | | | | 7,683 | |
Spectrum Fund |
Security Description | | Shares or
Principal
Amount ($) | | | Fair
Value ($) | |
Common Stocks - Long — continued |
Kohl’s Corp. | | | 481 | | | | 24,507 | |
L Brands, Inc. | | | 871 | | | | 15,783 | |
Lands’ End, Inc.(1) | | | 175 | | | | 2,940 | |
Las Vegas Sands Corp. | | | 1,466 | | | | 101,213 | |
Laureate Education, Inc.(1) | | | 3,653 | | | | 64,329 | |
La-Z-Boy, Inc. | | | 364 | | | | 11,459 | |
LCI Industries | | | 43 | | | | 4,607 | |
Leaf Group, Ltd.(1) | | | 973 | | | | 3,892 | |
Lear Corp. | | | 2,811 | | | | 385,669 | |
Lennar Corp. | | | 4,179 | | | | 233,146 | |
LKQ Corp.(1) | | | 2,731 | | | | 97,497 | |
Lowe’s Cos., Inc. | | | 656 | | | | 78,563 | |
Luby’s, Inc.(1) | | | 1,709 | | | | 3,760 | |
Lululemon Athletica, Inc.(1) | | | 1,321 | | | | 306,036 | |
M/I Homes, Inc.(1) | | | 427 | | | | 16,802 | |
Malibu Boats, Inc.(1) | | | 1,393 | | | | 57,043 | |
Marine Products Corp. | | | 374 | | | | 5,386 | |
MasterCraft Boat Holdings, Inc.(1) | | | 1,425 | | | | 22,444 | |
McDonald’s Corp. | | | 625 | | | | 123,506 | |
MDC Holdings, Inc. | | | 231 | | | | 8,815 | |
Meritage Homes Corp.(1) | | | 707 | | | | 43,205 | |
MGM Resorts International | | | 9,044 | | | | 300,894 | |
Michaels Cos., Inc./The(1) | | | 1,525 | | | | 12,337 | |
Mohawk Industries, Inc.(1) | | | 749 | | | | 102,149 | |
Murphy USA, Inc.(1) | | | 68 | | | | 7,956 | |
Nathan’s Famous, Inc. | | | 42 | | | | 2,977 | |
Nautilus, Inc.(1) | | | 6,280 | | | | 10,990 | |
NIKE, Inc. - Class B | | | 5,860 | | | | 593,677 | |
Nordstrom, Inc. | | | 180 | | | | 7,367 | |
Norwegian Cruise Line Holdings, Ltd.(1) | | | 3,228 | | | | 188,547 | |
NVR, Inc.(1) | | | 79 | | | | 300,864 | |
Office Depot, Inc. | | | 9,316 | | | | 25,526 | |
Penn National Gaming, Inc.(1) | | | 4,548 | | | | 116,247 | |
Perdoceo Education Corp.(1) | | | 2,312 | | | | 42,518 | |
PetMed Express, Inc. | | | 94 | | | | 2,211 | |
Polaris, Inc. | | | 1,564 | | | | 159,059 | |
PulteGroup, Inc. | | | 3,177 | | | | 123,268 | |
Purple Innovation, Inc.(1) | | | 1,001 | | | | 8,719 | |
Qurate Retail, Inc.(1) | | | 542 | | | | 4,569 | |
Ralph Lauren Corp. | | | 1,170 | | | | 137,147 | |
RCI Hospitality Holdings, Inc. | | | 116 | | | | 2,378 | |
RH(1) | | | 36 | | | | 7,686 | |
Rocky Brands, Inc. | | | 387 | | | | 11,389 | |
Ross Stores, Inc. | | | 2,767 | | | | 322,134 | |
Rubicon Project, Inc./The(1) | | | 174 | | | | 1,420 | |
Ruth’s Hospitality Group, Inc. | | | 1,260 | | | | 27,424 | |
Sally Beauty Holdings, Inc.(1) | | | 185 | | | | 3,376 | |
The accompanying notes are an integral part of these financial statements
2019 Annual Report | December 31, 2019 | Page 37 |
Schedule of Investments
December 31, 2019
Spectrum Fund |
Security Description | | Shares or
Principal
Amount ($) | | | Fair
Value ($) | |
Common Stocks - Long — continued |
Scientific Games Corp.(1) | | | 993 | | | | 26,593 | |
SeaWorld Entertainment, Inc.(1) | | | 1,628 | | | | 51,624 | |
Select Interior Concepts, Inc.(1) | | | 617 | | | | 5,547 | |
Signet Jewelers, Ltd. | | | 1,037 | | | | 22,544 | |
Six Flags Entertainment Corp. | | | 87 | | | | 3,925 | |
Skechers U.S.A., Inc.(1) | | | 1,049 | | | | 45,306 | |
Skyline Champion Corp.(1) | | | 50 | | | | 1,585 | |
Sleep Number Corp.(1) | | | 29 | | | | 1,428 | |
Sportsman’s Warehouse Holdings, Inc.(1) | | | 262 | | | | 2,104 | |
Stamps.com, Inc.(1) | | | 18 | | | | 1,503 | |
Standard Motor Products, Inc. | | | 39 | | | | 2,076 | |
Starbucks Corp. | | | 6,778 | | | | 595,922 | |
Steven Madden, Ltd. | | | 1,423 | | | | 61,203 | |
Stoneridge, Inc.(1) | | | 598 | | | | 17,533 | |
Tailored Brands, Inc. | | | 553 | | | | 2,289 | |
Tapestry, Inc. | | | 3,458 | | | | 93,262 | |
Target Corp. | | | 8,848 | | | | 1,134,402 | |
Taylor Morrison Home Corp.(1) | | | 2,196 | | | | 48,005 | |
Tile Shop Holdings, Inc. | | | 4,136 | | | | 6,990 | |
Tilly’s, Inc. - Class A | | | 1,727 | | | | 21,156 | |
TJX Cos., Inc./The(4) | | | 20,730 | | | | 1,265,774 | |
Toll Brothers, Inc. | | | 2,352 | | | | 92,928 | |
TopBuild Corp.(1) | | | 212 | | | | 21,853 | |
Town Sports International Holdings, Inc.(1) | | | 4,862 | | | | 8,314 | |
Tractor Supply Co. | | | 98 | | | | 9,157 | |
Tupperware Brands Corp. | | | 2,354 | | | | 20,197 | |
Turtle Beach Corp.(1) | | | 658 | | | | 6,218 | |
Twin River Worldwide Holdings, Inc. | | | 671 | | | | 17,211 | |
Urban Outfitters, Inc.(1) | | | 520 | | | | 14,440 | |
Vera Bradley, Inc.(1) | | | 299 | | | | 3,528 | |
Vista Outdoor, Inc.(1) | | | 1,000 | | | | 7,480 | |
Vuzix Corp.(1) | | | 5,455 | | | | 10,965 | |
Wendy’s Co./The | | | 1,590 | | | | 35,314 | |
Whirlpool Corp. | | | 939 | | | | 138,531 | |
Williams-Sonoma, Inc. | | | 280 | | | | 20,563 | |
Wingstop, Inc. | | | 66 | | | | 5,691 | |
Winnebago Industries, Inc. | | | 197 | | | | 10,437 | |
WW International, Inc.(1) | | | 74 | | | | 2,828 | |
Wyndham Destinations, Inc. | | | 1,237 | | | | 63,941 | |
Yum China Holdings, Inc. | | | 1,610 | | | | 77,296 | |
Yum! Brands, Inc. | | | 6,721 | | | | 677,006 | |
Zumiez, Inc.(1) | | | 113 | | | | 3,903 | |
| | | | | | | | 18,955,518 | |
| | | | | | | | | |
Consumer Staples — 4.9% | | | | | | | | |
BellRing Brands, Inc.(1) | | | 2,569 | | | | 54,694 | |
Boston Beer Co., Inc./The(1) | | | 59 | | | | 22,293 | |
Spectrum Fund |
Security Description | | Shares or
Principal
Amount ($) | | | Fair
Value ($) | |
Common Stocks - Long — continued |
Bunge, Ltd. | | | 2,305 | | | | 132,653 | |
Casey’s General Stores, Inc. | | | 1,030 | | | | 163,760 | |
Central Garden & Pet Co.(1) | | | 1,401 | | | | 41,133 | |
Coca-Cola Co./The | | | 10,546 | | | | 583,721 | |
Coca-Cola Consolidated, Inc. | | | 81 | | | | 23,008 | |
Costco Wholesale Corp. | | | 895 | | | | 263,058 | |
Edgewell Personal Care Co.(1) | | | 726 | | | | 22,477 | |
Estee Lauder Cos., Inc./The | | | 639 | | | | 131,979 | |
Flowers Foods, Inc. | | | 7,542 | | | | 163,963 | |
Fresh Del Monte Produce, Inc. | | | 335 | | | | 11,718 | |
General Mills, Inc. | | | 10,474 | | | | 560,987 | |
Herbalife Nutrition, Ltd.(1) | | | 1,349 | | | | 64,307 | |
Hershey Co./The | | | 2,708 | | | | 398,022 | |
Hostess Brands, Inc.(1) | | | 3,334 | | | | 48,476 | |
Ingredion, Inc. | | | 1,127 | | | | 104,755 | |
JM Smucker Co./The | | | 469 | | | | 48,837 | |
John B Sanfilippo & Son, Inc. | | | 56 | | | | 5,112 | |
Kellogg Co. | | | 4,824 | | | | 333,628 | |
Kimberly-Clark Corp. | | | 4,885 | | | | 671,932 | |
Kroger Co./The | | | 9,191 | | | | 266,447 | |
Lamb Weston Holdings, Inc. | | | 2,726 | | | | 234,518 | |
Lifevantage Corp.(1) | | | 445 | | | | 6,946 | |
Medifast, Inc. | | | 95 | | | | 10,410 | |
Molson Coors Beverage Co. | | | 6,871 | | | | 370,347 | |
Mondelez International, Inc. | | | 11,965 | | | | 659,032 | |
Monster Beverage Corp.(1) | | | 1,317 | | | | 83,695 | |
Nature’s Sunshine Products, Inc.(1) | | | 247 | | | | 2,206 | |
Nu Skin Enterprises, Inc. | | | 1,124 | | | | 46,062 | |
Oil-Dri Corp. of America | | | 114 | | | | 4,133 | |
PepsiCo, Inc.(4) | | | 9,045 | | | | 1,236,180 | |
Performance Food Group Co.(1) | | | 2,496 | | | | 128,494 | |
Philip Morris International, Inc. | | | 2,137 | | | | 181,837 | |
Pilgrim’s Pride Corp.(1) | | | 771 | | | | 25,223 | |
Post Holdings, Inc.(1) | | | 1,273 | | | | 138,884 | |
PriceSmart, Inc. | | | 235 | | | | 16,690 | |
Primo Water Corp.(1) | | | 642 | | | | 7,206 | |
Procter & Gamble Co./The | | | 9,870 | | | | 1,232,763 | |
Pyxus International, Inc.(1) | | | 695 | | | | 6,213 | |
Rite Aid Corp.(1) | | | 141 | | | | 2,181 | |
Sanderson Farms, Inc. | | | 26 | | | | 4,582 | |
Seneca Foods Corp.(1) | | | 451 | | | | 18,396 | |
Simply Good Foods Co./The(1) | | | 2,062 | | | | 58,849 | |
SpartanNash Co. | | | 1,403 | | | | 19,979 | |
Spectrum Brands Holdings, Inc. | | | 350 | | | | 22,502 | |
Sprouts Farmers Market, Inc.(1) | | | 2,099 | | | | 40,616 | |
Sysco Corp. | | | 220 | | | | 18,819 | |
TreeHouse Foods, Inc.(1) | | | 2,121 | | | | 102,869 | |
The accompanying notes are an integral part of these financial statements
Page 38 | 2019 Annual Report | December 31, 2019 |
Schedule of Investments
December 31, 2019
Spectrum Fund |
Security Description | | Shares or
Principal
Amount ($) | | | Fair
Value ($) | |
Common Stocks - Long — continued |
Tyson Foods, Inc. | | | 8,802 | | | | 801,334 | |
US Foods Holding Corp.(1) | | | 2,092 | | | | 87,634 | |
USANA Health Sciences, Inc.(1) | | | 565 | | | | 44,381 | |
Walmart, Inc.(4) | | | 5,724 | | | | 680,240 | |
| | | | | | | | 10,410,181 | |
| | | | | | | | | |
Energy — 3.7% | | | | | | | | |
Amplify Energy Corp. | | | 1,899 | | | | 12,552 | |
Antero Resources Corp.(1) | | | 528 | | | | 1,505 | |
Apergy Corp.(1) | | | 1,582 | | | | 53,440 | |
Arch Coal, Inc. - Class A | | | 178 | | | | 12,770 | |
Ardmore Shipping Corp.(1) | | | 1,075 | | | | 9,729 | |
Baker Hughes Co. | | | 4,640 | | | | 118,923 | |
Brigham Minerals, Inc. | | | 1,723 | | | | 36,941 | |
Cabot Oil & Gas Corp. | | | 4,135 | | | | 71,990 | |
Cactus, Inc. | | | 2,277 | | | | 78,147 | |
Chevron Corp.(4) | | | 8,709 | | | | 1,049,522 | |
ConocoPhillips(4) | | | 16,029 | | | | 1,042,366 | |
Contango Oil & Gas Co.(1) | | | 2,132 | | | | 7,824 | |
Continental Resources, Inc./OK | | | 1,235 | | | | 42,361 | |
Contura Energy, Inc.(1) | | | 1,030 | | | | 9,322 | |
Covia Holdings Corp.(1) | | | 2,973 | | | | 6,065 | |
CVR Energy, Inc. | | | 389 | | | | 15,727 | |
Dawson Geophysical Co.(1) | | | 3,821 | | | | 9,170 | |
Delek US Holdings, Inc. | | | 1,022 | | | | 34,268 | |
Devon Energy Corp. | | | 7,315 | | | | 189,971 | |
DHT Holdings, Inc. | | | 420 | | | | 3,478 | |
Dorian LPG, Ltd.(1) | | | 423 | | | | 6,548 | |
Encana Corp. | | | 5,170 | | | | 24,247 | |
EOG Resources, Inc.(4) | | | 2,132 | | | | 178,576 | |
EQT Corp. | | | 2,441 | | | | 26,607 | |
Exterran Corp.(1) | | | 2,820 | | | | 22,081 | |
Exxon Mobil Corp.(4) | | | 16,694 | | | | 1,164,907 | |
Goodrich Petroleum Corp.(1) | | | 330 | | | | 3,313 | |
Gulfport Energy Corp.(1) | | | 2,768 | | | | 8,415 | |
Hallador Energy Co. | | | 611 | | | | 1,815 | |
Helmerich & Payne, Inc. | | | 1,961 | | | | 89,088 | |
Hess Corp. | | | 2,256 | | | | 150,723 | |
HollyFrontier Corp. | | | 552 | | | | 27,992 | |
ION Geophysical Corp.(1) | | | 1,061 | | | | 9,209 | |
Kinder Morgan, Inc./DE | | | 4,032 | | | | 85,357 | |
KLX Energy Services Holdings, Inc.(1) | | | 314 | | | | 2,022 | |
Liberty Oilfield Services, Inc. | | | 2,548 | | | | 28,334 | |
Marathon Oil Corp. | | | 11,468 | | | | 155,735 | |
Marathon Petroleum Corp. | | | 8,206 | | | | 494,412 | |
Matrix Service Co.(1) | | | 984 | | | | 22,514 | |
Spectrum Fund |
Security Description | | Shares or
Principal
Amount ($) | | | Fair
Value ($) | |
Common Stocks - Long — continued |
McDermott International, Inc.(1) | | | 4 | | | | 3 | |
Nabors Industries, Ltd. | | | 2,799 | | | | 8,061 | |
NexTier Oilfield Solutions, Inc.(1) | | | 4,705 | | | | 31,524 | |
Nine Energy Service, Inc.(1) | | | 1,048 | | | | 8,195 | |
Noble Energy, Inc. | | | 4,509 | | | | 112,004 | |
Nordic American Tankers, Ltd. | | | 1,375 | | | | 6,765 | |
Northern Oil and Gas, Inc.(1) | | | 2,591 | | | | 6,063 | |
Occidental Petroleum Corp.(4) | | | 7,533 | | | | 310,435 | |
Oceaneering International, Inc.(1) | | | 2,644 | | | | 39,422 | |
Overseas Shipholding Group, Inc.(1) | | | 1,036 | | | | 2,383 | |
Panhandle Oil and Gas, Inc. | | | 744 | | | | 8,340 | |
Parsley Energy, Inc. | | | 844 | | | | 15,960 | |
Patterson-UTI Energy, Inc. | | | 2,873 | | | | 30,167 | |
PBF Energy, Inc. | | | 1,423 | | | | 44,640 | |
PDC Energy, Inc.(1) | | | 1,004 | | | | 26,275 | |
Peabody Energy Corp. | | | 2,370 | | | | 21,614 | |
Phillips 66 | | | 8,329 | | | | 927,934 | |
Pioneer Natural Resources Co. | | | 1,241 | | | | 187,850 | |
ProPetro Holding Corp.(1) | | | 1,056 | | | | 11,880 | |
QEP Resources, Inc. | | | 5,330 | | | | 23,985 | |
Quintana Energy Services, Inc.(1) | | | 1,461 | | | | 4,105 | |
Renewable Energy Group, Inc.(1) | | | 1,471 | | | | 39,643 | |
RigNet, Inc.(1) | | | 1,065 | | | | 7,029 | |
SandRidge Energy, Inc.(1) | | | 2,016 | | | | 8,548 | |
Scorpio Tankers, Inc. | | | 44 | | | | 1,731 | |
SEACOR Holdings, Inc.(1) | | | 147 | | | | 6,343 | |
Seadrill, Ltd.(1) | | | 2,067 | | | | 5,250 | |
Select Energy Services, Inc.(1) | | | 1,005 | | | | 9,326 | |
SilverBow Resources, Inc.(1) | | | 202 | | | | 2,000 | |
SRC Energy, Inc.(1) | | | 383 | | | | 1,578 | |
Talos Energy, Inc.(1) | | | 184 | | | | 5,548 | |
Teekay Corp. | | | 1,124 | | | | 5,980 | |
TETRA Technologies, Inc.(1) | | | 1,641 | | | | 3,216 | |
Tidewater, Inc.(1) | | | 618 | | | | 11,915 | |
US Silica Holdings, Inc. | | | 812 | | | | 4,994 | |
Valaris plc | | | 5,417 | | | | 35,536 | |
Valero Energy Corp. | | | 4,927 | | | | 461,414 | |
W&T Offshore, Inc.(1) | | | 5,114 | | | | 28,434 | |
Williams Cos., Inc./The | | | 6,153 | | | | 145,949 | |
World Fuel Services Corp. | | | 315 | | | | 13,677 | |
WPX Energy, Inc.(1) | | | 2,081 | | | | 28,593 | |
| | | | | | | | 7,962,275 | |
| | | | | | | | | |
Financials — 19.6% | | | | | | | | |
1st Constitution Bancorp | | | 538 | | | | 11,906 | |
1st Source Corp. | | | 2,533 | | | | 131,412 | |
ACNB Corp. | | | 1,044 | | | | 39,484 | |
The accompanying notes are an integral part of these financial statements
2019 Annual Report | December 31, 2019 | Page 39 |
Schedule of Investments
December 31, 2019
Spectrum Fund |
Security Description | | Shares or
Principal
Amount ($) | | | Fair
Value ($) | |
Common Stocks - Long — continued |
Allstate Corp./The | | | 7,047 | | | | 792,435 | |
Ally Financial, Inc. | | | 17,871 | | | | 546,138 | |
Amalgamated Bank | | | 722 | | | | 14,043 | |
American Express Co. | | | 2,004 | | | | 249,478 | |
American National Insurance Co. | | | 137 | | | | 16,122 | |
Ameris Bancorp | | | 2,436 | | | | 103,627 | |
Arbor Realty Trust, Inc. | | | 2,134 | | | | 30,623 | |
Ares Commercial Real Estate Corp. | | | 11,906 | | | | 188,591 | |
Arthur J Gallagher & Co. | | | 2,835 | | | | 269,977 | |
Artisan Partners Asset Management, Inc. | | | 3,515 | | | | 113,605 | |
Ashford, Inc.(1) | | | 296 | | | | 6,986 | |
Athene Holding, Ltd.(1) | | | 2,287 | | | | 107,558 | |
Atlantic Capital Bancshares, Inc.(1) | | | 4,420 | | | | 81,107 | |
Auburn National Bancorporation, Inc. | | | 51 | | | | 2,703 | |
B. Riley Financial, Inc. | | | 208 | | | | 5,237 | |
BancFirst Corp. | | | 4,733 | | | | 295,529 | |
Bancorp, Inc./The(1) | | | 5,676 | | | | 73,618 | |
BancorpSouth Bank | | | 13,154 | | | | 413,167 | |
Bank of America Corp.(4) | | | 45,538 | | | | 1,603,848 | |
Bank of Commerce Holdings | | | 1,258 | | | | 14,555 | |
Bank OZK | | | 7,269 | | | | 221,741 | |
BankFinancial Corp. | | | 5,720 | | | | 74,818 | |
BankUnited, Inc. | | | 2,059 | | | | 75,277 | |
BCB Bancorp, Inc. | | | 659 | | | | 9,088 | |
Berkshire Hathaway, Inc. - Class B(1)(4) | | | 9,844 | | | | 2,229,666 | |
Berkshire Hills Bancorp, Inc. | | | 910 | | | | 29,921 | |
Boston Private Financial Holdings, Inc. | | | 5,131 | | | | 61,726 | |
Bridgewater Bancshares, Inc.(1) | | | 2,733 | | | | 37,661 | |
Brighthouse Financial, Inc.(1) | | | 220 | | | | 8,631 | |
Brightsphere Investment Group, Inc. | | | 3,055 | | | | 31,222 | |
Brown & Brown, Inc. | | | 10,863 | | | | 428,871 | |
Bryn Mawr Bank Corp. | | | 554 | | | | 22,847 | |
C&F Financial Corp. | | | 538 | | | | 29,768 | |
Cannae Holdings, Inc.(1) | | | 865 | | | | 32,169 | |
Capital Bancorp, Inc.(1) | | | 386 | | | | 5,748 | |
Capital City Bank Group, Inc. | | | 2,197 | | | | 67,009 | |
Carolina Financial Corp. | | | 1,386 | | | | 59,917 | |
CenterState Bank Corp. | | | 2,869 | | | | 71,668 | |
Central Valley Community Bancorp | | | 1,595 | | | | 34,564 | |
Chemung Financial Corp. | | | 92 | | | | 3,910 | |
Cincinnati Financial Corp. | | | 2,602 | | | | 273,600 | |
CIT Group, Inc. | | | 11,400 | | | | 520,182 | |
Citigroup, Inc. | | | 13,001 | | | | 1,038,650 | |
Citizens & Northern Corp. | | | 419 | | | | 11,837 | |
Citizens Financial Group, Inc. | | | 19,542 | | | | 793,601 | |
Civista Bancshares, Inc. | | | 1,529 | | | | 36,696 | |
CNA Financial Corp. | | | 1,202 | | | | 53,862 | |
Spectrum Fund |
Security Description | | Shares or
Principal
Amount ($) | | | Fair
Value ($) | |
Common Stocks - Long — continued |
CNB Financial Corp./PA | | | 903 | | | | 29,510 | |
Codorus Valley Bancorp, Inc. | | | 261 | | | | 6,011 | |
Cohen & Steers, Inc. | | | 108 | | | | 6,778 | |
Comerica, Inc. | | | 8,285 | | | | 594,449 | |
Community Bankers Trust Corp. | | | 968 | | | | 8,596 | |
Community Financial Corp./The | | | 317 | | | | 11,276 | |
Community Trust Bancorp, Inc. | | | 2,145 | | | | 100,043 | |
ConnectOne Bancorp, Inc. | | | 4,303 | | | | 110,673 | |
Crawford & Co. | | | 290 | | | | 2,944 | |
Curo Group Holdings Corp.(1) | | | 1,167 | | | | 14,214 | |
Customers Bancorp, Inc.(1) | | | 2,716 | | | | 64,668 | |
Diamond Hill Investment Group, Inc. | | | 327 | | | | 45,930 | |
Discover Financial Services | | | 12,442 | | | | 1,055,330 | |
Ditech Holding Corp. Warrants - Class A(1)(7) | | | 228 | | | | — | |
Ditech Holding Corp. Warrants - Class B(1)(7) | | | 181 | | | | — | |
Donegal Group, Inc. | | | 95 | | | | 1,408 | |
Donnelley Financial Solutions, Inc.(1) | | | 2,219 | | | | 23,233 | |
E*TRADE Financial Corp. | | | 5,088 | | | | 230,843 | |
Eaton Vance Corp. | | | 594 | | | | 27,734 | |
Elevate Credit, Inc.(1) | | | 2,502 | | | | 11,134 | |
Ellington Financial, Inc. | | | 13,358 | | | | 244,852 | |
Employers Holdings, Inc. | | | 1,007 | | | | 42,042 | |
Enova International, Inc.(1) | | | 110 | | | | 2,647 | |
Enterprise Financial Services Corp. | | | 706 | | | | 34,036 | |
Esquire Financial Holdings, Inc.(1) | | | 283 | | | | 7,378 | |
ESSA Bancorp, Inc. | | | 459 | | | | 7,780 | |
Essent Group, Ltd. | | | 5,513 | | | | 286,621 | |
Evercore, Inc. | | | 1,627 | | | | 121,635 | |
Exantas Capital Corp. | | | 3,778 | | | | 44,618 | |
Farmers National Banc Corp. | | | 2,830 | | | | 46,186 | |
FB Financial Corp. | | | 1,517 | | | | 60,058 | |
Federated Investors, Inc. | | | 553 | | | | 18,022 | |
Fidelity National Financial, Inc. | | | 6,036 | | | | 273,733 | |
Fifth Third Bancorp | | | 46,930 | | | | 1,442,628 | |
Financial Institutions, Inc. | | | 1,406 | | | | 45,133 | |
First American Financial Corp. | | | 4,079 | | | | 237,887 | |
First BanCorp/Puerto Rico | | | 14,433 | | | | 152,845 | |
First Bancorp/Southern Pines NC | | | 5,590 | | | | 223,097 | |
First Bancshares, Inc./The | | | 1,770 | | | | 62,870 | |
First Business Financial Services, Inc. | | | 1,514 | | | | 39,864 | |
First Choice Bancorp | | | 1,159 | | | | 31,247 | |
First Citizens BancShares, Inc./NC | | | 970 | | | | 516,244 | |
First Defiance Financial Corp. | | | 652 | | | | 20,531 | |
First Financial Corp./IN | | | 2,326 | | | | 106,345 | |
First Hawaiian, Inc. | | | 9,139 | | | | 263,660 | |
First Horizon National Corp. | | | 26,808 | | | | 443,940 | |
The accompanying notes are an integral part of these financial statements
Page 40 | 2019 Annual Report | December 31, 2019 |
Schedule of Investments
December 31, 2019
Spectrum Fund |
Security Description | | Shares or
Principal
Amount ($) | | | Fair
Value ($) | |
Common Stocks - Long — continued |
First Merchants Corp. | | | 1,132 | | | | 47,080 | |
First Northwest Bancorp | | | 739 | | | | 13,398 | |
First of Long Island Corp./The | | | 2,477 | | | | 62,123 | |
FNB Corp./PA | | | 26,855 | | | | 341,059 | |
Franklin Financial Services Corp. | | | 95 | | | | 3,676 | |
FS Bancorp, Inc. | | | 32 | | | | 2,041 | |
Fulton Financial Corp. | | | 7,265 | | | | 126,629 | |
Great Ajax Corp. | | | 8,716 | | | | 129,084 | |
Great Southern Bancorp, Inc. | | | 1,783 | | | | 112,900 | |
Hallmark Financial Services, Inc.(1) | | | 583 | | | | 10,243 | |
Hancock Whitney Corp. | | | 1,871 | | | | 82,099 | |
Hanover Insurance Group, Inc./The | | | 332 | | | | 45,374 | |
HBT Financial, Inc.(1) | | | 1,555 | | | | 29,529 | |
Heritage Commerce Corp. | | | 13,477 | | | | 172,910 | |
Heritage Insurance Holdings, Inc. | | | 916 | | | | 12,137 | |
Hilltop Holdings, Inc. | | | 7,983 | | | | 199,016 | |
Home Bancorp, Inc. | | | 349 | | | | 13,677 | |
HomeStreet, Inc.(1) | | | 492 | | | | 16,728 | |
Horizon Bancorp, Inc./IN | | | 5,882 | | | | 111,758 | |
Houlihan Lokey, Inc. | | | 1,248 | | | | 60,990 | |
Huntington Bancshares, Inc./OH | | | 27,639 | | | | 416,796 | |
IBERIABANK Corp. | | | 7,733 | | | | 578,660 | |
Independent Bank Corp./MI | | | 8,825 | | | | 199,886 | |
International Bancshares Corp. | | | 7,768 | | | | 334,568 | |
INTL. FCStone, Inc.(1) | | | 908 | | | | 44,338 | |
Invesco Mortgage Capital, Inc. | | | 24,105 | | | | 401,348 | |
Investar Holding Corp. | | | 100 | | | | 2,400 | |
Investors Bancorp, Inc. | | | 2,683 | | | | 31,968 | |
Investors Title Co. | | | 43 | | | | 6,846 | |
JPMorgan Chase & Co.(4) | | | 9,203 | | | | 1,282,898 | |
Kemper Corp. | | | 1,287 | | | | 99,743 | |
KeyCorp | | | 49,026 | | | | 992,286 | |
Kinsale Capital Group, Inc. | | | 63 | | | | 6,405 | |
KKR Real Estate Finance Trust, Inc. | | | 2,006 | | | | 40,963 | |
Ladder Capital Corp. | | | 14,204 | | | | 256,240 | |
Lakeland Bancorp, Inc. | | | 500 | | | | 8,690 | |
Lazard, Ltd. | | | 1,799 | | | | 71,888 | |
Legg Mason, Inc. | | | 422 | | | | 15,154 | |
LPL Financial Holdings, Inc. | | | 2,289 | | | | 211,160 | |
Luther Burbank Corp. | | | 531 | | | | 6,122 | |
M&T Bank Corp. | | | 3,480 | | | | 590,730 | |
Macatawa Bank Corp. | | | 1,055 | | | | 11,742 | |
Mackinac Financial Corp. | | | 300 | | | | 5,238 | |
MainStreet Bancshares, Inc.(1) | | | 88 | | | | 2,024 | |
MarketAxess Holdings, Inc. | | | 372 | | | | 141,029 | |
Marlin Business Services Corp. | | | 407 | | | | 8,946 | |
Medley Management, Inc. | | | 2,879 | | | | 8,522 | |
Spectrum Fund |
Security Description | | Shares or
Principal
Amount ($) | | | Fair
Value ($) | |
Common Stocks - Long — continued |
Mercantile Bank Corp. | | | 837 | | | | 30,525 | |
Mercury General Corp. | | | 992 | | | | 48,340 | |
Meridian Bancorp, Inc. | | | 2,212 | | | | 44,439 | |
Meta Financial Group, Inc. | | | 524 | | | | 19,131 | |
Metropolitan Bank Holding Corp.(1) | | | 907 | | | | 43,745 | |
MFA Financial, Inc. | | | 44,359 | | | | 339,346 | |
MGIC Investment Corp. | | | 17,386 | | | | 246,360 | |
Middlefield Banc Corp. | | | 66 | | | | 1,722 | |
Midland States Bancorp, Inc. | | | 3,050 | | | | 88,328 | |
MidWestOne Financial Group, Inc. | | | 1,194 | | | | 43,259 | |
Moelis & Co. | | | 1,046 | | | | 33,388 | |
MSCI, Inc. | | | 56 | | | | 14,458 | |
MutualFirst Financial, Inc. | | | 142 | | | | 5,633 | |
MVB Financial Corp. | | | 1,058 | | | | 26,365 | |
Navient Corp. | | | 1,267 | | | | 17,333 | |
NewStar Financial Contingent Value Rights(1)(7) | | | 95 | | | | — | |
Nicolet Bankshares, Inc.(1) | | | 1,404 | | | | 103,685 | |
NMI Holdings, Inc. - Class A(1) | | | 3,247 | | | | 107,735 | |
Northeast Bank | | | 1,346 | | | | 29,599 | |
Northern Trust Corp. | | | 2,761 | | | | 293,329 | |
Northfield Bancorp, Inc. | | | 1,000 | | | | 16,960 | |
Northrim BanCorp, Inc. | | | 2,609 | | | | 99,925 | |
Norwood Financial Corp. | | | 213 | | | | 8,286 | |
Ocwen Financial Corp.(1) | | | 6,130 | | | | 8,398 | |
OFG Bancorp | | | 2,916 | | | | 68,847 | |
Old Republic International Corp. | | | 18,657 | | | | 417,357 | |
Old Second Bancorp, Inc. | | | 1,952 | | | | 26,293 | |
OneMain Holdings, Inc. | | | 2,177 | | | | 91,761 | |
OP Bancorp | | | 391 | | | | 4,055 | |
Oppenheimer Holdings, Inc. | | | 3,525 | | | | 96,867 | |
Opus Bank | | | 3,563 | | | | 92,175 | |
Pacific Premier Bancorp, Inc. | | | 3,233 | | | | 105,412 | |
PacWest Bancorp | | | 2,204 | | | | 84,347 | |
Parke Bancorp, Inc. | | | 1,443 | | | | 36,638 | |
PCB Bancorp | | | 2,077 | | | | 35,891 | |
PCSB Financial Corp. | | | 506 | | | | 10,247 | |
Peapack Gladstone Financial Corp. | | | 1,782 | | | | 55,064 | |
PennyMac Financial Services, Inc. | | | 3,154 | | | | 107,362 | |
PennyMac Mortgage Investment Trust | | | 9,295 | | | | 207,186 | |
Peoples Bancorp, Inc./OH | | | 1,113 | | | | 38,577 | |
Peoples Bancorp of North Carolina, Inc. | | | 143 | | | | 4,698 | |
People’s United Financial, Inc. | | | 2,772 | | | | 46,847 | |
People’s Utah Bancorp | | | 604 | | | | 18,192 | |
Pinnacle Financial Partners, Inc. | | | 2,426 | | | | 155,264 | |
Pioneer Bancorp, Inc./NY(1) | | | 241 | | | | 3,690 | |
Piper Sandler Cos. | | | 2,642 | | | | 211,201 | |
The accompanying notes are an integral part of these financial statements
2019 Annual Report | December 31, 2019 | Page 41 |
Schedule of Investments
December 31, 2019
Spectrum Fund |
Security Description | | Shares or
Principal
Amount ($) | | | Fair
Value ($) | |
Common Stocks - Long — continued |
PJT Partners, Inc. | | | 1,355 | | | | 61,151 | |
PNC Financial Services Group, Inc./The(4) | | | 6,144 | | | | 980,767 | |
Popular, Inc. | | | 11,432 | | | | 671,630 | |
Premier Financial Bancorp, Inc. | | | 1,736 | | | | 31,491 | |
Progressive Corp./The | | | 12,835 | | | | 929,126 | |
ProSight Global, Inc.(1) | | | 1,112 | | | | 17,937 | |
Provident Bancorp, Inc.(1) | | | 382 | | | | 4,756 | |
Provident Financial Holdings, Inc. | | | 862 | | | | 18,878 | |
Prudential Financial, Inc. | | | 8,313 | | | | 779,261 | |
Pzena Investment Management, Inc. | | | 2,939 | | | | 25,334 | |
QCR Holdings, Inc. | | | 3,058 | | | | 134,124 | |
Radian Group, Inc. | | | 11,711 | | | | 294,649 | |
RBB Bancorp | | | 2,331 | | | | 49,347 | |
Ready Capital Corp. | | | 10,424 | | | | 160,738 | |
Regional Management Corp.(1) | | | 543 | | | | 16,306 | |
Regions Financial Corp. | | | 47,459 | | | | 814,396 | |
Reinsurance Group of America, Inc. | | | 721 | | | | 117,566 | |
Renasant Corp. | | | 5,986 | | | | 212,024 | |
Republic Bancorp, Inc./KY | | | 1,067 | | | | 49,936 | |
Riverview Bancorp, Inc. | | | 237 | | | | 1,946 | |
S&P Global, Inc. | | | 18 | | | | 4,915 | |
S&T Bancorp, Inc. | | | 474 | | | | 19,097 | |
Safety Insurance Group, Inc. | | | 850 | | | | 78,651 | |
Sandy Spring Bancorp, Inc. | | | 2,677 | | | | 101,405 | |
SEI Investments Co. | | | 7,410 | | | | 485,207 | |
Select Bancorp, Inc.(1) | | | 1,200 | | | | 14,760 | |
Selective Insurance Group, Inc. | | | 1,384 | | | | 90,223 | |
Shore Bancshares, Inc. | | | 2,864 | | | | 49,719 | |
Sierra Bancorp | | | 3,644 | | | | 106,113 | |
Signature Bank/New York NY | | | 998 | | | | 136,337 | |
Silvercrest Asset Management Group, Inc. | | | 899 | | | | 11,309 | |
Simmons First National Corp. | | | 1,700 | | | | 45,543 | |
SLM Corp. | | | 7,530 | | | | 67,092 | |
SmartFinancial, Inc. | | | 1,300 | | | | 30,745 | |
Southern First Bancshares, Inc.(1) | | | 809 | | | | 34,374 | |
Southern Missouri Bancorp, Inc. | | | 40 | | | | 1,534 | |
Southern National Bancorp of Virginia, Inc. | | | 2,327 | | | | 38,046 | |
Spirit of Texas Bancshares, Inc.(1) | | | 1,314 | | | | 30,222 | |
Starwood Property Trust, Inc. | | | 10,410 | | | | 258,793 | |
Stewart Information Services Corp. | | | 2,887 | | | | 117,761 | |
Stifel Financial Corp. | | | 663 | | | | 40,211 | |
Stock Yards Bancorp, Inc. | | | 34 | | | | 1,396 | |
Summit Financial Group, Inc. | | | 1,426 | | | | 38,630 | |
Synchrony Financial | | | 14,584 | | | | 525,170 | |
T Rowe Price Group, Inc. | | | 27 | | | | 3,290 | |
TCF Financial Corp. | | | 7,439 | | | | 348,145 | |
Timberland Bancorp, Inc./WA | | | 807 | | | | 24,000 | |
Spectrum Fund |
Security Description | | Shares or
Principal
Amount ($) | | | Fair
Value ($) | |
Common Stocks - Long — continued |
Tiptree, Inc. - Class A | | | 1,725 | | | | 14,042 | |
TPG RE Finance Trust, Inc. | | | 18,898 | | | | 383,062 | |
TriCo Bancshares | | | 2,800 | | | | 114,268 | |
Truist Financial Corp. | | | 14,425 | | | | 812,416 | |
TrustCo Bank Corp. NY | | | 2,624 | | | | 22,750 | |
United Community Banks, Inc./GA | | | 3,939 | | | | 121,636 | |
United Security Bancshares/Fresno CA | | | 1,845 | | | | 19,797 | |
Unity Bancorp, Inc. | | | 1,232 | | | | 27,806 | |
Universal Insurance Holdings, Inc. | | | 1,051 | | | | 29,417 | |
Univest Financial Corp. | | | 5,816 | | | | 155,752 | |
Unum Group | | | 1,051 | | | | 30,647 | |
US Bancorp | | | 2,952 | | | | 175,024 | |
Valley National Bancorp | | | 24,407 | | | | 279,460 | |
Virtus Investment Partners, Inc. | | | 354 | | | | 43,089 | |
Walker & Dunlop, Inc. | | | 2,264 | | | | 146,436 | |
Washington Federal, Inc. | | | 1,489 | | | | 54,572 | |
Waterstone Financial, Inc. | | | 1,561 | | | | 29,706 | |
Wells Fargo & Co.(4) | | | 15,245 | | | | 820,181 | |
WesBanco, Inc. | | | 806 | | | | 30,459 | |
Western Alliance Bancorp | | | 5,087 | | | | 289,959 | |
WR Berkley Corp. | | | 8,559 | | | | 591,427 | |
WSFS Financial Corp. | | | 1,305 | | | | 57,407 | |
| | | | | | | | 41,777,737 | |
| | | | | | | | | |
Healthcare — 12.6% | | | | | | | | |
Abbott Laboratories(4) | | | 4,724 | | | | 410,327 | |
AbbVie, Inc.(4) | | | 7,454 | | | | 659,977 | |
Abeona Therapeutics, Inc.(1) | | | 443 | | | | 1,449 | |
ABIOMED, Inc.(1) | | | 134 | | | | 22,859 | |
ACADIA Pharmaceuticals, Inc.(1) | | | 701 | | | | 29,989 | |
Accuray, Inc.(1) | | | 4,441 | | | | 12,524 | |
AcelRx Pharmaceuticals, Inc.(1) | | | 2,985 | | | | 6,298 | |
Acer Therapeutics, Inc.(1) | | | 1,545 | | | | 6,195 | |
Aclaris Therapeutics, Inc.(1) | | | 1,216 | | | | 2,298 | |
ADMA Biologics, Inc.(1) | | | 1,421 | | | | 5,684 | |
Aeglea BioTherapeutics, Inc.(1) | | | 877 | | | | 6,700 | |
Affimed NV(1) | | | 3,729 | | | | 10,217 | |
Agenus, Inc.(1) | | | 3,697 | | | | 15,047 | |
AgeX Therapeutics, Inc.(1) | | | 1,077 | | | | 1,960 | |
Agilent Technologies, Inc. | | | 1,774 | | | | 151,340 | |
Akcea Therapeutics, Inc.(1) | | | 728 | | | | 12,332 | |
Akebia Therapeutics, Inc.(1) | | | 2,038 | | | | 12,880 | |
Akorn, Inc.(1) | | | 3,456 | | | | 5,184 | |
Albireo Pharma, Inc.(1) | | | 446 | | | | 11,337 | |
Aldeyra Therapeutics, Inc.(1) | | | 1,532 | | | | 8,901 | |
Alexion Pharmaceuticals, Inc.(1) | | | 2,986 | | | | 322,936 | |
Align Technology, Inc.(1) | | | 280 | | | | 78,131 | |
The accompanying notes are an integral part of these financial statements
Page 42 | 2019 Annual Report | December 31, 2019 |
Schedule of Investments
December 31, 2019
Spectrum Fund |
Security Description | | Shares or
Principal
Amount ($) | | | Fair
Value ($) | |
Common Stocks - Long — continued |
Alkermes PLC(1) | | | 3,267 | | | | 66,647 | |
Allakos, Inc.(1) | | | 41 | | | | 3,910 | |
Allena Pharmaceuticals, Inc.(1) | | | 2,614 | | | | 7,136 | |
Allergan PLC(4) | | | 1,978 | | | | 378,134 | |
Allscripts Healthcare Solutions, Inc.(1) | | | 4,611 | | | | 45,257 | |
Alnylam Pharmaceuticals, Inc.(1) | | | 1,722 | | | | 198,323 | |
Amedisys, Inc.(1) | | | 217 | | | | 36,222 | |
AmerisourceBergen Corp. | | | 1,466 | | | | 124,639 | |
Amgen, Inc.(4) | | | 4,369 | | | | 1,053,235 | |
Amneal Pharmaceuticals, Inc.(1) | | | 3,537 | | | | 17,048 | |
Amphastar Pharmaceuticals, Inc.(1) | | | 754 | | | | 14,545 | |
AnaptysBio, Inc.(1) | | | 392 | | | | 6,370 | |
AngioDynamics, Inc.(1) | | | 1,814 | | | | 29,042 | |
Applied Genetic Technologies Corp./DE(1) | | | 1,699 | | | | 7,679 | |
Aptinyx, Inc.(1) | | | 4,525 | | | | 15,476 | |
Aquestive Therapeutics, Inc.(1) | | | 1,692 | | | | 9,847 | |
Aravive, Inc.(1) | | | 174 | | | | 2,379 | |
Arcus Biosciences, Inc.(1) | | | 1,261 | | | | 12,736 | |
Ardelyx, Inc.(1) | | | 267 | | | | 2,004 | |
Arvinas, Inc.(1) | | | 116 | | | | 4,766 | |
Assembly Biosciences, Inc.(1) | | | 512 | | | | 10,476 | |
Assertio Therapeutics, Inc.(1) | | | 4,233 | | | | 5,291 | |
Athenex, Inc.(1) | | | 411 | | | | 6,276 | |
AtriCure, Inc.(1) | | | 332 | | | | 10,793 | |
Atrion Corp. | | | 2 | | | | 1,503 | |
Avantor, Inc.(1) | | | 10,281 | | | | 186,600 | |
Avid Bioservices, Inc.(1) | | | 983 | | | | 7,540 | |
Avrobio, Inc.(1) | | | 652 | | | | 13,125 | |
Axsome Therapeutics, Inc.(1) | | | 146 | | | | 15,091 | |
Baudax Bio, Inc.(1) | | | 300 | | | | 2,076 | |
Baxter International, Inc. | | | 5,891 | | | | 492,605 | |
Beyondspring, Inc.(1) | | | 904 | | | | 14,012 | |
BioCryst Pharmaceuticals, Inc.(1) | | | 599 | | | | 2,067 | |
BioDelivery Sciences International, Inc.(1) | | | 1,331 | | | | 8,412 | |
Biogen, Inc.(1)(4) | | | 1,828 | | | | 542,422 | |
BioMarin Pharmaceutical, Inc.(1) | | | 1,942 | | | | 164,196 | |
Bio-Rad Laboratories, Inc.(1) | | | 137 | | | | 50,694 | |
Bio-Techne Corp. | | | 188 | | | | 41,268 | |
Bristol-Myers Squibb Co.(4) | | | 15,565 | | | | 999,117 | |
Brookdale Senior Living, Inc.(1) | | | 692 | | | | 5,031 | |
Bruker Corp. | | | 2,082 | | | | 106,120 | |
Calithera Biosciences, Inc.(1) | | | 1,749 | | | | 9,987 | |
Calyxt, Inc.(1) | | | 962 | | | | 6,744 | |
Capital Senior Living Corp.(1) | | | 5,917 | | | | 18,284 | |
Cardinal Health, Inc. | | | 8,053 | | | | 407,321 | |
CareDx, Inc.(1) | | | 535 | | | | 11,540 | |
CASI Pharmaceuticals, Inc.(1) | | | 441 | | | | 1,363 | |
Spectrum Fund |
Security Description | | Shares or
Principal
Amount ($) | | | Fair
Value ($) | |
Common Stocks - Long — continued |
Catalent, Inc.(1) | | | 1,174 | | | | 66,096 | |
Cellular Biomedicine Group, Inc.(1) | | | 471 | | | | 7,649 | |
Cerecor, Inc.(1) | | | 2,329 | | | | 12,553 | |
Cerner Corp. | | | 12,457 | | | | 914,219 | |
Charles River Laboratories International, Inc.(1) | | | 400 | | | | 61,104 | |
Chemed Corp. | | | 285 | | | | 125,189 | |
ChemoCentryx, Inc.(1) | | | 430 | | | | 17,007 | |
Chiasma, Inc.(1) | | | 799 | | | | 3,963 | |
Chimerix, Inc.(1) | | | 2,001 | | | | 4,062 | |
Cidara Therapeutics, Inc.(1) | | | 4,501 | | | | 17,284 | |
Clovis Oncology, Inc.(1) | | | 261 | | | | 2,721 | |
Collegium Pharmaceutical, Inc.(1) | | | 149 | | | | 3,066 | |
Computer Programs & Systems, Inc. | | | 532 | | | | 14,045 | |
Concert Pharmaceuticals, Inc.(1) | | | 856 | | | | 7,897 | |
CONMED Corp. | | | 396 | | | | 44,285 | |
Constellation Pharmaceuticals, Inc.(1) | | | 30 | | | | 1,413 | |
Cooper Cos., Inc./The | | | 119 | | | | 38,234 | |
Corium International Contingent Value Rights(1)(7) | | | 106 | | | | — | |
CorMedix, Inc.(1) | | | 574 | | | | 4,179 | |
Corvus Pharmaceuticals, Inc.(1) | | | 2,088 | | | | 11,359 | |
Cross Country Healthcare, Inc.(1) | | | 1,839 | | | | 21,369 | |
CryoLife, Inc.(1) | | | 477 | | | | 12,922 | |
Cutera, Inc.(1) | | | 227 | | | | 8,129 | |
CVS Health Corp. | | | 8,346 | | | | 620,024 | |
Cymabay Therapeutics, Inc.(1) | | | 1,369 | | | | 2,683 | |
CytomX Therapeutics, Inc.(1) | | | 2,931 | | | | 24,357 | |
Danaher Corp.(4) | | | 5,083 | | | | 780,139 | |
Deciphera Pharmaceuticals, Inc.(1) | | | 84 | | | | 5,228 | |
DENTSPLY SIRONA, Inc. | | | 3,616 | | | | 204,629 | |
Dermira, Inc.(1) | | | 741 | | | | 11,234 | |
DexCom, Inc.(1) | | | 447 | | | | 97,777 | |
Dicerna Pharmaceuticals, Inc.(1) | | | 818 | | | | 18,021 | |
Dynavax Technologies Corp.(1) | | | 516 | | | | 2,952 | |
Editas Medicine, Inc.(1) | | | 588 | | | | 17,411 | |
Edwards Lifesciences Corp.(1) | | | 287 | | | | 66,954 | |
Eiger BioPharmaceuticals, Inc.(1) | | | 606 | | | | 9,029 | |
Elanco Animal Health, Inc.(1) | | | 297 | | | | 8,747 | |
Elanco Animal Health, Inc. Contingent Value Rights(1)(7) | | | 2,012 | | | | — | |
Eli Lilly & Co.(4) | | | 4,482 | | | | 589,069 | |
Eloxx Pharmaceuticals, Inc.(1) | | | 773 | | | | 5,689 | |
Emergent BioSolutions, Inc.(1) | | | 255 | | | | 13,757 | |
Enanta Pharmaceuticals, Inc.(1) | | | 127 | | | | 7,846 | |
Encompass Health Corp. | | | 2,632 | | | | 182,319 | |
Endo International PLC(1) | | | 4,134 | | | | 19,388 | |
The accompanying notes are an integral part of these financial statements
2019 Annual Report | December 31, 2019 | Page 43 |
Schedule of Investments
December 31, 2019
Spectrum Fund |
Security Description | | Shares or
Principal
Amount ($) | | | Fair
Value ($) | |
Common Stocks - Long — continued |
Endologix, Inc.(1) | | | 5,636 | | | | 8,905 | |
Enzo Biochem, Inc.(1) | | | 1,200 | | | | 3,156 | |
Exact Sciences Corp.(1) | | | 1,246 | | | | 115,230 | |
Exelixis, Inc.(1) | | | 2,018 | | | | 35,557 | |
EyePoint Pharmaceuticals, Inc.(1) | | | 2,837 | | | | 4,397 | |
Fate Therapeutics, Inc.(1) | | | 566 | | | | 11,077 | |
Fennec Pharmaceuticals, Inc.(1) | | | 1,458 | | | | 9,462 | |
FibroGen, Inc.(1) | | | 494 | | | | 21,188 | |
Five Prime Therapeutics, Inc.(1) | | | 355 | | | | 1,629 | |
Flexion Therapeutics, Inc.(1) | | | 611 | | | | 12,648 | |
Fortress Biotech, Inc.(1) | | | 2,533 | | | | 6,510 | |
Forty Seven, Inc.(1) | | | 239 | | | | 9,409 | |
G1 Therapeutics, Inc.(1) | | | 175 | | | | 4,625 | |
Genesis Healthcare, Inc.(1) | | | 1,033 | | | | 1,694 | |
Gilead Sciences, Inc.(4) | | | 11,735 | | | | 762,540 | |
Global Blood Therapeutics, Inc.(1) | | | 40 | | | | 3,180 | |
Globus Medical, Inc.(1) | | | 1,173 | | | | 69,066 | |
GlycoMimetics, Inc.(1) | | | 809 | | | | 4,280 | |
Haemonetics Corp.(1) | | | 438 | | | | 50,326 | |
Hanger, Inc.(1) | | | 204 | | | | 5,632 | |
Harvard Bioscience, Inc.(1) | | | 1,274 | | | | 3,886 | |
HCA Healthcare, Inc. | | | 5,690 | | | | 841,039 | |
HealthStream, Inc.(1) | | | 1,479 | | | | 40,229 | |
Heron Therapeutics, Inc.(1) | | | 407 | | | | 9,565 | |
Hill-Rom Holdings, Inc. | | | 1,959 | | | | 222,405 | |
HMS Holdings Corp.(1) | | | 276 | | | | 8,170 | |
Hologic, Inc.(1) | | | 4,230 | | | | 220,848 | |
Hookipa Pharma, Inc.(1) | | | 126 | | | | 1,541 | |
Horizon Therapeutics Plc(1) | | | 875 | | | | 31,675 | |
Humana, Inc. | | | 1,288 | | | | 472,078 | |
Idera Pharmaceuticals, Inc.(1) | | | 4,755 | | | | 8,654 | |
IDEXX Laboratories, Inc.(1) | | | 344 | | | | 89,829 | |
Immunic, Inc.(1) | | | 212 | | | | 2,056 | |
ImmunoGen, Inc.(1) | | | 2,859 | | | | 14,595 | |
Immunomedics, Inc.(1) | | | 1,666 | | | | 35,253 | |
Incyte Corp.(1) | | | 604 | | | | 52,741 | |
Insulet Corp.(1) | | | 321 | | | | 54,955 | |
Integer Holdings Corp.(1) | | | 56 | | | | 4,504 | |
Intercept Pharmaceuticals, Inc.(1) | | | 15 | | | | 1,859 | |
Intersect ENT, Inc.(1) | | | 634 | | | | 15,787 | |
Intra-Cellular Therapies, Inc.(1) | | | 311 | | | | 10,670 | |
Invacare Corp. | | | 173 | | | | 1,560 | |
Ionis Pharmaceuticals, Inc.(1) | | | 263 | | | | 15,888 | |
Iovance Biotherapeutics, Inc.(1) | | | 727 | | | | 20,123 | |
IQVIA Holdings, Inc.(1) | | | 2,973 | | | | 459,358 | |
Ironwood Pharmaceuticals, Inc.(1) | | | 1,118 | | | | 14,881 | |
Jazz Pharmaceuticals PLC(1) | | | 467 | | | | 69,714 | |
Spectrum Fund |
Security Description | | Shares or
Principal
Amount ($) | | | Fair
Value ($) | |
Common Stocks - Long — continued |
Johnson & Johnson(4) | | | 11,671 | | | | 1,702,449 | |
Jounce Therapeutics, Inc.(1) | | | 528 | | | | 4,609 | |
Kadmon Holdings, Inc.(1) | | | 1,326 | | | | 6,007 | |
Karyopharm Therapeutics, Inc.(1) | | | 112 | | | | 2,147 | |
Kezar Life Sciences, Inc.(1) | | | 767 | | | | 3,076 | |
Kindred Biosciences, Inc.(1) | | | 1,015 | | | | 8,607 | |
Kodiak Sciences, Inc.(1) | | | 77 | | | | 5,540 | |
Kura Oncology, Inc.(1) | | | 410 | | | | 5,638 | |
Lantheus Holdings, Inc.(1) | | | 334 | | | | 6,850 | |
Lexicon Pharmaceuticals, Inc.(1) | | | 722 | | | | 2,996 | |
LHC Group, Inc.(1) | | | 380 | | | | 52,349 | |
Liquidia Technologies, Inc.(1) | | | 1,007 | | | | 4,305 | |
LivaNova PLC(1) | | | 340 | | | | 25,646 | |
MacroGenics, Inc.(1) | | | 360 | | | | 3,917 | |
Magellan Health, Inc.(1) | | | 95 | | | | 7,434 | |
Mallinckrodt PLC(1) | | | 3,221 | | | | 11,241 | |
MannKind Corp.(1) | | | 4,020 | | | | 5,186 | |
Marinus Pharmaceuticals, Inc.(1) | | | 1,713 | | | | 3,700 | |
Masimo Corp.(1) | | | 1,272 | | | | 201,052 | |
McKesson Corp. | | | 1,038 | | | | 143,576 | |
MEDNAX, Inc.(1) | | | 51 | | | | 1,417 | |
Medtronic PLC(4) | | | 12,952 | | | | 1,469,404 | |
MEI Pharma, Inc.(1) | | | 1,212 | | | | 3,006 | |
MeiraGTx Holdings plc(1) | | | 230 | | | | 4,605 | |
Menlo Therapeutics, Inc.(1) | | | 724 | | | | 3,359 | |
Merck & Co., Inc.(4) | | | 17,249 | | | | 1,568,797 | |
Meridian Bioscience, Inc. | | | 1,845 | | | | 18,026 | |
Mersana Therapeutics, Inc.(1) | | | 825 | | | | 4,727 | |
Millendo Therapeutics, Inc.(1) | | | 272 | | | | 1,833 | |
Minerva Neurosciences, Inc.(1) | | | 890 | | | | 6,328 | |
Molecular Templates, Inc.(1) | | | 500 | | | | 6,993 | |
Momenta Pharmaceuticals, Inc.(1) | | | 1,477 | | | | 29,141 | |
Morphic Holding, Inc.(1) | | | 234 | | | | 4,015 | |
Mustang Bio, Inc.(1) | | | 618 | | | | 2,521 | |
Mylan NV(1) | | | 5,523 | | | | 111,012 | |
Myriad Genetics, Inc.(1) | | | 344 | | | | 9,367 | |
NantKwest, Inc.(1) | | | 2,024 | | | | 7,671 | |
Natera, Inc.(1) | | | 618 | | | | 20,820 | |
National Research Corp. | | | 62 | | | | 4,088 | |
Natus Medical, Inc.(1) | | | 908 | | | | 29,955 | |
Neon Therapeutics, Inc.(1) | | | 2,032 | | | | 2,398 | |
Neos Therapeutics, Inc.(1) | | | 7,568 | | | | 11,428 | |
Neurocrine Biosciences, Inc.(1) | | | 865 | | | | 92,979 | |
NewLink Genetics Corp.(1) | | | 3,774 | | | | 9,548 | |
NextGen Healthcare, Inc.(1) | | | 841 | | | | 13,515 | |
Novavax, Inc.(1) | | | 589 | | | | 2,344 | |
Ocular Therapeutix, Inc.(1)(2) | | | 1,100 | | | | 4,345 | |
The accompanying notes are an integral part of these financial statements
Page 44 | 2019 Annual Report | December 31, 2019 |
Schedule of Investments
December 31, 2019
Spectrum Fund |
Security Description | | Shares or
Principal
Amount ($) | | | Fair
Value ($) | |
Common Stocks - Long — continued |
Odonate Therapeutics, Inc.(1) | | | 169 | | | | 5,484 | |
Omeros Corp.(1) | | | 205 | | | | 2,888 | |
Oncocyte Corp.(1) | | | 905 | | | | 2,036 | |
Oncternal Therapeutics, Inc.(1) | | | 844 | | | | 3,334 | |
OPKO Health, Inc.(1) | | | 21,567 | | | | 31,703 | |
Option Care Health, Inc.(1) | | | 685 | | | | 2,555 | |
OraSure Technologies, Inc.(1) | | | 425 | | | | 3,413 | |
Organogenesis Holdings, Inc.(1) | | | 291 | | | | 1,400 | |
Orthofix Medical, Inc.(1) | | | 579 | | | | 26,738 | |
Osmotica Pharmaceuticals PLC(1) | | | 1,812 | | | | 12,666 | |
Otonomy, Inc.(1) | | | 6,128 | | | | 23,470 | |
Owens & Minor, Inc. | | | 959 | | | | 4,958 | |
Pacira BioSciences, Inc.(1) | | | 848 | | | | 38,414 | |
Paratek Pharmaceuticals, Inc.(1) | | | 672 | | | | 2,708 | |
Pennant Group, Inc./The(1) | | | 952 | | | | 31,483 | |
Perrigo Co. PLC | | | 1,968 | | | | 101,667 | |
Pfizer, Inc.(4) | | | 32,875 | | | | 1,288,043 | |
Phibro Animal Health Corp. | | | 1,335 | | | | 33,148 | |
Pieris Pharmaceuticals, Inc.(1) | | | 2,471 | | | | 8,945 | |
PRA Health Sciences, Inc.(1) | | | 1,239 | | | | 137,715 | |
Precision BioSciences, Inc.(1) | | | 400 | | | | 5,556 | |
Premier, Inc. - Class A(1) | | | 846 | | | | 32,046 | |
Principia Biopharma, Inc.(1) | | | 249 | | | | 13,640 | |
Progenics Pharmaceuticals, Inc.(1) | | | 1,599 | | | | 8,139 | |
Protagonist Therapeutics, Inc.(1) | | | 426 | | | | 3,003 | |
Prothena Corp. PLC(1) | | | 163 | | | | 2,580 | |
PTC Therapeutics, Inc.(1) | | | 643 | | | | 30,883 | |
Puma Biotechnology, Inc.(1) | | | 1,619 | | | | 14,166 | |
Quest Diagnostics, Inc. | | | 1,107 | | | | 118,217 | |
Radius Health, Inc.(1) | | | 436 | | | | 8,790 | |
Reata Pharmaceuticals, Inc.(1) | | | 57 | | | | 11,653 | |
Recro Pharma, Inc.(1) | | | 561 | | | | 10,283 | |
Regeneron Pharmaceuticals, Inc.(1) | | | 617 | | | | 231,671 | |
REGENXBIO, Inc.(1) | | | 355 | | | | 14,544 | |
Repligen Corp.(1) | | | 132 | | | | 12,210 | |
Replimune Group, Inc.(1) | | | 236 | | | | 3,387 | |
ResMed, Inc. | | | 204 | | | | 31,614 | |
resTORbio, Inc.(1) | | | 1,257 | | | | 1,873 | |
Retrophin, Inc.(1) | | | 1,645 | | | | 23,359 | |
Revance Therapeutics, Inc.(1) | | | 1,541 | | | | 25,010 | |
Rhythm Pharmaceuticals, Inc.(1) | | | 361 | | | | 8,289 | |
Rigel Pharmaceuticals, Inc.(1) | | | 9,132 | | | | 19,542 | |
Rocket Pharmaceuticals, Inc.(1) | | | 65 | | | | 1,479 | |
RTI Surgical Holdings, Inc.(1) | | | 2,145 | | | | 5,877 | |
Sangamo Therapeutics, Inc.(1) | | | 734 | | | | 6,144 | |
Sarepta Therapeutics, Inc.(1) | | | 38 | | | | 4,904 | |
Savara, Inc.(1) | | | 731 | | | | 3,275 | |
Spectrum Fund |
Security Description | | Shares or
Principal
Amount ($) | | | Fair
Value ($) | |
Common Stocks - Long — continued |
scPharmaceuticals, Inc.(1) | | | 693 | | | | 3,922 | |
Seattle Genetics, Inc.(1) | | | 770 | | | | 87,980 | |
Select Medical Holdings Corp.(1) | | | 499 | | | | 11,647 | |
Spectrum Pharmaceuticals, Inc.(1) | | | 961 | | | | 3,498 | |
Spero Therapeutics, Inc.(1) | | | 535 | | | | 5,144 | |
Spring Bank Pharmaceuticals, Inc.(1) | | | 2,782 | | | | 4,396 | |
STERIS PLC | | | 414 | | | | 63,102 | |
Surface Oncology, Inc.(1) | | | 4,461 | | | | 8,387 | |
Sutro Biopharma, Inc.(1) | | | 289 | | | | 3,179 | |
Syndax Pharmaceuticals, Inc.(1) | | | 366 | | | | 3,213 | |
Syneos Health, Inc.(1) | | | 359 | | | | 21,352 | |
Syros Pharmaceuticals, Inc.(1) | | | 434 | | | | 2,999 | |
Tenet Healthcare Corp.(1) | | | 944 | | | | 35,900 | |
Theravance Biopharma, Inc.(1) | | | 837 | | | | 21,670 | |
Thermo Fisher Scientific, Inc. | | | 640 | | | | 207,917 | |
Tivity Health, Inc.(1) | | | 11 | | | | 224 | |
Tricida, Inc.(1) | | | 562 | | | | 21,210 | |
Triple-S Management Corp.(1) | | | 354 | | | | 6,545 | |
United Therapeutics Corp.(1) | | | 941 | | | | 82,883 | |
UnitedHealth Group, Inc.(4) | | | 3,534 | | | | 1,038,925 | |
UNITY Biotechnology, Inc.(1) | | | 277 | | | | 1,997 | |
Universal Health Services, Inc. | | | 389 | | | | 55,806 | |
UroGen Pharma, Ltd.(1) | | | 304 | | | | 10,144 | |
Utah Medical Products, Inc. | | | 16 | | | | 1,726 | |
Vanda Pharmaceuticals, Inc.(1) | | | 785 | | | | 12,882 | |
Varian Medical Systems, Inc.(1) | | | 653 | | | | 92,733 | |
Veeva Systems, Inc.(1) | | | 260 | | | | 36,572 | |
Vericel Corp.(1) | | | 362 | | | | 6,299 | |
Verrica Pharmaceuticals, Inc.(1) | | | 294 | | | | 4,672 | |
Vertex Pharmaceuticals, Inc.(1) | | | 3,188 | | | | 698,013 | |
ViewRay, Inc.(1) | | | 554 | | | | 2,338 | |
Voyager Therapeutics, Inc.(1) | | | 173 | | | | 2,413 | |
WellCare Health Plans, Inc.(1) | | | 266 | | | | 87,836 | |
West Pharmaceutical Services, Inc. | | | 235 | | | | 35,328 | |
Xeris Pharmaceuticals, Inc.(1) | | | 909 | | | | 6,408 | |
Y-mAbs Therapeutics, Inc.(1) | | | 505 | | | | 15,781 | |
Zimmer Biomet Holdings, Inc. | | | 3,760 | | | | 562,797 | |
Zoetis, Inc. | | | 4,432 | | | | 586,575 | |
Zogenix, Inc.(1) | | | 1,265 | | | | 65,944 | |
| | | | | | | | 26,905,512 | |
| | | | | | | | | |
Industrials — 11.4% | | | | | | | | |
ACCO Brands Corp. | | | 2,569 | | | | 24,046 | |
Acuity Brands, Inc. | | | 225 | | | | 31,050 | |
Aegion Corp.(1) | | | 1,152 | | | | 25,770 | |
AGCO Corp. | | | 2,220 | | | | 171,495 | |
Albany International Corp. | | | 388 | | | | 29,457 | |
The accompanying notes are an integral part of these financial statements
2019 Annual Report | December 31, 2019 | Page 45 |
Schedule of Investments
December 31, 2019
Spectrum Fund |
Security Description | | Shares or
Principal
Amount ($) | | | Fair
Value ($) | |
Common Stocks - Long — continued |
Allison Transmission Holdings, Inc. | | | 8,380 | | | | 404,922 | |
Applied Industrial Technologies, Inc. | | | 221 | | | | 14,738 | |
ARC Document Solutions, Inc. | | | 3,057 | | | | 4,249 | |
ArcBest Corp. | | | 545 | | | | 15,042 | |
Arconic, Inc. | | | 638 | | | | 19,631 | |
Armstrong Flooring, Inc.(1) | | | 2,699 | | | | 11,525 | |
Armstrong World Industries, Inc. | | | 2,357 | | | | 221,487 | |
Atkore International Group, Inc.(1) | | | 1,069 | | | | 43,252 | |
AZZ, Inc. | | | 78 | | | | 3,584 | |
Barnes Group, Inc. | | | 239 | | | | 14,808 | |
Barrett Business Services, Inc. | | | 358 | | | | 32,385 | |
BG Staffing, Inc. | | | 216 | | | | 4,728 | |
Blue Bird Corp.(1) | | | 3,303 | | | | 75,705 | |
BlueLinx Holdings, Inc.(1) | | | 313 | | | | 4,460 | |
BMC Stock Holdings, Inc.(1) | | | 2,655 | | | | 76,172 | |
Builders FirstSource, Inc.(1) | | | 2,971 | | | | 75,493 | |
Carlisle Cos., Inc. | | | 379 | | | | 61,337 | |
Caterpillar, Inc. | | | 1,988 | | | | 293,588 | |
CBIZ, Inc.(1) | | | 1,888 | | | | 50,900 | |
Charah Solutions, Inc.(1) | | | 1,300 | | | | 3,172 | |
Cintas Corp. | | | 533 | | | | 143,420 | |
Clean Harbors, Inc.(1) | | | 149 | | | | 12,777 | |
Comfort Systems USA, Inc. | | | 1,337 | | | | 66,649 | |
Commercial Vehicle Group, Inc.(1) | | | 2,992 | | | | 18,999 | |
Concrete Pumping Holdings, Inc.(1) | | | 1,418 | | | | 7,756 | |
Construction Partners, Inc.(1) | | | 306 | | | | 5,162 | |
Copart, Inc.(1) | | | 3,259 | | | | 296,373 | |
Costamare, Inc. | | | 887 | | | | 8,453 | |
CoStar Group, Inc.(1) | | | 216 | | | | 129,233 | |
CRA International, Inc. | | | 320 | | | | 17,430 | |
Crane Co. | | | 2,149 | | | | 185,631 | |
CSW Industrials, Inc. | | | 465 | | | | 35,805 | |
CSX Corp.(4) | | | 1,891 | | | | 136,833 | |
Cummins, Inc. | | | 3,721 | | | | 665,910 | |
Curtiss-Wright Corp. | | | 328 | | | | 46,212 | |
Daseke, Inc.(1) | | | 870 | | | | 2,749 | |
Delta Air Lines, Inc. | | | 6,431 | | | | 376,085 | |
Donaldson Co., Inc. | | | 220 | | | | 12,676 | |
Douglas Dynamics, Inc. | | | 49 | | | | 2,695 | |
Dover Corp. | | | 2,487 | | | | 286,652 | |
Ducommun, Inc.(1) | | | 245 | | | | 12,380 | |
Eastern Co./The | | | 66 | | | | 2,015 | |
Eaton Corp. PLC | | | 9,859 | | | | 933,844 | |
Echo Global Logistics, Inc.(1) | | | 1,692 | | | | 35,024 | |
EMCOR Group, Inc. | | | 1,765 | | | | 152,320 | |
Emerson Electric Co. | | | 13,127 | | | | 1,001,065 | |
Encore Wire Corp. | | | 480 | | | | 27,552 | |
Spectrum Fund |
Security Description | | Shares or
Principal
Amount ($) | | | Fair
Value ($) | |
Common Stocks - Long — continued |
Energous Corp.(1) | | | 1,425 | | | | 2,522 | |
EnerSys | | | 490 | | | | 36,667 | |
ESCO Technologies, Inc. | | | 129 | | | | 11,933 | |
Expeditors International of Washington, Inc. | | | 425 | | | | 33,159 | |
Fastenal Co. | | | 2,548 | | | | 94,149 | |
Federal Signal Corp. | | | 2,017 | | | | 65,048 | |
Fluor Corp. | | | 4,678 | | | | 88,321 | |
Fortune Brands Home & Security, Inc. | | | 1,941 | | | | 126,825 | |
Forward Air Corp. | | | 127 | | | | 8,884 | |
Foundation Building Materials, Inc.(1) | | | 236 | | | | 4,567 | |
FTI Consulting, Inc.(1) | | | 141 | | | | 15,603 | |
Genco Shipping & Trading, Ltd. | | | 739 | | | | 7,848 | |
Generac Holdings, Inc.(1) | | | 306 | | | | 30,781 | |
GMS, Inc.(1) | | | 931 | | | | 25,211 | |
Gorman-Rupp Co./The | | | 201 | | | | 7,538 | |
Graco, Inc. | | | 4,241 | | | | 220,532 | |
Great Lakes Dredge & Dock Corp.(1) | | | 970 | | | | 10,990 | |
H&E Equipment Services, Inc. | | | 984 | | | | 32,895 | |
HD Supply Holdings, Inc.(1) | | | 6,429 | | | | 258,574 | |
Heartland Express, Inc. | | | 645 | | | | 13,577 | |
Heidrick & Struggles International, Inc. | | | 680 | | | | 22,100 | |
Herman Miller, Inc. | | | 417 | | | | 17,368 | |
Hillenbrand, Inc. | | | 690 | | | | 22,984 | |
HNI Corp. | | | 347 | | | | 12,999 | |
Hub Group, Inc.(1) | | | 359 | | | | 18,413 | |
Hubbell, Inc. | | | 1,159 | | | | 171,323 | |
Huntington Ingalls Industries, Inc. | | | 1,274 | | | | 319,621 | |
Hurco Cos., Inc. | | | 367 | | | | 14,078 | |
Huron Consulting Group, Inc.(1) | | | 368 | | | | 25,289 | |
IAA, Inc.(1) | | | 1,846 | | | | 86,873 | |
ICF International, Inc. | | | 300 | | | | 27,486 | |
IDEX Corp. | | | 466 | | | | 80,152 | |
Illinois Tool Works, Inc. | | | 125 | | | | 22,454 | |
Ingersoll-Rand PLC | | | 9,948 | | | | 1,322,288 | |
ITT, Inc. | | | 216 | | | | 15,965 | |
Jacobs Engineering Group, Inc. | | | 2,359 | | | | 211,909 | |
JB Hunt Transport Services, Inc. | | | 606 | | | | 70,769 | |
JetBlue Airways Corp.(1) | | | 6,656 | | | | 124,600 | |
Johnson Controls International plc | | | 6,270 | | | | 255,252 | |
Kadant, Inc. | | | 113 | | | | 11,903 | |
Kansas City Southern | | | 959 | | | | 146,880 | |
Kelly Services, Inc. - Class A | | | 2,139 | | | | 48,299 | |
Kforce, Inc. | | | 165 | | | | 6,551 | |
Kimball International, Inc. - Class B | | | 4,543 | | | | 93,904 | |
Knoll, Inc. | | | 533 | | | | 13,464 | |
Korn Ferry | | | 1,988 | | | | 84,291 | |
L3Harris Technologies, Inc. | | | 1,134 | | | | 224,385 | |
The accompanying notes are an integral part of these financial statements
Page 46 | 2019 Annual Report | December 31, 2019 |
Schedule of Investments
December 31, 2019
Spectrum Fund |
Security Description | | Shares or
Principal
Amount ($) | | | Fair
Value ($) | |
Common Stocks - Long — continued |
Landstar System, Inc. | | | 639 | | | | 72,763 | |
Lawson Products, Inc./DE(1) | | | 177 | | | | 9,222 | |
LB Foster Co. - Class A(1) | | | 453 | | | | 8,779 | |
Lincoln Electric Holdings, Inc. | | | 2,009 | | | | 194,331 | |
Lockheed Martin Corp. | | | 1,119 | | | | 435,716 | |
LSI Industries, Inc. | | | 364 | | | | 2,202 | |
Lydall, Inc.(1) | | | 199 | | | | 4,083 | |
ManpowerGroup, Inc. | | | 2,549 | | | | 247,508 | |
Marten Transport, Ltd. | | | 563 | | | | 12,099 | |
Masco Corp. | | | 7,068 | | | | 339,193 | |
Masonite International Corp.(1) | | | 1,216 | | | | 87,807 | |
MasTec, Inc.(1) | | | 217 | | | | 13,923 | |
Matson, Inc. | | | 2,149 | | | | 87,679 | |
McGrath RentCorp | | | 417 | | | | 31,917 | |
Meritor, Inc.(1) | | | 1,948 | | | | 51,018 | |
Miller Industries, Inc./TN | | | 724 | | | | 26,882 | |
Moog, Inc. | | | 120 | | | | 10,240 | |
MSC Industrial Direct Co., Inc. | | | 1,901 | | | | 149,171 | |
Mueller Industries, Inc. | | | 1,208 | | | | 38,354 | |
Mueller Water Products, Inc. | | | 3,536 | | | | 42,361 | |
MYR Group, Inc.(1) | | | 879 | | | | 28,647 | |
Navistar International Corp.(1) | | | 1,611 | | | | 46,622 | |
NL Industries, Inc.(1) | | | 356 | | | | 1,392 | |
Norfolk Southern Corp. | | | 5,432 | | | | 1,054,514 | |
Northrop Grumman Corp. | | | 2,158 | | | | 742,287 | |
Northwest Pipe Co.(1) | | | 396 | | | | 13,191 | |
nVent Electric PLC | | | 67 | | | | 1,714 | |
Oshkosh Corp. | | | 3,877 | | | | 366,958 | |
Owens Corning | | | 22 | | | | 1,433 | |
PACCAR, Inc. | | | 11,663 | | | | 922,543 | |
Parker-Hannifin Corp. | | | 4,268 | | | | 878,440 | |
Park-Ohio Holdings Corp. | | | 1,002 | | | | 33,717 | |
Parsons Corp.(1) | | | 957 | | | | 39,505 | |
PGT Innovations, Inc.(1) | | | 792 | | | | 11,809 | |
PICO Holdings, Inc.(1) | | | 344 | | | | 3,825 | |
Powell Industries, Inc. | | | 153 | | | | 7,495 | |
Primoris Services Corp. | | | 2,904 | | | | 64,585 | |
Quad/Graphics, Inc. | | | 3,537 | | | | 16,518 | |
Quanex Building Products Corp. | | | 2,806 | | | | 47,926 | |
Quanta Services, Inc. | | | 7,589 | | | | 308,948 | |
Radiant Logistics, Inc.(1) | | | 880 | | | | 4,902 | |
Raytheon Co. | | | 2,541 | | | | 558,359 | |
Regal Beloit Corp. | | | 131 | | | | 11,215 | |
Resources Connection, Inc. | | | 1,282 | | | | 20,935 | |
Rexnord Corp.(1) | | | 1,661 | | | | 54,182 | |
RR Donnelley & Sons Co. | | | 3,647 | | | | 14,406 | |
Rush Enterprises, Inc. | | | 1,484 | | | | 69,006 | |
Spectrum Fund |
Security Description | | Shares or
Principal
Amount ($) | | | Fair
Value ($) | |
Common Stocks - Long — continued |
Safe Bulkers, Inc.(1) | | | 6,018 | | | | 10,231 | |
Schneider National, Inc. | | | 499 | | | | 10,888 | |
Scorpio Bulkers, Inc. | | | 1,653 | | | | 10,530 | |
SkyWest, Inc. | | | 1,249 | | | | 80,723 | |
Southwest Airlines Co. | | | 12,695 | | | | 685,276 | |
Spirit AeroSystems Holdings, Inc. | | | 2,662 | | | | 194,007 | |
SPX Corp.(1) | | | 708 | | | | 36,023 | |
Standex International Corp. | | | 689 | | | | 54,672 | |
Steelcase, Inc. - Class A | | | 2,149 | | | | 43,969 | |
Sterling Construction Co., Inc.(1) | | | 1,330 | | | | 18,726 | |
Teledyne Technologies, Inc.(1) | | | 597 | | | | 206,884 | |
Textron, Inc. | | | 5,037 | | | | 224,650 | |
Thermon Group Holdings, Inc.(1) | | | 1,358 | | | | 36,394 | |
Timken Co./The | | | 2,930 | | | | 164,988 | |
Toro Co./The | | | 3,166 | | | | 252,235 | |
TriMas Corp.(1) | | | 2,101 | | | | 65,992 | |
Triton International, Ltd./Bermuda | | | 2,831 | | | | 113,806 | |
TrueBlue, Inc.(1) | | | 2,942 | | | | 70,785 | |
UniFirst Corp./MA | | | 368 | | | | 74,329 | |
Union Pacific Corp.(4) | | | 6,118 | | | | 1,106,073 | |
United Airlines Holdings, Inc.(1) | | | 5,888 | | | | 518,674 | |
United Technologies Corp. | | | 2,865 | | | | 429,062 | |
Universal Forest Products, Inc. | | | 134 | | | | 6,392 | |
Universal Logistics Holdings, Inc. | | | 112 | | | | 2,124 | |
Valmont Industries, Inc. | | | 720 | | | | 107,842 | |
Vectrus, Inc.(1) | | | 200 | | | | 10,252 | |
Veritiv Corp.(1) | | | 359 | | | | 7,062 | |
Viad Corp. | | | 214 | | | | 14,445 | |
Wabash National Corp. | | | 3,850 | | | | 56,557 | |
Waste Management, Inc.(1) | | | 7,889 | | | | 899,030 | |
Watts Water Technologies, Inc. | | | 15 | | | | 1,496 | |
WESCO International, Inc.(1) | | | 6,166 | | | | 366,199 | |
WW Grainger, Inc. | | | 945 | | | | 319,901 | |
YRC Worldwide, Inc.(1) | | | 1,175 | | | | 2,996 | |
| | | | | | | | 24,295,455 | |
| | | | | | | | | |
Information Technology — 19.4% | | | | | | | | |
A10 Networks, Inc.(1) | | | 2,845 | | | | 19,545 | |
Accenture PLC(4) | | | 5,301 | | | | 1,116,232 | |
ACI Worldwide, Inc.(1) | | | 642 | | | | 24,322 | |
ACM Research, Inc.(1) | | | 146 | | | | 2,694 | |
Adobe, Inc.(1)(4) | | | 4,452 | | | | 1,468,314 | |
Advanced Energy Industries, Inc.(1) | | | 824 | | | | 58,669 | |
Agilysys, Inc.(1) | | | 183 | | | | 4,650 | |
Akamai Technologies, Inc.(1) | | | 278 | | | | 24,014 | |
ALJ Regional Holdings, Inc.(1) | | | 1,293 | | | | 1,487 | |
Alliance Data Systems Corp. | | | 649 | | | | 72,818 | |
The accompanying notes are an integral part of these financial statements
2019 Annual Report | December 31, 2019 | Page 47 |
Schedule of Investments
December 31, 2019
Spectrum Fund |
Security Description | | Shares or
Principal
Amount ($) | | | Fair
Value ($) | |
Common Stocks - Long — continued |
Alpha & Omega Semiconductor, Ltd.(1) | | | 354 | | | | 4,821 | |
Amdocs, Ltd. | | | 1,057 | | | | 76,305 | |
American Software, Inc./GA | | | 225 | | | | 3,348 | |
Amkor Technology, Inc.(1) | | | 5,661 | | | | 73,593 | |
ANSYS, Inc.(1) | | | 1,555 | | | | 400,273 | |
Apple, Inc.(4) | | | 20,371 | | | | 5,981,944 | |
Applied Materials, Inc. | | | 10,874 | | | | 663,749 | |
Arista Networks, Inc.(1) | | | 78 | | | | 15,865 | |
Arlo Technologies, Inc.(1) | | | 527 | | | | 2,219 | |
Arrow Electronics, Inc.(1) | | | 2,395 | | | | 202,952 | |
Aspen Technology, Inc.(1) | | | 1,597 | | | | 193,125 | |
AstroNova, Inc. | | | 722 | | | | 9,906 | |
Atlassian Corp. PLC(1) | | | 172 | | | | 20,698 | |
Avaya Holdings Corp.(1) | | | 2,407 | | | | 32,495 | |
Avid Technology, Inc.(1) | | | 647 | | | | 5,551 | |
Avnet, Inc. | | | 4,145 | | | | 175,914 | |
Bel Fuse, Inc. | | | 408 | | | | 8,364 | |
Benchmark Electronics, Inc. | | | 4,105 | | | | 141,048 | |
Black Knight, Inc.(1) | | | 607 | | | | 39,139 | |
Booz Allen Hamilton Holding Corp. | | | 3,954 | | | | 281,248 | |
Bottomline Technologies DE, Inc.(1) | | | 562 | | | | 30,123 | |
Broadcom, Inc.(4) | | | 1,945 | | | | 614,659 | |
Cabot Microelectronics Corp. | | | 295 | | | | 42,574 | |
CACI International, Inc. - Class A(1) | | | 669 | | | | 167,243 | |
Cadence Design Systems, Inc.(1) | | | 7,914 | | | | 548,915 | |
Calix, Inc.(1) | | | 336 | | | | 2,688 | |
Cambium Networks Corp.(1) | | | 3,208 | | | | 28,038 | |
Cass Information Systems, Inc. | | | 460 | | | | 26,560 | |
CDK Global, Inc. | | | 5,115 | | | | 279,688 | |
CDW Corp./DE | | | 1,238 | | | | 176,836 | |
Cerence, Inc.(1) | | | 743 | | | | 16,814 | |
ChannelAdvisor Corp.(1) | | | 3,097 | | | | 27,997 | |
Ciena Corp.(1) | | | 57 | | | | 2,433 | |
Cirrus Logic, Inc.(1) | | | 438 | | | | 36,096 | |
Cisco Systems, Inc.(4) | | | 32,146 | | | | 1,541,722 | |
Citrix Systems, Inc. | | | 3,577 | | | | 396,689 | |
CommVault Systems, Inc.(1) | | | 2,230 | | | | 99,547 | |
Comtech Telecommunications Corp. | | | 1,279 | | | | 45,392 | |
Cornerstone OnDemand, Inc.(1) | | | 1,333 | | | | 78,047 | |
CTS Corp. | | | 1,169 | | | | 35,082 | |
Dell Technologies, Inc. - Class C(1) | | | 4,199 | | | | 215,787 | |
Diebold Nixdorf, Inc.(1) | | | 698 | | | | 7,371 | |
Digi International, Inc.(1) | | | 1,640 | | | | 29,061 | |
Dolby Laboratories, Inc. | | | 2,572 | | | | 176,954 | |
DXC Technology Co. | | | 3,508 | | | | 131,866 | |
Dynatrace, Inc.(1) | | | 6,716 | | | | 169,915 | |
Ebix, Inc. | | | 681 | | | | 22,752 | |
Spectrum Fund |
Security Description | | Shares or
Principal
Amount ($) | | | Fair
Value ($) | |
Common Stocks - Long — continued |
EchoStar Corp.(1) | | | 1,840 | | | | 79,690 | |
Endurance International Group Holdings, Inc.(1) | | | 778 | | | | 3,657 | |
Entegris, Inc. | | | 1,534 | | | | 76,838 | |
Euronet Worldwide, Inc.(1) | | | 440 | | | | 69,326 | |
EVERTEC, Inc. | | | 905 | | | | 30,806 | |
Extreme Networks, Inc.(1) | | | 4,878 | | | | 35,951 | |
F5 Networks, Inc.(1) | | | 271 | | | | 37,845 | |
Fabrinet(1) | | | 891 | | | | 57,772 | |
Fair Isaac Corp.(1) | | | 380 | | | | 142,378 | |
FormFactor, Inc.(1) | | | 1,403 | | | | 36,436 | |
Fortinet, Inc.(1) | | | 1,516 | | | | 161,848 | |
GTT Communications, Inc.(1) | | | 322 | | | | 3,655 | |
Hackett Group, Inc./The | | | 1,382 | | | | 22,305 | |
Harmonic, Inc.(1) | | | 229 | | | | 1,786 | |
Hewlett Packard Enterprise Co. | | | 39,839 | | | | 631,847 | |
HP, Inc. | | | 37,035 | | | | 761,069 | |
HubSpot, Inc.(1) | | | 62 | | | | 9,827 | |
Ichor Holdings, Ltd.(1) | | | 190 | | | | 6,321 | |
Information Services Group, Inc.(1) | | | 3,086 | | | | 7,808 | |
Insight Enterprises, Inc.(1) | | | 657 | | | | 46,181 | |
Intel Corp.(4) | | | 21,592 | | | | 1,292,281 | |
InterDigital, Inc. | | | 639 | | | | 34,819 | |
International Business Machines Corp.(4) | | | 6,260 | | | | 839,090 | |
Intevac, Inc.(1) | | | 616 | | | | 4,349 | |
Intuit, Inc. | | | 5,085 | | | | 1,331,914 | |
Itron, Inc.(1) | | | 441 | | | | 37,022 | |
j2 Global, Inc. | | | 1,392 | | | | 130,444 | |
Jabil, Inc. | | | 4,591 | | | | 189,746 | |
Juniper Networks, Inc. | | | 8,578 | | | | 211,276 | |
KBR, Inc. | | | 1,490 | | | | 45,445 | |
Keysight Technologies, Inc.(1) | | | 2,167 | | | | 222,399 | |
Kimball Electronics, Inc.(1) | | | 441 | | | | 7,740 | |
KLA Corp. | | | 2,077 | | | | 370,059 | |
Lam Research Corp. | | | 1,753 | | | | 512,577 | |
Lattice Semiconductor Corp.(1) | | | 150 | | | | 2,871 | |
Leidos Holdings, Inc. | | | 4,790 | | | | 468,893 | |
Lumentum Holdings, Inc.(1) | | | 742 | | | | 58,841 | |
Majesco(1) | | | 182 | | | | 1,502 | |
Manhattan Associates, Inc.(1) | | | 121 | | | | 9,650 | |
ManTech International Corp./VA | | | 358 | | | | 28,597 | |
Mastercard, Inc.(4) | | | 5,957 | | | | 1,778,701 | |
Maxim Integrated Products, Inc. | | | 7,370 | | | | 453,329 | |
MAXIMUS, Inc. | | | 1,225 | | | | 91,128 | |
Methode Electronics, Inc. | | | 716 | | | | 28,175 | |
Micron Technology, Inc.(1) | | | 13,679 | | | | 735,657 | |
Microsoft Corp.(4) | | | 34,354 | | | | 5,417,626 | |
The accompanying notes are an integral part of these financial statements
Page 48 | 2019 Annual Report | December 31, 2019 |
Schedule of Investments
December 31, 2019
Spectrum Fund |
Security Description | | Shares or
Principal
Amount ($) | | | Fair
Value ($) | |
Common Stocks - Long — continued |
MicroStrategy, Inc.(1) | | | 457 | | | | 65,182 | |
Mitek Systems, Inc.(1) | | | 2,777 | | | | 21,244 | |
MKS Instruments, Inc. | | | 544 | | | | 59,845 | |
Model N, Inc.(1) | | | 40 | | | | 1,403 | |
MoneyGram International, Inc.(1) | | | 1,364 | | | | 2,864 | |
Monolithic Power Systems, Inc. | | | 255 | | | | 45,395 | |
Motorola Solutions, Inc. | | | 1,506 | | | | 242,677 | |
MTS Systems Corp. | | | 514 | | | | 24,687 | |
NCR Corp.(1) | | | 2,711 | | | | 95,319 | |
NIC, Inc. | | | 831 | | | | 18,573 | |
NortonLifeLock, Inc. | | | 7,276 | | | | 185,684 | |
Novanta, Inc.(1) | | | 181 | | | | 16,008 | |
Nuance Communications, Inc.(1) | | | 3,828 | | | | 68,253 | |
NVIDIA Corp. | | | 769 | | | | 180,946 | |
ON Semiconductor Corp.(1) | | | 5,274 | | | | 128,580 | |
OneSpan, Inc.(1) | | | 889 | | | | 15,220 | |
Onto Innovation, Inc.(1) | | | 921 | | | | 33,653 | |
Oracle Corp.(4) | | | 17,518 | | | | 928,104 | |
Palo Alto Networks, Inc.(1) | | | 987 | | | | 228,244 | |
Paycom Software, Inc.(1) | | | 639 | | | | 169,182 | |
PC Connection, Inc. | | | 82 | | | | 4,072 | |
Perspecta, Inc. | | | 3,626 | | | | 95,871 | |
PFSweb, Inc.(1) | | | 1,567 | | | | 5,986 | |
Photronics, Inc.(1) | | | 3,140 | | | | 49,486 | |
Plexus Corp.(1) | | | 19 | | | | 1,462 | |
Progress Software Corp. | | | 2,536 | | | | 105,371 | |
QAD, Inc. - Class A | | | 47 | | | | 2,394 | |
Qorvo, Inc.(1) | | | 882 | | | | 102,515 | |
QUALCOMM, Inc. | | | 5,295 | | | | 467,178 | |
Ribbon Communications, Inc.(1) | | | 1,777 | | | | 5,509 | |
RingCentral, Inc. - Class A(1) | | | 459 | | | | 77,420 | |
Rogers Corp.(1) | | | 18 | | | | 2,245 | |
Rosetta Stone, Inc.(1) | | | 431 | | | | 7,818 | |
Sabre Corp. | | | 4,062 | | | | 91,151 | |
salesforce.com, Inc.(1) | | | 610 | | | | 99,210 | |
Sanmina Corp.(1) | | | 1,422 | | | | 48,689 | |
ScanSource, Inc.(1) | | | 2,071 | | | | 76,523 | |
Science Applications International Corp. | | | 1,053 | | | | 91,632 | |
Semtech Corp.(1) | | | 585 | | | | 30,947 | |
Skyworks Solutions, Inc. | | | 3,274 | | | | 395,761 | |
SMART Global Holdings, Inc.(1) | | | 1,108 | | | | 42,038 | |
SolarWinds Corp.(1) | | | 897 | | | | 16,639 | |
Sonim Technologies, Inc.(1) | | | 2,578 | | | | 9,358 | |
SPS Commerce, Inc.(1) | | | 534 | | | | 29,594 | |
SS&C Technologies Holdings, Inc. | | | 4,067 | | | | 249,714 | |
Sykes Enterprises, Inc.(1) | | | 391 | | | | 14,463 | |
Synaptics, Inc.(1) | | | 480 | | | | 31,570 | |
Spectrum Fund |
Security Description | | Shares or
Principal
Amount ($) | | | Fair
Value ($) | |
Common Stocks - Long — continued |
SYNNEX Corp. | | | 364 | | | | 46,883 | |
Synopsys, Inc.(1) | | | 3,754 | | | | 522,557 | |
Teradata Corp.(1) | | | 365 | | | | 9,771 | |
Teradyne, Inc. | | | 2,951 | | | | 201,229 | |
TESSCO Technologies, Inc. | | | 248 | | | | 2,783 | |
Texas Instruments, Inc.(4) | | | 10,448 | | | | 1,340,374 | |
TiVo Corp. | | | 8,898 | | | | 75,455 | |
TTEC Holdings, Inc. | | | 830 | | | | 32,885 | |
TTM Technologies, Inc.(1) | | | 689 | | | | 10,369 | |
Twilio, Inc.(1) | | | 47 | | | | 4,619 | |
Tyler Technologies, Inc.(1) | | | 194 | | | | 58,204 | |
Ultra Clean Holdings, Inc.(1) | | | 303 | | | | 7,111 | |
Unisys Corp.(1) | | | 1,773 | | | | 21,028 | |
Verint Systems, Inc.(1) | | | 1,089 | | | | 60,287 | |
Veritone, Inc.(1) | | | 5,946 | | | | 14,806 | |
Viavi Solutions, Inc.(1) | | | 7,904 | | | | 118,560 | |
Visa, Inc. | | | 3,082 | | | | 579,108 | |
Vishay Intertechnology, Inc. | | | 2,691 | | | | 57,291 | |
Vishay Precision Group, Inc.(1) | | | 887 | | | | 30,158 | |
VMware, Inc.(1) | | | 677 | | | | 102,762 | |
Western Digital Corp. | | | 1,006 | | | | 63,851 | |
Western Union Co./The | | | 61 | | | | 1,634 | |
Xerox Holdings Corp. | | | 5,936 | | | | 218,860 | |
Xperi Corp. | | | 3,332 | | | | 61,642 | |
Zebra Technologies Corp. - Class A(1) | | | 415 | | | | 106,008 | |
| | | | | | | | 41,037,542 | |
| | | | | | | | | |
Materials — 3.1% | | | | | | | | |
AdvanSix, Inc.(1) | | | 2,157 | | | | 43,054 | |
Air Products & Chemicals, Inc. | | | 2,180 | | | | 512,278 | |
AK Steel Holding Corp.(1) | | | 5,296 | | | | 17,424 | |
Cabot Corp. | | | 1,049 | | | | 49,848 | |
Celanese Corp. | | | 788 | | | | 97,019 | |
CF Industries Holdings, Inc. | | | 2,582 | | | | 123,265 | |
Coeur Mining, Inc.(1) | | | 2,374 | | | | 19,182 | |
Dow, Inc. | | | 3,765 | | | | 206,058 | |
Eastman Chemical Co. | | | 7,151 | | | | 566,788 | |
Ecolab, Inc. | | | 3,185 | | | | 614,673 | |
FutureFuel Corp. | | | 649 | | | | 8,041 | |
Hawkins, Inc. | | | 171 | | | | 7,834 | |
Huntsman Corp. | | | 1,932 | | | | 46,677 | |
Innospec, Inc. | | | 665 | | | | 68,788 | |
International Paper Co. | | | 17,551 | | | | 808,224 | |
Koppers Holdings, Inc.(1) | | | 243 | | | | 9,287 | |
Louisiana-Pacific Corp. | | | 630 | | | | 18,692 | |
LyondellBasell Industries NV | | | 10,534 | | | | 995,252 | |
Martin Marietta Materials, Inc. | | | 117 | | | | 32,718 | |
The accompanying notes are an integral part of these financial statements
2019 Annual Report | December 31, 2019 | Page 49 |
Schedule of Investments
December 31, 2019
Spectrum Fund |
Security Description | | Shares or
Principal
Amount ($) | | | Fair
Value ($) | |
Common Stocks - Long — continued |
Minerals Technologies, Inc. | | | 194 | | | | 11,180 | |
Newmont Corp. | | | 1,819 | | | | 79,036 | |
Nucor Corp. | | | 5,677 | | | | 319,502 | |
Olympic Steel, Inc. | | | 1,114 | | | | 19,963 | |
Orion Engineered Carbons SA | | | 525 | | | | 10,133 | |
Packaging Corp. of America | | | 13 | | | | 1,456 | |
PolyOne Corp. | | | 2,012 | | | | 74,021 | |
PPG Industries, Inc. | | | 4,977 | | | | 664,380 | |
Rayonier Advanced Materials, Inc. | | | 2,634 | | | | 10,115 | |
Reliance Steel & Aluminum Co. | | | 2,401 | | | | 287,544 | |
Royal Gold, Inc. | | | 567 | | | | 69,316 | |
RPM International, Inc. | | | 2,630 | | | | 201,879 | |
Ryerson Holding Corp.(1) | | | 1,366 | | | | 16,160 | |
Schnitzer Steel Industries, Inc. | | | 287 | | | | 6,222 | |
Steel Dynamics, Inc. | | | 5,403 | | | | 183,918 | |
Stepan Co. | | | 409 | | | | 41,898 | |
SunCoke Energy, Inc. | | | 1,411 | | | | 8,791 | |
Tredegar Corp. | | | 1,809 | | | | 40,431 | |
Trinseo SA | | | 432 | | | | 16,075 | |
United States Lime & Minerals, Inc. | | | 243 | | | | 21,943 | |
US Concrete, Inc.(1) | | | 502 | | | | 20,913 | |
Valvoline, Inc. | | | 6,090 | | | | 130,387 | |
Westrock Co. | | | 1,729 | | | | 74,191 | |
Worthington Industries, Inc. | | | 1,521 | | | | 64,156 | |
| | | | | | | | 6,618,712 | |
| | | | | | | | | |
Real Estate Investment Trust — 3.5% | | | | | | | | |
Alexander & Baldwin, Inc. | | | 208 | | | | 4,360 | |
American Homes 4 Rent | | | 7,840 | | | | 205,486 | |
American Tower Corp. | | | 2,931 | | | | 673,602 | |
Apple Hospitality REIT, Inc. | | | 298 | | | | 4,843 | |
Ashford Hospitality Trust, Inc. | | | 10,693 | | | | 29,833 | |
AvalonBay Communities, Inc. | | | 63 | | | | 13,211 | |
Bluerock Residential Growth REIT, Inc. | | | 1,796 | | | | 21,642 | |
Brixmor Property Group, Inc. | | | 534 | | | | 11,540 | |
Camden Property Trust | | | 400 | | | | 42,440 | |
CatchMark Timber Trust, Inc. | | | 10,786 | | | | 123,715 | |
Cedar Realty Trust, Inc. | | | 1,156 | | | | 3,410 | |
Clipper Realty, Inc. | | | 2,259 | | | | 23,945 | |
Colony Capital, Inc. | | | 11,373 | | | | 54,022 | |
CoreCivic, Inc. | | | 568 | | | | 9,872 | |
CorePoint Lodging, Inc. | | | 5,849 | | | | 62,467 | |
CubeSmart | | | 2,071 | | | | 65,195 | |
CyrusOne, Inc. | | | 628 | | | | 41,090 | |
Diversified Healthcare Trust(1) | | | 2,608 | | | | 22,012 | |
EastGroup Properties, Inc. | | | 282 | | | | 37,413 | |
Empire State Realty Trust, Inc. | | | 694 | | | | 9,688 | |
Spectrum Fund |
Security Description | | Shares or
Principal
Amount ($) | | | Fair
Value ($) | |
Common Stocks - Long — continued |
Essex Property Trust, Inc. | | | 3,312 | | | | 996,448 | |
Farmland Partners, Inc. | | | 1,537 | | | | 10,421 | |
Forestar Group, Inc.(1) | | | 591 | | | | 12,322 | |
Front Yard Residential Corp. | | | 2,454 | | | | 30,282 | |
Gaming and Leisure Properties, Inc. | | | 1,067 | | | | 45,934 | |
GEO Group, Inc./The | | | 1,082 | | | | 17,972 | |
Hersha Hospitality Trust | | | 1,594 | | | | 23,193 | |
Highwoods Properties, Inc. | | | 3,978 | | | | 194,564 | |
Host Hotels & Resorts, Inc. | | | 14,338 | | | | 265,970 | |
Hudson Pacific Properties, Inc. | | | 3,219 | | | | 121,195 | |
Industrial Logistics Properties Trust | | | 404 | | | | 9,058 | |
Kilroy Realty Corp. | | | 2,570 | | | | 215,623 | |
Kite Realty Group Trust | | | 101 | | | | 1,973 | |
Lamar Advertising Co. | | | 1,758 | | | | 156,919 | |
Lexington Realty Trust | | | 3,178 | | | | 33,750 | |
Macerich Co./The | | | 2,386 | | | | 64,231 | |
Maui Land & Pineapple Co., Inc.(1) | | | 470 | | | | 5,288 | |
National Storage Affiliates Trust | | | 911 | | | | 30,628 | |
New Senior Investment Group, Inc. | | | 4,918 | | | | 37,623 | |
Newmark Group, Inc. | | | 1,353 | | | | 18,205 | |
Office Properties, Income Trust | | | 2,646 | | | | 85,042 | |
Omega Healthcare Investors, Inc. | | | 402 | | | | 17,025 | |
Pennsylvania Real Estate Investment Trust(2) | | | 5,225 | | | | 27,849 | |
Piedmont Office Realty Trust, Inc. | | | 7,550 | | | | 167,912 | |
PS Business Parks, Inc. | | | 1,149 | | | | 189,436 | |
Public Storage | | | 1,271 | | | | 270,672 | |
Rayonier, Inc. | | | 5,184 | | | | 169,828 | |
RE/MAX Holdings, Inc. | | | 262 | | | | 10,084 | |
Realogy Holdings Corp. | | | 1,587 | | | | 15,362 | |
Redfin Corp.(1) | | | 1,201 | | | | 25,389 | |
Retail Properties of America, Inc. | | | 8,081 | | | | 108,285 | |
RLJ Lodging Trust | | | 563 | | | | 9,976 | |
Service Properties Trust | | | 4,231 | | | | 102,940 | |
Simon Property Group, Inc. | | | 6,345 | | | | 945,151 | |
STORE Capital Corp. | | | 2,374 | | | | 88,408 | |
Summit Hotel Properties, Inc. | | | 618 | | | | 7,626 | |
Tanger Factory Outlet Centers, Inc.(2) | | | 8,458 | | | | 124,586 | |
Trinity Place Holdings, Inc.(1) | | | 3,358 | | | | 10,108 | |
UDR, Inc. | | | 21,891 | | | | 1,022,310 | |
Uniti Group, Inc. | | | 2,627 | | | | 21,568 | |
Urstadt Biddle Properties, Inc. | | | 2,121 | | | | 52,686 | |
VEREIT, Inc. | | | 12,425 | | | | 114,807 | |
Washington Prime Group, Inc. | | | 469 | | | | 1,707 | |
Xenia Hotels & Resorts, Inc. | | | 4,927 | | | | 106,472 | |
| | | | | | | | 7,446,614 | |
The accompanying notes are an integral part of these financial statements
Page 50 | 2019 Annual Report | December 31, 2019 |
Schedule of Investments
December 31, 2019
Spectrum Fund |
Security Description | | Shares or
Principal
Amount ($) | | | Fair
Value ($) | |
Common Stocks - Long — continued |
Utilities — 4.3% | | | | | | | | |
AES Corp./VA | | | 4,354 | | | | 86,645 | |
Alliant Energy Corp. | | | 7,905 | | | | 432,562 | |
American States Water Co. | | | 3,485 | | | | 301,940 | |
American Water Works Co., Inc. | | | 6,916 | | | | 849,631 | |
Artesian Resources Corp. | | | 295 | | | | 10,977 | |
Atlantic Power Corp.(1) | | | 14,437 | | | | 33,638 | |
Atmos Energy Corp. | | | 4,819 | | | | 539,053 | |
California Water Service Group | | | 913 | | | | 47,074 | |
Chesapeake Utilities Corp. | | | 758 | | | | 72,639 | |
Consolidated Edison, Inc. | | | 1,070 | | | | 96,803 | |
Consolidated Water Co., Ltd. | | | 1,238 | | | | 20,179 | |
DTE Energy Co. | | | 933 | | | | 121,169 | |
Entergy Corp. | | | 1,261 | | | | 151,068 | |
Evergy, Inc. | | | 435 | | | | 28,314 | |
FirstEnergy Corp. | | | 3,817 | | | | 185,506 | |
Global Water Resources, Inc. | | | 220 | | | | 2,893 | |
IDACORP, Inc. | | | 1,323 | | | | 141,296 | |
MDU Resources Group, Inc. | | | 31,686 | | | | 941,391 | |
MGE Energy, Inc. | | | 1,701 | | | | 134,073 | |
Middlesex Water Co. | | | 537 | | | | 34,137 | |
National Fuel Gas Co. | | | 5,345 | | | | 248,756 | |
NorthWestern Corp. | | | 12,079 | | | | 865,702 | |
NRG Energy, Inc. | | | 9,144 | | | | 363,474 | |
ONE Gas, Inc. | | | 2,678 | | | | 250,580 | |
Otter Tail Corp. | | | 906 | | | | 46,469 | |
PG&E Corp.(1) | | | 1,948 | | | | 21,175 | |
Portland General Electric Co. | | | 15,598 | | | | 870,211 | |
PPL Corp. | | | 7,514 | | | | 269,602 | |
Public Service Enterprise Group, Inc. | | | 1,386 | | | | 81,843 | |
SJW Group | | | 3,164 | | | | 224,834 | |
Southern Co./The | | | 7,112 | | | | 453,034 | |
Southwest Gas Holdings, Inc. | | | 5,858 | | | | 445,032 | |
Spark Energy, Inc. - Class A | | | 1,774 | | | | 16,374 | |
TerraForm Power, Inc. | | | 372 | | | | 5,725 | |
UGI Corp. | | | 579 | | | | 26,148 | |
Unitil Corp. | | | 4,296 | | | | 265,579 | |
Vistra Energy Corp. | | | 9,608 | | | | 220,888 | |
Xcel Energy, Inc. | | | 3,824 | | | | 242,786 | |
York Water Co./The | | | 131 | | | | 6,022 | |
| | | | | | | | 9,155,222 | |
| | | | | | | | | |
Total Common Stocks - Long (Cost $170,141,480) | | | | | | | 209,309,209 | |
Spectrum Fund |
Security Description | | Shares or
Principal
Amount ($) | | | Fair
Value ($) | |
Money Market Registered Investment Companies — 2.8% |
Meeder Institutional Prime Money Market Fund, 1.75%(5) | | | 5,987,102 | | | | 5,987,102 | |
Morgan Stanley Government Institutional Fund, 1.51%(3) | | | 138,013 | | | | 138,013 | |
Total Money Market Registered Investment Companies (Cost $6,125,109) | | | | | | | 6,125,115 | |
Total Investments - Long — 101.1% (Cost $176,266,589) | | | | | | | 215,434,324 | |
Total Securities Sold Short— (33.5%) (Proceeds Received $69,353,024) | | | | | | | (71,384,614 | ) |
Other Assets less Liabilities — 32.4% | | | | | | | 69,016,998 | |
Total Net Assets — 100.0% | | | | | | | 213,066,708 | |
| | | | | | | | | |
Common Stocks - Short — (33.5%) |
Communication Services — (0.6%) | | | | | | | | |
Boingo Wireless, Inc.(1) | | | (177 | ) | | | (1,938 | ) |
Boston Omaha Corp.(1) | | | (700 | ) | | | (14,728 | ) |
Cargurus, Inc.(1) | | | (871 | ) | | | (30,642 | ) |
Daily Journal Corp.(1) | | | (73 | ) | | | (21,201 | ) |
Discovery, Inc.(1) | | | (4,402 | ) | | | (144,121 | ) |
Eventbrite, Inc.(1) | | | (443 | ) | | | (8,935 | ) |
EW Scripps Co./The | | | (656 | ) | | | (10,306 | ) |
Liberty Broadband Corp. - Class C(1) | | | (2,178 | ) | | | (273,884 | ) |
Madison Square Garden Co./The(1) | | | (580 | ) | | | (170,630 | ) |
Match Group, Inc.(1) | | | (2,013 | ) | | | (165,287 | ) |
Netflix, Inc.(1) | | | (669 | ) | | | (216,468 | ) |
New York Times Co./The | | | (2,859 | ) | | | (91,974 | ) |
Nexstar Media Group, Inc. | | | (226 | ) | | | (26,499 | ) |
World Wrestling Entertainment, Inc. | | | (52 | ) | | | (3,373 | ) |
Zillow Group, Inc.(1) | | | (2,902 | ) | | | (133,318 | ) |
| | | | | | | | (1,313,304 | ) |
| | | | | | | | | |
Consumer Discretionary — (1.7%) | | | | | | | | |
Adient PLC | | | (81 | ) | | | (1,721 | ) |
At Home Group, Inc.(1) | | | (811 | ) | | | (4,461 | ) |
Bluegreen Vacations Corp. | | | (1,342 | ) | | | (13,876 | ) |
Bright Horizons Family Solutions, Inc.(1) | | | (288 | ) | | | (43,284 | ) |
Caesars Entertainment Corp.(1) | | | (25,693 | ) | | | (349,425 | ) |
Callaway Golf Co. | | | (498 | ) | | | (10,558 | ) |
CarMax, Inc.(1) | | | (2,144 | ) | | | (187,964 | ) |
Carvana Co.(1) | | | (722 | ) | | | (66,460 | ) |
Century Communities, Inc.(1) | | | (1,560 | ) | | | (42,666 | ) |
Chegg, Inc.(1) | | | (4,638 | ) | | | (175,827 | ) |
Children’s Place, Inc./The | | | (137 | ) | | | (8,565 | ) |
Conn’s, Inc.(1) | | | (635 | ) | | | (7,868 | ) |
The accompanying notes are an integral part of these financial statements
2019 Annual Report | December 31, 2019 | Page 51 |
Schedule of Investments
December 31, 2019
Spectrum Fund |
Security Description | | Shares or
Principal
Amount ($) | | | Fair
Value ($) | |
Common Stocks - Short — continued |
Cooper Tire & Rubber Co. | | | (56 | ) | | | (1,610 | ) |
Dorman Products, Inc.(1) | | | (557 | ) | | | (42,176 | ) |
Drive Shack, Inc.(1) | | | (3,086 | ) | | | (11,295 | ) |
Eldorado Resorts, Inc.(1) | | | (1,187 | ) | | | (70,793 | ) |
Floor & Decor Holdings, Inc.(1) | | | (71 | ) | | | (3,608 | ) |
GoPro, Inc.(1) | | | (1,410 | ) | | | (6,119 | ) |
Grubhub, Inc.(1) | | | (223 | ) | | | (10,847 | ) |
Guess?, Inc. | | | (65 | ) | | | (1,455 | ) |
Hanesbrands, Inc. | | | (4,529 | ) | | | (67,256 | ) |
Harley-Davidson, Inc. | | | (728 | ) | | | (27,074 | ) |
iRobot Corp.(1) | | | (514 | ) | | | (26,024 | ) |
LGI Homes, Inc.(1) | | | (643 | ) | | | (45,428 | ) |
Lovesac Co./The(1) | | | (205 | ) | | | (3,290 | ) |
Mattel, Inc.(1) | | | (4,762 | ) | | | (64,525 | ) |
Monro, Inc. | | | (422 | ) | | | (33,000 | ) |
Motorcar Parts of America, Inc.(1) | | | (2,682 | ) | | | (59,084 | ) |
Noodles & Co.(1) | | | (1,324 | ) | | | (7,335 | ) |
Ollie’s Bargain Outlet Holdings, Inc.(1) | | | (274 | ) | | | (17,895 | ) |
OneSpaWorld Holdings, Ltd. | | | (5,603 | ) | | | (94,355 | ) |
Oxford Industries, Inc. | | | (1,068 | ) | | | (80,549 | ) |
Papa John’s International, Inc. | | | (766 | ) | | | (48,373 | ) |
Penske Automotive Group, Inc. | | | (58 | ) | | | (2,913 | ) |
Red Lion Hotels Corp.(1) | | | (1,015 | ) | | | (3,786 | ) |
Regis Corp.(1) | | | (1,718 | ) | | | (30,701 | ) |
Service Corp. International/US | | | (1,443 | ) | | | (66,421 | ) |
ServiceMaster Global Holdings, Inc.(1) | | | (638 | ) | | | (24,665 | ) |
Shake Shack, Inc.(1) | | | (707 | ) | | | (42,116 | ) |
Tenneco, Inc. | | | (490 | ) | | | (6,419 | ) |
Tesla, Inc.(1) | | | (1,808 | ) | | | (756,341 | ) |
Under Armour, Inc. - Class A(1) | | | (8,725 | ) | | | (188,460 | ) |
Universal Electronics, Inc.(1) | | | (532 | ) | | | (27,802 | ) |
VF Corp. | | | (6,808 | ) | | | (678,485 | ) |
Visteon Corp.(1) | | | (432 | ) | | | (37,407 | ) |
William Lyon Homes(1) | | | (4,085 | ) | | | (81,618 | ) |
YETI Holdings, Inc.(1) | | | (1,268 | ) | | | (44,101 | ) |
| | | | | | | | (3,626,001 | ) |
| | | | | | | | | |
Consumer Staples — (1.0%) | | | | | | | | |
Andersons, Inc./The | | | (979 | ) | | | (24,749 | ) |
Beyond Meat, Inc.(1) | | | (300 | ) | | | (22,680 | ) |
Calavo Growers, Inc. | | | (1,613 | ) | | | (146,122 | ) |
Cal-Maine Foods, Inc. | | | (2,605 | ) | | | (111,364 | ) |
Church & Dwight Co., Inc. | | | (9,834 | ) | | | (691,724 | ) |
Clorox Co./The | | | (347 | ) | | | (53,278 | ) |
Energizer Holdings, Inc. | | | (1,266 | ) | | | (63,579 | ) |
Freshpet, Inc.(1) | | | (326 | ) | | | (19,263 | ) |
Spectrum Fund |
Security Description | | Shares or
Principal
Amount ($) | | | Fair
Value ($) | |
Common Stocks - Short — continued |
Grocery Outlet Holding Corp.(1) | | | (750 | ) | | | (24,338 | ) |
Hain Celestial Group, Inc./The(1) | | | (1,084 | ) | | | (28,135 | ) |
Kraft Heinz Co./The | | | (11,654 | ) | | | (374,443 | ) |
Landec Corp.(1) | | | (1,000 | ) | | | (11,310 | ) |
Limoneira Co. | | | (2,518 | ) | | | (48,421 | ) |
MGP Ingredients, Inc. | | | (285 | ) | | | (13,808 | ) |
Seaboard Corp. | | | (18 | ) | | | (76,510 | ) |
Tootsie Roll Industries, Inc. | | | (7,123 | ) | | | (243,179 | ) |
WD-40 Co. | | | (1,370 | ) | | | (265,972 | ) |
| | | | | | | | (2,218,875 | ) |
| | | | | | | | | |
Energy — (0.4%) | | | | | | | | |
Callon Petroleum Co.(1) | | | (3,107 | ) | | | (15,007 | ) |
Concho Resources, Inc. | | | (1,156 | ) | | | (101,231 | ) |
Diamond S Shipping, Inc.(1) | | | (1,301 | ) | | | (21,779 | ) |
DMC Global, Inc. | | | (88 | ) | | | (3,955 | ) |
Dril-Quip, Inc.(1) | | | (519 | ) | | | (24,346 | ) |
Earthstone Energy, Inc.(1) | | | (252 | ) | | | (1,595 | ) |
Equitrans Midstream Corp. | | | (688 | ) | | | (9,192 | ) |
Evolution Petroleum Corp. | | | (765 | ) | | | (4,185 | ) |
Frank’s International NV(1) | | | (1,063 | ) | | | (5,496 | ) |
Green Plains, Inc. | | | (298 | ) | | | (4,598 | ) |
HighPoint Resources Corp.(1) | | | (2,128 | ) | | | (3,596 | ) |
Magnolia Oil & Gas Corp.(1) | | | (6,478 | ) | | | (81,493 | ) |
Matador Resources Co.(1) | | | (1,184 | ) | | | (21,276 | ) |
McDermott International, Inc.(1) | | | (4 | ) | | | (3 | ) |
NACCO Industries, Inc. | | | (148 | ) | | | (6,931 | ) |
National Oilwell Varco, Inc. | | | (1,206 | ) | | | (30,210 | ) |
Oasis Petroleum, Inc.(1) | | | (1,654 | ) | | | (5,392 | ) |
Parker Drilling Co.(1) | | | (594 | ) | | | (13,365 | ) |
Ring Energy, Inc.(1) | | | (3,817 | ) | | | (10,077 | ) |
SFL Corp., Ltd. | | | (1,799 | ) | | | (26,157 | ) |
Smart Sand, Inc.(1) | | | (995 | ) | | | (2,507 | ) |
Targa Resources Corp. | | | (8,942 | ) | | | (365,102 | ) |
Tellurian, Inc.(1) | | | (554 | ) | | | (4,033 | ) |
Tidewater, Inc.(1) | | | (313 | ) | | | (6,035 | ) |
Whiting Petroleum Corp.(1) | | | (222 | ) | | | (1,629 | ) |
| | | | | | | | (769,190 | ) |
| | | | | | | | | |
Financials — (12.8%) | | | | | | | | |
AGNC Investment Corp. | | | (307 | ) | | | (5,428 | ) |
Allegiance Bancshares, Inc.(1) | | | (777 | ) | | | (29,215 | ) |
Ambac Financial Group, Inc.(1) | | | (5,259 | ) | | | (113,437 | ) |
Amerant Bancorp, Inc.(1) | | | (984 | ) | | | (21,441 | ) |
Ameris Bancorp | | | (8,667 | ) | | | (368,694 | ) |
Annaly Capital Management, Inc. | | | (116,143 | ) | | | (1,094,067 | ) |
The accompanying notes are an integral part of these financial statements
Page 52 | 2019 Annual Report | December 31, 2019 |
Schedule of Investments
December 31, 2019
Spectrum Fund |
Security Description | | Shares or
Principal
Amount ($) | | | Fair
Value ($) | |
Common Stocks - Short — continued |
Arlington Asset Investment Corp. | | | (7,137 | ) | | | (39,753 | ) |
ARMOUR Residential REIT, Inc. | | | (26,260 | ) | | | (469,266 | ) |
Axos Financial, Inc.(1) | | | (5,122 | ) | | | (155,094 | ) |
Banc of California, Inc. | | | (11,195 | ) | | | (192,330 | ) |
Bank of Hawaii Corp. | | | (7,025 | ) | | | (668,499 | ) |
Bank of NT Butterfield & Son, Ltd./The | | | (1,360 | ) | | | (50,347 | ) |
Bank of Princeton/The | | | (686 | ) | | | (21,602 | ) |
Bankwell Financial Group, Inc. | | | (592 | ) | | | (17,073 | ) |
Berkshire Hills Bancorp, Inc. | | | (2,176 | ) | | | (71,547 | ) |
BlackRock, Inc. | | | (2,067 | ) | | | (1,039,081 | ) |
Blackstone Mortgage Trust, Inc. | | | (24,429 | ) | | | (909,247 | ) |
Blucora, Inc.(1) | | | (367 | ) | | | (9,593 | ) |
BOK Financial Corp. | | | (5,343 | ) | | | (466,978 | ) |
Bridge Bancorp, Inc. | | | (2,994 | ) | | | (100,389 | ) |
Brookline Bancorp, Inc. | | | (953 | ) | | | (15,686 | ) |
Cadence BanCorp | | | (618 | ) | | | (11,204 | ) |
CenterState Bank Corp. | | | (2,869 | ) | | | (71,668 | ) |
Century Bancorp, Inc./MA | | | (16 | ) | | | (1,439 | ) |
Cherry Hill Mortgage Investment Corp. | | | (2,847 | ) | | | (41,538 | ) |
Chimera Investment Corp. | | | (2,585 | ) | | | (53,148 | ) |
Citizens, Inc./TX(1) | | | (11,831 | ) | | | (79,859 | ) |
City Holding Co. | | | (268 | ) | | | (21,963 | ) |
Colony Credit Real Estate, Inc. | | | (2,401 | ) | | | (31,597 | ) |
Columbia Banking System, Inc. | | | (9,900 | ) | | | (402,782 | ) |
Columbia Financial, Inc.(1) | | | (436 | ) | | | (7,386 | ) |
Commerce Bancshares, Inc./MO | | | (15,923 | ) | | | (1,081,809 | ) |
Community Bank System, Inc. | | | (7,865 | ) | | | (557,943 | ) |
Cowen, Inc.(1) | | | (2,890 | ) | | | (45,518 | ) |
Cullen/Frost Bankers, Inc. | | | (6,025 | ) | | | (589,125 | ) |
CVB Financial Corp. | | | (5,133 | ) | | | (110,770 | ) |
Dynex Capital, Inc. | | | (11,776 | ) | | | (199,485 | ) |
Eagle Bancorp, Inc. | | | (1,812 | ) | | | (88,118 | ) |
East West Bancorp, Inc. | | | (2,538 | ) | | | (123,601 | ) |
eHealth, Inc.(1) | | | (268 | ) | | | (25,749 | ) |
Enstar Group, Ltd.(1) | | | (1,163 | ) | | | (240,578 | ) |
Equity Bancshares, Inc.(1) | | | (2,081 | ) | | | (64,240 | ) |
FactSet Research Systems, Inc. | | | (974 | ) | | | (261,324 | ) |
Farmers & Merchants Bancorp, Inc./Archbold OH | | | (1,449 | ) | | | (43,687 | ) |
FBL Financial Group, Inc. | | | (348 | ) | | | (20,508 | ) |
FedNat Holding Co. | | | (287 | ) | | | (4,773 | ) |
First Financial Bancorp | | | (8,891 | ) | | | (226,187 | ) |
First Financial Bankshares, Inc. | | | (16,673 | ) | | | (585,222 | ) |
First Foundation, Inc. | | | (161 | ) | | | (2,801 | ) |
First Internet Bancorp | | | (800 | ) | | | (18,968 | ) |
First Mid Bancshares, Inc. | | | (580 | ) | | | (20,445 | ) |
First Midwest Bancorp, Inc./IL | | | (3,286 | ) | | | (75,775 | ) |
Spectrum Fund |
Security Description | | Shares or
Principal
Amount ($) | | | Fair
Value ($) | |
Common Stocks - Short — continued |
First Republic Bank/CA | | | (8,834 | ) | | | (1,037,553 | ) |
Flushing Financial Corp. | | | (2,536 | ) | | | (54,790 | ) |
Franklin Financial Network, Inc. | | | (3,106 | ) | | | (106,629 | ) |
FVCBankcorp, Inc.(1) | | | (345 | ) | | | (6,027 | ) |
Glacier Bancorp, Inc. | | | (21,801 | ) | | | (1,002,628 | ) |
Goldman Sachs Group, Inc./The | | | (4,853 | ) | | | (1,115,850 | ) |
Granite Point Mortgage Trust, Inc. | | | (8,341 | ) | | | (153,308 | ) |
HarborOne Bancorp, Inc.(1) | | | (13,530 | ) | | | (148,695 | ) |
Heritage Financial Corp./WA | | | (20,534 | ) | | | (581,112 | ) |
Hingham Institution for Savings | | | (17 | ) | | | (3,573 | ) |
Home BancShares, Inc./AR | | | (3,602 | ) | | | (70,815 | ) |
HomeTrust Bancshares, Inc. | | | (700 | ) | | | (18,781 | ) |
Howard Bancorp, Inc.(1) | | | (1,545 | ) | | | (26,080 | ) |
Independent Bank Corp. | | | (1,299 | ) | | | (108,142 | ) |
Interactive Brokers Group, Inc. | | | (1,775 | ) | | | (82,751 | ) |
Invesco, Ltd. | | | (9,994 | ) | | | (179,692 | ) |
Lakeland Financial Corp. | | | (7,072 | ) | | | (346,033 | ) |
LendingClub Corp.(1) | | | (1,106 | ) | | | (13,958 | ) |
Level One Bancorp, Inc. | | | (146 | ) | | | (3,673 | ) |
Live Oak Bancshares, Inc. | | | (6,424 | ) | | | (122,120 | ) |
Malvern Bancorp, Inc.(1) | | | (210 | ) | | | (4,849 | ) |
Markel Corp.(1) | | | (841 | ) | | | (961,406 | ) |
MBIA, Inc.(1) | | | (8,963 | ) | | | (83,356 | ) |
Merchants Bancorp/IN | | | (3,273 | ) | | | (64,511 | ) |
Morningstar, Inc. | | | (1,030 | ) | | | (155,849 | ) |
NBT Bancorp, Inc. | | | (4,378 | ) | | | (177,572 | ) |
New Residential Investment Corp. | | | (20,376 | ) | | | (328,257 | ) |
New York Mortgage Trust, Inc. | | | (6,779 | ) | | | (42,233 | ) |
NI Holdings, Inc.(1) | | | (475 | ) | | | (8,170 | ) |
Northwest Bancshares, Inc. | | | (42,406 | ) | | | (705,212 | ) |
OceanFirst Financial Corp. | | | (1,895 | ) | | | (48,398 | ) |
Old National Bancorp/IN | | | (21,369 | ) | | | (390,839 | ) |
On Deck Capital, Inc.(1) | | | (652 | ) | | | (2,699 | ) |
Orchid Island Capital, Inc. | | | (4,231 | ) | | | (24,751 | ) |
Origin Bancorp, Inc. | | | (964 | ) | | | (36,478 | ) |
Pacific Mercantile Bancorp(1) | | | (3,622 | ) | | | (29,411 | ) |
Palomar Holdings, Inc.(1) | | | (336 | ) | | | (16,965 | ) |
People’s United Financial, Inc. | | | (26,290 | ) | | | (444,301 | ) |
PRA Group, Inc.(1) | | | (4,180 | ) | | | (151,734 | ) |
Primerica, Inc. | | | (1,290 | ) | | | (168,422 | ) |
Prosperity Bancshares, Inc. | | | (5,579 | ) | | | (401,074 | ) |
Redwood Trust, Inc. | | | (38,544 | ) | | | (637,518 | ) |
Reliant Bancorp, Inc. | | | (855 | ) | | | (19,015 | ) |
Republic First Bancorp, Inc.(1) | | | (9,371 | ) | | | (39,171 | ) |
S&T Bancorp, Inc. | | | (12,227 | ) | | | (492,626 | ) |
ServisFirst Bancshares, Inc. | | | (19,747 | ) | | | (744,067 | ) |
South State Corp. | | | (1,068 | ) | | | (92,649 | ) |
The accompanying notes are an integral part of these financial statements
2019 Annual Report | December 31, 2019 | Page 53 |
Schedule of Investments
December 31, 2019
Spectrum Fund |
Security Description | | Shares or
Principal
Amount ($) | | | Fair
Value ($) | |
Common Stocks - Short — continued |
Southside Bancshares, Inc. | | | (12,220 | ) | | | (453,851 | ) |
State Auto Financial Corp. | | | (1,980 | ) | | | (61,420 | ) |
TCF Financial Corp. | | | (7,439 | ) | | | (348,145 | ) |
Texas Capital Bancshares, Inc.(1) | | | (7,683 | ) | | | (436,164 | ) |
TFS Financial Corp. | | | (10,448 | ) | | | (205,617 | ) |
TriState Capital Holdings, Inc.(1) | | | (12,012 | ) | | | (313,753 | ) |
Trupanion, Inc.(1) | | | (647 | ) | | | (24,237 | ) |
UMB Financial Corp. | | | (3,121 | ) | | | (214,225 | ) |
Umpqua Holdings Corp. | | | (4,852 | ) | | | (85,880 | ) |
United Bankshares, Inc./WV | | | (12,178 | ) | | | (470,801 | ) |
United Fire Group, Inc. | | | (546 | ) | | | (23,877 | ) |
United Insurance Holdings Corp. | | | (2,534 | ) | | | (31,954 | ) |
Value Line, Inc. | | | (120 | ) | | | (3,469 | ) |
Veritex Holdings, Inc. | | | (641 | ) | | | (18,672 | ) |
Virtu Financial, Inc. | | | (7,161 | ) | | | (114,504 | ) |
Voya Financial, Inc. | | | (12,095 | ) | | | (737,553 | ) |
Webster Financial Corp. | | | (4,536 | ) | | | (242,041 | ) |
WesBanco, Inc. | | | (806 | ) | | | (30,459 | ) |
Westamerica Bancorporation | | | (12,086 | ) | | | (819,068 | ) |
Wintrust Financial Corp. | | | (626 | ) | | | (44,383 | ) |
WisdomTree Investments, Inc. | | | (4,844 | ) | | | (23,445 | ) |
WSFS Financial Corp. | | | (1,305 | ) | | | (57,407 | ) |
| | | | | | | | (27,182,645 | ) |
| | | | | | | | | |
Healthcare — (0.7%) | | | | | | | | |
Acadia Healthcare Co., Inc.(1) | | | (2,874 | ) | | | (95,474 | ) |
Accelerate Diagnostics, Inc.(1) | | | (549 | ) | | | (9,278 | ) |
Adaptive Biotechnologies Corp.(1) | | | (512 | ) | | | (15,319 | ) |
Axonics Modulation Technologies, Inc.(1) | | | (725 | ) | | | (20,090 | ) |
Biohaven Pharmaceutical Holding Co., Ltd.(1) | | | (32 | ) | | | (1,742 | ) |
BioTelemetry, Inc.(1) | | | (946 | ) | | | (43,800 | ) |
Castlight Health, Inc.(1) | | | (4,789 | ) | | | (6,369 | ) |
ChromaDex Corp.(1) | | | (539 | ) | | | (2,323 | ) |
Codexis, Inc.(1) | | | (4,139 | ) | | | (66,183 | ) |
CryoPort, Inc.(1) | | | (1,224 | ) | | | (20,147 | ) |
CytoSorbents Corp.(1) | | | (373 | ) | | | (1,436 | ) |
Denali Therapeutics, Inc.(1) | | | (919 | ) | | | (16,009 | ) |
Evolent Health, Inc.(1) | | | (348 | ) | | | (3,149 | ) |
GenMark Diagnostics, Inc.(1) | | | (1,800 | ) | | | (8,658 | ) |
Geron Corp.(1) | | | (1,782 | ) | | | (2,424 | ) |
Glaukos Corp.(1) | | | (110 | ) | | | (5,992 | ) |
Guardant Health, Inc.(1) | | | (368 | ) | | | (28,756 | ) |
Health Catalyst, Inc.(1) | | | (984 | ) | | | (34,145 | ) |
HealthEquity, Inc.(1) | | | (1,389 | ) | | | (102,883 | ) |
Henry Schein, Inc.(1) | | | (7,687 | ) | | | (512,877 | ) |
Heska Corp.(1) | | | (173 | ) | | | (16,598 | ) |
Spectrum Fund |
Security Description | | Shares or
Principal
Amount ($) | | | Fair
Value ($) | |
Common Stocks - Short — continued |
iRhythm Technologies, Inc.(1) | | | (37 | ) | | | (2,519 | ) |
Joint Corp./The(1) | | | (228 | ) | | | (3,680 | ) |
Ligand Pharmaceuticals, Inc.(1) | | | (116 | ) | | | (12,098 | ) |
Mesa Laboratories, Inc. | | | (27 | ) | | | (6,734 | ) |
NanoString Technologies, Inc.(1) | | | (116 | ) | | | (3,227 | ) |
Neogen Corp.(1) | | | (1,285 | ) | | | (83,859 | ) |
Pacific Biosciences of California, Inc.(1) | | | (7,555 | ) | | | (38,833 | ) |
PetIQ, Inc.(1) | | | (691 | ) | | | (17,310 | ) |
Portola Pharmaceuticals, Inc.(1) | | | (791 | ) | | | (18,889 | ) |
Pulse Biosciences, Inc.(1) | | | (109 | ) | | | (1,462 | ) |
Quanterix Corp.(1) | | | (431 | ) | | | (10,185 | ) |
Shockwave Medical, Inc.(1) | | | (852 | ) | | | (37,420 | ) |
Silk Road Medical, Inc.(1) | | | (245 | ) | | | (9,893 | ) |
Tabula Rasa HealthCare, Inc.(1) | | | (921 | ) | | | (44,834 | ) |
TCR2 Therapeutics, Inc.(1) | | | (100 | ) | | | (1,428 | ) |
Teladoc Health, Inc.(1) | | | (1,236 | ) | | | (103,478 | ) |
Tivity Health, Inc.(1) | | | (1,613 | ) | | | (32,816 | ) |
TransMedics Group, Inc.(1) | | | (750 | ) | | | (14,258 | ) |
Twist Bioscience Corp.(1) | | | (87 | ) | | | (1,827 | ) |
Vocera Communications, Inc.(1) | | | (577 | ) | | | (11,979 | ) |
Wright Medical Group NV(1) | | | (47 | ) | | | (1,433 | ) |
ZIOPHARM Oncology, Inc.(1) | | | (1,634 | ) | | | (7,712 | ) |
Zynex, Inc.(1) | | | (247 | ) | | | (1,944 | ) |
| | | | | | | | (1,481,470 | ) |
| | | | | | | | | |
Industrials — (6.2%) | | | | | | | | |
3M Co. | | | (770 | ) | | | (135,843 | ) |
AAON, Inc. | | | (5,933 | ) | | | (293,150 | ) |
Actuant Corp. | | | (1,503 | ) | | | (39,123 | ) |
Advanced Disposal Services, Inc.(1) | | | (3,271 | ) | | | (107,518 | ) |
Advanced Drainage Systems, Inc. | | | (4,040 | ) | | | (156,914 | ) |
Aerojet Rocketdyne Holdings, Inc.(1) | | | (1,056 | ) | | | (48,217 | ) |
AeroVironment, Inc.(1) | | | (1,418 | ) | | | (87,547 | ) |
Air Lease Corp. | | | (10,397 | ) | | | (494,065 | ) |
Air Transport Services Group, Inc.(1) | | | (457 | ) | | | (10,721 | ) |
Alaska Air Group, Inc. | | | (2,294 | ) | | | (155,419 | ) |
Allegiant Travel Co. | | | (288 | ) | | | (50,124 | ) |
Ameresco, Inc. - Class A(1) | | | (4,728 | ) | | | (82,740 | ) |
American Airlines Group, Inc. | | | (10,227 | ) | | | (293,310 | ) |
American Superconductor Corp.(1) | | | (1,266 | ) | | | (9,938 | ) |
Argan, Inc. | | | (914 | ) | | | (36,688 | ) |
Astec Industries, Inc. | | | (152 | ) | | | (6,384 | ) |
Atlas Air Worldwide Holdings, Inc.(1) | | | (96 | ) | | | (2,647 | ) |
Avis Budget Group, Inc.(1) | | | (203 | ) | | | (6,545 | ) |
Axon Enterprise, Inc.(1) | | | (1,329 | ) | | | (97,389 | ) |
Boeing Co./The | | | (1,568 | ) | | | (510,792 | ) |
Briggs & Stratton Corp. | | | (1,489 | ) | | | (9,917 | ) |
The accompanying notes are an integral part of these financial statements
Page 54 | 2019 Annual Report | December 31, 2019 |
Schedule of Investments
December 31, 2019
Spectrum Fund |
Security Description | | Shares or
Principal
Amount ($) | | | Fair
Value ($) | |
Common Stocks - Short — continued |
BrightView Holdings, Inc.(1) | | | (3,310 | ) | | | (55,840 | ) |
CAI International, Inc.(1) | | | (1,058 | ) | | | (30,661 | ) |
CECO Environmental Corp.(1) | | | (1,030 | ) | | | (7,890 | ) |
CH Robinson Worldwide, Inc. | | | (1,960 | ) | | | (153,272 | ) |
Chart Industries, Inc.(1) | | | (3,217 | ) | | | (217,115 | ) |
CIRCOR International, Inc.(1) | | | (35 | ) | | | (1,618 | ) |
Colfax Corp.(1) | | | (7,334 | ) | | | (266,811 | ) |
Cornerstone Building Brands, Inc.(1) | | | (2,937 | ) | | | (24,994 | ) |
Covenant Transportation Group, Inc.(1) | | | (307 | ) | | | (3,968 | ) |
Cubic Corp. | | | (1,345 | ) | | | (85,502 | ) |
Dycom Industries, Inc.(1) | | | (311 | ) | | | (14,664 | ) |
Eagle Bulk Shipping, Inc.(1) | | | (5,999 | ) | | | (27,595 | ) |
Energy Recovery, Inc.(1) | | | (8,883 | ) | | | (86,965 | ) |
EnPro Industries, Inc. | | | (425 | ) | �� | | (28,424 | ) |
Equifax, Inc. | | | (1,960 | ) | | | (274,635 | ) |
EVI Industries, Inc.(1) | | | (336 | ) | | | (9,085 | ) |
FedEx Corp. | | | (6,988 | ) | | | (1,056,655 | ) |
Forrester Research, Inc. | | | (392 | ) | | | (16,346 | ) |
Fortive Corp. | | | (8,873 | ) | | | (677,808 | ) |
Gates Industrial Corp. PLC(1) | | | (5,949 | ) | | | (81,858 | ) |
GATX Corp. | | | (2,504 | ) | | | (207,456 | ) |
Gencor Industries, Inc.(1) | | | (122 | ) | | | (1,424 | ) |
General Electric Co. | | | (35,704 | ) | | | (398,457 | ) |
Gibraltar Industries, Inc.(1) | | | (218 | ) | | | (10,996 | ) |
Graham Corp. | | | (1,177 | ) | | | (25,753 | ) |
Granite Construction, Inc. | | | (859 | ) | | | (23,769 | ) |
Greenbrier Cos., Inc./The | | | (267 | ) | | | (8,659 | ) |
Healthcare Services Group, Inc. | | | (3,953 | ) | | | (96,137 | ) |
Helios Technologies, Inc. | | | (907 | ) | | | (41,931 | ) |
Hertz Global Holdings, Inc.(1) | | | (5,768 | ) | | | (90,846 | ) |
Hillenbrand, Inc. | | | (204 | ) | | | (6,795 | ) |
IHS Markit, Ltd.(1) | | | (5,411 | ) | | | (407,719 | ) |
InnerWorkings, Inc.(1) | | | (1,414 | ) | | | (7,791 | ) |
Insperity, Inc. | | | (421 | ) | | | (36,223 | ) |
Insteel Industries, Inc. | | | (1,878 | ) | | | (40,358 | ) |
John Bean Technologies Corp. | | | (1,142 | ) | | | (128,658 | ) |
KAR Auction Services, Inc. | | | (12,976 | ) | | | (282,747 | ) |
Kirby Corp.(1) | | | (1,210 | ) | | | (108,331 | ) |
Knight-Swift Transportation Holdings, Inc. | | | (2,870 | ) | | | (102,861 | ) |
Kratos Defense & Security Solutions, Inc.(1) | | | (4,415 | ) | | | (79,514 | ) |
Lennox International, Inc. | | | (399 | ) | | | (97,344 | ) |
Lindsay Corp. | | | (1,877 | ) | | | (180,173 | ) |
Lyft, Inc.(1) | | | (1,337 | ) | | | (57,518 | ) |
Macquarie Infrastructure Corp. | | | (295 | ) | | | (12,638 | ) |
Manitowoc Co., Inc./The(1) | | | (1,268 | ) | | | (22,190 | ) |
Matthews International Corp. | | | (997 | ) | | | (38,055 | ) |
Mercury Systems, Inc.(1) | | | (1,950 | ) | | | (134,765 | ) |
Spectrum Fund |
Security Description | | Shares or
Principal
Amount ($) | | | Fair
Value ($) | |
Common Stocks - Short — continued |
Middleby Corp./The(1) | | | (757 | ) | | | (82,907 | ) |
Mobile Mini, Inc. | | | (608 | ) | | | (23,049 | ) |
National Presto Industries, Inc. | | | (224 | ) | | | (19,799 | ) |
Nielsen Holdings PLC | | | (1,859 | ) | | | (37,738 | ) |
Park Aerospace Corp. | | | (92 | ) | | | (1,497 | ) |
Proto Labs, Inc.(1) | | | (1,785 | ) | | | (181,267 | ) |
Raven Industries, Inc. | | | (2,863 | ) | | | (98,659 | ) |
REV Group, Inc. | | | (1,109 | ) | | | (13,563 | ) |
Robert Half International, Inc. | | | (3,872 | ) | | | (244,517 | ) |
Roper Technologies, Inc. | | | (2,975 | ) | | | (1,053,834 | ) |
SiteOne Landscape Supply, Inc.(1) | | | (1,123 | ) | | | (101,800 | ) |
Spirit Airlines, Inc.(1) | | | (2,175 | ) | | | (87,674 | ) |
Stericycle, Inc.(1) | | | (788 | ) | | | (50,282 | ) |
Sunrun, Inc.(1) | | | (4,839 | ) | | | (66,827 | ) |
Team, Inc.(1) | | | (3,827 | ) | | | (61,117 | ) |
Titan International, Inc. | | | (1,903 | ) | | | (6,889 | ) |
TransDigm Group, Inc. | | | (41 | ) | | | (22,960 | ) |
Trex Co., Inc.(1) | | | (1,006 | ) | | | (90,419 | ) |
TriNet Group, Inc.(1) | | | (2,899 | ) | | | (164,112 | ) |
Trinity Industries, Inc. | | | (12,971 | ) | | | (287,308 | ) |
Triumph Group, Inc. | | | (281 | ) | | | (7,101 | ) |
Twin Disc, Inc.(1) | | | (865 | ) | | | (9,532 | ) |
Uber Technologies, Inc.(1) | | | (23,730 | ) | | | (705,730 | ) |
Univar Solutions, Inc.(1) | | | (2,833 | ) | | | (68,672 | ) |
Upwork, Inc.(1) | | | (4,806 | ) | | | (51,280 | ) |
US Xpress Enterprises, Inc.(1) | | | (473 | ) | | | (2,379 | ) |
Vicor Corp.(1) | | | (400 | ) | | | (18,688 | ) |
Vivint Solar, Inc.(1) | | | (4,227 | ) | | | (30,688 | ) |
Welbilt, Inc.(1) | | | (10,804 | ) | | | (168,650 | ) |
Westinghouse Air Brake Technologies Corp. | | | (8,927 | ) | | | (694,521 | ) |
Willdan Group, Inc.(1) | | | (1,093 | ) | | | (34,736 | ) |
WillScot Corp.(1) | | | (5,736 | ) | | | (106,059 | ) |
Woodward, Inc. | | | (453 | ) | | | (53,653 | ) |
Xylem, Inc./NY | | | (3,158 | ) | | | (248,819 | ) |
| | | | | | | | (13,302,531 | ) |
| | | | | | | | | |
Information Technology — (2.7%) | | | | | | | | |
2U, Inc.(1) | | | (427 | ) | | | (10,244 | ) |
3D Systems Corp.(1) | | | (3,288 | ) | | | (28,770 | ) |
8x8, Inc.(1) | | | (7,861 | ) | | | (143,856 | ) |
Adesto Technologies Corp.(1) | | | (2,062 | ) | | | (17,527 | ) |
Advanced Micro Devices, Inc.(1) | | | (1,586 | ) | | | (72,734 | ) |
Alarm.com Holdings, Inc.(1) | | | (1,378 | ) | | | (59,213 | ) |
Anaplan, Inc.(1) | | | (280 | ) | | | (14,672 | ) |
Black Knight, Inc.(1) | | | (2,386 | ) | | | (153,849 | ) |
Blackline, Inc.(1) | | | (1,169 | ) | | | (60,274 | ) |
Brightcove, Inc.(1) | | | (1,552 | ) | | | (13,487 | ) |
The accompanying notes are an integral part of these financial statements
2019 Annual Report | December 31, 2019 | Page 55 |
Schedule of Investments
December 31, 2019
Spectrum Fund |
Security Description | | Shares or
Principal
Amount ($) | | | Fair
Value ($) | |
Common Stocks - Short — continued |
Cloudera, Inc.(1) | | | (1,360 | ) | | | (15,817 | ) |
Cohu, Inc. | | | (523 | ) | | | (11,951 | ) |
CommScope Holding Co., Inc.(1) | | | (118 | ) | | | (1,674 | ) |
Cree, Inc.(1) | | | (2,984 | ) | | | (137,712 | ) |
Digimarc Corp.(1) | | | (705 | ) | | | (23,660 | ) |
Elastic NV(1) | | | (99 | ) | | | (6,366 | ) |
Envestnet, Inc.(1) | | | (22 | ) | | | (1,532 | ) |
Everbridge, Inc.(1) | | | (130 | ) | | | (10,150 | ) |
FARO Technologies, Inc.(1) | | | (336 | ) | | | (16,918 | ) |
FireEye, Inc.(1) | | | (724 | ) | | | (11,968 | ) |
First Solar, Inc.(1) | | | (6,918 | ) | | | (387,131 | ) |
Fitbit, Inc.(1) | | | (1,743 | ) | | | (11,452 | ) |
ForeScout Technologies, Inc.(1) | | | (485 | ) | | | (15,908 | ) |
Gartner, Inc.(1) | | | (191 | ) | | | (29,433 | ) |
GoDaddy, Inc.(1) | | | (659 | ) | | | (44,759 | ) |
II-VI, Inc.(1) | | | (1,833 | ) | | | (61,717 | ) |
Immersion Corp.(1) | | | (5,583 | ) | | | (41,482 | ) |
Impinj, Inc.(1) | | | (1,417 | ) | | | (36,644 | ) |
Infinera Corp.(1) | | | (1,083 | ) | | | (8,599 | ) |
Inphi Corp.(1) | | | (30 | ) | | | (2,221 | ) |
IPG Photonics Corp.(1) | | | (1,635 | ) | | | (236,944 | ) |
Iteris, Inc.(1) | | | (2,257 | ) | | | (11,262 | ) |
Littelfuse, Inc. | | | (83 | ) | | | (15,878 | ) |
LivePerson, Inc.(1) | | | (510 | ) | | | (18,870 | ) |
LiveRamp Holdings, Inc.(1) | | | (2,737 | ) | | | (131,568 | ) |
MACOM Technology Solutions Holdings, Inc.(1) | | | (1,858 | ) | | | (49,423 | ) |
MaxLinear, Inc.(1) | | | (794 | ) | | | (16,849 | ) |
Microchip Technology, Inc. | | | (9,806 | ) | | | (1,026,884 | ) |
MongoDB, Inc.(1) | | | (544 | ) | | | (71,596 | ) |
NETGEAR, Inc.(1) | | | (244 | ) | | | (5,980 | ) |
NetScout Systems, Inc.(1) | | | (118 | ) | | | (2,840 | ) |
New Relic, Inc.(1) | | | (999 | ) | | | (65,644 | ) |
nLight, Inc.(1) | | | (1,297 | ) | | | (26,303 | ) |
Nutanix, Inc. - Class A(1) | | | (880 | ) | | | (27,509 | ) |
Okta, Inc.(1) | | | (1,582 | ) | | | (182,515 | ) |
PAR Technology Corp.(1) | | | (689 | ) | | | (21,180 | ) |
PDF Solutions, Inc.(1) | | | (1,680 | ) | | | (28,375 | ) |
Pluralsight, Inc.(1) | | | (2,347 | ) | | | (40,392 | ) |
Proofpoint, Inc.(1) | | | (572 | ) | | | (65,654 | ) |
PROS Holdings, Inc.(1) | | | (466 | ) | | | (27,923 | ) |
PTC, Inc.(1) | | | (618 | ) | | | (46,282 | ) |
Q2 Holdings, Inc.(1) | | | (2,904 | ) | | | (235,456 | ) |
Rapid7, Inc.(1) | | | (1,336 | ) | | | (74,843 | ) |
Rimini Street, Inc.(1) | | | (605 | ) | | | (2,347 | ) |
ShotSpotter, Inc.(1) | | | (291 | ) | | | (7,421 | ) |
Square, Inc.(1) | | | (12,014 | ) | | | (751,596 | ) |
Spectrum Fund |
Security Description | | Shares or
Principal
Amount ($) | | | Fair
Value ($) | |
Common Stocks - Short — continued |
SunPower Corp.(1) | | | (1,725 | ) | | | (13,455 | ) |
Switch, Inc. | | | (3,093 | ) | | | (45,838 | ) |
Tucows, Inc.(1) | | | (690 | ) | | | (42,628 | ) |
Twilio, Inc.(1) | | | (5,258 | ) | | | (516,756 | ) |
Upland Software, Inc.(1) | | | (715 | ) | | | (25,533 | ) |
Veeco Instruments, Inc.(1) | | | (1,402 | ) | | | (20,588 | ) |
Verra Mobility Corp.(1) | | | (3,767 | ) | | | (52,700 | ) |
ViaSat, Inc.(1) | | | (3,561 | ) | | | (260,647 | ) |
VirnetX Holding Corp.(1) | | | (1,928 | ) | | | (7,326 | ) |
Workiva, Inc.(1) | | | (284 | ) | | | (11,942 | ) |
Yext, Inc.(1) | | | (4,151 | ) | | | (59,857 | ) |
Zscaler, Inc.(1) | | | (947 | ) | | | (44,036 | ) |
Zuora, Inc.(1) | | | (958 | ) | | | (13,728 | ) |
| | | | | | | | (5,758,288 | ) |
| | | | | | | | | |
Materials — (2.1%) | | | | | | | | |
Albemarle Corp. | | | (5,043 | ) | | | (368,341 | ) |
Allegheny Technologies, Inc.(1) | | | (3,578 | ) | | | (73,921 | ) |
American Vanguard Corp. | | | (125 | ) | | | (2,434 | ) |
AptarGroup, Inc. | | | (1,255 | ) | | | (145,103 | ) |
Ball Corp. | | | (14,332 | ) | | | (926,850 | ) |
Berry Global Group, Inc.(1) | | | (946 | ) | | | (44,926 | ) |
Century Aluminum Co.(1) | | | (779 | ) | | | (5,854 | ) |
Chemours Co./The | | | (1,233 | ) | | | (22,305 | ) |
Compass Minerals International, Inc. | | | (246 | ) | | | (14,996 | ) |
Corteva, Inc. | | | (14,534 | ) | | | (429,625 | ) |
DuPont de Nemours, Inc. | | | (16,560 | ) | | | (1,063,152 | ) |
Element Solutions, Inc.(1) | | | (1,260 | ) | | | (14,717 | ) |
Ferroglobe PLC Contingent Value Rights(1)(7) | | | (2,326 | ) | | | — | |
Flotek Industries, Inc.(1) | | | (3,733 | ) | | | (7,466 | ) |
Freeport-McMoRan, Inc. | | | (5,635 | ) | | | (73,931 | ) |
GCP Applied Technologies, Inc.(1) | | | (1,112 | ) | | | (25,254 | ) |
Greif, Inc. - Class A | | | (63 | ) | | | (2,785 | ) |
Hecla Mining Co. | | | (648 | ) | | | (2,197 | ) |
Ingevity Corp.(1) | | | (209 | ) | | | (18,262 | ) |
International Flavors & Fragrances, Inc. | | | (3,498 | ) | | | (451,312 | ) |
Intrepid Potash, Inc.(1) | | | (841 | ) | | | (2,279 | ) |
Kronos Worldwide, Inc. | | | (3,315 | ) | | | (44,421 | ) |
Livent Corp.(1) | | | (2,977 | ) | | | (25,453 | ) |
Mosaic Co./The | | | (3,625 | ) | | | (78,445 | ) |
O-I Glass, Inc. | | | (1,722 | ) | | | (20,543 | ) |
Pan American Silver Corp. Contingent Value Rights(1)(7) | | | (3,148 | ) | | | — | |
Quaker Chemical Corp. | | | (854 | ) | | | (140,500 | ) |
Sealed Air Corp. | | | (4,682 | ) | | | (186,484 | ) |
Sensient Technologies Corp. | | | (1,191 | ) | | | (78,713 | ) |
Silgan Holdings, Inc. | | | (291 | ) | | | (9,044 | ) |
The accompanying notes are an integral part of these financial statements
Page 56 | 2019 Annual Report | December 31, 2019 |
Schedule of Investments
December 31, 2019
Spectrum Fund |
Security Description | | Shares or
Principal
Amount ($) | | | Fair
Value ($) | |
Common Stocks - Short — continued |
Sonoco Products Co. | | | (1,850 | ) | | | (114,182 | ) |
Summit Materials, Inc.(1) | | | (494 | ) | | | (11,807 | ) |
TimkenSteel Corp.(1) | | | (1,308 | ) | | | (10,281 | ) |
Trecora Resources(1) | | | (1,102 | ) | | | (7,879 | ) |
Tronox Holdings PLC | | | (2,021 | ) | | | (23,080 | ) |
United States Steel Corp. | | | (1,463 | ) | | | (16,693 | ) |
| | | | | | | | (4,463,235 | ) |
| | | | | | | | | |
Real Estate Investment Trust — (0.9%) | | | | | | | | |
Acadia Realty Trust | | | (1,301 | ) | | | (33,735 | ) |
Brookfield Property REIT, Inc. | | | (12,314 | ) | | | (227,132 | ) |
CIM Commercial Trust Corp. | | | (1,939 | ) | | | (28,116 | ) |
Crown Castle International Corp. | | | (1,602 | ) | | | (227,724 | ) |
Equity Commonwealth | | | (5,526 | ) | | | (181,419 | ) |
Four Corners Property Trust, Inc. | | | (390 | ) | | | (10,994 | ) |
Independence Realty Trust, Inc. | | | (4,085 | ) | | | (57,517 | ) |
Innovative Industrial Properties, Inc. | | | (83 | ) | | | (6,297 | ) |
iStar, Inc. | | | (6,825 | ) | | | (99,031 | ) |
JBG SMITH Properties | | | (2,865 | ) | | | (114,285 | ) |
Kimco Realty Corp. | | | (10,076 | ) | | | (208,674 | ) |
Mack-Cali Realty Corp. | | | (4,483 | ) | | | (103,692 | ) |
Medical Properties Trust, Inc. | | | (9,308 | ) | | | (196,492 | ) |
One Liberty Properties, Inc. | | | (51 | ) | | | (1,387 | ) |
Rafael Holdings, Inc.(1) | | | (228 | ) | | | (4,068 | ) |
Safehold, Inc. | | | (863 | ) | | | (34,779 | ) |
STAG Industrial, Inc. | | | (2,555 | ) | | | (80,661 | ) |
VICI Properties, Inc. | | | (933 | ) | | | (23,838 | ) |
Vornado Realty Trust | | | (2,712 | ) | | | (180,348 | ) |
Weingarten Realty Investors | | | (2,907 | ) | | | (90,815 | ) |
Whitestone REIT | | | (2,264 | ) | | | (30,836 | ) |
WP Carey, Inc. | | | (217 | ) | | | (17,369 | ) |
| | | | | | | | (1,959,209 | ) |
| | | | | | | | | |
Utilities — (4.4%) | | | | | | | | |
Ameren Corp. | | | (13,714 | ) | | | (1,053,235 | ) |
Avangrid, Inc. | | | (14,261 | ) | | | (729,593 | ) |
Black Hills Corp. | | | (531 | ) | | | (41,705 | ) |
Cadiz, Inc.(1) | | | (1,461 | ) | | | (16,100 | ) |
CenterPoint Energy, Inc. | | | (1,100 | ) | | | (29,997 | ) |
Clearway Energy, Inc. | | | (298 | ) | | | (5,945 | ) |
CMS Energy Corp. | | | (6,475 | ) | | | (406,889 | ) |
Dominion Energy, Inc.(1) | | | (12,699 | ) | | | (1,051,731 | ) |
Duke Energy Corp. | | | (11,362 | ) | | | (1,036,328 | ) |
Edison International | | | (6,306 | ) | | | (475,535 | ) |
Genie Energy, Ltd. | | | (331 | ) | | | (2,559 | ) |
Hawaiian Electric Industries, Inc. | | | (22,644 | ) | | | (1,061,098 | ) |
New Jersey Resources Corp. | | | (20,963 | ) | | | (934,321 | ) |
Spectrum Fund |
Security Description | | Shares or
Principal
Amount ($) | | | Fair
Value ($) | |
Common Stocks - Short — continued |
NiSource, Inc. | | | (38,474 | ) | | | (1,071,116 | ) |
Northwest Natural Holding Co. | | | (1,394 | ) | | | (102,780 | ) |
Pattern Energy Group, Inc. | | | (1,516 | ) | | | (40,561 | ) |
RGC Resources, Inc. | | | (469 | ) | | | (13,404 | ) |
South Jersey Industries, Inc. | | | (32,018 | ) | | | (1,055,954 | ) |
Sunnova Energy International, Inc.(1) | | | (725 | ) | | | (8,091 | ) |
WEC Energy Group, Inc.. | | | (1,875 | ) | | | (172,924 | ) |
| | | | | | | | (9,309,866 | ) |
| | | | | | | | | |
Total Securities Sold Short (Proceeds Received $69,353,024) | | | | | | | (71,384,614 | ) |
| | | | | | | | | |
Trustee Deferred Compensation(6) |
Meeder Balanced Fund | | | 443 | | | | 5,431 | |
Meeder Dynamic Allocation Fund | | | 1,033 | | | | 12,262 | |
Meeder Muirfield Fund | | | 1,126 | | | | 8,907 | |
Meeder Conservative Allocation Fund | | | 137 | | | | 3,130 | |
Total Trustee Deferred Compensation (Cost $28,114) | | | | | | | 29,730 | |
The accompanying notes are an integral part of these financial statements
2019 Annual Report | December 31, 2019 | Page 57 |
Schedule of Investments
December 31, 2019
Spectrum Fund |
| | | Long
(Short)
Contracts | | | Expiration
Date | | | Notional
Value of
Contracts
($) | | | Value and
Unrealized
Appreciation
(Depreciation)
($) | |
Futures Contracts |
Index Futures | | | | | | | | | | | | | | | | |
Mini MSCI EAFE Index Futures | | | 188 | | | | 3/20/2020 | | | | 19,143,100 | | | | 53,980 | |
Mini MSCI Emerging Markets Index Futures | | | 85 | | | | 3/20/2020 | | | | 4,760,850 | | | | 44,706 | |
Russell 2000 Mini Index Futures | | | 46 | | | | 3/20/2020 | | | | 3,842,380 | | | | 25,263 | |
Standard & Poors 500 Mini Futures | | | 358 | | | | 3/20/2020 | | | | 57,836,690 | | | | 455,295 | |
E-mini Standard & Poors MidCap 400 Futures | | | 75 | | | | 3/20/2020 | | | | 15,486,000 | | | | 133,448 | |
Total Futures Contracts | | | 752 | | | | | | | | 101,069,020 | | | | 712,692 | |
(1) | Represents non-income producing securities. |
(2) | All or a portion of the security is on loan. |
(3) | Investment purchased with cash received as securities lending collateral. The yield shown represents the 7-day yield in effect at December 31, 2019. |
(4) | All or a portion of the security is held as collateral for securities sold short. The total fair value of this collateral on December 31, 2019 was $66,605,403. |
(5) | Investment in affiliate. The yield shown represents the 7-day yield in effect at December 31, 2019. |
(6) | Assets of affiliates to the Spectrum Fund held for the benefit of the Fund’s Trustees in connection with the Trustee Deferred Compensation Plan. |
(7) | Fair valued security deemed as Level 3 security. |
The accompanying notes are an integral part of these financial statements
Page 58 | 2019 Annual Report | December 31, 2019 |
Schedule of Investments
December 31, 2019
Global Allocation Fund |
Security Description | | Shares or
Principal
Amount ($) | | | Fair
Value ($) | |
Common Stocks — 44.8% |
Communication Services — 4.1% | | | | | | | | |
Alphabet, Inc. - Class A(1) | | | 73 | | | | 97,775 | |
Alphabet, Inc. - Class C(1) | | | 347 | | | | 463,946 | |
Altice USA, Inc.(1) | | | 45 | | | | 1,230 | |
AT&T, Inc. | | | 6,688 | | | | 261,367 | |
Cinemark Holdings, Inc. | | | 127 | | | | 4,299 | |
Cogent Communications Holdings, Inc. | | | 173 | | | | 11,385 | |
Comcast Corp. - Class A | | | 3,331 | | | | 149,795 | |
Cumulus Media, Inc.(1) | | | 131 | | | | 2,302 | |
Electronic Arts, Inc.(1) | | | 506 | | | | 54,400 | |
Facebook, Inc.(1) | | | 1,639 | | | | 336,405 | |
Fluent, Inc.(1) | | | 88 | | | | 220 | |
Frontier Communications Corp.(1) | | | 547 | | | | 487 | |
Gannett Co., Inc. | | | 80 | | | | 510 | |
IDT Corp. - Class B(1) | | | 258 | | | | 1,860 | |
John Wiley & Sons, Inc. | | | 178 | | | | 8,637 | |
Lee Enterprises, Inc.(1) | | | 220 | | | | 312 | |
Liberty Latin America, Ltd. - Class A(1) | | | 290 | | | | 5,597 | |
Liberty TripAdvisor Holdings, Inc.(1) | | | 672 | | | | 4,939 | |
Live Nation Entertainment, Inc.(1) | | | 12 | | | | 858 | |
Marcus Corp./The | | | 242 | | | | 7,688 | |
MDC Partners, Inc.(1) | | | 158 | | | | 439 | |
National CineMedia, Inc. | | | 129 | | | | 940 | |
Ooma, Inc.(1) | | | 15 | | | | 198 | |
ORBCOMM, Inc.(1) | | | 140 | | | | 589 | |
Roku, Inc.(1) | | | 80 | | | | 10,712 | |
Take-Two Interactive Software, Inc.(1) | | | 368 | | | | 45,054 | |
TechTarget, Inc.(1) | | | 18 | | | | 470 | |
Telephone & Data Systems, Inc. | | | 481 | | | | 12,232 | |
T-Mobile US, Inc.(1) | | | 2,532 | | | | 198,559 | |
Verizon Communications, Inc. | | | 5,822 | | | | 357,471 | |
Walt Disney Co./The | | | 285 | | | | 41,220 | |
Yelp, Inc.(1) | | | 178 | | | | 6,200 | |
| | | | | | | | 2,088,096 | |
| | | | | | | | | |
Consumer Discretionary — 4.0% | | | | | | | | |
Aaron’s, Inc. | | | 13 | | | | 742 | |
Acushnet Holdings Corp. | | | 227 | | | | 7,378 | |
Amazon.com, Inc.(1) | | | 296 | | | | 546,961 | |
American Public Education, Inc.(1) | | | 91 | | | | 2,492 | |
Aramark | | | 375 | | | | 16,275 | |
Ascena Retail Group, Inc.(1) | | | 14 | | | | 107 | |
AutoZone, Inc.(1) | | | 78 | | | | 92,922 | |
Bassett Furniture Industries, Inc. | | | 243 | | | | 4,053 | |
BBX Capital Corp. | | | 242 | | | | 1,154 | |
Best Buy Co., Inc. | | | 476 | | | | 41,793 | |
Biglari Holdings, Inc. - Class B(1) | | | 30 | | | | 3,433 | |
Global Allocation Fund |
Security Description | | Shares or
Principal
Amount ($) | | | Fair
Value ($) | |
Common Stocks — continued |
Bloomin’ Brands, Inc. | | | 369 | | | | 8,144 | |
BorgWarner, Inc. | | | 224 | | | | 9,717 | |
Brunswick Corp./DE | | | 84 | | | | 5,038 | |
Citi Trends, Inc. | | | 26 | | | | 601 | |
Collectors Universe, Inc. | | | 1 | | | | 23 | |
Crocs, Inc.(1) | | | 195 | | | | 8,169 | |
Dana, Inc. | | | 312 | | | | 5,678 | |
Darden Restaurants, Inc. | | | 51 | | | | 5,560 | |
Dollar General Corp. | | | 657 | | | | 102,479 | |
eBay, Inc. | | | 2,512 | | | | 90,708 | |
Everi Holdings, Inc.(1) | | | 294 | | | | 3,948 | |
Extended Stay America, Inc. | | | 618 | | | | 9,183 | |
Genesco, Inc.(1) | | | 6 | | | | 288 | |
Gentex Corp. | | | 457 | | | | 13,244 | |
Golden Entertainment, Inc.(1) | | | 74 | | | | 1,422 | |
H&R Block, Inc. | | | 178 | | | | 4,179 | |
Hilton Grand Vacations, Inc.(1) | | | 16 | | | | 550 | |
J Alexander’s Holdings, Inc.(1) | | | 421 | | | | 4,025 | |
KB Home | | | 106 | | | | 3,633 | |
Kirkland’s, Inc.(1) | | | 423 | | | | 525 | |
Kohl’s Corp. | | | 98 | | | | 4,993 | |
Lear Corp. | | | 297 | | | | 40,748 | |
Lennar Corp. | | | 992 | | | | 55,344 | |
LKQ Corp.(1) | | | 776 | | | | 27,703 | |
Lululemon Athletica, Inc.(1) | | | 379 | | | | 87,803 | |
M/I Homes, Inc.(1) | | | 190 | | | | 7,477 | |
Malibu Boats, Inc.(1) | | | 55 | | | | 2,252 | |
MasterCraft Boat Holdings, Inc.(1) | | | 144 | | | | 2,268 | |
Meritage Homes Corp.(1) | | | 206 | | | | 12,589 | |
MGM Resorts International | | | 2,820 | | | | 93,821 | |
Murphy USA, Inc.(1) | | | 37 | | | | 4,329 | |
NIKE, Inc. - Class B | | | 2,606 | | | | 264,014 | |
NVR, Inc.(1) | | | 3 | | | | 11,425 | |
Office Depot, Inc. | | | 778 | | | | 2,132 | |
Penn National Gaming, Inc.(1) | | | 242 | | | | 6,186 | |
Polaris, Inc. | | | 217 | | | | 22,069 | |
PulteGroup, Inc. | | | 553 | | | | 21,456 | |
Purple Innovation, Inc.(1) | | | 119 | | | | 1,036 | |
Ralph Lauren Corp. | | | 78 | | | | 9,143 | |
Rent-A-Center, Inc./TX | | | 22 | | | | 634 | |
Rocky Brands, Inc. | | | 39 | | | | 1,148 | |
Ross Stores, Inc. | | | 591 | | | | 68,804 | |
Rubicon Project, Inc./The(1) | | | 27 | | | | 220 | |
Skechers U.S.A., Inc.(1) | | | 268 | | | | 11,575 | |
Sportsman’s Warehouse Holdings, Inc.(1) | | | 122 | | | | 980 | |
Steven Madden, Ltd. | | | 200 | | | | 8,602 | |
Stoneridge, Inc.(1) | | | 98 | | | | 2,873 | |
The accompanying notes are an integral part of these financial statements
2019 Annual Report | December 31, 2019 | Page 59 |
Schedule of Investments
December 31, 2019
Global Allocation Fund |
Security Description | | Shares or
Principal
Amount ($) | | | Fair
Value ($) | |
Common Stocks — continued |
Tailored Brands, Inc. | | | 38 | | | | 157 | |
Target Corp. | | | 1,700 | | | | 217,957 | |
Taylor Morrison Home Corp.(1) | | | 61 | | | | 1,333 | |
Tile Shop Holdings, Inc. | | | 80 | | | | 135 | |
Tilly’s, Inc. - Class A | | | 101 | | | | 1,237 | |
Toll Brothers, Inc. | | | 264 | | | | 10,431 | |
TopBuild Corp.(1) | | | 1 | | | | 103 | |
Town Sports International Holdings, Inc.(1) | | | 378 | | | | 646 | |
Tupperware Brands Corp. | | | 222 | | | | 1,905 | |
Whirlpool Corp. | | | 92 | | | | 13,573 | |
Winnebago Industries, Inc. | | | 70 | | | | 3,709 | |
Wyndham Destinations, Inc. | | | 173 | | | | 8,942 | |
Yum China Holdings, Inc. | | | 467 | | | | 22,421 | |
| | | | | | | | 2,048,597 | |
| | | | | | | | | |
Consumer Staples — 2.4% | | | | | | | | |
Alico, Inc. | | | 14 | | | | 502 | |
BellRing Brands, Inc.(1) | | | 183 | | | | 3,896 | |
Casey’s General Stores, Inc. | | | 112 | | | | 17,807 | |
Coca-Cola Consolidated, Inc. | | | 6 | | | | 1,704 | |
Costco Wholesale Corp. | | | 318 | | | | 93,467 | |
Flowers Foods, Inc. | | | 224 | | | | 4,870 | |
General Mills, Inc. | | | 3,654 | | | | 195,708 | |
Hershey Co./The | | | 344 | | | | 50,561 | |
Kroger Co./The | | | 746 | | | | 21,627 | |
Lamb Weston Holdings, Inc. | | | 220 | | | | 18,927 | |
Lifevantage Corp.(1) | | | 75 | | | | 1,171 | |
Molson Coors Beverage Co. | | | 718 | | | | 38,700 | |
Mondelez International, Inc. | | | 2,425 | | | | 133,569 | |
PepsiCo, Inc. | | | 2,074 | | | | 283,454 | |
Performance Food Group Co.(1) | | | 389 | | | | 20,026 | |
Pilgrim’s Pride Corp.(1) | | | 168 | | | | 5,496 | |
Post Holdings, Inc.(1) | | | 11 | | | | 1,200 | |
Procter & Gamble Co./The | | | 42 | | | | 5,246 | |
Seneca Foods Corp.(1) | | | 3 | | | | 122 | |
SpartanNash Co. | | | 113 | | | | 1,609 | |
Sysco Corp. | | | 903 | | | | 77,243 | |
Tyson Foods, Inc. | | | 1,238 | | | | 112,708 | |
Walmart, Inc. | | | 1,343 | | | | 159,602 | |
| | | | | | | | 1,249,215 | |
| | | | | | | | | |
Energy — 1.6% | | | | | | | | |
Amplify Energy Corp. | | | 320 | | | | 2,115 | |
Apergy Corp.(1) | | | 121 | | | | 4,087 | |
Archrock, Inc. | | | 430 | | | | 4,317 | |
Ardmore Shipping Corp.(1) | | | 21 | | | | 190 | |
Baker Hughes Co. | | | 802 | | | | 20,555 | |
Global Allocation Fund |
Security Description | | Shares or
Principal
Amount ($) | | | Fair
Value ($) | |
Common Stocks — continued |
Berry Petroleum Corp. | | | 111 | | | | 1,047 | |
Brigham Minerals, Inc. | | | 68 | | | | 1,458 | |
Cactus, Inc. | | | 440 | | | | 15,101 | |
Chevron Corp. | | | 1,684 | | | | 202,939 | |
ConocoPhillips | | | 1,952 | | | | 126,939 | |
Contura Energy, Inc.(1) | | | 122 | | | | 1,104 | |
Delek US Holdings, Inc. | | | 138 | | | | 4,627 | |
DHT Holdings, Inc. | | | 180 | | | | 1,490 | |
Dorian LPG, Ltd.(1) | | | 23 | | | | 356 | |
Exterran Corp.(1) | | | 244 | | | | 1,911 | |
Helmerich & Payne, Inc. | | | 72 | | | | 3,271 | |
Independence Contract Drilling, Inc.(1) | | | 195 | | | | 194 | |
International Seaways, Inc.(1) | | | 25 | | | | 744 | |
Liberty Oilfield Services, Inc. | | | 208 | | | | 2,313 | |
Marathon Petroleum Corp. | | | 1,932 | | | | 116,403 | |
Matrix Service Co.(1) | | | 111 | | | | 2,540 | |
Nabors Industries, Ltd. | | | 95 | | | | 274 | |
NexTier Oilfield Solutions, Inc.(1) | | | 189 | | | | 1,266 | |
Nordic American Tankers, Ltd. | | | 220 | | | | 1,082 | |
Oceaneering International, Inc.(1) | | | 178 | | | | 2,654 | |
ONEOK, Inc. | | | 72 | | | | 5,448 | |
Pacific Ethanol, Inc.(1) | | | 350 | | | | 228 | |
Panhandle Oil and Gas, Inc. | | | 13 | | | | 146 | |
PBF Energy, Inc. | | | 232 | | | | 7,278 | |
Peabody Energy Corp. | | | 99 | | | | 903 | |
Phillips 66 | | | 1,888 | | | | 210,342 | |
Renewable Energy Group, Inc.(1) | | | 93 | | | | 2,506 | |
Rosehill Resources, Inc.(1) | | | 79 | | | | 101 | |
SEACOR Holdings, Inc.(1) | | | 72 | | | | 3,107 | |
SilverBow Resources, Inc.(1) | | | 50 | | | | 495 | |
Superior Energy Services, Inc.(1) | | | 48 | | | | 240 | |
Teekay Tankers, Ltd.(1) | | | 30 | | | | 719 | |
TETRA Technologies, Inc.(1) | | | 91 | | | | 178 | |
Valero Energy Corp. | | | 969 | | | | 90,747 | |
W&T Offshore, Inc.(1) | | | 217 | | | | 1,207 | |
Westmoreland Coal Co.(1) | | | 539 | | | | 7 | |
World Fuel Services Corp. | | | 15 | | | | 651 | |
| | | | | | | | 843,280 | |
| | | | | | | | | |
Financials — 5.6% | | | | | | | | |
Ally Financial, Inc. | | | 1,001 | | | | 30,591 | |
Artisan Partners Asset Management, Inc. | | | 587 | | | | 18,972 | |
BancFirst Corp. | | | 190 | | | | 11,864 | |
Bank of America Corp. | | | 6,201 | | | | 218,399 | |
Bank OZK | | | 182 | | | | 5,552 | |
BankFinancial Corp. | | | 25 | | | | 327 | |
Berkshire Hathaway, Inc. - Class B(1) | | | 2,177 | | | | 493,091 | |
The accompanying notes are an integral part of these financial statements
Page 60 | 2019 Annual Report | December 31, 2019 |
Schedule of Investments
December 31, 2019
Global Allocation Fund |
Security Description | | Shares or
Principal
Amount ($) | | | Fair
Value ($) | |
Common Stocks — continued |
Brighthouse Financial, Inc.(1) | | | 235 | | | | 9,219 | |
Cannae Holdings, Inc.(1) | | | 107 | | | | 3,979 | |
Citigroup, Inc. | | | 3,753 | | | | 299,827 | |
Citizens Financial Group, Inc. | | | 1,242 | | | | 50,438 | |
Curo Group Holdings Corp.(1) | | | 259 | | | | 3,155 | |
Diamond Hill Investment Group, Inc. | | | 9 | | | | 1,264 | |
Elevate Credit, Inc.(1) | | | 482 | | | | 2,145 | |
Ellington Financial, Inc. | | | 931 | | | | 17,065 | |
Esquire Financial Holdings, Inc.(1) | | | 37 | | | | 965 | |
ESSA Bancorp, Inc. | | | 5 | | | | 85 | |
Essent Group, Ltd. | | | 752 | | | | 39,096 | |
Farmers National Banc Corp. | | | 4 | | | | 65 | |
Fidelity National Financial, Inc. | | | 1,593 | | | | 72,243 | |
Fifth Third Bancorp | | | 6,159 | | | | 189,328 | |
First American Financial Corp. | | | 632 | | | | 36,858 | |
First BanCorp/Puerto Rico | | | 1,196 | | | | 12,666 | |
First Choice Bancorp | | | 21 | | | | 566 | |
First Horizon National Corp. | | | 776 | | | | 12,851 | |
Great Ajax Corp. | | | 453 | | | | 6,709 | |
Hallmark Financial Services, Inc.(1) | | | 40 | | | | 703 | |
Hartford Financial Services Group, Inc./The | | | 286 | | | | 17,380 | |
HBT Financial, Inc.(1) | | | 16 | | | | 304 | |
Heritage Commerce Corp. | | | 200 | | | | 2,566 | |
Hilltop Holdings, Inc. | | | 823 | | | | 20,517 | |
Horizon Bancorp, Inc./IN | | | 55 | | | | 1,045 | |
Independent Bank Corp./MI | | | 185 | | | | 4,190 | |
International Bancshares Corp. | | | 130 | | | | 5,599 | |
INTL. FCStone, Inc.(1) | | | 40 | | | | 1,953 | |
JPMorgan Chase & Co. | | | 2,120 | | | | 295,528 | |
KeyCorp | | | 2,545 | | | | 51,511 | |
LPL Financial Holdings, Inc. | | | 67 | | | | 6,181 | |
MarketAxess Holdings, Inc. | | | 30 | | | | 11,373 | |
Medley Management, Inc. | | | 146 | | | | 432 | |
MGIC Investment Corp. | | | 1,974 | | | | 27,972 | |
NewStar Financial Contingent Value Rights(1)(5) | | | 34 | | | | — | |
Nicolet Bankshares, Inc.(1) | | | 46 | | | | 3,397 | |
NMI Holdings, Inc. - Class A(1) | | | 411 | | | | 13,637 | |
Northeast Bank | | | 45 | | | | 990 | |
Northrim BanCorp, Inc. | | | 150 | | | | 5,745 | |
Old Republic International Corp. | | | 1,038 | | | | 23,220 | |
OneMain Holdings, Inc. | | | 220 | | | | 9,273 | |
Oppenheimer Holdings, Inc. | | | 636 | | | | 17,477 | |
PennyMac Financial Services, Inc. | | | 138 | | | | 4,698 | |
Piper Sandler Cos. | | | 264 | | | | 21,104 | |
PNC Financial Services Group, Inc./The | | | 1,395 | | | | 222,684 | |
Popular, Inc. | | | 1,369 | | | | 80,429 | |
Global Allocation Fund |
Security Description | | Shares or
Principal
Amount ($) | | | Fair
Value ($) | |
Common Stocks — continued |
ProSight Global, Inc.(1) | | | 150 | | | | 2,420 | |
Prudential Financial, Inc. | | | 931 | | | | 87,272 | |
Pzena Investment Management, Inc. | | | 358 | | | | 3,086 | |
Radian Group, Inc. | | | 1,638 | | | | 41,212 | |
RBB Bancorp | | | 61 | | | | 1,291 | |
Ready Capital Corp. | | | 286 | | | | 4,410 | |
Regions Financial Corp. | | | 5,965 | | | | 102,359 | |
Reinsurance Group of America, Inc. | | | 31 | | | | 5,055 | |
Renasant Corp. | | | 502 | | | | 17,781 | |
Shore Bancshares, Inc. | | | 15 | | | | 260 | |
Silvercrest Asset Management Group, Inc. | | | 80 | | | | 1,006 | |
Stewart Information Services Corp. | | | 216 | | | | 8,811 | |
Synchrony Financial | | | 3,474 | | | | 125,099 | |
Tiptree, Inc. - Class A | | | 22 | | | | 179 | |
TPG RE Finance Trust, Inc. | | | 420 | | | | 8,513 | |
United Community Banks, Inc./GA | | | 81 | | | | 2,501 | |
Unity Bancorp, Inc. | | | 5 | | | | 113 | |
US Bancorp | | | 391 | | | | 23,182 | |
Valley National Bancorp | | | 2,197 | | | | 25,156 | |
Walker & Dunlop, Inc. | | | 93 | | | | 6,015 | |
Western Alliance Bancorp | | | 215 | | | | 12,255 | |
Wins Finance Holdings, Inc.(1) | | | 37 | | | | 389 | |
WR Berkley Corp. | | | 103 | | | | 7,117 | |
| | | | | | | | 2,872,710 | |
| | | | | | | | | |
Healthcare — 8.6% | | | | | | | | |
Abbott Laboratories | | | 914 | | | | 79,390 | |
AbbVie, Inc. | | | 1,210 | | | | 107,133 | |
Abeona Therapeutics, Inc.(1) | | | 5 | | | | 16 | |
ACADIA Pharmaceuticals, Inc.(1) | | | 139 | | | | 5,946 | |
ADMA Biologics, Inc.(1) | | | 71 | | | | 284 | |
Adverum Biotechnologies, Inc.(1) | | | 88 | | | | 1,014 | |
Affimed NV(1) | | | 497 | | | | 1,362 | |
Agenus, Inc.(1) | | | 652 | | | | 2,654 | |
AgeX Therapeutics, Inc.(1) | | | 13 | | | | 24 | |
Agilent Technologies, Inc. | | | 723 | | | | 61,679 | |
Akcea Therapeutics, Inc.(1) | | | 11 | | | | 186 | |
Akebia Therapeutics, Inc.(1) | | | 120 | | | | 758 | |
Akorn, Inc.(1) | | | 207 | | | | 311 | |
Albireo Pharma, Inc.(1) | | | 12 | | | | 305 | |
Aldeyra Therapeutics, Inc.(1) | | | 115 | | | | 668 | |
Alexion Pharmaceuticals, Inc.(1) | | | 557 | | | | 60,240 | |
Alkermes PLC(1) | | | 425 | | | | 8,670 | |
Allakos, Inc.(1) | | | 2 | | | | 191 | |
Allergan PLC | | | 989 | | | | 189,067 | |
Alnylam Pharmaceuticals, Inc.(1) | | | 246 | | | | 28,332 | |
AmerisourceBergen Corp. | | | 473 | | | | 40,214 | |
The accompanying notes are an integral part of these financial statements
2019 Annual Report | December 31, 2019 | Page 61 |
Schedule of Investments
December 31, 2019
Global Allocation Fund |
Security Description | | Shares or
Principal
Amount ($) | | | Fair
Value ($) | |
Common Stocks — continued |
Amgen, Inc. | | | 1,153 | | | | 277,954 | |
Amneal Pharmaceuticals, Inc.(1) | | | 303 | | | | 1,460 | |
Amphastar Pharmaceuticals, Inc.(1) | | | 61 | | | | 1,177 | |
Anavex Life Sciences Corp.(1) | | | 13 | | | | 34 | |
AngioDynamics, Inc.(1) | | | 51 | | | | 817 | |
ANI Pharmaceuticals, Inc.(1) | | | 41 | | | | 2,528 | |
Anika Therapeutics, Inc.(1) | | | 19 | | | | 985 | |
Apellis Pharmaceuticals, Inc.(1) | | | 72 | | | | 2,205 | |
Ardelyx, Inc.(1) | | | 134 | | | | 1,006 | |
Arena Pharmaceuticals, Inc.(1) | | | 207 | | | | 9,402 | |
Arrowhead Pharmaceuticals, Inc.(1) | | | 93 | | | | 5,899 | |
Arvinas, Inc.(1) | | | 36 | | | | 1,479 | |
Assembly Biosciences, Inc.(1) | | | 29 | | | | 593 | |
Assertio Therapeutics, Inc.(1) | | | 689 | | | | 861 | |
Athenex, Inc.(1) | | | 3 | | | | 46 | |
Avantor, Inc.(1) | | | 742 | | | | 13,467 | |
Avid Bioservices, Inc.(1) | | | 226 | | | | 1,733 | |
Avrobio, Inc.(1) | | | 49 | | | | 986 | |
Axsome Therapeutics, Inc.(1) | | | 27 | | | | 2,791 | |
Baudax Bio, Inc.(1) | | | 84 | | | | 581 | |
Beyondspring, Inc.(1) | | | 72 | | | | 1,116 | |
BioDelivery Sciences International, Inc.(1) | | | 595 | | | | 3,760 | |
Biogen, Inc.(1) | | | 713 | | | | 211,568 | |
Bio-Rad Laboratories, Inc.(1) | | | 22 | | | | 8,141 | |
BioSpecifics Technologies Corp.(1) | | | 25 | | | | 1,424 | |
Bioxcel Therapeutics, Inc.(1) | | | 55 | | | | 804 | |
Bristol-Myers Squibb Co. | | | 2,289 | | | | 146,931 | |
Bruker Corp. | | | 235 | | | | 11,978 | |
Calithera Biosciences, Inc.(1) | | | 145 | | | | 828 | |
Calyxt, Inc.(1) | | | 39 | | | | 273 | |
CareDx, Inc.(1) | | | 32 | | | | 690 | |
Catalent, Inc.(1) | | | 363 | | | | 20,437 | |
Catalyst Pharmaceuticals, Inc.(1) | | | 154 | | | | 578 | |
Celcuity, Inc.(1) | | | 1 | | | | 11 | |
Cellular Biomedicine Group, Inc.(1) | | | 108 | | | | 1,754 | |
Cerecor, Inc.(1) | | | 100 | | | | 539 | |
Cerner Corp. | | | 1,507 | | | | 110,599 | |
Chemed Corp. | | | 60 | | | | 26,356 | |
ChemoCentryx, Inc.(1) | | | 30 | | | | 1,187 | |
Coherus Biosciences, Inc.(1) | | | 63 | | | | 1,134 | |
Collegium Pharmaceutical, Inc.(1) | | | 94 | | | | 1,935 | |
Computer Programs & Systems, Inc. | | | 90 | | | | 2,376 | |
Concert Pharmaceuticals, Inc.(1) | | | 5 | | | | 46 | |
Constellation Pharmaceuticals, Inc.(1) | | | 19 | | | | 895 | |
Corium International Contingent Value Rights(1)(5) | | | 22 | | | | — | |
Cortexyme, Inc.(1) | | | 6 | | | | 337 | |
Global Allocation Fund |
Security Description | | Shares or
Principal
Amount ($) | | | Fair
Value ($) | |
Common Stocks — continued |
Cross Country Healthcare, Inc.(1) | | | 32 | | | | 372 | |
Cue Biopharma, Inc.(1) | | | 17 | | | | 270 | |
Cutera, Inc.(1) | | | 6 | | | | 215 | |
Cyclerion Therapeutics, Inc.(1) | | | 55 | | | | 150 | |
CytomX Therapeutics, Inc.(1) | | | 162 | | | | 1,346 | |
Deciphera Pharmaceuticals, Inc.(1) | | | 44 | | | | 2,739 | |
DENTSPLY SIRONA, Inc. | | | 349 | | | | 19,750 | |
Dermira, Inc.(1) | | | 49 | | | | 743 | |
DexCom, Inc.(1) | | | 74 | | | | 16,187 | |
Dicerna Pharmaceuticals, Inc.(1) | | | 14 | | | | 308 | |
Edwards Lifesciences Corp.(1) | | | 14 | | | | 3,266 | |
Eiger BioPharmaceuticals, Inc.(1) | | | 20 | | | | 298 | |
Elanco Animal Health, Inc. Contingent Value Rights(1)(5) | | | 99 | | | | — | |
Eli Lilly & Co. | | | 1,217 | | | | 159,950 | |
Eloxx Pharmaceuticals, Inc.(1) | | | 52 | | | | 383 | |
Emergent BioSolutions, Inc.(1) | | | 79 | | | | 4,262 | |
Encompass Health Corp. | | | 253 | | | | 17,525 | |
Endo International PLC(1) | | | 570 | | | | 2,673 | |
Enochian Biosciences, Inc.(1) | | | 22 | | | | 110 | |
Epizyme, Inc.(1) | | | 45 | | | | 1,107 | |
Exact Sciences Corp.(1) | | | 103 | | | | 9,525 | |
Exelixis, Inc.(1) | | | 869 | | | | 15,312 | |
Fate Therapeutics, Inc.(1) | | | 88 | | | | 1,722 | |
Forty Seven, Inc.(1) | | | 34 | | | | 1,339 | |
G1 Therapeutics, Inc.(1) | | | 16 | | | | 423 | |
Gilead Sciences, Inc. | | | 3,449 | | | | 224,116 | |
Global Blood Therapeutics, Inc.(1) | | | 8 | | | | 636 | |
Halozyme Therapeutics, Inc.(1) | | | 21 | | | | 372 | |
Harvard Bioscience, Inc.(1) | | | 26 | | | | 79 | |
Hill-Rom Holdings, Inc. | | | 381 | | | | 43,255 | |
Hookipa Pharma, Inc.(1) | | | 23 | | | | 281 | |
Horizon Therapeutics Plc(1) | | | 318 | | | | 11,512 | |
Humana, Inc. | | | 456 | | | | 167,133 | |
ImmunoGen, Inc.(1) | | | 416 | | | | 2,124 | |
Immunomedics, Inc.(1) | | | 85 | | | | 1,799 | |
Incyte Corp.(1) | | | 409 | | | | 35,714 | |
Innoviva, Inc.(1) | | | 91 | | | | 1,289 | |
Insulet Corp.(1) | | | 15 | | | | 2,568 | |
Intersect ENT, Inc.(1) | | | 92 | | | | 2,291 | |
Intra-Cellular Therapies, Inc.(1) | | | 46 | | | | 1,578 | |
Invacare Corp. | | | 2 | | | | 18 | |
Ionis Pharmaceuticals, Inc.(1) | | | 63 | | | | 3,806 | |
Iovance Biotherapeutics, Inc.(1) | | | 116 | | | | 3,211 | |
Jazz Pharmaceuticals PLC(1) | | | 76 | | | | 11,345 | |
Johnson & Johnson | | | 2,150 | | | | 313,621 | |
Jounce Therapeutics, Inc.(1) | | | 152 | | | | 1,327 | |
The accompanying notes are an integral part of these financial statements
Page 62 | 2019 Annual Report | December 31, 2019 |
Schedule of Investments
December 31, 2019
Global Allocation Fund |
Security Description | | Shares or
Principal
Amount ($) | | | Fair
Value ($) | |
Common Stocks — continued |
Kadmon Holdings, Inc.(1) | | | 351 | | | | 1,590 | |
KalVista Pharmaceuticals, Inc.(1) | | | 44 | | | | 784 | |
Karyopharm Therapeutics, Inc.(1) | | | 62 | | | | 1,189 | |
Kezar Life Sciences, Inc.(1) | | | 43 | | | | 172 | |
Kindred Biosciences, Inc.(1) | | | 46 | | | | 390 | |
Kodiak Sciences, Inc.(1) | | | 23 | | | | 1,655 | |
Krystal Biotech, Inc.(1) | | | 39 | | | | 2,160 | |
Kura Oncology, Inc.(1) | | | 67 | | | | 921 | |
La Jolla Pharmaceutical Co.(1) | | | 15 | | | | 59 | |
Lannett Co., Inc.(1) | | | 54 | | | | 476 | |
Lantheus Holdings, Inc.(1) | | | 37 | | | | 759 | |
Lexicon Pharmaceuticals, Inc.(1) | | | 189 | | | | 784 | |
Mallinckrodt PLC(1) | | | 450 | | | | 1,571 | |
Marinus Pharmaceuticals, Inc.(1) | | | 80 | | | | 173 | |
Masimo Corp.(1) | | | 61 | | | | 9,642 | |
McKesson Corp. | | | 393 | | | | 54,360 | |
Medtronic PLC | | | 2,501 | | | | 283,738 | |
MEI Pharma, Inc.(1) | | | 76 | | | | 188 | |
MeiraGTx Holdings plc(1) | | | 25 | | | | 501 | |
Menlo Therapeutics, Inc.(1) | | | 39 | | | | 181 | |
Merck & Co., Inc. | | | 3,435 | | | | 312,413 | |
Meridian Bioscience, Inc. | | | 121 | | | | 1,182 | |
Mersana Therapeutics, Inc.(1) | | | 51 | | | | 292 | |
Minerva Neurosciences, Inc.(1) | | | 21 | | | | 149 | |
Mirati Therapeutics, Inc.(1) | | | 28 | | | | 3,608 | |
Misonix, Inc.(1) | | | 39 | | | | 726 | |
Molecular Templates, Inc.(1) | | | 95 | | | | 1,329 | |
Momenta Pharmaceuticals, Inc.(1) | | | 39 | | | | 769 | |
Morphic Holding, Inc.(1) | | | 38 | | | | 652 | |
Mylan NV(1) | | | 618 | | | | 12,422 | |
Myriad Genetics, Inc.(1) | | | 39 | | | | 1,062 | |
Natera, Inc.(1) | | | 138 | | | | 4,649 | |
Natus Medical, Inc.(1) | | | 155 | | | | 5,113 | |
Neurocrine Biosciences, Inc.(1) | | | 215 | | | | 23,110 | |
Nevro Corp.(1) | | | 11 | | | | 1,293 | |
NextCure, Inc.(1) | | | 7 | | | | 394 | |
NextGen Healthcare, Inc.(1) | | | 10 | | | | 161 | |
NGM Biopharmaceuticals, Inc.(1) | | | 28 | | | | 518 | |
Novocure, Ltd.(1) | | | 88 | | | | 7,416 | |
Odonate Therapeutics, Inc.(1) | | | 36 | | | | 1,168 | |
Oncternal Therapeutics, Inc.(1) | | | 88 | | | | 348 | |
OPKO Health, Inc.(1) | | | 1,856 | | | | 2,728 | |
Organogenesis Holdings, Inc.(1) | | | 70 | | | | 337 | |
Orthofix Medical, Inc.(1) | | | 50 | | | | 2,309 | |
Osmotica Pharmaceuticals PLC(1) | | | 148 | | | | 1,035 | |
Owens & Minor, Inc. | | | 21 | | | | 109 | |
Pacira BioSciences, Inc.(1) | | | 182 | | | | 8,245 | |
Global Allocation Fund |
Security Description | | Shares or
Principal
Amount ($) | | | Fair
Value ($) | |
Common Stocks — continued |
Palatin Technologies, Inc.(1) | | | 1,366 | | | | 1,068 | |
Paratek Pharmaceuticals, Inc.(1) | | | 22 | | | | 89 | |
PDL BioPharma, Inc.(1) | | | 529 | | | | 1,717 | |
Pennant Group, Inc./The(1) | | | 101 | | | | 3,340 | |
Perrigo Co. PLC | | | 353 | | | | 18,236 | |
Pfenex, Inc.(1) | | | 133 | | | | 1,460 | |
Pfizer, Inc. | | | 7,816 | | | | 306,231 | |
Phibro Animal Health Corp. | | | 280 | | | | 6,952 | |
Pieris Pharmaceuticals, Inc.(1) | | | 276 | | | | 999 | |
PRA Health Sciences, Inc.(1) | | | 286 | | | | 31,789 | |
Precision BioSciences, Inc.(1) | | | 38 | | | | 528 | |
Principia Biopharma, Inc.(1) | | | 51 | | | | 2,794 | |
Progenics Pharmaceuticals, Inc.(1) | | | 391 | | | | 1,990 | |
Protagonist Therapeutics, Inc.(1) | | | 48 | | | | 338 | |
PTC Therapeutics, Inc.(1) | | | 162 | | | | 7,781 | |
Puma Biotechnology, Inc.(1) | | | 126 | | | | 1,103 | |
Reata Pharmaceuticals, Inc.(1) | | | 23 | | | | 4,702 | |
Recro Pharma, Inc.(1) | | | 210 | | | | 3,849 | |
Replimune Group, Inc.(1) | | | 113 | | | | 1,622 | |
ResMed, Inc. | | | 245 | | | | 37,968 | |
Revance Therapeutics, Inc.(1) | | | 82 | | | | 1,331 | |
Rigel Pharmaceuticals, Inc.(1) | | | 1,187 | | | | 2,540 | |
Rocket Pharmaceuticals, Inc.(1) | | | 30 | | | | 683 | |
Sarepta Therapeutics, Inc.(1) | | | 2 | | | | 258 | |
Savara, Inc.(1) | | | 91 | | | | 408 | |
Seattle Genetics, Inc.(1) | | | 122 | | | | 13,940 | |
SIGA Technologies, Inc.(1) | | | 329 | | | | 1,569 | |
STERIS PLC | | | 264 | | | | 40,239 | |
Strongbridge Biopharma PLC(1) | | | 57 | | | | 119 | |
Stryker Corp. | | | 604 | | | | 126,804 | |
Syndax Pharmaceuticals, Inc.(1) | | | 17 | | | | 149 | |
Syros Pharmaceuticals, Inc.(1) | | | 67 | | | | 463 | |
Tricida, Inc.(1) | | | 54 | | | | 2,038 | |
United Therapeutics Corp.(1) | | | 124 | | | | 10,922 | |
UnitedHealth Group, Inc. | | | 312 | | | | 91,722 | |
Vanda Pharmaceuticals, Inc.(1) | | | 137 | | | | 2,248 | |
VBI Vaccines, Inc.(1) | | | 83 | | | | 115 | |
Veeva Systems, Inc.(1) | | | 170 | | | | 23,912 | |
Veracyte, Inc.(1) | | | 72 | | | | 2,010 | |
Vericel Corp.(1) | | | 130 | | | | 2,262 | |
Verrica Pharmaceuticals, Inc.(1) | | | 94 | | | | 1,494 | |
Vertex Pharmaceuticals, Inc.(1) | | | 137 | | | | 29,996 | |
West Pharmaceutical Services, Inc. | | | 54 | | | | 8,118 | |
XBiotech, Inc.(1) | | | 42 | | | | 784 | |
Xencor, Inc.(1) | | | 48 | | | | 1,651 | |
Y-mAbs Therapeutics, Inc.(1) | | | 122 | | | | 3,813 | |
The accompanying notes are an integral part of these financial statements
2019 Annual Report | December 31, 2019 | Page 63 |
Schedule of Investments
December 31, 2019
Global Allocation Fund |
Security Description | | Shares or
Principal
Amount ($) | | | Fair
Value ($) | |
Common Stocks — continued |
Zimmer Biomet Holdings, Inc. | | | 863 | | | | 129,174 | |
Zoetis, Inc. | | | 1,297 | | | | 171,658 | |
| | | | | | | | 4,418,001 | |
| | | | | | | | | |
Industrials — 3.1% | | | | | | | | |
AGCO Corp. | | | 258 | | | | 19,931 | |
Allison Transmission Holdings, Inc. | | | 1,404 | | | | 67,841 | |
Arconic, Inc. | | | 677 | | | | 20,831 | |
Atkore International Group, Inc.(1) | | | 277 | | | | 11,207 | |
Barrett Business Services, Inc. | | | 10 | | | | 905 | |
Blue Bird Corp.(1) | | | 79 | | | | 1,811 | |
BMC Stock Holdings, Inc.(1) | | | 87 | | | | 2,496 | |
Builders FirstSource, Inc.(1) | | | 487 | | | | 12,375 | |
Caterpillar, Inc. | | | 1,558 | | | | 230,085 | |
CBIZ, Inc.(1) | | | 103 | | | | 2,777 | |
Comfort Systems USA, Inc. | | | 42 | | | | 2,094 | |
Commercial Vehicle Group, Inc.(1) | | | 466 | | | | 2,959 | |
Concrete Pumping Holdings, Inc.(1) | | | 35 | | | | 191 | |
Construction Partners, Inc.(1) | | | 6 | | | | 101 | |
Copart, Inc.(1) | | | 586 | | | | 53,291 | |
Costamare, Inc. | | | 146 | | | | 1,391 | |
Cummins, Inc. | | | 1,071 | | | | 191,666 | |
Eaton Corp. PLC | | | 55 | | | | 5,210 | |
EMCOR Group, Inc. | | | 462 | | | | 39,871 | |
Federal Signal Corp. | | | 109 | | | | 3,515 | |
Foundation Building Materials, Inc.(1) | | | 65 | | | | 1,258 | |
Generac Holdings, Inc.(1) | | | 88 | | | | 8,852 | |
GMS, Inc.(1) | | | 83 | | | | 2,248 | |
H&E Equipment Services, Inc. | | | 53 | | | | 1,772 | |
Heidrick & Struggles International, Inc. | | | 35 | | | | 1,138 | |
Herman Miller, Inc. | | | 4 | | | | 167 | |
Hubbell, Inc. | | | 86 | | | | 12,713 | |
Huntington Ingalls Industries, Inc. | | | 128 | | | | 32,113 | |
Illinois Tool Works, Inc. | | | 827 | | | | 148,554 | |
Jacobs Engineering Group, Inc. | | | 262 | | | | 23,535 | |
Johnson Controls International plc | | | 712 | | | | 28,986 | |
Kimball International, Inc. - Class B | | | 364 | | | | 7,524 | |
Lockheed Martin Corp. | | | 116 | | | | 45,168 | |
LSC Communications, Inc. | | | 522 | | | | 108 | |
ManpowerGroup, Inc. | | | 362 | | | | 35,150 | |
Matson, Inc. | | | 72 | | | | 2,938 | |
Meritor, Inc.(1) | | | 165 | | | | 4,321 | |
Miller Industries, Inc./TN | | | 172 | | | | 6,386 | |
Northwest Pipe Co.(1) | | | 20 | | | | 666 | |
Old Dominion Freight Line, Inc. | | | 81 | | | | 15,372 | |
Oshkosh Corp. | | | 390 | | | | 36,914 | |
PACCAR, Inc. | | | 1,869 | | | | 147,838 | |
Global Allocation Fund |
Security Description | | Shares or
Principal
Amount ($) | | | Fair
Value ($) | |
Common Stocks — continued |
Parker-Hannifin Corp. | | | 931 | | | | 191,618 | |
Park-Ohio Holdings Corp. | | | 70 | | | | 2,356 | |
Powell Industries, Inc. | | | 22 | | | | 1,078 | |
Primoris Services Corp. | | | 2 | | | | 44 | |
Quanex Building Products Corp. | | | 151 | | | | 2,579 | |
Quanta Services, Inc. | | | 480 | | | | 19,541 | |
Resources Connection, Inc. | | | 14 | | | | 229 | |
Rush Enterprises, Inc. | | | 91 | | | | 4,232 | |
Safe Bulkers, Inc.(1) | | | 239 | | | | 406 | |
Saia, Inc.(1) | | | 18 | | | | 1,676 | |
Spirit AeroSystems Holdings, Inc. | | | 66 | | | | 4,810 | |
Standex International Corp. | | | 14 | | | | 1,111 | |
Steelcase, Inc. - Class A | | | 62 | | | | 1,269 | |
Thermon Group Holdings, Inc.(1) | | | 27 | | | | 724 | |
Timken Co./The | | | 370 | | | | 20,835 | |
Triton International, Ltd./Bermuda | | | 565 | | | | 22,713 | |
TrueBlue, Inc.(1) | | | 172 | | | | 4,138 | |
UniFirst Corp./MA | | | 26 | | | | 5,251 | |
Universal Forest Products, Inc. | | | 18 | | | | 859 | |
Valmont Industries, Inc. | | | 43 | | | | 6,441 | |
Vectrus, Inc.(1) | | | 46 | | | | 2,358 | |
WESCO International, Inc.(1) | | | 374 | | | | 22,212 | |
Willis Lease Finance Corp.(1) | | | 13 | | | | 766 | |
WW Grainger, Inc. | | | 56 | | | | 18,957 | |
| | | | | | | | 1,570,472 | |
| | | | | | | | | |
Information Technology — 12.2% | | | | | | | | |
A10 Networks, Inc.(1) | | | 185 | | | | 1,271 | |
Alliance Data Systems Corp. | | | 7 | | | | 785 | |
Amkor Technology, Inc.(1) | | | 922 | | | | 11,986 | |
ANSYS, Inc.(1) | | | 210 | | | | 54,056 | |
Apple, Inc. | | | 3,536 | | | | 1,038,346 | |
Applied Materials, Inc. | | | 3,499 | | | | 213,579 | |
Arrow Electronics, Inc.(1) | | | 250 | | | | 21,185 | |
Aspen Technology, Inc.(1) | | | 232 | | | | 28,056 | |
AstroNova, Inc. | | | 108 | | | | 1,482 | |
Avalara, Inc.(1) | | | 23 | | | | 1,685 | |
Avaya Holdings Corp.(1) | | | 90 | | | | 1,215 | |
Avnet, Inc. | | | 866 | | | | 36,753 | |
Benchmark Electronics, Inc. | | | 567 | | | | 19,482 | |
Booz Allen Hamilton Holding Corp. | | | 223 | | | | 15,862 | |
Broadcom, Inc. | | | 565 | | | | 178,551 | |
Cadence Design Systems, Inc.(1) | | | 811 | | | | 56,251 | |
Cambium Networks Corp.(1) | | | 528 | | | | 4,615 | |
CDK Global, Inc. | | | 520 | | | | 28,434 | |
CDW Corp./DE | | | 258 | | | | 36,853 | |
Cerence, Inc.(1) | | | 96 | | | | 2,172 | |
The accompanying notes are an integral part of these financial statements
Page 64 | 2019 Annual Report | December 31, 2019 |
Schedule of Investments
December 31, 2019
Global Allocation Fund |
Security Description | | Shares or
Principal
Amount ($) | | | Fair
Value ($) | |
Common Stocks — continued |
ChannelAdvisor Corp.(1) | | | 291 | | | | 2,631 | |
Cirrus Logic, Inc.(1) | | | 67 | | | | 5,521 | |
Cisco Systems, Inc. | | | 1,548 | | | | 74,242 | |
Citrix Systems, Inc. | | | 957 | | | | 106,131 | |
CommVault Systems, Inc.(1) | | | 146 | | | | 6,517 | |
Comtech Telecommunications Corp. | | | 145 | | | | 5,146 | |
Dell Technologies, Inc. - Class C(1) | | | 593 | | | | 30,474 | |
Diebold Nixdorf, Inc.(1) | | | 69 | | | | 729 | |
Digi International, Inc.(1) | | | 202 | | | | 3,579 | |
Digital Turbine, Inc.(1) | | | 43 | | | | 307 | |
Dolby Laboratories, Inc. | | | 80 | | | | 5,504 | |
DXC Technology Co. | | | 28 | | | | 1,053 | |
Dynatrace, Inc.(1) | | | 957 | | | | 24,212 | |
Entegris, Inc. | | | 257 | | | | 12,873 | |
EVERTEC, Inc. | | | 40 | | | | 1,362 | |
Fair Isaac Corp.(1) | | | 37 | | | | 13,863 | |
FormFactor, Inc.(1) | | | 59 | | | | 1,532 | |
Fortinet, Inc.(1) | | | 343 | | | | 36,619 | |
Hewlett Packard Enterprise Co. | | | 4,963 | | | | 78,713 | |
HP, Inc. | | | 657 | | | | 13,501 | |
Information Services Group, Inc.(1) | | | 45 | | | | 114 | |
Intel Corp. | | | 4,957 | | | | 296,676 | |
International Business Machines Corp. | | | 607 | | | | 81,362 | |
Intuit, Inc. | | | 837 | | | | 219,235 | |
Itron, Inc.(1) | | | 20 | | | | 1,679 | |
j2 Global, Inc. | | | 274 | | | | 25,677 | |
Jabil, Inc. | | | 611 | | | | 25,253 | |
KBR, Inc. | | | 356 | | | | 10,858 | |
Keysight Technologies, Inc.(1) | | | 134 | | | | 13,752 | |
Kimball Electronics, Inc.(1) | | | 9 | | | | 158 | |
KLA Corp. | | | 657 | | | | 117,058 | |
Lam Research Corp. | | | 665 | | | | 194,446 | |
Lattice Semiconductor Corp.(1) | | | 16 | | | | 306 | |
Majesco(1) | | | 43 | | | | 355 | |
Manhattan Associates, Inc.(1) | | | 87 | | | | 6,938 | |
Mastercard, Inc. | | | 1,071 | | | | 319,790 | |
Maxim Integrated Products, Inc. | | | 1,160 | | | | 71,352 | |
Methode Electronics, Inc. | | | 140 | | | | 5,509 | |
Micron Technology, Inc.(1) | | | 4,044 | | | | 217,486 | |
Microsoft Corp. | | | 6,559 | | | | 1,034,354 | |
MicroStrategy, Inc.(1) | | | 23 | | | | 3,280 | |
Mitek Systems, Inc.(1) | | | 92 | | | | 704 | |
MKS Instruments, Inc. | | | 31 | | | | 3,410 | |
Model N, Inc.(1) | | | 78 | | | | 2,735 | |
Motorola Solutions, Inc. | | | 404 | | | | 65,101 | |
MTS Systems Corp. | | | 29 | | | | 1,393 | |
NCR Corp.(1) | | | 562 | | | | 19,760 | |
Global Allocation Fund |
Security Description | | Shares or
Principal
Amount ($) | | | Fair
Value ($) | |
Common Stocks — continued |
NortonLifeLock, Inc. | | | 1,443 | | | | 36,825 | |
Nuance Communications, Inc.(1) | | | 147 | | | | 2,621 | |
NVIDIA Corp. | | | 772 | | | | 181,652 | |
OneSpan, Inc.(1) | | | 39 | | | | 668 | |
Oracle Corp. | | | 4,474 | | | | 237,033 | |
Paycom Software, Inc.(1) | | | 67 | | | | 17,739 | |
PC Connection, Inc. | | | 119 | | | | 5,910 | |
Perspecta, Inc. | | | 175 | | | | 4,627 | |
Photronics, Inc.(1) | | | 210 | | | | 3,310 | |
Plexus Corp.(1) | | | 19 | | | | 1,462 | |
Progress Software Corp. | | | 458 | | | | 19,030 | |
Qorvo, Inc.(1) | | | 209 | | | | 24,292 | |
QUALCOMM, Inc. | | | 2,779 | | | | 245,191 | |
RingCentral, Inc. - Class A(1) | | | 71 | | | | 11,976 | |
Sanmina Corp.(1) | | | 198 | | | | 6,780 | |
ScanSource, Inc.(1) | | | 185 | | | | 6,836 | |
Skyworks Solutions, Inc. | | | 478 | | | | 57,781 | |
SMART Global Holdings, Inc.(1) | | | 148 | | | | 5,615 | |
Sonim Technologies, Inc.(1) | | | 191 | | | | 693 | |
SPS Commerce, Inc.(1) | | | 36 | | | | 1,995 | |
SS&C Technologies Holdings, Inc. | | | 641 | | | | 39,357 | |
Sykes Enterprises, Inc.(1) | | | 34 | | | | 1,258 | |
Synaptics, Inc.(1) | | | 38 | | | | 2,499 | |
SYNNEX Corp. | | | 118 | | | | 15,198 | |
Synopsys, Inc.(1) | | | 745 | | | | 103,704 | |
Teradyne, Inc. | | | 361 | | | | 24,617 | |
TESSCO Technologies, Inc. | | | 90 | | | | 1,010 | |
Texas Instruments, Inc. | | | 2,031 | | | | 260,557 | |
TiVo Corp. | | | 627 | | | | 5,317 | |
TTEC Holdings, Inc. | | | 22 | | | | 872 | |
Tyler Technologies, Inc.(1) | | | 47 | | | | 14,101 | |
Ultra Clean Holdings, Inc.(1) | | | 68 | | | | 1,596 | |
Unisys Corp.(1) | | | 58 | | | | 688 | |
Verint Systems, Inc.(1) | | | 30 | | | | 1,661 | |
Xerox Holdings Corp. | | | 1,179 | | | | 43,470 | |
Xperi Corp. | | | 239 | | | | 4,422 | |
Zebra Technologies Corp. - Class A(1) | | | 59 | | | | 15,071 | |
| | | | | | | | 6,323,303 | |
| | | | | | | | | |
Materials — 0.8% | | | | | | | | |
Air Products & Chemicals, Inc. | | | 451 | | | | 105,980 | |
AK Steel Holding Corp.(1) | | | 707 | | | | 2,326 | |
Celanese Corp. | | | 330 | | | | 40,630 | |
Coeur Mining, Inc.(1) | | | 93 | | | | 751 | |
Huntsman Corp. | | | 18 | | | | 435 | |
Innospec, Inc. | | | 33 | | | | 3,414 | |
Koppers Holdings, Inc.(1) | | | 43 | | | | 1,643 | |
The accompanying notes are an integral part of these financial statements
2019 Annual Report | December 31, 2019 | Page 65 |
Schedule of Investments
December 31, 2019
Global Allocation Fund |
Security Description | | Shares or
Principal
Amount ($) | | | Fair
Value ($) | |
Common Stocks — continued |
LyondellBasell Industries NV | | | 2,026 | | | | 191,416 | |
Olympic Steel, Inc. | | | 206 | | | | 3,692 | |
Rayonier Advanced Materials, Inc. | | | 157 | | | | 603 | |
Reliance Steel & Aluminum Co. | | | 305 | | | | 36,527 | |
Royal Gold, Inc. | | | 58 | | | | 7,091 | |
RPM International, Inc. | | | 8 | | | | 614 | |
Ryerson Holding Corp.(1) | | | 374 | | | | 4,424 | |
Steel Dynamics, Inc. | | | 452 | | | | 15,386 | |
Stepan Co. | | | 13 | | | | 1,332 | |
Valvoline, Inc. | | | 495 | | | | 10,598 | |
Warrior Met Coal, Inc. | | | 217 | | | | 4,585 | |
| | | | | | | | 431,447 | |
| | | | | | | | | |
Real Estate Investment Trust — 1.8% | | | | | | | | |
Altisource Portfolio Solutions SA(1) | | | 1 | | | | 19 | |
American Homes 4 Rent | | | 624 | | | | 16,355 | |
American Tower Corp. | | | 705 | | | | 162,023 | |
Apple Hospitality REIT, Inc. | | | 2,282 | | | | 37,083 | |
Ashford Hospitality Trust, Inc. | | | 842 | | | | 2,349 | |
AvalonBay Communities, Inc. | | | 42 | | | | 8,807 | |
CBL & Associates Properties, Inc. | | | 890 | | | | 935 | |
Clipper Realty, Inc. | | | 168 | | | | 1,781 | |
Colony Capital, Inc. | | | 257 | | | | 1,221 | |
CorEnergy Infrastructure Trust, Inc. | | | 113 | | | | 5,052 | |
CorePoint Lodging, Inc. | | | 317 | | | | 3,386 | |
Corporate Office Properties Trust | | | 512 | | | | 15,043 | |
CyrusOne, Inc. | | | 123 | | | | 8,048 | |
Essex Property Trust, Inc. | | | 594 | | | | 178,711 | |
Gaming and Leisure Properties, Inc. | | | 452 | | | | 19,459 | |
GEO Group, Inc./The | | | 76 | | | | 1,262 | |
Healthcare Realty Trust, Inc. | | | 481 | | | | 16,051 | |
Healthcare Trust of America, Inc. - Class A | | | 508 | | | | 15,382 | |
Lamar Advertising Co. | | | 535 | | | | 47,754 | |
Maui Land & Pineapple Co., Inc.(1) | | | 17 | | | | 191 | |
Mid-America Apartment Communities, Inc. | | | 176 | | | | 23,207 | |
National Health Investors, Inc. | | | 96 | | | | 7,822 | |
National Storage Affiliates Trust | | | 439 | | | | 14,759 | |
Office Properties Income Trust | | | 164 | | | | 5,271 | |
Pennsylvania Real Estate Investment Trust | | | 15 | | | | 80 | |
PS Business Parks, Inc. | | | 163 | | | | 26,874 | |
RAIT Financial Trust(1) | | | 287 | | | | 10 | |
Realogy Holdings Corp. | | | 167 | | | | 1,617 | |
Service Properties Trust | | | 1,937 | | | | 47,127 | |
Simon Property Group, Inc. | | | 1,391 | | | | 207,203 | |
Spirit MTA REIT | | | 385 | | | | 296 | |
Summit Hotel Properties, Inc. | | | 380 | | | | 4,689 | |
Tanger Factory Outlet Centers, Inc. | | | 1,242 | | | | 18,295 | |
Global Allocation Fund |
Security Description | | Shares or
Principal
Amount ($) | | | Fair
Value ($) | |
Common Stocks — continued |
Trinity Place Holdings, Inc.(1) | | | 331 | | | | 996 | |
Uniti Group, Inc. | | | 161 | | | | 1,322 | |
Urstadt Biddle Properties, Inc. | | | 148 | | | | 3,676 | |
Xenia Hotels & Resorts, Inc. | | | 174 | | | | 3,760 | |
| | | | | | | | 907,916 | |
| | | | | | | | | |
Utilities — 0.6% | | | | | | | | |
American Water Works Co., Inc. | | | 1,532 | | | | 188,206 | |
Atlantic Power Corp.(1) | | | 432 | | | | 1,007 | |
Consolidated Water Co., Ltd. | | | 148 | | | | 2,412 | |
MDU Resources Group, Inc. | | | 2,578 | | | | 76,592 | |
PG&E Corp.(1) | | | 46 | | | | 500 | |
Portland General Electric Co. | | | 117 | | | | 6,527 | |
PPL Corp. | | | 585 | | | | 20,990 | |
Spark Energy, Inc. - Class A | | | 103 | | | | 951 | |
Unitil Corp. | | | 148 | | | | 9,137 | |
| | | | | | | | 306,322 | |
| | | | | | | | | |
Total Common Stocks (Cost $18,967,972) | | | | | | | 23,059,359 | |
| | | | | | | | | |
Registered Investment Companies — 15.1% |
American Beacon SiM High Yield Opportunities Fund - Class I | | | 15,269 | | | | 145,517 | |
Baird Core Plus Bond Fund - Class I | | | 22,298 | | | | 257,769 | |
Dodge & Cox Income Fund | | | 20,804 | | | | 291,876 | |
DoubleLine Total Return Bond Fund - Class I | | | 16,152 | | | | 171,700 | |
Frost Total Return Bond Fund - Class I | | | 21,023 | | | | 217,589 | |
Guggenheim Total Return Bond Fund - Class I | | | 3,167 | | | | 85,889 | |
iShares Core MSCI EAFE ETF(6) | | | 42,298 | | | | 2,759,522 | |
iShares Core MSCI Emerging Markets ETF(6) | | | 12,312 | | | | 661,893 | |
iShares Core U.S. Aggregate Bond ETF(6) | | | 4,360 | | | | 489,933 | |
iShares JP Morgan USD Emerging Markets Bond ETF(6) | | | 1,959 | | | | 224,423 | |
Lord Abbett High Yield Fund - Class I | | | 29,705 | | | | 223,676 | |
Payden Emerging Markets Bond Fund - Class I | | | 14,243 | | | | 195,846 | |
PGIM Total Return Bond Fund - Class R6 | | | 17,794 | | | | 256,585 | |
PIMCO Investment Grade Credit Bond Fund - Class I | | | 9,251 | | | | 101,021 | |
Pioneer Bond Fund - Class Y | | | 26,484 | | | | 259,283 | |
Segall Bryant & Hamill Plus Bond Fund - Class I | | | 20,678 | | | | 221,043 | |
TCW Emerging Markets Income Fund - Class I | | | 23,613 | | | | 199,531 | |
The accompanying notes are an integral part of these financial statements
Page 66 | 2019 Annual Report | December 31, 2019 |
Schedule of Investments
December 31, 2019
Global Allocation Fund |
Security Description | | Shares or
Principal
Amount ($) | | | Fair
Value ($) | |
Registered Investment Companies — continued |
Vanguard Intermediate-Term Corporate Bond ETF(6) | | | 1,704 | | | | 155,626 | |
Vanguard Total Bond Market ETF(6) | | | 5,857 | | | | 491,168 | |
Xtrackers USD High Yield Corporate Bond ETF(6) | | | 6,863 | | | | 345,688 | |
Total Registered Investment Companies (Cost $6,969,985) | | | | | | | 7,755,578 | |
| | | | | | | | | |
Money Market Registered Investment Companies — 33.0% |
Meeder Institutional Prime Money Market Fund, 1.75%(2) | | | 16,954,500 | | | | 16,954,500 | |
Total Money Market Registered Investment Companies (Cost $16,953,030) | | | | | | | 16,954,500 | |
| | | | | | | | | |
Bank Obligations — 1.5% |
First Merchants Bank Deposit Account, 2.10%, 1/2/2020(3) | | | 249,236 | | | | 249,236 | |
Metro City Bank Deposit Account, 2.35%, 1/2/2020(3) | | | 249,416 | | | | 249,416 | |
Pacific Mercantile Bank Deposit Account, 1.55%, 1/2/2020(3) | | | 248,972 | | | | 248,972 | |
Total Bank Obligations (Cost $747,624) | | | | | | | 747,624 | |
| | | | | | | | | |
U.S. Government Obligations — 1.1% |
U.S. Treasury Note, 2.25%, due 1/31/2024 | | | 157,000 | | | | 160,637 | |
U.S. Treasury Note, 2.625%, due 2/15/2029 | | | 70,500 | | | | 74,769 | |
U.S. Treasury Note, 1.50%, due 8/15/2026 | | | 99,700 | | | | 97,772 | |
U.S. Treasury Note, 2.25%, due 11/15/2025 | | | 201,100 | | | | 206,575 | |
U.S. Treasury Note, 2.125%, due 12/31/2022 | | | 47,000 | | | | 47,716 | |
Total U.S. Government Obligations (Cost $574,317) | | | | | | | 587,469 | |
Total Investments — 95.5% (Cost $44,212,928) | | | | | | | 49,104,530 | |
Other Assets less Liabilities — 4.5% | | | | | | | 2,319,001 | |
Total Net Assets — 100.0% | | | | | | | 51,423,531 | |
| | | | | | | | | |
Global Allocation Fund |
Security Description | | Shares or
Principal
Amount ($) | | | Fair
Value ($) | |
Trustee Deferred Compensation(4) |
Meeder Balanced Fund | | | 1,726 | | | | 21,161 | |
Meeder Dynamic Allocation Fund | | | 4,375 | | | | 51,931 | |
Meeder Muirfield Fund | | | 1,911 | | | | 15,116 | |
Meeder Conservative Allocation Fund | | | 494 | | | | 11,288 | |
Total Trustee Deferred Compensation (Cost $86,800) | | | | | | | 99,496 | |
| | | Long
(Short)
Contracts | | | Expiration
Date | | | Notional
Value of
Contracts
($) | | | Value and
Unrealized
Appreciation
(Depreciation)
($) | |
Futures Contracts |
Index Futures | | | | | | | | | | | | | | | | |
Mini MSCI EAFE Index Futures | | | 154 | | | | 3/20/2020 | | | | 15,681,050 | | | | 50,249 | |
Mini MSCI Emerging Markets Index Futures | | | 69 | | | | 3/20/2020 | | | | 3,864,690 | | | | 37,387 | |
Standard & Poors 500 Mini Futures | | | 2 | | | | 3/20/2020 | | | | 323,110 | | | | 904 | |
Total Futures Contracts | | | 225 | | | | | | | | 19,868,850 | | | | 88,540 | |
(1) | Represents non-income producing securities. |
(2) | Investment in affiliate. The yield shown represents the 7-day yield in effect at December 31, 2019. |
(3) | Variable rate security. Securities payable at par, including accrued interest (usually within seven days notice) and unconditionally secured as to principal and interest by letters of credit or other credit support agreements from major banks. The interest rates are adjustable and are not based on a published reference rate and spread but are determined by the issuer or agent and are based on current market conditions. These securities do not indicate a reference rate and spread in their description above. The rate shown represents the rate in effect at December 31, 2019. The maturity date shown, if applicable, reflects the earlier of the next demand date or stated maturity date. |
(4) | Assets of affiliates to the Global Allocation Fund held for the benefit of the Fund’s Trustees in connection with the Trustee Deferred Compensation Plan. |
(5) | Fair valued security deemed as Level 3 security. |
The accompanying notes are an integral part of these financial statements
2019 Annual Report | December 31, 2019 | Page 67 |
Schedule of Investments
December 31, 2019
Balanced Fund |
Security Description | | Shares,
Contracts
or Principal
Amount ($) | | | Fair
Value ($) | |
Common Stocks — 52.3% |
Communication Services — 4.5% | | | | | | | | |
Alphabet, Inc. - Class A(1) | | | 699 | | | | 936,234 | |
Alphabet, Inc. - Class C(1) | | | 3,198 | | | | 4,275,790 | |
Altice USA, Inc.(1) | | | 1,799 | | | | 49,185 | |
AT&T, Inc. | | | 56,993 | | | | 2,227,286 | |
Beasley Broadcast Group, Inc. | | | 215 | | | | 664 | |
Cinemark Holdings, Inc. | | | 1,826 | | | | 61,810 | |
Cogent Communications Holdings, Inc. | | | 647 | | | | 42,579 | |
Comcast Corp. - Class A | | | 39,834 | | | | 1,791,335 | |
Cumulus Media, Inc.(1) | | | 1,632 | | | | 28,674 | |
Electronic Arts, Inc.(1) | | | 1,879 | | | | 202,011 | |
Facebook, Inc.(1) | | | 14,126 | | | | 2,899,362 | |
Frontier Communications Corp.(1) | | | 4,619 | | | | 4,109 | |
Gannett Co., Inc. | | | 786 | | | | 5,015 | |
IDT Corp. - Class B(1) | | | 3,628 | | | | 26,158 | |
John Wiley & Sons, Inc. | | | 1,015 | | | | 49,248 | |
Lee Enterprises, Inc.(1) | | | 1,932 | | | | 2,743 | |
Liberty Latin America, Ltd. - Class A(1) | | | 1,159 | | | | 22,369 | |
Liberty TripAdvisor Holdings, Inc.(1) | | | 7,823 | | | | 57,499 | |
Live Nation Entertainment, Inc.(1) | | | 246 | | | | 17,582 | |
Marcus Corp./The | | | 2,377 | | | | 75,517 | |
MDC Partners, Inc.(1) | | | 1,894 | | | | 5,265 | |
National CineMedia, Inc. | | | 682 | | | | 4,972 | |
Roku, Inc.(1) | | | 719 | | | | 96,274 | |
Take-Two Interactive Software, Inc.(1) | | | 2,996 | | | | 366,800 | |
TechTarget, Inc.(1) | | | 366 | | | | 9,553 | |
Telephone & Data Systems, Inc. | | | 6,885 | | | | 175,086 | |
T-Mobile US, Inc.(1) | | | 22,217 | | | | 1,742,257 | |
Travelzoo(1) | | | 17 | | | | 182 | |
Verizon Communications, Inc. | | | 46,094 | | | | 2,830,172 | |
Walt Disney Co./The | | | 2,321 | | | | 335,686 | |
Yelp, Inc.(1) | | | 1,574 | | | | 54,822 | |
| | | | | | | | 18,396,239 | |
| | | | | | | | | |
Consumer Discretionary — 5.5% | | | | | | | | |
Aaron’s, Inc. | | | 526 | | | | 30,040 | |
Acushnet Holdings Corp. | | | 1,825 | | | | 59,313 | |
Amazon.com, Inc.(1) | | | 2,640 | | | | 4,878,298 | |
American Public Education, Inc.(1) | | | 563 | | | | 15,421 | |
Aramark | | | 2,958 | | | | 128,377 | |
AutoZone, Inc.(1) | | | 720 | | | | 857,743 | |
Bassett Furniture Industries, Inc. | | | 1,866 | | | | 31,125 | |
BBX Capital Corp. | | | 740 | | | | 3,530 | |
Best Buy Co., Inc. | | | 4,371 | | | | 383,774 | |
Biglari Holdings, Inc. - Class B(1) | | | 270 | | | | 30,893 | |
Balanced Fund |
Security Description | | Shares,
Contracts
or Principal
Amount ($) | | | Fair
Value ($) | |
Common Stocks — continued |
Bloomin’ Brands, Inc. | | | 4,233 | | | | 93,422 | |
Booking Holdings, Inc.(1) | | | 143 | | | | 293,683 | |
BorgWarner, Inc. | | | 1,150 | | | | 49,887 | |
Cato Corp./The | | | 164 | | | | 2,854 | |
Citi Trends, Inc. | | | 641 | | | | 14,820 | |
Collectors Universe, Inc. | | | 4 | | | | 92 | |
Crocs, Inc.(1) | | | 2,209 | | | | 92,535 | |
Dana, Inc. | | | 2,321 | | | | 42,242 | |
Darden Restaurants, Inc. | | | 1,522 | | | | 165,913 | |
Dollar General Corp. | | | 4,800 | | | | 748,704 | |
eBay, Inc. | | | 17,773 | | | | 641,783 | |
Everi Holdings, Inc.(1) | | | 2,514 | | | | 33,763 | |
Extended Stay America, Inc. | | | 3,400 | | | | 50,524 | |
Ford Motor Co. | | | 3,794 | | | | 35,284 | |
Garmin, Ltd. | | | 1,611 | | | | 157,169 | |
General Motors Co. | | | 1,055 | | | | 38,613 | |
Gentex Corp. | | | 4,593 | | | | 133,105 | |
H&R Block, Inc. | | | 2,602 | | | | 61,095 | |
Home Depot, Inc./The | | | 1,984 | | | | 433,266 | |
Hudson, Ltd.(1) | | | 908 | | | | 13,929 | |
J Alexander’s Holdings, Inc.(1) | | | 3,933 | | | | 37,599 | |
KB Home | | | 1,207 | | | | 41,364 | |
Kirkland’s, Inc.(1) | | | 4,623 | | | | 5,733 | |
Kohl’s Corp. | | | 478 | | | | 24,354 | |
Lear Corp. | | | 2,371 | | | | 325,301 | |
Lennar Corp. | | | 6,840 | | | | 381,604 | |
LKQ Corp.(1) | | | 6,487 | | | | 231,586 | |
Lululemon Athletica, Inc.(1) | | | 4,619 | | | | 1,070,084 | |
M/I Homes, Inc.(1) | | | 1,495 | | | | 58,828 | |
Malibu Boats, Inc.(1) | | | 1,099 | | | | 45,004 | |
MasterCraft Boat Holdings, Inc.(1) | | | 1,354 | | | | 21,326 | |
MDC Holdings, Inc. | | | 628 | | | | 23,964 | |
Meritage Homes Corp.(1) | | | 1,698 | | | | 103,765 | |
MGM Resorts International | | | 21,697 | | | | 721,859 | |
Murphy USA, Inc.(1) | | | 424 | | | | 49,608 | |
NIKE, Inc. - Class B | | | 24,183 | | | | 2,449,980 | |
NVR, Inc.(1) | | | 43 | | | | 163,762 | |
Office Depot, Inc. | | | 6,650 | | | | 18,221 | |
Polaris, Inc. | | | 1,972 | | | | 200,552 | |
PulteGroup, Inc. | | | 4,531 | | | | 175,803 | |
Purple Innovation, Inc.(1) | | | 1,014 | | | | 8,832 | |
Ralph Lauren Corp. | | | 349 | | | | 40,910 | |
Rent-A-Center, Inc./TX | | | 633 | | | | 18,256 | |
Rocky Brands, Inc. | | | 295 | | | | 8,682 | |
Ross Stores, Inc. | | | 4,072 | | | | 474,062 | |
The accompanying notes are an integral part of these financial statements
Page 68 | 2019 Annual Report | December 31, 2019 |
Schedule of Investments
December 31, 2019
Balanced Fund |
Security Description | | Shares,
Contracts
or Principal
Amount ($) | | | Fair
Value ($) | |
Common Stocks — continued |
Rubicon Project, Inc./The(1) | | | 690 | | | | 5,630 | |
Skechers U.S.A., Inc.(1) | | | 1,296 | | | | 55,974 | |
Sportsman’s Warehouse Holdings, Inc.(1) | | | 2,526 | | | | 20,284 | |
Starbucks Corp. | | | 20,062 | | | | 1,763,851 | |
Steven Madden, Ltd. | | | 2,104 | | | | 90,493 | |
Stoneridge, Inc.(1) | | | 1,130 | | | | 33,132 | |
Superior Industries International, Inc. | | | 240 | | | | 886 | |
Tailored Brands, Inc. | | | 1,619 | | | | 6,703 | |
Target Corp. | | | 15,771 | | | | 2,022,000 | |
Tile Shop Holdings, Inc. | | | 1,899 | | | | 3,209 | |
Tilly’s, Inc. - Class A | | | 1,033 | | | | 12,654 | |
TJX Cos., Inc./The | | | 30,291 | | | | 1,849,568 | |
Toll Brothers, Inc. | | | 3,305 | | | | 130,581 | |
Town Sports International Holdings, Inc.(1) | | | 3,233 | | | | 5,528 | |
Tupperware Brands Corp. | | | 2,806 | | | | 24,075 | |
Whirlpool Corp. | | | 572 | | | | 84,387 | |
Winnebago Industries, Inc. | | | 934 | | | | 49,483 | |
Wyndham Destinations, Inc. | | | 1,519 | | | | 78,517 | |
Yum China Holdings, Inc. | | | 809 | | | | 38,840 | |
| | | | | | | | 22,498,031 | |
| | | | | | | | | |
Consumer Staples — 3.1% | | | | | | | | |
BellRing Brands, Inc.(1) | | | 997 | | | | 21,226 | |
Casey’s General Stores, Inc. | | | 2,405 | | | | 382,371 | |
Coca-Cola Consolidated, Inc. | | | 22 | | | | 6,249 | |
Costco Wholesale Corp. | | | 3,857 | | | | 1,133,649 | |
Flowers Foods, Inc. | | | 1,710 | | | | 37,175 | |
General Mills, Inc. | | | 29,089 | | | | 1,558,007 | |
Hershey Co./The | | | 4,657 | | | | 684,486 | |
Ingles Markets, Inc. | | | 205 | | | | 9,740 | |
Kroger Co./The | | | 4,920 | | | | 142,631 | |
Lifevantage Corp.(1) | | | 638 | | | | 9,959 | |
Molson Coors Beverage Co. | | | 11,209 | | | | 604,165 | |
PepsiCo, Inc. | | | 20,631 | | | | 2,819,639 | |
Performance Food Group Co.(1) | | | 4,069 | | | | 209,472 | |
Philip Morris International, Inc. | | | 2,242 | | | | 190,772 | |
Pilgrim’s Pride Corp.(1) | | | 928 | | | | 30,360 | |
Post Holdings, Inc.(1) | | | 103 | | | | 11,237 | |
Procter & Gamble Co./The | | | 2,087 | | | | 260,666 | |
SpartanNash Co. | | | 1,924 | | | | 27,398 | |
Sysco Corp. | | | 14,519 | | | | 1,241,955 | |
Tyson Foods, Inc. | | | 14,419 | | | | 1,312,706 | |
Walmart, Inc. | | | 15,499 | | | | 1,841,901 | |
| | | | | | | | 12,535,764 | |
| | | | | | | | | |
Balanced Fund |
Security Description | | Shares,
Contracts
or Principal
Amount ($) | | | Fair
Value ($) | |
Common Stocks — continued |
Energy — 2.0% | | | | | | | | |
Amplify Energy Corp. | | | 2,985 | | | | 19,731 | |
Archrock, Inc. | | | 4,236 | | | | 42,529 | |
Ardmore Shipping Corp.(1) | | | 150 | | | | 1,358 | |
Baker Hughes Co. | | | 5,423 | | | | 138,991 | |
Berry Petroleum Corp. | | | 1,367 | | | | 12,891 | |
Brigham Minerals, Inc. | | | 246 | | | | 5,274 | |
Cactus, Inc. | | | 3,561 | | | | 122,214 | |
Chevron Corp. | | | 14,018 | | | | 1,689,309 | |
ConocoPhillips | | | 17,301 | | | | 1,125,084 | |
Contura Energy, Inc.(1) | | | 1,446 | | | | 13,086 | |
Delek US Holdings, Inc. | | | 2,681 | | | | 89,894 | |
Devon Energy Corp. | | | 529 | | | | 13,738 | |
DHT Holdings, Inc. | | | 1,989 | | | | 16,469 | |
Dorian LPG, Ltd.(1) | | | 1,813 | | | | 28,065 | |
Exterran Corp.(1) | | | 3,045 | | | | 23,842 | |
Hallador Energy Co. | | | 1,603 | | | | 4,761 | |
Independence Contract Drilling, Inc.(1) | | | 468 | | | | 467 | |
International Seaways, Inc.(1) | | | 194 | | | | 5,773 | |
Liberty Oilfield Services, Inc. | | | 931 | | | | 10,353 | |
Marathon Petroleum Corp. | | | 17,768 | | | | 1,070,522 | |
Matrix Service Co.(1) | | | 948 | | | | 21,690 | |
NexTier Oilfield Solutions, Inc.(1) | | | 390 | | | | 2,613 | |
Nordic American Tankers, Ltd. | | | 2,572 | | | | 12,654 | |
Oceaneering International, Inc.(1) | | | 1,079 | | | | 16,088 | |
PBF Energy, Inc. | | | 1,881 | | | | 59,007 | |
Peabody Energy Corp. | | | 2,398 | | | | 21,870 | |
Phillips 66 | | | 17,519 | | | | 1,951,792 | |
Profire Energy, Inc.(1) | | | 45 | | | | 65 | |
Renewable Energy Group, Inc.(1) | | | 1,247 | | | | 33,607 | |
Rosehill Resources, Inc.(1) | | | 859 | | | | 1,100 | |
SEACOR Holdings, Inc.(1) | | | 720 | | | | 31,068 | |
SilverBow Resources, Inc.(1) | | | 492 | | | | 4,871 | |
Superior Energy Services, Inc.(1) | | | 400 | | | | 2,004 | |
Talos Energy, Inc.(1) | | | 95 | | | | 2,864 | |
Teekay Tankers, Ltd.(1) | | | 224 | | | | 5,369 | |
Valero Energy Corp. | | | 15,690 | | | | 1,469,369 | |
W&T Offshore, Inc.(1) | | | 160 | | | | 890 | |
World Fuel Services Corp. | | | 569 | | | | 24,706 | |
| | | | | | | | 8,095,978 | |
| | | | | | | | | |
Financials — 6.0% | | | | | | | | |
Ally Financial, Inc. | | | 14,563 | | | | 445,045 | |
Artisan Partners Asset Management, Inc. | | | 5,753 | | | | 185,937 | |
Ashford, Inc.(1) | | | 92 | | | | 2,171 | |
The accompanying notes are an integral part of these financial statements
2019 Annual Report | December 31, 2019 | Page 69 |
Schedule of Investments
December 31, 2019
Balanced Fund |
Security Description | | Shares,
Contracts
or Principal
Amount ($) | | | Fair
Value ($) | |
Common Stocks — continued |
BancFirst Corp. | | | 372 | | | | 23,228 | |
Bank of America Corp. | | | 53,820 | | | | 1,895,540 | |
BankFinancial Corp. | | | 411 | | | | 5,376 | |
Berkshire Hathaway, Inc. - Class B(1) | | | 16,955 | | | | 3,840,308 | |
Brighthouse Financial, Inc.(1) | | | 2,438 | | | | 95,643 | |
Cannae Holdings, Inc.(1) | | | 1,187 | | | | 44,145 | |
Citigroup, Inc. | | | 34,824 | | | | 2,782,089 | |
Citizens Financial Group, Inc. | | | 6,633 | | | | 269,366 | |
Curo Group Holdings Corp.(1) | | | 2,453 | | | | 29,878 | |
Diamond Hill Investment Group, Inc. | | | 112 | | | | 15,732 | |
Elevate Credit, Inc.(1) | | | 2,833 | | | | 12,607 | |
Ellington Financial, Inc. | | | 7,115 | | | | 130,418 | |
Esquire Financial Holdings, Inc.(1) | | | 16 | | | | 417 | |
ESSA Bancorp, Inc. | | | 88 | | | | 1,492 | |
Essent Group, Ltd. | | | 6,464 | | | | 336,063 | |
Farmers National Banc Corp. | | | 361 | | | | 5,892 | |
Fidelity National Financial, Inc. | | | 15,036 | | | | 681,883 | |
Fifth Third Bancorp | | | 56,813 | | | | 1,746,432 | |
First American Financial Corp. | | | 6,130 | | | | 357,502 | |
First BanCorp/Puerto Rico | | | 10,456 | | | | 110,729 | |
First Horizon National Corp. | | | 16,362 | | | | 270,955 | |
FNB Corp./PA | | | 271 | | | | 3,442 | |
GAMCO Investors, Inc. | | | 2 | | | | 39 | |
Great Ajax Corp. | | | 4,177 | | | | 61,861 | |
Hallmark Financial Services, Inc.(1) | | | 202 | | | | 3,549 | |
HBT Financial, Inc.(1) | | | 168 | | | | 3,190 | |
Heritage Commerce Corp. | | | 7,214 | | | | 92,556 | |
Hilltop Holdings, Inc. | | | 7,590 | | | | 189,219 | |
Horizon Bancorp, Inc./IN | | | 136 | | | | 2,584 | |
Independent Bank Corp./MI | | | 398 | | | | 9,015 | |
International Bancshares Corp. | | | 1,711 | | | | 73,693 | |
JPMorgan Chase & Co. | | | 15,859 | | | | 2,210,745 | |
Medley Management, Inc. | | | 1,010 | | | | 2,990 | |
MGIC Investment Corp. | | | 18,285 | | | | 259,098 | |
Nicolet Bankshares, Inc.(1) | | | 498 | | | | 36,777 | |
NMI Holdings, Inc. - Class A(1) | | | 3,460 | | | | 114,803 | |
Northeast Bank | | | 456 | | | | 10,027 | |
Northrim BanCorp, Inc. | | | 1,106 | | | | 42,360 | |
Old Republic International Corp. | | | 13,734 | | | | 307,230 | |
OneMain Holdings, Inc. | | | 1,919 | | | | 80,886 | |
Oppenheimer Holdings, Inc. | | | 5,127 | | | | 140,890 | |
Parke Bancorp, Inc. | | | 136 | | | | 3,453 | |
PCB Bancorp | | | 38 | | | | 657 | |
Peapack Gladstone Financial Corp. | | | 103 | | | | 3,183 | |
PennyMac Financial Services, Inc. | | | 1,137 | | | | 38,703 | |
Piper Sandler Cos. | | | 2,509 | | | | 200,569 | |
Balanced Fund |
Security Description | | Shares,
Contracts
or Principal
Amount ($) | | | Fair
Value ($) | |
Common Stocks — continued |
PNC Financial Services Group, Inc./The | | | 12,940 | | | | 2,065,612 | |
Popular, Inc. | | | 12,914 | | | | 758,698 | |
ProSight Global, Inc.(1) | | | 941 | | | | 15,178 | |
Prudential Financial, Inc. | | | 6,493 | | | | 608,654 | |
Pzena Investment Management, Inc. | | | 3,236 | | | | 27,894 | |
Radian Group, Inc. | | | 13,696 | | | | 344,591 | |
RBB Bancorp | | | 276 | | | | 5,843 | |
Ready Capital Corp. | | | 3,332 | | | | 51,379 | |
Regions Financial Corp. | | | 47,350 | | | | 812,526 | |
Reinsurance Group of America, Inc. | | | 200 | | | | 32,612 | |
Renasant Corp. | | | 3,467 | | | | 122,801 | |
Shore Bancshares, Inc. | | | 211 | | | | 3,663 | |
Silvercrest Asset Management Group, Inc. | | | 296 | | | | 3,724 | |
Stewart Information Services Corp. | | | 1,990 | | | | 81,172 | |
Summit Financial Group, Inc. | | | 273 | | | | 7,396 | |
Synchrony Financial | | | 32,570 | | | | 1,172,846 | |
TPG RE Finance Trust, Inc. | | | 4,005 | | | | 81,181 | |
United Community Banks, Inc./GA | | | 348 | | | | 10,746 | |
Unity Bancorp, Inc. | | | 19 | | | | 429 | |
Univest Financial Corp. | | | 1,389 | | | | 37,197 | |
US Bancorp | | | 10,999 | | | | 652,131 | |
Valley National Bancorp | | | 20,395 | | | | 233,523 | |
Walker & Dunlop, Inc. | | | 1,073 | | | | 69,402 | |
WR Berkley Corp. | | | 4,525 | | | | 312,678 | |
| | | | | | | | 24,692,243 | |
| | | | | | | | | |
Healthcare — 10.0% | | | | | | | | |
Abbott Laboratories | | | 7,500 | | | | 651,450 | |
AbbVie, Inc. | | | 15,648 | | | | 1,385,474 | |
ACADIA Pharmaceuticals, Inc.(1) | | | 1,181 | | | | 50,523 | |
Adverum Biotechnologies, Inc.(1) | | | 138 | | | | 1,590 | |
Affimed NV(1) | | | 4,044 | | | | 11,081 | |
Agenus, Inc.(1) | | | 5,677 | | | | 23,105 | |
Agilent Technologies, Inc. | | | 7,087 | | | | 604,592 | |
Akebia Therapeutics, Inc.(1) | | | 728 | | | | 4,601 | |
Aldeyra Therapeutics, Inc.(1) | | | 1,020 | | | | 5,926 | |
Alexion Pharmaceuticals, Inc.(1) | | | 5,190 | | | | 561,299 | |
Alkermes PLC(1) | | | 2,906 | | | | 59,282 | |
Allergan PLC | | | 4,687 | | | | 896,014 | |
Alnylam Pharmaceuticals, Inc.(1) | | | 2,666 | | | | 307,043 | |
AmerisourceBergen Corp. | | | 3,662 | | | | 311,343 | |
Amgen, Inc. | | | 7,719 | | | | 1,860,819 | |
Amneal Pharmaceuticals, Inc.(1) | | | 2,171 | | | | 10,464 | |
AngioDynamics, Inc.(1) | | | 520 | | | | 8,325 | |
ANI Pharmaceuticals, Inc.(1) | | | 470 | | | | 28,985 | |
Anika Therapeutics, Inc.(1) | | | 105 | | | | 5,444 | |
The accompanying notes are an integral part of these financial statements
Page 70 | 2019 Annual Report | December 31, 2019 |
Schedule of Investments
December 31, 2019
Balanced Fund |
Security Description | | Shares,
Contracts
or Principal
Amount ($) | | | Fair
Value ($) | |
Common Stocks — continued |
Apellis Pharmaceuticals, Inc.(1) | | | 722 | | | | 22,108 | |
Ardelyx, Inc.(1) | | | 1,397 | | | | 10,484 | |
Arena Pharmaceuticals, Inc.(1) | | | 1,855 | | | | 84,254 | |
Arrowhead Pharmaceuticals, Inc.(1) | | | 614 | | | | 38,946 | |
Arvinas, Inc.(1) | | | 209 | | | | 8,588 | |
Assembly Biosciences, Inc.(1) | | | 18 | | | | 368 | |
Assertio Therapeutics, Inc.(1) | | | 9,403 | | | | 11,754 | |
Avantor, Inc.(1) | | | 8,429 | | | | 152,986 | |
Avid Bioservices, Inc.(1) | | | 1,713 | | | | 13,139 | |
Avrobio, Inc.(1) | | | 348 | | | | 7,005 | |
Axsome Therapeutics, Inc.(1) | | | 271 | | | | 28,011 | |
Baudax Bio, Inc.(1) | | | 835 | | | | 5,778 | |
Beyondspring, Inc.(1) | | | 683 | | | | 10,587 | |
BioDelivery Sciences International, Inc.(1) | | | 6,505 | | | | 41,112 | |
Biogen, Inc.(1) | | | 5,037 | | | | 1,494,629 | |
Bio-Rad Laboratories, Inc.(1) | | | 75 | | | | 27,752 | |
Bristol-Myers Squibb Co. | | | 22,582 | | | | 1,449,539 | |
Bruker Corp. | | | 2,031 | | | | 103,520 | |
Calithera Biosciences, Inc.(1) | | | 1,418 | | | | 8,097 | |
Cardinal Health, Inc. | | | 1,322 | | | | 66,867 | |
CareDx, Inc.(1) | | | 6 | | | | 129 | |
Catalent, Inc.(1) | | | 2,197 | | | | 123,691 | |
Catalyst Pharmaceuticals, Inc.(1) | | | 1,412 | | | | 5,295 | |
Celcuity, Inc.(1) | | | 180 | | | | 1,915 | |
Cellular Biomedicine Group, Inc.(1) | | | 708 | | | | 11,498 | |
Cerecor, Inc.(1) | | | 511 | | | | 2,754 | |
Cerner Corp. | | | 11,664 | | | | 856,021 | |
Chemed Corp. | | | 597 | | | | 262,238 | |
Coherus Biosciences, Inc.(1) | | | 455 | | | | 8,192 | |
Collegium Pharmaceutical, Inc.(1) | | | 897 | | | | 18,460 | |
Computer Programs & Systems, Inc. | | | 988 | | | | 26,083 | |
CONMED Corp. | | | 688 | | | | 76,939 | |
Constellation Pharmaceuticals, Inc.(1) | | | 158 | | | | 7,443 | |
Corium International Contingent Value Rights(1)(7) | | | 164 | | | | — | |
Cross Country Healthcare, Inc.(1) | | | 1,428 | | | | 16,593 | |
Cutera, Inc.(1) | | | 208 | | | | 7,448 | |
CVS Health Corp. | | | 4,502 | | | | 334,454 | |
Deciphera Pharmaceuticals, Inc.(1) | | | 449 | | | | 27,946 | |
DENTSPLY SIRONA, Inc. | | | 1,852 | | | | 104,805 | |
DexCom, Inc.(1) | | | 782 | | | | 171,055 | |
Dicerna Pharmaceuticals, Inc.(1) | | | 1,410 | | | | 31,062 | |
Eagle Pharmaceuticals, Inc./DE(1) | | | 76 | | | | 4,566 | |
Edwards Lifesciences Corp.(1) | | | 156 | | | | 36,393 | |
Eiger BioPharmaceuticals, Inc.(1) | | | 16 | | | | 238 | |
Elanco Animal Health, Inc. Contingent Value Rights(1)(7) | | | 1,792 | | | | — | |
Balanced Fund |
Security Description | | Shares,
Contracts
or Principal
Amount ($) | | | Fair
Value ($) | |
Common Stocks — continued |
Eli Lilly & Co. | | | 14,199 | | | | 1,866,175 | |
Eloxx Pharmaceuticals, Inc.(1) | | | 119 | | | | 876 | |
Emergent BioSolutions, Inc.(1) | | | 671 | | | | 36,200 | |
Encompass Health Corp. | | | 1,899 | | | | 131,544 | |
Endo International PLC(1) | | | 4,700 | | | | 22,043 | |
Enochian Biosciences, Inc.(1) | | | 99 | | | | 497 | |
Epizyme, Inc.(1) | | | 28 | | | | 689 | |
Exact Sciences Corp.(1) | | | 1,830 | | | | 169,238 | |
Exelixis, Inc.(1) | | | 7,041 | | | | 124,062 | |
Fate Therapeutics, Inc.(1) | | | 73 | | | | 1,429 | |
Forty Seven, Inc.(1) | | | 330 | | | | 12,992 | |
Gilead Sciences, Inc. | | | 33,236 | | | | 2,159,675 | |
Haemonetics Corp.(1) | | | 54 | | | | 6,205 | |
Harvard Bioscience, Inc.(1) | | | 45 | | | | 137 | |
HealthStream, Inc.(1) | | | 1,099 | | | | 29,893 | |
Hill-Rom Holdings, Inc. | | | 3,437 | | | | 390,203 | |
Horizon Therapeutics Plc(1) | | | 1,698 | | | | 61,468 | |
Humana, Inc. | | | 3,288 | | | | 1,205,118 | |
ImmunoGen, Inc.(1) | | | 2,535 | | | | 12,941 | |
Incyte Corp.(1) | | | 5,242 | | | | 457,731 | |
Insulet Corp.(1) | | | 232 | | | | 39,718 | |
Intersect ENT, Inc.(1) | | | 662 | | | | 16,484 | |
Intra-Cellular Therapies, Inc.(1) | | | 86 | | | | 2,951 | |
Ionis Pharmaceuticals, Inc.(1) | | | 763 | | | | 46,093 | |
Iovance Biotherapeutics, Inc.(1) | | | 1,508 | | | | 41,741 | |
IQVIA Holdings, Inc.(1) | | | 1,481 | | | | 228,829 | |
Jazz Pharmaceuticals PLC(1) | | | 474 | | | | 70,759 | |
Johnson & Johnson | | | 19,141 | | | | 2,792,098 | |
Jounce Therapeutics, Inc.(1) | | | 2,631 | | | | 22,969 | |
Kadmon Holdings, Inc.(1) | | | 2,703 | | | | 12,245 | |
KalVista Pharmaceuticals, Inc.(1) | | | 2 | | | | 36 | |
Karyopharm Therapeutics, Inc.(1) | | | 462 | | | | 8,857 | |
Kodiak Sciences, Inc.(1) | | | 215 | | | | 15,469 | |
Krystal Biotech, Inc.(1) | | | 353 | | | | 19,549 | |
Kura Oncology, Inc.(1) | | | 344 | | | | 4,730 | |
Lannett Co., Inc.(1) | | | 556 | | | | 4,904 | |
Lantheus Holdings, Inc.(1) | | | 382 | | | | 7,835 | |
Lexicon Pharmaceuticals, Inc.(1) | | | 1,787 | | | | 7,416 | |
Mallinckrodt PLC(1) | | | 4,402 | | | | 15,363 | |
Masimo Corp.(1) | | | 799 | | | | 126,290 | |
McKesson Corp. | | | 3,213 | | | | 444,422 | |
Medtronic PLC | | | 21,743 | | | | 2,466,743 | |
MEI Pharma, Inc.(1) | | | 865 | | | | 2,145 | |
MeiraGTx Holdings plc(1) | | | 512 | | | | 10,250 | |
Merck & Co., Inc. | | | 30,082 | | | | 2,735,958 | |
Meridian Bioscience, Inc. | | | 791 | | | | 7,728 | |
The accompanying notes are an integral part of these financial statements
2019 Annual Report | December 31, 2019 | Page 71 |
Schedule of Investments
December 31, 2019
Balanced Fund |
Security Description | | Shares,
Contracts
or Principal
Amount ($) | | | Fair
Value ($) | |
Common Stocks — continued |
Mersana Therapeutics, Inc.(1) | | | 110 | | | | 630 | |
Mirati Therapeutics, Inc.(1) | | | 50 | | | | 6,443 | |
Misonix, Inc.(1) | | | 345 | | | | 6,420 | |
Molecular Templates, Inc.(1) | | | 828 | | | | 11,580 | |
Morphic Holding, Inc.(1) | | | 263 | | | | 4,513 | |
Natera, Inc.(1) | | | 1,283 | | | | 43,224 | |
Natus Medical, Inc.(1) | | | 1,033 | | | | 34,079 | |
Neurocrine Biosciences, Inc.(1) | | | 1,140 | | | | 122,539 | |
Nevro Corp.(1) | | | 16 | | | | 1,881 | |
NextCure, Inc.(1) | | | 13 | | | | 732 | |
NextGen Healthcare, Inc.(1) | | | 645 | | | | 10,365 | |
Novocure, Ltd.(1) | | | 285 | | | | 24,017 | |
Odonate Therapeutics, Inc.(1) | | | 299 | | | | 9,703 | |
Oncternal Therapeutics, Inc.(1) | | | 749 | | | | 2,959 | |
OPKO Health, Inc.(1) | | | 15,419 | | | | 22,666 | |
Organogenesis Holdings, Inc.(1) | | | 529 | | | | 2,544 | |
Orthofix Medical, Inc.(1) | | | 610 | | | | 28,170 | |
Osmotica Pharmaceuticals PLC(1) | | | 1,232 | | | | 8,612 | |
Pacira BioSciences, Inc.(1) | | | 1,984 | | | | 89,875 | |
Palatin Technologies, Inc.(1) | | | 11,896 | | | | 9,305 | |
PDL BioPharma, Inc.(1) | | | 3,439 | | | | 11,160 | |
Pennant Group, Inc./The(1) | | | 1,112 | | | | 36,774 | |
Perrigo Co. PLC | | | 3,102 | | | | 160,249 | |
Pfenex, Inc.(1) | | | 1,762 | | | | 19,347 | |
Pfizer, Inc. | | | 56,246 | | | | 2,203,718 | |
Phibro Animal Health Corp. | | | 2,341 | | | | 58,127 | |
Pieris Pharmaceuticals, Inc.(1) | | | 2,116 | | | | 7,660 | |
PRA Health Sciences, Inc.(1) | | | 2,936 | | | | 326,336 | |
Precision BioSciences, Inc.(1) | | | 68 | | | | 945 | |
Principia Biopharma, Inc.(1) | | | 535 | | | | 29,307 | |
Progenics Pharmaceuticals, Inc.(1) | | | 2,412 | | | | 12,277 | |
Protagonist Therapeutics, Inc.(1) | | | 147 | | | | 1,036 | |
PTC Therapeutics, Inc.(1) | | | 1,050 | | | | 50,432 | |
Puma Biotechnology, Inc.(1) | | | 850 | | | | 7,438 | |
Reata Pharmaceuticals, Inc.(1) | | | 185 | | | | 37,820 | |
Recro Pharma, Inc.(1) | | | 1,779 | | | | 32,609 | |
Regeneron Pharmaceuticals, Inc.(1) | | | 1,735 | | | | 651,458 | |
Replimune Group, Inc.(1) | | | 1,049 | | | | 15,053 | |
ResMed, Inc. | | | 1,646 | | | | 255,081 | |
Rigel Pharmaceuticals, Inc.(1) | | | 12,677 | | | | 27,129 | |
Savara, Inc.(1) | | | 340 | | | | 1,523 | |
Seattle Genetics, Inc.(1) | | | 1,505 | | | | 171,961 | |
SIGA Technologies, Inc.(1) | | | 1,818 | | | | 8,672 | |
STERIS PLC | | | 1,462 | | | | 222,838 | |
Stryker Corp. | | | 9,048 | | | | 1,899,537 | |
Syndax Pharmaceuticals, Inc.(1) | | | 149 | | | | 1,308 | |
Balanced Fund |
Security Description | | Shares,
Contracts
or Principal
Amount ($) | | | Fair
Value ($) | |
Common Stocks — continued |
Syros Pharmaceuticals, Inc.(1) | | | 161 | | | | 1,113 | |
Thermo Fisher Scientific, Inc. | | | 119 | | | | 38,660 | |
United Therapeutics Corp.(1) | | | 1,162 | | | | 102,349 | |
UnitedHealth Group, Inc. | | | 2,508 | | | | 737,302 | |
Vanda Pharmaceuticals, Inc.(1) | | | 2,095 | | | | 34,379 | |
Veeva Systems, Inc.(1) | | | 1,988 | | | | 279,632 | |
Veracyte, Inc.(1) | | | 1,159 | | | | 32,359 | |
Vericel Corp.(1) | | | 2,762 | | | | 48,059 | |
Verrica Pharmaceuticals, Inc.(1) | | | 800 | | | | 12,712 | |
Vertex Pharmaceuticals, Inc.(1) | | | 8,798 | | | | 1,926,322 | |
West Pharmaceutical Services, Inc. | | | 233 | | | | 35,027 | |
XBiotech, Inc.(1) | | | 450 | | | | 8,399 | |
Xencor, Inc.(1) | | | 1,249 | | | | 42,953 | |
Y-mAbs Therapeutics, Inc.(1) | | | 1,195 | | | | 37,344 | |
Zimmer Biomet Holdings, Inc. | | | 7,463 | | | | 1,117,062 | |
Zoetis, Inc. | | | 11,283 | | | | 1,493,305 | |
| | | | | | | | 40,985,829 | |
| | | | | | | | | |
Industrials — 3.2% | | | | | | | | |
AGCO Corp. | | | 2,168 | | | | 167,478 | |
Alamo Group, Inc. | | | 39 | | | | 4,896 | |
Allison Transmission Holdings, Inc. | | | 15,780 | | | | 762,490 | |
Atkore International Group, Inc.(1) | | | 2,631 | | | | 106,450 | |
Barrett Business Services, Inc. | | | 141 | | | | 12,755 | |
BG Staffing, Inc. | | | 28 | | | | 613 | |
BMC Stock Holdings, Inc.(1) | | | 761 | | | | 21,833 | |
Builders FirstSource, Inc.(1) | | | 4,298 | | | | 109,212 | |
Caterpillar, Inc. | | | 3,581 | | | | 528,842 | |
CBIZ, Inc.(1) | | | 776 | | | | 20,921 | |
Cintas Corp. | | | 480 | | | | 129,158 | |
Comfort Systems USA, Inc. | | | 695 | | | | 34,646 | |
Commercial Vehicle Group, Inc.(1) | | | 4,282 | | | | 27,191 | |
Copart, Inc.(1) | | | 6,136 | | | | 558,008 | |
Costamare, Inc. | | | 66 | | | | 629 | |
Cummins, Inc. | | | 9,906 | | | | 1,772,778 | |
Delta Air Lines, Inc. | | | 3,960 | | | | 231,581 | |
Douglas Dynamics, Inc. | | | 57 | | | | 3,135 | |
EMCOR Group, Inc. | | | 4,131 | | | | 356,505 | |
Federal Signal Corp. | | | 737 | | | | 23,768 | |
Fortune Brands Home & Security, Inc. | | | 3,759 | | | | 245,613 | |
Foundation Building Materials, Inc.(1) | | | 479 | | | | 9,269 | |
Generac Holdings, Inc.(1) | | | 1,169 | | | | 117,590 | |
GMS, Inc.(1) | | | 619 | | | | 16,763 | |
H&E Equipment Services, Inc. | | | 140 | | | | 4,680 | |
Heidrick & Struggles International, Inc. | | | 360 | | | | 11,700 | |
Herman Miller, Inc. | | | 533 | | | | 22,199 | |
The accompanying notes are an integral part of these financial statements
Page 72 | 2019 Annual Report | December 31, 2019 |
Schedule of Investments
December 31, 2019
Balanced Fund |
Security Description | | Shares,
Contracts
or Principal
Amount ($) | | | Fair
Value ($) | |
Common Stocks — continued |
Hubbell, Inc. | | | 1,145 | | | | 169,254 | |
Huntington Ingalls Industries, Inc. | | | 944 | | | | 236,831 | |
Illinois Tool Works, Inc. | | | 2,658 | | | | 477,457 | |
Ingersoll-Rand PLC | | | 420 | | | | 55,826 | |
Jacobs Engineering Group, Inc. | | | 968 | | | | 86,955 | |
JetBlue Airways Corp.(1) | | | 752 | | | | 14,077 | |
Johnson Controls International plc | | | 4,307 | | | | 175,338 | |
Kimball International, Inc. - Class B | | | 3,212 | | | | 66,392 | |
Knoll, Inc. | | | 898 | | | | 22,683 | |
Lockheed Martin Corp. | | | 2,218 | | | | 863,645 | |
LSC Communications, Inc. | | | 4,516 | | | | 930 | |
ManpowerGroup, Inc. | | | 3,277 | | | | 318,197 | |
Marten Transport, Ltd. | | | 681 | | | | 14,635 | |
Matson, Inc. | | | 2,098 | | | | 85,598 | |
Meritor, Inc.(1) | | | 768 | | | | 20,114 | |
Miller Industries, Inc./TN | | | 1,034 | | | | 38,392 | |
Northrop Grumman Corp. | | | 919 | | | | 316,108 | |
Northwest Pipe Co.(1) | | | 159 | | | | 5,296 | |
Oshkosh Corp. | | | 3,564 | | | | 337,333 | |
PACCAR, Inc. | | | 17,880 | | | | 1,414,308 | |
Parker-Hannifin Corp. | | | 5,518 | | | | 1,135,715 | |
Park-Ohio Holdings Corp. | | | 220 | | | | 7,403 | |
Powell Industries, Inc. | | | 219 | | | | 10,729 | |
Primoris Services Corp. | | | 328 | | | | 7,295 | |
Quanex Building Products Corp. | | | 1,287 | | | | 21,982 | |
Quanta Services, Inc. | | | 3,417 | | | | 139,106 | |
Resources Connection, Inc. | | | 46 | | | | 751 | |
Rush Enterprises, Inc. | | | 428 | | | | 19,902 | |
Safe Bulkers, Inc.(1) | | | 1,521 | | | | 2,586 | |
Saia, Inc.(1) | | | 276 | | | | 25,701 | |
Standex International Corp. | | | 550 | | | | 43,643 | |
Steelcase, Inc. - Class A | | | 888 | | | | 18,168 | |
Thermon Group Holdings, Inc.(1) | | | 553 | | | | 14,820 | |
Timken Co./The | | | 3,618 | | | | 203,730 | |
Triton International, Ltd./Bermuda | | | 5,144 | | | | 206,789 | |
TrueBlue, Inc.(1) | | | 1,298 | | | | 31,230 | |
UniFirst Corp./MA | | | 274 | | | | 55,343 | |
United Airlines Holdings, Inc.(1) | | | 128 | | | | 11,276 | |
Universal Logistics Holdings, Inc. | | | 49 | | | | 929 | |
Valmont Industries, Inc. | | | 618 | | | | 92,564 | |
Vectrus, Inc.(1) | | | 631 | | | | 32,345 | |
Wabash National Corp. | | | 2,805 | | | | 41,205 | |
WESCO International, Inc.(1) | | | 4,455 | | | | 264,582 | |
WW Grainger, Inc. | | | 2,050 | | | | 693,966 | |
| | | | | | | | 13,101,832 | |
| | | | | | | | | |
Balanced Fund |
Security Description | | Shares,
Contracts
or Principal
Amount ($) | | | Fair
Value ($) | |
Common Stocks — continued |
Information Technology — 14.3% | | | | | | | | |
A10 Networks, Inc.(1) | | | 488 | | | | 3,353 | |
Adobe, Inc.(1) | | | 3,113 | | | | 1,026,699 | |
Alliance Data Systems Corp. | | | 182 | | | | 20,420 | |
Amkor Technology, Inc.(1) | | | 6,551 | | | | 85,163 | |
ANSYS, Inc.(1) | | | 1,948 | | | | 501,435 | |
Apple, Inc. | | | 32,220 | | | | 9,461,403 | |
Applied Materials, Inc. | | | 32,472 | | | | 1,982,091 | |
Aspen Technology, Inc.(1) | | | 2,269 | | | | 274,390 | |
AstroNova, Inc. | | | 883 | | | | 12,115 | |
Avalara, Inc.(1) | | | 10 | | | | 733 | |
Avnet, Inc. | | | 7,484 | | | | 317,621 | |
Benchmark Electronics, Inc. | | | 6,396 | | | | 219,767 | |
Booz Allen Hamilton Holding Corp. | | | 3,627 | | | | 257,989 | |
Broadcom, Inc. | | | 6,269 | | | | 1,981,129 | |
Cadence Design Systems, Inc.(1) | | | 7,765 | | | | 538,580 | |
Cambium Networks Corp.(1) | | | 4,032 | | | | 35,240 | |
CDK Global, Inc. | | | 3,673 | | | | 200,840 | |
CDW Corp./DE | | | 2,861 | | | | 408,665 | |
ChannelAdvisor Corp.(1) | | | 908 | | | | 8,208 | |
Cirrus Logic, Inc.(1) | | | 214 | | | | 17,636 | |
Cisco Systems, Inc. | | | 23,241 | | | | 1,114,638 | |
Citrix Systems, Inc. | | | 9,395 | | | | 1,041,906 | |
CommVault Systems, Inc.(1) | | | 1,926 | | | | 85,977 | |
Comtech Telecommunications Corp. | | | 1,376 | | | | 48,834 | |
Dell Technologies, Inc. - Class C(1) | | | 5,799 | | | | 298,011 | |
Digi International, Inc.(1) | | | 1,575 | | | | 27,909 | |
Digital Turbine, Inc.(1) | | | 245 | | | | 1,747 | |
Dolby Laboratories, Inc. | | | 1,952 | | | | 134,298 | |
Dynatrace, Inc.(1) | | | 8,441 | | | | 213,557 | |
Entegris, Inc. | | | 128 | | | | 6,412 | |
FormFactor, Inc.(1) | | | 187 | | | | 4,856 | |
Fortinet, Inc.(1) | | | 2,791 | | | | 297,967 | |
Hewlett Packard Enterprise Co. | | | 44,951 | | | | 712,923 | |
HP, Inc. | | | 8,206 | | | | 168,633 | |
Intel Corp. | | | 44,065 | | | | 2,637,290 | |
International Business Machines Corp. | | | 11,454 | | | | 1,535,294 | |
Intuit, Inc. | | | 7,764 | | | | 2,033,625 | |
Itron, Inc.(1) | | | 66 | | | | 5,541 | |
j2 Global, Inc. | | | 2,510 | | | | 235,212 | |
Jabil, Inc. | | | 5,256 | | | | 217,230 | |
KBR, Inc. | | | 2,412 | | | | 73,566 | |
Kimball Electronics, Inc.(1) | | | 55 | | | | 965 | |
KLA Corp. | | | 7,406 | | | | 1,319,527 | |
Lam Research Corp. | | | 5,822 | | | | 1,702,353 | |
Leidos Holdings, Inc. | | | 7 | | | | 685 | |
The accompanying notes are an integral part of these financial statements
2019 Annual Report | December 31, 2019 | Page 73 |
Schedule of Investments
December 31, 2019
Balanced Fund |
Security Description | | Shares,
Contracts
or Principal
Amount ($) | | | Fair
Value ($) | |
Common Stocks — continued |
Majesco(1) | | | 67 | | | | 553 | |
Manhattan Associates, Inc.(1) | | | 997 | | | | 79,511 | |
Mastercard, Inc. | | | 11,328 | | | | 3,382,428 | |
Maxim Integrated Products, Inc. | | | 12,333 | | | | 758,603 | |
Methode Electronics, Inc. | | | 1,458 | | | | 57,372 | |
Micron Technology, Inc.(1) | | | 37,492 | | | | 2,016,320 | |
Microsoft Corp. | | | 55,479 | | | | 8,748,935 | |
MicroStrategy, Inc.(1) | | | 248 | | | | 35,372 | |
Mitek Systems, Inc.(1) | | | 315 | | | | 2,410 | |
MKS Instruments, Inc. | | | 243 | | | | 26,732 | |
Model N, Inc.(1) | | | 208 | | | | 7,295 | |
Motorola Solutions, Inc. | | | 3,222 | | | | 519,193 | |
MTS Systems Corp. | | | 623 | | | | 29,923 | |
NCR Corp.(1) | | | 3,323 | | | | 116,837 | |
NortonLifeLock, Inc. | | | 12,103 | | | | 308,869 | |
NVIDIA Corp. | | | 2,205 | | | | 518,837 | |
OneSpan, Inc.(1) | | | 1,285 | | | | 21,999 | |
Oracle Corp. | | | 42,843 | | | | 2,269,822 | |
Paycom Software, Inc.(1) | | | 796 | | | | 210,749 | |
PC Connection, Inc. | | | 828 | | | | 41,118 | |
Perspecta, Inc. | | | 1,208 | | | | 31,940 | |
Photronics, Inc.(1) | | | 2,686 | | | | 42,331 | |
Progress Software Corp. | | | 3,792 | | | | 157,558 | |
Qorvo, Inc.(1) | | | 1,908 | | | | 221,767 | |
QUALCOMM, Inc. | | | 25,789 | | | | 2,275,363 | |
RingCentral, Inc. - Class A(1) | | | 664 | | | | 111,997 | |
Sanmina Corp.(1) | | | 1,828 | | | | 62,591 | |
ScanSource, Inc.(1) | | | 1,027 | | | | 37,948 | |
Skyworks Solutions, Inc. | | | 3,842 | | | | 464,421 | |
SMART Global Holdings, Inc.(1) | | | 1,341 | | | | 50,878 | |
Sonim Technologies, Inc.(1) | | | 727 | | | | 2,639 | |
SPS Commerce, Inc.(1) | | | 316 | | | | 17,513 | |
SS&C Technologies Holdings, Inc. | | | 5,549 | | | | 340,709 | |
Synaptics, Inc.(1) | | | 338 | | | | 22,230 | |
SYNNEX Corp. | | | 1,138 | | | | 146,574 | |
Synopsys, Inc.(1) | | | 7,108 | | | | 989,434 | |
Teradyne, Inc. | | | 2,869 | | | | 195,637 | |
TESSCO Technologies, Inc. | | | 667 | | | | 7,484 | |
Texas Instruments, Inc. | | | 18,819 | | | | 2,414,290 | |
TiVo Corp. | | | 5,272 | | | | 44,707 | |
Tyler Technologies, Inc.(1) | | | 55 | | | | 16,501 | |
Ultra Clean Holdings, Inc.(1) | | | 546 | | | | 12,815 | |
Verint Systems, Inc.(1) | | | 226 | | | | 12,511 | |
Xerox Holdings Corp. | | | 9,921 | | | | 365,787 | |
Balanced Fund |
Security Description | | Shares,
Contracts
or Principal
Amount ($) | | | Fair
Value ($) | |
Common Stocks — continued |
Xperi Corp. | | | 3,217 | | | | 59,515 | |
Zebra Technologies Corp. - Class A(1) | | | 573 | | | | 146,367 | |
| | | | | | | | 58,676,818 | |
Materials — 1.0% | | | | | | | | |
Air Products & Chemicals, Inc. | | | 2,401 | | | | 564,211 | |
AK Steel Holding Corp.(1) | | | 3,767 | | | | 12,393 | |
Celanese Corp. | | | 3,955 | | | | 486,940 | |
CF Industries Holdings, Inc. | | | 140 | | | | 6,684 | |
Hawkins, Inc. | | | 96 | | | | 4,398 | |
Huntsman Corp. | | | 1,943 | | | | 46,943 | |
Innospec, Inc. | | | 404 | | | | 41,790 | |
Koppers Holdings, Inc.(1) | | | 454 | | | | 17,352 | |
LyondellBasell Industries NV | | | 16,243 | | | | 1,534,639 | |
Nucor Corp. | | | 2,715 | | | | 152,800 | |
Olympic Steel, Inc. | | | 1,980 | | | | 35,482 | |
Rayonier Advanced Materials, Inc. | | | 1,653 | | | | 6,348 | |
Reliance Steel & Aluminum Co. | | | 2,887 | | | | 345,747 | |
Royal Gold, Inc. | | | 521 | | | | 63,692 | |
RPM International, Inc. | | | 4,360 | | | | 334,674 | |
Ryerson Holding Corp.(1) | | | 4,773 | | | | 56,465 | |
Steel Dynamics, Inc. | | | 5,729 | | | | 195,015 | |
Stepan Co. | | | 279 | | | | 28,581 | |
Tredegar Corp. | | | 1,635 | | | | 36,542 | |
Valvoline, Inc. | | | 2,747 | | | | 58,813 | |
Warrior Met Coal, Inc. | | | 2,854 | | | | 60,305 | |
| | | | | | | | 4,089,814 | |
| | | | | | | | | |
Real Estate Investment Trust — 2.1% | | | | | | | | |
American Homes 4 Rent | | | 4,418 | | | | 115,796 | |
American Tower Corp. | | | 5,956 | | | | 1,368,808 | |
Apple Hospitality REIT, Inc. | | | 19,350 | | | | 314,438 | |
Ashford Hospitality Trust, Inc. | | | 6,321 | | | | 17,636 | |
AvalonBay Communities, Inc. | | | 2,587 | | | | 542,494 | |
CatchMark Timber Trust, Inc. | | | 2,055 | | | | 23,571 | |
CBL & Associates Properties, Inc. | | | 7,569 | | | | 7,947 | |
Clipper Realty, Inc. | | | 1,068 | | | | 11,321 | |
Colony Capital, Inc. | | | 1,307 | | | | 6,208 | |
CorEnergy Infrastructure Trust, Inc. | | | 1,489 | | | | 66,573 | |
CorePoint Lodging, Inc. | | | 5,217 | | | | 55,718 | |
Corporate Office Properties Trust | | | 2,554 | | | | 75,037 | |
CubeSmart | | | 89 | | | | 2,802 | |
CyrusOne, Inc. | | | 649 | | | | 42,464 | |
Essex Property Trust, Inc. | | | 4,818 | | | | 1,449,543 | |
Gaming and Leisure Properties, Inc. | | | 6,175 | | | | 265,834 | |
Healthcare Realty Trust, Inc. | | | 1,244 | | | | 41,512 | |
Healthcare Trust of America, Inc. - Class A | | | 535 | | | | 16,200 | |
The accompanying notes are an integral part of these financial statements
Page 74 | 2019 Annual Report | December 31, 2019 |
Schedule of Investments
December 31, 2019
Balanced Fund |
Security Description | | Shares,
Contracts
or Principal
Amount ($) | | | Fair
Value ($) | |
Common Stocks — continued |
Hudson Pacific Properties, Inc. | | | 1,347 | | | | 50,715 | |
Lamar Advertising Co. | | | 4,021 | | | | 358,914 | |
Mid-America Apartment Communities, Inc. | | | 1,949 | | | | 256,995 | |
National Health Investors, Inc. | | | 181 | | | | 14,748 | |
National Storage Affiliates Trust | | | 4,842 | | | | 162,788 | |
Office Properties Income Trust | | | 3,442 | | | | 110,626 | |
Pennsylvania Real Estate Investment Trust | | | 434 | | | | 2,313 | |
PS Business Parks, Inc. | | | 1,357 | | | | 223,729 | |
Realogy Holdings Corp. | | | 1,254 | | | | 12,139 | |
Service Properties Trust | | | 16,369 | | | | 398,258 | |
Simon Property Group, Inc. | | | 12,529 | | | | 1,866,320 | |
Spirit MTA REIT | | | 3,461 | | | | 2,657 | |
Summit Hotel Properties, Inc. | | | 4,074 | | | | 50,273 | |
Tanger Factory Outlet Centers, Inc.(2) | | | 14,765 | | | | 217,488 | |
UDR, Inc. | | | 526 | | | | 24,564 | |
Uniti Group, Inc. | | | 317 | | | | 2,603 | |
Urstadt Biddle Properties, Inc. | | | 3,524 | | | | 87,536 | |
Xenia Hotels & Resorts, Inc. | | | 7,527 | | | | 162,658 | |
| | | | | | | | 8,429,226 | |
| | | | | | | | | |
Utilities — 0.6% | | | | | | | | |
American Water Works Co., Inc. | | | 12,912 | | | | 1,586,239 | |
Consolidated Water Co., Ltd. | | | 1,147 | | | | 18,696 | |
MDU Resources Group, Inc. | | | 20,296 | | | | 602,994 | |
NorthWestern Corp. | | | 87 | | | | 6,235 | |
Portland General Electric Co. | | | 228 | | | | 12,720 | |
PPL Corp. | | | 2,052 | | | | 73,626 | |
Spark Energy, Inc. - Class A | | | 1,568 | | | | 14,473 | |
Unitil Corp. | | | 1,146 | | | | 70,828 | |
| | | | | | | | 2,385,811 | |
| | | | | | | | | |
Total Common Stocks (Cost $175,721,951) | | | | | | | 213,887,585 | |
| | | | | | | | | |
Registered Investment Companies — 26.0% |
American Beacon SiM High Yield Opportunities Fund - Class I | | | 375,756 | | | | 3,580,955 | |
Baird Core Plus Bond Fund - Class I | | | 555,625 | | | | 6,423,020 | |
Dodge & Cox Income Fund | | | 519,275 | | | | 7,285,430 | |
DoubleLine Total Return Bond Fund - Class I | | | 394,898 | | | | 4,197,766 | |
Frost Total Return Bond Fund - Class I | | | 513,008 | | | | 5,309,631 | |
Guggenheim Total Return Bond Fund - Class I | | | 79,906 | | | | 2,167,064 | |
iShares Core U.S. Aggregate Bond ETF(8) | | | 106,776 | | | | 11,998,419 | |
iShares JP Morgan USD Emerging Markets Bond ETF(8) | | | 47,124 | | | | 5,398,525 | |
Balanced Fund |
Security Description | | Shares,
Contracts
or Principal
Amount ($) | | | Fair
Value ($) | |
Registered Investment Companies — continued |
Lord Abbett High Yield Fund - Class I | | | 721,674 | | | | 5,434,204 | |
Payden Emerging Markets Bond Fund - Class I | | | 349,181 | | | | 4,801,243 | |
PGIM Total Return Bond Fund - Class R6 | | | 436,373 | | | | 6,292,492 | |
PIMCO Investment Grade Credit Bond Fund - Class I | | | 231,082 | | | | 2,523,412 | |
Pioneer Bond Fund - Class Y | | | 637,643 | | | | 6,242,529 | |
Segall Bryant & Hamill Plus Bond Fund - Class I | | | 495,594 | | | | 5,297,900 | |
TCW Emerging Markets Income Fund - Class I | | | 567,670 | | | | 4,796,809 | |
Vanguard Intermediate-Term Corporate Bond ETF(8) | | | 40,784 | | | | 3,724,803 | |
Vanguard Total Bond Market ETF(8) | | | 143,787 | | | | 12,057,978 | |
Xtrackers USD High Yield Corporate Bond ETF(8) | | | 167,137 | | | | 8,418,693 | |
Total Registered Investment Companies (Cost $103,400,911) | | | | | | | 105,950,873 | |
| | | | | | | | | |
Money Market Registered Investment Companies — 16.5% |
Meeder Institutional Prime Money Market Fund, 1.75%(4) | | | 67,392,229 | | | | 67,392,229 | |
Morgan Stanley Government Institutional Fund, 1.51%(3) | | | 122,950 | | | | 122,950 | |
Total Money Market Registered Investment Companies (Cost $67,506,947) | | | | | | | 67,515,179 | |
| | | | | | | | | |
Bank Obligations — 0.2% |
First Merchants Bank Deposit Account, 2.10%, 1/2/2020(5) | | | 249,236 | | | | 249,236 | |
Metro City Bank Deposit Account, 2.35%, 1/2/2020(5) | | | 249,416 | | | | 249,416 | |
Pacific Mercantile Bank Deposit Account, 1.55%, 1/2/2020(5) | | | 248,972 | | | | 248,972 | |
Total Bank Obligations (Cost $747,624) | | | | | | | 747,624 | |
| | | | | | | | | |
U.S. Government Obligations — 3.5% |
U.S. Treasury Note, 2.25%, due 1/31/2024 | | | 3,873,900 | | | | 3,963,635 | |
U.S. Treasury Note, 2.625%, due 2/15/2029 | | | 1,641,700 | | | | 1,741,100 | |
U.S. Treasury Note, 1.50%, due 8/15/2026 | | | 2,403,100 | | | | 2,356,634 | |
U.S. Treasury Note, 2.25%, due 11/15/2025 | | | 4,899,100 | | | | 5,032,486 | |
The accompanying notes are an integral part of these financial statements
2019 Annual Report | December 31, 2019 | Page 75 |
Schedule of Investments
December 31, 2019
Balanced Fund |
Security Description | | Shares,
Contracts
or Principal
Amount ($) | | | Fair
Value ($) | |
U.S. Government Obligations — continued |
U.S. Treasury Note, 2.125%, due 12/31/2022 | | | 1,044,500 | | | | 1,060,412 | |
Total U.S. Government Obligations (Cost $13,824,942) | | | | | | | 14,154,267 | |
Total Investments — 98.5% (Cost $361,202,375) | | | | | | | 402,255,528 | |
Other Assets less Liabilities — 1.5% | | | | | | | 5,941,497 | |
Total Net Assets — 100.0% | | | | | | | 408,197,025 | |
| | | | | | | | | |
Trustee Deferred Compensation(6) |
Meeder Balanced Fund | | | 2,558 | | | | 31,361 | |
Meeder Dynamic Allocation Fund | | | 6,380 | | | | 75,731 | |
Meeder Muirfield Fund | | | 3,720 | | | | 29,425 | |
Meeder Conservative Allocation Fund | | | 747 | | | | 17,069 | |
Total Trustee Deferred Compensation (Cost $136,698) | | | | | | | 153,586 | |
Balanced Fund |
| | | Long
(Short)
Contracts | | | Expiration
Date | | | Notional
Value of
Contracts
($) | | | Value and
Unrealized
Appreciation
(Depreciation)
($) | |
Futures Contracts |
Index Futures | | | | | | | | | | | | | | | | |
Mini MSCI EAFE Index Futures | | | 224 | | | | 3/20/2020 | | | | 22,808,800 | | | | 73,775 | |
Mini MSCI Emerging Markets Index Futures | | | 102 | | | | 3/20/2020 | | | | 5,713,020 | | | | 57,441 | |
Russell 2000 Mini Index Futures | | | 26 | | | | 3/20/2020 | | | | 2,171,780 | | | | 19,919 | |
Standard & Poors 500 Mini Futures | | | 198 | | | | 3/20/2020 | | | | 31,987,890 | | | | 335,425 | |
E-mini Standard & Poors MidCap 400 Futures | | | 42 | | | | 3/20/2020 | | | | 8,672,160 | | | | 96,449 | |
Total Futures Contracts | | | 592 | | | | | | | | 71,353,650 | | | | 583,009 | |
(1) | Represents non-income producing securities. |
(2) | All or a portion of this security is on loan. |
(3) | Investment purchased with cash received as securities lending collateral. The yield shown represents the 7-day yield in effect at December 31, 2019. |
(4) | Investment in affiliate. The yield shown represents the 7-day yield in effect at December 31, 2019. |
(5) | Variable rate security. Securities payable at par, including accrued interest (usually within seven days notice) and unconditionally secured as to principal and interest by letters of credit or other credit support agreements from major banks. The interest rates are adjustable and are not based on a published reference rate and spread but are determined by the issuer or agent and are based on current market conditions. These securities do not indicate a reference rate and spread in their description above. The rate shown represents the rate in effect at December 31, 2019. The maturity date shown, if applicable, reflects the earlier of the next demand date or stated maturity date. |
(6) | Assets of affiliates to the Balanced Fund held for the benefit of the Fund’s Trustees in connection with the Trustee Deferred Compensation Plan. |
(7) | Fair valued security deemed as Level 3 security. |
The accompanying notes are an integral part of these financial statements
Page 76 | 2019 Annual Report | December 31, 2019 |
Schedule of Investments
December 31, 2019
Moderate Allocation Fund |
Security Description | | Shares or
Principal
Amount ($) | | | Fair
Value ($) | |
Common Stocks — 35.9% |
Communication Services — 3.0% | | | | | | | | |
Alphabet, Inc. - Class A(1) | | | 182 | | | | 243,769 | |
Alphabet, Inc. - Class C(1) | | | 961 | | | | 1,284,876 | |
Altice USA, Inc.(1) | | | 163 | | | | 4,456 | |
AT&T, Inc. | | | 17,301 | | | | 676,123 | |
Beasley Broadcast Group, Inc. | | | 2 | | | | 6 | |
Cinemark Holdings, Inc. | | | 424 | | | | 14,352 | |
Cogent Communications Holdings, Inc. | | | 134 | | | | 8,819 | |
Comcast Corp. - Class A | | | 11,086 | | | | 498,537 | |
Cumulus Media, Inc.(1) | | | 495 | | | | 8,697 | |
Electronic Arts, Inc.(1) | | | 370 | | | | 39,779 | |
Facebook, Inc.(1) | | | 4,177 | | | | 857,329 | |
Frontier Communications Corp.(1) | | | 1,247 | | | | 1,109 | |
Gannett Co., Inc. | | | 179 | | | | 1,142 | |
IDT Corp. - Class B(1) | | | 979 | | | | 7,059 | |
John Wiley & Sons, Inc. | | | 145 | | | | 7,035 | |
Lee Enterprises, Inc.(1) | | | 250 | | | | 355 | |
Liberty Latin America, Ltd. - Class A(1) | | | 65 | | | | 1,255 | |
Liberty TripAdvisor Holdings, Inc.(1) | | | 2,186 | | | | 16,067 | |
Live Nation Entertainment, Inc.(1) | | | 26 | | | | 1,858 | |
Marcus Corp./The | | | 719 | | | | 22,843 | |
MDC Partners, Inc.(1) | | | 390 | | | | 1,084 | |
National CineMedia, Inc. | | | 62 | | | | 452 | |
Roku, Inc.(1) | | | 219 | | | | 29,324 | |
Take-Two Interactive Software, Inc.(1) | | | 910 | | | | 111,411 | |
TechTarget, Inc.(1) | | | 120 | | | | 3,132 | |
Telephone & Data Systems, Inc. | | | 1,989 | | | | 50,580 | |
T-Mobile US, Inc.(1) | | | 6,804 | | | | 533,570 | |
Verizon Communications, Inc. | | | 12,973 | | | | 796,542 | |
Walt Disney Co./The | | | 626 | | | | 90,538 | |
Yelp, Inc.(1) | | | 185 | | | | 6,444 | |
| | | | | | | | 5,318,543 | |
| | | | | | | | | |
Consumer Discretionary — 3.7% | | | | | | | | |
Aaron’s, Inc. | | | 161 | | | | 9,195 | |
Acushnet Holdings Corp. | | | 482 | | | | 15,665 | |
Amazon.com, Inc.(1) | | | 787 | | | | 1,454,250 | |
American Public Education, Inc.(1) | | | 136 | | | | 3,725 | |
America’s Car-Mart, Inc./TX(1) | | | 1 | | | | 110 | |
Aramark | | | 726 | | | | 31,508 | |
AutoZone, Inc.(1) | | | 207 | | | | 246,601 | |
Bassett Furniture Industries, Inc. | | | 567 | | | | 9,458 | |
BBX Capital Corp. | | | 271 | | | | 1,293 | |
Best Buy Co., Inc. | | | 1,200 | | | | 105,360 | |
Biglari Holdings, Inc. - Class B(1) | | | 71 | | | | 8,124 | |
Bloomin’ Brands, Inc. | | | 1,221 | | | | 26,947 | |
BorgWarner, Inc. | | | 567 | | | | 24,596 | |
Moderate Allocation Fund |
Security Description | | Shares or
Principal
Amount ($) | | | Fair
Value ($) | |
Common Stocks — continued |
Burlington Stores, Inc.(1) | | | 20 | | | | 4,561 | |
Citi Trends, Inc. | | | 182 | | | | 4,208 | |
Crocs, Inc.(1) | | | 633 | | | | 26,516 | |
Dana, Inc. | | | 679 | | | | 12,358 | |
Darden Restaurants, Inc. | | | 356 | | | | 38,808 | |
Dollar General Corp. | | | 1,377 | | | | 214,784 | |
eBay, Inc. | | | 5,440 | | | | 196,438 | |
Everi Holdings, Inc.(1) | | | 761 | | | | 10,220 | |
Extended Stay America, Inc. | | | 1,081 | | | | 16,064 | |
Garmin, Ltd. | | | 329 | | | | 32,097 | |
Gentex Corp. | | | 1,149 | | | | 33,298 | |
H&R Block, Inc. | | | 685 | | | | 16,084 | |
Home Depot, Inc./The | | | 307 | | | | 67,043 | |
Hudson, Ltd.(1) | | | 297 | | | | 4,556 | |
J Alexander’s Holdings, Inc.(1) | | | 1,070 | | | | 10,229 | |
KB Home | | | 451 | | | | 15,456 | |
Kirkland’s, Inc.(1) | | | 1,372 | | | | 1,701 | |
Kohl’s Corp. | | | 47 | | | | 2,395 | |
Lear Corp. | | | 698 | | | | 95,766 | |
Lennar Corp. | | | 2,303 | | | | 128,484 | |
LKQ Corp.(1) | | | 1,970 | | | | 70,329 | |
Lululemon Athletica, Inc.(1) | | | 1,229 | | | | 284,722 | |
M/I Homes, Inc.(1) | | | 478 | | | | 18,809 | |
Malibu Boats, Inc.(1) | | | 316 | | | | 12,940 | |
MasterCraft Boat Holdings, Inc.(1) | | | 347 | | | | 5,465 | |
MDC Holdings, Inc. | | | 305 | | | | 11,639 | |
Meritage Homes Corp.(1) | | | 497 | | | | 30,372 | |
MGM Resorts International | | | 7,368 | | | | 245,133 | |
Murphy USA, Inc.(1) | | | 129 | | | | 15,093 | |
NIKE, Inc. - Class B | | | 7,228 | | | | 732,269 | |
NVR, Inc.(1) | | | 6 | | | | 22,850 | |
Office Depot, Inc. | | | 2,064 | | | | 5,655 | |
Polaris, Inc. | | | 614 | | | | 62,444 | |
PulteGroup, Inc. | | | 1,336 | | | | 51,837 | |
Purple Innovation, Inc.(1) | | | 291 | | | | 2,535 | |
Ralph Lauren Corp. | | | 29 | | | | 3,399 | |
Rent-A-Center, Inc./TX | | | 177 | | | | 5,105 | |
Rocky Brands, Inc. | | | 95 | | | | 2,796 | |
Ross Stores, Inc. | | | 1,481 | | | | 172,418 | |
Rubicon Project, Inc./The(1) | | | 207 | | | | 1,689 | |
Skechers U.S.A., Inc.(1) | | | 625 | | | | 26,994 | |
Sportsman’s Warehouse Holdings, Inc.(1) | | | 738 | | | | 5,926 | |
Starbucks Corp. | | | 6,445 | | | | 566,644 | |
Steven Madden, Ltd. | | | 590 | | | | 25,376 | |
Stoneridge, Inc.(1) | | | 296 | | | | 8,679 | |
Superior Industries International, Inc. | | | 45 | | | | 166 | |
Tailored Brands, Inc. | | | 493 | | | | 2,041 | |
The accompanying notes are an integral part of these financial statements
2019 Annual Report | December 31, 2019 | Page 77 |
Schedule of Investments
December 31, 2019
Moderate Allocation Fund |
Security Description | | Shares or
Principal
Amount ($) | | | Fair
Value ($) | |
Common Stocks — continued |
Target Corp. | | | 4,714 | | | | 604,382 | |
Tile Shop Holdings, Inc. | | | 477 | | | | 806 | |
Tilly’s, Inc. - Class A | | | 475 | | | | 5,819 | |
TJX Cos., Inc./The | | | 10,058 | | | | 614,141 | |
Toll Brothers, Inc. | | | 944 | | | | 37,297 | |
Town Sports International Holdings, Inc.(1) | | | 961 | | | | 1,643 | |
Tupperware Brands Corp. | | | 801 | | | | 6,873 | |
Whirlpool Corp. | | | 171 | | | | 25,228 | |
Winnebago Industries, Inc. | | | 260 | | | | 13,775 | |
Wyndham Destinations, Inc. | | | 422 | | | | 21,813 | |
| | | | | | | | 6,593,000 | |
| | | | | | | | | |
Consumer Staples — 2.2% | | | | | | | | |
BellRing Brands, Inc.(1) | | | 228 | | | | 4,854 | |
Casey’s General Stores, Inc. | | | 589 | | | | 93,645 | |
Coca-Cola Consolidated, Inc. | | | 12 | | | | 3,409 | |
Costco Wholesale Corp. | | | 787 | | | | 231,315 | |
Flowers Foods, Inc. | | | 470 | | | | 10,218 | |
General Mills, Inc. | | | 9,769 | | | | 523,228 | |
Hershey Co./The | | | 1,620 | | | | 238,108 | |
Ingles Markets, Inc. | | | 34 | | | | 1,615 | |
Kroger Co./The | | | 1,388 | | | | 40,238 | |
Lifevantage Corp.(1) | | | 190 | | | | 2,966 | |
Molson Coors Beverage Co. | | | 3,442 | | | | 185,524 | |
PepsiCo, Inc. | | | 6,179 | | | | 844,484 | |
Performance Food Group Co.(1) | | | 1,154 | | | | 59,408 | |
Pilgrim’s Pride Corp.(1) | | | 94 | | | | 3,075 | |
Post Holdings, Inc.(1) | | | 14 | | | | 1,527 | |
Procter & Gamble Co./The | | | 1,567 | | | | 195,718 | |
SpartanNash Co. | | | 538 | | | | 7,661 | |
Sysco Corp. | | | 6,522 | | | | 557,892 | |
Tyson Foods, Inc. | | | 4,108 | | | | 373,992 | |
Walmart, Inc. | | | 5,094 | | | | 605,371 | |
| | | | | | | | 3,984,248 | |
| | | | | | | | | |
Energy — 1.3% | | | | | | | | |
Amplify Energy Corp. | | | 881 | | | | 5,823 | |
Archrock, Inc. | | | 900 | | | | 9,036 | |
Ardmore Shipping Corp.(1) | | | 53 | | | | 480 | |
Baker Hughes Co. | | | 1,579 | | | | 40,470 | |
Berry Petroleum Corp. | | | 383 | | | | 3,612 | |
Brigham Minerals, Inc. | | | 106 | | | | 2,273 | |
Cactus, Inc. | | | 1,049 | | | | 36,002 | |
Chevron Corp. | | | 4,180 | | | | 503,732 | |
ConocoPhillips | | | 4,561 | | | | 296,602 | |
Contura Energy, Inc.(1) | | | 374 | | | | 3,385 | |
Delek US Holdings, Inc. | | | 760 | | | | 25,483 | |
Moderate Allocation Fund |
Security Description | | Shares or
Principal
Amount ($) | | | Fair
Value ($) | |
Common Stocks — continued |
Devon Energy Corp. | | | 47 | | | | 1,221 | |
DHT Holdings, Inc. | | | 498 | | | | 4,123 | |
Dorian LPG, Ltd.(1) | | | 595 | | | | 9,211 | |
Exterran Corp.(1) | | | 1,006 | | | | 7,877 | |
Hallador Energy Co. | | | 575 | | | | 1,708 | |
Independence Contract Drilling, Inc.(1) | | | 524 | | | | 522 | |
International Seaways, Inc.(1) | | | 46 | | | | 1,369 | |
Liberty Oilfield Services, Inc. | | | 501 | | | | 5,571 | |
Marathon Petroleum Corp. | | | 5,206 | | | | 313,662 | |
Matrix Service Co.(1) | | | 350 | | | | 8,008 | |
NexTier Oilfield Solutions, Inc.(1) | | | 129 | | | | 864 | |
Nordic American Tankers, Ltd. | | | 724 | | | | 3,562 | |
Oceaneering International, Inc.(1) | | | 356 | | | | 5,308 | |
Pacific Ethanol, Inc.(1) | | | 783 | | | | 509 | |
PBF Energy, Inc. | | | 626 | | | | 19,638 | |
Peabody Energy Corp. | | | 760 | | | | 6,931 | |
Phillips 66 | | | 5,236 | | | | 583,343 | |
Profire Energy, Inc.(1) | | | 11 | | | | 16 | |
Renewable Energy Group, Inc.(1) | | | 378 | | | | 10,187 | |
Rosehill Resources, Inc.(1) | | | 220 | | | | 282 | |
SEACOR Holdings, Inc.(1) | | | 221 | | | | 9,536 | |
SilverBow Resources, Inc.(1) | | | 140 | | | | 1,386 | |
Superior Energy Services, Inc.(1) | | | 119 | | | | 596 | |
Talos Energy, Inc.(1) | | | 20 | | | | 603 | |
Teekay Tankers, Ltd.(1) | | | 74 | | | | 1,774 | |
Valero Energy Corp. | | | 4,267 | | | | 399,605 | |
Westmoreland Coal Co.(1) | | | 773 | | | | 10 | |
World Fuel Services Corp. | | | 86 | | | | 3,734 | |
| | | | | | | | 2,328,054 | |
| | | | | | | | | |
Financials — 4.2% | | | | | | | | |
Ally Financial, Inc. | | | 4,867 | | | | 148,736 | |
Artisan Partners Asset Management, Inc. | | | 1,461 | | | | 47,220 | |
Ashford, Inc.(1) | | | 26 | | | | 614 | |
BancFirst Corp. | | | 102 | | | | 6,369 | |
Bank of America Corp. | | | 15,223 | | | | 536,154 | |
BankFinancial Corp. | | | 97 | | | | 1,269 | |
Berkshire Hathaway, Inc. - Class B(1) | | | 5,022 | | | | 1,137,483 | |
Brighthouse Financial, Inc.(1) | | | 631 | | | | 24,754 | |
C&F Financial Corp. | | | 65 | | | | 3,596 | |
Cannae Holdings, Inc.(1) | | | 358 | | | | 13,314 | |
Citigroup, Inc. | | | 10,409 | | | | 831,575 | |
Citizens Financial Group, Inc. | | | 1,095 | | | | 44,468 | |
Curo Group Holdings Corp.(1) | | | 711 | | | | 8,660 | |
Diamond Hill Investment Group, Inc. | | | 15 | | | | 2,107 | |
Elevate Credit, Inc.(1) | | | 879 | | | | 3,912 | |
Ellington Financial, Inc. | | | 2,126 | | | | 38,970 | |
The accompanying notes are an integral part of these financial statements
Page 78 | 2019 Annual Report | December 31, 2019 |
Schedule of Investments
December 31, 2019
Moderate Allocation Fund |
Security Description | | Shares or
Principal
Amount ($) | | | Fair
Value ($) | |
Common Stocks — continued |
Esquire Financial Holdings, Inc.(1) | | | 69 | | | | 1,799 | |
ESSA Bancorp, Inc. | | | 11 | | | | 186 | |
Essent Group, Ltd. | | | 1,902 | | | | 98,885 | |
Exantas Capital Corp. | | | 510 | | | | 6,023 | |
Fidelity National Financial, Inc. | | | 4,028 | | | | 182,670 | |
Fifth Third Bancorp | | | 16,984 | | | | 522,088 | |
First American Financial Corp. | | | 1,693 | | | | 98,736 | |
First BanCorp/Puerto Rico | | | 2,885 | | | | 30,552 | |
First Horizon National Corp. | | | 5,954 | | | | 98,598 | |
FNB Corp./PA | | | 69 | | | | 876 | |
Great Ajax Corp. | | | 1,133 | | | | 16,780 | |
Hallmark Financial Services, Inc.(1) | | | 145 | | | | 2,548 | |
HBT Financial, Inc.(1) | | | 27 | | | | 513 | |
Heritage Commerce Corp. | | | 2,403 | | | | 30,830 | |
Hilltop Holdings, Inc. | | | 2,171 | | | | 54,123 | |
Horizon Bancorp, Inc./IN | | | 61 | | | | 1,159 | |
Independent Bank Corp./MI | | | 218 | | | | 4,938 | |
International Bancshares Corp. | | | 221 | | | | 9,518 | |
JPMorgan Chase & Co. | | | 4,990 | | | | 695,606 | |
Medley Management, Inc. | | | 271 | | | | 802 | |
MGIC Investment Corp. | | | 4,849 | | | | 68,710 | |
NewStar Financial Contingent Value Rights(1)(7) | | | 31 | | | | — | |
Nicolet Bankshares, Inc.(1) | | | 132 | | | | 9,748 | |
NMI Holdings, Inc. - Class A(1) | | | 1,128 | | | | 37,427 | |
Northeast Bank | | | 214 | | | | 4,706 | |
Northrim BanCorp, Inc. | | | 388 | | | | 14,860 | |
Old Republic International Corp. | | | 4,276 | | | | 95,654 | |
OneMain Holdings, Inc. | | | 414 | | | | 17,450 | |
Oppenheimer Holdings, Inc. | | | 1,504 | | | | 41,330 | |
Parke Bancorp, Inc. | | | 66 | | | | 1,676 | |
Peapack Gladstone Financial Corp. | | | 16 | | | | 494 | |
PennyMac Financial Services, Inc. | | | 319 | | | | 10,859 | |
Piper Sandler Cos. | | | 635 | | | | 50,762 | |
PNC Financial Services Group, Inc./The | | | 3,870 | | | | 617,768 | |
Popular, Inc. | | | 3,609 | | | | 212,029 | |
ProSight Global, Inc.(1) | | | 379 | | | | 6,113 | |
Prudential Financial, Inc. | | | 1,626 | | | | 152,421 | |
Pzena Investment Management, Inc. | | | 844 | | | | 7,275 | |
Radian Group, Inc. | | | 3,953 | | | | 99,457 | |
RBB Bancorp | | | 112 | | | | 2,371 | |
Ready Capital Corp. | | | 1,048 | | | | 16,160 | |
Regions Financial Corp. | | | 16,682 | | | | 286,263 | |
Renasant Corp. | | | 1,679 | | | | 59,470 | |
Silvercrest Asset Management Group, Inc. | | | 106 | | | | 1,333 | |
Stewart Information Services Corp. | | | 577 | | | | 23,536 | |
Summit Financial Group, Inc. | | | 96 | | | | 2,601 | |
Moderate Allocation Fund |
Security Description | | Shares or
Principal
Amount ($) | | | Fair
Value ($) | |
Common Stocks — continued |
Synchrony Financial | | | 10,727 | | | | 386,279 | |
TPG RE Finance Trust, Inc. | | | 1,394 | | | | 28,256 | |
United Community Banks, Inc./GA | | | 186 | | | | 5,744 | |
Unity Bancorp, Inc. | | | 10 | | | | 226 | |
Univest Financial Corp. | | | 435 | | | | 11,649 | |
US Bancorp | | | 5,697 | | | | 337,775 | |
Valley National Bancorp | | | 5,637 | | | | 64,544 | |
Walker & Dunlop, Inc. | | | 280 | | | | 18,110 | |
WR Berkley Corp. | | | 1,298 | | | | 89,692 | |
| | | | | | | | 7,489,179 | |
| | | | | | | | | |
Healthcare — 6.8% | | | | | | | | |
Abbott Laboratories | | | 2,150 | | | | 186,749 | |
AbbVie, Inc. | | | 5,660 | | | | 501,136 | |
ACADIA Pharmaceuticals, Inc.(1) | | | 344 | | | | 14,716 | |
Adverum Biotechnologies, Inc.(1) | | | 92 | | | | 1,060 | |
Aeglea BioTherapeutics, Inc.(1) | | | 83 | | | | 634 | |
Affimed NV(1) | | | 1,225 | | | | 3,357 | |
Agenus, Inc.(1) | | | 1,815 | | | | 7,387 | |
Agilent Technologies, Inc. | | | 1,739 | | | | 148,354 | |
Akebia Therapeutics, Inc.(1) | | | 237 | | | | 1,498 | |
Aldeyra Therapeutics, Inc.(1) | | | 293 | | | | 1,702 | |
Alexion Pharmaceuticals, Inc.(1) | | | 1,467 | | | | 158,656 | |
Alkermes PLC(1) | | | 935 | | | | 19,074 | |
Allergan PLC | | | 2,590 | | | | 495,130 | |
Alnylam Pharmaceuticals, Inc.(1) | | | 830 | | | | 95,591 | |
AmerisourceBergen Corp. | | | 1,161 | | | | 98,708 | |
Amgen, Inc. | | | 2,598 | | | | 626,300 | |
Amneal Pharmaceuticals, Inc.(1) | | | 607 | | | | 2,926 | |
AngioDynamics, Inc.(1) | | | 183 | | | | 2,930 | |
ANI Pharmaceuticals, Inc.(1) | | | 147 | | | | 9,065 | |
Anika Therapeutics, Inc.(1) | | | 51 | | | | 2,644 | |
Apellis Pharmaceuticals, Inc.(1) | | | 258 | | | | 7,900 | |
Ardelyx, Inc.(1) | | | 444 | | | | 3,332 | |
Arena Pharmaceuticals, Inc.(1) | | | 603 | | | | 27,388 | |
Arrowhead Pharmaceuticals, Inc.(1) | | | 220 | | | | 13,955 | |
Arvinas, Inc.(1) | | | 76 | | | | 3,123 | |
Assembly Biosciences, Inc.(1) | | | 16 | | | | 327 | |
Assertio Therapeutics, Inc.(1) | | | 3,169 | | | | 3,961 | |
Avantor, Inc.(1) | | | 2,082 | | | | 37,788 | |
Avid Bioservices, Inc.(1) | | | 616 | | | | 4,725 | |
Avrobio, Inc.(1) | | | 121 | | | | 2,436 | |
Axsome Therapeutics, Inc.(1) | | | 82 | | | | 8,476 | |
Baudax Bio, Inc.(1) | | | 295 | | | | 2,041 | |
Beyondspring, Inc.(1) | | | 183 | | | | 2,837 | |
BioDelivery Sciences International, Inc.(1) | | | 2,043 | | | | 12,912 | |
The accompanying notes are an integral part of these financial statements
2019 Annual Report | December 31, 2019 | Page 79 |
Schedule of Investments
December 31, 2019
Moderate Allocation Fund |
Security Description | | Shares or
Principal
Amount ($) | | | Fair
Value ($) | |
Common Stocks — continued |
Biogen, Inc.(1) | | | 1,892 | | | | 561,413 | |
Bio-Rad Laboratories, Inc.(1) | | | 8 | | | | 2,960 | |
Bristol-Myers Squibb Co. | | | 5,623 | | | | 360,940 | |
Bruker Corp. | | | 606 | | | | 30,888 | |
Calithera Biosciences, Inc.(1) | | | 454 | | | | 2,592 | |
Calyxt, Inc.(1) | | | 14 | | | | 98 | |
Cardinal Health, Inc. | | | 4 | | | | 202 | |
Catalent, Inc.(1) | | | 305 | | | | 17,172 | |
Catalyst Pharmaceuticals, Inc.(1) | | | 492 | | | | 1,845 | |
Celcuity, Inc.(1) | | | 82 | | | | 872 | |
Cellular Biomedicine Group, Inc.(1) | | | 12 | | | | 195 | |
Cerecor, Inc.(1) | | | 142 | | | | 765 | |
Cerner Corp. | | | 3,498 | | | | 256,718 | |
Chemed Corp. | | | 124 | | | | 54,468 | |
Coherus Biosciences, Inc.(1) | | | 186 | | | | 3,349 | |
Collegium Pharmaceutical, Inc.(1) | | | 268 | | | | 5,515 | |
Computer Programs & Systems, Inc. | | | 217 | | | | 5,729 | |
CONMED Corp. | | | 182 | | | | 20,353 | |
Constellation Pharmaceuticals, Inc.(1) | | | 51 | | | | 2,403 | |
Corium International Contingent Value Rights(1)(7) | | | 50 | | | | — | |
Cross Country Healthcare, Inc.(1) | | | 342 | | | | 3,974 | |
Cutera, Inc.(1) | | | 83 | | | | 2,972 | |
Deciphera Pharmaceuticals, Inc.(1) | | | 142 | | | | 8,838 | |
DENTSPLY SIRONA, Inc. | | | 502 | | | | 28,408 | |
DexCom, Inc.(1) | | | 221 | | | | 48,342 | |
Dicerna Pharmaceuticals, Inc.(1) | | | 487 | | | | 10,729 | |
Eagle Pharmaceuticals, Inc./DE(1) | | | 29 | | | | 1,742 | |
Eiger BioPharmaceuticals, Inc.(1) | | | 42 | | | | 626 | |
Elanco Animal Health, Inc. Contingent Value Rights(1)(7) | | | 162 | | | | — | |
Eli Lilly & Co. | | | 3,936 | | | | 517,308 | |
Eloxx Pharmaceuticals, Inc.(1) | | | 44 | | | | 324 | |
Emergent BioSolutions, Inc.(1) | | | 193 | | | | 10,412 | |
Encompass Health Corp. | | | 275 | | | | 19,049 | |
Endo International PLC(1) | | | 1,407 | | | | 6,599 | |
Enochian Biosciences, Inc.(1) | | | 37 | | | | 186 | |
Epizyme, Inc.(1) | | | 22 | | | | 541 | |
Exact Sciences Corp.(1) | | | 261 | | | | 24,137 | |
Exelixis, Inc.(1) | | | 2,082 | | | | 36,685 | |
Forty Seven, Inc.(1) | | | 96 | | | | 3,780 | |
Gilead Sciences, Inc. | | | 9,934 | | | | 645,511 | |
Haemonetics Corp.(1) | | | 17 | | | | 1,953 | |
Harvard Bioscience, Inc.(1) | | | 12 | | | | 37 | |
HealthStream, Inc.(1) | | | 55 | | | | 1,496 | |
Hill-Rom Holdings, Inc. | | | 1,093 | | | | 124,088 | |
Hologic, Inc.(1) | | | 35 | | | | 1,827 | |
Moderate Allocation Fund |
Security Description | | Shares or
Principal
Amount ($) | | | Fair
Value ($) | |
Common Stocks — continued |
Horizon Therapeutics Plc(1) | | | 552 | | | | 19,982 | |
Humana, Inc. | | | 1,235 | | | | 452,652 | |
ImmunoGen, Inc.(1) | | | 696 | | | | 3,553 | |
Incyte Corp.(1) | | | 1,712 | | | | 149,492 | |
Insulet Corp.(1) | | | 45 | | | | 7,704 | |
Intersect ENT, Inc.(1) | | | 186 | | | | 4,631 | |
Intra-Cellular Therapies, Inc.(1) | | | 30 | | | | 1,029 | |
Ionis Pharmaceuticals, Inc.(1) | | | 29 | | | | 1,752 | |
Iovance Biotherapeutics, Inc.(1) | | | 548 | | | | 15,169 | |
Jazz Pharmaceuticals PLC(1) | | | 80 | | | | 11,942 | |
Johnson & Johnson | | | 5,870 | | | | 856,257 | |
Jounce Therapeutics, Inc.(1) | | | 798 | | | | 6,967 | |
Kadmon Holdings, Inc.(1) | | | 884 | | | | 4,005 | |
KalVista Pharmaceuticals, Inc.(1) | | | 20 | | | | 356 | |
Karyopharm Therapeutics, Inc.(1) | | | 157 | | | | 3,010 | |
Kindred Biosciences, Inc.(1) | | | 71 | | | | 602 | |
Kodiak Sciences, Inc.(1) | | | 68 | | | | 4,893 | |
Krystal Biotech, Inc.(1) | | | 110 | | | | 6,092 | |
Kura Oncology, Inc.(1) | | | 171 | | | | 2,351 | |
Lannett Co., Inc.(1) | | | 186 | | | | 1,641 | |
Lantheus Holdings, Inc.(1) | | | 73 | | | | 1,497 | |
Lexicon Pharmaceuticals, Inc.(1) | | | 581 | | | | 2,411 | |
Mallinckrodt PLC(1) | | | 1,266 | | | | 4,418 | |
Masimo Corp.(1) | | | 236 | | | | 37,302 | |
McKesson Corp. | | | 1,049 | | | | 145,098 | |
Medtronic PLC | | | 6,583 | | | | 746,841 | |
MEI Pharma, Inc.(1) | | | 82 | | | | 203 | |
MeiraGTx Holdings plc(1) | | | 212 | | | | 4,244 | |
Merck & Co., Inc. | | | 8,972 | | | | 816,003 | |
Meridian Bioscience, Inc. | | | 251 | | | | 2,452 | |
Mersana Therapeutics, Inc.(1) | | | 65 | | | | 372 | |
Mirati Therapeutics, Inc.(1) | | | 14 | | | | 1,804 | |
Misonix, Inc.(1) | | | 90 | | | | 1,675 | |
Molecular Templates, Inc.(1) | | | 254 | | | | 3,552 | |
Morphic Holding, Inc.(1) | | | 98 | | | | 1,682 | |
Myriad Genetics, Inc.(1) | | | 23 | | | | 626 | |
Natera, Inc.(1) | | | 372 | | | | 12,533 | |
National Research Corp. | | | 55 | | | | 3,627 | |
Natus Medical, Inc.(1) | | | 414 | | | | 13,658 | |
Neurocrine Biosciences, Inc.(1) | | | 302 | | | | 32,462 | |
Nevro Corp.(1) | | | 43 | | | | 5,054 | |
NextCure, Inc.(1) | | | 6 | | | | 338 | |
NextGen Healthcare, Inc.(1) | | | 160 | | | | 2,571 | |
Novocure, Ltd.(1) | | | 113 | | | | 9,523 | |
Odonate Therapeutics, Inc.(1) | | | 93 | | | | 3,018 | |
Oncternal Therapeutics, Inc.(1) | | | 232 | | | | 916 | |
OPKO Health, Inc.(1) | | | 4,973 | | | | 7,310 | |
The accompanying notes are an integral part of these financial statements
Page 80 | 2019 Annual Report | December 31, 2019 |
Schedule of Investments
December 31, 2019
Moderate Allocation Fund |
Security Description | | Shares or
Principal
Amount ($) | | | Fair
Value ($) | |
Common Stocks — continued |
Organogenesis Holdings, Inc.(1) | | | 140 | | | | 673 | |
Orthofix Medical, Inc.(1) | | | 154 | | | | 7,112 | |
Osmotica Pharmaceuticals PLC(1) | | | 379 | | | | 2,649 | |
Owens & Minor, Inc. | | | 8 | | | | 41 | |
Pacira BioSciences, Inc.(1) | | | 415 | | | | 18,800 | |
Palatin Technologies, Inc.(1) | | | 3,675 | | | | 2,875 | |
PDL BioPharma, Inc.(1) | | | 1,080 | | | | 3,505 | |
Pennant Group, Inc./The(1) | | | 303 | | | | 10,020 | |
Perrigo Co. PLC | | | 896 | | | | 46,287 | |
Pfenex, Inc.(1) | | | 540 | | | | 5,929 | |
Pfizer, Inc. | | | 17,868 | | | | 700,068 | |
Phibro Animal Health Corp. | | | 690 | | | | 17,133 | |
Pieris Pharmaceuticals, Inc.(1) | | | 707 | | | | 2,559 | |
PRA Health Sciences, Inc.(1) | | | 1,056 | | | | 117,374 | |
Precision BioSciences, Inc.(1) | | | 35 | | | | 486 | |
Principia Biopharma, Inc.(1) | | | 116 | | | | 6,354 | |
Progenics Pharmaceuticals, Inc.(1) | | | 910 | | | | 4,632 | |
Protagonist Therapeutics, Inc.(1) | | | 82 | | | | 578 | |
PTC Therapeutics, Inc.(1) | | | 394 | | | | 18,924 | |
Puma Biotechnology, Inc.(1) | | | 79 | | | | 691 | |
Reata Pharmaceuticals, Inc.(1) | | | 57 | | | | 11,653 | |
Recro Pharma, Inc.(1) | | | 573 | | | | 10,503 | |
Regeneron Pharmaceuticals, Inc.(1) | | | 397 | | | | 149,066 | |
Replimune Group, Inc.(1) | | | 304 | | | | 4,362 | |
ResMed, Inc. | | | 602 | | | | 93,292 | |
Rigel Pharmaceuticals, Inc.(1) | | | 3,945 | | | | 8,442 | |
Seattle Genetics, Inc.(1) | | | 476 | | | | 54,388 | |
SIGA Technologies, Inc.(1) | | | 396 | | | | 1,889 | |
STERIS PLC | | | 590 | | | | 89,928 | |
Stryker Corp. | | | 2,650 | | | | 556,341 | |
Syndax Pharmaceuticals, Inc.(1) | | | 84 | | | | 738 | |
Tricida, Inc.(1) | | | 5 | | | | 189 | |
United Therapeutics Corp.(1) | | | 393 | | | | 34,615 | |
UnitedHealth Group, Inc. | | | 340 | | | | 99,953 | |
Vanda Pharmaceuticals, Inc.(1) | | | 632 | | | | 10,371 | |
Veeva Systems, Inc.(1) | | | 680 | | | | 95,649 | |
Veracyte, Inc.(1) | | | 328 | | | | 9,158 | |
Vericel Corp.(1) | | | 951 | | | | 16,547 | |
Verrica Pharmaceuticals, Inc.(1) | | | 227 | | | | 3,607 | |
Vertex Pharmaceuticals, Inc.(1) | | | 2,401 | | | | 525,699 | |
West Pharmaceutical Services, Inc. | | | 69 | | | | 10,373 | |
XBiotech, Inc.(1) | | | 138 | | | | 2,576 | |
Xencor, Inc.(1) | | | 486 | | | | 16,714 | |
Y-mAbs Therapeutics, Inc.(1) | | | 356 | | | | 11,125 | |
Zimmer Biomet Holdings, Inc. | | | 2,045 | | | | 306,096 | |
Zoetis, Inc. | | | 2,541 | | | | 336,301 | |
| | | | | | | | 12,178,394 | |
Moderate Allocation Fund |
Security Description | | Shares or
Principal
Amount ($) | | | Fair
Value ($) | |
Common Stocks — continued |
Industrials — 2.2% | | | | | | | | |
AGCO Corp. | | | 664 | | | | 51,294 | |
Alamo Group, Inc. | | | 15 | | | | 1,883 | |
Allison Transmission Holdings, Inc. | | | 4,672 | | | | 225,751 | |
Atkore International Group, Inc.(1) | | | 763 | | | | 30,871 | |
Barrett Business Services, Inc. | | | 38 | | | | 3,437 | |
BMC Stock Holdings, Inc.(1) | | | 212 | | | | 6,082 | |
Builders FirstSource, Inc.(1) | | | 1,352 | | | | 34,354 | |
Caterpillar, Inc. | | | 1,156 | | | | 170,718 | |
CBIZ, Inc.(1) | | | 299 | | | | 8,061 | |
Cintas Corp. | | | 171 | | | | 46,013 | |
Comfort Systems USA, Inc. | | | 182 | | | | 9,073 | |
Commercial Vehicle Group, Inc.(1) | | | 1,206 | | | | 7,658 | |
Copart, Inc.(1) | | | 1,446 | | | | 131,499 | |
Cummins, Inc. | | | 2,861 | | | | 512,005 | |
Delta Air Lines, Inc. | | | 1,791 | | | | 104,738 | |
EMCOR Group, Inc. | | | 1,172 | | | | 101,144 | |
Federal Signal Corp. | | | 273 | | | | 8,804 | |
Fortune Brands Home & Security, Inc. | | | 1,559 | | | | 101,865 | |
Foundation Building Materials, Inc.(1) | | | 154 | | | | 2,980 | |
Generac Holdings, Inc.(1) | | | 393 | | | | 39,532 | |
GMS, Inc.(1) | | | 211 | | | | 5,714 | |
H&E Equipment Services, Inc. | | | 62 | | | | 2,073 | |
Heidrick & Struggles International, Inc. | | | 99 | | | | 3,218 | |
Herman Miller, Inc. | | | 173 | | | | 7,205 | |
Hubbell, Inc. | | | 176 | | | | 26,016 | |
Huntington Ingalls Industries, Inc. | | | 239 | | | | 59,960 | |
Hurco Cos., Inc. | | | 1 | | | | 38 | |
Illinois Tool Works, Inc. | | | 1,916 | | | | 344,171 | |
Ingersoll-Rand PLC | | | 98 | | | | 13,026 | |
Jacobs Engineering Group, Inc. | | | 261 | | | | 23,446 | |
JetBlue Airways Corp.(1) | | | 655 | | | | 12,262 | |
Johnson Controls International plc | | | 91 | | | | 3,705 | |
Kimball International, Inc. - Class B | | | 844 | | | | 17,445 | |
Knoll, Inc. | | | 361 | | | | 9,119 | |
Lockheed Martin Corp. | | | 309 | | | | 120,318 | |
LSC Communications, Inc. | | | 1,369 | | | | 282 | |
ManpowerGroup, Inc. | | | 953 | | | | 92,536 | |
Marten Transport, Ltd. | | | 263 | | | | 5,652 | |
MasTec, Inc.(1) | | | 11 | | | | 706 | |
Matson, Inc. | | | 574 | | | | 23,419 | |
Meritor, Inc.(1) | | | 44 | | | | 1,152 | |
Miller Industries, Inc./TN | | | 461 | | | | 17,117 | |
Northrop Grumman Corp. | | | 52 | | | | 17,886 | |
Northwest Pipe Co.(1) | | | 56 | | | | 1,865 | |
Oshkosh Corp. | | | 926 | | | | 87,646 | |
The accompanying notes are an integral part of these financial statements
2019 Annual Report | December 31, 2019 | Page 81 |
Schedule of Investments
December 31, 2019
Moderate Allocation Fund |
Security Description | | Shares or
Principal
Amount ($) | | | Fair
Value ($) | |
Common Stocks — continued |
PACCAR, Inc. | | | 4,846 | | | | 383,319 | |
Parker-Hannifin Corp. | | | 1,872 | | | | 385,295 | |
Park-Ohio Holdings Corp. | | | 140 | | | | 4,711 | |
Powell Industries, Inc. | | | 59 | | | | 2,890 | |
Primoris Services Corp. | | | 33 | | | | 734 | |
Quanex Building Products Corp. | | | 453 | | | | 7,737 | |
Quanta Services, Inc. | | | 1,456 | | | | 59,274 | |
Resources Connection, Inc. | | | 9 | | | | 147 | |
Rush Enterprises, Inc. | | | 185 | | | | 8,603 | |
Safe Bulkers, Inc.(1) | | | 451 | | | | 767 | |
Saia, Inc.(1) | | | 87 | | | | 8,101 | |
Schneider National, Inc. | | | 46 | | | | 1,004 | |
SPX Corp.(1) | | | 9 | | | | 458 | |
Standex International Corp. | | | 174 | | | | 13,807 | |
Steelcase, Inc. - Class A | | | 356 | | | | 7,284 | |
Thermon Group Holdings, Inc.(1) | | | 75 | | | | 2,010 | |
Timken Co./The | | | 1,110 | | | | 62,504 | |
Triton International, Ltd./Bermuda | | | 1,399 | | | | 56,240 | |
TrueBlue, Inc.(1) | | | 441 | | | | 10,610 | |
UniFirst Corp./MA | | | 109 | | | | 22,016 | |
United Airlines Holdings, Inc.(1) | | | 179 | | | | 15,768 | |
Universal Logistics Holdings, Inc. | | | 18 | | | | 341 | |
Valmont Industries, Inc. | | | 154 | | | | 23,066 | |
Vectrus, Inc.(1) | | | 195 | | | | 9,996 | |
Wabash National Corp. | | | 665 | | | | 9,769 | |
WESCO International, Inc.(1) | | | 1,358 | | | | 80,652 | |
Willis Lease Finance Corp.(1) | | | 4 | | | | 236 | |
WW Grainger, Inc. | | | 557 | | | | 188,556 | |
| | | | | | | | 3,859,634 | |
| | | | | | | | | |
Information Technology — 9.9% | | | | | | | | |
Adobe, Inc.(1) | | | 999 | | | | 329,480 | |
Alliance Data Systems Corp. | | | 67 | | | | 7,517 | |
Amkor Technology, Inc.(1) | | | 2,231 | | | | 29,003 | |
ANSYS, Inc.(1) | | | 604 | | | | 155,476 | |
Apple, Inc. | | | 9,644 | | | | 2,831,961 | |
Applied Materials, Inc. | | | 9,705 | | | | 592,393 | |
Aspen Technology, Inc.(1) | | | 636 | | | | 76,911 | |
AstroNova, Inc. | | | 279 | | | | 3,828 | |
Avalara, Inc.(1) | | | 7 | | | | 513 | |
Avnet, Inc. | | | 2,251 | | | | 95,532 | |
Benchmark Electronics, Inc. | | | 1,781 | | | | 61,195 | |
Booz Allen Hamilton Holding Corp. | | | 1,211 | | | | 86,138 | |
Broadcom, Inc. | | | 1,899 | | | | 600,122 | |
Cadence Design Systems, Inc.(1) | | | 2,086 | | | | 144,685 | |
Cambium Networks Corp.(1) | | | 1,394 | | | | 12,184 | |
CDK Global, Inc. | | | 1,128 | | | | 61,679 | |
Moderate Allocation Fund |
Security Description | | Shares or
Principal
Amount ($) | | | Fair
Value ($) | |
Common Stocks — continued |
CDW Corp./DE | | | 800 | | | | 114,272 | |
ChannelAdvisor Corp.(1) | | | 295 | | | | 2,667 | |
Cirrus Logic, Inc.(1) | | | 105 | | | | 8,653 | |
Cisco Systems, Inc. | | | 5,351 | | | | 256,634 | |
Citrix Systems, Inc. | | | 2,664 | | | | 295,438 | |
CommVault Systems, Inc.(1) | | | 711 | | | | 31,739 | |
Comtech Telecommunications Corp. | | | 353 | | | | 12,528 | |
Dell Technologies, Inc. - Class C(1) | | | 1,482 | | | | 76,160 | |
Digi International, Inc.(1) | | | 483 | | | | 8,559 | |
Digital Turbine, Inc.(1) | | | 18 | | | | 128 | |
Dolby Laboratories, Inc. | | | 784 | | | | 53,939 | |
Dynatrace, Inc.(1) | | | 2,488 | | | | 62,946 | |
Entegris, Inc. | | | 69 | | | | 3,456 | |
FormFactor, Inc.(1) | | | 112 | | | | 2,909 | |
Fortinet, Inc.(1) | | | 914 | | | | 97,579 | |
Hewlett Packard Enterprise Co. | | | 12,344 | | | | 195,776 | |
HP, Inc. | | | 2,468 | | | | 50,717 | |
Information Services Group, Inc.(1) | | | 30 | | | | 76 | |
Insight Enterprises, Inc.(1) | | | 40 | | | | 2,812 | |
Intel Corp. | | | 13,419 | | | | 803,127 | |
International Business Machines Corp. | | | 4,393 | | | | 588,838 | |
Intuit, Inc. | | | 2,321 | | | | 607,940 | |
j2 Global, Inc. | | | 668 | | | | 62,598 | |
Jabil, Inc. | | | 1,543 | | | | 63,772 | |
KBR, Inc. | | | 946 | | | | 28,853 | |
Kimball Electronics, Inc.(1) | | | 23 | | | | 404 | |
KLA Corp. | | | 1,912 | | | | 340,661 | |
Lam Research Corp. | | | 1,636 | | | | 478,366 | |
Leidos Holdings, Inc. | | | 188 | | | | 18,403 | |
Majesco(1) | | | 78 | | | | 644 | |
Manhattan Associates, Inc.(1) | | | 177 | | | | 14,116 | |
Mastercard, Inc. | | | 3,388 | | | | 1,011,623 | |
Maxim Integrated Products, Inc. | | | 4,304 | | | | 264,739 | |
Methode Electronics, Inc. | | | 366 | | | | 14,402 | |
Micron Technology, Inc.(1) | | | 11,214 | | | | 603,089 | |
Microsoft Corp. | | | 16,444 | | | | 2,593,219 | |
MicroStrategy, Inc.(1) | | | 67 | | | | 9,556 | |
MKS Instruments, Inc. | | | 78 | | | | 8,581 | |
Model N, Inc.(1) | | | 166 | | | | 5,822 | |
Motorola Solutions, Inc. | | | 925 | | | | 149,055 | |
MTS Systems Corp. | | | 144 | | | | 6,916 | |
NCR Corp.(1) | | | 1,371 | | | | 48,204 | |
NortonLifeLock, Inc. | | | 3,517 | | | | 89,754 | |
NVIDIA Corp. | | | 746 | | | | 175,534 | |
OneSpan, Inc.(1) | | | 447 | | | | 7,653 | |
Oracle Corp. | | | 12,175 | | | | 645,032 | |
Paycom Software, Inc.(1) | | | 187 | | | | 49,510 | |
The accompanying notes are an integral part of these financial statements
Page 82 | 2019 Annual Report | December 31, 2019 |
Schedule of Investments
December 31, 2019
Moderate Allocation Fund |
Security Description | | Shares or
Principal
Amount ($) | | | Fair
Value ($) | |
Common Stocks — continued |
PC Connection, Inc. | | | 291 | | | | 14,451 | |
Perspecta, Inc. | | | 459 | | | | 12,136 | |
Photronics, Inc.(1) | | | 812 | | | | 12,797 | |
Plexus Corp.(1) | | | 19 | | | | 1,462 | |
Progress Software Corp. | | | 1,122 | | | | 46,619 | |
Qorvo, Inc.(1) | | | 561 | | | | 65,205 | |
QUALCOMM, Inc. | | | 7,708 | | | | 680,077 | |
RingCentral, Inc. - Class A(1) | | | 50 | | | | 8,434 | |
Sanmina Corp.(1) | | | 531 | | | | 18,181 | |
ScanSource, Inc.(1) | | | 471 | | | | 17,403 | |
Skyworks Solutions, Inc. | | | 1,099 | | | | 132,847 | |
SMART Global Holdings, Inc.(1) | | | 419 | | | | 15,897 | |
Sonim Technologies, Inc.(1) | | | 229 | | | | 831 | |
SPS Commerce, Inc.(1) | | | 78 | | | | 4,323 | |
SS&C Technologies Holdings, Inc. | | | 1,814 | | | | 111,380 | |
Synaptics, Inc.(1) | | | 106 | | | | 6,972 | |
SYNNEX Corp. | | | 296 | | | | 38,125 | |
Synopsys, Inc.(1) | | | 2,174 | | | | 302,621 | |
Telaria, Inc.(1) | | | 72 | | | | 634 | |
Teradyne, Inc. | | | 870 | | | | 59,325 | |
TESSCO Technologies, Inc. | | | 218 | | | | 2,446 | |
Texas Instruments, Inc. | | | 5,626 | | | | 721,760 | |
TiVo Corp. | | | 1,450 | | | | 12,296 | |
Tyler Technologies, Inc.(1) | | | 72 | | | | 21,601 | |
Ultra Clean Holdings, Inc.(1) | | | 182 | | | | 4,272 | |
Verint Systems, Inc.(1) | | | 140 | | | | 7,750 | |
Western Union Co./The | | | 75 | | | | 2,009 | |
Xerox Holdings Corp. | | | 2,699 | | | | 99,512 | |
Xperi Corp. | | | 978 | | | | 18,093 | |
Zebra Technologies Corp. - Class A(1) | | | 164 | | | | 41,892 | |
| | | | | | | | 17,537,367 | |
| | | | | | | | | |
Materials — 0.8% | | | | | | | | |
Air Products & Chemicals, Inc. | | | 1,340 | | | | 314,887 | |
AK Steel Holding Corp.(1) | | | 699 | | | | 2,300 | |
Celanese Corp. | | | 1,203 | | | | 148,113 | |
CF Industries Holdings, Inc. | | | 19 | | | | 907 | |
Hawkins, Inc. | | | 22 | | | | 1,008 | |
Huntsman Corp. | | | 789 | | | | 19,062 | |
Innospec, Inc. | | | 92 | | | | 9,516 | |
Koppers Holdings, Inc.(1) | | | 127 | | | | 4,854 | |
LyondellBasell Industries NV | | | 4,935 | | | | 466,259 | |
Nucor Corp. | | | 795 | | | | 44,743 | |
Olympic Steel, Inc. | | | 580 | | | | 10,394 | |
Rayonier Advanced Materials, Inc. | | | 408 | | | | 1,567 | |
Reliance Steel & Aluminum Co. | | | 777 | | | | 93,054 | |
Royal Gold, Inc. | | | 220 | | | | 26,895 | |
Moderate Allocation Fund |
Security Description | | Shares or
Principal
Amount ($) | | | Fair
Value ($) | |
Common Stocks — continued |
RPM International, Inc. | | | 1,216 | | | | 93,340 | |
Ryerson Holding Corp.(1) | | | 1,507 | | | | 17,828 | |
Steel Dynamics, Inc. | | | 2,113 | | | | 71,927 | |
Stepan Co. | | | 58 | | | | 5,942 | |
Tredegar Corp. | | | 526 | | | | 11,756 | |
Valvoline, Inc. | | | 358 | | | | 7,665 | |
Warrior Met Coal, Inc. | | | 863 | | | | 18,235 | |
| | | | | | | | 1,370,252 | |
| | | | | | | | | |
Real Estate Investment Trust — 1.4% | | | | | | | | |
American Homes 4 Rent | | | 2,111 | | | | 55,329 | |
American Tower Corp. | | | 1,895 | | | | 435,509 | |
Apple Hospitality REIT, Inc. | | | 5,776 | | | | 93,860 | |
Ashford Hospitality Trust, Inc. | | | 2,204 | | | | 6,149 | |
AvalonBay Communities, Inc. | | | 570 | | | | 119,529 | |
CatchMark Timber Trust, Inc. | | | 427 | | | | 4,898 | |
CBL & Associates Properties, Inc. | | | 2,189 | | | | 2,298 | |
Clipper Realty, Inc. | | | 350 | | | | 3,710 | |
Colony Capital, Inc. | | | 924 | | | | 4,389 | |
CorEnergy Infrastructure Trust, Inc. | | | 427 | | | | 19,091 | |
CorePoint Lodging, Inc. | | | 1,529 | | | | 16,330 | |
Corporate Office Properties Trust | | | 1,005 | | | | 29,527 | |
CubeSmart | | | 8 | | | | 252 | |
CyrusOne, Inc. | | | 249 | | | | 16,292 | |
Essex Property Trust, Inc. | | | 1,452 | | | | 436,849 | |
Farmland Partners, Inc. | | | 87 | | | | 590 | |
Gaming and Leisure Properties, Inc. | | | 1,517 | | | | 65,307 | |
Global Medical REIT, Inc. | | | 19 | | | | 251 | |
Healthcare Realty Trust, Inc. | | | 570 | | | | 19,021 | |
Healthcare Trust of America, Inc. - Class A | | | 569 | | | | 17,229 | |
Hudson Pacific Properties, Inc. | | | 635 | | | | 23,908 | |
Lamar Advertising Co. | | | 1,184 | | | | 105,684 | |
Maui Land & Pineapple Co., Inc.(1) | | | 56 | | | | 630 | |
Mid-America Apartment Communities, Inc. | | | 485 | | | | 63,952 | |
National Storage Affiliates Trust | | | 1,355 | | | | 45,555 | |
Office Properties Income Trust | | | 1,172 | | | | 37,668 | |
PS Business Parks, Inc. | | | 373 | | | | 61,497 | |
RAIT Financial Trust(1)(2) | | | 751 | | | | 26 | |
Realogy Holdings Corp. | | | 393 | | | | 3,804 | |
Service Properties Trust | | | 4,874 | | | | 118,584 | |
Simon Property Group, Inc. | | | 3,734 | | | | 556,217 | |
Spirit MTA REIT | | | 1,024 | | | | 786 | |
Summit Hotel Properties, Inc. | | | 1,241 | | | | 15,314 | |
Tanger Factory Outlet Centers, Inc.(2) | | | 4,205 | | | | 61,940 | |
Trinity Place Holdings, Inc.(1) | | | 645 | | | | 1,941 | |
Uniti Group, Inc. | | | 210 | | | | 1,724 | |
The accompanying notes are an integral part of these financial statements
2019 Annual Report | December 31, 2019 | Page 83 |
Schedule of Investments
December 31, 2019
Moderate Allocation Fund |
Security Description | | Shares or
Principal
Amount ($) | | | Fair
Value ($) | |
Common Stocks — continued |
Urstadt Biddle Properties, Inc. | | | 1,056 | | | | 26,231 | |
Xenia Hotels & Resorts, Inc. | | | 2,187 | | | | 47,261 | |
| | | | | | | | 2,519,132 | |
| | | | | | | | | |
Utilities — 0.4% | | | | | | | | |
American Water Works Co., Inc. | | | 4,022 | | | | 494,103 | |
Atlantic Power Corp.(1) | | | 810 | | | | 1,887 | |
Consolidated Water Co., Ltd. | | | 356 | | | | 5,803 | |
MDU Resources Group, Inc. | | | 6,305 | | | | 187,322 | |
NorthWestern Corp. | | | 12 | | | | 860 | |
Portland General Electric Co. | | | 307 | | | | 17,128 | |
PPL Corp. | | | 513 | | | | 18,406 | |
Spark Energy, Inc. - Class A | | | 419 | | | | 3,867 | |
Unitil Corp. | | | 360 | | | | 22,256 | |
| | | | | | | | 751,632 | |
| | | | | | | | | |
Total Common Stocks (Cost $54,030,658) | | | | | | | 63,929,435 | |
| | | | | | | | | |
Registered Investment Companies — 43.4% |
American Beacon SiM High Yield Opportunities Fund - Class I | | | 278,580 | | | | 2,654,871 | |
Baird Core Plus Bond Fund - Class I | | | 404,810 | | | | 4,679,599 | |
Dodge & Cox Income Fund | | | 375,427 | | | | 5,267,243 | |
DoubleLine Total Return Bond Fund - Class I | | | 281,563 | | | | 2,993,017 | |
Frost Total Return Bond Fund - Class I | | | 378,478 | | | | 3,917,250 | |
Guggenheim Total Return Bond Fund - Class I | | | 56,419 | | | | 1,530,077 | |
iShares Core U.S. Aggregate Bond ETF(8) | | | 78,009 | | | | 8,765,871 | |
iShares JP Morgan USD Emerging Markets Bond ETF(8) | | | 34,629 | | | | 3,967,098 | |
Lord Abbett High Yield Fund - Class I | | | 525,079 | | | | 3,953,843 | |
Payden Emerging Markets Bond Fund - Class I | | | 255,935 | | | | 3,519,110 | |
PGIM Total Return Bond Fund - Class R6 | | | 317,909 | | | | 4,584,245 | |
PIMCO Investment Grade Credit Bond Fund - Class I | | | 165,010 | | | | 1,801,907 | |
Pioneer Bond Fund - Class Y | | | 466,170 | | | | 4,563,800 | |
Segall Bryant & Hamill Plus Bond Fund - Class I | | | 366,805 | | | | 3,921,140 | |
TCW Emerging Markets Income Fund - Class I | | | 416,427 | | | | 3,518,811 | |
Vanguard Intermediate-Term Corporate Bond ETF(8) | | | 29,869 | | | | 2,727,936 | |
Moderate Allocation Fund |
Security Description | | Shares or
Principal
Amount ($) | | | Fair
Value ($) | |
Registered Investment Companies — continued |
Vanguard Total Bond Market ETF(8) | | | 104,535 | | | | 8,766,305 | |
Xtrackers USD High Yield Corporate Bond ETF(8) | | | 122,735 | | | | 6,182,163 | |
Total Registered Investment Companies (Cost $75,599,938) | | | | | | | 77,314,286 | |
| | | | | | | | | |
Money Market Registered Investment Companies — 13.0% |
Meeder Institutional Prime Money Market Fund, 1.75%(4) | | | 23,031,540 | | | | 23,031,540 | |
Morgan Stanley Government Institutional Fund, 1.51%(3) | | | 34,498 | | | | 34,498 | |
Total Money Market Registered Investment Companies (Cost $23,062,620) | | | | | | | 23,066,038 | |
| | | | | | | | | |
Bank Obligations — 0.1% |
Metro City Bank Deposit Account, 2.35%, 1/2/2020(5) | | | 249,416 | | | | 249,416 | |
Total Bank Obligations (Cost $249,416) | | | | | | | 249,416 | |
| | | | | | | | | |
U.S. Government Obligations — 5.9% |
U.S. Treasury Note, 2.25%, due 1/31/2024 | | | 2,801,000 | | | | 2,865,883 | |
U.S. Treasury Note, 2.625%, due 2/15/2029 | | | 1,228,800 | | | | 1,303,200 | |
U.S. Treasury Note, 1.50%, due 8/15/2026 | | | 1,776,900 | | | | 1,742,542 | |
U.S. Treasury Note, 2.25%, due 11/15/2025 | | | 3,619,500 | | | | 3,718,047 | |
U.S. Treasury Note, 2.125%, due 12/31/2022 | | | 773,900 | | | | 785,689 | |
Total U.S. Government Obligations (Cost $10,161,998) | | | | | | | 10,415,361 | |
Total Investments — 98.3% (Cost $163,104,630) | | | | | | | 174,974,536 | |
Other Assets less Liabilities — 1.7% | | | | | | | 3,065,565 | |
Total Net Assets — 100.0% | | | | | | | 178,040,101 | |
| | | | | | | | | |
Trustee Deferred Compensation(6) |
Meeder Balanced Fund | | | 264 | | | | 3,237 | |
Meeder Dynamic Allocation Fund | | | 618 | | | | 7,336 | |
Meeder Muirfield Fund | | | 833 | | | | 6,589 | |
Meeder Conservative Allocation Fund | | | 83 | | | | 1,897 | |
Total Trustee Deferred Compensation (Cost $18,116) | | | | | | | 19,059 | |
The accompanying notes are an integral part of these financial statements
Page 84 | 2019 Annual Report | December 31, 2019 |
Schedule of Investments
December 31, 2019
Moderate Allocation Fund |
| | | Long
(Short)
Contracts | | | Expiration
Date | | | Notional
Value of
Contracts
($) | | | Value and
Unrealized
Appreciation
(Depreciation)
($) | |
Futures Contracts |
Index Futures | | | | | | | | | | | | | | | | |
Mini MSCI EAFE Index Futures | | | 68 | | | | 3/20/2020 | | | | 6,924,100 | | | | 22,934 | |
Mini MSCI Emerging Markets Index Futures | | | 31 | | | | 3/20/2020 | | | | 1,736,310 | | | | 17,344 | |
Russell 2000 Mini Index Futures | | | 9 | | | | 3/20/2020 | | | | 751,770 | | | | 6,895 | |
Standard & Poors 500 Mini Futures | | | 73 | | | | 3/20/2020 | | | | 11,793,515 | | | | 124,546 | |
E-mini Standard & Poors MidCap 400 Futures | | | 15 | | | | 3/20/2020 | | | | 3,097,200 | | | | 34,446 | |
Total Futures Contracts | | | 196 | | | | | | | | 24,302,895 | | | | 206,165 | |
(1) | Represents non-income producing securities. |
(2) | All or a portion of this security is on loan. |
(3) | Investment purchased as securities lending collateral. The yield shown represents the 7-day yield in effect at December 31, 2019. |
(4) | Investment in affiliate. The yield shown represents the 7-day yield in effect at December 31, 2019. |
(5) | Variable rate security. Securities payable at par, including accrued interest (usually within seven days notice) and unconditionally secured as to principal and interest by letters of credit or other credit support agreements from major banks. The interest rates are adjustable and are not based on a published reference rate and spread but are determined by the issuer or agent and are based on current market conditions. These securities do not indicate a reference rate and spread in their description above. The rate shown represents the rate in effect at December 31, 2019. The maturity date shown, if applicable, reflects the earlier of the next demand date or stated maturity date. |
(6) | Assets of affiliates to the Moderate Allocation Fund held for the benefit of the Fund’s Trustees in connection with the Trustee Deferred Compensation Plan. |
(7) | Fair valued security deemed as Level 3 security. |
The accompanying notes are an integral part of these financial statements
2019 Annual Report | December 31, 2019 | Page 85 |
Schedule of Investments
December 31, 2019
Conservative Allocation |
Security Description | | Shares or
Principal
Amount ($) | | | Fair
Value ($) | |
Common Stocks — 22.6% |
Communication Services — 1.9% | | | | | | | | |
Alphabet, Inc. - Class A(1) | | | 84 | | | | 112,509 | |
Alphabet, Inc. - Class C(1) | | | 468 | | | | 625,725 | |
Altice USA, Inc.(1) | | | 37 | | | | 1,012 | |
AT&T, Inc. | | | 8,197 | | | | 320,339 | |
Beasley Broadcast Group, Inc. | | | 65 | | | | 201 | |
Cinemark Holdings, Inc. | | | 36 | | | | 1,219 | |
Cogent Communications Holdings, Inc. | | | 55 | | | | 3,620 | |
Comcast Corp. - Class A | | | 5,274 | | | | 237,172 | |
Cumulus Media, Inc.(1) | | | 251 | | | | 4,410 | |
Facebook, Inc.(1) | | | 2,035 | | | | 417,684 | |
Frontier Communications Corp.(1) | | | 606 | | | | 539 | |
Gannett Co., Inc. | | | 97 | | | | 619 | |
IDT Corp. - Class B(1) | | | 492 | | | | 3,547 | |
John Wiley & Sons, Inc. | | | 32 | | | | 1,553 | |
Lee Enterprises, Inc.(1) | | | 135 | | | | 192 | |
Liberty TripAdvisor Holdings, Inc.(1) | | | 1,074 | | | | 7,894 | |
Marcus Corp./The | | | 359 | | | | 11,405 | |
MDC Partners, Inc.(1) | | | 181 | | | | 503 | |
National CineMedia, Inc. | | | 62 | | | | 452 | |
Roku, Inc.(1) | | | 95 | | | | 12,721 | |
Take-Two Interactive Software, Inc.(1) | | | 443 | | | | 54,236 | |
TechTarget, Inc.(1) | | | 56 | | | | 1,462 | |
Telephone & Data Systems, Inc. | | | 1,016 | | | | 25,837 | |
T-Mobile US, Inc.(1) | | | 3,314 | | | | 259,884 | |
Verizon Communications, Inc. | | | 6,766 | | | | 415,432 | |
Walt Disney Co./The | | | 374 | | | | 54,092 | |
| | | | | | | | 2,574,259 | |
| | | | | | | | | |
Consumer Discretionary — 2.2% | | | | | | | | |
Aaron’s, Inc. | | | 76 | | | | 4,340 | |
Acushnet Holdings Corp. | | | 271 | | | | 8,808 | |
Amazon.com, Inc.(1) | | | 384 | | | | 709,571 | |
American Public Education, Inc.(1) | | | 68 | | | | 1,863 | |
America’s Car-Mart, Inc./TX(1) | | | 3 | | | | 329 | |
Aramark | | | 352 | | | | 15,277 | |
AutoZone, Inc.(1) | | | 95 | | | | 113,174 | |
Bassett Furniture Industries, Inc. | | | 270 | | | | 4,504 | |
BBX Capital Corp. | | | 133 | | | | 634 | |
Best Buy Co., Inc. | | | 571 | | | | 50,134 | |
Biglari Holdings, Inc. - Class B(1) | | | 35 | | | | 4,005 | |
Bloomin’ Brands, Inc. | | | 593 | | | | 13,088 | |
BorgWarner, Inc. | | | 255 | | | | 11,062 | |
Burlington Stores, Inc.(1) | | | 1 | | | | 228 | |
Cato Corp./The | | | 51 | | | | 887 | |
Citi Trends, Inc. | | | 98 | | | | 2,266 | |
Collectors Universe, Inc. | | | 4 | | | | 92 | |
Conservative Allocation |
Security Description | | Shares or
Principal
Amount ($) | | | Fair
Value ($) | |
Common Stocks — continued |
Crocs, Inc.(1) | | | 312 | | | | 13,070 | |
Dana, Inc. | | | 359 | | | | 6,534 | |
Darden Restaurants, Inc. | | | 196 | | | | 21,366 | |
Dollar General Corp. | | | 731 | | | | 114,021 | |
eBay, Inc. | | | 3,005 | | | | 108,511 | |
Everi Holdings, Inc.(1) | | | 381 | | | | 5,117 | |
Extended Stay America, Inc. | | | 477 | | | | 7,088 | |
Garmin, Ltd. | | | 178 | | | | 17,366 | |
Gentex Corp. | | | 550 | | | | 15,939 | |
H&R Block, Inc. | | | 355 | | | | 8,335 | |
Hudson, Ltd.(1) | | | 123 | | | | 1,887 | |
J Alexander’s Holdings, Inc.(1) | | | 527 | | | | 5,038 | |
KB Home | | | 178 | | | | 6,100 | |
Kirkland’s, Inc.(1) | | | 676 | | | | 838 | |
Kohl’s Corp. | | | 19 | | | | 968 | |
LCI Industries | | | 1 | | | | 107 | |
Lear Corp. | | | 342 | | | | 46,922 | |
Lennar Corp. | | | 462 | | | | 25,775 | |
LKQ Corp.(1) | | | 919 | | | | 32,808 | |
Lululemon Athletica, Inc.(1) | | | 579 | | | | 134,137 | |
M/I Homes, Inc.(1) | | | 226 | | | | 8,893 | |
Malibu Boats, Inc.(1) | | | 151 | | | | 6,183 | |
MasterCraft Boat Holdings, Inc.(1) | | | 170 | | | | 2,678 | |
MDC Holdings, Inc. | | | 209 | | | | 7,975 | |
Meritage Homes Corp.(1) | | | 250 | | | | 15,278 | |
MGM Resorts International | | | 3,789 | | | | 126,060 | |
Murphy USA, Inc.(1) | | | 64 | | | | 7,488 | |
NIKE, Inc. - Class B | | | 3,523 | | | | 356,915 | |
NVR, Inc.(1) | | | 6 | | | | 22,850 | |
Office Depot, Inc. | | | 942 | | | | 2,581 | |
Polaris, Inc. | | | 299 | | | | 30,408 | |
PulteGroup, Inc. | | | 571 | | | | 22,155 | |
Purple Innovation, Inc.(1) | | | 146 | | | | 1,272 | |
Ralph Lauren Corp. | | | 33 | | | | 3,868 | |
Rent-A-Center, Inc./TX | | | 94 | | | | 2,711 | |
Rocky Brands, Inc. | | | 49 | | | | 1,442 | |
Ross Stores, Inc. | | | 725 | | | | 84,405 | |
Rubicon Project, Inc./The(1) | | | 90 | | | | 734 | |
Skechers U.S.A., Inc.(1) | | | 265 | | | | 11,445 | |
Sportsman’s Warehouse Holdings, Inc.(1) | | | 389 | | | | 3,124 | |
Starbucks Corp. | | | 3,758 | | | | 330,403 | |
Steven Madden, Ltd. | | | 221 | | | | 9,505 | |
Stoneridge, Inc.(1) | | | 119 | | | | 3,489 | |
Superior Industries International, Inc. | | | 106 | | | | 391 | |
Tailored Brands, Inc. | | | 255 | | | | 1,056 | |
Target Corp. | | | 2,297 | | | | 294,498 | |
Tile Shop Holdings, Inc. | | | 354 | | | | 598 | |
The accompanying notes are an integral part of these financial statements
Page 86 | 2019 Annual Report | December 31, 2019 |
Schedule of Investments
December 31, 2019
Conservative Allocation |
Security Description | | Shares or
Principal
Amount ($) | | | Fair
Value ($) | |
Common Stocks — continued |
Tilly’s, Inc. - Class A | | | 232 | | | | 2,842 | |
TJX Cos., Inc./The | | | 4,905 | | | | 299,499 | |
Toll Brothers, Inc. | | | 440 | | | | 17,384 | |
TopBuild Corp.(1) | | | 6 | | | | 618 | |
Town Sports International Holdings, Inc.(1) | | | 464 | | | | 793 | |
Tupperware Brands Corp. | | | 465 | | | | 3,990 | |
Whirlpool Corp. | | | 141 | | | | 20,802 | |
Winnebago Industries, Inc. | | | 134 | | | | 7,099 | |
Wyndham Destinations, Inc. | | | 214 | | | | 11,062 | |
| | | | | | | | 3,234,683 | |
| | | | | | | | | |
Consumer Staples — 1.4% | | | | | | | | |
BellRing Brands, Inc.(1) | | | 124 | | | | 2,640 | |
Casey’s General Stores, Inc. | | | 275 | | | | 43,722 | |
Coca-Cola Consolidated, Inc. | | | 5 | | | | 1,420 | |
Costco Wholesale Corp. | | | 270 | | | | 79,358 | |
Flowers Foods, Inc. | | | 275 | | | | 5,979 | |
General Mills, Inc. | | | 4,920 | | | | 263,515 | |
Hershey Co./The | | | 802 | | | | 117,878 | |
Kroger Co./The | | | 699 | | | | 20,264 | |
Lifevantage Corp.(1) | | | 102 | | | | 1,592 | |
Molson Coors Beverage Co. | | | 1,690 | | | | 91,091 | |
PepsiCo, Inc. | | | 3,012 | | | | 411,650 | |
Performance Food Group Co.(1) | | | 573 | | | | 29,498 | |
Pilgrim’s Pride Corp.(1) | | | 41 | | | | 1,341 | |
Procter & Gamble Co./The | | | 1,253 | | | | 156,500 | |
SpartanNash Co. | | | 255 | | | | 3,631 | |
Sysco Corp. | | | 3,178 | | | | 271,846 | |
Tyson Foods, Inc. | | | 1,853 | | | | 168,697 | |
Walmart, Inc. | | | 2,490 | | | | 295,912 | |
| | | | | | | | 1,966,534 | |
| | | | | | | | | |
Energy — 0.8% | | | | | | | | |
Amplify Energy Corp. | | | 442 | | | | 2,922 | |
Archrock, Inc. | | | 490 | | | | 4,920 | |
Ardmore Shipping Corp.(1) | | | 27 | | | | 244 | |
Baker Hughes Co. | | | 869 | | | | 22,272 | |
Berry Petroleum Corp. | | | 223 | | | | 2,103 | |
Brigham Minerals, Inc. | | | 32 | | | | 686 | |
Cactus, Inc. | | | 539 | | | | 18,498 | |
Chevron Corp. | | | 2,019 | | | | 243,310 | |
ConocoPhillips | | | 1,980 | | | | 128,759 | |
Contura Energy, Inc.(1) | | | 185 | | | | 1,674 | |
Delek US Holdings, Inc. | | | 360 | | | | 12,071 | |
Devon Energy Corp. | | | 21 | | | | 545 | |
DHT Holdings, Inc. | | | 174 | | | | 1,441 | |
Dorian LPG, Ltd.(1) | | | 294 | | | | 4,551 | |
Conservative Allocation |
Security Description | | Shares or
Principal
Amount ($) | | | Fair
Value ($) | |
Common Stocks — continued |
Exterran Corp.(1) | | | 485 | | | | 3,798 | |
Hallador Energy Co. | | | 289 | | | | 858 | |
Independence Contract Drilling, Inc.(1) | | | 342 | | | | 341 | |
International Seaways, Inc.(1) | | | 22 | | | | 655 | |
Liberty Oilfield Services, Inc. | | | 257 | | | | 2,858 | |
Marathon Petroleum Corp. | | | 2,667 | | | | 160,687 | |
Matrix Service Co.(1) | | | 170 | | | | 3,890 | |
NexTier Oilfield Solutions, Inc.(1) | | | 37 | | | | 248 | |
Nordic American Tankers, Ltd. | | | 351 | | | | 1,727 | |
Oceaneering International, Inc.(1) | | | 173 | | | | 2,579 | |
Pacific Ethanol, Inc.(1) | | | 394 | | | | 256 | |
PBF Energy, Inc. | | | 293 | | | | 9,191 | |
Peabody Energy Corp. | | | 459 | | | | 4,186 | |
Phillips 66 | | | 2,552 | | | | 284,318 | |
Profire Energy, Inc.(1) | | | 5 | | | | 7 | |
Renewable Energy Group, Inc.(1) | | | 186 | | | | 5,013 | |
Rosehill Resources, Inc.(1) | | | 106 | | | | 136 | |
SEACOR Holdings, Inc.(1) | | | 109 | | | | 4,703 | |
SilverBow Resources, Inc.(1) | | | 64 | | | | 634 | |
Superior Energy Services, Inc.(1) | | | 58 | | | | 291 | |
Talos Energy, Inc.(1) | | | 24 | | | | 724 | |
Teekay Tankers, Ltd.(1) | | | 38 | | | | 911 | |
Valero Energy Corp. | | | 1,935 | | | | 181,213 | |
Westmoreland Coal Co.(1) | | | 410 | | | | 6 | |
World Fuel Services Corp. | | | 33 | | | | 1,433 | |
| | | | | | | | 1,114,659 | |
| | | | | | | | | |
Financials — 2.7% | | | | | | | | |
Ally Financial, Inc. | | | 2,417 | | | | 73,864 | |
Artisan Partners Asset Management, Inc. | | | 674 | | | | 21,784 | |
BancFirst Corp. | | | 57 | | | | 3,559 | |
Bank of America Corp. | | | 7,462 | | | | 262,812 | |
BankFinancial Corp. | | | 51 | | | | 667 | |
Berkshire Hathaway, Inc. - Class B(1) | | | 2,475 | | | | 560,588 | |
Brighthouse Financial, Inc.(1) | | | 265 | | | | 10,396 | |
Cannae Holdings, Inc.(1) | | | 181 | | | | 6,731 | |
Citigroup, Inc. | | | 5,073 | | | | 405,282 | |
Citizens Financial Group, Inc. | | | 512 | | | | 20,792 | |
Curo Group Holdings Corp.(1) | | | 375 | | | | 4,568 | |
Diamond Hill Investment Group, Inc. | | | 10 | | | | 1,405 | |
Elevate Credit, Inc.(1) | | | 386 | | | | 1,718 | |
Ellington Financial, Inc. | | | 1,134 | | | | 20,786 | |
Esquire Financial Holdings, Inc.(1) | | | 40 | | | | 1,043 | |
ESSA Bancorp, Inc. | | | 10 | | | | 170 | |
Essent Group, Ltd. | | | 936 | | | | 48,663 | |
Exantas Capital Corp. | | | 271 | | | | 3,201 | |
Farmers National Banc Corp. | | | 42 | | | | 685 | |
The accompanying notes are an integral part of these financial statements
2019 Annual Report | December 31, 2019 | Page 87 |
Schedule of Investments
December 31, 2019
Conservative Allocation |
Security Description | | Shares or
Principal
Amount ($) | | | Fair
Value ($) | |
Common Stocks — continued |
Fidelity National Financial, Inc. | | | 1,910 | | | | 86,619 | |
Fifth Third Bancorp | | | 8,281 | | | | 254,558 | |
First American Financial Corp. | | | 836 | | | | 48,756 | |
First BanCorp/Puerto Rico | | | 1,403 | | | | 14,858 | |
First Horizon National Corp. | | | 3,079 | | | | 50,988 | |
FNB Corp./PA | | | 127 | | | | 1,613 | |
Great Ajax Corp. | | | 580 | | | | 8,590 | |
Hallmark Financial Services, Inc.(1) | | | 58 | | | | 1,019 | |
HBT Financial, Inc.(1) | | | 15 | | | | 285 | |
Heritage Commerce Corp. | | | 1,358 | | | | 17,423 | |
Hilltop Holdings, Inc. | | | 1,010 | | | | 25,179 | |
Horizon Bancorp, Inc./IN | | | 66 | | | | 1,254 | |
Independent Bank Corp./MI | | | 154 | | | | 3,488 | |
International Bancshares Corp. | | | 138 | | | | 5,944 | |
JPMorgan Chase & Co. | | | 2,552 | | | | 355,749 | |
Medley Management, Inc. | | | 140 | | | | 414 | |
MGIC Investment Corp. | | | 2,303 | | | | 32,634 | |
NewStar Financial Contingent Value Rights(1)(4) | | | 8 | | | | — | |
Nicolet Bankshares, Inc.(1) | | | 56 | | | | 4,136 | |
NMI Holdings, Inc. - Class A(1) | | | 562 | | | | 18,647 | |
Northeast Bank | | | 106 | | | | 2,331 | |
Northrim BanCorp, Inc. | | | 198 | | | | 7,583 | |
Old Republic International Corp. | | | 2,263 | | | | 50,623 | |
OneMain Holdings, Inc. | | | 222 | | | | 9,357 | |
Oppenheimer Holdings, Inc. | | | 752 | | | | 20,665 | |
Peapack Gladstone Financial Corp. | | | 15 | | | | 464 | |
PennyMac Financial Services, Inc. | | | 157 | | | | 5,344 | |
Piper Sandler Cos. | | | 299 | | | | 23,902 | |
PNC Financial Services Group, Inc./The | | | 1,886 | | | | 301,062 | |
Popular, Inc. | | | 1,694 | | | | 99,523 | |
ProSight Global, Inc.(1) | | | 185 | | | | 2,984 | |
Prudential Financial, Inc. | | | 1,088 | | | | 101,989 | |
Pzena Investment Management, Inc. | | | 399 | | | | 3,439 | |
Radian Group, Inc. | | | 1,949 | | | | 49,037 | |
RBB Bancorp | | | 74 | | | | 1,567 | |
Ready Capital Corp. | | | 390 | | | | 6,014 | |
Regions Financial Corp. | | | 7,343 | | | | 126,006 | |
Reinsurance Group of America, Inc. | | | 9 | | | | 1,468 | |
Renasant Corp. | | | 863 | | | | 30,567 | |
Shore Bancshares, Inc. | | | 25 | | | | 434 | |
Silvercrest Asset Management Group, Inc. | | | 79 | | | | 994 | |
Stewart Information Services Corp. | | | 292 | | | | 11,911 | |
Summit Financial Group, Inc. | | | 21 | | | | 569 | |
Synchrony Financial | | | 4,837 | | | | 174,180 | |
TPG RE Finance Trust, Inc. | | | 651 | | | | 13,196 | |
United Community Banks, Inc./GA | | | 94 | | | | 2,903 | |
Conservative Allocation |
Security Description | | Shares or
Principal
Amount ($) | | | Fair
Value ($) | |
Common Stocks — continued |
Unity Bancorp, Inc. | | | 6 | | | | 135 | |
Univest Financial Corp. | | | 135 | | | | 3,615 | |
US Bancorp | | | 2,814 | | | | 166,842 | |
Valley National Bancorp | | | 2,624 | | | | 30,045 | |
Walker & Dunlop, Inc. | | | 138 | | | | 8,926 | |
WR Berkley Corp. | | | 740 | | | | 51,134 | |
| | | | | | | | 3,689,677 | |
| | | | | | | | | |
Healthcare — 4.2% | | | | | | | | |
Abbott Laboratories | | | 402 | | | | 34,918 | |
AbbVie, Inc. | | | 2,813 | | | | 249,063 | |
ACADIA Pharmaceuticals, Inc.(1) | | | 167 | | | | 7,144 | |
Adverum Biotechnologies, Inc.(1) | | | 45 | | | | 518 | |
Affimed NV(1) | | | 541 | | | | 1,482 | |
Agenus, Inc.(1) | | | 863 | | | | 3,512 | |
Agilent Technologies, Inc. | | | 799 | | | | 68,163 | |
Akorn, Inc.(1) | | | 2 | | | | 3 | |
Aldeyra Therapeutics, Inc.(1) | | | 66 | | | | 383 | |
Alexion Pharmaceuticals, Inc.(1) | | | 781 | | | | 84,465 | |
Alkermes PLC(1) | | | 429 | | | | 8,752 | |
Allergan PLC | | | 1,132 | | | | 216,404 | |
Alnylam Pharmaceuticals, Inc.(1) | | | 420 | | | | 48,371 | |
AmerisourceBergen Corp. | | | 571 | | | | 48,546 | |
Amgen, Inc. | | | 1,185 | | | | 285,668 | |
Amneal Pharmaceuticals, Inc.(1) | | | 251 | | | | 1,210 | |
AngioDynamics, Inc.(1) | | | 59 | | | | 945 | |
ANI Pharmaceuticals, Inc.(1) | | | 73 | | | | 4,502 | |
Anika Therapeutics, Inc.(1) | | | 22 | | | | 1,141 | |
Apellis Pharmaceuticals, Inc.(1) | | | 123 | | | | 3,766 | |
Ardelyx, Inc.(1) | | | 237 | | | | 1,779 | |
Arena Pharmaceuticals, Inc.(1) | | | 292 | | | | 13,263 | |
Arrowhead Pharmaceuticals, Inc.(1) | | | 97 | | | | 6,153 | |
Arvinas, Inc.(1) | | | 36 | | | | 1,479 | |
Assertio Therapeutics, Inc.(1) | | | 1,604 | | | | 2,005 | |
Avantor, Inc.(1) | | | 1,053 | | | | 19,112 | |
Avid Bioservices, Inc.(1) | | | 277 | | | | 2,125 | |
Avrobio, Inc.(1) | | | 12 | | | | 242 | |
Axsome Therapeutics, Inc.(1) | | | 41 | | | | 4,238 | |
Baudax Bio, Inc.(1) | | | 100 | | | | 692 | |
Beyondspring, Inc.(1) | | | 69 | | | | 1,070 | |
BioDelivery Sciences International, Inc.(1) | | | 970 | | | | 6,130 | |
Biogen, Inc.(1) | | | 923 | | | | 273,882 | |
Bio-Rad Laboratories, Inc.(1) | | | 6 | | | | 2,220 | |
Bio-Techne Corp. | | | 1 | | | | 220 | |
Bristol-Myers Squibb Co. | | | 2,742 | | | | 176,009 | |
Bruker Corp. | | | 285 | | | | 14,526 | |
Calithera Biosciences, Inc.(1) | | | 235 | | | | 1,342 | |
The accompanying notes are an integral part of these financial statements
Page 88 | 2019 Annual Report | December 31, 2019 |
Schedule of Investments
December 31, 2019
Conservative Allocation |
Security Description | | Shares or
Principal
Amount ($) | | | Fair
Value ($) | |
Common Stocks — continued |
Catalyst Pharmaceuticals, Inc.(1) | | | 227 | | | | 851 | |
Celcuity, Inc.(1) | | | 35 | | | | 372 | |
Cellular Biomedicine Group, Inc.(1) | | | 1 | | | | 16 | |
Cerecor, Inc.(1) | | | 60 | | | | 323 | |
Cerner Corp. | | | 1,603 | | | | 117,644 | |
Chemed Corp. | | | 73 | | | | 32,066 | |
ChemoCentryx, Inc.(1) | | | 3 | | | | 119 | |
Coherus Biosciences, Inc.(1) | | | 93 | | | | 1,674 | |
Collegium Pharmaceutical, Inc.(1) | | | 131 | | | | 2,696 | |
Computer Programs & Systems, Inc. | | | 110 | | | | 2,904 | |
CONMED Corp. | | | 84 | | | | 9,394 | |
Constellation Pharmaceuticals, Inc.(1) | | | 25 | | | | 1,178 | |
Corium International Contingent Value Rights(1)(4) | | | 24 | | | | — | |
Cross Country Healthcare, Inc.(1) | | | 173 | | | | 2,010 | |
Cutera, Inc.(1) | | | 35 | | | | 1,253 | |
Deciphera Pharmaceuticals, Inc.(1) | | | 69 | | | | 4,295 | |
DENTSPLY SIRONA, Inc. | | | 345 | | | | 19,524 | |
DexCom, Inc.(1) | | | 84 | | | | 18,374 | |
Dicerna Pharmaceuticals, Inc.(1) | | | 237 | | | | 5,221 | |
Eagle Pharmaceuticals, Inc./DE(1) | | | 8 | | | | 481 | |
Edwards Lifesciences Corp.(1) | | | 18 | | | | 4,199 | |
Eiger BioPharmaceuticals, Inc.(1) | | | 36 | | | | 536 | |
Elanco Animal Health, Inc. Contingent Value Rights(1)(4) | | | 32 | | | | — | |
Eli Lilly & Co. | | | 2,048 | | | | 269,169 | |
Emergent BioSolutions, Inc.(1) | | | 92 | | | | 4,963 | |
Encompass Health Corp. | | | 133 | | | | 9,213 | |
Endo International PLC(1) | | | 688 | | | | 3,227 | |
Enochian Biosciences, Inc.(1) | | | 15 | | | | 75 | |
Epizyme, Inc.(1) | | | 9 | | | | 221 | |
Exact Sciences Corp.(1) | | | 109 | | | | 10,080 | |
Exelixis, Inc.(1) | | | 1,043 | | | | 18,378 | |
Forty Seven, Inc.(1) | | | 47 | | | | 1,850 | |
Gilead Sciences, Inc. | | | 4,841 | | | | 314,568 | |
Haemonetics Corp.(1) | | | 22 | | | | 2,528 | |
HealthStream, Inc.(1) | | | 21 | | | | 571 | |
Hill-Rom Holdings, Inc. | | | 518 | | | | 58,809 | |
Hologic, Inc.(1) | | | 128 | | | | 6,683 | |
Horizon Therapeutics Plc(1) | | | 234 | | | | 8,471 | |
Humana, Inc. | | | 543 | | | | 199,020 | |
ImmunoGen, Inc.(1) | | | 336 | | | | 1,715 | |
Incyte Corp.(1) | | | 853 | | | | 74,484 | |
Insulet Corp.(1) | | | 18 | | | | 3,082 | |
Intersect ENT, Inc.(1) | | | 130 | | | | 3,237 | |
Ionis Pharmaceuticals, Inc.(1) | | | 10 | | | | 604 | |
Iovance Biotherapeutics, Inc.(1) | | | 274 | | | | 7,584 | |
Conservative Allocation |
Security Description | | Shares or
Principal
Amount ($) | | | Fair
Value ($) | |
Common Stocks — continued |
IQVIA Holdings, Inc.(1) | | | 31 | | | | 4,790 | |
Jazz Pharmaceuticals PLC(1) | | | 36 | | | | 5,374 | |
Johnson & Johnson | | | 2,903 | | | | 423,461 | |
Jounce Therapeutics, Inc.(1) | | | 426 | | | | 3,719 | |
Kadmon Holdings, Inc.(1) | | | 434 | | | | 1,966 | |
KalVista Pharmaceuticals, Inc.(1) | | | 6 | | | | 107 | |
Karyopharm Therapeutics, Inc.(1) | | | 96 | | | | 1,840 | |
Kindred Biosciences, Inc.(1) | | | 32 | | | | 271 | |
Kodiak Sciences, Inc.(1) | | | 32 | | | | 2,302 | |
Krystal Biotech, Inc.(1) | | | 50 | | | | 2,769 | |
Kura Oncology, Inc.(1) | | | 73 | | | | 1,004 | |
Lannett Co., Inc.(1) | | | 90 | | | | 794 | |
Lantheus Holdings, Inc.(1) | | | 131 | | | | 2,687 | |
Lexicon Pharmaceuticals, Inc.(1) | | | 274 | | | | 1,137 | |
Mallinckrodt PLC(1) | | | 617 | | | | 2,153 | |
Masimo Corp.(1) | | | 103 | | | | 16,280 | |
McKesson Corp. | | | 459 | | | | 63,489 | |
Medtronic PLC | | | 3,210 | | | | 364,175 | |
MeiraGTx Holdings plc(1) | | | 97 | | | | 1,942 | |
Merck & Co., Inc. | | | 4,194 | | | | 381,444 | |
Meridian Bioscience, Inc. | | | 107 | | | | 1,045 | |
Mersana Therapeutics, Inc.(1) | | | 18 | | | | 103 | |
Mirati Therapeutics, Inc.(1) | | | 3 | | | | 387 | |
Misonix, Inc.(1) | | | 40 | | | | 744 | |
Molecular Templates, Inc.(1) | | | 129 | | | | 1,804 | |
Morphic Holding, Inc.(1) | | | 50 | | | | 858 | |
Myriad Genetics, Inc.(1) | | | 8 | | | | 218 | |
Natera, Inc.(1) | | | 167 | | | | 5,626 | |
National Research Corp. | | | 28 | | | | 1,846 | |
Natus Medical, Inc.(1) | | | 192 | | | | 6,334 | |
Neurocrine Biosciences, Inc.(1) | | | 159 | | | | 17,091 | |
Nevro Corp.(1) | | | 20 | | | | 2,351 | |
NextCure, Inc.(1) | | | 4 | | | | 225 | |
NextGen Healthcare, Inc.(1) | | | 232 | | | | 3,728 | |
Novocure, Ltd.(1) | | | 54 | | | | 4,551 | |
Odonate Therapeutics, Inc.(1) | | | 45 | | | | 1,460 | |
Oncternal Therapeutics, Inc.(1) | | | 104 | | | | 411 | |
OPKO Health, Inc.(1) | | | 2,282 | | | | 3,355 | |
Organogenesis Holdings, Inc.(1) | | | 64 | | | | 308 | |
Orthofix Medical, Inc.(1) | | | 61 | | | | 2,817 | |
Osmotica Pharmaceuticals PLC(1) | | | 191 | | | | 1,335 | |
Pacira BioSciences, Inc.(1) | | | 147 | | | | 6,659 | |
Palatin Technologies, Inc.(1) | | | 1,704 | | | | 1,333 | |
PDL BioPharma, Inc.(1) | | | 522 | | | | 1,694 | |
Pennant Group, Inc./The(1) | | | 149 | | | | 4,927 | |
Perrigo Co. PLC | | | 423 | | | | 21,852 | |
Pfenex, Inc.(1) | | | 270 | | | | 2,965 | |
The accompanying notes are an integral part of these financial statements
2019 Annual Report | December 31, 2019 | Page 89 |
Schedule of Investments
December 31, 2019
Conservative Allocation |
Security Description | | Shares or
Principal
Amount ($) | | | Fair
Value ($) | |
Common Stocks — continued |
Pfizer, Inc. | | | 8,759 | | | | 343,178 | |
Phibro Animal Health Corp. | | | 342 | | | | 8,492 | |
Pieris Pharmaceuticals, Inc.(1) | | | 350 | | | | 1,267 | |
PRA Health Sciences, Inc.(1) | | | 506 | | | | 56,242 | |
Precision BioSciences, Inc.(1) | | | 26 | | | | 361 | |
Principia Biopharma, Inc.(1) | | | 74 | | | | 4,054 | |
Progenics Pharmaceuticals, Inc.(1) | | | 455 | | | | 2,316 | |
PTC Therapeutics, Inc.(1) | | | 225 | | | | 10,807 | |
Reata Pharmaceuticals, Inc.(1) | | | 30 | | | | 6,133 | |
Recro Pharma, Inc.(1) | | | 284 | | | | 5,206 | |
Regeneron Pharmaceuticals, Inc.(1) | | | 206 | | | | 77,349 | |
Replimune Group, Inc.(1) | | | 151 | | | | 2,167 | |
ResMed, Inc. | | | 289 | | | | 44,786 | |
Rigel Pharmaceuticals, Inc.(1) | | | 1,885 | | | | 4,034 | |
Seattle Genetics, Inc.(1) | | | 203 | | | | 23,195 | |
SIGA Technologies, Inc.(1) | | | 179 | | | | 854 | |
STERIS PLC | | | 261 | | | | 39,782 | |
Stryker Corp. | | | 1,025 | | | | 215,189 | |
Syndax Pharmaceuticals, Inc.(1) | | | 38 | | | | 334 | |
United Therapeutics Corp.(1) | | | 186 | | | | 16,383 | |
UnitedHealth Group, Inc. | | | 191 | | | | 56,150 | |
Vanda Pharmaceuticals, Inc.(1) | | | 346 | | | | 5,678 | |
Veeva Systems, Inc.(1) | | | 380 | | | | 53,451 | |
Veracyte, Inc.(1) | | | 160 | | | | 4,467 | |
Vericel Corp.(1) | | | 450 | | | | 7,830 | |
Verrica Pharmaceuticals, Inc.(1) | | | 112 | | | | 1,780 | |
Vertex Pharmaceuticals, Inc.(1) | | | 1,307 | | | | 286,168 | |
West Pharmaceutical Services, Inc. | | | 27 | | | | 4,059 | |
XBiotech, Inc.(1) | | | 73 | | | | 1,363 | |
Xencor, Inc.(1) | | | 232 | | | | 7,978 | |
Y-mAbs Therapeutics, Inc.(1) | | | 172 | | | | 5,375 | |
Zimmer Biomet Holdings, Inc. | | | 1,250 | | | | 187,100 | |
Zoetis, Inc. | | | 1,350 | | | | 178,673 | |
| | | | | | | | 5,859,037 | |
| | | | | | | | | |
Industrials — 1.4% | | | | | | | | |
AGCO Corp. | | | 301 | | | | 23,252 | |
Alamo Group, Inc. | | | 8 | | | | 1,004 | |
Allison Transmission Holdings, Inc. | | | 2,085 | | | | 100,747 | |
Atkore International Group, Inc.(1) | | | 377 | | | | 15,253 | |
Barrett Business Services, Inc. | | | 18 | | | | 1,628 | |
BMC Stock Holdings, Inc.(1) | | | 108 | | | | 3,099 | |
Builders FirstSource, Inc.(1) | | | 693 | | | | 17,609 | |
Caterpillar, Inc. | | | 951 | | | | 140,444 | |
CBIZ, Inc.(1) | | | 152 | | | | 4,098 | |
Cintas Corp. | | | 81 | | | | 21,795 | |
Comfort Systems USA, Inc. | | | 94 | | | | 4,686 | |
Conservative Allocation |
Security Description | | Shares or
Principal
Amount ($) | | | Fair
Value ($) | |
Common Stocks — continued |
Commercial Vehicle Group, Inc.(1) | | | 580 | | | | 3,683 | |
Construction Partners, Inc.(1) | | | 3 | | | | 51 | |
Copart, Inc.(1) | | | 736 | | | | 66,932 | |
Cummins, Inc. | | | 1,360 | | | | 243,386 | |
Delta Air Lines, Inc. | | | 1,076 | | | | 62,924 | |
EMCOR Group, Inc. | | | 569 | | | | 49,105 | |
Federal Signal Corp. | | | 130 | | | | 4,193 | |
Fortune Brands Home & Security, Inc. | | | 786 | | | | 51,357 | |
Foundation Building Materials, Inc.(1) | | | 80 | | | | 1,548 | |
Generac Holdings, Inc.(1) | | | 182 | | | | 18,307 | |
GMS, Inc.(1) | | | 104 | | | | 2,816 | |
H&E Equipment Services, Inc. | | | 32 | | | | 1,070 | |
Heidrick & Struggles International, Inc. | | | 43 | | | | 1,398 | |
Herman Miller, Inc. | | | 94 | | | | 3,915 | |
Hubbell, Inc. | | | 76 | | | | 11,234 | |
Huntington Ingalls Industries, Inc. | | | 135 | | | | 33,869 | |
Illinois Tool Works, Inc. | | | 1,298 | | | | 233,160 | |
Ingersoll-Rand PLC | | | 43 | | | | 5,716 | |
Jacobs Engineering Group, Inc. | | | 48 | | | | 4,312 | |
JetBlue Airways Corp.(1) | | | 262 | | | | 4,905 | |
Kimball International, Inc. - Class B | | | 422 | | | | 8,723 | |
Knoll, Inc. | | | 170 | | | | 4,294 | |
Lockheed Martin Corp. | | | 123 | | | | 47,894 | |
LSC Communications, Inc. | | | 641 | | | | 132 | |
ManpowerGroup, Inc. | | | 464 | | | | 45,054 | |
Marten Transport, Ltd. | | | 128 | | | | 2,751 | |
MasTec, Inc.(1) | | | 5 | | | | 321 | |
Matson, Inc. | | | 293 | | | | 11,954 | |
Meritor, Inc.(1) | | | 62 | | | | 1,624 | |
Miller Industries, Inc./TN | | | 245 | | | | 9,097 | |
Northwest Pipe Co.(1) | | | 24 | | | | 799 | |
Oshkosh Corp. | | | 467 | | | | 44,202 | |
PACCAR, Inc. | | | 2,202 | | | | 174,178 | |
Parker-Hannifin Corp. | | | 902 | | | | 185,650 | |
Park-Ohio Holdings Corp. | | | 68 | | | | 2,288 | |
Powell Industries, Inc. | | | 28 | | | | 1,372 | |
Primoris Services Corp. | | | 9 | | | | 200 | |
Quanex Building Products Corp. | | | 249 | | | | 4,253 | |
Quanta Services, Inc. | | | 764 | | | | 31,102 | |
Resources Connection, Inc. | | | 21 | | | | 343 | |
Rush Enterprises, Inc. | | | 106 | | | | 4,929 | |
Safe Bulkers, Inc.(1) | | | 244 | | | | 415 | |
Saia, Inc.(1) | | | 45 | | | | 4,190 | |
Schneider National, Inc. | | | 74 | | | | 1,615 | |
Standex International Corp. | | | 99 | | | | 7,856 | |
Steelcase, Inc. - Class A | | | 195 | | | | 3,990 | |
Thermon Group Holdings, Inc.(1) | | | 21 | | | | 563 | |
The accompanying notes are an integral part of these financial statements
Page 90 | 2019 Annual Report | December 31, 2019 |
Schedule of Investments
December 31, 2019
Conservative Allocation |
Security Description | | Shares or
Principal
Amount ($) | | | Fair
Value ($) | |
Common Stocks — continued |
Timken Co./The | | | 522 | | | | 29,394 | |
Triton International, Ltd./Bermuda | | | 646 | | | | 25,969 | |
TrueBlue, Inc.(1) | | | 214 | | | | 5,149 | |
UniFirst Corp./MA | | | 57 | | | | 11,513 | |
United Airlines Holdings, Inc.(1) | | | 25 | | | | 2,202 | |
Universal Logistics Holdings, Inc. | | | 11 | | | | 209 | |
Valmont Industries, Inc. | | | 71 | | | | 10,634 | |
Vectrus, Inc.(1) | | | 101 | | | | 5,177 | |
Wabash National Corp. | | | 425 | | | | 6,243 | |
WESCO International, Inc.(1) | | | 695 | | | | 41,276 | |
WW Grainger, Inc. | | | 257 | | | | 87,000 | |
| | | | | | | | 1,962,051 | |
| | | | | | | | | |
Information Technology — 6.3% | | | | | | | | |
Adobe, Inc.(1) | | | 453 | | | | 149,404 | |
Alliance Data Systems Corp. | | | 22 | | | | 2,468 | |
Amkor Technology, Inc.(1) | | | 1,114 | | | | 14,482 | |
ANSYS, Inc.(1) | | | 265 | | | | 68,214 | |
Apple, Inc. | | | 4,699 | | | | 1,379,861 | |
Applied Materials, Inc. | | | 4,730 | | | | 288,719 | |
Aspen Technology, Inc.(1) | | | 289 | | | | 34,949 | |
AstroNova, Inc. | | | 133 | | | | 1,825 | |
Avalara, Inc.(1) | | | 14 | | | | 1,026 | |
Avnet, Inc. | | | 1,127 | | | | 47,830 | |
Benchmark Electronics, Inc. | | | 926 | | | | 31,817 | |
Booz Allen Hamilton Holding Corp. | | | 566 | | | | 40,260 | |
Broadcom, Inc. | | | 827 | | | | 261,349 | |
Cadence Design Systems, Inc.(1) | | | 995 | | | | 69,013 | |
Cambium Networks Corp.(1) | | | 607 | | | | 5,305 | |
CDK Global, Inc. | | | 528 | | | | 28,871 | |
CDW Corp./DE | | | 380 | | | | 54,279 | |
Cerence, Inc.(1) | | | 16 | | | | 362 | |
ChannelAdvisor Corp.(1) | | | 150 | | | | 1,356 | |
Cirrus Logic, Inc.(1) | | | 47 | | | | 3,873 | |
Cisco Systems, Inc. | | | 2,549 | | | | 122,250 | |
Citrix Systems, Inc. | | | 1,284 | | | | 142,396 | |
CommVault Systems, Inc.(1) | | | 346 | | | | 15,445 | |
Comtech Telecommunications Corp. | | | 164 | | | | 5,820 | |
Dell Technologies, Inc. - Class C(1) | | | 740 | | | | 38,029 | |
Digi International, Inc.(1) | | | 243 | | | | 4,306 | |
Digital Turbine, Inc.(1) | | | 30 | | | | 214 | |
Dolby Laboratories, Inc. | | | 398 | | | | 27,382 | |
Dynatrace, Inc.(1) | | | 1,178 | | | | 29,803 | |
FormFactor, Inc.(1) | | | 9 | | | | 234 | |
Fortinet, Inc.(1) | | | 423 | | | | 45,159 | |
Hewlett Packard Enterprise Co. | | | 6,028 | | | | 95,604 | |
HP, Inc. | | | 918 | | | | 18,865 | |
Conservative Allocation |
Security Description | | Shares or
Principal
Amount ($) | | | Fair
Value ($) | |
Common Stocks — continued |
Insight Enterprises, Inc.(1) | | | 9 | | | | 633 | |
Intel Corp. | | | 6,462 | | | | 386,751 | |
International Business Machines Corp. | | | 2,316 | | | | 310,437 | |
Intuit, Inc. | | | 1,131 | | | | 296,243 | |
j2 Global, Inc. | | | 321 | | | | 30,081 | |
Jabil, Inc. | | | 754 | | | | 31,163 | |
KBR, Inc. | | | 468 | | | | 14,274 | |
Kimball Electronics, Inc.(1) | | | 11 | | | | 193 | |
KLA Corp. | | | 866 | | | | 154,295 | |
Lam Research Corp. | | | 742 | | | | 216,961 | |
Lattice Semiconductor Corp.(1) | | | 4 | | | | 77 | |
Leidos Holdings, Inc. | | | 140 | | | | 13,705 | |
Majesco(1) | | | 18 | | | | 149 | |
Manhattan Associates, Inc.(1) | | | 82 | | | | 6,540 | |
Mastercard, Inc. | | | 1,651 | | | | 492,972 | |
Maxim Integrated Products, Inc. | | | 2,115 | | | | 130,094 | |
MAXIMUS, Inc. | | | 65 | | | | 4,835 | |
Methode Electronics, Inc. | | | 175 | | | | 6,886 | |
Micron Technology, Inc.(1) | | | 5,465 | | | | 293,908 | |
Microsoft Corp. | | | 8,029 | | | | 1,266,173 | |
MicroStrategy, Inc.(1) | | | 27 | | | | 3,851 | |
MKS Instruments, Inc. | | | 29 | | | | 3,190 | |
Model N, Inc.(1) | | | 85 | | | | 2,981 | |
Motorola Solutions, Inc. | | | 416 | | | | 67,034 | |
MTS Systems Corp. | | | 60 | | | | 2,882 | |
NCR Corp.(1) | | | 676 | | | | 23,768 | |
NortonLifeLock, Inc. | | | 1,700 | | | | 43,384 | |
NVIDIA Corp. | | | 549 | | | | 129,180 | |
OneSpan, Inc.(1) | | | 226 | | | | 3,869 | |
Oracle Corp. | | | 5,426 | | | | 287,469 | |
Paycom Software, Inc.(1) | | | 85 | | | | 22,505 | |
PC Connection, Inc. | | | 152 | | | | 7,548 | |
Perspecta, Inc. | | | 222 | | | | 5,870 | |
Photronics, Inc.(1) | | | 410 | | | | 6,462 | |
Progress Software Corp. | | | 541 | | | | 22,479 | |
Qorvo, Inc.(1) | | | 282 | | | | 32,777 | |
QUALCOMM, Inc. | | | 3,756 | | | | 331,392 | |
RingCentral, Inc. - Class A(1) | | | 45 | | | | 7,590 | |
Sanmina Corp.(1) | | | 240 | | | | 8,218 | |
ScanSource, Inc.(1) | | | 226 | | | | 8,351 | |
Skyworks Solutions, Inc. | | | 683 | | | | 82,561 | |
SMART Global Holdings, Inc.(1) | | | 206 | | | | 7,816 | |
Sonim Technologies, Inc.(1) | | | 133 | | | | 483 | |
SPS Commerce, Inc.(1) | | | 42 | | | | 2,328 | |
SS&C Technologies Holdings, Inc. | | | 882 | | | | 54,155 | |
Synaptics, Inc.(1) | | | 53 | | | | 3,486 | |
SYNNEX Corp. | | | 153 | | | | 19,706 | |
The accompanying notes are an integral part of these financial statements
2019 Annual Report | December 31, 2019 | Page 91 |
Schedule of Investments
December 31, 2019
Conservative Allocation |
Security Description | | Shares or
Principal
Amount ($) | | | Fair
Value ($) | |
Common Stocks — continued |
Synopsys, Inc.(1) | | | 1,036 | | | | 144,211 | |
Telaria, Inc.(1) | | | 22 | | | | 194 | |
Teradyne, Inc. | | | 419 | | | | 28,572 | |
TESSCO Technologies, Inc. | | | 116 | | | | 1,302 | |
Texas Instruments, Inc. | | | 2,743 | | | | 351,899 | |
TiVo Corp. | | | 699 | | | | 5,928 | |
Tyler Technologies, Inc.(1) | | | 48 | | | | 14,401 | |
Ultra Clean Holdings, Inc.(1) | | | 100 | | | | 2,347 | |
Verint Systems, Inc.(1) | | | 74 | | | | 4,097 | |
Western Union Co./The | | | 381 | | | | 10,203 | |
Xerox Holdings Corp. | | | 1,317 | | | | 48,558 | |
Xperi Corp. | | | 442 | | | | 8,177 | |
Zebra Technologies Corp. - Class A(1) | | | 74 | | | | 18,903 | |
| | | | | | | | 8,517,267 | |
| | | | | | | | | |
Materials — 0.5% | | | | | | | | |
Air Products & Chemicals, Inc. | | | 607 | | | | 142,639 | |
AK Steel Holding Corp.(1) | | | 314 | | | | 1,033 | |
Celanese Corp. | | | 530 | | | | 65,254 | |
Hawkins, Inc. | | | 8 | | | | 366 | |
Huntsman Corp. | | | 351 | | | | 8,480 | |
Innospec, Inc. | | | 43 | | | | 4,448 | |
Koppers Holdings, Inc.(1) | | | 73 | | | | 2,790 | |
LyondellBasell Industries NV | | | 2,406 | | | | 227,319 | |
Nucor Corp. | | | 421 | | | | 23,694 | |
Olympic Steel, Inc. | | | 282 | | | | 5,053 | |
Rayonier Advanced Materials, Inc. | | | 204 | | | | 783 | |
Reliance Steel & Aluminum Co. | | | 384 | | | | 45,988 | |
Royal Gold, Inc. | | | 96 | | | | 11,736 | |
RPM International, Inc. | | | 558 | | | | 42,832 | |
Ryerson Holding Corp.(1) | | | 707 | | | | 8,364 | |
Steel Dynamics, Inc. | | | 1,007 | | | | 34,278 | |
Stepan Co. | | | 22 | | | | 2,254 | |
Tredegar Corp. | | | 237 | | | | 5,297 | |
Valvoline, Inc. | | | 179 | | | | 3,832 | |
Warrior Met Coal, Inc. | | | 418 | | | | 8,832 | |
| | | | | | | | 645,272 | |
| | | | | | | | | |
Real Estate Investment Trust — 0.9% | | | | | | | | |
American Homes 4 Rent | | | 942 | | | | 24,690 | |
American Tower Corp. | | | 1,037 | | | | 238,323 | |
Apple Hospitality REIT, Inc. | | | 2,862 | | | | 46,508 | |
Ashford Hospitality Trust, Inc. | | | 1,076 | | | | 3,002 | |
AvalonBay Communities, Inc. | | | 247 | | | | 51,796 | |
CatchMark Timber Trust, Inc. | | | 224 | | | | 2,569 | |
CBL & Associates Properties, Inc. | | | 1,071 | | | | 1,125 | |
Conservative Allocation |
Security Description | | Shares or
Principal
Amount ($) | | | Fair
Value ($) | |
Common Stocks — continued |
Clipper Realty, Inc. | | | 220 | | | | 2,332 | |
Colony Capital, Inc. | | | 384 | | | | 1,824 | |
CorEnergy Infrastructure Trust, Inc. | | | 235 | | | | 10,507 | |
CorePoint Lodging, Inc. | | | 768 | | | | 8,202 | |
Corporate Office Properties Trust | | | 580 | | | | 17,040 | |
CyrusOne, Inc. | | | 108 | | | | 7,066 | |
Essex Property Trust, Inc. | | | 707 | | | | 212,708 | |
Gaming and Leisure Properties, Inc. | | | 702 | | | | 30,221 | |
Healthcare Realty Trust, Inc. | | | 257 | | | | 8,576 | |
Healthcare Trust of America, Inc. - Class A | | | 229 | | | | 6,934 | |
Hudson Pacific Properties, Inc. | | | 491 | | | | 18,486 | |
Lamar Advertising Co. | | | 500 | | | | 44,630 | |
Maui Land & Pineapple Co., Inc.(1) | | | 12 | | | | 135 | |
Mid-America Apartment Communities, Inc. | | | 167 | | | | 22,021 | |
National Health Investors, Inc. | | | 1 | | | | 81 | |
National Storage Affiliates Trust | | | 675 | | | | 22,694 | |
Office Properties Income Trust | | | 593 | | | | 19,059 | |
PS Business Parks, Inc. | | | 123 | | | | 20,279 | |
RAIT Financial Trust(1) | | | 368 | | | | 13 | |
Realogy Holdings Corp. | | | 191 | | | | 1,849 | |
Service Properties Trust | | | 2,327 | | | | 56,616 | |
Simon Property Group, Inc. | | | 1,813 | | | | 270,064 | |
Spirit MTA REIT | | | 477 | | | | 366 | |
Summit Hotel Properties, Inc. | | | 553 | | | | 6,824 | |
Tanger Factory Outlet Centers, Inc. | | | 2,119 | | | | 31,213 | |
Trinity Place Holdings, Inc.(1) | | | 367 | | | | 1,105 | |
Uniti Group, Inc. | | | 81 | | | | 665 | |
Urstadt Biddle Properties, Inc. | | | 575 | | | | 14,283 | |
Xenia Hotels & Resorts, Inc. | | | 1,105 | | | | 23,879 | |
| | | | | | | | 1,227,685 | |
| | | | | | | | | |
Utilities — 0.3% | | | | | | | | |
American Water Works Co., Inc. | | | 1,975 | | | | 242,629 | |
Atlantic Power Corp.(1) | | | 423 | | | | 986 | |
Consolidated Water Co., Ltd. | | | 189 | | | | 3,081 | |
MDU Resources Group, Inc. | | | 3,122 | | | | 92,755 | |
NorthWestern Corp. | | | 17 | | | | 1,218 | |
Portland General Electric Co. | | | 150 | | | | 8,369 | |
PPL Corp. | | | 7 | | | | 251 | |
Spark Energy, Inc. - Class A | | | 232 | | | | 2,141 | |
Unitil Corp. | | | 187 | | | | 11,544 | |
| | | | | | | | 362,974 | |
| | | | | | | | | |
Total Common Stocks (Cost $26,588,052) | | | | | | | 31,154,098 | |
| | | | | | | | | |
The accompanying notes are an integral part of these financial statements
Page 92 | 2019 Annual Report | December 31, 2019 |
Schedule of Investments
December 31, 2019
Conservative Allocation |
Security Description | | Shares or
Principal
Amount ($) | | | Fair
Value ($) | |
Registered Investment Companies — 60.8% |
American Beacon SiM High Yield Opportunities Fund - Class I | | | 304,949 | | | | 2,906,164 | |
Baird Core Plus Bond Fund - Class I | | | 436,041 | | | | 5,040,634 | |
Dodge & Cox Income Fund | | | 406,865 | | | | 5,708,319 | |
DoubleLine Total Return Bond Fund - Class I | | | 304,642 | | | | 3,238,342 | |
Frost Total Return Bond Fund - Class I | | | 411,317 | | | | 4,257,129 | |
Guggenheim Total Return Bond Fund - Class I | | | 61,303 | | | | 1,662,543 | |
iShares Core U.S. Aggregate Bond ETF(5) | | | 84,584 | | | | 9,504,702 | |
iShares JP Morgan USD Emerging Markets Bond ETF(5) | | | 37,748 | | | | 4,324,411 | |
Lord Abbett High Yield Fund - Class I | | | 571,574 | | | | 4,303,949 | |
Payden Emerging Markets Bond Fund - Class I | | | 278,982 | | | | 3,836,000 | |
PGIM Total Return Bond Fund - Class R6 | | | 344,556 | | | | 4,968,498 | |
PIMCO Investment Grade Credit Bond Fund - Class I | | | 182,319 | | | | 1,990,928 | |
Pioneer Bond Fund - Class Y | | | 504,447 | | | | 4,938,533 | |
Segall Bryant & Hamill Plus Bond Fund - Class I | | | 396,372 | | | | 4,237,213 | |
TCW Emerging Markets Income Fund - Class I | | | 456,143 | | | | 3,854,409 | |
Vanguard Intermediate-Term Corporate Bond ETF(5) | | | 32,118 | | | | 2,933,337 | |
Vanguard Total Bond Market ETF(5) | | | 113,395 | | | | 9,509,305 | |
Xtrackers USD High Yield Corporate Bond ETF(5) | | | 132,445 | | | | 6,671,254 | |
Total Registered Investment Companies (Cost $82,044,214) | | | | | | | 83,885,670 | |
| | | | | | | | | |
Money Market Registered Investment Companies — 6.8% |
Meeder Institutional Prime Money Market Fund, 1.75%(2) | | | 9,379,205 | | | | 9,379,205 | |
Total Money Market Registered Investment Companies (Cost $9,377,913) | | | | | | | 9,379,205 | |
| | | | | | | | | |
U.S. Government Obligations — 8.2% |
U.S. Treasury Note, 2.25%, due 1/31/2024 | | | 3,052,800 | | | | 3,123,515 | |
U.S. Treasury Note, 2.625%, due 2/15/2029 | | | 1,333,400 | | | | 1,414,133 | |
U.S. Treasury Note, 1.50%, due 8/15/2026 | | | 1,950,100 | | | | 1,912,393 | |
U.S. Treasury Note, 2.25%, due 11/15/2025 | | | 3,898,700 | | | | 4,004,848 | |
Conservative Allocation |
Security Description | | Shares or
Principal
Amount ($) | | | Fair
Value ($) | |
U.S. Government Obligations — continued |
U.S. Treasury Note, 2.125%, due 12/31/2022 | | | 848,000 | | | | 860,919 | |
Total U.S. Government Obligations (Cost $11,051,312) | | | | | | | 11,315,808 | |
Total Investments — 98.4% (Cost $129,061,491) | | | | | | | 135,734,781 | |
Other Assets less Liabilities — 1.6% | | | | | | | 2,197,090 | |
Total Net Assets — 100.0% | | | | | | | 137,931,871 | |
| | | | | | | | | |
Trustee Deferred Compensation(3) |
Meeder Balanced Fund | | | 1,045 | | | | 12,812 | |
Meeder Dynamic Allocation Fund | | | 2,656 | | | | 31,527 | |
Meeder Muirfield Fund | | | 1,451 | | | | 11,477 | |
Meeder Conservative Allocation Fund | | | 303 | | | | 6,924 | |
Total Trustee Deferred Compensation (Cost $54,778) | | | | | | | 62,740 | |
| | | Long
(Short)
Contracts | | | Expiration
Date | | | Notional
Value of
Contracts
($) | | | Value and
Unrealized
Appreciation
(Depreciation)
($) | |
Futures Contracts |
Index Futures | | | | | | | | | | | | | | | | |
Mini MSCI EAFE Index Futures | | | 32 | | | | 3/20/2020 | | | | 3,258,400 | | | | 10,792 | |
Mini MSCI Emerging Markets Index Futures | | | 14 | | | | 3/20/2020 | | | | 784,140 | | | | 8,047 | |
Russell 2000 Mini Index Futures | | | 3 | | | | 3/20/2020 | | | | 250,590 | | | | 2,298 | |
Standard & Poors 500 Mini Futures | | | 27 | | | | 3/20/2020 | | | | 4,361,985 | | | | 46,192 | |
E-mini Standard & Poors MidCap 400 Futures | | | 5 | | | | 3/20/2020 | | | | 1,032,400 | | | | 11,483 | |
Total Futures Contracts | | | 81 | | | | | | | | 9,687,515 | | | | 78,812 | |
(1) | Represents non-income producing securities. |
(2) | Investment in affiliate. The yield shown represents the 7-day yield in effect at December 31, 2019. |
(3) | Assets of affiliates to the Conservative Allocation Fund held for the benefit of the Fund’s Trustees in connection with the Trustees Deferred Compensation Plan. |
(4) | Fair valued security deemed as Level 3 security. |
The accompanying notes are an integral part of these financial statements
2019 Annual Report | December 31, 2019 | Page 93 |
Schedule of Investments
December 31, 2019
Dynamic Allocation Fund |
Security Description | | Shares or
Principal
Amount ($) | | | Fair
Value ($) | |
Common Stocks — 72.6% |
Communication Services — 6.3% | | | | | | | | |
Alphabet, Inc. - Class A(1) | | | 485 | | | | 649,604 | |
Alphabet, Inc. - Class C(1) | | | 2,177 | | | | 2,910,693 | |
Altice USA, Inc.(1) | | | 1,681 | | | | 45,959 | |
AT&T, Inc. | | | 37,694 | | | | 1,473,082 | |
Cinemark Holdings, Inc. | | | 446 | | | | 15,097 | |
Cogent Communications Holdings, Inc. | | | 381 | | | | 25,074 | |
Comcast Corp. - Class A | | | 22,924 | | | | 1,030,892 | |
Cumulus Media, Inc.(1) | | | 1,110 | | | | 19,503 | |
Electronic Arts, Inc.(1) | | | 529 | | | | 56,873 | |
Facebook, Inc.(1) | | | 10,049 | | | | 2,062,557 | |
Frontier Communications Corp.(1) | | | 3,108 | | | | 2,765 | |
Gannett Co., Inc. | | | 1,100 | | | | 7,018 | |
IDT Corp. - Class B(1) | | | 2,025 | | | | 14,600 | |
John Wiley & Sons, Inc. | | | 894 | | | | 43,377 | |
Lee Enterprises, Inc.(1) | | | 686 | | | | 974 | |
Liberty Latin America, Ltd. - Class A(1) | | | 824 | | | | 15,903 | |
Liberty TripAdvisor Holdings, Inc.(1) | | | 4,871 | | | | 35,802 | |
Marcus Corp./The | | | 1,634 | | | | 51,912 | |
MDC Partners, Inc.(1) | | | 1,438 | | | | 3,998 | |
National CineMedia, Inc. | | | 286 | | | | 2,085 | |
Roku, Inc.(1) | | | 483 | | | | 64,674 | |
Sinclair Broadcast Group, Inc. | | | 135 | | | | 4,501 | |
Take-Two Interactive Software, Inc.(1) | | | 2,290 | | | | 280,365 | |
TechTarget, Inc.(1) | | | 254 | | | | 6,629 | |
Telephone & Data Systems, Inc. | | | 4,391 | | | | 111,663 | |
T-Mobile US, Inc.(1) | | | 15,489 | | | | 1,214,647 | |
Travelzoo(1) | | | 103 | | | | 1,102 | |
Verizon Communications, Inc. | | | 34,604 | | | | 2,124,686 | |
Walt Disney Co./The | | | 2,025 | | | | 292,876 | |
Yelp, Inc.(1) | | | 1,043 | | | | 36,328 | |
| | | | | | | | 12,605,239 | |
| | | | | | | | | |
Consumer Discretionary — 7.4% | | | | | | | | |
Aaron’s, Inc. | | | 440 | | | | 25,128 | |
Acushnet Holdings Corp. | | | 1,225 | | | | 39,813 | |
Amazon.com, Inc.(1) | | | 1,768 | | | | 3,266,981 | |
American Public Education, Inc.(1) | | | 348 | | | | 9,532 | |
Aramark | | | 1,857 | | | | 80,594 | |
AutoZone, Inc.(1) | | | 465 | | | | 553,959 | |
Bassett Furniture Industries, Inc. | | | 1,107 | | | | 18,465 | |
BBX Capital Corp. | | | 196 | | | | 935 | |
Best Buy Co., Inc. | | | 2,751 | | | | 241,538 | |
Biglari Holdings, Inc. - Class B(1) | | | 161 | | | | 18,422 | |
Bloomin’ Brands, Inc. | | | 2,755 | | | | 60,803 | |
BorgWarner, Inc. | | | 901 | | | | 39,085 | |
Buckle, Inc./The | | | 9 | | | | 243 | |
Dynamic Allocation Fund |
Security Description | | Shares or
Principal
Amount ($) | | | Fair
Value ($) | |
Common Stocks — continued |
Burlington Stores, Inc.(1) | | | 17 | | | | 3,877 | |
Citi Trends, Inc. | | | 368 | | | | 8,508 | |
Crocs, Inc.(1) | | | 1,367 | | | | 57,264 | |
Dana, Inc. | | | 1,367 | | | | 24,879 | |
Darden Restaurants, Inc. | | | 647 | | | | 70,529 | |
Dollar General Corp. | | | 2,868 | | | | 447,351 | |
eBay, Inc. | | | 4,311 | | | | 155,670 | |
Everi Holdings, Inc.(1) | | | 1,869 | | | | 25,101 | |
Extended Stay America, Inc. | | | 2,399 | | | | 35,649 | |
Garmin, Ltd. | | | 297 | | | | 28,975 | |
General Motors Co. | | | 18,352 | | | | 671,683 | |
Gentex Corp. | | | 2,979 | | | | 86,331 | |
H&R Block, Inc. | | | 2,915 | | | | 68,444 | |
Home Depot, Inc./The | | | 519 | | | | 113,339 | |
Hudson, Ltd.(1) | | | 625 | | | | 9,588 | |
J Alexander’s Holdings, Inc.(1) | | | 2,316 | | | | 22,141 | |
KB Home | | | 1,198 | | | | 41,055 | |
Kirkland’s, Inc.(1) | | | 2,842 | | | | 3,524 | |
Kohl’s Corp. | | | 157 | | | | 7,999 | |
Lear Corp. | | | 1,726 | | | | 236,807 | |
Lennar Corp. | | | 4,534 | | | | 252,952 | |
LKQ Corp.(1) | | | 4,742 | | | | 169,289 | |
Lululemon Athletica, Inc.(1) | | | 2,441 | | | | 565,506 | |
M/I Homes, Inc.(1) | | | 1,025 | | | | 40,334 | |
Malibu Boats, Inc.(1) | | | 679 | | | | 27,805 | |
MasterCraft Boat Holdings, Inc.(1) | | | 859 | | | | 13,529 | |
MDC Holdings, Inc. | | | 821 | | | | 31,329 | |
Meritage Homes Corp.(1) | | | 1,078 | | | | 65,877 | |
MGM Resorts International | | | 13,830 | | | | 460,124 | |
Murphy USA, Inc.(1) | | | 282 | | | | 32,994 | |
NIKE, Inc. - Class B | | | 16,427 | | | | 1,664,219 | |
NVR, Inc.(1) | | | 25 | | | | 95,210 | |
Office Depot, Inc. | | | 3,903 | | | | 10,694 | |
Polaris, Inc. | | | 1,370 | | | | 139,329 | |
PulteGroup, Inc. | | | 3,277 | | | | 127,148 | |
Purple Innovation, Inc.(1) | | | 663 | | | | 5,775 | |
Ralph Lauren Corp. | | | 289 | | | | 33,877 | |
Rent-A-Center, Inc./TX | | | 398 | | | | 11,478 | |
Rocky Brands, Inc. | | | 175 | | | | 5,150 | |
Ross Stores, Inc. | | | 3,387 | | | | 394,315 | |
Rubicon Project, Inc./The(1) | | | 357 | | | | 2,913 | |
Skechers U.S.A., Inc.(1) | | | 1,227 | | | | 52,994 | |
Sportsman’s Warehouse Holdings, Inc.(1) | | | 1,448 | | | | 11,627 | |
Starbucks Corp. | | | 12,468 | | | | 1,096,187 | |
Steven Madden, Ltd. | | | 1,357 | | | | 58,365 | |
Stoneridge, Inc.(1) | | | 591 | | | | 17,328 | |
Superior Industries International, Inc. | | | 97 | | | | 358 | |
The accompanying notes are an integral part of these financial statements
Page 94 | 2019 Annual Report | December 31, 2019 |
Schedule of Investments
December 31, 2019
Dynamic Allocation Fund |
Security Description | | Shares or
Principal
Amount ($) | | | Fair
Value ($) | |
Common Stocks — continued |
Tailored Brands, Inc. | | | 965 | | | | 3,995 | |
Target Corp. | | | 10,727 | | | | 1,375,309 | |
Tile Shop Holdings, Inc. | | | 975 | | | | 1,648 | |
Tilly’s, Inc. - Class A | | | 1,116 | | | | 13,671 | |
TJX Cos., Inc./The | | | 20,458 | | | | 1,249,165 | |
Toll Brothers, Inc. | | | 2,234 | | | | 88,265 | |
Town Sports International Holdings, Inc.(1) | | | 2,090 | | | | 3,574 | |
Tupperware Brands Corp. | | | 1,839 | | | | 15,779 | |
Whirlpool Corp. | | | 282 | | | | 41,603 | |
Winnebago Industries, Inc. | | | 244 | | | | 12,927 | |
Wyndham Destinations, Inc. | | | 995 | | | | 51,432 | |
Yum China Holdings, Inc. | | | 482 | | | | 23,141 | |
| | | | | | | | 14,741,427 | |
| | | | | | | | | |
Consumer Staples — 4.2% | | | | | | | | |
Casey’s General Stores, Inc. | | | 1,456 | | | | 231,489 | |
Costco Wholesale Corp. | | | 2,664 | | | | 783,003 | |
Flowers Foods, Inc. | | | 1,338 | | | | 29,088 | |
General Mills, Inc. | | | 21,797 | | | | 1,167,447 | |
Hershey Co./The | | | 2,705 | | | | 397,581 | |
Ingles Markets, Inc. | | | 140 | | | | 6,651 | |
Kroger Co./The | | | 3,141 | | | | 91,058 | |
Lifevantage Corp.(1) | | | 330 | | | | 5,151 | |
Molson Coors Beverage Co. | | | 6,429 | | | | 346,523 | |
PepsiCo, Inc. | | | 14,069 | | | | 1,922,810 | |
Performance Food Group Co.(1) | | | 1,975 | | | | 101,673 | |
Pilgrim’s Pride Corp.(1) | | | 434 | | | | 14,198 | |
Post Holdings, Inc.(1) | | | 56 | | | | 6,110 | |
Procter & Gamble Co./The | | | 1,329 | | | | 165,992 | |
SpartanNash Co. | | | 1,098 | | | | 15,636 | |
Sysco Corp. | | | 14,819 | | | | 1,267,617 | |
Tyson Foods, Inc. | | | 8,984 | | | | 817,903 | |
Walmart, Inc. | | | 9,367 | | | | 1,113,174 | |
| | | | | | | | 8,483,104 | |
| | | | | | | | | |
Energy — 2.6% | | | | | | | | |
Amplify Energy Corp. | | | 1,785 | | | | 11,799 | |
Archrock, Inc. | | | 4,271 | | | | 42,881 | |
Ardmore Shipping Corp.(1) | | | 135 | | | | 1,222 | |
Baker Hughes Co. | | | 3,144 | | | | 80,581 | |
Berry Petroleum Corp. | | | 964 | | | | 9,091 | |
Brigham Minerals, Inc. | | | 262 | | | | 5,617 | |
Cactus, Inc. | | | 2,469 | | | | 84,736 | |
Chevron Corp. | | | 9,867 | | | | 1,189,072 | |
ConocoPhillips | | | 9,282 | | | | 603,608 | |
Contura Energy, Inc.(1) | | | 832 | | | | 7,530 | |
Dynamic Allocation Fund |
Security Description | | Shares or
Principal
Amount ($) | | | Fair
Value ($) | |
Common Stocks — continued |
Delek US Holdings, Inc. | | | 1,675 | | | | 56,163 | |
Devon Energy Corp. | | | 172 | | | | 4,467 | |
DHT Holdings, Inc. | | | 1,239 | | | | 10,259 | |
Dorian LPG, Ltd.(1) | | | 996 | | | | 15,418 | |
Exterran Corp.(1) | | | 2,163 | | | | 16,936 | |
Hallador Energy Co. | | | 1,236 | | | | 3,671 | |
Independence Contract Drilling, Inc.(1) | | | 1,520 | | | | 1,515 | |
Liberty Oilfield Services, Inc. | | | 1,057 | | | | 11,754 | |
Marathon Petroleum Corp. | | | 10,398 | | | | 626,480 | |
Matrix Service Co.(1) | | | 748 | | | | 17,114 | |
NexTier Oilfield Solutions, Inc.(1) | | | 404 | | | | 2,707 | |
Nordic American Tankers, Ltd. | | | 1,792 | | | | 8,817 | |
Oceaneering International, Inc.(1) | | | 1,824 | | | | 27,196 | |
PBF Energy, Inc. | | | 1,313 | | | | 41,189 | |
Peabody Energy Corp. | | | 1,128 | | | | 10,287 | |
Phillips 66 | | | 11,915 | | | | 1,327,450 | |
Profire Energy, Inc.(1) | | | 11 | | | | 16 | |
Renewable Energy Group, Inc.(1) | | | 1,072 | | | | 28,890 | |
Rosehill Resources, Inc.(1) | | | 475 | | | | 608 | |
SEACOR Holdings, Inc.(1) | | | 507 | | | | 21,877 | |
SilverBow Resources, Inc.(1) | | | 362 | | | | 3,584 | |
Superior Energy Services, Inc.(1) | | | 271 | | | | 1,358 | |
Talos Energy, Inc.(1) | | | 93 | | | | 2,804 | |
Teekay Tankers, Ltd.(1) | | | 156 | | | | 3,739 | |
Valero Energy Corp. | | | 9,384 | | | | 878,812 | |
W&T Offshore, Inc.(1) | | | 354 | | | | 1,968 | |
World Fuel Services Corp. | | | 307 | | | | 13,330 | |
| | | | | | | | 5,174,546 | |
| | | | | | | | | |
Financials — 8.6% | | | | | | | | |
Ally Financial, Inc. | | | 10,435 | | | | 318,894 | |
Artisan Partners Asset Management, Inc. | | | 3,691 | | | | 119,293 | |
Ashford, Inc.(1) | | | 85 | | | | 2,006 | |
B. Riley Financial, Inc. | | | 424 | | | | 10,676 | |
BancFirst Corp. | | | 347 | | | | 21,667 | |
Bank of America Corp. | | | 38,305 | | | | 1,349,102 | |
BankFinancial Corp. | | | 106 | | | | 1,386 | |
Berkshire Hathaway, Inc. - Class B(1) | | | 13,428 | | | | 3,041,442 | |
Brighthouse Financial, Inc.(1) | | | 1,645 | | | | 64,533 | |
Cannae Holdings, Inc.(1) | | | 823 | | | | 30,607 | |
Citigroup, Inc. | | | 23,685 | | | | 1,892,195 | |
Citizens Financial Group, Inc. | | | 3,565 | | | | 144,775 | |
Curo Group Holdings Corp.(1) | | | 1,557 | | | | 18,964 | |
Diamond Hill Investment Group, Inc. | | | 55 | | | | 7,725 | |
Elevate Credit, Inc.(1) | | | 1,964 | | | | 8,740 | |
Ellington Financial, Inc. | | | 5,044 | | | | 92,457 | |
The accompanying notes are an integral part of these financial statements
2019 Annual Report | December 31, 2019 | Page 95 |
Schedule of Investments
December 31, 2019
Dynamic Allocation Fund |
Security Description | | Shares or
Principal
Amount ($) | | | Fair
Value ($) | |
Common Stocks — continued |
Esquire Financial Holdings, Inc.(1) | | | 113 | | | | 2,946 | |
ESSA Bancorp, Inc. | | | 12 | | | | 203 | |
Essent Group, Ltd. | | | 4,341 | | | | 225,689 | |
Exantas Capital Corp. | | | 973 | | | | 11,491 | |
Fidelity National Financial, Inc. | | | 8,076 | | | | 366,247 | |
Fifth Third Bancorp | | | 37,342 | | | | 1,147,893 | |
First American Financial Corp. | | | 3,815 | | | | 222,491 | |
First BanCorp/Puerto Rico | | | 10,008 | | | | 105,985 | |
First Horizon National Corp. | | | 13,727 | | | | 227,319 | |
FNB Corp./PA | | | 382 | | | | 4,851 | |
GAMCO Investors, Inc. | | | 7 | | | | 136 | |
Great Ajax Corp. | | | 2,053 | | | | 30,405 | |
Hallmark Financial Services, Inc.(1) | | | 281 | | | | 4,937 | |
Heritage Commerce Corp. | | | 7,208 | | | | 92,479 | |
Hilltop Holdings, Inc. | | | 4,570 | | | | 113,930 | |
Horizon Bancorp, Inc./IN | | | 133 | | | | 2,527 | |
Independent Bank Corp./MI | | | 218 | | | | 4,938 | |
International Bancshares Corp. | | | 1,182 | | | | 50,909 | |
JPMorgan Chase & Co. | | | 10,754 | | | | 1,499,108 | |
MGIC Investment Corp. | | | 11,761 | | | | 166,653 | |
NewStar Financial Contingent Value Rights(1)(7) | | | 179 | | | | — | |
Nicolet Bankshares, Inc.(1) | | | 232 | | | | 17,133 | |
NMI Holdings, Inc. - Class A(1) | | | 1,974 | | | | 65,497 | |
Northeast Bank | | | 146 | | | | 3,211 | |
Northrim BanCorp, Inc. | | | 839 | | | | 32,134 | |
Old Republic International Corp. | | | 12,375 | | | | 276,829 | |
OneMain Holdings, Inc. | | | 1,265 | | | | 53,320 | |
Oppenheimer Holdings, Inc. | | | 3,536 | | | | 97,169 | |
PCB Bancorp | | | 10 | | | | 173 | |
Peapack Gladstone Financial Corp. | | | 116 | | | | 3,584 | |
PennyMac Financial Services, Inc. | | | 643 | | | | 21,888 | |
Piper Sandler Cos. | | | 1,386 | | | | 110,797 | |
PNC Financial Services Group, Inc./The | | | 8,806 | | | | 1,405,702 | |
Popular, Inc. | | | 8,619 | | | | 506,366 | |
ProSight Global, Inc.(1) | | | 898 | | | | 14,485 | |
Prudential Financial, Inc. | | | 10,486 | | | | 982,958 | |
Pzena Investment Management, Inc. | | | 2,312 | | | | 19,929 | |
Radian Group, Inc. | | | 8,790 | | | | 221,156 | |
RBB Bancorp | | | 242 | | | | 5,123 | |
Ready Capital Corp. | | | 2,224 | | | | 34,294 | |
Regions Financial Corp. | | | 31,355 | | | | 538,052 | |
Reinsurance Group of America, Inc. | | | 45 | | | | 7,338 | |
Renasant Corp. | | | 2,725 | | | | 96,520 | |
Shore Bancshares, Inc. | | | 137 | | | | 2,378 | |
Stewart Information Services Corp. | | | 1,324 | | | | 54,006 | |
Synchrony Financial | | | 14,550 | | | | 523,946 | |
Dynamic Allocation Fund |
Security Description | | Shares or
Principal
Amount ($) | | | Fair
Value ($) | |
Common Stocks — continued |
TPG RE Finance Trust, Inc. | | | 1,695 | | | | 34,358 | |
United Community Banks, Inc./GA | | | 297 | | | | 9,171 | |
Unity Bancorp, Inc. | | | 17 | | | | 384 | |
Univest Financial Corp. | | | 1,179 | | | | 31,574 | |
US Bancorp | | | 1,959 | | | | 116,149 | |
Valley National Bancorp | | | 14,444 | | | | 165,384 | |
Walker & Dunlop, Inc. | | | 669 | | | | 43,271 | |
WR Berkley Corp. | | | 5,692 | | | | 393,317 | |
| | | | | | | | 17,293,195 | |
| | | | | | | | | |
Healthcare — 13.9% | | | | | | | | |
Abbott Laboratories | | | 4,913 | | | | 426,743 | |
AbbVie, Inc. | | | 15,227 | | | | 1,348,199 | |
ACADIA Pharmaceuticals, Inc.(1) | | | 791 | | | | 33,839 | |
Adverum Biotechnologies, Inc.(1) | | | 191 | | | | 2,200 | |
Aeglea BioTherapeutics, Inc.(1) | | | 243 | | | | 1,857 | |
Affimed NV(1) | | | 3,034 | | | | 8,313 | |
Agenus, Inc.(1) | | | 3,935 | | | | 16,015 | |
Agilent Technologies, Inc. | | | 4,167 | | | | 355,487 | |
Aldeyra Therapeutics, Inc.(1) | | | 679 | | | | 3,945 | |
Alexion Pharmaceuticals, Inc.(1) | | | 3,103 | | | | 335,589 | |
Alkermes PLC(1) | | | 1,911 | | | | 38,984 | |
Allergan PLC | | | 1,201 | | | | 229,595 | |
Alnylam Pharmaceuticals, Inc.(1) | | | 1,935 | | | | 222,854 | |
AmerisourceBergen Corp. | | | 2,665 | | | | 226,578 | |
Amgen, Inc. | | | 7,190 | | | | 1,733,293 | |
Amneal Pharmaceuticals, Inc.(1) | | | 1,585 | | | | 7,640 | |
AngioDynamics, Inc.(1) | | | 40 | | | | 640 | |
ANI Pharmaceuticals, Inc.(1) | | | 304 | | | | 18,748 | |
Anika Therapeutics, Inc.(1) | | | 81 | | | | 4,200 | |
Apellis Pharmaceuticals, Inc.(1) | | | 655 | | | | 20,056 | |
AquaBounty Technologies, Inc.(1) | | | 1,015 | | | | 2,203 | |
Aquestive Therapeutics, Inc.(1) | | | 1,276 | | | | 7,426 | |
Ardelyx, Inc.(1) | | | 1,026 | | | | 7,700 | |
Arena Pharmaceuticals, Inc.(1) | | | 1,466 | | | | 66,586 | |
Arrowhead Pharmaceuticals, Inc.(1) | | | 460 | | | | 29,178 | |
Arvinas, Inc.(1) | | | 137 | | | | 5,629 | |
Assertio Therapeutics, Inc.(1) | | | 6,255 | | | | 7,819 | |
Avantor, Inc.(1) | | | 5,001 | | | | 90,768 | |
Avid Bioservices, Inc.(1) | | | 1,117 | | | | 8,567 | |
Avrobio, Inc.(1) | | | 324 | | | | 6,522 | |
Axsome Therapeutics, Inc.(1) | | | 179 | | | | 18,501 | |
Baudax Bio, Inc.(1) | | | 562 | | | | 3,889 | |
Beyondspring, Inc.(1) | | | 358 | | | | 5,549 | |
BioDelivery Sciences International, Inc.(1) | | | 4,003 | | | | 25,299 | |
Biogen, Inc.(1) | | | 4,416 | | | | 1,310,360 | |
The accompanying notes are an integral part of these financial statements
Page 96 | 2019 Annual Report | December 31, 2019 |
Schedule of Investments
December 31, 2019
Dynamic Allocation Fund |
Security Description | | Shares or
Principal
Amount ($) | | | Fair
Value ($) | |
Common Stocks — continued |
Bio-Rad Laboratories, Inc.(1) | | | 65 | | | | 24,052 | |
Bio-Techne Corp. | | | 68 | | | | 14,927 | |
Bristol-Myers Squibb Co. | | | 12,776 | | | | 820,091 | |
Bruker Corp. | | | 1,258 | | | | 64,120 | |
Calithera Biosciences, Inc.(1) | | | 1,054 | | | | 6,018 | |
Cardinal Health, Inc. | | | 992 | | | | 50,175 | |
Catalent, Inc.(1) | | | 1,355 | | | | 76,287 | |
Catalyst Pharmaceuticals, Inc.(1) | | | 951 | | | | 3,566 | |
Cellular Biomedicine Group, Inc.(1) | | | 427 | | | | 6,934 | |
Cerecor, Inc.(1) | | | 444 | | | | 2,393 | |
Cerner Corp. | | | 8,242 | | | | 604,880 | |
Chemed Corp. | | | 389 | | | | 170,872 | |
ChemoCentryx, Inc.(1) | | | 3 | | | | 119 | |
Coherus Biosciences, Inc.(1) | | | 453 | | | | 8,156 | |
Collegium Pharmaceutical, Inc.(1) | | | 564 | | | | 11,607 | |
Computer Programs & Systems, Inc. | | | 461 | | | | 12,170 | |
CONMED Corp. | | | 369 | | | | 41,265 | |
Constellation Pharmaceuticals, Inc.(1) | | | 107 | | | | 5,041 | |
Cross Country Healthcare, Inc.(1) | | | 513 | | | | 5,961 | |
Cutera, Inc.(1) | | | 142 | | | | 5,085 | |
Deciphera Pharmaceuticals, Inc.(1) | | | 309 | | | | 19,232 | |
DENTSPLY SIRONA, Inc. | | | 1,614 | | | | 91,336 | |
DexCom, Inc.(1) | | | 470 | | | | 102,808 | |
Dicerna Pharmaceuticals, Inc.(1) | | | 1,013 | | | | 22,316 | |
Eagle Pharmaceuticals, Inc./DE(1) | | | 91 | | | | 5,467 | |
Edwards Lifesciences Corp.(1) | | | 64 | | | | 14,931 | |
Eiger BioPharmaceuticals, Inc.(1) | | | 148 | | | | 2,205 | |
Elanco Animal Health, Inc. Contingent Value Rights(1)(7) | | | 1,625 | | | | — | |
Eli Lilly & Co. | | | 12,186 | | | | 1,601,606 | |
Emergent BioSolutions, Inc.(1) | | | 465 | | | | 25,087 | |
Encompass Health Corp. | | | 956 | | | | 66,222 | |
Endo International PLC(1) | | | 3,130 | | | | 14,680 | |
Enochian Biosciences, Inc.(1) | | | 66 | | | | 331 | |
Epizyme, Inc.(1) | | | 82 | | | | 2,017 | |
Exact Sciences Corp.(1) | | | 931 | | | | 86,099 | |
Exelixis, Inc.(1) | | | 4,727 | | | | 83,290 | |
Forty Seven, Inc.(1) | | | 222 | | | | 8,740 | |
Gilead Sciences, Inc. | | | 19,476 | | | | 1,265,550 | |
Haemonetics Corp.(1) | | | 15 | | | | 1,724 | |
Harvard Bioscience, Inc.(1) | | | 49 | | | | 149 | |
HealthStream, Inc.(1) | | | 406 | | | | 11,043 | |
Hill-Rom Holdings, Inc. | | | 2,546 | | | | 289,047 | |
Hologic, Inc.(1) | | | 2,585 | | | | 134,963 | |
Horizon Therapeutics Plc(1) | | | 1,122 | | | | 40,616 | |
Humana, Inc. | | | 2,816 | | | | 1,032,120 | |
ImmunoGen, Inc.(1) | | | 1,654 | | | | 8,444 | |
Dynamic Allocation Fund |
Security Description | | Shares or
Principal
Amount ($) | | | Fair
Value ($) | |
Common Stocks — continued |
Incyte Corp.(1) | | | 3,659 | | | | 319,504 | |
Insulet Corp.(1) | | | 133 | | | | 22,770 | |
Intersect ENT, Inc.(1) | | | 381 | | | | 9,487 | |
Ionis Pharmaceuticals, Inc.(1) | | | 441 | | | | 26,641 | |
Iovance Biotherapeutics, Inc.(1) | | | 1,188 | | | | 32,884 | |
Jazz Pharmaceuticals PLC(1) | | | 165 | | | | 24,631 | |
Johnson & Johnson | | | 11,254 | | | | 1,641,621 | |
Jounce Therapeutics, Inc.(1) | | | 1,612 | | | | 14,073 | |
Kadmon Holdings, Inc.(1) | | | 1,959 | | | | 8,874 | |
KalVista Pharmaceuticals, Inc.(1) | | | 65 | | | | 1,158 | |
Karyopharm Therapeutics, Inc.(1) | | | 400 | | | | 7,668 | |
Kindred Biosciences, Inc.(1) | | | 443 | | | | 3,757 | |
Kodiak Sciences, Inc.(1) | | | 145 | | | | 10,433 | |
Krystal Biotech, Inc.(1) | | | 234 | | | | 12,959 | |
Kura Oncology, Inc.(1) | | | 517 | | | | 7,109 | |
Lannett Co., Inc.(1) | | | 663 | | | | 5,848 | |
Lantheus Holdings, Inc.(1) | | | 352 | | | | 7,220 | |
Lexicon Pharmaceuticals, Inc.(1) | | | 1,251 | | | | 5,192 | |
Mallinckrodt PLC(1) | | | 2,698 | | | | 9,416 | |
Masimo Corp.(1) | | | 263 | | | | 41,570 | |
McKesson Corp. | | | 2,252 | | | | 311,497 | |
Medtronic PLC | | | 15,200 | | | | 1,724,440 | |
MEI Pharma, Inc.(1) | | | 1,169 | | | | 2,899 | |
MeiraGTx Holdings plc(1) | | | 418 | | | | 8,368 | |
Merck & Co., Inc. | | | 19,857 | | | | 1,805,994 | |
Meridian Bioscience, Inc. | | | 1,001 | | | | 9,780 | |
Mersana Therapeutics, Inc.(1) | | | 162 | | | | 928 | |
Mirati Therapeutics, Inc.(1) | | | 36 | | | | 4,639 | |
Misonix, Inc.(1) | | | 225 | | | | 4,187 | |
Molecular Templates, Inc.(1) | | | 573 | | | | 8,013 | |
Morphic Holding, Inc.(1) | | | 198 | | | | 3,398 | |
Myriad Genetics, Inc.(1) | | | 532 | | | | 14,486 | |
Natera, Inc.(1) | | | 824 | | | | 27,761 | |
Natus Medical, Inc.(1) | | | 861 | | | | 28,404 | |
Neurocrine Biosciences, Inc.(1) | | | 753 | | | | 80,940 | |
Nevro Corp.(1) | | | 82 | | | | 9,638 | |
NextCure, Inc.(1) | | | 19 | | | | 1,070 | |
NextGen Healthcare, Inc.(1) | | | 504 | | | | 8,099 | |
Novocure, Ltd.(1) | | | 60 | | | | 5,056 | |
Odonate Therapeutics, Inc.(1) | | | 236 | | | | 7,658 | |
Oncternal Therapeutics, Inc.(1) | | | 482 | | | | 1,904 | |
OPKO Health, Inc.(1) | | | 11,676 | | | | 17,164 | |
Organogenesis Holdings, Inc.(1) | | | 353 | | | | 1,698 | |
Orthofix Medical, Inc.(1) | | | 630 | | | | 29,093 | |
Osmotica Pharmaceuticals PLC(1) | | | 790 | | | | 5,522 | |
Pacira BioSciences, Inc.(1) | | | 1,233 | | | | 55,855 | |
Palatin Technologies, Inc.(1) | | | 9,175 | | | | 7,177 | |
The accompanying notes are an integral part of these financial statements
2019 Annual Report | December 31, 2019 | Page 97 |
Schedule of Investments
December 31, 2019
Dynamic Allocation Fund |
Security Description | | Shares or
Principal
Amount ($) | | | Fair
Value ($) | |
Common Stocks — continued |
PDL BioPharma, Inc.(1) | | | 2,167 | | | | 7,032 | |
Pennant Group, Inc./The(1) | | | 678 | | | | 22,421 | |
Perrigo Co. PLC | | | 1,584 | | | | 81,829 | |
Pfenex, Inc.(1) | | | 1,081 | | | | 11,869 | |
Pfizer, Inc. | | | 43,383 | | | | 1,699,746 | |
Phibro Animal Health Corp. | | | 1,254 | | | | 31,137 | |
Pieris Pharmaceuticals, Inc.(1) | | | 1,223 | | | | 4,427 | |
PRA Health Sciences, Inc.(1) | | | 2,162 | | | | 240,306 | |
Precision BioSciences, Inc.(1) | | | 93 | | | | 1,292 | |
Principia Biopharma, Inc.(1) | | | 354 | | | | 19,392 | |
Progenics Pharmaceuticals, Inc.(1) | | | 1,751 | | | | 8,913 | |
PTC Therapeutics, Inc.(1) | | | 962 | | | | 46,205 | |
Reata Pharmaceuticals, Inc.(1) | | | 124 | | | | 25,349 | |
Recro Pharma, Inc.(1) | | | 1,211 | | | | 22,198 | |
Regeneron Pharmaceuticals, Inc.(1) | | | 1,335 | | | | 501,266 | |
Replimune Group, Inc.(1) | | | 644 | | | | 9,241 | |
ResMed, Inc. | | | 869 | | | | 134,669 | |
Rigel Pharmaceuticals, Inc.(1) | | | 9,031 | | | | 19,326 | |
Savara, Inc.(1) | | | 161 | | | | 721 | |
scPharmaceuticals, Inc.(1) | | | 397 | | | | 2,247 | |
Seattle Genetics, Inc.(1) | | | 991 | | | | 113,232 | |
SIGA Technologies, Inc.(1) | | | 865 | | | | 4,126 | |
STERIS PLC | | | 1,218 | | | | 185,648 | |
Stryker Corp. | | | 6,345 | | | | 1,332,069 | |
Syndax Pharmaceuticals, Inc.(1) | | | 238 | | | | 2,090 | |
United Therapeutics Corp.(1) | | | 931 | | | | 82,002 | |
UnitedHealth Group, Inc. | | | 1,167 | | | | 343,075 | |
Vanda Pharmaceuticals, Inc.(1) | | | 1,320 | | | | 21,661 | |
Veeva Systems, Inc.(1) | | | 1,139 | | | | 160,212 | |
Veracyte, Inc.(1) | | | 791 | | | | 22,085 | |
Vericel Corp.(1) | | | 2,216 | | | | 38,558 | |
Verrica Pharmaceuticals, Inc.(1) | | | 506 | | | | 8,040 | |
Vertex Pharmaceuticals, Inc.(1) | | | 5,838 | | | | 1,278,230 | |
West Pharmaceutical Services, Inc. | | | 198 | | | | 29,765 | |
XBiotech, Inc.(1) | | | 314 | | | | 5,861 | |
Xencor, Inc.(1) | | | 1,192 | | | | 40,993 | |
Y-mAbs Therapeutics, Inc.(1) | | | 941 | | | | 29,406 | |
Zimmer Biomet Holdings, Inc. | | | 6,157 | | | | 921,580 | |
Zoetis, Inc. | | | 3,581 | | | | 473,945 | |
| | | | | | | | 27,875,160 | |
| | | | | | | | | |
Industrials — 4.6% | | | | | | | | |
AGCO Corp. | | | 1,387 | | | | 107,146 | |
Alamo Group, Inc. | | | 32 | | | | 4,018 | |
Allison Transmission Holdings, Inc. | | | 10,751 | | | | 519,488 | |
Atkore International Group, Inc.(1) | | | 1,649 | | | | 66,719 | |
Dynamic Allocation Fund |
Security Description | | Shares or
Principal
Amount ($) | | | Fair
Value ($) | |
Common Stocks — continued |
Barrett Business Services, Inc. | | | 85 | | | | 7,689 | |
BMC Stock Holdings, Inc.(1) | | | 417 | | | | 11,964 | |
Builders FirstSource, Inc.(1) | | | 2,440 | | | | 62,000 | |
Caterpillar, Inc. | | | 1,510 | | | | 222,997 | |
CBIZ, Inc.(1) | | | 776 | | | | 20,921 | |
Cintas Corp. | | | 329 | | | | 88,527 | |
Comfort Systems USA, Inc. | | | 540 | | | | 26,919 | |
Commercial Vehicle Group, Inc.(1) | | | 2,838 | | | | 18,021 | |
Construction Partners, Inc.(1) | | | 28 | | | | 472 | |
Copart, Inc.(1) | | | 3,173 | | | | 288,553 | |
Costamare, Inc. | | | 7 | | | | 67 | |
Cummins, Inc. | | | 6,610 | | | | 1,182,926 | |
Delta Air Lines, Inc. | | | 3,528 | | | | 206,317 | |
Douglas Dynamics, Inc. | | | 98 | | | | 5,390 | |
EMCOR Group, Inc. | | | 2,600 | | | | 224,380 | |
Federal Signal Corp. | | | 739 | | | | 23,833 | |
Fortune Brands Home & Security, Inc. | | | 2,911 | | | | 190,205 | |
Foundation Building Materials, Inc.(1) | | | 333 | | | | 6,444 | |
Generac Holdings, Inc.(1) | | | 794 | | | | 79,868 | |
GMS, Inc.(1) | | | 414 | | | | 11,211 | |
Graco, Inc. | | | 938 | | | | 48,776 | |
H&E Equipment Services, Inc. | | | 51 | | | | 1,705 | |
Heidrick & Struggles International, Inc. | | | 281 | | | | 9,133 | |
Herman Miller, Inc. | | | 554 | | | | 23,074 | |
HNI Corp. | | | 34 | | | | 1,274 | |
Hubbell, Inc. | | | 857 | | | | 126,682 | |
Huntington Ingalls Industries, Inc. | | | 670 | | | | 168,090 | |
Illinois Tool Works, Inc. | | | 2,624 | | | | 471,349 | |
Ingersoll-Rand PLC | | | 307 | | | | 40,806 | |
Jacobs Engineering Group, Inc. | | | 449 | | | | 40,334 | |
JetBlue Airways Corp.(1) | | | 1,816 | | | | 33,996 | |
Johnson Controls International plc | | | 1,172 | | | | 47,712 | |
Kimball International, Inc. - Class B | | | 2,383 | | | | 49,257 | |
Knoll, Inc. | | | 803 | | | | 20,284 | |
Lockheed Martin Corp. | | | 1,816 | | | | 707,114 | |
LSC Communications, Inc. | | | 2,952 | | | | 608 | |
ManpowerGroup, Inc. | | | 2,354 | | | | 228,573 | |
Marten Transport, Ltd. | | | 618 | | | | 13,281 | |
MasTec, Inc.(1) | | | 31 | | | | 1,989 | |
Matson, Inc. | | | 1,367 | | | | 55,774 | |
Miller Industries, Inc./TN | | | 726 | | | | 26,956 | |
Northrop Grumman Corp. | | | 860 | | | | 295,814 | |
Northwest Pipe Co.(1) | | | 90 | | | | 2,998 | |
Oshkosh Corp. | | | 2,481 | | | | 234,827 | |
PACCAR, Inc. | | | 8,975 | | | | 709,923 | |
Parker-Hannifin Corp. | | | 4,068 | | | | 837,276 | |
Powell Industries, Inc. | | | 139 | | | | 6,810 | |
The accompanying notes are an integral part of these financial statements
Page 98 | 2019 Annual Report | December 31, 2019 |
Schedule of Investments
December 31, 2019
Dynamic Allocation Fund |
Security Description | | Shares or
Principal
Amount ($) | | | Fair
Value ($) | |
Common Stocks — continued |
Primoris Services Corp. | | | 137 | | | | 3,047 | |
Quanex Building Products Corp. | | | 904 | | | | 15,440 | |
Quanta Services, Inc. | | | 2,814 | | | | 114,558 | |
Resources Connection, Inc. | | | 106 | | | | 1,731 | |
Rush Enterprises, Inc. | | | 583 | | | | 27,110 | |
Safe Bulkers, Inc.(1) | | | 1,349 | | | | 2,293 | |
Saia, Inc.(1) | | | 94 | | | | 8,753 | |
Schneider National, Inc. | | | 870 | | | | 18,983 | |
SPX Corp.(1) | | | 109 | | | | 5,546 | |
Standex International Corp. | | | 405 | | | | 32,137 | |
Steelcase, Inc. - Class A | | | 717 | | | | 14,670 | |
Thermon Group Holdings, Inc.(1) | | | 429 | | | | 11,497 | |
Timken Co./The | | | 2,357 | | | | 132,723 | |
Triton International, Ltd./Bermuda | | | 3,664 | | | | 147,293 | |
TrueBlue, Inc.(1) | | | 1,019 | | | | 24,517 | |
UniFirst Corp./MA | | | 129 | | | | 26,055 | |
United Airlines Holdings, Inc.(1) | | | 3,610 | | | | 318,005 | |
Universal Logistics Holdings, Inc. | | | 41 | | | | 777 | |
Valmont Industries, Inc. | | | 528 | | | | 79,084 | |
Vectrus, Inc.(1) | | | 416 | | | | 21,324 | |
Wabash National Corp. | | | 1,934 | | | | 28,410 | |
WESCO International, Inc.(1) | | | 2,891 | | | | 171,696 | |
WW Grainger, Inc. | | | 1,312 | | | | 444,138 | |
| | | | | | | | 9,230,277 | |
| | | | | | | | | |
Information Technology — 19.9% | | | | | | | | |
A10 Networks, Inc.(1) | | | 202 | | | | 1,388 | |
Accenture PLC | | | 1,314 | | | | 276,689 | |
Adobe, Inc.(1) | | | 1,251 | | | | 412,592 | |
Alliance Data Systems Corp. | | | 217 | | | | 24,347 | |
Amkor Technology, Inc.(1) | | | 4,758 | | | | 61,854 | |
ANSYS, Inc.(1) | | | 1,606 | | | | 413,400 | |
Apple, Inc. | | | 21,980 | | | | 6,454,427 | |
Applied Materials, Inc. | | | 21,979 | | | | 1,341,598 | |
Aspen Technology, Inc.(1) | | | 1,500 | | | | 181,395 | |
AstroNova, Inc. | | | 576 | | | | 7,903 | |
Avnet, Inc. | | | 5,026 | | | | 213,303 | |
Benchmark Electronics, Inc. | | | 3,991 | | | | 137,131 | |
Booz Allen Hamilton Holding Corp. | | | 3,448 | | | | 245,256 | |
Broadcom, Inc. | | | 4,734 | | | | 1,496,039 | |
Cadence Design Systems, Inc.(1) | | | 5,534 | | | | 383,838 | |
Cambium Networks Corp.(1) | | | 2,946 | | | | 25,748 | |
CDK Global, Inc. | | | 2,763 | | | | 151,081 | |
CDW Corp./DE | | | 1,296 | | | | 185,121 | |
ChannelAdvisor Corp.(1) | | | 858 | | | | 7,756 | |
Cirrus Logic, Inc.(1) | | | 241 | | | | 19,861 | |
Dynamic Allocation Fund |
Security Description | | Shares or
Principal
Amount ($) | | | Fair
Value ($) | |
Common Stocks — continued |
Cisco Systems, Inc. | | | 10,994 | | | | 527,272 | |
Citrix Systems, Inc. | | | 5,846 | | | | 648,321 | |
CommVault Systems, Inc.(1) | | | 1,471 | | | | 65,665 | |
Comtech Telecommunications Corp. | | | 1,125 | | | | 39,926 | |
Dell Technologies, Inc. - Class C(1) | | | 3,769 | | | | 193,689 | |
Digi International, Inc.(1) | | | 998 | | | | 17,685 | |
Dolby Laboratories, Inc. | | | 1,618 | | | | 111,318 | |
Dynatrace, Inc.(1) | | | 5,668 | | | | 143,400 | |
Entegris, Inc. | | | 222 | | | | 11,120 | |
FormFactor, Inc.(1) | | | 173 | | | | 4,493 | |
Fortinet, Inc.(1) | | | 1,955 | | | | 208,716 | |
Hewlett Packard Enterprise Co. | | | 27,172 | | | | 430,948 | |
HP, Inc. | | | 4,251 | | | | 87,358 | |
Ideanomics, Inc.(1) | | | 3 | | | | 3 | |
Intel Corp. | | | 29,869 | | | | 1,787,660 | |
International Business Machines Corp. | | | 5,447 | | | | 730,116 | |
Intuit, Inc. | | | 5,281 | | | | 1,383,252 | |
Itron, Inc.(1) | | | 148 | | | | 12,425 | |
j2 Global, Inc. | | | 1,673 | | | | 156,777 | |
Jabil, Inc. | | | 3,588 | | | | 148,292 | |
KBR, Inc. | | | 2,148 | | | | 65,514 | |
Keysight Technologies, Inc.(1) | | | 97 | | | | 9,955 | |
Kimball Electronics, Inc.(1) | | | 50 | | | | 878 | |
KLA Corp. | | | 4,176 | | | | 744,038 | |
Lam Research Corp. | | | 3,946 | | | | 1,153,810 | |
Lattice Semiconductor Corp.(1) | | | 5 | | | | 96 | |
Leidos Holdings, Inc. | | | 2,434 | | | | 238,264 | |
Manhattan Associates, Inc.(1) | | | 498 | | | | 39,716 | |
Mastercard, Inc. | | | 7,701 | | | | 2,299,442 | |
Maxim Integrated Products, Inc. | | | 8,031 | | | | 493,987 | |
MAXIMUS, Inc. | | | 836 | | | | 62,190 | |
Methode Electronics, Inc. | | | 801 | | | | 31,519 | |
Micron Technology, Inc.(1) | | | 25,519 | | | | 1,372,412 | |
Microsoft Corp. | | | 38,350 | | | | 6,047,796 | |
MicroStrategy, Inc.(1) | | | 180 | | | | 25,673 | |
Mitek Systems, Inc.(1) | | | 1 | | | | 8 | |
MKS Instruments, Inc. | | | 200 | | | | 22,002 | |
Model N, Inc.(1) | | | 273 | | | | 9,574 | |
Motorola Solutions, Inc. | | | 2,304 | | | | 371,267 | |
MTS Systems Corp. | | | 276 | | | | 13,256 | |
NCR Corp.(1) | | | 2,627 | | | | 92,365 | |
NortonLifeLock, Inc. | | | 7,411 | | | | 189,129 | |
NVIDIA Corp. | | | 2,094 | | | | 492,718 | |
OneSpan, Inc.(1) | | | 960 | | | | 16,435 | |
Oracle Corp. | | | 29,016 | | | | 1,537,268 | |
Palo Alto Networks, Inc.(1) | | | 644 | | | | 148,925 | |
Paycom Software, Inc.(1) | | | 554 | | | | 146,677 | |
The accompanying notes are an integral part of these financial statements
2019 Annual Report | December 31, 2019 | Page 99 |
Schedule of Investments
December 31, 2019
Dynamic Allocation Fund |
Security Description | | Shares or
Principal
Amount ($) | | | Fair
Value ($) | |
Common Stocks — continued |
PC Connection, Inc. | | | 370 | | | | 18,374 | |
Perspecta, Inc. | | | 1,432 | | | | 37,862 | |
Photronics, Inc.(1) | | | 902 | | | | 14,216 | |
Progress Software Corp. | | | 2,626 | | | | 109,110 | |
Qorvo, Inc.(1) | | | 1,097 | | | | 127,504 | |
QUALCOMM, Inc. | | | 17,537 | | | | 1,547,290 | |
RingCentral, Inc. - Class A(1) | | | 50 | | | | 8,434 | |
Sanmina Corp.(1) | | | 1,251 | | | | 42,834 | |
ScanSource, Inc.(1) | | | 977 | | | | 36,100 | |
Skyworks Solutions, Inc. | | | 3,156 | | | | 381,497 | |
SMART Global Holdings, Inc.(1) | | | 876 | | | | 33,235 | |
Sonim Technologies, Inc.(1) | | | 619 | | | | 2,247 | |
SPS Commerce, Inc.(1) | | | 222 | | | | 12,303 | |
SS&C Technologies Holdings, Inc. | | | 4,004 | | | | 245,846 | |
Sykes Enterprises, Inc.(1) | | | 13 | | | | 481 | |
Synaptics, Inc.(1) | | | 247 | | | | 16,245 | |
SYNNEX Corp. | | | 710 | | | | 91,448 | |
Synopsys, Inc.(1) | | | 3,923 | | | | 546,082 | |
Telaria, Inc.(1) | | | 217 | | | | 1,912 | |
Teradyne, Inc. | | | 1,834 | | | | 125,060 | |
TESSCO Technologies, Inc. | | | 420 | | | | 4,712 | |
Texas Instruments, Inc. | | | 12,794 | | | | 1,641,342 | |
TiVo Corp. | | | 3,535 | | | | 29,977 | |
Tyler Technologies, Inc.(1) | | | 56 | | | | 16,801 | |
Ultra Clean Holdings, Inc.(1) | | | 43 | | | | 1,009 | |
Verint Systems, Inc.(1) | | | 405 | | | | 22,421 | |
Western Union Co./The | | | 1,746 | | | | 46,758 | |
Xerox Holdings Corp. | | | 6,250 | | | | 230,438 | |
Xperi Corp. | | | 1,966 | | | | 36,371 | |
Zebra Technologies Corp. - Class A(1) | | | 400 | | | | 102,176 | |
| | | | | | | | 39,904,162 | |
| | | | | | | | | |
Materials — 1.4% | | | | | | | | |
Air Products & Chemicals, Inc. | | | 1,788 | | | | 420,162 | |
AK Steel Holding Corp.(1) | | | 2,830 | | | | 9,311 | |
Celanese Corp. | | | 2,416 | | | | 297,458 | |
CF Industries Holdings, Inc. | | | 132 | | | | 6,302 | |
Hawkins, Inc. | | | 64 | | | | 2,932 | |
Huntsman Corp. | | | 1,219 | | | | 29,451 | |
Innospec, Inc. | | | 290 | | | | 29,998 | |
Koppers Holdings, Inc.(1) | | | 57 | | | | 2,179 | |
LyondellBasell Industries NV | | | 11,941 | | | | 1,128,186 | |
Nucor Corp. | | | 2,041 | | | | 114,867 | |
Olympic Steel, Inc. | | | 1,348 | | | | 24,156 | |
Rayonier Advanced Materials, Inc. | | | 760 | | | | 2,918 | |
Reliance Steel & Aluminum Co. | | | 1,598 | | | | 191,376 | |
Dynamic Allocation Fund |
Security Description | | Shares or
Principal
Amount ($) | | | Fair
Value ($) | |
Common Stocks — continued |
Royal Gold, Inc. | | | 496 | | | | 60,636 | |
RPM International, Inc. | | | 2,976 | | | | 228,438 | |
Ryerson Holding Corp.(1) | | | 3,157 | | | | 37,347 | |
Steel Dynamics, Inc. | | | 3,450 | | | | 117,438 | |
Stepan Co. | | | 368 | | | | 37,698 | |
Tredegar Corp. | | | 1,224 | | | | 27,356 | |
Valvoline, Inc. | | | 1,024 | | | | 21,924 | |
Warrior Met Coal, Inc. | | | 1,834 | | | | 38,752 | |
| | | | | | | | 2,828,885 | |
| | | | | | | | | |
Real Estate Investment Trust — 2.9% | | | | | | | | |
American Homes 4 Rent | | | 6,055 | | | | 158,702 | |
American Tower Corp. | | | 6,208 | | | | 1,426,723 | |
Apple Hospitality REIT, Inc. | | | 12,303 | | | | 199,924 | |
Ashford Hospitality Trust, Inc. | | | 5,119 | | | | 14,282 | |
AvalonBay Communities, Inc. | | | 3,206 | | | | 672,298 | |
CatchMark Timber Trust, Inc. | | | 819 | | | | 9,394 | |
CBL & Associates Properties, Inc. | | | 5,143 | | | | 5,400 | |
Clipper Realty, Inc. | | | 814 | | | | 8,628 | |
Colony Capital, Inc. | | | 2,851 | | | | 13,542 | |
CorEnergy Infrastructure Trust, Inc. | | | 1,009 | | | | 45,112 | |
CorePoint Lodging, Inc. | | | 3,469 | | | | 37,049 | |
Corporate Office Properties Trust | | | 1,858 | | | | 54,588 | |
CubeSmart | | | 572 | | | | 18,007 | |
CyrusOne, Inc. | | | 453 | | | | 29,640 | |
Essex Property Trust, Inc. | | | 3,931 | | | | 1,182,681 | |
Gaming and Leisure Properties, Inc. | | | 3,443 | | | | 148,221 | |
Global Medical REIT, Inc. | | | 111 | | | | 1,469 | |
Healthcare Realty Trust, Inc. | | | 2,786 | | | | 92,969 | |
Healthcare Trust of America, Inc. - Class A | | | 3,616 | | | | 109,492 | |
Hudson Pacific Properties, Inc. | | | 1,472 | | | | 55,421 | |
Lamar Advertising Co. | | | 3,560 | | | | 317,766 | |
Mid-America Apartment Communities, Inc. | | | 1,461 | | | | 192,647 | |
National Health Investors, Inc. | | | 52 | | | | 4,237 | |
National Storage Affiliates Trust | | | 3,300 | | | | 110,946 | |
Office Properties Income Trust | | | 2,303 | | | | 74,018 | |
Pennsylvania Real Estate Investment Trust | | | 182 | | | | 970 | |
PS Business Parks, Inc. | | | 849 | | | | 139,975 | |
Realogy Holdings Corp. | | | 946 | | | | 9,157 | |
Redfin Corp.(1) | | | 182 | | | | 3,847 | |
Regency Centers Corp. | | | 229 | | | | 14,448 | |
Service Properties Trust | | | 9,767 | | | | 237,631 | |
Spirit MTA REIT | | | 3,134 | | | | 2,406 | |
Summit Hotel Properties, Inc. | | | 3,592 | | | | 44,325 | |
Tanger Factory Outlet Centers, Inc.(2) | | | 8,829 | | | | 130,051 | |
Trinity Place Holdings, Inc.(1) | | | 97 | | | | 292 | |
The accompanying notes are an integral part of these financial statements
Page 100 | 2019 Annual Report | December 31, 2019 |
Schedule of Investments
December 31, 2019
Dynamic Allocation Fund |
Security Description | | Shares or
Principal
Amount ($) | | | Fair
Value ($) | |
Common Stocks — continued |
Uniti Group, Inc. | | | 755 | | | | 6,199 | |
Urstadt Biddle Properties, Inc. | | | 1,742 | | | | 43,271 | |
Xenia Hotels & Resorts, Inc. | | | 5,215 | | | | 112,696 | |
| | | | | | | | 5,728,424 | |
| | | | | | | | | |
Utilities — 0.8% | | | | | | | | |
American Water Works Co., Inc. | | | 8,813 | | | | 1,082,677 | |
Consolidated Water Co., Ltd. | | | 691 | | | | 11,263 | |
MDU Resources Group, Inc. | | | 10,723 | | | | 318,580 | |
NorthWestern Corp. | | | 703 | | | | 50,384 | |
Portland General Electric Co. | | | 683 | | | | 38,105 | |
PPL Corp. | | | 1,382 | | | | 49,586 | |
Spark Energy, Inc. - Class A | | | 882 | | | | 8,141 | |
Unitil Corp. | | | 779 | | | | 48,158 | |
| | | | | | | | 1,606,894 | |
| | | | | | | | | |
Total Common Stocks (Cost $118,998,674) | | | | | | | 145,471,313 | |
| | | | | | | | | |
Registered Investment Companies — 5.1% |
iShares Core MSCI EAFE ETF(8) | | | 15,725 | | | | 1,025,899 | |
iShares JP Morgan USD Emerging Markets Bond ETF(8) | | | 40,027 | | | | 4,585,493 | �� |
SPDR Bloomberg Barclays High Yield Bond ETF(8) | | | 41,758 | | | | 4,574,171 | |
Total Registered Investment Companies (Cost $9,975,989) | | | | | | | 10,185,563 | |
| | | | | | | | | |
Money Market Registered Investment Companies — 20.1% |
Meeder Institutional Prime Money Market Fund, 1.75%(4) | | | 40,107,913 | | | | 40,107,913 | |
Morgan Stanley Government Institutional Fund, 1.51%(3) | | | 64,474 | | | | 64,474 | |
Total Money Market Registered Investment Companies (Cost $40,168,062) | | | | | | | 40,172,387 | |
| | | | | | | | | |
Dynamic Allocation Fund |
Security Description | | Shares or
Principal
Amount ($) | | | Fair
Value ($) | |
Bank Obligations — 0.4% |
First Merchants Bank Deposit Account, 2.10%, 1/2/2020(5) | | | 249,236 | | | | 249,236 | |
Metro City Bank Deposit Account, 2.35%, 1/2/2020(5) | | | 249,416 | | | | 249,416 | |
Pacific Mercantile Bank Deposit Account, 1.55%, 1/2/2020(5) | | | 248,972 | | | | 248,972 | |
Total Bank Obligations (Cost $747,624) | | | | | | | 747,624 | |
Total Investments — 98.2% (Cost $169,890,349) | | | | | | | 196,576,887 | |
Other Assets less Liabilities — 1.8% | | | | | | | 3,656,106 | |
Total Net Assets — 100.0% | | | | | | | 200,232,993 | |
| | | | | | | | | |
Trustee Deferred Compensation(6) |
Meeder Balanced Fund | | | 3,364 | | | | 41,243 | |
Meeder Dynamic Allocation Fund | | | 8,649 | | | | 102,664 | |
Meeder Muirfield Fund | | | 3,933 | | | | 31,110 | |
Meeder Conservative Allocation Fund | | | 979 | | | | 22,370 | |
Total Trustee Deferred Compensation (Cost $170,236) | | | | | | | 197,387 | |
The accompanying notes are an integral part of these financial statements
2019 Annual Report | December 31, 2019 | Page 101 |
Schedule of Investments
December 31, 2019
Dynamic Allocation Fund |
| | | Long
(Short)
Contracts | | | Expiration
Date | | | Notional
Value of
Contracts
($) | | | Value and
Unrealized
Appreciation
(Depreciation)
($) | |
Futures Contracts |
Index Futures | | | | | | | | | | | | | | | | |
Mini MSCI EAFE Index Futures | | | 289 | | | | 3/20/2020 | | | | 29,427,425 | | | | 94,802 | |
Mini MSCI Emerging Markets Index Futures | | | 136 | | | | 3/20/2020 | | | | 7,617,360 | | | | 73,894 | |
Russell 2000 Mini Index Futures | | | 3 | | | | 3/20/2020 | | | | 250,590 | | | | 2,298 | |
Standard & Poors 500 Mini Futures | | | 28 | | | | 3/20/2020 | | | | 4,523,540 | | | | 47,804 | |
E-mini Standard & Poors MidCap 400 Futures | | | 6 | | | | 3/20/2020 | | | | 1,238,880 | | | | 13,778 | |
Total Futures Contracts | | | 462 | | | | | | | | 43,057,795 | | | | 232,576 | |
(1) | Represents non-income producing securities. |
(2) | All or a portion of this security is on loan. |
(3) | Investment purchased with cash received as securities lending collateral. The yield shown represents the 7-day yield in effect at December 31, 2019. |
(4) | Investment in affiliate. The yield shown represents the 7-day yield in effect at December 31, 2019. |
(5) | Variable rate security. Securities payable at par, including accrued interest (usually within seven days notice) and unconditionally secured as to principal and interest by letters of credit or other credit support agreements from major banks. The interest rates are adjustable and are not based on a published reference rate and spread but are determined by the issuer or agent and are based on current market conditions. These securities do not indicate a reference rate and spread in their description above. The rate shown represents the rate in effect at December 31, 2019. The maturity date shown, if applicable, reflects the earlier of the next demand date or stated maturity date. |
(6) | Assets of affiliates to the Dynamic Allocation Fund held for the benefit of the Fund’s Trustees in connection with the Trustee Deferred Compensation Plan. |
(7) | Fair valued security deemed as Level 3 security. |
The accompanying notes are an integral part of these financial statements
Page 102 | 2019 Annual Report | December 31, 2019 |
Schedule of Investments
December 31, 2019
Quantex Fund |
Security Description | | Shares or
Principal
Amount ($) | | | Fair
Value ($) | |
Common Stocks — 95.9% |
Communication Services — 3.3% | | | | | | | | |
AMC Networks, Inc.(1) | | | 1,770 | | | | 69,915 | |
Interpublic Group of Cos., Inc./The | | | 25,612 | | | | 591,637 | |
News Corp. | | | 48,439 | | | | 702,850 | |
TripAdvisor, Inc. | | | 20,394 | | | | 619,570 | |
Yelp, Inc.(1) | | | 2,009 | | | | 69,973 | |
| | | | | | | | 2,053,945 | |
| | | | | | | | | |
Consumer Discretionary — 23.0% | | | | | | | | |
Bed Bath & Beyond, Inc.(2) | | | 40,040 | | | | 692,692 | |
BorgWarner, Inc. | | | 15,702 | | | | 681,153 | |
Brinker International, Inc. | | | 13,215 | | | | 555,030 | |
Capri Holdings, Ltd.(1) | | | 15,458 | | | | 589,723 | |
Cheesecake Factory, Inc./The | | | 13,349 | | | | 518,742 | |
Dana, Inc. | | | 40,740 | | | | 741,468 | |
Dillard’s, Inc.(2) | | | 8,590 | | | | 631,193 | |
Gap, Inc./The | | | 3,926 | | | | 69,412 | |
H&R Block, Inc. | | | 24,099 | | | | 565,845 | |
Hanesbrands, Inc. | | | 37,953 | | | | 563,602 | |
Harley-Davidson, Inc. | | | 1,854 | | | | 68,950 | |
Jack in the Box, Inc. | | | 909 | | | | 70,929 | |
KB Home | | | 28,009 | | | | 959,868 | |
Kohl’s Corp. | | | 1,374 | | | | 70,005 | |
L Brands, Inc. | | | 20,840 | | | | 377,621 | |
Leggett & Platt, Inc. | | | 10,988 | | | | 558,520 | |
LKQ Corp.(1) | | | 21,292 | | | | 760,124 | |
Macy’s, Inc. | | | 20,530 | | | | 349,010 | |
Mohawk Industries, Inc.(1) | | | 4,119 | | | | 561,749 | |
Nordstrom, Inc. | | | 13,117 | | | | 536,879 | |
Norwegian Cruise Line Holdings, Ltd.(1) | | | 14,510 | | | | 847,529 | |
PulteGroup, Inc. | | | 23,532 | | | | 913,042 | |
PVH Corp. | | | 5,966 | | | | 627,325 | |
Ralph Lauren Corp. | | | 5,242 | | | | 614,467 | |
Sally Beauty Holdings, Inc.(1) | | | 3,874 | | | | 70,701 | |
Tapestry, Inc. | | | 2,604 | | | | 70,230 | |
TRI Pointe Group, Inc.(1) | | | 42,127 | | | | 656,339 | |
Whirlpool Corp. | | | 5,006 | | | | 738,535 | |
| | | | | | | | 14,460,683 | |
| | | | | | | | | |
Consumer Staples — 1.2% | | | | | | | | |
Coty, Inc. | | | 45,999 | | | | 517,489 | |
Edgewell Personal Care Co.(1) | | | 2,268 | | | | 70,217 | |
Nu Skin Enterprises, Inc. | | | 1,727 | | | | 70,772 | |
Spectrum Brands Holdings, Inc. | | | 2 | | | | 129 | |
Sprouts Farmers Market, Inc.(1) | | | 3,588 | | | | 69,428 | |
| | | | | | | | 728,035 | |
| | | | | | | | | |
Quantex Fund |
Security Description | | Shares or
Principal
Amount ($) | | | Fair
Value ($) | |
Common Stocks — continued |
Energy — 5.5% | | | | | | | | |
Apache Corp. | | | 2,680 | | | | 68,581 | |
Cabot Oil & Gas Corp. | | | 4,065 | | | | 70,772 | |
Cimarex Energy Co. | | | 1,348 | | | | 70,757 | |
Devon Energy Corp. | | | 2,721 | | | | 70,664 | |
Helmerich & Payne, Inc. | | | 12,115 | | | | 550,384 | |
HollyFrontier Corp. | | | 11,685 | | | | 592,546 | |
Marathon Oil Corp. | | | 5,193 | | | | 70,521 | |
Matador Resources Co.(1) | | | 3,968 | | | | 71,305 | |
Noble Energy, Inc. | | | 26,402 | | | | 655,826 | |
World Fuel Services Corp. | | | 28,557 | | | | 1,239,945 | |
| | | | | | | | 3,461,301 | |
| | | | | | | | | |
Financials — 8.9% | | | | | | | | |
Assurant, Inc. | | | 4,612 | | | | 604,541 | |
Brighthouse Financial, Inc.(1) | | | 15,917 | | | | 624,424 | |
Comerica, Inc. | | | 983 | | | | 70,530 | |
E*TRADE Financial Corp. | | | 1,536 | | | | 69,688 | |
Everest Re Group, Ltd. | | | 2,358 | | | | 652,789 | |
Genworth Financial, Inc.(1) | | | 16,055 | | | | 70,642 | |
Globe Life, Inc. | | | 5,727 | | | | 602,767 | |
Jefferies Financial Group, Inc. | | | 27,401 | | | | 585,559 | |
People’s United Financial, Inc. | | | 35,358 | | | | 597,550 | |
Trustmark Corp. | | | 16,722 | | | | 577,076 | |
Unum Group | | | 18,209 | | | | 530,974 | |
Wells Fargo & Co.(1)(7) | | | 1 | | | | — | |
Zions Bancorp NA | | | 11,770 | | | | 611,098 | |
| | | | | | | | 5,597,638 | |
| | | | | | | | | |
Healthcare — 8.5% | | | | | | | | |
ABIOMED, Inc.(1) | | | 414 | | | | 70,624 | |
Allscripts Healthcare Solutions, Inc.(1) | | | 54,573 | | | | 535,634 | |
Avanos Medical, Inc.(1) | | | 2,086 | | | | 70,298 | |
DaVita, Inc.(1) | | | 9,854 | | | | 739,346 | |
DENTSPLY SIRONA, Inc. | | | 15,242 | | | | 862,545 | |
Mylan NV(1) | | | 3,550 | | | | 71,355 | |
PerkinElmer, Inc. | | | 7,784 | | | | 755,826 | |
Perrigo Co. PLC | | | 13,806 | | | | 713,218 | |
Prestige Consumer Healthcare, Inc.(1) | | | 15,215 | | | | 616,208 | |
Tenet Healthcare Corp.(1) | | | 23,729 | | | | 902,414 | |
| | | | | | | | 5,337,468 | |
| | | | | | | | | |
Industrials — 21.0% | | | | | | | | |
Alaska Air Group, Inc. | | | 8,455 | | | | 572,826 | |
Allegion PLC | | | 7,952 | | | | 990,342 | |
AO Smith Corp. | | | 12,019 | | | | 572,585 | |
The accompanying notes are an integral part of these financial statements
2019 Annual Report | December 31, 2019 | Page 103 |
Schedule of Investments
December 31, 2019
Quantex Fund |
Security Description | | Shares or
Principal
Amount ($) | | | Fair
Value ($) | |
Common Stocks — continued |
Arconic, Inc. | | | 31,730 | | | | 976,332 | |
Deluxe Corp. | | | 11,229 | | | | 560,552 | |
Flowserve Corp. | | | 12,059 | | | | 600,176 | |
Fortune Brands Home & Security, Inc. | | | 17,103 | | | | 1,117,510 | |
Herman Miller, Inc. | | | 20,349 | | | | 847,536 | |
HNI Corp. | | | 14,854 | | | | 556,431 | |
Huntington Ingalls Industries, Inc. | | | 3,254 | | | | 816,364 | |
Jacobs Engineering Group, Inc. | | | 10,458 | | | | 939,442 | |
Masco Corp. | | | 18,297 | | | | 878,073 | |
Pentair PLC | | | 15,740 | | | | 721,994 | |
Quanta Services, Inc. | | | 20,312 | | | | 826,902 | |
Robert Half International, Inc. | | | 9,927 | | | | 626,890 | |
Snap-on, Inc. | | | 3,585 | | | | 607,299 | |
Terex Corp. | | | 2,327 | | | | 69,298 | |
Textron, Inc. | | | 1,578 | | | | 70,379 | |
United Rentals, Inc.(1) | | | 4,968 | | | | 828,513 | |
| | | | | | | | 13,179,444 | |
| | | | | | | | | |
Information Technology — 11.0% | | | | | | | | |
Alliance Data Systems Corp. | | | 3,565 | | | | 399,993 | |
Belden, Inc. | | | 10,766 | | | | 592,130 | |
CommVault Systems, Inc.(1) | | | 1,560 | | | | 69,638 | |
DXC Technology Co. | | | 2,080 | | | | 78,187 | |
F5 Networks, Inc.(1) | | | 503 | | | | 70,244 | |
FLIR Systems, Inc. | | | 12,284 | | | | 639,628 | |
InterDigital, Inc. | | | 1,273 | | | | 69,366 | |
IPG Photonics Corp.(1) | | | 486 | | | | 70,431 | |
Juniper Networks, Inc. | | | 23,020 | | | | 566,983 | |
NetScout Systems, Inc.(1) | | | 23,668 | | | | 569,689 | |
Qorvo, Inc.(1) | | | 8,542 | | | | 992,837 | |
Synaptics, Inc.(1) | | | 10,134 | | | | 666,513 | |
Western Union Co./The | | | 35,838 | | | | 959,742 | |
Xerox Holdings Corp. | | | 30,941 | | | | 1,140,795 | |
| | | | | | | | 6,886,176 | |
| | | | | | | | | |
Materials — 8.3% | | | | | | | | |
Avery Dennison Corp. | | | 6,818 | | | | 891,932 | |
Carpenter Technology Corp. | | | 12,441 | | | | 619,313 | |
CF Industries Holdings, Inc. | | | 1,472 | | | | 70,273 | |
Commercial Metals Co. | | | 34,442 | | | | 767,023 | |
Compass Minerals International, Inc. | | | 10,590 | | | | 645,566 | |
Domtar Corp. | | | 1,822 | | | | 69,673 | |
Eastman Chemical Co. | | | 894 | | | | 70,858 | |
Greif, Inc. - Class A | | | 13,133 | | | | 580,479 | |
Minerals Technologies, Inc. | | | 10,628 | | | | 612,492 | |
Quantex Fund |
Security Description | | Shares or
Principal
Amount ($) | | | Fair
Value ($) | |
Common Stocks — continued |
Packaging Corp. of America | | | 7,327 | | | | 820,551 | |
Worthington Industries, Inc. | | | 1,647 | | | | 69,470 | |
| | | | | | | | 5,217,630 | |
| | | | | | | | | |
Real Estate Investment Trust — 5.0% | | | | | | | | |
Alexander & Baldwin, Inc. | | | 26,700 | | | | 559,632 | |
Apartment Investment & Management Co. | | | 11,186 | | | | 577,757 | |
CoreCivic, Inc. | | | 3,995 | | | | 69,433 | |
Duke Realty Corp. | | | 16,414 | | | | 569,073 | |
Federal Realty Investment Trust | | | 4,401 | | | | 566,541 | |
GEO Group, Inc./The | | | 4,159 | | | | 69,081 | |
Kimco Realty Corp. | | | 30,622 | | | | 634,182 | |
Urban Edge Properties | | | 3,676 | | | | 70,506 | |
| | | | | | | | 3,116,205 | |
| | | | | | | | | |
Utilities — 0.2% | | | | | | | | |
NRG Energy, Inc. | | | 1,784 | | | | 70,914 | |
Pinnacle West Capital Corp. | | | 788 | | | | 70,865 | |
| | | | | | | | 141,779 | |
| | | | | | | | | |
Total Common Stocks (Cost $47,355,904) | | | | | | | 60,180,304 | |
| | | | | | | | | |
Money Market Registered Investment Companies — 4.5% |
Meeder Institutional Prime Money Market Fund, 1.75%(4) | | | 1,503,598 | | | | 1,503,598 | |
Morgan Stanley Government Institutional Fund, 1.51%(3) | | | 1,339,509 | | | | 1,339,509 | |
Total Money Market Registered Investment Companies (Cost $2,843,100) | | | | | | | 2,843,107 | |
| | | | | | | | | |
Bank Obligations — 1.2% |
First Merchants Bank Deposit Account, 2.10%, 1/2/2020(5) | | | 249,236 | | | | 249,236 | |
Metro City Bank Deposit Account, 2.35%, 1/2/2020(5) | | | 228,894 | | | | 228,894 | |
Pacific Mercantile Bank Deposit Account, 1.55%, 1/2/2020(5) | | | 248,973 | | | | 248,973 | |
Total Bank Obligations (Cost $727,103) | | | | | | | 727,103 | |
Total Investments — 101.6% (Cost $50,926,107) | | | | | | | 63,750,514 | |
Liabilities less Other Assets — (1.6%) | | | | | | | (1,011,789 | ) |
Total Net Assets — 100.0% | | | | | | | 62,738,725 | |
| | | | | | | | | |
The accompanying notes are an integral part of these financial statements
Page 104 | 2019 Annual Report | December 31, 2019 |
Schedule of Investments
December 31, 2019
Quantex Fund |
Security Description | | Shares or
Principal
Amount ($) | | | Fair
Value ($) | |
Trustee Deferred Compensation(6) |
Meeder Balanced Fund | | | 998 | | | | 12,235 | |
Meeder Dynamic Allocation Fund | | | 2,513 | | | | 29,829 | |
Meeder Muirfield Fund | | | 1,261 | | | | 9,975 | |
Meeder Conservative Allocation Fund | | | 290 | | | | 6,627 | |
Total Trustee Deferred Compensation (Cost $51,695) | | | | | | | 58,666 | |
| | | Long
(Short)
Contracts | | | Expiration
Date | | | Notional
Value of
Contracts
($) | | | Value and
Unrealized
Appreciation
(Depreciation)
($) | |
Futures Contracts |
Index Futures | | | | | | | | | | | | | | | | |
E-mini Standard & Poors MidCap 400 Futures | | | 11 | | | | 3/20/2020 | | | | 2,271,280 | | | | 15,697 | |
Total Futures Contracts | | | 11 | | | | | | | | 2,271,280 | | | | 15,697 | |
(1) | Represents non-income producing securities. |
(2) | All or a portion of this security is on loan. |
(3) | Investment purchased with cash received as securities lending collateral. The yield shown represents the 7-day yield in effect at December 31, 2019. |
(4) | Investment in affiliate. The yield shown represents the 7-day yield in effect at December 31, 2019. |
(5) | Variable rate security. Securities payable at par, including accrued interest (usually within seven days notice) and unconditionally secured as to principal and interest by letters of credit or other credit support agreements from major banks. The interest rates are adjustable and are not based on a published reference rate and spread but are determined by the issuer or agent and are based on current market conditions. These securities do not indicate a reference rate and spread in their description above. The rate shown represents the rate in effect at December 31, 2019. The maturity date shown, if applicable, reflects the earlier of the next demand date or stated maturity date. |
(6) | Assets of affiliates to the Quantex Fund held for the benefit of the Fund’s Trustees in connection with the Trustee Deferred Compensation Plan. |
(7) | Fair valued security deemed as Level 3 security. |
The accompanying notes are an integral part of these financial statements
2019 Annual Report | December 31, 2019 | Page 105 |
Schedule of Investments
December 31, 2019
Total Return Bond Fund |
Security Description | | Shares or
Principal
Amount ($) | | | Fair
Value ($) | |
Registered Investment Companies — 82.3% |
American Beacon SiM High Yield Opportunities Fund - Class I | | | 34,511 | | | | 328,890 | |
Baird Core Plus Bond Fund - Class I | | | 332,136 | | | | 3,839,493 | |
Dodge & Cox Income Fund | | | 315,020 | | | | 4,419,726 | |
DoubleLine Total Return Bond Fund - Class I | | | 230,486 | | | | 2,450,068 | |
Frost Total Return Bond Fund - Class I | | | 299,512 | | | | 3,099,948 | |
Guggenheim Total Return Bond Fund - Class I | | | 44,822 | | | | 1,215,569 | |
iShares Core U.S. Aggregate Bond ETF(3) | | | 59,823 | | | | 6,722,311 | |
iShares JP Morgan USD Emerging Markets Bond ETF(3) | | | 16,053 | | | | 1,839,032 | |
Lord Abbett High Yield Fund - Class I | | | 43,759 | | | | 329,506 | |
Payden Emerging Markets Bond Fund - Class I | | | 134,146 | | | | 1,844,512 | |
PGIM Total Return Bond Fund - Class R6 | | | 256,130 | | | | 3,693,401 | |
PIMCO Investment Grade Credit Bond Fund - Class I | | | 115,831 | | | | 1,264,869 | |
Pioneer Bond Fund - Class Y | | | 377,644 | | | | 3,697,137 | |
Segall Bryant & Hamill Plus Bond Fund - Class I | | | 299,891 | | | | 3,205,834 | |
TCW Emerging Markets Income Fund - Class I | | | 218,545 | | | | 1,846,708 | |
Vanguard Intermediate-Term Corporate Bond ETF(3) | | | 23,504 | | | | 2,146,620 | |
Vanguard Total Bond Market ETF(3) | | | 80,319 | | | | 6,735,549 | |
Xtrackers USD High Yield Corporate Bond ETF(3) | | | 42,770 | | | | 2,154,323 | |
Total Registered Investment Companies (Cost $49,295,663) | | | | | | | 50,833,496 | |
| | | | | | | | | |
Money Market Registered Investment Companies — 3.5% |
Meeder Institutional Prime Money Market Fund, 1.75%(1) | | | 2,171,908 | | | | 2,171,908 | |
Total Money Market Registered Investment Companies (Cost $2,171,834) | | | | | | | 2,171,908 | |
| | | | | | | | | |
U.S. Government Obligations — 14.2% |
Government National Mortgage Association, 6.50%, due 7/20/2038 | | | 51,087 | | | | 65,207 | |
U.S. Treasury Note, 2.25%, due 1/31/2024 | | | 2,389,300 | | | | 2,444,646 | |
U.S. Treasury Note, 2.625%, due 2/15/2029 | | | 1,158,600 | | | | 1,228,750 | |
U.S. Treasury Note, 1.50%, due 8/15/2026 | | | 1,435,200 | | | | 1,407,449 | |
U.S. Treasury Note, 2.25%, due 11/15/2025 | | | 2,965,600 | | | | 3,046,343 | |
Total Return Bond Fund |
Security Description | | Shares or
Principal
Amount ($) | | | Fair
Value ($) | |
U.S. Government Obligations — continued |
U.S. Treasury Note, 2.125%, due 12/31/2022 | | | 607,600 | | | | 616,857 | |
Total U.S. Government Obligations (Cost $8,596,102) | | | | | | | 8,809,252 | |
Total Investments — 100.0% (Cost $60,063,599) | | | | | | | 61,814,656 | |
Other Assets less Liabilities — 0.0% | | | | | | | 17,819 | |
Total Net Assets — 100.0% | | | | | | | 61,832,475 | |
| | | | | | | | | |
Trustee Deferred Compensation(2) |
Meeder Balanced Fund | | | 1,114 | | | | 13,658 | |
Meeder Dynamic Allocation Fund | | | 2,734 | | | | 32,453 | |
Meeder Muirfield Fund | | | 1,429 | | | | 11,303 | |
Meeder Conservative Allocation Fund | | | 329 | | | | 7,518 | |
Total Trustee Deferred Compensation (Cost $60,102) | | | | | | | 64,932 | |
(1) | Investment in affiliate. The yield shown represents the 7-day yield in effect at December 31, 2019. |
(2) | Assets of affiliates to the Total Return Bond Fund held for the benefit of the Fund’s Trustees in connection with the Trustee Deferred Compensation Plan. |
The accompanying notes are an integral part of these financial statements
Page 106 | 2019 Annual Report | December 31, 2019 |
Schedule of Investments
December 31, 2019
Prime Money Market Fund |
Security Description | | Coupon/
Yield | | | Maturity/
Demand
Date | | | Principal
Amount ($)
or Shares | | | Fair
Value ($) | |
Bank Obligations — 1.4% |
First Merchants Bank Deposit Account | | | 2.10 | %(1) | | | 01/02/20 | | | | 249,235 | | | | 249,235 | |
Pacific Mercantile Bank Deposit Account | | | 1.55 | %(1) | | | 01/02/20 | | | | 248,972 | | | | 248,972 | |
Total Bank Obligations (Cost $498,207) | | | 498,207 | |
| | | | | |
Certificates of Deposit — 16.5% |
Banco Estado Chile Yankee CD | | | 2.69 | % | | | 03/27/20 | | | | 500,000 | | | | 500,000 | |
Banco Estado Chile Yankee CD | | | 2.70 | % | | | 04/09/20 | | | | 250,000 | | | | 250,000 | |
Bank of Nova Scotia Yankee CD (Federal Funds Rate + 0.28%) | | | 1.83 | %(2) | | | 03/09/20 | | | | 250,000 | | | | 250,000 | |
Bank of Nova Scotia Yankee CD (Monthly U.S. LIBOR + 0.18%) | | | 1.92 | %(2) | | | 01/13/20 | | | | 500,000 | | | | 500,008 | |
BNP Paribas Yankee CD (Monthly U.S. LIBOR + 0.19%) | | | 1.95 | %(2) | | | 01/21/20 | | | | 500,000 | | | | 499,914 | |
Canadian Imperial Bank of NY Yankee CD (Monthly U.S. LIBOR + 0.17%) | | | 1.91 | %(2) | | | 01/14/20 | | | | 500,000 | | | | 500,039 | |
Cooperatieve Rabobank (Monthly U.S. LIBOR + 0.12%) | | | 1.84 | %(2) | | | 01/10/20 | | | | 250,000 | | | | 250,015 | |
Cooperatieve Rabobank (Monthly U.S. LIBOR + 0.23%) | | | 1.92 | %(2) | | | 01/06/20 | | | | 500,000 | | | | 500,045 | |
Credit Suisse AG/New York, NY Yankee CD (Secured Overnight Financing Rate + 0.30%) | | | 1.84 | %(2) | | | 01/08/20 | | | | 500,000 | | | | 500,000 | |
Mizuho Bank LTD/NY (Quarterly U.S. LIBOR + 0.33%) | | | 2.33 | %(2) | | | 01/15/20 | | | | 250,000 | | | | 250,132 | |
MUFG Bank LTD/New York, NY (Monthly U.S. LIBOR + 0.10%) | | | 1.89 | %(2) | | | 01/23/20 | | | | 500,000 | | | | 500,000 | |
Royal Bank of Canada Yankee CD (Monthly U.S. LIBOR + 0.17%) | | | 1.88 | %(2) | | | 01/08/20 | | | | 500,000 | | | | 500,000 | |
Westpac Banking Corp Yankee CD (Quarterly U.S. LIBOR + 0.05%) | | | 1.94 | %(2) | | | 03/13/20 | | | | 750,000 | | | | 749,996 | |
Total Certificates of Deposit (Cost $5,750,149) | | | 5,750,149 | |
| | | | | |
Prime Money Market Fund |
Security Description | | Coupon/
Yield | | | Maturity/
Demand
Date | | | Principal
Amount ($)
or Shares | | | Fair
Value ($) | |
Commercial Paper — 31.5% |
American Honda Finance Corp. | | | 1.71 | % | | | 02/12/20 | | | | 500,000 | | | | 499,008 | |
American Honda Finance Corp. | | | 1.81 | % | | | 03/16/20 | | | | 128,000 | | | | 127,520 | |
American Honda Finance Corp. | | | 1.71 | % | | | 03/18/20 | | | | 250,000 | | | | 249,091 | |
American Honda Finance Corp. | | | 1.71 | % | | | 03/19/20 | | | | 250,000 | | | | 249,079 | |
Anglesea Funding | | | 2.10 | % | | | 01/03/20 | | | | 250,000 | | | | 249,971 | |
Anglesea Funding | | | 1.85 | % | | | 01/07/20 | | | | 250,000 | | | | 249,919 | |
Anglesea Funding | | | 2.10 | % | | | 01/10/20 | | | | 250,000 | | | | 249,869 | |
Anglesea Funding | | | 1.90 | % | | | 02/13/20 | | | | 500,000 | | | | 498,800 | |
Banque et Caisse d’Epargne de l’Etat | | | 2.23 | % | | | 02/18/20 | | | | 250,000 | | | | 249,267 | |
Banque et Caisse d’Epargne de l’Etat | | | 1.77 | % | | | 05/27/20 | | | | 500,000 | | | | 496,427 | |
Credit Suisse AG/New York, NY | | | 2.58 | % | | | 01/28/20 | | | | 250,000 | | | | 249,526 | |
Credit Suisse AG/New York, NY | | | 2.18 | % | | | 03/30/20 | | | | 250,000 | | | | 248,671 | |
Exxon Mobil Corp. | | | 1.95 | % | | | 01/24/20 | | | | 300,000 | | | | 299,628 | |
ING US Funding, LLC | | | 1.87 | % | | | 05/01/20 | | | | 500,000 | | | | 496,891 | |
ING US Funding, LLC (Monthly U.S. LIBOR + 0.20%) | | | 1.94 | %(2) | | | 01/15/20 | | | | 500,000 | | | | 500,047 | |
JPMorgan Securities, LLC | | | 2.43 | % | | | 01/03/20 | | | | 600,000 | | | | 599,934 | |
JPMorgan Securities, LLC | | | 2.59 | % | | | 01/31/20 | | | | 250,000 | | | | 249,471 | |
JPMorgan Securities, LLC | | | 1.87 | % | | | 06/15/20 | | | | 750,000 | | | | 743,544 | |
Mizuho Bank LTD/NY | | | 1.86 | % | | | 04/21/20 | | | | 250,000 | | | | 248,574 | |
MUFG Bank LTD/New York, NY | | | 2.37 | % | | | 03/02/20 | | | | 250,000 | | | | 249,013 | |
MUFG Bank LTD/New York, NY | | | 1.92 | % | | | 05/04/20 | | | | 250,000 | | | | 248,364 | |
National Rural Utilities | | | 1.75 | % | | | 01/07/20 | | | | 250,000 | | | | 249,927 | |
Natixis SA/New York, NY | | | 1.89 | % | | | 08/14/20 | | | | 500,000 | | | | 494,162 | |
Prudential Financial, Inc. | | | 1.60 | % | | | 01/02/20 | | | | 500,000 | | | | 499,978 | |
Royal Bank of Canada (Federal Funds Rate + 0.28%) | | | 1.83 | %(2) | | | 03/12/20 | | | | 500,000 | | | | 500,000 | |
Royal Bank of Canada (Federal Funds Rate + 0.35%) | | | 1.90 | %(2) | | | 01/23/20 | | | | 500,000 | | | | 500,028 | |
Santander UK PLC | | | 1.99 | % | | | 02/07/20 | | | | 500,000 | | | | 498,983 | |
Santander UK PLC | | | 1.86 | % | | | 05/01/20 | | | | 500,000 | | | | 496,891 | |
Toyota Motor Puerto Rico | | | 1.89 | % | | | 08/10/20 | | | | 500,000 | | | | 494,263 | |
Total Commercial Paper (Cost $10,986,846) | | | 10,986,846 | |
The accompanying notes are an integral part of these financial statements
2019 Annual Report | December 31, 2019 | Page 107 |
Schedule of Investments
December 31, 2019
Prime Money Market Fund |
Security Description | | Coupon/
Yield | | | Maturity/
Demand
Date | | | Principal
Amount ($)
or Shares | | | Fair
Value ($) | |
Corporate Obligations — 15.1% |
Bank of Montreal (Monthly U.S. LIBOR + 0.16%) | | | 1.87 | %(2) | | | 01/02/20 | | | | 450,000 | | | | 449,845 | |
Common Wealth Bank of Australia New York, NY | | | 2.30 | % | | | 03/12/20 | | | | 250,000 | | | | 249,852 | |
IBM Corp. (Quarterly U.S. LIBOR + 0.23%) | | | 2.17 | %(2) | | | 01/27/20 | | | | 300,000 | | | | 300,024 | |
John Deere Capital Corp. (Quarterly U.S. LIBOR + 0.30%) | | | 2.19 | %(2) | | | 03/13/20 | | | | 250,000 | | | | 250,114 | |
Mizuho Securities, LLC (Monthly U.S. LIBOR + 0.225%) | | | 2.02 | %(2) | | | 01/27/20 | | | | 500,000 | | | | 500,000 | |
Toyota Motor Credit Corp. (Quarterly U.S. LIBOR + 0.10%) | | | 2.11 | %(2) | | | 01/10/20 | | | | 250,000 | | | | 250,006 | |
Toyota Motor Credit Corp. (Quarterly U.S. LIBOR + 0.40%) | | | 2.30 | %(2) | | | 02/13/20 | | | | 500,000 | | | | 500,217 | |
Toyota Motor Credit Corp. (Secured Overnight Financing Rate + 0.40%) | | | 1.94 | %(2) | | | 01/22/20 | | | | 500,000 | | | | 500,286 | |
UBS AG Stamford, CT | | | 2.35 | % | | | 03/26/20 | | | | 250,000 | | | | 250,009 | |
UBS AG Stamford, CT (Quarterly U.S. LIBOR + 0.85%) | | | 2.76 | %(2) | | | 03/02/20 | | | | 500,000 | | | | 501,706 | |
UBS AG Stamford, CT | | | 4.88 | % | | | 02/04/20 | | | | 250,000 | | | | 254,108 | |
Walt Disney Company (Quarterly U.S. LIBOR + 0.13%) | | | 2.03 | %(2) | | | 03/04/20 | | | | 250,000 | | | | 250,041 | |
Wells Fargo Bank N.A. | | | 2.40 | % | | | 01/15/20 | | | | 250,000 | | | | 249,961 | |
Wells Fargo Bank N.A. (Monthly U.S. LIBOR + 0.22%) | | | 1.96 | %(2) | | | 01/15/20 | | | | 500,000 | | | | 500,267 | |
Westpac Banking Corp. (Quarterly U.S. LIBOR + 0.43%) | | | 2.32 | %(2) | | | 03/06/20 | | | | 250,000 | | | | 250,160 | |
Total Corporate Obligations (Cost $5,256,596) | | | 5,256,596 | |
| | | | | |
Prime Money Market Fund |
Security Description | | Coupon/
Yield | | | Maturity/
Demand
Date | | | Principal
Amount ($)
or Shares | | | Fair
Value ($) | |
Repurchase Agreements — 18.7% |
INTL FCStone (Collateralized by $2,252,933 FNMAs, 3.50%, due 7/1/32 - 9/1/49, fair value $1,530,001)(proceeds $1,500,138) purchase date 12/31/19 | | | 1.65 | % | | | 01/02/20 | | | | 1,500,000 | | | | 1,500,000 | |
South Street (Collateralized by $4,863,209 various FNMAs, FHLBs, and FMACs, 2.404% - 5.66%, due 6/11/21 - 10/1/49, fair value $5,100,000)(proceeds $5,000,431), purchase date 12/31/19 | | | 1.55 | % | | | 01/02/20 | | | | 5,000,000 | | | | 5,000,000 | |
Total Repurchase Agreements (Cost $6,500,000) | | | 6,500,000 | |
| | | | | |
U.S. Government and Agency Obligations — 7.9% |
Federal Farm Credit Bank (Federal Funds Rate + 0.10%) | | | 1.65 | %(2) | | | 03/16/20 | | | | 500,000 | | | | 500,000 | |
United States Treasury Bill | | | 1.57 | % | | | 02/06/20 | | | | 250,000 | | | | 249,615 | |
United States Treasury Bill | | | 1.56 | % | | | 02/11/20 | | | | 250,000 | | | | 249,564 | |
United States Treasury Bill | | | 1.57 | % | | | 02/20/20 | | | | 250,000 | | | | 249,466 | |
United States Treasury Bill | | | 1.57 | % | | | 03/26/20 | | | | 250,000 | | | | 249,091 | |
United States Treasury Bill | | | 1.61 | % | | | 05/28/20 | | | | 250,000 | | | | 248,386 | |
United States Treasury Note | | | 1.63 | % | | | 06/30/20 | | | | 500,000 | | | | 500,136 | |
United States Treasury Note | | | 1.38 | % | | | 02/29/20 | | | | 250,000 | | | | 249,599 | |
United States Treasury Note | | | 1.38 | % | | | 03/15/20 | | | | 250,000 | | | | 249,610 | |
Total U.S. Government and Agency Obligations (Cost $2,745,468) | | | 2,745,468 | |
| | | | | |
The accompanying notes are an integral part of these financial statements
Page 108 | 2019 Annual Report | December 31, 2019 |
Schedule of Investments
December 31, 2019
Prime Money Market Fund |
Security Description | | Shares or
Principal
Amount ($) | | | Fair
Value ($)(1) | |
Money Market Registered Investment Companies - 8.8% |
Fidelity Prime Institutional Money Market Portfolio, 1.74%(3) | | | 99,310 | | | | 99,350 | |
Morgan Stanley Government Institutional Fund, 1.51%(3) | | | 2,953,308 | | | | 2,953,308 | |
Total Money Market Registered Investment Companies (Cost $3,052,658) | | | | | | | 3,052,658 | |
Total Investments — 99.9% (Cost $34,789,924) | | | | | | | 34,789,924 | |
Other Assets less Liabilities — 0.1% | | | | | | | 33,168 | |
Total Net Assets — 100.0% | | | | | | | 34,823,092 | |
| | | | | | | | | |
Trustee Deferred Compensation(4) |
Meeder Balanced Fund | | | 667 | | | | 8,177 | |
Meeder Dynamic Allocation Fund | | | 1,718 | | | | 20,393 | |
Meeder Muirfield Fund | | | 720 | | | | 5,695 | |
Meeder Conservative Allocation Fund | | | 191 | | | | 4,364 | |
Total Trustee Deferred Compensation (Cost $32,870) | | | | | | | 38,629 | |
(1) | Variable rate security. Securities payable at par including accrued interest (usually within seven days notice) and unconditionally secured as to principal and interest by letters of credit or other credit support agreements from major banks. The interest rates are adjustable and are not based on a published reference rate and spread but are determined by the issuer or agent and are based on current market conditions. These securities do not indicate a reference rate and spread in their description above. The rate shown represents the rate in effect at December 31, 2019. The maturity date shown, if applicable, reflects the earlier of the next demand date or stated maturity date. |
(2) | Floating rate security. Interest rates reset periodically. The reference rate and spread are indicated in the description above. The rate shown represents the rate in effect at December 31, 2019. The maturity date shown reflects the earlier of the next demand date or stated maturity date. |
(3) | 7-day yield as of December 31, 2019. The Fund may invest a significant portion of its assets in shares of one or more investment companies, including money market mutual funds. The Fund will incur additional indirect expenses (acquired fund fees and expenses) to the extent it invests in shares of other investment companies. |
(4) | Assets of affiliates to the Prime Money Market Fund held for the benefit of the Fund’s Trustees in connection with the Trustee Deferred Compensation Plan. |
The accompanying notes are an integral part of these financial statements
2019 Annual Report | December 31, 2019 | Page 109 |
Schedule of Investments
December 31, 2019
Institutional Prime Money Market Fund |
Security Description | | Coupon/
Yield | | | Maturity/
Demand
Date | | | Principal
Amount ($)
or Shares | | | Fair
Value ($) | |
Bank Obligations — 0.1% |
First Merchants Bank Deposit Account | | | 2.10 | %(1) | | | 01/02/20 | | | | 249,235 | | | | 249,235 | |
Pacific Mercantile Bank Deposit Account | | | 1.55 | %(1) | | | 01/02/20 | | | | 248,972 | | | | 248,972 | |
Total Bank Obligations (Cost $498,207) | | | 498,207 | |
| | | | | |
Certificates of Deposit — 18.5% |
Banco Estado Chile Yankee CD | | | 2.75 | % | | | 03/20/20 | | | | 2,000,000 | | | | 2,003,684 | |
Banco Estado Chile Yankee CD | | | 2.69 | % | | | 03/27/20 | | | | 3,000,000 | | | | 3,005,415 | |
Banco Estado Chile Yankee CD | | | 2.70 | % | | | 04/09/20 | | | | 3,000,000 | | | | 3,006,234 | |
Bank of Nova Scotia Yankee CD (Federal Funds Rate + 0.28%) | | | 1.83 | %(2) | | | 03/09/20 | | | | 4,750,000 | | | | 4,750,413 | |
Bank of Nova Scotia Yankee CD (Monthly U.S. LIBOR + 0.17%) | | | 1.88 | %(2) | | | 01/08/20 | | | | 1,342,000 | | | | 1,341,852 | |
Bank of Nova Scotia Yankee CD (Monthly U.S. LIBOR + 0.18%) | | | 1.92 | %(2) | | | 01/13/20 | | | | 5,000,000 | | | | 4,999,125 | |
BNP Paribas Yankee CD (Monthly U.S. LIBOR + 0.19%) | | | 1.95 | %(2) | | | 01/21/20 | | | | 5,000,000 | | | | 4,999,490 | |
Canadian Imperial Bank Yankee CD (Monthly U.S. LIBOR + 0.17%) | | | 1.91 | %(2) | | | 01/14/20 | | | | 5,000,000 | | | | 5,001,495 | |
Cooperatieve Rabobank (Monthly U.S. LIBOR + 0.12%) | | | 1.84 | %(2) | | | 01/10/20 | | | | 2,000,000 | | | | 2,000,186 | |
Cooperatieve Rabobank (Monthly U.S. LIBOR + 0.23%) | | | 1.92 | %(2) | | | 01/06/20 | | | | 3,000,000 | | | | 3,000,807 | |
Credit Suisse AG/New York, NY Yankee CD (Secured Overnight Financing Rate + 0.28%) | | | 1.82 | %(2) | | | 01/07/20 | | | | 2,715,000 | | | | 2,713,862 | |
Credit Suisse AG/New York, NY Yankee CD (Secured Overnight Financing Rate + 0.30%) | | | 1.84 | %(2) | | | 01/08/20 | | | | 9,500,000 | | | | 9,492,210 | |
Mizuho Bank LTD/NY (Quarterly U.S. LIBOR + 0.33%) | | | 2.33 | %(2) | | | 01/15/20 | | | | 5,000,000 | | | | 5,004,220 | |
MUFG Bank LTD/New York, NY (Monthly U.S. LIBOR + 0.10%) | | | 1.89 | %(2) | | | 01/23/20 | | | | 5,000,000 | | | | 4,996,040 | |
Institutional Prime Money Market Fund |
Security Description | | Coupon/
Yield | | | Maturity/
Demand
Date | | | Principal
Amount ($)
or Shares | | | Fair
Value ($) | |
Certificates of Deposit — continued |
Royal Bank of Canada Yankee CD (Monthly U.S. LIBOR + 0.17%) | | | 1.88 | %(2) | | | 01/08/20 | | | | 4,500,000 | | | | 4,499,730 | |
Westpac Banking Corp Yankee CD (Quarterly U.S. LIBOR + 0.05%) | | | 1.94 | %(2) | | | 03/13/20 | | | | 7,500,000 | | | | 7,500,406 | |
Total Certificates of Deposit (Cost $68,310,008) | | | 68,315,169 | |
| | | | | |
Commercial Paper — 18.2% |
American Honda Finance Corp. | | | 1.71 | % | | | 02/12/20 | | | | 400,000 | | | | 399,201 | |
American Honda Finance Corp. | | | 1.71 | % | | | 03/04/20 | | | | 1,600,000 | | | | 1,595,082 | |
American Honda Finance Corp. | | | 1.71 | % | | | 03/18/20 | | | | 2,000,000 | | | | 1,992,364 | |
American Honda Finance Corp. | | | 1.71 | % | | | 03/19/20 | | | | 1,000,000 | | | | 996,129 | |
American Honda Finance Corp. | | | 1.71 | % | | | 03/23/20 | | | | 1,000,000 | | | | 995,910 | |
Anglesea Funding | | | 1.60 | % | | | 01/02/20 | | | | 3,000,000 | | | | 2,999,748 | |
Anglesea Funding | | | 2.10 | % | | | 01/03/20 | | | | 2,000,000 | | | | 1,999,744 | |
Anglesea Funding | | | 1.85 | % | | | 01/07/20 | | | | 4,000,000 | | | | 3,998,740 | |
Anglesea Funding | | | 2.10 | % | | | 01/10/20 | | | | 2,000,000 | | | | 1,999,066 | |
Anglesea Funding | | | 1.90 | % | | | 02/13/20 | | | | 6,000,000 | | | | 5,986,434 | |
Banque et Caisse d’Epargne de l’Etat | | | 2.23 | % | | | 02/18/20 | | | | 2,000,000 | | | | 1,995,324 | |
Banque et Caisse d’Epargne de l’Etat | | | 1.77 | % | | | 05/27/20 | | | | 2,000,000 | | | | 1,985,036 | |
Credit Suisse AG/New York, NY | | | 2.58 | % | | | 01/28/20 | | | | 1,000,000 | | | | 998,571 | |
Credit Suisse AG/New York, NY | | | 2.18 | % | | | 03/30/20 | | | | 2,000,000 | | | | 1,990,450 | |
Exxon Mobil Corp. | | | 1.65 | % | | | 01/17/20 | | | | 1,000,000 | | | | 999,263 | |
ING US Funding, LLC | | | 1.87 | % | | | 05/01/20 | | | | 1,000,000 | | | | 993,761 | |
ING US Funding, LLC (Monthly U.S. LIBOR + 0.20%) | | | 1.94 | %(2) | | | 01/15/20 | | | | 5,000,000 | | | | 5,000,165 | |
JPMorgan Securities, LLC | | | 2.43 | % | | | 01/03/20 | | | | 1,500,000 | | | | 1,499,808 | |
JPMorgan Securities, LLC | | | 2.59 | % | | | 01/31/20 | | | | 1,000,000 | | | | 998,552 | |
JPMorgan Securities, LLC | | | 2.02 | % | | | 02/04/20 | | | | 1,000,000 | | | | 998,360 | |
JPMorgan Securities, LLC | | | 1.87 | % | | | 06/15/20 | | | | 750,000 | | | | 743,807 | |
Mizuho Bank LTD/NY | | | 1.86 | % | | | 04/21/20 | | | | 2,000,000 | | | | 1,988,488 | |
MUFG Bank LTD/New York, NY | | | 2.37 | % | | | 03/02/20 | | | | 1,000,000 | | | | 996,893 | |
The accompanying notes are an integral part of these financial statements
Page 110 | 2019 Annual Report | December 31, 2019 |
Schedule of Investments
December 31, 2019
Institutional Prime Money Market Fund |
Security Description | | Coupon/
Yield | | | Maturity/
Demand
Date | | | Principal
Amount ($)
or Shares | | | Fair
Value ($) | |
Commercial Paper — continued |
MUFG Bank LTD/New York, NY | | | 1.92 | % | | | 05/04/20 | | | | 1,290,000 | | | | 1,281,557 | |
MUFG Bank LTD/New York, NY | | | 1.95 | % | | | 05/15/20 | | | | 1,000,000 | | | | 992,837 | |
National Rural Utilities | | | 1.75 | % | | | 01/07/20 | | | | 2,000,000 | | | | 1,999,390 | |
Natixis SA/New York, NY | | | 1.89 | % | | | 08/14/20 | | | | 1,500,000 | | | | 1,481,510 | |
Prudential Financial, Inc. | | | 1.60 | % | | | 01/02/20 | | | | 5,000,000 | | | | 4,999,580 | |
Royal Bank of Canada (Federal Funds Rate + 0.28%) | | | 1.83 | %(2) | | | 03/12/20 | | | | 5,000,000 | | | | 5,000,210 | |
Royal Bank of Canada (Federal Funds Rate + 0.35%) | | | 1.90 | %(2) | | | 01/23/20 | | | | 4,000,000 | | | | 4,001,096 | |
Santander UK PLC | | | 1.99 | % | | | 02/07/20 | | | | 1,000,000 | | | | 998,099 | |
Santander UK PLC | | | 1.86 | % | | | 05/01/20 | | | | 2,400,000 | | | | 2,385,115 | |
Total Commercial Paper (Cost $67,286,836) | | | 67,290,290 | |
| | | | | |
Corporate Obligations — 21.5% |
Bank of Montreal (Monthly U.S. LIBOR + 0.16%) | | | 1.87 | %(2) | | | 01/02/20 | | | | 2,000,000 | | | | 1,999,704 | |
Bank of New York | | | 2.15 | % | | | 02/24/20 | | | | 1,435,000 | | | | 1,435,121 | |
Caterpillar, Inc. (Quarterly U.S. LIBOR + 0.18%) | | | 2.09 | %(2) | | | 02/18/20 | | | | 1,813,000 | | | | 1,813,961 | |
Common Wealth Bank of Australia New York, NY | | | 2.30 | % | | | 03/12/20 | | | | 1,500,000 | | | | 1,500,966 | |
IBM Corp. (Quarterly U.S. LIBOR + 0.23%) | | | 2.17 | %(2) | | | 01/27/20 | | | | 4,000,000 | | | | 4,000,972 | |
John Deere Capital Corp. (Quarterly U.S. LIBOR + 0.18%) | | | 2.22 | %(2) | | | 01/07/20 | | | | 2,460,000 | | | | 2,460,060 | |
John Deere Capital Corp. (Quarterly U.S. LIBOR + 0.30%) | | | 2.19 | %(2) | | | 03/13/20 | | | | 1,210,000 | | | | 1,210,550 | |
John Deere Capital Corp. (Quarterly U.S. LIBOR + 0.42%) | | | 2.43 | %(2) | | | 01/10/20 | | | | 1,682,000 | | | | 1,685,343 | |
Mizuho Securities, LLC (Monthly U.S. LIBOR + 0.225%) | | | 2.02 | %(2) | | | 01/27/20 | | | | 5,000,000 | | | | 5,000,245 | |
Royal Bank of Canada (Quarterly U.S. LIBOR + 0.38%) | | | 2.29 | %(2) | | | 03/02/20 | | | | 2,885,000 | | | | 2,886,595 | |
Royal Bank of Canada | | | 2.13 | % | | | 03/02/20 | | | | 5,000,000 | | | | 5,001,350 | |
Toyota Motor Credit Corp. (Quarterly U.S. LIBOR + 0.10%) | | | 2.11 | %(2) | | | 01/10/20 | | | | 4,750,000 | | | | 4,750,238 | |
Institutional Prime Money Market Fund |
Security Description | | Coupon/
Yield | | | Maturity/
Demand
Date | | | Principal
Amount ($)
or Shares | | | Fair
Value ($) | |
Corporate Obligations — continued |
Toyota Motor Credit Corp. (Quarterly U.S. LIBOR + 0.40%) | | | 2.30 | %(2) | | | 02/13/20 | | | | 6,095,000 | | | | 6,095,969 | |
Toyota Motor Credit Corp. (Secured Overnight Financing Rate + 0.40%) | | | 1.94 | %(2) | | | 01/22/20 | | | | 6,500,000 | | | | 6,503,556 | |
UBS AG Stamford, CT | | | 2.35 | % | | | 03/26/20 | | | | 1,291,000 | | | | 1,292,420 | |
UBS AG Stamford, CT (Quarterly U.S. LIBOR + 0.85%) | | | 2.76 | %(2) | | | 03/02/20 | | | | 3,620,000 | | | | 3,630,940 | |
UBS AG Stamford, CT | | | 4.88 | % | | | 02/04/20 | | | | 3,875,000 | | | | 3,940,836 | |
Walt Disney Company (Quarterly U.S. LIBOR + 0.13%) | | | 2.03 | %(2) | | | 03/04/20 | | | | 7,713,000 | | | | 7,715,052 | |
Wells Fargo Bank N.A. (Quarterly U.S. LIBOR + 0.23%) | | | 2.23 | %(2) | | | 01/15/20 | | | | 1,000,000 | | | | 1,000,151 | |
Wells Fargo Bank N.A. (Monthly U.S. LIBOR + 0.22%) | | | 1.96 | %(2) | | | 01/15/20 | | | | 5,000,000 | | | | 5,000,645 | |
Wells Fargo Bank N.A. | | | 2.40 | % | | | 01/15/20 | | | | 1,375,000 | | | | 1,375,199 | |
Westpac Banking Corp. (Quarterly U.S. LIBOR + 0.04%) | | | 1.94 | %(2) | | | 02/11/20 | | | | 5,000,000 | | | | 5,000,295 | |
Westpac Banking Corp. (Quarterly U.S. LIBOR + 0.43%) | | | 2.32 | %(2) | | | 03/06/20 | | | | 2,556,000 | | | | 2,557,454 | |
Westpac Banking Corp. | | | 2.15 | % | | | 03/06/20 | | | | 1,564,000 | | | | 1,564,405 | |
Total Corporate Obligations (Cost $79,409,295) | | | 79,422,027 | |
| | | | | |
Repurchase Agreements — 27.0% |
Guggenheim Securities (Collateralized by $19,091,228 FNMA, 4.00%, due 3/1/48, fair value $20,408,163)(proceeds $20,001,744), purchase date 12/31/19 | | | 1.57 | % | | | 01/02/20 | | | | 20,000,000 | | | | 20,000,000 | |
The accompanying notes are an integral part of these financial statements
2019 Annual Report | December 31, 2019 | Page 111 |
Schedule of Investments
December 31, 2019
Institutional Prime Money Market Fund |
Security Description | | Coupon/
Yield | | | Maturity/
Demand
Date | | | Principal
Amount ($)
or Shares | | | Fair
Value ($) | |
Repurchase Agreements — continued |
INTL FCStone (Collateralized by $19,813,408 various Corporate Bonds, FNMAs, and Treasury Notes, 1.55% - 6.10%, due 1/27/20 - 3/15/49, fair value $20,541,407)(proceeds $20,001,833), purchase date 12/31/19 | | | 1.65 | % | | | 01/02/20 | | | | 20,000,000 | | | | 20,000,000 | |
South Street (Collateralized by $19,452,835 various FNMAs, FHLBs, and FMACs, 2.404% - 5.66%, due 6/11/21 - 10/1/49, fair value $20,400,000)(proceeds $20,001,722), purchase date 12/31/19 | | | 1.55 | % | | | 01/02/20 | | | | 20,000,000 | | | | 20,000,000 | |
South Street (Collateralized by $39,048,836 various FHLBs, FNMAs, FMACs GNMAs and FFCBs, 2.405% - 6.50%, due 6/11/21 - 4/15/60, fair value $40,800,000)(proceeds $40,003,333), purchase date 12/31/19 | | | 1.50 | % | | | 01/02/20 | | | | 40,000,000 | | | | 40,000,000 | |
Total Repurchase Agreements (Cost $100,000,000) | | | 100,000,000 | |
| | | | | |
U.S. Government and Agency Obligations — 7.0% |
Federal Farm Credit Bank (Federal Funds Rate + 0.10%) | | | 1.65 | %(2) | | | 03/16/20 | | | | 5,000,000 | | | | 4,998,800 | |
United States Treasury Bill | | | 1.57 | % | | | 02/06/20 | | | | 2,000,000 | | | | 1,997,066 | |
United States Treasury Bill | | | 1.56 | % | | | 02/11/20 | | | | 2,000,000 | | | | 1,996,694 | |
United States Treasury Bill | | | 1.58 | % | | | 02/18/20 | | | | 2,000,000 | | | | 1,996,096 | |
Institutional Prime Money Market Fund |
Security Description | | Coupon/
Yield | | | Maturity/
Demand
Date | | | Principal
Amount ($)
or Shares | | | Fair
Value ($) | |
U.S. Government and Agency Obligations — continued |
United States Treasury Bill | | | 1.57 | % | | | 02/20/20 | | | | 2,000,000 | | | | 1,995,888 | |
United States Treasury Bill | | | 1.57 | % | | | 03/26/20 | | | | 2,000,000 | | | | 1,992,934 | |
United States Treasury Bill | | | 1.61 | % | | | 05/28/20 | | | | 2,000,000 | | | | 1,987,436 | |
United States Treasury Note | | | 1.63 | % | | | 06/30/20 | | | | 5,000,000 | | | | 4,999,805 | |
United States Treasury Note | | | 1.38 | % | | | 02/29/20 | | | | 2,000,000 | | | | 1,996,640 | |
United States Treasury Note | | | 1.38 | % | | | 03/15/20 | | | | 2,000,000 | | | | 1,996,484 | |
Total U.S. Government and Agency Obligations (Cost $25,959,893) | | | 25,957,843 | |
Security Description | | Shares or
Principal
Amount ($) | | | Fair
Value ($)(1) | |
Money Market Registered Investment Companies — 7.7% |
Fidelity Prime Institutional Money Market Portfolio, 1.74%(3) | | | 97,462 | | | | 97,501 | |
Morgan Stanley Government Institutional Fund, 1.51%(3) | | | 28,375,989 | | | | 28,375,989 | |
Total Money Market Registered Investment Companies (Cost $28,473,490) | | | | | | | 28,473,490 | |
Total Investments — 100.0% (Cost $369,937,729) | | | | | | | 369,957,026 | |
Other Assets less Liabilities — 0.0% | | | | | | | 162,990 | |
Total Net Assets — 100.0% | | | | | | | 370,120,016 | |
| | | | | | | | | |
Trustee Deferred Compensation(4) |
Meeder Balanced Fund | | | 44 | | | | 539 | |
Meeder Dynamic Allocation Fund | | | 102 | | | | 1,211 | |
Meeder Muirfield Fund | | | 139 | | | | 1,099 | |
Meeder Conservative Allocation Fund | | | 14 | | | | 320 | |
Total Trustee Deferred Compensation (Cost $3,040) | | | | | | | 3,169 | |
(1) | Variable rate security. Securities payable at par including accrued interest (usually within seven days notice) and unconditionally secured as to principal and interest by letters of credit or other credit support agreements from major banks. The interest rates are adjustable and are not based on a published reference rate and spread but are determined by the issuer or agent and are based on current market conditions. These securities do not indicate a reference rate and spread in their description above. The rate shown represents the rate in effect at December 31, 2019. The maturity date shown, if applicable, reflects the earlier of the next demand date or stated maturity date. |
The accompanying notes are an integral part of these financial statements
Page 112 | 2019 Annual Report | December 31, 2019 |
Schedule of Investments
December 31, 2019
(2) | Floating rate security. Interest rates reset periodically. The reference rate and spread are indicated in the description above. The rate shown represents the rate in effect at December 31, 2019. The maturity date shown reflects the earlier of the next demand date or stated maturity date. |
(3) | 7-day yield as of December 31, 2019. The Fund may invest a significant portion of its assets in shares of one or more investment companies, including money market mutual funds. The Fund will incur additional indirect expenses (acquired fund fees and expenses) to the extent it invests in shares of other investment companies. |
(4) | Assets of affiliates to the Institutional Prime Money Market Fund held for the benefit of the Fund’s Trustees in connection with the Trustee Deferred Compensation Plan. |
The accompanying notes are an integral part of these financial statements
2019 Annual Report | December 31, 2019 | Page 113 |
Statements of Assets & Liabilities
December 31, 2019 |
| | | Muirfield
Fund | | | Spectrum
Fund | | | Global
Allocation
Fund | |
Assets | | | | | | | | | | | | |
Investments, at fair value (1)(2) | | $ | 539,479,523 | | | $ | 209,447,222 | | | $ | 32,150,030 | |
Repurchase agreements, at fair value (1) | | | — | | | | — | | | | — | |
Investments in affiliates, at fair value (1) | | | 131,391,282 | | | | 5,987,102 | | | | 16,954,500 | |
Trustee deferred compensation investments, at fair value | | | 236,466 | | | | 29,730 | | | | 99,496 | |
Due from Broker | | | 2,700,000 | | | | 1,000,000 | | | | 800,000 | |
Deposits at broker for futures contracts (3) | | | 7,466,738 | | | | 5,090,541 | | | | 1,217,881 | |
Cash held at broker for collateral on securities sold short | | | — | | | | 63,392,920 | | | | — | |
Receivable for securities sold | | | 10,196,742 | | | | 2,672,829 | | | | 1,093,173 | |
Receivable for capital stock issued | | | 704,728 | | | | 198,580 | | | | 7,128 | |
Receivable from investment adviser | | | — | | | | — | | | | — | |
Interest and dividend receivable | | | 686,867 | | | | 316,776 | | | | 49,499 | |
Prepaid expenses/other assets | | | 427,253 | | | | 97,154 | | | | 15,174 | |
Total Assets | | | 693,289,599 | | | | 288,232,854 | | | | 52,386,881 | |
| | | | | | | | | | | | | |
Liabilities | | | | | | | | | | | | |
Securities sold short at fair value (proceeds $69,353,024) | | | — | | | | 71,384,614 | | | | — | |
Payable for securities purchased | | | 10,166,567 | | | | 3,070,194 | | | | 631,094 | |
Payable for collateral on securities loaned | | | 316,373 | | | | 138,013 | | | | — | |
Payable for Trustee Deferred Compensation Plan | | | 236,466 | | | | 29,730 | | | | 99,496 | |
Payable for capital stock redeemed | | | 420,504 | | | | 114,893 | | | | 145,388 | |
Dividends payable | | | — | | | | — | | | | — | |
Dividend expense payable on short positions | | | — | | | | 135,834 | | | | — | |
Payable to investment adviser | | | 358,849 | | | | 129,983 | | | | 31,954 | |
Accrued distribution plan (12b-1) and shareholder service plan fees | | | 249,947 | | | | 80,804 | | | | 14,348 | |
Accrued transfer agent, fund accounting, CCO, and administrative fees | | | 54,865 | | | | 41,244 | | | | 13,193 | |
Accrued trustee fees | | | 4,755 | | | | 1,270 | | | | 524 | |
Other accrued liabilities | | | 53,323 | | | | 39,567 | | | | 27,353 | |
Total Liabilities | | | 11,861,649 | | | | 75,166,147 | | | | 963,350 | |
| | | | | | | | | | | | | |
Net Assets | | $ | 681,427,950 | | | $ | 213,066,708 | | | $ | 51,423,531 | |
| | | | | | | | | | | | | |
Net Assets | | | | | | | | | | | | |
Capital | | $ | 610,752,838 | | | $ | 183,483,458 | | | $ | 45,579,749 | |
Distributable Earnings (Accumulated Deficit) | | | 70,675,112 | | | | 29,583,250 | | | | 5,843,782 | |
Total Net Assets | | $ | 681,427,950 | | | $ | 213,066,708 | | | $ | 51,423,531 | |
| | | | | | | | | | | | | |
Net Asset Value Per Share | | | | | | | | | | | | |
Retail Class | | | | | | | | | | | | |
Net Assets | | $ | 189,104,868 | | | $ | 51,060,331 | | | $ | 11,154,075 | |
Shares Outstanding | | | 23,894,270 | | | | 4,189,233 | | | | 985,751 | |
Net Asset Value, Offering and Redemption Price Per Share | | $ | 7.91 | | | $ | 12.19 | | | $ | 11.32 | |
| | | | | | | | | | | | | |
Adviser Class | | | | | | | | | | | | |
Net Assets | | $ | 60,024,027 | | | $ | 15,563,683 | | | $ | 1,772,440 | |
Shares Outstanding | | | 7,526,712 | | | | 1,267,937 | | | | 156,158 | |
Net Asset Value, Offering and Redemption Price Per Share | | $ | 7.97 | | | $ | 12.27 | | | $ | 11.35 | |
| | | | | | | | | | | | | |
Institutional Class | | | | | | | | | | | | |
Net Assets | | $ | 432,299,055 | | | $ | 146,442,694 | | | $ | 38,497,016 | |
Shares Outstanding | | | 54,121,917 | | | | 11,895,961 | | | | 3,389,889 | |
Net Asset Value, Offering and Redemption Price Per Share | | $ | 7.99 | | | $ | 12.31 | | | $ | 11.36 | |
| | | | | | | | | | | | | |
Net Asset Value Per Share - Money Market Funds | | | | | | | | | | | | |
Net Assets | | | | | | | | | | | | |
Shares Outstanding | | | | | | | | | | | | |
Net Asset Value, Offering and Redemption Price Per Share | | | | | | | | | | | | |
| | | | | | | | | | | | | |
(1) Investments and affiliated investments at cost | | $ | 575,929,625 | | | $ | 176,266,589 | | | $ | 44,212,928 | |
(2) Fair value of securities loaned included in investments at fair value (See Note #2, Note #3, and Note #5) | | $ | 310,803 | | | $ | 135,963 | | | $ | — | |
(3) Required margin held as collateral for futures contracts | | $ | 5,824,700 | | | $ | 4,000,400 | | | $ | 885,000 | |
The accompanying notes are an integral part of these financial statements
Page 114 | 2019 Annual Report | December 31, 2019 |
| |
Balanced
Fund | | | Moderate
Allocation
Fund | | | Conservative
Allocation
Fund | | | Dynamic
Allocation
Fund | | | Quantex
Fund | | | Total Return
Bond Fund | | | Prime Money
Market Fund | | | Institutional
Prime Money
Market Fund | |
| | | | | | | | | | | | | | | | | | | | | | | | | | | | | | | |
| $ | 334,863,299 | | | $ | 151,942,996 | | | $ | 126,355,576 | | | | 156,468,974 | | | $ | 62,246,916 | | | $ | 59,642,748 | | | $ | 28,289,924 | | | $ | 269,957,026 | |
| | — | | | | — | | | | — | | | | — | | | | — | | | | — | | | | 6,500,000 | | | | 100,000,000 | |
| | 67,392,229 | | | | 23,031,540 | | | | 9,379,205 | | | | 40,107,913 | | | | 1,503,598 | | | | 2,171,908 | | | | — | | | | — | |
| | 153,586 | | | | 19,059 | | | | 62,740 | | | | 197,387 | | | | 58,666 | | | | 64,932 | | | | 38,629 | | | | 3,169 | |
| | 1,800,000 | | | | 1,100,000 | | | | 500,000 | | | | 1,200,000 | | | | 150,000 | | | | — | | | | — | | | | — | |
| | 3,776,833 | | | | 1,296,607 | | | | 601,218 | | | | 2,553,987 | | | | 166,155 | | | | — | | | | — | | | | — | |
| | — | | | | — | | | | — | | | | — | | | | — | | | | — | | | | — | | | | — | |
| | 4,047,748 | | | | 1,819,675 | | | | 1,581,991 | | | | 3,547,121 | | | | 2,919,130 | | | | — | | | | — | | | | — | |
| | 524,158 | | | | 189,625 | | | | 213,354 | | | | 69,797 | | | | 11,642 | | | | 84,681 | | | | — | | | | — | |
| | — | | | | — | | | | — | | | | — | | | | — | | | | — | | | | 6,317 | | | | 22,359 | |
| | 381,893 | | | | 156,193 | | | | 109,719 | | | | 190,110 | | | | 83,151 | | | | 53,838 | | | | 50,711 | | | | 627,304 | |
| | 195,923 | | | | 15,161 | | | | 12,288 | | | | 17,971 | | | | 9,097 | | | | 11,205 | | | | 10,258 | | | | 12,401 | |
| | 413,135,669 | | | | 179,570,856 | | | | 138,816,091 | | | | 204,353,260 | | | | 67,148,355 | | | | 62,029,312 | | | | 34,895,839 | | | | 370,622,259 | |
| | | | | | | | | | | | | | | | | | | | | | | | | | | | | | | |
| | | | | | | | | | | | | | | | | | | | | | | | | | | | | | | |
| | — | | | | — | | | | — | | | | — | | | | — | | | | — | | | | — | | | | — | |
| | 4,041,261 | | | | 1,209,006 | | | | 581,591 | | | | 3,430,455 | | | | 2,800,904 | | | | — | | | | — | | | | — | |
| | 122,950 | | | | 34,498 | | | | — | | | | 64,474 | | | | 1,339,509 | | | | — | | | | — | | | | — | |
| | 153,586 | | | | 19,059 | | | | 62,740 | | | | 197,387 | | | | 58,666 | | | | 64,932 | | | | 38,629 | | | | 3,169 | |
| | 163,086 | | | | 48,905 | | | | 70,867 | | | | 191,125 | | | | 92,667 | | | | 58,112 | | | | — | | | | — | |
| | — | | | | — | | | | — | | | | — | | | | — | | | | — | | | | 469 | | | | 421,460 | |
| | — | | | | — | | | | — | | | | — | | | | — | | | | — | | | | — | | | | — | |
| | 226,965 | | | | 88,347 | | | | 57,195 | | | | 107,209 | | | | 38,662 | | | | 14,893 | | | | — | | | | — | |
| | 150,349 | | | | 61,590 | | | | 49,598 | | | | 56,128 | | | | 34,531 | | | | 20,044 | | | | 30 | | | | 53 | |
| | 34,778 | | | | 35,405 | | | | 28,508 | | | | 39,122 | | | | 15,156 | | | | 14,133 | | | | 8,183 | | | | 48,431 | |
| | 2,682 | | | | 1,158 | | | | 1,016 | | | | 1,239 | | | | 763 | | | | 592 | | | | 171 | | | | 171 | |
| | 42,987 | | | | 32,787 | | | | 32,705 | | | | 33,128 | | | | 28,772 | | | | 24,131 | | | | 25,265 | | | | 28,959 | |
| | 4,938,644 | | | | 1,530,755 | | | | 884,220 | | | | 4,120,267 | | | | 4,409,630 | | | | 196,837 | | | | 72,747 | | | | 502,243 | |
| | | | | | | | | | | | | | | | | | | | | | | | | | | | | | | |
| $ | 408,197,025 | | | $ | 178,040,101 | | | $ | 137,931,871 | | | $ | 200,232,993 | | | $ | 62,738,725 | | | $ | 61,832,475 | | | $ | 34,823,092 | | | $ | 370,120,016 | |
| | | | | | | | | | | | | | | | | | | | | | | | | | | | | | | |
| | | | | | | | | | | | | | | | | | | | | | | | | | | | | | | |
| $ | 371,849,763 | | | $ | 168,246,628 | | | $ | 133,941,417 | | | $ | 170,959,437 | | | $ | 50,423,941 | | | $ | 71,924,506 | | | $ | 34,823,092 | | | $ | 370,103,959 | |
| | 36,347,262 | | | | 9,793,473 | | | | 3,990,454 | | | | 29,273,556 | | | | 12,314,784 | | | | (10,092,031 | ) | | | — | | | | 16,057 | |
| $ | 408,197,025 | | | $ | 178,040,101 | | | $ | 137,931,871 | | | $ | 200,232,993 | | | $ | 62,738,725 | | | $ | 61,832,475 | | | $ | 34,823,092 | | | $ | 370,120,016 | |
| | | | | | | | | | | | | | | | | | | | | | | | | | | | | | | |
| | | | | | | | | | | | | | | | | | | | | | | | | | | | | | | |
| | | | | | | | | | | | | | | | | | | | | | | | | | | | | | | |
| $ | 92,815,223 | | | $ | 35,459,671 | | | $ | 31,688,314 | | | $ | 40,977,268 | | | $ | 24,978,843 | | | $ | 11,137,276 | | | | | | | | | |
| | 7,570,341 | | | | 2,993,234 | | | | 1,386,897 | | | | 3,453,342 | | | | 658,885 | | | | 1,177,297 | | | | | | | | | |
| $ | 12.26 | | | $ | 11.85 | | | $ | 22.85 | | | $ | 11.87 | | | $ | 37.91 | | | $ | 9.46 | | | | | | | | | |
| | | | | | | | | | | | | | | | | | | | | | | | | | | | | | | |
| | | | | | | | | | | | | | | | | | | | | | | | | | | | | | | |
| $ | 20,182,187 | | | $ | 10,079,940 | | | $ | 6,787,174 | | | $ | 13,136,739 | | | $ | 1,113,442 | | | $ | 4,205,468 | | | | | | | | | |
| | 1,634,042 | | | | 849,654 | | | | 293,422 | | | | 1,103,012 | | | | 29,293 | | | | 444,199 | | | | | | | | | |
| $ | 12.35 | | | $ | 11.86 | | | $ | 23.13 | | | $ | 11.91 | | | $ | 38.01 | | | $ | 9.47 | | | | | | | | | |
| | | | | | | | | | | | | | | | | | | | | | | | | | | | | | | |
| | | | | | | | | | | | | | | | | | | | | | | | | | | | | | | |
| $ | 295,199,615 | | | $ | 132,500,490 | | | $ | 99,456,383 | | | $ | 146,118,986 | | | $ | 36,646,440 | | | $ | 46,489,731 | | | | | | | | | |
| | 23,880,056 | | | | 11,146,098 | | | | 4,291,121 | | | | 12,275,220 | | | | 964,116 | | | | 4,911,295 | | | | | | | | | |
| $ | 12.36 | | | $ | 11.89 | | | $ | 23.18 | | | $ | 11.90 | | | $ | 38.01 | | | $ | 9.47 | | | | | | | | | |
| | | | | | | | | | | | | | | | | | | | | | | | | | | | | | | |
| | | | | | | | | | | | | | | | | | | | | | | | | | | | | | | |
| | | | | | | | | | | | | | | | | | | | | | | | | $ | 34,823,092 | | | $ | 370,120,016 | |
| | | | | | | | | | | | | | | | | | | | | | | | | | 34,823,092 | | | | 370,135,797 | |
| | | | | | | | | | | | | | | | | | | | | | | | | $ | 1.00 | | | $ | 1.0000 | |
| | | | | | | | | | | | | | | | | | | | | | | | | | | | | | | |
| $ | 361,202,375 | | | $ | 163,104,630 | | | $ | 129,061,491 | | | $ | 169,890,349 | | | $ | 50,926,107 | | | $ | 60,063,599 | | | $ | 34,789,924 | | | $ | 369,937,729 | |
| $ | 120,786 | | | $ | 33,890 | | | $ | — | | | $ | 63,339 | | | $ | 1,309,924 | | | $ | — | | | $ | — | | | $ | — | |
| $ | 2,901,000 | | | $ | 981,500 | | | $ | 395,500 | | | $ | 1,882,700 | | | $ | 79,200 | | | $ | — | | | $ | — | | | $ | — | |
The accompanying notes are an integral part of these financial statements
2019 Annual Report | December 31, 2019 | Page 115 |
Statements of Operations
For the Year Ended December 31, 2019 |
| | | Muirfield
Fund | | | Spectrum
Fund | | | Global
Allocation
Fund | |
Investment Income | | | | | | | | | | | | |
Interest | | $ | 20,116 | | | $ | 99 | | | $ | 33,760 | |
Income from affiliates | | | 4,142,249 | | | | 170,261 | | | | 462,832 | |
Dividends | | | 10,617,952 | | | | 4,186,227 | | | | 856,019 | |
Total Investment Income | | | 14,780,317 | | | | 4,356,587 | | | | 1,352,611 | |
| | | | | | | | | | | | | |
Fund Expenses | | | | | | | | | | | | |
Investment adviser | | | 4,264,413 | | | | 1,515,212 | | | | 417,657 | |
Transfer agent - Retail Class | | | 230,092 | | | | 61,269 | | | | 15,248 | |
Transfer agent - Adviser Class | | | 75,561 | | | | 18,123 | | | | 2,009 | |
Transfer agent - Institutional Class | | | 492,230 | | | | 164,146 | | | | 49,568 | |
Transfer agent - Money Market Funds | | | | | | | | | | | | |
Fund accounting | | | 103,490 | | | | 57,295 | | | | 40,138 | |
Administrative | | | 541,922 | | | | 172,359 | | | | 54,550 | |
Trustee | | | 28,221 | | | | 8,772 | | | | 2,655 | |
Audit | | | 18,051 | | | | 17,312 | | | | 18,009 | |
Legal | | | 5,743 | | | | 5,750 | | | | 5,741 | |
Custody | | | 67,323 | | | | 19,529 | | | | 5,272 | |
Printing | | | 20,365 | | | | 6,215 | | | | 1,185 | |
Distribution plan (12b-1) - Retail Class (1) | | | 383,487 | | | | 127,645 | | | | 31,767 | |
Distribution plan (12b-1) - Money Market Funds | | | | | | | | | | | | |
Shareholder service plan - Retail Class | | | 330,357 | | | | 102,116 | | | | 22,855 | |
Shareholder service plan - Adviser Class | | | 112,675 | | | | 29,234 | | | | 3,293 | |
Shareholder service plan - Institutional Class | | | 304,237 | | | | 101,872 | | | | 2,099 | |
Postage | | | 32,144 | | | | 20,519 | | | | 1,002 | |
Registration and filing | | | 103,159 | | | | 68,014 | | | | 47,723 | |
Insurance | | | 32,114 | | | | 10,264 | | | | 3,427 | |
Chief Compliance Officer | | | 6,818 | | | | 6,818 | | | | 6,818 | |
Dividend expense on securities sold short | | | — | | | | 511,287 | | | | — | |
Other | | | 36,214 | | | | 26,883 | | | | 23,189 | |
Total Expenses Before Reductions | | | 7,188,616 | | | | 3,050,634 | | | | 754,205 | |
| | | | | | | | | | | | | |
Expenses voluntarily reimbursed/waived by investment adviser (See Note #5) | | | — | | | | — | | | | — | |
Expenses contractually reimbursed/waived by investment adviser (See Note #5) | | | — | | | | — | | | | — | |
Securities lending credit (See Note #5) | | | (7,999 | ) | | | (1,794 | ) | | | (7,329 | ) |
Transfer agent expenses voluntarily waived (See Note #5) | | | (459,000 | ) | | | (27,000 | ) | | | — | |
| | | | | | | | | | | | | |
Net Expenses | | | 6,721,617 | | | | 3,021,840 | | | | 746,876 | |
| | | | | | | | | | | | | |
Net Investment Income (Loss) | | | 8,058,700 | | | | 1,334,747 | | | | 605,735 | |
| | | | | | | | | | | | | |
Net Realized and Unrealized Gain (Loss) from Investments | | | | | | | | | | | | |
Net realized gains (losses) from unaffiliated investments | | | 5,287,276 | | | | 1,951,713 | | | | 1,185,784 | |
Net realized gains (losses) from affiliated investments | | | 13,344 | | | | 2,628 | | | | 2,665 | |
Net realized gains (losses) from closed short positions | | | — | | | | (6,196,857 | ) | | | — | |
Net realized gains (losses) from futures contracts | | | (23,737,399 | ) | | | (2,807,340 | ) | | | 31,530 | |
Distributions of long-term realized gains by other investment companies | | | — | | | | — | | | | 6,397 | |
Net Realized Gains (Losses) from Investment Transactions, Futures Contracts, and Distributions of Long-term Realized Gains by Other Investment Companies | | | (18,436,779 | ) | | | (7,049,856 | ) | | | 1,226,376 | |
| | | | | | | | | | | | | |
Net change in unrealized appreciation (depreciation) of unaffiliated investments | | | 98,468,884 | | | | 40,906,534 | | | | 5,044,114 | |
Net change in unrealized appreciation (depreciation) of affiliated investments | | | 18,274 | | | | 6 | | | | 659 | |
Net change in unrealized appreciation (depreciation) of short positions | | | — | | | | (9,713,261 | ) | | | — | |
Net change in unrealized appreciation (depreciation) of futures contracts | | | (2,782,741 | ) | | | (167,593 | ) | | | (116,736 | ) |
Net Change in Unrealized Appreciation (Depreciation) of Investment Transactions and Futures Contracts | | | 95,704,417 | | | | 31,025,686 | | | | 4,928,037 | |
| | | | | | | | | | | | | |
Net Realized and Unrealized Gain (Loss) from Investments | | | 77,267,638 | | | | 23,975,830 | | | | 6,154,413 | |
| | | | | | | | | | | | | |
Net Change in Net Assets Resulting from Operations | | $ | 85,326,338 | | | $ | 25,310,577 | | | $ | 6,760,148 | |
(1) | Only the Retail Class of shares has adopted a Rule 12b-1 Plan. See #5 of the Notes to Financial Statements. |
The accompanying notes are an integral part of these financial statements
Page 116 | 2019 Annual Report | December 31, 2019 |
| |
Balanced
Fund | | | Moderate
Allocation
Fund | | | Conservative
Allocation
Fund | | | Dynamic
Allocation
Fund | | | Quantex
Fund | | | Total Return
Bond Fund | | | Prime Money
Market Fund | | | Institutional
Prime Money
Market Fund | |
| | | | | | | | | | | | | | | | | | | | | | | | | | | | | | | |
| $ | 345,959 | | | $ | 252,587 | | | $ | 269,682 | | | $ | 19,975 | | | $ | 19,233 | | | $ | 217,611 | | | $ | 853,934 | | | $ | 10,514,772 | |
| | 1,764,698 | | | | 639,840 | | | | 286,295 | | | | 950,849 | | | | 27,506 | | | | 51,265 | | | | — | | | | — | |
| | 8,564,930 | | | | 4,510,929 | | | | 4,217,347 | | | | 3,620,192 | | | | 1,306,659 | | | | 2,036,231 | | | | — | | | | — | |
| | 10,675,587 | | | | 5,403,356 | | | | 4,773,324 | | | | 4,591,016 | | | | 1,353,398 | | | | 2,305,107 | | | | 853,934 | | | | 10,514,772 | |
| | | | | | | | | | | | | | | | | | | | | | | | | | | | | | | |
| | | | | | | | | | | | | | | | | | | | | | | | | | | | | | | |
| | 2,636,888 | | | | 1,049,019 | | | | 692,245 | | | | 1,452,694 | | | | 499,671 | | | | 265,615 | | | | 141,770 | | | | 1,229,679 | |
| | 111,353 | | | | 40,997 | | | | 38,058 | | | | 50,409 | | | | 34,773 | | | | 11,144 | | | | | | | | | |
| | 24,026 | | | | 12,010 | | | | 7,945 | | | | 15,024 | | | | 1,241 | | | | 3,194 | | | | | | | | | |
| | 331,999 | | | | 156,797 | | | | 120,136 | | | | 167,001 | | | | 43,934 | | | | 38,786 | | | | | | | | | |
| | | | | | | | | | | | | | | | | | | | | | | | | | 28,356 | | | | 345,494 | |
| | 75,948 | | | | 54,484 | | | | 50,845 | | | | 56,369 | | | | 42,324 | | | | 42,281 | | | | 36,088 | | | | 80,187 | |
| | 321,585 | | | | 149,869 | | | | 120,759 | | | | 164,956 | | | | 63,298 | | | | 63,123 | | | | 35,442 | | | | 355,497 | |
| | 16,606 | | | | 7,635 | | | | 6,157 | | | | 8,560 | | | | 3,157 | | | | 3,187 | | | | 1,120 | | | | 1,045 | |
| | 15,584 | | | | 15,491 | | | | 15,547 | | | | 19,533 | | | | 18,009 | | | | 14,627 | | | | 14,317 | | | | 14,318 | |
| | 5,741 | | | | 5,748 | | | | 5,739 | | | | 5,096 | | | | 5,741 | | | | 5,736 | | | | 5,396 | | | | 5,697 | |
| | 38,837 | | | | 17,375 | | | | 13,923 | | | | 19,382 | | | | 6,372 | | | | 6,810 | | | | 3,019 | | | | 35,253 | |
| | 11,605 | | | | 5,386 | | | | 4,170 | | | | 5,728 | | | | 1,811 | | | | 994 | | | | 1,107 | | | | 11,930 | |
| | 231,985 | | | | 85,409 | | | | 79,287 | | | | 105,019 | | | | 57,955 | | | | 34,825 | | | | | | | | | |
| | | | | | | | | | | | | | | | | | | | | | | | | | 15 | | | | 3 | |
| | 181,781 | | | | 66,959 | | | | 54,618 | | | | 80,112 | | | | 36,013 | | | | 26,197 | | | | | | | | | |
| | 36,371 | | | | 17,305 | | | | 11,713 | | | | 25,309 | | | | 2,122 | | | | 7,073 | | | | | | | | | |
| | 213,337 | | | | 93,723 | | | | 78,484 | | | | 34,300 | | | | 16,099 | | | | 28,281 | | | | | | | | | |
| | 22,519 | | | | 11,618 | | | | 11,686 | | | | 12,942 | | | | 2,057 | | | | 1,553 | | | | 2,652 | | | | 3,481 | |
| | 72,456 | | | | 69,393 | | | | 64,327 | | | | 64,294 | | | | 48,525 | | | | 50,516 | | | | 23,246 | | | | 21,494 | |
| | 20,368 | | | | 9,413 | | | | 8,520 | | | | 8,192 | | | | 3,594 | | | | 1,229 | | | | 2,295 | | | | 22,893 | |
| | 6,818 | | | | 6,818 | | | | 6,818 | | | | 6,818 | | | | 6,818 | | | | 6,818 | | | | 6,818 | | | | 6,818 | |
| | — | | | | — | | | | — | | | | — | | | | — | | | | — | | | | — | | | | — | |
| | 30,046 | | | | 24,793 | | | | 24,106 | | | | 25,640 | | | | 24,660 | | | | 25,675 | | | | 35,097 | | | | 42,118 | |
| | 4,405,853 | | | | 1,900,242 | | | | 1,415,083 | | | | 2,327,378 | | | | 918,174 | | | | 637,664 | | | | 336,738 | | | | 2,175,907 | |
| | | | | | | | | | | | | | | | | | | | | | | | | | | | | | | |
| | — | | | | — | | | | — | | | | — | | | | — | | | | — | | | | (200,814 | ) | | | (1,526,569 | ) |
| | — | | | | — | | | | — | | | | (193,695 | ) | | | — | | | | (73,044 | ) | | | — | | | | — | |
| | (51,358 | ) | | | (38,030 | ) | | | (42,973 | ) | | | (19,779 | ) | | | (22,529 | ) | | | — | | | | — | | | | — | |
| | (207,000 | ) | | | — | | | | — | | | | — | | | | — | | | | — | | | | (7,091 | ) | | | (86,371 | ) |
| | | | | | | | | | | | | | | | | | | | | | | | | | | | | | | |
| | 4,147,495 | | | | 1,862,212 | | | | 1,372,110 | | | | 2,113,904 | | | | 895,645 | | | | 564,620 | | | | 128,833 | | | | 562,967 | |
| | | | | | | | | | | | | | | | | | | | | | | | | | | | | | | |
| | 6,528,092 | | | | 3,541,144 | | | | 3,401,214 | | | | 2,477,112 | | | | 457,753 | | | | 1,740,487 | | | | 725,101 | | | | 9,951,805 | |
| | | | | | | | | | | | | | | | | | | | | | | | | | | | | | | |
| | | | | | | | | | | | | | | | | | | | | | | | | | | | | | | |
| | 3,981,939 | | | | 1,811,605 | | | | 1,326,184 | | | | 3,749,011 | | | | 24,656 | | | | 463,187 | | | | — | | | | (20 | ) |
| | 2,455 | | | | 1,878 | | | | 577 | | | | (477 | ) | | | 140 | | | | 558 | | | | — | | | | — | |
| | — | | | | — | | | | — | | | | — | | | | — | | | | — | | | | — | | | | — | |
| | (7,664,888 | ) | | | (1,665,614 | ) | | | (906,104 | ) | | | 7,019,330 | | | | (30,996 | ) | | | — | | | | — | | | | — | |
| | 154,319 | | | | 113,587 | | | | 124,230 | | | | — | | | | — | | | | 92,938 | | | | — | | | | — | |
| | (3,526,175 | ) | | | 261,456 | | | | 544,887 | | | | 10,767,864 | | | | (6,200 | ) | | | 556,683 | | | | — | | | | (20 | ) |
| | | | | | | | | | | | | | | | | | | | | | | | | | | | | | | |
| | 44,261,682 | | | | 15,293,505 | | | | 9,945,652 | | | | 27,121,541 | | | | 9,749,209 | | | | 2,628,013 | | | | — | | | | 73,938 | |
| | 6,357 | | | | 1,665 | | | | 1,067 | | | | 3,616 | | | | 7 | | | | (232 | ) | | | — | | | | — | |
| | — | | | | — | | | | — | | | | — | | | | — | | | | — | | | | — | | | | — | |
| | (937,849 | ) | | | (226,337 | ) | | | (140,936 | ) | | | 958,062 | | | | 527,540 | | | | — | | | | — | | | | — | |
| | 43,330,190 | | | | 15,068,833 | | | | 9,805,783 | | | | 28,083,219 | | | | 10,276,756 | | | | 2,627,781 | | | | — | | | | 73,938 | |
| | | | | | | | | | | | | | | | | | | | | | | | | | | | | | | |
| | 39,804,015 | | | | 15,330,289 | | | | 10,350,670 | | | | 38,851,083 | | | | 10,270,556 | | | | 3,184,464 | | | | — | | | | 73,918 | |
| | | | | | | | | | | | | | | | | | | | | | | | | | | | | | | |
| $ | 46,332,107 | | | $ | 18,871,433 | | | $ | 13,751,884 | | | $ | 41,328,195 | | | $ | 10,728,309 | | | $ | 4,924,951 | | | $ | 725,101 | | | $ | 10,025,723 | |
The accompanying notes are an integral part of these financial statements
2019 Annual Report | December 31, 2019 | Page 117 |
Statements of Changes in Net Assets
For the Years Ended December 31, |
| | | Muirfield Fund | | | Spectrum Fund | |
| | | 2019 | | | 2018 | | | 2019 | | | 2018 | |
Operations | | | | | | | | | | | | | | | | |
Net investment income (loss) | | $ | 8,058,700 | | | $ | 4,316,352 | | | $ | 1,334,747 | | | $ | 939,831 | |
Net realized gain (loss) from investment transactions, futures contracts, and distributions of long-term realized gains by other investment companies | | | (18,436,779 | ) | | | 11,690,038 | | | | (7,049,856 | ) | | | 1,515,878 | |
Net change in unrealized appreciation (depreciation) of investment transactions and futures contracts | | | 95,704,417 | | | | (40,476,681 | ) | | | 31,025,686 | | | | (9,652,387 | ) |
Net change in net assets resulting from operations | | | 85,326,338 | | | | (24,470,291 | ) | | | 25,310,577 | | | | (7,196,678 | ) |
| | | | | | | | | | | | | | | | | |
Distributions to Shareholders | | | | | | | | | | | | | | | | |
Retail Class | | | (5,010,444 | ) | | | (3,029,797 | ) | | | (488,471 | ) | | | (634,850 | ) |
Adviser Class | | | (1,635,066 | ) | | | (976,171 | ) | | | (151,230 | ) | | | (205,754 | ) |
Institutional Class | | | (11,891,386 | ) | | | (5,553,367 | ) | | | (1,431,158 | ) | | | (1,832,352 | ) |
Net change in net assets resulting from distributions | | | (18,536,896 | ) | | | (9,559,335 | ) | | | (2,070,859 | ) | | | (2,672,956 | ) |
| | | | | | | | | | | | | | | | | |
Capital Transactions: | | | | | | | | | | | | | | | | |
Issued | | | 197,324,991 | | | | 377,780,674 | | | | 51,986,998 | | | | 93,858,412 | |
Reinvested | | | 18,362,502 | | | | 9,280,425 | | | | 2,059,900 | | | | 2,661,072 | |
Redeemed | | | (212,058,081 | ) | | | (219,984,539 | ) | | | (46,954,317 | ) | | | (58,789,698 | ) |
Net change in net assets resulting from capital transactions | | | 3,629,412 | | | | 167,076,560 | | | | 7,092,581 | | | | 37,729,786 | |
| | | | | | | | | | | | | | | | | |
Total Change in Net Assets | | | 70,418,854 | | | | 133,046,934 | | | | 30,332,299 | | | | 27,860,152 | |
| | | | | | | | | | | | | | | | | |
Net Assets - Beginning of Year | | | 611,009,096 | | | | 477,962,162 | | | | 182,734,409 | | | | 154,874,257 | |
| | | | | | | | | | | | | | | | | |
Net Assets - End of Year | | $ | 681,427,950 | | | $ | 611,009,096 | | | $ | 213,066,708 | | | $ | 182,734,409 | |
| | | | | | | | | | | | | | | | | |
Share Transactions: | | | | | | | | | | | | | | | | |
Issued | | | 26,485,691 | | | | 49,143,680 | | | | 4,579,626 | | | | 7,993,833 | |
Reinvested | | | 2,358,583 | | | | 1,258,674 | | | | 170,107 | | | | 239,817 | |
Redeemed | | | (28,277,770 | ) | | | (28,720,467 | ) | | | (4,096,807 | ) | | | (4,982,155 | ) |
Net change in shares | | | 566,504 | | | | 21,681,887 | | | | 652,926 | | | | 3,251,495 | |
The accompanying notes are an integral part of these financial statements
Page 118 | 2019 Annual Report | December 31, 2019 |
| |
Global
Allocation Fund | | | Balanced Fund | | | Moderate
Allocation Fund | | | Conservative
Allocation Fund | |
2019 | | | 2018 | | | 2019 | | | 2018 | | | 2019 | | | 2018 | | | 2019 | | | 2018 | |
| | | | | | | | | | | | | | | | | | | | | | | | | | | | | | | |
| $ | 605,735 | | | $ | 566,652 | | | $ | 6,528,092 | | | $ | 4,533,093 | | | $ | 3,541,144 | | | $ | 2,641,783 | | | $ | 3,401,214 | | | $ | 2,852,290 | |
| | 1,226,376 | | | | 1,115,237 | | | | (3,526,175 | ) | | | 277,369 | | | | 261,456 | | | | (2,620,849 | ) | | | 544,887 | | | | (3,518,554 | ) |
| | 4,928,037 | | | | (5,954,021 | ) | | | 43,330,190 | | | | (16,515,908 | ) | | | 15,068,833 | | | | (4,883,381 | ) | | | 9,805,783 | | | | (3,132,054 | ) |
| | 6,760,148 | | | | (4,272,132 | ) | | | 46,332,107 | | | | (11,705,446 | ) | | | 18,871,433 | | | | (4,862,447 | ) | | | 13,751,884 | | | | (3,798,318 | ) |
| | | | | | | | | | | | | | | | | | | | | | | | | | | | | | | |
| | | | | | | | | | | | | | | | | | | | | | | | | | | | | | | |
| | (242,208 | ) | | | (694,187 | ) | | | (1,368,254 | ) | | | (1,273,976 | ) | | | (571,424 | ) | | | (1,589,145 | ) | | | (689,225 | ) | | | (1,147,450 | ) |
| | (38,283 | ) | | | (80,880 | ) | | | (326,176 | ) | | | (307,223 | ) | | | (194,767 | ) | | | (435,680 | ) | | | (160,298 | ) | | | (226,427 | ) |
| | (940,057 | ) | | | (2,231,829 | ) | | | (4,882,547 | ) | | | (4,102,139 | ) | | | (2,678,105 | ) | | | (5,395,120 | ) | | | (2,525,999 | ) | | | (3,425,952 | ) |
| | (1,220,548 | ) | | | (3,006,896 | ) | | | (6,576,977 | ) | | | (5,683,338 | ) | | | (3,444,296 | ) | | | (7,419,945 | ) | | | (3,375,522 | ) | | | (4,799,829 | ) |
| | | | | | | | | | | | | | | | | | | | | | | | | | | | | | | |
| | | | | | | | | | | | | | | | | | | | | | | | | | | | | | | |
| | 7,060,084 | | | | 39,142,473 | | | | 104,242,588 | | | | 245,111,176 | | | | 39,833,668 | | | | 179,582,098 | | | | 32,486,841 | | | | 146,267,121 | |
| | 1,220,307 | | | | 3,001,909 | | | | 6,544,647 | | | | 5,665,161 | | | | 3,422,617 | | | | 7,391,639 | | | | 3,357,881 | | | | 4,785,255 | |
| | (20,806,165 | ) | | | (50,393,875 | ) | | | (91,154,144 | ) | | | (163,418,052 | ) | | | (42,505,891 | ) | | | (78,947,761 | ) | | | (37,570,100 | ) | | | (38,139,031 | ) |
| | (12,525,774 | ) | | | (8,249,493 | ) | | | 19,633,091 | | | | 87,358,285 | | | | 750,394 | | | | 108,025,976 | | | | (1,725,378 | ) | | | 112,913,345 | |
| | | | | | | | | | | | | | | | | | | | | | | | | | | | | | | |
| | (6,986,174 | ) | | | (15,528,521 | ) | | | 59,388,221 | | | | 69,969,501 | | | | 16,177,531 | | | | 95,743,584 | | | | 8,650,984 | | | | 104,315,198 | |
| | | | | | | | | | | | | | | | | | | | | | | | | | | | | | | |
| | 58,409,705 | | | | 73,938,226 | | | | 348,808,804 | | | | 278,839,303 | | | | 161,862,570 | | | | 66,118,986 | | | | 129,280,887 | | | | 24,965,689 | |
| | | | | | | | | | | | | | | | | | | | | | | | | | | | | | | |
| $ | 51,423,531 | | | $ | 58,409,705 | | | $ | 408,197,025 | | | $ | 348,808,804 | | | $ | 178,040,101 | | | $ | 161,862,570 | | | $ | 137,931,871 | | | $ | 129,280,887 | |
| | | | | | | | | | | | | | | | | | | | | | | | | | | | | | | |
| | | | | | | | | | | | | | | | | | | | | | | | | | | | | | | |
| | 662,661 | | | | 3,354,047 | | | | 9,007,314 | | | | 20,814,984 | | | | 3,527,952 | | | | 15,299,240 | | | | 1,456,459 | | | | 6,417,751 | |
| | 110,294 | | | | 286,815 | | | | 549,529 | | | | 496,215 | | | | 295,525 | | | | 665,473 | | | | 147,638 | | | | 218,857 | |
| | (1,946,833 | ) | | | (4,341,745 | ) | | | (7,799,068 | ) | | | (13,914,576 | ) | | | (3,730,284 | ) | | | (6,735,567 | ) | | | (1,669,810 | ) | | | (1,699,479 | ) |
| | (1,173,878 | ) | | | (700,883 | ) | | | 1,757,775 | | | | 7,396,623 | | | | 93,193 | | | | 9,229,146 | | | | (65,713 | ) | | | 4,937,129 | |
The accompanying notes are an integral part of these financial statements
2019 Annual Report | December 31, 2019 | Page 119 |
Statements of Changes in Net Assets
For the Year Ended December 31, 2019 |
| | | Dynamic
Allocation Fund | | | Quantex Fund | |
| | | 2019 | | | 2018 | | | 2019 | | | 2018 | |
Operations | | | | | | | | | | | | | | | | |
Net investment income (loss) | | $ | 2,477,112 | | | $ | 1,397,609 | | | $ | 457,753 | | | $ | 200,832 | |
Net realized gain (loss) from investment transactions, futures contracts, and distributions of long-term realized gains by other investment companies | | | 10,767,864 | | | | (2,670,698 | ) | | | (6,200 | ) | | | 7,943,066 | |
Net change in unrealized appreciation (depreciation) of investment transactions and futures contracts | | | 28,083,219 | | | | (16,036,140 | ) | | | 10,276,756 | | | | (16,873,003 | ) |
Net change in net assets resulting from operations | | | 41,328,195 | | | | (17,309,229 | ) | | | 10,728,309 | | | | (8,729,105 | ) |
| | | | | | | | | | | | | | | | | |
Distributions to Shareholders | | | | | | | | | | | | | | | | |
Retail Class | | | (913,644 | ) | | | (521,444 | ) | | | (180,584 | ) | | | — | |
Adviser Class | | | (313,636 | ) | | | (154,361 | ) | | | (7,848 | ) | | | (104 | ) |
Institutional Class | | | (3,749,086 | ) | | | (1,746,253 | ) | | | (333,427 | ) | | | (66,917 | ) |
Money Market Funds | | | | | | | | | | | | | | | | |
Net change in net assets resulting from distributions | | | (4,976,366 | ) | | | (2,422,058 | ) | | | (521,859 | ) | | | (67,021 | ) |
| | | | | | | | | | | | | | | | | |
Capital Transactions: | | | | | | | | | | | | | | | | |
Issued | | | 34,492,243 | | | | 113,204,066 | | | | 12,115,546 | | | | 47,785,941 | |
Reinvested | | | 4,969,211 | | | | 2,415,959 | | | | 409,937 | | | | 42,224 | |
Redeemed | | | (49,475,357 | ) | | | (52,891,314 | ) | | | (24,649,606 | ) | | | (69,140,186 | ) |
Net change in net assets resulting from capital transactions | | | (10,013,903 | ) | | | 62,728,711 | | | | (12,124,123 | ) | | | (21,312,021 | ) |
| | | | | | | | | | | | | | | | | |
Total Change in Net Assets | | | 26,337,926 | | | | 42,997,424 | | | | (1,917,673 | ) | | | (30,108,147 | ) |
| | | | | | | | | | | | | | | | | |
Net Assets - Beginning of Year | | | 173,895,067 | | | | 130,897,643 | | | | 64,656,398 | | | | 94,764,545 | |
| | | | | | | | | | | | | | | | | |
Net Assets - End of Year | | $ | 200,232,993 | | | $ | 173,895,067 | | | $ | 62,738,725 | | | $ | 64,656,398 | |
| | | | | | | | | | | | | | | | | |
Share Transactions: | | | | | | | | | | | | | | | | |
Issued | | | 3,147,990 | | | | 10,226,217 | | | | 338,751 | | | | 1,293,841 | |
Reinvested | | | 428,100 | | | | 234,222 | | | | 11,297 | | | | 1,112 | |
Redeemed | | | (4,466,355 | ) | | | (4,794,911 | ) | | | (702,095 | ) | | | (1,868,379 | ) |
Net change in shares | | | (890,265 | ) | | | 5,665,528 | | | | (352,047 | ) | | | (573,426 | ) |
The accompanying notes are an integral part of these financial statements
Page 120 | 2019 Annual Report | December 31, 2019 |
| |
Total Return
Bond Fund | | | Prime Money
Market Fund | | | Institutional
Prime
Money Market
Fund | |
2019 | | | 2018 | | | 2019 | | | 2018 | | | 2019 | | | 2018 | |
| | | | | | | | | | | | | | | | | | | | | | | |
| $ | 1,740,487 | | | $ | 1,639,459 | | | $ | 725,101 | | | $ | 560,559 | | | $ | 9,951,805 | | | $ | 7,187,753 | |
| | 556,683 | | | | (1,930,052 | ) | | | — | | | | — | | | | (20 | ) | | | (1,999 | ) |
| | 2,627,781 | | | | (1,036,232 | ) | | | — | | | | — | | | | 73,938 | | | | 5,465 | |
| | 4,924,951 | | | | (1,326,825 | ) | | | 725,101 | | | | 560,559 | | | | 10,025,723 | | | | 7,191,219 | |
| | | | | | | | | | | | | | | | | | | | | | | |
| | | | | | | | | | | | | | | | | | | | | | | |
| | (318,972 | ) | | | (370,637 | ) | | | | | | | | | | | | | | | | |
| | (105,786 | ) | | | (69,633 | ) | | | | | | | | | | | | | | | | |
| | (1,325,202 | ) | | | (1,132,401 | ) | | | | | | | | | | | | | | | | |
| | | | | | | | | | (725,101 | ) | | | (560,559 | ) | | | (9,951,803 | ) | | | (7,187,755 | ) |
| | (1,749,960 | ) | | | (1,572,671 | ) | | | (725,101 | ) | | | (560,559 | ) | | | (9,951,803 | ) | | | (7,187,755 | ) |
| | | | | | | | | | | | | | | | | | | | | | | |
| | | | | | | | | | | | | | | | | | | | | | | |
| | 16,660,352 | | | | 30,712,205 | | | | 21,752,554 | | | | 36,584,300 | | | | 337,972,181 | | | | 655,634,899 | |
| | 1,737,187 | | | | 1,565,286 | | | | 686,595 | | | | 520,240 | | | | 1,149,955 | | | | 770,570 | |
| | (26,679,180 | ) | | | (150,994,621 | ) | | | (28,496,871 | ) | | | (31,434,432 | ) | | | (440,678,548 | ) | | | (481,353,876 | ) |
| | (8,281,641 | ) | | | (118,717,130 | ) | | | (6,057,722 | ) | | | 5,670,108 | | | | (101,556,412 | ) | | | 175,051,593 | |
| | | | | | | | | | | | | | | | | | | | | | | |
| | (5,106,650 | ) | | | (121,616,626 | ) | | | (6,057,722 | ) | | | 5,670,108 | | | | (101,482,492 | ) | | | 175,055,057 | |
| | | | | | | | | | | | | | | | | | | | | | | |
| | 66,939,125 | | | | 188,555,751 | | | | 40,880,814 | | | | 35,210,706 | | | | 471,602,508 | | | | 296,547,451 | |
| | | | | | | | | | | | | | | | | | | | | | | |
| $ | 61,832,475 | | | $ | 66,939,125 | | | $ | 34,823,092 | | | $ | 40,880,814 | | | $ | 370,120,016 | | | $ | 471,602,508 | |
| | | | | | | | | | | | | | | | | | | | | | | |
| | | | | | | | | | | | | | | | | | | | | | | |
| | 1,785,878 | | | | 3,353,494 | | | | 21,752,554 | | | | 36,584,300 | | | | 337,937,146 | | | | 655,689,013 | |
| | 185,122 | | | | 172,277 | | | | 686,595 | | | | 520,240 | | | | 1,149,805 | | | | 770,617 | |
| | (2,847,058 | ) | | | (16,229,362 | ) | | | (28,496,871 | ) | | | (31,434,432 | ) | | | (440,622,456 | ) | | | (481,379,810 | ) |
| | (876,058 | ) | | | (12,703,591 | ) | | | (6,057,722 | ) | | | 5,670,108 | | | | (101,535,505 | ) | | | 175,079,820 | |
The accompanying notes are an integral part of these financial statements
2019 Annual Report | December 31, 2019 | Page 121 |
Financial Highlights
For the Periods Ended December 31, |
| | | | | | | Income
from
Investment Operations | | | Less
Distributions | |
| | Net Asset
Value,
Beginning
of Period | | | Net
Investment
Income
(Loss) (5) | | | Net gains (losses)
on securities and
futures (both realized
and unrealized) | | | Total from
Investment
Operations | | | From Net
Investment
Income | | | From Net
Capital
Gains | | | From
Return of
Capital | | | Total
Distributions | |
Muirfield Fund - Retail Class (1)(2)(3)(4) |
2019 | | $ | 7.16 | | | | 0.07 | | | | 0.89 | | | | 0.96 | | | | (0.03 | ) | | | (0.18 | ) | | | 0.00 | | | | (0.21 | ) |
2018 | | $ | 7.54 | | | | 0.04 | | | | (0.31 | ) | | | (0.27 | ) | | | (0.04 | ) | | | (0.07 | ) | | | 0.00 | | | | (0.11 | ) |
2017 | | $ | 6.79 | | | | 0.04 | | | | 1.34 | | | | 1.38 | | | | (0.04 | ) | | | (0.59 | ) | | | 0.00 | | | | (0.63 | ) |
2016 | | $ | 6.47 | | | | 0.05 | | | | 0.32 | | | | 0.37 | | | | (0.05 | ) | | | 0.00 | | | | 0.00 | | | | (0.05 | ) |
2015 | | $ | 7.03 | | | | 0.02 | | | | (0.41 | ) | | | (0.39 | ) | | | (0.02 | ) | | | (0.15 | ) | | | 0.00 | | | | (0.17 | ) |
Muirfield Fund - Adviser Class (1)(2)(3)(4) |
2019 | | $ | 7.20 | | | | 0.09 | | | | 0.90 | | | | 0.99 | | | | (0.04 | ) | | | (0.18 | ) | | | 0.00 | | | | (0.22 | ) |
2018 | | $ | 7.57 | | | | 0.06 | | | | (0.31 | ) | | | (0.25 | ) | | | (0.05 | ) | | | (0.07 | ) | | | 0.00 | | | | (0.12 | ) |
2017 | | $ | 6.80 | | | | 0.05 | | | | 1.34 | | | | 1.39 | | | | (0.03 | ) | | | (0.59 | ) | | | 0.00 | | | | (0.62 | ) |
2016 (9) | | $ | 6.51 | | | | 0.01 | | | | 0.29 | | | | 0.30 | | | | (0.01 | ) | | | 0.00 | | | | 0.00 | | | | (0.01 | ) |
Muirfield Fund - Institutional Class (1)(2)(3)(4) |
2019 | | $ | 7.21 | | | | 0.10 | | | | 0.90 | | | | 1.00 | | | | (0.04 | ) | | | (0.18 | ) | | | 0.00 | | | | (0.22 | ) |
2018 | | $ | 7.57 | | | | 0.08 | | | | (0.31 | ) | | | (0.23 | ) | | | (0.06 | ) | | | (0.07 | ) | | | 0.00 | | | | (0.13 | ) |
2017 | | $ | 6.80 | | | | 0.07 | | | | 1.33 | | | | 1.40 | | | | (0.04 | ) | | | (0.59 | ) | | | 0.00 | | | | (0.63 | ) |
2016 (9) | | $ | 6.51 | | | | 0.02 | | | | 0.29 | | | | 0.31 | | | | (0.02 | ) | | | 0.00 | | | | 0.00 | | | | (0.02 | ) |
Spectrum Fund - Retail Class (1)(2)(3)(4) |
2019 | | $ | 10.89 | | | | 0.04 | | | | 1.38 | | | | 1.42 | | | | (0.01 | ) | | | (0.11 | ) | | | 0.00 | | | | (0.12 | ) |
2018 | | $ | 11.48 | | | | 0.03 | | | | (0.49 | ) | | | (0.46 | ) | | | 0.00 | | | | (0.13 | ) | | | 0.00 | | | | (0.13 | ) |
2017 | | $ | 10.28 | | | | (0.01 | ) | | | 1.99 | | | | 1.98 | | | | 0.00 | | | | (0.78 | ) | | | 0.00 | | | | (0.78 | ) |
2016 | | $ | 9.73 | | | | 0.02 | | | | 0.66 | | | | 0.68 | | | | (0.02 | ) | | | (0.11 | ) | | | 0.00 | | | | (0.13 | ) |
2015 (6) | | $ | 10.00 | | | | (0.04 | ) | | | (0.08 | ) | | | (0.12 | ) | | | 0.00 | | | | (0.13 | ) | | | (0.02 | ) | | | (0.15 | ) |
Spectrum Fund - Adviser Class (1)(2)(3)(4) |
2019 | | $ | 10.95 | | | | 0.07 | | | | 1.37 | | | | 1.44 | | | | (0.01 | ) | | | (0.11 | ) | | | 0.00 | | | | (0.12 | ) |
2018 | | $ | 11.53 | | | | 0.06 | | | | (0.48 | ) | | | (0.42 | ) | | | (0.03 | ) | | | (0.13 | ) | | | 0.00 | | | | (0.16 | ) |
2017 | | $ | 10.29 | | | | 0.02 | | | | 2.00 | | | | 2.02 | | | | 0.00 | | | | (0.78 | ) | | | 0.00 | | | | (0.78 | ) |
2016 (9) | | $ | 9.97 | | | | 0.02 | | | | 0.43 | | | | 0.45 | | | | (0.02 | ) | | | (0.11 | ) | | | 0.00 | | | | (0.13 | ) |
Spectrum Fund - Institutional Class (1)(2)(3)(4) |
2019 | | $ | 10.96 | | | | 0.09 | | | | 1.38 | | | | 1.47 | | | | (0.01 | ) | | | (0.11 | ) | | | 0.00 | | | | (0.12 | ) |
2018 | | $ | 11.54 | | | | 0.08 | | | | (0.49 | ) | | | (0.41 | ) | | | (0.04 | ) | | | (0.13 | ) | | | 0.00 | | | | (0.17 | ) |
2017 | | $ | 10.29 | | | | 0.05 | | | | 1.98 | | | | 2.03 | | | | 0.00 | | | | (0.78 | ) | | | 0.00 | | | | (0.78 | ) |
2016 (9) | | $ | 9.97 | | | | 0.02 | | | | 0.43 | | | | 0.45 | | | | (0.02 | ) | | | (0.11 | ) | | | 0.00 | | | | (0.13 | ) |
Global Allocation Fund - Retail Class (1)(2)(3)(4) |
2019 | | $ | 10.22 | | | | 0.08 | | | | 1.26 | | | | 1.34 | | | | (0.04 | ) | | | (0.20 | ) | | | 0.00 | | | | (0.24 | ) |
2018 | | $ | 11.53 | | | | 0.05 | | | | (0.85 | ) | | | (0.80 | ) | | | (0.06 | ) | | | (0.45 | ) | | | 0.00 | | | | (0.51 | ) |
2017 | | $ | 9.56 | | | | 0.04 | | | | 2.09 | | | | 2.13 | | | | (0.03 | ) | | | (0.13 | ) | | | 0.00 | | | | (0.16 | ) |
2016 | | $ | 9.34 | | | | 0.09 | | | | 0.24 | | | | 0.33 | | | | (0.11 | ) | | | 0.00 | | | | 0.00 | | | | (0.11 | ) |
2015 | | $ | 10.38 | | | | 0.04 | | | | (0.79 | ) | | | (0.75 | ) | | | (0.04 | ) | | | (0.25 | ) | | | 0.00 | | | | (0.29 | ) |
Global Allocation Fund - Adviser Class (1)(2)(3)(4) |
2019 | | $ | 10.24 | | | | 0.11 | | | | 1.25 | | | | 1.36 | | | | (0.05 | ) | | | (0.20 | ) | | | 0.00 | | | | (0.25 | ) |
2018 | | $ | 11.54 | | | | 0.09 | | | | (0.86 | ) | | | (0.77 | ) | | | (0.08 | ) | | | (0.45 | ) | | | 0.00 | | | | (0.53 | ) |
2017 | | $ | 9.57 | | | | 0.15 | | | | 2.03 | | | | 2.18 | | | | (0.08 | ) | | | (0.13 | ) | | | 0.00 | | | | (0.21 | ) |
2016 (9) | | $ | 9.41 | | | | 0.06 | | | | 0.16 | | | | 0.22 | | | | (0.06 | ) | | | 0.00 | | | | 0.00 | | | | (0.06 | ) |
Global Allocation Fund - Institutional Class (1)(2)(3)(4) |
2019 | | $ | 10.24 | | | | 0.13 | | | | 1.26 | | | | 1.39 | | | | (0.07 | ) | | | (0.20 | ) | | | 0.00 | | | | (0.27 | ) |
2018 | | $ | 11.55 | | | | 0.11 | | | | (0.86 | ) | | | (0.75 | ) | | | (0.11 | ) | | | (0.45 | ) | | | 0.00 | | | | (0.56 | ) |
2017 | | $ | 9.58 | | | | 0.12 | | | | 2.09 | | | | 2.21 | | | | (0.11 | ) | | | (0.13 | ) | | | 0.00 | | | | (0.24 | ) |
2016 (9) | | $ | 9.41 | | | | 0.06 | | | | 0.16 | | | | 0.22 | | | | (0.05 | ) | | | 0.00 | | | | 0.00 | | | | (0.05 | ) |
See footnotes on pages 128 and 129.
The accompanying notes are an integral part of these financial statements
Page 122 | 2019 Annual Report | December 31, 2019 |
| |
| | | | | | | | | Ratios/
Supplemental
Data | |
Net Asset
Value, End
of Period | | | Total Return
(Assumes
Reinvestment of
Distributions) | | | Net Assets,
End of Period
($000) | | | Ratio of Net
Investment
Income (Loss)
to Average
Net Assets | | | Ratio of Expenses
to Average Net
Assets After Fee
Reductions (10) | | | Ratio of Expenses
to Average Net
Assets Before Fee
Reductions (11) | | | Portfolio
Turnover
Rate | |
| | |
| $ | 7.91 | | | | 13.53 | % | | $ | 189,105 | | | | 0.94 | % | | | 1.28 | % | | | 1.28 | % | | | 222 | % |
| $ | 7.16 | | | | (3.66 | %) | | $ | 203,287 | | | | 0.54 | % | | | 1.32 | % | | | 1.32 | % | | | 225 | % |
| $ | 7.54 | | | | 20.29 | % | | $ | 250,322 | | | | 0.49 | % | | | 1.33 | % | | | 1.33 | % | | | 276 | % |
| $ | 6.79 | | | | 5.72 | % | | $ | 390,817 | | | | 0.73 | % | | | 1.36 | % | | | 1.35 | % | | | 414 | % |
| $ | 6.47 | | | | (5.50 | %) | | $ | 390,945 | | | | 0.33 | % | | | 1.35 | % | | | 1.37 | % | | | 277 | % |
| |
| $ | 7.97 | | | | 13.81 | % | | $ | 60,024 | | | | 1.14 | % | | | 1.09 | % | | | 1.09 | % | | | 222 | % |
| $ | 7.20 | | | | (3.39 | %) | | $ | 61,159 | | | | 0.79 | % | | | 1.10 | % | | | 1.17 | % | | | 225 | % |
| $ | 7.57 | | | | 20.50 | % | | $ | 41,440 | | | | 0.71 | % | | | 1.11 | % | | | 1.20 | % | | | 276 | % |
| $ | 6.80 | | | | 4.68 | % | | $ | 154 | | | | 1.32 | % | | | 0.99 | % | | | 0.99 | % | | | 414 | % |
| |
| $ | 7.99 | | | | 14.01 | % | | $ | 432,299 | | | | 1.35 | % | | | 0.87 | % | | | 0.98 | % | | | 222 | % |
| $ | 7.21 | | | | (3.17 | %) | | $ | 346,563 | | | | 1.00 | % | | | 0.90 | % | | | 0.98 | % | | | 225 | % |
| $ | 7.57 | | | | 20.60 | % | | $ | 186,200 | | | | 0.88 | % | | | 0.91 | % | | | 1.00 | % | | | 276 | % |
| $ | 6.80 | | | | 4.72 | % | | $ | 845 | | | | 1.33 | % | | | 0.98 | % | | | 0.98 | % | | | 414 | % |
| |
| $ | 12.19 | | | | 13.03 | % | | $ | 51,060 | | | | 0.37 | % | | | 1.77 | % | | | 1.77 | % | | | 74 | % |
| $ | 10.89 | | | | (3.97 | %) | | $ | 51,083 | | | | 0.26 | % | | | 1.89 | % | | | 1.89 | % | | | 97 | % |
| $ | 11.48 | | | | 19.28 | % | | $ | 59,441 | | | | (0.08 | %) | | | 2.16 | % | | | 2.16 | % | | | 120 | % |
| $ | 10.28 | | | | 6.97 | % | | $ | 124,009 | | | | 0.16 | % | | | 1.99 | % | | | 1.99 | % | | | 235 | % |
| $ | 9.73 | | | | (1.21 | %) | | $ | 125,597 | | | | (0.36 | %) | | | 2.12 | % | | | 2.19 | % | | | 161 | % |
| |
| $ | 12.27 | | | | 13.17 | % | | $ | 15,564 | | | | 0.63 | % | | | 1.51 | % | | | 1.51 | % | | | 74 | % |
| $ | 10.95 | | | | (3.67 | %) | | $ | 14,486 | | | | 0.49 | % | | | 1.70 | % | | | 1.70 | % | | | 97 | % |
| $ | 11.53 | | | | 19.65 | % | | $ | 12,921 | | | | 0.21 | % | | | 1.89 | % | | | 2.01 | % | | | 120 | % |
| $ | 10.29 | | | | 4.49 | % | | $ | 48 | | | | 1.07 | % | | | 1.88 | % | | | 1.88 | % | | | 235 | % |
| |
| $ | 12.31 | | | | 13.44 | % | | $ | 146,443 | | | | 0.77 | % | | | 1.38 | % | | | 1.40 | % | | | 74 | % |
| $ | 10.96 | | | | (3.51 | %) | | $ | 117,166 | | | | 0.71 | % | | | 1.50 | % | | | 1.50 | % | | | 97 | % |
| $ | 11.54 | | | | 19.75 | % | | $ | 82,513 | | | | 0.45 | % | | | 1.70 | % | | | 1.82 | % | | | 120 | % |
| $ | 10.29 | | | | 4.52 | % | | $ | 461 | | | | 1.07 | % | | | 1.87 | % | | | 1.87 | % | | | 235 | % |
| |
| $ | 11.32 | | | | 13.17 | % | | $ | 11,154 | | | | 0.76 | % | | | 1.68 | % | | | 1.68 | % | | | 185 | % |
| $ | 10.22 | | | | (6.94 | %) | | $ | 13,810 | | | | 0.47 | % | | | 1.63 | % | | | 1.63 | % | | | 163 | % |
| $ | 11.53 | | | | 22.33 | % | | $ | 35,512 | | | | 0.35 | % | | | 1.63 | % | | | 1.63 | % | | | 179 | % |
| $ | 9.56 | | | | 3.54 | % | | $ | 75,657 | | | | 1.00 | % | | | 1.41 | % | | | 1.54 | % | | | 169 | % |
| $ | 9.34 | | | | (7.21 | %) | | $ | 106,422 | | | | 0.42 | % | | | 1.42 | % | | | 1.50 | % | | | 170 | % |
| |
| $ | 11.35 | | | | 13.34 | % | | $ | 1,772 | | | | 1.01 | % | | | 1.45 | % | | | 1.45 | % | | | 185 | % |
| $ | 10.24 | | | | (6.73 | %) | | $ | 1,624 | | | | 0.75 | % | | | 1.44 | % | | | 1.44 | % | | | 163 | % |
| $ | 11.54 | | | | 22.84 | % | | $ | 1,057 | | | | 1.38 | % | | | 1.33 | % | | | 1.44 | % | | | 179 | % |
| $ | 9.57 | | | | 2.34 | % | | $ | 30 | | | | 3.79 | % | | | 1.17 | % | | | 1.17 | % | | | 169 | % |
| |
| $ | 11.36 | | | | 13.66 | % | | $ | 38,497 | | | | 1.19 | % | | | 1.25 | % | | | 1.25 | % | | | 185 | % |
| $ | 10.24 | | | | (6.57 | %) | | $ | 42,976 | | | | 0.94 | % | | | 1.20 | % | | | 1.20 | % | | | 163 | % |
| $ | 11.55 | | | | 23.07 | % | | $ | 37,369 | | | | 1.13 | % | | | 1.10 | % | | | 1.21 | % | | | 179 | % |
| $ | 9.58 | | | | 2.34 | % | | $ | 330 | | | | 3.76 | % | | | 1.18 | % | | | 1.18 | % | | | 169 | % |
See footnotes on pages 128 and 129.
The accompanying notes are an integral part of these financial statements
2019 Annual Report | December 31, 2019 | Page 123 |
Financial Highlights
For the Periods Ended December 31, |
| | | | | | | Income
from
Investment Operations | | | Less
Distributions | |
| | Net Asset
Value,
Beginning
of Period | | | Net
Investment
Income
(Loss) (5) | | | Net gains (losses)
on securities and
futures (both realized
and unrealized) | | | Total from
Investment
Operations | | | From Net
Investment
Income | | | From Net
Capital
Gains | | | From
Return of
Capital | | | Total
Distributions | |
Balanced Fund - Retail Class (1)(2)(3)(4) |
2019 | | $ | 11.08 | | | | 0.16 | | | | 1.20 | | | | 1.36 | | | | (0.09 | ) | | | (0.09 | ) | | | 0.00 | | | | (0.18 | ) |
2018 | | $ | 11.61 | | | | 0.12 | | | | (0.49 | ) | | | (0.37 | ) | | | (0.10 | ) | | | (0.06 | ) | | | 0.00 | | | | (0.16 | ) |
2017 | | $ | 10.74 | | | | 0.09 | | | | 1.49 | | | | 1.58 | | | | (0.11 | ) | | | (0.60 | ) | | | 0.00 | | | | (0.71 | ) |
2016 | | $ | 10.36 | | | | 0.11 | | | | 0.39 | | | | 0.50 | | | | (0.12 | ) | | | 0.00 | | | | 0.00 | | | | (0.12 | ) |
2015 | | $ | 10.98 | | | | 0.09 | | | | (0.58 | ) | | | (0.49 | ) | | | (0.08 | ) | | | (0.05 | ) | | | 0.00 | | | | (0.13 | ) |
Balanced Fund - Adviser Class (1)(2)(3)(4) |
2019 | | $ | 11.15 | | | | 0.19 | | | | 1.21 | | | | 1.40 | | | | (0.11 | ) | | | (0.09 | ) | | | 0.00 | | | | (0.20 | ) |
2018 | | $ | 11.68 | | | | 0.15 | | | | (0.49 | ) | | | (0.34 | ) | | | (0.13 | ) | | | (0.06 | ) | | | 0.00 | | | | (0.19 | ) |
2017 | | $ | 10.74 | | | | 0.13 | | | | 1.50 | | | | 1.63 | | | | (0.09 | ) | | | (0.60 | ) | | | 0.00 | | | | (0.69 | ) |
2016 (9) | | $ | 10.49 | | | | 0.04 | | | | 0.25 | | | | 0.29 | | | | (0.04 | ) | | | 0.00 | | | | 0.00 | | | | (0.04 | ) |
Balanced Fund - Institutional Class (1)(2)(3)(4) |
2019 | | $ | 11.15 | | | | 0.21 | | | | 1.21 | | | | 1.42 | | | | (0.12 | ) | | | (0.09 | ) | | | 0.00 | | | | (0.21 | ) |
2018 | | $ | 11.68 | | | | 0.18 | | | | (0.51 | ) | | | (0.33 | ) | | | (0.14 | ) | | | (0.06 | ) | | | 0.00 | | | | (0.20 | ) |
2017 | | $ | 10.75 | | | | 0.16 | | | | 1.47 | | | | 1.63 | | | | (0.10 | ) | | | (0.60 | ) | | | 0.00 | | | | (0.70 | ) |
2016 (9) | | $ | 10.49 | | | | 0.04 | | | | 0.26 | | | | 0.30 | | | | (0.04 | ) | | | 0.00 | | | | 0.00 | | | | (0.04 | ) |
Moderate Allocation Fund - Retail Class (1)(2)(3)(4) |
2019 | | $ | 10.84 | | | | 0.20 | | | | 1.00 | | | | 1.20 | | | | (0.19 | ) | | | 0.00 | | | | 0.00 | | | | (0.19 | ) |
2018 | | $ | 11.66 | | | | 0.18 | | | | (0.48 | ) | | | (0.30 | ) | | | (0.16 | ) | | | (0.36 | ) | | | 0.00 | | | | (0.52 | ) |
2017 | | $ | 10.46 | | | | 0.07 | | | | 1.60 | | | | 1.67 | | | | (0.05 | ) | | | (0.42 | ) | | | 0.00 | | | | (0.47 | ) |
2016 | | $ | 9.50 | | | | 0.16 | | | | 0.97 | | | | 1.13 | | | | (0.17 | ) | | | 0.00 | | | | 0.00 | | | | (0.17 | ) |
2015 (7) | | $ | 10.00 | | | | 0.18 | | | | (0.59 | ) | | | (0.41 | ) | | | (0.09 | ) | | | 0.00 | | | | 0.00 | | | | (0.09 | ) |
Moderate Allocation Fund - Adviser Class (1)(2)(3)(4) |
2019 | | $ | 10.85 | | | | 0.24 | | | | 1.00 | | | | 1.24 | | | | (0.23 | ) | | | 0.00 | | | | 0.00 | | | | (0.23 | ) |
2018 | | $ | 11.66 | | | | 0.21 | | | | (0.49 | ) | | | (0.28 | ) | | | (0.17 | ) | | | (0.36 | ) | | | 0.00 | | | | (0.53 | ) |
2017 | | $ | 10.46 | | | | 0.12 | | | | 1.59 | | | | 1.71 | | | | (0.09 | ) | | | (0.42 | ) | | | 0.00 | | | | (0.51 | ) |
2016 (9) | | $ | 9.87 | | | | 0.03 | | | | 0.59 | | | | 0.62 | | | | (0.03 | ) | | | 0.00 | | | | 0.00 | | | | (0.03 | ) |
Moderate Allocation Fund - Institutional Class (1)(2)(3)(4) |
2019 | | $ | 10.88 | | | | 0.25 | | | | 1.00 | | | | 1.25 | | | | (0.24 | ) | | | 0.00 | | | | 0.00 | | | | (0.24 | ) |
2018 | | $ | 11.68 | | | | 0.23 | | | | (0.48 | ) | | | (0.25 | ) | | | (0.19 | ) | | | (0.36 | ) | | | 0.00 | | | | (0.55 | ) |
2017 | | $ | 10.47 | | | | 0.14 | | | | 1.59 | | | | 1.73 | | | | (0.10 | ) | | | (0.42 | ) | | | 0.00 | | | | (0.52 | ) |
2016 (9) | | $ | 9.87 | | | | 0.03 | | | | 0.59 | | | | 0.62 | | | | (0.02 | ) | | | 0.00 | | | | 0.00 | | | | (0.02 | ) |
Conservative Allocation Fund - Retail Class (1)(2)(3)(4) |
2019 | | $ | 21.18 | | | | 0.51 | | | | 1.65 | | | | 2.16 | | | | (0.49 | ) | | | 0.00 | | | | 0.00 | | | | (0.49 | ) |
2018 | | $ | 22.54 | | | | 0.46 | | | | (1.04 | ) | | | (0.58 | ) | | | (0.40 | ) | | | (0.38 | ) | | | 0.00 | | | | (0.78 | ) |
2017 | | $ | 21.32 | | | | 0.27 | | | | 1.36 | | | | 1.63 | | | | (0.41 | ) | | | 0.00 | | | | 0.00 | | | | (0.41 | ) |
2016 | | $ | 18.17 | | | | 0.11 | | | | 3.48 | | | | 3.59 | | | | 0.00 | | | | (0.20 | ) | | | (0.24 | ) | | | (0.44 | ) |
2015 | | $ | 30.45 | | | | 0.17 | | | | (5.40 | ) | | | (5.23 | ) | | | (0.25 | ) | | | (6.80 | ) | | | 0.00 | | | | (7.05 | ) |
Conservative Allocation Fund - Adviser Class (1)(2)(3)(4) |
2019 | | $ | 21.44 | | | | 0.57 | | | | 1.67 | | | | 2.24 | | | | (0.55 | ) | | | 0.00 | | | | 0.00 | | | | (0.55 | ) |
2018 | | $ | 22.82 | | | | 0.52 | | | | (1.08 | ) | | | (0.56 | ) | | | (0.44 | ) | | | (0.38 | ) | | | 0.00 | | | | (0.82 | ) |
2017 | | $ | 21.34 | | | | 0.36 | | | | 1.35 | | | | 1.71 | | | | (0.23 | ) | | | 0.00 | | | | 0.00 | | | | (0.23 | ) |
2016 (9) | | $ | 21.02 | | | | 0.00 | * | | | 0.55 | | | | 0.55 | | | | 0.00 | | | | (0.20 | ) | | | (0.03 | ) | | | (0.23 | ) |
Conservative Allocation Fund - Institutional Class (1)(2)(3)(4) |
2019 | | $ | 21.49 | | | | 0.59 | | | | 1.68 | | | | 2.27 | | | | (0.58 | ) | | | 0.00 | | | | 0.00 | | | | (0.58 | ) |
2018 | | $ | 22.85 | | | | 0.56 | | | | (1.07 | ) | | | (0.51 | ) | | | (0.47 | ) | | | (0.38 | ) | | | 0.00 | | | | (0.85 | ) |
2017 | | $ | 21.34 | | | | 0.59 | | | | 1.14 | | | | 1.73 | | | | (0.22 | ) | | | 0.00 | | | | 0.00 | | | | (0.22 | ) |
2016 (9) | | $ | 21.02 | | | | 0.00 | * | | | 0.55 | | | | 0.55 | | | | 0.00 | | | | (0.20 | ) | | | (0.03 | ) | | | (0.23 | ) |
See footnotes on pages 128 and 129.
The accompanying notes are an integral part of these financial statements
Page 124 | 2019 Annual Report | December 31, 2019 |
| |
| | | | | | | | | Ratios/
Supplemental
Data | |
Net Asset
Value, End
of Period | | | Total Return
(Assumes
Reinvestment of
Distributions) | | | Net Assets,
End of Period
($000) | | | Ratio of Net
Investment
Income (Loss)
to Average
Net Assets | | | Ratio of Expenses
to Average Net
Assets After Fee
Reductions (10) | | | Ratio of Expenses
to Average Net
Assets Before Fee
Reductions (11) | | | Portfolio
Turnover
Rate | |
| | | |
| $ | 12.26 | | | | 12.29 | % | | $ | 92,815 | | | | 1.34 | % | | | 1.41 | % | | | 1.41 | % | | | 180 | % |
| $ | 11.08 | | | | (3.25 | %) | | $ | 90,133 | | | | 1.06 | % | | | 1.43 | % | | | 1.43 | % | | | 218 | % |
| $ | 11.61 | | | | 14.74 | % | | $ | 97,116 | | | | 0.81 | % | | | 1.49 | % | | | 1.49 | % | | | 226 | % |
| $ | 10.74 | | | | 4.84 | % | | $ | 229,738 | | | | 1.02 | % | | | 1.46 | % | | | 1.46 | % | | | 322 | % |
| $ | 10.36 | | | | (4.47 | %) | | $ | 288,803 | | | | 0.81 | % | | | 1.47 | % | | | 1.48 | % | | | 246 | % |
| |
| $ | 12.35 | | | | 12.59 | % | | $ | 20,182 | | | | 1.61 | % | | | 1.14 | % | | | 1.14 | % | | | 180 | % |
| $ | 11.15 | | | | (2.99 | %) | | $ | 19,301 | | | | 1.31 | % | | | 1.21 | % | | | 1.23 | % | | | 218 | % |
| $ | 11.68 | | | | 15.21 | % | | $ | 12,137 | | | | 1.13 | % | | | 1.21 | % | | | 1.30 | % | | | 226 | % |
| $ | 10.74 | | | | 2.77 | % | | $ | 89 | | | | 2.42 | % | | | 1.06 | % | | | 1.06 | % | | | 322 | % |
| |
| $ | 12.36 | | | | 12.77 | % | | $ | 295,200 | | | | 1.79 | % | | | 0.96 | % | | | 1.04 | % | | | 180 | % |
| $ | 11.15 | | | | (2.85 | %) | | $ | 239,375 | | | | 1.51 | % | | | 1.02 | % | | | 1.05 | % | | | 218 | % |
| $ | 11.68 | | | | 15.25 | % | | $ | 169,586 | | | | 1.35 | % | | | 1.02 | % | | | 1.11 | % | | | 226 | % |
| $ | 10.75 | | | | 2.83 | % | | $ | 219 | | | | 2.42 | % | | | 1.07 | % | | | 1.07 | % | | | 322 | % |
| |
| $ | 11.85 | | | | 11.13 | % | | $ | 35,460 | | | | 1.73 | % | | | 1.38 | % | | | 1.38 | % | | | 155 | % |
| $ | 10.84 | | | | (2.60 | %) | | $ | 32,502 | | | | 1.51 | % | | | 1.39 | % | | | 1.44 | % | | | 213 | % |
| $ | 11.66 | | | | 15.99 | % | | $ | 24,635 | | | | 0.61 | % | | | 1.67 | % | | | 1.73 | % | | | 349 | % |
| $ | 10.46 | | | | 12.06 | % | | $ | 56,744 | | | | 1.62 | % | | | 1.61 | % | | | 1.80 | % | | | 250 | % |
| $ | 9.50 | | | | (4.15 | %) | | $ | 42,099 | | | | 1.80 | % | | | 1.66 | % | | | 1.85 | % | | | 70 | % |
| |
| $ | 11.86 | | | | 11.45 | % | | $ | 10,080 | | | | 2.00 | % | | | 1.11 | % | | | 1.11 | % | | | 155 | % |
| $ | 10.85 | | | | (2.47 | %) | | $ | 9,480 | | | | 1.78 | % | | | 1.19 | % | | | 1.24 | % | | | 213 | % |
| $ | 11.66 | | | | 16.40 | % | | $ | 3,538 | | | | 1.03 | % | | | 1.35 | % | | | 1.50 | % | | | 349 | % |
| $ | 10.46 | | | | 6.32 | % | | $ | 22 | | | | 1.92 | % | | | 1.21 | % | | | 1.21 | % | | | 250 | % |
| |
| $ | 11.89 | | | | 11.52 | % | | $ | 132,500 | | | | 2.10 | % | | | 1.01 | % | | | 1.01 | % | | | 155 | % |
| $ | 10.88 | | | | (2.20 | %) | | $ | 119,881 | | | | 1.97 | % | | | 1.01 | % | | | 1.05 | % | | | 213 | % |
| $ | 11.68 | | | | 16.55 | % | | $ | 37,945 | | | | 1.29 | % | | | 1.13 | % | | | 1.28 | % | | | 349 | % |
| $ | 10.47 | | | | 6.31 | % | | $ | 229 | | | | 1.92 | % | | | 1.24 | % | | | 1.24 | % | | | 250 | % |
| |
| $ | 22.85 | | | | 10.25 | % | | $ | 31,688 | | | | 2.19 | % | | | 1.28 | % | | | 1.28 | % | | | 136 | % |
| $ | 21.18 | | | | (2.62 | %) | | $ | 30,759 | | | | 2.09 | % | | | 1.27 | % | | | 1.38 | % | | | 185 | % |
| $ | 22.54 | | | | 7.64 | % | | $ | 12,545 | | | | 1.24 | % | | | 1.70 | % | | | 2.57 | % | | | 135 | % |
| $ | 21.32 | | | | 19.87 | % | | $ | 20,450 | | | | 0.55 | % | | | 2.17 | % | | | 2.55 | % | | | 44 | % |
| $ | 18.17 | | | | (16.92 | %) | | $ | 20,034 | | | | 0.56 | % | | | 1.98 | % | | | 2.01 | % | | | 54 | % |
| |
| $ | 23.13 | | | | 10.51 | % | | $ | 6,787 | | | | 2.44 | % | | | 1.04 | % | | | 1.04 | % | | | 136 | % |
| $ | 21.44 | | | | (2.50 | %) | | $ | 6,110 | | | | 2.29 | % | | | 1.12 | % | | | 1.22 | % | | | 185 | % |
| $ | 22.82 | | | | 8.01 | % | | $ | 682 | | | | 1.63 | % | | | 1.07 | % | | | 1.97 | % | | | 135 | % |
| $ | 21.34 | | | | 2.64 | % | | $ | 7 | | | | 0.11 | % | | | 1.93 | % | | | 2.18 | % | | | 44 | % |
| |
| $ | 23.18 | | | | 10.61 | % | | $ | 99,456 | | | | 2.54 | % | | | 0.94 | % | | | 0.94 | % | | | 136 | % |
| $ | 21.49 | | | | (2.28 | %) | | $ | 92,412 | | | | 2.50 | % | | | 0.92 | % | | | 1.04 | % | | | 185 | % |
| $ | 22.85 | | | | 8.10 | % | | $ | 11,739 | | | | 2.65 | % | | | 0.49 | % | | | 1.39 | % | | | 135 | % |
| $ | 21.34 | | | | 2.62 | % | | $ | 305 | | | | 0.08 | % | | | 1.96 | % | | | 2.21 | % | | | 44 | % |
See footnotes on pages 128 and 129.
The accompanying notes are an integral part of these financial statements
2019 Annual Report | December 31, 2019 | Page 125 |
Financial Highlights
For the Periods Ended December 31, |
| | | | | | | Income
from
Investment Operations | | | Less
Distributions | |
| | Net Asset
Value,
Beginning
of Period | | | Net
Investment
Income
(Loss) (5) | | | Net gains (losses)
on securities and
futures (both realized
and unrealized) | | | Total from
Investment
Operations | | | From Net
Investment
Income | | | From Net
Capital
Gains | | | From
Return of
Capital | | | Total
Distributions | |
Dynamic Allocation Fund - Retail Class (1)(2)(3)(4) |
2019 | | $ | 9.79 | | | | 0.11 | | | | 2.23 | | | | 2.34 | | | | (0.08 | ) | | | (0.18 | ) | | | 0.00 | | | | (0.26 | ) |
2018 | | $ | 10.85 | | | | 0.07 | | | | (1.00 | ) | | | (0.93 | ) | | | (0.06 | ) | | | (0.07 | ) | | | 0.00 | | | | (0.13 | ) |
2017 | | $ | 9.72 | | | | 0.06 | | | | 1.99 | | | | 2.05 | | | | (0.07 | ) | | | (0.85 | ) | | | 0.00 | | | | (0.92 | ) |
2016 | | $ | 9.36 | | | | 0.10 | | | | 0.40 | | | | 0.50 | | | | (0.09 | ) | | | (0.05 | ) | | | 0.00 | | | | (0.14 | ) |
2015 | | $ | 10.02 | | | | 0.05 | | | | (0.40 | ) | | | (0.35 | ) | | | (0.05 | ) | | | (0.26 | ) | | | 0.00 | | | | (0.31 | ) |
Dynamic Allocation Fund - Adviser Class (1)(2)(3)(4) |
2019 | | $ | 9.82 | | | | 0.13 | | | | 2.24 | | | | 2.37 | | | | (0.10 | ) | | | (0.18 | ) | | | 0.00 | | | | (0.28 | ) |
2018 | | $ | 10.88 | | | | 0.09 | | | | (1.00 | ) | | | (0.91 | ) | | | (0.08 | ) | | | (0.07 | ) | | | 0.00 | | | | (0.15 | ) |
2017 | | $ | 9.73 | | | | 0.10 | | | | 1.97 | | | | 2.07 | | | | (0.07 | ) | | | (0.85 | ) | | | 0.00 | | | | (0.92 | ) |
2016 (9) | | $ | 9.34 | | | | 0.02 | | | | 0.44 | | | | 0.46 | | | | (0.02 | ) | | | (0.05 | ) | | | 0.00 | | | | (0.07 | ) |
Dynamic Allocation Fund - Institutional Class (1)(2)(3)(4) |
2019 | | $ | 9.82 | | | | 0.15 | | | | 2.23 | | | | 2.38 | | | | (0.12 | ) | | | (0.18 | ) | | | 0.00 | | | | (0.30 | ) |
2018 | | $ | 10.86 | | | | 0.12 | | | | (1.00 | ) | | | (0.88 | ) | | | (0.09 | ) | | | (0.07 | ) | | | 0.00 | | | | (0.16 | ) |
2017 | | $ | 9.72 | | | | 0.12 | | | | 1.97 | | | | 2.09 | | | | (0.10 | ) | | | (0.85 | ) | | | 0.00 | | | | (0.95 | ) |
2016 (9) | | $ | 9.34 | | | | 0.02 | | | | 0.43 | | | | 0.45 | | | | (0.02 | ) | | | (0.05 | ) | | | 0.00 | | | | (0.07 | ) |
Quantex Fund - Retail Class (1)(2)(3)(4) |
2019 | | $ | 32.22 | | | | 0.19 | | | | 5.75 | | | | 5.94 | | | | (0.25 | ) | | | 0.00 | | | | 0.00 | | | | (0.25 | ) |
2018 | | $ | 36.76 | | | | (0.01 | ) | | | (4.53 | ) | | | (4.54 | ) | | | 0.00 | | | | 0.00 | | | | 0.00 | | | | 0.00 | |
2017 | | $ | 33.36 | | | | 0.09 | | | | 4.38 | | | | 4.47 | | | | (0.06 | ) | | | (1.01 | ) | | | 0.00 | | | | (1.07 | ) |
2016 | | $ | 27.84 | | | | 0.14 | | | | 6.02 | | | | 6.16 | | | | (0.16 | ) | | | (0.48 | ) | | | 0.00 | | | | (0.64 | ) |
2015 | | $ | 35.20 | | | | 0.17 | | | | (2.78 | ) | | | (2.61 | ) | | | (0.17 | ) | | | (4.58 | ) | | | 0.00 | | | | (4.75 | ) |
Quantex Fund - Adviser Class (1)(2)(3)(4) |
2019 | | $ | 32.28 | | | | 0.24 | | | | 5.76 | | | | 6.00 | | | | (0.27 | ) | | | 0.00 | | | | 0.00 | | | | (0.27 | ) |
2018 | | $ | 36.78 | | | | 0.10 | | | | (4.60 | ) | | | (4.50 | ) | | | 0.00 | | | | 0.00 | | | | 0.00 | | | | 0.00 | |
2017 | | $ | 33.37 | | | | 0.21 | | | | 4.35 | | | | 4.56 | | | | (0.14 | ) | | | (1.01 | ) | | | 0.00 | | | | (1.15 | ) |
2016 (9) | | $ | 30.67 | | | | 0.04 | | | | 3.18 | | | | 3.22 | | | | (0.04 | ) | | | (0.48 | ) | | | 0.00 | | | | (0.52 | ) |
Quantex - Institutional Class (1)(2)(3)(4) |
2019 | | $ | 32.29 | | | | 0.29 | | | | 5.77 | | | | 6.06 | | | | (0.34 | ) | | | 0.00 | | | | 0.00 | | | | (0.34 | ) |
2018 | | $ | 36.77 | | | | 0.20 | | | | (4.62 | ) | | | (4.42 | ) | | | (0.06 | ) | | | 0.00 | | | | 0.00 | | | | (0.06 | ) |
2017 | | $ | 33.37 | | | | 0.26 | | | | 4.35 | | | | 4.61 | | | | (0.20 | ) | | | (1.01 | ) | | | 0.00 | | | | (1.21 | ) |
2016 (9) | | $ | 30.67 | | | | 0.04 | | | | 3.18 | | | | 3.22 | | | | (0.04 | ) | | | (0.48 | ) | | | 0.00 | | | | (0.52 | ) |
See footnotes on pages 128 and 129.
The accompanying notes are an integral part of these financial statements
Page 126 | 2019 Annual Report | December 31, 2019 |
| |
| | | | | | | | | Ratios/
Supplemental
Data | |
Net Asset
Value, End
of Period | | | Total Return
(Assumes
Reinvestment of
Distributions) | | | Net Assets,
End of Period
($000) | | | Ratio of Net
Investment
Income (Loss)
to Average
Net Assets | | | Ratio of Expenses
to Average Net
Assets After Fee
Reductions (10) | | | Ratio of Expenses
to Average Net
Assets Before Fee
Reductions (11) | | | Portfolio
Turnover
Rate | |
| | | |
| $ | 11.87 | | | | 24.00 | % | | $ | 40,977 | | | | 0.97 | % | | | 1.41 | % | | | 1.51 | % | | | 265 | % |
| $ | 9.79 | | | | (8.66 | %) | | $ | 40,732 | | | | 0.62 | % | | | 1.45 | % | | | 1.55 | % | | | 273 | % |
| $ | 10.85 | | | | 21.20 | % | | $ | 50,570 | | | | 0.59 | % | | | 1.51 | % | | | 1.58 | % | | | 252 | % |
| $ | 9.72 | | | | 5.37 | % | | $ | 118,293 | | | | 1.04 | % | | | 1.42 | % | | | 1.56 | % | | | 369 | % |
| $ | 9.36 | | | | (3.46 | %) | | $ | 116,559 | | | | 0.47 | % | | | 1.48 | % | | | 1.54 | % | | | 245 | % |
| |
| $ | 11.91 | | | | 24.29 | % | | $ | 13,137 | | | | 1.20 | % | | | 1.18 | % | | | 1.28 | % | | | 265 | % |
| $ | 9.82 | | | | (8.49 | %) | | $ | 11,198 | | | | 0.84 | % | | | 1.23 | % | | | 1.33 | % | | | 273 | % |
| $ | 10.88 | | | | 21.42 | % | | $ | 10,140 | | | | 0.87 | % | | | 1.27 | % | | | 1.34 | % | | | 252 | % |
| $ | 9.73 | | | | 4.89 | % | | $ | 48 | | | | 1.33 | % | | | 1.12 | % | | | 1.12 | % | | | 369 | % |
| |
| $ | 11.90 | | | | 24.40 | % | | $ | 146,119 | | | | 1.38 | % | | | 1.00 | % | | | 1.10 | % | | | 265 | % |
| $ | 9.82 | | | | (8.18 | %) | | $ | 121,965 | | | | 1.08 | % | | | 1.01 | % | | | 1.11 | % | | | 273 | % |
| $ | 10.86 | | | | 21.61 | % | | $ | 70,187 | | | | 1.10 | % | | | 1.05 | % | | | 1.12 | % | | | 252 | % |
| $ | 9.72 | | | | 4.80 | % | | $ | 592 | | | | 1.33 | % | | | 1.11 | % | | | 1.11 | % | | | 369 | % |
| |
| $ | 37.91 | | | | 18.48 | % | | $ | 24,979 | | | | 0.52 | % | | | 1.53 | % | | | 1.53 | % | | | 82 | % |
| $ | 32.22 | | | | (12.35 | %) | | $ | 28,319 | | | | (0.03 | %) | | | 1.57 | % | | | 1.62 | % | | | 116 | % |
| $ | 36.76 | | | | 13.42 | % | | $ | 60,161 | | | | 0.27 | % | | | 1.52 | % | | | 1.66 | % | | | 72 | % |
| $ | 33.36 | | | | 22.14 | % | | $ | 85,235 | | | | 0.47 | % | | | 1.52 | % | | | 1.77 | % | | | 91 | % |
| $ | 27.84 | | | | (7.68 | %) | | $ | 58,883 | | | | 0.46 | % | | | 1.26 | % | | | 1.75 | % | | | 87 | % |
| |
| $ | 38.01 | | | | 18.63 | % | | $ | 1,113 | | | | 0.67 | % | | | 1.41 | % | | | 1.41 | % | | | 82 | % |
| $ | 32.28 | | | | (12.22 | %) | | $ | 923 | | | | 0.28 | % | | | 1.42 | % | | | 1.47 | % | | | 116 | % |
| $ | 36.78 | | | | 13.68 | % | | $ | 2,114 | | | | 0.59 | % | | | 1.39 | % | | | 1.56 | % | | | 72 | % |
| $ | 33.37 | | | | 10.48 | % | | $ | 31 | | | | 0.75 | % | | | 1.15 | % | | | 1.40 | % | | | 91 | % |
| |
| $ | 38.01 | | | | 18.81 | % | | $ | 36,646 | | | | 0.82 | % | | | 1.25 | % | | | 1.25 | % | | | 82 | % |
| $ | 32.29 | | | | (12.05 | %) | | $ | 35,414 | | | | 0.54 | % | | | 1.21 | % | | | 1.26 | % | | | 116 | % |
| $ | 36.77 | | | | 13.84 | % | | $ | 32,489 | | | | 0.75 | % | | | 1.18 | % | | | 1.35 | % | | | 72 | % |
| $ | 33.37 | | | | 10.48 | % | | $ | 951 | | | | 0.75 | % | | | 1.15 | % | | | 1.40 | % | | | 91 | % |
See footnotes on pages 128 and 129.
The accompanying notes are an integral part of these financial statements
2019 Annual Report | December 31, 2019 | Page 127 |
Financial Highlights
For the Periods Ended December 31, |
| | | | | | | Income
from
Investment Operations | | | Less
Distributions | |
| | Net Asset
Value,
Beginning
of Period | | | Net
Investment
Income
(Loss) (5) | | | Net gains (losses)
on securities and
futures (both realized
and unrealized) | | | Total from
Investment
Operations | | | From Net
Investment
Income | | | From Net
Capital
Gains | | | From
Return of
Capital | | | Total
Distributions | |
Total Return Bond Fund - Retail Class (1)(2)(3)(4) |
2019 | | $ | 9.03 | | | | 0.23 | | | | 0.42 | | | | 0.65 | | | | (0.22 | ) | | | 0.00 | | | | 0.00 | | | | (0.22 | ) |
2018 | | $ | 9.37 | | | | 0.17 | | | | (0.33 | ) | | | (0.16 | ) | | | (0.18 | ) | | | 0.00 | | | | 0.00 | | | | (0.18 | ) |
2017 | | $ | 9.28 | | | | 0.24 | | | | 0.10 | | | | 0.34 | | | | (0.25 | ) | | | 0.00 | | | | 0.00 | | | | (0.25 | ) |
2016 | | $ | 9.14 | | | | 0.27 | | | | 0.14 | | | | 0.41 | | | | (0.27 | ) | | | 0.00 | | | | 0.00 | | | | (0.27 | ) |
2015 | | $ | 9.63 | | | | 0.27 | | | | (0.51 | ) | | | (0.24 | ) | | | (0.25 | ) | | | 0.00 | | | | 0.00 | | | | (0.25 | ) |
Total Return Bond Fund - Adviser Class (1)(2)(3)(4) |
2019 | | $ | 9.04 | | | | 0.26 | | | | 0.42 | | | | 0.68 | | | | (0.25 | ) | | | 0.00 | | | | 0.00 | | | | (0.25 | ) |
2018 | | $ | 9.38 | | | | 0.21 | | | | (0.35 | ) | | | (0.14 | ) | | | (0.20 | ) | | | 0.00 | | | | 0.00 | | | | (0.20 | ) |
2017 | | $ | 9.28 | | | | 0.28 | | | | 0.10 | | | | 0.38 | | | | (0.28 | ) | | | 0.00 | | | | 0.00 | | | | (0.28 | ) |
2016 (9) | | $ | 9.46 | | | | 0.09 | | | | (0.19 | ) | | | (0.10 | ) | | | (0.08 | ) | | | 0.00 | | | | 0.00 | | | | (0.08 | ) |
Total Return Bond Fund - Institutional Class (1)(2)(3)(4) |
2019 | | $ | 9.04 | | | | 0.27 | | | | 0.42 | | | | 0.69 | | | | (0.26 | ) | | | 0.00 | | | | 0.00 | | | | (0.26 | ) |
2018 | | $ | 9.38 | | | | 0.23 | | | | (0.35 | ) | | | (0.12 | ) | | | (0.22 | ) | | | 0.00 | | | | 0.00 | | | | (0.22 | ) |
2017 | | $ | 9.28 | | | | 0.31 | | | | 0.08 | | | | 0.39 | | | | (0.29 | ) | | | 0.00 | | | | 0.00 | | | | (0.29 | ) |
2016 (9) | | $ | 9.46 | | | | 0.08 | | | | (0.18 | ) | | | (0.10 | ) | | | (0.08 | ) | | | 0.00 | | | | 0.00 | | | | (0.08 | ) |
Prime Money Market Fund (1)(2)(3)(4) |
2019 | | $ | 1.00 | | | | 0.020 | | | | N/A | | | | 0.020 | | | | (0.020 | ) | | | 0.000 | | | | 0.000 | | | | (0.020 | ) |
2018 | | $ | 1.00 | | | | 0.016 | | | | N/A | | | | 0.016 | | | | (0.016 | ) | | | 0.000 | | | | 0.000 | | | | (0.016 | ) |
2017 | | $ | 1.00 | | | | 0.007 | | | | N/A | | | | 0.007 | | | | (0.007 | ) | | | 0.000 | | | | 0.000 | | | | (0.007 | ) |
2016 | | $ | 1.00 | | | | 0.003 | | | | N/A | | | | 0.003 | | | | (0.003 | ) | | | 0.000 | | | | 0.000 | | | | (0.003 | ) |
2015 | | $ | 1.00 | | | | 0.001 | | | | N/A | | | | 0.001 | | | | (0.001 | ) | | | 0.000 | | | | 0.000 | | | | (0.001 | ) |
Institutional Prime Money Market Fund (1)(2)(3)(4) |
2019 | | $ | 0.9999 | | | | 0.0231 | | | | 0.0000 | | | | 0.0231 | | | | (0.0230 | ) | | | 0.0000 | | | | 0.0000 | | | | (0.0230 | ) |
2018 | | $ | 0.9999 | | | | 0.0190 | | | | 0.0000 | | | | 0.0190 | | | | (0.0190 | ) | | | 0.0000 | | | | 0.0000 | | | | (0.0190 | ) |
2017 | | $ | 1.0001 | | | | 0.0101 | | | | (0.0003 | ) | | | 0.0098 | | | | (0.0100 | ) | | | 0.0000 | | | | 0.0000 | | | | (0.0100 | ) |
2016 (8) | | $ | 1.0000 | | | | 0.0010 | | | | 0.0001 | | | | 0.0011 | | | | (0.0010 | ) | | | 0.0000 | | | | 0.0000 | | | | (0.0010 | ) |
|
1 | Ratio of net investment income (loss) to average net assets, ratio of expenses to average net assets after fee reductions, and ratio of expenses to average net assets before fee reductions do not include impact of expenses of the underlying security holdings as represented in the schedule of investments. |
2 | Recognition of net investment income by the Fund is affected by the timing of the declaration of dividends by the underlying investment companies in which the Fund invests. |
3 | Total return and portfolio turnover rate are not annualized for periods of less than one full year. |
4 | Ratio of net investment income (loss) to average net assets, ratio of expenses to average net assets after fee reductions, and ratio of expenses to average net assets before fee reductions are annualized for periods of less than one full year. |
5 | Except for the Money Market Funds, net investment income per share is based on average shares outstanding during the period. |
The accompanying notes are an integral part of these financial statements
Page 128 | 2019 Annual Report | December 31, 2019 |
| |
| | | | | | | | | Ratios/
Supplemental
Data | |
Net Asset
Value, End
of Period | | | Total Return
(Assumes
Reinvestment of
Distributions) | | | Net Assets,
End of Period
($000) | | | Ratio of Net
Investment
Income (Loss)
to Average
Net Assets | | | Ratio of Expenses
to Average Net
Assets After Fee
Reductions (10) | | | Ratio of Expenses
to Average Net
Assets Before Fee
Reductions (11) | | | Portfolio
Turnover
Rate | |
| | | |
| $ | 9.46 | | | | 7.24 | % | | $ | 11,137 | | | | 2.27 | % | | | 1.14 | % | | | 1.25 | % | | | 95 | % |
| $ | 9.03 | | | | (1.67 | %) | | $ | 14,932 | | | | 1.88 | % | | | 1.15 | % | | | 1.26 | % | | | 102 | % |
| $ | 9.37 | | | | 3.72 | % | | $ | 67,986 | | | | 2.59 | % | | | 1.02 | % | | | 1.03 | % | | | 133 | % |
| $ | 9.28 | | | | 4.49 | % | | $ | 214,755 | | | | 2.87 | % | | | 0.98 | % | | | 1.00 | % | | | 217 | % |
| $ | 9.14 | | | | (2.51 | %) | | $ | 214,618 | | | | 2.71 | % | | | 1.01 | % | | | 1.03 | % | | | 295 | % |
| |
| $ | 9.47 | | | | 7.54 | % | | $ | 4,205 | | | | 2.64 | % | | | 0.88 | % | | | 0.99 | % | | | 95 | % |
| $ | 9.04 | | | | (1.45 | %) | | $ | 3,570 | | | | 2.33 | % | | | 0.95 | % | | | 1.06 | % | | | 102 | % |
| $ | 9.38 | | | | 4.07 | % | | $ | 9,896 | | | | 2.95 | % | | | 0.83 | % | | | 0.84 | % | | | 133 | % |
| $ | 9.28 | | | | (1.05 | %) | | $ | 84 | | | | 5.49 | % | | | 0.53 | % | | | 0.53 | % | | | 217 | % |
| |
| $ | 9.47 | | | | 7.67 | % | | $ | 46,490 | | | | 2.72 | % | | | 0.76 | % | | | 0.87 | % | | | 95 | % |
| $ | 9.04 | | | | (1.22 | %) | | $ | 48,437 | | | | 2.50 | % | | | 0.76 | % | | | 0.87 | % | | | 102 | % |
| $ | 9.38 | | | | 4.20 | % | | $ | 110,674 | | | | 3.27 | % | | | 0.64 | % | | | 0.65 | % | | | 133 | % |
| $ | 9.28 | | | | (1.08 | %) | | $ | 70 | | | | 5.35 | % | | | 0.53 | % | | | 0.53 | % | | | 217 | % |
| |
| $ | 1.00 | | | | 2.06 | % | | $ | 34,823 | | | | 2.05 | % | | | 0.36 | % | | | 0.95 | % | | | N/A | |
| $ | 1.00 | | | | 1.59 | % | | $ | 40,881 | | | | 1.59 | % | | | 0.44 | % | | | 0.94 | % | | | N/A | |
| $ | 1.00 | | | | 0.68 | % | | $ | 35,211 | | | | 0.67 | % | | | 0.47 | % | | | 1.00 | % | | | N/A | |
| $ | 1.00 | | | | 0.29 | % | | $ | 36,666 | | | | 0.28 | % | | | 0.32 | % | | | 0.69 | % | | | N/A | |
| $ | 1.00 | | | | 0.07 | % | | $ | 56,530 | | | | 0.07 | % | | | 0.18 | % | | | 0.58 | % | | | N/A | |
| |
| $ | 1.0000 | | | | 2.31 | % | | $ | 370,120 | | | | 2.30 | % | | | 0.13 | % | | | 0.50 | % | | | N/A | |
| $ | 0.9999 | | | | 1.90 | % | | $ | 471,603 | | | | 1.90 | % | | | 0.16 | % | | | 0.51 | % | | | N/A | |
| $ | 0.9999 | | | | 0.96 | % | | $ | 296,547 | | | | 1.01 | % | | | 0.17 | % | | | 0.56 | % | | | N/A | |
| $ | 1.0001 | | | | 0.11 | % | | $ | 197,480 | | | | 0.43 | % | | | 0.24 | % | | | 0.62 | % | | | N/A | |
| |
6 | Commenced operations on January 1, 2015. |
7 | Commenced operations on June 30, 2015. |
8 | Commenced operations on October 7, 2016. |
9 | Commenced operations on October 31, 2016. |
10 | Ratio of expenses to average net assets after fee reductions reflects contractual or voluntary waivers and reimbursements of expenses by the investment adviser and transfer agent. |
11 | Ratio of expenses to average net assets before fee reductions reflects the total expenses before reductions reported in the Statement of Operations. |
* | Actual amounts were less than one-half of a cent per share |
The accompanying notes are an integral part of these financial statements
2019 Annual Report | December 31, 2019 | Page 129 |
Notes to Financial Statements
December 31, 2019
1. Organization
Meeder Funds (the Trust) is organized as a Massachusetts business trust and is registered under the Investment Company Act of 1940, as amended (the 1940 Act), as a diversified, open-end management investment company. The Trust offers eleven separate series, all of which are included in this report: Muirfield Fund (Muirfield), Spectrum Fund (Spectrum), Global Allocation Fund (Global), Balanced Fund (Balanced), Moderate Allocation Fund (Moderate), Conservative Allocation Fund (Conservative), Dynamic Allocation Fund (Dynamic), Quantex Fund (Quantex), Total Return Bond Fund (Bond), Prime Money Market Fund (Prime Money Market), and Institutional Prime Money Market Fund (Institutional Prime Money Market)(the Funds).
Each Fund, except Prime Money Market and Institutional Prime Money Market, offers three classes of shares: Retail Class, Adviser Class, and Institutional Class. Prime Money Market and Institutional Prime Money Market offer only one class of shares. The share classes differ with respect to distribution fees, service fees, and other expenses allocated to each class. Eligibility to purchase Adviser and Institutional Class shares is generally limited to customers of financial intermediaries who enter into special arrangements with the Funds or who meet certain initial investment minimums.
Prime Money Market operates as a retail money market fund. The Fund maintains a stable net asset value of $1.00 and is only available for purchase in accounts beneficially owned by natural persons. Institutional Prime Money Market operates as an institutional money market fund open to all forms of investors. Its net asset value fluctuates based upon changes in the value of its investments and the value of its shares is calculated daily to four decimal places. Prime Money Market and Institutional Prime Money Market have adopted policies and procedures to impose liquidity fees on redemptions or temporary redemption gates in the event that the Funds’ weekly liquid assets fall below designated thresholds and the Board of Trustees determines that such liquidity fees or redemption gates are in the best interests of the Fund.
For more information regarding the Funds’ objectives, strategies, and differences in share classes, please refer to the Funds’ prospectus.
2. Significant Accounting Policies
The Funds’ financial statements are prepared in conformity with accounting principles generally accepted in the United States of America (GAAP), which require management to make certain estimates and assumptions that affect the reported amounts of assets and liabilities and disclosure of contingent assets and liabilities at the date of the financial statements. The Trust is an investment company and applies the accounting and reporting guidance of the Financial Accounting Standards Board (FASB) Accounting Standards Codification Topic 946 Financial Services Companies. The following summarizes the significant accounting policies of the Trust and the Funds:
Securities valuation. All investments in securities are recorded at their estimated fair value, as described in Note #3.
Repurchase agreements. Each Fund may engage in repurchase agreement transactions whereby the Fund takes possession of an underlying debt instrument subject to an obligation of the seller to repurchase the instrument from the Fund and an obligation of the Fund to resell the instrument at an agreed upon price and term. At all times, the Fund maintains the fair value of collateral, including accrued interest, of at least 100% of the amount of the repurchase agreement, plus accrued interest. If the seller defaults or the fair value of the collateral declines, realization of the collateral by the Fund may be delayed or limited.
Short sales. Spectrum may enter into short sales as part of its overall portfolio management strategy or to offset a potential decline in value of a security. The Fund may engage in short sales with respect to various types of securities, including ETFs. A short sale involves the sale of a security that is borrowed from a broker or other institution to complete the sale. The Fund may engage in short sales with respect to securities it owns, as well as securities that it does not own. Short sales expose the Fund to the risk that it will be required to acquire, convert or exchange securities to replace the borrowed securities (also known as “covering” the short position) at a time when the securities sold short have appreciated in value, thus resulting in a loss to the Fund. The Fund’s investment performance may also suffer if the Fund is required to close out a short position earlier than it had intended. The Fund must segregate assets determined to be liquid in accordance with procedures established by the Board, or otherwise cover its position in a permissible manner. The Fund will be required to pledge its liquid assets to the broker in order to secure its performance on short sales. As a result, the assets pledged may not be available to meet the Fund’s needs for immediate cash or other liquidity. In addition, the Fund may be subject to expenses related to short sales that are not typically associated with investing in securities directly, such as costs of borrowing and margin account maintenance costs associated with the Fund’s open short positions. These types of short sales expenses are sometimes referred to as the “negative cost of carry,” and will tend to cause the Fund to lose money on a short sale even in instances where the price of the underlying security sold short does not change over the duration of the short sale. Dividend expenses on securities sold short and borrowing costs will be borne by the Fund and are reflected in the Statements of Operations.
Futures & options. Each Fund, except the Money Market Funds, may engage in transactions in financial futures contracts and options contracts in order to manage the risk of unanticipated changes in market values of securities held in the Fund, or which it intends to purchase. The futures and options contracts are adjusted by the daily exchange rate of the underlying currency, or index, and any gains or losses are recorded for financial statement purposes as unrealized gains or losses in the statement of assets and liabilities and the statement of operations until the contract settlement date, at which time realized gains and losses are included in the Statements of Operations.
Page 130 | 2019 Annual Report | December 31, 2019 |
To the extent that a Fund enters into futures contracts on an index or group of securities, the Fund exposes itself to an indeterminate liability and will be required to pay or receive a sum of money measured by the change in the fair value of the index. Upon entering into a futures contract, the Fund is required to deposit an initial margin, which is either cash or securities (disclosed as pledged as collateral on the Schedules of Investments) in an amount equal to a certain percentage of the contract value. Subsequently, margin movements, which are equal to changes in the daily price or last sale price on the exchanges where futures contracts trade, are recorded as unrealized gains or losses until the contract is closed. When the contract is closed, the Fund records a realized gain or loss equal to the difference between the proceeds from (or cost of) the closing transaction and the Fund’s basis in the contract. Should market conditions move unexpectedly, the Fund may not achieve the anticipated benefits of the futures contract and may realize a loss. The use of futures transactions involves the risk of imperfect correlation in movements in the price of futures contracts, interest rates, and the underlying hedged assets. With futures, there is minimal counterparty credit risk to the Fund since futures are exchange traded and the exchange’s clearinghouse, as counterparty to all exchange traded futures, guarantees the futures against default. Except for the Money Market Funds, it is normal practice for each Fund to invest in futures contracts on a daily basis. The Funds, except for Bond and the Money Market Funds, typically utilize equity index futures contracts to equitize cash positions or adjust targeted stock market exposure. Except for the Money Market Funds, the fixed income portion of any Fund can utilize Treasury futures contracts in order to adjust duration.
Call and put option contracts involve the payment of a premium for the right to purchase or sell an individual security or index aggregate at a specified price until the expiration of the contract. Such transactions expose the Fund to the loss of the premium paid if the Fund does not sell or exercise the contract prior to the expiration date. In the case of a call option, sufficient cash or money market instruments will be segregated to complete the purchase. Options are fair valued on the basis of the daily settlement price or last sale on the exchanges where they trade and the changes in fair value are recorded as unrealized appreciation or depreciation until closed, exercised or expired. For the year ended December 31, 2019, there were no call or put options transacted for any of the Funds.
The Funds may write covered call or put options for which premiums received are recorded as liabilities and are subsequently adjusted to the current value of the options written. When written options are closed or exercised, premiums received are offset against the proceeds paid, and the Fund records realized gains or losses for the difference. When written options expire, the liability is eliminated, and the Fund records realized gains for the entire amount of premiums received. Although permitted, it is currently not normal practice for the Funds to write call and put options and none were written during the year ended December 31, 2019.
The fair value of derivative instruments, not accounted for as hedging instruments, as reported within the Statements of Assets and Liabilities as of December 31, 2019 was as follows:
Amount of Deposits at Broker and Unrealized Appreciation (Depreciation) on Derivatives |
| | Type of
Derivative/
Risk | Statements of Assets & Liabilities Location | | Fair Value of
Deposits at
Broker for Futures
Contracts | | | Value of
Unrealized
Appreciation
(Depreciation) | |
Muirfield | Equity contracts | Assets, Deposits at broker for futures contracts; Net Assets, Distributable Earnings (Accumulated Deficit) | | $ | 7,466,738 | | | $ | 1,082,094 | |
Spectrum | Equity contracts | Assets, Deposits at broker for futures contracts; Net Assets, Distributable Earnings (Accumulated Deficit) | | | 5,090,541 | | | | 712,692 | |
Global | Equity contracts | Assets, Deposits at broker for futures contracts; Net Assets, Distributable Earnings (Accumulated Deficit) | | | 1,217,881 | | | | 88,540 | |
Balanced | Equity contracts | Assets, Deposits at broker for futures contracts; Net Assets, Distributable Earnings (Accumulated Deficit) | | | 3,776,833 | | | | 583,009 | |
Moderate | Equity contracts | Assets, Deposits at broker for futures contracts; Net Assets, Distributable Earnings (Accumulated Deficit) | | | 1,296,607 | | | | 206,165 | |
Conservative | Equity contracts | Assets, Deposits at broker for futures contracts; Net Assets, Distributable Earnings (Accumulated Deficit) | | | 601,218 | | | | 78,812 | |
Dynamic | Equity contracts | Assets, Deposits at broker for futures contracts; Net Assets, Distributable Earnings (Accumulated Deficit) | | | 2,553,987 | | | | 232,576 | |
Quantex | Equity contracts | Assets, Deposits at broker for futures contracts; Net Assets, Distributable Earnings (Accumulated Deficit) | | | 166,155 | | | | 15,697 | |
2019 Annual Report | December 31, 2019 | Page 131 |
The effect of derivative instruments on the Statements of Operations for the year ended December 31, 2019 and related activity was as follows:
Amount of Realized Gain (Loss) on Derivatives Recognized in Income |
| | Type of
Derivative/
Risk | | Contracts as of
December 31,
2018 | | | Long and
Short
Contracts
Opened
During the
Period | | | Long and
Short
Contracts
Closed/
Expired
During the
Period | | | Contracts as of
December 31,
2019 | | Statement of Operations
Location | | For the
Year Ended
December 31,
2019 | |
Muirfield | Equity contracts | | | 2,592 | | | | 12,208 | | | | 13,566 | | | | 1,234 | | Net realized gains (losses) from futures contracts | | $ | (23,737,399 | ) |
Spectrum | Equity contracts | | | 648 | | | | 4,745 | | | | 4,641 | | | | 752 | | Net realized gains (losses) from futures contracts | | | (2,807,340 | ) |
Global | Equity contracts | | | 127 | | | | 1,809 | | | | 1,711 | | | | 225 | | Net realized gains (losses) from futures contracts | | | 31,530 | |
Balanced | Equity contracts | | | 1,040 | | | | 5,428 | | | | 5,876 | | | | 592 | | Net realized gains (losses) from futures contracts | | | (7,664,888 | ) |
Moderate | Equity contracts | | | 307 | | | | 1,802 | | | | 1,913 | | | | 196 | | Net realized gains (losses) from futures contracts | | | (1,665,614 | ) |
Conservative | Equity contracts | | | 148 | | | | 860 | | | | 927 | | | | 81 | | Net realized gains (losses) from futures contracts | | | (906,104 | ) |
Dynamic | Equity contracts | | | 522 | | | | 2,657 | | | | 2,717 | | | | 462 | | Net realized gains (losses) from futures contracts | | | 7,019,330 | |
Quantex | Equity contracts | | | 71 | | | | 108 | | | | 168 | | | | 11 | | Net realized gains (losses) from futures contracts | | | (30,996 | ) |
Change in Unrealized Gain or (Loss) on Derivatives Recognized in Income |
| | Type of
Derivative/ Risk | Statement of Operations Location | | For the
Year Ended
December 31, 2019 | |
Muirfield | Equity contracts | Net change in unrealized appreciation (depreciation) of futures contracts | | $ | (2,782,741 | ) |
Spectrum | Equity contracts | Net change in unrealized appreciation (depreciation) of futures contracts | | | (167,593 | ) |
Global | Equity contracts | Net change in unrealized appreciation (depreciation) of futures contracts | | | (116,736 | ) |
Balanced | Equity contracts | Net change in unrealized appreciation (depreciation) of futures contracts | | | (937,849 | ) |
Moderate | Equity contracts | Net change in unrealized appreciation (depreciation) of futures contracts | | | (226,337 | ) |
Conservative | Equity contracts | Net change in unrealized appreciation (depreciation) of futures contracts | | | (140,936 | ) |
Dynamic | Equity contracts | Net change in unrealized appreciation (depreciation) of futures contracts | | | 958,062 | |
Quantex | Equity contracts | Net change in unrealized appreciation (depreciation) of futures contracts | | | 527,540 | |
Federal income taxes.It is each Fund’s policy to continue to comply with the requirements of Subchapter M of the Internal Revenue Code applicable to regulated investment companies and to distribute substantially all of its taxable income and net capital gains to its shareholders. Therefore, no federal income tax provision is required. The Funds recognize the tax benefits or expenses of uncertain tax positions only where the position is “more likely than not” to be sustained assuming examination by tax authorities. Management has reviewed tax positions taken on Federal income tax returns for all open tax years (tax years ended December 31, 2016 through December 31, 2019) and has concluded that no provision for unrecognized tax benefits or expenses is required in these financial statements. Each Fund identifies its major tax jurisdictions as U.S. Federal and certain State tax authorities; however the Funds are not aware of any tax positions for which it is reasonably possible that the total amounts of unrecognized tax benefits will change materially in the next twelve months. The Funds recognize interest and penalties, if any, related to unrecognized tax benefits as income tax expense in the Statements of Operations as incurred. During the year ended December 31, 2019, the Funds did not incur any material interest or penalties.
Distributions to shareholders. Distributions to shareholders are recorded on the ex-dividend date. Muirfield, Spectrum, Global, Balanced, Moderate, Conservative, Dynamic, and Quantex declare and pay dividends from net investment income, if any, on a quarterly basis. Bond declares and pays dividends from net investment income on a monthly basis. The Money Market Funds declare dividends from net investment income on a daily basis and pay such dividends on a monthly basis. Each Fund distributes net capital gains, if any, on an annual basis.
Page 132 | 2019 Annual Report | December 31, 2019 |
Distributions from net investment income and from net capital gains are determined in accordance with income tax regulations, which may differ from GAAP. Permanent differences relate to redemptions treated as distributions for tax purposes (i.e. equalization). Accordingly, timing differences relating to shareholder distributions are reflected in the components of net assets and permanent book and tax differences have been reclassified within the components of net assets based on their ultimate characterization for federal income tax purposes. For the year ended December 31, 2019, the Funds made the following reclassifications to increase/(decrease) the components of net assets:
| | | Capital | | | Distributable Earnings
(Accumulated Deficit) | |
Muirfield | | $ | — | | | $ | — | |
Spectrum | | | — | | | | — | |
Global | | | 9,189 | | | | (9,189 | ) |
Balanced | | | — | | | | — | |
Moderate | | | — | | | | — | |
Conservative | | | — | | | | — | |
Dynamic | | | 979,534 | | | | (979,534 | ) |
Quantex | | | 693,876 | | | | (693,876 | ) |
Bond | | | — | | | | — | |
Investment income & expenses. For all Funds, except the Money Market Funds, income and expenses (other than expenses attributable to a specific class) are allocated to each class of shares based on its relative net assets. Expenses incurred by the Trust that do not specifically relate to an individual Fund of the Trust are allocated to the Funds based on each Fund’s relative net assets or other appropriate basis.
Capital Share Transactions.All Funds, except the Money Market Funds, are authorized to issue an unlimited number of shares in the Retail Class, the Adviser Class, and the Institutional Class. Transactions in the capital shares of the Funds for the year ended December 31, 2019 and the year ended December 31, 2018 were as follows:
| | | Issued | | | Reinvested | |
Share Class | | Amount | | | Shares | | | Amount | | | Shares | |
Year Ended December 31, 2019 | | | | | | | | | | | | | | | | |
Muirfield - Retail | | $ | 33,050,249 | | | | 4,442,733 | | | $ | 4,977,939 | | | | 642,781 | |
Muirfield - Adviser | | | 19,959,892 | | | | 2,672,639 | | | | 1,634,444 | | | | 209,658 | |
Muirfield - Institutional | | | 144,314,850 | | | | 19,370,319 | | | | 11,750,119 | | | | 1,506,144 | |
Spectrum - Retail | | | 7,469,577 | | | | 660,057 | | | | 487,763 | | | | 40,590 | |
Spectrum - Adviser | | | 3,597,497 | | | | 315,554 | | | | 151,231 | | | | 12,488 | |
Spectrum - Institutional | | | 40,919,924 | | | | 3,604,015 | | | | 1,420,906 | | | | 117,029 | |
Global - Retail | | | 1,332,331 | | | | 125,389 | | | | 242,185 | | | | 21,882 | |
Global - Adviser | | | 480,969 | | | | 44,348 | | | | 38,283 | | | | 3,449 | |
Global - Institutional | | | 5,246,784 | | | | 492,924 | | | | 939,839 | | | | 84,963 | |
Balanced - Retail | | | 14,149,512 | | | | 1,224,953 | | | | 1,366,611 | | | | 115,154 | |
Balanced - Adviser | | | 4,473,744 | | | | 385,634 | | | | 326,176 | | | | 27,354 | |
Balanced - Institutional | | | 85,619,332 | | | | 7,396,727 | | | | 4,851,860 | | | | 407,021 | |
Moderate - Retail | | | 6,078,494 | | | | 535,812 | | | | 569,700 | | | | 49,224 | |
Moderate - Adviser | | | 2,059,946 | | | | 182,460 | | | | 194,767 | | | | 16,811 | |
Moderate - Institutional | | | 31,695,228 | | | | 2,809,680 | | | | 2,658,150 | | | | 229,490 | |
Conservative - Retail | | | 4,494,757 | | | | 203,394 | | | | 685,421 | | | | 30,465 | |
Conservative - Adviser | | | 1,779,179 | | | | 79,442 | | | | 160,298 | | | | 7,037 | |
Conservative - Institutional | | | 26,212,905 | | | | 1,173,623 | | | | 2,512,162 | | | | 110,136 | |
Dynamic - Retail | | | 3,843,119 | | | | 351,639 | | | | 912,848 | | | | 78,711 | |
Dynamic - Adviser | | | 3,221,800 | | | | 289,708 | | | | 313,636 | | | | 26,922 | |
Dynamic - Institutional | | | 27,427,324 | | | | 2,506,643 | | | | 3,742,727 | | | | 322,467 | |
Quantex - Retail | | | 4,513,460 | | | | 124,634 | | | | 179,660 | | | | 4,955 | |
Quantex - Adviser | | | 358,998 | | | | 9,903 | | | | 7,848 | | | | 216 | |
Quantex - Institutional | | | 7,243,250 | | | | 204,214 | | | | 222,429 | | | | 6,126 | |
Bond - Retail | | | 1,961,968 | | | | 209,895 | | | | 315,086 | | | | 33,629 | |
Bond - Adviser | | | 1,552,225 | | | | 166,213 | | | | 105,786 | | | | 11,256 | |
Bond - Institutional | | | 13,146,159 | | | | 1,409,770 | | | | 1,316,315 | | | | 140,237 | |
Prime Money Market | | | 21,752,554 | | | | 21,752,554 | | | | 686,595 | | | | 686,595 | |
Institutional Prime Money Market | | | 337,972,181 | | | | 337,937,146 | | | | 1,149,955 | | | | 1,149,805 | |
| | | | | | | | | | | | | | | | | |
2019 Annual Report | December 31, 2019 | Page 133 |
| | | Issued | | | Reinvested | |
Share Class | | Amount | | | Shares | | | Amount | | | Shares | |
Year Ended December 31, 2018 | | | | | | | | | | | | | | | | |
Muirfield - Retail | | $ | 81,607,430 | | | | 10,591,064 | | | $ | 2,838,289 | | | | 386,039 | |
Muirfield - Adviser | | | 45,772,169 | | | | 5,912,961 | | | | 976,171 | | | | 132,373 | |
Muirfield - Institutional | | | 250,401,075 | | | | 32,639,655 | | | | 5,465,965 | | | | 740,262 | |
Spectrum - Retail | | | 15,316,571 | | | | 1,306,662 | | | | 634,335 | | | | 57,336 | |
Spectrum - Adviser | | | 6,709,846 | | | | 572,286 | | | | 205,755 | | | | 18,534 | |
Spectrum - Institutional | | | 71,831,995 | | | | 6,114,885 | | | | 1,820,982 | | | | 163,947 | |
Global - Retail | | | 7,387,903 | | | | 625,162 | | | | 693,907 | | | | 66,424 | |
Global - Adviser | | | 1,666,708 | | | | 141,659 | | | | 80,880 | | | | 7,739 | |
Global - Institutional | | | 30,087,889 | | | | 2,587,226 | | | | 2,227,122 | | | | 212,652 | |
Balanced - Retail | | | 53,335,958 | | | | 4,526,600 | | | | 1,270,759 | | | | 111,704 | |
Balanced - Adviser | | | 15,554,044 | | | | 1,316,644 | | | | 307,224 | | | | 26,889 | |
Balanced - Institutional | | | 176,221,306 | | | | 14,971,740 | | | | 4,087,178 | | | | 357,622 | |
Moderate - Retail | | | 38,800,866 | | | | 3,283,431 | | | | 1,586,555 | | | | 143,168 | |
Moderate - Adviser | | | 11,337,112 | | | | 964,690 | | | | 435,680 | | | | 39,317 | |
Moderate - Institutional | | | 129,444,120 | | | | 11,051,119 | | | | 5,369,404 | | | | 482,988 | |
Conservative - Retail | | | 35,154,545 | | | | 1,550,412 | | | | 1,138,735 | | | | 52,592 | |
Conservative - Adviser | | | 7,718,877 | | | | 337,733 | | | | 226,424 | | | | 10,341 | |
Conservative - Institutional | | | 103,393,699 | | | | 4,529,606 | | | | 3,420,096 | | | | 155,924 | |
Dynamic - Retail | | | 23,582,325 | | | | 2,147,604 | | | | 521,063 | | | | 50,501 | |
Dynamic - Adviser | | | 5,694,870 | | | | 520,691 | | | | 154,361 | | | | 14,924 | |
Dynamic - Institutional | | | 83,356,132 | | | | 7,557,922 | | | | 1,740,535 | | | | 168,797 | |
Quantex - Retail | | | 13,035,850 | | | | 350,178 | | | | 1 | | | | — | |
Quantex - Adviser | | | 1,055,587 | | | | 28,146 | | | | 104 | | | | 3 | |
Quantex - Institutional | | | 33,694,504 | | | | 915,517 | | | | 42,119 | | | | 1,109 | |
Bond - Retail | | | 3,804,576 | | | | 412,911 | | | | 368,119 | | | | 40,486 | |
Bond - Adviser | | | 2,503,637 | | | | 274,289 | | | | 69,633 | | �� | | 7,671 | |
Bond - Institutional | | | 24,403,992 | | | | 2,666,294 | | | | 1,127,534 | | | | 124,120 | |
Prime Money Market | | | 36,584,300 | | | | 36,584,300 | | | | 520,240 | | | | 520,240 | |
Institutional Prime Money Market | | | 655,634,899 | | | | 655,689,013 | | | | 770,570 | | | | 770,617 | |
| | | Redeemed | | | Net Increase (Decrease) | |
Share Class | | Amount | | | Shares | | | Amount | | | Shares | |
Year Ended December 31, 2019 | | | | | | | | | | | | | | | | |
Muirfield - Retail | | $ | (70,868,511 | ) | | | (9,580,884 | ) | | $ | (32,840,323 | ) | | | (4,495,370 | ) |
Muirfield - Adviser | | | (28,851,525 | ) | | | (3,845,181 | ) | | | (7,257,189 | ) | | | (962,884 | ) |
Muirfield - Institutional | | | (112,338,045 | ) | | | (14,851,705 | ) | | | 43,726,924 | | | | 6,024,758 | |
Spectrum - Retail | | | (13,656,923 | ) | | | (1,200,248 | ) | | | (5,699,583 | ) | | | (499,601 | ) |
Spectrum - Adviser | | | (4,388,936 | ) | | | (383,545 | ) | | | (640,208 | ) | | | (55,503 | ) |
Spectrum - Institutional | | | (28,908,458 | ) | | | (2,513,014 | ) | | | 13,432,372 | | | | 1,208,030 | |
Global - Retail | | | (5,487,892 | ) | | | (512,715 | ) | | | (3,913,376 | ) | | | (365,444 | ) |
Global - Adviser | | | (540,172 | ) | | | (50,287 | ) | | | (20,920 | ) | | | (2,490 | ) |
Global - Institutional | | | (14,778,101 | ) | | | (1,383,831 | ) | | | (8,591,478 | ) | | | (805,944 | ) |
Balanced - Retail | | | (22,120,626 | ) | | | (1,902,554 | ) | | | (6,604,503 | ) | | | (562,447 | ) |
Balanced - Adviser | | | (5,953,857 | ) | | | (509,453 | ) | | | (1,153,937 | ) | | | (96,465 | ) |
Balanced - Institutional | | | (63,079,661 | ) | | | (5,387,061 | ) | | | 27,391,531 | | | | 2,416,687 | |
Moderate - Retail | | | (6,716,666 | ) | | | (591,069 | ) | | | (68,472 | ) | | | (6,033 | ) |
Moderate - Adviser | | | (2,538,479 | ) | | | (222,937 | ) | | | (283,766 | ) | | | (23,666 | ) |
Moderate - Institutional | | | (33,250,746 | ) | | | (2,916,278 | ) | | | 1,102,632 | | | | 122,892 | |
Conservative - Retail | | | (6,631,173 | ) | | | (298,972 | ) | | | (1,450,995 | ) | | | (65,113 | ) |
Conservative - Adviser | | | (1,757,987 | ) | | | (77,982 | ) | | | 181,490 | | | | 8,497 | |
Conservative - Institutional | | | (29,180,940 | ) | | | (1,292,856 | ) | | | (455,873 | ) | | | (9,097 | ) |
Dynamic - Retail | | | (12,530,345 | ) | | | (1,137,172 | ) | | | (7,774,378 | ) | | | (706,822 | ) |
Dynamic - Adviser | | | (3,913,271 | ) | | | (353,426 | ) | | | (377,835 | ) | | | (36,796 | ) |
Page 134 | 2019 Annual Report | December 31, 2019 |
| | | Redeemed | | | Net Increase (Decrease) | |
Share Class | | Amount | | | Shares | | | Amount | | | Shares | |
Dynamic - Institutional | | $ | (33,031,741 | ) | | | (2,975,757 | ) | | $ | (1,861,690 | ) | | | (146,647 | ) |
Quantex - Retail | | | (12,066,011 | ) | | | (349,669 | ) | | | (7,372,891 | ) | | | (220,080 | ) |
Quantex - Adviser | | | (334,676 | ) | | | (9,427 | ) | | | 32,170 | | | | 692 | |
Quantex - Institutional | | | (12,248,919 | ) | | | (342,999 | ) | | | (4,783,240 | ) | | | (132,659 | ) |
Bond - Retail | | | (6,762,369 | ) | | | (720,141 | ) | | | (4,485,315 | ) | | | (476,617 | ) |
Bond - Adviser | | | (1,201,377 | ) | | | (128,206 | ) | | | 456,634 | | | | 49,263 | |
Bond - Institutional | | | (18,715,434 | ) | | | (1,998,711 | ) | | | (4,252,960 | ) | | | (448,704 | ) |
Prime Money Market | | | (28,496,871 | ) | | | (28,496,871 | ) | | | (6,057,722 | ) | | | (6,057,722 | ) |
Institutional Prime Money Market | | | (440,678,548 | ) | | | (440,622,456 | ) | | | (101,556,412 | ) | | | (101,535,505 | ) |
| | | | | | | | | | | | | | | | | |
Year Ended December 31, 2018 | | | | | | | | | | | | | | | | |
Muirfield - Retail | | $ | (120,344,713 | ) | | | (15,805,053 | ) | | $ | (35,898,994 | ) | | | (4,827,950 | ) |
Muirfield - Adviser | | | (23,177,083 | ) | | | (3,027,534 | ) | | | 23,571,257 | | | | 3,017,800 | |
Muirfield - Institutional | | | (76,462,743 | ) | | | (9,887,880 | ) | | | 179,404,297 | | | | 23,492,037 | |
Spectrum - Retail | | | (21,651,506 | ) | | | (1,854,585 | ) | | | (5,700,600 | ) | | | (490,587 | ) |
Spectrum - Adviser | | | (4,581,453 | ) | | | (388,155 | ) | | | 2,334,148 | | | | 202,665 | |
Spectrum - Institutional | | | (32,556,739 | ) | | | (2,739,415 | ) | | | 41,096,238 | | | | 3,539,417 | |
Global - Retail | | | (27,936,806 | ) | | | (2,419,624 | ) | | | (19,854,996 | ) | | | (1,728,038 | ) |
Global - Adviser | | | (966,321 | ) | | | (82,334 | ) | | | 781,267 | | | | 67,064 | |
Global - Institutional | | | (21,490,748 | ) | | | (1,839,787 | ) | | | 10,824,263 | | | | 960,091 | |
Balanced - Retail | | | (57,110,196 | ) | | | (4,872,793 | ) | | | (2,503,479 | ) | | | (234,489 | ) |
Balanced - Adviser | | | (7,711,363 | ) | | | (651,971 | ) | | | 8,149,905 | | | | 691,562 | |
Balanced - Institutional | | | (98,596,493 | ) | | | (8,389,812 | ) | | | 81,711,991 | | | | 6,939,550 | |
Moderate - Retail | | | (29,729,790 | ) | | | (2,540,828 | ) | | | 10,657,631 | | | | 885,771 | |
Moderate - Adviser | | | (5,106,044 | ) | | | (434,215 | ) | | | 6,666,748 | | | | 569,792 | |
Moderate - Institutional | | | (44,111,927 | ) | | | (3,760,524 | ) | | | 90,701,597 | | | | 7,773,583 | |
Conservative - Retail | | | (15,769,100 | ) | | | (707,441 | ) | | | 20,524,180 | | | | 895,563 | |
Conservative - Adviser | | | (2,106,654 | ) | | | (93,049 | ) | | | 5,838,647 | | | | 255,025 | |
Conservative - Institutional | | | (20,263,277 | ) | | | (898,989 | ) | | | 86,550,518 | | | | 3,786,541 | |
Dynamic - Retail | | | (29,718,729 | ) | | | (2,700,614 | ) | | | (5,615,341 | ) | | | (502,509 | ) |
Dynamic - Adviser | | | (3,637,896 | ) | | | (328,036 | ) | | | 2,211,335 | | | | 207,579 | |
Dynamic - Institutional | | | (19,534,689 | ) | | | (1,766,261 | ) | | | 65,561,978 | | | | 5,960,458 | |
Quantex - Retail | | | (40,590,059 | ) | | | (1,107,858 | ) | | | (27,554,208 | ) | | | (757,680 | ) |
Quantex - Adviser | | | (2,143,773 | ) | | | (57,014 | ) | | | (1,088,082 | ) | | | (28,865 | ) |
Quantex - Institutional | | | (26,406,354 | ) | | | (703,507 | ) | | | 7,330,269 | | | | 213,119 | |
Bond - Retail | | | (56,261,664 | ) | | | (6,056,440 | ) | | | (52,088,969 | ) | | | (5,603,043 | ) |
Bond - Adviser | | | (8,796,720 | ) | | | (942,209 | ) | | | (6,223,450 | ) | | | (660,249 | ) |
Bond - Institutional | | | (85,936,237 | ) | | | (9,230,713 | ) | | | (60,404,711 | ) | | | (6,440,299 | ) |
Prime Money Market | �� | | (31,434,432 | ) | | | (31,434,432 | ) | | | 5,670,108 | | | | 5,670,108 | |
Institutional Prime Money Market | | | (481,353,876 | ) | | | (481,379,810 | ) | | | 175,051,593 | | | | 175,079,820 | |
2019 Annual Report | December 31, 2019 | Page 135 |
Offsetting Assets & Liabilities.The Funds are party to enforceable master netting arrangements between counter parties, such as the securities lending agreement, which provides for the right of offset under certain circumstances, such as the event of default. The securities lending transactions have an overnight and continuous contractual maturity. Risks arise from the possible inability of counterparties to meet the terms of their contracts. The table below reflects the offsetting assets and liabilities relating to securities lending, futures contracts, and repurchase agreements shown on the Statements of Assets and Liabilities at December 31, 2019.
| | | | | | | | | | | | | | | Gross Amounts Not Offset in the
Statements of Assets and Liabilities | | | | | |
Description/ Fund | | Gross Amounts
of Recognized
Assets/
Liabilities | | | Gross Amounts
Offset in the
Statements
of Assets and
Liabilities | | | Net Amounts
Presented in
the Statements
of Assets and
Liabilities | | | Financial
Instruments* | | | Collateral
Pledged
(Received)* | | | Net Amount | |
Assets: | | | | | | | | | | | | | | | | | | | | | | | | |
Securities Loaned | | | | | | | | | | | | | | | | | | | | | | | | |
Muirfield | | $ | 310,803 | | | $ | — | | | $ | 310,803 | | | $ | — | | | $ | (310,803 | ) | | $ | — | |
Spectrum | | | 135,963 | | | | — | | | | 135,963 | | | | — | | | | (135,963 | ) | | | — | |
Balanced | | | 120,786 | | | | — | | | | 120,786 | | | | — | | | | (120,786 | ) | | | — | |
Moderate | | | 33,890 | | | | — | | | | 33,890 | | | | — | | | | (33,890 | ) | | | — | |
Dynamic | | | 63,339 | | | | — | | | | 63,339 | | | | — | | | | (63,339 | ) | | | — | |
Quantex | | | 1,309,924 | | | | — | | | | 1,309,924 | | | | — | | | | (1,309,924 | ) | | | — | |
| | | | | | | | | | | | | | | | | | | | | | | | | |
Futures Contracts | | | | | | | | | | | | | | | | | | | | | | | | |
Muirfield | | $ | 1,083,542 | | | $ | 1,448 | | | $ | 1,082,094 | | | $ | — | | | $ | — | | | $ | 1,082,094 | |
Spectrum | | | 755,881 | | | | 43,189 | | | | 712,692 | | | | — | | | | — | | | | 712,692 | |
Global | | | 88,954 | | | | 414 | | | | 88,540 | | | | — | | | | — | | | | 88,540 | |
Balanced | | | 583,700 | | | | 691 | | | | 583,009 | | | | — | | | | — | | | | 583,009 | |
Moderate | | | 206,165 | | | | — | | | | 206,165 | | | | — | | | | — | | | | 206,165 | |
Conservative | | | 78,812 | | | | — | | | | 78,812 | | | | — | | | | — | | | | 78,812 | |
Dynamic | | | 233,333 | | | | 757 | | | | 232,576 | | | | — | | | | — | | | | 232,576 | |
Quantex | | | 15,850 | | | | 153 | | | | 15,697 | | | | — | | | | — | | | | 15,697 | |
| | | | | | | | | | | | | | | | | | | | | | | | | |
Repurchase Agreements | | | | | | | | | | | | | | | | | | | | | | | | |
Prime Money Market | | $ | 6,500,000 | | | $ | — | | | $ | 6,500,000 | | | $ | (6,500,000 | ) | | $ | — | | | $ | — | |
Institutional Prime Money Market | | | 100,000,000 | | | | — | | | | 100,000,000 | | | | (100,000,000 | ) | | | — | | | | — | |
| | | | | | | | | | | | | | | | | | | | | | | | | |
Liabilities: | | | | | | | | | | | | | | | | | | | | | | | | |
N/A | | | N/A | | | | N/A | | | | N/A | | | | N/A | | | | N/A | | | | N/A | |
* | The amount is limited to the net amounts of financial assets and liabilities and accordingly does not include excess collateral pledged. |
New Accounting Pronouncements. In August 2018, FASB issued Accounting Standards Update No. 2018-13 (“ASU 2018-13”), “Disclosure Framework – Changes to the Disclosure Requirements for Fair Value Measurement,” which amends the fair value measurement disclosure requirements of ASC Topic 820 (“ASC 820”), “Fair Value Measurement.” ASU 2018-13 includes new, eliminated, and modified disclosure requirements for ASC 820. In addition, ASU 2018-13 clarifies that materiality is an appropriate consideration when evaluating disclosure requirements. ASU 2018-13 is effective for fiscal years beginning after December 15, 2019, including interim periods therein. Early adoption is permitted, and the Fund has adopted ASU 2018-13 with these financial statements.
Other. The Funds record security transactions on the trade date. Gains and losses realized from the sale of securities are determined on the specific identification basis. Dividend income and dividend expenses are recognized on the ex-dividend date and interest income (including amortization of premium and accretion of discount) is recognized as earned. Short-term capital gain distributions from underlying funds are classified as dividend income for financial reporting purposes. Long-term capital gains distributions are separately stated. Discounts and premiums are amortized using the effective yield over the lives of the respective securities. Distributions received from partnerships are recorded as return of capital distributions. Withholding taxes on foreign dividends, if applicable, have been provided for in accordance with the Funds’ understanding of the applicable country’s tax rules and rates.
Distributions received from the Funds’ investments in real estate investment trusts (“REITs”) may be characterized as ordinary income, net capital gain, or return of capital. The proper characterization of REIT distributions is generally not known until after the end of each calendar year. As such, the Funds must use estimates in reporting the character of their income and distributions for financial statement purposes. The actual character of distributions to the Funds’ shareholders will be reflected on the Form 1099 received by shareholders after the end of the calendar year. Due to the nature of REIT investments, a portion of the distributions received by the Funds’ shareholders may represent a return of capital.
Page 136 | 2019 Annual Report | December 31, 2019 |
3. Securities Valuations
The Funds utilize various methods to measure the fair value of their investments on a recurring basis. GAAP establishes a hierarchy that prioritizes inputs to valuation methods. The three levels of inputs are as follows:
Level 1 – Unadjusted quoted prices in active markets for identical assets or liabilities that the Funds have the ability to access.
Level 2 – Observable inputs other than quoted prices included in level 1 that are observable for the asset or liability, either directly or indirectly. These inputs may include quoted prices for the identical instrument on an inactive market, prices for similar instruments, interest rates, prepayment speeds, credit risk, yield curves, default rates and similar data.
Level 3 – Significant unobservable inputs for the asset or liability, to the extent relevant observable inputs are not available, representing the Funds’ own assumptions about the assumptions a market participant would use in valuing the asset or liability, and would be based on the best information available.
The availability of observable inputs can vary from security to security and is affected by a wide variety of factors, including, for example, the type of security, whether the security is new and not yet established in the marketplace, the liquidity of markets, and other characteristics particular to the security. To the extent that valuation is based on models or inputs that are less observable or unobservable in the market, the determination of fair value requires more judgment. Accordingly, the degree of judgment exercised in determining fair value is greatest for instruments categorized in level 3.
The inputs used to measure fair value may fall into different levels of the fair value hierarchy. In such cases, for disclosure purposes, the level in the fair value hierarchy within which the fair value measurement falls in its entirety, is determined based on the lowest level input that is significant to the fair value measurement in its entirety.
A description of the valuation techniques applied to the Funds’ major categories of assets and liabilities measured at fair value on a recurring basis follows.
Equity securities (including publicly traded partnerships, real estate investment trusts, American depositary receipts, exchange traded funds, and common stock). Securities traded on a national securities exchange (or reported on the NASDAQ national market) are stated at the last reported sales price on the day of valuation and are categorized in level 1 of the fair value hierarchy.
Investments in registered open-end investment companies, including money market funds, are valued at the daily redemption net asset value as reported by the underlying fund and are categorized in level 1 of the fair value hierarchy.
Short-term notes (including bank obligations, commercial paper, corporate obligations, repurchase agreements, U.S. government agency obligations, and floating rate demand notes).Short-term notes held in the Funds, except Prime Money Market, maturing more than sixty days after the valuation date, are valued at the last sales price as of the close of business on the day of valuation, or, lacking any sales, at the most recent bid price or yield equivalent as obtained from dealers that make markets in such securities. When valued at last sales price, the securities will be categorized as level 1. When using bid prices or yield equivalents, they will be categorized as level 2. When such securities are valued within sixty days or less to maturity, the difference between the valuation existing on the sixty-first day before maturity and maturity value is amortized on a straight-line basis to maturity and will be categorized as level 2.
All securities held in Prime Money Market, other than money market funds, are valued at amortized cost, which approximates fair value, and will be categorized as level 2.
Certificates of deposit.Except for Institutional Money Market, certificates of deposit are valued at acquisition cost, which approximates fair value, and will be categorized as level 2. For Institutional Money Market, certificates of deposit are normally valued using a model that incorporates market observable data such as reported sales of similar securities, broker quotes, yields, bids, offers, and reference data, and will be categorized as level 2.
U.S. government obligations.U.S. government obligations are normally valued using a model that incorporates market observable data such as reported sales of similar securities, broker quotes, yields, bids, offers, and reference data. Certain securities are valued principally using dealer quotations. In either case, these securities will be categorized as level 2.
Restricted securities (equity and debt). Restricted securities for which quotations are not readily available are valued at fair value as determined by the Trustees. Depending on the relative significance of valuation inputs, these instruments may be classified in either level 2 or level 3 of the fair value hierarchy.
Derivative instruments (futures contracts). Listed derivative instruments that are actively traded, including futures contracts, are valued based on quoted prices from the exchange and are categorized in level 1 of the fair value hierarchy.
2019 Annual Report | December 31, 2019 | Page 137 |
For the year ended December 31, 2019, the Funds did not hold any assets at any time in which significant unobservable inputs were used in determining fair value. Therefore, no reconciliation of level 3 securities is provided. The following table summarizes the inputs used to value the Funds’ assets and liabilities measured at fair value as of December 31, 2019.
Muirfield – Assets/(Liabilities) | | Level 1 | | | Level 2 | | | Level 3 | | | Total | |
Common stocks* | | $ | 538,415,526 | | | $ | — | | | $ | — | | | $ | 538,415,526 | |
Money market registered investment companies | | | 131,707,655 | | | | — | | | | — | | | | 131,707,655 | |
Bank obligations | | | — | | | | 747,624 | | | | — | | | | 747,624 | |
Total | | $ | 670,123,181 | | | $ | 747,624 | | | $ | — | | | $ | 670,870,805 | |
Trustee deferred compensation*** | | $ | 236,466 | | | $ | — | | | $ | — | | | $ | 236,466 | |
Futures contracts** | | $ | 1,082,094 | | | $ | — | | | $ | — | | | $ | 1,082,094 | |
Spectrum - Assets/(Liabilities) | | Level 1 | | | Level 2 | | | Level 3 | | | Total | |
Common stocks - Long* | | $ | 209,309,209 | | | $ | — | | | $ | — | | | $ | 209,309,209 | |
Money market registered investment companies | | | 6,125,115 | | | | — | | | | — | | | | 6,125,115 | |
Total - Long investments | | $ | 215,434,324 | | | $ | — | | | $ | — | | | $ | 215,434,324 | |
Common stocks - Short* | | $ | (71,384,614 | ) | | $ | — | | | $ | — | | | $ | (71,384,614 | ) |
Trustee deferred compensation*** | | $ | 29,730 | | | $ | — | | | $ | — | | | $ | 29,730 | |
Futures contracts** | | $ | 712,692 | | | $ | — | | | $ | — | | | $ | 712,692 | |
Global - Assets/(Liabilities) | | Level 1 | | | Level 2 | | | Level 3 | | | Total | |
Common stocks* | | $ | 23,059,359 | | | $ | — | | | $ | — | | | $ | 23,059,359 | |
Registered investment companies | | | 7,755,578 | | | | — | | | | — | | | | 7,755,578 | |
Money market registered investment companies | | | 16,954,500 | | | | — | | | | — | | | | 16,954,500 | |
Bank obligations | | | — | | | | 747,624 | | | | — | | | | 747,624 | |
U.S. government obligations | | | — | | | | 587,469 | | | | — | | | | 587,469 | |
Total | | $ | 47,769,437 | | | $ | 1,335,093 | | | $ | — | | | $ | 49,104,530 | |
Trustee deferred compensation*** | | $ | 99,496 | | | $ | — | | | $ | — | | | $ | 99,496 | |
Futures contracts** | | $ | 88,540 | | | $ | — | | | $ | — | | | $ | 88,540 | |
Balanced - Assets/(Liabilities) | | Level 1 | | | Level 2 | | | Level 3 | | | Total | |
Common stocks* | | $ | 213,887,585 | | | $ | — | | | $ | — | | | $ | 213,887,585 | |
Registered investment companies | | | 105,950,873 | | | | — | | | | — | | | | 105,950,873 | |
Money market registered investment companies | | | 67,515,179 | | | | — | | | | — | | | | 67,515,179 | |
Bank obligations | | | — | | | | 747,624 | | | | — | | | | 747,624 | |
U.S. government obligations | | | — | | | | 14,154,267 | | | | — | | | | 14,154,267 | |
Total | | $ | 387,353,637 | | | $ | 14,901,891 | | | $ | — | | | $ | 402,255,528 | |
Trustee deferred compensation*** | | $ | 153,586 | | | $ | — | | | $ | — | | | $ | 153,586 | |
Futures contracts** | | $ | 583,009 | | | $ | — | | | $ | — | | | $ | 583,009 | |
Moderate - Assets/(Liabilities) | | Level 1 | | | Level 2 | | | Level 3 | | | Total | |
Common stocks* | | $ | 63,929,435 | | | $ | — | | | $ | — | | | $ | 63,929,435 | |
Registered investment companies | | | 77,314,286 | | | | — | | | | — | | | | 77,314,286 | |
Money market registered investment companies | | | 23,066,038 | | | | — | | | | — | | | | 23,066,038 | |
Bank obligations | | | — | | | | 249,416 | | | | — | | | | 249,416 | |
U.S. government obligations | | | — | | | | 10,415,361 | | | | — | | | | 10,415,361 | |
Total | | $ | 164,309,759 | | | $ | 10,664,777 | | | $ | — | | | $ | 174,974,536 | |
Trustee deferred compensation*** | | $ | 19,059 | | | $ | — | | | $ | — | | | $ | 19,059 | |
Futures contracts** | | $ | 206,165 | | | $ | — | | | $ | — | | | $ | 206,165 | |
Page 138 | 2019 Annual Report | December 31, 2019 |
Conservative - Assets/(Liabilities) | | Level 1 | | | Level 2 | | | Level 3 | | | Total | |
Common stocks* | | $ | 31,154,098 | | | $ | — | | | $ | — | | | $ | 31,154,098 | |
Registered investment companies | | | 83,885,670 | | | | — | | | | — | | | | 83,885,670 | |
Money market registered investment companies | | | 9,379,205 | | | | — | | | | — | | | | 9,379,205 | |
U.S. government obligations | | | — | | | | 11,315,808 | | | | — | | | | 11,315,808 | |
Total | | $ | 124,418,973 | | | $ | 11,315,808 | | | $ | — | | | $ | 135,734,781 | |
Trustee deferred compensation*** | | $ | 62,740 | | | $ | — | | | $ | — | | | $ | 62,740 | |
Futures contracts** | | $ | 78,812 | | | $ | — | | | $ | — | | | $ | 78,812 | |
Dynamic - Assets/(Liabilities) | | Level 1 | | | Level 2 | | | Level 3 | | | Total | |
Common stocks* | | $ | 145,471,313 | | | $ | — | | | $ | — | | | $ | 145,471,313 | |
Registered investment companies | | | 10,185,563 | | | | — | | | | — | | | | 10,185,563 | |
Money market registered investment companies | | | 40,172,387 | | | | — | | | | — | | | | 40,172,387 | |
Bank obligations | | | — | | | | 747,624 | | | | — | | | | 747,624 | |
Total | | $ | 195,829,263 | | | $ | 747,624 | | | $ | — | | | $ | 196,576,887 | |
Trustee deferred compensation*** | | $ | 197,387 | | | $ | — | | | $ | — | | | $ | 197,387 | |
Futures contracts** | | $ | 232,576 | | | $ | — | | | $ | — | | | $ | 232,576 | |
Quantex - Assets/(Liabilities) | | Level 1 | | | Level 2 | | | Level 3 | | | Total | |
Common stocks* | | $ | 60,180,304 | | | $ | — | | | $ | — | | | $ | 60,180,304 | |
Money market registered investment companies | | | 2,843,107 | | | | — | | | | — | | | | 2,843,107 | |
Bank obligations | | | — | | | | 727,103 | | | | — | | | | 727,103 | |
Total | | $ | 63,023,411 | | | $ | 727,103 | | | $ | — | | | $ | 63,750,514 | |
Trustee deferred compensation*** | | $ | 58,666 | | | $ | — | | | $ | — | | | $ | 58,666 | |
Futures contracts** | | $ | 15,697 | | | $ | — | | | $ | — | | | $ | 15,697 | |
Bond - Assets/(Liabilities) | | Level 1 | | | Level 2 | | | Level 3 | | | Total | |
Registered investment companies | | $ | 50,833,496 | | | $ | — | | | $ | — | | | $ | 50,833,496 | |
Money market registered investment companies | | | 2,171,908 | | | | — | | | | — | | | | 2,171,908 | |
U.S. government obligations | | | — | | | | 8,809,252 | | | | — | | | | 8,809,252 | |
Total | | $ | 53,005,404 | | | $ | 8,809,252 | | | $ | — | | | $ | 61,814,656 | |
Trustee deferred compensation*** | | $ | 64,932 | | | $ | — | | | $ | — | | | $ | 64,932 | |
Prime Money Market - Assets/(Liabilities) | | Level 1 | | | Level 2 | | | Level 3 | | | Total | |
Bank obligations | | $ | — | | | $ | 498,207 | | | $ | — | | | $ | 498,207 | |
Certificates of deposit | | | — | | | | 5,750,149 | | | | — | | | | 5,750,149 | |
Commercial paper | | | — | | | | 10,986,846 | | | | — | | | | 10,986,846 | |
Corporate obligations | | | — | | | | 5,256,596 | | | | — | | | | 5,256,596 | |
Repurchase agreements | | | — | | | | 6,500,000 | | | | — | | | | 6,500,000 | |
U.S. government and agency obligations | | | — | | | | 2,745,468 | | | | — | | | | 2,745,468 | |
Money market registered investment companies | | | 3,052,658 | | | | — | | | | — | | | | 3,052,658 | |
Total | | $ | 3,052,658 | | | $ | 31,737,266 | | | $ | — | | | $ | 34,789,924 | |
Trustee deferred compensation*** | | $ | 38,629 | | | $ | — | | | $ | — | | | $ | 38,629 | |
2019 Annual Report | December 31, 2019 | Page 139 |
Institutional Prime Money Market - Assets/(Liabilities) | | Level 1 | | | Level 2 | | | Level 3 | | | Total | |
Bank obligations | | $ | — | | | $ | 498,207 | | | $ | — | | | $ | 498,207 | |
Certificates of deposit | | | — | | | | 68,315,169 | | | | — | | | | 68,315,169 | |
Commercial paper | | | — | | | | 67,290,290 | | | | — | | | | 67,290,290 | |
Corporate obligations | | | — | | | | 79,422,027 | | | | — | | | | 79,422,027 | |
Repurchase agreements | | | — | | | | 100,000,000 | | | | — | | | | 100,000,000 | |
U.S. government and agency obligations | | | — | | | | 25,957,843 | | | | — | | | | 25,957,843 | |
Money market registered investment companies | | | 28,473,490 | | | | — | | | | — | | | | 28,473,490 | |
Total | | $ | 28,473,490 | | | $ | 341,483,536 | | | $ | — | | | $ | 369,957,026 | |
Trustee deferred compensation*** | | $ | 3,169 | | | $ | — | | | $ | — | | | $ | 3,169 | |
* | See schedules of investments for industry classifications. |
** | Futures contracts include unrealized gain/loss on contracts open at December 31, 2019. |
*** | A corresponding liability exists that is marked to market and is considered Level 1 in the fair value hierarchy. |
4. Investment Transactions
For the year ended December 31, 2019, the cost of purchases and proceeds from sales or maturities of long-term investments for the Funds, excluding U.S. Government investments and short positions, were as follows:
| | | Purchases | | | Sales | |
Muirfield | | $ | 1,068,963,868 | | | $ | 1,025,171,620 | |
Spectrum | | | 143,263,437 | | | | 138,637,173 | |
Global | | | 58,590,508 | | | | 64,925,248 | |
Balanced | | | 543,870,050 | | | | 527,279,908 | |
Moderate | | | 211,607,265 | | | | 210,719,247 | |
Conservative | | | 153,213,039 | | | | 156,787,792 | |
Dynamic | | | 378,454,395 | | | | 385,542,548 | |
Quantex | | | 50,480,922 | | | | 52,470,230 | |
Bond | | | 50,880,014 | | | | 59,222,782 | |
For the year ended December 31, 2019, the cost of purchases and proceeds from sales or maturities of long-term U.S. Government investments for the Funds are as follows:
| | | Purchases | | | Sales | |
Global | | $ | 992,427 | | | $ | 905,188 | |
Balanced | | | 21,740,123 | | | | 15,984,713 | |
Moderate | | | 15,879,441 | | | | 11,571,745 | |
Conservative | | | 16,949,809 | | | | 12,547,047 | |
Bond | | | 9,920,668 | | | | 9,204,769 | |
Page 140 | 2019 Annual Report | December 31, 2019 |
5. Investment Advisory Fees and Other Transactions with Affiliates and Non-Affiliates
Meeder Asset Management, Inc. (“MAM”), a wholly-owned subsidiary of Meeder Investment Management, Inc. (“Meeder”), provides the Funds with investment management, research, statistical and advisory services pursuant to the terms of an Investment Advisory Agreement. The services of MAM will terminate automatically if assigned and may be terminated without penalty at any time upon 60 days prior written notice by majority vote of the Fund, by the Trustees of the Fund, or by MAM. For such services the Funds pay a fee at the following annual rates:
| | Percentage of Average
Daily Net Assets up to
$50 Million | Percentage of Average
Daily Net Assets
Exceeding $50 Million up
to $100 Million | Percentage of Average
Daily Net Assets
Exceeding $100 Million
up to $200 Million | Percentage of Average
Daily Net Assets
Exceeding $200 Million |
Muirfield | 1.00% | 0.75% | 0.60% | 0.60% |
Spectrum | 0.75% | 0.75% | 0.75% | 0.60% |
Global | 0.75% | 0.75% | 0.75% | 0.60% |
Balanced | 0.75% | 0.75% | 0.75% | 0.60% |
Moderate | 0.60% | 0.60% | 0.60% | 0.60% |
Conservative | 0.50% | 0.50% | 0.50% | 0.50% |
Dynamic | 0.75% | 0.75% | 0.75% | 0.60% |
Quantex | 0.75% | 0.75% | 0.60% | 0.60% |
Bond | 0.40% | 0.40% | 0.20% | 0.20% |
Prime Money Market | 0.40% | 0.40% | 0.25% | 0.25% |
Institutional Prime Money Market | 0.40% | 0.40% | 0.25% | 0.25% |
Fee Waivers & Expense Limitation Agreements. MAM has contractually agreed to reduce its advisory fees or limit total annual ordinary fund operating expenses for certain Funds pursuant to written agreements that may only be amended or terminated with the approval of the board. The sums waived or reimbursed under these agreements are not subject to recoupment.
For the period January 1, 2019 through April 29, 2019, MAM contractually agreed to reimburse management fees or other fund expenses for Spectrum sufficient to limit total annual ordinary fund operating expenses (excluding interest, taxes, brokerage commissions, acquired fund fees and expenses, and extraordinary items) as a percentage of daily assets to 2.06% for the Retail Class, 1.91% for the Adviser Class and 1.72% for the Institutional Class.
For the period January 1, 2019 through April 29, 2019, MAM contractually agreed to reimburse management fees or other fund expenses for Moderate sufficient to limit total annual ordinary fund operating expenses (excluding interest, taxes, brokerage commissions, acquired fund fees and expenses, and extraordinary items) as a percentage of daily assets to 1.42% for the Retail Class, 1.22% for the Adviser Class and 1.02% for the Institutional Class.
For the period January 1, 2019 through April 29, 2019, MAM contractually agreed to reimburse management fees or other fund expenses for Conservative sufficient to limit total annual ordinary fund operating expenses (excluding interest, taxes, brokerage commissions, acquired fund fees and expenses, and extraordinary items) as a percentage of daily assets to 1.32% for the Retail Class, 1.12% for the Adviser Class and 0.92% for the Institutional Class.
MAM contractually agreed to reduce its investment advisory fee by 0.10% for Dynamic for average daily net assets up to $200 million. During the year ended December 31, 2019, $193,695 of investment advisory fees were waived in Dynamic.
MAM contractually agreed to reduce its investment advisory fee by 0.11% for Bond for average daily net assets up to $100 million. During the year ended December 31, 2019, $73,044 of investment advisory fees were waived in Bond.
2019 Annual Report | December 31, 2019 | Page 141 |
Mutual Funds Service Co. (“MFSCo”), a wholly-owned subsidiary of Meeder, serves as stock transfer, dividend disbursing and shareholder services agent for each Fund. In compensation for such services, each Fund pays MFSCo an annual fee equal to the greater of the following:
| | | Minimum Fee | | | Percentage of Average
Daily Net Assets | |
Muirfield | | $ | 4,000 | | | | 0.12 | % |
Spectrum | | | 4,000 | | | | 0.12 | % |
Global | | | 4,000 | | | | 0.12 | % |
Balanced | | | 4,000 | | | | 0.12 | % |
Moderate | | | 4,000 | | | | 0.12 | % |
Conservative | | | 4,000 | | | | 0.12 | % |
Dynamic | | | 4,000 | | | | 0.12 | % |
Quantex | | | 4,000 | | | | 0.12 | % |
Bond | | | 4,000 | | | | 0.08 | % |
Prime Money Market | | | 4,000 | | | | 0.08 | % |
Institutional Prime Money Market | | | 4,000 | | | | 0.08 | % |
For fixed income Funds (Bond, Prime Money Market, and Institutional Prime Money Market) that are subject to an expense cap and which are above the expense cap, the basis point fee is reduced by 0.02%. Management may voluntarily waive fees for any Fund. During the year ended December 31, 2019, MFSCo waived the following transfer agent fees:
| | | Voluntary Transfer
Agent Fees
Reimbursements | | | Impact of Voluntary
Transfer Agent Fees
Reimbursements to
Average Net Assets
- Retail Class | | | Impact of Voluntary
Transfer Agent Fees
Reimbursements to
Average Net Assets
- Adviser Class | | | Impact of Voluntary
Transfer Agent Fees
Reimbursements to
Average Net Assets
- Institutional Class | | | Impact of Voluntary
Transfer Agent Fees
Reimbursements to
Average Net Assets
- Money Market
Funds | |
Muirfield | | $ | 459,000 | | | | N/A | | | | N/A | | | | 0.11 | % | | | N/A | |
Spectrum | | | 27,000 | | | | N/A | | | | N/A | | | | 0.02 | % | | | N/A | |
Global | | | — | | | | N/A | | | | N/A | | | | N/A | | | | N/A | |
Balanced | | | 207,000 | | | | N/A | | | | N/A | | | | 0.07 | % | | | N/A | |
Moderate | | | — | | | | N/A | | | | N/A | | | | N/A | | | | N/A | |
Conservative | | | — | | | | N/A | | | | N/A | | | | N/A | | | | N/A | |
Dynamic | | | — | | | | N/A | | | | N/A | | | | N/A | | | | N/A | |
Quantex | | | — | | | | N/A | | | | N/A | | | | N/A | | | | N/A | |
Bond | | | — | | | | N/A | | | | N/A | | | | N/A | | | | N/A | |
Prime Money Market | | | 7,091 | | | | N/A | | | | N/A | | | | N/A | | | | 0.02 | % |
Institutional Prime Money Market | | | 86,371 | | | | N/A | | | | N/A | | | | N/A | | | | 0.02 | % |
MFSCo provides the Trust with certain administrative services. In compensation for such services, each Fund pays MFSCo at the following annual rates:
| | Percentage of Average
Daily Net Assets up to
$50 Million | Percentage of Average
Daily Net Assets
Exceeding $50 Million |
Muirfield | 0.10% | 0.08% |
Spectrum | 0.10% | 0.08% |
Global | 0.10% | 0.08% |
Balanced | 0.10% | 0.08% |
Moderate | 0.10% | 0.08% |
Conservative | 0.10% | 0.08% |
Dynamic | 0.10% | 0.08% |
Quantex | 0.10% | 0.08% |
Bond | 0.10% | 0.08% |
Prime Money Market | 0.10% | 0.08% |
Institutional Prime Money Market | 0.10% | 0.08% |
Page 142 | 2019 Annual Report | December 31, 2019 |
MFSCo serves as accounting services agent for each Fund. In compensation for such services, each Fund pays MFSCo an annual fee equal to the greater of a minimum fee or at a rate based on the percentage of average daily net assets. The annual rates are as follows:
| | | Minimum Fee | | | Percentage of
Average Daily Net
Assets up to $10
Million | | | Percentage of
Average Daily Net
Assets Exceeding
$10 Million up to
$30 Million | | | Percentage of
Average Daily Net
Assets Exceeding
$30 Million up to
$80 Million | | | Percentage of
Average Daily Net
Assets Exceeding
$80 Million | |
Muirfield | | $ | 7,500 | | | | 0.15 | % | | | 0.10 | % | | | 0.02 | % | | | 0.01 | % |
Spectrum | | | 7,500 | | | | 0.15 | % | | | 0.10 | % | | | 0.02 | % | | | 0.01 | % |
Global | | | 7,500 | | | | 0.15 | % | | | 0.10 | % | | | 0.02 | % | | | 0.01 | % |
Balanced | | | 7,500 | | | | 0.15 | % | | | 0.10 | % | | | 0.02 | % | | | 0.01 | % |
Moderate | | | 7,500 | | | | 0.15 | % | | | 0.10 | % | | | 0.02 | % | | | 0.01 | % |
Conservative | | | 7,500 | | | | 0.15 | % | | | 0.10 | % | | | 0.02 | % | | | 0.01 | % |
Dynamic | | | 7,500 | | | | 0.15 | % | | | 0.10 | % | | | 0.02 | % | | | 0.01 | % |
Quantex | | | 7,500 | | | | 0.15 | % | | | 0.10 | % | | | 0.02 | % | | | 0.01 | % |
Bond | | | 7,500 | | | | 0.15 | % | | | 0.10 | % | | | 0.02 | % | | | 0.01 | % |
Prime Money Market | | | 30,000 | | | | 0.15 | % | | | 0.10 | % | | | 0.02 | % | | | 0.01 | % |
Institutional Prime Money Market | | | 30,000 | | | | 0.15 | % | | | 0.10 | % | | | 0.02 | % | | | 0.01 | % |
For the year ended December 31, 2019, MAM and MFSCo agreed to voluntarily waive and/or reimburse investment advisory fees and/or transfer agent fees, respectively. The cumulative amounts voluntarily waived and/or reimbursed and the impact to the net expense ratio (excluding brokerage fees and commissions, taxes, interest, and extraordinary or non-recurring expenses) for each Fund are as follows:
| | | Voluntary Expense
Reimbursements | | | Impact of Voluntary
Waivers to Average
Net Assets | | | Impact of Voluntary
Waivers to Average
Net Assets - Retail
Class | | | Impact of Voluntary
Waivers to Average
Net Assets -
Adviser Class | | | Impact of Voluntary
Waivers to Average
Net Assets -
Institutional Class | |
Muirfield | | $ | 459,000 | | | | N/A | | | | N/A | | | | N/A | | | | 0.11 | % |
Spectrum | | | 27,000 | | | | N/A | | | | N/A | | | | N/A | | | | 0.02 | % |
Global | | | — | | | | N/A | | | | N/A | | | | N/A | | | | N/A | |
Balanced | | | 207,000 | | | | N/A | | | | N/A | | | | N/A | | | | 0.07 | % |
Moderate | | | — | | | | N/A | | | | N/A | | | | N/A | | | | N/A | |
Conservative | | | — | | | | N/A | | | | N/A | | | | N/A | | | | N/A | |
Dynamic | | | — | | | | N/A | | | | N/A | | | | N/A | | | | N/A | |
Quantex | | | — | | | | N/A | | | | N/A | | | | N/A | | | | N/A | |
Bond | | | — | | | | N/A | | | | N/A | | | | N/A | | | | N/A | |
Prime Money Market | | | 207,905 | | | | 0.59 | % | | | N/A | | | | N/A | | | | N/A | |
Institutional Prime Money Market | | | 1,612,940 | | | | 0.37 | % | | | N/A | | | | N/A | | | | N/A | |
2019 Annual Report | December 31, 2019 | Page 143 |
Certain Funds have entered into securities lending arrangements with Huntington National Bank (“HNB”). Under the terms of the agreement, HNB is authorized to loan securities on behalf of the Funds to approved brokers. In exchange, under normal market conditions, the Funds receive cash collateral in the amount of at least 102% of the value of securities loaned. The cash collateral is invested in short term instruments as noted in the Schedules of Investments. Although risk is mitigated by the collateral, the Funds could experience a delay in recovering their securities and possible loss of income or value if the borrower fails to return the borrowed securities. In addition, the Funds bear the risk of loss associated with the investment of cash collateral received. After predetermined rebates to brokers, a percentage of the net securities lending revenue is credited to the Funds to be used as an offset against charges incurred by the Funds. HNB is paid a fee for administering the securities lending program for the Funds, equal to the remaining percentage of the net securities lending revenues generated under the agreement. As of December 31, 2019, Muirfield, Spectrum, Balanced, Moderate, Dynamic, and Quantex had loaned securities that were collateralized by cash. The cash collateral received was invested in securities as listed in each Fund’s Schedule of Investments. For the year ended December 31, 2019, income earned through securities lending arrangements was as follows:
| | | Amount Received
to Reduce Gross
Expenses | |
Muirfield | | $ | 7,999 | |
Spectrum | | | 1,794 | |
Global | | | 7,329 | |
Balanced | | | 51,358 | |
Moderate | | | 38,030 | |
Conservative | | | 42,973 | |
Dynamic | | | 19,779 | |
Quantex | | | 22,529 | |
The Funds have adopted a written plan pursuant to Rule 12b-1 of the 1940 Act that allows the Funds to pay fees for the sale and distribution of Fund shares and for services provided to Fund shareholders. 12b-1 fees are paid by the Funds to financial intermediaries, securities brokers, investment advisers, and other persons, including affiliates of MAM. For the year ended December 31, 2019, total 12b-1 plan expense payments made to the Funds’ affiliated distributor was $93,916. The annual adopted 12b-1 plan maximum limitations for the year ended December 31, 2019, are as follows:
| | Maximum Annual 12b-1
Plan Expense as a
Percentage of Average
Daily Net Assets | Maximum Annual 12b-1
Plan Expense as a
Percentage of Average
Daily Net Assets - Retail
Class | Maximum Annual 12b-1
Plan Expense as a
Percentage of Average
Daily Net Assets -
Adviser Class | Maximum Annual 12b-1
Plan Expense as a
Percentage of Average
Daily Net Assets -
Institutional Class |
Muirfield | N/A | 0.20% | N/A | N/A |
Spectrum | N/A | 0.25% | N/A | N/A |
Global | N/A | 0.25% | N/A | N/A |
Balanced | N/A | 0.25% | N/A | N/A |
Moderate | N/A | 0.25% | N/A | N/A |
Conservative | N/A | 0.25% | N/A | N/A |
Dynamic | N/A | 0.25% | N/A | N/A |
Quantex | N/A | 0.20% | N/A | N/A |
Bond | N/A | 0.25% | N/A | N/A |
Prime Money Market | 0.20% | N/A | N/A | N/A |
Institutional Prime Money Market | 0.20% | N/A | N/A | N/A |
Page 144 | 2019 Annual Report | December 31, 2019 |
The Funds (other than the Money Market Funds) have adopted a shareholder services plan that allows the Funds to pay financial intermediaries and other persons, including “platforms,” for providing shareholder and administrative services to Fund shareholders and maintaining shareholder accounts. The annual adopted shareholder services plan maximum limitations for the year ended December 31, 2019 are as follows:
| | Maximum Annual
Shareholder Services
Plan Expense as a
Percentage of Average
Daily Net Assets - Retail
Class | Maximum Annual
Shareholder Services
Plan Expense as a
Percentage of Average
Daily Net Assets -
Adviser Class | Maximum Annual
Shareholder Services
Plan Expense as a
Percentage of Average
Daily Net Assets -
Institutional Class |
Muirfield | 0.20% | 0.25% | 0.10% |
Spectrum | 0.20% | 0.25% | 0.10% |
Global | 0.20% | 0.25% | 0.10% |
Balanced | 0.20% | 0.25% | 0.10% |
Moderate | 0.20% | 0.25% | 0.10% |
Conservative | 0.20% | 0.25% | 0.10% |
Dynamic | 0.20% | 0.25% | 0.10% |
Quantex | 0.20% | 0.25% | 0.10% |
Bond | 0.20% | 0.25% | 0.10% |
The Funds have adopted a Deferred Compensation Plan (the “Plan”) for the independent Trustees. Under the Plan, each eligible Trustee is permitted to defer all or a portion of the trustees fees payable by any of the Funds as an investment into any combination of Funds until a specified point of time. The investment into the Funds is recorded as an asset however an offsetting liability is also recorded for the deferred payment. Amounts deferred under the Plan may be distributed in a lump sum or generally equal annual installments over a period of up to ten (10) years to the eligible Trustee(s). The Funds may terminate this Plan at any time.
Certain trustees and officers of the Funds are also officers or directors of Meeder, MAM, and MFSCo.
During the year ended December 31, 2019, several of the Funds invested in the Institutional Prime Money Market Fund, an affiliate, as described in Section 2(a)(3) of the Investment Company Act of 1940. The purchases/sales amounts in the following table are presented on a gross basis, while the statement of changes in net assets shows subscriptions and redemptions into and out of the Fund on a net basis. The Funds’ investments in the Institutional Prime Money Market Fund, which had a 7-day yield of 1.75% on December 31, 2019, were as follows:
| | | 12/31/18 Fair
Value | | | Purchases | | | Sales | | | Realized
Gains
(Losses) | | | 12/31/19
Cost | | | Change in
Unrealized | | | Income | | | 12/31/19 Fair
Value | |
Muirfield | | $ | 203,128,346 | | | $ | 76,368,046 | | | $ | (148,136,728 | ) | | $ | 13,344 | | | $ | 131,375,486 | | | $ | 18,274 | | | $ | 4,142,249 | | | $ | 131,391,282 | |
Spectrum | | | 10,509,243 | | | | 42,804,023 | | | | (47,328,798 | ) | | | 2,628 | | | | 5,987,096 | | | | 6 | | | | 170,261 | | | | 5,987,102 | |
Global | | | 23,572,809 | | | | 14,200,191 | | | | (20,821,824 | ) | | | 2,665 | | | | 16,953,030 | | | | 659 | | | | 462,832 | | | | 16,954,500 | |
Balanced | | | 77,420,634 | | | | 73,286,901 | | | | (83,324,118 | ) | | | 2,455 | | | | 67,383,998 | | | | 6,357 | | | | 1,764,698 | | | | 67,392,229 | |
Moderate | | | 29,907,471 | | | | 36,787,971 | | | | (43,667,445 | ) | | | 1,878 | | | | 23,028,122 | | | | 1,665 | | | | 639,840 | | | | 23,031,540 | |
Conservative | | | 13,762,782 | | | | 37,259,021 | | | | (41,644,242 | ) | | | 577 | | | | 9,377,913 | | | | 1,067 | | | | 286,295 | | | | 9,379,205 | |
Dynamic | | | 38,098,890 | | | | 35,781,868 | | | | (33,775,984 | ) | | | (477 | ) | | | 40,103,588 | | | | 3,616 | | | | 950,849 | | | | 40,107,913 | |
Quantex | | | 9,650,794 | | | | 17,581,987 | | | | (25,729,330 | ) | | | 140 | | | | 1,503,591 | | | | 7 | | | | 27,506 | | | | 1,503,598 | |
Bond | | | 2,871,730 | | | | 24,068,231 | | | | (24,768,379 | ) | | | 558 | | | | 2,171,834 | | | | (232 | ) | | | 51,265 | | | | 2,171,908 | |
2019 Annual Report | December 31, 2019 | Page 145 |
6. Federal Tax Information
The following information is computed on a tax basis for each item as of December 31, 2019:
| | | Tax Cost of
Portfolio
Investments | | | Gross Unrealized
Appreciation | | | Gross Unrealized
Depreciation | | | Net Unrealized
Appreciation/
Depreciation | |
Muirfield | | $ | 582,492,556 | | | $ | 98,761,380 | | | $ | (10,383,131 | ) | | $ | 88,378,249 | |
Spectrum | | | 109,404,340 | | | | 45,507,927 | | | | (10,862,557 | ) | | | 34,645,370 | |
Global | | | 44,449,095 | | | | 5,051,765 | | | | (396,330 | ) | | | 4,655,435 | |
Balanced | | | 363,864,994 | | | | 42,802,913 | | | | (4,412,379 | ) | | | 38,390,534 | |
Moderate | | | 163,881,958 | | | | 12,492,276 | | | | (1,399,698 | ) | | | 11,092,578 | |
Conservative | | | 129,438,396 | | | | 7,115,526 | | | | (819,141 | ) | | | 6,296,385 | |
Dynamic | | | 171,684,610 | | | | 27,516,340 | | | | (2,624,063 | ) | | | 24,892,277 | |
Quantex | | | 51,060,234 | | | | 14,021,563 | | | | (1,331,283 | ) | | | 12,690,280 | |
Bond | | | 60,218,608 | | | | 1,806,908 | | | | (210,860 | ) | | | 1,596,048 | |
Prime Money Market | | | 34,789,924 | | | | — | | | | — | | | | — | |
Institutional Prime Money Market | | | 369,937,729 | | | | 46,398 | | | | (27,101 | ) | | | 19,297 | |
The tax characteristics of dividends paid by the Funds during the year ended December 31, 2019 were as follows:
| | | Ordinary Income | | | Net Short-Term
Capital Gains | | | Net Long-Term
Capital Gains | | | Total Dividends
Paid* | |
Muirfield | | $ | 3,218,545 | | | $ | — | | | $ | 15,318,351 | | | $ | 18,536,896 | |
Spectrum | | | 143,754 | | | | — | | | | 1,927,105 | | | | 2,070,859 | |
Global | | | 326,800 | | | | 279,432 | | | | 614,316 | | | | 1,220,548 | |
Balanced | | | 3,766,194 | | | | — | | | | 2,810,783 | | | | 6,576,977 | |
Moderate | | | 3,444,296 | | | | — | | | | — | | | | 3,444,296 | |
Conservative | | | 3,375,522 | | | | — | | | | — | | | | 3,375,522 | |
Dynamic | | | 1,941,019 | | | | — | | | | 3,035,347 | | | | 4,976,366 | |
Quantex | | | 521,859 | | | | — | | | | — | | | | 521,859 | |
Bond | | | 1,749,960 | | | | — | | | | — | | | | 1,749,960 | |
Prime Money Market | | | 725,101 | | | | — | | | | — | | | | 725,101 | |
Institutional Prime Money Market | | | 9,951,803 | | | | — | | | | — | | | | 9,951,803 | |
The tax characteristics of dividends paid by the Funds during the year ended December 31, 2018 were as follows:
| | | Ordinary Income | | | Net Short Term
Capital Gains | | | Net Long Term
Capital Gains | | | Total Dividends
Paid* | |
Muirfield | | $ | 4,158,041 | | | $ | 1,999,996 | | | $ | 3,470,512 | | | $ | 9,628,549 | |
Spectrum | | | 525,534 | | | | — | | | | 2,147,422 | | | | 2,672,956 | |
Global | | | 547,173 | | | | 252,504 | | | | 2,206,115 | | | | 3,005,792 | |
Balanced | | | 3,879,662 | | | | 1,729,689 | | | | 81,230 | | | | 5,690,581 | |
Moderate | | | 2,437,338 | | | | 3,777,218 | | | | 1,204,467 | | | | 7,419,023 | |
Conservative | | | 2,595,679 | | | | — | | | | 2,210,813 | | | | 4,806,492 | |
Dynamic | | | 1,272,412 | | | | 536,466 | | | | 616,039 | | | | 2,424,917 | |
Quantex | | | 68,853 | | | | — | | | | — | | | | 68,853 | |
Bond | | | 1,575,699 | | | | — | | | | — | | | | 1,575,699 | |
Prime Money Market | | | 552,567 | | | | — | | | | — | | | | 552,567 | |
Institutional Prime Money Market | | | 6,751,720 | | | | — | | | | — | | | | 6,751,720 | |
Page 146 | 2019 Annual Report | December 31, 2019 |
As of December 31, 2019, the components of distributable earnings/(accumulated deficit) on a tax basis for the Funds were as follows:
| | | Undistributed
Ordinary Income | | | Undistributed
Long-Term
Capital Gain | | | Accumulated
Capital and Other
Gains and (Losses) | | | Unrealized
Appreciation/
(Depreciation)** | | | Total
Distributable
Earnings/
(Accumulated
Deficit) | |
Muirfield | | $ | 4,846,891 | | | $ | — | | | $ | (22,550,028 | ) | | $ | 88,378,249 | | | $ | 70,675,112 | |
Spectrum | | | 1,378,978 | | | | — | | | | (6,441,098 | ) | | | 34,645,370 | | | | 29,583,250 | |
Global | | | 585,460 | | | | 689,687 | | | | (86,800 | ) | | | 4,655,435 | | | | 5,843,782 | |
Balanced | | | 3,266,299 | | | | — | | | | (5,309,571 | ) | | | 38,390,534 | | | | 36,347,262 | |
Moderate | | | 187,398 | | | | — | | | | (1,486,503 | ) | | | 11,092,578 | | | | 9,793,473 | |
Conservative | | | 181,653 | | | | — | | | | (2,487,584 | ) | | | 6,296,385 | | | | 3,990,454 | |
Dynamic | | | 1,179,110 | | | | 3,372,405 | | | | (170,236 | ) | | | 24,892,277 | | | | 29,273,556 | |
Quantex | | | 22,803 | | | | — | | | | (398,299 | ) | | | 12,690,280 | | | | 12,314,784 | |
Bond | | | 10,674 | | | | — | | | | (11,698,753 | ) | | | 1,596,048 | | | | (10,092,031 | ) |
Institutional Prime Money Market | | | 3,145 | | | | — | | | | (6,385 | ) | | | 19,297 | | | | 16,057 | |
* | Total dividends paid may differ from the amount reported in the Statements of Changes in Net Assets because for tax purposes dividends are recognized when actually paid. Short-term capital gains distributions are taxed as ordinary income. |
** | The differences between book- and tax-basis unrealized appreciation/(depreciation) are attributable primarily to: wash sales and the realization for tax purposes of unrealized gains/(losses) on certain derivative instruments. |
For federal income tax purposes, the following Funds have capital loss carryforwards as of December 31, 2019, which are not subject to expiration and are available to offset future capital gains, if any. To the extent that these carryforwards are used to offset future capital gains, it is probable that the gains that are offset will not be distributed to shareholders:
| | | Short-Term Capital
Loss Carryforward | | | Long-Term Capital
Loss Carryforward | | | Capital Loss
Carryforward Utilized | |
Muirfield | | $ | 11,699,298 | | | $ | 10,641,087 | | | $ | — | |
Spectrum | | | 6,375,172 | | | | — | | | | — | |
Balanced | | | 2,552,595 | | | | 2,620,278 | | | | — | |
Moderate | | | 1,333,092 | | | | 135,295 | | | | — | |
Conservative | | | 2,298,420 | | | | 134,386 | | | | — | |
Bond | | | 8,982,216 | | | | 2,656,435 | | | | 497,518 | |
Institutional Prime Money Market | | | 1,841 | | | | 1,504 | | | | — | |
Under the current tax law, capital losses realized after October 31 may be deferred and treated as occurring on the first day of the following fiscal year. As presented in the table below, the following Funds elected to defer capital losses for the fiscal year ended December 31, 2019:
| | | Short-Term
Post-October
Loss Deferral | | | Long-Term
Post-October
Loss Deferral | | | Total Late Year
Loss Deferral | |
Quantex | | $ | 218,672 | | | $ | 127,932 | | | $ | 346,604 | |
7. Control Ownership
The beneficial ownership, either directly or indirectly, of more than 25% of the voting securities of a fund creates a presumption of control of the fund under Section 2(a)(9) of the 1940 Act. As of December 31, 2019, beneficial owners that held more than 25% of the voting securities of the Funds and may be deemed to control the Funds are as follows:
Fund | Beneficial Owner | Percent of Voting
Securities |
Institutional Prime Money Market | Meeder Muirfield Fund | 36% |
2019 Annual Report | December 31, 2019 | Page 147 |
8. Contingencies and Commitments
The Funds indemnify the Trust’s officers and Trustees for certain liabilities that might arise from their performance of their duties to the Funds. Additionally, in the normal course of business the Funds enter into contracts that contain a variety of representations and warranties and which provide general indemnifications. The Funds’ maximum exposure under these arrangements is unknown, as this would involve future claims that may be made against the Funds that have not yet occurred. However, based on experience, the Funds expect the risk of loss to be remote.
9. Subsequent Events
Management evaluated subsequent events through the date these financial statements were issued and concluded no subsequent events required recognition or disclosure in these financial statements.
Page 148 | 2019 Annual Report | December 31, 2019 |
Report of Independent Registered Public Accounting Firm
To the Shareholders and Board of Trustees of
Meeder Funds
Opinion on the Financial Statements
We have audited the accompanying statements of assets & liabilities, including the schedules of investments, of Meeder Funds comprising Muirfield Fund, Spectrum Fund, Global Allocation Fund, Balanced Fund, Moderate Allocation Fund, Conservative Allocation Fund, Dynamic Allocation Fund, Quantex Fund, Total Return Bond Fund, Prime Money Market Fund, and Institutional Prime Money Market Fund (the “Funds”) as of December 31, 2019, the related statements of operations for the year then ended, the statements of changes in net assets for each of the two years in the period then ended, including the related notes, and the financial highlights for each of the five years or periods in the period then ended for Muirfield Fund, Spectrum Fund, Global Allocation Fund, Balanced Fund, Moderate Allocation Fund, Conservative Allocation Fund, Dynamic Allocation Fund, Quantex Fund, Total Return Bond Fund, Prime Money Market Fund and for each of the four periods or years in the period then ended for the Institutional Prime Money Market Fund (collectively referred to as the “financial statements”). In our opinion, the financial statements present fairly, in all material respects, the financial position of each of the Funds as of December 31, 2019, the results of their operations for the year then ended, the changes in their net assets for each of the two years in the period then ended, and the financial highlights for each of the periods presented, in conformity with accounting principles generally accepted in the United States of America.
Basis for Opinion
These financial statements are the responsibility of the Funds’ management. Our responsibility is to express an opinion on the Funds’ financial statements based on our audits. We are a public accounting firm registered with the Public Company Accounting Oversight Board (United States) (“PCAOB”) and are required to be independent with respect to the Funds in accordance with the U.S. federal securities laws and the applicable rules and regulations of the Securities and Exchange Commission and the PCAOB.
We conducted our audits in accordance with the standards of the PCAOB. Those standards require that we plan and perform the audit to obtain reasonable assurance about whether the financial statements are free of material misstatement whether due to error or fraud.
Our audits included performing procedures to assess the risks of material misstatement of the financial statements, whether due to error or fraud, and performing procedures that respond to those risks. Such procedures included examining, on a test basis, evidence regarding the amounts and disclosures in the financial statements. Our procedures included confirmation of securities owned as of December 31, 2019, by correspondence with the custodian and brokers. Our audits also included evaluating the accounting principles used and significant estimates made by management, as well as evaluating the overall presentation of the financial statements. We believe that our audits provide a reasonable basis for our opinion.
We have served as the Funds’ auditor since 2004.
COHEN & COMPANY, LTD.
Cleveland, Ohio
February 27, 2020
2019 Annual Report | December 31, 2019 | Page 149 |
Shareholder Expense Analysis(unaudited)
Shareholders of mutual funds pay ongoing expenses, such as advisory fees, distribution and service fees and other fund operating expenses. The following examples are intended to help you understand your ongoing costs (in dollars) of investing in the Funds and to compare these costs with the ongoing costs of investing in other mutual funds. The examples are based on an investment of $1,000 invested for the period of time indicated in the table below.
The Actual Expense example provides information about actual account values and actual expenses. You may use the information in this line, together with the amount you invested, to estimate the expenses that you paid over the period. Simply divide your account value by $1,000 (e.g.: an $8,600 account value divided by $1,000 = 8.6), then multiply the result by the number in the line under the heading “Expenses Paid During the Period” to estimate the expenses you paid on your account during this period.
The Hypothetical Expense example provides information about hypothetical account values and hypothetical expenses based on each Fund’s actual expense ratio and an assumed rate of return of 5% per year before expenses, which is not the actual return of any Fund. The hypothetical account values and expenses may not be used to estimate the actual ending account balance or expenses you paid for the period. You may use this information to compare the ongoing costs of investing in the Funds to other funds. To do so, compare this 5% hypothetical example with the 5% hypothetical examples that appear in the shareholder reports of the other funds.
| | | Beginning Account
Value June 30, 2019 | | | Ending Account Value
December 31, 2019 | | | Expenses Paid
During Period1 | | | Net Expense
Ratio2 | |
| | | Actual | | | Hypothetical | | | Actual | | | Hypothetical | | | Actual | | | Hypothetical | | | Actual | |
Muirfield Fund | | | | | | | | | | | | | | | | | | | | | | | | | | | | |
Retail Class | | $ | 1,000.00 | | | $ | 1,000.00 | | | $ | 1,078.10 | | | $ | 1,018.90 | | | $ | 6.55 | | | $ | 6.36 | | | | 1.25 | % |
Adviser Class | | | 1,000.00 | | | | 1,000.00 | | | | 1,078.90 | | | | 1,020.06 | | | | 5.34 | | | | 5.19 | | | | 1.02 | % |
Institutional Class | | | 1,000.00 | | | | 1,000.00 | | | | 1,081.60 | | | | 1,021.32 | | | | 4.04 | | | | 3.92 | | | | 0.77 | % |
Spectrum Fund | | | | | | | | | | | | | | | | | | | | | | | | | | | | |
Retail Class | | | 1,000.00 | | | | 1,000.00 | | | | 1,073.20 | | | | 1,015.53 | | | | 10.03 | | | | 9.75 | | | | 1.92 | % |
Adviser Class | | | 1,000.00 | | | | 1,000.00 | | | | 1,074.80 | | | | 1,017.14 | | | | 8.37 | | | | 8.13 | | | | 1.60 | % |
Institutional Class | | | 1,000.00 | | | | 1,000.00 | | | | 1,075.50 | | | | 1,017.54 | | | | 7.95 | | | | 7.73 | | | | 1.52 | % |
Global Allocation Fund | | | | | | | | | | | | | | | | | | | | | | | | | | | | |
Retail Class | | | 1,000.00 | | | | 1,000.00 | | | | 1,069.90 | | | | 1,016.79 | | | | 8.71 | | | | 8.49 | | | | 1.67 | % |
Adviser Class | | | 1,000.00 | | | | 1,000.00 | | | | 1,070.70 | | | | 1,018.20 | | | | 7.25 | | | | 7.07 | | | | 1.39 | % |
Institutional Class | | | 1,000.00 | | | | 1,000.00 | | | | 1,071.60 | | | | 1,018.85 | | | | 6.58 | | | | 6.41 | | | | 1.26 | % |
Balanced Fund | | | | | | | | | | | | | | | | | | | | | | | | | | | | |
Retail Class | | | 1,000.00 | | | | 1,000.00 | | | | 1,059.80 | | | | 1,018.10 | | | | 7.32 | | | | 7.17 | | | | 1.41 | % |
Adviser Class | | | 1,000.00 | | | | 1,000.00 | | | | 1,062.00 | | | | 1,019.81 | | | | 5.56 | | | | 5.45 | | | | 1.07 | % |
Institutional Class | | | 1,000.00 | | | | 1,000.00 | | | | 1,062.90 | | | | 1,020.72 | | | | 4.63 | | | | 4.53 | | | | 0.89 | % |
Moderate Allocation Fund | | | | | | | | | | | | | | | | | | | | | | | | | | | | |
Retail Class | | | 1,000.00 | | | | 1,000.00 | | | | 1,047.40 | | | | 1,018.25 | | | | 7.12 | | | | 7.02 | | | | 1.38 | % |
Adviser Class | | | 1,000.00 | | | | 1,000.00 | | | | 1,048.70 | | | | 1,019.96 | | | | 5.37 | | | | 5.30 | | | | 1.04 | % |
Institutional Class | | | 1,000.00 | | | | 1,000.00 | | | | 1,049.50 | | | | 1,020.06 | | | | 5.27 | | | | 5.19 | | | | 1.02 | % |
Conservative Allocation Fund | | | | | | | | | | | | | | | | | | | | | | | | | | | | |
Retail Class | | | 1,000.00 | | | | 1,000.00 | | | | 1,035.00 | | | | 1,018.70 | | | | 6.62 | | | | 6.56 | | | | 1.29 | % |
Adviser Class | | | 1,000.00 | | | | 1,000.00 | | | | 1,036.80 | | | | 1,020.32 | | | | 4.98 | | | | 4.94 | | | | 0.97 | % |
Institutional Class | | | 1,000.00 | | | | 1,000.00 | | | | 1,037.00 | | | | 1,020.37 | | | | 4.93 | | | | 4.89 | | | | 0.96 | % |
Dynamic Allocation Fund | | | | | | | | | | | | | | | | | | | | | | | | | | | | |
Retail Class | | | 1,000.00 | | | | 1,000.00 | | | | 1,081.90 | | | | 1,018.05 | | | | 7.45 | | | | 7.22 | | | | 1.42 | % |
Adviser Class | | | 1,000.00 | | | | 1,000.00 | | | | 1,083.00 | | | | 1,019.46 | | | | 5.99 | | | | 5.80 | | | | 1.14 | % |
Institutional Class | | | 1,000.00 | | | | 1,000.00 | | | | 1,083.90 | | | | 1,020.11 | | | | 5.31 | | | | 5.14 | | | | 1.01 | % |
Page 150 | 2019 Annual Report | December 31, 2019 |
| | | Beginning Account
Value June 30, 2019 | | | Ending Account Value
December 31, 2019 | | | Expenses Paid
During Period1 | | | Net Expense
Ratio2 | |
| | | Actual | | | Hypothetical | | | Actual | | | Hypothetical | | | Actual | | | Hypothetical | | | Actual | |
Quantex Fund | | | | | | | | | | | | | | | | | | | | | | | | | | | | |
Retail Class | | $ | 1,000.00 | | | $ | 1,000.00 | | | $ | 1,066.30 | | | $ | 1,017.69 | | | $ | 7.76 | | | $ | 7.58 | | | | 1.49 | % |
Adviser Class | | | 1,000.00 | | | | 1,000.00 | | | | 1,067.00 | | | | 1,018.20 | | | | 7.24 | | | | 7.07 | | | | 1.39 | % |
Institutional Class | | | 1,000.00 | | | | 1,000.00 | | | | 1,067.40 | | | | 1,018.70 | | | | 6.72 | | | | 6.56 | | | | 1.29 | % |
Total Return Bond Fund | | | | | | | | | | | | | | | | | | | | | | | | | | | | |
Retail Class | | | 1,000.00 | | | | 1,000.00 | | | | 1,015.30 | | | | 1,019.51 | | | | 5.74 | | | | 5.75 | | | | 1.13 | % |
Adviser Class | | | 1,000.00 | | | | 1,000.00 | | | | 1,016.40 | | | | 1,021.12 | | | | 4.12 | | | | 4.13 | | | | 0.81 | % |
Institutional Class | | | 1,000.00 | | | | 1,000.00 | | | | 1,016.80 | | | | 1,021.32 | | | | 3.91 | | | | 3.92 | | | | 0.77 | % |
Prime Money Market Fund | | | 1,000.00 | | | | 1,000.00 | | | | 1,009.40 | | | | 1,023.54 | | | | 1.67 | | | | 1.68 | | | | 0.33 | % |
Institutional Prime Money Market Fund | | | 1,000.00 | | | | 1,000.00 | | | | 1,010.20 | | | | 1,024.50 | | | | 0.71 | | | | 0.71 | | | | 0.14 | % |
Please note that the expenses shown in the tables are meant to highlight your ongoing costs only and do not reflect any transactional costs, such as redemption fees or exchange fees. Therefore, hypothetical information is useful in comparing ongoing costs only, and will not help you determine the relative total costs of owning different funds. In addition, if any transactional costs were included, your costs would have been higher.
1 | Expenses are equal to each Fund’s annualized net expense ratio, multiplied by the average account value over the period, multiplied by the number of days in the most recent fiscal half-year, divided by the number of days in the fiscal year (to reflect the one-half year period). |
2 | Annualized net expense ratio reflects contractual or voluntary waivers and reimbursements of expenses by the investment adviser and transfer agent. |
2019 Annual Report | December 31, 2019 | Page 151 |
Trustees and Officers (unaudited)
Certain trustees and officers of the Funds are also officers or directors of Meeder, MAM, and MFSCo. The Trustees oversee the management of the Trust and elect its officers. The officers are responsible for the Funds’ day-to-day operations. The Trustees’ and officers’ names, addresses, years of birth, positions held with the Trust, and length of service with the Meeder Funds, are listed below. Also included is each Board member’s principal occupation during, at least, the past five years. Except as indicated, each individual has held the office shown or other offices in the same company for the last five years. Those Trustees who are “interested persons”, as defined in the 1940 Act, by virtue of their affiliation with the Trust, are indicated by an asterisk (*).
Name, Address1,
and Year of Birth | Year First Elected a
Trustee or Officer of
the Trust | Position and Number
of Funds Overseen2 | Principal Occupation During
Past Five Years and Other
Directorships Held |
Robert S. Meeder, Jr.*
Year of Birth: 1961 | 1992 | Trustee and President | President, Meeder Investment Management, Inc. |
Stuart M. Allen**
Year of Birth: 1961 | 2006 | Trustee | President of Gardiner Allen DeRoberts Insurance LLC, an insurance agency. |
Anthony V. D’Angelo**
Year of Birth: 1959 | 2006 | Trustee | General Manager, WSYX ABC 6 /WTTE-TV Fox 28 /WWHO television stations, Columbus, Ohio, operated by Sinclair Broadcast Group (2014 – present); Director of Sales (2004 – 2014); Lead Trustee of the Trust. |
Jeffrey R. Provence**
Year of Birth: 1969 | 2017 | Trustee | CEO, Premier Fund Solutions, Inc. (2001 – present); General Partner & Portfolio Manager, Value Trend Capital Management, L.P. (1995 – present); Director, Blue Chip Investor Funds; Director, PFS Funds; Chairman of the Trust’s Audit Committee. |
Dale W. Smith
Year of Birth: 1959 | 2006 | Vice President | Co-Chief Investment Officer, Meeder Investment Management, Inc. (2006-present); Chief Financial Officer, Meeder Asset Management, Inc. (2005 - 2017). |
Douglas R. Jennings
Year of Birth: 1962 | 2017 | Chief Compliance Officer | Chief Compliance Officer, Meeder Investment Management, Inc. (2016 – present); Assistant General Counsel; Partner, Carlile Patchen & Murphy, LLP (2010 – 2016). |
Bruce E. McKibben
Year of Birth: 1969 | 2002 | Treasurer | Director of Fund Accounting, Mutual Funds Service Co. (1997 – present). |
Alaina Salonsky
Year of Birth: 1967 | 2017 | Secretary | Compliance Specialist, Meeder Investment Management, Inc. (2017 – present); Teacher, Big Walnut School District, Sunbury, Ohio (2013 – 2017). |
1 | The address of each Trustee is 6125 Memorial Drive, Dublin, OH 43017. |
2 | Each Trustee serves for an indefinite term, until his or her resignation, death, or removal. Each Trustee oversees all eleven Funds in the Trust. |
* | Robert S. Meeder, Jr. is deemed an “interested person” of the Trust by virtue of his position as President of Meeder Asset Management, Inc., the Adviser of the Trust. |
** | Each independent Trustee is a member of the Trust’s Audit Committee, Compensation Committee, and Nominating Committee. |
The Statement of Additional Information includes additional information about each Trustee and is available without charge. To obtain a copy of the Statement of Additional Information, please contact your financial representative or call toll free 1-800-325-3539.
Page 152 | 2019 Annual Report | December 31, 2019 |
Board Review and Approval of Investment Advisory Agreement (unaudited)
At a meeting held September 26, 2019, the Board of Trustees (“Board”), including all of its Independent Trustees, met in person to consider the renewal of the investment advisory agreement (“Agreement”) between the Funds and Meeder Asset Management, Inc. (“Adviser”).
Approval Process. Pursuant to the Investment Company Act of 1940 (“1940 Act”), the Board is required to consider the continuation of the Funds’ investment advisory agreement on an annual basis. Prior to the meeting, the Board reviewed materials sent to each Trustee in advance of the meeting in response to the Funds’ independent legal counsel’s supplemental written request pursuant to Section 15(c) of the 1940 Act for the provision to the Trustees of appropriately updated and amended information necessary or appropriate to assist the Trustees in their deliberations concerning renewal of the Agreement between the Adviser and each of the Funds. In reaching the decision to renew the Agreement, the Board also took into account information furnished throughout the year at regular Board meetings. Information furnished and discussed throughout the year included investment performance reports and related financial information for the Funds, as well as periodic reports on shareholder services, legal compliance, pricing, brokerage commissions, execution and other services provided by the Adviser and its affiliates.
Information furnished specifically in connection with the renewal process included a report for the Funds prepared by Broadridge Financial Solutions, Ltd. (“Broadridge”), an independent organization, as well as the Funds’ profitability analysis prepared by the Adviser. The Broadridge report compared each Fund’s advisory fees and expenses with those of other mutual funds deemed comparable to the Fund. The Funds’ profitability analysis discussed the profitability to the Adviser and Mutual Funds Service Co., an affiliate of the Adviser, from the overall Funds’ operations, as well as an analysis based on the profitability resulting from the operation of each individual Fund, utilizing expense allocation methodologies deemed reasonable by the Adviser.
In considering such materials, the Independent Trustees also received assistance and advice from and met separately with the Funds’ independent legal counsel and the chief compliance officer prior to the meeting. In their deliberations, the Board considered the terms of the existing Agreement between the Funds and the Adviser. While attention was given to all of the information furnished, the Board made the following specific findings in connection with its decision to renew the Agreement:
Nature, Extent and Quality of Services. The Board considered the nature, extent and quality of the services provided by the Adviser and its affiliates, including the reputation, qualifications, experience and capabilities of the personnel performing these services. The Board considered the qualifications of the investment management team and the resources committed to maintaining and improving the Adviser’s quantitative models. The Board noted that the Adviser and its affiliates provide a series of additional administrative services for the Funds, including fund accounting, transfer agency and compliance services, and recognized the continuing expenditures made to support and improve the scope of those services. Consideration was also given to the Adviser’s compliance resources and policies, including the periodic reporting provided to the Board. In making its judgment, the Board also considered the Adviser’s continual management of investment, operational, enterprise, legal and regulatory risk as it relates to the Funds as well as the manner in which the Adviser addressed new regulatory burdens that became effective during the preceding year. The Board concluded that the nature, extent and quality of the services provided by the Adviser have benefited and should continue to benefit each Fund and its shareholders.
Investment Performance. The Board placed emphasis on the investment performance of each Fund in view of its importance to shareholders. While consideration was given to performance reports and discussions with portfolio managers at Board meetings during the year, particular attention in assessing performance was given to the Broadridge reports furnished for the Agreement renewal. The Broadridge report prepared for each Fund showed the investment performance of the Fund for the one-, three-, five-, and ten-year periods, as applicable, ended June 30, 2019 in comparison with a performance universe similar to each Fund’s investment objectives. The Board evaluated performance in light of the investment strategy pursued by the Adviser, measures of investment risk, and steps taken by the Adviser to mitigate risk through active management of the portfolio. The Board noted that the Funds generally underperformed over the short-term and generally outperformed over the long-term. The Board was satisfied with the Adviser’s explanation of the factors that contributed to both the short-term and long-term performance of the Funds. The Board noted the Adviser’s continued efforts to improve performance and improve the quantitative models. The Board concluded that the Funds’ investment results have been satisfactory for renewal of the Agreement and that the Adviser’s record in managing the Funds indicated that its continued management should benefit the Funds and their shareholders.
Costs of Services. Consideration was given to a comparative analysis of the advisory fees and expense ratios of each Fund compared with those of a group of other relevant funds. The Board observed that the Funds’ advisory fees and expenses were within the range of those of other similar funds included in the comparable reports. The Board also considered an analysis comparing the Funds’ advisory fees with the fees charged by the Adviser to private clients, but noted the significant investment, operational, regulatory, and market differences between advising the Funds and advising private clients. The Board was satisfied with the Adviser’s continued efforts to reduce fees and expenses. The Board concluded that the Funds’ cost structures were fair and reasonable in relation to the services provided, and that the Funds’ shareholders receive reasonable value in return for the advisory fees and other amounts paid to the Adviser by the Funds.
Management Profitability. The Board also considered the level of profits realized by the Adviser and its affiliates in connection with the operation of the Funds. In this respect, the Board reviewed the Funds’ profitability analysis that addresses the overall profitability of the Meeder Funds’ business as well as the profitability resulting from the operation of each Fund. The Board also took into account management’s expenditures in improving shareholder services provided to the Funds, as well as the need to meet additional regulatory and compliance requirements resulting from recent SEC requirements. The Board determined that the level of profits realized by the Adviser under its Agreement with the Funds was not excessive in view of the nature, quality and extent of services provided.
2019 Annual Report | December 31, 2019 | Page 153 |
Economies of Scale. The Board also considered whether economies of scale are realized as the Funds grow larger and the extent to which this is reflected in the level of advisory fees charged. While recognizing that any precise determination is inherently subjective, the Board noted that economies of scale may develop for certain Funds as their assets increase, and their Fund level expenses decline as a percentage of assets. The Board also considered whether the advisory fee rate is reasonable in relation to the asset size of each Fund and any economies of scale that may exist. The Board acknowledged that the advisory fee structure for each Fund is reasonable and in most instances is tiered by assets under management, allowing the shareholders to benefit from economies of scale as the Funds grow in size. The Board expressed continued satisfaction with each Fund’s fee structure under its Agreement.
Ancillary Benefits. The Board also considered ancillary benefits received by the Adviser as a result of its relationship with the Trust, including its access to research that benefits other clients and the service of its affiliates as transfer agent, administrator and distributor for the Funds. The fees for these services were considered separately in the profitability analysis and the Board considered the revenue and expenses incurred by the Adviser and its affiliates in providing these services. The Board also took into consideration additional contractual breakpoints in certain affiliated service agreements. The Board also considered the benefits derived by the Adviser from soft dollar arrangements, noting that these arrangements are subject to regular reporting and oversight. The Board took the ancillary benefits into account in evaluating the reasonableness of the advisory fees and other amounts paid to the Adviser by the Funds.
Conclusion. Based upon the foregoing findings as well as all of the information provided by the Adviser, the Board, including all of its Independent Trustees, was satisfied that the terms of the Agreement, including the existing advisory fee structure, are fair and reasonable and in the best interest of the Funds and their shareholders. The Board, including all of its Independent Trustees, therefore approved the continuation of the Agreement effective for a one-year term ending September 30, 2020.
Statement Regarding Liquidity Risk Management Program
In accordance with Rule 22e-4 (“Liquidity Rule”) under the 1940 Act, the Funds have adopted and implemented a liquidity risk management program (“Program”). The purpose of the Program is to outline the techniques, tools and arrangements employed for the management of liquidity risk within the Funds, and the terms, contents and frequency of reporting and escalation of any issues to the Board of Trustees. Liquidity is managed taking account of the investment strategy, liquidity profile, and redemption history, with the objective of maintaining a level of liquidity that is appropriate in light of the Funds’ obligations to the Funds’ shareholders. The Program assesses liquidity risk under both normal and stressed market conditions.
The Board of Trustees reviewed the Program during the Funds’ most recent fiscal half-year, including a written report prepared by the Program Administrator. The report reviewed the terms and operation of the Program, investment strategy and liquidity of the Funds, cash flow projections, shareholder concentration and holdings of cash and cash equivalents. The Adviser utilizes quantitative tools that provide daily evaluation of the liquidity of nearly all Funds’ securities. The Program Administrator was satisfied with the design, operation and effectiveness of the Program and reported that there were no liquidity events that materially affected the performance of the Funds or the Funds’ ability to meet their redemption obligations under normal and reasonably foreseeable stressed conditions without dilution to existing shareholders.
The report confirmed that the Funds’ investment strategies utilize highly liquid securities and do not maintain concentrated positions. The Funds also maintain significant holdings of cash and cash equivalents, which were judged suitable to meet redemption needs under ordinary and reasonably stressed market conditions. During the reporting period, the Funds maintained a high level of liquidity and primarily held assets in securities judged highly liquid under the Liquidity Rule. As a result, the Funds see no reason to, and therefore have not adopted a “Highly Liquid Investment Minimum,” as defined under the Liquidity Rule.
There can be no assurance that the Program will achieve its objectives in the future. Further information on liquidity risks of the Funds can be found in the Funds’ prospectus.
Other Information
The Trust files a complete schedule of portfolio holdings for the first and third quarters of each fiscal year on Form N-PORT. In addition, Prime Money Market Fund and Institutional Prime Money Market Fund file their complete schedules of portfolio holdings with the SEC each month on Form N-MFP. Forms N-PORT and N-MFP are available on the SEC’s website at www.sec.gov. Information regarding Fund holdings is also available at www.meederinvestment.com.
The investment adviser is responsible for exercising the voting rights associated with the securities purchased or held by the Funds. A description of the policies and procedures that the adviser uses in fulfilling this responsibility and information regarding how those proxies were voted during the most recent 12-month period ending June 30 are available, without charge, by calling 1-800-325-3539 or on the SEC’s website at www.sec.gov.
Page 154 | 2019 Annual Report | December 31, 2019 |

Privacy Policy
Meeder Investment Management and the Meeder Funds are committed to maintaining the financial privacy of our current, former and prospective customers. This policy explains how we protect the security and confidentiality of our customer’s information.
PERSONAL INFORMATION WE COLLECT
We may collect information about Meeder customers from a variety of sources, including:
| | ● | Information provided by you or your representative on applications or forms, such as your name, address, date of birth, social security number and investment objectives; |
| | ● | Information about the transactions in your account, such as your account balance and transaction history; and |
| | ● | Information we obtain from third parties regarding you, to verify your identity or transfer your account. |
INFORMATION WE SHARE WITH OUR AFFILIATES
Our affiliates are financial service providers that offer transfer agency, customer accounting, customer servicing, investment advisory, and other financial services. We share information with our affiliates to service your account. In addition, we may also share information with our affiliates to alert you to other products or services offered by Meeder to the extent provided by law. Information collected from customers whose accounts are opened through investment professionals is not shared with Meeder affiliates for marketing purposes.
INFORMATION WE SHARE WITH THIRD PARTIES
On occasion, we share information we collect about you with unaffiliated third parties to perform services in connection with your account, such as processing transactions, preparing and mailing account statements, and other forms of customer servicing. Information provided to third parties may not be used for any other purpose and Meeder does not permit unaffiliated third parties to use customer information to market their products or services.
HOW WE PROTECT INFORMATION ABOUT YOU
We maintain policies, and require all unaffiliated third parties to maintain policies, to safeguard customer information. We restrict access to nonpublic personal information about you to those persons who need to know that information in order to provide products and services to you. We also maintain physical, electronic, and procedural safeguards to guard your nonpublic personal information.
WHO THIS POLICY APPLIES TO
This policy applies to customers who open relationships directly with Meeder. It applies to Meeder Funds and Meeder’s affiliated companies, including Meeder Asset Management, Meeder Advisory Services, Meeder Public Funds, Adviser Dealer Services and Mutual Funds Service Company.
QUESTIONS
Contact us at 800-325-3539 or visit us online at www.meederinvestment.com
2019 Annual Report | December 31, 2019 | Page 155 |
[This page intentionally left blank]
Manager and Investment Adviser
Meeder Asset Management, Inc.
6125 Memorial Drive
P.O. Box 7177
Dublin, Ohio 43017
Board of Trustees
Stuart M. Allen
Anthony V. D’Angelo
Robert S. Meeder, Jr.
Jeffrey R. Provence
Custodian
The Huntington National Bank
Columbus, Ohio 43215
Transfer Agent & Dividend Disbursing Agent
Mutual Funds Service Co.
6125 Memorial Drive
Dublin, Ohio 43017
Distributor
Adviser Dealer Services, Inc.
6125 Memorial Drive
Dublin, Ohio 43017
Independent Registered Public Accounting Firm
Cohen & Company, Ltd.
1350 Euclid Ave., Suite 800
Cleveland, Ohio 44115

Item 2. Code of Ethics.
The registrant has adopted a code of ethics that applies to the registrant’s principal executive officer, principal financial officer, comptroller or principal accounting officer, and any person who performs a similar function. There were no amendments made to, or waivers granted from, the code of ethics during the fiscal year.
Item 3. Audit Committee Financial Expert.
The Board of Trustees of the Trust has determined that Jeffrey R. Provence is an audit committee financial expert, as defined in Item 3 of Form N-CSR. Mr. Provence is independent for purposes of Item 3 of Form N-CSR.
Item 4. Principal Accountant Fees and Services.
(a) – (d) Aggregate fees billed to the registrant for the last two fiscal years for professional services rendered by the registrant’s principal accountant were as follows:
| | 2019 | 2018 |
| Audit Fees | $123,400 | $128,500 |
| Audit-Related Fees | 300 | 300 |
| Tax Fees | 51,000 | 54,500 |
| All Other Fees | 1,971 | 2,200 |
Audit fees include amounts related to the audit of the registrant’s annual financial statements and services normally provided by the accountant in connection with statutory and regulatory filings. Audit-related fees include amounts reasonably related to the performance of the audit of the registrant’s financial statements, including, but not limited to, mileage, lodging, and meals. Tax fees include amounts related to tax compliance, tax planning, and tax advice, including the review and preparation of the Funds’ income tax returns, the review and preparation of the Funds’ excise tax returns, the review of supporting schedules and documentation provided by management, the review and recalculation of the Funds’ estimated distribution calculations, and the review of wash sales for reasonableness. All other fees include amounts related to the registrant’s annual filing of Form N1A.
(e)(1) A purpose of the Audit Committee is to approve the engagement of the registrant’s independent auditors (i) to render audit and non-audit services for the registrant in accordance with Rule 2-01(c)(7)(i) of Regulation S-X, subject to the waiver provisions set forth in Rule 2-01(c)(7)(i)(C) of Regulation S-X, and (ii) to render non-audit services for the registrant’s investment advisors (other than a sub-advisor whose role is primarily portfolio management and is subcontracted or overseen by another investment advisor) and any other entity controlling by, or under common control with the investment advisor that provides ongoing services to the registrant, in each case under (ii) if the engagement relates directly to the operations and financial reporting of the registrant, in accordance with Rule 2-01(c)(7)(ii) of Regulation S-X, subject to waiver provisions set forth in Rule 2-01(c)(7)(ii) of Regulation S-X.
(e)(2) 0% of services included in (b) – (d) above were approved pursuant to Rule 2-01(c)(7)(i)(C) of Regulation S-X.
(f) Not applicable.
(g) The aggregate fees billed for the most recent fiscal year and the preceding fiscal year by the registrant’s principal accountant for non-audit services rendered to the registrant, its investment advisor, and any entity controlling, controlled by, or under common control with the investment advisor that provides ongoing services to the registrant were $65,140 and $69,450 respectively.
(h) The registrant’s audit committee of the board of directors has considered whether the provision of non-audit services that were rendered to the registrant’s investment adviser (not including any sub-adviser whose role is primarily portfolio management and is subcontracted with or overseen by another investment adviser), and any entity controlling, controlled by, or under common control with the investment adviser that provides ongoing services to the registrant that were not pre-approved pursuant to paragraph (c)(7)(ii) of Rule 2-01 of Regulation S-X is compatible with maintaining the principal accountant’s independence.
Items 5. Audit Committee of Listed Registrants.
Not applicable.
Item 6. Schedule of Investments.
Not applicable.
Item 7. Disclosure of Proxy Voting Policies and Procedures for Closed-End Management Investment Companies.
Not applicable.
Item 8. Portfolio Managers of Closed-End Management Investment Companies.
Not applicable.
Item 9. Purchases of Equity Securities by Closed-End Management Investment Company and Affiliated Purchasers.
Not applicable.
Item 10. Submission of Matters to a Vote of Security Holders.
Not applicable.
Item 11. Controls and Procedures.
(a) Based on our evaluation conducted within 90 days of the filing date, hereof, the design and operation of the registrant's disclosure controls and procedures are effective to ensure that material information relating to the registrant is made known to the certifying officers by others within the appropriate entities, particularly during the period in which Forms N-CSR are being prepared, and the registrant's disclosure controls and procedures allow timely preparation and review of the information for the registrant's Form N-CSR and the officer certifications of such Form N-CSR.
(b) There were no significant changes in the registrant's internal controls or in other factors that could significantly affect these controls subsequent to the date of their evaluation, including any corrective actions with regard to significant deficiencies and material weaknesses.
Item 12. Disclosure of Securities Lending Activities for Closed-End Management Investment Companies.
Not applicable.
Item 13. Exhibits.
(a)(1) Code of Ethics filed herewith as EX-99.CODE ETH.
(a)(2) A separate certification for each principal executive and principal financial officer of the registrant as required by Rule 30a-2(a) under the Act(17 CFR270.30a-2(a)). Filed herewith as EX-99.CERT.
(b) Certifications of principal executive officer and principal financial officer, under Section 906 of the Sarbanes-Oxley Act of 2002, and 18 U.S.C. ss.1350. Filed herewith as EX-99.906 CERT.
SIGNATURES
Pursuant to the requirements of the Securities Exchange Act of 1934 and the Investment Company Act of 1940, the registrant has duly caused this report to be signed on its behalf by the undersigned, thereunto duly authorized.
Meeder Funds
| By: | /s/ Bruce E. McKibben |
| | Bruce E. McKibben, Treasurer |
| | |
| Date: | March 4, 2020 |
Pursuant to the requirements of the Securities Exchange Act of 1934 and the Investment Company Act of 1940, this report has been signed below by the following persons on behalf of the registrant and in the capacities and on the dates indicated.
| By: | /s/ Bruce E. McKibben |
| | Bruce E. McKibben, Treasurer |
| | |
| Date: | March 4, 2020 |
| By: | /s/ Robert S. Meeder, Jr. |
| | Robert S. Meeder, Jr., President |
| | |
| Date: | March 4, 2020 |