Annual Report
The Quantex FundTM The Aggressive Growth Fund The Dynamic Growth Fund The Strategic Growth Fund The Muirfield Fund® | The Defensive Balanced Fund The Total Return Utilities Fund The U.S. Government Bond Fund The Money Market Fund |
TABLE OF CONTENTS
| Letter to Shareholders | 1 |
The Quantex FundTM | 4 |
| The Aggressive Growth Fund | 6 |
| The Dynamic Growth Fund | 8 |
| The Strategic Growth Fund | 10 |
| The Muirfield Fund® | 12 |
| The Defensive Balanced Fund | 14 |
| The Total Return Utilities Fund | 16 |
| The U.S. Government Bond Fund | 18 |
| The Money Market Fund | 20 |
| Shareholder Expense Analysis | 22 |
| Disclosure | 23 |
| Fund Holdings & Financial Statements | 24 |
| Our Mission Statement Every day, our mission is to exceed, with integrity, passion, and discipline, the expectations of our shareholders’ and clients’ overall investment experience. Core Values The Client/Shareholder Is Our #1 Priority Always remember whom we are serving. Our livelihood depends on providing a superior overall investment experience that exceeds the expectation of our shareholders and clients. Clarity Of Purpose Our organization has a clear, well-defined vision. All of our associates are committed to and understand how they will contribute to that vision. Communication We expect open and effective communication, full reporting, including good and bad news, and constructive feedback. Integrity We insist upon honesty and adhere to the highest ethical standards. Excellence/ Innovation Our associates strive each day for excellence in the work they perform, seek innovative ways to solve problems and introduce new ideas to take advantage of opportunities. We are a “Think Outside The Box” company. Associate Well-Being We value the success and well-being of our associates. We recognize and reward our associates’ contributions. Respect For Others Respect all people, value the differences among them and treat them as you would like to be treated. Seek First To Understand When interacting with others, place curiosity and understanding of their perspective FIRST, setting aside preconceived opinions and quick judgment. Teamwork We are a synergistic organization that works as a team to exceed our objectives. Profit We are profitable. Profitability enhances our services and capabilities, and affords everyone the opportunity to further their financial well-being. |
 | 2010 Annual Report | December 31, 2010 |
Letter to Shareholders December 31, 2010
The year ended December 31, 2010 proved encouraging to investors as major stock market indices continued to advance, which follows the strong gains of 2009. European debt concerns were overshadowed by domestic developments, including the ongoing economic recovery, strong corporate profits, and the extension of the “Bush Tax Cuts”. As these uncertainties were removed, the majority of stock market indices were able to rise to their highest levels since 2008. The Dow Jones Industrial Average closed the year at 11,578, which is 14.06% higher than a year ago. Similarly, the S&P 500 Index gained 15.06% over the last year (see chart 1). The full-year gains are especially impressive considering that the S&P 500 was down 7.38% year-to-date through July 2nd. Despite a modest fourth quarter, emerging market economies also experienced strong gains in 2010, as evidenced by the MSCI Emerging Market Index gain of 18.88%.
Despite continued volatility throughout 2010, we are very pleased with the performance of a number of our Funds. In a year when only 1 out of every 5 mutual funds outperformed the S&P 500 Index (according to Barron’s), we are pleased to report that 80% of our Funds outperformed their benchmarks. The Flex-funds® Total Return Utilities Fund is ahead of its benchmark for the 1-, 5-, 10-year, and since inception time periods. The Strategic Growth Fund remains ahead of the S&P 500 Index for the 1-year time period, while The Flex-funds® Aggressive Growth Fund has outperformed the S&P 500 Index during the 1-year and 5-year time periods. Additionally, both the retail and institutional classes of The Flex-funds® Money Market Fund continue to offer extremely competitive yields. According to iMoneyNet, the 7-day simple yield of the retail class was the highest in the country out of 224 first tier retail funds as of December 28, 2010. The institutional class ranked 2nd out of 269 first tier institutional funds according to iMoneyNet as of December 28, 2010.
The following pages provide an overview of how we managed our risk exposure and the strategies we employed during 2010. We will also provide a brief summary of the economic and financial events that took place throughout the year, discuss our expectations for 2011, and review the performance of The Flex-funds® Mutual Funds.
2010 in Review
Despite significant volatility during the first half of 2010, major stock market indices rallied into positive territory for the year during the third quarter, and the momentum continued in the final quarter of 2010. Investor concerns regarding key economic indicators such as unemployment and housing persisted, but positive drivers outweighed the negative catalysts. Economic growth accelerated, which suppressed investor anxiety regarding the possibility of a double-dip recession. Additionally, the temporary extension of the “Bush Tax Cuts” was passed, preventing tax rates from increasing in 2011 which would have presented an obstacle to further economic growth. Also, close attention was levied toward Federal Reserve policy and their guidance regarding the ongoing stabilization of the economy. Particularly, investors monitored whether the Federal Reserve would utilize additional
 | S&P 500 up 15.06% as of December 31, 2010 |
| | 2010 Annual Report | December 31, 2010 |
unconventional monetary policy measures to sustain the economic recovery. Sovereign debt problems continued in Europe, and as banks underwent stress tests in the euro zone, investors closely scrutinized the results and attempted to determine the impact on the overall global recovery. The following is a brief overview of significant events and developments that influenced investor decision making during 2010.
* Tax cut extension eases concerns. In 2001 and 2003, Congress enacted tax policy changes that lowered taxes through a variety of avenues, including lowering marginal tax rates, estate taxes, and taxes on capital gains. Because these changes were initially proposed by President Bush, they collectively became known as the “Bush Tax Cuts”. These tax cuts were set to expire at the end of 2010 and investors were concerned that the tax cut expiration at this stage of the economic recovery could prove detrimental. However, a two-year extension of the tax cuts was passed by the House and Senate, and signed into law in December. Furthermore, a 13-month extension of unemployment benefits and reduction in the social security tax witholding rate was included in the bill. However, the cost of the bill has been estimated at over $850 billion, and comes at a time when fiscal spending and substantial budget deficits are under increasing investor scrutiny.
* Federal Reserve continues accommodative monetary policy. The Federal Reserve has identified many issues threatening the ongoing progression of the U.S. economy. Among the most crucial are the struggling labor markets and the downward-drifting rate of inflation. The Fed recently stated that, “…the unemployment rate is elevated, and measures of underlying inflation are somewhat low, relative to levels that the Committee judges to be consistent, over the longer run, with its dual mandate [of maximum employment and price stability].” To combat deflation, unemployment, and other potential hindrances to economic growth, the Federal Reserve has maintained its policy of keeping interest rates at historic lows. Furthermore, the Fed has announced its intent to purchase a second round of treasury securities through the second quarter of 2011 in an attempt to keep interest rates low.
* Economy adding jobs, despite slow pace. Job growth showed signs of improvement during 2010, although the pace of job creation has been somewhat sluggish. There were over 1 million jobs created during 2010, while the unemployment rate ended the year at 9.4% compared to 9.7% in January (see chart 2). Many economists expect the level of unemployment to remain elevated for an extended period of time. Federal Reserve Chairman Ben Bernanke stated that unemployment is “probably the most important economic issue facing America today.” Furthermore, according to projections from the International Monetary Fund, unemployment is expected to remain high through 2011 for developed economies. However, weekly jobless claims were reported at 388,000 at the end of December. This is the lowest level of weekly claims since July of 2008, illustrating potential signs of improvement in the labor market. Investors will continue to monitor job growth closely in order to gauge the progress of the economic recovery.
* New home sales retreat to record low. Despite the homebuyer tax credit extension and historically low interest rates, new home sales fell to record low
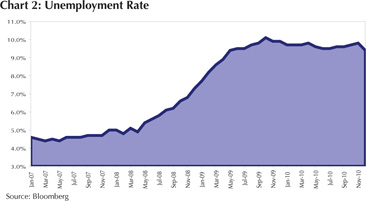 | Unemployment dropped to 9.4% for the month of December |
| | 2010 Annual Report | December 31, 2010 |
levels during 2010. New home sales fell to a seasonally adjusted annual rate of 274,000 during August, which represents a record low level since record keeping began. In addition, sales have struggled to recover from the exceptionally low base, and have remained below 300,000 during October and November. The ongoing uncertainty surrounding home prices coupled with the struggling labor markets and a heightened level of home foreclosures have hindered progress in home sales. Until housing prices stabilize and the employment picture improves, home sales may remain depressed.
* Sovereign debt concerns linger. Numerous countries in Europe continue to work through their debt problems with the safety net of a $1 trillion rescue fund organized by eurozone members and the International Monetary Fund. The majority of European banks passed the ‘stress tests’, which were designed to gauge their ability to withstand further deterioration in economic conditions and potential loan losses. However, many question whether or not the tests were strict enough to truly measure the banks’ ability to withstand losses. Investors also remain wary of financially weak countries within the eurozone, which is evidenced by various measures of default risk. Countries perceived to have higher financial risk are paying higher yields on government debt compared to their more financially stable neighbors.
Outlook for 2011
Last year presented numerous investment opportunities amidst the heightened stock market volatility. Many of the key drivers in 2010 remain unresolved and will shape the investment landscape in 2011. The durability of the economic recovery will be tested as the U.S. economy attempts to add jobs with reduced levels of government aid, and continued scrutiny will be placed on European nations as they take austerity measures to rectify fiscal imbalances and solve their sovereign debt problems. However, corporate profits remain strong, and accomodative monetary policy should continue to aid the economic recovery.
As we monitor the stock market and our investment models, we will continuously evaluate our defensive position in The Muirfield Fund® and the equity portion of The Defensive Balanced Fund. We will look for opportunities to adjust portfolio weights among growth and value stocks, large-, mid-, and small-caps, and domestic and international investments in order to enhance returns and manage risk for our clients. We will also continue to proactively manage our sector exposures and will make adjustments as our investment models evolve. On the following pages you will find a review of how the The Flex-funds® Mutual Funds have performed. Please read the commentaries to learn more about the investment decisions we made during the past quarter.
Since 1974, Meeder Financial has navigated through many different market environments. On behalf of all the associates at Meeder Asset Management and The Flex-funds®, I thank you for the continued trust and confidence you have placed in our investment management services. Be assured we are 100% committed to working with you and helping you achieve your most important financial goals.
Robert S. Meeder
President
The Flex-funds®
December 31, 2010
| | 2010 Annual Report | December 31, 2010 |
The Quantex Fund™ The Quantex FundTM outperformed both the Russell 2000 and the S&P 400 Mid-Cap indices for the five year period ending 12/31/10. |
The Flex-funds® Quantex Fund™ returned 23.21% for the year ended December 31, 2010. For the same time period, the Russell 2000 Index and the S&P 400 Mid-Cap Index returned 26.86% and 26.64%, respectively. For the period ending December 31, 2010, The Quantex Fund™ has outperformed both the Russell 2000 Index and the S&P 400 Mid-Cap Index for the 5-year time frame.
We have consistently employed our quantitative stock selection process since April 30, 2005 for The Quantex Fund™. We utilize rankings from our quantitative financial model to determine which securities are to be held in the Fund on an annual basis. As a result, the Fund is rebalanced annually in January. According to our allocation analysis at the beginning of 2010, there was a strong preference for value holdings, with mid-cap value companies comprising 39% of the Fund, followed by mid-cap core with 35%, mid-cap growth with 14%, and small-cap holdings of 12%.
After rebalancing the Fund in January 2011, there is also a strong preference for value holdings, with mid-cap value companies comprising 44% of the Fund, followed by mid-cap core with 26%, and mid-cap growth with 19%. Small-cap holdings of 11% comprise the remainder according to our allocation analysis at the beginning of the year.
Relative to the S&P 400 Mid-Cap Index, stock selection within the financial sector provided the greatest benefit to the Fund. The largest detractor from performance was stock selection within the consumer discrectionary sector, although the Fund’s overweight to the sector partially offset the negative selection impact. Stock selection in the energy sector also contributed to performance, while selection in the industrial sector detracted from returns. However, the Fund also benefited from other sector allocation decisions, including an underweight to the healthcare and utilities sectors during 2010.
For the full year 2010, many stocks contributed positively to the performance of the Fund. The top performing stock for the year was Huntington Bancshares, which was up nearly 90%. Other top performers for the year include Zions Bancorporation (up 89%) and Akamai Technologies (up 86%). The largest detractors from performance during the year were Dean Foods (down 51%), PulteGroup (down 25%), and AK Steel (down 22%).
| | 2010 Annual Report | December 31, 2010 |
Period & Average Annual Total Returns as of December 31, 2010
| | 1 | 5 | 4/30/05 to | 10 | Inception |
| | Year | Year | 12/31/102 | Year | Date |
The Flex-funds® Quantex Fund | 23.21% | 6.17% | 7.79% | 2.60% | 3/20/85 |
Expense Ratios+: Current net 1.65% Gross 2.39% | | | | | |
Blended Index1 | 26.77% | 5.15% | 6.89% | 6.81% | 3/31/85 |
| Russell 2000 Index | 26.86% | 4.48% | 8.07% | 6.36% | 3/31/85 |
| S&P 400 Mid-Cap Index | 26.64% | 5.73% | 7.53% | 7.15% | 3/31/85 |
Growth of $10,000: 12/31/00 - 12/31/10
The Quantex Fund™ was previously known as The Highlands Growth Fund. On April 30, 2005, The Highlands Growth Fund changed its name to The Quantex Fund™, also changing the Fund’s investment objective and strategies. Due to this, the Russell 2000 Index and the S&P 400 Mid-Cap Index are more comparative indices for Fund performance.
The Growth of $10,000 chart compares the value of The Quantex Fund™ to the S&P 400 Mid-Cap Index and the Russell 2000 Index, the Fund’s broad-based benchmarks, and to the Blended Index, which consists of 50% of the Russell 2000 Index and 50% of the S&P 400 Mid-Cap Index. The chart is intended to give you a general idea of how the Fund performed compared to these benchmarks over the period from December 31, 2000 to December 31, 2010. An understanding of the differences between the Fund and these indices is important. The benchmark indices do not take into account the deduction of expenses associated with a mutual fund, such as investment management and accounting fees. One cannot invest directly in an index.
Past performance does not guarantee future results. The chart and the table do not reflect the deduction of taxes that a shareholder would pay on Fund distributions or the redemption of Fund shares.
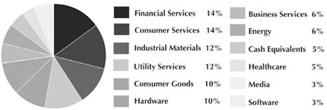
Sector Weightings as of December 31, 2010
Sector Weightings are subject to change.
Top Ten Holdings as of December 31, 2010
| 1) Stanley Black & Decker, Inc. | 2.08% |
| 2) Zions Bancorporation | 1.51% |
| 3) Huntington Bancshares, Inc. | 1.51% |
| 4) Akamai Technologies, Inc. | 1.49% |
| 5) Whole Foods Market, Inc. | 1.48% |
| 6) Family Dollar Stores, Inc. | 1.43% |
| 7) JDS Uniphase Corp. | 1.41% |
| 8) Abercrombie and Fitch Co. | 1.33% |
| 9) MetroPCS Communications, Inc. | 1.32% |
| 10) Apartment Investment & Management Co. | 1.30% |
As a percentage of total investments
Management fees were waived and/or expenses were reimbursed in order to reduce the operating expenses of The Quantex Fund™ during the periods shown above. + Current net expense ratio based on average daily net assets for the year ended 12/31/10, including effect of contractual expense waivers and reimbursements. This ratio may increase or decrease depending on fluctuations in Fund net assets. The Gross Expense Ratio is a percentage of the Fund’s average daily net assets as shown in the most current Fund Prospectus. Please see additional disclosures on page 23.
| | 2010 Annual Report | December 31, 2010 |
The Aggressive Growth Fund The Aggressive Growth Fund outperformed the S&P 500 Index for the five year period ending 12/31/10. |
The Flex-funds® Aggressive Growth Fund returned 15.67% for the year ended December 31, 2010. By comparison, the S&P 500 Index returned 15.06% during the same time period. Additionally, the Fund has outperformed the S&P 500 Index during the 5-year time period.
We entered the first quarter with an overweight to value investments, mid-cap stocks, and small-cap stocks, and increased our small-cap exposure as the quarter progressed due to model preferences. We also began the first quarter with an overweight position in the energy and industrial materials sectors, as well as a position in emerging market stocks. As the quarter progressed, our investment models increased preference for domestic securities relative to emerging markets, which led us to reduce our emerging market positions. We also increased our exposure to the healthcare sector due to indications from our investment models, which was largely driven by attractive valuations.
During the second quarter, our investment models pared preference for small-cap stocks as market declines intensified, which led us to decrease our small-cap position. Despite the adjustment, we maintained an overweight to small-cap stocks throughout the quarter, which benefited our performance. We also began the second quarter with an overweight position in the energy and healthcare sectors, as well as a small position in emerging market stocks. As the quarter progressed and stock market declines materialized, our investment models increased preference for defensive sectors, which led us to increase our healthcare position and establish an overweight position in the consumer staples sector. We ended the second quarter with an overweight position in the healthcare, consumer staples, and energy sectors, while being underweight in the technology and utilities sector.
We began the third quarter with an overweight to value investments, mid-cap stocks, and small-cap stocks. As the quarter progressed, our investment models maintained preference for mid- and small-cap stocks, but indicated preference for a neutral position among growth and value investments. As a result, we reduced our overweight to value investments, which had been in place since early 2009. We also began the third quarter with an overweight position in the energy, healthcare, and consumer staples sectors, while being underweight in the technology and utilities sectors. As the quarter progressed, our investment models pared preference for defensive sectors, which led us to decrease our healthcare overweight and eliminate our position in the consumer staples sector. We also exited our energy position, but began increasing our exposure to the technology sector due to model indications. We also noted significant changes in our model preference for international investments, which ranked emerging markets above domestic securities, and responded by establishing a direct position in emerging markets, which also resulted in an overweight position in the industrial materials sector.
We entered the fourth quarter with a neutral position among growth versus value investments; however, we established an overweight position in growth investments as the quarter progressed due to indications from our investment models. We also maintained our overweight in mid- and small-cap stocks, which has been a key component of our investment allocation throughout the year. Our sector exposure was concentrated among growth-oriented industries throughout the fourth quarter, particularly among the technology sector. We were also overweight in the industrial materials sector, while being underweight in the consumer staples and energy sector. We continue to maintain a direct position in emerging market securities, although we reduced our position as the quarter progressed, and continue to avoid direct exposure to developed international markets.
| | 2010 Annual Report | December 31, 2010 |
Period & Average Annual Total Returns as of December 31, 2010
| | 1 | 5 | 10 | Inception |
| | Year | Year | Year | Date |
The Flex-funds® Aggressive Growth Fund | 15.67% | 2.46% | 0.36% | 2/29/00 |
Expense Ratios+: Current net 1.59% Gross 1.82% | | | | |
| S&P 500 Index | 15.06% | 2.29% | 1.41% | 2/29/00 |
| NASDAQ Composite Index | 18.15% | 4.71% | 1.43% | 2/29/00 |
Growth of $10,000: 12/31/00 - 12/31/10
The Growth of $10,000 chart compares The Aggressive Growth Fund’s value to the NASDAQ Composite Index and the S&P 500 Index, the Fund’s broad-based benchmark. The chart is intended to give you a general idea of how the Fund performed compared to these benchmarks over the period from December 31, 2000 to December 31, 2010. An understanding of the differences between the Fund and these indices is important. The NASDAQ Composite Index is a hypothetical unmanaged index of small-cap and NASDAQ National Market stocks that does not take into account the deduction of expenses associated with a mutual fund, such as investment management and accounting fees. The S&P 500 Index is a widely recognized unmanaged index of common stock prices that does not take into account the deduction of expenses associated with a mutual fund, such as investment management and accounting fees. One cannot invest directly in an index.
Past performance does not guarantee future results. The chart and the table do not reflect the deduction of taxes that a shareholder would pay on Fund distributions or the redemption of Fund shares.
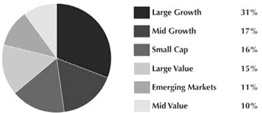
Fund Weightings as of December 31, 2010
Fund Weightings are subject to change.
Top Ten Holdings as of December 31, 2010
1) Morgan Stanley Institutional Mid Cap Growth Fund | 10.45% |
| 2) Wells Fargo Advantage Growth Fund | 10.28% |
| 3) Oppenheimer Developing Markets Fund | 10.15% |
| 4) RidgeWorth Small Cap Value Equity Fund | 8.27% |
| 5) Putnam Voyager Fund | 7.63% |
| 6) RidgeWorth Mid Cap Value Equity Fund | 7.59% |
| 7) RS Technology Fund | 7.40% |
| 8) Nuveen Tradewinds Value Opportunities Fund | 7.36% |
| 9) iShares Russell 2000 Growth Index Fund | 7.02% |
| 10) PowerShares QQQ | 7.01% |
As a percentage of total investments
Management fees were waived and/or expenses were reimbursed in order to reduce the operating expenses of The Aggressive Growth Fund during the periods shown above. This waiver is voluntary and may be terminated at any time. + Current net expense ratio based on average daily net assets for the year ended 12/31/10, including effect of voluntary expense waivers and reimbursements. This ratio may increase or decrease depending on fluctuations in Fund net assets. The Gross Expense Ratio is a percentage of the Fund’s average daily net assets, not including acquired fund fees and expenses, as shown in the most current Fund Prospectus. Please see additional disclosures on page 23.
| | 2010 Annual Report | December 31, 2010 |
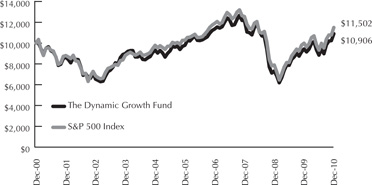
The Dynamic Growth Fund With a 15.54% return for 2010, The Dynamic Growth Fund has outperformed the S&P 500 Index five of the past six years. |
The Flex-funds® Dynamic Growth Fund returned 15.54% for the year through December 31, 2010 compared to the S&P 500 Index return of 15.06% for the same time period.
During the first quarter, our investment models maintained preference for value investments versus growth investments in The Dynamic Growth Fund. We also entered the first quarter with an overweight to small-cap stocks, and further increased our small-cap exposure as the quarter progressed. We also began the first quarter with an overweight position in the industrial materials and energy sectors, as well as a position in emerging markets. We maintained our overweight positions in the consumer staples and healthcare sector as well due to model preferences. As the quarter progressed, our investment models increased preference for domestic securities relative to emerging markets, which led us to decrease our holdings of emerging market securities. Our overweight positions were accomplished by underweighting the technology and utilities sectors as indicated by our models.
At the start of the second quarter, our investment models continued to maintain preference for value investments versus growth investments, and we also maintained our overweight to small-cap stocks. However, as the quarter progressed our investment models pared preference for small-cap stocks, which led us to scale back our position while still remaining overweight. In terms of sector exposure, we began the second quarter with an overweight position in the healthcare, consumer staples, and energy sectors. As the quarter progressed and market conditions deteriorated, our investment models maintained preference for the consumer staples and healthcare sector. Our overweight positions were accomplished by underweighting the technology and utilities sectors. We also maintained a modest exposure to emerging markets.
In the third quarter, our investment models continued to maintain preference for mid- and small-cap investments; however, our models are now indicating a more neutral positioning among value and growth investments, compared to the previous preference for value investments. As a result, we reduced our holdings of value investments and simultaneously increased our exposure to growth investments. We also entered the third quarter with an overweight in the healthcare and consumer staples sectors, while being underweight in the technology sector. As the quarter progressed, our investment models began shifting preference away from the traditionally ‘defensive’ consumer staples and healthcare sectors, and increased preference for technology. As a result, we eliminated our consumer staples overweight, reduced our healthcare overweight, and simultaneously increased our exposure to the technology sector. We also noted important changes in our international investment model, which now indicates preference for emerging markets compared to domestic securities and responded by establishing a direct position in emerging markets.
During the fourth quarter, we continued to make additional allocations to growth investments versus value, which resulted in an overweight to growth investments across all levels of market capitalizations. Additionally, our investment models have continued to maintain preference for mid- and small-cap companies. On an international basis, we continue to avoid direct exposure to developed international markets, and have reduced our emerging markets exposure based on our investment models. We also established an overweight position in the technology sector early in the fourth quarter, while also maintaining our overweight in the industrial materials sector and underweight in the energy sector. As the quarter progressed, our investment models pared preference for technology, and indicated greater exposure to the consumer discretionary and energy sector.
| | 2010 Annual Report | December 31, 2010 |
Period & Average Annual Total Returns as of December 31, 2010
| | 1 | 5 | 10 | Inception |
| | Year | Year | Year | Date |
The Flex-funds® Dynamic Growth Fund | 15.54% | 2.17% | 0.87% | 2/29/00 |
Expense Ratios+: Current net 1.39% Gross 1.63% | | | | |
| S&P 500 Index | 15.06% | 2.29% | 1.41% | 2/29/00 |
Growth of $10,000: 12/31/00 - 12/31/10
The Growth of $10,000 chart compares The Dynamic Growth Fund’s value to the S&P 500 Index, the Fund’s broad-based benchmark. The chart is intended to give you a general idea of how the Fund performed compared to this benchmark over the period from December 31, 2000 to December 31, 2010. An understanding of the differences between the Fund and this index is important. The S&P 500 Index is a hypothetical unmanaged index of common stocks that does not take into account the deduction of expenses associated with a mutual fund, such as investment management and accounting fees. One cannot invest directly in an index.
Past performance does not guarantee future results. The chart and the table do not reflect the deduction of taxes that a shareholder would pay on Fund distributions or the redemption of Fund shares.
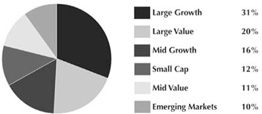
Fund Weightings as of December 31, 2010
Fund Weightings are subject to change.
Top Ten Holdings as of December 31, 2010
| 1) Oppenheimer Developing Markets Fund | 9.59% |
| 2) Wells Fargo Advantage Growth Fund | 9.13% |
| 3) Fairholme Fund | 8.91% |
| 4) Putnam Voyager Fund | 8.38% |
| 5) Nuveen Tradewinds Value Opportunities Fund | 7.68% |
| 6) RidgeWorth Mid Cap Value Equity Fund | 6.94% |
| 7) PowerShares QQQ | 6.83% |
| 8) RidgeWorth Small Cap Value Equity Fund | 6.00% |
| 9) Invesco Diversified Dividend Fund | 5.68% |
10) Consumer Discretionary Select Sector SPDR Fund | 5.41% |
As a percentage of total investments
Management fees were waived and/or expenses were reimbursed in order to reduce the operating expenses of The Dynamic Growth Fund during the periods shown above. This waiver is voluntary and may be terminated at any time. + Current net expense ratio based on average daily net assets for the year ended 12/31/10, including effect of voluntary expense waivers and reimbursements. This ratio may increase or decrease depending on fluctuations in Fund net assets. The Gross Expense Ratio is a percentage of the Fund’s average daily net assets, not including acquired fund fees and expenses, as shown in the most current Fund Prospectus. Please see additional disclosures on page 23.
| | 2010 Annual Report | December 31, 2010 |
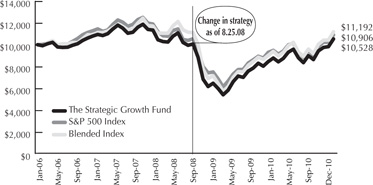
The Strategic Growth Fund Since the change in strategy, The Strategic Growth Fund has outperformed both the S&P 500 Index and its blended benchmark. |
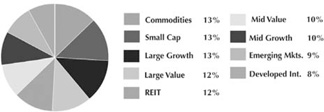
The Flex-funds® Strategic Growth Fund returned 19.96% for the year ended December 31, 2010, compared to the custom benchmark return of 19.19% for the same period. The Fund also outperformed the broader market during the year, as measured by the S&P 500 Index, which returned 15.06%. The Strategic Growth Fund is fully invested in the equity market at all times, and holds a fixed allocation across six distinct investment categories. The mix of investments selected to represent each investment category is variable and actively managed by using our strategic fund selection process. The current target allocation is comprised of the following: 25% large-cap, 20% mid-cap, 17.5% international, 12.5% small-cap, 12.5% real estate, and 12.5% commodities. Within each respective category, we seek to identify funds that will outperform their peers through an evaluation process based on valuation factors, measures of volatility, and risk-adjusted returns. Funds that fall out of favor within our models are sold and replaced with funds ranked higher by our evaluation process.
The Fund outperformed the custom benchmark during 2010 as a result of our strategic fund selection process in several categories. For instance, our large-cap holding of the Fairholme Fund returned 25.47% in 2010 compared to the S&P 500 Index return of 15.06%. Our real-estate holding of First American Real Estate returned 30.57% in 2010, which was 2.56% ahead of its benchmark index. Additionally, the Ridgeworth Small Cap Value Fund returned 28.79% compared to the small-cap benchmark return of 26.85% for the Russell 2000 Index.
The Fund’s favorable performance during 2010 versus the S&P 500 can be directly attributed to several of the asset allocation categories. Although the S&P 500 posted a sizeable gain of 15.06% during the year, several of the other asset allocation categories significantly outperformed the broader market. For instance, the Russell 2000 Index of small-cap stocks and the S&P 400 Index of mid-cap stocks increased by 26.86% and 26.64%, respectively (be advised that one cannot invest directly in an index). Also, the Dow Jones REIT Index increased by 28.01% in 2010, while an index of emerging market securities gained 18.88%.
| | 2010 Annual Report | December 31, 2010 |
Period & Average Annual Total Returns as of December 31, 2010
| | 1 | 8/25/08 to | Since | Inception |
| | Year | 12/31/104 | Inception | Date |
The Flex-funds® Strategic Growth Fund | 19.96% | 2.64% | 1.05% | 1/31/06 |
Expense Ratios+: Current net 1.49% Gross 1.80% | | | | |
Blended Index3 | 19.19% | 0.32% | 2.32% | 1/31/06 |
| S&P 500 Index | 15.06% | 2.02% | 1.79% | 1/31/06 |
Growth of $10,000: 1/31/06 - 12/31/10
The Growth of $10,000 chart compares The Strategic Growth Fund’s value to the S&P 500 Index, the Fund’s broad-based benchmark, and the Blended Index, which consists of 25% of the S&P 500 Index, 20% of the S&P 400 Index, 12.5% of the Russell 2000 Index, 12.5% of the Dow Jones US Select REIT Index, 12.5% of the S&P GSCI Index, 12% of the MSCI EAFE Index, and 5.5% of the MSCI Emerging Markets Index. The chart is intended to give you a general idea of how the Fund performed compared to these indices over the period from its inception on January 31, 2006 to December 31, 2010. An understanding of the differences between the Fund and these indices is important. The benchmark indices are hypothetical unmanaged indices of common stock that do not take into account the deduction of expenses associated with a mutual fund, such as investment management and accounting fees. One cannot invest directly in an index.
Past performance does not guarantee future results. The chart and the table do not reflect the deduction of taxes that a shareholder would pay on Fund distributions or the redemption of Fund shares.
Fund Weightings as of December 31, 2010
Fund Weightings are subject to change.
Top Ten Holdings as of December 31, 2010
| 1) Van Eck Global Hard Assets Fund | 12.65% |
| 2) First American Real Estate Securities Fund | 12.50% |
3) Morgan Stanley Institutional Mid Cap Growth Portfolio | 9.25% |
| 4) RidgeWorth Mid Cap Value Equity Fund | 9.20% |
| 5) Oppenheimer Developing Markets Fund | 8.74% |
| 6) Dodge & Cox International Stock Fund | 8.39% |
| 7) Lord Abbett Fundamental Equity Fund | 6.87% |
| 8) Wells Fargo Advantage Growth Fund | 6.39% |
| 9) Lord Abbett Developing Growth Fund | 6.11% |
| 10) RidgeWorth Small Cap Value Equity Fund | 5.98% |
As a percentage of total investments
Management fees were waived and/or expenses were reimbursed in order to reduce the operating expenses of The Strategic Growth Fund during the periods shown above. This waiver is voluntary and may be terminated at any time. + Current net expense ratio based on average daily net assets for the year ended 12/31/10, including effect of voluntary expense waivers and reimbursements. This ratio may increase or decrease depending on fluctuations in Fund net assets. The Gross Expense Ratio is a percentage of the Fund’s average daily net assets, not including acquired fund fees and expenses, as shown in the most current Fund Prospectus. Please see additional disclosures on page 23.
| | 2010 Annual Report | December 31, 2010 |
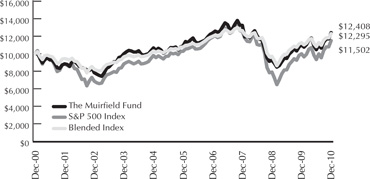
The Muirfield Fund® The Muirfield Fund® outperformed the S&P 500 for the five and ten year periods ending 12/31/10. |
The Flex-funds® Muirfield Fund® returned 12.65% for the year ended December 31, 2010. By comparison, a blended benchmark comprised of 60% of the S&P 500 Index and 40% of the 90-day U.S. Treasury Bill returned 9.29% for the same period, while the S&P 500 Index returned 15.06%.
We began the year with an approximate 90% allocation to the stock market and a 10% defensive position in fixed-income investments in The Muirfield Fund®. During the second quarter, stock market conditions worsened and our investment models indicated a deteriorating risk/reward market environment. As a result, we increased our defensive position to 25% in fixed-income investments. Amid continued stock market volatility, we made an incremental increase to our defensive position at the start of the third quarter in order to protect against potential downside risk. However, as the quarter progressed and stock market volatility began to subside, we noted substantial improvement in our investment models, which led us to revert back to our 25% defensive fixed-income position. During the fourth quarter, we noted rapid improvements in our investment models as market conditions progressed. As the stock market continued to advance, all of the technical and momentum factors within our investment models became positive, which indicated a more favorable risk/reward relationship in the stock market. The improvement led us to commence incremental increases to our invested position throughout the fourth quarter. As a result, we ended the year 95% invested in the stock market, including exposure to futures contracts, in The Muirfield Fund®.
We managed our industry and sector exposure throughout the year and initiated changes in sector allocations in the Fund as stock market conditions progressed. We began the year with an overweight position in the energy, consumer staples, and healthcare sectors due to indications from our investment models. Our overweight positions were accomplished by underweighting the technology and utilities sectors. During the third quarter, we reduced our energy position, decreased our exposure to the traditionally ‘defensive’ consumer staples and healthcare sectors, and increased our exposure to the technology and industrial materials sector. During the fourth quarter, our investment models decreased preference for the technology sector, while increasing preference for the consumer discretionary and energy sector. Due to the change in preference, we established an overweight position to the consumer discretionary sector and became neutral to the energy and technology sectors.
Regarding our exposure to growth versus value investments, we entered 2010 with an overweight to value investments across all market capitalization ranges. As the year progressed, we moved to a neutral position among growth versus value during the third quarter due to indications from our investment models. During the fourth quarter, we continued to make incremental allocations to growth investments, which resulted in an overweight position. We also maintained an overweight to mid- and small-cap investments throughout 2010.
We also entered 2010 with a position in emerging market securities. Although we reduced our position during the second quarter, we re-established a direct position in emerging market investments during the third quarter. Additionally, we avoided direct investments in developed international securities throughout the year.
| | 2010 Annual Report | December 31, 2010 |
Period & Average Annual Total Returns as of December 31, 2010
| | 1 | 5 | 10 | Inception |
| | Year | Year | Year | Date |
The Flex-funds Muirfield Fund® | 12.65% | 2.65% | 2.18% | 8/10/88 |
Expense Ratios+: Current net 1.39% Gross 1.66% | | | | |
Blended Index5 | 9.29% | 2.69% | 2.09% | 8/10/88 |
| S&P 500 Index | 15.06% | 2.29% | 1.41% | 8/10/88 |
Growth of $10,000: 12/31/00 - 12/31/10
The Growth of $10,000 chart compares the value of The Muirfield Fund® to the S&P 500 Index, the Fund’s broad-based benchmark, and to an index composed of 60% of the S&P 500 Index and 40% of 90-day T-bills. The chart is intended to give you a general idea of how the Fund performed compared to these indices over the period from December 31, 2000 to December 31, 2010. An understanding of the differences between the Fund and these indices is important. The benchmark indices are hypothetical unmanaged indices of common stocks and 90-day T-bills that do not take into account the deduction of expenses associated with a mutual fund, such as investment management and accounting fees. One cannot invest directly in an index.
Past performance does not guarantee future results. The chart and the table do not reflect the deduction of taxes that a shareholder would pay on Fund distributions or the redemption of Fund shares.
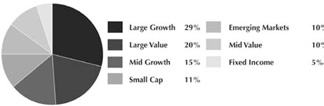
Fund Weightings as of December 31, 2010
Fund Weightings are subject to change.
Top Ten Holdings as of December 31, 2010
| 1) Wells Fargo Advantage Growth Fund | 8.70% |
| 2) Fairholme Fund | 8.55% |
| 3) Oppenheimer Developing Markets Fund | 8.45% |
| 4) Putnam Voyager Fund | 8.07% |
| 5) Caterpillar Financial Power Investment Floating Rate Demand Note | 7.62% |
| 6) Nuveen Tradewinds Value Opportunities Fund | 7.29% |
| 7) PowerShares QQQ | 6.48% |
| 8) RidgeWorth Mid Cap Value Equity Fund | 6.12% |
9) Morgan Stanley Institutional Mid Cap Growth Portfolio | 5.46% |
| 10) RidgeWorth Small Cap Value Equity Fund | 5.28% |
As a percentage of total investments
Management fees were waived and/or expenses were reimbursed in order to reduce the operating expenses of The Muirfield® Fund during the periods shown above. This waiver is voluntary and may be terminated at any time. + Current net expense ratio based on average daily net assets for the year ended 12/31/10, including effect of voluntary expense waivers and reimbursements. This ratio may increase or decrease depending on fluctuations in Fund net assets. The Gross Expense Ratio is a percentage of the Fund’s average daily net assets, not including acquired fund fees and expenses, as shown in the most current Fund Prospectus. Please see additional disclosures on page 23.
| | 2010 Annual Report | December 31, 2010 |
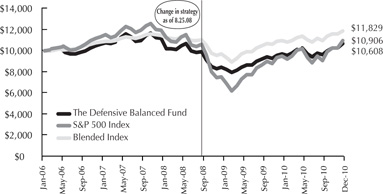
The Defensive Balanced Fund Since the change in strategy, The Defensive Balanced Fund has outperformed both the S&P 500 Index and its blended benchmark. |
The Flex-funds® Defensive Balanced Fund returned 9.76% for the year ended December 31, 2010. By comparison, a blended benchmark returned 8.44% for the same time period, while the S&P 500 Index returned 15.06%. The Defensive Balanced Fund will always invest at least 30% of its assets in fixed-income securities. The Fund will also hold a minimum 30% allocation in equity securities, with additional investments determined by our defensive equity discipline.
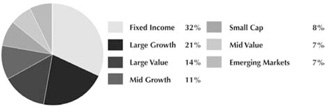
In the Defensive Balanced Fund, we began the year with an approximate 60% allocation to the stock market and a 40% position in fixed-income investments. During the second quarter, our investment models indicated a deteriorating risk/reward market environment, which led us to increase our exposure to fixed-income investments to approximately 45%. Amid continued stock market volatility, we made an incremental increase to fixed-income investments at the start of the third quarter in order to protect against potential downside risk. However, as the quarter progressed and stock market volatility began to subside, we noted substantial improvement in our investment models, which led us to increase our stock market exposure. During the fourth quarter, we noted further improvements in our investment models as market conditions improved, which led us to further increase our stock market exposure. As a result, we ended the year approximately 69% invested in the stock market and 31% invested in fixed-income investments in the Defensive Balanced Fund.
We also managed our sector exposure, and began the year with an overweight position in the energy, consumer staples, and healthcare sectors due to indications from our investment models. Our overweight positions were accomplished by underweighting the technology and utilities sectors. During the third quarter, we reduced our energy position, decreased our exposure to the traditionally ‘defensive’ consumer staples and healthcare sectors, and increased our exposure to the technology and industrial materials sector. During the fourth quarter, our investment models decreased preference for the technology sector, while increasing preference for the consumer discretionary and energy sector. Due to the change in preference, we established an overweight position to the consumer discretionary sector and became neutral to the energy and technology sectors. We also entered 2010 with a position in emerging market securities. Although we reduced our position during the second quarter, we re-established a direct position in emerging market investments during the third quarter.
Regarding our exposure to growth versus value investments, we entered 2010 with an overweight to value investments across all market capitalization ranges. As the year progressed, we moved to a neutral position among growth versus value during the third quarter due to indications from our investment models. During the fourth quarter, we continued to make incremental allocations to growth investments, which resulted in an overweight position. We also maintained an overweight to mid- and small-cap investments throughout 2010.
In the fixed-income portion of the Fund, the target allocation was overweight in investment grade corporate bond funds throughout 2010. During much of the past year, the yield on investments in this sector relative to U.S. Treasury securities narrowed toward average historical levels. Despite the narrower spreads, we still believe there is additional value to be generated from this sector. The duration of the fixed-income portion of the Fund was maintained slightly below that of our benchmark during 2010, consistent with readings from our fixed-income models that favored this position.
| | 2010 Annual Report | December 31, 2010 |
Period & Average Annual Total Returns as of December 31, 2010
| | 1 | 8/25/08 to | Since | Inception |
| | Year | 12/31/107 | Inception | Date |
The Flex-funds® Defensive Balanced Fund | 9.76% | 3.44% | 1.21% | 1/31/06 |
Expense Ratios+: Current net 1.52% Gross 1.72% | | | | |
Blended Index6 | 8.44% | 3.14% | 3.47% | 1/31/06 |
| S&P 500 Index | 15.06% | 2.02% | 1.79% | 1/31/06 |
Growth of $10,000: 1/31/06 - 12/31/10
The Growth of $10,000 chart compares The Defensive Balanced Fund’s value to the S&P 500 Index, the Fund’s broad-based benchmark, and to the Blended Index which, is comprised of 42% of the S&P 500 Index, 28% of the average 90-day U.S. T-bill and 30% of the Barclays Intermediate-Term Government/Credit Index. The chart is intended to give you a general idea of how the Fund performed compared to these indices over the period from its inception on January 31, 2006 through December 31, 2010. An understanding of the differences between the Fund and these indices is important. The benchmark indices are hypothetical unmanaged indices of common stock that do not take into account the deduction of expenses associated with a mutual fund, such as investment management and accounting fees. One cannot invest directly in an index.
Past performance does not guarantee future results. The chart and the table do not reflect the deduction of taxes that a shareholder would pay on Fund distributions or the redemption of Fund shares.
Fund Weightings as of December 31, 2010
Fund Weightings are subject to change.
Top Ten Holdings as of December 31, 2010
| 1) TCW Total Return Bond Fund (The) | 7.33% |
| 2) Metropolitan West Total Return Bond Fund | 7.32% |
| 3) PIMCO Total Return Fund | 7.30% |
| 4) Oppenheimer Developing Markets Fund | 6.64% |
| 5) Wells Fargo Advantage Growth Fund | 6.29% |
| 6) Fairholme Fund | 6.09% |
| 7) Putnam Voyager Fund | 5.63% |
| 8) RidgeWorth Mid Cap Value Equity Fund | 4.77% |
| 9) Nuveen Tradewinds Value Opportunities Fund | 4.56% |
| 10) PowerShares QQQ | 4.45% |
As a percentage of total investments
Management fees were waived and/or expenses were reimbursed in order to reduce the operating expenses of The Defensive Balanced Fund during the periods shown above. This waiver is voluntary and may be terminated at any time. + Current net expense ratio based on average daily net assets for the year ended 12/31/10, including effect of voluntary expense waivers and reimbursements. This ratio may increase or decrease depending on fluctuations in Fund net assets. The Gross Expense Ratio is a percentage of the Fund’s average daily net assets, not including acquired fund fees and expenses, as shown in the most current Fund Prospectus. Please see additional disclosures on page 23.
| | 2010 Annual Report | December 31, 2010 |
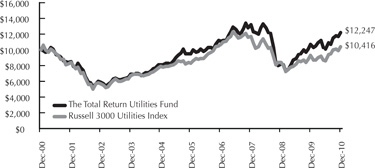
The Total Return Utilities Fund The Total Return Utilities Fund outperformed the Russell 3000 Utilities Index for the one, five, and ten year periods ending 12/31/10. |
The Flex-funds® Total Return Utilities Fund returned 14.10% for the year ended December 31, 2010, compared to the benchmark Russell 3000 Utilities Index return of 11.73% for the same time period. In addition, the Fund has outperformed the Russell 3000 Utilities benchmark for the 5-, 10-year, and since inception periods.
We bought and sold Telmex during the first quarter, with little result in terms of performance. We anticipated more upside for the stock as a player in Carlos Slim’s Helu’s consolidation and restructuring, but as the story unfolded we decided that gains were limited. We added American Tower, which is a major beneficiary of the wireless infrastructure build-out, and additional infrastructure appears necessary since smart phones use a multiple of the bandwidth used by regular voice phones. We also noticed that a tendency to intervene and delay construction of nuclear plants has been developing in various areas at the local level. This concerned us with regard to Shaw Group, so we took a small profit and moved to Wilbros, which is another engineering and construction company, but with greater focus on conventional energy sources.
Utilities generated favorable performance relative to the broader market indices during the second quarter. Our best performers in the quarter included a mix of infrastructure companies and master limited partnerships. Akamai, whose technology and services make high speed delivery of information on the internet possible, increased nearly 30% during the second quarter. The company reported results that were much better than expected, increased its share buy-back program, and raised future guidance. On the downside, NIHD Holdings was the worst performer, but this was primarily a result of market volatility, which we believe is tolerable since the stock has been a portfolio leader over the past year.
The third quarter was unusually strong for utilities and infrastructure stocks, and many of our stocks fully participated in the upside. Telecomm and associated companies were notably in demand, and the majority of our stocks generated double-digit gains for the quarter. NII Holdings (the former Sprint operations in Latin America) continues to benefit from a high-growth profile, though earnings came in soft last quarter. We increased our weight in American Superconductor, as the company continues to see design wins all over the world as a result of its unique control technology for wind and other power installations. Our enabling companies such as ABB, Fluor, and Chicago Bridge & Iron, each provided exceptional returns for the quarter. We did not experience many laggards during the third quarter. Two of our holdings with natural gas exposure, EQT and Ultra Petroleum, reflected relentlessly weak gas prices. We also sold underperforming Quanta Services, Calgon Carbon, and A123, which were all small positions.
The essential services sector, and the sectors that provide infrastructure to it, provided many opportunities during the fourth quarter. Among the largest gainers, National Fuel Gas rose sharply on news of a large energy find in the Marcellus Shale. Chicago Bridge rallied sharply along with other cyclical stocks; however, revenues and guidance were disappointing compared to our expectations which led us to reduce our position. There were detractors from our performance as well. We added Cisco as an infrastructure enabler ahead of its earnings report, and believed the stock’s low valuation would provide a cushion if earnings were below expectations. However, the earnings setback was greater than expected, and the stock detracted from performance during the quarter.
| | 2010 Annual Report | December 31, 2010 |
Period & Average Annual Total Returns as of December 31, 2010
| | 1 | 5 | 10 | Inception |
| | Year | Year | Year | Date |
The Flex-funds® Total Return Utilities Fund | 14.10% | 5.28% | 2.05% | 6/21/95 |
Expense Ratios+: Current net 1.92% Gross 2.20% | | | | |
| Russell 3000 Utilities Index | 11.73% | 4.64% | 0.41% | 6/30/95 |
Growth of $10,000: 12/31/00 - 12/31/10
The Growth of $10,000 chart compares The Total Return Utilities Fund’s value to the Russell 3000 Utilities Index, the Fund’s broad-based benchmark. The chart is intended to give you a general idea of how the Fund performed compared to this benchmarks over the period from December 31, 2000 to December 31, 2010. An understanding of the differences between the Fund and this index is important. The benchmark index does not take into account the deduction of expenses associated with a mutual fund, such as investment management and accounting fees. One cannot invest directly in an index.
Past performance does not guarantee future results. The chart and the table do not reflect the deduction of taxes that a shareholder would pay on Fund distributions or the redemption of Fund shares.
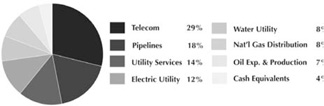
Sector Weightings as of December 31, 2010
Sector Weightings are subject to change.
Top Ten Holdings as of December 31, 2010
| 1) American Water Works Co., Inc. | 4.83% |
| 2) The Flex-funds Money Market Fund | 4.52% |
| 3) NII Holdings, Inc. | 4.50% |
| 4) Verizon Communications, Inc. | 4.25% |
| 5) AT&T, Inc. | 3.77% |
| 6) NiSource, Inc. | 3.72% |
| 7) Kinder Morgan Energy Partners, L.P. | 3.67% |
| 8) American Superconductor Corp. | 3.66% |
| 9) National Fuel Gas Co. | 3.63% |
| 10) QUALCOMM, Inc. | 3.37% |
As a percentage of total investments
Management fees were waived and/or expenses were reimbursed in order to reduce the operating expenses of The Total Return Utilities Fund during the periods shown above. This waiver is voluntary and may be terminated at any time. + Current net expense ratio based on average daily net assets for the year ended 12/31/10, including effect of voluntary expense waivers and reimbursements. This ratio may increase or decrease depending on fluctuations in Fund net assets. The Gross Expense Ratio is a percentage of the Fund’s average daily net assets as shown in the most current Fund Prospectus. Please see additional disclosures on page 23.
| | 2010 Annual Report | December 31, 2010 |
The U.S. Government Bond Fund This Fund seeks to maximize current income primarily through investments in U.S. Government securities or securities of related agencies that are guaranteed by the U.S. Government. |
The Flex-funds® U.S. Government Bond Fund returned 3.75% for the year ended December 31, 2010. The Fund’s benchmark, Barclays Capital Intermediate-Term Government/Credit Index, returned 5.89% for the same time period. The intermediate-term government bond sector vacillated between two themes throughout the year. The theme of a reemerging economy with growing inflation expectations was interrupted mid-year by a theme targeting deflation concerns and Eurozone instability. In the end, a second stimulus plan instituted by the U.S. government pushed the market from an extremely low yield, and back closer to where rates started the year.
For the quarter ended March 31, 2010, we believed that current interest rate policy would continue to benefit certain sectors in the credit markets. The Fund’s sector allocation remained positioned away from U.S. Treasury securities and towards U.S. Government agency securities. Additionally, the Fund was invested in investment grade corporate bonds. The maximum allocation to this sector at any time is 20%. At the end of the quarter, yields of U.S. Treasury securities were pressured higher from an active auction schedule and ongoing debates about the federal budget deficit. Interest rate projections based on our models indicated intermediate- and long-term interest rates may move higher, which led us to slightly reduce our duration.
The second quarter of 2010 introduced the Eurozone crisis, which would eventually engulf the banking system and political establishments. We continued to focus our attention to more domestic events with an eye on international actions. Through the second quarter of 2010, we believed the existing interest rate policy as implemented by policy makers would continue to benefit sectors in the fixed-income markets that offered an optimal risk/reward tradeoff. In accordance with this theme, the Fund’s sector allocation continued to hold a mixture of U.S. Government agency and investment grade corporate securities. Interest rate projections based on our models indicated a trend to higher levels over an intermediate period.
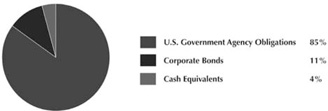
The third quarter of 2010 presented some additional challenges as concerns over sustainable economic growth ushered in fears of deflation. The allocation within the Fund at the end of the quarter was 85% in government related securities, 11% in investment grade corporate debt securities, and 4% in cash equivalents. In the government sector, we favored holding securities backed by the credit of the United States government. The Fund’s holdings in investment grade bonds tend to favor debt obligations of issuers which are recognized as industry leaders relative to their peers. For the quarter, our interest rate risk model favored a position toward a shorter duration.
The fourth quarter of 2010 saw the onset of a second round of economic stimulus. The injection of additional monetary easing was initiated as an insurance policy for domestic growth in the United States. This in turn accelerated investor’s expectations of inflation, which resulted in a sizeable drop in prices of the safest bond sectors. The U.S. Government treasury and agency sector underperformed all other fixed income sectors in the fourth quarter of 2010. The underperformance of the Fund was directly related to its lack of diversification across related sub-sectors, including government agency mortgage-backed securities and inflation protected securities. While these sub-sectors traded lower in price along with the overall bond market, the respective decline was not as pronounced. The Fund did maintain a position throughout the quarter in intermediate-term investment grade securities.
| | 2010 Annual Report | December 31, 2010 |
Period & Average Annual Total Returns as of December 31, 2010
| | 1 | 5 | 10 | Inception |
| | Year | Year | Year | Date |
The Flex-funds® U.S. Government Bond Fund | 3.75% | 4.50% | 3.05% | 5/8/85 |
Expense Ratios+: Current net 0.99% Gross 1.49% | | | | |
| Barclays Capital Intermediate-Term Government/Credit Index | 5.89% | 5.53% | 5.51% | 4/30/85 |
| Barclays Intermediate Government Index | 4.97% | 5.41% | 5.11% | 4/30/85 |
Growth of $10,000: 12/31/00 - 12/31/10
The Growth of $10,000 chart compares The U.S. Government Bond Fund’s value to the Barclays Capital Intermediate Government Index and the Barclays Capital Intermediate-Term Government/Credit Index, the Fund’s broad-based benchmark. The chart is intended to give you a general idea of how the Fund performed compared to these benchmarks over the period from December 31, 2000 to December 31, 2010. An understanding of the differences between the Fund and these indices is important. The indices are hypothetical unmanaged indices that do not take into account the deduction of expenses associated with a mutual fund, such as investment management and accounting fees. One cannot invest directly in an index.
Past performance does not guarantee future results. The chart and the table do not reflect the deduction of taxes that a shareholder would pay on Fund distributions or the redemption of Fund shares.
Fund Weightings as of December 31, 2010
Fund Weightings are subject to change.
Top Ten Holdings as of December 31, 2010
| 1) FFCB, 5.20%, 2/6/2026 | 8.86% |
| 2) FFCB, 5.25%, 4/21/2028 | 8.29% |
| 3) U.S. Treasury Note, 3.125%, 9/30/2013 | 5.41% |
| 4) FFCB, 2.875%, 4/14/2015 | 5.33% |
| 5) FNMA, 1.50%, 2/4/2014 | 5.10% |
| 6) FNMA, 1.45%, 12/23/2013 | 5.10% |
| 7) FFCB, 1.05%, 8/26/2013 | 5.10% |
| 8) FNMA, 1.05%, 8/26/2013 | 5.09% |
| 9) FHLB, 1.20%, 9/30/2013 | 5.09% |
| 10) FHLB, 0.55%, 10/25/2012 | 5.08% |
As a percentage of total investments
Management fees were waived and/or expenses were reimbursed in order to reduce the operating expenses of The U.S. Government Bond Fund during the periods shown above. This waiver is voluntary and may be terminated at any time. + Current net expense ratio based on average daily net assets for the year ended 12/31/10, including effect of voluntary waivers and reimbursements. This ratio may increase or decrease depending on fluctuations in Fund net assets. The Gross Expense Ratio is a percentage of the Fund’s average daily net assets as shown in the most current Fund Prospectus. Please see Additional Disclosures on page 23.
| | 2010 Annual Report | December 31, 2010 |
The Money Market Fund The retail and institutional classes of The Flex-funds® Money Market Fund ranked #1 and #2 in their respective categories as of December 31, 2010. |
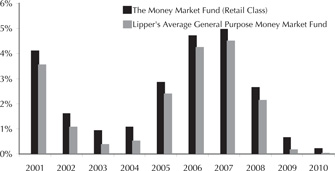
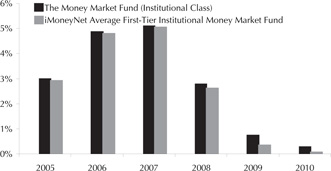
The retail class of The Flex-funds® Money Market Fund ranked among the top general purpose money market funds in the country for the quarter and year ended December 31, 2010, according to iMoneyNet. Based on the 7-day simple yield as of December 28, 2010, the retail class outperformed all 223 other funds it was measured against. The institutional class ranked as the second best among its peers for the same time period, outperforming 267 other funds it was measured against. The retail and institutional classes of The Flex-funds® Money Market Fund closed the year with a 7-day simple yield of 0.17% and 0.28%, respectively. By comparison, the median first tier retail and institutional money market fund finished the year with a yield of 0.01% and 0.04%, respectively. As a result, the retail and institutional classes of The Flex-funds® Money Market Fund continued to offer superior yields versus its competition.
Throughout 2010, investors debated the prospects for higher short-term interest rates. Investors gained confidence throughout the year as data suggested the U.S. economy may be showing greater signs of healing. Despite lingering damage from the U.S. credit crisis and financial stress in the Eurozone, it appeared sustainable growth was emerging. The only other hurdle remaining was the Federal Reserve. While investors anticipated higher short-term interest rates, the Federal Reserve policy setting committee showed no signs of deviating from its current position. The hold on the Fed Funds target rate continued to keep yields low on eligible investment options within the money market arena, and offered no optimism that the probability of higher short-term rates would materialize. Yield spread differentials for higher quality investments showed limited value throughout most of 2010. However, when opportunities were presented, the Fund was in position to take advantage of improved value.
We actively managed our weighted average maturity in order to generate additional yield as well as maneuver through the malaise of outcomes for short-term interest rates. We began the year with a weighted average maturity that was in line with our peer group. During the second quarter, we positioned our weighted average maturity above that of our peer group in order to generate incremental yield. However, during the third and fourth quarter we maintained a weighted average maturity that was in line with our peers due to the prospects for rising interest rates.
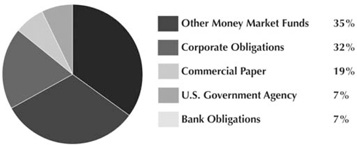
Holdings within the Fund remained allocated toward investments with superior credit quality, as we believed the risk and reward relationship favored this position. During 2010, our sector allocation favored an overweight in high quality liquid investments and short-term investment grade corporate debt. We also maintained our exposure to U.S. Government agency securities and products backed by the FDIC. At the end of the year, the Fund’s composition was as follows: 35% in other money market funds, 32% corporate obligations,19% in commercial paper, 7% U.S. Government agency securities, and 7% in bank obligations.
As we exit 2010, we believe the Fund is positioned to maintain its strong performance. Although we expect available investment options that meet our credit standards may remain limited for the next several months, we maintain our confidence that we can outperform a majority of our competitors. As we continuously monitor the markets and our strategy, we will remain vigilant and keep in mind the best interests of our shareholders.
| | 2010 Annual Report | December 31, 2010 |
Period & Average Annual Total Returns as of December 31, 2010
| | 1 | 5 | 10 | Inception |
| | Year | Year | Year | Date |
The Flex-funds® Money Market Fund- Retail Class | 0.20% | 2.61% | 2.35% | 3/27/85 |
| Current & Effective Yields* | 7-day Compound: 0.17% 7-day Simple: 0.17% |
| Lipper Average General Purpose Money Market Fund | 0.03% | 2.20% | 1.90% | 3/31/85 |
The Flex-funds® Money Market Fund- Instl Class | 0.28% | 2.74% | - | 12/28/04 |
| Current & Effective Yields* | 7-day Compound: 0.28% 7-day Simple: 0.28% |
| iMoneyNet, Inc. Average First-Tier Instl Money Market Fund | 0.08% | 2.55% | - | 12/31/04 |
Annual Returns (Retail Class): 2001 – 2010
Annual Returns (Institutional Class): 2005 – 2010
Fund Weightings as of December 31, 2010
Fund Weightings are subject to change.
Performance quoted represents past performance. Past performance does not guarantee future results. All performance figures represent average annual total returns for the periods ended December 31, 2010, and assume reinvestment of all dividend and capital gain distributions. The investment return and principal value of an investment will fluctuate so that an investor’s shares, when redeemed, may be worth more or less than their original cost. Current performance may be higher or lower than the performance quoted. Current month-end performance may be obtained at www.flexfunds.com or by calling 1.800.325.3539. Management fees were waived and/or expenses were reimbursed in order to reduce the operating expenses of both the retail class and the institutional class of The Money Market Fund during the periods shown above. Investments in The Money Market Fund are neither insured nor guaranteed by the Federal Deposit Insurance Corporation or any other governmental agency. Although the Fund seeks to preserve the value of your investment at $1.00 per share, it is possible to lose money by investing in The Money Market Fund. Source for average general purpose money market fund data: Lipper, Inc. Source for average first-tier institutional money market fund data: iMoneyNet, Inc.
| | 2010 Annual Report | December 31, 2010 |
Shareholder Expense Analysis (Unaudited)
Shareholders of mutual funds pay ongoing expenses, such as advisory fees, distribution and service fees (12b-1 fees) and other fund expenses. The following examples are intended to help you understand your ongoing costs (in dollars) of investing in the Funds and to compare these costs with the ongoing costs of investing in other mutual funds.
The examples below are based on an investment of $1,000 invested at the beginning of the period and held for the six-month period from June 30, 2010 to December 31, 2010.
ACTUAL EXPENSES: The first table below provides information about actual account values and actual expenses. You may use the information in this table, together with the amount you invested, to estimate the expenses that you paid over the period. Simply divide your account value by $1,000 (e.g.: an $8,600 account value divided by $1,000 = 8.6), then multiply the result by the number in the line under the heading “Expenses Paid During the Period” to estimate the expenses you paid on your account during this period.
| ACTUAL EXPENSES | Beginning Account Value (6/30/2010) | Ending Account Value (12/31/2010) | Expenses Paid During Period1 (6/30/2010 - 12/31/2010) | Expense Ratio (Annualized) |
| The Quantex Fund | $1,000.00 | $1,264.30 | $9.99 | 1.75% |
| The Aggressive Growth Fund | 1,000.00 | 1,233.70 | 8.95 | 1.59% |
| The Dynamic Growth Fund | 1,000.00 | 1,232.20 | 7.82 | 1.39% |
| The Strategic Growth Fund | 1,000.00 | 1,260.20 | 8.49 | 1.49% |
| The Muirfield Fund | 1,000.00 | 1,185.90 | 7.71 | 1.40% |
| The Defensive Balanced Fund | 1,000.00 | 1,131.60 | 8.22 | 1.53% |
| The Total Return Utilities Fund | 1,000.00 | 1,215.60 | 10.83 | 1.94% |
| The U.S. Government Bond Fund | 1,000.00 | 997.10 | 4.98 | 0.99% |
| The Money Market Fund - Retail Class | 1,000.00 | 1,000.90 | 1.71 | 0.34% |
| The Money Market Fund - Institutional Class | 1,000.00 | 1,001.40 | 1.21 | 0.24% |
HYPOTHETICAL EXAMPLE FOR COMPARISON PURPOSES: The second table below provides information about hypothetical account values and hypothetical expenses based on the Funds’ actual expense ratios and assumed rates of return of 5% per year before expenses, which are not the Funds’ actual returns. The hypothetical account values and expenses may not be used to estimate the actual ending account balance or expenses you paid for the period. You may use this information to compare the ongoing costs of investing in the Funds to other funds. To do so, compare this 5% hypothetical example with the 5% hypothetical examples that appear in the shareholder reports of the other funds.
HYPOTHETICAL EXAMPLE (5% return before expenses) | Beginning Account Value (6/30/2010) | Ending Account Value (12/31/2010) | Expenses Paid During Period1 (6/30/2010- 12/31/2010) | Expense Ratio (Annualized) |
| The Quantex Fund | $1,000.00 | $1,016.38 | $8.89 | 1.75% |
| The Aggressive Growth Fund | 1,000.00 | 1,017.19 | 8.08 | 1.59% |
| The Dynamic Growth Fund | 1,000.00 | 1,018.20 | 7.07 | 1.39% |
| The Strategic Growth Fund | 1,000.00 | 1,017.69 | 7.58 | 1.49% |
| The Muirfield Fund | 1,000.00 | 1,018.15 | 7.12 | 1.40% |
| The Defensive Balanced Fund | 1,000.00 | 1,017.49 | 7.78 | 1.53% |
| The Total Return Utilities Fund | 1,000.00 | 1,015.43 | 9.86 | 1.94% |
| The U.S. Government Bond Fund | 1,000.00 | 1,020.21 | 5.04 | 0.99% |
| The Money Market Fund - Retail Class | 1,000.00 | 1,023.49 | 1.73 | 0.34% |
| The Money Market Fund - Institutional Class | 1,000.00 | 1,024.00 | 1.22 | 0.24% |
Please note that the expenses shown in the tables are meant to highlight your ongoing costs only and do not reflect any transactional costs, such as redemption fees or exchange fees. Therefore, the second table is useful in comparing ongoing costs only, and will not help you determine the relative total costs of owning different funds. In addition, if any transactional costs were included, your costs would have been higher.
1 Expenses are equal to the Funds’ annualized expense ratios, multiplied by the average account value over the period, multiplied by 184/365 (to reflect the total number of days in the six-month period).
| | 2010 Annual Report | December 31, 2010 |
Disclosures
Past performance is not a guarantee of future results. All performance figures represent total returns and average annual total returns or current and effective yields for the periods ended December 31, 2010. Investment performance assumes reinvestment of all dividend and capital gain distributions. The investment return and principal value of an investment will fluctuate so an investor’s shares or units, when redeemed, may be worth more or less than their original cost. Management fees and/or expenses were waived and/or reimbursed in The Flex-funds® during the periods shown to reduce expenses. All expenses, management fees, reimbursements or waivers for the Funds are voluntary and may be terminated at any time, except for Quantex Fund TM. The Quantex Fund TM management fee waiver is contractual and can be terminated annually by the Adviser on its renewal date, September 15, 2011.
| 1 | The blended index consists of 50% of the Russell 2000 Index and 50% of the S&P 400 Mid-Cap Index. |
| 2 | The Quantex Fund™ was previously known as The Highlands Growth Fund. On April 30, 2005, The Highlands Growth Fund changed its name to The Quantex Fund™, also changing the Fund’s investment objective and strategies. The Highlands Growth Fund focused on large-cap equities, while The Quantex Fund™ utilizes quantitative investment strategies that invest primarily in small- and mid-cap equities. Due to this change in strategies on April 30, 2005, the S&P 500 Index is a more comparative index for Fund performance prior to April 30, 2005. The Russell 2000 Index and S&P 400 Mid-Cap Index are more comparative indices for Fund performance after April 30, 2005. |
| 3 | The blended index consists of 25% of the S&P 500 Index, 20% of the S&P 400 Index, 12.5% of the Russell 2000 Index, 12.5% of the Dow Jones US Select REIT Index, 12.5% of the S&P GSCI Index, 12% of the MSCI EAFE Index, and 5.5% of the MSCI Emerging Markets Index. |
| 4 | On August 25, 2008, The Focused Growth Fund became known as The Strategic Growth Fund and its investment strategy changed. This Fund will pursue its goal by investing primarily in open-end or closed-end investment companies that seek capital growth or appreciation without regard to current income. In addition, this Fund will always have set allocations to U.S. large-cap equities, U.S. mid-cap equities, U.S. small-cap equities, non-U.S./International (including emerging markets) equities, real estate equities and commodity based equities. |
| 5 | The blended index is comprised of 60% of the S&P 500 Index and 40% of the average 90-day U.S. T-bill. |
| 6 | The blended index consists of 42% of the S&P 500 Index, 28% of the average 90-day U.S. T-bill and 30% of the Barclays Intermediate-Term Government/Credit Index. |
| 7 | On August 25, 2008, The Defensive Growth Fund became known as The Defensive Balanced Fund and its investment strategy changed. This Fund will always invest at least 30% and may invest up to 70% of its assets primarily in equity mutual funds. In addition, this Fund will always invest at least 30% and may invest up to 70% of its assets primarily in investment grade bonds, money market instruments, or exchange traded funds. |
| + | Current net expense ratio based on average daily net assets for the year ended 12/31/10, including effect of voluntary and/or contractual expense waivers and reimbursements. This ratio may increase or decrease depending on fluctuations in Fund net assets. Gross Expense Ratios are percentages of the Funds’ assets as they are show in the most recent Prospectus. |
| * | The current and effective yields quoted for The Money Market Fund are as of December 31, 2010. Yield quotations more closely reflect the current earnings of The Money Market Fund than do total return quotations. To obtain the current 7-day yields for The Money Market Fund, call The Flex-funds® Shareholder Services Department toll free at 800-325-3539 or 614-760-2159. Investments in The Money Market Fund (either class) are not a deposit and are neither insured nor guaranteed by the Federal Deposit Insurance Corporation or any other governmental agency. Although the Fund seeks to preserve the value of your investment at $1.00 per share, it is possible to lose money by investing in The Money Market Fund (either class.) |
To obtain a prospectus containing more information about The Flex-funds®, including other fees and expenses that apply to a continued investment in the Funds, you may call (800)325-3539, or write to P.O. Box 7177, Dublin, OH 43017. Please read the prospectus carefully before investing.
Note on comparative indices: Returns for an index do not reflect fees, brokerage commissions, or other expenses associated with investing. One cannot invest directly in an index. Source for equity index data: Bloomberg LP. Source for fixed income index data: Morningstar, Inc. Source for average general-purpose money market fund performance: Lipper, Inc. Source for average first-tier institutional money market funds performance: iMoneyNet, Inc.
| | 2010 Annual Report | December 31, 2010 |
2010 Annual Report Fund Holdings & Financial Statements |
| The Muirfield Fund | |
| | Shares or
Principal
Amount ($) | | | | |
| Registered Investment Companies — 90.7% | |
| Consumer Discretionary Select Sector SPDR Fund | | | 163,300 | | | | 6,109,053 | |
Energy Select Sector SPDR Fund | | | 88,200 | | | | 6,019,650 | |
Fairholme Fund | | | 293,892 | | | | 10,456,669 | |
| Invesco Diversified Dividend Fund | | | 447,685 | | | | 5,488,613 | |
| iShares Russell 1000 Value Index Fund | | | 65,500 | | | | 4,248,985 | |
| iShares Russell 2000 Growth Index Fund | | | 65,600 | | | | 5,734,752 | |
Morgan Stanley Institutional Mid Cap Growth Portfolio | | | 178,626 | | | | 6,671,686 | |
| Nuveen Tradewinds Value Opportunities Fund | | | 254,283 | | | | 8,917,692 | |
| Oppenheimer Developing Markets Fund | | | 286,575 | | | | 10,336,773 | |
PowerShares QQQ | | | 145,430 | | | | 7,920,118 | |
Putnam Voyager Fund | | | 399,907 | | | | 9,873,704 | |
| RidgeWorth Mid Cap Value Equity Fund | | | 630,392 | | | | 7,482,755 | |
| RidgeWorth Small Cap Value Equity Fund | | | 470,628 | | | | 6,452,312 | |
| T. Rowe Price Mid Cap Growth Fund | | | 79,188 | | | | 4,634,859 | |
| Wells Fargo Advantage Growth Fund # | | | 332,081 | | | | 10,639,865 | |
Total Registered Investment Companies (Cost $96,105,433) | | | | | | | 110,987,486 | |
| Money Market Registered Investment Companies — 1.0% | |
| The Flex-funds Money Market Fund - Institutional Class, 0.28%* | | | 1,186,440 | | | | 1,186,440 | |
Total Money Market Registered Investment Companies (Cost $1,186,440) | | | | | | | 1,186,440 | |
| Floating Rate Demand Notes — 7.6% | |
Caterpillar Financial Power Investment Floating Rate Demand Note, 1.15%, 1/1/2011** | | | 9,314,173 | | | | 9,314,173 | |
Total Floating Rate Demand Notes (Cost $9,314,173) | | | | | | | 9,314,173 | |
| U.S. Government Obligations — 0.7% | |
U.S. Treasury Bill, 0.132%, due 3/24/2011*** | | | 800,000 | | | | 799,795 | |
Total U.S. Government Obligations (Cost $799,763) | | | | | | | 799,795 | |
Total Investments — 100.0% (Cost $107,405,809)(a) | | | | | | | 122,287,894 | |
| Liabilities less Other Assets — (0.0%) | | | | | | | (21,424 | ) |
Total Net Assets — 100.0% | | | | | | | 122,266,470 | |
| The Muirfield Fund | |
| | Shares or
Principal
Amount ($) | | | | |
| Trustee Deferred Compensation**** | |
| The Flex-funds Aggressive Growth Fund | | | 1,882 | | | | 15,000 | |
| The Flex-funds Defensive Balanced Fund | | | 959 | | | | 9,321 | |
| The Flex-funds Dynamic Growth Fund | | | 588 | | | | 4,786 | |
The Flex-funds Muirfield Fund | | | 3,529 | | | | 19,762 | |
The Flex-funds Quantex Fund | | | 2,457 | | | | 55,946 | |
| The Flex-funds Total Return Utilities Fund | | | 209 | | | | 4,914 | |
Total Trustee Deferred Compensation (Cost $84,951) | | | | | | | 109,729 | |
| | | | | | Unrealized Appreciation (Depreciation) ($) | |
| Futures Contracts | |
| Standard & Poors 500 expiring March 2011, notional value $5,012,000 | | | 16 | | | | 66,880 | |
Total Futures Contracts | | | | | | | 66,880 | |
| (a) | Represents cost for financial reporting purposes and differs for federal income tax purposes by the amount of losses deferred for federal income tax reporting in the amount of $312,180. Cost for federal income tax purposes of $107,717,989 differs from value by net unrealized appreciation (depreciation) of securities as follows: |
Unrealized appreciation | | $ | 14,598,662 | |
Unrealized depreciation | | | (28,757 | ) |
| Net unrealized appreciation (depreciation) | | $ | 14,569,905 | |
| # | Represents non-income producing securities. |
| * | Investment in affiliate. The yield shown represents the 7-day yield in effect at December 31, 2010. |
| ** | Floating rate security. The rate shown represents the rate in effect at December 31, 2010. |
| *** | Pledged as collateral on futures contracts. |
| **** | Assets of affiliates to The Muirfield Fund held for the benefit of the Fund’s Trustees in connection with the Trustee Deferred Compensation Plan. |
| The accompanying notes are an integral part of these financial statements. |
| 2010 Annual Report | December 31, 2010 |
| | |
Schedule of Investments December 31, 2010 | |
| The Dynamic Growth Fund | |
| | Shares or Principal Amount ($) | | | | |
| Registered Investment Companies — 97.2% | |
| Consumer Discretionary Select Sector SPDR Fund | | | 137,650 | | | | 5,149,487 | |
Energy Select Sector SPDR Fund | | | 68,950 | | | | 4,705,838 | |
Fairholme Fund | | | 238,603 | | | | 8,489,512 | |
| Invesco Diversified Dividend Fund | | | 441,504 | | | | 5,412,840 | |
| iShares Russell 1000 Value Index Fund | | | 52,725 | | | | 3,420,271 | |
| iShares Russell 2000 Growth Index Fund | | | 55,500 | | | | 4,851,810 | |
Morgan Stanley Institutional Mid Cap Growth Portfolio | | | 125,937 | | | | 4,703,755 | |
| Nuveen Tradewinds Value Opportunities Fund | | | 208,605 | | | | 7,315,789 | |
| Oppenheimer Developing Markets Fund | | | 253,123 | | | | 9,130,150 | |
PowerShares QQQ | | | 119,450 | | | | 6,505,247 | |
Putnam Voyager Fund | | | 323,299 | | | | 7,982,259 | |
| RidgeWorth Mid Cap Value Equity Fund | | | 556,520 | | | | 6,605,893 | |
| RidgeWorth Small Cap Value Equity Fund | | | 417,112 | | | | 5,718,601 | |
| T. Rowe Price Mid Cap Growth Fund | | | 65,866 | | | | 3,855,163 | |
| Wells Fargo Advantage Growth Fund # | | | 271,306 | | | | 8,692,648 | |
Total Registered Investment Companies (Cost $79,499,430) | | | | | | | 92,539,263 | |
| Money Market Registered Investment Companies — 2.0% | |
| The Flex-funds Money Market Fund - Institutional Class, 0.28%* | | | 1,901,691 | | | | 1,901,691 | |
Total Money Market Registered Investment Companies (Cost $1,901,691) | | | | | | | 1,901,691 | |
| U.S. Government Obligations — 0.8% | |
U.S. Treasury Bill, 0.132%, due 3/24/2011** | | | 800,000 | | | | 799,795 | |
Total U.S. Government Obligations (Cost $799,763) | | | | | | | 799,795 | |
Total Investments — 100.0% (Cost $82,200,884) (a) | | | | | | | 95,240,749 | |
| Liabilities less Other Assets — (0.0%) | | | | | | | (1,326 | ) |
Total Net Assets — 100.0% | | | | | | | 95,239,423 | |
| The Dynamic Growth Fund | |
| | Shares or Principal Amount ($) | | | | |
| Trustee Deferred Compensation*** | |
| The Flex-funds Aggressive Growth Fund | | | 1,328 | | | | 10,584 | |
| The Flex-funds Defensive Balanced Fund | | | 669 | | | | 6,503 | |
| The Flex-funds Dynamic Growth Fund | | | 415 | | | | 3,378 | |
The Flex-funds Muirfield Fund | | | 1,648 | | | | 9,229 | |
The Flex-funds Quantex Fund | | | 973 | | | | 22,155 | |
| The Flex-funds Total Return Utilities Fund | | | 147 | | | | 3,456 | |
Total Trustee Deferred Compensation (Cost $43,585) | | | | | | | 55,305 | |
| | | | | | Unrealized Appreciation (Depreciation) ($) | |
| Futures Contracts | |
| Standard & Poors 500 expiring March 2011, notional value $2,819,250 | | | 9 | | | | 29,445 | |
Total Futures Contracts | | | | | | | 29,445 | |
| (a) | Represents cost for financial reporting purposes and differs for federal income tax purposes by the amount of losses deferred for federal income tax reporting in the amount of $104,957. Cost for federal income tax purposes of $82,305,841 differs from value by net unrealized appreciation (depreciation) of securities as follows: |
Unrealized appreciation | | $ | 12,959,148 | |
Unrealized depreciation | | | (24,240 | ) |
| Net unrealized appreciation (depreciation) | | $ | 12,934,908 | |
| # | Represents non-income producing securities. |
| * | Investment in affiliate. The yield shown represents the 7-day yield in effect at December 31, 2010. |
| ** | Pledged as collateral on futures contracts. |
| *** | Assets of affiliates to The Dynamic Growth Fund held for the benefit of the Fund’s Trustees in connection with the Trustee Deferred Compensation Plan. |
| The accompanying notes are an integral part of these financial statements. |
| 2010 Annual Report | December 31, 2010 |
| | |
Schedule of Investments December 31, 2010 | |
| The Aggressive Growth Fund | |
| | Shares or Principal Amount ($) | | | | |
| Registered Investment Companies — 97.5% | |
| Consumer Discretionary Select Sector SPDR Fund | | | 40,300 | | | | 1,507,623 | |
Fairholme Fund | | | 57,376 | | | | 2,041,430 | |
| iShares MSCI Emerging Markets Index Fund | | | 26,675 | | | | 1,270,850 | |
| iShares Russell 2000 Growth Index Fund | | | 27,275 | | | | 2,384,381 | |
Morgan Stanley Institutional Mid Cap Growth Portfolio | | | 95,043 | | | | 3,549,849 | |
| Nuveen Tradewinds Value Opportunities Fund | | | 71,270 | | | | 2,499,439 | |
| Oppenheimer Developing Markets Fund | | | 95,593 | | | | 3,448,055 | |
PowerShares QQQ | | | 43,735 | | | | 2,381,808 | |
Putnam Voyager Fund | | | 104,998 | | | | 2,592,392 | |
| RidgeWorth Mid Cap Value Equity Fund | | | 217,263 | | | | 2,578,911 | |
| RidgeWorth Small Cap Value Equity Fund | | | 204,943 | | | | 2,809,767 | |
RS Technology Fund | | | 126,586 | | | | 2,513,995 | |
| Wells Fargo Advantage Growth Fund # | | | 108,971 | | | | 3,491,419 | |
Total Registered Investment Companies (Cost $27,825,374) | | | | | | | 33,069,919 | |
| Money Market Registered Investment Companies — 1.8% | |
| The Flex-funds Money Market Fund - Institutional Class, 0.28%* | | | 604,959 | | | | 604,959 | |
Total Money Market Registered Investment Companies (Cost $604,959) | | | | | | | 604,959 | |
| Floating Rate Demand Notes — 0.0% | |
Caterpillar Financial Power Investment Floating Rate Demand Note, 1.15%, 1/1/2011** | | | 2,008 | | | | 2,008 | |
Total Floating Rate Demand Notes (Cost $2,008) | | | | | | | 2,008 | |
| U.S. Government Obligations — 0.9% | |
U.S. Treasury Bill, 0.132%, due 3/24/2011*** | | | 300,000 | | | | 299,923 | |
| Total U.S. Government Obligations (Cost $299,911) | | | | | | | 299,923 | |
Total Investments — 100.2% (Cost $28,732,252)(a) | | | | | | | 33,976,809 | |
| Liabilities less Other Assets — (0.2%) | | | | | | | (68,494 | ) |
Total Net Assets — 100.0% | | | | | | | 33,908,315 | |
| The Aggressive Growth Fund | |
| | Shares or Principal Amount ($) | | | | |
| Trustee Deferred Compensation**** | |
| The Flex-funds Aggressive Growth Fund | | | 751 | | | | 5,985 | |
| The Flex-funds Defensive Balanced Fund | | | 390 | | | | 3,791 | |
| The Flex-funds Dynamic Growth Fund | | | 232 | | | | 1,888 | |
The Flex-funds Muirfield Fund | | | 1,058 | | | | 5,925 | |
The Flex-funds Quantex Fund | | | 654 | | | | 14,892 | |
| The Flex-funds Total Return Utilities Fund | | | 83 | | | | 1,951 | |
Total Trustee Deferred Compensation (Cost $28,050) | | | | | | | 34,432 | |
| | | | | | Unrealized Appreciation (Depreciation) ($) | |
| Futures Contracts | |
| Standard & Poors 500 expiring March 2011, notional value $939,750 | | | 3 | | | | 12,540 | |
Total Futures Contracts | | | | | | | 12,540 | |
| (a) | Represents cost for financial reporting purposes and income tax purposes. Net unrealized appreciation (depreciation) of securities is as follows: |
Unrealized appreciation | | $ | 5,251,654 | |
Unrealized depreciation | | | (7,097 | ) |
| Net unrealized appreciation (depreciation) | | $ | 5,244,557 | |
| # | Represents non-income producing securities. |
| * | Investment in affiliate. The yield shown represents the 7-day yield in effect at December 31, 2010. |
| ** | Floating rate security. The rate shown represents the rate in effect at December 31, 2010. |
| *** | Pledged as collateral on futures contracts. |
| **** | Assets of affiliates to The Aggressive Growth Fund held for the benefit of the Fund’s Trustees in connection with the Trustee Deferred Compensation Plan. |
| The accompanying notes are an integral part of these financial statements. |
| 2010 Annual Report | December 31, 2010 |
| | |
Schedule of Investments December 31, 2010 | |
| The Defensive Balanced Fund | |
| | Shares or Principal Amount ($) | | | | |
| Registered Investment Companies — 93.3% | |
| AllianceBernstein High Income Fund | | | 94,294 | | | | 855,244 | |
| Consumer Discretionary Select Sector SPDR Fund | | | 54,600 | | | | 2,042,586 | |
Energy Select Sector SPDR Fund | | | 27,650 | | | | 1,887,113 | |
Fairholme Fund | | | 98,992 | | | | 3,522,128 | |
| Invesco Diversified Dividend Fund | | | 187,603 | | | | 2,300,015 | |
| iShares Russell 1000 Value Index Fund | | | 22,400 | | | | 1,453,088 | |
| iShares Russell 2000 Growth Index Fund | | | 22,400 | | | | 1,958,208 | |
| Metropolitan West Total Return Bond Fund | | | 408,310 | | | | 4,234,174 | |
Morgan Stanley Institutional Mid Cap Growth Portfolio | | | 60,863 | | | | 2,273,229 | |
| Nuveen Tradewinds Value Opportunities Fund | | | 75,278 | | | | 2,639,983 | |
| Oppenheimer Developing Markets Fund | | | 106,443 | | | | 3,839,413 | |
PIMCO Total Return Fund | | | 389,243 | | | | 4,223,284 | |
PowerShares QQQ | | | 47,250 | | | | 2,573,235 | |
Putnam Voyager Fund | | | 131,789 | | | | 3,253,861 | |
| RidgeWorth Mid Cap Value Equity Fund | | | 232,251 | | | | 2,756,822 | |
| RidgeWorth Small Cap Value Equity Fund | | | 170,501 | | | | 2,337,563 | |
| Sentinel Government Securities Fund | | | 212,000 | | | | 2,232,360 | |
| T. Rowe Price Mid Cap Growth Fund | | | 27,286 | | | | 1,597,043 | |
TCW Total Return Bond Fund | | | 427,393 | | | | 4,239,739 | |
| Wells Fargo Advantage Growth Fund # | | | 113,528 | | | | 3,637,439 | |
Total Registered Investment Companies (Cost $49,794,557) | | | | | | | 53,856,527 | |
| Money Market Registered Investment Companies — 1.7% | |
| The Flex-funds Money Market Fund - Institutional Class, 0.28%* | | | 981,486 | | | | 981,486 | |
Total Money Market Registered Investment Companies (Cost $981,486) | | | | | | | 981,486 | |
| Floating Rate Demand Notes — 2.9% | |
Caterpillar Financial Power Investment Floating Rate Demand Note, 1.15%, 1/1/2011** | | | 1,703,520 | | | | 1,703,520 | |
Total Floating Rate Demand Notes (Cost $1,703,520) | | | | | | | 1,703,520 | |
| U.S. Government Obligations — 2.2% | |
| Federal Home Loan Mortgage Corporation, 4.00%, due 12/15/2022 | | | 1,000,000 | | | | 995,509 | |
| U.S. Treasury Bill, 0.132%, due 3/24/2011*** | | | 300,000 | | | | 299,923 | |
Total U.S. Government Obligations (Cost $1,293,234) | | | | | | | 1,295,432 | |
Total Investments — 100.1% (Cost $53,772,797)(a) | | | | | | | 57,836,965 | |
| Liabilities less Other Assets — (0.1%) | | | | | | | (58,332 | ) |
Total Net Assets — 100.0% | | | | | | | 57,778,633 | |
| The Defensive Balanced Fund | |
| | Shares or Principal Amount ($) | | | | |
| Trustee Deferred Compensation**** | |
| The Flex-funds Aggressive Growth Fund | | | 1,181 | | | | 9,413 | |
| The Flex-funds Defensive Balanced Fund | | | 620 | | | | 6,026 | |
| The Flex-funds Dynamic Growth Fund | | | 364 | | | | 2,963 | |
The Flex-funds Muirfield Fund | | | 1,030 | | | | 5,768 | |
The Flex-funds Quantex Fund | | | 471 | | | | 10,725 | |
| The Flex-funds Total Return Utilities Fund | | | 130 | | | | 3,056 | |
Total Trustee Deferred Compensation (Cost $33,159) | | | | | | | 37,951 | |
| | | | | | Unrealized Appreciation (Depreciation) ($) | |
| Futures Contracts | |
| Standard & Poors 500 expiring March 2011, notional value $1,253,000 | | | 4 | | | | 16,720 | |
Total Futures Contracts | | | | | | | 16,720 | |
| (a) | Represents cost for financial reporting purposes and differs for federal income tax purposes by the amount of losses deferred for federal income tax reporting in the amount of $15,532. Cost for federal income tax purposes of $53,788,329 differs from value by net unrealized appreciation (depreciation) of securities as follows: |
Unrealized appreciation | | $ | 4,740,708 | |
Unrealized depreciation | | | (692,072 | ) |
| Net unrealized appreciation (depreciation) | | $ | 4,048,636 | |
| # | Represents non-income producing securities. |
| * | Investment in affiliate. The yield shown represents the 7-day yield in effect at December 31, 2010. |
| ** | Floating rate security. The rate shown represents the rate in effect at December 31, 2010. |
| *** | Pledged as collateral on futures contracts. |
| **** | Assets of affiliates to The Defensive Balanced Fund held for the benefit of the Fund’s Trustees in connection with the Trustee Deferred Compensation Plan. |
| The accompanying notes are an integral part of these financial statements. |
| 2010 Annual Report | December 31, 2010 |
| | |
Schedule of Investments December 31, 2010 | |
| The Strategic Growth Fund | |
| | Shares or Principal Amount ($) | | | | |
| Registered Investment Companies — 97.1% | |
| Dodge & Cox International Stock Fund | | | 146,800 | | | | 5,242,217 | |
Fairholme Fund | | | 89,666 | | | | 3,190,301 | |
| First American Real Estate Securities Fund | | | 429,484 | | | | 7,812,315 | |
| Lord Abbett Developing Growth Fund, Inc. # | | | 169,166 | | | | 3,819,758 | |
| Lord Abbett Fundamental Equity Fund | | | 331,331 | | | | 4,294,052 | |
Morgan Stanley Institutional Mid Cap Growth Portfolio | | | 154,741 | | | | 5,779,563 | |
| Oppenheimer Developing Markets Fund | | | 151,532 | | | | 5,465,760 | |
Putnam Voyager Fund | | | 148,046 | | | | 3,655,247 | |
| RidgeWorth Mid Cap Value Equity Fund | | | 484,565 | | | | 5,751,781 | |
| RidgeWorth Small Cap Value Equity Fund | | | 272,770 | | | | 3,739,672 | |
| Van Eck Global Hard Assets Fund | | | 151,149 | | | | 7,909,649 | |
| Wells Fargo Advantage Growth Fund # | | | 124,634 | | | | 3,993,290 | |
Total Registered Investment Companies (Cost $55,331,142) | | | | | | | 60,653,605 | |
| Money Market Registered Investment Companies — 2.5% | |
| The Flex-funds Money Market Fund - Institutional Class, 0.28%* | | | 1,553,744 | | | | 1,553,744 | |
Total Money Market Registered Investment Companies (Cost $1,553,744) | | | | | | | 1,553,744 | |
| U.S. Government Obligations — 0.5% | |
U.S. Treasury Bill, 0.132%, due 3/24/2011** | | | 300,000 | | | | 299,923 | |
| Total U.S. Government Obligations (Cost $299,911) | | | | | | | 299,923 | |
Total Investments — 100.1% (Cost $57,184,797)(a) | | | | | | | 62,507,272 | |
| Liabilities less Other Assets — (0.1%) | | | | | | | (76,431 | ) |
Total Net Assets — 100.0% | | | | | | | 62,430,841 | |
| The Strategic Growth Fund | |
| | Shares or Principal Amount ($) | | | | |
| Trustee Deferred Compensation*** | |
| The Flex-funds Aggressive Growth Fund | | | 956 | | | | 7,619 | |
| The Flex-funds Defensive Balanced Fund | | | 507 | | | | 4,928 | |
| The Flex-funds Dynamic Growth Fund | | | 293 | | | | 2,385 | |
The Flex-funds Muirfield Fund | | | 837 | | | | 4,687 | |
The Flex-funds Quantex Fund | | | 382 | | | | 8,698 | |
| The Flex-funds Total Return Utilities Fund | | | 106 | | | | 2,492 | |
Total Trustee Deferred Compensation (Cost $27,320) | | | | | | | 30,809 | |
| | | | | | Unrealized Appreciation (Depreciation) ($) | |
| Futures Contracts | |
| Standard & Poors Mid Cap 400 expiring March 2011, notional value $2,715,900 | | | 6 | | | | 30,705 | |
Total Futures Contracts | | | | | | | 30,705 | |
| (a) | Represents cost for financial reporting purposes and differs for federal income tax purposes by the amount of losses deferred for federal income tax reporting in the amount of $87,322. Cost for federal income tax purposes of $57,272,119 differs from value by net unrealized appreciation (depreciation) of securities as follows: |
Unrealized appreciation | | $ | 5,235,153 | |
Unrealized depreciation | | | — | |
| Net unrealized appreciation (depreciation) | | $ | 5,235,153 | |
| # | Represents non-income producing securities. |
| * | Investment in affiliate. The yield shown represents the 7-day yield in effect at December 31, 2010. |
| ** | Pledged as collateral on futures contracts. |
| *** | Assets of affiliates to The Strategic Growth Fund held for the benefit of the Fund’s Trustees in connection with the Trustee Deferred Compensation Plan. |
| The accompanying notes are an integral part of these financial statements. |
| 2010 Annual Report | December 31, 2010 |
| | |
Schedule of Investments December 31, 2010 | |
| The Quantex Fund | |
| | Shares or Principal Amount ($) | | | | |
| Common Stocks — 95.2% | |
| Business Services — 6.4% | | | | | | |
Cintas Corporation | | | 5,240 | | | | 146,510 | |
DeVry, Inc. | | | 2,410 | | | | 115,632 | |
| Interpublic Group of Companies, Inc./The # | | | 18,475 | | | | 196,205 | |
Monster Worldwide, Inc. # | | | 7,840 | | | | 185,259 | |
Robert Half International, Inc. | | | 5,100 | | | | 156,060 | |
Ryder System, Inc. | | | 3,310 | | | | 174,238 | |
Total System Services, Inc. | | | 7,900 | | | | 121,502 | |
(Cost $1,000,813) | | | | | | | 1,095,406 | |
| Consumer Goods — 9.5% | | | | | | | | |
Avery Dennison Corp. | | | 3,740 | | | | 158,352 | |
Bemis Co., Inc. | | | 4,610 | | | | 150,563 | |
Constellation Brands, Inc. # | | | 8,550 | | | | 189,382 | |
Dean Foods Company # | | | 7,570 | | | | 66,919 | |
Eastman Kodak Company # | | | 32,270 | | | | 172,967 | |
| Harman International Industries, Inc. # | | | 3,850 | | | | 178,255 | |
Hasbro, Inc. | | | 4,250 | | | | 200,515 | |
| International Flavors & Fragrances, Inc. | | | 3,315 | | | | 184,281 | |
Newell Rubbermaid, Inc. | | | 9,090 | | | | 165,256 | |
Sealed Air Corp. | | | 6,235 | | | | 158,681 | |
(Cost $1,392,327) | | | | | | | 1,625,171 | |
| Consumer Services — 14.0% | | | | | | | | |
Abercrombie and Fitch Co. | | | 3,920 | | | | 225,910 | |
Airgas, Inc. | | | 2,850 | | | | 178,011 | |
AutoNation, Inc. # | | | 7,105 | | | | 200,361 | |
Big Lots, Inc. # | | | 4,715 | | | | 143,619 | |
D.R. Horton, Inc. | | | 12,530 | | | | 149,483 | |
Family Dollar Stores, Inc. | | | 4,900 | | | | 243,579 | |
GameStop Corp. # | | | 6,200 | | | | 141,856 | |
Lennar Corp. | | | 10,670 | | | | 200,063 | |
Office Depot, Inc. # | | | 21,120 | | | | 114,048 | |
Pulte Group, Inc. # | | | 13,643 | | | | 102,595 | |
RadioShack Corp. | | | 6,965 | | | | 128,783 | |
SUPERVALU, Inc. | | | 10,740 | | | | 103,426 | |
Whole Foods Market, Inc. # | | | 4,980 | | | | 251,938 | |
Wyndham Worldwide Corp. | | | 6,750 | | | | 202,230 | |
(Cost $1,889,600) | | | | | | | 2,385,902 | |
| Energy — 5.6% | | | | | | | | |
Denbury Resources, Inc. # | | | 9,180 | | | | 175,246 | |
Massey Energy Company | | | 3,230 | | | | 173,290 | |
Rowan Companies, Inc. # | | | 6,000 | | | | 209,460 | |
Sunoco, Inc. | | | 5,200 | | | | 209,612 | |
Tesoro Corp. # | | | 10,010 | | | | 185,585 | |
(Cost $672,153) | | | | | | | 953,193 | |
| Financial Services — 14.5% | | | | | | | | |
| Apartment Investment & Management Company @ | | | 8,555 | | | | 221,061 | |
Assurant, Inc. | | | 4,620 | | | | 177,963 | |
CB Richard Ellis Group, Inc. # | | | 10,050 | | | | 205,824 | |
Cincinnati Financial Corporation | | | 5,200 | | | | 164,788 | |
E*TRADE Financial Corp. # | | | 7,782 | | | | 124,512 | |
Equifax, Inc. | | | 4,420 | | | | 157,352 | |
Federated Investors, Inc. | | | 4,970 | | | | 130,065 | |
First Horizon National Corp. | | | 10,823 | | | | 127,491 | |
| The Quantex Fund | |
| | Shares or Principal Amount ($) | | | | |
| Common Stocks — continued | |
Huntington Bancshares, Inc. | | | 37,360 | | | | 256,663 | |
Janus Capital Group, Inc. | | | 10,120 | | | | 131,256 | |
Marshall & Ilsley Corp. | | | 24,970 | | | | 172,792 | |
| NASDAQ OMX Group, Inc./The # | | | 6,880 | | | | 163,263 | |
Torchmark Corp. | | | 3,100 | | | | 185,194 | |
Wells Fargo & Co. Preferred # | | | 1 | | | | 0 | |
Zions Bancorporation | | | 10,600 | | | | 256,838 | |
(Cost $2,012,345) | | | | | | | 2,475,062 | |
| Hardware — 10.3% | | | | | | | | |
Jabil Circuit, Inc. | | | 7,850 | | | | 157,706 | |
JDS Uniphase Corp. # | | | 16,542 | | | | 239,528 | |
Lexmark International, Inc. # | | | 5,240 | | | | 182,457 | |
LSI Logic Corp. # | | | 22,690 | | | | 135,913 | |
| MEMC Electronic Materials, Inc. # | | | 10,000 | | | | 112,600 | |
Molex, Inc. | | | 6,345 | | | | 144,158 | |
National Semiconductor Corp. | | | 8,900 | | | | 122,464 | |
Novellus Systems, Inc. # | | | 5,830 | | | | 188,426 | |
QLogic Corp. # | | | 7,225 | | | | 122,970 | |
Tellabs, Inc. | | | 23,995 | | | | 162,686 | |
Teradyne, Inc. # | | | 12,700 | | | | 178,308 | |
(Cost $1,488,695) | | | | | | | 1,747,216 | |
| Healthcare — 4.7% | | | | | | | | |
Coventry Health Care, Inc. # | | | 5,600 | | | | 147,840 | |
King Pharmaceuticals, Inc. # | | | 11,115 | | | | 156,166 | |
Patterson Companies, Inc. | | | 4,875 | | | | 149,321 | |
PerkinElmer, Inc. | | | 6,630 | | | | 171,187 | |
Tenet Healthcare Corp. # | | | 25,165 | | | | 168,354 | |
(Cost $605,011) | | | | | | | 792,868 | |
| Industrial Materials — 12.0% | | | | | | | | |
AK Steel Holding Corp. | | | 6,360 | | | | 104,113 | |
Allegheny Technologies, Inc. | | | 3,030 | | | | 167,195 | |
CF Industries Holdings, Inc. | | | 1,500 | | | | 202,725 | |
Eastman Chemical Company | | | 2,275 | | | | 191,282 | |
FMC Corp. | | | 2,440 | | | | 194,932 | |
| Goodyear Tire & Rubber Company/The # | | | 9,630 | | | | 114,115 | |
Leggett & Platt, Inc. | | | 6,695 | | | | 152,378 | |
Pall Corp. | | | 3,770 | | | | 186,917 | |
Snap-on, Inc. | | | 3,220 | | | | 182,188 | |
Stanley Black & Decker, Inc. | | | 5,308 | | | | 354,945 | |
Titanium Metals Corp. # | | | 10,840 | | | | 186,231 | |
(Cost $1,519,346) | | | | | | | 2,037,021 | |
| Media — 3.2% | | | | | | | | |
Gannett Co., Inc. | | | 9,160 | | | | 138,224 | |
Meredith Corp. | | | 4,425 | | | | 153,326 | |
New York Times Co./The # | | | 10,990 | | | | 107,702 | |
Washington Post Company/The | | | 315 | | | | 138,443 | |
(Cost $568,124) | | | | | | | 537,695 | |
| Software — 3.2% | | | | | | | | |
Compuware Corp. # | | | 18,830 | | | | 219,746 | |
Dun & Bradstreet Corp./The | | | 1,620 | | | | 132,986 | |
Novell, Inc. # | | | 32,815 | | | | 194,265 | |
(Cost $469,454) | | | | | | | 546,997 | |
| 2010 Annual Report | December 31, 2010 |
| | |
Schedule of Investments December 31, 2010 | |
| The Quantex Fund | |
| | Shares or Principal Amount ($) | | | | |
| Common Stocks — continued | |
| Utilities — 11.8% | | | | | | |
Akamai Technologies, Inc. # | | | 5,380 | | | | 253,129 | |
Allegheny Energy, Inc. | | | 5,810 | | | | 140,834 | |
CMS Energy Corp. | | | 8,705 | | | | 161,913 | |
Frontier Communications Corp. | | | 17,475 | | | | 170,032 | |
Integrys Energy Group, Inc. | | | 3,250 | | | | 157,658 | |
| MetroPCS Communications, Inc. # | | | 17,860 | | | | 225,572 | |
Nicor, Inc. | | | 3,245 | | | | 161,990 | |
NiSource, Inc. | | | 8,860 | | | | 156,113 | |
Pepco Holdings, Inc. | | | 8,100 | | | | 147,825 | |
Pinnacle West Capital Corp. | | | 3,740 | | | | 155,023 | |
Quanta Services, Inc. # | | | 6,540 | | | | 130,277 | |
TECO Energy, Inc. | | | 8,420 | | | | 149,876 | |
(Cost $1,656,060) | | | | | | | 2,010,242 | |
Total Common Stocks (Cost $13,273,928) | | | | | | | 16,206,773 | |
| Money Market Registered Investment Companies — 3.7% | |
| The Flex-funds Money Market Fund - Institutional Class, 0.28%* | | | 635,526 | | | | 635,526 | |
Total Money Market Registered Investment Companies (Cost $635,526) | | | | | | | 635,526 | |
| | |
| U.S. Government Obligations — 1.2% | |
U.S. Treasury Bill, 0.132%, due 3/24/2011** | | | 200,000 | | | | 199,949 | |
| Total U.S. Government Obligations (Cost $199,941) | | | | | | | 199,949 | |
Total Investments — 100.1% (Cost $14,109,395)(a) | | | | | | | 17,042,248 | |
| Liabilities less Other Assets — (0.1%) | | | | | | | (18,607 | ) |
Total Net Assets — 100.0% | | | | | | | 17,023,641 | |
| | |
| Trustee Deferred Compensation*** | |
| The Flex-funds Aggressive Growth Fund | | | 590 | | | | 4,702 | |
| The Flex-funds Defensive Balanced Fund | | | 307 | | | | 2,984 | |
| The Flex-funds Dynamic Growth Fund | | | 183 | | | | 1,490 | |
The Flex-funds Muirfield Fund | | | 1,419 | | | | 7,946 | |
The Flex-funds Quantex Fund | | | 1,038 | | | | 23,635 | |
| The Flex-funds Total Return Utilities Fund | | | 66 | | | | 1,552 | |
Total Trustee Deferred Compensation (Cost $32,591) | | | | | | | 42,309 | |
| The Quantex Fund | |
| | | | | | Unrealized Appreciation (Depreciation) ($) | |
| Futures Contracts | |
| Standard & Poors Mid Cap 400 expiring March 2011, notional value $905,300 | | | 2 | | | | 10,235 | |
Total Futures Contracts | | | | | | | 10,235 | |
| (a) | Represents cost for financial reporting purposes and differs for federal income tax purposes by the amount of losses deferred for federal income tax reporting in the amount of $214,388. Cost for federal income tax purposes of $14,323,783 differs from value by net unrealized appreciation (depreciation) of securities as follows: |
Unrealized appreciation | | $ | 3,215,751 | |
Unrealized depreciation | | | (497,286 | ) |
| Net unrealized appreciation (depreciation) | | $ | 2,718,465 | |
| # | Represents non-income producing securities. |
| @ | Real estate investment trust. |
| * | Investment in affiliate. The yield shown represents the 7-day yield in effect at December 31, 2010. |
| ** | Pledged as collateral on Futures Contracts. |
| *** | Assets of affiliates to The Flex-funds Quantex Fund held for the benefit of the Fund’s Trustees in connection with the Trustee Deferred Compensation Plan. |
| The accompanying notes are an integral part of these financial statements. |
| 2010 Annual Report | December 31, 2010 |
| | |
Schedule of Investments December 31, 2010 | |
| The Total Return Utilities Fund | |
| | Shares or Principal Amount ($) | | | | |
| Common Stocks — 95.6% | |
| Electric Utility 12.1% | | | | | | |
| American Superconductor Corp. # | | | 30,922 | | | | 884,060 | |
ITC Holdings Corp. | | | 9,030 | | | | 559,679 | |
MDU Resources Group, Inc. | | | 28,503 | | | | 577,756 | |
Northeast Utilities | | | 15,062 | | | | 480,177 | |
NV Energy, Inc. | | | 30,375 | | | | 426,769 | |
(Cost $2,914,196) | | | | | | | 2,928,441 | |
| Natural Gas Distribution 7.5% | | | | | | | | |
National Grid PLC - ADR | | | 17,476 | | | | 775,585 | |
ONEOK, Inc. | | | 7,490 | | | | 415,470 | |
Southern Union Co. | | | 26,630 | | | | 640,984 | |
(Cost $1,657,244) | | | | | | | 1,832,039 | |
| Oil Exploration & Production 6.5% | | | | | | | | |
Ensco PLC - ADR | | | 12,483 | | | | 666,343 | |
EQT Corp. | | | 13,940 | | | | 625,070 | |
Ultra Petroleum Corp. # | | | 6,034 | | | | 288,244 | |
(Cost $1,430,366) | | | | | | | 1,579,657 | |
| Pipelines 18.3% | | | | | | | | |
El Paso Corp. | | | 45,145 | | | | 621,195 | |
| Kinder Morgan Energy Partners, L.P. | | | 12,608 | | | | 885,838 | |
National Fuel Gas Co. | | | 13,357 | | | | 876,486 | |
QEP Resources, Inc. | | | 12,275 | | | | 445,705 | |
Questar Corp. | | | 46,062 | | | | 801,940 | |
Spectra Energy Corp. | | | 30,582 | | | | 764,244 | |
(Cost $3,547,303) | | | | | | | 4,395,408 | |
| Telephone & Telecommunications 29.6% | | | | | | | | |
American Tower Corp. # | | | 9,571 | | | | 494,246 | |
AT&T, Inc. | | | 30,999 | | | | 910,751 | |
BCE, Inc. | | | 8,323 | | | | 295,134 | |
Cisco Systems, Inc. # | | | 29,858 | | | | 604,027 | |
| Millicom International Cellular S.A. | | | 7,074 | | | | 676,274 | |
NII Holdings, Inc. # | | | 24,341 | | | | 1,087,000 | |
Nokia Corp. | | | 22,136 | | | | 228,444 | |
QUALCOMM, Inc. | | | 16,436 | | | | 813,418 | |
| Telephone and Data Systems, Inc. | | | 10,611 | | | | 387,832 | |
| Turkcell Iletisim Hizmetleri - ADR | | | 35,700 | | | | 611,541 | |
Verizon Communications, Inc. | | | 28,710 | | | | 1,027,244 | |
(Cost $6,784,469) | | | | | | | 7,135,911 | |
| Utility Services — 14.2% | | | | | | | | |
ABB Limited - ADR | | | 26,422 | | | | 593,174 | |
Chicago Bridge & Iron Co. # | | | 18,183 | | | | 598,221 | |
EnerSys # | | | 16,308 | | | | 523,813 | |
Fluor Corp. | | | 8,114 | | | | 537,634 | |
NiSource, Inc. | | | 50,972 | | | | 898,127 | |
Pepco Holdings, Inc. | | | 14,564 | | | | 265,793 | |
(Cost $2,989,244) | | | | | | | 3,416,762 | |
| Water Utility — 7.4% | | | | | | | | |
American Water Works Co., Inc. | | | 46,187 | | | | 1,168,068 | |
Veolia Environnement - ADR | | | 20,971 | | | | 615,709 | |
(Cost $1,624,737) | | | | | | | 1,783,777 | |
Total Common Stocks (Cost $20,947,559) | | | | | | | 23,071,995 | |
| The Total Return Utilities Fund | |
| | Shares or Principal Amount ($) | | | | |
| Money Market Registered Investment Companies — 4.5% | |
| The Flex-funds Money Market Fund - Institutional Class, 0.28%* | | | 1,091,819 | | | | 1,091,819 | |
Total Money Market Registered Investment Companies (Cost $1,091,819) | | | | | | | 1,091,819 | |
Total Investments — 100.1% (Cost $22,039,378)(a) | | | | | | | 24,163,814 | |
| Liabilities less Other Assets — (0.1%) | | | | | | | (19,987 | ) |
Total Net Assets — 100.0% | | | | | | | 24,143,827 | |
| Trustee Deferred Compensation** | |
| The Flex-funds Aggressive Growth Fund | | | 684 | | | | 5,451 | |
| The Flex-funds Defensive Balanced Fund | | | 358 | | | | 3,480 | |
| The Flex-funds Dynamic Growth Fund | | | 211 | | | | 1,718 | |
The Flex-funds Muirfield Fund | | | 1,264 | | | | 7,078 | |
The Flex-funds Quantex Fund | | | 867 | | | | 19,742 | |
| The Flex-funds Total Return Utilities Fund | | | 76 | | | | 1,787 | |
Total Trustee Deferred Compensation (Cost $30,803) | | | | | | | 39,256 | |
| (a) | Represents cost for financial reporting purposes and differs for federal income tax purposes by the amount of losses deferred for federal income tax reporting in the amount of $56,746. Cost for federal income tax purposes of $22,096,124 differs from value by net unrealized appreciation (depreciation) of securities as follows: |
Unrealized appreciation | | $ | 2,930,928 | |
Unrealized depreciation | | | (863,238 | ) |
| Net unrealized appreciation (depreciation) | | $ | 2,067,690 | |
| ADR | American Depositary Receipt |
| # | Represents non-income producing securities. |
| * | Investment in affiliate. The yield shown represents the 7-day yield in effect at December 31, 2010. |
| ** | Assets of affiliates to The Total Return Utilities Fund held for the benefit of the Fund’s Trustees in connection with the Trustees Deferred Compensation Plan. |
| The accompanying notes are an integral part of these financial statements. |
| 2010 Annual Report | December 31, 2010 |
| | |
Schedule of Investments December 31, 2010 | |
| The U.S. Government Bond Fund | |
| | Principal Amount ($) or Shares | | | | |
| U.S. Government Obligations — 84.6% | |
| Fannie Mae, 1.05%, due 08/26/2013 | | | 1,000,000 | | | | 997,607 | |
| Fannie Mae, 1.45%, due 12/23/2013 | | | 1,000,000 | | | | 1,000,836 | |
| Fannie Mae, 1.50%, due 02/04/2014 | | | 1,000,000 | | | | 1,000,891 | |
| Federal Farm Credit Bank, 1.05%, due 08/26/2013 | | | 1,000,000 | | | | 999,702 | |
| Federal Farm Credit Bank, 2.875%, due 04/14/2015 | | | 1,000,000 | | | | 1,045,462 | |
| Federal Farm Credit Bank, 1.85%, due 08/24/2015 | | | 1,000,000 | | | | 987,002 | |
| Federal Farm Credit Bank, 3.50%, due 09/29/2025 | | | 1,000,000 | | | | 935,723 | |
| Federal Farm Credit Bank, 5.20%, due 02/06/2026 | | | 1,600,000 | | | | 1,736,830 | |
| Federal Farm Credit Bank, 5.25%, due 04/21/2028 | | | 1,502,000 | | | | 1,625,134 | |
| Federal Home Loan Bank, 0.55%, due 10/25/2012 | | | 1,000,000 | | | | 996,784 | |
| Federal Home Loan Bank, 0.51%, due 05/29/2013 | | | 1,000,000 | | | | 990,874 | |
| Federal Home Loan Bank, 1.20%, due 09/30/2013 | | | 1,000,000 | | | | 997,545 | |
| Federal Home Loan Bank, 1.75%, due 09/11/2015 | | | 1,000,000 | | | | 979,580 | |
| Federal Home Loan Bank, 4.50%, due 09/13/2019 | | | 295,000 | | | | 317,224 | |
| Federal Home Loan Mortgage Corporation, 4.00%, due 12/15/2022 | | | 1,000,000 | | | | 995,509 | |
| Government National Mortgage Association, 6.50%, due 07/20/2038 | | | 28,506 | | | | 30,967 | |
| U.S. Treasury Note, 3.125%, due 09/30/2013 | | | 1,000,000 | | | | 1,060,859 | |
| Total U.S. Government Obligations (Cost $16,785,584) | | | | | | | 16,698,529 | |
| Corporate Bonds — 10.7% | |
| Abbott Labs, 5.875%, due 05/15/2016 | | | 500,000 | | | | 577,201 | |
Aspen Insurance Hldg., 6.00%, due 12/15/2020 | | | 500,000 | | | | 497,186 | |
| GE Capital Corp., 4.375%, due 09/16/2020 | | | 500,000 | | | | 492,079 | |
| Partnerre Finance, 6.875%, due 06/01/2018 | | | 500,000 | | | | 547,591 | |
Total Corporate Bonds (Cost $2,109,866) | | | | | | | 2,114,057 | |
| Money Market Registered Investment Companies — 1.0% | |
| The Flex-funds Money Market Fund - Institutional Class, 0.28%* | | | 197,989 | | | | 197,989 | |
Total Money Market Registered Investment Companies (Cost $197,989) | | | | | | | 197,989 | |
| The U.S. Government Bond Fund | |
| | Principal Amount ($) or Shares | | | | |
| Floating Rate Demand Notes — 3.1% | |
Caterpillar Financial Power Investment Floating Rate Demand Note, 1.15%, 1/1/2011** | | | 602,423 | | | | 602,423 | |
| Total Floating Rate Demand Notes (Cost $602,423) | | | | | | | 602,423 | |
Total Investments — 99.4% (Cost $19,695,862)(a) | | | | | | | 19,612,998 | |
| Other Assets less Liabilities — 0.6% | | | | | | | 109,735 | |
Total Net Assets — 100.0% | | | | | | | 19,722,733 | |
| Trustee Deferred Compensation*** | |
| The Flex-funds Aggressive Growth Fund | | | 557 | | | | 4,439 | |
| The Flex-funds Defensive Balanced Fund | | | 288 | | | | 2,799 | |
| The Flex-funds Dynamic Growth Fund | | | 172 | | | | 1,400 | |
The Flex-funds Muirfield Fund | | | 979 | | | | 5,482 | |
The Flex-funds Quantex Fund | | | 671 | | | | 15,279 | |
| The Flex-funds Total Return Utilities Fund | | | 62 | | | | 1,458 | |
Total Trustee Deferred Compensation (Cost $24,223) | | | | | | | 30,857 | |
| (a) | Represents cost for financial reporting purposes and differs for federal income tax purposes by the amount of losses deferred for federal income tax reporting in the amount of $78,987. Cost for federal income tax purposes of $19,774,849 differs from value by net unrealized appreciation (depreciation) of securities as follows: |
Unrealized appreciation | | $ | 57,080 | |
Unrealized depreciation | | | (218,931 | ) |
| Net unrealized appreciation (depreciation) | | $ | (161,851 | ) |
| * | Investment in affiliate. The yield shown represents the 7-day yield in effect at December 31, 2010. |
| ** | Floating rate security. The rate shown represents the rate in effect at December 31, 2010. |
| *** | Assets of affiliates to The U.S. Government Bond Fund held for the benefit of the Fund’s Trustees in connection with the Trustee Deferred Compensation Plan. |
| The accompanying notes are an integral part of these financial statements. |
| 2010 Annual Report | December 31, 2010 |
| | |
Schedule of Investments December 31, 2010 | |
| The Money Market Fund | |
| | | | | | Principal Amount ($) or Shares | | | | |
| Bank Obligations — 2.3% | |
| Bank of Internet Demand Deposit Account | | | 0.50 | %* | 01/01/11 | | | 249,000 | | | | 249,000 | |
| Brand Banking Company Demand Deposit Account | | | 0.50 | %* | 01/01/11 | | | 249,000 | | | | 249,000 | |
| Commerce National Bank Demand Deposit Account | | | 0.40 | %* | 01/01/11 | | | 249,442 | | | | 249,442 | |
EverBank Money Market Account | | | 1.05 | %* | 01/01/11 | | | 249,211 | | | | 249,211 | |
Excel Bank Demand Deposit Account | | | 0.75 | %* | 01/01/11 | | | 249,830 | | | | 249,830 | |
| First Citizens Bank & Trust Co. Demand Deposit Account | | | 0.30 | %* | 01/01/11 | | | 249,000 | | | | 249,000 | |
Huntington National Bank Conservative Deposit Account | | | 0.30 | %* | 01/01/11 | | | 250,000 | | | | 250,000 | |
Nationwide Bank Deposit Account | | | 0.85 | %* | 01/01/11 | | | 249,359 | | | | 249,359 | |
Synovus Bank of North Georgia Demand Deposit Account | | | 0.54 | %* | 01/01/11 | | | 249,000 | | | | 249,000 | |
TD Bank Demand Deposit Account | | | 0.40 | %* | 01/01/11 | | | 249,261 | | | | 249,261 | |
| The Trust Company Bank Demand Deposit Account | | | 0.50 | %* | 01/01/11 | | | 249,000 | | | | 249,000 | |
| United Community Bank Demand Deposit Account | | | 0.65 | %* | 01/01/11 | | | 249,000 | | | | 249,000 | |
Total Bank Obligations (Cost $2,991,103) | | | | | | | | | | | | 2,991,103 | |
| Certificates of Deposit — 4.6% | |
Amalgamated Bank | | | 0.75 | % | 09/15/11 | | | 238,500 | | | | 238,500 | |
Citizens Business Bank | | | 0.75 | % | 09/15/11 | | | 238,500 | | | | 238,500 | |
Cole Taylor Bank | | | 0.70 | % | 04/14/11 | | | 244,500 | | | | 244,500 | |
Community Bank | | | 0.75 | % | 09/15/11 | | | 238,500 | | | | 238,500 | |
Community Bank Corporation | | | 0.70 | % | 04/14/11 | | | 244,500 | | | | 244,500 | |
| Community Mutual Savings Bank | | | 0.70 | % | 04/14/11 | | | 244,500 | | | | 244,500 | |
East West Bank | | | 0.75 | % | 09/15/11 | | | 105,814 | | | | 105,814 | |
Farmers' and Traders' State Bank | | | 0.75 | % | 09/15/11 | | | 238,500 | | | | 238,500 | |
| First Bankers Trust Company, NA | | | 0.70 | % | 04/14/11 | | | 244,500 | | | | 244,500 | |
First Community Bank | | | 0.70 | % | 04/14/11 | | | 95,000 | | | | 95,000 | |
First Service Bank | | | 0.70 | % | 04/14/11 | | | 193,500 | | | | 193,500 | |
Flagstar Bank, FSB | | | 0.75 | % | 09/15/11 | | | 238,500 | | | | 238,500 | |
| Heartland Bank and Trust Company | | | 0.70 | % | 04/14/11 | | | 244,500 | | | | 244,500 | |
MB Financial Bank, NA | | | 0.75 | % | 09/15/11 | | | 238,500 | | | | 238,500 | |
Morton Community Bank | | | 0.75 | % | 09/15/11 | | | 238,500 | | | | 238,500 | |
Mutual of Omaha Bank | | | 0.75 | % | 09/15/11 | | | 238,500 | | | | 238,500 | |
Pinnacle National Bank | | | 0.70 | % | 04/14/11 | | | 244,500 | | | | 244,500 | |
PrivateBank and Trust Company (The) | | | 0.75 | % | 09/15/11 | | | 238,500 | | | | 238,500 | |
| The Money Market Fund | |
| | | | | | Principal Amount ($) or Shares | | | | |
| Certificates of Deposit — continued | |
| Regents Bank, National Association | | | 0.70 | % | 04/14/11 | | | 244,500 | | | | 244,500 | |
Rocky Mountain Bank | | | 0.70 | % | 04/14/11 | | | 244,500 | | | | 244,500 | |
| Southern Community Bank and Trust | | | 0.70 | % | 04/14/11 | | | 244,500 | | | | 244,500 | |
SpiritBank | | | 0.70 | % | 04/14/11 | | | 244,500 | | | | 244,500 | |
TriState Capital Bank | | | 0.70 | % | 04/14/11 | | | 244,500 | | | | 244,500 | |
Union Bank & Trust Co. | | | 0.75 | % | 09/15/11 | | | 32,186 | | | | 32,186 | |
Union Savings Bank | | | 0.70 | % | 04/14/11 | | | 22,000 | | | | 22,000 | |
United Bank | | | 0.75 | % | 09/15/11 | | | 238,500 | | | | 238,500 | |
Washington Trust Bank | | | 0.75 | % | 09/15/11 | | | 238,500 | | | | 238,500 | |
WashingtonFirst Bank | | | 0.75 | % | 09/15/11 | | | 238,500 | | | | 238,500 | |
| Total Certificates of Deposit (Cost $6,000,000) | | | | | | | | | | | | 6,000,000 | |
| Commercial Paper — 19.1% | |
Abbey National | | | 0.33 | % | 02/09/11 | | | 2,800,000 | | | | 2,799,028 | |
BNP Paribas | | | 0.27 | % | 01/06/11 | | | 1,000,000 | | | | 999,963 | |
BNP Paribas | | | 0.31 | % | 03/01/11 | | | 1,000,000 | | | | 999,508 | |
Dexia Delaware | | | 0.46 | % | 01/24/11 | | | 1,000,000 | | | | 999,712 | |
ING Funding | | | 0.31 | % | 01/19/11 | | | 1,000,000 | | | | 999,850 | |
ING Funding | | | 0.31 | % | 02/22/11 | | | 1,000,000 | | | | 999,567 | |
ING Funding | | | 0.31 | % | 02/25/11 | | | 2,000,000 | | | | 1,999,083 | |
ING Funding | | | 0.34 | % | 04/05/11 | | | 1,000,000 | | | | 999,138 | |
Rabobank USA Finance Corp. | | | 0.30 | % | 05/05/11 | | | 5,000,000 | | | | 4,995,006 | |
Societe Generale | | | 0.28 | % | 01/14/11 | | | 1,000,000 | | | | 999,899 | |
Societe Generale | | | 0.28 | % | 01/24/11 | | | 1,000,000 | | | | 999,821 | |
Societe Generale | | | 0.37 | % | 02/04/11 | | | 2,000,000 | | | | 1,999,320 | |
Toyota Motor Credit | | | 0.31 | % | 01/31/11 | | | 1,000,000 | | | | 999,750 | |
Toyota Motor Credit | | | 0.63 | % | 02/24/11 | | | 1,000,000 | | | | 999,070 | |
Toyota Motor Credit | | | 0.34 | % | 03/14/11 | | | 1,000,000 | | | | 999,340 | |
Toyota Motor Credit | | | 0.46 | % | 04/13/11 | | | 1,000,000 | | | | 998,725 | |
Toyota Motor Credit | | | 0.39 | % | 06/07/11 | | | 1,000,000 | | | | 998,343 | |
Total Commercial Paper (Cost $24,785,123) | | | | | | | | | | | | 24,785,123 | |
| 2010 Annual Report | December 31, 2010 |
| | |
Schedule of Investments December 31, 2010 | |
| The Money Market Fund | |
| | | | | | Principal Amount ($) or Shares | | | | |
| Corporate Obligations — 32.9% | |
Barclays Bank | | | 0.46 | %* | 03/11/11 | | | 5,000,000 | | | | 5,000,000 | |
Barclays Bank | | | 0.68 | %* | 05/18/11 | | | 1,000,000 | | | | 1,000,000 | |
Bath Technologies*** | | | 0.44 | %* | 01/06/11 | | | 855,000 | | | | 855,000 | |
Cascade Plaza Project*** | | | 0.36 | %* | 01/06/11 | | | 6,373,000 | | | | 6,373,000 | |
| Caterpillar Financial Power Investment Floating Rate Demand Note | | | 1.15 | %** | 01/01/11 | | | 9,672,023 | | | | 9,672,023 | |
Dexia Credit Local**** | | | 0.57 | %** | 01/03/11 | | | 5,000,000 | | | | 5,000,000 | |
| General Electric Interest Plus Variable Rate Demand Note | | | 0.95 | %* | 01/01/11 | | | 9,133,905 | | | | 9,133,905 | |
JP Morgan Chase | | | 5.60 | % | 06/01/11 | | | 1,000,000 | | | | 1,020,984 | |
Martin Wheel Co, Inc.*** | | | 3.01 | %* | 01/06/11 | | | 1,815,000 | | | | 1,815,000 | |
Seariver Maritime | | | 0.45 | %* | 01/01/11 | | | 600,000 | | | | 600,000 | |
| Springside Corp. Exchange Partners LLC*** | | | 0.36 | %* | 01/06/11 | | | 2,000,000 | | | | 2,000,000 | |
| Total Corporate Obligations (Cost $42,469,912) | | | | | | | | | | | | 42,469,912 | |
| U.S. Government Agency Obligations — 6.9% | |
Federal Home Loan Bank | | | 0.34 | % | 11/15/11 | | | 1,000,000 | | | | 1,000,000 | |
Federal Home Loan Bank | | | 0.35 | % | 11/15/11 | | | 1,000,000 | | | | 1,000,000 | |
Federal Home Loan Bank | | | 0.40 | % | 11/25/11 | | | 1,000,000 | | | | 1,000,000 | |
Federal Home Loan Bank | | | 0.40 | % | 12/09/11 | | | 1,000,000 | | | | 1,000,000 | |
Federal Home Loan Bank | | | 0.45 | % | 12/23/11 | | | 2,000,000 | | | | 2,000,000 | |
Federal Home Loan Bank | | | 0.50 | % | 12/30/11 | | | 2,000,000 | | | | 2,000,000 | |
Federal Home Loan Bank | | | 0.50 | % | 01/13/12 | | | 1,000,000 | | | | 1,000,000 | |
Total U.S. Government Agency Obligations (Cost $9,000,000) | | | | | | | | | | | | 9,000,000 | |
| The Money Market Fund | |
| | Principal Amount ($) or Shares | | | | |
| Money Market Registered Investment Companies — 35.0% | |
Federated Prime Value Obligations Fund, 0.23% # | | | 3,812,247 | | | | 3,812,247 | |
Fidelity Institutional Money Market Portfolio, 0.25% # | | | 41,612,287 | | | | 41,612,287 | |
Total Money Market Registered Investment Companies (Cost $45,424,534) | | | | | | | 45,424,534 | |
Total Investments — 100.8% (Cost $130,670,672) (a) | | | | | | | 130,670,672 | |
| Liabilities less Other Assets — (-0.8%) | | | | | | | (999,076 | ) |
Total Net Assets — 100.0% | | | | | | | 129,671,596 | |
| Trustee Deferred Compensation***** | |
| The Flex-funds Aggressive Growth Fund | | | 541 | | | | 4,312 | |
| The Flex-funds Defensive Balanced Fund | | | 280 | | | | 2,722 | |
| The Flex-funds Dynamic Growth Fund | | | 167 | | | | 1,359 | |
The Flex-funds Muirfield Fund | | | 1,271 | | | | 7,118 | |
The Flex-funds Quantex Fund | | | 931 | | | | 21,199 | |
| The Flex-funds Total Return Utilities Fund | | | 60 | | | | 1,411 | |
Total Trustee Deferred Compensation (Cost $32,114) | | | | | | | 38,121 | |
| (a) | Cost for federal income tax and financial reporting purposes are the same. |
| # | 7-day yield as of December 31, 2010. |
| * | Variable rate security. Securities payable at par including accrued interest (usually within seven days notice) and unconditionally secured as to principal and interest by letters of credit or other credit support agreements from major banks. The interest rates are adjustable and are based on bank prime rates or other interest rate adjustment indices. The rate shown represents the rate in effect at December 31, 2010. The maturity date shown reflects the earlier of the next demand date or stated maturity date. |
| ** | Floating rate security. The rate shown represents the rate in effect at December 31, 2010. |
| *** | Represents a restricted security purchased under Rule 144A, which is exempt from registration under the Securities Act of 1933, as amended. Security is restricted as to resale to institutional investors, but has been deemed liquid in accordance with guidelines approved by the Board of Trustees. Bath Technologies was acquired on 10/18/1999. Cascade Plaza Project was acquired on 2/28/2002. Martin Wheel Co., Inc. was acquired on 1/26/2001. Springside Corp. Exchange Partners LLC was acquired on 2/5/2004. As of December 31, 2010, securities restricted as to resale to institutional investors represented 8.5% of Total Investments. The fair value noted approximates amortized cost. |
| **** | Illiquid security. The sale or disposition of such security would not be possible in the ordinary course of business within seven days at approximately the value at which the Fund has valued the security. As of December 31, 2010, illiquid securities represented 3.8% of Total Investments. |
| ***** | Assets of affiliates to The Money Market Fund held for the benefit of the Fund’s Trustees in connection with the Trustee Deferred Compensation Plan. |
| The accompanying notes are an integral part of these financial statements. |
| | 2010 Annual Report | December 31, 2010 |
Statements of Assets & Liabilities December 31, 2010 | |
| | | | | | | |
| Assets | | | | | | |
| Investments, at fair value* | | $ | 121,101,454 | | | $ | 93,339,058 | |
| Investments in affiliates, at fair value* | | | 1,186,440 | | | | 1,901,691 | |
| Trustee deferred compensation investments, at fair value | | | 109,729 | | | | 55,305 | |
| Cash | | | — | | | | — | |
| Receivable for capital stock issued | | | 193,317 | | | | 141,510 | |
| Receivable from investment advisor | | | — | | | | — | |
| Interest and dividend receivable | | | 6,202 | | | | 1,224 | |
Prepaid expenses/other assets | | | 38,464 | | | | 33,594 | |
| | | 122,635,606 | | | | 95,472,382 | |
| Liabilities | | | | | | | | |
| Payable for securities purchased | | | — | | | | — | |
| Payable for Trustee Deferred Compensation Plan | | | 109,729 | | | | 55,305 | |
| Payable for net variation margin on futures contracts | | | 6,000 | | | | 3,375 | |
| Payable for capital stock redeemed | | | 58,640 | | | | 421 | |
| Dividends payable | | | 1,822 | | | | 189 | |
| Dividends payable - The Money Market Fund - Retail Class | | | | | | | | |
| Dividends payable - The Money Market Fund - Institutional Class | | | | | | | | |
| Payable to investment advisor | | | 60,741 | | | | 49,874 | |
| Accrued distribution plan (12b-1) and administrative service plan fees | | | 81,289 | | | | 81,118 | |
| Accrued transfer agent, fund accounting, CCO, and administrative fees | | | 21,271 | | | | 16,749 | |
| Accrued trustee fees | | | 3,545 | | | | 3,005 | |
Other accrued liabilities | | | 26,099 | | | | 22,923 | |
| | | 369,136 | | | | 232,959 | |
| | | | | | | | |
| | $ | 122,266,470 | | | $ | 95,239,423 | |
| Net Assets | | | | | | | | |
| Capital | | $ | 123,380,583 | | | $ | 99,363,212 | |
| Accumulated undistributed (distributions in excess of) net investment income | | | 171,704 | | | | — | |
| Accumulated undistributed net realized gain (loss) from investments and futures contracts | | | (16,234,782 | ) | | | (17,193,099 | ) |
Net unrealized appreciation (depreciation) of investments and futures contracts | | | 14,948,965 | | | | 13,069,310 | |
| | $ | 122,266,470 | | | $ | 95,239,423 | |
| Net Assets | | | | | | | | |
| The Money Market Fund - Retail Class | | | | | | | | |
The Money Market Fund - Institutional Class | | | | | | | | |
| | | | | | | | |
| Capital Stock Outstanding (indefinite number of shares authorized, $0.10 par value) | | | 21,824,649 | | | | 11,693,684 | |
| The Money Market Fund - Retail Class | | | | | | | | |
The Money Market Fund - Institutional Class | | | | | | | | |
Total Capital Stock Outstanding | | | | | | | | |
| Net Asset Value, Offering and Redemption Price Per Share | | $ | 5.60 | | | $ | 8.14 | |
| The Money Market Fund - Retail Class | | | | | | | | |
The Money Market Fund - Institutional Class | | | | | | | | |
* Investments and affiliated investments at cost | | $ | 107,405,809 | | | $ | 82,200,884 | |
| The accompanying notes are an integral part of these financial statements. |
| |
The Aggressive Growth Fund | | | The Defensive Balanced Fund | | | | | | | | | The Total Return Utilities Fund | | | The U.S. Government Bond Fund | | | | |
| | | | | | | | | | | | | | | | | | | | |
| $ | 33,371,850 | | | $ | 56,855,479 | | | $ | 60,953,528 | | | $ | 16,406,722 | | | $ | 23,071,995 | | | $ | 19,415,009 | | | $ | 130,670,672 | |
| | 604,959 | | | | 981,486 | | | | 1,553,744 | | | | 635,526 | | | | 1,091,819 | | | | 197,989 | | | | — | |
| | 34,432 | | | | 37,951 | | | | 30,809 | | | | 42,309 | | | | 39,256 | | | | 30,857 | | | | 38,121 | |
| | — | | | | — | | | | 100,000 | | | | — | | | | — | | | | — | | | | — | |
| | 938 | | | | 44,403 | | | | 34,830 | | | | 5,915 | | | | 11,380 | | | | 12,620 | | | | — | |
| | — | | | | — | | | | — | | | | — | | | | — | | | | 305 | | | | — | |
| | 1,272 | | | | 3,199 | | | | 560 | | | | 12,017 | | | | 31,961 | | | | 125,605 | | | | 56,224 | |
| | 11,973 | | | | 22,000 | | | | 23,986 | | | | 7,291 | | | | 6,658 | | | | 7,775 | | | | 22,635 | |
| | 34,025,424 | | | | 57,944,518 | | | | 62,697,457 | | | | 17,109,780 | | | | 24,253,069 | | | | 19,790,160 | | | | 130,787,652 | |
| | | | | | | | | | | | | | | | | | | | | | | | | | | |
| | — | | | | — | | | | 100,000 | | | | — | | | | — | | | | — | | | | 1,000,000 | |
| | 34,432 | | | | 37,951 | | | | 30,809 | | | | 42,309 | | | | 39,256 | | | | 30,857 | | | | 38,121 | |
| | 1,125 | | | | 1,500 | | | | 20,208 | | | | 6,300 | | | | — | | | | — | | | | — | |
| | 8,631 | | | | 14 | | | | 941 | | | | 1,052 | | | | 16,009 | | | | 6 | | | | — | |
| | — | | | | 4,440 | | | | 149 | | | | — | | | | 349 | | | | 552 | | | | | |
| | | | | | | | | | | | | | | | | | | | | | | | | | 582 | |
| | | | | | | | | | | | | | | | | | | | | | | | | | 5,492 | |
| | 17,930 | | | | 32,844 | | | | 34,246 | | | | 10,652 | | | | 20,186 | | | | — | | | | 8,502 | |
| | 27,298 | | | | 56,947 | | | | 46,461 | | | | 3,914 | | | | 7,036 | | | | 14,914 | | | | 8,752 | |
| | 9,338 | | | | 10,700 | | | | 10,634 | | | | 5,212 | | | | 7,134 | | | | 4,892 | | | | 23,563 | |
| | 1,242 | | | | 1,888 | | | | 2,377 | | | | 764 | | | | 920 | | | | 935 | | | | 825 | |
| | 17,113 | | | | 19,601 | | | | 20,791 | | | | 15,936 | | | | 18,352 | | | | 15,271 | | | | 30,219 | |
| | 117,109 | | | | 165,885 | | | | 266,616 | | | | 86,139 | | | | 109,242 | | | | 67,427 | | | | 1,116,056 | |
| | | | | | | | | | | | | | | | | | | | | | | | | | | |
| $ | 33,908,315 | | | $ | 57,778,633 | | | $ | 62,430,841 | | | $ | 17,023,641 | | | $ | 24,143,827 | | | $ | 19,722,733 | | | $ | 129,671,596 | |
| | | | | | | | | | | | | | | | | | | | | | | | | | | |
| $ | 38,391,339 | | | $ | 59,389,694 | | | $ | 59,032,847 | | | $ | 16,347,261 | | | $ | 22,206,694 | | | $ | 20,020,600 | | | $ | 129,671,596 | |
| | — | | | | 2 | | | | — | | | | — | | | | (788 | ) | | | 1,851 | | | | — | |
| | (9,740,121 | ) | | | (5,691,951 | ) | | | (1,955,186 | ) | | | (2,266,708 | ) | | | (186,515 | ) | | | (216,854 | ) | | | — | |
| | 5,257,097 | | | | 4,080,888 | | | | 5,353,180 | | | | 2,943,088 | | | | 2,124,436 | | | | (82,864 | ) | | | — | |
| $ | 33,908,315 | | | $ | 57,778,633 | | | $ | 62,430,841 | | | $ | 17,023,641 | | | $ | 24,143,827 | | | $ | 19,722,733 | | | $ | 129,671,596 | |
| | | | | | | | | | | | | | | | | | | | | | | | | | | |
| | | | | | | | | | | | | | | | | | | | | | | | | $ | 96,087,447 | |
| | | | | | | | | | | | | | | | | | | | | | | | | | 33,584,149 | |
| | | | | | | | | | | | | | | | | | | | | | | | | $ | 129,671,596 | |
| | 4,255,686 | | | | 5,942,789 | | | | 6,429,200 | | | | 747,738 | | | | 1,027,055 | | | | 944,832 | | | | | |
| | | | | | | | | | | | | | | | | | | | | | | | | | 96,087,447 | |
| | | | | | | | | | | | | | | | | | | | | | | | | | 33,584,149 | |
| | | | | | | | | | | | | | | | | | | | | | | | | | 129,671,596 | |
| $ | 7.97 | | | $ | 9.72 | | | $ | 9.71 | | | $ | 22.77 | | | $ | 23.51 | | | $ | 20.87 | | | | | |
| | | | | | | | | | | | | | | | | | | | | | | | | $ | 1.00 | |
| | | | | | | | | | | | | | | | | | | | | | | | | $ | 1.00 | |
| $ | 28,732,252 | | | $ | 53,772,797 | | | $ | 57,184,797 | | | $ | 14,109,395 | | | $ | 22,039,378 | | | $ | 19,695,862 | | | $ | 130,670,672 | |
| | 2010 Annual Report | December 31, 2010 |
Statements of Operations For the Year Ended December 31, 2010 | |
| | | | | | | |
| Investment Income | | | | | | |
| Interest | | $ | 82,948 | | | $ | 9,498 | |
| Interest from affiliates | | | 4,499 | | | | 4,997 | |
Dividends (Net of foreign tax withheld of $13,814 for The Total Return Utilities Fund) | | | 1,956,946 | | | | 1,395,485 | |
| | | 2,044,393 | | | | 1,409,980 | |
| Fund Expenses | | | | | | | | |
| Investment advisor | | | 957,763 | | | | 652,144 | |
| Transfer agent | | | 136,553 | | | | 104,343 | |
| Transfer agent - The Money Market Fund - Retail Class | | | | | | | | |
| Transfer agent - The Money Market Fund - Institutional Class | | | | | | | | |
| Fund accounting | | | 48,379 | | | | 45,691 | |
| Administrative | | | 101,035 | | | | 79,562 | |
| Trustee | | | 23,614 | | | | 17,786 | |
| Audit | | | 10,527 | | | | 10,527 | |
| Legal | | | 5,515 | | | | 5,475 | |
| Custody | | | 18,016 | | | | 13,069 | |
| Printing | | | 13,926 | | | | 10,704 | |
| Distribution plan (12b-1) | | | 227,302 | | | | 217,382 | |
| Distribution plan (12b-1) - The Money Market Fund - Retail Class | | | | | | | | |
| Distribution plan (12b-1) - The Money Market Fund - Institutional Class | | | | | | | | |
| Administrative service plan | | | 227,972 | | | | 173,592 | |
| Postage | | | 4,957 | | | | 3,852 | |
| Registration and filing | | | 21,738 | | | | 22,177 | |
| Insurance | | | 11,355 | | | | 8,604 | |
| Chief Compliance Officer | | | 2,819 | | | | 2,819 | |
| | | 12,602 | | | | 11,353 | |
Total Expenses Before Reductions | | | 1,824,073 | | | | 1,379,080 | |
| Expenses reimbursed/waived by investment advisor | | | (22,556 | ) | | | (9,095 | ) |
| Expenses paid indirectly | | | (85,507 | ) | | | (72,653 | ) |
| Distribution plan (12b-1) expenses waived | | | (14,793 | ) | | | — | |
| Administrative service plan expenses waived | | | (70,552 | ) | | | (42,607 | ) |
Transfer agent expenses waived | | | (45,518 | ) | | | (43,476 | ) |
| | | 1,585,147 | | | | 1,211,249 | |
| | | | | | | | |
Net Investment Income (Loss) | | | 459,246 | | | | 198,731 | |
| Realized and Unrealized Gain (Loss) from Investments | | | | | | | | |
| Net realized gains (losses) from investments | | | 6,065,003 | | | | 5,907,072 | |
| Net realized gains (losses) from futures contracts | | | 192,617 | | | | 485,487 | |
Distributions of long-term realized gains by other investment companies | | | 828,810 | | | | 727,786 | |
Net Realized Gains (Losses) from Investment Transactions, Futures Contracts, and Distributions of Long-term Realized Gains by Other Investment Companies | | | 7,086,430 | | | | 7,120,345 | |
Net change in unrealized appreciation (depreciation) of investments and futures contracts | | | 6,602,098 | | | | 6,409,206 | |
Net Realized and Unrealized Gain (Loss) from Investments | | | 13,688,528 | | | | 13,529,551 | |
| | | | | | | | |
Net Change in Net Assets Resulting from Operations | | $ | 14,147,774 | | | $ | 13,728,282 | |
| The accompanying notes are an integral part of these financial statements. |
| | 2010 Annual Report | December 31, 2010 |
| | | | | | | | | | | | | | | | | | | | |
The Aggressive Growth Fund | | | The Defensive Balanced Fund | | | | | | | | | The Total Return Utilities Fund | | | The U.S. Government Bond Fund | | | | |
| | | | | | | | | | | | | | | | | | | | |
| $ | 2,354 | | | $ | 122,303 | | | $ | 7,458 | | | $ | 1,486 | | | $ | — | | | $ | 564,621 | | | $ | 837,473 | |
| | 2,247 | | | | 4,347 | | | | 3,633 | | | | 1,824 | | | | 1,384 | | | | 3,470 | | | | — | |
| | 455,005 | | | | 1,472,233 | | | | 806,580 | | | | 209,176 | | | | 562,981 | | | | 791 | | | | — | |
| | 459,606 | | | | 1,598,883 | | | | 817,671 | | | | 212,486 | | | | 564,365 | | | | 568,882 | | | | 837,473 | |
| | | | | | | | | | | | | | | | | | | | | | | | | | | |
| | 226,582 | | | | 395,035 | | | | 311,077 | | | | 153,208 | | | | 215,472 | | | | 74,189 | | | | 513,184 | |
| | 36,253 | | | | 63,206 | | | | 49,772 | | | | 18,385 | | | | 25,857 | | | | 14,838 | | | | | |
| | | | | | | | | | | | | | | | | | | | | | | | | | 94,815 | |
| | | | | | | | | | | | | | | | | | | | | | | | | | 28,738 | |
| | 34,466 | | | | 39,534 | | | | 37,295 | | | | 20,321 | | | | 26,547 | | | | 23,547 | | | | 51,527 | |
| | 30,211 | | | | 52,103 | | | | 41,351 | | | | 15,321 | | | | 21,547 | | | | 18,547 | | | | 126,219 | |
| | 8,023 | | | | 12,648 | | | | 10,996 | | | | 5,699 | | | | 6,757 | | | | 5,965 | | | | 5,199 | |
| | 10,527 | | | | 10,527 | | | | 10,527 | | | | 10,527 | | | | 10,527 | | | | 10,527 | | | | 10,526 | |
| | 5,485 | | | | 5,495 | | | | 5,485 | | | | 5,484 | | | | 8,127 | | | | 5,490 | | | | 5,625 | |
| | 5,557 | | | | 10,629 | | | | 8,811 | | | | 8,201 | | | | 5,472 | | | | 3,788 | | | | 10,784 | |
| | 3,934 | | | | 7,320 | | | | 6,476 | | | | 2,265 | | | | 3,288 | | | | 2,571 | | | | 15,819 | |
| | 75,401 | | | | 131,680 | | | | 103,731 | | | | 30,683 | | | | 53,837 | | | | 37,086 | | | | | |
| | | | | | | | | | | | | | | | | | | | | | | | | | 218,566 | |
| | | | | | | | | | | | | | | | | | | | | | | | | | 10,814 | |
| | 60,448 | | | | 105,389 | | | | 82,896 | | | | 30,678 | | | | 43,111 | | | | 37,095 | | | | — | |
| | 2,037 | | | | 2,518 | | | | 2,110 | | | | 1,990 | | | | 4,011 | | | | 1,171 | | | | 6,474 | |
| | 20,381 | | | | 21,452 | | | | 21,194 | | | | 17,310 | | | | 16,727 | | | | 20,703 | | | | 32,725 | |
| | 2,850 | | | | 4,927 | | | | 3,685 | | | | 1,264 | | | | 1,979 | | | | 1,861 | | | | 19,507 | |
| | 2,819 | | | | 2,819 | | | | 2,819 | | | | 2,819 | | | | 2,819 | | | | 2,819 | | | | 2,819 | |
| | 9,153 | | | | 9,608 | | | | 8,936 | | | | 8,745 | | | | 9,432 | | | | 9,561 | | | | 31,421 | |
| | 534,127 | | | | 874,890 | | | | 707,161 | | | | 332,900 | | | | 455,510 | | | | 269,758 | | | | 1,184,762 | |
| | (8,219 | ) | | | (3,185 | ) | | | (1,437 | ) | | | (38,302 | ) | | | — | | | | (68,705 | ) | | | (472,524 | ) |
| | (22,594 | ) | | | (29,489 | ) | | | (42,510 | ) | | | — | | | | — | | | | — | | | | — | |
| | (1,511 | ) | | | — | | | | (6,222 | ) | | | (17,312 | ) | | | (14,437 | ) | | | (4,080 | ) | | | (185,215 | ) |
| | (20,543 | ) | | | (3,160 | ) | | | (8,710 | ) | | | (24,973 | ) | | | (26,718 | ) | | | (9,645 | ) | | | — | |
| | — | | | | (36,870 | ) | | | (29,034 | ) | | | — | | | | — | | | | (3,710 | ) | | | (12,634 | ) |
| | 481,260 | | | | 802,186 | | | | 619,248 | | | | 252,313 | | | | 414,355 | | | | 183,618 | | | | 514,389 | |
| | | | | | | | | | | | | | | | | | | | | | | | | | | |
| | (21,654 | ) | | | 796,697 | | | | 198,423 | | | | (39,827 | ) | | | 150,010 | | | | 385,264 | | | | 323,084 | |
| | | | | | | | | | | | | | | | | | | | | | | | | | | |
| | 3,471,543 | | | | 2,880,011 | | | | 5,940,893 | | | | 1,454,374 | | | | 959,028 | | | | 395,707 | | | | | |
| | 106,818 | | | | 29,187 | | | | 514,549 | | | | 72,139 | | | | — | | | | — | | | | | |
| | 241,021 | | | | 379,001 | | | | 177,328 | | | | — | | | | — | | | | — | | | | | |
| | 3,819,382 | | | | 3,288,199 | | | | 6,632,770 | | | | 1,526,513 | | | | 959,028 | | | | 395,707 | | | | | |
| | 1,054,758 | | | | 1,231,808 | | | | 1,458,237 | | | | 1,655,283 | | | | 1,830,913 | | | | (148,833 | ) | | | | |
| | 4,874,140 | | | | 4,520,007 | | | | 8,091,007 | | | | 3,181,796 | | | | 2,789,941 | | | | 246,874 | | | | | |
| | | | | | | | | | | | | | | | | | | | | | | | | | | |
| $ | 4,852,486 | | | $ | 5,316,704 | | | $ | 8,289,430 | | | $ | 3,141,969 | | | $ | 2,939,951 | | | $ | 632,138 | | | $ | 323,084 | |
| | 2010 Annual Report | December 31, 2010 |
Statements of Changes in Net Assets For the Years Ended December 31, | |
| | | | | | | |
| | | | | | | | | | | | | |
| Operations | | | | | | | | | | | | |
| Net investment income (loss) | | $ | 459,246 | | | $ | 171,769 | | | $ | 198,731 | | | $ | (28,671 | ) |
| Net realized gain (loss) from investment transactions, futures contracts, and distributions of long-term realized gains by other investment companies | | | 7,086,430 | | | | (3,114,982 | ) | | | 7,120,345 | | | | (5,412,561 | ) |
Net change in unrealized appreciation (depreciation) of investments and futures contracts | | | 6,602,098 | | | | 21,711,512 | | | | 6,409,206 | | | | 24,472,483 | |
Net change in net assets resulting from operations | | | 14,147,774 | | | | 18,768,299 | | | | 13,728,282 | | | | 19,031,251 | |
| Distributions to Shareholders | | | | | | | | | | | | | | | | |
| From net investment income | | | (459,247 | ) | | | (414,472 | ) | | | (198,736 | ) | | | (25,950 | ) |
| From net realized gain from investment transactions | | | — | | | | — | | | | — | | | | — | |
From tax return of capital | | | — | | | | — | | | | — | | | | — | |
Net change in net assets resulting from distributions | | | (459,247 | ) | | | (414,472 | ) | | | (198,736 | ) | | | (25,950 | ) |
| Capital Transactions | | | | | | | | | | | | | | | | |
| Issued | | | 24,058,379 | | | | 25,393,304 | | | | 25,201,324 | | | | 18,550,561 | |
| Reinvested | | | 457,414 | | | | 413,001 | | | | 198,546 | | | | 25,931 | |
| | | (31,076,006 | ) | | | (15,332,338 | ) | | | (28,048,074 | ) | | | (20,521,732 | ) |
Net change in net assets resulting from capital transactions | | | (6,560,213 | ) | | | 10,473,967 | | | | (2,648,204 | ) | | | (1,945,240 | ) |
| | | | | | | | | | | | | | | | |
Total Change in Net Assets | | | 7,128,314 | | | | 28,827,794 | | | | 10,881,342 | | | | 17,060,061 | |
Net Assets - Beginning of Year | | | 115,138,156 | | | | 86,310,362 | | | | 84,358,081 | | | | 67,298,020 | |
| | $ | 122,266,470 | | | $ | 115,138,156 | | | $ | 95,239,423 | | | $ | 84,358,081 | |
Accumulated undistributed (distributions in excess of) net investment income | | $ | 171,704 | | | $ | 171,705 | | | $ | — | | | $ | — | |
| Share Transactions | | | | | | | | | | | | | | | | |
| Issued | | | 4,734,508 | | | | 5,941,024 | | | | 3,526,238 | | | | 3,216,909 | |
| Reinvested | | | 81,680 | | | | 82,766 | | | | 24,392 | | | | 3,673 | |
| | | (6,042,300 | ) | | | (3,493,767 | ) | | | (3,799,857 | ) | | | (3,566,560 | ) |
| | | (1,226,112 | ) | | | 2,530,023 | | | | (249,227 | ) | | | (345,978 | ) |
| The accompanying notes are an integral part of these financial statements. |
| | 2010 Annual Report | December 31, 2010 |
| | |
The Aggressive Growth Fund | | | The Defensive Balanced Fund | | | The Strategic Growth Fund | |
| | | | | | | | | | | | | | | | |
| | | | | | | | | | | | | | | | | |
| $ | (21,654 | ) | | $ | (61,565 | ) | | $ | 796,697 | | | $ | 172,076 | | | $ | 198,423 | | | $ | (35,998 | ) |
| | 3,819,382 | | | | (2,031,983 | ) | | | 3,288,199 | | | | 590,479 | | | | 6,632,770 | | | | (1,451,360 | ) |
| | 1,054,758 | | | | 9,413,372 | | | | 1,231,808 | | | | 5,319,008 | | | | 1,458,237 | | | | 10,598,970 | |
| | 4,852,486 | | | | 7,319,824 | | | | 5,316,704 | | | | 6,081,563 | | | | 8,289,430 | | | | 9,111,612 | |
| | | | | | | | | | | | | | | | | | | | | | | |
| | — | | | | — | | | | (796,695 | ) | | | (172,076 | ) | | | (198,423 | ) | | | — | |
| | — | | | | — | | | | — | | | | — | | | | — | | | | — | |
| | — | | | | — | | | | — | | | | — | | | | — | | | | — | |
| | — | | | | — | | | | (796,695 | ) | | | (172,076 | ) | | | (198,423 | ) | | | — | |
| | | | | | | | | | | | | | | | | | | | | | | |
| | 8,752,427 | | | | 6,009,484 | | | | 17,820,187 | | | | 14,079,147 | | | | 32,446,042 | | | | 10,087,974 | |
| | — | | | | — | | | | 792,255 | | | | 172,076 | | | | 198,274 | | | | — | |
| | (9,591,588 | ) | | | (4,149,362 | ) | | | (14,742,252 | ) | | | (5,537,909 | ) | | | (12,356,363 | ) | | | (6,221,991 | ) |
| | (839,161 | ) | | | 1,860,122 | | | | 3,870,190 | | | | 8,713,314 | | | | 20,287,953 | | | | 3,865,983 | |
| | | | | | | | | | | | | | | | | | | | | | | |
| | 4,013,325 | | | | 9,179,946 | | | | 8,390,199 | | | | 14,622,801 | | | | 28,378,960 | | | | 12,977,595 | |
| | 29,894,990 | | | | 20,715,044 | | | | 49,388,434 | | | | 34,765,633 | | | | 34,051,881 | | | | 21,074,286 | |
| $ | 33,908,315 | | | $ | 29,894,990 | | | $ | 57,778,633 | | | $ | 49,388,434 | | | $ | 62,430,841 | | | $ | 34,051,881 | |
| $ | — | | | $ | — | | | $ | 2 | | | $ | — | | | $ | — | | | $ | — | |
| | | | | | | | | | | | | | | | | | | | | | | |
| | 1,240,188 | | | | 1,079,928 | | | | 1,948,394 | | | | 1,738,105 | | | | 3,648,465 | | | | 1,612,620 | |
| | — | | | | — | | | | 81,508 | | | | 19,162 | | | | 20,420 | | | | — | |
| | (1,324,833 | ) | | | (731,065 | ) | | | (1,589,341 | ) | | | (677,563 | ) | | | (1,431,682 | ) | | | (942,395 | ) |
| | (84,645 | ) | | | 348,863 | | | | 440,561 | | | | 1,079,704 | | | | 2,237,203 | | | | 670,225 | |
| | 2010 Annual Report | December 31, 2010 |
Statements of Changes in Net Assets For the Years Ended December 31, | |
| | | | |
| | | | | | | |
| Operations | | | | | | |
| Net investment income (loss) | | $ | (39,827 | ) | | $ | (4,452 | ) |
| Net realized gain (loss) from investment transactions, futures contracts, and distributions of long-term realized gains by other investment companies | | | 1,526,513 | | | | (1,551,576 | ) |
Net change in unrealized appreciation (depreciation) of investments and futures contracts | | | 1,655,283 | | | | 6,664,258 | |
Net change in net assets resulting from operations | | | 3,141,969 | | | | 5,108,230 | |
| Distributions to Shareholders | | | | | | | | |
| From net investment income | | | — | | | | (1,536 | ) |
| From net realized gain from investment transactions | | | — | | | | — | |
From tax return of capital | | | — | | | | — | |
Net change in net assets resulting from distributions | | | — | | | | (1,536 | ) |
| Distributions to Shareholders - The Money Market Fund | | | | | | | | |
| From net investment income (Retail Class) | | | | | | | | |
From net investment income (Institutional Class) | | | | | | | | |
Net change in net assets resulting from distributions | | | | | | | | |
| Capital Transactions | | | | | | | | |
| Issued | | | 8,147,706 | | | | 3,088,875 | |
| Reinvested | | | — | | | | 1,511 | |
| | | (6,933,509 | ) | | | (2,272,834 | ) |
Net change in net assets resulting from capital transactions | | | 1,214,197 | | | | 817,552 | |
| | | | | | | | |
Total Change in Net Assets | | | 4,356,166 | | | | 5,924,246 | |
Net Assets - Beginning of Year | | | 12,667,475 | | | | 6,743,229 | |
| | $ | 17,023,641 | | | $ | 12,667,475 | |
Accumulated undistributed (distributions in excess of) net investment income | | $ | — | | | $ | — | |
| Share Transactions | | | | | | | | |
| Issued | | | 413,282 | | | | 218,531 | |
| Reinvested | | | — | | | | 82 | |
| | | (351,002 | ) | | | (180,496 | ) |
| | | 62,280 | | | | 38,117 | |
| The accompanying notes are an integral part of these financial statements. |
| | 2010 Annual Report | December 31, 2010 |
| | |
The Total Return Utilities Fund | | | The U.S. Government Bond Fund | | | | |
| | | | | | | | | | | | | | | | |
| | | | | | | | | | | | | | | | | |
| $ | 150,010 | | | $ | 152,483 | | | $ | 385,264 | | | $ | 450,124 | | | $ | 323,084 | | | $ | 1,476,836 | |
| | 959,028 | | | | (570,777 | ) | | | 395,707 | | | | 109,775 | | | | — | | | | — | |
| | 1,830,913 | | | | 4,992,276 | | | | (148,833 | ) | | | (225,024 | ) | | | — | | | | — | |
| | 2,939,951 | | | | 4,573,982 | | | | 632,138 | | | | 334,875 | | | | 323,084 | | | | 1,476,836 | |
| | | | | | | | | | | | | | | | | | | | | | | |
| | (132,339 | ) | | | (152,483 | ) | | | (385,264 | ) | | | (450,124 | ) | | | | | | | | |
| | — | | | | — | | | | (232,564 | ) | | | — | | | | | | | | | |
| | — | | | | (123,774 | ) | | | — | | | | — | | | | | | | | | |
| | (132,339 | ) | | | (276,257 | ) | | | (617,828 | ) | | | (450,124 | ) | | | | | | | | |
| | | | | | | | | | | | | | | | | | | | | | | |
| | | | | | | | | | | | | | | | | | (219,387 | ) | | | (977,452 | ) |
| | | | | | | | | | | | | | | | | | (103,697 | ) | | | (499,384 | ) |
| | | | | | | | | | | | | | | | | | (323,084 | ) | | | (1,476,836 | ) |
| | | | | | | | | | | | | | | | | | | | | | | |
| | 5,387,988 | | | | 3,397,816 | | | | 6,707,688 | | | | 6,327,512 | | | | 362,248,902 | | | | 303,809,610 | |
| | 120,242 | | | | 265,690 | | | | 601,490 | | | | 433,301 | | | | 246,254 | | | | 1,011,767 | |
| | (4,903,245 | ) | | | (3,089,127 | ) | | | (4,791,322 | ) | | | (3,491,220 | ) | | | (401,214,866 | ) | | | (374,956,022 | ) |
| | 604,985 | | | | 574,379 | | | | 2,517,856 | | | | 3,269,593 | | | | (38,719,710 | ) | | | (70,134,645 | ) |
| | | | | | | | | | | | | | | | | | | | | | | |
| | 3,412,597 | | | | 4,872,104 | | | | 2,532,166 | | | | 3,154,344 | | | | (38,719,710 | ) | | | (70,134,645 | ) |
| | 20,731,230 | | | | 15,859,126 | | | | 17,190,567 | | | | 14,036,223 | | | | 168,391,306 | | | | 238,525,951 | |
| $ | 24,143,827 | | | $ | 20,731,230 | | | $ | 19,722,733 | | | $ | 17,190,567 | | | $ | 129,671,596 | | | $ | 168,391,306 | |
| $ | (788 | ) | | $ | — | | | $ | 1,851 | | | $ | 1,851 | | | $ | — | | | $ | — | |
| | | | | | | | | | | | | | | | | | | | | | | |
| | 252,216 | | | | 185,225 | | | | 315,030 | | | | 304,454 | | | | 362,248,902 | | | | 303,809,610 | |
| | 5,611 | | | | 15,135 | | | | 28,502 | | | | 20,819 | | | | 246,254 | | | | 1,011,767 | |
| | (230,839 | ) | | | (183,535 | ) | | | (225,702 | ) | | | (167,871 | ) | | | (401,214,866 | ) | | | (374,956,022 | ) |
| | 26,988 | | | | 16,825 | | | | 117,830 | | | | 157,402 | | | | (38,719,710 | ) | | | (70,134,645 | ) |
| | 2010 Annual Report | December 31, 2010 |
Financial Highlights For a Share Outstanding Through Each Fiscal Period Ended December 31, | |
| | | | | | | Income from Investment Operations | | | | |
| | | Net Asset Value, Beginning of Period | | | Net Investment Income (Loss) (5) | | | Net gains (losses) on securities, futures, and options (both realized and unrealized) | | | Total from Investment Operations | | | | | | | | | | | | | |
| The Muirfield Fund (1)(2) | |
| 2010 | | | $ | 4.99 | | | | 0.02 | | | | 0.61 | | | | 0.63 | | | | (0.02 | ) | | | 0.00 | | | | 0.00 | | | | (0.02 | ) |
| 2009 | | | $ | 4.21 | | | | 0.01 | | | | 0.79 | | | | 0.80 | | | | (0.02 | ) | | | 0.00 | | | | 0.00 | | | | (0.02 | ) |
| 2008 | | | $ | 6.02 | | | | 0.02 | | | | (1.83 | ) | | | (1.81 | ) | | | 0.00 | | | | 0.00 | | | | 0.00 | | | | 0.00 | |
| 2007 | | | $ | 5.81 | | | | 0.18 | | | | 0.23 | | | | 0.41 | | | | (0.20 | ) | | | 0.00 | | | | 0.00 | | | | (0.20 | ) |
| 2006 | | | $ | 5.15 | | | | 0.04 | | | | 0.66 | | | | 0.70 | | | | (0.04 | ) | | | 0.00 | | | | 0.00 | | | | (0.04 | ) |
The Dynamic Growth Fund (1)(2) | |
| 2010 | | | $ | 7.06 | | | | 0.02 | | | | 1.08 | | | | 1.10 | | | | (0.02 | ) | | | 0.00 | | | | 0.00 | | | | (0.02 | ) |
| 2009 | | | $ | 5.48 | | | | 0.00 | | | | 1.58 | | | | 1.58 | | | | 0.00 | ** | | | 0.00 | | | | 0.00 | | | | 0.00 | ** |
| 2008 | | | $ | 9.24 | | | | 0.04 | | | | (3.71 | ) | | | (3.67 | ) | | | (0.04 | ) | | | (0.05 | ) | | | 0.00 | | | | (0.09 | ) |
| 2007 | | | $ | 9.56 | | | | 0.29 | | | | 0.38 | | | | 0.67 | | | | (0.30 | ) | | | (0.69 | ) | | | 0.00 | | | | (0.99 | ) |
| 2006 | | | $ | 8.28 | | | | 0.04 | | | | 1.28 | | | | 1.32 | | | | (0.04 | ) | | | 0.00 | | | | 0.00 | | | | (0.04 | ) |
The Aggressive Growth Fund (1)(2) | |
| 2010 | | | $ | 6.89 | | | | (0.01 | ) | | | 1.09 | | | | 1.08 | | | | 0.00 | | | | 0.00 | | | | 0.00 | | | | 0.00 | |
| 2009 | | | $ | 5.19 | | | | (0.01 | ) | | | 1.71 | | | | 1.70 | | | | 0.00 | | | | 0.00 | | | | 0.00 | | | | 0.00 | |
| 2008 | | | $ | 8.59 | | | | 0.05 | | | | (3.40 | ) | | | (3.35 | ) | | | (0.05 | ) | | | 0.00 | | | | 0.00 | | | | (0.05 | ) |
| 2007 | | | $ | 8.13 | | | | 0.04 | | | | 0.46 | | | | 0.50 | | | | (0.04 | ) | | | 0.00 | | | | 0.00 | | | | (0.04 | ) |
| 2006 | | | $ | 7.19 | | | | 0.03 | | | | 0.94 | | | | 0.97 | | | | (0.03 | ) | | | 0.00 | | | | 0.00 | | | | (0.03 | ) |
The Defensive Balanced Fund (1)(2)(3)(4) | |
| 2010 | | | $ | 8.98 | | | | 0.14 | | | | 0.74 | | | | 0.88 | | | | (0.14 | ) | | | 0.00 | | | | 0.00 | | | | (0.14 | ) |
| 2009 | | | $ | 7.86 | | | | 0.03 | | | | 1.12 | | | | 1.15 | | | | (0.03 | ) | | | 0.00 | | | | 0.00 | | | | (0.03 | ) |
| 2008 | | | $ | 10.46 | | | | 0.07 | | | | (2.60 | ) | | | (2.53 | ) | | | (0.07 | ) | | | 0.00 | | | | 0.00 | | | | (0.07 | ) |
| 2007 | | | $ | 10.51 | | | | 0.07 | | | | 0.45 | | | | 0.52 | | | | (0.07 | ) | | | (0.50 | ) | | | 0.00 | | | | (0.57 | ) |
| 2006* | | $ | 10.00 | | | | 0.07 | | | | 0.51 | | | | 0.58 | | | | (0.07 | ) | | | 0.00 | | | | 0.00 | | | | (0.07 | ) |
The Strategic Growth Fund (1)(2)(3)(4) | |
| 2010 | | | $ | 8.12 | | | | 0.04 | | | | 1.58 | | | | 1.62 | | | | (0.03 | ) | | | 0.00 | | | | 0.00 | | | | (0.03 | ) |
| 2009 | | | $ | 5.98 | | | | (0.01 | ) | | | 2.15 | | | | 2.14 | | | | 0.00 | | | | 0.00 | | | | 0.00 | | | | 0.00 | |
| 2008 | | | $ | 10.58 | | | | 0.05 | | | | (4.60 | ) | | | (4.55 | ) | | | (0.05 | ) | | | 0.00 | | | | 0.00 | | | | (0.05 | ) |
| 2007 | | | $ | 10.73 | | | | 0.08 | | | | 0.46 | | | | 0.54 | | | | (0.07 | ) | | | (0.62 | ) | | | 0.00 | | | | (0.69 | ) |
| 2006* | | $ | 10.00 | | | | 0.06 | | | | 0.73 | | | | 0.79 | | | | (0.06 | ) | | | 0.00 | | | | 0.00 | | | | (0.06 | ) |
| 1 | Ratio of net expenses to average net assets, ratio of net investment income (loss) to average net assets, ratio of expenses to average net assets after reductions, excluding expenses paid indirectly, and ratio of expenses to average net assets before reductions do not include impact of expenses of the underlying security holdings as represented in the schedule of investments. |
| 2 | Recognition of net investment income by the Fund is affected by the timing of the declaration of dividends by the underlying investment companies in which the Fund invests. |
| 3 | Total return and portfolio turnover rate are not annualized for periods of less than one full year. |
| 4 | Ratio of net expenses to average net assets, ratio of net investment income (loss) to average net assets, ratio of average net assets after reductions, excluding expenses paid indirectly, and ratio of expenses to average net assets before reductions are annualized for periods of less than one full year. |
| | 2010 Annual Report | December 31, 2010 |
| |
| | | | | | | | |
Net Asset Value, End of Period | | | Total Return (Assumes Reinvestment of Distributions) | | | Net Assets, End of Period ($000) | | | Ratio of Net Expenses to Average Net Assets | | | Ratio of Net Investment Income (Loss) to Average Net Assets | | | Ratio of Expenses to Average Net Assets after Reductions, Excluding Expenses Paid Indirectly | | | Ratio of Expenses to Average Net Assets Before Reductions | | | | |
| | |
| $ | 5.60 | | | | 12.65 | % | | $ | 122,266 | | | | 1.39 | % | | | 0.40 | % | | | 1.47 | % | | | 1.60 | % | | | 128 | % |
| $ | 4.99 | | | | 18.95 | % | | $ | 115,138 | | | | 1.43 | % | | | 0.17 | % | | | 1.51 | % | | | 1.66 | % | | | 166 | % |
| $ | 4.21 | | | | (30.07 | %) | | $ | 86,310 | | | | 1.39 | % | | | 0.54 | % | | | 1.48 | % | | | 1.75 | % | | | 173 | % |
| $ | 6.02 | | | | 7.02 | % | | $ | 50,374 | | | | 1.38 | % | | | 3.01 | % | | | 1.52 | % | | | 1.88 | % | | | 144 | % |
| $ | 5.81 | | | | 13.62 | % | | $ | 53,227 | | | | 1.45 | % | | | 0.65 | % | | | 1.56 | % | | | 1.85 | % | | | 131 | % |
| |
| $ | 8.14 | | | | 15.54 | % | | $ | 95,239 | | | | 1.39 | % | | | 0.23 | % | | | 1.47 | % | | | 1.59 | % | | | 119 | % |
| $ | 7.06 | | | | 28.87 | % | | $ | 84,358 | | | | 1.37 | % | | | (0.04 | %) | | | 1.48 | % | | | 1.63 | % | | | 148 | % |
| $ | 5.48 | | | | (39.77 | %) | | $ | 67,298 | | | | 1.34 | % | | | 0.95 | % | | | 1.46 | % | | | 1.69 | % | | | 122 | % |
| $ | 9.24 | | | | 7.06 | % | | $ | 19,115 | | | | 1.32 | % | | | 2.94 | % | | | 1.46 | % | | | 1.86 | % | | | 150 | % |
| $ | 9.56 | | | | 15.96 | % | | $ | 21,566 | | | | 1.42 | % | | | 0.42 | % | | | 1.55 | % | | | 1.86 | % | | | 123 | % |
| |
| $ | 7.97 | | | | 15.67 | % | | $ | 33,908 | | | | 1.59 | % | | | (0.07 | %) | | | 1.66 | % | | | 1.77 | % | | | 124 | % |
| $ | 6.89 | | | | 32.76 | % | | $ | 29,895 | | | | 1.54 | % | | | (0.25 | %) | | | 1.63 | % | | | 1.82 | % | | | 156 | % |
| $ | 5.19 | | | | (38.98 | %) | | $ | 20,715 | | | | 1.62 | % | | | 0.77 | % | | | 1.65 | % | | | 1.84 | % | | | 213 | % |
| $ | 8.59 | | | | 6.14 | % | | $ | 28,841 | | | | 1.70 | % | | | 0.49 | % | | | 1.70 | % | | | 1.83 | % | | | 170 | % |
| $ | 8.13 | | | | 13.54 | % | | $ | 21,554 | | | | 1.80 | % | | | 0.51 | % | | | 1.81 | % | | | 1.98 | % | | | 200 | % |
| |
| $ | 9.72 | | | | 9.76 | % | | $ | 57,779 | | | | 1.52 | % | | | 1.51 | % | | | 1.57 | % | | | 1.66 | % | | | 161 | % |
| $ | 8.98 | | | | 14.65 | % | | $ | 49,388 | | | | 1.54 | % | | | 0.41 | % | | | 1.59 | % | | | 1.72 | % | | | 182 | % |
| $ | 7.86 | | | | (24.16 | %) | | $ | 34,766 | | | | 1.54 | % | | | 0.67 | % | | | 1.55 | % | | | 1.70 | % | | | 204 | % |
| $ | 10.46 | | | | 5.03 | % | | $ | 74,290 | | | | 1.56 | % | | | 0.79 | % | | | 1.56 | % | | | 1.66 | % | | | 137 | % |
| $ | 10.51 | | | | 5.84 | % | | $ | 42,489 | | | | 1.72 | % | | | 1.20 | % | | | 1.72 | % | | | 1.81 | % | | | 105 | % |
| |
| $ | 9.71 | | | | 19.96 | % | | $ | 62,431 | | | | 1.49 | % | | | 0.48 | % | | | 1.59 | % | | | 1.70 | % | | | 115 | % |
| $ | 8.12 | | | | 35.79 | % | | $ | 34,052 | | | | 1.54 | % | | | (0.13 | %) | | | 1.65 | % | | | 1.80 | % | | | 75 | % |
| $ | 5.98 | | | | (43.00 | %) | | $ | 21,074 | | | | 1.57 | % | | | 0.47 | % | | | 1.59 | % | | | 1.74 | % | | | 178 | % |
| $ | 10.58 | | | | 5.08 | % | | $ | 63,785 | | | | 1.58 | % | | | 0.75 | % | | | 1.58 | % | | | 1.68 | % | | | 134 | % |
| $ | 10.73 | | | | 7.91 | % | | $ | 36,533 | | | | 1.75 | % | | | 0.94 | % | | | 1.75 | % | | | 1.84 | % | | | 92 | % |
| 5 | Except for The Money Market Fund, net investment income per share is based on average shares outstanding during the period. |
| * | Commenced Operations January 31, 2006 |
| ** | Actual amounts were less than one-half of a cent per share |
| The accompanying notes are integral part of these financial statements. |
| | 2010 Annual Report | December 31, 2010 |
Financial Highlights For a Share Outstanding Through Each Fiscal Period Ended December 31, | |
| | | | | | Income from Investment Operations | | | | |
| | Net Asset Value, Beginning of Period | | | Net Investment Income (Loss) (1) | | | Net gains (losses) on securities, futures, and options (both realized and unrealized) | | | Total from Investment Operations | | | From Net Investment Income | | | | | | From Tax Return of Capital | | | | |
| The Quantex Fund | |
| 2010 | | $ | 18.48 | | | | (0.06 | ) | | | 4.35 | | | | 4.29 | | | | 0.00 | | | | 0.00 | | | | 0.00 | | | | 0.00 | |
| 2009 | | $ | 10.42 | | | | (0.01 | ) | | | 8.07 | | | | 8.06 | | | | 0.00 | * | | | 0.00 | | | | 0.00 | | | | 0.00 | * |
| 2008 | | $ | 18.32 | | | | 0.00 | | | | (7.90 | ) | | | (7.90 | ) | | | 0.00 | | | | 0.00 | | | | 0.00 | | | | 0.00 | |
| 2007 | | $ | 19.86 | | | | 0.16 | | | | (1.54 | ) | | | (1.38 | ) | | | (0.16 | ) | | | 0.00 | | | | 0.00 | | | | (0.16 | ) |
| 2006 | | $ | 17.09 | | | | 0.08 | | | | 2.77 | | | | 2.85 | | | | (0.08 | ) | | | 0.00 | | | | 0.00 | | | | (0.08 | ) |
The Total Return Utilities Fund | |
| 2010 | | $ | 20.73 | | | | 0.15 | | | | 2.76 | | | | 2.91 | | | | (0.13 | ) | | | 0.00 | | | | 0.00 | | | | (0.13 | ) |
| 2009 | | $ | 16.13 | | | | 0.15 | | | | 4.74 | | | | 4.89 | | | | (0.16 | ) | | | 0.00 | | | | (0.13 | ) | | | (0.29 | ) |
| 2008 | | $ | 26.14 | | | | 0.09 | | | | (9.90 | ) | | | (9.81 | ) | | | (0.14 | ) | | | 0.00 | | | | (0.06 | ) | | | (0.20 | ) |
| 2007 | | $ | 22.23 | | | | 0.14 | | | | 3.91 | | | | 4.05 | | | | (0.14 | ) | | | 0.00 | | | | 0.00 | | | | (0.14 | ) |
| 2006 | | $ | 19.03 | | | | 0.15 | | | | 3.20 | | | | 3.35 | | | | (0.15 | ) | | | 0.00 | | | | 0.00 | | | | (0.15 | ) |
The U.S. Government Bond Fund | |
| 2010 | | $ | 20.79 | | | | 0.43 | | | | 0.34 | | | | 0.77 | | | | (0.44 | ) | | | (0.25 | ) | | | 0.00 | | | | (0.69 | ) |
| 2009 | | $ | 20.96 | | | | 0.60 | | | | (0.17 | ) | | | 0.43 | | | | (0.60 | ) | | | 0.00 | | | | 0.00 | | | | (0.60 | ) |
| 2008 | | $ | 20.58 | | | | 0.66 | | | | 0.38 | | | | 1.04 | | | | (0.66 | ) | | | 0.00 | | | | 0.00 | | | | (0.66 | ) |
| 2007 | | $ | 20.30 | | | | 0.73 | | | | 0.72 | | | | 1.45 | | | | (1.17 | ) | | | 0.00 | | | | 0.00 | | | | (1.17 | ) |
| 2006 | | $ | 20.22 | | | | 0.68 | | | | 0.14 | | | | 0.82 | | | | (0.74 | ) | | | 0.00 | | | | 0.00 | | | | (0.74 | ) |
The Money Market Fund - Retail Class | |
| 2010 | | $ | 1.00 | | | | 0.002 | | | | N/A | | | | 0.002 | | | | (0.002 | ) | | | 0.000 | | | | 0.000 | | | | (0.002 | ) |
| 2009 | | $ | 1.00 | | | | 0.006 | | | | N/A | | | | 0.006 | | | | (0.006 | ) | | | 0.000 | | | | 0.000 | | | | (0.006 | ) |
| 2008 | | $ | 1.00 | | | | 0.026 | | | | N/A | | | | 0.026 | | | | (0.026 | ) | | | 0.000 | | | | 0.000 | | | | (0.026 | ) |
| 2007 | | $ | 1.00 | | | | 0.048 | | | | N/A | | | | 0.048 | | | | (0.048 | ) | | | 0.000 | | | | 0.000 | | | | (0.048 | ) |
| 2006 | | $ | 1.00 | | | | 0.046 | | | | N/A | | | | 0.046 | | | | (0.046 | ) | | | 0.000 | | | | 0.000 | | | | (0.046 | ) |
The Money Market Fund - Institutional Class | |
| 2010 | | $ | 1.00 | | | | 0.003 | | | | N/A | | | | 0.003 | | | | (0.003 | ) | | | 0.000 | | | | 0.000 | | | | (0.003 | ) |
| 2009 | | $ | 1.00 | | | | 0.008 | | | | N/A | | | | 0.008 | | | | (0.008 | ) | | | 0.000 | | | | 0.000 | | | | (0.008 | ) |
| 2008 | | $ | 1.00 | | | | 0.028 | | | | N/A | | | | 0.028 | | | | (0.028 | ) | | | 0.000 | | | | 0.000 | | | | (0.028 | ) |
| 2007 | | $ | 1.00 | | | | 0.050 | | | | N/A | | | | 0.050 | | | | (0.050 | ) | | | 0.000 | | | | 0.000 | | | | (0.050 | ) |
| 2006 | | $ | 1.00 | | | | 0.048 | | | | N/A | | | | 0.048 | | | | (0.048 | ) | | | 0.000 | | | | 0.000 | | | | (0.048 | ) |
| 1 | Except for The Money Market Fund, net investment income per share is based on average shares outstanding during the period. |
| * | Actual amounts were less than one-half of a cent per share |
| The accompanying notes are integral part of these financial statements. |
| | 2010 Annual Report | December 31, 2010 |
| |
| | | | | | | | |
Net Asset Value, End of Period | | | Total Return (Assumes Reinvestment of Distributions) | | | Net Assets, End of Period ($000) | | | Ratio of Net Expenses to Average Net Assets | | | Ratio of Net Investment Income (Loss) to Average Net Assets | | | Ratio of Expenses to Average Net Assets after Reductions, Excluding Expenses Paid Indirectly | | | Ratio of Expenses to Average Net Assets Before Reductions | | | | |
| | |
| $ | 22.77 | | | | 23.21 | % | | $ | 17,024 | | | | 1.65 | % | | | (0.26 | %) | | | 1.65 | % | | | 2.17 | % | | | 55 | % |
| $ | 18.48 | | | | 77.37 | % | | $ | 12,667 | | | | 1.79 | % | | | (0.05 | %) | | | 1.79 | % | | | 2.39 | % | | | 34 | % |
| $ | 10.42 | | | | (43.12 | %) | | $ | 6,743 | | | | 1.73 | % | | | 0.01 | % | | | 1.73 | % | | | 2.26 | % | | | 49 | % |
| $ | 18.32 | | | | (7.00 | %) | | $ | 17,450 | | | | 1.56 | % | | | 0.76 | % | | | 1.56 | % | | | 2.09 | % | | | 56 | % |
| $ | 19.86 | | | | 16.67 | % | | $ | 20,074 | | | | 1.66 | % | | | 0.47 | % | | | 1.66 | % | | | 2.25 | % | | | 30 | % |
| |
| $ | 23.51 | | | | 14.10 | % | | $ | 24,144 | | | | 1.92 | % | | | 0.70 | % | | | 1.92 | % | | | 2.11 | % | | | 53 | % |
| $ | 20.73 | | | | 30.63 | % | | $ | 20,731 | | | | 2.00 | % | | | 0.90 | % | | | 2.00 | % | | | 2.20 | % | | | 35 | % |
| $ | 16.13 | | | | (37.63 | %) | | $ | 15,859 | | | | 1.96 | % | | | 0.42 | % | | | 1.96 | % | | | 2.14 | % | | | 48 | % |
| $ | 26.14 | | | | 18.24 | % | | $ | 27,333 | | | | 1.90 | % | | | 0.57 | % | | | 1.90 | % | | | 2.10 | % | | | 50 | % |
| $ | 22.23 | | | | 17.68 | % | | $ | 23,969 | | | | 2.05 | % | | | 0.74 | % | | | 2.05 | % | | | 2.18 | % | | | 27 | % |
| |
| $ | 20.87 | | | | 3.75 | % | | $ | 19,723 | | | | 0.99 | % | | | 2.08 | % | | | 0.99 | % | | | 1.45 | % | | | 215 | % |
| $ | 20.79 | | | | 2.10 | % | | $ | 17,191 | | | | 0.99 | % | | | 2.90 | % | | | 0.99 | % | | | 1.49 | % | | | 138 | % |
| $ | 20.96 | | | | 5.16 | % | | $ | 14,036 | | | | 0.99 | % | | | 3.20 | % | | | 0.99 | % | | | 1.58 | % | | | 118 | % |
| $ | 20.58 | | | | 7.44 | % | | $ | 13,769 | | | | 1.01 | % | | | 3.92 | % | | | 1.01 | % | | | 1.72 | % | | | 88 | % |
| $ | 20.30 | | | | 4.13 | % | | $ | 7,118 | | | | 1.10 | % | | | 3.59 | % | | | 1.10 | % | | | 2.22 | % | | | 106 | % |
| |
| $ | 1.00 | | | | 0.20 | % | | $ | 96,087 | | | | 0.38 | % | | | 0.20 | % | | | 0.38 | % | | | 0.86 | % | | | N/A | |
| $ | 1.00 | | | | 0.64 | % | | $ | 122,142 | | | | 0.55 | % | | | 0.66 | % | | | 0.55 | % | | | 0.84 | % | | | N/A | |
| $ | 1.00 | | | | 2.65 | % | | $ | 161,232 | | | | 0.49 | % | | | 2.64 | % | | | 0.49 | % | | | 0.83 | % | | | N/A | |
| $ | 1.00 | | | | 4.95 | % | | $ | 195,479 | | | | 0.48 | % | | | 4.83 | % | | | 0.48 | % | | | 0.84 | % | | | N/A | |
| $ | 1.00 | | | | 4.71 | % | | $ | 159,641 | | | | 0.48 | % | | | 4.64 | % | | | 0.48 | % | | | 0.87 | % | | | N/A | |
| |
| $ | 1.00 | | | | 0.28 | % | | $ | 33,584 | | | | 0.29 | % | | | 0.29 | % | | | 0.29 | % | | | 0.68 | % | | | N/A | |
| $ | 1.00 | | | | 0.75 | % | | $ | 46,249 | | | | 0.43 | % | | | 0.83 | % | | | 0.43 | % | | | 0.67 | % | | | N/A | |
| $ | 1.00 | | | | 2.79 | % | | $ | 77,294 | | | | 0.37 | % | | | 2.55 | % | | | 0.37 | % | | | 0.68 | % | | | N/A | |
| $ | 1.00 | | | | 5.09 | % | | $ | 20,333 | | | | 0.34 | % | | | 4.98 | % | | | 0.34 | % | | | 0.67 | % | | | N/A | |
| $ | 1.00 | | | | 4.86 | % | | $ | 24,118 | | | | 0.34 | % | | | 4.76 | % | | | 0.34 | % | | | 0.71 | % | | | N/A | |
| | 2010 Annual Report | December 31, 2010 |
Notes to Financial Statements December 31, 2010 |
| 1. | Organization and Significant Accounting Policies |
The Flex-funds® Trust (the “Trust”) was organized in 1982 and is registered under the Investment Company Act of 1940, as amended (the “1940 Act”), as a diversified, open-end management investment company. The Trust offers nine separate series and is presently comprised of nine separate funds as follows: The Muirfield Fund® (“Muirfield”), The Dynamic Growth Fund (“Dynamic”), The Aggressive Growth Fund (“Aggressive”), The Defensive Balanced Fund (“Defensive”), The Strategic Growth Fund (“Strategic”), The Quantex Fund® (“Quantex”), The Total Return Utilities Fund (“Utilities”), The U.S. Government Bond Fund (“Bond”), and The Money Market Fund (“Money Market”) (each a “Fund” and collectively the “Funds”). Money Market offers two classes of shares (the Retail Class (“Retail Class”) and the Institutional Class (“Institutional Class”)). Each class of shares has equal rights as to earnings and assets except that each class bears different distribution and transfer agent expenses. The investment objective of Muirfield, Dynamic, Aggressive, and Strategic is growth of capital. The investment objective of Defensive is growth of capital, with current income usually of secondary importance. The investment objective of Quantex is long term capital appreciation. The investment objective of Utilities is total returns, including current income and growth of income. The investment objective of Bond is maximum current income. The investment objective of Money Market is current income while maintaining a stable share price of $1.00.
Use of estimates. The preparation of financial statements in conformity with accounting principles generally accepted in the United States of America (“GAAP”) requires management to make estimates and assumptions that affect the reported amounts of assets and liabilities and disclosure of contingent assets and liabilities at the date of the financial statements and the reported amounts of increases and decreases in net assets from operations during the reporting period. Actual results could differ from those estimates.
Security valuation. All investments in securities are recorded at their estimated fair value, as described in Note #2.
Repurchase agreements. Each Fund may engage in repurchase agreement transactions whereby the Fund takes possession of an underlying debt instrument subject to an obligation of the seller to repurchase the instrument from the Fund and an obligation of the Fund to resell the instrument at an agreed upon price and term. At all times, the Fund maintains the value of collateral, including accrued interest, of at least 100% of the amount of the repurchase agreement, plus accrued interest. If the seller defaults or if the fair value of the collateral declines, realization of the collateral by the Funds may be delayed or limited.
Futures & options. Each Fund, except Money Market, may engage in transactions in financial futures contracts and options contracts in order to manage the risk of unanticipated changes in market values of securities held in the Fund, or which it intends to purchase. The futures and options contracts are adjusted by the daily exchange rate of the underlying currency, or index, and any gains or losses are recorded for financial statement purposes as unrealized gains or losses in the statement of assets and liabilities and the statement of operations until the contract settlement date, at which time realized gains and losses are included in the statement of operations.
To the extent that the Fund enters into futures contracts on an index or group of securities, the Fund exposes itself to an indeterminate liability and will be required to pay or receive a sum of money measured by the change in the value of the index. Upon entering into a futures contract, the Fund is required to deposit an initial margin, which is either cash or securities in an amount equal to a certain percentage of the contract value. Subsequently, the variation margin, which is equal to changes in the daily settlement price or last sale price on the exchanges where futures contracts trade, is received or paid and is recorded as an unrealized gain or loss until the contract is closed. When the contract is closed, the Fund records a realized gain or loss equal to the difference between the proceeds from (or cost of) the closing transaction and the Fund’s basis in the contract. Should market conditions move unexpectedly, the Fund may not achieve the anticipated benefits of the futures contract and may realize a loss. The use of futures transactions involves the risk of imperfect correlation in movements in the price of futures contracts, interest rates, and the underlying hedged assets. With futures, there is minimal counterparty credit risk to the Fund since futures are exchange traded and the exchange’s clearinghouse, as counterparty to all exchange traded futures, guarantees the futures against default. Except for Money Market and Utilities, it is normal practice for each Fund to invest in futures contracts on a daily basis. Although Utilities is permitted to invest in futures contracts, it typically does not.
| | 2010 Annual Report | December 31, 2010 |
Call and put option contracts involve the payment of a premium for the right to purchase or sell an individual security or index aggregate at a specified price until the expiration of the contract. Such transactions expose the Fund to the loss of the premium paid if the Fund does not sell or exercise the contract prior to the expiration date. In the case of a call option, sufficient cash or money market instruments will be segregated to complete the purchase. Options are valued on the basis of the daily settlement price or last sale on the exchanges where they trade and the changes in value are recorded as unrealized appreciation or depreciation until closed, exercised or expired. For the year ended December 31, 2010, there were no call or put options transacted for any of the Funds.
The Funds may write covered call or put options for which premiums received are recorded as liabilities and are subsequently adjusted to the current value of the options written. When written options are closed or exercised, premiums received are offset against the proceeds paid, and the Fund records realized gains or losses for the difference. When written options expire, the liability is eliminated, and the Fund records realized gains for the entire amount of premiums received. Although permitted, it is currently not normal practice for the Funds to invest in call and put options.
The fair value of derivative instruments as reported within the Statements of Assets and Liabilities as of December 31, 2010 was as follows:
| Amount of Net Variation Margin on Derivatives |
| |
| | | | |
The Muirfield Fund® | Equity contracts | Liabilities, Payable for net variation margin on futures contracts | $6,000 |
| The Dynamic Growth Fund | Equity contracts | Liabilities, Payable for net variation margin on futures contracts | 3,375 |
| The Aggressive Growth Fund | Equity contracts | Liabilities, Payable for net variation margin on futures contracts | 1,125 |
| The Defensive Balanced Fund | Equity contracts | Liabilities, Payable for net variation margin on futures contracts | 1,500 |
| The Strategic Growth Fund | Equity contracts | Liabilities, Payable for net variation margin on futures contracts | 20,208 |
| The Quantex Fund™ | Equity contracts | Liabilities, Payable for net variation margin on futures contracts | 6,300 |
The effect of derivative instruments on the Statements of Operations for the period January 1, 2010 through December 31, 2010 was as follows:
| Amount of Realized Gain on Derivatives Recognized in Income |
| |
| | | Contracts Opened During the Year | Contracts Closed During the Year | Statement of Operations Location | For the Year Ended December 31, 2010 |
The Muirfield Fund® | Equity contracts | 240 | 240 | Net realized gains from futures contracts | $192,617 |
| The Dynamic Growth Fund | Equity contracts | 127 | 130 | Net realized gains from futures contracts | 485,487 |
| The Aggressive Growth Fund | Equity contracts | 43 | 43 | Net realized gains from futures contracts | 106,818 |
| The Defensive Balanced Fund | Equity contracts | 79 | 83 | Net realized gains from futures contracts | 29,187 |
| The Strategic Growth Fund | Equity contracts | 85 | 85 | Net realized gains from futures contracts | 514,549 |
| The Quantex Fund™ | Equity contracts | 25 | 24 | Net realized gains from futures contracts | 72,139 |
| | 2010 Annual Report | December 31, 2010 |
| Change in Unrealized Gain or (Loss) on Derivatives Recognized in Income |
| | | Statement of Operations Location | For the Year Ended December 31, 2010 |
The Muirfield Fund® | Equity contracts | Net change in unrealized appreciation (depreciation) of investments and futures contracts | $12,250 |
| The Dynamic Growth Fund | Equity contracts | Net change in unrealized appreciation (depreciation) of investments and futures contracts | (11,565) |
| The Aggressive Growth Fund | Equity contracts | Net change in unrealized appreciation (depreciation) of investments and futures contracts | 2,287 |
| The Defensive Balanced Fund | Equity contracts | Net change in unrealized appreciation (depreciation) of investments and futures contracts | (10,520) |
| The Strategic Growth Fund | Equity contracts | Net change in unrealized appreciation (depreciation) of investments and futures contracts | (4,950) |
| The Quantex Fund™ | Equity contracts | Net change in unrealized appreciation (depreciation) of investments and futures contracts | 4,292 |
Federal income taxes. It is each Fund’s policy to continue to comply with the requirements of Subchapter M of the Internal Revenue Code applicable to regulated investment companies and to distribute substantially all of its taxable income and net capital gains to its shareholders. Therefore, no federal income tax provision is required.
As of and during the year ended December 31, 2010, the Funds did not have a liability for any unrecognized tax benefits. The Funds recognize interest and penalties, if any, related to unrecognized tax benefits as income tax expense in the statements of operations. During the year ended December 31, 2010, the Funds did not incur any interest or penalties.
The Funds are not subject to examination by U.S. federal and state tax authorities for tax years before 2007.
Distributions to shareholders. Distributions to shareholders are recorded on the ex-dividend date. Muirfield, Quantex, Dynamic, Aggressive, Defensive, and Strategic declare and pay dividends from net investment income, if any, on a quarterly basis. Utilities declares and pays dividends from net investment income on a monthly basis. Bond and Money Market declare dividends from net investment income on a daily basis and pay such dividends on a monthly basis. Each Fund distributes net capital gains, if any, on an annual basis.
Distributions from net investment income and from net capital gains are determined in accordance with income tax regulations, which may differ from GAAP. These differences are primarily due to deferrals of certain losses, expiring capital loss carryforwards, and differing treatments of unrealized gains and losses of futures contracts held by each Fund. Accordingly, timing differences relating to shareholder distributions are reflected in the components of net assets and permanent book and tax differences have been reclassified within the components of net assets based on their ultimate characterization for federal income tax purposes. For the year ended December 31, 2010, the Funds made the following reclassifications to increase/(decrease) the components of net assets:
| | | | | | Undistributed Net Investment Income | | | Accumulated Net Realized Gain (Loss) | |
| The Dynamic Growth Fund | | $ | (5 | ) | | $ | 5 | | | $ | — | |
| The Aggressive Growth Fund | | | (21,654 | ) | | | 21,654 | | | | — | |
| The Quantex Fund™ | | | (39,827 | ) | | | 39,827 | | | | — | |
| The Total Return Utilities Fund | | | 13,997 | | | | (18,459 | ) | | | 4,462 | |
| The U.S. Government Bond Fund | | | (232,564 | ) | | | — | | | | 232,564 | |
Investment income & expenses. For Money Market, income and expenses (other than expenses attributable to a specific class) are allocated to each class of shares based on its relative net assets. Expenses incurred by the Trust that do not specifically relate to an individual Fund of the Trust are allocated to the Funds based on each Fund’s relative net assets or other appropriate basis.
| | 2010 Annual Report | December 31, 2010 |
Capital Share Transactions. Money Market is authorized to issue an indefinite number of shares in the Retail Class and the Institutional Class. Transactions in the capital shares of the Fund for the year ended December 31, 2010 and the year ended December 31, 2009 were as follows:
| | | | | | | |
| | | | | | | | | | | | | |
| Retail Class | | | | | | | | | | | | |
| Issued | | $ | 107,339,519 | | | | 107,339,519 | | | $ | 111,881,231 | | | | 111,881,231 | |
| Reinvested | | | 210,200 | | | | 210,200 | | | | 902,521 | | | | 902,521 | |
| Redeemed | | | (133,604,462 | ) | | | (133,604,462 | ) | | | (151,873,802 | ) | | | (151,873,802 | ) |
| Net increase (decrease) | | $ | (26,054,743 | ) | | | (26,054,743 | ) | | $ | (39,090,050 | ) | | | (39,090,050 | ) |
| | | | | | | | | | | | | | | | | |
| Institutional Class | | | | | | | | | | | | | | | | |
| Issued | | $ | 254,909,383 | | | | 254,909,383 | | | $ | 191,928,379 | | | | 191,928,379 | |
| Reinvested | | | 36,054 | | | | 36,054 | | | | 109,246 | | | | 109,246 | |
| Redeemed | | | (267,610,404 | ) | | | (267,610,404 | ) | | | (223,082,220 | ) | | | (223,082,220 | ) |
| Net increase (decrease) | | $ | (12,664,967 | ) | | | (12,664,967 | ) | | $ | (31,044,595 | ) | | | (31,044,595 | ) |
Other. The Funds record security transactions on the trade date. Gains and losses realized from the sale of securities are determined on the specific identification basis. Dividend income is recognized on the ex-dividend date and interest income (including amortization of premium and accretion of discount) is recognized as earned. Short-term capital gain distributions from underlying funds are classified as dividend income for financial reporting purposes. Long-term capital gains are broken out as such. Discounts and premiums are amortized over the lives of the respective securities. Distributions received from partnerships are booked as return of capital distributions. Withholding taxes on foreign dividends have been provided for in accordance with the Funds’ understanding of the applicable country’s tax rules and rates.
As described in Note #1, the Funds utilize various methods to measure the fair value of their investments on a recurring basis. GAAP establishes a hierarchy that prioritizes inputs to valuation methods. The three levels of inputs are as follows:
Level 1 – Unadjusted quoted prices in active markets for identical assets or liabilities that the Funds have the ability to access.
Level 2 – Observable inputs other than quoted prices included in level 1 that are observable for the asset or liability, either directly or indirectly. These inputs may include quoted prices for the identical instrument on an inactive market, prices for similar instruments, interest rates, prepayment speeds, credit risk, yield curves, default rates and similar data.
Level 3 – Significant unobservable inputs for the asset or liability, to the extent relevant observable inputs are not available, representing the Funds’ own assumptions about the assumptions a market participant would use in valuing the asset or liability, and would be based on the best information available.
The availability of observable inputs can vary from security to security and is affected by a wide variety of factors, including, for example, the type of security, whether the security is new and not yet established in the marketplace, the liquidity of markets, and other characteristics particular to the security. To the extent that valuation is based on models or inputs that are less observable or unobservable in the market, the determination of fair value requires more judgment. Accordingly, the degree of judgment exercised in determining fair value is greatest for instruments categorized in level 3.
The inputs used to measure fair value may fall into different levels of the fair value hierarchy. In such cases, for disclosure purposes, the level in the fair value hierarchy within which the fair value measurement falls in its entirety, is determined based on the lowest level input that is significant to the fair value measurement in its entirety.
A description of the valuation techniques applied to the Funds’ major categories of assets and liabilities measured at fair value on a recurring basis follows.
Equity securities (including publicly traded partnerships, real estate investment trusts, american depositary receipts, exchange traded funds, and common stock). Securities traded on a national securities exchange (or reported on the NASDAQ national market) are stated at the last reported sales price on the day of valuation and are categorized in level 1 of the fair value hierarchy.
| | 2010 Annual Report | December 31, 2010 |
Investments in registered open-end investment companies, including money market funds, are valued at the daily redemption value as reported by the underlying fund and are categorized in level 1 of the fair value hierarchy.
Corporate bonds. The fair value of corporate bonds is estimated using various techniques, which may consider recently executed transactions in securities of the issuer or comparable issuers, market price quotations (where observable), bond spreads, fundamental data relating to the issuer, and credit default swap spreads adjusted for any basis difference between cash and derivative instruments. While most corporate bonds are categorized in level 2 of the fair value hierarchy, in instances where lower relative weight is placed on transaction prices, quotations, or similar observable inputs, they are categorized in level 3.
Short-term notes (including bank obligations, commercial paper, corporate obligations, U.S. government agency obligations, and floating rate demand notes). Short-term notes held in the Funds, except Money Market, maturing more than sixty days after the valuation date, are valued at the last sales price as of the close of business on the day of valuation, or, lacking any sales, at the most recent bid price or yield equivalent as obtained from dealers that make markets in such securities. When valued at last sales price, the securities will be categorized as level 1. When using bid prices or yield equivalents, they will be categorized as level 2. When such securities are valued within sixty days or less to maturity, the difference between the valuation existing on the sixty-first day before maturity and maturity value is amortized on a straight-line basis to maturity and will be categorized as level 2.
All securities held in Money Market, other than money market funds, are valued at amortized cost, which approximates fair value, and will be categorized as level 2.
Certificates of Deposit. Certificates of deposit are valued at acquisition cost and will be categorized as level 2.
U.S. government obligations. U.S. government obligations are normally valued using a model that incorporates market observable data such as reported sales of similar securities, broker quotes, yields, bids, offers, and reference data. Certain securities are valued principally using dealer quotations. In either case, these securities will be categorized as level 2.
Restricted securities (equity and debt). Restricted securities for which quotations are not readily available are valued at fair value as determined by the Trustees. Depending on the relative significance of valuation inputs, these instruments may be classified in either level 2 or level 3 of the fair value hierarchy.
Derivative instruments (futures contracts). Listed derivative instruments that are actively traded, including futures contracts, are valued based on quoted prices from the exchange and are categorized in level 1 of the fair value hierarchy.
For the year ended December 31, 2010, the Funds did not hold any assets at any time in which significant unobservable inputs were used in determining fair value. Therefore, no reconciliation of level 3 securities is provided. Also, there were no significant transfers between level 1 and level 2 securities. The following table summarizes the inputs used to value the Funds’ assets and liabilities measured at fair value as of December 31, 2010.
Muirfield – Assets/(Liabilities) | | | | | | | | | | | | |
Registered investment companies | | $ | 110,987,486 | | | $ | — | | | $ | — | | | $ | 110,987,486 | |
Money market registered investment companies | | | 1,186,440 | | | | — | | | | — | | | | 1,186,440 | |
Floating rate demand notes | | | — | | | | 9,314,173 | | | | — | | | | 9,314,173 | |
U.S. government obligations | | | — | | | | 799,795 | | | | — | | | | 799,795 | |
Total | | $ | 112,173,926 | | | $ | 10,113,968 | | | $ | — | | | $ | 122,287,894 | |
Trustee deferred compensation | | $ | 109,729 | | | $ | — | | | $ | — | | | $ | 109,729 | |
Futures contracts* | | $ | 66,880 | | | $ | — | | | $ | — | | | $ | 66,880 | |
Dynamic – Assets/(Liabilities) | | | | | | | | | | | | |
Registered investment companies | | $ | 92,539,263 | | | $ | — | | | $ | — | | | $ | 92,539,263 | |
Money market registered investment companies | | | 1,901,691 | | | | — | | | | — | | | | 1,901,691 | |
U.S. government obligations | | | — | | | | 799,795 | | | | — | | | | 799,795 | |
Total | | $ | 94,440,954 | | | $ | 799,795 | | | $ | — | | | $ | 95,240,749 | |
Trustee deferred compensation | | $ | 55,305 | | | $ | — | | | $ | — | | | $ | 55,305 | |
Futures contracts* | | $ | 29,445 | | | $ | — | | | $ | — | | | $ | 29,445 | |
| | 2010 Annual Report | December 31, 2010 |
Aggressive – Assets/(Liabilities) | | | | | | | | | | | | |
Registered investment companies | | $ | 33,069,919 | | | $ | — | | | $ | — | | | $ | 33,069,919 | |
Money market registered investment companies | | | 604,959 | | | | — | | | | — | | | | 604,959 | |
Floating rate demand notes | | | — | | | | 2,008 | | | | — | | | | 2,008 | |
U.S. government obligations | | | — | | | | 299,923 | | | | — | | | | 299,923 | |
Total | | $ | 33,674,878 | | | $ | 301,931 | | | $ | — | | | $ | 33,976,809 | |
Trustee deferred compensation | | $ | 34,432 | | | $ | — | | | $ | — | | | $ | 34,432 | |
Futures contracts* | | $ | 12,540 | | | $ | — | | | $ | — | | | $ | 12,540 | |
Defensive – Assets/(Liabilities) | | | | | | | | | | | | |
Registered investment companies | | $ | 53,856,527 | | | $ | — | | | $ | — | | | $ | 53,856,527 | |
Money market registered investment companies | | | 981,486 | | | | — | | | | — | | | | 981,486 | |
Floating rate demand notes | | | — | | | | 1,703,520 | | | | — | | | | 1,703,520 | |
U.S. government obligations | | | — | | | | 1,295,432 | | | | — | | | | 1,295,432 | |
Total | | $ | 54,838,013 | | | $ | 2,998,952 | | | $ | — | | | $ | 57,836,965 | |
Trustee deferred compensation | | $ | 37,951 | | | $ | — | | | $ | — | | | $ | 37,951 | |
Futures contracts* | | $ | 16,720 | | | $ | — | | | $ | — | | | $ | 16,720 | |
Strategic – Assets/(Liabilities) | | | | | | | | | | | | |
Registered investment companies | | $ | 60,653,605 | | | $ | — | | | $ | — | | | $ | 60,653,605 | |
Money market registered investment companies | | | 1,553,744 | | | | — | | | | — | | | | 1,553,744 | |
U.S. government obligations | | | — | | | | 299,923 | | | | — | | | | 299,923 | |
Total | | $ | 62,207,349 | | | $ | 299,923 | | | $ | — | | | $ | 62,507,272 | |
Trustee deferred compensation | | $ | 30,809 | | | $ | — | | | $ | — | | | $ | 30,809 | |
Futures contracts* | | $ | 30,705 | | | $ | — | | | $ | — | | | $ | 30,705 | |
Quantex – Assets/(Liabilities) | | | | | | | | | | | | |
Common stocks** | | $ | 16,206,773 | | | $ | — | | | $ | — | | | $ | 16,206,773 | |
Money market registered investment companies | | | 635,526 | | | | — | | | | — | | | | 635,526 | |
U.S. government obligations | | | — | | | | 199,949 | | | | — | | | | 199,949 | |
Total | | $ | 16,842,299 | | | $ | 199,949 | | | $ | — | | | $ | 17,042,248 | |
Trustee deferred compensation | | $ | 42,309 | | | $ | — | | | $ | — | | | $ | 42,309 | |
Futures contracts* | | $ | 10,235 | | | $ | — | | | $ | — | | | $ | 10,235 | |
Utilities – Assets/(Liabilities) | | | | | | | | | | | | |
Common stocks** | | $ | 23,071,995 | | | $ | — | | | $ | — | | | $ | 23,071,995 | |
Money market registered investment companies | | | 1,091,819 | | | | — | | | | — | | | | 1,091,819 | |
Total | | $ | 24,163,814 | | | $ | — | | | $ | — | | | $ | 24,163,814 | |
Trustee deferred compensation | | $ | 39,256 | | | $ | — | | | $ | — | | | $ | 39,256 | |
Bond – Assets/(Liabilities) | | | | | | | | | | | | |
U.S. government obligations | | $ | — | | | $ | 16,698,529 | | | $ | — | | | $ | 16,698,529 | |
Corporate bonds | | | — | | | | 2,114,057 | | | | — | | | | 2,114,057 | |
Money market registered investment companies | | | 197,989 | | | | — | | | | — | | | | 197,989 | |
Floating rate demand notes | | | — | | | | 602,423 | | | | — | | | | 602,423 | |
Total | | $ | 197,989 | | | $ | 19,415,009 | | | $ | — | | | $ | 19,612,998 | |
Trustee deferred compensation | | $ | 30,857 | | | $ | — | | | $ | — | | | $ | 30,857 | |
| | 2010 Annual Report | December 31, 2010 |
Money Market – Assets/(Liabilities) | | | | | | | | | | | | |
Bank obligations | | $ | — | | | $ | 2,991,103 | | | $ | — | | | $ | 2,991,103 | |
Certificates of deposit | | | — | | | | 6,000,000 | | | | — | | | | 6,000,000 | |
Commercial paper | | | — | | | | 24,785,123 | | | | — | | | | 24,785,123 | |
Corporate obligations | | | — | | | | 42,469,912 | | | | — | | | | 42,469,912 | |
U.S. government agency obligations | | | — | | | | 9,000,000 | | | | — | | | | 9,000,000 | |
Money Market registered investment companies | | | 45,424,534 | | | | — | | | | — | | | | 45,424,534 | |
Total | | $ | 45,424,534 | | | $ | 85,246,138 | | | $ | — | | | $ | 130,670,672 | |
Trustee deferred compensation | | $ | 38,121 | | | $ | — | | | $ | — | | | $ | 38,121 | |
| * | Futures contracts include cumulative unrealized gain/loss on contracts open at December 31, 2010. |
| ** | See schedule of investments for industry classifications. |
| 3. | Investment Transactions |
For the year ended December 31, 2010, the cost of purchases and proceeds from sales or maturities of long-term investments for the Funds, including U.S. Government investments, were as follows:
| | | | | | | |
The Muirfield Fund® | | $ | 133,985,129 | | | $ | 144,659,520 | |
The Dynamic Growth Fund | | | 99,320,037 | | | | 100,052,086 | |
The Aggressive Growth Fund | | | 35,713,563 | | | | 36,098,907 | |
The Defensive Balanced Fund | | | 81,378,697 | | | | 75,305,917 | |
The Strategic Growth Fund | | | 66,660,180 | | | | 45,172,849 | |
The Quantex Fund™ | | | 8,625,937 | | | | 7,761,538 | |
The Total Return Utilities Fund | | | 11,314,927 | | | | 10,999,488 | |
The U.S. Government Bond Fund | | | 39,274,310 | | | | 37,593,411 | |
For the year ended December 31, 2010, the cost of purchases and proceeds from sales or maturities of long-term U.S. Government investments for the Funds as follows:
| | | | | | | |
The Defensive Balanced Fund | | $ | 993,000 | | | $ | 6,266,845 | |
The U.S. Government Bond Fund | | | 34,207,626 | | | | 31,603,487 | |
| 4. | Investment Advisory Fees and Other Transactions with Affiliates |
Meeder Asset Management, Inc. (“MAM”), a wholly-owned subsidiary of Meeder Financial, Inc. (“Meeder”), provides each Fund, under a separate Investment Advisory Contract, with investment management, research, statistical and advisory services. The services of MAM will terminate automatically if assigned and may be terminated without penalty at any time upon 60 days prior written notice by majority vote of the Fund, by the Trustees of the Fund, or by MAM. For such services the Funds pay a fee at the following annual rates: Muirfield and Quantex, 1.00% of average daily net assets up to $50 million, 0.75% of average daily net assets exceeding $50 million up to $100 million and 0.60% of average daily net assets exceeding $100 million; Dynamic, Aggressive, Defensive, and Strategic, 0.75% of average daily net assets up to $200 million and 0.60% of average daily net assets exceeding $200 million; Bond, 0.40% of average daily net assets up to $100 million and 0.20% of average daily net assets exceeding $100 million; and Money Market, 0.40% of average daily net assets up to $100 million and 0.25% of average daily net assets exceeding $100 million. MAM has contractually agreed to reduce its investment advisory fee by 0.25% for Quantex for average daily net assets up to $50 million. The foregoing reduction in investment advisory fees shall automatically renew annually on or about September 15th, unless MAM elects to terminate this reduction. During the year ended December 31, 2010, $38,302 of investment advisory fees was waived in Quantex. During the year ended December 31, 2010, MAM voluntarily agreed to reduce $62,838 of investment advisory fees in Money Market.
| | 2010 Annual Report | December 31, 2010 |
Under a separate Investment Subadvisory Agreement with MAM, Miller/Howard Investments, Inc. (“Miller/Howard”) serves as subadvisor of Utilities. The Investment Subadvisory Agreement provides that it will terminate automatically if assigned, and that it may be terminated by MAM without penalty to the Fund by MAM, the Trustees of the Fund, or by the vote of a majority of the outstanding voting securities of the Fund upon not less than 30 days written notice. For its services, Utilities pays MAM a fee of 1.00% of average daily net assets up to $50 million, 0.75% of average daily net assets exceeding $50 million up to $100 million and 0.60% of average daily net assets exceeding $100 million. As subadvisor to Utilities, Miller/Howard receives a fee paid by MAM.
Mutual Funds Service Co. (“MFSCo”), a wholly-owned subsidiary of Meeder, serves as stock transfer, dividend disbursing and shareholder services agent for each Fund. In compensation for such services, each Fund pays MFSCo an annual fee calculated as follows: For Muirfield, Utilities, Quantex, Dynamic, Aggressive, Defensive, and Strategic, such fee is equal to the greater of $15 per active shareholder account or 0.12% of each Fund’s average daily net assets. For Bond, such fee is equal to the greater of $15 per active shareholder account or 0.08% of the Fund’s average daily net assets. For Money Market Retail Class and Money Market Institutional Class, such fee is equal to the greater of $20 per active shareholder account or 0.08% of the Fund’s average daily net assets. MFSCo is entitled to receive an annual minimum fee of $4,000 for each Fund or class. For fixed income Funds that are subject to an expense cap and which are above the voluntary expense cap, the basis point fee will be reduced by 0.02%. During the year ended December 31, 2010, MFSCo waived $3,710 and $12,634 of transfer agent fees for Bond and the Institutional Class, respectively. MFSCo also voluntarily waived $45,518, $43,476, $36,870, and $29,034 of transfer agent fees for Muirfield, Dynamic, Defensive, and Strategic, respectively, during the year ended December 31, 2010.
MFSCo provides the Trust with certain administrative services. In compensation for such services, each Fund pays MFSCo an annual fee equal to 0.10% of each Fund’s average daily net assets up to $50 million and 0.08% of each Fund’s average daily net assets exceeding $50 million.
MFSCo serves as accounting services agent for each Fund. In compensation for such services, each Fund pays MFSCo an annual fee equal to the greater of:
| | a. | 0.15% of the first $10 million of average daily net assets, 0.10% of the next $20 million of average daily net assets, 0.02% of the next $50 million of average daily net assets, and 0.01% in excess of $80 million of average daily net assets, |
| | b. | $7,500 for non-Money Market Funds and $30,000 for Money Market. |
For the year ended December 31, 2010, MAM voluntarily agreed to reduce its fees and/or reimburse expenses (excluding brokerage fees and commissions, taxes, interest, and extraordinary or non-recurring expenses), to limit total annual operating expenses to 1.39%, 1.39%, 1.59%, 1.52%, 1.49%, and 0.99% of average daily net assets for Muirfield, Dynamic, Aggressive, Defensive, Strategic, and Bond, respectively. MAM has also voluntarily agreed to reduce its fees and/or reimburse expenses to limit the Retail Class’ and the Institutional Class’ total annual operating expenses to 0.38% and 0.29% of average daily net assets, respectively. Such reductions and/or reimbursements are limited to the total of fees charged to each Fund or Class by MAM and MFSCo. For the year ended December 31, 2010, MAM and/or MFSCo reimbursed $22,556, $9,095, $8,219, $3,185, $1,437, $68,705, and $409,686 to Muirfield, Dynamic, Aggressive, Defensive, Strategic, Bond, and Money Market, respectively.
Muirfield, Dynamic, Aggressive, Defensive, and Strategic have entered into an agreement with the Trust’s custodian, The Huntington National Bank (“HNB”), whereby HNB receives distribution, service, and administration fees (collectively the “fees”) from the underlying security holdings of the aforementioned Funds, and forwards those fees to the appropriate Funds. The Funds use the fees received to reduce the gross expenses of each Fund. For the year ended December 31, 2010, Muirfield, Dynamic, Aggressive, Defensive, and Strategic used $85,507, $72,653, $22,594, $29,489, and $42,510 of fees received, respectively, to reduce gross expenses of each Fund. It is possible that the Funds may invest in security holdings in which fees are not paid. As such, the gross expenses of a Fund would not be decreased. Also, without this agreement it is likely that the Funds would not collect any fees from underlying security holdings.
| | 2010 Annual Report | December 31, 2010 |
Pursuant to Rule 12b-1 of the 1940 Act, a mutual fund can adopt a written plan to pay certain expenses out of fund assets relating to the sale and distribution of its shares. Muirfield, Quantex, Bond, and the Retail Class have adopted a distribution plan with an annual limitation of 0.20% of average daily net assets. Utilities, Dynamic, Aggressive, Defensive, and Strategic have adopted a distribution plan with an annual limitation of 0.25% of average daily net assets. The Institutional Class has adopted a distribution plan with an annual limitation of 0.03% of average daily net assets. For the year ended December 31, 2010, Muirfield, Aggressive, Strategic, Quantex, Utilities, and Bond elected to charge less than the maximum annual amount, effectively waiving $14,793, $1,511, $6,222, $17,312, $14,437, and $4,080 of distribution plan (12b-1) expenses, respectively. The Retail Class and the Institutional Class waived $174,438 and $10,777, respectively, for a total of $185,215.
An Administrative Services Plan has been adopted for each Fund of the Trust except Money Market. The Administrative Services Plan allows for each eligible Fund to pay a maximum annual amount of 0.20% of average daily net assets to Service Organizations that provide administrative support services to their customers who own Shares of record or beneficially. For the year ended December 31, 2010, Muirfield, Dynamic, Aggressive, Defensive, Strategic, Quantex, Utilities, and Bond elected to charge less than the maximum annual amount, effectively waiving $70,552, $42,607, $20,543, $3,160, $8,710, $24,973, $26,718, and $9,645 of administrative service plan expenses, respectively.
The Funds have adopted a Deferred Compensation Plan (the “Plan”) for the independent Trustees. Under the Plan, each eligible Trustee is permitted to defer all or a portion of the trustees fees payable by any of the Funds as an investment into any combination of Funds until a specified point of time. The investment into the Funds is recorded as an asset however an offsetting liability is also recorded for the deferred payment. Once the eligible Trustees’ deferral amounts can be distributed, a lump sum or generally equal annual installments over a period of up to ten (10) years can be made to the eligible Trustee(s). The Funds may terminate this Plan at any time.
Certain trustees and officers of the Funds are also officers or directors of Meeder, MAM, and MFSCo.
During the year ended December 31, 2010, several of the Funds invested in The Money Market Fund, an affiliate, as described in Section 2(a)(3) of the Investment Company Act of 1940. As of December 31, 2010, the 7-day yield of the Institutional Class was 0.28%. A summary of the Funds’ investments in this affiliate during the year is noted below:
| | | | | | | | | | | | | | | | | | | |
The Muirfield Fund® | | $ | 2,521,062 | | | $ | 55,796,230 | | | $ | (57,130,852 | ) | | $ | 1,186,440 | | | $ | 4,499 | | | $ | 1,186,440 | |
The Dynamic Growth Fund | | | 2,660,901 | | | | 38,055,596 | | | | (38,814,806 | ) | | | 1,901,691 | | | | 4,997 | | | | 1,901,691 | |
The Aggressive Growth Fund | | | 779,984 | | | | 12,649,660 | | | | (12,824,685 | ) | | | 604,959 | | | | 2,247 | | | | 604,959 | |
The Defensive Balanced Fund | | | 2,449,157 | | | | 30,645,012 | | | | (32,112,683 | ) | | | 981,486 | | | | 4,347 | | | | 981,486 | |
The Strategic Growth Fund | | | 1,858,964 | | | | 32,155,453 | | | | (32,460,673 | ) | | | 1,553,744 | | | | 3,633 | | | | 1,553,744 | |
The Quantex Fund™ | | | 126,786 | | | | 8,129,250 | | | | (7,620,510 | ) | | | 635,526 | | | | 1,824 | | | | 635,526 | |
The Total Return Utilities Fund | | | 257,874 | | | | 9,124,246 | | | | (8,290,301 | ) | | | 1,091,819 | | | | 1,384 | | | | 1,091,819 | |
The U.S. Government Bond Fund | | | 88,306 | | | | 35,558,472 | | | | (35,448,789 | ) | | | 197,989 | | | | 3,470 | | | | 197,989 | |
| | 2010 Annual Report | December 31, 2010 |
| 5. | Federal Tax Information |
The tax characteristics of dividends paid by the Funds during the year ended December 31, 2010 were as follows:
| | | | | | Net Short- Term Capital Gains | | | Net Long- Term Capital Gains | | | | | | | |
The Muirfield Fund® | | $ | 458,892 | | | $ | — | | | $ | — | | | $ | — | | | $ | 458,892 | |
The Dynamic Growth Fund | | | 198,567 | | | | — | | | | — | | | | — | | | | 198,567 | |
The Aggressive Growth Fund | | | — | | | | — | | | | — | | | | — | | | | — | |
The Defensive Balanced Fund | | | 792,255 | | | | — | | | | — | | | | — | | | | 792,255 | |
The Strategic Growth Fund | | | 198,274 | | | | — | | | | — | | | | — | | | | 198,274 | |
The Quantex Fund™ | | | 25 | | | | — | | | | — | | | | — | | | | 25 | |
The Total Return Utilities Fund | | | 133,540 | | | | — | | | | — | | | | — | | | | 133,540 | |
The U.S. Government Bond Fund | | | 386,192 | | | | 232,564 | | | | — | | | | — | | | | 618,756 | |
The Money Market Fund | | | 330,246 | | | | — | | | | — | | | | — | | | | 330,246 | |
The tax characteristics of dividends paid by the Funds during the year ended December 31, 2009 were as follows:
| | | | | | Net Short- Term Capital Gains | | | Net Long- Term Capital Gains | | | | | | | |
The Muirfield Fund® | | $ | 413,069 | | | $ | — | | | $ | — | | | $ | — | | | $ | 413,069 | |
The Dynamic Growth Fund | | | 29,265 | | | | — | | | | — | | | | — | | | | 29,265 | |
The Aggressive Growth Fund | | | 5 | | | | — | | | | — | | | | — | | | | 5 | |
The Defensive Balanced Fund | | | 172,199 | | | | — | | | | — | | | | — | | | | 172,199 | |
The Strategic Growth Fund | | | — | | | | — | | | | — | | | | — | | | | — | |
The Quantex Fund™ | | | 1,515 | | | | — | | | | — | | | | — | | | | 1,515 | |
The Total Return Utilities Fund | | | 152,723 | | | | — | | | | — | | | | 123,774 | | | | 276,497 | |
The U.S. Government Bond Fund | | | 450,396 | | | | — | | | | — | | | | — | | | | 450,396 | |
The Money Market Fund | | | 1,592,107 | | | | — | | | | — | | | | — | | | | 1,592,107 | |
As of December 31, 2010, the components of accumulated earnings/(deficit) on a tax basis for the Funds were as follows:
| | | Undistributed Ordinary Income | | | | | | Accumulated Capital and Other Gains and (Losses) | | | Unrealized Appreciation/ (Depreciation)2 | | | Total Accumulated Earnings/ (Deficit) | |
The Muirfield Fund® | | $ | 173,526 | | | $ | (1,822 | ) | | $ | (15,855,722 | ) | | $ | 14,569,905 | | | $ | (1,114,113 | ) |
The Dynamic Growth Fund | | | 189 | | | | (189 | ) | | | (17,058,697 | ) | | | 12,934,908 | | | | (4,123,789 | ) |
The Aggressive Growth Fund | | | — | | | | — | | | | (9,727,581 | ) | | | 5,244,557 | | | | (4,483,024 | ) |
The Defensive Balanced Fund | | | 4,442 | | | | (4,440 | ) | | | (5,659,699 | ) | | | 4,048,636 | | | | (1,611,061 | ) |
The Strategic Growth Fund | | | 149 | | | | (149 | ) | | | (1,837,159 | ) | | | 5,235,153 | | | | 3,397,994 | |
The Quantex Fund™ | | | — | | | | — | | | | (2,042,085 | ) | | | 2,718,465 | | | | 676,380 | |
The Total Return Utilities Fund | | | 349 | | | | (349 | ) | | | (130,557 | ) | | | 2,067,690 | | | | 1,937,133 | |
The U.S. Government Bond Fund | | | 2,403 | | | | (552 | ) | | | (137,867 | ) | | | (161,851 | ) | | | (297,867 | ) |
The Money Market Fund | | | 6,074 | | | | (6,074 | ) | | | — | | | | — | | | | — | |
| 1 | Total dividends paid may differ from the amount reported in the Statement of Changes in Net Assets because for tax purposes dividends are recognized when actually paid. |
| 2 | The differences between book- and tax-basis unrealized appreciation/(depreciation) are attributable primarily to: deferral of post October losses, wash sales, and the realization for tax purposes of unrealized gains/(losses) on certain derivative instruments. |
| | 2010 Annual Report | December 31, 2010 |
For federal income tax purposes, the following Funds have capital loss carryforwards as of December 31, 2010, which are available to offset future capital gains, if any. To the extent that these carryforwards are used to offset future capital gains, it is probable that the gains that are offset will not be distributed to shareholders:
| | | | | | | |
The Muirfield Fund® | | $ | 10,372,337 | | | | 2016 | |
The Muirfield Fund® | | | 5,483,385 | | | | 2017 | |
The Dynamic Growth Fund | | | 5,920,810 | | | | 2016 | |
The Dynamic Growth Fund | | | 11,137,887 | | | | 2017 | |
The Aggressive Growth Fund | | | 6,373,039 | | | | 2016 | |
The Aggressive Growth Fund | | | 3,354,542 | | | | 2017 | |
The Defensive Balanced Fund | | | 4,745,858 | | | | 2016 | |
The Defensive Balanced Fund | | | 913,841 | | | | 2017 | |
The Strategic Growth Fund | | | 1,837,159 | | | | 2017 | |
The Quantex Fund™ | | | 491,279 | | | | 2016 | |
The Quantex Fund™ | | | 1,550,806 | | | | 2017 | |
The Total Return Utilities Fund | | | 130,557 | | | | 2017 | |
The U.S. Government Bond Fund | | | 24,633 | | | | 2013 | |
The U.S. Government Bond Fund | | | 113,234 | | | | 2014 | |
Under current tax laws, net capital losses incurred after October 31, within a Fund’s fiscal year, are deemed to arise on the first business day of the following fiscal year for tax purposes. For the year ended December 31, 2010, Bond deferred post October losses in the amount of $78,987.
The beneficial ownership, either directly or indirectly, of more than 25% of the voting securities of a fund creates a presumption of control of the fund under Section 2(a)(9) of the 1940 Act. As of December 31, 2010, Charles Schwab & Co., Inc. held for the benefit of others, in aggregate, 40% of Utilities; Nationwide Trust Company, FSB held for the benefit of others, in aggregate, 87% of Defensive; Nationwide Trust Company, FSB held for the benefit of others, in aggregate, 63% of Strategic; Nationwide Trust Company, FSB held for the benefit of others, in aggregate, 81% of Dynamic; Nationwide Trust Company, FSB held for the benefit of others, in aggregate, 73% of Aggressive; Nationwide Trust Company, FSB held for the benefit of others, in aggregate, 60% of Muirfield; Nationwide Trust Company, FSB held for the benefit of others, in aggregate, 64% of Bond; Carey & Co. held for the benefit of others, in aggregate, 65% of Institutional Class; and IBEW 683 Health & Welfare Plan held 30% of Institutional Class, and therefore may be deemed to control the Funds.
| 7. | Board Review of Investment Advisory and Subadvisory Agreements (unaudited) |
At a meeting held September 15, 2010, the Board of Trustees (the “Board”), including a majority of non-interested or independent Trustees, approved the renewal of the investment advisory agreements for the nine separate funds comprising The Flex-funds (the “Funds”) and an amended investment sub-advisory agreement relating to The Total Return Utilities Fund (individually, an “Agreement” and collectively, the “Agreements”). The primary change in the amended sub-advisory agreement involves the compensation paid to the sub-adviser (see Note #4 in these Notes to Financial Statements).
The Board reviewed materials sent to each Trustee in advance of the meeting for consideration in determining whether to approve the renewal of each Fund’s Agreements. Management reviewed with the Trustees the materials prepared by them in response to Funds’ legal counsel’s supplemental written request pursuant to Section 15(c) of the Investment Company Act of 1940 for the provision to the Trustees of appropriately updated and amended information necessary or appropriate to assist the Trustees in their deliberations concerning renewal of the Agreements. In reaching the decision to renew the Agreements, the Board also took into account information furnished throughout the year at regular Board meetings. Information furnished and discussed throughout the year included investment performance reports and related financial information for each Fund, as well as periodic
| | 2010 Annual Report | December 31, 2010 |
reports on shareholder services, legal compliance, pricing, brokerage commissions and execution and other services provided by the investment manager, Meeder Asset Management, Inc. (“Manager”) and its affiliates, or by or on behalf of The Total Return Utilities Fund’s Subadviser, Miller/Howard Investments, Inc. Information furnished specifically in connection with the renewal process included a report for the Funds prepared by Lipper Financial Services (“Lipper”), an independent organization, as well as a Funds’ profitability analysis prepared by the Manager. The Lipper report compared each Fund’s management fees and expenses with those of other mutual funds deemed comparable to the Fund. The Funds’ profitability analysis discussed the profitability to the Manager and Mutual Funds Service Co., an affiliate of the Manager, from the overall Funds’ operations utilizing expense allocation methodologies deemed reasonable by the Manager.
In considering such materials, the independent Trustees noted that they had received assistance and advice from and met separately with the Funds’ legal counsel and chief compliance officer prior to this meeting. In their deliberations, the Board dealt with each Fund separately. In approving continuance of the Agreement for each Fund, the Board, including a majority of independent Trustees, considered each Fund’s Agreement, a copy of which was made available at the meeting, and determined that the existing management fee structure was fair and reasonable and that continuance of the Agreement was in the best interests of each Fund and its shareholders. While attention was given to all information furnished, the following discusses the primary factors relevant to the Board’s decision.
Nature, Extent and Quality of Services. The Board continues to be satisfied with the nature and quality of the overall services provided by the Manager and its affiliates to the Funds and their shareholders. In addition to investment performance and expenses discussed earlier, the Board’s opinion was based, in part, upon periodic reports furnished them showing that the investment policies and restrictions for each Fund were consistently complied with as well as other reports periodically furnished the Board. Other factors taken into account by the Board were the Manager’s compliance procedures and the qualifications of the Manager’s chief compliance officer. Consideration was also given to the experience of each Fund’s portfolio management team. The Board also took into account the transfer agent, fund accounting agent and administrative services provided to Fund shareholders by an affiliate of the Manager, noting continuing expenditures by management to increase and improve the scope of such services. Similar considerations were applied to the Subadviser to The Total Return Utilities Fund.
Investment Performance. The Board placed emphasis on the investment performance of each Fund in view of its importance to shareholders. While consideration was given to performance reports and discussions with portfolio managers at Board meetings during the year, particular attention in assessing performance was given to the Lipper reports furnished for the Agreement renewals. The Lipper report prepared for each Fund showed the investment performance of the Fund for the one-, three-, and five-year periods, as applicable, ended June 30, 2010 (the “relevant periods”) in comparison with a performance universe similar to each Fund’s investment objectives.
| |
The Muirfield Fund® | Blended Benchmark of 60% S&P 500 Index and 40% Average 90-day U.S. T-Bill; S&P 500 Index; Lipper’s Average Flexible Portfolio Fund Universe; Lipper Index1 |
The Quantex Fund™ (Formerly The Highlands Growth Fund) | Blended Benchmark of 50% Russell 2000 Index and 50% S&P 400 Mid-Cap Index; Russell 2000 Index; S&P 400 Mid-Cap Index; Lipper’s Average Mid-Cap Value Fund Universe; Lipper Index1 |
| The Dynamic Growth Fund | S&P 500 Index; Lipper’s Average Multi-Cap Core Fund Universe; Lipper Index1 |
The Total Return Utilities Fund (Formerly The Socially Responsible Utilities Fund) | Russell 3000 Utilities Index; S&P 500 Utilities Index; Lipper’s Average Utility Fund Universe; Lipper Index1 |
| The U.S. Government Bond Fund | Barclays Capital Intermediate-Term Government/Credit Index; Barclays Intermediate Government Index; Lipper’s Average General U.S. Government Fund Universe; Lipper Index1 |
| The Aggressive Growth Fund | S&P 500 Index; NASDAQ Composite Index; Lipper’s Average Multi-Cap Growth Fund Universe; Lipper Index1 |
| | 2010 Annual Report | December 31, 2010 |
The Defensive Balanced Fund (Formerly The Defensive Growth Fund) | S&P 500 Index; Blended Benchmark consisting of 30% Barclays Intermediate Government/Credit Index, 42% S&P 500 Index, and 28% Average 90-day U.S. T-Bill; Lipper’s Average Flexible Portfolio Fund Universe; Lipper Index1 |
The Strategic Growth Fund (Formerly The Focused Growth Fund) | S&P 500 Index; Blended Benchmark of 25% S&P 500 Index, 20% S&P 400 Index, 12.5% Russell 2000 Index, 12% MSCI EAFE Index, 5.5% iShares MSCI Emerging Markets Index, 12.5% Dow Jones U.S. Select Real Estate Investment Trust, 12.5% Goldman Sachs Commodity Index; Lipper’s Average Multi-Cap Core Fund Universe; Lipper Index1 |
| The Money Market Fund | |
| Retail Class | Lipper Average General Purpose Money Market Fund |
| Institutional Class | iMoneyNet’s Average First Tier Institutional Money Market Fund |
| 1 | Given an adequate quantity of funds, the Lipper Index for a given investment classification or objective consists of the largest ten or thirty funds in that classification or objective. Each index is calculated daily with adjustments for dividends and capital gains. |
Comparative Expenses. Consideration was given to a comparative analysis of the management fees and total expense ratios of each Fund compared with those of a group of other funds.
Management Profitability. The Board also considered the level of profits realized by the Manager and its affiliates in connection with the operation of the Funds. In this respect, the Board reviewed the Funds’ profitability analysis that addresses the overall profitability of The Flex-funds’ business. The Board also considered the extent to which the Manager and its affiliates might derive ancillary benefits from fund operations, including potential benefits resulting from allocation of fund brokerage and the declining use of “soft” commission dollars to pay for research. The Board also took into account management’s expenditures in improving shareholder services provided to the Funds, as well as the need to meet additional regulatory and compliance requirements resulting from recent SEC requirements. The Board determined that the level of profits realized by the Manager under its Agreements with the Funds was not excessive in view of the nature, quality and extent of services provided.
Economies of Scale. The Board also considered whether economies of scale are realized by the Manager as the Funds grow larger and the extent to which this is reflected in the level of management fees charged. While recognizing that any precise determination is inherently subjective, the Board noted that based upon the Funds’ profitability analysis, it appears that as some Funds get larger, at some point economies of scale do result in the Manager realizing a larger profit margin on management services provided to such a Fund. The Board also noted that economies of scale are shared with each Fund and its shareholders through management fee breakpoints so that as a Fund grows in size, its effective management fee rate declines. The Board reviewed, and expressed continued satisfaction with, each Fund’s fee structure under its Agreement and approved a revised fee structure for The Total Return Utilities Fund under the investment sub-advisory agreement with Miller/Howard Investments, Inc.
| | 2010 Annual Report | December 31, 2010 |
REPORT OF INDEPENDENT REGISTERED PUBLIC ACCOUNTING FIRM |
To the Shareholders and Board of Trustees
The Flex-funds
We have audited the accompanying statements of assets and liabilities, including the schedules of investments, of The Flex-funds (the “Funds”), comprising The Muirfield Fund, The Dynamic Growth Fund, The Aggressive Growth Fund, The Defensive Balanced Fund, The Strategic Growth Fund, The Quantex Fund, The Total Return Utilities Fund, The U.S. Government Bond Fund, and The Money Market Fund, as of December 31, 2010, and the related statements of operations for the year then ended, statements of changes in net assets for each of the two years in the period then ended, and the financial highlights for each of the five periods in the period then ended. These financial statements and financial highlights are the responsibility of Fund management. Our responsibility is to express an opinion on these financial statements and financial highlights based on our audits.
We conducted our audits in accordance with the standards of the Public Company Accounting Oversight Board (United States). Those standards require that we plan and perform the audit to obtain reasonable assurance about whether the financial statements and financial highlights are free of material misstatement. An audit includes examining, on a test basis, evidence supporting the amounts and disclosures in the financial statements. Our procedures included confirmation of securities owned as of December 31, 2010, by correspondence with the custodian and brokers. An audit also includes assessing the accounting principles used and significant estimates made by management, as well as evaluating the overall financial statement presentation. We believe that our audits provide a reasonable basis for our opinion.
In our opinion, the financial statements and financial highlights referred to above present fairly, in all material respects, the financial position of each of the Funds constituting The Flex-funds, as of December 31, 2010, the results of their operations for the year then ended, the changes in their net assets for each of the two years in the period then ended, and their financial highlights for each of the five periods in the period then ended, in conformity with accounting principles generally accepted in the United States of America.
COHEN FUND AUDIT SERVICES, LTD.
Westlake, Ohio
February 22, 2011
| | 2010 Annual Report | December 31, 2010 |
Trustees and Officers (unaudited)
Certain trustees and officers of the Funds are also officers or directors of Meeder, MAM, and MFSCo. The Trustees oversee the management of the Trust and elect its officers. The officers are responsible for the Funds’ day-to-day operations. The Trustees’ and officers’ names, addresses, years of birth, positions held with the Trust, and length of service with The Flex-funds are listed below. Also included is each Board member’s principal occupation during, at least, the past five years. Except as indicated, each individual has held the office shown or other offices in the same company for the last five years. Those Trustees who are “interested persons”, as defined in the 1940 Act, by virtue of their affiliation with the Trust, are indicated by an asterisk (*).
Name, Address1, and Year of Birth | | Year First Elected a Trustee or Officer of the Trust | | Position and Number of Funds Overseen2 | | Principal Occupation During Past Five Years and Other Directorships Held |
Robert S. Meeder, Jr.* Year of Birth: 1961 | | 1992 | | Trustee and President | | President of Meeder Asset Management, Inc. |
Jack W. Nicklaus** Year of Birth: 1961 | | 1998 | | Trustee | | Designer, Nicklaus Design, a golf course design firm and division of The Nicklaus Companies. |
Stuart M. Allen** Year of Birth: 1961 | | 2006 | | Trustee | | President of Gardiner Allen DeRoberts Insurance LLC, an insurance agency; Chairman of the Trust’s Audit Committee. |
Anthony D’Angelo** Year of Birth: 1959 | | 2006 | | Trustee | | Director of Sales, WSYX ABC 6/WTTE Fox 28, television stations owned and operated by Sinclair Broadcast Group; Lead Trustee of the Trust. |
Dale W. Smith Year of Birth: 1959 | | 2006 | | Vice President | | Chief Financial Officer of Meeder Asset Management, Inc. (2005 - present); formerly Senior Vice President of Financial Services of BISYS Fund Services (1996 – 2004). |
David R. Carson Year of Birth: 1958 | | 2006 | | Chief Compliance Officer | | Chief Compliance Officer and Anti-Money Laundering Officer of the Huntington Funds (2005 – present); Treasurer and Assistant Treasurer of the Huntington Funds, Huntington Asset Advisors, Inc. (2002 – 2005). |
James B. Craver Year of Birth: 1943 | | 2009 | | Assistant Chief Compliance Officer | | President, James B. Craver & Associates, P.C., law firm (2009 – present); Counsel, K&L Gates, law firm (2007 – 2009); Of Counsel, Seyfarth Shaw, law firm (2005 – 2007). |
| | 2010 Annual Report | December 31, 2010 |
Name, Address1, and Year of Birth | | Year First Elected a Trustee or Officer of the Trust | | Position and Number of Funds Overseen2 | | Principal Occupation During Past Five Years and Other Directorships Held |
Bruce E. McKibben Year of Birth: 1969 | | 2002 | | Treasurer | | Director of Fund Accounting of Mutual Funds Service Co., the Trust’s transfer agent (1997 – present). Interim Chief Operating Officer of Meeder Asset Management, Inc. (June 2008 – October 2008). |
Ruth Kirkpatrick Year of Birth: 1951 | | 2009 | | Secretary, pro tempore | | Senior Legal Specialist of Meeder Asset Management, Inc. |
| 1 | The address of each Trustee is 6125 Memorial Drive, Dublin, OH 43017. |
| 2 | Each Trustee serves for an indefinite term, until his or her resignation, death, or removal. Each Trustee oversees all nine Funds in the Trust. |
| * | Robert S. Meeder, Jr. is deemed an “interested person” of the Trust by virtue of his position as President of Meeder Asset Management, Inc., the Advisor of the Trust. |
| ** | Each independent Trustee is a member of the Trust’s Audit Committee, Compensation Committee, and Nominating Committee. |
The Statement of Additional Information includes additional information about each Trustee and is available without charge. To obtain a copy of the Statement of Additional Information, please contact your financial representative or call toll free 1-800-325-3539.
The Funds file their complete schedules of portfolios holdings with the Securities and Exchange Commission (“SEC”) for the first and third quarters of each fiscal year on Form N-Q. The Funds’ Forms N-Q are available on the SEC’s website at http://www.sec.gov and may be reviewed and copied at the SEC’s Public Reference Room in Washington, DC. Information on the operation of the Public Reference Room may be obtained by calling 1-800-SEC-0330. The Funds’ schedules of positions are also available on the Funds’ website at www.flexfunds.com.
A description of the policies and procedures that the Funds use to determine how to vote proxies relating to portfolio securities, and information regarding how the Funds voted these proxies for the 12-month period ended June 30, 2010, is available on the SEC’s website at http://www/sec.gov, or, without charge, upon request by calling toll-free 1-800-325-3539.
[This page intentionally left blank]
[This page intentionally left blank]
[This page intentionally left blank]
[This page intentionally left blank]
[This page intentionally left blank]
| | 2010 Annual Report | December 31, 2010 |
Manager and Investment Advisor
Meeder Asset Management, Inc.
6125 Memorial Drive
P.O. Box 7177
Dublin, Ohio 43017
Subadvisor / The Total Return Utilities Fund
Miller/Howard Investments, Inc.
141 Upper Byrdcliffe Road, P.O. Box 549
Woodstock, New York 12498
Board of Trustees
Stuart Allen
Anthony D’Angelo
Robert S. Meeder, Jr.
Jack Nicklaus II
Custodian
The Huntington National Bank
Columbus, Ohio 43215
Transfer Agent & Dividend Disbursing Agent
Mutual Funds Service Co.
6125 Memorial Drive
Dublin, Ohio 43017
Independent Registered Public Accounting Firm
Cohen Fund Audit Services, Ltd.
800 Westpoint Parkway,
Suite 1100 Westlake, Ohio 44145
| The Flex-funds® 2010 Annual Report | December 31, 2010 | |
| | | |
| | Annual Report December 31, 2010 | |
| | Mutual funds can be a quick, efficient, cost-effective way to achieve investment diversification. The investment options available through The Flex-funds® are suitable for a wide range of investors, from the conservative-minded to the growth-oriented, to help investors achieve their individual financial goals. We provide professional management, ongoing supervision of clients’ holdings, automatic diversification and e-Delivery of statements and fund mailings: all important elements of a well-rounded investment plan. No matter what your objectives may be, The Flex-funds® can help you make the most of your personal investment plan and help you achieve your individual financial goals. | |
 | Go Paperless. Looking for ways to help the environment? Sign up to view reports online at www.flexfunds.com | |
| | Managed by Meeder Asset Management, Inc. 6125 Memorial Drive, Dublin, Ohio 43017 Call Toll Free: 800-325-3539 Local: 614-760-2159 Fax: 614-766-6669 www.flexfunds.com flexfunds@meederfinancial.com |  |