UNITED STATES
SECURITIES AND EXCHANGE COMMISSION
Washington, D.C. 20549
FORM N-CSR
CERTIFIED SHAREHOLDER REPORT OF REGISTERED
MANAGEMENT INVESTMENT COMPANIES
Investment Company Act file number 811-3462
The Flex-funds Trust
6125 Memorial Drive
Dublin, OH 43017
Bruce McKibben
c/o The Flex-funds Trust
6125 Memorial Drive
Dublin, OH 43017
Registrant’s telephone number, including area code: 800-325-3539
Date of fiscal year end: December 31, 2008
Date of reporting period: December 31, 2008
Item 1. Report to Stockholders.
| | |
| The Flex-funds® | | 2008 Annual Report | December 31, 2008 |
TABLE OF CONTENTS
|
Our Mission Statement Every day, our mission is to exceed, with integrity, passion, and discipline, the expectations of our shareholders’ and clients’ overall investment experience. Core Values The Client/Shareholder Is Our #1 Priority Always remember whom we are serving. Our livelihood depends on providing a superior overall investment experience that exceeds the expectation of our shareholders and clients. Clarity Of Purpose Our organization has a clear, well-defined vision. All of our associates are committed to and understand how they will contribute to that vision. Communication We expect open and effective communication, full reporting, including good and bad news, and constructive feedback. Integrity We insist upon honesty and adhere to the highest ethical standards. Excellence/ Innovation Our associates strive each day for excellence in the work they perform, seek innovative ways to solve problems and introduce new ideas to take advantage of opportunities. We are a “Think Outside The Box” company. Associate Well-Being We value the success and well-being of our associates. We recognize and reward our associates’ contributions. Respect For Others Respect all people, value the differences among them and treat them as you would like to be treated. Seek First To Understand When interacting with others, place curiosity and understanding of their perspective FIRST, setting aside preconceived opinions and quick judgment. Teamwork We are a synergistic organization that works as a team to exceed our objectives. Profit We are profitable. Profitability enhances our services and capabilities, and affords everyone the opportunity to further their financial well-being. |
| | |
| The Flex-funds® | | 2008 Annual Report | December 31, 2008 |
LETTER TO SHAREHOLDERS
Although 2008 began in the midst of a credit crisis spurred on by the deteriorating housing market, few investors anticipated the events that would unfurl. Among other incidents, the year was witness to financial and credit market turmoil, a complete transformation of Wall Street, record-setting bankruptcies, continued pressures in the housing market, a bubble (followed by a subsequent burst) in energy and commodity prices, and a deepening recession. While the current situation is challenging, governments and central banks around the world have responded with creative solutions designed to limit the impact of the extraordinary events taking place.
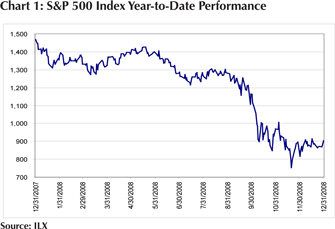
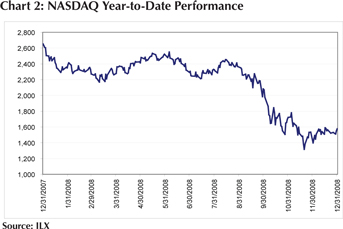
The stock market reflected the challenges facing the credit markets and global economy in 2008. Record point movements and volatility have characterized the year, especially during the third and fourth quarter. For example, the Dow recorded its largest one-day point loss in history, of nearly 778 points during the third quarter. Additionally, from October 2003 to January 2008 there were only two days that the S&P 500 gained or lost 2% or more. From September 4, 2008 to December 31, 2008, there were 48 days that the S&P 500 gained or lost 2% or more. The record point losses and volatility have combined to deliver the second worst annual performance since 1926 for the S&P 500. For the year ending December 31, 2008, the return for the S&P 500 was -37% while the NASDAQ Composite Index returned -39.98% (see Charts 1 and 2). The following pages will provide a brief summary on economic and financial events, an explanation of the strategies we employed, what we anticipate for 2009, and the performance of our Funds versus the overall market during the past year.
2008: The Year in Review
The series of events that transpired during 2008 will be discussed in the decades that follow. Detailed explanations of these events would be too long for this letter, but even an abbreviated listing is staggering.
* Multiple financial firm failures and bailouts. 2008 was witness to numerous bank failures that shook investor confidence and altered the Wall Street landscape. The Federal Reserve, through an arranged takeover by JP Morgan Chase, hastily rescued Bear Stearns in March. In July, IndyMac Bancorp failed and was taken over by the Federal Deposit Insurance Corporation (FDIC).
On September 7, Fannie Mae and Freddie Mac were placed in federal conservatorship in the wake of mounting losses. On September 14, Merrill Lynch agreed to be acquired by Bank of America. On September 15, Lehman Brothers, an investment bank that reportedly had never had a losing year in its 158-year history, became the largest firm in history to declare bankruptcy. On September 16, AIG accepted the terms of a Federal Reserve rescue package. Washington Mutual was placed into receivership on September 25, becoming the largest bank failure in U.S. history, and was subsequently acquired by JP Morgan Chase. On September 29, Wachovia agreed to an acquisition by Citigroup and, subsequently, by Wells Fargo. During November, the U.S. Government moved to guarantee hundreds of billions of Citigroup’s toxic assets.
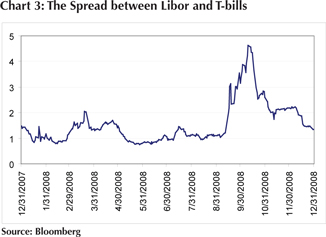
* Frozen credit markets results in government action. Continued woes in the housing market and multiple bank failures culminated in a severe shortage of credit and liquidity in the markets during September. Banks and institutional investors, both keen on avoiding exposure to the next bank failure, acutely restricted the extension of credit. As a result, several measures of credit availability indicated severe shortages (see Chart 3). The Bush Administration, led by Treasury Secretary Henry Paulson, received the approval from Congress to use $800 billion in bailout funds in an attempt to restore confidence. Originally devised as a solution to address the system-wide failure, the bailout funds have actually been used to directly inject capital into the banking system to encourage lending.
| | |
The Flex-funds® 2008 Annual Report | December 31, 2008 | | Page 1 |
| | |
| The Flex-funds® | | 2008 Annual Report | December 31, 2008 |
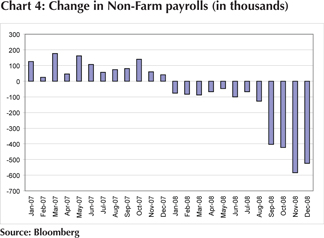
* Declining payrolls and rising unemployment. The sluggish economy has taken its toll on the job market. Employers reduced nonfarm payrolls every month of 2008 (see Chart 4), which has resulted in cumulative job losses of 2.6 million for the full year. As a result, the unemployment rate increased significantly, and now stands at 7.2% as of December, compared to 4.9% at the beginning of the year. More recent readings on the job market have been dismal as well with weekly initial jobless claims remaining well above 500,000 for most of December. The early signs of trouble in the job market, which deteriorated well before declines in GDP, spurred the National Bureau of Economic Research to declare that the current recession began over a year ago in December 2007.
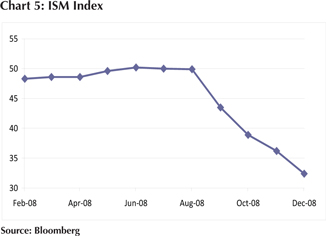
* Outlook for GDP weakening. The most recent reading on GDP shows a decline of 0.5% for the third quarter, driven substantially by a decline in consumer spending, which fell 3.8% and is the largest single component of GDP. As revealed by the minutes from its most recent meeting, the Federal Reserve has revised its expectations for economic activity downward, and expects moderate economic contraction through the first half of 2009. Recent data points concerning gauges of the manufacturing and service sector support the Fed’s evaluation of the economic situation. The ISM Manufacturing Index, which is a gauge of manufacturing activity, came in at 32 during the month of December (see Chart 5). A reading below 50 indicates contraction while a reading above 50 indicates expansion.
* Housing fundamentals remain weak. Home prices in major U.S. cities plummeted by a record 18% in October according to S&P/Case-Shiller, bringing prices back down to their early-2004 levels. Home prices declined every month through October 2008, and as home values decline further coupled with the losses in the equity markets, the wealth effect many homeowners feel also diminishes which results in less overall spending. Compounding this problem is the rising number of homes going into foreclosure, high inventory levels, and the emerging tendency for modified mortgages to become distressed once again. The housing market continues to present an obstacle to an economic recovery, and remains at the core of the ongoing credit crisis.
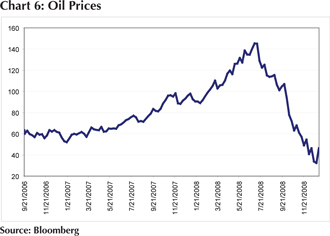
* Volatile energy and commodity prices. While there has been dramatic volatility in the equity markets, it has been common place in the energy and commodity markets as well. For example, oil prices rose from approximately $96 per barrel at the beginning of 2008 to a peak of $147 per barrel in mid-July, and have since fallen to approximately $40 at the end of December, a 73% decline from its peak price (see Chart 6). From its July highs, this represents a savings of nearly $1 billion per day in the U.S. The price of gold has also experienced wide swings, and has ranged from approximately $700 to $1,000 per ounce in 2008, and ended the year at $882 per ounce. While the heightened level of prices during the first half of the year gave way to inflationary concerns, the decline in prices in the second half of 2008 combined with generally falling asset prices and de-leveraging is now causing deflationary concerns.
* High expectations for the incoming President. Barack Obama’s victory in the presidential election as well as the formation of his cabinet has removed a key source of uncertainty heading into 2009. A strong Democratic performance in congressional elections also gives President-elect Obama a strong base in both houses of congress to pass legislation. Among the first pieces of legislation expected to pass is an economic stimulus package purported to be approximately $800 billion, and will be implemented in part to create jobs through an overhaul of the nation’s infrastructure.
| | |
Page 2 | | The Flex-funds® 2008 Annual Report | December 31, 2008 |
| | |
| The Flex-funds® | | 2008 Annual Report | December 31, 2008 |
* Domestic automakers facing bankruptcy. By the end of 2008, it became apparent that Detroit automakers were facing cash shortages as the demand for vehicles dampened amid the economic slump. While Ford maintained that it has enough cash to last through 2009, General Motors and Chrysler were in need of emergency funds to avoid bankruptcy. As a result, the Bush Administration provided over $13 billion in bailout funds to see the two companies through the first quarter of 2009. Uncertainty remains over the future of the automakers, with the problem effectively being passed to the incoming administration of President-elect Obama.
Our Investment Approach
Equity Funds
Each quarter of 2008 was witness to periods of heightened volatility that presented a difficult environment for investors.
We employed various tactics and strategies throughout the year in response to the changing economic and securities market environment. For instance, our asset allocation model that attempts to identify the risk of the stock market detected a change from a low risk environment to a more cautious environment in mid-January, 2008. Consequently, we established a 25% defensive position in The Muirfield Fund® and the equity portion of The Defensive Balanced Fund in mid-January and maintained this posture until late September. In late September and early October, we increased our defensive posture to approximately 50% as the stock market began to react negatively to the events surrounding the credit crisis and mounting economic challenges. As the stock market began to stabilize from late October through late November, we gradually began to increase our exposure to the stock market, finishing the year with a 59% allocation to the stock market in The Muirfield Fund® and the equity portion of The Defensive Balanced Fund.
We also took an active approach toward managing our exposure to growth versus value investments and across the range of market capitalization in our fund-of-funds based mutual funds. We began the year with an overweight in growth investments and placed an emphasis on the shares of mid-cap companies. The positioning served performance well until the beginning of the third quarter, which coincided with a significant change in market leadership. More specifically, value stocks staged a remarkable recovery in mid-July after under-performing the market for most of the prior year, and was driven by financial stocks that rebounded as investors bet on a bottom coupled with government imposed restrictions on short-selling certain financial stocks. Mid-July also witnessed a collapse in commodity prices as concerns over global demand emerged as a result of economic weakness in many of the world’s largest economies. A change in leadership also took place across the spectrum of market capitalization, with small-cap companies unexpectedly performing the best during the third quarter followed by large-cap stocks then mid-cap stocks. During the third quarter, we established a position in small-cap stocks due to relative valuations as well as favorable historical performance during recessions. As the third quarter progressed we also reduced our overweight in growth investments until we were essentially neutral to growth versus value in recognition of increasing market volatility that was leading to frequent changes in market leadership. During the fourth quarter we continued to add incremental exposure to value investments and finished the year slightly overweighted toward value.
We also managed industry sector exposure throughout the year as well, which has been largely characterized by our decision to underweight the financial sector for the entire year even as we shifted toward value investments. In addition, through the third quarter we maintained overweights to the energy and industrial materials sectors. As economic fundamentals deteriorated, we shifted our sector overweights to traditionally defensive sectors such as consumer staples, utilities and health care. Another aspect of our investment posture is characterized by the decision to allocate funds in markets outside of the U.S. We maintained exposure to developed as well as emerging international markets until the third quarter, when we began reducing and ultimately eliminating all direct international holdings. This coincided with the rapid deterioration in global economic fundamentals as well as the strengthening of the dollar.
Fixed Income Funds
In 2008, the underlying theme in the credit markets was, “flight to quality.” Uncertainty throughout global economies and capital markets was cited as the ultimate culprit. Confidence took its first hit when the value of lower quality securitized mortgage products and their derivatives, created and issued within the past several years, came under intense scrutiny. As questions began to swirl around these products, questions surrounding their value became clouded. Throughout the year the uncertainty mounted and ultimately the credit markets became frozen. Investors became wary of each other and their involvement in these markets, resulting in fear that ebbed and flowed throughout most of the year. U.S. Treasury securities, which are synonymous with safety, became the product of choice for investors looking to protect their money. U.S. Treasuries realized
| | |
The Flex-funds® 2008 Annual Report | December 31, 2008 | | Page 3 |
| | |
| The Flex-funds® | | 2008 Annual Report | December 31, 2008 |
unprecedented gains in 2008 as investors scrambled for these securities. Several times during the fourth quarter of 2008, fervor for U.S. Treasury bills reached such extreme levels that yields were actually quoted as being negative. This means that investors were actually paying the government more than they would receive at the maturity of the security. The difference between the yields of various fixed-income securities versus U.S. Treasury securities (spreads) widened significantly at various points throughout the year. We believe this created investment opportunities in certain areas of the fixed-income market. Throughout the year, we maneuvered our position in The U.S. Government Bond Fund to capitalize on yield opportunities without compromising safety. For the majority of the year, The U.S. Government Bond Fund was invested in U.S. Government agency securities (e.g., Federal Home Loan Corporation). These securities provided a higher yield than U.S. Treasuries, but lagged U.S. Treasuries in capital appreciation. As the year progressed we invested a portion in other areas that offered higher yields, such as investment grade corporate bonds.
For the 23rd consecutive calendar year, The Flex-funds® Money Market Fund performance was in the top 10% of iMoneyNet first-tier retail money market funds. The Fund’s strong performance was accomplished by maintaining its focus on high-quality money market securities and expense controls.
2009: Challenges and Opportunities Abound
It appears that the year ahead will present a number of challenges as well as opportunities regarding the financial markets and economy. Many anticipate that the current economic situation will worsen before experiencing any improvements, especially since the housing market remains weak, credit markets have not yet returned to a normal functioning status, and the unemployment rate seems destined to move higher. The Federal Reserve currently anticipates that GDP will range from a decline of 0.2% to an increase of 1.1% in 2009, and that the unemployment rate will have a range of approximately 7.1% to 7.6%.
We believe there are several key market and economic factors to monitor in 2009. The process of reducing debt levels among consumers and businesses alike will continue to have an impact on asset prices. However, the Federal Reserve has employed creative and unconventional tactics to offset the full impact of the de-leveraging process. The Federal Reserve has also played an important role in easing stresses that have been prominent in the credit markets, and we will continue to monitor credit spreads since further narrowing is needed to return to longer-term averages. We will also search for signs of stabilization in the housing market, which we believe will portend a recovery in the broader economy.
While the aforementioned challenges appear daunting, especially given the impact of these events during 2008, it is important to note that the equity markets are forward-looking in nature. In other words, equity markets tend to anticipate future economic activity, and thus tend to recover many months before the broader economy experiences recovery. As a result, we are constantly reviewing our models and other quantitative factors in search of opportunities to adjust our market exposures that will benefit our shareholders.
For now, we believe many uncertainties remain in the economy and the financial markets. Therefore, we are maintaining a partially defensive position in The Muirfield Fund® and The Defensive Balanced Fund. Going forward, we will continue to monitor conditions carefully and look for opportunities to adjust our weights among growth and value stocks, large-, mid-, and small-caps, and domestic and international investments in order to enhance returns and manage risk for our clients. We will also continue to proactively manage our sector exposures, and will make adjustments as we modify our outlook for the economy and financial markets. On the following pages you will find a review of how our Mutual Funds have performed. Please read the commentaries to learn more about the investment decisions that were made during the past year.
These are trying times in the financial services industry. Since 1974, Meeder Financial has navigated through periods of extremely difficult market environments. On behalf of all of the associates at Meeder Asset Management and The Flex-funds®, I thank you for the continued trust and confidence you have placed in our investment management services and be assured that we are 100% committed to working with you and helping you achieve your most important financial goals
|
| Sincerely, |
|

Robert S. Meeder, Jr. President The Flex-funds® December 31, 2008 |
| | |
Page 4 | | The Flex-funds® 2008 Annual Report | December 31, 2008 |
| | |
| The Flex-funds® | | 2008 Annual Report | December 31, 2008 |
2008 Mutual Fund Commentary
| | |
The Flex-funds® 2008 Annual Report | December 31, 2008 | | Page 5 |
| | |
| The Flex-funds® | | 2008 Annual Report | December 31, 2008 |
The Money Market Fund
Annual Market Perspective
FORTHE 23RDCONSECUTIVEYEAR, THE FLEX-FUNDS® MONEY MARKET FUNDPERFORMANCEWASINTHETOP 10%OFIMONEYNETFIRST-TIERRETAILMONEYMARKETFUNDS.
The Retail Class of The Flex-funds® Money Market Fund (the Fund) continued to rank among the top general-purpose money market funds in the country during the year ended December 31, 2008, according to iMoneyNet, Inc., The Retail Class of The Flex-funds® Money Market Fund closed the quarter with a 1.76% 7-day compound yield. The average first-tier retail money market fund finished the quarter with a 0.90% 7-day compound yield. For the 23rd consecutive year, The Flex-funds® Money Market Fund performance was in the top 10% of iMoneyNet first-tier retail money market funds.
The fourth quarter of 2008 capped off what was a rugged year in the capital markets all around the world. Short-term investment markets came to a halt as the credit crisis peaked between the third and fourth quarters, which quickened the pace of migration to safer investments. This ultimately pushed yields on short-term investments to unprecedented lows by the time the quarter came to a close. For example, the 90-day U.S. Treasury Bill started the quarter yielding less than one percent (0.90%), yet during the quarter would actually turn negative (-0.04%). Investors were willing to pay the government in order to hold these securities. Top rated commercial paper on average realized an even greater slump declining from 4.50% to under one percent (0.46%) by quarter end.
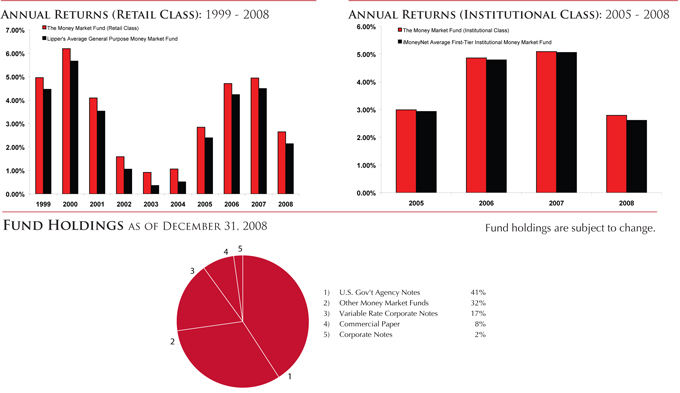
Our investment strategy focused on high quality investments and supported a longer than average weighted average maturity. As the quarter progressed we continued to overweight U.S. Government agency securities while we reduced our holdings in corporate debt securities. At the end of the year the Fund’s composition was as follows: 41% U.S. Government agency securities, 27% corporate debt securities and 32% in other money market funds. We also maintained a longer duration throughout the year relative to the benchmark, which aided performance as interest rate levels declined. The strategy served the Fund well as the retail class finished 2008 in the top ten percent versus its peers according to iMoneyNet, Inc.
As we start into 2009 we believe the Fund is positioned properly to perform well. As always, the quality of the Fund’s investments will remain top priority as credit quality concerns may persist. We believe actions taken by the U.S. Government to quell the credit crisis should prove successful, however effects of a stagnant economy may linger. With a weak economy at hand, short-term interest rates should remain under pressure in the upcoming quarter. Again, a longer than average weighted average maturity should prove beneficial. We will monitor the markets and our strategy continuously keeping in mind the best interest of our shareholders.
| | |
Page 6 | | The Flex-funds® 2008 Annual Report | December 31, 2008 |
| | |
| The Flex-funds® | | 2008 Annual Report | December 31, 2008 |
PERFORMANCE PERSPECTIVE
Period & Average Annual Total Returns as of December 31, 2008
| | | | | | | | | | | | |
| | | 1 Year | | | 5 Year | | | 10 Year | | | Since
Inception | |
The Money Market Fund
(Retail Class) | | 2.65 | % | | 3.23 | % | | 3.38 | % | | 4.92 | %1 |
Lipper’s Average General Purpose Money Market Fund | | 2.14 | % | | 2.75 | % | | 2.87 | % | | 4.36 | %2 |
Current & Effective Yields | | 7-day Compound Yield: 1.76%* | | | 7-day Simple Yield: 1.75%* | |
The Money Market Fund
(Institutional Class) | | 2.79 | % | | N/A | | | N/A | | | 3.92 | %3 |
iMoneyNet Average First-Tier
Institutional Money Market Fund | | 2.61 | % | | N/A | | | N/A | | | 3.84 | %4 |
Current & Effective Yields | | 7-day Compound Yield: 1.91%* | | | 7-day Simple Yield: 1.89%* | |
1 | Inception date for the Retail class of The Money Market Fund was 3/27/85. |
2 | Performance results for the Lipper Average General Purpose Money Market Fund is from 3/31/85 through 12/31/08. |
3 | Inception date for the Institutional class of The Money Market Fund was 12/28/04. |
4 | Performance results for the iMoneyNet Average First-Tier Institutional Money Market Fund is from 12/28/04 through 12/31/08. |
| * | For the seven-day period ended December 31, 2008, yield quotations more closely reflect the current earnings of The Money Market Fund than do total return quotations. |
Performance quoted represents past performance. Past Performance does not guarantee future results. All performance figures represent average annual total returns for the periods ended December 31, 2008, and assume reinvestment of all dividend and capital gain distributions. The investment return and principal value of an investment will fluctuate so that an investor’s shares, when redeemed, may be worth more or less than their original cost. Current performance may be higher or lower than the performance quoted. Current month-end performance may be obtained at www.flexfunds.com or by calling 1.800.325.3539. Management fees were waived and/or expenses were reimbursed in order to reduce the operating expenses of both the retail class and the institutional class of The Money Market Fund during the periods shown above. Investments in The Money Market Fund are neither insured nor guaranteed by the Federal Deposit Insurance Corporation or any other governmental agency. Although the Fund seeks to preserve the value of your investment at $1.00 per share, it is possible to lose money by investing in The Money Market Fund. Source for average general purpose money market fund data: Lipper, Inc. Source for average first-tier institutional money market fund data: iMoneyNet, Inc.
| | |
The Flex-funds® 2008 Annual Report | December 31, 2008 | | Page 7 |
| | |
| The Flex-funds® | | 2008 Annual Report | December 31, 2008 |
The U.S. Government Bond Fund
Annual Market Perspective
THE U.S. GOVERNMENT BOND FUNDISONEOFLESSTHAN 2%OF
INTERMEDIATE-TERM U.S. GOVERNMENT BOND FUNDSTHATEXCEEDEDTHE
BARCLAYS CAPITAL INTERMEDIATE-TERM GOVERNMENT CREDIT INDEX
FOREACHOFTHEPAST 3YEARS.
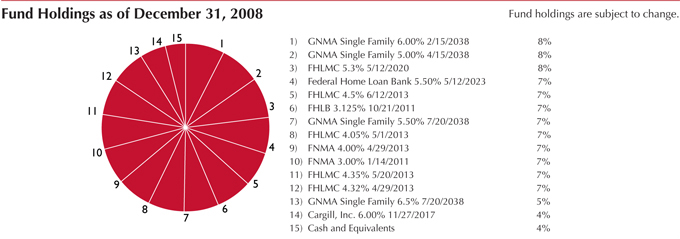
The Flex-funds® U.S. Government Bond Fund (the Fund) returned 5.16% for the full year compared against the benchmark return of 5.07%. Flight to quality ruled the fixed-income markets for all of 2008. As fears mounted that the economy would continue to weaken at the hands of the credit crisis, U.S. Treasury and Government Agency fixed-income securities appreciated in price. For a majority of 2008, spreads between U.S. Treasury securities and U.S. Government agency securities maintained above average yield spreads. We have attempted to take advantage of this dislocation between the security types by purchasing U.S. Government agency products. We also maintained a longer duration throughout the year relative to the benchmark, which aided performance as interest rate levels declined.
As we move into a new year and the first quarter of 2009, we anticipate economic weakness to persist. Even with stimulus activities from the U.S. Government and the Federal Reserve we believe the credit crisis will suppress growth adding to the length of the current recessionary environment. As mentioned above, investments in the Fund remain in U.S. Government agency securities as we believe they offer an attractive spread over U.S. Treasury securities. A move to add some high quality investment grade corporate bonds has been addressed as the Fund can hold a small portion of these securities (up to 20%). A move to add corporate bonds to the Fund would be based on the current attractive spreads offered by these securities. We believe the mix of these securities combined with our duration position should allow us to provide solid performance to our shareholders. We will continue to monitor economic data and our models for potential changes.
| | |
Page 8 | | The Flex-funds® 2008 Annual Report | December 31, 2008 |
| | |
| The Flex-funds® | | 2008 Annual Report | December 31, 2008 |
PERFORMANCE PERSPECTIVE
Period & Average Annual Total Returns as of December 31, 2008
| | | | | | | | | | | | | | | |
| | | 1 Year | | | 5 Year | | | 10 Year | | | Net Expense
Ratio+ | | | Gross Expense
Ratio+ | |
The U.S. Government Bond Fund1 | | 5.16 | % | | 3.61 | % | | 3.30 | % | | 1.01 | % | | 1.72 | % |
Lehman Bros. Intermediate-Term | | | | | | | | | | | | | | | |
Government/Credit Index2 | | 5.07 | % | | 4.21 | % | | 5.43 | % | | — | | | — | |
1 | The inception date of The U.S. Government Bond Fund is 12/31/1988. |
2 | The Lehman Brothers Intermediate-Term Government/Credit Index is an unmanaged index of fixed-rate bonds issued by the U.S. Government and its agencies that are rated investment-grade or higher, have one to ten years remaining until maturity, and at least $100 million outstanding. The Lehman Brothers Intermediate-Term Government/Credit Index does not take into account the deduction of expenses associated with a mutual fund, such as investment management and accounting fees. One cannot invest directly in an index. |
+ | The Net and Gross Expense Ratios are percentages of the Fund’s average net assets as they are shown in the most current Fund’s Prospectus. The Net Expense Ratio includes all waivers, reimbursements and expenses paid indirectly. |
Performance quoted represents past performance. Past Performance does not guarantee future results. All performance figures represent average annual total returns for the periods ended December 31, 2008, and assume reinvestment of all dividend and capital gain distributions. The investment return and principal value of an investment will fluctuate so that an investor’s shares, when redeemed, may be worth more or less than their original cost. Current performance may be higher or lower than the performance quoted. Current month-end performance may be obtained at www.flexfunds.com or by calling 1.800.325.3539. Management fees were waived and/or expenses were reimbursed in order to reduce the operating expenses of The U.S. Government Bond Fund during the periods shown above. Source for index data: Morningstar, Inc.
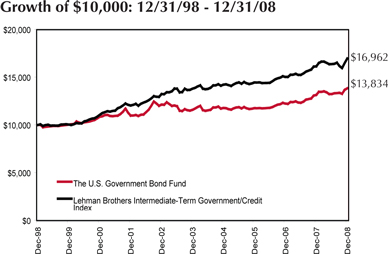
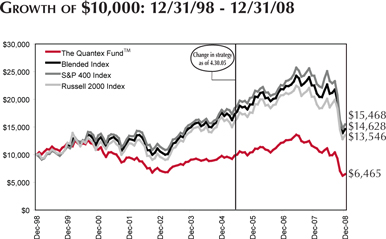
The Growth of $10,000 chart compares The U.S. Government Bond Fund’s value to the Lehman Brothers Intermediate-Term Government/Credit Index. The chart is intended to give you a general idea of how the Fund performed compared to this benchmark over the period from December 31, 1998 to December 31, 2008. An understanding of the differences between the Fund and this index is important. The Lehman Brothers Intermediate-Term Government/Credit Index is a hypothetical unmanaged index of fixed-rate bonds issued by the U.S. Government and its agencies that are rated investment-grade or higher, have one to ten years remaining until maturity, and at least $100 million outstanding. This index does not take into account the deduction of expenses associated with a mutual fund, such as investment management and accounting fees. One cannot invest directly in an index.
Past performance does not guarantee future results. The chart and the table do not reflect the deduction of taxes that a shareholder would pay on fund distributions or the redemption of fund shares.
| | |
The Flex-funds® 2008 Annual Report | December 31, 2008 | | Page 9 |
| | |
| The Flex-funds® | | 2008 Annual Report | December 31, 2008 |
The Muirfield Fund®
Annual Market Perspective
THE MUIRFIELD FUND®HASMAINTAINEDADEFENSIVEPOSITIONINCASH
EQUIVALENTSECURITIESOFATLEAST 25%SINCE JANUARY 2008.
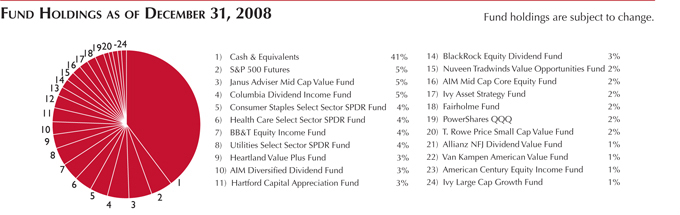
The Flex-funds Muirfield Fund® returned –30.07% for the 12 months ending December 31, 2008. By comparison, the S&P 500 Index declined -37.00%.
Since mid-January of 2008, The Muirfield Fund® has been invested in a partially defensive position. We initially established a 25% defensive position and have maintained a cash position of at least 25% and up to 55% as a result of deterioration in our trend and technical factors in our quantitative models.
As was discussed in the President’s letter, the prevailing theme during 2008, and particularly during the fourth quarter, was the intense focus on the impact from the credit crisis and the severity of the spillover into a weak economy already in the midst of a recession. While bankruptcies and failures slowed in the financial sector, distress spread to the domestic auto industry that turned to the government for funds to continue operations. As the stock market began to react more negatively to the events surrounding the credit crisis and mounting economic challenges, we increased our defensive posture in late September and early October. As the stock market began to demonstrate stability in late October through late November, we gradually began to increase our exposure toward the market. We ended the year with a 59% allocation to the equity market.
We actively managed our investment posture throughout the year as indications from our investment models changed. We began the year with an overweight in growth investments, and gradually shifted to a more neutral stance among value investments in recognition of increasing market volatility. We established a position in small-cap stocks in the third quarter as well due to attractive relative valuations and favorable historical small-cap performance during recessions, although this position harmed performance during the fourth quarter. We also managed our sector exposure, which has been largely characterized by our decision to underweight the financial sector for the entire year. In addition, we maintained overweights in the materials and energy sectors, which benefited performance until the third quarter, at which point we rotated to traditionally defensive sectors. Finally, we maintained exposure to developed as well as emerging international markets until the third quarter, when we began reducing and ultimately eliminating all direct international holdings.
| | |
Page 10 | | The Flex-funds® 2008 Annual Report | December 31, 2008 |
| | |
| The Flex-funds® | | 2008 Annual Report | December 31, 2008 |
PERFORMANCE PERSPECTIVE
Period & Average Annual Total Returns as of December 31, 2008
| | | | | | | | | | | | | | | |
| | | 1 Year | | | 5 Year | | | 10 Year | | | Net Expense
Ratio+ | | | Gross Expense
Ratio+ | |
The Muirfield Fund®1 | | -30.07 | % | | -1.50 | % | | -1.05 | % | | 1.38 | % | | 1.88 | % |
S&P 500 Index2 | | -37.00 | % | | -2.19 | % | | -1.38 | % | | — | | | — | |
60/40 Index3 | | -23.15 | % | | 0.15 | % | | 0.77 | % | | — | | | — | |
1 | Inception date for The Muirfield Fund® is 8/10/88. |
2 | The S&P 500 Index is a widely recognized unmanaged index of common stock prices that does not take into account the deduction of expenses associated with a mutual fund, such as investment management and accounting fees. One cannot invest directly in an index. |
3 | The 60/40 Index is comprised of 60% S&P 500 Index & 40% 90-day T-bills. This index does not take into account the deduction of expenses associated with a mutual fund, such as investment management and accounting fees. One cannot invest directly in an index. |
+ | The Net and Gross Expense Ratios are percentages of the Fund’s average net assets as they are shown in the most current Fund’s Prospectus. The Net Expense Ratio includes all waivers, reimbursements and expenses paid indirectly. |
Performance quoted represents past performance. Past Performance does not guarantee future results. All performance figures represent average annual total returns for the periods ended December 31, 2008, and assume reinvestment of all dividend and capital gain distributions. The investment return and principal value of an investment will fluctuate so that an investor’s shares, when redeemed, may be worth more or less than their original cost. Current performance may be higher or lower than the performance quoted. Current month-end performance may be obtained at www.flexfunds.com or by calling 1.800.325.3539. Management fees were waived and/or expenses were reimbursed in order to reduce the operating expenses of The Muirfield Fund® during the periods shown above. Source for index data: Morningstar, Inc.
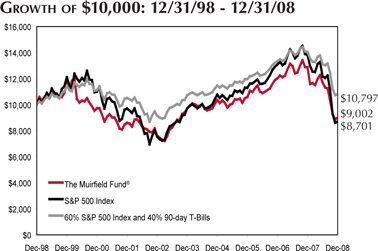
The Growth of $10,000 chart compares the value of The Muirfield Fund® to the S&P 500 Index, the Fund’s broad-based benchmark, and to an index composed of 60% of the S&P 500 Index and 40% of 90-day T-bills (“the 60/40 index”). The chart is intended to give you a general idea of how the Fund performed compared to these indices over the period from December 31, 1998 to December 31, 2008. An understanding of the differences between the Fund and these indices is important. The benchmark indices are hypothetical unmanaged indices of common stocks and 90-day T-bills that do not take into account the deduction of expenses associated with a mutual fund, such as investment management and accounting fees. One cannot invest directly in an index.
Past performance does not guarantee future results. The chart and the table do not reflect the deduction of taxes that a shareholder would pay on fund distributions or the redemption of fund shares.
| | |
The Flex-funds® 2008 Annual Report | December 31, 2008 | | Page 11 |
| | |
| The Flex-funds® | | 2008 Annual Report | December 31, 2008 |
The Defensive Balanced Fund (formerly The Defensive Growth Fund)
Annual Market Perspective
ACHANGEINSTRATEGYDURING AUGUSTINCLUDESANALLOCATIONTO
FIXEDINCOMESECURITIESOFATLEAST 30%ATALLTIMES.
The Defensive Balanced Fund (the Fund) returned –24.16% for the 12 months ending December 31, 2008. By comparison, the S&P 500 Index declined -37.00%. The Defensive Balanced Fund was previously known as The Defensive Growth Fund until August 25, 2008. At that point, the Fund’s strategy was altered to include an allocation to fixed income securities of at least 30% at all times.
Since mid-January of 2008, the equity portion of The Defensive Balanced Fund has been invested in a partially defensive position. We initially established a 25% defensive position and have maintained a cash position of at least 25% and up to 55% as a result of deterioration in our trend and technical factors in our quantitative models. Regarding our fixed income allocation, we predominantly held government agency securities, but gradually increased our position in corporate debt instruments. As of December 31, our fixed income allocation was comprised of 65% government agency securities and 35% corporate debt obligations.
As was discussed in the President’s letter, the prevailing theme during 2008, and particularly during the fourth quarter, was the intense focus on the impact from the credit crisis and the severity of the spillover into a weak economy already in the midst of a recession. While bankruptcies and failures slowed in the financial sector, distress spread to the domestic auto industry that turned to the government for funds to continue operations.
We actively managed our equity exposure throughout the year as indications from our investment models changed. We began the year with an overweight in growth investments, and gradually shifted to a more neutral stance among value investments in recognition of increasing market volatility. We established a position in small-cap stocks in the third quarter as well due to attractive relative valuations and favorable historical small-cap performance during recessions, although this position harmed performance during the fourth quarter. We also managed our sector exposure, which has been largely characterized by our decision to underweight the financial sector for the entire year. In addition, we maintained overweights in the materials and energy sectors, which benefited performance until the third quarter, at which point we rotated to traditionally defensive sectors. Finally, we maintained exposure to developed as well as emerging international markets until the third quarter, when we began reducing and ultimately eliminating all direct international holdings.
| | |
Page 12 | | The Flex-funds® 2008 Annual Report | December 31, 2008 |
| | |
| The Flex-funds® | | 2008 Annual Report | December 31, 2008 |
PERFORMANCE PERSPECTIVE
Period & Average Annual Total Returns as of December 31, 2008
| | | | | | | | | | | | | | | |
| | | 8/25/08 to
12/31/08* | | | 1 Year | | | Since
Inception | | | Net Expense
Ratio+ | | | Gross Expense
Ratio+ | |
The Defensive Balanced Fund | | -14.70 | % | | -24.16 | % | | -5.69 | %1 | | 1.39 | % | | 1.80 | % |
S&P 500 Index2 | | -29.39 | % | | -37.00 | % | | -9.40 | % | | — | | | — | |
Blended Index3 | | -12.30 | % | | -17.54 | % | | 1.70 | % | | — | | | — | |
1 | Inception date for The Defensive Balanced Fund is 1/31/06. |
2 | The S&P 500 Index is a widely recognized unmanaged index of common stock prices that does not take into account the deduction of expenses associated with a mutual fund, such as investment management and accounting fees. One cannot invest directly in an index. |
3 | The Blended Index is comprised of 70% 60/40 Index and 30% Lehman Brothers Intermediate-Term Government/Credit Index. The 60/40 Index is comprised of 60% S&P 500 Index and 40% 90-day T-bills. Lehman Brothers Intermediate-Term Government/Credit Index is an unmanaged index of fixed-rate bonds issued by the U.S. Government and its agencies that are rated investment grade or higher and have one to ten years remaining until maturity and at least $100 million outstanding. These indices do not take into account the deduction of expenses associated with a mutual fund such as investment management and accounting fees. An investor cannot invest directly in an index. |
* | On August 25, 2008, The Defensive Growth Fund became known as The Defensive Balanced Fund and its investment strategy changed. This Fund will always invest at least 30% and may invest up to 70% of its assets primarily in equity mutual funds. In addition, this Fund will always invest at least 30% and may invest up to 70% of its assets primarily in investment grade bonds, money market instruments, or exchange traded funds. |
+ | The Net and Gross Expense Ratios are percentages of the Fund’s average net assets as they are shown in the most current Fund’s Prospectus. The Net Expense Ratio includes all waivers, reimbursements and expenses paid indirectly. |
Performance quoted represents past performance. Past Performance does not guarantee future results. All performance figures represent average annual total returns for the periods ended December 31, 2008, and assume reinvestment of all dividend and capital gain distributions. The investment return and principal value of an investment will fluctuate so that an investor’s shares, when redeemed, may be worth more or less than their original cost. Current performance may be higher or lower than the performance quoted. Current month-end performance may be obtained at www.flexfunds.com or by calling 1.800.325.3539. Management fees were waived and/or expenses were reimbursed in order to reduce the operating expenses of The Defensive Balanced Fund during the periods shown above. Source for index data: Morningstar, Inc.
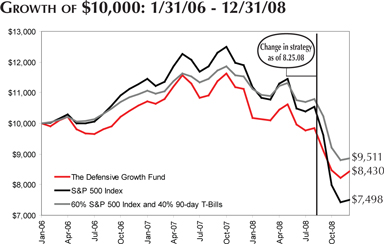
The Growth of $10,000 chart compares The Defensive Balanced Fund’s value to the S&P 500 Index, the Fund’s broad-based benchmark, and to the Blended Index which is comprised of 70% 60/40 Index and 30% Lehman Brothers Intermediate-Term Government/Credit Index. The chart is intended to give you a general idea of how the Fund performed compared to these indices over the period from its inception on January 31, 2006 through December 31, 2008. An understanding of the differences between the Fund and these indices is important. The benchmark indices are hypothetical unmanaged indices of common stock that do not take into account the deduction of expenses associated with a mutual fund, such as investment management and accounting fees. One cannot invest directly in an index.
Past performance does not guarantee future results. The chart and the table do not reflect the deduction of taxes that a shareholder would pay on fund distributions or the redemption of fund shares.

| | |
The Flex-funds® 2008 Annual Report | December 31, 2008 | | Page 13 |
| | |
| The Flex-funds® | | 2008 Annual Report | December 31, 2008 |
The Dynamic Growth Fund
Annual Market Perspective
OURDELIBERATEUNDERWEIGHTOFTHEFINANCIALSECTORALLOWED THE DYNAMIC GROWTH FUNDTOLARGELYCIRCUMVENTTURMOILINTHEBANKINGINDUSTRY.
Although 2008 began in the midst of a credit crisis spurred on by the deteriorating housing market, few investors anticipated the events that would unfurl. Among other incidents, the year was witness to financial and credit market turmoil, a complete transformation of Wall Street, record-setting bankruptcies, continued pressures in the housing market, a bubble (followed by a subsequent burst) in energy and commodity prices, and a deepening recession.
We took an active approach toward managing our exposure to growth versus value investments. We began the year with an overweight in growth investments and placed an emphasis on the shares of mid-cap companies. The positioning served performance well until the beginning of the third quarter, which coincided with a significant change in market leadership. More specifically, value stocks staged a remarkable recovery in mid-July after under-performing the market for most of the prior year, which was driven by financial stocks that rebounded as investors bet on a bottom coupled with government imposed restrictions on short-selling certain financial stocks. During the third quarter, we established a position in small-cap stocks due to relative valuations as well as favorable historical performance during recessions. As the third quarter progressed we also reduced our overweight in growth investments until we were essentially neutral to growth versus value in recognition of increasing market volatility that was leading to frequent changes in market leadership. During the fourth quarter we continued to add incremental exposure to value investments and finished the year slightly overweighted toward value.
We also managed industry sector exposure throughout the year as well, which has been largely characterized by our decision to underweight the financial sector for the entire year even as we shifted toward value investments. In addition, through the third quarter we maintained overweights to the energy and industrial materials sectors. As demand for energy and commodity products receded, these overweight positions contributed to our under performance against the S&P 500 benchmark for the year. As economic fundamentals deteriorated, we shifted our sector overweights to traditionally defensive sectors such as consumer staples, utilities and health care. We also maintained exposure to developed as well as emerging international markets until the third quarter, when we began reducing and ultimately eliminating all direct international holdings. This coincided with the rapid deterioration in global economic fundamentals as well as the strengthening of the dollar.
| | |
Page 14 | | The Flex-funds® 2008 Annual Report | December 31, 2008 |
| | |
| The Flex-funds® | | 2008 Annual Report | December 31, 2008 |
PERFORMANCE PERSPECTIVE
Period & Average Annual Total Returns as of December 31, 2008
| | | | | | | | | | | | | | | |
| | | 1 Year | | | 5 Year | | | Since
Inception | | | Net Expense
Ratio+ | | | Gross Expense
Ratio+ | |
The Dynamic Growth Fund | | -39.77 | % | | -4.05 | % | | -5.04 | %1 | | 1.32 | % | | 1.86 | % |
S&P 500 Index2 | | -37.00 | % | | -2.19 | % | | -2.89 | % | | — | | | — | |
1 | Inception date for The Dynamic Growth Fund is 2/29/00. |
2 | The S&P 500 Index is a widely recognized unmanaged index of common stock prices that does not take into account the deduction of expenses associated with a mutual fund, such as investment management and accounting fees. One cannot invest directly in an index. |
+ | The Net and Gross Expense Ratios are percentages of the Fund’s average net assets as they are shown in the most current Fund’s Prospectus. The Net Expense Ratio includes all waivers, reimbursements and expenses paid indirectly. |
Performance quoted represents past performance. Past Performance does not guarantee future results. All performance figures represent average annual total returns for the periods ended December 31, 2008, and assume reinvestment of all dividend and capital gain distributions. The investment return and principal value of an investment will fluctuate so that an investor’s shares, when redeemed, may be worth more or less than their original cost. Current performance may be higher or lower than the performance quoted. Current month-end performance may be obtained at www.flexfunds.com or by calling 1.800.325.3539. Management fees were waived and/or expenses were reimbursed in order to reduce the operating expenses of The Dynamic Growth Fund during the periods shown above. Source for index data: Morningstar, Inc.
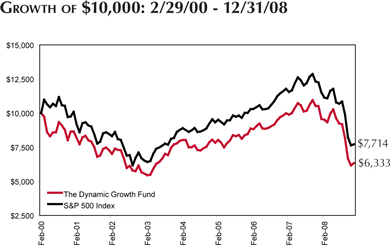
The Growth of $10,000 chart compares The Dynamic Growth Fund’s value to the S&P 500 Index, the Fund’s broad-based benchmark. The chart is intended to give you a general idea of how the Fund performed compared to this benchmark over the period from its inception on February 29, 2000 to December 31, 2008. An understanding of the differences between the Fund and this index is important. The S&P 500 Index is a hypothetical unmanaged index of common stocks that does not take into account the deduction of expenses associated with a mutual fund, such as investment management and accounting fees. One cannot invest directly in an index.
Past performance does not guarantee future results. The chart and the table do not reflect the deduction of taxes that a shareholder would pay on fund distributions or the redemption of fund shares.
| | |
The Flex-funds® 2008 Annual Report | December 31, 2008 | | Page 15 |
| | |
| The Flex-funds® | | 2008 Annual Report | December 31, 2008 |
The Aggressive Growth Fund
Annual Market Perspective
DEFENSIVESECTORALLOCATIONAIDEDOUTPERFORMANCEAGAINSTTHEBENCHMARKFOR 2008.
We began 2008 with an overweight in growth investments and placed an emphasis on the shares of mid-cap companies. The positioning served performance well until the beginning of the third quarter, which coincided with a significant change in market leadership. More specifically, value stocks staged a remarkable recovery in mid-July after under-performing the market for most of the prior year, and was driven by financial stocks that rebounded as investors bet on a bottom coupled with government imposed restrictions on short-selling certain financial stocks. Mid-July also witnessed a collapse in commodity prices as concerns over global demand emerged as a result of economic weakness in many of the world’s largest economies.
During the third quarter, we established a position in small-cap stocks due to relative valuations as well as favorable historical performance during recessions. As the third quarter progressed we also reduced our overweight in growth investments until we were essentially neutral to growth versus value in recognition of increasing market volatility that was leading to frequent changes in market leadership. During the fourth quarter we continued to add incremental exposure to value investments and finished the year slightly overweighted toward value.
We also managed industry sector exposure throughout the year as well, which has been largely characterized by our decision to underweight the financial sector for the entire year even as we shifted toward value investments. In addition, through the third quarter we maintained overweights to the energy and industrial materials sectors. While this positioning benefited performance during the first half of 2008, it detracted from performance during the third quarter as global demand for energy and commodity products waned. As economic fundamentals deteriorated, we shifted our sector overweights to traditionally defensive sectors such as consumer staples, utilities, and health care. We also maintained exposure to developed as well as emerging international markets until the third quarter, when we began reducing and ultimately eliminating all direct international holdings. This coincided with the rapid deterioration in global economic fundamentals as well as the strengthening of the dollar.
| | |
Page 16 | | The Flex-funds® 2008 Annual Report | December 31, 2008 |
| | |
| The Flex-funds® | | 2008 Annual Report | December 31, 2008 |
PERFORMANCE PERSPECTIVE
Period & Average Annual Total Returns as of December 31, 2008
| | | | | | | | | | | | | | | |
| | | 1 Year | | | 5 Year | | | Since
Inception | | | Net Expense
Ratio+ | | | Gross Expense
Ratio+ | |
The Aggressive Growth Fund | | -38.98 | % | | -4.42 | % | | -6.90 | %1 | | 1.70 | % | | 1.76 | % |
NASDAQ Composite Index2 | | -39.98 | % | | -3.95 | % | | -11.09 | % | | — | | | — | |
1 | Inception date for The Aggressive Growth Fund is 2/29/00. |
2 | The NASDAQ Composite Index is a broad-based capitalization-weighted index of all Nasdaq National Market and small-cap stocks that does not take into account the deduction of expenses associated with a mutual fund, such as investment management and accounting fees. One cannot invest directly in an index. |
+ | The Net and Gross Expense Ratios are percentages of the Fund’s average net assets as they are shown in the most current Fund’s Prospectus. The Net Expense Ratio includes all waivers, reimbursements and expenses paid indirectly. |
Performance quoted represents past performance. Past Performance does not guarantee future results. All performance figures represent average annual total returns for the periods ended December 31, 2008, and assume reinvestment of all dividend and capital gain distributions. The investment return and principal value of an investment will fluctuate so that an investor’s shares, when redeemed, may be worth more or less than their original cost. Current performance may be higher or lower than the performance quoted. Current month-end performance may be obtained at www.flexfunds.com or by calling 1.800.325.3539. Management fees were waived and/or expenses were reimbursed in order to reduce the operating expenses of The Aggressive Growth Fund during the periods shown above. Source for index data: Morningstar, Inc.
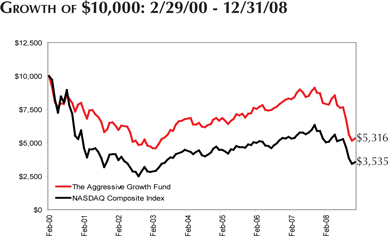
The Growth of $10,000 chart compares The Aggressive Growth Fund’s value to the Nasdaq Composite Index, the Fund’s broad-based benchmark. The chart is intended to give you a general idea of how the Fund performed compared to this benchmark over the period from its inception on February 29, 2000 to December 31, 2008. An understanding of the differences between the Fund and this index is important. The Nasdaq Composite Index is a hypothetical unmanaged index of small-cap and Nasdaq National Market stocks that does not take into account the deduction of expenses associated with a mutual fund, such as investment management and accounting fees. One cannot invest directly in an index.
Past performance does not guarantee future results. The chart and the table do not reflect the deduction of taxes that a shareholder would pay on fund distributions or the redemption of fund shares.
| | |
The Flex-funds® 2008 Annual Report | December 31, 2008 | | Page 17 |
| | |
| The Flex-funds® | | 2008 Annual Report | December 31, 2008 |
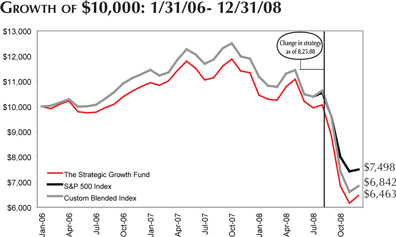
The Strategic Growth Fund (formerly The Focused Growth Fund)
Annual Market Perspective
THECHANGEININVESTMENTSTRATEGYDURING AUGUSTENSUREDBROADEXPOSURETONUMEROUSASSETCLASSES.
The Strategic Growth Fund (the Fund) was previously known as The Focused Growth Fund until August of 2008, at which point the strategy and investment mix of the Fund was altered. The Strategic Growth Fund is now designed to hold fixed allocations across six distinct investment categories, although the mix of investments selected to represent the investment category is variable and actively managed. Before August 25, 2008, the Fund was comprised of exchange-traded funds with an investment style similar to that of The Dynamic Growth Fund.
The fixed allocations were determined by examining an optimal asset allocation strategy, and as a result the current target allocation mix is comprised of the following: 25% large-cap holdings, 20% mid-cap holdings, 17.5% international holdings, 12.5% small-cap holdings, 12.5% real estate holdings, and 12.5% commodities holdings. Since the Fund’s change in strategy during August, it has underperformed the benchmark S&P 500 Index as a result of poor performance among the commodities and real estate investment trust asset classes. However, the Fund’s performance against a custom benchmark, which is based upon the aforementioned fixed asset allocations, is more favorable. Since the Fund’s change in strategy, it has returned approximately -36% versus the custom benchmark return of approximately -35.5%.
The Fund’s performance during the first half of 2008 was impacted favorably from our overweight positions in growth and mid-cap investments, as well as our underweight toward the financial sector. Subsequent to the change in investment strategy, we experienced favorable results from our holdings in various asset classes. For example, our large-cap holding of Columbia Dividend Income returned –13.61% during the fourth quarter of 2008 compared against the benchmark S&P 500 return of –21.95%. We experienced less favorable performance with other funds such as the Hartford Capital Appreciation Fund, which returned –26.09%.
| | |
Page 18 | | The Flex-funds® 2008 Annual Report | December 31, 2008 |
| | |
| The Flex-funds® | | 2008 Annual Report | December 31, 2008 |
PERFORMANCE PERSPECTIVE
Period & Average Annual Total Returns as of December 31, 2008
| | | | | | | | | | | | | | | |
| | | 8/25/08 to
12/31/08* | | | 1 Year | | | Since
Inception | | | Net Expense
Ratio+ | | | Gross Expense
Ratio+ | |
The Strategic Growth Fund | | -36.05 | % | | -43.00 | % | | -13.90 | %1 | | 1.39 | % | | 1.92 | % |
S&P 500 Index2 | | -29.39 | % | | -37.00 | % | | -9.40 | % | | — | | | — | |
Custom Blended Index3 | | -35.56 | % | | -42.51 | % | | -12.19 | % | | — | | | — | |
1 | Inception date for The Strategic Growth Fund is 1/31/06. |
2 | The S&P 500 Index is a widely recognized unmanaged index of common stock prices that does not take into account the deduction of expenses associated with a mutual fund, such as investment management and accounting fees. One cannot invest directly in an index. |
3 | The Custom Blended Index is comprised of 25% S&P 500, 20% S&P Midcap 400, 12.5% Russell 2000, 12.5% Dow Jones Wilshire Real Estate Investment Trust, 12.5% Goldman Sachs Commodity Index, 12% Morgan Stanley Capital International Europe, Australasia, and Far East, and 5.5% Morgan Stanley Capital International Europe Emerging Markets Index. These indices do not take into account the deduction of expenses associated with a mutual fund such as investment management and accounting fees. An investor cannot invest directly in an index. |
| * | On August 25, 2008, The Focused Growth Fund became known as The Strategic Growth Fund and its investment strategy changed. This Fund will pursue its goal by investing primarily in open-end or closed-end investment companies that seek capital growth or appreciation without regard to current income. In addition, this fund will always have set allocations to U.S. large-cap equities, U.S. mid-cap equities, U.S. small-cap equities, non-U.S./International (including emerging markets) equities, real estate equities and commodity based equities. |
+ | The Net and Gross Expense Ratios are percentages of the Fund’s average net assets as they are shown in the most current Fund’s Prospectus. The Net Expense Ratio includes all waivers, reimbursements and expenses paid indirectly. |
Performance quoted represents past performance. Past Performance does not guarantee future results. All performance figures represent average annual total returns for the periods ended December 31, 2008, and assume reinvestment of all dividend and capital gain distributions. The investment return and principal value of an investment will fluctuate so that an investor’s shares, when redeemed, may be worth more or less than their original cost. Current performance may be higher or lower than the performance quoted. Current month-end performance may be obtained at www.flexfunds.com or by calling 1.800.325.3539. Management fees were waived and/or expenses were reimbursed in order to reduce the operating expenses of The Strategic Growth Fund during the periods shown above. Source for index data: Morningstar, Inc.
The Growth of $10,000 chart compares The Strategic Growth Fund’s value to the S&P 500 Index, the Fund’s broad-based benchmark, and the Custom Blended Index, which is described above. The chart is intended to give you a general idea of how the Fund performed compared to these indices over the period from its inception on January 31, 2006 to December 31, 2008. An understanding of the differences between the Fund and these indices is important. The benchmark indices are hypothetical unmanaged indices of common stock that do not take into account the deduction of expenses associated with a mutual fund, such as investment management and accounting fees. One cannot invest directly in an index.
Past performance does not guarantee future results. The chart and the table do not reflect the deduction of taxes that a shareholder would pay on fund distributions or the redemption of fund shares.
| | |
The Flex-funds® 2008 Annual Report | December 31, 2008 | | Page 19 |
| | |
| The Flex-funds® | | 2008 Annual Report | December 31, 2008 |
The Total Return Utilities Fund (formerly The Socially Responsible Utilities Fund)
Annual Market Perspective
WEBELIEVETHATNONEOFOURCOMPANIESARESTRESSEDBYCONDITIONSINTHEFINANCIALMARKETS,ANDTHEYARESOLIDENTERPRISESWITHVALUABLELONG-TERMASSETS.
Relative to other kinds of utility and infrastructure investments, The Total Return Utilities Fund went from the head of the pack during the first half of the year to the back of the pack during the last two quarters. We also experienced perhaps our worst relative year in a history of consistently solid returns. However, our Fund is not that different from the way it appeared at the beginning of the year, or the beginning of 2007 for that matter. The simple fact is that investor selling at the end of the third quarter and into the fourth quarter was broad-based, without much regard for sector, company fundamentals, or long-term prospects.
Performance on a relative basis was favorable during the first half of the year compared against the Russell 3000 Utilities Index. However, the second half proved challenging, particularly during the fourth quarter, and led to under performance for the full year. Three areas that degraded returns the most in the fourth quarter were energy-related, foreign telecom, and infrastructure enablers. Energy-related stocks were obviously impacted by the astonishing declines in commodity prices, a factor that we hardly expect to see repeated in coming quarters, though we did miss the potential magnitude of decline in the second half of 2008. Foreign telecom negatively impacted performance due to the combination of slowing usage and currency declines. Additionally, infrastructure enablers experienced sharp declines, and we believe the declines may be attributable to the aggressive character of investors in these stocks, since these are among the best-positioned companies for global upgrades in telecom and electric grid infrastructure.
Still, none of our companies are stressed by conditions in the financial markets, and they are solid enterprises with valuable long-term assets. Our outperforming stocks during the year embodied the themes of solid market position, inelastic recurring revenues, and a visible growth path. During the third quarter, we believe the valuations experienced among the holdings were extraordinary, especially in the context of the revenue sources for these companies, which diminish least of any sector when the economy is soft. However, the stock prices have experienced significant declines just as much as elsewhere into the fourth quarter, but this has not dissuaded us from our opinion that long-term investors will look back on this moment as an extraordinary buying opportunity.
| | |
Page 20 | | The Flex-funds® 2008 Annual Report | December 31, 2008 |
| | |
| The Flex-funds® | | 2008 Annual Report | December 31, 2008 |
PERFORMANCE PERSPECTIVE
Period & Average Annual Total Returns as of December 31, 2008
| | | | | | | | | | | | | | | |
| | | 1 Year | | | 5 Year | | | 10 Year | | | Net Expense
Ratio+ | | | Gross Expense
Ratio+ | |
The Total Return Utilities Fund1 | | -37.63 | % | | 3.65 | % | | 1.70 | % | | 1.90 | % | | 2.10 | % |
Blended Index2 | | -19.16 | % | | 4.21 | % | | 0.52 | % | | — | | | — | |
Russell 3000 Utilities Index3 | | -28.48 | % | | 4.58 | % | | -3.10 | % | | — | | | — | |
1 | Inception date for The Total Return Utilities Fund is 6/21/1995. |
2 | The Blended Index is comprised of 60% of the Russell 3000 Utilities Index and 40% of the Lehman Bros. Long Credit Index. One cannot invest directly in an index. |
3 | The Russell 3000 Utilities Index is a market capitalization-weighted index that is comprised of utility stocks that are included in the Russell 3000 Index. This index does not take into account the deduction of expenses associated with a mutual fund, such as investment management and accounting fees. One cannot invest directly in an index. |
+ | The Net and Gross Expense Ratios are percentages of the Fund’s average net assets as they are shown in the most current Fund’s Prospectus. The Net Expense Ratio includes all waivers, reimbursements and expenses paid indirectly. |
Performance quoted represents past performance. Past Performance does not guarantee future results. All performance figures represent average annual total returns for the periods ended December 31, 2008, and assume reinvestment of all dividend and capital gain distributions. The investment return and principal value of an investment will fluctuate so that an investor’s shares, when redeemed, may be worth more or less than their original cost. Current performance may be higher or lower than the performance quoted. Current month-end performance may be obtained at www.flexfunds.com or by calling 1.800.325.3539. Management fees were waived and/or expenses were reimbursed in order to reduce the operating expenses of The Total Return Utilities Fund during the periods shown above. Because The Total Return Utilities Fund concentrates its investments in public utility companies, the value of the Fund’s shares may fluctuate more than if invested in a greater number of industries. Changes in interest rates may also affect the value of Utility stocks, and rising interest rates can be expected to reduce the Fund’s net asset value. Source for index data: Bloomberg, LP.
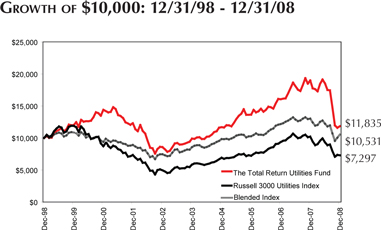
The Growth of $10,000 chart compares The Total Return Utilities Fund’s value to the Russell 3000 Utilities Index, the Fund’s broad-based benchmark, and to the Blended Index (comprised of 60% of the Russell 3000 Utilities Index and 40% of the Lehman Bros. Long Credit Index). The chart is intended to give you a general idea of how the Fund performed compared to these benchmarks over the period from December 31, 1998 to December 31, 2008. An understanding of the differences between the Fund and these indices is important. The benchmark indices do not take into account the deduction of expenses associated with a mutual fund, such as investment management and accounting fees. One cannot invest directly in an index.
Past performance does not guarantee future results. The chart and the table do not reflect the deduction of taxes that a shareholder would pay on fund distributions or the redemption of fund shares.
| | |
The Flex-funds® 2008 Annual Report | December 31, 2008 | | Page 21 |
| | |
| The Flex-funds® | | 2008 Annual Report | December 31, 2008 |
The Quantex Fund™
Annual Market Perspective
THE QUANTEX FUND®EMPLOYSAQUANTITATIVEINVESTMENTMODELTOSELECTSTOCKSOFCOMPANIESTHATHAVEDECLINEDSIGNIFICANTLYINPRICEANDOFSMALL,UP-AND-COMINGCOMPANIES.
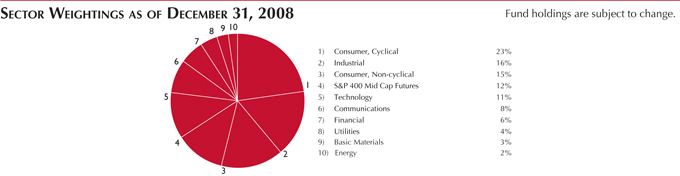
For 2008, the composition of The Quantex Fund™ (the Fund) was overweighted in consumer goods and underweighted in energy, with an overall tilt toward value investments. The position in consumer goods contributed slightly to performance while the position in energy detracted from performance for the full year. While the shares of energy companies generally experienced favorable returns through the first half of 2008, the second half of the year witnessed downward pressure on share prices as global demand for energy products deteriorated. Additionally, the shares of small and mid-cap companies performed worse during the fourth quarter compared to the shares of large-cap companies, but outperformed large-cap companies for the full year.
For the full year, Family Dollar Stores was the best performing stock in the Fund, with an increase of nearly 39%. Hasbro, a toy and game manufacturer, also experienced positive returns for the full year with an increase of nearly 17%. Relative to our benchmark, we also benefited from the performance of pharmaceutical companies, with King Pharmaceuticals returning approximately 4% and Watson Pharmaceuticals returning approximately –2%. The worst performing stocks during 2008 included Circuit City, which entered bankruptcy, and Ambac Financial group, which was severely impacted by the credit crisis. Consumer products companies, such as Liz Claiborne Inc. and Brunswick Corporation, as well as several real estate investment trust companies harmed our performance for the year.
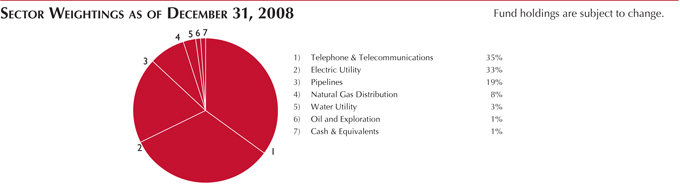
We have consistently employed our quantitative stock selection process for The Quantex Fund™ since April 30, 2005. We utilize rankings from our financial model to determine which 100 securities are to be held in the Fund on an annual basis. As a result, the Fund is rebalanced once each year in January. For 2009, the updated composition of the Fund displays large overweights in hardware (a technology sub-sector) and consumer services, and underweights in health care and energy. From a broader standpoint, the Fund has a 24% allocation to information technology, 45% allocation to the service economy, and 31% to the manufacturing economy. Additionally, there is a strong preference for value holdings in the 2009 composition, with mid-cap value companies comprising 36% of the Fund, followed by small-cap value with 23%, and mid-cap core with 22% of the composition.
| | |
Page 22 | | The Flex-funds® 2008 Annual Report | December 31, 2008 |
| | |
| The Flex-funds® | | 2008 Annual Report | December 31, 2008 |
PERFORMANCE PERSPECTIVE
Period & Average Annual Total Returns as of December 31, 2008
| | | | | | | | | | | | | | | | | | |
| | | 1 Year | | | 4/30/05 to
12/31/08* | | | 5 Year | | | 10 Year | | | Net Expense
Ratio+ | | | Gross Expense
Ratio+ | |
The Quantex Fund™1 | | -43.12 | % | | -9.25 | % | | -6.56 | % | | -4.27 | % | | 1.56 | % | | 2.09 | % |
Blended Index2 | | -34.98 | % | | -2.86 | % | | -0.44 | % | | 3.88 | % | | — | | | — | |
Russell 2000 Index3 | | -33.79 | % | | -2.68 | % | | -0.89 | % | | 3.07 | % | | — | | | — | |
S&P 400 Mid-Cap Index4 | | -36.23 | % | | -3.04 | % | | -0.09 | % | | 4.45 | % | | — | | | — | |
1 | The inception date of The Quantex FundTM is 3/20/1985. |
2 | The Blended Index consists of 50% Russell 2000 Index and 50% S&P 400 Mid-Cap Index. One cannot invest directly in an index. |
3 | The Russell 2000 Index is a market-capitalization weighted index measuring performance of the smallest 2,000 companies, on a market capitalization basis, in the Russell 3000 Index. One cannot invest directly in an index. |
4 | The S&P 400 Mid-Cap Index is an unmanaged index of common stock prices of mid-sized companies. One cannot invest directly in an index. |
* | The Quantex Fund™ was previously known as The Highlands Growth Fund. On April 30, 2005, The Highlands Growth Fund changed its name to The Quantex Fund™, also changing the Fund’s investment objective and strategies. The Highlands Growth Fund focused on large-cap equities, while The Quantex Fund™ utilizes quantitative investment strategies that invest primarily in small- and mid-cap equities. Due to this change in strategies on April 30, 2005, the S&P 500 Index is a more comparative index for Fund performance prior to April 30, 2005. The Russell 2000 Index and S&P 400 Mid-Cap Index are more comparative indices for Fund performance after April 30, 2005. |
+ | The Net and Gross Expense Ratios are percentages of the Fund’s average net assets as they are shown in the most current Fund’s Prospectus. The Net Expense Ratio includes all waivers, reimbursements and expenses paid indirectly. |
Performance quoted represents past performance. Past Performance does not guarantee future results. All performance figures represent average annual total returns for the periods ended December 31, 2008, and assume reinvestment of all dividend and capital gain distributions. The investment return and principal value of an investment will fluctuate so that an investor’s shares, when redeemed, may be worth more or less than their original cost. Current performance may be higher or lower than the performance quoted. Current month-end performance may be obtained at www.flexfunds.com or by calling 1.800.325.3539. Management fees were waived and/or expenses were reimbursed in order to reduce the operating expenses of The Quantex Fund™ during the periods shown above. Source for index data: Morningstar, Inc.
The Quantex Fund™ was previously known as The Highlands Growth Fund. On April 30, 2005, The Highlands Growth Fund changed its name to The Quantex Fund™, also changing the Fund’s investment objective and strategies. Due to this, the Russell 2000 Index and the S&P 400 Mid-Cap Index are more comparative indices for Fund performance.
The Growth of $10,000 chart compares the value of The Quantex Fund™ to the S&P 400 Mid-Cap Index, the Russell 2000 Index, and a Blended Index (comprised of 50% Russell 2000 and 50% S&P 400 Mid-Cap). The chart is intended to give you a general idea of how the Fund performed compared to these benchmarks over the period from December 31, 1998 to December 31, 2008. An understanding of the differences between the Fund and these indices is important. The benchmark indices do not take into account the deduction of expenses associated with a mutual fund, such as investment management and accounting fees. One cannot invest directly in an index.
Past performance does not guarantee future results. The chart and the table do not reflect the deduction of taxes that a shareholder would pay on fund distributions or the redemption of fund shares.
| | |
The Flex-funds® 2008 Annual Report | December 31, 2008 | | Page 23 |
| | |
| The Flex-funds® | | 2008 Annual Report | December 31, 2008 |
Shareholder Expense Analysis (Unaudited)
Shareholders of mutual funds pay ongoing expenses, such as advisory fees, distribution and service fees (12b-1 fees) and other fund expenses. The following examples are intended to help you understand your ongoing costs (in dollars) of investing in the Funds and to compare these costs with the ongoing costs of investing in other mutual funds.
The examples below are based on an investment of $1,000 invested at the beginning of the period and held for the six-month period from June 30, 2008 to December 31, 2008.
ACTUAL EXPENSES
| | | | | | | | | | | | |
| | | Beginning
Account Value
(6/30/2008) | | Ending
Account Value
(12/31/2008) | | Expenses Paid
During Period1
(6/30/2008 -
12/31/2008) | | Expense Ratio
(Annualized) | |
The Muirfield Fund® | | $ | 1,000.00 | | $ | 769.70 | | $ | 6.14 | | 1.38 | % |
The Dynamic Growth Fund | | | 1,000.00 | | | 658.60 | | | 5.67 | | 1.36 | % |
The Aggressive Growth Fund | | | 1,000.00 | | | 679.80 | | | 6.50 | | 1.54 | % |
The Defensive Balanced Fund | | | 1,000.00 | | | 845.70 | | | 7.10 | | 1.53 | % |
The Strategic Growth Fund | | | 1,000.00 | | | 633.40 | | | 6.45 | | 1.57 | % |
The Quantex Fund™ | | | 1,000.00 | | | 654.90 | | | 7.53 | | 1.81 | % |
The Total Return Utilities Fund | | | 1,000.00 | | | 639.80 | | | 8.33 | | 2.02 | % |
The U.S. Government Bond Fund | | | 1,000.00 | | | 1,044.80 | | | 5.09 | | 0.99 | % |
The Money Market Fund - Retail Class | | | 1,000.00 | | | 1,011.00 | | | 2.53 | | 0.50 | % |
The Money Market Fund - Institutional Class | | | 1,000.00 | | | 1,011.70 | | | 2.02 | | 0.40 | % |
ACTUAL EXPENSES: The first table below provides information about actual account values and actual expenses. You may use the information in this table, together with the amount you invested, to estimate the expenses that you paid over the period. Simply divide your account value by $1,000 (e.g.: an $8,600 account value divided by $1,000 = 8.6), then multiply the result by the number in the line under the heading “Expenses Paid During the Period” to estimate the expenses you paid on your account during this period.
HYPOTHETICAL EXAMPLE
(5% return before expenses)
| | | | | | | | | | | | |
| | | Beginning
Account Value
(6/30/2008) | | Ending
Account Value
(12/31/2008) | | Expenses Paid
During Period1
(6/30/2008 -
12/31/2008) | | Expense Ratio
(Annualized) | |
The Muirfield Fund® | | $ | 1,000.00 | | $ | 1,018.20 | | $ | 7.00 | | 1.38 | % |
The Dynamic Growth Fund | | | 1,000.00 | | | 1,018.30 | | | 6.90 | | 1.36 | % |
The Aggressive Growth Fund | | | 1,000.00 | | | 1,017.39 | | | 7.81 | | 1.54 | % |
The Defensive Balanced Fund | | | 1,000.00 | | | 1,017.44 | | | 7.76 | | 1.53 | % |
The Strategic Growth Fund | | | 1,000.00 | | | 1,017.24 | | | 7.96 | | 1.57 | % |
The Quantex Fund™ | | | 1,000.00 | | | 1,016.04 | | | 9.17 | | 1.81 | % |
The Total Return Utilities Fund | | | 1,000.00 | | | 1,014.98 | | | 10.23 | | 2.02 | % |
The U.S. Government Bond Fund | | | 1,000.00 | | | 1,020.16 | | | 5.03 | | 0.99 | % |
The Money Market Fund - Retail Class | | | 1,000.00 | | | 1,022.62 | | | 2.54 | | 0.50 | % |
HYPOTHETICAL EXAMPLE FOR COMPARISON PURPOSES: The second table below provides information about hypothetical account values and hypothetical expenses based on the Funds’ actual expense ratios and assumed rates of return of 5% per year before expenses, which are not the Funds’ actual returns. The hypothetical account values and expenses may not be used to estimate the actual ending account balance or expenses you paid for the period. You may use this information to compare the ongoing costs of investing in the Funds to other funds. To do so, compare this 5% hypothetical example with the 5% hypothetical examples that appear in the shareholder reports of the other funds.
Please note that the expenses shown in the tables are meant to highlight your ongoing costs only and do not reflect any transactional costs, such as redemption fees or exchange fees. Therefore, the second table is useful in comparing ongoing costs only, and will not help you determine the relative total costs of owning different funds. In addition, if any transactional costs were included, your costs would have been higher.
1 | Expenses are equal to the Funds’ annualized expense ratios, multiplied by the average account value over the period, multiplied by 184/366 (to reflect the total number of days in the six-month period). |
| | |
Page 24 | | The Flex-funds® 2008 Annual Report | December 31, 2008 |
| | |
| The Flex-funds® | | 2008 Annual Report | December 31, 2008 |
2008 ANNUAL REPORT
FUND HOLDINGS & FINANCIAL STATEMENTS
| | |
The Flex-funds® 2008 Annual Report | December 31, 2008 | | Page 25 |
Schedule of Investments
December 31, 2008
The Muirfield Fund
| | | | |
Security Description | | Shares or
Principal
Amount ($) | | Value ($)(a) |
Registered Investment Companies — 53.9% |
AIM Diversified Dividend Fund | | 309,534 | | 2,776,520 |
AIM Mid Cap Core Equity Fund | | 114,379 | | 1,906,701 |
Allianz NFJ Dividend Value Fund | | 121,369 | | 1,162,717 |
American Century Equity Income Fund | | 137,902 | | 830,170 |
BB&T Equity Income Fund | | 324,343 | | 3,275,864 |
BlackRock Equity Dividend Fund | | 173,677 | | 2,301,216 |
Columbia Dividend Income Fund | | 390,731 | | 4,020,627 |
Consumer Staples Select Sector SPDR Fund | | 148,425 | | 3,542,905 |
Fairholme Fund | | 74,482 | | 1,626,689 |
Hartford Capital Appreciation Fund | | 129,221 | | 2,775,677 |
Health Care Select Sector SPDR Fund | | 128,050 | | 3,399,727 |
Heartland Value Plus Fund | | 155,966 | | 2,916,567 |
Ivy Asset Strategy Fund | | 95,085 | | 1,718,180 |
Ivy Large Cap Growth Fund | | 52,561 | | 483,036 |
Janus Adviser Mid Cap Value Fund | | 322,710 | | 4,179,095 |
Nuveen Tradewinds Value Opportunities Fund | | 107,782 | | 2,122,225 |
PowerShares QQQ | | 54,425 | | 1,618,599 |
T. Rowe Price Small Cap Value Fund | | 65,124 | | 1,530,409 |
Utilities Select Sector SPDR Fund | | 110,650 | | 3,212,169 |
Van Kampen American Value Fund | | 68,417 | | 1,108,354 |
| | | | |
Total Registered Investment Companies (Cost $59,845,064) | | | | 46,507,447 |
| | | | |
Money Market Registered Investment Companies — 45.2% |
The Flex-funds Money Market Fund — Institutional Class* | | 39,001,248 | | 39,001,248 |
| | | | |
Total Money Market Registered Investment Companies
(Cost $39,001,248) | | | | 39,001,248 |
| | | | |
U.S. Government Obligations — 0.3% |
U.S. Treasury Bill,
0.50%, due 03/05/2009** | | 300,000 | | 299,949 |
| | | | |
Total U.S. Government Obligations (Cost $299,997) | | | | 299,949 |
| | | | |
Total Investments — 99.4%
(Cost $99,146,309)(b) | | | | 85,808,644 |
| | | | |
Other Assets less Liabilities — 0.6% | | | | 501,718 |
| | | | |
Total Net Assets — 100.0% | | | | 86,310,362 |
| | | | |
Trustee Deferred Compensation*** |
The Flex-funds Aggressive Growth Fund | | 859 | | 4,458 |
The Flex-funds Defensive Balanced Fund | | 448 | | 3,521 |
The Flex-funds Dynamic Growth Fund | | 1,608 | | 8,812 |
The Flex-funds Muirfield Fund | | 4,573 | | 19,252 |
The Flex-funds Quantex Fund | | 2,071 | | 21,580 |
The Flex-funds Total Return Utilities Fund | | 316 | | 5,097 |
| | | | |
Total Trustee Deferred Compensation
(Cost $80,875) | | | | 62,720 |
| | | | |
The Muirfield Fund
| | | | | |
Security Description | | Long
Contracts | | Unrealized
Appreciation
(Depreciation) ($) | |
Futures Contracts | | | |
Standard & Poors 500 expiring March 2009, notional value $4,275,475 | | 19 | | (26,980 | ) |
| | | | | |
Total Futures Contracts | | | | (26,980 | ) |
| | | | | |
| (a) | Statement on Financial Accounting Standard No. 157 “Fair Value Measurements” — Various inputs are used in determining the value of the Fund’s investments. These inputs are summarized in the three broad levels listed below. |
| | • | | Level 1 — quoted prices in active markets for identical securities |
| | • | | Level 2 — other significant observable inputs (including quoted prices for similar securities, interest rates, prepayment speeds, credit risk, etc.) |
| | • | | Level 3 — significant unobservable inputs (including the Fund’s own assumptions in determining the fair value of investments) |
| | The following is a summary of the inputs used as of December 31, 2008 in valuing the Fund’s assets carried at fair value: |
| | | | | | | |
Valuation Inputs | | Investments in
Securities | | Other Financial
Instruments**** | |
Level 1 — Quoted Prices | | $ | 85,508,695 | | $ | (26,980 | ) |
Level 2 — Other Significant Observable Inputs | | | 299,949 | | | — | |
Level 3 — Significant Unobservable Inputs | | | — | | | — | |
| | | | | | | |
Total | | $ | 85,808,644 | | | $(26,980) | |
| | | | | | | |
| | The inputs or methodology used for valuing securities are not necessarily an indication of the risk associated with investing in those securities. For example, short-term debt instruments and repurchase agreements with a maturity of less than 60 days are valued using amortized cost, in accordance with rules under the Investment Company Act of 1940. Generally, amortized cost approximates the current fair value of a security, but since the value is not obtained from a quoted price in an active market, such securities are reflected as Level 2. |
| (b) | Represents cost for financial reporting purposes and differs for federal income tax purposes by the amount of losses deferred for federal income tax reporting in the amount of $3,451,698. Cost for federal income tax purposes of $102,598,007 differs from value by net unrealized appreciation (depreciation) of securities as follows: |
| | | | |
Unrealized appreciation | | $ | 132,740 | |
Unrealized depreciation | | | (16,922,103 | ) |
| | | | |
Net unrealized appreciation (depreciation) | | $ | (16,789,363 | ) |
| | | | |
| * | Investment in affiliate. |
| ** | Pledged as collateral on futures contracts. |
| *** | Assets of affiliates to The Muirfield Fund held for the benefit of the Fund’s Trustees in connection with the Trustee Deferred Compensation Plan. |
| **** | Other financial instruments are derivative instruments not reflected in the Schedule of Investments, such as futures contracts, which are valued at the unrealized appreciation/depreciation on the instrument. |
The accompanying notes are an integral part of these financial statements.
Schedule of Investments
December 31, 2008
The Dynamic Growth Fund
| | | | |
Security Description | | Shares or
Principal
Amount ($) | | Value ($)(a) |
Registered Investment Companies — 94.0% |
AIM Diversified Dividend Fund | | 498,328 | | 4,470,002 |
AIM Mid Cap Core Equity Fund | | 131,803 | | 2,197,154 |
Allianz NFJ Dividend Value Fund | | 184,082 | | 1,763,510 |
American Century Equity Income Fund | | 241,329 | | 1,452,798 |
BB&T Equity Income Fund | | 402,427 | | 4,064,510 |
BlackRock Equity Dividend Fund | | 210,618 | | 2,790,688 |
Columbia Dividend Income Fund | | 523,926 | | 5,391,200 |
Consumer Staples Select Sector SPDR Fund | | 198,525 | | 4,738,792 |
DWS Large Cap Value Fund | | 80,687 | | 1,057,811 |
Fairholme Fund | | 114,499 | | 2,500,665 |
Hartford Capital Appreciation Fund | | 118,690 | | 2,549,470 |
Health Care Select Sector SPDR Fund | | 179,925 | | 4,777,009 |
Heartland Value Plus Fund | | 185,898 | | 3,476,301 |
Ivy Asset Strategy Fund | | 135,130 | | 2,441,801 |
Ivy Large Cap Growth Fund | | 153,893 | | 1,414,279 |
Janus Adviser Mid Cap Value Fund | | 388,111 | | 5,026,042 |
Nuveen Tradewinds Value Opportunities Fund | | 141,566 | | 2,787,432 |
PowerShares QQQ | | 107,750 | | 3,204,485 |
T. Rowe Price Small Cap Value Fund | | 145,095 | | 3,409,723 |
Utilities Select Sector SPDR Fund | | 86,525 | | 2,511,821 |
Van Kampen American Value Fund | | 76,003 | | 1,231,248 |
| | | | |
Total Registered Investment Companies
(Cost $81,044,915) | | | | 63,256,741 |
| | | | |
Money Market Registered Investment Companies — 4.7% |
The Flex-funds Money Market Fund — Institutional Class* | | 3,196,192 | | 3,196,192 |
| | | | |
Total Money Market Registered Investment Companies
(Cost $3,196,192) | | | | 3,196,192 |
| | | | |
U.S. Government Obligations — 0.6% |
U.S. Treasury Bill,
0.50%, due 03/05/2009** | | 400,000 | | 399,932 |
| | | | |
Total U.S. Government Obligations
(Cost $399,997) | | | | 399,932 |
| | | | |
Total Investments — 99.3%
(Cost $84,641,104)(b) | | | | 66,852,865 |
| | | | |
Other Assets less Liabilities — 0.7% | | | | 445,155 |
| | | | |
Total Net Assets — 100.0% | | | | 67,298,020 |
| | | | |
| | | | |
Trustee Deferred Compensation*** |
The Flex-funds Aggressive Growth Fund | | 532 | | 2,761 |
The Flex-funds Defensive Balanced Fund | | 272 | | 2,138 |
The Flex-funds Dynamic Growth Fund | | 483 | | 2,647 |
The Flex-funds Muirfield Fund | | 1,425 | | 5,999 |
The Flex-funds Quantex Fund | | 673 | | 7,013 |
The Flex-funds Total Return Utilities Fund | | 97 | | 1,565 |
| | | | |
Total Trustee Deferred Compensation
(Cost $29,076) | | | | 22,123 |
| | | | |
The Dynamic Growth Fund
| | | | | |
Security Description | | Long
Contracts | | Unrealized
Appreciation
(Depreciation) ($) | |
Futures Contracts | | | |
Standard & Poors 500 expiring March 2009, notional value $3,825,425 | | 17 | | (24,140 | ) |
| | | | | |
Total Futures Contracts | | | | (24,140 | ) |
| | | | | |
| (a) | Statement on Financial Accounting Standard No. 157 “Fair Value Measurements” — Various inputs are used in determining the value of the Fund’s investments. These inputs are summarized in the three broad levels listed below. |
| | • | | Level 1 — quoted prices in active markets for identical securities |
| | • | | Level 2 — other significant observable inputs (including quoted prices for similar securities, interest rates, prepayment speeds, credit risk, etc.) |
| | • | | Level 3 — significant unobservable inputs (including the Fund’s own assumptions in determining the fair value of investments) |
| | The following is a summary of the inputs used as of December 31, 2008 in valuing the Fund’s assets carried at fair value: |
| | | | | | | |
Valuation Inputs | | Investments in
Securities | | Other Financial
Instruments**** | |
Level 1 — Quoted Prices | | $ | 66,452,933 | | $ | (24,140 | ) |
Level 2 — Other Significant Observable Inputs | | | 399,932 | | | — | |
Level 3 — Significant Unobservable Inputs | | | — | | | — | |
| | | | | | | |
Total | | $ | 66,852,865 | | $ | (24,140 | ) |
| | | | | | | |
| | The inputs or methodology used for valuing securities are not necessarily an indication of the risk associated with investing in those securities. For example, short-term debt instruments and repurchase agreements with a maturity of less than 60 days are valued using amortized cost, in accordance with rules under the Investment Company Act of 1940. Generally, amortized cost approximates the current fair value of a security, but since the value is not obtained from a quoted price in an active market, such securities are reflected as Level 2. |
| (b) | Represents cost for financial reporting purposes and differs for federal income tax purposes by the amount of losses deferred for federal income tax reporting in the amount of $6,360,177. Cost for federal income tax purposes of $91,001,281 differs from value by net unrealized appreciation (depreciation) of securities as follows: |
| | | | |
Unrealized appreciation | | $ | 132,207 | |
Unrealized depreciation | | | (24,280,623 | ) |
| | | | |
Net unrealized appreciation (depreciation) | | $ | (24,148,416 | ) |
| | | | |
| * | Investment in affiliate. |
| ** | Pledged as collateral on futures contracts. |
| *** | Assets of affiliates to The Dynamic Growth Fund held for the benefit of the Fund’s Trustees in connection with the Trustee Deferred Compensation Plan. |
| **** | Other financial instruments are derivative instruments not reflected in the Schedule of Investments, such as futures contracts, which are valued at the unrealized appreciation/depreciation on the instrument. |
The accompanying notes are an integral part of these financial statements.
Schedule of Investments
December 31, 2008
The Aggressive Growth Fund
| | | | |
Security Description | | Shares or
Principal
Amount ($) | | Value ($)(a) |
Registered Investment Companies — 96.3% |
AIM Diversified Dividend Fund | | 210,062 | | 1,884,257 |
AIM Mid Cap Core Equity Fund | | 50,402 | | 840,198 |
Allianz NFJ Dividend Value Fund | | 62,763 | | 601,267 |
American Century Equity Income Fund | | 172,378 | | 1,037,713 |
Columbia Dividend Income Fund | | 231,557 | | 2,382,728 |
Consumer Staples Select Sector SPDR Fund | | 61,475 | | 1,467,408 |
DWS Large Cap Value Fund | | 15,904 | | 208,504 |
Fairholme Fund | | 28,673 | | 626,214 |
Hartford Capital Appreciation Fund | | 30,602 | | 657,337 |
Health Care Select Sector SPDR Fund | | 62,500 | | 1,659,375 |
Heartland Value Plus Fund | | 56,289 | | 1,052,607 |
iShares Russell Microcap Index Fund | | 10,625 | | 338,406 |
Ivy Asset Strategy Fund | | 51,548 | | 931,469 |
Ivy Large Cap Growth Fund | | 67,300 | | 618,487 |
Janus Adviser Mid Cap Value Fund | | 121,419 | | 1,572,379 |
Nuveen Tradewinds Value Opportunities Fund | | 50,604 | | 996,393 |
PowerShares QQQ | | 40,760 | | 1,212,202 |
T. Rowe Price Small Cap Value Fund | | 34,005 | | 799,113 |
Utilities Select Sector SPDR Fund | | 27,250 | | 791,068 |
Van Kampen American Value Fund | | 17,212 | | 278,832 |
| | | | |
Total Registered Investment Companies (Cost $25,164,102) | | | | 19,955,957 |
| | | | |
Money Market Registered Investment Companies — 1.1% |
The Flex-funds Money Market Fund — Institutional Class* | | 233,519 | | 233,519 |
| | | | |
Total Money Market Registered Investment Companies
(Cost $233,519) | | | | 233,519 |
| | | | |
U.S. Government Obligations — 1.5% |
U.S. Treasury Bill,
0.50%, due 03/05/2009** | | 300,000 | | 299,949 |
| | | | |
Total U.S. Government Obligations
(Cost $299,997) | | | | 299,949 |
| | | | |
Total Investments — 98.9%
(Cost $25,697,618)(b) | | | | 20,489,425 |
| | | | |
Other Assets less Liabilities — 1.1% | | | | 225,619 |
| | | | |
Total Net Assets — 100.0% | | | | 20,715,044 |
| | | | |
Trustee Deferred Compensation*** |
The Flex-funds Aggressive Growth Fund | | 417 | | 2,164 |
The Flex-funds Defensive Balanced Fund | | 222 | | 1,745 |
The Flex-funds Dynamic Growth Fund | | 402 | | 2,203 |
The Flex-funds Muirfield Fund | | 1,166 | | 4,909 |
The Flex-funds Quantex Fund | | 529 | | 5,512 |
The Flex-funds Total Return Utilities Fund | | 79 | | 1,274 |
| | | | |
Total Trustee Deferred Compensation
(Cost $24,239) | | | | 17,807 |
| | | | |
The Aggressive Growth Fund
| | | | | |
Security Description | | Long
Contracts | | Unrealized
Appreciation
(Depreciation) ($) | |
Futures Contracts | | | |
Standard & Poors 500 expiring March 2009, notional value $450,050 | | 2 | | (2,840 | ) |
| | | | | |
Total Futures Contracts | | | | (2,840 | ) |
| | | | | |
| (a) | Statement on Financial Accounting Standard No. 157 “Fair Value Measurements” — Various inputs are used in determining the value of the Fund’s investments. These inputs are summarized in the three broad levels listed below. |
| | • | | Level 1 — quoted prices in active markets for identical securities |
| | • | | Level 2 — other significant observable inputs (including quoted prices for similar securities, interest rates, prepayment speeds, credit risk, etc.) |
| | • | | Level 3 — significant unobservable inputs (including the Fund’s own assumptions in determining the fair value of investments) |
| | The following is a summary of the inputs used as of December 31, 2008 in valuing the Fund’s assets carried at fair value: |
| | | | | | | |
Valuation Inputs | | Investments in
Securities | | Other Financial
Instruments**** | |
Level 1 — Quoted Prices | | $ | 20,189,476 | | $ | (2,840 | ) |
Level 2 — Other Significant Observable Inputs | | | 299,949 | | | — | |
Level 3 — Significant Unobservable Inputs | | | — | | | — | |
| | | | | | | |
Total | | $ | 20,489,425 | | $ | (2,840 | ) |
| | | | | | | |
| | The inputs or methodology used for valuing securities are not necessarily an indication of the risk associated with investing in those securities. For example, short-term debt instruments and repurchase agreements with a maturity of less than 60 days are valued using amortized cost, in accordance with rules under the Investment Company Act of 1940. Generally, amortized cost approximates the current fair value of a security, but since the value is not obtained from a quoted price in an active market, such securities are reflected as Level 2. |
| (b) | Represents cost for financial reporting purposes and differs for federal income tax purposes by the amount of losses deferred for federal income tax reporting in the amount of $1,467,437. Cost for federal income tax purposes of $27,165,055 differs from value by net unrealized appreciation (depreciation) of securities as follows: |
| | | | |
Unrealized appreciation | | $ | 58,978 | |
Unrealized depreciation | | | (6,734,608 | ) |
| | | | |
Net unrealized appreciation (depreciation) | | $ | (6,675,630 | ) |
| | | | |
| * | Investment in affiliate. |
| ** | Pledged as collateral on futures contracts. |
| *** | Assets of affiliates to The Aggressive Growth Fund held for the benefit of the Fund’s Trustees in connection with the Trustee Deferred Compensation Plan. |
| **** | Other financial instruments are derivative instruments not reflected in the Schedule of Investments, such as futures contracts, which are valued at the unrealized appreciation/depreciation on the instrument. |
The accompanying notes are an integral part of these financial statements.
Schedule of Investments
December 31, 2008
The Defensive Balanced Fund
| | | | |
Security Description | | Shares or
Principal
Amount ($) | | Value ($)(a) |
Registered Investment Companies — 48.1% |
AIM Diversified Dividend Fund | | 116,357 | | 1,043,718 |
AIM Mid Cap Core Equity Fund | | 30,024 | | 500,502 |
Allianz NFJ Dividend Value Fund | | 27,484 | | 263,300 |
American Century Equity Income Fund | | 34,476 | | 207,543 |
Utilities Select Sector SPDR Fund | | 27,200 | | 789,616 |
BB&T Equity Income Fund | | 66,930 | | 675,995 |
BlackRock Equity Dividend Fund | | 51,020 | | 676,020 |
Columbia Dividend Income Fund | | 119,964 | | 1,234,434 |
Consumer Staples Select Sector SPDR Fund | | 35,325 | | 843,208 |
Fairholme Fund | | 27,960 | | 610,640 |
Hartford Capital Appreciation Fund | | 24,773 | | 532,130 |
Health Care Select Sector SPDR Fund | | 34,925 | | 927,259 |
Heartland Value Plus Fund | | 29,221 | | 546,430 |
iShares iBoxx $ Investment Grade Corporate Bond Fund | | 39,950 | | 4,060,917 |
Ivy Asset Strategy Fund | | 41,858 | | 756,378 |
Janus Adviser Mid Cap Value Fund | | 102,531 | | 1,327,780 |
Nuveen Tradewinds Value Opportunities Fund | | 32,388 | | 637,727 |
PowerShares QQQ | | 8,525 | | 253,533 |
T. Rowe Price Small Cap Value Fund | | 18,928 | | 444,811 |
Van Kampen American Value Fund | | 23,751 | | 384,774 |
| | | | |
Total Registered Investment Companies (Cost $19,204,460) | | | | 16,716,715 |
| | | | |
Money Market Registered Investment Companies — 32.4% |
The Flex-funds Money Market Fund — Institutional Class* | | 11,278,859 | | 11,278,859 |
| | | | |
Total Money Market Registered Investment Companies
(Cost $11,278,859) | | | | 11,278,859 |
| | | | |
U.S. Government Obligations — 19.3% |
Fannie Mae, 3.50%, due 12/14/2011 | | 500,000 | | 500,000 |
Fannie Mae, 4.00%, due 02/06/2013 | | 2,000,000 | | 1,997,131 |
Fannie Mae Discount Note,
2.73%, due 01/07/2009 | | 2,000,000 | | 1,999,103 |
Federal Home Loan Bank,
4.05%, due 02/05/2013 | | 1,000,000 | | 997,695 |
Government National Mortgage Association, 5.00%, due 10/20/2036 | | 876,610 | | 899,758 |
U.S. Treasury Bill,
0.99%, due 01/22/2009** | | 300,000 | | 299,827 |
| | | | |
Total U.S. Government Obligations
(Cost $6,667,177) | | | | 6,693,514 |
| | | | |
Total Investments — 99.8%
(Cost $37,150,496)(b) | | | | 34,689,088 |
| | | | |
Other Assets less Liabilities — 0.2% | | | | 76,545 |
| | | | |
Total Net Assets — 100.0% | | | | 34,765,633 |
| | | | |
Trustee Deferred Compensation*** | | |
The Flex-funds Aggressive Growth Fund | | 681 | | 3,534 |
The Flex-funds Defensive Balanced Fund | | 366 | | 2,877 |
The Flex-funds Dynamic Growth Fund | | 202 | | 1,107 |
The Flex-funds Muirfield Fund | | 594 | | 2,501 |
The Flex-funds Quantex Fund | | 283 | | 2,949 |
The Flex-funds Total Return Utilities Fund | | 73 | | 1,177 |
| | | | |
Total Trustee Deferred Compensation
(Cost $20,470) | | | | 14,145 |
| | | | |
The Defensive Balanced Fund
| | | | | |
Security Description | | Long
Contracts | | Unrealized
Appreciation
(Depreciation) ($) | |
Futures Contracts | | | |
Standard & Poors 500 expiring March 2009, notional value $1,350,150 | | 6 | | (8,520 | ) |
| | | | | |
Total Futures Contracts | | | | (8,520 | ) |
| | | | | |
| (a) | Statement on Financial Accounting Standard No. 157 “Fair Value Measurements” — Various inputs are used in determining the value of the Fund’s investments. These inputs are summarized in the three broad levels listed below. |
| | • | | Level 1 — quoted prices in active markets for identical securities |
| | • | | Level 2 — other significant observable inputs (including quoted prices for similar securities, interest rates, prepayment speeds, credit risk, etc.) |
| | • | | Level 3 — significant unobservable inputs (including the Fund’s own assumptions in determining the fair value of investments) |
| | The following is a summary of the inputs used as of December 31, 2008 in valuing the Fund’s assets carried at fair value: |
| | | | | | | |
Valuation Inputs | | Investments in
Securities | | Other Financial
Instruments**** | |
Level 1 — Quoted Prices | | $ | 27,995,574 | | $ | (8,520 | ) |
Level 2 — Other Significant Observable Inputs | | | 6,693,514 | | | — | |
Level 3 — Significant Unobservable Inputs | | | — | | | — | |
| | | | | | | |
Total | | $ | 34,689,088 | | $ | (8,520 | ) |
| | | | | | | |
| | The inputs or methodology used for valuing securities are not necessarily an indication of the risk associated with investing in those securities. For example, short-term debt instruments and repurchase agreements with a maturity of less than 60 days are valued using amortized cost, in accordance with rules under the Investment Company Act of 1940. Generally, amortized cost approximates the current fair value of a security, but since the value is not obtained from a quoted price in an active market, such securities are reflected as Level 2. |
| (b) | Represents cost for financial reporting purposes and differs for federal income tax purposes by the amount of losses deferred for federal income tax reporting in the amount of $1,645,875. Cost for federal income tax purposes of $38,796,371 differs from value by net unrealized appreciation (depreciation) of securities as follows: |
| | | | |
Unrealized appreciation | | $ | 166,834 | |
Unrealized depreciation | | | (4,274,117 | ) |
| | | | |
Net unrealized appreciation (depreciation) | | $ | (4,107,283 | ) |
| | | | |
| * | Investment in affiliate. |
| ** | Pledged as collateral on futures contracts. |
| *** | Assets of affiliates to The Defensive Balanced Fund held for the benefit of the Fund’s Trustees in connection with the Trustee Deferred Compensation Plan. |
| **** | Other financial instruments are derivative instruments not reflected in the Schedule of Investments, such as futures contracts, which are valued at the unrealized appreciation/depreciation on the instrument. |
The accompanying notes are an integral part of these financial statements.
Schedule of Investments
December 31, 2008
The Strategic Growth Fund
| | | | |
Security Description | | Shares or
Principal
Amount ($) | | Value ($)(a) |
Registered Investment Companies — 87.5% |
AIM Mid Cap Core Equity Fund | | 48,952 | | 816,033 |
Allianz NFJ Dividend Value Fund | | 40,333 | | 386,390 |
Allianz NFJ International Value Fund | | 170,842 | | 2,350,786 |
American Century Equity Income Fund | | 60,332 | | 363,200 |
Columbia Dividend Income Fund | | 70,097 | | 721,294 |
Consumer Staples Select Sector SPDR Fund | | 19,325 | | 461,288 |
DWS Large Cap Value Fund | | 21,206 | | 278,006 |
Fairholme Fund | | 24,447 | | 533,928 |
First American Real Estate Securities Fund | | 101,119 | | 1,157,810 |
Hartford Capital Appreciation Fund | | 10,201 | | 219,112 |
Health Care Select Sector SPDR Fund | | 27,525 | | 730,789 |
Heartland Value Plus Fund | | 61,403 | | 1,148,234 |
ING Real Estate Fund | | 124,536 | | 1,153,203 |
Ivy Asset Strategy Fund | | 30,090 | | 543,735 |
Ivy Large Cap Growth Fund | | 29,517 | | 271,258 |
Janus Adviser Mid Cap Value Fund | | 114,291 | | 1,480,073 |
Lazard Emerging Markets Portfolio | | 104,252 | | 1,151,982 |
Materials Select Sector SPDR Fund | | 41,225 | | 937,457 |
Nuveen Tradewinds Value Opportunities Fund | | 41,857 | | 824,155 |
PowerShares QQQ | | 16,775 | | 498,888 |
T. Rowe Price Small Cap Value Fund | | 43,070 | | 1,012,137 |
Van Eck Global Hard Assets Fund# | | 51,942 | | 1,394,130 |
| | | | |
Total Registered Investment Companies
(Cost $25,191,055) | | | | 18,433,888 |
| | | | |
Money Market Registered Investment Companies — 8.9% |
The Flex-funds Money Market Fund — Institutional Class* | | 1,886,088 | | 1,886,088 |
| | | | |
Total Money Market Registered Investment Companies
(Cost $1,886,088) | | | | 1,886,088 |
| | | | |
Total Investments — 96.4%
(Cost $27,077,143)(b) | | | | 20,319,976 |
| | | | |
Other Assets less Liabilities — 3.6% | | | | 754,310 |
| | | | |
Total Net Assets — 100.0% | | | | 21,074,286 |
| | | | |
Trustee Deferred Compensation** |
The Flex-funds Aggressive Growth Fund | | 584 | | 3,031 |
The Flex-funds Defensive Balanced Fund | | 316 | | 2,484 |
The Flex-funds Dynamic Growth Fund | | 174 | | 954 |
The Flex-funds Muirfield Fund | | 513 | | 2,160 |
The Flex-funds Quantex Fund | | 244 | | 2,542 |
The Flex-funds Total Return Utilities Fund | | 63 | | 1,016 |
| | | | |
Total Trustee Deferred Compensation
(Cost $17,820) | | | | 12,187 |
| | | | |
The Strategic Growth Fund
| | | | |
Security Description | | Long
Contracts | | Unrealized
Appreciation
(Depreciation) ($) |
Futures Contracts | | |
Standard & Poors Mid Cap 400 expiring March 2009, notional value $2,148,800 | | 8 | | 53,140 |
| | | | |
Total Futures Contracts | | | | 53,140 |
| | | | |
| (a) | Statement on Financial Accounting Standard No. 157 “Fair Value Measurements” — Various inputs are used in determining the value of the Fund’s investments. These inputs are summarized in the three broad levels listed below. |
| | • | | Level 1 — quoted prices in active markets for identical securities |
| | • | | Level 2 — other significant observable inputs (including quoted prices for similar securities, interest rates, prepayment speeds, credit risk, etc.) |
| | • | | Level 3 — significant unobservable inputs (including the Fund’s own assumptions in determining the fair value of investments) |
| | The following is a summary of the inputs used as of December 31, 2008 in valuing the Fund’s assets carried at fair value: |
| | | | | | |
Valuation Inputs | | Investments in
Securities | | Other Financial
Instruments*** |
Level 1 — Quoted Prices | | $ | 20,319,976 | | $ | 53,140 |
Level 2 — Other Significant Observable Inputs | | | — | | | — |
Level 3 — Significant Unobservable Inputs | | | — | | | — |
| | | | | | |
Total | | $ | 20,319,976 | | $ | 53,140 |
| | | | | | |
| | The inputs or methodology used for valuing securities are not necessarily an indication of the risk associated with investing in those securities. For example, short-term debt instruments and repurchase agreements with a maturity of less than 60 days are valued using amortized cost, in accordance with rules under the Investment Company Act of 1940. Generally, amortized cost approximates the current fair value of a security, but since the value is not obtained from a quoted price in an active market, such securities are reflected as Level 2. |
| (b) | Represents cost for financial reporting purposes and differs for federal income tax purposes by the amount of losses deferred for federal income tax reporting in the amount of $604,466. Cost for federal income tax purposes of $27,681,609 differs from value by net unrealized appreciation (depreciation) of securities as follows: |
| | | | |
Unrealized appreciation | | $ | 8,452 | |
Unrealized depreciation | | | (7,370,085 | ) |
| | | | |
Net unrealized appreciation (depreciation) | | $ | (7,361,633 | ) |
| | | | |
| # | Represents non-income producing securities. |
| * | Investment in affiliate. |
| ** | Assets of affiliates to The Strategic Growth Fund held for the benefit of the Fund’s Trustees in connection with the Trustee Deferred Compensation Plan. |
| *** | Other financial instruments are derivative instruments not reflected in the Schedule of Investments, such as futures contracts, which are valued at the unrealized appreciation/depreciation on the instrument. |
The accompanying notes are an integral part of these financial statements.
Schedule of Investments
December 31, 2008
The Quantex Fund
| | | | |
Security Description | | Shares or
Principal
Amount ($) | | Value ($)(a) |
Common Stocks — 90.6% | | | | |
Basic Materials — 2.9% | | | | |
Ashland, Inc. | | 2,774 | | 29,155 |
Eastman Chemical Co. | | 1,835 | | 58,188 |
Int’l Flavors & Fragrances, Inc. | | 2,315 | | 68,802 |
Titanium Metals Corp. | | 4,140 | | 36,473 |
| | | | |
(Cost $446,107) | | | | 192,618 |
| | | | |
Communications — 7.9% | | | | |
CenturyTel, Inc. | | 2,630 | | 71,878 |
Ciena Corp.# | | 3,239 | | 21,701 |
EW Scripps Co. | | 845 | | 1,867 |
Frontier Communications Corp. | | 8,535 | | 74,596 |
Interpublic Group of Cos., Inc.# | | 13,455 | | 53,282 |
JDS Uniphase Corp.# | | 8,222 | | 30,010 |
Meredith Corp. | | 2,015 | | 34,497 |
Monster Worldwide, Inc.# | | 3,370 | | 40,743 |
New York Times Co. | | 6,210 | | 45,519 |
Scripps Networks Interactive | | 2,435 | | 53,570 |
Tellabs, Inc.# | | 16,635 | | 68,536 |
Washington Post Co./The | | 95 | | 37,074 |
| | | | |
(Cost $1,258,907) | | | | 533,273 |
| | | | |
Consumer Cyclical — 23.2% | | | | |
Autonation, Inc.# | | 6,965 | | 68,814 |
Big Lots, Inc.# | | 6,765 | | 98,025 |
Brunswick Corp. | | 6,365 | | 26,797 |
Centex Corp. | | 4,310 | | 45,858 |
Cintas Corp. | | 3,190 | | 74,104 |
Circuit City Stores, Inc. | | 25,895 | | 3,366 |
Darden Restaurants, Inc. | | 3,970 | | 111,875 |
Dean Foods Co.# | | 4,170 | | 74,935 |
Dillards, Inc. | | 5,830 | | 23,145 |
D.R. Horton, Inc. | | 8,230 | | 58,186 |
Family Dollar Stores, Inc. | | 5,630 | | 146,774 |
Hasbro, Inc. | | 4,235 | | 123,535 |
HSN, Inc.# | | 808 | | 5,874 |
IAC/InterActiveCorp# | | 2,020 | | 31,775 |
Interval Leisure Group, Inc.# | | 808 | | 4,355 |
Jones Apparel Group, Inc. | | 6,860 | | 40,200 |
KB Home | | 5,050 | | 68,781 |
Liz Claiborne, Inc. | | 5,390 | | 14,014 |
Office Depot, Inc.# | | 7,810 | | 23,274 |
OfficeMax, lnc. | | 5,275 | | 40,301 |
Polo Ralph Lauren Corp. | | 1,800 | | 81,738 |
Pulte Homes, Inc. | | 10,360 | | 113,235 |
RadioShack Corp. | | 6,475 | | 77,312 |
Robert Half International, Inc. | | 4,010 | | 83,488 |
Ticketmaster Entertainment, Inc.# | | 808 | | 5,187 |
Tree.com, Inc.# | | 134 | | 348 |
Wendy’s/Arby’s Group, Inc. | | 17,765 | | 87,759 |
Wyndham Worldwide Corp. | | 4,660 | | 30,523 |
| | | | |
(Cost $2,965,740) | | | | 1,563,578 |
| | | | |
Consumer Noncyclical — 14.9% | | | | |
Constellation Brands, Inc.# | | 4,640 | | 73,173 |
Convergys Corp.# | | 6,590 | | 42,242 |
Equifax, Inc. | | 2,960 | | 78,499 |
Estee Lauder Cos., Inc./The | | 2,545 | | 78,793 |
IMS Health, Inc. | | 4,705 | | 71,328 |
King Pharmaceuticals, Inc.# | | 15,095 | | 160,308 |
The Quantex Fund
| | | | |
Security Description | | Shares or
Principal
Amount ($) | | Value ($)(a) |
Common Stocks — continued |
McCormick & Co., Inc. | | 2,880 | | 91,757 |
Millipore Corp.# | | 1,520 | | 78,310 |
Mylan Laboratories, Inc.# | | 7,785 | | 76,994 |
Patterson Cos., Inc.# | | 3,255 | | 61,031 |
Tenet Healthcare Corp.# | | 21,425 | | 24,639 |
Tyson Foods, Inc. | | 7,085 | | 62,065 |
Watson Pharmaceuticals, lnc.# | | 4,000 | | 106,280 |
| | | | |
(Cost $1,592,035) | | | | 1,005,419 |
| | | | |
Energy — 2.4% | | | | |
Dynegy, Inc.# | | 15,250 | | 30,500 |
Integrys Energy Group, Inc. | | 2,095 | | 90,043 |
Rowan Cos., Inc. | | 2,720 | | 43,248 |
| | | | |
(Cost $292,191) | | | | 163,791 |
| | | | |
Financial — 6.8% | | | | |
Ambac Financial Group, Inc. | | 4,190 | | 5,447 |
Apartment Investment & Management Co.@ | | 3,981 | | 45,981 |
CB Richard Ellis Group, Inc.# | | 5,070 | | 21,902 |
CIT Group, Inc. | | 4,530 | | 20,566 |
Developers Diversified Realty Corp.@ | | 2,830 | | 13,810 |
E*TRADE Financial Corp.# | | 30,740 | | 35,351 |
Federated Investors, Inc. | | 2,660 | | 45,114 |
First Horizon National Corp. | | 6,307 | | 66,664 |
Janus Capital Group, Inc. | | 3,310 | | 26,579 |
Lennar Corp. | | 6,140 | | 53,234 |
MBIA, Inc.# | | 5,890 | | 23,972 |
MGIC Investment Corp. | | 4,890 | | 17,017 |
Sovereign Bancorp, Inc.# | | 9,550 | | 28,459 |
Wachovia Corp. Pref. Dividend Equalization# | | 1,700 | | — |
Zions Bancorporation | | 2,310 | | 56,618 |
| | | | |
(Cost $1,560,047) | | | | 460,714 |
| | | | |
Industrial — 16.2% | | | | |
Ball Corp. | | 2,445 | | 101,688 |
Bemis Co. | | 3,940 | | 93,299 |
Black & Decker Corp. | | 1,510 | | 63,133 |
Leggett & Platt, Inc. | | 6,255 | | 95,013 |
Molex, Inc. | | 3,955 | | 57,308 |
Pactiv Corp.# | | 4,095 | | 101,884 |
Pall Corp. | | 2,740 | | 77,898 |
PerkinElmer, lnc. | | 4,150 | | 57,727 |
Republic Services, Inc. | | 4,464 | | 110,663 |
Ryder System, Inc. | | 2,280 | | 88,418 |
Sealed Air Corp. | | 4,675 | | 69,845 |
Snap — On, Inc. | | 2,310 | | 90,968 |
Stanley Works/The | | 2,295 | | 78,260 |
| | | | |
(Cost $1,430,773) | | | | 1,086,104 |
| | | | |
Technology — 11.7% | | | | |
Advanced Micro Devices, Inc.# | | 14,510 | | 31,342 |
Affiliated Computer Services, Inc.# | | 2,420 | | 111,199 |
Compuware Corp.# | | 12,310 | | 83,092 |
Harman International Industries, Inc. | | 1,490 | | 24,928 |
Jabil Circuit, Inc. | | 7,120 | | 48,060 |
Lexmark International, Inc.# | | 3,130 | | 84,197 |
LSI Logic Corp.# | | 20,510 | | 67,478 |
Novell, Inc.# | | 15,905 | | 61,870 |
Novellus Systems, Inc.# | | 3,900 | | 48,126 |
Schedule of Investments
December 31, 2008
The Quantex Fund
| | | | |
Security Description | | Shares or
Principal
Amount ($) | | Value ($)(a) |
Common Stocks — continued |
QLogic Corp.# | | 7,685 | | 103,286 |
Teradata Corp.# | | 3,930 | | 58,282 |
Teradyne, Inc.# | | 10,540 | | 44,479 |
Unisys Corp.# | | 23,080 | | 19,618 |
| | | | |
(Cost $1,535,341) | | | | 785,957 |
| | | | |
Utilities — 4.6% | | | | |
CMS Energy Corp. | | 6,295 | | 63,642 |
Nicor, Inc. | | 2,545 | | 88,413 |
Pinnacle West Capital Corp. | | 2,540 | | 81,610 |
TECO Energy, Inc. | | 6,290 | | 77,682 |
| | | | |
(Cost $417,993) | | | | 311,347 |
| | | | |
Total Common Stocks
(Cost $11,499,134) | | | | 6,102,801 |
| | | | |
Money Market Registered Investment Companies — 4.8% |
The Flex-funds Money Market Fund — Institutional Class* | | 324,465 | | 324,465 |
| | | | |
Total Money Market Registered Investment Companies
(Cost $324,465) | | | | 324,465 |
| | | | |
U.S. Government Obligations — 4.4% |
U.S. Treasury Bill,
0.50%, due 03/05/2009** | | 300,000 | | 299,949 |
| | | | |
Total U.S. Government Obligations
(Cost $299,997) | | | | 299,949 |
| | | | |
Total Investments — 99.8%
(Cost $12,123,596)(b) | | | | 6,727,215 |
| | | | |
Other Assets less Liabilities — 0.2% | | | | 16,014 |
| | | | |
Total Net Assets — 100.0% | | | | 6,743,229 |
| | | | |
Trustee Deferred Compensation*** |
The Flex-funds Aggressive Growth Fund | | 343 | | 1,780 |
The Flex-funds Defensive Balanced Fund | | 184 | | 1,446 |
The Flex-funds Dynamic Growth Fund | | 800 | | 4,384 |
The Flex-funds Muirfield Fund | | 2,204 | | 9,279 |
The Flex-funds Quantex Fund | | 944 | | 9,836 |
The Flex-funds Total Return Utilities Fund | | 149 | | 2,403 |
| | | | |
Total Trustee Deferred Compensation
(Cost $37,412) | | | | 29,128 |
| | | | |
The Quantex Fund
| | | | |
Security Description | | Long
Contracts | | Unrealized
Appreciation
(Depreciation) ($) |
Futures Contracts | | |
Standard & Poors Mid Cap 400 expiring March 2009, notional value $805,800 | | 3 | | 19,928 |
| | | | |
Total Futures Contracts | | | | 19,928 |
| | | | |
| (a) | Statement on Financial Accounting Standard No. 157 “Fair Value Measurements” — Various inputs are used in determining the value of the Fund’s investments. These inputs are summarized in the three broad levels listed below. |
| | • | | Level 1 — quoted prices in active markets for identical securities |
| | • | | Level 2 — other significant observable inputs (including quoted prices for similar securities, interest rates, prepayment speeds, credit risk, etc.) |
| | • | | Level 3 — significant unobservable inputs (including the Fund’s own assumptions in determining the fair value of investments) |
| | The following is a summary of the inputs used as of December 31, 2008 in valuing the Fund’s assets carried at fair value: |
| | | | | | |
Valuation Inputs | | Investments in
Securities | | Other Financial
Instruments**** |
Level 1 — Quoted Prices | | $ | 6,427,266 | | $ | 19,928 |
Level 2 — Other Significant Observable Inputs | | | 299,949 | | | — |
Level 3 — Significant Unobservable Inputs | | | — | | | — |
| | | | | | |
Total | | $ | 6,727,215 | | $ | 19,928 |
| | | | | | |
| | The inputs or methodology used for valuing securities are not necessarily an indication of the risk associated with investing in those securities. For example, short-term debt instruments and repurchase agreements with a maturity of less than 60 days are valued using amortized cost, in accordance with rules under the Investment Company Act of 1940. Generally, amortized cost approximates the current fair value of a security, but since the value is not obtained from a quoted price in an active market, such securities are reflected as Level 2. |
| (b) | Represents cost for financial reporting purposes and differs for federal income tax purposes by the amount of losses deferred for federal income tax reporting in the amount of $5,785. Cost for federal income tax purposes of $12,129,381 differs from value by net unrealized appreciation (depreciation) of securities as follows: |
| | | | |
Unrealized appreciation | | $ | 53,647 | |
Unrealized depreciation | | | (5,455,813 | ) |
| | | | |
Net unrealized appreciation (depreciation) | | $ | (5,402,166 | ) |
| | | | |
ADR American Depositary Receipt
| # | Represents non-income producing securities. |
| @ | Real estate investment trust. |
| * | Investment in affiliate. |
| ** | Pledged as collateral on Futures Contracts. |
| *** | Assets of affiliates to The Flex-funds Quantex Fund held for the benefit of the Fund’s Trustees in connection with the Trustee Deferred Compensation Plan. |
| **** | Other financial instruments are derivative instruments not reflected in the Schedule of Investments, such as futures contracts, which are valued at the unrealized appreciation/depreciation on the instrument. |
The accompanying notes are an integral part of these financial statements.
[THIS PAGE INTENTIONALLY LEFT BLANK]
Schedule of Investments
December 31, 2008
The Total Return Utilities Fund
| | | | |
Security Description | | Shares or
Principal
Amount ($) | | Value ($)(a) |
Common Stocks — 99.2% | | | | |
Electric Utility — 32.8% | | | | |
AES Corp.# | | 60,980 | | 502,475 |
CMS Energy Corp. | | 31,170 | | 315,129 |
Covanta Holding Corp.# | | 21,535 | | 472,909 |
Itron, Inc.# | | 5,840 | | 372,242 |
MDU Resources Group, Inc. | | 38,982 | | 841,231 |
Northeast Utilities | | 48,540 | | 1,167,805 |
NV Energy, Inc. | | 58,355 | | 577,131 |
Pepco Holdings, Inc. | | 14,660 | | 260,362 |
Puget Energy, Inc. | | 9,815 | | 267,655 |
Quanta Services, Inc.# | | 21,775 | | 431,145 |
| | | | |
(Cost $6,353,713) | | | | 5,208,084 |
| | | | |
Independent Power Producer — 0.4% | | | | |
Dynegy, Inc.# | | 33,485 | | 66,970 |
| | | | |
(Cost $163,747) | | | | 66,970 |
| | | | |
Natural Gas Distribution — 7.5% | | | | |
NiSource, Inc. | | 54,630 | | 599,291 |
ONEOK, Inc. | | 8,625 | | 251,160 |
Southern Union Co. | | 27,000 | | 352,080 |
| | | | |
(Cost $2,114,710) | | | | 1,202,531 |
| | | | |
Oil Exploration & Production — 1.5% | | | | |
Ultra Petroleum Corp.# | | 6,620 | | 228,456 |
| | | | |
(Cost $181,704) | | | | 228,456 |
| | | | |
Pipelines — 18.6% | | | | |
El Paso Corp. | | 48,495 | | 379,716 |
Enterprise Products Partners, L.P. | | 24,666 | | 511,326 |
Equitable Resources, Inc. | | 9,965 | | 334,326 |
Kinder Morgan Energy Partners, L.P. | | 16,898 | | 773,083 |
Questar Corp. | | 13,305 | | 434,940 |
Spectra Energy Corp. | | 33,050 | | 520,207 |
| | | | |
(Cost $3,725,889) | | | | 2,953,598 |
| | | | |
Telephone & Telecommunications — 34.9% | | |
America Movil SAB de CV — ADR | | 4,735 | | 146,738 |
AT&T, Inc. | | 28,960 | | 825,360 |
BCE, Inc. | | 16,885 | | 345,974 |
China Mobile Limited — ADR | | 6,605 | | 335,864 |
Fairpoint Communications Inc | | 592 | | 1,942 |
General Cable Corp.# | | 11,800 | | 208,742 |
NII Holdings, Inc.# | | 29,215 | | 531,129 |
Philippine Long Distance Telephone Company — ADR | | 8,915 | | 418,559 |
PT Telekomunikasi Indonesia — ADR | | 15,410 | | 385,404 |
Telefonica S.A. — ADR | | 9,245 | | 623,021 |
Telephone and Data Systems, Inc. | | 5,770 | | 183,197 |
Telus Corp. | | 11,530 | | 327,683 |
Verizon Communications, Inc. | | 26,830 | | 909,537 |
Vivo Participacoes SA — ADR | | 22,095 | | 277,071 |
| | | | |
(Cost $7,421,114) | | | | 5,520,221 |
| | | | |
Water Utility — 3.5% | | | | |
American Water Works Co., Inc. | | 26,260 | | 548,309 |
| | | | |
(Cost $566,045) | | | | 548,309 |
| | | | |
Total Common Stocks
(Cost $20,426,922) | | | | 15,728,169 |
| | | | |
The Total Return Utilities Fund
| | | | | |
Security Description | | Shares or
Principal
Amount ($) | | Value ($)(a) | |
Money Market Registered Investment Companies — 1.4% | |
The Flex-funds Money Market Fund — Institutional Class* | | 218,301 | | 218,301 | |
| | | | | |
Total Money Market Registered Investment Companies
(Cost $218,301) | | | | 218,301 | |
| | | | | |
Total Investments — 100.6%
(Cost $20,645,223)(b) | | | | 15,946,470 | |
| | | | | |
Liabilities less Other Assets — (0.6%) | | | | (87,344 | ) |
| | | | | |
Total Net Assets — 100.0% | | | | 15,859,126 | |
| | | | | |
Trustee Deferred Compensation** | |
The Flex-funds Aggressive Growth Fund | | 409 | | 2,123 | |
The Flex-funds Defensive Balanced Fund | | 219 | | 1,721 | |
The Flex-funds Dynamic Growth Fund | | 597 | | 3,272 | |
The Flex-funds Muirfield Fund | | 1,704 | | 7,174 | |
The Flex-funds Quantex Fund | | 763 | | 7,950 | |
The Flex-funds Total Return Utilities Fund | | 114 | | 1,839 | |
| | | | | |
Total Trustee Deferred Compensation
(Cost $31,598) | | | | 24,079 | |
| | | | | |
| (a) | Statement on Financial Accounting Standard No. 157 “Fair Value Measurements” — Various inputs are used in determining the value of the Fund’s investments. These inputs are summarized in the three broad levels listed below. |
| | • | | Level 1 — quoted prices in active markets for identical securities |
| | • | | Level 2 — other significant observable inputs (including quoted prices for similar securities, interest rates, prepayment speeds, credit risk, etc.) |
| | • | | Level 3 — significant unobservable inputs (including the Fund’s own assumptions in determining the fair value of investments) |
| | The following is a summary of the inputs used as of December 31, 2008 in valuing the Fund’s assets carried at fair value: |
| | | | | | |
Valuation Inputs | | Investments in
Securities | | Other Financial
Instruments*** |
Level 1 — Quoted Prices | | $ | 15,946,470 | | $ | — |
Level 2 — Other Significant Observable Inputs | | | — | | | — |
Level 3 — Significant Unobservable Inputs | | | — | | | — |
| | | | | | |
Total | | $ | 15,946,470 | | $ | — |
| | | | | | |
| | The inputs or methodology used for valuing securities are not necessarily an indication of the risk associated with investing in those securities. For example, short-term debt instruments and repurchase agreements with a maturity of less than 60 days are valued using amortized cost, in accordance with rules under the Investment Company Act of 1940. Generally, amortized cost approximates the current fair value of a security, but since the value is not obtained from a quoted price in an active market, such securities are reflected as Level 2. |
Schedule of Investments
December 31, 2008
The Total Return Utilities Fund
| (b) | Represents cost for financial reporting purposes and differs for federal income tax purposes by the amount of losses deferred for federal income tax reporting in the amount of $236,123. Cost for federal income tax purposes of $20,881,346 differs from value by net unrealized appreciation (depreciation) of securities as follows: |
| | | | |
Unrealized appreciation | | $ | 410,865 | |
Unrealized depreciation | | | (5,345,741 | ) |
| | | | |
Net unrealized appreciation (depreciation) | | $ | (4,934,876 | ) |
| | | | |
ADR American Depositary Receipt
| # | Represents non-income producing securities. |
| * | Investment in affiliate. |
| ** | Assets of affiliates to The Total Return Utilities Fund held for the benefit of the Fund’s Trustees in connection with the Trustees Deferred Compensation Plan. |
| *** | Other financial instruments are derivative instruments not reflected in the Schedule of Investments, such as futures contracts, which are valued at the unrealized appreciation/depreciation on the instrument. |
The accompanying notes are an integral part of these financial statements.
Schedule of Investments
December 31, 2008
The U.S. Government Bond Fund
| | | | |
Security Description | | Principal
Amount ($)
or Shares | | Value ($)(a) |
U.S. Government Obligations — 92.3% |
Fannie Mae,
3.00%, due 01/14/2011 | | 1,000,000 | | 1,003,900 |
Fannie Mae,
4.00%, due 04/29/2013 | | 1,000,000 | | 1,005,400 |
Federal Home Loan Bank,
3.125%, due 10/21/2011 | | 1,000,000 | | 1,010,900 |
Federal Home Loan Bank,
5.50%, due 05/12/2023 | | 1,000,000 | | 1,029,100 |
Federal Home Loan Mortgage Corporation,
4.32%, due 04/29/2013 | | 1,000,000 | | 1,002,000 |
Federal Home Loan Mortgage Corporation,
4.05%, due 05/01/2013 | | 1,000,000 | | 1,007,700 |
Federal Home Loan Mortgage Corporation,
4.35%, due 05/20/2013 | | 1,000,000 | | 1,002,900 |
Federal Home Loan Mortgage Corporation,
4.50%, due 06/12/2013 | | 1,000,000 | | 1,013,575 |
Federal Home Loan Mortgage Corporation,
5.30%, due 05/12/2020 | | 1,000,000 | | 1,034,500 |
Government National Mortgage Association,
6.00%, due 02/15/2038 | | 1,077,470 | | 1,109,458 |
Government National Mortgage Association,
5.00%, due 04/15/2038 | | 1,039,186 | | 1,065,491 |
Government National Mortgage Association,
5.50%, due 07/20/2038 | | 977,664 | | 1,008,063 |
Government National Mortgage Association,
6.50%, due 07/20/2038 | | 642,481 | | 668,481 |
| | | | |
Total U.S. Government Obligations
(Cost $12,698,583) | | | | 12,961,468 |
| | | | |
Corporate Bonds — 3.5% |
Cargill, Inc.,
6.00%, due 11/27/2017* | | 500,000 | | 487,600 |
| | | | |
Total Corporate Bonds
(Cost $459,492) | | | | 487,600 |
| | | | |
Money Market Registered Investment Companies — 4.0% |
The Flex-funds Money Market Fund — Institutional Class** | | 561,082 | | 561,082 |
| | | | |
Total Money Market Registered Investment Companies
(Cost $561,082) | | | | 561,082 |
| | | | |
Total Investments — 99.8%
(Cost $13,719,157)(b) | | | | 14,010,150 |
| | | | |
Other Assets less Liabilities — 0.2% | | | | 26,073 |
| | | | |
Total Net Assets — 100.0% | | | | 14,036,223 |
| | | | |
The U.S. Government Bond Fund
| | | | |
Security Description | | Principal
Amount ($)
or Shares | | Value ($)(a) |
Trustee Deferred Compensation*** |
The Flex-funds Aggressive Growth Fund | | 305 | | 1,583 |
The Flex-funds Defensive Balanced Fund | | 162 | | 1,273 |
The Flex-funds Dynamic Growth Fund | | 450 | | 2,466 |
The Flex-funds Muirfield Fund | | 1,275 | | 5,368 |
The Flex-funds Quantex Fund | | 575 | | 5,992 |
The Flex-funds Total Return Utilities Fund | | 88 | | 1,419 |
| | | | |
Total Trustee Deferred Compensation
(Cost $23,882) | | | | 18,101 |
| | | | |
| (a) | Statement on Financial Accounting Standard No. 157 “Fair Value Measurements” — Various inputs are used in determining the value of the Fund’s investments. These inputs are summarized in the three broad levels listed below. |
| | • | | Level 1 — quoted prices in active markets for identical securities |
| | • | | Level 2 — other significant observable inputs (including quoted prices for similar securities, interest rates, prepayment speeds, credit risk, etc.) |
| | • | | Level 3 — significant unobservable inputs (including the Fund’s own assumptions in determining the fair value of investments) |
| | The following is a summary of the inputs used as of December 31, 2008 in valuing the Fund’s assets carried at fair value: |
| | | | | | |
Valuation Inputs | | Investments in
Securities | | Other Financial
Instruments**** |
Level 1 — Quoted Prices | | $ | 561,082 | | $ | — |
Level 2 — Other Significant Observable Inputs | | | 13,449,068 | | | — |
Level 3 — Significant Unobservable Inputs | | | — | | | — |
| | | | | | |
Total | | $ | 14,010,150 | | $ | — |
| | | | | | |
| | The inputs or methodology used for valuing securities are not necessarily an indication of the risk associated with investing in those securities. For example, short-term debt instruments and repurchase agreements with a maturity of less than 60 days are valued using amortized cost, in accordance with rules under the Investment Company Act of 1940. Generally, amortized cost approximates the current fair value of a security, but since the value is not obtained from a quoted price in an active market, such securities are reflected as Level 2. |
| (b) | Represents cost for financial reporting purposes and differs for federal income tax purposes by the amount of losses deferred for federal income tax reporting in the amount of $3,378. Cost for federal income tax purposes of $13,722,535 differs from value by net unrealized appreciation (depreciation) of securities as follows: |
| | | | |
Unrealized appreciation | | $ | 290,993 | |
Unrealized depreciation | | | (3,378 | ) |
| | | | |
Net unrealized appreciation (depreciation) | | $ | 287,615 | |
| | | | |
| * | Represents a restricted security purchased under Rule 144A, which is exempt from registration under the Securities Act of 1933, as amended, and is restricted as to resale to institutional investors. As of December 31, 2008, securities restricted as to resale to institutional investors represented 3.5% of Total Investments. |
| ** | Investment in affiliate. |
Schedule of Investments
December 31, 2008
The U.S. Government Bond Fund
| *** | Assets of affiliates to The U.S. Government Bond Fund held for the benefit of the Fund’s Trustees in connection with the Trustee Deferred Compensation Plan. |
| **** | Other financial instruments are derivative instruments not reflected in the Schedule of Investments, such as futures contracts, which are valued at the unrealized appreciation/depreciation on the instrument. |
The accompanying notes are an integral part of these financial statements.
Schedule of Investments
December 31, 2008
The Money Market Fund
| | | | | | | | | |
Security Description | | Coupon/
Yield | | | Maturity | | Principal
Amount ($)
or Shares | | Value ($)(a) |
Commercial Paper — 8.5% | | |
American Honda Finance | | 2.40% | | | 01/06/09 | | 5,000,000 | | 4,998,333 |
Bank of America | | 1.75% | | | 02/12/09 | | 1,300,000 | | 1,297,346 |
HSBC Finance | | 2.00% | | | 01/16/09 | | 5,000,000 | | 4,995,833 |
Toyota Motor Credit | | 2.05% | | | 01/13/09 | | 4,000,000 | | 3,997,267 |
Toyota Motor Credit | | 2.05% | | | 01/21/09 | | 5,000,000 | | 4,994,305 |
| | | | | | | | | |
Total Commercial Paper
(Cost $20,283,084) | | | | | | | | | 20,283,084 |
| | | | | | | | | |
Corporate Obligations — 19.0% | | |
Bank of America | | 2.49% | * | | 02/11/09 | | 2,170,000 | | 2,169,949 |
Bath Technologies** | | 1.74% | * | | 01/02/09 | | 1,025,000 | | 1,025,000 |
Cascade Plaza Project** | | 2.48% | * | | 01/02/09 | | 7,083,000 | | 7,083,000 |
Credit Suisse | | 0.14% | * | | 01/02/09 | | 2,000,000 | | 1,994,886 |
Credit Suisse | | 0.21% | * | | 01/02/09 | | 2,500,000 | | 2,488,471 |
Credit Suisse | | 2.49% | * | | 03/03/09 | | 5,000,000 | | 5,000,000 |
GE Capital Corp | | 3.34% | * | | 02/02/09 | | 5,892,000 | | 5,883,711 |
GE Capital Corp | | 1.67% | * | | 03/23/09 | | 3,655,000 | | 3,632,997 |
Goldman Sachs | | 3.88% | | | 01/15/09 | | 4,000,000 | | 4,000,785 |
Goldman Sachs | | 0.23% | * | | 02/17/09 | | 2,559,000 | | 2,556,176 |
Goldman Sachs | | 6.65% | | | 05/15/09 | | 900,000 | | 910,674 |
J.P. Morgan | | 6.00% | | | 02/17/09 | | 750,000 | | 751,037 |
Martin Wheel Co, Inc.** | | 3.19% | * | | 01/02/09 | | 2,020,000 | | 2,020,000 |
Seariver Maritime | | 2.25% | * | | 01/02/09 | | 1,800,000 | | 1,800,000 |
Springside Corp Exchange Partners LLC** | | 2.48% | * | | 01/02/09 | | 2,000,000 | | 2,000,000 |
White Castle Project** | | 2.58% | * | | 01/02/09 | | 2,000,000 | | 2,000,000 |
| | | | | | | | | |
Total Corporate Obligations
(Cost $45,316,686) | | | | | | | 45,316,686 |
| | | | | | | | | |
U.S. Government Agency Obligations — 41.4% | | |
Fannie Mae Discount | | 1.23% | | | 06/24/09 | | 2,000,000 | | 1,988,400 |
Fannie Mae Discount | | 3.04% | | | 07/13/09 | | 5,000,000 | | 4,920,923 |
Fannie Mae Discount | | 1.70% | | | 11/02/09 | | 2,000,000 | | 1,972,042 |
Fannie Mae Discount | | 1.75% | | | 11/20/09 | | 2,000,000 | | 1,969,494 |
Federal Home Loan Bank | | 0.35% | * | | 01/02/09 | | 5,000,000 | | 5,000,000 |
Federal Home Loan Bank | | 0.61% | * | | 01/02/09 | | 5,000,000 | | 5,000,000 |
Federal Home Loan Bank | | 2.19% | * | | 03/10/09 | | 5,000,000 | | 5,000,000 |
Federal Home Loan Bank | | 2.40% | | | 04/17/09 | | 5,000,000 | | 5,000,000 |
Federal Home Loan Bank | | 3.15% | | | 04/20/09 | | 5,000,000 | | 5,000,000 |
Federal Home Loan Bank | | 3.00% | | | 07/30/09 | | 5,000,000 | | 5,000,000 |
Federal Home Loan Bank | | 4.00% | | | 10/06/09 | | 5,000,000 | | 5,000,000 |
Federal Home Loan Bank | | 3.25% | | | 10/26/09 | | 5,000,000 | | 5,000,000 |
Federal Home Loan Bank | | 3.11% | | | 11/03/09 | | 5,000,000 | | 5,000,000 |
Federal Home Loan Bank Discount | | 3.10% | | | 01/12/09 | | 10,000,000 | | 9,990,680 |
Federal Home Loan Bank Discount | | 2.81% | | | 01/28/09 | | 3,000,000 | | 2,993,774 |
Federal Home Loan Bank Discount | | 3.00% | | | 02/02/09 | | 5,000,000 | | 4,986,889 |
Federal Home Loan Bank Discount | | 3.11% | | | 03/02/09 | | 5,000,000 | | 4,974,583 |
Federal Home Loan Bank Discount | | 3.17% | | | 04/13/09 | | 5,000,000 | | 4,956,084 |
Freddie Mac | | 2.45% | | | 04/09/09 | | 5,000,000 | | 5,000,000 |
Freddie Mac | | 2.45% | | | 05/08/09 | | 5,000,000 | | 5,000,000 |
Freddie Mac | | 2.50% | | | 05/13/09 | | 5,000,000 | | 5,000,000 |
| | | | | | | | | |
Total U.S. Government Agency Obligations
(Cost $98,752,869) | | | | 98,752,869 |
| | | | | | | | | |
The Money Market Fund
| | | | | |
Security Description | | Principal
Amount ($)
or Shares | | Value ($)(a) | |
Money Market Registered Investment Companies — 32.5% | |
Federated Prime Obligations Fund, 1.74%# | | 28,012,666 | | 28,012,666 | |
Fidelity Institutional Prime Money Market Portfolio, 1.89%# | | 28,012,667 | | 28,012,667 | |
Morgan Stanley Institutional Liquidity Funds — Money Market Portfolio, 0.85%# | | 21,422,945 | | 21,422,945 | |
| | | | | |
Total Money Market Registered Investment Companies
(Cost $77,448,278) | | | | 77,448,278 | |
| | | | | |
Total Investments — 101.4%
(Cost $241,800,917)(b) | | | | 241,800,917 | |
| | | | | |
Liabilities less Other Assets — (-1.4%) | | | | (3,274,966 | ) |
| | | | | |
Total Net Assets — 100.0% | | | | 238,525,951 | |
| | | | | |
Trustee Deferred Compensation*** | | | | | |
The Flex-funds Aggressive Growth Fund | | 305 | | 1,583 | |
The Flex-funds Defensive Balanced Fund | | 162 | | 1,273 | |
The Flex-funds Dynamic Growth Fund | | 693 | | 3,798 | |
The Flex-funds Muirfield Fund | | 1,930 | | 8,125 | |
The Flex-funds Quantex Fund | | 841 | | 8,763 | |
The Flex-funds Total Return Utilities Fund | | 165 | | 2,661 | |
| | | | | |
Total Trustee Deferred Compensation (Cost $37,089) | | | | 26,203 | |
| | | | | |
| (a) | Statement on Financial Accounting Standard No. 157 “Fair Value Measurements” — Various inputs are used in determining the value of the Fund’s investments. These inputs are summarized in the three broad levels listed below. |
| | • | | Level 1 — quoted prices in active markets for identical securities |
| | • | | Level 2 — other significant observable inputs (including quoted prices for similar securities, interest rates, prepayment speeds, credit risk, etc.) |
| | • | | Level 3 — significant unobservable inputs (including the Fund’s own assumptions in determining the fair value of investments) |
| | The following is a summary of the inputs used as of December 31, 2008 in valuing the Fund’s assets carried at fair value: |
| | | | | | |
Valuation Inputs | | Investments in
Securities | | Other Financial
Instruments**** |
Level 1 — Quoted Prices | | $ | 77,448,278 | | $ | — |
Level 2 — Other Significant Observable Inputs | | | 164,352,639 | | | — |
Level 3 — Significant Unobservable Inputs | | | — | | | — |
| | | | | | |
Total | | $ | 241,800,917 | | $ | — |
| | | | | | |
| | The inputs or methodology used for valuing securities are not necessarily an indication of the risk associated with investing in those securities. For example, short-term debt instruments and repurchase agreements with a maturity of less than 60 days are valued using amortized cost, in accordance with rules under the Investment Company |
Schedule of Investments
December 31, 2008
The Money Market Fund
| | Act of 1940. Generally, amortized cost approximates the current fair value of a security, but since the value is not obtained from a quoted price in an active market, such securities are reflected as Level 2. |
| (b) | Cost for federal income tax and financial reporting purposes are the same. |
| # | 7-day yield as of December 31, 2008. |
| * | Variable rate security. Securities payable on demand at par including accrued interest (usually within seven days notice) and unconditionally secured as to principal and interest by letters of credit or other credit support agreements from major banks. The interest rates are adjustable and are based on bank prime rates or other interest rate adjustment indices. The rate shown represents the rate in effect at December 31, 2008. The maturity date shown reflects next rate change date. |
| ** | Represents a restricted security purchased under Rule 144A, which is exempt from registration under the Securities Act of 1933, as amended. Security is restricted as to resale to institutional investors, but has been deemed liquid in accordance with guidelines approved by the Board of Trustees. As of December 31, 2008, securities restricted as to resale to institutional investors represented 5.8% of Total Investments. |
| *** | Assets of affiliates to The Money Market Fund held for the benefit of the Fund’s Trustees in connection with the Trustee Deferred Compensation Plan. |
| **** | Other financial instruments are derivative instruments not reflected in the Schedule of Investments, such as futures contracts, which are valued at the unrealized appreciation/depreciation on the instrument. |
The accompanying notes are an integral part of these financial statements.
Statements of Assets & Liabilities
December 31, 2008
| | | | | | | | |
| | | The
Muirfield
Fund | | | The Dynamic
Growth Fund | |
Assets | | | | | | | | |
Investments, at value* | | $ | 46,807,396 | | | $ | 63,656,673 | |
Investments in affiliates, at amortized cost and value* | | | 39,001,248 | | | | 3,196,192 | |
Trustee deferred compensation investments, at value | | | 62,720 | | | | 22,123 | |
Cash held at broker | | | 372,262 | | | | 402,094 | |
Receivable for net variation margin on futures contracts | | | 56,525 | | | | 50,575 | |
Receivable for capital stock issued | | | 258,799 | | | | 107,565 | |
Receivable from investment advisor | | | 6,855 | | | | 4,949 | |
Interest and dividend receivable | | | 66,289 | | | | 6,697 | |
Prepaid expenses/other assets | | | 29,878 | | | | 31,791 | |
Total Assets | | | 86,661,972 | | | | 67,478,659 | |
| | |
Liabilities | | | | | | | | |
Payable for securities purchased | | | — | | | | — | |
Payable for Trustee Deferred Compensation Plan | | | 62,720 | | | | 22,123 | |
Payable for capital stock redeemed | | | 120,358 | | | | 16,622 | |
Dividends payable | | | 64 | | | | 3,335 | |
Dividends payable — The Money Market Fund — Retail Class | | | | | | | | |
Dividends payable — The Money Market Fund — Institutional Class | | | | | | | | |
Payable to investment advisor | | | 62,443 | | | | 40,518 | |
Accrued distribution plan (12b-1) and administrative service plan fees | | | 57,644 | | | | 57,570 | |
Accrued transfer agent, fund accounting, CCO, and administrative fees | | | 16,324 | | | | 12,835 | |
Accrued trustee fees | | | 7,121 | | | | 5,903 | |
Other accrued liabilities | | | 24,936 | | | | 21,733 | |
Total Liabilities | | | 351,610 | | | | 180,639 | |
| | | | | | | | | |
Net Assets | | | 86,310,362 | | | | 67,298,020 | |
| | |
Net Assets | | | | | | | | |
Capital | | | 119,466,765 | | | | 103,985,334 | |
Accumulated undistributed (distributions in excess of) net investment income | | | 414,472 | | | | 25,948 | |
Accumulated undistributed net realized gain (loss) from investments and futures contracts | | | (20,206,230 | ) | | | (18,900,883 | ) |
Net unrealized appreciation (depreciation) of investments and futures contracts | | | (13,364,645 | ) | | | (17,812,379 | ) |
Total Net Assets | | $ | 86,310,362 | | | $ | 67,298,020 | |
| | |
Net Assets | | | | | | | | |
The Money Market Fund — Retail Class | | | | | | | | |
The Money Market Fund — Institutional Class | | | | | | | | |
Total Net Assets | | | | | | | | |
| | |
Capital Stock Outstanding (indefinite number of shares authorized,
$0.10 par value) | | | 20,520,738 | | | | 12,288,889 | |
The Money Market Fund — Retail Class | | | | | | | | |
The Money Market Fund — Institutional Class | | | | | | | | |
Total Capital Stock Outstanding | | | | | | | | |
| | |
Net Asset Value, Offering and Redemption Price Per Share | | $ | 4.21 | | | $ | 5.48 | |
The Money Market Fund — Retail Class | | | | | | | | |
The Money Market Fund — Institutional Class | | | | | | | | |
* Investments and affiliated investments at cost | | $ | 99,146,309 | | | $ | 84,641,104 | |
The accompanying notes are an integral part of these financial statements.
| | | | | | | | | | | | | | | | | | | | | | | | | |
The Aggressive
Growth Fund | | | The Defensive
Balanced Fund | | | The Strategic
Growth Fund | | | The
Quantex
Fund | | | The Total
Return
Utilities Fund | | | The U.S.
Government
Bond Fund | | | The Money
Market Fund |
| | | | | | | | | | | | | | | | | | | | | | | | | |
| $ | 20,255,906 | | | $ | 23,410,229 | | | $ | 18,433,888 | | | $ | 6,402,750 | | | $ | 15,728,169 | | | $ | 13,449,068 | | | $ | 241,800,917 |
| | 233,519 | | | | 11,278,859 | | | | 1,886,088 | | | | 324,465 | | | | 218,301 | | | | 561,082 | | | | — |
| | 17,807 | | | | 14,145 | | | | 12,187 | | | | 29,128 | | | | 24,079 | | | | 18,101 | | | | 26,203 |
| | 240,089 | | | | — | | | | 697,256 | | | | 4 | | | | — | | | | — | | | | — |
| | 5,950 | | | | 17,850 | | | | 47,200 | | | | 17,700 | | | | — | | | | — | | | | — |
| | 21,014 | | | | 46,101 | | | | 40,167 | | | | 1,170 | | | | 32,930 | | | | 18,180 | | | | — |
| | 7,981 | | | | 3,738 | | | | 4,772 | | | | — | | | | — | | | | 10,032 | | | | 27,591 |
| | 150 | | | | 89,934 | | | | 4,091 | | | | 15,635 | | | | 23,671 | | | | 85,114 | | | | 580,249 |
| | 9,785 | | | | 14,953 | | | | 16,460 | | | | 5,020 | | | | 5,916 | | | | 5,919 | | | | 51,565 |
| | 20,792,201 | | | | 34,875,809 | | | | 21,142,109 | | | | 6,795,872 | | | | 16,033,066 | | | | 14,147,496 | | | | 242,486,525 |
| | | | | | |
| | | | | | | | | | | | | | | | | | | | | | | | | |
| | — | | | | — | | | | — | | | | — | | | | — | | | | — | | | | 3,634,856 |
| | 17,807 | | | | 14,145 | | | | 12,187 | | | | 29,128 | | | | 24,079 | | | | 18,101 | | | | 26,203 |
| | 3,916 | | | | 10,145 | | | | — | | | | — | | | | 101,895 | | | | 55,239 | | | | — |
| | 5 | | | | 123 | | | | — | | | | 4 | | | | 1,790 | | | | 1,752 | | | | |
| | | | | | | | | | | | | | | | | | | | | | | | | 16,630 |
| | | | | | | | | | | | | | | | | | | | | | | | | 111,877 |
| | 12,731 | | | | 20,672 | | | | 12,205 | | | | 4,127 | | | | 12,913 | | | | 4,845 | | | | 41,912 |
| | 18,591 | | | | 37,425 | | | | 21,255 | | | | 732 | | | | 8,669 | | | | 11,297 | | | | 34,119 |
| | 6,237 | | | | 7,387 | | | | 4,876 | | | | 2,499 | | | | 5,010 | | | | 3,995 | | | | 34,899 |
| | 2,458 | | | | 3,303 | | | | 2,312 | | | | 1,907 | | | | 1,984 | | | | 1,907 | | | | 1,907 |
| | 15,412 | | | | 16,976 | | | | 14,988 | | | | 14,246 | | | | 17,600 | | | | 14,137 | | | | 58,171 |
| | 77,157 | | | | 110,176 | | | | 67,823 | | | | 52,643 | | | | 173,940 | | | | 111,273 | | | | 3,960,574 |
| | | | | | | | | | | | | | | | | | | | | | | | | | |
| | 20,715,044 | | | | 34,765,633 | | | | 21,074,286 | | | | 6,743,229 | | | | 15,859,126 | | | | 14,036,223 | | | | 238,525,951 |
| | | | | | |
| | | | | | | | | | | | | | | | | | | | | | | | | |
| | 37,453,597 | | | | 46,806,190 | | | | 34,914,909 | | | | 14,359,787 | | | | 21,137,107 | | | | 14,465,715 | | | | 238,525,951 |
| | — | | | | — | | | | — | | | | 1,540 | | | | — | | | | 1,851 | | | | — |
| | | | | | |
| | (11,527,520 | ) | | | (9,570,629 | ) | | | (7,136,596 | ) | | | (2,241,645 | ) | | | (579,228 | ) | | | (722,336 | ) | | | — |
| | (5,211,033 | ) | | | (2,469,928 | ) | | | (6,704,027 | ) | | | (5,376,453 | ) | | | (4,698,753 | ) | | | 290,993 | | | | — |
| $ | 20,715,044 | | | $ | 34,765,633 | | | $ | 21,074,286 | | | $ | 6,743,229 | | | $ | 15,859,126 | | | $ | 14,036,223 | | | $ | 238,525,951 |
| | | | | | |
| | | | | | | | | | | | | | | | | | | | | | | | | |
| | | | | | | | | | | | | | | | | | | | | | | | $ | 161,232,240 |
| | | | | | | | | | | | | | | | | | | | | | | | | | 77,293,711 |
| | | | | | | | | | | | | | | | | | | | | | | | | $ | 238,525,951 |
| | | | | | |
| | 3,991,468 | | | | 4,422,524 | | | | 3,521,772 | | | | 647,341 | | | | 983,242 | | | | 669,600 | | | | |
| | | | | | | | | | | | | | | | | | | | | | | | | 161,232,240 |
| | | | | | | | | | | | | | | | | | | | | | | | | | 77,293,711 |
| | | | | | | | | | | | | | | | | | | | | | | | | | 238,525,951 |
| | | | | | |
| $ | 5.19 | | | $ | 7.86 | | | $ | 5.98 | | | $ | 10.42 | | | $ | 16.13 | | | $ | 20.96 | | | | |
| | | | | | | | | | | | | | | | | | | | | | | | $ | 1.00 |
| | | | | | | | | | | | | | | | | | | | | | | | | $ | 1.00 |
| $ | 25,697,618 | | | $ | 37,150,496 | | | $ | 27,077,143 | | | $ | 12,123,596 | | | $ | 20,645,223 | | | $ | 13,719,157 | | | $ | 241,800,917 |
Statements of Operations
For the Year Ended December 31, 2008
| | | | | | | | |
| | | The
Muirfield
Fund | | | The Dynamic
Growth Fund | |
Investment Income | | | | | | | | |
Interest | | $ | 396,159 | | | $ | 66,535 | |
Interest from affiliates | | | 249,893 | | | | 39,922 | |
Dividends | | | 835,499 | | | | 1,040,846 | |
Total Investment Income | | | 1,481,551 | | | | 1,147,303 | |
| | |
Fund Expenses | | | | | | | | |
Investment advisor | | | 695,340 | | | | 375,340 | |
Transfer agent | | | 91,860 | | | | 60,058 | |
Transfer agent — The Money Market Fund — Retail Class | | | | | | | | |
Transfer agent — The Money Market Fund — Institutional Class | | | | | | | | |
Fund accounting | | | 43,506 | | | | 35,894 | |
Administrative | | | 70,972 | | | | 47,821 | |
Trustee | | | 25,363 | | | | 19,717 | |
Audit | | | 10,184 | | | | 10,184 | |
Legal | | | 8,057 | | | | 8,094 | |
Custody | | | 14,498 | | | | 11,885 | |
Printing | | | 17,808 | | | | 13,391 | |
Distribution plan (12b-1) | | | 153,436 | | | | 125,288 | |
Distribution plan (12b-1) — The Money Market Fund — Retail Class | | | | | | | | |
Distribution plan (12b-1) — The Money Market Fund — Institutional Class | | | | | | | | |
Administrative service plan | | | 152,849 | | | | 100,287 | |
Postage | | | 9,057 | | | | 5,400 | |
Registration and filing | | | 18,633 | | | | 13,296 | |
Insurance | | | 6,732 | | | | 3,672 | |
Chief Compliance Officer | | | 5,373 | | | | 5,391 | |
Other | | | 13,789 | | | | 8,910 | |
Total Expenses Before Reductions | | | 1,337,457 | | | | 844,628 | |
| | |
Expenses reimbursed/waived by investment advisor | | | (35,304 | ) | | | (19,397 | ) |
Expenses paid indirectly | | | (69,016 | ) | | | (58,273 | ) |
Distribution plan (12b-1) expenses waived | | | (66,599 | ) | | | (30,530 | ) |
Administrative service plan expenses waived | | | (78,847 | ) | | | (47,046 | ) |
Transfer agent expenses waived | | | (20,612 | ) | | | (19,128 | ) |
Net Expenses | | | 1,067,079 | | | | 670,254 | |
| | | | | | | | | |
Net Investment Income (Loss) | | | 414,472 | | | | 477,049 | |
| | |
Realized and Unrealized Gain (Loss) from Investments | | | | | | | | |
Net realized gains (losses) from investments | | | (19,092,812 | ) | | | (15,976,314 | ) |
Net realized gains (losses) from futures contracts | | | (1,288,288 | ) | | | (3,783,617 | ) |
Distributions of long-term realized gains by other investment companies | | | 568,930 | | | | 854,285 | |
Net Realized Gains (Losses) from Investment Transactions, Futures Contracts, and Distributions of Long-term Realized Gains by Other Investment Companies | | | (19,812,170 | ) | | | (18,905,646 | ) |
| | |
Net change in unrealized appreciation (depreciation) of investments and futures contracts | | | (12,430,510 | ) | | | (17,380,438 | ) |
Net Realized and Unrealized Gain (Loss) from Investments | | | (32,242,680 | ) | | | (36,286,084 | ) |
| | | | | | | | | |
Net Change in Net Assets Resulting from Operations | | $ | (31,828,208 | ) | | $ | (35,809,035 | ) |
The accompanying notes are an integral part of these financial statements.
| | | | | | | | | | | | | | | | | | | | | | | | | | |
The Aggressive
Growth Fund | | | The Defensive
Balanced Fund | | | The Strategic
Growth Fund | | | The
Quantex
Fund | | | The Total
Return
Utilities Fund | | | The U.S.
Government
Bond Fund | | | The Money
Market Fund | |
| | | | | | | | | | | | | | | | | | | | | | | | | | |
| $ | 55,142 | | | $ | 402,297 | | | $ | 111,106 | | | $ | 40,263 | | | $ | 11,470 | | | $ | 609,127 | | | $ | 7,219,735 | |
| | 3,952 | | | | 69,158 | | | | 11,558 | | | | 2,542 | | | | 2,612 | | | | 2,793 | | | | — | |
| | 573,388 | | | | 582,535 | | | | 634,147 | | | | 194,138 | | | | 538,526 | | | | 2,843 | | | | — | |
| | 632,482 | | | | 1,053,990 | | | | 756,811 | | | | 236,943 | | | | 552,608 | | | | 614,763 | | | | 7,219,735 | |
| | | | | | |
| | | | | | | | | | | | | | | | | | | | | | | | | | |
| | 198,363 | | | | 357,978 | | | | 278,422 | | | | 136,035 | | | | 232,682 | | | | 58,635 | | | | 732,707 | |
| | 31,738 | | | | 57,281 | | | | 44,552 | | | | 16,323 | | | | 27,922 | | | | 11,727 | | | | | |
| | | | | | | | | | | | | | | | | | | | | | | | | 155,644 | |
| | | | | | | | | | | | | | | | | | | | | | | | | 30,835 | |
| | 31,262 | | | | 38,371 | | | | 33,298 | | | | 18,230 | | | | 28,268 | | | | 19,659 | | | | 60,308 | |
| | 26,448 | | | | 46,381 | | | | 36,469 | | | | 13,603 | | | | 23,268 | | | | 14,659 | | | | 196,466 | |
| | 9,809 | | | | 14,099 | | | | 10,539 | | | | 7,141 | | | | 8,654 | | | | 7,143 | | | | 7,089 | |
| | 10,184 | | | | 10,184 | | | | 10,166 | | | | 10,184 | | | | 10,184 | | | | 10,154 | | | | 10,105 | |
| | 9,365 | | | | 9,535 | | | | 9,373 | | | | 8,087 | | | | 9,067 | | | | 7,981 | | | | 8,080 | |
| | 6,384 | | | | 9,058 | | | | 7,119 | | | | 4,193 | | | | 4,671 | | | | 3,252 | | | | 17,903 | |
| | 5,441 | | | | 8,186 | | | | 5,604 | | | | 3,071 | | | | 4,769 | | | | 2,917 | | | | 51,899 | |
| | 66,010 | | | | 119,293 | | | | 92,845 | | | | 27,221 | | | | 58,285 | | | | 29,308 | | | | | |
| | | | | | | | | | | | | | | | | | | | | | | | | 388,200 | |
| | | | | | | | | | | | | | | | | | | | | | | | | 11,439 | |
| | 53,013 | | | | 95,461 | | | | 74,246 | | | | 27,229 | | | | 46,538 | | | | 29,363 | | | | — | |
| | 2,589 | | | | 3,877 | | | | 2,746 | | | | 2,237 | | | | 6,684 | | | | 1,648 | | | | 34,574 | |
| | 21,097 | | | | 22,351 | | | | 22,037 | | | | 18,261 | | | | 17,671 | | | | 20,604 | | | | 46,381 | |
| | 2,758 | | | | 4,836 | | | | 4,268 | | | | 1,963 | | | | 2,411 | | | | 1,268 | | | | 42,695 | |
| | 5,391 | | | | 5,391 | | | | 5,391 | | | | 5,377 | | | | 5,371 | | | | 5,373 | | | | 5,357 | |
| | 7,897 | | | | 9,543 | | | | 8,869 | | | | 8,906 | | | | 11,391 | | | | 7,224 | | | | 69,543 | |
| | 487,749 | | | | 811,825 | | | | 645,944 | | | | 308,061 | | | | 497,836 | | | | 230,915 | | | | 1,869,225 | |
| | | | | | |
| | (24,185 | ) | | | (17,013 | ) | | | (17,042 | ) | | | (34,016 | ) | | | — | | | | (69,124 | ) | | | (465,542 | ) |
| | (7,765 | ) | | | (5,562 | ) | | | (6,714 | ) | | | — | | | | — | | | | — | | | | — | |
| | (6,348 | ) | | | (20,526 | ) | | | (14,479 | ) | | | (16,600 | ) | | | (11,867 | ) | | | (5,570 | ) | | | (257,895 | ) |
| | (20,631 | ) | | | — | | | | — | | | | (22,042 | ) | | | (30,250 | ) | | | (7,769 | ) | | | — | |
| | — | | | | (33,416 | ) | | | (25,991 | ) | | | — | | | | — | | | | (2,932 | ) | | | (46,629 | ) |
| | 428,820 | | | | 735,308 | | | | 581,718 | | | | 235,403 | | | | 455,719 | | | | 145,520 | | | | 1,099,159 | |
| | | | | | | | | | | | | | | | | | | | | | | | | | | |
| | 203,662 | | | | 318,682 | | | | 175,093 | | | | 1,540 | | | | 96,889 | | | | 469,243 | | | | 6,120,576 | |
| | | | | | |
| | | | | | | | | | | | | | | | | | | | | | | | | | |
| | (7,526,060 | ) | | | (8,468,667 | ) | | | (5,854,680 | ) | | | (347,602 | ) | | | 821,946 | | | | 316,016 | | | | | |
| | (1,007,482 | ) | | | (1,070,956 | ) | | | (1,366,690 | ) | | | (415,613 | ) | | | — | | | | — | | | | | |
| | 280,242 | | | | 190,736 | | | | 309,532 | | | | — | | | | — | | | | — | | | | | |
| | | | | | |
| | (8,253,300 | ) | | | (9,348,887 | ) | | | (6,911,838 | ) | | | (763,215 | ) | | | 821,946 | | | | 316,016 | | | | | |
| | | | | | |
| | (5,557,678 | ) | | | (3,351,321 | ) | | | (7,519,096 | ) | | | (4,726,372 | ) | | | (10,986,315 | ) | | | (77,092 | ) | | | | |
| | (13,810,978 | ) | | | (12,700,208 | ) | | | (14,430,934 | ) | | | (5,489,587 | ) | | | (10,164,369 | ) | | | 238,924 | | | | | |
| | | | | | | | | | | | | | | | | | | | | | | | | | | |
| $ | (13,607,316 | ) | | $ | (12,381,526 | ) | | $ | (14,255,841 | ) | | $ | (5,488,047 | ) | | $ | (10,067,480 | ) | | $ | 708,167 | | | $ | 6,120,576 | |
Statements of Changes in Net Assets
For the Years Ended December 31,
| | | | | | | | | | | | | | | | |
| | | The Muirfield Fund | | | The Dynamic
Growth Fund | |
| | | 2008 | | | 2007 | | | 2008 | | | 2007 | |
Operations | | | | | | | | | | | | | | | | |
Net investment income (loss) | | $ | 414,472 | | | $ | 1,547,376 | | | $ | 477,049 | | | $ | 570,000 | |
Net realized gain (loss) from investments, futures contracts, and long-term capital gain distributions by other investment companies | | | (19,812,170 | ) | | | 6,022,274 | | | | (18,905,646 | ) | | | 2,295,081 | |
Net change in unrealized appreciation (depreciation) of investments and futures contracts | | | (12,430,510 | ) | | | (4,099,302 | ) | | | (17,380,438 | ) | | | (1,567,528 | ) |
Net change in net assets resulting from operations | | | (31,828,208 | ) | | | 3,470,348 | | | | (35,809,035 | ) | | | 1,297,553 | |
| | | | |
Distributions to Shareholders | | | | | | | | | | | | | | | | |
From net investment income | | | — | | | | (1,605,522 | ) | | | (451,101 | ) | | | (595,949 | ) |
From net realized gain from investments, futures contracts, and long-term capital gain distributions by other investment companies | | | — | | | | — | | | | (570,693 | ) | | | (1,280,280 | ) |
Net change in net assets resulting from distributions | | | — | | | | (1,605,522 | ) | | | (1,021,794 | ) | | | (1,876,229 | ) |
| | | | |
Capital Transactions | | | | | | | | | | | | | | | | |
Issued | | | 82,754,194 | | | | 3,848,671 | | | | 92,763,745 | | | | 2,106,628 | |
Reinvested | | | — | | | | 1,594,194 | | | | 1,014,370 | | | | 1,873,772 | |
Redeemed | | | (14,989,715 | ) | | | (10,160,626 | ) | | | (8,763,915 | ) | | | (5,853,044 | ) |
Net change in net assets resulting from capital transactions | | | 67,764,479 | | | | (4,717,761 | ) | | | 85,014,200 | | | | (1,872,644 | ) |
| | | | | | | | | | | | | | | | | |
Total Change in Net Assets | | | 35,936,271 | | | | (2,852,935 | ) | | | 48,183,371 | | | | (2,451,320 | ) |
| | | | |
Net Assets — Beginning of Year | | | 50,374,091 | | | | 53,227,026 | | | | 19,114,649 | | | | 21,565,969 | |
| | | | | | | | | | | | | | | | | |
| | | | |
Net Assets — End of Year | | $ | 86,310,362 | | | $ | 50,374,091 | | | $ | 67,298,020 | | | $ | 19,114,649 | |
| | | | | | | | | | | | | | | | | |
Accumulated undistributed (distributions in excess of) net investment income | | $ | 414,472 | | | $ | — | | | $ | 25,948 | | | $ | — | |
| | | | |
Share Transactions | | | | | | | | | | | | | | | | |
Issued | | | 15,296,042 | | | | 636,390 | | | | 11,373,131 | | | | 212,451 | |
Reinvested | | | — | | | | 264,816 | | | | 186,643 | | | | 200,434 | |
Redeemed | | | (3,144,167 | ) | | | (1,687,261 | ) | | | (1,340,303 | ) | | | (598,981 | ) |
Net change in shares | | | 12,151,875 | | | | (786,055 | ) | | | 10,219,471 | | | | (186,096 | ) |
The accompanying notes are an integral part of these financial statements.
| | | | | | | | | | | | | | | | | | | | | | |
The Aggressive
Growth Fund | | | The Defensive
Balanced Fund | | | The Strategic
Growth Fund | |
| 2008 | | | 2007 | | | 2008 | | | 2007 | | | 2008 | | | 2007 | |
| | | | | | | | | | | | | | | | | | | | | | |
| $ | 203,662 | | | $ | 131,376 | | | $ | 318,682 | | | $ | 482,437 | | | $ | 175,093 | | | $ | 400,726 | |
| | | | | |
| | (8,253,300 | ) | | | 2,377,643 | | | | (9,348,887 | ) | | | 3,617,605 | | | | (6,911,838 | ) | | | 3,626,617 | |
| | | | | |
| | (5,557,678 | ) | | | (1,158,622 | ) | | | (3,351,321 | ) | | | (1,651,889 | ) | | | (7,519,096 | ) | | | (1,944,304 | ) |
| | (13,607,316 | ) | | | 1,350,397 | | | | (12,381,526 | ) | | | 2,448,153 | | | | (14,255,841 | ) | | | 2,083,039 | |
| | | | | |
| | | | | | | | | | | | | | | | | | | | | | |
| | (203,662 | ) | | | (131,376 | ) | | | (318,682 | ) | | | (482,437 | ) | | | (175,093 | ) | | | (400,726 | ) |
| | | | | |
| | — | | | | — | | | | — | | | | (3,353,278 | ) | | | — | | | | (3,499,181 | ) |
| | | | | |
| | (203,662 | ) | | | (131,376 | ) | | | (318,682 | ) | | | (3,835,715 | ) | | | (175,093 | ) | | | (3,899,907 | ) |
| | | | | |
| | | | | | | | | | | | | | | | | | | | | | |
| | 19,997,583 | | | | 12,049,990 | | | | 34,494,596 | | | | 34,599,984 | | | | 36,110,816 | | | | 30,283,775 | |
| | 203,343 | | | | 131,376 | | | | 318,559 | | | | 3,835,713 | | | | 175,094 | | | | 3,900,118 | |
| | (14,515,621 | ) | | | (6,114,035 | ) | | | (61,637,761 | ) | | | (5,246,462 | ) | | | (64,566,176 | ) | | | (5,115,025 | ) |
| | | | | |
| | 5,685,305 | | | | 6,067,331 | | | | (26,824,606 | ) | | | 33,189,235 | | | | (28,280,266 | ) | | | 29,068,868 | |
| | | | | | | | | | | | | | | | | | | | | | | |
| | (8,125,673 | ) | | | 7,286,352 | | | | (39,524,814 | ) | | | 31,801,673 | | | | (42,711,200 | ) | | | 27,252,000 | |
| | | | | |
| | 28,840,717 | | | | 21,554,365 | | | | 74,290,447 | | | | 42,488,774 | | | | 63,785,486 | | | | 36,533,486 | |
| | | | | | | | | | | | | | | | | | | | | | | |
| | | | | |
| $ | 20,715,044 | | | $ | 28,840,717 | | | $ | 34,765,633 | | | $ | 74,290,447 | | | $ | 21,074,286 | | | $ | 63,785,486 | |
| | | | | | | | | | | | | | | | | | | | | | | |
| | | | | |
| $ | — | | | $ | — | | | $ | — | | | $ | — | | | $ | — | | | $ | — | |
| | | | | |
| | | | | | | | | | | | | | | | | | | | | | |
| | 2,595,026 | | | | 1,417,233 | | | | 3,689,768 | | | | 3,168,990 | | | | 3,983,712 | | | | 2,709,639 | |
| | 39,205 | | | | 15,294 | | | | 40,529 | | | | 366,328 | | | | 29,280 | | | | 368,262 | |
| | (2,002,069 | ) | | | (725,226 | ) | | | (6,411,277 | ) | | | (475,026 | ) | | | (6,518,762 | ) | | | (454,147 | ) |
| | 632,162 | | | | 707,301 | | | | (2,680,980 | ) | | | 3,060,292 | | | | (2,505,770 | ) | | | 2,623,754 | |
Statements of Changes in Net Assets
For the Years Ended December 31,
| | | | | | | | |
| | |
The Quantex Fund | |
| | | 2008 | | | 2007 | |
Operations | | | | | | | | |
Net investment income (loss) | | $ | 1,540 | | | $ | 173,871 | |
Net realized gain (loss) from investments, futures contracts, and long-term capital gain distributions by other investment companies | | | (763,215 | ) | | | 2,061,670 | |
Net change in unrealized appreciation (depreciation) of investments and futures contracts | | | (4,726,372 | ) | | | (3,891,736 | ) |
Net change in net assets resulting from operations | | | (5,488,047 | ) | | | (1,656,195 | ) |
| | |
Distributions to Shareholders | | | | | | | | |
From net investment income | | | — | | | | (173,871 | ) |
From net realized gain from investments, futures contracts, and long-term capital gain distributions by other investment companies | | | — | | | | — | |
From tax return of capital | | | — | | | | — | |
Net change in net assets resulting from distributions | | | — | | | | (173,871 | ) |
| | |
Distributions to Shareholders | | | | | | | | |
— The Money Market Fund | | | | | | | | |
From net investment income (Retail Class) | | | | | | | | |
From net investment income (Institutional Class) | | | | | | | | |
Net change in net assets resulting from distributions | | | | | | | | |
| | |
Capital Transactions | | | | | | | | |
Issued | | | 7,427,714 | | | | 12,925,921 | |
Reinvested | | | — | | | | 173,206 | |
Redeemed | | | (12,646,825 | ) | | | (13,892,276 | ) |
Net change in net assets resulting from capital transactions | | | (5,219,111 | ) | | | (793,149 | ) |
| | | | | | | | | |
Total Change in Net Assets | | | (10,707,158 | ) | | | (2,623,215 | ) |
| | |
Net Assets — Beginning of Year | | | 17,450,387 | | | | 20,073,602 | |
| | | | | | | | | |
| | |
Net Assets — End of Year | | $ | 6,743,229 | | | $ | 17,450,387 | |
| | | | | | | | | |
Accumulated undistributed (distributions in excess of) net investment income | | $ | 1,540 | | | $ | — | |
| | |
Share Transactions | | | | | | | | |
Issued | | | 451,739 | | | | 633,860 | |
Reinvested | | | — | | | | 8,768 | |
Redeemed | | | (757,116 | ) | | | (700,862 | ) |
Net change in shares | | | (305,377 | ) | | | (58,234 | ) |
The accompanying notes are an integral part of these financial statements.
| | | | | | | | | | | | | | | | | | | | | | |
The Total Return
Utilities Fund | | | The U.S. Government
Bond Fund | | | The Money
Market Fund | |
| 2008 | | | 2007 | | | 2008 | | | 2007 | | | 2008 | | | 2007 | |
| | | | | | | | | | | | | | | | | | | | | | |
| $ | 207,234 | | | $ | 147,631 | | | $ | 469,243 | | | $ | 388,962 | | | $ | 6,120,576 | | | $ | 9,798,785 | |
| | | | | | | | | | | | | | | | | | | | | | |
| | 821,946 | | | | 3,807,509 | | | | 316,016 | | | | 78,163 | | | | — | | | | — | |
| | | | | | | | | | | | | | | | | | | | | | |
| | (11,096,660 | ) | | | 448,200 | | | | (77,092 | ) | | | 331,609 | | | | — | | | | — | |
| | (10,067,480 | ) | | | 4,403,340 | | | | 708,167 | | | | 798,734 | | | | 6,120,576 | | | | 9,798,785 | |
| | | | | |
| | | | | | | | | | | | | | | | | | | | | | |
| | (147,421 | ) | | | (147,631 | ) | | | (469,243 | ) | | | (542,472 | ) | | | | | | | | |
| | | | | | | | | | | | | | | | | | | | | | |
| | — | | | | — | | | | — | | | | — | | | | | | | | | |
| | (59,813 | ) | | | — | | | | — | | | | — | | | | | | | | | |
| | (207,234 | ) | | | (147,631 | ) | | | (469,243 | ) | | | (542,472 | ) | | | | | | | | |
| | | | | |
| | | | | | | | | | | | | | | | | | | | | | |
| | | | | | | | | | | | | | | | | (5,139,222 | ) | | | (8,686,515 | ) |
| | | | | | | | | | | | | | | | | | (981,354 | ) | | | (1,112,270 | ) |
| | | | | | | | | | | | | | | | | | (6,120,576 | ) | | | (9,798,785 | ) |
| | | | | |
| | | | | | | | | | | | | | | | | | | | | | |
| | 5,332,650 | | | | 7,190,576 | | | | 8,134,715 | | | | 11,723,184 | | | | 354,625,946 | | | | 229,384,675 | |
| | 199,707 | | | | 143,876 | | | | 451,147 | | | | 509,089 | | | | 5,401,443 | | | | 9,336,911 | |
| | (6,731,034 | ) | | | (8,226,493 | ) | | | (8,557,158 | ) | | | (5,837,854 | ) | | | (337,313,889 | ) | | | (206,667,713 | ) |
| | (1,198,677 | ) | | | (892,041 | ) | | | 28,704 | | | | 6,394,419 | | | | 22,713,500 | | | | 32,053,873 | |
| | | | | | | | | | | | | | | | | | | | | | | |
| | (11,473,391 | ) | | | 3,363,668 | | | | 267,628 | | | | 6,650,681 | | | | 22,713,500 | | | | 32,053,873 | |
| | | | | |
| | 27,332,517 | | | | 23,968,849 | | | | 13,768,595 | | | | 7,117,914 | | | | 215,812,451 | | | | 183,758,578 | |
| | | | | | | | | | | | | | | | | | | | | | | |
| | | | | |
| $ | 15,859,126 | | | $ | 27,332,517 | | | $ | 14,036,223 | | | $ | 13,768,595 | | | $ | 238,525,951 | | | $ | 215,812,451 | |
| | | | | | | | | | | | | | | | | | | | | | | |
| $ | — | | | $ | — | | | $ | 1,851 | | | $ | 2,010 | | | $ | — | | | $ | — | |
| | | | | |
| | | | | | | | | | | | | | | | | | | | | | |
| | 240,848 | | | | 295,788 | | | | 393,943 | | | | 581,998 | | | | 354,625,946 | | | | 229,384,675 | |
| | 10,427 | | | | 5,678 | | | | 21,863 | | | | 25,266 | | | | 5,401,443 | | | | 9,336,911 | |
| | (313,724 | ) | | | (334,197 | ) | | | (415,296 | ) | | | (288,752 | ) | | | (337,313,889 | ) | | | (206,667,713 | ) |
| | (62,449 | ) | | | (32,731 | ) | | | 510 | | | | 318,512 | | | | 22,713,500 | | | | 32,053,873 | |
Financial Highlights
For a Share Outstanding Through Each Fiscal Year Ended December 31,
| | | | | | | | | | | | | | | | | | | | | | | |
| | | | | Income from Investment Operations | | | Less Distributions | |
| | | Net Asset
Value,
Beginning
of Period | | Net
Investment
Income | | |
Net gains (losses) on
securities, futures, and
options (both realized
and unrealized) | | | Total from
Investment
Operations | | | From Net
Investment
Income | | | From Net
Capital
Gains | | | From Tax
Return of
Capital | | Total
Distributions | |
The Muirfield Fund(1)(2)(5) | | | | | | | | | | | | | | | | | | |
2008 | | $ | 6.02 | | 0.02 | | | (1.83 | ) | | (1.81 | ) | | 0.00 | | | 0.00 | | | 0.00 | | 0.00 | |
2007 | | $ | 5.81 | | 0.18 | | | 0.23 | | | 0.41 | | | (0.20 | ) | | 0.00 | | | 0.00 | | (0.20 | ) |
2006 | | $ | 5.15 | | 0.04 | | | 0.66 | | | 0.70 | | | (0.04 | ) | | 0.00 | | | 0.00 | | (0.04 | ) |
2005 | | $ | 5.11 | | 0.07 | | | 0.04 | | | 0.11 | | | (0.07 | ) | | 0.00 | | | 0.00 | | (0.07 | ) |
2004 | | $ | 4.79 | | 0.01 | | | 0.32 | | | 0.33 | | | (0.01 | ) | | 0.00 | | | 0.00 | | (0.01 | ) |
The Dynamic Growth Fund(1)(2)(5) | | | | | | | | | | | | | | | | | | |
2008 | | $ | 9.24 | | 0.04 | | | (3.71 | ) | | (3.67 | ) | | (0.04 | ) | | (0.05 | ) | | 0.00 | | (0.09 | ) |
2007 | | $ | 9.56 | | 0.29 | | | 0.38 | | | 0.67 | | | (0.30 | ) | | (0.69 | ) | | 0.00 | | (0.99 | ) |
2006 | | $ | 8.28 | | 0.04 | | | 1.28 | | | 1.32 | | | (0.04 | ) | | 0.00 | | | 0.00 | | (0.04 | ) |
2005 | | $ | 7.94 | | 0.06 | | | 0.34 | | | 0.40 | | | (0.06 | ) | | 0.00 | | | 0.00 | | (0.06 | ) |
2004 | | $ | 7.67 | | (0.04 | ) | | 0.31 | | | 0.27 | | | 0.00 | | | 0.00 | | | 0.00 | | 0.00 | |
The Aggressive Growth Fund(1)(2)(5) | | | | | | | | | | | | | | | | | | |
2008 | | $ | 8.59 | | 0.05 | | | (3.40 | ) | | (3.35 | ) | | (0.05 | ) | | 0.00 | | | 0.00 | | (0.05 | ) |
2007 | | $ | 8.13 | | 0.04 | | | 0.46 | | | 0.50 | | | (0.04 | ) | | 0.00 | | | 0.00 | | (0.04 | ) |
2006 | | $ | 7.19 | | 0.03 | | | 0.94 | | | 0.97 | | | (0.03 | ) | | 0.00 | | | 0.00 | | (0.03 | ) |
2005 | | $ | 6.83 | | 0.02 | | | 0.36 | | | 0.38 | | | (0.02 | ) | | 0.00 | | | 0.00 | | (0.02 | ) |
2004 | | $ | 6.65 | | (0.03 | ) | | 0.21 | | | 0.18 | | | 0.00 | | | 0.00 | | | 0.00 | | 0.00 | |
The Defensive Balanced Fund(1)(2)(3)(4) | | | | | | | | | | | | | | | |
2008 | | $ | 10.46 | | 0.07 | | | (2.60 | ) | | (2.53 | ) | | (0.07 | ) | | 0.00 | | | 0.00 | | (0.07 | ) |
2007 | | $ | 10.51 | | 0.07 | | | 0.45 | | | 0.52 | | | (0.07 | ) | | (0.50 | ) | | 0.00 | | (0.57 | ) |
2006* | | $ | 10.00 | | 0.07 | | | 0.51 | | | 0.58 | | | (0.07 | ) | | 0.00 | | | 0.00 | | (0.07 | ) |
The Strategic Growth Fund(1)(2)(3)(4) | | | | | | | | | | | | | | | | | | |
2008 | | $ | 10.58 | | 0.05 | | | (4.60 | ) | | (4.55 | ) | | (0.05 | ) | | 0.00 | | | 0.00 | | (0.05 | ) |
2007 | | $ | 10.73 | | 0.08 | | | 0.46 | | | 0.54 | | | (0.07 | ) | | (0.62 | ) | | 0.00 | | (0.69 | ) |
2006* | | $ | 10.00 | | 0.06 | | | 0.73 | | | 0.79 | | | (0.06 | ) | | 0.00 | | | 0.00 | | (0.06 | ) |
The Quantex Fund | | | | | | | | | | | | | | | | | | |
2008 | | $ | 18.32 | | 0.00 | | | (7.90 | ) | | (7.90 | ) | | 0.00 | | | 0.00 | | | 0.00 | | 0.00 | |
2007 | | $ | 19.86 | | 0.16 | | | (1.54 | ) | | (1.38 | ) | | (0.16 | ) | | 0.00 | | | 0.00 | | (0.16 | ) |
2006 | | $ | 17.09 | | 0.08 | | | 2.77 | | | 2.85 | | | (0.08 | ) | | 0.00 | | | 0.00 | | (0.08 | ) |
2005 | | $ | 15.95 | | 0.01 | | | 1.14 | | | 1.15 | | | (0.01 | ) | | 0.00 | | | 0.00 | | (0.01 | ) |
2004 | | $ | 14.82 | | 0.00 | | | 1.13 | | | 1.13 | | | 0.00 | | | 0.00 | | | 0.00 | | 0.00 | |
| 1 | Ratio of net expenses to average net assets, ratio of net investment income (loss) to average net assets, ratio of average net assets after reductions, excluding expenses paid indirectly, and ratio of expenses to average net assets before reductions do not include impact of expenses of the underlying security holdings as represented in the schedule of investments. |
| 2 | Recognition of net investment income by the Fund is affected by the timing of the declaration of dividends by the underlying investment companies in which the Fund invests. |
| 3 | Total return and portfolio turnover rate are not annualized for periods of less than one full year. |
The accompanying notes are integral part of these financial statements.
| | | | | | | | | | | | | | | | | | | | | | |
| | | | | | Ratios/Supplemental Data | |
Net Asset
Value,
End of
Period | | Total Return
(assumes
Reinvestment
of Distributions) | | | Net Assets,
End of
Period
($000) | | Ratio of Net
Expenses
to Average
Net Assets | | | Ratio of Net
Investment
Income (Loss)
to Average
Net Assets | | | Ratio of Expenses
to Average Net Assets
after Reductions,
Excluding Expenses
Paid Indirectly | | | Ratio of Expenses
to Average Net
Assets Before
Reductions | | | Portfolio
Turnover
Rate | |
| | | | | | | | | | | | | | | | | | | | | | |
| $ | 4.21 | | (30.07 | %) | | $ | 86,310 | | 1.39 | % | | 0.54 | % | | 1.48 | % | | 1.75 | % | | 173 | % |
| $ | 6.02 | | 7.02 | % | | $ | 50,374 | | 1.38 | % | | 3.01 | % | | 1.52 | % | | 1.88 | % | | 144 | % |
| $ | 5.81 | | 13.62 | % | | $ | 53,227 | | 1.45 | % | | 0.65 | % | | 1.56 | % | | 1.85 | % | | 131 | % |
| $ | 5.15 | | 2.13 | % | | $ | 78,181 | | 1.42 | % | | 1.36 | % | | 1.53 | % | | 1.76 | % | | 145 | % |
| $ | 5.11 | | 6.80 | % | | $ | 69,656 | | 1.26 | % | | 0.12 | % | | 1.45 | % | | 1.70 | % | | 145 | % |
| | | | | | | | | | | | | | | | | | | | | | |
| $ | 5.48 | | (39.77 | %) | | $ | 67,298 | | 1.34 | % | | 0.95 | % | | 1.46 | % | | 1.69 | % | | 122 | % |
| $ | 9.24 | | 7.06 | % | | $ | 19,115 | | 1.32 | % | | 2.94 | % | | 1.46 | % | | 1.86 | % | | 150 | % |
| $ | 9.56 | | 15.96 | % | | $ | 21,566 | | 1.42 | % | | 0.42 | % | | 1.55 | % | | 1.86 | % | | 123 | % |
| $ | 8.28 | | 5.08 | % | | $ | 31,943 | | 1.41 | % | | 0.87 | % | | 1.58 | % | | 1.84 | % | | 202 | % |
| $ | 7.94 | | 3.52 | % | | $ | 24,862 | | 1.20 | % | | (0.48 | %) | | 1.41 | % | | 1.70 | % | | 174 | % |
| | | | | | | | | | | | | | | | | | | | | | |
| $ | 5.19 | | (38.98 | %) | | $ | 20,715 | | 1.62 | % | | 0.77 | % | | 1.65 | % | | 1.84 | % | | 213 | % |
| $ | 8.59 | | 6.14 | % | | $ | 28,841 | | 1.70 | % | | 0.49 | % | | 1.70 | % | | 1.83 | % | | 170 | % |
| $ | 8.13 | | 13.54 | % | | $ | 21,554 | | 1.80 | % | | 0.51 | % | | 1.81 | % | | 1.98 | % | | 200 | % |
| $ | 7.19 | | 5.62 | % | | $ | 11,639 | | 1.88 | % | | 0.35 | % | | 2.03 | % | | 2.30 | % | | 181 | % |
| $ | 6.83 | | 2.71 | % | | $ | 10,773 | | 1.64 | % | | (0.41 | %) | | 1.80 | % | | 2.07 | % | | 264 | % |
| | | | | | | | | | | | | | | | | | | | | | |
| $ | 7.86 | | (24.16 | %) | | $ | 34,766 | | 1.54 | % | | 0.67 | % | | 1.55 | % | | 1.70 | % | | 204 | % |
| $ | 10.46 | | 5.03 | % | | $ | 74,290 | | 1.56 | % | | 0.79 | % | | 1.56 | % | | 1.66 | % | | 137 | % |
| $ | 10.51 | | 5.84 | % | | $ | 42,489 | | 1.72 | % | | 1.20 | % | | 1.72 | % | | 1.81 | % | | 105 | % |
| | | | | | | | | | | | | | | | | | | | | | |
| $ | 5.98 | | (43.00 | %) | | $ | 21,074 | | 1.57 | % | | 0.47 | % | | 1.59 | % | | 1.74 | % | | 178 | % |
| $ | 10.58 | | 5.08 | % | | $ | 63,785 | | 1.58 | % | | 0.75 | % | | 1.58 | % | | 1.68 | % | | 134 | % |
| $ | 10.73 | | 7.91 | % | | $ | 36,533 | | 1.75 | % | | 0.94 | % | | 1.75 | % | | 1.84 | % | | 92 | % |
| | | | | | | | | | | | | | | | | | | | | | |
| $ | 10.42 | | (43.12 | %) | | $ | 6,743 | | 1.73 | % | | 0.01 | % | | 1.73 | % | | 2.26 | % | | 49 | % |
| $ | 18.32 | | (7.00 | %) | | $ | 17,450 | | 1.56 | % | | 0.76 | % | | 1.56 | % | | 2.09 | % | | 56 | % |
| $ | 19.86 | | 16.67 | % | | $ | 20,074 | | 1.66 | % | | 0.47 | % | | 1.66 | % | | 2.25 | % | | 30 | % |
| $ | 17.09 | | 7.21 | % | | $ | 17,114 | | 1.75 | % | | 0.06 | % | | 1.78 | % | | 2.19 | % | | 171 | % |
| $ | 15.95 | | 7.62 | % | | $ | 18,853 | | 1.73 | % | | 0.00 | % | | 1.77 | % | | 2.06 | % | | 253 | % |
| 4 | Ratio of net expenses to average net assets, ratio of net investment income (loss) to average net assets, ratio of average net assets after reductions, excluding expenses paid indirectly, and ratio of expenses to average net assets before reductions are annualized for periods of less than one full year. |
| 5 | In 2005, the advisor voluntarily reimbursed the Fund for a realized investment loss, which had no impact to total return. |
| * | Commenced Operations January 31, 2006 |
| ** | Commenced Operations on December 28, 2004 |
| *** | Actual amounts were less than one-tenth of a cent |
Financial Highlights
For a Share Outstanding Through Each Fiscal Year Ended December 31,
| | | | | | | | | | | | | | | | | | | | | | | |
| | | | | Income from Investment Operations | | | Less Distributions | |
| | | Net Asset
Value,
Beginning
of Period | | Net
Investment
Income | | |
Net gains (losses) on
securities, futures, and
options (both realized
and unrealized) | | | Total from
Investment
Operations | | | From Net
Investment
Income | | | From Net
Capital
Gains | | From Tax
Return of
Capital | | | Total
Distributions | |
The Total Return Utilities Fund | | | | | | | | | | | | | | | | | | |
2008 | | $ | 26.14 | | 0.09 | | | (9.90 | ) | | (9.81 | ) | | (0.14 | ) | | 0.00 | | (0.06 | ) | | (0.20 | ) |
2007 | | $ | 22.23 | | 0.14 | | | 3.91 | | | 4.05 | | | (0.14 | ) | | 0.00 | | 0.00 | | | (0.14 | ) |
2006 | | $ | 19.03 | | 0.15 | | | 3.20 | | | 3.35 | | | (0.15 | ) | | 0.00 | | 0.00 | | | (0.15 | ) |
2005 | | $ | 16.51 | | 0.24 | | | 2.52 | | | 2.76 | | | (0.24 | ) | | 0.00 | | 0.00 | | | (0.24 | ) |
2004 | | $ | 14.29 | | 0.32 | | | 2.22 | | | 2.54 | | | (0.32 | ) | | 0.00 | | 0.00 | | | (0.32 | ) |
The U.S. Government Bond Fund | | | | | | | | | | | | | | | | | | |
2008 | | $ | 20.58 | | 0.66 | | | 0.38 | | | 1.04 | | | (0.66 | ) | | 0.00 | | 0.00 | | | (0.66 | ) |
2007 | | $ | 20.30 | | 0.73 | | | 0.72 | | | 1.45 | | | (1.17 | ) | | 0.00 | | 0.00 | | | (1.17 | ) |
2006 | | $ | 20.22 | | 0.68 | | | 0.14 | | | 0.82 | | | (0.74 | ) | | 0.00 | | 0.00 | | | (0.74 | ) |
2005 | | $ | 20.82 | | 0.73 | | | (0.76 | ) | | (0.03 | ) | | (0.57 | ) | | 0.00 | | 0.00 | | | (0.57 | ) |
2004 | | $ | 21.00 | | 0.52 | | | (0.18 | ) | | 0.34 | | | (0.52 | ) | | 0.00 | | 0.00 | | | (0.52 | ) |
The Money Market Fund — Retail Class | | | | | | | | | | | | | | | |
2008 | | $ | 1.00 | | 0.026 | | | N/A | | | 0.026 | | | (0.026 | ) | | 0.000 | | 0.000 | | | (0.026 | ) |
2007 | | $ | 1.00 | | 0.048 | | | N/A | | | 0.048 | | | (0.048 | ) | | 0.000 | | 0.000 | | | (0.048 | ) |
2006 | | $ | 1.00 | | 0.046 | | | N/A | | | 0.046 | | | (0.046 | ) | | 0.000 | | 0.000 | | | (0.046 | ) |
2005 | | $ | 1.00 | | 0.028 | | | N/A | | | 0.028 | | | (0.028 | ) | | 0.000 | | 0.000 | | | (0.028 | ) |
2004 | | $ | 1.00 | | 0.011 | | | N/A | | | 0.011 | | | (0.011 | ) | | 0.000 | | 0.000 | | | (0.011 | ) |
The Money Market Fund — Institutional Class(3)(4) | | | | | | | | | |
2008 | | $ | 1.00 | | 0.028 | | | N/A | | | 0.028 | | | (0.028 | ) | | 0.000 | | 0.000 | | | (0.028 | ) |
2007 | | $ | 1.00 | | 0.050 | | | N/A | | | 0.050 | | | (0.050 | ) | | 0.000 | | 0.000 | | | (0.050 | ) |
2006 | | $ | 1.00 | | 0.048 | | | N/A | | | 0.048 | | | (0.048 | ) | | 0.000 | | 0.000 | | | (0.048 | ) |
2005 | | $ | 1.00 | | 0.030 | | | N/A | | | 0.030 | | | (0.030 | ) | | 0.000 | | 0.000 | | | (0.030 | ) |
2004** | | $ | 1.00 | | 0.000 | *** | | N/A | | | 0.000 | | | 0.000 | | | 0.000 | | 0.000 | | | 0.000 | *** |
| 1 | Ratio of net expenses to average net assets, ratio of net investment income (loss) to average net assets, ratio of average net assets after reductions, excluding expenses paid indirectly, and ratio of expenses to average net assets before reductions do not include impact of expenses of the underlying security holdings as represented in the schedule of investments. |
| 2 | Recognition of net investment income by the Fund is affected by the timing of the declaration of dividends by the underlying investment companies in which the Fund invests. |
| 3 | Total return and portfolio turnover rate are not annualized for periods of less than one full year. |
The accompanying notes are integral part of these financial statements.
| | | | | | | | | | | | | | | | | | | | | | |
| | | | | | Ratios/Supplemental Data | |
Net Asset
Value,
End of
Period | | Total Return
(assumes
Reinvestment
of Distributions) | | | Net Assets,
End of
Period
($000) | | Ratio of Net
Expenses
to Average
Net Assets | | | Ratio of Net
Investment
Income (Loss)
to Average
Net Assets | | | Ratio of Expenses
to Average Net Assets
after Reductions,
Excluding Expenses
Paid Indirectly | | | Ratio of Expenses
to Average Net
Assets before
Reductions | | | Portfolio
Turnover
Rate | |
| | | | | | | | | | | | | | | | | | | | | | |
| $ | 16.13 | | (37.63 | %) | | $ | 15,859 | | 1.96 | % | | 0.42 | % | | 1.96 | % | | 2.14 | % | | 48 | % |
| $ | 26.14 | | 18.24 | % | | $ | 27,333 | | 1.90 | % | | 0.57 | % | | 1.90 | % | | 2.10 | % | | 50 | % |
| $ | 22.23 | | 17.68 | % | | $ | 23,969 | | 2.05 | % | | 0.74 | % | | 2.05 | % | | 2.18 | % | | 27 | % |
| $ | 19.03 | | 16.80 | % | | $ | 22,644 | | 2.03 | % | | 1.32 | % | | 2.05 | % | | 2.19 | % | | 28 | % |
| $ | 16.51 | | 18.01 | % | | $ | 28,447 | | 1.91 | % | | 2.21 | % | | 1.91 | % | | 1.99 | % | | 38 | % |
| | | | | | | | | | | | | | | | | | | | | | |
| $ | 20.96 | | 5.16 | % | | $ | 14,036 | | 0.99 | % | | 3.20 | % | | 0.99 | % | | 1.58 | % | | 118 | % |
| $ | 20.58 | | 7.44 | % | | $ | 13,769 | | 1.01 | % | | 3.92 | % | | 1.01 | % | | 1.72 | % | | 88 | % |
| $ | 20.30 | | 4.13 | % | | $ | 7,118 | | 1.10 | % | | 3.59 | % | | 1.10 | % | | 2.22 | % | | 106 | % |
| $ | 20.22 | | (0.14 | %) | | $ | 6,324 | | 1.10 | % | | 2.75 | % | | 1.10 | % | | 2.02 | % | | 159 | % |
| $ | 20.82 | | 1.64 | % | | $ | 9,316 | | 1.10 | % | | 2.49 | % | | 1.10 | % | | 1.58 | % | | 352 | % |
| | | | | | | | | | | | | | | | | | | | | | |
| $ | 1.00 | | 2.65 | % | | $ | 161,232 | | 0.49 | % | | 2.64 | % | | 0.49 | % | | 0.83 | % | | N/A | |
| $ | 1.00 | | 4.95 | % | | $ | 195,479 | | 0.48 | % | | 4.83 | % | | 0.48 | % | | 0.84 | % | | N/A | |
| $ | 1.00 | | 4.71 | % | | $ | 159,641 | | 0.48 | % | | 4.64 | % | | 0.48 | % | | 0.87 | % | | N/A | |
| $ | 1.00 | | 2.85 | % | | $ | 129,200 | | 0.47 | % | | 2.79 | % | | 0.47 | % | | 0.89 | % | | N/A | |
| $ | 1.00 | | 1.06 | % | | $ | 148,650 | | 0.46 | % | | 1.04 | % | | 0.46 | % | | 0.84 | % | | N/A | |
| | | | | | | | | | | | | | | | | | | | | | |
| $ | 1.00 | | 2.79 | % | | $ | 77,294 | | 0.37 | % | | 2.55 | % | | 0.37 | % | | 0.68 | % | | N/A | |
| $ | 1.00 | | 5.09 | % | | $ | 20,333 | | 0.34 | % | | 4.98 | % | | 0.34 | % | | 0.67 | % | | N/A | |
| $ | 1.00 | | 4.86 | % | | $ | 24,118 | | 0.34 | % | | 4.76 | % | | 0.34 | % | | 0.71 | % | | N/A | |
| $ | 1.00 | | 2.99 | % | | $ | 21,083 | | 0.33 | % | | 2.93 | % | | 0.33 | % | | 0.71 | % | | N/A | |
| $ | 1.00 | | 0.02 | % | | $ | 30,310 | | 0.33 | % | | 1.96 | % | | 0.33 | % | | 0.67 | % | | N/A | |
| 4 | Ratio of net expenses to average net assets, ratio of net investment income (loss) to average net assets, ratio of average net assets after reductions, excluding expenses paid indirectly, and ratio of expenses to average net assets before reductions are annualized for periods of less than one full year. |
| 5 | In 2005, the advisor voluntarily reimbursed the Fund for a realized investment loss, which had no impact to total return. |
| * | Commenced Operations January 31, 2006 |
| ** | Commenced Operations on December 28, 2004 |
| *** | Actual amounts were less than one-tenth of a cent |
Notes to Financial Statements
December 31, 2008
1. Organization and Significant Accounting Policies
The Flex-funds® Trust (the “Trust”) was organized in 1982 and is registered under the Investment Company Act of 1940, as amended (the “1940 Act”), as a diversified, open-end management investment company. The Trust offers nine separate series and is presently comprised of nine separate funds as follows: The Muirfield Fund® (“Muirfield”), The Total Return Utilities Fund (f.k.a. The Socially Responsible Utilities Fund)(“Utilities”)(please see second paragraph of Note #1 for more information), The Quantex Fund™ (f.k.a. The Highlands Growth Fund)(“Quantex”), The Dynamic Growth Fund (“Dynamic”), The Aggressive Growth Fund (“Aggressive”)(please see third paragraph of Note #1 for more information), The Defensive Balanced Fund (f.k.a. The Defensive Growth Fund)(“Defensive”)(please see fourth paragraph of Note #1 for more information), The Strategic Growth Fund (f.k.a. The Focused Growth Fund)(“Strategic”)(please see fifth paragraph of Note #1 for more information), The U.S. Government Bond Fund (“Bond”), and The Money Market Fund (“Money Market”) (each a “Fund” and collectively the “Funds”). Money Market offers two classes of shares (the Retail Class (“Retail Class”) and the Institutional Class (“Institutional Class”)). Each class of shares has equal rights as to earnings and assets except that each class bears different distribution and transfer agent expenses. The investment objective of Muirfield, Quantex, Dynamic, Aggressive, and Strategic is growth of capital. The investment objective of Defensive is growth of capital, with current income usually of secondary importance. The investment objective of Utilities is current income and growth of income. The investment objective of Bond is maximum current income. The investment objective of Money Market is current income while maintaining a stable share price of $1.00.
Effective August 25, 2008, the Board of Trustees (“Trustees”), including a majority of non-interested or independent Trustees, approved the change of name of The Socially Responsible Utilities Fund to The Total Return Utilities Fund. The investment strategy remains the same with an investment objective seeking total returns through income and capital appreciation. The Fund does not and will not invest in electric utilities that generate power from nuclear reactors.
Effective August 25, 2008, the Trustees approved a change in investment strategy for Aggressive. The Fund is now able to hold investments in both actively managed mutual funds and exchange traded funds, rather than exchange traded funds only. This gives the Fund access to a greater number of investment options and additional opportunity for potential gains. The investment objective remains growth of capital.
Effective August 25, 2008, the Trustees approved the restructuring of Defensive. The Defensive Growth Fund changed its name to The Defensive Balanced Fund. The Fund always invests at least 30% and may invest up to 70% of its assets primarily in equity mutual funds. In addition, the Fund invests at least 30% and may invest up to 70% of its assets primarily in investment grade bonds, money market instruments, or exchange traded funds. The investment objective is now growth of capital, with current income usually of secondary importance. The Fund places a high degree of importance on maintaining and protecting portfolio values from adverse market conditions.
Effective August 25, 2008, the Trustees approved the restructuring of Strategic. The Focused Growth Fund changed its name to The Strategic Growth Fund. The Fund pursues its goal by investing primarily in open-end or closed-end investment companies that seek capital growth or appreciation without regard to current income. In addition, this Fund normally has set allocations to U.S. large-cap equities, U.S. mid-cap equities, U.S. small-cap equities, non-U.S./International (including emerging markets) equities, real estate equities, and commodity-based equities.
Use of estimates. The preparation of financial statements in conformity with accounting principles generally accepted in the United States of America (“GAAP”) requires management to make estimates and assumptions that affect the reported amounts of assets and liabilities and disclosure of contingent assets and liabilities at the date of the financial statements and the reported amounts of increases and decreases in net assets from operations during the reporting period. Actual results could differ from those estimates.
Security valuation. Securities and exchange traded funds that are traded on stock exchanges are valued at the last sales price as of the close of business of the New York Stock Exchange on the day of valuation or, lacking any sales, are valued using fair value procedures approved by the Trustees. Securities traded over-the-counter are valued at the most recent bid price or yield equivalent as obtained from one or more dealers that make markets in such securities. Registered investment companies are valued at the daily redemption value as reported by the underlying fund. Bond values the securities held at 4:00 P.M. Eastern Time. Securities held in Money Market are valued at amortized cost,
which approximates value. The Funds obtain prices from independent pricing services, which use valuation techniques approved by the Trustees. Money Market, in compliance with Rule 2a-7 of the 1940 Act, compares its amortized values, including illiquid and restricted securities, to the prices obtained from the independent pricing services. The ability of issuers of debt securities held by the Funds to meet their obligations may be affected by economic and political developments in a specific country or region.
Fixed income securities held in the Funds, except Money Market, maturing more than sixty days after the valuation date, are valued at the last sales price as of the close of business on the day of valuation, or, lacking any sales, at the most recent bid price or yield equivalent as obtained from dealers that make markets in such securities. When such securities are valued within sixty days or less to maturity, the difference between the valuation existing on the sixty-first day before maturity and maturity value is amortized on a straight-line basis to maturity. Securities maturing within sixty days from their date of acquisition are valued at amortized cost.
Effective January 1, 2008, the Funds adopted Statement of Financial Accounting Standards No. 157, “Fair Value Measurements” (“SFAS 157”). This standard establishes a single authoritative definition of fair value, sets out a framework for measuring fair value based on inputs used to value the Funds’ investments, and requires additional disclosures about fair value measurements. SFAS 157 applies to fair value measurements already required or permitted by existing standards. Please see each Fund’s Schedule of Investments for further disclosure as required under SFAS 157. For the year ended December 31, 2008, the Funds did not hold any assets at any time in which significant unobservable inputs were used in determining fair value. Therefore, no reconciliation of Level 3 securities is provided.
In March 2008, the Financial Accounting Standards Board issued Statement of Financial Accounting Standards (“SFAS”) No. 161 “Disclosures about Derivative Instruments and Hedging Activities.” SFAS No. 161 was issued and is effective for fiscal years and interim periods beginning after November 15, 2008. SFAS No. 161 is intended to improve financial reporting for derivative instruments by requiring enhanced disclosure that enables investors to understand how and why an entity used derivatives, how the entity accounts for derivatives, and how derivative instruments affect an entity’s results of operations and financial position. Management is currently evaluating the implications of SFAS No. 161 and the impact on the Funds’ financial statement disclosures.
Repurchase agreements. Each Fund may engage in repurchase agreement transactions whereby the Fund takes possession of an underlying debt instrument subject to an obligation of the seller to repurchase the instrument from the Fund and an obligation of the Fund to resell the instrument at an agreed upon price and term. At all times, the Fund maintains the value of collateral, including accrued interest, of at least 100% of the amount of the repurchase agreement, plus accrued interest. If the seller defaults or the fair value of the collateral declines, realization of the collateral by the Funds may be delayed or limited.
Futures & options. Each Fund, except Money Market, may engage in transactions in financial futures contracts and options contracts in order to manage the risk of unanticipated changes in market values of securities held in the fund, or which it intends to purchase. The futures and options contracts are adjusted by the daily exchange rate of the underlying currency, or index, and any gains or losses are recorded for financial statement purposes as unrealized gains or losses in the statement of assets and liabilities and the statement of operations until the contract settlement date, at which time realized gains and losses are included in the statement of operations.
To the extent that the Fund enters into futures contracts on an index or group of securities, the Fund exposes itself to an indeterminate liability and will be required to pay or receive a sum of money measured by the change in the value of the index. Upon entering into a futures contract, the Fund is required to deposit an initial margin, which is either cash or securities in an amount equal to a certain percentage of the contract value. As of December 31, 2008, a portion of cash held at broker is restricted as a maintenance margin requirement, as required by the broker. Subsequently, the variation margin, which is equal to changes in the daily settlement price or last sale price on the exchanges where futures contracts trade, is received or paid and is recorded as an unrealized gain or loss until the contract is closed. When the contract is closed, the Fund records a realized gain or loss equal to the difference between the proceeds from (or cost of) the closing transaction and the Fund’s basis in the contract. Should market conditions move unexpectedly, the Fund may not achieve the anticipated benefits of the futures contract and may realize a loss. The use of futures transactions involves the risk of imperfect correlation in movements in the price of futures contracts, interest rates, and the underlying hedged assets.
Call and put option contracts involve the payment of a premium for the right to purchase or sell an individual security or index aggregate at a specified price until the expiration of the contract. Such transactions expose the Fund to the loss of the premium paid if the Fund does not sell or exercise the contract prior to the expiration date. In the case of a call
option, sufficient cash or money market instruments will be segregated to complete the purchase. Options are valued on the basis of the daily settlement price or last sale on the exchanges where they trade and the changes in value are recorded as unrealized appreciation or depreciation until closed, exercised or expired.
The Funds may write covered call or put options for which premiums received are recorded as liabilities and are subsequently adjusted to the current value of the options written. When written options are closed or exercised, premiums received are offset against the proceeds paid, and the Fund records realized gains or losses for the difference. When written options expire, the liability is eliminated, and the Fund records realized gains for the entire amount of premiums received.
Federal income taxes. It is each Fund’s policy to continue to comply with the requirements of Subchapter M of the Internal Revenue Code applicable to regulated investment companies and to distribute substantially all of its taxable income and net capital gains to its shareholders. Therefore, no federal income tax provision is required.
The Funds adopted the provisions of Financial Accounting Standards Board Interpretation No. 48 (“FIN 48”), “Accounting for Uncertainty in Income Taxes”, in 2007. The implementation of FIN 48 resulted in no material liability for unrecognized tax benefits and no material changes to the beginning net asset values of the Funds.
As of and during the year ended December 31, 2008, the Funds did not have a liability for any unrecognized tax benefits. The Funds recognize interest and penalties, if any, related to unrecognized tax benefits as income tax expense in the statements of operations. During the year ended December 31, 2008, the Funds did not incur any interest or penalties.
The Funds are not subject to examination by U.S. federal and state tax authorities for tax years before 2005.
Distributions to shareholders. Distributions to shareholders are recorded on the ex-dividend date. Muirfield, Quantex, Dynamic, Aggressive, Defensive, and Strategic declare and pay dividends from net investment income, if any, on a quarterly basis. Utilities declares and pays dividends from net investment income on a monthly basis. Bond and Money Market declare dividends from net investment income on a daily basis and pay such dividends on a monthly basis. Each Fund distributes net capital gains, if any, on an annual basis.
Distributions from net investment income and from net capital gains are determined in accordance with income tax regulations, which may differ from GAAP. These differences are primarily due to deferrals of certain losses, expiring capital loss carryforwards, and differing treatments of unrealized gains and losses of futures contracts held by each Fund. Accordingly, timing differences relating to shareholder distributions are reflected in the components of net assets and permanent book and tax differences have been reclassified within the components of net assets based on their ultimate characterization for federal income tax purposes. For the year ended December 31, 2008, net investment income was reclassified to accumulated undistributed realized gain in the amount of $159 for Bond. For Utilities, $50,532 of ordinary income and $2,597 of long-term gains were recognized for federal tax purposes, but were not reflected in current year income for book purposes, and $59,813 of over distributions from net investment income were redesignated as return of paid-in-capital.
Investment income & expenses. For Money Market, income and expenses (other than expenses attributable to a specific class) are allocated to each class of shares based on its relative net assets. Expenses incurred by the Trust that do not specifically relate to an individual Fund of the Trust are allocated to the Funds based on each Fund’s relative net assets or other appropriate basis.
Capital Share Transactions. Money Market is authorized to issue an indefinite number of shares in the Retail Class and the Institutional Class. Transactions in the capital shares of the Fund for the year ended December 31, 2008 and the year ended December 31, 2007 were as follows:
| | | | | | | | | | | | | | |
| | | 2008 | | | 2007 | |
| | | Amount | | | Shares | | | Amount | | | Shares | |
Retail Class | | | | | | | | | | | | | | |
Issued | | $ | 217,175,811 | | | 217,175,811 | | | $ | 196,554,206 | | | 196,554,206 | |
Reinvested | | | 4,945,212 | | | 4,945,212 | | | | 8,603,255 | | | 8,603,255 | |
Redeemed | | | (256,368,000 | ) | | (256,368,000 | ) | | | (169,319,266 | ) | | (169,319,266 | ) |
Net increase (decrease) | | $ | (34,246,977 | ) | | (34,246,977 | ) | | $ | 35,838,195 | | | 35,838,195 | |
Institutional Class | | | | | | | | | | | | | | |
Issued | | $ | 137,450,135 | | | 137,450,135 | | | $ | 32,830,469 | | | 32,830,469 | |
Reinvested | | | 456,231 | | | 456,231 | | | | 733,656 | | | 733,656 | |
Redeemed | | | (80,945,889 | ) | | (80,945,889 | ) | | | (37,348,447 | ) | | (37,348,447 | ) |
Net increase (decrease) | | $ | 56,960,477 | | | 56,960,477 | | | $ | (3,784,322 | ) | | (3,784,322 | ) |
Other. The Funds record security transactions on the trade date. Gains and losses realized from the sale of securities are determined on the specific identification basis. Dividend income is recognized on the ex-dividend date and interest income (including amortization of premium and accretion of discount) is recognized as earned.
Effective September 19, 2008, Money Market has participated in the U.S. Treasury’s Temporary Guarantee Program for money market funds. The guarantee provides coverage to the total number of shares held in Money Market as of the close of business on September 19, 2008 less redemptions since September 19, 2008. The program covers all retail and institutional class money market funds that are regulated under Rule 2a-7 of the Investment Company Act of 1940, are publicly offered, are registered with the Securities and Exchange Commission, and maintain a stable share price of $1. The expense to participate in the program is included in the Insurance Expense disclosed in the Statements of Operations in this annual report. The insurance was extended to cover the Fund until April 30, 2009.
2. Investment Transactions
For the year ended December 31, 2008, the cost of purchases and proceeds from sales or maturities of long-term investments for the Funds were as follows:
| | | | | | |
| | | Purchases | | Sales |
The Muirfield Fund® | | $ | 119,582,325 | | $ | 88,525,344 |
The Dynamic Growth Fund | | | 137,445,184 | | | 57,981,146 |
The Aggressive Growth Fund | | | 58,633,479 | | | 51,093,037 |
The Defensive Balanced Fund | | | 63,262,034 | | | 95,718,083 |
The Strategic Growth Fund | | | 57,282,828 | | | 81,285,398 |
The Quantex Fund™ | | | 5,741,175 | | | 8,497,839 |
The Total Return Utilities Fund | | | 10,950,791 | | | 11,658,248 |
The U.S. Government Bond Fund | | | 17,666,698 | | | 15,501,620 |
For the year ended December 31, 2008, included above are the cost of purchases and proceeds from sales or maturities of long-term U.S. Government investments for the Funds as follows:
| | | | | | |
| | | Purchases | | Sales |
The Defensive Balanced Fund | | $ | 4,367,279 | | $ | — |
The U.S. Government Bond Fund | | | 16,704,816 | | | 15,022,280 |
3. Investment Advisory Fees and Other Transactions with Affiliates
Meeder Asset Management, Inc. (“MAM”), a wholly-owned subsidiary of Meeder Financial, Inc. (“Meeder”), provides each Fund, under a separate Investment Advisory Contract, with investment management, research, statistical and advisory services. The services of MAM will terminate automatically if assigned and may be terminated without penalty at any time upon 60 days prior written notice by majority vote of the Fund, by the Trustees of the Fund, or by MAM. Under a separate Investment Subadvisory Agreement with MAM, Miller/Howard Investments, Inc. (“Miller/Howard”) serves as subadvisor of Utilities. The Investment Subadvisory Agreement provides that it will terminate automatically if assigned, and that it may be terminated by MAM without penalty to the Fund by MAM, the Trustees of the Fund, or by the vote of a majority of the outstanding voting securities of the Fund upon not less than 30 days written notice.
For such services the Funds pay a fee at the following annual rates: Muirfield, Utilities, and Quantex, 1.00% of average daily net assets up to $50 million, 0.75% of average daily net assets exceeding $50 million up to $100 million and 0.60% of average daily net assets exceeding $100 million. As subadvisor to Utilities, Miller/Howard is paid 0.00% of the 1.00% of average daily net assets up to $10 million, 0.40% of the 1.00% of average daily net assets exceeding $10 million up to $50 million, 0.40% of the 0.75% of average daily net assets exceeding $50 million up to $60 million, 0.30% of the 0.75% of average daily net assets exceeding $60 million up to $100 million and 0.25% of the 0.60% of average daily net assets exceeding $100 million; Dynamic, Aggressive, Defensive, and Strategic, 0.75% of average daily net assets up to $200 million and 0.60% of average daily net assets exceeding $200 million; Bond, 0.40% of average daily net assets up to $100 million and 0.20% of average daily net assets exceeding $100 million; and Money Market, 0.40% of average daily net assets up to $100 million and 0.25% of average daily net assets exceeding $100 million. MAM has contractually agreed to reduce its investment advisory fee by 0.25% for Quantex. During the year ended December 31, 2008, $34,016 of investment advisory fees were waived in Quantex. During the year ended December 31, 2008, MAM voluntarily agreed to reduce $284,788 of investment advisory fees in Money Market.
The Chief Compliance Officer (“CCO”) of the Trust provides the Trust with certain compliance services. In compensation for such services, the Trust pays the CCO an annual fee of $46,350, plus out-of-pocket expenses.
Mutual Funds Service Co. (“MFSCo”), a wholly-owned subsidiary of Meeder, serves as stock transfer, dividend disbursing and shareholder services agent for each Fund. In compensation for such services, each Fund pays MFSCo an annual fee calculated as follows: For Muirfield, Utilities, Quantex, Dynamic, Aggressive, Defensive, and Strategic, such fee is equal to the greater of $15 per active shareholder account or 0.12% of each Fund’s average daily net assets. For Bond, such fee is equal to the greater of $15 per active shareholder account or 0.08% of the Fund’s average daily net assets. For Money Market Retail Class and Money Market Institutional Class, such fee is equal to the greater of $20 per active shareholder account or 0.08% of the Fund’s average daily net assets. MFSCo is entitled to receive an annual minimum fee of $4,000 for each Fund or class. For Funds that are subject to an expense cap and which are above the expense cap, the basis point fee will be reduced by 0.02%. During the year ended December 31, 2008, MFSCo waived $2,932 and $46,629 of transfer agent fees for Bond and Money Market, respectively. MFSCo also voluntarily waived $33,416 and $25,991 of transfer agent fees for Defensive and Strategic, respectively, during the year ended December 31, 2008, and voluntarily waived $20,612 and $19,128 of transfer agent fees for Muirfield and Dynamic, respectively, during the period June 13, 2008 through December 31, 2008.
MFSCo provides the Trust with certain administrative services. In compensation for such services, each Fund pays MFSCo an annual fee equal to 0.10% of each Fund’s average daily net assets up to $50 million and 0.08% of each Fund’s average daily net assets exceeding $50 million.
MFSCo serves as accounting services agent for each Fund. In compensation for such services, each Fund pays MFSCo an annual fee equal to the greater of:
| | a. | 0.15% of the first $10 million of average daily net assets, 0.10% of the next $20 million of average daily net assets, 0.02% of the next $50 million of average daily net assets, and 0.01% in excess of $80 million of average daily net assets, or |
| | b. | $7,500 for non-Money Market Funds and $30,000 for Money Market. |
For the year ended December 31, 2008, MAM voluntarily agreed to reduce its fees and/or reimburse expenses (excluding brokerage fees and commissions, taxes, interest, and extraordinary or non-recurring expenses), to limit Bond’s total annual operating expenses to 0.99% of average daily net assets. Beginning September 2, 2008, such operating expense limitations were also implemented for Muirfield, Dynamic, Aggressive, Defensive, and Strategic in the amounts of 1.35%, 1.32%, 1.39%, 1.39%, and 1.39%, respectively, of average daily net assets. On October 16, 2008, such limitation was increased to 1.35% for Dynamic. Effective November 14, 2008, the limitations for Muirfield, Dynamic, Aggressive, Defensive, and Strategic increased to 1.53%, 1.53%, 1.57%, 1.57%, and 1.57%, respectively. Finally, effective November 21, 2008, the limitations for Muirfield, Dynamic, Aggressive, Defensive, and Strategic increased to 1.56%, 1.56%, 1.60%, 1.60%, and 1.60%, respectively. MAM has also voluntarily agreed to reduce its fees and/or reimburse expenses to limit the Retail Class’ and the Institutional Class’ total annual operating expenses. Those limitations were 0.48% and 0.34%, respectively, of average daily net assets for the period January 1, 2008 through September 29, 2008. For the period September 30, 2008 through October 22, 2008, those limitations were 0.52% and 0.38%, respectively, of average daily net assets for the Retail Class and the Institutional Class. Finally, for the period October 23, 2008 through December 31, 2008, the limitations were 0.53% and 0.39%, respectively, of average daily net assets for the Retail Class and the Institutional Class. Such reductions and/or reimbursements are limited to the total of fees charged to each Fund or Class by MAM and MFSCo. For the year ended December 31, 2008, MAM and/or MFSCo reimbursed $35,304, $19,397, $24,185, $17,013, $17,042, $69,124, $125,780, and $54,974 to Muirfield, Dynamic, Aggressive, Defensive, Strategic, Bond, the Retail Class, and the Institutional Class, respectively.
Muirfield, Dynamic, Aggressive, Defensive, and Strategic have entered into an agreement with the Trust’s custodian, The Huntington National Bank (“HNB”), whereby HNB receives distribution, service, and administration fees (collectively the “fees”) from the underlying security holdings of the aforementioned Funds. Prior to June 1, 2008, HNB retained 0.03% of the fees collected and forwarded the remainder to the appropriate Funds. From June 1, 2008 through December 31, 2008, HNB forwarded all fees collected to the appropriate Funds. The Funds use their portion of the fees received to reduce the gross expenses of each Fund. For the year ended December 31, 2008, Muirfield, Dynamic, Aggressive, Defensive, and Strategic used $69,016, $58,273, $7,765, $5,562, and $6,714 of fees received, respectively, to reduce gross expenses of each Fund. It is possible that the Funds may invest in security holdings in
which fees are not paid. As such, the gross expenses of a Fund would not be decreased. Also, without this agreement it is likely that the Funds would not collect any fees from underlying security holdings.
Pursuant to Rule 12b-1 of the 1940 Act, a mutual fund can adopt a written plan to pay certain expenses out of fund assets relating to the sale and distribution of its shares. Muirfield, Quantex, Bond, and the Retail Class have adopted a distribution plan with an annual limitation of 0.20% of average daily net assets. Utilities, Dynamic, Aggressive, Defensive, and Strategic have adopted a distribution plan with an annual limitation of 0.25% of average daily net assets. The Institutional Class has adopted a distribution plan with an annual limitation of 0.03% of average daily net assets. For the year ended December 31, 2008, Muirfield, Utilities, Quantex, Dynamic, Aggressive, Defensive, Strategic, and Bond waived $66,599, $11,867, $16,600, $30,530, $6,348, $20,526, $14,479, and $5,570 of distribution plan (12b-1) expenses, respectively. The Retail Class and the Institutional Class waived $249,030 and $8,865, respectively, for a total of $257,895.
An Administrative Services Plan has been adopted for each Fund of the Trust except Money Market. The Administrative Services Plan allows for each eligible Fund to pay a maximum annual amount of 0.20% of average daily net assets to Service Organizations that provide administrative support services to their customers who own Shares of record or beneficially. For the year ended December 31, 2008, Muirfield, Utilities, Quantex, Dynamic, Aggressive, and Bond waived $78,847, $30,250, $22,042, $47,046, $20,631, and $7,769 of administrative service plan expenses, respectively.
The Funds have adopted a Deferred Compensation Plan (the “Plan”) for the independent Trustees. Under the Plan, each eligible Trustee is permitted to defer all or a portion of the trustees fees payable by any of the Funds as an investment into any combination of Funds until a specified point of time. The investment into the Funds is recorded as an asset, however an offsetting liability is also recorded for the deferred payment. Once the eligible Trustees’ deferral amounts can be distributed, a lump sum or generally equal annual installments over a period of up to ten (10) years can be made to the eligible Trustee(s). The Funds may terminate this Plan at any time.
Certain trustees and officers of the Funds are also officers or directors of Meeder, MAM, and MFSCo.
During the year ended December 31, 2008, several of the Funds invested in The Money Market Fund, an affiliate, as described in Section 2(a)(3) of the Investment Company Act of 1940. As of December 31, 2008, the 7-day yield of the Institutional Class was 1.89%. A summary of the Funds’ investments in this affiliate during the year is noted below:
| | | | | | | | | | | | | | | | | | | |
| | | 12/31/07
Balance | | Purchases | | Sales | | | 12/31/08
Cost | | Income | | 12/31/08
Value |
The Muirfield Fund® | | $ | — | | $ | 63,217,086 | | $ | (24,215,838 | ) | | $ | 39,001,248 | | $ | 249,893 | | $ | 39,001,248 |
The Dynamic Growth Fund | | | — | | | 28,055,239 | | | (24,859,047 | ) | | | 3,196,192 | | | 39,922 | | | 3,196,192 |
The Aggressive Growth Fund | | | — | | | 6,455,753 | | | (6,222,234 | ) | | | 233,519 | | | 3,952 | | | 233,519 |
The Defensive Balanced Fund | | | — | | | 22,001,827 | | | (10,722,968 | ) | | | 11,278,859 | | | 69,158 | | | 11,278,859 |
The Strategic Growth Fund | | | — | | | 10,885,914 | | | (8,999,826 | ) | | | 1,886,088 | | | 11,558 | | | 1,886,088 |
The Quantex Fund™ | | | — | | | 1,994,065 | | | (1,669,600 | ) | | | 324,465 | | | 2,542 | | | 324,465 |
The Total Return Utilities Fund | | | — | | | 1,884,790 | | | (1,666,489 | ) | | | 218,301 | | | 2,612 | | | 218,301 |
The U.S. Government Bond Fund | | | — | | | 6,084,941 | | | (5,523,859 | ) | | | 561,082 | | | 2,793 | | | 561,082 |
4. Federal Tax Information
The tax characteristics of dividends paid by the Funds during the year ended December 31, 2008 were as follows:
| | | | | | | | | | | | | | | |
| | | Ordinary
Income | | Net
Short-Term
Capital Gains | | Net
Long-Term
Capital Gains | | Tax Return
of Capital | | Total
Dividends
Paid(1) |
The Muirfield Fund® | | $ | 11,273 | | $ | — | | $ | — | | $ | — | | $ | 11,273 |
The Dynamic Growth Fund | | | 448,435 | | | — | | | 570,693 | | | — | | | 1,019,128 |
The Aggressive Growth Fund | | | 203,657 | | | — | | | — | | | — | | | 203,657 |
The Defensive Balanced Fund | | | 318,559 | | | — | | | — | | | — | | | 318,559 |
The Strategic Growth Fund | | | 175,093 | | | — | | | — | | | — | | | 175,093 |
The Quantex Fund™ | | | 320 | | | — | | | — | | | — | | | 320 |
The Total Return Utilities Fund | | | 146,913 | | | — | | | — | | | 59,813 | | | 206,726 |
The U.S. Government Bond Fund | | | 469,374 | | | — | | | — | | | — | | | 469,374 |
The Money Market Fund | | | 5,992,069 | | | — | | | — | | | — | | | 5,992,069 |
The tax characteristics of dividends paid by the Funds during the year ended December 31, 2007 were as follows:
| | | | | | | | | | | | |
| | | Ordinary
Income | | Net
Short-Term
Capital Gains | | Net
Long-Term
Capital Gains | | Total
Dividends
Paid(1) |
The Muirfield Fund® | | $ | 1,597,151 | | $ | — | | $ | — | | $ | 1,597151 |
The Dynamic Growth Fund | | | 595,277 | | | 238,705 | | | 1,041,578 | | | 1,875,560 |
The Aggressive Growth Fund | | | 132,213 | | | — | | | — | | | 132,213 |
The Defensive Balanced Fund | | | 482,437 | | | 1,399,872 | | | 1,953,406 | | | 3,835,715 |
The Strategic Growth Fund | | | 400,727 | | | 749,648 | | | 2,749,532 | | | 3,899,907 |
The Quantex Fund™ | | | 174,362 | | | — | | | — | | | 174,362 |
The Total Return Utilities Fund | | | 146,532 | | | — | | | — | | | 146,532 |
The U.S. Government Bond Fund | | | 542,339 | | | — | | | — | | | 542,339 |
The Money Market Fund | | | 9,829,339 | | | — | | | — | | | 9,829,339 |
As of December 31, 2008, the components of accumulated earnings/(deficit) on a tax basis for the Funds were as follows:
| | | | | | | | | | | | | | | | | | | |
| | | Undistributed
Ordinary
Income | | Dividends
Payable | | | Accumulated
Capital and
Other Gains
and (Losses) | | | Unrealized
Appreciation/
(Depreciation)(2) | | | Total
Accumulated
Earnings/
(Deficit) | |
The Muirfield Fund® | | $ | 414,536 | | $ | (64 | ) | | $ | (16,781,512 | ) | | $ | (16,789,363 | ) | | $ | (33,156,403 | ) |
The Dynamic Growth Fund | | | 29,283 | | | (3,335 | ) | | | (12,564,846 | ) | | | (24,148,416 | ) | | | (36,687,314 | ) |
The Aggressive Growth Fund | | | 5 | | | (5 | ) | | | (10,062,923 | ) | | | (6,675,630 | ) | | | (16,738,553 | ) |
The Defensive Balanced Fund | | | 123 | | | (123 | ) | | | (7,933,274 | ) | | | (4,107,283 | ) | | | (12,040,557 | ) |
The Strategic Growth Fund | | | — | | | — | | | | (6,478,990 | ) | | | (7,361,633 | ) | | | (13,840,623 | ) |
The Quantex Fund™ | | | 1,544 | | | (4 | ) | | | (2,215,932 | ) | | | (5,402,166 | ) | | | (7,616,558 | ) |
The Total Return Utilities Fund | | | 1,790 | | | (1,790 | ) | | | (343,105 | ) | | | (4,934,876 | ) | | | (5,277,981 | ) |
The U.S. Government Bond Fund | | | 3,603 | | | (1,752 | ) | | | (718,958 | ) | | | 287,615 | | | | (429,492 | ) |
The Money Market Fund | | | 128,507 | | | (128,507 | ) | | | — | | | | — | | | | — | |
| (1) | Total dividends paid may differ from the amount reported in the Statement of Changes in Net Assets because for tax purposes dividends are recognized when actually paid. |
| (2) | The differences between book- and tax-basis unrealized appreciation/(depreciation) are attributable primarily to: deferral of post October losses, wash sales, and the realization for tax purposes of unrealized gains/(losses) on certain derivative instruments. |
For federal income tax purposes, the following Funds have capital loss carryforwards as of December 31, 2008, which are available to offset future capital gains, if any. To the extent that these carryforwards are used to offset future capital gains, it is probable that the gains that are offset will not be distributed to shareholders:
| | | | | |
| | | Amount | | Expires |
The Muirfield Fund® | | $ | 387,760 | | 2010 |
The Muirfield Fund® | | | 16,393,752 | | 2016 |
The Dynamic Growth Fund | | | 12,564,846 | | 2016 |
The Aggressive Growth Fund | | | 3,287,233 | | 2010 |
The Aggressive Growth Fund | | | 6,775,690 | | 2016 |
The Defensive Balanced Fund | | | 7,933,274 | | 2016 |
The Strategic Growth Fund | | | 6,478,990 | | 2016 |
The Quantex Fund™ | | | 234,839 | | 2010 |
The Quantex Fund™ | | | 1,249,666 | | 2011 |
The Quantex Fund™ | | | 731,427 | | 2016 |
The Total Return Utilities Fund | | | 343,105 | | 2011 |
The U.S. Government Bond Fund | | | 338,199 | | 2011 |
The U.S. Government Bond Fund | | | 125,708 | | 2012 |
The U.S. Government Bond Fund | | | 141,817 | | 2013 |
The U.S. Government Bond Fund | | | 113,234 | | 2014 |
Under current tax laws, net capital losses incurred after October 31, within a Fund’s fiscal year, are deemed to arise on the first business day of the following fiscal year for tax purposes. For the year ended December 31, 2008, Muirfield, Dynamic, Aggressive, Defensive, Strategic, Quantex, Utilities, and Bond deferred post October losses in the amounts of $3,025,760, $5,643,153, $1,316,826, $1,561,273, $434,813, $5,110, $236,123, and $3,378, respectively.
5. Control Ownership
The beneficial ownership, either directly or indirectly, of more than 25% of the voting securities of a fund creates a presumption of control of the fund under Section 2(a)(9) of the 1940 Act. As of December 31, 2008, Charles Schwab & Co., Inc. held for the benefit of others, in aggregate, 41% of Utilities; Nationwide Trust Company, FSB held for the benefit of others, in aggregate, 99% of Defensive; Nationwide Trust Company, FSB held for the benefit of others, in aggregate, 98% of Strategic; Nationwide Trust Company, FSB held for the benefit of others, in aggregate, 84% of Dynamic; Nationwide Trust Company, FSB held for the benefit of others, in aggregate, 84% of Aggressive; Nationwide Trust Company, FSB held for the benefit of others, in aggregate, 64% of Muirfield; Carey & Co. held for the benefit of others, in aggregate, 32% of Quantex; Nationwide Trust Company, FSB held for the benefit of others, in aggregate, 70% of Bond; and Carey & Co. held for the benefit of others, in aggregate, 85% of Institutional Class and therefore may be deemed to control the Funds.
6. Board Review of Investment Advisory and Subadvisory Agreements (unaudited)
At a meeting held September 4, 2008, the Board of Trustees (the “Board”), including a majority of non-interested or independent Trustees, approved the renewal of the investment advisory agreements for the nine separate funds comprising The Flex-funds (the “Funds”) and the investment sub-advisory agreement relating to The Total Return Utilities Fund (individually, an “Agreement” and collectively, the “Agreements”).
The Board reviewed materials sent to each Trustee in advance of the meeting for consideration in determining whether to approve the renewal of each Fund’s Agreements. Management reviewed with the Trustees the materials prepared by them in response to Funds’ legal counsel’s supplemental written request pursuant to Section 15(c) of the Investment Company Act of 1940 for the provision to the Trustees of appropriately updated and amended information necessary or appropriate to assist the Trustees in their deliberations concerning renewal of the Agreements. In reaching the decision to renew the Agreements, the Board also took into account information furnished throughout the year at regular Board meetings. Information furnished and discussed throughout the year included investment performance reports and related financial information for each Fund, as well as periodic reports on shareholder services, legal compliance, pricing, brokerage commissions and execution and other services provided by the investment manager, Meeder Asset Management, Inc. (“Manager”) and its affiliates, or by or on behalf of The Total Return Utilities Fund’s Subadviser, Miller/Howard Investments, Inc. Information furnished specifically in connection with the renewal process included a report for the Funds prepared by Lipper Financial Services (“Lipper”), an independent organization, as well as a Funds’
profitability analysis prepared by the Manager. The Lipper report compared each Fund’s management fees and expenses with those of other mutual funds deemed comparable to the Fund. The Funds’ profitability analysis discussed the profitability to the Manager and Mutual Funds Service Co., an affiliate of the Manager, from the overall Funds’ operations utilizing expense allocation methodologies deemed reasonable by the Manager.
In considering such materials, the independent Trustees noted that they had received assistance and advice from and met separately with the Funds’ legal counsel and chief compliance officer prior to this meeting. In their deliberations, the Board dealt with each Fund separately. In approving continuance of the Agreement for each Fund, the Board, including a majority of independent Trustees, considered each Fund’s Agreement, a copy of which was made available at the meeting, and determined that the existing management fee structure was fair and reasonable and that continuance of the Agreement was in the best interests of each Fund and its shareholders. While attention was given to all information furnished, the following discusses the primary factors relevant to the Board’s decision.
Nature, Extent and Quality of Services. The Board continues to be satisfied with the nature and quality of the overall services provided by the Manager and its affiliates to the Funds and their shareholders. In addition to investment performance and expenses discussed earlier, the Board’s opinion was based, in part, upon periodic reports furnished them showing that the investment policies and restrictions for each Fund were consistently complied with as well as other reports periodically furnished the Board. Other factors taken into account by the Board were the Manager’s compliance procedures and the qualifications of the Manager’s chief compliance officer. Consideration was also given to the experience of each Fund’s portfolio management team. The Board also took into account the transfer agent, fund accounting agent and administrative services provided to Fund shareholders by an affiliate of the Manager, noting continuing expenditures by management to increase and improve the scope of such services. Similar considerations were applied to the Subadviser to The Total Return Utilities Fund.
Investment Performance. The Board placed emphasis on the investment performance of each Fund in view of its importance to shareholders. While consideration was given to performance reports and discussions with portfolio managers at Board meetings during the year, particular attention in assessing performance was given to the Lipper reports furnished for the Agreement renewals. The Lipper report prepared for each Fund showed the investment performance of the Fund for the one-, three-, and five-year periods, as applicable, ended May 31, 2008 (the “relevant periods”) in comparison with a performance universe similar to each Fund’s investment objectives.
| | |
Fund | | Performance Benchmark |
The Muirfield Fund® | | Blended Benchmark of 60% S&P 500 Index and
40% T-bill, S&P 500 Index, Lipper’s Average
Flexible Portfolio Fund Universe, Lipper Index(1) |
| |
The Quantex Fund™ (Formerly The Highlands Growth Fund) | | Russell 2000 Index, S&P 400 Mid-Cap Index,
Lipper’s Average Multi-Cap Core Fund Universe,
Lipper Index(1) |
| |
The Dynamic Growth Fund | | S&P 500 Index, Lipper’s Average Multi-Cap Core
Fund Universe, Lipper Index(1) |
| |
The Total Return Utilities Fund (Formerly The Socially Responsible
Utilities Fund) | | Russell 3000 Utilities Index, Blended Index of 60%
Russell 3000 Utilities and 40% Lehman Brothers
Long Credit Index, S&P 500 Utilities Index, Lipper’s
Average Utility Fund Universe, Lipper Index(1) |
| |
The U.S. Government Bond Fund | | Lehman Brothers Intermediate Government/Credit
Index, Lipper’s Average General U.S. Government
Fund Universe, Lipper Index(1) |
| |
The Aggressive Growth Fund | | NASDAQ Composite Index, Lipper’s Average Multi-
Cap Growth Fund Universe, Lipper Index(1) |
| |
The Defensive Balanced Fund (Formerly The Defensive Growth Fund) | | S&P 500 Index, Blended Benchmark of 60% S&P
500 Index and 40% 90-day T-Bills, Lipper’s
Average Flexible Portfolio Fund Universe, Lipper
Index(1) |
| (1) | Given an adequate quantity of funds, the Lipper Index for a given investment classification or objective consists of the largest ten or thirty funds in that classification or objective. Each index is calculated daily with adjustments for dividends and capital gains. |
| | |
Fund | | Performance Benchmark |
The Strategic Growth Fund (Formerly The Focused Growth Fund) | | S&P 500 Index, Lipper’s Average Multi-Cap Core
Fund Universe, Lipper Index(1) |
| |
The Money Market Fund | | |
| |
Retail Class | | Lipper Average General Purpose Money Market
Fund |
| |
Institutional Class | | iMoneyNet’s Average General Purpose Institutional
Money Market Fund |
| (1) | Given an adequate quantity of funds, the Lipper Index for a given investment classification or objective consists of the largest ten or thirty funds in that classification or objective. Each index is calculated daily with adjustments for dividends and capital gains. |
Comparative Expenses. Consideration was given to a comparative analysis of the management fees and total expense ratios of each Fund compared with those of a group of other funds.
Management Profitability. The Board also considered the level of profits realized by the Manager and its affiliates in connection with the operation of the Funds. In this respect, the Board reviewed the Funds’ profitability analysis that addresses the overall profitability of The Flex-funds’ business. The Board also considered the extent to which the Manager and its affiliates might derive ancillary benefits from fund operations, including potential benefits resulting from allocation of fund brokerage and the declining use of “soft” commission dollars to pay for research. The Board also took into account management’s expenditures in improving shareholder services provided to the Funds, as well as the need to meet additional regulatory and compliance requirements resulting from the Sarbanes-Oxley Act and recent SEC requirements. The Board determined that the level of profits realized by the Manager under its Agreements with the Funds was not excessive in view of the nature, quality and extent of services provided.
Economies of Scale. The Board also considered whether economies of scale are realized by the Manager as the Funds grow larger and the extent to which this is reflected in the level of management fees charged. While recognizing that any precise determination is inherently subjective, the Board noted that based upon the Funds’ profitability analysis, it appears that as some Funds get larger, at some point economies of scale do result in the Manager realizing a larger profit margin on management services provided to such a Fund. The Board also noted that economies of scale are shared with each Fund and its shareholders through management fee breakpoints so that as a Fund grows in size, its effective management fee rate declines. The Board reviewed, and expressed continued satisfaction with, each Fund’s fee structure under its Agreement, as well as The Total Return Utilities Fund’s fee structure under the investment subadvisory agreement with Miller/Howard Investments, Inc.
To The Shareholders and
Board of Trustees of
The Flex-funds
REPORT OF INDEPENDENT REGISTERED PUBLIC ACCOUNTING FIRM
We have audited the accompanying statements of assets and liabilities, including the schedules of investments, of The Flex-funds (the “Funds”), comprising The Muirfield Fund, The Dynamic Growth Fund, The Aggressive Growth Fund, The Defensive Balanced Fund, The Strategic Growth Fund, The Quantex Fund, The Total Return Utilities Fund, The U.S. Government Bond Fund, and The Money Market Fund, as of December 31, 2008, and the related statements of operations for the year then ended, statements of changes in net assets for each of the two years in the period then ended, and the financial highlights for each of the five years in the period then ended for The Muirfield Fund, The Dynamic Growth Fund, The Aggressive Growth Fund, The Quantex Fund, The Total Return Utilities Fund, The U.S. Government Bond Fund, and The Money Market Fund, and financial highlights for each of the three periods in the period then ended for The Defensive Balanced Fund and The Strategic Growth Fund. These financial statements and financial highlights are the responsibility of Fund management. Our responsibility is to express an opinion on these financial statements and financial highlights based on our audits.
We conducted our audits in accordance with the standards of the Public Company Accounting Oversight Board (United States). Those standards require that we plan and perform the audit to obtain reasonable assurance about whether the financial statements and financial highlights are free of material misstatement. An audit includes examining, on a test basis, evidence supporting the amounts and disclosures in the financial statements. Our procedures included confirmation of securities owned as of December 31, 2008, by correspondence with the custodian and brokers. An audit also includes assessing the accounting principles used and significant estimates made by management, as well as evaluating the overall financial statement presentation. We believe that our audits provide a reasonable basis for our opinion.
In our opinion, the financial statements and financial highlights referred to above present fairly, in all material respects, the financial position of each of the funds constituting The Flex-funds, as of December 31, 2008, the results of their operations, the changes in their net assets, and their financial highlights for the periods indicated herein, in conformity with accounting principles generally accepted in the United States of America.
Cohen Fund Audit Services, Ltd.
Westlake, Ohio
February 18, 2009
Trustees and Officers (unaudited)
Certain trustees and officers of the Funds are also officers or directors of Meeder, MAM, and MFSCo. The Trustees oversee the management of the Trust and elect its officers. The officers are responsible for the Funds’ day-to-day operations. The Trustees’ and officers’ names, addresses, years of birth, positions held with the Trust, and length of service with The Flex-funds are listed below. Also included is each Board member’s principal occupation during, at least, the past five years. Except as indicated, each individual has held the office shown or other offices in the same company for the last five years. Those Trustees who are “interested persons”, as defined in the 1940 Act, by virtue of their affiliation with the Trust, are indicated by an asterisk (*).
| | | | | | |
Name, Address(1), and
Year of Birth | | Year First Elected a
Trustee or Officer of the Trust | | Position and
Number of Funds
Overseen(2) | | Principal
Occupation During
Past Five Years and
Other Directorships Held |
Robert S. Meeder, Jr.* Year of Birth: 1961 | | 1992 | | Trustee and President | | President of Meeder Asset Management, Inc. |
| | | |
Walter L. Ogle** Year of Birth: 1937 | | 1982 | | Trustee | | Retired; formerly Executive Vice President of Aon Consulting, an employee benefits consulting group; Lead Trustee of the Trust. |
| | | |
James W. Didion** Year of Birth: 1930 | | 1982, 1998 | | Trustee | | Retired; formerly Executive Vice President of Core Source, Inc., an employee benefit and Workers’ Compensation administration and consulting firm (1991 – 1997); Chairman of the Trust’s Audit Committee. |
| | | |
Jack W. Nicklaus** Year of Birth: 1961 | | 1998 | | Trustee | | Designer, Nicklaus Design, a golf course design firm and division of The Nicklaus Companies; Chairman of the Trust’s Nominating Committee. |
| | | |
Stuart M. Allen** Year of Birth: 1961 | | 2006 | | Trustee | | President of Gardiner Allen DeRoberts Insurance LLC, an insurance agency; Chairman of the Trust’s Performance Committee. |
| | | |
Anthony D’Angelo** Year of Birth: 1959 | | 2006 | | Trustee | | Director of Sales, WSYX ABC 6/WTTE Fox 28, television stations owned and operated by Sinclair Broadcast Group; Chairman of the Trust’s Compensation Committee. |
| | | |
Dale W. Smith Year of Birth: 1959 | | 2006 | | Vice President | | Chief Financial Officer of Meeder Asset Management, Inc. (2005 - present); formerly Senior Vice President of Financial Services of BISYS Fund Services (1996 – 2004). |
Trustees and Officers (unaudited) (continued)
| | | | | | |
Name, Address(1), and
Year of Birth | | Year First Elected a
Trustee or Officer of the Trust | | Position and
Number of Funds
Overseen(2) | | Principal
Occupation During
Past Five Years and
Other Directorships Held |
David R. Carson Year of Birth: 1958 | | 2006 | | Chief Compliance Officer | | Chief Compliance Officer and Anti-Money Laundering Officer of the Huntington Funds and Huntington VA Funds (2005 – present); Treasurer and Assistant Treasurer of the Huntington Funds, Huntington Asset Advisors, Inc. (2002 – 2005). |
| | | |
Bruce E. McKibben Year of Birth: 1969 | | 2002 | | Treasurer | | Director of Fund Accounting of Mutual Funds Service Co., the Trust’s transfer agent (1997 – present). Interim Chief Operating Officer of Meeder Asset Management, Inc. (June 2008 – October 2008). |
| (1) | The address of each Trustee is 6125 Memorial Drive, Dublin, OH 43017. |
| (2) | Each Trustee serves for an indefinite term, until his or her resignation, death, or removal. Each Trustee oversees all nine Funds in the Trust. |
| * | Robert S. Meeder, Jr. is deemed an “interested person” of the Trust by virtue of his position as President of Meeder Asset Management, Inc., the Advisor of the Trust. |
| ** | Each independent Trustee is a member of the Trust’s Audit Committee, Performance Committee, Compensation Committee, and Nominating Committee. |
The Statement of Additional Information includes additional information about each Trustee and is available without charge. To obtain a copy of the Statement of Additional Information, please contact your financial representative or call toll free 1-800-325-3539.
Other Information
The Funds file their complete schedules of portfolios holdings with the Securities and Exchange Commission (“SEC”) for the first and third quarters of each fiscal year on Form N-Q. The Funds’ Forms N-Q are available on the SEC’s website at http://www.sec.gov and may be reviewed and copied at the SEC’s Public Reference Room in Washington, DC. Information on the operation of the Public Reference Room may be obtained by calling 1-800-SEC-0330. The Funds’ schedules of positions are also available on the Funds’ website at www.flexfunds.com.
A description of the policies and procedures that the Funds use to determine how to vote proxies relating to portfolio securities, and information regarding how the Funds voted these proxies for the 12-month period ended June 30, 2008, is available on the SEC’s website at http://www/sec.gov, or, without charge, upon request by calling toll-free 1-800-325-3539.
| | |
| The Flex-funds® | | 2008 Annual Report | December 31, 2008 |
Manager and Investment Advisor
Meeder Asset Management, Inc.
6125 Memorial Drive
P.O. Box 7177
Dublin, Ohio 43017
Subadvisor / The Total Return Utilities Fund
Miller/Howard Investments, Inc.
141 Upper Byrdcliffe Road, P.O. Box 549
Woodstock, New York 12498
Board of Trustees
James Didion
Robert S. Meeder, Jr.
Jack Nicklaus II
Walter L. Ogle
Anthony D’Angelo
Stuart Allen
Custodian
The Huntington National Bank
Columbus, Ohio 43215
Transfer Agent & Dividend Disbursing Agent
Mutual Funds Service Co.
6125 Memorial Drive
Dublin, Ohio 43017
Independent Registered Public Accounting Firm
Cohen Fund Audit Services, LTD
800 Westpoint Parkway, Suite 1100
Westlake, Ohio 44145
| | |
| | | The Flex-funds® 2008 Annual Report | December 31, 2008 |

Item 2. Code of Ethics.
The registrant has adopted a code of ethics that applies to the registrant’s principal executive officer, principal financial officer, comptroller or principal accounting officer, and any person who performs a similar function.
Item 3. Audit Committee Financial Expert.
Currently, The Flex-funds (the “Funds”) do not have an Audit Committee member who possesses all of the attributes required to be an “audit committee financial expert” as defined in instruction 2(b) of Item 3 of Form N-CSR. However, the Board of Trustees believes that each member of the Audit Committee has substantial experience relating to the review of financial statements and the operations of audit committees. Accordingly, the Board of Trustees believes that the members are qualified to evaluate the Funds’ financial statements, supervise the Funds’ preparation of its financial statements, and oversee the work of the Funds’ independent auditors. The Board of Trustees also believes that, although no single Audit Committee member possesses all of the attributes required to be an “audit committee financial expert”, the Audit Committee members collectively as a group possess the attributes required to be an “audit committee financial expert.”
Item 4. Principal Accountant Fees and Services.
(a) – (d) Aggregate fees billed to the registrant for the last two fiscal years for professional services rendered by the registrant’s principal accountant were as follows:
| | | | | | |
| | | 2008 | | 2007 |
Audit Fees | | $ | 61,000 | | $ | 59,500 |
Audit-Related Fees | | | 2,525 | | | 2,200 |
Tax Fees | | | 19,800 | | | 18,900 |
All Other Fees | | | 2,750 | | | 3,000 |
Audit fees include amounts related to the audit of the registrant’s annual financial statements and services normally provided by the accountant in connection with statutory and regulatory filings. Audit-related fees include amounts
reasonably related to the performance of the audit of the registrant’s financial statements. Tax fees include amounts related to tax compliance, tax planning, and tax advice. All other fees include amounts related to the registrant’s annual filing of Form N1A.
(e)(1) A purpose of the Audit Committee is to approve the engagement of the registrant’s independent auditors (i) to render audit and non-audit services for the registrant in accordance with Rule 2-01(c)(7)(i) of Regulation S-X, subject to the waiver provisions set forth in Rule 2-01(c)(7)(i)(C) of Regulation S-X, and (ii) to render non-audit services for the registrant’s investment advisors (other than a sub-advisor whose role is primarily portfolio management and is subcontracted or overseen by another investment advisor) and any other entity controlling by, or under common control with the investment advisor that provides ongoing services to the registrant, in each case under (ii) if the engagement relates directly to the operations and financial reporting of the registrant, in accordance with Rule 2-01(c)(7)(ii) of Regulation S-X, subject to waiver provisions set forth in Rule 2-01(c)(7)(ii) of Regulation S-X.
(e)(2) 100% of services included in (b) – (d) above were approved pursuant to Rule 2-01(c)(7)(i)(C) of Regulation S-X.
(f) Not applicable.
(g) The aggregate fees billed for the most recent fiscal year and the preceding fiscal year by the registrant’s principal accountant for non-audit services rendered to the registrant, its investment advisor, and any entity controlling, controlled by, or under common control with the investment advisor that provides ongoing services to the registrant were $24,675 and $25,525 respectively.
(h) Not applicable.
Items 5. Audit Committee of Listed Registrants.
Not applicable.
Item 6. Schedule of Investments.
Not applicable.
Item 7. Disclosure of Proxy Voting Policies and Procedures for Closed-End Management Investment Companies.
Not applicable.
Item 8. Portfolio Managers of Closed-End Management Investment Companies.
Not applicable.
Item 9. Purchases of Equity Securities by Closed-End Management Investment Company and Affiliated Purchasers.
Not applicable.
Item 10. Submission of Matters to a Vote of Security Holders.
Not applicable.
Item 11. Controls and Procedures.
(a) Based on our evaluation conducted within 90 days of the filing date, hereof, the design and operation of the registrant’s disclosure controls and procedures are effective to ensure that material information relating to the registrant is made known to the certifying officers by others within the appropriate entities, particularly during the period in which Forms N-CSR are being prepared, and the registrant’s disclosure controls and procedures allow timely preparation and review of the information for the registrant’s Form N-CSR and the officer certifications of such Form N-CSR.
(b) There were no significant changes in the registrant’s internal controls or in other factors that could significantly affect these controls subsequent to the date of their evaluation, including any corrective actions with regard to significant deficiencies and material weaknesses.
Item 12. Exhibits.
(a)(1) Code of Ethics filed herewith as EX-99.CODE ETH.
(a)(2) A separate certification for each principal executive and principal financial officer of the registrant as required by Rule 30a-2(a) under the Act(17 CFR270.30a-2(a)). Filed herewith as EX-99.CERT.
(b) Certifications of principal executive officer and principal financial officer, under Section 906 of the Sarbanes-Oxley Act of 2002, and 18 U.S.C. ss.1350. Filed herewith as EX-99.906 CERT.
SIGNATURES
Pursuant to the requirements of the Securities Exchange Act of 1934 and the Investment Company Act of 1940, the registrant has duly caused this report to be signed on its behalf by the undersigned, thereunto duly authorized.
| | |
| The Flex-funds |
| |
| By: | | /s/ Bruce E. McKibben |
| | Bruce E. McKibben, Treasurer |
Date: February 20, 2009
Pursuant to the requirements of the Securities Exchange Act of 1934 and the Investment Company Act of 1940, this report has been signed below by the following persons on behalf of the registrant and in the capacities and on the dates indicated.
| | |
| By: | | /s/ Bruce E. McKibben |
| | Bruce E. McKibben, Treasurer |
Date: February 20, 2009
| | |
| By: | | /s/ Robert S. Meeder, Jr. |
| | Robert S. Meeder, Jr., President |
Date: February 20, 2009