UNITED STATES
SECURITIES AND EXCHANGE COMMISSION
Washington, D.C. 20549
FORM N-CSR
CERTIFIED SHAREHOLDER REPORT OF REGISTERED
MANAGEMENT INVESTMENT COMPANIES
Investment Company Act file number 811-3587
Fidelity Financial Trust
(Exact name of registrant as specified in charter)
82 Devonshire St., Boston, Massachusetts 02109
(Address of principal executive offices) (Zip code)
Eric D. Roiter, Secretary
82 Devonshire St.
Boston, Massachusetts 02109
(Name and address of agent for service)
Registrant's telephone number, including area code: 617-563-7000
Date of fiscal year end: | November 30 |
| |
Date of reporting period: | November 30, 2005 |
Item 1. Reports to Stockholders
| | Fidelity®
Convertible Securities
Fund
|
| | Annual Report
November 30, 2005
|


| Contents | | | | |
| |
| Chairman’s Message | | 4 | | Ned Johnson’s message to shareholders. |
| Performance | | 5 | | How the fund has done over time. |
| Management’s Discussion | | 6 | | The manager’s review of fund |
| | | | | performance, strategy and outlook. |
| Shareholder Expense | | 7 | | An example of shareholder expenses. |
| Example | | | | |
| Investment Changes | | 8 | | A summary of major shifts in the fund’s |
| | | | | investments over the past six months. |
| Investments | | 9 | | A complete list of the fund’s investments |
| | | | | with their market values. |
| Financial Statements | | 19 | | Statements of assets and liabilities, |
| | | | | operations, and changes in net assets, |
| | | | | as well as financial highlights. |
| Notes | | 23 | | Notes to the financial statements. |
| Report of Independent | | 30 | | |
| Registered Public | | | | |
| Accounting Firm | | | | |
| Trustees and Officers | | 31 | | |
| Distributions | | 41 | | |
| Proxy Voting Results | | 42 | | |
| Board Approval of | | 44 | | |
| Investment Advisory | | | | |
| Contracts and | | | | |
| Management Fees | | | | |
| | To view a fund’s proxy voting guidelines and proxy voting record for the 12 month period
ended June 30, visit www.fidelity.com/proxyvotingresults or visit the Securities and Exchange
Commission’s (SEC) web site at www.sec.gov. You may also call 1-800-544-8544 to request a free
copy of the proxy voting guidelines.
Standard & Poor’s, S&P and S&P 500 are registered service marks of The McGraw Hill Companies,
Inc. and have been licensed for use by Fidelity Distributors Corporation.
Other third party marks appearing herein are the property of their respective owners.
All other marks appearing herein are registered or unregistered trademarks or service marks
of FMR Corp. or an affiliated company.
|
Annual Report 2
This report and the financial statements contained herein are submitted for the general information
of the shareholders of the fund. This report is not authorized for distribution to prospective investors
in the fund unless preceded or accompanied by an effective prospectus.
A fund files its complete schedule of portfolio holdings with the SEC for the first and third
quarters of each fiscal year on Form N Q. Forms N Q are available on the SEC’s web site at
http://www.sec.gov. A fund’s Forms N Q may be reviewed and copied at the SEC’s Public Reference
Room in Washington, DC. Information regarding the operation of the SEC’s Public Reference
Room may be obtained by calling 1-800-SEC-0330. For a complete list of a fund’s portfolio
holdings, view the most recent quarterly holdings report, semiannual report, or annual report
on Fidelity’s web site at http://www.fidelity.com/holdings.
NOT FDIC INSURED · MAY LOSE VALUE · NO BANK GUARANTEE
Neither the fund nor Fidelity Distributors Corporation is a bank.
|
3 Annual Report
Chairman’s Message
(photograph of Edward C. Johnson 3d)
Dear Shareholder:
During the past year or so, much has been reported about the mutual fund industry, and much of it has been more critical than I believe is warranted. Allegations that some companies have been less than forthright with their shareholders have cast a shadow on the entire industry. I continue to find these reports disturbing, and assert that they do not create an accurate picture of the industry overall. Therefore, I would like to remind every one where Fidelity stands on these issues. I will say two things specifically regarding allegations that some mutual fund companies were in violation of the Securities and Exchange Commission’s forward pricing rules or were involved in so called “market timing” activities.
First, Fidelity has no agreements that permit customers who buy fund shares after 4 p.m. to obtain the 4 p.m. price. This is not a new policy. This is not to say that some one could not deceive the company through fraudulent acts. However, we are extremely diligent in preventing fraud from occurring in this manner and in every other. But I underscore again that Fidelity has no so called “agreements” that sanction illegal practices.
Second, Fidelity continues to stand on record, as we have for years, in opposition to predatory short term trading that adversely affects shareholders in a mutual fund. Back in the 1980s, we initiated a fee which is returned to the fund and, therefore, to investors to discourage this activity. Further, we took the lead several years ago in developing a Fair Value Pricing Policy to prevent market timing on foreign securities in our funds. I am confident we will find other ways to make it more difficult for predatory traders to operate. However, this will only be achieved through close cooperation among regulators, legislators and the industry.
Yes, there have been unfortunate instances of unethical and illegal activity within the mutual fund industry from time to time. That is true of any industry. When this occurs, confessed or convicted offenders should be dealt with appropriately. But we are still concerned about the risk of over regulation and the quick application of simplistic solutions to intricate problems. Every system can be improved, and we support and applaud well thought out improvements by regulators, legislators and industry representatives that achieve the common goal of building and protecting the value of investors’ holdings.
For nearly 60 years, Fidelity has worked very hard to improve its products and service to justify your trust. When our family founded this company in 1946, we had only a few hundred customers. Today, we serve more than 18 million customers including individual investors and participants in retirement plans across America.
Let me close by saying that we do not take your trust in us for granted, and we realize that we must always work to improve all aspects of our service to you. In turn, we urge you to continue your active participation with your financial matters, so that your interests can be well served.
Best regards,
/s/ Edward C. Johnson 3d
Edward C. Johnson 3d
Annual Report 4
Performance: The Bottom Line
Average annual total return reflects the change in the value of an investment, assuming reinvestment of the fund’s dividend income and capital gains (the profits earned upon the sale of securities that have grown in value) and assuming a constant rate of perfor mance each year. The $10,000 table and the fund’s returns do not reflect the deduction of taxes that a shareholder would pay on fund distributions or the redemption of fund shares. During periods of reimbursement by Fidelity, a fund’s total return will be greater than it would be had the reimbursement not occurred. How a fund did yesterday is no guarantee of how it will do tomorrow.
| Average Annual Total Returns | | | | | | |
| Periods ended November 30, 2005 | | Past 1 | | Past 5 | | Past 10 |
| | | year | | years | | years |
| Fidelity® Convertible Securities Fund | | 6.91% | | 5.97% | | 11.72% |
| |
| |
| $10,000 Over 10 Years | | | | | | |
Let’s say hypothetically that $10,000 was invested in Fidelity® Convertible Securities Fund on November 30, 1995. The chart shows how the value of your investment would have changed, and also shows how the Merrill Lynch® All U.S. Convertible Securities Index performed over the same period.

Management’s Discussion of Fund Performance
Comments from Thomas Soviero, Portfolio Manager of Fidelity® Convertible Securities Fund
Numerous events unfolded during the 12 month period ending November 30, 2005, that were major influences on the U.S. equity markets. Issues exerting downward pressure on stocks included higher levels of inflation, eight short term interest rate hikes by the Federal Reserve Board, exorbitant energy prices, and a Category 4 hurricane that devas tated both the city of New Orleans and several nearby oil production and refinery facilities. Grabbing most of the markets’ upbeat headlines was consistent strength in consumer spending, corporate earnings and gross domestic product (GDP). When all was said and done, investors demonstrated their conviction in the economy, pushing stocks higher across the board. By period end, the Standard & Poor’s 500SM Index, the NASDAQ Composite® Index and the Dow Jones Industrial AverageSM approached or exceeded four and a half year highs. For the 12 months overall, the S&P 500® was up 8.44%, the NASDAQ® rose 7.28% and the Dow advanced 6.07%, threatening to eclipse the 11,000 threshold for the first time since 2001.
For the 12 months ending November 30, 2005, Fidelity Convertible Securities Fund returned 6.91%, outperforming the 2.66% return of the Merrill Lynch® All U.S. Convertible Securities Index and the 4.68% return of the LipperSM Convertible Securities Funds Average. Relative to the index, security selection and an overweighting in telecommunication services and energy helped the most. Some good picks in information technology and an underweighting in weak automotive related issues also bolstered performance. However, security selection in health care hampered relative performance. On top of the solid performance of our holdings in convertible securities, the fund’s out of benchmark stake in equities contributed strongly to returns. The fund’s top relative and absolute performers were refiner Valero Energy and oil services firm Halliburton. In telecom, Nextel Partners and NII Holdings added to returns, as did two cellular tower companies, Crown Castle and American Tower. Nextel Partners was sold during the period. Main detractors on both an absolute and relative basis included industrial conglomerate Tyco International and Puerto Rico based financial services provider Doral Financial. Biogen Idec and OSI Phar maceuticals hurt performance as well.
The views expressed in this statement reflect those of the portfolio manager only through the end of the period of the report as stated on the cover and do not necessarily represent the views of Fidelity or any other person in the Fidelity organization. Any such views are subject to change at any time based upon market or other conditions and Fidelity disclaims any responsibility to update such views. These views may not be relied on as investment advice and, because investment decisions for a Fidelity fund are based on numerous factors, may not be relied on as an indication of trading intent on behalf of any Fidelity fund.
Shareholder Expense Example
As a shareholder of the Fund, you incur two types of costs: (1) transaction costs, and (2) ongoing costs, including management fees and other Fund expenses. This Example is intended to help you understand your ongoing costs (in dollars) of investing in the Fund and to compare these costs with the ongoing costs of investing in other mutual funds. The Example is based on an investment of $1,000 invested at the beginning of the period and held for the entire period (June 1, 2005 to November 30, 2005).
The first line of the table below provides information about actual account values and actual expenses. You may use the information in this line, together with the amount you invested, to estimate the expenses that you paid over the period. Simply divide your account value by $1,000.00 (for example, an $8,600 account value divided by $1,000.00 = 8.6), then multiply the result by the number in the first line under the heading entitled “Expenses Paid During Period” to estimate the expenses you paid on your account during this period. A small balance maintenance fee of $12.00 that is charged once a year may apply for certain accounts with a value of less than $2,000. This fee is not included in the table below. If it was, the estimate of expenses you paid during the period would be higher, and your ending account value lower, by this amount.
Hypothetical Example for Comparison Purposes
The second line of the table below provides information about hypothetical account values and hypothetical expenses based on the Fund’s actual expense ratio and an assumed rate of return of 5% per year before expenses, which is not the Fund’s actual return. The hypothetical account values and expenses may not be used to estimate the actual ending account balance or expenses you paid for the period. You may use this information to compare the ongoing costs of investing in the Fund and other funds. To do so, compare this 5% hypothetical example with the 5% hypothetical examples that appear in the share holder reports of the other funds. A small balance maintenance fee of $12.00 that is charged once a year may apply for certain accounts with a value of less than $2,000. This fee is not included in the table below. If it was, the estimate of expenses you paid during the period would be higher, and your ending account value lower, by this amount.
Please note that the expenses shown in the table are meant to highlight your ongoing costs only and do not reflect any transaction costs. Therefore, the second line of the table is useful in comparing ongoing costs only, and will not help you determine the relative total costs of owning different funds.
| | | | | | | | | | | Expenses Paid |
| | | | | Beginning | | Ending | | During Period* |
| | | | | Account Value | | Account Value | | June 1, 2005 to |
| | | | | June 1, 2005 | | November 30, 2005 | | November 30, 2005 |
| Actual | | $ | | 1,000.00 | | $ | | 1,087.40 | | $ | | 4.08 |
| Hypothetical (5% return per | | | | | | | | | | | | |
| year before expenses) | | $ | | 1,000.00 | | $ | | 1,021.16 | | $ | | 3.95 |
*Expenses are equal to the Fund’s annualized expense ratio of .78%; multiplied by the average account value over the period, multiplied by 183/365 (to reflect the one half year period).
7 Annual Report
| Investment Changes | | | | |
| |
| |
| Top Ten Investments as of November 30, 2005 | | |
| (excluding cash equivalents) | | % of fund’s | | % of fund’s net assets |
| | | net assets | | 6 months ago |
| El Paso Corp. 4.99% | | 5.1 | | 0.6 |
| Vishay Intertechnology, Inc. 3.625% 8/1/23 | | 4.4 | | 3.6 |
| Halliburton Co. 3.125% 7/15/23 | | 3.9 | | 3.0 |
| Celanese Corp. 4.25% | | 3.2 | | 0.0 |
| Tyco International Group SA 3.125% 1/15/23 | | 3.0 | | 3.2 |
| Celanese Corp. Class A | | 2.7 | | 0.0 |
| Valero Energy Corp. 2.00% | | 2.6 | | 2.2 |
| Bausch & Lomb, Inc. 4.4219% 8/1/23 | | 2.6 | | 2.6 |
| American Express Co. 1.85% 12/1/33 | | 2.2 | | 2.2 |
| Six Flags, Inc. 4.5% 5/15/15 | | 2.1 | | 0.0 |
| | | 31.8 | | |
Top Five Market Sectors as of November 30, 2005 | | |
| | | % of fund’s | | % of fund’s net assets |
| | | net assets | | 6 months ago |
| Energy | | 23.0 | | 10.2 |
| Information Technology | | 16.3 | | 22.8 |
| Consumer Discretionary | | 13.0 | | 11.8 |
| Health Care | | 12.3 | | 22.7 |
| Industrials | | 10.2 | | 5.3 |

Annual Report 8
| Investments November 30, 2005 | | |
| Showing Percentage of Net Assets | | | | | | | | |
| |
| Corporate Bonds 64.5% | | | | | | | | |
| | | Principal | | Value (Note 1) |
| | | Amount (000s)(e) | | (000s) |
| Convertible Bonds – 64.2% | | | | | | | | |
| |
| CONSUMER DISCRETIONARY – 8.8% | | | | | | | | |
| Auto Components 0.5% | | | | | | | | |
| American Axle & Manufacturing Holdings, Inc. 2% | | | | | | | | |
| 2/15/24 (f) | | $ | | 12,500 | | $ | | 9,295 |
| Hotels, Restaurants & Leisure 4.2% | | | | | | | | |
| Kerzner International Ltd.: | | | | | | | | |
| 2.375% 4/15/24 (h) | | | | 4,000 | | | | 4,893 |
| 2.375% 4/15/24 | | | | 18,900 | | | | 23,118 |
| Six Flags, Inc. 4.5% 5/15/15 | | | | 27,700 | | | | 35,492 |
| WMS Industries, Inc.: | | | | | | | | |
| 2.75% 7/15/10 (h) | | | | 4,000 | | | | 5,475 |
| 2.75% 7/15/10 | | | | 2,800 | | | | 3,833 |
| | | | | | | | | 72,811 |
| Leisure Equipment & Products – 0.3% | | | | | | | | |
| Eastman Kodak Co. 3.375% 10/15/33 (h) | | | | 5,800 | | | | 5,655 |
| Media – 3.8% | | | | | | | | |
| Charter Communications, Inc.: | | | | | | | | |
| 5.875% 11/16/09 (h) | | | | 11,300 | | | | 8,503 |
| 5.875% 11/16/09 | | | | 30,840 | | | | 23,207 |
| Lamar Advertising Co. 2.875% 12/31/10 | | | | 8,200 | | | | 8,792 |
| XM Satellite Radio Holdings, Inc. 1.75% 12/1/09 | | | | 400 | | | | 352 |
| XM Satellite Radio, Inc. 1.75% 12/1/09 (h) | | | | 30,300 | | | | 26,409 |
| | | | | | | | | 67,263 |
| |
| TOTAL CONSUMER DISCRETIONARY | | | | | | | | 155,024 |
| |
| ENERGY 7.5% | | | | | | | | |
| Energy Equipment & Services – 4.4% | | | | | | | | |
| Halliburton Co. 3.125% 7/15/23 | | | | 39,400 | | | | 68,573 |
| Maverick Tube Corp. 1.875% 11/15/25 (h) | | | | 3,000 | | | | 3,270 |
| Oil States International, Inc. 2.375% 7/1/25 (h) | | | | 4,500 | | | | 5,693 |
| | | | | | | | | 77,536 |
| Oil, Gas & Consumable Fuels – 3.1% | | | | | | | | |
| McMoRan Exploration Co.: | | | | | | | | |
| 6% 7/2/08 (h) | | | | 1,000 | | | | 1,368 |
| |
| |
| |
| |
| See accompanying notes which are an integral part of the financial statements. | | | | |
| |
| 9 | | | | | | Annual Report |
| Investments continued | | | | | | | | |
| |
| Corporate Bonds continued | | | | | | | | |
| | | Principal | | Value (Note 1) |
| | | Amount (000s)(e) | | (000s) |
| Convertible Bonds continued | | | | | | | | |
| |
| ENERGY – continued | | | | | | | | |
| Oil, Gas & Consumable Fuels – continued | | | | | | | | |
| McMoRan Exploration Co.: – continued | | | | | | | | |
| 6% 7/2/08 | | $ | | 12,900 | | $ | | 17,641 |
| Quicksilver Resources, Inc. 1.875% 11/1/24 (h) | | | | 24,500 | | | | 34,160 |
| | | | | | | | | 53,169 |
| |
| TOTAL ENERGY | | | | | | | | 130,705 |
| |
| FINANCIALS – 3.5% | | | | | | | | |
| Consumer Finance – 3.0% | | | | | | | | |
| American Express Co.: | | | | | | | | |
| 1.85% 12/1/33 (f)(h) | | | | 36,500 | | | | 38,829 |
| 1.85% 12/1/33 (f) | | | | 12,600 | | | | 13,404 |
| | | | | | | | | 52,233 |
| Insurance – 0.5% | | | | | | | | |
| Scottish Re Group Ltd. 4.5% 12/1/22 | | | | 8,000 | | | | 9,690 |
| |
| TOTAL FINANCIALS | | | | | | | | 61,923 |
| |
| HEALTH CARE – 12.3% | | | | | | | | |
| Biotechnology – 1.5% | | | | | | | | |
| Protein Design Labs, Inc. 2% 2/15/12 (h) | | | | 20,500 | | | | 26,663 |
| Health Care Equipment & Supplies – 9.4% | | | | | | | | |
| Bausch & Lomb, Inc. 4.4219% 8/1/23 (i) | | | | 29,500 | | | | 45,043 |
| Cooper Companies, Inc.: | | | | | | | | |
| 2.625% 7/1/23 (h) | | | | 7,500 | | | | 9,860 |
| 2.625% 7/1/23 | | | | 10,000 | | | | 13,146 |
| Cytyc Corp.: | | | | | | | | |
| 2.25% 3/15/24 (h) | | | | 17,500 | | | | 18,879 |
| 2.25% 3/15/24 | | | | 7,600 | | | | 8,199 |
| Epix Pharmaceuticals, Inc.: | | | | | | | | |
| 3% 6/15/24 (h) | | | | 14,000 | | | | 8,820 |
| 3% 6/15/24 | | | | 7,000 | | | | 4,410 |
| Fisher Scientific International, Inc.: | | | | | | | | |
| 2.5% 10/1/23 (h) | | | | 15,600 | | | | 22,541 |
| 2.5% 10/1/23 | | | | 7,400 | | | | 10,692 |
| Medtronic, Inc. 1.25% 9/15/21 | | | | 23,000 | | | | 23,067 |
| | | | | | | | | 164,657 |
See accompanying notes which are an integral part of the financial statements.
| Corporate Bonds continued | | | | | | | | |
| | | Principal | | Value (Note 1) |
| | | Amount (000s)(e) | | (000s) |
| Convertible Bonds continued | | | | | | | | |
| |
| HEALTH CARE – continued | | | | | | | | |
| Pharmaceuticals – 1.4% | | | | | | | | |
| Roche Holdings, Inc. 0% 7/25/21 (h) | | $ | | 30,000 | | $ | | 23,955 |
| |
| TOTAL HEALTH CARE | | | | | | | | 215,275 |
| |
| INDUSTRIALS – 8.7% | | | | | | | | |
| Airlines – 2.5% | | | | | | | | |
| AirTran Holdings, Inc. 7% 7/1/23 | | | | 10,000 | | | | 15,812 |
| America West Holding Corp. 7.5% 1/18/09 | | | | 5,900 | | | | 6,933 |
| Continental Airlines, Inc. 4.5% 2/1/07 | | | | 9,830 | | | | 8,642 |
| US Airways Group, Inc. 7% 9/30/20 (h) | | | | 7,350 | | | | 11,453 |
| | | | | | | | | 42,840 |
| Commercial Services & Supplies – 0.1% | | | | | | | | |
| FTI Consulting, Inc. 3.75% 7/15/12 (h) | | | | 1,995 | | | | 2,266 |
| Construction & Engineering – 1.2% | | | | | | | | |
| Fluor Corp. 1.5% 2/15/24 | | | | 15,700 | | | | 21,583 |
| Industrial Conglomerates – 3.8% | | | | | | | | |
| Tyco International Group SA: | | | | | | | | |
| 3.125% 1/15/23 (h) | | | | 39,900 | | | | 53,769 |
| yankee 3.125% 1/15/23 | | | | 10,100 | | | | 13,611 |
| | | | | | | | | 67,380 |
| Marine – 1.1% | | | | | | | | |
| OMI Corp. 2.875% 12/1/24 | | | | 20,400 | | | | 19,176 |
| |
| TOTAL INDUSTRIALS | | | | | | | | 153,245 |
| |
| INFORMATION TECHNOLOGY – 14.2% | | | | | | | | |
| Communications Equipment – 2.9% | | | | | | | | |
| AudioCodes Ltd. 2% 11/9/24 (h) | | | | 10,000 | | | | 8,661 |
| Comverse Technology, Inc. 0% 5/15/23 | | | | 11,800 | | | | 17,464 |
| Juniper Networks, Inc. 0% 6/15/08 | | | | 20,900 | | | | 24,984 |
| | | | | | | | | 51,109 |
| Computers & Peripherals – 1.3% | | | | | | | | |
| Maxtor Corp.: | | | | | | | | |
| 2.375% 8/15/12 (h) | | | | 10,000 | | | | 8,298 |
| 6.8% 4/30/10 | | | | 15,000 | | | | 14,777 |
| | | | | | | | | 23,075 |
See accompanying notes which are an integral part of the financial statements.
11 Annual Report
| Investments continued | | | | | | | | |
| |
| Corporate Bonds continued | | | | | | | | |
| | | Principal | | Value (Note 1) |
| | | Amount (000s)(e) | | (000s) |
| Convertible Bonds continued | | | | | | | | |
| |
| INFORMATION TECHNOLOGY – continued | | | | | | | | |
| Electronic Equipment & Instruments – 4.8% | | | | | | | | |
| Flextronics International Ltd. 1% 8/1/10 | | $ | | 7,580 | | $ | | 6,851 |
| Vishay Intertechnology, Inc. 3.625% 8/1/23 | | | | 80,700 | | | | 76,915 |
| | | | | | | | | 83,766 |
| Internet Software & Services – 0.4% | | | | | | | | |
| aQuantive, Inc. 2.25% 8/15/24 | | | | 3,150 | | | | 6,757 |
| IT Services – 2.2% | | | | | | | | |
| DST Systems, Inc.: | | | | | | | | |
| Series A, 4.125% 8/15/23 (h) | | | | 12,300 | | | | 16,268 |
| 4.125% 8/15/23 | | | | 16,800 | | | | 22,220 |
| | | | | | | | | 38,488 |
| Semiconductors & Semiconductor Equipment – 2.6% | | | | | | | | |
| Amkor Technology, Inc. 5% 3/15/07 | | | | 9,800 | | | | 8,967 |
| EMCORE Corp. 5% 5/15/11 | | | | 9,000 | | | | 8,640 |
| Kulicke & Soffa Industries, Inc. 0.5% 11/30/08 | | | | 5,000 | | | | 3,781 |
| ON Semiconductor Corp. 0% 4/15/24 | | | | 29,500 | | | | 23,821 |
| | | | | | | | | 45,209 |
| |
| TOTAL INFORMATION TECHNOLOGY | | | | | | | | 248,404 |
| |
| MATERIALS 0.8% | | | | | | | | |
| Metals & Mining – 0.8% | | | | | | | | |
| Alamos Gold, Inc. 5.5% 2/15/10 (h) | | CAD | | 10,250 | | | | 9,183 |
| Coeur d’Alene Mines Corp. 1.25% 1/15/24 | | | | 4,600 | | | | 3,865 |
| | | | | | | | | 13,048 |
| |
| TELECOMMUNICATION SERVICES – 7.0% | | | | | | | | |
| Wireless Telecommunication Services – 7.0% | | | | | | | | |
| American Tower Corp.: | | | | | | | | |
| 3.25% 8/1/10 (h) | | | | 13,900 | | | | 32,224 |
| 3.25% 8/1/10 | | | | 7,255 | | | | 16,819 |
| Crown Castle International Corp. 4% 7/15/10 | | | | 11,660 | | | | 30,038 |
| ICO North America, Inc. 7.5% 8/15/09 (j) | | | | 6,370 | | | | 6,561 |
| NII Holdings, Inc.: | | | | | | | | |
| 2.875% 2/1/34 (h) | | | | 10,000 | | | | 17,193 |
| 2.875% 2/1/34 | | | | 11,500 | | | | 19,772 |
| | | | | | | | | 122,607 |
See accompanying notes which are an integral part of the financial statements.
| Corporate Bonds continued | | | | | | | | |
| | | Principal | | Value (Note 1) |
| | | Amount (000s)(e) | | (000s) |
| Convertible Bonds continued | | | | | | | | |
| |
| UTILITIES – 1.4% | | | | | | | | |
| Independent Power Producers & Energy Traders – 0.5% | | | | | | | | |
| Mirant Corp. 2.5% 6/15/21 (d) | | $ | | 8,310 | | $ | | 8,726 |
| Multi-Utilities – 0.9% | | | | | | | | |
| CMS Energy Corp. 3.375% 7/15/23 | | | | 11,800 | | | | 16,489 |
| |
| TOTAL UTILITIES | | | | | | | | 25,215 |
| |
| TOTAL CONVERTIBLE BONDS | | | | | | | | 1,125,446 |
| Nonconvertible Bonds – 0.3% | | | | | | | | |
| |
| CONSUMER STAPLES 0.1% | | | | | | | | |
| Food Products 0.1% | | | | | | | | |
| Doane Pet Care Co. 10.625% 11/15/15 (h) | | | | 2,080 | | | | 2,122 |
| ENERGY 0.2% | | | | | | | | |
| Oil, Gas & Consumable Fuels – 0.2% | | | | | | | | |
| The Coastal Corp. 6.95% 6/1/28 | | | | 3,420 | | | | 3,048 |
| |
| TOTAL NONCONVERTIBLE BONDS | | | | | | | | 5,170 |
| |
| TOTAL CORPORATE BONDS | | | | | | | | |
| (Cost $1,011,448) | | | | | | 1,130,616 |
| |
| Common Stocks 14.2% | | | | | | | | |
| | | | | Shares | | | | |
| |
| CONSUMER DISCRETIONARY – 2.1% | | | | | | | | |
| Diversified Consumer Services – 0.5% | | | | | | | | |
| Service Corp. International (SCI) | | | | 1,143,000 | | | | 9,384 |
| Media – 1.6% | | | | | | | | |
| EchoStar Communications Corp. Class A | | | | 1,099,069 | | | | 28,400 |
| |
| TOTAL CONSUMER DISCRETIONARY | | | | | | | | 37,784 |
| |
| ENERGY 2.9% | | | | | | | | |
| Energy Equipment & Services – 1.1% | | | | | | | | |
| Hercules Offshore, Inc. (a) | | | | 17,500 | | | | 470 |
| National Oilwell Varco, Inc. (a) | | | | 320,900 | | | | 19,453 |
| | | | | | | | | 19,923 |
See accompanying notes which are an integral part of the financial statements.
13 Annual Report
| Investments continued | | | | | | |
| |
| Common Stocks continued | | | | | | |
| | | Shares | | Value (Note 1) |
| | | | | (000s) |
| |
| ENERGY – continued | | | | | | |
| Oil, Gas & Consumable Fuels – 1.8% | | | | | | |
| General Maritime Corp. | | 162,000 | | $ | | 6,260 |
| OMI Corp. | | 200,000 | | | | 3,880 |
| Sasol Ltd. sponsored ADR | | 612,600 | | | | 20,461 |
| | | | | | | 30,601 |
| |
| TOTAL ENERGY | | | | | | 50,524 |
| |
| FINANCIALS – 0.7% | | | | | | |
| Capital Markets 0.7% | | | | | | |
| Lazard Ltd. unit | | 400,000 | | | | 11,711 |
| INDUSTRIALS – 0.9% | | | | | | |
| Airlines – 0.4% | | | | | | |
| Ryanair Holdings PLC sponsored ADR (a) | | 130,000 | | | | 6,477 |
| Building Products 0.5% | | | | | | |
| American Standard Companies, Inc. | | 220,200 | | | | 8,385 |
| Commercial Services & Supplies – 0.0% | | | | | | |
| Global Cash Access Holdings, Inc. | | 71,600 | | | | 906 |
| Marine – 0.0% | | | | | | |
| American Commercial Lines, Inc. | | 4,100 | | | | 120 |
| |
| TOTAL INDUSTRIALS | | | | | | 15,888 |
| |
| INFORMATION TECHNOLOGY – 2.1% | | | | | | |
| Computers & Peripherals – 0.9% | | | | | | |
| Seagate Technology | | 846,000 | | | | 16,006 |
| Internet Software & Services – 0.0% | | | | | | |
| Homestore, Inc. (a) | | 31,846 | | | | 140 |
| Semiconductors & Semiconductor Equipment – 1.2% | | | | | | |
| Amkor Technology, Inc. (a)(g) | | 1,243,200 | | | | 7,708 |
| ON Semiconductor Corp. (a) | | 2,169,500 | | | | 12,583 |
| | | | | | | 20,291 |
| |
| TOTAL INFORMATION TECHNOLOGY | | | | | | 36,437 |
See accompanying notes which are an integral part of the financial statements.
| Common Stocks continued | | | | | | | | |
| | | | | Shares | | Value (Note 1) |
| | | | | | | (000s) |
| |
| MATERIALS 5.5% | | | | | | | | |
| Chemicals – 3.1% | | | | | | | | |
| Celanese Corp. Class A | | | | 2,700,000 | | $ | | 46,710 |
| Monsanto Co. | | | | 100,000 | | | | 7,327 |
| | | | | | | | | 54,037 |
| Containers & Packaging – 0.7% | | | | | | | | |
| Temple-Inland, Inc. | | | | 299,900 | | | | 12,557 |
| Paper & Forest Products 1.7% | | | | | | | | |
| Aracruz Celulose SA (PN B) sponsored ADR | | 247,300 | | | | 9,645 |
| Weyerhaeuser Co. | | | | 300,000 | | | | 19,893 |
| | | | | | | | | 29,538 |
| |
| TOTAL MATERIALS | | | | | | | | 96,132 |
| |
| TOTAL COMMON STOCKS | | | | | | | | |
| (Cost $231,406) | | | | | | | | 248,476 |
| |
| Convertible Preferred Stocks 20.8% | | | | | | |
| |
| CONSUMER DISCRETIONARY – 2.1% | | | | | | | | |
| Automobiles – 1.6% | | | | | | | | |
| General Motors Corp. Series B, 5.25% | | | | 1,750,000 | | | | 27,265 |
| Media – 0.5% | | | | | | | | |
| Interpublic Group of Companies, Inc. Series B, 5.25% (h) | | 10,000 | | | | 9,152 |
| |
| TOTAL CONSUMER DISCRETIONARY | | | | | | | | 36,417 |
| |
| CONSUMER STAPLES 0.4% | | | | | | | | |
| Food & Staples Retailing – 0.4% | | | | | | | | |
| Rite Aid Corp. 5.50% | | | | 370,000 | | | | 8,153 |
| |
| ENERGY 12.4% | | | | | | | | |
| Oil, Gas & Consumable Fuels – 12.4% | | | | | | | | |
| Chesapeake Energy Corp.: | | | | | | | | |
| 4.50% | | | | 70,000 | | | | 6,318 |
| 5.00% (h) | | | | 55,000 | | | | 7,281 |
| 5.00% | | | | 155,000 | | | | 20,519 |
| 5.00% (h) | | | | 149,600 | | | | 14,997 |
| El Paso Corp. 4.99% (h) | | | | 86,400 | | | | 89,235 |
See accompanying notes which are an integral part of the financial statements.
15 Annual Report
| Investments continued | | | | | | |
| |
| Convertible Preferred Stocks continued | | | | | | |
| | | Shares | | Value (Note 1) |
| | | | | (000s) |
| |
| ENERGY – continued | | | | | | |
| Oil, Gas & Consumable Fuels – continued | | | | | | |
| Teekay Shipping Corp. Series A, 7.25% | | 710,600 | | $ | | 34,173 |
| Valero Energy Corp. 2.00% | | 473,800 | | | | 45,163 |
| | | | | | | 217,686 |
| |
| FINANCIALS – 1.8% | | | | | | |
| Diversified Financial Services – 0.5% | | | | | | |
| Citigroup Funding, Inc. 4.583% | | 270,000 | | | | 8,894 |
| Insurance – 1.1% | | | | | | |
| Fortis Insurance NV 7.75% (h) | | 16,700 | | | | 20,416 |
| Thrifts & Mortgage Finance – 0.2% | | | | | | |
| Doral Financial Corp. 4.75% (h) | | 21,400 | | | | 3,253 |
| |
| TOTAL FINANCIALS | | | | | | 32,563 |
| |
| INDUSTRIALS – 0.6% | | | | | | |
| Commercial Services & Supplies – 0.6% | | | | | | |
| Allied Waste Industries, Inc. Series D, 6.25% | | 40,000 | | | | 10,119 |
| MATERIALS 3.5% | | | | | | |
| Chemicals – 3.5% | | | | | | |
| Celanese Corp. 4.25% | | 2,121,600 | | | | 55,480 |
| Huntsman Corp. 5.00% | | 125,000 | | | | 5,313 |
| | | | | | | 60,793 |
| |
| TOTAL CONVERTIBLE PREFERRED STOCKS | | | | | | |
| (Cost $353,797) | | | | | | 365,731 |
See accompanying notes which are an integral part of the financial statements.
| Money Market Funds 0.2% | | | | | | |
| | | Shares | | Value (Note 1) |
| | | | | (000s) |
| Fidelity Cash Central Fund, 4.08% (b) | | 2,755,583 | | $ | | 2,756 |
| Fidelity Securities Lending Cash Central Fund, 4.09% (b)(c) | | 37,894 | | | | 38 |
| TOTAL MONEY MARKET FUNDS | | | | | | |
| (Cost $2,794) | | | | | | 2,794 |
| TOTAL INVESTMENT PORTFOLIO 99.7% | | | | | | |
| (Cost $1,599,445) | | | | | | 1,747,617 |
| |
| NET OTHER ASSETS – 0.3% | | | | | | 6,047 |
| NET ASSETS 100% | | | | $ | | 1,753,664 |
| Currency Abbreviations |
| CAD | — | Canadian dollar |
Legend
(a) Non-income producing
(b) Affiliated fund that is available only to
investment companies and other
accounts managed by Fidelity
Investments. The rate quoted is the
annualized seven-day yield of the fund
at period end. A complete unaudited
listing of the fund’s holdings as of its
most recent quarter end is available
upon request.
(c) Investment made with cash collateral
received from securities on loan.
(d) Non-income producing – Issuer is in
default.
(e) Principal amount is stated in United
States dollars unless otherwise noted.
(f) Debt obligation initially issued at one
coupon which converts to a higher
coupon at a specified date. The rate
shown is the rate at period end.
(g) Security or a portion of the security is on
loan at period end.
|
(h) Security exempt from registration under
Rule 144A of the Securities Act of 1933.
These securities may be resold in
transactions exempt from registration,
normally to qualified institutional buyers.
At the period end, the value of these
securities amounted to $550,744,000
or 31.4% of net assets.
(i) The coupon rate shown on floating or
adjustable rate securities represents the
rate at period end.
(j) Restricted securities – Investment in
securities not registered under the
Securities Act of 1933 (excluding 144A
issues). At the end of the period, the
value of restricted securities (excluding
144A issues) amounted to $6,561,000
or 0.4% of net assets.
|
Additional information on each holding is as follows:
| | | Acquisition | | Acquisition |
| Security | | Date | | Cost (000s) |
| ICO North | | | | | | |
| America, Inc. | | | | | | |
| 7.5% 8/15/09 | | 8/12/05 | | $ | | 6,370 |
See accompanying notes which are an integral part of the financial statements.
17 Annual Report
Investments continued
Affiliated Central Funds
Information regarding income received by the fund from the affiliated Central funds during the period is as follows:
| Fund | | | | Income |
| (Amounts in thousands) | | | | received |
| Fidelity Cash Central Fund | | | $ | 692 |
| Fidelity Securities Lending Cash Central Fund | | | | 39 |
| Total | | | $ | 731 |
Other Information
The composition of credit quality ratings as a percentage of net assets is as follows (ratings are unaudited):
| AAA, AA, A | | 5.5% |
| BBB | | 6.0% |
| BB | | 13.2% |
| B | | 10.9% |
| CCC, CC, C | | 8.5% |
| D | | 0.5% |
| Not Rated | | 19.9% |
| Equities | | 35.0% |
| Short Term Investments and Net | | |
| Other Assets | | 0.5% |
| | | 100.0% |
We have used ratings from Moody’s Investors Services, Inc. Where Moody’s ratings are not available, we have used S&P ratings.
Distribution of investments by country of issue, as a percentage of total net assets, is as follows:
| United States of America | | 84.1% |
| Luxembourg | | 3.8% |
| Marshall Islands | | 3.6% |
| Bahamas (Nassau) | | 1.6% |
| Cayman Islands | | 1.4% |
| South Africa | | 1.2% |
| Netherlands | | 1.1% |
| Others (individually less than 1%) . | | 3.2% |
| | | 100.0% |
Income Tax Information
At November 30, 2005, the fund had a capital loss carryforward of approximately $63,639,000 all of which will expire on November 30, 2010.
The fund intends to elect to defer to its fiscal year ending November 30, 2006 approximately $443,000 of losses recognized during the period November 1, 2005 to November 30, 2005.
See accompanying notes which are an integral part of the financial statements.
Annual Report 18
| Financial Statements | | | | | | | | |
| |
| |
| Statement of Assets and Liabilities | | | | | | | | |
| Amounts in thousands (except per share amount) | | | | | | November 30, 2005 |
| |
| Assets | | | | | | | | |
| Investment in securities, at value (including securities | | | | | | | | |
| loaned of $38) See accompanying schedule: | | | | | | | | |
| Unaffiliated issuers (cost $1,596,651) | | $ | | 1,744,823 | | | | |
| Affiliated Central Funds (cost $2,794) | | | | 2,794 | | | | |
| Total Investments (cost $1,599,445) | | | | | | $ | | 1,747,617 |
| Cash | | | | | | | | 1,267 |
| Receivable for investments sold | | | | | | | | 2,513 |
| Receivable for fund shares sold | | | | | | | | 1,059 |
| Dividends receivable | | | | | | | | 520 |
| Interest receivable | | | | | | | | 8,169 |
| Prepaid expenses | | | | | | | | 9 |
| Other receivables | | | | | | | | 9 |
| Total assets | | | | | | | | 1,761,163 |
| |
| Liabilities | | | | | | | | |
| Payable for investments purchased | | $ | | 4,502 | | | | |
| Payable for fund shares redeemed | | | | 1,741 | | | | |
| Accrued management fee | | | | 841 | | | | |
| Other affiliated payables | | | | 318 | | | | |
| Other payables and accrued expenses | | | | 59 | | | | |
| Collateral on securities loaned, at value | | | | 38 | | | | |
| Total liabilities | | | | | | | | 7,499 |
| |
| Net Assets | | | | | | $ | | 1,753,664 |
| Net Assets consist of: | | | | | | | | |
| Paid in capital | | | | | | $ | | 1,666,418 |
| Undistributed net investment income | | | | | | | | 5,180 |
| Accumulated undistributed net realized gain (loss) on | | | | | | | | |
| investments and foreign currency transactions | | | | | | | | (66,107) |
| Net unrealized appreciation (depreciation) on | | | | | | | | |
| investments and assets and liabilities in foreign | | | | | | | | |
| currencies | | | | | | | | 148,173 |
| Net Assets, for 79,216 shares outstanding | | | | | | $ | | 1,753,664 |
| Net Asset Value, offering price and redemption price per | | | | | | | | |
| share ($1,753,664 ÷ 79,216 shares) | | | | | | $ | | 22.14 |
See accompanying notes which are an integral part of the financial statements.
19 Annual Report
| Financial Statements continued | | | | |
| |
| Statement of Operations | | | | | | |
| Amounts in thousands | | | | Year ended November 30, 2005 |
| |
| Investment Income | | | | | | |
| Dividends | | | | $ | | 11,923 |
| Interest | | | | | | 33,867 |
| Income from affiliated Central Funds | | | | | | 731 |
| Total income | | | | | | 46,521 |
| |
| Expenses | | | | | | |
| Management fee | | | | | | |
| Basic fee | | $ | | 8,327 | | |
| Performance adjustment | | | | (93) | | |
| Transfer agent fees | | | | 3,357 | | |
| Accounting and security lending fees | | | | 524 | | |
| Independent trustees’ compensation | | | | 9 | | |
| Custodian fees and expenses | | | | 37 | | |
| Registration fees | | | | 47 | | |
| Audit | | | | 77 | | |
| Legal | | | | 7 | | |
| Interest | | | | 29 | | |
| Miscellaneous | | | | 84 | | |
| Total expenses before reductions | | | | 12,405 | | |
| Expense reductions | | | | (245) | | 12,160 |
| |
| Net investment income (loss) | | | | | | 34,361 |
| Realized and Unrealized Gain (Loss) | | | | |
| Net realized gain (loss) on: | | | | | | |
| Investment securities: | | | | | | |
| Unaffiliated issuers | | | | 121,105 | | |
| Foreign currency transactions | | | | 103 | | |
| Total net realized gain (loss) | | | | | | 121,208 |
| Change in net unrealized appreciation (depreciation) on: | | | | |
| Investment securities | | | | (40,452) | | |
| Assets and liabilities in foreign currencies | | (44) | | |
| Total change in net unrealized appreciation | | | | |
| (depreciation) | | | | | | (40,496) |
| Net gain (loss) | | | | | | 80,712 |
| Net increase (decrease) in net assets resulting from | | | | |
| operations | | | | $ | | 115,073 |
See accompanying notes which are an integral part of the financial statements.
| Statement of Changes in Net Assets | | | | | | | | |
| | | | | Year ended | | | | Year ended |
| | | | | November 30, | | | | November 30, |
| Amounts in thousands | | | | 2005 | | | | 2004 |
| Increase (Decrease) in Net Assets | | | | | | | | |
| Operations | | | | | | | | |
| Net investment income (loss) | | $ | | 34,361 | | $ | | 40,719 |
| Net realized gain (loss) | | | | 121,208 | | | | 146,674 |
| Change in net unrealized appreciation (depreciation) . | | (40,496) | | | | (12,134) |
| Net increase (decrease) in net assets resulting | | | | | | | | |
| from operations | | | | 115,073 | | | | 175,259 |
| Distributions to shareholders from net investment income | | . | | (28,144) | | | | (58,755) |
| Distributions to shareholders from net realized gain | | | | (1,739) | | | | — |
| Total distributions | | | | (29,883) | | | | (58,755) |
| Share transactions | | | | | | | | |
| Proceeds from sales of shares | | | | 196,331 | | | | 303,240 |
| Reinvestment of distributions | | | | 27,050 | | | | 52,664 |
| Cost of shares redeemed | | | | (390,181) | | | | (404,556) |
| Net increase (decrease) in net assets resulting from | | | | | | | | |
| share transactions | | | | (166,800) | | | | (48,652) |
| Total increase (decrease) in net assets | | | | (81,610) | | | | 67,852 |
| |
| Net Assets | | | | | | | | |
| Beginning of period | | | | 1,835,274 | | | | 1,767,422 |
| End of period (including undistributed net investment | | | | | | | | |
| income of $5,180 and undistributed net investment | | | | | | | | |
| income of $5,205, respectively) | | $ | | 1,753,664 | | $ | | 1,835,274 |
| |
| Other Information | | | | | | | | |
| Shares | | | | | | | | |
| Sold | | | | 9,211 | | | | 14,940 |
| Issued in reinvestment of distributions | | | | 1,269 | | | | 2,608 |
| Redeemed | | | | (18,412) | | | | (20,051) |
| Net increase (decrease) | | | | (7,932) | | | | (2,503) |
See accompanying notes which are an integral part of the financial statements.
21 Annual Report
| Financial Highlights | | | | | | | | | | |
| |
| Years ended November 30, | | 2005 | | 2004 | | 2003 | | 2002 | | 2001 |
| Selected Per Share Data | | | | | | | | | | |
| Net asset value, beginning of | | | | | | | | | | |
| period | | $ 21.06 | | $ 19.71 | | $ 16.88 | | $ 19.50 | | $ 24.04 |
| Income from Investment | | | | | | | | | | |
| Operations | | | | | | | | | | |
| Net investment income (loss)B | | .41 | | .46 | | .79 | | .79D,E | | .69 |
| Net realized and unrealized | | | | | | | | | | |
| gain (loss) | | 1.03 | | 1.55 | | 2.87 | | (2.46)D,E | | (.17) |
| Total from investment | | | | | | | | | | |
| operations | | 1.44 | | 2.01 | | 3.66 | | (1.67) | | .52 |
| Distributions from net investment | | | | | | | | | | |
| income | | (.34) | | (.66) | | (.83) | | (.95) | | (.72) |
| Distributions from net realized | | | | | | | | | | |
| gain | | (.02) | | — | | — | | — | | (4.34) |
| Total distributions | | (.36) | | (.66) | | (.83) | | (.95) | | (5.06) |
| Net asset value, end of period . | | $ 22.14 | | $ 21.06 | | $ 19.71 | | $ 16.88 | | $ 19.50 |
| Total ReturnA | | 6.91% | | 10.39% | | 22.48% | | (8.97)% | | 1.56% |
| Ratios to Average Net AssetsC | | | | | | | | | | |
| Expenses before reductions | | 70% | | .67% | | .84% | | .88% | | .81% |
| Expenses net of fee waivers, if | | | | | | | | | | |
| any | | 70% | | .67% | | .84% | | .88% | | .81% |
| Expenses net of all reductions | | .69% | | .66% | | .82% | | .85% | | .76% |
| Net investment income (loss) . | | 1.95% | | 2.26% | | 4.46% | | 4.40%D,E | | 3.40% |
| Supplemental Data | | | | | | | | | | |
| Net assets, end of period (in | | | | | | | | | | |
| millions) | | $ 1,754 | | $ 1,835 | | $ 1,767 | | $ 1,423 | | $ 1,734 |
| Portfolio turnover rate | | 81% | | 112% | | 136% | | 138% | | 282% |
A Total returns would have been lower had certain expenses not been reduced during the periods shown.
B Calculated based on average shares outstanding during the period.
C Expense ratios reflect operating expenses of the fund. Expenses before reductions do not reflect amounts reimbursed by the investment adviser or
reductions from brokerage service arrangements or other expense offset arrangements and do not represent the amount paid by the fund during
periods when reimbursements or reductions occur. Expenses net of fee waivers reflect expenses after reimbursement by the investment adviser but
prior to reductions from brokerage service arrangements or other expense offset arrangements. Expenses net of all reductions represent the net
expenses paid by the fund.
D Effective December 1, 2001, the fund adopted the provisions of the AICPA Audit and Accounting Guide for Investment Companies and began
amortizing premium and discount on all debt securities. Per share data and ratios for periods prior to adoption have not been restated to reflect
this change.
E As a result of a revision to reflect accretion of market discount using the interest method, certain amounts for the year ended November 30, 2002
have been reclassified from what was previously reported. The impact of this change was a decrease to net investment income (loss) of $0.06
per share with a corresponding increase to net realized and unrealized gain (loss) per share. The ratio of net investment income (loss) to average
net assets decreased from 4.76% to 4.40% . The reclassification has no impact on the net assets of the fund.
|
See accompanying notes which are an integral part of the financial statements.
Notes to Financial Statements
For the period ended November 30, 2005
(Amounts in thousands except ratios)
|
1. Significant Accounting Policies.
Fidelity Convertible Securities Fund (the fund) is a fund of Fidelity Financial Trust (the trust) and is authorized to issue an unlimited number of shares. The trust is registered under the Investment Company Act of 1940, as amended (the 1940 Act), as an open end management investment company organized as a Massachusetts business trust. The fund may invest in affiliated money market central funds (Money Market Central Funds) which are open end investment companies available to investment companies and other accounts managed by Fidelity Management & Research Company (FMR) and its affili ates. The financial statements have been prepared in conformity with accounting principles generally accepted in the United States of America, which require manage ment to make certain estimates and assumptions at the date of the financial statements. The following summarizes the significant accounting policies of the fund:
Security Valuation. Investments are valued and net asset value (NAV) per share is calculated (NAV calculation) as of the close of business of the New York Stock Exchange (NYSE), normally 4:00 p.m. Eastern time. Wherever possible, the fund uses independent pricing services approved by the Board of Trustees to value its investments.
Equity securities, including restricted securities, for which market quotations are readily available, are valued at the last reported sale price or official closing price as reported by an independent pricing service on the primary market or exchange on which they are traded. In the event there were no sales during the day or closing prices are not available, securities are valued at the last quoted bid price. Debt securities, including restricted securities, for which quotations are readily available, are valued by independent pricing services or by dealers who make markets in such securities. Pricing services consider yield or price of bonds of comparable quality, coupon, maturity and type as well as dealer supplied prices. Investments in open end mutual funds, are valued at their closing net asset value each business day. Short term securities with remaining maturities of sixty days or less for which quotations are not readily available are valued at amortized cost, which approximates value.
When current market prices or quotations are not readily available or do not accurately reflect fair value, valuations may be determined in accordance with procedures adopted by the Board of Trustees. For example, when developments occur between the close of a market and the close of the NYSE that may materially affect the value of some or all of the securities, or when trading in a security is halted, those securities may be fair valued. Factors used in the determination of fair value may include monitoring news to identify significant market or security specific events such as changes in the value of U.S. securi ties market, reviewing developments in foreign markets and evaluating the performance of ADRs, futures contracts and exchange traded funds. Because the fund’s utilization of fair value pricing depends on market activity, the frequency with which fair value pricing is used can not be predicted and may be utilized to a significant extent. The value of
23 Annual Report
Notes to Financial Statements continued
(Amounts in thousands except ratios)
1. Significant Accounting Policies continued
Security Valuation continued
securities used for NAV calculation under fair value pricing may differ from published prices for the same securities.
Foreign Currency. The fund uses foreign currency contracts to facilitate transactions in foreign denominated securities. Losses from these transactions may arise from changes in the value of the foreign currency or if the counterparties do not perform under the contracts’ terms.
Foreign denominated assets, including investment securities, and liabilities are trans lated into U.S. dollars at the exchange rate at period end. Purchases and sales of invest ment securities, income and dividends received and expenses denominated in foreign currencies are translated into U.S. dollars at the exchange rate in effect on the transac tion date.
The effects of exchange rate fluctuations on investments are included with the net realized and unrealized gain (loss) on investment securities. Other foreign currency transactions resulting in realized and unrealized gain (loss) are disclosed separately.
Investment Transactions and Income. Security transactions are accounted for as of trade date. Gains and losses on securities sold are determined on the basis of identified cost and may include proceeds received from litigation. Dividend income is recorded on the ex dividend date, except for certain dividends from foreign securities where the ex dividend date may have passed, which are recorded as soon as the fund is informed of the ex dividend date. Non cash dividends included in dividend income, if any, are recorded at the fair market value of the securities received. Distributions received on securities that represent a return of capital or capital gain are recorded as a reduction of cost of investments and/or as a realized gain. The fund estimates the components of distributions received that may be considered return of capital distributions or capital gain distributions. Interest income is accrued as earned. Interest income includes coupon interest and amortization of premium and accretion of discount on debt securi ties. Investment income is recorded net of foreign taxes withheld where recovery of such taxes is uncertain. Debt obligations may be placed on non accrual status and related interest income may be reduced by ceasing current accruals and writing off interest receivables when the collection of all or a portion of interest has become doubtful based on consistently applied procedures. A debt obligation is removed from non accrual status when the issuer resumes interest payments or when collectibility of interest is reasonably assured.
Expenses. Most expenses of the trust can be directly attributed to a fund. Expenses which cannot be directly attributed are apportioned among each fund in the trust.
1. Significant Accounting Policies continued
Income Tax Information and Distributions to Shareholders. Each year, the fund intends to qualify as a regulated investment company by distributing all of its taxable income and realized gains under Subchapter M of the Internal Revenue Code. As a result, no provision for income taxes is required in the accompanying financial statements.
Foreign taxes are provided for based on the fund’s understanding of the tax rules and rates that exist in the foreign markets in which it invests.
Distributions are recorded on the ex dividend date. Income and capital gain distribu tions are determined in accordance with income tax regulations, which may differ from generally accepted accounting principles. In addition, the fund will claim a portion of the payment made to redeeming shareholders as a distribution for income tax purposes.
Capital accounts within the financial statements are adjusted for permanent book tax differences. These adjustments have no impact on net assets or the results of operations. Temporary book tax differences will reverse in a subsequent period.
Book tax differences are primarily due to foreign currency transactions, prior period premium and discount on debt securities, market discount, deferred trustees compensa tion, capital loss carryforwards, losses deferred due to wash sales and excise tax regulations.
The tax basis components of distributable earnings and the federal tax cost as of period end were as follows:
| Unrealized appreciation | | $ | | 215,745 | | | | |
| Unrealized depreciation | | | | (72,989) | | | | |
| Net unrealized appreciation (depreciation) | | | | 142,756 | | | | |
| Undistributed ordinary income | | | | 7,796 | | | | |
| Capital loss carryforward | | | | (63,639) | | | | |
| |
| Cost for federal income tax purposes | | $ | | 1,604,861 | | | | |
| |
The tax character of distributions paid was as follows:
| | | | |
| | | | | November 30, 2005 | | | | November 30, 2004 |
| Ordinary Income | | $ | | 29,883 | | $ | | 58,755 |
| |
| |
| 2. Operating Policies. | | | | | | | | |
Repurchase Agreements. FMR has received an Exemptive Order from the Securities and Exchange Commission (the SEC) which permits the fund and other affiliated entities of FMR to transfer uninvested cash balances into joint trading accounts which are then invested in repurchase agreements. The fund may also invest directly with
25 Annual Report
Notes to Financial Statements continued
(Amounts in thousands except ratios)
2. Operating Policies continued
Repurchase Agreements continued
institutions in repurchase agreements. Repurchase agreements are collateralized by government or non government securities. Collateral is held in segregated accounts with custodian banks and may be obtained in the event of a default of the counterparty. The fund monitors, on a daily basis, the value of the collateral to ensure it is at least equal to the principal amount of the repurchase agreement (including accrued interest). In the event of a default by the counterparty, realization of the collateral proceeds could be delayed, during which time the value of the collateral may decline.
Restricted Securities. The fund may invest in securities that are subject to legal or contractual restrictions on resale. These securities generally may be resold in transac tions exempt from registration or to the public if the securities are registered. Disposal of these securities may involve time consuming negotiations and expense, and prompt sale at an acceptable price may be difficult. Information regarding restricted securities is included at the end of the fund’s Schedule of Investments.
3. Purchases and Sales of Investments.
Purchases and sales of securities, other than short term securities and U.S. government securities, aggregated $1,414,503 and $1,568,219, respectively.
4. Fees and Other Transactions with Affiliates.
Management Fee. FMR and its affiliates provide the fund with investment manage ment related services for which the fund pays a monthly management fee. The manage ment fee is the sum of an individual fund fee rate that is based on an annual rate of .20% of the fund’s average net assets and a group fee rate that averaged .27% during the period. The group fee rate is based upon the average net assets of all the mutual funds advised by FMR. The group fee rate decreases as assets under management increase and increases as assets under management decrease. In addition, the management fee is subject to a performance adjustment (up to a maximum of ±.15% of the fund’s average net assets over a 36 month performance period). The upward or downward adjustment to the management fee is based on the fund’s relative investment performance as compared to an appropriate benchmark index. For the period, the total annual management fee rate, including the performance adjustment, was .47% of the fund’s average net assets.
Transfer Agent Fees. Fidelity Service Company, Inc. (FSC), an affiliate of FMR, is the fund’s transfer, dividend disbursing and shareholder servicing agent. FSC receives account fees and asset based fees that vary according to account size and type of ac count. FSC pays for typesetting, printing and mailing of shareholder reports, except
| 4. Fees and Other Transactions with Affiliates continued |
Transfer Agent Fees continued | | |
proxy statements. For the period, the transfer agent fees were equivalent to an annual rate of .19% of average net assets.
Accounting and Security Lending Fees. FSC maintains the fund’s accounting records. The accounting fee is based on the level of average net assets for the month. Under a separate contract, FSC administers the security lending program. The security lending fee is based on the number and duration of lending transactions.
Affiliated Central Funds. The fund may invest in Money Market Central Funds which seek preservation of capital and current income and are managed by Fidelity Invest ments Money Management, Inc. (FIMM), an affiliate of FMR.
The Money Market Central Funds do not pay a management fee.
Brokerage Commissions. The fund placed a portion of its portfolio transactions with brokerage firms which are affiliates of the investment adviser. The commissions paid to these affiliated firms were $6 for the period.
Interfund Lending Program. Pursuant to an Exemptive Order issued by the SEC, the fund, along with other registered investment companies having management contracts with FMR, may participate in an interfund lending program. This program provides an alternative credit facility allowing the funds to borrow from, or lend money to, other participating affiliated funds. At period end, there were no interfund loans outstanding. The fund’s activity in this program during the period for which loans were outstanding was as follows:
| | | | | | | | | Interest Earned | | | | |
| Borrower | | Average Daily | | Weighted Average | | | | (included in | | | | |
| or Lender | | Loan Balance | | Interest Rate | | | | interest income) | | | | Interest Expense |
| Borrower $ | | 11,049 | | 3.01% | | $ | | — | | $ | | 25 |
| |
| |
| 5. Committed Line of Credit. | | | | | | | | |
The fund participates with other funds managed by FMR in a $4.2 billion credit facility (the “line of credit”) to be utilized for temporary or emergency purposes to fund share holder redemptions or for other short term liquidity purposes. The fund has agreed to pay commitment fees on its pro rata portion of the line of credit. During the period, there were no borrowings on this line of credit.
27 Annual Report
| Notes to Financial Statements continued |
(Amounts in thousands except ratios) | | |
| |
| 6. Security Lending. | | |
The fund lends portfolio securities from time to time in order to earn additional income. The fund receives collateral (in the form of U.S. Treasury obligations, letters of credit and/or cash) against the loaned securities and maintains collateral in an amount not less than 100% of the market value of the loaned securities during the period of the loan. The market value of the loaned securities is determined at the close of business of the fund and any additional required collateral is delivered to the fund on the next business day. If the borrower defaults on its obligation to return the securities loaned because of insol vency or other reasons, a fund could experience delays and costs in recovering the securities loaned or in gaining access to the collateral. Cash collateral is invested in the Fidelity Securities Lending Cash Central Fund. The value of loaned securities and cash collateral at period end are disclosed on the fund’s Statement of Assets and Liabilities. Security lending income represents the income earned on investing cash collateral, less fees and expenses associated with the loan, plus any premium payments that may be received on the loan of certain types of securities. Net income from lending portfolio securities during the period amounted to $39.
The fund is permitted to have bank borrowings for temporary or emergency purposes to fund shareholder redemptions. The fund has established borrowing arrangements with certain banks. The interest rate on the borrowings is the bank’s base rate, as revised from time to time. The average daily loan balance during the period for which loans were outstanding amounted to $9,664. The weighted average interest rate was 3.13% . At period end, there were no bank borrowings outstanding.
Many of the brokers with whom FMR places trades on behalf of the fund provided services to the fund in addition to trade execution. These services included payments of certain expenses on behalf of the fund totaling $227 for the period. In addition, through arrangements with the fund’s custodian and transfer agent, credits realized as a result of uninvested cash balances were used to reduce the fund’s expenses. During the period, these credits reduced the fund’s custody and transfer agent expenses by $1 and $17, respectively.
The fund’s organizational documents provide former and current trustees and officers with a limited indemnification against liabilities arising in connection with the perfor mance of their duties to the fund. In the normal course of business, the fund may also enter into contracts that provide general indemnifications. The fund’s maximum
exposure under these arrangements is unknown as this would be dependent on future claims that may be made against the fund. The risk of material loss from such claims is considered remote.
29 Annual Report
Report of Independent Registered Public Accounting Firm
To the Trustees of Fidelity Financial Trust and the Shareholders of Fidelity Convertible Securities Fund:
In our opinion, the accompanying statement of assets and liabilities, including the sched ule of investments, and the related statements of operations and of changes in net assets and the financial highlights present fairly, in all material respects, the financial position of Fidelity Convertible Securities Fund (a fund of Fidelity Financial Trust) at November 30, 2005 and the results of its operations, the changes in its net assets and the financial highlights for the periods indicated, in conformity with accounting principles generally accepted in the United States of America. These financial statements and financial highlights (hereafter referred to as “financial statements”) are the responsibility of the Fidelity Convertible Securities Fund’s management; our responsibility is to express an opinion on these financial statements based on our audits. We conducted our audits of these financial statements in accordance with the standards of the Public Company Accounting Oversight Board (United States). Those standards require that we plan and perform the audit to obtain reasonable assurance about whether the financial statements are free of material misstatement. An audit includes examining, on a test basis, evidence supporting the amounts and disclosures in the financial statements, assessing the accounting principles used and significant estimates made by management, and evaluating the overall financial statement presentation. We believe that our audits, which included confirmation of securities at November 30, 2005 by correspondence with the custodian and brokers, provide a reasonable basis for our opinion.
/s/ PricewaterhouseCoopers LLP
PricewaterhouseCoopers LLP
Boston, Massachusetts
January 13, 2006
|
Trustees and Officers
The Trustees, Member of the Advisory Board, and executive officers of the trust and fund, as applicable, are listed below. The Board of Trustees governs the fund and is responsible for protecting the interests of shareholders. The Trustees are experienced executives who meet periodically throughout the year to oversee the fund’s activities, review contractual arrangements with companies that provide services to the fund, and review the fund’s performance. Except for William O. McCoy and Albert R. Gamper, Jr., each of the Trustees oversees 326 funds advised by FMR or an affiliate. Mr. McCoy oversees 328 funds advised by FMR or an affiliate. Mr. Gamper oversees 235 funds advised by FMR or an affiliate.
The Trustees hold office without limit in time except that (a) any Trustee may resign; (b) any Trustee may be removed by written instrument, signed by at least two thirds of the number of Trustees prior to such removal; (c) any Trustee who requests to be retired or who has become incapacitated by illness or injury may be retired by written instru ment signed by a majority of the other Trustees; and (d) any Trustee may be removed at any special meeting of shareholders by a two thirds vote of the outstanding voting securities of the trust. Each Trustee who is not an interested person (as defined in the 1940 Act) (Independent Trustee), shall retire not later than the last day of the calendar year in which his or her 72nd birthday occurs. The Independent Trustees may waive this mandatory retirement age policy with respect to individual Trustees. The executive officers and Advisory Board Member hold office without limit in time, except that any officer and Advisory Board Member may resign or may be removed by a vote of a majority of the Trustees at any regular meeting or any special meeting of the Trustees. Except as indicated, each individual has held the office shown or other offices in the same company for the past five years.
The fund’s Statements of Additional Information (SAI) include more information about the Trustees. To request a free copy, call Fidelity at 1-800-544-8544.
Correspondence intended for each Trustee who is an interested person may be sent to Fidelity Investments, 82 Devonshire Street, Boston, Massachusetts 02109.
| | Name, Age; Principal Occupation
Edward C. Johnson 3d (75)
|
Year of Election or Appointment: 1982
Mr. Johnson is Chairman of the Board of Trustees. Mr. Johnson serves as Chief Executive Officer, Chairman, and a Director of FMR Corp.; a Di rector and Chairman of the Board and of the Executive Committee of FMR; Chairman and a Director of Fidelity Management & Research (Far East) Inc.; Chairman and a Director of Fidelity Investments Money Man agement, Inc.; and Chairman (2001 present) and a Director (2000 present) of FMR Co., Inc.
31 Annual Report
Trustees and Officers - continued
| | Name, Age; Principal Occupation
Stephen P. Jonas (52)
|
Year of Election or Appointment: 2005
Mr. Jonas is Senior Vice President of Convertible Securities
(2005 Present). He also serves as Senior Vice President of other Fidelity funds (2005 present). Mr. Jonas is Executive Director of FMR
(2005 present). Previously, Mr. Jonas served as President of Fidelity En terprise Operations and Risk Services (2004 2005), Chief Administra tive Officer (2002 2004), and Chief Financial Officer of FMR Co. (1998 2000). Mr. Jonas has been with Fidelity Investments since 1987 and has held various financial and management positions including Chief Financial Officer of FMR. In addition, he serves on the Boards of Boston Ballet (2003 present) and Simmons College (2003 present).
Year of Election or Appointment: 2003
Mr. Reynolds is a Director (2003 present) and Chief Operating Officer (2002 present) of FMR Corp. He also serves on the Board at Fidelity Investments Canada, Ltd. (2000 present). Previously, Mr. Reynolds served as President of Fidelity Investments Institutional Retirement Group (1996 2000).
* Trustees have been determined to be “Interested Trustees” by virtue of, among other things, their affiliation with the trust or various entities under common control with FMR.
Correspondence intended for each Independent Trustee (that is, the Trustees other than the Interested Trustees) may be sent to Fidelity Investments, P.O. Box 55235, Boston, Massachusetts 02205 5235.
| | Name, Age; Principal Occupation
Dennis J. Dirks (57)
|
Year of Election or Appointment: 2005
Prior to his retirement in May 2003, Mr. Dirks was Chief Operating Officer and a member of the Board of The Depository Trust & Clearing Corporation (DTCC) (1999 2003). He also served as President, Chief Operating Officer, and Board member of The Depository Trust Company (DTC) (1999 2003) and President and Board member of the National Securities Clearing Corporation (NSCC) (1999 2003). In addi tion, Mr. Dirks served as Chief Executive Officer and Board member of the Government Securities Clearing Corporation (2001 2003) and Chief Executive Officer and Board member of the Mortgage Backed Securities Clearing Corporation (2001 2003). Mr. Dirks also serves as a Trustee of Manhattan College (2005 present).
Name, Age; Principal Occupation
Albert R. Gamper, Jr. (63)
|
Year of Election or Appointment: 2006
Mr. Gamper also serves as a Trustee (2006 present) or Member of the Advisory Board (2005 present) of other investment companies advised by FMR. Prior to his retirement in December 2004, Mr. Gamper served as Chairman of the Board of CIT Group Inc. (commercial finance). Dur ing his tenure with CIT Group Inc. Mr. Gamper served in numerous se nior management positions, including Chairman (1987 1989; 1999 2001; 2002 2004), Chief Executive Officer (1987 2004), and President (1989 2002). He currently serves as a member of the Board of Directors of Public Service Enterprise Group (utilities, 2001 present), Chairman of the Board of Governors, Rutgers University (2004 present), and Chairman of the Board of Saint Barnabas Health Care System.
Year of Election or Appointment: 1997
Dr. Gates is Chairman of the Independent Trustees (2006 present). Dr. Gates is President of Texas A&M University (2002 present). He was Director of the Central Intelligence Agency (CIA) from 1991 to 1993. From 1989 to 1991, Dr. Gates served as Assistant to the President of the United States and Deputy National Security Advisor. Dr. Gates is a Director of NACCO Industries, Inc. (mining and manufacturing), Parker Drilling Co., Inc. (drilling and rental tools for the energy industry, 2001 present), and Brinker International (restaurant management, 2003 present). Previously, Dr. Gates served as a Director of LucasVarity PLC (automotive components and diesel engines), a Director of TRW Inc. (automotive, space, defense, and information technology), and Dean of the George Bush School of Government and Public Service at Texas A&M University (1999 2001). Dr. Gates also is a Trustee of the Forum for International Policy.
33 Annual Report
Trustees and Officers - continued
| | Name, Age; Principal Occupation
George H. Heilmeier (69)
|
Year of Election or Appointment: 2004
Dr. Heilmeier is Chairman Emeritus of Telcordia Technologies (commu nication software and systems), where prior to his retirement, he served as company Chairman and Chief Executive Officer. He currently serves on the Boards of Directors of The Mitre Corporation (systems engineer ing and information technology support for the government), and HRL Laboratories (private research and development, 2004 present). He is Chairman of the General Motors Science & Technology Advisory Board and a Life Fellow of the Institute of Electrical and Electronics Engineers (IEEE) (2000 present). Dr. Heilmeier is a member of the Defense Science Board and the National Security Agency Advisory Board. He is also a member of the National Academy of Engineering, the American Academy of Arts and Sciences, and the Board of Overseers of the School of Engineering and Applied Science of the University of Pennsyl vania. Previously, Dr. Heilmeier served as a Director of TRW Inc. (auto motive, space, defense, and information technology, 1992 2002), Compaq (1994 2002), Automatic Data Processing, Inc. (ADP) (technology based business outsourcing, 1995 2002), INET Technolo gies Inc. (telecommunications network surveillance, 2001 2004), and Teletech Holdings (customer management services). He is the recipient of the 2005 Kyoto Prize in Advanced Technology for his invention of the liquid display.
Year of Election or Appointment: 2001
Prior to Ms. Knowles’ retirement in June 2000, she served as Executive Vice President and Chief Financial Officer of Atlantic Richfield Company (ARCO) (diversified energy, 1996 2000). From 1993 to 1996, she was a Senior Vice President of ARCO and President of ARCO Transportation Company. She served as a Director of ARCO from 1996 to 1998. She currently serves as a Director of Phelps Dodge Corporation (copper mining and manufacturing) and McKesson Corporation (healthcare ser vice, 2002 present). Ms. Knowles is a Trustee of the Brookings Institution and the Catalina Island Conservancy and also serves as a member of the Advisory Board for the School of Engineering of the University of Southern California.
Name, Age; Principal Occupation
Ned C. Lautenbach (61)
|
Year of Election or Appointment: 2000
Mr. Lautenbach has been a partner of Clayton, Dubilier & Rice, Inc. (private equity investment firm) since September 1998. Previously, Mr. Lautenbach was with the International Business Machines Corporation (IBM) from 1968 until his retirement in 1998. Mr. Lautenbach serves as a Director of Italtel Holding S.p.A. (telecommunications (Milan, Italy), 2004 present) and Eaton Corporation (diversified industrial) as well as the Philharmonic Center for the Arts in Naples, Florida. He also is a member of the Board of Trustees of Fairfield University (2005 present), as well as a member of the Council on Foreign Relations.
Year of Election or Appointment: 1997
Prior to his retirement in December 1994, Mr. McCoy was Vice Chair man of the Board of BellSouth Corporation (telecommunications) and President of BellSouth Enterprises. He is currently a Director of Liberty Corporation (holding company), Duke Realty Corporation (real estate), and Progress Energy, Inc. (electric utility). He is also a partner of Frank lin Street Partners (private investment management firm) and a member of the Research Triangle Foundation Board. In addition, Mr. McCoy served as the Interim Chancellor (1999 2000) and a member of the Board of Visitors for the University of North Carolina at Chapel Hill and currently serves on the Board of Directors of the University of North Carolina Health Care System and the Board of Visitors of the Kenan Flagler Business School (University of North Carolina at Chapel Hill). He also served as Vice President of Finance for the University of North Car olina (16 school system).
Year of Election or Appointment: 2005
Ms. Small is a member (2000 present) and Chairperson (2002 present) of the Investment Committee, and a member (2002 present) of the Board of Trustees of Smith College. Previously, she served as Chief In vestment Officer (1999 2000), Director of Global Equity Investments (1996 1999), and a member of the Board of Directors of Scudder, Stevens & Clark (1990 1997) and Scudder Kemper Investments (1997 1998). In addition, Ms. Small served as Co Chair (2000 2003) of the Annual Fund for the Fletcher School of Law and Diplomacy.
35 Annual Report
Trustees and Officers - continued
| | Name, Age; Principal Occupation
William S. Stavropoulos (66)
|
Year of Election or Appointment: 2002
Mr. Stavropoulos is Chairman of the Board (2000 present) and a Mem ber of the Board of Directors of The Dow Chemical Company. Since joining The Dow Chemical Company in 1967, Mr. Stavropoulos served in numerous senior management positions, including President (1993 2000; 2002 2003), CEO (1995 2000; 2002 2004), and Chair man of the Executive Committee (2000 2004). Currently, he is a Direc tor of NCR Corporation (data warehousing and technology solutions), BellSouth Corporation (telecommunications), Chemical Financial Corpo ration, Maersk Inc. (industrial conglomerate, 2002 present), and Metal mark Capital (private equity investment firm, 2005 present). He also serves as a member of the Board of Trustees of the American Enterprise Institute for Public Policy Research. In addition, Mr. Stavropoulos is a member of The Business Council, J.P. Morgan International Council and the University of Notre Dame Advisory Council for the College of Science.
Year of Election or Appointment: 2005
Prior to his retirement in 2001, Mr. Wolfe was Chairman and Chief Executive Officer of Hershey Foods Corporation (1993 2001). He cur rently serves as a member of the boards of Adelphia Communications Corporation (2003 present), Bausch & Lomb, Inc., and Revlon Inc. (2004 present).
Advisory Board Member and Executive Officers:
Correspondence intended for each executive officer and Mr. Lynch may be sent to Fidelity Investments, 82 Devonshire Street, Boston, Massachusetts 02109.
| | Name, Age; Principal Occupation
Peter S. Lynch (61)
|
Year of Election or Appointment: 2003
Member of the Advisory Board of Fidelity Financial Trust. Vice Chair man and a Director of FMR, and Vice Chairman (2001 present) and a Director (2000 present) of FMR Co., Inc. Previously, Mr. Lynch served as a Trustee of the Fidelity funds (1990 2003). In addition, he serves as a Trustee of Boston College, Massachusetts Eye & Ear Infirmary, Historic Deerfield, John F. Kennedy Library, and the Museum of Fine Arts of Boston.
Name, Age; Principal Occupation
Thomas T. Soviero (42)
|
Year of Election or Appointment: 2005
Vice President of Convertible Securities. Mr. Soviero serves as Vice President of other funds advised by FMR. Prior to assuming his current responsibilities, Mr. Soviero managed a variety of Fidelity funds. Mr. Soviero also serves as Vice President of FMR (2001) and FMR Co., Inc. (2001).
Year of Election or Appointment: 2005
Vice President of Convertible Securities. Mr. Donovan also serves as Vice President of Fidelity’s High Income Funds (2005 present), Fidelity’s Fixed Income Funds (2005 present), certain Asset Allocation Funds (2005 present), and certain Balanced Funds (2005 present). Mr. Dono van also serves as Executive Vice President of FMR (2005 present) and FMRC (2005 present). Previously, Mr. Donovan served as Vice President and Director of Fidelity’s International Equity Trading group (1998 2005).
Year of Election or Appointment: 1998
Secretary of Convertible Securities. He also serves as Secretary of other Fidelity funds; Vice President, General Counsel, and Secretary of FMR Co., Inc. (2001 present) and FMR; Assistant Secretary of Fidelity Man agement & Research (U.K.) Inc. (2001 present), Fidelity Management & Research (Far East) Inc. (2001 present), and Fidelity Investments Money Management, Inc. (2001 present). Mr. Roiter is an Adjunct Member, Faculty of Law, at Boston College Law School (2003 present). Previously, Mr. Roiter served as Vice President and Secretary of Fidelity Distributors Corporation (FDC) (1998 2005).
Year of Election or Appointment: 2003
Assistant Secretary of Convertible Securities. Mr. Fross also serves as Assistant Secretary of other Fidelity funds (2003 present), Vice President and Secretary of FDC (2005 present), and is an employee of FMR.
Year of Election or Appointment: 2004
President, Treasurer, and Anti Money Laundering (AML) officer of Con vertible Securities. Ms. Reynolds also serves as President, Treasurer, and AML officer of other Fidelity funds (2004) and is a Vice President (2003) and an employee (2002) of FMR. Before joining Fidelity Investments, Ms. Reynolds worked at PricewaterhouseCoopers LLP (PwC) (1980 2002), where she was most recently an audit partner with PwC’s investment management practice.
37 Annual Report
Trustees and Officers - continued
| | Name, Age; Principal Occupation
Paul M. Murphy (58)
|
Year of Election or Appointment: 2005
Chief Financial Officer of Convertible Securities. Mr. Murphy also serves as Chief Financial Officer of other Fidelity funds (2005 present). He also serves as Senior Vice President of Fidelity Pricing and Cash Management Services Group (FPCMS).
| | Kenneth A. Rathgeber (58)
|
Year of Election or Appointment: 2004
Chief Compliance Officer of Convertible Securities. Mr. Rathgeber also serves as Chief Compliance Officer of other Fidelity funds (2004) and Executive Vice President of Risk Oversight for Fidelity Investments (2002). Previously, he served as Executive Vice President and Chief Op erating Officer for Fidelity Investments Institutional Services Company, Inc. (1998 2002).
Year of Election or Appointment: 2003
Deputy Treasurer of Convertible Securities. Mr. Hebble also serves as Deputy Treasurer of other Fidelity funds (2003), and is an employee of FMR. Before joining Fidelity Investments, Mr. Hebble worked at Deutsche Asset Management where he served as Director of Fund Accounting (2002 2003) and Assistant Treasurer of the Scudder Funds (1998 2003).
Year of Election or Appointment: 2005
Deputy Treasurer of Convertible Securities. Mr. Mehrmann also serves as Deputy Treasurer of other Fidelity funds (2005 present) and is an employee of FMR. Previously, Mr. Mehrmann served as Vice President of Fidelity Investments Institutional Services Group (FIIS)/Fidelity Investments Institutional Operations Corporation, Inc. (FIIOC) Client Services (1998 2004).
| | Kimberley H. Monasterio (41)
|
Year of Election or Appointment: 2004
Deputy Treasurer of Convertible Securities. Ms. Monasterio also serves as Deputy Treasurer of other Fidelity funds (2004) and is an employee of FMR (2004). Before joining Fidelity Investments, Ms. Monasterio served as Treasurer (2000 2004) and Chief Financial Officer (2002 2004) of the Franklin Templeton Funds and Senior Vice President of Franklin Templeton Services, LLC (2000 2004).
Name, Age; Principal Occupation
Kenneth B. Robins (36)
|
Year of Election or Appointment: 2005
Deputy Treasurer of Convertible Securities. Mr. Robins also serves as Deputy Treasurer of other Fidelity funds (2005 present) and is an em ployee of FMR (2004 present). Before joining Fidelity Investments, Mr. Robins worked at KPMG LLP, where he was a partner in KPMG’s de partment of professional practice (2002 2004) and a Senior Manager (1999 2000). In addition, Mr. Robins served as Assistant Chief Accoun tant, United States Securities and Exchange Commission (2000 2002).
Year of Election or Appointment: 2005
Assistant Treasurer of Convertible Securities. Mr. Byrnes also serves as Assistant Treasurer of other Fidelity funds (2005 present) and is an em ployee of FMR (2005 present). Previously, Mr. Byrnes served as Vice President of FPCMS (2003 2005). Before joining Fidelity Investments, Mr. Byrnes worked at Deutsche Asset Management where he served as Vice President of the Investment Operations Group (2000 2003).
Year of Election or Appointment: 1987
Assistant Treasurer of Convertible Securities. Mr. Costello also serves as Assistant Treasurer of other Fidelity funds and is an employee of FMR.
Year of Election or Appointment: 2004
Assistant Treasurer of Convertible Securities. Mr. Lydecker also serves as Assistant Treasurer of other Fidelity funds (2004) and is an employee of FMR.
Year of Election or Appointment: 2002
Assistant Treasurer of Convertible Securities. Mr. Osterheld also serves as Assistant Treasurer of other Fidelity funds (2002) and is an employee of FMR.
Year of Election or Appointment: 2005
Assistant Treasurer of Convertible Securities. Mr. Ryan also serves as Assistant Treasurer of other Fidelity funds (2005 present) and is an em ployee of FMR (2005 present). Previously, Mr. Ryan served as Vice Pres ident of Fund Reporting in FPCMS (1999 2005).
39 Annual Report
Trustees and Officers - continued
| | Name, Age; Principal Occupation
Salvatore Schiavone (40)
|
Year of Election or Appointment: 2005
Assistant Treasurer of Convertible Securities. Mr. Schiavone also serves as Assistant Treasurer of other Fidelity funds (2005 present) and is an employee of FMR (2005 present). Before joining Fidelity Investments, Mr. Schiavone worked at Deutsche Asset Management, where he most recently served as Assistant Treasurer (2003 2005) of the Scudder Funds and Vice President and Head of Fund Reporting (1996 2003).
The Board of Trustees of Fidelity Convertible Securities Fund voted to pay on Decem-ber 19, 2005, to shareholders of record at the opening of business on December 16, 2005, a distribution of $.01 per share derived from capital gains realized from sales of portfolio securities and a dividend of $.14 per share from net investment income.
A total of .06% of the dividends distributed during the fiscal year was derived from interest on U.S. Government securities which is generally exempt from state income tax.
The fund designates 8%, 4%, 4%, and 4% of the dividends distributed in December 2004, April 2005, July 2005, and October 2005, respectively during the fiscal year as qualifying for the dividends received deduction for corporate shareholders.
The fund designates 6%, 8%, 8%, and 8% of the dividends distributed in December 2004, April 2005, July 2005, and October 2005, respectively during the fiscal year as amounts which may be taken into account as a dividend for the purposes of the maximum rate under section 1(h)(11) of the Internal Revenue Code.
The fund will notify shareholders in January 2006 of amounts for use in preparing 2005 income tax returns.
41 Annual Report
Proxy Voting Results
A special meeting of the fund’s shareholders was held on March 16, 2005. The results of votes taken among shareholders on proposals before them are reported below. Each vote reported represents one dollar of net asset value held on the record date for the meeting.
| PROPOSAL 1 | | |
| To amend the Declaration of Trust to |
| allow the Board of Trustees, if per- |
| mitted by applicable law, to authorize |
| fund mergers without shareholder |
| approval.A | | | | |
| | | # of | | % of |
| | | Votes | | Votes |
| Affirmative | | 8,400,660,894.14 | | 71.170 |
| Against | | 2,413,818,167.07 | | 20.450 |
| Abstain | | 466,182,489.54 | | 3.949 |
| Broker | | | | |
| Non Votes | | 523,001,758.35 | | 4.431 |
| TOTAL | | 11,803,663,309.10 | | 100.000 |
| PROPOSAL 2 | | |
| To elect a Board of Trustees.A | | |
| | | # of | | % of |
| | | Votes | | Votes |
| |
| Laura B. Cronin | | |
| Affirmative | | 10,904,461,482.16 | | 92.382 |
| Withheld | | 899,201,826.94 | | 7.618 |
| TOTAL | | 11,803,663,309.10 | | 100.000 |
| Dennis J. Dirks | | |
| Affirmative | | 11,230,399,240.22 | | 95.143 |
| Withheld | | 573,264,068.88 | | 4.857 |
| TOTAL | | 11,803,663,309.10 | | 100.000 |
| Robert M. Gates | | |
| Affirmative | | 11,204,490,469.14 | | 94.924 |
| Withheld | | 599,172,839.96 | | 5.076 |
| TOTAL | | 11,803,663,309.10 | | 100.000 |
| George H. Heilmeier | | |
| Affirmative | | 11,216,568,766.75 | | 95.026 |
| Withheld | | 587,094,542.35 | | 4.974 |
| TOTAL | | 11,803,663,309.10 | | 100.000 |
| Abigail P. Johnson | | |
| Affirmative | | 11,170,882,517.64 | | 94.639 |
| Withheld | | 632,780,791.46 | | 5.361 |
| TOTAL | | 11,803,663,309.10 | | 100.000 |
| | | # of | | % of |
| | | Votes | | Votes |
| |
| Edward C. Johnson 3d | | |
| Affirmative | | 11,146,150,096.08 | | 94.430 |
| Withheld | | 657,513,213.02 | | 5.570 |
| TOTAL | | 11,803,663,309.10 | | 100.000 |
| |
| Marie L. Knowles | | |
| Affirmative | | 11,230,314,699.11 | | 95.143 |
| Withheld | | 573,348,609.99 | | 4.857 |
| TOTAL | | 11,803,663,309.10 | | 100.000 |
| |
| Ned C. Lautenbach | | |
| Affirmative | | 11,228,854,936.86 | | 95.130 |
| Withheld | | 574,808,372.24 | | 4.870 |
| TOTAL | | 11,803,663,309.10 | | 100.000 |
| |
| Marvin L. Mann | | |
| Affirmative | | 11,192,136,636.22 | | 94.819 |
| Withheld | | 611,526,672.88 | | 5.181 |
| TOTAL | | 11,803,663,309.10 | | 100.000 |
| |
| William O. McCoy | | |
| Affirmative | | 11,202,537,978.70 | | 94.907 |
| Withheld | | 601,125,330.40 | | 5.093 |
| TOTAL | | 11,803,663,309.10 | | 100.000 |
| |
| Robert L. Reynolds | | |
| Affirmative | | 11,216,557,272.63 | | 95.026 |
| Withheld | | 587,106,036.47 | | 4.974 |
| TOTAL | | 11,803,663,309.10 | | 100.000 |
| |
| Cornelia M. Small | | |
| Affirmative | | 11,221,057,350.30 | | 95.064 |
| Withheld | | 582,605,958.80 | | 4.936 |
| TOTAL | | 11,803,663,309.10 | | 100.000 |
| |
| William S. Stavropoulos | | |
| Affirmative | | 11,213,520,655.58 | | 95.000 |
| Withheld | | 590,142,653.52 | | 5.000 |
| TOTAL | | 11,803,663,309.10 | | 100.000 |
Annual Report 42
| | | # of | | % of |
| | | Votes | | Votes |
| |
| Kenneth L. Wolfe | | |
| Affirmative | | 11,218,319,970.33 | | 95.041 |
| Withheld | | 585,343,338.77 | | 4.959 |
| TOTAL | | 11,803,663,309.10 | | 100.000 |
A Denotes trust-wide proposals and voting results.
|
43 Annual Report
Board Approval of Investment Advisory Contracts and Management Fees
Fidelity Convertible Securities Fund
Each year, typically in July, the Board of Trustees, including the independent Trustees (together, the Board), votes on the renewal of the management contract and sub advisory agreements (together, the Advisory Contracts) for the fund. The Board, assisted by the advice of fund counsel and independent Trustees’ counsel, requests and considers a broad range of information throughout the year.
The Board meets regularly each month except August and takes into account throughout the year matters bearing on Advisory Contracts. The Board, acting directly and through its separate committees, considers at each of its meetings factors that are relevant to the annual renewal of the fund’s Advisory Contracts, including the services and support provided to the fund and its shareholders by Fidelity. At the time of the renewal, the Board had 11 standing committees, each composed of independent Trustees with varying backgrounds, to which the Board has assigned specific subject matter responsibilities in order to enhance effective decision making by the Board. Each committee has adopted a written charter outlining the structure and purposes of the committee. One such com mittee, the Equity Contract Committee, meets periodically during the first six months of each year and as necessary to consider matters specifically related to the annual renewal of Advisory Contracts. The committee requests and receives information on, and makes recommendations to the independent Trustees concerning, the approval and annual review of the Advisory Contracts.
At its July 2005 meeting, the Board of Trustees, including the independent Trustees, unanimously determined to renew the Advisory Contracts for the fund. In reaching its determination, the Board considered all factors it believed relevant, including (1) the nature, extent, and quality of the services to be provided to the fund and its shareholders by Fidelity (including the investment performance of the fund); (2) the competitiveness of the management fee and total expenses of the fund; (3) the total costs of the services to be provided by and the profits to be realized by the investment adviser and its affiliates from the relationship with the fund; (4) the extent to which economies of scale would be realized as the fund grows; and (5) whether fee levels reflect these economies of scale, if any, for the benefit of fund shareholders.
In determining whether to renew the Advisory Contracts for the fund, the Board ulti mately reached a determination, with the assistance of fund counsel and independent Trustees’ counsel, that the renewal of the Advisory Contracts and the compensation to be received by Fidelity under the management contract is consistent with Fidelity’s fidu ciary duty under applicable law. In addition to evaluating the specific factors noted above, the Board, in reaching its determination, is aware that shareholders in the fund have a broad range of investment choices available to them, including a wide choice among mutual funds offered by competitors to Fidelity, and that the fund’s shareholders, with the opportunity to review and weigh the disclosure provided by the fund in its
prospectus and other public disclosures, have chosen to invest in this fund, managed by Fidelity.
Nature, Extent, and Quality of Services Provided by Fidelity. The Board consid ered staffing within the investment adviser, FMR, and the sub advisers (together, the Investment Advisers), including the background of the fund’s portfolio manager and the fund’s investment objective and discipline. The independent Trustees also had discus sions with senior management of Fidelity’s investment operations and investment groups. The Board considered the structure of the portfolio manager compensation program and whether this structure provides appropriate incentives.
Fidelity Resources Dedicated to Investment Management and Support Services. The Board reviewed the size, education, and experience of the Investment Advisers’ invest ment staff, their use of technology, and the Investment Advisers’ approach to recruiting, training, and retaining portfolio managers and other research, advisory, and manage ment personnel. The Board considered Fidelity’s extensive global research capabilities that enable the Investment Advisers to aggregate data from various sources in an effort to produce positive investment results. The Board noted that Fidelity’s analysts have access to a variety of technological tools that enable them to perform both fundamental and quantitative analysis and to specialize in various disciplines. The Board also considered that Fidelity’s portfolio managers and analysts have access to daily portfolio attribution that allows for monitoring of a fund’s portfolio, as well as an electronic communication system that provides immediate real time access to research concerning issuers and credit enhancers.
Shareholder and Administrative Services. The Board considered the nature, extent, quality, and cost of administrative, distribution, and shareholder services performed by the Investment Advisers and their affiliates under the Advisory Contracts and under separate agreements covering transfer agency, pricing and bookkeeping, and securities lending services for the fund. The Board also considered the nature and extent of the Investment Advisers’ supervision of third party service providers, principally custodians and subcustodians. The Board reviewed the allocation of fund brokerage, including allocations to brokers affiliated with the Investment Advisers, the use of brokerage commissions to pay fund expenses, and the use of “soft” commission dollars to pay for research services. The Board also considered that Fidelity voluntarily decided in 2004 to stop using “soft” commission dollars to pay for market data and, instead, to pay for that data out of its own resources. The Board also considered the resources devoted to, and the record of compliance with, the fund’s compliance policies and procedures.
The Board noted that the growth of fund assets across the complex allows Fidelity to reinvest in the development of services designed to enhance the value or convenience of the Fidelity funds as investment vehicles. These services include 24 hour access to
45 Annual Report
Board Approval of Investment Advisory Contracts and Management Fees continued
account information and market information through phone representatives and over the Internet, and investor education materials and asset allocation tools.
Investment in a Large Fund Family. The Board considered the benefits to shareholders of investing in a Fidelity fund, including the benefits of investing in a fund that is part of a large family of funds offering a variety of investment disciplines and providing for a large variety of mutual fund investor services. For example, fund shareholders are offered the privilege of exchanging shares of the fund for shares of other Fidelity funds, as set forth in the fund’s prospectus, without paying a sales charge. The Board noted that, since the last Advisory Contract renewals in July 2004, Fidelity has taken a number of actions that benefited particular funds, including (i) voluntarily deciding in 2004 to stop using “soft” commission dollars to pay for market data and, instead, to pay for that data out of its own resources, (ii) contractually agreeing to impose management fee reductions and expense limitations on its five Spartan stock index funds and its stock index fund available through variable insurance products, (iii) contractually agreeing to eliminate the management fees on the Fidelity Freedom Funds and the Fidelity Advisor Freedom Funds, (iv) contractually agreeing to reduce the management fees on most of its investment grade taxable bond funds, and (v) contractually agreeing to impose expense limitations on its retail and Spartan investment grade taxable bond funds.
Investment Performance and Compliance. The Board considered whether the fund has operated within its investment objective, as well as its record of compliance with its investment restrictions. It also reviewed the fund’s absolute investment performance, as well as the fund’s relative investment performance measured against (i) a broad based securities market index, and (ii) a peer group of mutual funds deemed appropriate by the Board over multiple periods. The following charts considered by the Board show, over the one , three , and five year periods ended December 31, 2004, the fund’s returns, the returns of a broad based securities market index (“benchmark”), and a range of returns of a peer group of mutual funds identified by Lipper Inc. as having an investment objec tive similar to that of the fund. The box within each chart shows the 25th percentile return (bottom of box) and the 75th percentile return (top of box) of the Lipper peer group. Returns shown above the box are in the first quartile and returns shown below the box are in the fourth quartile. The percentage beaten number noted below each chart corresponds to the percentile box and represents the percentage of funds in the Lipper peer group whose performance was equal to or lower than that of the fund.
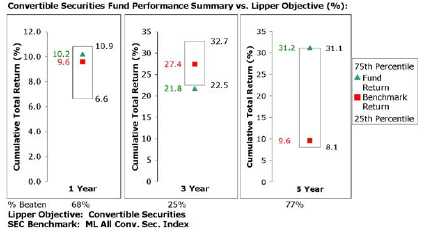
The Board reviewed the fund’s relative investment performance against its Lipper peer group and stated that the performance of the fund was in the second quartile for the one year period, the fourth quartile for the three year period, and the first quartile for the five year period. The Board also stated that the relative investment performance of the fund has compared favorably to its benchmark over time, although the fund’s three year cumulative total return was lower than its benchmark.
The Board also considered that the fund’s management fee is subject to upward or downward adjustment depending upon whether, and to what extent, the fund’s invest ment performance for the performance period exceeds, or is exceeded by, the record (over the same period) of a Board approved performance adjustment index. The Board realizes that the performance adjustment provides FMR with a strong economic incen tive to seek to achieve superior performance for the fund’s shareholders and helps to more closely align the interests of FMR and the fund’s shareholders.
The Board has had thorough discussions with FMR throughout the year about the Board’s and FMR’s concerns about equity research, equity fund performance, and compliance with internal policies governing gifts and entertainment. FMR has taken steps that it believes will refocus and strengthen equity research and equity portfolio management and compliance. The Board noted with favor FMR’s recent reorganization of its senior management team and FMR’s plans to dedicate additional resources to investment research, and participated in the process that led to those changes.
Based on its review, and giving particular weight to the nature and quality of the resources dedicated by the Investment Advisers to maintain and improve relative performance, the Board concluded that the nature, extent, and quality of the services
47 Annual Report
Board Approval of Investment Advisory Contracts and Management Fees continued
provided by Fidelity will benefit the fund’s shareholders, particularly in light of the Board’s view that the fund’s shareholders benefit from investing in a fund that is part of a large family of funds offering a variety of investment disciplines and services.
Competitiveness of Management Fee and Total Fund Expenses. The Board considered the fund’s management fee and total expenses compared to “mapped groups” of competitive funds and classes. Fidelity creates “mapped groups” by combining similar Lipper investment objective categories that have comparable management fee charac teristics. Combining Lipper investment objective categories aids the Board’s manage ment fee and total expense comparisons by broadening the competitive group used for comparison and by reducing the number of universes to which various Fidelity funds are compared.
The Board considered two proprietary management fee comparisons for the 12 month periods shown in the chart below. The group of Lipper funds used by the Board for management fee comparisons is referred to below as the “Total Mapped Group” and, for the reasons explained above, is broader than the Lipper peer group used by the Board for performance comparisons. The Total Mapped Group comparison focuses on a fund’s standing relative to the total universe of comparable funds available to investors, in terms of gross management fees before expense reimbursements or caps. “TMG %” represents the percentage of funds in the Total Mapped Group that had management fees that were lower than the fund’s. For example, a TMG % of 22% means that 78% of the funds in the Total Mapped Group had higher management fees than the fund.The “Asset Size Peer Group” (ASPG) comparison focuses on a fund’s standing relative to non Fidelity funds similar in size to the fund within the Total Mapped Group. The ASPG represents at least 15% of the funds in the Total Mapped Group with comparable asset size and management fee characteristics, subject to a minimum of 50 funds (or all funds in the Total Mapped Group if fewer than 50). Additional information, such as the ASPG quartile (“quadrant”) in which the fund’s management fee ranked and the impact of the fund’s performance adjustment, is also included in the chart and considered by the Board.

The Board noted that the fund’s management fee ranked below the median of its Total Mapped Group and below the median of its ASPG for 2004. The Board also noted the effect of the fund’s negative performance adjustment on the fund’s management fee ranking.
Based on its review, the Board concluded that the fund’s management fee was fair and reasonable in light of the services that the fund receives and the other factors considered.
In its review of the fund’s total expenses, the Board considered the fund’s management fee as well as other fund expenses, such as transfer agent fees, pricing and bookkeeping fees, and custodial, legal, and audit fees. The Board also noted the effects of any waivers and reimbursements on fees and expenses, as well as the fund’s negative performance adjustment. As part of its review, the Board also considered current and historical total expenses of the fund compared to competitive fund median expenses. The fund is compared to those funds and classes in the Total Mapped Group (used by the Board for management fee comparisons) that have a similar sales load structure.
The Board noted that the fund’s total expenses ranked below its competitive median for 2004.
In its review of total expenses, the Board also considered Fidelity fee structures and other information on clients that FMR and its affiliates service in other competitive markets, such as other mutual funds advised or subadvised by FMR or its affiliates, pension plan clients, and other institutional clients.
49 Annual Report
Board Approval of Investment Advisory Contracts and Management Fees continued
Based on its review, the Board concluded that the fund’s total expenses were reasonable in light of the services that the fund and its shareholders receive and the other factors considered.
Costs of the Services and Profitability. The Board considered the revenues earned and the expenses incurred by Fidelity in conducting the business of developing, market ing, distributing, managing, administering and servicing the fund and its shareholders. The Board also considered the level of Fidelity’s profits in respect of all the Fidelity funds.
On an annual basis, FMR presents to the Board Fidelity’s profitability for the fund. Fidelity calculates the profitability for each fund, as well as aggregate profitability for groups of Fidelity funds and all Fidelity funds, using a series of detailed revenue and cost allocation methodologies which originate with the audited books and records of Fidelity. The Audit Committee of the Board reviews any significant changes from the prior year’s methodologies.
PricewaterhouseCoopers LLP (PwC), independent registered accounting firm and auditor to Fidelity and certain Fidelity funds, has been engaged annually by the Board as part of the Board’s assessment of the results of Fidelity’s profitability analysis. PwC’s engagement includes the review and assessment of Fidelity’s methodologies used in determining the revenues and expenses attributable to Fidelity’s mutual fund business, and completion of agreed upon procedures surrounding the mathematical accuracy of fund profitability and its conformity to allocation methodologies. After considering PwC’s reports issued under the engagement and information provided by Fidelity, the Board believes that while other allocation methods may also be reasonable, Fidelity’s profitabil ity methodologies are reasonable in all material respects.
The Board has also reviewed Fidelity’s non fund businesses and any fall out benefits related to the mutual fund business as well as cases where Fidelity’s affiliates may benefit from or be related to the fund’s business. In addition, a special committee of the Board reviewed services provided to Fidelity by its affiliates and determined that the fees that Fidelity paid for such services were reasonable.
The Board considered the costs of the services provided by and the profits realized by Fidelity in connection with the operation of the fund and determined that the amount of profit is a fair entrepreneurial profit for the management of the fund.
Economies of Scale. The Board considered whether there have been economies of scale in respect of the management of the Fidelity funds, whether the Fidelity funds (including the fund) have appropriately benefited from any such economies of scale, and whether there is potential for realization of any further economies of scale. The Board considered the extent to which the fund will benefit from economies of scale through increased services to the fund, through waivers or reimbursements, or through fee or
expense reductions, including reductions that occur through operation of the transfer agent agreement. The transfer agent fee varies in part based on the number of accounts in the fund. If the number of accounts decreases or the average account size increases, the overall transfer agent fee rate decreases.
The Board recognized that the fund’s management contract incorporates a “group fee” structure, which provides for lower fee rates as total fund assets under FMR’s manage ment increase, and for higher fee rates as total fund assets under FMR’s management decrease. The Board considered that the group fee is designed to deliver the benefits of economies of scale to fund shareholders when total fund assets increase, even if assets of any particular fund are unchanged or have declined, because some portion of Fidelity’s costs are attributable to services provided to all Fidelity funds, and all funds benefit if those costs can be allocated among more assets. The Board concluded that, given the group fee structure, fund shareholders will achieve a certain level of economies of scale as assets under FMR’s management increase at the fund complex level, regardless of whether Fidelity achieves any such economies of scale.
The Board further concluded that any potential economies of scale are being shared between fund shareholders and Fidelity in an appropriate manner.
Additional Information Requested by the Board. In order to develop fully the factual basis for consideration of the Advisory Contracts, the Board requested additional information regarding (i) equity fund transfer agency fees; (ii) Fidelity’s fund profitability methodology and the impact of various changes in the methodology over time; (iii) benefits to shareholders from economies of scale; (iv) composition and characteristics of various fund and industry data used in comparisons; and (v) com pensation of portfolio managers and research analysts.
Based on its evaluation of all of the conclusions noted above, and after considering all material factors, the Board ultimately concluded that the existing advisory fee structures are fair and reasonable, and that the fund’s existing Advisory Contracts should be renewed.
51 Annual Report
Managing Your Investments
Fidelity offers several ways to conveniently manage your personal investments via your telephone or PC. You can access your account information, conduct trades and research your investments 24 hours a day.
By Phone
Fidelity Automated Service Telephone provides a single toll free number to access account balances, positions, quotes and trading. It’s easy to navigate the service, and on your first call, the system will help you create a personal identification number (PIN) for security.


By PC
Fidelity’s web site on the Internet provides a wide range of information, including daily financial news, fund performance, interactive planning tools and news about Fidelity products and services.

* When you call the quotes line, please remember that a fund’s yield and return will vary and, except for money market funds, share price will also vary. This means that you may have a gain or loss when you sell your shares. There is no assurance that money market funds will be able to maintain a stable $1 share price; an investment in a money market fund is not insured or guar anteed by the U.S. government. Total returns are historical and include changes in share price, reinvestment of dividends and capital gains, and the effects of any sales charges.
Annual Report 52
To Write Fidelity
We’ll give your correspondence immediate attention and send you written confirmation upon completion of your request.

| | (such as changing name, address, bank, etc.)
Fidelity Investments
P.O. Box 770001
Cincinnati, OH 45277-0002
|

| | Buying shares
Fidelity Investments
P.O. Box 770001
Cincinnati, OH 45277-0003
Overnight Express
Fidelity Investments
Attn: Distribution Services
100 Crosby Parkway KC1H
Covington, KY 41015
Selling shares
Fidelity Investments
P.O. Box 770001
Cincinnati, OH 45277-0035
Overnight Express
Fidelity Investments
Attn: Distribution Services
100 Crosby Parkway KC1H
Covington, KY 41015
General Correspondence
Fidelity Investments
P.O. Box 500
Merrimack, NH 03054-0500
|

Buying shares
Fidelity Investments
P.O. Box 770001
Cincinnati, OH 45277-0003
Selling shares
Fidelity Investments
P.O. Box 770001
Cincinnati, OH 45277-0035
Overnight Express
Fidelity Investments
Attn: Distribution Services
100 Crosby Parkway KC1H
Covington, KY 41015
General Correspondence
Fidelity Investments
P.O. Box 500
Merrimack, NH 03054-0500
|
53 Annual Report
To Visit Fidelity
For directions and hours,
please call 1-800-544-9797.
Arizona
7001 West Ray Road
Chandler, AZ
7373 N. Scottsdale Road
Scottsdale, AZ
California
815 East Birch Street
Brea, CA
1411 Chapin Avenue
Burlingame, CA
851 East Hamilton Avenue
Campbell, CA
19200 Von Karman Avenue
Irvine, CA
601 Larkspur Landing Circle
Larkspur, CA
10100 Santa Monica Blvd.
Los Angeles, CA
27101 Puerta Real
Mission Viejo, CA
73 575 El Paseo
Palm Desert, CA
251 University Avenue
Palo Alto, CA
123 South Lake Avenue
Pasadena, CA
16995 Bernardo Ctr. Drive
Rancho Bernardo, CA
1740 Arden Way
Sacramento, CA
7676 Hazard Center Drive
San Diego, CA
8 Montgomery Street
San Francisco, CA
3793 State Street
Santa Barbara, CA
21701 Hawthorne Boulevard
Torrance, CA
2001 North Main Street
Walnut Creek, CA
6300 Canoga Avenue
Woodland Hills, CA
|
Colorado
1625 Broadway
Denver, CO
9185 East Westview Road
Littleton, CO
Connecticut
48 West Putnam Avenue
Greenwich, CT
265 Church Street
New Haven, CT
300 Atlantic Street
Stamford, CT
29 South Main Street
West Hartford, CT
Delaware
222 Delaware Avenue
Wilmington, DE
Florida
4400 N. Federal Highway
Boca Raton, FL
121 Alhambra Plaza
Coral Gables, FL
2948 N. Federal Highway
Ft. Lauderdale, FL
1907 West State Road 434
Longwood, FL
8880 Tamiami Trail, North
Naples, FL
3550 Tamiami Trail, South
Sarasota, FL
1502 N. Westshore Blvd.
Tampa, FL
2465 State Road 7
Wellington, FL
3501 PGA Boulevard
West Palm Beach, FL
Georgia
3445 Peachtree Road, N.E.
Atlanta, GA
1000 Abernathy Road
Atlanta, GA
Illinois
One North LaSalle Street
Chicago, IL
875 North Michigan Ave.
Chicago, IL
1415 West 22nd Street
Oak Brook, IL
|
1700 East Golf Road
Schaumburg, IL
3232 Lake Avenue
Wilmette, IL
Indiana
4729 East 82nd Street
Indianapolis, IN
Kansas
5400 College Boulevard
Overland Park, KS
Maine
Three Canal Plaza
Portland, ME
Maryland
7315 Wisconsin Avenue
Bethesda, MD
One W. Pennsylvania Ave.
Towson, MD
Massachusetts
801 Boylston Street
Boston, MA
155 Congress Street
Boston, MA
300 Granite Street
Braintree, MA
44 Mall Road
Burlington, MA
405 Cochituate Road
Framingham, MA
416 Belmont Street
Worcester, MA
Michigan
500 E. Eisenhower Pkwy.
Ann Arbor, MI
280 Old N. Woodward Ave.
Birmingham, MI
43420 Grand River Avenue
Novi, MI
29155 Northwestern Hwy.
Southfield, MI
Minnesota
7600 France Avenue South
Edina, MN
Missouri
8885 Ladue Road
Ladue, MO
|
Annual Report 54
Nevada
2225 Village Walk Drive
Henderson, NV
New Jersey
150 Essex Street
Millburn, NJ
56 South Street
Morristown, NJ
396 Route 17, North
Paramus, NJ
3518 Route 1 North
Princeton, NJ
530 Highway 35
Shrewsbury, NJ
New York
1055 Franklin Avenue
Garden City, NY
37 West Jericho Turnpike
Huntington Station, NY
1271 Avenue of the Americas
New York, NY
61 Broadway
New York, NY
350 Park Avenue
New York, NY
200 Fifth Avenue
New York, NY
733 Third Avenue
New York, NY
11 Penn Plaza
New York, NY
2070 Broadway
New York, NY
1075 Northern Blvd.
Roslyn, NY
North Carolina
4611 Sharon Road
Charlotte, NC
Ohio
3805 Edwards Road
Cincinnati, OH
1324 Polaris Parkway
Columbus, OH
28699 Chagrin Boulevard
Woodmere Village, OH
Oregon
16850 SW 72nd Avenue
Tigard, OR
|
Pennsylvania
600 West DeKalb Pike
King of Prussia, PA
1735 Market Street
Philadelphia, PA
12001 Perry Highway
Wexford, PA
Rhode Island
47 Providence Place
Providence, RI
Tennessee
6150 Poplar Avenue
Memphis, TN
Texas
10000 Research Boulevard
Austin, TX
4001 Northwest Parkway
Dallas, TX
12532 Memorial Drive
Houston, TX
2701 Drexel Drive
Houston, TX
6500 N. MacArthur Blvd.
Irving, TX
6005 West Park Boulevard
Plano, TX
14100 San Pedro
San Antonio, TX
1576 East Southlake Blvd.
Southlake, TX
19740 IH 45 North
Spring, TX
Utah
215 South State Street
Salt Lake City, UT
Virginia
1861 International Drive
McLean, VA
Washington
411 108th Avenue, N.E.
Bellevue, WA
1518 6th Avenue
Seattle, WA
Washington, DC
1900 K Street, N.W.
Washington, DC
Wisconsin
595 North Barker Road
Brookfield, WI
|
Fidelity Brokerage Services, Inc., 100 Summer St., Boston, MA 02110 Member NYSE/SIPC
55 Annual Report
55
| | Investment Adviser
Fidelity Management & Research Company
Boston, MA
Investment Sub Advisers
FMR Co., Inc.
Fidelity Management & Research
(U.K.) Inc.
Fidelity Management & Research
(Far East) Inc.
Fidelity International Investment
Advisors
Fidelity Investments Japan Limited
Fidelity International Investment
Advisors (U.K.) Limited
General Distributor
Fidelity Distributors Corporation
Boston, MA
Transfer and Service Agent
Fidelity Service Company, Inc.
Boston, MA
Custodian
Citibank, N.A.
New York, NY
|
| The Fidelity Telephone Connection |
| Mutual Fund 24-Hour Service |
| Exchanges/Redemptions | | |
| and Account Assistance | | 1-800-544-6666 |
| Product Information | | 1-800-544-6666 |
| Retirement Accounts | | 1-800-544-4774 |
| (8 a.m. - 9 p.m.) | | |
| TDD Service | | 1-800-544-0118 |
| for the deaf and hearing impaired |
| (9 a.m. - 9 p.m. Eastern time) |
| Fidelity Automated Service | | |
| Telephone (FAST®) (automated phone logo) | | 1-800-544-5555 |
| (automated phone logo) Automated line for quickest service |
CVS-UANN-0106
1.786706.102
|

Fidelity®
Equity Income II
Fund
|
Annual Report
November 30, 2005
|


| Contents | | | | |
| |
| Chairman’s Message | | 4 | | Ned Johnson’s message to shareholders. |
| Performance | | 5 | | How the fund has done over time. |
| Management’s Discussion | | 6 | | The manager’s review of fund |
| | | | | performance, strategy and outlook. |
| Shareholder Expense | | 7 | | An example of shareholder expenses. |
| Example | | | | |
| Investment Changes | | 8 | | A summary of major shifts in the fund’s |
| | | | | investments over the past six months. |
| Investments | | 9 | | A complete list of the fund’s investments |
| | | | | with their market values. |
| Financial Statements | | 19 | | Statements of assets and liabilities, |
| | | | | operations, and changes in net assets, |
| | | | | as well as financial highlights. |
| Notes | | 23 | | Notes to the financial statements. |
| Report of Independent | | 29 | | |
| Registered Public | | | | |
| Accounting Firm | | | | |
| Trustees and Officers | | 30 | | |
| Distributions | | 40 | | |
| Proxy Voting Results | | 41 | | |
| Board Approval of | | 43 | | |
| Investment Advisory | | | | |
| Contracts and | | | | |
| Management Fees | | | | |
| | To view a fund’s proxy voting guidelines and proxy voting record for the 12 month period
ended June 30, visit www.fidelity.com/proxyvotingresults or visit the Securities and Exchange
Commission’s (SEC) web site at www.sec.gov. You may also call 1-800-544-8544 to request a free
copy of the proxy voting guidelines.
Standard & Poor’s, S&P and S&P 500 are registered service marks of The McGraw Hill Companies, Inc.
and have been licensed for use by Fidelity Distributors Corporation.
Other third party marks appearing herein are the property of their respective owners.
All other marks appearing herein are registered or unregistered trademarks or service marks
of FMR Corp. or an affiliated company.
|
Annual Report 2
This report and the financial statements contained herein are submitted for the general information
of the shareholders of the fund. This report is not authorized for distribution to prospective investors
in the fund unless preceded or accompanied by an effective prospectus.
A fund files its complete schedule of portfolio holdings with the SEC for the first and third
quarters of each fiscal year on Form N Q. Forms N Q are available on the SEC’s web site at
http://www.sec.gov. A fund’s Forms N Q may be reviewed and copied at the SEC’s Public Reference
Room in Washington, DC. Information regarding the operation of the SEC’s Public Reference
Room may be obtained by calling 1-800-SEC-0330. For a complete list of a fund’s portfolio
holdings, view the most recent quarterly holdings report, semiannual report, or annual report
on Fidelity’s web site at http://www.fidelity.com/holdings.
NOT FDIC INSURED · MAY LOSE VALUE · NO BANK GUARANTEE
Neither the fund nor Fidelity Distributors Corporation is a bank.
|
3 Annual Report
Chairman’s Message
(photograph of Edward C. Johnson 3d)
Dear Shareholder:
During the past year or so, much has been reported about the mutual fund industry, and much of it has been more critical than I believe is warranted. Allegations that some companies have been less than forthright with their shareholders have cast a shadow on the entire industry. I continue to find these reports disturbing, and assert that they do not create an accurate picture of the industry overall. Therefore, I would like to remind every one where Fidelity stands on these issues. I will say two things specifically regarding allegations that some mutual fund companies were in violation of the Securities and Exchange Commission’s forward pricing rules or were involved in so called “market timing” activities.
First, Fidelity has no agreements that permit customers who buy fund shares after 4 p.m. to obtain the 4 p.m. price. This is not a new policy. This is not to say that some one could not deceive the company through fraudulent acts. However, we are extremely diligent in preventing fraud from occurring in this manner and in every other. But I underscore again that Fidelity has no so called “agreements” that sanction illegal practices.
Second, Fidelity continues to stand on record, as we have for years, in opposition to predatory short term trading that adversely affects shareholders in a mutual fund. Back in the 1980s, we initiated a fee which is returned to the fund and, therefore, to investors to discourage this activity. Further, we took the lead several years ago in developing a Fair Value Pricing Policy to prevent market timing on foreign securities in our funds. I am confident we will find other ways to make it more difficult for predatory traders to operate. However, this will only be achieved through close cooperation among regulators, legislators and the industry.
Yes, there have been unfortunate instances of unethical and illegal activity within the mutual fund industry from time to time. That is true of any industry. When this occurs, confessed or convicted offenders should be dealt with appropriately. But we are still concerned about the risk of over regulation and the quick application of simplistic solutions to intricate problems. Every system can be improved, and we support and applaud well thought out improvements by regulators, legislators and industry representatives that achieve the common goal of building and protecting the value of investors’ holdings.
For nearly 60 years, Fidelity has worked very hard to improve its products and service to justify your trust. When our family founded this company in 1946, we had only a few hundred customers. Today, we serve more than 18 million customers including individual investors and participants in retirement plans across America.
Let me close by saying that we do not take your trust in us for granted, and we realize that we must always work to improve all aspects of our service to you. In turn, we urge you to continue your active participation with your financial matters, so that your interests can be well served.
Best regards,
/s/ Edward C. Johnson 3d
Edward C. Johnson 3d
Annual Report 4
Performance: The Bottom Line
Average annual total return reflects the change in the value of an investment, assuming reinvestment of the fund’s dividend income and capital gains (the profits earned upon the sale of securities that have grown in value) and assuming a constant rate of performance each year. The $10,000 table and the fund’s returns do not reflect the deduction of taxes that a shareholder would pay on fund distributions or the redemption of fund shares. During periods of reimbursement by Fidelity, a fund’s total return will be greater than it would be had the reimbursement not occurred. How a fund did yesterday is no guarantee of how it will do tomorrow.
| Average Annual Total Returns | | | | | | |
| Periods ended November 30, 2005 | | Past 1 | | Past 5 | | Past 10 |
| | | year | | years | | years |
| Fidelity® Equity Income II | | 7.41% | | 4.72% | | 9.78% |
| |
| $10,000 Over 10 Years | | | | | | |
Let’s say hypothetically that $10,000 was invested in Fidelity® Equity Income II Fund on November 30, 1995. The chart shows how the value of your investment would have changed, and also shows how the Russell 3000® Value Index performed over the same period.

5 Annual Report
5
Management’s Discussion of Fund Performance
Comments from Steve DuFour, Portfolio Manager of Fidelity® Equity Income II Fund
Numerous events unfolded during the 12 month period ending November 30, 2005, that were major influences on the U.S. equity markets. Issues exerting downward pressure on stocks included higher levels of inflation, eight short term interest rate hikes by the Federal Reserve Board, exorbitant energy prices, and a Category 4 hurricane that devastated both the city of New Orleans and several nearby oil production and refinery facilities. Grabbing most of the markets’ upbeat headlines was consistent strength in consumer spending, corporate earnings and gross domestic product (GDP). When all was said and done, investors demonstrated their conviction in the economy, pushing stocks higher across the board. By period end, the Standard & Poor’s 500SM Index, the NASDAQ Composite® Index and the Dow Jones Industrial AverageSM approached or exceeded four and a half year highs. For the 12 months overall, the S&P 500® was up 8.44%, the NASDAQ® rose 7.28% and the Dow advanced 6.07%, threatening to eclipse the 11,000 threshold for the first time since 2001.
Fidelity Equity Income II Fund returned 7.41% for the 12 months ending November 30, 2005, lagging the Russell 3000® Value Index and the LipperSM Equity Income Objective Funds Average, which posted returns of 9.80% and 8.23%, respectively. Inopportune stock selection was the primary driver of the fund’s underperformance versus the index. Some of the names that hurt the most generally were strong performing index components that the fund did not own or in which it was underweighted. Energy was a good example of this, although there also were stocks in which the fund held large overweighted positions particularly in the media group that detracted a lot as well. In media, such names as News Corp. and XM Satellite Radio were big detractors, while other large holdings such as Verizon Communications and Wal Mart disappointed, too. On the plus side, results were helped by an eclectic group of good performers across a variety of sectors, including such names as mall developer General Growth Properties, National Semiconductor and United Health Group, a managed care company. Some stocks mentioned here were no longer held at period end.
The views expressed in this statement reflect those of the portfolio manager only through the end of the period of the report as stated on the cover and do not necessarily represent the views of Fidelity or any other person in the Fidelity organization. Any such views are subject to change at any time based upon market or other conditions and Fidelity disclaims any responsibility to update such views. These views may not be relied on as investment advice and, because investment decisions for a Fidelity fund are based on numerous factors, may not be relied on as an indication of trading intent on behalf of any Fidelity fund.
Shareholder Expense Example
As a shareholder of the Fund, you incur two types of costs: (1) transaction costs, and (2) ongoing costs, including management fees and other Fund expenses. This Example is intended to help you understand your ongoing costs (in dollars) of investing in the Fund and to compare these costs with the ongoing costs of investing in other mutual funds. The Example is based on an investment of $1,000 invested at the beginning of the period and held for the entire period (June 1, 2005 to November 30, 2005).
The first line of the table below provides information about actual account values and actual expenses. You may use the information in this line, together with the amount you invested, to estimate the expenses that you paid over the period. Simply divide your account value by $1,000.00 (for example, an $8,600 account value divided by $1,000.00 = 8.6), then multiply the result by the number in the first line under the heading entitled “Expenses Paid During Period” to estimate the expenses you paid on your account during this period. A small balance maintenance fee of $12.00 that is charged once a year may apply for certain accounts with a value of less than $2,000. This fee is not included in the table below. If it was, the estimate of expenses you paid during the period would be higher, and your ending account value lower, by this amount.
Hypothetical Example for Comparison Purposes
The second line of the table below provides information about hypothetical account values and hypothetical expenses based on the Fund’s actual expense ratio and an assumed rate of return of 5% per year before expenses, which is not the Fund’s actual return. The hypothetical account values and expenses may not be used to estimate the actual ending account balance or expenses you paid for the period. You may use this information to compare the ongoing costs of investing in the Fund and other funds. To do so, compare this 5% hypothetical example with the 5% hypothetical examples that appear in the share holder reports of the other funds. A small balance maintenance fee of $12.00 that is charged once a year may apply for certain accounts with a value of less than $2,000. This fee is not included in the table below. If it was, the estimate of expenses you paid during the period would be higher, and your ending account value lower, by this amount.
Please note that the expenses shown in the table are meant to highlight your ongoing costs only and do not reflect any transaction costs. Therefore, the second line of the table is useful in comparing ongoing costs only, and will not help you determine the relative total costs of owning different funds.
| | | | | | | | | | | Expenses Paid |
| | | | | | | | | | | During Period* |
| | | | | Beginning | | Ending | | June 1, 2005 |
| | | | | Account Value | | Account Value | | to November 30, |
| | | | | June 1, 2005 | | November 30, 2005 | | 2005 |
| Actual | | $ | | 1,000.00 | | $ | | 1,062.60 | $ | 3.46 |
| Hypothetical (5% return per year | | | | | | | | | | |
| before expenses) | | $ | | 1,000.00 | | $ | | 1,021.71 | $ | 3.40 |
* Expenses are equal to the Fund’s annualized expense ratio of .67%; multiplied by the average account value over the period, multiplied by 183/365 (to reflect the one half year period).
7 Annual Report
| Investment Changes | | | | |
| |
| |
| Top Ten Stocks as of November 30, 2005 | | | | |
| | | % of fund’s | | % of fund’s net assets |
| | | net assets | | 6 months ago |
| American International Group, Inc. | | 3.9 | | 2.0 |
| Wal Mart Stores, Inc. | | 3.9 | | 3.1 |
| Intel Corp. | | 3.7 | | 1.7 |
| Citigroup, Inc. | | 3.4 | | 3.9 |
| General Growth Properties, Inc. | | 3.1 | | 2.5 |
| Bank of America Corp. | | 3.0 | | 2.8 |
| Exxon Mobil Corp. | | 3.0 | | 5.1 |
| General Electric Co. | | 2.3 | | 4.3 |
| Pfizer, Inc. | | 2.1 | | 2.0 |
| Merrill Lynch & Co., Inc. | | 1.8 | | 1.6 |
| | | 30.2 | | |
Top Five Market Sectors as of November 30, 2005 | | |
| | | % of fund’s | | % of fund’s net assets |
| | | net assets | | 6 months ago |
| Financials | | 37.0 | | 31.9 |
| Information Technology | | 13.9 | | 14.2 |
| Consumer Discretionary | | 9.4 | | 10.8 |
| Health Care | | 9.0 | | 5.7 |
| Industrials | | 8.0 | | 10.0 |

Annual Report 8
| Investments November 30, 2005 | | |
| Showing Percentage of Net Assets | | | | | | |
| |
| Common Stocks 98.8% | | | | | | |
| | | Shares | | Value (Note 1) |
| | | | | (000s) |
| |
| CONSUMER DISCRETIONARY – 9.4% | | | | | | |
| Auto Components 0.5% | | | | | | |
| Johnson Controls, Inc. | | 789,900 | | $ | | 54,859 |
| Automobiles – 1.3% | | | | | | |
| Monaco Coach Corp. (e) | | 1,737,725 | | | | 25,770 |
| Toyota Motor Corp. sponsored ADR | | 1,333,500 | | | | 129,016 |
| | | | | | | 154,786 |
| Diversified Consumer Services – 0.0% | | | | | | |
| Service Corp. International (SCI) | | 557,000 | | | | 4,573 |
| Hotels, Restaurants & Leisure 1.3% | | | | | | |
| Las Vegas Sands Corp. | | 215,900 | | | | 9,005 |
| McDonald’s Corp. | | 1,106,800 | | | | 37,465 |
| Royal Caribbean Cruises Ltd. | | 1,504,400 | | | | 68,992 |
| Wynn Resorts Ltd. (a)(d) | | 791,300 | | | | 44,178 |
| | | | | | | 159,640 |
| Household Durables – 0.4% | | | | | | |
| Matsushita Electric Industrial Co. Ltd. ADR | | 2,524,600 | | | | 50,946 |
| Media – 4.3% | | | | | | |
| Gannett Co., Inc. | | 2,137,200 | | | | 131,694 |
| News Corp. Class B | | 4,762,000 | | | | 74,478 |
| Omnicom Group, Inc. | | 679,400 | | | | 57,450 |
| The New York Times Co. Class A (d) | | 4,451,010 | | | | 122,403 |
| Time Warner, Inc. | | 2,386,800 | | | | 42,915 |
| Walt Disney Co. | | 3,954,900 | | | | 98,596 |
| | | | | | | 527,536 |
| Multiline Retail – 0.4% | | | | | | |
| Dollar General Corp. | | 2,739,100 | | | | 51,796 |
| Specialty Retail – 1.2% | | | | | | |
| Abercrombie & Fitch Co. Class A | | 242,600 | | | | 14,876 |
| Home Depot, Inc. | | 2,516,180 | | | | 105,126 |
| Staples, Inc. | | 954,000 | | | | 22,037 |
| | | | | | | 142,039 |
| Textiles, Apparel & Luxury Goods – 0.0% | | | | | | |
| Under Armour, Inc. Class A | | 10,300 | | | | 233 |
| |
| TOTAL CONSUMER DISCRETIONARY | | | | | | 1,146,408 |
| |
| |
| |
| |
| See accompanying notes which are an integral part of the financial statements. | | | | |
| |
| 9 | | | | Annual Report |
| Investments continued | | | | | | |
| |
| Common Stocks continued | | | | | | |
| | | | | Shares | | Value (Note 1) |
| | | | | | | (000s) |
| |
| CONSUMER STAPLES 7.0% | | | | | | |
| Beverages – 0.8% | | | | | | | | |
| Diageo PLC sponsored ADR | | 48,500 | | $ | | 2,820 |
| The Coca-Cola Co. | | | | 2,243,800 | | | | 95,788 |
| | | | | | | | | 98,608 |
| Food & Staples Retailing – 4.2% | | | | | | |
| CVS Corp. | | | | 939,900 | | | | 25,396 |
| Wal-Mart Stores, Inc. | | | | 9,771,500 | | | | 474,504 |
| Walgreen Co. | | | | 352,000 | | | | 16,079 |
| | | | | | | | | 515,979 |
| Food Products 0.8% | | | | | | | | |
| Nestle SA sponsored ADR | | 1,333,200 | | | | 98,390 |
| Personal Products 0.4% | | | | | | |
| Alberto-Culver Co. | | | | 650,700 | | | | 28,292 |
| Avon Products, Inc. | | | | 873,500 | | | | 23,890 |
| | | | | | | | | 52,182 |
| Tobacco 0.8% | | | | | | | | |
| Altria Group, Inc. | | | | 1,321,500 | | | | 96,192 |
| |
| TOTAL CONSUMER STAPLES | | | | | | 861,351 |
| |
| ENERGY 6.7% | | | | | | | | |
| Energy Equipment & Services – 0.5% | | | | | | |
| Halliburton Co. | | | | 922,550 | | | | 58,720 |
| Oil, Gas & Consumable Fuels – 6.2% | | | | | | |
| Amerada Hess Corp. | | | | 1,037,900 | | | | 127,164 |
| Canadian Natural Resources Ltd. | | 1,976,000 | | | | 89,563 |
| Exxon Mobil Corp. | | | | 6,284,300 | | | | 364,678 |
| Peabody Energy Corp. | | | | 605,300 | | | | 47,734 |
| Talisman Energy, Inc. | | | | 679,300 | | | | 32,479 |
| Total SA sponsored ADR (d) | | 823,200 | | | | 102,645 |
| | | | | | | | | 764,263 |
| |
| TOTAL ENERGY | | | | | | | | 822,983 |
| |
| FINANCIALS – 37.0% | | | | | | | | |
| Capital Markets 7.3% | | | | | | |
| American Capital Strategies Ltd. | | 1,631,600 | | | | 62,588 |
| Ameriprise Financial, Inc. | | 323,200 | | | | 13,591 |
| Bank of New York Co., Inc. | | 2,493,400 | | | | 80,786 |
| Goldman Sachs Group, Inc. | | 201,700 | | | | 26,011 |
See accompanying notes which are an integral part of the financial statements.
| Common Stocks continued | | | | | | |
| | | Shares | | Value (Note 1) |
| | | | | (000s) |
| |
| FINANCIALS – continued | | | | | | |
| Capital Markets continued | | | | | | |
| Investors Financial Services Corp. (d) | | 934,500 | | $ | | 35,277 |
| Janus Capital Group, Inc. | | 873,400 | | | | 16,743 |
| Lehman Brothers Holdings, Inc. | | 379,500 | | | | 47,817 |
| Merrill Lynch & Co., Inc. | | 3,239,500 | | | | 215,168 |
| Nomura Holdings, Inc. sponsored ADR | | 2,436,900 | | | | 40,574 |
| Northern Trust Corp. | | 2,962,000 | | | | 156,068 |
| Nuveen Investments, Inc. Class A | | 1,253,000 | | | | 51,949 |
| State Street Corp. | | 2,578,300 | | | | 148,742 |
| | | | | | | 895,314 |
| Commercial Banks – 8.1% | | | | | | |
| Bank of America Corp. | | 7,974,300 | | | | 365,941 |
| Cathay General Bancorp | | 606,713 | | | | 23,055 |
| East West Bancorp, Inc. | | 2,234,870 | | | | 84,567 |
| Mitsubishi UFJ Financial Group, Inc. sponsored ADR | | 4,251,800 | | | | 53,785 |
| U.S. Bancorp, Delaware | | 1,459,800 | | | | 44,203 |
| UCBH Holdings, Inc. | | 2,757,344 | | | | 48,640 |
| UnionBanCal Corp. | | 862,500 | | | | 59,685 |
| Wachovia Corp. | | 3,992,857 | | | | 213,219 |
| Wells Fargo & Co. | | 1,525,400 | | | | 95,871 |
| | | | | | | 988,966 |
| Consumer Finance – 1.7% | | | | | | |
| SLM Corp. | | 3,852,600 | | | | 202,454 |
| Diversified Financial Services – 4.1% | | | | | | |
| CapitalSource, Inc. (a)(d) | | 1,947,100 | | | | 46,536 |
| Citigroup, Inc. | | 8,663,577 | | | | 420,617 |
| JPMorgan Chase & Co. | | 912,212 | | | | 34,892 |
| | | | | | | 502,045 |
| Insurance – 8.2% | | | | | | |
| Allstate Corp. | | 1,872,300 | | | | 105,036 |
| American International Group, Inc. | | 7,162,180 | | | | 480,872 |
| Aspen Insurance Holdings Ltd. | | 306,000 | | | | 7,659 |
| Genworth Financial, Inc. Class A (non-vtg.) | | 751,500 | | | | 25,889 |
| Hartford Financial Services Group, Inc. | | 1,267,600 | | | | 110,750 |
| Manulife Financial Corp. | | 257,600 | | | | 14,829 |
| Marsh & McLennan Companies, Inc. | | 389,200 | | | | 12,022 |
| MetLife, Inc. unit | | 2,078,100 | | | | 59,309 |
| Prudential Financial, Inc. | | 1,643,000 | | | | 127,168 |
| RenaissanceRe Holdings Ltd. | | 319,900 | | | | 14,373 |
See accompanying notes which are an integral part of the financial statements.
11 Annual Report
| Investments continued | | | | | | |
| |
| Common Stocks continued | | | | | | |
| | | Shares | | Value (Note 1) |
| | | | | (000s) |
| |
| FINANCIALS – continued | | | | | | |
| Insurance – continued | | | | | | |
| Swiss Reinsurance Co. (Reg.) | | 269,954 | | $ | | 19,936 |
| XL Capital Ltd. Class A | | 397,600 | | | | 26,393 |
| | | | | | | 1,004,236 |
| Real Estate 3.8% | | | | | | |
| Equity Lifestyle Properties, Inc. | | 714,671 | | | | 33,132 |
| Equity Residential (SBI) | | 478,400 | | | | 19,500 |
| General Growth Properties, Inc. | | 8,363,826 | | | | 381,558 |
| Macquarie Goodman Group unit | | 1,838,203 | | | | 5,880 |
| Mitsui Fudosan Co. Ltd. | | 409,000 | | | | 6,605 |
| United Dominion Realty Trust, Inc. (SBI) | | 820,400 | | | | 18,369 |
| | | | | | | 465,044 |
| Thrifts & Mortgage Finance – 3.8% | | | | | | |
| Fannie Mae | | 3,644,724 | | | | 175,129 |
| Freddie Mac | | 1,652,100 | | | | 103,174 |
| Golden West Financial Corp., Delaware | | 2,351,400 | | | | 152,347 |
| Hudson City Bancorp, Inc. | | 3,217,700 | | | | 38,323 |
| | | | | | | 468,973 |
| |
| TOTAL FINANCIALS | | | | | | 4,527,032 |
| |
| HEALTH CARE – 9.0% | | | | | | |
| Biotechnology – 0.8% | | | | | | |
| Amylin Pharmaceuticals, Inc. (a)(d) | | 782,700 | | | | 29,281 |
| Biogen Idec, Inc. (a) | | 1,219,300 | | | | 52,198 |
| Invitrogen Corp. (a) | | 261,709 | | | | 17,443 |
| | | | | | | 98,922 |
| Health Care Equipment & Supplies – 1.7% | | | | | | |
| Becton, Dickinson & Co. | | 1,663,500 | | | | 96,866 |
| Hospira, Inc. (a) | | 1,848,100 | | | | 81,594 |
| Varian, Inc. (a) | | 694,100 | | | | 29,124 |
| | | | | | | 207,584 |
| Health Care Providers & Services – 1.7% | | | | | | |
| Aetna, Inc. | | 268,900 | | | | 24,871 |
| Brookdale Senior Living, Inc. | | 97,000 | | | | 2,580 |
| Cardinal Health, Inc. | | 1,514,800 | | | | 96,871 |
| Health Net, Inc. (a) | | 569,200 | | | | 29,046 |
| UnitedHealth Group, Inc. | | 857,400 | | | | 51,324 |
| | | | | | | 204,692 |
See accompanying notes which are an integral part of the financial statements.
| Common Stocks continued | | | | | | |
| | | Shares | | Value (Note 1) |
| | | | | (000s) |
| |
| HEALTH CARE – continued | | | | | | |
| Pharmaceuticals – 4.8% | | | | | | |
| Novartis AG sponsored ADR | | 1,035,300 | | $ | | 54,250 |
| Pfizer, Inc. | | 12,024,190 | | | | 254,913 |
| Roche Holding AG sponsored ADR | | 987,500 | | | | 74,556 |
| Wyeth | | 4,870,400 | | | | 202,414 |
| | | | | | | 586,133 |
| |
| TOTAL HEALTH CARE | | | | | | 1,097,331 |
| |
| INDUSTRIALS – 7.8% | | | | | | |
| Aerospace & Defense – 0.8% | | | | | | |
| Honeywell International, Inc. | | 661,230 | | | | 24,161 |
| The Boeing Co. | | 293,400 | | | | 20,007 |
| United Technologies Corp. | | 968,300 | | | | 52,133 |
| | | | | | | 96,301 |
| Airlines – 0.3% | | | | | | |
| AirTran Holdings, Inc. (a) | | 2,196,200 | | | | 32,987 |
| JetBlue Airways Corp. (a) | | 88,400 | | | | 1,630 |
| | | | | | | 34,617 |
| Electrical Equipment – 0.5% | | | | | | |
| Rockwell Automation, Inc. | | 1,058,600 | | | | 59,737 |
| Industrial Conglomerates – 2.7% | | | | | | |
| 3M Co. | | 630,800 | | | | 49,505 |
| General Electric Co. | | 8,064,510 | | | | 288,064 |
| | | | | | | 337,569 |
| Machinery – 0.2% | | | | | | |
| Illinois Tool Works, Inc. | | 257,600 | | | | 22,738 |
| Road & Rail 3.3% | | | | | | |
| Burlington Northern Santa Fe Corp. | | 2,734,800 | | | | 180,989 |
| Canadian National Railway Co. | | 516,900 | | | | 41,323 |
| Laidlaw International, Inc. | | 1,341,373 | | | | 29,000 |
| Norfolk Southern Corp. | | 3,353,714 | | | | 148,368 |
| | | | | | | 399,680 |
| |
| TOTAL INDUSTRIALS | | | | | | 950,642 |
See accompanying notes which are an integral part of the financial statements.
13 Annual Report
| Investments continued | | | | | | |
| |
| Common Stocks continued | | | | | | |
| | | Shares | | Value (Note 1) |
| | | | | (000s) |
| |
| INFORMATION TECHNOLOGY – 13.8% | | | | | | |
| Communications Equipment – 0.6% | | | | | | |
| Cisco Systems, Inc. (a) | | 3,284,200 | | $ | | 57,605 |
| Motorola, Inc. | | 840,500 | | | | 20,248 |
| | | | | | | 77,853 |
| Computers & Peripherals – 1.6% | | | | | | |
| EMC Corp. (a) | | 1,121,200 | | | | 15,618 |
| Hewlett-Packard Co. | | 4,300,000 | | | | 127,581 |
| NCR Corp. (a) | | 1,489,300 | | | | 50,562 |
| | | | | | | 193,761 |
| Electronic Equipment & Instruments – 1.0% | | | | | | |
| Arrow Electronics, Inc. (a) | | 1,073,500 | | | | 33,279 |
| Avnet, Inc. (a) | | 3,515,300 | | | | 79,094 |
| Symbol Technologies, Inc. | | 727,800 | | | | 8,319 |
| | | | | | | 120,692 |
| Internet Software & Services – 0.1% | | | | | | |
| aQuantive, Inc. (a) | | 485,200 | | | | 13,047 |
| IT Services – 0.5% | | | | | | |
| Automatic Data Processing, Inc. | | 1,067,500 | | | | 50,173 |
| First Data Corp. | | 436,800 | | | | 18,900 |
| | | | | | | 69,073 |
| Semiconductors & Semiconductor Equipment – 8.7% | | | | | | |
| Analog Devices, Inc. | | 1,357,260 | | | | 51,467 |
| Applied Materials, Inc. | | 5,324,700 | | | | 96,430 |
| FormFactor, Inc. (a) | | 555,100 | | | | 15,576 |
| Freescale Semiconductor, Inc. Class B (a) | | 1,160,322 | | | | 29,936 |
| Intel Corp. | | 17,020,100 | | | | 454,096 |
| KLA Tencor Corp. | | 2,958,900 | | | | 151,466 |
| Lam Research Corp. (a) | | 2,647,800 | | | | 99,398 |
| MKS Instruments, Inc. (a)(e) | | 3,588,800 | | | | 67,721 |
| National Semiconductor Corp. | | 3,348,000 | | | | 86,646 |
| Semtech Corp. (a) | | 485,300 | | | | 9,662 |
| | | | | | | 1,062,398 |
| Software 1.3% | | | | | | |
| Microsoft Corp. | | 5,737,940 | | | | 158,998 |
| |
| TOTAL INFORMATION TECHNOLOGY | | | | | | 1,695,822 |
See accompanying notes which are an integral part of the financial statements.
| Common Stocks continued | | | | | | |
| | | Shares | | Value (Note 1) |
| | | | | (000s) |
| |
| MATERIALS 3.4% | | | | | | |
| Chemicals – 2.0% | | | | | | |
| Bayer AG sponsored ADR | | 1,067,500 | | $ | | 42,433 |
| Chemtura Corp. | | 840,200 | | | | 10,124 |
| FMC Corp. (a) | | 1,865,800 | | | | 99,205 |
| Praxair, Inc. | | 869,400 | | | | 45,209 |
| Sigma Aldrich Corp. | | 818,600 | | | | 54,060 |
| | | | | | | 251,031 |
| Containers & Packaging – 0.4% | | | | | | |
| Ball Corp. | | 1,185,200 | | | | 48,854 |
| Metals & Mining – 1.0% | | | | | | |
| Newmont Mining Corp. | | 1,863,700 | | | | 85,954 |
| United States Steel Corp. | | 679,414 | | | | 32,340 |
| | | | | | | 118,294 |
| |
| TOTAL MATERIALS | | | | | | 418,179 |
| |
| TELECOMMUNICATION SERVICES – 4.0% | | | | | | |
| Diversified Telecommunication Services – 2.9% | | | | | | |
| AT&T, Inc. | | 5,192,800 | | | | 129,353 |
| BellSouth Corp. | | 3,393,600 | | | | 92,510 |
| Verizon Communications, Inc. | | 4,316,970 | | | | 138,057 |
| | | | | | | 359,920 |
| Wireless Telecommunication Services – 1.1% | | | | | | |
| ALLTEL Corp. | | 998,100 | | | | 66,703 |
| Sprint Nextel Corp. | | 2,663,000 | | | | 66,682 |
| | | | | | | 133,385 |
| |
| TOTAL TELECOMMUNICATION SERVICES | | | | | | 493,305 |
| |
| UTILITIES – 0.7% | | | | | | |
| Electric Utilities – 0.5% | | | | | | |
| Edison International | | 719,100 | | | | 32,446 |
| Exelon Corp. | | 613,200 | | | | 31,911 |
| | | | | | | 64,357 |
See accompanying notes which are an integral part of the financial statements.
15 Annual Report
| Investments continued | | | | | | | | |
| |
| Common Stocks continued | | | | | | | | |
| | | | | Shares | | Value (Note 1) |
| | | | | | | (000s) |
| |
| UTILITIES – continued | | | | | | | | |
| Multi-Utilities – 0.2% | | | | | | | | |
| Public Service Enterprise Group, Inc. | | | | 429,400 | | $ | | 26,932 |
| |
| TOTAL UTILITIES | | | | | | | | 91,289 |
| |
| TOTAL COMMON STOCKS | | | | | | | | |
| (Cost $10,768,947) | | | | | | 12,104,342 |
| |
| Convertible Preferred Stocks 0.0% | | | | | | | | |
| |
| FINANCIALS – 0.0% | | | | | | | | |
| Insurance – 0.0% | | | | | | | | |
| Platinum Underwriters Holdings Ltd. Series A, 6.00% | | | | 65,300 | | | | 1,969 |
| TOTAL CONVERTIBLE PREFERRED STOCKS | | | | | | | | |
| (Cost $1,969) | | | | | | | | 1,969 |
| |
| Convertible Bonds 0.3% | | | | | | | | |
| | | Principal | | | | |
| | | Amount (000s) | | | | |
| |
| INDUSTRIALS – 0.2% | | | | | | | | |
| Airlines – 0.2% | | | | | | | | |
| AirTran Holdings, Inc. 7% 7/1/23 | | $ | | 3,230 | | | | 5,107 |
| America West Holding Corp. 7.5% 1/18/09 | | | | 8,830 | | | | 10,375 |
| Continental Airlines, Inc. 4.5% 2/1/07 | | | | 9,710 | | | | 8,536 |
| | | | | | | | | 24,018 |
| |
| INFORMATION TECHNOLOGY – 0.1% | | | | | | | | |
| Semiconductors & Semiconductor Equipment – 0.1% | | | | | | | | |
| ASM International NV 4.25% 12/6/11 (f) | | | | 5,740 | | | | 5,123 |
| TOTAL CONVERTIBLE BONDS | | | | | | | | |
| (Cost $26,754) | | | | | | | | 29,141 |
| |
| Money Market Funds 3.2% | | | | | | | | |
| | | Shares | | | | |
| Fidelity Cash Central Fund, 4.08% (b) | | 240,042,848 | | | | 240,043 |
| Fidelity Securities Lending Cash Central Fund, 4.09% (b)(c) | | 151,916,475 | | | | 151,916 |
| TOTAL MONEY MARKET FUNDS | | | | | | | | |
| (Cost $391,959) | | | | | | | | 391,959 |
See accompanying notes which are an integral part of the financial statements.
| Cash Equivalents 0.1% | | | | | | | | | | |
| | | | | Maturity | | | | Value (Note 1) |
| | | | | Amount (000s) | | | | (000s) |
| Investments in repurchase agreements (Collateralized by U.S. | | | | | | | | |
| Treasury Obligations, in a joint trading account at 3.96%, | | | | | | | | |
| dated 11/30/05 due 12/1/05) | | | | | | | | | | |
| (Cost $12,652) | | | | $ | | 12,653 | | | | $ 12,652 |
| |
| |
| TOTAL INVESTMENT PORTFOLIO 102.4% | | | | | | | | |
| (Cost $11,202,281) | | | | | | | | | | 12,540,063 |
| |
| |
| NET OTHER ASSETS – (2.4)% | | | | | | | | | | (292,278) |
| |
| NET ASSETS 100% | | | | | | | | | | $ 12,247,785 |
Legend
(a) Non-income producing
(b) Affiliated fund that is available only to
investment companies and other
accounts managed by Fidelity
Investments. The rate quoted is the
annualized seven-day yield of the fund
at period end. A complete unaudited
listing of the fund’s holdings as of its
most recent quarter end is available
upon request.
(c) Includes investment made with cash
collateral received from securities on
loan.
|
(d) Security or a portion of the security is on
loan at period end.
(e) Affiliated company
(f) Security exempt from registration under
Rule 144A of the Securities Act of 1933.
These securities may be resold in
transactions exempt from registration,
normally to qualified institutional buyers.
At the period end, the value of these
securities amounted to $5,123,000 or
0.0% of net assets.
|
Affiliated Central Funds
Information regarding income received by the fund from the affiliated Central funds during the period is as follows:
| Fund | | | | Income received |
| | | | | (Amounts in Thousands) |
| Fidelity Cash Central Fund | | | $ | 6,225 |
| Fidelity Securities Lending Cash Central Fund | | | | 1,095 |
| Total | | | $ | 7,320 |
See accompanying notes which are an integral part of the financial statements.
17 Annual Report
Investments continued
Other Affiliated Issuers
An affiliated company is a company in which the fund has ownership of at least 5% of the voting securities. Transactions during the period with companies which are or were affiliates are as follows:
| | | Value, | | Purchases | | Sales | | Dividend | | Value, end of |
| Affiliate | | beginning of | | | | | | Proceeds | | Income | | period |
| (Amounts in Thousands) | | period | | | | | | | | | | | | | | |
| Eastman Chemical Co. | | $ | | 214,524 | | $ | | 58,555 | | $ 267,362 | | $ | | 5,110 | | $ | | — |
| MKS Instruments, Inc. | | | | 4,203 | | | | 72,844 | | 14,164 | | | | — | | | | 67,721 |
| Monaco Coach Corp. | | | | — | | | | 26,406 | | — | | | | 222 | | | | 25,770 |
| Total | | $ | | 218,727 | | $ | | 157,805 | | $ 281,526 | | $ | | 5,332 | | $ | | 93,491 |
See accompanying notes which are an integral part of the financial statements.
Annual Report 18
| Financial Statements | | | | | | | | |
| |
| |
| Statement of Assets and Liabilities | | | | | | | | |
| Amounts in thousands (except per share amount) | | | | | | November 30, 2005 |
| |
| Assets | | | | | | | | |
| Investment in securities, at value (including securities | | | | | | | | |
| loaned of $147,405 and repurchase agreements of | | | | | | | | |
| $12,652) See accompanying schedule: | | | | | | | | |
| Unaffiliated issuers (cost $10,721,639) | | $ | | 12,054,613 | | | | |
| Affiliated Central Funds (cost $391,959) | | | | 391,959 | | | | |
| Other affiliated issuers (cost $88,683) | | | | 93,491 | | | | |
| Total Investments (cost $11,202,281) | | | | | | $ | | 12,540,063 |
| Receivable for investments sold | | | | | | | | 92,899 |
| Receivable for fund shares sold | | | | | | | | 4,057 |
| Dividends receivable | | | | | | | | 31,514 |
| Interest receivable | | | | | | | | 2,571 |
| Prepaid expenses | | | | | | | | 67 |
| Other affiliated receivables | | | | | | | | 156 |
| Other receivables | | | | | | | | 1,647 |
| Total assets | | | | | | | | 12,672,974 |
| |
| Liabilities | | | | | | | | |
| Payable for investments purchased | | $ | | 252,770 | | | | |
| Payable for fund shares redeemed | | | | 13,311 | | | | |
| Accrued management fee | | | | 4,769 | | | | |
| Other affiliated payables | | | | 2,350 | | | | |
| Other payables and accrued expenses | | | | 73 | | | | |
| Collateral on securities loaned, at value | | | | 151,916 | | | | |
| Total liabilities | | | | | | | | 425,189 |
| |
| Net Assets | | | | | | $ | | 12,247,785 |
| Net Assets consist of: | | | | | | | | |
| Paid in capital | | | | | | $ | | 9,871,999 |
| Undistributed net investment income | | | | | | | | 40,878 |
| Accumulated undistributed net realized gain (loss) on | | | | | | | | |
| investments and foreign currency transactions | | | | | | | | 997,121 |
| Net unrealized appreciation (depreciation) on | | | | | | | | |
| investments and assets and liabilities in foreign | | | | | | | | |
| currencies | | | | | | | | 1,337,787 |
| Net Assets, for 498,543 shares outstanding | | | | | | $ | | 12,247,785 |
| Net Asset Value, offering price and redemption price per | | | | | | | | |
| share ($12,247,785 ÷ 498,543 shares) | | | | | | $ | | 24.57 |
See accompanying notes which are an integral part of the financial statements.
19 Annual Report
| Financial Statements continued | | | | | | |
| |
| |
| Statement of Operations | | | | | | |
| Amounts in thousands | | | | Year ended November 30, 2005 |
| |
| Investment Income | | | | | | |
| Dividends (including $5,332 received from other | | | | | | |
| affiliated issuers) | | | | $ | | 251,866 |
| Interest | | | | | | 682 |
| Income from affiliated Central Funds | | | | | | 7,320 |
| Total income | | | | | | 259,868 |
| |
| Expenses | | | | | | |
| Management fee | | $ | | 58,118 | | |
| Transfer agent fees | | | | 23,184 | | |
| Accounting and security lending fees | | | | 1,368 | | |
| Independent trustees’ compensation | | | | 57 | | |
| Appreciation in deferred trustee compensation account | | | | 30 | | |
| Custodian fees and expenses | | | | 196 | | |
| Registration fees | | | | 59 | | |
| Audit | | | | 129 | | |
| Legal | | | | 48 | | |
| Interest | | | | 3 | | |
| Miscellaneous | | | | 522 | | |
| Total expenses before reductions | | | | 83,714 | | |
| Expense reductions | | | | (7,044) | | 76,670 |
| |
| Net investment income (loss) | | | | | | 183,198 |
| Realized and Unrealized Gain (Loss) | | | | | | |
| Net realized gain (loss) on: | | | | | | |
| Investment securities: | | | | | | |
| Unaffiliated issuers | | | | 963,339 | | |
| Other affiliated issuers | | | | 56,421 | | |
| Foreign currency transactions | | | | (118) | | |
| Total net realized gain (loss) | | | | | | 1,019,642 |
| Change in net unrealized appreciation (depreciation) on: | | | | |
| Investment securities | | | | (325,047) | | |
| Assets and liabilities in foreign currencies | | | | 5 | | |
| Total change in net unrealized appreciation | | | | | | |
| (depreciation) | | | | | | (325,042) |
| Net gain (loss) | | | | | | 694,600 |
| Net increase (decrease) in net assets resulting from | | | | | | |
| operations | | | | $ | | 877,798 |
See accompanying notes which are an integral part of the financial statements.
| Statement of Changes in Net Assets | | | | | | | | |
| | | | | Year ended | | | | Year ended |
| | | | | November 30, | | | | November 30, |
| Amounts in thousands | | | | 2005 | | | | 2004 |
| Increase (Decrease) in Net Assets | | | | | | | | |
| Operations | | | | | | | | |
| Net investment income (loss) | | $ | | 183,198 | | $ | | 189,984 |
| Net realized gain (loss) | | | | 1,019,642 | | | | 423,629 |
| Change in net unrealized appreciation (depreciation) . | | | | (325,042) | | | | 889,857 |
| Net increase (decrease) in net assets resulting | | | | | | | | |
| from operations | | | | 877,798 | | | | 1,503,470 |
| Distributions to shareholders from net investment income . | | | | (213,550) | | | | (156,155) |
| Distributions to shareholders from net realized gain | | | | (333,350) | | | | (91,776) |
| Total distributions | | | | (546,900) | | | | (247,931) |
| Share transactions | | | | | | | | |
| Proceeds from sales of shares | | | | 910,438 | | | | 1,505,888 |
| Reinvestment of distributions | | | | 522,706 | | | | 236,038 |
| Cost of shares redeemed | | | | (2,147,906) | | | | (1,890,399) |
| Net increase (decrease) in net assets resulting from | | | | | | | | |
| share transactions | | | | (714,762) | | | | (148,473) |
| Total increase (decrease) in net assets | | | | (383,864) | | | | 1,107,066 |
| |
| Net Assets | | | | | | | | |
| Beginning of period | | | | 12,631,649 | | | | 11,524,583 |
| End of period (including undistributed net investment | | | | | | | | |
| income of $40,878 and undistributed net investment | | | | | | | | |
| income of $70,477, respectively) | | $ | | 12,247,785 | | $ | | 12,631,649 |
| |
| Other Information | | | | | | | | |
| Shares | | | | | | | | |
| Sold | | | | 38,615 | | | | 66,415 |
| Issued in reinvestment of distributions | | | | 22,238 | | | | 10,382 |
| Redeemed | | | | (90,786) | | | | (83,726) |
| Net increase (decrease) | | | | (29,933) | | | | (6,929) |
See accompanying notes which are an integral part of the financial statements.
21 Annual Report
| Financial Highlights | | | | | | | | | | |
| Years ended November 30, | | 2005 | | 2004 | | 2003 | | 2002 | | 2001 |
| Selected Per Share Data | | | | | | | | | | |
| Net asset value, beginning of | | | | | | | | | | |
| period | | $ 23.90 | | $ 21.52 | | $ 18.72 | | $ 21.21 | | $ 27.49 |
| Income from Investment | | | | | | | | | | |
| Operations | | | | | | | | | | |
| Net investment income (loss)B | | 35 | | .35C | | .25 | | .24E | | .34 |
| Net realized and unrealized | | | | | | | | | | |
| gain (loss) | | 1.36 | | 2.49 | | 2.78 | | (1.65)E | | (1.15) |
| Total from investment operations | | 1.71 | | 2.84 | | 3.03 | | (1.41) | | (.81) |
| Distributions from net investment | | | | | | | | | | |
| income | | (.41) | | (.29) | | (.23) | | (.23) | | (.39) |
| Distributions from net realized | | | | | | | | | | |
| gain | | (.63) | | (.17) | | — | | (.85) | | (5.08) |
| Total distributions | | (1.04) | | (.46) | | (.23) | | (1.08) | | (5.47) |
| Net asset value, end of period | | $ 24.57 | | $ 23.90 | | $ 21.52 | | $ 18.72 | | $ 21.21 |
| Total ReturnA | | 7.41% | | 13.32% | | 16.40% | | (7.08)% | | (4.33)% |
| Ratios to Average Net AssetsD | | | | | | | | | | |
| Expenses before reductions | | 68% | | .68% | | .70% | | .70% | | .67% |
| Expenses net of fee waivers, if | | | | | | | | | | |
| any | | 68% | | .68% | | .70% | | .70% | | .67% |
| Expenses net of all reductions | | 62% | | .64% | | .64% | | .63% | | .62% |
| Net investment income (loss) | | 1.49% | | 1.56% | | 1.31% | | 1.26%E | | 1.49% |
| Supplemental Data | | | | | | | | | | |
| Net assets, end of period (in | | | | | | | | | | |
| millions) | | $12,248 | | $12,632 | | $11,525 | | $10,156 | | $12,029 |
| Portfolio turnover rate | | 143% | | 123% | | 131% | | 135% | | 136% |
A Total returns would have been lower had certain expenses not been reduced during the periods shown.
B Calculated based on average shares outstanding during the period.
C Investment income per share reflects a special dividends which amounted to $.06 per share.
D Expense ratios reflect operating expenses of the fund. Expenses before reductions do not reflect amounts reimbursed by the investment adviser or
reductions from brokerage service arrangements or other expense offset arrangements and do not represent the amount paid by the fund during
periods when reimbursements or reductions occur. Expenses net of any fee waivers reflect expenses after reimbursement by the investment
adviser but prior to reductions from brokerage service arrangements or other expense offset arrangements. Expenses net of all reductions repre
sent the net expenses paid by the fund.
E Effective December 1, 2001, the fund adopted the provisions of the AICPA Audit and Accounting Guide for Investment Companies and began
amortizing premium and discount on all debt securities. Per share data and ratios for periods prior to adoption have not been restated to reflect
this change.
|
See accompanying notes which are an integral part of the financial statements.
Notes to Financial Statements
For the period ended November 30, 2005
(Amounts in thousands except ratios)
|
1. Significant Accounting Policies.
Fidelity Equity Income II Fund (the fund) is a fund of Fidelity Financial Trust (the trust) and is authorized to issue an unlimited number of shares. The trust is registered under the Investment Company Act of 1940, as amended (the 1940 Act), as an open end management investment company organized as a Massachusetts business trust. The fund may invest in affiliated money market central funds (Money Market Central Funds) which are open end investment companies available to investment companies and other accounts managed by Fidelity Management & Research Company (FMR) and its affili ates. The financial statements have been prepared in conformity with accounting principles generally accepted in the United States of America, which require manage ment to make certain estimates and assumptions at the date of the financial statements. The following summarizes the significant accounting policies of the fund:
Security Valuation. Investments are valued and net asset value (NAV) per share is calculated (NAV calculation) as of the close of business of the New York Stock Exchange (NYSE), normally 4:00 p.m. Eastern time. Wherever possible, the fund uses independent pricing services approved by the Board of Trustees to value its investments.
Equity securities, including restricted securities, for which market quotations are readily available, are valued at the last reported sale price or official closing price as reported by an independent pricing service on the primary market or exchange on which they are traded. In the event there were no sales during the day or closing prices are not available, securities are valued at the last quoted bid price. Investments in open end mutual funds, are valued at their closing net asset value each business day. Short term securities with remaining maturities of sixty days or less for which quotations are not readily available are valued at amortized cost, which approximates value.
When current market prices or quotations are not readily available or do not accurately reflect fair value, valuations may be determined in accordance with procedures adopted by the Board of Trustees. For example, when developments occur between the close of a market and the close of the NYSE that may materially affect the value of some or all of the securities, or when trading in a security is halted, those securities may be fair valued. Factors used in the determination of fair value may include monitoring news to identify significant market or security specific events such as changes in the value of U.S. securi ties market, reviewing developments in foreign markets and evaluating the performance of ADRs, futures contracts and exchange traded funds. Because the fund’s utilization of fair value pricing depends on market activity, the frequency with which fair value pricing is used can not be predicted and may be utilized to a significant extent. The value of securities used for NAV calculation under fair value pricing may differ from published prices for the same securities.
23 Annual Report
| Notes to Financial Statements continued |
(Amounts in thousands except ratios) | | |
| |
| 1. Significant Accounting Policies continued |
Foreign Currency. The fund uses foreign currency contracts to facilitate transactions in foreign denominated securities. Losses from these transactions may arise from changes in the value of the foreign currency or if the counterparties do not perform under the contracts’ terms.
Foreign denominated assets, including investment securities, and liabilities are trans lated into U.S. dollars at the exchange rate at period end. Purchases and sales of invest ment securities, income and dividends received and expenses denominated in foreign currencies are translated into U.S. dollars at the exchange rate in effect on the transac tion date.
The effects of exchange rate fluctuations on investments are included with the net realized and unrealized gain (loss) on investment securities. Other foreign currency transactions resulting in realized and unrealized gain (loss) are disclosed separately.
Investment Transactions and Income. Security transactions are accounted for as of trade date. Gains and losses on securities sold are determined on the basis of identified cost and may include proceeds received from litigation. Dividend income is recorded on the ex dividend date, except for certain dividends from foreign securities where the ex dividend date may have passed, which are recorded as soon as the fund is informed of the ex dividend date. Non cash dividends included in dividend income, if any, are recorded at the fair market value of the securities received. Distributions received on securities that represent a return of capital or capital gain are recorded as a reduction of cost of investments and/or as a realized gain. The funds estimates the components of distributions received that may be considered return of capital distributions or capital gain distributions. Interest income is accrued as earned. Interest income includes coupon interest and amortization of premium and accretion of discount on debt securi ties. Investment income is recorded net of foreign taxes withheld where recovery of such taxes is uncertain.
Expenses. Most expenses of the trust can be directly attributed to a fund. Expenses which cannot be directly attributed are apportioned among each fund in the trust.
Deferred Trustee Compensation. Under a Deferred Compensation Plan (the Plan), independent Trustees must defer receipt of a portion of, and may elect to defer receipt of an additional portion of, their annual compensation. Deferred amounts are treated as though equivalent dollar amounts had been invested in shares of the fund or are invested in a cross section of other Fidelity funds, and are marked to market. Deferred amounts remain in the fund until distributed in accordance with the Plan.
1. Significant Accounting Policies continued
Income Tax Information and Distributions to Shareholders. Each year, the fund intends to qualify as a regulated investment company by distributing all of its taxable income and realized gains under Subchapter M of the Internal Revenue Code. As a result, no provision for income taxes is required in the accompanying financial statements. Foreign taxes are provided for based on the fund’s understanding of the tax rules and rates that exist in the foreign markets in which it invests.
Distributions are recorded on the ex dividend date. Income and capital gain distribu tions are determined in accordance with income tax regulations, which may differ from generally accepted accounting principles. In addition, the fund will claim a portion of the payment made to redeeming shareholders as a distribution for income tax purposes.
Capital accounts within the financial statements are adjusted for permanent book tax differences. These adjustments have no impact on net assets or the results of operations. Temporary book tax differences will reverse in a subsequent period.
Book tax differences are primarily due to short term capital gains, foreign currency transactions, passive foreign investment companies (PFIC), market discount and losses deferred due to wash sales.
The tax basis components of distributable earnings and the federal tax cost as of period end were as follows:
| Unrealized appreciation | | $ | | 1,501,471 |
| Unrealized depreciation | | | | (200,765) |
| Net unrealized appreciation (depreciation) | | | | 1,300,706 |
| Undistributed ordinary income | | | | 84,764 |
| Undistributed long term capital gain | | | | 904,034 |
| |
| Cost for federal income tax purposes | | $ | | 11,239,357 |
The tax character of distributions paid was as follows:
| | | | | November 30, 2005 | | | | November 30, 2004 |
| Ordinary Income | | | $ | 234,787 | | $ | | 247,931 |
| Long term Capital Gains | | | | 312,113 | | | | — |
| Total | | | $ | 546,900 | | $ | | 247,931 |
25 Annual Report
| Notes to Financial Statements continued |
(Amounts in thousands except ratios) | | |
| |
| 2. Operating Policies. | | |
Repurchase Agreements. FMR has received an Exemptive Order from the Securities and Exchange Commission (the SEC) which permits the fund and other affiliated entities of FMR to transfer uninvested cash balances into joint trading accounts which are then invested in repurchase agreements. The fund may also invest directly with institutions in repurchase agreements. Repurchase agreements are collateralized by government or non government securities. Collateral is held in segregated accounts with custodian banks and may be obtained in the event of a default of the counterparty. The fund monitors, on a daily basis, the value of the collateral to ensure it is at least equal to the principal amount of the repurchase agreement (including accrued interest). In the event of a default by the counterparty, realization of the collateral proceeds could be delayed, during which time the value of the collateral may decline.
Restricted Securities. The fund may invest in securities that are subject to legal or contractual restrictions on resale. These securities generally may be resold in transac tions exempt from registration or to the public if the securities are registered. Disposal of these securities may involve time consuming negotiations and expense, and prompt sale at an acceptable price may be difficult. Information regarding restricted securities is included at the end of the fund’s Schedule of Investments.
3. Purchases and Sales of Investments.
Purchases and sales of securities, other than short term securities and U.S. government securities, aggregated $17,431,614 and $18,452,382, respectively.
4. Fees and Other Transactions with Affiliates.
Management Fee. FMR and its affiliates provide the fund with investment manage ment related services for which the fund pays a monthly management fee. The manage ment fee is the sum of an individual fund fee rate that is based on an annual rate of .20% of the fund’s average net assets and a group fee rate that averaged .27% during the period. The group fee rate is based upon the average net assets of all the mutual funds advised by FMR. The group fee rate decreases as assets under management increase and increases as assets under management decrease. For the period, the total annual man agement fee rate was .47% of the fund’s average net assets.
Transfer Agent Fees. Fidelity Service Company, Inc. (FSC), an affiliate of FMR, is the fund’s transfer, dividend disbursing and shareholder servicing agent. FSC receives account fees and asset based fees that vary according to account size and type of ac count. FSC pays for typesetting, printing and mailing of shareholder reports, except proxy statements. For the period, the transfer agent fees were equivalent to an annual rate of .19% of average net assets.
4. Fees and Other Transactions with Affiliates continued
Accounting and Security Lending Fees. FSC maintains the fund’s accounting re cords. The accounting fee is based on the level of average net assets for the month. Under a separate contract, FSC administers the security lending program. The security lending fee is based on the number and duration of lending transactions.
Affiliated Central Funds. The fund may invest in Money Market Central Funds which seek preservation of capital and current income and are managed by Fidelity Invest ments Money Management, Inc. (FIMM), an affiliate of FMR.
The Money Market Central Funds do not pay a management fee.
Brokerage Commissions. The fund placed a portion of its portfolio transactions with brokerage firms which are affiliates of the investment adviser. The commissions paid to these affiliated firms were $286 for the period.
Interfund Lending Program. Pursuant to an Exemptive Order issued by the SEC, the fund, along with other registered investment companies having management contracts with FMR, may participate in an interfund lending program. This program provides an alternative credit facility allowing the funds to borrow from, or lend money to, other participating affiliated funds. At period end, there were no interfund loans outstanding. The fund’s activity in this program during the period for which loans were outstanding was as follows:
| | | | | | | Weighted | | | | |
| | | | | Average Daily | | Average | | | | Interest |
| Borrower or Lender | | | | Loan Balance | | Interest Rate | | | | Expense |
| Borrower | | $ | | 13,814 | | 3.49% | | | $ | 3 |
| |
| |
| 5. Committed Line of Credit. | | | | | | | | | | |
The fund participates with other funds managed by FMR in a $4.2 billion credit facility (the “line of credit”) to be utilized for temporary or emergency purposes to fund share holder redemptions or for other short term liquidity purposes. The fund has agreed to pay commitment fees on its pro rata portion of the line of credit. During the period, there were no borrowings on this line of credit.
27 Annual Report
| Notes to Financial Statements continued |
(Amounts in thousands except ratios) | | |
| |
| 6. Security Lending. | | |
The fund lends portfolio securities from time to time in order to earn additional income. The fund receives collateral (in the form of U.S. Treasury obligations, letters of credit and/or cash) against the loaned securities and maintains collateral in an amount not less than 100% of the market value of the loaned securities during the period of the loan. The market value of the loaned securities is determined at the close of business of the fund and any additional required collateral is delivered to the fund on the next business day. If the borrower defaults on its obligation to return the securities loaned because of insol vency or other reasons, a fund could experience delays and costs in recovering the securities loaned or in gaining access to the collateral. Cash collateral is invested in the Fidelity Securities Lending Cash Central Fund. The value of loaned securities and cash collateral at period end are disclosed on the fund’s Statement of Assets and Liabilities. Security lending income represents the income earned on investing cash collateral, less fees and expenses associated with the loan, plus any premium payments that may be received on the loan of certain types of securities. Net income from lending portfolio securities during the period amounted to $1,095.
Many of the brokers with whom FMR places trades on behalf of the fund provided services to the fund in addition to trade execution. These services included payments of certain expenses on behalf of the fund totaling $6,819 for the period. In addition, through arrangements with the fund’s custodian and transfer agent, credits realized as a result of uninvested cash balances were used to reduce the fund’s expenses. During the period, these credits reduced the fund’s custody and transfer agent expenses by $2 and $223, respectively.
The fund’s organizational documents provide former and current trustees and officers with a limited indemnification against liabilities arising in connection with the perfor mance of their duties to the fund. In the normal course of business, the fund may also enter into contracts that provide general indemnifications. The fund’s maximum expo sure under these arrangements is unknown as this would be dependent on future claims that may be made against the fund. The risk of material loss from such claims is consid ered remote.
Report of Independent Registered Public Accounting Firm
To the Trustees of Fidelity Financial Trust and the Shareholders of Fidelity Equity Income II Fund:
In our opinion, the accompanying statement of assets and liabilities, including the sched ule of investments, and the related statements of operations and of changes in net assets and the financial highlights present fairly, in all material respects, the financial position of Fidelity Equity Income II Fund (a fund of Fidelity Financial Trust) at November 30, 2005 and the results of its operations, the changes in its net assets and the financial highlights for the periods indicated, in conformity with accounting principles generally accepted in the United States of America. These financial statements and financial highlights (hereaf ter referred to as “financial statements”) are the responsibility of the Fidelity Equity Income II Fund’s management; our responsibility is to express an opinion on these financial statements based on our audits. We conducted our audits of these financial statements in accordance with the standards of the Public Company Accounting Oversight Board (United States). Those standards require that we plan and perform the audit to obtain reasonable assurance about whether the financial statements are free of material misstatement. An audit includes examining, on a test basis, evidence supporting the amounts and disclosures in the financial statements, assessing the accounting principles used and significant estimates made by management, and evaluating the overall financial statement presentation. We believe that our audits, which included confirmation of securities at November 30, 2005 by correspondence with the custodian and brokers, provide a reasonable basis for our opinion.
/s/ PricewaterhouseCoopers LLP
PricewaterhouseCoopers LLP
Boston, Massachusetts
January 9, 2006
|
29 Annual Report
Trustees and Officers
The Trustees, Members of the Advisory Board, and executive officers of the trust and fund, as applicable, are listed below. The Board of Trustees governs the fund and is responsible for protecting the interests of shareholders. The Trustees are experienced executives who meet periodically throughout the year to oversee the fund’s activities, review contractual arrangements with companies that provide services to the fund, and review the fund’s performance. Except for William O. McCoy and Albert R. Gamper, Jr., each of the Trustees oversees 326 funds advised by FMR or an affiliate. Mr. McCoy oversees 328 funds advised by FMR or an affiliate. Mr. Gamper oversees 235 funds advised by FMR or an affiliate.
The Trustees hold office without limit in time except that (a) any Trustee may resign; (b) any Trustee may be removed by written instrument, signed by at least two thirds of the number of Trustees prior to such removal; (c) any Trustee who requests to be retired or who has become incapacitated by illness or injury may be retired by written instru ment signed by a majority of the other Trustees; and (d) any Trustee may be removed at any special meeting of shareholders by a two thirds vote of the outstanding voting securities of the trust. Each Trustee who is not an interested person (as defined in the 1940 Act) (Independent Trustee), shall retire not later than the last day of the calendar year in which his or her 72nd birthday occurs. The Independent Trustees may waive this mandatory retirement age policy with respect to individual Trustees. The executive officers and Advisory Board Members hold office without limit in time, except that any officer and Advisory Board Member may resign or may be removed by a vote of a majority of the Trustees at any regular meeting or any special meeting of the Trustees. Except as indicated, each individual has held the office shown or other offices in the same company for the past five years.
The fund’s Statement of Additional Information (SAI) includes more information about the Trustees. To request a free copy, call Fidelity at 1-800-544-8544.
Correspondence intended for each Trustee who is an interested person may be sent to Fidelity Investments, 82 Devonshire Street, Boston, Massachusetts 02109.
| | Name, Age; Principal Occupation
Edward C. Johnson 3d (75)
|
Year of Election or Appointment: 1982
Mr. Johnson is Chairman of the Board of Trustees. Mr. Johnson serves as Chief Executive Officer, Chairman, and a Director of FMR Corp.; a Director and Chairman of the Board and of the Executive Committee of FMR; Chairman and a Director of Fidelity Management & Research (Far East) Inc.; Chairman and a Director of Fidelity Investments Money Management, Inc.; and Chairman (2001 present) and a Director (2000 present) of FMR Co., Inc.
| | Name, Age; Principal Occupation
Stephen P. Jonas (52)
|
Year of Election or Appointment: 2005
Mr. Jonas is Senior Vice President of Equity Income II (2005 present). He also serves as Senior Vice President of other Fidelity funds (2005 present). Mr. Jonas is Executive Director of FMR (2005 present). Previously, Mr. Jonas served as President of Fidelity Enterprise Operations and Risk Services (2004 2005), Chief Administrative Officer (2002 2004), and Chief Financial Officer of FMR Co. (1998 2000). Mr. Jonas has been with Fidelity Investments since 1987 and has held various financial and management positions including Chief Financial Officer of FMR. In addition, he serves on the Boards of Boston Ballet (2003 present) and Simmons College (2003 present).
Year of Election or Appointment: 2003
Mr. Reynolds is a Director (2003 present) and Chief Operating Officer (2002 present) of FMR Corp. He also serves on the Board at Fidelity Investments Canada, Ltd. (2000 present). Previously, Mr. Reynolds served as President of Fidelity Investments Institutional Retirement Group (1996 2000).
* Trustees have been determined to be “Interested Trustees” by virtue of, among other things, their affiliation with the trust or various entities under common control with FMR.
31 Annual Report
Trustees and Officers - continued
Independent Trustees:
Correspondence intended for each Independent Trustee (that is, the Trustees other than the Interested Trustees) may be sent to Fidelity Investments, P.O. Box 55235, Boston, Massachusetts 02205 5235.
| | Name, Age; Principal Occupation
Dennis J. Dirks (57)
|
Year of Election or Appointment: 2005
Prior to his retirement in May 2003, Mr. Dirks was Chief Operating Officer and a member of the Board of The Depository Trust & Clearing Corporation (DTCC) (1999 2003). He also served as President, Chief Operating Officer, and Board member of The Depository Trust Company (DTC) (1999 2003) and President and Board member of the National Securities Clearing Corporation (NSCC) (1999 2003). In addition, Mr. Dirks served as Chief Executive Officer and Board member of the Government Securities Clearing Corporation (2001 2003) and Chief Executive Officer and Board member of the Mortgage Backed Securities Clearing Corporation (2001 2003). Mr. Dirks also serves as a Trustee of Manhattan College (2005 present).
| | Albert R. Gamper, Jr. (63)
|
Year of Election or Appointment: 2006
Mr. Gamper also serves as a Trustee (2006 present) or Member of the Advisory Board (2005 present) of other investment companies advised by FMR. Prior to his retirement in December 2004, Mr. Gamper served as Chairman of the Board of CIT Group Inc. (commercial finance). Dur ing his tenure with CIT Group Inc. Mr. Gamper served in numerous senior management positions, including Chairman (1987 1989; 1999 2001; 2002 2004), Chief Executive Officer (1987 2004), and President (1989 2002). He currently serves as a member of the Board of Directors of Public Service Enterprise Group (utilities, 2001 present), Chairman of the Board of Governors, Rutgers University (2004 present), and Chairman of the Board of Saint Barnabas Health Care System.
Name, Age; Principal Occupation
Robert M. Gates (62)
|
Year of Election or Appointment: 1997
Dr. Gates is Chairman of the Independent Trustees (2006 present). Dr. Gates is President of Texas A&M University (2002 present). He was Director of the Central Intelligence Agency (CIA) from 1991 to 1993. From 1989 to 1991, Dr. Gates served as Assistant to the President of the United States and Deputy National Security Advisor. Dr. Gates is a Director of NACCO Industries, Inc. (mining and manufacturing), Parker Drilling Co., Inc. (drilling and rental tools for the energy industry, 2001 present), and Brinker International (restaurant management, 2003 present). Previously, Dr. Gates served as a Director of LucasVarity PLC (automotive components and diesel engines), a Director of TRW Inc. (automotive, space, defense, and information technology), and Dean of the George Bush School of Government and Public Service at Texas A&M University (1999 2001). Dr. Gates also is a Trustee of the Forum for International Policy.
Year of Election or Appointment: 2004
Dr. Heilmeier is Chairman Emeritus of Telcordia Technologies (commu nication software and systems), where prior to his retirement, he served as company Chairman and Chief Executive Officer. He currently serves on the Boards of Directors of The Mitre Corporation (systems engineer ing and information technology support for the government), and HRL Laboratories (private research and development, 2004 present). He is Chairman of the General Motors Science & Technology Advisory Board and a Life Fellow of the Institute of Electrical and Electronics Engineers (IEEE) (2000 present). Dr. Heilmeier is a member of the Defense Science Board and the National Security Agency Advisory Board. He is also a member of the National Academy of Engineering, the American Academy of Arts and Sciences, and the Board of Overseers of the School of Engi neering and Applied Science of the University of Pennsylvania. Previously, Dr. Heilmeier served as a Director of TRW Inc. (automotive, space, defense, and information technology, 1992 2002), Compaq (1994 2002), Automatic Data Processing, Inc. (ADP) (technology based business out sourcing, 1995 2002), INET Technologies Inc. (telecommunications network surveillance, 2001 2004), and Teletech Holdings (customer management services). He is the recipient of the 2005 Kyoto Prize in Advanced Technology for his invention of the liquid display.
33 Annual Report
Trustees and Officers - continued
| | Name, Age; Principal Occupation
Marie L. Knowles (59)
|
Year of Election or Appointment: 2001
Prior to Ms. Knowles’ retirement in June 2000, she served as Executive Vice President and Chief Financial Officer of Atlantic Richfield Company (ARCO) (diversified energy, 1996 2000). From 1993 to 1996, she was a Senior Vice President of ARCO and President of ARCO Transportation Company. She served as a Director of ARCO from 1996 to 1998. She currently serves as a Director of Phelps Dodge Corporation (copper mining and manufacturing) and McKesson Corporation (healthcare ser vice, 2002 present). Ms. Knowles is a Trustee of the Brookings Institution and the Catalina Island Conservancy and also serves as a member of the Advisory Board for the School of Engineering of the University of Southern California.
Year of Election or Appointment: 2000
Mr. Lautenbach has been a partner of Clayton, Dubilier & Rice, Inc. (private equity investment firm) since September 1998. Previously, Mr. Lautenbach was with the International Business Machines Corpora tion (IBM) from 1968 until his retirement in 1998. Mr. Lautenbach serves as a Director of Italtel Holding S.p.A. (telecommunications (Milan, Italy), 2004 present) and Eaton Corporation (diversified industrial) as well as the Philharmonic Center for the Arts in Naples, Florida. He also is a member of the Board of Trustees of Fairfield University (2005 present), as well as a member of the Council on Foreign Relations.
Year of Election or Appointment: 1997
Prior to his retirement in December 1994, Mr. McCoy was Vice Chair man of the Board of BellSouth Corporation (telecommunications) and President of BellSouth Enterprises. He is currently a Director of Liberty Corporation (holding company), Duke Realty Corporation (real estate), and Progress Energy, Inc. (electric utility). He is also a partner of Frank lin Street Partners (private investment management firm) and a member of the Research Triangle Foundation Board. In addition, Mr. McCoy served as the Interim Chancellor (1999 2000) and a member of the Board of Visitors for the University of North Carolina at Chapel Hill and currently serves on the Board of Directors of the University of North Carolina Health Care System and the Board of Visitors of the Kenan Flagler Business School (University of North Carolina at Chapel Hill). He also served as Vice President of Finance for the University of North Carolina (16 school system).
Name, Age; Principal Occupation
Cornelia M. Small (61)
|
Year of Election or Appointment: 2005
Ms. Small is a member (2000 present) and Chairperson (2002 present) of the Investment Committee, and a member (2002 present) of the Board of Trustees of Smith College. Previously, she served as Chief Investment Officer (1999 2000), Director of Global Equity Investments (1996 1999), and a member of the Board of Directors of Scudder, Stevens & Clark (1990 1997) and Scudder Kemper Investments (1997 1998). In addi tion, Ms. Small served as Co Chair (2000 2003) of the Annual Fund for the Fletcher School of Law and Diplomacy.
William S. Stavropoulos (66)
|
Year of Election or Appointment: 2002
Mr. Stavropoulos is Chairman of the Board (2000 present) and a Member of the Board of Directors of The Dow Chemical Company. Since joining The Dow Chemical Company in 1967, Mr. Stavropoulos served in numerous senior management positions, including President (1993 2000; 2002 2003), CEO (1995 2000; 2002 2004), and Chair man of the Executive Committee (2000 2004). Currently, he is a Direc tor of NCR Corporation (data warehousing and technology solutions), BellSouth Corporation (telecommunications), Chemical Financial Corpo ration, Maersk Inc. (industrial conglomerate, 2002 present), and Metal mark Capital (private equity investment firm, 2005 present). He also serves as a member of the Board of Trustees of the American Enterprise Institute for Public Policy Research. In addition, Mr. Stavropoulos is a member of The Business Council, J.P. Morgan International Council and the University of Notre Dame Advisory Council for the College of Science.
Year of Election or Appointment: 2005
Prior to his retirement in 2001, Mr. Wolfe was Chairman and Chief Executive Officer of Hershey Foods Corporation (1993 2001). He cur rently serves as a member of the boards of Adelphia Communications Corporation (2003 present), Bausch & Lomb, Inc., and Revlon Inc. (2004 present).
35 Annual Report
Trustees and Officers - continued
Advisory Board Members and Executive Officers:
Correspondence intended for each executive officer and Mr. Lynch may be sent to Fidelity Investments, 82 Devonshire Street, Boston, Massachusetts 02109.
| | Name, Age; Principal Occupation
Peter S. Lynch (61)
|
Year of Election or Appointment: 2003
Member of the Advisory Board of Fidelity Financial Trust. Vice Chairman and a Director of FMR, and Vice Chairman (2001 present) and a Director (2000 present) of FMR Co., Inc. Previously, Mr. Lynch served as a Trustee of the Fidelity funds (1990 2003). In addition, he serves as a Trustee of Boston College, Massachusetts Eye & Ear Infirmary, Historic Deerfield, John F. Kennedy Library, and the Museum of Fine Arts of Boston.
Year of Election or Appointment: 2005
Vice President of Equity Income II. Mr. Churchill also serves as Vice Pres ident of certain Equity Funds (2005 present) and certain High Income Funds (2005 present). Previously, he served as Head of Fidelity’s Fixed Income Division (2000 2005), Vice President of Fidelity’s Money Market Funds (2000 2005), Vice President of Fidelity’s Bond Funds, and Senior Vice President of FIMM (2000) and FMR. Mr. Churchill joined Fidelity in 1993 as Vice President and Group Leader of Taxable Fixed Income Investments.
Year of Election or Appointment: 2000
Vice President of Equity Income II. Mr. Dufour is also Vice President of other funds advised by FMR. Prior to assuming his current responsibilities, Mr. DuFour managed a variety of Fidelity funds. Mr. Dufour also serves as Vice President of FMR and FMR Co., Inc. (2001).
Year of Election or Appointment: 1998
Secretary of Equity Income II. He also serves as Secretary of other Fidelity funds; Vice President, General Counsel, and Secretary of FMR Co., Inc. (2001 present) and FMR; Assistant Secretary of Fidelity Man agement & Research (U.K.) Inc. (2001 present), Fidelity Management & Research (Far East) Inc. (2001 present), and Fidelity Investments Money Management, Inc. (2001 present). Mr. Roiter is an Adjunct Member, Faculty of Law, at Boston College Law School (2003 present). Previously, Mr. Roiter served as Vice President and Secretary of Fidelity Distributors Corporation (FDC) (1998 2005).
Name, Age; Principal Occupation
|
Year of Election or Appointment: 2003
Assistant Secretary of Equity Income II. Mr. Fross also serves as Assistant Secretary of other Fidelity funds (2003 present), Vice President and Sec retary of FDC (2005 present), and is an employee of FMR.
Year of Election or Appointment: 2004
President, Treasurer, and Anti Money Laundering (AML) officer of Equity Income II. Ms. Reynolds also serves as President, Treasurer, and AML officer of other Fidelity funds (2004) and is a Vice President (2003) and an employee (2002) of FMR. Before joining Fidelity Investments, Ms. Reynolds worked at PricewaterhouseCoopers LLP (PwC) (1980 2002), where she was most recently an audit partner with PwC’s investment management practice.
Year of Election or Appointment: 2005
Chief Financial Officer of Equity Income II. Mr. Murphy also serves as Chief Financial Officer of other Fidelity funds (2005 present). He also serves as Senior Vice President of Fidelity Pricing and Cash Manage ment Services Group (FPCMS).
Kenneth A. Rathgeber (58)
|
Year of Election or Appointment: 2004
Chief Compliance Officer of Equity Income II. Mr. Rathgeber also serves as Chief Compliance Officer of other Fidelity funds (2004) and Execu tive Vice President of Risk Oversight for Fidelity Investments (2002). Previously, he served as Executive Vice President and Chief Operating Officer for Fidelity Investments Institutional Services Company, Inc. (1998 2002).
Year of Election or Appointment: 2003
Deputy Treasurer of Equity Income II. Mr. Hebble also serves as Deputy Treasurer of other Fidelity funds (2003), and is an employee of FMR. Before joining Fidelity Investments, Mr. Hebble worked at Deutsche Asset Management where he served as Director of Fund Accounting (2002 2003) and Assistant Treasurer of the Scudder Funds (1998 2003).
37 Annual Report
Trustees and Officers - continued
| | Name, Age; Principal Occupation
Bryan A. Mehrmann (44)
|
Year of Election or Appointment: 2005
Deputy Treasurer of Equity Income II. Mr. Mehrmann also serves as Deputy Treasurer of other Fidelity funds (2005 present) and is an employee of FMR. Previously, Mr. Mehrmann served as Vice President of Fidelity Investments Institutional Services Group (FIIS)/Fidelity Investments Institutional Operations Corporation, Inc. (FIIOC) Client Services (1998 2004).
| | Kimberley H. Monasterio (41)
|
Year of Election or Appointment: 2004
Deputy Treasurer of Equity Income II. Ms. Monasterio also serves as Deputy Treasurer of other Fidelity funds (2004) and is an employee of FMR (2004). Before joining Fidelity Investments, Ms. Monasterio served as Treasurer (2000 2004) and Chief Financial Officer (2002 2004) of the Franklin Templeton Funds and Senior Vice President of Franklin Templeton Services, LLC (2000 2004).
Year of Election or Appointment: 2005
Deputy Treasurer of Equity Income II. Mr. Robins also serves as Deputy Treasurer of other Fidelity funds (2005 present) and is an employee of FMR (2004 present). Before joining Fidelity Investments, Mr. Robins worked at KPMG LLP, where he was a partner in KPMG’s department of professional practice (2002 2004) and a Senior Manager (1999 2000). In addition, Mr. Robins served as Assistant Chief Accountant, United States Securities and Exchange Commission (2000 2002).
Year of Election or Appointment: 2005
Assistant Treasurer of Equity Income II. Mr. Byrnes also serves as Assis tant Treasurer of other Fidelity funds (2005 present) and is an employee of FMR (2005 present). Previously, Mr. Byrnes served as Vice President of FPCMS (2003 2005). Before joining Fidelity Investments, Mr. Byrnes worked at Deutsche Asset Management where he served as Vice Presi dent of the Investment Operations Group (2000 2003).
Year of Election or Appointment: 1990
Assistant Treasurer of Equity Income II. Mr. Costello also serves as Assistant Treasurer of other Fidelity funds and is an employee of FMR.
Name, Age; Principal Occupation
Peter L. Lydecker (51)
|
Year of Election or Appointment: 2004
Assistant Treasurer of Equity Income II. Mr. Lydecker also serves as Assistant Treasurer of other Fidelity funds (2004) and is an employee of FMR.
Year of Election or Appointment: 2002
Assistant Treasurer of Equity Income II. Mr. Osterheld also serves as Assistant Treasurer of other Fidelity funds (2002) and is an employee of FMR.
Year of Election or Appointment: 2005
Assistant Treasurer of Equity Income II. Mr. Ryan also serves as Assistant Treasurer of other Fidelity funds (2005 present) and is an employee of FMR (2005 present). Previously, Mr. Ryan served as Vice President of Fund Reporting in FPCMS (1999 2005).
Year of Election or Appointment: 2005
Assistant Treasurer of Equity Income II. Mr. Schiavone also serves as Assistant Treasurer of other Fidelity funds (2005 present) and is an employee of FMR (2005 present). Before joining Fidelity Investments, Mr. Schiavone worked at Deutsche Asset Management, where he most recently served as Assistant Treasurer (2003 2005) of the Scudder Funds and Vice President and Head of Fund Reporting (1996 2003).
39 Annual Report
The Board of Trustees of Equity-Income II Fund voted to pay on January 9, 2006, to shareholders of record at the opening of business on January 6, 2006, a distribution of $.19 per share derived from capital gains realized from sales of portfolio securities.
The Board of Trustees of Equity-Income II Fund voted to pay on December 19, 2005, to shareholders of record at the opening of business on December 16, 2005, a distribu tion of $1.72 per share derived from capital gains realized from sales of portfolio securities and a dividend of $.09 per share from net investment income.
The fund hereby designates as capital gain dividends: For dividends with respect to the taxable year ended November 30, 2005, $904,038,000 or, if subsequently determined to be different, the net capital gain of such year, and for dividends with respect to the taxable year ended November 30, 2004 $312,109,000, or, if subsequently determined to be different, the excess of: (a) the net capital gain of such year, over (b) amounts previously designated as capital gain dividends with respect to such year.
A total of 0.09% of the dividends distributed during the fiscal year was derived from interest on U.S. Government securities which is generally exempt from state income tax.
The fund designates 100% of the dividends distributed in December, January, April, July and October, during the fiscal year as qualifying for the dividends received de duction for corporate shareholders.
The fund designates 100% of the dividends distributed in December, January, April, July and October, during the fiscal year as amounts which may be taken into account as a dividend for the purposes of the maximum rate under section 1(h)(11) of the Internal Revenue Code.
The fund will notify shareholders in January 2006 of amounts for use in preparing 2005 income tax returns.
Proxy Voting Results
A special meeting of the fund’s shareholders was held on March 16, 2005. The results of votes taken among shareholders on proposals before them are reported below. Each vote reported represents one dollar of net asset value held on the record date for the meeting.
| PROPOSAL 1 | | |
| To amend the Declaration of Trust to |
| allow the Board of Trustees, if per- |
| mitted by applicable law, to authorize |
| fund mergers without shareholder |
| approval.A | | | | |
| | | # of | | % of |
| | | Votes | | Votes |
| Affirmative | | 8,400,660,894.14 | | 71.170 |
| Against | | 2,413,818,167.07 | | 20.450 |
| Abstain | | 466,182,489.54 | | 3.949 |
| Broker | | | | |
| Non Votes | | 523,001,758.35 | | 4.431 |
| TOTAL | | 11,803,663,309.10 | | 100.000 |
| PROPOSAL 2 | | |
| To elect a Board of Trustees.A | | |
| | | # of | | % of |
| | | Votes | | Votes |
| Laura B. Cronin | | |
| Affirmative | | 10,904,461,482.16 | | 92.382 |
| Withheld | | 899,201,826.94 | | 7.618 |
| TOTAL | | 11,803,663,309.10 | | 100.000 |
| Dennis J. Dirks | | |
| Affirmative | | 11,230,399,240.22 | | 95.143 |
| Withheld | | 573,264,068.88 | | 4.857 |
| TOTAL | | 11,803,663,309.10 | | 100.000 |
| Robert M. Gates | | |
| Affirmative | | 11,204,490,469.14 | | 94.924 |
| Withheld | | 599,172,839.96 | | 5.076 |
| TOTAL | | 11,803,663,309.10 | | 100.000 |
| George H. Heilmeier | | |
| Affirmative | | 11,216,568,766.75 | | 95.026 |
| Withheld | | 587,094,542.35 | | 4.974 |
| TOTAL | | 11,803,663,309.10 | | 100.000 |
| Abigail P. Johnson | | |
| Affirmative | | 11,170,882,517.64 | | 94.639 |
| Withheld | | 632,780,791.46 | | 5.361 |
| TOTAL | | 11,803,663,309.10 | | 100.000 |
| | | # of | | % of |
| | | Votes | | Votes |
| |
| Edward C. Johnson 3d | | |
| Affirmative | | 11,146,150,096.08 | | 94.430 |
| Withheld | | 657,513,213.02 | | 5.570 |
| TOTAL | | 11,803,663,309.10 | | 100.000 |
| |
| Marie L. Knowles | | |
| Affirmative | | 11,230,314,699.11 | | 95.143 |
| Withheld | | 573,348,609.99 | | 4.857 |
| TOTAL | | 11,803,663,309.10 | | 100.000 |
| |
| Ned C. Lautenbach | | |
| Affirmative | | 11,228,854,936.86 | | 95.130 |
| Withheld | | 574,808,372.24 | | 4.870 |
| TOTAL | | 11,803,663,309.10 | | 100.000 |
| |
| Marvin L. Mann | | |
| Affirmative | | 11,192,136,636.22 | | 94.819 |
| Withheld | | 611,526,672.88 | | 5.181 |
| TOTAL | | 11,803,663,309.10 | | 100.000 |
| |
| William O. McCoy | | |
| Affirmative | | 11,202,537,978.70 | | 94.907 |
| Withheld | | 601,125,330.40 | | 5.093 |
| TOTAL | | 11,803,663,309.10 | | 100.000 |
| |
| Robert L. Reynolds | | |
| Affirmative | | 11,216,557,272.63 | | 95.026 |
| Withheld | | 587,106,036.47 | | 4.974 |
| TOTAL | | 11,803,663,309.10 | | 100.000 |
| |
| Cornelia M. Small | | |
| Affirmative | | 11,221,057,350.30 | | 95.064 |
| Withheld | | 582,605,958.80 | | 4.936 |
| TOTAL | | 11,803,663,309.10 | | 100.000 |
| |
| William S. Stavropoulos | | |
| Affirmative | | 11,213,520,655.58 | | 95.000 |
| Withheld | | 590,142,653.52 | | 5.000 |
| TOTAL | | 11,803,663,309.10 | | 100.000 |
41 Annual Report
Proxy Voting Results - continued
| | | # of | | % of |
| | | Votes | | Votes |
| |
| Kenneth L. Wolfe | | |
| Affirmative | | 11,218,319,970.33 | | 95.041 |
| Withheld | | 585,343,338.77 | | 4.959 |
| TOTAL | | 11,803,663,309.10 | | 100.000 |
A Denotes trust-wide proposals and voting results.
Board Approval of Investment Advisory Contracts and Management Fees
Fidelity Equity Income II Fund
Each year, typically in July, the Board of Trustees, including the independent Trustees (together, the Board), votes on the renewal of the management contract and sub advisory agreements (together, the Advisory Contracts) for the fund. The Board, assisted by the advice of fund counsel and independent Trustees’ counsel, requests and considers a broad range of information throughout the year.
The Board meets regularly each month except August and takes into account throughout the year matters bearing on Advisory Contracts. The Board, acting directly and through its separate committees, considers at each of its meetings factors that are relevant to the annual renewal of the fund’s Advisory Contracts, including the services and support provided to the fund and its shareholders by Fidelity. At the time of the renewal, the Board had 11 standing committees, each composed of independent Trustees with varying backgrounds, to which the Board has assigned specific subject matter responsibilities in order to enhance effective decision making by the Board. Each committee has adopted a written charter outlining the structure and purposes of the committee. One such com mittee, the Equity Contract Committee, meets periodically during the first six months of each year and as necessary to consider matters specifically related to the annual renewal of Advisory Contracts. The committee requests and receives information on, and makes recommendations to the independent Trustees concerning, the approval and annual review of the Advisory Contracts.
At its July 2005 meeting, the Board of Trustees, including the independent Trustees, unanimously determined to renew the Advisory Contracts for the fund. In reaching its determination, the Board considered all factors it believed relevant, including (1) the nature, extent, and quality of the services to be provided to the fund and its shareholders by Fidelity (including the investment performance of the fund); (2) the competitiveness of the management fee and total expenses of the fund; (3) the total costs of the services to be provided by and the profits to be realized by the investment adviser and its affiliates from the relationship with the fund; (4) the extent to which economies of scale would be realized as the fund grows; and (5) whether fee levels reflect these economies of scale, if any, for the benefit of fund shareholders.
In determining whether to renew the Advisory Contracts for the fund, the Board ulti mately reached a determination, with the assistance of fund counsel and independent Trustees’ counsel, that the renewal of the Advisory Contracts and the compensation to be received by Fidelity under the management contract is consistent with Fidelity’s fidu ciary duty under applicable law. In addition to evaluating the specific factors noted above, the Board, in reaching its determination, is aware that shareholders in the fund have a broad range of investment choices available to them, including a wide choice among mutual funds offered by competitors to Fidelity, and that the fund’s shareholders, with the opportunity to review and weigh the disclosure provided by the fund in its
43 Annual Report
Board Approval of Investment Advisory Contracts and Management Fees continued
prospectus and other public disclosures, have chosen to invest in this fund, managed by Fidelity.
Nature, Extent, and Quality of Services Provided by Fidelity. The Board consid ered staffing within the investment adviser, FMR, and the sub advisers (together, the Investment Advisers), including the background of the fund’s portfolio manager and the fund’s investment objective and discipline. The independent Trustees also had discus sions with senior management of Fidelity’s investment operations and investment groups. The Board considered the structure of the portfolio manager compensation program and whether this structure provides appropriate incentives.
Fidelity Resources Dedicated to Investment Management and Support Services. The Board reviewed the size, education, and experience of the Investment Advisers’ invest ment staff, their use of technology, and the Investment Advisers’ approach to recruiting, training, and retaining portfolio managers and other research, advisory, and manage ment personnel. The Board considered Fidelity’s extensive global research capabilities that enable the Investment Advisers to aggregate data from various sources in an effort to produce positive investment results. The Board noted that Fidelity’s analysts have access to a variety of technological tools that enable them to perform both fundamental and quantitative analysis and to specialize in various disciplines. The Board also considered that Fidelity’s portfolio managers and analysts have access to daily portfolio attribution that allows for monitoring of a fund’s portfolio, as well as an electronic communication system that provides immediate real time access to research concerning issuers and credit enhancers.
Shareholder and Administrative Services. The Board considered the nature, extent, quality, and cost of administrative, distribution, and shareholder services performed by the Investment Advisers and their affiliates under the Advisory Contracts and under separate agreements covering transfer agency, pricing and bookkeeping, and securities lending services for the fund. The Board also considered the nature and extent of the Investment Advisers’ supervision of third party service providers, principally custodians and subcustodians. The Board reviewed the allocation of fund brokerage, including allocations to brokers affiliated with the Investment Advisers, the use of brokerage commissions to pay fund expenses, and the use of “soft” commission dollars to pay for research services. The Board also considered that Fidelity voluntarily decided in 2004 to stop using “soft” commission dollars to pay for market data and, instead, to pay for that data out of its own resources. The Board also considered the resources devoted to, and the record of compliance with, the fund’s compliance policies and procedures.
The Board noted that the growth of fund assets across the complex allows Fidelity to reinvest in the development of services designed to enhance the value or convenience of the Fidelity funds as investment vehicles. These services include 24 hour access to
account information and market information through phone representatives and over the Internet, and investor education materials and asset allocation tools.
Investment in a Large Fund Family. The Board considered the benefits to shareholders of investing in a Fidelity fund, including the benefits of investing in a fund that is part of a large family of funds offering a variety of investment disciplines and providing for a large variety of mutual fund investor services. For example, fund shareholders are offered the privilege of exchanging shares of the fund for shares of other Fidelity funds, as set forth in the fund’s prospectus, without paying a sales charge. The Board noted that, since the last Advisory Contract renewals in July 2004, Fidelity has taken a number of actions that benefited particular funds, including (i) voluntarily deciding in 2004 to stop using “soft” commission dollars to pay for market data and, instead, to pay for that data out of its own resources, (ii) contractually agreeing to impose management fee reductions and expense limitations on its five Spartan stock index funds and its stock index fund available through variable insurance products, (iii) contractually agreeing to eliminate the management fees on the Fidelity Freedom Funds and the Fidelity Advisor Freedom Funds, (iv) contractually agreeing to reduce the management fees on most of its investment grade taxable bond funds, and (v) contractually agreeing to impose expense limitations on its retail and Spartan investment grade taxable bond funds.
Investment Performance and Compliance. The Board considered whether the fund has operated within its investment objective, as well as its record of compliance with its investment restrictions. It also reviewed the fund’s absolute investment performance, as well as the fund’s relative investment performance measured against (i) a broad based securities market index, and (ii) a peer group of mutual funds deemed appropriate by the Board over multiple periods. The following charts considered by the Board show, over the one , three , and five year periods ended December 31, 2004, the fund’s returns, the returns of a broad based securities market index (“benchmark”), and a range of returns of a peer group of mutual funds identified by Lipper Inc. as having an investment objec tive similar to that of the fund. The box within each chart shows the 25th percentile return (bottom of box) and the 75th percentile return (top of box) of the Lipper peer group. Returns shown above the box are in the first quartile and returns shown below the box are in the fourth quartile. The percentage beaten number noted below each chart corresponds to the percentile box and represents the percentage of funds in the Lipper peer group whose performance was equal to or lower than that of the fund.
45 Annual Report
Board Approval of Investment Advisory Contracts and Management Fees continued
The Board reviewed the fund’s relative investment performance against its Lipper peer group and stated that the performance of the fund was in the fourth quartile for the one year period and the second quartile for the three and five year periods. The Board also stated that the relative investment performance of the fund was lower than its benchmark over time.
The Board has had thorough discussions with FMR throughout the year about the Board’s and FMR’s concerns about equity research, equity fund performance, and compliance with internal policies governing gifts and entertainment. FMR has taken steps that it believes will refocus and strengthen equity research and equity portfolio management and compliance. The Board noted with favor FMR’s recent reorganization of its senior management team and FMR’s plans to dedicate additional resources to investment research, and participated in the process that led to those changes.
Based on its review, and giving particular weight to the nature and quality of the resources dedicated by the Investment Advisers to maintain and improve relative performance, the Board concluded that the nature, extent, and quality of the services provided by Fidelity will benefit the fund’s shareholders, particularly in light of the Board’s view that the fund’s shareholders benefit from investing in a fund that is part of a large family of funds offering a variety of investment disciplines and services.
Competitiveness of Management Fee and Total Fund Expenses. The Board considered the fund’s management fee and total expenses compared to “mapped groups” of competitive funds and classes. Fidelity creates “mapped groups” by combining similar Lipper investment objective categories that have comparable management fee charac teristics. Combining Lipper investment objective categories aids the Board’s
management fee and total expense comparisons by broadening the competitive group used for comparison and by reducing the number of universes to which various Fidelity funds are compared.
The Board considered two proprietary management fee comparisons for the 12 month periods shown in the chart below. The group of Lipper funds used by the Board for management fee comparisons is referred to below as the “Total Mapped Group” and, for the reasons explained above, is broader than the Lipper peer group used by the Board for performance comparisons. The Total Mapped Group comparison focuses on a fund’s standing relative to the total universe of comparable funds available to investors, in terms of gross management fees before expense reimbursements or caps. “TMG %” represents the percentage of funds in the Total Mapped Group that had management fees that were lower than the fund’s. For example, a TMG % of 21% means that 79% of the funds in the Total Mapped Group had higher management fees than the fund. The “Asset Size Peer Group” (ASPG) comparison focuses on a fund’s standing relative to non Fidelity funds similar in size to the fund within the Total Mapped Group. The ASPG represents at least 15% of the funds in the Total Mapped Group with comparable asset size and management fee characteristics, subject to a minimum of 50 funds (or all funds in the Total Mapped Group if fewer than 50). Additional information, such as the ASPG quartile (“quadrant”) in which the fund’s management fee ranked, is also included in the chart and considered by the Board.

The Board noted that the fund’s management fee ranked below the median of its Total Mapped Group and below the median of its ASPG for 2004.
47 Annual Report
Board Approval of Investment Advisory Contracts and Management Fees continued
Based on its review, the Board concluded that the fund’s management fee was fair and reasonable in light of the services that the fund receives and the other factors considered.
In its review of the fund’s total expenses, the Board considered the fund’s management fee as well as other fund expenses, such as transfer agent fees, pricing and bookkeeping fees, and custodial, legal, and audit fees. The Board also noted the effects of any waivers and reimbursements on fees and expenses. As part of its review, the Board also consid ered current and historical total expenses of the fund compared to competitive fund median expenses. The fund is compared to those funds and classes in the Total Mapped Group (used by the Board for management fee comparisons) that have a similar sales load structure.
The Board noted that the fund’s total expenses ranked below its competitive median for 2004.
In its review of total expenses, the Board also considered Fidelity fee structures and other information on clients that FMR and its affiliates service in other competitive markets, such as other mutual funds advised or subadvised by FMR or its affiliates, pension plan clients, and other institutional clients.
Based on its review, the Board concluded that the fund’s total expenses were reasonable in light of the services that the fund and its shareholders receive and the other factors considered.
Costs of the Services and Profitability. The Board considered the revenues earned and the expenses incurred by Fidelity in conducting the business of developing, market ing, distributing, managing, administering and servicing the fund and its shareholders. The Board also considered the level of Fidelity’s profits in respect of all the Fidelity funds.
On an annual basis, FMR presents to the Board Fidelity’s profitability for the fund. Fidelity calculates the profitability for each fund, as well as aggregate profitability for groups of Fidelity funds and all Fidelity funds, using a series of detailed revenue and cost allocation methodologies which originate with the audited books and records of Fidelity. The Audit Committee of the Board reviews any significant changes from the prior year’s methodologies.
PricewaterhouseCoopers LLP (PwC), independent registered accounting firm and auditor to Fidelity and certain Fidelity funds, has been engaged annually by the Board as part of the Board’s assessment of the results of Fidelity’s profitability analysis. PwC’s engagement includes the review and assessment of Fidelity’s methodologies used in determining the revenues and expenses attributable to Fidelity’s mutual fund business, and completion of agreed upon procedures surrounding the mathematical accuracy of fund profitability and its conformity to allocation methodologies. After considering PwC’s
reports issued under the engagement and information provided by Fidelity, the Board believes that while other allocation methods may also be reasonable, Fidelity’s profitabil ity methodologies are reasonable in all material respects.
The Board has also reviewed Fidelity’s non fund businesses and any fall out benefits related to the mutual fund business as well as cases where Fidelity’s affiliates may benefit from or be related to the fund’s business. In addition, a special committee of the Board reviewed services provided to Fidelity by its affiliates and determined that the fees that Fidelity paid for such services were reasonable.
The Board considered the costs of the services provided by and the profits realized by Fidelity in connection with the operation of the fund and determined that the amount of profit is a fair entrepreneurial profit for the management of the fund.
Economies of Scale. The Board considered whether there have been economies of scale in respect of the management of the Fidelity funds, whether the Fidelity funds (including the fund) have appropriately benefited from any such economies of scale, and whether there is potential for realization of any further economies of scale. The Board considered the extent to which the fund will benefit from economies of scale through increased services to the fund, through waivers or reimbursements, or through fee or expense reductions, including reductions that occur through operation of the transfer agent agreement. The transfer agent fee varies in part based on the number of accounts in the fund. If the number of accounts decreases or the average account size increases, the overall transfer agent fee rate decreases.
The Board recognized that the fund’s management contract incorporates a “group fee” structure, which provides for lower fee rates as total fund assets under FMR’s manage ment increase, and for higher fee rates as total fund assets under FMR’s management decrease. The Board considered that the group fee is designed to deliver the benefits of economies of scale to fund shareholders when total fund assets increase, even if assets of any particular fund are unchanged or have declined, because some portion of Fidelity’s costs are attributable to services provided to all Fidelity funds, and all funds benefit if those costs can be allocated among more assets. The Board concluded that, given the group fee structure, fund shareholders will achieve a certain level of economies of scale as assets under FMR’s management increase at the fund complex level, regardless of whether Fidelity achieves any such economies of scale.
The Board further concluded that any potential economies of scale are being shared between fund shareholders and Fidelity in an appropriate manner.
Additional Information Requested by the Board. In order to develop fully the factual basis for consideration of the Advisory Contracts, the Board requested additional information regarding (i) equity fund transfer agency fees; (ii) Fidelity’s fund profitability methodology and the impact of various changes in the methodology over
49 Annual Report
Board Approval of Investment Advisory Contracts and Management Fees continued
time; (iii) benefits to shareholders from economies of scale; (iv) composition and characteristics of various fund and industry data used in comparisons; and (v) com pensation of portfolio managers and research analysts.
Based on its evaluation of all of the conclusions noted above, and after considering all material factors, the Board ultimately concluded that the existing advisory fee structures are fair and reasonable, and that the fund’s existing Advisory Contracts should be renewed.
Managing Your Investments
Fidelity offers several ways to conveniently manage your personal investments via your telephone or PC. You can access your account information, conduct trades and research your investments 24 hours a day.
By Phone
Fidelity Automated Service Telephone provides a single toll free number to access account balances, positions, quotes and trading. It’s easy to navigate the service, and on your first call, the system will help you create a personal identification number (PIN) for security.


By PC
Fidelity’s web site on the Internet provides a wide range of information, including daily financial news, fund performance, interactive planning tools and news about Fidelity products and services.

* When you call the quotes line, please remember that a fund’s yield and return will vary and, except for money market funds, share price will also vary. This means that you may have a gain or loss when you sell your shares. There is no assurance that money market funds will be able to maintain a stable $1 share price; an investment in a money market fund is not insured or guar anteed by the U.S. government. Total returns are historical and include changes in share price, reinvestment of dividends and capital gains, and the effects of any sales charges.
51 Annual Report
To Visit Fidelity
For directions and hours,
please call 1-800-544-9797.
Arizona
7001 West Ray Road
Chandler, AZ
7373 N. Scottsdale Road
Scottsdale, AZ
California
815 East Birch Street
Brea, CA
1411 Chapin Avenue
Burlingame, CA
851 East Hamilton Avenue
Campbell, CA
19200 Von Karman Avenue
Irvine, CA
601 Larkspur Landing Circle
Larkspur, CA
10100 Santa Monica Blvd.
Los Angeles, CA
27101 Puerta Real
Mission Viejo, CA
73 575 El Paseo
Palm Desert, CA
251 University Avenue
Palo Alto, CA
123 South Lake Avenue
Pasadena, CA
16995 Bernardo Ctr. Drive
Rancho Bernardo, CA
1740 Arden Way
Sacramento, CA
7676 Hazard Center Drive
San Diego, CA
8 Montgomery Street
San Francisco, CA
3793 State Street
Santa Barbara, CA
21701 Hawthorne Boulevard
Torrance, CA
2001 North Main Street
Walnut Creek, CA
6300 Canoga Avenue
Woodland Hills, CA
|
Colorado
1625 Broadway
Denver, CO
9185 East Westview Road
Littleton, CO
Connecticut
48 West Putnam Avenue
Greenwich, CT
265 Church Street
New Haven, CT
300 Atlantic Street
Stamford, CT
29 South Main Street
West Hartford, CT
Delaware
222 Delaware Avenue
Wilmington, DE
Florida
4400 N. Federal Highway
Boca Raton, FL
121 Alhambra Plaza
Coral Gables, FL
2948 N. Federal Highway
Ft. Lauderdale, FL
1907 West State Road 434
Longwood, FL
8880 Tamiami Trail, North
Naples, FL
3550 Tamiami Trail, South
Sarasota, FL
1502 N. Westshore Blvd.
Tampa, FL
2465 State Road 7
Wellington, FL
3501 PGA Boulevard
West Palm Beach, FL
Georgia
3445 Peachtree Road, N.E.
Atlanta, GA
1000 Abernathy Road
Atlanta, GA
Illinois
One North LaSalle Street
Chicago, IL
875 North Michigan Ave.
Chicago, IL
1415 West 22nd Street
Oak Brook, IL
|
1700 East Golf Road
Schaumburg, IL
3232 Lake Avenue
Wilmette, IL
Indiana
4729 East 82nd Street
Indianapolis, IN
Kansas
5400 College Boulevard
Overland Park, KS
Maine
Three Canal Plaza
Portland, ME
Maryland
7315 Wisconsin Avenue
Bethesda, MD
One W. Pennsylvania Ave.
Towson, MD
Massachusetts
801 Boylston Street
Boston, MA
155 Congress Street
Boston, MA
300 Granite Street
Braintree, MA
44 Mall Road
Burlington, MA
405 Cochituate Road
Framingham, MA
416 Belmont Street
Worcester, MA
Michigan
500 E. Eisenhower Pkwy.
Ann Arbor, MI
280 Old N. Woodward Ave.
Birmingham, MI
43420 Grand River Avenue
Novi, MI
29155 Northwestern Hwy.
Southfield, MI
Minnesota
7600 France Avenue South
Edina, MN
Missouri
8885 Ladue Road
Ladue, MO
|
Annual Report 52
Nevada
2225 Village Walk Drive
Henderson, NV
New Jersey
150 Essex Street
Millburn, NJ
56 South Street
Morristown, NJ
396 Route 17, North
Paramus, NJ
3518 Route 1 North
Princeton, NJ
530 Highway 35
Shrewsbury, NJ
New York
1055 Franklin Avenue
Garden City, NY
37 West Jericho Turnpike
Huntington Station, NY
1271 Avenue of the Americas
New York, NY
61 Broadway
New York, NY
350 Park Avenue
New York, NY
200 Fifth Avenue
New York, NY
733 Third Avenue
New York, NY
11 Penn Plaza
New York, NY
2070 Broadway
New York, NY
1075 Northern Blvd.
Roslyn, NY
North Carolina
4611 Sharon Road
Charlotte, NC
Ohio
3805 Edwards Road
Cincinnati, OH
1324 Polaris Parkway
Columbus, OH
28699 Chagrin Boulevard
Woodmere Village, OH
Oregon
16850 SW 72nd Avenue
Tigard, OR
|
Pennsylvania
600 West DeKalb Pike
King of Prussia, PA
1735 Market Street
Philadelphia, PA
12001 Perry Highway
Wexford, PA
Rhode Island
47 Providence Place
Providence, RI
Tennessee
6150 Poplar Avenue
Memphis, TN
Texas
10000 Research Boulevard
Austin, TX
4001 Northwest Parkway
Dallas, TX
12532 Memorial Drive
Houston, TX
2701 Drexel Drive
Houston, TX
6500 N. MacArthur Blvd.
Irving, TX
6005 West Park Boulevard
Plano, TX
14100 San Pedro
San Antonio, TX
1576 East Southlake Blvd.
Southlake, TX
19740 IH 45 North
Spring, TX
Utah
215 South State Street
Salt Lake City, UT
Virginia
1861 International Drive
McLean, VA
Washington
411 108th Avenue, N.E.
Bellevue, WA
1518 6th Avenue
Seattle, WA
Washington, DC
1900 K Street, N.W.
Washington, DC
Wisconsin
595 North Barker Road
Brookfield, WI
|
Fidelity Brokerage Services, Inc., 100 Summer St., Boston, MA 02110 Member NYSE/SIPC
53 Annual Report
53
To Write Fidelity
We’ll give your correspondence immediate attention and send you written confirmation upon completion of your request.

(such as changing name, address, bank, etc.)
Fidelity Investments
P.O. Box 770001
Cincinnati, OH 45277-0002
|

Buying shares
Fidelity Investments
P.O. Box 770001
Cincinnati, OH 45277-0003
Overnight Express
Fidelity Investments
Attn: Distribution Services
100 Crosby Parkway KC1H
Covington, KY 41015
Selling shares
Fidelity Investments
P.O. Box 770001
Cincinnati, OH 45277-0035
Overnight Express
Fidelity Investments
Attn: Distribution Services
100 Crosby Parkway KC1H
Covington, KY 41015
General Correspondence
Fidelity Investments
P.O. Box 500
Merrimack, NH 03054-0500
|

Buying shares
Fidelity Investments
P.O. Box 770001
Cincinnati, OH 45277-0003
Selling shares
Fidelity Investments
P.O. Box 770001
Cincinnati, OH 45277-0035
Overnight Express
Fidelity Investments
Attn: Distribution Services
100 Crosby Parkway KC1H
Covington, KY 41015
General Correspondence
Fidelity Investments
P.O. Box 500
Merrimack, NH 03054-0500
|
Annual Report 54
55 Annual Report
Investment Adviser
Fidelity Management & Research Company
Boston, MA
Investment Sub Advisers
FMR Co., Inc.
Fidelity Management & Research
(U.K.) Inc.
Fidelity Management & Research
(Far East) Inc.
Fidelity International Investment
Advisors
Fidelity Investments Japan Limited
Fidelity International Investment
Advisors (U.K.) Limited
General Distributor
Fidelity Distributors Corporation
Boston, MA
Transfer and Service Agent
Fidelity Service Company, Inc.
Boston, MA
Custodian
The Northern Trust Company
Chicago, IL
|
| The Fidelity Telephone Connection |
| Mutual Fund 24-Hour Service |
| Exchanges/Redemptions | | |
| and Account Assistance | | 1-800-544-6666 |
| Product Information | | 1-800-544-6666 |
| Retirement Accounts | | 1-800-544-4774 |
| (8 a.m. - 9 p.m.) | | |
| TDD Service | | 1-800-544-0118 |
| for the deaf and hearing impaired |
| (9 a.m. - 9 p.m. Eastern time) |
| Fidelity Automated Service | | |
| Telephone (FAST®) (automated phone logo) | | 1-800-544-5555 |
| (automated phone logo) Automated line for quickest service |
EII-UANN-0106
1.786707.102
|

Fidelity®
Independence
Fund
|
Annual Report
November 30, 2005
|


| Contents | | | | |
| |
| Chairman’s Message | | 4 | | Ned Johnson’s message to shareholders. |
| Performance | | 5 | | How the fund has done over time. |
| Management’s Discussion | | 6 | | The manager’s review of fund |
| | | | | performance, strategy and outlook. |
| Shareholder Expense | | 7 | | An example of shareholder expenses. |
| Example | | | | |
| Investment Changes | | 8 | | A summary of major shifts in the fund’s |
| | | | | investments over the past six months. |
| Investments | | 9 | | A complete list of the fund’s investments |
| | | | | with their market values. |
| Financial Statements | | 18 | | Statements of assets and liabilities, |
| | | | | operations, and changes in net assets, |
| | | | | as well as financial highlights. |
| Notes | | 22 | | Notes to the financial statements. |
| Report of Independent | | 28 | | |
| Registered Public | | | | |
| Accounting Firm | | | | |
| Trustees and Officers | | 29 | | |
| Distributions | | 39 | | |
| Proxy Voting Results | | 40 | | |
| Board Approval of | | 42 | | |
| Investment Advisory | | | | |
| Contracts and | | | | |
| Management Fees | | | | |
| | To view a fund’s proxy voting guidelines and proxy voting record for the 12 month period
ended June 30, visit www.fidelity.com/proxyvotingresults or visit the Securities and Exchange
Commission’s (SEC) web site at www.sec.gov. You may also call 1-800-544-8544 to request a free
copy of the proxy voting guidelines.
Standard & Poor’s, S&P and S&P 500 are registered service marks of The McGraw Hill Companies,
Inc. and have been licensed for use by Fidelity Distributors Corporation.
Other third party marks appearing herein are the property of their respective owners.
All other marks appearing herein are registered or unregistered trademarks or service marks
of FMR Corp. or an affiliated company.
|
Annual Report 2
This report and the financial statements contained herein are submitted for the general information
of the shareholders of the fund. This report is not authorized for distribution to prospective investors
in the fund unless preceded or accompanied by an effective prospectus.
A fund files its complete schedule of portfolio holdings with the SEC for the first and third
quarters of each fiscal year on Form N Q. Forms N Q are available on the SEC’s web site at
http://www.sec.gov. A fund’s Forms N Q may be reviewed and copied at the SEC’s Public Reference
Room in Washington, DC. Information regarding the operation of the SEC’s Public Reference
Room may be obtained by calling 1-800-SEC-0330. For a complete list of a fund’s portfolio
holdings, view the most recent quarterly holdings report, semiannual report, or annual report
on Fidelity’s web site at http://www.fidelity.com/holdings.
NOT FDIC INSURED · MAY LOSE VALUE · NO BANK GUARANTEE
Neither the fund nor Fidelity Distributors Corporation is a bank.
|
3 Annual Report
Chairman’s Message
(photograph of Edward C. Johnson 3d)
Dear Shareholder:
During the past year or so, much has been reported about the mutual fund industry, and much of it has been more critical than I believe is warranted. Allegations that some companies have been less than forthright with their shareholders have cast a shadow on the entire industry. I continue to find these reports disturbing, and assert that they do not create an accurate picture of the industry overall. Therefore, I would like to remind every one where Fidelity stands on these issues. I will say two things specifically regarding allegations that some mutual fund companies were in violation of the Securities and Exchange Commission’s forward pricing rules or were involved in so called “market timing” activities.
First, Fidelity has no agreements that permit customers who buy fund shares after 4 p.m. to obtain the 4 p.m. price. This is not a new policy. This is not to say that some one could not deceive the company through fraudulent acts. However, we are extremely diligent in preventing fraud from occurring in this manner and in every other. But I underscore again that Fidelity has no so called “agreements” that sanction illegal practices.
Second, Fidelity continues to stand on record, as we have for years, in opposition to predatory short term trading that adversely affects shareholders in a mutual fund. Back in the 1980s, we initiated a fee which is returned to the fund and, therefore, to investors to discourage this activity. Further, we took the lead several years ago in developing a Fair Value Pricing Policy to prevent market timing on foreign securities in our funds. I am confident we will find other ways to make it more difficult for predatory traders to operate. However, this will only be achieved through close cooperation among regulators, legislators and the industry.
Yes, there have been unfortunate instances of unethical and illegal activity within the mutual fund industry from time to time. That is true of any industry. When this occurs, confessed or convicted offenders should be dealt with appropriately. But we are still concerned about the risk of over regulation and the quick application of simplistic solutions to intricate problems. Every system can be improved, and we support and applaud well thought out improvements by regulators, legislators and industry representatives that achieve the common goal of building and protecting the value of investors’ holdings.
For nearly 60 years, Fidelity has worked very hard to improve its products and service to justify your trust. When our family founded this company in 1946, we had only a few hundred customers. Today, we serve more than 18 million customers including individual investors and participants in retirement plans across America.
Let me close by saying that we do not take your trust in us for granted, and we realize that we must always work to improve all aspects of our service to you. In turn, we urge you to continue your active participation with your financial matters, so that your interests can be well served.
Best regards,
/s/ Edward C. Johnson 3d
Edward C. Johnson 3d
Annual Report 4
Performance: The Bottom Line
Average annual total return reflects the change in the value of an investment, assuming reinvestment of the fund’s dividend income and capital gains (the profits earned upon the sale of securities that have grown in value) and assuming a constant rate of performance each year. The $10,000 table and the fund’s returns do not reflect the deduction of taxes that a shareholder would pay on fund distributions or the redemption of fund shares. During periods of reimbursement by Fidelity, a fund’s total return will be greater than it would be had the reimbursement not occurred. How a fund did yesterday is no guarantee of how it will do tomorrow.
| Average Annual Total Returns | | | | | | |
| Periods ended November 30, 2005 | | Past 1 | | Past 5 | | Past 10 |
| | | year | | years | | years |
| Fidelity Independence Fund | | 12.61% | | 0.26% | | 9.46% |
| |
| $10,000 Over 10 Years | | | | | | |
Let’s say hypothetically that $10,000 was invested in Fidelity® Independence Fund on November 30, 1995. The chart shows how the value of your investment would have changed, and also shows how the Standard & Poor’s 500 Index performed over the same period.
Management’s Discussion of Fund Performance
Comments from Jason Weiner, Portfolio Manager of Fidelity® Independence Fund
Numerous events unfolded during the 12 month period ending November 30, 2005, that were major influences on the U.S. equity markets. Issues exerting downward pressure on stocks included higher levels of inflation, eight short term interest rate hikes by the Federal Reserve Board, exorbitant energy prices, and a Category 4 hurricane that devastated both the city of New Orleans and several nearby oil production and refinery facilities. Grabbing most of the markets’ upbeat headlines was consistent strength in consumer spending, corporate earnings and gross domestic product (GDP). When all was said and done, investors demonstrated their conviction in the economy, pushing stocks higher across the board. By period end, the Standard & Poor’s 500SM Index, the NASDAQ Composite® Index and the Dow Jones Industrial AverageSM approached or exceeded four and a half year highs. For the 12 months overall, the S&P 500® was up 8.44%, the NASDAQ® rose 7.28% and the Dow advanced 6.07%, threatening to eclipse the 11,000 threshold for the first time since 2001.
The fund returned 12.61% during the past year, handily beating the S&P 500 and the 7.90% return of the LipperSM Capital Appreciation Funds Average. Stock selection in the industri als sector was especially strong versus the index, particularly in the capital goods group. My picks also helped in information technology, materials and energy. Internet search engine Google — the fund’s second largest holding at period end — topped the list of contributors by a wide margin both in absolute terms and versus the index, as the company continued to take market share and deliver better than expected earnings growth. Mining equipment provider Joy Global also outperformed, as high prices for raw materials such as copper and coal resulted in greater demand for Joy’s products. In the energy sector, refiner Valero Energy did well, as refining capacity — already tight to begin with — was further limited by hurricane damage. The primary disappointment was stock picking in health care. For example, Ireland based pharmaceutical stock Elan — along with partner Biogen Idec, also a detractor — was buffeted by the companies’ decision to withdraw their multiple sclerosis medication, Tysabri, from the market due to concerns about the drug’s safety. However, the fund’s largest overall detractor was Canada based Research In Motion (RIM) — maker of the BlackBerry handheld messaging device — which was hurt by concerns about increased competition and a patent dispute. I sold both Elan and Research In Motion before period end.
The views expressed in this statement reflect those of the portfolio manager only through the end of the period of the report as stated on the cover and do not necessarily represent the views of Fidelity or any other person in the Fidelity organization. Any such views are subject to change at any time based upon market or other conditions and Fidelity disclaims any responsibility to update such views. These views may not be relied on as investment advice and, because investment decisions for a Fidelity fund are based on numerous factors, may not be relied on as an indication of trading intent on behalf of any Fidelity fund.
Shareholder Expense Example
As a shareholder of the Fund, you incur two types of costs: (1) transaction costs, and (2) ongoing costs, including management fees and other Fund expenses. This Example is intended to help you understand your ongoing costs (in dollars) of investing in the Fund and to compare these costs with the ongoing costs of investing in other mutual funds. The Example is based on an investment of $1,000 invested at the beginning of the period and held for the entire period (June 1, 2005 to November 30, 2005).
The first line of the table below provides information about actual account values and actual expenses. You may use the information in this line, together with the amount you invested, to estimate the expenses that you paid over the period. Simply divide your account value by $1,000.00 (for example, an $8,600 account value divided by $1,000.00 = 8.6), then multiply the result by the number in the first line under the heading entitled “Expenses Paid During Period” to estimate the expenses you paid on your account during this period. A small balance maintenance fee of $12.00 that is charged once a year may apply for certain accounts with a value of less than $2,000. This fee is not included in the table below. If it was, the estimate of expenses you paid during the period would be higher, and your ending account value lower, by this amount.
Hypothetical Example for Comparison Purposes
The second line of the table below provides information about hypothetical account values and hypothetical expenses based on the Fund’s actual expense ratio and an assumed rate of return of 5% per year before expenses, which is not the Fund’s actual return. The hypothetical account values and expenses may not be used to estimate the actual ending account balance or expenses you paid for the period. You may use this information to compare the ongoing costs of investing in the Fund and other funds. To do so, compare this 5% hypothetical example with the 5% hypothetical examples that appear in the share holder reports of the other funds. A small balance maintenance fee of $12.00 that is charged once a year may apply for certain accounts with a value of less than $2,000. This fee is not included in the table below. If it was, the estimate of expenses you paid during the period would be higher, and your ending account value lower, by this amount.
Please note that the expenses shown in the table are meant to highlight your ongoing costs only and do not reflect any transaction costs. Therefore, the second line of the table is useful in comparing ongoing costs only, and will not help you determine the relative total costs of owning different funds.
| | | | | | | | | | | Expenses Paid |
| | | | | Beginning | | Ending | | During Period* |
| | | | | Account Value | | Account Value | | June 1, 2005 |
| | | | | June 1, 2005 | | November 30, 2005 | | to November 30, 2005 |
| Actual | | $ | | 1,000.00 | | $ | | 1,112.00 | | $ | | 4.18 |
| Hypothetical (5% return per | | | | | | | | | | | | |
| year before expenses) | | $ | | 1,000.00 | | $ | | 1,021.11 | | $ | | 4.00 |
* Expenses are equal to the Fund’s annualized expense ratio of .79%; multiplied by the average account value over the period, multiplied by 183/365 (to reflect the one half year period).
7 Annual Report
| Investment Changes | | | | |
| |
| |
| Top Ten Stocks as of November 30, 2005 | | | | |
| | | % of fund’s | | % of fund’s net assets |
| | | net assets | | 6 months ago |
| Microsoft Corp. | | 4.5 | | 5.2 |
| Google, Inc. Class A (sub. vtg.) | | 4.1 | | 3.4 |
| American International Group, Inc. | | 3.2 | | 1.3 |
| UnitedHealth Group, Inc. | | 2.9 | | 2.2 |
| Seagate Technology | | 2.8 | | 3.4 |
| 3M Co. | | 2.6 | | 0.5 |
| Halliburton Co. | | 2.5 | | 0.7 |
| Colgate Palmolive Co. | | 2.0 | | 0.7 |
| Infosys Technologies Ltd. | | 1.9 | | 2.6 |
| BJ Services Co. | | 1.7 | | 1.0 |
| | | 28.2 | | |
Top Five Market Sectors as of November 30, 2005 | | |
| | | % of fund’s | | % of fund’s net assets |
| | | net assets | | 6 months ago |
| Information Technology | | 23.9 | | 27.8 |
| Industrials | | 13.7 | | 20.1 |
| Financials | | 13.4 | | 6.6 |
| Health Care | | 11.9 | | 9.6 |
| Energy | | 11.3 | | 5.1 |
Annual Report 8
| Investments November 30, 2005 | | |
| Showing Percentage of Net Assets | | | | | | |
| |
| Common Stocks 96.1% | | | | | | |
| | | Shares | | Value (Note 1) |
| | | | | (000s) |
| |
| CONSUMER DISCRETIONARY – 10.7% | | | | | | |
| Diversified Consumer Services – 1.5% | | | | | | |
| Bright Horizons Family Solutions, Inc. (a) | | 368,000 | | $ | | 13,020 |
| Sothebys Holdings, Inc. Class A (ltd. vtg.) (a) | | 2,102,700 | | | | 40,014 |
| Universal Technical Institute, Inc. (a) | | 571,200 | | | | 17,353 |
| | | | | | | 70,387 |
| Hotels, Restaurants & Leisure 3.7% | | | | | | |
| Carnival Corp. unit | | 1,340,110 | | | | 73,023 |
| Domino’s Pizza, Inc. | | 606,700 | | | | 15,168 |
| Kerzner International Ltd. (a) | | 511,766 | | | | 33,270 |
| Las Vegas Sands Corp. | | 864,200 | | | | 36,046 |
| Ruth’s Chris Steak House, Inc. | | 951,512 | | | | 16,823 |
| | | | | | | 174,330 |
| Household Durables – 0.4% | | | | | | |
| Garmin Ltd. (d) | | 312,900 | | | | 17,241 |
| Interface, Inc. Class A (a) | | 56,570 | | | | 471 |
| | | | | | | 17,712 |
| Internet & Catalog Retail 1.3% | | | | | | |
| Coldwater Creek, Inc. (a) | | 451,800 | | | | 14,187 |
| eBay, Inc. (a) | | 999,400 | | | | 44,783 |
| | | | | | | 58,970 |
| Media – 1.2% | | | | | | |
| McGraw Hill Companies, Inc. | | 1,031,400 | | | | 54,716 |
| Multiline Retail – 0.9% | | | | | | |
| Target Corp. | | 742,900 | | | | 39,753 |
| Specialty Retail – 1.7% | | | | | | |
| bebe Stores, Inc. | | 1,429,870 | | | | 23,121 |
| Circuit City Stores, Inc. | | 1,711,300 | | | | 35,818 |
| Guitar Center, Inc. (a) | | 427,599 | | | | 22,552 |
| | | | | | | 81,491 |
| |
| TOTAL CONSUMER DISCRETIONARY | | | | | | 497,359 |
| |
| CONSUMER STAPLES 3.9% | | | | | | |
| Food & Staples Retailing – 0.7% | | | | | | |
| Walgreen Co. | | 702,700 | | | | 32,099 |
| Household Products – 2.0% | | | | | | |
| Colgate-Palmolive Co. | | 1,696,700 | | | | 92,504 |
| |
| |
| See accompanying notes which are an integral part of the financial statements. | | | | |
| |
| 9 | | | | Annual Report |
| Investments continued | | | | | | |
| |
| Common Stocks continued | | | | | | |
| | | Shares | | Value (Note 1) |
| | | | | (000s) |
| |
| CONSUMER STAPLES – continued | | | | | | |
| Personal Products 1.2% | | | | | | |
| Avon Products, Inc. | | 1,857,800 | | $ | | 50,811 |
| Herbalife Ltd. | | 159,252 | | | | 4,610 |
| | | | | | | 55,421 |
| |
| TOTAL CONSUMER STAPLES | | | | | | 180,024 |
| |
| ENERGY 11.3% | | | | | | |
| Energy Equipment & Services – 6.8% | | | | | | |
| BJ Services Co. | | 2,225,422 | | | | 81,562 |
| Halliburton Co. | | 1,815,400 | | | | 115,550 |
| Nabors Industries Ltd. (a) | | 512,200 | | | | 35,859 |
| Schlumberger Ltd. (NY Shares) | | 597,000 | | | | 57,151 |
| Smith International, Inc. | | 684,100 | | | | 25,852 |
| | | | | | | 315,974 |
| Oil, Gas & Consumable Fuels – 4.5% | | | | | | |
| Arch Coal, Inc. | | 464,500 | | | | 35,785 |
| Chesapeake Energy Corp. | | 954,300 | | | | 27,627 |
| EnCana Corp. | | 1,172,500 | | | | 52,039 |
| Ultra Petroleum Corp. (a) | | 675,500 | | | | 36,328 |
| Valero Energy Corp. | | 582,800 | | | | 56,065 |
| | | | | | | 207,844 |
| |
| TOTAL ENERGY | | | | | | 523,818 |
| |
| FINANCIALS – 13.4% | | | | | | |
| Capital Markets 0.8% | | | | | | |
| E*TRADE Financial Corp. (a) | | 1,436,600 | | | | 28,042 |
| Merrill Lynch & Co., Inc. | | 135,500 | | | | 9,000 |
| | | | | | | 37,042 |
| Commercial Banks – 1.7% | | | | | | |
| Canadian Western Bank, Edmonton | | 587,800 | | | | 17,355 |
| East West Bancorp, Inc. | | 599,982 | | | | 22,703 |
| PrivateBancorp, Inc. | | 771,900 | | | | 28,475 |
| Wells Fargo & Co. | | 151,700 | | | | 9,534 |
| | | | | | | 78,067 |
| Consumer Finance – 1.3% | | | | | | |
| American Express Co. | | 1,224,400 | | | | 62,959 |
See accompanying notes which are an integral part of the financial statements.
| Common Stocks continued | | | | | | |
| | | Shares | | Value (Note 1) |
| | | | | (000s) |
| |
| FINANCIALS – continued | | | | | | |
| Diversified Financial Services – 0.6% | | | | | | |
| CapitalSource, Inc. (a)(d) | | 1,099,800 | | $ | | 26,285 |
| Insurance – 8.6% | | | | | | |
| AFLAC, Inc. | | 129,400 | | | | 6,211 |
| AMBAC Financial Group, Inc. | | 422,500 | | | | 32,402 |
| American International Group, Inc. | | 2,208,200 | | | | 148,259 |
| Aon Corp. | | 1,702,100 | | | | 61,973 |
| Aspen Insurance Holdings Ltd. | | 329,000 | | | | 8,235 |
| Axis Capital Holdings Ltd. | | 639,900 | | | | 19,376 |
| Everest Re Group Ltd. | | 46,000 | | | | 4,836 |
| Navigators Group, Inc. (a) | | 113,200 | | | | 4,574 |
| PartnerRe Ltd. | | 509,400 | | | | 34,782 |
| Platinum Underwriters Holdings Ltd. | | 296,500 | | | | 9,031 |
| Prudential Financial, Inc. | | 603,800 | | | | 46,734 |
| White Mountains Insurance Group Ltd. | | 4,600 | | | | 2,799 |
| XL Capital Ltd. Class A | | 334,600 | | | | 22,211 |
| | | | | | | 401,423 |
| Real Estate 0.4% | | | | | | |
| Equity Residential (SBI) | | 466,600 | | | | 19,019 |
| |
| TOTAL FINANCIALS | | | | | | 624,795 |
| |
| HEALTH CARE – 11.9% | | | | | | |
| Biotechnology – 2.0% | | | | | | |
| Biogen Idec, Inc. (a) | | 1,016,168 | | | | 43,502 |
| Invitrogen Corp. (a) | | 460,800 | | | | 30,712 |
| ViroPharma, Inc. (a)(d) | | 1,097,800 | | | | 19,179 |
| | | | | | | 93,393 |
| Health Care Equipment & Supplies – 4.0% | | | | | | |
| Alcon, Inc. | | 154,200 | | | | 21,619 |
| Bausch & Lomb, Inc. | | 56,600 | | | | 4,599 |
| Baxter International, Inc. | | 1,039,200 | | | | 40,414 |
| Becton, Dickinson & Co. | | 344,400 | | | | 20,054 |
| DENTSPLY International, Inc. | | 418,800 | | | | 23,298 |
| Kinetic Concepts, Inc. (a) | | 463,800 | | | | 18,065 |
| Mentor Corp. | | 87,700 | | | | 4,274 |
| Nobel Biocare Holding AG (Switzerland) | | 57,790 | | | | 13,164 |
| ResMed, Inc. (a) | | 229,100 | | | | 9,347 |
See accompanying notes which are an integral part of the financial statements.
11 Annual Report
| Investments continued | | | | | | |
| |
| Common Stocks continued | | | | | | |
| | | Shares | | Value (Note 1) |
| | | | | (000s) |
| |
| HEALTH CARE – continued | | | | | | |
| Health Care Equipment & Supplies – continued | | | | | | |
| Respironics, Inc. (a) | | 615,200 | | $ | | 23,796 |
| Sybron Dental Specialties, Inc. (a) | | 106,500 | | | | 4,658 |
| | | | | | | 183,288 |
| Health Care Providers & Services – 4.2% | | | | | | |
| Brookdale Senior Living, Inc. | | 45,700 | | | | 1,216 |
| Covance, Inc. (a) | | 96,200 | | | | 4,573 |
| Emdeon Corp. (a) | | 345,100 | | | | 2,640 |
| Henry Schein, Inc. (a) | | 1,290,100 | | | | 55,023 |
| UnitedHealth Group, Inc. | | 2,232,900 | | | | 133,661 |
| | | | | | | 197,113 |
| Pharmaceuticals – 1.7% | | | | | | |
| Allergan, Inc. | | 54,500 | | | | 5,450 |
| Johnson & Johnson | | 498,100 | | | | 30,758 |
| Novartis AG sponsored ADR | | 341,200 | | | | 17,879 |
| Wyeth | | 592,060 | | | | 24,606 |
| | | | | | | 78,693 |
| |
| TOTAL HEALTH CARE | | | | | | 552,487 |
| |
| INDUSTRIALS – 13.7% | | | | | | |
| Aerospace & Defense – 0.8% | | | | | | |
| Precision Castparts Corp. | | 286,700 | | | | 14,619 |
| Rockwell Collins, Inc. | | 501,000 | | | | 22,896 |
| | | | | | | 37,515 |
| Air Freight & Logistics – 0.8% | | | | | | |
| Forward Air Corp. | | 509,955 | | | | 19,608 |
| UTI Worldwide, Inc. | | 184,125 | | | | 17,914 |
| | | | | | | 37,522 |
| Airlines – 1.2% | | | | | | |
| Ryanair Holdings PLC sponsored ADR (a)(d) | | 872,000 | | | | 43,443 |
| US Airways Group, Inc. (a) | | 378,500 | | | | 12,714 |
| | | | | | | 56,157 |
| Commercial Services & Supplies – 1.3% | | | | | | |
| Monster Worldwide, Inc. (a) | | 705,681 | | | | 27,451 |
| Navigant Consulting, Inc. (a) | | 1,368,400 | | | | 27,929 |
| Ritchie Brothers Auctioneers, Inc. | | 69,400 | | | | 2,710 |
| | | | | | | 58,090 |
See accompanying notes which are an integral part of the financial statements.
| Common Stocks continued | | | | | | |
| | | Shares | | Value (Note 1) |
| | | | | (000s) |
| |
| INDUSTRIALS – continued | | | | | | |
| Construction & Engineering – 1.8% | | | | | | |
| Fluor Corp. | | 588,400 | | $ | | 43,600 |
| Jacobs Engineering Group, Inc. (a) | | 642,400 | | | | 41,737 |
| | | | | | | 85,337 |
| Industrial Conglomerates – 4.4% | | | | | | |
| 3M Co. | | 1,525,600 | | | | 119,729 |
| General Electric Co. | | 1,829,300 | | | | 65,343 |
| Tyco International Ltd. | | 648,100 | | | | 18,484 |
| | | | | | | 203,556 |
| Machinery – 2.1% | | | | | | |
| Bucyrus International, Inc. Class A | | 233,580 | | | | 10,955 |
| Danaher Corp. | | 478,672 | | | | 26,566 |
| Joy Global, Inc. | | 857,042 | | | | 45,329 |
| Wabtec Corp. | | 625,500 | | | | 16,157 |
| | | | | | | 99,007 |
| Trading Companies & Distributors – 1.3% | | | | | | |
| Fastenal Co. | | 528,800 | | | | 20,993 |
| MSC Industrial Direct Co., Inc. Class A | | 330,600 | | | | 12,923 |
| WESCO International, Inc. (a) | | 604,600 | | | | 25,242 |
| | | | | | | 59,158 |
| |
| TOTAL INDUSTRIALS | | | | | | 636,342 |
| |
| INFORMATION TECHNOLOGY – 23.9% | | | | | | |
| Communications Equipment – 2.5% | | | | | | |
| Comverse Technology, Inc. (a) | | 1,119,620 | | | | 29,345 |
| Motorola, Inc. | | 1,511,500 | | | | 36,412 |
| Nokia Corp. sponsored ADR | | 257,900 | | | | 4,405 |
| QUALCOMM, Inc. | | 987,200 | | | | 44,888 |
| | | | | | | 115,050 |
| Computers & Peripherals – 3.3% | | | | | | |
| Seagate Technology | | 6,819,600 | | | | 129,027 |
| UNOVA, Inc. (a) | | 915,783 | | | | 25,761 |
| | | | | | | 154,788 |
| Electronic Equipment & Instruments – 0.8% | | | | | | |
| Agilent Technologies, Inc. (a) | | 1,134,200 | | | | 40,446 |
See accompanying notes which are an integral part of the financial statements.
13 Annual Report
| Investments continued | | | | | | |
| |
| Common Stocks continued | | | | | | |
| | | Shares | | Value (Note 1) |
| | | | | (000s) |
| |
| INFORMATION TECHNOLOGY – continued | | | | | | |
| Internet Software & Services – 4.6% | | | | | | |
| Google, Inc. Class A (sub. vtg.) (a) | | 467,400 | | $ | | 189,292 |
| Yahoo!, Inc. (a) | | 590,140 | | | | 23,741 |
| | | | | | | 213,033 |
| IT Services – 3.6% | | | | | | |
| Automatic Data Processing, Inc. | | 565,400 | | | | 26,574 |
| Infosys Technologies Ltd. | | 1,522,444 | | | | 89,059 |
| Paychex, Inc. | | 395,100 | | | | 16,756 |
| Satyam Computer Services Ltd. | | 2,489,272 | | | | 35,446 |
| | | | | | | 167,835 |
| Semiconductors & Semiconductor Equipment – 2.6% | | | | | | |
| Maxim Integrated Products, Inc. | | 685,600 | | | | 25,059 |
| MEMC Electronic Materials, Inc. (a) | | 2,619,800 | | | | 58,631 |
| Microchip Technology, Inc. | | 336,300 | | | | 11,219 |
| SiRF Technology Holdings, Inc. (a) | | 777,729 | | | | 21,559 |
| Supertex, Inc. (a) | | 131,300 | | | | 5,546 |
| | | | | | | 122,014 |
| Software 6.5% | | | | | | |
| Blackbaud, Inc. | | 136,400 | | | | 2,312 |
| Kronos, Inc. (a) | | 771,100 | | | | 36,496 |
| Microsoft Corp. | | 7,588,700 | | | | 210,282 |
| NAVTEQ Corp. (a) | | 737,100 | | | | 30,958 |
| Ulticom, Inc. (a) | | 587,594 | | | | 6,769 |
| Verint Systems, Inc. (a) | | 378,957 | | | | 14,260 |
| | | | | | | 301,077 |
| |
| TOTAL INFORMATION TECHNOLOGY | | | | | | 1,114,243 |
| |
| MATERIALS 5.3% | | | | | | |
| Chemicals – 1.7% | | | | | | |
| Chemtura Corp. | | 1,328,500 | | | | 16,008 |
| Monsanto Co. | | 427,900 | | | | 31,352 |
| Praxair, Inc. | | 653,100 | | | | 33,961 |
| | | | | | | 81,321 |
| Construction Materials 0.8% | | | | | | |
| Florida Rock Industries, Inc. | | 432,650 | | | | 21,576 |
| Vulcan Materials Co. | | 203,000 | | | | 13,540 |
| | | | | | | 35,116 |
See accompanying notes which are an integral part of the financial statements.
| Common Stocks continued | | | | | | |
| | | Shares | | Value (Note 1) |
| | | | | (000s) |
| |
| MATERIALS – continued | | | | | | |
| Metals & Mining – 2.8% | | | | | | |
| Allegheny Technologies, Inc. | | 711,300 | | $ | | 23,459 |
| BHP Billiton Ltd. sponsored ADR | | 1,756,200 | | | | 56,497 |
| Carpenter Technology Corp. | | 597,800 | | | | 39,186 |
| Compass Minerals International, Inc. | | 555,000 | | | | 13,364 |
| | | | | | | 132,506 |
| |
| TOTAL MATERIALS | | | | | | 248,943 |
| |
| TELECOMMUNICATION SERVICES – 2.0% | | | | | | |
| Wireless Telecommunication Services – 2.0% | | | | | | |
| America Movil SA de CV Series L sponsored ADR | | 1,495,400 | | | | 42,948 |
| American Tower Corp. Class A (a) | | 398,300 | | | | 10,870 |
| Sprint Nextel Corp. | | 1,647,000 | | | | 41,241 |
| | | | | | | 95,059 |
| |
| TOTAL COMMON STOCKS | | | | | | |
| (Cost $3,877,905) | | | | | | 4,473,070 |
| |
| Convertible Preferred Stocks 0.0% | | | | | | |
| |
| INFORMATION TECHNOLOGY – 0.0% | | | | | | |
| Communications Equipment – 0.0% | | | | | | |
| Chorum Technologies, Inc. Series E (a)(e) | | 41,400 | | | | 0 |
| Procket Networks, Inc. Series C (a)(e) | | 1,721,344 | | | | 0 |
| TOTAL CONVERTIBLE PREFERRED STOCKS | | | | | | |
| (Cost $17,621) | | | | | | 0 |
See accompanying notes which are an integral part of the financial statements.
15 Annual Report
| Investments continued | | | | | | | | |
| |
| Money Market Funds 5.1% | | | | | | | | |
| | | | | Shares | | Value (Note 1) (000s) |
| Fidelity Cash Central Fund, 4.08% (b) | | | | 169,631,079 | | $ | | 169,631 |
| Fidelity Securities Lending Cash Central Fund, | | | | | | |
| 4.09% (b)(c) | | | | 66,585,815 | | | | 66,586 |
| TOTAL MONEY MARKET FUNDS | | | | | | | | |
| (Cost $236,217) | | | | | | | | 236,217 |
| TOTAL INVESTMENT PORTFOLIO 101.2% | | | | | | |
| (Cost $4,131,743) | | | | | | | | 4,709,287 |
| |
| NET OTHER ASSETS – (1.2)% | | | | | | | | (55,514) |
| NET ASSETS 100% | | | | | | $ | | 4,653,773 |
Legend
(a) Non-income producing
(b) Affiliated fund that is available only to
investment companies and other
accounts managed by Fidelity
Investments. The rate quoted is the
annualized seven-day yield of the fund
at period end. A complete unaudited
listing of the fund’s holdings as of its
most recent quarter end is available
upon request.
(c) Investment made with cash collateral
received from securities on loan.
(d) Security or a portion of the security is on
loan at period end.
|
(e) Restricted securities – Investment in
securities not registered under the
Securities Act of 1933 (excluding 144A
issues). At the end of the period, the
value of restricted securities (excluding
144A issues) amounted to $0 or 0.0% of
net assets.
|
Additional information on each holding is as follows:
| | | Acquisition | | Acquisition |
| Security | | Date | | Cost (000s) |
| Chorum | | | | | | |
| Technologies, Inc. | | | | | | |
| Series E | | 9/19/00 | | $ | | 714 |
| Procket Networks, | | | | | | |
| Inc. Series C | | 2/9/01 | | $ | | 17,000 |
See accompanying notes which are an integral part of the financial statements.
Annual Report 16
Affiliated Central Funds
Information regarding income received by the fund from the affiliated Central funds during the period is as follows:
| Fund | | Income received |
| | | (Amounts in thousands) |
| Fidelity Cash Central Fund | | $ | | 4,563 |
| Fidelity Securities Lending Cash Central Fund | | | | 508 |
| Total | | $ | | 5,071 |
Other Affiliated Issuers
An affiliated company is a company in which the fund has ownership of at least 5% of the voting securities. Transactions during the period with companies which are or were affiliates are as follows:
| | | Value, | | | | | | | | | | | | | | | | |
| Affiliate | | beginning of | | | | | | | | Sales | | | | Dividend | | Value, end of |
| (Amounts in thousands) | | period | | Purchases | | | | Proceeds | | | | Income | | period |
| Animas Corp. | | $ | | — | | $ | | 22,095 | | $ | | 19,831 | | $ | | — | | $ | | — |
| Total s | | $ | | — | | $ | | 22,095 | | $ | | 19,831 | | $ | | — | | $ | | — |
Other Information
Distribution of investments by country of issue, as a percentage of total net assets, is as follows:
| United States of America | | 81.7% |
| Cayman Islands | | 3.3% |
| India | | 2.7% |
| Canada | | 2.4% |
| Bermuda | | 1.7% |
| Panama | | 1.6% |
| Netherlands Antilles | | 1.2% |
| Australia | | 1.2% |
| Switzerland | | 1.2% |
| Others (individually less than 1%) . | | 3.0% |
| | | 100.0% |
Income Tax Information
At November 30, 2005, the fund had a capital loss carryforward of approximately $1,167,962,000 of which $622,674,000 and $545,288,000 will expire on November 30, 2009 and 2010, respectively.
See accompanying notes which are an integral part of the financial statements.
17 Annual Report
| Financial Statements | | | | | | | | |
| |
| |
| Statement of Assets and Liabilities | | | | | | | | |
| Amounts in thousands (except per share amount) | | | | | | November 30, 2005 |
| |
| Assets | | | | | | | | |
| Investment in securities, at value (including securities | | | | | | | | |
| loaned of $64,750) See accompanying schedule: | | | | | | | | |
| Unaffiliated issuers (cost $3,895,526) | | $ | | 4,473,070 | | | | |
| Affiliated Central Funds (cost $236,217) | | | | 236,217 | | | | |
| Total Investments (cost $4,131,743) | | | | | | $ | | 4,709,287 |
| Receivable for investments sold | | | | | | | | 19,833 |
| Receivable for fund shares sold | | | | | | | | 747 |
| Dividends receivable | | | | | | | | 7,466 |
| Interest receivable | | | | | | | | 513 |
| Prepaid expenses | | | | | | | | 24 |
| Other affiliated receivables | | | | | | | | 54 |
| Other receivables | | | | | | | | 319 |
| Total assets | | | | | | | | 4,738,243 |
| |
| Liabilities | | | | | | | | |
| Payable for investments purchased | | $ | | 9,839 | | | | |
| Payable for fund shares redeemed | | | | 4,202 | | | | |
| Accrued management fee | | | | 2,410 | | | | |
| Other affiliated payables | | | | 875 | | | | |
| Other payables and accrued expenses | | | | 558 | | | | |
| Collateral on securities loaned, at value | | | | 66,586 | | | | |
| Total liabilities | | | | | | | | 84,470 |
| |
| Net Assets | | | | | | $ | | 4,653,773 |
| Net Assets consist of: | | | | | | | | |
| Paid in capital | | | | | | $ | | 5,237,743 |
| Undistributed net investment income | | | | | | | | 9,142 |
| Accumulated undistributed net realized gain (loss) on | | | | | | | | |
| investments and foreign currency transactions | | | | | | | | (1,170,208) |
| Net unrealized appreciation (depreciation) on | | | | | | | | |
| investments and assets and liabilities in foreign | | | | | | | | |
| currencies | | | | | | | | 577,096 |
| Net Assets, for 239,103 shares outstanding | | | | | | $ | | 4,653,773 |
| Net Asset Value, offering price and redemption price per | | | | | | | | |
| share ($4,653,773 ÷ 239,103 shares) | | | | | | $ | | 19.46 |
See accompanying notes which are an integral part of the financial statements.
| Statement of Operations | | | | | | |
| Amounts in thousands | | | | Year ended November 30, 2005 |
| |
| Investment Income | | | | | | |
| Dividends | | | | $ | | 38,019 |
| Interest | | | | | | 54 |
| Income from affiliated Central Funds | | | | | | 5,071 |
| Total income | | | | | | 43,144 |
| |
| Expenses | | | | | | |
| Management fee | | | | | | |
| Basic fee | | $ | | 25,654 | | |
| Performance adjustment | | | | (1,037) | | |
| Transfer agent fees | | | | 8,051 | | |
| Accounting and security lending fees | | | | 1,036 | | |
| Independent trustees’ compensation | | | | 21 | | |
| Appreciation in deferred trustee compensation account | | | | 16 | | |
| Custodian fees and expenses | | | | 405 | | |
| Registration fees | | | | 37 | | |
| Audit | | | | 85 | | |
| Legal | | | | 21 | | |
| Interest | | | | 3 | | |
| Miscellaneous | | | | 176 | | |
| Total expenses before reductions | | | | 34,468 | | |
| Expense reductions | | | | (2,214) | | 32,254 |
| |
| Net investment income (loss) | | | | | | 10,890 |
| Realized and Unrealized Gain (Loss) | | | | | | |
| Net realized gain (loss) on: | | | | | | |
| Investment securities: | | | | | | |
| Unaffiliated issuers | | | | 396,106 | | |
| Other affiliated issuers | | | | (2,264) | | |
| Foreign currency transactions | | | | 628 | | |
| Total net realized gain (loss) | | | | | | 394,470 |
| Change in net unrealized appreciation (depreciation) on: | | | | |
| Investment securities (net of decrease in deferred for- | | | | |
| eign taxes of $4,398) | | | | 132,116 | | |
| Assets and liabilities in foreign currencies | | | | (620) | | |
| Total change in net unrealized appreciation | | | | | | |
| (depreciation) | | | | | | 131,496 |
| Net gain (loss) | | | | | | 525,966 |
| Net increase (decrease) in net assets resulting from | | | | | | |
| operations | | | | $ | | 536,856 |
See accompanying notes which are an integral part of the financial statements.
19 Annual Report
| Financial Statements continued | | | | | | | | |
| |
| Statement of Changes in Net Assets | | | | | | | | |
| | | | | Year ended | | | | Year ended |
| | | | | November 30, | | | | November 30, |
| Amounts in thousands | | | | 2005 | | | | 2004 |
| Increase (Decrease) in Net Assets | | | | | | | | |
| Operations | | | | | | | | |
| Net investment income (loss) | | $ | | 10,890 | | $ | | 29,979 |
| Net realized gain (loss) | | | | 394,470 | | | | 441,603 |
| Change in net unrealized appreciation (depreciation) . | | 131,496 | | | | 96,185 |
| Net increase (decrease) in net assets resulting | | | | | | | | |
| from operations | | | | 536,856 | | | | 567,767 |
| Distributions to shareholders from net investment income | | . | | (28,963) | | | | (29,382) |
| Share transactions | | | | | | | | |
| Proceeds from sales of shares | | | | 226,102 | | | | 263,419 |
| Reinvestment of distributions | | | | 28,765 | | | | 29,180 |
| Cost of shares redeemed | | | | (693,020) | | | | (838,093) |
| Net increase (decrease) in net assets resulting from | | | | | | | | |
| share transactions | | | | (438,153) | | | | (545,494) |
| Total increase (decrease) in net assets | | | | 69,740 | | | | (7,109) |
| |
| Net Assets | | | | | | | | |
| Beginning of period | | | | 4,584,033 | | | | 4,591,142 |
| End of period (including undistributed net investment | | | | | | | | |
| income of $9,142 and undistributed net investment | | | | | | | | |
| income of $26,733, respectively) | | $ | | 4,653,773 | | $ | | 4,584,033 |
| |
| Other Information | | | | | | | | |
| Shares | | | | | | | | |
| Sold | | | | 12,714 | | | | 16,581 |
| Issued in reinvestment of distributions | | | | 1,645 | | | | 1,867 |
| Redeemed | | | | (38,879) | | | | (51,974) |
| Net increase (decrease) | | | | (24,520) | | | | (33,526) |
See accompanying notes which are an integral part of the financial statements.
| Financial Highlights | | | | | | | | | | | | | | | | | | | | |
| |
| Years ended November 30, | | | | 2005 | | | | 2004 | | | | 2003 | | | | 2002 | | | | 2001 |
| Selected Per Share Data | | | | | | | | | | | | | | | | | | | | |
| Net asset value, beginning of | | | | | | | | | | | | | | | | | | | | |
| period | | $ | | 17.39 | | $ | | 15.45 | | $ | | 13.83 | | $ | | 15.84 | | $ | | 24.46 |
| Income from Investment | | | | | | | | | | | | | | | | | | | | |
| Operations | | | | | | | | | | | | | | | | | | | | |
| Net investment income (loss)B | | | | 04 | | | | .11C,E | | | | .14 | | | | .21 | | | | .17 |
| Net realized and unrealized | | | | | | | | | | | | | | | | | | | | |
| gain (loss) | | | | 2.14 | | | | 1.93 | | | | 1.69 | | | | (2.02) | | | | (4.60) |
| Total from investment operations | | | | 2.18 | | | | 2.04 | | | | 1.83 | | | | (1.81) | | | | (4.43) |
| Distributions from net investment | | | | | | | | | | | | | | | | | | | | |
| income | | | | (.11) | | | | (.10) | | | | (.21) | | | | (.20) | | | | (.08) |
| Distributions from net realized | | | | | | | | | | | | | | | | | | | | |
| gain | | | | — | | | | — | | | | — | | | | — | | | | (4.11) |
| Total distributions | | | | (.11) | | | | (.10) | | | | (.21) | | | | (.20) | | | | (4.19) |
| Net asset value, end of period | | $ | | 19.46 | | $ | | 17.39 | | $ | | 15.45 | | $ | | 13.83 | | $ | | 15.84 |
| Total ReturnA | | | | 12.61% | | | | 13.28% | | | | 13.47% | | | | (11.57)% | | | | (22.86)% |
| Ratios to Average Net AssetsD | | | | | | | | | | | | | | | | | | | | |
| Expenses before reductions | | | | 77% | | | | .76% | | | | .62% | | | | 1.07% | | | | .97% |
| Expenses net of fee waivers, if | | | | | | | | | | | | | | | | | | | | |
| any | | | | 77% | | | | .76% | | | | .62% | | | | 1.07% | | | | .97% |
| Expenses net of all reductions | | | | 72% | | | | .71% | | | | .55% | | | | .97% | | | | .92% |
| Net investment income (loss) | | | | 24% | | | | .66%E | | | | 1.00% | | | | 1.41% | | | | .95% |
| Supplemental Data | | | | | | | | | | | | | | | | | | | | |
| Net assets, end of period | | | | | | | | | | | | | | | | | | | | |
| (in millions) | | $ | | 4,654 | | $ | | 4,584 | | $ | | 4,591 | | $ | | 4,443 | | $ | | 5,483 |
| Portfolio turnover rate | | | | 119% | | | | 119% | | | | 166% | | | | 191% | | | | 187% |
A Total returns would have been lower had certain expenses not been reduced during the periods shown.
B Calculated based on average shares outstanding during the period.
C Investment income per share reflects a special dividend which amounted to $.07 per share.
D Expense ratios reflect operating expenses of the fund. Expenses before reductions do not reflect amounts reimbursed by the investment adviser or
reductions from brokerage service arrangements or other expense offset arrangements and do not represent the amount paid by the fund during
periods when reimbursements or reductions occur. Expenses net of fee waivers reflect expenses after reimbursement by the investment adviser but
prior to reductions from brokerage service arrangements or other expense offset arrangements. Expenses net of all reductions represent the net
expenses paid by the fund.
E As a result in the change in the estimate of the return of capital component of dividend income realized in the year ended November 30, 2003,
net investment income per share and the ratio of net investment income to average net assets for the year ended November 30, 2004 have been
reduced by $.01 per share and .03%, respectively. The change in estimate has no impact on total net assets or total return of the fund.
|
See accompanying notes which are an integral part of the financial statements.
21 Annual Report
Notes to Financial Statements
For the period ended November 30, 2005
(Amounts in thousands except ratios)
1. Significant Accounting Policies.
Fidelity Independence Fund (the fund) is a fund of Fidelity Financial Trust (the trust) and is authorized to issue an unlimited number of shares. The trust is registered under the Investment Company Act of 1940, as amended (the 1940 Act), as an open end management investment company organized as a Massachusetts business trust. The fund’s investments in emerging markets can be subject to social, economic, regulatory, and political uncertainties and can be extremely volatile. The fund may invest in affili ated money market central funds (Money Market Central Funds) which are open end investment companies available to investment companies and other accounts managed by Fidelity Management & Research Company (FMR) and its affiliates. The financial statements have been prepared in conformity with accounting principles generally accepted in the United States of America, which require management to make certain estimates and assumptions at the date of the financial statements. The following summa rizes the significant accounting policies of the fund:
Security Valuation. Investments are valued and net asset value (NAV) per share is calculated (NAV calculation) as of the close of business of the New York Stock Exchange (NYSE), normally 4:00 p.m. Eastern time. Wherever possible, the fund uses independent pricing services approved by the Board of Trustees to value its investments.
Equity securities, including restricted securities, for which market quotations are readily available, are valued at the last reported sale price or official closing price as reported by an independent pricing service on the primary market or exchange on which they are traded. In the event there were no sales during the day or closing prices are not available, securities are valued at the last quoted bid price. Investments in open end mutual funds, are valued at their closing net asset value each business day. Short term securities with remaining maturities of sixty days or less for which quotations are not readily available are valued at amortized cost, which approximates value.
When current market prices or quotations are not readily available or do not accurately reflect fair value, valuations may be determined in accordance with procedures adopted by the Board of Trustees. For example, when developments occur between the close of a market and the close of the NYSE that may materially affect the value of some or all of the securities, or when trading in a security is halted, those securities may be fair valued. Factors used in the determination of fair value may include monitoring news to identify significant market or security specific events such as changes in the value of U.S. securi ties market, reviewing developments in foreign markets and evaluating the performance of ADRs, futures contracts and exchange traded funds. Because the fund’s utilization of fair value pricing depends on market activity, the frequency with which fair value pricing is used can not be predicted and may be utilized to a significant extent. The value of securities used for NAV calculation under fair value pricing may differ from published prices for the same securities.
1. Significant Accounting Policies continued
Foreign Currency. The fund uses foreign currency contracts to facilitate transactions in foreign denominated securities. Losses from these transactions may arise from changes in the value of the foreign currency or if the counterparties do not perform under the contracts’ terms.
Foreign denominated assets, including investment securities, and liabilities are trans lated into U.S. dollars at the exchange rate at period end. Purchases and sales of invest ment securities, income and dividends received and expenses denominated in foreign currencies are translated into U.S. dollars at the exchange rate in effect on the transac tion date.
The effects of exchange rate fluctuations on investments are included with the net realized and unrealized gain (loss) on investment securities. Other foreign currency transactions resulting in realized and unrealized gain (loss) are disclosed separately.
Investment Transactions and Income. Security transactions are accounted for as of trade date. Gains and losses on securities sold are determined on the basis of identified cost and may include proceeds received from litigation. Dividend income is recorded on the ex dividend date, except for certain dividends from foreign securities where the ex dividend date may have passed, which are recorded as soon as the fund is informed of the ex dividend date. Non cash dividends included in dividend income, if any, are recorded at the fair market value of the securities received. Distributions received on securities that represent a return of capital or capital gain are recorded as a reduction of cost of investments and/or as a realized gain. The fund estimates the components of distributions received that may be considered return of capital distributions or capital gain distributions. Interest income is accrued as earned. Interest income includes coupon interest and amortization of premium and accretion of discount on debt securi ties. Investment income is recorded net of foreign taxes withheld where recovery of such taxes is uncertain.
Expenses. Most expenses of the trust can be directly attributed to a fund. Expenses which cannot be directly attributed are apportioned among each fund in the trust.
Deferred Trustee Compensation. Under a Deferred Compensation Plan (the Plan), independent Trustees must defer receipt of a portion of, and may elect to defer receipt of an additional portion of, their annual compensation. Deferred amounts are treated as though equivalent dollar amounts had been invested in shares of the fund or are invested in a cross section of other Fidelity funds, and are marked to market. Deferred amounts remain in the fund until distributed in accordance with the Plan.
Income Tax Information and Distributions to Shareholders. Each year, the fund intends to qualify as a regulated investment company by distributing all of its taxable income and realized gains under Subchapter M of the Internal Revenue Code. As a result,
23 Annual Report
| Notes to Financial Statements continued | | |
(Amounts in thousands except ratios) | | |
| |
1. Significant Accounting Policies continued
| | |
| Income Tax Information and Distributions to Shareholders continued |
no provision for income taxes is required in the accompanying financial statements. Foreign taxes are provided for based on the fund’s understanding of the tax rules and rates that exist in the foreign markets in which it invests.
Distributions are recorded on the ex dividend date. Income and capital gain distribu tions are determined in accordance with income tax regulations, which may differ from generally accepted accounting principles.
Capital accounts within the financial statements are adjusted for permanent book tax differences. These adjustments have no impact on net assets or the results of operations. Temporary book tax differences will reverse in a subsequent period.
Book tax differences are primarily due to foreign currency transactions, market dis count, deferred trustees compensation, capital loss carryforwards and losses deferred due to wash sales.
The tax basis components of distributable earnings and the federal tax cost as of period end were as follows:
| Unrealized appreciation | | $ | | 681,428 |
| Unrealized depreciation | | | | (106,579) |
| Net unrealized appreciation (depreciation) | | | | 574,849 |
| Undistributed ordinary income | | | | 9,279 |
| Capital loss carryforward | | | | (1,167,962) |
| |
| Cost for federal income tax purposes | | $ | | 4,134,438 |
The tax character of distributions paid was as follows:
| | | | | November 30, 2005 | | | | November 30, 2004 |
| Ordinary Income | | | $ | 28,963 | | $ | | 29,382 |
2. Operating Policies.
Repurchase Agreements. FMR has received an Exemptive Order from the Securities and Exchange Commission (the SEC) which permits the fund and other affiliated entities of FMR to transfer uninvested cash balances into joint trading accounts which are then invested in repurchase agreements. The fund may also invest directly with institutions in repurchase agreements. Repurchase agreements are collateralized by government or non government securities. Collateral is held in segregated accounts with custodian banks and may be obtained in the event of a default of the counterparty. The fund monitors, on a daily basis, the value of the collateral to ensure it is at least equal to
Annual Report 24
2. Operating Policies continued
Repurchase Agreements continued
the principal amount of the repurchase agreement (including accrued interest). In the event of a default by the counterparty, realization of the collateral proceeds could be delayed, during which time the value of the collateral may decline.
Restricted Securities. The fund may invest in securities that are subject to legal or contractual restrictions on resale. These securities generally may be resold in transac tions exempt from registration or to the public if the securities are registered. Disposal of these securities may involve time consuming negotiations and expense, and prompt sale at an acceptable price may be difficult. Information regarding restricted securities is included at the end of the fund’s Schedule of Investments.
3. Purchases and Sales of Investments.
Purchases and sales of securities, other than short term securities and U.S. government securities, aggregated $5,142,688 and $5,508,160, respectively.
4. Fees and Other Transactions with Affiliates.
Management Fee. FMR and its affiliates provide the fund with investment manage ment related services for which the fund pays a monthly management fee. The manage ment fee is the sum of an individual fund fee rate that is based on an annual rate of .30% of the fund’s average net assets and a group fee rate that averaged .27% during the period. The group fee rate is based upon the average net assets of all the mutual funds advised by FMR. The group fee rate decreases as assets under management increase and increases as assets under management decrease. In addition, the management fee is subject to a performance adjustment (up to a maximum of .20% of the fund’s average net assets over a 36 month performance period). The upward or downward adjustment to the management fee is based on the fund’s relative investment performance as compared to an appropriate benchmark index. For the period, the total annual management fee rate, including the performance adjustment, was .55% of the fund’s average net assets.
Transfer Agent Fees. Fidelity Service Company, Inc. (FSC), an affiliate of FMR, is the fund’s transfer, dividend disbursing and shareholder servicing agent. FSC receives account fees and asset based fees that vary according to account size and type of ac count. FSC pays for typesetting, printing and mailing of shareholder reports, except proxy statements. For the period, the transfer agent fees were equivalent to an annual rate of .18% of average net assets.
25 Annual Report
| Notes to Financial Statements continued | | |
(Amounts in thousands except ratios) | | |
| |
| |
| 4. Fees and Other Transactions with Affiliates continued |
Accounting and Security Lending Fees. FSC maintains the fund’s accounting records. The accounting fee is based on the level of average net assets for the month. Under a separate contract, FSC administers the security lending program. The security lending fee is based on the number and duration of lending transactions.
Affiliated Central Funds. The fund may invest in Money Market Central Funds which seek preservation of capital and current income and are managed by Fidelity Invest ments Money Management, Inc. (FIMM), an affiliate of FMR.
The Money Market Central Funds do not pay a management fee.
Brokerage Commissions. The fund placed a portion of its portfolio transactions with brokerage firms which are affiliates of the investment adviser. The commissions paid to these affiliated firms were $196 for the period.
Interfund Lending Program. Pursuant to an Exemptive Order issued by the SEC, the fund, along with other registered investment companies having management contracts with FMR, may participate in an interfund lending program. This program provides an alternative credit facility allowing the funds to borrow from, or lend money to, other participating affiliated funds. At period end, there were no interfund loans outstanding. The fund’s activity in this program during the period for which loans were outstanding was as follows:
| | | | | | | Interest Earned | | | | |
| Borrower | | Average Daily | | Weighted Average | | (included in | | | | Interest |
| or Lender | | Loan Balance | | Interest Rate | | interest income) | | | | Expense |
| Borrower $ | | 6,782 | | 3.56% | | — | | | $ | 3 |
| |
| |
| 5. Committed Line of Credit. | | | | | | |
The fund participates with other funds managed by FMR in a $4.2 billion credit facility (the “line of credit”) to be utilized for temporary or emergency purposes to fund share holder redemptions or for other short term liquidity purposes. The fund has agreed to pay commitment fees on its pro rata portion of the line of credit. During the period, there were no borrowings on this line of credit.
The fund lends portfolio securities from time to time in order to earn additional income. The fund receives collateral (in the form of U.S. Treasury obligations, letters of credit and/or cash) against the loaned securities and maintains collateral in an amount not less than 100% of the market value of the loaned securities during the period of the loan. The market value of the loaned securities is determined at the close of business of the fund
6. Security Lending continued
and any additional required collateral is delivered to the fund on the next business day. If the borrower defaults on its obligation to return the securities loaned because of insol vency or other reasons, a fund could experience delays and costs in recovering the securities loaned or in gaining access to the collateral. Cash collateral is invested in the Fidelity Securities Lending Cash Central Fund. The value of loaned securities and cash collateral at period end are disclosed on the fund’s Statement of Assets and Liabilities. Security lending income represents the income earned on investing cash collateral, less fees and expenses associated with the loan, plus any premium payments that may be received on the loan of certain types of securities. Net income from lending portfolio securities during the period amounted to $508.
The fund is permitted to have bank borrowings for temporary or emergency purposes to fund shareholder redemptions. The fund has established borrowing arrangements with certain banks. The interest rate on the borrowings is the bank’s base rate, as revised from time to time. The average daily loan balance during the period for which loans were outstanding amounted to $6,640. The weighted average interest rate was 4.06% . At period end, there were no bank borrowings outstanding.
Many of the brokers with whom FMR places trades on behalf of the fund provided services to the fund in addition to trade execution. These services included payments of certain expenses on behalf of the fund totaling $2,155 for the period. In addition, through arrangements with the fund’s custodian and transfer agent, credits realized as a result of uninvested cash balances were used to reduce the fund’s expenses. During the period, these credits reduced the fund’s custody and transfer agent expenses by $3 and $56, respectively.
The fund’s organizational documents provide former and current trustees and officers with a limited indemnification against liabilities arising in connection with the perfor mance of their duties to the fund. In the normal course of business, the fund may also enter into contracts that provide general indemnifications. The fund’s maximum expo sure under these arrangements is unknown as this would be dependent on future claims that may be made against the fund. The risk of material loss from such claims is considered remote.
27 Annual Report
Report of Independent Registered Public Accounting Firm
To the Trustees of Fidelity Financial Trust and the Shareholders of Fidelity Independence Fund:
In our opinion, the accompanying statement of assets and liabilities, including the sched ule of investments, and the related statements of operations and of changes in net assets and the financial highlights present fairly, in all material respects, the financial position of Fidelity Independence Fund (a fund of Fidelity Financial Trust) at November 30, 2005 and the results of its operations, the changes in its net assets and the financial highlights for the periods indicated, in conformity with accounting principles generally accepted in the United States of America. These financial statements and financial highlights (hereafter referred to as “financial statements”) are the responsibility of the Fidelity Independence Fund’s management; our responsibility is to express an opinion on these financial state ments based on our audits. We conducted our audits of these financial statements in accordance with the standards of the Public Company Accounting Oversight Board (United States). Those standards require that we plan and perform the audit to obtain reasonable assurance about whether the financial statements are free of material mis statement. An audit includes examining, on a test basis, evidence supporting the amounts and disclosures in the financial statements, assessing the accounting principles used and significant estimates made by management, and evaluating the overall financial statement presentation. We believe that our audits, which included confirmation of securities at November 30, 2005 by correspondence with the custodian and brokers, provide a reason able basis for our opinion.
/s/ PricewaterhouseCoopers LLP
PricewaterhouseCoopers LLP
Boston, Massachusetts
January 9, 2006
|
Trustees and Officers
The Trustees, Members of the Advisory Board, and executive officers of the trust and fund, as applicable, are listed below. The Board of Trustees governs the fund and is responsible for protecting the interests of shareholders. The Trustees are experienced executives who meet periodically throughout the year to oversee the fund’s activities, review contractual arrangements with companies that provide services to the fund, and review the fund’s performance. Except for William O. McCoy and Albert R. Gamper, Jr., each of the Trustees oversees 326 funds advised by FMR or an affiliate. Mr. McCoy oversees 328 funds advised by FMR or an affiliate. Mr. Gamper oversees 235 funds advised by FMR or an affiliate.
The Trustees hold office without limit in time except that (a) any Trustee may resign; (b) any Trustee may be removed by written instrument, signed by at least two thirds of the number of Trustees prior to such removal; (c) any Trustee who requests to be retired or who has become incapacitated by illness or injury may be retired by written instru ment signed by a majority of the other Trustees; and (d) any Trustee may be removed at any special meeting of shareholders by a two thirds vote of the outstanding voting securities of the trust. Each Trustee who is not an interested person (as defined in the 1940 Act) (Independent Trustee), shall retire not later than the last day of the calendar year in which his or her 72nd birthday occurs. The Independent Trustees may waive this mandatory retirement age policy with respect to individual Trustees. The executive officers and Advisory Board Member hold office without limit in time, except that any officer and Advisory Board Member may resign or may be removed by a vote of a majority of the Trustees at any regular meeting or any special meeting of the Trustees. Except as indicated, each individual has held the office shown or other offices in the same company for the past five years.
The fund’s Statement of Additional Information (SAI) includes more information about the Trustees. To request a free copy, call Fidelity at 1-800-544-8544.
Correspondence intended for each Trustee who is an interested person may be sent to Fidelity Investments, 82 Devonshire Street, Boston, Massachusetts 02109.
| | Name, Age; Principal Occupation
Edward C. Johnson 3d (75)
|
Year of Election or Appointment: 1982
Mr. Johnson is Chairman of the Board of Trustees. Mr. Johnson serves as Chief Executive Officer, Chairman, and a Director of FMR Corp.; a Di rector and Chairman of the Board and of the Executive Committee of FMR; Chairman and a Director of Fidelity Management & Research (Far East) Inc.; Chairman and a Director of Fidelity Investments Money Man agement, Inc.; and Chairman (2001 present) and a Director (2000 present) of FMR Co., Inc.
29 Annual Report
Trustees and Officers - continued
| | Name, Age; Principal Occupation
Stephen P. Jonas (52)
|
Year of Election or Appointment: 2005
Mr. Jonas is Senior Vice President of Independence. He also serves as Senior Vice President of other Fidelity funds (2005 present). Mr. Jonas is Executive Director of FMR (2005 present). Previously, Mr. Jonas served as President of Fidelity Enterprise Operations and Risk Services (2004 2005), Chief Administrative Officer (2002 2004), and Chief Financial Officer of FMR Co. (1998 2000). Mr. Jonas has been with Fidelity Investments since 1987 and has held various financial and man agement positions including Chief Financial Officer of FMR. In addition, he serves on the Boards of Boston Ballet (2003 present) and Simmons College (2003 present).
Year of Election or Appointment: 2003
Mr. Reynolds is a Director (2003 present) and Chief Operating Officer (2002 present) of FMR Corp. He also serves on the Board at Fidelity Investments Canada, Ltd. (2000 present). Previously, Mr. Reynolds served as President of Fidelity Investments Institutional Retirement Group (1996 2000).
* Trustees have been determined to be “Interested Trustees” by virtue of, among other things, their affiliation with the trust or various entities under common control with FMR.
Correspondence intended for each Independent Trustee (that is, the Trustees other than the Interested Trustees) may be sent to Fidelity Investments, P.O. Box 55235, Boston, Massachusetts 02205 5235.
| | Name, Age; Principal Occupation
Dennis J. Dirks (57)
|
Year of Election or Appointment: 2005
Prior to his retirement in May 2003, Mr. Dirks was Chief Operating Officer and a member of the Board of The Depository Trust & Clearing Corporation (DTCC) (1999 2003). He also served as President, Chief Operating Officer, and Board member of The Depository Trust Company (DTC) (1999 2003) and President and Board member of the National Securities Clearing Corporation (NSCC) (1999 2003). In addi tion, Mr. Dirks served as Chief Executive Officer and Board member of the Government Securities Clearing Corporation (2001 2003) and Chief Executive Officer and Board member of the Mortgage Backed Securities Clearing Corporation (2001 2003). Mr. Dirks also serves as a Trustee of Manhattan College (2005 present).
Name, Age; Principal Occupation
Albert R. Gamper, Jr. (63)
|
Year of Election or Appointment: 2006
Mr. Gamper also serves as a Trustee (2006 present) or Member of the Advisory Board (2005 present) of other investment companies advised by FMR. Prior to his retirement in December 2004, Mr. Gamper served as Chairman of the Board of CIT Group Inc. (commercial finance). During his tenure with CIT Group Inc. Mr. Gamper served in numerous senior management positions, including Chairman (1987 1989; 1999 2001; 2002 2004), Chief Executive Officer (1987 2004), and President (1989 2002). He currently serves as a member of the Board of Directors of Public Service Enterprise Group (utilities, 2001 present), Chairman of the Board of Governors, Rutgers University (2004 present), and Chairman of the Board of Saint Barnabas Health Care System.
Year of Election or Appointment: 1997
Dr. Gates is Chairman of the Independent Trustees (2006 present). Dr. Gates is President of Texas A&M University (2002 present). He was Director of the Central Intelligence Agency (CIA) from 1991 to 1993. From 1989 to 1991, Dr. Gates served as Assistant to the President of the United States and Deputy National Security Advisor. Dr. Gates is a Director of NACCO Industries, Inc. (mining and manufacturing), Parker Drilling Co., Inc. (drilling and rental tools for the energy industry, 2001 present), and Brinker International (restaurant management, 2003 present). Previously, Dr. Gates served as a Director of LucasVarity PLC (automotive components and diesel engines), a Director of TRW Inc. (automotive, space, defense, and information technology), and Dean of the George Bush School of Government and Public Service at Texas A&M University (1999 2001). Dr. Gates also is a Trustee of the Forum for International Policy.
31 Annual Report
Trustees and Officers - continued
| | Name, Age; Principal Occupation
George H. Heilmeier (69)
|
Year of Election or Appointment: 2004
Dr. Heilmeier is Chairman Emeritus of Telcordia Technologies (commu nication software and systems), where prior to his retirement, he served as company Chairman and Chief Executive Officer. He currently serves on the Boards of Directors of The Mitre Corporation (systems engineer ing and information technology support for the government), and HRL Laboratories (private research and development, 2004 present). He is Chairman of the General Motors Science & Technology Advisory Board and a Life Fellow of the Institute of Electrical and Electronics Engineers (IEEE) (2000 present). Dr. Heilmeier is a member of the Defense Science Board and the National Security Agency Advisory Board. He is also a member of the National Academy of Engineering, the American Academy of Arts and Sciences, and the Board of Overseers of the School of Engineering and Applied Science of the University of Pennsyl vania. Previously, Dr. Heilmeier served as a Director of TRW Inc. (auto motive, space, defense, and information technology, 1992 2002), Compaq (1994 2002), Automatic Data Processing, Inc. (ADP) (technology based business outsourcing, 1995 2002), INET Technolo gies Inc. (telecommunications network surveillance, 2001 2004), and Teletech Holdings (customer management services). He is the recipient of the 2005 Kyoto Prize in Advanced Technology for his invention of the liquid display.
Year of Election or Appointment: 2001
Prior to Ms. Knowles’ retirement in June 2000, she served as Executive Vice President and Chief Financial Officer of Atlantic Richfield Company (ARCO) (diversified energy, 1996 2000). From 1993 to 1996, she was a Senior Vice President of ARCO and President of ARCO Transportation Company. She served as a Director of ARCO from 1996 to 1998. She currently serves as a Director of Phelps Dodge Corporation (copper mining and manufacturing) and McKesson Corporation (healthcare ser vice, 2002 present). Ms. Knowles is a Trustee of the Brookings Institution and the Catalina Island Conservancy and also serves as a member of the Advisory Board for the School of Engineering of the University of Southern California.
Name, Age; Principal Occupation
Ned C. Lautenbach (61)
|
Year of Election or Appointment: 2000
Mr. Lautenbach has been a partner of Clayton, Dubilier & Rice, Inc. (private equity investment firm) since September 1998. Previously, Mr. Lautenbach was with the International Business Machines Corporation (IBM) from 1968 until his retirement in 1998. Mr. Lautenbach serves as a Director of Italtel Holding S.p.A. (telecommunications (Milan, Italy), 2004 present) and Eaton Corporation (diversified industrial) as well as the Philharmonic Center for the Arts in Naples, Florida. He also is a member of the Board of Trustees of Fairfield University (2005 present), as well as a member of the Council on Foreign Relations.
Year of Election or Appointment: 1997
Prior to his retirement in December 1994, Mr. McCoy was Vice Chair man of the Board of BellSouth Corporation (telecommunications) and President of BellSouth Enterprises. He is currently a Director of Liberty Corporation (holding company), Duke Realty Corporation (real estate), and Progress Energy, Inc. (electric utility). He is also a partner of Frank lin Street Partners (private investment management firm) and a member of the Research Triangle Foundation Board. In addition, Mr. McCoy served as the Interim Chancellor (1999 2000) and a member of the Board of Visitors for the University of North Carolina at Chapel Hill and currently serves on the Board of Directors of the University of North Carolina Health Care System and the Board of Visitors of the Kenan Flagler Business School (University of North Carolina at Chapel Hill). He also served as Vice President of Finance for the University of North Car olina (16 school system).
Year of Election or Appointment: 2005
Ms. Small is a member (2000 present) and Chairperson (2002 present) of the Investment Committee, and a member (2002 present) of the Board of Trustees of Smith College. Previously, she served as Chief In vestment Officer (1999 2000), Director of Global Equity Investments (1996 1999), and a member of the Board of Directors of Scudder, Stevens & Clark (1990 1997) and Scudder Kemper Investments (1997 1998). In addition, Ms. Small served as Co Chair (2000 2003) of the Annual Fund for the Fletcher School of Law and Diplomacy.
33 Annual Report
Trustees and Officers - continued
| | Name, Age; Principal Occupation
William S. Stavropoulos (66)
|
Year of Election or Appointment: 2002
Mr. Stavropoulos is Chairman of the Board (2000 present) and a Mem ber of the Board of Directors of The Dow Chemical Company. Since joining The Dow Chemical Company in 1967, Mr. Stavropoulos served in numerous senior management positions, including President (1993 2000; 2002 2003), CEO (1995 2000; 2002 2004), and Chair man of the Executive Committee (2000 2004). Currently, he is a Direc tor of NCR Corporation (data warehousing and technology solutions), BellSouth Corporation (telecommunications), Chemical Financial Corpo ration, Maersk Inc. (industrial conglomerate, 2002 present), and Metal mark Capital (private equity investment firm, 2005 present). He also serves as a member of the Board of Trustees of the American Enterprise Institute for Public Policy Research. In addition, Mr. Stavropoulos is a member of The Business Council, J.P. Morgan International Council and the University of Notre Dame Advisory Council for the College of Science.
Year of Election or Appointment: 2005
Prior to his retirement in 2001, Mr. Wolfe was Chairman and Chief Executive Officer of Hershey Foods Corporation (1993 2001). He cur rently serves as a member of the boards of Adelphia Communications Corporation (2003 present), Bausch & Lomb, Inc., and Revlon Inc. (2004 present).
Advisory Board Member and Executive Officers:
Correspondence intended for each executive officer and Mr. Lynch may be sent to Fidelity Investments, 82 Devonshire Street, Boston, Massachusetts 02109.
| | Name, Age; Principal Occupation
Peter S. Lynch (61)
|
Year of Election or Appointment: 2003
Member of the Advisory Board of Fidelity Financial Trust. Vice Chair man and a Director of FMR, and Vice Chairman (2001 present) and a Director (2000 present) of FMR Co., Inc. Previously, Mr. Lynch served as a Trustee of the Fidelity funds (1990 2003). In addition, he serves as a Trustee of Boston College, Massachusetts Eye & Ear Infirmary, Historic Deerfield, John F. Kennedy Library, and the Museum of Fine Arts of Boston.
Name, Age; Principal Occupation
Dwight D. Churchill (51)
|
Year of Election or Appointment: 2005
Vice President of Independence. Mr. Churchill also serves as Vice Presi dent of certain Equity Funds (2005 present) and certain High Income Funds (2005 present). Previously, he served as Head of Fidelity’s Fixed Income Division (2000 2005), Vice President of Fidelity’s Money Market Funds (2000 2005), Vice President of Fidelity’s Bond Funds, and Senior Vice President of FIMM (2000) and FMR. Mr. Churchill joined Fidelity in 1993 as Vice President and Group Leader of Taxable Fixed Income Investments.
Year of Election or Appointment: 2003
Vice President of Independence. Mr. Weiner is also Vice President of other funds advised by FMR. Prior to assuming his current responsibili ties, Mr. Weiner managed a variety of Fidelity funds.
Year of Election or Appointment: 1998
Secretary of Independence. He also serves as Secretary of other Fidelity funds; Vice President, General Counsel, and Secretary of FMR Co., Inc. (2001 present) and FMR; Assistant Secretary of Fidelity Management & Research (U.K.) Inc. (2001 present), Fidelity Management & Research (Far East) Inc. (2001 present), and Fidelity Investments Money Manage ment, Inc. (2001 present). Mr. Roiter is an Adjunct Member, Faculty of Law, at Boston College Law School (2003 present). Previously, Mr. Roiter served as Vice President and Secretary of Fidelity Distributors Corpora tion (FDC) (1998 2005).
Year of Election or Appointment: 2003
Assistant Secretary of Independence. Mr. Fross also serves as Assistant Secretary of other Fidelity funds (2003 present), Vice President and Sec retary of FDC (2005 present), and is an employee of FMR.
Year of Election or Appointment: 2004
President, Treasurer, and Anti Money Laundering (AML) officer of Inde pendence. Ms. Reynolds also serves as President, Treasurer, and AML officer of other Fidelity funds (2004) and is a Vice President (2003) and an employee (2002) of FMR. Before joining Fidelity Investments, Ms. Reynolds worked at PricewaterhouseCoopers LLP (PwC) (1980 2002), where she was most recently an audit partner with PwC’s investment management practice.
35 Annual Report
Trustees and Officers - continued
| | Name, Age; Principal Occupation
Paul M. Murphy (58)
|
Year of Election or Appointment: 2005
Chief Financial Officer of Independence. Mr. Murphy also serves as Chief Financial Officer of other Fidelity funds (2005 present). He also serves as Senior Vice President of Fidelity Pricing and Cash Manage ment Services Group (FPCMS).
| | Kenneth A. Rathgeber (58)
|
Year of Election or Appointment: 2004
Chief Compliance Officer of Independence. Mr. Rathgeber also serves as Chief Compliance Officer of other Fidelity funds (2004) and Execu tive Vice President of Risk Oversight for Fidelity Investments (2002). Pre viously, he served as Executive Vice President and Chief Operating Officer for Fidelity Investments Institutional Services Company, Inc. (1998 2002).
Year of Election or Appointment: 2003
Deputy Treasurer of Independence. Mr. Hebble also serves as Deputy Treasurer of other Fidelity funds (2003), and is an employee of FMR. Before joining Fidelity Investments, Mr. Hebble worked at Deutsche Asset Management where he served as Director of Fund Accounting (2002 2003) and Assistant Treasurer of the Scudder Funds (1998 2003).
Year of Election or Appointment: 2005
Deputy Treasurer of Independence. Mr. Mehrmann also serves as Deputy Treasurer of other Fidelity funds (2005 present) and is an em ployee of FMR. Previously, Mr. Mehrmann served as Vice President of Fidelity Investments Institutional Services Group (FIIS)/Fidelity Investments Institutional Operations Corporation, Inc. (FIIOC) Client Services (1998 2004).
| | Kimberley H. Monasterio (41)
|
Year of Election or Appointment: 2004
Deputy Treasurer of Independence. Ms. Monasterio also serves as Deputy Treasurer of other Fidelity funds (2004) and is an employee of FMR (2004). Before joining Fidelity Investments, Ms. Monasterio served as Treasurer (2000 2004) and Chief Financial Officer (2002 2004) of the Franklin Templeton Funds and Senior Vice President of Franklin Tem pleton Services, LLC (2000 2004).
Name, Age; Principal Occupation
Kenneth B. Robins (36)
|
Year of Election or Appointment: 2005
Deputy Treasurer of Independence. Mr. Robins also serves as Deputy Treasurer of other Fidelity funds (2005 present) and is an employee of FMR (2004 present). Before joining Fidelity Investments, Mr. Robins worked at KPMG LLP, where he was a partner in KPMG’s department of professional practice (2002 2004) and a Senior Manager (1999 2000). In addition, Mr. Robins served as Assistant Chief Accoun tant, United States Securities and Exchange Commission (2000 2002).
Year of Election or Appointment: 2005
Assistant Treasurer of Independence. Mr. Byrnes also serves as Assistant Treasurer of other Fidelity funds (2005 present) and is an employee of FMR (2005 present). Previously, Mr. Byrnes served as Vice President of FPCMS (2003 2005). Before joining Fidelity Investments, Mr. Byrnes worked at Deutsche Asset Management where he served as Vice Presi dent of the Investment Operations Group (2000 2003).
Year of Election or Appointment: 1986
Assistant Treasurer of Independence. Mr. Costello also serves as Assis tant Treasurer of other Fidelity funds and is an employee of FMR.
Year of Election or Appointment: 2004
Assistant Treasurer of Independence. Mr. Lydecker also serves as Assis tant Treasurer of other Fidelity funds (2004) and is an employee of FMR.
Year of Election or Appointment: 2002
Assistant Treasurer of Independence. Mr. Osterheld also serves as Assis tant Treasurer of other Fidelity funds (2002) and is an employee of FMR.
Year of Election or Appointment: 2005
Assistant Treasurer of Independence. Mr. Ryan also serves as Assistant Treasurer of other Fidelity funds (2005 present) and is an employee of FMR (2005 present). Previously, Mr. Ryan served as Vice President of Fund Reporting in FPCMS (1999 2005).
37 Annual Report
Trustees and Officers - continued
| | Name, Age; Principal Occupation
Salvatore Schiavone (40)
|
Year of Election or Appointment: 2005
Assistant Treasurer of Independence. Mr. Schiavone also serves as Assis tant Treasurer of other Fidelity funds (2005 present) and is an employee of FMR (2005 present). Before joining Fidelity Investments, Mr. Schia vone worked at Deutsche Asset Management, where he most recently served as Assistant Treasurer (2003 2005) of the Scudder Funds and Vice President and Head of Fund Reporting (1996 2003).
The fund designates 100% of the dividends distributed during the fiscal year as qualifying for the dividends received deduction for corporate shareholders.
The fund designates 100% of the dividends distributed in December and January, respectively during the fiscal year as amounts which may be taken into account as a dividend for the purposes of the maximum rate under section 1(h)(11) of the Internal Revenue Code.
The fund will notify shareholders in January 2006 of amounts for use in preparing 2005 income tax returns.
39 Annual Report
Proxy Voting Results
A special meeting of the fund’s shareholders was held on March 16, 2005. The results of votes taken among shareholders on proposals before them are reported below. Each vote reported represents one dollar of net asset value held on the record date for the meeting.
| PROPOSAL 1 | | |
| To amend the Declaration of Trust to |
| allow the Board of Trustees, if per- |
| mitted by applicable law, to authorize |
| fund mergers without shareholder |
| approval.A | | | | |
| | | # of | | % of |
| | | Votes | | Votes |
| Affirmative | | 8,400,660,894.14 | | 71.170 |
| Against | | 2,413,818,167.07 | | 20.450 |
| Abstain | | 466,182,489.54 | | 3.949 |
| Broker | | | | |
| Non Votes | | 523,001,758.35 | | 4.431 |
| TOTAL | | 11,803,663,309.10 | | 100.000 |
| PROPOSAL 2 | | |
| To elect a Board of Trustees.A | | |
| | | # of | | % of |
| | | Votes | | Votes |
| |
| Laura B. Cronin | | |
| Affirmative | | 10,904,461,482.16 | | 92.382 |
| Withheld | | 899,201,826.94 | | 7.618 |
| TOTAL | | 11,803,663,309.10 | | 100.000 |
| Dennis J. Dirks | | |
| Affirmative | | 11,230,399,240.22 | | 95.143 |
| Withheld | | 573,264,068.88 | | 4.857 |
| TOTAL | | 11,803,663,309.10 | | 100.000 |
| Robert M. Gates | | |
| Affirmative | | 11,204,490,469.14 | | 94.924 |
| Withheld | | 599,172,839.96 | | 5.076 |
| TOTAL | | 11,803,663,309.10 | | 100.000 |
| George H. Heilmeier | | |
| Affirmative | | 11,216,568,766.75 | | 95.026 |
| Withheld | | 587,094,542.35 | | 4.974 |
| TOTAL | | 11,803,663,309.10 | | 100.000 |
| | | # of | | % of |
| | | Votes | | Votes |
| |
| Abigail P. Johnson | | |
| Affirmative | | 11,170,882,517.64 | | 94.639 |
| Withheld | | 632,780,791.46 | | 5.361 |
| TOTAL | | 11,803,663,309.10 | | 100.000 |
| |
| Edward C. Johnson 3d | | |
| Affirmative | | 11,146,150,096.08 | | 94.430 |
| Withheld | | 657,513,213.02 | | 5.570 |
| TOTAL | | 11,803,663,309.10 | | 100.000 |
| |
| Marie L. Knowles | | |
| Affirmative | | 11,230,314,699.11 | | 95.143 |
| Withheld | | 573,348,609.99 | | 4.857 |
| TOTAL | | 11,803,663,309.10 | | 100.000 |
| |
| Ned C. Lautenbach | | |
| Affirmative | | 11,228,854,936.86 | | 95.130 |
| Withheld | | 574,808,372.24 | | 4.870 |
| TOTAL | | 11,803,663,309.10 | | 100.000 |
| |
| Marvin L. Mann | | |
| Affirmative | | 11,192,136,636.22 | | 94.819 |
| Withheld | | 611,526,672.88 | | 5.181 |
| TOTAL | | 11,803,663,309.10 | | 100.000 |
| |
| William O. McCoy | | |
| Affirmative | | 11,202,537,978.70 | | 94.907 |
| Withheld | | 601,125,330.40 | | 5.093 |
| TOTAL | | 11,803,663,309.10 | | 100.000 |
| |
| Robert L. Reynolds | | |
| Affirmative | | 11,216,557,272.63 | | 95.026 |
| Withheld | | 587,106,036.47 | | 4.974 |
| TOTAL | | 11,803,663,309.10 | | 100.000 |
| |
| Cornelia M. Small | | |
| Affirmative | | 11,221,057,350.30 | | 95.064 |
| Withheld | | 582,605,958.80 | | 4.936 |
| TOTAL | | 11,803,663,309.10 | | 100.000 |
Annual Report 40
| | | # of | | % of |
| | | Votes | | Votes |
| |
| William S. Stavropoulos | | |
| Affirmative | | 11,213,520,655.58 | | 95.000 |
| Withheld | | 590,142,653.52 | | 5.000 |
| TOTAL | | 11,803,663,309.10 | | 100.000 |
| |
| Kenneth L. Wolfe | | |
| Affirmative | | 11,218,319,970.33 | | 95.041 |
| Withheld | | 585,343,338.77 | | 4.959 |
| TOTAL | | 11,803,663,309.10 | | 100.000 |
A Denotes trust-wide proposals and voting results.
|
41 Annual Report
Board Approval of Investment Advisory Contracts and Management Fees
Fidelity Independence Fund
Each year, typically in July, the Board of Trustees, including the independent Trustees (together, the Board), votes on the renewal of the management contract and sub advisory agreements (together, the Advisory Contracts) for the fund. The Board, assisted by the advice of fund counsel and independent Trustees’ counsel, requests and considers a broad range of information throughout the year.
The Board meets regularly each month except August and takes into account throughout the year matters bearing on Advisory Contracts. The Board, acting directly and through its separate committees, considers at each of its meetings factors that are relevant to the annual renewal of the fund’s Advisory Contracts, including the services and support provided to the fund and its shareholders by Fidelity. At the time of the renewal, the Board had 11 standing committees, each composed of independent Trustees with varying backgrounds, to which the Board has assigned specific subject matter responsibilities in order to enhance effective decision making by the Board. Each committee has adopted a written charter outlining the structure and purposes of the committee. One such com mittee, the Equity Contract Committee, meets periodically during the first six months of each year and as necessary to consider matters specifically related to the annual renewal of Advisory Contracts. The committee requests and receives information on, and makes recommendations to the independent Trustees concerning, the approval and annual review of the Advisory Contracts.
At its July 2005 meeting, the Board of Trustees, including the independent Trustees, unanimously determined to renew the Advisory Contracts for the fund. In reaching its determination, the Board considered all factors it believed relevant, including (1) the nature, extent, and quality of the services to be provided to the fund and its shareholders by Fidelity (including the investment performance of the fund); (2) the competitiveness of the management fee and total expenses of the fund; (3) the total costs of the services to be provided by and the profits to be realized by the investment adviser and its affiliates from the relationship with the fund; (4) the extent to which economies of scale would be realized as the fund grows; and (5) whether fee levels reflect these economies of scale, if any, for the benefit of fund shareholders.
In determining whether to renew the Advisory Contracts for the fund, the Board ulti mately reached a determination, with the assistance of fund counsel and independent Trustees’ counsel, that the renewal of the Advisory Contracts and the compensation to be received by Fidelity under the management contract is consistent with Fidelity’s fidu ciary duty under applicable law. In addition to evaluating the specific factors noted above, the Board, in reaching its determination, is aware that shareholders in the fund have a broad range of investment choices available to them, including a wide choice among mutual funds offered by competitors to Fidelity, and that the fund’s shareholders, with the opportunity to review and weigh the disclosure provided by the fund in its
prospectus and other public disclosures, have chosen to invest in this fund, managed by Fidelity.
Nature, Extent, and Quality of Services Provided by Fidelity. The Board consid ered staffing within the investment adviser, FMR, and the sub advisers (together, the Investment Advisers), including the background of the fund’s portfolio manager and the fund’s investment objective and discipline. The independent Trustees also had discus sions with senior management of Fidelity’s investment operations and investment groups. The Board considered the structure of the portfolio manager compensation program and whether this structure provides appropriate incentives.
Fidelity Resources Dedicated to Investment Management and Support Services. The Board reviewed the size, education, and experience of the Investment Advisers’ invest ment staff, their use of technology, and the Investment Advisers’ approach to recruiting, training, and retaining portfolio managers and other research, advisory, and manage ment personnel. The Board considered Fidelity’s extensive global research capabilities that enable the Investment Advisers to aggregate data from various sources in an effort to produce positive investment results. The Board noted that Fidelity’s analysts have access to a variety of technological tools that enable them to perform both fundamental and quantitative analysis and to specialize in various disciplines. The Board also considered that Fidelity’s portfolio managers and analysts have access to daily portfolio attribution that allows for monitoring of a fund’s portfolio, as well as an electronic communication system that provides immediate real time access to research concerning issuers and credit enhancers.
Shareholder and Administrative Services. The Board considered the nature, extent, quality, and cost of administrative, distribution, and shareholder services performed by the Investment Advisers and their affiliates under the Advisory Contracts and under separate agreements covering transfer agency, pricing and bookkeeping, and securities lending services for the fund. The Board also considered the nature and extent of the Investment Advisers’ supervision of third party service providers, principally custodians and subcustodians. The Board reviewed the allocation of fund brokerage, including allocations to brokers affiliated with the Investment Advisers, the use of brokerage commissions to pay fund expenses, and the use of “soft” commission dollars to pay for research services. The Board also considered that Fidelity voluntarily decided in 2004 to stop using “soft” commission dollars to pay for market data and, instead, to pay for that data out of its own resources. The Board also considered the resources devoted to, and the record of compliance with, the fund’s compliance policies and procedures.
The Board noted that the growth of fund assets across the complex allows Fidelity to reinvest in the development of services designed to enhance the value or convenience of the Fidelity funds as investment vehicles. These services include 24 hour access to
43 Annual Report
Board Approval of Investment Advisory Contracts and Management Fees continued
account information and market information through phone representatives and over the Internet, and investor education materials and asset allocation tools.
Investment in a Large Fund Family. The Board considered the benefits to shareholders of investing in a Fidelity fund, including the benefits of investing in a fund that is part of a large family of funds offering a variety of investment disciplines and providing for a large variety of mutual fund investor services. For example, fund shareholders are offered the privilege of exchanging shares of the fund for shares of other Fidelity funds, as set forth in the fund’s prospectus, without paying a sales charge. The Board noted that, since the last Advisory Contract renewals in July 2004, Fidelity has taken a number of actions that benefited particular funds, including (i) voluntarily deciding in 2004 to stop using “soft” commission dollars to pay for market data and, instead, to pay for that data out of its own resources, (ii) contractually agreeing to impose management fee reductions and expense limitations on its five Spartan stock index funds and its stock index fund available through variable insurance products, (iii) contractually agreeing to eliminate the management fees on the Fidelity Freedom Funds and the Fidelity Advisor Freedom Funds, (iv) contractually agreeing to reduce the management fees on most of its investment grade taxable bond funds, and (v) contractually agreeing to impose expense limitations on its retail and Spartan investment grade taxable bond funds.
Investment Performance and Compliance. The Board considered whether the fund has operated within its investment objective, as well as its record of compliance with its investment restrictions. It also reviewed the fund’s absolute investment performance, as well as the fund’s relative investment performance measured against (i) a broad based securities market index, and (ii) a peer group of mutual funds deemed appropriate by the Board over multiple periods. The following charts considered by the Board show, over the one , three , and five year periods ended December 31, 2004, the fund’s returns, the returns of a broad based securities market index (“benchmark”), and a range of returns of a peer group of mutual funds identified by Lipper Inc. as having an investment objec tive similar to that of the fund. The box within each chart shows the 25th percentile return (bottom of box) and the 75th percentile return (top of box) of the Lipper peer group. Returns shown above the box are in the first quartile and returns shown below the box are in the fourth quartile. The percentage beaten number noted below each chart corresponds to the percentile box and represents the percentage of funds in the Lipper peer group whose performance was equal to or lower than that of the fund.
The Board reviewed the fund’s relative investment performance against its Lipper peer group and stated that the performance of the fund was in the second quartile for the one and three year periods and the third quartile for the five year period. The Board also stated that the relative investment performance of the fund has compared favorably to its benchmark over time, although the fund’s five year cumulative total return was lower than its benchmark.
The Board also considered that the fund’s management fee is subject to upward or downward adjustment depending upon whether, and to what extent, the fund’s invest ment performance for the performance period exceeds, or is exceeded by, the record (over the same period) of a Board approved performance adjustment index. The Board realizes that the performance adjustment provides FMR with a strong economic incen tive to seek to achieve superior performance for the fund’s shareholders and helps to more closely align the interests of FMR and the fund’s shareholders.
The Board has had thorough discussions with FMR throughout the year about the Board’s and FMR’s concerns about equity research, equity fund performance, and compliance with internal policies governing gifts and entertainment. FMR has taken steps that it believes will refocus and strengthen equity research and equity portfolio management and compliance. The Board noted with favor FMR’s recent reorganization of its senior management team and FMR’s plans to dedicate additional resources to investment research, and participated in the process that led to those changes.
Based on its review, and giving particular weight to the nature and quality of the resources dedicated by the Investment Advisers to maintain and improve relative performance, the Board concluded that the nature, extent, and quality of the services
45 Annual Report
Board Approval of Investment Advisory Contracts and Management Fees continued
provided by Fidelity will benefit the fund’s shareholders, particularly in light of the Board’s view that the fund’s shareholders benefit from investing in a fund that is part of a large family of funds offering a variety of investment disciplines and services.
Competitiveness of Management Fee and Total Fund Expenses. The Board considered the fund’s management fee and total expenses compared to “mapped groups” of competitive funds and classes. Fidelity creates “mapped groups” by combining similar Lipper investment objective categories that have comparable management fee charac teristics. Combining Lipper investment objective categories aids the Board’s manage ment fee and total expense comparisons by broadening the competitive group used for comparison and by reducing the number of universes to which various Fidelity funds are compared.
The Board considered two proprietary management fee comparisons for the 12 month periods shown in the chart below. The group of Lipper funds used by the Board for management fee comparisons is referred to below as the “Total Mapped Group” and, for the reasons explained above, is broader than the Lipper peer group used by the Board for performance comparisons. The Total Mapped Group comparison focuses on a fund’s standing relative to the total universe of comparable funds available to investors, in terms of gross management fees before expense reimbursements or caps. “TMG %” represents the percentage of funds in the Total Mapped Group that had management fees that were lower than the fund’s. For example, a TMG % of 17% means that 83% of the funds in the Total Mapped Group had higher management fees than the fund. The “Asset Size Peer Group” (ASPG) comparison focuses on a fund’s standing relative to non Fidelity funds similar in size to the fund within the Total Mapped Group. The ASPG represents at least 15% of the funds in the Total Mapped Group with comparable asset size and management fee characteristics, subject to a minimum of 50 funds (or all funds in the Total Mapped Group if fewer than 50). Additional information, such as the ASPG quartile (“quadrant”) in which the fund’s management fee ranked and the impact of the fund’s performance adjustment, is also included in the chart and considered by the Board.

The Board noted that the fund’s management fee ranked below the median of its Total Mapped Group and below the median of its ASPG for 2004. The Board also noted the effect of the fund’s negative performance adjustment on the fund’s management fee ranking.
Based on its review, the Board concluded that the fund’s management fee was fair and reasonable in light of the services that the fund receives and the other factors considered.
In its review of the fund’s total expenses, the Board considered the fund’s management fee as well as other fund expenses, such as transfer agent fees, pricing and bookkeeping fees, and custodial, legal, and audit fees. The Board also noted the effects of any waivers and reimbursements on fees and expenses, as well as the fund’s negative performance adjustment. As part of its review, the Board also considered current and historical total expenses of the fund compared to competitive fund median expenses. The fund is compared to those funds and classes in the Total Mapped Group (used by the Board for management fee comparisons) that have a similar sales load structure.
The Board noted that the fund’s total expenses ranked below its competitive median for 2004.
In its review of total expenses, the Board also considered Fidelity fee structures and other information on clients that FMR and its affiliates service in other competitive markets, such as other mutual funds advised or subadvised by FMR or its affiliates, pension plan clients, and other institutional clients.
47 Annual Report
Board Approval of Investment Advisory Contracts and Management Fees continued
Based on its review, the Board concluded that the fund’s total expenses were reasonable in light of the services that the fund and its shareholders receive and the other factors considered.
Costs of the Services and Profitability. The Board considered the revenues earned and the expenses incurred by Fidelity in conducting the business of developing, market ing, distributing, managing, administering and servicing the fund and its shareholders. The Board also considered the level of Fidelity’s profits in respect of all the Fidelity funds.
On an annual basis, FMR presents to the Board Fidelity’s profitability for the fund. Fidelity calculates the profitability for each fund, as well as aggregate profitability for groups of Fidelity funds and all Fidelity funds, using a series of detailed revenue and cost allocation methodologies which originate with the audited books and records of Fidelity. The Audit Committee of the Board reviews any significant changes from the prior year’s methodologies.
PricewaterhouseCoopers LLP (PwC), independent registered accounting firm and auditor to Fidelity and certain Fidelity funds, has been engaged annually by the Board as part of the Board’s assessment of the results of Fidelity’s profitability analysis. PwC’s engagement includes the review and assessment of Fidelity’s methodologies used in determining the revenues and expenses attributable to Fidelity’s mutual fund business, and completion of agreed upon procedures surrounding the mathematical accuracy of fund profitability and its conformity to allocation methodologies. After considering PwC’s reports issued under the engagement and information provided by Fidelity, the Board believes that while other allocation methods may also be reasonable, Fidelity’s profitabil ity methodologies are reasonable in all material respects.
The Board has also reviewed Fidelity’s non fund businesses and any fall out benefits related to the mutual fund business as well as cases where Fidelity’s affiliates may benefit from or be related to the fund’s business. In addition, a special committee of the Board reviewed services provided to Fidelity by its affiliates and determined that the fees that Fidelity paid for such services were reasonable.
The Board considered the costs of the services provided by and the profits realized by Fidelity in connection with the operation of the fund and determined that the amount of profit is a fair entrepreneurial profit for the management of the fund.
Economies of Scale. The Board considered whether there have been economies of scale in respect of the management of the Fidelity funds, whether the Fidelity funds (including the fund) have appropriately benefited from any such economies of scale, and whether there is potential for realization of any further economies of scale. The Board considered the extent to which the fund will benefit from economies of scale through increased services to the fund, through waivers or reimbursements, or through fee or
expense reductions, including reductions that occur through operation of the transfer agent agreement. The transfer agent fee varies in part based on the number of accounts in the fund. If the number of accounts decreases or the average account size increases, the overall transfer agent fee rate decreases.
The Board recognized that the fund’s management contract incorporates a “group fee” structure, which provides for lower fee rates as total fund assets under FMR’s manage ment increase, and for higher fee rates as total fund assets under FMR’s management decrease. The Board considered that the group fee is designed to deliver the benefits of economies of scale to fund shareholders when total fund assets increase, even if assets of any particular fund are unchanged or have declined, because some portion of Fidelity’s costs are attributable to services provided to all Fidelity funds, and all funds benefit if those costs can be allocated among more assets. The Board concluded that, given the group fee structure, fund shareholders will achieve a certain level of economies of scale as assets under FMR’s management increase at the fund complex level, regardless of whether Fidelity achieves any such economies of scale.
The Board further concluded that any potential economies of scale are being shared between fund shareholders and Fidelity in an appropriate manner.
Additional Information Requested by the Board. In order to develop fully the factual basis for consideration of the Advisory Contracts, the Board requested additional information regarding (i) equity fund transfer agency fees; (ii) Fidelity’s fund profitability methodology and the impact of various changes in the methodology over time; (iii) benefits to shareholders from economies of scale; (iv) composition and characteristics of various fund and industry data used in comparisons; and (v) com pensation of portfolio managers and research analysts.
Based on its evaluation of all of the conclusions noted above, and after considering all material factors, the Board ultimately concluded that the existing advisory fee structures are fair and reasonable, and that the fund’s existing Advisory Contracts should be renewed.
49 Annual Report
Managing Your Investments
Fidelity offers several ways to conveniently manage your personal investments via your telephone or PC. You can access your account information, conduct trades and research your investments 24 hours a day.
By Phone
Fidelity Automated Service Telephone provides a single toll free number to access account balances, positions, quotes and trading. It’s easy to navigate the service, and on your first call, the system will help you create a personal identification number (PIN) for security.


By PC
Fidelity’s web site on the Internet provides a wide range of information, including daily financial news, fund performance, interactive planning tools and news about Fidelity products and services.

* When you call the quotes line, please remember that a fund’s yield and return will vary and, except for money market funds, share price will also vary. This means that you may have a gain or loss when you sell your shares. There is no assurance that money market funds will be able to maintain a stable $1 share price; an investment in a money market fund is not insured or guar anteed by the U.S. government. Total returns are historical and include changes in share price, reinvestment of dividends and capital gains, and the effects of any sales charges.
Annual Report 50
To Write Fidelity
We’ll give your correspondence immediate attention and send you written confirmation upon completion of your request.

| | (such as changing name, address, bank, etc.)
Fidelity Investments
P.O. Box 770001
Cincinnati, OH 45277-0002
|

| | Buying shares
Fidelity Investments
P.O. Box 770001
Cincinnati, OH 45277-0003
Overnight Express
Fidelity Investments
Attn: Distribution Services
100 Crosby Parkway KC1H
Covington, KY 41015
Selling shares
Fidelity Investments
P.O. Box 770001
Cincinnati, OH 45277-0035
Overnight Express
Fidelity Investments
Attn: Distribution Services
100 Crosby Parkway KC1H
Covington, KY 41015
General Correspondence
Fidelity Investments
P.O. Box 500
Merrimack, NH 03054-0500
|

Buying shares
Fidelity Investments
P.O. Box 770001
Cincinnati, OH 45277-0003
Selling shares
Fidelity Investments
P.O. Box 770001
Cincinnati, OH 45277-0035
Overnight Express
Fidelity Investments
Attn: Distribution Services
100 Crosby Parkway KC1H
Covington, KY 41015
General Correspondence
Fidelity Investments
P.O. Box 500
Merrimack, NH 03054-0500
|
51 Annual Report
To Visit Fidelity
For directions and hours,
please call 1-800-544-9797.
Arizona
7001 West Ray Road
Chandler, AZ
7373 N. Scottsdale Road
Scottsdale, AZ
California
815 East Birch Street
Brea, CA
1411 Chapin Avenue
Burlingame, CA
851 East Hamilton Avenue
Campbell, CA
19200 Von Karman Avenue
Irvine, CA
601 Larkspur Landing Circle
Larkspur, CA
10100 Santa Monica Blvd.
Los Angeles, CA
27101 Puerta Real
Mission Viejo, CA
73 575 El Paseo
Palm Desert, CA
251 University Avenue
Palo Alto, CA
123 South Lake Avenue
Pasadena, CA
16995 Bernardo Ctr. Drive
Rancho Bernardo, CA
1740 Arden Way
Sacramento, CA
7676 Hazard Center Drive
San Diego, CA
8 Montgomery Street
San Francisco, CA
3793 State Street
Santa Barbara, CA
21701 Hawthorne Boulevard
Torrance, CA
2001 North Main Street
Walnut Creek, CA
6300 Canoga Avenue
Woodland Hills, CA
|
Colorado
1625 Broadway
Denver, CO
9185 East Westview Road
Littleton, CO
Connecticut
48 West Putnam Avenue
Greenwich, CT
265 Church Street
New Haven, CT
300 Atlantic Street
Stamford, CT
29 South Main Street
West Hartford, CT
Delaware
222 Delaware Avenue
Wilmington, DE
Florida
4400 N. Federal Highway
Boca Raton, FL
121 Alhambra Plaza
Coral Gables, FL
2948 N. Federal Highway
Ft. Lauderdale, FL
1907 West State Road 434
Longwood, FL
8880 Tamiami Trail, North
Naples, FL
3550 Tamiami Trail, South
Sarasota, FL
1502 N. Westshore Blvd.
Tampa, FL
2465 State Road 7
Wellington, FL
3501 PGA Boulevard
West Palm Beach, FL
Georgia
3445 Peachtree Road, N.E.
Atlanta, GA
1000 Abernathy Road
Atlanta, GA
Illinois
One North LaSalle Street
Chicago, IL
875 North Michigan Ave.
Chicago, IL
1415 West 22nd Street
Oak Brook, IL
|
1700 East Golf Road
Schaumburg, IL
3232 Lake Avenue
Wilmette, IL
Indiana
4729 East 82nd Street
Indianapolis, IN
Kansas
5400 College Boulevard
Overland Park, KS
Maine
Three Canal Plaza
Portland, ME
Maryland
7315 Wisconsin Avenue
Bethesda, MD
One W. Pennsylvania Ave.
Towson, MD
Massachusetts
801 Boylston Street
Boston, MA
155 Congress Street
Boston, MA
300 Granite Street
Braintree, MA
44 Mall Road
Burlington, MA
405 Cochituate Road
Framingham, MA
416 Belmont Street
Worcester, MA
Michigan
500 E. Eisenhower Pkwy.
Ann Arbor, MI
280 Old N. Woodward Ave.
Birmingham, MI
43420 Grand River Avenue
Novi, MI
29155 Northwestern Hwy.
Southfield, MI
Minnesota
7600 France Avenue South
Edina, MN
Missouri
8885 Ladue Road
Ladue, MO
|
Annual Report 52
Nevada
2225 Village Walk Drive
Henderson, NV
New Jersey
150 Essex Street
Millburn, NJ
56 South Street
Morristown, NJ
396 Route 17, North
Paramus, NJ
3518 Route 1 North
Princeton, NJ
530 Highway 35
Shrewsbury, NJ
New York
1055 Franklin Avenue
Garden City, NY
37 West Jericho Turnpike
Huntington Station, NY
1271 Avenue of the Americas
New York, NY
61 Broadway
New York, NY
350 Park Avenue
New York, NY
200 Fifth Avenue
New York, NY
733 Third Avenue
New York, NY
11 Penn Plaza
New York, NY
2070 Broadway
New York, NY
1075 Northern Blvd.
Roslyn, NY
North Carolina
4611 Sharon Road
Charlotte, NC
Ohio
3805 Edwards Road
Cincinnati, OH
1324 Polaris Parkway
Columbus, OH
28699 Chagrin Boulevard
Woodmere Village, OH
Oregon
16850 SW 72nd Avenue
Tigard, OR
|
Pennsylvania
600 West DeKalb Pike
King of Prussia, PA
1735 Market Street
Philadelphia, PA
12001 Perry Highway
Wexford, PA
Rhode Island
47 Providence Place
Providence, RI
Tennessee
6150 Poplar Avenue
Memphis, TN
Texas
10000 Research Boulevard
Austin, TX
4001 Northwest Parkway
Dallas, TX
12532 Memorial Drive
Houston, TX
2701 Drexel Drive
Houston, TX
6500 N. MacArthur Blvd.
Irving, TX
6005 West Park Boulevard
Plano, TX
14100 San Pedro
San Antonio, TX
1576 East Southlake Blvd.
Southlake, TX
19740 IH 45 North
Spring, TX
Utah
215 South State Street
Salt Lake City, UT
Virginia
1861 International Drive
McLean, VA
Washington
411 108th Avenue, N.E.
Bellevue, WA
1518 6th Avenue
Seattle, WA
Washington, DC
1900 K Street, N.W.
Washington, DC
Wisconsin
595 North Barker Road
Brookfield, WI
|
Fidelity Brokerage Services, Inc., 100 Summer St., Boston, MA 02110 Member NYSE/SIPC
53 Annual Report
53
55 Annual Report
Investment Adviser
Fidelity Management & Research Company
Boston, MA
Investment Sub Advisers
FMR Co., Inc.
Fidelity Management & Research
(U.K.) Inc.
Fidelity Management & Research
(Far East) Inc.
Fidelity International Investment
Advisors
Fidelity Investments Japan Limited
Fidelity International Investment
Advisors (U.K.) Limited
General Distributor
Fidelity Distributors Corporation
Boston, MA
Transfer and Service Agent
Fidelity Service Company, Inc.
Boston, MA
Custodian
Brown Brothers Harriman & Co.
Boston, MA
|
| The Fidelity Telephone Connection |
| Mutual Fund 24-Hour Service |
| Exchanges/Redemptions | | |
| and Account Assistance | | 1-800-544-6666 |
| Product Information | | 1-800-544-6666 |
| Retirement Accounts | | 1-800-544-4774 |
| (8 a.m. - 9 p.m.) | | |
| TDD Service | | 1-800-544-0118 |
| for the deaf and hearing impaired |
| (9 a.m. - 9 p.m. Eastern time) |
| Fidelity Automated Service | | |
| Telephone (FAST®) (automated phone logo) | | 1-800-544-5555 |
| (automated phone logo) Automated line for quickest service |
FRE-UANN-0106
1.786709.102

Fidelity®
Strategic Dividend & Income®
Fund
|
Annual Report
November 30, 2005
|


| Contents | | | | |
| |
| Chairman’s Message | | 4 | | Ned Johnson’s message to shareholders. |
| Performance | | 5 | | How the fund has done over time. |
| Management’s Discussion | | 6 | | The managers’ review of fund |
| | | | | performance, strategy and outlook. |
| Shareholder Expense | | 7 | | An example of shareholder expenses. |
| Example | | | | |
| Investment Changes | | 9 | | A summary of the fund’s investments. |
| Investments | | 10 | | A complete list of the fund’s investments |
| | | | | with their market values. |
| Financial Statements | | 31 | | Statements of assets and liabilities, |
| | | | | operations, and changes in net assets, |
| | | | | as well as financial highlights. |
| Notes | | 41 | | Notes to the financial statements. |
| Report of Independent | | 50 | | |
| Registered Public | | | | |
| Accounting Firm | | | | |
| Trustees and Officers | | 51 | | |
| Distributions | | 61 | | |
| Proxy Voting Results | | 62 | | |
| Board Approval of | | 64 | | |
| Investment Advisory | | | | |
| Contracts and | | | | |
| Management Fees | | | | |
Standard & Poor’s, S&P and S&P 500 are registered service marks of The McGraw Hill Companies,
Inc. and have been licensed for use by Fidelity Distributors Corporation.
Other third party marks appearing herein are the property of their respective owners.
All other marks appearing herein are registered or unregistered trademarks or service marks
of FMR Corp. or an affiliated company.
To view a fund’s proxy voting guidelines and proxy voting record for the 12 month period
ended June 30, visit www.fidelity.com/proxyvotingresults or visit the Securities and Exchange
Commission’s (SEC) web site at www.sec.gov. You may also call 1-800-544-8544 to request a free
copy of the proxy voting guidelines.
|
Annual Report 2
This report and the financial statements contained herein are submitted for the general information
of the shareholders of the fund. This report is not authorized for distribution to prospective investors
in the fund unless preceded or accompanied by an effective prospectus.
A fund files its complete schedule of portfolio holdings with the SEC for the first and third
quarters of each fiscal year on Form N Q. Forms N Q are available on the SEC’s web site at
http://www.sec.gov. A fund’s Forms N Q may be reviewed and copied at the SEC’s Public Reference
Room in Washington, DC. Information regarding the operation of the SEC’s Public Reference
Room may be obtained by calling 1-800-SEC-0330. For a complete list of a fund’s portfolio
holdings, view the most recent quarterly holdings report, semiannual report, or annual report
on Fidelity’s web site at http://www.fidelity.com/holdings.
NOT FDIC INSURED · MAY LOSE VALUE · NO BANK GUARANTEE
Neither the fund nor Fidelity Distributors Corporation is a bank.
|
3 Annual Report
Chairman’s Message
(photograph of Edward C. Johnson 3d)
Dear Shareholder:
During the past year or so, much has been reported about the mutual fund industry, and much of it has been more critical than I believe is warranted. Allegations that some companies have been less than forthright with their shareholders have cast a shadow on the entire industry. I continue to find these reports disturbing, and assert that they do not create an accurate picture of the industry overall. Therefore, I would like to remind every one where Fidelity stands on these issues. I will say two things specifically regarding allegations that some mutual fund companies were in violation of the Securities and Exchange Commission’s forward pricing rules or were involved in so called “market timing” activities.
First, Fidelity has no agreements that permit customers who buy fund shares after 4 p.m. to obtain the 4 p.m. price. This is not a new policy. This is not to say that some one could not deceive the company through fraudulent acts. However, we are extremely diligent in preventing fraud from occurring in this manner and in every other. But I underscore again that Fidelity has no so called “agreements” that sanction illegal practices.
Second, Fidelity continues to stand on record, as we have for years, in opposition to predatory short term trading that adversely affects shareholders in a mutual fund. Back in the 1980s, we initiated a fee which is returned to the fund and, therefore, to investors to discourage this activity. Further, we took the lead several years ago in developing a Fair Value Pricing Policy to prevent market timing on foreign securities in our funds. I am confident we will find other ways to make it more difficult for predatory traders to operate. However, this will only be achieved through close cooperation among regulators, legislators and the industry.
Yes, there have been unfortunate instances of unethical and illegal activity within the mutual fund industry from time to time. That is true of any industry. When this occurs, confessed or convicted offenders should be dealt with appropriately. But we are still concerned about the risk of over regulation and the quick application of simplistic solutions to intricate problems. Every system can be improved, and we support and applaud well thought out improvements by regulators, legislators and industry representatives that achieve the common goal of building and protecting the value of investors’ holdings.
For nearly 60 years, Fidelity has worked very hard to improve its products and service to justify your trust. When our family founded this company in 1946, we had only a few hundred customers. Today, we serve more than 18 million customers including individual investors and participants in retirement plans across America.
Let me close by saying that we do not take your trust in us for granted, and we realize that we must always work to improve all aspects of our service to you. In turn, we urge you to continue your active participation with your financial matters, so that your interests can be well served.
Best regards,
/s/ Edward C. Johnson 3d
Edward C. Johnson 3d
Annual Report 4
Performance: The Bottom Line
Average annual total return reflects the change in the value of an investment, assuming reinvestment of Strategic Dividend & Income’s dividend income and capital gains (the profits earned upon the sale of securities that have grown in value) and assuming a constant rate of performance each year. The $10,000 table and the fund’s returns do not reflect the deduction of taxes that a shareholder would pay on fund distributions or the redemption of fund shares. During periods of reimbursement by Fidelity, a fund’s total return will be greater than it would be had the reimbursement not occurred. How a fund did yesterday is no guarantee of how it will do tomorrow.
| Average Annual Total Returns | | | | |
| Periods ended November 30, 2005 | | Past 1 | | Life of |
| | | year | | fundA |
| Strategic Dividend & Income | | 12.08% | | 12.60% |
| A From December 23, 2003. | | | | |
$10,000 Over Life of Fund | | | | |
Let’s say hypothetically that $10,000 was invested in Strategic Dividend & Income on December 23, 2003, when the fund started. The chart shows how the value of your investment would have changed, and also shows how the Standard & Poor’s 500SM Index performed over the same period.
5 Annual Report
5
Management’s Discussion of Fund Performance
Comments from Christopher Sharpe and Derek Young, who became Lead Co Managers of Fidelity® Strategic Dividend & Income® Fund on July 29, 2005
Numerous events unfolded during the 12 month period ending November 30, 2005, that were major influences on the U.S. equity markets. Issues exerting downward pressure on stocks included higher levels of inflation, eight short term interest rate hikes by the Federal Reserve Board, exorbitant energy prices, and a Category 4 hurricane that devastated both the city of New Orleans and several nearby oil production and refinery facilities. Grabbing most of the markets’ upbeat headlines was consistent strength in consumer spending, corporate earnings and gross domestic product (GDP). When all was said and done, investors demonstrated their conviction in the economy, pushing stocks higher across the board. By period end, the Standard & Poor’s 500SM Index, the NASDAQ Composite® Index and the Dow Jones Industrial AverageSM approached or exceeded four and a half year highs. For the 12 months overall, the S&P 500® was up 8.44%, the NASDAQ® rose 7.28% and the Dow advanced 6.07%, threatening to eclipse the 11,000 threshold for the first time since early 2000.
Strategic Dividend & Income was up 12.08% for the 12 months ending November 30, 2005, handily outdistancing both the Fidelity Strategic Dividend & Income Composite Index, which rose 8.52%, and the LipperSM Equity Income Objective Funds Average, which returned 8.23% . The fund’s overall asset allocation strategy was to overweight riskier assets such as equities and the more volatile segments of the fund’s other investment catego ries and underweight fixed income like instruments relative to the composite index. All four of the fund’s subportfolios turned in strong performance for the year, beating their respective benchmarks. The fund’s overweighting in common stocks included a selected group of large cap value names that did particularly well and drove a big portion of the fund’s performance. The strong performance of the common stock portfolio was partially offset by the underweighting of real estate investment trusts (REITs), which, given their particularly good returns, caused the fund to miss some of the robust gains of that asset class. Security selection in energy was a consistent theme almost across the board, driving strong performance in the preferred stock and convertibles subportfolios, as well as in common stocks. Solid stock picking also led to outsized returns in the REIT subportfolio.
The views expressed in this statement reflect those of the portfolio managers only through the end of the period of the report as stated on the cover and do not necessarily represent the views of Fidelity or any other person in the Fidelity organization. Any such views are subject to change at any time based upon market or other conditions and Fidelity disclaims any responsibility to update such views. These views may not be relied on as investment advice and, because investment decisions for a Fidelity fund are based on numerous factors, may not be relied on as an indication of trading intent on behalf of any Fidelity fund.
Shareholder Expense Example
As a shareholder of the Fund, you incur two types of costs: (1) transaction costs, including sales charges (loads) on purchase payments or redemption proceeds, and (2) ongoing costs, including management fees, distribution and/or service (12b 1) fees and other Fund expenses. This Example is intended to help you understand your ongoing costs (in dollars) of investing in the Fund and to compare these costs with the ongoing costs of investing in other mutual funds.
The Example is based on an investment of $1,000 invested at the beginning of the period and held for the entire period (June 1, 2005 to November 30, 2005).
The first line of the table below for each class of the Fund provides information about actual account values and actual expenses. You may use the information in this line, together with the amount you invested, to estimate the expenses that you paid over the period. Simply divide your account value by $1,000.00 (for example, an $8,600 account value divided by $1,000.00 = 8.6), then multiply the result by the number in the first line for a class of the Fund under the heading entitled “Expenses Paid During Period” to estimate the expenses you paid on your account during this period.
Hypothetical Example for Comparison Purposes
The second line of the table below for each class of the Fund provides information about hypothetical account values and hypothetical expenses based on a Class’ actual expense ratio and an assumed rate of return of 5% per year before expenses, which is not the Class’ actual return. The hypothetical account values and expenses may not be used to estimate the actual ending account balance or expenses you paid for the period. You may use this information to compare the ongoing costs of investing in the Fund and other funds. To do so, compare this 5% hypothetical example with the 5% hypothetical examples that appear in the shareholder reports of the other funds.
Please note that the expenses shown in the table are meant to highlight your ongoing costs only and do not reflect any transaction costs. Therefore, the second line of the table is useful in comparing ongoing costs only, and will not help you determine the relative total costs of owning different funds. In addition, if these transactional costs were included, your costs would have been higher.
| | | | | | | | | | | Expenses Paid |
| | | | | Beginning | | Ending | | During Period* |
| | | | | Account Value | | Account Value | | June 1, 2005 to |
| | | | | June 1, 2005 | | November 30, 2005 | | November 30, 2005 |
| Class A | | | | | | | | | | | | |
| Actual | | | $ | 1,000.00 | | $ | | 1,084.90 | | $ | | 6.01 |
| HypotheticalA | | | $ | 1,000.00 | | $ | | 1,019.30 | | $ | | 5.82 |
| Class T | | | | | | | | | | | | |
| Actual | | | $ | 1,000.00 | | $ | | 1,084.80 | | $ | | 7.11 |
| HypotheticalA | | | $ | 1,000.00 | | $ | | 1,018.25 | | $ | | 6.88 |
| Class B | | | | | | | | | | | | |
| Actual | | | $ | 1,000.00 | | $ | | 1,080.90 | | $ | | 10.17 |
| HypotheticalA | | | $ | 1,000.00 | | $ | | 1,015.29 | | $ | | 9.85 |
7 Annual Report
| Shareholder Expense Example continued | | | | |
| |
| |
| | | | | | | | | | | Expenses Paid |
| | | | | Beginning | | Ending | | During Period* |
| | | | | Account Value | | Account Value | | June 1, 2005 to |
| | | | | June 1, 2005 | | November 30, 2005 | | November 30, 2005 |
| Class C | | | | | | | | | | | | |
| Actual | | | $ | 1,000.00 | | $ | | 1,082.10 | | $ | | 9.81 |
| HypotheticalA | | | $ | 1,000.00 | | $ | | 1,015.64 | | $ | | 9.50 |
| Strategic Dividend & Income | | | | | | | | | | | | |
| Actual | | | $ | 1,000.00 | | $ | | 1,087.90 | | $ | | 4.19 |
| HypotheticalA | | | $ | 1,000.00 | | $ | | 1,021.06 | | $ | | 4.05 |
| Institutional Class | | | | | | | | | | | | |
| Actual | | | $ | 1,000.00 | | $ | | 1,086.90 | | $ | | 4.29 |
| HypotheticalA | | | $ | 1,000.00 | | $ | | 1,020.96 | | $ | | 4.15 |
| |
| A 5% return per year before expenses | | | | | | | | |
* Expenses are equal to each Class’ annualized expense ratio (shown in the table below); multiplied by the average account value over the period, multiplied by 183/365 (to reflect the one half year period).
| | | Annualized |
| | | Expense Ratio |
| Class A | | 1.15% |
| Class T | | 1.36% |
| Class B | | 1.95% |
| Class C | | 1.88% |
| Strategic Dividend & Income | | 80% |
| Institutional Class | | 82% |
| Investment Changes | | | | |
| |
| |
| Top Ten Investments as of November 30, 2005 | | |
| (excluding cash equivalents) | | % of fund’s | | % of fund’s net assets |
| | | net assets | | 6 months ago |
| American International Group, Inc. | | 2.5 | | 1.7 |
| Honeywell International, Inc. | | 2.0 | | 1.6 |
| General Electric Co. | | 1.8 | | 3.6 |
| Exxon Mobil Corp. | | 1.7 | | 2.0 |
| El Paso Corp. 4.99% | | 1.1 | | 1.2 |
| Bank of America Corp. | | 1.0 | | 1.4 |
| Valero Energy Corp. 2.00% | | 0.9 | | 0.8 |
| Halliburton Co. | | 0.9 | | 0.6 |
| JPMorgan Chase & Co. | | 0.9 | | 0.2 |
| Baxter International, Inc. | | 0.9 | | 1.0 |
| | | 13.7 | | |
Top Five Market Sectors as of November 30, 2005 | | |
| | | % of fund’s | | % of fund’s net assets |
| | | net assets | | 6 months ago |
| Financials | | 32.8 | | 31.5 |
| Energy | | 11.9 | | 9.9 |
| Industrials | | 9.7 | | 11.0 |
| Health Care | | 9.6 | | 10.0 |
| Information Technology | | 9.5 | | 10.3 |
9 Annual Report
| Investments November 30, 2005 | | | | |
| Showing Percentage of Net Assets | | | | | | | | |
| |
| Corporate Bonds 12.7% | | | | | | | | |
| | | | | Principal | | | | Value |
| | | | | Amount | | | | (Note 1) |
| Convertible Bonds – 12.7% | | | | | | | | |
| |
| CONSUMER DISCRETIONARY – 2.7% | | | | | | | | |
| Hotels, Restaurants & Leisure 1.5% | | | | | | | | |
| Carnival Corp. 1.132% 4/29/33 (e) | | | | $ 6,820,000 | | $ | | 5,565,802 |
| Kerzner International Ltd. 2.375% 4/15/24 | | 4,660,000 | | | | 5,700,112 |
| Six Flags, Inc. 4.5% 5/15/15 | | | | 3,300,000 | | | | 4,228,290 |
| | | | | | | | | 15,494,204 |
| Media – 1.2% | | | | | | | | |
| Charter Communications, Inc.: | | | | | | | | |
| 5.875% 11/16/09 (g) | | | | 700,000 | | | | 526,750 |
| 5.875% 11/16/09 | | | | 10,160,000 | | | | 7,645,400 |
| XM Satellite Radio Holdings, Inc. 1.75% 12/1/09 | | 580,000 | | | | 510,765 |
| XM Satellite Radio, Inc. 1.75% 12/1/09 (g) | | 3,300,000 | | | | 2,876,280 |
| | | | | | | | | 11,559,195 |
| |
| TOTAL CONSUMER DISCRETIONARY | | | | | | | | 27,053,399 |
| |
| ENERGY 1.2% | | | | | | | | |
| Energy Equipment & Services – 0.8% | | | | | | | | |
| Halliburton Co. 3.125% 7/15/23 | | | | 4,260,000 | | | | 7,414,232 |
| Oil, Gas & Consumable Fuels – 0.4% | | | | | | | | |
| McMoRan Exploration Co. 6% 7/2/08 | | | | 3,000,000 | | | | 4,102,500 |
| |
| TOTAL ENERGY | | | | | | | | 11,516,732 |
| |
| FINANCIALS – 0.6% | | | | | | | | |
| Consumer Finance – 0.6% | | | | | | | | |
| American Express Co.: | | | | | | | | |
| 1.85% 12/1/33 (e)(g) | | | | 1,800,000 | | | | 1,914,840 |
| 1.85% 12/1/33 (e) | | | | 3,850,000 | | | | 4,095,630 |
| | | | | | | | | 6,010,470 |
| |
| HEALTH CARE – 2.9% | | | | | | | | |
| Biotechnology – 1.0% | | | | | | | | |
| BioMarin Pharmaceutical, Inc. 3.5% 6/15/08 | | 4,780,000 | | | | 4,385,650 |
| Protein Design Labs, Inc. 2% 2/15/12 (g) | | | | 1,540,000 | | | | 2,002,955 |
| Serologicals Corp.: | | | | | | | | |
| 4.75% 8/15/33 (g) | | | | 770,000 | | | | 1,137,752 |
| 4.75% 8/15/33 | | | | 1,500,000 | | | | 2,216,400 |
| | | | | | | | | 9,742,757 |
| |
| See accompanying notes which are an integral part of the financial statements. | | | | |
| |
| Annual Report | | 10 | | | | | | |
| Corporate Bonds continued | | | | | | | | |
| | | | | Principal | | | | Value |
| | | | | Amount | | | | (Note 1) |
| Convertible Bonds continued | | | | | | | | |
| |
| HEALTH CARE – continued | | | | | | | | |
| Health Care Equipment & Supplies – 1.9% | | | | | | | | |
| Bausch & Lomb, Inc. 4.4219% 8/1/23 (h) | | $ | | 3,640,000 | | $ | | 5,557,843 |
| Cytyc Corp. 2.25% 3/15/24 | | | | 2,900,000 | | | | 3,128,520 |
| Fisher Scientific International, Inc.: | | | | | | | | |
| 2.5% 10/1/23 (g) | | | | 995,000 | | | | 1,437,705 |
| 2.5% 10/1/23 | | | | 2,400,000 | | | | 3,467,832 |
| Medtronic, Inc. 1.25% 9/15/21 | | | | 5,480,000 | | | | 5,495,892 |
| | | | | | | | | 19,087,792 |
| |
| TOTAL HEALTH CARE | | | | | | | | 28,830,549 |
| |
| INDUSTRIALS – 1.6% | | | | | | | | |
| Airlines – 0.6% | | | | | | | | |
| America West Holding Corp. 7.5% 1/18/09 | | | | 600,000 | | | | 705,000 |
| Continental Airlines, Inc. 4.5% 2/1/07 | | | | 5,170,000 | | | | 4,544,999 |
| US Airways Group, Inc. 7% 9/30/20 (g) | | | | 650,000 | | | | 1,012,830 |
| | | | | | | | | 6,262,829 |
| Industrial Conglomerates – 0.4% | | | | | | | | |
| Tyco International Group SA yankee 3.125% 1/15/23 . | | | | 3,010,000 | | | | 4,056,276 |
| Marine – 0.6% | | | | | | | | |
| OMI Corp. 2.875% 12/1/24 | | | | 6,300,000 | | | | 5,922,000 |
| |
| TOTAL INDUSTRIALS | | | | | | | | 16,241,105 |
| |
| INFORMATION TECHNOLOGY – 3.5% | | | | | | | | |
| Communications Equipment – 0.6% | | | | | | | | |
| Comverse Technology, Inc. 0% 5/15/23 | | | | 2,000,000 | | | | 2,960,000 |
| Juniper Networks, Inc. 0% 6/15/08 | | | | 2,260,000 | | | | 2,701,649 |
| | | | | | | | | 5,661,649 |
| Computers & Peripherals – 0.2% | | | | | | | | |
| Maxtor Corp. 6.8% 4/30/10 | | | | 1,510,000 | | | | 1,487,501 |
| Electronic Equipment & Instruments – 1.1% | | | | | | | | |
| Flextronics International Ltd. 1% 8/1/10 | | | | 6,420,000 | | | | 5,802,396 |
| Vishay Intertechnology, Inc. 3.625% 8/1/23 | | | | 5,560,000 | | | | 5,299,236 |
| | | | | | | | | 11,101,632 |
| Internet Software & Services – 0.4% | | | | | | | | |
| aQuantive, Inc. 2.25% 8/15/24 | | | | 1,800,000 | | | | 3,861,000 |
See accompanying notes which are an integral part of the financial statements.
11 Annual Report
| Investments continued | | | | | | |
| |
| Corporate Bonds continued | | | | | | |
| | | | | Principal | | Value |
| | | | | Amount | | (Note 1) |
| Convertible Bonds continued | | | | | | |
| |
| INFORMATION TECHNOLOGY – continued | | | | | | |
| IT Services – 0.6% | | | | | | |
| DST Systems, Inc.: | | | | | | |
| Series A, 4.125% 8/15/23 (g) | | $ | | 1,240,000 | | $ 1,640,024 |
| 4.125% 8/15/23 | | | | 3,470,000 | | 4,589,422 |
| | | | | | | 6,229,446 |
| Semiconductors & Semiconductor Equipment – 0.6% | | | | | | |
| EMCORE Corp. 5% 5/15/11 | | | | 1,000,000 | | 960,000 |
| ON Semiconductor Corp. 0% 4/15/24 | | | | 6,500,000 | | 5,248,750 |
| | | | | | | 6,208,750 |
| |
| TOTAL INFORMATION TECHNOLOGY | | | | | | 34,549,978 |
| |
| UTILITIES – 0.2% | | | | | | |
| Independent Power Producers & Energy Traders – 0.2% | | | | | | |
| Mirant Corp. 2.5% 6/15/21 (d) | | | | 1,690,000 | | 1,774,500 |
| |
| TOTAL CONVERTIBLE BONDS | | | | | | 125,976,733 |
| Nonconvertible Bonds – 0.0% | | | | | | |
| |
| CONSUMER DISCRETIONARY – 0.0% | | | | | | |
| Household Durables – 0.0% | | | | | | |
| Stanley-Martin Communities LLC 9.75% 8/15/15 (g) | | | | 90,000 | | 82,800 |
| TOTAL CORPORATE BONDS | | | | | | |
| (Cost $121,939,884) | | | | | | 126,059,533 |
| |
| Common Stocks 69.5% | | | | | | |
| | | | | Shares | | |
| |
| CONSUMER DISCRETIONARY – 6.1% | | | | | | |
| Diversified Consumer Services – 0.5% | | | | | | |
| Apollo Group, Inc. Class A (a) | | | | 24,500 | | 1,744,400 |
| Coinmach Service Corp. unit | | | | 156,800 | | 2,359,840 |
| Service Corp. International (SCI) | | | | 128,000 | | 1,050,880 |
| | | | | | | 5,155,120 |
| Hotels, Restaurants & Leisure 1.1% | | | | | | |
| Centerplate, Inc. unit | | | | 318,800 | | 4,023,256 |
| Hilton Hotels Corp. | | | | 60,000 | | 1,315,200 |
| McDonald’s Corp. | | | | 71,800 | | 2,430,430 |
See accompanying notes which are an integral part of the financial statements.
| Common Stocks continued | | | | | | |
| | | Shares | | Value (Note 1) |
| |
| CONSUMER DISCRETIONARY – continued | | | | | | |
| Hotels, Restaurants & Leisure continued | | | | | | |
| Red Robin Gourmet Burgers, Inc. (a) | | 15,000 | | $ | | 823,500 |
| Starwood Hotels & Resorts Worldwide, Inc. unit | | 38,100 | | | | 2,305,050 |
| | | | | | | 10,897,436 |
| Household Durables – 0.4% | | | | | | |
| D.R. Horton, Inc. | | 32,000 | | | | 1,134,080 |
| KB Home | | 7,000 | | | | 488,390 |
| LG Electronics, Inc. | | 4,250 | | | | 321,976 |
| Sony Corp. sponsored ADR | | 47,000 | | | | 1,739,470 |
| | | | | | | 3,683,916 |
| Internet & Catalog Retail 0.6% | | | | | | |
| Coldwater Creek, Inc. (a) | | 40,000 | | | | 1,256,000 |
| eBay, Inc. (a) | | 89,000 | | | | 3,988,090 |
| Expedia, Inc. (a) | | 13,750 | | | | 340,863 |
| IAC/InterActiveCorp (a) | | 17,750 | | | | 490,078 |
| | | | | | | 6,075,031 |
| Leisure Equipment & Products – 0.7% | | | | | | |
| Eastman Kodak Co. | | 256,500 | | | | 6,148,305 |
| Leapfrog Enterprises, Inc. Class A (a)(f) | | 75,000 | | | | 978,000 |
| | | | | | | 7,126,305 |
| Media – 1.9% | | | | | | |
| Clear Channel Communications, Inc. | | 41,600 | | | | 1,354,496 |
| Clear Channel Outdoor Holding, Inc. Class A | | 40,000 | | | | 812,000 |
| Lamar Advertising Co. Class A (a) | | 71,100 | | | | 3,295,485 |
| News Corp. Class A | | 22,400 | | | | 331,744 |
| The Reader’s Digest Association, Inc. (non-vtg.) | | 30,000 | | | | 465,900 |
| Time Warner, Inc. | | 210,900 | | | | 3,791,982 |
| Univision Communications, Inc. Class A (a) | | 164,500 | | | | 4,972,835 |
| Viacom, Inc. Class B (non-vtg.) | | 23,130 | | | | 772,542 |
| Walt Disney Co. | | 113,700 | | | | 2,834,541 |
| | | | | | | 18,631,525 |
| Multiline Retail – 0.1% | | | | | | |
| Federated Department Stores, Inc. | | 22,000 | | | | 1,417,460 |
| Specialty Retail – 0.8% | | | | | | |
| Gymboree Corp. (a) | | 25,000 | | | | 564,000 |
| Home Depot, Inc. | | 103,100 | | | | 4,307,518 |
| Maidenform Brands, Inc. | | 3,500 | | | | 45,010 |
| OfficeMax, Inc. | | 35,000 | | | | 1,021,300 |
See accompanying notes which are an integral part of the financial statements.
13 Annual Report
| Investments continued | | | | |
| |
| Common Stocks continued | | | | |
| | | Shares | | Value (Note 1) |
| |
| CONSUMER DISCRETIONARY – continued | | | | |
| Specialty Retail – continued | | | | |
| Staples, Inc. | | 47,200 | | $ 1,090,320 |
| Urban Outfitters, Inc. (a) | | 25,000 | | 771,500 |
| | | | | 7,799,648 |
| Textiles, Apparel & Luxury Goods – 0.0% | | | | |
| Under Armour, Inc. Class A | | 800 | | 18,104 |
| |
| TOTAL CONSUMER DISCRETIONARY | | | | 60,804,545 |
| |
| CONSUMER STAPLES 3.3% | | | | |
| Beverages – 0.5% | | | | |
| Coca-Cola Enterprises, Inc. | | 40,800 | | 784,176 |
| Diageo PLC sponsored ADR | | 13,000 | | 755,950 |
| PepsiCo, Inc. | | 13,500 | | 799,200 |
| The Coca-Cola Co. | | 60,000 | | 2,561,400 |
| | | | | 4,900,726 |
| Food & Staples Retailing – 1.0% | | | | |
| CVS Corp. | | 25,000 | | 675,500 |
| Kroger Co. (a) | | 166,000 | | 3,230,360 |
| Safeway, Inc. | | 135,600 | | 3,152,700 |
| Wal-Mart Stores, Inc. | | 46,500 | | 2,258,040 |
| Walgreen Co. | | 15,000 | | 685,200 |
| | | | | 10,001,800 |
| Food Products 0.4% | | | | |
| B&G Foods, Inc. unit | | 156,900 | | 2,282,895 |
| Nestle SA (Reg.) | | 4,000 | | 1,186,447 |
| Tyson Foods, Inc. Class A | | 63,000 | | 1,060,290 |
| | | | | 4,529,632 |
| Household Products – 0.6% | | | | |
| Colgate-Palmolive Co. | | 105,000 | | 5,724,600 |
| Personal Products 0.1% | | | | |
| Avon Products, Inc. | | 25,000 | | 683,750 |
| Tobacco 0.7% | | | | |
| Altria Group, Inc. | | 99,300 | | 7,228,047 |
| |
| TOTAL CONSUMER STAPLES | | | | 33,068,555 |
| |
| ENERGY 8.0% | | | | |
| Energy Equipment & Services – 3.4% | | | | |
| BJ Services Co. | | 83,800 | | 3,071,270 |
See accompanying notes which are an integral part of the financial statements.
| Common Stocks continued | | | | | | |
| | | Shares | | Value (Note 1) |
| |
| ENERGY – continued | | | | | | |
| Energy Equipment & Services – continued | | | | | | |
| FMC Technologies, Inc. (a) | | 34,000 | | $ | | 1,397,060 |
| GlobalSantaFe Corp. | | 50,800 | | | | 2,304,288 |
| Halliburton Co. | | 144,200 | | | | 9,178,330 |
| National Oilwell Varco, Inc. (a) | | 95,514 | | | | 5,790,059 |
| Noble Corp. | | 16,500 | | | | 1,189,155 |
| Pride International, Inc. (a) | | 81,300 | | | | 2,421,927 |
| Schlumberger Ltd. (NY Shares) | | 56,500 | | | | 5,408,745 |
| Smith International, Inc. | | 42,000 | | | | 1,587,180 |
| Weatherford International Ltd. (a) | | 18,000 | | | | 1,251,180 |
| | | | | | | 33,599,194 |
| Oil, Gas & Consumable Fuels – 4.6% | | | | | | |
| Amerada Hess Corp. | | 16,000 | | | | 1,960,320 |
| Apache Corp. | | 18,400 | | | | 1,201,152 |
| Chevron Corp. | | 117,100 | | | | 6,711,001 |
| ConocoPhillips | | 32,400 | | | | 1,960,524 |
| CONSOL Energy, Inc. | | 9,000 | | | | 582,480 |
| Devon Energy Corp. | | 34,000 | | | | 2,046,800 |
| El Paso Corp. | | 102,000 | | | | 1,120,980 |
| Encore Acquisition Co. (a) | | 14,000 | | | | 434,560 |
| Exxon Mobil Corp. | | 291,300 | | | | 16,904,139 |
| Houston Exploration Co. (a) | | 18,000 | | | | 983,880 |
| Massey Energy Co. | | 15,000 | | | | 569,250 |
| Occidental Petroleum Corp. | | 22,300 | | | | 1,768,390 |
| OMI Corp. | | 50,000 | | | | 970,000 |
| Quicksilver Resources, Inc. (a) | | 101,450 | | | | 3,840,897 |
| Valero Energy Corp. | | 35,000 | | | | 3,367,000 |
| XTO Energy, Inc. | | 43,000 | | | | 1,749,670 |
| | | | | | | 46,171,043 |
| |
| TOTAL ENERGY | | | | | | 79,770,237 |
| |
| FINANCIALS – 25.5% | | | | | | |
| Capital Markets 3.0% | | | | | | |
| Bear Stearns Companies, Inc. | | 8,200 | | | | 910,118 |
| Charles Schwab Corp. | | 107,000 | | | | 1,631,750 |
| Investors Financial Services Corp. | | 26,000 | | | | 981,500 |
| Lehman Brothers Holdings, Inc. | | 14,800 | | | | 1,864,800 |
| Merrill Lynch & Co., Inc. | | 76,600 | | | | 5,087,772 |
| Merrill Lynch & Co., Inc. (depositary shares) Series 1, unit | | 277,700 | | | | 7,020,256 |
| Morgan Stanley | | 75,000 | | | | 4,202,250 |
See accompanying notes which are an integral part of the financial statements.
15 Annual Report
| Investments continued | | | | |
| |
| Common Stocks continued | | | | |
| | | Shares | | Value (Note 1) |
| |
| FINANCIALS – continued | | | | |
| Capital Markets continued | | | | |
| Nomura Holdings, Inc. | | 95,000 | | $ 1,581,750 |
| Nuveen Investments, Inc. Class A | | 20,000 | | 829,200 |
| State Street Corp. | | 69,000 | | 3,980,610 |
| TradeStation Group, Inc. (a) | | 59,500 | | 708,645 |
| UBS AG (NY Shares) | | 15,000 | | 1,378,800 |
| | | | | 30,177,451 |
| Commercial Banks – 2.3% | | | | |
| Banco Bradesco SA (PN) sponsored ADR (non-vtg.) (a)(f) | | 23,000 | | 1,412,200 |
| Bank of America Corp. | | 224,914 | | 10,321,303 |
| Korea Exchange Bank (a) | | 130,000 | | 1,641,445 |
| UCBH Holdings, Inc. | | 68,600 | | 1,210,104 |
| Wachovia Corp. | | 112,884 | | 6,028,006 |
| Wells Fargo & Co. | | 40,800 | | 2,564,280 |
| | | | | 23,177,338 |
| Diversified Financial Services – 1.6% | | | | |
| CBOT Holdings, Inc. Class A | | 300 | | 29,025 |
| Citigroup, Inc. | | 145,000 | | 7,039,750 |
| IntercontinentalExchange, Inc. | | 1,400 | | 45,220 |
| JPMorgan Chase & Co. | | 231,904 | | 8,870,328 |
| | | | | 15,984,323 |
| Insurance – 5.6% | | | | |
| ACE Ltd. | | 117,200 | | 6,504,600 |
| American International Group, Inc. | | 375,500 | | 25,211,063 |
| Aspen Insurance Holdings Ltd. | | 25,000 | | 625,750 |
| Endurance Specialty Holdings Ltd. | | 18,000 | | 620,100 |
| Hartford Financial Services Group, Inc. | | 72,000 | | 6,290,640 |
| Hilb Rogal & Hobbs Co. | | 43,000 | | 1,676,140 |
| Montpelier Re Holdings Ltd. | | 20,000 | | 392,600 |
| Muenchener Rueckversicherungs Gesellschaft AG (Reg.) | | 6,500 | | 849,468 |
| PartnerRe Ltd. | | 56,000 | | 3,823,680 |
| Platinum Underwriters Holdings Ltd. | | 26,700 | | 813,282 |
| Scottish Re Group Ltd. | | 35,000 | | 883,050 |
| Swiss Reinsurance Co. (Reg.) | | 12,000 | | 886,185 |
| The Chubb Corp. | | 7,000 | | 677,880 |
| The St. Paul Travelers Companies, Inc. | | 32,800 | | 1,526,184 |
| W.R. Berkley Corp. | | 92,400 | | 4,307,688 |
| XL Capital Ltd. Class A | | 16,000 | | 1,062,080 |
| | | | | 56,150,390 |
See accompanying notes which are an integral part of the financial statements.
| Common Stocks continued | | | | | | |
| | | Shares | | Value (Note 1) |
| |
| FINANCIALS – continued | | | | | | |
| Real Estate 12.1% | | | | | | |
| Apartment Investment & Management Co. Class A | | 30,900 | | $ | | 1,196,757 |
| AvalonBay Communities, Inc. | | 32,660 | | | | 2,986,757 |
| Boston Properties, Inc. | | 68,614 | | | | 5,160,459 |
| Capital Automotive (REIT) (SBI) | | 21,900 | | | | 845,997 |
| CarrAmerica Realty Corp. | | 49,680 | | | | 1,753,704 |
| CBL & Associates Properties, Inc. | | 39,840 | | | | 1,603,560 |
| Cedar Shopping Centers, Inc. | | 28,000 | | | | 385,000 |
| CenterPoint Properties Trust (SBI) | | 60,130 | | | | 2,747,340 |
| Columbia Equity Trust, Inc. | | 58,300 | | | | 844,767 |
| Correctional Properties Trust | | 39,100 | | | | 1,124,516 |
| Cousins Properties, Inc. | | 13,800 | | | | 384,192 |
| Duke Realty Corp. | | 120,460 | | | | 4,095,640 |
| Equity Lifestyle Properties, Inc. | | 58,360 | | | | 2,705,570 |
| Equity Office Properties Trust | | 201,710 | | | | 6,289,318 |
| Equity Residential (SBI) | | 172,580 | | | | 7,034,361 |
| Federal Realty Investment Trust (SBI) | | 18,020 | | | | 1,134,900 |
| General Growth Properties, Inc. | | 162,525 | | | | 7,414,391 |
| GMH Communities Trust | | 63,400 | | | | 955,438 |
| Healthcare Realty Trust, Inc. | | 29,300 | | | | 1,026,086 |
| Host Marriott Corp. | | 119,300 | | | | 2,135,470 |
| Inland Real Estate Corp. | | 96,640 | | | | 1,438,003 |
| Innkeepers USA Trust (SBI) | | 7,300 | | | | 127,312 |
| Kilroy Realty Corp. | | 19,520 | | | | 1,202,432 |
| Kimco Realty Corp. | | 156,780 | | | | 4,930,731 |
| MeriStar Hospitality Corp. (a) | | 134,700 | | | | 1,318,713 |
| National Health Investors, Inc. | | 18,900 | | | | 522,585 |
| National Health Realty, Inc. | | 12,600 | | | | 244,062 |
| Newcastle Investment Corp. | | 13,400 | | | | 363,542 |
| Pan Pacific Retail Properties, Inc. | | 42,310 | | | | 2,847,463 |
| Pennsylvania (REIT) (SBI) | | 15,200 | | | | 561,336 |
| Plum Creek Timber Co., Inc. | | 112,680 | | | | 4,390,013 |
| Post Properties, Inc. | | 17,300 | | | | 699,958 |
| ProLogis Trust | | 185,565 | | | | 8,417,228 |
| Public Storage, Inc. | | 32,640 | | | | 2,304,384 |
| Rayonier, Inc. | | 29,820 | | | | 1,185,047 |
| Reckson Associates Realty Corp. | | 109,160 | | | | 4,009,447 |
| Shurgard Storage Centers, Inc. Class A | | 8,500 | | | | 497,420 |
| Simon Property Group, Inc. | | 87,210 | | | | 6,742,205 |
| SL Green Realty Corp. | | 42,600 | | | | 3,146,010 |
| Sovran Self Storage, Inc. | | 31,200 | | | | 1,547,520 |
| Tanger Factory Outlet Centers, Inc. | | 57,500 | | | | 1,580,675 |
See accompanying notes which are an integral part of the financial statements.
17 Annual Report
| Investments continued | | | | |
| |
| Common Stocks continued | | | | |
| | | Shares | | Value (Note 1) |
| |
| FINANCIALS – continued | | | | |
| Real Estate continued | | | | |
| Taubman Centers, Inc. | | 37,800 | | $ 1,323,756 |
| The Mills Corp. | | 20,200 | | 866,580 |
| Trizec Properties, Inc. | | 184,050 | | 4,137,444 |
| Trustreet Properties, Inc. | | 19,600 | | 306,544 |
| United Dominion Realty Trust, Inc. (SBI) | | 258,620 | | 5,790,502 |
| Ventas, Inc. | | 110,850 | | 3,495,101 |
| Vornado Realty Trust | | 48,150 | | 4,109,603 |
| | | | | 119,929,839 |
| Thrifts & Mortgage Finance – 0.9% | | | | |
| Doral Financial Corp. | | 87,000 | | 878,700 |
| Fannie Mae | | 79,400 | | 3,815,170 |
| Freddie Mac | | 26,900 | | 1,679,905 |
| Golden West Financial Corp., Delaware | | 16,800 | | 1,088,472 |
| Hudson City Bancorp, Inc. | | 39,000 | | 464,490 |
| Sovereign Bancorp, Inc. | | 40,300 | | 880,958 |
| W Holding Co., Inc. | | 24,480 | | 201,960 |
| | | | | 9,009,655 |
| |
| TOTAL FINANCIALS | | | | 254,428,996 |
| |
| HEALTH CARE – 6.7% | | | | |
| Biotechnology – 1.5% | | | | |
| Alkermes, Inc. (a) | | 9,000 | | 163,620 |
| Alnylam Pharmaceuticals, Inc. (a) | | 85,000 | | 1,067,600 |
| Amgen, Inc. (a) | | 17,000 | | 1,375,810 |
| Biogen Idec, Inc. (a) | | 30,000 | | 1,284,300 |
| BioMarin Pharmaceutical, Inc. (a) | | 95,000 | | 925,300 |
| Cephalon, Inc. (a) | | 104,000 | | 5,288,400 |
| Genentech, Inc. (a) | | 10,000 | | 956,200 |
| ImClone Systems, Inc. (a) | | 40,000 | | 1,296,400 |
| MedImmune, Inc. (a) | | 56,000 | | 2,010,960 |
| ONYX Pharmaceuticals, Inc. (a) | | 12,000 | | 302,760 |
| Serologicals Corp. (a) | | 18,000 | | 361,440 |
| | | | | 15,032,790 |
| Health Care Equipment & Supplies – 2.4% | | | | |
| Aspect Medical Systems, Inc. (a) | | 15,000 | | 565,050 |
| Baxter International, Inc. | | 225,600 | | 8,773,584 |
| C.R. Bard, Inc. | | 15,000 | | 973,050 |
| Cooper Companies, Inc. | | 8,000 | | 438,400 |
| Dionex Corp. (a) | | 10,000 | | 472,300 |
See accompanying notes which are an integral part of the financial statements.
| Common Stocks continued | | | | | | |
| | | Shares | | Value (Note 1) |
| |
| HEALTH CARE – continued | | | | | | |
| Health Care Equipment & Supplies – continued | | | | | | |
| Inverness Medical Innovations, Inc. (a) | | 41,200 | | $ | | 988,800 |
| Medtronic, Inc. | | 49,100 | | | | 2,728,487 |
| PerkinElmer, Inc. | | 83,000 | | | | 1,893,230 |
| Syneron Medical Ltd. (a) | | 12,000 | | | | 477,600 |
| Thermo Electron Corp. (a) | | 92,400 | | | | 2,850,540 |
| Varian, Inc. (a) | | 15,000 | | | | 629,400 |
| Waters Corp. (a) | | 69,500 | | | | 2,726,485 |
| | | | | | | 23,516,926 |
| Health Care Providers & Services – 0.8% | | | | | | |
| Community Health Systems, Inc. (a) | | 20,000 | | | | 801,800 |
| IMS Health, Inc. | | 30,000 | | | | 733,500 |
| McKesson Corp. | | 17,000 | | | | 855,100 |
| Psychiatric Solutions, Inc. (a) | | 21,300 | | | | 1,201,746 |
| Sierra Health Services, Inc. (a) | | 14,700 | | | | 1,149,834 |
| UnitedHealth Group, Inc. | | 38,200 | | | | 2,286,652 |
| WebMD Health Corp. Class A | | 18,700 | | | | 495,363 |
| | | | | | | 7,523,995 |
| Pharmaceuticals – 2.0% | | | | | | |
| Allergan, Inc. | | 11,000 | | | | 1,100,000 |
| Merck & Co., Inc. | | 91,000 | | | | 2,675,400 |
| Pfizer, Inc. | | 303,000 | | | | 6,423,600 |
| Schering-Plough Corp. | | 128,600 | | | | 2,484,552 |
| Teva Pharmaceutical Industries Ltd. sponsored ADR | | 63,000 | | | | 2,575,440 |
| Wyeth | | 121,800 | | | | 5,062,008 |
| | | | | | | 20,321,000 |
| |
| TOTAL HEALTH CARE | | | | | | 66,394,711 |
| |
| INDUSTRIALS – 7.9% | | | | | | |
| Aerospace & Defense – 2.3% | | | | | | |
| Hexcel Corp. (a) | | 30,000 | | | | 498,900 |
| Honeywell International, Inc. | | 540,300 | | | | 19,742,562 |
| Raytheon Co. | | 18,900 | | | | 726,138 |
| United Technologies Corp. | | 39,000 | | | | 2,099,760 |
| | | | | | | 23,067,360 |
| Air Freight & Logistics – 0.2% | | | | | | |
| EGL, Inc. (a) | | 36,000 | | | | 1,337,040 |
| Expeditors International of Washington, Inc. | | 11,000 | | | | 781,110 |
| | | | | | | 2,118,150 |
See accompanying notes which are an integral part of the financial statements.
19 Annual Report
| Investments continued | | | | | | |
| |
| Common Stocks continued | | | | | | |
| | | Shares | | Value (Note 1) |
| |
| INDUSTRIALS – continued | | | | | | |
| Airlines – 0.4% | | | | | | |
| ACE Aviation Holdings, Inc. Class A (a) | | 28,900 | | $ | | 955,364 |
| AirTran Holdings, Inc. (a) | | 74,000 | | | | 1,111,480 |
| JetBlue Airways Corp. (a) | | 50,000 | | | | 922,000 |
| Southwest Airlines Co. | | 45,100 | | | | 744,150 |
| US Airways Group, Inc. (a) | | 12,500 | | | | 419,875 |
| | | | | | | 4,152,869 |
| Building Products 0.2% | | | | | | |
| Lennox International, Inc. | | 37,000 | | | | 1,080,770 |
| Masco Corp. | | 17,100 | | | | 509,067 |
| | | | | | | 1,589,837 |
| Commercial Services & Supplies – 0.2% | | | | | | |
| Robert Half International, Inc. | | 60,200 | | | | 2,303,252 |
| Construction & Engineering – 0.8% | | | | | | |
| Chicago Bridge & Iron Co. NV (NY Shares) | | 30,000 | | | | 776,700 |
| Fluor Corp. | | 54,100 | | | | 4,008,810 |
| Foster Wheeler Ltd. (a) | | 17,000 | | | | 592,110 |
| Jacobs Engineering Group, Inc. (a) | | 32,000 | | | | 2,079,040 |
| | | | | | | 7,456,660 |
| Electrical Equipment – 0.2% | | | | | | |
| ABB Ltd. sponsored ADR (a) | | 25,000 | | | | 218,750 |
| Rockwell Automation, Inc. | | 30,000 | | | | 1,692,900 |
| | | | | | | 1,911,650 |
| Industrial Conglomerates – 2.6% | | | | | | |
| 3M Co. | | 9,500 | | | | 745,560 |
| General Electric Co. | | 514,200 | | | | 18,367,224 |
| Smiths Group PLC | | 81,000 | | | | 1,364,551 |
| Tyco International Ltd. | | 190,800 | | | | 5,441,616 |
| | | | | | | 25,918,951 |
| Machinery – 0.3% | | | | | | |
| Deere & Co. | | 22,000 | | | | 1,525,700 |
| ITT Industries, Inc. | | 7,000 | | | | 761,320 |
| Watts Water Technologies, Inc. Class A | | 17,000 | | | | 491,130 |
| | | | | | | 2,778,150 |
| Road & Rail 0.4% | | | | | | |
| Norfolk Southern Corp. | | 89,700 | | | | 3,968,328 |
See accompanying notes which are an integral part of the financial statements.
| Common Stocks continued | | | | |
| | | Shares | | Value (Note 1) |
| |
| INDUSTRIALS – continued | | | | |
| Trading Companies & Distributors – 0.3% | | | | |
| Watsco, Inc. | | 22,000 | | $ 1,380,500 |
| WESCO International, Inc. (a) | | 37,000 | | 1,544,750 |
| | | | | 2,925,250 |
| |
| TOTAL INDUSTRIALS | | | | 78,190,457 |
| |
| INFORMATION TECHNOLOGY – 6.0% | | | | |
| Communications Equipment – 0.7% | | | | |
| Comverse Technology, Inc. (a) | | 76,000 | | 1,991,960 |
| Dycom Industries, Inc. (a) | | 55,000 | | 1,123,650 |
| Extreme Networks, Inc. (a) | | 75,000 | | 369,000 |
| MasTec, Inc. (a) | | 40,000 | | 394,800 |
| Motorola, Inc. | | 26,000 | | 626,340 |
| Nokia Corp. sponsored ADR | | 134,000 | | 2,288,720 |
| | | | | 6,794,470 |
| Computers & Peripherals – 1.0% | | | | |
| EMC Corp. (a) | | 30,000 | | 417,900 |
| Hewlett-Packard Co. | | 286,900 | | 8,512,323 |
| Lexmark International, Inc. Class A (a) | | 9,000 | | 428,580 |
| Seagate Technology | | 65,000 | | 1,229,800 |
| | | | | 10,588,603 |
| Electronic Equipment & Instruments – 1.1% | | | | |
| Agilent Technologies, Inc. (a) | | 135,100 | | 4,817,666 |
| Amphenol Corp. Class A | | 14,000 | | 584,780 |
| Avnet, Inc. (a) | | 5,000 | | 112,500 |
| Jabil Circuit, Inc. (a) | | 28,000 | | 927,360 |
| Symbol Technologies, Inc. | | 132,200 | | 1,511,046 |
| Trimble Navigation Ltd. (a) | | 35,000 | | 1,140,300 |
| Vishay Intertechnology, Inc. (a) | | 117,000 | | 1,501,110 |
| | | | | 10,594,762 |
| Internet Software & Services – 0.6% | | | | |
| Digital River, Inc. (a) | | 13,000 | | 336,960 |
| Google, Inc. Class A (sub. vtg.) (a) | | 9,100 | | 3,685,409 |
| Yahoo!, Inc. (a) | | 48,000 | | 1,931,040 |
| | | | | 5,953,409 |
| IT Services – 0.5% | | | | |
| Anteon International Corp. (a) | | 29,500 | | 1,264,665 |
See accompanying notes which are an integral part of the financial statements.
21 Annual Report
| Investments continued | | | | |
| |
| Common Stocks continued | | | | |
| | | Shares | | Value (Note 1) |
| |
| INFORMATION TECHNOLOGY – continued | | | | |
| IT Services – continued | | | | |
| Ceridian Corp. (a) | | 67,000 | | $ 1,608,000 |
| First Data Corp. | | 45,000 | | 1,947,150 |
| | | | | 4,819,815 |
| Office Electronics – 0.1% | | | | |
| Xerox Corp. (a) | | 92,000 | | 1,306,400 |
| Semiconductors & Semiconductor Equipment – 1.0% | | | | |
| Altera Corp. (a) | | 30,000 | | 547,800 |
| Analog Devices, Inc. | | 32,000 | | 1,213,440 |
| Cabot Microelectronics Corp. (a)(f) | | 18,400 | | 569,112 |
| Freescale Semiconductor, Inc. Class A (a) | | 53,500 | | 1,377,625 |
| Intel Corp. | | 110,000 | | 2,934,800 |
| Maxim Integrated Products, Inc. | | 36,000 | | 1,315,800 |
| Micron Technology, Inc. (a) | | 64,000 | | 912,640 |
| PMC-Sierra, Inc. (a) | | 47,000 | | 369,890 |
| Saifun Semiconductors Ltd. | | 1,100 | | 31,790 |
| Samsung Electronics Co. Ltd. | | 1,480 | | 853,050 |
| | | | | 10,125,947 |
| Software 1.0% | | | | |
| BEA Systems, Inc. (a) | | 105,900 | | 928,743 |
| Cognos, Inc. (a) | | 11,000 | | 367,783 |
| Macrovision Corp. (a) | | 7,000 | | 108,780 |
| Microsoft Corp. | | 175,900 | | 4,874,189 |
| NAVTEQ Corp. (a) | | 35,000 | | 1,470,000 |
| Symantec Corp. (a) | | 105,000 | | 1,855,350 |
| Ulticom, Inc. (a) | | 40,000 | | 460,800 |
| | | | | 10,065,645 |
| |
| TOTAL INFORMATION TECHNOLOGY | | | | 60,249,051 |
| |
| MATERIALS 3.2% | | | | |
| Chemicals – 1.9% | | | | |
| Chemtura Corp. | | 30,000 | | 361,500 |
| E.I. du Pont de Nemours & Co. | | 157,600 | | 6,737,400 |
| Ecolab, Inc. | | 35,100 | | 1,167,777 |
| Georgia Gulf Corp. | | 28,000 | | 780,080 |
| Lyondell Chemical Co. | | 113,733 | | 2,892,230 |
| Monsanto Co. | | 7,000 | | 512,890 |
| Mosaic Co. (a) | | 38,000 | | 514,520 |
| NOVA Chemicals Corp. | | 47,000 | | 1,772,901 |
| Praxair, Inc. | | 40,000 | | 2,080,000 |
See accompanying notes which are an integral part of the financial statements.
| Common Stocks continued | | | | | | |
| | | | | Shares | | Value (Note 1) |
| |
| MATERIALS – continued | | | | | | | | |
| Chemicals – continued | | | | | | | | |
| Rockwood Holdings, Inc. | | | | 45,000 | | $ | | 820,800 |
| Rohm & Haas Co. | | | | 17,000 | | | | 744,600 |
| | | | | | | | | 18,384,698 |
| Construction Materials 0.1% | | | | | | |
| Martin Marietta Materials, Inc. | | 16,000 | | | | 1,201,760 |
| Containers & Packaging – 0.5% | | | | | | |
| Crown Holdings, Inc. (a) | | | | 25,000 | | | | 463,500 |
| Owens Illinois, Inc. (a) | | | | 84,700 | | | | 1,842,225 |
| Packaging Corp. of America | | 60,400 | | | | 1,400,676 |
| Smurfit-Stone Container Corp. (a) | | 125,000 | | | | 1,583,750 |
| | | | | | | | | 5,290,151 |
| Metals & Mining – 0.7% | | | | | | | | |
| Alcoa, Inc. | | | | 45,700 | | | | 1,252,637 |
| Freeport-McMoRan Copper & Gold, Inc. Class B | | 25,000 | | | | 1,302,750 |
| Newmont Mining Corp. | | | | 94,800 | | | | 4,372,176 |
| | | | | | | | | 6,927,563 |
| |
| TOTAL MATERIALS | | | | | | | | 31,804,172 |
| |
| TELECOMMUNICATION SERVICES – 2.2% | | | | | | |
| Diversified Telecommunication Services – 0.9% | | | | | | |
| AT&T, Inc. | | | | 237,800 | | | | 5,923,598 |
| CenturyTel, Inc. | | | | 48,689 | | | | 1,611,606 |
| Covad Communications Group, Inc. (a) | | 676,200 | | | | 527,436 |
| Verizon Communications, Inc. | | 34,800 | | | | 1,112,904 |
| | | | | | | | | 9,175,544 |
| Wireless Telecommunication Services – 1.3% | | | | | | |
| American Tower Corp. Class A (a) | | 151,000 | | | | 4,120,790 |
| Leap Wireless International, Inc. (a) | | 16,000 | | | | 608,960 |
| Nextel Partners, Inc. Class A (a) | | 83,000 | | | | 2,199,500 |
| Sprint Nextel Corp. | | | | 235,885 | | | | 5,906,560 |
| | | | | | | | | 12,835,810 |
| |
| TOTAL TELECOMMUNICATION SERVICES | | | | | | 22,011,354 |
See accompanying notes which are an integral part of the financial statements.
23 Annual Report
| Investments continued | | | | |
| |
| Common Stocks continued | | | | |
| | | Shares | | Value (Note 1) |
| |
| UTILITIES – 0.6% | | | | |
| Electric Utilities – 0.2% | | | | |
| PPL Corp. | | 50,600 | | $ 1,487,640 |
| Westar Energy, Inc. | | 20,000 | | 452,400 |
| | | | | 1,940,040 |
| Independent Power Producers & Energy Traders – 0.1% | | | | |
| AES Corp. (a) | | 55,600 | | 876,812 |
| TXU Corp. | | 5,460 | | 560,360 |
| | | | | 1,437,172 |
| Multi-Utilities – 0.3% | | | | |
| CMS Energy Corp. (a) | | 84,700 | | 1,184,106 |
| PG&E Corp. | | 35,200 | | 1,294,656 |
| | | | | 2,478,762 |
| |
| TOTAL UTILITIES | | | | 5,855,974 |
| |
| TOTAL COMMON STOCKS | | | | |
| (Cost $602,537,612) | | | | 692,578,052 |
| |
| Preferred Stocks 15.3% | | | | |
| |
| Convertible Preferred Stocks 6.0% | | | | |
| |
| CONSUMER DISCRETIONARY – 0.2% | | | | |
| Hotels, Restaurants & Leisure 0.2% | | | | |
| Six Flags, Inc. 7.25% PIERS | | 82,700 | | 1,889,695 |
| Media – 0.0% | | | | |
| Emmis Communications Corp. Series A, 6.25% | | 10,100 | | 463,716 |
| |
| TOTAL CONSUMER DISCRETIONARY | | | | 2,353,411 |
| |
| ENERGY 2.7% | | | | |
| Oil, Gas & Consumable Fuels – 2.7% | | | | |
| Chesapeake Energy Corp. 4.50% | | 15,000 | | 1,353,750 |
| El Paso Corp. 4.99% (g) | | 10,000 | | 10,328,900 |
| Teekay Shipping Corp. Series A, 7.25% | | 125,000 | | 6,011,250 |
| Valero Energy Corp. 2.00% | | 96,600 | | 9,207,912 |
| | | | | 26,901,812 |
| |
| FINANCIALS – 0.6% | | | | |
| Diversified Financial Services – 0.2% | | | | |
| Carriage Services Capital Trust 7.00% TIDES | | 45,000 | | 1,822,500 |
See accompanying notes which are an integral part of the financial statements.
| Preferred Stocks continued | | | | |
| | | Shares | | Value (Note 1) |
| Convertible Preferred Stocks continued | | | | |
| |
| FINANCIALS – continued | | | | |
| Insurance – 0.4% | | | | |
| Fortis Insurance NV 7.75% (g) | | 3,734 | | $ 4,564,815 |
| |
| TOTAL FINANCIALS | | | | 6,387,315 |
| |
| INDUSTRIALS – 0.1% | | | | |
| Road & Rail 0.1% | | | | |
| Kansas City Southern 4.25% | | 1,370 | | 1,159,664 |
| MATERIALS 1.2% | | | | |
| Chemicals – 0.7% | | | | |
| Celanese Corp. 4.25% | | 252,600 | | 6,605,490 |
| Containers & Packaging – 0.4% | | | | |
| Owens Illinois, Inc. 4.75% | | 113,510 | | 4,143,115 |
| Metals & Mining – 0.1% | | | | |
| Freeport-McMoRan Copper & Gold, Inc. 5.50% (g) | | 1,050 | | 1,191,351 |
| |
| TOTAL MATERIALS | | | | 11,939,956 |
| |
| UTILITIES – 1.2% | | | | |
| Electric Utilities – 0.7% | | | | |
| AES Trust VII 6.00% | | 140,500 | | 6,673,750 |
| Independent Power Producers & Energy Traders – 0.5% | | | | |
| NRG Energy, Inc. 4.00% (g) | | 3,900 | | 4,812,620 |
| |
| TOTAL UTILITIES | | | | 11,486,370 |
| |
| TOTAL CONVERTIBLE PREFERRED STOCKS | | | | 60,228,528 |
| Nonconvertible Preferred Stocks 9.3% | | | | |
| |
| CONSUMER DISCRETIONARY – 0.1% | | | | |
| Household Durables – 0.1% | | | | |
| Hovnanian Enterprises, Inc. Series A, 7.625% | | 40,000 | | 930,000 |
| CONSUMER STAPLES 0.1% | | | | |
| Food Products 0.1% | | | | |
| H.J. Heinz Finance Co. 6.226% | | 10 | | 1,038,500 |
See accompanying notes which are an integral part of the financial statements.
25 Annual Report
| Investments continued | | | | | | |
| |
| Preferred Stocks continued | | | | | | |
| | | Shares | | Value (Note 1) |
| Nonconvertible Preferred Stocks continued | | | | | | |
| |
| FINANCIALS – 6.1% | | | | | | |
| Capital Markets 1.3% | | | | | | |
| Bear Stearns Companies, Inc.: | | | | | | |
| Series E, 6.155% | | 15,000 | | $ | | 748,500 |
| Series G, 5.49% | | 15,000 | | | | 741,000 |
| Goldman Sachs Group, Inc.: | | | | | | |
| Series A, 3.9106% | | 120,000 | | | | 3,054,000 |
| Series C, 4.9931% | | 40,000 | | | | 1,020,000 |
| Lehman Brothers Holdings, Inc. (depositary shares) Series F, | | | | | | |
| 6.50% | | 169,015 | | | | 4,292,981 |
| Merrill Lynch & Co., Inc. Series H, 3.97% | | 120,000 | | | | 2,952,000 |
| | | | | | | 12,808,481 |
| Commercial Banks – 1.4% | | | | | | |
| ABN Amro Capital Funding Trust VII 6.08% | | 40,400 | | | | 965,156 |
| First Tennessee Bank NA, Memphis 3.90% (g) | | 5,000 | | | | 5,000,000 |
| HSBC USA, Inc.: | | | | | | |
| Series F, 3.87% | | 160,000 | | | | 4,048,000 |
| Series G, 4.9175% | | 80,000 | | | | 2,040,800 |
| Santander Finance Preferred SA Unipersonal 6.41% | | 69,400 | | | | 1,743,675 |
| | | | | | | 13,797,631 |
| Consumer Finance – 0.3% | | | | | | |
| SLM Corp.: | | | | | | |
| 4.07% | | 10,000 | | | | 1,010,000 |
| Series A, 6.97% | | 43,400 | | | | 2,317,560 |
| | | | | | | 3,327,560 |
| Diversified Financial Services – 0.2% | | | | | | |
| ABN AMRO Capital Funding Trust V 5.90% | | 20,000 | | | | 467,600 |
| CIT Group, Inc. Series B, 5.189% | | 15,000 | | | | 1,485,900 |
| JPMorgan Chase & Co. (depositary shares) Series H, 6.625% . | | 6,530 | | | | 332,377 |
| | | | | | | 2,285,877 |
| Insurance – 0.2% | | | | | | |
| AmerUs Group Co. 7.25% | | 40,000 | | | | 994,000 |
| MetLife, Inc. Series A, 4.39% | | 40,000 | | | | 1,029,600 |
| | | | | | | 2,023,600 |
| Real Estate 0.7% | | | | | | |
| Apartment Investment & Management Co.: | | | | | | |
| Series Q, 10.10% | | 46,510 | | | | 1,175,308 |
| Series V, 8.00% | | 79,000 | | | | 1,982,900 |
| Duke Realty Corp. (depositary shares) Series K, 6.50% | | 95,800 | | | | 2,268,544 |
See accompanying notes which are an integral part of the financial statements.
| Preferred Stocks continued | | | | | | |
| | | Shares | | Value (Note 1) |
| Nonconvertible Preferred Stocks continued | | | | | | |
| |
| FINANCIALS – continued | | | | | | |
| Real Estate continued | | | | | | |
| Host Marriott Corp. Series E, 8.875% | | 20,000 | | $ | | 547,000 |
| Vornado Realty Trust Series E, 7.00% | | 40,000 | | | | 1,003,200 |
| | | | | | | 6,976,952 |
| Thrifts & Mortgage Finance – 2.0% | | | | | | |
| Fannie Mae: | | | | | | |
| 7.00% | | 42,200 | | | | 2,346,320 |
| Series H, 5.81% | | 49,200 | | | | 2,290,260 |
| Series L, 5.125% | | 90,900 | | | | 3,858,705 |
| Series N, 5.50% | | 71,650 | | | | 3,144,002 |
| Freddie Mac: | | | | | | |
| Series F, 5.00% | | 58,500 | | | | 2,433,600 |
| Series H, 5.10% | | 10,300 | | | | 432,600 |
| Series K, 5.79% | | 35,200 | | | | 1,687,840 |
| Series O, 5.81% | | 19,500 | | | | 965,250 |
| Series R, 5.70% | | 57,000 | | | | 2,716,050 |
| | | | | | | 19,874,627 |
| |
| TOTAL FINANCIALS | | | | | | 61,094,728 |
| |
| INDUSTRIALS – 0.1% | | | | | | |
| Aerospace & Defense – 0.1% | | | | | | |
| RC Trust I 7.00% | | 9,680 | | | | 488,235 |
| |
| MATERIALS 0.1% | | | | | | |
| Chemicals – 0.1% | | | | | | |
| E.I. du Pont de Nemours & Co. Series B, 4.50% | | 9,900 | | | | 841,500 |
| Metals & Mining – 0.0% | | | | | | |
| Alcoa, Inc. 3.75% | | 6,400 | | | | 468,480 |
| |
| TOTAL MATERIALS | | | | | | 1,309,980 |
| |
| UTILITIES – 2.8% | | | | | | |
| Electric Utilities – 2.4% | | | | | | |
| Alabama Power Co. 5.30% | | 88,600 | | | | 2,075,012 |
| Duquesne Light Co. 6.50% | | 106,050 | | | | 5,456,273 |
| FPL Group Capital Trust I 5.875% | | 20,000 | | | | 471,200 |
| Heco Capital Trust III 6.50% | | 12,000 | | | | 307,440 |
| Pacific Gas & Electric Co.: | | | | | | |
| Series A, 5.00% | | 16,900 | | | | 355,745 |
See accompanying notes which are an integral part of the financial statements.
27 Annual Report
| Investments continued | | | | |
| |
| Preferred Stocks continued | | | | |
| | | Shares | | Value (Note 1) |
| Nonconvertible Preferred Stocks continued | | | | |
| |
| UTILITIES – continued | | | | |
| Electric Utilities – continued | | | | |
| Pacific Gas & Electric Co.: – continued | | | | |
| Series B, 5.50% | | 61,900 | | $ 1,420,605 |
| Series D 5.00% | | 69,200 | | 1,439,360 |
| Southern California Edison Co.: | | | | |
| 4.78% | | 46,500 | | 988,125 |
| 5.349% | | 40,000 | | 4,040,000 |
| 6.125% | | 30,000 | | 3,000,000 |
| Series B, 4.08% | | 27,271 | | 538,602 |
| Series C, 4.24% | | 94,600 | | 1,797,400 |
| Series D, 4.32% | | 70,000 | | 1,344,000 |
| | | | | 23,233,762 |
| Multi-Utilities – 0.4% | | | | |
| Consolidated Edison Co. of New York, Inc. Series A, 5.00% | | 28,705 | | 2,513,123 |
| San Diego Gas & Electric Co. 1.70% | | 67,548 | | 1,745,697 |
| | | | | 4,258,820 |
| |
| TOTAL UTILITIES | | | | 27,492,582 |
| |
| TOTAL NONCONVERTIBLE PREFERRED STOCKS | | | | 92,354,025 |
| |
| TOTAL PREFERRED STOCKS | | | | |
| (Cost $148,071,869) | | | | 152,582,553 |
See accompanying notes which are an integral part of the financial statements.
| Money Market Funds 2.5% | | | | | | | | |
| | | | | Shares | | | | Value (Note 1) |
| Fidelity Cash Central Fund, 4.08% (b) | | | | 22,090,879 | | $ | | 22,090,879 |
| Fidelity Securities Lending Cash Central Fund, | | | | | | |
| 4.09% (b)(c) | | | | 2,434,150 | | | | 2,434,150 |
| TOTAL MONEY MARKET FUNDS | | | | | | | | |
| (Cost $24,525,029) | | | | | | | | 24,525,029 |
| TOTAL INVESTMENT PORTFOLIO 100.0% | | | | | | |
| (Cost $897,074,394) | | | | | | | | 995,745,167 |
| |
| NET OTHER ASSETS – 0.0% | | | | | | | | 428,432 |
| NET ASSETS 100% | | | | | | $ | | 996,173,599 |
| Security Type Abbreviations |
| PIERS | | — | | Preferred Income Equity |
| | | | | Redeemable Securities |
| TIDES | | — | | Term Income Deferred Equity |
| | | | | Securities |
Legend
(a) Non-income producing
(b) Affiliated fund that is available only to
investment companies and other
accounts managed by Fidelity
Investments. The rate quoted is the
annualized seven-day yield of the fund
at period end. A complete unaudited
listing of the fund’s holdings as of its
most recent quarter end is available
upon request.
(c) Investment made with cash collateral
received from securities on loan.
|
(d) Non-income producing – Issuer is in
default.
(e) Debt obligation initially issued at one
coupon which converts to a higher
coupon at a specified date. The rate
shown is the rate at period end.
(f) Security or a portion of the security is on
loan at period end.
(g) Security exempt from registration under
Rule 144A of the Securities Act of 1933.
These securities may be resold in
transactions exempt from registration,
normally to qualified institutional buyers.
At the period end, the value of these
securities amounted to $38,529,622 or
3.9% of net assets.
(h) The coupon rate shown on floating or
adjustable rate securities represents the
rate at period end.
|
Affiliated Central Funds
Information regarding income received by the fund from the affiliated Central funds during the period is as follows:
| Fund | | | | Income received |
| Fidelity Cash Central Fund | | | $ | 597,880 |
| Fidelity Securities Lending Cash Central Fund | | | | 41,671 |
| Total | | | $ | 639,551 |
See accompanying notes which are an integral part of the financial statements.
29 Annual Report
Investments continued
Other Information
The composition of credit quality ratings as a percentage of net assets is as follows (ratings are unaudited):
| AAA, AA, A | | 1.7% |
| BBB | | 1.2% |
| BB | | 2.2% |
| B | | 2.7% |
| CCC, CC, C | | 2.1% |
| D | | 0.2% |
| Not Rated | | 2.6% |
| Equities | | 84.8% |
| Short Term Investments and Net | | |
| Other Assets | | 2.5% |
| | | 100.0% |
We have used ratings from Moody’s® Investors Services, Inc. Where Moody’s ratings are not available, we have used S&P® ratings. Percentages are adjusted for the effect of futures contracts, if applicable.
See accompanying notes which are an integral part of the financial statements.
Annual Report 30
| Financial Statements | | | | | | | | |
| |
| |
| Statement of Assets and Liabilities | | | | | | | | |
| | | | | | | November 30, 2005 |
| |
| Assets | | | | | | | | |
| Investment in securities, at value (including securities | | | | | | | | |
| loaned of $2,392,488) See accompanying | | | | | | | | |
| schedule: | | | | | | | | |
| Unaffiliated issuers (cost $872,549,365) | | $ | | 971,220,138 | | | | |
| Affiliated Central Funds (cost $24,525,029) | | | | 24,525,029 | | | | |
| Total Investments (cost $897,074,394) | | | | | | $ | | 995,745,167 |
| Cash | | | | | | | | 68,659 |
| Receivable for investments sold | | | | | | | | 6,337,511 |
| Receivable for fund shares sold | | | | | | | | 1,953,755 |
| Dividends receivable | | | | | | | | 1,526,164 |
| Interest receivable | | | | | | | | 935,785 |
| Prepaid expenses | | | | | | | | 4,886 |
| Receivable from investment adviser for expense | | | | | | | | |
| reductions | | | | | | | | 9 |
| Other receivables | | | | | | | | 49,770 |
| Total assets | | | | | | | | 1,006,621,706 |
| |
| Liabilities | | | | | | | | |
| Payable for investments purchased | | $ | | 6,206,782 | | | | |
| Payable for fund shares redeemed | | | | 1,036,991 | | | | |
| Accrued management fee | | | | 462,756 | | | | |
| Distribution fees payable | | | | 96,374 | | | | |
| Other affiliated payables | | | | 181,958 | | | | |
| Other payables and accrued expenses | | | | 29,096 | | | | |
| Collateral on securities loaned, at value | | | | 2,434,150 | | | | |
| Total liabilities | | | | | | | | 10,448,107 |
| |
| Net Assets | | | | | | $ | | 996,173,599 |
| Net Assets consist of: | | | | | | | | |
| Paid in capital | | | | | | $ | | 884,247,267 |
| Undistributed net investment income | | | | | | | | 3,125,667 |
| Accumulated undistributed net realized gain (loss) on | | | | | | | | |
| investments and foreign currency transactions | | | | | | | | 10,129,892 |
| Net unrealized appreciation (depreciation) on | | | | | | | | |
| investments | | | | | | | | 98,670,773 |
| Net Assets | | | | | | $ | | 996,173,599 |
See accompanying notes which are an integral part of the financial statements.
31 Annual Report
| Financial Statements continued | | | | |
| |
| Statement of Assets and Liabilities continued | | | | |
| | | November 30, 2005 |
| |
| Calculation of Maximum Offering Price | | | | |
| Class A: | | | | |
| Net Asset Value and redemption price per share | | | | |
| ($38,885,723 ÷ 3,191,319 shares) | | $ | | 12.18 |
| |
| Maximum offering price per share (100/94.25 of $12.18) | | $ | | 12.92 |
| Class T: | | | | |
| Net Asset Value and redemption price per share | | | | |
| ($79,920,243 ÷ 6,567,201 shares) | | $ | | 12.17 |
| |
| Maximum offering price per share (100/96.50 of $12.17) | | $ | | 12.61 |
| Class B: | | | | |
| Net Asset Value and offering price per share | | | | |
| ($19,743,710 ÷ 1,625,798 shares)A | | $ | | 12.14 |
| |
| Class C: | | | | |
| Net Asset Value and offering price per share | | | | |
| ($49,712,764 ÷ 4,091,976 shares)A | | $ | | 12.15 |
| |
| Strategic Dividend & Income: | | | | |
| Net Asset Value, offering price and redemption price per | | | | |
| share ($798,113,368 ÷ 65,333,621 shares) | | $ | | 12.22 |
| |
| Institutional Class: | | | | |
| Net Asset Value, offering price and redemption price per | | | | |
| share ($9,797,791 ÷ 802,532 shares) | | $ | | 12.21 |
| |
| A Redemption price per share is equal to net asset value less any applicable contingent deferred sales charge. | | | | |
See accompanying notes which are an integral part of the financial statements.
Annual Report 32
| Statement of Operations | | | | | | |
| | | | | Year ended November 30, 2005 |
| |
| Investment Income | | | | | | |
| Dividends | | | | | | $ 18,836,322 |
| Interest | | | | | | 3,135,959 |
| Income from affiliated Central Funds | | | | | | 639,551 |
| Total income | | | | | | 22,611,832 |
| |
| Expenses | | | | | | |
| Management fee | | $ | | 4,715,492 | | |
| Transfer agent fees | | | | 1,633,903 | | |
| Distribution fees | | | | 948,528 | | |
| Accounting and security lending fees | | | | 301,582 | | |
| Independent trustees’ compensation | | | | 3,582 | | |
| Custodian fees and expenses | | | | 34,296 | | |
| Registration fees | | | | 129,298 | | |
| Audit | | | | 37,554 | | |
| Legal | | | | 3,378 | | |
| Miscellaneous | | | | 29,118 | | |
| Total expenses before reductions | | | | 7,836,731 | | |
| Expense reductions | | | | (214,848) | | 7,621,883 |
| |
| Net investment income (loss) | | | | | | 14,989,949 |
| Realized and Unrealized Gain (Loss) | | | | | | |
| Net realized gain (loss) on: | | | | | | |
| Investment securities: | | | | | | |
| Unaffiliated issuers | | | | 18,346,538 | | |
| Foreign currency transactions | | | | 1,294 | | |
| Futures contracts | | | | 364,449 | | |
| Total net realized gain (loss) | | | | | | 18,712,281 |
| Change in net unrealized appreciation (depreciation) on: | | | | | | |
| Investment securities | | | | 59,851,577 | | |
| Futures contracts | | | | (290,281) | | |
| Total change in net unrealized appreciation | | | | | | |
| (depreciation) | | | | | | 59,561,296 |
| Net gain (loss) | | | | | | 78,273,577 |
| Net increase (decrease) in net assets resulting from | | | | | | |
| operations | | | | | | $ 93,263,526 |
See accompanying notes which are an integral part of the financial statements.
33 Annual Report
| Financial Statements continued | | | | | | | | |
| |
| Statement of Changes in Net Assets | | | | | | | | |
| | | | | | | For the period |
| | | | | | | December 23, 2003 |
| | | | | Year ended | | (commencement |
| | | | | November 30, | | of operations) to |
| | | | | 2005 | | November 30, 2004 |
| Increase (Decrease) in Net Assets | | | | | | | | |
| Operations | | | | | | | | |
| Net investment income (loss) | | $ | | 14,989,949 | | $ | | 6,636,433 |
| Net realized gain (loss) | | | | 18,712,281 | | | | (8,238,032) |
| Change in net unrealized appreciation (depreciation) | | | | 59,561,296 | | | | 39,109,477 |
| Net increase (decrease) in net assets resulting | | | | | | | | |
| from operations | | | | 93,263,526 | | | | 37,507,878 |
| Distributions to shareholders from net investment income | | | | (14,194,615) | | | | (4,647,719) |
| Share transactions - net increase (decrease) | | | | 335,336,361 | | | | 548,908,168 |
| Total increase (decrease) in net assets | | | | 414,405,272 | | | | 581,768,327 |
| |
| Net Assets | | | | | | | | |
| Beginning of period | | | | 581,768,327 | | | | — |
| End of period (including undistributed net investment | | | | | | | | |
| income of $3,125,667 and undistributed net in- | | | | | | | | |
| vestment income of $2,463,649, respectively) | | $ | | 996,173,599 | | $ | | 581,768,327 |
See accompanying notes which are an integral part of the financial statements.
| Financial Highlights Class A | | | | | | | | |
| |
| Years ended November 30, | | | | 2005 | | | | 2004F |
| Selected Per Share Data | | | | | | | | |
| Net asset value, beginning of period | | | | $ 11.09 | | | | $ 10.00 |
| Income from Investment Operations | | | | | | | | |
| Net investment income (loss)E | | | | 18 | | | | .16 |
| Net realized and unrealized gain (loss) | | | | 1.10 | | | | 1.04 |
| Total from investment operations | | | | 1.28 | | | | 1.20 |
| Distributions from net investment income | | | | (.19) | | | | (.11) |
| Net asset value, end of period | | | | $ 12.18 | | | | $ 11.09 |
| Total ReturnB,C,D | | | | 11.63% | | | | 12.01% |
| Ratios to Average Net AssetsG | | | | | | | | |
| Expenses before reductions | | | | 1.16% | | | | 1.20%A |
| Expenses net of fee waivers, if any | | | | 1.16% | | | | 1.20%A |
| Expenses net of all reductions | | | | 1.13% | | | | 1.17%A |
| Net investment income (loss) | | | | 1.60% | | | | 1.67%A |
| Supplemental Data | | | | | | | | |
| Net assets, end of period (000 omitted) | | | | $ 38,886 | | $ 21,985 |
| Portfolio turnover rate | | | | 64% | | | | 66%A |
A Annualized
B Total returns for periods of less than one year are not annualized.
C Total returns would have been lower had certain expenses not been reduced during the periods shown.
D Total returns do not include the effect of the sales charges.
E Calculated based on average shares outstanding during the period.
F For the period December 23, 2003 (commencement of operations) to November 30, 2004.
G Expense ratios reflect operating expenses of the class. Expenses before reductions do not reflect amounts reimbursed by the investment adviser or
reductions from brokerage service arrangements or other expense offset arrangements and do not represent the amount paid by the class during
periods when reimbursements or reductions occur. Expense ratios before reductions for start up periods may not be representative of longer term
operating periods. Expenses net of fee waivers reflect expenses after reimbursement by the investment adviser but prior to reductions from
brokerage service arrangements or other expense offset arrangements. Expenses net of all reductions represent the net expenses paid by the
class.
|
See accompanying notes which are an integral part of the financial statements.
35 Annual Report
| Financial Highlights Class T | | | | | | | | |
| |
| Years ended November 30, | | | | 2005 | | | | 2004F |
| Selected Per Share Data | | | | | | | | |
| Net asset value, beginning of period | | | | $11.08 | | | | $10.00 |
| Income from Investment Operations | | | | | | | | |
| Net investment income (loss)E | | | | 16 | | | | .13 |
| Net realized and unrealized gain (loss) | | | | 1.09 | | | | 1.04 |
| Total from investment operations | | | | 1.25 | | | | 1.17 |
| Distributions from net investment income | | | | (.16) | | | | (.09) |
| Net asset value, end of period | | | | $12.17 | | | | $11.08 |
| Total ReturnB,C,D | | | | 11.43% | | | | 11.75% |
| Ratios to Average Net AssetsG | | | | | | | | |
| Expenses before reductions | | | | 1.38% | | | | 1.45%A |
| Expenses net of fee waivers, if any | | | | 1.38% | | | | 1.45%A |
| Expenses net of all reductions | | | | 1.35% | | | | 1.42%A |
| Net investment income (loss) | | | | 1.38% | | | | 1.43%A |
| Supplemental Data | | | | | | | | |
| Net assets, end of period (000 omitted) | | | | $79,920 | | $36,526 |
| Portfolio turnover rate | | | | 64% | | | | 66%A |
A Annualized
B Total returns for periods of less than one year are not annualized.
C Total returns would have been lower had certain expenses not been reduced during the periods shown.
D Total returns do not include the effect of the sales charges.
E Calculated based on average shares outstanding during the period.
F For the period December 23, 2003 (commencement of operations) to November 30, 2004.
G Expense ratios reflect operating expenses of the class. Expenses before reductions do not reflect amounts reimbursed by the investment adviser or
reductions from brokerage service arrangements or other expense offset arrangements and do not represent the amount paid by the class during
periods when reimbursements or reductions occur. Expense ratios before reductions for start up periods may not be representative of longer term
operating periods. Expenses net of fee waivers reflect expenses after reimbursement by the investment adviser but prior to reductions from
brokerage service arrangements or other expense offset arrangements. Expenses net of all reductions represent the net expenses paid by the
class.
|
See accompanying notes which are an integral part of the financial statements.
| Financial Highlights Class B | | | | | | | | |
| |
| Years ended November 30, | | | | 2005 | | | | 2004F |
| Selected Per Share Data | | | | | | | | |
| Net asset value, beginning of period | | | | $ 11.06 | | | | $ 10.00 |
| Income from Investment Operations | | | | | | | | |
| Net investment income (loss)E | | | | 09 | | | | .09 |
| Net realized and unrealized gain (loss) | | | | 1.09 | | | | 1.03 |
| Total from investment operations | | | | 1.18 | | | | 1.12 |
| Distributions from net investment income | | | | (.10) | | | | (.06) |
| Net asset value, end of period | | | | $ 12.14 | | | | $ 11.06 |
| Total ReturnB,C,D | | | | 10.73% | | | | 11.24% |
| Ratios to Average Net AssetsG | | | | | | | | |
| Expenses before reductions | | | | 1.96% | | | | 1.99%A |
| Expenses net of fee waivers, if any | | | | 1.95% | | | | 1.95%A |
| Expenses net of all reductions | | | | 1.93% | | | | 1.92%A |
| Net investment income (loss) | | | | 81% | | | | .92%A |
| Supplemental Data | | | | | | | | |
| Net assets, end of period (000 omitted) | | $19,744 | | $13,457 |
| Portfolio turnover rate | | | | 64% | | | | 66%A |
A Annualized
B Total returns for periods of less than one year are not annualized.
C Total returns would have been lower had certain expenses not been reduced during the periods shown.
D Total returns do not include the effect of the contingent deferred sales charge.
E Calculated based on average shares outstanding during the period.
F For the period December 23, 2003 (commencement of operations) to November 30, 2004.
G Expense ratios reflect operating expenses of the class. Expenses before reductions do not reflect amounts reimbursed by the investment adviser or
reductions from brokerage service arrangements or other expense offset arrangements and do not represent the amount paid by the class during
periods when reimbursements or reductions occur. Expense ratios before reductions for start up periods may not be representative of longer term
operating periods. Expenses net of fee waivers reflect expenses after reimbursement by the investment adviser but prior to reductions from
brokerage service arrangements or other expense offset arrangements. Expenses net of all reductions represent the net expenses paid by the
class.
|
See accompanying notes which are an integral part of the financial statements.
37 Annual Report
| Financial Highlights Class C | | | | | | | | |
| |
| Years ended November 30, | | | | 2005 | | | | 2004F |
| Selected Per Share Data | | | | | | | | |
| Net asset value, beginning of period | | | | $ 11.06 | | | | $ 10.00 |
| Income from Investment Operations | | | | | | | | |
| Net investment income (loss)E | | | | 10 | | | | .09 |
| Net realized and unrealized gain (loss) | | | | 1.09 | | | | 1.03 |
| Total from investment operations | | | | 1.19 | | | | 1.12 |
| Distributions from net investment income | | | | (.10) | | | | (.06) |
| Net asset value, end of period | | | | $ 12.15 | | | | $ 11.06 |
| Total ReturnB,C,D | | | | 10.85% | | | | 11.24% |
| Ratios to Average Net AssetsG | | | | | | | | |
| Expenses before reductions | | | | 1.90% | | | | 1.94%A |
| Expenses net of fee waivers, if any | | | | 1.90% | | | | 1.94%A |
| Expenses net of all reductions | | | | 1.87% | | | | 1.92%A |
| Net investment income (loss) | | | | 86% | | | | .93%A |
| Supplemental Data | | | | | | | | |
| Net assets, end of period (000 omitted) | | $49,713 | | $28,795 |
| Portfolio turnover rate | | | | 64% | | | | 66%A |
A Annualized
B Total returns for periods of less than one year are not annualized.
C Total returns would have been lower had certain expenses not been reduced during the periods shown.
D Total returns do not include the effect of the contingent deferred sales charge.
E Calculated based on average shares outstanding during the period.
F For the period December 23, 2003 (commencement of operations) to November 30, 2004.
G Expense ratios reflect operating expenses of the class. Expenses before reductions do not reflect amounts reimbursed by the investment adviser or
reductions from brokerage service arrangements or other expense offset arrangements and do not represent the amount paid by the class during
periods when reimbursements or reductions occur. Expense ratios before reductions for start up periods may not be representative of longer term
operating periods. Expenses net of fee waivers reflect expenses after reimbursement by the investment adviser but prior to reductions from
brokerage service arrangements or other expense offset arrangements. Expenses net of all reductions represent the net expenses paid by the
class.
|
See accompanying notes which are an integral part of the financial statements.
| Financial Highlights Strategic Dividend & Income | | | | |
| |
| Years ended November 30, | | | | 2005 | | | | 2004E |
| Selected Per Share Data | | | | | | | | |
| Net asset value, beginning of period | | | | $ 11.11 | | | | $ 10.00 |
| Income from Investment Operations | | | | | | | | |
| Net investment income (loss)D | | | | 22 | | | | .19 |
| Net realized and unrealized gain (loss) | | | | 1.11 | | | | 1.04 |
| Total from investment operations | | | | 1.33 | | | | 1.23 |
| Distributions from net investment income | | | | (.22) | | | | (.12) |
| Net asset value, end of period | | | | $ 12.22 | | | | $ 11.11 |
| Total ReturnB,C | | | | 12.08% | | | | 12.32% |
| Ratios to Average Net AssetsF | | | | | | | | |
| Expenses before reductions | | | | 82% | | | | .90%A |
| Expenses net of fee waivers, if any | | | | 82% | | | | .90%A |
| Expenses net of all reductions | | | | 79% | | | | .87%A |
| Net investment income (loss) | | | | 1.94% | | | | 1.98%A |
| Supplemental Data | | | | | | | | |
| Net assets, end of period (000 omitted) | | $798,113 | | $476,032 |
| Portfolio turnover rate | | | | 64% | | | | 66%A |
A Annualized
B Total returns for periods of less than one year are not annualized.
C Total returns would have been lower had certain expenses not been reduced during the periods shown.
D Calculated based on average shares outstanding during the period.
E For the period December 23, 2003 (commencement of operations) to November 30, 2004.
F Expense ratios reflect operating expenses of the class. Expenses before reductions do not reflect amounts reimbursed by the investment adviser or
reductions from brokerage service arrangements or other expense offset arrangements and do not represent the amount paid by the class during
periods when reimbursements or reductions occur. Expense ratios before reductions for start up periods may not be representative of longer term
operating periods. Expenses net of fee waivers reflect expenses after reimbursement by the investment adviser but prior to reductions from
brokerage service arrangements or other expense offset arrangements. Expenses net of all reductions represent the net expenses paid by the
class.
|
See accompanying notes which are an integral part of the financial statements.
39 Annual Report
| Financial Highlights Institutional Class | | | | | | | | |
| |
| Years ended November 30, | | | | 2005 | | | | 2004E |
| Selected Per Share Data | | | | | | | | |
| Net asset value, beginning of period | | | | $ 11.11 | | | | $ 10.00 |
| Income from Investment Operations | | | | | | | | |
| Net investment income (loss)D | | | | 22 | | | | .19 |
| Net realized and unrealized gain (loss) | | | | 1.10 | | | | 1.04 |
| Total from investment operations | | | | 1.32 | | | | 1.23 |
| Distributions from net investment income | | | | (.22) | | | | (.12) |
| Net asset value, end of period | | | | $ 12.21 | | | | $ 11.11 |
| Total ReturnB,C | | | | 11.98% | | | | 12.38% |
| Ratios to Average Net AssetsF | | | | | | | | |
| Expenses before reductions | | | | 83% | | | | .88%A |
| Expenses net of fee waivers, if any | | | | 83% | | | | .88%A |
| Expenses net of all reductions | | | | 81% | | | | .85%A |
| Net investment income (loss) | | | | 1.93% | | | | 2.00%A |
| Supplemental Data | | | | | | | | |
| Net assets, end of period (000 omitted) | | | | $ 9,798 | | | | $ 4,973 |
| Portfolio turnover rate | | | | 64% | | | | 66%A |
A Annualized
B Total returns for periods of less than one year are not annualized.
C Total returns would have been lower had certain expenses not been reduced during the periods shown.
D Calculated based on average shares outstanding during the period.
E For the period December 23, 2003 (commencement of operations) to November 30, 2004.
F Expense ratios reflect operating expenses of the class. Expenses before reductions do not reflect amounts reimbursed by the investment adviser or
reductions from brokerage service arrangements or other expense offset arrangements and do not represent the amount paid by the class during
periods when reimbursements or reductions occur. Expense ratios before reductions for start up periods may not be representative of longer term
operating periods. Expenses net of fee waivers reflect expenses after reimbursement by the investment adviser but prior to reductions from
brokerage service arrangements or other expense offset arrangements. Expenses net of all reductions represent the net expenses paid by the
class.
|
See accompanying notes which are an integral part of the financial statements.
Notes to Financial Statements
For the period ended November 30, 2005
1. Significant Accounting Policies.
Fidelity Strategic Dividend & Income Fund (the fund) is a non diversified fund of Fidelity Financial Trust (the trust) and is authorized to issue an unlimited number of shares. The trust is registered under the Investment Company Act of 1940, as amended (the 1940 Act), as an open end management investment company organized as a Massa chusetts business trust.
The fund offers Class A, Class T, Class B, Class C, Strategic Dividend & Income, and Institutional Class shares, each of which has equal rights as to assets and voting privi leges. Each class has exclusive voting rights with respect to matters that affect that class. Class B shares will automatically convert to Class A shares after a holding period of seven years from the initial date of purchase. Investment income, realized and unrealized capital gains and losses, the common expenses of the fund, and certain fund level expense reductions, if any, are allocated on a pro rata basis to each class based on the relative net assets of each class to the total net assets of the fund. Each class differs with respect to transfer agent and distribution and service plan fees incurred. Certain ex pense reductions also differ by class.
The fund may invest in affiliated money market central funds (Money Market Central Funds) which are open end investment companies available to investment companies and other accounts managed by Fidelity Management & Research Company (FMR) and its affiliates. The financial statements have been prepared in conformity with accounting principles generally accepted in the United States of America, which require manage ment to make certain estimates and assumptions at the date of the financial statements. The following summarizes the significant accounting policies of the fund:
Security Valuation. Investments are valued and net asset value (NAV) per share is calculated (NAV calculation) as of the close of business of the New York Stock Exchange (NYSE), normally 4:00 p.m. Eastern time. Wherever possible, the fund uses independent pricing services approved by the Board of Trustees to value its investments.
Equity securities, including restricted securities, for which market quotations are readily available, are valued at the last reported sale price or official closing price as reported by an independent pricing service on the primary market or exchange on which they are traded. In the event there were no sales during the day or closing prices are not available, securities are valued at the last quoted bid price. Debt securities, including restricted securities, for which quotations are readily available, are valued by independent pricing services or by dealers who make markets in such securities. Pricing services consider yield or price of bonds of comparable quality, coupon, maturity and type as well as dealer supplied prices. Investments in open end mutual funds, are valued at their closing net asset value each business day. Short term securities with remaining maturities of sixty days or less for which quotations are not readily available are valued at amortized cost, which approximates value.
41 Annual Report
Notes to Financial Statements continued
1. Significant Accounting Policies continued
Security Valuation continued
When current market prices or quotations are not readily available or do not accurately reflect fair value, valuations may be determined in accordance with procedures adopted by the Board of Trustees. For example, when developments occur between the close of a market and the close of the NYSE that may materially affect the value of some or all of the securities, or when trading in a security is halted, those securities may be fair valued. Factors used in the determination of fair value may include monitoring news to identify significant market or security specific events such as changes in the value of U.S. securi ties market, reviewing developments in foreign markets and evaluating the performance of ADRs, futures contracts and exchange traded funds. Because the fund’s utilization of fair value pricing depends on market activity, the frequency with which fair value pricing is used can not be predicted and may be utilized to a significant extent. The value of securities used for NAV calculation under fair value pricing may differ from published prices for the same securities.
Foreign Currency. The fund uses foreign currency contracts to facilitate transactions in foreign denominated securities. Losses from these transactions may arise from changes in the value of the foreign currency or if the counterparties do not perform under the contracts’ terms.
Foreign denominated assets, including investment securities, and liabilities are trans lated into U.S. dollars at the exchange rate at period end. Purchases and sales of invest ment securities, income and dividends received and expenses denominated in foreign currencies are translated into U.S. dollars at the exchange rate in effect on the transac tion date.
The effects of exchange rate fluctuations on investments are included with the net realized and unrealized gain (loss) on investment securities. Other foreign currency transactions resulting in realized and unrealized gain (loss) are disclosed separately.
Investment Transactions and Income. Security transactions are accounted for as of trade date. Gains and losses on securities sold are determined on the basis of identified cost. Dividend income is recorded on the ex dividend date, except for certain dividends from foreign securities where the ex dividend date may have passed, which are recorded as soon as the fund is informed of the ex dividend date. Non cash dividends included in dividend income, if any, are recorded at the fair market value of the securities received. Distributions received on securities that represent a return of capital or capital gain are recorded as a reduction of cost of investments and/or as a realized gain. The fund esti mates the components of distributions received that may be considered return of capital distributions or capital gain distributions. Interest income is accrued as earned. Interest
1. Significant Accounting Policies continued
Investment Transactions and Income continued
income includes coupon interest and amortization of premium and accretion of discount on debt securities. Investment income is recorded net of foreign taxes withheld where recovery of such taxes is uncertain. Debt obligations may be placed on a non accrual status and related interest income may be reduced by ceasing current accruals and writing off interest receivables when the collection of all or a portion of interest has become doubtful based on consistently applied procedures. A debt obligation is removed from non accrual status when the issuer resumes interest payments or when collect ibility of interest is reasonably assured.
Expenses. Most expenses of the trust can be directly attributed to a fund. Expenses which cannot be directly attributed are apportioned among each fund in the trust.
Income Tax Information and Distributions to Shareholders. Each year, the fund intends to qualify as a regulated investment company by distributing all of its taxable income and realized gains under Subchapter M of the Internal Revenue Code. As a result, no provision for income taxes is required in the accompanying financial statements. Foreign taxes are provided for based on the fund’s understanding of the tax rules and rates that exist in the foreign markets in which it invests.
Distributions are recorded on the ex dividend date. Income dividends and capital gain distributions are declared separately for each class. Income and capital gain distribu tions are determined in accordance with income tax regulations, which may differ from generally accepted accounting principles. In addition, the fund will claim a portion of the payment made to redeeming shareholders as a distribution for income tax purposes.
Capital accounts within the financial statements are adjusted for permanent book tax differences. These adjustments have no impact on net assets or the results of operations. Temporary book tax differences will reverse in a subsequent period.
Book tax differences are primarily due to futures transactions, foreign currency transac tions, market discount, passive foreign investment companies (PFIC), capital loss carryforwards and losses deferred due to wash sales.
43 Annual Report
| Notes to Financial Statements continued | | |
| |
1. Significant Accounting Policies continued
| | |
| Income Tax Information and Distributions to Shareholders continued |
The tax basis components of distributable earnings and the federal tax cost as of period end were as follows:
| Unrealized appreciation | | $ | | 117,727,083 | | | | |
| Unrealized depreciation | | | | (20,680,574) | | | | |
| Net unrealized appreciation (depreciation) | | | | 97,046,509 | | | | |
| Undistributed ordinary income | | | | 2,727,387 | | | | |
| Undistributed long term capital gain | | | | 10,623,955 | | | | |
| |
| Cost for federal income tax purposes | | $ | | 898,698,658 | | | | |
| |
| The tax character of distributions paid was as follows: | | | | |
| | | | | November 30, 2005 | | | | November 30, 2004 |
| Ordinary Income | | $ | | 14,194,615 | | $ | | 4,647,719 |
| |
| |
| 2. Operating Policies. | | | | | | | | |
Repurchase Agreements. FMR has received an Exemptive Order from the Securities and Exchange Commission (the SEC) which permits the fund and other affiliated entities of FMR to transfer uninvested cash balances into joint trading accounts which are then invested in repurchase agreements. The fund may also invest directly with institutions in repurchase agreements. Repurchase agreements are collateralized by government or non government securities. Collateral is held in segregated accounts with custodian banks and may be obtained in the event of a default of the counterparty. The fund monitors, on a daily basis, the value of the collateral to ensure it is at least equal to the principal amount of the repurchase agreement (including accrued interest). In the event of a default by the counterparty, realization of the collateral proceeds could be delayed, during which time the value of the collateral may decline.
Futures Contracts. The fund may use futures contracts to manage its exposure to the stock market. Buying futures tends to increase a fund’s exposure to the underlying instrument, while selling futures tends to decrease a fund’s exposure to the underlying instrument or hedge other fund investments. Losses may arise from changes in the value of the underlying instruments or if the counterparties do not perform under the con tracts’ terms. Gains (losses) are realized upon the expiration or closing of the futures contracts. Futures contracts are valued at the settlement price established each day by the board of trade or exchange on which they are traded.
Restricted Securities. The fund may invest in securities that are subject to legal or contractual restrictions on resale. These securities generally may be resold in transac tions exempt from registration or to the public if the securities are registered. Disposal of
2. Operating Policies continued
Restricted Securities continued
these securities may involve time consuming negotiations and expense, and prompt sale at an acceptable price may be difficult. Information regarding restricted securities is included at the end of the fund’s Schedule of Investments.
3. Purchases and Sales of Investments.
Purchases and sales of securities, other than short term securities and U.S. government securities, aggregated $861,207,440 and $515,959,184, respectively.
4. Fees and Other Transactions with Affiliates.
Management Fee. FMR and its affiliates provide the fund with investment manage ment related services for which the fund pays a monthly management fee. The manage ment fee is the sum of an individual fund fee rate that is based on an annual rate of .30% of the fund’s average net assets and a group fee rate that averaged .27% during the period. The group fee rate is based upon the average net assets of all the mutual funds advised by FMR. The group fee rate decreases as assets under management increase and increases as assets under management decrease. For the period, the total annual man agement fee rate was .57% of the fund’s average net assets.
Distribution and Service Plan. In accordance with Rule 12b 1 of the 1940 Act, the fund has adopted separate Distribution and Service Plans for each class of shares. Certain classes pay Fidelity Distributors Corporation (FDC), an affiliate of FMR, separate Distribution and Service Fees, each of which is based on an annual percentage of each class’ average net assets. In addition, FDC may pay financial intermediaries for selling shares of the fund and providing shareholder support services. For the period, the Distribution and Service Fee rates and the total amounts paid to and retained by FDC were as follows:
| | | Distribution | | Service | | | | Paid to | | | | Retained |
| | | Fee | | Fee | | | | FDC | | | | by FDC |
| Class A | | 0% | | .25% | | $ | | 76,149 | | $ | | 764 |
| Class T | | 25% | | .25% | | | | 308,412 | | | | 8,604 |
| Class B | | 75% | | .25% | | | | 168,313 | | | | 129,099 |
| Class C | | 75% | | .25% | | | | 395,654 | | | | 169,537 |
| | | | | | | $ | | 948,528 | | $ | | 308,004 |
Sales Load. FDC receives a front end sales charge of up to 5.75% for selling Class A shares, and 3.50% for selling Class T shares, some of which is paid to financial intermedi aries for selling shares of the fund. FDC receives the proceeds of contingent deferred sales charges levied on Class A, Class T, Class B, and Class C redemptions. These charges
45 Annual Report
| Notes to Financial Statements continued | | |
| |
| 4. Fees and Other Transactions with Affiliates continued |
Sales Load continued | | |
depend on the holding period. The deferred sales charges range from 5% to 1% for Class B, 1% for Class C, and .25% for certain purchases of Class A and Class T shares.
For the period, sales charge amounts retained by FDC were as follows:
| | |
| | | | | Retained |
| | | | | by FDC |
| Class A | | | $ | 83,467 |
| Class T | | | | 36,944 |
| Class B* | | | | 28,188 |
| Class C* | | | | 8,440 |
| | | | $ | 157,039 |
* When Class B and Class C shares are initially sold, FDC pays commissions from its own resources to financial intermediaries through which the sales are made.
Transfer Agent Fees. Fidelity Investments Institutional Operations Company, Inc. (FIIOC), an affiliate of FMR, is the transfer, dividend disbursing and shareholder servic ing agent for each class of the fund, except for Strategic Dividend & Income. Fidelity Service Company, Inc. (FSC), an affiliate of FMR, is the transfer agent for Strategic Dividend & Income shares. FIIOC and FSC receive account fees and asset based fees that vary according to the account size and type of account of the shareholders of the respec tive classes of the fund. FIIOC and FSC pay for typesetting, printing and mailing of shareholder reports, except proxy statements. For the period the total transfer agent fees paid by each class to FIIOC or FSC, were as follows:
| | | | | | | % of |
| | | | | | | Average |
| | | | | Amount | | Net Assets |
| Class A | | | $ | 83,483 | | .27 |
| Class T | | | | 150,121 | | .24 |
| Class B | | | | 54,414 | | .32 |
| Class C | | | | 104,402 | | .26 |
| Strategic Dividend & Income | | | | 1,226,435 | | .18 |
| Institutional Class | | | | 15,048 | | .20 |
| | | | $ | 1,633,903 | | |
Accounting and Security Lending Fees. FSC maintains the fund’s accounting records. The accounting fee is based on the level of average net assets for the month. Under a separate contract, FSC administers the security lending program. The security lending fee is based on the number and duration of lending transactions.
4. Fees and Other Transactions with Affiliates continued
Affiliated Central Funds. The fund may invest in Money Market Central Funds which seek preservation of capital and current income and are managed by Fidelity Invest ments Money Management, Inc. (FIMM), an affiliate of FMR.
The Money Market Central Funds do not pay a management fee.
Brokerage Commissions. The fund placed a portion of its portfolio transactions with brokerage firms which are affiliates of the investment adviser. The commissions paid to these affiliated firms were $37,259 for the period.
5. Committed Line of Credit.
|
The fund participates with other funds managed by FMR in a $4.2 billion credit facility (the “line of credit”) to be utilized for temporary or emergency purposes to fund share holder redemptions or for other short term liquidity purposes. The fund has agreed to pay commitment fees on its pro rata portion of the line of credit. During the period, there were no borrowings on this line of credit.
The fund lends portfolio securities from time to time in order to earn additional income. The fund receives collateral (in the form of U.S. Treasury obligations, letters of credit and/or cash) against the loaned securities and maintains collateral in an amount not less than 100% of the market value of the loaned securities during the period of the loan. The market value of the loaned securities is determined at the close of business of the fund and any additional required collateral is delivered to the fund on the next business day. If the borrower defaults on its obligation to return the securities loaned because of insol vency or other reasons, a fund could experience delays and costs in recovering the securities loaned or in gaining access to the collateral. Cash collateral is invested in the Fidelity Securities Lending Cash Central Fund. The value of loaned securities and cash collateral at period end are disclosed on the fund’s Statement of Assets and Liabilities. Security lending income represents the income earned on investing cash collateral, less fees and expenses associated with the loan, plus any premium payments that may be received on the loan of certain types of securities. Net income from lending portfolio securities during the period amounted to $41,671.
47 Annual Report
Notes to Financial Statements continued
|
| 7. Expense Reductions. | | |
FMR voluntarily agreed to reimburse each class to the extent annual operating expenses exceeded certain levels of average net assets as noted in the table below. Some expenses, for example interest expense, are excluded from this reimbursement.
The following classes were in reimbursement during the period:
| | | | |
| | | Expense | | | | Reimbursement |
| | | Limitations | | | | from adviser |
| Class B | | 1.95% - 2.00%* | | | $ | 839 |
| * Expense limitation in effect at period end. | | | | | | |
Many of the brokers with whom FMR places trades on behalf of the fund provided services to the fund in addition to trade execution. These services included payments of certain expenses on behalf of the fund totaling $208,748 for the period. In addition, through arrangements with the fund’s custodian and each class’ transfer agent, credits realized as a result of uninvested cash balances were used to reduce the fund’s expenses. During the period, these credits reduced the fund’s custody expenses by $4,833. During the period, credits reduced each class’ transfer agent expense as noted in the table below.
| | | | | Transfer Agent |
| | | | | expense reduction |
| Strategic Dividend & Income | | | $ | 428 |
| |
| 8. Other. | | | | |
The fund’s organizational documents provide former and current trustees and officers with a limited indemnification against liabilities arising in connection with the perfor mance of their duties to the fund. In the normal course of business, the fund may also enter into contracts that provide general indemnifications. The fund’s maximum expo sure under these arrangements is unknown as this would be dependent on future claims that may be made against the fund. The risk of material loss from such claims is considered remote.
| 9. Distributions to Shareholders. | | | | | | |
| |
| Distributions to shareholders of each class were as follows: | | | | |
| Years ended November 30, | | | | 2005 | | | | 2004A |
| From net investment income | | | | | | | | |
| Class A | | $ | | 475,907 | | $ | | 159,582 |
| Class T | | | | 830,178 | | | | 189,189 |
| Class B | | | | 141,821 | | | | 55,805 |
| Class C | | | | 339,138 | | | | 123,216 |
| Strategic Dividend & Income | | | | 12,270,157 | | | | 4,080,966 |
Annual Report 48
4. Fees and Other Transactions with Affiliates continued
Distributions to shareholders of each class were as follows: continued
| Years ended November 30, | | | | 2005 | | | | 2004A |
| From net investment income | | | | | | | | |
| Institutional Class | | | | 137,414 | | | | 38,961 |
| Total | | | $ | 14,194,615 | | | $ | 4,647,719 |
| A For the period December 23, 2003 (commencement of operations) to November 30, 2004. | | | | |
10. Share Transactions.
Transactions for each class of shares were as follows:
| | | Shares | | | | Dollars |
| Years ended November 30, | | 2005 | | 2004A | | | | 2005 | | | | 2004A |
| Class A | | | | | | | | | | | | |
| Shares sold | | 1,768,977 | | 2,191,945 | | $ | | 20,345,648 | | $ | | 22,746,005 |
| Reinvestment of distributions . | | 30,595 | | 10,552 | | | | 349,961 | | | | 110,590 |
| Shares redeemed | | (589,953) | | (220,797) | | | | (6,809,260) | | | | (2,287,113) |
| Net increase (decrease) | | 1,209,619 | | 1,981,700 | | $ | | 13,886,349 | | $ | | 20,569,482 |
| Class T | | | | | | | | | | | | |
| Shares sold | | 3,882,259 | | 3,511,538 | | $ | | 44,416,238 | | $ | | 36,655,001 |
| Reinvestment of distributions . | | 59,648 | | 14,112 | | | | 681,858 | | | | 147,959 |
| Shares redeemed | | (669,970) | | (230,386) | | | | (7,729,006) | | | | (2,405,951) |
| Net increase (decrease) | | 3,271,937 | | 3,295,264 | | $ | | 37,369,090 | | $ | | 34,397,009 |
| Class B | | | | | | | | | | | | |
| Shares sold | | 744,114 | | 1,285,173 | | $ | | 8,505,041 | | $ | | 13,296,297 |
| Reinvestment of distributions . | | 9,782 | | 3,976 | | | | 111,311 | | | | 41,558 |
| Shares redeemed | | (344,455) | | (72,792) | | | | (3,964,823) | | | | (752,799) |
| Net increase (decrease) | | 409,441 | | 1,216,357 | | $ | | 4,651,529 | | $ | | 12,585,056 |
| Class C | | | | | | | | | | | | |
| Shares sold | | 2,014,501 | | 2,813,304 | | $ | | 23,123,712 | | $ | | 29,175,332 |
| Reinvestment of distributions . | | 19,942 | | 7,379 | | | | 227,493 | | | | 77,088 |
| Shares redeemed | | (545,060) | | (218,090) | | | | (6,287,937) | | | | (2,262,584) |
| Net increase (decrease) | | 1,489,383 | | 2,602,593 | | $ | | 17,063,268 | | $ | | 26,989,836 |
| Strategic Dividend & Income | | | | | | | | | | | | |
| Shares sold | | 36,814,600 | | 55,474,221 | | $424,067,244 | | $580,932,738 |
| Reinvestment of distributions . | | 944,881 | | 341,097 | | | | 10,819,574 | | | | 3,577,556 |
| Shares redeemed | | (15,256,951) | | (12,984,227) | | (176,595,063) | | (134,752,835) |
| Net increase (decrease) | | 22,502,530 | | 42,831,091 | | $258,291,755 | | $449,757,459 |
| Institutional Class | | | | | | | | | | | | |
| Shares sold | | 398,296 | | 464,040 | | $ | | 4,580,059 | | $ | | 4,776,823 |
| Reinvestment of distributions . | | 5,438 | | 1,845 | | | | 62,299 | | | | 19,348 |
| Shares redeemed | | (48,869) | | (18,218) | | | | (567,988) | | | | (186,845) |
| Net increase (decrease) | | 354,865 | | 447,667 | | $ | | 4,074,370 | | $ | | 4,609,326 |
| A For the period December 23, 2003 (commencement of operations) to November 30, 2004. | | | | | | | | |
49 Annual Report
Report of Independent Registered Public Accounting Firm
To the Trustees of Fidelity Financial Trust and the Shareholders of Fidelity Strategic Dividend & Income Fund:
In our opinion, the accompanying statement of assets and liabilities, including the sched ule of investments, and the related statements of operations and of changes in net assets and the financial highlights present fairly, in all material respects, the financial position of Fidelity Strategic Dividend & Income Fund (a fund of Fidelity Financial Trust) at Novem ber 30, 2005 and the results of its operations, the changes in its net assets and the financial highlights for the periods indicated, in conformity with accounting principles generally accepted in the United States of America. These financial statements and financial highlights (hereafter referred to as “financial statements”) are the responsibility of the Fidelity Strategic Dividend & Income Fund’s management; our responsibility is to express an opinion on these financial statements based on our audits. We conducted our audits of these financial statements in accordance with the standards of the Public Company Accounting Oversight Board (United States). Those standards require that we plan and perform the audit to obtain reasonable assurance about whether the financial statements are free of material misstatement. An audit includes examining, on a test basis, evidence supporting the amounts and disclosures in the financial statements, assessing the accounting principles used and significant estimates made by management, and evaluating the overall financial statement presentation. We believe that our audits, which included confirmation of securities at November 30, 2005 by correspondence with the custodian and brokers, provide a reasonable basis for our opinion.
/s/ PricewaterhouseCoopers LLP
PricewaterhouseCoopers LLP
Boston, Massachusetts
January 17, 2006
|
Trustees and Officers
The Trustees, Member of the Advisory Board, and executive officers of the trust and fund, as applicable, are listed below. The Board of Trustees governs the fund and is responsible for protecting the interests of shareholders. The Trustees are experienced executives who meet periodically throughout the year to oversee the fund’s activities, review contractual arrangements with companies that provide services to the fund, and review the fund’s performance. Except for William O. McCoy and Albert Gamper, Jr., each of the Trustees oversees 326 funds advised by FMR or an affiliate. Mr. McCoy oversees 328 funds advised by FMR or an affiliate. Mr. Gamper oversees 235 funds advised by FMR or an affiliate.
The Trustees hold office without limit in time except that (a) any Trustee may resign; (b) any Trustee may be removed by written instrument, signed by at least two thirds of the number of Trustees prior to such removal; (c) any Trustee who requests to be retired or who has become incapacitated by illness or injury may be retired by written instru ment signed by a majority of the other Trustees; and (d) any Trustee may be removed at any special meeting of shareholders by a two thirds vote of the outstanding voting securities of the trust. Each Trustee who is not an interested person (as defined in the 1940 Act) (Independent Trustee), shall retire not later than the last day of the calendar year in which his or her 72nd birthday occurs. The Independent Trustees may waive this mandatory retirement age policy with respect to individual Trustees. The executive officers and Advisory Board Member hold office without limit in time, except that any officer and Advisory Board Member may resign or may be removed by a vote of a majority of the Trustees at any regular meeting or any special meeting of the Trustees. Except as indicated, each individual has held the office shown or other offices in the same company for the past five years.
The fund’s Statement of Additional Information (SAIs) includes more information about the Trustees. To request a free copy, call Fidelity at 1-800-544-8544.
Correspondence intended for each Trustee who is an interested person may be sent to Fidelity Investments, 82 Devonshire Street, Boston, Massachusetts 02109.
| | Name, Age; Principal Occupation
Edward C. Johnson 3d (75)
|
Year of Election or Appointment: 1982
Mr. Johnson is Chairman of the Board of Trustees. Mr. Johnson serves as Chief Executive Officer, Chairman, and a Director of FMR Corp.; a Di rector and Chairman of the Board and of the Executive Committee of FMR; Chairman and a Director of Fidelity Management & Research (Far East) Inc.; Chairman and a Director of Fidelity Investments Money Man agement, Inc.; and Chairman (2001 present) and a Director (2000 present) of FMR Co., Inc.
51 Annual Report
Trustees and Officers - continued
| | Name, Age; Principal Occupation
Stephen P. Jonas (52)
|
Year of Election or Appointment: 2005
Mr. Jonas is Senior Vice President of Strategic Dividend & Income (2005 present). He also serves as Senior Vice President of other Fidelity funds (2005 present). Mr. Jonas is Executive Director of FMR
(2005 present). Previously, Mr. Jonas served as President of Fidelity En terprise Operations and Risk Services (2004 2005), Chief Administra tive Officer (2002 2004), and Chief Financial Officer of FMR Co. (1998 2000). Mr. Jonas has been with Fidelity Investments since 1987 and has held various financial and management positions including Chief Financial Officer of FMR. In addition, he serves on the Boards of Boston Ballet (2003 present) and Simmons College (2003 present).
Year of Election or Appointment: 2003
Mr. Reynolds is a Director (2003 present) and Chief Operating Officer (2002 present) of FMR Corp. He also serves on the Board at Fidelity Investments Canada, Ltd. (2000 present). Previously, Mr. Reynolds served as President of Fidelity Investments Institutional Retirement Group (1996 2000).
* Trustees have been determined to be “Interested Trustees” by virtue of, among other things, their affiliation with the trust or various entities under common control with FMR.
Correspondence intended for each Independent Trustee (that is, the Trustees other than the Interested Trustees) may be sent to Fidelity Investments, P.O. Box 55235, Boston, Massachusetts 02205 5235.
| | Name, Age; Principal Occupation
Dennis J. Dirks (57)
|
Year of Election or Appointment: 2005
Prior to his retirement in May 2003, Mr. Dirks was Chief Operating Officer and a member of the Board of The Depository Trust & Clearing Corporation (DTCC) (1999 2003). He also served as President, Chief Operating Officer, and Board member of The Depository Trust Company (DTC) (1999 2003) and President and Board member of the National Securities Clearing Corporation (NSCC) (1999 2003). In addi tion, Mr. Dirks served as Chief Executive Officer and Board member of the Government Securities Clearing Corporation (2001 2003) and Chief Executive Officer and Board member of the Mortgage Backed Securities Clearing Corporation (2001 2003). Mr. Dirks also serves as a Trustee of Manhattan College (2005 present).
Name, Age; Principal Occupation
Albert R. Gamper, Jr. (63)
|
Year of Election or Appointment: 2006
Mr. Gamper also serves as a Trustee (2006 present) or Member of the Advisory Board (2005 present) of other investment companies advised by FMR. Prior to his retirement in December 2004, Mr. Gamper served as Chairman of the Board of CIT Group Inc. (commercial finance). During his tenure with CIT Group Inc. Mr. Gamper served in numerous senior management positions, including Chairman (1987 1989; 1999 2001; 2002 2004), Chief Executive Officer (1987 2004), and President (1989 2002). He currently serves as a member of the Board of Directors of Public Service Enterprise Group (utilities, 2001 present), Chairman of the Board of Governors, Rutgers University (2004 present), and Chairman of the Board of Saint Barnabas Health Care System.
Year of Election or Appointment: 1997
Dr. Gates is Chairman of the Independent Trustees (2006 present). Dr. Gates is President of Texas A&M University (2002 present). He was Director of the Central Intelligence Agency (CIA) from 1991 to 1993. From 1989 to 1991, Dr. Gates served as Assistant to the President of the United States and Deputy National Security Advisor. Dr. Gates is a Director of NACCO Industries, Inc. (mining and manufacturing), Parker Drilling Co., Inc. (drilling and rental tools for the energy industry, 2001 present), and Brinker International (restaurant management, 2003 present). Previously, Dr. Gates served as a Director of LucasVarity PLC (automotive components and diesel engines), a Director of TRW Inc. (automotive, space, defense, and information technology), and Dean of the George Bush School of Government and Public Service at Texas A&M University (1999 2001). Dr. Gates also is a Trustee of the Forum for International Policy.
53 Annual Report
Trustees and Officers - continued
| | Name, Age; Principal Occupation
George H. Heilmeier (69)
|
Year of Election or Appointment: 2004
Dr. Heilmeier is Chairman Emeritus of Telcordia Technologies (commu nication software and systems), where prior to his retirement, he served as company Chairman and Chief Executive Officer. He currently serves on the Boards of Directors of The Mitre Corporation (systems engineer ing and information technology support for the government), and HRL Laboratories (private research and development, 2004 present). He is Chairman of the General Motors Science & Technology Advisory Board and a Life Fellow of the Institute of Electrical and Electronics Engineers (IEEE) (2000 present). Dr. Heilmeier is a member of the Defense Science Board and the National Security Agency Advisory Board. He is also a member of the National Academy of Engineering, the American Academy of Arts and Sciences, and the Board of Overseers of the School of Engineering and Applied Science of the University of Pennsyl vania. Previously, Dr. Heilmeier served as a Director of TRW Inc. (auto motive, space, defense, and information technology, 1992 2002), Compaq (1994 2002), Automatic Data Processing, Inc. (ADP) (technology based business outsourcing, 1995 2002), INET Technolo gies Inc. (telecommunications network surveillance, 2001 2004), and Teletech Holdings (customer management services). He is the recipient of the 2005 Kyoto Prize in Advanced Technology for his invention of the liquid display.
Year of Election or Appointment: 2001
Prior to Ms. Knowles’ retirement in June 2000, she served as Executive Vice President and Chief Financial Officer of Atlantic Richfield Company (ARCO) (diversified energy, 1996 2000). From 1993 to 1996, she was a Senior Vice President of ARCO and President of ARCO Transportation Company. She served as a Director of ARCO from 1996 to 1998. She currently serves as a Director of Phelps Dodge Corporation (copper mining and manufacturing) and McKesson Corporation (healthcare ser vice, 2002 present). Ms. Knowles is a Trustee of the Brookings Institution and the Catalina Island Conservancy and also serves as a member of the Advisory Board for the School of Engineering of the University of Southern California.
Name, Age; Principal Occupation
Ned C. Lautenbach (61)
|
Year of Election or Appointment: 2000
Mr. Lautenbach has been a partner of Clayton, Dubilier & Rice, Inc. (private equity investment firm) since September 1998. Previously, Mr. Lautenbach was with the International Business Machines Corporation (IBM) from 1968 until his retirement in 1998. Mr. Lautenbach serves as a Director of Italtel Holding S.p.A. (telecommunications (Milan, Italy), 2004 present) and Eaton Corporation (diversified industrial) as well as the Philharmonic Center for the Arts in Naples, Florida. He also is a member of the Board of Trustees of Fairfield University (2005 present), as well as a member of the Council on Foreign Relations.
Year of Election or Appointment: 1997
Prior to his retirement in December 1994, Mr. McCoy was Vice Chair man of the Board of BellSouth Corporation (telecommunications) and President of BellSouth Enterprises. He is currently a Director of Liberty Corporation (holding company), Duke Realty Corporation (real estate), and Progress Energy, Inc. (electric utility). He is also a partner of Frank lin Street Partners (private investment management firm) and a member of the Research Triangle Foundation Board. In addition, Mr. McCoy served as the Interim Chancellor (1999 2000) and a member of the Board of Visitors for the University of North Carolina at Chapel Hill and currently serves on the Board of Directors of the University of North Carolina Health Care System and the Board of Visitors of the Kenan Flagler Business School (University of North Carolina at Chapel Hill). He also served as Vice President of Finance for the University of North Car olina (16 school system).
Year of Election or Appointment: 2005
Ms. Small is a member (2000 present) and Chairperson (2002 present) of the Investment Committee, and a member (2002 present) of the Board of Trustees of Smith College. Previously, she served as Chief In vestment Officer (1999 2000), Director of Global Equity Investments (1996 1999), and a member of the Board of Directors of Scudder, Stevens & Clark (1990 1997) and Scudder Kemper Investments (1997 1998). In addition, Ms. Small served as Co Chair (2000 2003) of the Annual Fund for the Fletcher School of Law and Diplomacy.
55 Annual Report
Trustees and Officers - continued
| | Name, Age; Principal Occupation
William S. Stavropoulos (66)
|
Year of Election or Appointment: 2002
Mr. Stavropoulos is Chairman of the Board (2000 present) and a Mem ber of the Board of Directors of The Dow Chemical Company. Since joining The Dow Chemical Company in 1967, Mr. Stavropoulos served in numerous senior management positions, including President (1993 2000; 2002 2003), CEO (1995 2000; 2002 2004), and Chair man of the Executive Committee (2000 2004). Currently, he is a Direc tor of NCR Corporation (data warehousing and technology solutions), BellSouth Corporation (telecommunications), Chemical Financial Corpo ration, Maersk Inc. (industrial conglomerate, 2002 present), and Metal mark Capital (private equity investment firm, 2005 present). He also serves as a member of the Board of Trustees of the American Enterprise Institute for Public Policy Research. In addition, Mr. Stavropoulos is a member of The Business Council, J.P. Morgan International Council and the University of Notre Dame Advisory Council for the College of Science.
Year of Election or Appointment: 2005
Prior to his retirement in 2001, Mr. Wolfe was Chairman and Chief Executive Officer of Hershey Foods Corporation (1993 2001). He cur rently serves as a member of the boards of Adelphia Communications Corporation (2003 present), Bausch & Lomb, Inc., and Revlon Inc. (2004 present).
Advisory Board Members and Executive Officers:
Correspondence intended for each executive officer and Mr. Lynch may be sent to Fidelity Investments, 82 Devonshire Street, Boston, Massachusetts 02109.
| | Name, Age; Principal Occupation
Peter S. Lynch (61)
|
Year of Election or Appointment: 2003
Member of the Advisory Board of Fidelity Financial Trust. Vice Chair man and a Director of FMR, and Vice Chairman (2001 present) and a Director (2000 present) of FMR Co., Inc. Previously, Mr. Lynch served as a Trustee of the Fidelity funds (1990 2003). In addition, he serves as a Trustee of Boston College, Massachusetts Eye & Ear Infirmary, Historic Deerfield, John F. Kennedy Library, and the Museum of Fine Arts of Boston.
Name, Age; Principal Occupation
|
Year of Election or Appointment: 2005
Vice President of Strategic Dividend & Income. Mr. Lank also serves as Vice President of another fund advised by FMR. Prior to assuming his current responsibilities, Mr. Lank has worked as an analyst and manager.
Year of Election or Appointment: 2005
Vice President of Strategic Dividend & Income. Mr. Soviero also serves as Vice President of other funds advised by FMR. Prior to assuming his current responsibilities, Mr. Soviero has worked as a research analyst, manager and director of high yield research. Mr. Soviero also serves as Senior Vice President of FMR (2005) and FMR Co., Inc. (2005).
Year of Election or Appointment: 2003
Secretary of Strategic Dividend & Income. He also serves as Secretary of other Fidelity funds; Vice President, General Counsel, and Secretary of FMR Co., Inc. (2001 present) and FMR; Assistant Secretary of Fidelity Management & Research (U.K.) Inc. (2001 present), Fidelity Manage ment & Research (Far East) Inc. (2001 present), and Fidelity Investments Money Management, Inc. (2001 present). Mr. Roiter is an Adjunct Member, Faculty of Law, at Boston College Law School (2003 present). Previously, Mr. Roiter served as Vice President and Secretary of Fidelity Distributors Corporation (FDC) (1998 2005).
Year of Election or Appointment: 2003
Assistant Secretary of Strategic Dividend & Income. Mr. Fross also serves as Assistant Secretary of other Fidelity funds (2003 present), Vice President and Secretary of FDC (2005 present), and is an employee of FMR.
Year of Election or Appointment: 2004
President, Treasurer, and Anti Money Laundering (AML) officer of Strate gic Dividend & Income. Ms. Reynolds also serves as President, Treasurer, and AML officer of other Fidelity funds (2004) and is a Vice President (2003) and an employee (2002) of FMR. Before joining Fidelity Invest ments, Ms. Reynolds worked at PricewaterhouseCoopers LLP (PwC) (1980 2002), where she was most recently an audit partner with PwC’s investment management practice.
57 Annual Report
Trustees and Officers - continued
| | Name, Age; Principal Occupation
Paul M. Murphy (58)
|
Year of Election or Appointment: 2005
Chief Financial Officer of Strategic Dividend & Income. Mr. Murphy also serves as Chief Financial Officer of other Fidelity funds (2005 present). He also serves as Senior Vice President of Fidelity Pricing and Cash Management Services Group (FPCMS).
| | Kenneth A. Rathgeber (58)
|
Year of Election or Appointment: 2004
Chief Compliance Officer of Strategic Dividend & Income. Mr. Rathgeber also serves as Chief Compliance Officer of other Fidelity funds (2004) and Executive Vice President of Risk Oversight for Fidelity Investments (2002). Previously, he served as Executive Vice President and Chief Operating Officer for Fidelity Investments Institutional Services Company, Inc. (1998 2002).
Year of Election or Appointment: 2003
Deputy Treasurer of Strategic Dividend & Income. Mr. Hebble also serves as Deputy Treasurer of other Fidelity funds (2003), and is an employee of FMR. Before joining Fidelity Investments, Mr. Hebble worked at Deutsche Asset Management where he served as Director of Fund Accounting (2002 2003) and Assistant Treasurer of the Scudder Funds (1998 2003).
Year of Election or Appointment: 2005
Deputy Treasurer of Strategic Dividend & Income. Mr. Mehrmann also serves as Deputy Treasurer of other Fidelity funds (2005 present) and is an employee of FMR. Previously, Mr. Mehrmann served as Vice Presi dent of Fidelity Investments Institutional Services Group (FIIS)/Fidelity Investments Institutional Operations Corporation, Inc. (FIIOC) Client Services (1998 2004).
| | Kimberley H. Monasterio (41)
|
Year of Election or Appointment: 2004
Deputy Treasurer of Strategic Dividend & Income. Ms. Monasterio also serves as Deputy Treasurer of other Fidelity funds (2004) and is an em ployee of FMR (2004). Before joining Fidelity Investments, Ms. Monas terio served as Treasurer (2000 2004) and Chief Financial Officer (2002 2004) of the Franklin Templeton Funds and Senior Vice President of Franklin Templeton Services, LLC (2000 2004).
Name, Age; Principal Occupation
Kenneth B. Robins (36)
|
Year of Election or Appointment: 2005
Deputy Treasurer of Strategic Dividend & Income. Mr. Robins also serves as Deputy Treasurer of other Fidelity funds (2005 present) and is an employee of FMR (2004 present). Before joining Fidelity Investments, Mr. Robins worked at KPMG LLP, where he was a partner in KPMG’s department of professional practice (2002 2004) and a Senior Manager (1999 2000). In addition, Mr. Robins served as Assistant Chief Accountant, United States Securities and Exchange Commission (2000 2002).
Year of Election or Appointment: 2005
Assistant Treasurer of Strategic Dividend & Income. Mr. Byrnes also serves as Assistant Treasurer of other Fidelity funds (2005 present) and is an employee of FMR (2005 present). Previously, Mr. Byrnes served as Vice President of FPCMS (2003 2005). Before joining Fidelity Invest ments, Mr. Byrnes worked at Deutsche Asset Management where he served as Vice President of the Investment Operations Group (2000 2003).
Year of Election or Appointment: 2003
Assistant Treasurer of Strategic Dividend & Income. Mr. Costello also serves as Assistant Treasurer of other Fidelity funds and is an employee of FMR.
Year of Election or Appointment: 2004
Assistant Treasurer of Strategic Dividend & Income. Mr. Lydecker also serves as Assistant Treasurer of other Fidelity funds (2004) and is an employee of FMR.
Year of Election or Appointment: 2003
Assistant Treasurer of Strategic Dividend & Income. Mr. Osterheld also serves as Assistant Treasurer of other Fidelity funds (2002) and is an employee of FMR.
Year of Election or Appointment: 2005
Assistant Treasurer of Strategic Dividend & Income. Mr. Ryan also serves as Assistant Treasurer of other Fidelity funds (2005 present) and is an employee of FMR (2005 present). Previously, Mr. Ryan served as Vice President of Fund Reporting in FPCMS (1999 2005).
59 Annual Report
Trustees and Officers - continued
| | Name, Age; Principal Occupation
Salvatore Schiavone (40)
|
Year of Election or Appointment: 2005
Assistant Treasurer of Strategic Dividend & Income. Mr. Schiavone also serves as Assistant Treasurer of other Fidelity funds (2005 present) and is an employee of FMR (2005 present). Before joining Fidelity Investments, Mr. Schiavone worked at Deutsche Asset Management, where he most recently served as Assistant Treasurer (2003 2005) of the Scudder Funds and Vice President and Head of Fund Reporting (1996 2003).
The Board of Trustees of Fidelity Strategic Dividend & Income Fund voted to pay to shareholders of record at the opening of business on record date, the following distributions per share derived from capital gains realized from sales of portfolio securi ties, and dividends derived from net investment income:
| | | Pay Date | | Record Date | | Dividends | | Capital Gains |
| Strategic Dividend | | | | | | | | |
| & Income | | 12/19/05 | | 12/16/05 | | $0.059 | | $0.13 |
The fund hereby designates as capital gain dividends: For dividends with respect to the taxable year ended November 30, 2005, $12,115,601, or, if subsequently deter mined to be different, the net capital gain of such year, and for dividends with respect to the taxable year ended November 30, 2004, $0, or, if subsequently determined to be different, the excess of: (a) the net capital gain of such year, over (b) amounts pre viously designated as capital gain dividends with respect to such year.
A total of 0.14% of the dividends distributed during the fiscal year was derived from interest on U.S. Government securities which is generally exempt from state income tax.
Strategic Dividend & Income designates 83%, and 99% of the dividends distributed in December 2004 and July 2005, respectively during the fiscal year as qualifying for the dividends received deduction for corporate shareholders.
Strategic Dividend & Income designates 94%, and 100% of the dividends distributed in December 2004 and July 2005, respectively during the fiscal year as amounts which may be taken into account as a dividend for purposes of the maximum rate under section 1(h)(11) of the Internal Revenue Code.
The fund will notify shareholders in January 2006 of amounts for use in preparing 2005 income tax returns.
61 Annual Report
Proxy Voting Results
A special meeting of the fund’s shareholders was held on March 16, 2005. The results of votes taken among shareholders on proposals before them are reported below. Each vote reported represents one dollar of net asset value held on the record date for the meeting.
| PROPOSAL 1 | | |
| To amend the Declaration of Trust to |
| allow the Board of Trustees, if per- |
| mitted by applicable law, to authorize |
| fund mergers without shareholder |
| approval.A | | | | |
| | | # of | | % of |
| | | Votes | | Votes |
| Affirmative | | 8,400,660,894.14 | | 71.170 |
| Against | | 2,413,818,167.07 | | 20.450 |
| Abstain | | 466,182,489.54 | | 3.949 |
| Broker | | | | |
| Non Votes | | 523,001,758.35 | | 4.431 |
| TOTAL | | 11,803,663,309.10 | | 100.000 |
| PROPOSAL 2 | | |
| To elect a Board of Trustees.A | | |
| | | # of | | % of |
| | | Votes | | Votes |
| |
| Laura B. Cronin | | |
| Affirmative | | 10,904,461,482.16 | | 92.382 |
| Withheld | | 899,201,826.94 | | 7.618 |
| TOTAL | | 11,803,663,309.10 | | 100.000 |
| Dennis J. Dirks | | |
| Affirmative | | 11,230,399,240.22 | | 95.143 |
| Withheld | | 573,264,068.88 | | 4.857 |
| TOTAL | | 11,803,663,309.10 | | 100.000 |
| Robert M. Gates | | |
| Affirmative | | 11,204,490,469.14 | | 94.924 |
| Withheld | | 599,172,839.96 | | 5.076 |
| TOTAL | | 11,803,663,309.10 | | 100.000 |
| George H. Heilmeier | | |
| Affirmative | | 11,216,568,766.75 | | 95.026 |
| Withheld | | 587,094,542.35 | | 4.974 |
| TOTAL | | 11,803,663,309.10 | | 100.000 |
| | | # of | | % of |
| | | Votes | | Votes |
| |
| Abigail P. Johnson | | |
| Affirmative | | 11,170,882,517.64 | | 94.639 |
| Withheld | | 632,780,791.46 | | 5.361 |
| TOTAL | | 11,803,663,309.10 | | 100.000 |
| |
| Edward C. Johnson 3d | | |
| Affirmative | | 11,146,150,096.08 | | 94.430 |
| Withheld | | 657,513,213.02 | | 5.570 |
| TOTAL | | 11,803,663,309.10 | | 100.000 |
| |
| Marie L. Knowles | | |
| Affirmative | | 11,230,314,699.11 | | 95.143 |
| Withheld | | 573,348,609.99 | | 4.857 |
| TOTAL | | 11,803,663,309.10 | | 100.000 |
| |
| Ned C. Lautenbach | | |
| Affirmative | | 11,228,854,936.86 | | 95.130 |
| Withheld | | 574,808,372.24 | | 4.870 |
| TOTAL | | 11,803,663,309.10 | | 100.000 |
| |
| Marvin L. Mann | | |
| Affirmative | | 11,192,136,636.22 | | 94.819 |
| Withheld | | 611,526,672.88 | | 5.181 |
| TOTAL | | 11,803,663,309.10 | | 100.000 |
| |
| William O. McCoy | | |
| Affirmative | | 11,202,537,978.70 | | 94.907 |
| Withheld | | 601,125,330.40 | | 5.093 |
| TOTAL | | 11,803,663,309.10 | | 100.000 |
| |
| Robert L. Reynolds | | |
| Affirmative | | 11,216,557,272.63 | | 95.026 |
| Withheld | | 587,106,036.47 | | 4.974 |
| TOTAL | | 11,803,663,309.10 | | 100.000 |
| |
| Cornelia M. Small | | |
| Affirmative | | 11,221,057,350.30 | | 95.064 |
| Withheld | | 582,605,958.80 | | 4.936 |
| TOTAL | | 11,803,663,309.10 | | 100.000 |
Annual Report 62
| | | # of | | % of |
| | | Votes | | Votes |
| |
| William S. Stavropoulos | | |
| Affirmative | | 11,213,520,655.58 | | 95.000 |
| Withheld | | 590,142,653.52 | | 5.000 |
| TOTAL | | 11,803,663,309.10 | | 100.000 |
| |
| Kenneth L. Wolfe | | |
| Affirmative | | 11,218,319,970.33 | | 95.041 |
| Withheld | | 585,343,338.77 | | 4.959 |
| TOTAL | | 11,803,663,309.10 | | 100.000 |
A Denotes trust-wide proposals and voting results.
|
63 Annual Report
Board Approval of Investment Advisory Contracts and Management Fees
Fidelity Strategic Dividend & Income Fund
Each year, typically in July, the Board of Trustees, including the independent Trustees (together, the Board), votes on the renewal of the management contract and sub advisory agreements (together, the Advisory Contracts) for the fund. The Board, assisted by the advice of fund counsel and independent Trustees’ counsel, requests and considers a broad range of information throughout the year.
The Board meets regularly each month except August and takes into account throughout the year matters bearing on Advisory Contracts. The Board, acting directly and through its separate committees, considers at each of its meetings factors that are relevant to the annual renewal of the fund’s Advisory Contracts, including the services and support provided to the fund and its shareholders by Fidelity. At the time of the renewal, the Board had 11 standing committees, each composed of independent Trustees with varying backgrounds, to which the Board has assigned specific subject matter responsibilities in order to enhance effective decision making by the Board. Each committee has adopted a written charter outlining the structure and purposes of the committee. One such com mittee, the Equity Contract Committee, meets periodically during the first six months of each year and as necessary to consider matters specifically related to the annual renewal of Advisory Contracts. The committee requests and receives information on, and makes recommendations to the independent Trustees concerning, the approval and annual review of the Advisory Contracts.
At its July 2005 meeting, the Board of Trustees, including the independent Trustees, unanimously determined to renew the Advisory Contracts for the fund. In reaching its determination, the Board considered all factors it believed relevant, including (1) the nature, extent, and quality of the services to be provided to the fund and its shareholders by Fidelity (including the investment performance of the fund); (2) the competitiveness of the management fee and total expenses of the fund; (3) the total costs of the services to be provided by and the profits to be realized by the investment adviser and its affiliates from the relationship with the fund; (4) the extent to which economies of scale would be realized as the fund grows; and (5) whether fee levels reflect these economies of scale, if any, for the benefit of fund shareholders.
In determining whether to renew the Advisory Contracts for the fund, the Board ulti mately reached a determination, with the assistance of fund counsel and independent Trustees’ counsel, that the renewal of the Advisory Contracts and the compensation to be received by Fidelity under the management contract is consistent with Fidelity’s fidu ciary duty under applicable law. In addition to evaluating the specific factors noted above, the Board, in reaching its determination, is aware that shareholders in the fund have a broad range of investment choices available to them, including a wide choice among mutual funds offered by competitors to Fidelity, and that the fund’s shareholders, with the opportunity to review and weigh the disclosure provided by the fund in its
prospectus and other public disclosures, have chosen to invest in this fund, managed by Fidelity.
Nature, Extent, and Quality of Services Provided by Fidelity. The Board consid ered staffing within the investment adviser, FMR, and the sub advisers (together, the Investment Advisers), including the background of the fund’s portfolio manager and the fund’s investment objective and discipline. The independent Trustees also had discus sions with senior management of Fidelity’s investment operations and investment groups. The Board considered the structure of the portfolio manager compensation program and whether this structure provides appropriate incentives.
Fidelity Resources Dedicated to Investment Management and Support Services. The Board reviewed the size, education, and experience of the Investment Advisers’ invest ment staff, their use of technology, and the Investment Advisers’ approach to recruiting, training, and retaining portfolio managers and other research, advisory, and manage ment personnel. The Board considered Fidelity’s extensive global research capabilities that enable the Investment Advisers to aggregate data from various sources in an effort to produce positive investment results. The Board noted that Fidelity’s analysts have access to a variety of technological tools that enable them to perform both fundamental and quantitative analysis and to specialize in various disciplines. The Board also considered that Fidelity’s portfolio managers and analysts have access to daily portfolio attribution that allows for monitoring of a fund’s portfolio, as well as an electronic communication system that provides immediate real time access to research concerning issuers and credit enhancers.
Shareholder and Administrative Services. The Board considered the nature, extent, quality, and cost of administrative, distribution, and shareholder services performed by the Investment Advisers and their affiliates under the Advisory Contracts and under separate agreements covering transfer agency, pricing and bookkeeping, and securities lending services for the fund. The Board also considered the nature and extent of the Investment Advisers’ supervision of third party service providers, principally custodians and subcustodians. The Board reviewed the allocation of fund brokerage, including allocations to brokers affiliated with the Investment Advisers, the use of brokerage commissions to pay fund expenses, and the use of “soft” commission dollars to pay for research services. The Board also considered that Fidelity voluntarily decided in 2004 to stop using “soft” commission dollars to pay for market data and, instead, to pay for that data out of its own resources. The Board also considered the resources devoted to, and the record of compliance with, the fund’s compliance policies and procedures.
The Board noted that the growth of fund assets across the complex allows Fidelity to reinvest in the development of services designed to enhance the value or convenience of the Fidelity funds as investment vehicles. These services include 24 hour access to
65 Annual Report
Board Approval of Investment Advisory Contracts and Management Fees continued
account information and market information through phone representatives and over the Internet, and investor education materials and asset allocation tools.
Investment in a Large Fund Family. The Board considered the benefits to shareholders of investing in a Fidelity fund, including the benefits of investing in a fund that is part of a large family of funds offering a variety of investment disciplines and providing for a large variety of mutual fund investor services. For example, fund shareholders are offered the privilege of exchanging shares of the fund for shares of other Fidelity funds, as set forth in the fund’s prospectus, without paying an additional sales charge. The Board noted that, since the last Advisory Contract renewals in July 2004, Fidelity has taken a number of actions that benefited particular funds, including (i) voluntarily deciding in 2004 to stop using “soft” commission dollars to pay for market data and, instead, to pay for that data out of its own resources, (ii) contractually agreeing to impose management fee reductions and expense limitations on its five Spartan stock index funds and its stock index fund available through variable insurance products, (iii) contractually agreeing to eliminate the management fees on the Fidelity Freedom Funds and the Fidelity Advisor Freedom Funds, (iv) contractually agreeing to reduce the management fees on most of its investment grade taxable bond funds, and (v) contractually agreeing to impose expense limitations on its retail and Spartan investment grade taxable bond funds.
Investment Performance and Compliance. The Board considered whether the fund has operated within its investment objective, as well as its record of compliance with its investment restrictions. It also reviewed the fund’s absolute investment performance for each class, as well as the fund’s relative investment performance for each class measured against (i) a proprietary custom index, and (ii) a peer group of mutual funds deemed appropriate by the Board. Because the fund had been in existence less than three calendar years, the following chart considered by the Board shows, for the one year period ended December 31, 2004, the returns of Class C and the retail class of the fund, the return of a proprietary custom index (“benchmark”), and a range of returns of a peer group of mutual funds identified by Lipper Inc. as having an investment objective similar to that of the fund. The returns of Class C and the retail class represent the performance of classes with the highest and lowest 12b 1 fees, respectively (not necessarily with the highest and lowest total expenses). The box within the chart shows the 25th percentile return (bottom of box) and the 75th percentile return (top of box) of the Lipper peer group. Returns shown above the box are in the first quartile and returns shown below the box are in the fourth quartile. The percentage beaten numbers noted below the chart correspond to the percentile box and represent the percentage of funds in the Lipper peer group whose performance was equal to or lower than that of the class indicated. The fund’s proprietary custom index is an index developed by FMR that represents the fund’s four general investment categories according to their respective weightings in the fund’s neutral mix.

The Board reviewed the fund’s relative investment performance against its Lipper peer group and stated that the performance of the retail class of the fund was in the first quartile for the one year period. The Board also stated that the relative investment performance of the fund was lower than its benchmark for the one year period. The Board considered that the variations in performance among the fund’s classes reflect the variations in class expenses, which result in lower performance for higher expense classes. The Board stated that it is difficult to evaluate in any comprehensive fashion the performance of the fund, in light of its relatively recent launch.
The Board has had thorough discussions with FMR throughout the year about the Board’s and FMR’s concerns about equity research, equity fund performance, and compliance with internal policies governing gifts and entertainment. FMR has taken steps that it believes will refocus and strengthen equity research and equity portfolio management and compliance. The Board noted with favor FMR’s recent reorganization of its senior management team and FMR’s plans to dedicate additional resources to investment research, and participated in the process that led to those changes.
Based on its review, and giving particular weight to the nature and quality of the resources dedicated by the Investment Advisers to maintain and improve relative performance, the Board concluded that the nature, extent, and quality of the services provided by Fidelity will benefit the fund’s shareholders, particularly in light of the Board’s view that the fund’s shareholders benefit from investing in a fund that is part of a large family of funds offering a variety of investment disciplines and services.
Competitiveness of Management Fee and Total Fund Expenses. The Board considered the fund’s management fee and total expenses compared to “mapped groups”
67 Annual Report
Board Approval of Investment Advisory Contracts and Management Fees continued
of competitive funds and classes. Fidelity creates “mapped groups” by combining similar Lipper investment objective categories that have comparable management fee charac teristics. Combining Lipper investment objective categories aids the Board’s manage ment fee and total expense comparisons by broadening the competitive group used for comparison and by reducing the number of universes to which various Fidelity funds are compared.
The Board considered two proprietary management fee comparisons for the 12 month (or shorter) periods shown in the chart below. The group of Lipper funds used by the Board for management fee comparisons is referred to below as the “Total Mapped Group” and, for the reasons explained above, is broader than the Lipper peer group used by the Board for performance comparisons. The Total Mapped Group comparison focuses on a fund’s standing relative to the total universe of comparable funds available to investors, in terms of gross management fees before expense reimbursements or caps. “TMG %” represents the percentage of funds in the Total Mapped Group that had management fees that were lower than the fund’s. For example, a TMG % of 30% means that 70% of the funds in the Total Mapped Group had higher management fees than the fund. The “Asset Size Peer Group” (ASPG) comparison focuses on a fund’s standing relative to non Fidelity funds similar in size to the fund within the Total Mapped Group. The ASPG represents at least 15% of the funds in the Total Mapped Group with comparable asset size and management fee characteristics, subject to a minimum of 50 funds (or all funds in the Total Mapped Group if fewer than 50). Additional information, such as the ASPG quartile (“quadrant”) in which the fund’s management fee ranked, is also included in the chart and considered by the Board.
Annual Report 68
The Board noted that the fund’s management fee ranked below the median of its Total Mapped Group and below the median of its ASPG for 2004.
Based on its review, the Board concluded that the fund’s management fee was fair and reasonable in light of the services that the fund receives and the other factors considered.
In its review of each class’s total expenses, the Board considered the fund’s management fee as well as other fund or class expenses, as applicable, such as transfer agent fees, pricing and bookkeeping fees, fund paid 12b 1 fees, and custodial, legal, and audit fees. The Board also noted the effects of any waivers and reimbursements on fees and expenses. As part of its review, the Board also considered current and historical total expenses of each class of the fund compared to competitive fund median expenses. Each class of the fund is compared to those funds and classes in the Total Mapped Group (used by the Board for management fee comparisons) that have a similar sales load structure.
The Board noted that the total expenses of each of Class A, Class B, Institutional Class and Fidelity Strategic Dividend & Income Fund (retail class) ranked below its competi tive median for 2004, and the total expenses of each of Class C and Class T ranked above its competitive median for 2004. The Board noted that the fund offers multiple classes, each of which has a different sales load and 12b 1 fee structure, and that the multiple structures are intended to offer a range of pricing options for the intermediary market. The Board also noted that the total expenses of the classes vary primarily by the level of their 12b 1 fees, although differences in transfer agent fees may also cause expenses to vary from class to class.
In its review of total expenses, the Board also considered Fidelity fee structures and other information on clients that FMR and its affiliates service in other competitive markets, such as other mutual funds advised or subadvised by FMR or its affiliates, pension plan clients, and other institutional clients.
Based on its review, the Board concluded that the total expenses for each class of the fund were reasonable, although in some cases above the median of the universe presented for comparison, in light of the services that the fund and its shareholders receive and the other factors considered.
Costs of the Services and Profitability. The Board considered the revenues earned and the expenses incurred by Fidelity in conducting the business of developing, market ing, distributing, managing, administering and servicing the fund and its shareholders. The Board also considered the level of Fidelity’s profits in respect of all the Fidelity funds.
On an annual basis, FMR presents to the Board Fidelity’s profitability for the fund. Fidelity calculates the profitability for each fund, as well as aggregate profitability for
69 Annual Report
Board Approval of Investment Advisory Contracts and Management Fees continued
groups of Fidelity funds and all Fidelity funds, using a series of detailed revenue and cost allocation methodologies which originate with the audited books and records of Fidelity. The Audit Committee of the Board reviews any significant changes from the prior year’s methodologies.
PricewaterhouseCoopers LLP (PwC), independent registered accounting firm and auditor to Fidelity and certain Fidelity funds, has been engaged annually by the Board as part of the Board’s assessment of the results of Fidelity’s profitability analysis. PwC’s engagement includes the review and assessment of Fidelity’s methodologies used in determining the revenues and expenses attributable to Fidelity’s mutual fund business, and completion of agreed upon procedures surrounding the mathematical accuracy of fund profitability and its conformity to allocation methodologies. After considering PwC’s reports issued under the engagement and information provided by Fidelity, the Board believes that while other allocation methods may also be reasonable, Fidelity’s profitabil ity methodologies are reasonable in all material respects.
The Board has also reviewed Fidelity’s non fund businesses and any fall out benefits related to the mutual fund business as well as cases where Fidelity’s affiliates may benefit from or be related to the fund’s business. In addition, a special committee of the Board reviewed services provided to Fidelity by its affiliates and determined that the fees that Fidelity paid for such services were reasonable.
The Board considered the costs of the services provided by and the profits realized by Fidelity in connection with the operation of the fund and determined that the amount of profit is a fair entrepreneurial profit for the management of the fund.
Economies of Scale. The Board considered whether there have been economies of scale in respect of the management of the Fidelity funds, whether the Fidelity funds (including the fund) have appropriately benefited from any such economies of scale, and whether there is potential for realization of any further economies of scale. The Board considered the extent to which the fund will benefit from economies of scale through increased services to the fund, through waivers or reimbursements, or through fee or expense reductions, including reductions that occur through operation of the transfer agent agreement. The transfer agent fee varies in part based on the number of accounts in the fund. If the number of accounts decreases or the average account size increases, the overall transfer agent fee rate decreases.
The Board recognized that the fund’s management contract incorporates a “group fee” structure, which provides for lower fee rates as total fund assets under FMR’s manage ment increase, and for higher fee rates as total fund assets under FMR’s management decrease. The Board considered that the group fee is designed to deliver the benefits of economies of scale to fund shareholders when total fund assets increase, even if assets of any particular fund are unchanged or have declined, because some portion of Fidelity’s costs are attributable to services provided to all Fidelity funds, and all funds benefit if
those costs can be allocated among more assets. The Board concluded that, given the group fee structure, fund shareholders will achieve a certain level of economies of scale as assets under FMR’s management increase at the fund complex level, regardless of whether Fidelity achieves any such economies of scale.
The Board further concluded that any potential economies of scale are being shared between fund shareholders and Fidelity in an appropriate manner.
Additional Information Requested by the Board. In order to develop fully the factual basis for consideration of the Advisory Contracts, the Board requested additional information regarding (i) equity fund transfer agency fees; (ii) Fidelity’s fund profitability methodology and the impact of various changes in the methodology over time; (iii) benefits to shareholders from economies of scale; (iv) composition and characteristics of various fund and industry data used in comparisons; and (v) com pensation of portfolio managers and research analysts.
Based on its evaluation of all of the conclusions noted above, and after considering all material factors, the Board ultimately concluded that the existing advisory fee structures are fair and reasonable, and that the fund’s existing Advisory Contracts should be renewed.
71 Annual Report
| | Investment Adviser
Fidelity Management & Research Company
Boston, MA
Investment Sub Advisers
FMR Co., Inc.
Fidelity Management & Research
(U.K.) Inc.
Fidelity Management & Research
(Far East) Inc.
Fidelity International Investment
Advisors
Fidelity Investments Japan Limited
Fidelity International Investment
Advisors (U.K.) Limited
General Distributor
Fidelity Distributors Corporation
Boston, MA
Transfer and Service Agent
Fidelity Service Company, Inc.
Boston, MA
Custodian
Citibank, N.A.
New York, NY
|
| The Fidelity Telephone Connection |
| Mutual Fund 24-Hour Service |
| Exchanges/Redemptions | | |
| and Account Assistance | | 1-800-544-6666 |
| Product Information | | 1-800-544-6666 |
| Retirement Accounts | | 1-800-544-4774 |
| (8 a.m. - 9 p.m.) | | |
| TDD Service | | 1-800-544-0118 |
| for the deaf and hearing impaired |
| (9 a.m. - 9 p.m. Eastern time) |
| Fidelity Automated Service | | |
| Telephone (FAST®) (automated phone logo) | | 1-800-544-5555 |
| (automated phone logo) Automated line for quickest service |
SDI-UANN-0106
1.802527.101
|


| | Fidelity Advisor
Strategic Dividend & Income
Fund - Class A, Class T,
Class B and Class C
|
| | Annual Report
November 30, 2005
|

Class A, Class T, Class B, and Class C are classes of Fidelity® Strategic Dividend & Income® Fund
| Contents | | | | |
| |
| Chairman’s Message | | 4 | | Ned Johnson’s message to shareholders. |
| Performance | | 5 | | How the fund has done over time. |
| Management’s Discussion | | 7 | | The managers’ review of fund |
| | | | | performance, strategy and outlook. |
| Shareholder Expense | | 8 | | An example of shareholder expenses. |
| Example | | | | |
| Investment Changes | | 10 | | A summary of the fund’s investments. |
| Investments | | 11 | | A complete list of the fund’s investments |
| | | | | with their market values. |
| Financial Statements | | 32 | | Statements of assets and liabilities, |
| | | | | operations, and changes in net assets, |
| | | | | as well as financial highlights. |
| Notes | | 42 | | Notes to the financial statements. |
| Report of Independent | | 51 | | |
| Registered Public | | | | |
| Accounting Firm | | | | |
| Trustees and Officers | | 52 | | |
| Distributions | | 62 | | |
| Proxy Voting Results | | 63 | | |
| Board Approval of | | 65 | | |
| Investment Advisory | | | | |
| Contracts and | | | | |
| Management Fees | | | | |
To view a fund’s proxy voting guidelines and proxy voting record for the 12 month period ended
June 30, visit www.fidelity.com/proxyvotingresults or visit the Securities and Exchange Commis
sion’s (SEC) web site at www.sec.gov. You may also call 1- 877-208-0098 to request a free copy of
the proxy voting guidelines.
Standard & Poor’s, S&P and S&P 500 are registered service marks of The McGraw Hill Companies,
Inc. and have been licensed for use by Fidelity Distributors Corporation.
Other third party marks appearing herein are the property of their respective owners.
All other marks appearing herein are registered or unregistered trademarks or service marks
of FMR Corp. or an affiliated company.
|
This report and the financial statements contained herein are submitted for the general information
of the shareholders of the fund. This report is not authorized for distribution to prospective investors
in the fund unless preceded or accompanied by an effective prospectus.
A fund files its complete schedule of portfolio holdings with the SEC for the first and third
quarters of each fiscal year on Form N Q. Forms N Q are available on the SEC’s web site at
http://www.sec.gov. A fund’s Forms N Q may be reviewed and copied at the SEC’s Public Reference
Room in Washington, DC. Information regarding the operation of the SEC’s Public Reference
Room may be obtained by calling 1-800-SEC-0330. For a complete list of a fund’s portfolio hold
ings, view the most recent quarterly holdings report, semiannual report, or annual report on
Fidelity’s web site at http://www.advisor.fidelity.com.
NOT FDIC INSURED · MAY LOSE VALUE · NO BANK GUARANTEE
Neither the fund nor Fidelity Distributors Corporation is a bank.
|
3 Annual Report
Chairman’s Message
(photograph of Edward C. Johnson 3d)
Dear Shareholder:
During the past year or so, much has been reported about the mutual fund industry, and much of it has been more critical than I believe is warranted. Allegations that some companies have been less than forthright with their shareholders have cast a shadow on the entire industry. I continue to find these reports disturbing, and assert that they do not create an accurate picture of the industry overall. Therefore, I would like to remind every one where Fidelity stands on these issues. I will say two things specifically regarding allegations that some mutual fund companies were in violation of the Securities and Exchange Commission’s forward pricing rules or were involved in so called “market timing” activities.
First, Fidelity has no agreements that permit customers who buy fund shares after 4 p.m. to obtain the 4 p.m. price. This is not a new policy. This is not to say that some one could not deceive the company through fraudulent acts. However, we are extremely diligent in preventing fraud from occurring in this manner and in every other. But I underscore again that Fidelity has no so called “agreements” that sanction illegal practices.
Second, Fidelity continues to stand on record, as we have for years, in opposition to predatory short term trading that adversely affects shareholders in a mutual fund. Back in the 1980s, we initiated a fee which is returned to the fund and, therefore, to investors to discourage this activity. Further, we took the lead several years ago in developing a Fair Value Pricing Policy to prevent market timing on foreign securities in our funds. I am confident we will find other ways to make it more difficult for predatory traders to operate. However, this will only be achieved through close cooperation among regulators, legislators and the industry.
Yes, there have been unfortunate instances of unethical and illegal activity within the mutual fund industry from time to time. That is true of any industry. When this occurs, confessed or convicted offenders should be dealt with appropriately. But we are still concerned about the risk of over regulation and the quick application of simplistic solutions to intricate problems. Every system can be improved, and we support and applaud well thought out improvements by regulators, legislators and industry representatives that achieve the common goal of building and protecting the value of investors’ holdings.
For nearly 60 years, Fidelity has worked very hard to improve its products and service to justify your trust. When our family founded this company in 1946, we had only a few hundred customers. Today, we serve more than 18 million customers including individual investors and participants in retirement plans across America.
Let me close by saying that we do not take your trust in us for granted, and we realize that we must always work to improve all aspects of our service to you. In turn, we urge you to continue your active participation with your financial matters, so that your interests can be well served.
Best regards,
Edward C. Johnson 3d
Edward C. Johnson 3d
Annual Report 4
Performance: The Bottom Line
Average annual total return reflects the change in the value of an investment, assuming reinvestment of the class’ dividend income and capital gains (the profits earned upon the sale of securities that have grown in value) and assuming a constant rate of performance each year. The $10,000 table and the fund’s returns do not reflect the deduction of taxes that a shareholder would pay on fund distributions or the redemption of fund shares. During periods of reimbursement by Fidelity, a fund’s total return will be greater than it would be had the reimbursement not occurred. How a fund did yesterday is no guarantee of how it will do tomorrow.
| Average Annual Total Returns | | | | |
| Periods ended November 30, 2005 | | Past 1 | | Life of |
| | | year | | FundA |
| Class A (incl. 5.75% sales charge) | | 5.21% | | 8.84% |
| Class T (incl. 3.50% sales charge) | | 7.53% | | 9.93% |
| Class B (incl. contingent deferred | | | | |
| sales charge)B | | 5.73% | | 9.46% |
| Class C (incl. contingent deferred | | | | |
| sales charge)C | | 9.85% | | 11.41% |
A From December 23, 2003.
B Class B shares’ contingent deferred sales charges included in the past one year and life of fund
total return figures is 5% and 4%, respectively.
C Class C shares’ contingent deferred sales charges included in the past one year and life of fund
total return figures is 1% and 0%, respectively.
|
5 Annual Report
5
| | $10,000 Over Life of Fund
|
Let’s say hypothetically that $10,000 was invested in Fidelity Advisor Strategic Dividend & Income Fund — Class T on December 23, 2003, when the fund started, and the current 3.50% sales charge was paid. The chart shows how the value of your investment would have changed, and also shows how the Standard & Poor’s 500SM Index performed over the same period.

Management’s Discussion of Fund Performance
Comments from Christopher Sharpe and Derek Young, who became Lead Co Managers of Fidelity Advisor Strategic Dividend & Income Fund on July 29, 2005
Numerous events unfolded during the 12 month period ending November 30, 2005, that were major influences on the U.S. equity markets. Issues exerting downward pressure on stocks included higher levels of inflation, eight short term interest rate hikes by the Federal Reserve Board, exorbitant energy prices, and a Category 4 hurricane that devastated both the city of New Orleans and several nearby oil production and refinery facilities. Grabbing most of the markets’ upbeat headlines was consistent strength in consumer spending, corporate earnings and gross domestic product (GDP). When all was said and done, investors demonstrated their conviction in the economy, pushing stocks higher across the board. By period end, the Standard & Poor’s 500SM Index, the NASDAQ Composite® Index and the Dow Jones Industrial AverageSM approached or exceeded four and a half year highs. For the 12 months overall, the S&P 500® was up 8.44%, the NASDAQ® rose 7.28% and the Dow advanced 6.07%, threatening to eclipse the 11,000 threshold for the first time since early 2000.
Fidelity Advisor Strategic Dividend & Income Fund’s Class A, Class T, Class B and Class C shares were up 11.63%, 11.43%, 10.73% and 10.85%, respectively (excluding sales charges), for the 12 months ending November 30, 2005. In comparison, the Fidelity Strategic Divi dend & Income Composite Index rose 8.52% and the LipperSM Equity Income Objective Funds Average returned 8.23% . The fund’s overall asset allocation strategy was to over weight riskier assets such as equities and the more volatile segments of the fund’s other investment categories and underweight fixed income like instruments relative to the composite index. All four of the fund’s subportfolios turned in strong performance for the year, beating their respective benchmarks. The fund’s overweighting in common stocks included a selected group of large cap value names that did particularly well and drove a big portion of the fund’s performance. The strong performance of the common stock subportfolio was partially offset by underweighting real estate investment trusts (REITs), which, given their particularly good returns caused the fund to miss some of the robust gains of that asset class. Security selection in energy was a consistent theme almost across the board, driving strong performance in the preferred stock and convertibles subportfolios, as well as in common stocks. Solid stock picking also led to outsized returns in the REIT subportfolio.
The views expressed in this statement reflect those of the portfolio managers only through the end of the period of the report as stated on the cover and do not necessarily represent the views of Fidelity or any other person in the Fidelity organization. Any such views are subject to change at any time based upon market or other conditions and Fidelity disclaims any responsibility to update such views. These views may not be relied on as investment advice and, because investment decisions for a Fidelity fund are based on numerous factors, may not be relied on as an indication of trading intent on behalf of any Fidelity fund.
Shareholder Expense Example
As a shareholder of the Fund, you incur two types of costs: (1) transaction costs, including sales charges (loads) on purchase payments or redemption proceeds, and (2) ongoing costs, including management fees, distribution and/or service (12b 1) fees and other Fund expenses. This Example is intended to help you understand your ongoing costs (in dollars) of investing in the Fund and to compare these costs with the ongoing costs of investing in other mutual funds.
The Example is based on an investment of $1,000 invested at the beginning of the period and held for the entire period (June 1, 2005 to November 30, 2005).
The first line of the table below for each class of the Fund provides information about actual account values and actual expenses. You may use the information in this line, together with the amount you invested, to estimate the expenses that you paid over the period. Simply divide your account value by $1,000.00 (for example, an $8,600 account value divided by $1,000.00 = 8.6), then multiply the result by the number in the first line for a class of the Fund under the heading entitled “Expenses Paid During Period” to estimate the expenses you paid on your account during this period.
Hypothetical Example for Comparison Purposes
The second line of the table below for each class of the Fund provides information about hypothetical account values and hypothetical expenses based on a Class’ actual expense ratio and an assumed rate of return of 5% per year before expenses, which is not the Class’ actual return. The hypothetical account values and expenses may not be used to estimate the actual ending account balance or expenses you paid for the period. You may use this information to compare the ongoing costs of investing in the Fund and other funds. To do so, compare this 5% hypothetical example with the 5% hypothetical examples that appear in the shareholder reports of the other funds.
Please note that the expenses shown in the table are meant to highlight your ongoing costs only and do not reflect any transaction costs. Therefore, the second line of the table is useful in comparing ongoing costs only, and will not help you determine the relative total costs of owning different funds. In addition, if these transactional costs were included, your costs would have been higher.
| | | | | | | | | | | Expenses Paid |
| | | | | Beginning | | Ending | | During Period* |
| | | | | Account Value | | Account Value | | June 1, 2005 to |
| | | | | June 1, 2005 | | November 30, 2005 | | November 30, 2005 |
| Class A | | | | | | | | | | | | |
| Actual | | | $ | 1,000.00 | | $ | | 1,084.90 | | $ | | 6.01 |
| HypotheticalA | | | $ | 1,000.00 | | $ | | 1,019.30 | | $ | | 5.82 |
| Class T | | | | | | | | | | | | |
| Actual | | | $ | 1,000.00 | | $ | | 1,084.80 | | $ | | 7.11 |
| HypotheticalA | | | $ | 1,000.00 | | $ | | 1,018.25 | | $ | | 6.88 |
| Class B | | | | | | | | | | | | |
| Actual | | | $ | 1,000.00 | | $ | | 1,080.90 | | $ | | 10.17 |
| HypotheticalA | | | $ | 1,000.00 | | $ | | 1,015.29 | | $ | | 9.85 |
Annual Report 8
| | | | | | | | | | | Expenses Paid |
| | | | | Beginning | | Ending | | During Period* |
| | | | | Account Value | | Account Value | | June 1, 2005 to |
| | | | | June 1, 2005 | | November 30, 2005 | | November 30, 2005 |
| Class C | | | | | | | | | | | | |
| Actual | | | $ | 1,000.00 | | $ | | 1,082.10 | | $ | | 9.81 |
| HypotheticalA | | | $ | 1,000.00 | | $ | | 1,015.64 | | $ | | 9.50 |
| Strategic Dividend & Income | | | | | | | | | | | | |
| Actual | | | $ | 1,000.00 | | $ | | 1,087.90 | | $ | | 4.19 |
| HypotheticalA | | | $ | 1,000.00 | | $ | | 1,021.06 | | $ | | 4.05 |
| Institutional Class | | | | | | | | | | | | |
| Actual | | | $ | 1,000.00 | | $ | | 1,086.90 | | $ | | 4.29 |
| HypotheticalA | | | $ | 1,000.00 | | $ | | 1,020.96 | | $ | | 4.15 |
| |
| A 5% return per year before expenses | | | | | | | | |
* Expenses are equal to each Class’ annualized expense ratio (shown in the table below); multiplied by the average account value over the period, multiplied by 183/365 (to reflect the one half year period).
| | | Annualized |
| | | Expense Ratio |
| Class A | | 1.15% |
| Class T | | 1.36% |
| Class B | | 1.95% |
| Class C | | 1.88% |
| Strategic Dividend & Income | | 80% |
| Institutional Class | | 82% |
9 Annual Report
| Investment Changes | | | | |
| |
| |
| Top Ten Investments as of November 30, 2005 | | |
| (excluding cash equivalents) | | % of fund’s | | % of fund’s net assets |
| | | net assets | | 6 months ago |
| American International Group, Inc. | | 2.5 | | 1.7 |
| Honeywell International, Inc. | | 2.0 | | 1.6 |
| General Electric Co. | | 1.8 | | 3.6 |
| Exxon Mobil Corp. | | 1.7 | | 2.0 |
| El Paso Corp. 4.99% | | 1.1 | | 1.2 |
| Bank of America Corp. | | 1.0 | | 1.4 |
| Valero Energy Corp. 2.00% | | 0.9 | | 0.8 |
| Halliburton Co. | | 0.9 | | 0.6 |
| JPMorgan Chase & Co. | | 0.9 | | 0.2 |
| Baxter International, Inc. | | 0.9 | | 1.0 |
| | | 13.7 | | |
Top Five Market Sectors as of November 30, 2005 | | |
| | | % of fund’s | | % of fund’s net assets |
| | | net assets | | 6 months ago |
| Financials | | 32.8 | | 31.5 |
| Energy | | 11.9 | | 9.9 |
| Industrials | | 9.7 | | 11.0 |
| Health Care | | 9.6 | | 10.0 |
| Information Technology | | 9.5 | | 10.3 |
Annual Report 10
| Investments November 30, 2005 |
| Showing Percentage of Net Assets | | | | |
| |
| Corporate Bonds 12.7% | | | | |
| | | Principal | | Value |
| | | Amount | | (Note 1) |
| Convertible Bonds – 12.7% | | | | |
| |
| CONSUMER DISCRETIONARY – 2.7% | | | | |
| Hotels, Restaurants & Leisure 1.5% | | | | |
| Carnival Corp. 1.132% 4/29/33 (e) | | $ 6,820,000 | | $ 5,565,802 |
| Kerzner International Ltd. 2.375% 4/15/24 | | 4,660,000 | | 5,700,112 |
| Six Flags, Inc. 4.5% 5/15/15 | | 3,300,000 | | 4,228,290 |
| | | | | 15,494,204 |
| Media – 1.2% | | | | |
| Charter Communications, Inc.: | | | | |
| 5.875% 11/16/09 (g) | | 700,000 | | 526,750 |
| 5.875% 11/16/09 | | 10,160,000 | | 7,645,400 |
| XM Satellite Radio Holdings, Inc. 1.75% 12/1/09 | | 580,000 | | 510,765 |
| XM Satellite Radio, Inc. 1.75% 12/1/09 (g) | | 3,300,000 | | 2,876,280 |
| | | | | 11,559,195 |
| |
| TOTAL CONSUMER DISCRETIONARY | | | | 27,053,399 |
| |
| ENERGY 1.2% | | | | |
| Energy Equipment & Services – 0.8% | | | | |
| Halliburton Co. 3.125% 7/15/23 | | 4,260,000 | | 7,414,232 |
| Oil, Gas & Consumable Fuels – 0.4% | | | | |
| McMoRan Exploration Co. 6% 7/2/08 | | 3,000,000 | | 4,102,500 |
| |
| TOTAL ENERGY | | | | 11,516,732 |
| |
| FINANCIALS – 0.6% | | | | |
| Consumer Finance – 0.6% | | | | |
| American Express Co.: | | | | |
| 1.85% 12/1/33 (e)(g) | | 1,800,000 | | 1,914,840 |
| 1.85% 12/1/33 (e) | | 3,850,000 | | 4,095,630 |
| | | | | 6,010,470 |
| |
| HEALTH CARE – 2.9% | | | | |
| Biotechnology – 1.0% | | | | |
| BioMarin Pharmaceutical, Inc. 3.5% 6/15/08 | | 4,780,000 | | 4,385,650 |
| Protein Design Labs, Inc. 2% 2/15/12 (g) | | 1,540,000 | | 2,002,955 |
| Serologicals Corp.: | | | | |
| 4.75% 8/15/33 (g) | | 770,000 | | 1,137,752 |
| 4.75% 8/15/33 | | 1,500,000 | | 2,216,400 |
| | | | | 9,742,757 |
| |
| |
| See accompanying notes which are an integral part of the financial statements. | | |
| |
| 11 | | | | Annual Report |
| Investments continued | | | | | | | | |
| |
| Corporate Bonds continued | | | | | | | | |
| | | | | Principal | | | | Value |
| | | | | Amount | | | | (Note 1) |
| Convertible Bonds continued | | | | | | | | |
| |
| HEALTH CARE – continued | | | | | | | | |
| Health Care Equipment & Supplies – 1.9% | | | | | | | | |
| Bausch & Lomb, Inc. 4.4219% 8/1/23 (h) | | $ | | 3,640,000 | | $ | | 5,557,843 |
| Cytyc Corp. 2.25% 3/15/24 | | | | 2,900,000 | | | | 3,128,520 |
| Fisher Scientific International, Inc.: | | | | | | | | |
| 2.5% 10/1/23 (g) | | | | 995,000 | | | | 1,437,705 |
| 2.5% 10/1/23 | | | | 2,400,000 | | | | 3,467,832 |
| Medtronic, Inc. 1.25% 9/15/21 | | | | 5,480,000 | | | | 5,495,892 |
| | | | | | | | | 19,087,792 |
| |
| TOTAL HEALTH CARE | | | | | | | | 28,830,549 |
| |
| INDUSTRIALS – 1.6% | | | | | | | | |
| Airlines – 0.6% | | | | | | | | |
| America West Holding Corp. 7.5% 1/18/09 | | | | 600,000 | | | | 705,000 |
| Continental Airlines, Inc. 4.5% 2/1/07 | | | | 5,170,000 | | | | 4,544,999 |
| US Airways Group, Inc. 7% 9/30/20 (g) | | | | 650,000 | | | | 1,012,830 |
| | | | | | | | | 6,262,829 |
| Industrial Conglomerates – 0.4% | | | | | | | | |
| Tyco International Group SA yankee 3.125% 1/15/23 . | | | | 3,010,000 | | | | 4,056,276 |
| Marine – 0.6% | | | | | | | | |
| OMI Corp. 2.875% 12/1/24 | | | | 6,300,000 | | | | 5,922,000 |
| |
| TOTAL INDUSTRIALS | | | | | | | | 16,241,105 |
| |
| INFORMATION TECHNOLOGY – 3.5% | | | | | | | | |
| Communications Equipment – 0.6% | | | | | | | | |
| Comverse Technology, Inc. 0% 5/15/23 | | | | 2,000,000 | | | | 2,960,000 |
| Juniper Networks, Inc. 0% 6/15/08 | | | | 2,260,000 | | | | 2,701,649 |
| | | | | | | | | 5,661,649 |
| Computers & Peripherals – 0.2% | | | | | | | | |
| Maxtor Corp. 6.8% 4/30/10 | | | | 1,510,000 | | | | 1,487,501 |
| Electronic Equipment & Instruments – 1.1% | | | | | | | | |
| Flextronics International Ltd. 1% 8/1/10 | | | | 6,420,000 | | | | 5,802,396 |
| Vishay Intertechnology, Inc. 3.625% 8/1/23 | | | | 5,560,000 | | | | 5,299,236 |
| | | | | | | | | 11,101,632 |
| Internet Software & Services – 0.4% | | | | | | | | |
| aQuantive, Inc. 2.25% 8/15/24 | | | | 1,800,000 | | | | 3,861,000 |
See accompanying notes which are an integral part of the financial statements.
| Corporate Bonds continued | | | | | | |
| | | | | Principal | | Value |
| | | | | Amount | | (Note 1) |
| Convertible Bonds continued | | | | | | |
| |
| INFORMATION TECHNOLOGY – continued | | | | | | |
| IT Services – 0.6% | | | | | | |
| DST Systems, Inc.: | | | | | | |
| Series A, 4.125% 8/15/23 (g) | | $ | | 1,240,000 | | $ 1,640,024 |
| 4.125% 8/15/23 | | | | 3,470,000 | | 4,589,422 |
| | | | | | | 6,229,446 |
| Semiconductors & Semiconductor Equipment – 0.6% | | | | | | |
| EMCORE Corp. 5% 5/15/11 | | | | 1,000,000 | | 960,000 |
| ON Semiconductor Corp. 0% 4/15/24 | | | | 6,500,000 | | 5,248,750 |
| | | | | | | 6,208,750 |
| |
| TOTAL INFORMATION TECHNOLOGY | | | | | | 34,549,978 |
| |
| UTILITIES – 0.2% | | | | | | |
| Independent Power Producers & Energy Traders – 0.2% | | | | | | |
| Mirant Corp. 2.5% 6/15/21 (d) | | | | 1,690,000 | | 1,774,500 |
| |
| TOTAL CONVERTIBLE BONDS | | | | | | 125,976,733 |
| Nonconvertible Bonds – 0.0% | | | | | | |
| |
| CONSUMER DISCRETIONARY – 0.0% | | | | | | |
| Household Durables – 0.0% | | | | | | |
| Stanley-Martin Communities LLC 9.75% 8/15/15 (g) | | | | 90,000 | | 82,800 |
| TOTAL CORPORATE BONDS | | | | | | |
| (Cost $121,939,884) | | | | | | 126,059,533 |
| |
| Common Stocks 69.5% | | | | | | |
| | | | | Shares | | |
| |
| CONSUMER DISCRETIONARY – 6.1% | | | | | | |
| Diversified Consumer Services – 0.5% | | | | | | |
| Apollo Group, Inc. Class A (a) | | | | 24,500 | | 1,744,400 |
| Coinmach Service Corp. unit | | | | 156,800 | | 2,359,840 |
| Service Corp. International (SCI) | | | | 128,000 | | 1,050,880 |
| | | | | | | 5,155,120 |
| Hotels, Restaurants & Leisure 1.1% | | | | | | |
| Centerplate, Inc. unit | | | | 318,800 | | 4,023,256 |
| Hilton Hotels Corp. | | | | 60,000 | | 1,315,200 |
| McDonald’s Corp. | | | | 71,800 | | 2,430,430 |
See accompanying notes which are an integral part of the financial statements.
13 Annual Report
| Investments continued | | | | | | |
| |
| Common Stocks continued | | | | | | |
| | | Shares | | Value (Note 1) |
| |
| CONSUMER DISCRETIONARY – continued | | | | | | |
| Hotels, Restaurants & Leisure continued | | | | | | |
| Red Robin Gourmet Burgers, Inc. (a) | | 15,000 | | $ | | 823,500 |
| Starwood Hotels & Resorts Worldwide, Inc. unit | | 38,100 | | | | 2,305,050 |
| | | | | | | 10,897,436 |
| Household Durables – 0.4% | | | | | | |
| D.R. Horton, Inc. | | 32,000 | | | | 1,134,080 |
| KB Home | | 7,000 | | | | 488,390 |
| LG Electronics, Inc. | | 4,250 | | | | 321,976 |
| Sony Corp. sponsored ADR | | 47,000 | | | | 1,739,470 |
| | | | | | | 3,683,916 |
| Internet & Catalog Retail 0.6% | | | | | | |
| Coldwater Creek, Inc. (a) | | 40,000 | | | | 1,256,000 |
| eBay, Inc. (a) | | 89,000 | | | | 3,988,090 |
| Expedia, Inc. (a) | | 13,750 | | | | 340,863 |
| IAC/InterActiveCorp (a) | | 17,750 | | | | 490,078 |
| | | | | | | 6,075,031 |
| Leisure Equipment & Products – 0.7% | | | | | | |
| Eastman Kodak Co. | | 256,500 | | | | 6,148,305 |
| Leapfrog Enterprises, Inc. Class A (a)(f) | | 75,000 | | | | 978,000 |
| | | | | | | 7,126,305 |
| Media – 1.9% | | | | | | |
| Clear Channel Communications, Inc. | | 41,600 | | | | 1,354,496 |
| Clear Channel Outdoor Holding, Inc. Class A | | 40,000 | | | | 812,000 |
| Lamar Advertising Co. Class A (a) | | 71,100 | | | | 3,295,485 |
| News Corp. Class A | | 22,400 | | | | 331,744 |
| The Reader’s Digest Association, Inc. (non-vtg.) | | 30,000 | | | | 465,900 |
| Time Warner, Inc. | | 210,900 | | | | 3,791,982 |
| Univision Communications, Inc. Class A (a) | | 164,500 | | | | 4,972,835 |
| Viacom, Inc. Class B (non-vtg.) | | 23,130 | | | | 772,542 |
| Walt Disney Co. | | 113,700 | | | | 2,834,541 |
| | | | | | | 18,631,525 |
| Multiline Retail – 0.1% | | | | | | |
| Federated Department Stores, Inc. | | 22,000 | | | | 1,417,460 |
| Specialty Retail – 0.8% | | | | | | |
| Gymboree Corp. (a) | | 25,000 | | | | 564,000 |
| Home Depot, Inc. | | 103,100 | | | | 4,307,518 |
| Maidenform Brands, Inc. | | 3,500 | | | | 45,010 |
| OfficeMax, Inc. | | 35,000 | | | | 1,021,300 |
See accompanying notes which are an integral part of the financial statements.
| Common Stocks continued | | | | |
| | | Shares | | Value (Note 1) |
| |
| CONSUMER DISCRETIONARY – continued | | | | |
| Specialty Retail – continued | | | | |
| Staples, Inc. | | 47,200 | | $ 1,090,320 |
| Urban Outfitters, Inc. (a) | | 25,000 | | 771,500 |
| | | | | 7,799,648 |
| Textiles, Apparel & Luxury Goods – 0.0% | | | | |
| Under Armour, Inc. Class A | | 800 | | 18,104 |
| |
| TOTAL CONSUMER DISCRETIONARY | | | | 60,804,545 |
| |
| CONSUMER STAPLES 3.3% | | | | |
| Beverages – 0.5% | | | | |
| Coca-Cola Enterprises, Inc. | | 40,800 | | 784,176 |
| Diageo PLC sponsored ADR | | 13,000 | | 755,950 |
| PepsiCo, Inc. | | 13,500 | | 799,200 |
| The Coca-Cola Co. | | 60,000 | | 2,561,400 |
| | | | | 4,900,726 |
| Food & Staples Retailing – 1.0% | | | | |
| CVS Corp. | | 25,000 | | 675,500 |
| Kroger Co. (a) | | 166,000 | | 3,230,360 |
| Safeway, Inc. | | 135,600 | | 3,152,700 |
| Wal-Mart Stores, Inc. | | 46,500 | | 2,258,040 |
| Walgreen Co. | | 15,000 | | 685,200 |
| | | | | 10,001,800 |
| Food Products 0.4% | | | | |
| B&G Foods, Inc. unit | | 156,900 | | 2,282,895 |
| Nestle SA (Reg.) | | 4,000 | | 1,186,447 |
| Tyson Foods, Inc. Class A | | 63,000 | | 1,060,290 |
| | | | | 4,529,632 |
| Household Products – 0.6% | | | | |
| Colgate-Palmolive Co. | | 105,000 | | 5,724,600 |
| Personal Products 0.1% | | | | |
| Avon Products, Inc. | | 25,000 | | 683,750 |
| Tobacco 0.7% | | | | |
| Altria Group, Inc. | | 99,300 | | 7,228,047 |
| |
| TOTAL CONSUMER STAPLES | | | | 33,068,555 |
| |
| ENERGY 8.0% | | | | |
| Energy Equipment & Services – 3.4% | | | | |
| BJ Services Co. | | 83,800 | | 3,071,270 |
See accompanying notes which are an integral part of the financial statements.
15 Annual Report
| Investments continued | | | | | | |
| |
| Common Stocks continued | | | | | | |
| | | Shares | | Value (Note 1) |
| |
| ENERGY – continued | | | | | | |
| Energy Equipment & Services – continued | | | | | | |
| FMC Technologies, Inc. (a) | | 34,000 | | $ | | 1,397,060 |
| GlobalSantaFe Corp. | | 50,800 | | | | 2,304,288 |
| Halliburton Co. | | 144,200 | | | | 9,178,330 |
| National Oilwell Varco, Inc. (a) | | 95,514 | | | | 5,790,059 |
| Noble Corp. | | 16,500 | | | | 1,189,155 |
| Pride International, Inc. (a) | | 81,300 | | | | 2,421,927 |
| Schlumberger Ltd. (NY Shares) | | 56,500 | | | | 5,408,745 |
| Smith International, Inc. | | 42,000 | | | | 1,587,180 |
| Weatherford International Ltd. (a) | | 18,000 | | | | 1,251,180 |
| | | | | | | 33,599,194 |
| Oil, Gas & Consumable Fuels – 4.6% | | | | | | |
| Amerada Hess Corp. | | 16,000 | | | | 1,960,320 |
| Apache Corp. | | 18,400 | | | | 1,201,152 |
| Chevron Corp. | | 117,100 | | | | 6,711,001 |
| ConocoPhillips | | 32,400 | | | | 1,960,524 |
| CONSOL Energy, Inc. | | 9,000 | | | | 582,480 |
| Devon Energy Corp. | | 34,000 | | | | 2,046,800 |
| El Paso Corp. | | 102,000 | | | | 1,120,980 |
| Encore Acquisition Co. (a) | | 14,000 | | | | 434,560 |
| Exxon Mobil Corp. | | 291,300 | | | | 16,904,139 |
| Houston Exploration Co. (a) | | 18,000 | | | | 983,880 |
| Massey Energy Co. | | 15,000 | | | | 569,250 |
| Occidental Petroleum Corp. | | 22,300 | | | | 1,768,390 |
| OMI Corp. | | 50,000 | | | | 970,000 |
| Quicksilver Resources, Inc. (a) | | 101,450 | | | | 3,840,897 |
| Valero Energy Corp. | | 35,000 | | | | 3,367,000 |
| XTO Energy, Inc. | | 43,000 | | | | 1,749,670 |
| | | | | | | 46,171,043 |
| |
| TOTAL ENERGY | | | | | | 79,770,237 |
| |
| FINANCIALS – 25.5% | | | | | | |
| Capital Markets 3.0% | | | | | | |
| Bear Stearns Companies, Inc. | | 8,200 | | | | 910,118 |
| Charles Schwab Corp. | | 107,000 | | | | 1,631,750 |
| Investors Financial Services Corp. | | 26,000 | | | | 981,500 |
| Lehman Brothers Holdings, Inc. | | 14,800 | | | | 1,864,800 |
| Merrill Lynch & Co., Inc. | | 76,600 | | | | 5,087,772 |
| Merrill Lynch & Co., Inc. (depositary shares) Series 1, unit | | 277,700 | | | | 7,020,256 |
| Morgan Stanley | | 75,000 | | | | 4,202,250 |
See accompanying notes which are an integral part of the financial statements.
| Common Stocks continued | | | | |
| | | Shares | | Value (Note 1) |
| |
| FINANCIALS – continued | | | | |
| Capital Markets continued | | | | |
| Nomura Holdings, Inc. | | 95,000 | | $ 1,581,750 |
| Nuveen Investments, Inc. Class A | | 20,000 | | 829,200 |
| State Street Corp. | | 69,000 | | 3,980,610 |
| TradeStation Group, Inc. (a) | | 59,500 | | 708,645 |
| UBS AG (NY Shares) | | 15,000 | | 1,378,800 |
| | | | | 30,177,451 |
| Commercial Banks – 2.3% | | | | |
| Banco Bradesco SA (PN) sponsored ADR (non-vtg.) (a)(f) | | 23,000 | | 1,412,200 |
| Bank of America Corp. | | 224,914 | | 10,321,303 |
| Korea Exchange Bank (a) | | 130,000 | | 1,641,445 |
| UCBH Holdings, Inc. | | 68,600 | | 1,210,104 |
| Wachovia Corp. | | 112,884 | | 6,028,006 |
| Wells Fargo & Co. | | 40,800 | | 2,564,280 |
| | | | | 23,177,338 |
| Diversified Financial Services – 1.6% | | | | |
| CBOT Holdings, Inc. Class A | | 300 | | 29,025 |
| Citigroup, Inc. | | 145,000 | | 7,039,750 |
| IntercontinentalExchange, Inc. | | 1,400 | | 45,220 |
| JPMorgan Chase & Co. | | 231,904 | | 8,870,328 |
| | | | | 15,984,323 |
| Insurance – 5.6% | | | | |
| ACE Ltd. | | 117,200 | | 6,504,600 |
| American International Group, Inc. | | 375,500 | | 25,211,063 |
| Aspen Insurance Holdings Ltd. | | 25,000 | | 625,750 |
| Endurance Specialty Holdings Ltd. | | 18,000 | | 620,100 |
| Hartford Financial Services Group, Inc. | | 72,000 | | 6,290,640 |
| Hilb Rogal & Hobbs Co. | | 43,000 | | 1,676,140 |
| Montpelier Re Holdings Ltd. | | 20,000 | | 392,600 |
| Muenchener Rueckversicherungs Gesellschaft AG (Reg.) | | 6,500 | | 849,468 |
| PartnerRe Ltd. | | 56,000 | | 3,823,680 |
| Platinum Underwriters Holdings Ltd. | | 26,700 | | 813,282 |
| Scottish Re Group Ltd. | | 35,000 | | 883,050 |
| Swiss Reinsurance Co. (Reg.) | | 12,000 | | 886,185 |
| The Chubb Corp. | | 7,000 | | 677,880 |
| The St. Paul Travelers Companies, Inc. | | 32,800 | | 1,526,184 |
| W.R. Berkley Corp. | | 92,400 | | 4,307,688 |
| XL Capital Ltd. Class A | | 16,000 | | 1,062,080 |
| | | | | 56,150,390 |
See accompanying notes which are an integral part of the financial statements.
17 Annual Report
| Investments continued | | | | | | |
| |
| Common Stocks continued | | | | | | |
| | | Shares | | Value (Note 1) |
| |
| FINANCIALS – continued | | | | | | |
| Real Estate 12.1% | | | | | | |
| Apartment Investment & Management Co. Class A | | 30,900 | | $ | | 1,196,757 |
| AvalonBay Communities, Inc. | | 32,660 | | | | 2,986,757 |
| Boston Properties, Inc. | | 68,614 | | | | 5,160,459 |
| Capital Automotive (REIT) (SBI) | | 21,900 | | | | 845,997 |
| CarrAmerica Realty Corp. | | 49,680 | | | | 1,753,704 |
| CBL & Associates Properties, Inc. | | 39,840 | | | | 1,603,560 |
| Cedar Shopping Centers, Inc. | | 28,000 | | | | 385,000 |
| CenterPoint Properties Trust (SBI) | | 60,130 | | | | 2,747,340 |
| Columbia Equity Trust, Inc. | | 58,300 | | | | 844,767 |
| Correctional Properties Trust | | 39,100 | | | | 1,124,516 |
| Cousins Properties, Inc. | | 13,800 | | | | 384,192 |
| Duke Realty Corp. | | 120,460 | | | | 4,095,640 |
| Equity Lifestyle Properties, Inc. | | 58,360 | | | | 2,705,570 |
| Equity Office Properties Trust | | 201,710 | | | | 6,289,318 |
| Equity Residential (SBI) | | 172,580 | | | | 7,034,361 |
| Federal Realty Investment Trust (SBI) | | 18,020 | | | | 1,134,900 |
| General Growth Properties, Inc. | | 162,525 | | | | 7,414,391 |
| GMH Communities Trust | | 63,400 | | | | 955,438 |
| Healthcare Realty Trust, Inc. | | 29,300 | | | | 1,026,086 |
| Host Marriott Corp. | | 119,300 | | | | 2,135,470 |
| Inland Real Estate Corp. | | 96,640 | | | | 1,438,003 |
| Innkeepers USA Trust (SBI) | | 7,300 | | | | 127,312 |
| Kilroy Realty Corp. | | 19,520 | | | | 1,202,432 |
| Kimco Realty Corp. | | 156,780 | | | | 4,930,731 |
| MeriStar Hospitality Corp. (a) | | 134,700 | | | | 1,318,713 |
| National Health Investors, Inc. | | 18,900 | | | | 522,585 |
| National Health Realty, Inc. | | 12,600 | | | | 244,062 |
| Newcastle Investment Corp. | | 13,400 | | | | 363,542 |
| Pan Pacific Retail Properties, Inc. | | 42,310 | | | | 2,847,463 |
| Pennsylvania (REIT) (SBI) | | 15,200 | | | | 561,336 |
| Plum Creek Timber Co., Inc. | | 112,680 | | | | 4,390,013 |
| Post Properties, Inc. | | 17,300 | | | | 699,958 |
| ProLogis Trust | | 185,565 | | | | 8,417,228 |
| Public Storage, Inc. | | 32,640 | | | | 2,304,384 |
| Rayonier, Inc. | | 29,820 | | | | 1,185,047 |
| Reckson Associates Realty Corp. | | 109,160 | | | | 4,009,447 |
| Shurgard Storage Centers, Inc. Class A | | 8,500 | | | | 497,420 |
| Simon Property Group, Inc. | | 87,210 | | | | 6,742,205 |
| SL Green Realty Corp. | | 42,600 | | | | 3,146,010 |
| Sovran Self Storage, Inc. | | 31,200 | | | | 1,547,520 |
| Tanger Factory Outlet Centers, Inc. | | 57,500 | | | | 1,580,675 |
See accompanying notes which are an integral part of the financial statements.
| Common Stocks continued | | | | |
| | | Shares | | Value (Note 1) |
| |
| FINANCIALS – continued | | | | |
| Real Estate continued | | | | |
| Taubman Centers, Inc. | | 37,800 | | $ 1,323,756 |
| The Mills Corp. | | 20,200 | | 866,580 |
| Trizec Properties, Inc. | | 184,050 | | 4,137,444 |
| Trustreet Properties, Inc. | | 19,600 | | 306,544 |
| United Dominion Realty Trust, Inc. (SBI) | | 258,620 | | 5,790,502 |
| Ventas, Inc. | | 110,850 | | 3,495,101 |
| Vornado Realty Trust | | 48,150 | | 4,109,603 |
| | | | | 119,929,839 |
| Thrifts & Mortgage Finance – 0.9% | | | | |
| Doral Financial Corp. | | 87,000 | | 878,700 |
| Fannie Mae | | 79,400 | | 3,815,170 |
| Freddie Mac | | 26,900 | | 1,679,905 |
| Golden West Financial Corp., Delaware | | 16,800 | | 1,088,472 |
| Hudson City Bancorp, Inc. | | 39,000 | | 464,490 |
| Sovereign Bancorp, Inc. | | 40,300 | | 880,958 |
| W Holding Co., Inc. | | 24,480 | | 201,960 |
| | | | | 9,009,655 |
| |
| TOTAL FINANCIALS | | | | 254,428,996 |
| |
| HEALTH CARE – 6.7% | | | | |
| Biotechnology – 1.5% | | | | |
| Alkermes, Inc. (a) | | 9,000 | | 163,620 |
| Alnylam Pharmaceuticals, Inc. (a) | | 85,000 | | 1,067,600 |
| Amgen, Inc. (a) | | 17,000 | | 1,375,810 |
| Biogen Idec, Inc. (a) | | 30,000 | | 1,284,300 |
| BioMarin Pharmaceutical, Inc. (a) | | 95,000 | | 925,300 |
| Cephalon, Inc. (a) | | 104,000 | | 5,288,400 |
| Genentech, Inc. (a) | | 10,000 | | 956,200 |
| ImClone Systems, Inc. (a) | | 40,000 | | 1,296,400 |
| MedImmune, Inc. (a) | | 56,000 | | 2,010,960 |
| ONYX Pharmaceuticals, Inc. (a) | | 12,000 | | 302,760 |
| Serologicals Corp. (a) | | 18,000 | | 361,440 |
| | | | | 15,032,790 |
| Health Care Equipment & Supplies – 2.4% | | | | |
| Aspect Medical Systems, Inc. (a) | | 15,000 | | 565,050 |
| Baxter International, Inc. | | 225,600 | | 8,773,584 |
| C.R. Bard, Inc. | | 15,000 | | 973,050 |
| Cooper Companies, Inc. | | 8,000 | | 438,400 |
| Dionex Corp. (a) | | 10,000 | | 472,300 |
See accompanying notes which are an integral part of the financial statements.
19 Annual Report
| Investments continued | | | | | | |
| |
| Common Stocks continued | | | | | | |
| | | Shares | | Value (Note 1) |
| |
| HEALTH CARE – continued | | | | | | |
| Health Care Equipment & Supplies – continued | | | | | | |
| Inverness Medical Innovations, Inc. (a) | | 41,200 | | $ | | 988,800 |
| Medtronic, Inc. | | 49,100 | | | | 2,728,487 |
| PerkinElmer, Inc. | | 83,000 | | | | 1,893,230 |
| Syneron Medical Ltd. (a) | | 12,000 | | | | 477,600 |
| Thermo Electron Corp. (a) | | 92,400 | | | | 2,850,540 |
| Varian, Inc. (a) | | 15,000 | | | | 629,400 |
| Waters Corp. (a) | | 69,500 | | | | 2,726,485 |
| | | | | | | 23,516,926 |
| Health Care Providers & Services – 0.8% | | | | | | |
| Community Health Systems, Inc. (a) | | 20,000 | | | | 801,800 |
| IMS Health, Inc. | | 30,000 | | | | 733,500 |
| McKesson Corp. | | 17,000 | | | | 855,100 |
| Psychiatric Solutions, Inc. (a) | | 21,300 | | | | 1,201,746 |
| Sierra Health Services, Inc. (a) | | 14,700 | | | | 1,149,834 |
| UnitedHealth Group, Inc. | | 38,200 | | | | 2,286,652 |
| WebMD Health Corp. Class A | | 18,700 | | | | 495,363 |
| | | | | | | 7,523,995 |
| Pharmaceuticals – 2.0% | | | | | | |
| Allergan, Inc. | | 11,000 | | | | 1,100,000 |
| Merck & Co., Inc. | | 91,000 | | | | 2,675,400 |
| Pfizer, Inc. | | 303,000 | | | | 6,423,600 |
| Schering-Plough Corp. | | 128,600 | | | | 2,484,552 |
| Teva Pharmaceutical Industries Ltd. sponsored ADR | | 63,000 | | | | 2,575,440 |
| Wyeth | | 121,800 | | | | 5,062,008 |
| | | | | | | 20,321,000 |
| |
| TOTAL HEALTH CARE | | | | | | 66,394,711 |
| |
| INDUSTRIALS – 7.9% | | | | | | |
| Aerospace & Defense – 2.3% | | | | | | |
| Hexcel Corp. (a) | | 30,000 | | | | 498,900 |
| Honeywell International, Inc. | | 540,300 | | | | 19,742,562 |
| Raytheon Co.�� | | 18,900 | | | | 726,138 |
| United Technologies Corp. | | 39,000 | | | | 2,099,760 |
| | | | | | | 23,067,360 |
| Air Freight & Logistics – 0.2% | | | | | | |
| EGL, Inc. (a) | | 36,000 | | | | 1,337,040 |
| Expeditors International of Washington, Inc. | | 11,000 | | | | 781,110 |
| | | | | | | 2,118,150 |
See accompanying notes which are an integral part of the financial statements.
| Common Stocks continued | | | | | | |
| | | Shares | | Value (Note 1) |
| |
| INDUSTRIALS – continued | | | | | | |
| Airlines – 0.4% | | | | | | |
| ACE Aviation Holdings, Inc. Class A (a) | | 28,900 | | $ | | 955,364 |
| AirTran Holdings, Inc. (a) | | 74,000 | | | | 1,111,480 |
| JetBlue Airways Corp. (a) | | 50,000 | | | | 922,000 |
| Southwest Airlines Co. | | 45,100 | | | | 744,150 |
| US Airways Group, Inc. (a) | | 12,500 | | | | 419,875 |
| | | | | | | 4,152,869 |
| Building Products 0.2% | | | | | | |
| Lennox International, Inc. | | 37,000 | | | | 1,080,770 |
| Masco Corp. | | 17,100 | | | | 509,067 |
| | | | | | | 1,589,837 |
| Commercial Services & Supplies – 0.2% | | | | | | |
| Robert Half International, Inc. | | 60,200 | | | | 2,303,252 |
| Construction & Engineering – 0.8% | | | | | | |
| Chicago Bridge & Iron Co. NV (NY Shares) | | 30,000 | | | | 776,700 |
| Fluor Corp. | | 54,100 | | | | 4,008,810 |
| Foster Wheeler Ltd. (a) | | 17,000 | | | | 592,110 |
| Jacobs Engineering Group, Inc. (a) | | 32,000 | | | | 2,079,040 |
| | | | | | | 7,456,660 |
| Electrical Equipment – 0.2% | | | | | | |
| ABB Ltd. sponsored ADR (a) | | 25,000 | | | | 218,750 |
| Rockwell Automation, Inc. | | 30,000 | | | | 1,692,900 |
| | | | | | | 1,911,650 |
| Industrial Conglomerates – 2.6% | | | | | | |
| 3M Co. | | 9,500 | | | | 745,560 |
| General Electric Co. | | 514,200 | | | | 18,367,224 |
| Smiths Group PLC | | 81,000 | | | | 1,364,551 |
| Tyco International Ltd. | | 190,800 | | | | 5,441,616 |
| | | | | | | 25,918,951 |
| Machinery – 0.3% | | | | | | |
| Deere & Co. | | 22,000 | | | | 1,525,700 |
| ITT Industries, Inc. | | 7,000 | | | | 761,320 |
| Watts Water Technologies, Inc. Class A | | 17,000 | | | | 491,130 |
| | | | | | | 2,778,150 |
| Road & Rail 0.4% | | | | | | |
| Norfolk Southern Corp. | | 89,700 | | | | 3,968,328 |
See accompanying notes which are an integral part of the financial statements.
21 Annual Report
| Investments continued | | | | |
| |
| Common Stocks continued | | | | |
| | | Shares | | Value (Note 1) |
| |
| INDUSTRIALS – continued | | | | |
| Trading Companies & Distributors – 0.3% | | | | |
| Watsco, Inc. | | 22,000 | | $ 1,380,500 |
| WESCO International, Inc. (a) | | 37,000 | | 1,544,750 |
| | | | | 2,925,250 |
| |
| TOTAL INDUSTRIALS | | | | 78,190,457 |
| |
| INFORMATION TECHNOLOGY – 6.0% | | | | |
| Communications Equipment – 0.7% | | | | |
| Comverse Technology, Inc. (a) | | 76,000 | | 1,991,960 |
| Dycom Industries, Inc. (a) | | 55,000 | | 1,123,650 |
| Extreme Networks, Inc. (a) | | 75,000 | | 369,000 |
| MasTec, Inc. (a) | | 40,000 | | 394,800 |
| Motorola, Inc. | | 26,000 | | 626,340 |
| Nokia Corp. sponsored ADR | | 134,000 | | 2,288,720 |
| | | | | 6,794,470 |
| Computers & Peripherals – 1.0% | | | | |
| EMC Corp. (a) | | 30,000 | | 417,900 |
| Hewlett-Packard Co. | | 286,900 | | 8,512,323 |
| Lexmark International, Inc. Class A (a) | | 9,000 | | 428,580 |
| Seagate Technology | | 65,000 | | 1,229,800 |
| | | | | 10,588,603 |
| Electronic Equipment & Instruments – 1.1% | | | | |
| Agilent Technologies, Inc. (a) | | 135,100 | | 4,817,666 |
| Amphenol Corp. Class A | | 14,000 | | 584,780 |
| Avnet, Inc. (a) | | 5,000 | | 112,500 |
| Jabil Circuit, Inc. (a) | | 28,000 | | 927,360 |
| Symbol Technologies, Inc. | | 132,200 | | 1,511,046 |
| Trimble Navigation Ltd. (a) | | 35,000 | | 1,140,300 |
| Vishay Intertechnology, Inc. (a) | | 117,000 | | 1,501,110 |
| | | | | 10,594,762 |
| Internet Software & Services – 0.6% | | | | |
| Digital River, Inc. (a) | | 13,000 | | 336,960 |
| Google, Inc. Class A (sub. vtg.) (a) | | 9,100 | | 3,685,409 |
| Yahoo!, Inc. (a) | | 48,000 | | 1,931,040 |
| | | | | 5,953,409 |
| IT Services – 0.5% | | | | |
| Anteon International Corp. (a) | | 29,500 | | 1,264,665 |
See accompanying notes which are an integral part of the financial statements.
| Common Stocks continued | | | | |
| | | Shares | | Value (Note 1) |
| |
| INFORMATION TECHNOLOGY – continued | | | | |
| IT Services – continued | | | | |
| Ceridian Corp. (a) | | 67,000 | | $ 1,608,000 |
| First Data Corp. | | 45,000 | | 1,947,150 |
| | | | | 4,819,815 |
| Office Electronics – 0.1% | | | | |
| Xerox Corp. (a) | | 92,000 | | 1,306,400 |
| Semiconductors & Semiconductor Equipment – 1.0% | | | | |
| Altera Corp. (a) | | 30,000 | | 547,800 |
| Analog Devices, Inc. | | 32,000 | | 1,213,440 |
| Cabot Microelectronics Corp. (a)(f) | | 18,400 | | 569,112 |
| Freescale Semiconductor, Inc. Class A (a) | | 53,500 | | 1,377,625 |
| Intel Corp. | | 110,000 | | 2,934,800 |
| Maxim Integrated Products, Inc. | | 36,000 | | 1,315,800 |
| Micron Technology, Inc. (a) | | 64,000 | | 912,640 |
| PMC-Sierra, Inc. (a) | | 47,000 | | 369,890 |
| Saifun Semiconductors Ltd. | | 1,100 | | 31,790 |
| Samsung Electronics Co. Ltd. | | 1,480 | | 853,050 |
| | | | | 10,125,947 |
| Software 1.0% | | | | |
| BEA Systems, Inc. (a) | | 105,900 | | 928,743 |
| Cognos, Inc. (a) | | 11,000 | | 367,783 |
| Macrovision Corp. (a) | | 7,000 | | 108,780 |
| Microsoft Corp. | | 175,900 | | 4,874,189 |
| NAVTEQ Corp. (a) | | 35,000 | | 1,470,000 |
| Symantec Corp. (a) | | 105,000 | | 1,855,350 |
| Ulticom, Inc. (a) | | 40,000 | | 460,800 |
| | | | | 10,065,645 |
| |
| TOTAL INFORMATION TECHNOLOGY | | | | 60,249,051 |
| |
| MATERIALS 3.2% | | | | |
| Chemicals – 1.9% | | | | |
| Chemtura Corp. | | 30,000 | | 361,500 |
| E.I. du Pont de Nemours & Co. | | 157,600 | | 6,737,400 |
| Ecolab, Inc. | | 35,100 | | 1,167,777 |
| Georgia Gulf Corp. | | 28,000 | | 780,080 |
| Lyondell Chemical Co. | | 113,733 | | 2,892,230 |
| Monsanto Co. | | 7,000 | | 512,890 |
| Mosaic Co. (a) | | 38,000 | | 514,520 |
| NOVA Chemicals Corp. | | 47,000 | | 1,772,901 |
| Praxair, Inc. | | 40,000 | | 2,080,000 |
See accompanying notes which are an integral part of the financial statements.
23 Annual Report
| Investments continued | | | | | | |
| |
| Common Stocks continued | | | | | | |
| | | | | Shares | | Value (Note 1) |
| |
| MATERIALS – continued | | | | | | | | |
| Chemicals – continued | | | | | | | | |
| Rockwood Holdings, Inc. | | | | 45,000 | | $ | | 820,800 |
| Rohm & Haas Co. | | | | 17,000 | | | | 744,600 |
| | | | | | | | | 18,384,698 |
| Construction Materials 0.1% | | | | | | |
| Martin Marietta Materials, Inc. | | 16,000 | | | | 1,201,760 |
| Containers & Packaging – 0.5% | | | | | | |
| Crown Holdings, Inc. (a) | | | | 25,000 | | | | 463,500 |
| Owens Illinois, Inc. (a) | | | | 84,700 | | | | 1,842,225 |
| Packaging Corp. of America | | 60,400 | | | | 1,400,676 |
| Smurfit-Stone Container Corp. (a) | | 125,000 | | | | 1,583,750 |
| | | | | | | | | 5,290,151 |
| Metals & Mining – 0.7% | | | | | | | | |
| Alcoa, Inc. | | | | 45,700 | | | | 1,252,637 |
| Freeport-McMoRan Copper & Gold, Inc. Class B | | 25,000 | | | | 1,302,750 |
| Newmont Mining Corp. | | | | 94,800 | | | | 4,372,176 |
| | | | | | | | | 6,927,563 |
| |
| TOTAL MATERIALS | | | | | | | | 31,804,172 |
| |
| TELECOMMUNICATION SERVICES – 2.2% | | | | | | |
| Diversified Telecommunication Services – 0.9% | | | | | | |
| AT&T, Inc. | | | | 237,800 | | | | 5,923,598 |
| CenturyTel, Inc. | | | | 48,689 | | | | 1,611,606 |
| Covad Communications Group, Inc. (a) | | 676,200 | | | | 527,436 |
| Verizon Communications, Inc. | | 34,800 | | | | 1,112,904 |
| | | | | | | | | 9,175,544 |
| Wireless Telecommunication Services – 1.3% | | | | | | |
| American Tower Corp. Class A (a) | | 151,000 | | | | 4,120,790 |
| Leap Wireless International, Inc. (a) | | 16,000 | | | | 608,960 |
| Nextel Partners, Inc. Class A (a) | | 83,000 | | | | 2,199,500 |
| Sprint Nextel Corp. | | | | 235,885 | | | | 5,906,560 |
| | | | | | | | | 12,835,810 |
| |
| TOTAL TELECOMMUNICATION SERVICES | | | | | | 22,011,354 |
See accompanying notes which are an integral part of the financial statements.
| Common Stocks continued | | | | |
| | | Shares | | Value (Note 1) |
| |
| UTILITIES – 0.6% | | | | |
| Electric Utilities – 0.2% | | | | |
| PPL Corp. | | 50,600 | | $ 1,487,640 |
| Westar Energy, Inc. | | 20,000 | | 452,400 |
| | | | | 1,940,040 |
| Independent Power Producers & Energy Traders – 0.1% | | | | |
| AES Corp. (a) | | 55,600 | | 876,812 |
| TXU Corp. | | 5,460 | | 560,360 |
| | | | | 1,437,172 |
| Multi-Utilities – 0.3% | | | | |
| CMS Energy Corp. (a) | | 84,700 | | 1,184,106 |
| PG&E Corp. | | 35,200 | | 1,294,656 |
| | | | | 2,478,762 |
| |
| TOTAL UTILITIES | | | | 5,855,974 |
| |
| TOTAL COMMON STOCKS | | | | |
| (Cost $602,537,612) | | | | 692,578,052 |
| |
| Preferred Stocks 15.3% | | | | |
| |
| Convertible Preferred Stocks 6.0% | | | | |
| |
| CONSUMER DISCRETIONARY – 0.2% | | | | |
| Hotels, Restaurants & Leisure 0.2% | | | | |
| Six Flags, Inc. 7.25% PIERS | | 82,700 | | 1,889,695 |
| Media – 0.0% | | | | |
| Emmis Communications Corp. Series A, 6.25% | | 10,100 | | 463,716 |
| |
| TOTAL CONSUMER DISCRETIONARY | | | | 2,353,411 |
| |
| ENERGY 2.7% | | | | |
| Oil, Gas & Consumable Fuels – 2.7% | | | | |
| Chesapeake Energy Corp. 4.50% | | 15,000 | | 1,353,750 |
| El Paso Corp. 4.99% (g) | | 10,000 | | 10,328,900 |
| Teekay Shipping Corp. Series A, 7.25% | | 125,000 | | 6,011,250 |
| Valero Energy Corp. 2.00% | | 96,600 | | 9,207,912 |
| | | | | 26,901,812 |
| |
| FINANCIALS – 0.6% | | | | |
| Diversified Financial Services – 0.2% | | | | |
| Carriage Services Capital Trust 7.00% TIDES | | 45,000 | | 1,822,500 |
See accompanying notes which are an integral part of the financial statements.
25 Annual Report
| Investments continued | | | | |
| |
| Preferred Stocks continued | | | | |
| | | Shares | | Value (Note 1) |
| Convertible Preferred Stocks continued | | | | |
| |
| FINANCIALS – continued | | | | |
| Insurance – 0.4% | | | | |
| Fortis Insurance NV 7.75% (g) | | 3,734 | | $ 4,564,815 |
| |
| TOTAL FINANCIALS | | | | 6,387,315 |
| |
| INDUSTRIALS – 0.1% | | | | |
| Road & Rail 0.1% | | | | |
| Kansas City Southern 4.25% | | 1,370 | | 1,159,664 |
| MATERIALS 1.2% | | | | |
| Chemicals – 0.7% | | | | |
| Celanese Corp. 4.25% | | 252,600 | | 6,605,490 |
| Containers & Packaging – 0.4% | | | | |
| Owens Illinois, Inc. 4.75% | | 113,510 | | 4,143,115 |
| Metals & Mining – 0.1% | | | | |
| Freeport-McMoRan Copper & Gold, Inc. 5.50% (g) | | 1,050 | | 1,191,351 |
| |
| TOTAL MATERIALS | | | | 11,939,956 |
| |
| UTILITIES – 1.2% | | | | |
| Electric Utilities – 0.7% | | | | |
| AES Trust VII 6.00% | | 140,500 | | 6,673,750 |
| Independent Power Producers & Energy Traders – 0.5% | | | | |
| NRG Energy, Inc. 4.00% (g) | | 3,900 | | 4,812,620 |
| |
| TOTAL UTILITIES | | | | 11,486,370 |
| |
| TOTAL CONVERTIBLE PREFERRED STOCKS | | | | 60,228,528 |
| Nonconvertible Preferred Stocks 9.3% | | | | |
| |
| CONSUMER DISCRETIONARY – 0.1% | | | | |
| Household Durables – 0.1% | | | | |
| Hovnanian Enterprises, Inc. Series A, 7.625% | | 40,000 | | 930,000 |
| CONSUMER STAPLES 0.1% | | | | |
| Food Products 0.1% | | | | |
| H.J. Heinz Finance Co. 6.226% | | 10 | | 1,038,500 |
See accompanying notes which are an integral part of the financial statements.
| Preferred Stocks continued | | | | | | |
| | | Shares | | Value (Note 1) |
| Nonconvertible Preferred Stocks continued | | | | | | |
| |
| FINANCIALS – 6.1% | | | | | | |
| Capital Markets 1.3% | | | | | | |
| Bear Stearns Companies, Inc.: | | | | | | |
| Series E, 6.155% | | 15,000 | | $ | | 748,500 |
| Series G, 5.49% | | 15,000 | | | | 741,000 |
| Goldman Sachs Group, Inc.: | | | | | | |
| Series A, 3.9106% | | 120,000 | | | | 3,054,000 |
| Series C, 4.9931% | | 40,000 | | | | 1,020,000 |
| Lehman Brothers Holdings, Inc. (depositary shares) Series F, | | | | | | |
| 6.50% | | 169,015 | | | | 4,292,981 |
| Merrill Lynch & Co., Inc. Series H, 3.97% | | 120,000 | | | | 2,952,000 |
| | | | | | | 12,808,481 |
| Commercial Banks – 1.4% | | | | | | |
| ABN Amro Capital Funding Trust VII 6.08% | | 40,400 | | | | 965,156 |
| First Tennessee Bank NA, Memphis 3.90% (g) | | 5,000 | | | | 5,000,000 |
| HSBC USA, Inc.: | | | | | | |
| Series F, 3.87% | | 160,000 | | | | 4,048,000 |
| Series G, 4.9175% | | 80,000 | | | | 2,040,800 |
| Santander Finance Preferred SA Unipersonal 6.41% | | 69,400 | | | | 1,743,675 |
| | | | | | | 13,797,631 |
| Consumer Finance – 0.3% | | | | | | |
| SLM Corp.: | | | | | | |
| 4.07% | | 10,000 | | | | 1,010,000 |
| Series A, 6.97% | | 43,400 | | | | 2,317,560 |
| | | | | | | 3,327,560 |
| Diversified Financial Services – 0.2% | | | | | | |
| ABN AMRO Capital Funding Trust V 5.90% | | 20,000 | | | | 467,600 |
| CIT Group, Inc. Series B, 5.189% | | 15,000 | | | | 1,485,900 |
| JPMorgan Chase & Co. (depositary shares) Series H, 6.625% . | | 6,530 | | | | 332,377 |
| | | | | | | 2,285,877 |
| Insurance – 0.2% | | | | | | |
| AmerUs Group Co. 7.25% | | 40,000 | | | | 994,000 |
| MetLife, Inc. Series A, 4.39% | | 40,000 | | | | 1,029,600 |
| | | | | | | 2,023,600 |
| Real Estate 0.7% | | | | | | |
| Apartment Investment & Management Co.: | | | | | | |
| Series Q, 10.10% | | 46,510 | | | | 1,175,308 |
| Series V, 8.00% | | 79,000 | | | | 1,982,900 |
| Duke Realty Corp. (depositary shares) Series K, 6.50% | | 95,800 | | | | 2,268,544 |
See accompanying notes which are an integral part of the financial statements.
27 Annual Report
| Investments continued | | | | | | |
| |
| Preferred Stocks continued | | | | | | |
| | | Shares | | Value (Note 1) |
| Nonconvertible Preferred Stocks continued | | | | | | |
| |
| FINANCIALS – continued | | | | | | |
| Real Estate continued | | | | | | |
| Host Marriott Corp. Series E, 8.875% | | 20,000 | | $ | | 547,000 |
| Vornado Realty Trust Series E, 7.00% | | 40,000 | | | | 1,003,200 |
| | | | | | | 6,976,952 |
| Thrifts & Mortgage Finance – 2.0% | | | | | | |
| Fannie Mae: | | | | | | |
| 7.00% | | 42,200 | | | | 2,346,320 |
| Series H, 5.81% | | 49,200 | | | | 2,290,260 |
| Series L, 5.125% | | 90,900 | | | | 3,858,705 |
| Series N, 5.50% | | 71,650 | | | | 3,144,002 |
| Freddie Mac: | | | | | | |
| Series F, 5.00% | | 58,500 | | | | 2,433,600 |
| Series H, 5.10% | | 10,300 | | | | 432,600 |
| Series K, 5.79% | | 35,200 | | | | 1,687,840 |
| Series O, 5.81% | | 19,500 | | | | 965,250 |
| Series R, 5.70% | | 57,000 | | | | 2,716,050 |
| | | | | | | 19,874,627 |
| |
| TOTAL FINANCIALS | | | | | | 61,094,728 |
| |
| INDUSTRIALS – 0.1% | | | | | | |
| Aerospace & Defense – 0.1% | | | | | | |
| RC Trust I 7.00% | | 9,680 | | | | 488,235 |
| |
| MATERIALS 0.1% | | | | | | |
| Chemicals – 0.1% | | | | | | |
| E.I. du Pont de Nemours & Co. Series B, 4.50% | | 9,900 | | | | 841,500 |
| Metals & Mining – 0.0% | | | | | | |
| Alcoa, Inc. 3.75% | | 6,400 | | | | 468,480 |
| |
| TOTAL MATERIALS | | | | | | 1,309,980 |
| |
| UTILITIES – 2.8% | | | | | | |
| Electric Utilities – 2.4% | | | | | | |
| Alabama Power Co. 5.30% | | 88,600 | | | | 2,075,012 |
| Duquesne Light Co. 6.50% | | 106,050 | | | | 5,456,273 |
| FPL Group Capital Trust I 5.875% | | 20,000 | | | | 471,200 |
| Heco Capital Trust III 6.50% | | 12,000 | | | | 307,440 |
| Pacific Gas & Electric Co.: | | | | | | |
| Series A, 5.00% | | 16,900 | | | | 355,745 |
See accompanying notes which are an integral part of the financial statements.
| Preferred Stocks continued | | | | |
| | | Shares | | Value (Note 1) |
| Nonconvertible Preferred Stocks continued | | | | |
| |
| UTILITIES – continued | | | | |
| Electric Utilities – continued | | | | |
| Pacific Gas & Electric Co.: – continued | | | | |
| Series B, 5.50% | | 61,900 | | $ 1,420,605 |
| Series D 5.00% | | 69,200 | | 1,439,360 |
| Southern California Edison Co.: | | | | |
| 4.78% | | 46,500 | | 988,125 |
| 5.349% | | 40,000 | | 4,040,000 |
| 6.125% | | 30,000 | | 3,000,000 |
| Series B, 4.08% | | 27,271 | | 538,602 |
| Series C, 4.24% | | 94,600 | | 1,797,400 |
| Series D, 4.32% | | 70,000 | | 1,344,000 |
| | | | | 23,233,762 |
| Multi-Utilities – 0.4% | | | | |
| Consolidated Edison Co. of New York, Inc. Series A, 5.00% | | 28,705 | | 2,513,123 |
| San Diego Gas & Electric Co. 1.70% | | 67,548 | | 1,745,697 |
| | | | | 4,258,820 |
| |
| TOTAL UTILITIES | | | | 27,492,582 |
| |
| TOTAL NONCONVERTIBLE PREFERRED STOCKS | | | | 92,354,025 |
| |
| TOTAL PREFERRED STOCKS | | | | |
| (Cost $148,071,869) | | | | 152,582,553 |
See accompanying notes which are an integral part of the financial statements.
29 Annual Report
| Investments continued | | | | | | | | |
| |
| Money Market Funds 2.5% | | | | | | | | |
| | | | | Shares | | | | Value (Note 1) |
| Fidelity Cash Central Fund, 4.08% (b) | | | | 22,090,879 | | $ | | 22,090,879 |
| Fidelity Securities Lending Cash Central Fund, | | | | | | |
| 4.09% (b)(c) | | | | 2,434,150 | | | | 2,434,150 |
| TOTAL MONEY MARKET FUNDS | | | | | | | | |
| (Cost $24,525,029) | | | | | | | | 24,525,029 |
| TOTAL INVESTMENT PORTFOLIO 100.0% | | | | | | |
| (Cost $897,074,394) | | | | | | | | 995,745,167 |
| |
| NET OTHER ASSETS – 0.0% | | | | | | | | 428,432 |
| NET ASSETS 100% | | | | | | $ | | 996,173,599 |
| Security Type Abbreviations |
| PIERS | | — | | Preferred Income Equity |
| | | | | Redeemable Securities |
| TIDES | | — | | Term Income Deferred Equity |
| | | | | Securities |
Legend
(a) Non-income producing
(b) Affiliated fund that is available only to
investment companies and other
accounts managed by Fidelity
Investments. The rate quoted is the
annualized seven-day yield of the fund
at period end. A complete unaudited
listing of the fund’s holdings as of its
most recent quarter end is available
upon request.
(c) Investment made with cash collateral
received from securities on loan.
|
(d) Non-income producing – Issuer is in
default.
(e) Debt obligation initially issued at one
coupon which converts to a higher
coupon at a specified date. The rate
shown is the rate at period end.
(f) Security or a portion of the security is on
loan at period end.
(g) Security exempt from registration under
Rule 144A of the Securities Act of 1933.
These securities may be resold in
transactions exempt from registration,
normally to qualified institutional buyers.
At the period end, the value of these
securities amounted to $38,529,622 or
3.9% of net assets.
(h) The coupon rate shown on floating or
adjustable rate securities represents the
rate at period end.
|
Affiliated Central Funds
Information regarding income received by the fund from the affiliated Central funds during the period is as follows:
| Fund | | | | Income received |
| Fidelity Cash Central Fund | | | $ | 597,880 |
| Fidelity Securities Lending Cash Central Fund | | | | 41,671 |
| Total | | | $ | 639,551 |
See accompanying notes which are an integral part of the financial statements.
Annual Report 30
Other Information
The composition of credit quality ratings as a percentage of net assets is as follows (ratings are unaudited):
| AAA, AA, A | | 1.7% |
| BBB | | 1.2% |
| BB | | 2.2% |
| B | | 2.7% |
| CCC, CC, C | | 2.1% |
| D | | 0.2% |
| Not Rated | | 2.6% |
| Equities | | 84.8% |
| Short Term Investments and Net | | |
| Other Assets | | 2.5% |
| | | 100.0% |
We have used ratings from Moody’s® Investors Services, Inc. Where Moody’s ratings are not available, we have used S&P® ratings. Percentages are adjusted for the effect of futures contracts, if applicable.
See accompanying notes which are an integral part of the financial statements.
31 Annual Report
| Financial Statements | | | | | | | | |
| |
| |
| Statement of Assets and Liabilities | | | | | | | | |
| | | | | | | November 30, 2005 |
| |
| Assets | | | | | | | | |
| Investment in securities, at value (including securities | | | | | | | | |
| loaned of $2,392,488) See accompanying | | | | | | | | |
| schedule: | | | | | | | | |
| Unaffiliated issuers (cost $872,549,365) | | $ | | 971,220,138 | | | | |
| Affiliated Central Funds (cost $24,525,029) | | | | 24,525,029 | | | | |
| Total Investments (cost $897,074,394) | | | | | | $ | | 995,745,167 |
| Cash | | | | | | | | 68,659 |
| Receivable for investments sold | | | | | | | | 6,337,511 |
| Receivable for fund shares sold | | | | | | | | 1,953,755 |
| Dividends receivable | | | | | | | | 1,526,164 |
| Interest receivable | | | | | | | | 935,785 |
| Prepaid expenses | | | | | | | | 4,886 |
| Receivable from investment adviser for expense | | | | | | | | |
| reductions | | | | | | | | 9 |
| Other receivables | | | | | | | | 49,770 |
| Total assets | | | | | | | | 1,006,621,706 |
| |
| Liabilities | | | | | | | | |
| Payable for investments purchased | | $ | | 6,206,782 | | | | |
| Payable for fund shares redeemed | | | | 1,036,991 | | | | |
| Accrued management fee | | | | 462,756 | | | | |
| Distribution fees payable | | | | 96,374 | | | | |
| Other affiliated payables | | | | 181,958 | | | | |
| Other payables and accrued expenses | | | | 29,096 | | | | |
| Collateral on securities loaned, at value | | | | 2,434,150 | | | | |
| Total liabilities | | | | | | | | 10,448,107 |
| |
| Net Assets | | | | | | $ | | 996,173,599 |
| Net Assets consist of: | | | | | | | | |
| Paid in capital | | | | | | $ | | 884,247,267 |
| Undistributed net investment income | | | | | | | | 3,125,667 |
| Accumulated undistributed net realized gain (loss) on | | | | | | | | |
| investments and foreign currency transactions | | | | | | | | 10,129,892 |
| Net unrealized appreciation (depreciation) on | | | | | | | | |
| investments | | | | | | | | 98,670,773 |
| Net Assets | | | | | | $ | | 996,173,599 |
See accompanying notes which are an integral part of the financial statements.
| Statement of Assets and Liabilities continued | | | | |
| | | November 30, 2005 |
| |
| Calculation of Maximum Offering Price | | | | |
| Class A: | | | | |
| Net Asset Value and redemption price per share | | | | |
| ($38,885,723 ÷ 3,191,319 shares) | | $ | | 12.18 |
| |
| Maximum offering price per share (100/94.25 of $12.18) | | $ | | 12.92 |
| Class T: | | | | |
| Net Asset Value and redemption price per share | | | | |
| ($79,920,243 ÷ 6,567,201 shares) | | $ | | 12.17 |
| |
| Maximum offering price per share (100/96.50 of $12.17) | | $ | | 12.61 |
| Class B: | | | | |
| Net Asset Value and offering price per share | | | | |
| ($19,743,710 ÷ 1,625,798 shares)A | | $ | | 12.14 |
| |
| Class C: | | | | |
| Net Asset Value and offering price per share | | | | |
| ($49,712,764 ÷ 4,091,976 shares)A | | $ | | 12.15 |
| |
| Strategic Dividend & Income: | | | | |
| Net Asset Value, offering price and redemption price per | | | | |
| share ($798,113,368 ÷ 65,333,621 shares) | | $ | | 12.22 |
| |
| Institutional Class: | | | | |
| Net Asset Value, offering price and redemption price per | | | | |
| share ($9,797,791 ÷ 802,532 shares) | | $ | | 12.21 |
| |
| A Redemption price per share is equal to net asset value less any applicable contingent deferred sales charge. | | | | |
See accompanying notes which are an integral part of the financial statements.
33 Annual Report
| Financial Statements continued | | | | |
| |
| Statement of Operations | | | | | | |
| | | | | Year ended November 30, 2005 |
| |
| Investment Income | | | | | | |
| Dividends | | | | | | $ 18,836,322 |
| Interest | | | | | | 3,135,959 |
| Income from affiliated Central Funds | | | | | | 639,551 |
| Total income | | | | | | 22,611,832 |
| |
| Expenses | | | | | | |
| Management fee | | $ | | 4,715,492 | | |
| Transfer agent fees | | | | 1,633,903 | | |
| Distribution fees | | | | 948,528 | | |
| Accounting and security lending fees | | | | 301,582 | | |
| Independent trustees’ compensation | | | | 3,582 | | |
| Custodian fees and expenses | | | | 34,296 | | |
| Registration fees | | | | 129,298 | | |
| Audit | | | | 37,554 | | |
| Legal | | | | 3,378 | | |
| Miscellaneous | | | | 29,118 | | |
| Total expenses before reductions | | | | 7,836,731 | | |
| Expense reductions | | | | (214,848) | | 7,621,883 |
| |
| Net investment income (loss) | | | | | | 14,989,949 |
| Realized and Unrealized Gain (Loss) | | | | |
| Net realized gain (loss) on: | | | | | | |
| Investment securities: | | | | | | |
| Unaffiliated issuers | | | | 18,346,538 | | |
| Foreign currency transactions | | | | 1,294 | | |
| Futures contracts | | | | 364,449 | | |
| Total net realized gain (loss) | | | | | | 18,712,281 |
| Change in net unrealized appreciation (depreciation) on: | | | | |
| Investment securities | | | | 59,851,577 | | |
| Futures contracts | | | | (290,281) | | |
| Total change in net unrealized appreciation | | | | |
| (depreciation) | | | | | | 59,561,296 |
| Net gain (loss) | | | | | | 78,273,577 |
| Net increase (decrease) in net assets resulting from | | | | |
| operations | | | | | | $ 93,263,526 |
See accompanying notes which are an integral part of the financial statements.
| Statement of Changes in Net Assets | | | | | | | | |
| | | | | | | For the period |
| | | | | | | December 23, 2003 |
| | | | | Year ended | | (commencement |
| | | | | November 30, | | of operations) to |
| | | | | 2005 | | November 30, 2004 |
| Increase (Decrease) in Net Assets | | | | | | | | |
| Operations | | | | | | | | |
| Net investment income (loss) | | $ | | 14,989,949 | | $ | | 6,636,433 |
| Net realized gain (loss) | | | | 18,712,281 | | | | (8,238,032) |
| Change in net unrealized appreciation (depreciation) | | | | 59,561,296 | | | | 39,109,477 |
| Net increase (decrease) in net assets resulting | | | | | | | | |
| from operations | | | | 93,263,526 | | | | 37,507,878 |
| Distributions to shareholders from net investment income | | | | (14,194,615) | | | | (4,647,719) |
| Share transactions - net increase (decrease) | | | | 335,336,361 | | | | 548,908,168 |
| Total increase (decrease) in net assets | | | | 414,405,272 | | | | 581,768,327 |
| |
| Net Assets | | | | | | | | |
| Beginning of period | | | | 581,768,327 | | | | — |
| End of period (including undistributed net investment | | | | | | | | |
| income of $3,125,667 and undistributed net in- | | | | | | | | |
| vestment income of $2,463,649, respectively) | | $ | | 996,173,599 | | $ | | 581,768,327 |
See accompanying notes which are an integral part of the financial statements.
35 Annual Report
| Financial Highlights Class A | | | | | | | | |
| |
| Years ended November 30, | | | | 2005 | | | | 2004F |
| Selected Per Share Data | | | | | | | | |
| Net asset value, beginning of period | | | | $ 11.09 | | | | $ 10.00 |
| Income from Investment Operations | | | | | | | | |
| Net investment income (loss)E | | | | 18 | | | | .16 |
| Net realized and unrealized gain (loss) | | | | 1.10 | | | | 1.04 |
| Total from investment operations | | | | 1.28 | | | | 1.20 |
| Distributions from net investment income | | | | (.19) | | | | (.11) |
| Net asset value, end of period | | | | $ 12.18 | | | | $ 11.09 |
| Total ReturnB,C,D | | | | 11.63% | | | | 12.01% |
| Ratios to Average Net AssetsG | | | | | | | | |
| Expenses before reductions | | | | 1.16% | | | | 1.20%A |
| Expenses net of fee waivers, if any | | | | 1.16% | | | | 1.20%A |
| Expenses net of all reductions | | | | 1.13% | | | | 1.17%A |
| Net investment income (loss) | | | | 1.60% | | | | 1.67%A |
| Supplemental Data | | | | | | | | |
| Net assets, end of period (000 omitted) | | $38,886 | | $21,985 |
| Portfolio turnover rate | | | | 64% | | | | 66%A |
A Annualized
B Total returns for periods of less than one year are not annualized.
C Total returns would have been lower had certain expenses not been reduced during the periods shown.
D Total returns do not include the effect of the sales charges.
E Calculated based on average shares outstanding during the period.
F For the period December 23, 2003 (commencement of operations) to November 30, 2004.
G Expense ratios reflect operating expenses of the class. Expenses before reductions do not reflect amounts reimbursed by the investment adviser or
reductions from brokerage service arrangements or other expense offset arrangements and do not represent the amount paid by the class during
periods when reimbursements or reductions occur. Expense ratios before reductions for start up periods may not be representative of longer term
operating periods. Expenses net of fee waivers reflect expenses after reimbursement by the investment adviser but prior to reductions from
brokerage service arrangements or other expense offset arrangements. Expenses net of all reductions represent the net expenses paid by the
class.
|
See accompanying notes which are an integral part of the financial statements.
| Financial Highlights Class T | | | | | | | | |
| |
| Years ended November 30, | | | | 2005 | | | | 2004F |
| Selected Per Share Data | | | | | | | | |
| Net asset value, beginning of period | | | | $ 11.08 | | | | $ 10.00 |
| Income from Investment Operations | | | | | | | | |
| Net investment income (loss)E | | | | 16 | | | | .13 |
| Net realized and unrealized gain (loss) | | | | 1.09 | | | | 1.04 |
| Total from investment operations | | | | 1.25 | | | | 1.17 |
| Distributions from net investment income | | | | (.16) | | | | (.09) |
| Net asset value, end of period | | | | $ 12.17 | | | | $ 11.08 |
| Total ReturnB,C,D | | | | 11.43% | | | | 11.75% |
| Ratios to Average Net AssetsG | | | | | | | | |
| Expenses before reductions | | | | 1.38% | | | | 1.45%A |
| Expenses net of fee waivers, if any | | | | 1.38% | | | | 1.45%A |
| Expenses net of all reductions | | | | 1.35% | | | | 1.42%A |
| Net investment income (loss) | | | | 1.38% | | | | 1.43%A |
| Supplemental Data | | | | | | | | |
| Net assets, end of period (000 omitted) | | $79,920 | | $36,526 |
| Portfolio turnover rate | | | | 64% | | | | 66%A |
A Annualized
B Total returns for periods of less than one year are not annualized.
C Total returns would have been lower had certain expenses not been reduced during the periods shown.
D Total returns do not include the effect of the sales charges.
E Calculated based on average shares outstanding during the period.
F For the period December 23, 2003 (commencement of operations) to November 30, 2004.
G Expense ratios reflect operating expenses of the class. Expenses before reductions do not reflect amounts reimbursed by the investment adviser or
reductions from brokerage service arrangements or other expense offset arrangements and do not represent the amount paid by the class during
periods when reimbursements or reductions occur. Expense ratios before reductions for start up periods may not be representative of longer term
operating periods. Expenses net of fee waivers reflect expenses after reimbursement by the investment adviser but prior to reductions from
brokerage service arrangements or other expense offset arrangements. Expenses net of all reductions represent the net expenses paid by the
class.
|
See accompanying notes which are an integral part of the financial statements.
37 Annual Report
| Financial Highlights Class B | | | | | | | | |
| |
| Years ended November 30, | | | | 2005 | | | | 2004F |
| Selected Per Share Data | | | | | | | | |
| Net asset value, beginning of period | | | | $ 11.06 | | | | $ 10.00 |
| Income from Investment Operations | | | | | | | | |
| Net investment income (loss)E | | | | 09 | | | | .09 |
| Net realized and unrealized gain (loss) | | | | 1.09 | | | | 1.03 |
| Total from investment operations | | | | 1.18 | | | | 1.12 |
| Distributions from net investment income | | | | (.10) | | | | (.06) |
| Net asset value, end of period | | | | $ 12.14 | | | | $ 11.06 |
| Total ReturnB,C,D | | | | 10.73% | | | | 11.24% |
| Ratios to Average Net AssetsG | | | | | | | | |
| Expenses before reductions | | | | 1.96% | | | | 1.99%A |
| Expenses net of fee waivers, if any | | | | 1.95% | | | | 1.95%A |
| Expenses net of all reductions | | | | 1.93% | | | | 1.92%A |
| Net investment income (loss) | | | | 81% | | | | .92%A |
| Supplemental Data | | | | | | | | |
| Net assets, end of period (000 omitted) | | $19,744 | | $13,457 |
| Portfolio turnover rate | | | | 64% | | | | 66%A |
A Annualized
B Total returns for periods of less than one year are not annualized.
C Total returns would have been lower had certain expenses not been reduced during the periods shown.
D Total returns do not include the effect of the contingent deferred sales charge.
E Calculated based on average shares outstanding during the period.
F For the period December 23, 2003 (commencement of operations) to November 30, 2004.
G Expense ratios reflect operating expenses of the class. Expenses before reductions do not reflect amounts reimbursed by the investment adviser or
reductions from brokerage service arrangements or other expense offset arrangements and do not represent the amount paid by the class during
periods when reimbursements or reductions occur. Expense ratios before reductions for start up periods may not be representative of longer term
operating periods. Expenses net of fee waivers reflect expenses after reimbursement by the investment adviser but prior to reductions from
brokerage service arrangements or other expense offset arrangements. Expenses net of all reductions represent the net expenses paid by the
class.
|
See accompanying notes which are an integral part of the financial statements.
| Financial Highlights Class C | | | | | | | | |
| |
| Years ended November 30, | | | | 2005 | | | | 2004F |
| Selected Per Share Data | | | | | | | | |
| Net asset value, beginning of period | | | | $ 11.06 | | | | $ 10.00 |
| Income from Investment Operations | | | | | | | | |
| Net investment income (loss)E | | | | 10 | | | | .09 |
| Net realized and unrealized gain (loss) | | | | 1.09 | | | | 1.03 |
| Total from investment operations | | | | 1.19 | | | | 1.12 |
| Distributions from net investment income | | | | (.10) | | | | (.06) |
| Net asset value, end of period | | | | $ 12.15 | | | | $ 11.06 |
| Total ReturnB,C,D | | | | 10.85% | | | | 11.24% |
| Ratios to Average Net AssetsG | | | | | | | | |
| Expenses before reductions | | | | 1.90% | | | | 1.94%A |
| Expenses net of fee waivers, if any | | | | 1.90% | | | | 1.94%A |
| Expenses net of all reductions | | | | 1.87% | | | | 1.92%A |
| Net investment income (loss) | | | | 86% | | | | .93%A |
| Supplemental Data | | | | | | | | |
| Net assets, end of period (000 omitted) | | $49,713 | | $28,795 |
| Portfolio turnover rate | | | | 64% | | | | 66%A |
A Annualized
B Total returns for periods of less than one year are not annualized.
C Total returns would have been lower had certain expenses not been reduced during the periods shown.
D Total returns do not include the effect of the contingent deferred sales charge.
E Calculated based on average shares outstanding during the period.
F For the period December 23, 2003 (commencement of operations) to November 30, 2004.
G Expense ratios reflect operating expenses of the class. Expenses before reductions do not reflect amounts reimbursed by the investment adviser or
reductions from brokerage service arrangements or other expense offset arrangements and do not represent the amount paid by the class during
periods when reimbursements or reductions occur. Expense ratios before reductions for start up periods may not be representative of longer term
operating periods. Expenses net of fee waivers reflect expenses after reimbursement by the investment adviser but prior to reductions from
brokerage service arrangements or other expense offset arrangements. Expenses net of all reductions represent the net expenses paid by the
class.
|
See accompanying notes which are an integral part of the financial statements.
39 Annual Report
| Financial Highlights Strategic Dividend & Income | | | | |
| |
| Years ended November 30, | | | | 2005 | | | | 2004E |
| Selected Per Share Data | | | | | | | | |
| Net asset value, beginning of period | | | | $ 11.11 | | | | $ 10.00 |
| Income from Investment Operations | | | | | | | | |
| Net investment income (loss)D | | | | 22 | | | | .19 |
| Net realized and unrealized gain (loss) | | | | 1.11 | | | | 1.04 |
| Total from investment operations | | | | 1.33 | | | | 1.23 |
| Distributions from net investment income | | | | (.22) | | | | (.12) |
| Net asset value, end of period | | | | $ 12.22 | | | | $ 11.11 |
| Total ReturnB,C | | | | 12.08% | | | | 12.32% |
| Ratios to Average Net AssetsF | | | | | | | | |
| Expenses before reductions | | | | 82% | | | | .90%A |
| Expenses net of fee waivers, if any | | | | 82% | | | | .90%A |
| Expenses net of all reductions | | | | 79% | | | | .87%A |
| Net investment income (loss) | | | | 1.94% | | | | 1.98%A |
| Supplemental Data | | | | | | | | |
| Net assets, end of period (000 omitted) | | $798,113 | | $476,032 |
| Portfolio turnover rate | | | | 64% | | | | 66%A |
A Annualized
B Total returns for periods of less than one year are not annualized.
C Total returns would have been lower had certain expenses not been reduced during the periods shown.
D Calculated based on average shares outstanding during the period.
E For the period December 23, 2003 (commencement of operations) to November 30, 2004.
F Expense ratios reflect operating expenses of the class. Expenses before reductions do not reflect amounts reimbursed by the investment adviser or
reductions from brokerage service arrangements or other expense offset arrangements and do not represent the amount paid by the class during
periods when reimbursements or reductions occur. Expense ratios before reductions for start up periods may not be representative of longer term
operating periods. Expenses net of fee waivers reflect expenses after reimbursement by the investment adviser but prior to reductions from
brokerage service arrangements or other expense offset arrangements. Expenses net of all reductions represent the net expenses paid by the
class.
|
See accompanying notes which are an integral part of the financial statements.
| Financial Highlights Institutional Class | | | | | | | | |
| |
| Years ended November 30, | | | | 2005 | | | | 2004E |
| Selected Per Share Data | | | | | | | | |
| Net asset value, beginning of period | | | | $ 11.11 | | | | $ 10.00 |
| Income from Investment Operations | | | | | | | | |
| Net investment income (loss)D | | | | 22 | | | | .19 |
| Net realized and unrealized gain (loss) | | | | 1.10 | | | | 1.04 |
| Total from investment operations | | | | 1.32 | | | | 1.23 |
| Distributions from net investment income | | | | (.22) | | | | (.12) |
| Net asset value, end of period | | | | $ 12.21 | | | | $ 11.11 |
| Total ReturnB,C | | | | 11.98% | | | | 12.38% |
| Ratios to Average Net AssetsF | | | | | | | | |
| Expenses before reductions | | | | 83% | | | | .88%A |
| Expenses net of fee waivers, if any | | | | 83% | | | | .88%A |
| Expenses net of all reductions | | | | 81% | | | | .85%A |
| Net investment income (loss) | | | | 1.93% | | | | 2.00%A |
| Supplemental Data | | | | | | | | |
| Net assets, end of period (000 omitted) | | | | $ 9,798 | | | | $ 4,973 |
| Portfolio turnover rate | | | | 64% | | | | 66%A |
A Annualized
B Total returns for periods of less than one year are not annualized.
C Total returns would have been lower had certain expenses not been reduced during the periods shown.
D Calculated based on average shares outstanding during the period.
E For the period December 23, 2003 (commencement of operations) to November 30, 2004.
F Expense ratios reflect operating expenses of the class. Expenses before reductions do not reflect amounts reimbursed by the investment adviser or
reductions from brokerage service arrangements or other expense offset arrangements and do not represent the amount paid by the class during
periods when reimbursements or reductions occur. Expense ratios before reductions for start up periods may not be representative of longer term
operating periods. Expenses net of fee waivers reflect expenses after reimbursement by the investment adviser but prior to reductions from
brokerage service arrangements or other expense offset arrangements. Expenses net of all reductions represent the net expenses paid by the
class.
|
See accompanying notes which are an integral part of the financial statements.
41 Annual Report
Notes to Financial Statements
For the period ended November 30, 2005
1. Significant Accounting Policies.
Fidelity Strategic Dividend & Income Fund (the fund) is a non diversified fund of Fidelity Financial Trust (the trust) and is authorized to issue an unlimited number of shares. The trust is registered under the Investment Company Act of 1940, as amended (the 1940 Act), as an open end management investment company organized as a Massa chusetts business trust.
The fund offers Class A, Class T, Class B, Class C, Strategic Dividend & Income, and Institutional Class shares, each of which has equal rights as to assets and voting privi leges. Each class has exclusive voting rights with respect to matters that affect that class. Class B shares will automatically convert to Class A shares after a holding period of seven years from the initial date of purchase. Investment income, realized and unrealized capital gains and losses, the common expenses of the fund, and certain fund level expense reductions, if any, are allocated on a pro rata basis to each class based on the relative net assets of each class to the total net assets of the fund. Each class differs with respect to transfer agent and distribution and service plan fees incurred. Certain ex pense reductions also differ by class.
The fund may invest in affiliated money market central funds (Money Market Central Funds) which are open end investment companies available to investment companies and other accounts managed by Fidelity Management & Research Company (FMR) and its affiliates. The financial statements have been prepared in conformity with accounting principles generally accepted in the United States of America, which require manage ment to make certain estimates and assumptions at the date of the financial statements. The following summarizes the significant accounting policies of the fund:
Security Valuation. Investments are valued and net asset value (NAV) per share is calculated (NAV calculation) as of the close of business of the New York Stock Exchange (NYSE), normally 4:00 p.m. Eastern time. Wherever possible, the fund uses independent pricing services approved by the Board of Trustees to value its investments.
Equity securities, including restricted securities, for which market quotations are readily available, are valued at the last reported sale price or official closing price as reported by an independent pricing service on the primary market or exchange on which they are traded. In the event there were no sales during the day or closing prices are not available, securities are valued at the last quoted bid price. Debt securities, including restricted securities, for which quotations are readily available, are valued by independent pricing services or by dealers who make markets in such securities. Pricing services consider yield or price of bonds of comparable quality, coupon, maturity and type as well as dealer supplied prices. Investments in open end mutual funds, are valued at their closing net asset value each business day. Short term securities with remaining maturities of sixty days or less for which quotations are not readily available are valued at amortized cost, which approximates value.
1. Significant Accounting Policies continued
|
| Security Valuation continued | | |
When current market prices or quotations are not readily available or do not accurately reflect fair value, valuations may be determined in accordance with procedures adopted by the Board of Trustees. For example, when developments occur between the close of a market and the close of the NYSE that may materially affect the value of some or all of the securities, or when trading in a security is halted, those securities may be fair valued. Factors used in the determination of fair value may include monitoring news to identify significant market or security specific events such as changes in the value of U.S. securi ties market, reviewing developments in foreign markets and evaluating the performance of ADRs, futures contracts and exchange traded funds. Because the fund’s utilization of fair value pricing depends on market activity, the frequency with which fair value pricing is used can not be predicted and may be utilized to a significant extent. The value of securities used for NAV calculation under fair value pricing may differ from published prices for the same securities.
Foreign Currency. The fund uses foreign currency contracts to facilitate transactions in foreign denominated securities. Losses from these transactions may arise from changes in the value of the foreign currency or if the counterparties do not perform under the contracts’ terms.
Foreign denominated assets, including investment securities, and liabilities are trans lated into U.S. dollars at the exchange rate at period end. Purchases and sales of invest ment securities, income and dividends received and expenses denominated in foreign currencies are translated into U.S. dollars at the exchange rate in effect on the transac tion date.
The effects of exchange rate fluctuations on investments are included with the net realized and unrealized gain (loss) on investment securities. Other foreign currency transactions resulting in realized and unrealized gain (loss) are disclosed separately.
Investment Transactions and Income. Security transactions are accounted for as of trade date. Gains and losses on securities sold are determined on the basis of identified cost. Dividend income is recorded on the ex dividend date, except for certain dividends from foreign securities where the ex dividend date may have passed, which are recorded as soon as the fund is informed of the ex dividend date. Non cash dividends included in dividend income, if any, are recorded at the fair market value of the securities received. Distributions received on securities that represent a return of capital or capital gain are recorded as a reduction of cost of investments and/or as a realized gain. The fund esti mates the components of distributions received that may be considered return of capital distributions or capital gain distributions. Interest income is accrued as earned. Interest
43 Annual Report
Notes to Financial Statements continued
1. Significant Accounting Policies continued
Investment Transactions and Income continued
income includes coupon interest and amortization of premium and accretion of discount on debt securities. Investment income is recorded net of foreign taxes withheld where recovery of such taxes is uncertain. Debt obligations may be placed on a non accrual status and related interest income may be reduced by ceasing current accruals and writing off interest receivables when the collection of all or a portion of interest has become doubtful based on consistently applied procedures. A debt obligation is removed from non accrual status when the issuer resumes interest payments or when collect ibility of interest is reasonably assured.
Expenses. Most expenses of the trust can be directly attributed to a fund. Expenses which cannot be directly attributed are apportioned among each fund in the trust.
Income Tax Information and Distributions to Shareholders. Each year, the fund intends to qualify as a regulated investment company by distributing all of its taxable income and realized gains under Subchapter M of the Internal Revenue Code. As a result, no provision for income taxes is required in the accompanying financial statements. Foreign taxes are provided for based on the fund’s understanding of the tax rules and rates that exist in the foreign markets in which it invests.
Distributions are recorded on the ex dividend date. Income dividends and capital gain distributions are declared separately for each class. Income and capital gain distribu tions are determined in accordance with income tax regulations, which may differ from generally accepted accounting principles. In addition, the fund will claim a portion of the payment made to redeeming shareholders as a distribution for income tax purposes.
Capital accounts within the financial statements are adjusted for permanent book tax differences. These adjustments have no impact on net assets or the results of operations. Temporary book tax differences will reverse in a subsequent period.
Book tax differences are primarily due to futures transactions, foreign currency transactions, market discount, passive foreign investment companies (PFIC), capital loss carryforwards and losses deferred due to wash sales.
1. Significant Accounting Policies continued
| | |
| Income Tax Information and Distributions to Shareholders continued |
The tax basis components of distributable earnings and the federal tax cost as of period end were as follows:
| Unrealized appreciation | | $ | | 117,727,083 |
| Unrealized depreciation | | | | (20,680,574) |
| Net unrealized appreciation (depreciation) | | | | 97,046,509 |
| Undistributed ordinary income | | | | 2,727,387 |
| Undistributed long term capital gain | | | | 10,623,955 |
| |
| Cost for federal income tax purposes | | $ | | 898,698,658 |
The tax character of distributions paid was as follows:
| | | | | November 30, 2005 | | | | November 30, 2004 |
| Ordinary Income | | | $ | 14,194,615 | | $ | | 4,647,719 |
2. Operating Policies.
Repurchase Agreements. FMR has received an Exemptive Order from the Securities and Exchange Commission (the SEC) which permits the fund and other affiliated entities of FMR to transfer uninvested cash balances into joint trading accounts which are then invested in repurchase agreements. The fund may also invest directly with institutions in repurchase agreements. Repurchase agreements are collateralized by government or non government securities. Collateral is held in segregated accounts with custodian banks and may be obtained in the event of a default of the counterparty. The fund monitors, on a daily basis, the value of the collateral to ensure it is at least equal to the principal amount of the repurchase agreement (including accrued interest). In the event of a default by the counterparty, realization of the collateral proceeds could be delayed, during which time the value of the collateral may decline.
Futures Contracts. The fund may use futures contracts to manage its exposure to the stock market. Buying futures tends to increase a fund’s exposure to the underlying instrument, while selling futures tends to decrease a fund’s exposure to the underlying instrument or hedge other fund investments. Losses may arise from changes in the value of the underlying instruments or if the counterparties do not perform under the con tracts’ terms. Gains (losses) are realized upon the expiration or closing of the futures contracts. Futures contracts are valued at the settlement price established each day by the board of trade or exchange on which they are traded.
Restricted Securities. The fund may invest in securities that are subject to legal or contractual restrictions on resale. These securities generally may be resold in transac tions exempt from registration or to the public if the securities are registered. Disposal of
45 Annual Report
Notes to Financial Statements continued
2. Operating Policies continued
Restricted Securities continued
these securities may involve time consuming negotiations and expense, and prompt sale at an acceptable price may be difficult. Information regarding restricted securities is included at the end of the fund’s Schedule of Investments.
3. Purchases and Sales of Investments.
Purchases and sales of securities, other than short term securities and U.S. government securities, aggregated $861,207,440 and $515,959,184, respectively.
4. Fees and Other Transactions with Affiliates.
Management Fee. FMR and its affiliates provide the fund with investment manage ment related services for which the fund pays a monthly management fee. The manage ment fee is the sum of an individual fund fee rate that is based on an annual rate of .30% of the fund’s average net assets and a group fee rate that averaged .27% during the period. The group fee rate is based upon the average net assets of all the mutual funds advised by FMR. The group fee rate decreases as assets under management increase and increases as assets under management decrease. For the period, the total annual man agement fee rate was .57% of the fund’s average net assets.
Distribution and Service Plan. In accordance with Rule 12b 1 of the 1940 Act, the fund has adopted separate Distribution and Service Plans for each class of shares. Certain classes pay Fidelity Distributors Corporation (FDC), an affiliate of FMR, separate Distribution and Service Fees, each of which is based on an annual percentage of each class’ average net assets. In addition, FDC may pay financial intermediaries for selling shares of the fund and providing shareholder support services. For the period, the Distribution and Service Fee rates and the total amounts paid to and retained by FDC were as follows:
| | | Distribution | | Service | | | | Paid to | | | | Retained |
| | | Fee | | Fee | | | | FDC | | | | by FDC |
| Class A | | 0% | | .25% | | $ | | 76,149 | | $ | | 764 |
| Class T | | 25% | | .25% | | | | 308,412 | | | | 8,604 |
| Class B | | 75% | | .25% | | | | 168,313 | | | | 129,099 |
| Class C | | 75% | | .25% | | | | 395,654 | | | | 169,537 |
| | | | | | | $ | | 948,528 | | $ | | 308,004 |
Sales Load. FDC receives a front end sales charge of up to 5.75% for selling Class A shares, and 3.50% for selling Class T shares, some of which is paid to financial intermedi aries for selling shares of the fund. FDC receives the proceeds of contingent deferred sales charges levied on Class A, Class T, Class B, and Class C redemptions. These charges
4. Fees and Other Transactions with Affiliates continued
|
| Sales Load continued | | |
depend on the holding period. The deferred sales charges range from 5% to 1% for Class B, 1% for Class C, and .25% for certain purchases of Class A and Class T shares.
For the period, sales charge amounts retained by FDC were as follows:
| | |
| | | | | Retained |
| | | | | by FDC |
| Class A | | | $ | 83,467 |
| Class T | | | | 36,944 |
| Class B* | | | | 28,188 |
| Class C* | | | | 8,440 |
| | | | $ | 157,039 |
* When Class B and Class C shares are initially sold, FDC pays commissions from its own resources to financial intermediaries through which the sales are made.
Transfer Agent Fees. Fidelity Investments Institutional Operations Company, Inc. (FIIOC), an affiliate of FMR, is the transfer, dividend disbursing and shareholder servic ing agent for each class of the fund, except for Strategic Dividend & Income. Fidelity Service Company, Inc. (FSC), an affiliate of FMR, is the transfer agent for Strategic Dividend & Income shares. FIIOC and FSC receive account fees and asset based fees that vary according to the account size and type of account of the shareholders of the respec tive classes of the fund. FIIOC and FSC pay for typesetting, printing and mailing of shareholder reports, except proxy statements. For the period the total transfer agent fees paid by each class to FIIOC or FSC, were as follows:
| | | | | | | % of |
| | | | | | | Average |
| | | | | Amount | | Net Assets |
| Class A | | | $ | 83,483 | | .27 |
| Class T | | | | 150,121 | | .24 |
| Class B | | | | 54,414 | | .32 |
| Class C | | | | 104,402 | | .26 |
| Strategic Dividend & Income | | | | 1,226,435 | | .18 |
| Institutional Class | | | | 15,048 | | .20 |
| | | | $ | 1,633,903 | | |
Accounting and Security Lending Fees. FSC maintains the fund’s accounting re cords. The accounting fee is based on the level of average net assets for the month. Under a separate contract, FSC administers the security lending program. The security lending fee is based on the number and duration of lending transactions.
47 Annual Report
Notes to Financial Statements continued
| | |
| 4. Fees and Other Transactions with Affiliates continued |
Affiliated Central Funds. The fund may invest in Money Market Central Funds which seek preservation of capital and current income and are managed by Fidelity Invest ments Money Management, Inc. (FIMM), an affiliate of FMR.
The Money Market Central Funds do not pay a management fee.
Brokerage Commissions. The fund placed a portion of its portfolio transactions with brokerage firms which are affiliates of the investment adviser. The commissions paid to these affiliated firms were $37,259 for the period.
5. Committed Line of Credit.
|
The fund participates with other funds managed by FMR in a $4.2 billion credit facility (the “line of credit”) to be utilized for temporary or emergency purposes to fund share holder redemptions or for other short term liquidity purposes. The fund has agreed to pay commitment fees on its pro rata portion of the line of credit. During the period, there were no borrowings on this line of credit.
The fund lends portfolio securities from time to time in order to earn additional income. The fund receives collateral (in the form of U.S. Treasury obligations, letters of credit and/or cash) against the loaned securities and maintains collateral in an amount not less than 100% of the market value of the loaned securities during the period of the loan. The market value of the loaned securities is determined at the close of business of the fund and any additional required collateral is delivered to the fund on the next business day. If the borrower defaults on its obligation to return the securities loaned because of insol vency or other reasons, a fund could experience delays and costs in recovering the securities loaned or in gaining access to the collateral. Cash collateral is invested in the Fidelity Securities Lending Cash Central Fund. The value of loaned securities and cash collateral at period end are disclosed on the fund’s Statement of Assets and Liabilities. Security lending income represents the income earned on investing cash collateral, less fees and expenses associated with the loan, plus any premium payments that may be received on the loan of certain types of securities. Net income from lending portfolio securities during the period amounted to $41,671.
FMR voluntarily agreed to reimburse each class to the extent annual operating expenses exceeded certain levels of average net assets as noted in the table below. Some expenses, for example interest expense, are excluded from this reimbursement.
| The following classes were in reimbursement during the period: | | | | |
| | | Expense | | | | Reimbursement |
| | | Limitations | | | | from adviser |
| Class B | | 1.95% - 2.00%* | | $ | | 839 |
| * Expense limitation in effect at period end. | | | | | | |
Many of the brokers with whom FMR places trades on behalf of the fund provided services to the fund in addition to trade execution. These services included payments of certain expenses on behalf of the fund totaling $208,748 for the period. In addition, through arrangements with the fund’s custodian and each class’ transfer agent, credits realized as a result of uninvested cash balances were used to reduce the fund’s expenses. During the period, these credits reduced the fund’s custody expenses by $4,833. During the period, credits reduced each class’ transfer agent expense as noted in the table below.
| | | | | Transfer Agent |
| | | | | expense reduction |
| Strategic Dividend & Income | | | $ | 428 |
| |
| 8. Other. | | | | |
The fund’s organizational documents provide former and current trustees and officers with a limited indemnification against liabilities arising in connection with the perfor mance of their duties to the fund. In the normal course of business, the fund may also enter into contracts that provide general indemnifications. The fund’s maximum expo sure under these arrangements is unknown as this would be dependent on future claims that may be made against the fund. The risk of material loss from such claims is considered remote.
| 9. Distributions to Shareholders. | | | | | | |
| |
Distributions to shareholders of each class were as follows:
| | | | |
| Years ended November 30, | | | | 2005 | | | | 2004A |
| From net investment income | | | | | | | | |
| Class A | | | $ | 475,907 | | | $ | 159,582 |
| Class T | | | | 830,178 | | | | 189,189 |
| Class B | | | | 141,821 | | | | 55,805 |
| Class C | | | | 339,138 | | | | 123,216 |
| Strategic Dividend & Income | | | | 12,270,157 | | | | 4,080,966 |
49 Annual Report
Notes to Financial Statements continued
4. Fees and Other Transactions with Affiliates continued
| Distributions to shareholders of each class were as follows: continued | | | | |
| Years ended November 30, | | | | | | 2005 | | | | | | 2004A |
| From net investment income | | | | | | | | | | | | | | |
| Institutional Class | | | | | | 137,414 | | | | | | | | | | | | 38,961 |
| Total | | | | | $ | 14,194,615 | | | | | | | | | | | $ | 4,647,719 |
| A For the period December 23, 2003 (commencement of operations) to November 30, 2004. | | | | | | | | |
| |
| 10. Share Transactions. | | | | | | | | | | | | |
| |
Transactions for each class of shares were as follows:
| | | | | | | | |
| | | Shares | | | | Dollars |
| Years ended November 30, | | 2005 | | | | 2004A | | | | 2005 | | | | 2004A |
| Class A | | | | | | | | | | | | | | |
| Shares sold | | 1,768,977 | | | | 2,191,945 | | $ | | 20,345,648 | | $ | | 22,746,005 |
| Reinvestment of distributions . | | 30,595 | | | | 10,552 | | | | 349,961 | | | | 110,590 |
| Shares redeemed | | (589,953) | | | | (220,797) | | | | (6,809,260) | | | | (2,287,113) |
| Net increase (decrease) | | 1,209,619 | | | | 1,981,700 | | $ | | 13,886,349 | | $ | | 20,569,482 |
| Class T | | | | | | | | | | | | | | |
| Shares sold | | 3,882,259 | | | | 3,511,538 | | $ | | 44,416,238 | | $ | | 36,655,001 |
| Reinvestment of distributions . | | 59,648 | | | | 14,112 | | | | 681,858 | | | | 147,959 |
| Shares redeemed | | (669,970) | | | | (230,386) | | | | (7,729,006) | | | | (2,405,951) |
| Net increase (decrease) | | 3,271,937 | | | | 3,295,264 | | $ | | 37,369,090 | | $ | | 34,397,009 |
| Class B | | | | | | | | | | | | | | |
| Shares sold | | 744,114 | | | | 1,285,173 | | $ | | 8,505,041 | | $ | | 13,296,297 |
| Reinvestment of distributions . | | 9,782 | | | | 3,976 | | | | 111,311 | | | | 41,558 |
| Shares redeemed | | (344,455) | | | | (72,792) | | | | (3,964,823) | | | | (752,799) |
| Net increase (decrease) | | 409,441 | | | | 1,216,357 | | $ | | 4,651,529 | | $ | | 12,585,056 |
| Class C | | | | | | | | | | | | | | |
| Shares sold | | 2,014,501 | | | | 2,813,304 | | $ | | 23,123,712 | | $ | | 29,175,332 |
| Reinvestment of distributions . | | 19,942 | | | | 7,379 | | | | 227,493 | | | | 77,088 |
| Shares redeemed | | (545,060) | | | | (218,090) | | | | (6,287,937) | | | | (2,262,584) |
| Net increase (decrease) | | 1,489,383 | | | | 2,602,593 | | $ | | 17,063,268 | | $ | | 26,989,836 |
| Strategic Dividend & Income | | | | | | | | | | | | | | |
| Shares sold | | 36,814,600 | | | | 55,474,221 | | $424,067,244 | | $580,932,738 |
| Reinvestment of distributions . | | 944,881 | | | | 341,097 | | | | 10,819,574 | | | | 3,577,556 |
| Shares redeemed | | (15,256,951) | | (12,984,227) | | (176,595,063) | | (134,752,835) |
| Net increase (decrease) | | 22,502,530 | | | | 42,831,091 | | $258,291,755 | | $449,757,459 |
| Institutional Class | | | | | | | | | | | | | | |
| Shares sold | | 398,296 | | | | 464,040 | | $ | | 4,580,059 | | $ | | 4,776,823 |
| Reinvestment of distributions . | | 5,438 | | | | 1,845 | | | | 62,299 | | | | 19,348 |
| Shares redeemed | | (48,869) | | | | (18,218) | | | | (567,988) | | | | (186,845) |
| Net increase (decrease) | | 354,865 | | | | 447,667 | | $ | | 4,074,370 | | $ | | 4,609,326 |
| A For the period December 23, 2003 (commencement of operations) to November 30, 2004. | | | | | | | | |
| |
| |
| Annual Report | | | | 50 | | | | | | | | |
Report of Independent Registered Public Accounting Firm
To the Trustees of Fidelity Financial Trust and the Shareholders of Fidelity Strategic Dividend & Income Fund:
In our opinion, the accompanying statement of assets and liabilities, including the sched ule of investments, and the related statements of operations and of changes in net assets and the financial highlights present fairly, in all material respects, the financial position of Fidelity Strategic Dividend & Income Fund (a fund of Fidelity Financial Trust) at Novem ber 30, 2005 and the results of its operations, the changes in its net assets and the financial highlights for the periods indicated, in conformity with accounting principles generally accepted in the United States of America. These financial statements and financial highlights (hereafter referred to as “financial statements”) are the responsibility of the Fidelity Strategic Dividend & Income Fund’s management; our responsibility is to express an opinion on these financial statements based on our audits. We conducted our audits of these financial statements in accordance with the standards of the Public Company Accounting Oversight Board (United States). Those standards require that we plan and perform the audit to obtain reasonable assurance about whether the financial statements are free of material misstatement. An audit includes examining, on a test basis, evidence supporting the amounts and disclosures in the financial statements, assessing the accounting principles used and significant estimates made by management, and evaluating the overall financial statement presentation. We believe that our audits, which included confirmation of securities at November 30, 2005 by correspondence with the custodian and brokers, provide a reasonable basis for our opinion.
/s/ PricewatershouseCoopers LLP
PricewaterhouseCoopers LLP
Boston, Massachusetts
January 17, 2006
|
51 Annual Report
Trustees and Officers
The Trustees, Member of the Advisory Board, and executive officers of the trust and fund, as applicable, are listed below. The Board of Trustees governs the fund and is responsible for protecting the interests of shareholders. The Trustees are experienced executives who meet periodically throughout the year to oversee the fund’s activities, review contractual arrangements with companies that provide services to the fund, and review the fund’s performance. Except for William O. McCoy and Albert R. Gamper, Jr., each of the Trustees oversees 326 funds advised by FMR or an affiliate. Mr. McCoy oversees 328 funds advised by FMR or an affiliate. Mr. Gamper oversees 235 funds advised by FMR or an affiliate.
The Trustees hold office without limit in time except that (a) any Trustee may resign; (b) any Trustee may be removed by written instrument, signed by at least two thirds of the number of Trustees prior to such removal; (c) any Trustee who requests to be retired or who has become incapacitated by illness or injury may be retired by written instru ment signed by a majority of the other Trustees; and (d) any Trustee may be removed at any special meeting of shareholders by a two thirds vote of the outstanding voting securities of the trust. Each Trustee who is not an interested person (as defined in the 1940 Act) (Independent Trustee), shall retire not later than the last day of the calendar year in which his or her 72nd birthday occurs. The Independent Trustees may waive this mandatory retirement age policy with respect to individual Trustees. The executive officers and Advisory Board Member hold office without limit in time, except that any officer and Advisory Board Member may resign or may be removed by a vote of a majority of the Trustees at any regular meeting or any special meeting of the Trustees. Except as indicated, each individual has held the office shown or other offices in the same company for the past five years.
The fund’s Statement of Additional Information (SAI) includes more information about the Trustees. To request a free copy, call Fidelity at 1-877-208-0098.
Correspondence intended for each Trustee who is an interested person may be sent to Fidelity Investments, 82 Devonshire Street, Boston, Massachusetts 02109.
| | Name, Age; Principal Occupation
Edward C. Johnson 3d (75)
|
Year of Election or Appointment: 1982
Mr. Johnson is Chairman of the Board of Trustees. Mr. Johnson serves as Chief Executive Officer, Chairman, and a Director of FMR Corp.; a Di rector and Chairman of the Board and of the Executive Committee of FMR; Chairman and a Director of Fidelity Management & Research (Far East) Inc.; Chairman and a Director of Fidelity Investments Money Man agement, Inc.; and Chairman (2001 present) and a Director (2000 present) of FMR Co., Inc.
| | Name, Age; Principal Occupation
Stephen P. Jonas (52)
|
Year of Election or Appointment: 2005
Mr. Jonas is Senior Vice President of the fund (2005 present). He also serves as Senior Vice President of other Fidelity funds (2005 present). Mr. Jonas is Executive Director of FMR (2005 present). Previously, Mr. Jonas served as President of Fidelity Enterprise Operations and Risk Services (2004 2005), Chief Administrative Officer (2002 2004), and Chief Financial Officer of FMR Co. (1998 2000). Mr. Jonas has been with Fidelity Investments since 1987 and has held various financial and management positions including Chief Financial Officer of FMR. In addi tion, he serves on the Boards of Boston Ballet (2003 present) and Sim mons College (2003 present).
Year of Election or Appointment: 2003
Mr. Reynolds is a Director (2003 present) and Chief Operating Officer (2002 present) of FMR Corp. He also serves on the Board at Fidelity Investments Canada, Ltd. (2000 present). Previously, Mr. Reynolds served as President of Fidelity Investments Institutional Retirement Group (1996 2000).
* Trustees have been determined to be “Interested Trustees” by virtue of, among
other things, their affiliation with the trust or various entities under common
control with FMR.
|
Correspondence intended for each Independent Trustee (that is, the Trustees other than the Interested Trustees) may be sent to Fidelity Investments, P.O. Box 55235, Boston, Massachusetts 02205 5235.
| | Name, Age; Principal Occupation
Dennis J. Dirks (57)
|
Year of Election or Appointment: 2005
Prior to his retirement in May 2003, Mr. Dirks was Chief Operating Officer and a member of the Board of The Depository Trust & Clearing Corporation (DTCC) (1999 2003). He also served as President, Chief Operating Officer, and Board member of The Depository Trust Com pany (DTC) (1999 2003) and President and Board member of the National Securities Clearing Corporation (NSCC) (1999 2003). In addi tion, Mr. Dirks served as Chief Executive Officer and Board member of the Government Securities Clearing Corporation (2001 2003) and Chief Executive Officer and Board member of the Mortgage Backed Securities Clearing Corporation (2001 2003). Mr. Dirks also serves as a Trustee of Manhattan College (2005 present).
53 Annual Report
Trustees and Officers - continued
| | Name, Age; Principal Occupation
Albert R. Gamper, Jr. (63)
|
Year of Election or Appointment: 2006
Mr. Gamper also serves as a Trustee (2006 present) or Member of the Advisory Board (2005 present) of other investment companies advised by FMR. Prior to his retirement in December 2004, Mr. Gamper served as Chairman of the Board of CIT Group Inc. (commercial finance). During his tenure with CIT Group Inc. Mr. Gamper served in numerous senior management positions, including Chairman (1987 1989; 1999 2001; 2002 2004), Chief Executive Officer (1987 2004), and President (1989 2002). He currently serves as a member of the Board of Directors of Public Service Enterprise Group (utilities, 2001 present), Chairman of the Board of Governors, Rutgers University (2004 present), and Chairman of the Board of Saint Barnabas Health Care System.
Year of Election or Appointment: 1997
Dr. Gates is Chairman of the Independent Trustees (2006 present). Dr. Gates is President of Texas A&M University (2002 present). He was Director of the Central Intelligence Agency (CIA) from 1991 to 1993. From 1989 to 1991, Dr. Gates served as Assistant to the President of the United States and Deputy National Security Advisor. Dr. Gates is a Director of NACCO Industries, Inc. (mining and manufacturing), Parker Drilling Co., Inc. (drilling and rental tools for the energy industry, 2001 present), and Brinker International (restaurant management, 2003 present). Previously, Dr. Gates served as a Director of LucasVarity PLC (automotive components and diesel engines), a Director of TRW Inc. (automotive, space, defense, and information technology), and Dean of the George Bush School of Government and Public Service at Texas A&M University (1999 2001). Dr. Gates also is a Trustee of the Forum for International Policy.
Name, Age; Principal Occupation
George H. Heilmeier (69)
|
Year of Election or Appointment: 2004
Dr. Heilmeier is Chairman Emeritus of Telcordia Technologies (commu nication software and systems), where prior to his retirement, he served as company Chairman and Chief Executive Officer. He currently serves on the Boards of Directors of The Mitre Corporation (systems engineer ing and information technology support for the government), and HRL Laboratories (private research and development, 2004 present). He is Chairman of the General Motors Science & Technology Advisory Board and a Life Fellow of the Institute of Electrical and Electronics Engineers (IEEE) (2000 present). Dr. Heilmeier is a member of the Defense Science Board and the National Security Agency Advisory Board. He is also a member of the National Academy of Engineering, the American Acad emy of Arts and Sciences, and the Board of Overseers of the School of Engineering and Applied Science of the University of Pennsylvania. Pre viously, Dr. Heilmeier served as a Director of TRW Inc. (automotive, space, defense, and information technology, 1992 2002), Compaq (1994 2002), Automatic Data Processing, Inc. (ADP) (technology based business outsourcing, 1995 2002), INET Technologies Inc. (telecommu nications network surveillance, 2001 2004), and Teletech Holdings (cus tomer management services). He is the recipient of the 2005 Kyoto Prize in Advanced Technology for his invention of the liquid display.
Year of Election or Appointment: 2001
Prior to Ms. Knowles’ retirement in June 2000, she served as Executive Vice President and Chief Financial Officer of Atlantic Richfield Company (ARCO) (diversified energy, 1996 2000). From 1993 to 1996, she was a Senior Vice President of ARCO and President of ARCO Transportation Company. She served as a Director of ARCO from 1996 to 1998. She currently serves as a Director of Phelps Dodge Corporation (copper mining and manufacturing) and McKesson Corporation (healthcare ser vice, 2002 present). Ms. Knowles is a Trustee of the Brookings Institution and the Catalina Island Conservancy and also serves as a member of the Advisory Board for the School of Engineering of the University of Southern California.
55 Annual Report
Trustees and Officers - continued
| | Name, Age; Principal Occupation
Ned C. Lautenbach (61)
|
Year of Election or Appointment: 2000
Mr. Lautenbach has been a partner of Clayton, Dubilier & Rice, Inc. (private equity investment firm) since September 1998. Previously, Mr. Lautenbach was with the International Business Machines Corporation (IBM) from 1968 until his retirement in 1998. Mr. Lautenbach serves as a Director of Italtel Holding S.p.A. (telecommunications (Milan, Italy), 2004 present) and Eaton Corporation (diversified industrial) as well as the Philharmonic Center for the Arts in Naples, Florida. He also is a member of the Board of Trustees of Fairfield University (2005 present), as well as a member of the Council on Foreign Relations.
Year of Election or Appointment: 1997
Prior to his retirement in December 1994, Mr. McCoy was Vice Chair man of the Board of BellSouth Corporation (telecommunications) and President of BellSouth Enterprises. He is currently a Director of Liberty Corporation (holding company), Duke Realty Corporation (real estate), and Progress Energy, Inc. (electric utility). He is also a partner of Frank lin Street Partners (private investment management firm) and a member of the Research Triangle Foundation Board. In addition, Mr. McCoy served as the Interim Chancellor (1999 2000) and a member of the Board of Visitors for the University of North Carolina at Chapel Hill and currently serves on the Board of Directors of the University of North Carolina Health Care System and the Board of Visitors of the Kenan Flagler Business School (University of North Carolina at Chapel Hill). He also served as Vice President of Finance for the University of North Car olina (16 school system).
Year of Election or Appointment: 2005
Ms. Small is a member (2000 present) and Chairperson (2002 present) of the Investment Committee, and a member (2002 present) of the Board of Trustees of Smith College. Previously, she served as Chief In vestment Officer (1999 2000), Director of Global Equity Investments (1996 1999), and a member of the Board of Directors of Scudder, Stevens & Clark (1990 1997) and Scudder Kemper Investments (1997 1998). In addition, Ms. Small served as Co Chair (2000 2003) of the Annual Fund for the Fletcher School of Law and Diplomacy.
| | Name, Age; Principal Occupation
William S. Stavropoulos (66)
|
Year of Election or Appointment: 2002
Mr. Stavropoulos is Chairman of the Board (2000 present) and a Mem ber of the Board of Directors of The Dow Chemical Company. Since joining The Dow Chemical Company in 1967, Mr. Stavropoulos served in numerous senior management positions, including President (1993 2000; 2002 2003), CEO (1995 2000; 2002 2004), and Chair man of the Executive Committee (2000 2004). Currently, he is a Direc tor of NCR Corporation (data warehousing and technology solutions), BellSouth Corporation (telecommunications), Chemical Financial Corpo ration, Maersk Inc. (industrial conglomerate, 2002 present), and Metal mark Capital (private equity investment firm, 2005 present). He also serves as a member of the Board of Trustees of the American Enterprise Institute for Public Policy Research. In addition, Mr. Stavropoulos is a member of The Business Council, J.P. Morgan International Council and the University of Notre Dame Advisory Council for the College of Science.
Year of Election or Appointment: 2005
Prior to his retirement in 2001, Mr. Wolfe was Chairman and Chief Executive Officer of Hershey Foods Corporation (1993 2001). He cur rently serves as a member of the boards of Adelphia Communications Corporation (2003 present), Bausch & Lomb, Inc., and Revlon Inc. (2004 present).
Advisory Board Member and Executive Officers:
Correspondence intended for each executive officer and Mr. Lynch may be sent to Fidelity Investments, 82 Devonshire Street, Boston, Massachusetts 02109.
| | Name, Age; Principal Occupation
Peter S. Lynch (61)
|
Year of Election or Appointment: 2003
Member of the Advisory Board of Fidelity Financial Trust. Vice Chair man and a Director of FMR, and Vice Chairman (2001 present) and a Director (2000 present) of FMR Co., Inc. Previously, Mr. Lynch served as a Trustee of the Fidelity funds (1990 2003). In addition, he serves as a Trustee of Boston College, Massachusetts Eye & Ear Infirmary, Historic Deerfield, John F. Kennedy Library, and the Museum of Fine Arts of Boston.
57 Annual Report
Trustees and Officers - continued
| | Name, Age; Principal Occupation
|
Year of Election or Appointment: 2005
Vice President of the fund. Mr. Lank also serves as Vice President of another fund advised by FMR. Prior to assuming his current responsibili ties, Mr. Lank has worked as an analyst and manager.
Year of Election or Appointment: 2005
Vice President of the fund. Mr. Soviero also serves as Vice President of other funds advised by FMR. Prior to assuming his current responsibili ties, Mr. Soviero has worked as a research analyst, manager and direc tor of high yield research.
Year of Election or Appointment: 2003
Secretary of the fund. He also serves as Secretary of other Fidelity funds; Vice President, General Counsel, and Secretary of FMR Co., Inc. (2001 present) and FMR; Assistant Secretary of Fidelity Management & Research (U.K.) Inc. (2001 present), Fidelity Management & Research (Far East) Inc. (2001 present), and Fidelity Investments Money Manage ment, Inc. (2001 present). Mr. Roiter is an Adjunct Member, Faculty of Law, at Boston College Law School (2003 present). Previously, Mr. Roiter served as Vice President and Secretary of Fidelity Distributors Corpora tion (FDC) (1998 2005).
Year of Election or Appointment: 2003
Assistant Secretary of the fund. Mr. Fross also serves as Assistant Secre tary of other Fidelity funds (2003 present), Vice President and Secretary of FDC (2005 present), and is an employee of FMR.
Year of Election or Appointment: 2004
President, Treasurer, and Anti Money Laundering (AML) officer of the fund. Ms. Reynolds also serves as President, Treasurer, and AML officer of other Fidelity funds (2004) and is a Vice President (2003) and an employee (2002) of FMR. Before joining Fidelity Investments, Ms. Reynolds worked at PricewaterhouseCoopers LLP (PwC) (1980 2002), where she was most recently an audit partner with PwC’s investment management practice.
Name, Age; Principal Occupation
Paul M. Murphy (58)
|
Year of Election or Appointment: 2005
Chief Financial Officer of the fund. Mr. Murphy also serves as Chief Financial Officer of other Fidelity funds (2005 present). He also serves as Senior Vice President of Fidelity Pricing and Cash Management Ser vices Group (FPCMS).
Kenneth A. Rathgeber (58)
|
Year of Election or Appointment: 2004
Chief Compliance Officer of the fund. Mr. Rathgeber also serves as Chief Compliance Officer of other Fidelity funds (2004) and Executive Vice President of Risk Oversight for Fidelity Investments (2002). Pre viously, he served as Executive Vice President and Chief Operating Offi cer for Fidelity Investments Institutional Services Company, Inc.
(1998 2002).
Year of Election or Appointment: 2003
Deputy Treasurer of the fund. Mr. Hebble also serves as Deputy Trea surer of other Fidelity funds (2003), and is an employee of FMR. Before joining Fidelity Investments, Mr. Hebble worked at Deutsche Asset Man agement where he served as Director of Fund Accounting (2002 2003) and Assistant Treasurer of the Scudder Funds (1998 2003).
Year of Election or Appointment: 2005
Deputy Treasurer of the fund. Mr. Mehrmann also serves as Deputy Treasurer of other Fidelity funds (2005 present) and is an employee of FMR. Previously, Mr. Mehrmann served as Vice President of Fidelity In vestments Institutional Services Group (FIIS)/Fidelity Investments Institu tional Operations Corporation, Inc. (FIIOC) Client Services (1998 2004).
Kimberley H. Monasterio (41)
|
Year of Election or Appointment: 2004
Deputy Treasurer of the fund. Ms. Monasterio also serves as Deputy Treasurer of other Fidelity funds (2004) and is an employee of FMR (2004). Before joining Fidelity Investments, Ms. Monasterio served as Treasurer (2000 2004) and Chief Financial Officer (2002 2004) of the Franklin Templeton Funds and Senior Vice President of Franklin Temple ton Services, LLC (2000 2004).
59 Annual Report
Trustees and Officers - continued
| | Name, Age; Principal Occupation
Kenneth B. Robins (36)
|
Year of Election or Appointment: 2005
Deputy Treasurer of the fund. Mr. Robins also serves as Deputy Treasurer of other Fidelity funds (2005 present) and is an employee of FMR (2004 present). Before joining Fidelity Investments, Mr. Robins worked at KPMG LLP, where he was a partner in KPMG’s department of profes sional practice (2002 2004) and a Senior Manager (1999 2000). In addition, Mr. Robins served as Assistant Chief Accountant, United States Securities and Exchange Commission (2000 2002).
Year of Election or Appointment: 2005
Assistant Treasurer of the fund. Mr. Byrnes also serves as Assistant Trea surer of other Fidelity funds (2005 present) and is an employee of FMR (2005 present). Previously, Mr. Byrnes served as Vice President of FPCMS (2003 2005). Before joining Fidelity Investments, Mr. Byrnes worked at Deutsche Asset Management where he served as Vice Presi dent of the Investment Operations Group (2000 2003).
Year of Election or Appointment: 2003
Assistant Treasurer of the fund. Mr. Costello also serves as Assistant Treasurer of other Fidelity funds and is an employee of FMR.
Year of Election or Appointment: 2004
Assistant Treasurer of the fund. Mr. Lydecker also serves as Assistant Treasurer of other Fidelity funds (2004) and is an employee of FMR.
Year of Election or Appointment: 2003
Assistant Treasurer of the fund. Mr. Osterheld also serves as Assistant Treasurer of other Fidelity funds (2002) and is an employee of FMR.
Year of Election or Appointment: 2005
Assistant Treasurer of the fund. Mr. Ryan also serves as Assistant Trea surer of other Fidelity funds (2005 present) and is an employee of FMR (2005 present). Previously, Mr. Ryan served as Vice President of Fund Reporting in FPCMS (1999 2005).
Name, Age; Principal Occupation
Salvatore Schiavone (40)
|
Year of Election or Appointment: 2005
Assistant Treasurer of the fund. Mr. Schiavone also serves as Assistant Treasurer of other Fidelity funds (2005 present) and is an employee of FMR (2005 present). Before joining Fidelity Investments, Mr. Schiavone worked at Deutsche Asset Management, where he most recently served as Assistant Treasurer (2003 2005) of the Scudder Funds and Vice Pres ident and Head of Fund Reporting (1996 2003).
61 Annual Report
The Board of Trustees of Fidelity Advisor Strategic Dividend & Income Fund voted to pay to shareholders of record at the opening of business on record date, the following distributions per share derived from capital gains realized from sales of portfolio se curities, and dividends derived from net investment income:
| | | Pay Date | | Record Date | | Dividends | | Capital Gains |
| Class A | | 12/19/05 | | 12/16/05 | | $0.050 | | $0.13 |
| Class T | | 12/19/05 | | 12/16/05 | | $0.043 | | $0.13 |
| Class B | | 12/19/05 | | 12/16/05 | | $0.026 | | $0.13 |
| Class C | | 12/19/05 | | 12/16/05 | | $0.028 | | $0.13 |
The fund hereby designates as capital gain dividends: For dividends with respect to the taxable year ended November 30, 2005, $12,115,601 or, if subsequently deter mined to be different, the net capital gain of such year, and for dividends with respect to the taxable year ended November 30, 2004, $0, or, if subsequently determined to be different, the excess of: (a) the net capital gain of such year, over (b) amounts pre viously designated as capital gain dividends with respect to such year.
A total of 0.14% of the dividends distributed during the fiscal year was derived from interest on U.S. Government securities which is generally exempt from state income tax.
Class A designates 96%, and 100%; Class T designates 100%, and 100%; Class B designates 100%, and 100%; and Class C designates 100%, and 100% of the dividends distributed in December 2004 and July 2005, respectively during the fiscal year as qualifying for the dividends received deduction for corporate shareholders.
Class A designates 100%, and 100%; Class T designates 100%, and 100%; Class B designates 100%, and 100%; and Class C designates 100%, and 100% of the dividends distributed in December 2004 and July 2005, respectively during the fiscal year as amounts which may be taken into account as a dividend for purposes of the maximum rate under section 1(h)(11) of the Internal Revenue Code.
The fund will notify shareholders in January 2006 of amounts for use in preparing 2005 income tax returns.
Proxy Voting Results
A special meeting of the fund’s shareholders was held on March 16, 2005. The results of votes taken among shareholders on proposals before them are reported below. Each vote reported represents one dollar of net asset value held on the record date for the meeting.
| PROPOSAL 1 | | |
| To amend the Declaration of Trust to |
| allow the Board of Trustees, if per- |
| mitted by applicable law, to authorize |
| fund mergers without shareholder |
| approval.A | | | | |
| | | # of | | % of |
| | | Votes | | Votes |
| Affirmative | | 8,400,660,894.14 | | 71.170 |
| Against | | 2,413,818,167.07 | | 20.450 |
| Abstain | | 466,182,489.54 | | 3.949 |
| Broker | | | | |
| Non Votes | | 523,001,758.35 | | 4.431 |
| TOTAL | | 11,803,663,309.10 | | 100.000 |
| PROPOSAL 2 | | |
| To elect a Board of Trustees.A | | |
| | | # of | | % of |
| | | Votes | | Votes |
| |
| Laura B. Cronin | | |
| Affirmative | | 10,904,461,482.16 | | 92.382 |
| Withheld | | 899,201,826.94 | | 7.618 |
| TOTAL | | 11,803,663,309.10 | | 100.000 |
| Dennis J. Dirks | | |
| Affirmative | | 11,230,399,240.22 | | 95.143 |
| Withheld | | 573,264,068.88 | | 4.857 |
| TOTAL | | 11,803,663,309.10 | | 100.000 |
| Robert M. Gates | | |
| Affirmative | | 11,204,490,469.14 | | 94.924 |
| Withheld | | 599,172,839.96 | | 5.076 |
| TOTAL | | 11,803,663,309.10 | | 100.000 |
| George H. Heilmeier | | |
| Affirmative | | 11,216,568,766.75 | | 95.026 |
| Withheld | | 587,094,542.35 | | 4.974 |
| TOTAL | | 11,803,663,309.10 | | 100.000 |
| | | # of | | % of |
| | | Votes | | Votes |
| |
| Abigail P. Johnson | | |
| Affirmative | | 11,170,882,517.64 | | 94.639 |
| Withheld | | 632,780,791.46 | | 5.361 |
| TOTAL | | 11,803,663,309.10 | | 100.000 |
| |
| Edward C. Johnson 3d | | |
| Affirmative | | 11,146,150,096.08 | | 94.430 |
| Withheld | | 657,513,213.02 | | 5.570 |
| TOTAL | | 11,803,663,309.10 | | 100.000 |
| |
| Marie L. Knowles | | |
| Affirmative | | 11,230,314,699.11 | | 95.143 |
| Withheld | | 573,348,609.99 | | 4.857 |
| TOTAL | | 11,803,663,309.10 | | 100.000 |
| |
| Ned C. Lautenbach | | |
| Affirmative | | 11,228,854,936.86 | | 95.130 |
| Withheld | | 574,808,372.24 | | 4.870 |
| TOTAL | | 11,803,663,309.10 | | 100.000 |
| |
| Marvin L. Mann | | |
| Affirmative | | 11,192,136,636.22 | | 94.819 |
| Withheld | | 611,526,672.88 | | 5.181 |
| TOTAL | | 11,803,663,309.10 | | 100.000 |
| |
| William O. McCoy | | |
| Affirmative | | 11,202,537,978.70 | | 94.907 |
| Withheld | | 601,125,330.40 | | 5.093 |
| TOTAL | | 11,803,663,309.10 | | 100.000 |
| |
| Robert L. Reynolds | | |
| Affirmative | | 11,216,557,272.63 | | 95.026 |
| Withheld | | 587,106,036.47 | | 4.974 |
| TOTAL | | 11,803,663,309.10 | | 100.000 |
| |
| Cornelia M. Small | | |
| Affirmative | | 11,221,057,350.30 | | 95.064 |
| Withheld | | 582,605,958.80 | | 4.936 |
| TOTAL | | 11,803,663,309.10 | | 100.000 |
63 Annual Report
Proxy Voting Results - continued
| | | # of | | % of |
| | | Votes | | Votes |
| |
| William S. Stavropoulos | | |
| Affirmative | | 11,213,520,655.58 | | 95.000 |
| Withheld | | 590,142,653.52 | | 5.000 |
| TOTAL | | 11,803,663,309.10 | | 100.000 |
| |
| Kenneth L. Wolfe | | |
| Affirmative | | 11,218,319,970.33 | | 95.041 |
| Withheld | | 585,343,338.77 | | 4.959 |
| TOTAL | | 11,803,663,309.10 | | 100.000 |
A Denotes trust-wide proposals and voting results.
Board Approval of Investment Advisory Contracts and Management Fees
Fidelity Strategic Dividend & Income Fund
Each year, typically in July, the Board of Trustees, including the independent Trustees (together, the Board), votes on the renewal of the management contract and sub advisory agreements (together, the Advisory Contracts) for the fund. The Board, assisted by the advice of fund counsel and independent Trustees’ counsel, requests and considers a broad range of information throughout the year.
The Board meets regularly each month except August and takes into account throughout the year matters bearing on Advisory Contracts. The Board, acting directly and through its separate committees, considers at each of its meetings factors that are relevant to the annual renewal of the fund’s Advisory Contracts, including the services and support provided to the fund and its shareholders by Fidelity. At the time of the renewal, the Board had 11 standing committees, each composed of independent Trustees with varying backgrounds, to which the Board has assigned specific subject matter responsibilities in order to enhance effective decision making by the Board. Each committee has adopted a written charter outlining the structure and purposes of the committee. One such com mittee, the Equity Contract Committee, meets periodically during the first six months of each year and as necessary to consider matters specifically related to the annual renewal of Advisory Contracts. The committee requests and receives information on, and makes recommendations to the independent Trustees concerning, the approval and annual review of the Advisory Contracts.
At its July 2005 meeting, the Board of Trustees, including the independent Trustees, unanimously determined to renew the Advisory Contracts for the fund. In reaching its determination, the Board considered all factors it believed relevant, including (1) the nature, extent, and quality of the services to be provided to the fund and its shareholders by Fidelity (including the investment performance of the fund); (2) the competitiveness of the management fee and total expenses of the fund; (3) the total costs of the services to be provided by and the profits to be realized by the investment adviser and its affiliates from the relationship with the fund; (4) the extent to which economies of scale would be realized as the fund grows; and (5) whether fee levels reflect these economies of scale, if any, for the benefit of fund shareholders.
In determining whether to renew the Advisory Contracts for the fund, the Board ulti mately reached a determination, with the assistance of fund counsel and independent Trustees’ counsel, that the renewal of the Advisory Contracts and the compensation to be received by Fidelity under the management contract is consistent with Fidelity’s fidu ciary duty under applicable law. In addition to evaluating the specific factors noted above, the Board, in reaching its determination, is aware that shareholders in the fund have a broad range of investment choices available to them, including a wide choice among mutual funds offered by competitors to Fidelity, and that the fund’s shareholders, with the opportunity to review and weigh the disclosure provided by the fund in its
65 Annual Report
Board Approval of Investment Advisory Contracts and Management Fees continued
prospectus and other public disclosures, have chosen to invest in this fund, managed by Fidelity.
Nature, Extent, and Quality of Services Provided by Fidelity. The Board consid ered staffing within the investment adviser, FMR, and the sub advisers (together, the Investment Advisers), including the background of the fund’s portfolio manager and the fund’s investment objective and discipline. The independent Trustees also had discus sions with senior management of Fidelity’s investment operations and investment groups. The Board considered the structure of the portfolio manager compensation program and whether this structure provides appropriate incentives.
Fidelity Resources Dedicated to Investment Management and Support Services. The Board reviewed the size, education, and experience of the Investment Advisers’ invest ment staff, their use of technology, and the Investment Advisers’ approach to recruiting, training, and retaining portfolio managers and other research, advisory, and manage ment personnel. The Board considered Fidelity’s extensive global research capabilities that enable the Investment Advisers to aggregate data from various sources in an effort to produce positive investment results. The Board noted that Fidelity’s analysts have access to a variety of technological tools that enable them to perform both fundamental and quantitative analysis and to specialize in various disciplines. The Board also considered that Fidelity’s portfolio managers and analysts have access to daily portfolio attribution that allows for monitoring of a fund’s portfolio, as well as an electronic communication system that provides immediate real time access to research concerning issuers and credit enhancers.
Shareholder and Administrative Services. The Board considered the nature, extent, quality, and cost of administrative, distribution, and shareholder services performed by the Investment Advisers and their affiliates under the Advisory Contracts and under separate agreements covering transfer agency, pricing and bookkeeping, and securities lending services for the fund. The Board also considered the nature and extent of the Investment Advisers’ supervision of third party service providers, principally custodians and subcustodians. The Board reviewed the allocation of fund brokerage, including allocations to brokers affiliated with the Investment Advisers, the use of brokerage commissions to pay fund expenses, and the use of “soft” commission dollars to pay for research services. The Board also considered that Fidelity voluntarily decided in 2004 to stop using “soft” commission dollars to pay for market data and, instead, to pay for that data out of its own resources. The Board also considered the resources devoted to, and the record of compliance with, the fund’s compliance policies and procedures.
The Board noted that the growth of fund assets across the complex allows Fidelity to reinvest in the development of services designed to enhance the value or convenience of the Fidelity funds as investment vehicles. These services include 24 hour access to
account information and market information through phone representatives and over the Internet, and investor education materials and asset allocation tools.
Investment in a Large Fund Family. The Board considered the benefits to shareholders of investing in a Fidelity fund, including the benefits of investing in a fund that is part of a large family of funds offering a variety of investment disciplines and providing for a large variety of mutual fund investor services. For example, fund shareholders are offered the privilege of exchanging shares of the fund for shares of other Fidelity funds, as set forth in the fund’s prospectus, without paying an additional sales charge. The Board noted that, since the last Advisory Contract renewals in July 2004, Fidelity has taken a number of actions that benefited particular funds, including (i) voluntarily deciding in 2004 to stop using “soft” commission dollars to pay for market data and, instead, to pay for that data out of its own resources, (ii) contractually agreeing to impose management fee reductions and expense limitations on its five Spartan stock index funds and its stock index fund available through variable insurance products, (iii) contractually agreeing to eliminate the management fees on the Fidelity Freedom Funds and the Fidelity Advisor Freedom Funds, (iv) contractually agreeing to reduce the management fees on most of its investment grade taxable bond funds, and (v) contractually agreeing to impose expense limitations on its retail and Spartan investment grade taxable bond funds.
Investment Performance and Compliance. The Board considered whether the fund has operated within its investment objective, as well as its record of compliance with its investment restrictions. It also reviewed the fund’s absolute investment performance for each class, as well as the fund’s relative investment performance for each class measured against (i) a proprietary custom index, and (ii) a peer group of mutual funds deemed appropriate by the Board. Because the fund had been in existence less than three calendar years, the following chart considered by the Board shows, for the one year period ended December 31, 2004, the returns of Class C and the retail class of the fund, the return of a proprietary custom index (“benchmark”), and a range of returns of a peer group of mutual funds identified by Lipper Inc. as having an investment objective similar to that of the fund. The returns of Class C and the retail class represent the performance of classes with the highest and lowest 12b 1 fees, respectively (not necessarily with the highest and lowest total expenses). The box within the chart shows the 25th percentile return (bottom of box) and the 75th percentile return (top of box) of the Lipper peer group. Returns shown above the box are in the first quartile and returns shown below the box are in the fourth quartile. The percentage beaten numbers noted below the chart correspond to the percentile box and represent the percentage of funds in the Lipper peer group whose performance was equal to or lower than that of the class indicated. The fund’s proprietary custom index is an index developed by FMR that represents the fund’s four general investment categories according to their respective weightings in the fund’s neutral mix.
67 Annual Report
Board Approval of Investment Advisory Contracts and Management Fees continued
The Board reviewed the fund’s relative investment performance against its Lipper peer group and stated that the performance of the retail class of the fund was in the first quartile for the one year period. The Board also stated that the relative investment performance of the fund was lower than its benchmark for the one year period. The Board considered that the variations in performance among the fund’s classes reflect the variations in class expenses, which result in lower performance for higher expense classes. The Board stated that it is difficult to evaluate in any comprehensive fashion the performance of the fund, in light of its relatively recent launch.
The Board has had thorough discussions with FMR throughout the year about the Board’s and FMR’s concerns about equity research, equity fund performance, and compliance with internal policies governing gifts and entertainment. FMR has taken steps that it believes will refocus and strengthen equity research and equity portfolio management and compliance. The Board noted with favor FMR’s recent reorganization of its senior management team and FMR’s plans to dedicate additional resources to investment research, and participated in the process that led to those changes.
Based on its review, and giving particular weight to the nature and quality of the resources dedicated by the Investment Advisers to maintain and improve relative performance, the Board concluded that the nature, extent, and quality of the services provided by Fidelity will benefit the fund’s shareholders, particularly in light of the Board’s view that the fund’s shareholders benefit from investing in a fund that is part of a large family of funds offering a variety of investment disciplines and services.
Competitiveness of Management Fee and Total Fund Expenses. The Board considered the fund’s management fee and total expenses compared to “mapped groups”
of competitive funds and classes. Fidelity creates “mapped groups” by combining similar Lipper investment objective categories that have comparable management fee charac teristics. Combining Lipper investment objective categories aids the Board’s manage ment fee and total expense comparisons by broadening the competitive group used for comparison and by reducing the number of universes to which various Fidelity funds are compared.
The Board considered two proprietary management fee comparisons for the 12 month (or shorter) periods shown in the chart below. The group of Lipper funds used by the Board for management fee comparisons is referred to below as the “Total Mapped Group” and, for the reasons explained above, is broader than the Lipper peer group used by the Board for performance comparisons. The Total Mapped Group comparison focuses on a fund’s standing relative to the total universe of comparable funds available to investors, in terms of gross management fees before expense reimbursements or caps. “TMG %” represents the percentage of funds in the Total Mapped Group that had management fees that were lower than the fund’s. For example, a TMG % of 30% means that 70% of the funds in the Total Mapped Group had higher management fees than the fund. The “Asset Size Peer Group” (ASPG) comparison focuses on a fund’s standing relative to non Fidelity funds similar in size to the fund within the Total Mapped Group. The ASPG represents at least 15% of the funds in the Total Mapped Group with comparable asset size and management fee characteristics, subject to a minimum of 50 funds (or all funds in the Total Mapped Group if fewer than 50). Additional information, such as the ASPG quartile (“quadrant”) in which the fund’s management fee ranked, is also included in the chart and considered by the Board.

69 Annual Report
Board Approval of Investment Advisory Contracts and Management Fees continued
The Board noted that the fund’s management fee ranked below the median of its Total Mapped Group and below the median of its ASPG for 2004.
Based on its review, the Board concluded that the fund’s management fee was fair and reasonable in light of the services that the fund receives and the other factors considered.
In its review of each class’s total expenses, the Board considered the fund’s management fee as well as other fund or class expenses, as applicable, such as transfer agent fees, pricing and bookkeeping fees, fund paid 12b 1 fees, and custodial, legal, and audit fees. The Board also noted the effects of any waivers and reimbursements on fees and expenses. As part of its review, the Board also considered current and historical total expenses of each class of the fund compared to competitive fund median expenses. Each class of the fund is compared to those funds and classes in the Total Mapped Group (used by the Board for management fee comparisons) that have a similar sales load structure.
The Board noted that the total expenses of each of Class A, Class B, Institutional Class and Fidelity Strategic Dividend & Income Fund (retail class) ranked below its competi tive median for 2004, and the total expenses of each of Class C and Class T ranked above its competitive median for 2004. The Board noted that the fund offers multiple classes, each of which has a different sales load and 12b 1 fee structure, and that the multiple structures are intended to offer a range of pricing options for the intermediary market. The Board also noted that the total expenses of the classes vary primarily by the level of their 12b 1 fees, although differences in transfer agent fees may also cause expenses to vary from class to class.
In its review of total expenses, the Board also considered Fidelity fee structures and other information on clients that FMR and its affiliates service in other competitive markets, such as other mutual funds advised or subadvised by FMR or its affiliates, pension plan clients, and other institutional clients.
Based on its review, the Board concluded that the total expenses for each class of the fund were reasonable, although in some cases above the median of the universe presented for comparison, in light of the services that the fund and its shareholders receive and the other factors considered.
Costs of the Services and Profitability. The Board considered the revenues earned and the expenses incurred by Fidelity in conducting the business of developing, market ing, distributing, managing, administering and servicing the fund and its shareholders. The Board also considered the level of Fidelity’s profits in respect of all the Fidelity funds.
On an annual basis, FMR presents to the Board Fidelity’s profitability for the fund. Fidelity calculates the profitability for each fund, as well as aggregate profitability for
groups of Fidelity funds and all Fidelity funds, using a series of detailed revenue and cost allocation methodologies which originate with the audited books and records of Fidelity. The Audit Committee of the Board reviews any significant changes from the prior year’s methodologies.
PricewaterhouseCoopers LLP (PwC), independent registered accounting firm and auditor to Fidelity and certain Fidelity funds, has been engaged annually by the Board as part of the Board’s assessment of the results of Fidelity’s profitability analysis. PwC’s engagement includes the review and assessment of Fidelity’s methodologies used in determining the revenues and expenses attributable to Fidelity’s mutual fund business, and completion of agreed upon procedures surrounding the mathematical accuracy of fund profitability and its conformity to allocation methodologies. After considering PwC’s reports issued under the engagement and information provided by Fidelity, the Board believes that while other allocation methods may also be reasonable, Fidelity’s profitabil ity methodologies are reasonable in all material respects.
The Board has also reviewed Fidelity’s non fund businesses and any fall out benefits related to the mutual fund business as well as cases where Fidelity’s affiliates may benefit from or be related to the fund’s business. In addition, a special committee of the Board reviewed services provided to Fidelity by its affiliates and determined that the fees that Fidelity paid for such services were reasonable.
The Board considered the costs of the services provided by and the profits realized by Fidelity in connection with the operation of the fund and determined that the amount of profit is a fair entrepreneurial profit for the management of the fund.
Economies of Scale. The Board considered whether there have been economies of scale in respect of the management of the Fidelity funds, whether the Fidelity funds (including the fund) have appropriately benefited from any such economies of scale, and whether there is potential for realization of any further economies of scale. The Board considered the extent to which the fund will benefit from economies of scale through increased services to the fund, through waivers or reimbursements, or through fee or expense reductions, including reductions that occur through operation of the transfer agent agreement. The transfer agent fee varies in part based on the number of accounts in the fund. If the number of accounts decreases or the average account size increases, the overall transfer agent fee rate decreases.
The Board recognized that the fund’s management contract incorporates a “group fee” structure, which provides for lower fee rates as total fund assets under FMR’s manage ment increase, and for higher fee rates as total fund assets under FMR’s management decrease. The Board considered that the group fee is designed to deliver the benefits of economies of scale to fund shareholders when total fund assets increase, even if assets of any particular fund are unchanged or have declined, because some portion of Fidelity’s costs are attributable to services provided to all Fidelity funds, and all funds benefit if
71 Annual Report
Board Approval of Investment Advisory Contracts and Management Fees continued
those costs can be allocated among more assets. The Board concluded that, given the group fee structure, fund shareholders will achieve a certain level of economies of scale as assets under FMR’s management increase at the fund complex level, regardless of whether Fidelity achieves any such economies of scale.
The Board further concluded that any potential economies of scale are being shared between fund shareholders and Fidelity in an appropriate manner.
Additional Information Requested by the Board. In order to develop fully the factual basis for consideration of the Advisory Contracts, the Board requested additional information regarding (i) equity fund transfer agency fees; (ii) Fidelity’s fund profitability methodology and the impact of various changes in the methodology over time; (iii) benefits to shareholders from economies of scale; (iv) composition and characteristics of various fund and industry data used in comparisons; and (v) com pensation of portfolio managers and research analysts.
Based on its evaluation of all of the conclusions noted above, and after considering all material factors, the Board ultimately concluded that the existing advisory fee structures are fair and reasonable, and that the fund’s existing Advisory Contracts should be renewed.
73 Annual Report
75 Annual Report
77 Annual Report
Investment Adviser
Fidelity Management & Research Company
Boston, MA
Investment Sub Advisers
FMR Co., Inc.
Fidelity Management & Research
(U.K.) Inc.
Fidelity Management & Research
(Far East) Inc.
Fidelity International Investment Advisors
Fidelity Investments Japan Limited
Fidelity International Investment Advisors (U.K.) Limited
General Distributor
Fidelity Distributors Corporation
Boston, MA
Transfer and Service Agents
Fidelity Investments Institutional
Operations Company, Inc.
Boston, MA
Fidelity Service Company, Inc.
Boston, MA
Custodian
Citibank, N.A.
New York, NY
|
ASDI-UANN-0106
1.802529.101
|


| | Fidelity Advisor
Strategic Dividend & Income
Fund - Institutional Class
|
| | Annual Report
November 30, 2005
|

Institutional Class is a class of Fidelity® Strategic Dividend & Income® Fund
| Contents | | | | |
| |
| Chairman’s Message | | 4 | | Ned Johnson’s message to shareholders. |
| Performance | | 5 | | How the fund has done over time. |
| Management’s Discussion | | 7 | | The managers’ review of fund |
| | | | | performance, strategy and outlook. |
| Shareholder Expense | | 8 | | An example of shareholder expenses. |
| Example | | | | |
| Investment Changes | | 10 | | A summary of the fund’s investments. |
| Investments | | 11 | | A complete list of the fund’s investments |
| | | | | with their market values. |
| Financial Statements | | 32 | | Statements of assets and liabilities, |
| | | | | operations, and changes in net assets, |
| | | | | as well as financial highlights. |
| Notes | | 42 | | Notes to the financial statements. |
| Report of Independent | | 51 | | |
| Registered Public | | | | |
| Accounting Firm | | | | |
| Trustees and Officers | | 52 | | |
| Distributions | | 62 | | |
| Proxy Voting Results | | 63 | | |
| Board Approval of | | 65 | | |
| Investment Advisory | | | | |
| Contracts and | | | | |
| Management Fees | | | | |
To view a fund’s proxy voting guidelines and proxy voting record for the 12 month period ended
June 30, visit www.fidelity.com/proxyvotingresults or visit the Securities and Exchange Commis
sion’s (SEC) web site at www.sec.gov. You may also call 1-877-208-0098 to request a free copy of
the proxy voting guidelines.
Standard & Poor’s, S&P and S&P 500 are registered service marks of The McGraw Hill Companies,
Inc. and have been licensed for use by Fidelity Distributors Corporation.
Other third party marks appearing herein are the property of their respective owners.
All other marks appearing herein are registered or unregistered trademarks or service marks
of FMR Corp. or an affiliated company.
|
This report and the financial statements contained herein are submitted for the general information
of the shareholders of the fund. This report is not authorized for distribution to prospective investors
in the fund unless preceded or accompanied by an effective prospectus.
A fund files its complete schedule of portfolio holdings with the SEC for the first and third
quarters of each fiscal year on Form N Q. Forms N Q are available on the SEC’s web site at
http://www.sec.gov. A fund’s Forms N Q may be reviewed and copied at the SEC’s Public Reference
Room in Washington, DC. Information regarding the operation of the SEC’s Public Reference
Room may be obtained by calling 1-800-SEC-0330. For a complete list of a fund’s portfolio hold
ings, view the most recent quarterly holdings report, semiannual report, or annual report on
Fidelity’s web site at http://www.advisor.fidelity.com.
NOT FDIC INSURED · MAY LOSE VALUE · NO BANK GUARANTEE
Neither the fund nor Fidelity Distributors Corporation is a bank.
|
3 Annual Report
Chairman’s Message
(photograph of Edward C. Johnson 3d)
Dear Shareholder:
During the past year or so, much has been reported about the mutual fund industry, and much of it has been more critical than I believe is warranted. Allegations that some companies have been less than forthright with their shareholders have cast a shadow on the entire industry. I continue to find these reports disturbing, and assert that they do not create an accurate picture of the industry overall. Therefore, I would like to remind every one where Fidelity stands on these issues. I will say two things specifically regarding allegations that some mutual fund companies were in violation of the Securities and Exchange Commission’s forward pricing rules or were involved in so called “market timing” activities.
First, Fidelity has no agreements that permit customers who buy fund shares after 4 p.m. to obtain the 4 p.m. price. This is not a new policy. This is not to say that some one could not deceive the company through fraudulent acts. However, we are extremely diligent in preventing fraud from occurring in this manner and in every other. But I underscore again that Fidelity has no so called “agreements” that sanction illegal practices.
Second, Fidelity continues to stand on record, as we have for years, in opposition to predatory short term trading that adversely affects shareholders in a mutual fund. Back in the 1980s, we initiated a fee which is returned to the fund and, therefore, to investors to discourage this activity. Further, we took the lead several years ago in developing a Fair Value Pricing Policy to prevent market timing on foreign securities in our funds. I am confident we will find other ways to make it more difficult for predatory traders to operate. However, this will only be achieved through close cooperation among regulators, legislators and the industry.
Yes, there have been unfortunate instances of unethical and illegal activity within the mutual fund industry from time to time. That is true of any industry. When this occurs, confessed or convicted offenders should be dealt with appropriately. But we are still concerned about the risk of over regulation and the quick application of simplistic solutions to intricate problems. Every system can be improved, and we support and applaud well thought out improvements by regulators, legislators and industry representatives that achieve the common goal of building and protecting the value of investors’ holdings.
For nearly 60 years, Fidelity has worked very hard to improve its products and service to justify your trust. When our family founded this company in 1946, we had only a few hundred customers. Today, we serve more than 18 million customers including individual investors and participants in retirement plans across America.
Let me close by saying that we do not take your trust in us for granted, and we realize that we must always work to improve all aspects of our service to you. In turn, we urge you to continue your active participation with your financial matters, so that your interests can be well served.
Best regards,
/s/ Edward C. Johnson 3d
Edward C. Johnson 3d
Annual Report 4
Performance: The Bottom Line
Average annual total return reflects the change in the value of an investment, assuming reinvestment of the class’ dividend income and capital gains (the profits earned upon the sale of securities that have grown in value) and assuming a constant rate of performance each year. The $10,000 table and the fund’s returns do not reflect the deduction of taxes that a shareholder would pay on fund distributions or the redemption of fund shares. During periods of reimbursement by Fidelity, a fund’s total return will be greater than it would be had the reimbursement not occurred. How a fund did yesterday is no guarantee of how it will do tomorrow.
| Average Annual Total Returns | | | | |
| Periods ended November 30, 2005 | | Past 1 | | Life of |
| | | year | | FundA |
| Institutional Class | | 11.98% | | 12.58% |
| |
| A From December 23, 2003. | | | | |
| | $10,000 Over Life of Fund
|
Let’s say hypothetically that $10,000 was invested in Fidelity Advisor Strategic Dividend & Income Fund Institutional Class on December 23, 2003, when the fund started. The chart shows how the value of your investment would have changed, and also shows how the Standard & Poor’s 500SM Index performed over the same period.
Management’s Discussion of Fund Performance
Comments from Christopher Sharpe and Derek Young, who became Lead Co Managers of Fidelity Advisor Strategic Dividend & Income Fund on July 29, 2005
Numerous events unfolded during the 12 month period ending November 30, 2005, that were major influences on the U.S. equity markets. Issues exerting downward pressure on stocks included higher levels of inflation, eight short term interest rate hikes by the Federal Reserve Board, exorbitant energy prices, and a Category 4 hurricane that devastated both the city of New Orleans and several nearby oil production and refinery facilities. Grabbing most of the markets’ upbeat headlines was consistent strength in consumer spending, corporate earnings and gross domestic product (GDP). When all was said and done, investors demonstrated their conviction in the economy, pushing stocks higher across the board. By period end, the Standard & Poor’s 500SM Index, the NASDAQ Composite® Index and the Dow Jones Industrial AverageSM approached or exceeded four and a half year highs. For the 12 months overall, the S&P 500® was up 8.44%, the NASDAQ® rose 7.28% and the Dow advanced 6.07%, threatening to eclipse the 11,000 threshold for the first time since early 2000.
Fidelity Advisor Strategic Dividend & Income Fund’s Institutional Class shares were up 11.98% for the 12 months ending November 30, 2005, while the Fidelity Strategic Dividend & Income Composite Index rose 8.52% and the LipperSM Equity Income Objective Funds Average returned 8.23% . The fund’s overall asset allocation strategy was to overweight riskier assets such as equities and the more volatile segments of the fund’s other investment categories and underweight fixed income like instruments relative to the composite index. All four of the fund’s subportfolios turned in strong performance for the year, beating their respective benchmarks. The fund’s overweighting in common stocks included a selected group of large cap value names that did particularly well and drove a big portion of the fund’s performance. The strong performance of the common stock subportfolio was partially offset by underweighting real estate investment trusts (REITs), which, given their particularly good returns, caused the fund to miss some of the robust gains of that asset class. Security selection in energy was a consistent theme almost across the board, driving strong performance in the preferred stock and convertibles subportfolios, as well as in common stocks. Solid stock picking also led to outsized returns in the REIT subportfolio.
The views expressed in this statement reflect those of the portfolio managers only through the end of the period of the report as stated on the cover and do not necessarily represent the views of Fidelity or any other person in the Fidelity organization. Any such views are subject to change at any time based upon market or other conditions and Fidelity disclaims any responsibility to update such views. These views may not be relied on as investment advice and, because investment decisions for a Fidelity fund are based on numerous factors, may not be relied on as an indication of trading intent on behalf of any Fidelity fund.
Shareholder Expense Example
As a shareholder of the Fund, you incur two types of costs: (1) transaction costs, including sales charges (loads) on purchase payments or redemption proceeds, and (2) ongoing costs, including management fees, distribution and/or service (12b 1) fees and other Fund expenses. This Example is intended to help you understand your ongoing costs (in dollars) of investing in the Fund and to compare these costs with the ongoing costs of investing in other mutual funds.
The Example is based on an investment of $1,000 invested at the beginning of the period and held for the entire period (June 1, 2005 to November 30, 2005).
The first line of the table below for each class of the Fund provides information about actual account values and actual expenses. You may use the information in this line, together with the amount you invested, to estimate the expenses that you paid over the period. Simply divide your account value by $1,000.00 (for example, an $8,600 account value divided by $1,000.00 = 8.6), then multiply the result by the number in the first line for a class of the Fund under the heading entitled “Expenses Paid During Period” to estimate the expenses you paid on your account during this period.
Hypothetical Example for Comparison Purposes
The second line of the table below for each class of the Fund provides information about hypothetical account values and hypothetical expenses based on a Class’ actual expense ratio and an assumed rate of return of 5% per year before expenses, which is not the Class’ actual return. The hypothetical account values and expenses may not be used to estimate the actual ending account balance or expenses you paid for the period. You may use this information to compare the ongoing costs of investing in the Fund and other funds. To do so, compare this 5% hypothetical example with the 5% hypothetical examples that appear in the shareholder reports of the other funds.
Please note that the expenses shown in the table are meant to highlight your ongoing costs only and do not reflect any transaction costs. Therefore, the second line of the table is useful in comparing ongoing costs only, and will not help you determine the relative total costs of owning different funds. In addition, if these transactional costs were included, your costs would have been higher.
| | | | | | | | | | | Expenses Paid |
| | | | | Beginning | | Ending | | During Period* |
| | | | | Account Value | | Account Value | | June 1, 2005 to |
| | | | | June 1, 2005 | | November 30, 2005 | | November 30, 2005 |
| Class A | | | | | | | | | | | | |
| Actual | | | $ | 1,000.00 | | $ | | 1,084.90 | | $ | | 6.01 |
| HypotheticalA | | | $ | 1,000.00 | | $ | | 1,019.30 | | $ | | 5.82 |
| Class T | | | | | | | | | | | | |
| Actual | | | $ | 1,000.00 | | $ | | 1,084.80 | | $ | | 7.11 |
| HypotheticalA | | | $ | 1,000.00 | | $ | | 1,018.25 | | $ | | 6.88 |
| Class B | | | | | | | | | | | | |
| Actual | | | $ | 1,000.00 | | $ | | 1,080.90 | | $ | | 10.17 |
| HypotheticalA | | | $ | 1,000.00 | | $ | | 1,015.29 | | $ | | 9.85 |
Annual Report 8
| | | | | | | | | | | Expenses Paid |
| | | | | Beginning | | Ending | | During Period* |
| | | | | Account Value | | Account Value | | June 1, 2005 to |
| | | | | June 1, 2005 | | November 30, 2005 | | November 30, 2005 |
| Class C | | | | | | | | | | | | |
| Actual | | | $ | 1,000.00 | | $ | | 1,082.10 | | $ | | 9.81 |
| HypotheticalA | | | $ | 1,000.00 | | $ | | 1,015.64 | | $ | | 9.50 |
| Strategic Dividend & Income | | | | | | | | | | | | |
| Actual | | | $ | 1,000.00 | | $ | | 1,087.90 | | $ | | 4.19 |
| HypotheticalA | | | $ | 1,000.00 | | $ | | 1,021.06 | | $ | | 4.05 |
| Institutional Class | | | | | | | | | | | | |
| Actual | | | $ | 1,000.00 | | $ | | 1,086.90 | | $ | | 4.29 |
| HypotheticalA | | | $ | 1,000.00 | | $ | | 1,020.96 | | $ | | 4.15 |
| |
| A 5% return per year before expenses | | | | | | | | |
* Expenses are equal to each Class’ annualized expense ratio (shown in the table below); multiplied by the average account value over the period, multiplied by 183/365 (to reflect the one half year period).
| | | Annualized |
| | | Expense Ratio |
| Class A | | 1.15% |
| Class T | | 1.36% |
| Class B | | 1.95% |
| Class C | | 1.88% |
| Strategic Dividend & Income | | 80% |
| Institutional Class | | 82% |
9 Annual Report
| Investment Changes | | | | |
| |
| |
| Top Ten Investments as of November 30, 2005 | | |
| (excluding cash equivalents) | | % of fund’s | | % of fund’s net assets |
| | | net assets | | 6 months ago |
| American International Group, Inc. | | 2.5 | | 1.7 |
| Honeywell International, Inc. | | 2.0 | | 1.6 |
| General Electric Co. | | 1.8 | | 3.6 |
| Exxon Mobil Corp. | | 1.7 | | 2.0 |
| El Paso Corp. 4.99% | | 1.1 | | 1.2 |
| Bank of America Corp. | | 1.0 | | 1.4 |
| Valero Energy Corp. 2.00% | | 0.9 | | 0.8 |
| Halliburton Co. | | 0.9 | | 0.6 |
| JPMorgan Chase & Co. | | 0.9 | | 0.2 |
| Baxter International, Inc. | | 0.9 | | 1.0 |
| | | 13.7 | | |
Top Five Market Sectors as of November 30, 2005 | | |
| | | % of fund’s | | % of fund’s net assets |
| | | net assets | | 6 months ago |
| Financials | | 32.8 | | 31.5 |
| Energy | | 11.9 | | 9.9 |
| Industrials | | 9.7 | | 11.0 |
| Health Care | | 9.6 | | 10.0 |
| Information Technology | | 9.5 | | 10.3 |

Annual Report 10
| Investments November 30, 2005 |
| Showing Percentage of Net Assets | | | | |
| |
| Corporate Bonds 12.7% | | | | |
| | | Principal | | Value |
| | | Amount | | (Note 1) |
| Convertible Bonds – 12.7% | | | | |
| |
| CONSUMER DISCRETIONARY – 2.7% | | | | |
| Hotels, Restaurants & Leisure 1.5% | | | | |
| Carnival Corp. 1.132% 4/29/33 (e) | | $ 6,820,000 | | $ 5,565,802 |
| Kerzner International Ltd. 2.375% 4/15/24 | | 4,660,000 | | 5,700,112 |
| Six Flags, Inc. 4.5% 5/15/15 | | 3,300,000 | | 4,228,290 |
| | | | | 15,494,204 |
| Media – 1.2% | | | | |
| Charter Communications, Inc.: | | | | |
| 5.875% 11/16/09 (g) | | 700,000 | | 526,750 |
| 5.875% 11/16/09 | | 10,160,000 | | 7,645,400 |
| XM Satellite Radio Holdings, Inc. 1.75% 12/1/09 | | 580,000 | | 510,765 |
| XM Satellite Radio, Inc. 1.75% 12/1/09 (g) | | 3,300,000 | | 2,876,280 |
| | | | | 11,559,195 |
| |
| TOTAL CONSUMER DISCRETIONARY | | | | 27,053,399 |
| |
| ENERGY 1.2% | | | | |
| Energy Equipment & Services – 0.8% | | | | |
| Halliburton Co. 3.125% 7/15/23 | | 4,260,000 | | 7,414,232 |
| Oil, Gas & Consumable Fuels – 0.4% | | | | |
| McMoRan Exploration Co. 6% 7/2/08 | | 3,000,000 | | 4,102,500 |
| |
| TOTAL ENERGY | | | | 11,516,732 |
| |
| FINANCIALS – 0.6% | | | | |
| Consumer Finance – 0.6% | | | | |
| American Express Co.: | | | | |
| 1.85% 12/1/33 (e)(g) | | 1,800,000 | | 1,914,840 |
| 1.85% 12/1/33 (e) | | 3,850,000 | | 4,095,630 |
| | | | | 6,010,470 |
| |
| HEALTH CARE – 2.9% | | | | |
| Biotechnology – 1.0% | | | | |
| BioMarin Pharmaceutical, Inc. 3.5% 6/15/08 | | 4,780,000 | | 4,385,650 |
| Protein Design Labs, Inc. 2% 2/15/12 (g) | | 1,540,000 | | 2,002,955 |
| Serologicals Corp.: | | | | |
| 4.75% 8/15/33 (g) | | 770,000 | | 1,137,752 |
| 4.75% 8/15/33 | | 1,500,000 | | 2,216,400 |
| | | | | 9,742,757 |
| |
| |
| See accompanying notes which are an integral part of the financial statements. | | |
| |
| 11 | | | | Annual Report |
| Investments continued | | | | | | | | |
| |
| Corporate Bonds continued | | | | | | | | |
| | | | | Principal | | | | Value |
| | | | | Amount | | | | (Note 1) |
| Convertible Bonds continued | | | | | | | | |
| |
| HEALTH CARE – continued | | | | | | | | |
| Health Care Equipment & Supplies – 1.9% | | | | | | | | |
| Bausch & Lomb, Inc. 4.4219% 8/1/23 (h) | | $ | | 3,640,000 | | $ | | 5,557,843 |
| Cytyc Corp. 2.25% 3/15/24 | | | | 2,900,000 | | | | 3,128,520 |
| Fisher Scientific International, Inc.: | | | | | | | | |
| 2.5% 10/1/23 (g) | | | | 995,000 | | | | 1,437,705 |
| 2.5% 10/1/23 | | | | 2,400,000 | | | | 3,467,832 |
| Medtronic, Inc. 1.25% 9/15/21 | | | | 5,480,000 | | | | 5,495,892 |
| | | | | | | | | 19,087,792 |
| |
| TOTAL HEALTH CARE | | | | | | | | 28,830,549 |
| |
| INDUSTRIALS – 1.6% | | | | | | | | |
| Airlines – 0.6% | | | | | | | | |
| America West Holding Corp. 7.5% 1/18/09 | | | | 600,000 | | | | 705,000 |
| Continental Airlines, Inc. 4.5% 2/1/07 | | | | 5,170,000 | | | | 4,544,999 |
| US Airways Group, Inc. 7% 9/30/20 (g) | | | | 650,000 | | | | 1,012,830 |
| | | | | | | | | 6,262,829 |
| Industrial Conglomerates – 0.4% | | | | | | | | |
| Tyco International Group SA yankee 3.125% 1/15/23 . | | | | 3,010,000 | | | | 4,056,276 |
| Marine – 0.6% | | | | | | | | |
| OMI Corp. 2.875% 12/1/24 | | | | 6,300,000 | | | | 5,922,000 |
| |
| TOTAL INDUSTRIALS | | | | | | | | 16,241,105 |
| |
| INFORMATION TECHNOLOGY – 3.5% | | | | | | | | |
| Communications Equipment – 0.6% | | | | | | | | |
| Comverse Technology, Inc. 0% 5/15/23 | | | | 2,000,000 | | | | 2,960,000 |
| Juniper Networks, Inc. 0% 6/15/08 | | | | 2,260,000 | | | | 2,701,649 |
| | | | | | | | | 5,661,649 |
| Computers & Peripherals – 0.2% | | | | | | | | |
| Maxtor Corp. 6.8% 4/30/10 | | | | 1,510,000 | | | | 1,487,501 |
| Electronic Equipment & Instruments – 1.1% | | | | | | | | |
| Flextronics International Ltd. 1% 8/1/10 | | | | 6,420,000 | | | | 5,802,396 |
| Vishay Intertechnology, Inc. 3.625% 8/1/23 | | | | 5,560,000 | | | | 5,299,236 |
| | | | | | | | | 11,101,632 |
| Internet Software & Services – 0.4% | | | | | | | | |
| aQuantive, Inc. 2.25% 8/15/24 | | | | 1,800,000 | | | | 3,861,000 |
See accompanying notes which are an integral part of the financial statements.
| Corporate Bonds continued | | | | | | |
| | | | | Principal | | Value |
| | | | | Amount | | (Note 1) |
| Convertible Bonds continued | | | | | | |
| |
| INFORMATION TECHNOLOGY – continued | | | | | | |
| IT Services – 0.6% | | | | | | |
| DST Systems, Inc.: | | | | | | |
| Series A, 4.125% 8/15/23 (g) | | $ | | 1,240,000 | | $ 1,640,024 |
| 4.125% 8/15/23 | | | | 3,470,000 | | 4,589,422 |
| | | | | | | 6,229,446 |
| Semiconductors & Semiconductor Equipment – 0.6% | | | | | | |
| EMCORE Corp. 5% 5/15/11 | | | | 1,000,000 | | 960,000 |
| ON Semiconductor Corp. 0% 4/15/24 | | | | 6,500,000 | | 5,248,750 |
| | | | | | | 6,208,750 |
| |
| TOTAL INFORMATION TECHNOLOGY | | | | | | 34,549,978 |
| |
| UTILITIES – 0.2% | | | | | | |
| Independent Power Producers & Energy Traders – 0.2% | | | | | | |
| Mirant Corp. 2.5% 6/15/21 (d) | | | | 1,690,000 | | 1,774,500 |
| |
| TOTAL CONVERTIBLE BONDS | | | | | | 125,976,733 |
| Nonconvertible Bonds – 0.0% | | | | | | |
| |
| CONSUMER DISCRETIONARY – 0.0% | | | | | | |
| Household Durables – 0.0% | | | | | | |
| Stanley-Martin Communities LLC 9.75% 8/15/15 (g) | | | | 90,000 | | 82,800 |
| TOTAL CORPORATE BONDS | | | | | | |
| (Cost $121,939,884) | | | | | | 126,059,533 |
| |
| Common Stocks 69.5% | | | | | | |
| | | | | Shares | | |
| |
| CONSUMER DISCRETIONARY – 6.1% | | | | | | |
| Diversified Consumer Services – 0.5% | | | | | | |
| Apollo Group, Inc. Class A (a) | | | | 24,500 | | 1,744,400 |
| Coinmach Service Corp. unit | | | | 156,800 | | 2,359,840 |
| Service Corp. International (SCI) | | | | 128,000 | | 1,050,880 |
| | | | | | | 5,155,120 |
| Hotels, Restaurants & Leisure 1.1% | | | | | | |
| Centerplate, Inc. unit | | | | 318,800 | | 4,023,256 |
| Hilton Hotels Corp. | | | | 60,000 | | 1,315,200 |
| McDonald’s Corp. | | | | 71,800 | | 2,430,430 |
See accompanying notes which are an integral part of the financial statements.
13 Annual Report
| Investments continued | | | | | | |
| |
| Common Stocks continued | | | | | | |
| | | Shares | | Value (Note 1) |
| |
| CONSUMER DISCRETIONARY – continued | | | | | | |
| Hotels, Restaurants & Leisure continued | | | | | | |
| Red Robin Gourmet Burgers, Inc. (a) | | 15,000 | | $ | | 823,500 |
| Starwood Hotels & Resorts Worldwide, Inc. unit | | 38,100 | | | | 2,305,050 |
| | | | | | | 10,897,436 |
| Household Durables – 0.4% | | | | | | |
| D.R. Horton, Inc. | | 32,000 | | | | 1,134,080 |
| KB Home | | 7,000 | | | | 488,390 |
| LG Electronics, Inc. | | 4,250 | | | | 321,976 |
| Sony Corp. sponsored ADR | | 47,000 | | | | 1,739,470 |
| | | | | | | 3,683,916 |
| Internet & Catalog Retail 0.6% | | | | | | |
| Coldwater Creek, Inc. (a) | | 40,000 | | | | 1,256,000 |
| eBay, Inc. (a) | | 89,000 | | | | 3,988,090 |
| Expedia, Inc. (a) | | 13,750 | | | | 340,863 |
| IAC/InterActiveCorp (a) | | 17,750 | | | | 490,078 |
| | | | | | | 6,075,031 |
| Leisure Equipment & Products – 0.7% | | | | | | |
| Eastman Kodak Co. | | 256,500 | | | | 6,148,305 |
| Leapfrog Enterprises, Inc. Class A (a)(f) | | 75,000 | | | | 978,000 |
| | | | | | | 7,126,305 |
| Media – 1.9% | | | | | | |
| Clear Channel Communications, Inc. | | 41,600 | | | | 1,354,496 |
| Clear Channel Outdoor Holding, Inc. Class A | | 40,000 | | | | 812,000 |
| Lamar Advertising Co. Class A (a) | | 71,100 | | | | 3,295,485 |
| News Corp. Class A | | 22,400 | | | | 331,744 |
| The Reader’s Digest Association, Inc. (non-vtg.) | | 30,000 | | | | 465,900 |
| Time Warner, Inc. | | 210,900 | | | | 3,791,982 |
| Univision Communications, Inc. Class A (a) | | 164,500 | | | | 4,972,835 |
| Viacom, Inc. Class B (non-vtg.) | | 23,130 | | | | 772,542 |
| Walt Disney Co. | | 113,700 | | | | 2,834,541 |
| | | | | | | 18,631,525 |
| Multiline Retail – 0.1% | | | | | | |
| Federated Department Stores, Inc. | | 22,000 | | | | 1,417,460 |
| Specialty Retail – 0.8% | | | | | | |
| Gymboree Corp. (a) | | 25,000 | | | | 564,000 |
| Home Depot, Inc. | | 103,100 | | | | 4,307,518 |
| Maidenform Brands, Inc. | | 3,500 | | | | 45,010 |
| OfficeMax, Inc. | | 35,000 | | | | 1,021,300 |
See accompanying notes which are an integral part of the financial statements.
| Common Stocks continued | | | | |
| | | Shares | | Value (Note 1) |
| |
| CONSUMER DISCRETIONARY – continued | | | | |
| Specialty Retail – continued | | | | |
| Staples, Inc. | | 47,200 | | $ 1,090,320 |
| Urban Outfitters, Inc. (a) | | 25,000 | | 771,500 |
| | | | | 7,799,648 |
| Textiles, Apparel & Luxury Goods – 0.0% | | | | |
| Under Armour, Inc. Class A | | 800 | | 18,104 |
| |
| TOTAL CONSUMER DISCRETIONARY | | | | 60,804,545 |
| |
| CONSUMER STAPLES 3.3% | | | | |
| Beverages – 0.5% | | | | |
| Coca-Cola Enterprises, Inc. | | 40,800 | | 784,176 |
| Diageo PLC sponsored ADR | | 13,000 | | 755,950 |
| PepsiCo, Inc. | | 13,500 | | 799,200 |
| The Coca-Cola Co. | | 60,000 | | 2,561,400 |
| | | | | 4,900,726 |
| Food & Staples Retailing – 1.0% | | | | |
| CVS Corp. | | 25,000 | | 675,500 |
| Kroger Co. (a) | | 166,000 | | 3,230,360 |
| Safeway, Inc. | | 135,600 | | 3,152,700 |
| Wal-Mart Stores, Inc. | | 46,500 | | 2,258,040 |
| Walgreen Co. | | 15,000 | | 685,200 |
| | | | | 10,001,800 |
| Food Products 0.4% | | | | |
| B&G Foods, Inc. unit | | 156,900 | | 2,282,895 |
| Nestle SA (Reg.) | | 4,000 | | 1,186,447 |
| Tyson Foods, Inc. Class A | | 63,000 | | 1,060,290 |
| | | | | 4,529,632 |
| Household Products – 0.6% | | | | |
| Colgate-Palmolive Co. | | 105,000 | | 5,724,600 |
| Personal Products 0.1% | | | | |
| Avon Products, Inc. | | 25,000 | | 683,750 |
| Tobacco 0.7% | | | | |
| Altria Group, Inc. | | 99,300 | | 7,228,047 |
| |
| TOTAL CONSUMER STAPLES | | | | 33,068,555 |
| |
| ENERGY 8.0% | | | | |
| Energy Equipment & Services – 3.4% | | | | |
| BJ Services Co. | | 83,800 | | 3,071,270 |
See accompanying notes which are an integral part of the financial statements.
15 Annual Report
| Investments continued | | | | | | |
| |
| Common Stocks continued | | | | | | |
| | | Shares | | Value (Note 1) |
| |
| ENERGY – continued | | | | | | |
| Energy Equipment & Services – continued | | | | | | |
| FMC Technologies, Inc. (a) | | 34,000 | | $ | | 1,397,060 |
| GlobalSantaFe Corp. | | 50,800 | | | | 2,304,288 |
| Halliburton Co. | | 144,200 | | | | 9,178,330 |
| National Oilwell Varco, Inc. (a) | | 95,514 | | | | 5,790,059 |
| Noble Corp. | | 16,500 | | | | 1,189,155 |
| Pride International, Inc. (a) | | 81,300 | | | | 2,421,927 |
| Schlumberger Ltd. (NY Shares) | | 56,500 | | | | 5,408,745 |
| Smith International, Inc. | | 42,000 | | | | 1,587,180 |
| Weatherford International Ltd. (a) | | 18,000 | | | | 1,251,180 |
| | | | | | | 33,599,194 |
| Oil, Gas & Consumable Fuels – 4.6% | | | | | | |
| Amerada Hess Corp. | | 16,000 | | | | 1,960,320 |
| Apache Corp. | | 18,400 | | | | 1,201,152 |
| Chevron Corp. | | 117,100 | | | | 6,711,001 |
| ConocoPhillips | | 32,400 | | | | 1,960,524 |
| CONSOL Energy, Inc. | | 9,000 | | | | 582,480 |
| Devon Energy Corp. | | 34,000 | | | | 2,046,800 |
| El Paso Corp. | | 102,000 | | | | 1,120,980 |
| Encore Acquisition Co. (a) | | 14,000 | | | | 434,560 |
| Exxon Mobil Corp. | | 291,300 | | | | 16,904,139 |
| Houston Exploration Co. (a) | | 18,000 | | | | 983,880 |
| Massey Energy Co. | | 15,000 | | | | 569,250 |
| Occidental Petroleum Corp. | | 22,300 | | | | 1,768,390 |
| OMI Corp. | | 50,000 | | | | 970,000 |
| Quicksilver Resources, Inc. (a) | | 101,450 | | | | 3,840,897 |
| Valero Energy Corp. | | 35,000 | | | | 3,367,000 |
| XTO Energy, Inc. | | 43,000 | | | | 1,749,670 |
| | | | | | | 46,171,043 |
| |
| TOTAL ENERGY | | | | | | 79,770,237 |
| |
| FINANCIALS – 25.5% | | | | | | |
| Capital Markets 3.0% | | | | | | |
| Bear Stearns Companies, Inc. | | 8,200 | | | | 910,118 |
| Charles Schwab Corp. | | 107,000 | | | | 1,631,750 |
| Investors Financial Services Corp. | | 26,000 | | | | 981,500 |
| Lehman Brothers Holdings, Inc. | | 14,800 | | | | 1,864,800 |
| Merrill Lynch & Co., Inc. | | 76,600 | | | | 5,087,772 |
| Merrill Lynch & Co., Inc. (depositary shares) Series 1, unit | | 277,700 | | | | 7,020,256 |
| Morgan Stanley | | 75,000 | | | | 4,202,250 |
See accompanying notes which are an integral part of the financial statements.
| Common Stocks continued | | | | |
| | | Shares | | Value (Note 1) |
| |
| FINANCIALS – continued | | | | |
| Capital Markets continued | | | | |
| Nomura Holdings, Inc. | | 95,000 | | $ 1,581,750 |
| Nuveen Investments, Inc. Class A | | 20,000 | | 829,200 |
| State Street Corp. | | 69,000 | | 3,980,610 |
| TradeStation Group, Inc. (a) | | 59,500 | | 708,645 |
| UBS AG (NY Shares) | | 15,000 | | 1,378,800 |
| | | | | 30,177,451 |
| Commercial Banks – 2.3% | | | | |
| Banco Bradesco SA (PN) sponsored ADR (non-vtg.) (a)(f) | | 23,000 | | 1,412,200 |
| Bank of America Corp. | | 224,914 | | 10,321,303 |
| Korea Exchange Bank (a) | | 130,000 | | 1,641,445 |
| UCBH Holdings, Inc. | | 68,600 | | 1,210,104 |
| Wachovia Corp. | | 112,884 | | 6,028,006 |
| Wells Fargo & Co. | | 40,800 | | 2,564,280 |
| | | | | 23,177,338 |
| Diversified Financial Services – 1.6% | | | | |
| CBOT Holdings, Inc. Class A | | 300 | | 29,025 |
| Citigroup, Inc. | | 145,000 | | 7,039,750 |
| IntercontinentalExchange, Inc. | | 1,400 | | 45,220 |
| JPMorgan Chase & Co. | | 231,904 | | 8,870,328 |
| | | | | 15,984,323 |
| Insurance – 5.6% | | | | |
| ACE Ltd. | | 117,200 | | 6,504,600 |
| American International Group, Inc. | | 375,500 | | 25,211,063 |
| Aspen Insurance Holdings Ltd. | | 25,000 | | 625,750 |
| Endurance Specialty Holdings Ltd. | | 18,000 | | 620,100 |
| Hartford Financial Services Group, Inc. | | 72,000 | | 6,290,640 |
| Hilb Rogal & Hobbs Co. | | 43,000 | | 1,676,140 |
| Montpelier Re Holdings Ltd. | | 20,000 | | 392,600 |
| Muenchener Rueckversicherungs Gesellschaft AG (Reg.) | | 6,500 | | 849,468 |
| PartnerRe Ltd. | | 56,000 | | 3,823,680 |
| Platinum Underwriters Holdings Ltd. | | 26,700 | | 813,282 |
| Scottish Re Group Ltd. | | 35,000 | | 883,050 |
| Swiss Reinsurance Co. (Reg.) | | 12,000 | | 886,185 |
| The Chubb Corp. | | 7,000 | | 677,880 |
| The St. Paul Travelers Companies, Inc. | | 32,800 | | 1,526,184 |
| W.R. Berkley Corp. | | 92,400 | | 4,307,688 |
| XL Capital Ltd. Class A | | 16,000 | | 1,062,080 |
| | | | | 56,150,390 |
See accompanying notes which are an integral part of the financial statements.
17 Annual Report
| Investments continued | | | | | | |
| |
| Common Stocks continued | | | | | | |
| | | Shares | | Value (Note 1) |
| |
| FINANCIALS – continued | | | | | | |
| Real Estate 12.1% | | | | | | |
| Apartment Investment & Management Co. Class A | | 30,900 | | $ | | 1,196,757 |
| AvalonBay Communities, Inc. | | 32,660 | | | | 2,986,757 |
| Boston Properties, Inc. | | 68,614 | | | | 5,160,459 |
| Capital Automotive (REIT) (SBI) | | 21,900 | | | | 845,997 |
| CarrAmerica Realty Corp. | | 49,680 | | | | 1,753,704 |
| CBL & Associates Properties, Inc. | | 39,840 | | | | 1,603,560 |
| Cedar Shopping Centers, Inc. | | 28,000 | | | | 385,000 |
| CenterPoint Properties Trust (SBI) | | 60,130 | | | | 2,747,340 |
| Columbia Equity Trust, Inc. | | 58,300 | | | | 844,767 |
| Correctional Properties Trust | | 39,100 | | | | 1,124,516 |
| Cousins Properties, Inc. | | 13,800 | | | | 384,192 |
| Duke Realty Corp. | | 120,460 | | | | 4,095,640 |
| Equity Lifestyle Properties, Inc. | | 58,360 | | | | 2,705,570 |
| Equity Office Properties Trust | | 201,710 | | | | 6,289,318 |
| Equity Residential (SBI) | | 172,580 | | | | 7,034,361 |
| Federal Realty Investment Trust (SBI) | | 18,020 | | | | 1,134,900 |
| General Growth Properties, Inc. | | 162,525 | | | | 7,414,391 |
| GMH Communities Trust | | 63,400 | | | | 955,438 |
| Healthcare Realty Trust, Inc. | | 29,300 | | | | 1,026,086 |
| Host Marriott Corp. | | 119,300 | | | | 2,135,470 |
| Inland Real Estate Corp. | | 96,640 | | | | 1,438,003 |
| Innkeepers USA Trust (SBI) | | 7,300 | | | | 127,312 |
| Kilroy Realty Corp. | | 19,520 | | | | 1,202,432 |
| Kimco Realty Corp. | | 156,780 | | | | 4,930,731 |
| MeriStar Hospitality Corp. (a) | | 134,700 | | | | 1,318,713 |
| National Health Investors, Inc. | | 18,900 | | | | 522,585 |
| National Health Realty, Inc. | | 12,600 | | | | 244,062 |
| Newcastle Investment Corp. | | 13,400 | | | | 363,542 |
| Pan Pacific Retail Properties, Inc. | | 42,310 | | | | 2,847,463 |
| Pennsylvania (REIT) (SBI) | | 15,200 | | | | 561,336 |
| Plum Creek Timber Co., Inc. | | 112,680 | | | | 4,390,013 |
| Post Properties, Inc. | | 17,300 | | | | 699,958 |
| ProLogis Trust | | 185,565 | | | | 8,417,228 |
| Public Storage, Inc. | | 32,640 | | | | 2,304,384 |
| Rayonier, Inc. | | 29,820 | | | | 1,185,047 |
| Reckson Associates Realty Corp. | | 109,160 | | | | 4,009,447 |
| Shurgard Storage Centers, Inc. Class A | | 8,500 | | | | 497,420 |
| Simon Property Group, Inc. | | 87,210 | | | | 6,742,205 |
| SL Green Realty Corp. | | 42,600 | | | | 3,146,010 |
| Sovran Self Storage, Inc. | | 31,200 | | | | 1,547,520 |
| Tanger Factory Outlet Centers, Inc. | | 57,500 | | | | 1,580,675 |
See accompanying notes which are an integral part of the financial statements.
| Common Stocks continued | | | | |
| | | Shares | | Value (Note 1) |
| |
| FINANCIALS – continued | | | | |
| Real Estate continued | | | | |
| Taubman Centers, Inc. | | 37,800 | | $ 1,323,756 |
| The Mills Corp. | | 20,200 | | 866,580 |
| Trizec Properties, Inc. | | 184,050 | | 4,137,444 |
| Trustreet Properties, Inc. | | 19,600 | | 306,544 |
| United Dominion Realty Trust, Inc. (SBI) | | 258,620 | | 5,790,502 |
| Ventas, Inc. | | 110,850 | | 3,495,101 |
| Vornado Realty Trust | | 48,150 | | 4,109,603 |
| | | | | 119,929,839 |
| Thrifts & Mortgage Finance – 0.9% | | | | |
| Doral Financial Corp. | | 87,000 | | 878,700 |
| Fannie Mae | | 79,400 | | 3,815,170 |
| Freddie Mac | | 26,900 | | 1,679,905 |
| Golden West Financial Corp., Delaware | | 16,800 | | 1,088,472 |
| Hudson City Bancorp, Inc. | | 39,000 | | 464,490 |
| Sovereign Bancorp, Inc. | | 40,300 | | 880,958 |
| W Holding Co., Inc. | | 24,480 | | 201,960 |
| | | | | 9,009,655 |
| |
| TOTAL FINANCIALS | | | | 254,428,996 |
| |
| HEALTH CARE – 6.7% | | | | |
| Biotechnology – 1.5% | | | | |
| Alkermes, Inc. (a) | | 9,000 | | 163,620 |
| Alnylam Pharmaceuticals, Inc. (a) | | 85,000 | | 1,067,600 |
| Amgen, Inc. (a) | | 17,000 | | 1,375,810 |
| Biogen Idec, Inc. (a) | | 30,000 | | 1,284,300 |
| BioMarin Pharmaceutical, Inc. (a) | | 95,000 | | 925,300 |
| Cephalon, Inc. (a) | | 104,000 | | 5,288,400 |
| Genentech, Inc. (a) | | 10,000 | | 956,200 |
| ImClone Systems, Inc. (a) | | 40,000 | | 1,296,400 |
| MedImmune, Inc. (a) | | 56,000 | | 2,010,960 |
| ONYX Pharmaceuticals, Inc. (a) | | 12,000 | | 302,760 |
| Serologicals Corp. (a) | | 18,000 | | 361,440 |
| | | | | 15,032,790 |
| Health Care Equipment & Supplies – 2.4% | | | | |
| Aspect Medical Systems, Inc. (a) | | 15,000 | | 565,050 |
| Baxter International, Inc. | | 225,600 | | 8,773,584 |
| C.R. Bard, Inc. | | 15,000 | | 973,050 |
| Cooper Companies, Inc. | | 8,000 | | 438,400 |
| Dionex Corp. (a) | | 10,000 | | 472,300 |
See accompanying notes which are an integral part of the financial statements.
19 Annual Report
| Investments continued | | | | | | |
| |
| Common Stocks continued | | | | | | |
| | | Shares | | Value (Note 1) |
| |
| HEALTH CARE – continued | | | | | | |
| Health Care Equipment & Supplies – continued | | | | | | |
| Inverness Medical Innovations, Inc. (a) | | 41,200 | | $ | | 988,800 |
| Medtronic, Inc. | | 49,100 | | | | 2,728,487 |
| PerkinElmer, Inc. | | 83,000 | | | | 1,893,230 |
| Syneron Medical Ltd. (a) | | 12,000 | | | | 477,600 |
| Thermo Electron Corp. (a) | | 92,400 | | | | 2,850,540 |
| Varian, Inc. (a) | | 15,000 | | | | 629,400 |
| Waters Corp. (a) | | 69,500 | | | | 2,726,485 |
| | | | | | | 23,516,926 |
| Health Care Providers & Services – 0.8% | | | | | | |
| Community Health Systems, Inc. (a) | | 20,000 | | | | 801,800 |
| IMS Health, Inc. | | 30,000 | | | | 733,500 |
| McKesson Corp. | | 17,000 | | | | 855,100 |
| Psychiatric Solutions, Inc. (a) | | 21,300 | | | | 1,201,746 |
| Sierra Health Services, Inc. (a) | | 14,700 | | | | 1,149,834 |
| UnitedHealth Group, Inc. | | 38,200 | | | | 2,286,652 |
| WebMD Health Corp. Class A | | 18,700 | | | | 495,363 |
| | | | | | | 7,523,995 |
| Pharmaceuticals – 2.0% | | | | | | |
| Allergan, Inc. | | 11,000 | | | | 1,100,000 |
| Merck & Co., Inc. | | 91,000 | | | | 2,675,400 |
| Pfizer, Inc. | | 303,000 | | | | 6,423,600 |
| Schering-Plough Corp. | | 128,600 | | | | 2,484,552 |
| Teva Pharmaceutical Industries Ltd. sponsored ADR | | 63,000 | | | | 2,575,440 |
| Wyeth | | 121,800 | | | | 5,062,008 |
| | | | | | | 20,321,000 |
| |
| TOTAL HEALTH CARE | | | | | | 66,394,711 |
| |
| INDUSTRIALS – 7.9% | | | | | | |
| Aerospace & Defense – 2.3% | | | | | | |
| Hexcel Corp. (a) | | 30,000 | | | | 498,900 |
| Honeywell International, Inc. | | 540,300 | | | | 19,742,562 |
| Raytheon Co. | | 18,900 | | | | 726,138 |
| United Technologies Corp. | | 39,000 | | | | 2,099,760 |
| | | | | | | 23,067,360 |
| Air Freight & Logistics – 0.2% | | | | | | |
| EGL, Inc. (a) | | 36,000 | | | | 1,337,040 |
| Expeditors International of Washington, Inc. | | 11,000 | | | | 781,110 |
| | | | | | | 2,118,150 |
See accompanying notes which are an integral part of the financial statements.
| Common Stocks continued | | | | | | |
| | | Shares | | Value (Note 1) |
| |
| INDUSTRIALS – continued | | | | | | |
| Airlines – 0.4% | | | | | | |
| ACE Aviation Holdings, Inc. Class A (a) | | 28,900 | | $ | | 955,364 |
| AirTran Holdings, Inc. (a) | | 74,000 | | | | 1,111,480 |
| JetBlue Airways Corp. (a) | | 50,000 | | | | 922,000 |
| Southwest Airlines Co. | | 45,100 | | | | 744,150 |
| US Airways Group, Inc. (a) | | 12,500 | | | | 419,875 |
| | | | | | | 4,152,869 |
| Building Products 0.2% | | | | | | |
| Lennox International, Inc. | | 37,000 | | | | 1,080,770 |
| Masco Corp. | | 17,100 | | | | 509,067 |
| | | | | | | 1,589,837 |
| Commercial Services & Supplies – 0.2% | | | | | | |
| Robert Half International, Inc. | | 60,200 | | | | 2,303,252 |
| Construction & Engineering – 0.8% | | | | | | |
| Chicago Bridge & Iron Co. NV (NY Shares) | | 30,000 | | | | 776,700 |
| Fluor Corp. | | 54,100 | | | | 4,008,810 |
| Foster Wheeler Ltd. (a) | | 17,000 | | | | 592,110 |
| Jacobs Engineering Group, Inc. (a) | | 32,000 | | | | 2,079,040 |
| | | | | | | 7,456,660 |
| Electrical Equipment – 0.2% | | | | | | |
| ABB Ltd. sponsored ADR (a) | | 25,000 | | | | 218,750 |
| Rockwell Automation, Inc. | | 30,000 | | | | 1,692,900 |
| | | | | | | 1,911,650 |
| Industrial Conglomerates – 2.6% | | | | | | |
| 3M Co. | | 9,500 | | | | 745,560 |
| General Electric Co. | | 514,200 | | | | 18,367,224 |
| Smiths Group PLC | | 81,000 | | | | 1,364,551 |
| Tyco International Ltd. | | 190,800 | | | | 5,441,616 |
| | | | | | | 25,918,951 |
| Machinery – 0.3% | | | | | | |
| Deere & Co. | | 22,000 | | | | 1,525,700 |
| ITT Industries, Inc. | | 7,000 | | | | 761,320 |
| Watts Water Technologies, Inc. Class A | | 17,000 | | | | 491,130 |
| | | | | | | 2,778,150 |
| Road & Rail 0.4% | | | | | | |
| Norfolk Southern Corp. | | 89,700 | | | | 3,968,328 |
See accompanying notes which are an integral part of the financial statements.
21 Annual Report
| Investments continued | | | | |
| |
| Common Stocks continued | | | | |
| | | Shares | | Value (Note 1) |
| |
| INDUSTRIALS – continued | | | | |
| Trading Companies & Distributors – 0.3% | | | | |
| Watsco, Inc. | | 22,000 | | $ 1,380,500 |
| WESCO International, Inc. (a) | | 37,000 | | 1,544,750 |
| | | | | 2,925,250 |
| |
| TOTAL INDUSTRIALS | | | | 78,190,457 |
| |
| INFORMATION TECHNOLOGY – 6.0% | | | | |
| Communications Equipment – 0.7% | | | | |
| Comverse Technology, Inc. (a) | | 76,000 | | 1,991,960 |
| Dycom Industries, Inc. (a) | | 55,000 | | 1,123,650 |
| Extreme Networks, Inc. (a) | | 75,000 | | 369,000 |
| MasTec, Inc. (a) | | 40,000 | | 394,800 |
| Motorola, Inc. | | 26,000 | | 626,340 |
| Nokia Corp. sponsored ADR | | 134,000 | | 2,288,720 |
| | | | | 6,794,470 |
| Computers & Peripherals – 1.0% | | | | |
| EMC Corp. (a) | | 30,000 | | 417,900 |
| Hewlett-Packard Co. | | 286,900 | | 8,512,323 |
| Lexmark International, Inc. Class A (a) | | 9,000 | | 428,580 |
| Seagate Technology | | 65,000 | | 1,229,800 |
| | | | | 10,588,603 |
| Electronic Equipment & Instruments – 1.1% | | | | |
| Agilent Technologies, Inc. (a) | | 135,100 | | 4,817,666 |
| Amphenol Corp. Class A | | 14,000 | | 584,780 |
| Avnet, Inc. (a) | | 5,000 | | 112,500 |
| Jabil Circuit, Inc. (a) | | 28,000 | | 927,360 |
| Symbol Technologies, Inc. | | 132,200 | | 1,511,046 |
| Trimble Navigation Ltd. (a) | | 35,000 | | 1,140,300 |
| Vishay Intertechnology, Inc. (a) | | 117,000 | | 1,501,110 |
| | | | | 10,594,762 |
| Internet Software & Services – 0.6% | | | | |
| Digital River, Inc. (a) | | 13,000 | | 336,960 |
| Google, Inc. Class A (sub. vtg.) (a) | | 9,100 | | 3,685,409 |
| Yahoo!, Inc. (a) | | 48,000 | | 1,931,040 |
| | | | | 5,953,409 |
| IT Services – 0.5% | | | | |
| Anteon International Corp. (a) | | 29,500 | | 1,264,665 |
See accompanying notes which are an integral part of the financial statements.
| Common Stocks continued | | | | |
| | | Shares | | Value (Note 1) |
| |
| INFORMATION TECHNOLOGY – continued | | | | |
| IT Services – continued | | | | |
| Ceridian Corp. (a) | | 67,000 | | $ 1,608,000 |
| First Data Corp. | | 45,000 | | 1,947,150 |
| | | | | 4,819,815 |
| Office Electronics – 0.1% | | | | |
| Xerox Corp. (a) | | 92,000 | | 1,306,400 |
| Semiconductors & Semiconductor Equipment – 1.0% | | | | |
| Altera Corp. (a) | | 30,000 | | 547,800 |
| Analog Devices, Inc. | | 32,000 | | 1,213,440 |
| Cabot Microelectronics Corp. (a)(f) | | 18,400 | | 569,112 |
| Freescale Semiconductor, Inc. Class A (a) | | 53,500 | | 1,377,625 |
| Intel Corp. | | 110,000 | | 2,934,800 |
| Maxim Integrated Products, Inc. | | 36,000 | | 1,315,800 |
| Micron Technology, Inc. (a) | | 64,000 | | 912,640 |
| PMC-Sierra, Inc. (a) | | 47,000 | | 369,890 |
| Saifun Semiconductors Ltd. | | 1,100 | | 31,790 |
| Samsung Electronics Co. Ltd. | | 1,480 | | 853,050 |
| | | | | 10,125,947 |
| Software 1.0% | | | | |
| BEA Systems, Inc. (a) | | 105,900 | | 928,743 |
| Cognos, Inc. (a) | | 11,000 | | 367,783 |
| Macrovision Corp. (a) | | 7,000 | | 108,780 |
| Microsoft Corp. | | 175,900 | | 4,874,189 |
| NAVTEQ Corp. (a) | | 35,000 | | 1,470,000 |
| Symantec Corp. (a) | | 105,000 | | 1,855,350 |
| Ulticom, Inc. (a) | | 40,000 | | 460,800 |
| | | | | 10,065,645 |
| |
| TOTAL INFORMATION TECHNOLOGY | | | | 60,249,051 |
| |
| MATERIALS 3.2% | | | | |
| Chemicals – 1.9% | | | | |
| Chemtura Corp. | | 30,000 | | 361,500 |
| E.I. du Pont de Nemours & Co. | | 157,600 | | 6,737,400 |
| Ecolab, Inc. | | 35,100 | | 1,167,777 |
| Georgia Gulf Corp. | | 28,000 | | 780,080 |
| Lyondell Chemical Co. | | 113,733 | | 2,892,230 |
| Monsanto Co. | | 7,000 | | 512,890 |
| Mosaic Co. (a) | | 38,000 | | 514,520 |
| NOVA Chemicals Corp. | | 47,000 | | 1,772,901 |
| Praxair, Inc. | | 40,000 | | 2,080,000 |
See accompanying notes which are an integral part of the financial statements.
23 Annual Report
| Investments continued | | | | | | |
| |
| Common Stocks continued | | | | | | |
| | | | | Shares | | Value (Note 1) |
| |
| MATERIALS – continued | | | | | | | | |
| Chemicals – continued | | | | | | | | |
| Rockwood Holdings, Inc. | | | | 45,000 | | $ | | 820,800 |
| Rohm & Haas Co. | | | | 17,000 | | | | 744,600 |
| | | | | | | | | 18,384,698 |
| Construction Materials 0.1% | | | | | | |
| Martin Marietta Materials, Inc. | | 16,000 | | | | 1,201,760 |
| Containers & Packaging – 0.5% | | | | | | |
| Crown Holdings, Inc. (a) | | | | 25,000 | | | | 463,500 |
| Owens Illinois, Inc. (a) | | | | 84,700 | | | | 1,842,225 |
| Packaging Corp. of America | | 60,400 | | | | 1,400,676 |
| Smurfit-Stone Container Corp. (a) | | 125,000 | | | | 1,583,750 |
| | | | | | | | | 5,290,151 |
| Metals & Mining – 0.7% | | | | | | | | |
| Alcoa, Inc. | | | | 45,700 | | | | 1,252,637 |
| Freeport-McMoRan Copper & Gold, Inc. Class B | | 25,000 | | | | 1,302,750 |
| Newmont Mining Corp. | | | | 94,800 | | | | 4,372,176 |
| | | | | | | | | 6,927,563 |
| |
| TOTAL MATERIALS | | | | | | | | 31,804,172 |
| |
| TELECOMMUNICATION SERVICES – 2.2% | | | | | | |
| Diversified Telecommunication Services – 0.9% | | | | | | |
| AT&T, Inc. | | | | 237,800 | | | | 5,923,598 |
| CenturyTel, Inc. | | | | 48,689 | | | | 1,611,606 |
| Covad Communications Group, Inc. (a) | | 676,200 | | | | 527,436 |
| Verizon Communications, Inc. | | 34,800 | | | | 1,112,904 |
| | | | | | | | | 9,175,544 |
| Wireless Telecommunication Services – 1.3% | | | | | | |
| American Tower Corp. Class A (a) | | 151,000 | | | | 4,120,790 |
| Leap Wireless International, Inc. (a) | | 16,000 | | | | 608,960 |
| Nextel Partners, Inc. Class A (a) | | 83,000 | | | | 2,199,500 |
| Sprint Nextel Corp. | | | | 235,885 | | | | 5,906,560 |
| | | | | | | | | 12,835,810 |
| |
| TOTAL TELECOMMUNICATION SERVICES | | | | | | 22,011,354 |
See accompanying notes which are an integral part of the financial statements.
| Common Stocks continued | | | | |
| | | Shares | | Value (Note 1) |
| |
| UTILITIES – 0.6% | | | | |
| Electric Utilities – 0.2% | | | | |
| PPL Corp. | | 50,600 | | $ 1,487,640 |
| Westar Energy, Inc. | | 20,000 | | 452,400 |
| | | | | 1,940,040 |
| Independent Power Producers & Energy Traders – 0.1% | | | | |
| AES Corp. (a) | | 55,600 | | 876,812 |
| TXU Corp. | | 5,460 | | 560,360 |
| | | | | 1,437,172 |
| Multi-Utilities – 0.3% | | | | |
| CMS Energy Corp. (a) | | 84,700 | | 1,184,106 |
| PG&E Corp. | | 35,200 | | 1,294,656 |
| | | | | 2,478,762 |
| |
| TOTAL UTILITIES | | | | 5,855,974 |
| |
| TOTAL COMMON STOCKS | | | | |
| (Cost $602,537,612) | | | | 692,578,052 |
| |
| Preferred Stocks 15.3% | | | | |
| |
| Convertible Preferred Stocks 6.0% | | | | |
| |
| CONSUMER DISCRETIONARY – 0.2% | | | | |
| Hotels, Restaurants & Leisure 0.2% | | | | |
| Six Flags, Inc. 7.25% PIERS | | 82,700 | | 1,889,695 |
| Media – 0.0% | | | | |
| Emmis Communications Corp. Series A, 6.25% | | 10,100 | | 463,716 |
| |
| TOTAL CONSUMER DISCRETIONARY | | | | 2,353,411 |
| |
| ENERGY 2.7% | | | | |
| Oil, Gas & Consumable Fuels – 2.7% | | | | |
| Chesapeake Energy Corp. 4.50% | | 15,000 | | 1,353,750 |
| El Paso Corp. 4.99% (g) | | 10,000 | | 10,328,900 |
| Teekay Shipping Corp. Series A, 7.25% | | 125,000 | | 6,011,250 |
| Valero Energy Corp. 2.00% | | 96,600 | | 9,207,912 |
| | | | | 26,901,812 |
| |
| FINANCIALS – 0.6% | | | | |
| Diversified Financial Services – 0.2% | | | | |
| Carriage Services Capital Trust 7.00% TIDES | | 45,000 | | 1,822,500 |
See accompanying notes which are an integral part of the financial statements.
25 Annual Report
| Investments continued | | | | |
| |
| Preferred Stocks continued | | | | |
| | | Shares | | Value (Note 1) |
| Convertible Preferred Stocks continued | | | | |
| |
| FINANCIALS – continued | | | | |
| Insurance – 0.4% | | | | |
| Fortis Insurance NV 7.75% (g) | | 3,734 | | $ 4,564,815 |
| |
| TOTAL FINANCIALS | | | | 6,387,315 |
| |
| INDUSTRIALS – 0.1% | | | | |
| Road & Rail 0.1% | | | | |
| Kansas City Southern 4.25% | | 1,370 | | 1,159,664 |
| MATERIALS 1.2% | | | | |
| Chemicals – 0.7% | | | | |
| Celanese Corp. 4.25% | | 252,600 | | 6,605,490 |
| Containers & Packaging – 0.4% | | | | |
| Owens Illinois, Inc. 4.75% | | 113,510 | | 4,143,115 |
| Metals & Mining – 0.1% | | | | |
| Freeport-McMoRan Copper & Gold, Inc. 5.50% (g) | | 1,050 | | 1,191,351 |
| |
| TOTAL MATERIALS | | | | 11,939,956 |
| |
| UTILITIES – 1.2% | | | | |
| Electric Utilities – 0.7% | | | | |
| AES Trust VII 6.00% | | 140,500 | | 6,673,750 |
| Independent Power Producers & Energy Traders – 0.5% | | | | |
| NRG Energy, Inc. 4.00% (g) | | 3,900 | | 4,812,620 |
| |
| TOTAL UTILITIES | | | | 11,486,370 |
| |
| TOTAL CONVERTIBLE PREFERRED STOCKS | | | | 60,228,528 |
| Nonconvertible Preferred Stocks 9.3% | | | | |
| |
| CONSUMER DISCRETIONARY – 0.1% | | | | |
| Household Durables – 0.1% | | | | |
| Hovnanian Enterprises, Inc. Series A, 7.625% | | 40,000 | | 930,000 |
| CONSUMER STAPLES 0.1% | | | | |
| Food Products 0.1% | | | | |
| H.J. Heinz Finance Co. 6.226% | | 10 | | 1,038,500 |
See accompanying notes which are an integral part of the financial statements.
| Preferred Stocks continued | | | | | | |
| | | Shares | | Value (Note 1) |
| Nonconvertible Preferred Stocks continued | | | | | | |
| |
| FINANCIALS – 6.1% | | | | | | |
| Capital Markets 1.3% | | | | | | |
| Bear Stearns Companies, Inc.: | | | | | | |
| Series E, 6.155% | | 15,000 | | $ | | 748,500 |
| Series G, 5.49% | | 15,000 | | | | 741,000 |
| Goldman Sachs Group, Inc.: | | | | | | |
| Series A, 3.9106% | | 120,000 | | | | 3,054,000 |
| Series C, 4.9931% | | 40,000 | | | | 1,020,000 |
| Lehman Brothers Holdings, Inc. (depositary shares) Series F, | | | | | | |
| 6.50% | | 169,015 | | | | 4,292,981 |
| Merrill Lynch & Co., Inc. Series H, 3.97% | | 120,000 | | | | 2,952,000 |
| | | | | | | 12,808,481 |
| Commercial Banks – 1.4% | | | | | | |
| ABN Amro Capital Funding Trust VII 6.08% | | 40,400 | | | | 965,156 |
| First Tennessee Bank NA, Memphis 3.90% (g) | | 5,000 | | | | 5,000,000 |
| HSBC USA, Inc.: | | | | | | |
| Series F, 3.87% | | 160,000 | | | | 4,048,000 |
| Series G, 4.9175% | | 80,000 | | | | 2,040,800 |
| Santander Finance Preferred SA Unipersonal 6.41% | | 69,400 | | | | 1,743,675 |
| | | | | | | 13,797,631 |
| Consumer Finance – 0.3% | | | | | | |
| SLM Corp.: | | | | | | |
| 4.07% | | 10,000 | | | | 1,010,000 |
| Series A, 6.97% | | 43,400 | | | | 2,317,560 |
| | | | | | | 3,327,560 |
| Diversified Financial Services – 0.2% | | | | | | |
| ABN AMRO Capital Funding Trust V 5.90% | | 20,000 | | | | 467,600 |
| CIT Group, Inc. Series B, 5.189% | | 15,000 | | | | 1,485,900 |
| JPMorgan Chase & Co. (depositary shares) Series H, 6.625% . | | 6,530 | | | | 332,377 |
| | | | | | | 2,285,877 |
| Insurance – 0.2% | | | | | | |
| AmerUs Group Co. 7.25% | | 40,000 | | | | 994,000 |
| MetLife, Inc. Series A, 4.39% | | 40,000 | | | | 1,029,600 |
| | | | | | | 2,023,600 |
| Real Estate 0.7% | | | | | | |
| Apartment Investment & Management Co.: | | | | | | |
| Series Q, 10.10% | | 46,510 | | | | 1,175,308 |
| Series V, 8.00% | | 79,000 | | | | 1,982,900 |
| Duke Realty Corp. (depositary shares) Series K, 6.50% | | 95,800 | | | | 2,268,544 |
See accompanying notes which are an integral part of the financial statements.
27 Annual Report
| Investments continued | | | | | | |
| |
| Preferred Stocks continued | | | | | | |
| | | Shares | | Value (Note 1) |
| Nonconvertible Preferred Stocks continued | | | | | | |
| |
| FINANCIALS – continued | | | | | | |
| Real Estate continued | | | | | | |
| Host Marriott Corp. Series E, 8.875% | | 20,000 | | $ | | 547,000 |
| Vornado Realty Trust Series E, 7.00% | | 40,000 | | | | 1,003,200 |
| | | | | | | 6,976,952 |
| Thrifts & Mortgage Finance – 2.0% | | | | | | |
| Fannie Mae: | | | | | | |
| 7.00% | | 42,200 | | | | 2,346,320 |
| Series H, 5.81% | | 49,200 | | | | 2,290,260 |
| Series L, 5.125% | | 90,900 | | | | 3,858,705 |
| Series N, 5.50% | | 71,650 | | | | 3,144,002 |
| Freddie Mac: | | | | | | |
| Series F, 5.00% | | 58,500 | | | | 2,433,600 |
| Series H, 5.10% | | 10,300 | | | | 432,600 |
| Series K, 5.79% | | 35,200 | | | | 1,687,840 |
| Series O, 5.81% | | 19,500 | | | | 965,250 |
| Series R, 5.70% | | 57,000 | | | | 2,716,050 |
| | | | | | | 19,874,627 |
| |
| TOTAL FINANCIALS | | | | | | 61,094,728 |
| |
| INDUSTRIALS – 0.1% | | | | | | |
| Aerospace & Defense – 0.1% | | | | | | |
| RC Trust I 7.00% | | 9,680 | | | | 488,235 |
| |
| MATERIALS 0.1% | | | | | | |
| Chemicals – 0.1% | | | | | | |
| E.I. du Pont de Nemours & Co. Series B, 4.50% | | 9,900 | | | | 841,500 |
| Metals & Mining – 0.0% | | | | | | |
| Alcoa, Inc. 3.75% | | 6,400 | | | | 468,480 |
| |
| TOTAL MATERIALS | | | | | | 1,309,980 |
| |
| UTILITIES – 2.8% | | | | | | |
| Electric Utilities – 2.4% | | | | | | |
| Alabama Power Co. 5.30% | | 88,600 | | | | 2,075,012 |
| Duquesne Light Co. 6.50% | | 106,050 | | | | 5,456,273 |
| FPL Group Capital Trust I 5.875% | | 20,000 | | �� | | 471,200 |
| Heco Capital Trust III 6.50% | | 12,000 | | | | 307,440 |
| Pacific Gas & Electric Co.: | | | | | | |
| Series A, 5.00% | | 16,900 | | | | 355,745 |
See accompanying notes which are an integral part of the financial statements.
| Preferred Stocks continued | | | | |
| | | Shares | | Value (Note 1) |
| Nonconvertible Preferred Stocks continued | | | | |
| |
| UTILITIES – continued | | | | |
| Electric Utilities – continued | | | | |
| Pacific Gas & Electric Co.: – continued | | | | |
| Series B, 5.50% | | 61,900 | | $ 1,420,605 |
| Series D 5.00% | | 69,200 | | 1,439,360 |
| Southern California Edison Co.: | | | | |
| 4.78% | | 46,500 | | 988,125 |
| 5.349% | | 40,000 | | 4,040,000 |
| 6.125% | | 30,000 | | 3,000,000 |
| Series B, 4.08% | | 27,271 | | 538,602 |
| Series C, 4.24% | | 94,600 | | 1,797,400 |
| Series D, 4.32% | | 70,000 | | 1,344,000 |
| | | | | 23,233,762 |
| Multi-Utilities – 0.4% | | | | |
| Consolidated Edison Co. of New York, Inc. Series A, 5.00% | | 28,705 | | 2,513,123 |
| San Diego Gas & Electric Co. 1.70% | | 67,548 | | 1,745,697 |
| | | | | 4,258,820 |
| |
| TOTAL UTILITIES | | | | 27,492,582 |
| |
| TOTAL NONCONVERTIBLE PREFERRED STOCKS | | | | 92,354,025 |
| |
| TOTAL PREFERRED STOCKS | | | | |
| (Cost $148,071,869) | | | | 152,582,553 |
See accompanying notes which are an integral part of the financial statements.
29 Annual Report
| Investments continued | | | | | | | | |
| |
| Money Market Funds 2.5% | | | | | | | | |
| | | | | Shares | | | | Value (Note 1) |
| Fidelity Cash Central Fund, 4.08% (b) | | | | 22,090,879 | | $ | | 22,090,879 |
| Fidelity Securities Lending Cash Central Fund, | | | | | | |
| 4.09% (b)(c) | | | | 2,434,150 | | | | 2,434,150 |
| TOTAL MONEY MARKET FUNDS | | | | | | | | |
| (Cost $24,525,029) | | | | | | | | 24,525,029 |
| TOTAL INVESTMENT PORTFOLIO 100.0% | | | | | | |
| (Cost $897,074,394) | | | | | | | | 995,745,167 |
| |
| NET OTHER ASSETS – 0.0% | | | | | | | | 428,432 |
| NET ASSETS 100% | | | | | | $ | | 996,173,599 |
| Security Type Abbreviations |
| PIERS | | — | | Preferred Income Equity |
| | | | | Redeemable Securities |
| TIDES | | — | | Term Income Deferred Equity |
| | | | | Securities |
Legend
(a) Non-income producing
(b) Affiliated fund that is available only to
investment companies and other
accounts managed by Fidelity
Investments. The rate quoted is the
annualized seven-day yield of the fund
at period end. A complete unaudited
listing of the fund’s holdings as of its
most recent quarter end is available
upon request.
(c) Investment made with cash collateral
received from securities on loan.
|
(d) Non-income producing – Issuer is in
default.
(e) Debt obligation initially issued at one
coupon which converts to a higher
coupon at a specified date. The rate
shown is the rate at period end.
(f) Security or a portion of the security is on
loan at period end.
(g) Security exempt from registration under
Rule 144A of the Securities Act of 1933.
These securities may be resold in
transactions exempt from registration,
normally to qualified institutional buyers.
At the period end, the value of these
securities amounted to $38,529,622 or
3.9% of net assets.
(h) The coupon rate shown on floating or
adjustable rate securities represents the
rate at period end.
|
Affiliated Central Funds
Information regarding income received by the fund from the affiliated Central funds during the period is as follows:
| Fund | | | | Income received |
| Fidelity Cash Central Fund | | | $ | 597,880 |
| Fidelity Securities Lending Cash Central Fund | | | | 41,671 |
| Total | | | $ | 639,551 |
See accompanying notes which are an integral part of the financial statements.
Annual Report 30
Other Information
The composition of credit quality ratings as a percentage of net assets is as follows (ratings are unaudited):
| AAA, AA, A | | 1.7% |
| BBB | | 1.2% |
| BB | | 2.2% |
| B | | 2.7% |
| CCC, CC, C | | 2.1% |
| D | | 0.2% |
| Not Rated | | 2.6% |
| Equities | | 84.8% |
| Short Term Investments and Net | | |
| Other Assets | | 2.5% |
| | | 100.0% |
We have used ratings from Moody’s® Investors Services, Inc. Where Moody’s ratings are not available, we have used S&P® ratings. Percentages are adjusted for the effect of futures contracts, if applicable.
See accompanying notes which are an integral part of the financial statements.
31 Annual Report
| Financial Statements | | | | | | | | |
| |
| |
| Statement of Assets and Liabilities | | | | | | | | |
| | | | | | | November 30, 2005 |
| |
| Assets | | | | | | | | |
| Investment in securities, at value (including securities | | | | | | | | |
| loaned of $2,392,488) See accompanying | | | | | | | | |
| schedule: | | | | | | | | |
| Unaffiliated issuers (cost $872,549,365) | | $ | | 971,220,138 | | | | |
| Affiliated Central Funds (cost $24,525,029) | | | | 24,525,029 | | | | |
| Total Investments (cost $897,074,394) | | | | | | $ | | 995,745,167 |
| Cash | | | | | | | | 68,659 |
| Receivable for investments sold | | | | | | | | 6,337,511 |
| Receivable for fund shares sold | | | | | | | | 1,953,755 |
| Dividends receivable | | | | | | | | 1,526,164 |
| Interest receivable | | | | | | | | 935,785 |
| Prepaid expenses | | | | | | | | 4,886 |
| Receivable from investment adviser for expense | | | | | | | | |
| reductions | | | | | | | | 9 |
| Other receivables | | | | | | | | 49,770 |
| Total assets | | | | | | | | 1,006,621,706 |
| |
| Liabilities | | | | | | | | |
| Payable for investments purchased | | $ | | 6,206,782 | | | | |
| Payable for fund shares redeemed | | | | 1,036,991 | | | | |
| Accrued management fee | | | | 462,756 | | | | |
| Distribution fees payable | | | | 96,374 | | | | |
| Other affiliated payables | | | | 181,958 | | | | |
| Other payables and accrued expenses | | | | 29,096 | | | | |
| Collateral on securities loaned, at value | | | | 2,434,150 | | | | |
| Total liabilities | | | | | | | | 10,448,107 |
| |
| Net Assets | | | | | | $ | | 996,173,599 |
| Net Assets consist of: | | | | | | | | |
| Paid in capital | | | | | | $ | | 884,247,267 |
| Undistributed net investment income | | | | | | | | 3,125,667 |
| Accumulated undistributed net realized gain (loss) on | | | | | | | | |
| investments and foreign currency transactions | | | | | | | | 10,129,892 |
| Net unrealized appreciation (depreciation) on | | | | | | | | |
| investments | | | | | | | | 98,670,773 |
| Net Assets | | | | | | $ | | 996,173,599 |
See accompanying notes which are an integral part of the financial statements.
| Statement of Assets and Liabilities continued | | | | |
| | | November 30, 2005 |
| |
| Calculation of Maximum Offering Price | | | | |
| Class A: | | | | |
| Net Asset Value and redemption price per share | | | | |
| ($38,885,723 ÷ 3,191,319 shares) | | $ | | 12.18 |
| |
| Maximum offering price per share (100/94.25 of $12.18) | | $ | | 12.92 |
| Class T: | | | | |
| Net Asset Value and redemption price per share | | | | |
| ($79,920,243 ÷ 6,567,201 shares) | | $ | | 12.17 |
| |
| Maximum offering price per share (100/96.50 of $12.17) | | $ | | 12.61 |
| Class B: | | | | |
| Net Asset Value and offering price per share | | | | |
| ($19,743,710 ÷ 1,625,798 shares)A | | $ | | 12.14 |
| |
| Class C: | | | | |
| Net Asset Value and offering price per share | | | | |
| ($49,712,764 ÷ 4,091,976 shares)A | | $ | | 12.15 |
| |
| Strategic Dividend & Income: | | | | |
| Net Asset Value, offering price and redemption price per | | | | |
| share ($798,113,368 ÷ 65,333,621 shares) | | $ | | 12.22 |
| |
| Institutional Class: | | | | |
| Net Asset Value, offering price and redemption price per | | | | |
| share ($9,797,791 ÷ 802,532 shares) | | $ | | 12.21 |
| |
| A Redemption price per share is equal to net asset value less any applicable contingent deferred sales charge. | | | | |
See accompanying notes which are an integral part of the financial statements.
33 Annual Report
| Financial Statements continued | | | | |
| |
| Statement of Operations | | | | | | |
| | | | | Year ended November 30, 2005 |
| |
| Investment Income | | | | | | |
| Dividends | | | | | | $ 18,836,322 |
| Interest | | | | | | 3,135,959 |
| Income from affiliated Central Funds | | | | | | 639,551 |
| Total income | | | | | | 22,611,832 |
| |
| Expenses | | | | | | |
| Management fee | | $ | | 4,715,492 | | |
| Transfer agent fees | | | | 1,633,903 | | |
| Distribution fees | | | | 948,528 | | |
| Accounting and security lending fees | | | | 301,582 | | |
| Independent trustees’ compensation | | | | 3,582 | | |
| Custodian fees and expenses | | | | 34,296 | | |
| Registration fees | | | | 129,298 | | |
| Audit | | | | 37,554 | | |
| Legal | | | | 3,378 | | |
| Miscellaneous | | | | 29,118 | | |
| Total expenses before reductions | | | | 7,836,731 | | |
| Expense reductions | | | | (214,848) | | 7,621,883 |
| |
| Net investment income (loss) | | | | | | 14,989,949 |
| Realized and Unrealized Gain (Loss) | | | | |
| Net realized gain (loss) on: | | | | | | |
| Investment securities: | | | | | | |
| Unaffiliated issuers | | | | 18,346,538 | | |
| Foreign currency transactions | | | | 1,294 | | |
| Futures contracts | | | | 364,449 | | |
| Total net realized gain (loss) | | | | | | 18,712,281 |
| Change in net unrealized appreciation (depreciation) on: | | | | |
| Investment securities | | | | 59,851,577 | | |
| Futures contracts | | | | (290,281) | | |
| Total change in net unrealized appreciation | | | | |
| (depreciation) | | | | | | 59,561,296 |
| Net gain (loss) | | | | | | 78,273,577 |
| Net increase (decrease) in net assets resulting from | | | | |
| operations | | | | | | $ 93,263,526 |
See accompanying notes which are an integral part of the financial statements.
| Statement of Changes in Net Assets | | | | | | | | |
| | | | | | | For the period |
| | | | | | | December 23, 2003 |
| | | | | Year ended | | (commencement |
| | | | | November 30, | | of operations) to |
| | | | | 2005 | | November 30, 2004 |
| Increase (Decrease) in Net Assets | | | | | | | | |
| Operations | | | | | | | | |
| Net investment income (loss) | | $ | | 14,989,949 | | $ | | 6,636,433 |
| Net realized gain (loss) | | | | 18,712,281 | | | | (8,238,032) |
| Change in net unrealized appreciation (depreciation) | | | | 59,561,296 | | | | 39,109,477 |
| Net increase (decrease) in net assets resulting | | | | | | | | |
| from operations | | | | 93,263,526 | | | | 37,507,878 |
| Distributions to shareholders from net investment income | | | | (14,194,615) | | | | (4,647,719) |
| Share transactions - net increase (decrease) | | | | 335,336,361 | | | | 548,908,168 |
| Total increase (decrease) in net assets | | | | 414,405,272 | | | | 581,768,327 |
| |
| Net Assets | | | | | | | | |
| Beginning of period | | | | 581,768,327 | | | | — |
| End of period (including undistributed net investment | | | | | | | | |
| income of $3,125,667 and undistributed net in- | | | | | | | | |
| vestment income of $2,463,649, respectively) | | $ | | 996,173,599 | | $ | | 581,768,327 |
See accompanying notes which are an integral part of the financial statements.
35 Annual Report
| Financial Highlights Class A | | | | | | | | |
| |
| Years ended November 30, | | | | 2005 | | | | 2004F |
| Selected Per Share Data | | | | | | | | |
| Net asset value, beginning of period | | | | $ 11.09 | | | | $ 10.00 |
| Income from Investment Operations | | | | | | | | |
| Net investment income (loss)E | | | | 18 | | | | .16 |
| Net realized and unrealized gain (loss) | | | | 1.10 | | | | 1.04 |
| Total from investment operations | | | | 1.28 | | | | 1.20 |
| Distributions from net investment income | | | | (.19) | | | | (.11) |
| Net asset value, end of period | | | | $ 12.18 | | | | $ 11.09 |
| Total ReturnB,C,D | | | | 11.63% | | | | 12.01% |
| Ratios to Average Net AssetsG | | | | | | | | |
| Expenses before reductions | | | | 1.16% | | | | 1.20%A |
| Expenses net of fee waivers, if any | | | | 1.16% | | | | 1.20%A |
| Expenses net of all reductions | | | | 1.13% | | | | 1.17%A |
| Net investment income (loss) | | | | 1.60% | | | | 1.67%A |
| Supplemental Data | | | | | | | | |
| Net assets, end of period (000 omitted) | | $38,886 | | $21,985 |
| Portfolio turnover rate | | | | 64% | | | | 66%A |
A Annualized
B Total returns for periods of less than one year are not annualized.
C Total returns would have been lower had certain expenses not been reduced during the periods shown.
D Total returns do not include the effect of the sales charges.
E Calculated based on average shares outstanding during the period.
F For the period December 23, 2003 (commencement of operations) to November 30, 2004.
G Expense ratios reflect operating expenses of the class. Expenses before reductions do not reflect amounts reimbursed by the investment adviser or
reductions from brokerage service arrangements or other expense offset arrangements and do not represent the amount paid by the class during
periods when reimbursements or reductions occur. Expense ratios before reductions for start up periods may not be representative of longer term
operating periods. Expenses net of fee waivers reflect expenses after reimbursement by the investment adviser but prior to reductions from
brokerage service arrangements or other expense offset arrangements. Expenses net of all reductions represent the net expenses paid by the
class.
|
See accompanying notes which are an integral part of the financial statements.
| Financial Highlights Class T | | | | | | | | |
| |
| Years ended November 30, | | | | 2005 | | | | 2004F |
| Selected Per Share Data | | | | | | | | |
| Net asset value, beginning of period | | | | $ 11.08 | | | | $ 10.00 |
| Income from Investment Operations | | | | | | | | |
| Net investment income (loss)E | | | | 16 | | | | .13 |
| Net realized and unrealized gain (loss) | | | | 1.09 | | | | 1.04 |
| Total from investment operations | | | | 1.25 | | | | 1.17 |
| Distributions from net investment income | | | | (.16) | | | | (.09) |
| Net asset value, end of period | | | | $ 12.17 | | | | $ 11.08 |
| Total ReturnB,C,D | | | | 11.43% | | | | 11.75% |
| Ratios to Average Net AssetsG | | | | | | | | |
| Expenses before reductions | | | | 1.38% | | | | 1.45%A |
| Expenses net of fee waivers, if any | | | | 1.38% | | | | 1.45%A |
| Expenses net of all reductions | | | | 1.35% | | | | 1.42%A |
| Net investment income (loss) | | | | 1.38% | | | | 1.43%A |
| Supplemental Data | | | | | | | | |
| Net assets, end of period (000 omitted) | | $79,920 | | $36,526 |
| Portfolio turnover rate | | | | 64% | | | | 66%A |
A Annualized
B Total returns for periods of less than one year are not annualized.
C Total returns would have been lower had certain expenses not been reduced during the periods shown.
D Total returns do not include the effect of the sales charges.
E Calculated based on average shares outstanding during the period.
F For the period December 23, 2003 (commencement of operations) to November 30, 2004.
G Expense ratios reflect operating expenses of the class. Expenses before reductions do not reflect amounts reimbursed by the investment adviser or
reductions from brokerage service arrangements or other expense offset arrangements and do not represent the amount paid by the class during
periods when reimbursements or reductions occur. Expense ratios before reductions for start up periods may not be representative of longer term
operating periods. Expenses net of fee waivers reflect expenses after reimbursement by the investment adviser but prior to reductions from
brokerage service arrangements or other expense offset arrangements. Expenses net of all reductions represent the net expenses paid by the
class.
|
See accompanying notes which are an integral part of the financial statements.
37 Annual Report
| Financial Highlights Class B | | | | | | | | |
| |
| Years ended November 30, | | | | 2005 | | | | 2004F |
| Selected Per Share Data | | | | | | | | |
| Net asset value, beginning of period | | | | $ 11.06 | | | | $ 10.00 |
| Income from Investment Operations | | | | | | | | |
| Net investment income (loss)E | | | | 09 | | | | .09 |
| Net realized and unrealized gain (loss) | | | | 1.09 | | | | 1.03 |
| Total from investment operations | | | | 1.18 | | | | 1.12 |
| Distributions from net investment income | | | | (.10) | | | | (.06) |
| Net asset value, end of period | | | | $ 12.14 | | | | $ 11.06 |
| Total ReturnB,C,D | | | | 10.73% | | | | 11.24% |
| Ratios to Average Net AssetsG | | | | | | | | |
| Expenses before reductions | | | | 1.96% | | | | 1.99%A |
| Expenses net of fee waivers, if any | | | | 1.95% | | | | 1.95%A |
| Expenses net of all reductions | | | | 1.93% | | | | 1.92%A |
| Net investment income (loss) | | | | 81% | | | | .92%A |
| Supplemental Data | | | | | | | | |
| Net assets, end of period (000 omitted) | | $19,744 | | $13,457 |
| Portfolio turnover rate | | | | 64% | | | | 66%A |
A Annualized
B Total returns for periods of less than one year are not annualized.
C Total returns would have been lower had certain expenses not been reduced during the periods shown.
D Total returns do not include the effect of the contingent deferred sales charge.
E Calculated based on average shares outstanding during the period.
F For the period December 23, 2003 (commencement of operations) to November 30, 2004.
G Expense ratios reflect operating expenses of the class. Expenses before reductions do not reflect amounts reimbursed by the investment adviser or
reductions from brokerage service arrangements or other expense offset arrangements and do not represent the amount paid by the class during
periods when reimbursements or reductions occur. Expense ratios before reductions for start up periods may not be representative of longer term
operating periods. Expenses net of fee waivers reflect expenses after reimbursement by the investment adviser but prior to reductions from
brokerage service arrangements or other expense offset arrangements. Expenses net of all reductions represent the net expenses paid by the
class.
|
See accompanying notes which are an integral part of the financial statements.
| Financial Highlights Class C | | | | | | | | |
| |
| Years ended November 30, | | | | 2005 | | | | 2004F |
| Selected Per Share Data | | | | | | | | |
| Net asset value, beginning of period | | | | $ 11.06 | | | | $ 10.00 |
| Income from Investment Operations | | | | | | | | |
| Net investment income (loss)E | | | | 10 | | | | .09 |
| Net realized and unrealized gain (loss) | | | | 1.09 | | | | 1.03 |
| Total from investment operations | | | | 1.19 | | | | 1.12 |
| Distributions from net investment income | | | | (.10) | | | | (.06) |
| Net asset value, end of period | | | | $ 12.15 | | | | $ 11.06 |
| Total ReturnB,C,D | | | | 10.85% | | | | 11.24% |
| Ratios to Average Net AssetsG | | | | | | | | |
| Expenses before reductions | | | | 1.90% | | | | 1.94%A |
| Expenses net of fee waivers, if any | | | | 1.90% | | | | 1.94%A |
| Expenses net of all reductions | | | | 1.87% | | | | 1.92%A |
| Net investment income (loss) | | | | 86% | | | | .93%A |
| Supplemental Data | | | | | | | | |
| Net assets, end of period (000 omitted) | | $49,713 | | $28,795 |
| Portfolio turnover rate | | | | 64% | | | | 66%A |
A Annualized
B Total returns for periods of less than one year are not annualized.
C Total returns would have been lower had certain expenses not been reduced during the periods shown.
D Total returns do not include the effect of the contingent deferred sales charge.
E Calculated based on average shares outstanding during the period.
F For the period December 23, 2003 (commencement of operations) to November 30, 2004.
G Expense ratios reflect operating expenses of the class. Expenses before reductions do not reflect amounts reimbursed by the investment adviser or
reductions from brokerage service arrangements or other expense offset arrangements and do not represent the amount paid by the class during
periods when reimbursements or reductions occur. Expense ratios before reductions for start up periods may not be representative of longer term
operating periods. Expenses net of fee waivers reflect expenses after reimbursement by the investment adviser but prior to reductions from
brokerage service arrangements or other expense offset arrangements. Expenses net of all reductions represent the net expenses paid by the
class.
|
See accompanying notes which are an integral part of the financial statements.
39 Annual Report
| Financial Highlights Strategic Dividend & Income | | | | |
| |
| Years ended November 30, | | | | 2005 | | | | 2004E |
| Selected Per Share Data | | | | | | | | |
| Net asset value, beginning of period | | | | $ 11.11 | | | | $ 10.00 |
| Income from Investment Operations | | | | | | | | |
| Net investment income (loss)D | | | | 22 | | | | .19 |
| Net realized and unrealized gain (loss) | | | | 1.11 | | | | 1.04 |
| Total from investment operations | | | | 1.33 | | | | 1.23 |
| Distributions from net investment income | | | | (.22) | | | | (.12) |
| Net asset value, end of period | | | | $ 12.22 | | | | $ 11.11 |
| Total ReturnB,C | | | | 12.08% | | | | 12.32% |
| Ratios to Average Net AssetsF | | | | | | | | |
| Expenses before reductions | | | | 82% | | | | .90%A |
| Expenses net of fee waivers, if any | | | | 82% | | | | .90%A |
| Expenses net of all reductions | | | | 79% | | | | .87%A |
| Net investment income (loss) | | | | 1.94% | | | | 1.98%A |
| Supplemental Data | | | | | | | | |
| Net assets, end of period (000 omitted) | | $798,113 | | $476,032 |
| Portfolio turnover rate | | | | 64% | | | | 66%A |
A Annualized
B Total returns for periods of less than one year are not annualized.
C Total returns would have been lower had certain expenses not been reduced during the periods shown.
D Calculated based on average shares outstanding during the period.
E For the period December 23, 2003 (commencement of operations) to November 30, 2004.
F Expense ratios reflect operating expenses of the class. Expenses before reductions do not reflect amounts reimbursed by the investment adviser or
reductions from brokerage service arrangements or other expense offset arrangements and do not represent the amount paid by the class during
periods when reimbursements or reductions occur. Expense ratios before reductions for start up periods may not be representative of longer term
operating periods. Expenses net of fee waivers reflect expenses after reimbursement by the investment adviser but prior to reductions from
brokerage service arrangements or other expense offset arrangements. Expenses net of all reductions represent the net expenses paid by the
class.
|
See accompanying notes which are an integral part of the financial statements.
| Financial Highlights Institutional Class | | | | | | | | |
| |
| Years ended November 30, | | | | 2005 | | | | 2004E |
| Selected Per Share Data | | | | | | | | |
| Net asset value, beginning of period | | | | $ 11.11 | | | | $ 10.00 |
| Income from Investment Operations | | | | | | | | |
| Net investment income (loss)D | | | | 22 | | | | .19 |
| Net realized and unrealized gain (loss) | | | | 1.10 | | | | 1.04 |
| Total from investment operations | | | | 1.32 | | | | 1.23 |
| Distributions from net investment income | | | | (.22) | | | | (.12) |
| Net asset value, end of period | | | | $ 12.21 | | | | $ 11.11 |
| Total ReturnB,C | | | | 11.98% | | | | 12.38% |
| Ratios to Average Net AssetsF | | | | | | | | |
| Expenses before reductions | | | | 83% | | | | .88%A |
| Expenses net of fee waivers, if any | | | | 83% | | | | .88%A |
| Expenses net of all reductions | | | | 81% | | | | .85%A |
| Net investment income (loss) | | | | 1.93% | | | | 2.00%A |
| Supplemental Data | | | | | | | | |
| Net assets, end of period (000 omitted) | | | | $ 9,798 | | | | $ 4,973 |
| Portfolio turnover rate | | | | 64% | | | | 66%A |
A Annualized
B Total returns for periods of less than one year are not annualized.
C Total returns would have been lower had certain expenses not been reduced during the periods shown.
D Calculated based on average shares outstanding during the period.
E For the period December 23, 2003 (commencement of operations) to November 30, 2004.
F Expense ratios reflect operating expenses of the class. Expenses before reductions do not reflect amounts reimbursed by the investment adviser or
reductions from brokerage service arrangements or other expense offset arrangements and do not represent the amount paid by the class during
periods when reimbursements or reductions occur. Expense ratios before reductions for start up periods may not be representative of longer term
operating periods. Expenses net of fee waivers reflect expenses after reimbursement by the investment adviser but prior to reductions from
brokerage service arrangements or other expense offset arrangements. Expenses net of all reductions represent the net expenses paid by the
class.
|
See accompanying notes which are an integral part of the financial statements.
41 Annual Report
Notes to Financial Statements
For the period ended November 30, 2005
1. Significant Accounting Policies.
Fidelity Strategic Dividend & Income Fund (the fund) is a non diversified fund of Fidelity Financial Trust (the trust) and is authorized to issue an unlimited number of shares. The trust is registered under the Investment Company Act of 1940, as amended (the 1940 Act), as an open end management investment company organized as a Massa chusetts business trust.
The fund offers Class A, Class T, Class B, Class C, Strategic Dividend & Income, and Institutional Class shares, each of which has equal rights as to assets and voting privi leges. Each class has exclusive voting rights with respect to matters that affect that class. Class B shares will automatically convert to Class A shares after a holding period of seven years from the initial date of purchase. Investment income, realized and unrealized capital gains and losses, the common expenses of the fund, and certain fund level expense reductions, if any, are allocated on a pro rata basis to each class based on the relative net assets of each class to the total net assets of the fund. Each class differs with respect to transfer agent and distribution and service plan fees incurred. Certain ex pense reductions also differ by class.
The fund may invest in affiliated money market central funds (Money Market Central Funds) which are open end investment companies available to investment companies and other accounts managed by Fidelity Management & Research Company (FMR) and its affiliates. The financial statements have been prepared in conformity with accounting principles generally accepted in the United States of America, which require manage ment to make certain estimates and assumptions at the date of the financial statements. The following summarizes the significant accounting policies of the fund:
Security Valuation. Investments are valued and net asset value (NAV) per share is calculated (NAV calculation) as of the close of business of the New York Stock Exchange (NYSE), normally 4:00 p.m. Eastern time. Wherever possible, the fund uses independent pricing services approved by the Board of Trustees to value its investments.
Equity securities, including restricted securities, for which market quotations are readily available, are valued at the last reported sale price or official closing price as reported by an independent pricing service on the primary market or exchange on which they are traded. In the event there were no sales during the day or closing prices are not available, securities are valued at the last quoted bid price. Debt securities, including restricted securities, for which quotations are readily available, are valued by independent pricing services or by dealers who make markets in such securities. Pricing services consider yield or price of bonds of comparable quality, coupon, maturity and type as well as dealer supplied prices. Investments in open end mutual funds, are valued at their closing net asset value each business day. Short term securities with remaining maturities of sixty days or less for which quotations are not readily available are valued at amortized cost, which approximates value.
1. Significant Accounting Policies continued
|
| Security Valuation continued | | |
When current market prices or quotations are not readily available or do not accurately reflect fair value, valuations may be determined in accordance with procedures adopted by the Board of Trustees. For example, when developments occur between the close of a market and the close of the NYSE that may materially affect the value of some or all of the securities, or when trading in a security is halted, those securities may be fair valued. Factors used in the determination of fair value may include monitoring news to identify significant market or security specific events such as changes in the value of U.S. securi ties market, reviewing developments in foreign markets and evaluating the performance of ADRs, futures contracts and exchange traded funds. Because the fund’s utilization of fair value pricing depends on market activity, the frequency with which fair value pricing is used can not be predicted and may be utilized to a significant extent. The value of securities used for NAV calculation under fair value pricing may differ from published prices for the same securities.
Foreign Currency. The fund uses foreign currency contracts to facilitate transactions in foreign denominated securities. Losses from these transactions may arise from changes in the value of the foreign currency or if the counterparties do not perform under the contracts’ terms.
Foreign denominated assets, including investment securities, and liabilities are trans lated into U.S. dollars at the exchange rate at period end. Purchases and sales of invest ment securities, income and dividends received and expenses denominated in foreign currencies are translated into U.S. dollars at the exchange rate in effect on the transac tion date.
The effects of exchange rate fluctuations on investments are included with the net realized and unrealized gain (loss) on investment securities. Other foreign currency transactions resulting in realized and unrealized gain (loss) are disclosed separately.
Investment Transactions and Income. Security transactions are accounted for as of trade date. Gains and losses on securities sold are determined on the basis of identified cost. Dividend income is recorded on the ex dividend date, except for certain dividends from foreign securities where the ex dividend date may have passed, which are recorded as soon as the fund is informed of the ex dividend date. Non cash dividends included in dividend income, if any, are recorded at the fair market value of the securities received. Distributions received on securities that represent a return of capital or capital gain are recorded as a reduction of cost of investments and/or as a realized gain. The fund esti mates the components of distributions received that may be considered return of capital distributions or capital gain distributions. Interest income is accrued as earned. Interest
43 Annual Report
Notes to Financial Statements continued
1. Significant Accounting Policies continued
Investment Transactions and Income continued
income includes coupon interest and amortization of premium and accretion of discount on debt securities. Investment income is recorded net of foreign taxes withheld where recovery of such taxes is uncertain. Debt obligations may be placed on a non accrual status and related interest income may be reduced by ceasing current accruals and writing off interest receivables when the collection of all or a portion of interest has become doubtful based on consistently applied procedures. A debt obligation is removed from non accrual status when the issuer resumes interest payments or when collect ibility of interest is reasonably assured.
Expenses. Most expenses of the trust can be directly attributed to a fund. Expenses which cannot be directly attributed are apportioned among each fund in the trust.
Income Tax Information and Distributions to Shareholders. Each year, the fund intends to qualify as a regulated investment company by distributing all of its taxable income and realized gains under Subchapter M of the Internal Revenue Code. As a result, no provision for income taxes is required in the accompanying financial statements. Foreign taxes are provided for based on the fund’s understanding of the tax rules and rates that exist in the foreign markets in which it invests.
Distributions are recorded on the ex dividend date. Income dividends and capital gain distributions are declared separately for each class. Income and capital gain distribu tions are determined in accordance with income tax regulations, which may differ from generally accepted accounting principles. In addition, the fund will claim a portion of the payment made to redeeming shareholders as a distribution for income tax purposes.
Capital accounts within the financial statements are adjusted for permanent book tax differences. These adjustments have no impact on net assets or the results of operations. Temporary book tax differences will reverse in a subsequent period.
Book tax differences are primarily due to futures transactions, foreign currency transac tions, market discount, passive foreign investment companies (PFIC), capital loss carryforwards and losses deferred due to wash sales.
1. Significant Accounting Policies continued
| | |
| Income Tax Information and Distributions to Shareholders continued |
The tax basis components of distributable earnings and the federal tax cost as of period end were as follows:
| Unrealized appreciation | | $ | | 117,727,083 | | | | |
| Unrealized depreciation | | | | (20,680,574) | | | | |
| Net unrealized appreciation (depreciation) | | | | 97,046,509 | | | | |
| Undistributed ordinary income | | | | 2,727,387 | | | | |
| Undistributed long term capital gain | | | | 10,623,955 | | | | |
| |
| Cost for federal income tax purposes | | $ | | 898,698,658 | | | | |
| |
The tax character of distributions paid was as follows:
| | | | |
| | | | | November 30, 2005 | | | | November 30, 2004 |
| Ordinary Income | | $ | | 14,194,615 | | $ | | 4,647,719 |
| |
| |
| 2. Operating Policies. | | | | | | | | |
Repurchase Agreements. FMR has received an Exemptive Order from the Securities and Exchange Commission (the SEC) which permits the fund and other affiliated entities of FMR to transfer uninvested cash balances into joint trading accounts which are then invested in repurchase agreements. The fund may also invest directly with institutions in repurchase agreements. Repurchase agreements are collateralized by government or non government securities. Collateral is held in segregated accounts with custodian banks and may be obtained in the event of a default of the counterparty. The fund monitors, on a daily basis, the value of the collateral to ensure it is at least equal to the principal amount of the repurchase agreement (including accrued interest). In the event of a default by the counterparty, realization of the collateral proceeds could be delayed, during which time the value of the collateral may decline.
Futures Contracts. The fund may use futures contracts to manage its exposure to the stock market. Buying futures tends to increase a fund’s exposure to the underlying instrument, while selling futures tends to decrease a fund’s exposure to the underlying instrument or hedge other fund investments. Losses may arise from changes in the value of the underlying instruments or if the counterparties do not perform under the con tracts’ terms. Gains (losses) are realized upon the expiration or closing of the futures contracts. Futures contracts are valued at the settlement price established each day by the board of trade or exchange on which they are traded.
Restricted Securities. The fund may invest in securities that are subject to legal or contractual restrictions on resale. These securities generally may be resold in transac tions exempt from registration or to the public if the securities are registered. Disposal of
45 Annual Report
Notes to Financial Statements continued
2. Operating Policies continued
Restricted Securities continued
these securities may involve time consuming negotiations and expense, and prompt sale at an acceptable price may be difficult. Information regarding restricted securities is included at the end of the fund’s Schedule of Investments.
3. Purchases and Sales of Investments.
Purchases and sales of securities, other than short term securities and U.S. government securities, aggregated $861,207,440 and $515,959,184, respectively.
4. Fees and Other Transactions with Affiliates.
Management Fee. FMR and its affiliates provide the fund with investment manage ment related services for which the fund pays a monthly management fee. The manage ment fee is the sum of an individual fund fee rate that is based on an annual rate of .30% of the fund’s average net assets and a group fee rate that averaged .27% during the period. The group fee rate is based upon the average net assets of all the mutual funds advised by FMR. The group fee rate decreases as assets under management increase and increases as assets under management decrease. For the period, the total annual man agement fee rate was .57% of the fund’s average net assets.
Distribution and Service Plan. In accordance with Rule 12b 1 of the 1940 Act, the fund has adopted separate Distribution and Service Plans for each class of shares. Certain classes pay Fidelity Distributors Corporation (FDC), an affiliate of FMR, separate Distribution and Service Fees, each of which is based on an annual percentage of each class’ average net assets. In addition, FDC may pay financial intermediaries for selling shares of the fund and providing shareholder support services. For the period, the Distribution and Service Fee rates and the total amounts paid to and retained by FDC were as follows:
| | | Distribution | | Service | | | | Paid to | | | | Retained |
| | | Fee | | Fee | | | | FDC | | | | by FDC |
| Class A | | 0% | | .25% | | $ | | 76,149 | | $ | | 764 |
| Class T | | 25% | | .25% | | | | 308,412 | | | | 8,604 |
| Class B | | 75% | | .25% | | | | 168,313 | | | | 129,099 |
| Class C | | 75% | | .25% | | | | 395,654 | | | | 169,537 |
| | | | | | | $ | | 948,528 | | $ | | 308,004 |
Sales Load. FDC receives a front end sales charge of up to 5.75% for selling Class A shares, and 3.50% for selling Class T shares, some of which is paid to financial intermedi aries for selling shares of the fund. FDC receives the proceeds of contingent deferred sales charges levied on Class A, Class T, Class B, and Class C redemptions. These charges
4. Fees and Other Transactions with Affiliates continued
|
| Sales Load continued | | |
depend on the holding period. The deferred sales charges range from 5% to 1% for Class B, 1% for Class C, and .25% for certain purchases of Class A and Class T shares.
For the period, sales charge amounts retained by FDC were as follows:
| | |
| | | | | Retained |
| | | | | by FDC |
| Class A | | | $ | 83,467 |
| Class T | | | | 36,944 |
| Class B* | | | | 28,188 |
| Class C* | | | | 8,440 |
| | | | $ | 157,039 |
* When Class B and Class C shares are initially sold, FDC pays commissions from its own resources to financial intermediaries through which the sales are made.
Transfer Agent Fees. Fidelity Investments Institutional Operations Company, Inc. (FIIOC), an affiliate of FMR, is the transfer, dividend disbursing and shareholder servic ing agent for each class of the fund, except for Strategic Dividend & Income. Fidelity Service Company, Inc. (FSC), an affiliate of FMR, is the transfer agent for Strategic Dividend & Income shares. FIIOC and FSC receive account fees and asset based fees that vary according to the account size and type of account of the shareholders of the respec tive classes of the fund. FIIOC and FSC pay for typesetting, printing and mailing of shareholder reports, except proxy statements. For the period the total transfer agent fees paid by each class to FIIOC or FSC, were as follows:
| | | | | | | % of |
| | | | | | | Average |
| | | | | Amount | | Net Assets |
| Class A | | | $ | 83,483 | | .27 |
| Class T | | | | 150,121 | | .24 |
| Class B | | | | 54,414 | | .32 |
| Class C | | | | 104,402 | | .26 |
| Strategic Dividend & Income | | | | 1,226,435 | | .18 |
| Institutional Class | | | | 15,048 | | .20 |
| | | | $ | 1,633,903 | | |
Accounting and Security Lending Fees. FSC maintains the fund’s accounting re cords. The accounting fee is based on the level of average net assets for the month. Under a separate contract, FSC administers the security lending program. The security lending fee is based on the number and duration of lending transactions.
47 Annual Report
Notes to Financial Statements continued
| | |
| 4. Fees and Other Transactions with Affiliates continued |
Affiliated Central Funds. The fund may invest in Money Market Central Funds which seek preservation of capital and current income and are managed by Fidelity Invest ments Money Management, Inc. (FIMM), an affiliate of FMR.
The Money Market Central Funds do not pay a management fee.
Brokerage Commissions. The fund placed a portion of its portfolio transactions with brokerage firms which are affiliates of the investment adviser. The commissions paid to these affiliated firms were $37,259 for the period.
5. Committed Line of Credit.
|
The fund participates with other funds managed by FMR in a $4.2 billion credit facility (the “line of credit”) to be utilized for temporary or emergency purposes to fund share holder redemptions or for other short term liquidity purposes. The fund has agreed to pay commitment fees on its pro rata portion of the line of credit. During the period, there were no borrowings on this line of credit.
The fund lends portfolio securities from time to time in order to earn additional income. The fund receives collateral (in the form of U.S. Treasury obligations, letters of credit and/or cash) against the loaned securities and maintains collateral in an amount not less than 100% of the market value of the loaned securities during the period of the loan. The market value of the loaned securities is determined at the close of business of the fund and any additional required collateral is delivered to the fund on the next business day. If the borrower defaults on its obligation to return the securities loaned because of insol vency or other reasons, a fund could experience delays and costs in recovering the securities loaned or in gaining access to the collateral. Cash collateral is invested in the Fidelity Securities Lending Cash Central Fund. The value of loaned securities and cash collateral at period end are disclosed on the fund’s Statement of Assets and Liabilities. Security lending income represents the income earned on investing cash collateral, less fees and expenses associated with the loan, plus any premium payments that may be received on the loan of certain types of securities. Net income from lending portfolio securities during the period amounted to $41,671.
FMR voluntarily agreed to reimburse each class to the extent annual operating expenses exceeded certain levels of average net assets as noted in the table below. Some expenses, for example interest expense, are excluded from this reimbursement.
The following classes were in reimbursement during the period:
| | | | |
| | | Expense | | | | Reimbursement |
| | | Limitations | | | | from adviser |
| Class B | | 1.95% - 2.00%* | | $ | | 839 |
| * Expense limitation in effect at period end. | | | | | | |
Many of the brokers with whom FMR places trades on behalf of the fund provided services to the fund in addition to trade execution. These services included payments of certain expenses on behalf of the fund totaling $208,748 for the period. In addition, through arrangements with the fund’s custodian and each class’ transfer agent, credits realized as a result of uninvested cash balances were used to reduce the fund’s expenses. During the period, these credits reduced the fund’s custody expenses by $4,833. During the period, credits reduced each class’ transfer agent expense as noted in the table below.
| | | | | Transfer Agent |
| | | | | expense reduction |
| Strategic Dividend & Income | | | $ | 428 |
| |
| 8. Other. | | | | |
The fund’s organizational documents provide former and current trustees and officers with a limited indemnification against liabilities arising in connection with the perfor mance of their duties to the fund. In the normal course of business, the fund may also enter into contracts that provide general indemnifications. The fund’s maximum expo sure under these arrangements is unknown as this would be dependent on future claims that may be made against the fund. The risk of material loss from such claims is considered remote.
| 9. Distributions to Shareholders. | | | | | | |
| |
Distributions to shareholders of each class were as follows:
| | | | |
| Years ended November 30, | | | | 2005 | | | | 2004A |
| From net investment income | | | | | | | | |
| Class A | | | $ | 475,907 | | | $ | 159,582 |
| Class T | | | | 830,178 | | | | 189,189 |
| Class B | | | | 141,821 | | | | 55,805 |
| Class C | | | | 339,138 | | | | 123,216 |
| Strategic Dividend & Income | | | | 12,270,157 | | | | 4,080,966 |
| |
| |
| | | 49 | | | | | | Annual Report |
Notes to Financial Statements continued
4. Fees and Other Transactions with Affiliates continued
| Distributions to shareholders of each class were as follows: continued | | | | |
| Years ended November 30, | | | | | | 2005 | | | | | | 2004A |
| From net investment income | | | | | | | | | | | | | | |
| Institutional Class | | | | | | 137,414 | | | | | | | | | | | | 38,961 |
| Total | | | | | $ | 14,194,615 | | | | | | | | | | $ | | 4,647,719 |
| A For the period December 23, 2003 (commencement of operations) to November 30, 2004. | | | | | | | | |
| |
| 10. Share Transactions. | | | | | | | | | | | | |
| |
Transactions for each class of shares were as follows:
| | | | | | | | |
| | | Shares | | | | Dollars |
| Years ended November 30, | | 2005 | | | | 2004A | | | | 2005 | | | | 2004A |
| Class A | | | | | | | | | | | | | | |
| Shares sold | | 1,768,977 | | | | 2,191,945 | | $ | | 20,345,648 | | $ | | 22,746,005 |
| Reinvestment of distributions . | | 30,595 | | | | 10,552 | | | | 349,961 | | | | 110,590 |
| Shares redeemed | | (589,953) | | | | (220,797) | | | | (6,809,260) | | | | (2,287,113) |
| Net increase (decrease) | | 1,209,619 | | | | 1,981,700 | | $ | | 13,886,349 | | $ | | 20,569,482 |
| Class T | | | | | | | | | | | | | | |
| Shares sold | | 3,882,259 | | | | 3,511,538 | | $ | | 44,416,238 | | $ | | 36,655,001 |
| Reinvestment of distributions . | | 59,648 | | | | 14,112 | | | | 681,858 | | | | 147,959 |
| Shares redeemed | | (669,970) | | | | (230,386) | | | | (7,729,006) | | | | (2,405,951) |
| Net increase (decrease) | | 3,271,937 | | | | 3,295,264 | | $ | | 37,369,090 | | $ | | 34,397,009 |
| Class B | | | | | | | | | | | | | | |
| Shares sold | | 744,114 | | | | 1,285,173 | | $ | | 8,505,041 | | $ | | 13,296,297 |
| Reinvestment of distributions . | | 9,782 | | | | 3,976 | | | | 111,311 | | | | 41,558 |
| Shares redeemed | | (344,455) | | | | (72,792) | | | | (3,964,823) | | | | (752,799) |
| Net increase (decrease) | | 409,441 | | | | 1,216,357 | | $ | | 4,651,529 | | $ | | 12,585,056 |
| Class C | | | | | | | | | | | | | | |
| Shares sold | | 2,014,501 | | | | 2,813,304 | | $ | | 23,123,712 | | $ | | 29,175,332 |
| Reinvestment of distributions . | | 19,942 | | | | 7,379 | | | | 227,493 | | | | 77,088 |
| Shares redeemed | | (545,060) | | | | (218,090) | | | | (6,287,937) | | | | (2,262,584) |
| Net increase (decrease) | | 1,489,383 | | | | 2,602,593 | | $ | | 17,063,268 | | $ | | 26,989,836 |
| Strategic Dividend & Income | | | | | | | | | | | | | | |
| Shares sold | | 36,814,600 | | | | 55,474,221 | | $424,067,244 | | $580,932,738 |
| Reinvestment of distributions . | | 944,881 | | | | 341,097 | | | | 10,819,574 | | | | 3,577,556 |
| Shares redeemed | | (15,256,951) | | (12,984,227) | | (176,595,063) | | (134,752,835) |
| Net increase (decrease) | | 22,502,530 | | | | 42,831,091 | | $258,291,755 | | $449,757,459 |
| Institutional Class | | | | | | | | | | | | | | |
| Shares sold | | 398,296 | | | | 464,040 | | $ | | 4,580,059 | | $ | | 4,776,823 |
| Reinvestment of distributions . | | 5,438 | | | | 1,845 | | | | 62,299 | | | | 19,348 |
| Shares redeemed | | (48,869) | | | | (18,218) | | | | (567,988) | | | | (186,845) |
| Net increase (decrease) | | 354,865 | | | | 447,667 | | $ | | 4,074,370 | | $ | | 4,609,326 |
| A For the period December 23, 2003 (commencement of operations) to November 30, 2004. | | | | | | | | |
| |
| |
| Annual Report | | | | 50 | | | | | | | | |
Report of Independent Registered Public Accounting Firm
To the Trustees of Fidelity Financial Trust and the Shareholders of Fidelity Strategic Dividend & Income Fund:
In our opinion, the accompanying statement of assets and liabilities, including the sched ule of investments, and the related statements of operations and of changes in net assets and the financial highlights present fairly, in all material respects, the financial position of Fidelity Strategic Dividend & Income Fund (a fund of Fidelity Financial Trust) at Novem ber 30, 2005 and the results of its operations, the changes in its net assets and the financial highlights for the periods indicated, in conformity with accounting principles generally accepted in the United States of America. These financial statements and financial highlights (hereafter referred to as “financial statements”) are the responsibility of the Fidelity Strategic Dividend & Income Fund’s management; our responsibility is to express an opinion on these financial statements based on our audits. We conducted our audits of these financial statements in accordance with the standards of the Public Company Accounting Oversight Board (United States). Those standards require that we plan and perform the audit to obtain reasonable assurance about whether the financial statements are free of material misstatement. An audit includes examining, on a test basis, evidence supporting the amounts and disclosures in the financial statements, assessing the accounting principles used and significant estimates made by management, and evaluating the overall financial statement presentation. We believe that our audits, which included confirmation of securities at November 30, 2005 by correspondence with the custodian and brokers, provide a reasonable basis for our opinion.
/s/ PricewaterhouseCoopers LLP
PricewaterhouseCoopers LLP
Boston, Massachusetts
January 17, 2006
|
51 Annual Report
Trustees and Officers
The Trustees, Member of the Advisory Board, and executive officers of the trust and fund, as applicable, are listed below. The Board of Trustees governs the fund and is responsible for protecting the interests of shareholders. The Trustees are experienced executives who meet periodically throughout the year to oversee the fund’s activities, review contractual arrangements with companies that provide services to the fund, and review the fund’s performance. Except for William O. McCoy and Albert R. Gamper, Jr., each of the Trustees oversees 326 funds advised by FMR or an affiliate. Mr. McCoy oversees 328 funds advised by FMR or an affiliate. Mr. Gamper oversees 235 funds advised by FMR or an affiliate.
The Trustees hold office without limit in time except that (a) any Trustee may resign; (b) any Trustee may be removed by written instrument, signed by at least two thirds of the number of Trustees prior to such removal; (c) any Trustee who requests to be retired or who has become incapacitated by illness or injury may be retired by written instru ment signed by a majority of the other Trustees; and (d) any Trustee may be removed at any special meeting of shareholders by a two thirds vote of the outstanding voting securities of the trust. Each Trustee who is not an interested person (as defined in the 1940 Act) (Independent Trustee), shall retire not later than the last day of the calendar year in which his or her 72nd birthday occurs. The Independent Trustees may waive this mandatory retirement age policy with respect to individual Trustees. The executive officers and Advisory Board Member hold office without limit in time, except that any officer and Advisory Board Member may resign or may be removed by a vote of a majority of the Trustees at any regular meeting or any special meeting of the Trustees. Except as indicated, each individual has held the office shown or other offices in the same company for the past five years.
The fund’s Statement of Additional Information (SAI) includes more information about the Trustees. To request a free copy, call Fidelity at 1-877-208-0098.
Correspondence intended for each Trustee who is an interested person may be sent to Fidelity Investments, 82 Devonshire Street, Boston, Massachusetts 02109.
| | Name, Age; Principal Occupation
Edward C. Johnson 3d (75)
|
Year of Election or Appointment: 1982
Mr. Johnson is Chairman of the Board of Trustees. Mr. Johnson serves as Chief Executive Officer, Chairman, and a Director of FMR Corp.; a Di rector and Chairman of the Board and of the Executive Committee of FMR; Chairman and a Director of Fidelity Management & Research (Far East) Inc.; Chairman and a Director of Fidelity Investments Money Man agement, Inc.; and Chairman (2001 present) and a Director (2000 present) of FMR Co., Inc.
| | Name, Age; Principal Occupation
Stephen P. Jonas (52)
|
Year of Election or Appointment: 2005
Mr. Jonas is Senior Vice President of the fund (2005 present). He also serves as Senior Vice President of other Fidelity funds (2005 present). Mr. Jonas is Executive Director of FMR (2005 present). Previously, Mr. Jonas served as President of Fidelity Enterprise Operations and Risk Services (2004 2005), Chief Administrative Officer (2002 2004), and Chief Financial Officer of FMR Co. (1998 2000). Mr. Jonas has been with Fidelity Investments since 1987 and has held various financial and management positions including Chief Financial Officer of FMR. In addi tion, he serves on the Boards of Boston Ballet (2003 present) and Sim mons College (2003 present).
Year of Election or Appointment: 2003
Mr. Reynolds is a Director (2003 present) and Chief Operating Officer (2002 present) of FMR Corp. He also serves on the Board at Fidelity Investments Canada, Ltd. (2000 present). Previously, Mr. Reynolds served as President of Fidelity Investments Institutional Retirement Group (1996 2000).
* Trustees have been determined to be “Interested Trustees” by virtue of, among other things, their affiliation with the trust or various entities under common control with FMR.
Correspondence intended for each Independent Trustee (that is, the Trustees other than the Interested Trustees) may be sent to Fidelity Investments, P.O. Box 55235, Boston, Massachusetts 02205 5235.
| | Name, Age; Principal Occupation
Dennis J. Dirks (57)
|
Year of Election or Appointment: 2005
Prior to his retirement in May 2003, Mr. Dirks was Chief Operating Officer and a member of the Board of The Depository Trust & Clearing Corporation (DTCC) (1999 2003). He also served as President, Chief Operating Officer, and Board member of The Depository Trust Com pany (DTC) (1999 2003) and President and Board member of the National Securities Clearing Corporation (NSCC) (1999 2003). In addi tion, Mr. Dirks served as Chief Executive Officer and Board member of the Government Securities Clearing Corporation (2001 2003) and Chief Executive Officer and Board member of the Mortgage Backed Securities Clearing Corporation (2001 2003). Mr. Dirks also serves as a Trustee of Manhattan College (2005 present).
53 Annual Report
Trustees and Officers - continued
| | Name, Age; Principal Occupation
Albert R. Gamper, Jr. (63)
|
Year of Election or Appointment: 2006
Mr. Gamper also serves as a Trustee (2006 present) or Member of the Advisory Board (2005 present) of other investment companies advised by FMR. Prior to his retirement in December 2004, Mr. Gamper served as Chairman of the Board of CIT Group Inc. (commercial finance). During his tenure with CIT Group Inc. Mr. Gamper served in numerous senior management positions, including Chairman (1987 1989; 1999 2001; 2002 2004), Chief Executive Officer (1987 2004), and President (1989 2002). He currently serves as a member of the Board of Directors of Public Service Enterprise Group (utilities, 2001 present), Chairman of the Board of Governors, Rutgers University (2004 present), and Chairman of the Board of Saint Barnabas Health Care System.
Year of Election or Appointment: 1997
Dr. Gates is Chairman of the Independent Trustees (2006 present). Dr. Gates is President of Texas A&M University (2002 present). He was Director of the Central Intelligence Agency (CIA) from 1991 to 1993. From 1989 to 1991, Dr. Gates served as Assistant to the President of the United States and Deputy National Security Advisor. Dr. Gates is a Director of NACCO Industries, Inc. (mining and manufacturing), Parker Drilling Co., Inc. (drilling and rental tools for the energy industry, 2001 present), and Brinker International (restaurant management, 2003 present). Previously, Dr. Gates served as a Director of LucasVarity PLC (automotive components and diesel engines), a Director of TRW Inc. (automotive, space, defense, and information technology), and Dean of the George Bush School of Government and Public Service at Texas A&M University (1999 2001). Dr. Gates also is a Trustee of the Forum for International Policy.
Name, Age; Principal Occupation
George H. Heilmeier (69)
|
Year of Election or Appointment: 2004
Dr. Heilmeier is Chairman Emeritus of Telcordia Technologies (commu nication software and systems), where prior to his retirement, he served as company Chairman and Chief Executive Officer. He currently serves on the Boards of Directors of The Mitre Corporation (systems engineer ing and information technology support for the government), and HRL Laboratories (private research and development, 2004 present). He is Chairman of the General Motors Science & Technology Advisory Board and a Life Fellow of the Institute of Electrical and Electronics Engineers (IEEE) (2000 present). Dr. Heilmeier is a member of the Defense Science Board and the National Security Agency Advisory Board. He is also a member of the National Academy of Engineering, the American Acad emy of Arts and Sciences, and the Board of Overseers of the School of Engineering and Applied Science of the University of Pennsylvania. Pre viously, Dr. Heilmeier served as a Director of TRW Inc. (automotive, space, defense, and information technology, 1992 2002), Compaq (1994 2002), Automatic Data Processing, Inc. (ADP) (technology based business outsourcing, 1995 2002), INET Technologies Inc. (telecommu nications network surveillance, 2001 2004), and Teletech Holdings (cus tomer management services). He is the recipient of the 2005 Kyoto Prize in Advanced Technology for his invention of the liquid display.
Year of Election or Appointment: 2001
Prior to Ms. Knowles’ retirement in June 2000, she served as Executive Vice President and Chief Financial Officer of Atlantic Richfield Company (ARCO) (diversified energy, 1996 2000). From 1993 to 1996, she was a Senior Vice President of ARCO and President of ARCO Transportation Company. She served as a Director of ARCO from 1996 to 1998. She currently serves as a Director of Phelps Dodge Corporation (copper mining and manufacturing) and McKesson Corporation (healthcare ser vice, 2002 present). Ms. Knowles is a Trustee of the Brookings Institution and the Catalina Island Conservancy and also serves as a member of the Advisory Board for the School of Engineering of the University of Southern California.
55 Annual Report
Trustees and Officers - continued
| | Name, Age; Principal Occupation
Ned C. Lautenbach (61)
|
Year of Election or Appointment: 2000
Mr. Lautenbach has been a partner of Clayton, Dubilier & Rice, Inc. (private equity investment firm) since September 1998. Previously, Mr. Lautenbach was with the International Business Machines Corporation (IBM) from 1968 until his retirement in 1998. Mr. Lautenbach serves as a Director of Italtel Holding S.p.A. (telecommunications (Milan, Italy), 2004 present) and Eaton Corporation (diversified industrial) as well as the Philharmonic Center for the Arts in Naples, Florida. He also is a member of the Board of Trustees of Fairfield University (2005 present), as well as a member of the Council on Foreign Relations.
Year of Election or Appointment: 1997
Prior to his retirement in December 1994, Mr. McCoy was Vice Chair man of the Board of BellSouth Corporation (telecommunications) and President of BellSouth Enterprises. He is currently a Director of Liberty Corporation (holding company), Duke Realty Corporation (real estate), and Progress Energy, Inc. (electric utility). He is also a partner of Frank lin Street Partners (private investment management firm) and a member of the Research Triangle Foundation Board. In addition, Mr. McCoy served as the Interim Chancellor (1999 2000) and a member of the Board of Visitors for the University of North Carolina at Chapel Hill and currently serves on the Board of Directors of the University of North Carolina Health Care System and the Board of Visitors of the Kenan Flagler Business School (University of North Carolina at Chapel Hill). He also served as Vice President of Finance for the University of North Car olina (16 school system).
Year of Election or Appointment: 2005
Ms. Small is a member (2000 present) and Chairperson (2002 present) of the Investment Committee, and a member (2002 present) of the Board of Trustees of Smith College. Previously, she served as Chief In vestment Officer (1999 2000), Director of Global Equity Investments (1996 1999), and a member of the Board of Directors of Scudder, Stevens & Clark (1990 1997) and Scudder Kemper Investments (1997 1998). In addition, Ms. Small served as Co Chair (2000 2003) of the Annual Fund for the Fletcher School of Law and Diplomacy.
| | Name, Age; Principal Occupation
William S. Stavropoulos (66)
|
Year of Election or Appointment: 2002
Mr. Stavropoulos is Chairman of the Board (2000 present) and a Mem ber of the Board of Directors of The Dow Chemical Company. Since joining The Dow Chemical Company in 1967, Mr. Stavropoulos served in numerous senior management positions, including President (1993 2000; 2002 2003), CEO (1995 2000; 2002 2004), and Chair man of the Executive Committee (2000 2004). Currently, he is a Direc tor of NCR Corporation (data warehousing and technology solutions), BellSouth Corporation (telecommunications), Chemical Financial Corpo ration, Maersk Inc. (industrial conglomerate, 2002 present), and Metal mark Capital (private equity investment firm, 2005 present). He also serves as a member of the Board of Trustees of the American Enterprise Institute for Public Policy Research. In addition, Mr. Stavropoulos is a member of The Business Council, J.P. Morgan International Council and the University of Notre Dame Advisory Council for the College of Science.
Year of Election or Appointment: 2005
Prior to his retirement in 2001, Mr. Wolfe was Chairman and Chief Executive Officer of Hershey Foods Corporation (1993 2001). He cur rently serves as a member of the boards of Adelphia Communications Corporation (2003 present), Bausch & Lomb, Inc., and Revlon Inc. (2004 present).
Advisory Board Member and Executive Officers:
Correspondence intended for each executive officer and Mr. Lynch may be sent to Fidelity Investments, 82 Devonshire Street, Boston, Massachusetts 02109.
| | Name, Age; Principal Occupation
Peter S. Lynch (61)
|
Year of Election or Appointment: 2003
Member of the Advisory Board of Fidelity Financial Trust. Vice Chair man and a Director of FMR, and Vice Chairman (2001 present) and a Director (2000 present) of FMR Co., Inc. Previously, Mr. Lynch served as a Trustee of the Fidelity funds (1990 2003). In addition, he serves as a Trustee of Boston College, Massachusetts Eye & Ear Infirmary, Historic Deerfield, John F. Kennedy Library, and the Museum of Fine Arts of Boston.
57 Annual Report
Trustees and Officers - continued
| | Name, Age; Principal Occupation
|
Year of Election or Appointment: 2005
Vice President of the fund. Mr. Lank also serves as Vice President of another fund advised by FMR. Prior to assuming his current responsibili ties, Mr. Lank has worked as an analyst and manager.
Year of Election or Appointment: 2005
Vice President of the fund. Mr. Soviero also serves as Vice President of other funds advised by FMR. Prior to assuming his current responsibili ties, Mr. Soviero has worked as a research analyst, manager and direc tor of high yield research.
Year of Election or Appointment: 2003
Secretary of the fund. He also serves as Secretary of other Fidelity funds; Vice President, General Counsel, and Secretary of FMR Co., Inc. (2001 present) and FMR; Assistant Secretary of Fidelity Management & Research (U.K.) Inc. (2001 present), Fidelity Management & Research (Far East) Inc. (2001 present), and Fidelity Investments Money Manage ment, Inc. (2001 present). Mr. Roiter is an Adjunct Member, Faculty of Law, at Boston College Law School (2003 present). Previously, Mr. Roiter served as Vice President and Secretary of Fidelity Distributors Corpora tion (FDC) (1998 2005).
Year of Election or Appointment: 2003
Assistant Secretary of the fund. Mr. Fross also serves as Assistant Secre tary of other Fidelity funds (2003 present), Vice President and Secretary of FDC (2005 present), and is an employee of FMR.
Year of Election or Appointment: 2004
President, Treasurer, and Anti Money Laundering (AML) officer of the fund. Ms. Reynolds also serves as President, Treasurer, and AML officer of other Fidelity funds (2004) and is a Vice President (2003) and an employee (2002) of FMR. Before joining Fidelity Investments, Ms. Reynolds worked at PricewaterhouseCoopers LLP (PwC) (1980 2002), where she was most recently an audit partner with PwC’s investment management practice.
Name, Age; Principal Occupation
Paul M. Murphy (58)
|
Year of Election or Appointment: 2005
Chief Financial Officer of the fund. Mr. Murphy also serves as Chief Financial Officer of other Fidelity funds (2005 present). He also serves as Senior Vice President of Fidelity Pricing and Cash Management Ser vices Group (FPCMS).
Kenneth A. Rathgeber (58)
|
Year of Election or Appointment: 2004
Chief Compliance Officer of the fund. Mr. Rathgeber also serves as Chief Compliance Officer of other Fidelity funds (2004) and Executive Vice President of Risk Oversight for Fidelity Investments (2002). Pre viously, he served as Executive Vice President and Chief Operating Offi cer for Fidelity Investments Institutional Services Company, Inc.
(1998 2002).
Year of Election or Appointment: 2003
Deputy Treasurer of the fund. Mr. Hebble also serves as Deputy Trea surer of other Fidelity funds (2003), and is an employee of FMR. Before joining Fidelity Investments, Mr. Hebble worked at Deutsche Asset Man agement where he served as Director of Fund Accounting (2002 2003) and Assistant Treasurer of the Scudder Funds (1998 2003).
Year of Election or Appointment: 2005
Deputy Treasurer of the fund. Mr. Mehrmann also serves as Deputy Treasurer of other Fidelity funds (2005 present) and is an employee of FMR. Previously, Mr. Mehrmann served as Vice President of Fidelity In vestments Institutional Services Group (FIIS)/Fidelity Investments Institu tional Operations Corporation, Inc. (FIIOC) Client Services (1998 2004).
Kimberley H. Monasterio (41)
|
Year of Election or Appointment: 2004
Deputy Treasurer of the fund. Ms. Monasterio also serves as Deputy Treasurer of other Fidelity funds (2004) and is an employee of FMR (2004). Before joining Fidelity Investments, Ms. Monasterio served as Treasurer (2000 2004) and Chief Financial Officer (2002 2004) of the Franklin Templeton Funds and Senior Vice President of Franklin Temple ton Services, LLC (2000 2004).
59 Annual Report
Trustees and Officers - continued
| | Name, Age; Principal Occupation
Kenneth B. Robins (36)
|
Year of Election or Appointment: 2005
Deputy Treasurer of the fund. Mr. Robins also serves as Deputy Treasurer of other Fidelity funds (2005 present) and is an employee of FMR (2004 present). Before joining Fidelity Investments, Mr. Robins worked at KPMG LLP, where he was a partner in KPMG’s department of profes sional practice (2002 2004) and a Senior Manager (1999 2000). In addition, Mr. Robins served as Assistant Chief Accountant, United States Securities and Exchange Commission (2000 2002).
Year of Election or Appointment: 2005
Assistant Treasurer of the fund. Mr. Byrnes also serves as Assistant Trea surer of other Fidelity funds (2005 present) and is an employee of FMR (2005 present). Previously, Mr. Byrnes served as Vice President of FPCMS (2003 2005). Before joining Fidelity Investments, Mr. Byrnes worked at Deutsche Asset Management where he served as Vice Presi dent of the Investment Operations Group (2000 2003).
Year of Election or Appointment: 2003
Assistant Treasurer of the fund. Mr. Costello also serves as Assistant Treasurer of other Fidelity funds and is an employee of FMR.
Year of Election or Appointment: 2004
Assistant Treasurer of the fund. Mr. Lydecker also serves as Assistant Treasurer of other Fidelity funds (2004) and is an employee of FMR.
Year of Election or Appointment: 2003
Assistant Treasurer of the fund. Mr. Osterheld also serves as Assistant Treasurer of other Fidelity funds (2002) and is an employee of FMR.
Year of Election or Appointment: 2005
Assistant Treasurer of the fund. Mr. Ryan also serves as Assistant Trea surer of other Fidelity funds (2005 present) and is an employee of FMR (2005 present). Previously, Mr. Ryan served as Vice President of Fund Reporting in FPCMS (1999 2005).
Name, Age; Principal Occupation
Salvatore Schiavone (40)
|
Year of Election or Appointment: 2005
Assistant Treasurer of the fund. Mr. Schiavone also serves as Assistant Treasurer of other Fidelity funds (2005 present) and is an employee of FMR (2005 present). Before joining Fidelity Investments, Mr. Schiavone worked at Deutsche Asset Management, where he most recently served as Assistant Treasurer (2003 2005) of the Scudder Funds and Vice Pres ident and Head of Fund Reporting (1996 2003).
61 Annual Report
The Board of Trustees of Fidelity Advisor Strategic Dividend & Income Fund voted to pay to shareholders of record at the opening of business on record date, the following distributions per share derived from capital gains realized from sales of portfolio se curities, and dividends derived from net investment income:
| | | Pay Date | | Record Date | | Dividends | | Capital Gains |
| Institutional Class | | 12/19/05 | | 12/16/05 | | $0.059 | | $0.13 |
The fund hereby designates as capital gain dividends: For dividends with respect to the taxable year ended November 30, 2005, $112,115,601, or, if subsequently deter mined to be different, the net capital gain of such year, and for dividends with respect to the taxable year ended November 30, 2004, $0, or, if subsequently determined to be different, the excess of: (a) the net capital gain of such year, over (b) amounts pre viously designated as capital gain dividends with respect to such year.
A total of 0.14% of the dividends distributed during the fiscal year was derived from interest on U.S. Government securities which is generally exempt from state income tax.
Institutional Class designates 89%, and 99% of the dividends distributed in December 2004 and July 2005, respectively during the fiscal year as qualifying for the dividends received deduction for corporate shareholders.
Institutional Class designates 94%, and 100% of the dividends distributed in Decem ber 2004 and July 2005, respectively during the fiscal year as amounts which may be taken into account as a dividend for purposes of the maximum rate under section 1(h)(11) of the Internal Revenue Code.
The fund will notify shareholders in January 2006 of amounts for use in preparing 2005 income tax returns.
Proxy Voting Results
A special meeting of the fund’s shareholders was held on March 16, 2005. The results of votes taken among shareholders on proposals before them are reported below. Each vote reported represents one dollar of net asset value held on the record date for the meeting.
| PROPOSAL 1 | | |
| To amend the Declaration of Trust to |
| allow the Board of Trustees, if per- |
| mitted by applicable law, to authorize |
| fund mergers without shareholder |
| approval.A | | | | |
| | | # of | | % of |
| | | Votes | | Votes |
| Affirmative | | 8,400,660,894.14 | | 71.170 |
| Against | | 2,413,818,167.07 | | 20.450 |
| Abstain | | 466,182,489.54 | | 3.949 |
| Broker | | | | |
| Non Votes | | 523,001,758.35 | | 4.431 |
| TOTAL | | 11,803,663,309.10 | | 100.000 |
| PROPOSAL 2 | | |
| To elect a Board of Trustees.A | | |
| | | # of | | % of |
| | | Votes | | Votes |
| |
| Laura B. Cronin | | |
| Affirmative | | 10,904,461,482.16 | | 92.382 |
| Withheld | | 899,201,826.94 | | 7.618 |
| TOTAL | | 11,803,663,309.10 | | 100.000 |
| Dennis J. Dirks | | |
| Affirmative | | 11,230,399,240.22 | | 95.143 |
| Withheld | | 573,264,068.88 | | 4.857 |
| TOTAL | | 11,803,663,309.10 | | 100.000 |
| Robert M. Gates | | |
| Affirmative | | 11,204,490,469.14 | | 94.924 |
| Withheld | | 599,172,839.96 | | 5.076 |
| TOTAL | | 11,803,663,309.10 | | 100.000 |
| George H. Heilmeier | | |
| Affirmative | | 11,216,568,766.75 | | 95.026 |
| Withheld | | 587,094,542.35 | | 4.974 |
| TOTAL | | 11,803,663,309.10 | | 100.000 |
| | | Votes | | Votes |
| |
| Abigail P. Johnson | | |
| Affirmative | | 11,170,882,517.64 | | 94.639 |
| Withheld | | 632,780,791.46 | | 5.361 |
| TOTAL | | 11,803,663,309.10 | | 100.000 |
| |
| Edward C. Johnson 3d | | |
| Affirmative | | 11,146,150,096.08 | | 94.430 |
| Withheld | | 657,513,213.02 | | 5.570 |
| TOTAL | | 11,803,663,309.10 | | 100.000 |
| |
| Marie L. Knowles | | |
| Affirmative | | 11,230,314,699.11 | | 95.143 |
| Withheld | | 573,348,609.99 | | 4.857 |
| TOTAL | | 11,803,663,309.10 | | 100.000 |
| |
| Ned C. Lautenbach | | |
| Affirmative | | 11,228,854,936.86 | | 95.130 |
| Withheld | | 574,808,372.24 | | 4.870 |
| TOTAL | | 11,803,663,309.10 | | 100.000 |
| |
| Marvin L. Mann | | |
| Affirmative | | 11,192,136,636.22 | | 94.819 |
| Withheld | | 611,526,672.88 | | 5.181 |
| TOTAL | | 11,803,663,309.10 | | 100.000 |
| |
| William O. McCoy | | |
| Affirmative | | 11,202,537,978.70 | | 94.907 |
| Withheld | | 601,125,330.40 | | 5.093 |
| TOTAL | | 11,803,663,309.10 | | 100.000 |
| |
| Robert L. Reynolds | | |
| Affirmative | | 11,216,557,272.63 | | 95.026 |
| Withheld | | 587,106,036.47 | | 4.974 |
| TOTAL | | 11,803,663,309.10 | | 100.000 |
| |
| Cornelia M. Small | | |
| Affirmative | | 11,221,057,350.30 | | 95.064 |
| Withheld | | 582,605,958.80 | | 4.936 |
| TOTAL | | 11,803,663,309.10 | | 100.000 |
63 Annual Report
Proxy Voting Results - continued
| | | # of | | % of |
| | | Votes | | Votes |
| |
| William S. Stavropoulos | | |
| Affirmative | | 11,213,520,655.58 | | 95.000 |
| Withheld | | 590,142,653.52 | | 5.000 |
| TOTAL | | 11,803,663,309.10 | | 100.000 |
| |
| Kenneth L. Wolfe | | |
| Affirmative | | 11,218,319,970.33 | | 95.041 |
| Withheld | | 585,343,338.77 | | 4.959 |
| TOTAL | | 11,803,663,309.10 | | 100.000 |
A Denotes trust-wide proposals and voting results.
Board Approval of Investment Advisory Contracts and Management Fees
Fidelity Strategic Dividend & Income Fund
Each year, typically in July, the Board of Trustees, including the independent Trustees (together, the Board), votes on the renewal of the management contract and sub advisory agreements (together, the Advisory Contracts) for the fund. The Board, assisted by the advice of fund counsel and independent Trustees’ counsel, requests and considers a broad range of information throughout the year.
The Board meets regularly each month except August and takes into account throughout the year matters bearing on Advisory Contracts. The Board, acting directly and through its separate committees, considers at each of its meetings factors that are relevant to the annual renewal of the fund’s Advisory Contracts, including the services and support provided to the fund and its shareholders by Fidelity. At the time of the renewal, the Board had 11 standing committees, each composed of independent Trustees with varying backgrounds, to which the Board has assigned specific subject matter responsibilities in order to enhance effective decision making by the Board. Each committee has adopted a written charter outlining the structure and purposes of the committee. One such com mittee, the Equity Contract Committee, meets periodically during the first six months of each year and as necessary to consider matters specifically related to the annual renewal of Advisory Contracts. The committee requests and receives information on, and makes recommendations to the independent Trustees concerning, the approval and annual review of the Advisory Contracts.
At its July 2005 meeting, the Board of Trustees, including the independent Trustees, unanimously determined to renew the Advisory Contracts for the fund. In reaching its determination, the Board considered all factors it believed relevant, including (1) the nature, extent, and quality of the services to be provided to the fund and its shareholders by Fidelity (including the investment performance of the fund); (2) the competitiveness of the management fee and total expenses of the fund; (3) the total costs of the services to be provided by and the profits to be realized by the investment adviser and its affiliates from the relationship with the fund; (4) the extent to which economies of scale would be realized as the fund grows; and (5) whether fee levels reflect these economies of scale, if any, for the benefit of fund shareholders.
In determining whether to renew the Advisory Contracts for the fund, the Board ulti mately reached a determination, with the assistance of fund counsel and independent Trustees’ counsel, that the renewal of the Advisory Contracts and the compensation to be received by Fidelity under the management contract is consistent with Fidelity’s fidu ciary duty under applicable law. In addition to evaluating the specific factors noted above, the Board, in reaching its determination, is aware that shareholders in the fund have a broad range of investment choices available to them, including a wide choice among mutual funds offered by competitors to Fidelity, and that the fund’s shareholders, with the opportunity to review and weigh the disclosure provided by the fund in its
65 Annual Report
Board Approval of Investment Advisory Contracts and Management Fees continued
prospectus and other public disclosures, have chosen to invest in this fund, managed by Fidelity.
Nature, Extent, and Quality of Services Provided by Fidelity. The Board consid ered staffing within the investment adviser, FMR, and the sub advisers (together, the Investment Advisers), including the background of the fund’s portfolio manager and the fund’s investment objective and discipline. The independent Trustees also had discus sions with senior management of Fidelity’s investment operations and investment groups. The Board considered the structure of the portfolio manager compensation program and whether this structure provides appropriate incentives.
Fidelity Resources Dedicated to Investment Management and Support Services. The Board reviewed the size, education, and experience of the Investment Advisers’ invest ment staff, their use of technology, and the Investment Advisers’ approach to recruiting, training, and retaining portfolio managers and other research, advisory, and manage ment personnel. The Board considered Fidelity’s extensive global research capabilities that enable the Investment Advisers to aggregate data from various sources in an effort to produce positive investment results. The Board noted that Fidelity’s analysts have access to a variety of technological tools that enable them to perform both fundamental and quantitative analysis and to specialize in various disciplines. The Board also considered that Fidelity’s portfolio managers and analysts have access to daily portfolio attribution that allows for monitoring of a fund’s portfolio, as well as an electronic communication system that provides immediate real time access to research concerning issuers and credit enhancers.
Shareholder and Administrative Services. The Board considered the nature, extent, quality, and cost of administrative, distribution, and shareholder services performed by the Investment Advisers and their affiliates under the Advisory Contracts and under separate agreements covering transfer agency, pricing and bookkeeping, and securities lending services for the fund. The Board also considered the nature and extent of the Investment Advisers’ supervision of third party service providers, principally custodians and subcustodians. The Board reviewed the allocation of fund brokerage, including allocations to brokers affiliated with the Investment Advisers, the use of brokerage commissions to pay fund expenses, and the use of “soft” commission dollars to pay for research services. The Board also considered that Fidelity voluntarily decided in 2004 to stop using “soft” commission dollars to pay for market data and, instead, to pay for that data out of its own resources. The Board also considered the resources devoted to, and the record of compliance with, the fund’s compliance policies and procedures.
The Board noted that the growth of fund assets across the complex allows Fidelity to reinvest in the development of services designed to enhance the value or convenience of the Fidelity funds as investment vehicles. These services include 24 hour access to
account information and market information through phone representatives and over the Internet, and investor education materials and asset allocation tools.
Investment in a Large Fund Family. The Board considered the benefits to shareholders of investing in a Fidelity fund, including the benefits of investing in a fund that is part of a large family of funds offering a variety of investment disciplines and providing for a large variety of mutual fund investor services. For example, fund shareholders are offered the privilege of exchanging shares of the fund for shares of other Fidelity funds, as set forth in the fund’s prospectus, without paying an additional sales charge. The Board noted that, since the last Advisory Contract renewals in July 2004, Fidelity has taken a number of actions that benefited particular funds, including (i) voluntarily deciding in 2004 to stop using “soft” commission dollars to pay for market data and, instead, to pay for that data out of its own resources, (ii) contractually agreeing to impose management fee reductions and expense limitations on its five Spartan stock index funds and its stock index fund available through variable insurance products, (iii) contractually agreeing to eliminate the management fees on the Fidelity Freedom Funds and the Fidelity Advisor Freedom Funds, (iv) contractually agreeing to reduce the management fees on most of its investment grade taxable bond funds, and (v) contractually agreeing to impose expense limitations on its retail and Spartan investment grade taxable bond funds.
Investment Performance and Compliance. The Board considered whether the fund has operated within its investment objective, as well as its record of compliance with its investment restrictions. It also reviewed the fund’s absolute investment performance for each class, as well as the fund’s relative investment performance for each class measured against (i) a proprietary custom index, and (ii) a peer group of mutual funds deemed appropriate by the Board. Because the fund had been in existence less than three calendar years, the following chart considered by the Board shows, for the one year period ended December 31, 2004, the returns of Class C and the retail class of the fund, the return of a proprietary custom index (“benchmark”), and a range of returns of a peer group of mutual funds identified by Lipper Inc. as having an investment objective similar to that of the fund. The returns of Class C and the retail class represent the performance of classes with the highest and lowest 12b 1 fees, respectively (not necessarily with the highest and lowest total expenses). The box within the chart shows the 25th percentile return (bottom of box) and the 75th percentile return (top of box) of the Lipper peer group. Returns shown above the box are in the first quartile and returns shown below the box are in the fourth quartile. The percentage beaten numbers noted below the chart correspond to the percentile box and represent the percentage of funds in the Lipper peer group whose performance was equal to or lower than that of the class indicated. The fund’s proprietary custom index is an index developed by FMR that represents the fund’s four general investment categories according to their respective weightings in the fund’s neutral mix.
67 Annual Report
Board Approval of Investment Advisory Contracts and Management Fees continued

The Board reviewed the fund’s relative investment performance against its Lipper peer group and stated that the performance of the retail class of the fund was in the first quartile for the one year period. The Board also stated that the relative investment performance of the fund was lower than its benchmark for the one year period. The Board considered that the variations in performance among the fund’s classes reflect the variations in class expenses, which result in lower performance for higher expense classes. The Board stated that it is difficult to evaluate in any comprehensive fashion the performance of the fund, in light of its relatively recent launch.
The Board has had thorough discussions with FMR throughout the year about the Board’s and FMR’s concerns about equity research, equity fund performance, and compliance with internal policies governing gifts and entertainment. FMR has taken steps that it believes will refocus and strengthen equity research and equity portfolio management and compliance. The Board noted with favor FMR’s recent reorganization of its senior management team and FMR’s plans to dedicate additional resources to investment research, and participated in the process that led to those changes.
Based on its review, and giving particular weight to the nature and quality of the resources dedicated by the Investment Advisers to maintain and improve relative performance, the Board concluded that the nature, extent, and quality of the services provided by Fidelity will benefit the fund’s shareholders, particularly in light of the Board’s view that the fund’s shareholders benefit from investing in a fund that is part of a large family of funds offering a variety of investment disciplines and services.
Competitiveness of Management Fee and Total Fund Expenses. The Board considered the fund’s management fee and total expenses compared to “mapped groups”
of competitive funds and classes. Fidelity creates “mapped groups” by combining similar Lipper investment objective categories that have comparable management fee charac teristics. Combining Lipper investment objective categories aids the Board’s manage ment fee and total expense comparisons by broadening the competitive group used for comparison and by reducing the number of universes to which various Fidelity funds are compared.
The Board considered two proprietary management fee comparisons for the 12 month (or shorter) periods shown in the chart below. The group of Lipper funds used by the Board for management fee comparisons is referred to below as the “Total Mapped Group” and, for the reasons explained above, is broader than the Lipper peer group used by the Board for performance comparisons. The Total Mapped Group comparison focuses on a fund’s standing relative to the total universe of comparable funds available to investors, in terms of gross management fees before expense reimbursements or caps. “TMG %” represents the percentage of funds in the Total Mapped Group that had management fees that were lower than the fund’s. For example, a TMG % of 30% means that 70% of the funds in the Total Mapped Group had higher management fees than the fund. The “Asset Size Peer Group” (ASPG) comparison focuses on a fund’s standing relative to non Fidelity funds similar in size to the fund within the Total Mapped Group. The ASPG represents at least 15% of the funds in the Total Mapped Group with comparable asset size and management fee characteristics, subject to a minimum of 50 funds (or all funds in the Total Mapped Group if fewer than 50). Additional information, such as the ASPG quartile (“quadrant”) in which the fund’s management fee ranked, is also included in the chart and considered by the Board.

69 Annual Report
Board Approval of Investment Advisory Contracts and Management Fees continued
The Board noted that the fund’s management fee ranked below the median of its Total Mapped Group and below the median of its ASPG for 2004.
Based on its review, the Board concluded that the fund’s management fee was fair and reasonable in light of the services that the fund receives and the other factors considered.
In its review of each class’s total expenses, the Board considered the fund’s management fee as well as other fund or class expenses, as applicable, such as transfer agent fees, pricing and bookkeeping fees, fund paid 12b 1 fees, and custodial, legal, and audit fees. The Board also noted the effects of any waivers and reimbursements on fees and expenses. As part of its review, the Board also considered current and historical total expenses of each class of the fund compared to competitive fund median expenses. Each class of the fund is compared to those funds and classes in the Total Mapped Group (used by the Board for management fee comparisons) that have a similar sales load structure.
The Board noted that the total expenses of each of Class A, Class B, Institutional Class and Fidelity Strategic Dividend & Income Fund (retail class) ranked below its competi tive median for 2004, and the total expenses of each of Class C and Class T ranked above its competitive median for 2004. The Board noted that the fund offers multiple classes, each of which has a different sales load and 12b 1 fee structure, and that the multiple structures are intended to offer a range of pricing options for the intermediary market. The Board also noted that the total expenses of the classes vary primarily by the level of their 12b 1 fees, although differences in transfer agent fees may also cause expenses to vary from class to class.
In its review of total expenses, the Board also considered Fidelity fee structures and other information on clients that FMR and its affiliates service in other competitive markets, such as other mutual funds advised or subadvised by FMR or its affiliates, pension plan clients, and other institutional clients.
Based on its review, the Board concluded that the total expenses for each class of the fund were reasonable, although in some cases above the median of the universe presented for comparison, in light of the services that the fund and its shareholders receive and the other factors considered.
Costs of the Services and Profitability. The Board considered the revenues earned and the expenses incurred by Fidelity in conducting the business of developing, market ing, distributing, managing, administering and servicing the fund and its shareholders. The Board also considered the level of Fidelity’s profits in respect of all the Fidelity funds.
On an annual basis, FMR presents to the Board Fidelity’s profitability for the fund. Fidelity calculates the profitability for each fund, as well as aggregate profitability for
groups of Fidelity funds and all Fidelity funds, using a series of detailed revenue and cost allocation methodologies which originate with the audited books and records of Fidelity. The Audit Committee of the Board reviews any significant changes from the prior year’s methodologies.
PricewaterhouseCoopers LLP (PwC), independent registered accounting firm and auditor to Fidelity and certain Fidelity funds, has been engaged annually by the Board as part of the Board’s assessment of the results of Fidelity’s profitability analysis. PwC’s engagement includes the review and assessment of Fidelity’s methodologies used in determining the revenues and expenses attributable to Fidelity’s mutual fund business, and completion of agreed upon procedures surrounding the mathematical accuracy of fund profitability and its conformity to allocation methodologies. After considering PwC’s reports issued under the engagement and information provided by Fidelity, the Board believes that while other allocation methods may also be reasonable, Fidelity’s profitabil ity methodologies are reasonable in all material respects.
The Board has also reviewed Fidelity’s non fund businesses and any fall out benefits related to the mutual fund business as well as cases where Fidelity’s affiliates may benefit from or be related to the fund’s business. In addition, a special committee of the Board reviewed services provided to Fidelity by its affiliates and determined that the fees that Fidelity paid for such services were reasonable.
The Board considered the costs of the services provided by and the profits realized by Fidelity in connection with the operation of the fund and determined that the amount of profit is a fair entrepreneurial profit for the management of the fund.
Economies of Scale. The Board considered whether there have been economies of scale in respect of the management of the Fidelity funds, whether the Fidelity funds (including the fund) have appropriately benefited from any such economies of scale, and whether there is potential for realization of any further economies of scale. The Board considered the extent to which the fund will benefit from economies of scale through increased services to the fund, through waivers or reimbursements, or through fee or expense reductions, including reductions that occur through operation of the transfer agent agreement. The transfer agent fee varies in part based on the number of accounts in the fund. If the number of accounts decreases or the average account size increases, the overall transfer agent fee rate decreases.
The Board recognized that the fund’s management contract incorporates a “group fee” structure, which provides for lower fee rates as total fund assets under FMR’s manage ment increase, and for higher fee rates as total fund assets under FMR’s management decrease. The Board considered that the group fee is designed to deliver the benefits of economies of scale to fund shareholders when total fund assets increase, even if assets of any particular fund are unchanged or have declined, because some portion of Fidelity’s costs are attributable to services provided to all Fidelity funds, and all funds benefit if
71 Annual Report
Board Approval of Investment Advisory Contracts and Management Fees continued
those costs can be allocated among more assets. The Board concluded that, given the group fee structure, fund shareholders will achieve a certain level of economies of scale as assets under FMR’s management increase at the fund complex level, regardless of whether Fidelity achieves any such economies of scale.
The Board further concluded that any potential economies of scale are being shared between fund shareholders and Fidelity in an appropriate manner.
Additional Information Requested by the Board. In order to develop fully the factual basis for consideration of the Advisory Contracts, the Board requested additional information regarding (i) equity fund transfer agency fees; (ii) Fidelity’s fund profitability methodology and the impact of various changes in the methodology over time; (iii) benefits to shareholders from economies of scale; (iv) composition and characteristics of various fund and industry data used in comparisons; and (v) com pensation of portfolio managers and research analysts.
Based on its evaluation of all of the conclusions noted above, and after considering all material factors, the Board ultimately concluded that the existing advisory fee structures are fair and reasonable, and that the fund’s existing Advisory Contracts should be renewed.
73 Annual Report
75 Annual Report
77 Annual Report
79 Annual Report
Investment Adviser
Fidelity Management & Research Company
Boston, MA
Investment Sub Advisers
FMR Co., Inc.
Fidelity Management & Research
(U.K.) Inc.
Fidelity Management & Research
(Far East) Inc.
Fidelity International Investment Advisors
Fidelity Investments Japan Limited
Fidelity International Investment Advisors (U.K.) Limited
General Distributor
Fidelity Distributors Corporation
Boston, MA
Transfer and Service Agents
Fidelity Investments Institutional
Operations Company, Inc.
Boston, MA
Fidelity Service Company, Inc.
Boston, MA
Custodian
Citibank, N.A.
New York, NY
|
ASDII-UANN-0106
1.802531.101
|

Item 2. Code of Ethics
As of the end of the period, November 30, 2005, Fidelity Financial Trust (the trust) has adopted a code of ethics, as defined in Item 2 of Form N-CSR, that applies to its President and Treasurer and its Chief Financial Officer. A copy of the code of ethics is filed as an exhibit to this Form N-CSR.
Item 3. Audit Committee Financial Expert
The Board of Trustees of the trust has determined that Marie L. Knowles is an audit committee financial expert, as defined in Item 3 of Form N-CSR. Ms. Knowles is independent for purposes of Item 3 of Form N-CSR.
Item 4. Principal Accountant Fees and Services
(a) Audit Fees.
For the fiscal years ended November 30, 2005 and November 30, 2004, the aggregate Audit Fees billed by PricewaterhouseCoopers LLP (PwC) for professional services rendered for the audits of the financial statements, or services that are normally provided in connection with statutory and regulatory filings or engagements for those fiscal years, for the Fidelity Convertible Securities Fund, Fidelity Equity-Income II Fund, Fidelity Independence Fund and Fidelity Strategic Dividend & Income Fund (the funds) and for all funds in the Fidelity Group of Funds are shown in the table below.
Fund | 2005A | 2004A,B |
Fidelity Convertible Securities Fund | $66,000 | $60,000 |
Fidelity Equity-Income II Fund | $96,000 | $86,000 |
Fidelity Independence Fund | $64,000 | $64,000 |
Fidelity Strategic Dividend & Income Fund | $33,000 | $32,000 |
All funds in the Fidelity Group of Funds audited by PwC | $12,100,000 | $10,600,000 |
A | Aggregate amounts may reflect rounding. |
B | Fidelity Strategic Dividend & Income Fund commenced operations on December 23, 2003. |
(b) Audit-Related Fees.
In each of the fiscal years ended November 30, 2005 and November 30, 2004 the aggregate Audit-Related Fees billed by PwC for services rendered for assurance and related services to each fund that are reasonably related to the performance of the audit or review of the fund's financial statements, but not reported as Audit Fees, are shown in the table below.
Fund | 2005A | 2004A,B |
Fidelity Convertible Securities Fund | $0 | $0 |
Fidelity Equity-Income II Fund | $0 | $0 |
Fidelity Independence Fund | $0 | $0 |
Fidelity Strategic Dividend & Income Fund | $0 | $0 |
A | Aggregate amounts may reflect rounding. |
B | Fidelity Strategic Dividend & Income Fund commenced operations on December 23, 2003. |
In each of the fiscal years ended November 30, 2005 and November 30, 2004, the aggregate Audit-Related Fees that were billed by PwC that were required to be approved by the Audit Committee for services rendered on behalf of Fidelity Management & Research Company (FMR) and entities controlling, controlled by, or under common control with FMR (not including any sub-adviser whose role is primarily portfolio management and is subcontracted with or overseen by another investment adviser) that provide ongoing services to the funds ("Fund Service Providers") for assurance and related services that relate directly to the operations and financial reporting of each fund that are reasonably related to the performance of the audit or review of the fund's financial statements, but not reported as Audit Fees, are shown in the table below.
Billed By | 2005A | 2004A,B |
PwC | $0 | $0 |
A | Aggregate amounts may reflect rounding. |
B | May include amounts billed prior to Fidelity Strategic Dividend & Income Fund's commencement of operations. |
Fees included in the audit-related category comprise assurance and related services (e.g., due diligence services) that are traditionally performed by the independent registered public accounting firm. These audit-related services include due diligence related to mergers and acquisitions, accounting consultations and audits in connection with acquisitions, internal control reviews, attest services that are not required by statute or regulation and consultation concerning financial accounting and reporting standards.
(c) Tax Fees.
In each of the fiscal years ended November 30, 2005 and November 30, 2004, the aggregate Tax Fees billed by PwC for professional services rendered for tax compliance, tax advice, and tax planning for each fund is shown in the table below.
Fund | 2005A | 2004A,B |
Fidelity Convertible Securities Fund | $3,400 | $3,200 |
Fidelity Equity-Income II Fund | $3,400 | $3,200 |
Fidelity Independence Fund | $3,400 | $3,200 |
Fidelity Strategic Dividend & Income Fund | $2,200 | $2,200 |
A | Aggregate amounts may reflect rounding. |
B | Fidelity Strategic Dividend & Income Fund commenced operations on December 23, 2003. |
In each of the fiscal years ended November 30, 2005 and November 30, 2004, the aggregate Tax Fees billed by PwC that were required to be approved by the Audit Committee for professional services rendered on behalf of the Fund Service Providers for tax compliance, tax advice, and tax planning that relate directly to the operations and financial reporting of each fund is shown in the table below.
Billed By | 2005A | 2004A,B |
PwC | $0 | $0 |
A | Aggregate amounts may reflect rounding. |
B | May include amounts billed prior to Fidelity Strategic Dividend & Income Fund's commencement of operations. |
Fees included in the Tax Fees category comprise all services performed by professional staff in the independent registered public accounting firm's tax division except those services related to the audit. Typically, this category would include fees for tax compliance, tax planning, and tax advice. Tax compliance, tax advice, and tax planning services include preparation of original and amended tax returns, claims for refund and tax payment-planning services, assistance with tax audits and appeals, tax advice related to mergers and acquisitions and requests for rulings or technical advice from taxing authorities.
(d) All Other Fees.
In each of the fiscal years ended November 30, 2005 and November 30, 2004, the aggregate Other Fees billed by PwC for all other non-audit services rendered to the funds is shown in the table below.
Fund | 2005A | 2004A,B |
Fidelity Convertible Securities Fund | $2,900 | $2,800 |
Fidelity Equity-Income II Fund | $12,200 | $11,600 |
Fidelity Independence Fund | $5,300 | $5,100 |
Fidelity Strategic Dividend & Income Fund | $2,000 | $1,500 |
A | Aggregate amounts may reflect rounding. |
B | Fidelity Strategic Dividend & Income Fund commenced operations on December 23, 2003. |
In each of the fiscal years ended November 30, 2005 and November 30, 2004, the aggregate Other Fees billed by PwC that were required to be approved by the Audit Committee for all other non-audit services rendered on behalf of the Fund Service Providers that relate directly to the operations and financial reporting of each fund is shown in the table below.
Billed By | 2005A | 2004A,B |
PwC | $170,000 | $540,000 |
A | Aggregate amounts may reflect rounding. |
B | May include amounts billed prior to Fidelity Strategic Dividend & Income Fund's commencement of operations. |
Fees included in the All Other Fees category include services related to internal control reviews, strategy and other consulting, financial information systems design and implementation, consulting on other information systems, and other tax services unrelated to the fund.
(e) (1) | Audit Committee Pre-Approval Policies and Procedures: |
The trust's Audit Committee must pre-approve all audit and non-audit services provided by the independent registered public accounting firm relating to the operations or financial reporting of the funds. Prior to the commencement of any audit or non-audit services to a fund, the Audit Committee reviews the services to determine whether they are appropriate and permissible under applicable law.
The trust's Audit Committee has adopted policies and procedures to, among other purposes, provide a framework for the Committee's consideration of non-audit services by the audit firms that audit the Fidelity funds. The policies and procedures require that any non-audit service provided by a fund audit firm to a Fidelity Fund and any non-audit service provided by a fund auditor to a Fund Service Provider that relates directly to the operations and financial reporting of a Fidelity fund (Covered Service) are subject to approval by the Audit Committee before such service is provided. Non-audit services provided by a fund audit firm for a Fund Service Provider that do not relate directly to the operations and financial reporting of a Fidelity fund (Non-Covered Service) but that are expected to exceed $50,000 are also subject to pre-approval by the Audit Committee.
All Covered Services, as well as Non-Covered Services that are expected to exceed $50,000, must be approved in advance of provision of the service either: (i) by formal resolution of the Audit Committee, or (ii) by oral or written approval of the service by the Chair of the Audit Committee (or if the Chair is unavailable, such other member of the Audit Committee as may be designated by the Chair to act in the Chair's absence). The approval contemplated by (ii) above is permitted where the Treasurer determines that action on such an engagement is necessary before the next meeting of the Audit Committee. Neither pre-approval nor advance notice of Non-Covered Service engagements for which fees are not expected to exceed $50,000 is required; such engagements are to be reported to the Audit Committee monthly.
(e) (2) | Services approved pursuant to paragraph (c)(7)(i)(C) of Rule 2-01 of Regulation S-X: |
Audit-Related Fees:
There were no amounts that were approved by the Audit Committee pursuant to the de minimis exception for the fiscal years ended November 30, 2005 and November 30, 2004 on behalf of each fund.
There were no amounts that were required to be approved by the Audit Committee pursuant to the de minimis exception for the fiscal years ended November 30, 2005 and November 30, 2004 on behalf of the Fund Service Providers that relate directly to the operations and financial reporting of each fund.
Tax Fees:
There were no amounts that were approved by the Audit Committee pursuant to the de minimis exception for the fiscal years ended November 30, 2005 and November 30, 2004 on behalf of each fund.
There were no amounts that were required to be approved by the Audit Committee pursuant to the de minimis exception for the fiscal years ended November 30, 2005 and November 30, 2004 on behalf of the Fund Service Providers that relate directly to the operations and financial reporting of each fund.
All Other Fees:
There were no amounts that were approved by the Audit Committee pursuant to the de minimis exception for the fiscal years ended November 30, 2005 and November 30, 2004 on behalf of each fund.
There were no amounts that were required to be approved by the Audit Committee pursuant to the de minimis exception for the fiscal years ended November 30, 2005 and November 30, 2004 on behalf of the Fund Service Providers that relate directly to the operations and financial reporting of each fund.
(f) Not applicable.
(g) For the fiscal years ended November 30, 2005 and November 30, 2004, the aggregate fees billed by PwC of $3,700,000A and $2,750,000A,B for non-audit services rendered on behalf of the funds, FMR (not including any sub-adviser whose role is primarily portfolio management and is subcontracted with or overseen by another investment adviser) and Fund Service Providers relating to Covered Services and Non-Covered Services are shown in the table below.
| 2005A | 2004A,B |
Covered Services | $200,000 | $600,000 |
Non-Covered Services | $3,500,000 | $2,150,000 |
A | Aggregate amounts may reflect rounding. |
B | May include amounts billed prior to Fidelity Strategic Dividend & Income Fund's commencement of operations. |
(h) The trust's Audit Committee has considered Non-Covered Services that were not pre-approved that were provided by PwC to Fund Service Providers to be compatible with maintaining the independence of PwC in its audit of the funds, taking into account representations from PwC, in accordance with Independence Standards Board Standard No.1, regarding its independence from the funds and their related entities.
Item 5. Audit Committee of Listed Registrants
Not applicable.
Item 6. Schedule of Investments
Not applicable.
Item 7. Disclosure of Proxy Voting Policies and Procedures for Closed-End Management Investment Companies
Not applicable.
Item 8. Portfolio Managers of Closed-End Management Investment Companies
Not applicable.
Item 9. Purchase of Equity Securities by Closed-End Management Investment Company and Affiliated Purchasers
Not applicable.
Item 10. Submission of Matters to a Vote of Security Holders
There were no material changes to the procedures by which shareholders may recommend nominees to the trust's Board of Trustees.
Item 11. Controls and Procedures
(a)(i) The President and Treasurer and the Chief Financial Officer have concluded that the trust's disclosure controls and procedures (as defined in Rule 30a-3(c) under the Investment Company Act) provide reasonable assurances that material information relating to the trust is made known to them by the appropriate persons, based on their evaluation of these controls and procedures as of a date within 90 days of the filing date of this report.
(a)(ii) There was no change in the trust's internal control over financial reporting (as defined in Rule 30a-3(d) under the Investment Company Act) that occurred during the second fiscal quarter of the period covered by this report that has materially affected, or is reasonably likely to materially affect, the trust's internal control over financial reporting.
Item 12. Exhibits
(a) | (1) | Code of Ethics pursuant to Item 2 of Form N-CSR is filed and attached hereto as EX-99.CODE ETH. |
(a) | (2) | Certification pursuant to Rule 30a-2(a) under the Investment Company Act of 1940 (17 CFR 270.30a-2(a)) is filed and attached hereto as Exhibit 99.CERT. |
(a) | (3) | Not applicable. |
(b) | | Certification pursuant to Rule 30a-2(b) under the Investment Company Act of 1940 (17 CFR 270.30a-2(b)) is furnished and attached hereto as Exhibit 99.906CERT. |
SIGNATURES
Pursuant to the requirements of the Securities Exchange Act of 1934 and the Investment Company Act of 1940, the registrant has duly caused this report to be signed on its behalf by the undersigned, thereunto duly authorized.
Fidelity Financial Trust
By: | /s/Christine Reynolds |
| Christine Reynolds |
| President and Treasurer |
| |
Date: | January 20, 2006 |
Pursuant to the requirements of the Securities Exchange Act of 1934 and the Investment Company Act of 1940, this report has been signed below by the following persons on behalf of the registrant and in the capacities and on the dates indicated.
By: | /s/Christine Reynolds |
| Christine Reynolds |
| President and Treasurer |
| |
Date: | January 20, 2006 |
By: | /s/Paul M. Murphy |
| Paul M. Murphy |
| Chief Financial Officer |
| |
Date: | January 20, 2006 |