UNITED STATES
SECURITIES AND EXCHANGE COMMISSION
Washington, D.C. 20549
FORM N-CSR
CERTIFIED SHAREHOLDER REPORT OF REGISTERED
MANAGEMENT INVESTMENT COMPANIES
Investment Company Act file number 811-3587
Fidelity Financial Trust
(Exact name of registrant as specified in charter)
82 Devonshire St., Boston, Massachusetts 02109
(Address of principal executive offices) (Zip code)
Eric D. Roiter, Secretary
82 Devonshire St.
Boston, Massachusetts 02109
(Name and address of agent for service)
Registrant's telephone number, including area code: 617-563-7000
Date of fiscal year end: | November 30 |
Date of reporting period: | November 30, 2003 |
Item 1. Reports to Stockholders
Fidelity®
Convertible Securities
Fund
Annual Report
November 30, 2003
(2_fidelity_logos) (Registered_Trademark)
Contents
Chairman's Message | Ned Johnson's message to shareholders. | |
Performance | How the fund has done over time. | |
Management's Discussion | The manager's review of fund performance, strategy and outlook. | |
Investment Changes | A summary of major shifts in the fund's investments over the past six months. | |
Investments | A complete list of the fund's investments with their market values. | |
Financial Statements | Statements of assets and liabilities, operations, and changes in net assets, | |
Notes | Notes to the financial statements. | |
Auditors' Opinion | ||
Trustees and Officers | ||
Distributions |
For a free copy of the fund's proxy voting guidelines visit www.fidelity.com/goto/proxyguidelines, call 1-800-544-8544, or visit the Securities and Exchange Commission (SEC)'s web site at www.sec.gov.
Standard & Poor's, S&P and S&P 500 are registered service marks of The McGraw-Hill Companies, Inc. and have been licensed for use by Fidelity Distributors Corporation.
Other third party marks appearing herein are the property of their respective owners.
All other marks appearing herein are registered or unregistered trademarks or service marks of FMR Corp. or an affiliated company.
(Recycle graphic) This report is printed on recycled paper using soy-based inks.
This report and the financial statements contained herein are submitted for the general information of the shareholders of the fund. This report is not authorized for distribution to prospective investors in the fund unless preceded or accompanied by an effective prospectus.
Mutual fund shares are not deposits or obligations of, or guaranteed by, any depository institution. Shares are not insured by the FDIC, Federal Reserve Board or any other agency, and are subject to investment risks, including possible loss of principal amount invested.
Neither the fund nor Fidelity Distributors Corporation is a bank.
For more information on any Fidelity fund, including charges and expenses, call 1-800-544-6666 for a free prospectus. Read it carefully before you invest or send money.
Annual Report
Chairman's Message
(photo_of_Edward_C_Johnson_3d)
Dear Shareholder:
Many of you have read or heard news stories recently that were critical of mutual funds and made allegations that the mutual fund industry has been less than forthright. I find these reports unsettling and not necessarily an accurate picture of the overall industry, and I would like you to know where we at Fidelity stand.
With specific regard to allegations that certain mutual fund companies were violating the Securities and Exchange Commission's forward pricing rules or were involved in so-called "market timing" activities, I want to say two things:
First, Fidelity does not have agreements that permit customers who buy fund shares after 4 p.m. to obtain the 4 p.m. price. This is not to say that someone could not deceive the company through fraudulent acts. But I underscore that we have no so-called "agreements" which would permit this illegal practice.
Second, Fidelity has been on record for years opposing predatory short-term trading which adversely affects other shareholders in a mutual fund. In fact, in the 1980s, we began charging a fee - which is returned to the fund and, therefore, to investors - to discourage this activity. What's more, several years ago we took the industry lead in developing a Fair Value Pricing Policy to prevent market timing on foreign securities in our funds. It is reasonable to assume that another structure can be developed that would alter the system to make it much more difficult for predatory traders to operate. This, however, will only be achieved through close cooperation among regulators, legislators and the industry.
Certainly no industry is perfect, and there have been instances of unethical and illegal activity from time to time within the mutual fund industry. When this occurs, confessed or convicted offenders should be dealt with appropriately. Clearly, every system can be improved. We applaud well thought out improvements by regulators, legislators and industry representatives that achieve the common goal of building and protecting the value of investors' holdings. But we remain concerned about the risk of over-regulation and the quick application of simplistic solutions to intricate problems.
For more than 57 years, Fidelity Investments has worked very hard to improve its products and service to justify your trust. When our family founded this company in 1946, we had only a few hundred customers. Many of them were family and friends. Today, we serve more than 18 million customers including individual investors and participants in retirement plans across America.
Let me close by saying that we do not take your trust in us for granted, and we realize that we must always work to improve all aspects of our service to you. In turn, we urge you to continue your active participation with your financial matters, so that your interests can be well served.
Best regards,
/s/Edward C. Johnson 3d
Edward C. Johnson 3d
Annual Report
Performance: The Bottom Line
Average annual total return reflects the change in the value of an investment, assuming reinvestment of the fund's dividend income and capital gains (the profits earned upon the sale of securities that have grown in value) and assuming a constant rate of performance each year. The $10,000 table and the fund's returns do not reflect the deduction of taxes that a shareholder would pay on fund distributions or the redemption of fund shares. During periods of reimbursement by Fidelity, a fund's total return will be greater than it would be had the reimbursement not occurred. How a fund did yesterday is no guarantee of how it will do tomorrow.
Average Annual Total Returns
Periods ended November 30, 2003 | Past 1 | Past 5 | Past 10 |
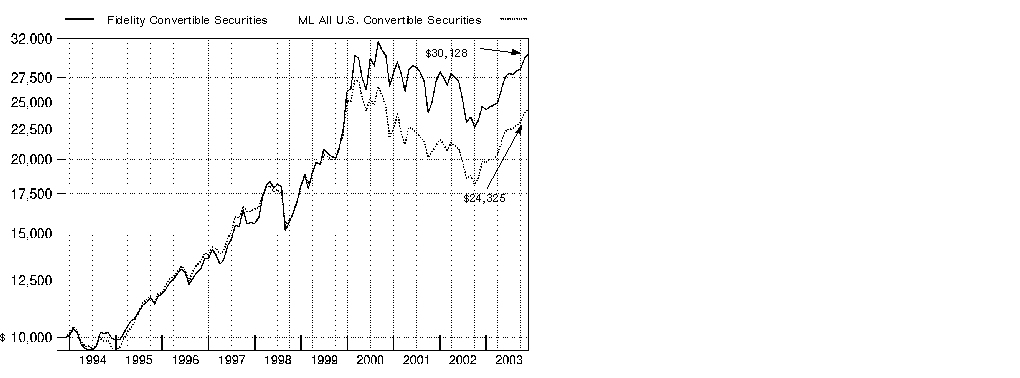
Fidelity® Convertible Securities | 22.48% | 12.09% | 11.66% |
$10,000 Over 10 Years
Let's say hypothetically that $10,000 was invested in Fidelity® Convertible Securities Fund on November 30, 1993. The chart shows how the value of your investment would have grown, and also shows how the Merrill Lynch® All U.S. Convertible Securities Index did over the same period.
Annual Report
Management's Discussion of Fund Performance
Comments from Victor Thay, Portfolio Manager of Fidelity® Convertible Securities Fund
A healthier economy translated into improved equity market performance for the year ending November 30, 2003. Early signals of an economic recovery were seen when growth in gross domestic product (GDP) surprised on the upside in the first and second quarters of 2003. The Federal Reserve Board added further fuel in June by dropping interest rates to a 45-year low. Federal tax cuts and credits, as well as a boom in mortgage refinancing, put even more discretionary income in consumers' pockets. In the third quarter, GDP growth, propelled by robust consumer and business spending, grew 8.2%, its highest level since 1984. Consumer spending had its strongest third quarter since 1997, while corporate profits had their best showing since 1992. As a result of 2003's economic momentum, stocks enjoyed their best showing since 1999 and were poised to end their three-year losing streak. For the year ending November 30, 2003, the Standard & Poor's 500SM Index gained 15.09%, the Dow Jones Industrial AverageSM returned 12.47% and the NASDAQ Composite® Index advanced 33.23%.
The fund gained 22.48% for the year ending November 30, 2003, while the Merrill Lynch® All U.S. Convertible Securities Index and the LipperSM Convertible Securities Funds Average rose 22.46% and 22.06%, respectively. I was more aggressive at times during the first half of the period, focusing on a mix of securities likely to benefit from a cyclical upturn in the economy. This mix included more-volatile equity-sensitive convertible issues, as well as some common stocks and high-yield bonds that I felt had better upside potential. This positioning paid off nicely given improving credit and equity markets, particularly versus our average competitor, which may have had less pure-equity or high-yield exposure. Rebounding wireless services names Crown Castle and Nextel Communications led the way versus the index, followed by Internet holdings Amazon.com and Yahoo!. On the down side, I turned too defensive prematurely and thus didn't have enough overall equity risk exposure when the markets continued to rally. We lost ground in technology, as I shied away from beaten-down, lower-quality telecom equipment names - including Nortel Networks and Lucent - that snapped back sharply. Elsewhere, media holdings such as Viacom and Radio One failed to rebound and ended up trailing the market by a sizable margin.
The views expressed in this statement reflect those of the portfolio manager only through the end of the period of the report as stated on the cover and do not necessarily represent the views of Fidelity or any other person in the Fidelity organization. Any such views are subject to change at any time based upon market or other conditions and Fidelity disclaims any responsibility to update such views. These views may not be relied on as investment advice and, because investment decisions for a Fidelity fund are based on numerous factors, may not be relied on as an indication of trading intent on behalf of any Fidelity fund.
Annual Report
Investment Changes
Top Ten Investments as of November 30, 2003 | ||
(excluding cash equivalents) | % of fund's | % of fund's net assets |
Amazon.com, Inc. 4.75% 2/1/09 | 3.0 | 3.0 |
Tyco International Group SA 3.125% 1/15/23 | 2.8 | 2.6 |
Baxter International, Inc. 7.00% | 2.3 | 1.9 |
Liberty Media Corp. 3.25% 3/15/31 | 1.9 | 2.3 |
EchoStar Communications Corp. Class A | 1.9 | 1.4 |
ALZA Corp. 0% 7/28/20 | 1.8 | 0.0 |
CIENA Corp. 3.75% 2/1/08 | 1.8 | 1.6 |
BEA Systems, Inc. 4% 12/15/06 | 1.5 | 0.0 |
Freeport-McMoRan Copper & Gold, Inc. | 1.5 | 1.1 |
Radio One, Inc. 6.5% | 1.5 | 1.3 |
20.0 | ||
Top Five Market Sectors as of November 30, 2003 | ||
% of fund's | % of fund's net assets | |
Information Technology | 23.2 | 19.8 |
Health Care | 18.9 | 13.6 |
Consumer Discretionary | 15.3 | 15.1 |
Financials | 11.1 | 12.3 |
Industrials | 7.2 | 10.5 |
Asset Allocation (% of fund's net assets) | |||||||
As of November 30, 2003 * | As of May 31, 2003 ** | ||||||
 | Convertible | | Convertible | ||||
 | Stocks 15.0% | | Stocks 11.4% | ||||
 | Nonconvertible | | Nonconvertible | ||||
 | Short-Term | | Short-Term | ||||
* Foreign | 13.5% | ** Foreign investments | 12.2% | ||||

Annual Report
Investments November 30, 2003
Showing Percentage of Net Assets
Corporate Bonds - 63.4% | ||||
Principal Amount | Value (Note 1) | |||
Convertible Bonds - 62.0% | ||||
CONSUMER DISCRETIONARY - 9.4% | ||||
Hotels, Restaurants & Leisure - 0.7% | ||||
Navigant International, Inc. 4.875% 11/1/23 (f) | $ 1,000 | $ 1,128 | ||
Starwood Hotels & Resorts Worldwide, Inc.: | ||||
0% 5/25/21 (f) | 5,400 | 3,078 | ||
0% 5/25/21 | 3,000 | 1,710 | ||
WMS Industries, Inc. 2.75% 7/15/10 (f) | 4,000 | 6,200 | ||
12,116 | ||||
Household Durables - 0.8% | ||||
American Greetings Corp. 7% 7/15/06 | 1,100 | 1,879 | ||
Lennar Corp. 0% 4/4/21 | 17,900 | 12,829 | ||
14,708 | ||||
Internet & Catalog Retail - 3.1% | ||||
Alloy, Inc. 5.375% 8/1/23 (f) | 2,000 | 1,938 | ||
Amazon.com, Inc. 4.75% 2/1/09 | 52,930 | 53,185 | ||
55,123 | ||||
Media - 4.4% | ||||
Interpublic Group of Companies, Inc.: | ||||
1.8% 9/16/04 | 14,300 | 13,854 | ||
1.87% 6/1/06 | 17,100 | 15,626 | ||
4.5% 3/15/23 (f) | 3,600 | 5,148 | ||
Lamar Advertising Co. 2.875% 12/31/10 | 7,200 | 7,209 | ||
Liberty Media Corp.: | ||||
3.25% 3/15/31 | 35,100 | 34,282 | ||
(Viacom, Inc. Class B (non-vtg.)) 3.25% 3/15/31 (f) | 1,600 | 1,563 | ||
77,682 | ||||
Specialty Retail - 0.4% | ||||
Sonic Automotive, Inc. 5.25% 5/7/09 | 7,225 | 6,895 | ||
TOTAL CONSUMER DISCRETIONARY | 166,524 | |||
CONSUMER STAPLES - 0.3% | ||||
Food & Staples Retailing - 0.3% | ||||
Duane Reade, Inc. 2.1478% 4/16/22 (e) | 2,400 | 1,261 | ||
Performance Food Group Co. 5.5% 10/16/08 | 3,100 | 3,962 | ||
5,223 | ||||
Corporate Bonds - continued | ||||
Principal Amount | Value (Note 1) | |||
Convertible Bonds - continued | ||||
ENERGY - 0.4% | ||||
Energy Equipment & Services - 0.2% | ||||
Pride International, Inc. 2.5% 3/1/07 | $ 2,100 | $ 2,369 | ||
Oil & Gas - 0.2% | ||||
Evergreen Resources, Inc. 4.75% 12/15/21 (f) | 2,000 | 2,660 | ||
McMoRan Exploration Co. 6% 7/2/08 (f) | 1,000 | 1,472 | ||
4,132 | ||||
TOTAL ENERGY | 6,501 | |||
FINANCIALS - 4.9% | ||||
Capital Markets - 0.4% | ||||
E*TRADE Group, Inc. 6% 2/1/07 | 7,100 | 7,127 | ||
Commercial Banks - 0.1% | ||||
Silicon Valley Bancshares 0% 6/15/08 | 1,600 | 1,932 | ||
Consumer Finance - 1.2% | ||||
Providian Financial Corp.: | ||||
3.25% 8/15/05 | 10,000 | 9,500 | ||
4% 5/15/08 | 10,900 | 12,344 | ||
21,844 | ||||
Diversified Financial Services - 2.1% | ||||
Bunge Ltd. Finance Corp. 3.75% 11/15/22 (f) | 5,000 | 5,481 | ||
IOS Capital LLC 5% 5/1/07 (f) | 14,500 | 13,857 | ||
Navistar Financial Corp. 4.75% 4/1/09 | 6,700 | 6,998 | ||
Teva Pharmaceutical Finance BV 0.375% 11/15/22 (f) | 7,000 | 10,255 | ||
36,591 | ||||
Insurance - 0.5% | ||||
Fairfax Financial Holdings Ltd. 5% 7/15/23 (f) | 1,500 | 1,469 | ||
HCC Insurance Holdings, Inc. 1.3% 4/1/23 | 3,000 | 3,154 | ||
LandAmerica Financial Group, Inc. | 1,000 | 1,039 | ||
XL Capital Ltd. 0% 5/23/21 | 5,000 | 3,188 | ||
8,850 | ||||
Real Estate - 0.6% | ||||
EOP Operating LP 7.25% 11/15/08 (f) | 8,000 | 8,410 | ||
MeriStar Hospitality Corp. 9.5% 4/1/10 | 1,500 | 1,764 | ||
10,174 | ||||
TOTAL FINANCIALS | 86,518 | |||
Corporate Bonds - continued | ||||
Principal Amount | Value (Note 1) | |||
Convertible Bonds - continued | ||||
HEALTH CARE - 16.3% | ||||
Biotechnology - 3.9% | ||||
BioMarin Pharmaceutical, Inc. 3.5% 6/15/08 (f) | $ 2,000 | $ 1,805 | ||
Celgene Corp. 1.75% 6/1/08 (f) | 2,000 | 2,385 | ||
Cephalon, Inc. 2.5% 12/15/06 | 9,300 | 8,707 | ||
Ciphergen Biosystems, Inc. 4.5% 9/1/08 (f) | 5,000 | 6,038 | ||
Connetics Corp. 2.25% 5/30/08 (f) | 1,500 | 1,574 | ||
Corixa Corp. 4.25% 7/1/08 (f) | 1,000 | 933 | ||
Cubist Pharmaceuticals, Inc. 5.5% 11/1/08 | 2,500 | 2,213 | ||
Enzon Pharmaceuticals, Inc. 4.5% 7/1/08 | 11,800 | 10,045 | ||
Gilead Sciences, Inc. 2% 12/15/07 (f) | 8,500 | 11,723 | ||
Indevus Pharmaceuticals, Inc. 6.25% 7/15/08 (f) | 500 | 575 | ||
Invitrogen Corp.: | ||||
2% 8/1/23 (f) | 9,200 | 11,236 | ||
2.25% 12/15/06 | 8,500 | 8,861 | ||
Vertex Pharmaceuticals, Inc. 5% 9/19/07 | 3,500 | 3,019 | ||
69,114 | ||||
Health Care Equipment & Supplies - 3.3% | ||||
Bausch & Lomb, Inc. 1.6388% 8/1/23 (f)(g) | 9,100 | 10,519 | ||
Cooper Companies, Inc.: | ||||
2.625% 7/1/23 (f) | 7,500 | 9,272 | ||
2.625% 7/1/23 | 1,300 | 1,607 | ||
Fisher Scientific International, Inc. 2.5% 10/1/23 (f) | 14,800 | 16,422 | ||
Integra LifeSciences Holdings Corp.: | ||||
2.5% 3/15/08 (f) | 6,000 | 6,975 | ||
2.5% 3/15/08 | 1,300 | 1,511 | ||
ResMed, Inc. 4% 6/20/06 | 8,030 | 8,176 | ||
Wilson Greatbatch Technologies, Inc. | 3,000 | 3,608 | ||
58,090 | ||||
Health Care Providers & Services - 2.7% | ||||
Health Management Associates, Inc. 1.5% 8/1/23 (f) | 6,000 | 6,773 | ||
LifePoint Hospitals, Inc. 4.5% 6/1/09 | 12,400 | 12,230 | ||
Service Corp. International (SCI) 6.75% 6/22/08 | 24,870 | 25,725 | ||
WebMD Corp. 3.25% 4/1/07 | 2,100 | 2,478 | ||
47,206 | ||||
Pharmaceuticals - 6.4% | ||||
Allergan, Inc.: | ||||
0% 11/6/22 (f) | 10,000 | 9,403 | ||
0% 11/6/22 | 6,300 | 5,924 | ||
Corporate Bonds - continued | ||||
Principal Amount | Value (Note 1) | |||
Convertible Bonds - continued | ||||
HEALTH CARE - continued | ||||
Pharmaceuticals - continued | ||||
ALZA Corp. 0% 7/28/20 | $ 47,000 | $ 32,371 | ||
ICN Pharmaceuticals, Inc. 6.5% 7/15/08 | 4,900 | 5,200 | ||
Isis Pharmaceuticals, Inc. 5.5% 5/1/09 (f) | 1,500 | 1,211 | ||
IVAX Corp. 4.5% 5/15/08 | 10,580 | 10,606 | ||
Medicis Pharmaceutical Corp. 2.5% 6/4/32 | 2,600 | 3,356 | ||
Pharmaceutical Resources, Inc. 2.875% 9/30/10 (f) | 1,600 | 1,832 | ||
Roche Holdings, Inc.: | ||||
0% 1/19/15 (f) | 12,800 | 9,760 | ||
0% 7/25/21 (f) | 30,000 | 17,363 | ||
Sepracor, Inc. 5.75% 11/15/06 | 7,700 | 7,411 | ||
Watson Pharmaceuticals, Inc.: | ||||
1.75% 3/15/23 (f) | 5,300 | 7,076 | ||
1.75% 3/15/23 | 1,300 | 1,723 | ||
113,236 | ||||
TOTAL HEALTH CARE | 287,646 | |||
INDUSTRIALS - 4.6% | ||||
Commercial Services & Supplies - 0.7% | ||||
Labor Ready, Inc. 6.25% 6/15/07 (f) | 7,500 | 13,059 | ||
Electrical Equipment - 0.1% | ||||
Artesyn Technologies, Inc. 5.5% 8/15/10 (f) | 600 | 784 | ||
Industrial Conglomerates - 3.5% | ||||
Tyco International Group SA: | ||||
2.75% 1/15/18 (f) | 11,272 | 13,104 | ||
3.125% 1/15/23 (f) | 39,900 | 48,778 | ||
61,882 | ||||
Machinery - 0.3% | ||||
Actuant Corp. 2% 11/15/23 (f) | 2,000 | 2,085 | ||
Wabash National Corp. 3.25% 8/1/08 (f) | 2,000 | 3,331 | ||
5,416 | ||||
Road & Rail - 0.0% | ||||
Yellow Corp. 3.375% 11/25/23 (f) | 500 | 516 | ||
TOTAL INDUSTRIALS | 81,657 | |||
Corporate Bonds - continued | ||||
Principal Amount | Value (Note 1) | |||
Convertible Bonds - continued | ||||
INFORMATION TECHNOLOGY - 17.3% | ||||
Communications Equipment - 4.2% | ||||
Andrew Corp. 3.25% 8/15/13 (f) | $ 700 | $ 829 | ||
Brocade Communications Systems, Inc. 2% 1/1/07 | 24,000 | 21,242 | ||
CIENA Corp. 3.75% 2/1/08 | 33,900 | 31,442 | ||
Comverse Technology, Inc.: | ||||
1.5% 12/1/05 (f) | 4,900 | 4,778 | ||
1.5% 12/1/05 | 1,500 | 1,463 | ||
Harris Corp. 3.5% 8/15/22 | 800 | 895 | ||
Juniper Networks, Inc. 4.75% 3/15/07 | 4,566 | 4,657 | ||
Nortel Networks Corp. 4.25% 9/1/08 | 9,300 | 8,765 | ||
74,071 | ||||
Computers & Peripherals - 0.8% | ||||
Electronics for Imaging, Inc. 1.5% 6/1/23 (f) | 2,000 | 2,453 | ||
Hutchinson Technology, Inc. 2.25% 3/15/10 | 5,200 | 6,794 | ||
Maxtor Corp. 6.8% 4/30/10 | 3,200 | 4,566 | ||
13,813 | ||||
Electronic Equipment & Instruments - 1.8% | ||||
Global Imaging Systems, Inc. 4% 11/15/08 (f) | 5,000 | 7,000 | ||
RadiSys Corp. 1.375% 11/15/23 (f) | 1,000 | 1,046 | ||
Sanmina-SCI Corp. 0% 9/12/20 | 20,500 | 10,377 | ||
Solectron Corp. liquid yield option note 0% 11/20/20 | 10,000 | 5,750 | ||
Tech Data Corp. 2% 12/15/21 | 4,000 | 3,943 | ||
Veeco Instruments, Inc. 4.125% 12/21/08 | 3,500 | 3,623 | ||
31,739 | ||||
Internet Software & Services - 0.6% | ||||
America Online, Inc. 0% 12/6/19 | 15,900 | 9,858 | ||
IT Services - 0.7% | ||||
Ciber, Inc. 2.875% 12/15/23 (f) | 1,500 | 1,543 | ||
CNET, Inc. 5% 3/1/06 | 9,945 | 9,597 | ||
DST Systems, Inc. 4.125% 8/15/23 (f) | 2,000 | 2,233 | ||
13,373 | ||||
Semiconductors & Semiconductor Equipment - 7.2% | ||||
Agere Systems, Inc. 6.5% 12/15/09 | 8,200 | 12,092 | ||
Amkor Technology, Inc.: | ||||
5% 3/15/07 | 7,330 | 7,367 | ||
5.75% 6/1/06 | 4,000 | 4,060 | ||
ASML Holding NV 5.5% 5/15/10 | EUR | 12,500 | 21,352 | |
Atmel Corp. 0% 5/23/21 | 13,500 | 5,670 | ||
Corporate Bonds - continued | ||||
Principal Amount | Value (Note 1) | |||
Convertible Bonds - continued | ||||
INFORMATION TECHNOLOGY - continued | ||||
Semiconductors & Semiconductor Equipment - continued | ||||
Conexant Systems, Inc.: | ||||
4% 2/1/07 | $ 14,500 | $ 13,666 | ||
4.25% 5/1/06 | 4,000 | 3,980 | ||
FEI Co. 5.5% 8/15/08 | 3,200 | 3,168 | ||
Infineon Technologies AG 4.25% 2/6/07 | EUR | 12,000 | 13,665 | |
International Rectifier Corp. 4.25% 7/15/07 | 3,540 | 3,540 | ||
LSI Logic Corp. 4% 11/1/06 | 24,780 | 24,284 | ||
PMC-Sierra, Inc. 3.75% 8/15/06 | 2,000 | 1,890 | ||
Vitesse Semiconductor Corp. 4% 3/15/05 | 12,000 | 11,820 | ||
126,554 | ||||
Software - 2.0% | ||||
BEA Systems, Inc. 4% 12/15/06 | 26,400 | 26,260 | ||
i2 Technologies, Inc. 5.25% 12/15/06 | 830 | 709 | ||
Mercury Interactive Corp. 4.75% 7/1/07 | 9,500 | 9,393 | ||
36,362 | ||||
TOTAL INFORMATION TECHNOLOGY | 305,770 | |||
MATERIALS - 3.9% | ||||
Chemicals - 0.1% | ||||
Millennium Chemicals, Inc. 4% 11/15/23 (f) | 1,750 | 1,982 | ||
Metals & Mining - 3.8% | ||||
Agnico-Eagle Mines Ltd. 4.5% 2/15/12 | 15,000 | 16,256 | ||
Freeport-McMoRan Copper & Gold, Inc.: | ||||
7% 2/11/11 (f) | 15,600 | 26,130 | ||
7% 2/11/11 | 5,800 | 9,715 | ||
Inco Ltd. yankee 3.5% 3/14/52 | 7,300 | 10,776 | ||
Steel Dynamics, Inc. 4% 12/15/12 | 3,700 | 5,051 | ||
67,928 | ||||
TOTAL MATERIALS | 69,910 | |||
TELECOMMUNICATION SERVICES - 3.7% | ||||
Diversified Telecommunication Services - 0.3% | ||||
Commonwealth Telephone Enterprises, Inc. | 1,516 | 1,529 | ||
Level 3 Communications, Inc. 6% 9/15/09 | 6,800 | 4,658 | ||
6,187 | ||||
Corporate Bonds - continued | ||||
Principal Amount | Value (Note 1) | |||
Convertible Bonds - continued | ||||
TELECOMMUNICATION SERVICES - continued | ||||
Wireless Telecommunication Services - 3.4% | ||||
American Tower Corp.: | ||||
3.25% 8/1/10 (f) | $ 9,700 | $ 11,624 | ||
6.25% 10/15/09 | 4,500 | 4,478 | ||
Crown Castle International Corp. 4% 7/15/10 | 2,000 | 2,890 | ||
Nextel Communications, Inc.: | ||||
5.25% 1/15/10 | 18,000 | 17,820 | ||
6% 6/1/11 | 10,000 | 11,700 | ||
Nextel Partners, Inc.: | ||||
1.5% 11/15/08 (f) | 4,000 | 6,830 | ||
1.5% 11/15/08 (f) | 3,300 | 3,878 | ||
59,220 | ||||
TOTAL TELECOMMUNICATION SERVICES | 65,407 | |||
UTILITIES - 1.2% | ||||
Electric Utilities - 0.1% | ||||
Xcel Energy, Inc. 7.5% 11/21/07 | 1,200 | 1,817 | ||
Multi-Utilities & Unregulated Power - 1.1% | ||||
AES Corp. 4.5% 8/15/05 | 7,200 | 6,844 | ||
El Paso Corp. 0% 2/28/21 | 27,400 | 12,090 | ||
18,934 | ||||
TOTAL UTILITIES | 20,751 | |||
TOTAL CONVERTIBLE BONDS | 1,095,907 | |||
Nonconvertible Bonds - 1.4% | ||||
CONSUMER DISCRETIONARY - 0.1% | ||||
Household Durables - 0.1% | ||||
Champion Home Builders Co. 11.25% 4/15/07 | 1,045 | 1,118 | ||
ENERGY - 0.1% | ||||
Oil & Gas - 0.1% | ||||
The Coastal Corp. 7.75% 6/15/10 | 2,390 | 2,091 | ||
Corporate Bonds - continued | ||||
Principal Amount | Value (Note 1) | |||
Nonconvertible Bonds - continued | ||||
INDUSTRIALS - 0.3% | ||||
Aerospace & Defense - 0.3% | ||||
BE Aerospace, Inc.: | ||||
8% 3/1/08 | $ 1,250 | $ 1,141 | ||
9.5% 11/1/08 | 4,485 | 4,261 | ||
5,402 | ||||
TELECOMMUNICATION SERVICES - 0.3% | ||||
Diversified Telecommunication Services - 0.3% | ||||
Telewest Communications PLC yankee 11.25% 11/1/08 (c) | 9,200 | 5,382 | ||
UTILITIES - 0.6% | ||||
Multi-Utilities & Unregulated Power - 0.6% | ||||
AES Corp. 9.5% 6/1/09 | 4,000 | 4,295 | ||
El Paso Corp. 7% 5/15/11 | 7,200 | 6,156 | ||
10,451 | ||||
TOTAL NONCONVERTIBLE BONDS | 24,444 | |||
TOTAL CORPORATE BONDS (Cost $1,003,191) | 1,120,351 | |||
Common Stocks - 14.8% | |||
Shares | |||
CONSUMER DISCRETIONARY - 3.9% | |||
Distributors - 0.2% | |||
Li & Fung Ltd. | 2,000,000 | 3,425 | |
Hotels, Restaurants & Leisure - 0.1% | |||
Krispy Kreme Doughnuts, Inc. (a) | 50,000 | 2,069 | |
Internet & Catalog Retail - 0.7% | |||
InterActiveCorp (a) | 396,700 | 13,032 | |
Leisure Equipment & Products - 0.2% | |||
Mega Bloks, Inc. (a) | 178,200 | 3,235 | |
Mega Bloks, Inc. (a)(f) | 21,800 | 397 | |
3,632 | |||
Common Stocks - continued | |||
Shares | Value (Note 1) | ||
CONSUMER DISCRETIONARY - continued | |||
Media - 2.0% | |||
Clear Media Ltd. (a) | 2,405,000 | $ 1,657 | |
EchoStar Communications Corp. Class A (a) | 978,669 | 33,745 | |
35,402 | |||
Specialty Retail - 0.2% | |||
Foot Locker, Inc. | 50,000 | 1,105 | |
Select Comfort Corp. (a) | 75,000 | 2,018 | |
3,123 | |||
Textiles Apparel & Luxury Goods - 0.5% | |||
Coach, Inc. (a) | 216,086 | 8,609 | |
TOTAL CONSUMER DISCRETIONARY | 69,292 | ||
CONSUMER STAPLES - 1.2% | |||
Food & Staples Retailing - 0.6% | |||
Sysco Corp. | 157,600 | 5,724 | |
United Natural Foods, Inc. (a) | 28,100 | 1,079 | |
Whole Foods Market, Inc. | 61,955 | 4,070 | |
10,873 | |||
Food Products - 0.6% | |||
Dean Foods Co. (a) | 264,800 | 8,688 | |
Tyson Foods, Inc. Class A | 100,000 | 1,365 | |
10,053 | |||
TOTAL CONSUMER STAPLES | 20,926 | ||
ENERGY - 2.0% | |||
Energy Equipment & Services - 1.2% | |||
National-Oilwell, Inc. (a) | 320,900 | 6,174 | |
Precision Drilling Corp. (a) | 100,000 | 3,924 | |
Trican Well Service Ltd. (a) | 150,000 | 2,827 | |
Weatherford International Ltd. (a) | 269,000 | 8,818 | |
21,743 | |||
Oil & Gas - 0.8% | |||
Apache Corp. | 124,950 | 8,971 | |
EnCana Corp. | 125,000 | 4,592 | |
13,563 | |||
TOTAL ENERGY | 35,306 | ||
Common Stocks - continued | |||
Shares | Value (Note 1) | ||
FINANCIALS - 0.6% | |||
Thrifts & Mortgage Finance - 0.6% | |||
Golden West Financial Corp., Delaware | 83,330 | $ 8,408 | |
New York Community Bancorp, Inc. | 52,800 | 2,051 | |
10,459 | |||
HEALTH CARE - 0.3% | |||
Health Care Equipment & Supplies - 0.3% | |||
St. Jude Medical, Inc. (a) | 82,800 | 5,245 | |
INDUSTRIALS - 0.4% | |||
Airlines - 0.0% | |||
JetBlue Airways Corp. (a) | 12,000 | 438 | |
Building Products - 0.1% | |||
Trex Co., Inc. (a) | 26,000 | 961 | |
Electrical Equipment - 0.0% | |||
Aura Systems, Inc. warrants 5/31/05 (a) | 1 | 0 | |
Machinery - 0.2% | |||
Terex Corp. (a) | 162,400 | 4,188 | |
Road & Rail - 0.1% | |||
Mullen Transportation, Inc. | 50,000 | 1,445 | |
TOTAL INDUSTRIALS | 7,032 | ||
INFORMATION TECHNOLOGY - 5.3% | |||
Communications Equipment - 1.8% | |||
Alcatel SA sponsored ADR (a) | 251,400 | 3,273 | |
Avaya, Inc. (a) | 808,600 | 10,997 | |
Comverse Technology, Inc. (a) | 462,700 | 8,898 | |
Juniper Networks, Inc. (a) | 294,500 | 5,557 | |
QLogic Corp. (a) | 10,056 | 571 | |
Sonus Networks, Inc. (a) | 70,600 | 645 | |
Telefonaktiebolaget LM Ericsson ADR (a) | 100,000 | 1,624 | |
31,565 | |||
Computers & Peripherals - 0.3% | |||
M-Systems Flash Disk Pioneers Ltd. (a) | 255,700 | 4,961 | |
Electronic Equipment & Instruments - 0.3% | |||
Veeco Instruments, Inc. (a) | 177,200 | 5,227 | |
Internet Software & Services - 1.2% | |||
Openwave Systems, Inc. (a) | 85,100 | 1,024 | |
Common Stocks - continued | |||
Shares | Value (Note 1) | ||
INFORMATION TECHNOLOGY - continued | |||
Internet Software & Services - continued | |||
Yahoo Japan Corp. (a) | 400 | $ 5,260 | |
Yahoo!, Inc. (a) | 356,081 | 15,304 | |
21,588 | |||
Semiconductors & Semiconductor Equipment - 1.3% | |||
Axcelis Technologies, Inc. (a) | 153,500 | 1,761 | |
Photronics, Inc. (a) | 100,000 | 1,847 | |
Rohm Co. Ltd. | 25,500 | 2,983 | |
Samsung Electronics Co. Ltd. | 23,800 | 9,207 | |
Tokyo Electron Ltd. | 60,400 | 4,275 | |
Trident Microsystems, Inc. (a) | 110,000 | 2,895 | |
22,968 | |||
Software - 0.4% | |||
BEA Systems, Inc. (a) | 320,652 | 4,072 | |
KFX, Inc. (a) | 154,500 | 925 | |
Red Hat, Inc. (a) | 139,500 | 1,853 | |
6,850 | |||
TOTAL INFORMATION TECHNOLOGY | 93,159 | ||
MATERIALS - 0.5% | |||
Chemicals - 0.3% | |||
Hercules Trust II unit | 5,600 | 3,908 | |
Lyondell Chemical Co. | 149,100 | 2,213 | |
6,121 | |||
Containers & Packaging - 0.2% | |||
Owens-Illinois, Inc. (a) | 290,000 | 3,271 | |
TOTAL MATERIALS | 9,392 | ||
TELECOMMUNICATION SERVICES - 0.6% | |||
Wireless Telecommunication Services - 0.6% | |||
Crown Castle International Corp. (a) | 22,312 | 277 | |
Nextel Communications, Inc. Class A (a) | 437,700 | 11,087 | |
11,364 | |||
TOTAL COMMON STOCKS (Cost $218,215) | 262,175 | ||
Preferred Stocks - 20.5% | |||
Shares | Value (Note 1) | ||
Convertible Preferred Stocks - 20.3% | |||
CONSUMER DISCRETIONARY - 1.9% | |||
Hotels, Restaurants & Leisure - 0.1% | |||
Six Flags, Inc. 7.25% PIERS | 68,000 | $ 1,471 | |
Media - 1.8% | |||
Radio One, Inc.: | |||
6.50% (f) | 5,970 | 6,222 | |
6.50% | 24,995 | 26,051 | |
32,273 | |||
TOTAL CONSUMER DISCRETIONARY | 33,744 | ||
ENERGY - 2.2% | |||
Oil & Gas - 2.2% | |||
Chesapeake Energy Corp.: | |||
6.75% (f) | 283,600 | 23,893 | |
6.00% (f) | 31,400 | 2,092 | |
6.00% | 21,700 | 1,486 | |
Teekay Shipping Corp. Series A, 7.25% | 289,000 | 9,153 | |
Valero Energy Corp. 2.00% | 90,000 | 2,160 | |
38,784 | |||
FINANCIALS - 5.6% | |||
Consumer Finance - 0.5% | |||
Capital One Financial Corp. 6.25% Upper DECS | 193,700 | 8,941 | |
Diversified Financial Services - 3.1% | |||
AES Trust III 6.75% | 108,700 | 4,422 | |
AES Trust VII: | |||
6.00% (f) | 126,215 | 5,490 | |
6.00% | 128,900 | 5,607 | |
News Corp. Finance Trust II (British Sky Broadcasting Group PLC (BSkyB)) 0.75% (f) | 15,000 | 15,555 | |
Omnicare Capital Trust I 4.00% PIERS | 50,000 | 3,025 | |
PPL Capital Funding Trust I 7.75% PEPS | 80,900 | 1,658 | |
SMFG Finance Cayman Ltd. 2.25% (f) | 378 | 18,343 | |
54,100 | |||
Insurance - 1.4% | |||
Conseco, Inc. 10.50% | 200,000 | 5,040 | |
Hartford Financial Services Group, Inc. 7.00% | 88,900 | 5,078 | |
The Chubb Corp. Series B, 7.00% | 92,500 | 2,544 | |
Preferred Stocks - continued | |||
Shares | Value (Note 1) | ||
Convertible Preferred Stocks - continued | |||
FINANCIALS - continued | |||
Insurance - continued | |||
Travelers Property Casualty Corp. 4.50% | 319,000 | $ 7,592 | |
UnumProvident Corp. 8.25% | 124,900 | 3,991 | |
24,245 | |||
Real Estate - 0.3% | |||
Equity Office Properties Trust Series B, 5.25% | 30,300 | 1,485 | |
Reckson Associates Realty Corp. Series A, 7.625% | 62,200 | 1,547 | |
Simon Property Group, Inc. 6.50% | 18,000 | 2,210 | |
5,242 | |||
Thrifts & Mortgage Finance - 0.3% | |||
Doral Financial Corp. 4.75% (f) | 12,800 | 3,323 | |
The PMI Group, Inc. 5.875% | 120,000 | 3,042 | |
6,365 | |||
TOTAL FINANCIALS | 98,893 | ||
HEALTH CARE - 2.3% | |||
Health Care Equipment & Supplies - 2.3% | |||
Baxter International, Inc. 7.00% | 792,000 | 40,689 | |
INDUSTRIALS - 1.9% | |||
Aerospace & Defense - 1.7% | |||
Northrop Grumman Corp.: | |||
7.25% | 239,900 | 24,568 | |
Series B, 7.00% | 36,000 | 4,307 | |
28,875 | |||
Road & Rail - 0.2% | |||
CNF Trust I Series A, 5.00% TECONS | 71,200 | 3,562 | |
TOTAL INDUSTRIALS | 32,437 | ||
INFORMATION TECHNOLOGY - 0.6% | |||
Communications Equipment - 0.6% | |||
Corning, Inc. Series C, 7.00% | 10,100 | 5,994 | |
Nortel Networks Corp. 7.00% | 48 | 3,828 | |
9,822 | |||
Preferred Stocks - continued | |||
Shares | Value (Note 1) | ||
Convertible Preferred Stocks - continued | |||
MATERIALS - 1.2% | |||
Metals & Mining - 1.1% | |||
Phelps Dodge Corp. Series A 6.75% MEDS | 113,000 | $ 16,498 | |
United States Steel Corp. Series B, 7.00% | 37,000 | 3,164 | |
19,662 | |||
Paper & Forest Products - 0.1% | |||
Boise Cascade Corp. 7.50% | 41,000 | 1,952 | |
TOTAL MATERIALS | 21,614 | ||
TELECOMMUNICATION SERVICES - 1.8% | |||
Diversified Telecommunication Services - 1.1% | |||
ALLTEL Corp. 7.75% PRIDES | 145,900 | 7,058 | |
CenturyTel, Inc. 6.875% ACES | 334,500 | 8,951 | |
Citizens Communications Co. 6.75% | 119,000 | 2,744 | |
18,753 | |||
Wireless Telecommunication Services - 0.7% | |||
Crown Castle International Corp. 6.25% PIERS | 320,000 | 13,440 | |
TOTAL TELECOMMUNICATION SERVICES | 32,193 | ||
UTILITIES - 2.8% | |||
Electric Utilities - 1.6% | |||
Ameren Corp. 9.75% ACES | 120,000 | 3,390 | |
Cinergy Corp. 9.50% PRIDES | 102,600 | 6,225 | |
Dominion Resources, Inc. 8.75% | 194,900 | 10,166 | |
FPL Group, Inc. 8.00% | 144,000 | 7,893 | |
27,674 | |||
Gas Utilities - 1.0% | |||
KeySpan Corp. 8.75% MEDS | 233,100 | 11,907 | |
Southern Union Co. 5.75% | 117,000 | 6,771 | |
18,678 | |||
Multi-Utilities & Unregulated Power - 0.2% | |||
Williams Companies, Inc. 5.50% (f) | 60,000 | 3,690 | |
TOTAL UTILITIES | 50,042 | ||
TOTAL CONVERTIBLE PREFERRED STOCKS | 358,218 | ||
Preferred Stocks - continued | |||
Shares | Value (Note 1) | ||
Nonconvertible Preferred Stocks - 0.2% | |||
CONSUMER STAPLES - 0.2% | |||
Beverages - 0.2% | |||
Constellation Brands, Inc. (depositary shares) Series A, 5.75% | 123,000 | $ 3,790 | |
TOTAL PREFERRED STOCKS (Cost $322,384) | 362,008 | ||
Money Market Funds - 1.7% | |||
Fidelity Cash Central Fund, 1.09% (b) | 27,964,491 | 27,964 | |
Fidelity Securities Lending Cash Central Fund, 1.11% (b) | 2,754,508 | 2,755 | |
TOTAL MONEY MARKET FUNDS (Cost $30,719) | 30,719 | ||
TOTAL INVESTMENT PORTFOLIO - 100.4% (Cost $1,574,509) | 1,775,253 | ||
NET OTHER ASSETS - (0.4)% | (7,831) | ||
NET ASSETS - 100% | $ 1,767,422 | ||
Currency Abbreviations | ||
EUR | - | European Monetary Unit |
Security Type Abbreviations | ||
ACES | - | Automatic Common Exchange Securities |
DECS | - | Dividend Enhanced Convertible Stock/Debt Exchangeable for Common Stock |
MEDS | - | Mandatorily Exchangeable Debt Securities |
PEPS | - | Participating Equity Preferred Shares/Premium Exchangeable Participating Shares |
PIERS | - | Preferred Income Equity Redeemable Securities |
PRIDES | - | Preferred Redeemable Increased Dividend Equity Securities |
TECONS | - | Term Convertible Shares |
Legend |
(a) Non-income producing |
(b) The rate quoted is the annualized seven-day yield of the fund at period end. A complete listing of the fund's holdings as of its most recent fiscal year end is available upon request. |
(c) Non-income producing - issuer filed for bankruptcy or is in default of interest payments. |
(d) Principal amount is stated in United States dollars unless otherwise noted. |
(e) Debt obligation initially issued at one coupon which converts to a higher coupon at a specified date. The rate shown is the rate at period end. |
(f) Security exempt from registration under Rule 144A of the Securities Act of 1933. These securities may be resold in transactions exempt from registration, normally to qualified institutional buyers. At the period end, the value of these securities amounted to $432,698,000 or 24.5% of net assets. |
(g) The coupon rate shown on floating or adjustable rate securities represents the rate at period end. |
Other Information |
The composition of credit quality ratings as a percentage of net assets is as follows (ratings are unaudited): |
AAA,AA,A | 3.0% |
BBB | 4.9% |
BB | 8.9% |
B | 22.5% |
CCC,CC,C | 8.9% |
Not Rated | 15.2% |
Equities | 35.3% |
Short-Term Investments and Net Other Assets | 1.3% |
We have used ratings from Moody's Investors Services, Inc. Where Moody's ratings are not available, we have used S&P ratings. |
Distribution of investments by country of issue, as a percentage of total net assets, is as follows: |
United States of America | 86.5% |
Luxembourg | 3.5% |
Canada | 3.3% |
Netherlands | 1.8% |
Japan | 1.7% |
Others (individually less than 1%) | 3.2% |
100.0% |
Purchases and sales of securities, other than short-term securities, aggregated $2,115,775,000 and $2,057,141,000, respectively. |
The fund placed a portion of its portfolio transactions with brokerage firms which are affiliates of the investment adviser. The commissions paid to these affiliated firms were $44,000 for the period. |
The fund participated in the interfund lending program as a borrower. The average daily loan balance during the period for which the loan was outstanding amounted to $12,124,000. The weighted average interest rate was 1.12%. At period end there were no interfund loans outstanding. |
Income Tax Information |
At November 30, 2003, the fund had a capital loss carryforward of approximately $329,726,000 of which $113,099,000 and $216,627,000 will expire on November 30, 2009 and 2010, respectively. |
See accompanying notes which are an integral part of the financial statements.
Annual Report
Financial Statements
Statement of Assets and Liabilities
Amounts in thousands (except per-share amount) | November 30, 2003 | |
Assets | ||
Investment in securities, at value (including securities loaned of $2,623) (cost $1,574,509) - See accompanying schedule | $ 1,775,253 | |
Receivable for fund shares sold | 1,384 | |
Dividends receivable | 218 | |
Interest receivable | 11,243 | |
Prepaid expenses | 8 | |
Other receivables | 105 | |
Total assets | 1,788,211 | |
Liabilities | ||
Payable for investments purchased | $ 14,904 | |
Payable for fund shares redeemed | 2,060 | |
Accrued management fee | 731 | |
Other affiliated payables | 305 | |
Other payables and accrued expenses | 34 | |
Collateral on securities loaned, at value | 2,755 | |
Total liabilities | 20,789 | |
Net Assets | $ 1,767,422 | |
Net Assets consist of: | ||
Paid in capital | $ 1,876,973 | |
Undistributed net investment income | 22,497 | |
Accumulated undistributed net realized gain (loss) on investments and foreign currency transactions | (332,851) | |
Net unrealized appreciation (depreciation) on investments and assets and liabilities in foreign currencies | 200,803 | |
Net Assets, for 89,651 shares outstanding | $ 1,767,422 | |
Net Asset Value, offering price and redemption price per share ($1,767,422 ÷ 89,651 shares) | $ 19.71 | |
See accompanying notes which are an integral part of the financial statements.
Annual Report
Financial Statements - continued
Statement of Operations
Amounts in thousands | Year ended November 30, 2003 | |
Investment Income | ||
Dividends | $ 27,815 | |
Interest | 54,286 | |
Security lending | 32 | |
Total income | 82,133 | |
Expenses | ||
Management fee | $ 7,489 | |
Performance adjustment | 1,892 | |
Transfer agent fees | 3,064 | |
Accounting and security lending fees | 350 | |
Non-interested trustees' compensation | 8 | |
Custodian fees and expenses | 48 | |
Registration fees | 57 | |
Audit | 57 | |
Legal | 7 | |
Interest | 1 | |
Miscellaneous | 23 | |
Total expenses before reductions | 12,996 | |
Expense reductions | (276) | 12,720 |
Net investment income (loss) | 69,413 | |
Realized and Unrealized Gain (Loss) Net realized gain (loss) on: | ||
Investment securities | 49,820 | |
Foreign currency transactions | (328) | |
Total net realized gain (loss) | 49,492 | |
Change in net unrealized appreciation (depreciation) on: Investment securities | 200,932 | |
Assets and liabilities in foreign currencies | 59 | |
Total change in net unrealized appreciation (depreciation) | 200,991 | |
Net gain (loss) | 250,483 | |
Net increase (decrease) in net assets resulting from operations | $ 319,896 | |
See accompanying notes which are an integral part of the financial statements.
Annual Report
Statement of Changes in Net Assets
Amounts in thousands | Year ended | Year ended |
Increase (Decrease) in Net Assets | ||
Operations | ||
Net investment income (loss) | $ 69,413 | $ 70,524 |
Net realized gain (loss) | 49,492 | (206,449) |
Change in net unrealized appreciation (depreciation) | 200,991 | (25,832) |
Net increase (decrease) in net assets resulting | 319,896 | (161,757) |
Distributions to shareholders from net investment income | (71,200) | (85,392) |
Share transactions | 431,770 | 351,508 |
Reinvestment of distributions | 64,277 | 77,521 |
Cost of shares redeemed | (400,393) | (492,829) |
Net increase (decrease) in net assets resulting from share transactions | 95,654 | (63,800) |
Total increase (decrease) in net assets | 344,350 | (310,949) |
Net Assets | ||
Beginning of period | 1,423,072 | 1,734,021 |
End of period (including undistributed net investment income of $22,497 and undistributed net investment income of $20,048, respectively) | $ 1,767,422 | $ 1,423,072 |
Other Information Shares | ||
Sold | 24,029 | 18,929 |
Issued in reinvestment of distributions | 3,719 | 4,132 |
Redeemed | (22,390) | (27,692) |
Net increase (decrease) | 5,358 | (4,631) |
A Certain amounts have been reclassified. See Note 1 of the Notes to the Financial Statements.
See accompanying notes which are an integral part of the financial statements.
Annual Report
Financial Highlights
Years ended November 30, | 2003 | 2002 | 2001 | 2000 | 1999 |
Selected Per-Share Data | |||||
Net asset value, beginning of period | $ 16.88 | $ 19.50 | $ 24.04 | $ 22.43 | $ 18.61 |
Income from Investment Operations | |||||
Net investment income (loss) B | .79 | .79 D,E | .69 | .77 | .57 |
Net realized and unrealized gain (loss) | 2.87 | (2.46) D,E | (.17) | 3.18 | 5.01 |
Total from investment operations | 3.66 | (1.67) | .52 | 3.95 | 5.58 |
Distributions from net investment income | (.83) | (.95) | (.72) | (.64) | (.62) |
Distributions from net realized gain | - | - | (4.34) | (1.70) | (1.14) |
Total distributions | (.83) | (.95) | (5.06) | (2.34) | (1.76) |
Net asset value, end of period | $ 19.71 | $ 16.88 | $ 19.50 | $ 24.04 | $ 22.43 |
Total Return A | 22.48% | (8.97)% | 1.56% | 18.07% | 32.36% |
Ratios to Average Net Assets C | |||||
Expenses before expense reductions | .84% | .88% | .81% | .78% | .85% |
Expenses net of voluntary waivers, if any | .84% | .88% | .81% | .78% | .85% |
Expenses net of all reductions | .82% | .85% | .76% | .77% | .82% |
Net investment income (loss) | 4.46% | 4.40% D,E | 3.40% | 2.96% | 2.85% |
Supplemental Data | |||||
Net assets, end of period | $ 1,767 | $ 1,423 | $ 1,734 | $ 1,843 | $ 1,214 |
Portfolio turnover rate | 136% | 138% | 282% | 262% | 246% |
A Total returns would have been lower had certain expenses not been reduced during the periods shown.
B Calculated based on average shares outstanding during the period.
C Expense ratios reflect operating expenses of the fund. Expenses before reductions do not reflect amounts reimbursed by the investment adviser or reductions from brokerage service arrangements or other expense offset arrangements and do not represent the amount paid by the fund during periods when reimbursements or reductions occur. Expenses net of any voluntary waivers reflect expenses after reimbursement by the investment adviser but prior to reductions from brokerage service arrangements or other expense offset arrangements. Expenses net of all reductions represent the net expenses paid by the fund.
D Effective December 1, 2001, the fund adopted the provisions of the AICPA Audit and Accounting Guide for Investment Companies and began amortizing premium and discount on all debt securities. Per-share data and ratios for periods prior to adoption have not been restated to reflect this change.
E As a result of a revision to reflect accretion of market discount using the interest method, certain amounts for the year ended November 30, 2002 have been reclassified from what was previously reported. The impact of this change was a decrease to net investment income (loss) of $0.06 per share with a corresponding increase to net realized and unrealized gain (loss) per share. The ratio of net investment income (loss) to average net assets decreased from 4.76% to 4.40%. The reclassification has no impact on the net assets of the fund.
See accompanying notes which are an integral part of the financial statements.
Annual Report
Notes to Financial Statements
For the period ended November 30, 2003
(Amounts in thousands except ratios)
1. Significant Accounting Policies.
Fidelity Convertible Securities Fund (the fund) is a fund of Fidelity Financial Trust (the trust) and is authorized to issue an unlimited number of shares. The trust is registered under the Investment Company Act of 1940, as amended (the 1940 Act), as an open-end management investment company organized as a Massachusetts business trust. The financial statements have been prepared in conformity with accounting principles generally accepted in the United States of America, which require management to make certain estimates and assumptions at the date of the financial statements. The following summarizes the significant accounting policies of the fund:
Security Valuation. Net asset value per share (NAV calculation) is calculated as of the close of business of the New York Stock Exchange, normally 4:00 p.m. Eastern time. Equity securities for which market quotations are available are valued at the last sale price or official closing price (closing bid price or last evaluated quote if no sale has occurred) on the primary market or exchange on which they trade. Debt securities for which quotations are readily available are valued at their most recent bid prices (sales prices if the principal market is an exchange) in the principal market in which such securities are normally traded, as determined by recognized dealers in such securities, or securities are valued on the basis of information provided by a pricing service. Pricing services use valuation matrices that incorporate both dealer-supplied valuations and valuation models. If an event that is expected to materially affect the value of a security occurs after the close of an exchange or market on which that security trades, but prior to the NAV calculation, then that security will be fair valued taking the event into account. Securities (including restricted securities) for which market quotations are not readily available are valued at their fair value as determined in good faith under consistently applied procedures under the general supervision of the Board of Trustees. Price movements in futures contracts and ADRs, market and trading trends, the bid/ask quotes of brokers and off-exchange institutional trading may be reviewed in the course of making a good faith determination of a security's fair value. Short-term securities with remaining maturities of sixty days or less for which quotations are not readily available are valued on the basis of amortized cost. Investments in open-end investment companies are valued at their net asset value each business day.
Foreign Currency. The fund uses foreign currency contracts to facilitate transactions in foreign-denominated securities. Losses from these transactions may arise from changes in the value of the foreign currency or if the counterparties do not perform under the contracts' terms.
Foreign denominated assets, including investment securities, and liabilities are translated into U.S. dollars at the exchange rate at period end. Purchases and sales of investment securities, income and dividends received and expenses denominated in foreign currencies are translated into U.S. dollars at the exchange rate in effect on the transaction date.
Annual Report
Notes to Financial Statements - continued
(Amounts in thousands except ratios)
1. Significant Accounting Policies - continued
Foreign Currency - continued
The effects of exchange rate fluctuations on investments are included with the net realized and unrealized gain (loss) on investment securities. Other foreign currency transactions resulting in realized and unrealized gain (loss) are disclosed separately.
Investment Transactions and Income. Security transactions are accounted for as of trade date. Gains and losses on securities sold are determined on the basis of identified cost. Dividend income is recorded on the ex-dividend date, except for certain dividends from foreign securities where the ex-dividend date may have passed, which are recorded as soon as the fund is informed of the ex-dividend date. Non-cash dividends included in dividend income, if any, are recorded at the fair market value of the securities received. The fund estimates the components of distributions received from Real Estate Investment Trusts (REITs). Distributions received in excess of income are recorded as a reduction of cost of investments and/or realized gain. Interest income is accrued as earned. Interest income includes coupon interest and amortization of premium and accretion of discount on debt securities, which is accrued using the interest method. Investment income is recorded net of foreign taxes withheld where recovery of such taxes is uncertain. Debt obligations may be placed on non-accrual status and related interest income may be reduced by ceasing current accruals and writing off interest receivables when the collection of all or a portion of interest has become doubtful based on consistently applied procedures. A debt obligation is removed from non-accrual status when the issuer resumes interest payments or when collectibility of interest is reasonably assured.
Reclassification of Financial Information. As a result of a revision to reflect accretion of market discount using the interest method, certain amounts for the year ended November 30, 2002, have been reclassified from what was previously reported. Net investment income (loss) for the fund decreased by $5,674 with a corresponding decrease to realized and unrealized loss of $2,349. The reclassification has no impact on the net assets of the fund.
Expenses. Most expenses of the trust can be directly attributed to a fund. Expenses which cannot be directly attributed are apportioned among the funds in the trust.
Income Tax Information and Distributions to Shareholders. Each year the fund intends to qualify as a regulated investment company by distributing all of its taxable income and realized gains under Subchapter M of the Internal Revenue Code. As a result, no provision for income taxes is required in the accompanying financial statements. Foreign taxes are provided for based on each fund's understanding of the tax rules and rates that exist in the foreign markets in which it invests. Distributions are recorded on the ex-dividend date.
Annual Report
1. Significant Accounting Policies - continued
Income Tax Information and Distributions to Shareholders - continued
Income and capital gain distributions are determined in accordance with income tax regulations, which may differ from generally accepted accounting principles. Capital accounts within the financial statements are adjusted for permanent and temporary book and tax differences. These adjustments have no impact on net assets or the results of operations. Temporary differences will reverse in a subsequent period. These differences are primarily due to foreign currency transactions, prior period premium and discount on debt securities market, discount contingent interest, non-taxable dividends, capital loss carryforwards and losses deferred due to wash sales and excise tax regulations.
The tax-basis components of distributable earnings and the federal tax cost as of period end were as follows:
Unrealized appreciation | $ 228,713 | | |
Unrealized depreciation | (19,066) | |
Net unrealized appreciation (depreciation) | 209,647 | |
Undistributed ordinary income | 10,527 | |
Capital loss carryforward | (329,726) | |
Cost for federal income tax purposes | $ 1,565,606 |
The tax character of distributions paid was as follows:
November 30, | November 30, | |
Ordinary Income | $ 71,200 | $ 85,392 |
2. Operating Policies.
Repurchase Agreements. Fidelity Management & Research Company (FMR) has received an Exemptive Order from the Securities and Exchange Commission (the SEC) which permits the fund and other affiliated entities of FMR to transfer uninvested cash balances into joint trading accounts. These accounts are then invested in repurchase agreements that are collateralized by U.S. Treasury or Government obligations. The fund may also invest directly with institutions, in repurchase agreements that are collateralized by commercial paper obligations and corporate obligations. Collateral is held in segregated accounts with custodian banks and may be obtained in the event of a default of the counterparty. Collateral is marked-to-market daily and maintained at a value at least equal to the principal amount of the repurchase agreement (including accrued interest).
Annual Report
Notes to Financial Statements - continued
(Amounts in thousands except ratios)
2. Operating Policies - continued
Restricted Securities. The fund may invest in securities that are subject to legal or contractual restrictions on resale. These securities generally may be resold in transactions exempt from registration or to the public if the securities are registered. Disposal of these securities may involve time-consuming negotiations and expense, and prompt sale at an acceptable price may be difficult. Information regarding restricted securities is included at the end of the fund's Schedule of Investments.
3. Purchases and Sales of Investments.
Information regarding purchases and sales of securities is included under the caption "Other Information" at the end of the fund's Schedule of Investments.
4. Fees and Other Transactions with Affiliates.
Management Fee. FMR and its affiliates provide the fund with investment management related services for which the fund pays a monthly management fee. The management fee is the sum of an individual fund fee rate that is based on an annual rate of .20% of the fund's average net assets and a group fee rate that averaged .28% during the period. The group fee rate is based upon the average net assets of all the mutual funds advised by FMR. The group fee rate decreases as assets under management increase and increases as assets under management decrease. In addition, the management fee is subject to a performance adjustment (up to a maximum of ± .15% of the fund's average net assets over a 36 month performance period). The upward or downward adjustment to the management fee is based on the fund's relative investment performance as compared to an appropriate benchmark index. For the period, the total annual management fee rate, including the performance adjustment, was .60% of the fund's average net assets.
Transfer Agent Fees. Fidelity Service Company, Inc. (FSC), an affiliate of FMR, is the fund's transfer, dividend disbursing and shareholder servicing agent. FSC receives account fees and asset-based fees that vary according to account size and type of account. FSC pays for typesetting, printing and mailing of all shareholder reports, except proxy statements. For the period, the transfer agent fees were equivalent to an annual rate of .20% of average net assets.
Accounting and Security Lending Fees. FSC maintains the fund's accounting records and administers the security lending program. The security lending fee is based on the number and duration of lending transactions. The accounting fee is based on the level of average net assets for the month plus out-of-pocket expenses.
Central Funds. The fund may invest in affiliated Central Funds managed by Fidelity Investments Money Management, Inc. (FIMM), an affiliate of FMR. The Central Funds are open-end investment companies available only to investment companies and other
Annual Report
4. Fees and Other Transactions with Affiliates - continued
Central Funds - continued
accounts managed by FMR and its affiliates. The Central Funds seek preservation of capital and current income and do not pay a management fee. Income distributions earned by the fund are recorded as income in the accompanying financial statements and totaled $403 for the period.
Brokerage Commissions. The fund placed a portion of its portfolio transactions with brokerage firms which are affiliates of the investment adviser. The commissions paid to these affiliated firms are shown under the caption "Other Information" at the end of the fund's Schedule of Investments.
Interfund Lending Program. Pursuant to an Exemptive Order issued by the SEC, the fund, along with other registered investment companies having management contracts with FMR, may participate in an interfund lending program. This program provides an alternative credit facility allowing the funds to borrow from, or lend money to, other participating funds. Information regarding the fund's participation in the program is included under the caption "Other Information" at the end of the fund's Schedule of Investments.
5. Committed Line of Credit.
The fund participates with other funds managed by FMR in a $3.5 billion credit facility (the "line of credit") to be utilized for temporary or emergency purposes to fund shareholder redemptions or for other short-term liquidity purposes. The fund has agreed to pay commitment fees on its pro rata portion of the line of credit. During the period, there were no borrowings on this line of credit.
6. Security Lending.
The fund lends portfolio securities from time to time in order to earn additional income. The fund receives collateral (in the form of U.S. Treasury obligations, letters of credit and/or cash) against the loaned securities and maintains collateral in an amount not less than 100% of the market value of the loaned securities during the period of the loan. The market value of the loaned securities is determined at the close of business of the fund and any additional required collateral is delivered to the fund on the next business day. If the borrower defaults on its obligation to return the securities loaned because of insolvency or other reasons, a fund could experience delays and costs in recovering the securities loaned or in gaining access to the collateral. Cash collateral is invested in cash equivalents. The value of loaned securities and cash collateral at period end are disclosed on the fund's Statement of Assets and Liabilities.
Annual Report
Notes to Financial Statements - continued
(Amounts in thousands except ratios)
7. Expense Reductions.
Many of the brokers with whom FMR places trades on behalf of the fund provided services to the fund in addition to trade execution. These services included payments of certain expenses on behalf of the fund totaling $270 for the period. In addition, through arrangements with the fund's custodian, credits realized as a result of uninvested cash balances were used to reduce the fund's expenses. During the period, these credits reduced the fund's custody expenses by $6.
Annual Report
Report of Independent Auditors
To the Trustees of Fidelity Financial Trust and the Shareholders of Fidelity Convertible Securities Fund.
In our opinion, the accompanying statement of assets and liabilities, including the schedule of investments, and the related statements of operations and of changes in net assets and the financial highlights present fairly, in all material respects, the financial position of Fidelity Convertible Securities Fund (a fund of Fidelity Financial Trust) at November 30, 2003 and the results of its operations, the changes in its net assets and the financial highlights for the periods indicated, in conformity with accounting principles generally accepted in the United States of America. These financial statements and financial highlights (hereafter referred to as "financial statements") are the responsibility of the Fidelity Convertible Securities Fund's management; our responsibility is to express an opinion on these financial statements based on our audits. We conducted our audits of these financial statements in accordance with auditing standards generally accepted in the United States of America which require that we plan and perform the audit to obtain reasonable assurance about whether the financial statements are free of material misstatement. An audit includes examining, on a test basis, evidence supporting the amounts and disclosures in the financial statements, assessing the accounting principles used and significant estimates made by management, and evaluating the overall financial statement presentation. We believe that our audits, which included confirmation of securities at November 30, 2003 by correspondence with the custodian and brokers, provide a reasonable basis for our opinion.
/s/PricewaterhouseCoopers LLP
PricewaterhouseCoopers LLP
Boston, Massachusetts
January 8, 2004
Annual Report
Trustees and Officers
The Trustees, Members of the Advisory Board, and executive officers of the trust and fund, as applicable, are listed below. The Board of Trustees governs the fund and is responsible for protecting the interests of shareholders. The Trustees are experienced executives who meet periodically throughout the year to oversee the fund's activities, review contractual arrangements with companies that provide services to the fund, and review the fund's performance. Except for William O. McCoy, each of the Trustees oversees 291 funds advised by FMR or an affiliate. Mr. McCoy oversees 293 funds advised by FMR or an affiliate.
The Trustees hold office without limit in time except that (a) any Trustee may resign; (b) any Trustee may be removed by written instrument, signed by at least two-thirds of the number of Trustees prior to such removal; (c) any Trustee who requests to be retired or who has become incapacitated by illness or injury may be retired by written instrument signed by a majority of the other Trustees; and (d) any Trustee may be removed at any special meeting of shareholders by a two-thirds vote of the outstanding voting securities of the trust. In any event, each non-interested Trustee shall retire not later than the last day of the calendar year in which his or her 72nd birthday occurs. The executive officers and Advisory Board Members hold office without limit in time, except that any officer and Advisory Board Member may resign or may be removed by a vote of a majority of the Trustees at any regular meeting or any special meeting of the Trustees. Except as indicated, each individual has held the office shown or other offices in the same company for the past five years.
The fund's Statement of Additional Information (SAI) includes more information about the Trustees. To request a free copy, call Fidelity at 1-800-544-8544.
Interested Trustees*:
Correspondence intended for each Trustee who is an "interested person" (as defined in the 1940 Act) may be sent to 82 Devonshire Street, Boston, Massachusetts 02109.
Name, Age; Principal Occupation | |
Edward C. Johnson 3d (73)** | |
Year of Election or Appointment: 1982 Mr. Johnson is Chairman of the Board of Trustees. Mr. Johnson serves as Chief Executive Officer, Chairman, and a Director of FMR Corp.; a Director and Chairman of the Board and of the Executive Committee of FMR; Chairman and a Director of Fidelity Management & Research (Far East) Inc.; Chairman (1998) and a Director of Fidelity Investments Money Management, Inc.; and Chairman (2001) and a Director (2000) of FMR Co., Inc. | |
Abigail P. Johnson (41)** | |
Year of Election or Appointment: 2001 Senior Vice President of Convertible Securities (2001). Ms. Johnson also serves as Senior Vice President of other Fidelity funds (2001). She is President and a Director of FMR (2001), Fidelity Investments Money Management, Inc. (2001), FMR Co., Inc. (2001), and a Director of FMR Corp. Previously, Ms. Johnson managed a number of Fidelity funds. | |
Laura B. Cronin (49) | |
Year of Election or Appointment: 2003 Ms. Cronin is an Executive Vice President (2002) and Chief Financial Officer (2002) of FMR Corp. and is a member of the Fidelity Management Committee (2003). Previously, Ms. Cronin served as Vice President of Finance of FMR (1997-1999), and Chief Financial Officer of FMR (1999-2001), Fidelity Personal Investments (2001), and Fidelity Brokerage Company (2001-2002). | |
Robert L. Reynolds (51) | |
Year of Election or Appointment: 2003 Mr. Reynolds is a Director (2003) and Chief Operating Officer (2002) of FMR Corp. and is the head of the Fidelity Management Committee (2003). He also serves on the Board at Fidelity Investments Canada, Ltd. (2000). Previously, Mr. Reynolds served as President of Fidelity Investments Institutional Retirement Group (1996-2000). | |
* Trustees have been determined to be "Interested Trustees" by virtue of, among other things, their affiliation with the trust or various entities under common control with FMR.
** Edward C. Johnson 3d, Trustee, is Abigail P. Johnson's father.
Annual Report
Non-Interested Trustees:
Correspondence intended for each non-interested Trustee (that is, the Trustees other than the Interested Trustees) may be sent to Fidelity Investments, P.O. Box 55235, Boston, Massachusetts 02205-5235.
Name, Age; Principal Occupation | |
J. Michael Cook (61) | |
Year of Election or Appointment: 2001 Prior to Mr. Cook's retirement in May 1999, he served as Chairman and Chief Executive Officer of Deloitte & Touche LLP (accounting/consulting), Chairman of the Deloitte & Touche Foundation, and a member of the Board of Deloitte Touche Tohmatsu. He currently serves as a Director of Comcast (telecommunications, 2002), International Flavors & Fragrances, Inc. (2000), Rockwell Automation (2000) and The Dow Chemical Company (2000). He is a Member of the Diversity Advisory Council of Marakon (2003) and the Advisory Board of the Directorship Search Group, Chairman Emeritus of the Board of Catalyst (a leading organization for the advancement of women in business), and is Chairman of the Accountability Advisory Council to the Comptroller General of the United States. He also serves as a Member of the Advisory Board of the Graduate School of Business of the University of Florida, his alma mater. | |
Ralph F. Cox (71) | |
Year of Election or Appointment: 1991 Mr. Cox is President of RABAR Enterprises (management consulting for the petroleum industry). Prior to February 1994, he was President of Greenhill Petroleum Corporation (petroleum exploration and production). Until March 1990, Mr. Cox was President and Chief Operating Officer of Union Pacific Resources Company (exploration and production). He is a Director of CH2M Hill Companies (engineering), and Abraxas Petroleum (petroleum exploration and production, 1999). In addition, he is a member of advisory boards of Texas A&M University and the University of Texas at Austin. | |
Robert M. Gates (60) | |
Year of Election or Appointment: 1997 Dr. Gates is President of Texas A&M University (2002). He was Director of the Central Intelligence Agency (CIA) from 1991 to 1993. From 1989 to 1991, Dr. Gates served as Assistant to the President of the United States and Deputy National Security Advisor. Dr. Gates is a Director of NACCO Industries, Inc. (mining and manufacturing), and Parker Drilling Co., Inc. (drilling and rental tools for the energy industry, 2001). He also serves as a member of the Advisory Board of VoteHere.net (secure internet voting, 2001). Previously, Dr. Gates served as a Director of LucasVarity PLC (automotive components and diesel engines), a Director of TRW Inc. (automotive, space, defense, and information technology), and Dean of the George Bush School of Government and Public Service at Texas A&M University (1999-2001). Dr. Gates also is a Trustee of the Forum for International Policy. | |
George H. Heilmeier (67) | |
Year of Election or Appointment: 2004 Dr. Heilmeier is Chairman Emeritus of Telcordia Technologies (communication software and systems), where prior to his retirement, he served as company Chairman and Chief Executive Officer. He currently serves on the Boards of Directors of The Mitre Corporation (systems engineering and information technology support for the government), INET Technologies Inc. (telecommunications network surveillance, 2001) and Teletech Holdings (customer management services, 1998). He is Chairman of the General Motors Technology Advisory Committee and a Life Fellow of the IEEE (2000). Dr. Heilmeier is a member of the Defense Science Board and the National Security Agency Advisory Board. He is also a member of the National Academy of Engineering, the American Academy of Arts and Sciences and The Board of Overseers of the School of Engineering and Applied Science of the University of Pennsylvania. Previously, Dr. Heilmeier served as a Director of TRW Inc. (automotive, space, defense, and information technology, 1992-2002) and Compaq (1994-2002). | |
Donald J. Kirk (71) | |
Year of Election or Appointment: 1987 Mr. Kirk is a Governor of the American Stock Exchange (2001), a Trustee and former Chairman of the Board of Trustees of the Greenwich Hospital Association, a Director of the Yale-New Haven Health Services Corp. (1998), and a Director Emeritus and former Chairman of the Board of Directors of National Arts Strategies Inc. Mr. Kirk was an Executive-in-Residence (1995-2000) and a Professor (1987-1995) at Columbia University Graduate School of Business. Prior to 1987, he was Chairman of the Financial Accounting Standards Board. Previously, Mr. Kirk served as a Governor of the National Association of Securities Dealers, Inc. (1996-2002), a member and Vice Chairman of the Public Oversight Board of the American Institute of Certified Public Accountants' SEC Practice Section (1995-2002), a Director of General Re Corporation (reinsurance, 1987-1998) and as a Director of Valuation Research Corp. (appraisals and valuations). | |
Marie L. Knowles (57) | |
Year of Election or Appointment: 2001 Prior to Ms. Knowles' retirement in June 2000, she served as Executive Vice President and Chief Financial Officer of Atlantic Richfield Company (ARCO) (diversified energy, 1996-2000). From 1993 to 1996, she was a Senior Vice President of ARCO and President of ARCO Transportation Company. She served as a Director of ARCO from 1996 to 1998. She currently serves as a Director of Phelps Dodge Corporation (copper mining and manufacturing), URS Corporation (multidisciplinary engineering, 1999), and McKesson Corporation (healthcare service, 2002). Ms. Knowles is a Trustee of the Brookings Institution and the Catalina Island Conservancy and also serves as a member of the Advisory Board for the School of Engineering of the University of Southern California. | |
Ned C. Lautenbach (59) | |
Year of Election or Appointment: 2000 Mr. Lautenbach has been a partner of Clayton, Dubilier & Rice, Inc. (private equity investment firm) since September 1998. Previously, Mr. Lautenbach was with the International Business Machines Corporation (IBM) from 1968 until his retirement in 1998. He was most recently Senior Vice President and Group Executive of Worldwide Sales and Services. From 1993 to 1995, he was Chairman of IBM World Trade Corporation, and from 1994 to 1998 was a member of IBM's Corporate Executive Committee. Mr. Lautenbach serves as Chairman and as a Director (1998) of Acterna Corporation (communications test equipment). He is also Co-Chairman of Covansys, Inc. (global provider of business and technology solutions, 2000). In addition, he is a Director of Eaton Corporation (diversified industrial) and the Philharmonic Center for the Arts in Naples, Florida (1999). He also is a member of the Council on Foreign Relations. | |
Marvin L. Mann (70) | |
Year of Election or Appointment: 1993 Mr. Mann is Chairman of the non-interested Trustees (2001). He is Chairman Emeritus of Lexmark International, Inc. (computer peripherals) where he served as CEO until April 1998 and retired as Chairman May 1999, and remains a member of the Board. Prior to 1991, he held the positions of Vice President of International Business Machines Corporation (IBM) and President and General Manager of various IBM divisions and subsidiaries. Mr. Mann is a Board member of Imation Corp. (imaging and information storage) and Acterna Corporation (communications test equipment, 1999). He is also a member of the Director Services Committee of the Investment Company Institute. In addition, Mr. Mann is a member of the President's Cabinet at the University of Alabama and the Board of Visitors of the Culverhouse College of Commerce and Business Administration at the University of Alabama. | |
William O. McCoy (70) | |
Year of Election or Appointment: 1997 Prior to his retirement in December 1994, Mr. McCoy was Vice Chairman of the Board of BellSouth Corporation (telecommunications) and President of BellSouth Enterprises. He is currently a Director of Liberty Corporation (holding company), Duke Realty Corporation (real estate), Progress Energy, Inc. (electric utility), and Acterna Corporation (communications test equipment, 1999). He is also a partner of Franklin Street Partners (private investment management firm) and a member of the Research Triangle Foundation Board. In addition, Mr. McCoy served as the Interim Chancellor (1999-2000) and a member of the Board of Visitors (1994-1998) for the University of North Carolina at Chapel Hill and currently serves on the Board of Directors of the University of North Carolina Health Care System and the Board of Visitors of the Kenan-Flagler Business School (University of North Carolina at Chapel Hill). He also served as Vice President of Finance for the University of North Carolina (16-school system, 1995-1998). | |
William S. Stavropoulos (64) | |
Year of Election or Appointment: 2002 Mr. Stavropoulos is Chairman of the Board, President and CEO (2002), and Chairman of the Executive Committee (2000) and a Director of The Dow Chemical Company. Since joining The Dow Chemical Company in 1967, Mr. Stavropoulos served in numerous senior management positions, including President (1993-2000) and Chief Executive Officer (1995-2000). Currently, he is a Director of NCR Corporation (data warehousing and technology solutions), BellSouth Corporation (telecommunications), Chemical Financial Corporation, and Maersk Inc. (industrial conglomerate, 2002). He also serves as a member of the Board of Trustees of the American Enterprise Institute for Public Policy Research. In addition, Mr. Stavropoulos is a member of The Business Council, J.P. Morgan International Council, World Business Council for Sustainable Development, and the University of Notre Dame Advisory Council for the College of Science. | |
Annual Report
Trustees and Officers - continued
Advisory Board Members and Executive Officers:
Correspondence intended for Ms. Small may be sent to Fidelity Investments, P.O. Box 55235, Boston, Massachusetts 02205-5235. Correspondence intended for each executive officer and Mr. Lynch may be sent to 82 Devonshire Street, Boston, Massachusetts 02109.
Name, Age; Principal Occupation | |
Peter S. Lynch (60) | |
Year of Election or Appointment: 2003 Member of the Advisory Board of Fidelity Financial Trust. Vice Chairman and a Director of FMR, and Vice Chairman (2001) and a Director (2000) of FMR Co., Inc. Previously, Mr. Lynch served as a Trustee of the Fidelity funds (1990-2003). Prior to May 31, 1990, he was a Director of FMR and Executive Vice President of FMR (a position he held until March 31, 1991), Vice President of Fidelity Magellan Fund and FMR Growth Group Leader, and Managing Director of FMR Corp. Mr. Lynch was also Vice President of Fidelity Investments Corporate Services. In addition, he serves as a Trustee of Boston College, Massachusetts Eye & Ear Infirmary, Historic Deerfield, John F. Kennedy Library, and the Museum of Fine Arts of Boston. | |
Cornelia M. Small (59) | |
Year of Election or Appointment: 2004 Member of the Advisory Board of Fidelity Mt. Vernon Street Trust. Ms. Small is a member (2000) and Chairperson (2002) of the Investment Committee, and a member (2002) of the Board of Trustees of Smith College. Previously, she served as Chief Investment Officer (1999-2000), Director of Global Equity Investments (1996-1999), and a member of the Board of Directors (1998-1999) of Scudder Kemper Investments. In addition, Ms. Small served as Co-Chair (2000-2003) of the Annual Fund for the Fletcher School of Law and Diplomacy. | |
Bart A. Grenier (44) | |
Year of Election or Appointment: 2001 Vice President of Convertible Securities. Mr. Grenier also serves as Vice President of certain Equity Funds (2001), a position he previously held from 1999 to 2000, and Vice President of certain High Income Funds (2002). He is Senior Vice President of FMR (1999) and FMR Co., Inc. (2001), and President and Director of Strategic Advisers, Inc. (2002). He also heads Fidelity's Asset Allocation Group (2000), Fidelity's Growth and Income Group (2001), Fidelity's Value Group (2001), and Fidelity's High Income Division (2001). Previously, Mr. Grenier served as President of Fidelity Ventures (2000), Vice President of certain High Income Funds (1997-2000), High Income Division Head (1997-2000), Group Leader of the Income-Growth and Asset Allocation-Income Groups (1996-2000), and Assistant Equity Division Head (1997-2000). | |
Victor Thay (29) | |
Year of Election or Appointment: 2003 Vice President of Convertible Securities. Prior to assuming his current responsibilities, Mr. Thay managed a variety of Fidelity funds. | |
Eric D. Roiter (55) | |
Year of Election or Appointment: 1998 Secretary of Convertible Securities. He also serves as Secretary of other Fidelity funds (1998); Vice President, General Counsel, and Clerk of FMR Co., Inc. (2001) and FMR (1998); Vice President and Clerk of FDC (1998); Assistant Clerk of Fidelity Management & Research (U.K.) Inc. (2001) and Fidelity Management & Research (Far East) Inc. (2001); and Assistant Secretary of Fidelity Investments Money Management Inc. (2001). Prior to joining Fidelity, Mr. Roiter was with the law firm of Debevoise & Plimpton, as an associate (1981-1984) and as a partner (1985-1997), and served as an Assistant General Counsel of the U.S. Securities and Exchange Commission (1979-1981). Mr. Roiter is an Adjunct Member, Faculty of Law, at Boston College Law School (2003). | |
Stuart Fross (44) | |
Year of Election or Appointment: 2003 Assistant Secretary of Convertible Securities. Mr. Fross also serves as Assistant Secretary of other Fidelity funds (2003) and is an employee of FMR. | |
Maria F. Dwyer (44) | |
Year of Election or Appointment: 2002 President and Treasurer of Convertible Securities. Ms. Dwyer also serves as President and Treasurer of other Fidelity funds (2002) and is a Vice President (1999) and an employee (1996) of FMR. Prior to joining Fidelity, Ms. Dwyer served as Director of Compliance for MFS Investment Management. | |
Timothy F. Hayes (52) | |
Year of Election or Appointment: 2002 Chief Financial Officer of Convertible Securities. Mr. Hayes also serves as Chief Financial Officer of other Fidelity funds (2002). Recently he was appointed President of Fidelity Service Company (2003) where he also serves as a Director. Mr. Hayes also serves as President of Fidelity Investments Operations Group (FIOG, 2002), which includes Fidelity Pricing and Cash Management Services Group (FPCMS), where he was appointed President in 1998. Previously, Mr. Hayes served as Chief Financial Officer of Fidelity Investments Corporate Systems and Service Group (1998) and Fidelity Systems Company (1997-1998). | |
John R. Hebble (45) | |
Year of Election or Appointment: 2003 Deputy Treasurer of Convertible Securities. Mr. Hebble also serves as Deputy Treasurer of other Fidelity funds (2003), and is an employee of FMR. Before joining Fidelity Investments, Mr. Hebble worked at Deutsche Asset Management where he served as Director of Fund Accounting (2002-2003) and Assistant Treasurer of the Scudder Funds (1998-2003). | |
John H. Costello (57) | |
Year of Election or Appointment: 1987 Assistant Treasurer of Convertible Securities. Mr. Costello also serves as Assistant Treasurer of other Fidelity funds and is an employee of FMR. | |
Francis V. Knox, Jr. (56) | |
Year of Election or Appointment: 2002 Assistant Treasurer of Convertible Securities. Mr. Knox also serves as Assistant Treasurer of other Fidelity funds (2002), and is a Vice President and an employee of FMR. Previously, Mr. Knox served as Vice President of Investment & Advisor Compliance (1990-2001), and Compliance Officer of Fidelity Management & Research (U.K.) Inc. (1992-2002), Fidelity Management & Research (Far East) Inc. (1991-2002), and FMR Corp. (1995-2002). | |
Mark Osterheld (48) | |
Year of Election or Appointment: 2002 Assistant Treasurer of Convertible Securities. Mr. Osterheld also serves as Assistant Treasurer of other Fidelity funds (2002) and is an employee of FMR. | |
Thomas J. Simpson (45) | |
Year of Election or Appointment: 2000 Assistant Treasurer of Convertible Securities. Mr. Simpson is Assistant Treasurer of other Fidelity funds (2000) and an employee of FMR (1996). Prior to joining FMR, Mr. Simpson was Vice President and Fund Controller of Liberty Investment Services (1987-1995). | |
Annual Report
Distributions
The fund designates 24%, 26%, 26%, and 26% of the dividends distributed in December, March, June and September, respectively during the fiscal year as qualifying for the dividends-received deduction for corporate shareholders.
A total of .05% of the dividends distributed during the fiscal year was derived from interest on U.S. Government securities which is generally exempt from state income tax.
The fund designates 11%, 11%, and 11% of the dividends distributed in March, June and September, respectively during the fiscal year as amounts which may be taken into account as a dividend for purposes of the maximum rate under section 1(h)(11) of the Internal Revenue Code.
The fund will notify shareholders in January 2004 of amounts for use in preparing 2003 income tax returns.
Annual Report
Managing Your Investments
Fidelity offers several ways to conveniently manage your personal investments via your telephone or PC. You can access your account information, conduct trades and research your investments 24 hours a day.
By Phone
Fidelity Automated Service Telephone provides a single toll-free number to access account balances, positions, quotes and trading. It's easy to navigate the service, and on your first call, the system will help you create a personal identification number (PIN) for security.
(phone_graphic)
Fidelity Automated
Service Telephone (FAST®)
1-800-544-5555
Press
1 For mutual fund and brokerage trading.
2 For quotes.*
3 For account balances and holdings.
4 To review orders and mutual
fund activity.
5 To change your PIN.
*0 To speak to a Fidelity representative.
By PC
Fidelity's web site on the Internet provides a wide range of information, including daily financial news, fund performance, interactive planning tools and news about Fidelity products and services.
(computer_graphic)
Fidelity's Web Site
www.fidelity.com
* When you call the quotes line, please remember that a fund's yield and return will vary and, except for money market funds, share price will also vary. This means that you may have a gain or loss when you sell your shares. There is no assurance that money market funds will be able to maintain a stable $1 share price; an investment in a money market fund is not insured or guaranteed by the U.S. government. Total returns are historical and include changes in share price, reinvestment of dividends and capital gains, and the effects of any sales charges.
Annual Report
To Visit Fidelity
For directions and hours,
please call 1-800-544-9797.
Arizona
7001 West Ray Road
Chandler, AZ
7373 N. Scottsdale Road
Scottsdale, AZ
California
815 East Birch Street
Brea, CA
1411 Chapin Avenue
Burlingame, CA
851 East Hamilton Avenue
Campbell, CA
527 North Brand Boulevard
Glendale, CA
19200 Von Karman Avenue
Irvine, CA
601 Larkspur Landing Circle
Larkspur, CA
10100 Santa Monica Blvd.
Los Angeles, CA
27101 Puerta Real
Mission Viejo, CA
73-575 El Paseo
Palm Desert, CA
251 University Avenue
Palo Alto, CA
1760 Challenge Way
Sacramento, CA
7676 Hazard Center Drive
San Diego, CA
8 Montgomery Street
San Francisco, CA
21701 Hawthorne Boulevard
Torrance, CA
2001 North Main Street
Walnut Creek, CA
6300 Canoga Avenue
Woodland Hills, CA
Colorado
1625 Broadway
Denver, CO
9185 East Westview Road
Littleton, CO
Connecticut
48 West Putnam Avenue
Greenwich, CT
265 Church Street
New Haven, CT
300 Atlantic Street
Stamford, CT
29 South Main Street
West Hartford, CT
Delaware
222 Delaware Avenue
Wilmington, DE
Florida
4400 N. Federal Highway
Boca Raton, FL
121 Alhambra Plaza
Coral Gables, FL
2948 N. Federal Highway
Ft. Lauderdale, FL
1907 West State Road 434
Longwood, FL
8880 Tamiami Trail, North
Naples, FL
3501 PGA Boulevard
West Palm Beach, FL
8065 Beneva Road
Sarasota, FL
1502 N. Westshore Blvd.
Tampa, FL
Georgia
3445 Peachtree Road, N.E.
Atlanta, GA
1000 Abernathy Road
Atlanta, GA
Illinois
One North LaSalle Street
Chicago, IL
1415 West 22nd Street
Oak Brook, IL
1700 East Golf Road
Schaumburg, IL
3232 Lake Avenue
Wilmette, IL
Indiana
4729 East 82nd Street
Indianapolis, IN
Kansas
5400 College Boulevard
Overland Park, KS
Maine
Three Canal Plaza
Portland, ME
Maryland
7401 Wisconsin Avenue
Bethesda, MD
One W. Pennsylvania Ave.
Towson, MD
Massachusetts
801 Boylston Street
Boston, MA
155 Congress Street
Boston, MA
300 Granite Street
Braintree, MA
44 Mall Road
Burlington, MA
405 Cochituate Road
Framingham, MA
416 Belmont Street
Worcester, MA
Annual Report
Michigan
280 Old N. Woodward Ave.
Birmingham, MI
43420 Grand River Avenue
Novi, MI
29155 Northwestern Hwy.
Southfield, MI
Minnesota
7600 France Avenue South
Edina, MN
Missouri
8885 Ladue Road
Ladue, MO
New Jersey
150 Essex Street
Millburn, NJ
56 South Street
Morristown, NJ
501 Route 17, South
Paramus, NJ
3518 Route 1 North
Princeton, NJ
New York
1055 Franklin Avenue
Garden City, NY
37 West Jericho Turnpike
Huntington Station, NY
1271 Avenue of the Americas
New York, NY
61 Broadway
New York, NY
350 Park Avenue
New York, NY
North Carolina
4611 Sharon Road
Charlotte, NC
Ohio
3805 Edwards Road
Cincinnati, OH
28699 Chagrin Boulevard
Woodmere Village, OH
Oregon
16850 SW 72nd Avenue
Tigard, OR
Pennsylvania
600 West DeKalb Pike
King of Prussia, PA
1735 Market Street
Philadelphia, PA
12001 Perry Highway
Wexford, PA
Rhode Island
47 Providence Place
Providence, RI
Tennessee
6150 Poplar Avenue
Memphis, TN
Texas
10000 Research Boulevard
Austin, TX
4017 Northwest Parkway
Dallas, TX
12532 Memorial Drive
Houston, TX
2701 Drexel Drive
Houston, TX
400 East Las Colinas Blvd.
Irving, TX
14100 San Pedro
San Antonio, TX
19740 IH 45 North
Spring, TX
6005 West Park Boulevard
Plano, TX 75093
Utah
215 South State Street
Salt Lake City, UT
Virginia
1861 International Drive
McLean, VA
Washington
411 108th Avenue, N.E.
Bellevue, WA
1518 6th Avenue
Seattle, WA
Washington, DC
1900 K Street, N.W.
Washington, DC
Wisconsin
595 North Barker Road
Brookfield, WI
Fidelity Brokerage Services, Inc., 100 Summer St., Boston, MA 02110 Member NYSE/SIPC
Annual Report
Investment Adviser
Fidelity Management & Research Company
Boston, MA
Investment Sub-Advisers
FMR Co., Inc.
Fidelity Management & Research (U.K.) Inc.
Fidelity Management & Research
(Far East) Inc.
Fidelity International Investment Advisors
Fidelity Investments Japan Limited
Fidelity International Investment Advisors (U.K.) Limited
General Distributor
Fidelity Distributors Corporation
Boston, MA
Transfer and Shareholder
Servicing Agent
Fidelity Service Company, Inc.
Boston, MA
Custodian
Citibank, N.A.
New York, NY
Fidelity's Growth and Income Funds
Balanced Fund
Convertible Securities Fund
Equity-Income Fund
Equity-Income II Fund
Fidelity® Fund
Global Balanced Fund
Growth & Income Portfolio
Growth & Income II Portfolio
Puritan® Fund
Real Estate Income Fund
Real Estate Investment Portfolio
Utilities Fund
The Fidelity Telephone Connection
Mutual Fund 24-Hour Service
Exchanges/Redemptions
and Account Assistance 1-800-544-6666
Product Information 1-800-544-6666
Retirement Accounts 1-800-544-4774
(8 a.m. - 9 p.m.)
TDD Service 1-800-544-0118
for the deaf and hearing impaired
(9 a.m. - 9 p.m. Eastern time)
Fidelity Automated Service
Telephone (FAST®) (automated graphic) 1-800-544-5555
(automated graphic) Automated line for quickest service
CVS-UANN-0104
1.786706.100
(Fidelity Investment logo)(registered trademark)
Corporate Headquarters
82 Devonshire St., Boston, MA 02109
www.fidelity.com
Fidelity®
Equity-Income II
Fund
Annual Report
November 30, 2003
(2_fidelity_logos) (Registered_Trademark)
Contents
Chairman's Message | Ned Johnson's message to shareholders. | |
Performance | How the fund has done over time. | |
Management's Discussion | The manager's review of fund performance, strategy and outlook. | |
Investment Changes | A summary of major shifts in the fund's investments over the past six months. | |
Investments | A complete list of the fund's investments with their market values. | |
Financial Statements | Statements of assets and liabilities, operations, and changes in net assets, | |
Notes | Notes to the financial statements. | |
Auditors' Opinion | ||
Trustees and Officers | ||
Distributions |
For a free copy of the fund's proxy voting guidelines visit www.fidelity.com/goto/proxyguidelines, call 1-800-544-8544, or visit the Securities and Exchange Commission (SEC)'s web site at www.sec.gov.
Standard & Poor's, S&P and S&P 500 are registered service marks of The McGraw-Hill Companies, Inc. and have been licensed for use by Fidelity Distributors Corporation.
Other third party marks appearing herein are the property of their respective owners.
All other marks appearing herein are registered or unregistered trademarks or service marks of FMR Corp. or an affiliated company.
(Recycle graphic) This report is printed on recycled paper using soy-based inks.
This report and the financial statements contained herein are submitted for the general information of the shareholders of the fund. This report is not authorized for distribution to prospective investors in the fund unless preceded or accompanied by an effective prospectus.
Mutual fund shares are not deposits or obligations of, or guaranteed by, any depository institution. Shares are not insured by the FDIC, Federal Reserve Board or any other agency, and are subject to investment risks, including possible loss of principal amount invested.
Neither the fund nor Fidelity Distributors Corporation is a bank.
For more information on any Fidelity Advisor fund, including charges and expenses, contact your investment professional for a free prospectus. Read it carefully before you invest or send money.
Annual Report
Chairman's Message
(photo_of_Edward_C_Johnson_3d)
Dear Shareholder:
Many of you have read or heard news stories recently that were critical of mutual funds and made allegations that the mutual fund industry has been less than forthright. I find these reports unsettling and not necessarily an accurate picture of the overall industry, and I would like you to know where we at Fidelity stand.
With specific regard to allegations that certain mutual fund companies were violating the Securities and Exchange Commission's forward pricing rules or were involved in so-called "market timing" activities, I want to say two things:
First, Fidelity does not have agreements that permit customers who buy fund shares after 4 p.m. to obtain the 4 p.m. price. This is not to say that someone could not deceive the company through fraudulent acts. But I underscore that we have no so-called "agreements" which would permit this illegal practice.
Second, Fidelity has been on record for years opposing predatory short-term trading which adversely affects other shareholders in a mutual fund. In fact, in the 1980s, we began charging a fee - which is returned to the fund and, therefore, to investors - to discourage this activity. What's more, several years ago we took the industry lead in developing a Fair Value Pricing Policy to prevent market timing on foreign securities in our funds. It is reasonable to assume that another structure can be developed that would alter the system to make it much more difficult for predatory traders to operate. This, however, will only be achieved through close cooperation among regulators, legislators and the industry.
Certainly no industry is perfect, and there have been instances of unethical and illegal activity from time to time within the mutual fund industry. When this occurs, confessed or convicted offenders should be dealt with appropriately. Clearly, every system can be improved. We applaud well thought out improvements by regulators, legislators and industry representatives that achieve the common goal of building and protecting the value of investors' holdings. But we remain concerned about the risk of over-regulation and the quick application of simplistic solutions to intricate problems.
For more than 57 years, Fidelity Investments has worked very hard to improve its products and service to justify your trust. When our family founded this company in 1946, we had only a few hundred customers. Many of them were family and friends. Today, we serve more than 18 million customers including individual investors and participants in retirement plans across America.
Let me close by saying that we do not take your trust in us for granted, and we realize that we must always work to improve all aspects of our service to you. In turn, we urge you to continue your active participation with your financial matters, so that your interests can be well served.
Best regards,
/s/Edward C. Johnson 3d
Edward C. Johnson 3d
Annual Report
Performance: The Bottom Line
Average annual total return reflects the change in the value of an investment, assuming reinvestment of the fund's dividend income and capital gains (the profits earned upon the sale of securities that have grown in value) and assuming a constant rate of performance each year. The $10,000 table and the fund's returns do not reflect the deduction of taxes that a shareholder would pay on fund distributions or the redemption of fund shares. During periods of reimbursement by Fidelity, a fund's total return will be greater than it would be had the reimbursement not occurred. How a fund did yesterday is no guarantee of how it will do tomorrow.
Average Annual Total Returns
Periods ended November 30, 2003 | Past 1 | Past 5 | Past 10 |
Fidelity Equity-Income II | 16.40% | 3.00% | 10.53% |
$10,000 Over 10 Years
Let's say hypothetically that $10,000 was invested in Fidelity® Equity-Income II Fund on November 30, 1993. The chart shows how the value of your investment would have grown, and also shows how the Russell 3000 Value Index did over the same period.

Annual Report
Management's Discussion of Fund Performance
Comments from Steve DuFour, Portfolio Manager of Fidelity® Equity-Income II Fund
A healthier economy translated into improved equity market performance for the year ending November 30, 2003. Early signals of an economic recovery were seen when growth in gross domestic product (GDP) surprised on the upside in the first and second quarters of 2003. The Federal Reserve Board added further fuel in June by dropping interest rates to a 45-year low. Federal tax cuts and credits, as well as a boom in mortgage refinancing, put even more discretionary income in consumers' pockets. In the third quarter, GDP growth, propelled by robust consumer and business spending, grew 8.2%, its highest level since 1984. Consumer spending had its strongest third quarter since 1997, while corporate profits had their best showing since 1992. As a result of 2003's economic momentum, stocks enjoyed their best showing since 1999 and were poised to end their three-year losing streak. For the year ending November 30, 2003, the Standard & Poor's 500SM Index gained 15.09%, the Dow Jones Industrial AverageSM returned 12.47% and the NASDAQ Composite® Index advanced 33.23%.
For the 12 months ending November 30, 2003, Fidelity Equity-Income II Fund returned 16.40%, topping the 14.65% return for the LipperSM Equity Income Objective Funds Average, but lagging the 18.39% return for the Russell 3000® Value Index. Despite a positive return for the fund's financial holdings, they lagged those of the index, resulting in the bulk of the fund's relative shortfall. Although business improved for a few of our larger holdings in this sector - such as brokerage Charles Schwab, insurance giant American International Group and financial services provider Mellon - these stocks underperformed the overall sector. Elsewhere, the fund's overweighting in poor-performing energy services stocks, such as Schlumberger and Weatherford International, also held back its return versus the index. I believe the fund outperformed its peers because it generally owned a large percentage of stocks in economically sensitive industries - including capital goods, materials and semiconductors - that experienced a pickup in business activity. Some top performers included truck manufacturer PACCAR, aerospace supplier Goodrich and aluminum producer Alcoa. Adding several stocks as they declined earlier in the period, such as semiconductor maker Analog Devices and retailer Home Depot, also made a strong contribution.
The views expressed in this statement reflect those of the portfolio manager only through the end of the period of the report as stated on the cover and do not necessarily represent the views of Fidelity or any other person in the Fidelity organization. Any such views are subject to change at any time based upon market or other conditions and Fidelity disclaims any responsibility to update such views. These views may not be relied on as investment advice and, because investment decisions for a Fidelity fund are based on numerous factors, may not be relied on as an indication of trading intent on behalf of any Fidelity fund.
Annual Report
Investment Changes
Top Ten Stocks as of November 30, 2003 | ||
% of fund's | % of fund's net assets | |
Burlington Resources, Inc. | 4.7 | 4.8 |
Charles Schwab Corp. | 4.4 | 4.5 |
Verizon Communications, Inc. | 4.2 | 3.9 |
Morgan Stanley | 4.2 | 3.7 |
Exxon Mobil Corp. | 3.4 | 3.1 |
Citigroup, Inc. | 3.3 | 3.9 |
Union Pacific Corp. | 2.4 | 2.6 |
Bank of America Corp. | 2.4 | 1.8 |
International Business Machines Corp. | 2.2 | 0.4 |
Wells Fargo & Co. | 2.1 | 0.0 |
33.3 | ||
Top Five Market Sectors as of November 30, 2003 | ||
% of fund's | % of fund's net assets | |
Financials | 29.7 | 28.5 |
Industrials | 16.6 | 19.3 |
Consumer Discretionary | 12.2 | 13.2 |
Information Technology | 11.0 | 11.6 |
Energy | 9.6 | 9.2 |
Asset Allocation (% of fund's net assets) | |||||||
As of November 30, 2003 * | As of May 31, 2003 ** | ||||||
| Stocks 98.3% | | Stocks 97.3% | ||||
 | Convertible | | Convertible | ||||
| Short-Term | | Short-Term | ||||
* Foreign investments | 4.2% | ** Foreign investments | 2.7% | ||||

Annual Report
Investments November 30, 2003
Showing Percentage of Net Assets
Common Stocks - 98.2% | |||
Shares | Value (Note 1) | ||
CONSUMER DISCRETIONARY - 12.2% | |||
Automobiles - 0.5% | |||
Ford Motor Co. | 4,451,600 | $ 58,761 | |
Hotels, Restaurants & Leisure - 0.6% | |||
Mandalay Resort Group | 566,000 | 24,310 | |
Marriott International, Inc. Class A | 956,300 | 43,827 | |
68,137 | |||
Household Durables - 0.2% | |||
Sony Corp. sponsored ADR | 662,600 | 22,760 | |
Internet & Catalog Retail - 2.0% | |||
InterActiveCorp (a) | 6,969,850 | 228,960 | |
Media - 5.8% | |||
Belo Corp. Series A | 2,502,200 | 71,088 | |
EchoStar Communications Corp. Class A (a) | 869,500 | 29,980 | |
McGraw-Hill Companies, Inc. | 152,800 | 10,467 | |
News Corp. Ltd. ADR | 4,654,100 | 159,403 | |
Omnicom Group, Inc. | 765,480 | 60,978 | |
PanAmSat Corp. (a) | 474,900 | 10,491 | |
The New York Times Co. Class A | 14,000 | 643 | |
Time Warner, Inc. (a) | 6,620,200 | 107,777 | |
Tribune Co. | 1,243,500 | 60,745 | |
Viacom, Inc. Class B (non-vtg.) | 3,808,700 | 149,758 | |
Washington Post Co. Class B | 15,200 | 12,212 | |
673,542 | |||
Multiline Retail - 1.0% | |||
Federated Department Stores, Inc. | 913,500 | 44,844 | |
Kohl's Corp. (a) | 370,400 | 17,898 | |
Saks, Inc. (a) | 1,418,500 | 21,817 | |
Target Corp. | 717,900 | 27,797 | |
112,356 | |||
Specialty Retail - 2.1% | |||
AutoZone, Inc. (a) | 213,100 | 20,385 | |
Foot Locker, Inc. | 1,415,400 | 31,280 | |
Gap, Inc. | 4,725,500 | 101,598 | |
Home Depot, Inc. | 1,439,600 | 52,920 | |
TJX Companies, Inc. | 1,230,900 | 27,806 | |
Zale Corp. (a) | 134,500 | 7,283 | |
241,272 | |||
TOTAL CONSUMER DISCRETIONARY | 1,405,788 | ||
Common Stocks - continued | |||
Shares | Value (Note 1) | ||
CONSUMER STAPLES - 5.2% | |||
Beverages - 0.4% | |||
Anheuser-Busch Companies, Inc. | 1,004,600 | $ 52,058 | |
Food & Staples Retailing - 0.9% | |||
BJ's Wholesale Club, Inc. (a) | 132,200 | 3,364 | |
Safeway, Inc. (a) | 1,815,900 | 37,680 | |
Walgreen Co. | 1,401,000 | 51,571 | |
Whole Foods Market, Inc. | 84,800 | 5,571 | |
98,186 | |||
Food Products - 2.0% | |||
Campbell Soup Co. | 1,312,600 | 33,616 | |
McCormick & Co., Inc. (non-vtg.) | 3,849,000 | 110,428 | |
Smithfield Foods, Inc. (a) | 741,800 | 17,395 | |
Unilever NV (NY Shares) | 1,133,650 | 68,132 | |
229,571 | |||
Household Products - 1.2% | |||
Colgate-Palmolive Co. | 1,487,700 | 78,104 | |
Procter & Gamble Co. | 684,700 | 65,896 | |
144,000 | |||
Personal Products - 0.7% | |||
Estee Lauder Companies, Inc. Class A | 404,600 | 15,375 | |
Gillette Co. | 1,790,000 | 60,377 | |
75,752 | |||
TOTAL CONSUMER STAPLES | 599,567 | ||
ENERGY - 9.5% | |||
Energy Equipment & Services - 1.4% | |||
BJ Services Co. (a) | 451,300 | 14,392 | |
Cooper Cameron Corp. (a) | 443,900 | 19,270 | |
ENSCO International, Inc. | 1,051,910 | 26,613 | |
Nabors Industries Ltd. (a) | 334,900 | 12,431 | |
Noble Corp. (a) | 764,900 | 26,450 | |
Rowan Companies, Inc. (a) | 332,600 | 7,041 | |
Smith International, Inc. (a) | 87,200 | 3,273 | |
Weatherford International Ltd. (a) | 1,737,500 | 56,955 | |
166,425 | |||
Common Stocks - continued | |||
Shares | Value (Note 1) | ||
ENERGY - continued | |||
Oil & Gas - 8.1% | |||
Burlington Resources, Inc. (c) | 10,686,400 | $ 536,456 | |
Exxon Mobil Corp. | 10,814,500 | 391,160 | |
927,616 | |||
TOTAL ENERGY | 1,094,041 | ||
FINANCIALS - 29.6% | |||
Capital Markets - 12.4% | |||
Bank of New York Co., Inc. | 5,575,700 | 171,062 | |
Charles Schwab Corp. | 44,286,140 | 513,719 | |
Mellon Financial Corp. | 1,186,200 | 34,163 | |
Morgan Stanley | 8,712,993 | 481,654 | |
Northern Trust Corp. | 4,023,400 | 180,449 | |
State Street Corp. | 930,500 | 47,418 | |
1,428,465 | |||
Commercial Banks - 7.4% | |||
Bank of America Corp. | 3,613,300 | 272,551 | |
Bank One Corp. | 2,157,400 | 93,545 | |
City National Corp. | 287,600 | 18,194 | |
Comerica, Inc. | 302,500 | 15,775 | |
SunTrust Banks, Inc. | 307,900 | 21,876 | |
U.S. Bancorp, Delaware | 3,671,200 | 101,729 | |
Wachovia Corp. | 1,937,457 | 88,639 | |
Wells Fargo & Co. | 4,283,400 | 245,567 | |
857,876 | |||
Consumer Finance - 0.4% | |||
AmeriCredit Corp. (a) | 1,801,100 | 24,225 | |
SLM Corp. | 594,400 | 22,070 | |
46,295 | |||
Diversified Financial Services - 3.6% | |||
Citigroup, Inc. | 8,184,641 | 385,006 | |
GATX Corp. | 1,175,000 | 28,553 | |
413,559 | |||
Insurance - 2.6% | |||
AFLAC, Inc. | 1,081,500 | 38,902 | |
Allstate Corp. | 783,600 | 31,642 | |
American International Group, Inc. | 3,913,200 | 226,770 | |
297,314 | |||
Common Stocks - continued | |||
Shares | Value (Note 1) | ||
FINANCIALS - continued | |||
Real Estate - 1.3% | |||
Duke Realty Corp. | 1,799,900 | $ 55,437 | |
Friedman, Billings, Ramsey Group, Inc. Class A | 1,941,100 | 41,442 | |
ProLogis | 1,590,978 | 48,525 | |
145,404 | |||
Thrifts & Mortgage Finance - 1.9% | |||
Fannie Mae | 2,792,360 | 195,465 | |
Golden West Financial Corp., Delaware | 266,900 | 26,930 | |
222,395 | |||
TOTAL FINANCIALS | 3,411,308 | ||
HEALTH CARE - 4.9% | |||
Health Care Equipment & Supplies - 0.6% | |||
Becton, Dickinson & Co. | 992,400 | 39,726 | |
Guidant Corp. | 233,200 | 13,239 | |
Steris Corp. (a) | 614,500 | 14,213 | |
67,178 | |||
Pharmaceuticals - 4.3% | |||
AstraZeneca PLC sponsored ADR | 833,500 | 38,299 | |
Forest Laboratories, Inc. (a) | 155,600 | 8,502 | |
Johnson & Johnson | 1,962,600 | 96,737 | |
Merck & Co., Inc. | 2,354,100 | 95,576 | |
Novartis AG sponsored ADR | 1,331,300 | 56,181 | |
Pfizer, Inc. | 5,501,190 | 184,565 | |
Valeant Pharmaceuticals International | 673,700 | 16,108 | |
495,968 | |||
TOTAL HEALTH CARE | 563,146 | ||
INDUSTRIALS - 16.6% | |||
Aerospace & Defense - 3.9% | |||
EADS NV | 874,967 | 19,089 | |
Goodrich Corp. (c) | 6,851,200 | 188,477 | |
Honeywell International, Inc. | 636,800 | 18,907 | |
Lockheed Martin Corp. | 4,151,540 | 190,722 | |
Raytheon Co. | 1,166,000 | 32,310 | |
449,505 | |||
Air Freight & Logistics - 0.3% | |||
United Parcel Service, Inc. Class B | 551,000 | 40,096 | |
Common Stocks - continued | |||
Shares | Value (Note 1) | ||
INDUSTRIALS - continued | |||
Airlines - 0.4% | |||
Continental Airlines, Inc. Class B (a) | 2,193,300 | $ 40,905 | |
Commercial Services & Supplies - 0.4% | |||
HON Industries, Inc. | 41,700 | 1,772 | |
R.R. Donnelley & Sons Co. | 1,387,900 | 38,944 | |
40,716 | |||
Electrical Equipment - 0.3% | |||
Emerson Electric Co. | 347,800 | 21,230 | |
Thomas & Betts Corp. | 766,000 | 15,933 | |
37,163 | |||
Industrial Conglomerates - 3.1% | |||
3M Co. | 2,393,200 | 189,159 | |
General Electric Co. | 5,426,000 | 155,563 | |
Teleflex, Inc. | 349,600 | 15,998 | |
360,720 | |||
Machinery - 3.3% | |||
Caterpillar, Inc. | 273,300 | 20,784 | |
Dover Corp. | 4,545,900 | 174,517 | |
Eaton Corp. | 404,940 | 41,705 | |
Illinois Tool Works, Inc. | 1,475,500 | 115,237 | |
PACCAR, Inc. | 102,700 | 8,238 | |
Parker Hannifin Corp. | 411,500 | 22,628 | |
Wabash National Corp. (a) | 115,400 | 3,212 | |
386,321 | |||
Road & Rail - 4.8% | |||
Norfolk Southern Corp. | 8,551,044 | 183,078 | |
Union Pacific Corp. | 4,420,700 | 281,510 | |
Werner Enterprises, Inc. (c) | 4,903,541 | 88,999 | |
553,587 | |||
Trading Companies & Distributors - 0.1% | |||
MSC Industrial Direct Co., Inc. Class A | 252,300 | 6,646 | |
TOTAL INDUSTRIALS | 1,915,659 | ||
INFORMATION TECHNOLOGY - 10.7% | |||
Communications Equipment - 1.8% | |||
Alcatel SA sponsored ADR (a) | 1,802,800 | 23,472 | |
Avaya, Inc. (a) | 4,395,600 | 59,780 | |
CIENA Corp. (a) | 1,698,600 | 12,026 | |
Common Stocks - continued | |||
Shares | Value (Note 1) | ||
INFORMATION TECHNOLOGY - continued | |||
Communications Equipment - continued | |||
Motorola, Inc. | 3,627,300 | $ 50,927 | |
Nokia Corp. sponsored ADR | 1,097,100 | 19,726 | |
Nortel Networks Corp. (a) | 6,553,400 | 29,571 | |
Telefonaktiebolaget LM Ericsson ADR (a) | 805,800 | 13,086 | |
208,588 | |||
Computers & Peripherals - 3.7% | |||
Hewlett-Packard Co. | 7,876,300 | 170,837 | |
International Business Machines Corp. | 2,824,500 | 255,730 | |
426,567 | |||
Electronic Equipment & Instruments - 1.1% | |||
Arrow Electronics, Inc. (a) | 1,546,400 | 36,155 | |
Avnet, Inc. (a) | 846,300 | 18,052 | |
Ingram Micro, Inc. Class A (a) | 2,214,800 | 32,292 | |
Solectron Corp. (a) | 2,463,200 | 14,410 | |
Vishay Intertechnology, Inc. (a) | 1,134,200 | 23,830 | |
124,739 | |||
Internet Software & Services - 0.2% | |||
Ariba, Inc. (a) | 3,219,800 | 10,175 | |
DoubleClick, Inc. (a) | 909,000 | 8,681 | |
18,856 | |||
IT Services - 0.7% | |||
BearingPoint, Inc. (a) | 501,100 | 4,645 | |
Electronic Data Systems Corp. | 3,082,800 | 66,650 | |
Unisys Corp. (a) | 748,600 | 12,217 | |
83,512 | |||
Office Electronics - 0.1% | |||
Xerox Corp. (a) | 696,000 | 8,477 | |
Semiconductors & Semiconductor Equipment - 2.1% | |||
Altera Corp. (a) | 424,000 | 10,740 | |
Atmel Corp. (a) | 1,188,400 | 7,998 | |
Axcelis Technologies, Inc. (a) | 860,800 | 9,873 | |
DSP Group, Inc. (a) | 191,900 | 4,623 | |
Fairchild Semiconductor International, Inc. (a) | 1,491,000 | 38,766 | |
Integrated Circuit Systems, Inc. (a) | 203,900 | 6,066 | |
Integrated Device Technology, Inc. (a) | 2,580,100 | 48,635 | |
Kulicke & Soffa Industries, Inc. (a) | 1,226,800 | 20,218 | |
Common Stocks - continued | |||
Shares | Value (Note 1) | ||
INFORMATION TECHNOLOGY - continued | |||
Semiconductors & Semiconductor Equipment - continued | |||
NVIDIA Corp. (a) | 550,500 | $ 11,643 | |
Teradyne, Inc. (a) | 3,305,900 | 83,210 | |
241,772 | |||
Software - 1.0% | |||
BMC Software, Inc. (a) | 2,370,800 | 39,426 | |
Concord Communications, Inc. (a) | 170,200 | 3,768 | |
Microsoft Corp. | 2,211,100 | 56,825 | |
Network Associates, Inc. (a) | 1,420,352 | 19,019 | |
119,038 | |||
TOTAL INFORMATION TECHNOLOGY | 1,231,549 | ||
MATERIALS - 3.5% | |||
Chemicals - 1.9% | |||
Air Products & Chemicals, Inc. | 1,880,400 | 90,146 | |
E.I. du Pont de Nemours & Co. | 1,229,100 | 50,958 | |
Eastman Chemical Co. | 1,404,400 | 50,095 | |
Ecolab, Inc. | 534,300 | 14,009 | |
Rohm & Haas Co. | 283,500 | 11,383 | |
216,591 | |||
Construction Materials - 0.2% | |||
Vulcan Materials Co. | 517,400 | 23,009 | |
Metals & Mining - 1.4% | |||
Alcoa, Inc. | 4,943,250 | 162,188 | |
TOTAL MATERIALS | 401,788 | ||
TELECOMMUNICATION SERVICES - 4.8% | |||
Diversified Telecommunication Services - 4.8% | |||
SBC Communications, Inc. | 3,206,400 | 74,645 | |
Verizon Communications, Inc. | 14,787,100 | 484,573 | |
559,218 | |||
UTILITIES - 1.2% | |||
Electric Utilities - 1.0% | |||
DPL, Inc. | 661,700 | 12,797 | |
Entergy Corp. | 637,000 | 33,672 | |
Wisconsin Energy Corp. | 2,106,800 | 68,892 | |
115,361 | |||
Common Stocks - continued | |||
Shares | Value (Note 1) | ||
UTILITIES - continued | |||
Multi-Utilities & Unregulated Power - 0.2% | |||
AES Corp. (a) | 2,589,200 | $ 22,966 | |
TOTAL UTILITIES | 138,327 | ||
TOTAL COMMON STOCKS (Cost $10,554,885) | 11,320,391 | ||
Preferred Stocks - 0.5% | |||
Convertible Preferred Stocks - 0.4% | |||
ENERGY - 0.1% | |||
Oil & Gas - 0.1% | |||
Amerada Hess Corp. 7.00% | 171,900 | 8,638 | |
INFORMATION TECHNOLOGY - 0.3% | |||
Electronic Equipment & Instruments - 0.3% | |||
Solectron Corp. 7.25% ACES | 2,077,900 | 33,870 | |
Office Electronics - 0.0% | |||
Xerox Corp. Series C, 6.25% | 55,300 | 6,503 | |
TOTAL INFORMATION TECHNOLOGY | 40,373 | ||
TOTAL CONVERTIBLE PREFERRED STOCKS | 49,011 | ||
Nonconvertible Preferred Stocks - 0.1% | |||
FINANCIALS - 0.1% | |||
Commercial Banks - 0.1% | |||
Chevy Chase Bank FSB Series C, 8.00% | 350,100 | 9,803 | |
TOTAL PREFERRED STOCKS (Cost $58,487) | 58,814 | ||
Convertible Bonds - 0.3% | ||||
Principal | Value (Note 1) | |||
HEALTH CARE - 0.1% | ||||
Pharmaceuticals - 0.1% | ||||
Pharmaceutical Resources, Inc. 2.875% 9/30/10 (d) | $ 3,665 | $ 4,196 | ||
Valeant Pharmaceuticals International 3% 8/16/10 (d) | 2,850 | 3,053 | ||
7,249 | ||||
TELECOMMUNICATION SERVICES - 0.2% | ||||
Diversified Telecommunication Services - 0.2% | ||||
Level 3 Communications, Inc. 6% 9/15/09 | 29,960 | 20,523 | ||
TOTAL CONVERTIBLE BONDS (Cost $20,633) | 27,772 | |||
Money Market Funds - 1.6% | |||
Shares | |||
Fidelity Cash Central Fund, 1.09% (b) | 150,608,277 | 150,608 | |
Fidelity Securities Lending Cash Central Fund, 1.11% (b) | 36,075,600 | 36,076 | |
TOTAL MONEY MARKET FUNDS (Cost $186,684) | 186,684 | ||
TOTAL INVESTMENT PORTFOLIO - 100.6% (Cost $10,820,689) | 11,593,661 | ||
NET OTHER ASSETS - (0.6)% | (69,078) | ||
NET ASSETS - 100% | $ 11,524,583 | ||
Security Type Abbreviation |
ACES - Automatic Common |
Legend |
(a) Non-income producing |
(b) The rate quoted is the annualized seven-day yield of the fund at period end. A complete listing of the fund's holdings as of its most recent fiscal year end is available upon request. |
(c) Affiliated company |
(d) Security exempt from registration under Rule 144A of the Securities Act of 1933. These securities may be resold in transactions exempt from registration, normally to qualified institutional buyers. At the period end, the value of these securities amounted to $7,249,000 or 0.1% of net assets. |
Other Information |
Purchases and sales of securities, other than short-term securities, aggregated $13,672,424,000 and $13,335,597,000, respectively. |
The fund placed a portion of its portfolio transactions with brokerage firms which are affiliates of the investment adviser. The commissions paid to these affiliated firms were $832,000 for the period. |
See accompanying notes which are an integral part of the financial statements.
Annual Report
Financial Statements
Statement of Assets and Liabilities
Amounts in thousands (except per-share amount) | November 30, 2003 | |
Assets | ||
Investment in securities, at value (including securities loaned of $35,426) (cost $10,820,689) - See accompanying schedule | $ 11,593,661 | |
Receivable for investments sold | 64,839 | |
Receivable for fund shares sold | 7,095 | |
Dividends receivable | 16,726 | |
Interest receivable | 462 | |
Prepaid expenses | 52 | |
Other receivables | 2,591 | |
Total assets | 11,685,426 | |
Liabilities | ||
Payable for investments purchased | $ 105,340 | |
Payable for fund shares redeemed | 12,641 | |
Accrued management fee | 4,578 | |
Other affiliated payables | 1,882 | |
Other payables and accrued expenses | 326 | |
Collateral on securities loaned, at value | 36,076 | |
Total liabilities | 160,843 | |
Net Assets | $ 11,524,583 | |
Net Assets consist of: | ||
Paid in capital | $ 10,690,050 | |
Undistributed net investment income | 35,073 | |
Accumulated undistributed net realized gain (loss) on investments and foreign currency transactions | 26,488 | |
Net unrealized appreciation (depreciation) on investments | 772,972 | |
Net Assets, for 535,405 shares outstanding | $ 11,524,583 | |
Net Asset Value, offering price and redemption price per share ($11,524,583 ÷ 535,405 shares) | $ 21.52 | |
See accompanying notes which are an integral part of the financial statements.
Annual Report
Financial Statements - continued
Statement of Operations
Amounts in thousands | Year ended November 30, 2003 | |
Investment Income | ||
Dividends (including $3,321 received from | $ 186,722 | |
Interest | 11,220 | |
Security lending | 134 | |
Total income | 198,076 | |
Expenses | ||
Management fee | $ 48,775 | |
Transfer agent fees | 20,282 | |
Accounting and security lending fees | 879 | |
Non-interested trustees' compensation | 41 | |
Depreciation in deferred trustee compensation account | (6) | |
Custodian fees and expenses | 169 | |
Registration fees | 94 | |
Audit | 109 | |
Legal | 45 | |
Miscellaneous | 111 | |
Total expenses before reductions | 70,499 | |
Expense reductions | (5,559) | 64,940 |
Net investment income (loss) | 133,136 | |
Realized and Unrealized Gain (Loss) Net realized gain (loss) on: | ||
Investment securities (including realized gain (loss) of $8,600 on sales of investments in affiliated issuers) | 888,251 | |
Foreign currency transactions | 53 | |
Futures contracts | 3,494 | |
Total net realized gain (loss) | 891,798 | |
Change in net unrealized appreciation (depreciation) on investment securities | 546,040 | |
Net gain (loss) | 1,437,838 | |
Net increase (decrease) in net assets resulting from operations | $ 1,570,974 | |
See accompanying notes which are an integral part of the financial statements.
Annual Report
Statement of Changes in Net Assets
Amounts in thousands | Year ended | Year ended |
Increase (Decrease) in Net Assets | ||
Operations | ||
Net investment income (loss) | $ 133,136 | $ 138,094 |
Net realized gain (loss) | 891,798 | (812,590) |
Change in net unrealized appreciation (depreciation) | 546,040 | (192,103) |
Net increase (decrease) in net assets resulting | 1,570,974 | (866,599) |
Distributions to shareholders from net investment income | (122,229) | (130,488) |
Distributions to shareholders from net realized gain | - | (483,185) |
Total distributions | (122,229) | (613,673) |
Share transactions | 1,470,308 | 1,021,592 |
Reinvestment of distributions | 115,783 | 582,605 |
Cost of shares redeemed | (1,666,126) | (1,997,487) |
Net increase (decrease) in net assets resulting from share transactions | (80,035) | (393,290) |
Total increase (decrease) in net assets | 1,368,710 | (1,873,562) |
Net Assets | ||
Beginning of period | 10,155,873 | 12,029,435 |
End of period (including undistributed net investment income of $35,073 and undistributed net investment income of $23,665, respectively) | $ 11,524,583 | $ 10,155,873 |
Other Information Shares | ||
Sold | 75,917 | 52,428 |
Issued in reinvestment of distributions | 6,305 | 28,094 |
Redeemed | (89,210) | (105,330) |
Net increase (decrease) | (6,988) | (24,808) |
See accompanying notes which are an integral part of the financial statements.
Annual Report
Financial Highlights
Years ended November 30, | 2003 | 2002 | 2001 | 2000 | 1999 |
Selected Per-Share Data | |||||
Net asset value, beginning of period | $ 18.72 | $ 21.21 | $ 27.49 | $ 30.34 | $ 30.73 |
Income from Investment Operations | |||||
Net investment income (loss)B | .25 | .24D | .34 | .40 | .37 |
Net realized and unrealized gain (loss) | 2.78 | (1.65)D | (1.15) | .50 | 2.01 |
Total from investment operations | 3.03 | (1.41) | (.81) | .90 | 2.38 |
Distributions from net investment income | (.23) | (.23) | (.39) | (.40) | (.35) |
Distributions from net realized gain | - | (.85) | (5.08) | (3.35) | (2.42) |
Total distributions | (.23) | (1.08) | (5.47) | (3.75) | (2.77) |
Net asset value, end of period | $ 21.52 | $ 18.72 | $ 21.21 | $ 27.49 | $ 30.34 |
Total ReturnA | 16.40% | (7.08)% | (4.33)% | 3.50% | 8.25% |
Ratios to Average Net AssetsC | |||||
Expenses before expense | .70% | .70% | .67% | .67% | .66% |
Expenses net of voluntary | .70% | .70% | .67% | .67% | .66% |
Expenses net of all reductions | .64% | .63% | .62% | .63% | .64% |
Net investment income (loss) | 1.31% | 1.26%D | 1.49% | 1.47% | 1.19% |
Supplemental Data | |||||
Net assets, end of period | $ 11,525 | $ 10,156 | $ 12,029 | $ 13,401 | $ 18,184 |
Portfolio turnover rate | 131% | 135% | 136% | 151% | 71% |
A Total returns would have been lower had certain expenses not been reduced during the periods shown.
B Calculated based on average shares outstanding during the period.
C Expense ratios reflect operating expenses of the fund. Expenses before reductions do not reflect amounts reimbursed by the investment adviser or reductions from brokerage service arrangements or other expense offset arrangements and do not represent the amount paid by the fund during periods when reimbursements or reductions occur. Expenses net of any voluntary waivers reflect expenses after reimbursement by the investment adviser but prior to reductions from brokerage service arrangements or other expense offset arrangements. Expenses net of all reductions represent the net expenses paid by the fund.
D Effective December 1, 2001, the fund adopted the provisions of the AICPA Audit and Accounting Guide for Investment Companies and began amortizing premium and discount on all debt securities. Per-share data and ratios for periods prior to adoption have not been restated to reflect this change.
See accompanying notes which are an integral part of the financial statements.
Annual Report
Notes to Financial Statements
For the period ended November 30, 2003
(Amounts in thousands except ratios)
1. Significant Accounting Policies.
Fidelity Equity-Income II Fund (the fund) is a fund of Fidelity Financial Trust (the trust) and is authorized to issue an unlimited number of shares. The trust is registered under the Investment Company Act of 1940, as amended (the 1940 Act), as an open-end management investment company organized as a Massachusetts business trust. The financial statements have been prepared in conformity with accounting principles generally accepted in the United States of America, which require management to make certain estimates and assumptions at the date of the financial statements. The following summarizes the significant accounting policies of the fund:
Security Valuation. Net asset value per share (NAV calculation) is calculated as of the close of business of the New York Stock Exchange, normally 4:00 p.m. Eastern time. Equity securities for which market quotations are available are valued at the last sale price or official closing price (closing bid price or last evaluated quote if no sale has occurred) on the primary market or exchange on which they trade. Debt securities for which quotations are readily available are valued at their most recent bid prices (sales prices if the principal market is an exchange) in the principal market in which such securities are normally traded, as determined by recognized dealers in such securities, or securities are valued on the basis of information provided by a pricing service. Pricing services use valuation matrices that incorporate both dealer-supplied valuations and valuation models. If an event that is expected to materially affect the value of a security occurs after the close of an exchange or market on which that security trades, but prior to the NAV calculation, then that security will be fair valued taking the event into account. Securities (including restricted securities) for which market quotations are not readily available are valued at their fair value as determined in good faith under consistently applied procedures under the general supervision of the Board of Trustees. Price movements in futures contracts and ADRs, market and trading trends, the bid/ask quotes of brokers and off-exchange institutional trading may be reviewed in the course of making a good faith determination of a security's fair value. Short-term securities with remaining maturities of sixty days or less for which quotations are not readily available are valued on the basis of amortized cost. Investments in open-end investment companies are valued at their net asset value each business day.
Foreign Currency. The fund uses foreign currency contracts to facilitate transactions in foreign-denominated securities. Losses from these transactions may arise from changes in the value of the foreign currency or if the counterparties do not perform under the contracts' terms.
Foreign denominated assets, including investment securities, and liabilities are translated into U.S. dollars at the exchange rate at period end. Purchases and sales of investment securities, income and dividends received and expenses denominated in foreign currencies are translated into U.S. dollars at the exchange rate in effect on the transaction date.
Annual Report
Notes to Financial Statements - continued
(Amounts in thousands except ratios)
1. Significant Accounting Policies - continued
Foreign Currency - continued
The effects of exchange rate fluctuations on investments are included with the net realized and unrealized gain (loss) on investment securities. Other foreign currency transactions resulting in realized and unrealized gain (loss) are disclosed separately.
Investment Transactions and Income. Security transactions are accounted for as of trade date. Gains and losses on securities sold are determined on the basis of identified cost. Dividend income is recorded on the ex-dividend date, except for certain dividends from foreign securities where the ex-dividend date may have passed, which are recorded as soon as the fund is informed of the ex-dividend date. Non-cash dividends included in dividend income, if any, are recorded at the fair market value of the securities received. The fund estimates the components of distributions received from Real Estate Investment Trusts (REITs). Distributions received in excess of income are recorded as a reduction of cost of investments and/or realized gain. Interest income is accrued as earned. Interest income includes coupon interest and amortization of premium and accretion of discount on debt securities, which is accrued using the interest method. Investment income is recorded net of foreign taxes withheld where recovery of such taxes is uncertain.
Expenses. Most expenses of the trust can be directly attributed to a fund. Expenses which cannot be directly attributed are apportioned among the funds in the trust.
Deferred Trustee Compensation. Under a Deferred Compensation Plan (the Plan), non-interested Trustees must defer receipt of a portion of, and may elect to defer receipt of an additional portion of, their annual compensation. Deferred amounts are treated as though equivalent dollar amounts had been invested in shares of the fund or are invested in a cross-section of other Fidelity funds, and are marked-to-market. Deferred amounts remain in the fund until distributed in accordance with the Plan.
Income Tax Information and Distributions to Shareholders. Each year the fund intends to qualify as a regulated investment company by distributing all of its taxable income and realized gains under Subchapter M of the Internal Revenue Code. As a result, no provision for income taxes is required in the accompanying financial statements. Foreign taxes are provided for based on each fund's understanding of the tax rules and rates that exist in the foreign markets in which it invests. Distributions are recorded on the ex-dividend date.
Income and capital gain distributions are determined in accordance with income tax regulations, which may differ from generally accepted accounting principles. In addition, the fund will treat a portion of the proceeds from shares redeemed as a distribution from realized gain for income tax purposes. Capital accounts within the financial statements are adjusted for permanent and temporary book and tax differences. These adjustments
Annual Report
1. Significant Accounting Policies - continued
Income Tax Information and Distributions to Shareholders - continued
have no impact on net assets or the results of operations. Temporary differences will reverse in a subsequent period. These differences are primarily due to futures transactions, foreign currency transactions, market discount, contingent interest, non-taxable dividends and losses deferred due to wash sales.
The tax-basis components of distributable earnings and the federal tax cost as of period end were as follows:
Unrealized appreciation | $ 1,018,767 | | |
Unrealized depreciation | (303,472) | |
Net unrealized appreciation (depreciation) | 715,295 | |
Undistributed ordinary income | 126,705 | |
Cost for federal income tax purposes | $ 10,878,366 |
The tax character of distributions paid was as follows:
November 30, | November 30, | |
Ordinary Income | $ 122,229 | $ 131,934 |
Long-term Capital Gains | - | 481,739 |
Total | $ 122,229 | $ 613,673 |
2. Operating Policies.
Repurchase Agreements. Fidelity Management & Research Company (FMR) has received an Exemptive Order from the Securities and Exchange Commission (the SEC) which permits the fund and other affiliated entities of FMR to transfer uninvested cash balances into joint trading accounts. These accounts are then invested in repurchase agreements that are collateralized by U.S. Treasury or Government obligations. The fund may also invest directly with institutions, in repurchase agreements that are collateralized by commercial paper obligations and corporate obligations. Collateral is held in segregated accounts with custodian banks and may be obtained in the event of a default of the counterparty. Collateral is marked-to-market daily and maintained at a value at least equal to the principal amount of the repurchase agreement (including accrued interest).
Futures Contracts. The fund may use futures contracts to manage its exposure to the stock market. Buying futures tends to increase the fund's exposure to the underlying instrument, while selling futures tends to decrease the fund's exposure to the underlying instrument or hedge other fund investments. Losses may arise from changes in the value
Annual Report
Notes to Financial Statements - continued
(Amounts in thousands except ratios)
2. Operating Policies - continued
Futures Contracts - continued
of the underlying instruments or if the counter-parties do not perform under the contracts' terms. Gains (losses) are realized upon the expiration or closing of the futures contracts. Futures contracts are valued at the settlement price established each day by the board of trade or exchange on which they are traded.
Restricted Securities. The fund may invest in securities that are subject to legal or contractual restrictions on resale. These securities generally may be resold in transactions exempt from registration or to the public if the securities are registered. Disposal of these securities may involve time-consuming negotiations and expense, and prompt sale at an acceptable price may be difficult. Information regarding restricted securities is included at the end of the fund's Schedule of Investments.
3. Purchases and Sales of Investments.
Information regarding purchases and sales of securities is included under the caption "Other Information" at the end of the fund's Schedule of Investments.
4. Fees and Other Transactions with Affiliates.
Management Fee. FMR and its affiliates provide the fund with investment management related services for which the fund pays a monthly management fee. The management fee is the sum of an individual fund fee rate that is based on an annual rate of .20% of the fund's average net assets and a group fee rate that averaged .28% during the period. The group fee rate is based upon the average net assets of all the mutual funds advised by FMR. The group fee rate decreases as assets under management increase and increases as assets under management decrease. For the period, the total annual management fee rate was .48% of the fund's average net assets.
Transfer Agent Fees. Fidelity Service Company, Inc. (FSC), an affiliate of FMR, is the fund's transfer, dividend disbursing and shareholder servicing agent. FSC receives account fees and asset-based fees that vary according to account size and type of account. FSC pays for typesetting, printing and mailing of all shareholder reports, except proxy statements. For the period, the transfer agent fees were equivalent to an annual rate of .20% of average net assets.
Accounting and Security Lending Fees. FSC maintains the fund's accounting records and administers the security lending program. The security lending fee is based on the number and duration of lending transactions. The accounting fee is based on the level of average net assets for the month plus out-of-pocket expenses.
Annual Report
4. Fees and Other Transactions with Affiliates - continued
Central Funds. The fund may invest in affiliated Central Funds managed by Fidelity Investments Money Management, Inc. (FIMM), an affiliate of FMR. The Central Funds are open-end investment companies available only to investment companies and other accounts managed by FMR and its affiliates. The Central Funds seek preservation of capital and current income and do not pay a management fee. Income distributions earned by the fund are recorded as income in the accompanying financial statements and totaled $3,570 for the period.
Brokerage Commissions. The fund placed a portion of its portfolio transactions with brokerage firms which are affiliates of the investment adviser. The commissions paid to these affiliated firms are shown under the caption "Other Information" at the end of the fund's Schedule of Investments.
5. Committed Line of Credit.
The fund participates with other funds managed by FMR in a $3.5 billion credit facility (the "line of credit") to be utilized for temporary or emergency purposes to fund shareholder redemptions or for other short-term liquidity purposes. The fund has agreed to pay commitment fees on its pro rata portion of the line of credit. During the period, there were no borrowings on this line of credit.
6. Security Lending.
The fund lends portfolio securities from time to time in order to earn additional income. The fund receives collateral (in the form of U.S. Treasury obligations, letters of credit and/or cash) against the loaned securities and maintains collateral in an amount not less than 100% of the market value of the loaned securities during the period of the loan. The market value of the loaned securities is determined at the close of business of the fund and any additional required collateral is delivered to the fund on the next business day. If the borrower defaults on its obligation to return the securities loaned because of insolvency or other reasons, a fund could experience delays and costs in recovering the securities loaned or in gaining access to the collateral. Cash collateral is invested in cash equivalents. The value of loaned securities and cash collateral at period end are disclosed on the fund's Statement of Assets and Liabilities.
7. Expense Reductions.
Many of the brokers with whom FMR places trades on behalf of the fund provided services to the fund in addition to trade execution. These services included payments of certain expenses on behalf of the fund totaling $5,526 for the period. In addition, through arrangements with the fund's custodian and transfer agent, credits realized as a result of uninvested cash balances were used to reduce the fund's expenses. During the period, these credits reduced the fund's custody and transfer agent expenses by $3 and $30, respectively.
Annual Report
Notes to Financial Statements - continued
(Amounts in thousands except ratios)
8. Transactions with Affiliated Companies.
An affiliated company is a company in which the fund has ownership of at least 5% of the voting securities. Transactions during the period with companies which are or were affiliates are as follows:
Affiliate | Purchase | Sales | Dividend | Value |
Burlington Resources, Inc. | $ 35,264 | $ - | $ 1,506 | $ 536,456 |
Goodrich Corp. | 25,417 | - | 1,370 | 188,477 |
Werner Enterprises, Inc. | 25,456 | 12,336 | 445 | 88,999 |
TOTALS | $ 86,137 | $ 12,336 | $ 3,321 | $ 813,932 |
Annual Report
Report of Independent Auditors
To the Trustees of Fidelity Financial Trust and the Shareholders of Fidelity Equity-Income II Fund:
In our opinion, the accompanying statement of assets and liabilities, including the schedule of investments, and the related statements of operations and of changes in net assets and the financial highlights present fairly, in all material respects, the financial position of Fidelity Equity-Income II Fund (a fund of Fidelity Financial Trust) at November 30, 2003 and the results of its operations, the changes in its net assets and the financial highlights for the periods indicated, in conformity with accounting principles generally accepted in the United States of America. These financial statements and financial highlights (hereafter referred to as "financial statements") are the responsibility of the Fidelity Equity-Income II Fund's management; our responsibility is to express an opinion on these financial statements based on our audits. We conducted our audits of these financial statements in accordance with auditing standards generally accepted in the United States of America which require that we plan and perform the audit to obtain reasonable assurance about whether the financial statements are free of material misstatement. An audit includes examining, on a test basis, evidence supporting the amounts and disclosures in the financial statements, assessing the accounting principles used and significant estimates made by management, and evaluating the overall financial statement presentation. We believe that our audits, which included confirmation of securities at November 30, 2003 by correspondence with the custodian and brokers, provide a reasonable basis for our opinion.
/s/PricewaterhouseCoopers LLP
PricewaterhouseCoopers LLP
Boston, Massachusetts
January 7, 2004
Annual Report
Trustees and Officers
The Trustees, Members of the Advisory Board, and executive officers of the trust and fund, as applicable, are listed below. The Board of Trustees governs the fund and is responsible for protecting the interests of shareholders. The Trustees are experienced executives who meet periodically throughout the year to oversee the fund's activities, review contractual arrangements with companies that provide services to the fund, and review the fund's performance. Except for William O. McCoy, each of the Trustees oversees 291 funds advised by FMR or an affiliate. Mr. McCoy oversees 293 funds advised by FMR or an affiliate.
The Trustees hold office without limit in time except that (a) any Trustee may resign; (b) any Trustee may be removed by written instrument, signed by at least two-thirds of the number of Trustees prior to such removal; (c) any Trustee who requests to be retired or who has become incapacitated by illness or injury may be retired by written instrument signed by a majority of the other Trustees; and (d) any Trustee may be removed at any special meeting of shareholders by a two-thirds vote of the outstanding voting securities of the trust. In any event, each non-interested Trustee shall retire not later than the last day of the calendar year in which his or her 72nd birthday occurs. The executive officers and Advisory Board Members hold office without limit in time, except that any officer and Advisory Board Member may resign or may be removed by a vote of a majority of the Trustees at any regular meeting or any special meeting of the Trustees. Except as indicated, each individual has held the office shown or other offices in the same company for the past five years.
The fund's Statement of Additional Information (SAI) includes more information about the Trustees. To request a free copy, call Fidelity at 1-877-208-0098.
Interested Trustees*:
Correspondence intended for each Trustee who is an "interested person" (as defined in the 1940 Act) may be sent to 82 Devonshire Street, Boston, Massachusetts 02109.
Name, Age; Principal Occupation | |
Edward C. Johnson 3d (73)** | |
Year of Election or Appointment: 1992 Mr. Johnson is Chairman of the Board of Trustees. Mr. Johnson serves as Chief Executive Officer, Chairman, and a Director of FMR Corp.; a Director and Chairman of the Board and of the Executive Committee of FMR; Chairman and a Director of Fidelity Management & Research (Far East) Inc.; Chairman (1998) and a Director of Fidelity Investments Money Management, Inc.; and Chairman (2001) and a Director (2000) of FMR Co., Inc. | |
Abigail P. Johnson (41)** | |
Year of Election or Appointment: 2001 Senior Vice President of Equity-Income II (2001). Ms. Johnson also serves as Senior Vice President of other Fidelity funds (2001). She is President and a Director of FMR (2001), Fidelity Investments Money Management, Inc. (2001), FMR Co., Inc. (2001), and a Director of FMR Corp. Previously, Ms. Johnson managed a number of Fidelity funds. | |
Laura B. Cronin (49) | |
Year of Election or Appointment: 2003 Ms. Cronin is an Executive Vice President (2002) and Chief Financial Officer (2002) of FMR Corp. and is a member of the Fidelity Management Committee (2003). Previously, Ms. Cronin served as Vice President of Finance of FMR (1997-1999), and Chief Financial Officer of FMR (1999-2001), Fidelity Personal Investments (2001), and Fidelity Brokerage Company (2001-2002). | |
Robert L. Reynolds (51) | |
Year of Election or Appointment: 2003 Mr. Reynolds is a Director (2003) and Chief Operating Officer (2002) of FMR Corp. and is the head of the Fidelity Management Committee (2003). He also serves on the Board at Fidelity Investments Canada, Ltd. (2000). Previously, Mr. Reynolds served as President of Fidelity Investments Institutional Retirement Group (1996-2000). | |
* Trustees have been determined to be "Interested Trustees" by virtue of, among other things, their affiliation with the trust or various entities under common control with FMR.
** Edward C. Johnson 3d, Trustee, is Abigail P. Johnson's father.
Annual Report
Non-Interested Trustees:
Correspondence intended for each non-interested Trustee (that is, the Trustees other than the Interested Trustees) may be sent to Fidelity Investments, P.O. Box 55235, Boston, Massachusetts 02205-5235.
Name, Age; Principal Occupation | |
J. Michael Cook (61) | |
Year of Election or Appointment: 2001 Prior to Mr. Cook's retirement in May 1999, he served as Chairman and Chief Executive Officer of Deloitte & Touche LLP (accounting/consulting), Chairman of the Deloitte & Touche Foundation, and a member of the Board of Deloitte Touche Tohmatsu. He currently serves as a Director of Comcast (telecommunications, 2002), International Flavors & Fragrances, Inc. (2000), Rockwell Automation (2000) and The Dow Chemical Company (2000). He is a Member of the Diversity Advisory Council of Marakon (2003) and the Advisory Board of the Directorship Search Group, Chairman Emeritus of the Board of Catalyst (a leading organization for the advancement of women in business), and is Chairman of the Accountability Advisory Council to the Comptroller General of the United States. He also serves as a Member of the Advisory Board of the Graduate School of Business of the University of Florida, his alma mater. | |
Ralph F. Cox (71) | |
Year of Election or Appointment: 1991 Mr. Cox is President of RABAR Enterprises (management consulting for the petroleum industry). Prior to February 1994, he was President of Greenhill Petroleum Corporation (petroleum exploration and production). Until March 1990, Mr. Cox was President and Chief Operating Officer of Union Pacific Resources Company (exploration and production). He is a Director of CH2M Hill Companies (engineering), and Abraxas Petroleum (petroleum exploration and production, 1999). In addition, he is a member of advisory boards of Texas A&M University and the University of Texas at Austin. | |
Robert M. Gates (60) | |
Year of Election or Appointment: 1997 Dr. Gates is President of Texas A&M University (2002). He was Director of the Central Intelligence Agency (CIA) from 1991 to 1993. From 1989 to 1991, Dr. Gates served as Assistant to the President of the United States and Deputy National Security Advisor. Dr. Gates is a Director of NACCO Industries, Inc. (mining and manufacturing), and Parker Drilling Co., Inc. (drilling and rental tools for the energy industry, 2001). He also serves as a member of the Advisory Board of VoteHere.net (secure internet voting, 2001). Previously, Dr. Gates served as a Director of LucasVarity PLC (automotive components and diesel engines), a Director of TRW Inc. (automotive, space, defense, and information technology), and Dean of the George Bush School of Government and Public Service at Texas A&M University (1999-2001). Dr. Gates also is a Trustee of the Forum for International Policy. | |
George Heilmeier (67) | |
Year of Election or Appointment:2004 Dr. Heilmeier is Chairman Emeritus of Telcordia Technologies (communication software and systems), where prior to his retirement, he served as company Chairman and Chief Executive Officer. He currently serves on the Boards of Directors of The Mitre Corporation (systems engineering and information technology support for the government), INET Technologies Inc. (telecommunications network surveillance, 2001) and Teletech Holdings (customer management services, 1998). He is Chairman of the General Motors Technology Advisory Committee and a Life Fellow of the IEEE (2000). Dr. Heilmeier is a member of the Defense Science Board and the National Security Agency Advisory Board. He is also a member of the National Academy of Engineering, the American Academy of Arts and Sciences and The Board of Overseers of the School of Engineering and Applied Science of the University of Pennsylvania. Previously, Dr. Heilmeier served as a Director of TRW Inc. (automotive, space, defense, and information technology, 1992-2002) and Compaq (1994-2002). | |
Donald J. Kirk (70) | |
Year of Election or Appointment: 1987 Mr. Kirk is a Governor of the American Stock Exchange (2001), a Trustee and former Chairman of the Board of Trustees of the Greenwich Hospital Association, Director of the Yale-New Haven Health Services Corp. (1998), and a Director Emeritus and former Chairman of the Board of Directors of National Arts Strategies Inc. Mr. Kirk was an Executive-in-Residence (1995-2000) and a Professor (1987-1995) at Columbia University Graduate School of Business. Prior to 1987, he was Chairman of the Financial Accounting Standards Board. Previously, Mr. Kirk served as a Governor of the National Association of Securities Dealers, Inc. (1996-2002), a member and Vice Chairman of the Public Oversight Board of the American Institute of Certified Public Accountants' SEC Practice Section (1995-2002), a Director of General Re Corporation (reinsurance, 1987-1998) and as a Director of Valuation Research Corp. (appraisals and valuations). | |
Marie L. Knowles (57) | |
Year of Election or Appointment: 2001 Prior to Ms. Knowles' retirement in June 2000, she served as Executive Vice President and Chief Financial Officer of Atlantic Richfield Company (ARCO) (diversified energy, 1996-2000). From 1993 to 1996, she was a Senior Vice President of ARCO and President of ARCO Transportation Company. She served as a Director of ARCO from 1996 to 1998. She currently serves as a Director of Phelps Dodge Corporation (copper mining and manufacturing), URS Corporation (multidisciplinary engineering, 1999), and McKesson Corporation (healthcare service, 2002). Ms. Knowles is a Trustee of the Brookings Institution and the Catalina Island Conservancy and also serves as a member of the Advisory Board for the School of Engineering of the University of Southern California. | |
Ned C. Lautenbach (59) | |
Year of Election or Appointment: 2000 Mr. Lautenbach has been a partner of Clayton, Dubilier & Rice, Inc. (private equity investment firm) since September 1998. Previously, Mr. Lautenbach was with the International Business Machines Corporation (IBM) from 1968 until his retirement in 1998. He was most recently Senior Vice President and Group Executive of Worldwide Sales and Services. From 1993 to 1995, he was Chairman of IBM World Trade Corporation, and from 1994 to 1998 was a member of IBM's Corporate Executive Committee. Mr. Lautenbach serves as Chairman and as a Director (1998) of Acterna Corporation (communications test equipment). He is also Co-Chairman of Covansys, Inc. (global provider of business and technology solutions, 2000). In addition, he is a Director of Eaton Corporation (diversified industrial) and the Philharmonic Center for the Arts in Naples, Florida (1999). He also is a member of the Council on Foreign Relations. | |
Marvin L. Mann (70) | |
Year of Election or Appointment: 1993 Mr. Mann is Chairman of the non-interested Trustees (2001). He is Chairman Emeritus of Lexmark International, Inc. (computer peripherals) where he served as CEO until April 1998 and retired as Chairman May 1999, and remains a member of the Board. Prior to 1991, he held the positions of Vice President of International Business Machines Corporation (IBM) and President and General Manager of various IBM divisions and subsidiaries. Mr. Mann is a Board member of Imation Corp. (imaging and information storage) and Acterna Corporation (communications test equipment, 1999). He is also a member of the Director Services Committee of the Investment Company Institute. In addition, Mr. Mann is a member of the President's Cabinet at the University of Alabama and the Board of Visitors of the Culverhouse College of Commerce and Business Administration at the University of Alabama. | |
William O. McCoy (70) | |
Year of Election or Appointment: 1997 Prior to his retirement in December 1994, Mr. McCoy was Vice Chairman of the Board of BellSouth Corporation (telecommunications) and President of BellSouth Enterprises. He is currently a Director of Liberty Corporation (holding company), Duke Realty Corporation (real estate), Progress Energy, Inc. (electric utility), and Acterna Corporation (communications test equipment, 1999). He is also a partner of Franklin Street Partners (private investment management firm) and a member of the Research Triangle Foundation Board. In addition, Mr. McCoy served as the Interim Chancellor (1999-2000) and a member of the Board of Visitors (1994-1998) for the University of North Carolina at Chapel Hill and currently serves on the Board of Directors of the University of North Carolina Health Care System and the Board of Visitors of the Kenan-Flagler Business School (University of North Carolina at Chapel Hill). He also served as Vice President of Finance for the University of North Carolina (16-school system, 1995-1998). | |
William S. Stavropoulos (64) | |
Year of Election or Appointment: 2002 Mr. Stavropoulos is Chairman of the Board, President and CEO (2002), and Chairman of the Executive Committee (2000) and a Director of The Dow Chemical Company. Since joining The Dow Chemical Company in 1967, Mr. Stavropoulos served in numerous senior management positions, including President (1993-2000) and Chief Executive Officer (1995-2000). Currently, he is a Director of NCR Corporation (data warehousing and technology solutions), BellSouth Corporation (telecommunications), Chemical Financial Corporation, and Maersk Inc. (industrial conglomerate, 2002). He also serves as a member of the Board of Trustees of the American Enterprise Institute for Public Policy Research. In addition, Mr. Stavropoulos is a member of The Business Council, J.P. Morgan International Council, World Business Council for Sustainable Development, and the University of Notre Dame Advisory Council for the College of Science. | |
Annual Report
Advisory Board Members and Executive Officers:
Correspondence intended for Ms. Small may be sent to Fidelity Investments, P.O. Box 55235, Boston, Massachusetts 02205-5235. Correspondence intended for each executive officer and Mr. Lynch may be sent to 82 Devonshire Street, Boston, Massachusetts 02109.
Name, Age; Principal Occupation | |
Peter S. Lynch (60) | |
Year of Election or Appointment: 2003 Member of the Advisory Board of Fidelity Financial Trust. Vice Chairman and a Director of FMR, and Vice Chairman (2001) and a Director (2000) of FMR Co., Inc. Previously, Mr. Lynch served as a Trustee of the Fidelity funds (1990-2003). Prior to May 31, 1990, he was a Director of FMR and Executive Vice President of FMR (a position he held until March 31, 1991), Vice President of Fidelity® Magellan® Fund and FMR Growth Group Leader, and Managing Director of FMR Corp. Mr. Lynch was also Vice President of Fidelity Investments Corporate Services. In addition, he serves as a Trustee of Boston College, Massachusetts Eye & Ear Infirmary, Historic Deerfield, John F. Kennedy Library, and the Museum of Fine Arts of Boston. | |
Cornelia M. Small (59) | |
Year of Election or Appointment: 2004 Member of the Advisory Board of Fidelity Financial Trust. Ms. Small is a member (2000) and Chairperson (2002) of the Investment Committee, and a member (2002) of the Board of Trustees of Smith College. Previously, she served as Chief Investment Officer (1999-2000), Director of Global Equity Investments (1996-1999), and a member of the Board of Directors (1998-1999) of Scudder Kemper Investments. In addition, Ms. Small served as Co-Chair (2000-2003) of the Annual Fund for the Fletcher School of Law and Diplomacy. | |
Bart A. Grenier (44) | |
Year of Election or Appointment: 2001 Vice President of Equity-Income II. Mr. Grenier also serves as Vice President of certain Equity Funds (2001), a position he previously held from 1999 to 2000, and Vice President of certain High Income Funds (2002). He is Senior Vice President of FMR (1999) and FMR Co., Inc. (2001), and President and Director of Strategic Advisers, Inc. (2002). He also heads Fidelity's Asset Allocation Group (2000), Fidelity's Growth and Income Group (2001), Fidelity's Value Group (2001), and Fidelity's High Income Division (2001). Previously, Mr. Grenier served as President of Fidelity Ventures (2000), Vice President of certain High Income Funds (1997-2000), High Income Division Head (1997-2000), Group Leader of the Income-Growth and Asset Allocation-Income Groups (1996-2000), and Assistant Equity Division Head (1997-2000). | |
Stephen M. Dufour (37) | |
Year of Election or Appointment: 2000 Vice President of Equity-Income II and other funds managed by FMR. Prior to assuming his current responsibilities, Mr. Dufour managed a variety of Fidelity funds. | |
Eric D. Roiter (54) | |
Year of Election or Appointment: 1998 Secretary of Equity-Income II. He also serves as Secretary of other Fidelity funds (1998); Vice President, General Counsel, and Clerk of FMR Co., Inc. (2001) and FMR (1998); Vice President and Clerk of FDC (1998); Assistant Clerk of Fidelity Management & Research (U.K.) Inc. (2001) and Fidelity Management & Research (Far East) Inc. (2001); and Assistant Secretary of Fidelity Investments Money Management Inc. (2001). Prior to joining Fidelity, Mr. Roiter was with the law firm of Debevoise & Plimpton, as an associate (1981-1984) and as a partner (1985-1997), and served as an Assistant General Counsel of the U.S. Securities and Exchange Commission (1979-1981). Mr. Roiter is an Adjunct Member, Faculty of Law, at Boston College Law School (2003). | |
Stuart Fross (44) | |
Year of Election or Appointment: 2003 Assistant Secretary of Equity-Income II. Mr. Fross also serves as Assistant Secretary of other Fidelity funds (2003) and is an employee of FMR. | |
Maria F. Dwyer (44) | |
Year of Election or Appointment: 2002 President and Treasurer of Equity-Income II. Ms. Dwyer also serves as President and Treasurer of other Fidelity funds (2002) and is a Vice President (1999) and an employee (1996) of FMR. Prior to joining Fidelity, Ms. Dwyer served as Director of Compliance for MFS Investment Management. | |
Timothy F. Hayes (52) | |
Year of Election or Appointment: 2002 Chief Financial Officer of Equity-Income II. Mr. Hayes also serves as Chief Financial Officer of other Fidelity funds (2002). Recently he was appointed President of Fidelity Service Company (2003) where he also serves as a Director. Mr. Hayes also serves as President of Fidelity Investments Operations Group (FIOG, 2002), which includes Fidelity Pricing and Cash Management Services Group (FPCMS), where he was appointed President in 1998. Previously, Mr. Hayes served as Chief Financial Officer of Fidelity Investments Corporate Systems and Service Group (1998) and Fidelity Systems Company (1997-1998). | |
John R. Hebble (45) | |
Year of Election or Appointment: 2003 Deputy Treasurer of Equity-Income II. Mr. Hebble also serves as Deputy Treasurer of other Fidelity funds (2003), and is an employee of FMR. Before joining Fidelity Investments, Mr. Hebble worked at Deutsche Asset Management where he served as Director of Fund Accounting (2002-2003) and Assistant Treasurer of the Scudder Funds (1998-2003). | |
John H. Costello (57) | |
Year of Election or Appointment: 1986 Assistant Treasurer of Equity-Income II. Mr. Costello also serves as Assistant Treasurer of other Fidelity funds and is an employee of FMR. | |
Francis V. Knox, Jr. (56) | |
Year of Election or Appointment: 2002 Assistant Treasurer of Equity-Income II. Mr. Knox also serves as Assistant Treasurer of other Fidelity funds (2002), and is a Vice President and an employee of FMR. Previously, Mr. Knox served as Vice President of Investment & Advisor Compliance (1990-2001), and Compliance Officer of Fidelity Management & Research (U.K.) Inc. (1992-2002), Fidelity Management & Research (Far East) Inc. (1991-2002), and FMR Corp. (1995-2002). | |
Mark Osterheld (48) | |
Year of Election or Appointment: 2002 Assistant Treasurer of Equity-Income II. Mr. Osterheld also serves as Assistant Treasurer of other Fidelity funds (2002) and is an employee of FMR. | |
Thomas J. Simpson (45) | |
Year of Election or Appointment: 2000 Assistant Treasurer of Equity-Income II. Mr. Simpson is Assistant Treasurer of other Fidelity funds (2000) and an employee of FMR (1996). Prior to joining FMR, Mr. Simpson was Vice President and Fund Controller of Liberty Investment Services (1987-1995). | |
Annual Report
Distributions
The Board of Trustees of Equity Income II voted to pay on January 12, 2004, to shareholders of record at the opening of business on January 9, 2004, a distribution of $.17 per share derived from capital gains realized from sales of portfolio securities.
A total of .21% of the dividends distributed during the fiscal year was derived from interest on U.S. Government securities which is generally exempt from state income tax.
The fund designates 100%, 100%, 100%, and 100% of the dividends distributed in September 2003, June 2003, March 2003, December 2002, respectively during the fiscal year as qualifying for the dividends-received deduction for corporate shareholders.
The fund designates 100%, 100%, and 100% of the dividends distributed in September 2003, June 2003, and March 2003, respectively during the fiscal year as amounts which may be taken into account as a dividend for purposes of the maximum rate under section 1(h)(11) of the Internal Revenue Code.
The fund will notify shareholders in January 2004 of amounts for use in preparing 2003 income tax returns.
Annual Report
Managing Your Investments
Fidelity offers several ways to conveniently manage your personal investments via your telephone or PC. You can access your account information, conduct trades and research your investments 24 hours a day.
By Phone
Fidelity Automated Service Telephone provides a single toll-free number to access account balances, positions, quotes and trading. It's easy to navigate the service, and on your first call, the system will help you create a personal identification number (PIN) for security.
(phone_graphic)
Fidelity Automated
Service Telephone (FAST®)
1-800-544-5555
Press
1 For mutual fund and brokerage trading.
2 For quotes.*
3 For account balances and holdings.
4 To review orders and mutual
fund activity.
5 To change your PIN.
*0 To speak to a Fidelity representative.
By PC
Fidelity's web site on the Internet provides a wide range of information, including daily financial news, fund performance, interactive planning tools and news about Fidelity products and services.
(computer_graphic)
Fidelity's Web Site
www.fidelity.com
* When you call the quotes line, please remember that a fund's yield and return will vary and, except for money market funds, share price will also vary. This means that you may have a gain or loss when you sell your shares. There is no assurance that money market funds will be able to maintain a stable $1 share price; an investment in a money market fund is not insured or guaranteed by the U.S. government. Total returns are historical and include changes in share price, reinvestment of dividends and capital gains, and the effects of any sales charges.
Annual Report
Investment Adviser
Fidelity Management & Research Company
Boston, MA
Investment Sub-Advisers
FMR Co., Inc.
Fidelity Management & Research (U.K.) Inc.
Fidelity Management & Research
(Far East) Inc.
Fidelity International Investment Advisors
Fidelity Investments Japan Limited
Fidelity International Investment Advisors (U.K.) Limited
General Distributor
Fidelity Distributors Corporation
Boston, MA
Transfer and Shareholder
Servicing Agent
Fidelity Service Company, Inc.
Boston, MA
Custodian
JPMorgan Chase Bank
New York, NY
Fidelity's Growth and Income Funds
Balanced Fund
Convertible Securities Fund
Equity-Income Fund
Equity-Income II Fund
Fidelity ® Fund
Global Balanced Fund
Growth & Income Portfolio
Growth & Income II Portfolio
Puritan® Fund
Real Estate Income Fund
Real Estate Investment Portfolio
Utilities Fund
The Fidelity Telephone Connection
Mutual Fund 24-Hour Service
Exchanges/Redemptions
and Account Assistance 1-800-544-6666
Product Information 1-800-544-6666
Retirement Accounts 1-800-544-4774
(8 a.m. - 9 p.m.)
TDD Service 1-800-544-0118
for the deaf and hearing impaired
(9 a.m. - 9 p.m. Eastern time)
Fidelity Automated Service
Telephone (FAST®) (automated graphic) 1-800-544-5555
(automated graphic) Automated line for quickest service
EII-UANN-0104
1.786707.100
(Fidelity Investment logo)(registered trademark)
Corporate Headquarters
82 Devonshire St., Boston, MA 02109
www.fidelity.com
Fidelity®
Independence
Fund
Annual Report
November 30, 2003
(2_fidelity_logos) (Registered_Trademark)
Contents
Chairman's Message | Ned Johnson's message to shareholders. | |
Performance | How the fund has done over time. | |
Management's Discussion | The manager's review of fund performance, strategy and outlook. | |
Investment Changes | A summary of major shifts in the fund's investments over the past six months. | |
Investments | A complete list of the fund's investments with their market values. | |
Financial Statements | Statements of assets and liabilities, operations, and changes in net assets, | |
Notes | Notes to the financial statements. | |
Auditors' Opinion | ||
Trustees and Officers |
For a free copy of the fund's proxy voting guidelines visit www.fidelity.com/goto/proxyguidelines, call 1-800-544-8544, or visit the Securities and Exchange Commission (SEC)'s web site at www.sec.gov.
Standard & Poor's, S&P and S&P 500 are registered service marks of The McGraw-Hill Companies, Inc. and have been licensed for use by Fidelity Distributors Corporation.
Other third party marks appearing herein are the property of their respective owners.
All other marks appearing herein are registered or unregistered trademarks or service marks of FMR Corp. or an affiliated company.
(Recycle graphic) This report is printed on recycled paper using soy-based inks.
This report and the financial statements contained herein are submitted for the general information of the shareholders of the fund. This report is not authorized for distribution to prospective investors in the fund unless preceded or accompanied by an effective prospectus.
Mutual fund shares are not deposits or obligations of, or guaranteed by, any depository institution. Shares are not insured by the FDIC, Federal Reserve Board or any other agency, and are subject to investment risks, including possible loss of principal amount invested.
Neither the fund nor Fidelity Distributors Corporation is a bank.
For more information on any Fidelity fund, including charges and expenses, call 1-800-544-6666 for a free prospectus. Read it carefully before you invest or send money.
Annual Report
Chairman's Message
(photo_of_Edward_C_Johnson_3d)
Dear Shareholder:
Many of you have read or heard news stories recently that were critical of mutual funds and made allegations that the mutual fund industry has been less than forthright. I find these reports unsettling and not necessarily an accurate picture of the overall industry, and I would like you to know where we at Fidelity stand.
With specific regard to allegations that certain mutual fund companies were violating the Securities and Exchange Commission's forward pricing rules or were involved in so-called "market timing" activities, I want to say two things:
First, Fidelity does not have agreements that permit customers who buy fund shares after 4 p.m. to obtain the 4 p.m. price. This is not to say that someone could not deceive the company through fraudulent acts. But I underscore that we have no so-called "agreements" which would permit this illegal practice.
Second, Fidelity has been on record for years opposing predatory short-term trading which adversely affects other shareholders in a mutual fund. In fact, in the 1980s, we began charging a fee - which is returned to the fund and, therefore, to investors - to discourage this activity. What's more, several years ago we took the industry lead in developing a Fair Value Pricing Policy to prevent market timing on foreign securities in our funds. It is reasonable to assume that another structure can be developed that would alter the system to make it much more difficult for predatory traders to operate. This, however, will only be achieved through close cooperation among regulators, legislators and the industry.
Certainly no industry is perfect, and there have been instances of unethical and illegal activity from time to time within the mutual fund industry. When this occurs, confessed or convicted offenders should be dealt with appropriately. Clearly, every system can be improved. We applaud well thought out improvements by regulators, legislators and industry representatives that achieve the common goal of building and protecting the value of investors' holdings. But we remain concerned about the risk of over-regulation and the quick application of simplistic solutions to intricate problems.
For more than 57 years, Fidelity Investments has worked very hard to improve its products and service to justify your trust. When our family founded this company in 1946, we had only a few hundred customers. Many of them were family and friends. Today, we serve more than 18 million customers including individual investors and participants in retirement plans across America.
Let me close by saying that we do not take your trust in us for granted, and we realize that we must always work to improve all aspects of our service to you. In turn, we urge you to continue your active participation with your financial matters, so that your interests can be well served.
Best regards,
/s/Edward C. Johnson 3d
Edward C. Johnson 3d
Annual Report
Performance: The Bottom Line
Average annual total return reflects the change in the value of an investment, assuming reinvestment of the fund's dividend income and capital gains (the profits earned upon the sale of securities that have grown in value) and assuming a constant rate of performance each year. The $10,000 table and the fund's returns do not reflect the deduction of taxes that a shareholder would pay on fund distributions or the redemption of fund shares. During periods of reimbursement by Fidelity, a fund's total return will be greater than it would be had the reimbursement not occurred. How a fund did yesterday is no guarantee of how it will do tomorrow.
Average Annual Total Returns
Periods ended November 30, 2003 | Past 1 | Past 5 | Past 10 |
Fidelity Independence | 13.47% | 2.99% | 9.37% |
$10,000 Over 10 Years
Let's say hypothetically that $10,000 was invested in Fidelity® Independence Fund on November 30, 1993. The chart shows how the value of your investment would have grown, and also shows how the Standard & Poor's 500 Index did over the same period.
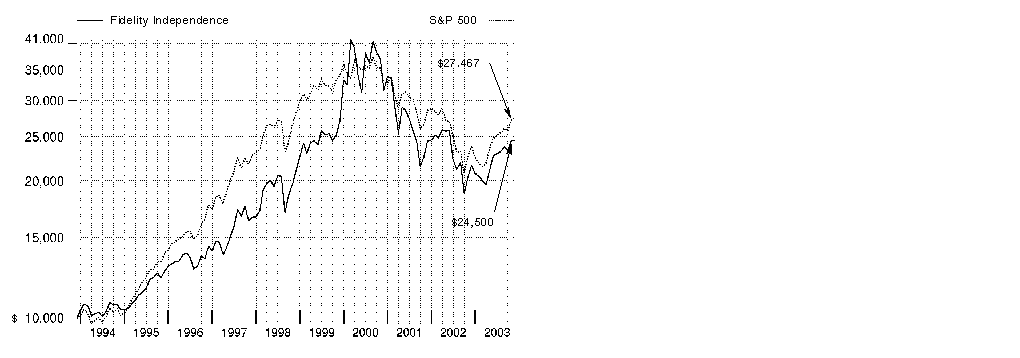
Annual Report
Management's Discussion of Fund Performance
Comments from Jason Weiner, Portfolio Manager of Fidelity® Independence Fund
A healthier economy translated into improved equity market performance for the year ending November 30, 2003. Early signals of an economic recovery were seen when growth in gross domestic product (GDP) surprised on the upside in the first and second quarters of 2003. The Federal Reserve Board added further fuel in June by dropping interest rates to a 45-year low. Federal tax cuts and credits, as well as a boom in mortgage refinancing, put even more discretionary income in consumers' pockets. In the third quarter, GDP growth, propelled by robust consumer and business spending, grew 8.2%, its highest level since 1984. Consumer spending had its strongest third quarter since 1997, while corporate profits had their best showing since 1992. As a result of 2003's economic momentum, stocks enjoyed their best showing since 1999 and were poised to end their three-year losing streak. For the year ending November 30, 2003, the Standard & Poor's 500SM Index gained 15.09%, the Dow Jones Industrial AverageSM returned 12.47% and the NASDAQ Composite® Index advanced 33.23%.
The fund was up 13.47% for the one-year period ending November 30, 2003, while the Standard & Poor's 500 Index and the LipperSM Capital Appreciation Funds Average returned 15.09% and 16.93%, respectively. Unfavorable security selection in some of the year's weaker-performing sectors was primarily to blame. The biggest drag came from our holdings in health care, which lagged those in the index by a wide margin. While the fund benefited from underweighting weak large-cap drug stocks, it wasn't enough to make up for some poor picks in the pharmaceuticals and biotechnology space, most notably Canadian-based Biovail and Trimeris. Another drag was overweighting tobacco holdings R.J. Reynolds and Altria Group during the first half of the period. Security selection in energy services also detracted, as did our underexposure to strong-performing semiconductor names such as Intel. Conversely, the fund got a boost in telecommunication services by favoring surging wireless stocks - including Nextel and tower company Crown Castle - rather than fixed-line carriers such as Verizon, which had a tough period. We also had strong results from our media holdings, led by satellite giant EchoStar. Positions in successful turnaround stories such as Xerox - which I eventually sold - further contributed.
The views expressed in this statement reflect those of the portfolio manager only through the end of the period of the report as stated on the cover and do not necessarily represent the views of Fidelity or any other person in the Fidelity organization. Any such views are subject to change at any time based upon market or other conditions and Fidelity disclaims any responsibility to update such views. These views may not be relied on as investment advice and, because investment decisions for a Fidelity fund are based on numerous factors, may not be relied on as an indication of trading intent on behalf of any Fidelity fund.
Annual Report
Investment Changes
Top Ten Stocks as of November 30, 2003 | ||
% of fund's | % of fund's net assets | |
Microsoft Corp. | 4.1 | 2.0 |
EchoStar Communications Corp. Class A | 3.1 | 6.9 |
Cisco Systems, Inc. | 2.6 | 0.0 |
Clear Channel Communications, Inc. | 2.5 | 1.2 |
First Data Corp. | 2.4 | 2.7 |
QUALCOMM, Inc. | 2.4 | 0.0 |
Crown Castle International Corp. | 2.2 | 0.4 |
Johnson & Johnson | 2.1 | 0.0 |
Analog Devices, Inc. | 2.1 | 1.3 |
Vodafone Group PLC sponsored ADR | 2.0 | 0.0 |
25.5 | ||
Top Five Market Sectors as of November 30, 2003 | ||
% of fund's | % of fund's net assets | |
Information Technology | 27.6 | 19.0 |
Financials | 17.2 | 13.7 |
Consumer Discretionary | 15.0 | 18.7 |
Health Care | 13.6 | 7.1 |
Industrials | 11.6 | 12.9 |
Asset Allocation (% of fund's net assets) | |||||||
As of November 30, 2003* | As of May 31, 2003** | ||||||
| Stocks 97.1% | | Stocks 89.7% | ||||
| Short-Term | | Short-Term | ||||
* Foreign | 14.3% | ** Foreign | 6.7% | ||||

Annual Report
Investments November 30, 2003
Showing Percentage of Net Assets
Common Stocks - 97.1% | |||
Shares | Value (Note 1) (000s) | ||
CONSUMER DISCRETIONARY - 15.0% | |||
Automobiles - 0.1% | |||
Harley-Davidson, Inc. | 97,300 | $ 4,590 | |
Hotels, Restaurants & Leisure - 3.4% | |||
Carnival Corp. unit | 1,233,000 | 43,389 | |
Kerzner International Ltd. (a) | 736,700 | 27,184 | |
Krispy Kreme Doughnuts, Inc. (a) | 406,500 | 16,817 | |
McDonald's Corp. | 1,434,300 | 36,761 | |
Outback Steakhouse, Inc. | 656,100 | 29,360 | |
Red Robin Gourmet Burgers, Inc. (a) | 32,300 | 870 | |
154,381 | |||
Household Durables - 0.9% | |||
Garmin Ltd. | 778,600 | 43,617 | |
Internet & Catalog Retail - 1.0% | |||
InterActiveCorp (a) | 1,385,200 | 45,504 | |
Media - 9.3% | |||
Clear Channel Communications, Inc. | 2,715,400 | 113,531 | |
EchoStar Communications Corp. Class A (a) | 4,090,100 | 141,027 | |
EMI Group PLC | 12,556,200 | 36,690 | |
Lamar Advertising Co. Class A (a) | 718,000 | 25,274 | |
Pixar (a) | 225,800 | 15,831 | |
Radio One, Inc. Class D (non-vtg.) (a) | 1,182,100 | 20,675 | |
Viacom, Inc. Class B (non-vtg.) | 1,876,200 | 73,772 | |
426,800 | |||
Multiline Retail - 0.2% | |||
Tuesday Morning Corp. (a) | 345,600 | 11,045 | |
Specialty Retail - 0.1% | |||
AutoZone, Inc. (a) | 49,800 | 4,764 | |
TOTAL CONSUMER DISCRETIONARY | 690,701 | ||
CONSUMER STAPLES - 2.2% | |||
Beverages - 1.3% | |||
The Coca-Cola Co. | 1,311,300 | 60,975 | |
Food & Staples Retailing - 0.9% | |||
Sysco Corp. | 704,400 | 25,584 | |
Whole Foods Market, Inc. | 242,500 | 15,930 | |
41,514 | |||
TOTAL CONSUMER STAPLES | 102,489 | ||
Common Stocks - continued | |||
Shares | Value (Note 1) (000s) | ||
ENERGY - 0.9% | |||
Energy Equipment & Services - 0.3% | |||
BJ Services Co. (a) | 483,700 | $ 15,425 | |
Oil & Gas - 0.6% | |||
PetroKazakhstan, Inc. Class A (a) | 1,282,000 | 24,707 | |
TOTAL ENERGY | 40,132 | ||
FINANCIALS - 17.2% | |||
Capital Markets - 3.3% | |||
Bank of New York Co., Inc. | 2,043,900 | 62,707 | |
Charles Schwab Corp. | 1,221,819 | 14,173 | |
Legg Mason, Inc. | 169,100 | 13,479 | |
Merrill Lynch & Co., Inc. | 464,300 | 26,349 | |
Morgan Stanley | 647,780 | 35,809 | |
152,517 | |||
Commercial Banks - 2.0% | |||
Bank One Corp. | 400,300 | 17,357 | |
Fifth Third Bancorp | 786,700 | 45,731 | |
Wells Fargo & Co. | 501,900 | 28,774 | |
91,862 | |||
Consumer Finance - 2.9% | |||
American Express Co. | 1,180,700 | 53,970 | |
Capital One Financial Corp. | 480,100 | 28,672 | |
MBNA Corp. | 2,087,200 | 51,178 | |
133,820 | |||
Insurance - 4.8% | |||
ACE Ltd. | 1,033,300 | 37,664 | |
AFLAC, Inc. | 1,003,500 | 36,096 | |
Allstate Corp. | 955,900 | 38,599 | |
AMBAC Financial Group, Inc. | 783,100 | 53,838 | |
American International Group, Inc. | 935,700 | 54,224 | |
220,421 | |||
Thrifts & Mortgage Finance - 4.2% | |||
Countrywide Financial Corp. | 710,400 | 75,018 | |
Fannie Mae | 715,500 | 50,085 | |
Golden West Financial Corp., Delaware | 638,100 | 64,384 | |
189,487 | |||
TOTAL FINANCIALS | 788,107 | ||
Common Stocks - continued | |||
Shares | Value (Note 1) (000s) | ||
HEALTH CARE - 13.6% | |||
Biotechnology - 2.3% | |||
Amgen, Inc. (a) | 600,700 | $ 34,546 | |
Angiotech Pharmaceuticals, Inc. (a) | 481,000 | 23,805 | |
Genentech, Inc. (a) | 270,500 | 22,803 | |
SciClone Pharmaceuticals, Inc. (a) | 200,000 | 1,470 | |
Trimeris, Inc. (a) | 943,600 | 21,542 | |
104,166 | |||
Health Care Equipment & Supplies - 4.8% | |||
Alcon, Inc. | 438,600 | 25,513 | |
American Medical Systems Holdings, Inc. (a) | 605,100 | 13,754 | |
Baxter International, Inc. | 1,325,600 | 36,878 | |
Becton, Dickinson & Co. | 609,800 | 24,410 | |
C.R. Bard, Inc. | 42,600 | 3,221 | |
Cooper Companies, Inc. | 687,584 | 31,388 | |
Medtronic, Inc. | 1,154,100 | 52,165 | |
ResMed, Inc. (a) | 330,600 | 12,893 | |
Respironics, Inc. (a) | 332,900 | 15,147 | |
Sybron Dental Specialties, Inc. (a) | 253,600 | 7,306 | |
222,675 | |||
Health Care Providers & Services - 3.0% | |||
Aetna, Inc. | 796,600 | 51,285 | |
Health Management Associates, Inc. Class A | 1,817,300 | 46,705 | |
Henry Schein, Inc. (a) | 570,900 | 38,416 | |
136,406 | |||
Pharmaceuticals - 3.5% | |||
Biovail Corp. (a) | 2,255,400 | 42,423 | |
Johnson & Johnson | 1,955,700 | 96,396 | |
Pfizer, Inc. | 663,600 | 22,264 | |
161,083 | |||
TOTAL HEALTH CARE | 624,330 | ||
INDUSTRIALS - 11.6% | |||
Aerospace & Defense - 0.2% | |||
Embraer - Empresa Brasileira de Aeronautica SA sponsored ADR | 287,390 | 8,455 | |
Airlines - 3.7% | |||
ExpressJet Holdings, Inc. Class A (a) | 769,100 | 12,083 | |
Ryanair Holdings PLC: | |||
warrants (UBS Warrant Programme) 2/25/04 (a) | 1,587,379 | 12,178 | |
Common Stocks - continued | |||
Shares | Value (Note 1) (000s) | ||
INDUSTRIALS - continued | |||
Airlines - continued | |||
Ryanair Holdings PLC: - continued | |||
sponsored ADR (a) | 1,170,100 | $ 54,807 | |
Southwest Airlines Co. | 5,016,600 | 90,198 | |
169,266 | |||
Commercial Services & Supplies - 3.4% | |||
Apollo Group, Inc. Class A (a) | 476,900 | 32,920 | |
Central Parking Corp. | 230,300 | 3,213 | |
Equifax, Inc. | 137,800 | 3,256 | |
HON Industries, Inc. | 380,700 | 16,176 | |
Monster Worldwide, Inc. (a) | 1,228,700 | 29,563 | |
Robert Half International, Inc. (a) | 912,200 | 20,306 | |
Sothebys Holdings, Inc. Class A (ltd. vtg.) (a) | 1,974,900 | 22,909 | |
Sylvan Learning Systems, Inc. (a) | 823,300 | 26,650 | |
154,993 | |||
Industrial Conglomerates - 2.6% | |||
3M Co. | 746,400 | 58,995 | |
Tyco International Ltd. | 2,705,900 | 62,100 | |
121,095 | |||
Machinery - 1.7% | |||
Caterpillar, Inc. | 500,000 | 38,025 | |
Ingersoll-Rand Co. Ltd. Class A | 659,700 | 41,126 | |
79,151 | |||
TOTAL INDUSTRIALS | 532,960 | ||
INFORMATION TECHNOLOGY - 27.6% | |||
Communications Equipment - 6.5% | |||
Advanced Fibre Communications, Inc. (a) | 493,200 | 11,023 | |
Avocent Corp. (a) | 594,600 | 22,767 | |
Cisco Systems, Inc. (a) | 5,278,200 | 119,604 | |
QUALCOMM, Inc. | 2,445,500 | 108,947 | |
Research in Motion Ltd. (a) | 798,500 | 36,379 | |
298,720 | |||
Computers & Peripherals - 0.7% | |||
Seagate Technology | 1,702,600 | 33,626 | |
Common Stocks - continued | |||
Shares | Value (Note 1) (000s) | ||
INFORMATION TECHNOLOGY - continued | |||
Electronic Equipment & Instruments - 1.4% | |||
Cognex Corp. | 795,600 | $ 21,855 | |
Ingram Micro, Inc. Class A (a) | 3,019,240 | 44,021 | |
65,876 | |||
Internet Software & Services - 2.5% | |||
eCollege.com (a) | 158,200 | 3,512 | |
VeriSign, Inc. (a) | 2,619,100 | 42,456 | |
Yahoo!, Inc. (a) | 1,552,300 | 66,718 | |
112,686 | |||
IT Services - 4.3% | |||
Affiliated Computer Services, Inc. Class A (a) | 561,300 | 28,144 | |
Anteon International Corp. (a) | 280,000 | 10,685 | |
DST Systems, Inc. (a) | 186,200 | 6,949 | |
First Data Corp. | 2,914,700 | 110,321 | |
Paychex, Inc. | 651,388 | 25,059 | |
Satyam Computer Services Ltd. ADR | 674,800 | 14,157 | |
195,315 | |||
Semiconductors & Semiconductor Equipment - 5.3% | |||
Altera Corp. (a) | 612,500 | 15,515 | |
Analog Devices, Inc. | 1,921,600 | 95,600 | |
Cymer, Inc. (a) | 872,800 | 40,472 | |
FormFactor, Inc. | 188,700 | 4,812 | |
Linear Technology Corp. | 239,500 | 10,332 | |
Microchip Technology, Inc. | 343,500 | 11,816 | |
Taiwan Semiconductor Manufacturing Co. Ltd. (a) | 35,640,000 | 66,271 | |
244,818 | |||
Software - 6.9% | |||
Microsoft Corp. | 7,299,400 | 187,596 | |
SAP AG sponsored ADR | 900,200 | 34,703 | |
Siebel Systems, Inc. (a) | 3,471,600 | 45,756 | |
Synopsys, Inc. (a) | 1,576,600 | 47,235 | |
315,290 | |||
TOTAL INFORMATION TECHNOLOGY | 1,266,331 | ||
MATERIALS - 1.7% | |||
Chemicals - 1.7% | |||
Dow Chemical Co. | 2,126,900 | 79,865 | |
Common Stocks - continued | |||
Shares | Value (Note 1) (000s) | ||
TELECOMMUNICATION SERVICES - 5.7% | |||
Wireless Telecommunication Services - 5.7% | |||
American Tower Corp. Class A (a) | 2,204,100 | $ 25,083 | |
At Road, Inc. (a) | 523,800 | 6,595 | |
Crown Castle International Corp. (a) | 8,114,069 | 100,696 | |
Nextel Communications, Inc. Class A (a) | 1,508,500 | 38,210 | |
Vodafone Group PLC sponsored ADR | 3,883,400 | 90,677 | |
261,261 | |||
UTILITIES - 1.6% | |||
Electric Utilities - 0.4% | |||
FirstEnergy Corp. | 583,500 | 20,218 | |
Multi-Utilities & Unregulated Power - 1.2% | |||
AES Corp. (a) | 4,166,067 | 36,953 | |
Sierra Pacific Resources (a) | 2,359,200 | 16,349 | |
53,302 | |||
TOTAL UTILITIES | 73,520 | ||
TOTAL COMMON STOCKS (Cost $4,093,416) | 4,459,696 | ||
Convertible Preferred Stocks - 0.0% | |||
INFORMATION TECHNOLOGY - 0.0% | |||
Communications Equipment - 0.0% | |||
Chorum Technologies, Inc. Series E (c) | 41,400 | 0 | |
Procket Networks, Inc. Series C (c) | 1,721,344 | 430 | |
TOTAL CONVERTIBLE PREFERRED STOCKS (Cost $17,714) | 430 | ||
Money Market Funds - 3.7% | |||
Shares | Value (Note 1) (000s) | ||
Fidelity Cash Central Fund, 1.09% (b) | 136,867,914 | $ 136,868 | |
Fidelity Securities Lending Cash Central Fund, 1.11% (b) | 30,899,900 | 30,900 | |
TOTAL MONEY MARKET FUNDS (Cost $167,768) | 167,768 | ||
TOTAL INVESTMENT PORTFOLIO - 100.8% (Cost $4,278,898) | 4,627,894 | |
NET OTHER ASSETS - (0.8)% | (36,752) | |
NET ASSETS - 100% | $ 4,591,142 | |
Legend |
(a) Non-income producing |
(b) The rate quoted is the annualized seven-day yield of the fund at period end. A complete listing of the fund's holdings as of its most recent fiscal year end is available upon request. |
(c) Restricted securities - Investment in securities not registered under the Securities Act of 1933 (excluding 144A issues). At the end of the period, the value of restricted securities (excluding 144A issues) amounted to $430,000 or 0.0% of net assets. |
Additional information on each holding is as follows: |
Security | Acquisition Date | Acquisition Cost (000s) |
Chorum Technologies, Inc. Series E | 9/19/00 | $ 714 |
Procket Networks, Inc. Series C | 2/9/01 | $ 17,000 |
Other Information |
Distribution of investments by country of issue, as a percentage of total net assets, is as follows: |
United States of America | 85.7% |
United Kingdom | 2.8% |
Canada | 2.8% |
Cayman Islands | 1.6% |
Ireland | 1.5% |
Taiwan | 1.4% |
Panama | 1.0% |
Others (individually less than 1%) | 3.2% |
100.0% |
Purchases and sales of securities, other than short-term securities, aggregated $6,926,794,000 and $7,300,890,000, respectively. |
The fund placed a portion of its portfolio transactions with brokerage firms which are affiliates of the investment adviser. The commissions paid to these affiliated firms were $622,000 for the period. |
The fund participated in the interfund lending program as a borrower. The average daily loan balance during the period for which loans were outstanding amounted to $15,278,000. The weighted average interest rate was 1.13%. At period end there were no interfund loans outstanding. |
Income Tax Information |
At November 30, 2003, the fund had a capital loss carryforward of approximately $2,000,656,000 of which $1,455,368,000 and $545,288,000 will expire on November 30, 2009 and 2010, respectively. |
The fund designates 100% of the dividends distributed during the fiscal year as qualifying for the dividends-received deduction for corporate shareholders. |
The fund will notify shareholders in January 2004 of amounts for use in preparing 2003 income tax returns. |
See accompanying notes which are an integral part of the financial statements.
Annual Report
Financial Statements
Statement of Assets and Liabilities
Amounts in thousands (except per-share amount) | November 30, 2003 | |
Assets | ||
Investment in securities, at value (including securities loaned of $30,063) (cost $4,278,898) - See accompanying schedule | $ 4,627,894 | |
Foreign currency held at value (cost $911) | 906 | |
Receivable for investments sold | 6,077 | |
Receivable for fund shares sold | 907 | |
Dividends receivable | 6,737 | |
Interest receivable | 84 | |
Prepaid expenses | 22 | |
Other receivables | 1,298 | |
Total assets | 4,643,925 | |
Liabilities | ||
Payable for investments purchased | $ 3,046 | |
Payable for fund shares redeemed | 16,327 | |
Accrued management fee | 1,585 | |
Other affiliated payables | 757 | |
Other payables and accrued expenses | 168 | |
Collateral on securities loaned, at value | 30,900 | |
Total liabilities | 52,783 | |
Net Assets | $ 4,591,142 | |
Net Assets consist of: | ||
Paid in capital | $ 6,221,391 | |
Undistributed net investment income | 25,847 | |
Accumulated undistributed net realized gain (loss) on investments and foreign currency transactions | (2,005,511) | |
Net unrealized appreciation (depreciation) on investments and assets and liabilities in foreign currencies | 349,415 | |
Net Assets, for 297,149 shares outstanding | $ 4,591,142 | |
Net Asset Value, offering price and redemption price per share ($4,591,142 ÷ 297,149 shares) | $ 15.45 | |
See accompanying notes which are an integral part of the financial statements.
Annual Report
Financial Statements - continued
Statement of Operations
Amounts in thousands | Year ended November 30, 2003 | |
Investment Income | ||
Dividends (including $16,926 received from affiliated issuers) | $ 64,921 | |
Interest | 2,456 | |
Security lending | 201 | |
Total income | 67,578 | |
Expenses | ||
Management fee | $ 25,327 | |
Performance adjustment | (7,508) | |
Transfer agent fees | 8,340 | |
Accounting and security lending fees | 641 | |
Non-interested trustees' compensation | 19 | |
Depreciation in deferred trustee compensation account | (3) | |
Custodian fees and expenses | 182 | |
Registration fees | 32 | |
Audit | 72 | |
Legal | 27 | |
Interest | 3 | |
Miscellaneous | 42 | |
Total expenses before reductions | 27,174 | |
Expense reductions | (3,337) | 23,837 |
Net investment income (loss) | 43,741 | |
Realized and Unrealized Gain (Loss) Net realized gain (loss) on: | ||
Investment securities (including realized gain (loss) of $45,831 on sales of investments in affiliated issuers) | 608,578 | |
Foreign currency transactions | 205 | |
Total net realized gain (loss) | 608,783 | |
Change in net unrealized appreciation (depreciation) on: Investment securities | (101,318) | |
Assets and liabilities in foreign currencies | 307 | |
Total change in net unrealized appreciation (depreciation) | (101,011) | |
Net gain (loss) | 507,772 | |
Net increase (decrease) in net assets resulting from operations | $ 551,513 | |
See accompanying notes which are an integral part of the financial statements.
Annual Report
Statement of Changes in Net Assets
Amounts in thousands | Year ended | Year ended |
Increase (Decrease) in Net Assets | ||
Operations | ||
Net investment income (loss) | $ 43,741 | $ 69,784 |
Net realized gain (loss) | 608,783 | (385,902) |
Change in net unrealized appreciation (depreciation) | (101,011) | (290,042) |
Net increase (decrease) in net assets resulting | 551,513 | (606,160) |
Distributions to shareholders from net investment income | (67,226) | (68,843) |
Share transactions | 409,847 | 624,261 |
Reinvestment of distributions | 66,756 | 68,326 |
Cost of shares redeemed | (812,268) | (1,057,577) |
Net increase (decrease) in net assets resulting from share transactions | (335,665) | (364,990) |
Total increase (decrease) in net assets | 148,622 | (1,039,993) |
Net Assets | ||
Beginning of period | 4,442,520 | 5,482,513 |
End of period (including undistributed net investment income of $25,847 and undistributed net investment income of $49,135, respectively) | $ 4,591,142 | $ 4,442,520 |
Other Information Shares | ||
Sold | 29,449 | 42,115 |
Issued in reinvestment of distributions | 4,989 | 4,377 |
Redeemed | (58,519) | (71,382) |
Net increase (decrease) | (24,081) | (24,890) |
See accompanying notes which are an integral part of the financial statements.
Annual Report
Financial Highlights
Years ended November 30, | 2003 | 2002 | 2001 | 2000 | 1999 |
Selected Per-Share Data | |||||
Net asset value, beginning of period | $ 13.83 | $ 15.84 | $ 24.46 | $ 23.82 | $ 21.40 |
Income from Investment Operations | |||||
Net investment income (loss) B | .14 | .21 | .17 | .05 | .05 |
Net realized and unrealized gain (loss) | 1.69 | (2.02) | (4.60) | 3.83 | 5.25 |
Total from investment operations | 1.83 | (1.81) | (4.43) | 3.88 | 5.30 |
Distributions from net investment income | (.21) | (.20) | (.08) | (.05) | (.14) |
Distributions from net realized gain | - | - | (4.11) | (3.19) | (2.74) |
Total distributions | (.21) | (.20) | (4.19) | (3.24) | (2.88) |
Net asset value, end of period | $ 15.45 | $ 13.83 | $ 15.84 | $ 24.46 | $ 23.82 |
Total Return A | 13.47% | (11.57)% | (22.86)% | 17.02% | 27.93% |
Ratios to Average Net Assets C | |||||
Expenses before expense reductions | .62% | 1.07% | .97% | .88% | .63% |
Expenses net of voluntary waivers, if any | .62% | 1.07% | .97% | .88% | .63% |
Expenses net of all reductions | .55% | .97% | .92% | .85% | .58% |
Net investment income (loss) | 1.00% | 1.41% | .95% | .19% | .25% |
Supplemental Data | |||||
Net assets, end of period | $ 4,591 | $ 4,443 | $ 5,483 | $ 7,921 | $ 5,912 |
Portfolio turnover rate | 166% | 191% | 187% | 249% | 310% |
A Total returns would have been lower had certain expenses not been reduced during the periods shown.
B Calculated based on average shares outstanding during the period.
C Expense ratios reflect operating expenses of the fund. Expenses before reductions do not reflect amounts reimbursed by the investment adviser or reductions from brokerage service arrangements or other expense offset arrangements and do not represent the amount paid by the fund during periods when reimbursements or reductions occur. Expenses net of any voluntary waivers reflect expenses after reimbursement by the investment adviser but prior to reductions from brokerage service arrangements or other expense offset arrangements. Expenses net of all reductions represent the net expenses paid by the fund.
See accompanying notes which are an integral part of the financial statements.
Annual Report
Notes to Financial Statements
For the period ended November 30, 2003
(Amounts in thousands except ratios)
1. Significant Accounting Policies.
Fidelity Independence Fund (the fund) is a fund of Fidelity Financial Trust (the trust) and is authorized to issue an unlimited number of shares. The trust is registered under the Investment Company Act of 1940, as amended (the 1940 Act), as an open-end management investment company organized as a Massachusetts business trust. The financial statements have been prepared in conformity with accounting principles generally accepted in the United States of America, which require management to make certain estimates and assumptions at the date of the financial statements. The following summarizes the significant accounting policies of the fund:
Security Valuation. Net asset value per share (NAV calculation) is calculated as of the close of business of the New York Stock Exchange, normally 4:00 p.m. Eastern time. Equity securities for which market quotations are available are valued at the last sale price or official closing price (closing bid price or last evaluated quote if no sale has occurred) on the primary market or exchange on which they trade. If an event that is expected to materially affect the value of a security occurs after the close of an exchange or market on which that security trades, but prior to the NAV calculation, then that security will be fair valued taking the event into account. Securities (including restricted securities) for which market quotations are not readily available are valued at their fair value as determined in good faith under consistently applied procedures under the general supervision of the Board of Trustees. Price movements in futures contracts and ADRs, market and trading trends, the bid/ask quotes of brokers and off-exchange institutional trading may be reviewed in the course of making a good faith determination of a security's fair value. Short-term securities with remaining maturities of sixty days or less for which quotations are not readily available are valued on the basis of amortized cost. Investments in open-end investment companies are valued at their net asset value each business day.
Foreign Currency. The fund uses foreign currency contracts to facilitate transactions in foreign-denominated securities. Losses from these transactions may arise from changes in the value of the foreign currency or if the counterparties do not perform under the contracts' terms.
Foreign denominated assets, including investment securities, and liabilities are translated into U.S. dollars at the exchange rate at period end. Purchases and sales of investment securities, income and dividends received and expenses denominated in foreign currencies are translated into U.S. dollars at the exchange rate in effect on the transaction date.
The effects of exchange rate fluctuations on investments are included with the net realized and unrealized gain (loss) on investment securities. Other foreign currency transactions resulting in realized and unrealized gain (loss) are disclosed separately.
Annual Report
Notes to Financial Statements - continued
(Amounts in thousands except ratios)
1. Significant Accounting Policies - continued
Investment Transactions and Income. Security transactions are accounted for as of trade date. Gains and losses on securities sold are determined on the basis of identified cost. Dividend income is recorded on the ex-dividend date, except for certain dividends from foreign securities where the ex-dividend date may have passed, which are recorded as soon as the fund is informed of the ex-dividend date. Non-cash dividends included in dividend income, if any, are recorded at the fair market value of the securities received. Interest income is accrued as earned. Interest income includes coupon interest and amortization of premium and accretion of discount on debt securities, which is accrued using the interest method. Investment income is recorded net of foreign taxes withheld where recovery of such taxes is uncertain.
Expenses. Most expenses of the trust can be directly attributed to a fund. Expenses which cannot be directly attributed are apportioned among the funds in the trust.
Deferred Trustee Compensation. Under a Deferred Compensation Plan (the Plan), non-interested Trustees must defer receipt of a portion of, and may elect to defer receipt of an additional portion of, their annual compensation. Deferred amounts are treated as though equivalent dollar amounts had been invested in shares of the fund or are invested in a cross-section of other Fidelity funds, and are marked-to-market. Deferred amounts remain in the fund until distributed in accordance with the Plan.
Income Tax Information and Distributions to Shareholders. Each year the fund intends to qualify as a regulated investment company by distributing all of its taxable income and realized gains under Subchapter M of the Internal Revenue Code. As a result, no provision for income taxes is required in the accompanying financial statements. Foreign taxes are provided for based on each fund's understanding of the tax rules and rates that exist in the foreign markets in which it invests. Distributions are recorded on the ex-dividend date.
Income and capital gain distributions are determined in accordance with income tax regulations, which may differ from generally accepted accounting principles. Capital accounts within the financial statements are adjusted for permanent and temporary book and tax differences. These adjustments have no impact on net assets or the results of operations. Temporary differences will reverse in a subsequent period. These differences are primarily due to foreign currency transactions, non-taxable dividends, capital loss carryforwards and losses deferred due to wash sales.
Annual Report
1. Significant Accounting Policies - continued
Income Tax Information and Distributions to Shareholders - continued
The tax-basis components of distributable earnings and the federal tax cost as of period end were as follows:
Unrealized appreciation | $ 519,568 | | |
Unrealized depreciation | (175,008) | |
Net unrealized appreciation (depreciation) | 344,560 | |
Undistributed ordinary income | 25,847 | |
Capital loss carryforward | (2,000,656) | |
Cost for federal income tax purposes | $ 4,283,334 |
The tax character of distributions paid was as follows:
November 30, | November 30, | |
Ordinary Income | $ 67,226 | $ 68,843 |
2. Operating Policies.
Repurchase Agreements. Fidelity Management & Research Company (FMR) has received an Exemptive Order from the Securities and Exchange Commission (the SEC) which permits the fund and other affiliated entities of FMR to transfer uninvested cash balances into joint trading accounts. These accounts are then invested in repurchase agreements that are collateralized by U.S. Treasury or Government obligations. The fund may also invest directly with institutions, in repurchase agreements that are collateralized by commercial paper obligations and corporate obligations. Collateral is held in segregated accounts with custodian banks and may be obtained in the event of a default of the counterparty. Collateral is marked-to-market daily and maintained at a value at least equal to the principal amount of the repurchase agreement (including accrued interest).
Restricted Securities. The fund may invest in securities that are subject to legal or contractual restrictions on resale. These securities generally may be resold in transactions exempt from registration or to the public if the securities are registered. Disposal of these securities may involve time-consuming negotiations and expense, and prompt sale at an acceptable price may be difficult. Information regarding restricted securities is included at the end of the fund's Schedule of Investments.
Annual Report
Notes to Financial Statements - continued
(Amounts in thousands except ratios)
3. Purchases and Sales of Investments.
Information regarding purchases and sales of securities is included under the caption "Other Information" at the end of the fund's Schedule of Investments.
4. Fees and Other Transactions with Affiliates.
Management Fee. FMR and its affiliates provide the fund with investment management related services for which the fund pays a monthly management fee. The management fee is the sum of an individual fund fee rate that is based on an annual rate of .30% of the fund's average net assets and a group fee rate that averaged .28% during the period. The group fee rate is based upon the average net assets of all the mutual funds advised by FMR. The group fee rate decreases as assets under management increase and increases as assets under management decrease. In addition, the management fee is subject to a performance adjustment (up to a maximum of +/- .20% of the fund's average net assets over a 36 month performance period). The upward or downward adjustment to the management fee is based on the fund's relative investment performance as compared to an appropriate benchmark index. For the period, the total annual management fee rate, including the performance adjustment, was .41% of the fund's average net assets.
Transfer Agent Fees. Fidelity Service Company, Inc. (FSC), an affiliate of FMR, is the fund's transfer, dividend disbursing and shareholder servicing agent. FSC receives account fees and asset-based fees that vary according to account size and type of account. FSC pays for typesetting, printing and mailing of all shareholder reports, except proxy statements. For the period, the transfer agent fees were equivalent to an annual rate of .19% of average net assets.
Accounting and Security Lending Fees. FSC maintains the fund's accounting records and administers the security lending program. The security lending fee is based on the number and duration of lending transactions. The accounting fee is based on the level of average net assets for the month plus out-of-pocket expenses.
Central Funds. The fund may invest in affiliated Central Funds managed by Fidelity Investments Money Management, Inc. (FIMM), an affiliate of FMR. The Central Funds are open-end investment companies available only to investment companies and other accounts managed by FMR and its affiliates. The Central Funds seek preservation of capital and current income and do not pay a management fee. Income distributions earned by the fund are recorded as income in the accompanying financial statements and totaled $2,451 for the period.
Brokerage Commissions. The fund placed a portion of its portfolio transactions with brokerage firms which are affiliates of the investment adviser. The commissions paid to these affiliated firms are shown under the caption "Other Information" at the end of the fund's Schedule of Investments.
Annual Report
4. Fees and Other Transactions with Affiliates - continued
Interfund Lending Program. Pursuant to an Exemptive Order issued by the SEC, the fund, along with other registered investment companies having management contracts with FMR, may participate in an interfund lending program. This program provides an alternative credit facility allowing the funds to borrow from, or lend money to, other participating funds. Information regarding the fund's participation in the program is included under the caption "Other Information" at the end of the fund's Schedule of Investments.
5. Committed Line of Credit.
The fund participates with other funds managed by FMR in a $3.5 billion credit facility (the "line of credit") to be utilized for temporary or emergency purposes to fund shareholder redemptions or for other short-term liquidity purposes. The fund has agreed to pay commitment fees on its pro rata portion of the line of credit. During the period, there were no borrowings on this line of credit.
6. Security Lending.
The fund lends portfolio securities from time to time in order to earn additional income. The fund receives collateral (in the form of U.S. Treasury obligations, letters of credit and/or cash) against the loaned securities and maintains collateral in an amount not less than 100% of the market value of the loaned securities during the period of the loan. The market value of the loaned securities is determined at the close of business of the fund and any additional required collateral is delivered to the fund on the next business day. If the borrower defaults on its obligation to return the securities loaned because of insolvency or other reasons, a fund could experience delays and costs in recovering the securities loaned or in gaining access to the collateral. Cash collateral is invested in cash equivalents. The value of loaned securities and cash collateral at period end are disclosed on the fund's Statement of Assets and Liabilities.
7. Expense Reductions.
Many of the brokers with whom FMR places trades on behalf of the fund provided services to the fund in addition to trade execution. These services included payments of certain expenses on behalf of the fund totaling $3,314 for the period. In addition, through arrangements with the fund's custodian and transfer agent, credits realized as a result of uninvested cash balances were used to reduce the fund's expenses. During the period, these credits reduced the fund's custody and transfer agent expenses by $2 and $21, respectively.
Annual Report
Notes to Financial Statements - continued
(Amounts in thousands except ratios)
8. Transactions with Affiliated Companies.
An affiliated company is a company in which the fund has ownership of at least 5% of the voting securities. Transactions during the period with companies which are or were affiliates are as follows:
Affiliate | Purchase | Sales | Dividend | Value |
Arnotts PLC | $ - | $ 5,390 | $ - | $ - |
Irish Continental Group | - | 26,288 | 396 | - |
RJ Reynolds Tobacco | - | 92,182 | 16,530 | - |
TOTALS | $ - | $ 123,860 | $ 16,926 | $ - |
Annual Report
Report of Independent Auditors
To the Trustees of Fidelity Financial Trust and the Shareholders of Fidelity Independence Fund:
In our opinion, the accompanying statement of assets and liabilities, including the schedule of investments, and the related statements of operations and of changes in net assets and the financial highlights present fairly, in all material respects, the financial position of Fidelity Independence Fund (a fund of Fidelity Financial Trust) at November 30, 2003 and the results of its operations, the changes in its net assets and the financial highlights for the periods indicated, in conformity with accounting principles generally accepted in the United States of America. These financial statements and financial highlights (hereafter referred to as "financial statements") are the responsibility of the Fidelity Independence Fund's management; our responsibility is to express an opinion on these financial statements based on our audits. We conducted our audits of these financial statements in accordance with auditing standards generally accepted in the United States of America which require that we plan and perform the audit to obtain reasonable assurance about whether the financial statements are free of material misstatement. An audit includes examining, on a test basis, evidence supporting the amounts and disclosures in the financial statements, assessing the accounting principles used and significant estimates made by management, and evaluating the overall financial statement presentation. We believe that our audits, which included confirmation of securities at November 30, 2003 by correspondence with the custodian and brokers, provide a reasonable basis for our opinion.
/s/PricewaterhouseCoopers LLP
PricewaterhouseCoopers LLP
Boston, Massachusetts
January 7, 2004
Annual Report
Trustees and Officers
The Trustees, Members of the Advisory Board, and executive officers of the trust and fund, as applicable, are listed below. The Board of Trustees governs the fund and is responsible for protecting the interests of shareholders. The Trustees are experienced executives who meet periodically throughout the year to oversee the fund's activities, review contractual arrangements with companies that provide services to the fund, and review the fund's performance. Except for William O. McCoy, each of the Trustees oversees 291 funds advised by FMR or an affiliate. Mr. McCoy oversees 293 funds advised by FMR or an affiliate.
The Trustees hold office without limit in time except that (a) any Trustee may resign; (b) any Trustee may be removed by written instrument, signed by at least two-thirds of the number of Trustees prior to such removal; (c) any Trustee who requests to be retired or who has become incapacitated by illness or injury may be retired by written instrument signed by a majority of the other Trustees; and (d) any Trustee may be removed at any special meeting of shareholders by a two-thirds vote of the outstanding voting securities of the trust. In any event, each non-interested Trustee shall retire not later than the last day of the calendar year in which his or her 72nd birthday occurs. The executive officers and Advisory Board Members hold office without limit in time, except that any officer and Advisory Board Member may resign or may be removed by a vote of a majority of the Trustees at any regular meeting or any special meeting of the Trustees. Except as indicated, each individual has held the office shown or other offices in the same company for the past five years.
The fund's Statement of Additional Information (SAI) includes more information about the Trustees. To request a free copy, call Fidelity at 1-800-544-8544.
Interested Trustees*:
Correspondence intended for each Trustee who is an "interested person" (as defined in the 1940 Act) may be sent to 82 Devonshire Street, Boston, Massachusetts 02109.
Name, Age; Principal Occupation | |
Edward C. Johnson 3d (73)** | |
Year of Election or Appointment: 1982 Mr. Johnson is Chairman of the Board of Trustees. Mr. Johnson serves as Chief Executive Officer, Chairman, and a Director of FMR Corp.; a Director and Chairman of the Board and of the Executive Committee of FMR; Chairman and a Director of Fidelity Management & Research (Far East) Inc.; Chairman (1998) and a Director of Fidelity Investments Money Management, Inc.; and Chairman (2001) and a Director (2000) of FMR Co., Inc. | |
Abigail P. Johnson (41)** | |
Year of Election or Appointment: 2001 Senior Vice President of Independence (2001). Ms. Johnson also serves as Senior Vice President of other Fidelity funds (2001). She is President and a Director of FMR (2001), Fidelity Investments Money Management, Inc. (2001), FMR Co., Inc. (2001), and a Director of FMR Corp. Previously, Ms. Johnson managed a number of Fidelity funds. | |
Laura B. Cronin (49) | |
Year of Election or Appointment: 2003 Ms. Cronin is an Executive Vice President (2002) and Chief Financial Officer (2002) of FMR Corp. and is a member of the Fidelity Management Committee (2003). Previously, Ms. Cronin served as Vice President of Finance of FMR (1997-1999), and Chief Financial Officer of FMR (1999-2001), Fidelity Personal Investments (2001), and Fidelity Brokerage Company (2001-2002). | |
Robert L. Reynolds (51) | |
Year of Election or Appointment: 2003 Mr. Reynolds is a Director (2003) and Chief Operating Officer (2002) of FMR Corp. and is the head of the Fidelity Management Committee (2003). He also serves on the Board at Fidelity Investments Canada, Ltd. (2000). Previously, Mr. Reynolds served as President of Fidelity Investments Institutional Retirement Group (1996-2000). | |
* Trustees have been determined to be "Interested Trustees" by virtue of, among other things, their affiliation with the trust or various entities under common control with FMR.
** Edward C. Johnson 3d, Trustee, is Abigail P. Johnson's father.
Annual Report
Non-Interested Trustees:
Correspondence intended for each non-interested Trustee (that is, the Trustees other than the Interested Trustees) may be sent to Fidelity Investments, P.O. Box 55235, Boston, Massachusetts 02205-5235.
Name, Age; Principal Occupation | |
J. Michael Cook (61) | |
Year of Election or Appointment: 2001 Prior to Mr. Cook's retirement in May 1999, he served as Chairman and Chief Executive Officer of Deloitte & Touche LLP (accounting/consulting), Chairman of the Deloitte & Touche Foundation, and a member of the Board of Deloitte Touche Tohmatsu. He currently serves as a Director of Comcast (telecommunications, 2002), International Flavors & Fragrances, Inc. (2000), Rockwell Automation (2000) and The Dow Chemical Company (2000). He is a Member of the Diversity Advisory Council of Marakon (2003) and the Advisory Board of the Directorship Search Group, Chairman Emeritus of the Board of Catalyst (a leading organization for the advancement of women in business), and is Chairman of the Accountability Advisory Council to the Comptroller General of the United States. He also serves as a Member of the Advisory Board of the Graduate School of Business of the University of Florida, his alma mater. | |
Ralph F. Cox (71) | |
Year of Election or Appointment: 1991 Mr. Cox is President of RABAR Enterprises (management consulting for the petroleum industry). Prior to February 1994, he was President of Greenhill Petroleum Corporation (petroleum exploration and production). Until March 1990, Mr. Cox was President and Chief Operating Officer of Union Pacific Resources Company (exploration and production). He is a Director of CH2M Hill Companies (engineering), and Abraxas Petroleum (petroleum exploration and production, 1999). In addition, he is a member of advisory boards of Texas A&M University and the University of Texas at Austin. | |
Robert M. Gates (60) | |
Year of Election or Appointment: 1997 Dr. Gates is President of Texas A&M University (2002). He was Director of the Central Intelligence Agency (CIA) from 1991 to 1993. From 1989 to 1991, Dr. Gates served as Assistant to the President of the United States and Deputy National Security Advisor. Dr. Gates is a Director of NACCO Industries, Inc. (mining and manufacturing), and Parker Drilling Co., Inc. (drilling and rental tools for the energy industry, 2001). He also serves as a member of the Advisory Board of VoteHere.net (secure internet voting, 2001). Previously, Dr. Gates served as a Director of LucasVarity PLC (automotive components and diesel engines), a Director of TRW Inc. (automotive, space, defense, and information technology), and Dean of the George Bush School of Government and Public Service at Texas A&M University (1999-2001). Dr. Gates also is a Trustee of the Forum for International Policy. | |
George H. Heilmeier (67) | |
Year of Election or Appointment: 2004 Dr. Heilmeier is Chairman Emeritus of Telcordia Technologies (communication software and systems), where prior to his retirement, he served as company Chairman and Chief Executive Officer. He currently serves on the Boards of Directors of The Mitre Corporation (systems engineering and information technology support for the government), INET Technologies Inc. (telecommunications network surveillance, 2001) and Teletech Holdings (customer management services, 1998). He is Chairman of the General Motors Technology Advisory Committee and a Life Fellow of the IEEE (2000). Dr. Heilmeier is a member of the Defense Science Board and the National Security Agency Advisory Board. He is also a member of the National Academy of Engineering, the American Academy of Arts and Sciences and The Board of Overseers of the School of Engineering and Applied Science of the University of Pennsylvania. Previously, Dr. Heilmeier served as a Director of TRW Inc. (automotive, space, defense, and information technology, 1992-2002) and Compaq (1994-2002). | |
Donald J. Kirk (71) | |
Year of Election or Appointment: 1987 Mr. Kirk is a Governor of the American Stock Exchange (2001), a Trustee and former Chairman of the Board of Trustees of the Greenwich Hospital Association, a Director of the Yale-New Haven Health Services Corp. (1998), and a Director Emeritus and former Chairman of the Board of Directors of National Arts Strategies Inc. Mr. Kirk was an Executive-in-Residence (1995-2000) and a Professor (1987-1995) at Columbia University Graduate School of Business. Prior to 1987, he was Chairman of the Financial Accounting Standards Board. Previously, Mr. Kirk served as a Governor of the National Association of Securities Dealers, Inc. (1996-2002), a member and Vice Chairman of the Public Oversight Board of the American Institute of Certified Public Accountants' SEC Practice Section (1995-2002), a Director of General Re Corporation (reinsurance, 1987-1998) and as a Director of Valuation Research Corp. (appraisals and valuations). | |
Marie L. Knowles (57) | |
Year of Election or Appointment: 2001 Prior to Ms. Knowles' retirement in June 2000, she served as Executive Vice President and Chief Financial Officer of Atlantic Richfield Company (ARCO) (diversified energy, 1996-2000). From 1993 to 1996, she was a Senior Vice President of ARCO and President of ARCO Transportation Company. She served as a Director of ARCO from 1996 to 1998. She currently serves as a Director of Phelps Dodge Corporation (copper mining and manufacturing), URS Corporation (multidisciplinary engineering, 1999), and McKesson Corporation (healthcare service, 2002). Ms. Knowles is a Trustee of the Brookings Institution and the Catalina Island Conservancy and also serves as a member of the Advisory Board for the School of Engineering of the University of Southern California. | |
Ned C. Lautenbach (59) | |
Year of Election or Appointment: 2000 Mr. Lautenbach has been a partner of Clayton, Dubilier & Rice, Inc. (private equity investment firm) since September 1998. Previously, Mr. Lautenbach was with the International Business Machines Corporation (IBM) from 1968 until his retirement in 1998. He was most recently Senior Vice President and Group Executive of Worldwide Sales and Services. From 1993 to 1995, he was Chairman of IBM World Trade Corporation, and from 1994 to 1998 was a member of IBM's Corporate Executive Committee. Mr. Lautenbach serves as Chairman and as a Director (1998) of Acterna Corporation (communications test equipment). He is also Co-Chairman of Covansys, Inc. (global provider of business and technology solutions, 2000). In addition, he is a Director of Eaton Corporation (diversified industrial) and the Philharmonic Center for the Arts in Naples, Florida (1999). He also is a member of the Council on Foreign Relations. | |
Marvin L. Mann (70) | |
Year of Election or Appointment: 1993 Mr. Mann is Chairman of the non-interested Trustees (2001). He is Chairman Emeritus of Lexmark International, Inc. (computer peripherals) where he served as CEO until April 1998 and retired as Chairman May 1999, and remains a member of the Board. Prior to 1991, he held the positions of Vice President of International Business Machines Corporation (IBM) and President and General Manager of various IBM divisions and subsidiaries. Mr. Mann is a Board member of Imation Corp. (imaging and information storage) and Acterna Corporation (communications test equipment, 1999). He is also a member of the Director Services Committee of the Investment Company Institute. In addition, Mr. Mann is a member of the President's Cabinet at the University of Alabama and the Board of Visitors of the Culverhouse College of Commerce and Business Administration at the University of Alabama. | |
William O. McCoy (70) | |
Year of Election or Appointment: 1997 Prior to his retirement in December 1994, Mr. McCoy was Vice Chairman of the Board of BellSouth Corporation (telecommunications) and President of BellSouth Enterprises. He is currently a Director of Liberty Corporation (holding company), Duke Realty Corporation (real estate), Progress Energy, Inc. (electric utility), and Acterna Corporation (communications test equipment, 1999). He is also a partner of Franklin Street Partners (private investment management firm) and a member of the Research Triangle Foundation Board. In addition, Mr. McCoy served as the Interim Chancellor (1999-2000) and a member of the Board of Visitors (1994-1998) for the University of North Carolina at Chapel Hill and currently serves on the Board of Directors of the University of North Carolina Health Care System and the Board of Visitors of the Kenan-Flagler Business School (University of North Carolina at Chapel Hill). He also served as Vice President of Finance for the University of North Carolina (16-school system, 1995-1998). | |
William S. Stavropoulos (64) | |
Year of Election or Appointment: 2002 Mr. Stavropoulos is Chairman of the Board, President and CEO (2002), and Chairman of the Executive Committee (2000) and a Director of The Dow Chemical Company. Since joining The Dow Chemical Company in 1967, Mr. Stavropoulos served in numerous senior management positions, including President (1993-2000) and Chief Executive Officer (1995-2000). Currently, he is a Director of NCR Corporation (data warehousing and technology solutions), BellSouth Corporation (telecommunications), Chemical Financial Corporation, and Maersk Inc. (industrial conglomerate, 2002). He also serves as a member of the Board of Trustees of the American Enterprise Institute for Public Policy Research. In addition, Mr. Stavropoulos is a member of The Business Council, J.P. Morgan International Council, World Business Council for Sustainable Development, and the University of Notre Dame Advisory Council for the College of Science. | |
Annual Report
Trustees and Officers - continued
Advisory Board Members and Executive Officers:
Correspondence intended for Ms. Small may be sent to Fidelity Investments, P.O. Box 55235, Boston, Massachusetts 02205-5235. Correspondence intended for each executive officer and Mr. Lynch may be sent to 82 Devonshire Street, Boston, Massachusetts 02109.
Name, Age; Principal Occupation | |
Peter S. Lynch (60) | |
Year of Election or Appointment: 2003 Member of the Advisory Board of Fidelity Financial Trust. Vice Chairman and a Director of FMR, and Vice Chairman (2001) and a Director (2000) of FMR Co., Inc. Previously, Mr. Lynch served as a Trustee of the Fidelity funds (1990-2003). Prior to May 31, 1990, he was a Director of FMR and Executive Vice President of FMR (a position he held until March 31, 1991), Vice President of Fidelity® Magellan® Fund and FMR Growth Group Leader, and Managing Director of FMR Corp. Mr. Lynch was also Vice President of Fidelity Investments Corporate Services. In addition, he serves as a Trustee of Boston College, Massachusetts Eye & Ear Infirmary, Historic Deerfield, John F. Kennedy Library, and the Museum of Fine Arts of Boston. | |
Cornelia M. Small (60) | |
Year of Election or Appointment: 2004 Member of the Advisory Board of Fidelity Financial Trust. Ms. Small is a member (2000) and Chairperson (2002) of the Investment Committee, and a member (2002) of the Board of Trustees of Smith College. Previously, she served as Chief Investment Officer (1999-2000), Director of Global Equity Investments (1996-1999), and a member of the Board of Directors (1998-1999) of Scudder Kemper Investments. In addition, Ms. Small served as Co-Chair (2000-2003) of the Annual Fund for the Fletcher School of Law and Diplomacy. | |
John B. McDowell (45) | |
Year of Election or Appointment: 2002 Vice President of Independence. Mr. McDowell also serves as Vice President of certain Equity Funds (2002). He is Senior Vice President of FMR (1999), FMR Co., Inc. (2001), and Fidelity Management Trust Company (FMTC). Since joining Fidelity Investments in 1985, Mr. McDowell has worked as a research analyst and manager. | |
Jason Weiner (35) | |
Year of Election or Appointment: 2003 Vice President of Independence. He has managed since April 2003. He also manages other Fidelity funds. Since joining Fidelity Investments in 1991, Mr. Weiner has worked as a research analyst and manager. | |
Eric D. Roiter (55) | |
Year of Election or Appointment: 1998 Secretary of Independence. He also serves as Secretary of other Fidelity funds (1998); Vice President, General Counsel, and Clerk of FMR Co., Inc. (2001) and FMR (1998); Vice President and Clerk of FDC (1998); Assistant Clerk of Fidelity Management & Research (U.K.) Inc. (2001) and Fidelity Management & Research (Far East) Inc. (2001); and Assistant Secretary of Fidelity Investments Money Management Inc. (2001). Prior to joining Fidelity, Mr. Roiter was with the law firm of Debevoise & Plimpton, as an associate (1981-1984) and as a partner (1985-1997), and served as an Assistant General Counsel of the U.S. Securities and Exchange Commission (1979-1981). Mr. Roiter is an Adjunct Member, Faculty of Law, at Boston College Law School (2003). | |
Stuart Fross (44) | |
Year of Election or Appointment: 2003 Assistant Secretary of Independence. Mr. Fross also serves as Assistant Secretary of other Fidelity funds (2003) and is an employee of FMR. | |
Maria F. Dwyer (44) | |
Year of Election or Appointment: 2002 President and Treasurer of Independence. Ms. Dwyer also serves as President and Treasurer of other Fidelity funds (2002) and is a Vice President (1999) and an employee (1996) of FMR. Prior to joining Fidelity, Ms. Dwyer served as Director of Compliance for MFS Investment Management. | |
Timothy F. Hayes (52) | |
Year of Election or Appointment: Chief Financial Officer of Independence. Mr. Hayes also serves as Chief Financial Officer of other Fidelity funds (2002). Recently he was appointed President of Fidelity Service Company (2003) where he also serves as a Director. Mr. Hayes also serves as President of Fidelity Investments Operations Group (FIOG, 2002), which includes Fidelity Pricing and Cash Management Services Group (FPCMS), where he was appointed President in 1998. Previously, Mr. Hayes served as Chief Financial Officer of Fidelity Investments Corporate Systems and Service Group (1998) and Fidelity Systems Company (1997-1998). | |
John R. Hebble (45) | |
Year of Election or Appointment: 2003 Deputy Treasurer of Independence. Mr. Hebble also serves as Deputy Treasurer of other Fidelity funds (2003), and is an employee of FMR. Before joining Fidelity Investments, Mr. Hebble worked at Deutsche Asset Management where he served as Director of Fund Accounting (2002-2003) and Assistant Treasurer of the Scudder Funds (1998-2003). | |
John H. Costello (57) | |
Year of Election or Appointment: 1986 Assistant Treasurer of Independence. Mr. Costello also serves as Assistant Treasurer of other Fidelity funds and is an employee of FMR. | |
Francis V. Knox, Jr. (56) | |
Year of Election or Appointment:2002 Assistant Treasurer of Independence. Mr. Knox also serves as Assistant Treasurer of other Fidelity funds (2002), and is a Vice President and an employee of FMR. Previously, Mr. Knox served as Vice President of Investment & Advisor Compliance (1990-2001), and Compliance Officer of Fidelity Management & Research (U.K.) Inc. (1992-2002), Fidelity Management & Research (Far East) Inc. (1991-2002), and FMR Corp. (1995-2002). | |
Mark Osterheld (48) | |
Year of Election or Appointment: 2002 Assistant Treasurer of Independence. Mr. Osterheld also serves as Assistant Treasurer of other Fidelity funds (2002) and is an employee of FMR. | |
Thomas J. Simpson (45) | |
Year of Election or Appointment: 1998 Assistant Treasurer of Independence. Mr. Simpson is Assistant Treasurer of other Fidelity funds (2000) and an employee of FMR (1996). Prior to joining FMR, Mr. Simpson was Vice President and Fund Controller of Liberty Investment Services (1987-1995). | |
Annual Report
Managing Your Investments
Fidelity offers several ways to conveniently manage your personal investments via your telephone or PC. You can access your account information, conduct trades and research your investments 24 hours a day.
By Phone
Fidelity Automated Service Telephone provides a single toll-free number to access account balances, positions, quotes and trading. It's easy to navigate the service, and on your first call, the system will help you create a personal identification number (PIN) for security.
(phone_graphic)
Fidelity Automated
Service Telephone (FAST®)
1-800-544-5555
Press
1 For mutual fund and brokerage trading.
2 For quotes.*
3 For account balances and holdings.
4 To review orders and mutual
fund activity.
5 To change your PIN.
*0 To speak to a Fidelity representative.
By PC
Fidelity's web site on the Internet provides a wide range of information, including daily financial news, fund performance, interactive planning tools and news about Fidelity products and services.
(computer_graphic)
Fidelity's Web Site
www.fidelity.com
* When you call the quotes line, please remember that a fund's yield and return will vary and, except for money market funds, share price will also vary. This means that you may have a gain or loss when you sell your shares. There is no assurance that money market funds will be able to maintain a stable $1 share price; an investment in a money market fund is not insured or guaranteed by the U.S. government. Total returns are historical and include changes in share price, reinvestment of dividends and capital gains, and the effects of any sales charges.
Annual Report
To Write Fidelity
We'll give your correspondence immediate attention and send you written confirmation upon completion of your request.
(letter_graphic)
Making Changes
To Your Account
(such as changing name, address, bank, etc.)
Fidelity Investments
P.O. Box 770001
Cincinnati, OH 45277-0002
(letter_graphic)
For Non-Retirement
Accounts
Buying shares
Fidelity Investments
P.O. Box 770001
Cincinnati, OH 45277-0003
Overnight Express
Fidelity Investments
Attn: Distribution Services
100 Crosby Parkway - KC1H
Covington, KY 41015
Selling shares
Fidelity Investments
P.O. Box 770001
Cincinnati, OH 45277-0035
Overnight Express
Fidelity Investments
Attn: Distribution Services
100 Crosby Parkway - KC1H
Covington, KY 41015
General Correspondence
Fidelity Investments
P.O. Box 500
Merrimack, NH 03054-0500
(letter_graphic)
For Retirement
Accounts
Buying shares
Fidelity Investments
P.O. Box 770001
Cincinnati, OH 45277-0003
Selling shares
Fidelity Investments
P.O. Box 770001
Cincinnati, OH 45277-0035
Overnight Express
Fidelity Investments
Attn: Distribution Services
100 Crosby Parkway - KC1H
Covington, KY 41015
General Correspondence
Fidelity Investments
P.O. Box 500
Merrimack, NH 03054-0500
Annual Report
To Visit Fidelity
For directions and hours,
please call 1-800-544-9797.
Arizona
7001 West Ray Road
Chandler, AZ
7373 N. Scottsdale Road
Scottsdale, AZ
California
815 East Birch Street
Brea, CA
1411 Chapin Avenue
Burlingame, CA
851 East Hamilton Avenue
Campbell, CA
527 North Brand Boulevard
Glendale, CA
19200 Von Karman Avenue
Irvine, CA
601 Larkspur Landing Circle
Larkspur, CA
10100 Santa Monica Blvd.
Los Angeles, CA
27101 Puerta Real
Mission Viejo, CA
73-575 El Paseo
Palm Desert, CA
251 University Avenue
Palo Alto, CA
1760 Challenge Way
Sacramento, CA
7676 Hazard Center Drive
San Diego, CA
8 Montgomery Street
San Francisco, CA
21701 Hawthorne Boulevard
Torrance, CA
2001 North Main Street
Walnut Creek, CA
6300 Canoga Avenue
Woodland Hills, CA
Colorado
1625 Broadway
Denver, CO
9185 East Westview Road
Littleton, CO
Connecticut
48 West Putnam Avenue
Greenwich, CT
265 Church Street
New Haven, CT
300 Atlantic Street
Stamford, CT
29 South Main Street
West Hartford, CT
Delaware
222 Delaware Avenue
Wilmington, DE
Florida
4400 N. Federal Highway
Boca Raton, FL
121 Alhambra Plaza
Coral Gables, FL
2948 N. Federal Highway
Ft. Lauderdale, FL
1907 West State Road 434
Longwood, FL
8880 Tamiami Trail, North
Naples, FL
3501 PGA Boulevard
West Palm Beach, FL
8065 Beneva Road
Sarasota, FL
1502 N. Westshore Blvd.
Tampa, FL
Georgia
3445 Peachtree Road, N.E.
Atlanta, GA
1000 Abernathy Road
Atlanta, GA
Illinois
One North LaSalle Street
Chicago, IL
1415 West 22nd Street
Oak Brook, IL
1700 East Golf Road
Schaumburg, IL
3232 Lake Avenue
Wilmette, IL
Indiana
4729 East 82nd Street
Indianapolis, IN
Kansas
5400 College Boulevard
Overland Park, KS
Maine
Three Canal Plaza
Portland, ME
Maryland
7401 Wisconsin Avenue
Bethesda, MD
One W. Pennsylvania Ave.
Towson, MD
Massachusetts
801 Boylston Street
Boston, MA
155 Congress Street
Boston, MA
300 Granite Street
Braintree, MA
44 Mall Road
Burlington, MA
405 Cochituate Road
Framingham, MA
416 Belmont Street
Worcester, MA
Annual Report
Michigan
280 Old N. Woodward Ave.
Birmingham, MI
43420 Grand River Avenue
Novi, MI
29155 Northwestern Hwy.
Southfield, MI
Minnesota
7600 France Avenue South
Edina, MN
Missouri
8885 Ladue Road
Ladue, MO
New Jersey
150 Essex Street
Millburn, NJ
56 South Street
Morristown, NJ
501 Route 17, South
Paramus, NJ
3518 Route 1 North
Princeton, NJ
New York
1055 Franklin Avenue
Garden City, NY
37 West Jericho Turnpike
Huntington Station, NY
1271 Avenue of the Americas
New York, NY
61 Broadway
New York, NY
350 Park Avenue
New York, NY
North Carolina
4611 Sharon Road
Charlotte, NC
Ohio
3805 Edwards Road
Cincinnati, OH
28699 Chagrin Boulevard
Woodmere Village, OH
Oregon
16850 SW 72nd Avenue
Tigard, OR
Pennsylvania
600 West DeKalb Pike
King of Prussia, PA
1735 Market Street
Philadelphia, PA
12001 Perry Highway
Wexford, PA
Rhode Island
47 Providence Place
Providence, RI
Tennessee
6150 Poplar Avenue
Memphis, TN
Texas
10000 Research Boulevard
Austin, TX
4017 Northwest Parkway
Dallas, TX
12532 Memorial Drive
Houston, TX
2701 Drexel Drive
Houston, TX
400 East Las Colinas Blvd.
Irving, TX
14100 San Pedro
San Antonio, TX
19740 IH 45 North
Spring, TX
6005 West Park Boulevard
Plano, TX 75093
Utah
215 South State Street
Salt Lake City, UT
Virginia
1861 International Drive
McLean, VA
Washington
411 108th Avenue, N.E.
Bellevue, WA
1518 6th Avenue
Seattle, WA
Washington, DC
1900 K Street, N.W.
Washington, DC
Wisconsin
595 North Barker Road
Brookfield, WI
Fidelity Brokerage Services, Inc., 100 Summer St., Boston, MA 02110 Member NYSE/SIPC
Annual Report
Investment Adviser
Fidelity Management & Research Company
Boston, MA
Investment Sub-Advisers
FMR Co., Inc.
Fidelity Management & Research
(U.K.) Inc.
Fidelity Management & Research
(Far East) Inc.
Fidelity International Investment
Advisors
Fidelity Investments Japan Limited
Fidelity International Investment
Advisors (U.K.) Limited
General Distributor
Fidelity Distributors Corporation
Boston, MA
Transfer and Shareholder
Servicing Agent
Fidelity Service Company, Inc.
Boston, MA
Custodian
Brown Brothers Harriman & Co.
Boston, MA
Fidelity's Growth Funds
Aggressive Growth Fund
Blue Chip Growth Fund
Blue Chip Value Fund
Capital Appreciation Fund
Contrafund®
Disciplined Equity Fund
Discovery Fund
Dividend Growth Fund
Export and Multinational Fund
Fidelity Fifty®
Fidelity Value Discovery Fund
Focused Stock Fund
Growth Company Fund
Independence Fund
Large Cap Stock Fund
Leveraged Company Stock Fund
Low-Priced Stock Fund
Magellan® Fund
Mid-Cap Stock Fund
New Millennium Fund®
OTC Portfolio
Small Cap Independence Fund
Small Cap Stock Fund
Stock Selector
Structured Large Cap Growth Fund
Structured Large Cap Value Fund
Structured Mid Cap Growth Fund
Structured Mid Cap Value Fund
Tax Managed Stock Fund
Trend Fund
Value Fund
The Fidelity Telephone Connection
Mutual Fund 24-Hour Service
Exchanges/Redemptions
and Account Assistance 1-800-544-6666
Product Information 1-800-544-6666
Retirement Accounts 1-800-544-4774
(8 a.m. - 9 p.m.)
TDD Service 1-800-544-0118
for the deaf and hearing impaired
(9 a.m. - 9 p.m. Eastern time)
Fidelity Automated Service
Telephone (FAST®) (automated graphic) 1-800-544-5555
(automated graphic) Automated line for quickest service
FRE-UANN-0104
1.786709.100
(Fidelity Investment logo)(registered trademark)
Corporate Headquarters
82 Devonshire St., Boston, MA 02109
www.fidelity.com
Item 2. Code of Ethics
As of the end of the period, November 30, 2003, the Fidelity Financial Trust has adopted a code of ethics, as defined in Item 2 of Form N-CSR, that applies to its President and Treasurer and its Chief Financial Officer. A copy of the code of ethics is filed as an exhibit to this Form N-CSR.
Item 3. Audit Committee Financial Expert
The Board of Trustees of Fidelity Financial Trust has determined that Marie L. Knowles and Donald J. Kirk are each audit committee financial experts, as defined in Item 3 of Form N-CSR. Ms. Knowles and Mr. Kirk are each independent for purposes of Item 3 of Form N-CSR.
Item 4. Principal Accountant Fees and Services
Not applicable.
Item 5. Audit Committee of Listed Registrants
Not applicable.
Item 6. Reserved
Item 7. Disclosure of Proxy Voting Policies and Procedures for Closed-End Management Investment Companies
Not applicable.
Item 8. Reserved
Item 9. Submission of Matters to a Vote of Security Holders
Not applicable.
Item 10. Controls and Procedures
(a)(i) The President and Treasurer and the Chief Financial Officer have concluded that the Fidelity Financial Trust's (the "Trust") disclosure controls and procedures (as defined in Rule 30a-3(c) under the Investment Company Act) provide reasonable assurances that material information relating to the Trust is made known to them by the appropriate persons, based on their evaluation of these controls and procedures as of a date within 90 days of the filing date of this report.
(a)(ii) There was no change in the Trust's internal control over financial reporting (as defined in Rule 30a-3(d) under the Investment Company Act) that occurred during the Trust's second fiscal half-year that has materially affected, or is reasonably likely to materially affect, the Trust's internal control over financial reporting.
Item 11. Exhibits
(a) | (1) | Code of Ethics pursuant to Item 2 of Form N-CSR is filed and attached hereto as EX-99.CODE ETH. |
(a) | (2) | Certification pursuant to Rule 30a-2(a) under the Investment Company Act of 1940 (17 CFR 270.30a-2(a)) is filed and attached hereto as Exhibit 99.CERT. |
(b) | Certification pursuant to Rule 30a-2(b) under the Investment Company Act of 1940 (17 CFR 270.30a-2(b)) is furnished and attached hereto as Exhibit 99.906CERT. |
SIGNATURES
Pursuant to the requirements of the Securities Exchange Act of 1934 and the Investment Company Act of 1940, the registrant has duly caused this report to be signed on its behalf by the undersigned, thereunto duly authorized.
Fidelity Financial Trust
By: | /s/Maria Dwyer |
Maria Dwyer | |
President and Treasurer | |
Date: | January 21, 2004 |
Pursuant to the requirements of the Securities Exchange Act of 1934 and the Investment Company Act of 1940, this report has been signed below by the following persons on behalf of the registrant and in the capacities and on the dates indicated.
By: | /s/Maria Dwyer |
Maria Dwyer | |
President and Treasurer | |
Date: | January 21, 2004 |
By: | /s/Timothy F. Hayes |
Timothy F. Hayes | |
Chief Financial Officer | |
Date: | January 21, 2004 |