UNITED STATES
SECURITIES AND EXCHANGE COMMISSION
Washington, D.C. 20549
FORM N-CSR
CERTIFIED SHAREHOLDER REPORT OF REGISTERED
MANAGEMENT INVESTMENT COMPANIES
Investment Company Act file number 811-3587
Fidelity Financial Trust
(Exact name of registrant as specified in charter)
82 Devonshire St., Boston, Massachusetts 02109
(Address of principal executive offices) (Zip code)
Eric D. Roiter, Secretary
82 Devonshire St.
Boston, Massachusetts 02109
(Name and address of agent for service)
Registrant's telephone number, including area code: 617-563-7000
Date of fiscal year end: | November 30 |
| |
Date of reporting period: | November 30, 2004 |
Item 1. Reports to Stockholders
Fidelity®
Equity-Income II
Fund
Annual Report
November 30, 2004
(2_fidelity_logos) (Registered_Trademark)
Contents
Chairman's Message | 4 | Ned Johnson's message to shareholders. |
Performance | 5 | How the fund has done over time. |
Management's Discussion | 6 | The manager's review of fund performance, strategy and outlook. |
Shareholder Expense Example | 7 | An example of shareholder expenses. |
Investment Changes | 8 | A summary of major shifts in the fund's investments over the past six months. |
Investments | 9 | A complete list of the fund's investments with their market values. |
Financial Statements | 17 | Statements of assets and liabilities, operations, and changes in net assets,
as well as financial highlights. |
Notes | 21 | Notes to the financial statements. |
Report of Independent Registered Public Accounting Firm | 26 | |
Trustees and Officers | 27 | |
Distributions | 36 | |
| | |
To view a fund's proxy voting guidelines and proxy voting record for the 12-month period ended June 30, visit www.fidelity.com/proxyvotingresults or visit the Securities and Exchange Commission's (SEC) web site at www.sec.gov. You may also call 1-800-544-8544 to request a free copy of the proxy voting guidelines.
Standard & Poor's, S&P and S&P 500 are registered service marks of The McGraw-Hill Companies, Inc. and have been licensed for use by Fidelity Distributors Corporation.
Other third party marks appearing herein are the property of their respective owners.
All other marks appearing herein are registered or unregistered trademarks or service marks of FMR Corp. or an affiliated company.
(Recycle graphic) This report is printed on recycled paper using soy-based inks.
Annual Report
This report and the financial statements contained herein are submitted for the general information of the shareholders of the fund. This report is not authorized for distribution to prospective investors in the fund unless preceded or accompanied by an effective prospectus.
A fund files its complete schedule of portfolio holdings with the SEC for the first and third quarters of each fiscal year on Form N-Q. Forms N-Q are available on the SEC's web site at http://www.sec.gov. A fund's Forms N-Q may be reviewed and copied at the SEC's Public Reference Room in Washington, DC. Information regarding the operation of the SEC's Public Reference Room may be obtained by calling 1-800-SEC-0330. For a complete list of a fund's portfolio holdings, view the most recent quarterly holdings report, semiannual report, or annual report on Fidelity's web site at http://www.fidelity.com/holdings.
NOT FDIC INSURED · MAY LOSE VALUE · NO BANK GUARANTEE
Neither the fund nor Fidelity Distributors Corporation is a bank.
Annual Report
Chairman's Message
(photo_of_Edward_C_Johnson_3d)
Dear Shareholder:
During the past year or so, much has been reported about the mutual fund industry, and much of it has been more critical than I believe is warranted. Allegations that some companies have been less than forthright with their shareholders have cast a shadow on the entire industry. I continue to find these reports disturbing, and assert that they do not create an accurate picture of the industry overall. Therefore, I would like to remind everyone where Fidelity stands on these issues. I will say two things specifically regarding allegations that some mutual fund companies were in violation of the Securities and Exchange Commission's forward pricing rules or were involved in so-called "market timing" activities.
First, Fidelity has no agreements that permit customers who buy fund shares after 4 p.m. to obtain the 4 p.m. price. This is not a new policy. This is not to say that someone could not deceive the company through fraudulent acts. However, we are extremely diligent in preventing fraud from occurring in this manner - and in every other. But I underscore again that Fidelity has no so-called "agreements" that sanction illegal practices.
Second, Fidelity continues to stand on record, as we have for years, in opposition to predatory short-term trading that adversely affects shareholders in a mutual fund. Back in the 1980s, we initiated a fee - which is returned to the fund and, therefore, to investors - - to discourage this activity. Further, we took the lead several years ago in developing a Fair Value Pricing Policy to prevent market timing on foreign securities in our funds. I am confident we will find other ways to make it more difficult for predatory traders to operate. However, this will only be achieved through close cooperation among regulators, legislators and the industry.
Yes, there have been unfortunate instances of unethical and illegal activity within the mutual fund industry from time to time. That is true of any industry. When this occurs, confessed or convicted offenders should be dealt with appropriately. But we are still concerned about the risk of over-regulation and the quick application of simplistic solutions to intricate problems. Every system can be improved, and we support and applaud well thought out improvements by regulators, legislators and industry representatives that achieve the common goal of building and protecting the value of investors' holdings.
For nearly 60 years, Fidelity has worked very hard to improve its products and service to justify your trust. When our family founded this company in 1946, we had only a few hundred customers. Today, we serve more than 18 million customers including individual investors and participants in retirement plans across America.
Let me close by saying that we do not take your trust in us for granted, and we realize that we must always work to improve all aspects of our service to you. In turn, we urge you to continue your active participation with your financial matters, so that your interests can be well served.
Best regards,
/s/Edward C. Johnson 3d
Edward C. Johnson 3d
Annual Report
Performance: The Bottom Line
Average annual total return reflects the change in the value of an investment, assuming reinvestment of the fund's dividend income and capital gains (the profits earned upon the sale of securities that have grown in value) and assuming a constant rate of performance each year. The $10,000 table and the fund's returns do not reflect the deduction of taxes that a shareholder would pay on fund distributions or the redemption of fund shares. During periods of reimbursement by Fidelity, a fund's total return will be greater than it would be had the reimbursement not occurred. How a fund did yesterday is no guarantee of how it will do tomorrow.
Average Annual Total Returns
Periods ended November 30, 2004 | Past 1
year | Past 5
years | Past 10
years |
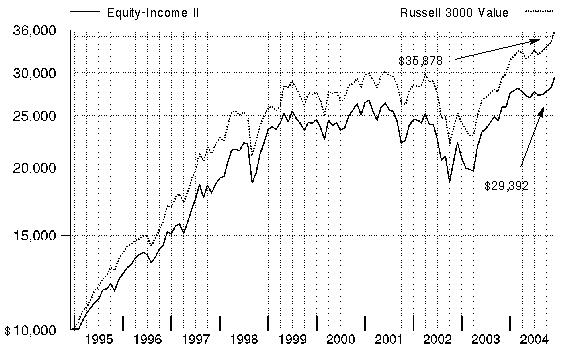
Fidelity Equity-Income II | 13.32% | 3.95% | 11.38% |
$10,000 Over 10 Years
Let's say hypothetically that $10,000 was invested in Fidelity® Equity-Income II Fund on November 30, 1994. The chart shows how the value of your investment would have changed, and also shows how the Russell 3000 Value Index performed over the same period.
Annual Report
Management's Discussion of Fund Performance
Comments from Steve DuFour, Portfolio Manager of Fidelity® Equity-Income II Fund
Despite surging oil prices, a struggling job market and four interest rate hikes in a five-month span, U.S. equity markets posted solid results for the 12-month period ending November 30, 2004, and were closing in on a second straight year in the black. There was great disparity in the market during the past year. For instance, value stocks trounced their growth counterparts during the period. To illustrate, the Russell 1000® Value Index shot up 19.67%, while the Russell 1000 Growth Index rose only 5.83%. Meanwhile, small- and mid-cap stocks vastly outperformed larger-cap stocks. Energy was the best-performing sector of the market, propelled by a spike in oil prices. Conversely, technology stocks dipped lower in response to a slowdown in corporate capital spending. For the 12-month period overall, the Standard & Poor's 500SM Index returned 12.86% - slightly above its historical average. Elsewhere, the Dow Jones Industrial AverageSM rose 8.85% and the tech-heavy NASDAQ Composite® Index advanced 7.50%.
Fidelity Equity-Income II Fund's shares were up 13.32% during the one-year period ending November 30, 2004. This return trailed the 20.00% advance of the Russell 3000® Value Index and the 15.58% return for the LipperSM Equity Income Objective Funds Average. The fund's emphasis on large-capitalization stocks caused some of its underperformance relative to the Russell index. Mid- and small-caps, which made up a greater percentage of the index than the fund, generally outperformed larger-cap issues during the period. Underweighting banking, utilities and real estate - three of the better-performing groups in the index - also hurt the fund's relative results. Among the fund's biggest individual detractors were brokerage firms Charles Schwab and Morgan Stanley, as well as Internet company IAC/InterActiveCorp, all three of which declined. On the positive side of the ledger, good stock selection in and having a higher average exposure to the strong-performing energy sector boosted the fund's return relative to its index. Natural gas producer Burlington Resources was among the fund's top-performing holdings in this sector. Other positions that made strong contributions to the fund's performance were railroad operator Norfolk Southern and Eastman Chemical, a provider of raw materials for industrial uses.
The views expressed in this statement reflect those of the portfolio manager only through the end of the period of the report as stated on the cover and do not necessarily represent the views of Fidelity or any other person in the Fidelity organization. Any such views are subject to change at any time based upon market or other conditions and Fidelity disclaims any responsibility to update such views. These views may not be relied on as investment advice and, because investment decisions for a Fidelity fund are based on numerous factors, may not be relied on as an indication of trading intent on behalf of any Fidelity fund.
Annual Report
Shareholder Expense Example
As a shareholder of the Fund, you incur two types of costs: (1) transaction costs, and (2) ongoing costs, including management fees and other Fund expenses. This Example is intended to help you understand your ongoing costs (in dollars) of investing in the Fund and to compare these costs with the ongoing costs of investing in other mutual funds.
The Example is based on an investment of $1,000 invested at the beginning of the period and held for the entire period (June 1, 2004 to November 30, 2004).
Actual Expenses
The first line of the table below provides information about actual account values and actual expenses. You may use the information in this line, together with the amount you invested, to estimate the expenses that you paid over the period. Simply divide your account value by $1,000.00 (for example, an $8,600 account value divided by $1,000.00 = 8.6), then multiply the result by the number in the first line under the heading entitled "Expenses Paid During Period" to estimate the expenses you paid on your account during this period. A small balance maintenance fee of $12.00 that is charged once a year may apply for certain accounts with a value of less than $2,000. This fee is not included in the table below. If it was, the estimate of expenses you paid during the period would be higher, and your ending account value lower, by this amount.
Hypothetical Example for Comparison Purposes
The second line of the table below provides information about hypothetical account values and hypothetical expenses based on the Fund's actual expense ratio and an assumed rate of return of 5% per year before expenses, which is not the Fund's actual return. The hypothetical account values and expenses may not be used to estimate the actual ending account balance or expenses you paid for the period. You may use this information to compare the ongoing costs of investing in the Fund and other funds. To do so, compare this 5% hypothetical example with the 5% hypothetical examples that appear in the shareholder reports of the other funds. A small balance maintenance fee of $12.00 that is charged once a year may apply for certain accounts with a value of less than $2,000. This fee is not included in the table below. If it was, the estimate of expenses you paid during the period would be higher, and your ending account value lower, by this amount.
Please note that the expenses shown in the table are meant to highlight your ongoing costs only and do not reflect any transaction costs. Therefore, the second line of the table is useful in comparing ongoing costs only, and will not help you determine the relative total costs of owning different funds.
| Beginning
Account Value
June 1, 2004 | Ending
Account Value
November 30, 2004 | Expenses Paid
During Period*
June 1, 2004
to November 30, 2004 |
Actual | $ 1,000.00 | $ 1,088.10 | $ 3.55 |
Hypothetical (5% return per year before expenses) | $ 1,000.00 | $ 1,021.56 | $ 3.44 |
*Expenses are equal to the Fund's annualized expense ratio of .68%; multiplied by the average account value over the period, multiplied by 183/366 (to reflect the one-half year period).
Annual Report
Investment Changes
Top Ten Stocks as of November 30, 2004 |
| % of fund's
net assets | % of fund's net assets
6 months ago |
Exxon Mobil Corp. | 5.1 | 5.1 |
Verizon Communications, Inc. | 4.7 | 4.5 |
General Electric Co. | 4.5 | 1.5 |
Bank of America Corp. | 3.8 | 2.4 |
American International Group, Inc. | 3.4 | 4.5 |
Burlington Resources, Inc. | 2.9 | 5.0 |
News Corp. Class B | 2.9 | 2.3 |
Sprint Corp. | 2.9 | 1.0 |
Norfolk Southern Corp. | 2.6 | 2.0 |
Wachovia Corp. | 2.5 | 1.2 |
| 35.3 | |
Top Five Market Sectors as of November 30, 2004 |
| % of fund's
net assets | % of fund's net assets
6 months ago |
Financials | 28.5 | 27.8 |
Industrials | 13.8 | 12.2 |
Energy | 10.5 | 13.5 |
Information Technology | 10.2 | 8.4 |
Telecommunication Services | 8.7 | 7.2 |
Asset Allocation (% of fund's net assets) |
As of November 30, 2004 * | As of May 31, 2004 ** |
 | Stocks 98.3% | | | Stocks 97.1% | |
 | Convertible
Securities 0.4% | | | Convertible
Securities 0.4% | |
 | Short-Term
Investments and
Net Other Assets 1.3% | | | Short-Term
Investments and
Net Other Assets 2.5% | |
* Foreign investments | 1.3% | | ** Foreign investments | 4.0% | |

Annual Report
Investments November 30, 2004
Showing Percentage of Net Assets
Common Stocks - 98.3% |
| Shares | | Value (Note 1)
(000s) |
CONSUMER DISCRETIONARY - 8.5% |
Internet & Catalog Retail - 0.4% |
IAC/InterActiveCorp (a) | 2,113,550 | | $ 52,184 |
Media - 6.8% |
Clear Channel Communications, Inc. | 537,513 | | 18,103 |
News Corp. Class B (d) | 20,417,200 | | 369,347 |
Omnicom Group, Inc. | 1,924,780 | | 155,907 |
Tribune Co. | 2,034,200 | | 88,223 |
Walt Disney Co. | 1,416,400 | | 38,073 |
Washington Post Co. Class B | 11,560 | | 10,843 |
XM Satellite Radio Holdings, Inc. Class A (a)(d) | 4,713,726 | | 173,984 |
| | 854,480 |
Multiline Retail - 0.8% |
JCPenney Co., Inc. | 1,290,100 | | 49,798 |
The May Department Stores Co. | 1,747,300 | | 49,134 |
| | 98,932 |
Specialty Retail - 0.5% |
Home Depot, Inc. | 1,637,300 | | 68,357 |
TOTAL CONSUMER DISCRETIONARY | | 1,073,953 |
CONSUMER STAPLES - 6.3% |
Beverages - 0.1% |
The Coca-Cola Co. | 345,400 | | 13,578 |
Food & Staples Retailing - 2.5% |
Safeway, Inc. (a) | 2,924,400 | | 56,382 |
Wal-Mart Stores, Inc. | 4,948,500 | | 257,619 |
| | 314,001 |
Food Products - 1.1% |
Campbell Soup Co. | 258,500 | | 7,375 |
Hormel Foods Corp. | 443,600 | | 13,579 |
McCormick & Co., Inc. (non-vtg.) | 3,192,900 | | 116,381 |
| | 137,335 |
Household Products - 0.3% |
Colgate-Palmolive Co. | 315,400 | | 14,505 |
Procter & Gamble Co. | 517,000 | | 27,649 |
| | 42,154 |
Common Stocks - continued |
| Shares | | Value (Note 1)
(000s) |
CONSUMER STAPLES - continued |
Tobacco - 2.3% |
Altria Group, Inc. | 4,913,000 | | $ 282,448 |
Loews Corp. - Carolina Group | 387,400 | | 11,390 |
| | 293,838 |
TOTAL CONSUMER STAPLES | | 800,906 |
ENERGY - 10.5% |
Energy Equipment & Services - 1.6% |
Halliburton Co. | 5,040,600 | | 208,429 |
Oil & Gas - 8.9% |
Ashland, Inc. | 1,401,000 | | 82,869 |
Burlington Resources, Inc. | 7,983,660 | | 370,522 |
Exxon Mobil Corp. | 12,653,800 | | 648,505 |
Williams Companies, Inc. | 1,033,900 | | 17,235 |
| | 1,119,131 |
TOTAL ENERGY | | 1,327,560 |
FINANCIALS - 28.5% |
Capital Markets - 4.5% |
Charles Schwab Corp. | 10,582,940 | | 114,084 |
Goldman Sachs Group, Inc. | 969,300 | | 101,544 |
Lehman Brothers Holdings, Inc. | 667,000 | | 55,881 |
Merrill Lynch & Co., Inc. | 1,464,900 | | 81,610 |
Morgan Stanley | 1,528,393 | | 77,566 |
State Street Corp. | 3,156,300 | | 140,645 |
| | 571,330 |
Commercial Banks - 9.2% |
Bank of America Corp. | 10,224,600 | | 473,092 |
M&T Bank Corp. | 331,500 | | 34,943 |
North Fork Bancorp, Inc., New York | 968,850 | | 27,903 |
Wachovia Corp. | 6,129,157 | | 317,184 |
Wells Fargo & Co. | 4,996,100 | | 308,609 |
| | 1,161,731 |
Consumer Finance - 2.1% |
American Express Co. | 1,162,500 | | 64,763 |
SLM Corp. | 4,010,400 | | 205,212 |
| | 269,975 |
Common Stocks - continued |
| Shares | | Value (Note 1)
(000s) |
FINANCIALS - continued |
Diversified Financial Services - 3.2% |
Citigroup, Inc. | 5,626,141 | | $ 251,770 |
J.P. Morgan Chase & Co. | 4,009,912 | | 150,973 |
| | 402,743 |
Insurance - 4.6% |
ACE Ltd. | 463,000 | | 18,714 |
American International Group, Inc. | 6,848,700 | | 433,865 |
Hartford Financial Services Group, Inc. | 689,000 | | 44,096 |
Marsh & McLennan Companies, Inc. | 473,600 | | 13,540 |
St. Paul Travelers Companies, Inc. | 794,700 | | 28,991 |
Willis Group Holdings Ltd. | 1,106,500 | | 41,881 |
| | 581,087 |
Real Estate - 2.7% |
Capital Automotive (SBI) | 385,310 | | 12,989 |
CenterPoint Properties Trust (SBI) | 732,020 | | 34,295 |
Equity Lifestyle Properties, Inc. | 242,971 | | 8,820 |
Equity Office Properties Trust | 1,937,700 | | 53,190 |
General Growth Properties, Inc. | 6,508,626 | | 223,311 |
Macquarie Goodman Industrial Trust | 2,750,000 | | 4,372 |
| | 336,977 |
Thrifts & Mortgage Finance - 2.2% |
Fannie Mae | 3,233,560 | | 222,146 |
Washington Mutual, Inc. | 1,369,700 | | 55,760 |
| | 277,906 |
TOTAL FINANCIALS | | 3,601,749 |
HEALTH CARE - 5.5% |
Health Care Equipment & Supplies - 0.4% |
Medtronic, Inc. | 974,900 | | 46,844 |
Health Care Providers & Services - 2.1% |
Aetna, Inc. | 301,400 | | 35,719 |
Cardinal Health, Inc. | 689,200 | | 36,031 |
McKesson Corp. | 1,378,500 | | 40,735 |
UnitedHealth Group, Inc. | 1,945,600 | | 161,193 |
| | 273,678 |
Pharmaceuticals - 3.0% |
Bristol-Myers Squibb Co. | 1,843,100 | | 43,313 |
Common Stocks - continued |
| Shares | | Value (Note 1)
(000s) |
HEALTH CARE - continued |
Pharmaceuticals - continued |
Pfizer, Inc. | 10,888,790 | | $ 302,382 |
Wyeth | 732,500 | | 29,205 |
| | 374,900 |
TOTAL HEALTH CARE | | 695,422 |
INDUSTRIALS - 13.8% |
Aerospace & Defense - 2.2% |
Goodrich Corp. | 2,987,300 | | 94,847 |
Honeywell International, Inc. | 806,500 | | 28,494 |
Lockheed Martin Corp. | 561,180 | | 34,142 |
Northrop Grumman Corp. | 861,100 | | 48,506 |
Precision Castparts Corp. | 1,021,300 | | 66,221 |
| | 272,210 |
Air Freight & Logistics - 0.3% |
Ryder System, Inc. | 258,300 | | 13,855 |
United Parcel Service, Inc. Class B | 301,400 | | 25,363 |
| | 39,218 |
Commercial Services & Supplies - 0.1% |
Cendant Corp. | 689,000 | | 15,620 |
Industrial Conglomerates - 4.5% |
General Electric Co. | 15,817,800 | | 559,317 |
Machinery - 3.6% |
Caterpillar, Inc. | 1,191,500 | | 109,082 |
Dover Corp. | 6,531,500 | | 264,199 |
Eaton Corp. | 731,900 | | 49,330 |
Navistar International Corp. (a) | 861,800 | | 35,463 |
| | 458,074 |
Marine - 0.0% |
Alexander & Baldwin, Inc. | 53,975 | | 2,284 |
Road & Rail - 3.1% |
Landstar System, Inc. (a) | 925,674 | | 65,269 |
Norfolk Southern Corp. | 9,501,144 | | 326,174 |
| | 391,443 |
Trading Companies & Distributors - 0.0% |
UAP Holding Corp. | 176,600 | | 2,887 |
TOTAL INDUSTRIALS | | 1,741,053 |
Common Stocks - continued |
| Shares | | Value (Note 1)
(000s) |
INFORMATION TECHNOLOGY - 9.8% |
Communications Equipment - 0.9% |
Cisco Systems, Inc. (a) | 2,929,300 | | $ 54,807 |
Nokia Corp. sponsored ADR | 2,886,200 | | 46,670 |
QUALCOMM, Inc. | 387,800 | | 16,140 |
| | 117,617 |
Computers & Peripherals - 0.2% |
Dell, Inc. (a) | 516,700 | | 20,937 |
Emulex Corp. (a) | 430,900 | | 6,093 |
| | 27,030 |
Electronic Equipment & Instruments - 0.8% |
Agilent Technologies, Inc. (a) | 2,584,700 | | 59,164 |
Arrow Electronics, Inc. (a) | 603,200 | | 14,796 |
Avnet, Inc. (a) | 1,594,600 | | 29,341 |
| | 103,301 |
Semiconductors & Semiconductor Equipment - 5.5% |
Analog Devices, Inc. | 2,836,600 | | 104,812 |
Applied Materials, Inc. (a) | 4,997,900 | | 83,165 |
Axcelis Technologies, Inc. (a) | 1,093,800 | | 7,985 |
Fairchild Semiconductor International, Inc. (a) | 603,200 | | 9,229 |
Intel Corp. | 5,945,800 | | 132,889 |
KLA-Tencor Corp. (a) | 3,013,900 | | 135,806 |
Lam Research Corp. (a) | 2,198,600 | | 57,186 |
LTX Corp. (a) | 702,600 | | 5,017 |
MKS Instruments, Inc. (a) | 247,400 | | 4,203 |
National Semiconductor Corp. (a) | 4,365,500 | | 67,491 |
Novellus Systems, Inc. (a) | 2,196,000 | | 59,160 |
Portalplayer, Inc. | 8,100 | | 236 |
Teradyne, Inc. (a) | 1,205,100 | | 20,559 |
| | 687,738 |
Software - 2.4% |
Microsoft Corp. | 11,052,800 | | 296,326 |
TOTAL INFORMATION TECHNOLOGY | | 1,232,012 |
MATERIALS - 4.0% |
Chemicals - 3.5% |
Air Products & Chemicals, Inc. | 804,000 | | 46,029 |
Eastman Chemical Co. (e) | 3,944,900 | | 214,524 |
FMC Corp. (a) | 1,570,500 | | 77,818 |
Lubrizol Corp. | 1,033,400 | | 35,704 |
Common Stocks - continued |
| Shares | | Value (Note 1)
(000s) |
MATERIALS - continued |
Chemicals - continued |
Lyondell Chemical Co. | 2,040,800 | | $ 57,265 |
Nalco Holding Co. | 817,700 | | 15,724 |
| | 447,064 |
Containers & Packaging - 0.2% |
Smurfit-Stone Container Corp. (a) | 1,451,225 | | 26,064 |
Metals & Mining - 0.3% |
Alcoa, Inc. | 958,350 | | 32,565 |
TOTAL MATERIALS | | 505,693 |
TELECOMMUNICATION SERVICES - 8.7% |
Diversified Telecommunication Services - 8.3% |
Citizens Communications Co. | 1,133,800 | | 16,213 |
Iowa Telecommunication Services, Inc. | 264,900 | | 5,619 |
SBC Communications, Inc. | 2,972,900 | | 74,828 |
Sprint Corp. | 15,789,300 | | 360,154 |
Verizon Communications, Inc. | 14,366,800 | | 592,343 |
| | 1,049,157 |
Wireless Telecommunication Services - 0.4% |
InPhonic, Inc. | 16,300 | | 416 |
Vodafone Group PLC sponsored ADR | 1,766,400 | | 48,170 |
| | 48,586 |
TOTAL TELECOMMUNICATION SERVICES | | 1,097,743 |
UTILITIES - 2.7% |
Electric Utilities - 2.6% |
American Electric Power Co., Inc. | 1,275,600 | | 43,587 |
DPL, Inc. | 215,400 | | 5,165 |
Edison International | 990,300 | | 31,591 |
Entergy Corp. | 2,641,400 | | 171,216 |
Exelon Corp. | 784,100 | | 32,705 |
Southern Co. | 1,418,600 | | 46,516 |
| | 330,780 |
Common Stocks - continued |
| Shares | | Value (Note 1)
(000s) |
UTILITIES - continued |
Gas Utilities - 0.1% |
AGL Resources, Inc. | 297,100 | | $ 9,861 |
TOTAL UTILITIES | | 340,641 |
TOTAL COMMON STOCKS (Cost $10,751,668) | 12,416,732 |
Convertible Preferred Stocks - 0.4% |
| | | |
INFORMATION TECHNOLOGY - 0.4% |
Office Electronics - 0.4% |
Xerox Corp. Series C, 6.25% | 344,700 | | 47,063 |
TOTAL CONVERTIBLE PREFERRED STOCKS (Cost $49,298) | 47,063 |
Money Market Funds - 3.3% |
| | | |
Fidelity Cash Central Fund, 1.98% (b) | 163,212,200 | | 163,212 |
Fidelity Securities Lending Cash Central Fund, 2% (b)(c) | 262,326,125 | | 262,326 |
TOTAL MONEY MARKET FUNDS (Cost $425,538) | 425,538 |
TOTAL INVESTMENT PORTFOLIO - 102.0% (Cost $11,226,504) | | 12,889,333 |
NET OTHER ASSETS - (2.0)% | | (257,684) |
NET ASSETS - 100% | $ 12,631,649 |
Legend |
(a) Non-income producing |
(b) Affiliated fund that is available only to investment companies and other accounts managed by Fidelity Investments. The rate quoted is the annualized seven-day yield of the fund at period end. A complete listing of the fund's holdings as of its most recent fiscal year end is available upon request. |
(c) Includes investment made with cash collateral received from securities on loan. |
(d) Security or a portion of the security is on loan at period end. |
(e) Affiliated company |
An affiliated company is a company in which the fund has ownership of at least 5% of the voting securities. Companies which are affiliates of the fund at period-end are noted in the fund's Schedule of Investments. Transactions during the period with companies which are or were affiliates are as follows: |
Affiliate | Value, beginning of period | Purchases | Sales Proceeds | Dividend Income | Value, end of period |
Burlington Resources, Inc. | $ 536,456 | $ 9,474 | $ 512,096 | $ 5,894 | $ - |
Eastman Chemical Co. | 50,095 | 103,875 | - | 5,466 | 214,524 |
Goodrich Corp. | 188,477 | 18,063 | 138,810 | 4,289 | - |
Werner Enterprises, Inc. | 88,999 | - | 93,227 | 191 | - |
Total | $ 864,027 | $ 131,412 | $ 744,133 | $ 15,840 | $ 214,524 |
Income Tax Information |
The fund hereby designates approximately $5,360,000 as a capital gain dividend for the purpose of the dividends paid deduction. |
See accompanying notes which are an integral part of the financial statements.
Annual Report
Financial Statements
Statement of Assets and Liabilities
Amounts in thousands (except per-share amount) | November 30, 2004 |
| | |
Assets | | |
Investment in securities, at value (including securities loaned of $256,508) (cost $11,226,504) - See accompanying schedule | | $ 12,889,333 |
Receivable for investments sold | | 29,215 |
Receivable for fund shares sold | | 4,660 |
Dividends receivable | | 53,940 |
Interest receivable | | 294 |
Prepaid expenses | | 52 |
Other affiliated receivables | | 80 |
Other receivables | | 3,043 |
Total assets | | 12,980,617 |
| | |
Liabilities | | |
Payable for investments purchased | $ 66,697 | |
Payable for fund shares redeemed | 12,533 | |
Accrued management fee | 4,972 | |
Other affiliated payables | 2,375 | |
Other payables and accrued expenses | 65 | |
Collateral on securities loaned, at value | 262,326 | |
Total liabilities | | 348,968 |
| | |
Net Assets | | $ 12,631,649 |
Net Assets consist of: | | |
Paid in capital | | $ 10,544,224 |
Undistributed net investment income | | 70,477 |
Accumulated undistributed net realized gain (loss) on investments and foreign currency transactions | | 354,119 |
Net unrealized appreciation (depreciation) on investments | | 1,662,829 |
Net Assets, for 528,476 shares outstanding | | $ 12,631,649 |
Net Asset Value, offering price and redemption price per share ($12,631,649 ÷ 528,476 shares) | | $ 23.90 |
See accompanying notes which are an integral part of the financial statements.
Annual Report
Financial Statements - continued
Statement of Operations
Amounts in thousands | Year ended November 30, 2004 |
| | |
Investment Income | | |
Dividends (including $15,840 received from affiliated issuers) | | $ 228,653 |
Special Dividends | | 34,043 |
Interest | | 3,584 |
Security lending | | 1,239 |
Total income | | 267,519 |
| | |
Expenses | | |
Management fee | $ 58,019 | |
Transfer agent fees | 23,357 | |
Accounting and security lending fees | 1,336 | |
Non-interested trustees' compensation | 73 | |
Appreciation in deferred trustee compensation account | 36 | |
Custodian fees and expenses | 169 | |
Registration fees | 101 | |
Audit | 110 | |
Legal | 38 | |
Miscellaneous | 137 | |
Total expenses before reductions | 83,376 | |
Expense reductions | (5,841) | 77,535 |
Net investment income (loss) | | 189,984 |
Realized and Unrealized Gain (Loss) Net realized gain (loss) on: | | |
Investment securities (including realized gain (loss) of $242,257 from affiliated issuers) | 423,706 | |
Foreign currency transactions | (77) | |
Total net realized gain (loss) | | 423,629 |
Change in net unrealized appreciation (depreciation) on investment securities | | 889,857 |
Net gain (loss) | | 1,313,486 |
Net increase (decrease) in net assets resulting from operations | | $ 1,503,470 |
See accompanying notes which are an integral part of the financial statements.
Annual Report
Statement of Changes in Net Assets
Amounts in thousands | Year ended
November 30,
2004 | Year ended
November 30,
2003 |
Increase (Decrease) in Net Assets | | |
Operations | | |
Net investment income (loss) | $ 189,984 | $ 133,136 |
Net realized gain (loss) | 423,629 | 891,798 |
Change in net unrealized appreciation (depreciation) | 889,857 | 546,040 |
Net increase (decrease) in net assets resulting
from operations | 1,503,470 | 1,570,974 |
Distributions to shareholders from net investment income | (156,155) | (122,229) |
Distributions to shareholders from net realized gain | (91,776) | - |
Total distributions | (247,931) | (122,229) |
Share transactions
Proceeds from sales of shares | 1,505,888 | 1,470,308 |
Reinvestment of distributions | 236,038 | 115,783 |
Cost of shares redeemed | (1,890,399) | (1,666,126) |
Net increase (decrease) in net assets resulting from share transactions | (148,473) | (80,035) |
Total increase (decrease) in net assets | 1,107,066 | 1,368,710 |
| | |
Net Assets | | |
Beginning of period | 11,524,583 | 10,155,873 |
End of period (including undistributed net investment income of $70,477 and undistributed net investment income of $35,073, respectively) | $ 12,631,649 | $ 11,524,583 |
Other Information Shares | | |
Sold | 66,415 | 75,917 |
Issued in reinvestment of distributions | 10,382 | 6,305 |
Redeemed | (83,726) | (89,210) |
Net increase (decrease) | (6,929) | (6,988) |
See accompanying notes which are an integral part of the financial statements.
Annual Report
Financial Highlights
Years ended November 30, | 2004 | 2003 | 2002 | 2001 | 2000 |
Selected Per-Share Data | | | | | |
Net asset value, beginning of period | $ 21.52 | $ 18.72 | $ 21.21 | $ 27.49 | $ 30.34 |
Income from Investment Operations | | | | | |
Net investment income (loss)B | .35C | .25 | .24E | .34 | .40 |
Net realized and unrealized gain (loss) | 2.49 | 2.78 | (1.65)E | (1.15) | .50 |
Total from investment operations | 2.84 | 3.03 | (1.41) | (.81) | .90 |
Distributions from net investment income | (.29) | (.23) | (.23) | (.39) | (.40) |
Distributions from net realized gain | (.17) | - | (.85) | (5.08) | (3.35) |
Total distributions | (.46) | (.23) | (1.08) | (5.47) | (3.75) |
Net asset value, end of period | $ 23.90 | $ 21.52 | $ 18.72 | $ 21.21 | $ 27.49 |
Total ReturnA | 13.32% | 16.40% | (7.08)% | (4.33)% | 3.50% |
Ratios to Average Net AssetsD | | | | | |
Expenses before expense
reductions | .68% | .70% | .70% | .67% | .67% |
Expenses net of voluntary
waivers, if any | .68% | .70% | .70% | .67% | .67% |
Expenses net of all reductions | .64% | .64% | .63% | .62% | .63% |
Net investment income (loss) | 1.56% | 1.31% | 1.26%E | 1.49% | 1.47% |
Supplemental Data | | | | | |
Net assets, end of period
(in millions) | $ 12,632 | $ 11,525 | $ 10,156 | $ 12,029 | $ 13,401 |
Portfolio turnover rate | 123% | 131% | 135% | 136% | 151% |
A Total returns would have been lower had certain expenses not been reduced during the periods shown.
B Calculated based on average shares outstanding during the period.
C Investment income per share reflects a special dividend which amounted to $.06 per share.
D Expense ratios reflect operating expenses of the fund. Expenses before reductions do not reflect amounts reimbursed by the investment adviser or reductions from brokerage service arrangements or other expense offset arrangements and do not represent the amount paid by the fund during periods when reimbursements or reductions occur. Expenses net of any voluntary waivers reflect expenses after reimbursement by the investment adviser but prior to reductions from brokerage service arrangements or other expense offset arrangements. Expenses net of all reductions represent the net expenses paid by the fund.
E Effective December 1, 2001, the fund adopted the provisions of the AICPA Audit and Accounting Guide for Investment Companies and began amortizing premium and discount on all debt securities. Per-share data and ratios for periods prior to adoption have not been restated to reflect this change.
See accompanying notes which are an integral part of the financial statements.
Annual Report
Notes to Financial Statements
For the period ended November 30, 2004
(Amounts in thousands except ratios)
1. Significant Accounting Policies.
Fidelity Equity-Income II Fund (the fund) is a fund of Fidelity Financial Trust (the trust) and is authorized to issue an unlimited number of shares. The trust is registered under the Investment Company Act of 1940, as amended (the 1940 Act), as an open-end management investment company organized as a Massachusetts business trust. The financial statements have been prepared in conformity with accounting principles generally accepted in the United States of America, which require management to make certain estimates and assumptions at the date of the financial statements. The following summarizes the significant accounting policies of the fund:
Security Valuation. Net asset value per share (NAV calculation) is calculated as of the close of business of the New York Stock Exchange, normally 4:00 p.m. Eastern time. Equity securities, including restricted securities, for which market quotations are available are valued at the last sale price or official closing price (closing bid price or last evaluated quote if no sale has occurred) on the primary market or exchange on which they trade. If prices are not readily available or do not accurately reflect fair value for a security, or if a security's value has been materially affected by events occurring after the close of the exchange or market on which the security is principally traded, that security may be valued by another method that the Board of Trustees believes accurately reflects fair value. A security's valuation may differ depending on the method used for determining value. Price movements in futures contracts and ADRs, market and trading trends, the bid/ask quotes of brokers and off-exchange institutional trading may be reviewed in the course of making a good faith determination of a security's fair value. Short-term securities with remaining maturities of sixty days or less for which quotations are not readily available are valued on the basis of amortized cost. Investments in open-end investment companies are valued at their net asset value each business day.
Foreign Currency. The fund uses foreign currency contracts to facilitate transactions in foreign-denominated securities. Losses from these transactions may arise from changes in the value of the foreign currency or if the counterparties do not perform under the contracts' terms.
Foreign-denominated assets, including investment securities, and liabilities are translated into U.S. dollars at the exchange rate at period end. Purchases and sales of investment securities, income and dividends received and expenses denominated in foreign currencies are translated into U.S. dollars at the exchange rate in effect on the transaction date.
The effects of exchange rate fluctuations on investments are included with the net realized and unrealized gain (loss) on investment securities. Other foreign currency transactions resulting in realized and unrealized gain (loss) are disclosed separately.
Annual Report
Notes to Financial Statements - continued
(Amounts in thousands except ratios)
1. Significant Accounting Policies - continued
Investment Transactions and Income. Security transactions are accounted for as of trade date. Gains and losses on securities sold are determined on the basis of identified cost and may include proceeds from litigation. Dividend income is recorded on the ex-dividend date, except for certain dividends from foreign securities where the ex-dividend date may have passed, which are recorded as soon as the fund is informed of the ex-dividend date. Non-cash dividends included in dividend income, if any, are recorded at the fair market value of the securities received. Distributions received on securities that represent a return of capital or capital gain are recorded as a reduction of cost of investments and/or as a realized gain. The fund estimates the components of distributions received that may be considered return of capital distributions or capital gain distributions. Large, non-recurring dividends recognized by the fund are presented separately on the Statement of Operations as "Special Dividends" and the impact of these dividends to net investment income per share is presented in the Financial Highlights. Interest income is accrued as earned. Interest income includes coupon interest and amortization of premium and accretion of discount on debt securities. Investment income is recorded net of foreign taxes withheld where recovery of such taxes is uncertain.
Expenses. Most expenses of the trust can be directly attributed to a fund. Expenses which cannot be directly attributed are apportioned among the funds in the trust.
Deferred Trustee Compensation. Under a Deferred Compensation Plan (the Plan), non-interested Trustees must defer receipt of a portion of, and may elect to defer receipt of an additional portion of, their annual compensation. Deferred amounts are treated as though equivalent dollar amounts had been invested in shares of the fund or are invested in a cross-section of other Fidelity funds, and are marked-to-market. Deferred amounts remain in the fund until distributed in accordance with the Plan.
Income Tax Information and Distributions to Shareholders. Each year, the fund intends to qualify as a regulated investment company by distributing all of its taxable income and realized gains under Subchapter M of the Internal Revenue Code. As a result, no provision for income taxes is required in the accompanying financial statements. Foreign taxes are provided for based on the fund's understanding of the tax rules and rates that exist in the foreign markets in which it invests.
Distributions are recorded on the ex-dividend date. Income and capital gain distributions are determined in accordance with income tax regulations, which may differ from generally accepted accounting principles. In addition, the fund will claim a portion of the payment made to redeeming shareholders as a distribution for income tax purposes.
Capital accounts within the financial statements are adjusted for permanent book-tax differences. These adjustments have no impact on net assets or the results of operations. Temporary book-tax differences will reverse in a subsequent period.
Annual Report
1. Significant Accounting Policies - continued
Income Tax Information and Distributions to Shareholders - continued
Book-tax differences are primarily due to short term capital gains, foreign currency transactions, market discount and losses deferred due to wash sales.
The tax-basis components of distributable earnings and the federal tax cost as of period end were as follows:
Unrealized appreciation | $ 1,789,664 | |
Unrealized depreciation | (148,805) | |
Net unrealized appreciation (depreciation) | 1,640,859 | |
Undistributed ordinary income | 93,488 | |
Undistributed long-term capital gain | 310,960 | |
| | |
Cost for federal income tax purposes | $ 11,248,474 | |
The tax character of distributions paid was as follows:
| November 30, 2004 | November 30, 2003 |
Ordinary Income | $ 247,931 | $ 122,229 |
2. Operating Policies.
Repurchase Agreements. Fidelity Management & Research Company (FMR) has received an Exemptive Order from the Securities and Exchange Commission (the SEC) which permits the fund and other affiliated entities of FMR to transfer uninvested cash balances into joint trading accounts. These accounts are then invested in repurchase agreements that are collateralized by U.S. Treasury or Government obligations. The fund may also invest directly with institutions, in repurchase agreements that are collateralized by commercial paper obligations and corporate obligations. Collateral is held in segregated accounts with custodian banks and may be obtained in the event of a default of the counterparty. Collateral is marked-to-market daily and maintained at a value at least equal to the principal amount of the repurchase agreement (including accrued interest).
3. Purchases and Sales of Investments.
Purchases and sales of securities, other than short-term securities and U.S. government securities, aggregated $14,795,498 and $15,053,521, respectively.
Annual Report
Notes to Financial Statements - continued
(Amounts in thousands except ratios)
4. Fees and Other Transactions with Affiliates.
Management Fee. FMR and its affiliates provide the fund with investment management related services for which the fund pays a monthly management fee. The management fee is the sum of an individual fund fee rate that is based on an annual rate of .20% of the fund's average net assets and a group fee rate that averaged .28% during the period. The group fee rate is based upon the average net assets of all the mutual funds advised by FMR. The group fee rate decreases as assets under management increase and increases as assets under management decrease. For the period, the total annual management fee rate was .48% of the fund's average net assets.
Transfer Agent Fees. Fidelity Service Company, Inc. (FSC), an affiliate of FMR, is the fund's transfer, dividend disbursing and shareholder servicing agent. FSC receives account fees and asset-based fees that vary according to account size and type of account. FSC pays for typesetting, printing and mailing of shareholder reports, except proxy statements. For the period, the transfer agent fees were equivalent to an annual rate of .19% of average net assets.
Accounting and Security Lending Fees. FSC maintains the fund's accounting records. The accounting fee is based on the level of average net assets for the month. Under a separate contract, FSC administers the security lending program. The security lending fee is based on the number and duration of lending transactions.
Central Funds. The fund may invest in affiliated Central Funds managed by Fidelity Investments Money Management, Inc. (FIMM), an affiliate of FMR. The Central Funds are open-end investment companies available only to investment companies and other accounts managed by FMR and its affiliates. The Central Funds seek preservation of capital and current income and do not pay a management fee. Income distributions earned by the fund are recorded as income in the accompanying financial statements and totaled $2,277 for the period.
Brokerage Commissions. The fund placed a portion of its portfolio transactions with brokerage firms which are affiliates of the investment adviser. The commissions paid to these affiliated firms were $860 for the period.
5. Committed Line of Credit.
The fund participates with other funds managed by FMR in a $4.2 billion credit facility (the "line of credit") to be utilized for temporary or emergency purposes to fund shareholder redemptions or for other short-term liquidity purposes. The fund has agreed to pay commitment fees on its pro rata portion of the line of credit. During the period, there were no borrowings on this line of credit.
Annual Report
6. Security Lending.
The fund lends portfolio securities from time to time in order to earn additional income. The fund receives collateral (in the form of U.S. Treasury obligations, letters of credit and/or cash) against the loaned securities and maintains collateral in an amount not less than 100% of the market value of the loaned securities during the period of the loan. The market value of the loaned securities is determined at the close of business of the fund and any additional required collateral is delivered to the fund on the next business day. If the borrower defaults on its obligation to return the securities loaned because of insolvency or other reasons, a fund could experience delays and costs in recovering the securities loaned or in gaining access to the collateral. Cash collateral is invested in cash equivalents. The value of loaned securities and cash collateral at period end are disclosed on the fund's Statement of Assets and Liabilities.
7. Expense Reductions.
Many of the brokers with whom FMR places trades on behalf of the fund provided services to the fund in addition to trade execution. These services included payments of certain expenses on behalf of the fund totaling $5,784 for the period. In addition, through arrangements with the fund's custodian and transfer agent, credits realized as a result of uninvested cash balances were used to reduce the fund's expenses. During the period, these credits reduced the fund's custody and transfer agent expenses by $8 and $49, respectively.
Annual Report
Report of Independent Registered Public Accounting Firm
To the Trustees of Fidelity Financial Trust and the Shareholders of Fidelity Equity-Income II Fund:
In our opinion, the accompanying statement of assets and liabilities, including the schedule of investments, and the related statements of operations and of changes in net assets and the financial highlights present fairly, in all material respects, the financial position of Fidelity Equity-Income II Fund (a fund of Fidelity Financial Trust) at November 30, 2004 and the results of its operations, the changes in its net assets and the financial highlights for the periods indicated, in conformity with accounting principles generally accepted in the United States of America. These financial statements and financial highlights (hereafter referred to as "financial statements") are the responsibility of the Fidelity Equity-Income II Fund's management; our responsibility is to express an opinion on these financial statements based on our audits. We conducted our audits of these financial statements in accordance with the standards of the Public Company Accounting Oversight Board (United States). Those standards require that we plan and perform the audit to obtain reasonable assurance about whether the financial statements are free of material misstatement. An audit includes examining, on a test basis, evidence supporting the amounts and disclosures in the financial statements, assessing the accounting principles used and significant estimates made by management, and evaluating the overall financial statement presentation. We believe that our audits, which included confirmation of securities at November 30, 2004 by correspondence with the custodian and brokers, provide a reasonable basis for our opinion.
/s/PricewaterhouseCoopers LLP
PricewaterhouseCoopers LLP
Boston, Massachusetts
January 11, 2005
Annual Report
Trustees and Officers
The Trustees, Members of the Advisory Board, and executive officers of the trust and fund, as applicable, are listed below. The Board of Trustees governs the fund and is responsible for protecting the interests of shareholders. The Trustees are experienced executives who meet periodically throughout the year to oversee the fund's activities, review contractual arrangements with companies that provide services to the fund, and review the fund's performance. Except for William O. McCoy, Dennis J. Dirks, and Kenneth L. Wolfe, each of the Trustees oversees 301 funds advised by FMR or an affiliate. Mr. McCoy oversees 303 funds advised by FMR or an affiliate. Mr. Dirks and Mr. Wolfe oversee 223 funds advised by FMR or an affiliate.
The Trustees hold office without limit in time except that (a) any Trustee may resign; (b) any Trustee may be removed by written instrument, signed by at least two-thirds of the number of Trustees prior to such removal; (c) any Trustee who requests to be retired or who has become incapacitated by illness or injury may be retired by written instrument signed by a majority of the other Trustees; and (d) any Trustee may be removed at any special meeting of shareholders by a two-thirds vote of the outstanding voting securities of the trust. In any event, each non-interested Trustee shall retire not later than the last day of the calendar year in which his or her 72nd birthday occurs. The executive officers and Advisory Board Members hold office without limit in time, except that any officer and Advisory Board Member may resign or may be removed by a vote of a majority of the Trustees at any regular meeting or any special meeting of the Trustees. Except as indicated, each individual has held the office shown or other offices in the same company for the past five years.
The fund's Statement of Additional Information (SAI) includes more information about the Trustees. To request a free copy, call Fidelity at 1-877-208-0098.
Interested Trustees*:
Correspondence intended for each Trustee who is an "interested person" (as defined in the 1940 Act) may be sent to Fidelity Investments, 82 Devonshire Street, Boston, Massachusetts 02109.
Name, Age; Principal Occupation |
Edward C. Johnson 3d (74)** |
| Year of Election or Appointment: 1992 Mr. Johnson is Chairman of the Board of Trustees. Mr. Johnson serves as Chief Executive Officer, Chairman, and a Director of FMR Corp.; a Director and Chairman of the Board and of the Executive Committee of FMR; Chairman and a Director of Fidelity Management & Research (Far East) Inc.; Chairman (1998) and a Director of Fidelity Investments Money Management, Inc.; and Chairman (2001) and a Director (2000) of FMR Co., Inc. |
Abigail P. Johnson (42)** |
| Year of Election or Appointment: 2001 Senior Vice President of Equity-Income II (2001). Ms. Johnson also serves as Senior Vice President of other Fidelity funds (2001). She is President and a Director of FMR (2001), Fidelity Investments Money Management, Inc. (2001), FMR Co., Inc. (2001), and a Director of FMR Corp. Previously, Ms. Johnson managed a number of Fidelity funds. |
Laura B. Cronin (50) |
| Year of Election or Appointment: 2003 Ms. Cronin is an Executive Vice President (2002) and Chief Financial Officer (2002) of FMR Corp. and is a member of the Fidelity Management Committee (2003). Previously, Ms. Cronin served as Vice President of Finance of FMR (1997-1999), and Chief Financial Officer of FMR (1999-2001), Fidelity Personal Investments (2001), and Fidelity Brokerage Company (2001-2002). |
Robert L. Reynolds (52) |
| Year of Election or Appointment: 2003 Mr. Reynolds is a Director (2003) and Chief Operating Officer (2002) of FMR Corp. and is the head of the Fidelity Management Committee (2003). He also serves on the Board at Fidelity Investments Canada, Ltd. (2000). Previously, Mr. Reynolds served as President of Fidelity Investments Institutional Retirement Group (1996-2000). |
* Trustees have been determined to be "Interested Trustees" by virtue of, among other things, their affiliation with the trust or various entities under common control with FMR.
** Edward C. Johnson 3d, Trustee, is Abigail P. Johnson's father.
Annual Report
Non-Interested Trustees:
Correspondence intended for each non-interested Trustee (that is, the Trustees other than the Interested Trustees) may be sent to Fidelity Investments, P.O. Box 55235, Boston, Massachusetts 02205-5235.
Name, Age; Principal Occupation |
Robert M. Gates (61) |
| Year of Election or Appointment: 1997 Dr. Gates is Vice Chairman of the non-interested Trustees (2005). Dr. Gates is President of Texas A&M University (2002). He was Director of the Central Intelligence Agency (CIA) from 1991 to 1993. From 1989 to 1991, Dr. Gates served as Assistant to the President of the United States and Deputy National Security Advisor. Dr. Gates is a Director of NACCO Industries, Inc. (mining and manufacturing), Parker Drilling Co., Inc. (drilling and rental tools for the energy industry, 2001), and Brinker International (restaurant management, 2003). He also serves as a member of the Advisory Board of VoteHere.net (secure internet voting, 2001). Previously, Dr. Gates served as a Director of LucasVarity PLC (automotive components and diesel engines), a Director of TRW Inc. (automotive, space, defense, and information technology), and Dean of the George Bush School of Government and Public Service at Texas A&M University (1999-2001). Dr. Gates also is a Trustee of the Forum for International Policy. |
George H. Heilmeier (68) |
| Year of Election or Appointment: 2004 Dr. Heilmeier is Chairman Emeritus of Telcordia Technologies (communication software and systems), where prior to his retirement, he served as company Chairman and Chief Executive Officer. He currently serves on the Boards of Directors of The Mitre Corporation (systems engineering and information technology support for the government), INET Technologies Inc. (telecommunications network surveillance, 2001), Teletech Holdings (customer management services), and HRL Laboratories (private research and development, 2004). He is Chairman of the General Motors Technology Advisory Committee and a Life Fellow of the Institute of Electrical and Electronics Engineers (IEEE) (2000). Dr. Heilmeier is a member of the Defense Science Board and the National Security Agency Advisory Board. He is also a member of the National Academy of Engineering, the American Academy of Arts and Sciences, and the Board of Overseers of the School of Engineering and Applied Science of the University of Pennsylvania. Previously, Dr. Heilmeier served as a Director of TRW Inc. (automotive, space, defense, and information technology, 1992-2002), Compaq (1994-2002), and Automatic Data Processing, Inc. (ADP) (technology-based business outsourcing, 1995-2002). |
Marie L. Knowles (58) |
| Year of Election or Appointment: 2001 Prior to Ms. Knowles' retirement in June 2000, she served as Executive Vice President and Chief Financial Officer of Atlantic Richfield Company (ARCO) (diversified energy, 1996-2000). From 1993 to 1996, she was a Senior Vice President of ARCO and President of ARCO Transportation Company. She served as a Director of ARCO from 1996 to 1998. She currently serves as a Director of Phelps Dodge Corporation (copper mining and manufacturing) and McKesson Corporation (healthcare service, 2002). Ms. Knowles is a Trustee of the Brookings Institution and the Catalina Island Conservancy and also serves as a member of the Advisory Board for the School of Engineering of the University of Southern California. |
Ned C. Lautenbach (60) |
| Year of Election or Appointment: 2000 Mr. Lautenbach has been a partner of Clayton, Dubilier & Rice, Inc. (private equity investment firm) since September 1998. Previously, Mr. Lautenbach was with the International Business Machines Corporation (IBM) from 1968 until his retirement in 1998. He was most recently Senior Vice President and Group Executive of Worldwide Sales and Services. From 1993 to 1995, he was Chairman of IBM World Trade Corporation, and from 1994 to 1998 was a member of IBM's Corporate Executive Committee. Mr. Lautenbach serves as Co-Chairman and a Director of Covansys, Inc. (global provider of business and technology solutions, 2000). In addition, he is a Director of Italtel Holding S.p.A. (telecommunications (Milan, Italy), 2004) and Eaton Corporation (diversified industrial) as well as the Philharmonic Center for the Arts in Naples, Florida (1999). He also is a member of the Council on Foreign Relations. |
Marvin L. Mann (71) |
| Year of Election or Appointment: 1993 Mr. Mann is Chairman of the non-interested Trustees (2001). He is Chairman Emeritus of Lexmark International, Inc. (computer peripherals), where he served as CEO until April 1998, retired as Chairman May 1999, and remains a member of the Board. Prior to 1991, he held the positions of Vice President of International Business Machines Corporation (IBM) and President and General Manager of various IBM divisions and subsidiaries. He is a member of the Executive Committee of the Independent Director's Council of the Investment Company Institute. In addition, Mr. Mann is a member of the President's Cabinet at the University of Alabama and the Board of Visitors of the Culverhouse College of Commerce and Business Administration at the University of Alabama. |
William O. McCoy (71) |
| Year of Election or Appointment: 1997 Prior to his retirement in December 1994, Mr. McCoy was Vice Chairman of the Board of BellSouth Corporation (telecommunications) and President of BellSouth Enterprises. He is currently a Director of Liberty Corporation (holding company), Duke Realty Corporation (real estate), and Progress Energy, Inc. (electric utility). He is also a partner of Franklin Street Partners (private investment management firm) and a member of the Research Triangle Foundation Board. In addition, Mr. McCoy served as the Interim Chancellor (1999-2000) and a member of the Board of Visitors (1994-1998) for the University of North Carolina at Chapel Hill and currently serves on the Board of Directors of the University of North Carolina Health Care System and the Board of Visitors of the Kenan-Flagler Business School (University of North Carolina at Chapel Hill). He also served as Vice President of Finance for the University of North Carolina (16-school system, 1995-1998). |
Cornelia M. Small (60) |
| Year of Election or Appointment: 2005 Ms. Small is a member (2000) and Chairperson (2002) of the Investment Committee, and a member (2002) of the Board of Trustees of Smith College. Previously, she served as Chief Investment Officer (1999-2000), Director of Global Equity Investments (1996-1999), and a member of the Board of Directors of Scudder, Stevens & Clark (1990-1997) and Scudder Kemper Investments (1997-1998). In addition, Ms. Small served as Co-Chair (2000-2003) of the Annual Fund for the Fletcher School of Law and Diplomacy. |
William S. Stavropoulos (65) |
| Year of Election or Appointment: 2002 Mr. Stavropoulos is Chairman of the Board (2000), CEO (2002), a position he previously held from 1995-2000, Chairman of the Executive Committee (2000), and a Member of the Board of Directors of The Dow Chemical Company. Since joining The Dow Chemical Company in 1967, Mr. Stavropoulos served in numerous senior management positions, including President (1993-2000; 2002-2003). Currently, he is a Director of NCR Corporation (data warehousing and technology solutions), BellSouth Corporation (telecommunications), Chemical Financial Corporation, and Maersk Inc. (industrial conglomerate, 2002). He also serves as a member of the Board of Trustees of the American Enterprise Institute for Public Policy Research. In addition, Mr. Stavropoulos is a member of The Business Council, J.P. Morgan International Council and the University of Notre Dame Advisory Council for the College of Science. |
Annual Report
Trustees and Officers - continued
Advisory Board Members and Executive Officers:
Correspondence intended for Mr. Dirks and Mr. Wolfe may be sent to Fidelity Investments, P.O. Box 55235, Boston, Massachusetts 02205-5235. Correspondence intended for each executive officer and Mr. Lynch may be sent to Fidelity Investments, 82 Devonshire Street, Boston, Massachusetts 02109.
Name, Age; Principal Occupation |
Dennis J. Dirks (56) |
| Year of Election or Appointment: 2004 Member of the Advisory Board of Fidelity Financial Trust. Prior to his retirement in May 2003, Mr. Dirks was Chief Operating Officer and a member of the Board of The Depository Trust & Clearing Corporation (DTCC) (1999-2003). He also served as President, Chief Operating Officer, and Board member of The Depository Trust Company (DTC) (1999-2003) and President and Board member of the National Securities Clearing Corporation (NSCC) (1999-2003). In addition, Mr. Dirks served as Chief Executive Officer and Board member of the Government Securities Clearing Corporation (2001-2003) and Chief Executive Officer and Board member of the Mortgage-Backed Securities Clearing Corporation (2001-2003). |
Peter S. Lynch (61) |
| Year of Election or Appointment: 2003 Member of the Advisory Board of Fidelity Financial Trust. Vice Chairman and a Director of FMR, and Vice Chairman (2001) and a Director (2000) of FMR Co., Inc. Previously, Mr. Lynch served as a Trustee of the Fidelity funds (1990-2003). Prior to May 31, 1990, he was a Director of FMR and Executive Vice President of FMR (a position he held until March 31, 1991), Vice President of Fidelity® Magellan® Fund and FMR Growth Group Leader, and Managing Director of FMR Corp. Mr. Lynch was also Vice President of Fidelity Investments Corporate Services. In addition, he serves as a Trustee of Boston College, Massachusetts Eye & Ear Infirmary, Historic Deerfield, John F. Kennedy Library, and the Museum of Fine Arts of Boston. |
Kenneth L. Wolfe (65) |
| Year of Election or Appointment: 2004 Member of the Advisory Board of Fidelity Financial Trust. Prior to his retirement in 2001, Mr. Wolfe was Chairman and Chief Executive Officer of Hershey Foods Corporation (1993-2001). He currently serves as a member of the boards of Adelphia Communications Corporation (2003), Bausch & Lomb, Inc., and Revlon Inc. (2004). |
Bart A. Grenier (45) |
| Year of Election or Appointment: 2001 Vice President of Equity-Income II. Mr. Grenier also serves as Vice President of certain Equity Funds (2001), a position he previously held from 1999 to 2000, and Vice President of certain High Income Funds (2002). He is Senior Vice President of FMR (1999) and FMR Co., Inc. (2001), and President and Director of Strategic Advisers, Inc. (2002). He also heads Fidelity's Asset Allocation Group (2000), Fidelity's Growth and Income Group (2001), Fidelity's Value Group (2001), and Fidelity's High Income Division (2001). Previously, Mr. Grenier served as President of Fidelity Ventures (2000), Vice President of certain High Income Funds (1997-2000), High Income Division Head (1997-2000), Group Leader of the Income-Growth and Asset Allocation-Income Groups (1996-2000), and Assistant Equity Division Head (1997-2000). |
Stephen M. Dufour (38) |
| Year of Election or Appointment: 2000
Vice President of Equity-Income II and other funds advised by FMR. Prior to assuming his current responsibilities, Mr. Dufour managed a variety of Fidelity funds. |
Eric D. Roiter (55) |
| Year of Election or Appointment: 1998 Secretary of Equity-Income II. He also serves as Secretary of other Fidelity funds (1998); Vice President, General Counsel, and Clerk of FMR Co., Inc. (2001) and FMR (1998); Vice President and Clerk of FDC (1998); Assistant Clerk of Fidelity Management & Research (U.K.) Inc. (2001) and Fidelity Management & Research (Far East) Inc. (2001); and Assistant Secretary of Fidelity Investments Money Management, Inc. (2001). Prior to joining Fidelity, Mr. Roiter was with the law firm of Debevoise & Plimpton, as an associate (1981-1984) and as a partner (1985-1997), and served as an Assistant General Counsel of the U.S. Securities and Exchange Commission (1979-1981). Mr. Roiter is an Adjunct Member, Faculty of Law, at Boston College Law School (2003). |
Stuart Fross (45) |
| Year of Election or Appointment: 2003 Assistant Secretary of Equity-Income II. Mr. Fross also serves as Assistant Secretary of other Fidelity funds (2003) and is an employee of FMR. |
Christine Reynolds (46) |
| Year of Election or Appointment: 2004 President, Treasurer, and Anti-Money Laundering (AML) officer of Equity-Income II. Ms. Reynolds also serves as President, Treasurer, and AML officer of other Fidelity funds (2004) and is a Vice President (2003) and an employee (2002) of FMR. Before joining Fidelity Investments, Ms. Reynolds worked at PricewaterhouseCoopers LLP (PwC) (1980-2002), where she was most recently an audit partner with PwC's investment management practice. |
Timothy F. Hayes (53) |
| Year of Election or Appointment: 2002 Chief Financial Officer of Equity-Income II. Mr. Hayes also serves as Chief Financial Officer of other Fidelity funds (2002). Recently he was appointed President of Fidelity Service Company (2003) where he also serves as a Director. Mr. Hayes also serves as President of Fidelity Investments Operations Group (FIOG, 2002), which includes Fidelity Pricing and Cash Management Services Group (FPCMS), where he was appointed President in 1998. Previously, Mr. Hayes served as Chief Financial Officer of Fidelity Investments Corporate Systems and Service Group (1998) and Fidelity Systems Company (1997-1998). |
Kenneth A. Rathgeber (57) |
| Year of Election or Appointment: 2004 Chief Compliance Officer of Equity-Income II. Mr. Rathgeber also serves as Chief Compliance Officer of other Fidelity funds (2004) and Executive Vice President of Risk Oversight for Fidelity Investments (2002). Previously, he served as Executive Vice President and Chief Operating Officer for Fidelity Investments Institutional Services Company, Inc. (1998-2002). |
John R. Hebble (46) |
| Year of Election or Appointment: 2003 Deputy Treasurer of Equity-Income II. Mr. Hebble also serves as Deputy Treasurer of other Fidelity funds (2003), and is an employee of FMR. Before joining Fidelity Investments, Mr. Hebble worked at Deutsche Asset Management where he served as Director of Fund Accounting (2002-2003) and Assistant Treasurer of the Scudder Funds (1998-2003). |
Kimberley H. Monasterio (40) |
| Year of Election or Appointment: 2004 Deputy Treasurer of Equity-Income II. Ms. Monasterio also serves as Deputy Treasurer of other Fidelity funds (2004) and is an employee of FMR (2004). Before joining Fidelity Investments, Ms. Monasterio served as Treasurer (2000-2004) and Chief Financial Officer (2002-2004) of the Franklin Templeton Funds and Senior Vice President of Franklin Templeton Services, LLC (2000-2004). |
John H. Costello (58) |
| Year of Election or Appointment: 1986 Assistant Treasurer of Equity-Income II. Mr. Costello also serves as Assistant Treasurer of other Fidelity funds and is an employee of FMR. |
Peter L. Lydecker (50) |
| Year of Election or Appointment: 2004 Assistant Treasurer of Equity-Income II. Mr. Lydecker also serves as Assistant Treasurer of other Fidelity funds (2004) and is an employee of FMR. |
Mark Osterheld (49) |
| Year of Election or Appointment: 2002 Assistant Treasurer of Equity-Income II. Mr. Osterheld also serves as Assistant Treasurer of other Fidelity funds (2002) and is an employee of FMR. |
Kenneth B. Robins (35) |
| Year of Election or Appointment: 2004 Assistant Treasurer of Equity-Income II. Mr. Robins also serves as Assistant Treasurer of other Fidelity funds (2004) and is an employee of FMR (2004). Before joining Fidelity Investments, Mr. Robins worked at KPMG LLP, where he was a partner in KPMG's department of professional practice (2002-2004) and a Senior Manager (1999-2000). In addition, Mr. Robins served as Assistant Chief Accountant, United States Securities and Exchange Commission (2000-2002). |
Thomas J. Simpson (46) |
| Year of Election or Appointment: 2000 Assistant Treasurer of Equity-Income II. Mr. Simpson is Assistant Treasurer of other Fidelity funds (2000) and an employee of FMR (1996). Prior to joining FMR, Mr. Simpson was Vice President and Fund Controller of Liberty Investment Services (1987-1995). |
Annual Report
Distributions
The Board of Trustees of Equity Income II voted to pay on December 20, 2004, to shareholders of record at the opening of business on December 17, 2004, a distribution of $.44 per share derived from capital gains realized from sales of portfolio securities and a dividend of $.16 per share from net investment income.
A total of .06% of the dividends distributed during the fiscal year was derived from interest on U.S. Government securities which is generally exempt from state income tax.
The fund designates 100%, 100%, 100%, and 100% of the dividends distributed in March, June, September and December, respectively during the fiscal year as qualifying for the dividends-received deduction for corporate shareholders.
The fund designates 44%, 100%, 100%, 100%, and 100% of the dividends distributed in January, March, June, September and December, respectively during the fiscal year as amounts which may be taken into account as a dividend for purposes of the maximum rate under section 1(h)(11) of the Internal Revenue Code.
The fund will notify shareholders in January 2005 of amounts for use in preparing 2004 income tax returns.
Annual Report
Managing Your Investments
Fidelity offers several ways to conveniently manage your personal investments via your telephone or PC. You can access your account information, conduct trades and research your investments 24 hours a day.
By Phone
Fidelity Automated Service Telephone provides a single toll-free number to access account balances, positions, quotes and trading. It's easy to navigate the service, and on your first call, the system will help you create a personal identification number (PIN) for security.
(phone_graphic)Fidelity Automated
Service Telephone (FAST®)
1-800-544-5555
Press
1 For mutual fund and brokerage trading.
2 For quotes.*
3 For account balances and holdings.
4 To review orders and mutual
fund activity.
5 To change your PIN.
*0 To speak to a Fidelity representative.
By PC
Fidelity's web site on the Internet provides a wide range of information, including daily financial news, fund performance, interactive planning tools and news about Fidelity products and services.
(computer_graphic)Fidelity's Web Site
www.fidelity.com
* When you call the quotes line, please remember that a fund's yield and return will vary and, except for money market funds, share price will also vary. This means that you may have a gain or loss when you sell your shares. There is no assurance that money market funds will be able to maintain a stable $1 share price; an investment in a money market fund is not insured or guaranteed by the U.S. government. Total returns are historical and include changes in share price, reinvestment of dividends and capital gains, and the effects of any sales charges.
Annual Report
To Visit Fidelity
For directions and hours,
please call 1-800-544-9797.
Arizona
7001 West Ray Road
Chandler, AZ
7373 N. Scottsdale Road
Scottsdale, AZ
California
815 East Birch Street
Brea, CA
1411 Chapin Avenue
Burlingame, CA
851 East Hamilton Avenue
Campbell, CA
527 North Brand Boulevard
Glendale, CA
19200 Von Karman Avenue
Irvine, CA
601 Larkspur Landing Circle
Larkspur, CA
10100 Santa Monica Blvd.
Los Angeles, CA
27101 Puerta Real
Mission Viejo, CA
73-575 El Paseo
Palm Desert, CA
251 University Avenue
Palo Alto, CA
1760 Challenge Way
Sacramento, CA
7676 Hazard Center Drive
San Diego, CA
8 Montgomery Street
San Francisco, CA
21701 Hawthorne Boulevard
Torrance, CA
2001 North Main Street
Walnut Creek, CA
6300 Canoga Avenue
Woodland Hills, CA
Colorado
1625 Broadway
Denver, CO
9185 East Westview Road
Littleton, CO
Connecticut
48 West Putnam Avenue
Greenwich, CT
265 Church Street
New Haven, CT
300 Atlantic Street
Stamford, CT
29 South Main Street
West Hartford, CT
Delaware
222 Delaware Avenue
Wilmington, DE
Florida
4400 N. Federal Highway
Boca Raton, FL
121 Alhambra Plaza
Coral Gables, FL
2948 N. Federal Highway
Ft. Lauderdale, FL
1907 West State Road 434
Longwood, FL
8880 Tamiami Trail, North
Naples, FL
3501 PGA Boulevard
West Palm Beach, FL
8065 Beneva Road
Sarasota, FL
1502 N. Westshore Blvd.
Tampa, FL
Georgia
3445 Peachtree Road, N.E.
Atlanta, GA
1000 Abernathy Road
Atlanta, GA
Illinois
One North LaSalle Street
Chicago, IL
1415 West 22nd Street
Oak Brook, IL
1700 East Golf Road
Schaumburg, IL
3232 Lake Avenue
Wilmette, IL
Indiana
4729 East 82nd Street
Indianapolis, IN
Kansas
5400 College Boulevard
Overland Park, KS
Maine
Three Canal Plaza
Portland, ME
Maryland
7401 Wisconsin Avenue
Bethesda, MD
One W. Pennsylvania Ave.
Towson, MD
Massachusetts
801 Boylston Street
Boston, MA
155 Congress Street
Boston, MA
300 Granite Street
Braintree, MA
44 Mall Road
Burlington, MA
405 Cochituate Road
Framingham, MA
416 Belmont Street
Worcester, MA
Annual Report
Michigan
280 Old N. Woodward Ave.
Birmingham, MI
43420 Grand River Avenue
Novi, MI
29155 Northwestern Hwy.
Southfield, MI
Minnesota
7600 France Avenue South
Edina, MN
Missouri
8885 Ladue Road
Ladue, MO
New Jersey
150 Essex Street
Millburn, NJ
56 South Street
Morristown, NJ
501 Route 17, South
Paramus, NJ
3518 Route 1 North
Princeton, NJ
New York
1055 Franklin Avenue
Garden City, NY
37 West Jericho Turnpike
Huntington Station, NY
1271 Avenue of the Americas
New York, NY
61 Broadway
New York, NY
350 Park Avenue
New York, NY
North Carolina
4611 Sharon Road
Charlotte, NC
Ohio
3805 Edwards Road
Cincinnati, OH
28699 Chagrin Boulevard
Woodmere Village, OH
1324 Polaris Parkway
Columbus, OH
Oregon
16850 SW 72nd Avenue
Tigard, OR
Pennsylvania
600 West DeKalb Pike
King of Prussia, PA
1735 Market Street
Philadelphia, PA
12001 Perry Highway
Wexford, PA
Rhode Island
47 Providence Place
Providence, RI
Tennessee
6150 Poplar Avenue
Memphis, TN
Texas
10000 Research Boulevard
Austin, TX
4017 Northwest Parkway
Dallas, TX
12532 Memorial Drive
Houston, TX
2701 Drexel Drive
Houston, TX
400 East Las Colinas Blvd.
Irving, TX
14100 San Pedro
San Antonio, TX
19740 IH 45 North
Spring, TX
6005 West Park Boulevard
Plano, TX
Utah
215 South State Street
Salt Lake City, UT
Virginia
1861 International Drive
McLean, VA
Washington
411 108th Avenue, N.E.
Bellevue, WA
1518 6th Avenue
Seattle, WA
Washington, DC
1900 K Street, N.W.
Washington, DC
Wisconsin
595 North Barker Road
Brookfield, WI
Fidelity Brokerage Services, Inc., 100 Summer St., Boston, MA 02110 Member NYSE/SIPC
Annual Report
Investment Adviser
Fidelity Management & Research Company
Boston, MA
Investment Sub-Advisers
FMR Co., Inc.
Fidelity Management & Research (U.K.) Inc.
Fidelity Management & Research
(Far East) Inc.
Fidelity International Investment Advisors
Fidelity Investments Japan Limited
Fidelity International Investment Advisors (U.K.) Limited
General Distributor
Fidelity Distributors Corporation
Boston, MA
Transfer and Shareholder
Servicing Agent
Fidelity Service Company, Inc.
Boston, MA
Custodian
The Northern Trust Company
Chicago, IL
Fidelity's Growth and Income Funds
Balanced Fund
Convertible Securities Fund
Equity-Income Fund
Equity-Income II Fund
Fidelity ® Fund
Global Balanced Fund
Growth & Income Portfolio
Growth & Income II Portfolio
Puritan® Fund
Real Estate Income Fund
Real Estate Investment Portfolio
Utilities Fund
Please carefully consider the funds' investment objectives, risks, charges and expenses before investing. For this and other information, call 1-800-544-6666 for a free prospectus. Read it carefully before you invest or send money.
The Fidelity Telephone Connection
Mutual Fund 24-Hour Service
Exchanges/Redemptions
and Account Assistance 1-800-544-6666
Product Information 1-800-544-6666
Retirement Accounts 1-800-544-4774
(8 a.m. - 9 p.m.)
TDD Service 1-800-544-0118
for the deaf and hearing impaired
(9 a.m. - 9 p.m. Eastern time)
Fidelity Automated Service
Telephone (FAST®) (automated graphic) 1-800-544-5555
(automated graphic) Automated line for quickest service
(Fidelity Investment logo)(registered trademark)
Corporate Headquarters
82 Devonshire St., Boston, MA 02109
www.fidelity.com
EII-UANN-0105
1.786707.101
Fidelity®
Convertible Securities
Fund
Annual Report
November 30, 2004
(2_fidelity_logos) (Registered_Trademark)
Contents
Chairman's Message | 3 | Ned Johnson's message to shareholders. |
Performance | 4 | How the fund has done over time. |
Management's Discussion | 5 | The manager's review of fund performance, strategy and outlook. |
Shareholder Expense Example | 6 | An example of shareholder expenses. |
Investment Changes | 7 | A summary of major shifts in the fund's investments over the past six months. |
Investments | 8 | A complete list of the fund's investments with their market values. |
Financial Statements | 18 | Statements of assets and liabilities, operations, and changes in net assets,
as well as financial highlights. |
Notes | 22 | Notes to the financial statements. |
Report of Independent Registered Public Accounting Firm | 28 | |
Trustees and Officers | 29 | |
Distributions | 38 | |
To view a fund's proxy voting guidelines and proxy voting record for the 12-month period ended June 30, visit www.fidelity.com/proxyvotingresults or visit the Securities and Exchange Commission's (SEC) web site at www.sec.gov. You may also call 1-800-544-8544 to request a free copy of the proxy voting guidelines.
Standard & Poor's, S&P and S&P 500 are registered service marks of The McGraw-Hill Companies, Inc. and have been licensed for use by Fidelity Distributors Corporation.
Other third party marks appearing herein are the property of their respective owners.
All other marks appearing herein are registered or unregistered trademarks or service marks of FMR Corp. or an affiliated company.
(Recycle graphic) This report is printed on recycled paper using soy-based inks.
This report and the financial statements contained herein are submitted for the general information of the shareholders of the fund. This report is not authorized for distribution to prospective investors in the fund unless preceded or accompanied by an effective prospectus.
A fund files its complete schedule of portfolio holdings with the SEC for the first and third quarters of each fiscal year on Form N-Q. Forms N-Q are available on the SEC's web site at http://www.sec.gov. A fund's Forms N-Q may be reviewed and copied at the SEC's Public Reference Room in Washington, DC. Information regarding the operation of the SEC's Public Reference Room may be obtained by calling 1-800-SEC-0330. For a complete list of a fund's portfolio holdings, view the most recent quarterly holdings report, semiannual report, or annual report on Fidelity's web site at http://www.fidelity.com/holdings.
NOT FDIC INSURED · MAY LOSE VALUE · NO BANK GUARANTEE
Neither the fund nor Fidelity Distributors Corporation is a bank.
Annual Report
Chairman's Message
(photo_of_Edward_C_Johnson_3d)
Dear Shareholder:
During the past year or so, much has been reported about the mutual fund industry, and much of it has been more critical than I believe is warranted. Allegations that some companies have been less than forthright with their shareholders have cast a shadow on the entire industry. I continue to find these reports disturbing, and assert that they do not create an accurate picture of the industry overall. Therefore, I would like to remind everyone where Fidelity stands on these issues. I will say two things specifically regarding allegations that some mutual fund companies were in violation of the Securities and Exchange Commission's forward pricing rules or were involved in so-called "market timing" activities.
First, Fidelity has no agreements that permit customers who buy fund shares after 4 p.m. to obtain the 4 p.m. price. This is not a new policy. This is not to say that someone could not deceive the company through fraudulent acts. However, we are extremely diligent in preventing fraud from occurring in this manner - and in every other. But I underscore again that Fidelity has no so-called "agreements" that sanction illegal practices.
Second, Fidelity continues to stand on record, as we have for years, in opposition to predatory short-term trading that adversely affects shareholders in a mutual fund. Back in the 1980s, we initiated a fee - which is returned to the fund and, therefore, to investors - - to discourage this activity. Further, we took the lead several years ago in developing a Fair Value Pricing Policy to prevent market timing on foreign securities in our funds. I am confident we will find other ways to make it more difficult for predatory traders to operate. However, this will only be achieved through close cooperation among regulators, legislators and the industry.
Yes, there have been unfortunate instances of unethical and illegal activity within the mutual fund industry from time to time. That is true of any industry. When this occurs, confessed or convicted offenders should be dealt with appropriately. But we are still concerned about the risk of over-regulation and the quick application of simplistic solutions to intricate problems. Every system can be improved, and we support and applaud well thought out improvements by regulators, legislators and industry representatives that achieve the common goal of building and protecting the value of investors' holdings.
For nearly 60 years, Fidelity has worked very hard to improve its products and service to justify your trust. When our family founded this company in 1946, we had only a few hundred customers. Today, we serve more than 18 million customers including individual investors and participants in retirement plans across America.
Let me close by saying that we do not take your trust in us for granted, and we realize that we must always work to improve all aspects of our service to you. In turn, we urge you to continue your active participation with your financial matters, so that your interests can be well served.
Best regards,
/s/Edward C. Johnson 3d
Edward C. Johnson 3d
Annual Report
Performance: The Bottom Line
Average annual total return reflects the change in the value of an investment, assuming reinvestment of the fund's dividend income and capital gains (the profits earned upon the sale of securities that have grown in value) and assuming a constant rate of performance each year. The $10,000 table and the fund's returns do not reflect the deduction of taxes that a shareholder would pay on fund distributions or the redemption of fund shares. During periods of reimbursement by Fidelity, a fund's total return will be greater than it would be had the reimbursement not occurred. How a fund did yesterday is no guarantee of how it will do tomorrow.
Average Annual Total Returns
Periods ended November 30, 2004 | Past 1
year | Past 5
years | Past 10
years |
Fidelity® Convertible Securities | 10.39% | 8.10% | 12.83% |
$10,000 Over 10 Years
Let's say hypothetically that $10,000 was invested in Fidelity® Convertible Securities Fund on November 30, 1994. The chart shows how the value of your investment would have changed, and also shows how the Merrill Lynch® All U.S. Convertible Securities Index performed over the same period.

Annual Report
Management's Discussion of Fund Performance
Comments from Victor Thay, Portfolio Manager of Fidelity® Convertible Securities Fund
Despite surging oil prices, a struggling job market and four interest rate hikes in a five-month span, U.S. equity markets posted solid results for the 12-month period ending November 30, 2004, and were closing in on a second straight year in the black. There was great disparity in the market during the past year. For instance, value stocks trounced their growth counterparts during the period. To illustrate, the Russell 1000® Value Index shot up 19.67%, while the Russell 1000 Growth Index rose only 5.83%. Meanwhile, small- and mid-cap stocks vastly outperformed larger-cap stocks. Energy was the best-performing sector of the market, propelled by a spike in oil prices. Conversely, technology stocks dipped lower in response to a slowdown in corporate capital spending. For the 12-month period overall, the Standard & Poor's 500SM Index returned 12.86% - slightly above its historical average. Elsewhere, the Dow Jones Industrial AverageSM rose 8.85% and the tech-heavy NASDAQ Composite® Index advanced 7.50%.
For the 12 months ending November 30, 2004, the fund had a return of 10.39%, edging
the 10.25% return of the Merrill Lynch® All U.S. Convertible Securities Index. The fund also beat the LipperSM Convertible Securities Funds Average, which posted a gain of 9.17%. Security selection was most beneficial in the energy, software and services, and telecommunication services groups. The largest individual contributor by a long shot - both in absolute terms and compared with the index - was Internet portal Yahoo!. Online advertising has recovered significantly since 2002, and Yahoo! successfully expanded its paid-search business through its acquisition of Overture Services. The fund's second-largest holding at the end of the period - industrial conglomerate Tyco International - also performed well, adding another chapter to the company's recovery story. Conversely, my picks hurt performance in the technology hardware, semiconductor and pharmaceuticals/
biotechnology groups. OSI Pharmaceuticals struggled after determining that the market for Tarceva - its recently approved drug for non-small cell lung cancer - might be smaller than initially expected. Additionally, not owning Irish drug stock Elan hurt performance versus the index, as the security soared by more than 200%.
The views expressed in this statement reflect those of the portfolio manager only through the end of the period of the report as stated on the cover and do not necessarily represent the views of Fidelity or any other person in the Fidelity organization. Any such views are subject to change at any time based upon market or other conditions and Fidelity disclaims any responsibility to update such views. These views may not be relied on as investment advice and, because investment decisions for a Fidelity fund are based on numerous factors, may not be relied on as an indication of trading intent on behalf of any Fidelity fund.
Annual Report
Shareholder Expense Example
As a shareholder of the Fund, you incur two types of costs: (1) transaction costs, and (2) ongoing costs, including management fees and other Fund expenses. This Example is intended to help you understand your ongoing costs (in dollars) of investing in the Fund and to compare these costs with the ongoing costs of investing in other mutual funds.
The Example is based on an investment of $1,000 invested at the beginning of the period and held for the entire period (June 1, 2004 to November 30, 2004).
Actual Expenses
The first line of the table below provides information about actual account values and actual expenses. You may use the information in this line, together with the amount you invested, to estimate the expenses that you paid over the period. Simply divide your account value by $1,000.00 (for example, an $8,600 account value divided by $1,000.00 = 8.6), then multiply the result by the number in the first line under the heading entitled "Expenses Paid During Period" to estimate the expenses you paid on your account during this period. A small balance maintenance fee of $12.00 that is charged once a year may apply for certain accounts with a value of less than $2,000. This fee is not included in the table below. If it was, the estimate of expenses you paid during the period would be higher, and your ending account value lower, by this amount.
Hypothetical Example for Comparison Purposes
The second line of the table below provides information about hypothetical account values and hypothetical expenses based on the Fund's actual expense ratio and an assumed rate of return of 5% per year before expenses, which is not the Fund's actual return. The hypothetical account values and expenses may not be used to estimate the actual ending account balance or expenses you paid for the period. You may use this information to compare the ongoing costs of investing in the Fund and other funds. To do so, compare this 5% hypothetical example with the 5% hypothetical examples that appear in the shareholder reports of the other funds. A small balance maintenance fee of $12.00 that is charged once a year may apply for certain accounts with a value of less than $2,000. This fee is not included in the table below. If it was, the estimate of expenses you paid during the period would be higher, and your ending account value lower, by this amount.
Please note that the expenses shown in the table are meant to highlight your ongoing costs only and do not reflect any transaction costs. Therefore, the second line of the table is useful in comparing ongoing costs only, and will not help you determine the relative total costs of owning different funds.
| Beginning
Account Value
June 1, 2004 | Ending
Account Value
November 30, 2004 | Expenses Paid
During Period*
June 1, 2004
to November 30, 2004 |
Actual | $ 1,000.00 | $ 1,054.10 | $ 3.44 |
Hypothetical (5% return per year before expenses) | $ 1,000.00 | $ 1,021.61 | $ 3.39 |
* Expenses are equal to the Fund's annualized expense ratio of .67%; multiplied by the average account value over the period, multiplied by 183/366 (to reflect the one-half year period).
Annual Report
Investment Changes
Top Ten Investments as of November 30, 2004 |
(excluding cash equivalents) | % of fund's
net assets | % of fund's net assets
6 months ago |
Yahoo!, Inc. 0% 4/1/08 | 4.2 | 3.3 |
Tyco International Group SA 3.125% 1/15/23 | 3.5 | 3.4 |
Merrill Lynch & Co., Inc. liquid yield option note 0% 3/13/32 | 3.0 | 2.3 |
Comverse Technology, Inc. 0% 5/15/23 | 3.0 | 2.1 |
Enzon Pharmaceuticals, Inc. 4.5% 7/1/08 | 2.6 | 1.4 |
Cytyc Corp. 2.25% 3/15/24 | 2.2 | 0.9 |
American Express Co. 1.85% 12/1/33 | 2.2 | 2.2 |
ALZA Corp. 0% 7/28/20 | 2.1 | 2.1 |
Nextel Partners, Inc. 1.5% 11/15/08 | 2.0 | 1.7 |
Vishay Intertechnology, Inc. 3.625% 8/1/23 | 2.0 | 0.0 |
| 26.8 | |
Top Five Market Sectors as of November 30, 2004 |
| % of fund's
net assets | % of fund's net assets
6 months ago |
Health Care | 25.5 | 26.6 |
Information Technology | 20.1 | 20.1 |
Financials | 13.3 | 18.1 |
Consumer Discretionary | 9.3 | 8.2 |
Telecommunication Services | 8.4 | 7.6 |
Asset Allocation (% of fund's net assets) |
As of November 30, 2004* | As of May 31, 2004** |
| Convertible
Securities 88.6% | | | Convertible
Securities 85.1% | |
 | Stocks 10.3% | | | Stocks 13.6% | |
 | Nonconvertible
Bonds 0.0% | | | Nonconvertible
Bonds 0.3% | |
| Short-Term
Investments and
Net Other Assets 1.1% | | | Short-Term
Investments and
Net Other Assets 1.0% | |
* Foreign
investments | 12.9% | | ** Foreign
investments | 14.3% | |

Annual Report
Investments November 30, 2004
Showing Percentage of Net Assets
Convertible Bonds - 75.4% |
| Principal
Amount (000s) (h) | | Value (Note 1) (000s) |
CONSUMER DISCRETIONARY - 6.0% |
Auto Components - 0.9% |
American Axle & Manufacturing Holdings, Inc.: | | | | |
2% 2/15/24 (d)(f) | | $ 17,200 | | $ 15,442 |
2% 2/15/24 (d) | | 1,100 | | 988 |
| | 16,430 |
Hotels, Restaurants & Leisure - 1.8% |
Kerzner International Ltd.: | | | | |
2.375% 4/15/24 (f) | | 9,000 | | 10,424 |
2.375% 4/15/24 | | 11,500 | | 13,319 |
WMS Industries, Inc.: | | | | |
2.75% 7/15/10 (f) | | 4,000 | | 6,720 |
2.75% 7/15/10 | | 1,200 | | 2,016 |
| | 32,479 |
Leisure Equipment & Products - 0.9% |
Eastman Kodak Co.: | | | | |
3.375% 10/15/33 (f) | | 7,800 | | 9,900 |
3.375% 10/15/33 | | 6,100 | | 7,743 |
| | 17,643 |
Media - 2.4% |
Interpublic Group of Companies, Inc.: | | | | |
4.5% 3/15/23 (f) | | 3,600 | | 4,555 |
4.5% 3/15/23 | | 9,700 | | 12,272 |
Lamar Advertising Co. 2.875% 12/31/10 | | 8,200 | | 8,683 |
XM Satellite Radio, Inc. 1.75% 12/1/09 (f) | | 18,000 | | 18,247 |
| | 43,757 |
TOTAL CONSUMER DISCRETIONARY | | 110,309 |
CONSUMER STAPLES - 1.2% |
Food Products - 1.2% |
Bunge Ltd. Finance Corp.: | | | | |
3.75% 11/15/22 (f) | | 5,000 | | 8,313 |
3.75% 11/15/22 | | 7,800 | | 12,968 |
| | 21,281 |
ENERGY - 3.3% |
Energy Equipment & Services - 1.5% |
Halliburton Co. 3.125% 7/15/23 | | 14,500 | | 18,445 |
Pride International, Inc. 2.5% 3/1/07 | | 7,100 | | 8,694 |
| | 27,139 |
Convertible Bonds - continued |
| Principal
Amount (000s) (h) | | Value (Note 1) (000s) |
ENERGY - continued |
Oil & Gas - 1.8% |
McMoRan Exploration Co.: | | | | |
5.25% 10/6/11 (f) | | $ 2,000 | | $ 2,469 |
6% 7/2/08 (f) | | 1,000 | | 1,348 |
6% 7/2/08 | | 6,000 | | 8,085 |
Quicksilver Resources, Inc. 1.875% 11/1/24 (f) | | 20,000 | | 20,728 |
| | 32,630 |
TOTAL ENERGY | | 59,769 |
FINANCIALS - 6.4% |
Capital Markets - 3.0% |
Merrill Lynch & Co., Inc. liquid yield option note 0% 3/13/32 | | 54,000 | | 54,605 |
Consumer Finance - 2.9% |
American Express Co.: | | | | |
1.85% 12/1/33 (d)(f) | | 36,500 | | 39,968 |
1.85% 12/1/33 (d) | | 12,600 | | 13,797 |
| | 53,765 |
Insurance - 0.5% |
Scottish Re Group Ltd. 4.5% 12/1/22 | | 7,000 | | 8,261 |
TOTAL FINANCIALS | | 116,631 |
HEALTH CARE - 23.3% |
Biotechnology - 9.2% |
Affymetrix, Inc. 0.75% 12/15/33 | | 8,500 | | 10,859 |
BioMarin Pharmaceutical, Inc.: | | | | |
3.5% 6/15/08 (f) | | 2,000 | | 1,760 |
3.5% 6/15/08 | | 11,700 | | 10,296 |
Celgene Corp.: | | | | |
1.75% 6/1/08 (f) | | 2,000 | | 2,658 |
1.75% 6/1/08 | | 4,300 | | 5,714 |
Ciphergen Biosystems, Inc. 4.5% 9/1/08 (f) | | 5,000 | | 3,100 |
Enzon Pharmaceuticals, Inc. 4.5% 7/1/08 | | 50,660 | | 47,114 |
IDEC Pharmaceuticals Corp. liquid yield option note 0% 2/16/19 | | 10,900 | | 25,843 |
Invitrogen Corp. 2.25% 12/15/06 | | 17,800 | | 17,978 |
Medarex, Inc. 2.25% 5/15/11 (f) | | 10,000 | | 10,787 |
Oscient Pharmaceuticals Corp. 3.5% 4/15/11 (f) | | 19,200 | | 16,451 |
Convertible Bonds - continued |
| Principal
Amount (000s) (h) | | Value (Note 1) (000s) |
HEALTH CARE - continued |
Biotechnology - continued |
OSI Pharmaceuticals, Inc. 3.25% 9/8/23 | | $ 11,500 | | $ 14,476 |
Protein Design Labs, Inc. 2.75% 8/16/23 | | 1,400 | | 1,640 |
| | 168,676 |
Health Care Equipment & Supplies - 8.3% |
Bausch & Lomb, Inc.: | | | | |
2.4863% 8/1/23 (f)(g) | | 6,200 | | 7,780 |
2.4863% 8/1/23 (g) | | 17,700 | | 22,209 |
Cooper Companies, Inc.: | | | | |
2.625% 7/1/23 (f) | | 7,500 | | 12,560 |
2.625% 7/1/23 | | 8,800 | | 14,737 |
Cytyc Corp.: | | | | |
2.25% 3/15/24 (f) | | 35,000 | | 41,475 |
2.25% 3/15/24 | | 7,600 | | 9,006 |
Epix Pharmaceuticals, Inc. 3% 6/15/24 (f) | | 14,000 | | 12,950 |
Fisher Scientific International, Inc.: | | | | |
2.5% 10/1/23 (f) | | 15,600 | | 21,700 |
2.5% 10/1/23 | | 7,400 | | 10,293 |
| | 152,710 |
Pharmaceuticals - 5.8% |
ALZA Corp. 0% 7/28/20 | | 46,500 | | 38,508 |
Guilford Pharmaceuticals, Inc. 5% 7/1/08 | | 4,985 | | 5,647 |
IVAX Corp. 1.5% 3/1/24 (f) | | 16,750 | | 16,112 |
MGI Pharma, Inc.: | | | | |
1.6821% 3/2/24 (d)(f) | | 32,400 | | 25,920 |
1.6821% 3/2/24 (d) | | 1,100 | | 880 |
Roche Holdings, Inc. 0% 7/25/21 (f) | | 30,000 | | 18,713 |
Sepracor, Inc. 0% 10/15/24 (f) | | 1,000 | | 914 |
| | 106,694 |
TOTAL HEALTH CARE | | 428,080 |
INDUSTRIALS - 5.6% |
Construction & Engineering - 0.6% |
Fluor Corp. 1.5% 2/15/24 | | 9,000 | | 9,932 |
Industrial Conglomerates - 4.4% |
Tyco International Group SA: | | | | |
3.125% 1/15/23 (f) | | 39,900 | | 64,810 |
yankee 3.125% 1/15/23 | | 10,100 | | 16,405 |
| | 81,215 |
Convertible Bonds - continued |
| Principal
Amount (000s) (h) | | Value (Note 1) (000s) |
INDUSTRIALS - continued |
Machinery - 0.4% |
Wabash National Corp. 3.25% 8/1/08 (f) | | $ 5,300 | | $ 7,943 |
Marine - 0.2% |
OMI Corp. 2.875% 12/1/24 (f) | | 4,000 | | 4,000 |
TOTAL INDUSTRIALS | | 103,090 |
INFORMATION TECHNOLOGY - 19.7% |
Communications Equipment - 5.6% |
AudioCodes Ltd. 2% 11/19/24 (f) | | 10,000 | | 10,787 |
CIENA Corp. 3.75% 2/1/08 | | 12,930 | | 11,087 |
Comverse Technology, Inc. 0% 5/15/23 | | 41,100 | | 54,252 |
Juniper Networks, Inc. 0% 6/15/08 | | 17,500 | | 26,294 |
| | 102,420 |
Computers & Peripherals - 1.7% |
Electronics for Imaging, Inc.: | | | | |
1.5% 6/1/23 (f) | | 7,300 | | 6,954 |
1.5% 6/1/23 | | 1,800 | | 1,715 |
Maxtor Corp. 6.8% 4/30/10 | | 19,800 | | 18,430 |
Silicon Graphics, Inc. 6.5% 6/1/09 | | 2,500 | | 3,388 |
| | 30,487 |
Electronic Equipment & Instruments - 2.3% |
Bell Microproducts, Inc.: | | | | |
3.75% 3/5/24 (f) | | 3,000 | | 3,180 |
3.75% 3/5/24 | | 2,600 | | 2,756 |
Vishay Intertechnology, Inc. 3.625% 8/1/23 | | 32,900 | | 36,424 |
| | 42,360 |
Internet Software & Services - 4.2% |
Yahoo!, Inc. 0% 4/1/08 | | 40,500 | | 77,119 |
IT Services - 2.0% |
DST Systems, Inc.: | | | | |
Series A, 4.125% 8/15/23 (f) | | 12,300 | | 15,545 |
4.125% 8/15/23 | | 16,800 | | 21,232 |
| | 36,777 |
Semiconductors & Semiconductor Equipment - 1.8% |
Agere Systems, Inc. 6.5% 12/15/09 | | 16,700 | | 17,619 |
ASML Holding NV 5.5% 5/15/10 | EUR | 10,000 | | 15,968 |
| | 33,587 |
Convertible Bonds - continued |
| Principal
Amount (000s) (h) | | Value (Note 1) (000s) |
INFORMATION TECHNOLOGY - continued |
Software - 2.1% |
Concord Communications, Inc. 3% 12/15/23 (f) | | $ 8,950 | | $ 7,627 |
Red Hat, Inc.: | | | | |
0.5% 1/15/24 (f) | | 11,368 | | 10,764 |
0.5% 1/15/24 | | 8,684 | | 8,223 |
Shanda Interactive Entertainment Ltd. 0% 10/15/14 | | 10,000 | | 12,159 |
| | 38,773 |
TOTAL INFORMATION TECHNOLOGY | | 361,523 |
MATERIALS - 2.6% |
Chemicals - 0.6% |
Millennium Chemicals, Inc. 4% 11/15/23 (f) | | 5,500 | | 12,020 |
Metals & Mining - 2.0% |
Agnico-Eagle Mines Ltd. 4.5% 2/15/12 | | 15,000 | | 18,507 |
Massey Energy Co.: | | | | |
2.25% 4/1/24 (f) | | 7,000 | | 8,924 |
2.25% 4/1/24 | | 7,000 | | 8,924 |
| | 36,355 |
TOTAL MATERIALS | | 48,375 |
TELECOMMUNICATION SERVICES - 7.3% |
Diversified Telecommunication Services - 0.1% |
Level 3 Communications, Inc. 6% 9/15/09 | | 3,344 | | 1,940 |
Wireless Telecommunication Services - 7.2% |
American Tower Corp.: | | | | |
3.25% 8/1/10 (f) | | 15,400 | | 25,088 |
3.25% 8/1/10 | | 7,255 | | 11,819 |
Crown Castle International Corp. 4% 7/15/10 | | 16,860 | | 30,432 |
Nextel Partners, Inc.: | | | | |
1.5% 11/15/08 (f) | | 4,000 | | 9,820 |
1.5% 11/15/08 | | 15,250 | | 37,439 |
Convertible Bonds - continued |
| Principal
Amount (000s) (h) | | Value (Note 1) (000s) |
TELECOMMUNICATION SERVICES - continued |
Wireless Telecommunication Services - continued |
NII Holdings, Inc.: | | | | |
2.875% 2/1/34 (f) | | $ 10,000 | | $ 11,114 |
2.875% 2/1/34 | | 6,300 | | 7,002 |
| | 132,714 |
TOTAL TELECOMMUNICATION SERVICES | | 134,654 |
TOTAL CONVERTIBLE BONDS (Cost $1,272,907) | 1,383,712 |
Common Stocks - 10.3% |
| Shares | | |
CONSUMER DISCRETIONARY - 2.5% |
Internet & Catalog Retail - 0.5% |
IAC/InterActiveCorp (a) | 376,700 | | 9,301 |
Media - 2.0% |
EchoStar Communications Corp. Class A | 1,099,069 | | 36,038 |
TOTAL CONSUMER DISCRETIONARY | | 45,339 |
ENERGY - 2.7% |
Energy Equipment & Services - 1.2% |
National-Oilwell, Inc. (a) | 320,900 | | 11,617 |
Precision Drilling Corp. (a) | 100,000 | | 6,556 |
Weatherford International Ltd. (a) | 87,600 | | 4,676 |
| | 22,849 |
Oil & Gas - 1.5% |
Chesapeake Energy Corp. | 1,066,556 | | 19,198 |
EnCana Corp. | 138,800 | | 7,935 |
| | 27,133 |
TOTAL ENERGY | | 49,982 |
Common Stocks - continued |
| Shares | | Value (Note 1) (000s) |
FINANCIALS - 1.6% |
Real Estate - 0.8% |
General Growth Properties, Inc. | 425,000 | | $ 14,582 |
Thrifts & Mortgage Finance - 0.8% |
Golden West Financial Corp., Delaware | 117,030 | | 13,955 |
TOTAL FINANCIALS | | 28,537 |
HEALTH CARE - 1.2% |
Health Care Equipment & Supplies - 0.5% |
St. Jude Medical, Inc. (a) | 249,200 | | 9,504 |
Health Care Providers & Services - 0.7% |
Pharmaceutical Product Development, Inc. (a) | 300,000 | | 12,633 |
TOTAL HEALTH CARE | | 22,137 |
INDUSTRIALS - 0.9% |
Building Products - 0.4% |
Trex Co., Inc. (a)(e) | 169,700 | | 7,967 |
Commercial Services & Supplies - 0.5% |
Strayer Education, Inc. | 80,200 | | 8,620 |
Electrical Equipment - 0.0% |
Aura Systems, Inc. warrants 5/31/05 (a) | 1 | | 0 |
TOTAL INDUSTRIALS | | 16,587 |
INFORMATION TECHNOLOGY - 0.4% |
Internet Software & Services - 0.4% |
Google, Inc. Class A (e) | 43,000 | | 7,869 |
MATERIALS - 1.0% |
Chemicals - 0.4% |
Lyondell Chemical Co. | 283,304 | | 7,950 |
Metals & Mining - 0.6% |
Cameco Corp. | 100,000 | | 9,861 |
TOTAL MATERIALS | | 17,811 |
TOTAL COMMON STOCKS (Cost $147,030) | 188,262 |
Convertible Preferred Stocks - 13.2% |
| Shares | | Value (Note 1) (000s) |
CONSUMER DISCRETIONARY - 0.8% |
Specialty Retail - 0.8% |
Toys 'R' US, Inc. 6.25% | 296,000 | | $ 14,776 |
CONSUMER STAPLES - 1.0% |
Food & Staples Retailing - 1.0% |
Albertsons, Inc. 7.25% | 699,000 | | 18,363 |
ENERGY - 1.6% |
Oil & Gas - 1.6% |
Teekay Shipping Corp. Series A, 7.25% | 150,000 | | 9,177 |
Valero Energy Corp. 2.00% | 433,000 | | 20,080 |
| | 29,257 |
FINANCIALS - 5.3% |
Diversified Financial Services - 3.6% |
AES Trust III 6.75% | 108,700 | | 4,962 |
AES Trust VII: | | | |
6.00% (f) | 126,215 | | 6,185 |
6.00% | 128,900 | | 6,316 |
CMS Energy Trust I 7.75% | 350,000 | | 16,374 |
SMFG Finance Cayman Ltd. 2.25% (f) | 378 | | 25,169 |
Sovereign Capital Trust IV 4.375% | 154,000 | | 7,354 |
| | 66,360 |
Thrifts & Mortgage Finance - 1.7% |
Doral Financial Corp.: | | | |
4.75% (f) | 21,400 | | 6,827 |
4.75% | 30,900 | | 9,857 |
The PMI Group, Inc. 5.875% | 532,000 | | 13,837 |
| | 30,521 |
TOTAL FINANCIALS | | 96,881 |
HEALTH CARE - 1.0% |
Health Care Equipment & Supplies - 1.0% |
Baxter International, Inc. 7.00% | 346,800 | | 18,172 |
INDUSTRIALS - 0.6% |
Aerospace & Defense - 0.6% |
Northrop Grumman Corp. Series B, 7.00% | 86,100 | | 11,251 |
Convertible Preferred Stocks - continued |
| Shares | | Value (Note 1) (000s) |
MATERIALS - 1.8% |
Metals & Mining - 1.8% |
Freeport-McMoRan Copper & Gold, Inc. 5.50% (f) | 34,500 | | $ 33,715 |
TELECOMMUNICATION SERVICES - 1.1% |
Wireless Telecommunication Services - 1.1% |
Crown Castle International Corp. 6.25% PIERS | 418,150 | | 20,280 |
TOTAL CONVERTIBLE PREFERRED STOCKS (Cost $206,108) | 242,695 |
Money Market Funds - 2.1% |
| | | |
Fidelity Cash Central Fund, 1.98% (b) | 31,132,588 | | 31,133 |
Fidelity Securities Lending Cash Central Fund, 2% (b)(c) | 7,544,750 | | 7,545 |
TOTAL MONEY MARKET FUNDS (Cost $38,678) | 38,678 |
TOTAL INVESTMENT PORTFOLIO - 101.0% (Cost $1,664,723) | | 1,853,347 |
NET OTHER ASSETS - (1.0)% | | (18,073) |
NET ASSETS - 100% | $ 1,835,274 |
Currency Abbreviations |
EUR | - | European Monetary Unit |
Security Type Abbreviations |
PIERS | - | Preferred Income Equity Redeemable Securities |
Legend |
(a) Non-income producing |
(b) Affiliated fund that is available only to investment companies and other accounts managed by Fidelity Investments. The rate quoted is the annualized seven-day yield of the fund at period end. A complete listing of the fund's holdings as of its most recent fiscal year end is available upon request. |
(c) Includes investment made with cash collateral received from securities on loan. |
(d) Debt obligation initially issued at one coupon which converts to a higher coupon at a specified date. The rate shown is the rate at period end. |
(e) Security or a portion of the security is on loan at period end. |
(f) Security exempt from registration under Rule 144A of the Securities Act of 1933. These securities may be resold in transactions exempt from registration, normally to qualified institutional buyers. At the period end, the value of these securities amounted to $601,466,000 or 32.8% of net assets. |
(g) The coupon rate shown on floating or adjustable rate securities represents the rate at period end. |
(h) Principal amount is stated in United States dollars unless otherwise noted. |
Other Information |
The composition of credit quality ratings as a percentage of net assets is as follows (ratings are unaudited): |
AAA, AA, A | 8.6% |
BBB | 10.5% |
BB | 11.4% |
B | 12.2% |
CCC, CC, C | 5.2% |
Not Rated | 27.5% |
Equities | 23.5% |
Short-Term Investments and Net Other Assets | 1.1% |
| 100.0% |
We have used ratings from Moody's Investors Services, Inc. Where Moody's ratings are not available, we have used S&P ratings. |
Distribution of investments by country of issue, as a percentage of total net assets, is as follows: |
United States of America | 87.1% |
Luxembourg | 4.4% |
Canada | 2.4% |
Japan | 1.4% |
Bahamas (Nassau) | 1.3% |
Others (individually less than 1%) | 3.4% |
| 100.0% |
Income Tax Information |
At November 30, 2004, the fund had a capital loss carryforward of approximately $188,855,000 all of which will expire on November 30, 2010. |
See accompanying notes which are an integral part of the financial statements.
Annual Report
Financial Statements
Statement of Assets and Liabilities
Amounts in thousands (except per-share amount) | November 30, 2004 |
| | |
Assets | | |
Investment in securities, at value (including securities loaned of $7,426) (cost $1,664,723) - See accompanying schedule | | $ 1,853,347 |
Receivable for investments sold | | 35,468 |
Receivable for fund shares sold | | 1,239 |
Dividends receivable | | 275 |
Interest receivable | | 8,415 |
Prepaid expenses | | 8 |
Other receivables | | 41 |
Total assets | | 1,898,793 |
| | |
Liabilities | | |
Payable for investments purchased | $ 52,967 | |
Payable for fund shares redeemed | 2,006 | |
Accrued management fee | 614 | |
Other affiliated payables | 335 | |
Other payables and accrued expenses | 52 | |
Collateral on securities loaned, at value | 7,545 | |
Total liabilities | | 63,519 |
| | |
Net Assets | | $ 1,835,274 |
Net Assets consist of: | | |
Paid in capital | | $ 1,833,189 |
Undistributed net investment income | | 5,205 |
Accumulated undistributed net realized gain (loss) on investments and foreign currency transactions | | (191,789) |
Net unrealized appreciation (depreciation) on investments and assets and liabilities in foreign currencies | | 188,669 |
Net Assets, for 87,148 shares outstanding | | $ 1,835,274 |
Net Asset Value, offering price and redemption price per share ($1,835,274 ÷ 87,148 shares) | | $ 21.06 |
See accompanying notes which are an integral part of the financial statements.
Annual Report
Financial Statements - continued
Statement of Operations
Amounts in thousands | Year ended November 30, 2004 |
| | |
Investment Income | | |
Dividends | | $ 16,784 |
Interest | | 35,843 |
Security lending | | 37 |
Total income | | 52,664 |
| | |
Expenses | | |
Management fee
Basic fee | $ 8,557 | |
Performance adjustment | (650) | |
Transfer agent fees | 3,460 | |
Accounting and security lending fees | 521 | |
Non-interested trustees' compensation | 10 | |
Custodian fees and expenses | 47 | |
Registration fees | 51 | |
Audit | 66 | |
Legal | 6 | |
Interest | 3 | |
Miscellaneous | 23 | |
Total expenses before reductions | 12,094 | |
Expense reductions | (149) | 11,945 |
Net investment income (loss) | | 40,719 |
Realized and Unrealized Gain (Loss) Net realized gain (loss) on: | | |
Investment securities | 146,606 | |
Foreign currency transactions | 68 | |
Total net realized gain (loss) | | 146,674 |
Change in net unrealized appreciation (depreciation) on: Investment securities | (12,120) | |
Assets and liabilities in foreign currencies | (14) | |
Total change in net unrealized appreciation (depreciation) | | (12,134) |
Net gain (loss) | | 134,540 |
Net increase (decrease) in net assets resulting from operations | | $ 175,259 |
See accompanying notes which are an integral part of the financial statements.
Annual Report
Statement of Changes in Net Assets
Amounts in thousands | Year ended
November 30, 2004 | Year ended
November 30, 2003 |
Increase (Decrease) in Net Assets | | |
Operations | | |
Net investment income (loss) | $ 40,719 | $ 69,413 |
Net realized gain (loss) | 146,674 | 49,492 |
Change in net unrealized appreciation (depreciation) | (12,134) | 200,991 |
Net increase (decrease) in net assets resulting
from operations | 175,259 | 319,896 |
Distributions to shareholders from net investment income | (58,755) | (71,200) |
Share transactions
Proceeds from sales of shares | 303,240 | 431,770 |
Reinvestment of distributions | 52,664 | 64,277 |
Cost of shares redeemed | (404,556) | (400,393) |
Net increase (decrease) in net assets resulting from share transactions | (48,652) | 95,654 |
Total increase (decrease) in net assets | 67,852 | 344,350 |
| | |
Net Assets | | |
Beginning of period | 1,767,422 | 1,423,072 |
End of period (including undistributed net investment income of $5,205 and undistributed net investment income of $22,497, respectively) | $ 1,835,274 | $ 1,767,422 |
Other Information Shares | | |
Sold | 14,940 | 24,029 |
Issued in reinvestment of distributions | 2,608 | 3,719 |
Redeemed | (20,051) | (22,390) |
Net increase (decrease) | (2,503) | 5,358 |
See accompanying notes which are an integral part of the financial statements.
Annual Report
Financial Highlights
Years ended November 30, | 2004 | 2003 | 2002 | 2001 | 2000 |
Selected Per-Share Data | | | | | |
Net asset value, beginning of period | $ 19.71 | $ 16.88 | $ 19.50 | $ 24.04 | $ 22.43 |
Income from Investment Operations | | | | | |
Net investment income (loss)B | .46 | .79 | .79D,E | .69 | .77 |
Net realized and unrealized gain (loss) | 1.55 | 2.87 | (2.46)D,E | (.17) | 3.18 |
Total from investment operations | 2.01 | 3.66 | (1.67) | .52 | 3.95 |
Distributions from net investment income | (.66) | (.83) | (.95) | (.72) | (.64) |
Distributions from net realized gain | - | - | - | (4.34) | (1.70) |
Total distributions | (.66) | (.83) | (.95) | (5.06) | (2.34) |
Net asset value, end of period | $ 21.06 | $ 19.71 | $ 16.88 | $ 19.50 | $ 24.04 |
Total ReturnA | 10.39% | 22.48% | (8.97)% | 1.56% | 18.07% |
Ratios to Average Net AssetsC | | | | |
Expenses before expense reductions | .67% | .84% | .88% | .81% | .78% |
Expenses net of voluntary waivers, if any | .67% | .84% | .88% | .81% | .78% |
Expenses net of all reductions | .66% | .82% | .85% | .76% | .77% |
Net investment income (loss) | 2.26% | 4.46% | 4.40%D,E | 3.40% | 2.96% |
Supplemental Data | | | | | |
Net assets, end of period
(in millions) | $ 1,835 | $ 1,767 | $ 1,423 | $ 1,734 | $ 1,843 |
Portfolio turnover rate | 112% | 136% | 138% | 282% | 262% |
A Total returns would have been lower had certain expenses not been reduced during the periods shown.
B Calculated based on average shares outstanding during the period.
C Expense ratios reflect operating expenses of the fund. Expenses before reductions do not reflect amounts reimbursed by the investment adviser or reductions from brokerage service arrangements or other expense offset arrangements and do not represent the amount paid by the fund during periods when reimbursements or reductions occur. Expenses net of any voluntary waivers reflect expenses after reimbursement by the investment adviser but prior to reductions from brokerage service arrangements or other expense offset arrangements. Expenses net of all reductions represent the net expenses paid by the fund.
D Effective December 1, 2001, the fund adopted the provisions of the AICPA Audit and Accounting Guide for Investment Companies and began amortizing premium and discount on all debt securities. Per-share data and ratios for periods prior to adoption have not been restated to reflect this change.
E As a result of a revision to reflect accretion of market discount using the interest method, certain amounts for the year ended November 30, 2002 have been reclassified from what was previously reported. The impact of this change was a decrease to net investment income (loss) of $0.06 per share with a corresponding increase to net realized and unrealized gain (loss) per share. The ratio of net investment income (loss) to average net assets decreased from 4.76% to 4.40%. The reclassification has no impact on the net assets of the fund.
See accompanying notes which are an integral part of the financial statements.
Annual Report
Notes to Financial Statements
For the period ended November 30, 2004
(Amounts in thousands except ratios)
1. Significant Accounting Policies.
Fidelity Convertible Securities Fund (the fund) is a fund of Fidelity Financial Trust (the trust) and is authorized to issue an unlimited number of shares. The trust is registered under the Investment Company Act of 1940, as amended (the 1940 Act), as an open-end management investment company organized as a Massachusetts business trust. The financial statements have been prepared in conformity with accounting principles generally accepted in the United States of America, which require management to make certain estimates and assumptions at the date of the financial statements. The following summarizes the significant accounting policies of the fund:
Security Valuation. Net asset value per share (NAV calculation) is calculated as of the close of business of the New York Stock Exchange, normally 4:00 p.m. Eastern time. Equity securities, including restricted securities, for which market quotations are available are valued at the last sale price or official closing price (closing bid price or last evaluated quote if no sale has occurred) on the primary market or exchange on which they trade. Debt securities, including restricted securities, for which quotations are readily available are valued at their most recent bid prices (sales prices if the principal market is an exchange) in the principal market in which such securities are normally traded, as determined by recognized dealers in such securities, or securities are valued on the basis of information provided by a pricing service. Pricing services use valuation matrices that incorporate both dealer-supplied valuations and valuation models. If prices are not readily available or do not accurately reflect fair value for a security, or if a security's value has been materially affected by events occurring after the close of the exchange or market on which the security is principally traded, that security may be valued by another method that the Board of Trustees believes accurately reflects fair value. A security's valuation may differ depending on the method used for determining value. Price movements in futures contracts and ADRs, market and trading trends, the bid/ask quotes of brokers and off-exchange institutional trading may be reviewed in the course of making a good faith determination of a security's fair value. Short-term securities with remaining maturities of sixty days or less for which quotations are not readily available are valued on the basis of amortized cost. Investments in open-end investment companies are valued at their net asset value each business day.
Foreign Currency. The fund uses foreign currency contracts to facilitate transactions in foreign-denominated securities. Losses from these transactions may arise from changes in the value of the foreign currency or if the counterparties do not perform under the contracts' terms.
Annual Report
Notes to Financial Statements - continued
(Amounts in thousands except ratios)
1. Significant Accounting Policies - continued
Foreign Currency - continued
Foreign-denominated assets, including investment securities, and liabilities are translated into U.S. dollars at the exchange rate at period end. Purchases and sales of investment securities, income and dividends received and expenses denominated in foreign currencies are translated into U.S. dollars at the exchange rate in effect on the transaction date.
The effects of exchange rate fluctuations on investments are included with the net realized and unrealized gain (loss) on investment securities. Other foreign currency transactions resulting in realized and unrealized gain (loss) are disclosed separately.
Investment Transactions and Income. Security transactions are accounted for as of trade date. Gains and losses on securities sold are determined on the basis of identified cost and may include proceeds from litigation. Dividend income is recorded on the ex-dividend date, except for certain dividends from foreign securities where the ex-dividend date may have passed, which are recorded as soon as the fund is informed of the ex-dividend date. Non-cash dividends included in dividend income, if any, are recorded at the fair market value of the securities received. Distributions received on securities that represent a return of capital or capital gain are recorded as a reduction of cost of investments and/or as a realized gain. The fund estimates the components of distributions received that may be considered return of capital distributions or capital gain distributions. Interest income is accrued as earned. Interest income includes coupon interest and amortization of premium and accretion of discount on debt securities. Investment income is recorded net of foreign taxes withheld where recovery of such taxes is uncertain.
Expenses. Most expenses of the trust can be directly attributed to a fund. Expenses which cannot be directly attributed are apportioned among the funds in the trust.
Income Tax Information and Distributions to Shareholders. Each year, the fund intends to qualify as a regulated investment company by distributing all of its taxable income and realized gains under Subchapter M of the Internal Revenue Code. As a result, no provision for income taxes is required in the accompanying financial statements. Foreign taxes are provided for based on the fund's understanding of the tax rules and rates that exist in the foreign markets in which it invests.
Distributions are recorded on the ex-dividend date. Income and capital gain distributions are determined in accordance with income tax regulations, which may differ from generally accepted accounting principles.
Annual Report
1. Significant Accounting Policies - continued
Income Tax Information and Distributions to Shareholders - continued
Capital accounts within the financial statements are adjusted for permanent book-tax differences. These adjustments have no impact on net assets or the results of operations. Temporary book-tax differences will reverse in a subsequent period.
Book-tax differences are primarily due to short-term capital gains, to foreign currency transactions, prior period premium and discount on debt securities, market discount, non-taxable dividends, capital loss carryforwards and losses deferred due to wash sales.
The tax-basis components of distributable earnings and the federal tax cost as of period end were as follows:
Unrealized appreciation | $ 232,723 | |
Unrealized depreciation | (46,581) | |
Net unrealized appreciation (depreciation) | 186,142 | |
Undistributed ordinary income | 4,804 | |
Capital loss carryforward | (188,855) | |
| | |
Cost for federal income tax purposes | $ 1,667,205 | |
The tax character of distributions paid was as follows:
| November 30, 2004 | November 30, 2003 |
Ordinary Income | $ 58,755 | $ 71,200 |
2. Operating Policies.
Repurchase Agreements. Fidelity Management & Research Company (FMR) has received an Exemptive Order from the Securities and Exchange Commission (the SEC) which permits the fund and other affiliated entities of FMR to transfer uninvested cash balances into joint trading accounts. These accounts are then invested in repurchase agreements that are collateralized by U.S. Treasury or Government obligations. The fund may also invest directly with institutions, in repurchase agreements that are collateralized by commercial paper obligations and corporate obligations. Collateral is held in segregated accounts with custodian banks and may be obtained in the event of a default of the counterparty. Collateral is marked-to-market daily and maintained at a value at least equal to the principal amount of the repurchase agreement (including accrued interest).
Annual Report
Notes to Financial Statements - continued
(Amounts in thousands except ratios)
2. Operating Policies - continued
Restricted Securities. The fund may invest in securities that are subject to legal or contractual restrictions on resale. These securities generally may be resold in transactions exempt from registration or to the public if the securities are registered. Disposal of these securities may involve time-consuming negotiations and expense, and prompt sale at an acceptable price may be difficult. Information regarding restricted securities is included at the end of the fund's Schedule of Investments.
3. Purchases and Sales of Investments.
Purchases and sales of securities, other than short-term securities and U.S. government securities, aggregated $1,980,576 and $2,046,934, respectively.
4. Fees and Other Transactions with Affiliates.
Management Fee. FMR and its affiliates provide the fund with investment management related services for which the fund pays a monthly management fee. The management fee is the sum of an individual fund fee rate that is based on an annual rate of .20% of the fund's average net assets and a group fee rate that averaged .28% during the period. The group fee rate is based upon the average net assets of all the mutual funds advised by FMR. The group fee rate decreases as assets under management increase and increases as assets under management decrease. In addition, the management fee is subject to a performance adjustment (up to a maximum of ±.15% of the fund's average net assets over a 36 month performance period). The upward or downward adjustment to the management fee is based on the fund's relative investment performance as compared to an appropriate benchmark index. For the period, the total annual management fee rate, including the performance adjustment, was .44% of the fund's average net assets.
Transfer Agent Fees. Fidelity Service Company, Inc. (FSC), an affiliate of FMR, is the fund's transfer, dividend disbursing and shareholder servicing agent. FSC receives account fees and asset-based fees that vary according to account size and type of account. FSC pays for typesetting, printing and mailing of shareholder reports, except proxy statements. For the period, the transfer agent fees were equivalent to an annual rate of .19% of average net assets.
Accounting and Security Lending Fees. FSC maintains the fund's accounting records. The accounting fee is based on the level of average net assets for the month. Under a separate contract, FSC administers the security lending program. The security lending fee is based on the number and duration of lending transactions.
Annual Report
4. Fees and Other Transactions with Affiliates - continued
Central Funds. The fund may invest in affiliated Central Funds managed by Fidelity Investments Money Management, Inc. (FIMM), an affiliate of FMR. The Central Funds are open-end investment companies available only to investment companies and other accounts managed by FMR and its affiliates. The Central Funds seek preservation of capital and current income and do not pay a management fee. Income distributions earned by the fund are recorded as income in the accompanying financial statements and totaled $207 for the period.
Brokerage Commissions. The fund placed a portion of its portfolio transactions with brokerage firms which are affiliates of the investment adviser. The commissions paid to these affiliated firms were $25 for the period.
Interfund Lending Program. Pursuant to an Exemptive Order issued by the SEC, the fund, along with other registered investment companies having management contracts with FMR, may participate in an interfund lending program. This program provides an alternative credit facility allowing the funds to borrow from, or lend money to, other participating funds. At period end, there were no interfund loans outstanding. The fund's activity in this program during the period was as follows:
Borrower or Lender | Average Daily Loan Balance | Weighted Average Interest Rate | Interest Expense |
Borrower | $ 6,256 | 1.13% | $ 3 |
5. Committed Line of Credit.
The fund participates with other funds managed by FMR in a $4.2 billion credit facility (the "line of credit") to be utilized for temporary or emergency purposes to fund shareholder redemptions or for other short-term liquidity purposes. The fund has agreed to pay commitment fees on its pro rata portion of the line of credit. During the period, there were no borrowings on this line of credit.
6. Security Lending.
The fund lends portfolio securities from time to time in order to earn additional income. The fund receives collateral (in the form of U.S. Treasury obligations, letters of credit and/or cash) against the loaned securities and maintains collateral in an amount not less than 100% of the market value of the loaned securities during the period of the loan. The market value of the loaned securities is determined at the close of business of the fund and any additional required collateral is delivered to the fund on the next business day. If the borrower defaults on its obligation to return the securities loaned because of insolvency or other reasons, a fund could experience delays and costs in recovering the
Annual Report
Notes to Financial Statements - continued
(Amounts in thousands except ratios)
6. Security Lending - continued
securities loaned or in gaining access to the collateral. Cash collateral is invested in cash equivalents. The value of loaned securities and cash collateral at period end are disclosed on the fund's Statement of Assets and Liabilities.
7. Bank Borrowings.
The fund is permitted to have bank borrowings for temporary or emergency purposes to fund shareholder redemptions. The fund has established borrowing arrangements with certain banks. The interest rate on the borrowings is the bank's base rate, as revised from time to time. The average daily loan balance during the period amounted to $4,820. The weighted average interest rate was 1.52%. At period end, there were no bank borrowings outstanding.
8. Expense Reductions.
Many of the brokers with whom FMR places trades on behalf of the fund provided services to the fund in addition to trade execution. These services included payments of certain expenses on behalf of the fund totaling $144 for the period. In addition, through arrangements with the fund's custodian and transfer agent, credits realized as a result of uninvested cash balances were used to reduce the fund's expenses. During the period, these credits reduced the fund's custody and transfer agent expenses by $4 and $1, respectively.
Annual Report
Report of Independent Registered Public Accounting Firm
To the Trustees of Fidelity Financial Trust and the Shareholders of Fidelity Convertible Securities Fund:
In our opinion, the accompanying statement of assets and liabilities, including the schedule of investments, and the related statements of operations and of changes in net assets and the financial highlights present fairly, in all material respects, the financial position of Fidelity Convertible Securities Fund (a fund of Fidelity Financial Trust) at November 30, 2004 and the results of its operations, the changes in its net assets and the financial highlights for the periods indicated, in conformity with accounting principles generally accepted in the United States of America. These financial statements and financial highlights (hereafter referred to as "financial statements") are the responsibility of the Fidelity Convertible Securities Fund's management; our responsibility is to express an opinion on these financial statements based on our audits. We conducted our audits of these financial statements in accordance with the standards of the Public Company Accounting Oversight Board (United States). Those standards require that we plan and perform the audit to obtain reasonable assurance about whether the financial statements are free of material misstatement. An audit includes examining, on a test basis, evidence supporting the amounts and disclosures in the financial statements, assessing the accounting principles used and significant estimates made by management, and evaluating the overall financial statement presentation. We believe that our audits, which included confirmation of securities at November 30, 2004 by correspondence with the custodian and brokers, provide a reasonable basis for our opinion.
/s/PricewaterhouseCoopers LLP
PricewaterhouseCoopers LLP
Boston, Massachusetts
January 11, 2005
Annual Report
Trustees and Officers
The Trustees, Members of the Advisory Board, and executive officers of the trust and fund, as applicable, are listed below. The Board of Trustees governs the fund and is responsible for protecting the interests of shareholders. The Trustees are experienced executives who meet periodically throughout the year to oversee the fund's activities, review contractual arrangements with companies that provide services to the fund, and review the fund's performance. Except for William O. McCoy, Dennis J. Dirks, and Kenneth L. Wolfe, each of the Trustees oversees 301 funds advised by FMR or an affiliate. Mr. McCoy oversees 303 funds advised by FMR or an affiliate. Mr. Dirks and Mr. Wolfe oversee 223 funds advised by FMR or an affiliate.
The Trustees hold office without limit in time except that (a) any Trustee may resign; (b) any Trustee may be removed by written instrument, signed by at least two-thirds of the number of Trustees prior to such removal; (c) any Trustee who requests to be retired or who has become incapacitated by illness or injury may be retired by written instrument signed by a majority of the other Trustees; and (d) any Trustee may be removed at any special meeting of shareholders by a two-thirds vote of the outstanding voting securities of the trust. In any event, each non-interested Trustee shall retire not later than the last day of the calendar year in which his or her 72nd birthday occurs. The executive officers and Advisory Board Members hold office without limit in time, except that any officer and Advisory Board Member may resign or may be removed by a vote of a majority of the Trustees at any regular meeting or any special meeting of the Trustees. Except as indicated, each individual has held the office shown or other offices in the same company for the past five years.
The fund's Statement of Additional Information (SAI) includes more information about the Trustees. To request a free copy, call Fidelity at 1-800-544-8544.
Interested Trustees*:
Correspondence intended for each Trustee who is an "interested person" (as defined in the 1940 Act) may be sent to Fidelity Investments, 82 Devonshire Street, Boston, Massachusetts 02109.
Name, Age; Principal Occupation |
Edward C. Johnson 3d (74)** |
| Year of Election or Appointment: 1982 Mr. Johnson is Chairman of the Board of Trustees. Mr. Johnson serves as Chief Executive Officer, Chairman, and a Director of FMR Corp.; a Director and Chairman of the Board and of the Executive Committee of FMR; Chairman and a Director of Fidelity Management & Research (Far East) Inc.; Chairman (1998) and a Director of Fidelity Investments Money Management, Inc.; and Chairman (2001) and a Director (2000) of FMR Co., Inc. |
Abigail P. Johnson (42)** |
| Year of Election or Appointment: 2001 Senior Vice President of Convertible Securities (2001). Ms. Johnson also serves as Senior Vice President of other Fidelity funds (2001). She is President and a Director of FMR (2001), Fidelity Investments Money Management, Inc. (2001), FMR Co., Inc. (2001), and a Director of FMR Corp. Previously, Ms. Johnson managed a number of Fidelity funds. |
Laura B. Cronin (50) |
| Year of Election or Appointment: 2003 Ms. Cronin is an Executive Vice President (2002) and Chief Financial Officer (2002) of FMR Corp. and is a member of the Fidelity Management Committee (2003). Previously, Ms. Cronin served as Vice President of Finance of FMR (1997-1999), and Chief Financial Officer of FMR (1999-2001), Fidelity Personal Investments (2001), and Fidelity Brokerage Company (2001-2002). |
Robert L. Reynolds (52) |
| Year of Election or Appointment: 2003 Mr. Reynolds is a Director (2003) and Chief Operating Officer (2002) of FMR Corp. and is the head of the Fidelity Management Committee (2003). He also serves on the Board at Fidelity Investments Canada, Ltd. (2000). Previously, Mr. Reynolds served as President of Fidelity Investments Institutional Retirement Group (1996-2000). |
* Trustees have been determined to be "Interested Trustees" by virtue of, among other things, their affiliation with the trust or various entities under common control with FMR.
** Edward C. Johnson 3d, Trustee, is Abigail P. Johnson's father.
Annual Report
Non-Interested Trustees:
Correspondence intended for each non-interested Trustee (that is, the Trustees other than the Interested Trustees) may be sent to Fidelity Investments, P.O. Box 55235, Boston, Massachusetts 02205-5235.
Name, Age; Principal Occupation |
Robert M. Gates (61) |
| Year of Election or Appointment: 1997 Dr. Gates is Vice Chairman of the non-interested Trustees (2005). Dr. Gates is President of Texas A&M University (2002). He was Director of the Central Intelligence Agency (CIA) from 1991 to 1993. From 1989 to 1991, Dr. Gates served as Assistant to the President of the United States and Deputy National Security Advisor. Dr. Gates is a Director of NACCO Industries, Inc. (mining and manufacturing), Parker Drilling Co., Inc. (drilling and rental tools for the energy industry, 2001), and Brinker International (restaurant management, 2003). He also serves as a member of the Advisory Board of VoteHere.net (secure Internet voting, 2001). Previously, Dr. Gates served as a Director of LucasVarity PLC (automotive components and diesel engines), a Director of TRW Inc. (automotive, space, defense, and information technology), and Dean of the George Bush School of Government and Public Service at Texas A&M University (1999-2001). Dr. Gates also is a Trustee of the Forum for International Policy. |
George H. Heilmeier (68) |
| Year of Election or Appointment: 2004 Dr. Heilmeier is Chairman Emeritus of Telcordia Technologies (communication software and systems), where prior to his retirement, he served as company Chairman and Chief Executive Officer. He currently serves on the Boards of Directors of The Mitre Corporation (systems engineering and information technology support for the government), INET Technologies Inc. (telecommunications network surveillance, 2001), Teletech Holdings (customer management services), and HRL Laboratories (private research and development, 2004). He is Chairman of the General Motors Technology Advisory Committee and a Life Fellow of the Institute of Electrical and Electronics Engineers (IEEE) (2000). Dr. Heilmeier is a member of the Defense Science Board and the National Security Agency Advisory Board. He is also a member of the National Academy of Engineering, the American Academy of Arts and Sciences, and the Board of Overseers of the School of Engineering and Applied Science of the University of Pennsylvania. Previously, Dr. Heilmeier served as a Director of TRW Inc. (automotive, space, defense, and information technology, 1992-2002), Compaq (1994-2002), and Automatic Data Processing, Inc. (ADP) (technology-based business outsourcing, 1995-2002). |
Marie L. Knowles (58) |
| Year of Election or Appointment: 2001 Prior to Ms. Knowles' retirement in June 2000, she served as Executive Vice President and Chief Financial Officer of Atlantic Richfield Company (ARCO) (diversified energy, 1996-2000). From 1993 to 1996, she was a Senior Vice President of ARCO and President of ARCO Transportation Company. She served as a Director of ARCO from 1996 to 1998. She currently serves as a Director of Phelps Dodge Corporation (copper mining and manufacturing) and McKesson Corporation (healthcare service, 2002). Ms. Knowles is a Trustee of the Brookings Institution and the Catalina Island Conservancy and also serves as a member of the Advisory Board for the School of Engineering of the University of Southern California. |
Ned C. Lautenbach (60) |
| Year of Election or Appointment: 2000 Mr. Lautenbach has been a partner of Clayton, Dubilier & Rice, Inc. (private equity investment firm) since September 1998. Previously,
Mr. Lautenbach was with the International Business Machines Corporation (IBM) from 1968 until his retirement in 1998. He was most recently Senior Vice President and Group Executive of Worldwide Sales and Services. From 1993 to 1995, he was Chairman of IBM World Trade Corporation, and from 1994 to 1998 was a member of IBM's Corporate Executive Committee. Mr. Lautenbach serves as Co-Chairman and a Director of Covansys, Inc. (global provider of business and technology solutions, 2000). In addition, he is a Director of Italtel Holding S.p.A. (telecommunications (Milan, Italy), 2004) and Eaton Corporation (diversified industrial) as well as the Philharmonic Center for the Arts in Naples, Florida (1999). He also is a member of the Council on Foreign Relations. |
Marvin L. Mann (71) |
| Year of Election or Appointment: 1993 Mr. Mann is Chairman of the non-interested Trustees (2001). He is Chairman Emeritus of Lexmark International, Inc. (computer peripherals), where he served as CEO until April 1998, retired as Chairman May 1999, and remains a member of the Board. Prior to 1991, he held the positions of Vice President of International Business Machines Corporation (IBM) and President and General Manager of various IBM divisions and subsidiaries. He is a member of the Executive Committee of the Independent Director's Council of the Investment Company Institute. In addition, Mr. Mann is a member of the President's Cabinet at the University of Alabama and the Board of Visitors of the Culverhouse College of Commerce and Business Administration at the University of Alabama. |
William O. McCoy (71) |
| Year of Election or Appointment: 1997 Prior to his retirement in December 1994, Mr. McCoy was Vice Chairman of the Board of BellSouth Corporation (telecommunications) and President of BellSouth Enterprises. He is currently a Director of Liberty Corporation (holding company), Duke Realty Corporation (real estate), and Progress Energy, Inc. (electric utility). He is also a partner of Franklin Street Partners (private investment management firm) and a member of the Research Triangle Foundation Board. In addition, Mr. McCoy served as the Interim Chancellor (1999-2000) and a member of the Board of Visitors (1994-1998) for the University of North Carolina at Chapel Hill and currently serves on the Board of Directors of the University of North Carolina Health Care System and the Board of Visitors of the Kenan-Flagler Business School (University of North Carolina at Chapel Hill). He also served as Vice President of Finance for the University of North Carolina (16-school system, 1995-1998). |
Cornelia M. Small (60) |
| Year of Election or Appointment: 2005 Ms. Small is a member (2000) and Chairperson (2002) of the Investment Committee, and a member (2002) of the Board of Trustees of Smith College. Previously, she served as Chief Investment Officer (1999-2000), Director of Global Equity Investments (1996-1999), and a member of the Board of Directors of Scudder, Stevens & Clark (1990-1997) and Scudder Kemper Investments (1997-1998). In addition, Ms. Small served as Co-Chair (2000-2003) of the Annual Fund for the Fletcher School of Law and Diplomacy. |
William S. Stavropoulos (65) |
| Year of Election or Appointment: 2002 Mr. Stavropoulos is Chairman of the Board (2000), CEO (2002), a position he previously held from 1995-2000, Chairman of the Executive Committee (2000), and a Member of the Board of Directors of The Dow Chemical Company. Since joining The Dow Chemical Company in 1967, Mr. Stavropoulos served in numerous senior management positions, including President (1993-2000; 2002-2003). Currently, he is a Director of NCR Corporation (data warehousing and technology solutions), BellSouth Corporation (telecommunications), Chemical Financial Corporation, and Maersk Inc. (industrial conglomerate, 2002). He also serves as a member of the Board of Trustees of the American Enterprise Institute for Public Policy Research. In addition, Mr. Stavropoulos is a member of The Business Council, J.P. Morgan International Council and the University of Notre Dame Advisory Council for the College of Science. |
Annual Report
Trustees and Officers - continued
Advisory Board Members and Executive Officers:
Correspondence intended for Mr. Dirks and Mr. Wolfe may be sent to Fidelity Investments, P.O. Box 55235, Boston, Massachusetts 02205-5235. Correspondence intended for each executive officer and Mr. Lynch may be sent to Fidelity Investments, 82 Devonshire Street, Boston, Massachusetts 02109.
Name, Age; Principal Occupation |
Dennis J. Dirks (56) |
| Year of Election or Appointment: 2004 Member of the Advisory Board of Fidelity Financial Trust. Mr. Dirks also serves as a Trustee (2005) or Member of the Advisory Board (2004) of other investment companies advised by FMR. Prior to his retirement in May 2003, Mr. Dirks was Chief Operating Officer and a member of the Board of The Depository Trust & Clearing Corporation (DTCC) (1999-2003). He also served as President, Chief Operating Officer, and Board member of The Depository Trust Company (DTC) (1999-2003) and President and Board member of the National Securities Clearing Corporation (NSCC) (1999-2003). In addition, Mr. Dirks served as Chief Executive Officer and Board member of the Government Securities Clearing Corporation (2001-2003) and Chief Executive Officer and Board member of the Mortgage-Backed Securities Clearing Corporation (2001-2003). |
Peter S. Lynch (61) |
| Year of Election or Appointment: 2003 Member of the Advisory Board of Fidelity Financial Trust. Vice Chairman and a Director of FMR, and Vice Chairman (2001) and a Director (2000) of FMR Co., Inc. Previously, Mr. Lynch served as a Trustee of the Fidelity funds (1990-2003). Prior to May 31, 1990, he was a Director of FMR and Executive Vice President of FMR (a position he held until March 31, 1991), Vice President of Fidelity® Magellan® Fund and FMR Growth Group Leader, and Managing Director of FMR Corp. Mr. Lynch was also Vice President of Fidelity Investments Corporate Services. In addition, he serves as a Trustee of Boston College, Massachusetts Eye & Ear Infirmary, Historic Deerfield, John F. Kennedy Library, and the Museum of Fine Arts of Boston. |
Kenneth L. Wolfe (65) |
| Year of Election or Appointment: 2004 Member of the Advisory Board of Fidelity Financial Trust. Mr. Wolfe also serves as a Trustee (2005) or Member of the Advisory Board (2004) of other investment companies advised by FMR. Prior to his retirement in 2001, Mr. Wolfe was Chairman and Chief Executive Officer of Hershey Foods Corporation (1993-2001). He currently serves as a member of the boards of Adelphia Communications Corporation (2003), Bausch & Lomb, Inc., and Revlon Inc. (2004). |
Bart A. Grenier (45) |
| Year of Election or Appointment: 2001 Vice President of Convertible Securities. Mr. Grenier also serves as Vice President of certain Equity Funds (2001), a position he previously held from 1999 to 2000, and Vice President of certain High Income Funds (2002). He is Senior Vice President of FMR (1999) and FMR Co., Inc. (2001), and President and Director of Strategic Advisers, Inc. (2002). He also heads Fidelity's Asset Allocation Group (2000), Fidelity's Growth and Income Group (2001), Fidelity's Value Group (2001), and Fidelity's High Income Division (2001). Previously, Mr. Grenier served as President of Fidelity Ventures (2000), Vice President of certain High Income Funds (1997-2000), High Income Division Head (1997-2000), Group Leader of the Income-Growth and Asset Allocation-Income Groups (1996-2000), and Assistant Equity Division Head (1997-2000). |
Victor Thay (30) |
| <R>Year of Election or Appointment: 2003</R> <R>Vice President of Convertible Securities. Prior to assuming his current responsibilities, Mr. Thay managed a variety of Fidelity funds. Mr. Thay also serves as Vice President of FMR (2003) and FMR Co., Inc. (2003).</R> |
Eric D. Roiter (56) |
| Year of Election or Appointment: 1998 Secretary of Convertible Securities. He also serves as Secretary of other Fidelity funds (1998); Vice President, General Counsel, and Clerk of FMR Co., Inc. (2001) and FMR (1998); Vice President and Clerk of FDC (1998); Assistant Clerk of Fidelity Management & Research (U.K.) Inc. (2001) and Fidelity Management & Research (Far East) Inc. (2001); and Assistant Secretary of Fidelity Investments Money Management, Inc. (2001). Prior to joining Fidelity, Mr. Roiter was with the law firm of Debevoise & Plimpton, as an associate (1981-1984) and as a partner (1985-1997), and served as an Assistant General Counsel of the U.S. Securities and Exchange Commission (1979-1981). Mr. Roiter is an Adjunct Member, Faculty of Law, at Boston College Law School (2003). |
Stuart Fross (45) |
| Year of Election or Appointment: 2003 Assistant Secretary of Convertible Securities. Mr. Fross also serves as Assistant Secretary of other Fidelity funds (2003) and is an employee of FMR. |
Christine Reynolds (46) |
| Year of Election or Appointment: 2004 President, Treasurer, and Anti-Money Laundering (AML) officer of Convertible Securities. Ms. Reynolds also serves as President, Treasurer, and AML officer of other Fidelity funds (2004) and is a Vice President (2003) and an employee (2002) of FMR. Before joining Fidelity Investments, Ms. Reynolds worked at PricewaterhouseCoopers LLP (PwC) (1980-2002), where she was most recently an audit partner with PwC's investment management practice. |
Timothy F. Hayes (53) |
| Year of Election or Appointment: 2002 Chief Financial Officer of Convertible Securities. Mr. Hayes also serves as Chief Financial Officer of other Fidelity funds (2002). Recently he was appointed President of Fidelity Service Company (2003) where he also serves as a Director. Mr. Hayes also serves as President of Fidelity Investments Operations Group (FIOG, 2002), which includes Fidelity Pricing and Cash Management Services Group (FPCMS), where he was appointed President in 1998. Previously, Mr. Hayes served as Chief Financial Officer of Fidelity Investments Corporate Systems and Service Group (1998) and Fidelity Systems Company (1997-1998). |
Kenneth A. Rathgeber (57) |
| Year of Election or Appointment: 2004 Chief Compliance Officer of Convertible Securities. Mr. Rathgeber also serves as Chief Compliance Officer of other Fidelity funds (2004) and Executive Vice President of Risk Oversight for Fidelity Investments (2002). Previously, he served as Executive Vice President and Chief Operating Officer for Fidelity Investments Institutional Services Company, Inc. (1998-2002). |
John R. Hebble (46) |
| Year of Election or Appointment: 2003 Deputy Treasurer of Convertible Securities. Mr. Hebble also serves as Deputy Treasurer of other Fidelity funds (2003), and is an employee of FMR. Before joining Fidelity Investments, Mr. Hebble worked at Deutsche Asset Management where he served as Director of Fund Accounting (2002-2003) and Assistant Treasurer of the Scudder Funds (1998-2003). |
Kimberley H. Monasterio (40) |
| Year of Election or Appointment: 2004 Deputy Treasurer of Convertible Securities. Ms. Monasterio also serves as Deputy Treasurer of other Fidelity funds (2004) and is an employee of FMR (2004). Before joining Fidelity Investments, Ms. Monasterio served as Treasurer (2000-2004) and Chief Financial Officer (2002-2004) of the Franklin Templeton Funds and Senior Vice President of Franklin Templeton Services, LLC (2000-2004). |
John H. Costello (58) |
| Year of Election or Appointment: 1987 Assistant Treasurer of Convertible Securities. Mr. Costello also serves as Assistant Treasurer of other Fidelity funds and is an employee of FMR. |
Peter L. Lydecker (50) |
| Year of Election or Appointment: 2004 Assistant Treasurer of Convertible Securities. Mr. Lydecker also serves as Assistant Treasurer of other Fidelity funds (2004) and is an employee of FMR. |
Mark Osterheld (49) |
| Year of Election or Appointment: 2002 Assistant Treasurer of Convertible Securities. Mr. Osterheld also serves as Assistant Treasurer of other Fidelity funds (2002) and is an employee of FMR. |
Kenneth B. Robins (35) |
| Year of Election or Appointment: 2004 Assistant Treasurer of Convertible Securities. Mr. Robins also serves as Assistant Treasurer of other Fidelity funds (2004) and is an employee of FMR (2004). Before joining Fidelity Investments, Mr. Robins worked at KPMG LLP, where he was a partner in KPMG's department of professional practice (2002-2004) and a Senior Manager (1999-2000). In addition, Mr. Robins served as Assistant Chief Accountant, United States Securities and Exchange Commission (2000-2002). |
Thomas J. Simpson (46) |
| Year of Election or Appointment: 2000 Assistant Treasurer of Convertible Securities. Mr. Simpson is Assistant Treasurer of other Fidelity funds (2000) and an employee of FMR (1996). Prior to joining FMR, Mr. Simpson was Vice President and Fund Controller of Liberty Investment Services (1987-1995). |
Annual Report
Distributions
The Board of Trustees of Fidelity Convertible Securities Fund voted to pay on December 20, 2004, to shareholders of record at the opening of business on December 17, 2004, a distribution of $.02 per share derived from capital gains realized from sales of portfolio securities and a dividend of $.08 per share from net investment income.
A total of .02% of the dividends distributed during the fiscal year was derived from interest on U.S. Government securities which is generally exempt from state income tax.
The fund designates 12%, 8%, 8%, and 8% of the dividends distributed in December, March, June and October, respectively during the fiscal year as qualifying for the dividends-received deduction for corporate shareholders.
The fund designates 4%, 6%, 6%, and 6% of the dividends distributed in December, March, June and October, respectively during the fiscal year as amounts which may be taken into account as a dividend for purposes of the maximum rate under section 1(h)(11) of the Internal Revenue Code.
The fund will notify shareholders in January 2005 of amounts for use in preparing 2004 income tax returns.
Annual Report
Managing Your Investments
Fidelity offers several ways to conveniently manage your personal investments via your telephone or PC. You can access your account information, conduct trades and research your investments 24 hours a day.
By Phone
Fidelity Automated Service Telephone provides a single toll-free number to access account balances, positions, quotes and trading. It's easy to navigate the service, and on your first call, the system will help you create a personal identification number (PIN) for security.
(phone_graphic)Fidelity Automated
Service Telephone (FAST®)
1-800-544-5555
Press
1 For mutual fund and brokerage trading.
2 For quotes.*
3 For account balances and holdings.
4 To review orders and mutual
fund activity.
5 To change your PIN.
*0 To speak to a Fidelity representative.
By PC
Fidelity's web site on the Internet provides a wide range of information, including daily financial news, fund performance, interactive planning tools and news about Fidelity products and services.
(computer_graphic)Fidelity's Web Site
www.fidelity.com
* When you call the quotes line, please remember that a fund's yield and return will vary and, except for money market funds, share price will also vary. This means that you may have a gain or loss when you sell your shares. There is no assurance that money market funds will be able to maintain a stable $1 share price; an investment in a money market fund is not insured or guaranteed by the U.S. government. Total returns are historical and include changes in share price, reinvestment of dividends and capital gains, and the effects of any sales charges.
Annual Report
Investment Adviser
Fidelity Management & Research Company
Boston, MA
Investment Sub-Advisers
FMR Co., Inc.
Fidelity Management & Research (U.K.) Inc.
Fidelity Management & Research
(Far East) Inc.
Fidelity International Investment Advisors
Fidelity Investments Japan Limited
Fidelity International Investment Advisors (U.K.) Limited
General Distributor
Fidelity Distributors Corporation
Boston, MA
Transfer and Shareholder
Servicing Agent
Fidelity Service Company, Inc.
Boston, MA
Custodian
Citibank, N.A.
New York, NY
Fidelity's Growth and Income Funds
Balanced Fund
Convertible Securities Fund
Equity-Income Fund
Equity-Income II Fund
Fidelity® Fund
Global Balanced Fund
Growth & Income Portfolio
Growth & Income II Portfolio
Puritan® Fund
Strategic Dividend & Income Fund
Utilities Fund
Please carefully consider the funds' investment objectives, risks, charges and expenses before investing. For this and other information, call 1-800-544-6666 for a free prospectus. Read it carefully before you invest or send money.
The Fidelity Telephone Connection
Mutual Fund 24-Hour Service
Exchanges/Redemptions
and Account Assistance 1-800-544-6666
Product Information 1-800-544-6666
Retirement Accounts 1-800-544-4774
(8 a.m. - 9 p.m.)
TDD Service 1-800-544-0118
for the deaf and hearing impaired
(9 a.m. - 9 p.m. Eastern time)
Fidelity Automated Service
Telephone (FAST®) (automated graphic) 1-800-544-5555
(automated graphic) Automated line for quickest service
(Fidelity Investment logo)(registered trademark)
Corporate Headquarters
82 Devonshire St., Boston, MA 02109
www.fidelity.com
CVS-UANN-0105
1.786706.101
Fidelity®
Independence
Fund
Annual Report
November 30, 2004
(2_fidelity_logos) (Registered_Trademark)
Contents
Chairman's Message | 4 | Ned Johnson's message to shareholders. |
Performance | 5 | How the fund has done over time. |
Management's Discussion | 6 | The manager's review of fund performance, strategy and outlook. |
Shareholder Expense Example | 7 | An example of shareholder expenses. |
Investment Changes | 8 | A summary of major shifts in the fund's investments over the past six months. |
Investments | 9 | A complete list of the fund's investments with their market values. |
Financial Statements | 18 | Statements of assets and liabilities, operations, and changes in net assets,
as well as financial highlights. |
Notes | 22 | Notes to the financial statements. |
Report of Independent Registered Public Accounting Firm | 28 | |
Trustees and Officers | 29 | |
Distributions | 38 | |
To view a fund's proxy voting guidelines and proxy voting record for the 12-month period ended June 30, visit www.fidelity.com/proxyvotingresults or visit the Securities and Exchange Commission's (SEC) web site at www.sec.gov. You may also call 1-800-544-8544 to request a free copy of the proxy voting guidelines.
Standard & Poor's, S&P and S&P 500 are registered service marks of The McGraw-Hill Companies, Inc. and have been licensed for use by Fidelity Distributors Corporation.
Other third party marks appearing herein are the property of their respective owners.
All other marks appearing herein are registered or unregistered trademarks or service marks of FMR Corp. or an affiliated company.
(Recycle graphic) This report is printed on recycled paper using soy-based inks.
Annual Report
This report and the financial statements contained herein are submitted for the general information of the shareholders of the fund. This report is not authorized for distribution to prospective investors in the fund unless preceded or accompanied by an effective prospectus.
A fund files its complete schedule of portfolio holdings with the SEC for the first and third quarters of each fiscal year on Form N-Q. Forms N-Q are available on the SEC's web site at http://www.sec.gov. A fund's Forms N-Q may be reviewed and copied at the SEC's Public Reference Room in Washington, DC. Information regarding the operation of the SEC's Public Reference Room may be obtained by calling 1-800-SEC-0330. For a complete list of a fund's portfolio holdings, view the most recent quarterly holdings report, semiannual report, or annual report on Fidelity's web site at http://www.fidelity.com/holdings.
NOT FDIC INSURED · MAY LOSE VALUE · NO BANK GUARANTEE
Neither the fund nor Fidelity Distributors Corporation is a bank.
Annual Report
Chairman's Message
(photo_of_Edward_C_Johnson_3d)
Dear Shareholder:
During the past year or so, much has been reported about the mutual fund industry, and much of it has been more critical than I believe is warranted. Allegations that some companies have been less than forthright with their shareholders have cast a shadow on the entire industry. I continue to find these reports disturbing, and assert that they do not create an accurate picture of the industry overall. Therefore, I would like to remind everyone where Fidelity stands on these issues. I will say two things specifically regarding allegations that some mutual fund companies were in violation of the Securities and Exchange Commission's forward pricing rules or were involved in so-called "market timing" activities.
First, Fidelity has no agreements that permit customers who buy fund shares after 4 p.m. to obtain the 4 p.m. price. This is not a new policy. This is not to say that someone could not deceive the company through fraudulent acts. However, we are extremely diligent in preventing fraud from occurring in this manner - and in every other. But I underscore again that Fidelity has no so-called "agreements" that sanction illegal practices.
Second, Fidelity continues to stand on record, as we have for years, in opposition to predatory short-term trading that adversely affects shareholders in a mutual fund. Back in the 1980s, we initiated a fee - which is returned to the fund and, therefore, to investors - - to discourage this activity. Further, we took the lead several years ago in developing a Fair Value Pricing Policy to prevent market timing on foreign securities in our funds. I am confident we will find other ways to make it more difficult for predatory traders to operate. However, this will only be achieved through close cooperation among regulators, legislators and the industry.
Yes, there have been unfortunate instances of unethical and illegal activity within the mutual fund industry from time to time. That is true of any industry. When this occurs, confessed or convicted offenders should be dealt with appropriately. But we are still concerned about the risk of over-regulation and the quick application of simplistic solutions to intricate problems. Every system can be improved, and we support and applaud well thought out improvements by regulators, legislators and industry representatives that achieve the common goal of building and protecting the value of investors' holdings.
For nearly 60 years, Fidelity has worked very hard to improve its products and service to justify your trust. When our family founded this company in 1946, we had only a few hundred customers. Today, we serve more than 18 million customers including individual investors and participants in retirement plans across America.
Let me close by saying that we do not take your trust in us for granted, and we realize that we must always work to improve all aspects of our service to you. In turn, we urge you to continue your active participation with your financial matters, so that your interests can be well served.
Best regards,
/s/Edward C. Johnson 3d
Edward C. Johnson 3d
Annual Report
Performance: The Bottom Line
Average annual total return reflects the change in the value of an investment, assuming reinvestment of the fund's dividend income and capital gains (the profits earned upon the sale of securities that have grown in value) and assuming a constant rate of perfor-mance each year. The $10,000 table and the fund's returns do not reflect the deduction of taxes that a shareholder would pay on fund distributions or the redemption of fund shares. During periods of reimbursement by Fidelity, a fund's total return will be greater than it would be had the reimbursement not occurred. How a fund did yesterday is no guarantee of how it will do tomorrow.
Average Annual Total Returns
Periods ended November 30, 2004 | Past 1
year | Past 5
years | Past 10
years |
Fidelity Independence Fund | 13.28% | 0.51% | 10.29% |
$10,000 Over 10 Years
Let's say hypothetically that $10,000 was invested in Fidelity® Independence Fund on November 30, 1994. The chart shows how the value of your investment would have changed, and also shows how the Standard & Poor's 500 Index performed over the same period.
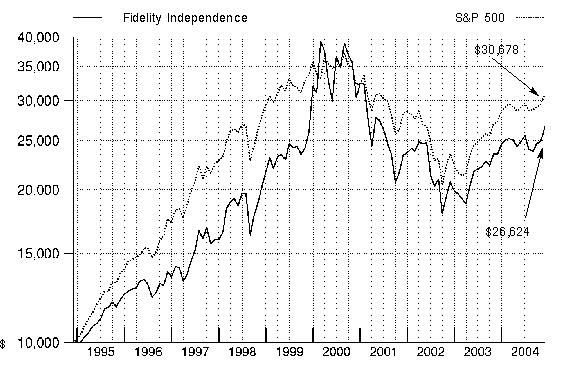
Annual Report
Management's Discussion of Fund Performance
Comments from Jason Weiner, Portfolio Manager of Fidelity® Independence Fund
Despite surging oil prices, a struggling job market and four interest rate hikes in a five-month span, U.S. equity markets posted solid results for the 12-month period ending November 30, 2004, and were closing in on a second straight year in the black. There was great disparity in the market during the past year. For instance, value stocks trounced their growth counterparts during the period. To illustrate, the Russell 1000® Value Index shot up 19.67%, while the Russell 1000 Growth Index rose only 5.83%. Meanwhile, small- and mid-cap stocks vastly outperformed larger-cap stocks. Energy was the best-performing sector of the market, propelled by a spike in oil prices. Conversely, technology stocks dipped lower in response to a slowdown in corporate capital spending. For the 12-month period overall, the Standard & Poor's 500SM Index returned 12.86% - slightly above its historical average. Elsewhere, the Dow Jones Industrial AverageSM rose 8.85% and the tech-heavy NASDAQ Composite® Index advanced 7.50%.
For the 12 months ending November 30, 2004, the fund returned 13.28%, beating the S&P 500® and the 8.52% return of the LipperSM Capital Appreciation Funds Average. Stock picking in the technology hardware and equipment industry was a positive factor versus the index, in large part due to one stock - Research In Motion, maker of the BlackBerry wireless phone and e-mail device. The company was one of the few wireless handset providers that could charge a monthly fee for licensing the software that enables users to receive e-mail messages on their cell phones. In the wireless infrastructure space, Ericsson was a standout, benefiting from the push by wireless services providers to improve their networks. I liquidated the position to lock in profits. Conversely, media stocks hurt relative performance, with radio holding Clear Channel Communications the fund's biggest detractor. I expected radio advertising revenues to rebound given the generally favorable economic backdrop and the potential catalyst of a U.S. presidential election, but there never was much of a recovery. Not owning Exxon Mobil also hampered our results compared with the index, as the stock was a big beneficiary of high prices for crude oil and natural gas.
The views expressed in this statement reflect those of the portfolio manager only through the end of the period of the report as stated on the cover and do not necessarily represent the views of Fidelity or any other person in the Fidelity organization. Any such views are subject to change at any time based upon market or other conditions and Fidelity disclaims any responsibility to update such views. These views may not be relied on as investment advice and, because investment decisions for a Fidelity fund are based on numerous factors, may not be relied on as an indication of trading intent on behalf of any Fidelity fund.
Annual Report
Shareholder Expense Example
As a shareholder of the Fund, you incur two types of costs: (1) transaction costs, and (2) ongoing costs, including management fees and other Fund expenses. This Example is intended to help you understand your ongoing costs (in dollars) of investing in the Fund and to compare these costs with the ongoing costs of investing in other mutual funds.
The Example is based on an investment of $1,000 invested at the beginning of the period and held for the entire period (June 1, 2004 to November 30, 2004).
Actual Expenses
The first line of the table below provides information about actual account values and actual expenses. You may use the information in this line, together with the amount you invested, to estimate the expenses that you paid over the period. Simply divide your account value by $1,000.00 (for example, an $8,600 account value divided by $1,000.00 = 8.6), then multiply the result by the number in the first line under the heading entitled "Expenses Paid During Period" to estimate the expenses you paid on your account during this period. A small balance maintenance fee of $12.00 that is charged once a year may apply for certain accounts with a value of less than $2,000. This fee is not included in the table below. If it were, the estimate of expenses you paid during the period would be higher, and your ending account value lower, by this amount.
Hypothetical Example for Comparison Purposes
The second line of the table below provides information about hypothetical account values and hypothetical expenses based on the Fund's actual expense ratio and an assumed rate of return of 5% per year before expenses, which is not the Fund's actual return. The hypothetical account values and expenses may not be used to estimate the actual ending account balance or expenses you paid for the period. You may use this information to compare the ongoing costs of investing in the Fund and other funds. To do so, compare this 5% hypothetical example with the 5% hypothetical examples that appear in the shareholder reports of the other funds. A small balance maintenance fee of $12.00 that is charged once a year may apply for certain accounts with a value of less than $2,000. This fee is not included in the table below. If it were, the estimate of expenses you paid during the period would be higher, and your ending account value lower, by this amount.
Please note that the expenses shown in the table are meant to highlight your ongoing costs only and do not reflect any transaction costs. Therefore, the second line of the table is useful in comparing ongoing costs only, and will not help you determine the relative total costs of owning different funds.
| Beginning
Account Value
June 1, 2004 | Ending
Account Value
November 30, 2004 | Expenses Paid
During Period*
June 1, 2004
to November 30, 2004 |
Actual | $ 1,000.00 | $ 1,070.20 | $ 4.40 |
Hypothetical (5% return per year before expenses) | $ 1,000.00 | $ 1,020.70 | $ 4.30 |
* Expenses are equal to the Fund's annualized expense ratio of .85%; multiplied by the average account value over the period, multiplied by 183/366 (to reflect the one-half year period).
Annual Report
Investment Changes
Top Ten Stocks as of November 30, 2004 |
| % of fund's
net assets | % of fund's net assets
6 months ago |
Microsoft Corp. | 4.0 | 2.3 |
Carnival Corp. unit | 2.8 | 1.7 |
Seagate Technology | 2.7 | 1.5 |
Vodafone Group PLC sponsored ADR | 2.5 | 2.3 |
Siebel Systems, Inc. | 2.4 | 2.2 |
Pfizer, Inc. | 2.1 | 4.1 |
Crown Castle International Corp. | 2.1 | 2.0 |
Infosys Technologies Ltd. | 2.1 | 0.9 |
Clear Channel Communications, Inc. | 2.1 | 2.8 |
Yahoo!, Inc. | 2.1 | 2.1 |
| 24.9 | |
Top Five Market Sectors as of November 30, 2004 |
| % of fund's
net assets | % of fund's net assets
6 months ago |
Information Technology | 25.0 | 29.3 |
Industrials | 18.9 | 11.2 |
Consumer Discretionary | 15.2 | 17.9 |
Health Care | 11.8 | 19.2 |
Materials | 7.2 | 4.2 |
Asset Allocation (% of fund's net assets) |
As of November 30, 2004 * | As of May 31, 2004 ** |
| Stocks 94.2% | | | Stocks 96.9% | |
| Short-Term
Investments and
Net Other Assets 5.8% | | | Short-Term
Investments and
Net Other Assets 3.1% | |
* Foreign
investments | 22.1% | | ** Foreign
investments | 20.4% | |

Annual Report
Investments November 30, 2004
Showing Percentage of Net Assets
Common Stocks - 94.2% |
| Shares | | Value (Note 1) (000s) |
CONSUMER DISCRETIONARY - 15.2% |
Auto Components - 0.1% |
Gentex Corp. | 104,600 | | $ 3,381 |
Automobiles - 0.0% |
Harley-Davidson, Inc. | 40,000 | | 2,313 |
Hotels, Restaurants & Leisure - 6.0% |
Carnival Corp. unit | 2,405,900 | | 127,537 |
Kerzner International Ltd. (a) | 1,153,200 | | 65,698 |
McDonald's Corp. | 448,300 | | 13,781 |
Outback Steakhouse, Inc. | 225,200 | | 9,751 |
Penn National Gaming, Inc. (a) | 527,100 | | 27,815 |
Starwood Hotels & Resorts Worldwide, Inc. unit | 546,700 | | 28,587 |
| | 273,169 |
Household Durables - 0.3% |
Interface, Inc. Class A (a) | 1,302,700 | | 12,897 |
Internet & Catalog Retail - 0.2% |
eBay, Inc. (a) | 88,400 | | 9,941 |
Leisure Equipment & Products - 1.2% |
Brunswick Corp. | 1,180,200 | | 57,617 |
Media - 4.6% |
Clear Channel Communications, Inc. | 2,808,500 | | 94,590 |
Lamar Advertising Co. Class A (a) | 861,500 | | 33,978 |
LodgeNet Entertainment Corp. (a) | 5,641 | | 87 |
Radio One, Inc. Class D (non-vtg.) (a) | 2,563,000 | | 35,754 |
Spanish Broadcasting System, Inc. Class A (a) | 45,487 | | 486 |
Viacom, Inc. Class B (non-vtg.) | 1,377,300 | | 47,792 |
| | 212,687 |
Multiline Retail - 0.8% |
JCPenney Co., Inc. | 436,700 | | 16,857 |
Kohl's Corp. (a) | 372,500 | | 17,195 |
Tuesday Morning Corp. (a) | 35,600 | | 1,192 |
| | 35,244 |
Specialty Retail - 2.0% |
bebe Stores, Inc. | 288,000 | | 10,449 |
Hennes & Mauritz AB (H&M) (B Shares) | 444,750 | | 14,299 |
Home Depot, Inc. | 857,500 | | 35,801 |
Common Stocks - continued |
| Shares | | Value (Note 1) (000s) |
CONSUMER DISCRETIONARY - continued |
Specialty Retail - continued |
Ross Stores, Inc. | 981,500 | | $ 26,402 |
The Children's Place Retail Stores, Inc. (a) | 145,100 | | 4,594 |
| | 91,545 |
TOTAL CONSUMER DISCRETIONARY | | 698,794 |
CONSUMER STAPLES - 0.6% |
Food & Staples Retailing - 0.5% |
CVS Corp. | 496,000 | | 22,504 |
Personal Products - 0.1% |
Gillette Co. | 106,200 | | 4,619 |
TOTAL CONSUMER STAPLES | | 27,123 |
ENERGY - 3.2% |
Energy Equipment & Services - 2.3% |
BJ Services Co. | 1,465,361 | | 74,250 |
Nabors Industries Ltd. (a) | 575,800 | | 29,942 |
| | 104,192 |
Oil & Gas - 0.9% |
Frontline Ltd. (e) | 228,900 | | 13,849 |
Frontline Ltd. (NY Shares) | 46,000 | | 2,762 |
Ship Finance International Ltd. | 36,652 | | 918 |
Teekay Shipping Corp. | 303,600 | | 16,170 |
Valero Energy Corp. | 193,000 | | 9,030 |
| | 42,729 |
TOTAL ENERGY | | 146,921 |
FINANCIALS - 5.9% |
Capital Markets - 0.7% |
Ameritrade Holding Corp. (a) | 1,822,400 | | 25,386 |
Northern Trust Corp. | 107,100 | | 5,038 |
| | 30,424 |
Commercial Banks - 0.7% |
Wells Fargo & Co. | 541,000 | | 33,418 |
Consumer Finance - 1.8% |
American Express Co. | 1,450,800 | | 80,824 |
Common Stocks - continued |
| Shares | | Value (Note 1) (000s) |
FINANCIALS - continued |
Diversified Financial Services - 0.3% |
TSX Group, Inc. (d) | 320,500 | | $ 14,674 |
Insurance - 1.6% |
AFLAC, Inc. | 330,500 | | 12,433 |
AMBAC Financial Group, Inc. | 66,700 | | 5,425 |
American International Group, Inc. | 906,200 | | 57,408 |
| | 75,266 |
Thrifts & Mortgage Finance - 0.8% |
New York Community Bancorp, Inc. | 1,916,300 | | 37,904 |
TOTAL FINANCIALS | | 272,510 |
HEALTH CARE - 11.8% |
Biotechnology - 2.6% |
Angiotech Pharmaceuticals, Inc. (a) | 1,570,800 | | 29,046 |
Biogen Idec, Inc. (a) | 715,200 | | 41,968 |
Genentech, Inc. (a) | 368,900 | | 17,799 |
QLT, Inc. (a) | 1,066,200 | | 17,279 |
SciClone Pharmaceuticals, Inc. (a) | 200,000 | | 816 |
Serologicals Corp. (a) | 629,100 | | 14,683 |
| | 121,591 |
Health Care Equipment & Supplies - 4.1% |
Advanced Medical Optics, Inc. (a)(d) | 566,800 | | 23,568 |
American Medical Systems Holdings, Inc. (a) | 79,800 | | 3,045 |
Aspect Medical Systems, Inc. (a) | 45,600 | | 1,113 |
Becton, Dickinson & Co. | 260,700 | | 14,281 |
Cooper Companies, Inc. | 595,484 | | 41,404 |
DENTSPLY International, Inc. | 169,200 | | 8,902 |
Foxhollow Technologies, Inc. | 182,100 | | 4,716 |
Intuitive Surgical, Inc. (a) | 222,700 | | 8,002 |
Kinetic Concepts, Inc. | 724,700 | | 45,960 |
Medtronic, Inc. | 185,600 | | 8,918 |
ResMed, Inc. (a) | 304,000 | | 15,218 |
St. Jude Medical, Inc. (a) | 383,400 | | 14,623 |
| | 189,750 |
Health Care Providers & Services - 2.6% |
Cardinal Health, Inc. | 29,100 | | 1,521 |
Henry Schein, Inc. (a) | 643,800 | | 41,963 |
Common Stocks - continued |
| Shares | | Value (Note 1) (000s) |
HEALTH CARE - continued |
Health Care Providers & Services - continued |
Service Corp. International (SCI) (a) | 2,078,000 | | $ 14,671 |
UnitedHealth Group, Inc. | 728,600 | | 60,365 |
| | 118,520 |
Pharmaceuticals - 2.5% |
Elan Corp. PLC sponsored ADR (a) | 578,800 | | 15,280 |
Pfizer, Inc. | 3,515,500 | | 97,625 |
| | 112,905 |
TOTAL HEALTH CARE | | 542,766 |
INDUSTRIALS - 18.9% |
Aerospace & Defense - 4.7% |
Embraer - Empresa Brasileira de Aeronautica SA sponsored ADR | 725,020 | | 20,279 |
General Dynamics Corp. | 106,100 | | 11,497 |
Hexcel Corp. (a) | 170,400 | | 2,599 |
Honeywell International, Inc. | 604,100 | | 21,343 |
Precision Castparts Corp. | 524,800 | | 34,028 |
The Boeing Co. | 615,300 | | 32,962 |
United Technologies Corp. | 931,700 | | 90,915 |
| | 213,623 |
Air Freight & Logistics - 0.4% |
C.H. Robinson Worldwide, Inc. | 31,700 | | 1,704 |
Forward Air Corp. (a) | 207,500 | | 9,618 |
Ryder System, Inc. | 167,900 | | 9,006 |
| | 20,328 |
Airlines - 1.7% |
AirTran Holdings, Inc. (a) | 2,407,000 | | 28,451 |
Ryanair Holdings PLC: | | | |
warrants (UBS Warrant Programme) 2/25/06 (a) | 1,587,379 | | 10,740 |
sponsored ADR (a)(d) | 982,400 | | 38,461 |
| | 77,652 |
Building Products - 0.3% |
Trex Co., Inc. (a)(d) | 332,500 | | 15,611 |
Commercial Services & Supplies - 6.4% |
ChoicePoint, Inc. (a) | 309,200 | | 13,558 |
Dun & Bradstreet Corp. (a) | 304,600 | | 18,081 |
Heidrick & Struggles International, Inc. (a) | 672,300 | | 23,127 |
Common Stocks - continued |
| Shares | | Value (Note 1) (000s) |
INDUSTRIALS - continued |
Commercial Services & Supplies - continued |
Herman Miller, Inc. | 1,259,100 | | $ 30,927 |
HNI Corp. | 488,200 | | 20,695 |
Korn/Ferry International (a) | 1,900,100 | | 35,399 |
Manpower, Inc. | 200,700 | | 9,708 |
Monster Worldwide, Inc. (a) | 1,546,381 | | 43,592 |
Robert Half International, Inc. | 1,657,000 | | 44,789 |
Sothebys Holdings, Inc. Class A (ltd. vtg.) (a) | 2,118,100 | | 33,212 |
Universal Technical Institute, Inc. | 571,200 | | 19,021 |
| | 292,109 |
Construction & Engineering - 0.6% |
Fluor Corp. | 564,600 | | 29,303 |
Industrial Conglomerates - 1.8% |
General Electric Co. | 1,613,800 | | 57,064 |
Tyco International Ltd. | 712,000 | | 24,187 |
| | 81,251 |
Machinery - 1.8% |
Bucyrus International, Inc. Class A | 417,300 | | 16,483 |
Joy Global, Inc. | 1,343,200 | | 54,655 |
Mueller Industries, Inc. | 310,700 | | 9,548 |
| | 80,686 |
Road & Rail - 0.4% |
Norfolk Southern Corp. | 571,500 | | 19,620 |
Trading Companies & Distributors - 0.8% |
Fastenal Co. | 157,800 | | 9,651 |
MSC Industrial Direct Co., Inc. Class A | 682,400 | | 24,307 |
United Rentals, Inc. (a) | 77,300 | | 1,381 |
| | 35,339 |
TOTAL INDUSTRIALS | | 865,522 |
INFORMATION TECHNOLOGY - 25.0% |
Communications Equipment - 3.2% |
Comverse Technology, Inc. (a) | 1,018,820 | | 21,670 |
FalconStor Software, Inc. (a) | 60,800 | | 476 |
Option NV (a) | 154,600 | | 5,372 |
QUALCOMM, Inc. | 737,500 | | 30,695 |
Common Stocks - continued |
| Shares | | Value (Note 1) (000s) |
INFORMATION TECHNOLOGY - continued |
Communications Equipment - continued |
Research In Motion Ltd. (a) | 879,900 | | $ 77,762 |
Sierra Wireless, Inc. (a) | 624,500 | | 11,795 |
| | 147,770 |
Computers & Peripherals - 4.6% |
Dell, Inc. (a) | 844,700 | | 34,227 |
Emulex Corp. (a) | 809,300 | | 11,444 |
Novatel Wireless, Inc. | 226,300 | | 4,766 |
QLogic Corp. (a) | 295,492 | | 10,162 |
Seagate Technology | 8,138,200 | | 121,910 |
UNOVA, Inc. (a) | 1,180,583 | | 26,162 |
| | 208,671 |
Electronic Equipment & Instruments - 0.6% |
AU Optronics Corp. sponsored ADR | 405,300 | | 5,322 |
National Instruments Corp. | 278,741 | | 7,972 |
ScanSource, Inc. (a) | 243,500 | | 15,754 |
| | 29,048 |
Internet Software & Services - 2.6% |
Google, Inc. Class A | 54,900 | | 10,047 |
SkillSoft PLC sponsored ADR (a) | 1,953,700 | | 14,106 |
Yahoo!, Inc. (a) | 2,510,900 | | 94,460 |
| | 118,613 |
IT Services - 5.8% |
Affiliated Computer Services, Inc. Class A (a) | 743,600 | | 44,006 |
Ceridian Corp. (a) | 2,229,400 | | 42,158 |
First Data Corp. | 904,800 | | 37,178 |
Infosys Technologies Ltd. | 1,976,984 | | 95,482 |
Paychex, Inc. | 374,588 | | 12,421 |
Satyam Computer Services Ltd. | 2,494,700 | | 24,319 |
The BISYS Group, Inc. (a) | 614,100 | | 9,832 |
| | 265,396 |
Semiconductors & Semiconductor Equipment - 0.8% |
Sigmatel, Inc. (a) | 963,600 | | 34,478 |
Software - 7.4% |
Kronos, Inc. (a) | 293,900 | | 14,854 |
Microsoft Corp. | 6,923,400 | | 185,613 |
Common Stocks - continued |
| Shares | | Value (Note 1) (000s) |
INFORMATION TECHNOLOGY - continued |
Software - continued |
NAVTEQ Corp. | 712,400 | | $ 30,740 |
Siebel Systems, Inc. (a) | 10,772,200 | | 108,584 |
| | 339,791 |
TOTAL INFORMATION TECHNOLOGY | | 1,143,767 |
MATERIALS - 7.2% |
Chemicals - 1.1% |
Monsanto Co. | 315,700 | | 14,529 |
Spartech Corp. | 1,232,607 | | 34,451 |
| | 48,980 |
Construction Materials - 0.3% |
Vulcan Materials Co. | 265,200 | | 13,751 |
Metals & Mining - 5.8% |
Alcoa, Inc. | 556,200 | | 18,900 |
Arch Coal, Inc. | 865,200 | | 33,051 |
BHP Billiton Ltd. sponsored ADR | 2,629,400 | | 62,475 |
Companhia Vale do Rio Doce sponsored ADR | 2,357,200 | | 58,506 |
Grupo Mexico SA de CV Series B (a) | 2,396,400 | | 11,587 |
Massey Energy Co. | 961,200 | | 33,757 |
Peabody Energy Corp. | 77,700 | | 6,449 |
Phelps Dodge Corp. | 417,000 | | 40,503 |
| | 265,228 |
TOTAL MATERIALS | | 327,959 |
TELECOMMUNICATION SERVICES - 6.4% |
Wireless Telecommunication Services - 6.4% |
Alamosa Holdings, Inc. (a) | 2,334,600 | | 25,447 |
America Movil SA de CV sponsored ADR | 340,100 | | 15,886 |
American Tower Corp. Class A (a) | 2,014,200 | | 36,517 |
Crown Castle International Corp. (a) | 5,737,369 | | 96,847 |
Vodafone Group PLC sponsored ADR | 4,275,000 | | 116,579 |
| | 291,276 |
TOTAL COMMON STOCKS (Cost $3,849,284) | 4,316,638 |
Convertible Preferred Stocks - 0.0% |
| Shares | | Value (Note 1) (000s) |
INFORMATION TECHNOLOGY - 0.0% |
Communications Equipment - 0.0% |
Chorum Technologies, Inc. Series E (a)(f) | 41,400 | | $ 0 |
Procket Networks, Inc. Series C (a)(f) | 1,721,344 | | 0 |
TOTAL CONVERTIBLE PREFERRED STOCKS (Cost $17,621) | 0 |
Nonconvertible Bonds - 0.0% |
| Principal Amount (000s) | | |
INDUSTRIALS - 0.0% |
Machinery - 0.0% |
Mueller Industries, Inc. 6% 11/1/14 | | $ 2,640 | | 2,600 |
TOTAL NONCONVERTIBLE BONDS (Cost $2,507) | 2,600 |
Money Market Funds - 8.0% |
| Shares | | |
Fidelity Cash Central Fund, 1.98% (b) | 329,404,220 | | 329,404 |
Fidelity Securities Lending Cash Central Fund, 2% (b)(c) | 36,717,875 | | 36,718 |
TOTAL MONEY MARKET FUNDS (Cost $366,122) | 366,122 |
TOTAL INVESTMENT PORTFOLIO - 102.2% (Cost $4,235,534) | | 4,685,360 |
NET OTHER ASSETS - (2.2)% | | (101,327) |
NET ASSETS - 100% | $ 4,584,033 |
Legend |
(a) Non-income producing |
(b) Affiliated fund that is available only to investment companies and other accounts managed by Fidelity Investments. The rate quoted is the annualized seven-day yield of the fund at period end. A complete listing of the fund's holdings as of its most recent fiscal year end is available upon request. |
(c) Includes investment made with cash collateral received from securities on loan. |
(d) Security or a portion of the security is on loan at period end. |
(e) Security exempt from registration under Rule 144A of the Securities Act of 1933. These securities may be resold in transactions exempt from registration, normally to qualified institutional buyers. At the period end, the value of these securities amounted to $13,849,000 or 0.3% of net assets. |
(f) Restricted securities - Investment in securities not registered under the Securities Act of 1933 (excluding 144A issues). At the end of the period, the value of restricted securities (excluding 144A issues) amounted to $0 or 0.0% of net assets. |
Additional information on each holding is as follows: |
Security | Acquisition Date | Acquisition Cost (000s) |
Chorum Technologies, Inc. Series E | 9/19/00 | $ 714 |
Procket Networks, Inc. Series C | 2/9/01 | $ 17,000 |
Other Information |
Distribution of investments by country of issue, as a percentage of total net assets, is as follows: |
United States of America | 77.9% |
Canada | 3.2% |
Panama | 2.8% |
Cayman Islands | 2.7% |
India | 2.6% |
United Kingdom | 2.5% |
Ireland | 1.8% |
Brazil | 1.7% |
Bahamas (Nassau) | 1.5% |
Australia | 1.4% |
Others (individually less than 1%) | 1.9% |
| 100.0% |
Income Tax Information |
At November 30, 2004, the fund had a capital loss carryforward of approximately $1,561,640,000 of which $1,016,352,000 and $545,288,000 will expire on November 30, 2009 and 2010, respectively. |
See accompanying notes which are an integral part of the financial statements.
Annual Report
Financial Statements
Statement of Assets and Liabilities
Amounts in thousands (except per-share amount) | November 30, 2004 |
| | |
Assets | | |
Investment in securities, at value (including securities loaned of $35,746) (cost $4,235,534) - See accompanying schedule | | $ 4,685,360 |
Foreign currency held at value (cost $18) | | 19 |
Receivable for investments sold | | 6,518 |
Receivable for fund shares sold | | 799 |
Dividends receivable | | 28,913 |
Interest receivable | | 624 |
Prepaid expenses | | 19 |
Other affiliated receivables | | 28 |
Other receivables | | 893 |
Total assets | | 4,723,173 |
| | |
Liabilities | | |
Payable for investments purchased | $ 89,885 | |
Payable for fund shares redeemed | 4,186 | |
Accrued management fee | 2,551 | |
Other affiliated payables | 878 | |
Other payables and accrued expenses | 4,922 | |
Collateral on securities loaned, at value | 36,718 | |
Total liabilities | | 139,140 |
| | |
Net Assets | | $ 4,584,033 |
Net Assets consist of: | | |
Paid in capital | | $ 5,675,896 |
Undistributed net investment income | | 26,733 |
Accumulated undistributed net realized gain (loss) on investments and foreign currency transactions | | (1,564,196) |
Net unrealized appreciation (depreciation) on investments and assets and liabilities in foreign currencies | | 445,600 |
Net Assets, for 263,623 shares outstanding | | $ 4,584,033 |
Net Asset Value, offering price and redemption price per share ($4,584,033 ÷ 263,623 shares) | | $ 17.39 |
See accompanying notes which are an integral part of the financial statements.
Annual Report
Financial Statements - continued
Statement of Operations
Amounts in thousands | Year ended November 30, 2004 |
| | |
Investment Income | | |
Dividends (a) | | $ 38,370 |
Special Dividends | | 20,770 |
Interest | | 2,349 |
Security lending | | 557 |
Total income | | 62,046 |
| | |
Expenses | | |
Management fee
Basic fee | $ 25,986 | |
Performance adjustment | (1,575) | |
Transfer agent fees | 8,263 | |
Accounting and security lending fees | 1,003 | |
Non-interested trustees' compensation | 27 | |
Appreciation in deferred trustee compensation account | 13 | |
Custodian fees and expenses | 272 | |
Registration fees | 36 | |
Audit | 80 | |
Legal | 19 | |
Interest | 2 | |
Miscellaneous | 57 | |
Total expenses before reductions | 34,183 | |
Expense reductions | (2,116) | 32,067 |
Net investment income (loss) | | 29,979 |
Realized and Unrealized Gain (Loss) Net realized gain (loss) on: | | |
Investment securities | 440,929 | |
Foreign currency transactions | 674 | |
Total net realized gain (loss) | | 441,603 |
Change in net unrealized appreciation (depreciation) on: Investment securities (net of increase in deferred foreign taxes of $4,846) | 95,984 | |
Assets and liabilities in foreign currencies | 201 | |
Total change in net unrealized appreciation (depreciation) | | 96,185 |
Net gain (loss) | | 537,788 |
Net increase (decrease) in net assets resulting from operations | | $ 567,767 |
(a) As a result of the change in the estimate of the return of capital component of dividend income realized in the year ended November 30, 2003, dividend income has been reduced by $1,128 with a corresponding increase to net unrealized appreciation (depreciation). |
See accompanying notes which are an integral part of the financial statements.
Annual Report
Statement of Changes in Net Assets
Amounts in thousands | Year ended
November 30,
2004 | Year ended
November 30,
2003 |
Increase (Decrease) in Net Assets | | |
Operations | | |
Net investment income (loss) | $ 29,979 | $ 43,741 |
Net realized gain (loss) | 441,603 | 608,783 |
Change in net unrealized appreciation (depreciation) | 96,185 | (101,011) |
Net increase (decrease) in net assets resulting
from operations | 567,767 | 551,513 |
Distributions to shareholders from net investment income | (29,382) | (67,226) |
Share transactions
Proceeds from sales of shares | 263,419 | 409,847 |
Reinvestment of distributions | 29,180 | 66,756 |
Cost of shares redeemed | (838,093) | (812,268) |
Net increase (decrease) in net assets resulting from share transactions | (545,494) | (335,665) |
Total increase (decrease) in net assets | (7,109) | 148,622 |
| | |
Net Assets | | |
Beginning of period | 4,591,142 | 4,442,520 |
End of period (including undistributed net investment income of $26,733 and undistributed net investment income of $25,847, respectively) | $ 4,584,033 | $ 4,591,142 |
Other Information Shares | | |
Sold | 16,581 | 29,449 |
Issued in reinvestment of distributions | 1,867 | 4,989 |
Redeemed | (51,974) | (58,519) |
Net increase (decrease) | (33,526) | (24,081) |
See accompanying notes which are an integral part of the financial statements.
Annual Report
Financial Highlights
Years ended November 30, | 2004 | 2003 | 2002 | 2001 | 2000 |
Selected Per-Share Data | | | | | |
Net asset value, beginning of period | $ 15.45 | $ 13.83 | $ 15.84 | $ 24.46 | $ 23.82 |
Income from Investment Operations | | | | |
Net investment income (loss) B | .11C,E | .14 | .21 | .17 | .05 |
Net realized and unrealized gain (loss) | 1.93 | 1.69 | (2.02) | (4.60) | 3.83 |
Total from investment operations | 2.04 | 1.83 | (1.81) | (4.43) | 3.88 |
Distributions from net investment income | (.10) | (.21) | (.20) | (.08) | (.05) |
Distributions from net realized gain | - | - | - | (4.11) | (3.19) |
Total distributions | (.10) | (.21) | (.20) | (4.19) | (3.24) |
Net asset value, end of period | $ 17.39 | $ 15.45 | $ 13.83 | $ 15.84 | $ 24.46 |
Total Return A | 13.28% | 13.47% | (11.57)% | (22.86)% | 17.02% |
Ratios to Average Net Assets D | | | | | |
Expenses before expense reductions | .76% | .62% | 1.07% | .97% | .88% |
Expenses net of voluntary waivers, if any | .76% | .62% | 1.07% | .97% | .88% |
Expenses net of all reductions | .71% | .55% | .97% | .92% | .85% |
Net investment income (loss) | .66% E | 1.00% | 1.41% | .95% | .19% |
Supplemental Data | | | | | |
Net assets, end of period
(in millions) | $ 4,584 | $ 4,591 | $ 4,443 | $ 5,483 | $ 7,921 |
Portfolio turnover rate | 119% | 166% | 191% | 187% | 249% |
A Total returns would have been lower had certain expenses not been reduced during the periods shown.
B Calculated based on average shares outstanding during the period.
C Investment income per share reflects a special dividend which amounted to $.07 per share.
D Expense ratios reflect operating expenses of the fund. Expenses before reductions do not reflect amounts reimbursed by the investment adviser or reductions from brokerage service arrangements or other expense offset arrangements and do not represent the amount paid by the fund during periods when reimbursements or reductions occur. Expenses net of any voluntary waivers reflect expenses after reimbursement by the investment adviser but prior to reductions from brokerage service arrangements or other expense offset arrangements. Expenses net of all reductions represent the net expenses paid by the fund.
E As a result in the change in the estimate of the return of capital component of dividend income realized in the year ended November 30, 2003, net investment income per share and the ratio of net investment income to average net assets for the year ended November 30, 2004 have been reduced by $.01 per share and .03%, respectively. The change in estimate has no impact on total net assets or total return of the fund.
See accompanying notes which are an integral part of the financial statements.
Annual Report
Notes to Financial Statements
For the period ended November 30, 2004
(Amounts in thousands except ratios)
1. Significant Accounting Policies.
Fidelity Independence Fund (the fund) is a fund of Fidelity Financial Trust (the trust) and is authorized to issue an unlimited number of shares. The trust is registered under the Investment Company Act of 1940, as amended (the 1940 Act), as an open-end management investment company organized as a Massachusetts business trust. The fund's investments in emerging markets can be subject to social, economic, regulatory, and political uncertainties and can be extremely volatile. The financial statements have been prepared in conformity with accounting principles generally accepted in the United States of America, which require management to make certain estimates and assumptions at the date of the financial statements. The following summarizes the significant accounting policies of the fund:
Security Valuation. Net asset value per share (NAV calculation) is calculated as of the close of business of the New York Stock Exchange, normally 4:00 p.m. Eastern time. Equity securities, including restricted securities, for which market quotations are available are valued at the last sale price or official closing price (closing bid price or last evaluated quote if no sale has occurred) on the primary market or exchange on which they trade. Debt securities, including restricted securities, for which quotations are readily available are valued at their most recent bid prices (sales prices if the principal market is an exchange) in the principal market in which such securities are normally traded, as determined by recognized dealers in such securities, or securities are valued on the basis of information provided by a pricing service. Pricing services use valuation matrices that incorporate both dealer-supplied valuations and valuation models. If prices are not readily available or do not accurately reflect fair value for a security, or if a security's value has been materially affected by events occurring after the close of the exchange or market on which the security is principally traded, that security may be valued by another method that the Board of Trustees believes accurately reflects fair value. A security's valuation may differ depending on the method used for determining value. Price movements in futures contracts and ADRs, market and trading trends, the bid/ask quotes of brokers and off-exchange institutional trading may be reviewed in the course of making a good faith determination of a security's fair value. Short-term securities with remaining maturities of sixty days or less for which quotations are not readily available are valued on the basis of amortized cost. Investments in open-end investment companies are valued at their net asset value each business day.
Foreign Currency. The fund uses foreign currency contracts to facilitate transactions in foreign-denominated securities. Losses from these transactions may arise from changes in the value of the foreign currency or if the counterparties do not perform under the contracts' terms.
Annual Report
Notes to Financial Statements - continued
(Amounts in thousands except ratios)
1. Significant Accounting Policies - continued
Foreign Currency - continued
Foreign-denominated assets, including investment securities, and liabilities are translated into U.S. dollars at the exchange rate at period end. Purchases and sales of investment securities, income and dividends received and expenses denominated in foreign currencies are translated into U.S. dollars at the exchange rate in effect on the transaction date.
The effects of exchange rate fluctuations on investments are included with the net realized and unrealized gain (loss) on investment securities. Other foreign currency transactions resulting in realized and unrealized gain (loss) are disclosed separately.
Investment Transactions and Income. Security transactions are accounted for as of trade date. Gains and losses on securities sold are determined on the basis of identified cost and may include proceeds received from litigation. Dividend income is recorded on the ex-dividend date, except for certain dividends from foreign securities where the ex-dividend date may have passed, which are recorded as soon as the fund is informed of the ex-dividend date. Non-cash dividends included in dividend income, if any, are recorded at the fair market value of the securities received. Distributions received on securities that represent a return of capital or capital gain are recorded as a reduction of cost of investments and/or as a realized gain. The fund estimates the components of distributions received that may be considered return of capital distributions or capital gain distributions. Large, non-recurring dividends recognized by the fund are presented separately on the Statement of Operations as "Special Dividends" and the impact of these dividends to net investment income per share is presented in the Financial Highlights. Interest income is accrued as earned. Interest income includes coupon interest and amortization of premium and accretion of discount on debt securities. Investment income is recorded net of foreign taxes withheld where recovery of such taxes is uncertain.
Expenses. Most expenses of the trust can be directly attributed to a fund. Expenses which cannot be directly attributed are apportioned among the funds in the trust.
Deferred Trustee Compensation. Under a Deferred Compensation Plan (the Plan), non-interested Trustees must defer receipt of a portion of, and may elect to defer receipt of an additional portion of, their annual compensation. Deferred amounts are treated as though equivalent dollar amounts had been invested in shares of the fund or are invested in a cross-section of other Fidelity funds, and are marked-to-market. Deferred amounts remain in the fund until distributed in accordance with the Plan.
Income Tax Information and Distributions to Shareholders. Each year, the fund intends to qualify as a regulated investment company by distributing all of its taxable income and realized gains under Subchapter M of the Internal Revenue Code. As a result, no provision for income taxes is required in the accompanying financial statements.
Annual Report
1. Significant Accounting Policies - continued
Income Tax Information and Distributions to Shareholders - continued
Foreign taxes are provided for based on the fund's understanding of the tax rules and rates that exist in the foreign markets in which it invests.
Distributions are recorded on the ex-dividend date. Income and capital gain distributions are determined in accordance with income tax regulations, which may differ from generally accepted accounting principles.
Capital accounts within the financial statements are adjusted for permanent book-tax differences. These adjustments have no impact on net assets or the results of operations. Temporary book-tax differences will reverse in a subsequent period.
Book-tax differences are primarily due to foreign currency transactions, capital loss carryforwards and losses deferred due to wash sales.
The tax-basis components of distributable earnings and the federal tax cost as of period end were as follows:
Unrealized appreciation | $ 621,686 |
Unrealized depreciation | (178,642) |
Net unrealized appreciation (depreciation) | 443,044 |
Undistributed ordinary income | 26,852 |
Capital loss carryforward | (1,561,640) |
| |
Cost for federal income tax purposes | $ 4,242,316 |
The tax character of distributions paid was as follows:
| November 30,
2004 | November 30,
2003 |
Ordinary Income | $ 29,382 | $ 67,226 |
2. Operating Policies.
Repurchase Agreements. Fidelity Management & Research Company (FMR) has received an Exemptive Order from the Securities and Exchange Commission (the SEC) which permits the fund and other affiliated entities of FMR to transfer uninvested cash balances into joint trading accounts. These accounts are then invested in repurchase agreements that are collateralized by U.S. Treasury or Government obligations. The fund may also invest directly with institutions, in repurchase agreements that are collateralized by commercial paper obligations and corporate obligations. Collateral is held in segregated accounts with custodian banks and may be obtained in the event of a default of the counterparty. Collateral is marked-to-market daily and maintained at a value at least equal to the principal amount of the repurchase agreement (including accrued interest).
Annual Report
Notes to Financial Statements - continued
(Amounts in thousands except ratios)
2. Operating Policies - continued
Restricted Securities. The fund may invest in securities that are subject to legal or contractual restrictions on resale. These securities generally may be resold in transactions exempt from registration or to the public if the securities are registered. Disposal of these securities may involve time-consuming negotiations and expense, and prompt sale at an acceptable price may be difficult. Information regarding restricted securities is included at the end of the fund's Schedule of Investments.
3. Purchases and Sales of Investments.
Purchases and sales of securities, other than short-term securities and U.S. government securities, aggregated $5,157,985 and $5,838,232, respectively.
4. Fees and Other Transactions with Affiliates.
Management Fee. FMR and its affiliates provide the fund with investment management related services for which the fund pays a monthly management fee. The management fee is the sum of an individual fund fee rate that is based on an annual rate of .30% of the fund's average net assets and a group fee rate that averaged .28% during the period. The group fee rate is based upon the average net assets of all the mutual funds advised by FMR. The group fee rate decreases as assets under management increase and increases as assets under management decrease. In addition, the management fee is subject to a performance adjustment (up to a maximum of ±.20% of the fund's average net assets over a 36 month performance period). The upward or downward adjustment to the management fee is based on the fund's relative investment performance as compared to an appropriate benchmark index. For the period, the total annual management fee rate, including the performance adjustment, was .54% of the fund's average net assets.
Transfer Agent Fees. Fidelity Service Company, Inc. (FSC), an affiliate of FMR, is the fund's transfer, dividend disbursing and shareholder servicing agent. FSC receives account fees and asset-based fees that vary according to account size and type of account. FSC pays for typesetting, printing and mailing of shareholder reports, except proxy statements. For the period, the transfer agent fees were equivalent to an annual rate of .18% of average net assets.
Accounting and Security Lending Fees. FSC maintains the fund's accounting records. The accounting fee is based on the level of average net assets for the month. Under a separate contract, FSC administers the security lending program. The security lending fee is based on the number and duration of lending transactions.
Annual Report
4. Fees and Other Transactions with Affiliates - continued
Central Funds. The fund may invest in affiliated Central Funds managed by Fidelity Investments Money Management, Inc. (FIMM), an affiliate of FMR. The Central Funds are open-end investment companies available only to investment companies and other accounts managed by FMR and its affiliates. The Central Funds seek preservation of capital and current income and do not pay a management fee. Income distributions earned by the fund are recorded as income in the accompanying financial statements and totaled $2,299 for the period.
Brokerage Commissions. The fund placed a portion of its portfolio transactions with brokerage firms which are affiliates of the investment adviser. The commissions paid to these affiliated firms were $372 for the period.
Interfund Lending Program. Pursuant to an Exemptive Order issued by the SEC, the fund, along with other registered investment companies having management contracts with FMR, may participate in an interfund lending program. This program provides an alternative credit facility allowing the funds to borrow from, or lend money to, other participating funds. At period end, there were no interfund loans outstanding. The fund's activity in this program during the period was as follows:
Borrower or Lender | Average Daily Loan Balance | Weighted Average Interest Rate | Interest Earned (included in interest income) | Interest Expense |
Borrower | $ 10,256 | 1.13% | $ - | $ 2 |
5. Committed Line of Credit.
The fund participates with other funds managed by FMR in a $4.2 billion credit facility (the "line of credit") to be utilized for temporary or emergency purposes to fund shareholder redemptions or for other short-term liquidity purposes. The fund has agreed to pay commitment fees on its pro rata portion of the line of credit. During the period, there were no borrowings on this line of credit.
6. Security Lending.
The fund lends portfolio securities from time to time in order to earn additional income. The fund receives collateral (in the form of U.S. Treasury obligations, letters of credit and/or cash) against the loaned securities and maintains collateral in an amount not less than 100% of the market value of the loaned securities during the period of the loan. The market value of the loaned securities is determined at the close of business of the fund and any additional required collateral is delivered to the fund on the next business day. If the borrower defaults on its obligation to return the securities loaned because of insolvency or other reasons, a fund could experience delays and costs in recovering the securities loaned or in gaining access to the collateral. Cash collateral is invested in cash
Annual Report
Notes to Financial Statements - continued
(Amounts in thousands except ratios)
6. Security Lending - continued
equivalents. The value of loaned securities and cash collateral at period end are disclosed on the fund's Statement of Assets and Liabilities.
7. Expense Reductions.
Many of the brokers with whom FMR places trades on behalf of the fund provided services to the fund in addition to trade execution. These services included payments of certain expenses on behalf of the fund totaling $2,094 for the period. In addition, through arrangements with the fund's custodian and transfer agent, credits realized as a result of uninvested cash balances were used to reduce the fund's expenses. During the period, these credits reduced the fund's custody and transfer agent expenses by $1 and $21, respectively.
Annual Report
Report of Independent Registered Public Accounting Firm
To the Trustees of Fidelity Financial Trust and the Shareholders of Fidelity Independence Fund:
In our opinion, the accompanying statement of assets and liabilities, including the schedule of investments, and the related statements of operations and of changes in net assets and the financial highlights present fairly, in all material respects, the financial position of Fidelity Independence Fund (a fund of Fidelity Financial Trust) at November 30, 2004, and the results of its operations, the changes in its net assets and the financial highlights for the periods indicated, in conformity with accounting principles generally accepted in the United States of America. These financial statements and financial highlights (hereafter referred to as "financial statements") are the responsibility of the Fidelity Independence Fund's management; our responsibility is to express an opinion on these financial statements based on our audits. We conducted our audits of these financial statements in accordance with the standards of the Public Company Accounting Oversight Board (United States). Those standards require that we plan and perform the audit to obtain reasonable assurance about whether the financial statements are free of material misstatement. An audit includes examining, on a test basis, evidence supporting the amounts and disclosures in the financial statements, assessing the accounting principles used and significant estimates made by management, and evaluating the overall financial statement presentation. We believe that our audits, which included confirmation of securities at November 30, 2004 by correspondence with the custodian and brokers, provide a reasonable basis for our opinion.
/s/PricewaterhouseCoopers LLP
PricewaterhouseCoopers LLP
Boston, Massachusetts
January 11, 2005
Annual Report
Trustees and Officers
The Trustees, Members of the Advisory Board, and executive officers of the trust and fund, as applicable, are listed below. The Board of Trustees governs the fund and is responsible for protecting the interests of shareholders. The Trustees are experienced executives who meet periodically throughout the year to oversee the fund's activities, review contractual arrangements with companies that provide services to the fund, and review the fund's performance. Except for William O. McCoy, each of the Trustees oversees 301 funds advised by FMR or an affiliate. Mr. McCoy oversees 303 funds advised by FMR or an affiliate.
The Trustees hold office without limit in time except that (a) any Trustee may resign; (b) any Trustee may be removed by written instrument, signed by at least two-thirds of the number of Trustees prior to such removal; (c) any Trustee who requests to be retired or who has become incapacitated by illness or injury may be retired by written instrument signed by a majority of the other Trustees; and (d) any Trustee may be removed at any special meeting of shareholders by a two-thirds vote of the outstanding voting securities of the trust. In any event, each non-interested Trustee shall retire not later than the last day of the calendar year in which his or her 72nd birthday occurs. The executive officers and Advisory Board Members hold office without limit in time, except that any officer and Advisory Board Member may resign or may be removed by a vote of a majority of the Trustees at any regular meeting or any special meeting of the Trustees. Except as indicated, each individual has held the office shown or other offices in the same company for the past five years.
The fund's Statement of Additional Information (SAI) includes more information about the Trustees. To request a free copy, call Fidelity at 1-800-544-8544.
Interested Trustees*:
Correspondence intended for each Trustee who is an "interested person" (as defined in the 1940 Act) may be sent to Fidelity Investments, 82 Devonshire Street, Boston, Massachusetts 02109.
Name, Age; Principal Occupation |
Edward C. Johnson 3d (74)** |
| Year of Election or Appointment: 1982 Mr. Johnson is Chairman of the Board of Trustees. Mr. Johnson serves as Chief Executive Officer, Chairman, and a Director of FMR Corp.; a Director and Chairman of the Board and of the Executive Committee of FMR; Chairman and a Director of Fidelity Management & Research (Far East) Inc.; Chairman (1998) and a Director of Fidelity Investments Money Management, Inc.; and Chairman (2001) and a Director (2000) of FMR Co., Inc. |
Abigail P. Johnson (42)** |
| Year of Election or Appointment: 2001 Senior Vice President of Independence (2001). Ms. Johnson also serves as Senior Vice President of other Fidelity funds (2001). She is President and a Director of FMR (2001), Fidelity Investments Money Management, Inc. (2001), FMR Co., Inc. (2001), and a Director of FMR Corp. Previously, Ms. Johnson managed a number of Fidelity funds. |
Laura B. Cronin (50) |
| Year of Election or Appointment: 2003 Ms. Cronin is an Executive Vice President (2002) and Chief Financial Officer (2002) of FMR Corp. and is a member of the Fidelity Management Committee (2003). Previously, Ms. Cronin served as Vice President of Finance of FMR (1997-1999), and Chief Financial Officer of FMR (1999-2001), Fidelity Personal Investments (2001), and Fidelity Brokerage Company (2001-2002). |
Robert L. Reynolds (52) |
| Year of Election or Appointment: 2003 Mr. Reynolds is a Director (2003) and Chief Operating Officer (2002) of FMR Corp. and is the head of the Fidelity Management Committee (2003). He also serves on the Board at Fidelity Investments Canada, Ltd. (2000). Previously, Mr. Reynolds served as President of Fidelity Investments Institutional Retirement Group (1996-2000). |
* Trustees have been determined to be "Interested Trustees" by virtue of, among other things, their affiliation with the trust or various entities under common control with FMR.
** Edward C. Johnson 3d, Trustee, is Abigail P. Johnson's father.
Annual Report
Non-Interested Trustees:
Correspondence intended for each non-interested Trustee (that is, the Trustees other than the Interested Trustees) may be sent to Fidelity Investments, P.O. Box 55235, Boston, Massachusetts 02205-5235.
Name, Age; Principal Occupation |
Robert M. Gates (61) |
| Year of Election or Appointment: 1997 Dr. Gates is Vice Chairman of the non-interested Trustees (2005). Dr. Gates is President of Texas A&M University (2002). He was Director of the Central Intelligence Agency (CIA) from 1991 to 1993. From 1989 to 1991, Dr. Gates served as Assistant to the President of the United States and Deputy National Security Advisor. Dr. Gates is a Director of NACCO Industries, Inc. (mining and manufacturing), Parker Drilling Co., Inc. (drilling and rental tools for the energy industry, 2001), and Brinker International (restaurant management, 2003). He also serves as a member of the Advisory Board of VoteHere.net (secure Internet voting, 2001). Previously, Dr. Gates served as a Director of LucasVarity PLC (automotive components and diesel engines), a Director of TRW Inc. (automotive, space, defense, and information technology), and Dean of the George Bush School of Government and Public Service at Texas A&M University (1999-2001). Dr. Gates also is a Trustee of the Forum for International Policy. |
George H. Heilmeier (68) |
| Year of Election or Appointment: 2004 Dr. Heilmeier is Chairman Emeritus of Telcordia Technologies (communication software and systems), where prior to his retirement, he served as company Chairman and Chief Executive Officer. He currently serves on the Boards of Directors of The Mitre Corporation (systems engineering and information technology support for the government), INET Technologies Inc. (telecommunications network surveillance, 2001), Teletech Holdings (customer management services), and HRL Laboratories (private research and development, 2004). He is Chairman of the General Motors Technology Advisory Committee and a Life Fellow of the Institute of Electrical and Electronics Engineers (IEEE) (2000). Dr. Heilmeier is a member of the Defense Science Board and the National Security Agency Advisory Board. He is also a member of the National Academy of Engineering, the American Academy of Arts and Sciences, and the Board of Overseers of the School of Engineering and Applied Science of the University of Pennsylvania. Previously, Dr. Heilmeier served as a Director of TRW Inc. (automotive, space, defense, and information technology, 1992-2002), Compaq (1994-2002), and Automatic Data Processing, Inc. (ADP) (technology-based business outsourcing, 1995-2002). |
Marie L. Knowles (58) |
| Year of Election or Appointment: 2001 Prior to Ms. Knowles' retirement in June 2000, she served as Executive Vice President and Chief Financial Officer of Atlantic Richfield Company (ARCO) (diversified energy, 1996-2000). From 1993 to 1996, she was a Senior Vice President of ARCO and President of ARCO Transportation Company. She served as a Director of ARCO from 1996 to 1998. She currently serves as a Director of Phelps Dodge Corporation (copper mining and manufacturing) and McKesson Corporation (healthcare service, 2002). Ms. Knowles is a Trustee of the Brookings Institution and the Catalina Island Conservancy and also serves as a member of the Advisory Board for the School of Engineering of the University of Southern California. |
Ned C. Lautenbach (60) |
| Year of Election or Appointment: 2000 Mr. Lautenbach has been a partner of Clayton, Dubilier & Rice, Inc. (private equity investment firm) since September 1998. Previously, Mr. Lautenbach was with the International Business Machines Corporation (IBM) from 1968 until his retirement in 1998. He was most recently Senior Vice President and Group Executive of Worldwide Sales and Services. From 1993 to 1995, he was Chairman of IBM World Trade Corporation, and from 1994 to 1998 was a member of IBM's Corporate Executive Committee. Mr. Lautenbach serves as Co-Chairman and a Director of Covansys, Inc. (global provider of business and technology solutions, 2000). In addition, he is a Director of Italtel Holding S.p.A. (telecommunications (Milan, Italy), 2004) and Eaton Corporation (diversified industrial) as well as the Philharmonic Center for the Arts in Naples, Florida (1999). He also is a member of the Council on Foreign Relations. |
Marvin L. Mann (71) |
| Year of Election or Appointment: 1993 Mr. Mann is Chairman of the non-interested Trustees (2001). He is Chairman Emeritus of Lexmark International, Inc. (computer peripherals), where he served as CEO until April 1998, retired as Chairman May 1999, and remains a member of the Board. Prior to 1991, he held the positions of Vice President of International Business Machines Corporation (IBM) and President and General Manager of various IBM divisions and subsidiaries. He is a member of the Executive Committee of the Independent Director's Council of the Investment Company Institute. In addition, Mr. Mann is a member of the President's Cabinet at the University of Alabama and the Board of Visitors of the Culverhouse College of Commerce and Business Administration at the University of Alabama. |
William O. McCoy (71) |
| Year of Election or Appointment: 1997 Prior to his retirement in December 1994, Mr. McCoy was Vice Chairman of the Board of BellSouth Corporation (telecommunications) and President of BellSouth Enterprises. He is currently a Director of Liberty Corporation (holding company), Duke Realty Corporation (real estate), and Progress Energy, Inc. (electric utility). He is also a partner of Franklin Street Partners (private investment management firm) and a member of the Research Triangle Foundation Board. In addition, Mr. McCoy served as the Interim Chancellor (1999-2000) and a member of the Board of Visitors (1994-1998) for the University of North Carolina at Chapel Hill and currently serves on the Board of Directors of the University of North Carolina Health Care System and the Board of Visitors of the Kenan-Flagler Business School (University of North Carolina at Chapel Hill). He also served as Vice President of Finance for the University of North Carolina (16-school system, 1995-1998). |
Cornelia M. Small (60) |
| Year of Election or Appointment: 2005 Ms. Small is a member (2000) and Chairperson (2002) of the Investment Committee, and a member (2002) of the Board of Trustees of Smith College. Previously, she served as Chief Investment Officer (1999-2000), Director of Global Equity Investments (1996-1999), and a member of the Board of Directors of Scudder, Stevens & Clark (1990-1997) and Scudder Kemper Investments (1997-1998). In addition, Ms. Small served as Co-Chair (2000-2003) of the Annual Fund for the Fletcher School of Law and Diplomacy. |
William S. Stavropoulos (65) |
| Year of Election or Appointment: 2002 Mr. Stavropoulos is Chairman of the Board (2000), CEO (2002), a position he previously held from 1995-2000, Chairman of the Executive Committee (2000), and a Member of the Board of Directors of The Dow Chemical Company. Since joining The Dow Chemical Company in 1967, Mr. Stavropoulos served in numerous senior management positions, including President (1993-2000; 2002-2003). Currently, he is a Director of NCR Corporation (data warehousing and technology solutions), BellSouth Corporation (telecommunications), Chemical Financial Corporation, and Maersk Inc. (industrial conglomerate, 2002). He also serves as a member of the Board of Trustees of the American Enterprise Institute for Public Policy Research. In addition, Mr. Stavropoulos is a member of The Business Council, J.P. Morgan International Council and the University of Notre Dame Advisory Council for the College of Science. |
Annual Report
Trustees and Officers - continued
Advisory Board Members and Executive Officers:
Correspondence intended for Mr. Dirks and Mr. Wolfe may be sent to Fidelity Investments, P.O. Box 55235, Boston, Massachusetts 02205-5235. Correspondence intended for each executive officer and Mr. Lynch may be sent to Fidelity Investments, 82 Devonshire Street, Boston, Massachusetts 02109.
Name, Age; Principal Occupation |
Dennis J. Dirks (56) |
| Year of Election or Appointment: 2004 Member of the Advisory Board of Fidelity Financial Trust. Mr. Dirks also serves as a Trustee (2005) or Member of the Advisory Board (2004) of other investment companies advised by FMR. Prior to his retirement in May 2003, Mr. Dirks was Chief Operating Officer and a member of the Board of The Depository Trust & Clearing Corporation (DTCC) (1999-2003). He also served as President, Chief Operating Officer, and Board member of The Depository Trust Company (DTC) (1999-2003) and President and Board member of the National Securities Clearing Corporation (NSCC) (1999-2003). In addition, Mr. Dirks served as Chief Executive Officer and Board member of the Government Securities Clearing Corporation (2001-2003) and Chief Executive Officer and Board member of the Mortgage-Backed Securities Clearing Corporation (2001-2003). |
Peter S. Lynch (61) |
| Year of Election or Appointment: 2003 Member of the Advisory Board of Fidelity Financial Trust. Vice Chairman and a Director of FMR, and Vice Chairman (2001) and a Director (2000) of FMR Co., Inc. Previously, Mr. Lynch served as a Trustee of the Fidelity funds (1990-2003). Prior to May 31, 1990, he was a Director of FMR and Executive Vice President of FMR (a position he held until March 31, 1991), Vice President of Fidelity® Magellan® Fund and FMR Growth Group Leader, and Managing Director of FMR Corp. Mr. Lynch was also Vice President of Fidelity Investments Corporate Services. In addition, he serves as a Trustee of Boston College, Massachusetts Eye & Ear Infirmary, Historic Deerfield, John F. Kennedy Library, and the Museum of Fine Arts of Boston. |
Kenneth L. Wolfe (65) |
| Year of Election or Appointment: 2004 Member of the Advisory Board of Fidelity Financial Trust. Mr. Wolfe also serves as a Trustee (2005) or Member of the Advisory Board (2004) of other investment companies advised by FMR. Prior to his retirement in 2001, Mr. Wolfe was Chairman and Chief Executive Officer of Hershey Foods Corporation (1993-2001). He currently serves as a member of the boards of Adelphia Communications Corporation (2003), Bausch & Lomb, Inc., and Revlon Inc. (2004). |
John B. McDowell (46) |
| Year of Election or Appointment: 2002 Vice President of Independence. Mr. McDowell also serves as Vice President of certain Equity Funds (2002). He is Senior Vice President of FMR (1999), FMR Co., Inc. (2001), and Fidelity Management Trust Company (FMTC). Since joining Fidelity Investments in 1985, Mr. McDowell has worked as a research analyst and manager. |
Jason Weiner (35) |
| Year of Election or Appointment: 2003 Vice President of Independence. Mr. Weiner is also Vice President of other funds advised by FMR. Prior to assuming his current responsibilities, Mr. Weiner managed a variety of Fidelity funds. |
Eric D. Roiter (56) |
| Year of Election or Appointment: 1998 Secretary of Independence. He also serves as Secretary of other Fidelity funds; Vice President, General Counsel, and Secretary of FMR Co., Inc. (2001-present) and FMR; Vice President and Secretary of FDC; Assistant Secretary of Fidelity Management & Research (U.K.) Inc. (2001-present), Fidelity Management & Research (Far East) Inc. (2001-present), of Fidelity Investments Money Management, Inc. (2001-present). Mr. Roiter is an Adjunct Member, Faculty of Law, at Boston College Law School (2003-present). |
Stuart Fross (45) |
| Year of Election or Appointment: 2003 Assistant Secretary of Independence. Mr. Fross also serves as Assistant Secretary of other Fidelity funds (2003) and is an employee of FMR. |
Christine Reynolds (46) |
| Year of Election or Appointment: 2004 President, Treasurer, and Anti-Money Laundering (AML) officer of Independence. Ms. Reynolds also serves as President, Treasurer, and AML officer of other Fidelity funds (2004) and is a Vice President (2003) and an employee (2002) of FMR. Before joining Fidelity Investments, Ms. Reynolds worked at PricewaterhouseCoopers LLP (PwC) (1980-2002), where she was most recently an audit partner with PwC's investment management practice. |
Timothy F. Hayes (53) |
| Year of Election or Appointment: 2002 Chief Financial Officer of Independence. Mr. Hayes also serves as Chief Financial Officer of other Fidelity funds (2002). Recently he was appointed President of Fidelity Service Company (2003) where he also serves as a Director. Mr. Hayes also serves as President of Fidelity Investments Operations Group (FIOG, 2002), which includes Fidelity Pricing and Cash Management Services Group (FPCMS), where he was appointed President in 1998. Previously, Mr. Hayes served as Chief Financial Officer of Fidelity Investments Corporate Systems and Service Group (1998) and Fidelity Systems Company (1997-1998). |
Kenneth A. Rathgeber (57) |
| Year of Election or Appointment: 2004 Chief Compliance Officer of Independence. Mr. Rathgeber also serves as Chief Compliance Officer of other Fidelity funds (2004) and Executive Vice President of Risk Oversight for Fidelity Investments (2002). Previously, he served as Executive Vice President and Chief Operating Officer for Fidelity Investments Institutional Services Company, Inc. (1998-2002). |
John R. Hebble (46) |
| Year of Election or Appointment: 2003 Deputy Treasurer of Independence. Mr. Hebble also serves as Deputy Treasurer of other Fidelity funds (2003), and is an employee of FMR. Before joining Fidelity Investments, Mr. Hebble worked at Deutsche Asset Management where he served as Director of Fund Accounting (2002-2003) and Assistant Treasurer of the Scudder Funds (1998-2003). |
Kimberley H. Monasterio (40) |
| Year of Election or Appointment: 2004 Deputy Treasurer of Independence. Ms. Monasterio also serves as Deputy Treasurer of other Fidelity funds (2004) and is an employee of FMR (2004). Before joining Fidelity Investments, Ms. Monasterio served as Treasurer (2000-2004) and Chief Financial Officer (2002-2004) of the Franklin Templeton Funds and Senior Vice President of Franklin Templeton Services, LLC (2000-2004). |
John H. Costello (58) |
| Year of Election or Appointment: 1986 Assistant Treasurer of Independence. Mr. Costello also serves as Assistant Treasurer of other Fidelity funds and is an employee of FMR. |
Peter L. Lydecker (50) |
| Year of Election or Appointment: 2004 Assistant Treasurer of Independence. Mr. Lydecker also serves as Assistant Treasurer of other Fidelity funds (2004) and is an employee of FMR. |
Mark Osterheld (49) |
| Year of Election or Appointment: 2002 Assistant Treasurer of Independence. Mr. Osterheld also serves as Assistant Treasurer of other Fidelity funds (2002) and is an employee of FMR. |
Kenneth B. Robins (35) |
| Year of Election or Appointment: 2004 Assistant Treasurer of Independence. Mr. Robins also serves as Assistant Treasurer of other Fidelity funds (2004) and is an employee of FMR (2004). Before joining Fidelity Investments, Mr. Robins worked at KPMG LLP, where he was a partner in KPMG's department of professional practice (2002-2004) and a Senior Manager (1999-2000). In addition, Mr. Robins served as Assistant Chief Accountant, United States Securities and Exchange Commission (2000-2002). |
Thomas J. Simpson (46) |
| Year of Election or Appointment: 2000 Assistant Treasurer of Independence. Mr. Simpson is Assistant Treasurer of other Fidelity funds (2000) and an employee of FMR (1996). Prior to joining FMR, Mr. Simpson was Vice President and Fund Controller of Liberty Investment Services (1987-1995). |
Annual Report
Distributions
The fund designates 100% of the dividends distributed during the fiscal year as qualifying for the dividends-received deduction for corporate shareholders.
The fund designates 100% of the dividends distributed in December during the fiscal year as amounts which may be taken into account as a dividend for purposes of the maximum rate under section 1(h)(11) of the Internal Revenue Code.
The fund will notify shareholders in January 2005 of amounts for use in preparing 2004 income tax returns.
Annual Report
Annual Report
Investment Adviser
Fidelity Management & Research Company
Boston, MA
Investment Sub-Advisers
FMR Co., Inc.
Fidelity Management & Research
(U.K.) Inc.
Fidelity Management & Research
(Far East) Inc.
Fidelity International Investment
Advisors
Fidelity Investments Japan Limited
Fidelity International Investment
Advisors (U.K.) Limited
General Distributor
Fidelity Distributors Corporation
Boston, MA
Transfer and Shareholder
Servicing Agent
Fidelity Service Company, Inc.
Boston, MA
Custodian
Brown Brothers Harriman & Co.
Boston, MA
Fidelity's Growth Funds
Aggressive Growth Fund
Blue Chip Growth Fund
Blue Chip Value Fund
Capital Appreciation Fund
Contrafund®
Disciplined Equity Fund
Discovery Fund
Dividend Growth Fund
Export and Multinational Fund
Fidelity Fifty®
Fidelity Value Discovery Fund
Focused Stock Fund
Growth Company Fund
Independence Fund
Large Cap Stock Fund
Leveraged Company Stock Fund
Low-Priced Stock Fund
Magellan® Fund
Mid-Cap Stock Fund
New Millennium Fund®
OTC Portfolio
Small Cap Independence Fund
Small Cap Stock Fund
Stock Selector
Structured Large Cap Growth Fund
Structured Large Cap Value Fund
Structured Mid Cap Growth Fund
Structured Mid Cap Value Fund
Tax Managed Stock Fund
Trend Fund
Value Fund
Please carefully consider the funds' investment objectives, risks, charges and expenses before investing. For this and other information, call 1-800-544-6666 for a free prospectus. Read it carefully before you invest or send money.
The Fidelity Telephone Connection
Mutual Fund 24-Hour Service
Exchanges/Redemptions
and Account Assistance 1-800-544-6666
Product Information 1-800-544-6666
Retirement Accounts 1-800-544-4774
(8 a.m. - 9 p.m.)
TDD Service 1-800-544-0118
for the deaf and hearing impaired
(9 a.m. - 9 p.m. Eastern time)
Fidelity Automated Service
Telephone (FAST®) (automated graphic) 1-800-544-5555
(automated graphic) Automated line for quickest service
(Fidelity Investment logo)(registered trademark)
Corporate Headquarters
82 Devonshire St., Boston, MA 02109
www.fidelity.com
FRE-UANN-0105
1.786709.101
Fidelity Advisor
Strategic Dividend & Income
Fund - Class A, Class T,
Class B and Class C
Annual Report
November 30, 2004
(2_fidelity_logos) (Registered_Trademark)
Class A, Class T, Class B,
and Class C are classes
of Fidelity® Strategic
Dividend & IncomeSM Fund
Contents
Chairman's Message | <Click Here> | Ned Johnson's message to shareholders. |
Performance | <Click Here> | How the fund has done over time. |
Management's Discussion | <Click Here> | The manager's review of fund performance, strategy and outlook. |
Shareholder Expense Example | <Click Here> | An example of shareholder expenses. |
Investment Changes | <Click Here> | A summary of the fund's investments. |
Investments | <Click Here> | A complete list of the fund's investments with their market values. |
Financial Statements | <Click Here> | Statements of assets and liabilities, operations, and changes in net assets,
as well as financial highlights. |
Notes | <Click Here> | Notes to the financial statements. |
Report of Independent Registered Public Accounting Firm | <Click Here> | |
Trustees and Officers | <Click Here> | |
Distributions | <Click Here> | |
| | |
Standard & Poor's, S&P and S&P 500 are registered service marks of The McGraw-Hill Companies, Inc. and have been licensed for use by Fidelity Distributors Corporation.
Other third party marks appearing herein are the property of their respective owners.
All other marks appearing herein are registered or unregistered trademarks or service marks of FMR Corp. or an affiliated company.
To view a fund's proxy voting guidelines and proxy voting record for the 12-month period ended June 30, visit www.fidelity.com/proxyvotingresults or visit the Securities and Exchange Commission's (SEC) web site at www.sec.gov. You may also call 1-877-208-0098 to request a free copy of the proxy voting guidelines.
(Recycle graphic) This report is printed on recycled paper using soy-based inks.
Annual Report
This report and the financial statements contained herein are submitted for the general information of the shareholders of the fund. This report is not authorized for distribution to prospective investors in the fund unless preceded or accompanied by an effective prospectus.
A fund files its complete schedule of portfolio holdings with the SEC for the first and third quarters of each fiscal year on Form N-Q. Forms N-Q are available on the SEC's web site at http://www.sec.gov. A fund's Forms N-Q may be reviewed and copied at the SEC's Public Reference Room in Washington, DC. Information regarding the operation of the SEC's Public Reference Room may be obtained by calling 1-800-SEC-0330. For a complete list of a fund's portfolio holdings, view the most recent quarterly holdings report, semiannual report, or annual report on Fidelity's web site at http://www.advisor.fidelity.com.
NOT FDIC INSURED · MAY LOSE VALUE · NO BANK GUARANTEE
Neither the fund nor Fidelity Distributors Corporation is a bank.
Annual Report
Chairman's Message
(photo_of_Edward_C_Johnson_3d)
Dear Shareholder:
During the past year or so, much has been reported about the mutual fund industry, and much of it has been more critical than I believe is warranted. Allegations that some companies have been less than forthright with their shareholders have cast a shadow on the entire industry. I continue to find these reports disturbing, and assert that they do not create an accurate picture of the industry overall. Therefore, I would like to remind everyone where Fidelity stands on these issues. I will say two things specifically regarding allegations that some mutual fund companies were in violation of the Securities and Exchange Commission's forward pricing rules or were involved in so-called "market timing" activities.
First, Fidelity has no agreements that permit customers who buy fund shares after 4 p.m. to obtain the 4 p.m. price. This is not a new policy. This is not to say that someone could not deceive the company through fraudulent acts. However, we are extremely diligent in preventing fraud from occurring in this manner - and in every other. But I underscore again that Fidelity has no so-called "agreements" that sanction illegal practices.
Second, Fidelity continues to stand on record, as we have for years, in opposition to predatory short-term trading that adversely affects shareholders in a mutual fund. Back in the 1980s, we initiated a fee - which is returned to the fund and, therefore, to investors - - to discourage this activity. Further, we took the lead several years ago in developing a Fair Value Pricing Policy to prevent market timing on foreign securities in our funds. I am confident we will find other ways to make it more difficult for predatory traders to operate. However, this will only be achieved through close cooperation among regulators, legislators and the industry.
Yes, there have been unfortunate instances of unethical and illegal activity within the mutual fund industry from time to time. That is true of any industry. When this occurs, confessed or convicted offenders should be dealt with appropriately. But we are still concerned about the risk of over-regulation and the quick application of simplistic solutions to intricate problems. Every system can be improved, and we support and applaud well thought out improvements by regulators, legislators and industry representatives that achieve the common goal of building and protecting the value of investors' holdings.
For nearly 60 years, Fidelity has worked very hard to improve its products and service to justify your trust. When our family founded this company in 1946, we had only a few hundred customers. Today, we serve more than 18 million customers including individual investors and participants in retirement plans across America.
Let me close by saying that we do not take your trust in us for granted, and we realize that we must always work to improve all aspects of our service to you. In turn, we urge you to continue your active participation with your financial matters, so that your interests can be well served.
Best regards,
/s/Edward C. Johnson 3d
Edward C. Johnson 3d
Annual Report
Performance: The Bottom Line
Average annual total return reflects the change in the value of an investment, assuming reinvestment of the class' dividend income and capital gains (the profits earned upon the sale of securities that have grown in value) and assuming a constant rate of performance each year. The $10,000 table and the fund's returns do not reflect the deduction of taxes that a shareholder would pay on fund distributions or the redemption of fund shares. During periods of reimbursement by Fidelity, a fund's total return will be greater than it would be had the reimbursement not occurred. How a fund did yesterday is no guarantee of how it will do tomorrow. Returns may reflect the conversion of Class B shares to Class A shares after a maximum of seven years.
Average annual total returns take Fidelity Advisor Strategic Dividend & Income Fund's cumulative total return and show you what would have happened if Fidelity Advisor Strategic Dividend & Income Fund shares had performed at a constant rate each year. These numbers will be reported once the fund is a year old.
$10,000 Over Life of Fund
Let's say hypothetically that $10,000 was invested in Fidelity Advisor Strategic Dividend & Income Fund - Class T on December 23, 2003, when the fund started, and the current 3.50% sales charge was paid. The chart shows how the value of your investment would have changed, and also shows how the Standard & Poor's 500 Index performed over the same period.

Annual Report
Management's Discussion of Fund Performance
Comments from William Eigen, Portfolio Manager of Fidelity Advisor Strategic Dividend & Income Fund
Despite surging oil prices, a struggling job market and four interest rate hikes in a five-month span, U.S. equity markets posted solid results for the 12-month period ending November 30, 2004, and were closing in on a second straight year in the black. There was great disparity in the market during the past year. For instance, value stocks trounced their growth counterparts during the period. To illustrate, the Russell 1000® Value Index shot up 19.67%, while the Russell 1000 Growth Index rose only 5.83%. Meanwhile, small- and mid-cap stocks vastly outperformed larger-cap stocks. Energy was the best-performing sector of the market, propelled by a spike in oil prices. Conversely, technology stocks dipped lower in response to a slowdown in corporate capital spending. For the 12-month period overall, the Standard & Poor's 500SM Index returned 12.86% - slightly above its historical average. Elsewhere, the Dow Jones Industrial AverageSM rose 8.87% and the tech-heavy NASDAQ Composite® Index advanced 7.50%.
From its inception on December 23, 2003, through November 30, 2004, the fund's Class A, Class T, Class B and Class C shares rose 12.01%, 11.75%, 11.24% and 11.24%, respectively, versus 12.63% for the Fidelity Strategic Dividend & Income Composite Index. Though solid, the fund's overall results could have been better, I felt, given that a lot went right during the period. Specifically, three of the fund's four subportfolios handily beat their respective benchmarks. Some well-timed tactical asset allocation shifts also helped, although my decision to underweight real estate investment trusts (REITs) - the period's top-performing asset class - detracted from performance versus the composite index as demand for these securities remained red hot. The biggest contribution to relative returns came from the fund's positioning in preferred stocks, which significantly trailed the broader equity market. In addition to modestly underweighting the sector overall, the fund benefited from favoring high-yield and convertible preferreds, which did relatively well amid an upturn in equities. We achieved strong results in the convertible bond subportfolio, mainly by being aggressive and taking concentrated positions in selected, more-volatile names. Solid security selection also contributed to outsized returns in the preferred stock and REIT subportfolios. The common stock subportfolio slightly trailed its index in part because it did not hold REITs.
The views expressed in this statement reflect those of the portfolio manager only through the end of the period of the report as stated on the cover and do not necessarily represent the views of Fidelity or any other person in the Fidelity organization. Any such views are subject to change at any time based upon market or other conditions and Fidelity disclaims any responsibility to update such views. These views may not be relied on as investment advice and, because investment decisions for a Fidelity fund are based on numerous factors, may not be relied on as an indication of trading intent on behalf of any Fidelity fund.
Annual Report
Shareholder Expense Example
As a shareholder of the Fund, you incur two types of costs: (1) transaction costs, including sales charges (loads) on purchase payments or redemption proceeds, and (2) ongoing costs, including management fees, distribution and/or service (12b-1) fees and other Fund expenses. This Example is intended to help you understand your ongoing costs (in dollars) of investing in the Fund and to compare these costs with the ongoing costs of investing in other mutual funds.
The Example is based on an investment of $1,000 invested at the beginning of the period and held for the entire period (June 1, 2004 to November 30, 2004).
Actual Expenses
The first line of the table below for each class of the Fund provides information about actual account values and actual expenses. You may use the information in this line, together with the amount you invested, to estimate the expenses that you paid over the period. Simply divide your account value by $1,000.00 (for example, an $8,600 account value divided by $1,000.00 = 8.6), then multiply the result by the number in the first line for a class of the Fund under the heading entitled "Expenses Paid During Period" to estimate the expenses you paid on your account during this period.
Hypothetical Example for Comparison Purposes
The second line of the table below for each class of the Fund provides information about hypothetical account values and hypothetical expenses based on a Class' actual expense ratio and an assumed rate of return of 5% per year before expenses, which is not the Class' actual return. The hypothetical account values and expenses may not be used to estimate the actual ending account balance or expenses you paid for the period. You may use this information to compare the ongoing costs of investing in the Fund and other funds. To do so, compare this 5% hypothetical example with the 5% hypothetical examples that appear in the shareholder reports of the other funds.
Please note that the expenses shown in the table are meant to highlight your ongoing costs only and do not reflect any transaction costs. Therefore, the second line of the table is useful in comparing ongoing costs only, and will not help you determine the relative total costs of owning different funds. In addition, if these transactional costs were included, your costs would have been higher.
Annual Report
| Beginning
Account Value
June 1, 2004 | Ending
Account Value
November 30, 2004 | Expenses Paid
During Period*
June 1, 2004
to November 30, 2004 |
Class A | | | |
Actual | $ 1,000.00 | $ 1,095.60 | $ 6.29 |
HypotheticalA | $ 1,000.00 | $ 1,018.92 | $ 6.08 |
Class T | | | |
Actual | $ 1,000.00 | $ 1,094.60 | $ 7.59 |
HypotheticalA | $ 1,000.00 | $ 1,017.66 | $ 7.34 |
Class B | | | |
Actual | $ 1,000.00 | $ 1,091.10 | $ 10.19 |
HypotheticalA | $ 1,000.00 | $ 1,015.13 | $ 9.87 |
Class C | | | |
Actual | $ 1,000.00 | $ 1,091.10 | $ 10.19 |
HypotheticalA | $ 1,000.00 | $ 1,015.13 | $ 9.87 |
Strategic Dividend & Income | | | |
Actual | $ 1,000.00 | $ 1,097.50 | $ 4.56 |
HypotheticalA | $ 1,000.00 | $ 1,020.60 | $ 4.40 |
Institutional Class | | | |
Actual | $ 1,000.00 | $ 1,098.60 | $ 4.46 |
HypotheticalA | $ 1,000.00 | $ 1,020.70 | $ 4.30 |
A 5% return per year before expenses
*Expenses are equal to each Class' annualized expense ratio (shown in the table below); multiplied by the average account value over the period, multiplied by 183/366 (to reflect the one-half year period).
| Annualized
Expense Ratio |
Class A | 1.20% |
Class T | 1.45% |
Class B | 1.95% |
Class C | 1.95% |
Strategic Dividend & Income | .87% |
Institutional Class | .85% |
Annual Report
Investment Changes
Top Ten Investments as of November 30, 2004 |
(excluding cash equivalents) | % of fund's
net assets | % of fund's net assets
6 months ago |
General Electric Co. | 3.3 | 1.0 |
Exxon Mobil Corp. | 2.1 | 1.6 |
Bank of America Corp. | 1.8 | 1.7 |
El Paso Tennessee Pipeline Co. Series A, 8.25% | 1.5 | 1.8 |
American International Group, Inc. | 1.5 | 1.6 |
Honeywell International, Inc. | 1.3 | 0.9 |
SBC Communications, Inc. | 1.1 | 1.0 |
Tyco International Ltd. | 1.0 | 1.5 |
AES Trust VII 6.00% | 1.0 | 0.9 |
Wachovia Corp. | 1.0 | 0.7 |
| 15.6 | |
Top Five Market Sectors as of November 30, 2004 |
| % of fund's
net assets | % of fund's net assets
6 months ago |
Financials | 28.5 | 33.5 |
Industrials | 12.0 | 8.2 |
Health Care | 10.4 | 10.5 |
Energy | 9.9 | 9.8 |
Consumer Discretionary | 8.2 | 9.5 |
Asset Allocation (% of fund's net assets) |
As of November 30, 2004 * | As of May 31, 2004 ** |
 | Convertible
Bonds 13.8% | | | Convertible
Bonds 13.4% | |
| Common Stocks 66.3% | | | Common Stocks 67.5% | |
 | Preferred Stocks 14.4% | | | Preferred Stocks 17.7% | |
| Short-Term
Investments and
Net Other Assets 5.5% | | | Short-Term
Investments and
Net Other Assets 1.4% | |
* Foreign
investments | 3.4% | | ** Foreign
investments | 3.3% | |

Annual Report
Investments November 30, 2004
Showing Percentage of Net Assets
Corporate Bonds - 13.8% |
| Principal Amount | | Value
(Note 1) |
Convertible Bonds - 13.8% |
CONSUMER DISCRETIONARY - 1.1% |
Hotels, Restaurants & Leisure - 0.6% |
Kerzner International Ltd. 2.375% 4/15/24 | | $ 3,030,000 | | $ 3,509,346 |
Media - 0.5% |
Interpublic Group of Companies, Inc. 4.5% 3/15/23 | | 2,270,000 | | 2,872,004 |
TOTAL CONSUMER DISCRETIONARY | | 6,381,350 |
ENERGY - 0.3% |
Energy Equipment & Services - 0.3% |
Halliburton Co. 3.125% 7/15/23 | | 1,440,000 | | 1,831,752 |
FINANCIALS - 1.1% |
Capital Markets - 0.5% |
Merrill Lynch & Co., Inc. liquid yield option note 0% 3/13/32 | | 3,010,000 | | 3,043,712 |
Consumer Finance - 0.6% |
American Express Co.: | | | | |
1.85% 12/1/33 (d)(f) | | 1,800,000 | | 1,971,000 |
1.85% 12/1/33 (d) | | 1,330,000 | | 1,456,350 |
| | 3,427,350 |
TOTAL FINANCIALS | | 6,471,062 |
HEALTH CARE - 5.7% |
Biotechnology - 2.3% |
BioMarin Pharmaceutical, Inc. 3.5% 6/15/08 | | 3,610,000 | | 3,176,800 |
Enzon Pharmaceuticals, Inc. 4.5% 7/1/08 | | 3,360,000 | | 3,124,800 |
IDEC Pharmaceuticals Corp. liquid yield option note 0% 2/16/19 | | 1,030,000 | | 2,442,027 |
Invitrogen Corp. 2.25% 12/15/06 | | 2,630,000 | | 2,656,300 |
Serologicals Corp.: | | | | |
4.75% 8/15/33 (f) | | 770,000 | | 1,357,895 |
4.75% 8/15/33 | | 420,000 | | 740,670 |
| | 13,498,492 |
Health Care Equipment & Supplies - 2.0% |
Bausch & Lomb, Inc. 2.4863% 8/1/23 (h) | | 1,860,000 | | 2,333,854 |
Cooper Companies, Inc. 2.625% 7/1/23 | | 1,660,000 | | 2,780,002 |
Cytyc Corp. 2.25% 3/15/24 | | 2,900,000 | | 3,436,500 |
Corporate Bonds - continued |
| Principal Amount | | Value
(Note 1) |
Convertible Bonds - continued |
HEALTH CARE - continued |
Health Care Equipment & Supplies - continued |
Fisher Scientific International, Inc.: | | | | |
2.5% 10/1/23 (f) | | $ 995,000 | | $ 1,384,055 |
2.5% 10/1/23 | | 960,000 | | 1,335,370 |
| | 11,269,781 |
Health Care Providers & Services - 0.5% |
Community Health Systems, Inc. 4.25% 10/15/08 | | 2,900,000 | | 3,006,981 |
Pharmaceuticals - 0.9% |
IVAX Corp.: | | | | |
1.5% 3/1/24 (f) | | 1,800,000 | | 1,731,420 |
1.5% 3/1/24 | | 770,000 | | 740,663 |
MGI Pharma, Inc.: | | | | |
1.6821% 3/2/24 (d)(f) | | 2,450,000 | | 1,960,000 |
1.6821% 3/2/24 (d) | | 950,000 | | 760,000 |
| | 5,192,083 |
TOTAL HEALTH CARE | | 32,967,337 |
INDUSTRIALS - 0.6% |
Industrial Conglomerates - 0.6% |
Tyco International Group SA yankee 3.125% 1/15/23 | | 2,110,000 | | 3,427,273 |
INFORMATION TECHNOLOGY - 3.2% |
Communications Equipment - 0.8% |
Comverse Technology, Inc. 0% 5/15/23 | | 2,070,000 | | 2,732,400 |
Juniper Networks, Inc. 0% 6/15/08 | | 1,110,000 | | 1,667,775 |
| | 4,400,175 |
Computers & Peripherals - 0.1% |
Maxtor Corp. 6.8% 4/30/10 | | 930,000 | | 865,644 |
Electronic Equipment & Instruments - 0.5% |
Vishay Intertechnology, Inc. 3.625% 8/1/23 | | 2,500,000 | | 2,767,750 |
Internet Software & Services - 0.6% |
Yahoo!, Inc. 0% 4/1/08 | | 1,900,000 | | 3,618,313 |
IT Services - 0.5% |
DST Systems, Inc.: | | | | |
Series A, 4.125% 8/15/23 (f) | | 1,240,000 | | 1,567,112 |
4.125% 8/15/23 | | 1,150,000 | | 1,453,370 |
| | 3,020,482 |
Corporate Bonds - continued |
| Principal Amount | | Value
(Note 1) |
Convertible Bonds - continued |
INFORMATION TECHNOLOGY - continued |
Semiconductors & Semiconductor Equipment - 0.4% |
Agere Systems, Inc. 6.5% 12/15/09 | | $ 2,100,000 | | $ 2,215,605 |
Software - 0.3% |
Concord Communications, Inc. 3% 12/15/23 (f) | | 2,180,000 | | 1,857,694 |
TOTAL INFORMATION TECHNOLOGY | | 18,745,663 |
TELECOMMUNICATION SERVICES - 1.2% |
Wireless Telecommunication Services - 1.2% |
Crown Castle International Corp. 4% 7/15/10 | | 1,840,000 | | 3,321,200 |
Nextel Partners, Inc. 1.5% 11/15/08 | | 1,405,000 | | 3,449,275 |
| | 6,770,475 |
UTILITIES - 0.6% |
Multi-Utilities & Unregulated Power - 0.6% |
AES Corp. 4.5% 8/15/05 | | 3,430,000 | | 3,438,575 |
TOTAL CONVERTIBLE BONDS | | 80,033,487 |
Nonconvertible Bonds - 0.0% |
INDUSTRIALS - 0.0% |
Machinery - 0.0% |
Mueller Industries, Inc. 6% 11/1/14 | | 76,000 | | 74,860 |
TOTAL CORPORATE BONDS (Cost $78,379,455) | 80,108,347 |
U.S. Treasury Obligations - 0.1% |
|
U.S. Treasury Bills, yield at date of purchase 1.62% to 1.67% 12/9/04 to 12/30/04 (g)
(Cost $449,723) | | 450,000 | | 449,673 |
Common Stocks - 66.3% |
| Shares | | |
CONSUMER DISCRETIONARY - 6.3% |
Hotels, Restaurants & Leisure - 1.3% |
Centerplate, Inc. unit | 318,800 | | 4,048,760 |
Empire Resorts, Inc. (a) | 8,300 | | 89,308 |
Common Stocks - continued |
| Shares | | Value (Note 1) |
CONSUMER DISCRETIONARY - continued |
Hotels, Restaurants & Leisure - continued |
McDonald's Corp. | 95,600 | | $ 2,938,744 |
Wendy's International, Inc. | 7,000 | | 249,690 |
| | 7,326,502 |
Household Durables - 0.7% |
Centex Corp. | 26,000 | | 1,364,220 |
D.R. Horton, Inc. | 10,000 | | 352,100 |
KB Home | 14,400 | | 1,265,616 |
LG Electronics, Inc. | 4,250 | | 256,581 |
Sony Corp. sponsored ADR | 21,000 | | 763,560 |
| | 4,002,077 |
Leisure Equipment & Products - 0.2% |
Brunswick Corp. | 8,000 | | 390,560 |
Eastman Kodak Co. | 32,500 | | 1,063,075 |
| | 1,453,635 |
Media - 2.5% |
Clear Channel Communications, Inc. | 47,600 | | 1,603,168 |
DreamWorks Animation SKG, Inc. Class A | 1,100 | | 40,656 |
Emmis Communications Corp. Class A (a) | 36,200 | | 669,338 |
Fox Entertainment Group, Inc. Class A (a) | 24,000 | | 705,600 |
Grupo Televisa SA de CV sponsored ADR | 15,900 | | 990,093 |
Lamar Advertising Co. Class A (a) | 32,500 | | 1,281,800 |
News Corp. Class A | 22,400 | | 396,256 |
Omnicom Group, Inc. | 8,000 | | 648,000 |
Salem Communications Corp. Class A (a) | 14,900 | | 365,944 |
Spanish Broadcasting System, Inc. Class A (a) | 14,100 | | 150,729 |
The DIRECTV Group, Inc. (a) | 27,100 | | 433,329 |
Time Warner, Inc. (a) | 97,900 | | 1,733,809 |
Univision Communications, Inc. Class A (a) | 26,000 | | 782,600 |
Valassis Communications, Inc. (a) | 8,000 | | 271,600 |
Viacom, Inc. Class B (non-vtg.) | 61,130 | | 2,121,211 |
Walt Disney Co. | 74,700 | | 2,007,936 |
XM Satellite Radio Holdings, Inc. Class A (a) | 10,000 | | 369,100 |
| | 14,571,169 |
Multiline Retail - 0.4% |
99 Cents Only Stores (a)(e) | 35,000 | | 522,200 |
JCPenney Co., Inc. | 23,300 | | 899,380 |
Kohl's Corp. (a) | 7,000 | | 323,120 |
Nordstrom, Inc. | 20,500 | | 896,875 |
| | 2,641,575 |
Common Stocks - continued |
| Shares | | Value (Note 1) |
CONSUMER DISCRETIONARY - continued |
Specialty Retail - 1.1% |
American Eagle Outfitters, Inc. | 17,966 | | $ 750,440 |
Asbury Automotive Group, Inc. (a) | 22,000 | | 305,360 |
CarMax, Inc. (a) | 26,000 | | 724,100 |
Home Depot, Inc. | 47,600 | | 1,987,300 |
Sonic Automotive, Inc. Class A (sub. vtg.) | 23,498 | | 583,455 |
The Pep Boys - Manny, Moe & Jack | 28,000 | | 441,000 |
Toys 'R' Us, Inc. (a) | 70,900 | | 1,371,206 |
| | 6,162,861 |
Textiles, Apparel & Luxury Goods - 0.1% |
Deckers Outdoor Corp. (a)(e) | 16,700 | | 726,784 |
TOTAL CONSUMER DISCRETIONARY | | 36,884,603 |
CONSUMER STAPLES - 2.3% |
Beverages - 0.2% |
Anheuser-Busch Companies, Inc. | 4,700 | | 235,423 |
Efes Breweries International NV unit (f) | 800 | | 24,120 |
PepsiCo, Inc. | 14,500 | | 723,695 |
| | 983,238 |
Food & Staples Retailing - 0.3% |
Albertsons, Inc. | 23,000 | | 581,900 |
Safeway, Inc. (a) | 53,000 | | 1,021,840 |
| | 1,603,740 |
Food Products - 0.7% |
B&G Foods, Inc. unit | 200,000 | | 2,976,000 |
Bunge Ltd. | 13,500 | | 711,720 |
Interstate Bakeries Corp. (a) | 14,600 | | 84,972 |
Smithfield Foods, Inc. (a) | 9,000 | | 261,450 |
| | 4,034,142 |
Household Products - 0.1% |
Clorox Co. | 9,200 | | 507,104 |
Personal Products - 0.1% |
Gillette Co. | 17,200 | | 748,028 |
Tobacco - 0.9% |
Altria Group, Inc. | 93,800 | | 5,392,562 |
TOTAL CONSUMER STAPLES | | 13,268,814 |
Common Stocks - continued |
| Shares | | Value (Note 1) |
ENERGY - 7.5% |
Energy Equipment & Services - 2.8% |
Baker Hughes, Inc. | 31,300 | | $ 1,387,529 |
BJ Services Co. | 13,900 | | 704,313 |
ENSCO International, Inc. | 22,100 | | 691,951 |
FMC Technologies, Inc. (a) | 10,000 | | 328,500 |
GlobalSantaFe Corp. | 33,800 | | 1,061,320 |
Halliburton Co. | 73,200 | | 3,026,820 |
Hornbeck Offshore Services, Inc. | 17,000 | | 343,400 |
Pride International, Inc. (a) | 96,300 | | 1,883,628 |
Rowan Companies, Inc. (a) | 15,000 | | 388,500 |
Smith International, Inc. (a) | 16,000 | | 969,120 |
Transocean, Inc. (a) | 44,200 | | 1,779,934 |
Varco International, Inc. (a) | 61,598 | | 1,831,925 |
Weatherford International Ltd. (a) | 33,400 | | 1,782,892 |
| | 16,179,832 |
Oil & Gas - 4.7% |
Apache Corp. | 20,400 | | 1,102,824 |
BP PLC sponsored ADR | 17,900 | | 1,098,165 |
Burlington Resources, Inc. | 34,300 | | 1,591,863 |
Chesapeake Energy Corp. | 75,973 | | 1,367,514 |
ChevronTexaco Corp. | 63,100 | | 3,445,260 |
ConocoPhillips | 19,200 | | 1,747,008 |
Encore Acquisition Co. (a) | 15,000 | | 528,150 |
Exxon Mobil Corp. | 243,800 | | 12,494,750 |
Occidental Petroleum Corp. | 24,300 | | 1,463,103 |
Pioneer Natural Resources Co. | 8,500 | | 299,200 |
Premcor, Inc. | 14,500 | | 645,975 |
Quicksilver Resources, Inc. (a) | 32,300 | | 1,111,120 |
Valero Energy Corp. | 13,000 | | 608,270 |
| | 27,503,202 |
TOTAL ENERGY | | 43,683,034 |
FINANCIALS - 20.8% |
Capital Markets - 2.4% |
Bear Stearns Companies, Inc. | 19,200 | | 1,873,536 |
Calamos Asset Management, Inc. Class A | 2,900 | | 68,788 |
Eurocastle Investment Ltd. | 9,200 | | 197,263 |
Lehman Brothers Holdings, Inc. | 20,300 | | 1,700,734 |
MarketAxess Holdings, Inc. | 1,500 | | 29,400 |
Merrill Lynch & Co., Inc. | 68,600 | | 3,821,706 |
Common Stocks - continued |
| Shares | | Value (Note 1) |
FINANCIALS - continued |
Capital Markets - continued |
Merrill Lynch & Co., Inc. (depositary shares) Series 1, unit | 120,000 | | $ 3,033,600 |
Morgan Stanley | 58,700 | | 2,979,025 |
TradeStation Group, Inc. (a) | 40,000 | | 296,800 |
| | 14,000,852 |
Commercial Banks - 3.3% |
Banco Bradesco SA sponsored ADR (non-vtg.) | 13,000 | | 846,560 |
Bank of America Corp. | 221,914 | | 10,267,961 |
UCBH Holdings, Inc. | 14,400 | | 652,896 |
Wachovia Corp. | 107,884 | | 5,582,997 |
Wells Fargo & Co. | 30,800 | | 1,902,516 |
| | 19,252,930 |
Consumer Finance - 0.2% |
Capital One Financial Corp. | 10,650 | | 836,877 |
MBNA Corp. | 22,200 | | 589,632 |
| | 1,426,509 |
Diversified Financial Services - 1.1% |
Citigroup, Inc. | 89,000 | | 3,982,750 |
J.P. Morgan Chase & Co. | 64,404 | | 2,424,811 |
| | 6,407,561 |
Insurance - 3.2% |
ACE Ltd. | 53,700 | | 2,170,554 |
AFLAC, Inc. | 36,200 | | 1,361,844 |
AMBAC Financial Group, Inc. | 13,100 | | 1,065,423 |
American International Group, Inc. | 137,800 | | 8,729,630 |
Hartford Financial Services Group, Inc. | 14,500 | | 928,000 |
Hilb Rogal & Hobbs Co. | 28,000 | | 971,320 |
MetLife, Inc. | 22,900 | | 893,100 |
Scottish Re Group Ltd. | 15,000 | | 345,000 |
W.R. Berkley Corp. | 27,600 | | 1,251,660 |
XL Capital Ltd. Class A | 8,100 | | 610,416 |
| | 18,326,947 |
Real Estate - 9.5% |
Acadia Realty Trust (SBI) | 16,300 | | 246,945 |
American Campus Communities, Inc. | 33,670 | | 703,703 |
AvalonBay Communities, Inc. | 16,910 | | 1,202,301 |
Boston Properties, Inc. | 38,074 | | 2,291,293 |
BRE Properties, Inc. Class A | 11,400 | | 463,296 |
CarrAmerica Realty Corp. | 24,050 | | 778,980 |
Catellus Development Corp. | 24,290 | | 762,706 |
Common Stocks - continued |
| Shares | | Value (Note 1) |
FINANCIALS - continued |
Real Estate - continued |
CBL & Associates Properties, Inc. | 22,050 | | $ 1,616,045 |
CenterPoint Properties Trust (SBI) | 15,820 | | 741,167 |
Cornerstone Realty Income Trust, Inc. | 38,690 | | 387,287 |
Correctional Properties Trust | 26,950 | | 766,189 |
Duke Realty Corp. | 47,190 | | 1,630,415 |
Eagle Hospitality Properties Trust, Inc. | 9,100 | | 86,905 |
Equity Lifestyle Properties, Inc. | 27,260 | | 989,538 |
Equity Office Properties Trust | 89,430 | | 2,454,854 |
Equity One, Inc. | 29,390 | | 668,329 |
Equity Residential (SBI) | 95,670 | | 3,225,036 |
Federal Realty Investment Trust (SBI) | 16,230 | | 813,935 |
General Growth Properties, Inc. | 84,810 | | 2,909,831 |
GMH Communities Trust | 23,000 | | 308,200 |
Health Care Property Investors, Inc. | 21,430 | | 574,967 |
Health Care REIT, Inc. | 26,160 | | 926,587 |
Highwoods Properties, Inc. (SBI) | 45,290 | | 1,171,652 |
Home Properties of New York, Inc. | 3,200 | | 131,776 |
HomeBanc Mortgage Corp., Georgia | 40,100 | | 361,301 |
Inland Real Estate Corp. | 40,500 | | 627,750 |
Innkeepers USA Trust (SBI) | 79,990 | | 1,078,265 |
Kilroy Realty Corp. | 12,020 | | 485,848 |
Kimco Realty Corp. | 40,780 | | 2,319,566 |
Liberty Property Trust (SBI) | 15,650 | | 641,650 |
MeriStar Hospitality Corp. (a) | 172,520 | | 1,173,136 |
Newcastle Investment Corp. (a) | 9,000 | | 282,420 |
Pan Pacific Retail Properties, Inc. | 21,830 | | 1,294,519 |
Plum Creek Timber Co., Inc. | 36,630 | | 1,355,310 |
Post Properties, Inc. | 9,200 | | 313,720 |
Price Legacy Corp. | 23,700 | | 452,670 |
ProLogis | 71,510 | | 2,876,847 |
Public Storage, Inc. | 29,950 | | 1,598,731 |
Rayonier, Inc. | 7,980 | | 381,045 |
Reckson Associates Realty Corp. | 59,440 | | 1,924,667 |
Shurgard Storage Centers, Inc. Class A | 8,500 | | 351,730 |
Simon Property Group, Inc. | 46,510 | | 2,887,341 |
SL Green Realty Corp. | 15,310 | | 882,315 |
Sunstone Hotel Investors, Inc. New | 15,000 | | 274,050 |
Trizec Properties, Inc. | 97,700 | | 1,609,119 |
U-Store-It Trust | 21,300 | | 363,378 |
United Dominion Realty Trust, Inc. (SBI) | 70,890 | | 1,629,761 |
Ventas, Inc. | 24,390 | | 660,969 |
Common Stocks - continued |
| Shares | | Value (Note 1) |
FINANCIALS - continued |
Real Estate - continued |
Vornado Realty Trust | 41,600 | | $ 3,057,600 |
Weingarten Realty Investors (SBI) | 10,200 | | 415,650 |
| | 55,151,295 |
Thrifts & Mortgage Finance - 1.1% |
Fannie Mae | 15,900 | | 1,092,330 |
Freddie Mac | 15,900 | | 1,085,334 |
Golden West Financial Corp., Delaware | 8,400 | | 1,001,616 |
New York Community Bancorp, Inc. | 71,000 | | 1,404,380 |
Sovereign Bancorp, Inc. | 42,500 | | 928,625 |
W Holding Co., Inc. | 16,000 | | 352,320 |
Washington Mutual, Inc. | 9,000 | | 366,390 |
| | 6,230,995 |
TOTAL FINANCIALS | | 120,797,089 |
HEALTH CARE - 4.7% |
Biotechnology - 0.4% |
Biogen Idec, Inc. (a) | 5,700 | | 334,476 |
BioMarin Pharmaceutical, Inc. (a) | 42,000 | | 223,860 |
Genentech, Inc. (a) | 15,000 | | 723,750 |
MedImmune, Inc. (a) | 22,900 | | 609,140 |
Millennium Pharmaceuticals, Inc. (a) | 22,700 | | 286,474 |
ONYX Pharmaceuticals, Inc. (a) | 6,000 | | 187,680 |
| | 2,365,380 |
Health Care Equipment & Supplies - 2.1% |
Aspect Medical Systems, Inc. (a) | 1,100 | | 26,840 |
Baxter International, Inc. | 155,600 | | 4,924,740 |
Dade Behring Holdings, Inc. (a) | 11,700 | | 628,173 |
Foxhollow Technologies, Inc. | 400 | | 10,360 |
Guidant Corp. | 14,000 | | 907,620 |
Medtronic, Inc. | 46,100 | | 2,215,105 |
PerkinElmer, Inc. | 44,500 | | 949,185 |
St. Jude Medical, Inc. (a) | 11,400 | | 434,796 |
Thermo Electron Corp. (a) | 21,400 | | 647,350 |
Waters Corp. (a) | 38,500 | | 1,796,410 |
| | 12,540,579 |
Health Care Providers & Services - 0.9% |
McKesson Corp. | 28,000 | | 827,400 |
Omnicare, Inc. | 9,000 | | 291,690 |
Common Stocks - continued |
| Shares | | Value (Note 1) |
HEALTH CARE - continued |
Health Care Providers & Services - continued |
Sierra Health Services, Inc. (a) | 19,000 | | $ 1,056,970 |
UnitedHealth Group, Inc. | 34,100 | | 2,825,185 |
| | 5,001,245 |
Pharmaceuticals - 1.3% |
Johnson & Johnson | 22,600 | | 1,363,232 |
Merck & Co., Inc. | 40,000 | | 1,120,800 |
Pfizer, Inc. | 17,000 | | 472,090 |
Schering-Plough Corp. | 105,600 | | 1,884,960 |
Valeant Pharmaceuticals International | 12,000 | | 290,520 |
Wyeth | 57,800 | | 2,304,486 |
| | 7,436,088 |
TOTAL HEALTH CARE | | 27,343,292 |
INDUSTRIALS - 11.2% |
Aerospace & Defense - 2.3% |
DRS Technologies, Inc. (a) | 10,000 | | 427,200 |
Honeywell International, Inc. | 214,300 | | 7,571,219 |
Lockheed Martin Corp. | 27,100 | | 1,648,764 |
Northrop Grumman Corp. | 7,400 | | 416,842 |
Precision Castparts Corp. | 15,700 | | 1,017,988 |
Raytheon Co. | 34,900 | | 1,407,866 |
The Boeing Co. | 16,900 | | 905,333 |
| | 13,395,212 |
Air Freight & Logistics - 0.1% |
Expeditors International of Washington, Inc. | 11,000 | | 585,860 |
Airlines - 0.3% |
AirTran Holdings, Inc. (a) | 22,000 | | 260,040 |
Delta Air Lines, Inc. (a) | 85,000 | | 592,450 |
Southwest Airlines Co. | 50,100 | | 788,073 |
| | 1,640,563 |
Building Products - 0.6% |
Masco Corp. | 99,100 | | 3,495,257 |
Commercial Services & Supplies - 1.6% |
Apollo Group, Inc. Class A (a) | 16,500 | | 1,315,050 |
Asset Acceptance Capital Corp. | 3,400 | | 70,074 |
Career Education Corp. (a) | 45,300 | | 1,762,170 |
Cintas Corp. | 47,700 | | 2,133,144 |
On Assignment, Inc. (a) | 20,000 | | 104,400 |
Common Stocks - continued |
| Shares | | Value (Note 1) |
INDUSTRIALS - continued |
Commercial Services & Supplies - continued |
Resources Connection, Inc. (a) | 10,000 | | $ 453,600 |
Robert Half International, Inc. | 117,200 | | 3,167,916 |
ServiceMaster Co. | 18,000 | | 237,060 |
| | 9,243,414 |
Construction & Engineering - 0.7% |
Chicago Bridge & Iron Co. NV (NY Shares) | 30,671 | | 1,186,968 |
Fluor Corp. | 21,100 | | 1,095,090 |
Jacobs Engineering Group, Inc. (a) | 19,000 | | 873,430 |
MasTec, Inc. (a) | 97,000 | | 813,830 |
| | 3,969,318 |
Electrical Equipment - 0.3% |
A.O. Smith Corp. | 11,000 | | 330,550 |
ABB Ltd. sponsored ADR (e) | 50,000 | | 309,000 |
FuelCell Energy, Inc. (a)(e) | 43,000 | | 432,150 |
Rockwell Automation, Inc. | 12,000 | | 567,600 |
| | 1,639,300 |
Industrial Conglomerates - 4.4% |
General Electric Co. | 535,200 | | 18,924,667 |
Siemens AG sponsored ADR | 7,000 | | 558,740 |
Tyco International Ltd. | 174,100 | | 5,914,177 |
| | 25,397,584 |
Machinery - 0.3% |
ITT Industries, Inc. | 10,500 | | 893,760 |
Mueller Industries, Inc. | 9,000 | | 276,570 |
Pall Corp. | 12,000 | | 325,080 |
| | 1,495,410 |
Road & Rail - 0.6% |
Norfolk Southern Corp. | 49,700 | | 1,706,201 |
Sirva, Inc. | 20,000 | | 398,000 |
Swift Transportation Co., Inc. (a) | 39,000 | | 760,110 |
Union Pacific Corp. | 14,800 | | 938,912 |
| | 3,803,223 |
Trading Companies & Distributors - 0.0% |
UAP Holding Corp. | 20,000 | | 327,000 |
TOTAL INDUSTRIALS | | 64,992,141 |
Common Stocks - continued |
| Shares | | Value (Note 1) |
INFORMATION TECHNOLOGY - 4.5% |
Communications Equipment - 0.7% |
Comverse Technology, Inc. (a) | 48,000 | | $ 1,020,960 |
Foundry Networks, Inc. (a) | 53,000 | | 707,550 |
Juniper Networks, Inc. (a) | 56,000 | | 1,541,680 |
Lucent Technologies, Inc. (a) | 60,000 | | 235,800 |
QUALCOMM, Inc. | 19,000 | | 790,780 |
| | 4,296,770 |
Computers & Peripherals - 0.5% |
Hewlett-Packard Co. | 31,900 | | 638,000 |
International Business Machines Corp. | 12,700 | | 1,196,848 |
Sun Microsystems, Inc. (a) | 65,000 | | 360,750 |
Western Digital Corp. (a) | 65,200 | | 637,004 |
| | 2,832,602 |
Electronic Equipment & Instruments - 0.5% |
Amphenol Corp. Class A (a) | 12,700 | | 445,897 |
Avnet, Inc. (a) | 5,000 | | 92,000 |
Flextronics International Ltd. (a) | 38,000 | | 545,300 |
Molex, Inc. | 7,000 | | 192,990 |
National Instruments Corp. | 22,900 | | 654,940 |
Symbol Technologies, Inc. | 52,200 | | 791,352 |
| | 2,722,479 |
Internet Software & Services - 0.2% |
Yahoo!, Inc. (a) | 28,600 | | 1,075,932 |
IT Services - 0.4% |
Affiliated Computer Services, Inc. Class A (a) | 32,000 | | 1,893,760 |
Sapient Corp. (a) | 30,000 | | 237,300 |
| | 2,131,060 |
Office Electronics - 0.1% |
Xerox Corp. (a) | 57,000 | | 873,240 |
Semiconductors & Semiconductor Equipment - 1.0% |
Analog Devices, Inc. | 28,000 | | 1,034,600 |
Applied Materials, Inc. (a) | 17,000 | | 282,880 |
Cabot Microelectronics Corp. (a) | 22,300 | | 823,985 |
Freescale Semiconductor, Inc. Class A | 64,500 | | 1,139,070 |
Intel Corp. | 31,300 | | 699,555 |
KLA-Tencor Corp. (a) | 16,200 | | 729,972 |
Lam Research Corp. (a) | 15,000 | | 390,150 |
PMC-Sierra, Inc. (a) | 22,000 | | 242,880 |
Samsung Electronics Co. Ltd. | 1,480 | | 613,314 |
| | 5,956,406 |
Common Stocks - continued |
| Shares | | Value (Note 1) |
INFORMATION TECHNOLOGY - continued |
Software - 1.1% |
BEA Systems, Inc. (a) | 86,100 | | $ 695,688 |
Macrovision Corp. (a) | 4,100 | | 108,855 |
Microsoft Corp. | 189,400 | | 5,077,814 |
PalmSource, Inc. (a) | 9,700 | | 153,648 |
Siebel Systems, Inc. (a) | 60,000 | | 604,800 |
| | 6,640,805 |
TOTAL INFORMATION TECHNOLOGY | | 26,529,294 |
MATERIALS - 4.9% |
Chemicals - 2.9% |
Dow Chemical Co. | 73,300 | | 3,699,451 |
E.I. du Pont de Nemours & Co. | 80,600 | | 3,652,792 |
Ecolab, Inc. | 8,100 | | 283,338 |
Lubrizol Corp. | 11,700 | | 404,235 |
Lyondell Chemical Co. (e) | 122,700 | | 3,442,962 |
Millennium Chemicals, Inc. (a) | 54,772 | | 1,455,840 |
Monsanto Co. | 35,000 | | 1,610,700 |
Nalco Holding Co. | 45,000 | | 865,350 |
Olin Corp. | 33,900 | | 769,191 |
Valspar Corp. | 8,000 | | 385,760 |
Westlake Chemical Corp. | 15,000 | | 470,850 |
| | 17,040,469 |
Containers & Packaging - 0.7% |
Crown Holdings, Inc. (a) | 25,000 | | 320,000 |
Owens-Illinois, Inc. (a) | 36,500 | | 763,580 |
Packaging Corp. of America | 55,400 | | 1,274,200 |
Sealed Air Corp. (a) | 1,300 | | 66,833 |
Smurfit-Stone Container Corp. (a) | 84,200 | | 1,512,232 |
| | 3,936,845 |
Metals & Mining - 1.3% |
Alcoa, Inc. | 48,700 | | 1,654,826 |
Allegheny Technologies, Inc. | 25,000 | | 550,000 |
Companhia Vale do Rio Doce sponsored ADR | 26,100 | | 647,802 |
Freeport-McMoRan Copper & Gold, Inc. Class B | 12,000 | | 469,560 |
International Steel Group, Inc. | 15,000 | | 604,950 |
Massey Energy Co. | 14,800 | | 519,776 |
Metals USA, Inc. (a) | 14,800 | | 277,500 |
Newmont Mining Corp. | 21,800 | | 1,032,230 |
Common Stocks - continued |
| Shares | | Value (Note 1) |
MATERIALS - continued |
Metals & Mining - continued |
Nucor Corp. | 18,000 | | $ 952,200 |
Phelps Dodge Corp. | 8,000 | | 777,040 |
| | 7,485,884 |
TOTAL MATERIALS | | 28,463,198 |
TELECOMMUNICATION SERVICES - 2.7% |
Diversified Telecommunication Services - 2.2% |
Cincinnati Bell, Inc. (a) | 55,000 | | 198,000 |
Citizens Communications Co. | 16,400 | | 234,520 |
Covad Communications Group, Inc. (a) | 435,300 | | 679,068 |
SBC Communications, Inc. | 256,800 | | 6,463,656 |
Telewest Global, Inc. (a) | 59,100 | | 865,224 |
Verizon Communications, Inc. | 105,800 | | 4,362,134 |
| | 12,802,602 |
Wireless Telecommunication Services - 0.5% |
American Tower Corp. Class A (a) | 71,000 | | 1,287,230 |
Leap Wireless International, Inc. (a) | 11,000 | | 279,400 |
Nextel Communications, Inc. Class A (a) | 28,600 | | 813,956 |
Nextel Partners, Inc. Class A (a) | 40,000 | | 723,600 |
| | 3,104,186 |
TOTAL TELECOMMUNICATION SERVICES | | 15,906,788 |
UTILITIES - 1.4% |
Electric Utilities - 1.2% |
Entergy Corp. | 32,700 | | 2,119,614 |
FirstEnergy Corp. | 22,000 | | 929,060 |
PG&E Corp. (a) | 30,200 | | 1,004,452 |
PPL Corp. | 11,300 | | 587,035 |
Southern Co. | 16,200 | | 531,198 |
TXU Corp. | 12,700 | | 797,814 |
Westar Energy, Inc. | 25,000 | | 553,750 |
Xcel Energy, Inc. | 7,500 | | 135,450 |
| | 6,658,373 |
Multi-Utilities & Unregulated Power - 0.2% |
AES Corp. (a) | 53,600 | | 656,064 |
Common Stocks - continued |
| Shares | | Value (Note 1) |
UTILITIES - continued |
Multi-Utilities & Unregulated Power - continued |
CMS Energy Corp. (a) | 50,000 | | $ 510,000 |
Public Service Enterprise Group, Inc. | 5,000 | | 219,950 |
| | 1,386,014 |
TOTAL UTILITIES | | 8,044,387 |
TOTAL COMMON STOCKS (Cost $350,410,465) | 385,912,640 |
Preferred Stocks - 14.4% |
| | | |
Convertible Preferred Stocks - 3.8% |
CONSUMER DISCRETIONARY - 0.8% |
Hotels, Restaurants & Leisure - 0.3% |
Six Flags, Inc. 7.25% PIERS | 82,700 | | 1,757,375 |
Media - 0.1% |
Emmis Communications Corp. Series A, 6.25% | 10,100 | | 459,550 |
Specialty Retail - 0.4% |
Toys 'R' US, Inc. 6.25% | 52,500 | | 2,620,800 |
TOTAL CONSUMER DISCRETIONARY | | 4,837,725 |
ENERGY - 0.6% |
Oil & Gas - 0.6% |
Valero Energy Corp. 2.00% | 80,800 | | 3,747,100 |
FINANCIALS - 1.0% |
Diversified Financial Services - 1.0% |
AES Trust VII 6.00% | 120,300 | | 5,894,700 |
INDUSTRIALS - 0.2% |
Road & Rail - 0.2% |
Kansas City Southern 4.25% | 1,370 | | 853,606 |
MATERIALS - 0.9% |
Containers & Packaging - 0.7% |
Owens-Illinois, Inc. 4.75% | 113,510 | | 4,347,433 |
Metals & Mining - 0.2% |
Freeport-McMoRan Copper & Gold, Inc. 5.50% (f) | 1,050 | | 1,026,113 |
TOTAL MATERIALS | | 5,373,546 |
Preferred Stocks - continued |
| Shares | | Value (Note 1) |
Convertible Preferred Stocks - continued |
TELECOMMUNICATION SERVICES - 0.3% |
Diversified Telecommunication Services - 0.3% |
CenturyTel, Inc. 6.875% ACES | 60,200 | | $ 1,531,488 |
TOTAL CONVERTIBLE PREFERRED STOCKS | | 22,238,165 |
Nonconvertible Preferred Stocks - 10.6% |
CONSUMER STAPLES - 0.2% |
Food Products - 0.2% |
H.J. Heinz Finance Co. 6.226% | 10 | | 1,080,000 |
ENERGY - 1.5% |
Oil & Gas - 1.5% |
El Paso Tennessee Pipeline Co. Series A, 8.25% | 180,600 | | 8,849,400 |
FINANCIALS - 5.6% |
Capital Markets - 1.1% |
Bear Stearns Companies, Inc.: | | | |
Series E, 6.155% | 15,000 | | 795,000 |
Series G, 5.49% | 15,000 | | 748,500 |
Lehman Brothers Holdings, Inc. (depositary shares) Series F, 6.50% | 169,015 | | 4,534,672 |
| | 6,078,172 |
Commercial Banks - 0.1% |
Santander Finance Preferred SA Unipersonal 6.41% | 31,400 | | 796,775 |
Consumer Finance - 0.4% |
SLM Corp. Series A, 6.97% | 43,400 | | 2,469,460 |
Diversified Financial Services - 0.5% |
ABN Amro Capital Funding Trust VII 6.08% | 60,400 | | 1,500,940 |
Heco Capital Trust III 6.50% | 12,000 | | 315,360 |
J.P. Morgan Chase & Co. (depositary shares) Series H, 6.625% | 6,530 | | 350,988 |
RC Trust I 7.00% (a) | 9,680 | | 514,973 |
| | 2,682,261 |
Real Estate - 1.1% |
Apartment Investment & Management Co.: | | | |
Series Q, 10.10% | 46,510 | | 1,252,049 |
Series V, 8.00% | 40,000 | | 1,005,000 |
Duke Realty Corp. (depositary shares) Series K, 6.50% | 95,800 | | 2,404,580 |
Preferred Stocks - continued |
| Shares | | Value (Note 1) |
Nonconvertible Preferred Stocks - continued |
FINANCIALS - continued |
Real Estate - continued |
Host Marriott Corp. Series E, 8.875% | 20,000 | | $ 545,000 |
Vornado Realty Trust Series E, 7.00% | 40,000 | | 1,080,000 |
| | 6,286,629 |
Thrifts & Mortgage Finance - 2.4% |
Fannie Mae: | | | |
Series H, 5.81% | 29,200 | | 1,486,280 |
Series L, 5.125% | 90,900 | | 4,022,325 |
Series N, 5.50% | 71,650 | | 3,360,385 |
Freddie Mac: | | | |
Series F, 5.00% | 12,000 | | 516,000 |
Series H, 5.10% | 10,300 | | 450,625 |
Series K, 5.79% | 6,000 | | 300,000 |
Series O, 5.81% | 19,500 | | 983,775 |
Series R, 5.70% | 57,000 | | 2,778,750 |
| | 13,898,140 |
TOTAL FINANCIALS | | 32,211,437 |
MATERIALS - 0.2% |
Chemicals - 0.1% |
E.I. du Pont de Nemours & Co. Series B, 4.50% | 9,900 | | 873,675 |
Metals & Mining - 0.1% |
Alcoa, Inc. 3.75% | 6,400 | | 498,240 |
TOTAL MATERIALS | | 1,371,915 |
UTILITIES - 3.1% |
Electric Utilities - 3.1% |
Alabama Power Co. 5.30% | 88,600 | | 2,206,140 |
Consolidated Edison Co. of New York, Inc. Series A, 5.00% | 28,705 | | 2,526,040 |
Duquesne Light Co. 6.50% | 106,050 | | 5,302,500 |
FPL Group Capital Trust I 5.875% | 20,000 | | 493,000 |
Monongahela Power Co. Series L, 7.73% | 10,800 | | 1,075,680 |
Pacific Gas & Electric Co. Series A, 5.00% | 16,900 | | 362,505 |
San Diego Gas & Electric Co. 1.70% | 67,548 | | 1,740,036 |
Southern California Edison Co.: | | | |
4.78% | 46,500 | | 960,225 |
Series B, 4.08% | 27,271 | | 512,695 |
Preferred Stocks - continued |
| Shares | | Value (Note 1) |
Nonconvertible Preferred Stocks - continued |
UTILITIES - continued |
Electric Utilities - continued |
Southern California Edison Co.: - continued | | | |
Series C, 4.24% | 94,600 | | $ 1,750,100 |
Series D, 4.32% | 70,000 | | 1,312,500 |
| | 18,241,421 |
TOTAL NONCONVERTIBLE PREFERRED STOCKS | | 61,754,173 |
TOTAL PREFERRED STOCKS (Cost $82,404,159) | 83,992,338 |
Money Market Funds - 6.0% |
| | | |
Fidelity Cash Central Fund, 1.98% (b) | 33,442,765 | | 33,442,765 |
Fidelity Securities Lending Cash Central Fund, 2% (b)(c) | 1,531,100 | | 1,531,100 |
TOTAL MONEY MARKET FUNDS (Cost $34,973,865) | 34,973,865 |
TOTAL INVESTMENT PORTFOLIO - 100.6% (Cost $546,617,667) | | 585,436,863 |
NET OTHER ASSETS - (0.6)% | | (3,668,536) |
NET ASSETS - 100% | $ 581,768,327 |
Futures Contracts |
| Expiration Date | | Underlying Face Amount at Value | | Unrealized Appreciation/
(Depreciation) |
Purchased |
Equity Index Contracts |
24 S&P 500 Index Contracts | Dec. 2004 | | $ 7,044,600 | | $ 290,281 |
The face value of futures purchased as a percentage of net assets - 1.2% |
Security Type Abbreviations |
ACES | - | Automatic Common Exchange Securities |
PIERS | - | Preferred Income Equity Redeemable Securities |
Legend |
(a) Non-income producing |
(b) Affiliated fund that is available only to investment companies and other accounts managed by Fidelity Investments. The rate quoted is the annualized seven-day yield of the fund at period end. A complete listing of the fund's holdings as of its most recent fiscal year end is available upon request. |
(c) Includes investment made with cash collateral received from securities on loan. |
(d) Debt obligation initially issued at one coupon which converts to a higher coupon at a specified date. The rate shown is the rate at period end. |
(e) Security or a portion of the security is on loan at period end. |
(f) Security exempt from registration under Rule 144A of the Securities Act of 1933. These securities may be resold in transactions exempt from registration, normally to qualified institutional buyers. At the period end, the value of these securities amounted to $12,879,409 or 2.2% of net assets. |
(g) Security or a portion of the security was pledged to cover margin requirements for futures contracts. At the period end, the value of securities pledged amounted to $449,673. |
(h) The coupon rate shown on floating or adjustable rate securities represents the rate at period end. |
Other Information |
The composition of credit quality ratings as a percentage of net assets is as follows (ratings are unaudited): |
AAA, AA, A | 1.1% |
BBB | 2.0% |
BB | 1.4% |
B | 3.9% |
CCC, CC, C | 0.6% |
Not Rated | 4.8% |
Equities | 80.7% |
Short-Term Investments and
Net Other Assets | 5.5% |
| 100.0% |
We have used ratings from Moody's Investors Services, Inc. Where Moody's ratings are not available, we have used S&P ratings. Percentages are adjusted for the effect of futures contracts, if applicable. |
Income Tax Information |
At November 30, 2004, the fund had a capital loss carryforward of approximately $7,643,000 all of which will expire on November 30, 2012. |
See accompanying notes which are an integral part of the financial statements.
Annual Report
Financial Statements
Statement of Assets and Liabilities
November 30, 2004 |
| | |
Assets | | |
Investment in securities, at value (including securities loaned of $1,465,492) (cost $546,617,667) - See accompanying schedule | | $ 585,436,863 |
Cash | | 264,563 |
Receivable for investments sold | | 3,195,546 |
Receivable for fund shares sold | | 2,149,095 |
Dividends receivable | | 1,094,217 |
Interest receivable | | 642,822 |
Prepaid expenses | | 454 |
Receivable from investment adviser for expense reductions | | 133 |
Other receivables | | 62,911 |
Total assets | | 592,846,604 |
| | |
Liabilities | | |
Payable for investments purchased | $ 8,009,986 | |
Payable for fund shares redeemed | 1,067,708 | |
Accrued management fee | 267,488 | |
Distribution fees payable | 51,820 | |
Payable for daily variation on futures contracts | 11,400 | |
Other affiliated payables | 108,073 | |
Other payables and accrued expenses | 30,702 | |
Collateral on securities loaned, at value | 1,531,100 | |
Total liabilities | | 11,078,277 |
| | |
Net Assets | | $ 581,768,327 |
Net Assets consist of: | | |
Paid in capital | | $ 548,910,904 |
Undistributed net investment income | | 2,463,649 |
Accumulated undistributed net realized gain (loss) on investments and foreign currency transactions | | (8,715,703) |
Net unrealized appreciation (depreciation) on investments | | 39,109,477 |
Net Assets | | $ 581,768,327 |
See accompanying notes which are an integral part of the financial statements.
Annual Report
Financial Statements - continued
Statement of Assets and Liabilities - continued
November 30, 2004 |
| | |
Calculation of Maximum Offering Price
Class A:
Net Asset Value and redemption price per share ($21,985,396 ÷ 1,981,700 shares) | | $ 11.09 |
| | |
Maximum offering price per share (100/94.25 of $11.09) | | $ 11.77 |
Class T:
Net Asset Value and redemption price per share ($36,526,147 ÷ 3,295,264 shares) | | $ 11.08 |
| | |
Maximum offering price per share (100/96.50 of $11.08) | | $ 11.48 |
Class B:
Net Asset Value and offering price per share ($13,457,083 ÷ 1,216,357 shares) A | | $ 11.06 |
| | |
Class C:
Net Asset Value and offering price per share ($28,794,624 ÷ 2,602,593 shares) A | | $ 11.06 |
| | |
Strategic Dividend & Income:
Net Asset Value, offering price and redemption price per share ($476,032,290 ÷ 42,831,091 shares) | | $ 11.11 |
| | |
Institutional Class:
Net Asset Value, offering price and redemption price per share ($4,972,787 ÷ 447,667 shares) | | $ 11.11 |
A Redemption price per share is equal to net asset value less any applicable contingent deferred sales charge.
See accompanying notes which are an integral part of the financial statements.
Annual Report
Statement of Operations
For the period December 23, 2003 (commencement of operations) to November 30, 2004 |
| | |
Investment Income | | |
Dividends | | $ 8,755,650 |
Interest | | 1,320,268 |
Security lending | | 6,718 |
Total income | | 10,082,636 |
| | |
Expenses | | |
Management fee | $ 2,031,291 | |
Transfer agent fees | 765,538 | |
Distribution fees | 343,283 | |
Accounting and security lending fees | 146,320 | |
Non-interested trustees' compensation | 1,673 | |
Custodian fees and expenses | 65,363 | |
Registration fees | 157,585 | |
Audit | 35,583 | |
Legal | 860 | |
Miscellaneous | 939 | |
Total expenses before reductions | 3,548,435 | |
Expense reductions | (102,232) | 3,446,203 |
Net investment income (loss) | | 6,636,433 |
Realized and Unrealized Gain (Loss) Net realized gain (loss) on: | | |
Investment securities | (8,229,482) | |
Foreign currency transactions | (4) | |
Futures contracts | (8,546) | |
Total net realized gain (loss) | | (8,238,032) |
Change in net unrealized appreciation (depreciation) on: Investment securities | 38,819,196 | |
Futures contracts | 290,281 | |
Total change in net unrealized appreciation (depreciation) | | 39,109,477 |
Net gain (loss) | | 30,871,445 |
Net increase (decrease) in net assets resulting from operations | | $ 37,507,878 |
See accompanying notes which are an integral part of the financial statements.
Annual Report
Financial Statements - continued
Statement of Changes in Net Assets
| For the period December 23, 2003 (commencement
of operations) to November 30, 2004 |
Increase (Decrease) in Net Assets | |
Operations | |
Net investment income (loss) | $ 6,636,433 |
Net realized gain (loss) | (8,238,032) |
Change in net unrealized appreciation (depreciation) | 39,109,477 |
Net increase (decrease) in net assets resulting from operations | 37,507,878 |
Distributions to shareholders from net investment income | (4,647,719) |
Share transactions - net increase (decrease) | 548,908,168 |
Total increase (decrease) in net assets | 581,768,327 |
| |
Net Assets | |
Beginning of period | - |
End of period (including undistributed net investment income of $2,463,649) | $ 581,768,327 |
See accompanying notes which are an integral part of the financial statements.
Annual Report
Financial Highlights - Class A
Year ended November 30, | 2004 F |
Selected Per-Share Data | |
Net asset value, beginning of period | $ 10.00 |
Income from Investment Operations | |
Net investment income (loss) E | .16 |
Net realized and unrealized gain (loss) | 1.04 |
Total from investment operations | 1.20 |
Distributions from net investment income | (.11) |
Net asset value, end of period | $ 11.09 |
Total Return B,C,D | 12.01% |
Ratios to Average Net Assets G | |
Expenses before expense reductions | 1.20% A |
Expenses net of voluntary waivers, if any | 1.20% A |
Expenses net of all reductions | 1.17% A |
Net investment income (loss) | 1.67% A |
Supplemental Data | |
Net assets, end of period (000 omitted) | $ 21,985 |
Portfolio turnover rate | 66% A |
A Annualized
B Total returns for periods of less than one year are not annualized.
C Total returns would have been lower had certain expenses not been reduced during the periods shown.
D Total returns do not include the effect of the sales charges.
E Calculated based on average shares outstanding during the period.
F For the period December 23, 2003 (commencement of operations) to November 30, 2004.
G Expense ratios reflect operating expenses of the class. Expenses before reductions do not reflect amounts reimbursed by the investment adviser or reductions from brokerage service arrangements or other expense offset arrangements and do not represent the amount paid by the class during periods when reimbursements or reductions occur. Expense ratios before reductions for start-up periods may not be representative of longer-term operating periods. Expenses net of any voluntary waivers reflect expenses after reimbursement by the investment adviser but prior to reductions from brokerage service arrangements or other expense offset arrangements. Expenses net of all reductions represent the net expenses paid by the class.
See accompanying notes which are an integral part of the financial statements.
Annual Report
Financial Highlights - Class T
Year ended November 30, | 2004F |
Selected Per-Share Data | |
Net asset value, beginning of period | $ 10.00 |
Income from Investment Operations | |
Net investment income (loss) E | .13 |
Net realized and unrealized gain (loss) | 1.04 |
Total from investment operations | 1.17 |
Distributions from net investment income | (.09) |
Net asset value, end of period | $ 11.08 |
Total Return B,C,D | 11.75% |
Ratios to Average Net Assets G | |
Expenses before expense reductions | 1.45% A |
Expenses net of voluntary waivers, if any | 1.45% A |
Expenses net of all reductions | 1.42% A |
Net investment income (loss) | 1.43% A |
Supplemental Data | |
Net assets, end of period (000 omitted) | $ 36,526 |
Portfolio turnover rate | 66% A |
A Annualized
B Total returns for periods of less than one year are not annualized.
C Total returns would have been lower had certain expenses not been reduced during the periods shown.
D Total returns do not include the effect of the sales charges.
E Calculated based on average shares outstanding during the period.
F For the period December 23, 2003 (commencement of operations) to November 30, 2004.
G Expense ratios reflect operating expenses of the class. Expenses before reductions do not reflect amounts reimbursed by the investment adviser or reductions from brokerage service arrangements or other expense offset arrangements and do not represent the amount paid by the class during periods when reimbursements or reductions occur. Expense ratios before reductions for start-up periods may not be representative of longer-term operating periods. Expenses net of any voluntary waivers reflect expenses after reimbursement by the investment adviser but prior to reductions from brokerage service arrangements or other expense offset arrangements. Expenses net of all reductions represent the net expenses paid by the class.
See accompanying notes which are an integral part of the financial statements.
Annual Report
Financial Highlights - Class B
Year ended November 30, | 2004 F |
Selected Per-Share Data | |
Net asset value, beginning of period | $ 10.00 |
Income from Investment Operations | |
Net investment income (loss) E | .09 |
Net realized and unrealized gain (loss) | 1.03 |
Total from investment operations | 1.12 |
Distributions from net investment income | (.06) |
Net asset value, end of period | $ 11.06 |
Total Return B,C,D | 11.24% |
Ratios to Average Net Assets G | |
Expenses before expense reductions | 1.99% A |
Expenses net of voluntary waivers, if any | 1.95% A |
Expenses net of all reductions | 1.92% A |
Net investment income (loss) | .92% A |
Supplemental Data | |
Net assets, end of period (000 omitted) | $ 13,457 |
Portfolio turnover rate | 66% A |
A Annualized
B Total returns for periods of less than one year are not annualized.
C Total returns would have been lower had certain expenses not been reduced during the periods shown.
D Total returns do not include the effect of the contingent deferred sales charge.
E Calculated based on average shares outstanding during the period.
F For the period December 23, 2003 (commencement of operations) to November 30, 2004.
G Expense ratios reflect operating expenses of the class. Expenses before reductions do not reflect amounts reimbursed by the investment adviser or reductions from brokerage service arrangements or other expense offset arrangements and do not represent the amount paid by the class during periods when reimbursements or reductions occur. Expense ratios before reductions for start-up periods may not be representative of longer-term operating periods. Expenses net of any voluntary waivers reflect expenses after reimbursement by the investment adviser but prior to reductions from brokerage service arrangements or other expense offset arrangements. Expenses net of all reductions represent the net expenses paid by the class.
See accompanying notes which are an integral part of the financial statements.
Annual Report
Financial Highlights - Class C
Year ended November 30, | 2004 F |
Selected Per-Share Data | |
Net asset value, beginning of period | $ 10.00 |
Income from Investment Operations | |
Net investment income (loss) E | .09 |
Net realized and unrealized gain (loss) | 1.03 |
Total from investment operations | 1.12 |
Distributions from net investment income | (.06) |
Net asset value, end of period | $ 11.06 |
Total Return B,C,D | 11.24% |
Ratios to Average Net Assets G | |
Expenses before expense reductions | 1.94% A |
Expenses net of voluntary waivers, if any | 1.94% A |
Expenses net of all reductions | 1.92% A |
Net investment income (loss) | .93% A |
Supplemental Data | |
Net assets, end of period (000 omitted) | $ 28,795 |
Portfolio turnover rate | 66% A |
A Annualized
B Total returns for periods of less than one year are not annualized.
C Total returns would have been lower had certain expenses not been reduced during the periods shown.
D Total returns do not include the effect of the contingent deferred sales charge.
E Calculated based on average shares outstanding during the period.
F For the period December 23, 2003 (commencement of operations) to November 30, 2004.
G Expense ratios reflect operating expenses of the class. Expenses before reductions do not reflect amounts reimbursed by the investment adviser or reductions from brokerage service arrangements or other expense offset arrangements and do not represent the amount paid by the class during periods when reimbursements or reductions occur. Expense ratios before reductions for start-up periods may not be representative of longer-term operating periods. Expenses net of any voluntary waivers reflect expenses after reimbursement by the investment adviser but prior to reductions from brokerage service arrangements or other expense offset arrangements. Expenses net of all reductions represent the net expenses paid by the class.
See accompanying notes which are an integral part of the financial statements.
Annual Report
Financial Highlights - Strategic Dividend & Income
Year ended November 30, | 2004 E |
Selected Per-Share Data | |
Net asset value, beginning of period | $ 10.00 |
Income from Investment Operations | |
Net investment income (loss) D | .19 |
Net realized and unrealized gain (loss) | 1.04 |
Total from investment operations | 1.23 |
Distributions from net investment income | (.12) |
Net asset value, end of period | $ 11.11 |
Total Return B,C | 12.32% |
Ratios to Average Net Assets F | |
Expenses before expense reductions | .90% A |
Expenses net of voluntary waivers, if any | .90% A |
Expenses net of all reductions | .87% A |
Net investment income (loss) | 1.98% A |
Supplemental Data | |
Net assets, end of period (000 omitted) | $ 476,032 |
Portfolio turnover rate | 66% A |
A Annualized
B Total returns for periods of less than one year are not annualized.
C Total returns would have been lower had certain expenses not been reduced during the periods shown.
D Calculated based on average shares outstanding during the period.
E For the period December 23, 2003 (commencement of operations) to November 30, 2004.
F Expense ratios reflect operating expenses of the class. Expenses before reductions do not reflect amounts reimbursed by the investment adviser or reductions from brokerage service arrangements or other expense offset arrangements and do not represent the amount paid by the class during periods when reimbursements or reductions occur. Expense ratios before reductions for start-up periods may not be representative of longer-term operating periods. Expenses net of any voluntary waivers reflect expenses after reimbursement by the investment adviser but prior to reductions from brokerage service arrangements or other expense offset arrangements. Expenses net of all reductions represent the net expenses paid by the class.
See accompanying notes which are an integral part of the financial statements.
Annual Report
Financial Highlights - Institutional Class
Year ended November 30, | 2004 E |
Selected Per-Share Data | |
Net asset value, beginning of period | $ 10.00 |
Income from Investment Operations | |
Net investment income (loss) D | .19 |
Net realized and unrealized gain (loss) | 1.04 |
Total from investment operations | 1.23 |
Distributions from net investment income | (.12) |
Net asset value, end of period | $ 11.11 |
Total Return B,C | 12.38% |
Ratios to Average Net Assets F | |
Expenses before expense reductions | .88% A |
Expenses net of voluntary waivers, if any | .88% A |
Expenses net of all reductions | .85% A |
Net investment income (loss) | 2.00% A |
Supplemental Data | |
Net assets, end of period (000 omitted) | $ 4,973 |
Portfolio turnover rate | 66% A |
A Annualized
B Total returns for periods of less than one year are not annualized.
C Total returns would have been lower had certain expenses not been reduced during the periods shown.
D Calculated based on average shares outstanding during the period.
E For the period December 23, 2003 (commencement of operations) to November 30, 2004.
F Expense ratios reflect operating expenses of the class. Expenses before reductions do not reflect amounts reimbursed by the investment adviser or reductions from brokerage service arrangements or other expense offset arrangements and do not represent the amount paid by the class during periods when reimbursements or reductions occur. Expense ratios before reductions for start-up periods may not be representative of longer-term operating periods. Expenses net of any voluntary waivers reflect expenses after reimbursement by the investment adviser but prior to reductions from brokerage service arrangements or other expense offset arrangements. Expenses net of all reductions represent the net expenses paid by the class.
See accompanying notes which are an integral part of the financial statements.
Annual Report
Notes to Financial Statements
For the period ended November 30, 2004
1. Significant Accounting Policies.
Fidelity Strategic Dividend & Income Fund (the fund) is a fund of Fidelity Financial Trust (the trust) and is authorized to issue an unlimited number of shares. The trust is registered under the Investment Company Act of 1940, as amended (the 1940 Act), as an open-end management investment company organized as a Massachusetts business trust.
The fund offers Class A, Class T, Class B, Class C, Strategic Dividend & Income, and Institutional Class shares, each of which has equal rights as to assets and voting privileges. Each class has exclusive voting rights with respect to matters that affect that class. Class B shares will automatically convert to Class A shares after a holding period of seven years from the initial date of purchase. Investment income, realized and unrealized capital gains and losses, the common expenses of the fund, and certain fund-level expense reductions, if any, are allocated on a pro rata basis to each class based on the relative net assets of each class to the total net assets of the fund. Each class differs with respect to transfer agent and distribution and service plan fees incurred. Certain expense reductions also differ by class.
The financial statements have been prepared in conformity with accounting principles generally accepted in the United States of America, which require management to make certain estimates and assumptions at the date of the financial statements. The following summarizes the significant accounting policies of the fund:
Security Valuation. Net asset value per share (NAV calculation) is calculated as of the close of business of the New York Stock Exchange, normally 4:00 p.m. Eastern time. Equity securities, including restricted securities, for which market quotations are available are valued at the last sale price or official closing price (closing bid price or last evaluated quote if no sale has occurred) on the primary market or exchange on which they trade. Debt securities, including restricted securities, for which quotations are readily available are valued at their most recent bid prices (sales prices if the principal market is an exchange) in the principal market in which such securities are normally traded, as determined by recognized dealers in such securities, or securities are valued on the basis of information provided by a pricing service. Pricing services use valuation matrices that incorporate both dealer-supplied valuations and valuation models. If prices are not readily available or do not accurately reflect fair value for a security, or if a security's value has been materially affected by events occurring after the close of the exchange or market on which the security is principally traded, that security may be valued by another method that the Board of Trustees believes accurately reflects fair value. A security's valuation may differ depending on the method used for determining value. Price movements in futures contracts and ADRs, market and trading trends, the bid/ask quotes of brokers and off-exchange institutional trading may be reviewed in the course of making a good faith determination of a security's fair value. Short-term securities with remaining maturities of sixty days or less for which quotations are not readily available are valued on the basis of amortized cost. Investments in open-end investment companies are valued at their net asset value each business day.
Annual Report
Notes to Financial Statements - continued
1. Significant Accounting Policies - continued
Foreign Currency. The fund uses foreign currency contracts to facilitate transactions in foreign-denominated securities. Losses from these transactions may arise from changes in the value of the foreign currency or if the counterparties do not perform under the contracts' terms.
Foreign-denominated assets, including investment securities, and liabilities are translated into U.S. dollars at the exchange rate at period end. Purchases and sales of investment securities, income and dividends received and expenses denominated in foreign currencies are translated into U.S. dollars at the exchange rate in effect on the transaction date.
The effects of exchange rate fluctuations on investments are included with the net realized and unrealized gain (loss) on investment securities. Other foreign currency transactions resulting in realized and unrealized gain (loss) are disclosed separately.
Investment Transactions and Income. Security transactions are accounted for as of trade date. Gains and losses on securities sold are determined on the basis of identified cost and may include proceeds received from litigation. Dividend income is recorded on the ex-dividend date, except for certain dividends from foreign securities where the ex-dividend date may have passed, which are recorded as soon as the fund is informed of the ex-dividend date. Non-cash dividends included in dividend income, if any, are recorded at the fair market value of the securities received. Distributions received on securities that represent a return of capital or capital gain are recorded as a reduction of cost of investments and/or as a realized gain. The fund estimates the components of distributions received that may be considered return of capital distributions or capital gain distributions. Interest income is accrued as earned. Interest income includes coupon interest and amortization of premium and accretion of discount on debt securities. Investment income is recorded net of foreign taxes withheld where recovery of such taxes is uncertain.
Expenses. Most expenses of the trust can be directly attributed to a fund. Expenses which cannot be directly attributed are apportioned among the funds in the trust.
Income Tax Information and Distributions to Shareholders. Each year, the fund intends to qualify as a regulated investment company by distributing all of its taxable income and realized gains under Subchapter M of the Internal Revenue Code. As a result, no provision for income taxes is required in the accompanying financial statements. Foreign taxes are provided for based on the fund's understanding of the tax rules and rates that exist in the foreign markets in which it invests.
Annual Report
1. Significant Accounting Policies - continued
Income Tax Information and Distributions to Shareholders - continued
Distributions are recorded on the ex-dividend date. Income dividends and capital gain distributions are declared separately for each class. Income and capital gain distributions are determined in accordance with income tax regulations, which may differ from generally accepted accounting principles. Capital accounts within the financial statements are adjusted for permanent book-tax differences. These adjustments have no impact on net assets or the results of operations. Temporary book-tax differences will reverse in a subsequent period.
Book-tax differences are primarily due to foreign currency transactions, non-taxable dividends, futures transactions, market discount, passive foreign investment companies (PFIC), capital loss carryforwards and losses deferred due to wash sales.
The tax-basis components of distributable earnings and the federal tax cost as of period end were as follows:
Unrealized appreciation | $ 49,133,039 | |
Unrealized depreciation | (11,088,285) | |
Net unrealized appreciation (depreciation) | 38,044,754 | |
Undistributed ordinary income | 2,455,813 | |
Capital loss carryforward | (7,643,145) | |
| | |
Cost for federal income tax purposes | $ 547,392,109 | |
The tax character of distributions paid was as follows:
| November 30, 2004 | |
| | |
Ordinary Income | $ 4,647,719 | |
2. Operating Policies.
Repurchase Agreements. Fidelity Management & Research Company (FMR) has received an Exemptive Order from the Securities and Exchange Commission (the SEC) which permits the fund and other affiliated entities of FMR to transfer uninvested cash balances into joint trading accounts. These accounts are then invested in repurchase agreements that are collateralized by U.S. Treasury or Government obligations. The fund may also invest directly with institutions, in repurchase agreements that are collateralized by commercial paper obligations and corporate obligations. Collateral is held in segregated accounts with custodian banks and may be obtained in the event of a default of the counterparty. Collateral is marked-to-market daily and maintained at a value at least equal to the principal amount of the repurchase agreement (including accrued interest).
Annual Report
Notes to Financial Statements - continued
2. Operating Policies - continued
Futures Contracts. The fund may use futures contracts to manage its exposure to the stock market. Buying futures tends to increase the fund's exposure to the underlying instrument, while selling futures tends to decrease the fund's exposure to the underlying instrument or hedge other fund investments. Futures contracts involve, to varying degrees, risk of loss in excess of any futures variation margin reflected in the Statement of Assets and Liabilities. The underlying face amount at value of any open futures contracts at period end is shown in the Schedule of Investments under the caption "Futures Contracts." This amount reflects each contract's exposure to the underlying instrument at period end. Losses may arise from changes in the value of the underlying instruments or if the counter-parties do not perform under the contracts' terms. Gains (losses) are realized upon the expiration or closing of the futures contracts. Futures contracts are valued at the settlement price established each day by the board of trade or exchange on which they are traded.
Restricted Securities. The fund may invest in securities that are subject to legal or contractual restrictions on resale. These securities generally may be resold in transactions exempt from registration or to the public if the securities are registered. Disposal of these securities may involve time-consuming negotiations and expense, and prompt sale at an acceptable price may be difficult. Information regarding restricted securities is included at the end of the fund's Schedule of Investments.
3. Purchases and Sales of Investments.
Purchases and sales of securities, other than short-term securities and U.S. government securities, aggregated $744,022,486 and $224,900,566, respectively.
4. Fees and Other Transactions with Affiliates.
Management Fee. FMR and its affiliates provide the fund with investment management related services for which the fund pays a monthly management fee. The management fee is the sum of an individual fund fee rate that is based on an annual rate of .30% of the fund's average net assets and a group fee rate that averaged .28% during the period. The group fee rate is based upon the average net assets of all the mutual funds advised by FMR. The group fee rate decreases as assets under management increase and increases as assets under management decrease. For the period, the total annualized management fee rate was .57% of the fund's average net assets.
Annual Report
4. Fees and Other Transactions with Affiliates - continued
Distribution and Service Plan. In accordance with Rule 12b-1 of the 1940 Act, the fund has adopted separate Distribution and Service Plans for each class of shares. Certain classes pay Fidelity Distributors Corporation (FDC), an affiliate of FMR, separate Distribution and Service Fees, each of which is based on an annual percentage of each class' average net assets. In addition, FDC may pay financial intermediaries for selling shares of the fund and providing shareholder support services. For the period, the Distribution and Service Fee rates and the total amounts paid to and retained by FDC were as follows:
| Distribution
Fee | Service
Fee | Paid to
FDC | Retained
by FDC |
Class A | 0% | .25% | $ 30,719 | $ 2,320 |
Class T | .25% | .25% | 82,780 | 6,333 |
Class B | .75% | .25% | 71,575 | 56,029 |
Class C | .75% | .25% | 158,209 | 122,573 |
| | | $ 343,283 | $ 187,255 |
Sales Load. FDC receives a front-end sales charge of up to 5.75% for selling Class A shares, and 3.50% for selling Class T shares, some of which is paid to financial intermediaries for selling shares of the fund. FDC receives the proceeds of contingent deferred sales charges levied on Class A, Class T, Class B, and Class C redemptions. These charges depend on the holding period. The deferred sales charges range from 5% to 1% for Class B, 1% for Class C, and .25% for certain purchases of Class A and Class T shares.
For the period, sales charge amounts retained by FDC were as follows:
| Retained
by FDC | |
Class A | $ 94,769 | |
Class T | 49,710 | |
Class B * | 6,510 | |
Class C * | 6,473 | |
| $ 157,462 | |
* When Class B and Class C shares are initially sold, FDC pays commissions from its own resources to financial intermediaries through which the sales are made.
Transfer Agent Fees. Fidelity Investments Institutional Operations Company, Inc. (FIIOC), an affiliate of FMR, is the transfer, dividend disbursing and shareholder servicing agent for each class of the fund, except for Strategic Dividend & Income. Fidelity Service Company, Inc. (FSC), an affiliate of FMR, is the transfer agent for Strategic Dividend & Income shares. FIIOC and FSC receive account fees and asset-based fees that vary according to the account size and type of account of the shareholders of the respective classes of the fund. FIIOC and FSC pay for typesetting, printing and mailing of shareholder reports, except proxy statements. For the period, the total transfer agent fees paid by each class to FIIOC or FSC were as follows:
Annual Report
Notes to Financial Statements - continued
4. Fees and Other Transactions with Affiliates - continued
Transfer Agent Fees - continued
| Amount | % of
Average
Net Assets |
Class A | $ 32,480 | .26* |
Class T | 43,373 | .26* |
Class B | 21,591 | .30* |
Class C | 41,184 | .26* |
Strategic Dividend & Income | 621,448 | .21* |
Institutional Class | 5,462 | .19* |
| $ 765,538 | |
* Annualized
Accounting and Security Lending Fees. FSC maintains the fund's accounting records. The accounting fee is based on the level of average net assets for the month. Under a separate contract, FSC administers the security lending program. The security lending fee is based on the number and duration of lending transactions.
Central Funds. The fund may invest in affiliated Central Funds managed by Fidelity Investments Money Management, Inc. (FIMM), an affiliate of FMR. The Central Funds are open-end investment companies available only to investment companies and other accounts managed by FMR and its affiliates. The Central Funds seek preservation of capital and current income and do not pay a management fee. Income distributions earned by the fund are recorded as income in the accompanying financial statements and totaled $187,845 for the period.
Brokerage Commissions. The fund placed a portion of its portfolio transactions with brokerage firms which are affiliates of the investment adviser. The commissions paid to these affiliated firms were $47,196 for the period.
5. Committed Line of Credit.
The fund participates with other funds managed by FMR in a $4.2 billion credit facility (the "line of credit") to be utilized for temporary or emergency purposes to fund shareholder redemptions or for other short-term liquidity purposes. The fund has agreed to pay commitment fees on its pro rata portion of the line of credit. During the period, there were no borrowings on this line of credit.
6. Security Lending.
The fund lends portfolio securities from time to time in order to earn additional income. The fund receives collateral (in the form of U.S. Treasury obligations, letters of credit
Annual Report
6. Security Lending - continued
and/or cash) against the loaned securities and maintains collateral in an amount not less than 100% of the market value of the loaned securities during the period of the loan. The market value of the loaned securities is determined at the close of business of the fund and any additional required collateral is delivered to the fund on the next business day. If the borrower defaults on its obligation to return the securities loaned because of insolvency or other reasons, a fund could experience delays and costs in recovering the securities loaned or in gaining access to the collateral. Cash collateral is invested in cash equivalents. The value of loaned securities and cash collateral at period end are disclosed on the fund's Statement of Assets and Liabilities.
7. Expense Reductions.
Effective December 23, 2003, FMR voluntarily agreed to reimburse each class to the extent annual operating expenses exceeded certain levels of average net assets as noted in the table below. Some expenses, for example interest expense, are excluded from this reimbursement.
| Expense
Limitations | Reimbursement
from adviser |
Class B | 1.95% | $ 2,427 |
Many of the brokers with whom FMR places trades on behalf of the fund provided services to the fund in addition to trade execution. These services included payments of certain expenses on behalf of the fund totaling $97,043 for the period. In addition, through arrangements with the fund's custodian, credits realized as a result of uninvested cash balances were used to reduce the fund's expenses. During the period, these credits reduced the fund's custody expenses by $2,762.
8. Distributions to Shareholders.
Distributions to shareholders of each class were as follows:
| Year Ended
November 30, 2004A | |
From net investment income | | |
Class A | $ 159,582 | |
Class T | 189,189 | |
Class B | 55,805 | |
Class C | 123,216 | |
Strategic Dividend & Income | 4,080,966 | |
Institutional Class | 38,961 | |
Total | $ 4,647,719 | |
A For the period December 23, 2003 (commencement of operations) to November 30, 2004.
Annual Report
Notes to Financial Statements - continued
9. Share Transactions.
Transactions for each class of shares were as follows:
| Year Ended
November 30, 2004A | Year Ended
November 30, 2004A |
| Shares | Dollars |
Class A | | |
Shares sold | 2,191,945 | $ 22,746,005 |
Reinvestment of distributions | 10,552 | 110,590 |
Shares redeemed | (220,797) | (2,287,113) |
Net increase (decrease) | 1,981,700 | $ 20,569,482 |
Class T | | |
Shares sold | 3,511,538 | $ 36,655,001 |
Reinvestment of distributions | 14,112 | 147,959 |
Shares redeemed | (230,386) | (2,405,951) |
Net increase (decrease) | 3,295,264 | $ 34,397,009 |
Class B | | |
Shares sold | 1,285,173 | $ 13,296,297 |
Reinvestment of distributions | 3,976 | 41,558 |
Shares redeemed | (72,792) | (752,799) |
Net increase (decrease) | 1,216,357 | $ 12,585,056 |
Class C | | |
Shares sold | 2,813,304 | $ 29,175,332 |
Reinvestment of distributions | 7,379 | 77,088 |
Shares redeemed | (218,090) | (2,262,584) |
Net increase (decrease) | 2,602,593 | $ 26,989,836 |
Strategic Dividend & Income | | |
Shares sold | 55,474,221 | $580,932,738 |
Reinvestment of distributions | 341,097 | 3,577,556 |
Shares redeemed | (12,984,227) | (134,752,835) |
Net increase (decrease) | 42,831,091 | $ 449,757,459 |
Institutional Class | | |
Shares sold | 464,040 | $ 4,776,823 |
Reinvestment of distributions | 1,845 | 19,348 |
Shares redeemed | (18,218) | (186,845) |
Net increase (decrease) | 447,667 | $ 4,609,326 |
A For the period December 23, 2003 (commencement of operations) to November 30, 2004.
Annual Report
Report of Independent Registered Public Accounting Firm
To the Trustees of Fidelity Financial Trust and the Shareholders of Fidelity Strategic Dividend & Income Fund:
In our opinion, the accompanying statement of assets and liabilities, including the schedule of investments, and the related statements of operations and of changes in net assets and the financial highlights present fairly, in all material respects, the financial position of Fidelity Strategic Dividend & Income Fund (a fund of Fidelity Financial Trust) at November 30, 2004 and the results of its operations, the changes in its net assets and the financial highlights for the periods indicated, in conformity with accounting principles generally accepted in the United States of America. These financial statements and financial highlights (hereafter referred to as "financial statements") are the responsibility of the Fidelity Strategic Dividend & Income Fund's management; our responsibility is to express an opinion on these financial statements based on our audits. We conducted our audits of these financial statements in accordance with the standards of the Public Company Accounting Oversight Board (United States). Those standards require that we plan and perform the audit to obtain reasonable assurance about whether the financial statements are free of material misstatement. An audit includes examining, on a test basis, evidence supporting the amounts and disclosures in the financial statements, assessing the accounting principles used and significant estimates made by management, and evaluating the overall financial statement presentation. We believe that our audits, which included confirmation of securities at November 30, 2004 by correspondence with the custodian and brokers, provide a reasonable basis for our opinion.
/s/PricewaterhouseCoopers LLP
PricewaterhouseCoopers LLP
Boston, Massachusetts
January 11, 2005
Annual Report
Trustees and Officers
The Trustees, Members of the Advisory Board, and executive officers of the trust and fund, as applicable, are listed below. The Board of Trustees governs the fund and is responsible for protecting the interests of shareholders. The Trustees are experienced executives who meet periodically throughout the year to oversee the fund's activities, review contractual arrangements with companies that provide services to the fund, and review the fund's performance. Except for William O. McCoy, Dennis J. Dirks, and Kenneth L. Wolfe, each of the Trustees oversees 301 funds advised by FMR or an affiliate. Mr. McCoy oversees 303 funds advised by FMR or an affiliate. Mr. Dirks and Mr. Wolfe oversee 223 funds advised by FMR or an affiliate.
The Trustees hold office without limit in time except that (a) any Trustee may resign; (b) any Trustee may be removed by written instrument, signed by at least two-thirds of the number of Trustees prior to such removal; (c) any Trustee who requests to be retired or who has become incapacitated by illness or injury may be retired by written instrument signed by a majority of the other Trustees; and (d) any Trustee may be removed at any special meeting of shareholders by a two-thirds vote of the outstanding voting securities of the trust. In any event, each non-interested Trustee shall retire not later than the last day of the calendar year in which his or her 72nd birthday occurs. The executive officers and Advisory Board Members hold office without limit in time, except that any officer and Advisory Board Member may resign or may be removed by a vote of a majority of the Trustees at any regular meeting or any special meeting of the Trustees. Except as indicated, each individual has held the office shown or other offices in the same company for the past five years.
The fund's Statement of Additional Information (SAI) includes more information about the Trustees. To request a free copy, call Fidelity at 1-877-208-0098.
Interested Trustees*:
Correspondence intended for each Trustee who is an "interested person" (as defined in the 1940 Act) may be sent to Fidelity Investments, 82 Devonshire Street, Boston, Massachusetts 02109.
Name, Age; Principal Occupation |
Edward C. Johnson 3d (74)** |
| Year of Election or Appointment: 1982 Mr. Johnson is Chairman of the Board of Trustees. Mr. Johnson serves as Chief Executive Officer, Chairman, and a Director of FMR Corp.; a Director and Chairman of the Board and of the Executive Committee of FMR; Chairman and a Director of Fidelity Management & Research (Far East) Inc.; Chairman (1998) and a Director of Fidelity Investments Money Management, Inc.; and Chairman (2001) and a Director (2000) of FMR Co., Inc. |
Abigail P. Johnson (42)** |
| Year of Election or Appointment: 2001 Senior Vice President of the fund (2003). Ms. Johnson also serves as Senior Vice President of other Fidelity funds (2001). She is President and a Director of FMR (2001), Fidelity Investments Money Management, Inc. (2001), FMR Co., Inc. (2001), and a Director of FMR Corp. Previously, Ms. Johnson managed a number of Fidelity funds. |
Laura B. Cronin (50) |
| Year of Election or Appointment: 2003 Ms. Cronin is an Executive Vice President (2002) and Chief Financial Officer (2002) of FMR Corp. and is a member of the Fidelity Management Committee (2003). Previously, Ms. Cronin served as Vice President of Finance of FMR (1997-1999), and Chief Financial Officer of FMR (1999-2001), Fidelity Personal Investments (2001), and Fidelity Brokerage Company (2001-2002). |
Robert L. Reynolds (52) |
| Year of Election or Appointment: 2003 Mr. Reynolds is a Director (2003) and Chief Operating Officer (2002) of FMR Corp. and is the head of the Fidelity Management Committee (2003). He also serves on the Board at Fidelity Investments Canada, Ltd. (2000). Previously, Mr. Reynolds served as President of Fidelity Investments Institutional Retirement Group (1996-2000). |
* Trustees have been determined to be "Interested Trustees" by virtue of, among other things, their affiliation with the trust or various entities under common control with FMR.
** Edward C. Johnson 3d, Trustee, is Abigail P. Johnson's father.
Annual Report
Non-Interested Trustees:
Correspondence intended for each non-interested Trustee (that is, the Trustees other than the Interested Trustees) may be sent to Fidelity Investments, P.O. Box 55235, Boston, Massachusetts 02205-5235.
Name, Age; Principal Occupation |
Robert M. Gates (61) |
| Year of Election or Appointment: 1997 Dr. Gates is Vice Chairman of the non-interested Trustees (2005). Dr. Gates is President of Texas A&M University (2002). He was Director of the Central Intelligence Agency (CIA) from 1991 to 1993. From 1989 to 1991, Dr. Gates served as Assistant to the President of the United States and Deputy National Security Advisor. Dr. Gates is a Director of NACCO Industries, Inc. (mining and manufacturing), Parker Drilling Co., Inc. (drilling and rental tools for the energy industry, 2001), and Brinker International (restaurant management, 2003). He also serves as a member of the Advisory Board of VoteHere.net (secure Internet voting, 2001). Previously, Dr. Gates served as a Director of LucasVarity PLC (automotive components and diesel engines), a Director of TRW Inc. (automotive, space, defense, and information technology), and Dean of the George Bush School of Government and Public Service at Texas A&M University (1999-2001). Dr. Gates also is a Trustee of the Forum for International Policy. |
George H. Heilmeier (68) |
| Year of Election or Appointment: 2004 Dr. Heilmeier is Chairman Emeritus of Telcordia Technologies (communication software and systems), where prior to his retirement, he served as company Chairman and Chief Executive Officer. He currently serves on the Boards of Directors of The Mitre Corporation (systems engineering and information technology support for the government), INET Technologies Inc. (telecommunications network surveillance, 2001), Teletech Holdings (customer management services), and HRL Laboratories (private research and development, 2004). He is Chairman of the General Motors Technology Advisory Committee and a Life Fellow of the Institute of Electrical and Electronics Engineers (IEEE) (2000). Dr. Heilmeier is a member of the Defense Science Board and the National Security Agency Advisory Board. He is also a member of the National Academy of Engineering, the American Academy of Arts and Sciences, and the Board of Overseers of the School of Engineering and Applied Science of the University of Pennsylvania. Previously, Dr. Heilmeier served as a Director of TRW Inc. (automotive, space, defense, and information technology, 1992-2002), Compaq (1994-2002), and Automatic Data Processing, Inc. (ADP) (technology-based business outsourcing, 1995-2002). |
Marie L. Knowles (58) |
| Year of Election or Appointment: 2001 Prior to Ms. Knowles' retirement in June 2000, she served as Executive Vice President and Chief Financial Officer of Atlantic Richfield Company (ARCO) (diversified energy, 1996-2000). From 1993 to 1996, she was a Senior Vice President of ARCO and President of ARCO Transportation Company. She served as a Director of ARCO from 1996 to 1998. She currently serves as a Director of Phelps Dodge Corporation (copper mining and manufacturing) and McKesson Corporation (healthcare service, 2002). Ms. Knowles is a Trustee of the Brookings Institution and the Catalina Island Conservancy and also serves as a member of the Advisory Board for the School of Engineering of the University of Southern California. |
Ned C. Lautenbach (60) |
| Year of Election or Appointment: 2000 Mr. Lautenbach has been a partner of Clayton, Dubilier & Rice, Inc. (private equity investment firm) since September 1998. Previously, Mr. Lautenbach was with the International Business Machines Corporation (IBM) from 1968 until his retirement in 1998. He was most recently Senior Vice President and Group Executive of Worldwide Sales and Services. From 1993 to 1995, he was Chairman of IBM World Trade Corporation, and from 1994 to 1998 was a member of IBM's Corporate Executive Committee. Mr. Lautenbach serves as Co-Chairman and a Director of Covansys, Inc. (global provider of business and technology solutions, 2000). In addition, he is a Director of Italtel Holding S.p.A. (telecommunications (Milan, Italy), 2004) and Eaton Corporation (diversified industrial) as well as the Philharmonic Center for the Arts in Naples, Florida (1999). He also is a member of the Council on Foreign Relations. |
Marvin L. Mann (71) |
| Year of Election or Appointment: 1993 Mr. Mann is Chairman of the non-interested Trustees (2001). He is Chairman Emeritus of Lexmark International, Inc. (computer peripherals), where he served as CEO until April 1998, retired as Chairman May 1999, and remains a member of the Board. Prior to 1991, he held the positions of Vice President of International Business Machines Corporation (IBM) and President and General Manager of various IBM divisions and subsidiaries. He is a member of the Executive Committee of the Independent Director's Council of the Investment Company Institute. In addition, Mr. Mann is a member of the President's Cabinet at the University of Alabama and the Board of Visitors of the Culverhouse College of Commerce and Business Administration at the University of Alabama. |
William O. McCoy (71) |
| Year of Election or Appointment: 1997 Prior to his retirement in December 1994, Mr. McCoy was Vice Chairman of the Board of BellSouth Corporation (telecommunications) and President of BellSouth Enterprises. He is currently a Director of Liberty Corporation (holding company), Duke Realty Corporation (real estate), and Progress Energy, Inc. (electric utility). He is also a partner of Franklin Street Partners (private investment management firm) and a member of the Research Triangle Foundation Board. In addition, Mr. McCoy served as the Interim Chancellor (1999-2000) and a member of the Board of Visitors (1994-1998) for the University of North Carolina at Chapel Hill and currently serves on the Board of Directors of the University of North Carolina Health Care System and the Board of Visitors of the Kenan-Flagler Business School (University of North Carolina at Chapel Hill). He also served as Vice President of Finance for the University of North Carolina (16-school system, 1995-1998). |
Cornelia M. Small (60) |
| Year of Election or Appointment: 2005 Ms. Small is a member (2000) and Chairperson (2002) of the Investment Committee, and a member (2002) of the Board of Trustees of Smith College. Previously, she served as Chief Investment Officer (1999-2000), Director of Global Equity Investments (1996-1999), and a member of the Board of Directors of Scudder, Stevens & Clark (1990-1997) and Scudder Kemper Investments (1997-1998). In addition, Ms. Small served as Co-Chair (2000-2003) of the Annual Fund for the Fletcher School of Law and Diplomacy. |
William S. Stavropoulos (65) |
| Year of Election or Appointment: 2002 Mr. Stavropoulos is Chairman of the Board (2000), CEO (2002), a position he previously held from 1995-2000, Chairman of the Executive Committee (2000), and a Member of the Board of Directors of The Dow Chemical Company. Since joining The Dow Chemical Company in 1967, Mr. Stavropoulos served in numerous senior management positions, including President (1993-2000; 2002-2003). Currently, he is a Director of NCR Corporation (data warehousing and technology solutions), BellSouth Corporation (telecommunications), Chemical Financial Corporation, and Maersk Inc. (industrial conglomerate, 2002). He also serves as a member of the Board of Trustees of the American Enterprise Institute for Public Policy Research. In addition, Mr. Stavropoulos is a member of The Business Council, J.P. Morgan International Council and the University of Notre Dame Advisory Council for the College of Science. |
Annual Report
Trustees and Officers - continued
Advisory Board Members and Executive Officers:
Correspondence intended for Mr. Dirks and Mr. Wolfe may be sent to Fidelity Investments, P.O. Box 55235, Boston, Massachusetts 02205-5235. Correspondence intended for each executive officer and Mr. Lynch may be sent to Fidelity Investments, 82 Devonshire Street, Boston, Massachusetts 02109.
Name, Age; Principal Occupation |
Dennis J. Dirks (56) |
| Year of Election or Appointment: 2004 Member of the Advisory Board of Fidelity Financial Trust. Mr. Dirks also serves as a Trustee (2005) or member of the Advisory Board (2004) of other investment companies advised by FMR. Prior to his retirement in May 2003, Mr. Dirks was Chief Operating Officer and a member of the Board of The Depository Trust & Clearing Corporation (DTCC) (1999-2003). He also served as President, Chief Operating Officer, and Board member of The Depository Trust Company (DTC) (1999-2003) and President and Board member of the National Securities Clearing Corporation (NSCC) (1999-2003). In addition, Mr. Dirks served as Chief Executive Officer and Board member of the Government Securities Clearing Corporation (2001-2003) and Chief Executive Officer and Board member of the Mortgage-Backed Securities Clearing Corporation (2001-2003). |
Peter S. Lynch (61) |
| Year of Election or Appointment: 2003 Member of the Advisory Board of Fidelity Financial Trust. Vice Chairman and a Director of FMR, and Vice Chairman (2001) and a Director (2000) of FMR Co., Inc. Previously, Mr. Lynch served as a Trustee of the Fidelity funds (1990-2003). Prior to May 31, 1990, he was a Director of FMR and Executive Vice President of FMR (a position he held until March 31, 1991), Vice President of Fidelity® Magellan® Fund and FMR Growth Group Leader, and Managing Director of FMR Corp. Mr. Lynch was also Vice President of Fidelity Investments Corporate Services. In addition, he serves as a Trustee of Boston College, Massachusetts Eye & Ear Infirmary, Historic Deerfield, John F. Kennedy Library, and the Museum of Fine Arts of Boston. |
Kenneth L. Wolfe (65) |
| Year of Election or Appointment: 2004 Member of the Advisory Board of Fidelity Financial Trust. Mr. Wolfe also serves as a Trustee (2005) or member of the Advisory Board (2004) of other investment companies advised by FMR. Prior to his retirement in 2001, Mr. Wolfe was Chairman and Chief Executive Officer of Hershey Foods Corporation (1993-2001). He currently serves as a member of the boards of Adelphia Communications Corporation (2003), Bausch & Lomb, Inc., and Revlon Inc. (2004). |
Bart A. Grenier (45) |
| Year of Election or Appointment: 2003 Vice President of the fund. Mr. Grenier also serves as Vice President of certain Equity Funds (2001), a position he previously held from 1999 to 2000, and Vice President of certain High Income Funds (2002). He is Senior Vice President of FMR (1999) and FMR Co., Inc. (2001), and President and Director of Strategic Advisers, Inc. (2002). He also heads Fidelity's Asset Allocation Group (2000), Fidelity's Growth and Income Group (2001), Fidelity's Value Group (2001), and Fidelity's High Income Division (2001). Previously, Mr. Grenier served as President of Fidelity Ventures (2000), Vice President of certain High Income Funds (1997-2000), High Income Division Head (1997-2000), Group Leader of the Income-Growth and Asset Allocation-Income Groups (1996-2000), and Assistant Equity Division Head (1997-2000). |
William Eigen (36) |
| Year of Election or Appointment: 2003 Vice President of the fund. Mr. Eigen also serves as Vice President of other funds advised by FMR. Prior to assuming his current responsibilities, Mr. Eigen managed a variety of Fidelity funds. |
Eric D. Roiter (56) |
| Year of Election or Appointment: 2003 Secretary of the fund. He also serves as Secretary of other Fidelity funds (1998); Vice President, General Counsel, and Clerk of FMR Co., Inc. (2001) and FMR (1998); Vice President and Clerk of FDC (1998); Assistant Clerk of Fidelity Management & Research (U.K.) Inc. (2001) and Fidelity Management & Research (Far East) Inc. (2001); and Assistant Secretary of Fidelity Investments Money Management, Inc. (2001). Prior to joining Fidelity, Mr. Roiter was with the law Firm of Debevoise & Plimpton, as on associate (1981-1984) and as a partner (1985-1997), and served as an Assistant General Counsel of the U.S. Securities and Exchange Commission (1979-1981). Mr. Roiter is an Adjunct Member, Faculty of Law, at Boston College Law School (2003). |
Stuart Fross (45) |
| Year of Election or Appointment: 2003 Assistant Secretary of the fund. Mr. Fross also serves as Assistant Secretary of other Fidelity funds (2003) and is an employee of FMR. |
Name, Age; Principal Occupation |
Christine Reynolds (46) |
| Year of Election or Appointment: 2004 President, Treasurer, and Anti-Money Laundering (AML) officer of the fund. Ms. Reynolds also serves as President, Treasurer, and AML officer of other Fidelity funds (2004) and is a Vice President (2003) and an employee (2002) of FMR. Before joining Fidelity Investments, Ms. Reynolds worked at PricewaterhouseCoopers LLP (PwC) (1980-2002), where she was most recently an audit partner with PwC's investment management practice. |
Timothy F. Hayes (53) |
| Year of Election or Appointment: 2003 Chief Financial Officer of the fund. Mr. Hayes also serves as Chief Financial Officer of other Fidelity funds (2002). Recently he was appointed President of Fidelity Service Company (2003) where he also serves as a Director. Mr. Hayes also serves as President of Fidelity Investments Operations Group (FIOG, 2002), which includes Fidelity Pricing and Cash Management Services Group (FPCMS), where he was appointed President in 1998. Previously, Mr. Hayes served as Chief Financial Officer of Fidelity Investments Corporate Systems and Service Group (1998) and Fidelity Systems Company (1997-1998). |
Kenneth A. Rathgeber (57) |
| Year of Election or Appointment: 2004 Chief Compliance Officer of the fund. Mr. Rathgeber also serves as Chief Compliance Officer of other Fidelity funds (2004) and Executive Vice President of Risk Oversight for Fidelity Investments (2002). Previously, he served as Executive Vice President and Chief Operating Officer for Fidelity Investments Institutional Services Company, Inc. (1998-2002). |
John R. Hebble (46) |
| Year of Election or Appointment: 2003 Deputy Treasurer of the fund. Mr. Hebble also serves as Deputy Treasurer of other Fidelity funds (2003), and is an employee of FMR. Before joining Fidelity Investments, Mr. Hebble worked at Deutsche Asset Management where he served as Director of Fund Accounting (2002-2003) and Assistant Treasurer of the Scudder Funds (1998-2003). |
Kimberley H. Monasterio (41) |
| Year of Election or Appointment: 2004 Deputy Treasurer of the fund. Ms. Monasterio also serves as Deputy Treasurer of other Fidelity funds (2004) and is an employee of FMR (2004). Before joining Fidelity Investments, Ms. Monasterio served as Treasurer (2000-2004) and Chief Financial Officer (2002-2004) of the Franklin Templeton Funds and Senior Vice President of Franklin Templeton Services, LLC (2000-2004). |
John H. Costello (58) |
| Year of Election or Appointment: 2003 Assistant Treasurer of the fund. Mr. Costello also serves as Assistant Treasurer of other Fidelity funds and is an employee of FMR. |
Peter L. Lydecker (50) |
| Year of Election or Appointment: 2004 Assistant Treasurer of the fund. Mr. Lydecker also serves as Assistant Treasurer of other Fidelity funds (2004) and is an employee of FMR. |
Mark Osterheld (49) |
| Year of Election or Appointment: 2003 Assistant Treasurer of the fund. Mr. Osterheld also serves as Assistant Treasurer of other Fidelity funds (2002) and is an employee of FMR. |
Kenneth B. Robins (35) |
| Year of Election or Appointment: 2004 Assistant Treasurer of the fund. Mr. Robins also serves as Assistant Treasurer of other Fidelity funds (2004) and is an employee of FMR (2004). Before joining Fidelity Investments, Mr. Robins worked at KPMG LLP, where he was a partner in KPMG's department of professional practice (2002-2004) and a Senior Manager (1999-2000). In addition, Mr. Robins served as Assistant Chief Accountant, United States Securities and Exchange Commission (2000-2002). |
Thomas J. Simpson (46) |
| Year of Election or Appointment: 2003 Assistant Treasurer of the fund. Mr. Simpson is Assistant Treasurer of other Fidelity funds (2000) and an employee of FMR (1996). Prior to joining FMR, Mr. Simpson was Vice President and Fund Controller of Liberty Investment Services (1987-1995). |
Annual Report
Distributions
A total of 0.13% of the dividends distributed during the fiscal year was derived from interest on U.S. Government securities which is generally exempt from state income tax.
Class A designates 96%, Class T designates 100%, Class B designates 100%, and Class C designates 100% of the dividends distributed during the fiscal year as qualifying for the dividends-received deduction for corporate shareholders.
Class A designates 100%, 100%, and 67.79%; Class T designates 100%, 100%, and 75.32%; Class B designates 100%, 100%, and 100%; and Class C designates 100%, 100%, and 100% of the dividends distributed in March, June, and October, respectively during the fiscal year as amounts which may be taken into account as a dividend for purposes of the maximum rate under section 1(h)(11) of the Internal Revenue Code.
The fund will notify shareholders in January 2005 of amounts for use in preparing 2004 income tax returns.
Annual Report
Annual Report
Annual Report
Annual Report
Annual Report
Annual Report
Annual Report
Investment Adviser
Fidelity Management & Research Company
Boston, MA
Investment Sub-Advisers
FMR Co., Inc.
Fidelity Management & Research
(U.K.) Inc.
Fidelity Management & Research
(Far East) Inc.
Fidelity International Investment Advisors
Fidelity Investments Japan Limited
Fidelity International Investment Advisors (U.K.) Limited
General Distributor
Fidelity Distributors Corporation
Boston, MA
Transfer and Shareholder
Servicing Agent
Fidelity Investments Institutional
Operations Company, Inc.
Boston, MA
Custodian
Citibank, N.A.
New York, NY
(Fidelity Investment logo)(registered trademark)
Corporate Headquarters
82 Devonshire St., Boston, MA 02109
www.fidelity.com
ASDI-UANN-0105
1.802529.100
Fidelity Advisor
Strategic Dividend & Income
Fund - Institutional Class
Annual Report
November 30, 2004
(2_fidelity_logos) (Registered_Trademark)
Institutional Class
is a class of Fidelity®
Strategic Dividend &
IncomeSM Fund
Contents
Chairman's Message | <Click Here> | Ned Johnson's message to shareholders. |
Performance | <Click Here> | How the fund has done over time. |
Management's Discussion | <Click Here> | The manager's review of fund performance, strategy and outlook. |
Shareholder Expense Example | <Click Here> | An example of shareholder expenses. |
Investment Changes | <Click Here> | A summary of the fund's investments. |
Investments | <Click Here> | A complete list of the fund's investments with their market values. |
Financial Statements | <Click Here> | Statements of assets and liabilities, operations, and changes in net assets,
as well as financial highlights. |
Notes | <Click Here> | Notes to the financial statements. |
Report of Independent Registered Public Accounting Firm | <Click Here> | |
Trustees and Officers | <Click Here> | |
Distributions | <Click Here> | |
| | |
Standard & Poor's, S&P and S&P 500 are registered service marks of The McGraw-Hill Companies, Inc. and have been licensed for use by Fidelity Distributors Corporation.
Other third party marks appearing herein are the property of their respective owners.
All other marks appearing herein are registered or unregistered trademarks or service marks of FMR Corp. or an affiliated company.
To view a fund's proxy voting guidelines and proxy voting record for the 12-month period ended June 30, visit www.fidelity.com/proxyvotingresults or visit the Securities and Exchange Commission's (SEC) web site at www.sec.gov. You may also call 1-877-208-0098 to request a free copy of the proxy voting guidelines.
(Recycle graphic) This report is printed on recycled paper using soy-based inks.
Annual Report
This report and the financial statements contained herein are submitted for the general information of the shareholders of the fund. This report is not authorized for distribution to prospective investors in the fund unless preceded or accompanied by an effective prospectus.
A fund files its complete schedule of portfolio holdings with the SEC for the first and third quarters of each fiscal year on Form N-Q. Forms N-Q are available on the SEC's web site at http://www.sec.gov. A fund's Forms N-Q may be reviewed and copied at the SEC's Public Reference Room in Washington, DC. Information regarding the operation of the SEC's Public Reference Room may be obtained by calling 1-800-SEC-0330. For a complete list of a fund's portfolio holdings, view the most recent quarterly holdings report, semiannual report, or annual report on Fidelity's web site at http://www.advisor.fidelity.com.
NOT FDIC INSURED · MAY LOSE VALUE · NO BANK GUARANTEE
Neither the fund nor Fidelity Distributors Corporation is a bank.
Annual Report
Chairman's Message
(photo_of_Edward_C_Johnson_3d)
Dear Shareholder:
During the past year or so, much has been reported about the mutual fund industry, and much of it has been more critical than I believe is warranted. Allegations that some companies have been less than forthright with their shareholders have cast a shadow on the entire industry. I continue to find these reports disturbing, and assert that they do not create an accurate picture of the industry overall. Therefore, I would like to remind everyone where Fidelity stands on these issues. I will say two things specifically regarding allegations that some mutual fund companies were in violation of the Securities and Exchange Commission's forward pricing rules or were involved in so-called "market timing" activities.
First, Fidelity has no agreements that permit customers who buy fund shares after 4 p.m. to obtain the 4 p.m. price. This is not a new policy. This is not to say that someone could not deceive the company through fraudulent acts. However, we are extremely diligent in preventing fraud from occurring in this manner - and in every other. But I underscore again that Fidelity has no so-called "agreements" that sanction illegal practices.
Second, Fidelity continues to stand on record, as we have for years, in opposition to predatory short-term trading that adversely affects shareholders in a mutual fund. Back in the 1980s, we initiated a fee - which is returned to the fund and, therefore, to investors - - to discourage this activity. Further, we took the lead several years ago in developing a Fair Value Pricing Policy to prevent market timing on foreign securities in our funds. I am confident we will find other ways to make it more difficult for predatory traders to operate. However, this will only be achieved through close cooperation among regulators, legislators and the industry.
Yes, there have been unfortunate instances of unethical and illegal activity within the mutual fund industry from time to time. That is true of any industry. When this occurs, confessed or convicted offenders should be dealt with appropriately. But we are still concerned about the risk of over-regulation and the quick application of simplistic solutions to intricate problems. Every system can be improved, and we support and applaud well thought out improvements by regulators, legislators and industry representatives that achieve the common goal of building and protecting the value of investors' holdings.
For nearly 60 years, Fidelity has worked very hard to improve its products and service to justify your trust. When our family founded this company in 1946, we had only a few hundred customers. Today, we serve more than 18 million customers including individual investors and participants in retirement plans across America.
Let me close by saying that we do not take your trust in us for granted, and we realize that we must always work to improve all aspects of our service to you. In turn, we urge you to continue your active participation with your financial matters, so that your interests can be well served.
Best regards,
/s/Edward C. Johnson 3d
Edward C. Johnson 3d
Annual Report
Performance: The Bottom Line
Average annual total return reflects the change in the value of an investment, assuming reinvestment of the class' dividend income and capital gains (the profits earned upon the sale of securities that have grown in value) and assuming a constant rate of performance each year. The $10,000 table and the fund's returns do not reflect the deduction of taxes that a shareholder would pay on fund distributions or the redemption of fund shares. During periods of reimbursement by Fidelity, a fund's total return will be greater than it would be had the reimbursement not occurred. How a fund did yesterday is no guarantee of how it will do tomorrow.
Average annual total returns take Fidelity Advisor Strategic Dividend & Income Fund's cumulative total return and show you what would have happened if Fidelity Advisor Strategic Dividend & Income Fund shares had performed at a constant rate each year. These numbers will be reported once the fund is a year old.
$10,000 Over Life of Fund
Let's say hypothetically that $10,000 was invested in Fidelity Advisor Strategic Dividend & Income Fund - Institutional Class on December 23, 2003, when the fund started. The chart shows how the value of your investment would have changed, and also shows how the Standard & Poor's 500SM Index performed over the same period.

Annual Report
Management's Discussion of Fund Performance
Comments from William Eigen, Portfolio Manager of Fidelity Advisor Strategic Dividend & Income Fund
Despite surging oil prices, a struggling job market and four interest rate hikes in a five-month span, U.S. equity markets posted solid results for the 12-month period ending November 30, 2004, and were closing in on a second straight year in the black. There was great disparity in the market during the past year. For instance, value stocks trounced their growth counterparts during the period. To illustrate, the Russell 1000® Value Index shot up 19.67%, while the Russell 1000 Growth Index rose only 5.83%. Meanwhile, small- and mid-cap stocks vastly outperformed larger-cap stocks. Energy was the best-performing sector of the market, propelled by a spike in oil prices. Conversely, technology stocks dipped lower in response to a slowdown in corporate capital spending. For the 12-month period overall, the Standard & Poor's 500SM Index returned 12.86% - slightly above its historical average. Elsewhere, the Dow Jones Industrial AverageSM rose 8.87% and the tech-heavy NASDAQ Composite® Index advanced 7.50%.
From its inception on December 23, 2003, through November 30, 2004, the fund's Institutional Class shares rose 12.38%, versus 12.63% for the Fidelity Strategic Dividend & Income Composite Index. Despite finishing roughly in line with the composite index, the fund's overall results could have been better, I felt, given that a lot went right during the period. Specifically, three of the fund's four subportfolios handily beat their respective benchmarks. Some well-timed tactical asset allocation shifts also helped, although my decision to underweight real estate investment trusts (REITs) - the period's top-performing asset class - detracted from performance versus the composite index as demand for these securities remained red hot. The biggest contribution to relative returns came from the fund's positioning in preferred stocks, which significantly trailed the broader equity market. In addition to modestly underweighting the sector overall, the fund benefited from favoring high-yield and convertible preferreds, which did relatively well amid an upturn in equities. We achieved strong results in the convertible bond subportfolio, mainly by being aggressive and taking concentrated positions in selected, more-volatile names. Solid security selection also contributed to outsized returns in the preferred stock and REIT subportfolios. The common stock subportfolio slightly trailed its index in part because it did not hold REITs.
The views expressed in this statement reflect those of the portfolio manager only through the end of the period of the report as stated on the cover and do not necessarily represent the views of Fidelity or any other person in the Fidelity organization. Any such views are subject to change at any time based upon market or other conditions and Fidelity disclaims any responsibility to update such views. These views may not be relied on as investment advice and, because investment decisions for a Fidelity fund are based on numerous factors, may not be relied on as an indication of trading intent on behalf of any Fidelity fund.
Annual Report
Shareholder Expense Example
As a shareholder of the Fund, you incur two types of costs: (1) transaction costs, including sales charges (loads) on purchase payments or redemption proceeds, and (2) ongoing costs, including management fees, distribution and/or service (12b-1) fees and other Fund expenses. This Example is intended to help you understand your ongoing costs (in dollars) of investing in the Fund and to compare these costs with the ongoing costs of investing in other mutual funds.
The Example is based on an investment of $1,000 invested at the beginning of the period and held for the entire period (June 1, 2004 to November 30, 2004).
Actual Expenses
The first line of the table below for each class of the Fund provides information about actual account values and actual expenses. You may use the information in this line, together with the amount you invested, to estimate the expenses that you paid over the period. Simply divide your account value by $1,000.00 (for example, an $8,600 account value divided by $1,000.00 = 8.6), then multiply the result by the number in the first line for a class of the Fund under the heading entitled "Expenses Paid During Period" to estimate the expenses you paid on your account during this period.
Hypothetical Example for Comparison Purposes
The second line of the table below for each class of the Fund provides information about hypothetical account values and hypothetical expenses based on a Class' actual expense ratio and an assumed rate of return of 5% per year before expenses, which is not the Class' actual return. The hypothetical account values and expenses may not be used to estimate the actual ending account balance or expenses you paid for the period. You may use this information to compare the ongoing costs of investing in the Fund and other funds. To do so, compare this 5% hypothetical example with the 5% hypothetical examples that appear in the shareholder reports of the other funds.
Please note that the expenses shown in the table are meant to highlight your ongoing costs only and do not reflect any transaction costs. Therefore, the second line of the table is useful in comparing ongoing costs only, and will not help you determine the relative total costs of owning different funds. In addition, if these transactional costs were included, your costs would have been higher.
Annual Report
| Beginning
Account Value
June 1, 2004 | Ending
Account Value
November 30, 2004 | Expenses Paid
During Period*
June 1, 2004
to November 30, 2004 |
Class A | | | |
Actual | $ 1,000.00 | $ 1,095.60 | $ 6.29 |
HypotheticalA | $ 1,000.00 | $ 1,018.92 | $ 6.08 |
Class T | | | |
Actual | $ 1,000.00 | $ 1,094.60 | $ 7.59 |
HypotheticalA | $ 1,000.00 | $ 1,017.66 | $ 7.34 |
Class B | | | |
Actual | $ 1,000.00 | $ 1,091.10 | $ 10.19 |
HypotheticalA | $ 1,000.00 | $ 1,015.13 | $ 9.87 |
Class C | | | |
Actual | $ 1,000.00 | $ 1,091.10 | $ 10.19 |
HypotheticalA | $ 1,000.00 | $ 1,015.13 | $ 9.87 |
Strategic Dividend & Income | | | |
Actual | $ 1,000.00 | $ 1,097.50 | $ 4.56 |
HypotheticalA | $ 1,000.00 | $ 1,020.60 | $ 4.40 |
Institutional Class | | | |
Actual | $ 1,000.00 | $ 1,098.60 | $ 4.46 |
HypotheticalA | $ 1,000.00 | $ 1,020.70 | $ 4.30 |
A 5% return per year before expenses
*Expenses are equal to each Class' annualized expense ratio (shown in the table below); multiplied by the average account value over the period, multiplied by 183/366 (to reflect the one-half year period).
| Annualized
Expense Ratio |
Class A | 1.20% |
Class T | 1.45% |
Class B | 1.95% |
Class C | 1.95% |
Strategic Dividend & Income | .87% |
Institutional Class | .85% |
Annual Report
Investment Changes
Top Ten Investments as of November 30, 2004 |
(excluding cash equivalents) | % of fund's
net assets | % of fund's net assets
6 months ago |
General Electric Co. | 3.3 | 1.0 |
Exxon Mobil Corp. | 2.1 | 1.6 |
Bank of America Corp. | 1.8 | 1.7 |
El Paso Tennessee Pipeline Co. Series A, 8.25% | 1.5 | 1.8 |
American International Group, Inc. | 1.5 | 1.6 |
Honeywell International, Inc. | 1.3 | 0.9 |
SBC Communications, Inc. | 1.1 | 1.0 |
Tyco International Ltd. | 1.0 | 1.5 |
AES Trust VII 6.00% | 1.0 | 0.9 |
Wachovia Corp. | 1.0 | 0.7 |
| 15.6 | |
Top Five Market Sectors as of November 30, 2004 |
| % of fund's
net assets | % of fund's net assets
6 months ago |
Financials | 28.5 | 33.5 |
Industrials | 12.0 | 8.2 |
Health Care | 10.4 | 10.5 |
Energy | 9.9 | 9.8 |
Consumer Discretionary | 8.2 | 9.5 |
Asset Allocation (% of fund's net assets) |
As of November 30, 2004 * | As of May 31, 2004 ** |
| Convertible
Bonds 13.8% | | | Convertible
Bonds 13.4% | |
| Common Stocks 66.3% | | | Common Stocks 67.5% | |
| Preferred Stocks 14.4% | | | Preferred Stocks 17.7% | |
| Short-Term
Investments and
Net Other Assets 5.5% | | | Short-Term
Investments and
Net Other Assets 1.4% | |
* Foreign
investments | 3.4% | | ** Foreign
investments | 3.3% | |

Annual Report
Investments November 30, 2004
Showing Percentage of Net Assets
Corporate Bonds - 13.8% |
| Principal Amount | | Value
(Note 1) |
Convertible Bonds - 13.8% |
CONSUMER DISCRETIONARY - 1.1% |
Hotels, Restaurants & Leisure - 0.6% |
Kerzner International Ltd. 2.375% 4/15/24 | | $ 3,030,000 | | $ 3,509,346 |
Media - 0.5% |
Interpublic Group of Companies, Inc. 4.5% 3/15/23 | | 2,270,000 | | 2,872,004 |
TOTAL CONSUMER DISCRETIONARY | | 6,381,350 |
ENERGY - 0.3% |
Energy Equipment & Services - 0.3% |
Halliburton Co. 3.125% 7/15/23 | | 1,440,000 | | 1,831,752 |
FINANCIALS - 1.1% |
Capital Markets - 0.5% |
Merrill Lynch & Co., Inc. liquid yield option note 0% 3/13/32 | | 3,010,000 | | 3,043,712 |
Consumer Finance - 0.6% |
American Express Co.: | | | | |
1.85% 12/1/33 (d)(f) | | 1,800,000 | | 1,971,000 |
1.85% 12/1/33 (d) | | 1,330,000 | | 1,456,350 |
| | 3,427,350 |
TOTAL FINANCIALS | | 6,471,062 |
HEALTH CARE - 5.7% |
Biotechnology - 2.3% |
BioMarin Pharmaceutical, Inc. 3.5% 6/15/08 | | 3,610,000 | | 3,176,800 |
Enzon Pharmaceuticals, Inc. 4.5% 7/1/08 | | 3,360,000 | | 3,124,800 |
IDEC Pharmaceuticals Corp. liquid yield option note 0% 2/16/19 | | 1,030,000 | | 2,442,027 |
Invitrogen Corp. 2.25% 12/15/06 | | 2,630,000 | | 2,656,300 |
Serologicals Corp.: | | | | |
4.75% 8/15/33 (f) | | 770,000 | | 1,357,895 |
4.75% 8/15/33 | | 420,000 | | 740,670 |
| | 13,498,492 |
Health Care Equipment & Supplies - 2.0% |
Bausch & Lomb, Inc. 2.4863% 8/1/23 (h) | | 1,860,000 | | 2,333,854 |
Cooper Companies, Inc. 2.625% 7/1/23 | | 1,660,000 | | 2,780,002 |
Cytyc Corp. 2.25% 3/15/24 | | 2,900,000 | | 3,436,500 |
Corporate Bonds - continued |
| Principal Amount | | Value
(Note 1) |
Convertible Bonds - continued |
HEALTH CARE - continued |
Health Care Equipment & Supplies - continued |
Fisher Scientific International, Inc.: | | | | |
2.5% 10/1/23 (f) | | $ 995,000 | | $ 1,384,055 |
2.5% 10/1/23 | | 960,000 | | 1,335,370 |
| | 11,269,781 |
Health Care Providers & Services - 0.5% |
Community Health Systems, Inc. 4.25% 10/15/08 | | 2,900,000 | | 3,006,981 |
Pharmaceuticals - 0.9% |
IVAX Corp.: | | | | |
1.5% 3/1/24 (f) | | 1,800,000 | | 1,731,420 |
1.5% 3/1/24 | | 770,000 | | 740,663 |
MGI Pharma, Inc.: | | | | |
1.6821% 3/2/24 (d)(f) | | 2,450,000 | | 1,960,000 |
1.6821% 3/2/24 (d) | | 950,000 | | 760,000 |
| | 5,192,083 |
TOTAL HEALTH CARE | | 32,967,337 |
INDUSTRIALS - 0.6% |
Industrial Conglomerates - 0.6% |
Tyco International Group SA yankee 3.125% 1/15/23 | | 2,110,000 | | 3,427,273 |
INFORMATION TECHNOLOGY - 3.2% |
Communications Equipment - 0.8% |
Comverse Technology, Inc. 0% 5/15/23 | | 2,070,000 | | 2,732,400 |
Juniper Networks, Inc. 0% 6/15/08 | | 1,110,000 | | 1,667,775 |
| | 4,400,175 |
Computers & Peripherals - 0.1% |
Maxtor Corp. 6.8% 4/30/10 | | 930,000 | | 865,644 |
Electronic Equipment & Instruments - 0.5% |
Vishay Intertechnology, Inc. 3.625% 8/1/23 | | 2,500,000 | | 2,767,750 |
Internet Software & Services - 0.6% |
Yahoo!, Inc. 0% 4/1/08 | | 1,900,000 | | 3,618,313 |
IT Services - 0.5% |
DST Systems, Inc.: | | | | |
Series A, 4.125% 8/15/23 (f) | | 1,240,000 | | 1,567,112 |
4.125% 8/15/23 | | 1,150,000 | | 1,453,370 |
| | 3,020,482 |
Corporate Bonds - continued |
| Principal Amount | | Value
(Note 1) |
Convertible Bonds - continued |
INFORMATION TECHNOLOGY - continued |
Semiconductors & Semiconductor Equipment - 0.4% |
Agere Systems, Inc. 6.5% 12/15/09 | | $ 2,100,000 | | $ 2,215,605 |
Software - 0.3% |
Concord Communications, Inc. 3% 12/15/23 (f) | | 2,180,000 | | 1,857,694 |
TOTAL INFORMATION TECHNOLOGY | | 18,745,663 |
TELECOMMUNICATION SERVICES - 1.2% |
Wireless Telecommunication Services - 1.2% |
Crown Castle International Corp. 4% 7/15/10 | | 1,840,000 | | 3,321,200 |
Nextel Partners, Inc. 1.5% 11/15/08 | | 1,405,000 | | 3,449,275 |
| | 6,770,475 |
UTILITIES - 0.6% |
Multi-Utilities & Unregulated Power - 0.6% |
AES Corp. 4.5% 8/15/05 | | 3,430,000 | | 3,438,575 |
TOTAL CONVERTIBLE BONDS | | 80,033,487 |
Nonconvertible Bonds - 0.0% |
INDUSTRIALS - 0.0% |
Machinery - 0.0% |
Mueller Industries, Inc. 6% 11/1/14 | | 76,000 | | 74,860 |
TOTAL CORPORATE BONDS (Cost $78,379,455) | 80,108,347 |
U.S. Treasury Obligations - 0.1% |
|
U.S. Treasury Bills, yield at date of purchase 1.62% to 1.67% 12/9/04 to 12/30/04 (g)
(Cost $449,723) | | 450,000 | | 449,673 |
Common Stocks - 66.3% |
| Shares | | |
CONSUMER DISCRETIONARY - 6.3% |
Hotels, Restaurants & Leisure - 1.3% |
Centerplate, Inc. unit | 318,800 | | 4,048,760 |
Empire Resorts, Inc. (a) | 8,300 | | 89,308 |
Common Stocks - continued |
| Shares | | Value (Note 1) |
CONSUMER DISCRETIONARY - continued |
Hotels, Restaurants & Leisure - continued |
McDonald's Corp. | 95,600 | | $ 2,938,744 |
Wendy's International, Inc. | 7,000 | | 249,690 |
| | 7,326,502 |
Household Durables - 0.7% |
Centex Corp. | 26,000 | | 1,364,220 |
D.R. Horton, Inc. | 10,000 | | 352,100 |
KB Home | 14,400 | | 1,265,616 |
LG Electronics, Inc. | 4,250 | | 256,581 |
Sony Corp. sponsored ADR | 21,000 | | 763,560 |
| | 4,002,077 |
Leisure Equipment & Products - 0.2% |
Brunswick Corp. | 8,000 | | 390,560 |
Eastman Kodak Co. | 32,500 | | 1,063,075 |
| | 1,453,635 |
Media - 2.5% |
Clear Channel Communications, Inc. | 47,600 | | 1,603,168 |
DreamWorks Animation SKG, Inc. Class A | 1,100 | | 40,656 |
Emmis Communications Corp. Class A (a) | 36,200 | | 669,338 |
Fox Entertainment Group, Inc. Class A (a) | 24,000 | | 705,600 |
Grupo Televisa SA de CV sponsored ADR | 15,900 | | 990,093 |
Lamar Advertising Co. Class A (a) | 32,500 | | 1,281,800 |
News Corp. Class A | 22,400 | | 396,256 |
Omnicom Group, Inc. | 8,000 | | 648,000 |
Salem Communications Corp. Class A (a) | 14,900 | | 365,944 |
Spanish Broadcasting System, Inc. Class A (a) | 14,100 | | 150,729 |
The DIRECTV Group, Inc. (a) | 27,100 | | 433,329 |
Time Warner, Inc. (a) | 97,900 | | 1,733,809 |
Univision Communications, Inc. Class A (a) | 26,000 | | 782,600 |
Valassis Communications, Inc. (a) | 8,000 | | 271,600 |
Viacom, Inc. Class B (non-vtg.) | 61,130 | | 2,121,211 |
Walt Disney Co. | 74,700 | | 2,007,936 |
XM Satellite Radio Holdings, Inc. Class A (a) | 10,000 | | 369,100 |
| | 14,571,169 |
Multiline Retail - 0.4% |
99 Cents Only Stores (a)(e) | 35,000 | | 522,200 |
JCPenney Co., Inc. | 23,300 | | 899,380 |
Kohl's Corp. (a) | 7,000 | | 323,120 |
Nordstrom, Inc. | 20,500 | | 896,875 |
| | 2,641,575 |
Common Stocks - continued |
| Shares | | Value (Note 1) |
CONSUMER DISCRETIONARY - continued |
Specialty Retail - 1.1% |
American Eagle Outfitters, Inc. | 17,966 | | $ 750,440 |
Asbury Automotive Group, Inc. (a) | 22,000 | | 305,360 |
CarMax, Inc. (a) | 26,000 | | 724,100 |
Home Depot, Inc. | 47,600 | | 1,987,300 |
Sonic Automotive, Inc. Class A (sub. vtg.) | 23,498 | | 583,455 |
The Pep Boys - Manny, Moe & Jack | 28,000 | | 441,000 |
Toys 'R' Us, Inc. (a) | 70,900 | | 1,371,206 |
| | 6,162,861 |
Textiles, Apparel & Luxury Goods - 0.1% |
Deckers Outdoor Corp. (a)(e) | 16,700 | | 726,784 |
TOTAL CONSUMER DISCRETIONARY | | 36,884,603 |
CONSUMER STAPLES - 2.3% |
Beverages - 0.2% |
Anheuser-Busch Companies, Inc. | 4,700 | | 235,423 |
Efes Breweries International NV unit (f) | 800 | | 24,120 |
PepsiCo, Inc. | 14,500 | | 723,695 |
| | 983,238 |
Food & Staples Retailing - 0.3% |
Albertsons, Inc. | 23,000 | | 581,900 |
Safeway, Inc. (a) | 53,000 | | 1,021,840 |
| | 1,603,740 |
Food Products - 0.7% |
B&G Foods, Inc. unit | 200,000 | | 2,976,000 |
Bunge Ltd. | 13,500 | | 711,720 |
Interstate Bakeries Corp. (a) | 14,600 | | 84,972 |
Smithfield Foods, Inc. (a) | 9,000 | | 261,450 |
| | 4,034,142 |
Household Products - 0.1% |
Clorox Co. | 9,200 | | 507,104 |
Personal Products - 0.1% |
Gillette Co. | 17,200 | | 748,028 |
Tobacco - 0.9% |
Altria Group, Inc. | 93,800 | | 5,392,562 |
TOTAL CONSUMER STAPLES | | 13,268,814 |
Common Stocks - continued |
| Shares | | Value (Note 1) |
ENERGY - 7.5% |
Energy Equipment & Services - 2.8% |
Baker Hughes, Inc. | 31,300 | | $ 1,387,529 |
BJ Services Co. | 13,900 | | 704,313 |
ENSCO International, Inc. | 22,100 | | 691,951 |
FMC Technologies, Inc. (a) | 10,000 | | 328,500 |
GlobalSantaFe Corp. | 33,800 | | 1,061,320 |
Halliburton Co. | 73,200 | | 3,026,820 |
Hornbeck Offshore Services, Inc. | 17,000 | | 343,400 |
Pride International, Inc. (a) | 96,300 | | 1,883,628 |
Rowan Companies, Inc. (a) | 15,000 | | 388,500 |
Smith International, Inc. (a) | 16,000 | | 969,120 |
Transocean, Inc. (a) | 44,200 | | 1,779,934 |
Varco International, Inc. (a) | 61,598 | | 1,831,925 |
Weatherford International Ltd. (a) | 33,400 | | 1,782,892 |
| | 16,179,832 |
Oil & Gas - 4.7% |
Apache Corp. | 20,400 | | 1,102,824 |
BP PLC sponsored ADR | 17,900 | | 1,098,165 |
Burlington Resources, Inc. | 34,300 | | 1,591,863 |
Chesapeake Energy Corp. | 75,973 | | 1,367,514 |
ChevronTexaco Corp. | 63,100 | | 3,445,260 |
ConocoPhillips | 19,200 | | 1,747,008 |
Encore Acquisition Co. (a) | 15,000 | | 528,150 |
Exxon Mobil Corp. | 243,800 | | 12,494,750 |
Occidental Petroleum Corp. | 24,300 | | 1,463,103 |
Pioneer Natural Resources Co. | 8,500 | | 299,200 |
Premcor, Inc. | 14,500 | | 645,975 |
Quicksilver Resources, Inc. (a) | 32,300 | | 1,111,120 |
Valero Energy Corp. | 13,000 | | 608,270 |
| | 27,503,202 |
TOTAL ENERGY | | 43,683,034 |
FINANCIALS - 20.8% |
Capital Markets - 2.4% |
Bear Stearns Companies, Inc. | 19,200 | | 1,873,536 |
Calamos Asset Management, Inc. Class A | 2,900 | | 68,788 |
Eurocastle Investment Ltd. | 9,200 | | 197,263 |
Lehman Brothers Holdings, Inc. | 20,300 | | 1,700,734 |
MarketAxess Holdings, Inc. | 1,500 | | 29,400 |
Merrill Lynch & Co., Inc. | 68,600 | | 3,821,706 |
Common Stocks - continued |
| Shares | | Value (Note 1) |
FINANCIALS - continued |
Capital Markets - continued |
Merrill Lynch & Co., Inc. (depositary shares) Series 1, unit | 120,000 | | $ 3,033,600 |
Morgan Stanley | 58,700 | | 2,979,025 |
TradeStation Group, Inc. (a) | 40,000 | | 296,800 |
| | 14,000,852 |
Commercial Banks - 3.3% |
Banco Bradesco SA sponsored ADR (non-vtg.) | 13,000 | | 846,560 |
Bank of America Corp. | 221,914 | | 10,267,961 |
UCBH Holdings, Inc. | 14,400 | | 652,896 |
Wachovia Corp. | 107,884 | | 5,582,997 |
Wells Fargo & Co. | 30,800 | | 1,902,516 |
| | 19,252,930 |
Consumer Finance - 0.2% |
Capital One Financial Corp. | 10,650 | | 836,877 |
MBNA Corp. | 22,200 | | 589,632 |
| | 1,426,509 |
Diversified Financial Services - 1.1% |
Citigroup, Inc. | 89,000 | | 3,982,750 |
J.P. Morgan Chase & Co. | 64,404 | | 2,424,811 |
| | 6,407,561 |
Insurance - 3.2% |
ACE Ltd. | 53,700 | | 2,170,554 |
AFLAC, Inc. | 36,200 | | 1,361,844 |
AMBAC Financial Group, Inc. | 13,100 | | 1,065,423 |
American International Group, Inc. | 137,800 | | 8,729,630 |
Hartford Financial Services Group, Inc. | 14,500 | | 928,000 |
Hilb Rogal & Hobbs Co. | 28,000 | | 971,320 |
MetLife, Inc. | 22,900 | | 893,100 |
Scottish Re Group Ltd. | 15,000 | | 345,000 |
W.R. Berkley Corp. | 27,600 | | 1,251,660 |
XL Capital Ltd. Class A | 8,100 | | 610,416 |
| | 18,326,947 |
Real Estate - 9.5% |
Acadia Realty Trust (SBI) | 16,300 | | 246,945 |
American Campus Communities, Inc. | 33,670 | | 703,703 |
AvalonBay Communities, Inc. | 16,910 | | 1,202,301 |
Boston Properties, Inc. | 38,074 | | 2,291,293 |
BRE Properties, Inc. Class A | 11,400 | | 463,296 |
CarrAmerica Realty Corp. | 24,050 | | 778,980 |
Catellus Development Corp. | 24,290 | | 762,706 |
Common Stocks - continued |
| Shares | | Value (Note 1) |
FINANCIALS - continued |
Real Estate - continued |
CBL & Associates Properties, Inc. | 22,050 | | $ 1,616,045 |
CenterPoint Properties Trust (SBI) | 15,820 | | 741,167 |
Cornerstone Realty Income Trust, Inc. | 38,690 | | 387,287 |
Correctional Properties Trust | 26,950 | | 766,189 |
Duke Realty Corp. | 47,190 | | 1,630,415 |
Eagle Hospitality Properties Trust, Inc. | 9,100 | | 86,905 |
Equity Lifestyle Properties, Inc. | 27,260 | | 989,538 |
Equity Office Properties Trust | 89,430 | | 2,454,854 |
Equity One, Inc. | 29,390 | | 668,329 |
Equity Residential (SBI) | 95,670 | | 3,225,036 |
Federal Realty Investment Trust (SBI) | 16,230 | | 813,935 |
General Growth Properties, Inc. | 84,810 | | 2,909,831 |
GMH Communities Trust | 23,000 | | 308,200 |
Health Care Property Investors, Inc. | 21,430 | | 574,967 |
Health Care REIT, Inc. | 26,160 | | 926,587 |
Highwoods Properties, Inc. (SBI) | 45,290 | | 1,171,652 |
Home Properties of New York, Inc. | 3,200 | | 131,776 |
HomeBanc Mortgage Corp., Georgia | 40,100 | | 361,301 |
Inland Real Estate Corp. | 40,500 | | 627,750 |
Innkeepers USA Trust (SBI) | 79,990 | | 1,078,265 |
Kilroy Realty Corp. | 12,020 | | 485,848 |
Kimco Realty Corp. | 40,780 | | 2,319,566 |
Liberty Property Trust (SBI) | 15,650 | | 641,650 |
MeriStar Hospitality Corp. (a) | 172,520 | | 1,173,136 |
Newcastle Investment Corp. (a) | 9,000 | | 282,420 |
Pan Pacific Retail Properties, Inc. | 21,830 | | 1,294,519 |
Plum Creek Timber Co., Inc. | 36,630 | | 1,355,310 |
Post Properties, Inc. | 9,200 | | 313,720 |
Price Legacy Corp. | 23,700 | | 452,670 |
ProLogis | 71,510 | | 2,876,847 |
Public Storage, Inc. | 29,950 | | 1,598,731 |
Rayonier, Inc. | 7,980 | | 381,045 |
Reckson Associates Realty Corp. | 59,440 | | 1,924,667 |
Shurgard Storage Centers, Inc. Class A | 8,500 | | 351,730 |
Simon Property Group, Inc. | 46,510 | | 2,887,341 |
SL Green Realty Corp. | 15,310 | | 882,315 |
Sunstone Hotel Investors, Inc. New | 15,000 | | 274,050 |
Trizec Properties, Inc. | 97,700 | | 1,609,119 |
U-Store-It Trust | 21,300 | | 363,378 |
United Dominion Realty Trust, Inc. (SBI) | 70,890 | | 1,629,761 |
Ventas, Inc. | 24,390 | | 660,969 |
Common Stocks - continued |
| Shares | | Value (Note 1) |
FINANCIALS - continued |
Real Estate - continued |
Vornado Realty Trust | 41,600 | | $ 3,057,600 |
Weingarten Realty Investors (SBI) | 10,200 | | 415,650 |
| | 55,151,295 |
Thrifts & Mortgage Finance - 1.1% |
Fannie Mae | 15,900 | | 1,092,330 |
Freddie Mac | 15,900 | | 1,085,334 |
Golden West Financial Corp., Delaware | 8,400 | | 1,001,616 |
New York Community Bancorp, Inc. | 71,000 | | 1,404,380 |
Sovereign Bancorp, Inc. | 42,500 | | 928,625 |
W Holding Co., Inc. | 16,000 | | 352,320 |
Washington Mutual, Inc. | 9,000 | | 366,390 |
| | 6,230,995 |
TOTAL FINANCIALS | | 120,797,089 |
HEALTH CARE - 4.7% |
Biotechnology - 0.4% |
Biogen Idec, Inc. (a) | 5,700 | | 334,476 |
BioMarin Pharmaceutical, Inc. (a) | 42,000 | | 223,860 |
Genentech, Inc. (a) | 15,000 | | 723,750 |
MedImmune, Inc. (a) | 22,900 | | 609,140 |
Millennium Pharmaceuticals, Inc. (a) | 22,700 | | 286,474 |
ONYX Pharmaceuticals, Inc. (a) | 6,000 | | 187,680 |
| | 2,365,380 |
Health Care Equipment & Supplies - 2.1% |
Aspect Medical Systems, Inc. (a) | 1,100 | | 26,840 |
Baxter International, Inc. | 155,600 | | 4,924,740 |
Dade Behring Holdings, Inc. (a) | 11,700 | | 628,173 |
Foxhollow Technologies, Inc. | 400 | | 10,360 |
Guidant Corp. | 14,000 | | 907,620 |
Medtronic, Inc. | 46,100 | | 2,215,105 |
PerkinElmer, Inc. | 44,500 | | 949,185 |
St. Jude Medical, Inc. (a) | 11,400 | | 434,796 |
Thermo Electron Corp. (a) | 21,400 | | 647,350 |
Waters Corp. (a) | 38,500 | | 1,796,410 |
| | 12,540,579 |
Health Care Providers & Services - 0.9% |
McKesson Corp. | 28,000 | | 827,400 |
Omnicare, Inc. | 9,000 | | 291,690 |
Common Stocks - continued |
| Shares | | Value (Note 1) |
HEALTH CARE - continued |
Health Care Providers & Services - continued |
Sierra Health Services, Inc. (a) | 19,000 | | $ 1,056,970 |
UnitedHealth Group, Inc. | 34,100 | | 2,825,185 |
| | 5,001,245 |
Pharmaceuticals - 1.3% |
Johnson & Johnson | 22,600 | | 1,363,232 |
Merck & Co., Inc. | 40,000 | | 1,120,800 |
Pfizer, Inc. | 17,000 | | 472,090 |
Schering-Plough Corp. | 105,600 | | 1,884,960 |
Valeant Pharmaceuticals International | 12,000 | | 290,520 |
Wyeth | 57,800 | | 2,304,486 |
| | 7,436,088 |
TOTAL HEALTH CARE | | 27,343,292 |
INDUSTRIALS - 11.2% |
Aerospace & Defense - 2.3% |
DRS Technologies, Inc. (a) | 10,000 | | 427,200 |
Honeywell International, Inc. | 214,300 | | 7,571,219 |
Lockheed Martin Corp. | 27,100 | | 1,648,764 |
Northrop Grumman Corp. | 7,400 | | 416,842 |
Precision Castparts Corp. | 15,700 | | 1,017,988 |
Raytheon Co. | 34,900 | | 1,407,866 |
The Boeing Co. | 16,900 | | 905,333 |
| | 13,395,212 |
Air Freight & Logistics - 0.1% |
Expeditors International of Washington, Inc. | 11,000 | | 585,860 |
Airlines - 0.3% |
AirTran Holdings, Inc. (a) | 22,000 | | 260,040 |
Delta Air Lines, Inc. (a) | 85,000 | | 592,450 |
Southwest Airlines Co. | 50,100 | | 788,073 |
| | 1,640,563 |
Building Products - 0.6% |
Masco Corp. | 99,100 | | 3,495,257 |
Commercial Services & Supplies - 1.6% |
Apollo Group, Inc. Class A (a) | 16,500 | | 1,315,050 |
Asset Acceptance Capital Corp. | 3,400 | | 70,074 |
Career Education Corp. (a) | 45,300 | | 1,762,170 |
Cintas Corp. | 47,700 | | 2,133,144 |
On Assignment, Inc. (a) | 20,000 | | 104,400 |
Common Stocks - continued |
| Shares | | Value (Note 1) |
INDUSTRIALS - continued |
Commercial Services & Supplies - continued |
Resources Connection, Inc. (a) | 10,000 | | $ 453,600 |
Robert Half International, Inc. | 117,200 | | 3,167,916 |
ServiceMaster Co. | 18,000 | | 237,060 |
| | 9,243,414 |
Construction & Engineering - 0.7% |
Chicago Bridge & Iron Co. NV (NY Shares) | 30,671 | | 1,186,968 |
Fluor Corp. | 21,100 | | 1,095,090 |
Jacobs Engineering Group, Inc. (a) | 19,000 | | 873,430 |
MasTec, Inc. (a) | 97,000 | | 813,830 |
| | 3,969,318 |
Electrical Equipment - 0.3% |
A.O. Smith Corp. | 11,000 | | 330,550 |
ABB Ltd. sponsored ADR (e) | 50,000 | | 309,000 |
FuelCell Energy, Inc. (a)(e) | 43,000 | | 432,150 |
Rockwell Automation, Inc. | 12,000 | | 567,600 |
| | 1,639,300 |
Industrial Conglomerates - 4.4% |
General Electric Co. | 535,200 | | 18,924,667 |
Siemens AG sponsored ADR | 7,000 | | 558,740 |
Tyco International Ltd. | 174,100 | | 5,914,177 |
| | 25,397,584 |
Machinery - 0.3% |
ITT Industries, Inc. | 10,500 | | 893,760 |
Mueller Industries, Inc. | 9,000 | | 276,570 |
Pall Corp. | 12,000 | | 325,080 |
| | 1,495,410 |
Road & Rail - 0.6% |
Norfolk Southern Corp. | 49,700 | | 1,706,201 |
Sirva, Inc. | 20,000 | | 398,000 |
Swift Transportation Co., Inc. (a) | 39,000 | | 760,110 |
Union Pacific Corp. | 14,800 | | 938,912 |
| | 3,803,223 |
Trading Companies & Distributors - 0.0% |
UAP Holding Corp. | 20,000 | | 327,000 |
TOTAL INDUSTRIALS | | 64,992,141 |
Common Stocks - continued |
| Shares | | Value (Note 1) |
INFORMATION TECHNOLOGY - 4.5% |
Communications Equipment - 0.7% |
Comverse Technology, Inc. (a) | 48,000 | | $ 1,020,960 |
Foundry Networks, Inc. (a) | 53,000 | | 707,550 |
Juniper Networks, Inc. (a) | 56,000 | | 1,541,680 |
Lucent Technologies, Inc. (a) | 60,000 | | 235,800 |
QUALCOMM, Inc. | 19,000 | | 790,780 |
| | 4,296,770 |
Computers & Peripherals - 0.5% |
Hewlett-Packard Co. | 31,900 | | 638,000 |
International Business Machines Corp. | 12,700 | | 1,196,848 |
Sun Microsystems, Inc. (a) | 65,000 | | 360,750 |
Western Digital Corp. (a) | 65,200 | | 637,004 |
| | 2,832,602 |
Electronic Equipment & Instruments - 0.5% |
Amphenol Corp. Class A (a) | 12,700 | | 445,897 |
Avnet, Inc. (a) | 5,000 | | 92,000 |
Flextronics International Ltd. (a) | 38,000 | | 545,300 |
Molex, Inc. | 7,000 | | 192,990 |
National Instruments Corp. | 22,900 | | 654,940 |
Symbol Technologies, Inc. | 52,200 | | 791,352 |
| | 2,722,479 |
Internet Software & Services - 0.2% |
Yahoo!, Inc. (a) | 28,600 | | 1,075,932 |
IT Services - 0.4% |
Affiliated Computer Services, Inc. Class A (a) | 32,000 | | 1,893,760 |
Sapient Corp. (a) | 30,000 | | 237,300 |
| | 2,131,060 |
Office Electronics - 0.1% |
Xerox Corp. (a) | 57,000 | | 873,240 |
Semiconductors & Semiconductor Equipment - 1.0% |
Analog Devices, Inc. | 28,000 | | 1,034,600 |
Applied Materials, Inc. (a) | 17,000 | | 282,880 |
Cabot Microelectronics Corp. (a) | 22,300 | | 823,985 |
Freescale Semiconductor, Inc. Class A | 64,500 | | 1,139,070 |
Intel Corp. | 31,300 | | 699,555 |
KLA-Tencor Corp. (a) | 16,200 | | 729,972 |
Lam Research Corp. (a) | 15,000 | | 390,150 |
PMC-Sierra, Inc. (a) | 22,000 | | 242,880 |
Samsung Electronics Co. Ltd. | 1,480 | | 613,314 |
| | 5,956,406 |
Common Stocks - continued |
| Shares | | Value (Note 1) |
INFORMATION TECHNOLOGY - continued |
Software - 1.1% |
BEA Systems, Inc. (a) | 86,100 | | $ 695,688 |
Macrovision Corp. (a) | 4,100 | | 108,855 |
Microsoft Corp. | 189,400 | | 5,077,814 |
PalmSource, Inc. (a) | 9,700 | | 153,648 |
Siebel Systems, Inc. (a) | 60,000 | | 604,800 |
| | 6,640,805 |
TOTAL INFORMATION TECHNOLOGY | | 26,529,294 |
MATERIALS - 4.9% |
Chemicals - 2.9% |
Dow Chemical Co. | 73,300 | | 3,699,451 |
E.I. du Pont de Nemours & Co. | 80,600 | | 3,652,792 |
Ecolab, Inc. | 8,100 | | 283,338 |
Lubrizol Corp. | 11,700 | | 404,235 |
Lyondell Chemical Co. (e) | 122,700 | | 3,442,962 |
Millennium Chemicals, Inc. (a) | 54,772 | | 1,455,840 |
Monsanto Co. | 35,000 | | 1,610,700 |
Nalco Holding Co. | 45,000 | | 865,350 |
Olin Corp. | 33,900 | | 769,191 |
Valspar Corp. | 8,000 | | 385,760 |
Westlake Chemical Corp. | 15,000 | | 470,850 |
| | 17,040,469 |
Containers & Packaging - 0.7% |
Crown Holdings, Inc. (a) | 25,000 | | 320,000 |
Owens-Illinois, Inc. (a) | 36,500 | | 763,580 |
Packaging Corp. of America | 55,400 | | 1,274,200 |
Sealed Air Corp. (a) | 1,300 | | 66,833 |
Smurfit-Stone Container Corp. (a) | 84,200 | | 1,512,232 |
| | 3,936,845 |
Metals & Mining - 1.3% |
Alcoa, Inc. | 48,700 | | 1,654,826 |
Allegheny Technologies, Inc. | 25,000 | | 550,000 |
Companhia Vale do Rio Doce sponsored ADR | 26,100 | | 647,802 |
Freeport-McMoRan Copper & Gold, Inc. Class B | 12,000 | | 469,560 |
International Steel Group, Inc. | 15,000 | | 604,950 |
Massey Energy Co. | 14,800 | | 519,776 |
Metals USA, Inc. (a) | 14,800 | | 277,500 |
Newmont Mining Corp. | 21,800 | | 1,032,230 |
Common Stocks - continued |
| Shares | | Value (Note 1) |
MATERIALS - continued |
Metals & Mining - continued |
Nucor Corp. | 18,000 | | $ 952,200 |
Phelps Dodge Corp. | 8,000 | | 777,040 |
| | 7,485,884 |
TOTAL MATERIALS | | 28,463,198 |
TELECOMMUNICATION SERVICES - 2.7% |
Diversified Telecommunication Services - 2.2% |
Cincinnati Bell, Inc. (a) | 55,000 | | 198,000 |
Citizens Communications Co. | 16,400 | | 234,520 |
Covad Communications Group, Inc. (a) | 435,300 | | 679,068 |
SBC Communications, Inc. | 256,800 | | 6,463,656 |
Telewest Global, Inc. (a) | 59,100 | | 865,224 |
Verizon Communications, Inc. | 105,800 | | 4,362,134 |
| | 12,802,602 |
Wireless Telecommunication Services - 0.5% |
American Tower Corp. Class A (a) | 71,000 | | 1,287,230 |
Leap Wireless International, Inc. (a) | 11,000 | | 279,400 |
Nextel Communications, Inc. Class A (a) | 28,600 | | 813,956 |
Nextel Partners, Inc. Class A (a) | 40,000 | | 723,600 |
| | 3,104,186 |
TOTAL TELECOMMUNICATION SERVICES | | 15,906,788 |
UTILITIES - 1.4% |
Electric Utilities - 1.2% |
Entergy Corp. | 32,700 | | 2,119,614 |
FirstEnergy Corp. | 22,000 | | 929,060 |
PG&E Corp. (a) | 30,200 | | 1,004,452 |
PPL Corp. | 11,300 | | 587,035 |
Southern Co. | 16,200 | | 531,198 |
TXU Corp. | 12,700 | | 797,814 |
Westar Energy, Inc. | 25,000 | | 553,750 |
Xcel Energy, Inc. | 7,500 | | 135,450 |
| | 6,658,373 |
Multi-Utilities & Unregulated Power - 0.2% |
AES Corp. (a) | 53,600 | | 656,064 |
Common Stocks - continued |
| Shares | | Value (Note 1) |
UTILITIES - continued |
Multi-Utilities & Unregulated Power - continued |
CMS Energy Corp. (a) | 50,000 | | $ 510,000 |
Public Service Enterprise Group, Inc. | 5,000 | | 219,950 |
| | 1,386,014 |
TOTAL UTILITIES | | 8,044,387 |
TOTAL COMMON STOCKS (Cost $350,410,465) | 385,912,640 |
Preferred Stocks - 14.4% |
| | | |
Convertible Preferred Stocks - 3.8% |
CONSUMER DISCRETIONARY - 0.8% |
Hotels, Restaurants & Leisure - 0.3% |
Six Flags, Inc. 7.25% PIERS | 82,700 | | 1,757,375 |
Media - 0.1% |
Emmis Communications Corp. Series A, 6.25% | 10,100 | | 459,550 |
Specialty Retail - 0.4% |
Toys 'R' US, Inc. 6.25% | 52,500 | | 2,620,800 |
TOTAL CONSUMER DISCRETIONARY | | 4,837,725 |
ENERGY - 0.6% |
Oil & Gas - 0.6% |
Valero Energy Corp. 2.00% | 80,800 | | 3,747,100 |
FINANCIALS - 1.0% |
Diversified Financial Services - 1.0% |
AES Trust VII 6.00% | 120,300 | | 5,894,700 |
INDUSTRIALS - 0.2% |
Road & Rail - 0.2% |
Kansas City Southern 4.25% | 1,370 | | 853,606 |
MATERIALS - 0.9% |
Containers & Packaging - 0.7% |
Owens-Illinois, Inc. 4.75% | 113,510 | | 4,347,433 |
Metals & Mining - 0.2% |
Freeport-McMoRan Copper & Gold, Inc. 5.50% (f) | 1,050 | | 1,026,113 |
TOTAL MATERIALS | | 5,373,546 |
Preferred Stocks - continued |
| Shares | | Value (Note 1) |
Convertible Preferred Stocks - continued |
TELECOMMUNICATION SERVICES - 0.3% |
Diversified Telecommunication Services - 0.3% |
CenturyTel, Inc. 6.875% ACES | 60,200 | | $ 1,531,488 |
TOTAL CONVERTIBLE PREFERRED STOCKS | | 22,238,165 |
Nonconvertible Preferred Stocks - 10.6% |
CONSUMER STAPLES - 0.2% |
Food Products - 0.2% |
H.J. Heinz Finance Co. 6.226% | 10 | | 1,080,000 |
ENERGY - 1.5% |
Oil & Gas - 1.5% |
El Paso Tennessee Pipeline Co. Series A, 8.25% | 180,600 | | 8,849,400 |
FINANCIALS - 5.6% |
Capital Markets - 1.1% |
Bear Stearns Companies, Inc.: | | | |
Series E, 6.155% | 15,000 | | 795,000 |
Series G, 5.49% | 15,000 | | 748,500 |
Lehman Brothers Holdings, Inc. (depositary shares) Series F, 6.50% | 169,015 | | 4,534,672 |
| | 6,078,172 |
Commercial Banks - 0.1% |
Santander Finance Preferred SA Unipersonal 6.41% | 31,400 | | 796,775 |
Consumer Finance - 0.4% |
SLM Corp. Series A, 6.97% | 43,400 | | 2,469,460 |
Diversified Financial Services - 0.5% |
ABN Amro Capital Funding Trust VII 6.08% | 60,400 | | 1,500,940 |
Heco Capital Trust III 6.50% | 12,000 | | 315,360 |
J.P. Morgan Chase & Co. (depositary shares) Series H, 6.625% | 6,530 | | 350,988 |
RC Trust I 7.00% (a) | 9,680 | | 514,973 |
| | 2,682,261 |
Real Estate - 1.1% |
Apartment Investment & Management Co.: | | | |
Series Q, 10.10% | 46,510 | | 1,252,049 |
Series V, 8.00% | 40,000 | | 1,005,000 |
Duke Realty Corp. (depositary shares) Series K, 6.50% | 95,800 | | 2,404,580 |
Preferred Stocks - continued |
| Shares | | Value (Note 1) |
Nonconvertible Preferred Stocks - continued |
FINANCIALS - continued |
Real Estate - continued |
Host Marriott Corp. Series E, 8.875% | 20,000 | | $ 545,000 |
Vornado Realty Trust Series E, 7.00% | 40,000 | | 1,080,000 |
| | 6,286,629 |
Thrifts & Mortgage Finance - 2.4% |
Fannie Mae: | | | |
Series H, 5.81% | 29,200 | | 1,486,280 |
Series L, 5.125% | 90,900 | | 4,022,325 |
Series N, 5.50% | 71,650 | | 3,360,385 |
Freddie Mac: | | | |
Series F, 5.00% | 12,000 | | 516,000 |
Series H, 5.10% | 10,300 | | 450,625 |
Series K, 5.79% | 6,000 | | 300,000 |
Series O, 5.81% | 19,500 | | 983,775 |
Series R, 5.70% | 57,000 | | 2,778,750 |
| | 13,898,140 |
TOTAL FINANCIALS | | 32,211,437 |
MATERIALS - 0.2% |
Chemicals - 0.1% |
E.I. du Pont de Nemours & Co. Series B, 4.50% | 9,900 | | 873,675 |
Metals & Mining - 0.1% |
Alcoa, Inc. 3.75% | 6,400 | | 498,240 |
TOTAL MATERIALS | | 1,371,915 |
UTILITIES - 3.1% |
Electric Utilities - 3.1% |
Alabama Power Co. 5.30% | 88,600 | | 2,206,140 |
Consolidated Edison Co. of New York, Inc. Series A, 5.00% | 28,705 | | 2,526,040 |
Duquesne Light Co. 6.50% | 106,050 | | 5,302,500 |
FPL Group Capital Trust I 5.875% | 20,000 | | 493,000 |
Monongahela Power Co. Series L, 7.73% | 10,800 | | 1,075,680 |
Pacific Gas & Electric Co. Series A, 5.00% | 16,900 | | 362,505 |
San Diego Gas & Electric Co. 1.70% | 67,548 | | 1,740,036 |
Southern California Edison Co.: | | | |
4.78% | 46,500 | | 960,225 |
Series B, 4.08% | 27,271 | | 512,695 |
Preferred Stocks - continued |
| Shares | | Value (Note 1) |
Nonconvertible Preferred Stocks - continued |
UTILITIES - continued |
Electric Utilities - continued |
Southern California Edison Co.: - continued | | | |
Series C, 4.24% | 94,600 | | $ 1,750,100 |
Series D, 4.32% | 70,000 | | 1,312,500 |
| | 18,241,421 |
TOTAL NONCONVERTIBLE PREFERRED STOCKS | | 61,754,173 |
TOTAL PREFERRED STOCKS (Cost $82,404,159) | 83,992,338 |
Money Market Funds - 6.0% |
| | | |
Fidelity Cash Central Fund, 1.98% (b) | 33,442,765 | | 33,442,765 |
Fidelity Securities Lending Cash Central Fund, 2% (b)(c) | 1,531,100 | | 1,531,100 |
TOTAL MONEY MARKET FUNDS (Cost $34,973,865) | 34,973,865 |
TOTAL INVESTMENT PORTFOLIO - 100.6% (Cost $546,617,667) | | 585,436,863 |
NET OTHER ASSETS - (0.6)% | | (3,668,536) |
NET ASSETS - 100% | $ 581,768,327 |
Futures Contracts |
| Expiration Date | | Underlying Face Amount at Value | | Unrealized Appreciation/
(Depreciation) |
Purchased |
Equity Index Contracts |
24 S&P 500 Index Contracts | Dec. 2004 | | $ 7,044,600 | | $ 290,281 |
The face value of futures purchased as a percentage of net assets - 1.2% |
Security Type Abbreviations |
ACES | - | Automatic Common Exchange Securities |
PIERS | - | Preferred Income Equity Redeemable Securities |
Legend |
(a) Non-income producing |
(b) Affiliated fund that is available only to investment companies and other accounts managed by Fidelity Investments. The rate quoted is the annualized seven-day yield of the fund at period end. A complete listing of the fund's holdings as of its most recent fiscal year end is available upon request. |
(c) Includes investment made with cash collateral received from securities on loan. |
(d) Debt obligation initially issued at one coupon which converts to a higher coupon at a specified date. The rate shown is the rate at period end. |
(e) Security or a portion of the security is on loan at period end. |
(f) Security exempt from registration under Rule 144A of the Securities Act of 1933. These securities may be resold in transactions exempt from registration, normally to qualified institutional buyers. At the period end, the value of these securities amounted to $12,879,409 or 2.2% of net assets. |
(g) Security or a portion of the security was pledged to cover margin requirements for futures contracts. At the period end, the value of securities pledged amounted to $449,673. |
(h) The coupon rate shown on floating or adjustable rate securities represents the rate at period end. |
Other Information |
The composition of credit quality ratings as a percentage of net assets is as follows (ratings are unaudited): |
AAA, AA, A | 1.1% |
BBB | 2.0% |
BB | 1.4% |
B | 3.9% |
CCC, CC, C | 0.6% |
Not Rated | 4.8% |
Equities | 80.7% |
Short-Term Investments and
Net Other Assets | 5.5% |
| 100.0% |
We have used ratings from Moody's Investors Services, Inc. Where Moody's ratings are not available, we have used S&P ratings. Percentages are adjusted for the effect of futures contracts, if applicable. |
Income Tax Information |
At November 30, 2004, the fund had a capital loss carryforward of approximately $7,643,000 all of which will expire on November 30, 2012. |
See accompanying notes which are an integral part of the financial statements.
Annual Report
Financial Statements
Statement of Assets and Liabilities
November 30, 2004 |
| | |
Assets | | |
Investment in securities, at value (including securities loaned of $1,465,492) (cost $546,617,667) - See accompanying schedule | | $ 585,436,863 |
Cash | | 264,563 |
Receivable for investments sold | | 3,195,546 |
Receivable for fund shares sold | | 2,149,095 |
Dividends receivable | | 1,094,217 |
Interest receivable | | 642,822 |
Prepaid expenses | | 454 |
Receivable from investment adviser for expense reductions | | 133 |
Other receivables | | 62,911 |
Total assets | | 592,846,604 |
| | |
Liabilities | | |
Payable for investments purchased | $ 8,009,986 | |
Payable for fund shares redeemed | 1,067,708 | |
Accrued management fee | 267,488 | |
Distribution fees payable | 51,820 | |
Payable for daily variation on futures contracts | 11,400 | |
Other affiliated payables | 108,073 | |
Other payables and accrued expenses | 30,702 | |
Collateral on securities loaned, at value | 1,531,100 | |
Total liabilities | | 11,078,277 |
| | |
Net Assets | | $ 581,768,327 |
Net Assets consist of: | | |
Paid in capital | | $ 548,910,904 |
Undistributed net investment income | | 2,463,649 |
Accumulated undistributed net realized gain (loss) on investments and foreign currency transactions | | (8,715,703) |
Net unrealized appreciation (depreciation) on investments | | 39,109,477 |
Net Assets | | $ 581,768,327 |
See accompanying notes which are an integral part of the financial statements.
Annual Report
Financial Statements - continued
Statement of Assets and Liabilities - continued
November 30, 2004 |
| | |
Calculation of Maximum Offering Price
Class A:
Net Asset Value and redemption price per share ($21,985,396 ÷ 1,981,700 shares) | | $ 11.09 |
| | |
Maximum offering price per share (100/94.25 of $11.09) | | $ 11.77 |
Class T:
Net Asset Value and redemption price per share ($36,526,147 ÷ 3,295,264 shares) | | $ 11.08 |
| | |
Maximum offering price per share (100/96.50 of $11.08) | | $ 11.48 |
Class B:
Net Asset Value and offering price per share ($13,457,083 ÷ 1,216,357 shares) A | | $ 11.06 |
| | |
Class C:
Net Asset Value and offering price per share ($28,794,624 ÷ 2,602,593 shares) A | | $ 11.06 |
| | |
Strategic Dividend & Income:
Net Asset Value, offering price and redemption price per share ($476,032,290 ÷ 42,831,091 shares) | | $ 11.11 |
| | |
Institutional Class:
Net Asset Value, offering price and redemption price per share ($4,972,787 ÷ 447,667 shares) | | $ 11.11 |
A Redemption price per share is equal to net asset value less any applicable contingent deferred sales charge.
See accompanying notes which are an integral part of the financial statements.
Annual Report
Statement of Operations
For the period December 23, 2003 (commencement of operations) to November 30, 2004 |
| | |
Investment Income | | |
Dividends | | $ 8,755,650 |
Interest | | 1,320,268 |
Security lending | | 6,718 |
Total income | | 10,082,636 |
| | |
Expenses | | |
Management fee | $ 2,031,291 | |
Transfer agent fees | 765,538 | |
Distribution fees | 343,283 | |
Accounting and security lending fees | 146,320 | |
Non-interested trustees' compensation | 1,673 | |
Custodian fees and expenses | 65,363 | |
Registration fees | 157,585 | |
Audit | 35,583 | |
Legal | 860 | |
Miscellaneous | 939 | |
Total expenses before reductions | 3,548,435 | |
Expense reductions | (102,232) | 3,446,203 |
Net investment income (loss) | | 6,636,433 |
Realized and Unrealized Gain (Loss) Net realized gain (loss) on: | | |
Investment securities | (8,229,482) | |
Foreign currency transactions | (4) | |
Futures contracts | (8,546) | |
Total net realized gain (loss) | | (8,238,032) |
Change in net unrealized appreciation (depreciation) on: Investment securities | 38,819,196 | |
Futures contracts | 290,281 | |
Total change in net unrealized appreciation (depreciation) | | 39,109,477 |
Net gain (loss) | | 30,871,445 |
Net increase (decrease) in net assets resulting from operations | | $ 37,507,878 |
See accompanying notes which are an integral part of the financial statements.
Annual Report
Financial Statements - continued
Statement of Changes in Net Assets
| For the period December 23, 2003 (commencement
of operations) to November 30, 2004 |
Increase (Decrease) in Net Assets | |
Operations | |
Net investment income (loss) | $ 6,636,433 |
Net realized gain (loss) | (8,238,032) |
Change in net unrealized appreciation (depreciation) | 39,109,477 |
Net increase (decrease) in net assets resulting from operations | 37,507,878 |
Distributions to shareholders from net investment income | (4,647,719) |
Share transactions - net increase (decrease) | 548,908,168 |
Total increase (decrease) in net assets | 581,768,327 |
| |
Net Assets | |
Beginning of period | - |
End of period (including undistributed net investment income of $2,463,649) | $ 581,768,327 |
See accompanying notes which are an integral part of the financial statements.
Annual Report
Financial Highlights - Class A
Year ended November 30, | 2004 F |
Selected Per-Share Data | |
Net asset value, beginning of period | $ 10.00 |
Income from Investment Operations | |
Net investment income (loss) E | .16 |
Net realized and unrealized gain (loss) | 1.04 |
Total from investment operations | 1.20 |
Distributions from net investment income | (.11) |
Net asset value, end of period | $ 11.09 |
Total Return B,C,D | 12.01% |
Ratios to Average Net Assets G | |
Expenses before expense reductions | 1.20% A |
Expenses net of voluntary waivers, if any | 1.20% A |
Expenses net of all reductions | 1.17% A |
Net investment income (loss) | 1.67% A |
Supplemental Data | |
Net assets, end of period (000 omitted) | $ 21,985 |
Portfolio turnover rate | 66% A |
A Annualized
B Total returns for periods of less than one year are not annualized.
C Total returns would have been lower had certain expenses not been reduced during the periods shown.
D Total returns do not include the effect of the sales charges.
E Calculated based on average shares outstanding during the period.
F For the period December 23, 2003 (commencement of operations) to November 30, 2004.
G Expense ratios reflect operating expenses of the class. Expenses before reductions do not reflect amounts reimbursed by the investment adviser or reductions from brokerage service arrangements or other expense offset arrangements and do not represent the amount paid by the class during periods when reimbursements or reductions occur. Expense ratios before reductions for start-up periods may not be representative of longer-term operating periods. Expenses net of any voluntary waivers reflect expenses after reimbursement by the investment adviser but prior to reductions from brokerage service arrangements or other expense offset arrangements. Expenses net of all reductions represent the net expenses paid by the class.
See accompanying notes which are an integral part of the financial statements.
Annual Report
Financial Highlights - Class T
Year ended November 30, | 2004F |
Selected Per-Share Data | |
Net asset value, beginning of period | $ 10.00 |
Income from Investment Operations | |
Net investment income (loss) E | .13 |
Net realized and unrealized gain (loss) | 1.04 |
Total from investment operations | 1.17 |
Distributions from net investment income | (.09) |
Net asset value, end of period | $ 11.08 |
Total Return B,C,D | 11.75% |
Ratios to Average Net Assets G | |
Expenses before expense reductions | 1.45% A |
Expenses net of voluntary waivers, if any | 1.45% A |
Expenses net of all reductions | 1.42% A |
Net investment income (loss) | 1.43% A |
Supplemental Data | |
Net assets, end of period (000 omitted) | $ 36,526 |
Portfolio turnover rate | 66% A |
A Annualized
B Total returns for periods of less than one year are not annualized.
C Total returns would have been lower had certain expenses not been reduced during the periods shown.
D Total returns do not include the effect of the sales charges.
E Calculated based on average shares outstanding during the period.
F For the period December 23, 2003 (commencement of operations) to November 30, 2004.
G Expense ratios reflect operating expenses of the class. Expenses before reductions do not reflect amounts reimbursed by the investment adviser or reductions from brokerage service arrangements or other expense offset arrangements and do not represent the amount paid by the class during periods when reimbursements or reductions occur. Expense ratios before reductions for start-up periods may not be representative of longer-term operating periods. Expenses net of any voluntary waivers reflect expenses after reimbursement by the investment adviser but prior to reductions from brokerage service arrangements or other expense offset arrangements. Expenses net of all reductions represent the net expenses paid by the class.
See accompanying notes which are an integral part of the financial statements.
Annual Report
Financial Highlights - Class B
Year ended November 30, | 2004 F |
Selected Per-Share Data | |
Net asset value, beginning of period | $ 10.00 |
Income from Investment Operations | |
Net investment income (loss) E | .09 |
Net realized and unrealized gain (loss) | 1.03 |
Total from investment operations | 1.12 |
Distributions from net investment income | (.06) |
Net asset value, end of period | $ 11.06 |
Total Return B,C,D | 11.24% |
Ratios to Average Net Assets G | |
Expenses before expense reductions | 1.99% A |
Expenses net of voluntary waivers, if any | 1.95% A |
Expenses net of all reductions | 1.92% A |
Net investment income (loss) | .92% A |
Supplemental Data | |
Net assets, end of period (000 omitted) | $ 13,457 |
Portfolio turnover rate | 66% A |
A Annualized
B Total returns for periods of less than one year are not annualized.
C Total returns would have been lower had certain expenses not been reduced during the periods shown.
D Total returns do not include the effect of the contingent deferred sales charge.
E Calculated based on average shares outstanding during the period.
F For the period December 23, 2003 (commencement of operations) to November 30, 2004.
G Expense ratios reflect operating expenses of the class. Expenses before reductions do not reflect amounts reimbursed by the investment adviser or reductions from brokerage service arrangements or other expense offset arrangements and do not represent the amount paid by the class during periods when reimbursements or reductions occur. Expense ratios before reductions for start-up periods may not be representative of longer-term operating periods. Expenses net of any voluntary waivers reflect expenses after reimbursement by the investment adviser but prior to reductions from brokerage service arrangements or other expense offset arrangements. Expenses net of all reductions represent the net expenses paid by the class.
See accompanying notes which are an integral part of the financial statements.
Annual Report
Financial Highlights - Class C
Year ended November 30, | 2004 F |
Selected Per-Share Data | |
Net asset value, beginning of period | $ 10.00 |
Income from Investment Operations | |
Net investment income (loss) E | .09 |
Net realized and unrealized gain (loss) | 1.03 |
Total from investment operations | 1.12 |
Distributions from net investment income | (.06) |
Net asset value, end of period | $ 11.06 |
Total Return B,C,D | 11.24% |
Ratios to Average Net Assets G | |
Expenses before expense reductions | 1.94% A |
Expenses net of voluntary waivers, if any | 1.94% A |
Expenses net of all reductions | 1.92% A |
Net investment income (loss) | .93% A |
Supplemental Data | |
Net assets, end of period (000 omitted) | $ 28,795 |
Portfolio turnover rate | 66% A |
A Annualized
B Total returns for periods of less than one year are not annualized.
C Total returns would have been lower had certain expenses not been reduced during the periods shown.
D Total returns do not include the effect of the contingent deferred sales charge.
E Calculated based on average shares outstanding during the period.
F For the period December 23, 2003 (commencement of operations) to November 30, 2004.
G Expense ratios reflect operating expenses of the class. Expenses before reductions do not reflect amounts reimbursed by the investment adviser or reductions from brokerage service arrangements or other expense offset arrangements and do not represent the amount paid by the class during periods when reimbursements or reductions occur. Expense ratios before reductions for start-up periods may not be representative of longer-term operating periods. Expenses net of any voluntary waivers reflect expenses after reimbursement by the investment adviser but prior to reductions from brokerage service arrangements or other expense offset arrangements. Expenses net of all reductions represent the net expenses paid by the class.
See accompanying notes which are an integral part of the financial statements.
Annual Report
Financial Highlights - Strategic Dividend & Income
Year ended November 30, | 2004 E |
Selected Per-Share Data | |
Net asset value, beginning of period | $ 10.00 |
Income from Investment Operations | |
Net investment income (loss) D | .19 |
Net realized and unrealized gain (loss) | 1.04 |
Total from investment operations | 1.23 |
Distributions from net investment income | (.12) |
Net asset value, end of period | $ 11.11 |
Total Return B,C | 12.32% |
Ratios to Average Net Assets F | |
Expenses before expense reductions | .90% A |
Expenses net of voluntary waivers, if any | .90% A |
Expenses net of all reductions | .87% A |
Net investment income (loss) | 1.98% A |
Supplemental Data | |
Net assets, end of period (000 omitted) | $ 476,032 |
Portfolio turnover rate | 66% A |
A Annualized
B Total returns for periods of less than one year are not annualized.
C Total returns would have been lower had certain expenses not been reduced during the periods shown.
D Calculated based on average shares outstanding during the period.
E For the period December 23, 2003 (commencement of operations) to November 30, 2004.
F Expense ratios reflect operating expenses of the class. Expenses before reductions do not reflect amounts reimbursed by the investment adviser or reductions from brokerage service arrangements or other expense offset arrangements and do not represent the amount paid by the class during periods when reimbursements or reductions occur. Expense ratios before reductions for start-up periods may not be representative of longer-term operating periods. Expenses net of any voluntary waivers reflect expenses after reimbursement by the investment adviser but prior to reductions from brokerage service arrangements or other expense offset arrangements. Expenses net of all reductions represent the net expenses paid by the class.
See accompanying notes which are an integral part of the financial statements.
Annual Report
Financial Highlights - Institutional Class
Year ended November 30, | 2004 E |
Selected Per-Share Data | |
Net asset value, beginning of period | $ 10.00 |
Income from Investment Operations | |
Net investment income (loss) D | .19 |
Net realized and unrealized gain (loss) | 1.04 |
Total from investment operations | 1.23 |
Distributions from net investment income | (.12) |
Net asset value, end of period | $ 11.11 |
Total Return B,C | 12.38% |
Ratios to Average Net Assets F | |
Expenses before expense reductions | .88% A |
Expenses net of voluntary waivers, if any | .88% A |
Expenses net of all reductions | .85% A |
Net investment income (loss) | 2.00% A |
Supplemental Data | |
Net assets, end of period (000 omitted) | $ 4,973 |
Portfolio turnover rate | 66% A |
A Annualized
B Total returns for periods of less than one year are not annualized.
C Total returns would have been lower had certain expenses not been reduced during the periods shown.
D Calculated based on average shares outstanding during the period.
E For the period December 23, 2003 (commencement of operations) to November 30, 2004.
F Expense ratios reflect operating expenses of the class. Expenses before reductions do not reflect amounts reimbursed by the investment adviser or reductions from brokerage service arrangements or other expense offset arrangements and do not represent the amount paid by the class during periods when reimbursements or reductions occur. Expense ratios before reductions for start-up periods may not be representative of longer-term operating periods. Expenses net of any voluntary waivers reflect expenses after reimbursement by the investment adviser but prior to reductions from brokerage service arrangements or other expense offset arrangements. Expenses net of all reductions represent the net expenses paid by the class.
See accompanying notes which are an integral part of the financial statements.
Annual Report
Notes to Financial Statements
For the period ended November 30, 2004
1. Significant Accounting Policies.
Fidelity Strategic Dividend & Income Fund (the fund) is a fund of Fidelity Financial Trust (the trust) and is authorized to issue an unlimited number of shares. The trust is registered under the Investment Company Act of 1940, as amended (the 1940 Act), as an open-end management investment company organized as a Massachusetts business trust.
The fund offers Class A, Class T, Class B, Class C, Strategic Dividend & Income, and Institutional Class shares, each of which has equal rights as to assets and voting privileges. Each class has exclusive voting rights with respect to matters that affect that class. Class B shares will automatically convert to Class A shares after a holding period of seven years from the initial date of purchase. Investment income, realized and unrealized capital gains and losses, the common expenses of the fund, and certain fund-level expense reductions, if any, are allocated on a pro rata basis to each class based on the relative net assets of each class to the total net assets of the fund. Each class differs with respect to transfer agent and distribution and service plan fees incurred. Certain expense reductions also differ by class.
The financial statements have been prepared in conformity with accounting principles generally accepted in the United States of America, which require management to make certain estimates and assumptions at the date of the financial statements. The following summarizes the significant accounting policies of the fund:
Security Valuation. Net asset value per share (NAV calculation) is calculated as of the close of business of the New York Stock Exchange, normally 4:00 p.m. Eastern time. Equity securities, including restricted securities, for which market quotations are available are valued at the last sale price or official closing price (closing bid price or last evaluated quote if no sale has occurred) on the primary market or exchange on which they trade. Debt securities, including restricted securities, for which quotations are readily available are valued at their most recent bid prices (sales prices if the principal market is an exchange) in the principal market in which such securities are normally traded, as determined by recognized dealers in such securities, or securities are valued on the basis of information provided by a pricing service. Pricing services use valuation matrices that incorporate both dealer-supplied valuations and valuation models. If prices are not readily available or do not accurately reflect fair value for a security, or if a security's value has been materially affected by events occurring after the close of the exchange or market on which the security is principally traded, that security may be valued by another method that the Board of Trustees believes accurately reflects fair value. A security's valuation may differ depending on the method used for determining value. Price movements in futures contracts and ADRs, market and trading trends, the bid/ask quotes of brokers and off-exchange institutional trading may be reviewed in the course of making a good faith determination of a security's fair value. Short-term securities with remaining maturities of sixty days or less for which quotations are not readily available are valued on the basis of amortized cost. Investments in open-end investment companies are valued at their net asset value each business day.
Annual Report
Notes to Financial Statements - continued
1. Significant Accounting Policies - continued
Foreign Currency. The fund uses foreign currency contracts to facilitate transactions in foreign-denominated securities. Losses from these transactions may arise from changes in the value of the foreign currency or if the counterparties do not perform under the contracts' terms.
Foreign-denominated assets, including investment securities, and liabilities are translated into U.S. dollars at the exchange rate at period end. Purchases and sales of investment securities, income and dividends received and expenses denominated in foreign currencies are translated into U.S. dollars at the exchange rate in effect on the transaction date.
The effects of exchange rate fluctuations on investments are included with the net realized and unrealized gain (loss) on investment securities. Other foreign currency transactions resulting in realized and unrealized gain (loss) are disclosed separately.
Investment Transactions and Income. Security transactions are accounted for as of trade date. Gains and losses on securities sold are determined on the basis of identified cost and may include proceeds received from litigation. Dividend income is recorded on the ex-dividend date, except for certain dividends from foreign securities where the ex-dividend date may have passed, which are recorded as soon as the fund is informed of the ex-dividend date. Non-cash dividends included in dividend income, if any, are recorded at the fair market value of the securities received. Distributions received on securities that represent a return of capital or capital gain are recorded as a reduction of cost of investments and/or as a realized gain. The fund estimates the components of distributions received that may be considered return of capital distributions or capital gain distributions. Interest income is accrued as earned. Interest income includes coupon interest and amortization of premium and accretion of discount on debt securities. Investment income is recorded net of foreign taxes withheld where recovery of such taxes is uncertain.
Expenses. Most expenses of the trust can be directly attributed to a fund. Expenses which cannot be directly attributed are apportioned among the funds in the trust.
Income Tax Information and Distributions to Shareholders. Each year, the fund intends to qualify as a regulated investment company by distributing all of its taxable income and realized gains under Subchapter M of the Internal Revenue Code. As a result, no provision for income taxes is required in the accompanying financial statements. Foreign taxes are provided for based on the fund's understanding of the tax rules and rates that exist in the foreign markets in which it invests.
Annual Report
1. Significant Accounting Policies - continued
Income Tax Information and Distributions to Shareholders - continued
Distributions are recorded on the ex-dividend date. Income dividends and capital gain distributions are declared separately for each class. Income and capital gain distributions are determined in accordance with income tax regulations, which may differ from generally accepted accounting principles. Capital accounts within the financial statements are adjusted for permanent book-tax differences. These adjustments have no impact on net assets or the results of operations. Temporary book-tax differences will reverse in a subsequent period.
Book-tax differences are primarily due to foreign currency transactions, non-taxable dividends, futures transactions, market discount, passive foreign investment companies (PFIC), capital loss carryforwards and losses deferred due to wash sales.
The tax-basis components of distributable earnings and the federal tax cost as of period end were as follows:
Unrealized appreciation | $ 49,133,039 | |
Unrealized depreciation | (11,088,285) | |
Net unrealized appreciation (depreciation) | 38,044,754 | |
Undistributed ordinary income | 2,455,813 | |
Capital loss carryforward | (7,643,145) | |
| | |
Cost for federal income tax purposes | $ 547,392,109 | |
The tax character of distributions paid was as follows:
| November 30, 2004 | |
| | |
Ordinary Income | $ 4,647,719 | |
2. Operating Policies.
Repurchase Agreements. Fidelity Management & Research Company (FMR) has received an Exemptive Order from the Securities and Exchange Commission (the SEC) which permits the fund and other affiliated entities of FMR to transfer uninvested cash balances into joint trading accounts. These accounts are then invested in repurchase agreements that are collateralized by U.S. Treasury or Government obligations. The fund may also invest directly with institutions, in repurchase agreements that are collateralized by commercial paper obligations and corporate obligations. Collateral is held in segregated accounts with custodian banks and may be obtained in the event of a default of the counterparty. Collateral is marked-to-market daily and maintained at a value at least equal to the principal amount of the repurchase agreement (including accrued interest).
Annual Report
Notes to Financial Statements - continued
2. Operating Policies - continued
Futures Contracts. The fund may use futures contracts to manage its exposure to the stock market. Buying futures tends to increase the fund's exposure to the underlying instrument, while selling futures tends to decrease the fund's exposure to the underlying instrument or hedge other fund investments. Futures contracts involve, to varying degrees, risk of loss in excess of any futures variation margin reflected in the Statement of Assets and Liabilities. The underlying face amount at value of any open futures contracts at period end is shown in the Schedule of Investments under the caption "Futures Contracts." This amount reflects each contract's exposure to the underlying instrument at period end. Losses may arise from changes in the value of the underlying instruments or if the counter-parties do not perform under the contracts' terms. Gains (losses) are realized upon the expiration or closing of the futures contracts. Futures contracts are valued at the settlement price established each day by the board of trade or exchange on which they are traded.
Restricted Securities. The fund may invest in securities that are subject to legal or contractual restrictions on resale. These securities generally may be resold in transactions exempt from registration or to the public if the securities are registered. Disposal of these securities may involve time-consuming negotiations and expense, and prompt sale at an acceptable price may be difficult. Information regarding restricted securities is included at the end of the fund's Schedule of Investments.
3. Purchases and Sales of Investments.
Purchases and sales of securities, other than short-term securities and U.S. government securities, aggregated $744,022,486 and $224,900,566, respectively.
4. Fees and Other Transactions with Affiliates.
Management Fee. FMR and its affiliates provide the fund with investment management related services for which the fund pays a monthly management fee. The management fee is the sum of an individual fund fee rate that is based on an annual rate of .30% of the fund's average net assets and a group fee rate that averaged .28% during the period. The group fee rate is based upon the average net assets of all the mutual funds advised by FMR. The group fee rate decreases as assets under management increase and increases as assets under management decrease. For the period, the total annualized management fee rate was .57% of the fund's average net assets.
Annual Report
4. Fees and Other Transactions with Affiliates - continued
Distribution and Service Plan. In accordance with Rule 12b-1 of the 1940 Act, the fund has adopted separate Distribution and Service Plans for each class of shares. Certain classes pay Fidelity Distributors Corporation (FDC), an affiliate of FMR, separate Distribution and Service Fees, each of which is based on an annual percentage of each class' average net assets. In addition, FDC may pay financial intermediaries for selling shares of the fund and providing shareholder support services. For the period, the Distribution and Service Fee rates and the total amounts paid to and retained by FDC were as follows:
| Distribution
Fee | Service
Fee | Paid to
FDC | Retained
by FDC |
Class A | 0% | .25% | $ 30,719 | $ 2,320 |
Class T | .25% | .25% | 82,780 | 6,333 |
Class B | .75% | .25% | 71,575 | 56,029 |
Class C | .75% | .25% | 158,209 | 122,573 |
| | | $ 343,283 | $ 187,255 |
Sales Load. FDC receives a front-end sales charge of up to 5.75% for selling Class A shares, and 3.50% for selling Class T shares, some of which is paid to financial intermediaries for selling shares of the fund. FDC receives the proceeds of contingent deferred sales charges levied on Class A, Class T, Class B, and Class C redemptions. These charges depend on the holding period. The deferred sales charges range from 5% to 1% for Class B, 1% for Class C, and .25% for certain purchases of Class A and Class T shares.
For the period, sales charge amounts retained by FDC were as follows:
| Retained
by FDC | |
Class A | $ 94,769 | |
Class T | 49,710 | |
Class B * | 6,510 | |
Class C * | 6,473 | |
| $ 157,462 | |
* When Class B and Class C shares are initially sold, FDC pays commissions from its own resources to financial intermediaries through which the sales are made.
Transfer Agent Fees. Fidelity Investments Institutional Operations Company, Inc. (FIIOC), an affiliate of FMR, is the transfer, dividend disbursing and shareholder servicing agent for each class of the fund, except for Strategic Dividend & Income. Fidelity Service Company, Inc. (FSC), an affiliate of FMR, is the transfer agent for Strategic Dividend & Income shares. FIIOC and FSC receive account fees and asset-based fees that vary according to the account size and type of account of the shareholders of the respective classes of the fund. FIIOC and FSC pay for typesetting, printing and mailing of shareholder reports, except proxy statements. For the period, the total transfer agent fees paid by each class to FIIOC or FSC were as follows:
Annual Report
Notes to Financial Statements - continued
4. Fees and Other Transactions with Affiliates - continued
Transfer Agent Fees - continued
| Amount | % of
Average
Net Assets |
Class A | $ 32,480 | .26* |
Class T | 43,373 | .26* |
Class B | 21,591 | .30* |
Class C | 41,184 | .26* |
Strategic Dividend & Income | 621,448 | .21* |
Institutional Class | 5,462 | .19* |
| $ 765,538 | |
* Annualized
Accounting and Security Lending Fees. FSC maintains the fund's accounting records. The accounting fee is based on the level of average net assets for the month. Under a separate contract, FSC administers the security lending program. The security lending fee is based on the number and duration of lending transactions.
Central Funds. The fund may invest in affiliated Central Funds managed by Fidelity Investments Money Management, Inc. (FIMM), an affiliate of FMR. The Central Funds are open-end investment companies available only to investment companies and other accounts managed by FMR and its affiliates. The Central Funds seek preservation of capital and current income and do not pay a management fee. Income distributions earned by the fund are recorded as income in the accompanying financial statements and totaled $187,845 for the period.
Brokerage Commissions. The fund placed a portion of its portfolio transactions with brokerage firms which are affiliates of the investment adviser. The commissions paid to these affiliated firms were $47,196 for the period.
5. Committed Line of Credit.
The fund participates with other funds managed by FMR in a $4.2 billion credit facility (the "line of credit") to be utilized for temporary or emergency purposes to fund shareholder redemptions or for other short-term liquidity purposes. The fund has agreed to pay commitment fees on its pro rata portion of the line of credit. During the period, there were no borrowings on this line of credit.
6. Security Lending.
The fund lends portfolio securities from time to time in order to earn additional income. The fund receives collateral (in the form of U.S. Treasury obligations, letters of credit
Annual Report
6. Security Lending - continued
and/or cash) against the loaned securities and maintains collateral in an amount not less than 100% of the market value of the loaned securities during the period of the loan. The market value of the loaned securities is determined at the close of business of the fund and any additional required collateral is delivered to the fund on the next business day. If the borrower defaults on its obligation to return the securities loaned because of insolvency or other reasons, a fund could experience delays and costs in recovering the securities loaned or in gaining access to the collateral. Cash collateral is invested in cash equivalents. The value of loaned securities and cash collateral at period end are disclosed on the fund's Statement of Assets and Liabilities.
7. Expense Reductions.
Effective December 23, 2003, FMR voluntarily agreed to reimburse each class to the extent annual operating expenses exceeded certain levels of average net assets as noted in the table below. Some expenses, for example interest expense, are excluded from this reimbursement.
| Expense
Limitations | Reimbursement
from adviser |
Class B | 1.95% | $ 2,427 |
Many of the brokers with whom FMR places trades on behalf of the fund provided services to the fund in addition to trade execution. These services included payments of certain expenses on behalf of the fund totaling $97,043 for the period. In addition, through arrangements with the fund's custodian, credits realized as a result of uninvested cash balances were used to reduce the fund's expenses. During the period, these credits reduced the fund's custody expenses by $2,762.
8. Distributions to Shareholders.
Distributions to shareholders of each class were as follows:
| Year Ended
November 30, 2004A | |
From net investment income | | |
Class A | $ 159,582 | |
Class T | 189,189 | |
Class B | 55,805 | |
Class C | 123,216 | |
Strategic Dividend & Income | 4,080,966 | |
Institutional Class | 38,961 | |
Total | $ 4,647,719 | |
A For the period December 23, 2003 (commencement of operations) to November 30, 2004.
Annual Report
Notes to Financial Statements - continued
9. Share Transactions.
Transactions for each class of shares were as follows:
| Year Ended
November 30, 2004A | Year Ended
November 30, 2004A |
| Shares | Dollars |
Class A | | |
Shares sold | 2,191,945 | $ 22,746,005 |
Reinvestment of distributions | 10,552 | 110,590 |
Shares redeemed | (220,797) | (2,287,113) |
Net increase (decrease) | 1,981,700 | $ 20,569,482 |
Class T | | |
Shares sold | 3,511,538 | $ 36,655,001 |
Reinvestment of distributions | 14,112 | 147,959 |
Shares redeemed | (230,386) | (2,405,951) |
Net increase (decrease) | 3,295,264 | $ 34,397,009 |
Class B | | |
Shares sold | 1,285,173 | $ 13,296,297 |
Reinvestment of distributions | 3,976 | 41,558 |
Shares redeemed | (72,792) | (752,799) |
Net increase (decrease) | 1,216,357 | $ 12,585,056 |
Class C | | |
Shares sold | 2,813,304 | $ 29,175,332 |
Reinvestment of distributions | 7,379 | 77,088 |
Shares redeemed | (218,090) | (2,262,584) |
Net increase (decrease) | 2,602,593 | $ 26,989,836 |
Strategic Dividend & Income | | |
Shares sold | 55,474,221 | $580,932,738 |
Reinvestment of distributions | 341,097 | 3,577,556 |
Shares redeemed | (12,984,227) | (134,752,835) |
Net increase (decrease) | 42,831,091 | $ 449,757,459 |
Institutional Class | | |
Shares sold | 464,040 | $ 4,776,823 |
Reinvestment of distributions | 1,845 | 19,348 |
Shares redeemed | (18,218) | (186,845) |
Net increase (decrease) | 447,667 | $ 4,609,326 |
A For the period December 23, 2003 (commencement of operations) to November 30, 2004.
Annual Report
Report of Independent Registered Public Accounting Firm
To the Trustees of Fidelity Financial Trust and the Shareholders of Fidelity Strategic Dividend & Income Fund:
In our opinion, the accompanying statement of assets and liabilities, including the schedule of investments, and the related statements of operations and of changes in net assets and the financial highlights present fairly, in all material respects, the financial position of Fidelity Strategic Dividend & Income Fund (a fund of Fidelity Financial Trust) at November 30, 2004 and the results of its operations, the changes in its net assets and the financial highlights for the periods indicated, in conformity with accounting principles generally accepted in the United States of America. These financial statements and financial highlights (hereafter referred to as "financial statements") are the responsibility of the Fidelity Strategic Dividend & Income Fund's management; our responsibility is to express an opinion on these financial statements based on our audits. We conducted our audits of these financial statements in accordance with the standards of the Public Company Accounting Oversight Board (United States). Those standards require that we plan and perform the audit to obtain reasonable assurance about whether the financial statements are free of material misstatement. An audit includes examining, on a test basis, evidence supporting the amounts and disclosures in the financial statements, assessing the accounting principles used and significant estimates made by management, and evaluating the overall financial statement presentation. We believe that our audits, which included confirmation of securities at November 30, 2004 by correspondence with the custodian and brokers, provide a reasonable basis for our opinion.
/s/PricewaterhouseCoopers LLP
PricewaterhouseCoopers LLP
Boston, Massachusetts
January 11, 2005
Annual Report
Trustees and Officers
The Trustees, Members of the Advisory Board, and executive officers of the trust and fund, as applicable, are listed below. The Board of Trustees governs the fund and is responsible for protecting the interests of shareholders. The Trustees are experienced executives who meet periodically throughout the year to oversee the fund's activities, review contractual arrangements with companies that provide services to the fund, and review the fund's performance. Except for William O. McCoy, Dennis J. Dirks, and Kenneth L. Wolfe, each of the Trustees oversees 301 funds advised by FMR or an affiliate. Mr. McCoy oversees 303 funds advised by FMR or an affiliate. Mr. Dirks and Mr. Wolfe oversee 223 funds advised by FMR or an affiliate.
The Trustees hold office without limit in time except that (a) any Trustee may resign; (b) any Trustee may be removed by written instrument, signed by at least two-thirds of the number of Trustees prior to such removal; (c) any Trustee who requests to be retired or who has become incapacitated by illness or injury may be retired by written instrument signed by a majority of the other Trustees; and (d) any Trustee may be removed at any special meeting of shareholders by a two-thirds vote of the outstanding voting securities of the trust. In any event, each non-interested Trustee shall retire not later than the last day of the calendar year in which his or her 72nd birthday occurs. The executive officers and Advisory Board Members hold office without limit in time, except that any officer and Advisory Board Member may resign or may be removed by a vote of a majority of the Trustees at any regular meeting or any special meeting of the Trustees. Except as indicated, each individual has held the office shown or other offices in the same company for the past five years.
The fund's Statement of Additional Information (SAI) includes more information about the Trustees. To request a free copy, call Fidelity at 1-877-208-0098.
Interested Trustees*:
Correspondence intended for each Trustee who is an "interested person" (as defined in the 1940 Act) may be sent to Fidelity Investments, 82 Devonshire Street, Boston, Massachusetts 02109.
Name, Age; Principal Occupation |
Edward C. Johnson 3d (74)** |
| Year of Election or Appointment: 1982 Mr. Johnson is Chairman of the Board of Trustees. Mr. Johnson serves as Chief Executive Officer, Chairman, and a Director of FMR Corp.; a Director and Chairman of the Board and of the Executive Committee of FMR; Chairman and a Director of Fidelity Management & Research (Far East) Inc.; Chairman (1998) and a Director of Fidelity Investments Money Management, Inc.; and Chairman (2001) and a Director (2000) of FMR Co., Inc. |
Abigail P. Johnson (42)** |
| Year of Election or Appointment: 2001 Senior Vice President of the fund (2003). Ms. Johnson also serves as Senior Vice President of other Fidelity funds (2001). She is President and a Director of FMR (2001), Fidelity Investments Money Management, Inc. (2001), FMR Co., Inc. (2001), and a Director of FMR Corp. Previously, Ms. Johnson managed a number of Fidelity funds. |
Laura B. Cronin (50) |
| Year of Election or Appointment: 2003 Ms. Cronin is an Executive Vice President (2002) and Chief Financial Officer (2002) of FMR Corp. and is a member of the Fidelity Management Committee (2003). Previously, Ms. Cronin served as Vice President of Finance of FMR (1997-1999), and Chief Financial Officer of FMR (1999-2001), Fidelity Personal Investments (2001), and Fidelity Brokerage Company (2001-2002). |
Robert L. Reynolds (52) |
| Year of Election or Appointment: 2003 Mr. Reynolds is a Director (2003) and Chief Operating Officer (2002) of FMR Corp. and is the head of the Fidelity Management Committee (2003). He also serves on the Board at Fidelity Investments Canada, Ltd. (2000). Previously, Mr. Reynolds served as President of Fidelity Investments Institutional Retirement Group (1996-2000). |
* Trustees have been determined to be "Interested Trustees" by virtue of, among other things, their affiliation with the trust or various entities under common control with FMR.
** Edward C. Johnson 3d, Trustee, is Abigail P. Johnson's father.
Annual Report
Non-Interested Trustees:
Correspondence intended for each non-interested Trustee (that is, the Trustees other than the Interested Trustees) may be sent to Fidelity Investments, P.O. Box 55235, Boston, Massachusetts 02205-5235.
Name, Age; Principal Occupation |
Robert M. Gates (61) |
| Year of Election or Appointment: 1997 Dr. Gates is Vice Chairman of the non-interested Trustees (2005). Dr. Gates is President of Texas A&M University (2002). He was Director of the Central Intelligence Agency (CIA) from 1991 to 1993. From 1989 to 1991, Dr. Gates served as Assistant to the President of the United States and Deputy National Security Advisor. Dr. Gates is a Director of NACCO Industries, Inc. (mining and manufacturing), Parker Drilling Co., Inc. (drilling and rental tools for the energy industry, 2001), and Brinker International (restaurant management, 2003). He also serves as a member of the Advisory Board of VoteHere.net (secure Internet voting, 2001). Previously, Dr. Gates served as a Director of LucasVarity PLC (automotive components and diesel engines), a Director of TRW Inc. (automotive, space, defense, and information technology), and Dean of the George Bush School of Government and Public Service at Texas A&M University (1999-2001). Dr. Gates also is a Trustee of the Forum for International Policy. |
George H. Heilmeier (68) |
| Year of Election or Appointment: 2004 Dr. Heilmeier is Chairman Emeritus of Telcordia Technologies (communication software and systems), where prior to his retirement, he served as company Chairman and Chief Executive Officer. He currently serves on the Boards of Directors of The Mitre Corporation (systems engineering and information technology support for the government), INET Technologies Inc. (telecommunications network surveillance, 2001), Teletech Holdings (customer management services), and HRL Laboratories (private research and development, 2004). He is Chairman of the General Motors Technology Advisory Committee and a Life Fellow of the Institute of Electrical and Electronics Engineers (IEEE) (2000). Dr. Heilmeier is a member of the Defense Science Board and the National Security Agency Advisory Board. He is also a member of the National Academy of Engineering, the American Academy of Arts and Sciences, and the Board of Overseers of the School of Engineering and Applied Science of the University of Pennsylvania. Previously, Dr. Heilmeier served as a Director of TRW Inc. (automotive, space, defense, and information technology, 1992-2002), Compaq (1994-2002), and Automatic Data Processing, Inc. (ADP) (technology-based business outsourcing, 1995-2002). |
Marie L. Knowles (58) |
| Year of Election or Appointment: 2001 Prior to Ms. Knowles' retirement in June 2000, she served as Executive Vice President and Chief Financial Officer of Atlantic Richfield Company (ARCO) (diversified energy, 1996-2000). From 1993 to 1996, she was a Senior Vice President of ARCO and President of ARCO Transportation Company. She served as a Director of ARCO from 1996 to 1998. She currently serves as a Director of Phelps Dodge Corporation (copper mining and manufacturing) and McKesson Corporation (healthcare service, 2002). Ms. Knowles is a Trustee of the Brookings Institution and the Catalina Island Conservancy and also serves as a member of the Advisory Board for the School of Engineering of the University of Southern California. |
Ned C. Lautenbach (60) |
| Year of Election or Appointment: 2000 Mr. Lautenbach has been a partner of Clayton, Dubilier & Rice, Inc. (private equity investment firm) since September 1998. Previously, Mr. Lautenbach was with the International Business Machines Corporation (IBM) from 1968 until his retirement in 1998. He was most recently Senior Vice President and Group Executive of Worldwide Sales and Services. From 1993 to 1995, he was Chairman of IBM World Trade Corporation, and from 1994 to 1998 was a member of IBM's Corporate Executive Committee. Mr. Lautenbach serves as Co-Chairman and a Director of Covansys, Inc. (global provider of business and technology solutions, 2000). In addition, he is a Director of Italtel Holding S.p.A. (telecommunications (Milan, Italy), 2004) and Eaton Corporation (diversified industrial) as well as the Philharmonic Center for the Arts in Naples, Florida (1999). He also is a member of the Council on Foreign Relations. |
Marvin L. Mann (71) |
| Year of Election or Appointment: 1993 Mr. Mann is Chairman of the non-interested Trustees (2001). He is Chairman Emeritus of Lexmark International, Inc. (computer peripherals), where he served as CEO until April 1998, retired as Chairman May 1999, and remains a member of the Board. Prior to 1991, he held the positions of Vice President of International Business Machines Corporation (IBM) and President and General Manager of various IBM divisions and subsidiaries. He is a member of the Executive Committee of the Independent Director's Council of the Investment Company Institute. In addition, Mr. Mann is a member of the President's Cabinet at the University of Alabama and the Board of Visitors of the Culverhouse College of Commerce and Business Administration at the University of Alabama. |
William O. McCoy (71) |
| Year of Election or Appointment: 1997 Prior to his retirement in December 1994, Mr. McCoy was Vice Chairman of the Board of BellSouth Corporation (telecommunications) and President of BellSouth Enterprises. He is currently a Director of Liberty Corporation (holding company), Duke Realty Corporation (real estate), and Progress Energy, Inc. (electric utility). He is also a partner of Franklin Street Partners (private investment management firm) and a member of the Research Triangle Foundation Board. In addition, Mr. McCoy served as the Interim Chancellor (1999-2000) and a member of the Board of Visitors (1994-1998) for the University of North Carolina at Chapel Hill and currently serves on the Board of Directors of the University of North Carolina Health Care System and the Board of Visitors of the Kenan-Flagler Business School (University of North Carolina at Chapel Hill). He also served as Vice President of Finance for the University of North Carolina (16-school system, 1995-1998). |
Cornelia M. Small (60) |
| Year of Election or Appointment: 2005 Ms. Small is a member (2000) and Chairperson (2002) of the Investment Committee, and a member (2002) of the Board of Trustees of Smith College. Previously, she served as Chief Investment Officer (1999-2000), Director of Global Equity Investments (1996-1999), and a member of the Board of Directors of Scudder, Stevens & Clark (1990-1997) and Scudder Kemper Investments (1997-1998). In addition, Ms. Small served as Co-Chair (2000-2003) of the Annual Fund for the Fletcher School of Law and Diplomacy. |
William S. Stavropoulos (65) |
| Year of Election or Appointment: 2002 Mr. Stavropoulos is Chairman of the Board (2000), CEO (2002), a position he previously held from 1995-2000, Chairman of the Executive Committee (2000), and a Member of the Board of Directors of The Dow Chemical Company. Since joining The Dow Chemical Company in 1967, Mr. Stavropoulos served in numerous senior management positions, including President (1993-2000; 2002-2003). Currently, he is a Director of NCR Corporation (data warehousing and technology solutions), BellSouth Corporation (telecommunications), Chemical Financial Corporation, and Maersk Inc. (industrial conglomerate, 2002). He also serves as a member of the Board of Trustees of the American Enterprise Institute for Public Policy Research. In addition, Mr. Stavropoulos is a member of The Business Council, J.P. Morgan International Council and the University of Notre Dame Advisory Council for the College of Science. |
Annual Report
Trustees and Officers - continued
Advisory Board Members and Executive Officers:
Correspondence intended for Mr. Dirks and Mr. Wolfe may be sent to Fidelity Investments, P.O. Box 55235, Boston, Massachusetts 02205-5235. Correspondence intended for each executive officer and Mr. Lynch may be sent to Fidelity Investments, 82 Devonshire Street, Boston, Massachusetts 02109.
Name, Age; Principal Occupation |
Dennis J. Dirks (56) |
| Year of Election or Appointment: 2004 Member of the Advisory Board of Fidelity Financial Trust. Mr. Dirks also serves as a Trustee (2005) or member of the Advisory Board (2004) of other investment companies advised by FMR. Prior to his retirement in May 2003, Mr. Dirks was Chief Operating Officer and a member of the Board of The Depository Trust & Clearing Corporation (DTCC) (1999-2003). He also served as President, Chief Operating Officer, and Board member of The Depository Trust Company (DTC) (1999-2003) and President and Board member of the National Securities Clearing Corporation (NSCC) (1999-2003). In addition, Mr. Dirks served as Chief Executive Officer and Board member of the Government Securities Clearing Corporation (2001-2003) and Chief Executive Officer and Board member of the Mortgage-Backed Securities Clearing Corporation (2001-2003). |
Peter S. Lynch (61) |
| Year of Election or Appointment: 2003 Member of the Advisory Board of Fidelity Financial Trust. Vice Chairman and a Director of FMR, and Vice Chairman (2001) and a Director (2000) of FMR Co., Inc. Previously, Mr. Lynch served as a Trustee of the Fidelity funds (1990-2003). Prior to May 31, 1990, he was a Director of FMR and Executive Vice President of FMR (a position he held until March 31, 1991), Vice President of Fidelity® Magellan® Fund and FMR Growth Group Leader, and Managing Director of FMR Corp. Mr. Lynch was also Vice President of Fidelity Investments Corporate Services. In addition, he serves as a Trustee of Boston College, Massachusetts Eye & Ear Infirmary, Historic Deerfield, John F. Kennedy Library, and the Museum of Fine Arts of Boston. |
Kenneth L. Wolfe (65) |
| Year of Election or Appointment: 2004 Member of the Advisory Board of Fidelity Financial Trust. Mr. Wolfe also serves as a Trustee (2005) or member of the Advisory Board (2004) of other investment companies advised by FMR. Prior to his retirement in 2001, Mr. Wolfe was Chairman and Chief Executive Officer of Hershey Foods Corporation (1993-2001). He currently serves as a member of the boards of Adelphia Communications Corporation (2003), Bausch & Lomb, Inc., and Revlon Inc. (2004). |
Bart A. Grenier (45) |
| Year of Election or Appointment: 2003 Vice President of the fund. Mr. Grenier also serves as Vice President of certain Equity Funds (2001), a position he previously held from 1999 to 2000, and Vice President of certain High Income Funds (2002). He is Senior Vice President of FMR (1999) and FMR Co., Inc. (2001), and President and Director of Strategic Advisers, Inc. (2002). He also heads Fidelity's Asset Allocation Group (2000), Fidelity's Growth and Income Group (2001), Fidelity's Value Group (2001), and Fidelity's High Income Division (2001). Previously, Mr. Grenier served as President of Fidelity Ventures (2000), Vice President of certain High Income Funds (1997-2000), High Income Division Head (1997-2000), Group Leader of the Income-Growth and Asset Allocation-Income Groups (1996-2000), and Assistant Equity Division Head (1997-2000). |
William Eigen (36) |
| Year of Election or Appointment: 2003 Vice President of the fund. Mr. Eigen also serves as Vice President of other funds advised by FMR. Prior to assuming his current responsibilities, Mr. Eigen managed a variety of Fidelity funds. |
Eric D. Roiter (56) |
| Year of Election or Appointment: 2003 Secretary of the fund. He also serves as Secretary of other Fidelity funds (1998); Vice President, General Counsel, and Clerk of FMR Co., Inc. (2001) and FMR (1998); Vice President and Clerk of FDC (1998); Assistant Clerk of Fidelity Management & Research (U.K.) Inc. (2001) and Fidelity Management & Research (Far East) Inc. (2001); and Assistant Secretary of Fidelity Investments Money Management, Inc. (2001). Prior to joining Fidelity, Mr. Roiter was with the law Firm of Debevoise & Plimpton, as on associate (1981-1984) and as a partner (1985-1997), and served as an Assistant General Counsel of the U.S. Securities and Exchange Commission (1979-1981). Mr. Roiter is an Adjunct Member, Faculty of Law, at Boston College Law School (2003). |
Stuart Fross (45) |
| Year of Election or Appointment: 2003 Assistant Secretary of the fund. Mr. Fross also serves as Assistant Secretary of other Fidelity funds (2003) and is an employee of FMR. |
Name, Age; Principal Occupation |
Christine Reynolds (46) |
| Year of Election or Appointment: 2004 President, Treasurer, and Anti-Money Laundering (AML) officer of the fund. Ms. Reynolds also serves as President, Treasurer, and AML officer of other Fidelity funds (2004) and is a Vice President (2003) and an employee (2002) of FMR. Before joining Fidelity Investments, Ms. Reynolds worked at PricewaterhouseCoopers LLP (PwC) (1980-2002), where she was most recently an audit partner with PwC's investment management practice. |
Timothy F. Hayes (53) |
| Year of Election or Appointment: 2003 Chief Financial Officer of the fund. Mr. Hayes also serves as Chief Financial Officer of other Fidelity funds (2002). Recently he was appointed President of Fidelity Service Company (2003) where he also serves as a Director. Mr. Hayes also serves as President of Fidelity Investments Operations Group (FIOG, 2002), which includes Fidelity Pricing and Cash Management Services Group (FPCMS), where he was appointed President in 1998. Previously, Mr. Hayes served as Chief Financial Officer of Fidelity Investments Corporate Systems and Service Group (1998) and Fidelity Systems Company (1997-1998). |
Kenneth A. Rathgeber (57) |
| Year of Election or Appointment: 2004 Chief Compliance Officer of the fund. Mr. Rathgeber also serves as Chief Compliance Officer of other Fidelity funds (2004) and Executive Vice President of Risk Oversight for Fidelity Investments (2002). Previously, he served as Executive Vice President and Chief Operating Officer for Fidelity Investments Institutional Services Company, Inc. (1998-2002). |
John R. Hebble (46) |
| Year of Election or Appointment: 2003 Deputy Treasurer of the fund. Mr. Hebble also serves as Deputy Treasurer of other Fidelity funds (2003), and is an employee of FMR. Before joining Fidelity Investments, Mr. Hebble worked at Deutsche Asset Management where he served as Director of Fund Accounting (2002-2003) and Assistant Treasurer of the Scudder Funds (1998-2003). |
Kimberley H. Monasterio (41) |
| Year of Election or Appointment: 2004 Deputy Treasurer of the fund. Ms. Monasterio also serves as Deputy Treasurer of other Fidelity funds (2004) and is an employee of FMR (2004). Before joining Fidelity Investments, Ms. Monasterio served as Treasurer (2000-2004) and Chief Financial Officer (2002-2004) of the Franklin Templeton Funds and Senior Vice President of Franklin Templeton Services, LLC (2000-2004). |
John H. Costello (58) |
| Year of Election or Appointment: 2003 Assistant Treasurer of the fund. Mr. Costello also serves as Assistant Treasurer of other Fidelity funds and is an employee of FMR. |
Peter L. Lydecker (50) |
| Year of Election or Appointment: 2004 Assistant Treasurer of the fund. Mr. Lydecker also serves as Assistant Treasurer of other Fidelity funds (2004) and is an employee of FMR. |
Mark Osterheld (49) |
| Year of Election or Appointment: 2003 Assistant Treasurer of the fund. Mr. Osterheld also serves as Assistant Treasurer of other Fidelity funds (2002) and is an employee of FMR. |
Kenneth B. Robins (35) |
| Year of Election or Appointment: 2004 Assistant Treasurer of the fund. Mr. Robins also serves as Assistant Treasurer of other Fidelity funds (2004) and is an employee of FMR (2004). Before joining Fidelity Investments, Mr. Robins worked at KPMG LLP, where he was a partner in KPMG's department of professional practice (2002-2004) and a Senior Manager (1999-2000). In addition, Mr. Robins served as Assistant Chief Accountant, United States Securities and Exchange Commission (2000-2002). |
Thomas J. Simpson (46) |
| Year of Election or Appointment: 2003 Assistant Treasurer of the fund. Mr. Simpson is Assistant Treasurer of other Fidelity funds (2000) and an employee of FMR (1996). Prior to joining FMR, Mr. Simpson was Vice President and Fund Controller of Liberty Investment Services (1987-1995). |
Annual Report
Distributions
A total of 0.13% of the dividends distributed during the fiscal year was derived from interest on U.S. Government securities which is generally exempt from state income tax.
Institutional Class designates 89% of the dividends distributed during the fiscal year as qualifying for the dividends-received deduction for corporate shareholders.
Institutional Class designates 100%, 98.18%, and 61.63% of the dividends distributed in March, June, and October, respectively during the fiscal year as amounts which may be taken into account as a dividend for purposes of the maximum rate under section 1(h)(11) of the Internal Revenue Code.
The fund will notify shareholders in January 2005 of amounts for use in preparing 2004 income tax returns.
Annual Report
Annual Report
Annual Report
Annual Report
Annual Report
Annual Report
Annual Report
Investment Adviser
Fidelity Management & Research Company
Boston, MA
Investment Sub-Advisers
FMR Co., Inc.
Fidelity Management & Research
(U.K.) Inc.
Fidelity Management & Research
(Far East) Inc.
Fidelity International Investment Advisors
Fidelity Investments Japan Limited
Fidelity International Investment Advisors (U.K.) Limited
General Distributor
Fidelity Distributors Corporation
Boston, MA
Transfer and Shareholder
Servicing Agent
Fidelity Investments Institutional
Operations Company, Inc.
Boston, MA
Custodian
Citibank, N.A.
New York, NY
(Fidelity Investment logo)(registered trademark)
Corporate Headquarters
82 Devonshire St., Boston, MA 02109
www.fidelity.com
ASDII-UANN-0105
1.802531.100
Fidelity®
Strategic Dividend & IncomeSM
Fund
Annual Report
November 30, 2004
(2_fidelity_logos) (Registered_Trademark)
Contents
Chairman's Message | <Click Here> | Ned Johnson's message to shareholders. |
Performance | <Click Here> | How the fund has done over time. |
Management's Discussion | <Click Here> | The manager's review of fund performance, strategy and outlook. |
Shareholder Expense Example | <Click Here> | An example of shareholder expenses. |
Investment Changes | <Click Here> | A summary of the fund's investments. |
Investments | <Click Here> | A complete list of the fund's investments with their market values. |
Financial Statements | <Click Here> | Statements of assets and liabilities, operations, and changes in net assets,
as well as financial highlights. |
Notes | <Click Here> | Notes to the financial statements. |
Report of Independent Registered Public Accounting Firm | <Click Here> | |
Trustees and Officers | <Click Here> | |
Distributions | <Click Here> | |
Standard & Poor's, S&P and S&P 500 are registered service marks of The McGraw-Hill Companies, Inc. and have been licensed for use by Fidelity Distributors Corporation.
Other third party marks appearing herein are the property of their respective owners.
All other marks appearing herein are registered or unregistered trademarks or service marks of FMR Corp. or an affiliated company.
To view a fund's proxy voting guidelines and proxy voting record for the 12-month period ended June 30, visit www.fidelity.com/proxyvotingresults or visit the Securities and Exchange Commission's (SEC) web site at www.sec.gov. You may also call 1-800-544-8544 to request a free copy of the proxy voting guidelines.
(Recycle graphic) This report is printed on recycled paper using soy-based inks.
This report and the financial statements contained herein are submitted for the general information of the shareholders of the fund. This report is not authorized for distribution to prospective investors in the fund unless preceded or accompanied by an effective prospectus.
A fund files its complete schedule of portfolio holdings with the SEC for the first and third quarters of each fiscal year on Form N-Q. Forms N-Q are available on the SEC's web site at http://www.sec.gov. A fund's Forms N-Q may be reviewed and copied at the SEC's Public Reference Room in Washington, DC. Information regarding the operation of the SEC's Public Reference Room may be obtained by calling 1-800-SEC-0330. For a complete list of a fund's portfolio holdings, view the most recent quarterly holdings report, semiannual report, or annual report on Fidelity's web site at http://www.fidelity.com/holdings.
NOT FDIC INSURED · MAY LOSE VALUE · NO BANK GUARANTEE
Neither the fund nor Fidelity Distributors Corporation is a bank.
Annual Report
Chairman's Message
(photo_of_Edward_C_Johnson_3d)
Dear Shareholder:
During the past year or so, much has been reported about the mutual fund industry, and much of it has been more critical than I believe is warranted. Allegations that some companies have been less than forthright with their shareholders have cast a shadow on the entire industry. I continue to find these reports disturbing, and assert that they do not create an accurate picture of the industry overall. Therefore, I would like to remind everyone where Fidelity stands on these issues. I will say two things specifically regarding allegations that some mutual fund companies were in violation of the Securities and Exchange Commission's forward pricing rules or were involved in so-called "market timing" activities.
First, Fidelity has no agreements that permit customers who buy fund shares after 4 p.m. to obtain the 4 p.m. price. This is not a new policy. This is not to say that someone could not deceive the company through fraudulent acts. However, we are extremely diligent in preventing fraud from occurring in this manner - and in every other. But I underscore again that Fidelity has no so-called "agreements" that sanction illegal practices.
Second, Fidelity continues to stand on record, as we have for years, in opposition to predatory short-term trading that adversely affects shareholders in a mutual fund. Back in the 1980s, we initiated a fee - which is returned to the fund and, therefore, to investors - - to discourage this activity. Further, we took the lead several years ago in developing a Fair Value Pricing Policy to prevent market timing on foreign securities in our funds. I am confident we will find other ways to make it more difficult for predatory traders to operate. However, this will only be achieved through close cooperation among regulators, legislators and the industry.
Yes, there have been unfortunate instances of unethical and illegal activity within the mutual fund industry from time to time. That is true of any industry. When this occurs, confessed or convicted offenders should be dealt with appropriately. But we are still concerned about the risk of over-regulation and the quick application of simplistic solutions to intricate problems. Every system can be improved, and we support and applaud well thought out improvements by regulators, legislators and industry representatives that achieve the common goal of building and protecting the value of investors' holdings.
For nearly 60 years, Fidelity has worked very hard to improve its products and service to justify your trust. When our family founded this company in 1946, we had only a few hundred customers. Today, we serve more than 18 million customers including individual investors and participants in retirement plans across America.
Let me close by saying that we do not take your trust in us for granted, and we realize that we must always work to improve all aspects of our service to you. In turn, we urge you to continue your active participation with your financial matters, so that your interests can be well served.
Best regards,
/s/Edward C. Johnson 3d
Edward C. Johnson 3d
Annual Report
Performance: The Bottom Line
Average annual total return reflects the change in the value of an investment, assuming reinvestment of Strategic Dividend & Income's dividend income and capital gains (the profits earned upon the sale of securities that have grown in value) and assuming a constant rate of performance each year. The $10,000 table and the fund's returns do not reflect the deduction of taxes that a shareholder would pay on fund distributions or the redemption of fund shares. During periods of reimbursement by Fidelity, a fund's total return will be greater than it would be had the reimbursement not occurred. How a fund did yesterday is no guarantee of how it will do tomorrow.
Average annual total returns take Strategic Dividend & Income's cumulative total return and show you what would have happened if Strategic Dividend & Income shares had performed at a constant rate each year. These numbers will be reported once the fund is a year old.
$10,000 Over Life of Fund
Let's say hypothetically that $10,000 was invested in Strategic Dividend & Income on December 23, 2003. The chart shows how the value of your investment would have changed, and also shows how the Standard & Poor's 500SM Index performed over the same period.
Annual Report
Management's Discussion of Fund Performance
Comments from William Eigen, Portfolio Manager of Fidelity® Strategic Dividend & IncomeSM Fund
Despite surging oil prices, a struggling job market and four interest rate hikes in a five-month span, U.S. equity markets posted solid results for the 12-month period ending November 30, 2004, and were closing in on a second straight year in the black. There was great disparity in the market during the past year. For instance, value stocks trounced their growth counterparts during the period. To illustrate, the Russell 1000® Value Index shot up 19.67%, while the Russell 1000 Growth Index rose only 5.83%. Meanwhile, small- and mid-cap stocks vastly outperformed larger-cap stocks. Energy was the best-performing sector of the market, propelled by a spike in oil prices. Conversely, technology stocks dipped lower in response to a slowdown in corporate capital spending. For the 12-month period overall, the Standard & Poor's 500SM Index returned 12.86% - slightly above its historical average. Elsewhere, the Dow Jones Industrial AverageSM rose 8.87% and the tech-heavy NASDAQ Composite® Index advanced 7.50%.
From its inception on December 23, 2003, through November 30, 2004, Strategic Dividend & Income gained 12.32%, versus 12.63% for the Fidelity Strategic Dividend & Income Composite Index. Despite finishing roughly in line with the composite index, the fund's overall results could have been better, I felt, given that a lot went right during the period. Specifically, three of the fund's four subportfolios handily beat their respective benchmarks. Some well-timed tactical asset allocation shifts also helped, although my decision to underweight real estate investment trusts (REITs) - the period's top-performing asset class - detracted from performance versus the composite index as demand for these securities remained red hot. The biggest contribution to relative returns came from the fund's positioning in preferred stocks, which significantly trailed the broader equity market. In addition to modestly underweighting the sector overall, the fund benefited from favoring high-yield and convertible preferreds, which did relatively well amid an upturn in equities. We achieved strong results in the convertible bond subportfolio, mainly by being aggressive and taking concentrated positions in selected, more-volatile names. Solid security selection also contributed to outsized returns in the preferred stock and REIT subportfolios. The common stock subportfolio slightly trailed its index in part because it did not hold REITs.
The views expressed in this statement reflect those of the portfolio manager only through the end of the period of the report as stated on the cover and do not necessarily represent the views of Fidelity or any other person in the Fidelity organization. Any such views are subject to change at any time based upon market or other conditions and Fidelity disclaims any responsibility to update such views. These views may not be relied on as investment advice and, because investment decisions for a Fidelity fund are based on numerous factors, may not be relied on as an indication of trading intent on behalf of any Fidelity fund.
Annual Report
Shareholder Expense Example
As a shareholder of the Fund, you incur two types of costs: (1) transaction costs, including sales charges (loads) on purchase payments or redemption proceeds, and (2) ongoing costs, including management fees, distribution and/or service (12b-1) fees and other Fund expenses. This Example is intended to help you understand your ongoing costs (in dollars) of investing in the Fund and to compare these costs with the ongoing costs of investing in other mutual funds.
The Example is based on an investment of $1,000 invested at the beginning of the period and held for the entire period (June 1, 2004 to November 30, 2004).
Actual Expenses
The first line of the table below for each class of the Fund provides information about actual account values and actual expenses. You may use the information in this line, together with the amount you invested, to estimate the expenses that you paid over the period. Simply divide your account value by $1,000.00 (for example, an $8,600 account value divided by $1,000.00 = 8.6), then multiply the result by the number in the first line for a class of the Fund under the heading entitled "Expenses Paid During Period" to estimate the expenses you paid on your account during this period.
Hypothetical Example for Comparison Purposes
The second line of the table below for each class of the Fund provides information about hypothetical account values and hypothetical expenses based on a Class' actual expense ratio and an assumed rate of return of 5% per year before expenses, which is not the Class' actual return. The hypothetical account values and expenses may not be used to estimate the actual ending account balance or expenses you paid for the period. You may use this information to compare the ongoing costs of investing in the Fund and other funds. To do so, compare this 5% hypothetical example with the 5% hypothetical examples that appear in the shareholder reports of the other funds.
Please note that the expenses shown in the table are meant to highlight your ongoing costs only and do not reflect any transaction costs. Therefore, the second line of the table is useful in comparing ongoing costs only, and will not help you determine the relative total costs of owning different funds. In addition, if these transactional costs were included, your costs would have been higher.
Annual Report
| Beginning
Account Value
June 1, 2004 | Ending
Account Value
November 30, 2004 | Expenses Paid
During Period*
June 1, 2004
to November 30, 2004 |
Class A | | | |
Actual | $ 1,000.00 | $ 1,095.60 | $ 6.29 |
HypotheticalA | $ 1,000.00 | $ 1,018.92 | $ 6.08 |
Class T | | | |
Actual | $ 1,000.00 | $ 1,094.60 | $ 7.59 |
HypotheticalA | $ 1,000.00 | $ 1,017.66 | $ 7.34 |
Class B | | | |
Actual | $ 1,000.00 | $ 1,091.10 | $ 10.19 |
HypotheticalA | $ 1,000.00 | $ 1,015.13 | $ 9.87 |
Class C | | | |
Actual | $ 1,000.00 | $ 1,091.10 | $ 10.19 |
HypotheticalA | $ 1,000.00 | $ 1,015.13 | $ 9.87 |
Strategic Dividend & Income | | | |
Actual | $ 1,000.00 | $ 1,097.50 | $ 4.56 |
HypotheticalA | $ 1,000.00 | $ 1,020.60 | $ 4.40 |
Institutional Class | | | |
Actual | $ 1,000.00 | $ 1,098.60 | $ 4.46 |
HypotheticalA | $ 1,000.00 | $ 1,020.70 | $ 4.30 |
A 5% return per year before expenses
*Expenses are equal to each Class' annualized expense ratio (shown in the table below); multiplied by the average account value over the period, multiplied by 183/366 (to reflect the one-half year period).
| Annualized
Expense Ratio |
Class A | 1.20% |
Class T | 1.45% |
Class B | 1.95% |
Class C | 1.95% |
Strategic Dividend & Income | .87% |
Institutional Class | .85% |
Annual Report
Investment Changes
Top Ten Investments as of November 30, 2004 |
(excluding cash equivalents) | % of fund's
net assets | % of fund's net assets
6 months ago |
General Electric Co. | 3.3 | 1.0 |
Exxon Mobil Corp. | 2.1 | 1.6 |
Bank of America Corp. | 1.8 | 1.7 |
El Paso Tennessee Pipeline Co. Series A, 8.25% | 1.5 | 1.8 |
American International Group, Inc. | 1.5 | 1.6 |
Honeywell International, Inc. | 1.3 | 0.9 |
SBC Communications, Inc. | 1.1 | 1.0 |
Tyco International Ltd. | 1.0 | 1.5 |
AES Trust VII 6.00% | 1.0 | 0.9 |
Wachovia Corp. | 1.0 | 0.7 |
| 15.6 | |
Top Five Market Sectors as of November 30, 2004 |
| % of fund's
net assets | % of fund's net assets
6 months ago |
Financials | 28.5 | 33.5 |
Industrials | 12.0 | 8.2 |
Health Care | 10.4 | 10.5 |
Energy | 9.9 | 9.8 |
Consumer Discretionary | 8.2 | 9.5 |
Asset Allocation (% of fund's net assets) |
As of November 30, 2004 * | As of May 31, 2004 ** |
| Convertible
Bonds 13.8% | | | Convertible
Bonds 13.4% | |
| Common Stocks 66.3% | | | Common Stocks 67.5% | |
| Preferred Stocks 14.4% | | | Preferred Stocks 17.7% | |
| Short-Term
Investments and
Net Other Assets 5.5% | | | Short-Term
Investments and
Net Other Assets 1.4% | |
* Foreign
investments | 3.4% | | ** Foreign
investments | 3.3% | |

Annual Report
Investments November 30, 2004
Showing Percentage of Net Assets
Corporate Bonds - 13.8% |
| Principal Amount | | Value
(Note 1) |
Convertible Bonds - 13.8% |
CONSUMER DISCRETIONARY - 1.1% |
Hotels, Restaurants & Leisure - 0.6% |
Kerzner International Ltd. 2.375% 4/15/24 | | $ 3,030,000 | | $ 3,509,346 |
Media - 0.5% |
Interpublic Group of Companies, Inc. 4.5% 3/15/23 | | 2,270,000 | | 2,872,004 |
TOTAL CONSUMER DISCRETIONARY | | 6,381,350 |
ENERGY - 0.3% |
Energy Equipment & Services - 0.3% |
Halliburton Co. 3.125% 7/15/23 | | 1,440,000 | | 1,831,752 |
FINANCIALS - 1.1% |
Capital Markets - 0.5% |
Merrill Lynch & Co., Inc. liquid yield option note 0% 3/13/32 | | 3,010,000 | | 3,043,712 |
Consumer Finance - 0.6% |
American Express Co.: | | | | |
1.85% 12/1/33 (d)(f) | | 1,800,000 | | 1,971,000 |
1.85% 12/1/33 (d) | | 1,330,000 | | 1,456,350 |
| | 3,427,350 |
TOTAL FINANCIALS | | 6,471,062 |
HEALTH CARE - 5.7% |
Biotechnology - 2.3% |
BioMarin Pharmaceutical, Inc. 3.5% 6/15/08 | | 3,610,000 | | 3,176,800 |
Enzon Pharmaceuticals, Inc. 4.5% 7/1/08 | | 3,360,000 | | 3,124,800 |
IDEC Pharmaceuticals Corp. liquid yield option note 0% 2/16/19 | | 1,030,000 | | 2,442,027 |
Invitrogen Corp. 2.25% 12/15/06 | | 2,630,000 | | 2,656,300 |
Serologicals Corp.: | | | | |
4.75% 8/15/33 (f) | | 770,000 | | 1,357,895 |
4.75% 8/15/33 | | 420,000 | | 740,670 |
| | 13,498,492 |
Health Care Equipment & Supplies - 2.0% |
Bausch & Lomb, Inc. 2.4863% 8/1/23 (h) | | 1,860,000 | | 2,333,854 |
Cooper Companies, Inc. 2.625% 7/1/23 | | 1,660,000 | | 2,780,002 |
Cytyc Corp. 2.25% 3/15/24 | | 2,900,000 | | 3,436,500 |
Corporate Bonds - continued |
| Principal Amount | | Value
(Note 1) |
Convertible Bonds - continued |
HEALTH CARE - continued |
Health Care Equipment & Supplies - continued |
Fisher Scientific International, Inc.: | | | | |
2.5% 10/1/23 (f) | | $ 995,000 | | $ 1,384,055 |
2.5% 10/1/23 | | 960,000 | | 1,335,370 |
| | 11,269,781 |
Health Care Providers & Services - 0.5% |
Community Health Systems, Inc. 4.25% 10/15/08 | | 2,900,000 | | 3,006,981 |
Pharmaceuticals - 0.9% |
IVAX Corp.: | | | | |
1.5% 3/1/24 (f) | | 1,800,000 | | 1,731,420 |
1.5% 3/1/24 | | 770,000 | | 740,663 |
MGI Pharma, Inc.: | | | | |
1.6821% 3/2/24 (d)(f) | | 2,450,000 | | 1,960,000 |
1.6821% 3/2/24 (d) | | 950,000 | | 760,000 |
| | 5,192,083 |
TOTAL HEALTH CARE | | 32,967,337 |
INDUSTRIALS - 0.6% |
Industrial Conglomerates - 0.6% |
Tyco International Group SA yankee 3.125% 1/15/23 | | 2,110,000 | | 3,427,273 |
INFORMATION TECHNOLOGY - 3.2% |
Communications Equipment - 0.8% |
Comverse Technology, Inc. 0% 5/15/23 | | 2,070,000 | | 2,732,400 |
Juniper Networks, Inc. 0% 6/15/08 | | 1,110,000 | | 1,667,775 |
| | 4,400,175 |
Computers & Peripherals - 0.1% |
Maxtor Corp. 6.8% 4/30/10 | | 930,000 | | 865,644 |
Electronic Equipment & Instruments - 0.5% |
Vishay Intertechnology, Inc. 3.625% 8/1/23 | | 2,500,000 | | 2,767,750 |
Internet Software & Services - 0.6% |
Yahoo!, Inc. 0% 4/1/08 | | 1,900,000 | | 3,618,313 |
IT Services - 0.5% |
DST Systems, Inc.: | | | | |
Series A, 4.125% 8/15/23 (f) | | 1,240,000 | | 1,567,112 |
4.125% 8/15/23 | | 1,150,000 | | 1,453,370 |
| | 3,020,482 |
Corporate Bonds - continued |
| Principal Amount | | Value
(Note 1) |
Convertible Bonds - continued |
INFORMATION TECHNOLOGY - continued |
Semiconductors & Semiconductor Equipment - 0.4% |
Agere Systems, Inc. 6.5% 12/15/09 | | $ 2,100,000 | | $ 2,215,605 |
Software - 0.3% |
Concord Communications, Inc. 3% 12/15/23 (f) | | 2,180,000 | | 1,857,694 |
TOTAL INFORMATION TECHNOLOGY | | 18,745,663 |
TELECOMMUNICATION SERVICES - 1.2% |
Wireless Telecommunication Services - 1.2% |
Crown Castle International Corp. 4% 7/15/10 | | 1,840,000 | | 3,321,200 |
Nextel Partners, Inc. 1.5% 11/15/08 | | 1,405,000 | | 3,449,275 |
| | 6,770,475 |
UTILITIES - 0.6% |
Multi-Utilities & Unregulated Power - 0.6% |
AES Corp. 4.5% 8/15/05 | | 3,430,000 | | 3,438,575 |
TOTAL CONVERTIBLE BONDS | | 80,033,487 |
Nonconvertible Bonds - 0.0% |
INDUSTRIALS - 0.0% |
Machinery - 0.0% |
Mueller Industries, Inc. 6% 11/1/14 | | 76,000 | | 74,860 |
TOTAL CORPORATE BONDS (Cost $78,379,455) | 80,108,347 |
U.S. Treasury Obligations - 0.1% |
|
U.S. Treasury Bills, yield at date of purchase 1.62% to 1.67% 12/9/04 to 12/30/04 (g)
(Cost $449,723) | | 450,000 | | 449,673 |
Common Stocks - 66.3% |
| Shares | | |
CONSUMER DISCRETIONARY - 6.3% |
Hotels, Restaurants & Leisure - 1.3% |
Centerplate, Inc. unit | 318,800 | | 4,048,760 |
Empire Resorts, Inc. (a) | 8,300 | | 89,308 |
Common Stocks - continued |
| Shares | | Value (Note 1) |
CONSUMER DISCRETIONARY - continued |
Hotels, Restaurants & Leisure - continued |
McDonald's Corp. | 95,600 | | $ 2,938,744 |
Wendy's International, Inc. | 7,000 | | 249,690 |
| | 7,326,502 |
Household Durables - 0.7% |
Centex Corp. | 26,000 | | 1,364,220 |
D.R. Horton, Inc. | 10,000 | | 352,100 |
KB Home | 14,400 | | 1,265,616 |
LG Electronics, Inc. | 4,250 | | 256,581 |
Sony Corp. sponsored ADR | 21,000 | | 763,560 |
| | 4,002,077 |
Leisure Equipment & Products - 0.2% |
Brunswick Corp. | 8,000 | | 390,560 |
Eastman Kodak Co. | 32,500 | | 1,063,075 |
| | 1,453,635 |
Media - 2.5% |
Clear Channel Communications, Inc. | 47,600 | | 1,603,168 |
DreamWorks Animation SKG, Inc. Class A | 1,100 | | 40,656 |
Emmis Communications Corp. Class A (a) | 36,200 | | 669,338 |
Fox Entertainment Group, Inc. Class A (a) | 24,000 | | 705,600 |
Grupo Televisa SA de CV sponsored ADR | 15,900 | | 990,093 |
Lamar Advertising Co. Class A (a) | 32,500 | | 1,281,800 |
News Corp. Class A | 22,400 | | 396,256 |
Omnicom Group, Inc. | 8,000 | | 648,000 |
Salem Communications Corp. Class A (a) | 14,900 | | 365,944 |
Spanish Broadcasting System, Inc. Class A (a) | 14,100 | | 150,729 |
The DIRECTV Group, Inc. (a) | 27,100 | | 433,329 |
Time Warner, Inc. (a) | 97,900 | | 1,733,809 |
Univision Communications, Inc. Class A (a) | 26,000 | | 782,600 |
Valassis Communications, Inc. (a) | 8,000 | | 271,600 |
Viacom, Inc. Class B (non-vtg.) | 61,130 | | 2,121,211 |
Walt Disney Co. | 74,700 | | 2,007,936 |
XM Satellite Radio Holdings, Inc. Class A (a) | 10,000 | | 369,100 |
| | 14,571,169 |
Multiline Retail - 0.4% |
99 Cents Only Stores (a)(e) | 35,000 | | 522,200 |
JCPenney Co., Inc. | 23,300 | | 899,380 |
Kohl's Corp. (a) | 7,000 | | 323,120 |
Nordstrom, Inc. | 20,500 | | 896,875 |
| | 2,641,575 |
Common Stocks - continued |
| Shares | | Value (Note 1) |
CONSUMER DISCRETIONARY - continued |
Specialty Retail - 1.1% |
American Eagle Outfitters, Inc. | 17,966 | | $ 750,440 |
Asbury Automotive Group, Inc. (a) | 22,000 | | 305,360 |
CarMax, Inc. (a) | 26,000 | | 724,100 |
Home Depot, Inc. | 47,600 | | 1,987,300 |
Sonic Automotive, Inc. Class A (sub. vtg.) | 23,498 | | 583,455 |
The Pep Boys - Manny, Moe & Jack | 28,000 | | 441,000 |
Toys 'R' Us, Inc. (a) | 70,900 | | 1,371,206 |
| | 6,162,861 |
Textiles, Apparel & Luxury Goods - 0.1% |
Deckers Outdoor Corp. (a)(e) | 16,700 | | 726,784 |
TOTAL CONSUMER DISCRETIONARY | | 36,884,603 |
CONSUMER STAPLES - 2.3% |
Beverages - 0.2% |
Anheuser-Busch Companies, Inc. | 4,700 | | 235,423 |
Efes Breweries International NV unit (f) | 800 | | 24,120 |
PepsiCo, Inc. | 14,500 | | 723,695 |
| | 983,238 |
Food & Staples Retailing - 0.3% |
Albertsons, Inc. | 23,000 | | 581,900 |
Safeway, Inc. (a) | 53,000 | | 1,021,840 |
| | 1,603,740 |
Food Products - 0.7% |
B&G Foods, Inc. unit | 200,000 | | 2,976,000 |
Bunge Ltd. | 13,500 | | 711,720 |
Interstate Bakeries Corp. (a) | 14,600 | | 84,972 |
Smithfield Foods, Inc. (a) | 9,000 | | 261,450 |
| | 4,034,142 |
Household Products - 0.1% |
Clorox Co. | 9,200 | | 507,104 |
Personal Products - 0.1% |
Gillette Co. | 17,200 | | 748,028 |
Tobacco - 0.9% |
Altria Group, Inc. | 93,800 | | 5,392,562 |
TOTAL CONSUMER STAPLES | | 13,268,814 |
Common Stocks - continued |
| Shares | | Value (Note 1) |
ENERGY - 7.5% |
Energy Equipment & Services - 2.8% |
Baker Hughes, Inc. | 31,300 | | $ 1,387,529 |
BJ Services Co. | 13,900 | | 704,313 |
ENSCO International, Inc. | 22,100 | | 691,951 |
FMC Technologies, Inc. (a) | 10,000 | | 328,500 |
GlobalSantaFe Corp. | 33,800 | | 1,061,320 |
Halliburton Co. | 73,200 | | 3,026,820 |
Hornbeck Offshore Services, Inc. | 17,000 | | 343,400 |
Pride International, Inc. (a) | 96,300 | | 1,883,628 |
Rowan Companies, Inc. (a) | 15,000 | | 388,500 |
Smith International, Inc. (a) | 16,000 | | 969,120 |
Transocean, Inc. (a) | 44,200 | | 1,779,934 |
Varco International, Inc. (a) | 61,598 | | 1,831,925 |
Weatherford International Ltd. (a) | 33,400 | | 1,782,892 |
| | 16,179,832 |
Oil & Gas - 4.7% |
Apache Corp. | 20,400 | | 1,102,824 |
BP PLC sponsored ADR | 17,900 | | 1,098,165 |
Burlington Resources, Inc. | 34,300 | | 1,591,863 |
Chesapeake Energy Corp. | 75,973 | | 1,367,514 |
ChevronTexaco Corp. | 63,100 | | 3,445,260 |
ConocoPhillips | 19,200 | | 1,747,008 |
Encore Acquisition Co. (a) | 15,000 | | 528,150 |
Exxon Mobil Corp. | 243,800 | | 12,494,750 |
Occidental Petroleum Corp. | 24,300 | | 1,463,103 |
Pioneer Natural Resources Co. | 8,500 | | 299,200 |
Premcor, Inc. | 14,500 | | 645,975 |
Quicksilver Resources, Inc. (a) | 32,300 | | 1,111,120 |
Valero Energy Corp. | 13,000 | | 608,270 |
| | 27,503,202 |
TOTAL ENERGY | | 43,683,034 |
FINANCIALS - 20.8% |
Capital Markets - 2.4% |
Bear Stearns Companies, Inc. | 19,200 | | 1,873,536 |
Calamos Asset Management, Inc. Class A | 2,900 | | 68,788 |
Eurocastle Investment Ltd. | 9,200 | | 197,263 |
Lehman Brothers Holdings, Inc. | 20,300 | | 1,700,734 |
MarketAxess Holdings, Inc. | 1,500 | | 29,400 |
Merrill Lynch & Co., Inc. | 68,600 | | 3,821,706 |
Common Stocks - continued |
| Shares | | Value (Note 1) |
FINANCIALS - continued |
Capital Markets - continued |
Merrill Lynch & Co., Inc. (depositary shares) Series 1, unit | 120,000 | | $ 3,033,600 |
Morgan Stanley | 58,700 | | 2,979,025 |
TradeStation Group, Inc. (a) | 40,000 | | 296,800 |
| | 14,000,852 |
Commercial Banks - 3.3% |
Banco Bradesco SA sponsored ADR (non-vtg.) | 13,000 | | 846,560 |
Bank of America Corp. | 221,914 | | 10,267,961 |
UCBH Holdings, Inc. | 14,400 | | 652,896 |
Wachovia Corp. | 107,884 | | 5,582,997 |
Wells Fargo & Co. | 30,800 | | 1,902,516 |
| | 19,252,930 |
Consumer Finance - 0.2% |
Capital One Financial Corp. | 10,650 | | 836,877 |
MBNA Corp. | 22,200 | | 589,632 |
| | 1,426,509 |
Diversified Financial Services - 1.1% |
Citigroup, Inc. | 89,000 | | 3,982,750 |
J.P. Morgan Chase & Co. | 64,404 | | 2,424,811 |
| | 6,407,561 |
Insurance - 3.2% |
ACE Ltd. | 53,700 | | 2,170,554 |
AFLAC, Inc. | 36,200 | | 1,361,844 |
AMBAC Financial Group, Inc. | 13,100 | | 1,065,423 |
American International Group, Inc. | 137,800 | | 8,729,630 |
Hartford Financial Services Group, Inc. | 14,500 | | 928,000 |
Hilb Rogal & Hobbs Co. | 28,000 | | 971,320 |
MetLife, Inc. | 22,900 | | 893,100 |
Scottish Re Group Ltd. | 15,000 | | 345,000 |
W.R. Berkley Corp. | 27,600 | | 1,251,660 |
XL Capital Ltd. Class A | 8,100 | | 610,416 |
| | 18,326,947 |
Real Estate - 9.5% |
Acadia Realty Trust (SBI) | 16,300 | | 246,945 |
American Campus Communities, Inc. | 33,670 | | 703,703 |
AvalonBay Communities, Inc. | 16,910 | | 1,202,301 |
Boston Properties, Inc. | 38,074 | | 2,291,293 |
BRE Properties, Inc. Class A | 11,400 | | 463,296 |
CarrAmerica Realty Corp. | 24,050 | | 778,980 |
Catellus Development Corp. | 24,290 | | 762,706 |
Common Stocks - continued |
| Shares | | Value (Note 1) |
FINANCIALS - continued |
Real Estate - continued |
CBL & Associates Properties, Inc. | 22,050 | | $ 1,616,045 |
CenterPoint Properties Trust (SBI) | 15,820 | | 741,167 |
Cornerstone Realty Income Trust, Inc. | 38,690 | | 387,287 |
Correctional Properties Trust | 26,950 | | 766,189 |
Duke Realty Corp. | 47,190 | | 1,630,415 |
Eagle Hospitality Properties Trust, Inc. | 9,100 | | 86,905 |
Equity Lifestyle Properties, Inc. | 27,260 | | 989,538 |
Equity Office Properties Trust | 89,430 | | 2,454,854 |
Equity One, Inc. | 29,390 | | 668,329 |
Equity Residential (SBI) | 95,670 | | 3,225,036 |
Federal Realty Investment Trust (SBI) | 16,230 | | 813,935 |
General Growth Properties, Inc. | 84,810 | | 2,909,831 |
GMH Communities Trust | 23,000 | | 308,200 |
Health Care Property Investors, Inc. | 21,430 | | 574,967 |
Health Care REIT, Inc. | 26,160 | | 926,587 |
Highwoods Properties, Inc. (SBI) | 45,290 | | 1,171,652 |
Home Properties of New York, Inc. | 3,200 | | 131,776 |
HomeBanc Mortgage Corp., Georgia | 40,100 | | 361,301 |
Inland Real Estate Corp. | 40,500 | | 627,750 |
Innkeepers USA Trust (SBI) | 79,990 | | 1,078,265 |
Kilroy Realty Corp. | 12,020 | | 485,848 |
Kimco Realty Corp. | 40,780 | | 2,319,566 |
Liberty Property Trust (SBI) | 15,650 | | 641,650 |
MeriStar Hospitality Corp. (a) | 172,520 | | 1,173,136 |
Newcastle Investment Corp. (a) | 9,000 | | 282,420 |
Pan Pacific Retail Properties, Inc. | 21,830 | | 1,294,519 |
Plum Creek Timber Co., Inc. | 36,630 | | 1,355,310 |
Post Properties, Inc. | 9,200 | | 313,720 |
Price Legacy Corp. | 23,700 | | 452,670 |
ProLogis | 71,510 | | 2,876,847 |
Public Storage, Inc. | 29,950 | | 1,598,731 |
Rayonier, Inc. | 7,980 | | 381,045 |
Reckson Associates Realty Corp. | 59,440 | | 1,924,667 |
Shurgard Storage Centers, Inc. Class A | 8,500 | | 351,730 |
Simon Property Group, Inc. | 46,510 | | 2,887,341 |
SL Green Realty Corp. | 15,310 | | 882,315 |
Sunstone Hotel Investors, Inc. New | 15,000 | | 274,050 |
Trizec Properties, Inc. | 97,700 | | 1,609,119 |
U-Store-It Trust | 21,300 | | 363,378 |
United Dominion Realty Trust, Inc. (SBI) | 70,890 | | 1,629,761 |
Ventas, Inc. | 24,390 | | 660,969 |
Common Stocks - continued |
| Shares | | Value (Note 1) |
FINANCIALS - continued |
Real Estate - continued |
Vornado Realty Trust | 41,600 | | $ 3,057,600 |
Weingarten Realty Investors (SBI) | 10,200 | | 415,650 |
| | 55,151,295 |
Thrifts & Mortgage Finance - 1.1% |
Fannie Mae | 15,900 | | 1,092,330 |
Freddie Mac | 15,900 | | 1,085,334 |
Golden West Financial Corp., Delaware | 8,400 | | 1,001,616 |
New York Community Bancorp, Inc. | 71,000 | | 1,404,380 |
Sovereign Bancorp, Inc. | 42,500 | | 928,625 |
W Holding Co., Inc. | 16,000 | | 352,320 |
Washington Mutual, Inc. | 9,000 | | 366,390 |
| | 6,230,995 |
TOTAL FINANCIALS | | 120,797,089 |
HEALTH CARE - 4.7% |
Biotechnology - 0.4% |
Biogen Idec, Inc. (a) | 5,700 | | 334,476 |
BioMarin Pharmaceutical, Inc. (a) | 42,000 | | 223,860 |
Genentech, Inc. (a) | 15,000 | | 723,750 |
MedImmune, Inc. (a) | 22,900 | | 609,140 |
Millennium Pharmaceuticals, Inc. (a) | 22,700 | | 286,474 |
ONYX Pharmaceuticals, Inc. (a) | 6,000 | | 187,680 |
| | 2,365,380 |
Health Care Equipment & Supplies - 2.1% |
Aspect Medical Systems, Inc. (a) | 1,100 | | 26,840 |
Baxter International, Inc. | 155,600 | | 4,924,740 |
Dade Behring Holdings, Inc. (a) | 11,700 | | 628,173 |
Foxhollow Technologies, Inc. | 400 | | 10,360 |
Guidant Corp. | 14,000 | | 907,620 |
Medtronic, Inc. | 46,100 | | 2,215,105 |
PerkinElmer, Inc. | 44,500 | | 949,185 |
St. Jude Medical, Inc. (a) | 11,400 | | 434,796 |
Thermo Electron Corp. (a) | 21,400 | | 647,350 |
Waters Corp. (a) | 38,500 | | 1,796,410 |
| | 12,540,579 |
Health Care Providers & Services - 0.9% |
McKesson Corp. | 28,000 | | 827,400 |
Omnicare, Inc. | 9,000 | | 291,690 |
Common Stocks - continued |
| Shares | | Value (Note 1) |
HEALTH CARE - continued |
Health Care Providers & Services - continued |
Sierra Health Services, Inc. (a) | 19,000 | | $ 1,056,970 |
UnitedHealth Group, Inc. | 34,100 | | 2,825,185 |
| | 5,001,245 |
Pharmaceuticals - 1.3% |
Johnson & Johnson | 22,600 | | 1,363,232 |
Merck & Co., Inc. | 40,000 | | 1,120,800 |
Pfizer, Inc. | 17,000 | | 472,090 |
Schering-Plough Corp. | 105,600 | | 1,884,960 |
Valeant Pharmaceuticals International | 12,000 | | 290,520 |
Wyeth | 57,800 | | 2,304,486 |
| | 7,436,088 |
TOTAL HEALTH CARE | | 27,343,292 |
INDUSTRIALS - 11.2% |
Aerospace & Defense - 2.3% |
DRS Technologies, Inc. (a) | 10,000 | | 427,200 |
Honeywell International, Inc. | 214,300 | | 7,571,219 |
Lockheed Martin Corp. | 27,100 | | 1,648,764 |
Northrop Grumman Corp. | 7,400 | | 416,842 |
Precision Castparts Corp. | 15,700 | | 1,017,988 |
Raytheon Co. | 34,900 | | 1,407,866 |
The Boeing Co. | 16,900 | | 905,333 |
| | 13,395,212 |
Air Freight & Logistics - 0.1% |
Expeditors International of Washington, Inc. | 11,000 | | 585,860 |
Airlines - 0.3% |
AirTran Holdings, Inc. (a) | 22,000 | | 260,040 |
Delta Air Lines, Inc. (a) | 85,000 | | 592,450 |
Southwest Airlines Co. | 50,100 | | 788,073 |
| | 1,640,563 |
Building Products - 0.6% |
Masco Corp. | 99,100 | | 3,495,257 |
Commercial Services & Supplies - 1.6% |
Apollo Group, Inc. Class A (a) | 16,500 | | 1,315,050 |
Asset Acceptance Capital Corp. | 3,400 | | 70,074 |
Career Education Corp. (a) | 45,300 | | 1,762,170 |
Cintas Corp. | 47,700 | | 2,133,144 |
On Assignment, Inc. (a) | 20,000 | | 104,400 |
Common Stocks - continued |
| Shares | | Value (Note 1) |
INDUSTRIALS - continued |
Commercial Services & Supplies - continued |
Resources Connection, Inc. (a) | 10,000 | | $ 453,600 |
Robert Half International, Inc. | 117,200 | | 3,167,916 |
ServiceMaster Co. | 18,000 | | 237,060 |
| | 9,243,414 |
Construction & Engineering - 0.7% |
Chicago Bridge & Iron Co. NV (NY Shares) | 30,671 | | 1,186,968 |
Fluor Corp. | 21,100 | | 1,095,090 |
Jacobs Engineering Group, Inc. (a) | 19,000 | | 873,430 |
MasTec, Inc. (a) | 97,000 | | 813,830 |
| | 3,969,318 |
Electrical Equipment - 0.3% |
A.O. Smith Corp. | 11,000 | | 330,550 |
ABB Ltd. sponsored ADR (e) | 50,000 | | 309,000 |
FuelCell Energy, Inc. (a)(e) | 43,000 | | 432,150 |
Rockwell Automation, Inc. | 12,000 | | 567,600 |
| | 1,639,300 |
Industrial Conglomerates - 4.4% |
General Electric Co. | 535,200 | | 18,924,667 |
Siemens AG sponsored ADR | 7,000 | | 558,740 |
Tyco International Ltd. | 174,100 | | 5,914,177 |
| | 25,397,584 |
Machinery - 0.3% |
ITT Industries, Inc. | 10,500 | | 893,760 |
Mueller Industries, Inc. | 9,000 | | 276,570 |
Pall Corp. | 12,000 | | 325,080 |
| | 1,495,410 |
Road & Rail - 0.6% |
Norfolk Southern Corp. | 49,700 | | 1,706,201 |
Sirva, Inc. | 20,000 | | 398,000 |
Swift Transportation Co., Inc. (a) | 39,000 | | 760,110 |
Union Pacific Corp. | 14,800 | | 938,912 |
| | 3,803,223 |
Trading Companies & Distributors - 0.0% |
UAP Holding Corp. | 20,000 | | 327,000 |
TOTAL INDUSTRIALS | | 64,992,141 |
Common Stocks - continued |
| Shares | | Value (Note 1) |
INFORMATION TECHNOLOGY - 4.5% |
Communications Equipment - 0.7% |
Comverse Technology, Inc. (a) | 48,000 | | $ 1,020,960 |
Foundry Networks, Inc. (a) | 53,000 | | 707,550 |
Juniper Networks, Inc. (a) | 56,000 | | 1,541,680 |
Lucent Technologies, Inc. (a) | 60,000 | | 235,800 |
QUALCOMM, Inc. | 19,000 | | 790,780 |
| | 4,296,770 |
Computers & Peripherals - 0.5% |
Hewlett-Packard Co. | 31,900 | | 638,000 |
International Business Machines Corp. | 12,700 | | 1,196,848 |
Sun Microsystems, Inc. (a) | 65,000 | | 360,750 |
Western Digital Corp. (a) | 65,200 | | 637,004 |
| | 2,832,602 |
Electronic Equipment & Instruments - 0.5% |
Amphenol Corp. Class A (a) | 12,700 | | 445,897 |
Avnet, Inc. (a) | 5,000 | | 92,000 |
Flextronics International Ltd. (a) | 38,000 | | 545,300 |
Molex, Inc. | 7,000 | | 192,990 |
National Instruments Corp. | 22,900 | | 654,940 |
Symbol Technologies, Inc. | 52,200 | | 791,352 |
| | 2,722,479 |
Internet Software & Services - 0.2% |
Yahoo!, Inc. (a) | 28,600 | | 1,075,932 |
IT Services - 0.4% |
Affiliated Computer Services, Inc. Class A (a) | 32,000 | | 1,893,760 |
Sapient Corp. (a) | 30,000 | | 237,300 |
| | 2,131,060 |
Office Electronics - 0.1% |
Xerox Corp. (a) | 57,000 | | 873,240 |
Semiconductors & Semiconductor Equipment - 1.0% |
Analog Devices, Inc. | 28,000 | | 1,034,600 |
Applied Materials, Inc. (a) | 17,000 | | 282,880 |
Cabot Microelectronics Corp. (a) | 22,300 | | 823,985 |
Freescale Semiconductor, Inc. Class A | 64,500 | | 1,139,070 |
Intel Corp. | 31,300 | | 699,555 |
KLA-Tencor Corp. (a) | 16,200 | | 729,972 |
Lam Research Corp. (a) | 15,000 | | 390,150 |
PMC-Sierra, Inc. (a) | 22,000 | | 242,880 |
Samsung Electronics Co. Ltd. | 1,480 | | 613,314 |
| | 5,956,406 |
Common Stocks - continued |
| Shares | | Value (Note 1) |
INFORMATION TECHNOLOGY - continued |
Software - 1.1% |
BEA Systems, Inc. (a) | 86,100 | | $ 695,688 |
Macrovision Corp. (a) | 4,100 | | 108,855 |
Microsoft Corp. | 189,400 | | 5,077,814 |
PalmSource, Inc. (a) | 9,700 | | 153,648 |
Siebel Systems, Inc. (a) | 60,000 | | 604,800 |
| | 6,640,805 |
TOTAL INFORMATION TECHNOLOGY | | 26,529,294 |
MATERIALS - 4.9% |
Chemicals - 2.9% |
Dow Chemical Co. | 73,300 | | 3,699,451 |
E.I. du Pont de Nemours & Co. | 80,600 | | 3,652,792 |
Ecolab, Inc. | 8,100 | | 283,338 |
Lubrizol Corp. | 11,700 | | 404,235 |
Lyondell Chemical Co. (e) | 122,700 | | 3,442,962 |
Millennium Chemicals, Inc. (a) | 54,772 | | 1,455,840 |
Monsanto Co. | 35,000 | | 1,610,700 |
Nalco Holding Co. | 45,000 | | 865,350 |
Olin Corp. | 33,900 | | 769,191 |
Valspar Corp. | 8,000 | | 385,760 |
Westlake Chemical Corp. | 15,000 | | 470,850 |
| | 17,040,469 |
Containers & Packaging - 0.7% |
Crown Holdings, Inc. (a) | 25,000 | | 320,000 |
Owens-Illinois, Inc. (a) | 36,500 | | 763,580 |
Packaging Corp. of America | 55,400 | | 1,274,200 |
Sealed Air Corp. (a) | 1,300 | | 66,833 |
Smurfit-Stone Container Corp. (a) | 84,200 | | 1,512,232 |
| | 3,936,845 |
Metals & Mining - 1.3% |
Alcoa, Inc. | 48,700 | | 1,654,826 |
Allegheny Technologies, Inc. | 25,000 | | 550,000 |
Companhia Vale do Rio Doce sponsored ADR | 26,100 | | 647,802 |
Freeport-McMoRan Copper & Gold, Inc. Class B | 12,000 | | 469,560 |
International Steel Group, Inc. | 15,000 | | 604,950 |
Massey Energy Co. | 14,800 | | 519,776 |
Metals USA, Inc. (a) | 14,800 | | 277,500 |
Newmont Mining Corp. | 21,800 | | 1,032,230 |
Common Stocks - continued |
| Shares | | Value (Note 1) |
MATERIALS - continued |
Metals & Mining - continued |
Nucor Corp. | 18,000 | | $ 952,200 |
Phelps Dodge Corp. | 8,000 | | 777,040 |
| | 7,485,884 |
TOTAL MATERIALS | | 28,463,198 |
TELECOMMUNICATION SERVICES - 2.7% |
Diversified Telecommunication Services - 2.2% |
Cincinnati Bell, Inc. (a) | 55,000 | | 198,000 |
Citizens Communications Co. | 16,400 | | 234,520 |
Covad Communications Group, Inc. (a) | 435,300 | | 679,068 |
SBC Communications, Inc. | 256,800 | | 6,463,656 |
Telewest Global, Inc. (a) | 59,100 | | 865,224 |
Verizon Communications, Inc. | 105,800 | | 4,362,134 |
| | 12,802,602 |
Wireless Telecommunication Services - 0.5% |
American Tower Corp. Class A (a) | 71,000 | | 1,287,230 |
Leap Wireless International, Inc. (a) | 11,000 | | 279,400 |
Nextel Communications, Inc. Class A (a) | 28,600 | | 813,956 |
Nextel Partners, Inc. Class A (a) | 40,000 | | 723,600 |
| | 3,104,186 |
TOTAL TELECOMMUNICATION SERVICES | | 15,906,788 |
UTILITIES - 1.4% |
Electric Utilities - 1.2% |
Entergy Corp. | 32,700 | | 2,119,614 |
FirstEnergy Corp. | 22,000 | | 929,060 |
PG&E Corp. (a) | 30,200 | | 1,004,452 |
PPL Corp. | 11,300 | | 587,035 |
Southern Co. | 16,200 | | 531,198 |
TXU Corp. | 12,700 | | 797,814 |
Westar Energy, Inc. | 25,000 | | 553,750 |
Xcel Energy, Inc. | 7,500 | | 135,450 |
| | 6,658,373 |
Multi-Utilities & Unregulated Power - 0.2% |
AES Corp. (a) | 53,600 | | 656,064 |
Common Stocks - continued |
| Shares | | Value (Note 1) |
UTILITIES - continued |
Multi-Utilities & Unregulated Power - continued |
CMS Energy Corp. (a) | 50,000 | | $ 510,000 |
Public Service Enterprise Group, Inc. | 5,000 | | 219,950 |
| | 1,386,014 |
TOTAL UTILITIES | | 8,044,387 |
TOTAL COMMON STOCKS (Cost $350,410,465) | 385,912,640 |
Preferred Stocks - 14.4% |
| | | |
Convertible Preferred Stocks - 3.8% |
CONSUMER DISCRETIONARY - 0.8% |
Hotels, Restaurants & Leisure - 0.3% |
Six Flags, Inc. 7.25% PIERS | 82,700 | | 1,757,375 |
Media - 0.1% |
Emmis Communications Corp. Series A, 6.25% | 10,100 | | 459,550 |
Specialty Retail - 0.4% |
Toys 'R' US, Inc. 6.25% | 52,500 | | 2,620,800 |
TOTAL CONSUMER DISCRETIONARY | | 4,837,725 |
ENERGY - 0.6% |
Oil & Gas - 0.6% |
Valero Energy Corp. 2.00% | 80,800 | | 3,747,100 |
FINANCIALS - 1.0% |
Diversified Financial Services - 1.0% |
AES Trust VII 6.00% | 120,300 | | 5,894,700 |
INDUSTRIALS - 0.2% |
Road & Rail - 0.2% |
Kansas City Southern 4.25% | 1,370 | | 853,606 |
MATERIALS - 0.9% |
Containers & Packaging - 0.7% |
Owens-Illinois, Inc. 4.75% | 113,510 | | 4,347,433 |
Metals & Mining - 0.2% |
Freeport-McMoRan Copper & Gold, Inc. 5.50% (f) | 1,050 | | 1,026,113 |
TOTAL MATERIALS | | 5,373,546 |
Preferred Stocks - continued |
| Shares | | Value (Note 1) |
Convertible Preferred Stocks - continued |
TELECOMMUNICATION SERVICES - 0.3% |
Diversified Telecommunication Services - 0.3% |
CenturyTel, Inc. 6.875% ACES | 60,200 | | $ 1,531,488 |
TOTAL CONVERTIBLE PREFERRED STOCKS | | 22,238,165 |
Nonconvertible Preferred Stocks - 10.6% |
CONSUMER STAPLES - 0.2% |
Food Products - 0.2% |
H.J. Heinz Finance Co. 6.226% | 10 | | 1,080,000 |
ENERGY - 1.5% |
Oil & Gas - 1.5% |
El Paso Tennessee Pipeline Co. Series A, 8.25% | 180,600 | | 8,849,400 |
FINANCIALS - 5.6% |
Capital Markets - 1.1% |
Bear Stearns Companies, Inc.: | | | |
Series E, 6.155% | 15,000 | | 795,000 |
Series G, 5.49% | 15,000 | | 748,500 |
Lehman Brothers Holdings, Inc. (depositary shares) Series F, 6.50% | 169,015 | | 4,534,672 |
| | 6,078,172 |
Commercial Banks - 0.1% |
Santander Finance Preferred SA Unipersonal 6.41% | 31,400 | | 796,775 |
Consumer Finance - 0.4% |
SLM Corp. Series A, 6.97% | 43,400 | | 2,469,460 |
Diversified Financial Services - 0.5% |
ABN Amro Capital Funding Trust VII 6.08% | 60,400 | | 1,500,940 |
Heco Capital Trust III 6.50% | 12,000 | | 315,360 |
J.P. Morgan Chase & Co. (depositary shares) Series H, 6.625% | 6,530 | | 350,988 |
RC Trust I 7.00% (a) | 9,680 | | 514,973 |
| | 2,682,261 |
Real Estate - 1.1% |
Apartment Investment & Management Co.: | | | |
Series Q, 10.10% | 46,510 | | 1,252,049 |
Series V, 8.00% | 40,000 | | 1,005,000 |
Duke Realty Corp. (depositary shares) Series K, 6.50% | 95,800 | | 2,404,580 |
Preferred Stocks - continued |
| Shares | | Value (Note 1) |
Nonconvertible Preferred Stocks - continued |
FINANCIALS - continued |
Real Estate - continued |
Host Marriott Corp. Series E, 8.875% | 20,000 | | $ 545,000 |
Vornado Realty Trust Series E, 7.00% | 40,000 | | 1,080,000 |
| | 6,286,629 |
Thrifts & Mortgage Finance - 2.4% |
Fannie Mae: | | | |
Series H, 5.81% | 29,200 | | 1,486,280 |
Series L, 5.125% | 90,900 | | 4,022,325 |
Series N, 5.50% | 71,650 | | 3,360,385 |
Freddie Mac: | | | |
Series F, 5.00% | 12,000 | | 516,000 |
Series H, 5.10% | 10,300 | | 450,625 |
Series K, 5.79% | 6,000 | | 300,000 |
Series O, 5.81% | 19,500 | | 983,775 |
Series R, 5.70% | 57,000 | | 2,778,750 |
| | 13,898,140 |
TOTAL FINANCIALS | | 32,211,437 |
MATERIALS - 0.2% |
Chemicals - 0.1% |
E.I. du Pont de Nemours & Co. Series B, 4.50% | 9,900 | | 873,675 |
Metals & Mining - 0.1% |
Alcoa, Inc. 3.75% | 6,400 | | 498,240 |
TOTAL MATERIALS | | 1,371,915 |
UTILITIES - 3.1% |
Electric Utilities - 3.1% |
Alabama Power Co. 5.30% | 88,600 | | 2,206,140 |
Consolidated Edison Co. of New York, Inc. Series A, 5.00% | 28,705 | | 2,526,040 |
Duquesne Light Co. 6.50% | 106,050 | | 5,302,500 |
FPL Group Capital Trust I 5.875% | 20,000 | | 493,000 |
Monongahela Power Co. Series L, 7.73% | 10,800 | | 1,075,680 |
Pacific Gas & Electric Co. Series A, 5.00% | 16,900 | | 362,505 |
San Diego Gas & Electric Co. 1.70% | 67,548 | | 1,740,036 |
Southern California Edison Co.: | | | |
4.78% | 46,500 | | 960,225 |
Series B, 4.08% | 27,271 | | 512,695 |
Preferred Stocks - continued |
| Shares | | Value (Note 1) |
Nonconvertible Preferred Stocks - continued |
UTILITIES - continued |
Electric Utilities - continued |
Southern California Edison Co.: - continued | | | |
Series C, 4.24% | 94,600 | | $ 1,750,100 |
Series D, 4.32% | 70,000 | | 1,312,500 |
| | 18,241,421 |
TOTAL NONCONVERTIBLE PREFERRED STOCKS | | 61,754,173 |
TOTAL PREFERRED STOCKS (Cost $82,404,159) | 83,992,338 |
Money Market Funds - 6.0% |
| | | |
Fidelity Cash Central Fund, 1.98% (b) | 33,442,765 | | 33,442,765 |
Fidelity Securities Lending Cash Central Fund, 2% (b)(c) | 1,531,100 | | 1,531,100 |
TOTAL MONEY MARKET FUNDS (Cost $34,973,865) | 34,973,865 |
TOTAL INVESTMENT PORTFOLIO - 100.6% (Cost $546,617,667) | | 585,436,863 |
NET OTHER ASSETS - (0.6)% | | (3,668,536) |
NET ASSETS - 100% | $ 581,768,327 |
Futures Contracts |
| Expiration Date | | Underlying Face Amount at Value | | Unrealized Appreciation/
(Depreciation) |
Purchased |
Equity Index Contracts |
24 S&P 500 Index Contracts | Dec. 2004 | | $ 7,044,600 | | $ 290,281 |
The face value of futures purchased as a percentage of net assets - 1.2% |
Security Type Abbreviations |
ACES | - | Automatic Common Exchange Securities |
PIERS | - | Preferred Income Equity Redeemable Securities |
Legend |
(a) Non-income producing |
(b) Affiliated fund that is available only to investment companies and other accounts managed by Fidelity Investments. The rate quoted is the annualized seven-day yield of the fund at period end. A complete listing of the fund's holdings as of its most recent fiscal year end is available upon request. |
(c) Includes investment made with cash collateral received from securities on loan. |
(d) Debt obligation initially issued at one coupon which converts to a higher coupon at a specified date. The rate shown is the rate at period end. |
(e) Security or a portion of the security is on loan at period end. |
(f) Security exempt from registration under Rule 144A of the Securities Act of 1933. These securities may be resold in transactions exempt from registration, normally to qualified institutional buyers. At the period end, the value of these securities amounted to $12,879,409 or 2.2% of net assets. |
(g) Security or a portion of the security was pledged to cover margin requirements for futures contracts. At the period end, the value of securities pledged amounted to $449,673. |
(h) The coupon rate shown on floating or adjustable rate securities represents the rate at period end. |
Other Information |
The composition of credit quality ratings as a percentage of net assets is as follows (ratings are unaudited): |
AAA, AA, A | 1.1% |
BBB | 2.0% |
BB | 1.4% |
B | 3.9% |
CCC, CC, C | 0.6% |
Not Rated | 4.8% |
Equities | 80.7% |
Short-Term Investments and
Net Other Assets | 5.5% |
| 100.0% |
We have used ratings from Moody's Investors Services, Inc. Where Moody's ratings are not available, we have used S&P ratings. Percentages are adjusted for the effect of futures contracts, if applicable. |
Income Tax Information |
At November 30, 2004, the fund had a capital loss carryforward of approximately $7,643,000 all of which will expire on November 30, 2012. |
See accompanying notes which are an integral part of the financial statements.
Annual Report
Financial Statements
Statement of Assets and Liabilities
November 30, 2004 |
| | |
Assets | | |
Investment in securities, at value (including securities loaned of $1,465,492) (cost $546,617,667) - See accompanying schedule | | $ 585,436,863 |
Cash | | 264,563 |
Receivable for investments sold | | 3,195,546 |
Receivable for fund shares sold | | 2,149,095 |
Dividends receivable | | 1,094,217 |
Interest receivable | | 642,822 |
Prepaid expenses | | 454 |
Receivable from investment adviser for expense reductions | | 133 |
Other receivables | | 62,911 |
Total assets | | 592,846,604 |
| | |
Liabilities | | |
Payable for investments purchased | $ 8,009,986 | |
Payable for fund shares redeemed | 1,067,708 | |
Accrued management fee | 267,488 | |
Distribution fees payable | 51,820 | |
Payable for daily variation on futures contracts | 11,400 | |
Other affiliated payables | 108,073 | |
Other payables and accrued expenses | 30,702 | |
Collateral on securities loaned, at value | 1,531,100 | |
Total liabilities | | 11,078,277 |
| | |
Net Assets | | $ 581,768,327 |
Net Assets consist of: | | |
Paid in capital | | $ 548,910,904 |
Undistributed net investment income | | 2,463,649 |
Accumulated undistributed net realized gain (loss) on investments and foreign currency transactions | | (8,715,703) |
Net unrealized appreciation (depreciation) on investments | | 39,109,477 |
Net Assets | | $ 581,768,327 |
See accompanying notes which are an integral part of the financial statements.
Annual Report
Financial Statements - continued
Statement of Assets and Liabilities - continued
November 30, 2004 |
| | |
Calculation of Maximum Offering Price
Class A:
Net Asset Value and redemption price per share ($21,985,396 ÷ 1,981,700 shares) | | $ 11.09 |
| | |
Maximum offering price per share (100/94.25 of $11.09) | | $ 11.77 |
Class T:
Net Asset Value and redemption price per share ($36,526,147 ÷ 3,295,264 shares) | | $ 11.08 |
| | |
Maximum offering price per share (100/96.50 of $11.08) | | $ 11.48 |
Class B:
Net Asset Value and offering price per share ($13,457,083 ÷ 1,216,357 shares) A | | $ 11.06 |
| | |
Class C:
Net Asset Value and offering price per share ($28,794,624 ÷ 2,602,593 shares) A | | $ 11.06 |
| | |
Strategic Dividend & Income:
Net Asset Value, offering price and redemption price per share ($476,032,290 ÷ 42,831,091 shares) | | $ 11.11 |
| | |
Institutional Class:
Net Asset Value, offering price and redemption price per share ($4,972,787 ÷ 447,667 shares) | | $ 11.11 |
A Redemption price per share is equal to net asset value less any applicable contingent deferred sales charge.
See accompanying notes which are an integral part of the financial statements.
Annual Report
Statement of Operations
For the period December 23, 2003 (commencement of operations) to November 30, 2004 |
| | |
Investment Income | | |
Dividends | | $ 8,755,650 |
Interest | | 1,320,268 |
Security lending | | 6,718 |
Total income | | 10,082,636 |
| | |
Expenses | | |
Management fee | $ 2,031,291 | |
Transfer agent fees | 765,538 | |
Distribution fees | 343,283 | |
Accounting and security lending fees | 146,320 | |
Non-interested trustees' compensation | 1,673 | |
Custodian fees and expenses | 65,363 | |
Registration fees | 157,585 | |
Audit | 35,583 | |
Legal | 860 | |
Miscellaneous | 939 | |
Total expenses before reductions | 3,548,435 | |
Expense reductions | (102,232) | 3,446,203 |
Net investment income (loss) | | 6,636,433 |
Realized and Unrealized Gain (Loss) Net realized gain (loss) on: | | |
Investment securities | (8,229,482) | |
Foreign currency transactions | (4) | |
Futures contracts | (8,546) | |
Total net realized gain (loss) | | (8,238,032) |
Change in net unrealized appreciation (depreciation) on: Investment securities | 38,819,196 | |
Futures contracts | 290,281 | |
Total change in net unrealized appreciation (depreciation) | | 39,109,477 |
Net gain (loss) | | 30,871,445 |
Net increase (decrease) in net assets resulting from operations | | $ 37,507,878 |
See accompanying notes which are an integral part of the financial statements.
Annual Report
Financial Statements - continued
Statement of Changes in Net Assets
| For the period December 23, 2003 (commencement
of operations) to November 30, 2004 |
Increase (Decrease) in Net Assets | |
Operations | |
Net investment income (loss) | $ 6,636,433 |
Net realized gain (loss) | (8,238,032) |
Change in net unrealized appreciation (depreciation) | 39,109,477 |
Net increase (decrease) in net assets resulting from operations | 37,507,878 |
Distributions to shareholders from net investment income | (4,647,719) |
Share transactions - net increase (decrease) | 548,908,168 |
Total increase (decrease) in net assets | 581,768,327 |
| |
Net Assets | |
Beginning of period | - |
End of period (including undistributed net investment income of $2,463,649) | $ 581,768,327 |
See accompanying notes which are an integral part of the financial statements.
Annual Report
Financial Highlights - Class A
Year ended November 30, | 2004 F |
Selected Per-Share Data | |
Net asset value, beginning of period | $ 10.00 |
Income from Investment Operations | |
Net investment income (loss) E | .16 |
Net realized and unrealized gain (loss) | 1.04 |
Total from investment operations | 1.20 |
Distributions from net investment income | (.11) |
Net asset value, end of period | $ 11.09 |
Total Return B,C,D | 12.01% |
Ratios to Average Net Assets G | |
Expenses before expense reductions | 1.20% A |
Expenses net of voluntary waivers, if any | 1.20% A |
Expenses net of all reductions | 1.17% A |
Net investment income (loss) | 1.67% A |
Supplemental Data | |
Net assets, end of period (000 omitted) | $ 21,985 |
Portfolio turnover rate | 66% A |
A Annualized
B Total returns for periods of less than one year are not annualized.
C Total returns would have been lower had certain expenses not been reduced during the periods shown.
D Total returns do not include the effect of the sales charges.
E Calculated based on average shares outstanding during the period.
F For the period December 23, 2003 (commencement of operations) to November 30, 2004.
G Expense ratios reflect operating expenses of the class. Expenses before reductions do not reflect amounts reimbursed by the investment adviser or reductions from brokerage service arrangements or other expense offset arrangements and do not represent the amount paid by the class during periods when reimbursements or reductions occur. Expense ratios before reductions for start-up periods may not be representative of longer-term operating periods. Expenses net of any voluntary waivers reflect expenses after reimbursement by the investment adviser but prior to reductions from brokerage service arrangements or other expense offset arrangements. Expenses net of all reductions represent the net expenses paid by the class.
See accompanying notes which are an integral part of the financial statements.
Annual Report
Financial Highlights - Class T
Year ended November 30, | 2004F |
Selected Per-Share Data | |
Net asset value, beginning of period | $ 10.00 |
Income from Investment Operations | |
Net investment income (loss) E | .13 |
Net realized and unrealized gain (loss) | 1.04 |
Total from investment operations | 1.17 |
Distributions from net investment income | (.09) |
Net asset value, end of period | $ 11.08 |
Total Return B,C,D | 11.75% |
Ratios to Average Net Assets G | |
Expenses before expense reductions | 1.45% A |
Expenses net of voluntary waivers, if any | 1.45% A |
Expenses net of all reductions | 1.42% A |
Net investment income (loss) | 1.43% A |
Supplemental Data | |
Net assets, end of period (000 omitted) | $ 36,526 |
Portfolio turnover rate | 66% A |
A Annualized
B Total returns for periods of less than one year are not annualized.
C Total returns would have been lower had certain expenses not been reduced during the periods shown.
D Total returns do not include the effect of the sales charges.
E Calculated based on average shares outstanding during the period.
F For the period December 23, 2003 (commencement of operations) to November 30, 2004.
G Expense ratios reflect operating expenses of the class. Expenses before reductions do not reflect amounts reimbursed by the investment adviser or reductions from brokerage service arrangements or other expense offset arrangements and do not represent the amount paid by the class during periods when reimbursements or reductions occur. Expense ratios before reductions for start-up periods may not be representative of longer-term operating periods. Expenses net of any voluntary waivers reflect expenses after reimbursement by the investment adviser but prior to reductions from brokerage service arrangements or other expense offset arrangements. Expenses net of all reductions represent the net expenses paid by the class.
See accompanying notes which are an integral part of the financial statements.
Annual Report
Financial Highlights - Class B
Year ended November 30, | 2004 F |
Selected Per-Share Data | |
Net asset value, beginning of period | $ 10.00 |
Income from Investment Operations | |
Net investment income (loss) E | .09 |
Net realized and unrealized gain (loss) | 1.03 |
Total from investment operations | 1.12 |
Distributions from net investment income | (.06) |
Net asset value, end of period | $ 11.06 |
Total Return B,C,D | 11.24% |
Ratios to Average Net Assets G | |
Expenses before expense reductions | 1.99% A |
Expenses net of voluntary waivers, if any | 1.95% A |
Expenses net of all reductions | 1.92% A |
Net investment income (loss) | .92% A |
Supplemental Data | |
Net assets, end of period (000 omitted) | $ 13,457 |
Portfolio turnover rate | 66% A |
A Annualized
B Total returns for periods of less than one year are not annualized.
C Total returns would have been lower had certain expenses not been reduced during the periods shown.
D Total returns do not include the effect of the contingent deferred sales charge.
E Calculated based on average shares outstanding during the period.
F For the period December 23, 2003 (commencement of operations) to November 30, 2004.
G Expense ratios reflect operating expenses of the class. Expenses before reductions do not reflect amounts reimbursed by the investment adviser or reductions from brokerage service arrangements or other expense offset arrangements and do not represent the amount paid by the class during periods when reimbursements or reductions occur. Expense ratios before reductions for start-up periods may not be representative of longer-term operating periods. Expenses net of any voluntary waivers reflect expenses after reimbursement by the investment adviser but prior to reductions from brokerage service arrangements or other expense offset arrangements. Expenses net of all reductions represent the net expenses paid by the class.
See accompanying notes which are an integral part of the financial statements.
Annual Report
Financial Highlights - Class C
Year ended November 30, | 2004 F |
Selected Per-Share Data | |
Net asset value, beginning of period | $ 10.00 |
Income from Investment Operations | |
Net investment income (loss) E | .09 |
Net realized and unrealized gain (loss) | 1.03 |
Total from investment operations | 1.12 |
Distributions from net investment income | (.06) |
Net asset value, end of period | $ 11.06 |
Total Return B,C,D | 11.24% |
Ratios to Average Net Assets G | |
Expenses before expense reductions | 1.94% A |
Expenses net of voluntary waivers, if any | 1.94% A |
Expenses net of all reductions | 1.92% A |
Net investment income (loss) | .93% A |
Supplemental Data | |
Net assets, end of period (000 omitted) | $ 28,795 |
Portfolio turnover rate | 66% A |
A Annualized
B Total returns for periods of less than one year are not annualized.
C Total returns would have been lower had certain expenses not been reduced during the periods shown.
D Total returns do not include the effect of the contingent deferred sales charge.
E Calculated based on average shares outstanding during the period.
F For the period December 23, 2003 (commencement of operations) to November 30, 2004.
G Expense ratios reflect operating expenses of the class. Expenses before reductions do not reflect amounts reimbursed by the investment adviser or reductions from brokerage service arrangements or other expense offset arrangements and do not represent the amount paid by the class during periods when reimbursements or reductions occur. Expense ratios before reductions for start-up periods may not be representative of longer-term operating periods. Expenses net of any voluntary waivers reflect expenses after reimbursement by the investment adviser but prior to reductions from brokerage service arrangements or other expense offset arrangements. Expenses net of all reductions represent the net expenses paid by the class.
See accompanying notes which are an integral part of the financial statements.
Annual Report
Financial Highlights - Strategic Dividend & Income
Year ended November 30, | 2004 E |
Selected Per-Share Data | |
Net asset value, beginning of period | $ 10.00 |
Income from Investment Operations | |
Net investment income (loss) D | .19 |
Net realized and unrealized gain (loss) | 1.04 |
Total from investment operations | 1.23 |
Distributions from net investment income | (.12) |
Net asset value, end of period | $ 11.11 |
Total Return B,C | 12.32% |
Ratios to Average Net Assets F | |
Expenses before expense reductions | .90% A |
Expenses net of voluntary waivers, if any | .90% A |
Expenses net of all reductions | .87% A |
Net investment income (loss) | 1.98% A |
Supplemental Data | |
Net assets, end of period (000 omitted) | $ 476,032 |
Portfolio turnover rate | 66% A |
A Annualized
B Total returns for periods of less than one year are not annualized.
C Total returns would have been lower had certain expenses not been reduced during the periods shown.
D Calculated based on average shares outstanding during the period.
E For the period December 23, 2003 (commencement of operations) to November 30, 2004.
F Expense ratios reflect operating expenses of the class. Expenses before reductions do not reflect amounts reimbursed by the investment adviser or reductions from brokerage service arrangements or other expense offset arrangements and do not represent the amount paid by the class during periods when reimbursements or reductions occur. Expense ratios before reductions for start-up periods may not be representative of longer-term operating periods. Expenses net of any voluntary waivers reflect expenses after reimbursement by the investment adviser but prior to reductions from brokerage service arrangements or other expense offset arrangements. Expenses net of all reductions represent the net expenses paid by the class.
See accompanying notes which are an integral part of the financial statements.
Annual Report
Financial Highlights - Institutional Class
Year ended November 30, | 2004 E |
Selected Per-Share Data | |
Net asset value, beginning of period | $ 10.00 |
Income from Investment Operations | |
Net investment income (loss) D | .19 |
Net realized and unrealized gain (loss) | 1.04 |
Total from investment operations | 1.23 |
Distributions from net investment income | (.12) |
Net asset value, end of period | $ 11.11 |
Total Return B,C | 12.38% |
Ratios to Average Net Assets F | |
Expenses before expense reductions | .88% A |
Expenses net of voluntary waivers, if any | .88% A |
Expenses net of all reductions | .85% A |
Net investment income (loss) | 2.00% A |
Supplemental Data | |
Net assets, end of period (000 omitted) | $ 4,973 |
Portfolio turnover rate | 66% A |
A Annualized
B Total returns for periods of less than one year are not annualized.
C Total returns would have been lower had certain expenses not been reduced during the periods shown.
D Calculated based on average shares outstanding during the period.
E For the period December 23, 2003 (commencement of operations) to November 30, 2004.
F Expense ratios reflect operating expenses of the class. Expenses before reductions do not reflect amounts reimbursed by the investment adviser or reductions from brokerage service arrangements or other expense offset arrangements and do not represent the amount paid by the class during periods when reimbursements or reductions occur. Expense ratios before reductions for start-up periods may not be representative of longer-term operating periods. Expenses net of any voluntary waivers reflect expenses after reimbursement by the investment adviser but prior to reductions from brokerage service arrangements or other expense offset arrangements. Expenses net of all reductions represent the net expenses paid by the class.
See accompanying notes which are an integral part of the financial statements.
Annual Report
Notes to Financial Statements
For the period ended November 30, 2004
1. Significant Accounting Policies.
Fidelity Strategic Dividend & Income Fund (the fund) is a fund of Fidelity Financial Trust (the trust) and is authorized to issue an unlimited number of shares. The trust is registered under the Investment Company Act of 1940, as amended (the 1940 Act), as an open-end management investment company organized as a Massachusetts business trust.
The fund offers Class A, Class T, Class B, Class C, Strategic Dividend & Income, and Institutional Class shares, each of which has equal rights as to assets and voting privileges. Each class has exclusive voting rights with respect to matters that affect that class. Class B shares will automatically convert to Class A shares after a holding period of seven years from the initial date of purchase. Investment income, realized and unrealized capital gains and losses, the common expenses of the fund, and certain fund-level expense reductions, if any, are allocated on a pro rata basis to each class based on the relative net assets of each class to the total net assets of the fund. Each class differs with respect to transfer agent and distribution and service plan fees incurred. Certain expense reductions also differ by class.
The financial statements have been prepared in conformity with accounting principles generally accepted in the United States of America, which require management to make certain estimates and assumptions at the date of the financial statements. The following summarizes the significant accounting policies of the fund:
Security Valuation. Net asset value per share (NAV calculation) is calculated as of the close of business of the New York Stock Exchange, normally 4:00 p.m. Eastern time. Equity securities, including restricted securities, for which market quotations are available are valued at the last sale price or official closing price (closing bid price or last evaluated quote if no sale has occurred) on the primary market or exchange on which they trade. Debt securities, including restricted securities, for which quotations are readily available are valued at their most recent bid prices (sales prices if the principal market is an exchange) in the principal market in which such securities are normally traded, as determined by recognized dealers in such securities, or securities are valued on the basis of information provided by a pricing service. Pricing services use valuation matrices that incorporate both dealer-supplied valuations and valuation models. If prices are not readily available or do not accurately reflect fair value for a security, or if a security's value has been materially affected by events occurring after the close of the exchange or market on which the security is principally traded, that security may be valued by another method that the Board of Trustees believes accurately reflects fair value. A security's valuation may differ depending on the method used for determining value. Price movements in futures contracts and ADRs, market and trading trends, the bid/ask quotes of brokers and off-exchange institutional trading may be reviewed in the course of making a good faith determination of a security's fair value. Short-term securities with remaining maturities of sixty days or less for which quotations are not readily available are valued on the basis of amortized cost. Investments in open-end investment companies are valued at their net asset value each business day.
Annual Report
Notes to Financial Statements - continued
1. Significant Accounting Policies - continued
Foreign Currency. The fund uses foreign currency contracts to facilitate transactions in foreign-denominated securities. Losses from these transactions may arise from changes in the value of the foreign currency or if the counterparties do not perform under the contracts' terms.
Foreign-denominated assets, including investment securities, and liabilities are translated into U.S. dollars at the exchange rate at period end. Purchases and sales of investment securities, income and dividends received and expenses denominated in foreign currencies are translated into U.S. dollars at the exchange rate in effect on the transaction date.
The effects of exchange rate fluctuations on investments are included with the net realized and unrealized gain (loss) on investment securities. Other foreign currency transactions resulting in realized and unrealized gain (loss) are disclosed separately.
Investment Transactions and Income. Security transactions are accounted for as of trade date. Gains and losses on securities sold are determined on the basis of identified cost and may include proceeds received from litigation. Dividend income is recorded on the ex-dividend date, except for certain dividends from foreign securities where the ex-dividend date may have passed, which are recorded as soon as the fund is informed of the ex-dividend date. Non-cash dividends included in dividend income, if any, are recorded at the fair market value of the securities received. Distributions received on securities that represent a return of capital or capital gain are recorded as a reduction of cost of investments and/or as a realized gain. The fund estimates the components of distributions received that may be considered return of capital distributions or capital gain distributions. Interest income is accrued as earned. Interest income includes coupon interest and amortization of premium and accretion of discount on debt securities. Investment income is recorded net of foreign taxes withheld where recovery of such taxes is uncertain.
Expenses. Most expenses of the trust can be directly attributed to a fund. Expenses which cannot be directly attributed are apportioned among the funds in the trust.
Income Tax Information and Distributions to Shareholders. Each year, the fund intends to qualify as a regulated investment company by distributing all of its taxable income and realized gains under Subchapter M of the Internal Revenue Code. As a result, no provision for income taxes is required in the accompanying financial statements. Foreign taxes are provided for based on the fund's understanding of the tax rules and rates that exist in the foreign markets in which it invests.
Annual Report
1. Significant Accounting Policies - continued
Income Tax Information and Distributions to Shareholders - continued
Distributions are recorded on the ex-dividend date. Income dividends and capital gain distributions are declared separately for each class. Income and capital gain distributions are determined in accordance with income tax regulations, which may differ from generally accepted accounting principles. Capital accounts within the financial statements are adjusted for permanent book-tax differences. These adjustments have no impact on net assets or the results of operations. Temporary book-tax differences will reverse in a subsequent period.
Book-tax differences are primarily due to foreign currency transactions, non-taxable dividends, futures transactions, market discount, passive foreign investment companies (PFIC), capital loss carryforwards and losses deferred due to wash sales.
The tax-basis components of distributable earnings and the federal tax cost as of period end were as follows:
Unrealized appreciation | $ 49,133,039 | |
Unrealized depreciation | (11,088,285) | |
Net unrealized appreciation (depreciation) | 38,044,754 | |
Undistributed ordinary income | 2,455,813 | |
Capital loss carryforward | (7,643,145) | |
| | |
Cost for federal income tax purposes | $ 547,392,109 | |
The tax character of distributions paid was as follows:
| November 30, 2004 | |
| | |
Ordinary Income | $ 4,647,719 | |
2. Operating Policies.
Repurchase Agreements. Fidelity Management & Research Company (FMR) has received an Exemptive Order from the Securities and Exchange Commission (the SEC) which permits the fund and other affiliated entities of FMR to transfer uninvested cash balances into joint trading accounts. These accounts are then invested in repurchase agreements that are collateralized by U.S. Treasury or Government obligations. The fund may also invest directly with institutions, in repurchase agreements that are collateralized by commercial paper obligations and corporate obligations. Collateral is held in segregated accounts with custodian banks and may be obtained in the event of a default of the counterparty. Collateral is marked-to-market daily and maintained at a value at least equal to the principal amount of the repurchase agreement (including accrued interest).
Annual Report
Notes to Financial Statements - continued
2. Operating Policies - continued
Futures Contracts. The fund may use futures contracts to manage its exposure to the stock market. Buying futures tends to increase the fund's exposure to the underlying instrument, while selling futures tends to decrease the fund's exposure to the underlying instrument or hedge other fund investments. Futures contracts involve, to varying degrees, risk of loss in excess of any futures variation margin reflected in the Statement of Assets and Liabilities. The underlying face amount at value of any open futures contracts at period end is shown in the Schedule of Investments under the caption "Futures Contracts." This amount reflects each contract's exposure to the underlying instrument at period end. Losses may arise from changes in the value of the underlying instruments or if the counter-parties do not perform under the contracts' terms. Gains (losses) are realized upon the expiration or closing of the futures contracts. Futures contracts are valued at the settlement price established each day by the board of trade or exchange on which they are traded.
Restricted Securities. The fund may invest in securities that are subject to legal or contractual restrictions on resale. These securities generally may be resold in transactions exempt from registration or to the public if the securities are registered. Disposal of these securities may involve time-consuming negotiations and expense, and prompt sale at an acceptable price may be difficult. Information regarding restricted securities is included at the end of the fund's Schedule of Investments.
3. Purchases and Sales of Investments.
Purchases and sales of securities, other than short-term securities and U.S. government securities, aggregated $744,022,486 and $224,900,566, respectively.
4. Fees and Other Transactions with Affiliates.
Management Fee. FMR and its affiliates provide the fund with investment management related services for which the fund pays a monthly management fee. The management fee is the sum of an individual fund fee rate that is based on an annual rate of .30% of the fund's average net assets and a group fee rate that averaged .28% during the period. The group fee rate is based upon the average net assets of all the mutual funds advised by FMR. The group fee rate decreases as assets under management increase and increases as assets under management decrease. For the period, the total annualized management fee rate was .57% of the fund's average net assets.
Annual Report
4. Fees and Other Transactions with Affiliates - continued
Distribution and Service Plan. In accordance with Rule 12b-1 of the 1940 Act, the fund has adopted separate Distribution and Service Plans for each class of shares. Certain classes pay Fidelity Distributors Corporation (FDC), an affiliate of FMR, separate Distribution and Service Fees, each of which is based on an annual percentage of each class' average net assets. In addition, FDC may pay financial intermediaries for selling shares of the fund and providing shareholder support services. For the period, the Distribution and Service Fee rates and the total amounts paid to and retained by FDC were as follows:
| Distribution
Fee | Service
Fee | Paid to
FDC | Retained
by FDC |
Class A | 0% | .25% | $ 30,719 | $ 2,320 |
Class T | .25% | .25% | 82,780 | 6,333 |
Class B | .75% | .25% | 71,575 | 56,029 |
Class C | .75% | .25% | 158,209 | 122,573 |
| | | $ 343,283 | $ 187,255 |
Sales Load. FDC receives a front-end sales charge of up to 5.75% for selling Class A shares, and 3.50% for selling Class T shares, some of which is paid to financial intermediaries for selling shares of the fund. FDC receives the proceeds of contingent deferred sales charges levied on Class A, Class T, Class B, and Class C redemptions. These charges depend on the holding period. The deferred sales charges range from 5% to 1% for Class B, 1% for Class C, and .25% for certain purchases of Class A and Class T shares.
For the period, sales charge amounts retained by FDC were as follows:
| Retained
by FDC | |
Class A | $ 94,769 | |
Class T | 49,710 | |
Class B * | 6,510 | |
Class C * | 6,473 | |
| $ 157,462 | |
* When Class B and Class C shares are initially sold, FDC pays commissions from its own resources to financial intermediaries through which the sales are made.
Transfer Agent Fees. Fidelity Investments Institutional Operations Company, Inc. (FIIOC), an affiliate of FMR, is the transfer, dividend disbursing and shareholder servicing agent for each class of the fund, except for Strategic Dividend & Income. Fidelity Service Company, Inc. (FSC), an affiliate of FMR, is the transfer agent for Strategic Dividend & Income shares. FIIOC and FSC receive account fees and asset-based fees that vary according to the account size and type of account of the shareholders of the respective classes of the fund. FIIOC and FSC pay for typesetting, printing and mailing of shareholder reports, except proxy statements. For the period, the total transfer agent fees paid by each class to FIIOC or FSC were as follows:
Annual Report
Notes to Financial Statements - continued
4. Fees and Other Transactions with Affiliates - continued
Transfer Agent Fees - continued
| Amount | % of
Average
Net Assets |
Class A | $ 32,480 | .26* |
Class T | 43,373 | .26* |
Class B | 21,591 | .30* |
Class C | 41,184 | .26* |
Strategic Dividend & Income | 621,448 | .21* |
Institutional Class | 5,462 | .19* |
| $ 765,538 | |
* Annualized
Accounting and Security Lending Fees. FSC maintains the fund's accounting records. The accounting fee is based on the level of average net assets for the month. Under a separate contract, FSC administers the security lending program. The security lending fee is based on the number and duration of lending transactions.
Central Funds. The fund may invest in affiliated Central Funds managed by Fidelity Investments Money Management, Inc. (FIMM), an affiliate of FMR. The Central Funds are open-end investment companies available only to investment companies and other accounts managed by FMR and its affiliates. The Central Funds seek preservation of capital and current income and do not pay a management fee. Income distributions earned by the fund are recorded as income in the accompanying financial statements and totaled $187,845 for the period.
Brokerage Commissions. The fund placed a portion of its portfolio transactions with brokerage firms which are affiliates of the investment adviser. The commissions paid to these affiliated firms were $47,196 for the period.
5. Committed Line of Credit.
The fund participates with other funds managed by FMR in a $4.2 billion credit facility (the "line of credit") to be utilized for temporary or emergency purposes to fund shareholder redemptions or for other short-term liquidity purposes. The fund has agreed to pay commitment fees on its pro rata portion of the line of credit. During the period, there were no borrowings on this line of credit.
6. Security Lending.
The fund lends portfolio securities from time to time in order to earn additional income. The fund receives collateral (in the form of U.S. Treasury obligations, letters of credit
Annual Report
6. Security Lending - continued
and/or cash) against the loaned securities and maintains collateral in an amount not less than 100% of the market value of the loaned securities during the period of the loan. The market value of the loaned securities is determined at the close of business of the fund and any additional required collateral is delivered to the fund on the next business day. If the borrower defaults on its obligation to return the securities loaned because of insolvency or other reasons, a fund could experience delays and costs in recovering the securities loaned or in gaining access to the collateral. Cash collateral is invested in cash equivalents. The value of loaned securities and cash collateral at period end are disclosed on the fund's Statement of Assets and Liabilities.
7. Expense Reductions.
Effective December 23, 2003, FMR voluntarily agreed to reimburse each class to the extent annual operating expenses exceeded certain levels of average net assets as noted in the table below. Some expenses, for example interest expense, are excluded from this reimbursement.
| Expense
Limitations | Reimbursement
from adviser |
Class B | 1.95% | $ 2,427 |
Many of the brokers with whom FMR places trades on behalf of the fund provided services to the fund in addition to trade execution. These services included payments of certain expenses on behalf of the fund totaling $97,043 for the period. In addition, through arrangements with the fund's custodian, credits realized as a result of uninvested cash balances were used to reduce the fund's expenses. During the period, these credits reduced the fund's custody expenses by $2,762.
8. Distributions to Shareholders.
Distributions to shareholders of each class were as follows:
| Year Ended
November 30, 2004A | |
From net investment income | | |
Class A | $ 159,582 | |
Class T | 189,189 | |
Class B | 55,805 | |
Class C | 123,216 | |
Strategic Dividend & Income | 4,080,966 | |
Institutional Class | 38,961 | |
Total | $ 4,647,719 | |
A For the period December 23, 2003 (commencement of operations) to November 30, 2004.
Annual Report
Notes to Financial Statements - continued
9. Share Transactions.
Transactions for each class of shares were as follows:
| Year Ended
November 30, 2004A | Year Ended
November 30, 2004A |
| Shares | Dollars |
Class A | | |
Shares sold | 2,191,945 | $ 22,746,005 |
Reinvestment of distributions | 10,552 | 110,590 |
Shares redeemed | (220,797) | (2,287,113) |
Net increase (decrease) | 1,981,700 | $ 20,569,482 |
Class T | | |
Shares sold | 3,511,538 | $ 36,655,001 |
Reinvestment of distributions | 14,112 | 147,959 |
Shares redeemed | (230,386) | (2,405,951) |
Net increase (decrease) | 3,295,264 | $ 34,397,009 |
Class B | | |
Shares sold | 1,285,173 | $ 13,296,297 |
Reinvestment of distributions | 3,976 | 41,558 |
Shares redeemed | (72,792) | (752,799) |
Net increase (decrease) | 1,216,357 | $ 12,585,056 |
Class C | | |
Shares sold | 2,813,304 | $ 29,175,332 |
Reinvestment of distributions | 7,379 | 77,088 |
Shares redeemed | (218,090) | (2,262,584) |
Net increase (decrease) | 2,602,593 | $ 26,989,836 |
Strategic Dividend & Income | | |
Shares sold | 55,474,221 | $580,932,738 |
Reinvestment of distributions | 341,097 | 3,577,556 |
Shares redeemed | (12,984,227) | (134,752,835) |
Net increase (decrease) | 42,831,091 | $ 449,757,459 |
Institutional Class | | |
Shares sold | 464,040 | $ 4,776,823 |
Reinvestment of distributions | 1,845 | 19,348 |
Shares redeemed | (18,218) | (186,845) |
Net increase (decrease) | 447,667 | $ 4,609,326 |
A For the period December 23, 2003 (commencement of operations) to November 30, 2004.
Annual Report
Report of Independent Registered Public Accounting Firm
To the Trustees of Fidelity Financial Trust and the Shareholders of Fidelity Strategic Dividend & Income Fund:
In our opinion, the accompanying statement of assets and liabilities, including the schedule of investments, and the related statements of operations and of changes in net assets and the financial highlights present fairly, in all material respects, the financial position of Fidelity Strategic Dividend & Income Fund (a fund of Fidelity Financial Trust) at November 30, 2004 and the results of its operations, the changes in its net assets and the financial highlights for the periods indicated, in conformity with accounting principles generally accepted in the United States of America. These financial statements and financial highlights (hereafter referred to as "financial statements") are the responsibility of the Fidelity Strategic Dividend & Income Fund's management; our responsibility is to express an opinion on these financial statements based on our audits. We conducted our audits of these financial statements in accordance with the standards of the Public Company Accounting Oversight Board (United States). Those standards require that we plan and perform the audit to obtain reasonable assurance about whether the financial statements are free of material misstatement. An audit includes examining, on a test basis, evidence supporting the amounts and disclosures in the financial statements, assessing the accounting principles used and significant estimates made by management, and evaluating the overall financial statement presentation. We believe that our audits, which included confirmation of securities at November 30, 2004 by correspondence with the custodian and brokers, provide a reasonable basis for our opinion.
/s/PricewaterhouseCoopers LLP
PricewaterhouseCoopers LLP
Boston, Massachusetts
January 11, 2005
Annual Report
Trustees and Officers
The Trustees, Members of the Advisory Board, and executive officers of the trust and fund, as applicable, are listed below. The Board of Trustees governs the fund and is responsible for protecting the interests of shareholders. The Trustees are experienced executives who meet periodically throughout the year to oversee the fund's activities, review contractual arrangements with companies that provide services to the fund, and review the fund's performance. Except for William O. McCoy, Dennis J. Dirks, and Kenneth L. Wolfe, each of the Trustees oversees 301 funds advised by FMR or an affiliate. Mr. McCoy oversees 303 funds advised by FMR or an affiliate. Mr. Dirks and Mr. Wolfe oversee 223 funds advised by FMR or an affiliate.
The Trustees hold office without limit in time except that (a) any Trustee may resign; (b) any Trustee may be removed by written instrument, signed by at least two-thirds of the number of Trustees prior to such removal; (c) any Trustee who requests to be retired or who has become incapacitated by illness or injury may be retired by written instrument signed by a majority of the other Trustees; and (d) any Trustee may be removed at any special meeting of shareholders by a two-thirds vote of the outstanding voting securities of the trust. In any event, each non-interested Trustee shall retire not later than the last day of the calendar year in which his or her 72nd birthday occurs. The executive officers and Advisory Board Members hold office without limit in time, except that any officer and Advisory Board Member may resign or may be removed by a vote of a majority of the Trustees at any regular meeting or any special meeting of the Trustees. Except as indicated, each individual has held the office shown or other offices in the same company for the past five years.
The fund's Statement of Additional Information (SAI) includes more information about the Trustees. To request a free copy, call Fidelity at 1-800-544-8544.
Interested Trustees*:
Correspondence intended for each Trustee who is an "interested person" (as defined in the 1940 Act) may be sent to Fidelity Investments, 82 Devonshire Street, Boston, Massachusetts 02109.
Name, Age; Principal Occupation |
Edward C. Johnson 3d (74)** |
| Year of Election or Appointment: 1982 Mr. Johnson is Chairman of the Board of Trustees. Mr. Johnson serves as Chief Executive Officer, Chairman, and a Director of FMR Corp.; a Director and Chairman of the Board and of the Executive Committee of FMR; Chairman and a Director of Fidelity Management & Research (Far East) Inc.; Chairman (1998) and a Director of Fidelity Investments Money Management, Inc.; and Chairman (2001) and a Director (2000) of FMR Co., Inc. |
Abigail P. Johnson (42)** |
| Year of Election or Appointment: 2001 Senior Vice President of Strategic Dividend & Income (2003). Ms. Johnson also serves as Senior Vice President of other Fidelity funds (2001). She is President and a Director of FMR (2001), Fidelity Investments Money Management, Inc. (2001), FMR Co., Inc. (2001), and a Director of FMR Corp. Previously, Ms. Johnson managed a number of Fidelity funds. |
Laura B. Cronin (50) |
| Year of Election or Appointment: 2003 Ms. Cronin is an Executive Vice President (2002) and Chief Financial Officer (2002) of FMR Corp. and is a member of the Fidelity Management Committee (2003). Previously, Ms. Cronin served as Vice President of Finance of FMR (1997-1999), and Chief Financial Officer of FMR (1999-2001), Fidelity Personal Investments (2001), and Fidelity Brokerage Company (2001-2002). |
Robert L. Reynolds (52) |
| Year of Election or Appointment: 2003 Mr. Reynolds is a Director (2003) and Chief Operating Officer (2002) of FMR Corp. and is the head of the Fidelity Management Committee (2003). He also serves on the Board at Fidelity Investments Canada, Ltd. (2000). Previously, Mr. Reynolds served as President of Fidelity Investments Institutional Retirement Group (1996-2000). |
* Trustees have been determined to be "Interested Trustees" by virtue of, among other things, their affiliation with the trust or various entities under common control with FMR.
** Edward C. Johnson 3d, Trustee, is Abigail P. Johnson's father.
Annual Report
Non-Interested Trustees:
Correspondence intended for each non-interested Trustee (that is, the Trustees other than the Interested Trustees) may be sent to Fidelity Investments, P.O. Box 55235, Boston, Massachusetts 02205-5235.
Name, Age; Principal Occupation |
Robert M. Gates (61) |
| Year of Election or Appointment: 1997 Dr. Gates is Vice Chairman of the non-interested Trustees (2005). Dr. Gates is President of Texas A&M University (2002). He was Director of the Central Intelligence Agency (CIA) from 1991 to 1993. From 1989 to 1991, Dr. Gates served as Assistant to the President of the United States and Deputy National Security Advisor. Dr. Gates is a Director of NACCO Industries, Inc. (mining and manufacturing), Parker Drilling Co., Inc. (drilling and rental tools for the energy industry, 2001), and Brinker International (restaurant management, 2003). He also serves as a member of the Advisory Board of VoteHere.net (secure Internet voting, 2001). Previously, Dr. Gates served as a Director of LucasVarity PLC (automotive components and diesel engines), a Director of TRW Inc. (automotive, space, defense, and information technology), and Dean of the George Bush School of Government and Public Service at Texas A&M University (1999-2001). Dr. Gates also is a Trustee of the Forum for International Policy. |
George H. Heilmeier (68) |
| Year of Election or Appointment: 2004 Dr. Heilmeier is Chairman Emeritus of Telcordia Technologies (communication software and systems), where prior to his retirement, he served as company Chairman and Chief Executive Officer. He currently serves on the Boards of Directors of The Mitre Corporation (systems engineering and information technology support for the government), INET Technologies Inc. (telecommunications network surveillance, 2001), Teletech Holdings (customer management services), and HRL Laboratories (private research and development, 2004). He is Chairman of the General Motors Technology Advisory Committee and a Life Fellow of the Institute of Electrical and Electronics Engineers (IEEE) (2000). Dr. Heilmeier is a member of the Defense Science Board and the National Security Agency Advisory Board. He is also a member of the National Academy of Engineering, the American Academy of Arts and Sciences, and the Board of Overseers of the School of Engineering and Applied Science of the University of Pennsylvania. Previously, Dr. Heilmeier served as a Director of TRW Inc. (automotive, space, defense, and information technology, 1992-2002), Compaq (1994-2002), and Automatic Data Processing, Inc. (ADP) (technology-based business outsourcing, 1995-2002). |
Marie L. Knowles (58) |
| Year of Election or Appointment: 2001 Prior to Ms. Knowles' retirement in June 2000, she served as Executive Vice President and Chief Financial Officer of Atlantic Richfield Company (ARCO) (diversified energy, 1996-2000). From 1993 to 1996, she was a Senior Vice President of ARCO and President of ARCO Transportation Company. She served as a Director of ARCO from 1996 to 1998. She currently serves as a Director of Phelps Dodge Corporation (copper mining and manufacturing) and McKesson Corporation (healthcare service, 2002). Ms. Knowles is a Trustee of the Brookings Institution and the Catalina Island Conservancy and also serves as a member of the Advisory Board for the School of Engineering of the University of Southern California. |
Ned C. Lautenbach (60) |
| Year of Election or Appointment: 2000 Mr. Lautenbach has been a partner of Clayton, Dubilier & Rice, Inc. (private equity investment firm) since September 1998. Previously, Mr. Lautenbach was with the International Business Machines Corporation (IBM) from 1968 until his retirement in 1998. He was most recently Senior Vice President and Group Executive of Worldwide Sales and Services. From 1993 to 1995, he was Chairman of IBM World Trade Corporation, and from 1994 to 1998 was a member of IBM's Corporate Executive Committee. Mr. Lautenbach serves as Co-Chairman and a Director of Covansys, Inc. (global provider of business and technology solutions, 2000). In addition, he is a Director of Italtel Holding S.p.A. (telecommunications (Milan, Italy), 2004) and Eaton Corporation (diversified industrial) as well as the Philharmonic Center for the Arts in Naples, Florida (1999). He also is a member of the Council on Foreign Relations. |
Marvin L. Mann (71) |
| Year of Election or Appointment: 1993 Mr. Mann is Chairman of the non-interested Trustees (2001). He is Chairman Emeritus of Lexmark International, Inc. (computer peripherals), where he served as CEO until April 1998, retired as Chairman May 1999, and remains a member of the Board. Prior to 1991, he held the positions of Vice President of International Business Machines Corporation (IBM) and President and General Manager of various IBM divisions and subsidiaries. He is a member of the Executive Committee of the Independent Director's Council of the Investment Company Institute. In addition, Mr. Mann is a member of the President's Cabinet at the University of Alabama and the Board of Visitors of the Culverhouse College of Commerce and Business Administration at the University of Alabama. |
William O. McCoy (71) |
| Year of Election or Appointment: 1997 Prior to his retirement in December 1994, Mr. McCoy was Vice Chairman of the Board of BellSouth Corporation (telecommunications) and President of BellSouth Enterprises. He is currently a Director of Liberty Corporation (holding company), Duke Realty Corporation (real estate), and Progress Energy, Inc. (electric utility). He is also a partner of Franklin Street Partners (private investment management firm) and a member of the Research Triangle Foundation Board. In addition, Mr. McCoy served as the Interim Chancellor (1999-2000) and a member of the Board of Visitors (1994-1998) for the University of North Carolina at Chapel Hill and currently serves on the Board of Directors of the University of North Carolina Health Care System and the Board of Visitors of the Kenan-Flagler Business School (University of North Carolina at Chapel Hill). He also served as Vice President of Finance for the University of North Carolina (16-school system, 1995-1998). |
Cornelia M. Small (60) |
| Year of Election or Appointment: 2005 Member of the Advisory Board of Fidelity Financial Trust. Ms. Small is a member (2000) and Chairperson (2002) of the Investment Committee, and a member (2002) of the Board of Trustees of Smith College. Previously, she served as Chief Investment Officer (1999-2000), Director of Global Equity Investments (1996-1999), and a member of the Board of Directors of Scudder, Stevens & Clark (1990-1997) and Scudder Kemper Investments (1997-1998). In addition, Ms. Small served as Co-Chair (2000-2003) of the Annual Fund for the Fletcher School of Law and Diplomacy. |
William S. Stavropoulos (65) |
| Year of Election or Appointment: 2002 Mr. Stavropoulos is Chairman of the Board (2000), CEO (2002), a position he previously held from 1995-2000, Chairman of the Executive Committee (2000), and a Member of the Board of Directors of The Dow Chemical Company. Since joining The Dow Chemical Company in 1967, Mr. Stavropoulos served in numerous senior management positions, including President (1993-2000; 2002-2003). Currently, he is a Director of NCR Corporation (data warehousing and technology solutions), BellSouth Corporation (telecommunications), Chemical Financial Corporation, and Maersk Inc. (industrial conglomerate, 2002). He also serves as a member of the Board of Trustees of the American Enterprise Institute for Public Policy Research. In addition, Mr. Stavropoulos is a member of The Business Council, J.P. Morgan International Council and the University of Notre Dame Advisory Council for the College of Science. |
Annual Report
Trustees and Officers - continued
Advisory Board Members and Executive Officers:
Correspondence intended for Mr. Dirks and Mr. Wolfe may be sent to Fidelity Investments, P.O. Box 55235, Boston, Massachusetts 02205-5235. Correspondence intended for each executive officer and Mr. Lynch may be sent to Fidelity Investments, 82 Devonshire Street, Boston, Massachusetts 02109.
Name, Age; Principal Occupation |
Dennis J. Dirks (56) |
| Year of Election or Appointment: 2004 Member of the Advisory Board of Fidelity Financial Trust. Mr. Dirks also serves as a Trustee (2005) or member of the Advisory Board (2004) of other investment companies advised by FMR. Prior to his retirement in May 2003, Mr. Dirks was Chief Operating Officer and a member of the Board of The Depository Trust & Clearing Corporation (DTCC) (1999-2003). He also served as President, Chief Operating Officer, and Board member of The Depository Trust Company (DTC) (1999-2003) and President and Board member of the National Securities Clearing Corporation (NSCC) (1999-2003). In addition, Mr. Dirks served as Chief Executive Officer and Board member of the Government Securities Clearing Corporation (2001-2003) and Chief Executive Officer and Board member of the Mortgage-Backed Securities Clearing Corporation (2001-2003). |
Peter S. Lynch (61) |
| Year of Election or Appointment: 2003 Member of the Advisory Board of Fidelity Financial Trust. Vice Chairman and a Director of FMR, and Vice Chairman (2001) and a Director (2000) of FMR Co., Inc. Previously, Mr. Lynch served as a Trustee of the Fidelity funds (1990-2003). Prior to May 31, 1990, he was a Director of FMR and Executive Vice President of FMR (a position he held until March 31, 1991), Vice President of Fidelity® Magellan® Fund and FMR Growth Group Leader, and Managing Director of FMR Corp. Mr. Lynch was also Vice President of Fidelity Investments Corporate Services. In addition, he serves as a Trustee of Boston College, Massachusetts Eye & Ear Infirmary, Historic Deerfield, John F. Kennedy Library, and the Museum of Fine Arts of Boston. |
Kenneth L. Wolfe (65) |
| Year of Election or Appointment: 2004 Member of the Advisory Board of Fidelity Financial Trust. Mr. Wolfe also serves as a Trustee (2005) or member of the Advisory Board (2004) of other investment companies advised by FMR. Prior to his retirement in 2001, Mr. Wolfe was Chairman and Chief Executive Officer of Hershey Foods Corporation (1993-2001). He currently serves as a member of the boards of Adelphia Communications Corporation (2003), Bausch & Lomb, Inc., and Revlon Inc. (2004). |
Name, Age; Principal Occupation |
Bart A. Grenier (45) |
| Year of Election or Appointment: 2003 Vice President of Strategic Dividend & Income. Mr. Grenier also serves as Vice President of certain Equity Funds (2001), a position he previously held from 1999 to 2000, and Vice President of certain High Income Funds (2002). He is Senior Vice President of FMR (1999) and FMR Co., Inc. (2001), and President and Director of Strategic Advisers, Inc. (2002). He also heads Fidelity's Asset Allocation Group (2000), Fidelity's Growth and Income Group (2001), Fidelity's Value Group (2001), and Fidelity's High Income Division (2001). Previously, Mr. Grenier served as President of Fidelity Ventures (2000), Vice President of certain High Income Funds (1997-2000), High Income Division Head (1997-2000), Group Leader of the Income-Growth and Asset Allocation-Income Groups (1996-2000), and Assistant Equity Division Head (1997-2000). |
William Eigen (36) |
| Year of Election or Appointment: 2003 Vice President of Strategic Dividend & Income. Mr. Eigen also serves as Vice President of other funds advised by FMR. Prior to assuming his current responsibilities, Mr. Eigen managed a variety of Fidelity funds. |
Eric D. Roiter (56) |
| Year of Election or Appointment: 2003 Secretary of Strategic Dividend & Income. He also serves as Secretary of other Fidelity funds (1998); Vice President, General Counsel, and Clerk of FMR Co., Inc. (2001) and FMR (1998); Vice President and Clerk of FDC (1998); Assistant Clerk of Fidelity Management & Research (U.K.) Inc. (2001) and Fidelity Management & Research (Far East) Inc. (2001); and Assistant Secretary of Fidelity Investments Money Management, Inc. (2001). Prior to joining Fidelity, Mr. Roiter was with the law Firm of Debevoise & Plimpton, as on associate (1981-1984) and as a partner (1985-1997), and served as an Assistant General Counsel of the U.S. Securities and Exchange Commission (1979-1981). Mr. Roiter is an Adjunct Member, Faculty of Law, at Boston College Law School (2003). |
Stuart Fross (45) |
| Year of Election or Appointment: 2003 Assistant Secretary of Strategic Dividend & Income. Mr. Fross also serves as Assistant Secretary of other Fidelity funds (2003) and is an employee of FMR. |
Christine Reynolds (46) |
| Year of Election or Appointment: 2004 President, Treasurer, and Anti-Money Laundering (AML) officer of Strategic Dividend & Income. Ms. Reynolds also serves as President, Treasurer, and AML officer of other Fidelity funds (2004) and is a Vice President (2003) and an employee (2002) of FMR. Before joining Fidelity Investments, Ms. Reynolds worked at PricewaterhouseCoopers LLP (PwC) (1980-2002), where she was most recently an audit partner with PwC's investment management practice. |
Timothy F. Hayes (53) |
| Year of Election or Appointment: 2003 Chief Financial Officer of Strategic Dividend & Income. Mr. Hayes also serves as Chief Financial Officer of other Fidelity funds (2002). Recently he was appointed President of Fidelity Service Company (2003) where he also serves as a Director. Mr. Hayes also serves as President of Fidelity Investments Operations Group (FIOG, 2002), which includes Fidelity Pricing and Cash Management Services Group (FPCMS), where he was appointed President in 1998. Previously, Mr. Hayes served as Chief Financial Officer of Fidelity Investments Corporate Systems and Service Group (1998) and Fidelity Systems Company (1997-1998). |
Kenneth A. Rathgeber (57) |
| Year of Election or Appointment: 2004 Chief Compliance Officer of Strategic Dividend & Income. Mr. Rathgeber also serves as Chief Compliance Officer of other Fidelity funds (2004) and Executive Vice President of Risk Oversight for Fidelity Investments (2002). Previously, he served as Executive Vice President and Chief Operating Officer for Fidelity Investments Institutional Services Company, Inc. (1998-2002). |
John R. Hebble (46) |
| Year of Election or Appointment: 2003 Deputy Treasurer of Strategic Dividend & Income. Mr. Hebble also serves as Deputy Treasurer of other Fidelity funds (2003), and is an employee of FMR. Before joining Fidelity Investments, Mr. Hebble worked at Deutsche Asset Management where he served as Director of Fund Accounting (2002-2003) and Assistant Treasurer of the Scudder Funds (1998-2003). |
Kimberley H. Monasterio (41) |
| Year of Election or Appointment: 2004 Deputy Treasurer of Strategic Dividend & Income. Ms. Monasterio also serves as Deputy Treasurer of other Fidelity funds (2004) and is an employee of FMR (2004). Before joining Fidelity Investments, Ms. Monasterio served as Treasurer (2000-2004) and Chief Financial Officer (2002-2004) of the Franklin Templeton Funds and Senior Vice President of Franklin Templeton Services, LLC (2000-2004). |
John H. Costello (58) |
| Year of Election or Appointment: 2003 Assistant Treasurer of Strategic Dividend & Income. Mr. Costello also serves as Assistant Treasurer of other Fidelity funds and is an employee of FMR. |
Peter L. Lydecker (50) |
| Year of Election or Appointment: 2004 Assistant Treasurer of Strategic Dividend & Income. Mr. Lydecker also serves as Assistant Treasurer of other Fidelity funds (2004) and is an employee of FMR. |
Mark Osterheld (49) |
| Year of Election or Appointment: 2003 Assistant Treasurer of Strategic Dividend & Income. Mr. Osterheld also serves as Assistant Treasurer of other Fidelity funds (2002) and is an employee of FMR. |
Kenneth B. Robins (35) |
| Year of Election or Appointment: 2004 Assistant Treasurer of Strategic Dividend & Income. Mr. Robins also serves as Assistant Treasurer of other Fidelity funds (2004) and is an employee of FMR (2004). Before joining Fidelity Investments, Mr. Robins worked at KPMG LLP, where he was a partner in KPMG's department of professional practice (2002-2004) and a Senior Manager (1999-2000). In addition, Mr. Robins served as Assistant Chief Accountant, United States Securities and Exchange Commission (2000-2002). |
Thomas J. Simpson (46) |
| Year of Election or Appointment: 2003 Assistant Treasurer of Strategic Dividend & Income. Mr. Simpson is Assistant Treasurer of other Fidelity funds (2000) and an employee of FMR (1996). Prior to joining FMR, Mr. Simpson was Vice President and Fund Controller of Liberty Investment Services (1987-1995). |
Annual Report
Distributions
A total of 0.13% of the dividends distributed during the fiscal year was derived from interest on U.S. Government securities which is generally exempt from state income tax.
Fidelity Strategic Dividend & Income designates 83% of the dividends distributed during the fiscal year as qualifying for the dividends-received deduction for corporate shareholders.
Fidelity Strategic Dividend & Income designates 100%, 98.18%, and 61.63% of the dividends distributed in March, June and October, respectively during the fiscal year as amounts which may be taken into account as a dividend for purposes of the maximum rate under section 1(h)(11) of the Internal Revenue Code.
The fund will notify shareholders in January 2005 of amounts for use in preparing 2004 income tax returns.
Annual Report
Managing Your Investments
Fidelity offers several ways to conveniently manage your personal investments via your telephone or PC. You can access your account information, conduct trades and research your investments 24 hours a day.
By Phone
Fidelity Automated Service Telephone provides a single toll-free number to access account balances, positions, quotes and trading. It's easy to navigate the service, and on your first call, the system will help you create a personal identification number (PIN) for security.
(phone_graphic)Fidelity Automated
Service Telephone (FAST®)
1-800-544-5555
Press
1 For mutual fund and brokerage trading.
2 For quotes.*
3 For account balances and holdings.
4 To review orders and mutual
fund activity.
5 To change your PIN.
*0 To speak to a Fidelity representative.
By PC
Fidelity's web site on the Internet provides a wide range of information, including daily financial news, fund performance, interactive planning tools and news about Fidelity products and services.
(computer_graphic)Fidelity's Web Site
www.fidelity.com
* When you call the quotes line, please remember that a fund's yield and return will vary and, except for money market funds, share price will also vary. This means that you may have a gain or loss when you sell your shares. There is no assurance that money market funds will be able to maintain a stable $1 share price; an investment in a money market fund is not insured or guaranteed by the U.S. government. Total returns are historical and include changes in share price, reinvestment of dividends and capital gains, and the effects of any sales charges.
Annual Report
To Visit Fidelity
For directions and hours,
please call 1-800-544-9797.
Arizona
7001 West Ray Road
Chandler, AZ
7373 N. Scottsdale Road
Scottsdale, AZ
California
815 East Birch Street
Brea, CA
1411 Chapin Avenue
Burlingame, CA
851 East Hamilton Avenue
Campbell, CA
527 North Brand Boulevard
Glendale, CA
19200 Von Karman Avenue
Irvine, CA
601 Larkspur Landing Circle
Larkspur, CA
10100 Santa Monica Blvd.
Los Angeles, CA
27101 Puerta Real
Mission Viejo, CA
73-575 El Paseo
Palm Desert, CA
251 University Avenue
Palo Alto, CA
1760 Challenge Way
Sacramento, CA
7676 Hazard Center Drive
San Diego, CA
8 Montgomery Street
San Francisco, CA
21701 Hawthorne Boulevard
Torrance, CA
2001 North Main Street
Walnut Creek, CA
6300 Canoga Avenue
Woodland Hills, CA
Colorado
1625 Broadway
Denver, CO
9185 East Westview Road
Littleton, CO
Connecticut
48 West Putnam Avenue
Greenwich, CT
265 Church Street
New Haven, CT
300 Atlantic Street
Stamford, CT
29 South Main Street
West Hartford, CT
Delaware
222 Delaware Avenue
Wilmington, DE
Florida
4400 N. Federal Highway
Boca Raton, FL
121 Alhambra Plaza
Coral Gables, FL
2948 N. Federal Highway
Ft. Lauderdale, FL
1907 West State Road 434
Longwood, FL
8880 Tamiami Trail, North
Naples, FL
3501 PGA Boulevard
West Palm Beach, FL
8065 Beneva Road
Sarasota, FL
1502 N. Westshore Blvd.
Tampa, FL
Georgia
3445 Peachtree Road, N.E.
Atlanta, GA
1000 Abernathy Road
Atlanta, GA
Illinois
One North LaSalle Street
Chicago, IL
1415 West 22nd Street
Oak Brook, IL
1700 East Golf Road
Schaumburg, IL
3232 Lake Avenue
Wilmette, IL
Indiana
4729 East 82nd Street
Indianapolis, IN
Kansas
5400 College Boulevard
Overland Park, KS
Maine
Three Canal Plaza
Portland, ME
Maryland
7401 Wisconsin Avenue
Bethesda, MD
One W. Pennsylvania Ave.
Towson, MD
Massachusetts
801 Boylston Street
Boston, MA
155 Congress Street
Boston, MA
300 Granite Street
Braintree, MA
44 Mall Road
Burlington, MA
405 Cochituate Road
Framingham, MA
416 Belmont Street
Worcester, MA
Annual Report
Michigan
280 Old N. Woodward Ave.
Birmingham, MI
43420 Grand River Avenue
Novi, MI
29155 Northwestern Hwy.
Southfield, MI
Minnesota
7600 France Avenue South
Edina, MN
Missouri
8885 Ladue Road
Ladue, MO
New Jersey
150 Essex Street
Millburn, NJ
56 South Street
Morristown, NJ
501 Route 17, South
Paramus, NJ
3518 Route 1 North
Princeton, NJ
New York
1055 Franklin Avenue
Garden City, NY
37 West Jericho Turnpike
Huntington Station, NY
1271 Avenue of the Americas
New York, NY
61 Broadway
New York, NY
350 Park Avenue
New York, NY
North Carolina
4611 Sharon Road
Charlotte, NC
Ohio
3805 Edwards Road
Cincinnati, OH
28699 Chagrin Boulevard
Woodmere Village, OH
1324 Polaris Parkway
Columbus, OH
Oregon
16850 SW 72nd Avenue
Tigard, OR
Pennsylvania
600 West DeKalb Pike
King of Prussia, PA
1735 Market Street
Philadelphia, PA
12001 Perry Highway
Wexford, PA
Rhode Island
47 Providence Place
Providence, RI
Tennessee
6150 Poplar Avenue
Memphis, TN
Texas
10000 Research Boulevard
Austin, TX
4017 Northwest Parkway
Dallas, TX
12532 Memorial Drive
Houston, TX
2701 Drexel Drive
Houston, TX
400 East Las Colinas Blvd.
Irving, TX
14100 San Pedro
San Antonio, TX
19740 IH 45 North
Spring, TX
6005 West Park Boulevard
Plano, TX
Utah
215 South State Street
Salt Lake City, UT
Virginia
1861 International Drive
McLean, VA
Washington
411 108th Avenue, N.E.
Bellevue, WA
1518 6th Avenue
Seattle, WA
Washington, DC
1900 K Street, N.W.
Washington, DC
Wisconsin
595 North Barker Road
Brookfield, WI
Fidelity Brokerage Services, Inc., 100 Summer St., Boston, MA 02110 Member NYSE/SIPC
Annual Report
To Write Fidelity
We'll give your correspondence immediate attention and send you written confirmation upon completion of your request.
(letter_graphic)Making Changes
To Your Account
(such as changing name, address, bank, etc.)
Fidelity Investments
P.O. Box 770001
Cincinnati, OH 45277-0002
(letter_graphic)For Non-Retirement
Accounts
Buying shares
Fidelity Investments
P.O. Box 770001
Cincinnati, OH 45277-0003
Overnight Express
Fidelity Investments
Attn: Distribution Services
100 Crosby Parkway - KC1H
Covington, KY 41015
Selling shares
Fidelity Investments
P.O. Box 770001
Cincinnati, OH 45277-0035
Overnight Express
Fidelity Investments
Attn: Distribution Services
100 Crosby Parkway - KC1H
Covington, KY 41015
General Correspondence
Fidelity Investments
P.O. Box 500
Merrimack, NH 03054-0500
(letter_graphic)For Retirement
Accounts
Buying shares
Fidelity Investments
P.O. Box 770001
Cincinnati, OH 45277-0003
Selling shares
Fidelity Investments
P.O. Box 770001
Cincinnati, OH 45277-0035
Overnight Express
Fidelity Investments
Attn: Distribution Services
100 Crosby Parkway - KC1H
Covington, KY 41015
General Correspondence
Fidelity Investments
P.O. Box 500
Merrimack, NH 03054-0500
Annual Report
Annual Report
Annual Report
Annual Report
Investment Adviser
Fidelity Management & Research Company
Boston, MA
Investment Sub-Advisers
FMR Co., Inc.
Fidelity Management & Research (U.K.) Inc.
Fidelity Management & Research
(Far East) Inc.
Fidelity International Investment Advisors
Fidelity Investments Japan Limited
Fidelity International Investment Advisors (U.K.) Limited
General Distributor
Fidelity Distributors Corporation
Boston, MA
Transfer and Shareholder
Servicing Agent
Fidelity Service Company, Inc.
Boston, MA
Custodian
Citibank, N.A.
New York, NY
Fidelity's Growth and Income Funds
Balanced Fund
Convertible Securities Fund
Equity-Income Fund
Equity-Income II Fund
Fidelity® Fund
Global Balanced Fund
Growth & Income Portfolio
Growth & Income II Portfolio
Puritan® Fund
Real Estate Income Fund
Real Estate Investment Portfolio
Utilities Fund
Please carefully consider the funds' investment objectives, risks, charges and expenses before investing. For this and other information, call 1-800-544-6666 for a free prospectus. Read it carefully before you invest or send money.
The Fidelity Telephone Connection
Mutual Fund 24-Hour Service
Exchanges/Redemptions
and Account Assistance 1-800-544-6666
Product Information 1-800-544-6666
Retirement Accounts 1-800-544-4774
(8 a.m. - 9 p.m.)
TDD Service 1-800-544-0118
for the deaf and hearing impaired
(9 a.m. - 9 p.m. Eastern time)
Fidelity Automated Service
Telephone (FAST®) (automated graphic) 1-800-544-5555
(automated graphic) Automated line for quickest service
(Fidelity Investment logo)(registered trademark)
Corporate Headquarters
82 Devonshire St., Boston, MA 02109
www.fidelity.com
SDI-UANN-0105
1.802527.100
Item 2. Code of Ethics
As of the end of the period, November 30, 2004, Fidelity Financial Trust (the trust) has adopted a code of ethics, as defined in Item 2 of Form N-CSR, that applies to its President and Treasurer and its Chief Financial Officer. A copy of the code of ethics is filed as an exhibit to this Form N-CSR.
Item 3. Audit Committee Financial Expert
The Board of Trustees of the trust has determined that Marie L. Knowles is an audit committee financial expert, as defined in Item 3 of Form N-CSR. Ms. Knowles is independent for purposes of Item 3 of Form N-CSR.
Item 4. Principal Accountant Fees and Services
(a) Audit Fees.
For the fiscal years ended November 30, 2004 and November 30, 2003, the aggregate Audit Fees billed by PricewaterhouseCoopers LLP (PwC) for professional services rendered for the audits of the financial statements, or services that are normally provided in connection with statutory and regulatory filings or engagements for those fiscal years, for the Fidelity Convertible Securities Fund, Fidelity Equity-Income II Fund, Fidelity Independence Fund and Fidelity Strategic Dividend & Income Fund (the funds) and for all funds in the Fidelity Group of Funds are shown in the table below.
Fund | 2004A,B | 2003A |
Fidelity Convertible Securities Fund | $60,000 | $72,000 |
Fidelity Equity-Income II Fund | $86,000 | $90,000 |
Fidelity Independence Fund | $64,000 | $55,000 |
Fidelity Strategic Dividend & Income Fund | $32,000 | $0 |
All funds in the Fidelity Group of Funds audited by PwC | $10,600,000 | $10,500,000 |
A | Aggregate amounts may reflect rounding. |
B | Fidelity Strategic Dividend & Income Fund commenced operations on December 23, 2003. |
(b) Audit-Related Fees.
In each of the fiscal years ended November 30, 2004 and November 30, 2003 the aggregate Audit-Related Fees billed by PwC for services rendered for assurance and related services to each fund that are reasonably related to the performance of the audit or review of the fund's financial statements, but not reported as Audit Fees, are shown in the table below.
Fund | 2004A,C | 2003A,B |
Fidelity Convertible Securities Fund | $0 | $0 |
Fidelity Equity-Income II Fund | $0 | $0 |
Fidelity Independence Fund | $0 | $0 |
Fidelity Strategic Dividend & Income Fund | $0 | $0 |
A | Aggregate amounts may reflect rounding. |
B | Includes amounts related to non-audit services prior to May 6, 2003 that would have been subject to pre-approval if the SEC rules relating to the pre-approval of non-audit services had been in effect at that time. |
C | Fidelity Strategic Dividend & Income Fund commenced operations on December 23, 2003. |
In each of the fiscal years ended November 30, 2004 and November 30, 2003, the aggregate Audit-Related Fees that were billed by PwC that were required to be approved by the Audit Committee for services rendered on behalf of Fidelity Management & Research Company (FMR) and entities controlling, controlled by, or under common control with FMR (not including any sub-adviser whose role is primarily portfolio management and is subcontracted with or overseen by another investment adviser) that provide ongoing services to the funds ("Fund Service Providers") for assurance and related services that relate directly to the operations and financial reporting of each fund that are reasonably related to the performance of the audit or review of the fund's financial statements, but not reported as Audit Fees, are shown in the table below.
Billed By | 2004A,C | 2003A,B,C |
PwC | $0 | $50,000 |
A | Aggregate amounts may reflect rounding. |
B | Includes amounts related to non-audit services prior to May 6, 2003 that would have been subject to pre-approval if the SEC rules relating to the pre-approval of non-audit services had been in effect at that time. |
C | May include amounts billed prior to Fidelity Strategic Dividend & Income Fund's commencement of operations. |
Fees included in the audit-related category comprise assurance and related services (e.g., due diligence services) that are traditionally performed by the independent registered public accounting firm. These audit-related services include due diligence related to mergers and acquisitions, accounting consultations and audits in connection with acquisitions, internal control reviews, attest services that are not required by statute or regulation and consultation concerning financial accounting and reporting standards.
(c) Tax Fees.
In each of the fiscal years ended November 30, 2004 and November 30, 2003, the aggregate Tax Fees billed by PwC for professional services rendered for tax compliance, tax advice, and tax planning for each fund is shown in the table below.
Fund | 2004A,C | 2003A,B |
Fidelity Convertible Securities Fund | $3,200 | $3,000 |
Fidelity Equity-Income II Fund | $3,200 | $3,000 |
Fidelity Independence Fund | $3,200 | $3,000 |
Fidelity Strategic Dividend & Income Fund | $2,200 | $0 |
A | Aggregate amounts may reflect rounding. |
B | Includes amounts related to non-audit services prior to May 6, 2003 that would have been subject to pre-approval if the SEC rules relating to the pre-approval of non-audit services had been in effect at that time. |
C | Fidelity Strategic Dividend & Income Fund commenced operations on December 23, 2003. |
In each of the fiscal years ended November 30, 2004 and November 30, 2003, the aggregate Tax Fees billed by PwC that were required to be approved by the Audit Committee for professional services rendered on behalf of the Fund Service Providers for tax compliance, tax advice, and tax planning that relate directly to the operations and financial reporting of each fund is shown in the table below.
Billed By | 2004A,C | 2003A,B,C |
PwC | $0 | $0 |
A | Aggregate amounts may reflect rounding. |
B | Includes amounts related to non-audit services prior to May 6, 2003 that would have been subject to pre-approval if the SEC rules relating to the pre-approval of non-audit services had been in effect at that time. |
C | May include amounts billed prior to Fidelity Strategic Dividend & Income Fund's commencement of operations. |
Fees included in the Tax Fees category comprise all services performed by professional staff in the independent registered public accounting firm's tax division except those services related to the audit. Typically, this category would include fees for tax compliance, tax planning, and tax advice. Tax compliance, tax advice, and tax planning services include preparation of original and amended tax returns, claims for refund and tax payment-planning services, assistance with tax audits and appeals, tax advice related to mergers and acquisitions and requests for rulings or technical advice from taxing authorities.
(d) All Other Fees.
In each of the fiscal years ended November 30, 2004 and November 30, 2003, the aggregate Other Fees billed by PwC for all other non-audit services rendered to the funds is shown in the table below.
Fund | 2004A,C | 2003A,B |
Fidelity Convertible Securities Fund | $2,800 | $2,700 |
Fidelity Equity-Income II Fund | $11,600 | $10,900 |
Fidelity Independence Fund | $5,100 | $5,500 |
Fidelity Strategic Dividend & Income Fund | $1,500 | $0 |
A | Aggregate amounts may reflect rounding. |
B | Includes amounts related to non-audit services prior to May 6, 2003 that would have been subject to pre-approval if the SEC rules relating to the pre-approval of non-audit services had been in effect at that time. |
C | Fidelity Strategic Dividend & Income Fund commenced operations on December 23, 2003. |
In each of the fiscal years ended November 30, 2004 and November 30, 2003, the aggregate Other Fees billed by PwC that were required to be approved by the Audit Committee for all other non-audit services rendered on behalf of the Fund Service Providers that relate directly to the operations and financial reporting of each fund is shown in the table below.
Billed By | 2004A,C | 2003A,B,C |
PwC | $540,000 | $140,000 |
A | Aggregate amounts may reflect rounding. |
B | Includes amounts related to non-audit services prior to May 6, 2003 that would have been subject to pre-approval if the SEC rules relating to the pre-approval of non-audit services had been in effect at that time. |
C | May include amounts billed prior to Fidelity Strategic Dividend & Income Fund's commencement of operations. |
Fees included in the All Other Fees category include services related to internal control reviews, strategy and other consulting, financial information systems design and implementation, consulting on other information systems, and other tax services unrelated to the fund.
(e) (1) | Audit Committee Pre-Approval Policies and Procedures: |
The trust's Audit Committee must pre-approve all audit and non-audit services provided by the independent registered public accounting firm relating to the operations or financial reporting of the funds. Prior to the commencement of any audit or non-audit services to a fund, the Audit Committee reviews the services to determine whether they are appropriate and permissible under applicable law.
The trust's Audit Committee has adopted policies and procedures to, among other purposes, provide a framework for the Committee's consideration of non-audit services by the audit firms that audit the Fidelity funds. The policies and procedures require that any non-audit service provided by a fund audit firm to a Fidelity Fund and any non-audit service provided by a fund auditor to a Fund Service Provider that relates directly to the operations and financial reporting of a Fidelity fund (Covered Service) are subject to approval by the Audit Committee before such service is provided. Non-audit services provided by a fund audit firm for a Fund Service Provider that do not relate directly to the operations and financial reporting of a Fidelity fund (Non-Covered Service) but that are expected to exceed $50,000 are also subject to pre-approval by the Audit Committee.
All Covered Services, as well as Non-Covered Services that are expected to exceed $50,000, must be approved in advance of provision of the service either: (i) by formal resolution of the Audit Committee, or (ii) by oral or written approval of the service by the Chair of the Audit Committee (or if the Chair is unavailable, such other member of the Audit Committee as may be designated by the Chair to act in the Chair's absence). The approval contemplated by (ii) above is permitted where the Treasurer determines that action on such an engagement is necessary before the next meeting of the Audit Committee. Neither pre-approval nor advance notice of Non-Covered Service engagements for which fees are not expected to exceed $50,000 is required; such engagements are to be reported to the Audit Committee monthly.
(e) (2) | Services approved pursuant to paragraph (c)(7)(i)(C) of Rule 2-01 of Regulation S-X: |
Audit-Related Fees:
There were no amounts, including amounts related to non-audit services prior to May 6, 2003 that would have been subject to pre-approval if the SEC rules relating to the pre-approval of non-audit services had been in effect at that time, that were approved by the Audit Committee pursuant to the de minimis exception for the fiscal years ended November 30, 2004 and November 30, 2003 on behalf of each fund.
There were no amounts, including amounts related to non-audit services prior to May 6, 2003 that would have been subject to pre-approval if the SEC rules relating to the pre-approval of non-audit services had been in effect at that time, that were required to be approved by the Audit Committee pursuant to the de minimis exception for the fiscal years ended November 30, 2004 and November 30, 2003 on behalf of the Fund Service Providers that relate directly to the operations and financial reporting of each fund.
Tax Fees:
There were no amounts, including amounts related to non-audit services prior to May 6, 2003 that would have been subject to pre-approval if the SEC rules relating to the pre-approval of non-audit services had been in effect at that time, that were approved by the Audit Committee pursuant to the de minimis exception for the fiscal years ended November 30, 2004 and November 30, 2003 on behalf of each fund.
There were no amounts, including amounts related to non-audit services prior to May 6, 2003 that would have been subject to pre-approval if the SEC rules relating to the pre-approval of non-audit services had been in effect at that time, that were required to be approved by the Audit Committee pursuant to the de minimis exception for the fiscal years ended November 30, 2004 and November 30, 2003 on behalf of the Fund Service Providers that relate directly to the operations and financial reporting of each fund.
All Other Fees:
There were no amounts, including amounts related to non-audit services prior to May 6, 2003 that would have been subject to pre-approval if the SEC rules relating to the pre-approval of non-audit services had been in effect at that time, that were approved by the Audit Committee pursuant to the de minimis exception for the fiscal years ended November 30, 2004 and November 30, 2003 on behalf of each fund.
There were no amounts, including amounts related to non-audit services prior to May 6, 2003 that would have been subject to pre-approval if the SEC rules relating to the pre-approval of non-audit services had been in effect at that time, that were required to be approved by the Audit Committee pursuant to the de minimis exception for the fiscal years ended November 30, 2004 and November 30, 2003 on behalf of the Fund Service Providers that relate directly to the operations and financial reporting of each fund.
(f) According to PwC for the fiscal year ended November 30, 2004, the percentage of hours spent on the audit of each fund's financial statements for the most recent fiscal year that were attributed to work performed by persons who are not full-time, permanent employees of PwC is as follows:
Fund | 2004 |
Fidelity Convertible Securities Fund | 0% |
Fidelity Equity-Income II Fund | 0% |
Fidelity Independence Fund | 0% |
Fidelity Strategic Dividend & Income Fund | 0% |
(g) For the fiscal years ended November 30, 2004 and November 30, 2003, the aggregate fees billed by PwC of $2,750,000A,C and $1,850,000A,B,C for non-audit services rendered on behalf of the funds, FMR (not including any sub-adviser whose role is primarily portfolio management and is subcontracted with or overseen by another investment adviser) and Fund Service Providers relating to Covered Services and Non-Covered Services are shown in the table below.
| 2004A,C | 2003A,B,C |
Covered Services | $600,000 | $200,000 |
Non-Covered Services | $2,150,000 | $1,650,000 |
A | Aggregate amounts may reflect rounding. |
B | Includes amounts related to non-audit services prior to May 6, 2003 that would have been subject to pre-approval if the SEC rules relating to the pre-approval of non-audit services had been in effect at that time. |
C | May include amounts billed prior to Fidelity Strategic Dividend & Income Fund's commencement of operations. |
(h) The trust's Audit Committee has considered Non-Covered Services that were not pre-approved that were provided by PwC to Fund Service Providers to be compatible with maintaining the independence of PwC in its audit of the funds, taking into account representations from PwC, in accordance with Independence Standards Board Standard No.1, regarding its independence from the funds and their related entities.
Item 5. Audit Committee of Listed Registrants
Not applicable.
Item 6. Schedule of Investments
Not applicable.
Item 7. Disclosure of Proxy Voting Policies and Procedures for Closed-End Management Investment Companies
Not applicable.
Item 8. Portfolio Managers of Closed-End Management Investment Companies
Not applicable.
Item 9. Purchase of Equity Securities by Closed-End Management Investment Company and Affiliated Purchasers
Not applicable.
Item 10. Submission of Matters to a Vote of Security Holders
There were no material changes to the procedures by which shareholders may recommend nominees to the trust's Board of Trustees.
Item 11. Controls and Procedures
(a)(i) The President and Treasurer and the Chief Financial Officer have concluded that the trust's disclosure controls and procedures (as defined in Rule 30a-3(c) under the Investment Company Act) provide reasonable assurances that material information relating to the trust is made known to them by the appropriate persons, based on their evaluation of these controls and procedures as of a date within 90 days of the filing date of this report.
(a)(ii) There was no change in the trust's internal control over financial reporting (as defined in Rule 30a-3(d) under the Investment Company Act) that occurred during the second fiscal quarter of the period covered by this report that has materially affected, or is reasonably likely to materially affect, the trust's internal control over financial reporting.
Item 12. Exhibits
(a) | (1) | Code of Ethics pursuant to Item 2 of Form N-CSR is filed and attached hereto as EX-99.CODE ETH. |
(a) | (2) | Certification pursuant to Rule 30a-2(a) under the Investment Company Act of 1940 (17 CFR 270.30a-2(a)) is filed and attached hereto as Exhibit 99.CERT. |
(a) | (3) | Not applicable. |
(b) | | Certification pursuant to Rule 30a-2(b) under the Investment Company Act of 1940 (17 CFR 270.30a-2(b)) is furnished and attached hereto as Exhibit 99.906CERT. |
SIGNATURES
Pursuant to the requirements of the Securities Exchange Act of 1934 and the Investment Company Act of 1940, the registrant has duly caused this report to be signed on its behalf by the undersigned, thereunto duly authorized.
Fidelity Financial Trust
By: | /s/Christine Reynolds |
| Christine Reynolds |
| President and Treasurer |
| |
Date: | January 24, 2005 |
Pursuant to the requirements of the Securities Exchange Act of 1934 and the Investment Company Act of 1940, this report has been signed below by the following persons on behalf of the registrant and in the capacities and on the dates indicated.
By: | /s/Christine Reynolds |
| Christine Reynolds |
| President and Treasurer |
| |
Date: | January 24, 2005 |
By: | /s/Timothy F. Hayes |
| Timothy F. Hayes |
| Chief Financial Officer |
| |
Date: | January 24, 2005 |