UNITED STATES
SECURITIES AND EXCHANGE COMMISSION
Washington, D.C. 20549
FORM N-CSR
CERTIFIED SHAREHOLDER REPORT OF REGISTERED
MANAGEMENT INVESTMENT COMPANIES
Investment Company Act file number 811-3587
Fidelity Financial Trust
(Exact name of registrant as specified in charter)
82 Devonshire St., Boston, Massachusetts 02109
(Address of principal executive offices) (Zip code)
Eric D. Roiter, Secretary
82 Devonshire St.
Boston, Massachusetts 02109
(Name and address of agent for service)
Registrant's telephone number, including area code: 617-563-7000
Date of fiscal year end: | November 30 |
| |
Date of reporting period: | November 30, 2006 |
Item 1. Reports to Stockholders
Fidelity®
Equity-Income II
Fund
Annual Report
November 30, 2006
(2_fidelity_logos) (Registered_Trademark)
Contents
Chairman's Message | <Click Here> | Ned Johnson's message to shareholders. |
Performance | <Click Here> | How the fund has done over time. |
Management's Discussion | <Click Here> | The manager's review of fund performance, strategy and outlook. |
Shareholder Expense Example | <Click Here> | An example of shareholder expenses. |
Investment Changes | <Click Here> | A summary of major shifts in the fund's investments over the past six months. |
Investments | <Click Here> | A complete list of the fund's investments with their market values. |
Financial Statements | <Click Here> | Statements of assets and liabilities, operations, and changes in net assets,
as well as financial highlights. |
Notes | <Click Here> | Notes to the financial statements. |
Report of Independent Registered Public Accounting Firm | <Click Here> | |
Trustees and Officers | <Click Here> | |
Distributions | <Click Here> | |
Proxy Voting Results | <Click Here> | |
Board Approval of Investment Advisory Contracts and Management Fees | <Click Here> | |
To view a fund's proxy voting guidelines and proxy voting record for the 12-month period ended June 30, visit www.fidelity.com/proxyvotingresults or visit the Securities and Exchange Commission's (SEC) web site at www.sec.gov. You may also call 1-800-544-8544 to request a free copy of the proxy voting guidelines.
Standard & Poor's, S&P and S&P 500 are registered service marks of The McGraw-Hill Companies, Inc. and have been licensed for use by Fidelity Distributors Corporation.
Other third party marks appearing herein are the property of their respective owners.
All other marks appearing herein are registered or unregistered trademarks or service marks of FMR Corp. or an affiliated company.
Annual Report
This report and the financial statements contained herein are submitted for the general information of the shareholders of the fund. This report is not authorized for distribution to prospective investors in the fund unless preceded or accompanied by an effective prospectus.
A fund files its complete schedule of portfolio holdings with the SEC for the first and third quarters of each fiscal year on Form N-Q. Forms N-Q are available on the SEC's web site at http://www.sec.gov. A fund's Forms N-Q may be reviewed and copied at the SEC's Public Reference Room in Washington, DC. Information regarding the operation of the SEC's Public Reference Room may be obtained by calling 1-800-SEC-0330. For a complete list of a fund's portfolio holdings, view the most recent quarterly holdings report, semiannual report, or annual report on Fidelity's web site at http://www.fidelity.com/holdings.
NOT FDIC INSURED · MAY LOSE VALUE · NO BANK GUARANTEE
Neither the fund nor Fidelity Distributors Corporation is a bank.
Annual Report
Chairman's Message
(photo_of_Edward_C_Johnson_3d)
Dear Shareholder:
Stock and bond markets around the world have seen largely positive results year to date, although weakness in the technology sector and growth stocks in general have tempered performance. While financial markets are always unpredictable, there are a number of time-tested principles that can put the historical odds in your favor.
One of the basic tenets is to invest for the long term. Over time, riding out the markets' inevitable ups and downs has proven much more effective than selling into panic or chasing the hottest trend. Even missing only a few of the markets' best days can significantly diminish investor returns. Patience also affords the benefits of compounding - of earning interest on additional income or reinvested dividends and capital gains. There are tax advantages and cost benefits to consider as well. The more you sell, the more taxes you pay, and the more you trade, the higher the costs. While staying the course doesn't eliminate risk, it can considerably lessen the effect of short-term declines.
You can further manage your investing risk through diversification. And today, more than ever, geographic diversification should be taken into account. Studies indicate that asset allocation is the single most important determinant of a portfolio's long-term success. The right mix of stocks, bonds and cash - aligned to your particular risk tolerance and investment objective - is very important. Age-appropriate rebalancing is also an essential aspect of asset allocation. For younger investors, an emphasis on equities - which historically have been the best performing asset class over time - is encouraged. As investors near their specific goal, such as retirement or sending a child to college, consideration may be given to replacing volatile assets (e.g. common stocks) with more-stable fixed investments (bonds or savings plans).
A third investment principle - investing regularly - can help lower the average cost of your purchases. Investing a certain amount of money each month or quarter helps ensure you won't pay for all your shares at market highs. This strategy - known as dollar cost averaging - also reduces unconstructive "emotion" from investing, helping shareholders avoid selling weak performers just prior to an upswing, or chasing a hot performer just before a correction.
We invite you to contact us via the Internet, through our Investor Centers or over the phone. It is our privilege to provide you the information you need to make the investments that are right for you.
Sincerely,
/s/Edward C. Johnson 3d
Edward C. Johnson 3d
Annual Report
Performance: The Bottom Line
Average annual total return reflects the change in the value of an investment, assuming reinvestment of the fund's dividend income and capital gains (the profits earned upon the sale of securities that have grown in value) and assuming a constant rate of performance each year. The $10,000 table and the fund's returns do not reflect the deduction of taxes that a shareholder would pay on fund distributions or the redemption of fund shares. During periods of reimbursement by Fidelity, a fund's total return will be greater than it would be had the reimbursement not occurred. How a fund did yesterday is no guarantee of how it will do tomorrow.
Average Annual Total Returns
Periods ended November 30, 2006 | Past 1
year | Past 5
years | Past 10
years |
Fidelity® Equity-Income II | 12.28% | 8.13% | 8.81% |
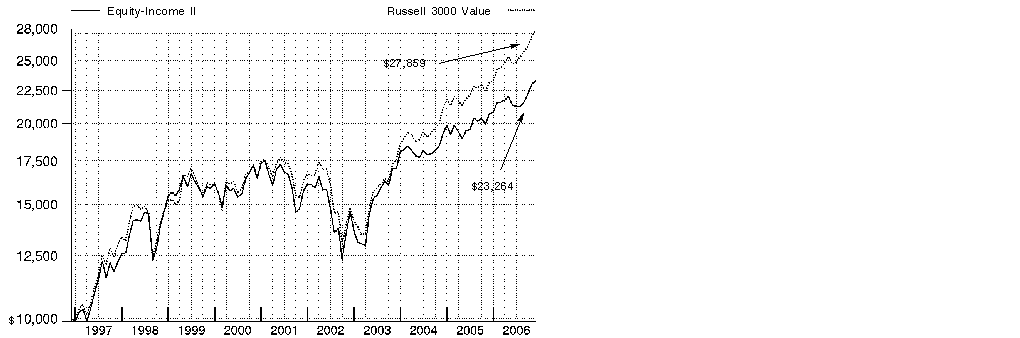
$10,000 Over 10 Years
Let's say hypothetically that $10,000 was invested in Fidelity® Equity-Income II Fund on November 30, 1996. The chart shows how the value of your investment would have changed, and also shows how the Russell 3000® Value Index performed over the same period.
Annual Report
Management's Discussion of Fund Performance
Comments from Stephen DuFour, who managed Fidelity® Equity-Income II Fund for most of the period covered by this report
There were a number of reasons why the overall U.S. stock market could have had subpar results during the 12-month period that ended on November 30, 2006, including rising interest rates, inflation concerns, historically high energy prices, unrest in the Middle East, North Korea's nuclear test and a worse-than-expected housing slump. Despite these negative conditions, though, U.S. stocks fared well. In fact, several bellwether market benchmarks reached record highs, including the larger-cap Dow Jones Industrial AverageSM - a gauge of 30 mega-cap, blue-chip stocks - and the small-cap-oriented Russell 2000® Index. The strength in equities was sparked in large part by two major factors: the double-digit earnings growth achieved by U.S. corporations, and steady economic growth that was neither overheated nor recessionary, thanks primarily to the Federal Reserve Board's monetary policy. For the 12 months overall, the Dow rose 15.76%, the Russell 2000 checked in with a 17.43% advance, the Standard & Poor's 500SM Index gained 14.23% and the NASDAQ Composite® Index returned 9.78%.
Equity-Income II Fund returned 12.28% during the past 12 months, compared with a gain of 20.40% for the benchmark Russell 3000® Value Index. Most of the fund's relative underperformance was the result of owning stocks whose returns, while generally strong, were not as good as those of some of the index's largest names, which helped the index produce a return that ran at the high end of its historical performance range. Among the stocks that detracted from performance relative to the index were mega-retailer Wal-Mart Stores, semiconductor giant Intel, student loan underwriter SLM Corp. and global insurance writer American International Group. A moderate underweighting in the energy sector also hampered relative performance, although good stock picking there - particularly in coal producer Peabody Energy - helped narrow the gap. A few good picks within the technology hardware/equipment and transportation groups - among them Hewlett-Packard and US Airways - as well as in the materials sector, helped boost the fund's return. Some of the stocks mentioned here were no longer in the fund at period end.
Note to shareholders: C. Robert Chow became Portfolio Manager of the fund on November 9, 2006.
The views expressed above reflect those of the portfolio manager(s) only through the end of the period as stated on the cover of this report and do not necessarily represent the views of Fidelity or any other person in the Fidelity organization. Any such views are subject to change at any time based upon market or other conditions and Fidelity disclaims any responsibility to update such views. These views may not be relied on as investment advice and, because investment decisions for a Fidelity fund are based on numerous factors, may not be relied on as an indication of trading intent on behalf of any Fidelity fund.
Annual Report
Shareholder Expense Example
As a shareholder of the Fund, you incur two types of costs: (1) transaction costs, and (2) ongoing costs, including management fees and other Fund expenses. This Example is intended to help you understand your ongoing costs (in dollars) of investing in the Fund and to compare these costs with the ongoing costs of investing in other mutual funds.
The Example is based on an investment of $1,000 invested at the beginning of the period and held for the entire period (June 1, 2006 to November 30, 2006).
Actual Expenses
The first line of the accompanying table provides information about actual account values and actual expenses. You may use the information in this line, together with the amount you invested, to estimate the expenses that you paid over the period. Simply divide your account value by $1,000.00 (for example, an $8,600 account value divided by $1,000.00 = 8.6), then multiply the result by the number in the first line under the heading entitled "Expenses Paid During Period" to estimate the expenses you paid on your account during this period. A small balance maintenance fee of $12.00 that is charged once a year may apply for certain accounts with a value of less than $2,000. This fee is not included in the table below. If it was, the estimate of expenses you paid during the period would be higher, and your ending account value lower, by this amount.
Hypothetical Example for Comparison Purposes
The second line of the accompanying table provides information about hypothetical account values and hypothetical expenses based on the Fund's actual expense ratio and an assumed rate of return of 5% per year before expenses, which is not the Fund's actual return. The hypothetical account values and expenses may not be used to estimate the actual ending account balance or expenses you paid for the period. You may use this information to compare the ongoing costs of investing in the Fund and other funds. To do so, compare this 5% hypothetical example with the 5% hypothetical examples that appear in the shareholder reports of the other funds. A small balance maintenance fee of $12.00 that is charged once a year may apply for certain accounts with a value of less than $2,000. This fee is not included in the table below. If it was, the estimate of expenses you paid during the period would be higher, and your ending account value lower, by this amount.
Please note that the expenses shown in the table are meant to highlight your ongoing costs only and do not reflect any transaction costs. Therefore, the second line of the table is useful in comparing ongoing costs only, and will not help you determine the relative total costs of owning different funds.
| Beginning
Account Value
June 1, 2006 | Ending
Account Value
November 30, 2006 | Expenses Paid
During Period*
June 1, 2006
to November 30, 2006 |
Actual | $ 1,000.00 | $ 1,089.10 | $ 3.51 |
Hypothetical (5% return per year before expenses) | $ 1,000.00 | $ 1,021.71 | $ 3.40 |
* Expenses are equal to the Fund's annualized expense ratio of .67%; multiplied by the average account value over the period, multiplied by 183/365 (to reflect the one-half year period).
Annual Report
Investment Changes
Top Ten Stocks as of November 30, 2006 |
| % of fund's
net assets | % of fund's net assets
6 months ago |
Exxon Mobil Corp. | 5.7 | 5.5 |
American International Group, Inc. | 4.4 | 2.0 |
Citigroup, Inc. | 2.9 | 3.3 |
Wal-Mart Stores, Inc. | 2.9 | 5.0 |
General Growth Properties, Inc. | 2.7 | 3.2 |
Bank of America Corp. | 2.7 | 3.0 |
Merck & Co., Inc. | 2.5 | 0.9 |
Burlington Northern Santa Fe Corp. | 2.5 | 1.7 |
AT&T, Inc. | 2.3 | 1.8 |
Pfizer, Inc. | 2.1 | 1.7 |
| 30.7 | |
Top Five Market Sectors as of November 30, 2006 |
| % of fund's
net assets | % of fund's net assets
6 months ago |
Financials | 29.0 | 31.0 |
Energy | 13.3 | 9.0 |
Industrials | 12.6 | 12.3 |
Health Care | 12.1 | 7.1 |
Information Technology | 10.2 | 5.7 |
Asset Allocation (% of fund's net assets) |
As of November 30, 2006* | As of May 31, 2006** |
 | Stocks 99.0% | | | Stocks 93.2% | |
 | Short-Term
Investments and
Net Other Assets 1.0% | | | Short-Term
Investments and
Net Other Assets 6.8% | |
* Foreign investments | 2.4% | | ** Foreign investments | 4.4% | |

Annual Report
Investments November 30, 2006
Showing Percentage of Net Assets
Common Stocks - 99.0% |
| Shares | | Value (Note 1) (000s) |
CONSUMER DISCRETIONARY - 7.5% |
Hotels, Restaurants & Leisure - 0.3% |
Red Robin Gourmet Burgers, Inc. (a)(c) | 860,000 | | $ 29,558 |
Household Durables - 0.8% |
KB Home | 660,000 | | 34,115 |
Whirlpool Corp. | 660,000 | | 56,298 |
| | 90,413 |
Media - 3.8% |
Comcast Corp. Class A | 1,800,000 | | 72,828 |
Dow Jones & Co., Inc. | 1,600,000 | | 57,744 |
The Walt Disney Co. | 3,400,000 | | 112,370 |
Time Warner, Inc. | 5,900,000 | | 118,826 |
Viacom, Inc. Class B (non-vtg.) (a) | 2,200,000 | | 82,522 |
| | 444,290 |
Multiline Retail - 0.5% |
Target Corp. | 1,000,000 | | 58,090 |
Specialty Retail - 1.9% |
Big 5 Sporting Goods Corp. | 873,547 | | 21,376 |
Home Depot, Inc. | 3,800,000 | | 144,286 |
Williams-Sonoma, Inc. | 1,800,000 | | 57,096 |
| | 222,758 |
Textiles, Apparel & Luxury Goods - 0.2% |
Adidas-Salomon AG | 600,000 | | 29,548 |
TOTAL CONSUMER DISCRETIONARY | | 874,657 |
CONSUMER STAPLES - 6.7% |
Beverages - 1.0% |
Anheuser-Busch Companies, Inc. | 1,400,000 | | 66,514 |
The Coca-Cola Co. | 1,000,100 | | 46,835 |
| | 113,349 |
Food & Staples Retailing - 3.2% |
CVS Corp. | 1,100,000 | | 31,647 |
Wal-Mart Stores, Inc. | 7,300,000 | | 336,530 |
| | 368,177 |
Food Products - 1.4% |
General Mills, Inc. | 1,000,000 | | 55,950 |
Hershey Co. | 1,100,000 | | 58,267 |
McCormick & Co., Inc. (non-vtg.) | 1,197,599 | | 46,371 |
| | 160,588 |
Common Stocks - continued |
| Shares | | Value (Note 1) (000s) |
CONSUMER STAPLES - continued |
Household Products - 0.7% |
Kimberly-Clark Corp. | 1,300,000 | | $ 86,411 |
Tobacco - 0.4% |
Altria Group, Inc. | 521,700 | | 43,932 |
TOTAL CONSUMER STAPLES | | 772,457 |
ENERGY - 13.3% |
Energy Equipment & Services - 3.3% |
Baker Hughes, Inc. | 820,000 | | 60,213 |
BJ Services Co. | 1,900,000 | | 64,163 |
Halliburton Co. | 3,700,000 | | 124,838 |
Schlumberger Ltd. (NY Shares) | 1,100,000 | | 75,328 |
Smith International, Inc. | 1,400,000 | | 59,304 |
| | 383,846 |
Oil, Gas & Consumable Fuels - 10.0% |
BP PLC sponsored ADR | 1,800,000 | | 122,544 |
Chevron Corp. | 2,500,000 | | 180,800 |
ConocoPhillips | 1,400,000 | | 94,220 |
Exxon Mobil Corp. | 8,600,000 | | 660,568 |
Massey Energy Co. | 1,713,496 | | 47,155 |
Valero Energy Corp. | 1,100,000 | | 60,577 |
| | 1,165,864 |
TOTAL ENERGY | | 1,549,710 |
FINANCIALS - 29.0% |
Capital Markets - 2.8% |
Merrill Lynch & Co., Inc. | 1,000,000 | | 87,430 |
Morgan Stanley | 1,540,000 | | 117,286 |
Northern Trust Corp. | 1,000,000 | | 56,960 |
State Street Corp. | 920,000 | | 57,160 |
| | 318,836 |
Commercial Banks - 2.6% |
U.S. Bancorp, Delaware | 3,800,000 | | 127,832 |
Wachovia Corp. | 580,657 | | 31,466 |
Wells Fargo & Co. | 4,000,000 | | 140,960 |
| | 300,258 |
Diversified Financial Services - 7.6% |
Bank of America Corp. | 5,900,000 | | 317,715 |
Common Stocks - continued |
| Shares | | Value (Note 1) (000s) |
FINANCIALS - continued |
Diversified Financial Services - continued |
Citigroup, Inc. | 6,900,000 | | $ 342,171 |
JPMorgan Chase & Co. | 4,900,000 | | 226,772 |
| | 886,658 |
Insurance - 11.5% |
AFLAC, Inc. | 3,300,000 | | 145,662 |
American International Group, Inc. | 7,300,000 | | 513,336 |
Genworth Financial, Inc. Class A (non-vtg.) | 3,500,000 | | 114,800 |
Hartford Financial Services Group, Inc. | 1,300,000 | | 111,488 |
Lincoln National Corp. | 900,000 | | 57,231 |
Marsh & McLennan Companies, Inc. | 5,220,870 | | 164,040 |
MetLife, Inc. | 2,000,000 | | 117,460 |
The Chubb Corp. | 1,100,000 | | 56,936 |
XL Capital Ltd. Class A | 820,000 | | 58,318 |
| | 1,339,271 |
Real Estate Investment Trusts - 2.7% |
General Growth Properties, Inc. | 5,800,000 | | 318,652 |
Thrifts & Mortgage Finance - 1.8% |
Fannie Mae | 3,000,000 | | 171,090 |
MGIC Investment Corp. | 700,000 | | 40,572 |
| | 211,662 |
TOTAL FINANCIALS | | 3,375,337 |
HEALTH CARE - 12.1% |
Biotechnology - 0.5% |
Biogen Idec, Inc. (a) | 1,200,000 | | 62,712 |
Health Care Equipment & Supplies - 2.3% |
Bausch & Lomb, Inc. | 600,000 | | 29,052 |
Baxter International, Inc. | 1,600,000 | | 71,584 |
Becton, Dickinson & Co. | 1,200,000 | | 86,064 |
DENTSPLY International, Inc. | 847,054 | | 27,046 |
Hospira, Inc. (a) | 900,000 | | 29,520 |
Respironics, Inc. (a) | 800,000 | | 28,848 |
| | 272,114 |
Health Care Providers & Services - 4.2% |
Caremark Rx, Inc. | 600,000 | | 28,380 |
Health Net, Inc. (a) | 3,300,000 | | 152,262 |
Medco Health Solutions, Inc. (a) | 600,000 | | 30,126 |
Common Stocks - continued |
| Shares | | Value (Note 1) (000s) |
HEALTH CARE - continued |
Health Care Providers & Services - continued |
Quest Diagnostics, Inc. | 1,200,000 | | $ 63,804 |
UnitedHealth Group, Inc. | 4,300,000 | | 211,044 |
| | 485,616 |
Pharmaceuticals - 5.1% |
Merck & Co., Inc. | 6,600,000 | | 293,766 |
Pfizer, Inc. | 8,700,000 | | 239,163 |
Wyeth | 1,200,000 | | 57,936 |
| | 590,865 |
TOTAL HEALTH CARE | | 1,411,307 |
INDUSTRIALS - 12.6% |
Aerospace & Defense - 1.5% |
Lockheed Martin Corp. | 680,000 | | 61,506 |
The Boeing Co. | 680,000 | | 60,200 |
United Technologies Corp. | 880,000 | | 56,786 |
| | 178,492 |
Air Freight & Logistics - 1.5% |
EGL, Inc. (a) | 860,000 | | 27,468 |
United Parcel Service, Inc. Class B | 1,900,000 | | 148,048 |
| | 175,516 |
Building Products - 0.3% |
Masco Corp. | 1,000,000 | | 28,690 |
Industrial Conglomerates - 3.2% |
3M Co. | 460,000 | | 37,472 |
General Electric Co. | 6,400,000 | | 225,792 |
Teleflex, Inc. | 460,000 | | 29,730 |
Tyco International Ltd. | 2,700,000 | | 81,783 |
| | 374,777 |
Machinery - 2.2% |
Caterpillar, Inc. | 960,000 | | 59,549 |
Graco, Inc. | 700,000 | | 29,239 |
Illinois Tool Works, Inc. | 1,200,000 | | 56,640 |
Oshkosh Truck Co. | 640,000 | | 30,726 |
SPX Corp. | 1,200,000 | | 73,332 |
| | 249,486 |
Road & Rail - 3.9% |
Burlington Northern Santa Fe Corp. | 3,800,000 | | 285,608 |
Common Stocks - continued |
| Shares | | Value (Note 1) (000s) |
INDUSTRIALS - continued |
Road & Rail - continued |
CSX Corp. | 2,400,000 | | $ 86,064 |
Laidlaw International, Inc. | 1,389,373 | | 40,361 |
YRC Worldwide, Inc. (a) | 1,200,000 | | 46,500 |
| | 458,533 |
TOTAL INDUSTRIALS | | 1,465,494 |
INFORMATION TECHNOLOGY - 10.2% |
Communications Equipment - 1.0% |
Cisco Systems, Inc. (a) | 2,200,000 | | 59,136 |
Motorola, Inc. | 2,700,000 | | 59,859 |
| | 118,995 |
Computers & Peripherals - 2.6% |
Hewlett-Packard Co. | 4,400,000 | | 173,624 |
International Business Machines Corp. | 1,350,000 | | 124,092 |
| | 297,716 |
Electronic Equipment & Instruments - 1.5% |
Arrow Electronics, Inc. (a) | 866,300 | | 27,514 |
Avnet, Inc. (a) | 4,605,800 | | 114,178 |
Flextronics International Ltd. (a) | 2,500,000 | | 28,125 |
| | 169,817 |
Internet Software & Services - 0.3% |
Yahoo!, Inc. (a) | 1,400,000 | | 37,786 |
IT Services - 0.2% |
Computer Sciences Corp. (a) | 560,000 | | 29,232 |
Semiconductors & Semiconductor Equipment - 4.3% |
Analog Devices, Inc. | 1,800,000 | | 58,536 |
Applied Materials, Inc. | 5,200,000 | | 93,496 |
Intel Corp. | 5,300,000 | | 113,155 |
Linear Technology Corp. | 900,000 | | 28,926 |
Maxim Integrated Products, Inc. | 1,900,000 | | 59,812 |
MKS Instruments, Inc. (a) | 2,700,000 | | 56,187 |
National Semiconductor Corp. | 2,300,000 | | 55,637 |
Verigy Ltd. | 1,800,000 | | 32,112 |
| | 497,861 |
Common Stocks - continued |
| Shares | | Value (Note 1) (000s) |
INFORMATION TECHNOLOGY - continued |
Software - 0.3% |
Microsoft Corp. | 1,000,000 | | $ 29,330 |
TOTAL INFORMATION TECHNOLOGY | | 1,180,737 |
MATERIALS - 1.1% |
Chemicals - 0.6% |
Airgas, Inc. | 1,100,000 | | 46,805 |
FMC Corp. | 306,772 | | 21,744 |
| | 68,549 |
Metals & Mining - 0.5% |
Alcoa, Inc. | 1,000,000 | | 31,170 |
Newmont Mining Corp. | 640,000 | | 30,022 |
| | 61,192 |
TOTAL MATERIALS | | 129,741 |
TELECOMMUNICATION SERVICES - 4.8% |
Diversified Telecommunication Services - 4.3% |
AT&T, Inc. | 8,000,000 | | 271,280 |
BellSouth Corp. | 2,713,700 | | 121,004 |
Verizon Communications, Inc. | 3,300,000 | | 115,302 |
| | 507,586 |
Wireless Telecommunication Services - 0.5% |
Sprint Nextel Corp. | 2,800,000 | | 54,628 |
TOTAL TELECOMMUNICATION SERVICES | | 562,214 |
UTILITIES - 1.7% |
Electric Utilities - 1.1% |
Entergy Corp. | 650,000 | | 59,358 |
Exelon Corp. | 1,208,400 | | 73,386 |
| | 132,744 |
Independent Power Producers & Energy Traders - 0.3% |
TXU Corp. | 500,000 | | 28,695 |
Common Stocks - continued |
| Shares | | Value (Note 1) (000s) |
UTILITIES - continued |
Multi-Utilities - 0.3% |
Duke Energy Corp. | 1,207,200 | | $ 38,292 |
TOTAL UTILITIES | | 199,731 |
TOTAL COMMON STOCKS (Cost $10,076,910) | 11,521,385 |
Money Market Funds - 1.1% |
| | | |
Fidelity Cash Central Fund, 5.35% (b)
(Cost $123,642) | 123,642,001 | | 123,642 |
TOTAL INVESTMENT PORTFOLIO - 100.1% (Cost $10,200,552) | | 11,645,027 |
NET OTHER ASSETS - (0.1)% | | (10,408) |
NET ASSETS - 100% | $ 11,634,619 |
Legend |
(a) Non-income producing |
(b) Affiliated fund that is available only to investment companies and other accounts managed by Fidelity Investments. The rate quoted is the annualized seven-day yield of the fund at period end. A complete unaudited listing of the fund's holdings as of its most recent quarter end is available upon request. |
(c) Affiliated company |
Affiliated Central Funds |
Information regarding fiscal year to date income earned by the Fund from investments in Fidelity Central Funds is as follows: |
Fund | Income earned
(Amounts in thousands) |
Fidelity Cash Central Fund | $ 11,746 |
Fidelity Securities Lending Cash Central Fund | 1,057 |
Total | $ 12,803 |
Other Affiliated Issuers |
An affiliated company is a company in which the fund has ownership of at least 5% of the voting securities. Fiscal year to date transactions with companies which are or were affiliates are as follows: |
Affiliates (Amounts in thousands) | Value, beginning of period | Purchases | Sales Proceeds | Dividend Income | Value, end of period |
FMC Corp. | $ 99,205 | $ 48,907 | $ 163,132 | $ 1,289 | $ - |
MKS Instruments, Inc. | 67,721 | 36,748 | 56,694 | - | - |
Monaco Coach Corp. | 25,770 | - | 20,009 | 208 | - |
Red Robin Gourmet Burgers, Inc. | - | 30,164 | - | - | 29,558 |
Winnebago Industries, Inc. | - | 49,850 | 57,072 | 289 | - |
Total | $ 192,696 | $ 165,669 | $ 296,907 | $ 1,786 | $ 29,558 |
See accompanying notes which are an integral part of the financial statements.
Annual Report
Financial Statements
Statement of Assets and Liabilities
Amounts in thousands (except per-share amount) | November 30, 2006 |
| | |
Assets | | |
Investment in securities, at value -
See accompanying schedule: Unaffiliated issuers (cost $10,046,746) | $ 11,491,827 | |
Fidelity Central Funds (cost $123,642) | 123,642 | |
Other affiliated issuers (cost $30,164) | 29,558 | |
Total Investments (cost $10,200,552) | | $ 11,645,027 |
Foreign currency held at value (cost $20) | | 20 |
Receivable for investments sold | | 255,899 |
Receivable for fund shares sold | | 3,118 |
Dividends receivable | | 21,798 |
Interest receivable | | 891 |
Other receivables | | 434 |
Total assets | | 11,927,187 |
| | |
Liabilities | | |
Payable for investments purchased | $ 266,033 | |
Payable for fund shares redeemed | 19,376 | |
Accrued management fee | 4,485 | |
Other affiliated payables | 2,227 | |
Other payables and accrued expenses | 447 | |
Total liabilities | | 292,568 |
| | |
Net Assets | | $ 11,634,619 |
Net Assets consist of: | | |
Paid in capital | | $ 9,106,113 |
Undistributed net investment income | | 53,029 |
Accumulated undistributed net realized gain (loss) on investments and foreign currency transactions | | 1,031,002 |
Net unrealized appreciation (depreciation) on investments and assets and liabilities in foreign currencies | | 1,444,475 |
Net Assets, for 463,136 shares outstanding | | $ 11,634,619 |
Net Asset Value, offering price and redemption price per share ($11,634,619 ÷ 463,136 shares) | | $ 25.12 |
See accompanying notes which are an integral part of the financial statements.
Annual Report
Financial Statements - continued
Statement of Operations
Amounts in thousands | Year ended November 30, 2006 |
| | |
Investment Income | | |
Dividends (including $1,786 earned from other affiliated issuers) | | $ 238,136 |
Interest | | 1,630 |
Income from Fidelity Central Funds | | 12,803 |
Total income | | 252,569 |
| | |
Expenses | | |
Management fee | $ 54,695 | |
Transfer agent fees | 21,442 | |
Accounting and security lending fees | 1,349 | |
Custodian fees and expenses | 189 | |
Independent trustees' compensation | 45 | |
Appreciation in deferred trustee compensation account | 10 | |
Registration fees | 53 | |
Audit | 126 | |
Legal | 193 | |
Interest | 63 | |
Miscellaneous | 478 | |
Total expenses before reductions | 78,643 | |
Expense reductions | (1,502) | 77,141 |
Net investment income (loss) | | 175,428 |
Realized and Unrealized Gain (Loss) Net realized gain (loss) on: | | |
Investment securities: | | |
Unaffiliated issuers | 1,016,709 | |
Other affiliated issuers | 52,175 | |
Foreign currency transactions | (126) | |
Total net realized gain (loss) | | 1,068,758 |
Change in net unrealized appreciation (depreciation) on: Investment securities | 106,693 | |
Assets and liabilities in foreign currencies | (5) | |
Total change in net unrealized appreciation (depreciation) | | 106,688 |
Net gain (loss) | | 1,175,446 |
Net increase (decrease) in net assets resulting from operations | | $ 1,350,874 |
See accompanying notes which are an integral part of the financial statements.
Annual Report
Statement of Changes in Net Assets
Amounts in thousands | Year ended
November 30,
2006 | Year ended
November 30,
2005 |
Increase (Decrease) in Net Assets | | |
Operations | | |
Net investment income (loss) | $ 175,428 | $ 183,198 |
Net realized gain (loss) | 1,068,758 | 1,019,642 |
Change in net unrealized appreciation (depreciation) | 106,688 | (325,042) |
Net increase (decrease) in net assets resulting
from operations | 1,350,874 | 877,798 |
Distributions to shareholders from net investment income | (161,449) | (213,550) |
Distributions to shareholders from net realized gain | (950,596) | (333,350) |
Total distributions | (1,112,045) | (546,900) |
Share transactions
Proceeds from sales of shares | 684,251 | 910,438 |
Reinvestment of distributions | 1,066,583 | 522,706 |
Cost of shares redeemed | (2,602,829) | (2,147,906) |
Net increase (decrease) in net assets resulting from share transactions | (851,995) | (714,762) |
Total increase (decrease) in net assets | (613,166) | (383,864) |
| | |
Net Assets | | |
Beginning of period | 12,247,785 | 12,631,649 |
End of period (including undistributed net investment income of $53,029 and undistributed net investment income of $40,878, respectively) | $ 11,634,619 | $ 12,247,785 |
Other Information Shares | | |
Sold | 28,934 | 38,615 |
Issued in reinvestment of distributions | 46,025 | 22,238 |
Redeemed | (110,366) | (90,786) |
Net increase (decrease) | (35,407) | (29,933) |
See accompanying notes which are an integral part of the financial statements.
Annual Report
Financial Highlights
Years ended November 30, | 2006 | 2005 | 2004 | 2003 | 2002 |
Selected Per-Share Data | | | | | |
Net asset value,
beginning of period | $ 24.57 | $ 23.90 | $ 21.52 | $ 18.72 | $ 21.21 |
Income from Investment Operations | | | | | |
Net investment income (loss) B | .35 | .35 | .35 E | .25 | .24 |
Net realized and unrealized gain (loss) | 2.44 | 1.36 | 2.49 | 2.78 | (1.65) |
Total from investment
operations | 2.79 | 1.71 | 2.84 | 3.03 | (1.41) |
Distributions from net investment income | (.33) | (.41) | (.29) | (.23) | (.23) |
Distributions from net realized gain | (1.91) | (.63) | (.17) | - | (.85) |
Total distributions | (2.24) | (1.04) | (.46) | (.23) | (1.08) |
Net asset value, end of period | $ 25.12 | $ 24.57 | $ 23.90 | $ 21.52 | $ 18.72 |
Total Return A | 12.28% | 7.41% | 13.32% | 16.40% | (7.08)% |
Ratios to Average Net Assets C, F | | | | | |
Expenses before reductions | .67% | .68% | .68% | .70% | .70% |
Expenses net of fee waivers,
if any | .67% | .68% | .68% | .70% | .70% |
Expenses net of all reductions | .66% | .62% | .64% | .64% | .63% |
Net investment income (loss) | 1.50% | 1.49% | 1.56% | 1.31% | 1.26% |
Supplemental Data | | | | | |
Net assets, end of period
(in millions) | $ 11,635 | $ 12,248 | $ 12,632 | $ 11,525 | $ 10,156 |
Portfolio turnover rate D | 160% | 143% | 123% | 131% | 135% |
A Total returns would have been lower had certain expenses not been reduced during the periods shown.
B Calculated based on average shares outstanding during the period.
C Fees and expenses of the underlying Fidelity Central Funds are not included in the Fund's expense ratio. The Fund indirectly bears its proportionate share of the expenses of any underlying Fidelity Central Funds.
D Amount does not include the portfolio activity of any underlying Fidelity Central Funds.
E Investment income per share reflects a special dividend which amounted to $.06 per share.
F Expense ratios reflect operating expenses of the Fund. Expenses before reductions do not reflect amounts reimbursed by the investment adviser or reductions from brokerage service arrangements or other expense offset arrangements and do not represent the amount paid by the Fund during periods when reimbursements or reductions occur. Expenses net of fee waivers reflect expenses after reimbursement by the investment adviser but prior to reductions from brokerage service arrangements or other expense offset arrangements. Expenses net of all reductions represent the net expenses paid by the Fund.
See accompanying notes which are an integral part of the financial statements.
Annual Report
Notes to Financial Statements
For the period ended November 30, 2006
(Amounts in thousands except ratios)
1. Significant Accounting Policies.
Fidelity Equity-Income II Fund (the Fund) is a fund of Fidelity Financial Trust (the trust) and is authorized to issue an unlimited number of shares. The trust is registered under the Investment Company Act of 1940, as amended (the 1940 Act), as an open-end management investment company organized as a Massachusetts business trust. The Fund may invest in Fidelity Central Funds which are open-end investment companies available to investment companies and other accounts managed by Fidelity Management & Research Company (FMR) and its affiliates. The financial statements have been prepared in conformity with accounting principles generally accepted in the United States of America, which require management to make certain estimates and assumptions at the date of the financial statements. The following summarizes the significant accounting policies of the Fund, which are also consistently followed by the Fidelity Central Funds:
Security Valuation. Investments are valued and net asset value (NAV) per share is calculated (NAV calculation) as of the close of business of the New York Stock Exchange (NYSE), normally 4:00 p.m. Eastern time. Wherever possible, the Fund uses independent pricing services approved by the Board of Trustees to value its investments.
Equity securities, including restricted securities, for which market quotations are readily available, are valued at the last reported sale price or official closing price as reported by an independent pricing service on the primary market or exchange on which they are traded. In the event there were no sales during the day or closing prices are not available, securities are valued at the last quoted bid price. Investments in open-end mutual funds, including the Fidelity Central Funds, are valued at their closing net asset value each business day. Short-term securities with remaining maturities of sixty days or less for which quotations are not readily available are valued at amortized cost, which approximates value.
When current market prices or quotations are not readily available or do not accurately reflect fair value, valuations may be determined in accordance with procedures adopted by the Board of Trustees. For example, when developments occur between the close of a market and the close of the NYSE that may materially affect the value of some or all of the securities, or when trading in a security is halted, those securities may be fair valued. Factors used in the determination of fair value may include monitoring news to identify significant market or security specific events such as changes in the value of U.S. securities markets, reviewing developments in foreign markets and evaluating the performance of ADRs, futures contracts and exchange-traded funds. Because the Fund's utilization of fair value pricing depends on market activity, the frequency with which fair value pricing is used can not be predicted and may be utilized to a significant extent. The value of securities used for NAV calculation under fair value pricing may differ from published prices for the same securities.
Annual Report
Notes to Financial Statements - continued
(Amounts in thousands except ratios)
1. Significant Accounting Policies - continued
Foreign Currency. The Fund uses foreign currency contracts to facilitate transactions in foreign-denominated securities. Losses from these transactions may arise from changes in the value of the foreign currency or if the counterparties do not perform under the contracts' terms.
Foreign-denominated assets, including investment securities, and liabilities are translated into U.S. dollars at the exchange rate at period end. Purchases and sales of investment securities, income and dividends received and expenses denominated in foreign currencies are translated into U.S. dollars at the exchange rate in effect on the transaction date.
The effects of exchange rate fluctuations on investments are included with the net realized and unrealized gain (loss) on investment securities. Other foreign currency transactions resulting in realized and unrealized gain (loss) are disclosed separately.
Investment Transactions and Income. Security transactions, including the Fund's investment activity in the Fidelity Central Funds, are accounted for as of trade date. Gains and losses on securities sold are determined on the basis of identified cost and may include proceeds received from litigation. Dividend income is recorded on the ex-dividend date, except for certain dividends from foreign securities where the ex-dividend date may have passed, which are recorded as soon as the Fund is informed of the ex-dividend date. Non-cash dividends included in dividend income, if any, are recorded at the fair market value of the securities received. Distributions received on securities that represent a return of capital or capital gain are recorded as a reduction of cost of investments and/or as a realized gain. The Fund estimates the components of distributions received that may be considered return of capital distributions or capital gain distributions. Interest income and income distributions from the Fidelity Central Funds are accrued as earned, with any income distributions receivable as of period end included in Interest Receivable on the Statement of Assets and Liabilities. Interest income includes coupon interest and amortization of premium and accretion of discount on debt securities. Investment income is recorded net of foreign taxes withheld where recovery of such taxes is uncertain.
Expenses. Most expenses of the trust can be directly attributed to a fund. Expenses which cannot be directly attributed are apportioned among each Fund in the trust. Expense estimates are accrued in the period to which they relate and adjustments are made when actual amounts are known.
Annual Report
1. Significant Accounting Policies - continued
Deferred Trustee Compensation. Under a Deferred Compensation Plan (the Plan), Independent Trustees must defer receipt of a portion of, and may elect to defer receipt of an additional portion of, their annual compensation. Deferred amounts are invested in a cross-section of Fidelity funds, are marked-to-market and remain in the Fund until distributed in accordance with the Plan. The investment of deferred amounts and the offsetting payable to the Trustees are included in the accompanying Statement of Assets and Liabilities.
Income Tax Information and Distributions to Shareholders. Each year, the Fund intends to qualify as a regulated investment company by distributing all of its taxable income and realized gains under Subchapter M of the Internal Revenue Code. As a result, no provision for income taxes is required in the accompanying financial statements. Foreign taxes are provided for based on the Fund's understanding of the tax rules and rates that exist in the foreign markets in which it invests.
Distributions are recorded on the ex-dividend date. Income and capital gain distributions are determined in accordance with income tax regulations, which may differ from generally accepted accounting principles. In addition, the Fund will claim a portion of the payment made to redeeming shareholders as a distribution for income tax purposes.
Capital accounts within the financial statements are adjusted for permanent book-tax differences. These adjustments have no impact on net assets or the results of operations. Temporary book-tax differences will reverse in a subsequent period.
Book-tax differences are primarily due to short-term capital gains, foreign currency transactions, passive foreign investment companies (PFIC), market discount, deferred trustees compensation, and losses deferred due to wash sales.
The tax-basis components of distributable earnings and the federal tax cost as of period end were as follows:
Unrealized appreciation | $ 1,480,477 | |
Unrealized depreciation | (51,730) | |
Net unrealized appreciation (depreciation) | 1,428,747 | |
Undistributed ordinary income | 411,152 | |
Undistributed long-term capital gain | 611,814 | |
| | |
Cost for federal income tax purposes | $ 10,216,280 | |
Annual Report
Notes to Financial Statements - continued
(Amounts in thousands except ratios)
1. Significant Accounting Policies - continued
Income Tax Information and Distributions to Shareholders - continued
The tax character of distributions paid was as follows:
| November 30, 2006 | November 30, 2005 |
Ordinary Income | $ 208,243 | $ 234,787 |
Long-term Capital Gains | 903,802 | 312,113 |
Total | $ 1,112,045 | $ 546,900 |
New Accounting Pronouncements. In July 2006, Financial Accounting Standards Board Interpretation No. 48, Accounting for Uncertainty in Income Taxes - an interpretation of FASB Statement 109 (FIN 48), was issued and is effective for fiscal years beginning after December 15, 2006. FIN 48 sets forth a threshold for financial statement recognition, measurement and disclosure of a tax position taken or expected to be taken on a tax return. Management is currently evaluating the impact, if any, the adoption of FIN 48 will have on the Fund's net assets, results of operations and financial statement disclosures.
In addition, in September 2006, Statement of Financial Accounting Standards No. 157, Fair Value Measurements (SFAS 157), was issued and is effective for fiscal years beginning after November 15, 2007. SFAS 157 defines fair value, establishes a framework for measuring fair value and expands disclosures about fair value measurements. Management is currently evaluating the impact the adoption of SFAS 157 will have on the Fund's financial statement disclosures.
2. Operating Policies.
Repurchase Agreements. FMR has received an Exemptive Order from the Securities and Exchange Commission (the SEC) which permits the Fund and other affiliated entities of FMR to transfer uninvested cash balances into joint trading accounts which are then invested in repurchase agreements. The Fund may also invest directly with institutions in repurchase agreements. Repurchase agreements are collateralized by government or non-government securities. Upon settlement date, collateral is held in segregated accounts with custodian banks and may be obtained in the event of a default of the counterparty. The Fund monitors, on a daily basis, the value of the collateral to ensure it is at least equal to the principal amount of the repurchase agreement (including accrued interest). In the event of a default by the counterparty, realization of the collateral proceeds could be delayed, during which time the value of the collateral may decline.
Annual Report
3. Purchases and Sales of Investments.
Purchases and sales of securities other than short-term securities, aggregated $18,394,748 and $20,169,591, respectively.
4. Fees and Other Transactions with Affiliates.
Management Fee. FMR and its affiliates provide the Fund with investment management related services for which the Fund pays a monthly management fee. The management fee is the sum of an individual fund fee rate that is based on an annual rate of .20% of the Fund's average net assets and a group fee rate that averaged ..27% during the period. The group fee rate is based upon the average net assets of all the mutual funds advised by FMR. The group fee rate decreases as assets under management increase and increases as assets under management decrease. For the period, the total annual management fee rate was .47% of the Fund's average net assets.
Transfer Agent Fees. Fidelity Service Company, Inc. (FSC), an affiliate of FMR, is the Fund's transfer, dividend disbursing and shareholder servicing agent. FSC receives account fees and asset-based fees that vary according to account size and type of account. FSC pays for typesetting, printing and mailing of shareholder reports, except proxy statements. For the period, the transfer agent fees were equivalent to an annual rate of .18% of average net assets.
Accounting and Security Lending Fees. FSC maintains the Fund's accounting records. The accounting fee is based on the level of average net assets for the month. Under a separate contract, FSC administers the security lending program. The security lending fee is based on the number and duration of lending transactions.
Investments in Fidelity Central Funds. The Fund may invest in Fidelity Central Funds. The Fund's Schedule of Investments lists each of the Fidelity Central Funds as an investment of the Fund but does not include the underlying holdings of each Fidelity Central Fund. As an Investing Fund, the Fund indirectly bears its proportionate share of the expenses of the underlying Fidelity Central Funds. A complete unaudited list of holdings for each Fidelity Central Fund is available upon request. In addition, the financial statements of the Fidelity Central Funds, which are not covered by the Fund's Report of Independent Registered Public Accounting Firm, are available on the EDGAR Database on the SEC's web site, www.sec.gov, or upon request.
The Money Market Central Funds seek preservation of capital and current income and are managed by Fidelity Investments Money Management, Inc. (FIMM), an affiliate of FMR.
Brokerage Commissions. The Fund placed a portion of its portfolio transactions with brokerage firms which are affiliates of the investment adviser. The commissions paid to these affiliated firms were $121 for the period.
Annual Report
Notes to Financial Statements - continued
(Amounts in thousands except ratios)
4. Fees and Other Transactions with Affiliates - continued
Interfund Lending Program. Pursuant to an Exemptive Order issued by the SEC, the Fund, along with other registered investment companies having management contracts with FMR, may participate in an interfund lending program. This program provides an alternative credit facility allowing the funds to borrow from, or lend money to, other participating affiliated funds. At period end, there were no interfund loans outstanding. The Fund's activity in this program during the period for which loans were outstanding was as follows:
Borrower or Lender | Average Daily Loan Balance | Weighted Average Interest Rate | Interest
Expense |
Borrower | $ 25,139 | 4.98% | $ 63 |
5. Committed Line of Credit.
The Fund participates with other funds managed by FMR in a $4.2 billion credit facility (the "line of credit") to be utilized for temporary or emergency purposes to fund shareholder redemptions or for other short-term liquidity purposes. The Fund has agreed to pay commitment fees on its pro rata portion of the line of credit, which amounts to $33 and is reflected in Miscellaneous Expense on the Statement of Operations. During the period, there were no borrowings on this line of credit.
6. Security Lending.
The Fund lends portfolio securities from time to time in order to earn additional income. On the settlement date of the loan, the Fund receives collateral (in the form of U.S. Treasury obligations, letters of credit and/or cash) against the loaned securities and maintains collateral in an amount not less than 100% of the market value of the loaned securities during the period of the loan. The market value of the loaned securities is determined at the close of business of the Fund and any additional required collateral is delivered to the Fund on the next business day. If the borrower defaults on its obligation to return the securities loaned because of insolvency or other reasons, a fund could experience delays and costs in recovering the securities loaned or in gaining access to the collateral. Any cash collateral received is invested in the Fidelity Securities Lending Cash Central Fund. At period end, there were no security loans outstanding. Security lending income represents the income earned on investing cash collateral, less fees and expenses associated with the loan, plus any premium payments that may be received on the loan of certain types of securities. Security lending income is presented in the Statement of Operations as a component of income from Fidelity Central Funds. Net income from lending portfolio securities during the period amounted to $1,057.
Annual Report
7. Expense Reductions.
Many of the brokers with whom FMR places trades on behalf of the Fund provided services to the Fund in addition to trade execution. These services included payments of certain expenses on behalf of the Fund totaling $1,106 for the period. In addition, through arrangements with the Fund's custodian and transfer agent, credits realized as a result of uninvested cash balances were used to reduce the Fund's expenses. During the period, these credits reduced the Fund's custody and transfer agent expenses by $1 and $395, respectively.
8. Other.
The Fund's organizational documents provide former and current trustees and officers with a limited indemnification against liabilities arising in connection with the performance of their duties to the Fund. In the normal course of business, the Fund may also enter into contracts that provide general indemnifications. The Fund's maximum exposure under these arrangements is unknown as this would be dependent on future claims that may be made against the Fund. The risk of material loss from such claims is considered remote.
The United States Securities and Exchange Commission ("SEC") is conducting an investigation of FMR (covering the years 2002 to 2004) arising from gifts, gratuities and business entertainment provided by certain brokers to certain individuals who were employed on FMR's domestic equity trading desk during that period. FMR is in discussions with the SEC staff regarding the possible resolution of the matter, but as of period-end no final resolution has been reached.
In December 2006, the Independent Trustees completed their own investigation of the matter with the assistance of independent counsel. The Independent Trustees and FMR agree that, despite the absence of proof that the Fidelity mutual funds experienced diminished execution quality as a result of the improper receipt of gifts and business entertainment, the conduct at issue was serious and is worthy of redress. Accordingly, the Independent Trustees have requested and FMR has agreed to pay $42 million to Fidelity mutual funds, plus interest to be determined at the time that payment is made. A method of allocating this payment among the funds has not yet been determined. In addition, subsequent to period-end, FMR has reimbursed related legal expenses. The total payment to the Fund is not anticipated to have a material impact on the Fund's net assets.
Annual Report
Report of Independent Registered Public Accounting Firm
To the Trustees of Fidelity Financial Trust and the Shareholders of Fidelity Equity-Income II Fund:
In our opinion, the accompanying statement of assets and liabilities, including the schedule of investments, and the related statements of operations and of changes in net assets and the financial highlights present fairly, in all material respects, the financial position of Fidelity Equity-Income II Fund (a fund of Fidelity Financial Trust) at November 30, 2006, the results of its operations for the year then ended, the changes in its net assets for each of the two years in the period then ended and the financial highlights for each of the five years in the period then ended, in conformity with accounting principles generally accepted in the United States of America. These financial statements and financial highlights (hereafter referred to as "financial statements") are the responsibility of the Fidelity Equity-Income II Fund's management; our responsibility is to express an opinion on these financial statements based on our audits. We conducted our audits of these financial statements in accordance with the standards of the Public Company Accounting Oversight Board (United States). Those standards require that we plan and perform the audit to obtain reasonable assurance about whether the financial statements are free of material misstatement. An audit includes examining, on a test basis, evidence supporting the amounts and disclosures in the financial statements, assessing the accounting principles used and significant estimates made by management, and evaluating the overall financial statement presentation. We believe that our audits, which included confirmation of securities at November 30, 2006 by correspondence with the custodian and brokers, provide a reasonable basis for our opinion.
PricewaterhouseCoopers LLP
Boston, Massachusetts
January 18, 2007
Annual Report
Trustees and Officers
The Trustees, Member of the Advisory Board, and executive officers of the trust and fund, as applicable, are listed below. The Board of Trustees governs the fund and is responsible for protecting the interests of shareholders. The Trustees are experienced executives who meet periodically throughout the year to oversee the fund's activities, review contractual arrangements with companies that provide services to the fund, and review the fund's performance. Except for William O. McCoy, each of the Trustees oversees 348 funds advised by FMR or an affiliate. Mr. McCoy oversees 350 funds advised by FMR or an affiliate.
The Trustees hold office without limit in time except that (a) any Trustee may resign; (b) any Trustee may be removed by written instrument, signed by at least two-thirds of the number of Trustees prior to such removal; (c) any Trustee who requests to be retired or who has become incapacitated by illness or injury may be retired by written instrument signed by a majority of the other Trustees; and (d) any Trustee may be removed at any special meeting of shareholders by a two-thirds vote of the outstanding voting securities of the trust. Each Trustee who is not an interested person (as defined in the 1940 Act) (Independent Trustee), shall retire not later than the last day of the calendar year in which his or her 72nd birthday occurs. The Independent Trustees may waive this mandatory retirement age policy with respect to individual Trustees. The executive officers and Advisory Board Member hold office without limit in time, except that any officer and Advisory Board Member may resign or may be removed by a vote of a majority of the Trustees at any regular meeting or any special meeting of the Trustees. Except as indicated, each individual has held the office shown or other offices in the same company for the past five years.
The fund's Statement of Additional information (SAI) includes more information about the Trustees. To request a free copy, call Fidelity at 1-800-544-8544.
Interested Trustees*:
Correspondence intended for each Trustee who is an interested person may be sent to Fidelity Investments, 82 Devonshire Street, Boston, Massachusetts 02109.
Name, Age; Principal Occupation |
Edward C. Johnson 3d (76) |
| Year of Election or Appointment: 1982 Mr. Johnson is Chairman of the Board of Trustees. Mr. Johnson serves as President (2006-present), Chief Executive Officer, Chairman, and a Director of FMR Corp.; Chairman and a Director of FMR; Chairman and a Director of Fidelity Research & Analysis Company (FRAC); Chairman and a Director of Fidelity Investments Money Management, Inc.; and Chairman (2001-present) and a Director of FMR Co., Inc. In addition, Mr. Johnson serves as Chairman and Director of Fidelity International Limited (FIL). |
Robert L. Reynolds (54) |
| Year of Election or Appointment: 2003 Mr. Reynolds is President and a Director of FMR (2005-present), Fidelity Investments Money Management, Inc. (2005-present), and FMR Co., Inc. (2005-present). Mr. Reynolds also serves as Vice Chairman (2006-present), a Director (2003-present), and Chief Operating Officer of FMR Corp. and a Director of Strategic Advisers, Inc. (2005-present). He also serves on the Board at Fidelity Investments Canada, Ltd. |
* Trustees have been determined to be "Interested Trustees" by virtue of, among other things, their affiliation with the trust or various entities under common control with FMR.
Annual Report
Independent Trustees:
Correspondence intended for each Independent Trustee (that is, the Trustees other than the Interested Trustees) may be sent to Fidelity Investments, P.O. Box 55235, Boston, Massachusetts 02205-5235.
Name, Age; Principal Occupation |
Dennis J. Dirks (58) |
| Year of Election or Appointment: 2005 Prior to his retirement in May 2003, Mr. Dirks was Chief Operating Officer and a member of the Board of The Depository Trust & Clearing Corporation (DTCC) (1999-2003). He also served as President, Chief Operating Officer, and Board member of The Depository Trust Company (DTC) (1999-2003) and President and Board member of the National Securities Clearing Corporation (NSCC) (1999-2003). In addition, Mr. Dirks served as Chief Executive Officer and Board member of the Government Securities Clearing Corporation (2001-2003) and Chief Executive Officer and Board member of the Mortgage-Backed Securities Clearing Corporation (2001-2003). Mr. Dirks also serves as a Trustee and a member of the Finance Committee of Manhattan College (2005-present) and a Trustee and a member of the Finance Committee of AHRC of Nassau County (2006-present). |
Albert R. Gamper, Jr. (64) |
| Year of Election or Appointment: 2006 Prior to his retirement in December 2004, Mr. Gamper served as Chairman of the Board of CIT Group Inc. (commercial finance). During his tenure with CIT Group Inc. Mr. Gamper served in numerous senior management positions, including Chairman (1987-1989; 1999-2001; 2002-2004), Chief Executive Officer (1987-2004), and President (1989-2002). He currently serves as a member of the Board of Directors of Public Service Enterprise Group (utilities, 2001-present), Chairman of the Board of Governors, Rutgers University (2004-present), and Chairman of the Board of Saint Barnabas Health Care System. |
George H. Heilmeier (70) |
| Year of Election or Appointment: 2004 Dr. Heilmeier is Chairman Emeritus of Telcordia Technologies (communication software and systems), where prior to his retirement, he served as company Chairman and Chief Executive Officer. He currently serves on the Boards of Directors of The Mitre Corporation (systems engineering and information technology support for the government), and HRL Laboratories (private research and development, 2004-present). He is Chairman of the General Motors Science & Technology Advisory Board and a Life Fellow of the Institute of Electrical and Electronics Engineers (IEEE). Dr. Heilmeier is a member of the Defense Science Board and the National Security Agency Advisory Board. He is also a member of the National Academy of Engineering, the American Academy of Arts and Sciences, and the Board of Overseers of the School of Engineering and Applied Science of the University of Pennsylvania. Previously, Dr. Heilmeier served as a Director of TRW Inc. (automotive, space, defense, and information technology, 1992-2002), Compaq (1994-2002), Automatic Data Processing, Inc. (ADP) (technology-based business outsourcing, 1995-2002), INET Technologies Inc. (telecommunications network surveillance, 2001-2004), and Teletech Holdings (customer management services). He is the recipient of the 2005 Kyoto Prize in Advanced Technology for his invention of the liquid crystal display, and a member of the Consumer Electronics Hall of Fame. |
James H. Keyes (66) |
| Year of Election or Appointment: 2007 Prior to his retirement in 2003, Mr. Keyes was Chairman, President, and Chief Executive Officer of Johnson Controls, Inc. (automotive supplier, 1993-2003). He currently serves as a member of the boards of LSI Logic Corporation (semiconductor technologies), Navistar International Corporation (manufacture and sale of trucks, buses, and diesel engines, 2002-present), and Pitney Bowes, Inc. (integrated mail, messaging, and document management solutions). |
Marie L. Knowles (60) |
| Year of Election or Appointment: 2001 Prior to Ms. Knowles' retirement in June 2000, she served as Executive Vice President and Chief Financial Officer of Atlantic Richfield Company (ARCO) (diversified energy, 1996-2000). From 1993 to 1996, she was a Senior Vice President of ARCO and President of ARCO Transportation Company. She served as a Director of ARCO from 1996 to 1998. She currently serves as a Director of Phelps Dodge Corporation (copper mining and manufacturing) and McKesson Corporation (healthcare service, 2002-present). Ms. Knowles is a Trustee of the Brookings Institution and the Catalina Island Conservancy and also serves as a member of the Advisory Board for the School of Engineering of the University of Southern California. |
Ned C. Lautenbach (62) |
| Year of Election or Appointment: 2000 Mr. Lautenbach is Chairman of the Independent Trustees (2006-present). Mr. Lautenbach has been a partner of Clayton, Dubilier & Rice, Inc. (private equity investment firm) since September 1998. Previously, Mr. Lautenbach was with the International Business Machines Corporation (IBM) from 1968 until his retirement in 1998. Mr. Lautenbach serves as a Director of Sony Corporation (2006-present) and Eaton Corporation (diversified industrial) as well as the Philharmonic Center for the Arts in Naples, Florida. He also is a member of the Board of Trustees of Fairfield University (2005-present), as well as a member of the Council on Foreign Relations. |
William O. McCoy (73) |
| Year of Election or Appointment: 1997 Prior to his retirement in December 1994, Mr. McCoy was Vice Chairman of the Board of BellSouth Corporation (telecommunications) and President of BellSouth Enterprises. He is currently a Director of Duke Realty Corporation (real estate). He is also a partner of Franklin Street Partners (private investment management firm). In addition, Mr. McCoy served as the Interim Chancellor (1999-2000) and a member of the Board of Visitors for the University of North Carolina at Chapel Hill and currently serves as Chairman of the Board of Directors of the University of North Carolina Health Care System. He also served as Vice President of Finance for the University of North Carolina (16-school system). |
Cornelia M. Small (62) |
| Year of Election or Appointment: 2005 Ms. Small is a member (2000-present) and Chairperson (2002-present) of the Investment Committee, and a member (2002-present) of the Board of Trustees of Smith College. Previously, she served as Chief Investment Officer (1999-2000), Director of Global Equity Investments (1996-1999), and a member of the Board of Directors of Scudder, Stevens & Clark (1990-1997) and Scudder Kemper Investments (1997-1999). In addition, Ms. Small served as Co-Chair (2000-2003) of the Annual Fund for the Fletcher School of Law and Diplomacy. |
William S. Stavropoulos (67) |
| Year of Election or Appointment: 2002 Mr. Stavropoulos is Chairman Emeritus of the Board of Directors of The Dow Chemical Company. Since joining The Dow Chemical Company in 1967, Mr. Stavropoulos served in numerous senior management positions, including President (1993-2000; 2002-2003), CEO (1995-2000; 2002-2004), and Chairman of the Executive Committee (2000-2004). Currently, he is a Director of NCR Corporation (data warehousing and technology solutions), BellSouth Corporation (telecommunications), Chemical Financial Corporation, Maersk Inc. (industrial conglomerate, 2002-present), and Metalmark Capital (private equity investment firm, 2005-present). He also serves as a member of the Board of Trustees of the American Enterprise Institute for Public Policy Research. In addition, Mr. Stavropoulos is a member of The Business Council, J.P. Morgan International Council and the University of Notre Dame Advisory Council for the College of Science. |
Kenneth L. Wolfe (67) |
| Year of Election or Appointment: 2005 Prior to his retirement in 2001, Mr. Wolfe was Chairman and Chief Executive Officer of Hershey Foods Corporation (1993-2001). He currently serves as a member of the boards of Adelphia Communications Corporation (2003-present), Bausch & Lomb, Inc., and Revlon Inc. (2004-present). |
Annual Report
Advisory Board Member and Executive Officers:
Correspondence intended for each executive officer and Mr. Lynch may be sent to Fidelity Investments, 82 Devonshire Street, Boston, Massachusetts 02109.
Name, Age; Principal Occupation |
Peter S. Lynch (62) |
| Year of Election or Appointment: 2003 Member of the Advisory Board of Fidelity Financial Trust. Mr. Lynch is Vice Chairman and a Director of FMR, and Vice Chairman (2001-present) and a Director of FMR Co., Inc. Previously, Mr. Lynch served as a Trustee of the Fidelity funds (1990-2003). In addition, he serves as a Trustee of Boston College and as the Chairman of the Inner-City Scholarship Fund. |
Dwight D. Churchill (52) |
| Year of Election or Appointment: 2005 Vice President of Equity-Income II. Mr. Churchill also serves as Vice President of certain Equity Funds (2005-present). Mr. Churchill is Executive Vice President of FMR (2005-present) and FMR Co., Inc. (2005-present). Previously, Mr. Churchill served as Senior Vice President of Fidelity Investments Money Management, Inc. (2005-2006), Head of Fidelity's Fixed-Income Division (2000-2005), Vice President of Fidelity's Money Market Funds (2000-2005), Vice President of Fidelity's Bond Funds, and Senior Vice President of FMR. |
Bruce T. Herring (41) |
| Year of Election or Appointment: 2006 Vice President of Equity-Income II. Mr. Herring also serves as Vice President of certain Equity Funds (2006-present). Mr. Herring is Senior Vice President of FMR (2006-present) and Vice President of FMR Co., Inc. (2001-present). Previously, Mr. Herring served as a portfolio manager for Fidelity U.S. Equity Funds (2001-2005). |
C. Robert Chow (45) |
| Year of Election or Appointment: 2006 Vice President of Equity Income II. Mr. Chow also serves as Vice President of another fund advised by FMR. Prior to assuming his current responsibilities, Mr. Chow worked as a research analyst and manager. Mr. Chow also serves as Vice President of FMR (1999) and FMR Co., Inc. (2001). |
Eric D. Roiter (58) |
| Year of Election or Appointment: 1998 Secretary of Equity-Income II. He also serves as Secretary of other Fidelity funds; Vice President, General Counsel, and Secretary of FMR Co., Inc. (2001-present) and FMR; Assistant Secretary of Fidelity Management & Research (U.K.) Inc. (2001-present), Fidelity Research & Analysis Company (2001-present), and Fidelity Investments Money Management, Inc. (2001-present). Mr. Roiter is an Adjunct Member, Faculty of Law, at Boston College Law School (2003-present). Previously, Mr. Roiter served as Vice President and Secretary of Fidelity Distributors Corporation (FDC) (1998-2005). |
Stuart Fross (47) |
| Year of Election or Appointment: 2003 Assistant Secretary of Equity-Income II. Mr. Fross also serves as Assistant Secretary of other Fidelity funds (2003-present), Vice President and Secretary of FDC (2005-present), and is an employee of FMR. |
R. Stephen Ganis (40) |
| Year of Election or Appointment: 2006 Anti-Money Laundering (AML) officer of Equity-Income II. Mr. Ganis also serves as AML officer of other Fidelity funds (2006-present) and FMR Corp. (2003-present). Before joining Fidelity Investments, Mr. Ganis practiced law at Goodwin Procter, LLP (2000-2002). |
Joseph B. Hollis (58) |
| Year of Election or Appointment: 2006 Chief Financial Officer of Equity-Income II. Mr. Hollis also serves as Chief Financial Officer of other Fidelity funds. Mr. Hollis is President of Fidelity Pricing and Cash Management Services (FPCMS) (2005-present). Mr. Hollis also serves as President and Director of Fidelity Service Company, Inc. (2006-present). Previously, Mr. Hollis served as Senior Vice President of Cash Management Services (1999-2002) and Investment Management Operations (2002-2005). |
Kenneth A. Rathgeber (59) |
| Year of Election or Appointment: 2004 Chief Compliance Officer of Equity-Income II. Mr. Rathgeber also serves as Chief Compliance Officer of other Fidelity funds (2004-present) and Executive Vice President of Risk Oversight for Fidelity Investments (2002-present). He is Chief Compliance Officer of FMR (2005-present), FMR Co., Inc. (2005-present), Fidelity Management & Research (U.K.) Inc. (2005-present), Fidelity Research & Analysis Company (2005-present), Fidelity Investments Money Management, Inc. (2005-present), and Strategic Advisers, Inc. (2005-present). Previously, Mr. Rathgeber served as Executive Vice President and Chief Operating Officer for Fidelity Investments Institutional Services Company, Inc. (1998-2002). |
Bryan A. Mehrmann (45) |
| Year of Election or Appointment: 2005 Deputy Treasurer of Equity-Income II. Mr. Mehrmann also serves as Deputy Treasurer of other Fidelity funds (2005-present) and is an employee of FMR. Previously, Mr. Mehrmann served as Vice President of Fidelity Investments Institutional Services Group (FIIS)/Fidelity Investments Institutional Operations Corporation, Inc. (FIIOC) Client Services (1998-2004). |
Kimberley H. Monasterio (42) |
| Year of Election or Appointment: 2007 President and Treasurer of Equity-Income II. Ms. Monasterio also serves as President and Treasurer of other Fidelity funds (2007-present) and is an employee of FMR (2004-present). Previously, Ms. Monasterio served as Deputy Treasurer of the Fidelity funds (2004-2006). Before joining Fidelity Investments, Ms. Monasterio served as Treasurer (2000-2004) and Chief Financial Officer (2002-2004) of the Franklin Templeton Funds and Senior Vice President of Franklin Templeton Services, LLC (2000-2004). |
Kenneth B. Robins (37) |
| Year of Election or Appointment: 2005 Deputy Treasurer of Equity-Income II. Mr. Robins also serves as Deputy Treasurer of other Fidelity funds (2005-present) and is an employee of FMR (2004-present). Before joining Fidelity Investments, Mr. Robins worked at KPMG LLP, where he was a partner in KPMG's department of professional practice (2002-2004) and a Senior Manager (1999-2000). In addition, Mr. Robins served as Assistant Chief Accountant, United States Securities and Exchange Commission (2000-2002). |
Robert G. Byrnes (39) |
| Year of Election or Appointment: 2005 Assistant Treasurer of Equity-Income II. Mr. Byrnes also serves as Assistant Treasurer of other Fidelity funds (2005-present) and is an employee of FMR (2005-present). Previously, Mr. Byrnes served as Vice President of FPCMS (2003-2005). Before joining Fidelity Investments, Mr. Byrnes worked at Deutsche Asset Management where he served as Vice President of the Investment Operations Group (2000-2003). |
John H. Costello (60) |
| Year of Election or Appointment: 1990 Assistant Treasurer of Equity-Income II. Mr. Costello also serves as Assistant Treasurer of other Fidelity funds and is an employee of FMR. |
Peter L. Lydecker (52) |
| Year of Election or Appointment: 2004 Assistant Treasurer of Equity-Income II. Mr. Lydecker also serves as Assistant Treasurer of other Fidelity funds (2004) and is an employee of FMR. |
Mark Osterheld (51) |
| Year of Election or Appointment: 2002 Assistant Treasurer of Equity-Income II. Mr. Osterheld also serves as Assistant Treasurer of other Fidelity funds (2002) and is an employee of FMR. |
Gary W. Ryan (48) |
| Year of Election or Appointment: 2005 Assistant Treasurer of Equity-Income II. Mr. Ryan also serves as Assistant Treasurer of other Fidelity funds (2005-present) and is an employee of FMR (2005-present). Previously, Mr. Ryan served as Vice President of Fund Reporting in FPCMS (1999-2005). |
Salvatore Schiavone (41) |
| Year of Election or Appointment: 2005 Assistant Treasurer of Equity-Income II. Mr. Schiavone also serves as Assistant Treasurer of other Fidelity funds (2005-present) and is an employee of FMR (2005-present). Before joining Fidelity Investments, Mr. Schiavone worked at Deutsche Asset Management, where he most recently served as Assistant Treasurer (2003-2005) of the Scudder Funds and Vice President and Head of Fund Reporting (1996-2003). |
Annual Report
Distributions
The Board of Trustees of Fidelity Equity Income II Fund voted to pay to shareholders of record at the opening of business on record date, the following distributions per share derived from capital gains realized from sales of portfolio securities and dividends derived from net investment income:
Pay Date | Record Date | Dividends | Capital Gains |
12/18/06 | 12/15/06 | $ .12 | $ 1.17 |
01/08/07 | 01/05/07 | $ .00 | $ .90 |
The fund hereby designates as a capital gain dividend with respect to the taxable year ended November 30, 2006 $611,814,164, or, if subsequently determined to be different, the net capital gain of such year.
The fund designates 100%, 80%, 100%, 100%, and 100% of the dividends distributed in December 2005, January 2006, April 2006, July 2006, and October 2006, respectively during the fiscal year as qualifying for the dividends-received deduction for corporate shareholders.
The fund designates 100%, 76%, 100%, 100%, and 100% of the dividends distributed in December 2005, January 2006, April 2006, July 2006, and October 2006, respectively during the fiscal year as amounts which may be taken into account as a dividend for the purposes of the maximum rate under section 1(h)(11) of the Internal Revenue Code.
The fund will notify shareholders in January 2007 of amounts for use in preparing 2006 income tax returns.
Annual Report
Proxy Voting Results
A special meeting of the fund's shareholders was held on September 20, 2006. The results of votes taken among shareholders on the proposal before them are reported below. Each vote reported represents one dollar of net asset value held on the record date for the meeting.
PROPOSAL 1 |
To elect a Board of Trustees. A |
| # of
Votes | % of
Votes |
Dennis J. Dirks |
Affirmative | 10,327,434,641.22 | 95.770 |
Withheld | 456,199,004.95 | 4.230 |
TOTAL | 10,783,633,646.17 | 100.000 |
Albert R. Gamper, Jr. |
Affirmative | 10,322,116,523.07 | 95.720 |
Withheld | 461,517,123.10 | 4.280 |
TOTAL | 10,783,633,646.17 | 100.000 |
Robert M. Gates |
Affirmative | 10,288,766,799.53 | 95.411 |
Withheld | 494,866,846.64 | 4.589 |
TOTAL | 10,783,633,646.17 | 100.000 |
George H. Heilmeier |
Affirmative | 10,298,619,061.42 | 95.502 |
Withheld | 485,014,584.75 | 4.498 |
TOTAL | 10,783,633,646.17 | 100.000 |
Edward C. Johnson 3d |
Affirmative | 10,257,561,582.55 | 95.122 |
Withheld | 526,072,063.62 | 4.878 |
TOTAL | 10,783,633,646.17 | 100.000 |
Stephen P. Jonas |
Affirmative | 10,317,222,628.79 | 95.675 |
Withheld | 466,411,017.38 | 4.325 |
TOTAL | 10,783,633,646.17 | 100.000 |
James H. KeyesB |
Affirmative | 10,318,195,711.25 | 95.684 |
Withheld | 465,437,934.92 | 4.316 |
TOTAL | 10,783,633,646.17 | 100.000 |
| # of
Votes | % of
Votes |
Marie L. Knowles |
Affirmative | 10,317,835,129.19 | 95.681 |
Withheld | 465,798,516.98 | 4.319 |
TOTAL | 10,783,633,646.17 | 100.000 |
Ned C. Lautenbach |
Affirmative | 10,317,039,890.90 | 95.673 |
Withheld | 466,593,755.27 | 4.327 |
TOTAL | 10,783,633,646.17 | 100.000 |
William O. McCoy |
Affirmative | 10,278,036,936.38 | 95.311 |
Withheld | 505,596,709.79 | 4.689 |
TOTAL | 10,783,633,646.17 | 100.000 |
Robert L. Reynolds |
Affirmative | 10,320,662,459.03 | 95.707 |
Withheld | 462,971,187.14 | 4.293 |
TOTAL | 10,783,633,646.17 | 100.000 |
Cornelia M. Small |
Affirmative | 10,329,731,930.45 | 95.791 |
Withheld | 453,901,715.72 | 4.209 |
TOTAL | 10,783,633,646.17 | 100.000 |
William S. Stavropoulos |
Affirmative | 10,298,039,656.66 | 95.497 |
Withheld | 485,593,989.51 | 4.503 |
TOTAL | 10,783,633,646.17 | 100.000 |
Kenneth L. Wolfe |
Affirmative | 10,310,583,687.33 | 95.613 |
Withheld | 473,049,958.84 | 4.387 |
TOTAL | 10,783,633,646.17 | 100.000 |
A Denotes trust-wide proposal and voting results. B Effective on or about January 1, 2007. |
Annual Report
Board Approval of Investment Advisory Contracts and Management Fees
Fidelity Equity-Income II Fund
Each year, typically in July, the Board of Trustees, including the Independent Trustees (together, the Board), votes on the renewal of the management contract and sub-advisory agreements (together, the Advisory Contracts) for the fund. The Board, assisted by the advice of fund counsel and Independent Trustees' counsel, requests and considers a broad range of information throughout the year.
The Board meets regularly each month except August and takes into account throughout the year matters bearing on Advisory Contracts. The Board, acting directly and through its separate committees, considers at each of its meetings factors that are relevant to the annual renewal of the fund's Advisory Contracts, including the services and support provided to the fund and its shareholders. At the time of the renewal, the Board had 12 standing committees, each composed of Independent Trustees with varying backgrounds, to which the Board has assigned specific subject matter responsibilities in order to enhance effective decision-making by the Board. Each committee has adopted a written charter outlining the structure and purposes of the committee. One such committee, the Equity Contract Committee, meets periodically as needed throughout the year to consider matters specifically related to the annual renewal of Advisory Contracts. The committee requests and receives information on, and makes recommendations to the Independent Trustees concerning, the approval and annual review of the Advisory Contracts.
At its July 2006 meeting, the Board of Trustees, including the Independent Trustees, unanimously determined to renew the Advisory Contracts for the fund. In reaching its determination, the Board considered all factors it believed relevant, including (i) the nature, extent, and quality of the services to be provided to the fund and its shareholders (including the investment performance of the fund); (ii) the competitiveness of the management fee and total expenses of the fund; (iii) the total costs of the services to be provided by and the profits to be realized by the investment adviser and its affiliates from the relationship with the fund; (iv) the extent to which economies of scale would be realized as the fund grows; and (v) whether fee levels reflect these economies of scale, if any, for the benefit of fund shareholders.
In determining whether to renew the Advisory Contracts for the fund, the Board ultimately reached a determination, with the assistance of fund counsel and Independent Trustees' counsel, that the renewal of the Advisory Contracts and the compensation to be received by Fidelity under the management contract is consistent with Fidelity's fiduciary duty under applicable law. In addition to evaluating the specific factors noted above, the Board, in reaching its determination, is aware that shareholders in the fund have a broad range of investment choices available to them, including a wide choice among mutual funds offered by competitors to Fidelity, and that the fund's shareholders, with the opportunity to review and weigh the disclosure provided by the fund in its prospectus and other public disclosures, have chosen to invest in this fund, managed by Fidelity.
Annual Report
Board Approval of Investment Advisory Contracts and
Management Fees - continued
Nature, Extent, and Quality of Services Provided. The Board considered staffing within the investment adviser, FMR, and the sub-advisers (together, the Investment Advisers), including the background of the fund's portfolio manager and the fund's investment objective and discipline. The Independent Trustees also had discussions with senior management of Fidelity's investment operations and investment groups. The Board considered the structure of the portfolio manager compensation program and whether this structure provides appropriate incentives.
Resources Dedicated to Investment Management and Support Services. The Board reviewed the size, education, and experience of the Investment Advisers' investment staff, their use of technology, and the Investment Advisers' approach to recruiting, training, and retaining portfolio managers and other research, advisory, and management personnel. The Board considered Fidelity's extensive global research capabilities that enable the Investment Advisers to aggregate data from various sources in an effort to produce positive investment results. The Board noted that Fidelity's analysts have access to a variety of technological tools that enable them to perform both fundamental and quantitative analysis and to specialize in various disciplines. The Board also considered that Fidelity's portfolio managers and analysts have access to daily portfolio attribution that allows for monitoring of a fund's portfolio, as well as an electronic communication system that provides immediate real-time access to research concerning issuers and credit enhancers.
Shareholder and Administrative Services. The Board considered (i) the nature, extent, quality, and cost of administrative, distribution, and shareholder services performed by the Investment Advisers and their affiliates under the Advisory Contracts and under separate agreements covering transfer agency, pricing and bookkeeping, and securities lending services for the fund; (ii) the nature and extent of the Investment Advisers' supervision of third party service providers, principally custodians and subcustodians; and (iii) the resources devoted to, and the record of compliance with, the fund's compliance policies and procedures. The Board reviewed the allocation of fund brokerage, including allocations to brokers affiliated with the Investment Advisers, the use of brokerage commissions to pay fund expenses, and the use of "soft" commission dollars to pay for research services. The Board also considered that Fidelity voluntarily pays for market data out of its own resources.
The Board noted that the growth of fund assets across the complex allows Fidelity to reinvest in the development of services designed to enhance the value or convenience of the Fidelity funds as investment vehicles. These services include 24-hour access to account information and market information through phone representatives and over the Internet, and investor education materials and asset allocation tools.
Annual Report
Investment in a Large Fund Family. The Board considered the benefits to shareholders of investing in a Fidelity fund, including the benefits of investing in a fund that is part of a large family of funds offering a variety of investment disciplines and providing for a large variety of mutual fund investor services. For example, fund shareholders are offered the privilege of exchanging shares of the fund for shares of other Fidelity funds, as set forth in the fund's prospectus, without paying a sales charge. The Board noted that, since the last Advisory Contract renewals in July 2005, Fidelity has taken a number of actions that benefited particular funds, including (i) dedicating additional resources to investment research and to restructure the investment research teams; (ii) voluntarily entering into contractual arrangements with certain brokers pursuant to which Fidelity pays for research products and services separately out of its own resources, rather than bundling with fund commissions; (iii) launching the Fidelity Advantage Class of its five Spartan stock index funds and three Spartan bond index funds, which is a lower-fee class available to shareholders with higher account balances; (iv) contractually agreeing to impose expense limitations on Fidelity U.S. Bond Index Fund and reducing the fund's initial investment minimum; and (v) offering shareholders of each of the Fidelity Institutional Money Market Funds the privilege of exchanging shares of the fund for shares of other Fidelity funds.
Investment Performance and Compliance. The Board considered whether the fund has operated within its investment objective, as well as its record of compliance with its investment restrictions. It also reviewed the fund's absolute investment performance, as well as the fund's relative investment performance measured against (i) a broad-based securities market index, and (ii) a peer group of mutual funds deemed appropriate by the Board over multiple periods. The following charts considered by the Board show, over the one-, three-, and five-year periods ended December 31, 2005, the fund's cumulative total returns, the cumulative total returns of a broad-based securities market index ("benchmark"), and a range of cumulative total returns of a peer group of mutual funds identified by Lipper Inc. as having an investment objective similar to that of the fund. The box within each chart shows the 25th percentile return (bottom of box) and the 75th percentile return (top of box) of the Lipper peer group. Returns shown above the box are in the first quartile and returns shown below the box are in the fourth quartile. The percentage beaten number noted below each chart corresponds to the percentile box and represents the percentage of funds in the Lipper peer group whose performance was equal to or lower than that of the fund.
Annual Report
Board Approval of Investment Advisory Contracts and
Management Fees - continued
Fidelity Equity-Income II Fund
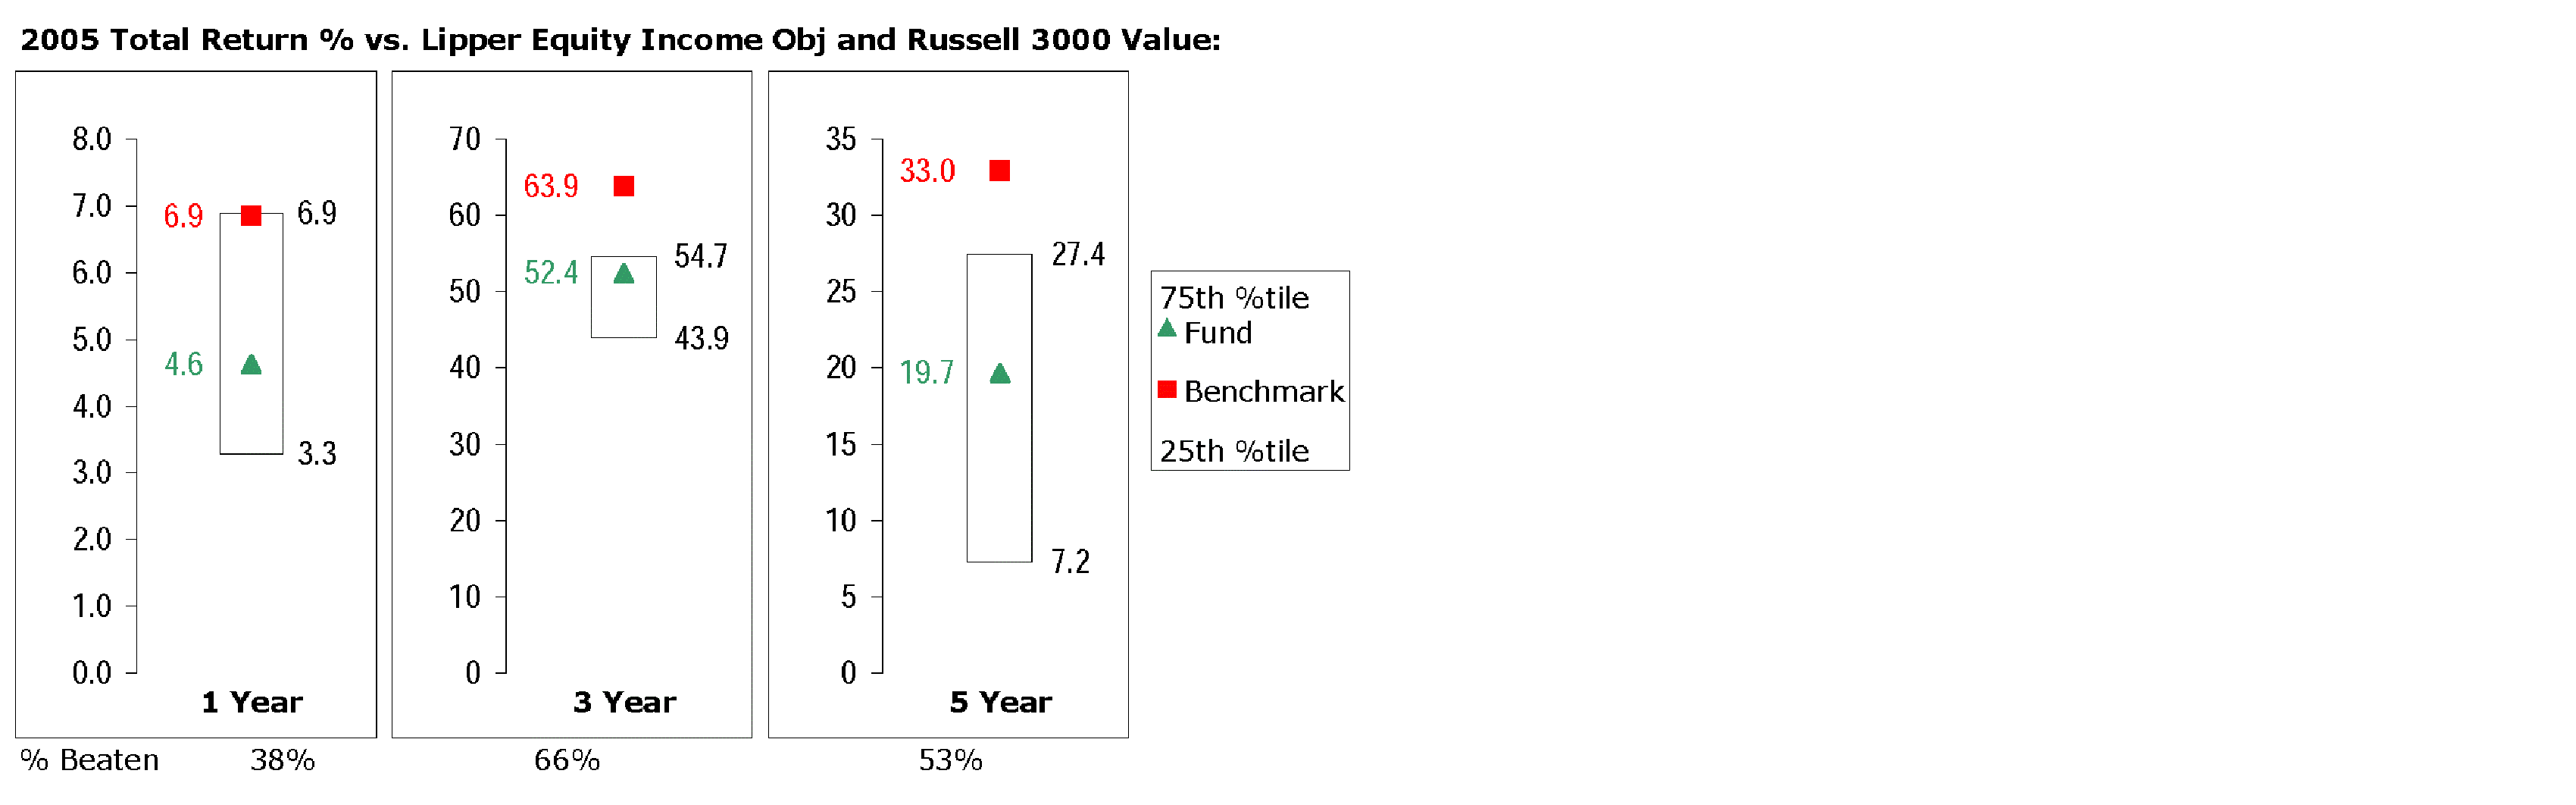
The Board reviewed the fund's relative investment performance against its Lipper peer group and stated that the performance of the fund was in the third quartile for the one-year period and the second quartile for the three- and five-year periods. The Board also stated that the relative investment performance of the fund was lower than its benchmark for all the periods shown.
The Board considered that FMR has taken steps to refocus and strengthen equity research, equity portfolio management, and compliance. The Board noted with favor FMR's reorganization of its senior management team in 2005 and FMR's dedication of additional resources to investment research, and participated in the process that led to those changes.
Based on its review, and giving particular weight to the nature and quality of the resources dedicated by the Investment Advisers to maintain and improve relative performance, the Board concluded that the nature, extent, and quality of the services provided to the fund will benefit the fund's shareholders, particularly in light of the Board's view that the fund's shareholders benefit from investing in a fund that is part of a large family of funds offering a variety of investment disciplines and services.
Competitiveness of Management Fee and Total Fund Expenses. The Board considered the fund's management fee and total expenses compared to "mapped groups" of competitive funds and classes. Fidelity creates "mapped groups" by combining similar Lipper investment objective categories that have comparable management fee characteristics. Combining Lipper investment objective categories aids the Board's management fee and total expense comparisons by broadening the competitive group used for comparison and by reducing the number of universes to which various Fidelity funds are compared.
Annual Report
The Board considered two proprietary management fee comparisons for the 12-month periods shown in the chart below. The group of Lipper funds used by the Board for management fee comparisons is referred to below as the "Total Mapped Group" and, for the reasons explained above, is broader than the Lipper peer group used by the Board for performance comparisons. The Total Mapped Group comparison focuses on a fund's standing relative to the total universe of comparable funds available to investors, in terms of gross management fees before expense reimbursements or caps. "TMG %" represents the percentage of funds in the Total Mapped Group that had management fees that were lower than the fund's. For example, a TMG % of 10% means that 90% of the funds in the Total Mapped Group had higher management fees than the fund. The "Asset-Size Peer Group" (ASPG) comparison focuses on a fund's standing relative to non-Fidelity funds similar in size to the fund within the Total Mapped Group. The ASPG represents at least 15% of the funds in the Total Mapped Group with comparable asset size and management fee characteristics, subject to a minimum of 50 funds (or all funds in the Total Mapped Group if fewer than 50). Additional information, such as the ASPG quartile in which the fund's management fee ranked, is also included in the chart and considered by the Board.
Fidelity Equity-Income II Fund
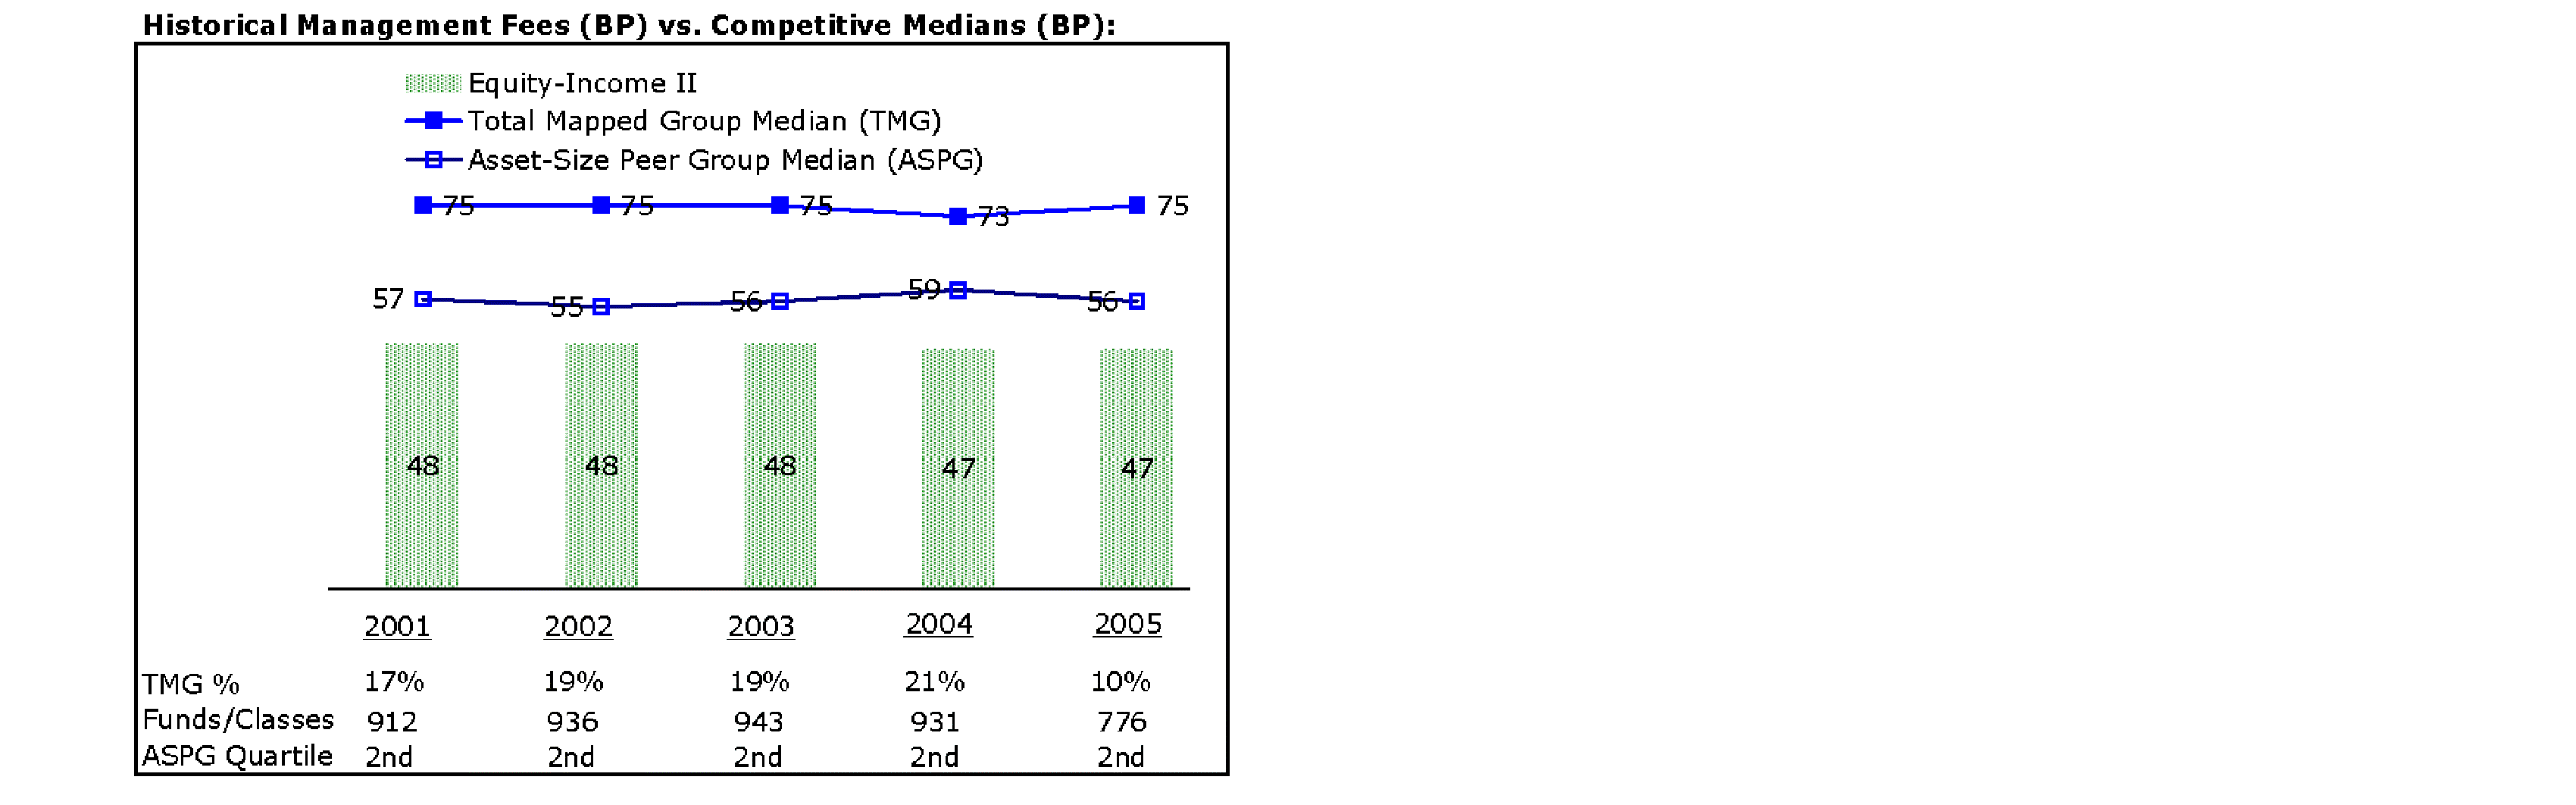
The Board noted that the fund's management fee ranked below the median of its Total Mapped Group and below the median of its ASPG for 2005.
Annual Report
Board Approval of Investment Advisory Contracts and
Management Fees - continued
Based on its review, the Board concluded that the fund's management fee was fair and reasonable in light of the services that the fund receives and the other factors considered.
In its review of the fund's total expenses, the Board considered the fund's management fee as well as other fund expenses, such as transfer agent fees, pricing and bookkeeping fees, and custodial, legal, and audit fees. The Board also noted the effects of any waivers and reimbursements on fees and expenses. As part of its review, the Board also considered current and historical total expenses of the fund compared to competitive fund median expenses. The fund is compared to those funds and classes in the Total Mapped Group (used by the Board for management fee comparisons) that have a similar sales load structure.
The Board noted that the fund's total expenses ranked below its competitive median for 2005.
In its review of total expenses, the Board also considered Fidelity fee structures and other information on clients that FMR and its affiliates service in other competitive markets, such as other mutual funds advised or subadvised by FMR or its affiliates, pension plan clients, and other institutional clients.
Based on its review, the Board concluded that the fund's total expenses were reasonable in light of the services that the fund and its shareholders receive and the other factors considered.
Costs of the Services and Profitability. The Board considered the revenues earned and the expenses incurred by Fidelity in conducting the business of developing, marketing, distributing, managing, administering and servicing the fund and its shareholders. The Board also considered the level of Fidelity's profits in respect of all the Fidelity funds.
On an annual basis, FMR presents to the Board Fidelity's profitability for the fund. Fidelity calculates the profitability for each fund, as well as aggregate profitability for groups of Fidelity funds and all Fidelity funds, using a series of detailed revenue and cost allocation methodologies which originate with the audited books and records of Fidelity. The Audit Committee of the Board reviews any significant changes from the prior year's methodologies.
PricewaterhouseCoopers LLP (PwC), independent registered accounting firm and auditor to Fidelity and certain Fidelity funds, has been engaged annually by the Board as part of the Board's assessment of the results of Fidelity's profitability analysis. PwC's engagement includes the review and assessment of Fidelity's methodologies used in determining the revenues and expenses attributable to Fidelity's mutual fund business, and completion of agreed-upon procedures surrounding the mathematical accuracy of fund profitability and its conformity to allocation methodologies. After considering PwC's reports issued under the engagement and information provided by Fidelity, the Board believes that while other allocation methods may also be reasonable, Fidelity's profitability methodologies are reasonable in all material respects.
Annual Report
The Board has also reviewed Fidelity's non-fund businesses and any fall-out benefits related to the mutual fund business as well as cases where Fidelity's affiliates may benefit from or be related to the fund's business.
The Board considered the costs of the services provided by and the profits realized by Fidelity in connection with the operation of the fund and determined that the amount of profit is a fair entrepreneurial profit for the management of the fund.
Economies of Scale. The Board considered whether there have been economies of scale in respect of the management of the Fidelity funds, whether the Fidelity funds (including the fund) have appropriately benefited from any such economies of scale, and whether there is potential for realization of any further economies of scale. The Board considered the extent to which the fund will benefit from economies of scale through increased services to the fund, through waivers or reimbursements, or through fee or expense reductions, including reductions that occur through operation of the transfer agent agreement. The transfer agent fee varies in part based on the number of accounts in the fund. If the number of accounts decreases or the average account size increases, the overall transfer agent fee rate decreases.
The Board recognized that the fund's management contract incorporates a "group fee" structure, which provides for lower fee rates as total fund assets under FMR's management increase, and for higher fee rates as total fund assets under FMR's management decrease. The Board considered that the group fee is designed to deliver the benefits of economies of scale to fund shareholders when total fund assets increase, even if assets of any particular fund are unchanged or have declined, because some portion of Fidelity's costs are attributable to services provided to all Fidelity funds, and all funds benefit if those costs can be allocated among more assets. The Board concluded that, given the group fee structure, fund shareholders will achieve a certain level of economies of scale as assets under FMR's management increase at the fund complex level, regardless of whether Fidelity achieves any such economies of scale.
The Board further concluded that any potential economies of scale are being shared between fund shareholders and Fidelity in an appropriate manner.
Additional Information Requested by the Board. In order to develop fully the factual basis for consideration of the Advisory Contracts, the Board requested additional information on several topics, including (i) Fidelity's fund profitability methodology and profitability trends within certain funds; (ii) portfolio manager compensation; (iii) the extent to which any economies of scale exist and are shared between the funds and Fidelity; (iv) the total expenses of certain funds and classes relative to competitors, including the extent to which the expenses of certain funds have been or could be capped; (v) fund performance trends; and (vi) Fidelity's fee structures, including use of performance fees.
Annual Report
Board Approval of Investment Advisory Contracts and
Management Fees - continued
Based on its evaluation of all of the conclusions noted above, and after considering all material factors, the Board ultimately concluded that the advisory fee structures are fair and reasonable, and that the fund's Advisory Contracts should be renewed.
Annual Report
Managing Your Investments
Fidelity offers several ways to conveniently manage your personal investments via your telephone or PC. You can access your account information, conduct trades and research your investments 24 hours a day.
By Phone
Fidelity Automated Service Telephone provides a single toll-free number to access account balances, positions, quotes and trading. It's easy to navigate the service, and on your first call, the system will help you create a personal identification number (PIN) for security.
(phone_graphic)
Fidelity Automated
Service Telephone (FAST®)
1-800-544-5555
Press
1 For mutual fund and brokerage trading.
2 For quotes.*
3 For account balances and holdings.
4 To review orders and mutual
fund activity.
5 To change your PIN.
*0 To speak to a Fidelity representative.
By PC
Fidelity's web site on the Internet provides a wide range of information, including daily financial news, fund performance, interactive planning tools and news about Fidelity products and services.
(computer_graphic)
Fidelity's Web Site
www.fidelity.com
* When you call the quotes line, please remember that a fund's yield and return will vary and, except for money market funds, share price will also vary. This means that you may have a gain or loss when you sell your shares. There is no assurance that money market funds will be able to maintain a stable $1 share price; an investment in a money market fund is not insured or guaranteed by the U.S. government. Total returns are historical and include changes in share price, reinvestment of dividends and capital gains, and the effects of any sales charges.
Annual Report
To Write Fidelity
We'll give your correspondence immediate attention and send you written confirmation upon completion of your request.
(letter_graphic)
Making Changes
To Your Account
(such as changing name, address, bank, etc.)
Fidelity Investments
P.O. Box 770001
Cincinnati, OH 45277-0002
(letter_graphic)
For Non-Retirement
Accounts
Buying shares
Fidelity Investments
P.O. Box 770001
Cincinnati, OH 45277-0003
Overnight Express
Fidelity Investments
Attn: Distribution Services
100 Crosby Parkway - KC1H
Covington, KY 41015
Selling shares
Fidelity Investments
P.O. Box 770001
Cincinnati, OH 45277-0035
Overnight Express
Fidelity Investments
Attn: Distribution Services
100 Crosby Parkway - KC1H
Covington, KY 41015
General Correspondence
Fidelity Investments
P.O. Box 500
Merrimack, NH 03054-0500
(letter_graphic)
For Retirement
Accounts
Buying shares
Fidelity Investments
P.O. Box 770001
Cincinnati, OH 45277-0003
Selling shares
Fidelity Investments
P.O. Box 770001
Cincinnati, OH 45277-0035
Overnight Express
Fidelity Investments
Attn: Distribution Services
100 Crosby Parkway - KC1H
Covington, KY 41015
General Correspondence
Fidelity Investments
P.O. Box 500
Merrimack, NH 03054-0500
Annual Report
To Visit Fidelity
For directions and hours,
please call 1-800-544-9797.
Arizona
7001 West Ray Road
Chandler, AZ
15445 N. Scottsdale Road
Scottsdale, AZ
California
815 East Birch Street
Brea, CA
1411 Chapin Avenue
Burlingame, CA
851 East Hamilton Avenue
Campbell, CA
19200 Von Karman Avenue
Irvine, CA
601 Larkspur Landing Circle
Larkspur, CA
10100 Santa Monica Blvd.
Los Angeles, CA
27101 Puerta Real
Mission Viejo, CA
73-575 El Paseo
Palm Desert, CA
251 University Avenue
Palo Alto, CA
123 South Lake Avenue
Pasadena, CA
16995 Bernardo Ctr. Drive
Rancho Bernardo, CA
1220 Roseville Parkway
Roseville, CA
1740 Arden Way
Sacramento, CA
7676 Hazard Center Drive
San Diego, CA
11943 El Camino Real
San Diego, CA
8 Montgomery Street
San Francisco, CA
3793 State Street
Santa Barbara, CA
1200 Wilshire Boulevard
Santa Monica, CA
21701 Hawthorne Boulevard
Torrance, CA
2001 North Main Street
Walnut Creek, CA
6300 Canoga Avenue
Woodland Hills, CA
Colorado
1625 Broadway
Denver, CO
9185 Westview Road
Lone Tree, CO
Connecticut
48 West Putnam Avenue
Greenwich, CT
265 Church Street
New Haven, CT
300 Atlantic Street
Stamford, CT
29 South Main Street
West Hartford, CT
Delaware
400 Delaware Avenue
Wilmington, DE
Florida
4400 N. Federal Highway
Boca Raton, FL
121 Alhambra Plaza
Coral Gables, FL
2948 N. Federal Highway
Ft. Lauderdale, FL
4671 Town Center Parkway
Jacksonville, FL
1907 West State Road 434
Longwood, FL
8880 Tamiami Trail, North
Naples, FL
3501 PGA Boulevard
Palm Beach Gardens, FL
3550 Tamiami Trail, South
Sarasota, FL
1502 N. Westshore Blvd.
Tampa, FL
2465 State Road 7
Wellington, FL
Georgia
3445 Peachtree Road, N.E.
Atlanta, GA
1000 Abernathy Road
Atlanta, GA
Illinois
One North LaSalle Street
Chicago, IL
875 North Michigan Ave.
Chicago, IL
1415 West 22nd Street
Oak Brook, IL
1572 East Golf Road
Schaumburg, IL
3232 Lake Avenue
Wilmette, IL
Indiana
4729 East 82nd Street
Indianapolis, IN
Kansas
5400 College Boulevard
Overland Park, KS
Maine
Three Canal Plaza
Portland, ME
Maryland
7315 Wisconsin Avenue
Bethesda, MD
One W. Pennsylvania Ave.
Towson, MD
Massachusetts
801 Boylston Street
Boston, MA
155 Congress Street
Boston, MA
300 Granite Street
Braintree, MA
44 Mall Road
Burlington, MA
238 Main Street
Cambridge, MA
405 Cochituate Road
Framingham, MA
416 Belmont Street
Worcester, MA
Fidelity Brokerage Services, Inc., 100 Summer St., Boston, MA 02110 Member NYSE/SIPC
Annual Report
Michigan
500 E. Eisenhower Pkwy.
Ann Arbor, MI
280 Old N. Woodward Ave.
Birmingham, MI
43420 Grand River Avenue
Novi, MI
29155 Northwestern Hwy.
Southfield, MI
Minnesota
7600 France Avenue South
Edina, MN
Missouri
1524 South Lindbergh Blvd.
St. Louis, MO
Nevada
2225 Village Walk Drive
Henderson, NV
New Jersey
150 Essex Street
Millburn, NJ
56 South Street
Morristown, NJ
396 Route 17, North
Paramus, NJ
3518 Route 1 North
Princeton, NJ
530 Broad Street
Shrewsbury, NJ
New York
1055 Franklin Avenue
Garden City, NY
37 West Jericho Turnpike
Huntington Station, NY
1271 Avenue of the Americas
New York, NY
980 Madison Avenue
New York, NY
61 Broadway
New York, NY
350 Park Avenue
New York, NY
200 Fifth Avenue
New York, NY
733 Third Avenue
New York, NY
11 Penn Plaza
New York, NY
2070 Broadway
New York, NY
1075 Northern Blvd.
Roslyn, NY
799 Central Park Avenue
Scarsdale, NY
North Carolina
4611 Sharon Road
Charlotte, NC
7011 Fayetteville Road
Durham, NC
Ohio
3805 Edwards Road
Cincinnati, OH
1324 Polaris Parkway
Columbus, OH
28699 Chagrin Boulevard
Woodmere Village, OH
Oregon
7493 SW Bridgeport Road
Tigard, OR
Pennsylvania
600 West DeKalb Pike
King of Prussia, PA
1735 Market Street
Philadelphia, PA
12001 Perry Highway
Wexford, PA
Rhode Island
47 Providence Place
Providence, RI
Tennessee
6150 Poplar Avenue
Memphis, TN
Texas
10000 Research Boulevard
Austin, TX
4001 Northwest Parkway
Dallas, TX
12532 Memorial Drive
Houston, TX
2701 Drexel Drive
Houston, TX
6560 Fannin Street
Houston, TX
6500 N. MacArthur Blvd.
Irving, TX
6005 West Park Boulevard
Plano, TX
14100 San Pedro
San Antonio, TX
1576 East Southlake Blvd.
Southlake, TX
19740 IH 45 North
Spring, TX
Utah
279 West South Temple
Salt Lake City, UT
Virginia
1861 International Drive
McLean, VA
Washington
411 108th Avenue, N.E.
Bellevue, WA
1518 6th Avenue
Seattle, WA
Washington, DC
1900 K Street, N.W.
Washington, DC
Wisconsin
595 North Barker Road
Brookfield, WI
Annual Report
Annual Report
Annual Report
Investment Adviser
Fidelity Management & Research Company
Boston, MA
Investment Sub-Advisers
FMR Co., Inc.
Fidelity Management & Research (U.K.) Inc.
Fidelity Research & Analysis Company
(formerly Fidelity Management &
Research (Far East) Inc.)
Fidelity International Investment Advisors
Fidelity Investments Japan Limited
Fidelity International Investment Advisors (U.K.) Limited
General Distributor
Fidelity Distributors Corporation
Boston, MA
Transfer and Service Agent
Fidelity Service Company, Inc.
Boston, MA
Custodian
The Northern Trust Company
Chicago, IL
The Fidelity Telephone Connection
Mutual Fund 24-Hour Service
Exchanges/Redemptions
and Account Assistance 1-800-544-6666
Product Information 1-800-544-6666
Retirement Accounts 1-800-544-4774
(8 a.m. - 9 p.m.)
TDD Service 1-800-544-0118
for the deaf and hearing impaired
(9 a.m. - 9 p.m. Eastern time)
Fidelity Automated Service
Telephone (FAST®) (automated graphic) 1-800-544-5555
(automated graphic) Automated line for quickest service
EII-UANN-0107
1.786707.103
(Fidelity Investment logo)(registered trademark)
Corporate Headquarters
82 Devonshire St., Boston, MA 02109
www.fidelity.com
Fidelity®
Convertible Securities
Fund
Annual Report
November 30, 2006
(2_fidelity_logos) (Registered_Trademark)
Contents
Chairman's Message | <Click Here> | Ned Johnson's message to shareholders. |
Performance | <Click Here> | How the fund has done over time. |
Management's Discussion | <Click Here> | The manager's review of fund performance, strategy and outlook. |
Shareholder Expense Example | <Click Here> | An example of shareholder expenses. |
Investment Changes | <Click Here> | A summary of major shifts in the fund's investments over the past six months. |
Investments | <Click Here> | A complete list of the fund's investments with their market values. |
Financial Statements | <Click Here> | Statements of assets and liabilities, operations, and changes in net assets,
as well as financial highlights. |
Notes | <Click Here> | Notes to the financial statements. |
Report of Independent Registered Public Accounting Firm | <Click Here> | |
Trustees and Officers | <Click Here> | |
Distributions | <Click Here> | |
Proxy Voting Results | <Click Here> | |
Board Approval of Investment Advisory Contracts and Management Fees | <Click Here> | |
To view a fund's proxy voting guidelines and proxy voting record for the 12-month period ended June 30, visit www.fidelity.com/proxyvotingresults or visit the Securities and Exchange Commission's (SEC) web site at www.sec.gov. You may also call 1-800-544-8544 to request a free copy of the proxy voting guidelines.
Standard & Poor's, S&P and S&P 500 are registered service marks of The McGraw-Hill Companies, Inc. and have been licensed for use by Fidelity Distributors Corporation.
Other third party marks appearing herein are the property of their respective owners.
All other marks appearing herein are registered or unregistered trademarks or service marks of FMR Corp. or an affiliated company.
Annual Report
This report and the financial statements contained herein are submitted for the general information of the shareholders of the fund. This report is not authorized for distribution to prospective investors in the fund unless preceded or accompanied by an effective prospectus.
A fund files its complete schedule of portfolio holdings with the SEC for the first and third quarters of each fiscal year on Form N-Q. Forms N-Q are available on the SEC's web site at http://www.sec.gov. A fund's Forms N-Q may be reviewed and copied at the SEC's Public Reference Room in Washington, DC. Information regarding the operation of the SEC's Public Reference Room may be obtained by calling 1-800-SEC-0330. For a complete list of a fund's portfolio holdings, view the most recent quarterly holdings report, semiannual report, or annual report on Fidelity's web site at http://www.fidelity.com/holdings.
NOT FDIC INSURED · MAY LOSE VALUE · NO BANK GUARANTEE
Neither the fund nor Fidelity Distributors Corporation is a bank.
Annual Report
Chairman's Message
(photo_of_Edward_C_Johnson_3d)
Dear Shareholder:
Stock and bond markets around the world have seen largely positive results year to date, although weakness in the technology sector and growth stocks in general have tempered performance. While financial markets are always unpredictable, there are a number of time-tested principles that can put the historical odds in your favor.
One of the basic tenets is to invest for the long term. Over time, riding out the markets' inevitable ups and downs has proven much more effective than selling into panic or chasing the hottest trend. Even missing only a few of the markets' best days can significantly diminish investor returns. Patience also affords the benefits of compounding - of earning interest on additional income or reinvested dividends and capital gains. There are tax advantages and cost benefits to consider as well. The more you sell, the more taxes you pay, and the more you trade, the higher the costs. While staying the course doesn't eliminate risk, it can considerably lessen the effect of short-term declines.
You can further manage your investing risk through diversification. And today, more than ever, geographic diversification should be taken into account. Studies indicate that asset allocation is the single most important determinant of a portfolio's long-term success. The right mix of stocks, bonds and cash - aligned to your particular risk tolerance and investment objective - is very important. Age-appropriate rebalancing is also an essential aspect of asset allocation. For younger investors, an emphasis on equities - which historically have been the best performing asset class over time - is encouraged. As investors near their specific goal, such as retirement or sending a child to college, consideration may be given to replacing volatile assets (e.g. common stocks) with more-stable fixed investments (bonds or savings plans).
A third investment principle - investing regularly - can help lower the average cost of your purchases. Investing a certain amount of money each month or quarter helps ensure you won't pay for all your shares at market highs. This strategy - known as dollar cost averaging - also reduces unconstructive "emotion" from investing, helping shareholders avoid selling weak performers just prior to an upswing, or chasing a hot performer just before a correction.
We invite you to contact us via the Internet, through our Investor Centers or over the phone. It is our privilege to provide you the information you need to make the investments that are right for you.
Sincerely,
/s/Edward C. Johnson 3d
Edward C. Johnson 3d
Annual Report
Performance: The Bottom Line
Average annual total return reflects the change in the value of an investment, assuming reinvestment of the fund's dividend income and capital gains (the profits earned upon the sale of securities that have grown in value) and assuming a constant rate of performance each year. The $10,000 table and the fund's returns do not reflect the deduction of taxes that a shareholder would pay on fund distributions or the redemption of fund shares. During periods of reimbursement by Fidelity, a fund's total return will be greater than it would be had the reimbursement not occurred. How a fund did yesterday is no guarantee of how it will do tomorrow.
Average Annual Total Returns
Periods ended November 30, 2006 | Past 1
year | Past 5
years | Past 10
years |
Fidelity® Convertible Securities Fund | 16.38% | 8.90% | 11.76% |
$10,000 Over 10 Years
Let's say hypothetically that $10,000 was invested in Fidelity® Convertible Securities Fund on November 30, 1996. The chart shows how the value of your investment would have changed, and also shows how the Merrill Lynch® All U.S. Convertible Securities Index performed over the same period.
Annual Report
Management's Discussion of Fund Performance
Comments from Thomas Soviero, Portfolio Manager of Fidelity® Convertible Securities Fund
There were a number of reasons why the overall U.S. stock market could have had subpar results during the 12-month period that ended on November 30, 2006, including rising interest rates, inflation concerns, historically high energy prices, unrest in the Middle East, North Korea's nuclear test and a worse-than-expected housing slump. Despite these negative conditions, though, U.S. stocks fared well. In fact, several bellwether market benchmarks reached record highs, including the larger-cap Dow Jones Industrial AverageSM - a gauge of 30 mega-cap, blue-chip stocks - and the small-cap-oriented Russell 2000® Index. The strength in equities was sparked in large part by two major factors: the double-digit earnings growth achieved by U.S. corporations, and steady economic growth that was neither overheated nor recessionary, thanks primarily to the Federal Reserve Board's monetary policy. For the 12 months overall, the Dow rose 15.76%, the Russell 2000 checked in with a 17.43% advance, the Standard & Poor's 500SM Index gained 14.23% and the NASDAQ Composite® Index returned 9.78%.
For the 12 months ending November 30, 2006, the fund returned 16.38%, handily outperforming the 13.30% return of the Merrill Lynch® All U.S. Convertible Securities Index. Strong security selection in the consumer discretionary sector - particularly in the media group - was a main driver of the fund's outperformance. Solid security selection in and an overweighting of telecommunication services also helped. The fund's out-of-benchmark stake in equities further contributed to returns. Poor security selection in health care equipment and services detracted. Top individual contributors to performance relative to the index included the convertible preferred stock of energy firms El Paso and Valero Energy, the latter of which I held during the first half of the period. The convertible bonds of cable TV provider Charter Communications, US Airways, hard-drive manufacturer Maxtor and cellular/broadcast tower company American Tower also helped. Among the detractors were holdings in the common stock of Valero Energy - which declined in price after the convertible preferred stock was converted to an equity position midway through the period - as well as convertible bonds issued by theme park operator Six Flags and eye-care product manufacturer Bausch & Lomb. An underweighting of General Motors' convertible preferred stock also hurt.
The views expressed above reflect those of the portfolio manager(s) only through the end of the period as stated on the cover of this report and do not necessarily represent the views of Fidelity or any other person in the Fidelity organization. Any such views are subject to change at any time based upon market or other conditions and Fidelity disclaims any responsibility to update such views. These views may not be relied on as investment advice and, because investment decisions for a Fidelity fund are based on numerous factors, may not be relied on as an indication of trading intent on behalf of any Fidelity fund.
Annual Report
Shareholder Expense Example
As a shareholder of the Fund, you incur two types of costs: (1) transaction costs, and (2) ongoing costs, including management fees and other Fund expenses. This Example is intended to help you understand your ongoing costs (in dollars) of investing in the Fund and to compare these costs with the ongoing costs of investing in other mutual funds.
The Example is based on an investment of $1,000 invested at the beginning of the period and held for the entire period (June 1, 2006 to November 30, 2006).
Actual Expenses
The first line of the accompanying table provides information about actual account values and actual expenses. You may use the information in this line, together with the amount you invested, to estimate the expenses that you paid over the period. Simply divide your account value by $1,000.00 (for example, an $8,600 account value divided by $1,000.00 = 8.6), then multiply the result by the number in the first line under the heading entitled "Expenses Paid During Period" to estimate the expenses you paid on your account during this period. A small balance maintenance fee of $12.00 that is charged once a year may apply for certain accounts with a value of less than $2,000. This fee is not included in the table below. If it was, the estimate of expenses you paid during the period would be higher, and your ending account value lower, by this amount.
Hypothetical Example for Comparison Purposes
The second line of the accompanying table provides information about hypothetical account values and hypothetical expenses based on the Fund's actual expense ratio and an assumed rate of return of 5% per year before expenses, which is not the Fund's actual return. The hypothetical account values and expenses may not be used to estimate the actual ending account balance or expenses you paid for the period. You may use this information to compare the ongoing costs of investing in the Fund and other funds. To do so, compare this 5% hypothetical example with the 5% hypothetical examples that appear in the shareholder reports of the other funds. A small balance maintenance fee of $12.00 that is charged once a year may apply for certain accounts with a value of less than $2,000. This fee is not included in the table below. If it was, the estimate of expenses you paid during the period would be higher, and your ending account value lower, by this amount.
Please note that the expenses shown in the table are meant to highlight your ongoing costs only and do not reflect any transaction costs. Therefore, the second line of the table is useful in comparing ongoing costs only, and will not help you determine the relative total costs of owning different funds.
| Beginning
Account Value
June 1, 2006 | Ending
Account Value
November 30, 2006 | Expenses Paid
During Period*
June 1, 2006 to
November 30, 2006 |
Actual | $ 1,000.00 | $ 1,065.10 | $ 4.30 |
Hypothetical (5% return per year before expenses) | $ 1,000.00 | $ 1,020.91 | $ 4.20 |
* Expenses are equal to the Fund's annualized expense ratio of .83%; multiplied by the average account value over the period, multiplied by 183/365 (to reflect the one-half year period).
Annual Report
Investment Changes
Top Ten Investments as of November 30, 2006 |
(excluding cash equivalents) | % of fund's
net assets | % of fund's net assets
6 months ago |
El Paso Corp. 4.99% | 8.5 | 8.6 |
Celanese Corp. 4.25% | 4.2 | 3.1 |
Halliburton Co. 3.125% 7/15/23 | 3.8 | 3.9 |
Tyco International Group SA 3.125% 1/15/23 | 2.7 | 2.5 |
Charter Communications, Inc. 5.875% 11/16/09 | 2.6 | 1.1 |
Valero Energy Corp. | 2.2 | 2.9 |
Celanese Corp. Class A | 2.0 | 2.7 |
Maxtor Corp. 2.375% 8/15/12 | 1.9 | 0.0 |
Quicksilver Resources, Inc. 1.875% 11/1/24 | 1.8 | 1.6 |
Teekay Shipping Corp. | 1.8 | 1.6 |
| 31.5 | |
Top Five Market Sectors as of November 30, 2006 |
| % of fund's
net assets | % of fund's net assets
6 months ago |
Energy | 27.4 | 26.8 |
Information Technology | 20.0 | 22.7 |
Consumer Discretionary | 12.1 | 10.8 |
Industrials | 11.9 | 11.4 |
Materials | 9.7 | 9.6 |
Asset Allocation (% of fund's net assets) |
As of November 30, 2006 * | As of May 31, 2006 ** |
| Convertible
Securities 82.4% | | | Convertible
Securities 80.8% | |
 | Stocks 14.9% | | | Stocks 16.3% | |
 | Nonconvertible
Bonds 0.4% | | | Nonconvertible
Bonds 0.5% | |
| Short-Term
Investments and
Net Other Assets 2.3% | | | Short-Term
Investments and
Net Other Assets 2.4% | |
* Foreign investments | 10.5% | | ** Foreign investments | 12.0% | |

Annual Report
Investments November 30, 2006
Showing Percentage of Net Assets
Corporate Bonds - 59.7% |
| Principal Amount (000s) | | Value (Note 1) (000s) |
Convertible Bonds - 59.3% |
CONSUMER DISCRETIONARY - 6.7% |
Hotels, Restaurants & Leisure - 2.0% |
Six Flags, Inc. 4.5% 5/15/15 | | $ 27,700 | | $ 29,570 |
WMS Industries, Inc.: | | | | |
2.75% 7/15/10 (g) | | 4,000 | | 7,340 |
2.75% 7/15/10 | | 2,800 | | 5,138 |
| | 42,048 |
Media - 4.1% |
Charter Communications, Inc.: | | | | |
5.875% 11/16/09 (g) | | 1,127 | | 1,565 |
5.875% 11/16/09 | | 39,074 | | 54,274 |
Lamar Advertising Co. 2.875% 12/31/10 | | 8,200 | | 10,549 |
XM Satellite Radio Holdings, Inc. 1.75% 12/1/09 | | 400 | | 332 |
XM Satellite Radio, Inc. 1.75% 12/1/09 (g) | | 23,300 | | 19,337 |
| | 86,057 |
Specialty Retail - 0.6% |
United Auto Group, Inc. 3.5% 4/1/26 (g) | | 10,000 | | 11,557 |
TOTAL CONSUMER DISCRETIONARY | | 139,662 |
CONSUMER STAPLES - 0.4% |
Food & Staples Retailing - 0.4% |
Nash-Finch Co. 1.6314% 3/15/35 (e) | | 18,480 | | 7,682 |
ENERGY - 8.0% |
Energy Equipment & Services - 5.3% |
Grey Wolf, Inc. 5.3216% 4/1/24 (h) | | 3,880 | | 5,049 |
Halliburton Co. 3.125% 7/15/23 | | 42,400 | | 78,228 |
Hornbeck Offshore Services, Inc. 1.625% 11/15/26 (e)(g) | | 5,000 | | 5,186 |
Maverick Tube Corp.: | | | | |
1.875% 11/15/25 (g) | | 3,000 | | 4,805 |
1.875% 11/15/25 | | 7,000 | | 11,211 |
Oil States International, Inc. 2.375% 7/1/25 (g) | | 4,500 | | 5,895 |
| | 110,374 |
Oil, Gas & Consumable Fuels - 2.7% |
McMoRan Exploration Co.: | | | | |
6% 7/2/08 (g) | | 1,000 | | 1,271 |
Corporate Bonds - continued |
| Principal Amount (000s) | | Value (Note 1) (000s) |
Convertible Bonds - continued |
ENERGY - continued |
Oil, Gas & Consumable Fuels - continued |
McMoRan Exploration Co.: - continued | | | | |
6% 7/2/08 | | $ 12,900 | | $ 16,400 |
Quicksilver Resources, Inc. 1.875% 11/1/24 (g) | | 24,500 | | 37,924 |
| | 55,595 |
TOTAL ENERGY | | 165,969 |
FINANCIALS - 2.6% |
Consumer Finance - 2.1% |
American Express Co.: | | | | |
1.85% 12/1/33 (e)(g) | | 31,800 | | 31,781 |
1.85% 12/1/33 (e) | | 12,600 | | 12,592 |
| | 44,373 |
Real Estate Investment Trusts - 0.5% |
Ventas, Inc. 3.875% 11/15/11 (g) | | 9,000 | | 8,976 |
TOTAL FINANCIALS | | 53,349 |
HEALTH CARE - 6.1% |
Biotechnology - 1.4% |
Amgen, Inc. 0.375% 2/1/13 (g) | | 25,000 | | 25,088 |
BioMarin Pharmaceutical, Inc. 2.5% 3/29/13 | | 2,510 | | 3,137 |
| | 28,225 |
Health Care Equipment & Supplies - 0.5% |
Bausch & Lomb, Inc. 6.0481% 8/1/23 (h) | | 10,000 | | 11,319 |
Life Sciences Tools & Services - 2.8% |
Charles River Laboratories International, Inc. 2.25% 6/15/13 (g) | | 4,000 | | 4,238 |
Fisher Scientific International, Inc.: | | | | |
2.5% 10/1/23 (g) | | 15,600 | | 29,946 |
2.5% 10/1/23 | | 7,400 | | 14,205 |
Nektar Therapeutics 3.25% 9/28/12 | | 9,000 | | 9,274 |
| | 57,663 |
Pharmaceuticals - 1.4% |
Roche Holdings, Inc. 0% 7/25/21 (g) | | 30,000 | | 29,025 |
TOTAL HEALTH CARE | | 126,232 |
Corporate Bonds - continued |
| Principal Amount (000s) | | Value (Note 1) (000s) |
Convertible Bonds - continued |
INDUSTRIALS - 10.2% |
Aerospace & Defense - 0.1% |
AAR Corp. 1.75% 2/1/26 (g) | | $ 2,500 | | $ 2,748 |
Airlines - 2.3% |
AirTran Holdings, Inc. 7% 7/1/23 | | 10,000 | | 13,650 |
UAL Corp. 4.5% 6/30/21 (g) | | 10,500 | | 14,150 |
US Airways Group, Inc. 7% 9/30/20 (g) | | 7,810 | | 20,250 |
| | 48,050 |
Commercial Services & Supplies - 0.6% |
FTI Consulting, Inc. 3.75% 7/15/12 (g) | | 11,995 | | 13,554 |
Construction & Engineering - 1.6% |
Fluor Corp. 1.5% 2/15/24 | | 15,700 | | 25,056 |
Quanta Services, Inc. 3.75% 4/30/26 (g) | | 7,000 | | 7,630 |
| | 32,686 |
Electrical Equipment - 0.6% |
C&D Technologies, Inc. 5.25% 11/1/25 (g) | | 4,400 | | 3,650 |
GrafTech International Ltd. 1.625% 1/15/24 | | 11,280 | | 9,306 |
| | 12,956 |
Industrial Conglomerates - 3.4% |
Tyco International Group SA: | | | | |
3.125% 1/15/23 (g) | | 39,900 | | 56,115 |
yankee 3.125% 1/15/23 | | 10,100 | | 14,205 |
| | 70,320 |
Machinery - 0.6% |
Greenbrier Companies, Inc. 2.375% 5/15/26 (g) | | 5,500 | | 5,727 |
Trinity Industries, Inc. 3.875% 6/1/36 | | 7,000 | | 7,356 |
| | 13,083 |
Marine - 1.0% |
OMI Corp. 2.875% 12/1/24 | | 20,400 | | 20,247 |
TOTAL INDUSTRIALS | | 213,644 |
INFORMATION TECHNOLOGY - 18.8% |
Communications Equipment - 2.6% |
AudioCodes Ltd. 2% 11/9/24 (g) | | 10,000 | | 8,956 |
Ciena Corp. 0.25% 5/1/13 | | 2,650 | | 2,302 |
Finisar Corp. 2.5% 10/15/10 | | 15,760 | | 20,449 |
Corporate Bonds - continued |
| Principal Amount (000s) | | Value (Note 1) (000s) |
Convertible Bonds - continued |
INFORMATION TECHNOLOGY - continued |
Communications Equipment - continued |
JDS Uniphase Corp. 1% 5/15/26 (g) | | $ 15,000 | | $ 13,586 |
Symmetricom, Inc. 3.25% 6/15/25 | | 8,000 | | 8,050 |
| | 53,343 |
Computers & Peripherals - 3.1% |
Maxtor Corp.: | | | | |
2.375% 8/15/12 (g) | | 10,000 | | 15,908 |
2.375% 8/15/12 | | 25,100 | | 39,930 |
SanDisk Corp. 1% 5/15/13 | | 11,000 | | 9,778 |
| | 65,616 |
Electronic Equipment & Instruments - 4.3% |
Coherent, Inc. 2.75% 3/1/11 (g) | | 1,890 | | 2,043 |
Flextronics International Ltd. 1% 8/1/10 | | 35,580 | | 34,399 |
Itron, Inc. 2.5% 8/1/26 | | 7,000 | | 7,269 |
Merix Corp. 4% 5/15/13 (g) | | 11,250 | | 10,448 |
Solectron Corp. 0.5% 2/15/34 | | 5,500 | | 4,476 |
Vishay Intertechnology, Inc. 3.625% 8/1/23 | | 30,330 | | 30,217 |
| | 88,852 |
Internet Software & Services - 0.7% |
aQuantive, Inc. 2.25% 8/15/24 | | 7,150 | | 13,947 |
IT Services - 1.9% |
DST Systems, Inc.: | | | | |
Series A, 4.125% 8/15/23 (g) | | 12,300 | | 17,043 |
4.125% 8/15/23 | | 16,800 | | 23,279 |
| | 40,322 |
Semiconductors & Semiconductor Equipment - 5.7% |
Amkor Technology, Inc. 2.5% 5/15/11 | | 5,000 | | 4,943 |
Conexant Systems, Inc. 4% 3/1/26 | | 7,000 | | 6,388 |
Credence Systems Corp. 1.5% 5/15/08 | | 4,000 | | 3,650 |
EMCORE Corp. 5% 5/15/11 | | 9,000 | | 9,473 |
Intel Corp.: | | | | |
2.95% 12/15/35 (g) | | 10,000 | | 9,239 |
2.95% 12/15/35 | | 38,000 | | 35,109 |
ON Semiconductor Corp.: | | | | |
0% 4/15/24 | | 29,500 | | 26,698 |
1.875% 12/15/25 (g) | | 3,750 | | 4,252 |
Corporate Bonds - continued |
| Principal Amount (000s) | | Value (Note 1) (000s) |
Convertible Bonds - continued |
INFORMATION TECHNOLOGY - continued |
Semiconductors & Semiconductor Equipment - continued |
Photronics, Inc. 2.25% 4/15/08 | | $ 7,000 | | $ 7,900 |
PMC-Sierra, Inc. 2.25% 10/15/25 | | 10,000 | | 11,463 |
| | 119,115 |
Software - 0.5% |
Symantec Corp. 1% 6/15/13 (g) | | 9,000 | | 11,025 |
TOTAL INFORMATION TECHNOLOGY | | 392,220 |
MATERIALS - 0.2% |
Metals & Mining - 0.2% |
Coeur d'Alene Mines Corp. 1.25% 1/15/24 | | 4,600 | | 4,569 |
TELECOMMUNICATION SERVICES - 5.4% |
Diversified Telecommunication Services - 1.4% |
Broadwing Corp. 3.125% 5/15/26 (g) | | 12,000 | | 13,230 |
Level 3 Communications, Inc. 3.5% 6/15/12 | | 8,000 | | 9,569 |
Time Warner Telecom, Inc. 2.375% 4/1/26 | | 6,000 | | 7,136 |
| | 29,935 |
Wireless Telecommunication Services - 4.0% |
American Tower Corp.: | | | | |
3.25% 8/1/10 (g) | | 9,700 | | 30,299 |
3.25% 8/1/10 | | 3,935 | | 12,291 |
ICO North America, Inc. 7.5% 8/15/09 (i) | | 5,905 | | 6,614 |
NII Holdings, Inc.: | | | | |
2.875% 2/1/34 (g) | | 2,000 | | 5,026 |
2.875% 2/1/34 | | 11,500 | | 28,902 |
| | 83,132 |
TOTAL TELECOMMUNICATION SERVICES | | 113,067 |
UTILITIES - 0.9% |
Multi-Utilities - 0.9% |
CMS Energy Corp. 3.375% 7/15/23 | | 11,800 | | 18,447 |
TOTAL CONVERTIBLE BONDS | | 1,234,841 |
Corporate Bonds - continued |
| Principal Amount (000s) | | Value (Note 1) (000s) |
Nonconvertible Bonds - 0.4% |
CONSUMER DISCRETIONARY - 0.4% |
Auto Components - 0.4% |
IdleAire Technologies Corp. 0% 12/15/12 unit (d)(g) | | $ 12,510 | | $ 9,383 |
TOTAL CORPORATE BONDS (Cost $1,054,940) | 1,244,224 |
Common Stocks - 14.9% |
| Shares | | |
CONSUMER DISCRETIONARY - 1.2% |
Diversified Consumer Services - 0.7% |
Coinmach Service Corp. Class A | 359,400 | | 3,673 |
Service Corp. International | 1,143,000 | | 11,281 |
| | 14,954 |
Media - 0.5% |
Charter Communications, Inc. Class A (a) | 3,793,900 | | 11,192 |
TOTAL CONSUMER DISCRETIONARY | | 26,146 |
ENERGY - 6.6% |
Energy Equipment & Services - 1.0% |
National Oilwell Varco, Inc. (a) | 320,900 | | 21,343 |
Oil, Gas & Consumable Fuels - 5.6% |
General Maritime Corp. | 162,000 | | 5,706 |
OMI Corp. | 200,000 | | 4,672 |
Sasol Ltd. sponsored ADR | 612,600 | | 21,594 |
Teekay Shipping Corp. | 895,625 | | 37,509 |
Valero Energy Corp. | 839,072 | | 46,208 |
| | 115,689 |
TOTAL ENERGY | | 137,032 |
INDUSTRIALS - 1.0% |
Building Products - 0.8% |
American Standard Companies, Inc. | 353,600 | | 15,845 |
Commercial Services & Supplies - 0.0% |
Global Cash Access Holdings, Inc. (a) | 71,600 | | 1,148 |
Common Stocks - continued |
| Shares | | Value (Note 1) (000s) |
INDUSTRIALS - continued |
Machinery - 0.2% |
FreightCar America, Inc. (f) | 76,700 | | $ 4,226 |
TOTAL INDUSTRIALS | | 21,219 |
INFORMATION TECHNOLOGY - 1.2% |
Semiconductors & Semiconductor Equipment - 1.2% |
Amkor Technology, Inc. (a) | 1,043,200 | | 10,662 |
ON Semiconductor Corp. (a) | 2,169,500 | | 13,972 |
| | 24,634 |
MATERIALS - 4.6% |
Chemicals - 2.5% |
Celanese Corp. Class A | 1,913,500 | | 42,097 |
Monsanto Co. | 200,000 | | 9,614 |
| | 51,711 |
Containers & Packaging - 0.6% |
Temple-Inland, Inc. | 299,900 | | 11,726 |
Paper & Forest Products - 1.5% |
Aracruz Celulose SA (PN-B) sponsored ADR (non-vtg.) | 200,000 | | 12,172 |
Weyerhaeuser Co. | 300,000 | | 19,404 |
| | 31,576 |
TOTAL MATERIALS | | 95,013 |
UTILITIES - 0.3% |
Independent Power Producers & Energy Traders - 0.3% |
Mirant Corp. (a) | 190,060 | | 5,782 |
TOTAL COMMON STOCKS (Cost $232,363) | 309,826 |
Convertible Preferred Stocks - 23.1% |
| | | |
CONSUMER DISCRETIONARY - 3.8% |
Automobiles - 3.3% |
Ford Motor Co. Capital Trust II 6.50% | 350,000 | | 12,086 |
General Motors Corp.: | | | |
Series B, 5.25% | 1,750,000 | | 36,138 |
Series C, 6.25% | 901,500 | | 20,293 |
| | 68,517 |
Convertible Preferred Stocks - continued |
| Shares | | Value (Note 1) (000s) |
CONSUMER DISCRETIONARY - continued |
Media - 0.5% |
Interpublic Group of Companies, Inc. Series B, 5.25% (g) | 10,000 | | $ 11,031 |
TOTAL CONSUMER DISCRETIONARY | | 79,548 |
CONSUMER STAPLES - 0.4% |
Food & Staples Retailing - 0.4% |
Rite Aid Corp. 5.50% | 370,000 | | 9,198 |
ENERGY - 12.8% |
Energy Equipment & Services - 0.4% |
Bristow Group, Inc. 5.50% | 160,000 | | 7,940 |
Oil, Gas & Consumable Fuels - 12.4% |
Chesapeake Energy Corp.: | | | |
4.50% | 170,000 | | 17,298 |
5.00% (g) | 55,000 | | 8,064 |
5.00% | 215,000 | | 31,524 |
5.00% (g) | 149,600 | | 16,851 |
El Paso Corp. 4.99% | 136,390 | | 177,152 |
Goodrich Petroleum Corp. Series B, 5.375% (g) | 93,500 | | 7,449 |
| | 258,338 |
TOTAL ENERGY | | 266,278 |
FINANCIALS - 0.1% |
Thrifts & Mortgage Finance - 0.1% |
Doral Financial Corp.: | | | |
4.75% (g) | 21,400 | | 2,408 |
4.75% | 5,000 | | 563 |
| | 2,971 |
INDUSTRIALS - 0.7% |
Commercial Services & Supplies - 0.7% |
Allied Waste Industries, Inc. Series D, 6.25% | 40,000 | | 13,640 |
MATERIALS - 4.9% |
Chemicals - 4.4% |
Celanese Corp. 4.25% | 2,767,500 | | 87,619 |
Huntsman Corp. 5.00% | 125,000 | | 4,779 |
| | 92,398 |
Convertible Preferred Stocks - continued |
| Shares | | Value (Note 1) (000s) |
MATERIALS - continued |
Metals & Mining - 0.5% |
Freeport-McMoRan Copper & Gold, Inc. 5.50% | 7,200 | | $ 10,057 |
TOTAL MATERIALS | | 102,455 |
UTILITIES - 0.4% |
Independent Power Producers & Energy Traders - 0.4% |
NRG Energy, Inc. Series A, 5.75% | 26,800 | | 7,319 |
TOTAL CONVERTIBLE PREFERRED STOCKS (Cost $424,903) | 481,409 |
Money Market Funds - 2.7% |
| | | |
Fidelity Cash Central Fund, 5.35% (b) | 54,390,068 | | 54,390 |
Fidelity Securities Lending Cash Central Fund, 5.35% (b)(c) | 2,034,000 | | 2,034 |
TOTAL MONEY MARKET FUNDS (Cost $56,424) | 56,424 |
TOTAL INVESTMENT PORTFOLIO - 100.4% (Cost $1,768,630) | | 2,091,883 |
NET OTHER ASSETS - (0.4)% | | (8,790) |
NET ASSETS - 100% | $ 2,083,093 |
Legend |
(a) Non-income producing |
(b) Affiliated fund that is available only to investment companies and other accounts managed by Fidelity Investments. The rate quoted is the annualized seven-day yield of the fund at period end. A complete unaudited listing of the fund's holdings as of its most recent quarter end is available upon request. |
(c) Investment made with cash collateral received from securities on loan. |
(d) Security initially issued in zero coupon form which converts to coupon form at a specified rate and date. The rate shown is the rate at period end. |
(e) Security initially issued at one coupon which converts to a higher coupon at a specified date. The rate shown is the rate at period end. |
(f) Security or a portion of the security is on loan at period end. |
(g) Security exempt from registration under Rule 144A of the Securities Act of 1933. These securities may be resold in transactions exempt from registration, normally to qualified institutional buyers. At the end of the period, the value of these securities amounted to $543,999,000 or 26.1% of net assets. |
(h) The coupon rate shown on floating or adjustable rate securities represents the rate at period end. |
(i) Restricted securities - Investment in securities not registered under the Securities Act of 1933 (excluding 144A issues). At the end of the period, the value of restricted securities (excluding 144A issues) amounted to $6,614,000 or 0.3% of net assets. |
Additional information on each holding is as follows: |
Security | Acquisition Date | Acquisition Cost (000s) |
ICO North America, Inc. 7.5% 8/15/09 | 8/12/05 | $ 5,905 |
Affiliated Central Funds |
Information regarding fiscal year to date income earned by the Fund from investments in Fidelity Central Funds is as follows: |
Fund | Income earned
(Amounts in thousands) |
Fidelity Cash Central Fund | $ 1,575 |
Fidelity Securities Lending Cash Central Fund | 11 |
Total | $ 1,586 |
Other Information |
The composition of credit quality ratings as a percentage of net assets is as follows (ratings are unaudited): |
AAA,AA,A | 6.6% |
BBB | 5.2% |
BB | 11.8% |
B | 8.5% |
CCC,CC,C | 7.8% |
Not Rated | 19.8% |
Equities | 38.0% |
Short-Term Investments and Net Other Assets | 2.3% |
| 100.0% |
We have used ratings from Moody's Investors Services, Inc. Where Moody's ratings are not available, we have used S&P ratings. |
Distribution of investments by country of issue, as a percentage of total net assets, is as follows: |
United States of America | 89.5% |
Luxembourg | 3.4% |
Marshall Islands | 3.3% |
Singapore | 1.7% |
South Africa | 1.1% |
Others (individually less than 1%) | 1.0% |
| 100.0% |
See accompanying notes which are an integral part of the financial statements.
Annual Report
Financial Statements
Statement of Assets and Liabilities
Amounts in thousands (except per-share amount) | November 30, 2006 |
| | |
Assets | | |
Investment in securities, at value (including securities loaned of $1,984) - See accompanying schedule: Unaffiliated issuers (cost $1,712,206) | $ 2,035,459 | |
Fidelity Central Funds (cost $56,424) | 56,424 | |
Total Investments (cost $1,768,630) | | $ 2,091,883 |
Receivable for investments sold | | 5,202 |
Receivable for fund shares sold | | 1,139 |
Dividends receivable | | 1,195 |
Interest receivable | | 7,803 |
Other receivables | | 14 |
Total assets | | 2,107,236 |
| | |
Liabilities | | |
Payable to custodian bank | $ 147 | |
Payable for investments purchased | 18,222 | |
Payable for fund shares redeemed | 2,226 | |
Accrued management fee | 1,019 | |
Other affiliated payables | 360 | |
Other payables and accrued expenses | 135 | |
Collateral on securities loaned, at value | 2,034 | |
Total liabilities | | 24,143 |
| | |
Net Assets | | $ 2,083,093 |
Net Assets consist of: | | |
Paid in capital | | $ 1,747,939 |
Undistributed net investment income | | 4,627 |
Accumulated undistributed net realized gain (loss) on investments and foreign currency transactions | | 7,274 |
Net unrealized appreciation (depreciation) on investments and assets and liabilities in foreign currencies | | 323,253 |
Net Assets, for 82,625 shares outstanding | | $ 2,083,093 |
Net Asset Value, offering price and redemption price per share ($2,083,093 ÷ 82,625 shares) | | $ 25.21 |
See accompanying notes which are an integral part of the financial statements.
Annual Report
Financial Statements - continued
Statement of Operations
Amounts in thousands | Year ended November 30, 2006 |
| | |
Investment Income | | |
Dividends | | $ 22,485 |
Interest | | 33,475 |
Income from Fidelity Central Funds | | 1,586 |
Total income | | 57,546 |
| | |
Expenses | | |
Management fee
Basic fee | $ 9,199 | |
Performance adjustment | 2,659 | |
Transfer agent fees | 3,642 | |
Accounting and security lending fees | 579 | |
Custodian fees and expenses | 34 | |
Independent trustees' compensation | 8 | |
Registration fees | 66 | |
Audit | 81 | |
Legal | 33 | |
Interest | 3 | |
Miscellaneous | 86 | |
Total expenses before reductions | 16,390 | |
Expense reductions | (69) | 16,321 |
Net investment income (loss) | | 41,225 |
Realized and Unrealized Gain (Loss) Net realized gain (loss) on: | | |
Investment securities: | | |
Unaffiliated issuers | 74,730 | |
Foreign currency transactions | 9 | |
Total net realized gain (loss) | | 74,739 |
Change in net unrealized appreciation (depreciation) on: Investment securities | 175,081 | |
Assets and liabilities in foreign currencies | (1) | |
Total change in net unrealized appreciation (depreciation) | | 175,080 |
Net gain (loss) | | 249,819 |
Net increase (decrease) in net assets resulting from operations | | $ 291,044 |
See accompanying notes which are an integral part of the financial statements.
Annual Report
Statement of Changes in Net Assets
Amounts in thousands | Year ended
November 30, 2006 | Year ended
November 30, 2005 |
Increase (Decrease) in Net Assets | | |
Operations | | |
Net investment income (loss) | $ 41,225 | $ 34,361 |
Net realized gain (loss) | 74,739 | 121,208 |
Change in net unrealized appreciation (depreciation) | 175,080 | (40,496) |
Net increase (decrease) in net assets resulting
from operations | 291,044 | 115,073 |
Distributions to shareholders from net investment income | (41,398) | (28,144) |
Distributions to shareholders from net realized gain | (791) | (1,739) |
Total distributions | (42,189) | (29,883) |
Share transactions
Proceeds from sales of shares | 477,908 | 196,331 |
Reinvestment of distributions | 38,524 | 27,050 |
Cost of shares redeemed | (435,858) | (390,181) |
Net increase (decrease) in net assets resulting from share transactions | 80,574 | (166,800) |
Total increase (decrease) in net assets | 329,429 | (81,610) |
| | |
Net Assets | | |
Beginning of period | 1,753,664 | 1,835,274 |
End of period (including undistributed net investment income of $4,627 and undistributed net investment income of $5,180, respectively) | $ 2,083,093 | $ 1,753,664 |
Other Information Shares | | |
Sold | 20,180 | 9,211 |
Issued in reinvestment of distributions | 1,650 | 1,269 |
Redeemed | (18,421) | (18,412) |
Net increase (decrease) | 3,409 | (7,932) |
See accompanying notes which are an integral part of the financial statements.
Annual Report
Financial Highlights
Years ended November 30, | 2006 | 2005 | 2004 | 2003 | 2002 |
Selected Per-Share Data | | | | | |
Net asset value, beginning of period | $ 22.14 | $ 21.06 | $ 19.71 | $ 16.88 | $ 19.50 |
Income from Investment Operations | | | | | |
Net investment income (loss) B | .49 | .41 | .46 | .79 | .79 F |
Net realized and unrealized gain (loss) | 3.09 | 1.03 | 1.55 | 2.87 | (2.46) F |
Total from investment operations | 3.58 | 1.44 | 2.01 | 3.66 | (1.67) |
Distributions from net investment income | (.50) | (.34) | (.66) | (.83) | (.95) |
Distributions from net realized gain | (.01) | (.02) | - | - | - |
Total distributions | (.51) | (.36) | (.66) | (.83) | (.95) |
Net asset value, end of period | $ 25.21 | $ 22.14 | $ 21.06 | $ 19.71 | $ 16.88 |
Total Return A | 16.38% | 6.91% | 10.39% | 22.48% | (8.97)% |
Ratios to Average Net Assets C, E | | | | | |
Expenses before reductions | .83% | .70% | .67% | .84% | .88% |
Expenses net of fee waivers, if any | .83% | .70% | .67% | .84% | .88% |
Expenses net of all reductions | .83% | .69% | .66% | .82% | .85% |
Net investment income (loss) | 2.09% | 1.95% | 2.26% | 4.46% | 4.40% F |
Supplemental Data | | | | | |
Net assets, end of period (in millions) | $ 2,083 | $ 1,754 | $ 1,835 | $ 1,767 | $ 1,423 |
Portfolio turnover rate D | 35% | 81% | 112% | 136% | 138% |
A Total returns would have been lower had certain expenses not been reduced during the periods shown.
B Calculated based on average shares outstanding during the period.
C Fees and expenses of the underlying Fidelity Central Funds are not included in the Fund's expense ratio. The Fund indirectly bears its proportionate share of the expenses of any underlying Fidelity Central Funds.
D Amount does not include the portfolio activity of any underlying Fidelity Central Funds.
E Expense ratios reflect operating expenses of the Fund. Expenses before reductions do not reflect amounts reimbursed by the investment adviser or reductions from brokerage service arrangements or other expense offset arrangements and do not represent the amount paid by the Fund during periods when reimbursements or reductions occur. Expenses net of fee waivers reflect expenses after reimbursement by the investment adviser but prior to reductions from brokerage service arrangements or other expense offset arrangements. Expenses net of all reductions represent the net expenses paid by the Fund.
F As a result of a revision to reflect accretion of market discount using the interest method, certain amounts for the year ended November 30, 2002 have been reclassified from what was previously reported. The impact of this change was a decrease to net investment income (loss) of $0.06 per share with a corresponding increase to net realized and unrealized gain (loss) per share. The ratio of net investment income (loss) to average net assets decreased from 4.76% to 4.40%. The reclassification has no impact on the net assets of the Fund.
See accompanying notes which are an integral part of the financial statements.
Annual Report
Notes to Financial Statements
For the period ended November 30, 2006
(Amounts in thousands except ratios)
1. Significant Accounting Policies.
Fidelity Convertible Securities Fund (the Fund) is a fund of Fidelity Financial Trust (the trust) and is authorized to issue an unlimited number of shares. The trust is registered under the Investment Company Act of 1940, as amended (the 1940 Act), as an open-end management investment company organized as a Massachusetts business trust. The Fund may invest in Fidelity Central Funds which are open-end investment companies available to investment companies and other accounts managed by Fidelity Management & Research Company (FMR) and its affiliates. The financial statements have been prepared in conformity with accounting principles generally accepted in the United States of America, which require management to make certain estimates and assumptions at the date of the financial statements. The following summarizes the significant accounting policies of the Fund, which are also consistently followed by the Fidelity Central Funds:
Security Valuation. Investments are valued and net asset value (NAV) per share is calculated (NAV calculation) as of the close of business of the New York Stock Exchange (NYSE), normally 4:00 p.m. Eastern time. Wherever possible, the Fund uses independent pricing services approved by the Board of Trustees to value its investments.
Equity securities, including restricted securities, for which market quotations are readily available, are valued at the last reported sale price or official closing price as reported by an independent pricing service on the primary market or exchange on which they are traded. In the event there were no sales during the day or closing prices are not available, securities are valued at the last quoted bid price. Debt securities, including restricted securities, for which quotations are readily available, are valued by independent pricing services or by dealers who make markets in such securities. Pricing services consider yield or price of bonds of comparable quality, coupon, maturity and type as well as dealer supplied prices. Investments in open-end mutual funds, including the Fidelity Central Funds, are valued at their closing net asset value each business day. Short-term securities with remaining maturities of sixty days or less for which quotations are not readily available are valued at amortized cost, which approximates value.
When current market prices or quotations are not readily available or do not accurately reflect fair value, valuations may be determined in accordance with procedures adopted by the Board of Trustees. For example, when developments occur between the close of a market and the close of the NYSE that may materially affect the value of some or all of the securities, or when trading in a security is halted, those securities may be fair valued. Factors used in the determination of fair value may include monitoring news to identify significant market or security specific events such as changes in the value of U.S. securities markets, reviewing developments in foreign markets and evaluating the performance of ADRs, futures contracts and exchange-traded funds. Because the Fund's utilization of fair value pricing depends on market activity, the frequency with which fair
Annual Report
Notes to Financial Statements - continued
(Amounts in thousands except ratios)
1. Significant Accounting Policies - continued
Security Valuation - continued
value pricing is used can not be predicted and may be utilized to a significant extent. The value of securities used for NAV calculation under fair value pricing may differ from published prices for the same securities.
Foreign Currency. The Fund uses foreign currency contracts to facilitate transactions in foreign-denominated securities. Losses from these transactions may arise from changes in the value of the foreign currency or if the counterparties do not perform under the contracts' terms.
Foreign-denominated assets, including investment securities, and liabilities are translated into U.S. dollars at the exchange rate at period end. Purchases and sales of investment securities, income and dividends received and expenses denominated in foreign currencies are translated into U.S. dollars at the exchange rate in effect on the transaction date.
The effects of exchange rate fluctuations on investments are included with the net realized and unrealized gain (loss) on investment securities. Other foreign currency transactions resulting in realized and unrealized gain (loss) are disclosed separately.
Investment Transactions and Income. Security transactions, including the Fund's investment activity in the Fidelity Central Funds, are accounted for as of trade date. Gains and losses on securities sold are determined on the basis of identified cost and may include proceeds received from litigation. Dividend income is recorded on the ex-dividend date, except for certain dividends from foreign securities where the ex-dividend date may have passed, which are recorded as soon as the Fund is informed of the ex-dividend date. Non-cash dividends included in dividend income, if any, are recorded at the fair market value of the securities received. Distributions received on securities that represent a return of capital or capital gain are recorded as a reduction of cost of investments and/or as a realized gain. The Fund estimates the components of distributions received that may be considered return of capital distributions or capital gain distributions. Interest income and income distributions from the Fidelity Central Funds are accrued as earned, with any income distributions receivable as of period end included in Interest Receivable on the Statement of Assets and Liabilities. Interest income includes coupon interest and amortization of premium and accretion of discount on debt securities. Investment income is recorded net of foreign taxes withheld where recovery of such taxes is uncertain.
Expenses. Most expenses of the trust can be directly attributed to a fund. Expenses which cannot be directly attributed are apportioned among each Fund in the trust. Expense estimates are accrued in the period to which they relate and adjustments are made when actual amounts are known.
Annual Report
1. Significant Accounting Policies - continued
Income Tax Information and Distributions to Shareholders. Each year, the Fund intends to qualify as a regulated investment company by distributing all of its taxable income and realized gains under Subchapter M of the Internal Revenue Code. As a result, no provision for income taxes is required in the accompanying financial statements. Foreign taxes are provided for based on the Fund's understanding of the tax rules and rates that exist in the foreign markets in which it invests.
Distributions are recorded on the ex-dividend date. Income and capital gain distributions are determined in accordance with income tax regulations, which may differ from generally accepted accounting principles. In addition, the Fund will claim a portion of the payment made to redeeming shareholders as a distribution for income tax purposes.
Capital accounts within the financial statements are adjusted for permanent book-tax differences. These adjustments have no impact on net assets or the results of operations. Temporary book-tax differences will reverse in a subsequent period.
Book-tax differences are primarily due to foreign currency transactions, passive foreign investment companies (PFIC), defaulted bonds, market discount, deferred trustees compensation, losses deferred due to excise tax regulations.
The tax-basis components of distributable earnings and the federal tax cost as of period end were as follows:
Unrealized appreciation | $ 353,789 |
Unrealized depreciation | (34,636) |
Net unrealized appreciation (depreciation) | 319,153 |
Undistributed ordinary income | 6,146 |
Undistributed long-term capital gain | 1,692 |
| |
Cost for federal income tax purposes | $ 1,772,730 |
The tax character of distributions paid was as follows:
| November 30, 2006 | November 30, 2005 |
Ordinary Income | $ 42,189 | $ 29,883 |
New Accounting Pronouncements. In July 2006, Financial Accounting Standards Board Interpretation No. 48, Accounting for Uncertainty in Income Taxes - an interpretation of FASB Statement 109 (FIN 48), was issued and is effective for fiscal years beginning after December 15, 2006. FIN 48 sets forth a threshold for financial statement recognition, measurement and disclosure of a tax position taken or expected to be taken on a tax return. Management is currently evaluating the impact, if any, the adoption of
Annual Report
Notes to Financial Statements - continued
(Amounts in thousands except ratios)
1. Significant Accounting Policies - continued
New Accounting Pronouncements - continued
FIN 48 will have on the Fund's net assets, results of operations and financial statement disclosures.
In addition, in September 2006, Statement of Financial Accounting Standards No. 157, Fair Value Measurements (SFAS 157), was issued and is effective for fiscal years beginning after November 15, 2007. SFAS 157 defines fair value, establishes a framework for measuring fair value and expands disclosures about fair value measurements. Management is currently evaluating the impact the adoption of SFAS 157 will have on the Fund's financial statement disclosures.
2. Operating Policies.
Repurchase Agreements. FMR has received an Exemptive Order from the Securities and Exchange Commission (the SEC) which permits the Fund and other affiliated entities of FMR to transfer uninvested cash balances into joint trading accounts which are then invested in repurchase agreements. The Fund may also invest directly with institutions in repurchase agreements. Repurchase agreements are collateralized by government or non-government securities. Upon settlement date, collateral is held in segregated accounts with custodian banks and may be obtained in the event of a default of the counterparty. The Fund monitors, on a daily basis, the value of the collateral to ensure it is at least equal to the principal amount of the repurchase agreement (including accrued interest). In the event of a default by the counterparty, realization of the collateral proceeds could be delayed, during which time the value of the collateral may decline.
Restricted Securities. The Fund may invest in securities that are subject to legal or contractual restrictions on resale. These securities generally may be resold in transactions exempt from registration or to the public if the securities are registered. Disposal of these securities may involve time-consuming negotiations and expense, and prompt sale at an acceptable price may be difficult. Information regarding restricted securities is included at the end of the Fund's Schedule of Investments.
3. Purchases and Sales of Investments.
Purchases and sales of securities, other than short-term securities, aggregated $721,935 and $685,643, respectively.
Annual Report
4. Fees and Other Transactions with Affiliates.
Management Fee. FMR and its affiliates provide the Fund with investment management related services for which the Fund pays a monthly management fee. The management fee is the sum of an individual fund fee rate that is based on an annual rate of .20% of the Fund's average net assets and a group fee rate that averaged ..27% during the period. The group fee rate is based upon the average net assets of all the mutual funds advised by FMR. The group fee rate decreases as assets under management increase and increases as assets under management decrease. In addition, the management fee is subject to a performance adjustment (up to a maximum of ± .15% of the Fund's average net assets over a 36 month performance period). The upward or downward adjustment to the management fee is based on the Fund's relative investment performance as compared to an appropriate benchmark index. For the period, the total annual management fee rate, including the performance adjustment, was .60% of the Fund's average net assets.
Transfer Agent Fees. Fidelity Service Company, Inc. (FSC), an affiliate of FMR, is the Fund's transfer, dividend disbursing and shareholder servicing agent. FSC receives account fees and asset-based fees that vary according to account size and type of account. FSC pays for typesetting, printing and mailing of shareholder reports, except proxy statements. For the period, the transfer agent fees were equivalent to an annual rate of .18% of average net assets.
Accounting and Security Lending Fees. FSC maintains the Fund's accounting records. The accounting fee is based on the level of average net assets for the month. Under a separate contract, FSC administers the security lending program. The security lending fee is based on the number and duration of lending transactions.
Investments in Fidelity Central Funds. The Fund may invest in Fidelity Central Funds. The Fund's Schedule of Investments lists each of the Fidelity Central Funds as an investment of the Fund but does not include the underlying holdings of each Fidelity Central Fund. As an Investing Fund, the Fund indirectly bears its proportionate share of the expenses of the underlying Fidelity Central Funds. A complete unaudited list of holdings for each Fidelity Central Fund is available upon request. In addition, the financial statements of the Fidelity Central Funds, which are not covered by the Fund's Report of Independent Registered Public Accounting Firm, are available on the EDGAR Database on the SEC's web site, www.sec.gov, or upon request.
The Money Market Central Funds seek preservation of capital and current income and are managed by Fidelity Investments Money Management, Inc. (FIMM), an affiliate of FMR.
Interfund Lending Program. Pursuant to an Exemptive Order issued by the SEC, the Fund, along with other registered investment companies having management contracts
Annual Report
Notes to Financial Statements - continued
(Amounts in thousands except ratios)
4. Fees and Other Transactions with Affiliates - continued
Interfund Lending Program - continued
with FMR, may participate in an interfund lending program. This program provides an alternative credit facility allowing the funds to borrow from, or lend money to, other participating affiliated funds. At period end, there were no interfund loans outstanding. The Fund's activity in this program during the period for which loans were outstanding was as follows:
Borrower or Lender | Average Daily
Loan Balance | Weighted Average Interest Rate | Interest Expense |
Borrower | $ 6,136 | 4.38% | $ 3 |
5. Committed Line of Credit.
The Fund participates with other funds managed by FMR in a $4.2 billion credit facility (the "line of credit") to be utilized for temporary or emergency purposes to fund shareholder redemptions or for other short-term liquidity purposes. The Fund has agreed to pay commitment fees on its pro rata portion of the line of credit, which amounts to $5 and is reflected in Miscellaneous Expense on the Statement of Operations. During the period, there were no borrowings on this line of credit.
6. Security Lending.
The Fund lends portfolio securities from time to time in order to earn additional income. On the settlement date of the loan, the Fund receives collateral (in the form of U.S. Treasury obligations, letters of credit and/or cash) against the loaned securities and maintains collateral in an amount not less than 100% of the market value of the loaned securities during the period of the loan. The market value of the loaned securities is determined at the close of business of the Fund and any additional required collateral is delivered to the Fund on the next business day. If the borrower defaults on its obligation to return the securities loaned because of insolvency or other reasons, a fund could experience delays and costs in recovering the securities loaned or in gaining access to the collateral. Any cash collateral received is invested in the Fidelity Securities Lending Cash Central Fund. The value of loaned securities and cash collateral at period end are disclosed on the Fund's Statement of Assets and Liabilities. Security lending income represents the income earned on investing cash collateral, less fees and expenses associated with the loan, plus any premium payments that may be received on the loan of certain types of securities. Security lending income is presented in the Statement of Operations as a component of income from Fidelity Central Funds. Net income from lending portfolio securities during the period amounted to $11.
Annual Report
7. Expense Reductions.
Many of the brokers with whom FMR places trades on behalf of the Fund provided services to the Fund in addition to trade execution. These services included payments of certain expenses on behalf of the Fund totaling $31 for the period. In addition, through arrangements with the Fund's custodian and transfer agent, credits realized as a result of uninvested cash balances were used to reduce the Fund's expenses. During the period, these credits reduced the Fund's custody and transfer agent expenses by $6 and $32, respectively.
8. Other.
The Fund's organizational documents provide former and current trustees and officers with a limited indemnification against liabilities arising in connection with the performance of their duties to the Fund. In the normal course of business, the Fund may also enter into contracts that provide general indemnifications. The Fund's maximum exposure under these arrangements is unknown as this would be dependent on future claims that may be made against the Fund. The risk of material loss from such claims is considered remote.
The United States Securities and Exchange Commission ("SEC") is conducting an investigation of FMR (covering the years 2002 to 2004) arising from gifts, gratuities and business entertainment provided by certain brokers to certain individuals who were employed on FMR's domestic equity trading desk during that period. FMR is in discussions with the SEC staff regarding the possible resolution of the matter, but as of period-end no final resolution has been reached.
In December 2006, the Independent Trustees completed their own investigation of the matter with the assistance of independent counsel. The Independent Trustees and FMR agree that, despite the absence of proof that the Fidelity mutual funds experienced diminished execution quality as a result of the improper receipt of gifts and business entertainment, the conduct at issue was serious and is worthy of redress. Accordingly, the Independent Trustees have requested and FMR has agreed to pay $42 million to Fidelity mutual funds, plus interest to be determined at the time that payment is made. A method of allocating this payment among the funds has not yet been determined. In addition, subsequent to period-end, FMR has reimbursed related legal expenses. The total payment to the Fund is not anticipated to have a material impact on the Fund's net assets.
Annual Report
Report of Independent Registered Public Accounting Firm
To the Trustees of Fidelity Financial Trust and the Shareholders of Fidelity Convertible Securities Fund:
In our opinion, the accompanying statement of assets and liabilities, including the schedule of investments, and the related statements of operations and of changes in net assets and the financial highlights present fairly, in all material respects, the financial position of Fidelity Convertible Securities Fund (a fund of Fidelity Financial Trust) at November 30, 2006, the results of its operations for the year then ended, the changes in its net assets for each of the two years in the period then ended and the financial highlights for each of the five years in the period then ended, in conformity with accounting principles generally accepted in the United States of America. These financial statements and financial highlights (hereafter referred to as "financial statements") are the responsibility of the Fidelity Convertible Securities Fund's management; our responsibility is to express an opinion on these financial statements based on our audits. We conducted our audits of these financial statements in accordance with the standards of the Public Company Accounting Oversight Board (United States). Those standards require that we plan and perform the audit to obtain reasonable assurance about whether the financial statements are free of material misstatement. An audit includes examining, on a test basis, evidence supporting the amounts and disclosures in the financial statements, assessing the accounting principles used and significant estimates made by management, and evaluating the overall financial statement presentation. We believe that our audits, which included confirmation of securities at November 30, 2006 by correspondence with the custodian and brokers, provide a reasonable basis for our opinion.
PricewaterhouseCoopers LLP
Boston, Massachusetts
January 18, 2007
Annual Report
Trustees and Officers
The Trustees, Member of the Advisory Board, and executive officers of the trust and fund, as applicable, are listed below. The Board of Trustees governs the fund and is responsible for protecting the interests of shareholders. The Trustees are experienced executives who meet periodically throughout the year to oversee the fund's activities, review contractual arrangements with companies that provide services to the fund, and review the fund's performance. Except for William O. McCoy, each of the Trustees oversees 348 funds advised by FMR or an affiliate. Mr. McCoy oversees 350 funds advised by FMR or an affiliate.
The Trustees hold office without limit in time except that (a) any Trustee may resign; (b) any Trustee may be removed by written instrument, signed by at least two-thirds of the number of Trustees prior to such removal; (c) any Trustee who requests to be retired or who has become incapacitated by illness or injury may be retired by written instrument signed by a majority of the other Trustees; and (d) any Trustee may be removed at any special meeting of shareholders by a two-thirds vote of the outstanding voting securities of the trust. Each Trustee who is not an interested person (as defined in the 1940 Act) (Independent Trustee), shall retire not later than the last day of the calendar year in which his or her 72nd birthday occurs. The Independent Trustees may waive this mandatory retirement age policy with respect to individual Trustees. The executive officers and Advisory Board Member hold office without limit in time, except that any officer and Advisory Board Member may resign or may be removed by a vote of a majority of the Trustees at any regular meeting or any special meeting of the Trustees. Except as indicated, each individual has held the office shown or other offices in the same company for the past five years.
The fund's Statement of Additional Information (SAI) includes more information about the Trustees. To request a free copy, call Fidelity at 1-800-544-8544.
Interested Trustees*:
Correspondence intended for each Trustee who is an interested person may be sent to Fidelity Investments, 82 Devonshire Street, Boston, Massachusetts 02109.
Name, Age; Principal Occupation |
Edward C. Johnson 3d (76) |
| Year of Election or Appointment: 1982 Mr. Johnson is Chairman of the Board of Trustees. Mr. Johnson serves as President (2006-present), Chief Executive Officer, Chairman, and a Director of FMR Corp.; Chairman and a Director of FMR; Chairman and a Director of Fidelity Research & Analysis Company (FRAC); Chairman and a Director of Fidelity Investments Money Management, Inc.; and Chairman (2001-present) and a Director of FMR Co., Inc. In addition, Mr. Johnson serves as Chairman and Director of Fidelity International Limited (FIL). |
Robert L. Reynolds (54) |
| Year of Election or Appointment: 2003 Mr. Reynolds is President and a Director of FMR (2005-present), Fidelity Investments Money Management, Inc. (2005-present), and FMR Co., Inc. (2005-present). Mr. Reynolds also serves as Vice Chairman (2006-present), a Director (2003-present), and Chief Operating Officer of FMR Corp. and a Director of Strategic Advisers, Inc. (2005-present). He also serves on the Board at Fidelity Investments Canada, Ltd. |
* Trustees have been determined to be "Interested Trustees" by virtue of, among other things, their affiliation with the trust or various entities under common control with FMR.
Annual Report
Independent Trustees:
Correspondence intended for each Independent Trustee (that is, the Trustees other than the Interested Trustees) may be sent to Fidelity Investments, P.O. Box 55235, Boston, Massachusetts 02205-5235.
Name, Age; Principal Occupation |
Dennis J. Dirks (58) |
| Year of Election or Appointment: 2005 Prior to his retirement in May 2003, Mr. Dirks was Chief Operating Officer and a member of the Board of The Depository Trust & Clearing Corporation (DTCC) (1999-2003). He also served as President, Chief Operating Officer, and Board member of The Depository Trust Company (DTC) (1999-2003) and President and Board member of the National Securities Clearing Corporation (NSCC) (1999-2003). In addition, Mr. Dirks served as Chief Executive Officer and Board member of the Government Securities Clearing Corporation (2001-2003) and Chief Executive Officer and Board member of the Mortgage-Backed Securities Clearing Corporation (2001-2003). Mr. Dirks also serves as a Trustee and a member of the Finance Committee of Manhattan College (2005-present) and a Trustee and a member of the Finance Committee of AHRC of Nassau County (2006-present). |
Albert R. Gamper, Jr. (64) |
| Year of Election or Appointment: 2006 Prior to his retirement in December 2004, Mr. Gamper served as Chairman of the Board of CIT Group Inc. (commercial finance). During his tenure with CIT Group Inc. Mr. Gamper served in numerous senior management positions, including Chairman (1987-1989; 1999-2001; 2002-2004), Chief Executive Officer (1987-2004), and President (1989-2002). He currently serves as a member of the Board of Directors of Public Service Enterprise Group (utilities, 2001-present), Chairman of the Board of Governors, Rutgers University (2004-present), and Chairman of the Board of Saint Barnabas Health Care System. |
George H. Heilmeier (70) |
| Year of Election or Appointment: 2004 Dr. Heilmeier is Chairman Emeritus of Telcordia Technologies (communication software and systems), where prior to his retirement, he served as company Chairman and Chief Executive Officer. He currently serves on the Boards of Directors of The Mitre Corporation (systems engineering and information technology support for the government), and HRL Laboratories (private research and development, 2004-present). He is Chairman of the General Motors Science & Technology Advisory Board and a Life Fellow of the Institute of Electrical and Electronics Engineers (IEEE). Dr. Heilmeier is a member of the Defense Science Board and the National Security Agency Advisory Board. He is also a member of the National Academy of Engineering, the American Academy of Arts and Sciences, and the Board of Overseers of the School of Engineering and Applied Science of the University of Pennsylvania. Previously, Dr. Heilmeier served as a Director of TRW Inc. (automotive, space, defense, and information technology, 1992-2002), Compaq (1994-2002), Automatic Data Processing, Inc. (ADP) (technology-based business outsourcing, 1995-2002), INET Technologies Inc. (telecommunications network surveillance, 2001-2004), and Teletech Holdings (customer management services). He is the recipient of the 2005 Kyoto Prize in Advanced Technology for his invention of the liquid crystal display, and a member of the Consumer Electronics Hall of Fame. |
James H. Keyes (66) |
| Year of Election or Appointment: 2007 Prior to his retirement in 2003, Mr. Keyes was Chairman, President, and Chief Executive Officer of Johnson Controls, Inc. (automotive supplier, 1993-2003). He currently serves as a member of the boards of LSI Logic Corporation (semiconductor technologies), Navistar International Corporation (manufacture and sale of trucks, buses, and diesel engines, 2002-present), and Pitney Bowes, Inc. (integrated mail, messaging, and document management solutions). |
Marie L. Knowles (60) |
| Year of Election or Appointment: 2001 Prior to Ms. Knowles' retirement in June 2000, she served as Executive Vice President and Chief Financial Officer of Atlantic Richfield Company (ARCO) (diversified energy, 1996-2000). From 1993 to 1996, she was a Senior Vice President of ARCO and President of ARCO Transportation Company. She served as a Director of ARCO from 1996 to 1998. She currently serves as a Director of Phelps Dodge Corporation (copper mining and manufacturing) and McKesson Corporation (healthcare service, 2002-present). Ms. Knowles is a Trustee of the Brookings Institution and the Catalina Island Conservancy and also serves as a member of the Advisory Board for the School of Engineering of the University of Southern California. |
Ned C. Lautenbach (62) |
| Year of Election or Appointment: 2000 Mr. Lautenbach is Chairman of the Independent Trustees (2006-present). Mr. Lautenbach has been a partner of Clayton, Dubilier & Rice, Inc. (private equity investment firm) since September 1998. Previously, Mr. Lautenbach was with the International Business Machines Corporation (IBM) from 1968 until his retirement in 1998. Mr. Lautenbach serves as a Director of Sony Corporation (2006-present) and Eaton Corporation (diversified industrial) as well as the Philharmonic Center for the Arts in Naples, Florida. He also is a member of the Board of Trustees of Fairfield University (2005-present), as well as a member of the Council on Foreign Relations. |
William O. McCoy (73) |
| Year of Election or Appointment: 1997 Prior to his retirement in December 1994, Mr. McCoy was Vice Chairman of the Board of BellSouth Corporation (telecommunications) and President of BellSouth Enterprises. He is currently a Director of Duke Realty Corporation (real estate). He is also a partner of Franklin Street Partners (private investment management firm). In addition, Mr. McCoy served as the Interim Chancellor (1999-2000) and a member of the Board of Visitors for the University of North Carolina at Chapel Hill and currently serves as Chairman of the Board of Directors of the University of North Carolina Health Care System. He also served as Vice President of Finance for the University of North Carolina (16-school system). |
Cornelia M. Small (62) |
| Year of Election or Appointment: 2005 Ms. Small is a member (2000-present) and Chairperson (2002-present) of the Investment Committee, and a member (2002-present) of the Board of Trustees of Smith College. Previously, she served as Chief Investment Officer (1999-2000), Director of Global Equity Investments (1996-1999), and a member of the Board of Directors of Scudder, Stevens & Clark (1990-1997) and Scudder Kemper Investments (1997-1999). In addition, Ms. Small served as Co-Chair (2000-2003) of the Annual Fund for the Fletcher School of Law and Diplomacy. |
William S. Stavropoulos (67) |
| Year of Election or Appointment: 2002 Mr. Stavropoulos is Chairman Emeritus of the Board of Directors of The Dow Chemical Company. Since joining The Dow Chemical Company in 1967, Mr. Stavropoulos served in numerous senior management positions, including President (1993-2000; 2002-2003), CEO (1995-2000; 2002-2004), and Chairman of the Executive Committee (2000-2004). Currently, he is a Director of NCR Corporation (data warehousing and technology solutions), BellSouth Corporation (telecommunications), Chemical Financial Corporation, Maersk Inc. (industrial conglomerate, 2002-present), and Metalmark Capital (private equity investment firm, 2005-present). He also serves as a member of the Board of Trustees of the American Enterprise Institute for Public Policy Research. In addition, Mr. Stavropoulos is a member of The Business Council, J.P. Morgan International Council and the University of Notre Dame Advisory Council for the College of Science. |
Kenneth L. Wolfe (67) |
| Year of Election or Appointment: 2005 Prior to his retirement in 2001, Mr. Wolfe was Chairman and Chief Executive Officer of Hershey Foods Corporation (1993-2001). He currently serves as a member of the boards of Adelphia Communications Corporation (2003-present), Bausch & Lomb, Inc., and Revlon Inc. (2004-present). |
Annual Report
Advisory Board Member and Executive Officers:
Correspondence intended for each executive officer and Mr. Lynch may be sent to Fidelity Investments, 82 Devonshire Street, Boston, Massachusetts 02109.
Name, Age; Principal Occupation |
Peter S. Lynch (62) |
| Year of Election or Appointment: 2003 Member of the Advisory Board of Fidelity Financial Trust. Mr. Lynch is Vice Chairman and a Director of FMR, and Vice Chairman (2001-present) and a Director of FMR Co., Inc. Previously, Mr. Lynch served as a Trustee of the Fidelity funds (1990-2003). In addition, he serves as a Trustee of Boston College and as the Chairman of the Inner-City Scholarship Fund. |
Walter C. Donovan (44) |
| Year of Election or Appointment: 2005 Vice President of Convertible Securities. Mr. Donovan also serves as Vice President of Fidelity's High Income Funds (2005-present).
Mr. Donovan also serves as Executive Vice President of FMR (2005-present) and FMR Co., Inc. (2005-present). Previously,
Mr. Donovan served as Vice President of Fidelity's Fixed-Income Funds (2005-2006), certain Asset Allocation Funds (2005-2006), certain Balanced Funds (2005-2006), and as Vice President and Director of Fidelity's International Equity Trading group (1998-2005). |
Robert A. Lawrence (54) |
| Year of Election or Appointment: 2006 Vice President of Convertible Securities. Mr. Lawrence also serves as Vice President of the High Income Funds. Mr. Lawrence is Senior Vice President of FMR (2006-present) and FMR Co., Inc. (2006-present). Previously, Mr. Lawrence served as President of Fidelity Strategic Investments (2002-2005). |
Thomas T. Soviero (43) |
| Year of Election or Appointment: 2005 Vice President of Convertible Securities. Mr. Soviero also serves as Vice President of other funds advised by FMR. Prior to assuming his current responsibilities, Mr. Soviero worked as a research analyst, manager and director of high-yield research. Mr. Soviero also serves as Senior Vice President of FMR and FMR Co., Inc. (2005). |
Eric D. Roiter (58) |
| Year of Election or Appointment: 1998 Secretary of Convertible Securities. He also serves as Secretary of other Fidelity funds; Vice President, General Counsel, and Secretary of FMR Co., Inc. (2001-present) and FMR; Assistant Secretary of Fidelity Management & Research (U.K.) Inc. (2001-present), Fidelity Research & Analysis Company (2001-present), and Fidelity Investments Money Management, Inc. (2001-present). Mr. Roiter is an Adjunct Member, Faculty of Law, at Boston College Law School (2003-present). Previously, Mr. Roiter served as Vice President and Secretary of Fidelity Distributors Corporation (FDC) (1998-2005). |
Stuart Fross (47) |
| Year of Election or Appointment: 2003 Assistant Secretary of Convertible Securities. Mr. Fross also serves as Assistant Secretary of other Fidelity funds (2003-present), Vice President and Secretary of FDC (2005-present), and is an employee of FMR. |
R. Stephen Ganis (40) |
| Year of Election or Appointment: 2006 Anti-Money Laundering (AML) officer of Convertible Securities. Mr. Ganis also serves as AML officer of other Fidelity funds (2006-present) and FMR Corp. (2003-present). Before joining Fidelity Investments, Mr. Ganis practiced law at Goodwin Procter, LLP (2000-2002). |
Joseph B. Hollis (58) |
| Year of Election or Appointment: 2006 Chief Financial Officer of Convertible Securities. Mr. Hollis also serves as Chief Financial Officer of other Fidelity funds. Mr. Hollis is President of Fidelity Pricing and Cash Management Services (FPCMS) (2005-present). Mr. Hollis also serves as President and Director of Fidelity Service Company, Inc. (2006-present). Previously, Mr. Hollis served as Senior Vice President of Cash Management Services (1999-2002) and Investment Management Operations (2002-2005). |
Kenneth A. Rathgeber (59) |
| Year of Election or Appointment: 2004 Chief Compliance Officer of Convertible Securities. Mr. Rathgeber also serves as Chief Compliance Officer of other Fidelity funds (2004-present) and Executive Vice President of Risk Oversight for Fidelity Investments (2002-present). He is Chief Compliance Officer of FMR (2005-present), FMR Co., Inc. (2005-present), Fidelity Management & Research (U.K.) Inc. (2005-present), Fidelity Research & Analysis Company (2005-present), Fidelity Investments Money Management, Inc. (2005-present), and Strategic Advisers, Inc. (2005-present). Previously, Mr. Rathgeber served as Executive Vice President and Chief Operating Officer for Fidelity Investments Institutional Services Company, Inc. (1998-2002). |
Bryan A. Mehrmann (45) |
| Year of Election or Appointment: 2005 Deputy Treasurer of Convertible Securities. Mr. Mehrmann also serves as Deputy Treasurer of other Fidelity funds (2005-present) and is an employee of FMR. Previously, Mr. Mehrmann served as Vice President of Fidelity Investments Institutional Services Group (FIIS)/Fidelity Investments Institutional Operations Corporation, Inc. (FIIOC) Client Services (1998-2004). |
Kimberley H. Monasterio (42) |
| Year of Election or Appointment: 2007 President and Treasurer of Convertible Securities. Ms. Monasterio also serves as President and Treasurer of other Fidelity funds (2007-present) and is an employee of FMR (2004-present). Previously, Ms. Monasterio served as Deputy Treasurer of the Fidelity funds (2004-2006). Before joining Fidelity Investments, Ms. Monasterio served as Treasurer (2000-2004) and Chief Financial Officer (2002-2004) of the Franklin Templeton Funds and Senior Vice President of Franklin Templeton Services, LLC (2000-2004). |
Kenneth B. Robins (37) |
| Year of Election or Appointment: 2005 Deputy Treasurer of Convertible Securities. Mr. Robins also serves as Deputy Treasurer of other Fidelity funds (2005-present) and is an employee of FMR (2004-present). Before joining Fidelity Investments, Mr. Robins worked at KPMG LLP, where he was a partner in KPMG's department of professional practice (2002-2004) and a Senior Manager (1999-2000). In addition, Mr. Robins served as Assistant Chief Accountant, United States Securities and Exchange Commission (2000-2002). |
Robert G. Byrnes (39) |
| Year of Election or Appointment: 2005 Assistant Treasurer of Convertible Securities. Mr. Byrnes also serves as Assistant Treasurer of other Fidelity funds (2005-present) and is an employee of FMR (2005-present). Previously, Mr. Byrnes served as Vice President of FPCMS (2003-2005). Before joining Fidelity Investments, Mr. Byrnes worked at Deutsche Asset Management where he served as Vice President of the Investment Operations Group (2000-2003). |
John H. Costello (60) |
| Year of Election or Appointment: 1987 Assistant Treasurer of Convertible Securities. Mr. Costello also serves as Assistant Treasurer of other Fidelity funds and is an employee of FMR. |
Peter L. Lydecker (52) |
| Year of Election or Appointment: 2004 Assistant Treasurer of Convertible Securities. Mr. Lydecker also serves as Assistant Treasurer of other Fidelity funds (2004) and is an employee of FMR. |
Mark Osterheld (51) |
| Year of Election or Appointment: 2002 Assistant Treasurer of Convertible Securities. Mr. Osterheld also serves as Assistant Treasurer of other Fidelity funds (2002) and is an employee of FMR. |
Gary W. Ryan (48) |
| Year of Election or Appointment: 2005 Assistant Treasurer of Convertible Securities. Mr. Ryan also serves as Assistant Treasurer of other Fidelity funds (2005-present) and is an employee of FMR (2005-present). Previously, Mr. Ryan served as Vice President of Fund Reporting in FPCMS (1999-2005). |
Salvatore Schiavone (41) |
| Year of Election or Appointment: 2005 Assistant Treasurer of Convertible Securities. Mr. Schiavone also serves as Assistant Treasurer of other Fidelity funds (2005-present) and is an employee of FMR (2005-present). Before joining Fidelity Investments, Mr. Schiavone worked at Deutsche Asset Management, where he most recently served as Assistant Treasurer (2003-2005) of the Scudder Funds and Vice President and Head of Fund Reporting (1996-2003). |
Annual Report
Distributions
The Board of Trustees of Convertible Securities Fund voted to pay on December 18, 2006, to shareholders of record at the opening of business on December 15, 2006, a distribution of $.02 per share derived from capital gains realized from sales of portfolio securities and a dividend of $.12 per share from net investment income.
The fund hereby designates as a capital gain dividend with respect to the taxable year ended November 30, 2006, $1,691,693 or, if subsequently determined to be different, the net capital gain of such year.
A total of .05% of the dividends distributed during the fiscal year was derived from interest on U.S. Government securities which is generally exempt from state income tax.
The fund designates $20,409,285 of distributions paid during the period January 1, 2006 to November 30, 2006 as qualifying to be taxed as interest-related dividends for nonresident alien shareholders.
The fund designates 15%, 15%, and 15% of the dividends distributed in April 2006, July 2006, and October 2006, respectively during the fiscal year as amounts which may be taken into account as a dividend for the purposes of the maximum rate under section 1(h)(11) of the Internal Revenue Code.
The fund designates 9%, 9%, and 9% of the dividends distributed in April 2006, July 2006, and October 2006, respectively during the fiscal year as qualifying for the dividends-received deduction for corporate shareholders.
The fund will notify shareholders in January 2007 of amounts for use in preparing 2006 income tax returns.
Annual Report
Proxy Voting Results
A special meeting of the fund's shareholders was held on September 20, 2006. The results of votes taken among shareholders on the proposal before them are reported below. Each vote reported represents one dollar of net asset value held on the record date for the meeting.
PROPOSAL 1 |
To elect a Board of Trustees. A |
| # of
Votes | % of
Votes |
Dennis J. Dirks |
Affirmative | 10,327,434,641.22 | 95.770 |
Withheld | 456,199,004.95 | 4.230 |
TOTAL | 10,783,633,646.17 | 100.000 |
Albert R. Gamper, Jr. |
Affirmative | 10,322,116,523.07 | 95.720 |
Withheld | 461,517,123.10 | 4.280 |
TOTAL | 10,783,633,646.17 | 100.000 |
Robert M. Gates |
Affirmative | 10,288,766,799.53 | 95.411 |
Withheld | 494,866,846.64 | 4.589 |
TOTAL | 10,783,633,646.17 | 100.000 |
George H. Heilmeier |
Affirmative | 10,298,619,061.42 | 95.502 |
Withheld | 485,014,584.75 | 4.498 |
TOTAL | 10,783,633,646.17 | 100.000 |
Edward C. Johnson 3d |
Affirmative | 10,257,561,582.55 | 95.122 |
Withheld | 526,072,063.62 | 4.878 |
TOTAL | 10,783,633,646.17 | 100.000 |
Stephen P. Jonas |
Affirmative | 10,317,222,628.79 | 95.675 |
Withheld | 466,411,017.38 | 4.325 |
TOTAL | 10,783,633,646.17 | 100.000 |
James H. KeyesB |
Affirmative | 10,318,195,711.25 | 95.684 |
Withheld | 465,437,934.92 | 4.316 |
TOTAL | 10,783,633,646.17 | 100.000 |
| # of
Votes | % of
Votes |
Marie L. Knowles |
Affirmative | 10,317,835,129.19 | 95.681 |
Withheld | 465,798,516.98 | 4.319 |
TOTAL | 10,783,633,646.17 | 100.000 |
Ned C. Lautenbach |
Affirmative | 10,317,039,890.90 | 95.673 |
Withheld | 466,593,755.27 | 4.327 |
TOTAL | 10,783,633,646.17 | 100.000 |
William O. McCoy |
Affirmative | 10,278,036,936.38 | 95.311 |
Withheld | 505,596,709.79 | 4.689 |
TOTAL | 10,783,633,646.17 | 100.000 |
Robert L. Reynolds |
Affirmative | 10,320,662,459.03 | 95.707 |
Withheld | 462,971,187.14 | 4.293 |
TOTAL | 10,783,633,646.17 | 100.000 |
Cornelia M. Small |
Affirmative | 10,329,731,930.45 | 95.791 |
Withheld | 453,901,715.72 | 4.209 |
TOTAL | 10,783,633,646.17 | 100.000 |
William S. Stavropoulos |
Affirmative | 10,298,039,656.66 | 95.497 |
Withheld | 485,593,989.51 | 4.503 |
TOTAL | 10,783,633,646.17 | 100.000 |
Kenneth L. Wolfe |
Affirmative | 10,310,583,687.33 | 95.613 |
Withheld | 473,049,958.84 | 4.387 |
TOTAL | 10,783,633,646.17 | 100.000 |
A Denotes trust-wide proposal and voting results. B Effective on or about January 1, 2007. |
Annual Report
Board Approval of Investment Advisory Contracts and Management Fees
Fidelity Convertible Securities Fund
Each year, typically in July, the Board of Trustees, including the Independent Trustees (together, the Board), votes on the renewal of the management contract and sub-advisory agreements (together, the Advisory Contracts) for the fund. The Board, assisted by the advice of fund counsel and Independent Trustees' counsel, requests and considers a broad range of information throughout the year.
The Board meets regularly each month except August and takes into account throughout the year matters bearing on Advisory Contracts. The Board, acting directly and through its separate committees, considers at each of its meetings factors that are relevant to the annual renewal of the fund's Advisory Contracts, including the services and support provided to the fund and its shareholders. At the time of the renewal, the Board had 12 standing committees, each composed of Independent Trustees with varying backgrounds, to which the Board has assigned specific subject matter responsibilities in order to enhance effective decision-making by the Board. Each committee has adopted a written charter outlining the structure and purposes of the committee. One such committee, the Equity Contract Committee, meets periodically as needed throughout the year to consider matters specifically related to the annual renewal of Advisory Contracts. The committee requests and receives information on, and makes recommendations to the Independent Trustees concerning, the approval and annual review of the Advisory Contracts.
At its July 2006 meeting, the Board of Trustees, including the Independent Trustees, unanimously determined to renew the Advisory Contracts for the fund. In reaching its determination, the Board considered all factors it believed relevant, including (i) the nature, extent, and quality of the services to be provided to the fund and its shareholders (including the investment performance of the fund); (ii) the competitiveness of the management fee and total expenses of the fund; (iii) the total costs of the services to be provided by and the profits to be realized by the investment adviser and its affiliates from the relationship with the fund; (iv) the extent to which economies of scale would be realized as the fund grows; and (v) whether fee levels reflect these economies of scale, if any, for the benefit of fund shareholders.
In determining whether to renew the Advisory Contracts for the fund, the Board ultimately reached a determination, with the assistance of fund counsel and Independent Trustees' counsel, that the renewal of the Advisory Contracts and the compensation to be received by Fidelity under the management contract is consistent with Fidelity's fiduciary duty under applicable law. In addition to evaluating the specific factors noted above, the Board, in reaching its determination, is aware that shareholders in the fund have a broad range of investment choices available to them, including a wide choice among mutual funds offered by competitors to Fidelity, and that the fund's shareholders, with the opportunity to review and weigh the disclosure provided by the fund in its prospectus and other public disclosures, have chosen to invest in this fund, managed by Fidelity.
Annual Report
Board Approval of Investment Advisory Contracts and
Management Fees - continued
Nature, Extent, and Quality of Services Provided. The Board considered staffing within the investment adviser, FMR, and the sub-advisers (together, the Investment Advisers), including the background of the fund's portfolio manager and the fund's investment objective and discipline. The Independent Trustees also had discussions with senior management of Fidelity's investment operations and investment groups. The Board considered the structure of the portfolio manager compensation program and whether this structure provides appropriate incentives.
Resources Dedicated to Investment Management and Support Services. The Board reviewed the size, education, and experience of the Investment Advisers' investment staff, their use of technology, and the Investment Advisers' approach to recruiting, training, and retaining portfolio managers and other research, advisory, and management personnel. The Board considered Fidelity's extensive global research capabilities that enable the Investment Advisers to aggregate data from various sources in an effort to produce positive investment results. The Board noted that Fidelity's analysts have access to a variety of technological tools that enable them to perform both fundamental and quantitative analysis and to specialize in various disciplines. The Board also considered that Fidelity's portfolio managers and analysts have access to daily portfolio attribution that allows for monitoring of a fund's portfolio, as well as an electronic communication system that provides immediate real-time access to research concerning issuers and credit enhancers.
Shareholder and Administrative Services. The Board considered (i) the nature, extent, quality, and cost of administrative, distribution, and shareholder services performed by the Investment Advisers and their affiliates under the Advisory Contracts and under separate agreements covering transfer agency, pricing and bookkeeping, and securities lending services for the fund; (ii) the nature and extent of the Investment Advisers' supervision of third party service providers, principally custodians and subcustodians; and (iii) the resources devoted to, and the record of compliance with, the fund's compliance policies and procedures. The Board reviewed the allocation of fund brokerage, including allocations to brokers affiliated with the Investment Advisers, the use of brokerage commissions to pay fund expenses, and the use of "soft" commission dollars to pay for research services. The Board also considered that Fidelity voluntarily pays for market data out of its own resources.
The Board noted that the growth of fund assets across the complex allows Fidelity to reinvest in the development of services designed to enhance the value or convenience of the Fidelity funds as investment vehicles. These services include 24-hour access to account information and market information through phone representatives and over the Internet, and investor education materials and asset allocation tools.
Annual Report
Investment in a Large Fund Family. The Board considered the benefits to shareholders of investing in a Fidelity fund, including the benefits of investing in a fund that is part of a large family of funds offering a variety of investment disciplines and providing for a large variety of mutual fund investor services. For example, fund shareholders are offered the privilege of exchanging shares of the fund for shares of other Fidelity funds, as set forth in the fund's prospectus, without paying a sales charge. The Board noted that, since the last Advisory Contract renewals in July 2005, Fidelity has taken a number of actions that benefited particular funds, including (i) dedicating additional resources to investment research and to restructure the investment research teams; (ii) voluntarily entering into contractual arrangements with certain brokers pursuant to which Fidelity pays for research products and services separately out of its own resources, rather than bundling with fund commissions; (iii) launching the Fidelity Advantage Class of its five Spartan stock index funds and three Spartan bond index funds, which is a lower-fee class available to shareholders with higher account balances; (iv) contractually agreeing to impose expense limitations on Fidelity U.S. Bond Index Fund and reducing the fund's initial investment minimum; and (v) offering shareholders of each of the Fidelity Institutional Money Market Funds the privilege of exchanging shares of the fund for shares of other Fidelity funds.
Investment Performance and Compliance. The Board considered whether the fund has operated within its investment objective, as well as its record of compliance with its investment restrictions. It also reviewed the fund's absolute investment performance, as well as the fund's relative investment performance measured against (i) a broad-based securities market index, and (ii) a peer group of mutual funds deemed appropriate by the Board over multiple periods. The following charts considered by the Board show, over the one-, three-, and five-year periods ended December 31, 2005, the fund's cumulative total returns, the cumulative total returns of a broad-based securities market index ("benchmark"), and a range of cumulative total returns of a peer group of mutual funds identified by Lipper Inc. as having an investment objective similar to that of the fund. The box within each chart shows the 25th percentile return (bottom of box) and the 75th percentile return (top of box) of the Lipper peer group. Returns shown above the box are in the first quartile and returns shown below the box are in the fourth quartile. The percentage beaten number noted below each chart corresponds to the percentile box and represents the percentage of funds in the Lipper peer group whose performance was equal to or lower than that of the fund.
Annual Report
Board Approval of Investment Advisory Contracts and
Management Fees - continued
Fidelity Convertible Securities Fund
The Board reviewed the fund's relative investment performance against its Lipper peer group and stated that the performance of the fund was in the first quartile for the one- and three-year periods and the second quartile for the five-year period. The Board also stated that the relative investment performance of the fund compared favorably to its benchmark for all the periods shown. The Board also reviewed the fund's relative investment performance against a peer group defined by Morningstar.
The Board also considered that the fund's management fee is subject to upward or downward adjustment depending upon whether, and to what extent, the fund's investment performance for the performance period exceeds, or is exceeded by, the record (over the same period) of a Board-approved performance adjustment index. The Board realizes that the performance adjustment provides FMR with a strong economic incentive to seek to achieve superior performance for the fund's shareholders and helps to more closely align the interests of FMR and the fund's shareholders.
The Board considered that FMR has taken steps to refocus and strengthen equity research, equity portfolio management, and compliance. The Board noted with favor FMR's reorganization of its senior management team in 2005 and FMR's dedication of additional resources to investment research, and participated in the process that led to those changes.
Based on its review, and giving particular weight to the nature and quality of the resources dedicated by the Investment Advisers to maintain and improve relative performance, the Board concluded that the nature, extent, and quality of the services provided to the fund will benefit the fund's shareholders, particularly in light of the Board's view that the fund's shareholders benefit from investing in a fund that is part of a large family of funds offering a variety of investment disciplines and services.
Annual Report
Competitiveness of Management Fee and Total Fund Expenses. The Board considered the fund's management fee and total expenses compared to "mapped groups" of competitive funds and classes. Fidelity creates "mapped groups" by combining similar Lipper investment objective categories that have comparable management fee characteristics. Combining Lipper investment objective categories aids the Board's management fee and total expense comparisons by broadening the competitive group used for comparison and by reducing the number of universes to which various Fidelity funds are compared.
The Board considered two proprietary management fee comparisons for the 12-month periods shown in the chart below. The group of Lipper funds used by the Board for management fee comparisons is referred to below as the "Total Mapped Group" and, for the reasons explained above, is broader than the Lipper peer group used by the Board for performance comparisons. The Total Mapped Group comparison focuses on a fund's standing relative to the total universe of comparable funds available to investors, in terms of gross management fees before expense reimbursements or caps, and without giving effect to the fund's performance adjustment. "TMG %" represents the percentage of funds in the Total Mapped Group that had management fees that were lower than the fund's. For example, a TMG % of 10% means that 90% of the funds in the Total Mapped Group had higher management fees than the fund. The "Asset-Size Peer Group" (ASPG) comparison focuses on a fund's standing relative to non-Fidelity funds similar in size to the fund within the Total Mapped Group. The ASPG represents at least 15% of the funds in the Total Mapped Group with comparable asset size and management fee characteristics, subject to a minimum of 50 funds (or all funds in the Total Mapped Group if fewer than 50). Additional information, such as the ASPG quartile in which the fund's management fee ranked and the impact of the fund's performance adjustment, is also included in the chart and considered by the Board.
Annual Report
Board Approval of Investment Advisory Contracts and
Management Fees - continued
Fidelity Convertible Securities Fund
The Board noted that the fund's management fee ranked below the median of its Total Mapped Group and below the median of its ASPG for 2005. The Board also noted the effect of the fund's positive performance adjustment on the fund's management fee ranking. The Board noted that the performance adjustment for each year represents calculations for rolling 36-month periods that differ from the periods shown in the performance charts above.
Based on its review, the Board concluded that the fund's management fee was fair and reasonable in light of the services that the fund receives and the other factors considered.
In its review of the fund's total expenses, the Board considered the fund's management fee as well as other fund expenses, such as transfer agent fees, pricing and bookkeeping fees, and custodial, legal, and audit fees. The Board also noted the effects of any waivers and reimbursements on fees and expenses, as well as the fund's positive performance adjustment. As part of its review, the Board also considered current and historical total expenses of the fund compared to competitive fund median expenses. The fund is compared to those funds and classes in the Total Mapped Group (used by the Board for management fee comparisons) that have a similar sales load structure.
The Board noted that the fund's total expenses ranked below its competitive median for 2005.
In its review of total expenses, the Board also considered Fidelity fee structures and other information on clients that FMR and its affiliates service in other competitive markets, such as other mutual funds advised or subadvised by FMR or its affiliates, pension plan clients, and other institutional clients.
Annual Report
Based on its review, the Board concluded that the fund's total expenses were reasonable in light of the services that the fund and its shareholders receive and the other factors considered.
Costs of the Services and Profitability. The Board considered the revenues earned and the expenses incurred by Fidelity in conducting the business of developing, marketing, distributing, managing, administering and servicing the fund and its shareholders. The Board also considered the level of Fidelity's profits in respect of all the Fidelity funds.
On an annual basis, FMR presents to the Board Fidelity's profitability for the fund. Fidelity calculates the profitability for each fund, as well as aggregate profitability for groups of Fidelity funds and all Fidelity funds, using a series of detailed revenue and cost allocation methodologies which originate with the audited books and records of Fidelity. The Audit Committee of the Board reviews any significant changes from the prior year's methodologies.
PricewaterhouseCoopers LLP (PwC), independent registered accounting firm and auditor to Fidelity and certain Fidelity funds, has been engaged annually by the Board as part of the Board's assessment of the results of Fidelity's profitability analysis. PwC's engagement includes the review and assessment of Fidelity's methodologies used in determining the revenues and expenses attributable to Fidelity's mutual fund business, and completion of agreed-upon procedures surrounding the mathematical accuracy of fund profitability and its conformity to allocation methodologies. After considering PwC's reports issued under the engagement and information provided by Fidelity, the Board believes that while other allocation methods may also be reasonable, Fidelity's profitability methodologies are reasonable in all material respects.
The Board has also reviewed Fidelity's non-fund businesses and any fall-out benefits related to the mutual fund business as well as cases where Fidelity's affiliates may benefit from or be related to the fund's business.
The Board considered the costs of the services provided by and the profits realized by Fidelity in connection with the operation of the fund and determined that the amount of profit is a fair entrepreneurial profit for the management of the fund.
Economies of Scale. The Board considered whether there have been economies of scale in respect of the management of the Fidelity funds, whether the Fidelity funds (including the fund) have appropriately benefited from any such economies of scale, and whether there is potential for realization of any further economies of scale. The Board considered the extent to which the fund will benefit from economies of scale through increased services to the fund, through waivers or reimbursements, or through fee or expense reductions, including reductions that occur through operation of the transfer agent agreement. The transfer agent fee varies in part based on the number of accounts in the fund. If the number of accounts decreases or the average account size increases, the overall transfer agent fee rate decreases.
Annual Report
Board Approval of Investment Advisory Contracts and
Management Fees - continued
The Board recognized that the fund's management contract incorporates a "group fee" structure, which provides for lower fee rates as total fund assets under FMR's management increase, and for higher fee rates as total fund assets under FMR's management decrease. The Board considered that the group fee is designed to deliver the benefits of economies of scale to fund shareholders when total fund assets increase, even if assets of any particular fund are unchanged or have declined, because some portion of Fidelity's costs are attributable to services provided to all Fidelity funds, and all funds benefit if those costs can be allocated among more assets. The Board concluded that, given the group fee structure, fund shareholders will achieve a certain level of economies of scale as assets under FMR's management increase at the fund complex level, regardless of whether Fidelity achieves any such economies of scale.
The Board further concluded that any potential economies of scale are being shared between fund shareholders and Fidelity in an appropriate manner.
Additional Information Requested by the Board. In order to develop fully the factual basis for consideration of the Advisory Contracts, the Board requested additional information on several topics, including (i) Fidelity's fund profitability methodology and profitability trends within certain funds; (ii) portfolio manager compensation; (iii) the extent to which any economies of scale exist and are shared between the funds and Fidelity; (iv) the total expenses of certain funds and classes relative to competitors, including the extent to which the expenses of certain funds have been or could be capped; (v) fund performance trends; and (vi) Fidelity's fee structures, including use of performance fees.
Based on its evaluation of all of the conclusions noted above, and after considering all material factors, the Board ultimately concluded that the advisory fee structures are fair and reasonable, and that the fund's Advisory Contracts should be renewed.
Annual Report
Managing Your Investments
Fidelity offers several ways to conveniently manage your personal investments via your telephone or PC. You can access your account information, conduct trades and research your investments 24 hours a day.
By Phone
Fidelity Automated Service Telephone provides a single toll-free number to access account balances, positions, quotes and trading. It's easy to navigate the service, and on your first call, the system will help you create a personal identification number (PIN) for security.
(phone_graphic)
Fidelity Automated
Service Telephone (FAST®)
1-800-544-5555
Press
1 For mutual fund and brokerage trading.
2 For quotes.*
3 For account balances and holdings.
4 To review orders and mutual
fund activity.
5 To change your PIN.
*0 To speak to a Fidelity representative.
By PC
Fidelity's web site on the Internet provides a wide range of information, including daily financial news, fund performance, interactive planning tools and news about Fidelity products and services.
(computer_graphic)
Fidelity's Web Site
www.fidelity.com
* When you call the quotes line, please remember that a fund's yield and return will vary and, except for money market funds, share price will also vary. This means that you may have a gain or loss when you sell your shares. There is no assurance that money market funds will be able to maintain a stable $1 share price; an investment in a money market fund is not insured or guaranteed by the U.S. government. Total returns are historical and include changes in share price, reinvestment of dividends and capital gains, and the effects of any sales charges.
Annual Report
To Visit Fidelity
For directions and hours,
please call 1-800-544-9797.
Arizona
7001 West Ray Road
Chandler, AZ
15445 N. Scottsdale Road
Scottsdale, AZ
California
815 East Birch Street
Brea, CA
1411 Chapin Avenue
Burlingame, CA
851 East Hamilton Avenue
Campbell, CA
19200 Von Karman Avenue
Irvine, CA
601 Larkspur Landing Circle
Larkspur, CA
10100 Santa Monica Blvd.
Los Angeles, CA
27101 Puerta Real
Mission Viejo, CA
73-575 El Paseo
Palm Desert, CA
251 University Avenue
Palo Alto, CA
123 South Lake Avenue
Pasadena, CA
16995 Bernardo Ctr. Drive
Rancho Bernardo, CA
1220 Roseville Parkway
Roseville, CA
1740 Arden Way
Sacramento, CA
7676 Hazard Center Drive
San Diego, CA
11943 El Camino Real
San Diego, CA
8 Montgomery Street
San Francisco, CA
3793 State Street
Santa Barbara, CA
1200 Wilshire Boulevard
Santa Monica, CA
21701 Hawthorne Boulevard
Torrance, CA
2001 North Main Street
Walnut Creek, CA
6300 Canoga Avenue
Woodland Hills, CA
Colorado
1625 Broadway
Denver, CO
9185 Westview Road
Lone Tree, CO
Connecticut
48 West Putnam Avenue
Greenwich, CT
265 Church Street
New Haven, CT
300 Atlantic Street
Stamford, CT
29 South Main Street
West Hartford, CT
Delaware
400 Delaware Avenue
Wilmington, DE
Florida
4400 N. Federal Highway
Boca Raton, FL
121 Alhambra Plaza
Coral Gables, FL
2948 N. Federal Highway
Ft. Lauderdale, FL
4671 Town Center Parkway
Jacksonville, FL
1907 West State Road 434
Longwood, FL
8880 Tamiami Trail, North
Naples, FL
3501 PGA Boulevard
Palm Beach Gardens, FL
3550 Tamiami Trail, South
Sarasota, FL
1502 N. Westshore Blvd.
Tampa, FL
2465 State Road 7
Wellington, FL
Georgia
3445 Peachtree Road, N.E.
Atlanta, GA
1000 Abernathy Road
Atlanta, GA
Illinois
One North LaSalle Street
Chicago, IL
875 North Michigan Ave.
Chicago, IL
1415 West 22nd Street
Oak Brook, IL
1572 East Golf Road
Schaumburg, IL
3232 Lake Avenue
Wilmette, IL
Indiana
4729 East 82nd Street
Indianapolis, IN
Kansas
5400 College Boulevard
Overland Park, KS
Maine
Three Canal Plaza
Portland, ME
Maryland
7315 Wisconsin Avenue
Bethesda, MD
One W. Pennsylvania Ave.
Towson, MD
Massachusetts
801 Boylston Street
Boston, MA
155 Congress Street
Boston, MA
300 Granite Street
Braintree, MA
44 Mall Road
Burlington, MA
238 Main Street
Cambridge, MA
405 Cochituate Road
Framingham, MA
416 Belmont Street
Worcester, MA
Fidelity Brokerage Services, Inc., 100 Summer St., Boston, MA 02110 Member NYSE/SIPC
Annual Report
Michigan
500 E. Eisenhower Pkwy.
Ann Arbor, MI
280 Old N. Woodward Ave.
Birmingham, MI
43420 Grand River Avenue
Novi, MI
29155 Northwestern Hwy.
Southfield, MI
Minnesota
7600 France Avenue South
Edina, MN
Missouri
1524 South Lindbergh Blvd.
St. Louis, MO
Nevada
2225 Village Walk Drive
Henderson, NV
New Jersey
150 Essex Street
Millburn, NJ
56 South Street
Morristown, NJ
396 Route 17, North
Paramus, NJ
3518 Route 1 North
Princeton, NJ
530 Broad Street
Shrewsbury, NJ
New York
1055 Franklin Avenue
Garden City, NY
37 West Jericho Turnpike
Huntington Station, NY
1271 Avenue of the Americas
New York, NY
980 Madison Avenue
New York, NY
61 Broadway
New York, NY
350 Park Avenue
New York, NY
200 Fifth Avenue
New York, NY
733 Third Avenue
New York, NY
11 Penn Plaza
New York, NY
2070 Broadway
New York, NY
1075 Northern Blvd.
Roslyn, NY
799 Central Park Avenue
Scarsdale, NY
North Carolina
4611 Sharon Road
Charlotte, NC
7011 Fayetteville Road
Durham, NC
Ohio
3805 Edwards Road
Cincinnati, OH
1324 Polaris Parkway
Columbus, OH
28699 Chagrin Boulevard
Woodmere Village, OH
Oregon
7493 SW Bridgeport Road
Tigard, OR
Pennsylvania
600 West DeKalb Pike
King of Prussia, PA
1735 Market Street
Philadelphia, PA
12001 Perry Highway
Wexford, PA
Rhode Island
47 Providence Place
Providence, RI
Tennessee
6150 Poplar Avenue
Memphis, TN
Texas
10000 Research Boulevard
Austin, TX
4001 Northwest Parkway
Dallas, TX
12532 Memorial Drive
Houston, TX
2701 Drexel Drive
Houston, TX
6560 Fannin Street
Houston, TX
6500 N. MacArthur Blvd.
Irving, TX
6005 West Park Boulevard
Plano, TX
14100 San Pedro
San Antonio, TX
1576 East Southlake Blvd.
Southlake, TX
19740 IH 45 North
Spring, TX
Utah
279 West South Temple
Salt Lake City, UT
Virginia
1861 International Drive
McLean, VA
Washington
411 108th Avenue, N.E.
Bellevue, WA
1518 6th Avenue
Seattle, WA
Washington, DC
1900 K Street, N.W.
Washington, DC
Wisconsin
595 North Barker Road
Brookfield, WI
Annual Report
To Write Fidelity
We'll give your correspondence immediate attention and send you written confirmation upon completion of your request.
(letter_graphic)
Making Changes
To Your Account
(such as changing name, address, bank, etc.)
Fidelity Investments
P.O. Box 770001
Cincinnati, OH 45277-0002
(letter_graphic)
For Non-Retirement
Accounts
Buying shares
Fidelity Investments
P.O. Box 770001
Cincinnati, OH 45277-0003
Overnight Express
Fidelity Investments
Attn: Distribution Services
100 Crosby Parkway - KC1H
Covington, KY 41015
Selling shares
Fidelity Investments
P.O. Box 770001
Cincinnati, OH 45277-0035
Overnight Express
Fidelity Investments
Attn: Distribution Services
100 Crosby Parkway - KC1H
Covington, KY 41015
General Correspondence
Fidelity Investments
P.O. Box 500
Merrimack, NH 03054-0500
(letter_graphic)
For Retirement
Accounts
Buying shares
Fidelity Investments
P.O. Box 770001
Cincinnati, OH 45277-0003
Selling shares
Fidelity Investments
P.O. Box 770001
Cincinnati, OH 45277-0035
Overnight Express
Fidelity Investments
Attn: Distribution Services
100 Crosby Parkway - KC1H
Covington, KY 41015
General Correspondence
Fidelity Investments
P.O. Box 500
Merrimack, NH 03054-0500
Annual Report
Annual Report
Investment Adviser
Fidelity Management & Research Company
Boston, MA
Investment Sub-Advisers
FMR Co., Inc.
Fidelity Management & Research (U.K.) Inc.
Fidelity Research & Analysis Company
(formerly Fidelity Management &
Research (Far East) Inc.)
Fidelity International Investment Advisors
Fidelity Investments Japan Limited
Fidelity International Investment Advisors (U.K.) Limited
General Distributor
Fidelity Distributors Corporation
Boston, MA
Transfer and Service Agent
Fidelity Service Company, Inc.
Boston, MA
Custodian
Citibank, N.A.
New York, NY
The Fidelity Telephone Connection
Mutual Fund 24-Hour Service
Exchanges/Redemptions
and Account Assistance 1-800-544-6666
Product Information 1-800-544-6666
Retirement Accounts 1-800-544-4774
(8 a.m. - 9 p.m.)
TDD Service 1-800-544-0118
for the deaf and hearing impaired
(9 a.m. - 9 p.m. Eastern time)
Fidelity Automated Service
Telephone (FAST®) (automated graphic) 1-800-544-5555
(automated graphic) Automated line for quickest service
CVS-UANN-0107
1.786706.103
(Fidelity Investment logo)(registered trademark)
Corporate Headquarters
82 Devonshire St., Boston, MA 02109
www.fidelity.com
Fidelity®
Independence
Fund
Annual Report
November 30, 2006
(2_fidelity_logos) (Registered_Trademark)
Contents
Chairman's Message | <Click Here> | Ned Johnson's message to shareholders. |
Performance | <Click Here> | How the fund has done over time. |
Management's Discussion | <Click Here> | The manager's review of fund performance, strategy and outlook |
Shareholder Expense Example | <Click Here> | An example of shareholder expenses. |
Investment Changes | <Click Here> | A summary of major shifts in the fund's investments over the past year. |
Investments | <Click Here> | A complete list of the fund's investments with their market values. |
Financial Statements | <Click Here> | Statements of assets and liabilities, operations, and changes in net assets,
as well as financial highlights. |
Notes | <Click Here> | Notes to the financial statements. |
Report of Independent Registered Public Accounting Firm | <Click Here> | |
Trustees and Officers | <Click Here> | |
Distributions | <Click Here> | |
Proxy Voting Results | <Click Here> | |
Board Approval of Investment Advisory Contracts and Management Fees | <Click Here> | |
To view a fund's proxy voting guidelines and proxy voting record for the 12-month period ended June 30, visit www.fidelity.com/proxyvotingresults or visit the Securities and Exchange Commission's (SEC) web site at www.sec.gov. You may also call 1-800-544-8544 to request a free copy of the proxy voting guidelines.
Standard & Poor's, S&P and S&P 500 are registered service marks of The McGraw-Hill Companies, Inc. and have been licensed for use by Fidelity Distributors Corporation.
Other third party marks appearing herein are the property of their respective owners.
All other marks appearing herein are registered or unregistered trademarks or service marks of FMR Corp. or an affiliated company.
Annual Report
This report and the financial statements contained herein are submitted for the general information of the shareholders of the fund. This report is not authorized for distribution to prospective investors in the fund unless preceded or accompanied by an effective prospectus.
A fund files its complete schedule of portfolio holdings with the SEC for the first and third quarters of each fiscal year on Form N-Q. Forms N-Q are available on the SEC's web site at http://www.sec.gov. A fund's Forms N-Q may be reviewed and copied at the SEC's Public Reference Room in Washington, DC. Information regarding the operation of the SEC's Public Reference Room may be obtained by calling 1-800-SEC-0330. For a complete list of a fund's portfolio holdings, view the most recent quarterly holdings report, semiannual report, or annual report on Fidelity's web site at http://www.fidelity.com/holdings.
NOT FDIC INSURED · MAY LOSE VALUE · NO BANK GUARANTEE
Neither the fund nor Fidelity Distributors Corporation is a bank.
Annual Report
Chairman's Message
(photo_of_Edward_C_Johnson_3d)
Dear Shareholder:
Stock and bond markets around the world have seen largely positive results year to date, although weakness in the technology sector and growth stocks in general have tempered performance. While financial markets are always unpredictable, there are a number of time-tested principles that can put the historical odds in your favor.
One of the basic tenets is to invest for the long term. Over time, riding out the markets' inevitable ups and downs has proven much more effective than selling into panic or chasing the hottest trend. Even missing only a few of the markets' best days can significantly diminish investor returns. Patience also affords the benefits of compounding - of earning interest on additional income or reinvested dividends and capital gains. There are tax advantages and cost benefits to consider as well. The more you sell, the more taxes you pay, and the more you trade, the higher the costs. While staying the course doesn't eliminate risk, it can considerably lessen the effect of short-term declines.
You can further manage your investing risk through diversification. And today, more than ever, geographic diversification should be taken into account. Studies indicate that asset allocation is the single most important determinant of a portfolio's long-term success. The right mix of stocks, bonds and cash - aligned to your particular risk tolerance and investment objective - is very important. Age-appropriate rebalancing is also an essential aspect of asset allocation. For younger investors, an emphasis on equities - which historically have been the best performing asset class over time - is encouraged. As investors near their specific goal, such as retirement or sending a child to college, consideration may be given to replacing volatile assets (e.g. common stocks) with more-stable fixed investments (bonds or savings plans).
A third investment principle - investing regularly - can help lower the average cost of your purchases. Investing a certain amount of money each month or quarter helps ensure you won't pay for all your shares at market highs. This strategy - known as dollar cost averaging - also reduces unconstructive "emotion" from investing, helping shareholders avoid selling weak performers just prior to an upswing, or chasing a hot performer just before a correction.
We invite you to contact us via the Internet, through our Investor Centers or over the phone. It is our privilege to provide you the information you need to make the investments that are right for you.
Sincerely,
/s/Edward C. Johnson 3d
Edward C. Johnson 3d
Annual Report
Performance: The Bottom Line
Average annual total return reflects the change in the value of an investment, assuming reinvestment of the fund's dividend income and capital gains (the profits earned upon the sale of securities that have grown in value) and assuming a constant rate of perfor-mance each year. The $10,000 table and the fund's returns do not reflect the deduction of taxes that a shareholder would pay on fund distributions or the redemption of fund shares. During periods of reimbursement by Fidelity, a fund's total return will be greater than it would be had the reimbursement not occurred. How a fund did yesterday is no guarantee of how it will do tomorrow.
Average Annual Total Returns
Periods ended November 30, 2006 | Past 1
year | Past 5
years | Past 10
years |
Fidelity® Independence Fund | 13.49% | 7.75% | 9.46% |
$10,000 Over 10 Years
Let's say hypothetically that $10,000 was invested in Fidelity® Independence Fund on November 30, 1996. The chart shows how the value of your investment would have changed, and also shows how the Standard & Poor's 500SM Index (S&P 500®) performed over the same period.
Annual Report
Management's Discussion of Fund Performance
Comments from Jason Weiner, who managed Fidelity® Independence Fund for most of the period covered by this report
There were a number of reasons why the overall U.S. stock market could have had subpar results during the 12-month period that ended on November 30, 2006, including rising interest rates, inflation concerns, historically high energy prices, unrest in the Middle East, North Korea's nuclear test and a worse-than-expected housing slump. Despite these negative conditions, though, U.S. stocks fared well. In fact, several bellwether market benchmarks reached record highs, including the larger-cap Dow Jones Industrial AverageSM - a gauge of 30 mega-cap, blue-chip stocks - and the small-cap-oriented Russell 2000® Index. The strength in equities was sparked in large part by two major factors: the double-digit earnings growth achieved by U.S. corporations, and steady economic growth that was neither overheated nor recessionary, thanks primarily to the Federal Reserve Board's monetary policy. For the 12 months overall, the Dow rose 15.76%, the Russell 2000 advanced 17.43%, the Standard & Poor's 500SM Index gained 14.23% and the NASDAQ Composite® Index returned 9.78%.
During the past year, the fund returned 13.49%, slightly trailing the S&P 500®. Fund performance suffered from my large-cap stock selection - including my bias toward growth stocks - although favorable picks in smaller stocks partially offset that negative impact. Among sectors, overweighting technology and health care detracted, as did underweighting financials and consumer discretionary. Stock selection in financials and energy hurt as well. Software giant Microsoft was our biggest detractor, as I trimmed the position on weakness, only to watch the stock rally. Underweighting energy giant Exxon Mobil was detrimental as well, as this major index component posted a strong gain. HMO UnitedHealth Group also hurt, as did online auctioneer eBay and communications products maker Comverse Technology. Conversely, stock selection in industrials, materials and technology aided our results. Canada's Research In Motion, maker of the popular BlackBerry handheld messaging device, benefited from new products and the settlement of patent infringement litigation. Other contributors included semiconductor maker MEMC Electronic Materials, India-based Infosys Technologies, a software outsourcing services provider, and hard-disk-drive maker Seagate Technology. All the contributors I mentioned were out-of-benchmark holdings. Some stocks noted above were sold by period end.
Note to shareholders: Robert Bertelson became Portfolio Manager of the fund on November 9, 2006.
The views expressed above reflect those of the portfolio manager(s) only through the end of the period as stated on the cover of this report and do not necessarily represent the views of Fidelity or any other person in the Fidelity organization. Any such views are subject to change at any time based upon market or other conditions and Fidelity disclaims any responsibility to update such views. These views may not be relied on as investment advice and, because investment decisions for a Fidelity fund are based on numerous factors, may not be relied on as an indication of trading intent on behalf of any Fidelity fund.
Annual Report
Shareholder Expense Example
As a shareholder of the Fund, you incur two types of costs: (1) transaction costs, and (2) ongoing costs, including management fees and other Fund expenses. This Example is intended to help you understand your ongoing costs (in dollars) of investing in the Fund and to compare these costs with the ongoing costs of investing in other mutual funds.
The Example is based on an investment of $1,000 invested at the beginning of the period and held for the entire period (June 1, 2006 to November 30, 2006).
Actual Expenses
The first line of the accompanying table provides information about actual account values and actual expenses. You may use the information in this line, together with the amount you invested, to estimate the expenses that you paid over the period. Simply divide your account value by $1,000.00 (for example, an $8,600 account value divided by $1,000.00 = 8.6), then multiply the result by the number in the first line under the heading entitled "Expenses Paid During Period" to estimate the expenses you paid on your account during this period. A small balance maintenance fee of $12.00 that is charged once a year may apply for certain accounts with a value of less than $2,000. This fee is not included in the table below. If it was, the estimate of expenses you paid during the period would be higher, and your ending account value lower, by this amount.
Hypothetical Example for Comparison Purposes
The second line of the accompanying table provides information about hypothetical account values and hypothetical expenses based on the Fund's actual expense ratio and an assumed rate of return of 5% per year before expenses, which is not the Fund's actual return. The hypothetical account values and expenses may not be used to estimate the actual ending account balance or expenses you paid for the period. You may use this information to compare the ongoing costs of investing in the Fund and other funds. To do so, compare this 5% hypothetical example with the 5% hypothetical examples that appear in the shareholder reports of the other funds. A small balance maintenance fee of $12.00 that is charged once a year may apply for certain accounts with a value of less than $2,000. This fee is not included in the table below. If it was, the estimate of expenses you paid during the period would be higher, and your ending account value lower, by this amount.
Please note that the expenses shown in the table are meant to highlight your ongoing costs only and do not reflect any transaction costs. Therefore, the second line of the table is useful in comparing ongoing costs only, and will not help you determine the relative total costs of owning different funds.
| Beginning
Account Value
June 1, 2006 | Ending
Account Value
November 30, 2006 | Expenses Paid
During Period*
June 1, 2006
to November 30, 2006 |
Actual | $ 1,000.00 | $ 1,081.00 | $ 4.38 |
Hypothetical (5% return per year before expenses) | $ 1,000.00 | $ 1,020.86 | $ 4.26 |
* Expenses are equal to the Fund's annualized expense ratio of .84%; multiplied by the average account value over the period, multiplied by 183/365 (to reflect the one-half year period).
Annual Report
Investment Changes
Top Ten Stocks as of November 30, 2006 |
| % of fund's
net assets | % of fund's net assets
6 months ago |
Exxon Mobil Corp. | 3.0 | 0.0 |
General Electric Co. | 2.9 | 0.0 |
American International Group, Inc. | 2.8 | 2.8 |
AT&T, Inc. | 2.1 | 0.0 |
Valero Energy Corp. | 2.1 | 1.4 |
Schlumberger Ltd. (NY Shares) | 2.1 | 1.7 |
Altria Group, Inc. | 2.0 | 0.0 |
Apple Computer, Inc. | 2.0 | 0.0 |
Ultra Petroleum Corp. | 1.9 | 1.4 |
Research In Motion Ltd. | 1.9 | 0.5 |
| 22.8 | |
Top Five Market Sectors as of November 30, 2006 |
| % of fund's
net assets | % of fund's net assets
6 months ago |
Energy | 17.4 | 7.9 |
Financials | 17.2 | 19.1 |
Information Technology | 16.1 | 21.3 |
Industrials | 13.9 | 7.8 |
Health Care | 9.4 | 14.8 |
Asset Allocation (% of fund's net assets) |
As of November 30, 2006* | As of May 31, 2006** |
| Stocks 99.3% | | | Stocks 94.3% | |
| Short-Term
Investments and
Net Other Assets 0.7% | | | Short-Term
Investments and
Net Other Assets 5.7% | |
* Foreign investments | 20.2% | | ** Foreign investments | 20.4% | |

Annual Report
Investments November 30, 2006
Showing Percentage of Net Assets
Common Stocks - 99.3% |
| Shares | | Value (Note 1) (000s) |
CONSUMER DISCRETIONARY - 9.3% |
Automobiles - 0.2% |
Renault SA | 93,800 | | $ 11,241 |
Hotels, Restaurants & Leisure - 2.5% |
International Game Technology | 647,300 | | 28,339 |
Marriott International, Inc. Class A | 888,800 | | 40,129 |
McDonald's Corp. | 1,102,600 | | 46,276 |
Vail Resorts, Inc. (a) | 100,000 | | 4,402 |
| | 119,146 |
Internet & Catalog Retail - 0.8% |
Coldwater Creek, Inc. (a) | 677,300 | | 17,034 |
Priceline.com, Inc. (a)(d) | 452,000 | | 17,849 |
| | 34,883 |
Media - 2.9% |
Comcast Corp. Class A (special) (a)(d) | 1,746,000 | | 70,329 |
Time Warner, Inc. | 3,234,000 | | 65,133 |
| | 135,462 |
Multiline Retail - 1.9% |
Federated Department Stores, Inc. | 566,900 | | 23,861 |
Kohl's Corp. (a) | 312,800 | | 21,771 |
Saks, Inc. (d) | 2,160,900 | | 44,342 |
| | 89,974 |
Textiles, Apparel & Luxury Goods - 1.0% |
Brown Shoe Co., Inc. | 254,100 | | 12,055 |
Crocs, Inc. | 300,000 | | 12,885 |
VF Corp. | 306,100 | | 23,995 |
| | 48,935 |
TOTAL CONSUMER DISCRETIONARY | | 439,641 |
CONSUMER STAPLES - 6.4% |
Food & Staples Retailing - 0.2% |
Sysco Corp. | 312,927 | | 11,218 |
Food Products - 0.5% |
Nestle SA sponsored ADR | 267,400 | | 23,799 |
Household Products - 2.1% |
Colgate-Palmolive Co. | 502,862 | | 32,711 |
Procter & Gamble Co. | 1,097,100 | | 68,887 |
| | 101,598 |
Common Stocks - continued |
| Shares | | Value (Note 1) (000s) |
CONSUMER STAPLES - continued |
Personal Products - 0.9% |
Avon Products, Inc. | 374,700 | | $ 12,230 |
Herbalife Ltd. (a) | 725,802 | | 28,277 |
| | 40,507 |
Tobacco - 2.7% |
Altria Group, Inc. | 1,130,000 | | 95,157 |
Reynolds American, Inc. | 470,800 | | 30,244 |
| | 125,401 |
TOTAL CONSUMER STAPLES | | 302,523 |
ENERGY - 17.4% |
Energy Equipment & Services - 3.2% |
Nabors Industries Ltd. (a) | 348,200 | | 11,755 |
Noble Corp. | 153,100 | | 11,827 |
Oceaneering International, Inc. (a) | 82,300 | | 3,589 |
Schlumberger Ltd. (NY Shares) | 1,432,400 | | 98,091 |
Transocean, Inc. (a) | 312,300 | | 24,344 |
W-H Energy Services, Inc. (a) | 36,400 | | 1,738 |
| | 151,344 |
Oil, Gas & Consumable Fuels - 14.2% |
Cabot Oil & Gas Corp. | 359,100 | | 22,311 |
Chesapeake Energy Corp. | 1,436,200 | | 48,874 |
Chevron Corp. | 1,000,000 | | 72,320 |
EOG Resources, Inc. | 1,039,100 | | 73,288 |
Exxon Mobil Corp. | 1,863,700 | | 143,152 |
Petroplus Holdings AG (a) | 258,240 | | 15,070 |
Quicksilver Resources, Inc. (a) | 1,383,900 | | 58,553 |
Range Resources Corp. | 1,365,600 | | 42,457 |
Ultra Petroleum Corp. (a) | 1,686,379 | | 90,896 |
Valero Energy Corp. | 1,785,100 | | 98,305 |
Venoco, Inc. | 250,000 | | 4,435 |
| | 669,661 |
TOTAL ENERGY | | 821,005 |
FINANCIALS - 17.2% |
Capital Markets - 4.5% |
Goldman Sachs Group, Inc. | 371,200 | | 72,310 |
Lazard Ltd. Class A | 47,000 | | 2,135 |
Common Stocks - continued |
| Shares | | Value (Note 1) (000s) |
FINANCIALS - continued |
Capital Markets - continued |
Merrill Lynch & Co., Inc. | 778,700 | | $ 68,082 |
Morgan Stanley | 915,000 | | 69,686 |
| | 212,213 |
Commercial Banks - 3.2% |
Banco Bradesco SA (PN) sponsored ADR (non-vtg.) | 1,154,000 | | 43,517 |
Banco Itau Holding Financeira SA sponsored ADR (non-vtg.) | 150,100 | | 5,025 |
Industrial & Commercial Bank of China | 12,948,000 | | 6,558 |
PrivateBancorp, Inc. | 128,169 | | 5,141 |
Uniao de Bancos Brasileiros SA (Unibanco) GDR | 558,300 | | 47,271 |
Wells Fargo & Co. | 1,296,500 | | 45,689 |
| | 153,201 |
Consumer Finance - 1.0% |
American Express Co. | 797,100 | | 46,806 |
Diversified Financial Services - 1.5% |
Bank of America Corp. | 1,318,500 | | 71,001 |
Insurance - 5.2% |
American International Group, Inc. | 1,882,100 | | 132,349 |
Navigators Group, Inc. (a) | 71,868 | | 3,325 |
PartnerRe Ltd. | 284,700 | | 19,849 |
Prudential Financial, Inc. | 884,300 | | 72,053 |
RLI Corp. | 84,100 | | 4,652 |
XL Capital Ltd. Class A | 215,300 | | 15,312 |
| | 247,540 |
Real Estate Investment Trusts - 1.3% |
Equity Residential (SBI) | 449,500 | | 23,940 |
SL Green Realty Corp. | 172,300 | | 23,302 |
Vornado Realty Trust | 97,200 | | 12,258 |
| | 59,500 |
Thrifts & Mortgage Finance - 0.5% |
Fannie Mae | 377,300 | | 21,517 |
TOTAL FINANCIALS | | 811,778 |
HEALTH CARE - 9.4% |
Biotechnology - 4.5% |
Biogen Idec, Inc. (a) | 1,516,848 | | 79,270 |
Common Stocks - continued |
| Shares | | Value (Note 1) (000s) |
HEALTH CARE - continued |
Biotechnology - continued |
Celgene Corp. (a) | 1,178,100 | | $ 65,656 |
Gilead Sciences, Inc. (a) | 1,003,500 | | 66,151 |
| | 211,077 |
Health Care Equipment & Supplies - 1.0% |
Becton, Dickinson & Co. | 285,100 | | 20,447 |
Cochlear Ltd. | 98,399 | | 4,371 |
Nobel Biocare Holding AG (Switzerland) | 85,497 | | 23,252 |
| | 48,070 |
Health Care Providers & Services - 0.9% |
Brookdale Senior Living, Inc. | 475,305 | | 21,698 |
UnitedHealth Group, Inc. | 372,600 | | 18,287 |
| | 39,985 |
Pharmaceuticals - 3.0% |
Allergan, Inc. | 297,500 | | 34,683 |
Merck & Co., Inc. | 1,324,340 | | 58,946 |
Novartis AG sponsored ADR | 843,600 | | 49,275 |
| | 142,904 |
TOTAL HEALTH CARE | | 442,036 |
INDUSTRIALS - 13.9% |
Aerospace & Defense - 2.2% |
General Dynamics Corp. | 337,200 | | 25,236 |
Rockwell Collins, Inc. | 407,100 | | 24,560 |
Spirit AeroSystems Holdings, Inc. Class A | 65,200 | | 1,901 |
The Boeing Co. | 569,500 | | 50,418 |
| | 102,115 |
Air Freight & Logistics - 0.5% |
United Parcel Service, Inc. Class B | 303,200 | | 23,625 |
Airlines - 1.8% |
AMR Corp. (a) | 1,075,900 | | 34,386 |
Ryanair Holdings PLC sponsored ADR (a) | 241,300 | | 18,481 |
US Airways Group, Inc. (a) | 562,300 | | 31,916 |
| | 84,783 |
Construction & Engineering - 1.7% |
Fluor Corp. | 556,900 | | 48,495 |
Foster Wheeler Ltd. (a) | 577,700 | | 31,196 |
| | 79,691 |
Common Stocks - continued |
| Shares | | Value (Note 1) (000s) |
INDUSTRIALS - continued |
Electrical Equipment - 1.0% |
ABB Ltd. sponsored ADR | 2,942,800 | | $ 47,909 |
Industrial Conglomerates - 4.9% |
3M Co. | 543,900 | | 44,306 |
General Electric Co. | 3,918,400 | | 138,241 |
McDermott International, Inc. (a) | 991,788 | | 51,652 |
| | 234,199 |
Machinery - 0.4% |
Danaher Corp. | 265,172 | | 19,389 |
Road & Rail - 1.4% |
Burlington Northern Santa Fe Corp. | 890,600 | | 66,937 |
TOTAL INDUSTRIALS | | 658,648 |
INFORMATION TECHNOLOGY - 16.1% |
Communications Equipment - 3.6% |
Alcatel SA sponsored ADR | 2,659,200 | | 35,314 |
Cisco Systems, Inc. (a) | 1,726,000 | | 46,395 |
Research In Motion Ltd. (a) | 646,900 | | 89,809 |
| | 171,518 |
Computers & Peripherals - 5.0% |
Apple Computer, Inc. (a) | 1,036,100 | | 94,990 |
Dell, Inc. (a) | 907,100 | | 24,709 |
EMC Corp. (a) | 1,815,000 | | 23,795 |
Hewlett-Packard Co. | 922,100 | | 36,386 |
Intermec, Inc. (a) | 388,883 | | 9,858 |
Network Appliance, Inc. (a) | 1,174,600 | | 46,056 |
| | 235,794 |
Internet Software & Services - 1.8% |
Akamai Technologies, Inc. (a) | 200,000 | | 9,774 |
Google, Inc. Class A (sub. vtg.) (a) | 134,951 | | 65,440 |
ValueClick, Inc. (a) | 400,000 | | 9,948 |
| | 85,162 |
IT Services - 1.7% |
Cognizant Technology Solutions Corp. Class A (a) | 181,000 | | 14,762 |
Infosys Technologies Ltd. | 1,208,224 | | 59,049 |
MoneyGram International, Inc. | 200,000 | | 6,100 |
| | 79,911 |
Common Stocks - continued |
| Shares | | Value (Note 1) (000s) |
INFORMATION TECHNOLOGY - continued |
Semiconductors & Semiconductor Equipment - 1.0% |
Broadcom Corp. Class A (a) | 318,200 | | $ 10,447 |
FormFactor, Inc. (a) | 265,500 | | 9,919 |
Intel Corp. | 1,161,800 | | 24,804 |
Spansion, Inc. Class A | 234,200 | | 3,422 |
| | 48,592 |
Software - 3.0% |
Allot Communications Ltd. | 121,000 | | 1,411 |
FactSet Research Systems, Inc. | 28,800 | | 1,523 |
Microsoft Corp. | 1,195,600 | | 35,067 |
Nintendo Co. Ltd. ADR | 70,000 | | 2,104 |
Oracle Corp. (a) | 4,060,000 | | 77,262 |
Red Hat, Inc. (a) | 1,308,993 | | 22,776 |
| | 140,143 |
TOTAL INFORMATION TECHNOLOGY | | 761,120 |
MATERIALS - 4.3% |
Chemicals - 1.1% |
Monsanto Co. | 1,116,901 | | 53,689 |
Metals & Mining - 3.2% |
Allegheny Technologies, Inc. | 349,216 | | 31,307 |
Carpenter Technology Corp. | 283,482 | | 30,279 |
Goldcorp, Inc. | 2,432,800 | | 76,070 |
Southern Copper Corp. (d) | 196,600 | | 10,756 |
| | 148,412 |
TOTAL MATERIALS | | 202,101 |
TELECOMMUNICATION SERVICES - 4.5% |
Diversified Telecommunication Services - 2.1% |
AT&T, Inc. | 2,958,800 | | 100,333 |
Wireless Telecommunication Services - 2.4% |
America Movil SA de CV Series L sponsored ADR | 1,370,100 | | 60,928 |
American Tower Corp. Class A (a) | 1,396,200 | | 52,874 |
| | 113,802 |
TOTAL TELECOMMUNICATION SERVICES | | 214,135 |
Common Stocks - continued |
| Shares | | Value (Note 1) (000s) |
UTILITIES - 0.8% |
Electric Utilities - 0.3% |
Entergy Corp. | 170,700 | | $ 15,588 |
Independent Power Producers & Energy Traders - 0.5% |
AES Corp. (a) | 472,300 | | 11,038 |
TXU Corp. | 207,600 | | 11,914 |
| | 22,952 |
TOTAL UTILITIES | | 38,540 |
TOTAL COMMON STOCKS (Cost $4,385,398) | 4,691,527 |
Convertible Preferred Stocks - 0.0% |
| | | |
INFORMATION TECHNOLOGY - 0.0% |
Communications Equipment - 0.0% |
Chorum Technologies, Inc. Series E (a)(e) | 41,400 | | 0 |
TOTAL CONVERTIBLE PREFERRED STOCKS (Cost $621) | 0 |
Money Market Funds - 1.7% |
| | | |
Fidelity Cash Central Fund, 5.35% (b) | 51,658,674 | | 51,659 |
Fidelity Securities Lending Cash Central Fund, 5.35% (b)(c) | 25,924,100 | | 25,924 |
TOTAL MONEY MARKET FUNDS (Cost $77,583) | 77,583 |
TOTAL INVESTMENT PORTFOLIO - 101.0% (Cost $4,463,602) | | 4,769,110 |
NET OTHER ASSETS - (1.0)% | | (46,434) |
NET ASSETS - 100% | $ 4,722,676 |
Legend |
(a) Non-income producing |
(b) Affiliated fund that is available only to investment companies and other accounts managed by Fidelity Investments. The rate quoted is the annualized seven-day yield of the fund at period end. A complete unaudited listing of the fund's holdings as of its most recent quarter end is available upon request. |
(c) Investment made with cash collateral received from securities on loan. |
(d) Security or a portion of the security is on loan at period end. |
(e) Restricted securities - Investment in securities not registered under the Securities Act of 1933 (excluding 144A issues). At the end of the period, the value of restricted securities (excluding 144A issues) amounted to $0 or 0.0% of net assets. |
Additional information on each holding is as follows: |
Security | Acquisition Date | Acquisition Cost (000s) |
Chorum Technologies, Inc. Series E | 9/19/00 | $ 621 |
Affiliated Central Funds |
Information regarding fiscal year to date income earned by the Fund from investments in Fidelity Central Funds is as follows: |
Fund | Income earned
(Amounts in thousands) |
Fidelity Cash Central Fund | $ 6,883 |
Fidelity Securities Lending Cash Central Fund | 3,178 |
Total | $ 10,061 |
Other Affiliated Issuers |
An affiliated company is a company in which the fund has ownership of at least 5% of the voting securities. Fiscal year to date transactions with companies which are or were affiliates are as follows: |
Affiliate (Amounts in thousands) | Value, beginning of period | Purchases | Sales Proceeds | Dividend Income | Value, end of period |
Ruth's Chris Steak House, Inc. | $ 16,823 | $ 13,394 | $ 30,216 | $ - | $ - |
Other Information |
Distribution of investments by country of issue, as a percentage of total net assets, is as follows: |
United States of America | 79.8% |
Canada | 5.4% |
Switzerland | 3.3% |
Netherlands Antilles | 2.1% |
Brazil | 2.0% |
Mexico | 1.3% |
India | 1.3% |
Bermuda | 1.2% |
Panama | 1.1% |
Others (individually less than 1%) | 2.5% |
| 100.0% |
Income Tax Information |
At November 30, 2006, the fund had a capital loss carryforward of approximately $333,464,000 all of which will expire on November 30, 2010. |
See accompanying notes which are an integral part of the financial statements.
Annual Report
Financial Statements
Statement of Assets and Liabilities
Amounts in thousands (except per-share amount) | November 30, 2006 |
| | |
Assets | | |
Investment in securities, at value (including securities loaned of $25,313) - See accompanying schedule: Unaffiliated issuers (cost $4,386,019) | $ 4,691,527 | |
Fidelity Central Funds (cost $77,583) | 77,583 | |
Total Investments (cost $4,463,602) | | $ 4,769,110 |
Cash | | 48 |
Receivable for investments sold | | 280,592 |
Receivable for fund shares sold | | 1,618 |
Dividends receivable | | 6,897 |
Interest receivable | | 1,048 |
Other receivables | | 244 |
Total assets | | 5,059,557 |
| | |
Liabilities | | |
Payable for investments purchased | $ 290,252 | |
Payable for fund shares redeemed | 2,811 | |
Accrued management fee | 2,557 | |
Other affiliated payables | 872 | |
Other liabilities | 14,465 | |
Collateral on securities loaned, at value | 25,924 | |
Total liabilities | | 336,881 |
| | |
Net Assets | | $ 4,722,676 |
Net Assets consist of: | | |
Paid in capital | | $ 4,744,319 |
Undistributed net investment income | | 14,804 |
Accumulated undistributed net realized gain (loss) on investments and foreign currency transactions | | (336,330) |
Net unrealized appreciation (depreciation) on investments and assets and liabilities in foreign currencies | | 299,883 |
Net Assets, for 214,366 shares outstanding | | $ 4,722,676 |
Net Asset Value, offering price and redemption price per share ($4,722,676 ÷ 214,366 shares) | | $ 22.03 |
See accompanying notes which are an integral part of the financial statements.
Annual Report
Financial Statements - continued
Statement of Operations
Amounts in thousands | Year ended November 30, 2006 |
| | |
Investment Income | | |
Dividends | | $ 47,405 |
Interest | | 91 |
Income from Fidelity Central Funds (including $3,178 from security lending) | | 10,061 |
Total income | | 57,557 |
| | |
Expenses | | |
Management fee
Basic fee | $ 25,691 | |
Performance adjustment | 4,515 | |
Transfer agent fees | 7,679 | |
Accounting and security lending fees | 1,047 | |
Custodian fees and expenses | 348 | |
Independent trustees' compensation | 17 | |
Appreciation in deferred trustee compensation account | 7 | |
Registration fees | 37 | |
Audit | 85 | |
Legal | 74 | |
Interest | 12 | |
Miscellaneous | 166 | |
Total expenses before reductions | 39,678 | |
Expense reductions | (582) | 39,096 |
Net investment income (loss) | | 18,461 |
Realized and Unrealized Gain (Loss) Net realized gain (loss) on: | | |
Investment securities: | | |
Unaffiliated issuers | 838,113 | |
Other affiliated issuers | (2,426) | |
Foreign currency transactions | (428) | |
Futures contracts | (2,106) | |
Total net realized gain (loss) | | 833,153 |
Change in net unrealized appreciation (depreciation) on: Investment securities (net of increase in deferred foreign taxes of $5,162) | (277,199) | |
Assets and liabilities in foreign currencies | (14) | |
Total change in net unrealized appreciation (depreciation) | | (277,213) |
Net gain (loss) | | 555,940 |
Net increase (decrease) in net assets resulting from operations | | $ 574,401 |
See accompanying notes which are an integral part of the financial statements.
Annual Report
Statement of Changes in Net Assets
Amounts in thousands | Year ended
November 30,
2006 | Year ended
November 30,
2005 |
Increase (Decrease) in Net Assets | | |
Operations | | |
Net investment income (loss) | $ 18,461 | $ 10,890 |
Net realized gain (loss) | 833,153 | 394,470 |
Change in net unrealized appreciation (depreciation) | (277,213) | 131,496 |
Net increase (decrease) in net assets resulting
from operations | 574,401 | 536,856 |
Distributions to shareholders from net investment income | (12,074) | (28,963) |
Share transactions
Proceeds from sales of shares | 430,858 | 226,102 |
Reinvestment of distributions | 11,979 | 28,765 |
Cost of shares redeemed | (936,261) | (693,020) |
Net increase (decrease) in net assets resulting from share transactions | (493,424) | (438,153) |
Total increase (decrease) in net assets | 68,903 | 69,740 |
| | |
Net Assets | | |
Beginning of period | 4,653,773 | 4,584,033 |
End of period (including undistributed net investment income of $14,804 and undistributed net investment income of $9,142, respectively) | $ 4,722,676 | $ 4,653,773 |
Other Information Shares | | |
Sold | 20,820 | 12,714 |
Issued in reinvestment of distributions | 605 | 1,645 |
Redeemed | (46,162) | (38,879) |
Net increase (decrease) | (24,737) | (24,520) |
See accompanying notes which are an integral part of the financial statements.
Annual Report
Financial Highlights
Years ended November 30, | 2006 | 2005 | 2004 | 2003 | 2002 |
Selected Per-Share Data | | | | | |
Net asset value,
beginning of period | $ 19.46 | $ 17.39 | $ 15.45 | $ 13.83 | $ 15.84 |
Income from Investment Operations | | | | | |
Net investment income (loss) B | .08 | .04 | .11 E, G | .14 | .21 |
Net realized and unrealized gain (loss) | 2.54 | 2.14 | 1.93 | 1.69 | (2.02) |
Total from investment operations | 2.62 | 2.18 | 2.04 | 1.83 | (1.81) |
Distributions from net investment income | (.05) | (.11) | (.10) | (.21) | (.20) |
Net asset value, end of period | $ 22.03 | $ 19.46 | $ 17.39 | $ 15.45 | $ 13.83 |
Total Return A | 13.49% | 12.61% | 13.28% | 13.47% | (11.57)% |
Ratios to Average Net Assets C, F | | | | | |
Expenses before reductions | .87% | .77% | .76% | .62% | 1.07% |
Expenses net of fee waivers,
if any | .87% | .77% | .76% | .62% | 1.07% |
Expenses net of all reductions | .86% | .72% | .71% | .55% | .97% |
Net investment income (loss) | .41% | .24% | .66% G | 1.00% | 1.41% |
Supplemental Data | | | | | |
Net assets, end of period
(in millions) | $ 4,723 | $ 4,654 | $ 4,584 | $ 4,591 | $ 4,443 |
Portfolio turnover rate D | 169% | 119% | 119% | 166% | 191% |
A Total returns would have been lower had certain expenses not been reduced during the periods shown.
B Calculated based on average shares outstanding during the period.
C Fees and expenses of the underlying Fidelity Central Funds are not included in the Fund's expense ratio. The Fund indirectly bears its proportionate share of the expenses of any underlying Fidelity Central Funds.
D Amount does not include the portfolio activity of any underlying Fidelity Central Funds.
E Investment income per share reflects a special dividend which amounted to $.07 per share.
F Expense ratios reflect operating expenses of the Fund. Expenses before reductions do not reflect amounts reimbursed by the investment adviser or reductions from brokerage service arrangements or other expense offset arrangements and do not represent the amount paid by the Fund during periods when reimbursements or reductions occur. Expenses net of fee waivers reflect expenses after reimbursement by the investment adviser but prior to reductions from brokerage service arrangements or other expense offset arrangements. Expenses net of all reductions represent the net expenses paid by the Fund.
G As a result in the change in the estimate of the return of capital component of dividend income realized in the year ended November 30, 2003, net investment income per share and the ratio of net investment income to average net assets for the year ended November 30, 2004 have been reduced by $.01 per share and .03%, respectively. The change in estimate has no impact on total net assets or total return of the fund.
See accompanying notes which are an integral part of the financial statements.
Annual Report
Notes to Financial Statements
For the period ended November 30, 2006
(Amounts in thousands except ratios)
1. Significant Accounting Policies.
Fidelity Independence Fund (the Fund) is a fund of Fidelity Financial Trust (the trust) and is authorized to issue an unlimited number of shares. The trust is registered under the Investment Company Act of 1940, as amended (the 1940 Act), as an open-end management investment company organized as a Massachusetts business trust. The Fund may invest in Fidelity Central Funds which are open-end investment companies available to investment companies and other accounts managed by Fidelity Management & Research Company (FMR) and its affiliates. The financial statements have been prepared in conformity with accounting principles generally accepted in the United States of America, which require management to make certain estimates and assumptions at the date of the financial statements. The following summarizes the significant accounting policies of the Fund, which are also consistently followed by the Fidelity Central Funds:
Security Valuation. Investments are valued and net asset value (NAV) per share is calculated (NAV calculation) as of the close of business of the New York Stock Exchange (NYSE), normally 4:00 p.m. Eastern time. Wherever possible, the Fund uses independent pricing services approved by the Board of Trustees to value its investments.
Equity securities, including restricted securities, for which market quotations are readily available, are valued at the last reported sale price or official closing price as reported by an independent pricing service on the primary market or exchange on which they are traded. In the event there were no sales during the day or closing prices are not available, securities are valued at the last quoted bid price. Investments in open-end mutual funds, including the Fidelity Central Funds, are valued at their closing net asset value each business day. Short-term securities with remaining maturities of sixty days or less for which quotations are not readily available are valued at amortized cost, which approximates value.
When current market prices or quotations are not readily available or do not accurately reflect fair value, valuations may be determined in accordance with procedures adopted by the Board of Trustees. For example, when developments occur between the close of a market and the close of the NYSE that may materially affect the value of some or all of the securities, or when trading in a security is halted, those securities may be fair valued. Factors used in the determination of fair value may include monitoring news to identify significant market or security specific events such as changes in the value of U.S. securities markets, reviewing developments in foreign markets and evaluating the performance of ADRs, futures contracts and exchange-traded funds. Because the Fund's utilization of fair value pricing depends on market activity, the frequency with which fair value pricing is used can not be predicted and may be utilized to a significant extent. The value of securities used for NAV calculation under fair value pricing may differ from published prices for the same securities.
Annual Report
Notes to Financial Statements - continued
(Amounts in thousands except ratios)
1. Significant Accounting Policies - continued
Foreign Currency. The Fund uses foreign currency contracts to facilitate transactions in foreign-denominated securities. Losses from these transactions may arise from changes in the value of the foreign currency or if the counterparties do not perform under the contracts' terms.
Foreign-denominated assets, including investment securities, and liabilities are translated into U.S. dollars at the exchange rate at period end. Purchases and sales of investment securities, income and dividends received and expenses denominated in foreign currencies are translated into U.S. dollars at the exchange rate in effect on the transaction date.
The effects of exchange rate fluctuations on investments are included with the net realized and unrealized gain (loss) on investment securities. Other foreign currency transactions resulting in realized and unrealized gain (loss) are disclosed separately.
Investment Transactions and Income. Security transactions, including the Fund's investment activity in the Fidelity Central Funds, are accounted for as of trade date. Gains and losses on securities sold are determined on the basis of identified cost and may include proceeds received from litigation. Dividend income is recorded on the ex-dividend date, except for certain dividends from foreign securities where the ex-dividend date may have passed, which are recorded as soon as the Fund is informed of the ex-dividend date. Non-cash dividends included in dividend income, if any, are recorded at the fair market value of the securities received. Distributions received on securities that represent a return of capital or capital gain are recorded as a reduction of cost of investments and/or as a realized gain. The Fund estimates the components of distributions received that may be considered return of capital distributions or capital gain distributions. Interest income and income distributions from the Fidelity Central Funds are accrued as earned, with any income distributions receivable as of period end included in Interest Receivable on the Statement of Assets and Liabilities. Interest income includes coupon interest and amortization of premium and accretion of discount on debt securities. Investment income is recorded net of foreign taxes withheld where recovery of such taxes is uncertain.
Expenses. Most expenses of the trust can be directly attributed to a fund. Expenses which cannot be directly attributed are apportioned among each Fund in the trust. Expense estimates are accrued in the period to which they relate and adjustments are made when actual amounts are known.
Annual Report
1. Significant Accounting Policies - continued
Deferred Trustee Compensation. Under a Deferred Compensation Plan (the Plan), Independent Trustees must defer receipt of a portion of, and may elect to defer receipt of an additional portion of, their annual compensation. Deferred amounts are invested in a cross-section of Fidelity funds, are marked-to-market and remain in the Fund until distributed in accordance with the Plan. The investment of deferred amounts and the offsetting payable to the Trustees are included in the accompanying Statement of Assets and Liabilities.
Income Tax Information and Distributions to Shareholders. Each year, the Fund intends to qualify as a regulated investment company by distributing all of its taxable income and realized gains under Subchapter M of the Internal Revenue Code. As a result, no provision for income taxes is required in the accompanying financial statements. Foreign taxes are provided for based on the Fund's understanding of the tax rules and rates that exist in the foreign markets in which it invests.
Distributions are recorded on the ex-dividend date. Income and capital gain distributions are determined in accordance with income tax regulations, which may differ from generally accepted accounting principles.
Capital accounts within the financial statements are adjusted for permanent book-tax differences. These adjustments have no impact on net assets or the results of operations. Temporary book-tax differences will reverse in a subsequent period.
Book-tax differences are primarily due to futures transactions, foreign currency transactions, deferred trustees compensation, capital loss carryforwards and losses deferred due to wash sales.
The tax-basis components of distributable earnings and the federal tax cost as of period end were as follows:
Unrealized appreciation | $ 351,954 | |
Unrealized depreciation | (49,207) | |
Net unrealized appreciation (depreciation) | 302,747 | |
Undistributed ordinary income | 14,947 | |
Capital loss carryforward | (333,464) | |
| | |
Cost for federal income tax purposes | $ 4,466,363 | |
The tax character of distributions paid was as follows:
| November 30, 2006 | November 30, 2005 |
Ordinary Income | $ 12,074 | $ 28,963 |
Annual Report
Notes to Financial Statements - continued
(Amounts in thousands except ratios)
1. Significant Accounting Policies - continued
New Accounting Pronouncements. In July 2006, Financial Accounting Standards Board Interpretation No. 48, Accounting for Uncertainty in Income Taxes - an interpretation of FASB Statement 109 (FIN 48), was issued and is effective for fiscal years beginning after December 15, 2006. FIN 48 sets forth a threshold for financial statement recognition, measurement and disclosure of a tax position taken or expected to be taken on a tax return. Management is currently evaluating the impact, if any, the adoption of FIN 48 will have on the Fund's net assets, results of operations and financial statement disclosures.
In addition, in September 2006, Statement of Financial Accounting Standards No. 157, Fair Value Measurements (SFAS 157), was issued and is effective for fiscal years beginning after November 15, 2007. SFAS 157 defines fair value, establishes a framework for measuring fair value and expands disclosures about fair value measurements. Management is currently evaluating the impact the adoption of SFAS 157 will have on the Fund's financial statement disclosures.
2. Operating Policies.
Repurchase Agreements. FMR has received an Exemptive Order from the Securities and Exchange Commission (the SEC) which permits the Fund and other affiliated entities of FMR to transfer uninvested cash balances into joint trading accounts which are then invested in repurchase agreements. The Fund may also invest directly with institutions in repurchase agreements. Repurchase agreements are collateralized by government or non-government securities. Upon settlement date, collateral is held in segregated accounts with custodian banks and may be obtained in the event of a default of the counterparty. The Fund monitors, on a daily basis, the value of the collateral to ensure it is at least equal to the principal amount of the repurchase agreement (including accrued interest). In the event of a default by the counterparty, realization of the collateral proceeds could be delayed, during which time the value of the collateral may decline.
Futures Contracts. The Fund may use futures contracts to manage its exposure to the stock. Buying futures tends to increase a fund's exposure to the underlying instrument, while selling futures tends to decrease a fund's exposure to the underlying instrument or hedge other fund investments. Upon entering into a futures contract, a fund is required to deposit with a clearing broker, no later than the following business day, an amount ("initial margin") equal to a certain percentage of the face value of the contract. The initial margin may be in the form of cash or securities and is transferred to a segregated account on settlement date. Subsequent payments ("variation margin") are made or received by a fund depending on the daily fluctuations in the value of the futures
Annual Report
2. Operating Policies - continued
Futures Contracts - continued
contract and are accounted for as unrealized gains or losses. Realized gains (losses) are recorded upon the expiration or closing of the futures contract. Securities deposited to meet margin requirements are identified in the Schedule of Investments. Losses may arise from changes in the value of the underlying instruments or if the counterparties do not perform under the contract's terms. Futures contracts are valued at the settlement price established each day by the board of trade or exchange on which they are traded.
Restricted Securities. The Fund may invest in securities that are subject to legal or contractual restrictions on resale. These securities generally may be resold in transactions exempt from registration or to the public if the securities are registered. Disposal of these securities may involve time-consuming negotiations and expense, and prompt sale at an acceptable price may be difficult.
3. Purchases and Sales of Investments.
Purchases and sales of securities, other than short-term securities, aggregated $7,436,008 and $7,779,320, respectively.
4. Fees and Other Transactions with Affiliates.
Management Fee. FMR and its affiliates provide the Fund with investment management related services for which the Fund pays a monthly management fee. The management fee is the sum of an individual fund fee rate that is based on an annual rate of .30% of the Fund's average net assets and a group fee rate that averaged .27% during the period. The group fee rate is based upon the average net assets of all the mutual funds advised by FMR. The group fee rate decreases as assets under management increase and increases as assets under management decrease. In addition, the management fee is subject to a performance adjustment (up to a maximum of ±.20% of the Fund's average net assets over a 36 month performance period). The upward or downward adjustment to the management fee is based on the Fund's relative investment performance as compared to an appropriate benchmark index. For the period, the total annual management fee rate, including the performance adjustment, was .67% of the Fund's average net assets.
Transfer Agent Fees. Fidelity Service Company, Inc. (FSC), an affiliate of FMR, is the Fund's transfer, dividend disbursing and shareholder servicing agent. FSC receives account fees and asset-based fees that vary according to account size and type of account. FSC pays for typesetting, printing and mailing of shareholder reports, except proxy statements. For the period, the transfer agent fees were equivalent to an annual rate of .17% of average net assets.
Annual Report
Notes to Financial Statements - continued
(Amounts in thousands except ratios)
4. Fees and Other Transactions with Affiliates - continued
Accounting and Security Lending Fees. FSC maintains the Fund's accounting records. The accounting fee is based on the level of average net assets for the month. Under a separate contract, FSC administers the security lending program. The security lending fee is based on the number and duration of lending transactions.
Investments in Fidelity Central Funds. The Fund may invest in Fidelity Central Funds. The Fund's Schedule of Investments lists each of the Fidelity Central Funds as an investment of the Fund but does not include the underlying holdings of each Fidelity Central Fund. As an Investing Fund, the Fund indirectly bears its proportionate share of the expenses of the underlying Fidelity Central Funds. A complete unaudited list of holdings for each Fidelity Central Fund is available upon request. In addition, the financial statements of the Fidelity Central Funds, which are not covered by the Fund's Report of Independent Registered Public Accounting Firm, are available on the EDGAR Database on the SEC's web site, www.sec.gov, or upon request.
The Money Market Central Funds seek preservation of capital and current income and are managed by Fidelity Investments Money Management, Inc. (FIMM), an affiliate of FMR.
Brokerage Commissions. The Fund placed a portion of its portfolio transactions with brokerage firms which are affiliates of the investment adviser. The commissions paid to these affiliated firms were $41 for the period.
Interfund Lending Program. Pursuant to an Exemptive Order issued by the SEC, the Fund, along with other registered investment companies having management contracts with FMR, may participate in an interfund lending program. This program provides an alternative credit facility allowing the funds to borrow from, or lend money to, other participating affiliated funds. At period end, there were no interfund loans outstanding. The Fund's activity in this program during the period for which loans were outstanding was as follows:
Borrower or Lender | Average Daily
Loan Balance | Weighted Average Interest Rate | Interest
Expense |
Borrower | $ 82,006 | 5.38% | $ 12 |
5. Committed Line of Credit.
The Fund participates with other funds managed by FMR in a $4.2 billion credit facility (the "line of credit") to be utilized for temporary or emergency purposes to fund shareholder redemptions or for other short-term liquidity purposes. The Fund has agreed to pay commitment fees on its pro rata portion of the line of credit, which amounts to $13 and is reflected in Miscellaneous Expense on the Statement of Operations. During the period, there were no borrowings on this line of credit.
Annual Report
6. Security Lending.
The Fund lends portfolio securities from time to time in order to earn additional income. On the settlement date of the loan, the Fund receives collateral (in the form of U.S. Treasury obligations, letters of credit and/or cash) against the loaned securities and maintains collateral in an amount not less than 100% of the market value of the loaned securities during the period of the loan. The market value of the loaned securities is determined at the close of business of the Fund and any additional required collateral is delivered to the Fund on the next business day. If the borrower defaults on its obligation to return the securities loaned because of insolvency or other reasons, a fund could experience delays and costs in recovering the securities loaned or in gaining access to the collateral. Any cash collateral received is invested in the Fidelity Securities Lending Cash Central Fund. The value of loaned securities and cash collateral at period end are disclosed on the Fund's Statement of Assets and Liabilities. Security lending income represents the income earned on investing cash collateral, less fees and expenses associated with the loan, plus any premium payments that may be received on the loan of certain types of securities. Security lending income is presented in the Statement of Operations as a component of income from Fidelity Central Funds.
7. Expense Reductions.
Many of the brokers with whom FMR places trades on behalf of the Fund provided services to the Fund in addition to trade execution. These services included payments of certain expenses on behalf of the Fund totaling $454 for the period. In addition, through arrangements with the Fund's custodian and transfer agent, credits realized as a result of uninvested cash balances were used to reduce the Fund's expenses. During the period, these credits reduced the Fund's custody and transfer agent expenses by $6 and $122, respectively.
8. Other.
The Fund's organizational documents provide former and current trustees and officers with a limited indemnification against liabilities arising in connection with the performance of their duties to the Fund. In the normal course of business, the Fund may also enter into contracts that provide general indemnifications. The Fund's maximum exposure under these arrangements is unknown as this would be dependent on future claims that may be made against the Fund. The risk of material loss from such claims is considered remote.
The United States Securities and Exchange Commission ("SEC") is conducting an investigation of FMR (covering the years 2002 to 2004) arising from gifts, gratuities and business entertainment provided by certain brokers to certain individuals who were
Annual Report
Notes to Financial Statements - continued
(Amounts in thousands except ratios)
8. Other - continued
employed on FMR's domestic equity trading desk during that period. FMR is in discussions with the SEC staff regarding the possible resolution of the matter, but as of period-end no final resolution has been reached.
In December 2006, the Independent Trustees completed their own investigation of the matter with the assistance of independent counsel. The Independent Trustees and FMR agree that, despite the absence of proof that the Fidelity mutual funds experienced diminished execution quality as a result of the improper receipt of gifts and business entertainment, the conduct at issue was serious and is worthy of redress. Accordingly, the Independent Trustees have requested and FMR has agreed to pay $42 million to Fidelity mutual funds, plus interest to be determined at the time that payment is made. A method of allocating this payment among the funds has not yet been determined. In addition, subsequent to period-end, FMR has reimbursed related legal expenses. The total payment to the Fund is not anticipated to have a material impact on the Fund's net assets.
Annual Report
Report of Independent Registered Public Accounting Firm
To the Trustees of Fidelity Financial Trust and the Shareholders of Fidelity Independence Fund:
In our opinion, the accompanying statement of assets and liabilities, including the schedule of investments, and the related statements of operations and of changes in net assets and the financial highlights present fairly, in all material respects, the financial position of Fidelity Independence Fund (a fund of Fidelity Financial Trust) at November 30, 2006, the results of its operations for the year then ended, the changes in its net assets for each of the two years in the period then ended and the financial highlights for each of the five years in the period then ended, in conformity with accounting principles generally accepted in the United States of America. These financial statements and financial highlights (hereafter referred to as "financial statements") are the responsibility of the Fidelity Independence Fund's management; our responsibility is to express an opinion on these financial statements based on our audits. We conducted our audits of these financial statements in accordance with the standards of the Public Company Accounting Oversight Board (United States). Those standards require that we plan and perform the audit to obtain reasonable assurance about whether the financial statements are free of material misstatement. An audit includes examining, on a test basis, evidence supporting the amounts and disclosures in the financial statements, assessing the accounting principles used and significant estimates made by management, and evaluating the overall financial statement presentation. We believe that our audits, which included confirmation of securities at November 30, 2006 by correspondence with the custodian and brokers, provide a reasonable basis for our opinion.
PricewaterhouseCoopers LLP
Boston, Massachusetts
January 23, 2007
Annual Report
Trustees and Officers
The Trustees, Member of the Advisory Board, and executive officers of the trust and fund, as applicable, are listed below. The Board of Trustees governs the fund and is responsible for protecting the interests of shareholders. The Trustees are experienced executives who meet periodically throughout the year to oversee the fund's activities, review contractual arrangements with companies that provide services to the fund, and review the fund's performance. Except for William O. McCoy, each of the Trustees oversees 348 funds advised by FMR or an affiliate. Mr. McCoy oversees 350 funds advised by FMR or an affiliate.
The Trustees hold office without limit in time except that (a) any Trustee may resign; (b) any Trustee may be removed by written instrument, signed by at least two-thirds of the number of Trustees prior to such removal; (c) any Trustee who requests to be retired or who has become incapacitated by illness or injury may be retired by written instrument signed by a majority of the other Trustees; and (d) any Trustee may be removed at any special meeting of shareholders by a two-thirds vote of the outstanding voting securities of the trust. Each Trustee who is not an interested person (as defined in the 1940 Act) (Independent Trustee), shall retire not later than the last day of the calendar year in which his or her 72nd birthday occurs. The Independent Trustees may waive this mandatory retirement age policy with respect to individual Trustees. The executive officers and Advisory Board Member hold office without limit in time, except that any officer and Advisory Board Member may resign or may be removed by a vote of a majority of the Trustees at any regular meeting or any special meeting of the Trustees. Except as indicated, each individual has held the office shown or other offices in the same company for the past five years.
The fund's Statement of Additional Information (SAI) includes more information about the Trustees. To request a free copy, call Fidelity at 1-800-544-8544.
Interested Trustees*:
Correspondence intended for each Trustee who is an interested person may be sent to Fidelity Investments, 82 Devonshire Street, Boston, Massachusetts 02109.
Name, Age; Principal Occupation |
Edward C. Johnson 3d (76) |
| Year of Election or Appointment: 1982 Mr. Johnson is Chairman of the Board of Trustees. Mr. Johnson serves as President (2006-present), Chief Executive Officer, Chairman, and a Director of FMR Corp.; Chairman and a Director of FMR; Chairman and a Director of Fidelity Research & Analysis Company (FRAC); Chairman and a Director of Fidelity Investments Money Management, Inc.; and Chairman (2001-present) and a Director of FMR Co., Inc. In addition, Mr. Johnson serves as Chairman and Director of Fidelity International Limited (FIL). |
Robert L. Reynolds (54) |
| Year of Election or Appointment: 2003 Mr. Reynolds is President and a Director of FMR (2005-present), Fidelity Investments Money Management, Inc. (2005-present), and FMR Co., Inc. (2005-present). Mr. Reynolds also serves as Vice Chairman (2006-present), a Director (2003-present), and Chief Operating Officer of FMR Corp. and a Director of Strategic Advisers, Inc. (2005-present). He also serves on the Board at Fidelity Investments Canada, Ltd. |
* Trustees have been determined to be "Interested Trustees" by virtue of, among other things, their affiliation with the trust or various entities under common control with FMR.
Annual Report
Independent Trustees:
Correspondence intended for each Independent Trustee (that is, the Trustees other than the Interested Trustees) may be sent to Fidelity Investments, P.O. Box 55235, Boston, Massachusetts 02205-5235.
Name, Age; Principal Occupation |
Dennis J. Dirks (58) |
| Year of Election or Appointment: 2005 Prior to his retirement in May 2003, Mr. Dirks was Chief Operating Officer and a member of the Board of The Depository Trust & Clearing Corporation (DTCC) (1999-2003). He also served as President, Chief Operating Officer, and Board member of The Depository Trust Company (DTC) (1999-2003) and President and Board member of the National Securities Clearing Corporation (NSCC) (1999-2003). In addition, Mr. Dirks served as Chief Executive Officer and Board member of the Government Securities Clearing Corporation (2001-2003) and Chief Executive Officer and Board member of the Mortgage-Backed Securities Clearing Corporation (2001-2003). Mr. Dirks also serves as a Trustee and a member of the Finance Committee of Manhattan College (2005-present) and a Trustee and a member of the Finance Committee of AHRC of Nassau County (2006-present). |
Albert R. Gamper, Jr. (64) |
| Year of Election or Appointment: 2006 Prior to his retirement in December 2004, Mr. Gamper served as Chairman of the Board of CIT Group Inc. (commercial finance). During his tenure with CIT Group Inc. Mr. Gamper served in numerous senior management positions, including Chairman (1987-1989; 1999-2001; 2002-2004), Chief Executive Officer (1987-2004), and President (1989-2002). He currently serves as a member of the Board of Directors of Public Service Enterprise Group (utilities, 2001-present), Chairman of the Board of Governors, Rutgers University (2004-present), and Chairman of the Board of Saint Barnabas Health Care System. |
George H. Heilmeier (70) |
| Year of Election or Appointment: 2004 Dr. Heilmeier is Chairman Emeritus of Telcordia Technologies (communication software and systems), where prior to his retirement, he served as company Chairman and Chief Executive Officer. He currently serves on the Boards of Directors of The Mitre Corporation (systems engineering and information technology support for the government), and HRL Laboratories (private research and development, 2004-present). He is Chairman of the General Motors Science & Technology Advisory Board and a Life Fellow of the Institute of Electrical and Electronics Engineers (IEEE). Dr. Heilmeier is a member of the Defense Science Board and the National Security Agency Advisory Board. He is also a member of the National Academy of Engineering, the American Academy of Arts and Sciences, and the Board of Overseers of the School of Engineering and Applied Science of the University of Pennsylvania. Previously, Dr. Heilmeier served as a Director of TRW Inc. (automotive, space, defense, and information technology, 1992-2002), Compaq (1994-2002), Automatic Data Processing, Inc. (ADP) (technology-based business outsourcing, 1995-2002), INET Technologies Inc. (telecommunications network surveillance, 2001-2004), and Teletech Holdings (customer management services). He is the recipient of the 2005 Kyoto Prize in Advanced Technology for his invention of the liquid crystal display, and a member of the Consumer Electronics Hall of Fame. |
James H. Keyes (66) |
| Year of Election or Appointment: 2007 Prior to his retirement in 2003, Mr. Keyes was Chairman, President, and Chief Executive Officer of Johnson Controls, Inc. (automotive supplier, 1993-2003). He currently serves as a member of the boards of LSI Logic Corporation (semiconductor technologies), Navistar International Corporation (manufacture and sale of trucks, buses, and diesel engines, 2002-present), and Pitney Bowes, Inc. (integrated mail, messaging, and document management solutions). |
Marie L. Knowles (60) |
| Year of Election or Appointment: 2001 Prior to Ms. Knowles' retirement in June 2000, she served as Executive Vice President and Chief Financial Officer of Atlantic Richfield Company (ARCO) (diversified energy, 1996-2000). From 1993 to 1996, she was a Senior Vice President of ARCO and President of ARCO Transportation Company. She served as a Director of ARCO from 1996 to 1998. She currently serves as a Director of Phelps Dodge Corporation (copper mining and manufacturing) and McKesson Corporation (healthcare service, 2002-present). Ms. Knowles is a Trustee of the Brookings Institution and the Catalina Island Conservancy and also serves as a member of the Advisory Board for the School of Engineering of the University of Southern California. |
Ned C. Lautenbach (62) |
| Year of Election or Appointment: 2000 Mr. Lautenbach is Chairman of the Independent Trustees (2006-present). Mr. Lautenbach has been a partner of Clayton, Dubilier & Rice, Inc. (private equity investment firm) since September 1998. Previously, Mr. Lautenbach was with the International Business Machines Corporation (IBM) from 1968 until his retirement in 1998. Mr. Lautenbach serves as a Director of Sony Corporation (2006-present) and Eaton Corporation (diversified industrial) as well as the Philharmonic Center for the Arts in Naples, Florida. He also is a member of the Board of Trustees of Fairfield University (2005-present), as well as a member of the Council on Foreign Relations. |
William O. McCoy (73) |
| Year of Election or Appointment: 1997 Prior to his retirement in December 1994, Mr. McCoy was Vice Chairman of the Board of BellSouth Corporation (telecommunications) and President of BellSouth Enterprises. He is currently a Director of Duke Realty Corporation (real estate). He is also a partner of Franklin Street Partners (private investment management firm). In addition, Mr. McCoy served as the Interim Chancellor (1999-2000) and a member of the Board of Visitors for the University of North Carolina at Chapel Hill and currently serves as Chairman of the Board of Directors of the University of North Carolina Health Care System. He also served as Vice President of Finance for the University of North Carolina (16-school system). |
Cornelia M. Small (62) |
| Year of Election or Appointment: 2005 Ms. Small is a member (2000-present) and Chairperson (2002-present) of the Investment Committee, and a member (2002-present) of the Board of Trustees of Smith College. Previously, she served as Chief Investment Officer (1999-2000), Director of Global Equity Investments (1996-1999), and a member of the Board of Directors of Scudder, Stevens & Clark (1990-1997) and Scudder Kemper Investments (1997-1999). In addition, Ms. Small served as Co-Chair (2000-2003) of the Annual Fund for the Fletcher School of Law and Diplomacy. |
William S. Stavropoulos (67) |
| Year of Election or Appointment: 2002 Mr. Stavropoulos is Chairman Emeritus of the Board of Directors of The Dow Chemical Company. Since joining The Dow Chemical Company in 1967, Mr. Stavropoulos served in numerous senior management positions, including President (1993-2000; 2002-2003), CEO (1995-2000; 2002-2004), and Chairman of the Executive Committee (2000-2004). Currently, he is a Director of NCR Corporation (data warehousing and technology solutions), BellSouth Corporation (telecommunications), Chemical Financial Corporation, Maersk Inc. (industrial conglomerate, 2002-present), and Metalmark Capital (private equity investment firm, 2005-present). He also serves as a member of the Board of Trustees of the American Enterprise Institute for Public Policy Research. In addition, Mr. Stavropoulos is a member of The Business Council, J.P. Morgan International Council and the University of Notre Dame Advisory Council for the College of Science. |
Kenneth L. Wolfe (67) |
| Year of Election or Appointment: 2005 Prior to his retirement in 2001, Mr. Wolfe was Chairman and Chief Executive Officer of Hershey Foods Corporation (1993-2001). He currently serves as a member of the boards of Adelphia Communications Corporation (2003-present), Bausch & Lomb, Inc., and Revlon Inc. (2004-present). |
Annual Report
Advisory Board Member and Executive Officers:
Correspondence intended for each executive officer and Mr. Lynch may be sent to Fidelity Investments, 82 Devonshire Street, Boston, Massachusetts 02109.
Name, Age; Principal Occupation |
Peter S. Lynch (62) |
| Year of Election or Appointment: 2003 Member of the Advisory Board of Fidelity Financial Trust. Mr. Lynch is Vice Chairman and a Director of FMR, and Vice Chairman (2001-present) and a Director of FMR Co., Inc. Previously, Mr. Lynch served as a Trustee of the Fidelity funds (1990-2003). In addition, he serves as a Trustee of Boston College and as the Chairman of the Inner-City Scholarship Fund. |
Philip L. Bullen (47) |
| Year of Election or Appointment: 2006 Vice President of Independence. Mr. Bullen also serves as Vice President of certain Equity Funds (2006-present). Mr. Bullen is Senior Vice President of FMR (2001-present) and FMR Co., Inc. (2001-present). Previously, Mr. Bullen served as President and a Director of Fidelity Research & Analysis Company (2001-2005), President and a Director of Fidelity Management & Research (U.K.) Inc. (2002-2006), and a Director of Strategic Advisers, Inc. (2002-2005). |
Dwight D. Churchill (52) |
| Year of Election or Appointment: 2005 Vice President of Independence. Mr. Churchill also serves as Vice President of certain Equity Funds (2005-present). Mr. Churchill is Executive Vice President of FMR (2005-present) and FMR Co., Inc. (2005-present). Previously, Mr. Churchill served as Senior Vice President of Fidelity Investments Money Management, Inc. (2005-2006), Head of Fidelity's Fixed-Income Division (2000-2005), Vice President of Fidelity's Money Market Funds (2000-2005), Vice President of Fidelity's Bond Funds, and Senior Vice President of FMR. |
Robert Bertelson (46) |
| Year of Election or Appointment: 2006 Vice President of Independence. Mr. Bertelson also serves as Vice President of other funds advised by FMR. Prior to assuming his current responsibilities, Mr. Bertelson worked as a research analyst and manager. Mr. Bertelson also serves as Vice President of FMR (1999) and FMR Co., Inc. (2001). |
Eric D. Roiter (58) |
| Year of Election or Appointment: 1998 Secretary of Independence. He also serves as Secretary of other Fidelity funds; Vice President, General Counsel, and Secretary of FMR Co., Inc. (2001-present) and FMR; Assistant Secretary of Fidelity Management & Research (U.K.) Inc. (2001-present), Fidelity Research & Analysis Company (2001-present), and Fidelity Investments Money Management, Inc. (2001-present). Mr. Roiter is an Adjunct Member, Faculty of Law, at Boston College Law School (2003-present). Previously, Mr. Roiter served as Vice President and Secretary of Fidelity Distributors Corporation (FDC) (1998-2005). |
Stuart Fross (47) |
| Year of Election or Appointment: 2003 Assistant Secretary of Independence. Mr. Fross also serves as Assistant Secretary of other Fidelity funds (2003-present), Vice President and Secretary of FDC (2005-present), and is an employee of FMR. |
R. Stephen Ganis (40) |
| Year of Election or Appointment: 2006 Anti-Money Laundering (AML) officer of Independence. Mr. Ganis also serves as AML officer of other Fidelity funds (2006-present) and FMR Corp. (2003-present). Before joining Fidelity Investments, Mr. Ganis practiced law at Goodwin Procter, LLP (2000-2002). |
Joseph B. Hollis (58) |
| Year of Election or Appointment: 2006 Chief Financial Officer of Independence. Mr. Hollis also serves as Chief Financial Officer of other Fidelity funds. Mr. Hollis is President of Fidelity Pricing and Cash Management Services (FPCMS) (2005-present). Mr. Hollis also serves as President and Director of Fidelity Service Company, Inc. (2006-present). Previously, Mr. Hollis served as Senior Vice President of Cash Management Services (1999-2002) and Investment Management Operations (2002-2005). |
Kenneth A. Rathgeber (59) |
| Year of Election or Appointment: 2004 Chief Compliance Officer of Independence. Mr. Rathgeber also serves as Chief Compliance Officer of other Fidelity funds (2004-present) and Executive Vice President of Risk Oversight for Fidelity Investments (2002-present). He is Chief Compliance Officer of FMR (2005-present), FMR Co., Inc. (2005-present), Fidelity Management & Research (U.K.) Inc. (2005-present), Fidelity Research & Analysis Company (2005-present), Fidelity Investments Money Management, Inc. (2005-present), and Strategic Advisers, Inc. (2005-present). Previously, Mr. Rathgeber served as Executive Vice President and Chief Operating Officer for Fidelity Investments Institutional Services Company, Inc. (1998-2002). |
Bryan A. Mehrmann (45) |
| Year of Election or Appointment: 2005 Deputy Treasurer of Independence. Mr. Mehrmann also serves as Deputy Treasurer of other Fidelity funds (2005-present) and is an employee of FMR. Previously, Mr. Mehrmann served as Vice President of Fidelity Investments Institutional Services Group (FIIS)/Fidelity Investments Institutional Operations Corporation, Inc. (FIIOC) Client Services (1998-2004). |
Kimberley H. Monasterio (42) |
| Year of Election or Appointment: 2007 President and Treasurer of Independence. Ms. Monasterio also serves as President and Treasurer of other Fidelity funds (2007-present) and is an employee of FMR (2004-present). Previously, Ms. Monasterio served as Deputy Treasurer of the Fidelity funds (2004-2006). Before joining Fidelity Investments, Ms. Monasterio served as Treasurer (2000-2004) and Chief Financial Officer (2002-2004) of the Franklin Templeton Funds and Senior Vice President of Franklin Templeton Services, LLC (2000-2004). |
Kenneth B. Robins (37) |
| Year of Election or Appointment: 2005 Deputy Treasurer of Independence. Mr. Robins also serves as Deputy Treasurer of other Fidelity funds (2005-present) and is an employee of FMR (2004-present). Before joining Fidelity Investments, Mr. Robins worked at KPMG LLP, where he was a partner in KPMG's department of professional practice (2002-2004) and a Senior Manager (1999-2000). In addition, Mr. Robins served as Assistant Chief Accountant, United States Securities and Exchange Commission (2000-2002). |
Robert G. Byrnes (39) |
| Year of Election or Appointment: 2005 Assistant Treasurer of Independence. Mr. Byrnes also serves as Assistant Treasurer of other Fidelity funds (2005-present) and is an employee of FMR (2005-present). Previously, Mr. Byrnes served as Vice President of FPCMS (2003-2005). Before joining Fidelity Investments, Mr. Byrnes worked at Deutsche Asset Management where he served as Vice President of the Investment Operations Group (2000-2003). |
John H. Costello (60) |
| Year of Election or Appointment: 1986 Assistant Treasurer of Independence. Mr. Costello also serves as Assistant Treasurer of other Fidelity funds and is an employee of FMR. |
Peter L. Lydecker (52) |
| Year of Election or Appointment: 2004 Assistant Treasurer of Independence. Mr. Lydecker also serves as Assistant Treasurer of other Fidelity funds (2004) and is an employee of FMR. |
Mark Osterheld (51) |
| Year of Election or Appointment: 2002 Assistant Treasurer of Independence. Mr. Osterheld also serves as Assistant Treasurer of other Fidelity funds (2002) and is an employee of FMR. |
Gary W. Ryan (48) |
| Year of Election or Appointment: 2005 Assistant Treasurer of Independence. Mr. Ryan also serves as Assistant Treasurer of other Fidelity funds (2005-present) and is an employee of FMR (2005-present). Previously, Mr. Ryan served as Vice President of Fund Reporting in FPCMS (1999-2005). |
Salvatore Schiavone (41) |
| Year of Election or Appointment: 2005 Assistant Treasurer of Independence. Mr. Schiavone also serves as Assistant Treasurer of other Fidelity funds (2005-present) and is an employee of FMR (2005-present). Before joining Fidelity Investments, Mr. Schiavone worked at Deutsche Asset Management, where he most recently served as Assistant Treasurer (2003-2005) of the Scudder Funds and Vice President and Head of Fund Reporting (1996-2003). |
Annual Report
Distributions
The fund designates 100% and 93% of the dividends distributed on December 16, 2005 and December 29, 2005, respectively during the fiscal year as qualifying for the dividends-received deduction for corporate shareholders.
The fund designates 100% of the dividends distributed during the fiscal year as amounts which may be taken into account as a dividend for the purposes of the maximum rate under section 1(h)(11) of the Internal Revenue Code.
The fund will notify shareholders in January 2007 of amounts for use in preparing 2006 income tax returns.
Annual Report
Proxy Voting Results
A special meeting of the fund's shareholders was held on September 20, 2006. The results of votes taken among shareholders on the proposal before them are reported below. Each vote reported represents one dollar of net asset value held on the record date for the meeting.
PROPOSAL 1 |
To elect a Board of Trustees. A |
| # of
Votes | % of
Votes |
Dennis J. Dirks |
Affirmative | 10,327,434,641.22 | 95.770 |
Withheld | 456,199,004.95 | 4.230 |
TOTAL | 10,783,633,646.17 | 100.000 |
Albert R. Gamper, Jr. |
Affirmative | 10,322,116,523.07 | 95.720 |
Withheld | 461,517,123.10 | 4.280 |
TOTAL | 10,783,633,646.17 | 100.000 |
Robert M. Gates |
Affirmative | 10,288,766,799.53 | 95.411 |
Withheld | 494,866,846.64 | 4.589 |
TOTAL | 10,783,633,646.17 | 100.000 |
George H. Heilmeier |
Affirmative | 10,298,619,061.42 | 95.502 |
Withheld | 485,014,584.75 | 4.498 |
TOTAL | 10,783,633,646.17 | 100.000 |
Edward C. Johnson 3d |
Affirmative | 10,257,561,582.55 | 95.122 |
Withheld | 526,072,063.62 | 4.878 |
TOTAL | 10,783,633,646.17 | 100.000 |
Stephen P. Jonas |
Affirmative | 10,317,222,628.79 | 95.675 |
Withheld | 466,411,017.38 | 4.325 |
TOTAL | 10,783,633,646.17 | 100.000 |
James H. KeyesB |
Affirmative | 10,318,195,711.25 | 95.684 |
Withheld | 465,437,934.92 | 4.316 |
TOTAL | 10,783,633,646.17 | 100.000 |
| # of
Votes | % of
Votes |
Marie L. Knowles |
Affirmative | 10,317,835,129.19 | 95.681 |
Withheld | 465,798,516.98 | 4.319 |
TOTAL | 10,783,633,646.17 | 100.000 |
Ned C. Lautenbach |
Affirmative | 10,317,039,890.90 | 95.673 |
Withheld | 466,593,755.27 | 4.327 |
TOTAL | 10,783,633,646.17 | 100.000 |
William O. McCoy |
Affirmative | 10,278,036,936.38 | 95.311 |
Withheld | 505,596,709.79 | 4.689 |
TOTAL | 10,783,633,646.17 | 100.000 |
Robert L. Reynolds |
Affirmative | 10,320,662,459.03 | 95.707 |
Withheld | 462,971,187.14 | 4.293 |
TOTAL | 10,783,633,646.17 | 100.000 |
Cornelia M. Small |
Affirmative | 10,329,731,930.45 | 95.791 |
Withheld | 453,901,715.72 | 4.209 |
TOTAL | 10,783,633,646.17 | 100.000 |
William S. Stavropoulos |
Affirmative | 10,298,039,656.66 | 95.497 |
Withheld | 485,593,989.51 | 4.503 |
TOTAL | 10,783,633,646.17 | 100.000 |
Kenneth L. Wolfe |
Affirmative | 10,310,583,687.33 | 95.613 |
Withheld | 473,049,958.84 | 4.387 |
TOTAL | 10,783,633,646.17 | 100.000 |
A Denotes trust-wide proposal and voting results. B Effective on or about January 1, 2007. |
Annual Report
Board Approval of Investment Advisory Contracts and Management Fees
Fidelity Independence Fund
Each year, typically in July, the Board of Trustees, including the Independent Trustees (together, the Board), votes on the renewal of the management contract and sub-advisory agreements (together, the Advisory Contracts) for the fund. The Board, assisted by the advice of fund counsel and Independent Trustees' counsel, requests and considers a broad range of information throughout the year.
The Board meets regularly each month except August and takes into account throughout the year matters bearing on Advisory Contracts. The Board, acting directly and through its separate committees, considers at each of its meetings factors that are relevant to the annual renewal of the fund's Advisory Contracts, including the services and support provided to the fund and its shareholders. At the time of the renewal, the Board had 12 standing committees, each composed of Independent Trustees with varying backgrounds, to which the Board has assigned specific subject matter responsibilities in order to enhance effective decision-making by the Board. Each committee has adopted a written charter outlining the structure and purposes of the committee. One such committee, the Equity Contract Committee, meets periodically as needed throughout the year to consider matters specifically related to the annual renewal of Advisory Contracts. The committee requests and receives information on, and makes recommendations to the Independent Trustees concerning, the approval and annual review of the Advisory Contracts.
At its July 2006 meeting, the Board of Trustees, including the Independent Trustees, unanimously determined to renew the Advisory Contracts for the fund. In reaching its determination, the Board considered all factors it believed relevant, including (i) the nature, extent, and quality of the services to be provided to the fund and its shareholders (including the investment performance of the fund); (ii) the competitiveness of the management fee and total expenses of the fund; (iii) the total costs of the services to be provided by and the profits to be realized by the investment adviser and its affiliates from the relationship with the fund; (iv) the extent to which economies of scale would be realized as the fund grows; and (v) whether fee levels reflect these economies of scale, if any, for the benefit of fund shareholders.
In determining whether to renew the Advisory Contracts for the fund, the Board ultimately reached a determination, with the assistance of fund counsel and Independent Trustees' counsel, that the renewal of the Advisory Contracts and the compensation to be received by Fidelity under the management contract is consistent with Fidelity's fiduciary duty under applicable law. In addition to evaluating the specific factors noted above, the Board, in reaching its determination, is aware that shareholders in the fund have a broad range of investment choices available to them, including a wide choice among mutual funds offered by competitors to Fidelity, and that the fund's shareholders, with the opportunity to review and weigh the disclosure provided by the fund in its prospectus and other public disclosures, have chosen to invest in this fund, managed by Fidelity.
Annual Report
Board Approval of Investment Advisory Contracts and
Management Fees - continued
Nature, Extent, and Quality of Services Provided. The Board considered staffing within the investment adviser, FMR, and the sub-advisers (together, the Investment Advisers), including the background of the fund's portfolio manager and the fund's investment objective and discipline. The Independent Trustees also had discussions with senior management of Fidelity's investment operations and investment groups. The Board considered the structure of the portfolio manager compensation program and whether this structure provides appropriate incentives.
Resources Dedicated to Investment Management and Support Services. The Board reviewed the size, education, and experience of the Investment Advisers' investment staff, their use of technology, and the Investment Advisers' approach to recruiting, training, and retaining portfolio managers and other research, advisory, and management personnel. The Board considered Fidelity's extensive global research capabilities that enable the Investment Advisers to aggregate data from various sources in an effort to produce positive investment results. The Board noted that Fidelity's analysts have access to a variety of technological tools that enable them to perform both fundamental and quantitative analysis and to specialize in various disciplines. The Board also considered that Fidelity's portfolio managers and analysts have access to daily portfolio attribution that allows for monitoring of a fund's portfolio, as well as an electronic communication system that provides immediate real-time access to research concerning issuers and credit enhancers.
Shareholder and Administrative Services. The Board considered (i) the nature, extent, quality, and cost of administrative, distribution, and shareholder services performed by the Investment Advisers and their affiliates under the Advisory Contracts and under separate agreements covering transfer agency, pricing and bookkeeping, and securities lending services for the fund; (ii) the nature and extent of the Investment Advisers' supervision of third party service providers, principally custodians and subcustodians; and (iii) the resources devoted to, and the record of compliance with, the fund's compliance policies and procedures. The Board reviewed the allocation of fund brokerage, including allocations to brokers affiliated with the Investment Advisers, the use of brokerage commissions to pay fund expenses, and the use of "soft" commission dollars to pay for research services. The Board also considered that Fidelity voluntarily pays for market data out of its own resources.
The Board noted that the growth of fund assets across the complex allows Fidelity to reinvest in the development of services designed to enhance the value or convenience of the Fidelity funds as investment vehicles. These services include 24-hour access to account information and market information through phone representatives and over the Internet, and investor education materials and asset allocation tools.
Annual Report
Investment in a Large Fund Family. The Board considered the benefits to shareholders of investing in a Fidelity fund, including the benefits of investing in a fund that is part of a large family of funds offering a variety of investment disciplines and providing for a large variety of mutual fund investor services. For example, fund shareholders are offered the privilege of exchanging shares of the fund for shares of other Fidelity funds, as set forth in the fund's prospectus, without paying a sales charge. The Board noted that, since the last Advisory Contract renewals in July 2005, Fidelity has taken a number of actions that benefited particular funds, including (i) dedicating additional resources to investment research and to restructure the investment research teams; (ii) voluntarily entering into contractual arrangements with certain brokers pursuant to which Fidelity pays for research products and services separately out of its own resources, rather than bundling with fund commissions; (iii) launching the Fidelity Advantage Class of its five Spartan stock index funds and three Spartan bond index funds, which is a lower-fee class available to shareholders with higher account balances; (iv) contractually agreeing to impose expense limitations on Fidelity U.S. Bond Index Fund and reducing the fund's initial investment minimum; and (v) offering shareholders of each of the Fidelity Institutional Money Market Funds the privilege of exchanging shares of the fund for shares of other Fidelity funds.
Investment Performance and Compliance. The Board considered whether the fund has operated within its investment objective, as well as its record of compliance with its investment restrictions. It also reviewed the fund's absolute investment performance, as well as the fund's relative investment performance measured against (i) a broad-based securities market index, and (ii) a peer group of mutual funds deemed appropriate by the Board over multiple periods. The following charts considered by the Board show, over the one-, three-, and five-year periods ended December 31, 2005, the fund's cumulative total returns, the cumulative total returns of a broad-based securities market index ("benchmark"), and a range of cumulative total returns of a peer group of mutual funds identified by Lipper Inc. as having an investment objective similar to that of the fund. The box within each chart shows the 25th percentile return (bottom of box) and the 75th percentile return (top of box) of the Lipper peer group. Returns shown above the box are in the first quartile and returns shown below the box are in the fourth quartile. The percentage beaten number noted below each chart corresponds to the percentile box and represents the percentage of funds in the Lipper peer group whose performance was equal to or lower than that of the fund.
Annual Report
Board Approval of Investment Advisory Contracts and
Management Fees - continued
Fidelity Independence Fund
The Board reviewed the fund's relative investment performance against its Lipper peer group and stated that the performance of the fund was in the first quartile for the one-year period and the third quartile for the three- and five-year periods. The Board also stated that the relative investment performance of the fund compared favorably to its benchmark for the one- and three-year periods, although the fund's five-year cumulative total return was lower than its benchmark. The Board also reviewed the fund's relative investment performance against a customized peer group based on a combination of categories defined by Morningstar.
The Board also considered that the fund's management fee is subject to upward or downward adjustment depending upon whether, and to what extent, the fund's investment performance for the performance period exceeds, or is exceeded by, the record (over the same period) of a Board-approved performance adjustment index. The Board realizes that the performance adjustment provides FMR with a strong economic incentive to seek to achieve superior performance for the fund's shareholders and helps to more closely align the interests of FMR and the fund's shareholders.
The Board considered that FMR has taken steps to refocus and strengthen equity research, equity portfolio management, and compliance. The Board noted with favor FMR's reorganization of its senior management team in 2005 and FMR's dedication of additional resources to investment research, and participated in the process that led to those changes.
Based on its review, and giving particular weight to the nature and quality of the resources dedicated by the Investment Advisers to maintain and improve relative performance, the Board concluded that the nature, extent, and quality of the services provided to the fund will benefit the fund's shareholders, particularly in light of the Board's view that the fund's shareholders benefit from investing in a fund that is part of a large family of funds offering a variety of investment disciplines and services.
Annual Report
Competitiveness of Management Fee and Total Fund Expenses. The Board considered the fund's management fee and total expenses compared to "mapped groups" of competitive funds and classes. Fidelity creates "mapped groups" by combining similar Lipper investment objective categories that have comparable management fee characteristics. Combining Lipper investment objective categories aids the Board's management fee and total expense comparisons by broadening the competitive group used for comparison and by reducing the number of universes to which various Fidelity funds are compared.
The Board considered two proprietary management fee comparisons for the 12-month periods shown in the chart below. The group of Lipper funds used by the Board for management fee comparisons is referred to below as the "Total Mapped Group" and, for the reasons explained above, is broader than the Lipper peer group used by the Board for performance comparisons. The Total Mapped Group comparison focuses on a fund's standing relative to the total universe of comparable funds available to investors, in terms of gross management fees before expense reimbursements or caps, and without giving effect to the fund's performance adjustment. "TMG %" represents the percentage of funds in the Total Mapped Group that had management fees that were lower than the fund's. For example, a TMG % of 9% means that 91% of the funds in the Total Mapped Group had higher management fees than the fund. The "Asset-Size Peer Group" (ASPG) comparison focuses on a fund's standing relative to non-Fidelity funds similar in size to the fund within the Total Mapped Group. The ASPG represents at least 15% of the funds in the Total Mapped Group with comparable asset size and management fee characteristics, subject to a minimum of 50 funds (or all funds in the Total Mapped Group if fewer than 50). Additional information, such as the ASPG quartile in which the fund's management fee ranked and the impact of the fund's performance adjustment, is also included in the chart and considered by the Board.
Annual Report
Board Approval of Investment Advisory Contracts and
Management Fees - continued
Fidelity Independence Fund
The Board noted that the fund's management fee ranked below the median of its Total Mapped Group and below the median of its ASPG for 2005. The Board also noted the effect of the fund's negative performance adjustment on the fund's management fee ranking. The Board noted that the performance adjustment for each year represents calculations for rolling 36-month periods that differ from the periods shown in the performance charts above.
Based on its review, the Board concluded that the fund's management fee was fair and reasonable in light of the services that the fund receives and the other factors considered.
In its review of the fund's total expenses, the Board considered the fund's management fee as well as other fund expenses, such as transfer agent fees, pricing and bookkeeping fees, and custodial, legal, and audit fees. The Board also noted the effects of any waivers and reimbursements on fees and expenses, as well as the fund's negative performance adjustment. As part of its review, the Board also considered current and historical total expenses of the fund compared to competitive fund median expenses. The fund is compared to those funds and classes in the Total Mapped Group (used by the Board for management fee comparisons) that have a similar sales load structure.
The Board noted that the fund's total expenses ranked below its competitive median for 2005.
In its review of total expenses, the Board also considered Fidelity fee structures and other information on clients that FMR and its affiliates service in other competitive markets, such as other mutual funds advised or subadvised by FMR or its affiliates, pension plan clients, and other institutional clients.
Annual Report
Based on its review, the Board concluded that the fund's total expenses were reasonable in light of the services that the fund and its shareholders receive and the other factors considered.
Costs of the Services and Profitability. The Board considered the revenues earned and the expenses incurred by Fidelity in conducting the business of developing, marketing, distributing, managing, administering and servicing the fund and its shareholders. The Board also considered the level of Fidelity's profits in respect of all the Fidelity funds.
On an annual basis, FMR presents to the Board Fidelity's profitability for the fund. Fidelity calculates the profitability for each fund, as well as aggregate profitability for groups of Fidelity funds and all Fidelity funds, using a series of detailed revenue and cost allocation methodologies which originate with the audited books and records of Fidelity. The Audit Committee of the Board reviews any significant changes from the prior year's methodologies.
PricewaterhouseCoopers LLP (PwC), independent registered accounting firm and auditor to Fidelity and certain Fidelity funds, has been engaged annually by the Board as part of the Board's assessment of the results of Fidelity's profitability analysis. PwC's engagement includes the review and assessment of Fidelity's methodologies used in determining the revenues and expenses attributable to Fidelity's mutual fund business, and completion of agreed-upon procedures surrounding the mathematical accuracy of fund profitability and its conformity to allocation methodologies. After considering PwC's reports issued under the engagement and information provided by Fidelity, the Board believes that while other allocation methods may also be reasonable, Fidelity's profitability methodologies are reasonable in all material respects.
The Board has also reviewed Fidelity's non-fund businesses and any fall-out benefits related to the mutual fund business as well as cases where Fidelity's affiliates may benefit from or be related to the fund's business.
The Board considered the costs of the services provided by and the profits realized by Fidelity in connection with the operation of the fund and determined that the amount of profit is a fair entrepreneurial profit for the management of the fund.
Economies of Scale. The Board considered whether there have been economies of scale in respect of the management of the Fidelity funds, whether the Fidelity funds (including the fund) have appropriately benefited from any such economies of scale, and whether there is potential for realization of any further economies of scale. The Board considered the extent to which the fund will benefit from economies of scale through increased services to the fund, through waivers or reimbursements, or through fee or expense reductions, including reductions that occur through operation of the transfer agent agreement. The transfer agent fee varies in part based on the number of accounts in the fund. If the number of accounts decreases or the average account size increases, the overall transfer agent fee rate decreases.
Annual Report
Board Approval of Investment Advisory Contracts and
Management Fees - continued
The Board recognized that the fund's management contract incorporates a "group fee" structure, which provides for lower fee rates as total fund assets under FMR's management increase, and for higher fee rates as total fund assets under FMR's management decrease. The Board considered that the group fee is designed to deliver the benefits of economies of scale to fund shareholders when total fund assets increase, even if assets of any particular fund are unchanged or have declined, because some portion of Fidelity's costs are attributable to services provided to all Fidelity funds, and all funds benefit if those costs can be allocated among more assets. The Board concluded that, given the group fee structure, fund shareholders will achieve a certain level of economies of scale as assets under FMR's management increase at the fund complex level, regardless of whether Fidelity achieves any such economies of scale.
The Board further concluded that any potential economies of scale are being shared between fund shareholders and Fidelity in an appropriate manner.
Additional Information Requested by the Board. In order to develop fully the factual basis for consideration of the Advisory Contracts, the Board requested additional information on several topics, including (i) Fidelity's fund profitability methodology and profitability trends within certain funds; (ii) portfolio manager compensation; (iii) the extent to which any economies of scale exist and are shared between the funds and Fidelity; (iv) the total expenses of certain funds and classes relative to competitors, including the extent to which the expenses of certain funds have been or could be capped; (v) fund performance trends; and (vi) Fidelity's fee structures, including use of performance fees.
Based on its evaluation of all of the conclusions noted above, and after considering all material factors, the Board ultimately concluded that the advisory fee structures are fair and reasonable, and that the fund's Advisory Contracts should be renewed.
Annual Report
Managing Your Investments
Fidelity offers several ways to conveniently manage your personal investments via your telephone or PC. You can access your account information, conduct trades and research your investments 24 hours a day.
By Phone
Fidelity Automated Service Telephone provides a single toll-free number to access account balances, positions, quotes and trading. It's easy to navigate the service, and on your first call, the system will help you create a personal identification number (PIN) for security.
(phone_graphic)
Fidelity Automated
Service Telephone (FAST®)
1-800-544-5555
Press
1 For mutual fund and brokerage trading.
2 For quotes.*
3 For account balances and holdings.
4 To review orders and mutual
fund activity.
5 To change your PIN.
*0 To speak to a Fidelity representative.
By PC
Fidelity's web site on the Internet provides a wide range of information, including daily financial news, fund performance, interactive planning tools and news about Fidelity products and services.
(computer_graphic)
Fidelity's Web Site
www.fidelity.com
* When you call the quotes line, please remember that a fund's yield and return will vary and, except for money market funds, share price will also vary. This means that you may have a gain or loss when you sell your shares. There is no assurance that money market funds will be able to maintain a stable $1 share price; an investment in a money market fund is not insured or guaranteed by the U.S. government. Total returns are historical and include changes in share price, reinvestment of dividends and capital gains, and the effects of any sales charges.
Annual Report
To Write Fidelity
We'll give your correspondence immediate attention and send you written confirmation upon completion of your request.
(letter_graphic)Making Changes
To Your Account
(such as changing name, address, bank, etc.)
Fidelity Investments
P.O. Box 770001
Cincinnati, OH 45277-0002
(letter_graphic)
For Non-Retirement
Accounts
Buying shares
Fidelity Investments
P.O. Box 770001
Cincinnati, OH 45277-0003
Overnight Express
Fidelity Investments
Attn: Distribution Services
100 Crosby Parkway - KC1H
Covington, KY 41015
Selling shares
Fidelity Investments
P.O. Box 770001
Cincinnati, OH 45277-0035
Overnight Express
Fidelity Investments
Attn: Distribution Services
100 Crosby Parkway - KC1H
Covington, KY 41015
General Correspondence
Fidelity Investments
P.O. Box 500
Merrimack, NH 03054-0500
(letter_graphic)
For Retirement
Accounts
Buying shares
Fidelity Investments
P.O. Box 770001
Cincinnati, OH 45277-0003
Selling shares
Fidelity Investments
P.O. Box 770001
Cincinnati, OH 45277-0035
Overnight Express
Fidelity Investments
Attn: Distribution Services
100 Crosby Parkway - KC1H
Covington, KY 41015
General Correspondence
Fidelity Investments
P.O. Box 500
Merrimack, NH 03054-0500
Annual Report
To Visit Fidelity
For directions and hours,
please call 1-800-544-9797.
Arizona
7001 West Ray Road
Chandler, AZ
15445 N. Scottsdale Road
Scottsdale, AZ
California
815 East Birch Street
Brea, CA
1411 Chapin Avenue
Burlingame, CA
851 East Hamilton Avenue
Campbell, CA
19200 Von Karman Avenue
Irvine, CA
601 Larkspur Landing Circle
Larkspur, CA
10100 Santa Monica Blvd.
Los Angeles, CA
27101 Puerta Real
Mission Viejo, CA
73-575 El Paseo
Palm Desert, CA
251 University Avenue
Palo Alto, CA
123 South Lake Avenue
Pasadena, CA
16995 Bernardo Ctr. Drive
Rancho Bernardo, CA
1220 Roseville Parkway
Roseville, CA
1740 Arden Way
Sacramento, CA
7676 Hazard Center Drive
San Diego, CA
11943 El Camino Real
San Diego, CA
8 Montgomery Street
San Francisco, CA
3793 State Street
Santa Barbara, CA
1200 Wilshire Boulevard
Santa Monica, CA
21701 Hawthorne Boulevard
Torrance, CA
2001 North Main Street
Walnut Creek, CA
6300 Canoga Avenue
Woodland Hills, CA
Colorado
1625 Broadway
Denver, CO
9185 Westview Road
Lone Tree, CO
Connecticut
48 West Putnam Avenue
Greenwich, CT
265 Church Street
New Haven, CT
300 Atlantic Street
Stamford, CT
29 South Main Street
West Hartford, CT
Delaware
400 Delaware Avenue
Wilmington, DE
Florida
4400 N. Federal Highway
Boca Raton, FL
121 Alhambra Plaza
Coral Gables, FL
2948 N. Federal Highway
Ft. Lauderdale, FL
4671 Town Center Parkway
Jacksonville, FL
1907 West State Road 434
Longwood, FL
8880 Tamiami Trail, North
Naples, FL
3501 PGA Boulevard
Palm Beach Gardens, FL
3550 Tamiami Trail, South
Sarasota, FL
1502 N. Westshore Blvd.
Tampa, FL
2465 State Road 7
Wellington, FL
Georgia
3445 Peachtree Road, N.E.
Atlanta, GA
1000 Abernathy Road
Atlanta, GA
Illinois
One North LaSalle Street
Chicago, IL
875 North Michigan Ave.
Chicago, IL
1415 West 22nd Street
Oak Brook, IL
1572 East Golf Road
Schaumburg, IL
3232 Lake Avenue
Wilmette, IL
Indiana
4729 East 82nd Street
Indianapolis, IN
Kansas
5400 College Boulevard
Overland Park, KS
Maine
Three Canal Plaza
Portland, ME
Maryland
7315 Wisconsin Avenue
Bethesda, MD
One W. Pennsylvania Ave.
Towson, MD
Massachusetts
801 Boylston Street
Boston, MA
155 Congress Street
Boston, MA
300 Granite Street
Braintree, MA
44 Mall Road
Burlington, MA
238 Main Street
Cambridge, MA
405 Cochituate Road
Framingham, MA
416 Belmont Street
Worcester, MA
Fidelity Brokerage Services, Inc., 100 Summer St., Boston, MA 02110 Member NYSE/SIPC
Annual Report
Michigan
500 E. Eisenhower Pkwy.
Ann Arbor, MI
280 Old N. Woodward Ave.
Birmingham, MI
43420 Grand River Avenue
Novi, MI
29155 Northwestern Hwy.
Southfield, MI
Minnesota
7600 France Avenue South
Edina, MN
Missouri
1524 South Lindbergh Blvd.
St. Louis, MO
Nevada
2225 Village Walk Drive
Henderson, NV
New Jersey
150 Essex Street
Millburn, NJ
56 South Street
Morristown, NJ
396 Route 17, North
Paramus, NJ
3518 Route 1 North
Princeton, NJ
530 Broad Street
Shrewsbury, NJ
New York
1055 Franklin Avenue
Garden City, NY
37 West Jericho Turnpike
Huntington Station, NY
1271 Avenue of the Americas
New York, NY
980 Madison Avenue
New York, NY
61 Broadway
New York, NY
350 Park Avenue
New York, NY
200 Fifth Avenue
New York, NY
733 Third Avenue
New York, NY
11 Penn Plaza
New York, NY
2070 Broadway
New York, NY
1075 Northern Blvd.
Roslyn, NY
799 Central Park Avenue
Scarsdale, NY
North Carolina
4611 Sharon Road
Charlotte, NC
7011 Fayetteville Road
Durham, NC
Ohio
3805 Edwards Road
Cincinnati, OH
1324 Polaris Parkway
Columbus, OH
28699 Chagrin Boulevard
Woodmere Village, OH
Oregon
7493 SW Bridgeport Road
Tigard, OR
Pennsylvania
600 West DeKalb Pike
King of Prussia, PA
1735 Market Street
Philadelphia, PA
12001 Perry Highway
Wexford, PA
Rhode Island
47 Providence Place
Providence, RI
Tennessee
6150 Poplar Avenue
Memphis, TN
Texas
10000 Research Boulevard
Austin, TX
4001 Northwest Parkway
Dallas, TX
12532 Memorial Drive
Houston, TX
2701 Drexel Drive
Houston, TX
6560 Fannin Street
Houston, TX
6500 N. MacArthur Blvd.
Irving, TX
6005 West Park Boulevard
Plano, TX
14100 San Pedro
San Antonio, TX
1576 East Southlake Blvd.
Southlake, TX
19740 IH 45 North
Spring, TX
Utah
279 West South Temple
Salt Lake City, UT
Virginia
1861 International Drive
McLean, VA
Washington
411 108th Avenue, N.E.
Bellevue, WA
1518 6th Avenue
Seattle, WA
Washington, DC
1900 K Street, N.W.
Washington, DC
Wisconsin
595 North Barker Road
Brookfield, WI
Annual Report
Investment Adviser
Fidelity Management & Research Company
Boston, MA
Investment Sub-Advisers
FMR Co., Inc.
Fidelity Management & Research
(U.K.) Inc.
Fidelity Research & Analysis Company
(formerly Fidelity Management &
Research (Far East) Inc.)
Fidelity International Investment
Advisors
Fidelity Investments Japan Limited
Fidelity International Investment
Advisors (U.K.) Limited
General Distributor
Fidelity Distributors Corporation
Boston, MA
Transfer and Service Agent
Fidelity Service Company, Inc.
Boston, MA
Custodian
Brown Brothers Harriman & Co.
Boston, MA
The Fidelity Telephone Connection
Mutual Fund 24-Hour Service
Exchanges/Redemptions
and Account Assistance 1-800-544-6666
Product Information 1-800-544-6666
Retirement Accounts 1-800-544-4774
(8 a.m. - 9 p.m.)
TDD Service 1-800-544-0118
for the deaf and hearing impaired
(9 a.m. - 9 p.m. Eastern time)
Fidelity Automated Service
Telephone (FAST®) (automated graphic) 1-800-544-5555
(automated graphic) Automated line for quickest service
FRE-UANN-0107
1.786709.103
(Fidelity Investment logo)(registered trademark)
Corporate Headquarters
82 Devonshire St., Boston, MA 02109
www.fidelity.com
Fidelity®
Strategic Dividend & Income®
Fund
Annual Report
November 30, 2006
(2_fidelity_logos) (Registered_Trademark)
Contents
Chairman's Message | <Click Here> | Ned Johnson's message to shareholders. |
Performance | <Click Here> | How the fund has done over time. |
Management's Discussion | <Click Here> | The managers' review of fund performance, strategy and outlook. |
Shareholder Expense Example | <Click Here> | An example of shareholder expenses. |
Investment Changes | <Click Here> | A summary of major shifts in the fund's investments over the past six months. |
Investments | <Click Here> | A complete list of the fund's investments with their market values. |
Financial Statements | <Click Here> | Statements of assets and liabilities, operations, and changes in net assets,
as well as financial highlights. |
Notes | <Click Here> | Notes to the financial statements. |
Report of Independent Registered Public Accounting Firm | <Click Here> | |
Trustees and Officers | <Click Here> | |
Distributions | <Click Here> | |
Proxy Voting Results | <Click Here> | |
Board Approval of Investment Advisory Contracts and Management Fees | <Click Here> | |
To view a fund's proxy voting guidelines and proxy voting record for the 12-month period ended June 30, visit www.fidelity.com/proxyvotingresults or visit the Securities and Exchange Commission's (SEC) web site at www.sec.gov. You may also call 1-800-544-8544 to request a free copy of the proxy voting guidelines.
Standard & Poor's, S&P and S&P 500 are registered service marks of The McGraw-Hill Companies, Inc. and have been licensed for use by Fidelity Distributors Corporation.
Other third party marks appearing herein are the property of their respective owners.
All other marks appearing herein are registered or unregistered trademarks or service marks of FMR Corp. or an affiliated company.
Annual Report
This report and the financial statements contained herein are submitted for the general information of the shareholders of the fund. This report is not authorized for distribution to prospective investors in the fund unless preceded or accompanied by an effective prospectus.
A fund files its complete schedule of portfolio holdings with the SEC for the first and third quarters of each fiscal year on Form N-Q. Forms N-Q are available on the SEC's web site at http://www.sec.gov. A fund's Forms N-Q may be reviewed and copied at the SEC's Public Reference Room in Washington, DC. Information regarding the operation of the SEC's Public Reference Room may be obtained by calling 1-800-SEC-0330. For a complete list of a fund's portfolio holdings, view the most recent quarterly holdings report, semiannual report, or annual report on Fidelity's web site at http://www.fidelity.com/holdings.
NOT FDIC INSURED · MAY LOSE VALUE · NO BANK GUARANTEE
Neither the fund nor Fidelity Distributors Corporation is a bank.
Annual Report
Chairman's Message
(photo_of_Edward_C_Johnson_3d)
Dear Shareholder:
Stock and bond markets around the world have seen largely positive results year to date, although weakness in the technology sector and growth stocks in general have tempered performance. While financial markets are always unpredictable, there are a number of time-tested principles that can put the historical odds in your favor.
One of the basic tenets is to invest for the long term. Over time, riding out the markets' inevitable ups and downs has proven much more effective than selling into panic or chasing the hottest trend. Even missing only a few of the markets' best days can significantly diminish investor returns. Patience also affords the benefits of compounding - of earning interest on additional income or reinvested dividends and capital gains. There are tax advantages and cost benefits to consider as well. The more you sell, the more taxes you pay, and the more you trade, the higher the costs. While staying the course doesn't eliminate risk, it can considerably lessen the effect of short-term declines.
You can further manage your investing risk through diversification. And today, more than ever, geographic diversification should be taken into account. Studies indicate that asset allocation is the single most important determinant of a portfolio's long-term success. The right mix of stocks, bonds and cash - aligned to your particular risk tolerance and investment objective - is very important. Age-appropriate rebalancing is also an essential aspect of asset allocation. For younger investors, an emphasis on equities - which historically have been the best performing asset class over time - is encouraged. As investors near their specific goal, such as retirement or sending a child to college, consideration may be given to replacing volatile assets (e.g. common stocks) with more-stable fixed investments (bonds or savings plans).
A third investment principle - investing regularly - can help lower the average cost of your purchases. Investing a certain amount of money each month or quarter helps ensure you won't pay for all your shares at market highs. This strategy - known as dollar cost averaging - also reduces unconstructive "emotion" from investing, helping shareholders avoid selling weak performers just prior to an upswing, or chasing a hot performer just before a correction.
We invite you to contact us via the Internet, through our Investor Centers or over the phone. It is our privilege to provide you the information you need to make the investments that are right for you.
Sincerely,
/s/Edward C. Johnson 3d
Edward C. Johnson 3d
Annual Report
Performance: The Bottom Line
Average annual total return reflects the change in the value of an investment, assuming reinvestment of Strategic Dividend & Income's dividend income and capital gains (the profits earned upon the sale of securities that have grown in value) and assuming a constant rate of performance each year. The $10,000 table and the fund's returns do not reflect the deduction of taxes that a shareholder would pay on fund distributions or the redemption of fund shares. During periods of reimbursement by Fidelity, a fund's total return will be greater than it would be had the reimbursement not occurred. How a fund did yesterday is no guarantee of how it will do tomorrow.
Average Annual Total Returns
Periods ended November 30, 2006 | Past 1
year | Life of
fund A |
Strategic Dividend & Income | 15.33% | 13.52% |
A From December 23, 2003.
$10,000 Over Life of Fund
Let's say hypothetically that $10,000 was invested in Strategic Dividend & Income on December 23, 2003, when the fund started. The chart shows how the value of your investment would have changed, and also shows how the Standard & Poor's 500SM Index (S&P 500®) performed over the same period.

Annual Report
Management's Discussion of Fund Performance
Comments from Christopher Sharpe and Derek Young, Lead Co-Portfolio Managers of Fidelity® Strategic Dividend & Income® Fund
There were a number of reasons why the overall U.S. stock market could have had subpar results during the 12-month period that ended on November 30, 2006, including rising interest rates, inflation concerns, historically high energy prices, unrest in the Middle East, North Korea's nuclear test and a worse-than-expected housing slump. Despite these negative conditions, though, U.S. stocks fared well. In fact, several bellwether market benchmarks reached record highs, including the larger-cap Dow Jones Industrial AverageSM - a gauge of 30 mega-cap, blue-chip stocks - and the small-cap-oriented Russell 2000® Index. The strength in equities was sparked in large part by two major factors: the double-digit earnings growth achieved by U.S. corporations, and steady economic growth that was neither overheated nor recessionary, thanks primarily to the Federal Reserve Board's monetary policy. For the 12 months overall, the Dow rose 15.76%, the Russell 2000 checked in with a 17.43% advance, the Standard & Poor's 500SM Index gained 14.23% and the NASDAQ Composite® Index returned 9.78%.
During the fiscal year, Strategic Dividend & Income gained 15.33%, compared with 19.64% for the Fidelity Strategic Dividend & Income Composite Index. All four of the fund's subportfolios achieved strong absolute returns. Our asset allocation strategy of overweighting common stocks, underweighting real estate investment trusts (REITs) and preferred stocks, and neutrally weighting convertible securities was basically sound. The fund lagged its benchmark mostly due to unfavorable selection in common stocks, especially in energy and health care, and the subportfolio underperformed relative to its benchmark. Underweighting the robust REIT group also hurt a bit, despite relative outperformance driven by good security selection in the industrial, lodging/resorts and office segments. The preferred stock subportfolio outperformed, driven by strong selection in food/beverage/tobacco and energy, as well as by favoring high-yield issues and the more equity-like convertible preferreds. Underweighting preferred stocks overall also helped. Meanwhile, unfavorable picks in information technology and energy caused the convertible bond subportfolio to underperform slightly.
Note to shareholders: On October 1, 2006, the fund's common stock subportfolio changed its benchmark from the Russell 1000® Value Index to the Russell 3000® Value Index, which conforms more closely to the fund's investment strategy.
The views expressed above reflect those of the portfolio manager(s) only through the end of the period as stated on the cover of this report and do not necessarily represent the views of Fidelity or any other person in the Fidelity organization. Any such views are subject to change at any time based upon market or other conditions and Fidelity disclaims any responsibility to update such views. These views may not be relied on as investment advice and, because investment decisions for a Fidelity fund are based on numerous factors, may not be relied on as an indication of trading intent on behalf of any Fidelity fund.
Annual Report
Shareholder Expense Example
As a shareholder of the Fund, you incur two types of costs: (1) transaction costs, including sales charges (loads) on purchase payments or redemption proceeds, and (2) ongoing costs, including management fees, distribution and/or service (12b-1) fees and other Fund expenses. This Example is intended to help you understand your ongoing costs (in dollars) of investing in the Fund and to compare these costs with the ongoing costs of investing in other mutual funds.
The Example is based on an investment of $1,000 invested at the beginning of the period and held for the entire period (June 1, 2006 to November 30, 2006).
Actual Expenses
The first line of the accompanying table for each class of the Fund provides information about actual account values and actual expenses. You may use the information in this line, together with the amount you invested, to estimate the expenses that you paid over the period. Simply divide your account value by $1,000.00 (for example, an $8,600 account value divided by $1,000.00 = 8.6), then multiply the result by the number in the first line for a class of the Fund under the heading entitled "Expenses Paid During Period" to estimate the expenses you paid on your account during this period.
Hypothetical Example for Comparison Purposes
The second line of the accompanying table for each class of the Fund provides information about hypothetical account values and hypothetical expenses based on a Class' actual expense ratio and an assumed rate of return of 5% per year before expenses, which is not the Class' actual return. The hypothetical account values and expenses may not be used to estimate the actual ending account balance or expenses you paid for the period. You may use this information to compare the ongoing costs of investing in the Fund and other funds. To do so, compare this 5% hypothetical example with the 5% hypothetical examples that appear in the shareholder reports of the other funds.
Annual Report
Investments - continued
Please note that the expenses shown in the table are meant to highlight your ongoing costs only and do not reflect any transaction costs. Therefore, the second line of the table is useful in comparing ongoing costs only, and will not help you determine the relative total costs of owning different funds. In addition, if these transactional costs were included, your costs would have been higher.
| Beginning
Account Value
June 1, 2006 | Ending
Account Value
November 30, 2006 | Expenses Paid
During Period*
June 1, 2006 to
November 30, 2006 |
Class A | | | |
Actual | $ 1,000.00 | $ 1,096.00 | $ 5.99 |
HypotheticalA | $ 1,000.00 | $ 1,019.35 | $ 5.77 |
Class T | | | |
Actual | $ 1,000.00 | $ 1,095.00 | $ 7.09 |
HypotheticalA | $ 1,000.00 | $ 1,018.30 | $ 6.83 |
Class B | | | |
Actual | $ 1,000.00 | $ 1,091.10 | $ 10.33 |
HypotheticalA | $ 1,000.00 | $ 1,015.19 | $ 9.95 |
Class C | | | |
Actual | $ 1,000.00 | $ 1,091.50 | $ 9.91 |
HypotheticalA | $ 1,000.00 | $ 1,015.59 | $ 9.55 |
Strategic Dividend and Income | | | |
Actual | $ 1,000.00 | $ 1,098.40 | $ 4.16 |
HypotheticalA | $ 1,000.00 | $ 1,021.11 | $ 4.00 |
Institutional Class | | | |
Actual | $ 1,000.00 | $ 1,096.70 | $ 4.31 |
HypotheticalA | $ 1,000.00 | $ 1,020.96 | $ 4.15 |
A 5% return per year before expenses
* Expenses are equal to each Class' annualized expense ratio (shown in the table below); multiplied by the average account value over the period, multiplied by 183/365 (to reflect the one-half year period).
| Annualized
Expense Ratio |
Class A | 1.14% |
Class T | 1.35% |
Class B | 1.97% |
Class C | 1.89% |
Strategic Dividend and Income | .79% |
Institutional Class | .82% |
Annual Report
Investment Changes
Top Ten Investments as of November 30, 2006 |
(excluding cash equivalents) | % of fund's
net assets | % of fund's net assets
6 months ago |
Valero Energy Corp. | 1.7 | 0.3 |
Equity Residential (SBI) | 1.4 | 0.7 |
JPMorgan Chase & Co. | 1.4 | 1.3 |
National Oilwell Varco, Inc. | 1.2 | 0.7 |
General Growth Properties, Inc. | 1.2 | 0.7 |
Noble Corp. | 1.1 | 0.0 |
Smith International, Inc. | 1.0 | 0.2 |
AT&T, Inc. | 1.0 | 1.0 |
American International Group, Inc. | 1.0 | 2.1 |
El Paso Corp. 4.99% | 0.9 | 1.1 |
| 11.9 | |
Top Five Market Sectors as of November 30, 2006 |
| % of fund's
net assets | % of fund's net assets
6 months ago |
Financials | 34.2 | 30.8 |
Information Technology | 14.8 | 11.9 |
Energy | 13.4 | 11.6 |
Consumer Discretionary | 7.3 | 8.7 |
Industrials | 6.6 | 10.8 |
Asset Allocation (% of fund's net assets) |
As of November 30, 2006 * | As of May 31, 2006 ** |
| Common Stocks 66.8% | | | Common Stocks 68.2% | |
| Preferred Stocks 13.0% | | | Preferred Stocks 12.8% | |
 | Convertible Bonds 13.5% | | | Convertible Bonds 14.4% | |
 | Other Investments 0.9% | | | Other Investments 0.3% | |
| Short-Term
Investments and
Net Other Assets 5.8% | | | Short-Term
Investments and
Net Other Assets 4.3% | |
* Foreign investments | 10.8% | | ** Foreign investments | 8.4% | |

Annual Report
Investments November 30, 2006
Showing Percentage of Net Assets
Corporate Bonds - 14.4% |
| Principal Amount | | Value
(Note 1) |
Convertible Bonds - 13.5% |
CONSUMER DISCRETIONARY - 1.0% |
Hotels, Restaurants & Leisure - 0.6% |
Carnival Corp. 1.132% 4/29/33 (c) | | $ 5,820,000 | | $ 4,237,426 |
Six Flags, Inc. 4.5% 5/15/15 | | 3,300,000 | | 3,522,750 |
| | 7,760,176 |
Media - 0.4% |
Charter Communications, Inc.: | | | | |
5.875% 11/16/09 (d) | | 70,000 | | 97,230 |
5.875% 11/16/09 | | 4,013,000 | | 5,574,057 |
| | 5,671,287 |
TOTAL CONSUMER DISCRETIONARY | | 13,431,463 |
CONSUMER STAPLES - 0.0% |
Food & Staples Retailing - 0.0% |
Nash-Finch Co. 1.6314% 3/15/35 (c) | | 1,520,000 | | 631,864 |
ENERGY - 2.4% |
Energy Equipment & Services - 1.2% |
Grey Wolf, Inc. 5.3216% 4/1/24 (e) | | 2,300,000 | | 2,992,875 |
Halliburton Co. 3.125% 7/15/23 | | 4,260,000 | | 7,859,700 |
Hornbeck Offshore Services, Inc. 1.625% 11/15/26 (c)(d) | | 1,000,000 | | 1,037,200 |
Maverick Tube Corp. 1.875% 11/15/25 | | 3,000,000 | | 4,804,920 |
| | 16,694,695 |
Oil, Gas & Consumable Fuels - 1.2% |
Chesapeake Energy Corp.: | | | | |
2.75% 11/15/35 (d) | | 5,000,000 | | 5,564,500 |
2.75% 11/15/35 | | 6,600,000 | | 7,345,140 |
McMoRan Exploration Co. 6% 7/2/08 | | 3,000,000 | | 3,813,900 |
| | 16,723,540 |
TOTAL ENERGY | | 33,418,235 |
FINANCIALS - 0.5% |
Consumer Finance - 0.4% |
American Express Co.: | | | | |
1.85% 12/1/33 (c)(d) | | 1,800,000 | | 1,798,920 |
1.85% 12/1/33 (c) | | 3,850,000 | | 3,847,690 |
| | 5,646,610 |
Corporate Bonds - continued |
| Principal Amount | | Value
(Note 1) |
Convertible Bonds - continued |
FINANCIALS - continued |
Real Estate Investment Trusts - 0.1% |
Ventas, Inc. 3.875% 11/15/11 (d) | | $ 1,000,000 | | $ 997,300 |
TOTAL FINANCIALS | | 6,643,910 |
HEALTH CARE - 1.0% |
Biotechnology - 0.4% |
Amgen, Inc. 0.375% 2/1/13 (d) | | 5,000,000 | | 5,017,500 |
Life Sciences Tools & Services - 0.6% |
Charles River Laboratories International, Inc. 2.25% 6/15/13 (d) | | 1,000,000 | | 1,059,600 |
Fisher Scientific International, Inc.: | | | | |
2.5% 10/1/23 (d) | | 995,000 | | 1,910,002 |
2.5% 10/1/23 | | 2,400,000 | | 4,607,040 |
Nektar Therapeutics 3.25% 9/28/12 | | 1,000,000 | | 1,030,460 |
| | 8,607,102 |
TOTAL HEALTH CARE | | 13,624,602 |
INDUSTRIALS - 2.1% |
Aerospace & Defense - 0.1% |
AAR Corp. 1.75% 2/1/26 (d) | | 1,000,000 | | 1,099,180 |
Airlines - 0.4% |
UAL Corp. 4.5% 6/30/21 (d) | | 2,000,000 | | 2,695,200 |
US Airways Group, Inc. 7% 9/30/20 (d) | | 960,000 | | 2,489,069 |
| | 5,184,269 |
Commercial Services & Supplies - 0.1% |
FTI Consulting, Inc. 3.75% 7/15/12 (d) | | 1,000,000 | | 1,129,949 |
Construction & Engineering - 0.2% |
Quanta Services, Inc. 3.75% 4/30/26 (d) | | 3,000,000 | | 3,270,006 |
Electrical Equipment - 0.2% |
GrafTech International Ltd. 1.625% 1/15/24 | | 2,720,000 | | 2,244,000 |
Industrial Conglomerates - 0.5% |
Tyco International Group SA yankee 3.125% 1/15/23 | | 5,310,000 | | 7,467,984 |
Machinery - 0.1% |
Greenbrier Companies, Inc. 2.375% 5/15/26 (d) | | 1,000,000 | | 1,041,311 |
Trinity Industries, Inc. 3.875% 6/1/36 | | 1,000,000 | | 1,050,842 |
| | 2,092,153 |
Corporate Bonds - continued |
| Principal Amount | | Value
(Note 1) |
Convertible Bonds - continued |
INDUSTRIALS - continued |
Marine - 0.5% |
OMI Corp. 2.875% 12/1/24 | | $ 6,300,000 | | $ 6,252,750 |
TOTAL INDUSTRIALS | | 28,740,291 |
INFORMATION TECHNOLOGY - 5.9% |
Communications Equipment - 1.2% |
Ciena Corp. 0.25% 5/1/13 | | 1,560,000 | | 1,355,172 |
Finisar Corp. 2.5% 10/15/10 | | 6,920,000 | | 8,978,700 |
JDS Uniphase Corp. 1% 5/15/26 (d) | | 5,000,000 | | 4,528,500 |
Symmetricom, Inc. 3.25% 6/15/25 | | 2,000,000 | | 2,012,600 |
| | 16,874,972 |
Computers & Peripherals - 0.3% |
Maxtor Corp. 2.375% 8/15/12 | | 1,200,000 | | 1,909,008 |
SanDisk Corp. 1% 5/15/13 | | 2,000,000 | | 1,777,800 |
| | 3,686,808 |
Electronic Equipment & Instruments - 1.7% |
Coherent, Inc. 2.75% 3/1/11 (d) | | 1,110,000 | | 1,200,021 |
Flextronics International Ltd. 1% 8/1/10 | | 13,420,000 | | 12,974,456 |
Itron, Inc. 2.5% 8/1/26 | | 3,000,000 | | 3,115,200 |
Merix Corp. 4% 5/15/13 (d) | | 1,000,000 | | 928,750 |
Solectron Corp. 0.5% 2/15/34 | | 1,000,000 | | 813,750 |
Vishay Intertechnology, Inc. 3.625% 8/1/23 | | 4,600,000 | | 4,582,888 |
| | 23,615,065 |
Internet Software & Services - 0.4% |
aQuantive, Inc. 2.25% 8/15/24 | | 2,800,000 | | 5,461,680 |
IT Services - 0.5% |
DST Systems, Inc.: | | | | |
Series A, 4.125% 8/15/23 (d) | | 1,240,000 | | 1,718,190 |
4.125% 8/15/23 | | 3,470,000 | | 4,808,160 |
| | 6,526,350 |
Semiconductors & Semiconductor Equipment - 1.7% |
Amkor Technology, Inc. 2.5% 5/15/11 | | 2,000,000 | | 1,977,200 |
Conexant Systems, Inc. 4% 3/1/26 | | 3,000,000 | | 2,737,500 |
Credence Systems Corp. 1.5% 5/15/08 | | 2,000,000 | | 1,825,000 |
EMCORE Corp. 5% 5/15/11 | | 1,000,000 | | 1,052,500 |
Intel Corp. 2.95% 12/15/35 | | 6,000,000 | | 5,543,460 |
Corporate Bonds - continued |
| Principal Amount | | Value
(Note 1) |
Convertible Bonds - continued |
INFORMATION TECHNOLOGY - continued |
Semiconductors & Semiconductor Equipment - continued |
ON Semiconductor Corp.: | | | | |
0% 4/15/24 | | $ 6,500,000 | | $ 5,882,500 |
1.875% 12/15/25 (d) | | 1,250,000 | | 1,417,188 |
Photronics, Inc. 2.25% 4/15/08 | | 3,000,000 | | 3,385,860 |
| | 23,821,208 |
Software - 0.1% |
Symantec Corp. 1% 6/15/13 (d) | | 1,000,000 | | 1,225,000 |
TOTAL INFORMATION TECHNOLOGY | | 81,211,083 |
TELECOMMUNICATION SERVICES - 0.6% |
Diversified Telecommunication Services - 0.6% |
Broadwing Corp. 3.125% 5/15/26 (d) | | 3,000,000 | | 3,307,500 |
Level 3 Communications, Inc. 3.5% 6/15/12 | | 2,000,000 | | 2,392,260 |
Time Warner Telecom, Inc. 2.375% 4/1/26 | | 2,000,000 | | 2,378,800 |
| | 8,078,560 |
TOTAL CONVERTIBLE BONDS | | 185,780,008 |
Nonconvertible Bonds - 0.9% |
CONSUMER DISCRETIONARY - 0.2% |
Media - 0.2% |
Charter Communications Holdings II LLC/Charter Communications Holdings II Capital Corp. 10.25% 9/15/10 | | 3,176,000 | | 3,310,980 |
FINANCIALS - 0.7% |
Commercial Banks - 0.4% |
PNC Preferred Funding Trust I 6.517% 12/31/49 (c)(d) | | 3,000,000 | | 3,031,800 |
SunTrust Preferred Capital I 5.853% 12/15/49 (e) | | 1,000,000 | | 1,015,420 |
Wells Fargo Capital X 5.95% 12/15/36 | | 1,000,000 | | 1,005,446 |
| | 5,052,666 |
Diversified Financial Services - 0.2% |
Wachovia Capital Trust III 5.8% (e) | | 2,000,000 | | 2,026,884 |
Corporate Bonds - continued |
| Principal Amount | | Value
(Note 1) |
Nonconvertible Bonds - continued |
FINANCIALS - continued |
Thrifts & Mortgage Finance - 0.1% |
Washington Mutual Preferred Funding Trust I 6.534% (d)(e) | | $ 2,000,000 | | $ 1,984,320 |
TOTAL FINANCIALS | | 9,063,870 |
TOTAL NONCONVERTIBLE BONDS | | 12,374,850 |
TOTAL CORPORATE BONDS (Cost $185,691,579) | 198,154,858 |
Common Stocks - 66.8% |
| Shares | | |
CONSUMER DISCRETIONARY - 5.7% |
Automobiles - 0.2% |
Renault SA | 20,900 | | 2,504,658 |
Diversified Consumer Services - 0.3% |
Coinmach Service Corp. unit | 156,800 | | 2,765,952 |
Service Corp. International | 155,800 | | 1,537,746 |
| | 4,303,698 |
Hotels, Restaurants & Leisure - 2.0% |
Accor SA | 23,500 | | 1,708,417 |
Applebee's International, Inc. | 19,600 | | 445,900 |
Aristocrat Leisure Ltd. | 197,300 | | 2,418,954 |
Boyd Gaming Corp. | 40,700 | | 1,723,645 |
Centerplate, Inc. unit | 318,800 | | 5,531,180 |
Domino's Pizza, Inc. | 99,100 | | 2,721,286 |
Greek Organization of Football Prognostics SA | 11,300 | | 424,962 |
McDonald's Corp. | 101,749 | | 4,270,406 |
Minor International PCL (For. Reg.) | 1,212,900 | | 391,967 |
Starwood Hotels & Resorts Worldwide, Inc. | 79,300 | | 5,088,681 |
WMS Industries, Inc. (a) | 63,400 | | 2,205,052 |
| | 26,930,450 |
Household Durables - 0.6% |
Bassett Furniture Industries, Inc. | 51,605 | | 913,409 |
Cyrela Brazil Realty SA | 35,000 | | 669,446 |
La-Z-Boy, Inc. | 95,477 | | 1,124,719 |
The Stanley Works | 38,010 | | 1,939,270 |
Common Stocks - continued |
| Shares | | Value (Note 1) |
CONSUMER DISCRETIONARY - continued |
Household Durables - continued |
Urbi, Desarrollos Urbanos, SA de CV (a) | 144,300 | | $ 454,053 |
Whirlpool Corp. | 42,000 | | 3,582,600 |
| | 8,683,497 |
Leisure Equipment & Products - 0.2% |
Eastman Kodak Co. | 120,400 | | 3,132,808 |
Media - 0.8% |
Charter Communications, Inc. Class A (a) | 977,700 | | 2,884,215 |
Gannett Co., Inc. | 4,000 | | 238,080 |
Grupo Televisa SA de CV (CPO) sponsored ADR | 21,500 | | 565,020 |
Idearc, Inc. (a) | 8,300 | | 228,582 |
News Corp. Class A | 86,700 | | 1,786,020 |
R.H. Donnelley Corp. | 55,100 | | 3,416,200 |
Viacom, Inc. Class B (non-vtg.) (a) | 39,965 | | 1,499,087 |
| | 10,617,204 |
Multiline Retail - 0.7% |
Federated Department Stores, Inc. | 74,800 | | 3,148,332 |
JCPenney Co., Inc. | 38,800 | | 3,000,792 |
Lojas Renner SA | 21,000 | | 276,443 |
Sears Holdings Corp. (a) | 17,200 | | 2,948,424 |
Tuesday Morning Corp. | 25,400 | | 447,040 |
| | 9,821,031 |
Specialty Retail - 0.3% |
AutoZone, Inc. (a) | 3,400 | | 386,274 |
OfficeMax, Inc. | 92,400 | | 4,349,268 |
| | 4,735,542 |
Textiles, Apparel & Luxury Goods - 0.6% |
Brown Shoe Co., Inc. | 48,800 | | 2,315,072 |
Liz Claiborne, Inc. | 91,800 | | 3,924,450 |
Polo Ralph Lauren Corp. Class A | 7,400 | | 578,680 |
VF Corp. | 21,000 | | 1,646,190 |
| | 8,464,392 |
TOTAL CONSUMER DISCRETIONARY | | 79,193,280 |
CONSUMER STAPLES - 2.6% |
Beverages - 0.2% |
Fomento Economico Mexicano SA de CV sponsored ADR | 3,300 | | 347,325 |
Pernod Ricard SA | 7,800 | | 1,726,969 |
| | 2,074,294 |
Common Stocks - continued |
| Shares | | Value (Note 1) |
CONSUMER STAPLES - continued |
Food & Staples Retailing - 0.6% |
Rite Aid Corp. | 380,300 | | $ 1,806,425 |
Safeway, Inc. | 173,400 | | 5,342,454 |
Wal-Mart de Mexico SA de CV Series V | 189,700 | | 708,968 |
| | 7,857,847 |
Food Products - 0.6% |
B&G Foods, Inc. unit | 156,900 | | 3,075,240 |
Chiquita Brands International, Inc. | 139,500 | | 1,994,850 |
Del Monte Foods Co. | 61,500 | | 694,335 |
Tyson Foods, Inc. Class A | 170,500 | | 2,709,245 |
| | 8,473,670 |
Personal Products - 0.5% |
Avon Products, Inc. | 165,600 | | 5,405,184 |
Playtex Products, Inc. (a) | 144,000 | | 2,139,840 |
| | 7,545,024 |
Tobacco - 0.7% |
Altria Group, Inc. | 112,600 | | 9,482,046 |
TOTAL CONSUMER STAPLES | | 35,432,881 |
ENERGY - 9.5% |
Energy Equipment & Services - 4.9% |
Grant Prideco, Inc. (a) | 80,300 | | 3,518,746 |
Halliburton Co. | 320,700 | | 10,820,418 |
National Oilwell Varco, Inc. (a) | 252,489 | | 16,793,043 |
Noble Corp. | 191,763 | | 14,813,692 |
Pride International, Inc. (a) | 110,700 | | 3,574,503 |
Rowan Companies, Inc. | 100,100 | | 3,605,602 |
Smith International, Inc. | 341,300 | | 14,457,468 |
| | 67,583,472 |
Oil, Gas & Consumable Fuels - 4.6% |
Alpha Natural Resources, Inc. (a) | 77,158 | | 1,215,239 |
Aurora Oil & Gas Corp. (a) | 480,572 | | 1,638,751 |
Cabot Oil & Gas Corp. | 63,200 | | 3,926,616 |
CONSOL Energy, Inc. | 99,300 | | 3,645,303 |
Foundation Coal Holdings, Inc. | 97,000 | | 3,599,670 |
Peabody Energy Corp. | 109,900 | | 5,056,499 |
Plains Exploration & Production Co. (a) | 41,200 | | 1,939,696 |
Quicksilver Resources, Inc. (a) | 88,700 | | 3,752,897 |
Range Resources Corp. | 29,100 | | 904,719 |
Common Stocks - continued |
| Shares | | Value (Note 1) |
ENERGY - continued |
Oil, Gas & Consumable Fuels - continued |
Teekay Shipping Corp. | 142,050 | | $ 5,949,054 |
Ultra Petroleum Corp. (a) | 137,200 | | 7,395,080 |
Valero Energy Corp. | 435,961 | | 24,008,366 |
| | 63,031,890 |
TOTAL ENERGY | | 130,615,362 |
FINANCIALS - 26.8% |
Capital Markets - 1.8% |
Ameriprise Financial, Inc. | 8,400 | | 454,440 |
Bank of New York Co., Inc. | 48,200 | | 1,713,028 |
Franklin Resources, Inc. | 17,900 | | 1,910,646 |
KKR Private Equity Investors, LP | 64,700 | | 1,436,340 |
Merrill Lynch & Co., Inc. | 68,200 | | 5,962,726 |
Merrill Lynch & Co., Inc. (depositary shares) Series 1, unit | 277,700 | | 7,147,998 |
Morgan Stanley | 81,000 | | 6,168,960 |
State Street Corp. | 9,400 | | 584,022 |
| | 25,378,160 |
Commercial Banks - 1.1% |
Cathay General Bancorp | 21,219 | | 729,085 |
East West Bancorp, Inc. | 52,000 | | 1,851,720 |
UCBH Holdings, Inc. | 117,400 | | 1,979,364 |
Wachovia Corp. | 102,709 | | 5,565,801 |
Wells Fargo & Co. | 159,700 | | 5,627,828 |
| | 15,753,798 |
Consumer Finance - 0.1% |
Capital One Financial Corp. | 21,900 | | 1,705,572 |
Diversified Financial Services - 2.3% |
Bank of America Corp. | 224,214 | | 12,073,924 |
JPMorgan Chase & Co. | 410,704 | | 19,007,381 |
| | 31,081,305 |
Insurance - 5.4% |
ACE Ltd. | 94,800 | | 5,388,432 |
AFLAC, Inc. | 77,600 | | 3,425,264 |
Allied World Assurance Co. Holdings Ltd. | 18,800 | | 798,060 |
American International Group, Inc. | 194,400 | | 13,670,208 |
Aspen Insurance Holdings Ltd. | 270,300 | | 7,284,585 |
Axis Capital Holdings Ltd. | 216,656 | | 7,416,135 |
Endurance Specialty Holdings Ltd. | 188,171 | | 7,062,058 |
Common Stocks - continued |
| Shares | | Value (Note 1) |
FINANCIALS - continued |
Insurance - continued |
Everest Re Group Ltd. | 38,700 | | $ 3,808,467 |
Hartford Financial Services Group, Inc. | 35,900 | | 3,078,784 |
Marsh & McLennan Companies, Inc. | 31,500 | | 989,730 |
MetLife, Inc. | 52,500 | | 3,083,325 |
Platinum Underwriters Holdings Ltd. | 220,400 | | 6,706,772 |
Scottish Re Group Ltd. | 97,111 | | 577,810 |
The St. Paul Travelers Companies, Inc. | 116,800 | | 6,051,408 |
W.R. Berkley Corp. | 124,050 | | 4,355,396 |
| | 73,696,434 |
Real Estate Investment Trusts - 15.3% |
Alexandria Real Estate Equities, Inc. | 53,500 | | 5,514,780 |
AMB Property Corp. (SBI) | 8,000 | | 490,160 |
American Financial Realty Trust (SBI) | 140,800 | | 1,655,808 |
Apartment Investment & Management Co. Class A | 20,000 | | 1,152,800 |
AvalonBay Communities, Inc. | 40,460 | | 5,384,417 |
BioMed Realty Trust, Inc. | 22,900 | | 691,580 |
Boston Properties, Inc. | 60,014 | | 7,024,639 |
CBL & Associates Properties, Inc. | 121,540 | | 5,238,374 |
CBRE Realty Finance, Inc. | 28,800 | | 465,120 |
Columbia Equity Trust, Inc. | 67,900 | | 1,279,915 |
Corporate Office Properties Trust (SBI) | 177,900 | | 8,843,409 |
Developers Diversified Realty Corp. | 89,500 | | 5,797,810 |
Douglas Emmett, Inc. (a) | 97,700 | | 2,569,510 |
Duke Realty Corp. | 290,488 | | 12,642,038 |
Education Realty Trust, Inc. | 6,800 | | 106,964 |
Equity Lifestyle Properties, Inc. | 33,260 | | 1,728,522 |
Equity Office Properties Trust | 243,310 | | 11,727,542 |
Equity One, Inc. | 88,900 | | 2,425,192 |
Equity Residential (SBI) | 357,380 | | 19,034,059 |
Federal Realty Investment Trust (SBI) | 44,500 | | 3,790,510 |
General Growth Properties, Inc. | 293,125 | | 16,104,288 |
GMH Communities Trust | 107,200 | | 1,330,352 |
Health Care Property Investors, Inc. | 26,100 | | 946,647 |
Health Care REIT, Inc. | 17,300 | | 725,389 |
Home Properties of New York, Inc. | 13,600 | | 840,616 |
HomeBanc Mortgage Corp., Georgia | 191,600 | | 806,636 |
Host Hotels & Resorts, Inc. | 363,445 | | 9,166,083 |
Inland Real Estate Corp. | 140,600 | | 2,727,640 |
Innkeepers USA Trust (SBI) | 44,100 | | 705,600 |
Kilroy Realty Corp. | 16,300 | | 1,333,340 |
Common Stocks - continued |
| Shares | | Value (Note 1) |
FINANCIALS - continued |
Real Estate Investment Trusts - continued |
Kimco Realty Corp. | 230,638 | | $ 10,696,990 |
Longview Fibre Co. | 44,000 | | 916,080 |
Mission West Properties, Inc. | 81,500 | | 1,018,750 |
Newcastle Investment Corp. | 12,100 | | 362,395 |
Potlatch Corp. | 10,230 | | 426,489 |
ProLogis Trust | 141,165 | | 9,199,723 |
Public Storage, Inc. | 98,936 | | 9,525,558 |
Rayonier, Inc. | 34,320 | | 1,431,144 |
Reckson Associates Realty Corp. | 7,800 | | 377,364 |
Simon Property Group, Inc. | 81,110 | | 8,271,598 |
SL Green Realty Corp. | 41,200 | | 5,571,888 |
Sovran Self Storage, Inc. | 47,900 | | 2,802,150 |
Tanger Factory Outlet Centers, Inc. | 84,800 | | 3,342,816 |
Taubman Centers, Inc. | 29,500 | | 1,459,070 |
United Dominion Realty Trust, Inc. (SBI) | 275,040 | | 9,235,843 |
Ventas, Inc. | 64,550 | | 2,514,223 |
Vornado Realty Trust | 77,650 | | 9,792,442 |
Washington (REIT) (SBI) | 27,000 | | 1,157,490 |
Weingarten Realty Investors (SBI) | 4,100 | | 195,652 |
| | 210,547,405 |
Real Estate Management & Development - 0.2% |
Brookfield Properties Corp. | 8,000 | | 321,200 |
GAGFAH SA | 9,700 | | 303,136 |
Mitsubishi Estate Co. Ltd. | 112,000 | | 2,766,387 |
| | 3,390,723 |
Thrifts & Mortgage Finance - 0.6% |
Countrywide Financial Corp. | 48,200 | | 1,914,504 |
Fannie Mae | 64,000 | | 3,649,920 |
Hudson City Bancorp, Inc. | 204,100 | | 2,708,407 |
| | 8,272,831 |
TOTAL FINANCIALS | | 369,826,228 |
HEALTH CARE - 3.1% |
Biotechnology - 0.1% |
Alkermes, Inc. (a) | 12,000 | | 182,160 |
Amgen, Inc. (a) | 24,100 | | 1,711,100 |
| | 1,893,260 |
Common Stocks - continued |
| Shares | | Value (Note 1) |
HEALTH CARE - continued |
Health Care Equipment & Supplies - 0.9% |
Baxter International, Inc. | 107,400 | | $ 4,805,076 |
Becton, Dickinson & Co. | 47,700 | | 3,421,044 |
C.R. Bard, Inc. | 46,700 | | 3,842,943 |
| | 12,069,063 |
Health Care Providers & Services - 0.7% |
Acibadem Saglik Hizmetleri AS | 57,000 | | 627,343 |
Brookdale Senior Living, Inc. | 105,000 | | 4,793,250 |
Bumrungrad Hospital PCL (For. Reg.) | 346,100 | | 351,933 |
Capital Senior Living Corp. (a) | 17,000 | | 174,420 |
DaVita, Inc. (a) | 56,400 | | 3,001,044 |
| | 8,947,990 |
Life Sciences Tools & Services - 0.1% |
Thermo Fisher Scientific, Inc. (a) | 31,300 | | 1,371,879 |
Pharmaceuticals - 1.3% |
Merck & Co., Inc. | 71,500 | | 3,182,465 |
Novartis AG sponsored ADR | 50,800 | | 2,967,228 |
Pfizer, Inc. | 380,400 | | 10,457,196 |
Teva Pharmaceutical Industries Ltd. sponsored ADR | 51,800 | | 1,660,708 |
| | 18,267,597 |
TOTAL HEALTH CARE | | 42,549,789 |
INDUSTRIALS - 4.3% |
Aerospace & Defense - 0.8% |
General Dynamics Corp. | 46,800 | | 3,502,512 |
Honeywell International, Inc. | 135,400 | | 5,819,492 |
Precision Castparts Corp. | 25,100 | | 1,894,046 |
| | 11,216,050 |
Air Freight & Logistics - 0.2% |
United Parcel Service, Inc. Class B | 42,100 | | 3,280,432 |
Building Products - 0.2% |
Masco Corp. | 73,000 | | 2,094,370 |
Commercial Services & Supplies - 0.4% |
Allied Waste Industries, Inc. | 129,700 | | 1,644,596 |
The Brink's Co. | 29,300 | | 1,644,902 |
The Geo Group, Inc. (a) | 21,250 | | 798,150 |
Waste Management, Inc. | 48,400 | | 1,771,924 |
| | 5,859,572 |
Common Stocks - continued |
| Shares | | Value (Note 1) |
INDUSTRIALS - continued |
Construction & Engineering - 0.8% |
Fluor Corp. | 84,035 | | $ 7,317,768 |
Shaw Group, Inc. (a) | 113,100 | | 3,380,559 |
| | 10,698,327 |
Electrical Equipment - 0.1% |
Cooper Industries Ltd. Class A | 14,200 | | 1,298,448 |
Industrial Conglomerates - 0.2% |
Tyco International Ltd. | 65,100 | | 1,971,879 |
Machinery - 0.5% |
Deere & Co. | 41,300 | | 3,964,800 |
Flowserve Corp. (a) | 21,206 | | 1,141,731 |
Oshkosh Truck Co. | 42,300 | | 2,030,823 |
| | 7,137,354 |
Road & Rail - 1.1% |
AMERCO (a) | 21,774 | | 1,891,072 |
Burlington Northern Santa Fe Corp. | 36,700 | | 2,758,372 |
Con-way, Inc. | 67,400 | | 3,108,488 |
CSX Corp. | 82,700 | | 2,965,622 |
Laidlaw International, Inc. | 110,500 | | 3,210,025 |
Landstar System, Inc. | 39,600 | | 1,783,584 |
| | 15,717,163 |
TOTAL INDUSTRIALS | | 59,273,595 |
INFORMATION TECHNOLOGY - 8.9% |
Communications Equipment - 0.1% |
Comverse Technology, Inc. (a) | 88,200 | | 1,721,664 |
Computers & Peripherals - 2.2% |
Dell, Inc. (a) | 124,000 | | 3,377,760 |
Hewlett-Packard Co. | 78,200 | | 3,085,772 |
Imation Corp. | 62,682 | | 2,902,803 |
International Business Machines Corp. | 66,300 | | 6,094,296 |
Komag, Inc. (a) | 83,200 | | 3,284,736 |
NCR Corp. (a) | 147,900 | | 6,346,389 |
Seagate Technology (a) | 211,000 | | 5,435,360 |
| | 30,527,116 |
Electronic Equipment & Instruments - 2.0% |
Agilent Technologies, Inc. (a) | 80,400 | | 2,559,936 |
Amphenol Corp. Class A | 117,500 | | 8,005,275 |
Arrow Electronics, Inc. (a) | 119,500 | | 3,795,320 |
Common Stocks - continued |
| Shares | | Value (Note 1) |
INFORMATION TECHNOLOGY - continued |
Electronic Equipment & Instruments - continued |
Flextronics International Ltd. (a) | 211,000 | | $ 2,373,750 |
FLIR Systems, Inc. (a) | 59,100 | | 1,903,611 |
Ingram Micro, Inc. Class A (a) | 83,100 | | 1,693,578 |
Molex, Inc. | 91,500 | | 2,928,000 |
Solectron Corp. (a) | 382,700 | | 1,274,391 |
Vishay Intertechnology, Inc. (a) | 166,900 | | 2,186,390 |
| | 26,720,251 |
Internet Software & Services - 0.1% |
VeriSign, Inc. (a) | 55,100 | | 1,438,661 |
IT Services - 0.4% |
Infosys Technologies Ltd. sponsored ADR | 12,500 | | 669,125 |
Mastercard, Inc. Class A | 25,400 | | 2,584,450 |
Satyam Computer Services Ltd. sponsored ADR | 86,200 | | 2,012,770 |
| | 5,266,345 |
Office Electronics - 0.2% |
Xerox Corp. | 180,700 | | 2,981,550 |
Semiconductors & Semiconductor Equipment - 2.4% |
Analog Devices, Inc. | 40,800 | | 1,326,816 |
Applied Materials, Inc. | 168,600 | | 3,031,428 |
ASML Holding NV (NY Shares) (a) | 129,600 | | 3,227,040 |
Atmel Corp. (a) | 433,400 | | 2,193,004 |
Axcelis Technologies, Inc. (a) | 242,800 | | 1,551,492 |
Broadcom Corp. Class A (a) | 27,500 | | 902,825 |
Brooks Automation, Inc. (a) | 106,500 | | 1,487,805 |
Cypress Semiconductor Corp. (a) | 9,500 | | 165,205 |
DSP Group, Inc. (a) | 8,996 | | 194,224 |
Fairchild Semiconductor International, Inc. (a) | 116,000 | | 1,893,120 |
Hittite Microwave Corp. (a) | 33,600 | | 1,312,752 |
Intel Corp. | 145,400 | | 3,104,290 |
Intersil Corp. Class A | 79,800 | | 1,976,646 |
Linear Technology Corp. | 39,000 | | 1,253,460 |
Maxim Integrated Products, Inc. | 97,000 | | 3,053,560 |
National Semiconductor Corp. | 127,300 | | 3,079,387 |
ON Semiconductor Corp. (a) | 439,100 | | 2,827,804 |
PMC-Sierra, Inc. (a) | 49,800 | | 378,978 |
Verigy Ltd. | 10,639 | | 189,800 |
| | 33,149,636 |
Software - 1.5% |
BEA Systems, Inc. (a) | 115,622 | | 1,592,115 |
Common Stocks - continued |
| Shares | | Value (Note 1) |
INFORMATION TECHNOLOGY - continued |
Software - continued |
Compuware Corp. (a) | 34,500 | | $ 289,455 |
Hyperion Solutions Corp. (a) | 44,000 | | 1,617,440 |
Microsoft Corp. | 301,600 | | 8,845,928 |
Nintendo Co. Ltd. | 8,900 | | 2,121,427 |
Quest Software, Inc. (a) | 121,600 | | 1,740,096 |
Symantec Corp. (a) | 133,300 | | 2,825,960 |
Ubisoft Entertainment SA (a) | 29,052 | | 1,827,356 |
| | 20,859,777 |
TOTAL INFORMATION TECHNOLOGY | | 122,665,000 |
MATERIALS - 1.4% |
Chemicals - 0.7% |
Agrium, Inc. | 66,400 | | 2,038,426 |
Ashland, Inc. | 43,300 | | 2,927,513 |
Celanese Corp. Class A | 43,300 | | 952,600 |
Cytec Industries, Inc. | 9,300 | | 495,969 |
Monsanto Co. | 63,600 | | 3,057,252 |
| | 9,471,760 |
Metals & Mining - 0.7% |
Alcoa, Inc. | 96,900 | | 3,020,373 |
Titanium Metals Corp. | 237,300 | | 7,586,481 |
| | 10,606,854 |
TOTAL MATERIALS | | 20,078,614 |
TELECOMMUNICATION SERVICES - 2.7% |
Diversified Telecommunication Services - 2.0% |
AT&T, Inc. | 415,600 | | 14,092,996 |
BellSouth Corp. | 113,700 | | 5,069,883 |
CenturyTel, Inc. | 48,689 | | 2,071,717 |
Citizens Communications Co. | 16,900 | | 239,473 |
Verizon Communications, Inc. | 154,500 | | 5,398,230 |
| | 26,872,299 |
Wireless Telecommunication Services - 0.7% |
America Movil SA de CV Series L sponsored ADR | 20,800 | | 924,976 |
American Tower Corp. Class A (a) | 76,200 | | 2,885,694 |
Bharti Airtel Ltd. (a) | 26,731 | | 390,926 |
Crown Castle International Corp. (a) | 70,200 | | 2,419,092 |
Common Stocks - continued |
| Shares | | Value (Note 1) |
TELECOMMUNICATION SERVICES - continued |
Wireless Telecommunication Services - continued |
MTN Group Ltd. | 50,200 | | $ 512,931 |
SBA Communications Corp. Class A (a) | 104,500 | | 2,964,665 |
| | 10,098,284 |
TOTAL TELECOMMUNICATION SERVICES | | 36,970,583 |
UTILITIES - 1.8% |
Electric Utilities - 0.7% |
Edison International | 57,500 | | 2,643,850 |
Exelon Corp. | 48,500 | | 2,945,405 |
FPL Group, Inc. | 30,200 | | 1,609,660 |
PPL Corp. | 81,100 | | 2,947,985 |
| | 10,146,900 |
Independent Power Producers & Energy Traders - 0.7% |
AES Corp. (a) | 388,100 | | 9,069,897 |
Multi-Utilities - 0.4% |
CMS Energy Corp. (a) | 193,300 | | 3,133,393 |
Duke Energy Corp. | 72,400 | | 2,296,528 |
| | 5,429,921 |
TOTAL UTILITIES | | 24,646,718 |
TOTAL COMMON STOCKS (Cost $772,358,048) | 921,252,050 |
Preferred Stocks - 13.0% |
| | | |
Convertible Preferred Stocks - 3.7% |
CONSUMER DISCRETIONARY - 0.3% |
Automobiles - 0.3% |
General Motors Corp.: | | | |
Series A, 4.50% | 41,400 | | 1,035,000 |
Series C, 6.25% | 98,500 | | 2,217,235 |
| | 3,252,235 |
Media - 0.0% |
Emmis Communications Corp. Series A, 6.25% | 10,100 | | 401,071 |
TOTAL CONSUMER DISCRETIONARY | | 3,653,306 |
Preferred Stocks - continued |
| Shares | | Value (Note 1) |
Convertible Preferred Stocks - continued |
ENERGY - 1.3% |
Oil, Gas & Consumable Fuels - 1.3% |
Chesapeake Energy Corp.: | | | |
4.50% | 20,500 | | $ 2,085,875 |
6.25% | 8,000 | | 2,246,720 |
El Paso Corp. 4.99% | 10,000 | | 12,988,987 |
| | 17,321,582 |
FINANCIALS - 0.2% |
Diversified Financial Services - 0.1% |
Carriage Services Capital Trust 7.00% TIDES | 45,000 | | 1,845,000 |
Real Estate Investment Trusts - 0.1% |
HRPT Properties Trust 6.50% (a) | 40,000 | | 1,045,920 |
TOTAL FINANCIALS | | 2,890,920 |
INDUSTRIALS - 0.2% |
Road & Rail - 0.2% |
Kansas City Southern: | | | |
4.25% | 1,370 | | 1,239,182 |
5.125% | 1,000 | | 1,176,950 |
| | 2,416,132 |
MATERIALS - 0.8% |
Chemicals - 0.6% |
Celanese Corp. 4.25% | 252,600 | | 7,997,316 |
Containers & Packaging - 0.1% |
Owens-Illinois, Inc. 4.75% | 63,510 | | 2,337,168 |
Metals & Mining - 0.1% |
Freeport-McMoRan Copper & Gold, Inc. 5.50% | 1,050 | | 1,466,594 |
TOTAL MATERIALS | | 11,801,078 |
UTILITIES - 0.9% |
Electric Utilities - 0.5% |
AES Trust VII 6.00% | 140,500 | | 6,884,500 |
Preferred Stocks - continued |
| Shares | | Value (Note 1) |
Convertible Preferred Stocks - continued |
UTILITIES - continued |
Independent Power Producers & Energy Traders - 0.4% |
NRG Energy, Inc.: | | | |
4.00% (d) | 3,900 | | $ 5,890,599 |
Series A, 5.75% | 1,000 | | 273,100 |
| | 6,163,699 |
TOTAL UTILITIES | | 13,048,199 |
TOTAL CONVERTIBLE PREFERRED STOCKS | | 51,131,217 |
Nonconvertible Preferred Stocks - 9.3% |
CONSUMER DISCRETIONARY - 0.1% |
Household Durables - 0.1% |
Hovnanian Enterprises, Inc. Series A, 7.625% | 40,000 | | 979,600 |
CONSUMER STAPLES - 0.1% |
Food Products - 0.1% |
H.J. Heinz Finance Co. 6.226% | 10 | | 1,024,500 |
ENERGY - 0.2% |
Oil, Gas & Consumable Fuels - 0.2% |
Apache Corp. (depositary shares) Series B, 5.68% | 9,875 | | 982,563 |
Devon Energy Corp. 6.49% | 13,750 | | 1,400,781 |
| | 2,383,344 |
FINANCIALS - 6.1% |
Capital Markets - 1.4% |
Bear Stearns Companies, Inc.: | | | |
Series E, 6.155% | 15,000 | | 759,750 |
Series G, 5.49% | 15,000 | | 723,900 |
Goldman Sachs Group, Inc.: | | | |
Series A, 3.9106% | 120,000 | | 3,156,000 |
Series C, 4.9931% | 40,000 | | 1,042,400 |
Series D | 160,000 | | 4,192,000 |
Lehman Brothers Holdings, Inc. (depositary shares) Series F, 6.50% | 169,015 | | 4,360,587 |
Merrill Lynch & Co., Inc. Series H, 3.97% | 120,000 | | 3,060,000 |
Morgan Stanley Capital Trust IV 6.60% | 80,000 | | 2,056,000 |
| | 19,350,637 |
Preferred Stocks - continued |
| Shares | | Value (Note 1) |
Nonconvertible Preferred Stocks - continued |
FINANCIALS - continued |
Commercial Banks - 1.0% |
ABN AMRO Capital Funding Trust V 5.90% | 20,000 | | $ 493,200 |
ABN Amro Capital Funding Trust VII 6.08% | 40,400 | | 1,018,484 |
Barclays Bank PLC Series 2, 6.625% | 40,000 | | 1,046,000 |
First Tennessee Bank NA, Memphis 3.90% (d) | 5,000 | | 5,175,000 |
Keycorp Capital IX 6.75% | 40,000 | | 1,010,000 |
Santander Finance Preferred SA Unipersonal: | | | |
6.41% | 69,400 | | 1,728,060 |
6.80% (d) | 80,000 | | 2,048,000 |
U.S. Bancorp, Delaware Series B, 0.00% | 40,000 | | 1,042,000 |
| | 13,560,744 |
Consumer Finance - 0.5% |
HSBC USA, Inc.: | | | |
Series G, 4.9175% | 80,000 | | 2,088,800 |
Series H, 6.50% | 40,000 | | 1,064,000 |
SLM Corp.: | | | |
4.07% | 10,000 | | 1,037,500 |
Series A, 6.97% | 43,400 | | 2,363,564 |
| | 6,553,864 |
Diversified Financial Services - 0.5% |
Bank of America Corp.: | | | |
Series D | 20,000 | | 526,400 |
Series E | 40,000 | | 1,005,600 |
CIT Group, Inc. Series B, 5.189% | 15,000 | | 1,504,950 |
Citigroup Capital XVI Series C, 6.45% | 120,000 | | 3,012,000 |
Deutsche Bank Capital Funding Trust VIII 6.375% | 40,000 | | 1,028,000 |
| | 7,076,950 |
Insurance - 0.1% |
MetLife, Inc. Series A, 4.39% | 40,000 | | 1,046,000 |
Real Estate Investment Trusts - 0.4% |
Apartment Investment & Management Co. Series V, 8.00% | 79,000 | | 2,034,250 |
Duke Realty Corp. (depositary shares) Series K, 6.50% | 95,800 | | 2,402,664 |
Host Hotels & Resorts, Inc. Series E, 8.875% | 20,000 | | 551,400 |
Vornado Realty Trust Series E, 7.00% | 40,000 | | 1,040,000 |
| | 6,028,314 |
Thrifts & Mortgage Finance - 2.2% |
Countrywide Capital V 7.00% | 80,000 | | 2,020,000 |
Preferred Stocks - continued |
| Shares | | Value (Note 1) |
Nonconvertible Preferred Stocks - continued |
FINANCIALS - continued |
Thrifts & Mortgage Finance - continued |
Fannie Mae: | | | |
5.10% | 11,400 | | $ 477,375 |
7.00% | 42,200 | | 2,270,360 |
Series H, 5.81% | 71,200 | | 3,552,880 |
Series L, 5.125% | 90,900 | | 4,272,300 |
Series N, 5.50% | 71,650 | | 3,489,355 |
Freddie Mac: | | | |
5.90% | 40,000 | | 1,038,000 |
Series F, 5.00% | 58,500 | | 2,705,625 |
Series H, 5.10% | 10,300 | | 479,980 |
Series K, 5.79% | 35,200 | | 1,837,440 |
Series O, 5.81% | 19,500 | | 1,004,250 |
Series R, 5.70% | 97,000 | | 4,762,700 |
Series S, adj. rate | 10,000 | | 523,200 |
Series T 6.42% | 10,000 | | 545,000 |
Sovereign Bancorp, Inc. Series C, 7.30% | 80,000 | | 2,224,000 |
| | 31,202,465 |
TOTAL FINANCIALS | | 84,818,974 |
MATERIALS - 0.1% |
Chemicals - 0.1% |
E.I. du Pont de Nemours & Co. Series B, 4.50% | 9,900 | | 856,350 |
Metals & Mining - 0.0% |
Alcoa, Inc. 3.75% | 6,400 | | 472,960 |
TOTAL MATERIALS | | 1,329,310 |
UTILITIES - 2.7% |
Electric Utilities - 2.4% |
Alabama Power Co.: | | | |
5.20% | 120,000 | | 2,889,600 |
5.30% | 88,600 | | 2,210,570 |
Baltimore Gas & Electric Co. Series 1993, 6.70% | 10,000 | | 1,033,750 |
Duquesne Light Co. 6.50% | 106,050 | | 5,355,525 |
Entergy Louisiana LLC 6.95% | 7,500 | | 746,250 |
FPL Group Capital Trust I 5.875% | 20,000 | | 488,200 |
Preferred Stocks - continued |
| Shares | | Value (Note 1) |
Nonconvertible Preferred Stocks - continued |
UTILITIES - continued |
Electric Utilities - continued |
Pacific Gas & Electric Co.: | | | |
Series A, 5.00% | 16,900 | | $ 376,025 |
Series B, 5.50% | 61,900 | | 1,519,645 |
Series D 5.00% | 69,200 | | 1,532,780 |
PPL Electric Utilities Corp. 6.25% | 80,000 | | 2,116,000 |
Southern California Edison Co.: | | | |
4.78% | 46,500 | | 1,029,975 |
5.349% | 40,000 | | 4,050,000 |
6.125% | 35,000 | | 3,640,000 |
Series B, 4.08% | 27,271 | | 524,967 |
Series C: | | | |
4.24% | 94,600 | | 1,787,940 |
6.00% | 20,000 | | 2,000,000 |
Series D, 4.32% | 70,000 | | 1,393,000 |
| | 32,694,227 |
Independent Power Producers & Energy Traders - 0.0% |
Heco Capital Trust III 6.50% | 12,000 | | 302,760 |
Multi-Utilities - 0.3% |
Consolidated Edison Co. of New York, Inc. Series A, 5.00% | 28,705 | | 2,596,367 |
San Diego Gas & Electric Co. 1.70% | 67,548 | | 1,758,362 |
| | 4,354,729 |
TOTAL UTILITIES | | 37,351,716 |
TOTAL NONCONVERTIBLE PREFERRED STOCKS | | 127,887,444 |
TOTAL PREFERRED STOCKS (Cost $169,816,748) | 179,018,661 |
Money Market Funds - 6.5% |
| Shares | | Value (Note 1) |
Fidelity Cash Central Fund, 5.35% (b)
(Cost $88,981,514) | 88,981,514 | | $ 88,981,514 |
TOTAL INVESTMENT PORTFOLIO - 100.7% (Cost $1,216,847,889) | | 1,387,407,083 |
NET OTHER ASSETS - (0.7)% | | (9,077,038) |
NET ASSETS - 100% | $ 1,378,330,045 |
Security Type Abbreviations |
TIDES - | Term Income Deferred
Equity Securities |
Legend |
(a) Non-income producing |
(b) Affiliated fund that is available only to investment companies and other accounts managed by Fidelity Investments. The rate quoted is the annualized seven-day yield of the fund at period end. A complete unaudited listing of the fund's holdings as of its most recent quarter end is available upon request. |
(c) Security initially issued at one coupon which converts to a higher coupon at a specified date. The rate shown is the rate at period end. |
(d) Security exempt from registration under Rule 144A of the Securities Act of 1933. These securities may be resold in transactions exempt from registration, normally to qualified institutional buyers. At the end of the period, the value of these securities amounted to $61,661,835 or 4.5% of net assets. |
(e) The coupon rate shown on floating or adjustable rate securities represents the rate at period end. |
Affiliated Central Funds |
Information regarding fiscal year to date income earned by the Fund from investments in Fidelity Central Funds is as follows: |
Fund | Income earned |
Fidelity Cash Central Fund | $ 3,249,017 |
Fidelity Securities Lending Cash Central Fund | 51,351 |
Total | $ 3,300,368 |
Other Information |
The composition of credit quality ratings as a percentage of net assets is as follows (ratings are unaudited): |
AAA,AA,A | 1.9% |
BBB | 1.5% |
BB | 2.6% |
B | 2.7% |
CCC,CC,C | 1.6% |
Not Rated | 4.1% |
Equities | 79.8% |
Short-Term Investments and Net Other Assets | 5.8% |
| 100.0% |
We have used ratings from Moody's Investors Services, Inc. Where Moody's ratings are not available, we have used S&P ratings. Percentages are adjusted for the effect of futures contracts, if applicable. |
Distribution of investments by country of issue, as a percentage of total net assets, is as follows: |
United States of America | 89.2% |
Bermuda | 2.5% |
Cayman Islands | 2.1% |
Singapore | 1.1% |
Others (individually less than 1%) | 5.1% |
| 100.0% |
See accompanying notes which are an integral part of the financial statements.
Annual Report
Financial Statements
Statement of Assets and Liabilities
| November 30, 2006 |
Assets | | |
Investment in securities, at value - See accompanying schedule: Unaffiliated issuers (cost $1,127,866,375) | $ 1,298,425,569 | |
Fidelity Central Funds (cost $88,981,514) | 88,981,514 | |
Total Investments (cost $1,216,847,889) | | $ 1,387,407,083 |
Cash | | 47 |
Receivable for investments sold | | 16,147,882 |
Receivable for fund shares sold | | 2,347,267 |
Dividends receivable | | 1,340,393 |
Interest receivable | | 1,594,639 |
Other receivables | | 23,825 |
Total assets | | 1,408,861,136 |
| | |
Liabilities | | |
Payable for investments purchased | $ 27,918,850 | |
Payable for fund shares redeemed | 1,487,938 | |
Accrued management fee | 637,172 | |
Distribution fees payable | 143,036 | |
Other affiliated payables | 245,895 | |
Other payables and accrued expenses | 98,200 | |
Total liabilities | | 30,531,091 |
| | |
Net Assets | | $ 1,378,330,045 |
Net Assets consist of: | | |
Paid in capital | | $ 1,131,281,652 |
Undistributed net investment income | | 4,371,372 |
Accumulated undistributed net realized gain (loss) on investments and foreign currency transactions | | 72,129,753 |
Net unrealized appreciation (depreciation) on investments and assets and liabilities in foreign currencies | | 170,547,268 |
Net Assets | | $ 1,378,330,045 |
See accompanying notes which are an integral part of the financial statements.
Annual Report
Financial Statements - continued
Statement of Assets and Liabilities - continued
| November 30, 2006 |
Calculation of Maximum Offering Price
Class A:
Net Asset Value and redemption price per share
($70,083,256 ÷ 5,132,404 shares) | | $ 13.66 |
| | |
Maximum offering price per share (100/94.25 of $13.66) | | $ 14.49 |
Class T:
Net Asset Value and redemption price per share
($119,834,346 ÷ 8,786,457 shares) | | $ 13.64 |
| | |
Maximum offering price per share (100/96.50 of $13.64) | | $ 14.13 |
Class B:
Net Asset Value and offering price per share
($23,992,457 ÷ 1,763,110 shares)A | | $ 13.61 |
| | |
Class C:
Net Asset Value and offering price per share
($75,300,889 ÷ 5,532,242 shares)A | | $ 13.61 |
| | |
Strategic Dividend and Income:
Net Asset Value, offering price and redemption price per
share ($1,075,348,259 ÷ 78,520,803 shares) | | $ 13.70 |
| | |
Institutional Class:
Net Asset Value, offering price and redemption price per
share ($13,770,838 ÷ 1,006,276 shares) | | $ 13.68 |
A Redemption price per share is equal to net asset value less any applicable contingent deferred sales charge.
See accompanying notes which are an integral part of the financial statements.
Annual Report
Statement of Operations
| Year ended November 30, 2006 |
Investment Income | | |
Dividends | | $ 23,830,075 |
Interest | | 5,031,742 |
Income from Fidelity Central Funds | | 3,300,368 |
Total income | | 32,162,185 |
| | |
Expenses | | |
Management fee | $ 6,835,128 | |
Transfer agent fees | 2,267,385 | |
Distribution fees | 1,438,280 | |
Accounting and security lending fees | 413,694 | |
Custodian fees and expenses | 64,831 | |
Independent trustees' compensation | 4,468 | |
Registration fees | 115,137 | |
Audit | 48,141 | |
Legal | 22,215 | |
Interest | 5,328 | |
Miscellaneous | 51,182 | |
Total expenses before reductions | 11,265,789 | |
Expense reductions | (65,588) | 11,200,201 |
Net investment income (loss) | | 20,961,984 |
Realized and Unrealized Gain (Loss) Net realized gain (loss) on: | | |
Investment securities: | | |
Unaffiliated issuers (net of foreign taxes of $2,605) | 74,081,652 | |
Foreign currency transactions | (23,442) | |
Total net realized gain (loss) | | 74,058,210 |
Change in net unrealized appreciation (depreciation) on: Investment securities (net of increase in deferred foreign taxes of $13,035) | 71,875,386 | |
Assets and liabilities in foreign currencies | 1,109 | |
Total change in net unrealized appreciation (depreciation) | | 71,876,495 |
Net gain (loss) | | 145,934,705 |
Net increase (decrease) in net assets resulting from operations | | $ 166,896,689 |
See accompanying notes which are an integral part of the financial statements.
Annual Report
Financial Statements - continued
Statement of Changes in Net Assets
| Year ended
November 30, 2006 | Year ended
November 30, 2005 |
Increase (Decrease) in Net Assets | | |
Operations | | |
Net investment income (loss) | $ 20,961,984 | $ 14,989,949 |
Net realized gain (loss) | 74,058,210 | 18,712,281 |
Change in net unrealized appreciation (depreciation) | 71,876,495 | 59,561,296 |
Net increase (decrease) in net assets resulting
from operations | 166,896,689 | 93,263,526 |
Distributions to shareholders from net investment income | (19,594,724) | (14,194,615) |
Distributions to shareholders from net realized gain | (10,685,905) | - |
Total distributions | (30,280,629) | (14,194,615) |
Share transactions - net increase (decrease) | 245,540,386 | 335,336,361 |
Total increase (decrease) in net assets | 382,156,446 | 414,405,272 |
| | |
Net Assets | | |
Beginning of period | 996,173,599 | 581,768,327 |
End of period (including undistributed net investment income of $4,371,372 and undistributed net investment income of $3,125,667, respectively) | $ 1,378,330,045 | $ 996,173,599 |
See accompanying notes which are an integral part of the financial statements.
Annual Report
Financial Highlights - Class A
Years ended November 30, | 2006 | 2005 | 2004 H |
Selected Per-Share Data | | | |
Net asset value, beginning of period | $ 12.18 | $ 11.09 | $ 10.00 |
Income from Investment Operations | | | |
Net investment income (loss) E | .19 | .18 | .16 |
Net realized and unrealized gain (loss) | 1.61 | 1.10 | 1.04 |
Total from investment operations | 1.80 | 1.28 | 1.20 |
Distributions from net investment income | (.19) | (.19) | (.11) |
Distributions from net realized gain | (.13) | - | - |
Total distributions | (.32) | (.19) | (.11) |
Net asset value, end of period | $ 13.66 | $ 12.18 | $ 11.09 |
Total Return B, C, D | 15.01% | 11.63% | 12.01% |
Ratios to Average Net Assets F, I | | | |
Expenses before reductions | 1.14% | 1.16% | 1.20% A |
Expenses net of fee waivers, if any | 1.14% | 1.16% | 1.20% A |
Expenses net of all reductions | 1.14% | 1.13% | 1.17% A |
Net investment income (loss) | 1.52% | 1.60% | 1.67% A |
Supplemental Data | | | |
Net assets, end of period (000 omitted) | $ 70,083 | $ 38,886 | $ 21,985 |
Portfolio turnover rate G | 125% | 64% | 66% A |
A Annualized
B Total returns for periods of less than one year are not annualized.
C Total returns would have been lower had certain expenses not been reduced during the periods shown.
D Total returns do not include the effect of the sales charges.
E Calculated based on average shares outstanding during the period.
F Fees and expenses of the underlying Fidelity Central Funds are not included in the Fund's expense ratio. The Fund indirectly bears its proportionate share of the expenses of any underlying Fidelity Central Funds.
G Amount does not include the portfolio activity of any underlying Fidelity Central Funds.
H For the period December 23, 2003 (commencement of operations) to November 30, 2004.
I Expense ratios reflect operating expenses of the class. Expenses before reductions do not reflect amounts reimbursed by the investment adviser or reductions from brokerage service arrangements or other expense offset arrangements and do not represent the amount paid by the class during periods when reimbursements or reductions occur. Expense ratios before reductions for start-up periods may not be representative of longer-term operating periods. Expenses net of fee waivers reflect expenses after reimbursement by the investment adviser but prior to reductions from brokerage service arrangements or other expense offset arrangements. Expenses net of all reductions represent the net expenses paid by the class.
See accompanying notes which are an integral part of the financial statements.
Annual Report
Financial Highlights - Class T
Years ended November 30, | 2006 | 2005 | 2004 H |
Selected Per-Share Data | | | |
Net asset value, beginning of period | $ 12.17 | $ 11.08 | $ 10.00 |
Income from Investment Operations | | | |
Net investment income (loss) E | .17 | .16 | .13 |
Net realized and unrealized gain (loss) | 1.59 | 1.09 | 1.04 |
Total from investment operations | 1.76 | 1.25 | 1.17 |
Distributions from net investment income | (.16) | (.16) | (.09) |
Distributions from net realized gain | (.13) | - | - |
Total distributions | (.29) | (.16) | (.09) |
Net asset value, end of period | $ 13.64 | $ 12.17 | $ 11.08 |
Total Return B, C, D | 14.70% | 11.43% | 11.75% |
Ratios to Average Net Assets F, I | | | |
Expenses before reductions | 1.35% | 1.38% | 1.45% A |
Expenses net of fee waivers, if any | 1.35% | 1.38% | 1.45% A |
Expenses net of all reductions | 1.35% | 1.35% | 1.42% A |
Net investment income (loss) | 1.31% | 1.38% | 1.43% A |
Supplemental Data | | | |
Net assets, end of period (000 omitted) | $ 119,834 | $ 79,920 | $ 36,526 |
Portfolio turnover rate G | 125% | 64% | 66% A |
A Annualized
B Total returns for periods of less than one year are not annualized.
C Total returns would have been lower had certain expenses not been reduced during the periods shown.
D Total returns do not include the effect of the sales charges.
E Calculated based on average shares outstanding during the period.
F Fees and expenses of the underlying Fidelity Central Funds are not included in the Fund's expense ratio. The Fund indirectly bears its proportionate share of the expenses of any underlying Fidelity Central Funds.
G Amount does not include the portfolio activity of any underlying Fidelity Central Funds.
H For the period December 23, 2003 (commencement of operations) to November 30, 2004.
I Expense ratios reflect operating expenses of the class. Expenses before reductions do not reflect amounts reimbursed by the investment adviser or reductions from brokerage service arrangements or other expense offset arrangements and do not represent the amount paid by the class during periods when reimbursements or reductions occur. Expense ratios before reductions for start-up periods may not be representative of longer-term operating periods. Expenses net of fee waivers reflect expenses after reimbursement by the investment adviser but prior to reductions from brokerage service arrangements or other expense offset arrangements. Expenses net of all reductions represent the net expenses paid by the class.
See accompanying notes which are an integral part of the financial statements.
Annual Report
Financial Highlights - Class B
Years ended November 30, | 2006 | 2005 | 2004 H |
Selected Per-Share Data | | | |
Net asset value, beginning of period | $ 12.14 | $ 11.06 | $ 10.00 |
Income from Investment Operations | | | |
Net investment income (loss) E | .09 | .09 | .09 |
Net realized and unrealized gain (loss) | 1.59 | 1.09 | 1.03 |
Total from investment operations | 1.68 | 1.18 | 1.12 |
Distributions from net investment income | (.08) | (.10) | (.06) |
Distributions from net realized gain | (.13) | - | - |
Total distributions | (.21) | (.10) | (.06) |
Net asset value, end of period | $ 13.61 | $ 12.14 | $ 11.06 |
Total Return B, C, D | 14.05% | 10.73% | 11.24% |
Ratios to Average Net Assets F, I | | | |
Expenses before reductions | 1.96% | 1.96% | 1.99% A |
Expenses net of fee waivers, if any | 1.96% | 1.95% | 1.95% A |
Expenses net of all reductions | 1.96% | 1.93% | 1.92% A |
Net investment income (loss) | .70% | .81% | .92% A |
Supplemental Data | | | |
Net assets, end of period (000 omitted) | $ 23,992 | $ 19,744 | $ 13,457 |
Portfolio turnover rate G | 125% | 64% | 66% A |
A Annualized
B Total returns for periods of less than one year are not annualized.
C Total returns would have been lower had certain expenses not been reduced during the periods shown.
D Total returns do not include the effect of the contingent deferred sales charge.
E Calculated based on average shares outstanding during the period.
F Fees and expenses of the underlying Fidelity Central Funds are not included in the Fund's expense ratio. The Fund indirectly bears its proportionate share of the expenses of any underlying Fidelity Central Funds.
G Amount does not include the portfolio activity of any underlying Fidelity Central Funds.
H For the period December 23, 2003 (commencement of operations) to November 30, 2004.
I Expense ratios reflect operating expenses of the class. Expenses before reductions do not reflect amounts reimbursed by the investment adviser or reductions from brokerage service arrangements or other expense offset arrangements and do not represent the amount paid by the class during periods when reimbursements or reductions occur. Expense ratios before reductions for start-up periods may not be representative of longer-term operating periods. Expenses net of fee waivers reflect expenses after reimbursement by the investment adviser but prior to reductions from brokerage service arrangements or other expense offset arrangements. Expenses net of all reductions represent the net expenses paid by the class.
See accompanying notes which are an integral part of the financial statements.
Annual Report
Financial Highlights - Class C
Years ended November 30, | 2006 | 2005 | 2004 H |
Selected Per-Share Data | | | |
Net asset value, beginning of period | $ 12.15 | $ 11.06 | $ 10.00 |
Income from Investment Operations | | | |
Net investment income (loss) E | .10 | .10 | .09 |
Net realized and unrealized gain (loss) | 1.58 | 1.09 | 1.03 |
Total from investment operations | 1.68 | 1.19 | 1.12 |
Distributions from net investment income | (.09) | (.10) | (.06) |
Distributions from net realized gain | (.13) | - | - |
Total distributions | (.22) | (.10) | (.06) |
Net asset value, end of period | $ 13.61 | $ 12.15 | $ 11.06 |
Total Return B, C, D | 14.05% | 10.85% | 11.24% |
Ratios to Average Net Assets F, I | | | |
Expenses before reductions | 1.89% | 1.90% | 1.94% A |
Expenses net of fee waivers, if any | 1.89% | 1.90% | 1.94% A |
Expenses net of all reductions | 1.88% | 1.87% | 1.92% A |
Net investment income (loss) | .78% | .86% | .93% A |
Supplemental Data | | | |
Net assets, end of period (000 omitted) | $ 75,301 | $ 49,713 | $ 28,795 |
Portfolio turnover rate G | 125% | 64% | 66% A |
A Annualized
B Total returns for periods of less than one year are not annualized.
C Total returns would have been lower had certain expenses not been reduced during the periods shown.
D Total returns do not include the effect of the contingent deferred sales charge.
E Calculated based on average shares outstanding during the period.
F Fees and expenses of the underlying Fidelity Central Funds are not included in the Fund's expense ratio. The Fund indirectly bears its proportionate share of the expenses of any underlying Fidelity Central Funds.
G Amount does not include the portfolio activity of any underlying Fidelity Central Funds.
H For the period December 23, 2003 (commencement of operations) to November 30, 2004.
I Expense ratios reflect operating expenses of the class. Expenses before reductions do not reflect amounts reimbursed by the investment adviser or reductions from brokerage service arrangements or other expense offset arrangements and do not represent the amount paid by the class during periods when reimbursements or reductions occur. Expense ratios before reductions for start-up periods may not be representative of longer-term operating periods. Expenses net of fee waivers reflect expenses after reimbursement by the investment adviser but prior to reductions from brokerage service arrangements or other expense offset arrangements. Expenses net of all reductions represent the net expenses paid by the class.
See accompanying notes which are an integral part of the financial statements.
Annual Report
Financial Highlights - Strategic Dividend and Income
Years ended November 30, | 2006 | 2005 | 2004 G |
Selected Per-Share Data | | | |
Net asset value, beginning of period | $ 12.22 | $ 11.11 | $ 10.00 |
Income from Investment Operations | | | |
Net investment income (loss) D | .24 | .22 | .19 |
Net realized and unrealized gain (loss) | 1.60 | 1.11 | 1.04 |
Total from investment operations | 1.84 | 1.33 | 1.23 |
Distributions from net investment income | (.23) | (.22) | (.12) |
Distributions from net realized gain | (.13) | - | - |
Total distributions | (.36) | (.22) | (.12) |
Net asset value, end of period | $ 13.70 | $ 12.22 | $ 11.11 |
Total Return B, C | 15.33% | 12.08% | 12.32% |
Ratios to Average Net Assets E, H | | | |
Expenses before reductions | .80% | .82% | .90% A |
Expenses net of fee waivers, if any | .80% | .82% | .90% A |
Expenses net of all reductions | .79% | .79% | .87% A |
Net investment income (loss) | 1.87% | 1.94% | 1.98% A |
Supplemental Data | | | |
Net assets, end of period (000 omitted) | $ 1,075,348 | $ 798,113 | $ 476,032 |
Portfolio turnover rate F | 125% | 64% | 66% A |
A Annualized
B Total returns for periods of less than one year are not annualized.
C Total returns would have been lower had certain expenses not been reduced during the periods shown.
D Calculated based on average shares outstanding during the period.
E Fees and expenses of the underlying Fidelity Central Funds are not included in the Fund's expense ratio. The Fund indirectly bears its proportionate share of the expenses of any underlying Fidelity Central Funds.
F Amount does not include the portfolio activity of any underlying Fidelity Central Funds.
G For the period December 23, 2003 (commencement of operations) to November 30, 2004.
H Expense ratios reflect operating expenses of the class. Expenses before reductions do not reflect amounts reimbursed by the investment adviser or reductions from brokerage service arrangements or other expense offset arrangements and do not represent the amount paid by the class during periods when reimbursements or reductions occur. Expense ratios before reductions for start-up periods may not be representative of longer-term operating periods. Expenses net of fee waivers reflect expenses after reimbursement by the investment adviser but prior to reductions from brokerage service arrangements or other expense offset arrangements. Expenses net of all reductions represent the net expenses paid by the class.
See accompanying notes which are an integral part of the financial statements.
Annual Report
Financial Highlights - Institutional Class
Years ended November 30, | 2006 | 2005 | 2004 G |
Selected Per-Share Data | | | |
Net asset value, beginning of period | $ 12.21 | $ 11.11 | $ 10.00 |
Income from Investment Operations | | | |
Net investment income (loss) D | .23 | .22 | .19 |
Net realized and unrealized gain (loss) | 1.59 | 1.10 | 1.04 |
Total from investment operations | 1.82 | 1.32 | 1.23 |
Distributions from net investment income | (.22) | (.22) | (.12) |
Distributions from net realized gain | (.13) | - | - |
Total distributions | (.35) | (.22) | (.12) |
Net asset value, end of period | $ 13.68 | $ 12.21 | $ 11.11 |
Total Return B, C | 15.24% | 11.98% | 12.38% |
Ratios to Average Net Assets E, H | | | |
Expenses before reductions | .82% | .83% | .88% A |
Expenses net of fee waivers, if any | .82% | .83% | .88% A |
Expenses net of all reductions | .82% | .81% | .85% A |
Net investment income (loss) | 1.84% | 1.93% | 2.00% A |
Supplemental Data | | | |
Net assets, end of period (000 omitted) | $ 13,771 | $ 9,798 | $ 4,973 |
Portfolio turnover rate F | 125% | 64% | 66% A |
A Annualized
B Total returns for periods of less than one year are not annualized.
C Total returns would have been lower had certain expenses not been reduced during the periods shown.
D Calculated based on average shares outstanding during the period.
E Fees and expenses of the underlying Fidelity Central Funds are not included in the Fund's expense ratio. The Fund indirectly bears its proportionate share of the expenses of any underlying Fidelity Central Funds.
F Amount does not include the portfolio activity of any underlying Fidelity Central Funds.
G For the period December 23, 2003 (commencement of operations) to November 30, 2004.
H Expense ratios reflect operating expenses of the class. Expenses before reductions do not reflect amounts reimbursed by the investment adviser or reductions from brokerage service arrangements or other expense offset arrangements and do not represent the amount paid by the class during periods when reimbursements or reductions occur. Expense ratios before reductions for start-up periods may not be representative of longer-term operating periods. Expenses net of fee waivers reflect expenses after reimbursement by the investment adviser but prior to reductions from brokerage service arrangements or other expense offset arrangements. Expenses net of all reductions represent the net expenses paid by the class.
See accompanying notes which are an integral part of the financial statements.
Annual Report
Notes to Financial Statements
For the period ended November 30, 2006
1. Significant Accounting Policies.
Fidelity Strategic Dividend & Income Fund (the Fund) is a fund of Fidelity Financial Trust (the trust) and is authorized to issue an unlimited number of shares. The trust is registered under the Investment Company Act of 1940, as amended (the 1940 Act), as an open-end management investment company organized as a Massachusetts business trust.
The Fund offers Class A, Class T, Class B, Class C, Strategic Dividend & Income, and Institutional Class shares, each of which has equal rights as to assets and voting privileges. Each class has exclusive voting rights with respect to matters that affect that class. Class B shares will automatically convert to Class A shares after a holding period of seven years from the initial date of purchase. Investment income, realized and unrealized capital gains and losses, the common expenses of the Fund, and certain fund-level expense reductions, if any, are allocated on a pro rata basis to each class based on the relative net assets of each class to the total net assets of the Fund. Each class differs with respect to transfer agent and distribution and service plan fees incurred. Certain expense reductions also differ by class.
The Fund may invest in Fidelity Central Funds which are open-end investment companies available to investment companies and other accounts managed by Fidelity Management & Research Company (FMR) and its affiliates. The financial statements have been prepared in conformity with accounting principles generally accepted in the United States of America, which require management to make certain estimates and assumptions at the date of the financial statements. The following summarizes the significant accounting policies of the Fund, which are also consistently followed by the Fidelity Central Funds:
Security Valuation. Investments are valued and net asset value (NAV) per share is calculated (NAV calculation) as of the close of business of the New York Stock Exchange (NYSE), normally 4:00 p.m. Eastern time. Wherever possible, the Fund uses independent pricing services approved by the Board of Trustees to value its investments.
Equity securities, including restricted securities, for which market quotations are readily available, are valued at the last reported sale price or official closing price as reported by an independent pricing service on the primary market or exchange on which they are traded. In the event there were no sales during the day or closing prices are not available, securities are valued at the last quoted bid price. Debt securities, including restricted securities, for which quotations are readily available, are valued by independent pricing services or by dealers who make markets in such securities. Pricing services consider yield or price of bonds of comparable quality, coupon, maturity and type as well as dealer supplied prices. Investments in open-end mutual funds, including the Fidelity Central Funds, are valued at their closing net asset value each business day. Short-term
Annual Report
Notes to Financial Statements - continued
1. Significant Accounting Policies - continued
Security Valuation - continued
securities with remaining maturities of sixty days or less for which quotations are not readily available are valued at amortized cost, which approximates value.
When current market prices or quotations are not readily available or do not accurately reflect fair value, valuations may be determined in accordance with procedures adopted by the Board of Trustees. For example, when developments occur between the close of a market and the close of the NYSE that may materially affect the value of some or all of the securities, or when trading in a security is halted, those securities may be fair valued. Factors used in the determination of fair value may include monitoring news to identify significant market or security specific events such as changes in the value of U.S. securities markets, reviewing developments in foreign markets and evaluating the performance of ADRs, futures contracts and exchange-traded funds. Because the Fund's utilization of fair value pricing depends on market activity, the frequency with which fair value pricing is used can not be predicted and may be utilized to a significant extent. The value of securities used for NAV calculation under fair value pricing may differ from published prices for the same securities.
Foreign Currency. The Fund uses foreign currency contracts to facilitate transactions in foreign-denominated securities. Losses from these transactions may arise from changes in the value of the foreign currency or if the counterparties do not perform under the contracts' terms.
Foreign-denominated assets, including investment securities, and liabilities are translated into U.S. dollars at the exchange rate at period end. Purchases and sales of investment securities, income and dividends received and expenses denominated in foreign currencies are translated into U.S. dollars at the exchange rate in effect on the transaction date.
The effects of exchange rate fluctuations on investments are included with the net realized and unrealized gain (loss) on investment securities. Other foreign currency transactions resulting in realized and unrealized gain (loss) are disclosed separately.
Investment Transactions and Income. Security transactions, including the Fund's investment activity in the Fidelity Central Funds, are accounted for as of trade date. Gains and losses on securities sold are determined on the basis of identified cost. Dividend income is recorded on the ex-dividend date, except for certain dividends from foreign securities where the ex-dividend date may have passed, which are recorded as soon as the Fund is informed of the ex-dividend date. Non-cash dividends included in dividend income, if any, are recorded at the fair market value of the securities received. Distributions received on securities that represent a return of capital or capital gain are recorded as a reduction of cost of investments and/or as a realized gain. The Fund
Annual Report
1. Significant Accounting Policies - continued
Investment Transactions and Income - continued
estimates the components of distributions received that may be considered return of capital distributions or capital gain distributions. Interest income and income distributions from the Fidelity Central Funds are accrued as earned, with any income distributions receivable as of period end included in Interest Receivable on the Statement of Assets and Liabilities. Interest income includes coupon interest and amortization of premium and accretion of discount on debt securities. Investment income is recorded net of foreign taxes withheld where recovery of such taxes is uncertain.
Expenses. Most expenses of the trust can be directly attributed to a fund. Expenses which cannot be directly attributed are apportioned among each Fund in the trust. Expense estimates are accrued in the period to which they relate and adjustments are made when actual amounts are known.
Income Tax Information and Distributions to Shareholders. Each year, the Fund intends to qualify as a regulated investment company by distributing all of its taxable income and realized gains under Subchapter M of the Internal Revenue Code. As a result, no provision for income taxes is required in the accompanying financial statements. Foreign taxes are provided for based on the Fund's understanding of the tax rules and rates that exist in the foreign markets in which it invests.
Distributions are recorded on the ex-dividend date. Income dividends and capital gain distributions are declared separately for each class. Income and capital gain distributions are determined in accordance with income tax regulations, which may differ from generally accepted accounting principles. In addition, the Fund will claim a portion of the payment made to redeeming shareholders as a distribution for income tax purposes.
Capital accounts within the financial statements are adjusted for permanent book-tax differences. These adjustments have no impact on net assets or the results of operations. Temporary book-tax differences will reverse in a subsequent period.
Book-tax differences are primarily due to foreign currency transactions, passive foreign investment companies (PFIC), market discount and losses deferred due to wash sales.
The tax-basis components of distributable earnings and the federal tax cost as of period end were as follows:
Unrealized appreciation | $ 180,327,420 |
Unrealized depreciation | (12,101,011) |
Net unrealized appreciation (depreciation) | 168,226,409 |
Undistributed ordinary income | 6,925,686 |
Undistributed long-term capital gain | 63,595,262 |
| |
Cost for federal income tax purposes | $ 1,219,180,674 |
Annual Report
Notes to Financial Statements - continued
1. Significant Accounting Policies - continued
Income Tax Information and Distributions to Shareholders - continued
The tax character of distributions paid was as follows:
| November 30, 2006 | November 30, 2005 |
Ordinary Income | $ 19,594,724 | $ 14,194,615 |
Long-term Capital Gains | 10,685,905 | - |
Total | $ 30,280,629 | $ 14,194,615 |
New Accounting Pronouncements. In July 2006, Financial Accounting Standards Board Interpretation No. 48, Accounting for Uncertainty in Income Taxes - an interpretation of FASB Statement 109 (FIN 48), was issued and is effective for fiscal years beginning after December 15, 2006. FIN 48 sets forth a threshold for financial statement recognition, measurement and disclosure of a tax position taken or expected to be taken on a tax return. Management is currently evaluating the impact, if any, the adoption of FIN 48 will have on the Fund's net assets, results of operations and financial statement disclosures.
In addition, in September 2006, Statement of Financial Accounting Standards No. 157, Fair Value Measurements (SFAS 157), was issued and is effective for fiscal years beginning after November 15, 2007. SFAS 157 defines fair value, establishes a framework for measuring fair value and expands disclosures about fair value measurements. Management is currently evaluating the impact the adoption of SFAS 157 will have on the Fund's financial statement disclosures.
2. Operating Policies.
Repurchase Agreements. FMR has received an Exemptive Order from the Securities and Exchange Commission (the SEC) which permits the Fund and other affiliated entities of FMR to transfer uninvested cash balances into joint trading accounts which are then invested in repurchase agreements. The Fund may also invest directly with institutions in repurchase agreements. Repurchase agreements are collateralized by government or non-government securities. Upon settlement date, collateral is held in segregated accounts with custodian banks and may be obtained in the event of a default of the counterparty. The Fund monitors, on a daily basis, the value of the collateral to ensure it is at least equal to the principal amount of the repurchase agreement (including accrued interest). In the event of a default by the counterparty, realization of the collateral proceeds could be delayed, during which time the value of the collateral may decline.
Restricted Securities. The Fund may invest in securities that are subject to legal or contractual restrictions on resale. These securities generally may be resold in transactions exempt from registration or to the public if the securities are registered. Disposal of
Annual Report
2. Operating Policies - continued
Restricted Securities - continued
these securities may involve time-consuming negotiations and expense, and prompt sale at an acceptable price may be difficult. Information regarding restricted securities is included at the end of the Fund's Schedule of Investments.
3. Purchases and Sales of Investments.
Purchases and sales of securities, other than short-term securities, aggregated $1,623,471,419 and $1,440,513,795, respectively.
4. Fees and Other Transactions with Affiliates.
Management Fee. FMR and its affiliates provide the Fund with investment management related services for which the Fund pays a monthly management fee. The management fee is the sum of an individual fund fee rate that is based on an annual rate of .30% of the Fund's average net assets and a group fee rate that averaged ..27% during the period. The group fee rate is based upon the average net assets of all the mutual funds advised by FMR. The group fee rate decreases as assets under management increase and increases as assets under management decrease. For the period, the total annual management fee rate was .56% of the Fund's average net assets.
Distribution and Service Plan. In accordance with Rule 12b-1 of the 1940 Act, the Fund has adopted separate Distribution and Service Plans for each class of shares. Certain classes pay Fidelity Distributors Corporation (FDC), an affiliate of FMR, separate Distribution and Service Fees, each of which is based on an annual percentage of each class' average net assets. In addition, FDC may pay financial intermediaries for selling shares of the Fund and providing shareholder support services. For the period, the Distribution and Service Fee rates and the total amounts paid to and retained by FDC were as follows:
| Distribution
Fee | Service
Fee | Paid to
FDC | Retained
by FDC |
Class A | 0% | .25% | $ 131,994 | $ 3,829 |
Class T | .25% | .25% | 488,194 | 27,702 |
Class B | .75% | .25% | 206,600 | 155,348 |
Class C | .75% | .25% | 611,492 | 170,452 |
| | | $ 1,438,280 | $ 357,331 |
Sales Load. FDC receives a front-end sales charge of up to 5.75% for selling Class A shares, and 3.50% for selling Class T shares, some of which is paid to financial intermediaries for selling shares of the Fund. FDC receives the proceeds of contingent deferred sales charges levied on Class A, Class T, Class B, and Class C redemptions. These charges depend on the holding period. The deferred sales charges range from 5% to 1% for
Annual Report
Notes to Financial Statements - continued
4. Fees and Other Transactions with Affiliates - continued
Sales Load - continued
Class B, 1% for Class C, 1.00% to .50% for certain purchases of Class A shares (.25% prior to February 24, 2006) and .25% for certain purchases of Class T shares.
For the period, sales charge amounts retained by FDC were as follows:
| Retained
by FDC |
Class A | $ 101,404 |
Class T | 40,021 |
Class B* | 35,066 |
Class C* | 7,583 |
| $ 184,074 |
* When Class B and Class C shares are initially sold, FDC pays commissions from its own resources to financial intermediaries through which the sales are made.
Transfer Agent Fees. Fidelity Investments Institutional Operations Company, Inc. (FIIOC), an affiliate of FMR, is the transfer, dividend disbursing and shareholder servicing agent for each class of the Fund, except for Strategic Dividend & Income. Fidelity Service Company, Inc. (FSC), an affiliate of FMR, is the transfer agent for Strategic Dividend & Income shares. FIIOC and FSC receive account fees and asset-based fees that vary according to the account size and type of account of the shareholders of the respective classes of the Fund. FIIOC and FSC pay for typesetting, printing and mailing of shareholder reports, except proxy statements. For the period, the total transfer agent fees paid by each class to FIIOC or FSC, were as follows:
| Amount | % of
Average
Net Assets |
Class A | $ 141,182 | .27 |
Class T | 224,910 | .23 |
Class B | 70,224 | .34 |
Class C | 160,748 | .26 |
Strategic Dividend and Income | 1,647,958 | .17 |
Institutional Class | 22,363 | .20 |
| $ 2,267,385 | |
Annual Report
4. Fees and Other Transactions with Affiliates - continued
Accounting and Security Lending Fees. FSC maintains the Fund's accounting records. The accounting fee is based on the level of average net assets for the month. Under a separate contract, FSC administers the security lending program. The security lending fee is based on the number and duration of lending transactions.
Investments in Fidelity Central Funds. The Fund may invest in Fidelity Central Funds. The Fund's Schedule of Investments lists each of the Fidelity Central Funds as an investment of the Fund but does not include the underlying holdings of each Fidelity Central Fund. As an Investing Fund, the Fund indirectly bears its proportionate share of the expenses of the underlying Fidelity Central Funds. A complete unaudited list of holdings for each Fidelity Central Fund is available upon request. In addition, the financial statements of the Fidelity Central Funds, which are not covered by the Fund's Report of Independent Registered Public Accounting Firm, are available on the EDGAR Database on the SEC's web site, www.sec.gov, or upon request.
The Money Market Central Funds seek preservation of capital and current income and are managed by Fidelity Investments Money Management, Inc. (FIMM), an affiliate of FMR.
Brokerage Commissions. The Fund placed a portion of its portfolio transactions with brokerage firms which are affiliates of the investment adviser. The commissions paid to these affiliated firms were $12,265 for the period.
5. Committed Line of Credit.
The Fund participates with other funds managed by FMR in a $4.2 billion credit facility (the "line of credit") to be utilized for temporary or emergency purposes to fund shareholder redemptions or for other short-term liquidity purposes. The Fund has agreed to pay commitment fees on its pro rata portion of the line of credit, which amounts to $3,149 and is reflected in Miscellaneous Expense on the Statement of Operations. During the period, there were no borrowings on this line of credit.
Annual Report
Notes to Financial Statements - continued
6. Security Lending.
The Fund lends portfolio securities from time to time in order to earn additional income. On the settlement date of the loan, the Fund receives collateral (in the form of U.S. Treasury obligations, letters of credit and/or cash) against the loaned securities and maintains collateral in an amount not less than 100% of the market value of the loaned securities during the period of the loan. The market value of the loaned securities is determined at the close of business of the Fund and any additional required collateral is delivered to the Fund on the next business day. If the borrower defaults on its obligation to return the securities loaned because of insolvency or other reasons, a fund could experience delays and costs in recovering the securities loaned or in gaining access to the collateral. Any cash collateral received is invested in the Fidelity Securities Lending Cash Central Fund. At period end, there were no security loans outstanding. Security lending income represents the income earned on investing cash collateral, less fees and expenses associated with the loan, plus any premium payments that may be received on the loan of certain types of securities. Security lending income is presented in the Statement of Operations as a component of income from Fidelity Central Funds. Net income from lending portfolio securities during the period amounted to $51,351.
7. Bank Borrowings.
The Fund is permitted to have bank borrowings for temporary or emergency purposes to fund shareholder redemptions. The Fund has established borrowing arrangements with certain banks. The interest rate on the borrowings is the bank's base rate, as revised from time to time. The average daily loan balance during the period for which loans were outstanding amounted to $11,495,000. The weighted average interest rate was 5.56%. At period end, there were no bank borrowings outstanding.
8. Expense Reductions.
Many of the brokers with whom FMR places trades on behalf of the Fund provided services to the Fund in addition to trade execution. These services included payments of certain expenses on behalf of the Fund totaling $60,975 for the period. In addition, through arrangements with each class' transfer agent, credits realized as a result of uninvested cash balances were used to reduce the Fund's expenses. During the period, credits reduced each class' transfer agent expense as noted in the table below.
| Transfer Agent
expense reduction |
Strategic Dividend and Income | $ 4,613 |
Annual Report
9. Other.
The Fund's organizational documents provide former and current trustees and officers with a limited indemnification against liabilities arising in connection with the performance of their duties to the Fund. In the normal course of business, the Fund may also enter into contracts that provide general indemnifications. The Fund's maximum exposure under these arrangements is unknown as this would be dependent on future claims that may be made against the Fund. The risk of material loss from such claims is considered remote.
During the period, the Fund's transfer agent, Fidelity Investments Institutional Operations Company, Inc. (FIIOC), an affiliate of Fidelity Management & Research Company, notified the Fund that the fund's books and records did not reflect a conversion of certain Class B to Class A shares upon their conversion date. Management has determined that this did not have a material impact to the Fund's reported net assets or results of operations in the accompanying financial statements. FIIOC will cause the books and records of the Fund to reflect a conversion of the relevant Class B shares to Class A and is in the process of determining the impact to affected shareholder accounts for purposes of its remediation.
The United States Securities and Exchange Commission ("SEC") is conducting an investigation of FMR (covering the years 2002 to 2004) arising from gifts, gratuities and business entertainment provided by certain brokers to certain individuals who were employed on FMR's domestic equity trading desk during that period. FMR is in discussions with the SEC staff regarding the possible resolution of the matter, but as of period-end no final resolution has been reached.
In December 2006, the Independent Trustees completed their own investigation of the matter with the assistance of independent counsel. The Independent Trustees and FMR agree that, despite the absence of proof that the Fidelity mutual funds experienced diminished execution quality as a result of the improper receipt of gifts and business entertainment, the conduct at issue was serious and is worthy of redress. Accordingly, the Independent Trustees have requested and FMR has agreed to pay $42 million to Fidelity mutual funds, plus interest to be determined at the time that payment is made. A method of allocating this payment among the funds has not yet been determined. In addition, subsequent to period-end, FMR has reimbursed related legal expenses. The total payment to the Fund is not anticipated to have a material impact on the Fund's net assets.
Annual Report
Notes to Financial Statements - continued
10. Distributions to Shareholders.
Distributions to shareholders of each class were as follows:
Years ended November 30, | 2006 | 2005 |
From net investment income | | |
Class A | $ 755,007 | $ 475,907 |
Class T | 1,207,524 | 830,178 |
Class B | 136,347 | 141,821 |
Class C | 455,492 | 339,138 |
Strategic Dividend and Income | 16,844,509 | 12,270,157 |
Institutional Class | 195,845 | 137,414 |
Total | $ 19,594,724 | $ 14,194,615 |
From net realized gain | | |
Class A | $ 422,135 | $ - |
Class T | 869,186 | - |
Class B | 212,465 | - |
Class C | 535,091 | - |
Strategic Dividend and Income | 8,542,657 | - |
Institutional Class | 104,371 | - |
Total | $ 10,685,905 | $ - |
Annual Report
11. Share Transactions.
Transactions for each class of shares were as follows:
| Shares | Dollars |
Years ended November 30, | 2006 | 2005 | 2006 | 2005 |
Class A | | | | |
Shares sold | 2,652,278 | 1,768,977 | $ 33,771,371 | $ 20,345,648 |
Reinvestment of distributions | 74,313 | 30,595 | 927,356 | 349,961 |
Shares redeemed | (785,506) | (589,953) | (9,972,783) | (6,809,260) |
Net increase (decrease) | 1,941,085 | 1,209,619 | $ 24,725,944 | $ 13,886,349 |
Class T | | | | |
Shares sold | 3,093,279 | 3,882,259 | $ 39,401,358 | $ 44,416,238 |
Reinvestment of distributions | 142,542 | 59,648 | 1,774,211 | 681,858 |
Shares redeemed | (1,016,565) | (669,970) | (12,945,160) | (7,729,006) |
Net increase (decrease) | 2,219,256 | 3,271,937 | $ 28,230,409 | $ 37,369,090 |
Class B | | | | |
Shares sold | 651,095 | 744,114 | $ 8,286,669 | $ 8,505,041 |
Reinvestment of distributions | 22,168 | 9,782 | 273,978 | 111,311 |
Shares redeemed | (535,951) | (344,455) | (6,733,248) | (3,964,823) |
Net increase (decrease) | 137,312 | 409,441 | $ 1,827,399 | $ 4,651,529 |
Class C | | | | |
Shares sold | 2,077,679 | 2,014,501 | $ 26,455,087 | $ 23,123,712 |
Reinvestment of distributions | 59,230 | 19,942 | 735,267 | 227,493 |
Shares redeemed | (696,643) | (545,060) | (8,845,742) | (6,287,937) |
Net increase (decrease) | 1,440,266 | 1,489,383 | $ 18,344,612 | $ 17,063,268 |
Strategic Dividend and Income | | | |
Shares sold | 36,957,213 | 36,814,600 | $ 472,572,702 | $ 424,067,244 |
Reinvestment of distributions | 1,804,449 | 944,881 | 22,539,587 | 10,819,574 |
Shares redeemed | (25,574,480) | (15,256,951) | (325,330,308) | (176,595,063) |
Net increase (decrease) | 13,187,182 | 22,502,530 | $ 169,781,981 | $ 258,291,755 |
Institutional Class | | | | |
Shares sold | 358,059 | 398,296 | $ 4,585,437 | $ 4,580,059 |
Reinvestment of distributions | 10,004 | 5,438 | 124,626 | 62,299 |
Shares redeemed | (164,319) | (48,869) | (2,080,022) | (567,988) |
Net increase (decrease) | 203,744 | 354,865 | $ 2,630,041 | $ 4,074,370 |
Annual Report
Report of Independent Registered Public Accounting Firm
To the Trustees of Fidelity Financial Trust and the Shareholders of Fidelity Strategic Dividend & Income Fund:
In our opinion, the accompanying statement of assets and liabilities, including the schedule of investments, and the related statements of operations and of changes in net assets and the financial highlights present fairly, in all material respects, the financial position of Fidelity Strategic Dividend & Income Fund (a fund of Fidelity Financial Trust) at November 30, 2006, the results of its operations for the year then ended, the changes in its net assets for each of the two years in the period then ended and the financial highlights for each of the three years in the period then ended, in conformity with accounting principles generally accepted in the United States of America. These financial statements and financial highlights (hereafter referred to as "financial statements") are the responsibility of the Fidelity Strategic Dividend & Income Fund's management; our responsibility is to express an opinion on these financial statements based on our audits. We conducted our audits of these financial statements in accordance with the standards of the Public Company Accounting Oversight Board (United States). Those standards require that we plan and perform the audit to obtain reasonable assurance about whether the financial statements are free of material misstatement. An audit includes examining, on a test basis, evidence supporting the amounts and disclosures in the financial statements, assessing the accounting principles used and significant estimates made by management, and evaluating the overall financial statement presentation. We believe that our audits, which included confirmation of securities at November 30, 2006 by correspondence with the custodian and brokers, provide a reasonable basis for our opinion.
PricewaterhouseCoopers LLP
Boston, Massachusetts
January 18, 2007
Annual Report
Trustees and Officers
The Trustees, Member of the Advisory Board, and executive officers of the trust and fund, as applicable, are listed below. The Board of Trustees governs the fund and is responsible for protecting the interests of shareholders. The Trustees are experienced executives who meet periodically throughout the year to oversee the fund's activities, review contractual arrangements with companies that provide services to the fund, and review the fund's performance. Except for William O. McCoy, each of the Trustees oversees 348 funds advised by FMR or an affiliate. Mr. McCoy oversees 350 funds advised by FMR or an affiliate.
The Trustees hold office without limit in time except that (a) any Trustee may resign; (b) any Trustee may be removed by written instrument, signed by at least two-thirds of the number of Trustees prior to such removal; (c) any Trustee who requests to be retired or who has become incapacitated by illness or injury may be retired by written instrument signed by a majority of the other Trustees; and (d) any Trustee may be removed at any special meeting of shareholders by a two-thirds vote of the outstanding voting securities of the trust. Each Trustee who is not an interested person (as defined in the 1940 Act) (Independent Trustee), shall retire not later than the last day of the calendar year in which his or her 72nd birthday occurs. The Independent Trustees may waive this mandatory retirement age policy with respect to individual Trustees. The executive officers and Advisory Board Member hold office without limit in time, except that any officer and Advisory Board Member may resign or may be removed by a vote of a majority of the Trustees at any regular meeting or any special meeting of the Trustees. Except as indicated, each individual has held the office shown or other offices in the same company for the past five years.
The fund's Statement of Additional Information (SAI) includes more information about the Trustees. To request a free copy, call Fidelity at 1-800-544-8544.
Interested Trustees*:
Correspondence intended for each Trustee who is an interested person may be sent to Fidelity Investments, 82 Devonshire Street, Boston, Massachusetts 02109.
Name, Age; Principal Occupation |
Edward C. Johnson 3d (76) |
| Year of Election or Appointment: 1982 Mr. Johnson is Chairman of the Board of Trustees. Mr. Johnson serves as President (2006-present), Chief Executive Officer, Chairman, and a Director of FMR Corp.; Chairman and a Director of FMR; Chairman and a Director of Fidelity Research & Analysis Company (FRAC); Chairman and a Director of Fidelity Investments Money Management, Inc.; and Chairman (2001-present) and a Director of FMR Co., Inc. In addition, Mr. Johnson serves as Chairman and Director of Fidelity International Limited (FIL). |
Robert L. Reynolds (54) |
| Year of Election or Appointment: 2003 Mr. Reynolds is President and a Director of FMR (2005-present), Fidelity Investments Money Management, Inc. (2005-present), and FMR Co., Inc. (2005-present). Mr. Reynolds also serves as Vice Chairman (2006-present), a Director (2003-present), and Chief Operating Officer of FMR Corp. and a Director of Strategic Advisers, Inc. (2005-present). He also serves on the Board at Fidelity Investments Canada, Ltd. |
* Trustees have been determined to be "Interested Trustees" by virtue of, among other things, their affiliation with the trust or various entities under common control with FMR.
Annual Report
Independent Trustees:
Correspondence intended for each Independent Trustee (that is, the Trustees other than the Interested Trustees) may be sent to Fidelity Investments, P.O. Box 55235, Boston, Massachusetts 02205-5235.
Name, Age; Principal Occupation |
Dennis J. Dirks (58) |
| Year of Election or Appointment: 2005 Prior to his retirement in May 2003, Mr. Dirks was Chief Operating Officer and a member of the Board of The Depository Trust & Clearing Corporation (DTCC) (1999-2003). He also served as President, Chief Operating Officer, and Board member of The Depository Trust Company (DTC) (1999-2003) and President and Board member of the National Securities Clearing Corporation (NSCC) (1999-2003). In addition, Mr. Dirks served as Chief Executive Officer and Board member of the Government Securities Clearing Corporation (2001-2003) and Chief Executive Officer and Board member of the Mortgage-Backed Securities Clearing Corporation (2001-2003). Mr. Dirks also serves as a Trustee and a member of the Finance Committee of Manhattan College (2005-present) and a Trustee and a member of the Finance Committee of AHRC of Nassau County (2006-present). |
Albert R. Gamper, Jr. (64) |
| Year of Election or Appointment: 2006 Prior to his retirement in December 2004, Mr. Gamper served as Chairman of the Board of CIT Group Inc. (commercial finance). During his tenure with CIT Group Inc. Mr. Gamper served in numerous senior management positions, including Chairman (1987-1989; 1999-2001; 2002-2004), Chief Executive Officer (1987-2004), and President (1989-2002). He currently serves as a member of the Board of Directors of Public Service Enterprise Group (utilities, 2001-present), Chairman of the Board of Governors, Rutgers University (2004-present), and Chairman of the Board of Saint Barnabas Health Care System. |
George H. Heilmeier (70) |
| Year of Election or Appointment: 2004 Dr. Heilmeier is Chairman Emeritus of Telcordia Technologies (communication software and systems), where prior to his retirement, he served as company Chairman and Chief Executive Officer. He currently serves on the Boards of Directors of The Mitre Corporation (systems engineering and information technology support for the government), and HRL Laboratories (private research and development, 2004-present). He is Chairman of the General Motors Science & Technology Advisory Board and a Life Fellow of the Institute of Electrical and Electronics Engineers (IEEE). Dr. Heilmeier is a member of the Defense Science Board and the National Security Agency Advisory Board. He is also a member of the National Academy of Engineering, the American Academy of Arts and Sciences, and the Board of Overseers of the School of Engineering and Applied Science of the University of Pennsylvania. Previously, Dr. Heilmeier served as a Director of TRW Inc. (automotive, space, defense, and information technology, 1992-2002), Compaq (1994-2002), Automatic Data Processing, Inc. (ADP) (technology-based business outsourcing, 1995-2002), INET Technologies Inc. (telecommunications network surveillance, 2001-2004), and Teletech Holdings (customer management services). He is the recipient of the 2005 Kyoto Prize in Advanced Technology for his invention of the liquid crystal display, and a member of the Consumer Electronics Hall of Fame. |
James H. Keyes (66) |
| Year of Election or Appointment: 2007 Prior to his retirement in 2003, Mr. Keyes was Chairman, President, and Chief Executive Officer of Johnson Controls, Inc. (automotive supplier, 1993-2003). He currently serves as a member of the boards of LSI Logic Corporation (semiconductor technologies), Navistar International Corporation (manufacture and sale of trucks, buses, and diesel engines, 2002-present), and Pitney Bowes, Inc. (integrated mail, messaging, and document management solutions). |
Marie L. Knowles (60) |
| Year of Election or Appointment: 2001 Prior to Ms. Knowles' retirement in June 2000, she served as Executive Vice President and Chief Financial Officer of Atlantic Richfield Company (ARCO) (diversified energy, 1996-2000). From 1993 to 1996, she was a Senior Vice President of ARCO and President of ARCO Transportation Company. She served as a Director of ARCO from 1996 to 1998. She currently serves as a Director of Phelps Dodge Corporation (copper mining and manufacturing) and McKesson Corporation (healthcare service, 2002-present). Ms. Knowles is a Trustee of the Brookings Institution and the Catalina Island Conservancy and also serves as a member of the Advisory Board for the School of Engineering of the University of Southern California. |
Ned C. Lautenbach (62) |
| Year of Election or Appointment: 2000 Mr. Lautenbach is Chairman of the Independent Trustees (2006-present). Mr. Lautenbach has been a partner of Clayton, Dubilier & Rice, Inc. (private equity investment firm) since September 1998. Previously, Mr. Lautenbach was with the International Business Machines Corporation (IBM) from 1968 until his retirement in 1998. Mr. Lautenbach serves as a Director of Sony Corporation (2006-present) and Eaton Corporation (diversified industrial) as well as the Philharmonic Center for the Arts in Naples, Florida. He also is a member of the Board of Trustees of Fairfield University (2005-present), as well as a member of the Council on Foreign Relations. |
William O. McCoy (73) |
| Year of Election or Appointment: 1997 Prior to his retirement in December 1994, Mr. McCoy was Vice Chairman of the Board of BellSouth Corporation (telecommunications) and President of BellSouth Enterprises. He is currently a Director of Duke Realty Corporation (real estate). He is also a partner of Franklin Street Partners (private investment management firm). In addition, Mr. McCoy served as the Interim Chancellor (1999-2000) and a member of the Board of Visitors for the University of North Carolina at Chapel Hill and currently serves as Chairman of the Board of Directors of the University of North Carolina Health Care System. He also served as Vice President of Finance for the University of North Carolina (16-school system). |
Cornelia M. Small (62) |
| Year of Election or Appointment: 2005 Ms. Small is a member (2000-present) and Chairperson (2002-present) of the Investment Committee, and a member (2002-present) of the Board of Trustees of Smith College. Previously, she served as Chief Investment Officer (1999-2000), Director of Global Equity Investments (1996-1999), and a member of the Board of Directors of Scudder, Stevens & Clark (1990-1997) and Scudder Kemper Investments (1997-1999). In addition, Ms. Small served as Co-Chair (2000-2003) of the Annual Fund for the Fletcher School of Law and Diplomacy. |
William S. Stavropoulos (67) |
| Year of Election or Appointment: 2002 Mr. Stavropoulos is Chairman Emeritus of the Board of Directors of The Dow Chemical Company. Since joining The Dow Chemical Company in 1967, Mr. Stavropoulos served in numerous senior management positions, including President (1993-2000; 2002-2003), CEO (1995-2000; 2002-2004), and Chairman of the Executive Committee (2000-2004). Currently, he is a Director of NCR Corporation (data warehousing and technology solutions), BellSouth Corporation (telecommunications), Chemical Financial Corporation, Maersk Inc. (industrial conglomerate, 2002-present), and Metalmark Capital (private equity investment firm, 2005-present). He also serves as a member of the Board of Trustees of the American Enterprise Institute for Public Policy Research. In addition, Mr. Stavropoulos is a member of The Business Council, J.P. Morgan International Council and the University of Notre Dame Advisory Council for the College of Science. |
Kenneth L. Wolfe (67) |
| Year of Election or Appointment: 2005 Prior to his retirement in 2001, Mr. Wolfe was Chairman and Chief Executive Officer of Hershey Foods Corporation (1993-2001). He currently serves as a member of the boards of Adelphia Communications Corporation (2003-present), Bausch & Lomb, Inc., and Revlon Inc. (2004-present). |
Annual Report
Advisory Board Member and Executive Officers:
Correspondence intended for each executive officer and Mr. Lynch may be sent to Fidelity Investments, 82 Devonshire Street, Boston, Massachusetts 02109.
Name, Age; Principal Occupation |
Peter S. Lynch (62) |
| Year of Election or Appointment: 2003 Member of the Advisory Board of Fidelity Financial Trust. Mr. Lynch is Vice Chairman and a Director of FMR, and Vice Chairman (2001-present) and a Director of FMR Co., Inc. Previously, Mr. Lynch served as a Trustee of the Fidelity funds (1990-2003). In addition, he serves as a Trustee of Boston College and as the Chairman of the Inner-City Scholarship Fund. |
Walter C. Donovan (44) |
| Year of Election or Appointment: 2005 Vice President of Strategic Dividend & Income. Mr. Donovan also serves as Vice President of Fidelity's High Income Funds (2005-present). Mr. Donovan also serves as Executive Vice President of FMR (2005-present) and FMR Co., Inc. (2005-present). Previously, Mr. Donovan served as Vice President of Fidelity's Fixed-Income Funds (2005-2006), certain Asset Allocation Funds (2005-2006), certain Balanced Funds (2005-2006), and as Vice President and Director of Fidelity's International Equity Trading group (1998-2005). |
Robert A. Lawrence (54) |
| Year of Election or Appointment: 2006 Vice President of Strategic Dividend & Income. Mr. Lawrence also serves as Vice President of the High Income Funds. Mr. Lawrence is Senior Vice President of FMR (2006-present) and FMR Co., Inc. (2006-present). Previously, Mr. Lawrence served as President of Fidelity Strategic Investments (2002-2005). |
Christopher L. Sharpe (38) |
| Year of Election or Appointment: 2005 Vice President of Strategic Dividend & Income. Mr. Sharpe also serves as Vice President of other funds advised by FMR. Prior to assuming his current responsibilities, Mr. Sharpe worked as an associate investment policy officer for John Hancock Financial Services, Inc. in Boston. From 1990 to 2000 he was with William M. Mercer, Inc. in Boston. Mr. Sharpe also serves as Vice President of FMR (2006) and FMR Co., Inc. (2006). |
Derek L. Young (42) |
| Year of Election or Appointment: 2005 Vice President of Strategic Dividend & Income. Mr. Young also serves as Vice President of other funds advised by FMR. Prior to assuming his current responsibilities, Mr. Young worked as director of Risk Management, senior vice president of Strategic Services and portfolio manager. Mr. Young also serves as Vice President of FMR and FMR Co., Inc (2004). |
Eric D. Roiter (58) |
| Year of Election or Appointment: 2003 Secretary of Strategic Dividend & Income. He also serves as Secretary of other Fidelity funds; Vice President, General Counsel, and Secretary of FMR Co., Inc. (2001-present) and FMR; Assistant Secretary of Fidelity Management & Research (U.K.) Inc. (2001-present), Fidelity Research & Analysis Company (2001-present), and Fidelity Investments Money Management, Inc. (2001-present). Mr. Roiter is an Adjunct Member, Faculty of Law, at Boston College Law School (2003-present). Previously, Mr. Roiter served as Vice President and Secretary of Fidelity Distributors Corporation (FDC) (1998-2005). |
Stuart Fross (47) |
| Year of Election or Appointment: 2003 Assistant Secretary of Strategic Dividend & Income. Mr. Fross also serves as Assistant Secretary of other Fidelity funds (2003-present), Vice President and Secretary of FDC (2005-present), and is an employee of FMR. |
R. Stephen Ganis (40) |
| Year of Election or Appointment: 2006 Anti-Money Laundering (AML) officer of Strategic Dividend & Income. Mr. Ganis also serves as AML officer of other Fidelity funds (2006-present) and FMR Corp. (2003-present). Before joining Fidelity Investments, Mr. Ganis practiced law at Goodwin Procter, LLP (2000-2002). |
Joseph B. Hollis (58) |
| Year of Election or Appointment: 2006 Chief Financial Officer of Strategic Dividend & Income. Mr. Hollis also serves as Chief Financial Officer of other Fidelity funds. Mr. Hollis is President of Fidelity Pricing and Cash Management Services (FPCMS) (2005-present). Mr. Hollis also serves as President and Director of Fidelity Service Company, Inc. (2006-present). Previously, Mr. Hollis served as Senior Vice President of Cash Management Services (1999-2002) and Investment Management Operations (2002-2005). |
Kenneth A. Rathgeber (59) |
| Year of Election or Appointment: 2004 Chief Compliance Officer of Strategic Dividend & Income. Mr. Rathgeber also serves as Chief Compliance Officer of other Fidelity funds (2004-present) and Executive Vice President of Risk Oversight for Fidelity Investments (2002-present). He is Chief Compliance Officer of FMR (2005-present), FMR Co., Inc. (2005-present), Fidelity Management & Research (U.K.) Inc. (2005-present), Fidelity Research & Analysis Company (2005-present), Fidelity Investments Money Management, Inc. (2005-present), and Strategic Advisers, Inc. (2005-present). Previously, Mr. Rathgeber served as Executive Vice President and Chief Operating Officer for Fidelity Investments Institutional Services Company, Inc. (1998-2002). |
Bryan A. Mehrmann (45) |
| Year of Election or Appointment: 2005 Deputy Treasurer of Strategic Dividend & Income. Mr. Mehrmann also serves as Deputy Treasurer of other Fidelity funds (2005-present) and is an employee of FMR. Previously, Mr. Mehrmann served as Vice President of Fidelity Investments Institutional Services Group (FIIS)/ Fidelity Investments Institutional Operations Corporation, Inc. (FIIOC) Client Services (1998-2004). |
Kimberley H. Monasterio (42) |
| Year of Election or Appointment: 2007 President and Treasurer of Strategic Dividend & Income. Ms. Monasterio also serves as President and Treasurer of other Fidelity funds (2007-present) and is an employee of FMR (2004-present). Previously, Ms. Monasterio served as Deputy Treasurer of the Fidelity funds (2004-2006). Before joining Fidelity Investments, Ms. Monasterio served as Treasurer (2000-2004) and Chief Financial Officer (2002-2004) of the Franklin Templeton Funds and Senior Vice President of Franklin Templeton Services, LLC (2000-2004). |
Kenneth B. Robins (37) |
| Year of Election or Appointment: 2005 Deputy Treasurer of Strategic Dividend & Income. Mr. Robins also serves as Deputy Treasurer of other Fidelity funds (2005-present) and is an employee of FMR (2004-present). Before joining Fidelity Investments, Mr. Robins worked at KPMG LLP, where he was a partner in KPMG's department of professional practice (2002-2004) and a Senior Manager (1999-2000). In addition, Mr. Robins served as Assistant Chief Accountant, United States Securities and Exchange Commission (2000-2002). |
Robert G. Byrnes (39) |
| Year of Election or Appointment: 2005 Assistant Treasurer of Strategic Dividend & Income. Mr. Byrnes also serves as Assistant Treasurer of other Fidelity funds (2005-present) and is an employee of FMR (2005-present). Previously, Mr. Byrnes served as Vice President of FPCMS (2003-2005). Before joining Fidelity Investments, Mr. Byrnes worked at Deutsche Asset Management where he served as Vice President of the Investment Operations Group (2000-2003). |
John H. Costello (60) |
| Year of Election or Appointment: 2003 Assistant Treasurer of Strategic Dividend & Income. Mr. Costello also serves as Assistant Treasurer of other Fidelity funds and is an employee of FMR. |
Peter L. Lydecker (52) |
| Year of Election or Appointment: 2004 Assistant Treasurer of Strategic Dividend & Income. Mr. Lydecker also serves as Assistant Treasurer of other Fidelity funds (2004) and is an employee of FMR. |
Mark Osterheld (51) |
| Year of Election or Appointment: 2003 Assistant Treasurer of Strategic Dividend & Income. Mr. Osterheld also serves as Assistant Treasurer of other Fidelity funds (2002) and is an employee of FMR. |
Gary W. Ryan (48) |
| Year of Election or Appointment: 2005 Assistant Treasurer of Strategic Dividend & Income. Mr. Ryan also serves as Assistant Treasurer of other Fidelity funds (2005-present) and is an employee of FMR (2005-present). Previously, Mr. Ryan served as Vice President of Fund Reporting in FPCMS (1999-2005). |
Salvatore Schiavone (41) |
| Year of Election or Appointment: 2005 Assistant Treasurer of Strategic Dividend & Income. Mr. Schiavone also serves as Assistant Treasurer of other Fidelity funds (2005-present) and is an employee of FMR (2005-present). Before joining Fidelity Investments, Mr. Schiavone worked at Deutsche Asset Management, where he most recently served as Assistant Treasurer (2003-2005) of the Scudder Funds and Vice President and Head of Fund Reporting (1996-2003). |
Annual Report
Distributions
The Board of Trustees of Fidelity Strategic Dividend & Income Fund voted to pay to shareholders of record at the opening of business on record date, the following distributions per share derived from capital gains realized from sales of portfolio securities, and dividends derived from net investment income:
| Pay Date | Record Date | Dividends | Capital Gains |
Strategic Dividend & Income: | 12/18/2006 | 12/15/2006 | $0.065 | $0.61 |
Strategic Dividend & Income: | 01/08/2007 | 01/05/2007 | $0.00 | $0.05 |
The fund hereby designates as a capital gain dividend with respect to the taxable year ended November 30, 2006, $63,595,262, or, if subsequently determined to be different, the net capital gain of such year.
A total of .17% of the dividends distributed during the fiscal year was derived from interest on U.S. Government securities which is generally exempt from state income tax.
Strategic Dividend & Income designates 28%, 93%, 93%, and 93% of the dividends distributed in December 2005 and April, July and October 2006, respectively during the fiscal year as qualifying for the dividends-received deduction for corporate shareholders.
Strategic Dividend & Income designates 41%, 97%, 97% and 96% of the dividends distributed in December 2005, April, July and October 2006, respectively during the fiscal year as amounts which may be taken into account as a dividend for purposes of the maximum rate under section 1(h)(11) of the Internal Revenue Code.
The fund will notify shareholders in January 2007 of amounts for use in preparing 2006 income tax returns.
Annual Report
Proxy Voting Results
A special meeting of the fund's shareholders was held on September 20, 2006. The results of votes taken among shareholders on the proposal before them are reported below. Each vote reported represents one dollar of net asset value held on the record date for the meeting.
PROPOSAL 1 |
To elect a Board of Trustees. A |
| # of
Votes | % of
Votes |
Dennis J. Dirks |
Affirmative | 10,327,434,641.22 | 95.770 |
Withheld | 456,199,004.95 | 4.230 |
TOTAL | 10,783,633,646.17 | 100.000 |
Albert R. Gamper, Jr. |
Affirmative | 10,322,116,523.07 | 95.720 |
Withheld | 461,517,123.10 | 4.280 |
TOTAL | 10,783,633,646.17 | 100.000 |
Robert M. Gates |
Affirmative | 10,288,766,799.53 | 95.411 |
Withheld | 494,866,846.64 | 4.589 |
TOTAL | 10,783,633,646.17 | 100.000 |
George H. Heilmeier |
Affirmative | 10,298,619,061.42 | 95.502 |
Withheld | 485,014,584.75 | 4.498 |
TOTAL | 10,783,633,646.17 | 100.000 |
Edward C. Johnson 3d |
Affirmative | 10,257,561,582.55 | 95.122 |
Withheld | 526,072,063.62 | 4.878 |
TOTAL | 10,783,633,646.17 | 100.000 |
Stephen P. Jonas |
Affirmative | 10,317,222,628.79 | 95.675 |
Withheld | 466,411,017.38 | 4.325 |
TOTAL | 10,783,633,646.17 | 100.000 |
James H. KeyesB |
Affirmative | 10,318,195,711.25 | 95.684 |
Withheld | 465,437,934.92 | 4.316 |
TOTAL | 10,783,633,646.17 | 100.000 |
| # of
Votes | % of
Votes |
Marie L. Knowles |
Affirmative | 10,317,835,129.19 | 95.681 |
Withheld | 465,798,516.98 | 4.319 |
TOTAL | 10,783,633,646.17 | 100.000 |
Ned C. Lautenbach |
Affirmative | 10,317,039,890.90 | 95.673 |
Withheld | 466,593,755.27 | 4.327 |
TOTAL | 10,783,633,646.17 | 100.000 |
William O. McCoy |
Affirmative | 10,278,036,936.38 | 95.311 |
Withheld | 505,596,709.79 | 4.689 |
TOTAL | 10,783,633,646.17 | 100.000 |
Robert L. Reynolds |
Affirmative | 10,320,662,459.03 | 95.707 |
Withheld | 462,971,187.14 | 4.293 |
TOTAL | 10,783,633,646.17 | 100.000 |
Cornelia M. Small |
Affirmative | 10,329,731,930.45 | 95.791 |
Withheld | 453,901,715.72 | 4.209 |
TOTAL | 10,783,633,646.17 | 100.000 |
William S. Stavropoulos |
Affirmative | 10,298,039,656.66 | 95.497 |
Withheld | 485,593,989.51 | 4.503 |
TOTAL | 10,783,633,646.17 | 100.000 |
Kenneth L. Wolfe |
Affirmative | 10,310,583,687.33 | 95.613 |
Withheld | 473,049,958.84 | 4.387 |
TOTAL | 10,783,633,646.17 | 100.000 |
A Denotes trust-wide proposal and voting results. B Effective on or about January 1, 2007. |
Annual Report
Board Approval of Investment Advisory Contracts and Management Fees
Fidelity Strategic Dividend & Income Fund
Each year, typically in July, the Board of Trustees, including the Independent Trustees (together, the Board), votes on the renewal of the management contract and sub-advisory agreements (together, the Advisory Contracts) for the fund. The Board, assisted by the advice of fund counsel and Independent Trustees' counsel, requests and considers a broad range of information throughout the year.
The Board meets regularly each month except August and takes into account throughout the year matters bearing on Advisory Contracts. The Board, acting directly and through its separate committees, considers at each of its meetings factors that are relevant to the annual renewal of the fund's Advisory Contracts, including the services and support provided to the fund and its shareholders. At the time of the renewal, the Board had 12 standing committees, each composed of Independent Trustees with varying backgrounds, to which the Board has assigned specific subject matter responsibilities in order to enhance effective decision-making by the Board. Each committee has adopted a written charter outlining the structure and purposes of the committee. One such committee, the Equity Contract Committee, meets periodically as needed throughout the year to consider matters specifically related to the annual renewal of Advisory Contracts. The committee requests and receives information on, and makes recommendations to the Independent Trustees concerning, the approval and annual review of the Advisory Contracts.
At its July 2006 meeting, the Board of Trustees, including the Independent Trustees, unanimously determined to renew the Advisory Contracts for the fund. In reaching its determination, the Board considered all factors it believed relevant, including (i) the nature, extent, and quality of the services to be provided to the fund and its shareholders (including the investment performance of the fund); (ii) the competitiveness of the management fee and total expenses of the fund; (iii) the total costs of the services to be provided by and the profits to be realized by the investment adviser and its affiliates from the relationship with the fund; (iv) the extent to which economies of scale would be realized as the fund grows; and (v) whether fee levels reflect these economies of scale, if any, for the benefit of fund shareholders.
In determining whether to renew the Advisory Contracts for the fund, the Board ultimately reached a determination, with the assistance of fund counsel and Independent Trustees' counsel, that the renewal of the Advisory Contracts and the compensation to be received by Fidelity under the management contract is consistent with Fidelity's fiduciary duty under applicable law. In addition to evaluating the specific factors noted above, the Board, in reaching its determination, is aware that shareholders in the fund have a broad range of investment choices available to them, including a wide choice among mutual funds offered by competitors to Fidelity, and that the fund's shareholders, with the opportunity to review and weigh the disclosure provided by the fund in its prospectus and other public disclosures, have chosen to invest in this fund, managed by Fidelity.
Annual Report
Board Approval of Investment Advisory Contracts and
Management Fees - continued
Nature, Extent, and Quality of Services Provided. The Board considered staffing within the investment adviser, FMR, and the sub-advisers (together, the Investment Advisers), including the background of the fund's portfolio manager and the fund's investment objective and discipline. The Independent Trustees also had discussions with senior management of Fidelity's investment operations and investment groups. The Board considered the structure of the portfolio manager compensation program and whether this structure provides appropriate incentives.
Resources Dedicated to Investment Management and Support Services. The Board reviewed the size, education, and experience of the Investment Advisers' investment staff, their use of technology, and the Investment Advisers' approach to recruiting, training, and retaining portfolio managers and other research, advisory, and management personnel. The Board considered Fidelity's extensive global research capabilities that enable the Investment Advisers to aggregate data from various sources in an effort to produce positive investment results. The Board noted that Fidelity's analysts have access to a variety of technological tools that enable them to perform both fundamental and quantitative analysis and to specialize in various disciplines. The Board also considered that Fidelity's portfolio managers and analysts have access to daily portfolio attribution that allows for monitoring of a fund's portfolio, as well as an electronic communication system that provides immediate real-time access to research concerning issuers and credit enhancers.
Shareholder and Administrative Services. The Board considered (i) the nature, extent, quality, and cost of administrative, distribution, and shareholder services performed by the Investment Advisers and their affiliates under the Advisory Contracts and under separate agreements covering transfer agency, pricing and bookkeeping, and securities lending services for the fund; (ii) the nature and extent of the Investment Advisers' supervision of third party service providers, principally custodians and subcustodians; and (iii) the resources devoted to, and the record of compliance with, the fund's compliance policies and procedures. The Board reviewed the allocation of fund brokerage, including allocations to brokers affiliated with the Investment Advisers, the use of brokerage commissions to pay fund expenses, and the use of "soft" commission dollars to pay for research services. The Board also considered that Fidelity voluntarily pays for market data out of its own resources.
The Board noted that the growth of fund assets across the complex allows Fidelity to reinvest in the development of services designed to enhance the value or convenience of the Fidelity funds as investment vehicles. These services include 24-hour access to account information and market information through phone representatives and over the Internet, and investor education materials and asset allocation tools.
Annual Report
Investment in a Large Fund Family. The Board considered the benefits to shareholders of investing in a Fidelity fund, including the benefits of investing in a fund that is part of a large family of funds offering a variety of investment disciplines and providing for a large variety of mutual fund investor services. For example, fund shareholders are offered the privilege of exchanging shares of the fund for shares of other Fidelity funds, as set forth in the fund's prospectus, without paying an additional sales charge. The Board noted that, since the last Advisory Contract renewals in July 2005, Fidelity has taken a number of actions that benefited particular funds, including (i) dedicating additional resources to investment research and to restructure the investment research teams; (ii) voluntarily entering into contractual arrangements with certain brokers pursuant to which Fidelity pays for research products and services separately out of its own resources, rather than bundling with fund commissions; (iii) launching the Fidelity Advantage Class of its five Spartan stock index funds and three Spartan bond index funds, which is a lower-fee class available to shareholders with higher account balances; (iv) contractually agreeing to impose expense limitations on Fidelity U.S. Bond Index Fund and reducing the fund's initial investment minimum; and (v) offering shareholders of each of the Fidelity Institutional Money Market Funds the privilege of exchanging shares of the fund for shares of other Fidelity funds.
Investment Performance and Compliance. The Board considered whether the fund has operated within its investment objective, as well as its record of compliance with its investment restrictions. It also reviewed the fund's absolute investment performance for each class, as well as the fund's relative investment performance for each class measured against (i) a proprietary custom index, and (ii) a peer group of mutual funds deemed appropriate by the Board. Because the fund had been in existence less than three calendar years, the following chart considered by the Board shows, for the one-year period ended December 31, 2005, the total returns of Class C and Fidelity Strategic Dividend & Income (retail class), the total return of a proprietary custom index ("benchmark"), and a range of total returns of a peer group of mutual funds identified by Lipper Inc. as having an investment objective similar to that of the fund. The returns of Class C and Fidelity Strategic Dividend & Income (retail class) represent the performance of classes with the highest and lowest 12b-1 fees, respectively (not necessarily with the highest and lowest total expenses). The box within the chart shows the 25th percentile return (bottom of box) and the 75th percentile return (top of box) of the Lipper peer group. Returns shown above the box are in the first quartile and returns shown below the box are in the fourth quartile. The percentage beaten numbers noted below the chart correspond to the percentile box and represent the percentage of funds in the Lipper peer group whose performance was equal to or lower than that of the class indicated. The fund's proprietary custom index is an index developed by FMR that represents the performance of the fund's four general investment categories according to their respective weightings in the fund's neutral mix.
Annual Report
Board Approval of Investment Advisory Contracts and
Management Fees - continued
Fidelity Strategic Dividend & Income Fund

The Board reviewed the fund's relative investment performance against its Lipper peer group and stated that the performance of Fidelity Strategic Dividend & Income (retail class) was in the first quartile for the period shown. The Board also stated that the relative investment performance of Fidelity Strategic Dividend & Income (retail class) compared favorably to its benchmark for the period shown. The Board considered that the variations in performance among the fund's classes reflect the variations in class expenses, which result in lower performance for higher expense classes. The Board stated that it is difficult to evaluate in any comprehensive fashion the performance of the fund, in light of its relatively recent launch. The Board also reviewed the fund's relative investment performance against a peer group defined by Morningstar.
The Board considered that FMR has taken steps to refocus and strengthen equity research, equity portfolio management, and compliance. The Board noted with favor FMR's reorganization of its senior management team in 2005 and FMR's dedication of additional resources to investment research, and participated in the process that led to those changes.
Based on its review, and giving particular weight to the nature and quality of the resources dedicated by the Investment Advisers to maintain and improve relative performance, the Board concluded that the nature, extent, and quality of the services provided to the fund will benefit the fund's shareholders, particularly in light of the Board's view that the fund's shareholders benefit from investing in a fund that is part of a large family of funds offering a variety of investment disciplines and services.
Annual Report
Competitiveness of Management Fee and Total Fund Expenses. The Board considered the fund's management fee and total expenses compared to "mapped groups" of competitive funds and classes. Fidelity creates "mapped groups" by combining similar Lipper investment objective categories that have comparable management fee characteristics. Combining Lipper investment objective categories aids the Board's management fee and total expense comparisons by broadening the competitive group used for comparison and by reducing the number of universes to which various Fidelity funds are compared.
The Board considered two proprietary management fee comparisons for the 12-month (or shorter) periods shown in the chart below. The group of Lipper funds used by the Board for management fee comparisons is referred to below as the "Total Mapped Group" and, for the reasons explained above, is broader than the Lipper peer group used by the Board for performance comparisons. The Total Mapped Group comparison focuses on a fund's standing relative to the total universe of comparable funds available to investors, in terms of gross management fees before expense reimbursements or caps. "TMG %" represents the percentage of funds in the Total Mapped Group that had management fees that were lower than the fund's. For example, a TMG % of 21% means that 79% of the funds in the Total Mapped Group had higher management fees than the fund. The "Asset-Size Peer Group" (ASPG) comparison focuses on a fund's standing relative to non-Fidelity funds similar in size to the fund within the Total Mapped Group. The ASPG represents at least 15% of the funds in the Total Mapped Group with comparable asset size and management fee characteristics, subject to a minimum of 50 funds (or all funds in the Total Mapped Group if fewer than 50). Additional information, such as the ASPG quartile in which the fund's management fee ranked, is also included in the chart and considered by the Board.
Annual Report
Board Approval of Investment Advisory Contracts and
Management Fees - continued
Fidelity Strategic Dividend & Income Fund

The Board noted that the fund's management fee ranked below the median of its Total Mapped Group and below the median of its ASPG for 2005.
Based on its review, the Board concluded that the fund's management fee was fair and reasonable in light of the services that the fund receives and the other factors considered.
In its review of each class's total expenses, the Board considered the fund's management fee as well as other fund or class expenses, as applicable, such as transfer agent fees, pricing and bookkeeping fees, fund-paid 12b-1 fees, and custodial, legal, and audit fees. The Board also noted the effects of any waivers and reimbursements on fees and expenses. As part of its review, the Board also considered current and historical total expenses of each class of the fund compared to competitive fund median expenses. Each class of the fund is compared to those funds and classes in the Total Mapped Group (used by the Board for management fee comparisons) that have a similar sales load structure.
The Board noted that the total expenses of each of Class A, Class B, Class C, Institutional Class and Fidelity Strategic Dividend & Income (retail class) ranked below its competitive median for 2005, and the total expenses of Class T ranked above its competitive median for 2005. The Board noted that the fund offers multiple classes, each of which has a different sales load and 12b-1 fee structure, and that the multiple structures are intended to offer a range of pricing options for the intermediary market. The Board also noted that the total expenses of the classes vary primarily by the level of their 12b-1 fees, although differences in transfer agent fees may also cause expenses to vary from class to class.
Annual Report
In its review of total expenses, the Board also considered Fidelity fee structures and other information on clients that FMR and its affiliates service in other competitive markets, such as other mutual funds advised or subadvised by FMR or its affiliates, pension plan clients, and other institutional clients.
Based on its review, the Board concluded that the total expenses of each class of the fund were reasonable, although in one case above the median of the universe presented for comparison, in light of the services that the fund and its shareholders receive and the other factors considered.
Costs of the Services and Profitability. The Board considered the revenues earned and the expenses incurred by Fidelity in conducting the business of developing, marketing, distributing, managing, administering and servicing the fund and its shareholders. The Board also considered the level of Fidelity's profits in respect of all the Fidelity funds.
On an annual basis, FMR presents to the Board Fidelity's profitability for the fund. Fidelity calculates the profitability for each fund, as well as aggregate profitability for groups of Fidelity funds and all Fidelity funds, using a series of detailed revenue and cost allocation methodologies which originate with the audited books and records of Fidelity. The Audit Committee of the Board reviews any significant changes from the prior year's methodologies.
PricewaterhouseCoopers LLP (PwC), independent registered accounting firm and auditor to Fidelity and certain Fidelity funds, has been engaged annually by the Board as part of the Board's assessment of the results of Fidelity's profitability analysis. PwC's engagement includes the review and assessment of Fidelity's methodologies used in determining the revenues and expenses attributable to Fidelity's mutual fund business, and completion of agreed-upon procedures surrounding the mathematical accuracy of fund profitability and its conformity to allocation methodologies. After considering PwC's reports issued under the engagement and information provided by Fidelity, the Board believes that while other allocation methods may also be reasonable, Fidelity's profitability methodologies are reasonable in all material respects.
The Board has also reviewed Fidelity's non-fund businesses and any fall-out benefits related to the mutual fund business as well as cases where Fidelity's affiliates may benefit from or be related to the fund's business.
The Board considered the costs of the services provided by and the profits realized by Fidelity in connection with the operation of the fund and determined that the amount of profit is a fair entrepreneurial profit for the management of the fund.
Annual Report
Board Approval of Investment Advisory Contracts and
Management Fees - continued
Economies of Scale. The Board considered whether there have been economies of scale in respect of the management of the Fidelity funds, whether the Fidelity funds (including the fund) have appropriately benefited from any such economies of scale, and whether there is potential for realization of any further economies of scale. The Board considered the extent to which the fund will benefit from economies of scale through increased services to the fund, through waivers or reimbursements, or through fee or expense reductions, including reductions that occur through operation of the transfer agent agreement. The transfer agent fee varies in part based on the number of accounts in the fund. If the number of accounts decreases or the average account size increases, the overall transfer agent fee rate decreases.
The Board recognized that the fund's management contract incorporates a "group fee" structure, which provides for lower fee rates as total fund assets under FMR's management increase, and for higher fee rates as total fund assets under FMR's management decrease. The Board considered that the group fee is designed to deliver the benefits of economies of scale to fund shareholders when total fund assets increase, even if assets of any particular fund are unchanged or have declined, because some portion of Fidelity's costs are attributable to services provided to all Fidelity funds, and all funds benefit if those costs can be allocated among more assets. The Board concluded that, given the group fee structure, fund shareholders will achieve a certain level of economies of scale as assets under FMR's management increase at the fund complex level, regardless of whether Fidelity achieves any such economies of scale.
The Board further concluded that any potential economies of scale are being shared between fund shareholders and Fidelity in an appropriate manner.
Additional Information Requested by the Board. In order to develop fully the factual basis for consideration of the Advisory Contracts, the Board requested additional information on several topics, including (i) Fidelity's fund profitability methodology and profitability trends within certain funds; (ii) portfolio manager compensation; (iii) the extent to which any economies of scale exist and are shared between the funds and Fidelity; (iv) the total expenses of certain funds and classes relative to competitors, including the extent to which the expenses of certain funds have been or could be capped; (v) fund performance trends; and (vi) Fidelity's fee structures, including use of performance fees.
Based on its evaluation of all of the conclusions noted above, and after considering all material factors, the Board ultimately concluded that the advisory fee structures are fair and reasonable, and that the fund's Advisory Contracts should be renewed.
Annual Report
Annual Report
Investment Adviser
Fidelity Management & Research Company
Boston, MA
Investment Sub-Advisers
FMR Co., Inc.
Fidelity Management & Research (U.K.) Inc.
Fidelity Research & Analysis Company
(formerly Fidelity Management &
Research (Far East) Inc.)
Fidelity International Investment Advisors
Fidelity Investments Japan Limited
Fidelity International Investment Advisors (U.K.) Limited
General Distributor
Fidelity Distributors Corporation
Boston, MA
Transfer and Service Agent
Fidelity Service Company, Inc.
Boston, MA
Custodian
Citibank, N.A.
New York, NY
The Fidelity Telephone Connection
Mutual Fund 24-Hour Service
Exchanges/Redemptions
and Account Assistance 1-800-544-6666
Product Information 1-800-544-6666
Retirement Accounts 1-800-544-4774
(8 a.m. - 9 p.m.)
TDD Service 1-800-544-0118
for the deaf and hearing impaired
(9 a.m. - 9 p.m. Eastern time)
Fidelity Automated Service
Telephone (FAST®) (automated graphic) 1-800-544-5555
(automated graphic) Automated line for quickest service
SDI-UANN-0107
1.802527.102
(Fidelity Investment logo)(registered trademark)
Corporate Headquarters
82 Devonshire St., Boston, MA 02109
www.fidelity.com
(Fidelity Investment logo)(registered trademark)
Fidelity Advisor
Strategic Dividend & Income
Fund - Class A, Class T,
Class B and Class C
Annual Report
November 30, 2006
(2_fidelity_logos) (Registered_Trademark)
Class A, Class T, Class B,
and Class C are classes
of Fidelity® Strategic
Dividend & Income® Fund
Contents
Chairman's Message | <Click Here> | Ned Johnson's message to shareholders. |
Performance | <Click Here> | How the fund has done over time. |
Management's Discussion | <Click Here> | The managers' review of fund performance, strategy and outlook. |
Shareholder Expense Example | <Click Here> | An example of shareholder expenses. |
Investment Changes | <Click Here> | A summary of major shifts in the fund's investments over the past six months. |
Investments | <Click Here> | A complete list of the fund's investments with their market values. |
Financial Statements | <Click Here> | Statements of assets and liabilities, operations, and changes in net assets,
as well as financial highlights. |
Notes | <Click Here> | Notes to the financial statements. |
Report of Independent Registered Public Accounting Firm | <Click Here> | |
Trustees and Officers | <Click Here> | |
Distributions | <Click Here> | |
Proxy Voting Results | <Click Here> | |
Board Approval of Investment Advisory Contracts and Management Fees | <Click Here> | |
To view a fund's proxy voting guidelines and proxy voting record for the 12-month period ended June 30, visit www.fidelity.com/proxyvotingresults or visit the Securities and Exchange Commission's (SEC) web site at www.sec.gov. You may also call 1-877-208-0098 to request a free copy of the proxy voting guidelines.
Standard & Poor's, S&P and S&P 500 are registered service marks of The McGraw-Hill Companies, Inc. and have been licensed for use by Fidelity Distributors Corporation.
Other third party marks appearing herein are the property of their respective owners.
All other marks appearing herein are registered or unregistered trademarks or service marks of FMR Corp. or an affiliated company.
Annual Report
This report and the financial statements contained herein are submitted for the general information of the shareholders of the fund. This report is not authorized for distribution to prospective investors in the fund unless preceded or accompanied by an effective prospectus.
A fund files its complete schedule of portfolio holdings with the SEC for the first and third quarters of each fiscal year on Form N-Q. Forms N-Q are available on the SEC's web site at http://www.sec.gov. A fund's Forms N-Q may be reviewed and copied at the SEC's Public Reference Room in Washington, DC. Information regarding the operation of the SEC's Public Reference Room may be obtained by calling 1-800-SEC-0330. For a complete list of a fund's portfolio holdings, view the most recent quarterly holdings report, semiannual report, or annual report on Fidelity's web site at http://www.advisor.fidelity.com.
NOT FDIC INSURED · MAY LOSE VALUE · NO BANK GUARANTEE
Neither the fund nor Fidelity Distributors Corporation is a bank.
Annual Report
Chairman's Message
(photo_of_Edward_C_Johnson_3d)
Dear Shareholder:
Stock and bond markets around the world have seen largely positive results year to date, although weakness in the technology sector and growth stocks in general have tempered performance. While financial markets are always unpredictable, there are a number of time-tested principles that can put the historical odds in your favor.
One of the basic tenets is to invest for the long term. Over time, riding out the markets' inevitable ups and downs has proven much more effective than selling into panic or chasing the hottest trend. Even missing only a few of the markets' best days can significantly diminish investor returns. Patience also affords the benefits of compounding - of earning interest on additional income or reinvested dividends and capital gains. There are tax advantages and cost benefits to consider as well. The more you sell, the more taxes you pay, and the more you trade, the higher the costs. While staying the course doesn't eliminate risk, it can considerably lessen the effect of short-term declines.
You can further manage your investing risk through diversification. And today, more than ever, geographic diversification should be taken into account. Studies indicate that asset allocation is the single most important determinant of a portfolio's long-term success. The right mix of stocks, bonds and cash - aligned to your particular risk tolerance and investment objective - is very important. Age-appropriate rebalancing is also an essential aspect of asset allocation. For younger investors, an emphasis on equities - which historically have been the best performing asset class over time - is encouraged. As investors near their specific goal, such as retirement or sending a child to college, consideration may be given to replacing volatile assets (e.g. common stocks) with more-stable fixed investments (bonds or savings plans).
A third investment principle - investing regularly - can help lower the average cost of your purchases. Investing a certain amount of money each month or quarter helps ensure you won't pay for all your shares at market highs. This strategy - known as dollar cost averaging - also reduces unconstructive "emotion" from investing, helping shareholders avoid selling weak performers just prior to an upswing, or chasing a hot performer just before a correction.
We invite you to contact us via the Internet, through our Investor Centers or over the phone. It is our privilege to provide you the information you need to make the investments that are right for you.
Sincerely,
/s/Edward C. Johnson 3d
Edward C. Johnson 3d
Annual Report
Performance: The Bottom Line
Average annual total return reflects the change in the value of an investment, assuming reinvestment of the class' dividend income and capital gains (the profits earned upon the sale of securities that have grown in value) and assuming a constant rate of performance each year. The $10,000 table and the fund's returns do not reflect the deduction of taxes that a shareholder would pay on fund distributions or the redemption of fund shares. During periods of reimbursement by Fidelity, a fund's total return will be greater than it would be had the reimbursement not occurred. How a fund did yesterday is no guarantee of how it will do tomorrow.
Average Annual Total Returns
Periods ended November 30, 2006 | | Past 1
year | Life of
fundA |
Class A (incl. 5.75% sales charge) | | 8.40% | 10.90% |
Class T (incl. 3.50% sales charge) | | 10.68% | 11.53% |
Class B (incl. contingent deferred
sales charge) B | | 9.05% | 11.43% |
Class C (incl. contingent deferred
sales charge) C | | 13.05% | 12.30% |
A From December 23, 2003.
B Class B shares' contingent deferred sales charges included in the past one year and life of fund total return figures are 5% and 3%, respectively.
C Class C shares' contingent deferred sales charges included in the past one year and life of fund total return figures are 1% and 0%, respectively.
Annual Report
Fidelity Advisor Strategic Dividend & Income - Class A, T, B, and C
Performance - continued
$10,000 Over Life of Fund
Let's say hypothetically that $10,000 was invested in Fidelity Advisor Strategic Dividend & Income Fund - Class T on December 23, 2003, when the fund started, and the current 3.50% sales charge was paid. The chart shows how the value of your investment would have changed, and also shows how the Standard & Poor's 500SM Index (S&P 500®) performed over the same period.
Annual Report
Management's Discussion of Fund Performance
Comments from Christopher Sharpe and Derek Young, Lead Co-Portfolio Managers of Fidelity Advisor Strategic Dividend & Income Fund
There were a number of reasons why the overall U.S. stock market could have had subpar results during the 12-month period that ended on November 30, 2006, including rising interest rates, inflation concerns, historically high energy prices, unrest in the Middle East, North Korea's nuclear test and a worse-than-expected housing slump. Despite these negative conditions, though, U.S. stocks fared well. In fact, several bellwether market benchmarks reached record highs, including the larger-cap Dow Jones Industrial AverageSM - a gauge of 30 mega-cap, blue-chip stocks - and the small-cap-oriented Russell 2000® Index. The strength in equities was sparked in large part by two major factors: the double-digit earnings growth achieved by U.S. corporations, and steady economic growth that was neither overheated nor recessionary, thanks primarily to the Federal Reserve Board's monetary policy. For the 12 months overall, the Dow rose 15.76%, the Russell 2000 checked in with a 17.43% advance, the Standard & Poor's 500SM Index gained 14.23% and the NASDAQ Composite® Index returned 9.78%.
During the fiscal year, the fund's Class A, Class T, Class B and Class C shares gained 15.01%, 14.70%, 14.05% and 14.05%, respectively (excluding sales charges), compared with 19.64% for the Fidelity Strategic Dividend & Income Composite Index. All four of the fund's subportfolios achieved strong absolute returns. Our asset allocation strategy of overweighting common stocks, underweighting real estate investment trusts (REITs) and preferred stocks, and neutrally weighting convertible securities was basically sound. The fund lagged its benchmark mostly due to unfavorable selection in common stocks, especially in energy and health care, and the subportfolio underperformed relative to its benchmark. Underweighting the robust REIT group also hurt a bit, despite relative outperformance driven by good security selection in the industrial, lodging/resorts and office segments. The preferred stock subportfolio outperformed, driven by strong selection in food/beverage/tobacco and energy, as well as by favoring high-yield issues and the more equity-like convertible preferreds. Underweighting preferred stocks overall also helped. Meanwhile, unfavorable picks in information technology and energy caused the convertible bond subportfolio to underperform slightly.
Note to shareholders: On October 1, 2006, the fund's common stock subportfolio changed its benchmark from the Russell 1000® Value Index to the Russell 3000® Value Index, which conforms more closely to the fund's investment strategy.
The views expressed above reflect those of the portfolio manager(s) only through the end of the period as stated on the cover of this report and do not necessarily represent the views of Fidelity or any other person in the Fidelity organization. Any such views are subject to change at any time based upon market or other conditions and Fidelity disclaims any responsibility to update such views. These views may not be relied on as investment advice and, because investment decisions for a Fidelity fund are based on numerous factors, may not be relied on as an indication of trading intent on behalf of any Fidelity fund.
Annual Report
Shareholder Expense Example
As a shareholder of the Fund, you incur two types of costs: (1) transaction costs, including sales charges (loads) on purchase payments or redemption proceeds, and (2) ongoing costs, including management fees, distribution and/or service (12b-1) fees and other Fund expenses. This Example is intended to help you understand your ongoing costs (in dollars) of investing in the Fund and to compare these costs with the ongoing costs of investing in other mutual funds.
The Example is based on an investment of $1,000 invested at the beginning of the period and held for the entire period (June 1, 2006 to November 30, 2006).
Actual Expenses
The first line of the accompanying table for each class of the Fund provides information about actual account values and actual expenses. You may use the information in this line, together with the amount you invested, to estimate the expenses that you paid over the period. Simply divide your account value by $1,000.00 (for example, an $8,600 account value divided by $1,000.00 = 8.6), then multiply the result by the number in the first line for a class of the Fund under the heading entitled "Expenses Paid During Period" to estimate the expenses you paid on your account during this period.
Hypothetical Example for Comparison Purposes
The second line of the accompanying table for each class of the Fund provides information about hypothetical account values and hypothetical expenses based on a Class' actual expense ratio and an assumed rate of return of 5% per year before expenses, which is not the Class' actual return. The hypothetical account values and expenses may not be used to estimate the actual ending account balance or expenses you paid for the period. You may use this information to compare the ongoing costs of investing in the Fund and other funds. To do so, compare this 5% hypothetical example with the 5% hypothetical examples that appear in the shareholder reports of the other funds.
Annual Report
Investments - continued
Please note that the expenses shown in the table are meant to highlight your ongoing costs only and do not reflect any transaction costs. Therefore, the second line of the table is useful in comparing ongoing costs only, and will not help you determine the relative total costs of owning different funds. In addition, if these transactional costs were included, your costs would have been higher.
| Beginning
Account Value
June 1, 2006 | Ending
Account Value
November 30, 2006 | Expenses Paid
During Period*
June 1, 2006 to
November 30, 2006 |
Class A | | | |
Actual | $ 1,000.00 | $ 1,096.00 | $ 5.99 |
HypotheticalA | $ 1,000.00 | $ 1,019.35 | $ 5.77 |
Class T | | | |
Actual | $ 1,000.00 | $ 1,095.00 | $ 7.09 |
HypotheticalA | $ 1,000.00 | $ 1,018.30 | $ 6.83 |
Class B | | | |
Actual | $ 1,000.00 | $ 1,091.10 | $ 10.33 |
HypotheticalA | $ 1,000.00 | $ 1,015.19 | $ 9.95 |
Class C | | | |
Actual | $ 1,000.00 | $ 1,091.50 | $ 9.91 |
HypotheticalA | $ 1,000.00 | $ 1,015.59 | $ 9.55 |
Strategic Dividend and Income | | | |
Actual | $ 1,000.00 | $ 1,098.40 | $ 4.16 |
HypotheticalA | $ 1,000.00 | $ 1,021.11 | $ 4.00 |
Institutional Class | | | |
Actual | $ 1,000.00 | $ 1,096.70 | $ 4.31 |
HypotheticalA | $ 1,000.00 | $ 1,020.96 | $ 4.15 |
A 5% return per year before expenses
* Expenses are equal to each Class' annualized expense ratio (shown in the table below); multiplied by the average account value over the period, multiplied by 183/365 (to reflect the one-half year period).
| Annualized
Expense Ratio |
Class A | 1.14% |
Class T | 1.35% |
Class B | 1.97% |
Class C | 1.89% |
Strategic Dividend and Income | .79% |
Institutional Class | .82% |
Annual Report
Investment Changes
Top Ten Investments as of November 30, 2006 |
(excluding cash equivalents) | % of fund's
net assets | % of fund's net assets
6 months ago |
Valero Energy Corp. | 1.7 | 0.3 |
Equity Residential (SBI) | 1.4 | 0.7 |
JPMorgan Chase & Co. | 1.4 | 1.3 |
National Oilwell Varco, Inc. | 1.2 | 0.7 |
General Growth Properties, Inc. | 1.2 | 0.7 |
Noble Corp. | 1.1 | 0.0 |
Smith International, Inc. | 1.0 | 0.2 |
AT&T, Inc. | 1.0 | 1.0 |
American International Group, Inc. | 1.0 | 2.1 |
El Paso Corp. 4.99% | 0.9 | 1.1 |
| 11.9 | |
Top Five Market Sectors as of November 30, 2006 |
| % of fund's
net assets | % of fund's net assets
6 months ago |
Financials | 34.2 | 30.8 |
Information Technology | 14.8 | 11.9 |
Energy | 13.4 | 11.6 |
Consumer Discretionary | 7.3 | 8.7 |
Industrials | 6.6 | 10.8 |
Asset Allocation (% of fund's net assets) |
As of November 30, 2006 * | As of May 31, 2006 ** |
| Common Stocks 66.8% | | | Common Stocks 68.2% | |
| Preferred Stocks 13.0% | | | Preferred Stocks 12.8% | |
| Convertible Bonds 13.5% | | | Convertible Bonds 14.4% | |
| Other Investments 0.9% | | | Other Investments 0.3% | |
| Short-Term
Investments and
Net Other Assets 5.8% | | | Short-Term
Investments and
Net Other Assets 4.3% | |
* Foreign investments | 10.8% | | ** Foreign investments | 8.4% | |

Annual Report
Investments November 30, 2006
Showing Percentage of Net Assets
Corporate Bonds - 14.4% |
| Principal Amount | | Value
(Note 1) |
Convertible Bonds - 13.5% |
CONSUMER DISCRETIONARY - 1.0% |
Hotels, Restaurants & Leisure - 0.6% |
Carnival Corp. 1.132% 4/29/33 (c) | | $ 5,820,000 | | $ 4,237,426 |
Six Flags, Inc. 4.5% 5/15/15 | | 3,300,000 | | 3,522,750 |
| | 7,760,176 |
Media - 0.4% |
Charter Communications, Inc.: | | | | |
5.875% 11/16/09 (d) | | 70,000 | | 97,230 |
5.875% 11/16/09 | | 4,013,000 | | 5,574,057 |
| | 5,671,287 |
TOTAL CONSUMER DISCRETIONARY | | 13,431,463 |
CONSUMER STAPLES - 0.0% |
Food & Staples Retailing - 0.0% |
Nash-Finch Co. 1.6314% 3/15/35 (c) | | 1,520,000 | | 631,864 |
ENERGY - 2.4% |
Energy Equipment & Services - 1.2% |
Grey Wolf, Inc. 5.3216% 4/1/24 (e) | | 2,300,000 | | 2,992,875 |
Halliburton Co. 3.125% 7/15/23 | | 4,260,000 | | 7,859,700 |
Hornbeck Offshore Services, Inc. 1.625% 11/15/26 (c)(d) | | 1,000,000 | | 1,037,200 |
Maverick Tube Corp. 1.875% 11/15/25 | | 3,000,000 | | 4,804,920 |
| | 16,694,695 |
Oil, Gas & Consumable Fuels - 1.2% |
Chesapeake Energy Corp.: | | | | |
2.75% 11/15/35 (d) | | 5,000,000 | | 5,564,500 |
2.75% 11/15/35 | | 6,600,000 | | 7,345,140 |
McMoRan Exploration Co. 6% 7/2/08 | | 3,000,000 | | 3,813,900 |
| | 16,723,540 |
TOTAL ENERGY | | 33,418,235 |
FINANCIALS - 0.5% |
Consumer Finance - 0.4% |
American Express Co.: | | | | |
1.85% 12/1/33 (c)(d) | | 1,800,000 | | 1,798,920 |
1.85% 12/1/33 (c) | | 3,850,000 | | 3,847,690 |
| | 5,646,610 |
Corporate Bonds - continued |
| Principal Amount | | Value
(Note 1) |
Convertible Bonds - continued |
FINANCIALS - continued |
Real Estate Investment Trusts - 0.1% |
Ventas, Inc. 3.875% 11/15/11 (d) | | $ 1,000,000 | | $ 997,300 |
TOTAL FINANCIALS | | 6,643,910 |
HEALTH CARE - 1.0% |
Biotechnology - 0.4% |
Amgen, Inc. 0.375% 2/1/13 (d) | | 5,000,000 | | 5,017,500 |
Life Sciences Tools & Services - 0.6% |
Charles River Laboratories International, Inc. 2.25% 6/15/13 (d) | | 1,000,000 | | 1,059,600 |
Fisher Scientific International, Inc.: | | | | |
2.5% 10/1/23 (d) | | 995,000 | | 1,910,002 |
2.5% 10/1/23 | | 2,400,000 | | 4,607,040 |
Nektar Therapeutics 3.25% 9/28/12 | | 1,000,000 | | 1,030,460 |
| | 8,607,102 |
TOTAL HEALTH CARE | | 13,624,602 |
INDUSTRIALS - 2.1% |
Aerospace & Defense - 0.1% |
AAR Corp. 1.75% 2/1/26 (d) | | 1,000,000 | | 1,099,180 |
Airlines - 0.4% |
UAL Corp. 4.5% 6/30/21 (d) | | 2,000,000 | | 2,695,200 |
US Airways Group, Inc. 7% 9/30/20 (d) | | 960,000 | | 2,489,069 |
| | 5,184,269 |
Commercial Services & Supplies - 0.1% |
FTI Consulting, Inc. 3.75% 7/15/12 (d) | | 1,000,000 | | 1,129,949 |
Construction & Engineering - 0.2% |
Quanta Services, Inc. 3.75% 4/30/26 (d) | | 3,000,000 | | 3,270,006 |
Electrical Equipment - 0.2% |
GrafTech International Ltd. 1.625% 1/15/24 | | 2,720,000 | | 2,244,000 |
Industrial Conglomerates - 0.5% |
Tyco International Group SA yankee 3.125% 1/15/23 | | 5,310,000 | | 7,467,984 |
Machinery - 0.1% |
Greenbrier Companies, Inc. 2.375% 5/15/26 (d) | | 1,000,000 | | 1,041,311 |
Trinity Industries, Inc. 3.875% 6/1/36 | | 1,000,000 | | 1,050,842 |
| | 2,092,153 |
Corporate Bonds - continued |
| Principal Amount | | Value
(Note 1) |
Convertible Bonds - continued |
INDUSTRIALS - continued |
Marine - 0.5% |
OMI Corp. 2.875% 12/1/24 | | $ 6,300,000 | | $ 6,252,750 |
TOTAL INDUSTRIALS | | 28,740,291 |
INFORMATION TECHNOLOGY - 5.9% |
Communications Equipment - 1.2% |
Ciena Corp. 0.25% 5/1/13 | | 1,560,000 | | 1,355,172 |
Finisar Corp. 2.5% 10/15/10 | | 6,920,000 | | 8,978,700 |
JDS Uniphase Corp. 1% 5/15/26 (d) | | 5,000,000 | | 4,528,500 |
Symmetricom, Inc. 3.25% 6/15/25 | | 2,000,000 | | 2,012,600 |
| | 16,874,972 |
Computers & Peripherals - 0.3% |
Maxtor Corp. 2.375% 8/15/12 | | 1,200,000 | | 1,909,008 |
SanDisk Corp. 1% 5/15/13 | | 2,000,000 | | 1,777,800 |
| | 3,686,808 |
Electronic Equipment & Instruments - 1.7% |
Coherent, Inc. 2.75% 3/1/11 (d) | | 1,110,000 | | 1,200,021 |
Flextronics International Ltd. 1% 8/1/10 | | 13,420,000 | | 12,974,456 |
Itron, Inc. 2.5% 8/1/26 | | 3,000,000 | | 3,115,200 |
Merix Corp. 4% 5/15/13 (d) | | 1,000,000 | | 928,750 |
Solectron Corp. 0.5% 2/15/34 | | 1,000,000 | | 813,750 |
Vishay Intertechnology, Inc. 3.625% 8/1/23 | | 4,600,000 | | 4,582,888 |
| | 23,615,065 |
Internet Software & Services - 0.4% |
aQuantive, Inc. 2.25% 8/15/24 | | 2,800,000 | | 5,461,680 |
IT Services - 0.5% |
DST Systems, Inc.: | | | | |
Series A, 4.125% 8/15/23 (d) | | 1,240,000 | | 1,718,190 |
4.125% 8/15/23 | | 3,470,000 | | 4,808,160 |
| | 6,526,350 |
Semiconductors & Semiconductor Equipment - 1.7% |
Amkor Technology, Inc. 2.5% 5/15/11 | | 2,000,000 | | 1,977,200 |
Conexant Systems, Inc. 4% 3/1/26 | | 3,000,000 | | 2,737,500 |
Credence Systems Corp. 1.5% 5/15/08 | | 2,000,000 | | 1,825,000 |
EMCORE Corp. 5% 5/15/11 | | 1,000,000 | | 1,052,500 |
Intel Corp. 2.95% 12/15/35 | | 6,000,000 | | 5,543,460 |
Corporate Bonds - continued |
| Principal Amount | | Value
(Note 1) |
Convertible Bonds - continued |
INFORMATION TECHNOLOGY - continued |
Semiconductors & Semiconductor Equipment - continued |
ON Semiconductor Corp.: | | | | |
0% 4/15/24 | | $ 6,500,000 | | $ 5,882,500 |
1.875% 12/15/25 (d) | | 1,250,000 | | 1,417,188 |
Photronics, Inc. 2.25% 4/15/08 | | 3,000,000 | | 3,385,860 |
| | 23,821,208 |
Software - 0.1% |
Symantec Corp. 1% 6/15/13 (d) | | 1,000,000 | | 1,225,000 |
TOTAL INFORMATION TECHNOLOGY | | 81,211,083 |
TELECOMMUNICATION SERVICES - 0.6% |
Diversified Telecommunication Services - 0.6% |
Broadwing Corp. 3.125% 5/15/26 (d) | | 3,000,000 | | 3,307,500 |
Level 3 Communications, Inc. 3.5% 6/15/12 | | 2,000,000 | | 2,392,260 |
Time Warner Telecom, Inc. 2.375% 4/1/26 | | 2,000,000 | | 2,378,800 |
| | 8,078,560 |
TOTAL CONVERTIBLE BONDS | | 185,780,008 |
Nonconvertible Bonds - 0.9% |
CONSUMER DISCRETIONARY - 0.2% |
Media - 0.2% |
Charter Communications Holdings II LLC/Charter Communications Holdings II Capital Corp. 10.25% 9/15/10 | | 3,176,000 | | 3,310,980 |
FINANCIALS - 0.7% |
Commercial Banks - 0.4% |
PNC Preferred Funding Trust I 6.517% 12/31/49 (c)(d) | | 3,000,000 | | 3,031,800 |
SunTrust Preferred Capital I 5.853% 12/15/49 (e) | | 1,000,000 | | 1,015,420 |
Wells Fargo Capital X 5.95% 12/15/36 | | 1,000,000 | | 1,005,446 |
| | 5,052,666 |
Diversified Financial Services - 0.2% |
Wachovia Capital Trust III 5.8% (e) | | 2,000,000 | | 2,026,884 |
Corporate Bonds - continued |
| Principal Amount | | Value
(Note 1) |
Nonconvertible Bonds - continued |
FINANCIALS - continued |
Thrifts & Mortgage Finance - 0.1% |
Washington Mutual Preferred Funding Trust I 6.534% (d)(e) | | $ 2,000,000 | | $ 1,984,320 |
TOTAL FINANCIALS | | 9,063,870 |
TOTAL NONCONVERTIBLE BONDS | | 12,374,850 |
TOTAL CORPORATE BONDS (Cost $185,691,579) | 198,154,858 |
Common Stocks - 66.8% |
| Shares | | |
CONSUMER DISCRETIONARY - 5.7% |
Automobiles - 0.2% |
Renault SA | 20,900 | | 2,504,658 |
Diversified Consumer Services - 0.3% |
Coinmach Service Corp. unit | 156,800 | | 2,765,952 |
Service Corp. International | 155,800 | | 1,537,746 |
| | 4,303,698 |
Hotels, Restaurants & Leisure - 2.0% |
Accor SA | 23,500 | | 1,708,417 |
Applebee's International, Inc. | 19,600 | | 445,900 |
Aristocrat Leisure Ltd. | 197,300 | | 2,418,954 |
Boyd Gaming Corp. | 40,700 | | 1,723,645 |
Centerplate, Inc. unit | 318,800 | | 5,531,180 |
Domino's Pizza, Inc. | 99,100 | | 2,721,286 |
Greek Organization of Football Prognostics SA | 11,300 | | 424,962 |
McDonald's Corp. | 101,749 | | 4,270,406 |
Minor International PCL (For. Reg.) | 1,212,900 | | 391,967 |
Starwood Hotels & Resorts Worldwide, Inc. | 79,300 | | 5,088,681 |
WMS Industries, Inc. (a) | 63,400 | | 2,205,052 |
| | 26,930,450 |
Household Durables - 0.6% |
Bassett Furniture Industries, Inc. | 51,605 | | 913,409 |
Cyrela Brazil Realty SA | 35,000 | | 669,446 |
La-Z-Boy, Inc. | 95,477 | | 1,124,719 |
The Stanley Works | 38,010 | | 1,939,270 |
Common Stocks - continued |
| Shares | | Value (Note 1) |
CONSUMER DISCRETIONARY - continued |
Household Durables - continued |
Urbi, Desarrollos Urbanos, SA de CV (a) | 144,300 | | $ 454,053 |
Whirlpool Corp. | 42,000 | | 3,582,600 |
| | 8,683,497 |
Leisure Equipment & Products - 0.2% |
Eastman Kodak Co. | 120,400 | | 3,132,808 |
Media - 0.8% |
Charter Communications, Inc. Class A (a) | 977,700 | | 2,884,215 |
Gannett Co., Inc. | 4,000 | | 238,080 |
Grupo Televisa SA de CV (CPO) sponsored ADR | 21,500 | | 565,020 |
Idearc, Inc. (a) | 8,300 | | 228,582 |
News Corp. Class A | 86,700 | | 1,786,020 |
R.H. Donnelley Corp. | 55,100 | | 3,416,200 |
Viacom, Inc. Class B (non-vtg.) (a) | 39,965 | | 1,499,087 |
| | 10,617,204 |
Multiline Retail - 0.7% |
Federated Department Stores, Inc. | 74,800 | | 3,148,332 |
JCPenney Co., Inc. | 38,800 | | 3,000,792 |
Lojas Renner SA | 21,000 | | 276,443 |
Sears Holdings Corp. (a) | 17,200 | | 2,948,424 |
Tuesday Morning Corp. | 25,400 | | 447,040 |
| | 9,821,031 |
Specialty Retail - 0.3% |
AutoZone, Inc. (a) | 3,400 | | 386,274 |
OfficeMax, Inc. | 92,400 | | 4,349,268 |
| | 4,735,542 |
Textiles, Apparel & Luxury Goods - 0.6% |
Brown Shoe Co., Inc. | 48,800 | | 2,315,072 |
Liz Claiborne, Inc. | 91,800 | | 3,924,450 |
Polo Ralph Lauren Corp. Class A | 7,400 | | 578,680 |
VF Corp. | 21,000 | | 1,646,190 |
| | 8,464,392 |
TOTAL CONSUMER DISCRETIONARY | | 79,193,280 |
CONSUMER STAPLES - 2.6% |
Beverages - 0.2% |
Fomento Economico Mexicano SA de CV sponsored ADR | 3,300 | | 347,325 |
Pernod Ricard SA | 7,800 | | 1,726,969 |
| | 2,074,294 |
Common Stocks - continued |
| Shares | | Value (Note 1) |
CONSUMER STAPLES - continued |
Food & Staples Retailing - 0.6% |
Rite Aid Corp. | 380,300 | | $ 1,806,425 |
Safeway, Inc. | 173,400 | | 5,342,454 |
Wal-Mart de Mexico SA de CV Series V | 189,700 | | 708,968 |
| | 7,857,847 |
Food Products - 0.6% |
B&G Foods, Inc. unit | 156,900 | | 3,075,240 |
Chiquita Brands International, Inc. | 139,500 | | 1,994,850 |
Del Monte Foods Co. | 61,500 | | 694,335 |
Tyson Foods, Inc. Class A | 170,500 | | 2,709,245 |
| | 8,473,670 |
Personal Products - 0.5% |
Avon Products, Inc. | 165,600 | | 5,405,184 |
Playtex Products, Inc. (a) | 144,000 | | 2,139,840 |
| | 7,545,024 |
Tobacco - 0.7% |
Altria Group, Inc. | 112,600 | | 9,482,046 |
TOTAL CONSUMER STAPLES | | 35,432,881 |
ENERGY - 9.5% |
Energy Equipment & Services - 4.9% |
Grant Prideco, Inc. (a) | 80,300 | | 3,518,746 |
Halliburton Co. | 320,700 | | 10,820,418 |
National Oilwell Varco, Inc. (a) | 252,489 | | 16,793,043 |
Noble Corp. | 191,763 | | 14,813,692 |
Pride International, Inc. (a) | 110,700 | | 3,574,503 |
Rowan Companies, Inc. | 100,100 | | 3,605,602 |
Smith International, Inc. | 341,300 | | 14,457,468 |
| | 67,583,472 |
Oil, Gas & Consumable Fuels - 4.6% |
Alpha Natural Resources, Inc. (a) | 77,158 | | 1,215,239 |
Aurora Oil & Gas Corp. (a) | 480,572 | | 1,638,751 |
Cabot Oil & Gas Corp. | 63,200 | | 3,926,616 |
CONSOL Energy, Inc. | 99,300 | | 3,645,303 |
Foundation Coal Holdings, Inc. | 97,000 | | 3,599,670 |
Peabody Energy Corp. | 109,900 | | 5,056,499 |
Plains Exploration & Production Co. (a) | 41,200 | | 1,939,696 |
Quicksilver Resources, Inc. (a) | 88,700 | | 3,752,897 |
Range Resources Corp. | 29,100 | | 904,719 |
Common Stocks - continued |
| Shares | | Value (Note 1) |
ENERGY - continued |
Oil, Gas & Consumable Fuels - continued |
Teekay Shipping Corp. | 142,050 | | $ 5,949,054 |
Ultra Petroleum Corp. (a) | 137,200 | | 7,395,080 |
Valero Energy Corp. | 435,961 | | 24,008,366 |
| | 63,031,890 |
TOTAL ENERGY | | 130,615,362 |
FINANCIALS - 26.8% |
Capital Markets - 1.8% |
Ameriprise Financial, Inc. | 8,400 | | 454,440 |
Bank of New York Co., Inc. | 48,200 | | 1,713,028 |
Franklin Resources, Inc. | 17,900 | | 1,910,646 |
KKR Private Equity Investors, LP | 64,700 | | 1,436,340 |
Merrill Lynch & Co., Inc. | 68,200 | | 5,962,726 |
Merrill Lynch & Co., Inc. (depositary shares) Series 1, unit | 277,700 | | 7,147,998 |
Morgan Stanley | 81,000 | | 6,168,960 |
State Street Corp. | 9,400 | | 584,022 |
| | 25,378,160 |
Commercial Banks - 1.1% |
Cathay General Bancorp | 21,219 | | 729,085 |
East West Bancorp, Inc. | 52,000 | | 1,851,720 |
UCBH Holdings, Inc. | 117,400 | | 1,979,364 |
Wachovia Corp. | 102,709 | | 5,565,801 |
Wells Fargo & Co. | 159,700 | | 5,627,828 |
| | 15,753,798 |
Consumer Finance - 0.1% |
Capital One Financial Corp. | 21,900 | | 1,705,572 |
Diversified Financial Services - 2.3% |
Bank of America Corp. | 224,214 | | 12,073,924 |
JPMorgan Chase & Co. | 410,704 | | 19,007,381 |
| | 31,081,305 |
Insurance - 5.4% |
ACE Ltd. | 94,800 | | 5,388,432 |
AFLAC, Inc. | 77,600 | | 3,425,264 |
Allied World Assurance Co. Holdings Ltd. | 18,800 | | 798,060 |
American International Group, Inc. | 194,400 | | 13,670,208 |
Aspen Insurance Holdings Ltd. | 270,300 | | 7,284,585 |
Axis Capital Holdings Ltd. | 216,656 | | 7,416,135 |
Endurance Specialty Holdings Ltd. | 188,171 | | 7,062,058 |
Common Stocks - continued |
| Shares | | Value (Note 1) |
FINANCIALS - continued |
Insurance - continued |
Everest Re Group Ltd. | 38,700 | | $ 3,808,467 |
Hartford Financial Services Group, Inc. | 35,900 | | 3,078,784 |
Marsh & McLennan Companies, Inc. | 31,500 | | 989,730 |
MetLife, Inc. | 52,500 | | 3,083,325 |
Platinum Underwriters Holdings Ltd. | 220,400 | | 6,706,772 |
Scottish Re Group Ltd. | 97,111 | | 577,810 |
The St. Paul Travelers Companies, Inc. | 116,800 | | 6,051,408 |
W.R. Berkley Corp. | 124,050 | | 4,355,396 |
| | 73,696,434 |
Real Estate Investment Trusts - 15.3% |
Alexandria Real Estate Equities, Inc. | 53,500 | | 5,514,780 |
AMB Property Corp. (SBI) | 8,000 | | 490,160 |
American Financial Realty Trust (SBI) | 140,800 | | 1,655,808 |
Apartment Investment & Management Co. Class A | 20,000 | | 1,152,800 |
AvalonBay Communities, Inc. | 40,460 | | 5,384,417 |
BioMed Realty Trust, Inc. | 22,900 | | 691,580 |
Boston Properties, Inc. | 60,014 | | 7,024,639 |
CBL & Associates Properties, Inc. | 121,540 | | 5,238,374 |
CBRE Realty Finance, Inc. | 28,800 | | 465,120 |
Columbia Equity Trust, Inc. | 67,900 | | 1,279,915 |
Corporate Office Properties Trust (SBI) | 177,900 | | 8,843,409 |
Developers Diversified Realty Corp. | 89,500 | | 5,797,810 |
Douglas Emmett, Inc. (a) | 97,700 | | 2,569,510 |
Duke Realty Corp. | 290,488 | | 12,642,038 |
Education Realty Trust, Inc. | 6,800 | | 106,964 |
Equity Lifestyle Properties, Inc. | 33,260 | | 1,728,522 |
Equity Office Properties Trust | 243,310 | | 11,727,542 |
Equity One, Inc. | 88,900 | | 2,425,192 |
Equity Residential (SBI) | 357,380 | | 19,034,059 |
Federal Realty Investment Trust (SBI) | 44,500 | | 3,790,510 |
General Growth Properties, Inc. | 293,125 | | 16,104,288 |
GMH Communities Trust | 107,200 | | 1,330,352 |
Health Care Property Investors, Inc. | 26,100 | | 946,647 |
Health Care REIT, Inc. | 17,300 | | 725,389 |
Home Properties of New York, Inc. | 13,600 | | 840,616 |
HomeBanc Mortgage Corp., Georgia | 191,600 | | 806,636 |
Host Hotels & Resorts, Inc. | 363,445 | | 9,166,083 |
Inland Real Estate Corp. | 140,600 | | 2,727,640 |
Innkeepers USA Trust (SBI) | 44,100 | | 705,600 |
Kilroy Realty Corp. | 16,300 | | 1,333,340 |
Common Stocks - continued |
| Shares | | Value (Note 1) |
FINANCIALS - continued |
Real Estate Investment Trusts - continued |
Kimco Realty Corp. | 230,638 | | $ 10,696,990 |
Longview Fibre Co. | 44,000 | | 916,080 |
Mission West Properties, Inc. | 81,500 | | 1,018,750 |
Newcastle Investment Corp. | 12,100 | | 362,395 |
Potlatch Corp. | 10,230 | | 426,489 |
ProLogis Trust | 141,165 | | 9,199,723 |
Public Storage, Inc. | 98,936 | | 9,525,558 |
Rayonier, Inc. | 34,320 | | 1,431,144 |
Reckson Associates Realty Corp. | 7,800 | | 377,364 |
Simon Property Group, Inc. | 81,110 | | 8,271,598 |
SL Green Realty Corp. | 41,200 | | 5,571,888 |
Sovran Self Storage, Inc. | 47,900 | | 2,802,150 |
Tanger Factory Outlet Centers, Inc. | 84,800 | | 3,342,816 |
Taubman Centers, Inc. | 29,500 | | 1,459,070 |
United Dominion Realty Trust, Inc. (SBI) | 275,040 | | 9,235,843 |
Ventas, Inc. | 64,550 | | 2,514,223 |
Vornado Realty Trust | 77,650 | | 9,792,442 |
Washington (REIT) (SBI) | 27,000 | | 1,157,490 |
Weingarten Realty Investors (SBI) | 4,100 | | 195,652 |
| | 210,547,405 |
Real Estate Management & Development - 0.2% |
Brookfield Properties Corp. | 8,000 | | 321,200 |
GAGFAH SA | 9,700 | | 303,136 |
Mitsubishi Estate Co. Ltd. | 112,000 | | 2,766,387 |
| | 3,390,723 |
Thrifts & Mortgage Finance - 0.6% |
Countrywide Financial Corp. | 48,200 | | 1,914,504 |
Fannie Mae | 64,000 | | 3,649,920 |
Hudson City Bancorp, Inc. | 204,100 | | 2,708,407 |
| | 8,272,831 |
TOTAL FINANCIALS | | 369,826,228 |
HEALTH CARE - 3.1% |
Biotechnology - 0.1% |
Alkermes, Inc. (a) | 12,000 | | 182,160 |
Amgen, Inc. (a) | 24,100 | | 1,711,100 |
| | 1,893,260 |
Common Stocks - continued |
| Shares | | Value (Note 1) |
HEALTH CARE - continued |
Health Care Equipment & Supplies - 0.9% |
Baxter International, Inc. | 107,400 | | $ 4,805,076 |
Becton, Dickinson & Co. | 47,700 | | 3,421,044 |
C.R. Bard, Inc. | 46,700 | | 3,842,943 |
| | 12,069,063 |
Health Care Providers & Services - 0.7% |
Acibadem Saglik Hizmetleri AS | 57,000 | | 627,343 |
Brookdale Senior Living, Inc. | 105,000 | | 4,793,250 |
Bumrungrad Hospital PCL (For. Reg.) | 346,100 | | 351,933 |
Capital Senior Living Corp. (a) | 17,000 | | 174,420 |
DaVita, Inc. (a) | 56,400 | | 3,001,044 |
| | 8,947,990 |
Life Sciences Tools & Services - 0.1% |
Thermo Fisher Scientific, Inc. (a) | 31,300 | | 1,371,879 |
Pharmaceuticals - 1.3% |
Merck & Co., Inc. | 71,500 | | 3,182,465 |
Novartis AG sponsored ADR | 50,800 | | 2,967,228 |
Pfizer, Inc. | 380,400 | | 10,457,196 |
Teva Pharmaceutical Industries Ltd. sponsored ADR | 51,800 | | 1,660,708 |
| | 18,267,597 |
TOTAL HEALTH CARE | | 42,549,789 |
INDUSTRIALS - 4.3% |
Aerospace & Defense - 0.8% |
General Dynamics Corp. | 46,800 | | 3,502,512 |
Honeywell International, Inc. | 135,400 | | 5,819,492 |
Precision Castparts Corp. | 25,100 | | 1,894,046 |
| | 11,216,050 |
Air Freight & Logistics - 0.2% |
United Parcel Service, Inc. Class B | 42,100 | | 3,280,432 |
Building Products - 0.2% |
Masco Corp. | 73,000 | | 2,094,370 |
Commercial Services & Supplies - 0.4% |
Allied Waste Industries, Inc. | 129,700 | | 1,644,596 |
The Brink's Co. | 29,300 | | 1,644,902 |
The Geo Group, Inc. (a) | 21,250 | | 798,150 |
Waste Management, Inc. | 48,400 | | 1,771,924 |
| | 5,859,572 |
Common Stocks - continued |
| Shares | | Value (Note 1) |
INDUSTRIALS - continued |
Construction & Engineering - 0.8% |
Fluor Corp. | 84,035 | | $ 7,317,768 |
Shaw Group, Inc. (a) | 113,100 | | 3,380,559 |
| | 10,698,327 |
Electrical Equipment - 0.1% |
Cooper Industries Ltd. Class A | 14,200 | | 1,298,448 |
Industrial Conglomerates - 0.2% |
Tyco International Ltd. | 65,100 | | 1,971,879 |
Machinery - 0.5% |
Deere & Co. | 41,300 | | 3,964,800 |
Flowserve Corp. (a) | 21,206 | | 1,141,731 |
Oshkosh Truck Co. | 42,300 | | 2,030,823 |
| | 7,137,354 |
Road & Rail - 1.1% |
AMERCO (a) | 21,774 | | 1,891,072 |
Burlington Northern Santa Fe Corp. | 36,700 | | 2,758,372 |
Con-way, Inc. | 67,400 | | 3,108,488 |
CSX Corp. | 82,700 | | 2,965,622 |
Laidlaw International, Inc. | 110,500 | | 3,210,025 |
Landstar System, Inc. | 39,600 | | 1,783,584 |
| | 15,717,163 |
TOTAL INDUSTRIALS | | 59,273,595 |
INFORMATION TECHNOLOGY - 8.9% |
Communications Equipment - 0.1% |
Comverse Technology, Inc. (a) | 88,200 | | 1,721,664 |
Computers & Peripherals - 2.2% |
Dell, Inc. (a) | 124,000 | | 3,377,760 |
Hewlett-Packard Co. | 78,200 | | 3,085,772 |
Imation Corp. | 62,682 | | 2,902,803 |
International Business Machines Corp. | 66,300 | | 6,094,296 |
Komag, Inc. (a) | 83,200 | | 3,284,736 |
NCR Corp. (a) | 147,900 | | 6,346,389 |
Seagate Technology (a) | 211,000 | | 5,435,360 |
| | 30,527,116 |
Electronic Equipment & Instruments - 2.0% |
Agilent Technologies, Inc. (a) | 80,400 | | 2,559,936 |
Amphenol Corp. Class A | 117,500 | | 8,005,275 |
Arrow Electronics, Inc. (a) | 119,500 | | 3,795,320 |
Common Stocks - continued |
| Shares | | Value (Note 1) |
INFORMATION TECHNOLOGY - continued |
Electronic Equipment & Instruments - continued |
Flextronics International Ltd. (a) | 211,000 | | $ 2,373,750 |
FLIR Systems, Inc. (a) | 59,100 | | 1,903,611 |
Ingram Micro, Inc. Class A (a) | 83,100 | | 1,693,578 |
Molex, Inc. | 91,500 | | 2,928,000 |
Solectron Corp. (a) | 382,700 | | 1,274,391 |
Vishay Intertechnology, Inc. (a) | 166,900 | | 2,186,390 |
| | 26,720,251 |
Internet Software & Services - 0.1% |
VeriSign, Inc. (a) | 55,100 | | 1,438,661 |
IT Services - 0.4% |
Infosys Technologies Ltd. sponsored ADR | 12,500 | | 669,125 |
Mastercard, Inc. Class A | 25,400 | | 2,584,450 |
Satyam Computer Services Ltd. sponsored ADR | 86,200 | | 2,012,770 |
| | 5,266,345 |
Office Electronics - 0.2% |
Xerox Corp. | 180,700 | | 2,981,550 |
Semiconductors & Semiconductor Equipment - 2.4% |
Analog Devices, Inc. | 40,800 | | 1,326,816 |
Applied Materials, Inc. | 168,600 | | 3,031,428 |
ASML Holding NV (NY Shares) (a) | 129,600 | | 3,227,040 |
Atmel Corp. (a) | 433,400 | | 2,193,004 |
Axcelis Technologies, Inc. (a) | 242,800 | | 1,551,492 |
Broadcom Corp. Class A (a) | 27,500 | | 902,825 |
Brooks Automation, Inc. (a) | 106,500 | | 1,487,805 |
Cypress Semiconductor Corp. (a) | 9,500 | | 165,205 |
DSP Group, Inc. (a) | 8,996 | | 194,224 |
Fairchild Semiconductor International, Inc. (a) | 116,000 | | 1,893,120 |
Hittite Microwave Corp. (a) | 33,600 | | 1,312,752 |
Intel Corp. | 145,400 | | 3,104,290 |
Intersil Corp. Class A | 79,800 | | 1,976,646 |
Linear Technology Corp. | 39,000 | | 1,253,460 |
Maxim Integrated Products, Inc. | 97,000 | | 3,053,560 |
National Semiconductor Corp. | 127,300 | | 3,079,387 |
ON Semiconductor Corp. (a) | 439,100 | | 2,827,804 |
PMC-Sierra, Inc. (a) | 49,800 | | 378,978 |
Verigy Ltd. | 10,639 | | 189,800 |
| | 33,149,636 |
Software - 1.5% |
BEA Systems, Inc. (a) | 115,622 | | 1,592,115 |
Common Stocks - continued |
| Shares | | Value (Note 1) |
INFORMATION TECHNOLOGY - continued |
Software - continued |
Compuware Corp. (a) | 34,500 | | $ 289,455 |
Hyperion Solutions Corp. (a) | 44,000 | | 1,617,440 |
Microsoft Corp. | 301,600 | | 8,845,928 |
Nintendo Co. Ltd. | 8,900 | | 2,121,427 |
Quest Software, Inc. (a) | 121,600 | | 1,740,096 |
Symantec Corp. (a) | 133,300 | | 2,825,960 |
Ubisoft Entertainment SA (a) | 29,052 | | 1,827,356 |
| | 20,859,777 |
TOTAL INFORMATION TECHNOLOGY | | 122,665,000 |
MATERIALS - 1.4% |
Chemicals - 0.7% |
Agrium, Inc. | 66,400 | | 2,038,426 |
Ashland, Inc. | 43,300 | | 2,927,513 |
Celanese Corp. Class A | 43,300 | | 952,600 |
Cytec Industries, Inc. | 9,300 | | 495,969 |
Monsanto Co. | 63,600 | | 3,057,252 |
| | 9,471,760 |
Metals & Mining - 0.7% |
Alcoa, Inc. | 96,900 | | 3,020,373 |
Titanium Metals Corp. | 237,300 | | 7,586,481 |
| | 10,606,854 |
TOTAL MATERIALS | | 20,078,614 |
TELECOMMUNICATION SERVICES - 2.7% |
Diversified Telecommunication Services - 2.0% |
AT&T, Inc. | 415,600 | | 14,092,996 |
BellSouth Corp. | 113,700 | | 5,069,883 |
CenturyTel, Inc. | 48,689 | | 2,071,717 |
Citizens Communications Co. | 16,900 | | 239,473 |
Verizon Communications, Inc. | 154,500 | | 5,398,230 |
| | 26,872,299 |
Wireless Telecommunication Services - 0.7% |
America Movil SA de CV Series L sponsored ADR | 20,800 | | 924,976 |
American Tower Corp. Class A (a) | 76,200 | | 2,885,694 |
Bharti Airtel Ltd. (a) | 26,731 | | 390,926 |
Crown Castle International Corp. (a) | 70,200 | | 2,419,092 |
Common Stocks - continued |
| Shares | | Value (Note 1) |
TELECOMMUNICATION SERVICES - continued |
Wireless Telecommunication Services - continued |
MTN Group Ltd. | 50,200 | | $ 512,931 |
SBA Communications Corp. Class A (a) | 104,500 | | 2,964,665 |
| | 10,098,284 |
TOTAL TELECOMMUNICATION SERVICES | | 36,970,583 |
UTILITIES - 1.8% |
Electric Utilities - 0.7% |
Edison International | 57,500 | | 2,643,850 |
Exelon Corp. | 48,500 | | 2,945,405 |
FPL Group, Inc. | 30,200 | | 1,609,660 |
PPL Corp. | 81,100 | | 2,947,985 |
| | 10,146,900 |
Independent Power Producers & Energy Traders - 0.7% |
AES Corp. (a) | 388,100 | | 9,069,897 |
Multi-Utilities - 0.4% |
CMS Energy Corp. (a) | 193,300 | | 3,133,393 |
Duke Energy Corp. | 72,400 | | 2,296,528 |
| | 5,429,921 |
TOTAL UTILITIES | | 24,646,718 |
TOTAL COMMON STOCKS (Cost $772,358,048) | 921,252,050 |
Preferred Stocks - 13.0% |
| | | |
Convertible Preferred Stocks - 3.7% |
CONSUMER DISCRETIONARY - 0.3% |
Automobiles - 0.3% |
General Motors Corp.: | | | |
Series A, 4.50% | 41,400 | | 1,035,000 |
Series C, 6.25% | 98,500 | | 2,217,235 |
| | 3,252,235 |
Media - 0.0% |
Emmis Communications Corp. Series A, 6.25% | 10,100 | | 401,071 |
TOTAL CONSUMER DISCRETIONARY | | 3,653,306 |
Preferred Stocks - continued |
| Shares | | Value (Note 1) |
Convertible Preferred Stocks - continued |
ENERGY - 1.3% |
Oil, Gas & Consumable Fuels - 1.3% |
Chesapeake Energy Corp.: | | | |
4.50% | 20,500 | | $ 2,085,875 |
6.25% | 8,000 | | 2,246,720 |
El Paso Corp. 4.99% | 10,000 | | 12,988,987 |
| | 17,321,582 |
FINANCIALS - 0.2% |
Diversified Financial Services - 0.1% |
Carriage Services Capital Trust 7.00% TIDES | 45,000 | | 1,845,000 |
Real Estate Investment Trusts - 0.1% |
HRPT Properties Trust 6.50% (a) | 40,000 | | 1,045,920 |
TOTAL FINANCIALS | | 2,890,920 |
INDUSTRIALS - 0.2% |
Road & Rail - 0.2% |
Kansas City Southern: | | | |
4.25% | 1,370 | | 1,239,182 |
5.125% | 1,000 | | 1,176,950 |
| | 2,416,132 |
MATERIALS - 0.8% |
Chemicals - 0.6% |
Celanese Corp. 4.25% | 252,600 | | 7,997,316 |
Containers & Packaging - 0.1% |
Owens-Illinois, Inc. 4.75% | 63,510 | | 2,337,168 |
Metals & Mining - 0.1% |
Freeport-McMoRan Copper & Gold, Inc. 5.50% | 1,050 | | 1,466,594 |
TOTAL MATERIALS | | 11,801,078 |
UTILITIES - 0.9% |
Electric Utilities - 0.5% |
AES Trust VII 6.00% | 140,500 | | 6,884,500 |
Preferred Stocks - continued |
| Shares | | Value (Note 1) |
Convertible Preferred Stocks - continued |
UTILITIES - continued |
Independent Power Producers & Energy Traders - 0.4% |
NRG Energy, Inc.: | | | |
4.00% (d) | 3,900 | | $ 5,890,599 |
Series A, 5.75% | 1,000 | | 273,100 |
| | 6,163,699 |
TOTAL UTILITIES | | 13,048,199 |
TOTAL CONVERTIBLE PREFERRED STOCKS | | 51,131,217 |
Nonconvertible Preferred Stocks - 9.3% |
CONSUMER DISCRETIONARY - 0.1% |
Household Durables - 0.1% |
Hovnanian Enterprises, Inc. Series A, 7.625% | 40,000 | | 979,600 |
CONSUMER STAPLES - 0.1% |
Food Products - 0.1% |
H.J. Heinz Finance Co. 6.226% | 10 | | 1,024,500 |
ENERGY - 0.2% |
Oil, Gas & Consumable Fuels - 0.2% |
Apache Corp. (depositary shares) Series B, 5.68% | 9,875 | | 982,563 |
Devon Energy Corp. 6.49% | 13,750 | | 1,400,781 |
| | 2,383,344 |
FINANCIALS - 6.1% |
Capital Markets - 1.4% |
Bear Stearns Companies, Inc.: | | | |
Series E, 6.155% | 15,000 | | 759,750 |
Series G, 5.49% | 15,000 | | 723,900 |
Goldman Sachs Group, Inc.: | | | |
Series A, 3.9106% | 120,000 | | 3,156,000 |
Series C, 4.9931% | 40,000 | | 1,042,400 |
Series D | 160,000 | | 4,192,000 |
Lehman Brothers Holdings, Inc. (depositary shares) Series F, 6.50% | 169,015 | | 4,360,587 |
Merrill Lynch & Co., Inc. Series H, 3.97% | 120,000 | | 3,060,000 |
Morgan Stanley Capital Trust IV 6.60% | 80,000 | | 2,056,000 |
| | 19,350,637 |
Preferred Stocks - continued |
| Shares | | Value (Note 1) |
Nonconvertible Preferred Stocks - continued |
FINANCIALS - continued |
Commercial Banks - 1.0% |
ABN AMRO Capital Funding Trust V 5.90% | 20,000 | | $ 493,200 |
ABN Amro Capital Funding Trust VII 6.08% | 40,400 | | 1,018,484 |
Barclays Bank PLC Series 2, 6.625% | 40,000 | | 1,046,000 |
First Tennessee Bank NA, Memphis 3.90% (d) | 5,000 | | 5,175,000 |
Keycorp Capital IX 6.75% | 40,000 | | 1,010,000 |
Santander Finance Preferred SA Unipersonal: | | | |
6.41% | 69,400 | | 1,728,060 |
6.80% (d) | 80,000 | | 2,048,000 |
U.S. Bancorp, Delaware Series B, 0.00% | 40,000 | | 1,042,000 |
| | 13,560,744 |
Consumer Finance - 0.5% |
HSBC USA, Inc.: | | | |
Series G, 4.9175% | 80,000 | | 2,088,800 |
Series H, 6.50% | 40,000 | | 1,064,000 |
SLM Corp.: | | | |
4.07% | 10,000 | | 1,037,500 |
Series A, 6.97% | 43,400 | | 2,363,564 |
| | 6,553,864 |
Diversified Financial Services - 0.5% |
Bank of America Corp.: | | | |
Series D | 20,000 | | 526,400 |
Series E | 40,000 | | 1,005,600 |
CIT Group, Inc. Series B, 5.189% | 15,000 | | 1,504,950 |
Citigroup Capital XVI Series C, 6.45% | 120,000 | | 3,012,000 |
Deutsche Bank Capital Funding Trust VIII 6.375% | 40,000 | | 1,028,000 |
| | 7,076,950 |
Insurance - 0.1% |
MetLife, Inc. Series A, 4.39% | 40,000 | | 1,046,000 |
Real Estate Investment Trusts - 0.4% |
Apartment Investment & Management Co. Series V, 8.00% | 79,000 | | 2,034,250 |
Duke Realty Corp. (depositary shares) Series K, 6.50% | 95,800 | | 2,402,664 |
Host Hotels & Resorts, Inc. Series E, 8.875% | 20,000 | | 551,400 |
Vornado Realty Trust Series E, 7.00% | 40,000 | | 1,040,000 |
| | 6,028,314 |
Thrifts & Mortgage Finance - 2.2% |
Countrywide Capital V 7.00% | 80,000 | | 2,020,000 |
Preferred Stocks - continued |
| Shares | | Value (Note 1) |
Nonconvertible Preferred Stocks - continued |
FINANCIALS - continued |
Thrifts & Mortgage Finance - continued |
Fannie Mae: | | | |
5.10% | 11,400 | | $ 477,375 |
7.00% | 42,200 | | 2,270,360 |
Series H, 5.81% | 71,200 | | 3,552,880 |
Series L, 5.125% | 90,900 | | 4,272,300 |
Series N, 5.50% | 71,650 | | 3,489,355 |
Freddie Mac: | | | |
5.90% | 40,000 | | 1,038,000 |
Series F, 5.00% | 58,500 | | 2,705,625 |
Series H, 5.10% | 10,300 | | 479,980 |
Series K, 5.79% | 35,200 | | 1,837,440 |
Series O, 5.81% | 19,500 | | 1,004,250 |
Series R, 5.70% | 97,000 | | 4,762,700 |
Series S, adj. rate | 10,000 | | 523,200 |
Series T 6.42% | 10,000 | | 545,000 |
Sovereign Bancorp, Inc. Series C, 7.30% | 80,000 | | 2,224,000 |
| | 31,202,465 |
TOTAL FINANCIALS | | 84,818,974 |
MATERIALS - 0.1% |
Chemicals - 0.1% |
E.I. du Pont de Nemours & Co. Series B, 4.50% | 9,900 | | 856,350 |
Metals & Mining - 0.0% |
Alcoa, Inc. 3.75% | 6,400 | | 472,960 |
TOTAL MATERIALS | | 1,329,310 |
UTILITIES - 2.7% |
Electric Utilities - 2.4% |
Alabama Power Co.: | | | |
5.20% | 120,000 | | 2,889,600 |
5.30% | 88,600 | | 2,210,570 |
Baltimore Gas & Electric Co. Series 1993, 6.70% | 10,000 | | 1,033,750 |
Duquesne Light Co. 6.50% | 106,050 | | 5,355,525 |
Entergy Louisiana LLC 6.95% | 7,500 | | 746,250 |
FPL Group Capital Trust I 5.875% | 20,000 | | 488,200 |
Preferred Stocks - continued |
| Shares | | Value (Note 1) |
Nonconvertible Preferred Stocks - continued |
UTILITIES - continued |
Electric Utilities - continued |
Pacific Gas & Electric Co.: | | | |
Series A, 5.00% | 16,900 | | $ 376,025 |
Series B, 5.50% | 61,900 | | 1,519,645 |
Series D 5.00% | 69,200 | | 1,532,780 |
PPL Electric Utilities Corp. 6.25% | 80,000 | | 2,116,000 |
Southern California Edison Co.: | | | |
4.78% | 46,500 | | 1,029,975 |
5.349% | 40,000 | | 4,050,000 |
6.125% | 35,000 | | 3,640,000 |
Series B, 4.08% | 27,271 | | 524,967 |
Series C: | | | |
4.24% | 94,600 | | 1,787,940 |
6.00% | 20,000 | | 2,000,000 |
Series D, 4.32% | 70,000 | | 1,393,000 |
| | 32,694,227 |
Independent Power Producers & Energy Traders - 0.0% |
Heco Capital Trust III 6.50% | 12,000 | | 302,760 |
Multi-Utilities - 0.3% |
Consolidated Edison Co. of New York, Inc. Series A, 5.00% | 28,705 | | 2,596,367 |
San Diego Gas & Electric Co. 1.70% | 67,548 | | 1,758,362 |
| | 4,354,729 |
TOTAL UTILITIES | | 37,351,716 |
TOTAL NONCONVERTIBLE PREFERRED STOCKS | | 127,887,444 |
TOTAL PREFERRED STOCKS (Cost $169,816,748) | 179,018,661 |
Money Market Funds - 6.5% |
| Shares | | Value (Note 1) |
Fidelity Cash Central Fund, 5.35% (b)
(Cost $88,981,514) | 88,981,514 | | $ 88,981,514 |
TOTAL INVESTMENT PORTFOLIO - 100.7% (Cost $1,216,847,889) | | 1,387,407,083 |
NET OTHER ASSETS - (0.7)% | | (9,077,038) |
NET ASSETS - 100% | $ 1,378,330,045 |
Security Type Abbreviations |
TIDES - | Term Income Deferred
Equity Securities |
Legend |
(a) Non-income producing |
(b) Affiliated fund that is available only to investment companies and other accounts managed by Fidelity Investments. The rate quoted is the annualized seven-day yield of the fund at period end. A complete unaudited listing of the fund's holdings as of its most recent quarter end is available upon request. |
(c) Security initially issued at one coupon which converts to a higher coupon at a specified date. The rate shown is the rate at period end. |
(d) Security exempt from registration under Rule 144A of the Securities Act of 1933. These securities may be resold in transactions exempt from registration, normally to qualified institutional buyers. At the end of the period, the value of these securities amounted to $61,661,835 or 4.5% of net assets. |
(e) The coupon rate shown on floating or adjustable rate securities represents the rate at period end. |
Affiliated Central Funds |
Information regarding fiscal year to date income earned by the Fund from investments in Fidelity Central Funds is as follows: |
Fund | Income earned |
Fidelity Cash Central Fund | $ 3,249,017 |
Fidelity Securities Lending Cash Central Fund | 51,351 |
Total | $ 3,300,368 |
Other Information |
The composition of credit quality ratings as a percentage of net assets is as follows (ratings are unaudited): |
AAA,AA,A | 1.9% |
BBB | 1.5% |
BB | 2.6% |
B | 2.7% |
CCC,CC,C | 1.6% |
Not Rated | 4.1% |
Equities | 79.8% |
Short-Term Investments and Net Other Assets | 5.8% |
| 100.0% |
We have used ratings from Moody's Investors Services, Inc. Where Moody's ratings are not available, we have used S&P ratings. Percentages are adjusted for the effect of futures contracts, if applicable. |
Distribution of investments by country of issue, as a percentage of total net assets, is as follows: |
United States of America | 89.2% |
Bermuda | 2.5% |
Cayman Islands | 2.1% |
Singapore | 1.1% |
Others (individually less than 1%) | 5.1% |
| 100.0% |
See accompanying notes which are an integral part of the financial statements.
Annual Report
Financial Statements
Statement of Assets and Liabilities
| November 30, 2006 |
Assets | | |
Investment in securities, at value - See accompanying schedule: Unaffiliated issuers (cost $1,127,866,375) | $ 1,298,425,569 | |
Fidelity Central Funds (cost $88,981,514) | 88,981,514 | |
Total Investments (cost $1,216,847,889) | | $ 1,387,407,083 |
Cash | | 47 |
Receivable for investments sold | | 16,147,882 |
Receivable for fund shares sold | | 2,347,267 |
Dividends receivable | | 1,340,393 |
Interest receivable | | 1,594,639 |
Other receivables | | 23,825 |
Total assets | | 1,408,861,136 |
| | |
Liabilities | | |
Payable for investments purchased | $ 27,918,850 | |
Payable for fund shares redeemed | 1,487,938 | |
Accrued management fee | 637,172 | |
Distribution fees payable | 143,036 | |
Other affiliated payables | 245,895 | |
Other payables and accrued expenses | 98,200 | |
Total liabilities | | 30,531,091 |
| | |
Net Assets | | $ 1,378,330,045 |
Net Assets consist of: | | |
Paid in capital | | $ 1,131,281,652 |
Undistributed net investment income | | 4,371,372 |
Accumulated undistributed net realized gain (loss) on investments and foreign currency transactions | | 72,129,753 |
Net unrealized appreciation (depreciation) on investments and assets and liabilities in foreign currencies | | 170,547,268 |
Net Assets | | $ 1,378,330,045 |
See accompanying notes which are an integral part of the financial statements.
Annual Report
Financial Statements - continued
Statement of Assets and Liabilities - continued
| November 30, 2006 |
Calculation of Maximum Offering Price
Class A:
Net Asset Value and redemption price per share
($70,083,256 ÷ 5,132,404 shares) | | $ 13.66 |
| | |
Maximum offering price per share (100/94.25 of $13.66) | | $ 14.49 |
Class T:
Net Asset Value and redemption price per share
($119,834,346 ÷ 8,786,457 shares) | | $ 13.64 |
| | |
Maximum offering price per share (100/96.50 of $13.64) | | $ 14.13 |
Class B:
Net Asset Value and offering price per share
($23,992,457 ÷ 1,763,110 shares)A | | $ 13.61 |
| | |
Class C:
Net Asset Value and offering price per share
($75,300,889 ÷ 5,532,242 shares)A | | $ 13.61 |
| | |
Strategic Dividend and Income:
Net Asset Value, offering price and redemption price per
share ($1,075,348,259 ÷ 78,520,803 shares) | | $ 13.70 |
| | |
Institutional Class:
Net Asset Value, offering price and redemption price per
share ($13,770,838 ÷ 1,006,276 shares) | | $ 13.68 |
A Redemption price per share is equal to net asset value less any applicable contingent deferred sales charge.
See accompanying notes which are an integral part of the financial statements.
Annual Report
Statement of Operations
| Year ended November 30, 2006 |
Investment Income | | |
Dividends | | $ 23,830,075 |
Interest | | 5,031,742 |
Income from Fidelity Central Funds | | 3,300,368 |
Total income | | 32,162,185 |
| | |
Expenses | | |
Management fee | $ 6,835,128 | |
Transfer agent fees | 2,267,385 | |
Distribution fees | 1,438,280 | |
Accounting and security lending fees | 413,694 | |
Custodian fees and expenses | 64,831 | |
Independent trustees' compensation | 4,468 | |
Registration fees | 115,137 | |
Audit | 48,141 | |
Legal | 22,215 | |
Interest | 5,328 | |
Miscellaneous | 51,182 | |
Total expenses before reductions | 11,265,789 | |
Expense reductions | (65,588) | 11,200,201 |
Net investment income (loss) | | 20,961,984 |
Realized and Unrealized Gain (Loss) Net realized gain (loss) on: | | |
Investment securities: | | |
Unaffiliated issuers (net of foreign taxes of $2,605) | 74,081,652 | |
Foreign currency transactions | (23,442) | |
Total net realized gain (loss) | | 74,058,210 |
Change in net unrealized appreciation (depreciation) on: Investment securities (net of increase in deferred foreign taxes of $13,035) | 71,875,386 | |
Assets and liabilities in foreign currencies | 1,109 | |
Total change in net unrealized appreciation (depreciation) | | 71,876,495 |
Net gain (loss) | | 145,934,705 |
Net increase (decrease) in net assets resulting from operations | | $ 166,896,689 |
See accompanying notes which are an integral part of the financial statements.
Annual Report
Financial Statements - continued
Statement of Changes in Net Assets
| Year ended
November 30, 2006 | Year ended
November 30, 2005 |
Increase (Decrease) in Net Assets | | |
Operations | | |
Net investment income (loss) | $ 20,961,984 | $ 14,989,949 |
Net realized gain (loss) | 74,058,210 | 18,712,281 |
Change in net unrealized appreciation (depreciation) | 71,876,495 | 59,561,296 |
Net increase (decrease) in net assets resulting
from operations | 166,896,689 | 93,263,526 |
Distributions to shareholders from net investment income | (19,594,724) | (14,194,615) |
Distributions to shareholders from net realized gain | (10,685,905) | - |
Total distributions | (30,280,629) | (14,194,615) |
Share transactions - net increase (decrease) | 245,540,386 | 335,336,361 |
Total increase (decrease) in net assets | 382,156,446 | 414,405,272 |
| | |
Net Assets | | |
Beginning of period | 996,173,599 | 581,768,327 |
End of period (including undistributed net investment income of $4,371,372 and undistributed net investment income of $3,125,667, respectively) | $ 1,378,330,045 | $ 996,173,599 |
See accompanying notes which are an integral part of the financial statements.
Annual Report
Financial Highlights - Class A
Years ended November 30, | 2006 | 2005 | 2004 H |
Selected Per-Share Data | | | |
Net asset value, beginning of period | $ 12.18 | $ 11.09 | $ 10.00 |
Income from Investment Operations | | | |
Net investment income (loss) E | .19 | .18 | .16 |
Net realized and unrealized gain (loss) | 1.61 | 1.10 | 1.04 |
Total from investment operations | 1.80 | 1.28 | 1.20 |
Distributions from net investment income | (.19) | (.19) | (.11) |
Distributions from net realized gain | (.13) | - | - |
Total distributions | (.32) | (.19) | (.11) |
Net asset value, end of period | $ 13.66 | $ 12.18 | $ 11.09 |
Total Return B, C, D | 15.01% | 11.63% | 12.01% |
Ratios to Average Net Assets F, I | | | |
Expenses before reductions | 1.14% | 1.16% | 1.20% A |
Expenses net of fee waivers, if any | 1.14% | 1.16% | 1.20% A |
Expenses net of all reductions | 1.14% | 1.13% | 1.17% A |
Net investment income (loss) | 1.52% | 1.60% | 1.67% A |
Supplemental Data | | | |
Net assets, end of period (000 omitted) | $ 70,083 | $ 38,886 | $ 21,985 |
Portfolio turnover rate G | 125% | 64% | 66% A |
A Annualized
B Total returns for periods of less than one year are not annualized.
C Total returns would have been lower had certain expenses not been reduced during the periods shown.
D Total returns do not include the effect of the sales charges.
E Calculated based on average shares outstanding during the period.
F Fees and expenses of the underlying Fidelity Central Funds are not included in the Fund's expense ratio. The Fund indirectly bears its proportionate share of the expenses of any underlying Fidelity Central Funds.
G Amount does not include the portfolio activity of any underlying Fidelity Central Funds.
H For the period December 23, 2003 (commencement of operations) to November 30, 2004.
I Expense ratios reflect operating expenses of the class. Expenses before reductions do not reflect amounts reimbursed by the investment adviser or reductions from brokerage service arrangements or other expense offset arrangements and do not represent the amount paid by the class during periods when reimbursements or reductions occur. Expense ratios before reductions for start-up periods may not be representative of longer-term operating periods. Expenses net of fee waivers reflect expenses after reimbursement by the investment adviser but prior to reductions from brokerage service arrangements or other expense offset arrangements. Expenses net of all reductions represent the net expenses paid by the class.
See accompanying notes which are an integral part of the financial statements.
Annual Report
Financial Highlights - Class T
Years ended November 30, | 2006 | 2005 | 2004 H |
Selected Per-Share Data | | | |
Net asset value, beginning of period | $ 12.17 | $ 11.08 | $ 10.00 |
Income from Investment Operations | | | |
Net investment income (loss) E | .17 | .16 | .13 |
Net realized and unrealized gain (loss) | 1.59 | 1.09 | 1.04 |
Total from investment operations | 1.76 | 1.25 | 1.17 |
Distributions from net investment income | (.16) | (.16) | (.09) |
Distributions from net realized gain | (.13) | - | - |
Total distributions | (.29) | (.16) | (.09) |
Net asset value, end of period | $ 13.64 | $ 12.17 | $ 11.08 |
Total Return B, C, D | 14.70% | 11.43% | 11.75% |
Ratios to Average Net Assets F, I | | | |
Expenses before reductions | 1.35% | 1.38% | 1.45% A |
Expenses net of fee waivers, if any | 1.35% | 1.38% | 1.45% A |
Expenses net of all reductions | 1.35% | 1.35% | 1.42% A |
Net investment income (loss) | 1.31% | 1.38% | 1.43% A |
Supplemental Data | | | |
Net assets, end of period (000 omitted) | $ 119,834 | $ 79,920 | $ 36,526 |
Portfolio turnover rate G | 125% | 64% | 66% A |
A Annualized
B Total returns for periods of less than one year are not annualized.
C Total returns would have been lower had certain expenses not been reduced during the periods shown.
D Total returns do not include the effect of the sales charges.
E Calculated based on average shares outstanding during the period.
F Fees and expenses of the underlying Fidelity Central Funds are not included in the Fund's expense ratio. The Fund indirectly bears its proportionate share of the expenses of any underlying Fidelity Central Funds.
G Amount does not include the portfolio activity of any underlying Fidelity Central Funds.
H For the period December 23, 2003 (commencement of operations) to November 30, 2004.
I Expense ratios reflect operating expenses of the class. Expenses before reductions do not reflect amounts reimbursed by the investment adviser or reductions from brokerage service arrangements or other expense offset arrangements and do not represent the amount paid by the class during periods when reimbursements or reductions occur. Expense ratios before reductions for start-up periods may not be representative of longer-term operating periods. Expenses net of fee waivers reflect expenses after reimbursement by the investment adviser but prior to reductions from brokerage service arrangements or other expense offset arrangements. Expenses net of all reductions represent the net expenses paid by the class.
See accompanying notes which are an integral part of the financial statements.
Annual Report
Financial Highlights - Class B
Years ended November 30, | 2006 | 2005 | 2004 H |
Selected Per-Share Data | | | |
Net asset value, beginning of period | $ 12.14 | $ 11.06 | $ 10.00 |
Income from Investment Operations | | | |
Net investment income (loss) E | .09 | .09 | .09 |
Net realized and unrealized gain (loss) | 1.59 | 1.09 | 1.03 |
Total from investment operations | 1.68 | 1.18 | 1.12 |
Distributions from net investment income | (.08) | (.10) | (.06) |
Distributions from net realized gain | (.13) | - | - |
Total distributions | (.21) | (.10) | (.06) |
Net asset value, end of period | $ 13.61 | $ 12.14 | $ 11.06 |
Total Return B, C, D | 14.05% | 10.73% | 11.24% |
Ratios to Average Net Assets F, I | | | |
Expenses before reductions | 1.96% | 1.96% | 1.99% A |
Expenses net of fee waivers, if any | 1.96% | 1.95% | 1.95% A |
Expenses net of all reductions | 1.96% | 1.93% | 1.92% A |
Net investment income (loss) | .70% | .81% | .92% A |
Supplemental Data | | | |
Net assets, end of period (000 omitted) | $ 23,992 | $ 19,744 | $ 13,457 |
Portfolio turnover rate G | 125% | 64% | 66% A |
A Annualized
B Total returns for periods of less than one year are not annualized.
C Total returns would have been lower had certain expenses not been reduced during the periods shown.
D Total returns do not include the effect of the contingent deferred sales charge.
E Calculated based on average shares outstanding during the period.
F Fees and expenses of the underlying Fidelity Central Funds are not included in the Fund's expense ratio. The Fund indirectly bears its proportionate share of the expenses of any underlying Fidelity Central Funds.
G Amount does not include the portfolio activity of any underlying Fidelity Central Funds.
H For the period December 23, 2003 (commencement of operations) to November 30, 2004.
I Expense ratios reflect operating expenses of the class. Expenses before reductions do not reflect amounts reimbursed by the investment adviser or reductions from brokerage service arrangements or other expense offset arrangements and do not represent the amount paid by the class during periods when reimbursements or reductions occur. Expense ratios before reductions for start-up periods may not be representative of longer-term operating periods. Expenses net of fee waivers reflect expenses after reimbursement by the investment adviser but prior to reductions from brokerage service arrangements or other expense offset arrangements. Expenses net of all reductions represent the net expenses paid by the class.
See accompanying notes which are an integral part of the financial statements.
Annual Report
Financial Highlights - Class C
Years ended November 30, | 2006 | 2005 | 2004 H |
Selected Per-Share Data | | | |
Net asset value, beginning of period | $ 12.15 | $ 11.06 | $ 10.00 |
Income from Investment Operations | | | |
Net investment income (loss) E | .10 | .10 | .09 |
Net realized and unrealized gain (loss) | 1.58 | 1.09 | 1.03 |
Total from investment operations | 1.68 | 1.19 | 1.12 |
Distributions from net investment income | (.09) | (.10) | (.06) |
Distributions from net realized gain | (.13) | - | - |
Total distributions | (.22) | (.10) | (.06) |
Net asset value, end of period | $ 13.61 | $ 12.15 | $ 11.06 |
Total Return B, C, D | 14.05% | 10.85% | 11.24% |
Ratios to Average Net Assets F, I | | | |
Expenses before reductions | 1.89% | 1.90% | 1.94% A |
Expenses net of fee waivers, if any | 1.89% | 1.90% | 1.94% A |
Expenses net of all reductions | 1.88% | 1.87% | 1.92% A |
Net investment income (loss) | .78% | .86% | .93% A |
Supplemental Data | | | |
Net assets, end of period (000 omitted) | $ 75,301 | $ 49,713 | $ 28,795 |
Portfolio turnover rate G | 125% | 64% | 66% A |
A Annualized
B Total returns for periods of less than one year are not annualized.
C Total returns would have been lower had certain expenses not been reduced during the periods shown.
D Total returns do not include the effect of the contingent deferred sales charge.
E Calculated based on average shares outstanding during the period.
F Fees and expenses of the underlying Fidelity Central Funds are not included in the Fund's expense ratio. The Fund indirectly bears its proportionate share of the expenses of any underlying Fidelity Central Funds.
G Amount does not include the portfolio activity of any underlying Fidelity Central Funds.
H For the period December 23, 2003 (commencement of operations) to November 30, 2004.
I Expense ratios reflect operating expenses of the class. Expenses before reductions do not reflect amounts reimbursed by the investment adviser or reductions from brokerage service arrangements or other expense offset arrangements and do not represent the amount paid by the class during periods when reimbursements or reductions occur. Expense ratios before reductions for start-up periods may not be representative of longer-term operating periods. Expenses net of fee waivers reflect expenses after reimbursement by the investment adviser but prior to reductions from brokerage service arrangements or other expense offset arrangements. Expenses net of all reductions represent the net expenses paid by the class.
See accompanying notes which are an integral part of the financial statements.
Annual Report
Financial Highlights - Strategic Dividend and Income
Years ended November 30, | 2006 | 2005 | 2004 G |
Selected Per-Share Data | | | |
Net asset value, beginning of period | $ 12.22 | $ 11.11 | $ 10.00 |
Income from Investment Operations | | | |
Net investment income (loss) D | .24 | .22 | .19 |
Net realized and unrealized gain (loss) | 1.60 | 1.11 | 1.04 |
Total from investment operations | 1.84 | 1.33 | 1.23 |
Distributions from net investment income | (.23) | (.22) | (.12) |
Distributions from net realized gain | (.13) | - | - |
Total distributions | (.36) | (.22) | (.12) |
Net asset value, end of period | $ 13.70 | $ 12.22 | $ 11.11 |
Total Return B, C | 15.33% | 12.08% | 12.32% |
Ratios to Average Net Assets E, H | | | |
Expenses before reductions | .80% | .82% | .90% A |
Expenses net of fee waivers, if any | .80% | .82% | .90% A |
Expenses net of all reductions | .79% | .79% | .87% A |
Net investment income (loss) | 1.87% | 1.94% | 1.98% A |
Supplemental Data | | | |
Net assets, end of period (000 omitted) | $ 1,075,348 | $ 798,113 | $ 476,032 |
Portfolio turnover rate F | 125% | 64% | 66% A |
A Annualized
B Total returns for periods of less than one year are not annualized.
C Total returns would have been lower had certain expenses not been reduced during the periods shown.
D Calculated based on average shares outstanding during the period.
E Fees and expenses of the underlying Fidelity Central Funds are not included in the Fund's expense ratio. The Fund indirectly bears its proportionate share of the expenses of any underlying Fidelity Central Funds.
F Amount does not include the portfolio activity of any underlying Fidelity Central Funds.
G For the period December 23, 2003 (commencement of operations) to November 30, 2004.
H Expense ratios reflect operating expenses of the class. Expenses before reductions do not reflect amounts reimbursed by the investment adviser or reductions from brokerage service arrangements or other expense offset arrangements and do not represent the amount paid by the class during periods when reimbursements or reductions occur. Expense ratios before reductions for start-up periods may not be representative of longer-term operating periods. Expenses net of fee waivers reflect expenses after reimbursement by the investment adviser but prior to reductions from brokerage service arrangements or other expense offset arrangements. Expenses net of all reductions represent the net expenses paid by the class.
See accompanying notes which are an integral part of the financial statements.
Annual Report
Financial Highlights - Institutional Class
Years ended November 30, | 2006 | 2005 | 2004 G |
Selected Per-Share Data | | | |
Net asset value, beginning of period | $ 12.21 | $ 11.11 | $ 10.00 |
Income from Investment Operations | | | |
Net investment income (loss) D | .23 | .22 | .19 |
Net realized and unrealized gain (loss) | 1.59 | 1.10 | 1.04 |
Total from investment operations | 1.82 | 1.32 | 1.23 |
Distributions from net investment income | (.22) | (.22) | (.12) |
Distributions from net realized gain | (.13) | - | - |
Total distributions | (.35) | (.22) | (.12) |
Net asset value, end of period | $ 13.68 | $ 12.21 | $ 11.11 |
Total Return B, C | 15.24% | 11.98% | 12.38% |
Ratios to Average Net Assets E, H | | | |
Expenses before reductions | .82% | .83% | .88% A |
Expenses net of fee waivers, if any | .82% | .83% | .88% A |
Expenses net of all reductions | .82% | .81% | .85% A |
Net investment income (loss) | 1.84% | 1.93% | 2.00% A |
Supplemental Data | | | |
Net assets, end of period (000 omitted) | $ 13,771 | $ 9,798 | $ 4,973 |
Portfolio turnover rate F | 125% | 64% | 66% A |
A Annualized
B Total returns for periods of less than one year are not annualized.
C Total returns would have been lower had certain expenses not been reduced during the periods shown.
D Calculated based on average shares outstanding during the period.
E Fees and expenses of the underlying Fidelity Central Funds are not included in the Fund's expense ratio. The Fund indirectly bears its proportionate share of the expenses of any underlying Fidelity Central Funds.
F Amount does not include the portfolio activity of any underlying Fidelity Central Funds.
G For the period December 23, 2003 (commencement of operations) to November 30, 2004.
H Expense ratios reflect operating expenses of the class. Expenses before reductions do not reflect amounts reimbursed by the investment adviser or reductions from brokerage service arrangements or other expense offset arrangements and do not represent the amount paid by the class during periods when reimbursements or reductions occur. Expense ratios before reductions for start-up periods may not be representative of longer-term operating periods. Expenses net of fee waivers reflect expenses after reimbursement by the investment adviser but prior to reductions from brokerage service arrangements or other expense offset arrangements. Expenses net of all reductions represent the net expenses paid by the class.
See accompanying notes which are an integral part of the financial statements.
Annual Report
Notes to Financial Statements
For the period ended November 30, 2006
1. Significant Accounting Policies.
Fidelity Strategic Dividend & Income Fund (the Fund) is a fund of Fidelity Financial Trust (the trust) and is authorized to issue an unlimited number of shares. The trust is registered under the Investment Company Act of 1940, as amended (the 1940 Act), as an open-end management investment company organized as a Massachusetts business trust.
The Fund offers Class A, Class T, Class B, Class C, Strategic Dividend & Income, and Institutional Class shares, each of which has equal rights as to assets and voting privileges. Each class has exclusive voting rights with respect to matters that affect that class. Class B shares will automatically convert to Class A shares after a holding period of seven years from the initial date of purchase. Investment income, realized and unrealized capital gains and losses, the common expenses of the Fund, and certain fund-level expense reductions, if any, are allocated on a pro rata basis to each class based on the relative net assets of each class to the total net assets of the Fund. Each class differs with respect to transfer agent and distribution and service plan fees incurred. Certain expense reductions also differ by class.
The Fund may invest in Fidelity Central Funds which are open-end investment companies available to investment companies and other accounts managed by Fidelity Management & Research Company (FMR) and its affiliates. The financial statements have been prepared in conformity with accounting principles generally accepted in the United States of America, which require management to make certain estimates and assumptions at the date of the financial statements. The following summarizes the significant accounting policies of the Fund, which are also consistently followed by the Fidelity Central Funds:
Security Valuation. Investments are valued and net asset value (NAV) per share is calculated (NAV calculation) as of the close of business of the New York Stock Exchange (NYSE), normally 4:00 p.m. Eastern time. Wherever possible, the Fund uses independent pricing services approved by the Board of Trustees to value its investments.
Equity securities, including restricted securities, for which market quotations are readily available, are valued at the last reported sale price or official closing price as reported by an independent pricing service on the primary market or exchange on which they are traded. In the event there were no sales during the day or closing prices are not available, securities are valued at the last quoted bid price. Debt securities, including restricted securities, for which quotations are readily available, are valued by independent pricing services or by dealers who make markets in such securities. Pricing services consider yield or price of bonds of comparable quality, coupon, maturity and type as well as dealer supplied prices. Investments in open-end mutual funds, including the Fidelity Central Funds, are valued at their closing net asset value each business day. Short-term
Annual Report
Notes to Financial Statements - continued
1. Significant Accounting Policies - continued
Security Valuation - continued
securities with remaining maturities of sixty days or less for which quotations are not readily available are valued at amortized cost, which approximates value.
When current market prices or quotations are not readily available or do not accurately reflect fair value, valuations may be determined in accordance with procedures adopted by the Board of Trustees. For example, when developments occur between the close of a market and the close of the NYSE that may materially affect the value of some or all of the securities, or when trading in a security is halted, those securities may be fair valued. Factors used in the determination of fair value may include monitoring news to identify significant market or security specific events such as changes in the value of U.S. securities markets, reviewing developments in foreign markets and evaluating the performance of ADRs, futures contracts and exchange-traded funds. Because the Fund's utilization of fair value pricing depends on market activity, the frequency with which fair value pricing is used can not be predicted and may be utilized to a significant extent. The value of securities used for NAV calculation under fair value pricing may differ from published prices for the same securities.
Foreign Currency. The Fund uses foreign currency contracts to facilitate transactions in foreign-denominated securities. Losses from these transactions may arise from changes in the value of the foreign currency or if the counterparties do not perform under the contracts' terms.
Foreign-denominated assets, including investment securities, and liabilities are translated into U.S. dollars at the exchange rate at period end. Purchases and sales of investment securities, income and dividends received and expenses denominated in foreign currencies are translated into U.S. dollars at the exchange rate in effect on the transaction date.
The effects of exchange rate fluctuations on investments are included with the net realized and unrealized gain (loss) on investment securities. Other foreign currency transactions resulting in realized and unrealized gain (loss) are disclosed separately.
Investment Transactions and Income. Security transactions, including the Fund's investment activity in the Fidelity Central Funds, are accounted for as of trade date. Gains and losses on securities sold are determined on the basis of identified cost. Dividend income is recorded on the ex-dividend date, except for certain dividends from foreign securities where the ex-dividend date may have passed, which are recorded as soon as the Fund is informed of the ex-dividend date. Non-cash dividends included in dividend income, if any, are recorded at the fair market value of the securities received. Distributions received on securities that represent a return of capital or capital gain are recorded as a reduction of cost of investments and/or as a realized gain. The Fund
Annual Report
1. Significant Accounting Policies - continued
Investment Transactions and Income - continued
estimates the components of distributions received that may be considered return of capital distributions or capital gain distributions. Interest income and income distributions from the Fidelity Central Funds are accrued as earned, with any income distributions receivable as of period end included in Interest Receivable on the Statement of Assets and Liabilities. Interest income includes coupon interest and amortization of premium and accretion of discount on debt securities. Investment income is recorded net of foreign taxes withheld where recovery of such taxes is uncertain.
Expenses. Most expenses of the trust can be directly attributed to a fund. Expenses which cannot be directly attributed are apportioned among each Fund in the trust. Expense estimates are accrued in the period to which they relate and adjustments are made when actual amounts are known.
Income Tax Information and Distributions to Shareholders. Each year, the Fund intends to qualify as a regulated investment company by distributing all of its taxable income and realized gains under Subchapter M of the Internal Revenue Code. As a result, no provision for income taxes is required in the accompanying financial statements. Foreign taxes are provided for based on the Fund's understanding of the tax rules and rates that exist in the foreign markets in which it invests.
Distributions are recorded on the ex-dividend date. Income dividends and capital gain distributions are declared separately for each class. Income and capital gain distributions are determined in accordance with income tax regulations, which may differ from generally accepted accounting principles. In addition, the Fund will claim a portion of the payment made to redeeming shareholders as a distribution for income tax purposes.
Capital accounts within the financial statements are adjusted for permanent book-tax differences. These adjustments have no impact on net assets or the results of operations. Temporary book-tax differences will reverse in a subsequent period.
Book-tax differences are primarily due to foreign currency transactions, passive foreign investment companies (PFIC), market discount and losses deferred due to wash sales.
The tax-basis components of distributable earnings and the federal tax cost as of period end were as follows:
Unrealized appreciation | $ 180,327,420 |
Unrealized depreciation | (12,101,011) |
Net unrealized appreciation (depreciation) | 168,226,409 |
Undistributed ordinary income | 6,925,686 |
Undistributed long-term capital gain | 63,595,262 |
| |
Cost for federal income tax purposes | $ 1,219,180,674 |
Annual Report
Notes to Financial Statements - continued
1. Significant Accounting Policies - continued
Income Tax Information and Distributions to Shareholders - continued
The tax character of distributions paid was as follows:
| November 30, 2006 | November 30, 2005 |
Ordinary Income | $ 19,594,724 | $ 14,194,615 |
Long-term Capital Gains | 10,685,905 | - |
Total | $ 30,280,629 | $ 14,194,615 |
New Accounting Pronouncements. In July 2006, Financial Accounting Standards Board Interpretation No. 48, Accounting for Uncertainty in Income Taxes - an interpretation of FASB Statement 109 (FIN 48), was issued and is effective for fiscal years beginning after December 15, 2006. FIN 48 sets forth a threshold for financial statement recognition, measurement and disclosure of a tax position taken or expected to be taken on a tax return. Management is currently evaluating the impact, if any, the adoption of FIN 48 will have on the Fund's net assets, results of operations and financial statement disclosures.
In addition, in September 2006, Statement of Financial Accounting Standards No. 157, Fair Value Measurements (SFAS 157), was issued and is effective for fiscal years beginning after November 15, 2007. SFAS 157 defines fair value, establishes a framework for measuring fair value and expands disclosures about fair value measurements. Management is currently evaluating the impact the adoption of SFAS 157 will have on the Fund's financial statement disclosures.
2. Operating Policies.
Repurchase Agreements. FMR has received an Exemptive Order from the Securities and Exchange Commission (the SEC) which permits the Fund and other affiliated entities of FMR to transfer uninvested cash balances into joint trading accounts which are then invested in repurchase agreements. The Fund may also invest directly with institutions in repurchase agreements. Repurchase agreements are collateralized by government or non-government securities. Upon settlement date, collateral is held in segregated accounts with custodian banks and may be obtained in the event of a default of the counterparty. The Fund monitors, on a daily basis, the value of the collateral to ensure it is at least equal to the principal amount of the repurchase agreement (including accrued interest). In the event of a default by the counterparty, realization of the collateral proceeds could be delayed, during which time the value of the collateral may decline.
Restricted Securities. The Fund may invest in securities that are subject to legal or contractual restrictions on resale. These securities generally may be resold in transactions exempt from registration or to the public if the securities are registered. Disposal of
Annual Report
2. Operating Policies - continued
Restricted Securities - continued
these securities may involve time-consuming negotiations and expense, and prompt sale at an acceptable price may be difficult. Information regarding restricted securities is included at the end of the Fund's Schedule of Investments.
3. Purchases and Sales of Investments.
Purchases and sales of securities, other than short-term securities, aggregated $1,623,471,419 and $1,440,513,795, respectively.
4. Fees and Other Transactions with Affiliates.
Management Fee. FMR and its affiliates provide the Fund with investment management related services for which the Fund pays a monthly management fee. The management fee is the sum of an individual fund fee rate that is based on an annual rate of .30% of the Fund's average net assets and a group fee rate that averaged ..27% during the period. The group fee rate is based upon the average net assets of all the mutual funds advised by FMR. The group fee rate decreases as assets under management increase and increases as assets under management decrease. For the period, the total annual management fee rate was .56% of the Fund's average net assets.
Distribution and Service Plan. In accordance with Rule 12b-1 of the 1940 Act, the Fund has adopted separate Distribution and Service Plans for each class of shares. Certain classes pay Fidelity Distributors Corporation (FDC), an affiliate of FMR, separate Distribution and Service Fees, each of which is based on an annual percentage of each class' average net assets. In addition, FDC may pay financial intermediaries for selling shares of the Fund and providing shareholder support services. For the period, the Distribution and Service Fee rates and the total amounts paid to and retained by FDC were as follows:
| Distribution
Fee | Service
Fee | Paid to
FDC | Retained
by FDC |
Class A | 0% | .25% | $ 131,994 | $ 3,829 |
Class T | .25% | .25% | 488,194 | 27,702 |
Class B | .75% | .25% | 206,600 | 155,348 |
Class C | .75% | .25% | 611,492 | 170,452 |
| | | $ 1,438,280 | $ 357,331 |
Sales Load. FDC receives a front-end sales charge of up to 5.75% for selling Class A shares, and 3.50% for selling Class T shares, some of which is paid to financial intermediaries for selling shares of the Fund. FDC receives the proceeds of contingent deferred sales charges levied on Class A, Class T, Class B, and Class C redemptions. These charges depend on the holding period. The deferred sales charges range from 5% to 1% for
Annual Report
Notes to Financial Statements - continued
4. Fees and Other Transactions with Affiliates - continued
Sales Load - continued
Class B, 1% for Class C, 1.00% to .50% for certain purchases of Class A shares (.25% prior to February 24, 2006) and .25% for certain purchases of Class T shares.
For the period, sales charge amounts retained by FDC were as follows:
| Retained
by FDC |
Class A | $ 101,404 |
Class T | 40,021 |
Class B* | 35,066 |
Class C* | 7,583 |
| $ 184,074 |
* When Class B and Class C shares are initially sold, FDC pays commissions from its own resources to financial intermediaries through which the sales are made.
Transfer Agent Fees. Fidelity Investments Institutional Operations Company, Inc. (FIIOC), an affiliate of FMR, is the transfer, dividend disbursing and shareholder servicing agent for each class of the Fund, except for Strategic Dividend & Income. Fidelity Service Company, Inc. (FSC), an affiliate of FMR, is the transfer agent for Strategic Dividend & Income shares. FIIOC and FSC receive account fees and asset-based fees that vary according to the account size and type of account of the shareholders of the respective classes of the Fund. FIIOC and FSC pay for typesetting, printing and mailing of shareholder reports, except proxy statements. For the period, the total transfer agent fees paid by each class to FIIOC or FSC, were as follows:
| Amount | % of
Average
Net Assets |
Class A | $ 141,182 | .27 |
Class T | 224,910 | .23 |
Class B | 70,224 | .34 |
Class C | 160,748 | .26 |
Strategic Dividend and Income | 1,647,958 | .17 |
Institutional Class | 22,363 | .20 |
| $ 2,267,385 | |
Annual Report
4. Fees and Other Transactions with Affiliates - continued
Accounting and Security Lending Fees. FSC maintains the Fund's accounting records. The accounting fee is based on the level of average net assets for the month. Under a separate contract, FSC administers the security lending program. The security lending fee is based on the number and duration of lending transactions.
Investments in Fidelity Central Funds. The Fund may invest in Fidelity Central Funds. The Fund's Schedule of Investments lists each of the Fidelity Central Funds as an investment of the Fund but does not include the underlying holdings of each Fidelity Central Fund. As an Investing Fund, the Fund indirectly bears its proportionate share of the expenses of the underlying Fidelity Central Funds. A complete unaudited list of holdings for each Fidelity Central Fund is available upon request. In addition, the financial statements of the Fidelity Central Funds, which are not covered by the Fund's Report of Independent Registered Public Accounting Firm, are available on the EDGAR Database on the SEC's web site, www.sec.gov, or upon request.
The Money Market Central Funds seek preservation of capital and current income and are managed by Fidelity Investments Money Management, Inc. (FIMM), an affiliate of FMR.
Brokerage Commissions. The Fund placed a portion of its portfolio transactions with brokerage firms which are affiliates of the investment adviser. The commissions paid to these affiliated firms were $12,265 for the period.
5. Committed Line of Credit.
The Fund participates with other funds managed by FMR in a $4.2 billion credit facility (the "line of credit") to be utilized for temporary or emergency purposes to fund shareholder redemptions or for other short-term liquidity purposes. The Fund has agreed to pay commitment fees on its pro rata portion of the line of credit, which amounts to $3,149 and is reflected in Miscellaneous Expense on the Statement of Operations. During the period, there were no borrowings on this line of credit.
Annual Report
Notes to Financial Statements - continued
6. Security Lending.
The Fund lends portfolio securities from time to time in order to earn additional income. On the settlement date of the loan, the Fund receives collateral (in the form of U.S. Treasury obligations, letters of credit and/or cash) against the loaned securities and maintains collateral in an amount not less than 100% of the market value of the loaned securities during the period of the loan. The market value of the loaned securities is determined at the close of business of the Fund and any additional required collateral is delivered to the Fund on the next business day. If the borrower defaults on its obligation to return the securities loaned because of insolvency or other reasons, a fund could experience delays and costs in recovering the securities loaned or in gaining access to the collateral. Any cash collateral received is invested in the Fidelity Securities Lending Cash Central Fund. At period end, there were no security loans outstanding. Security lending income represents the income earned on investing cash collateral, less fees and expenses associated with the loan, plus any premium payments that may be received on the loan of certain types of securities. Security lending income is presented in the Statement of Operations as a component of income from Fidelity Central Funds. Net income from lending portfolio securities during the period amounted to $51,351.
7. Bank Borrowings.
The Fund is permitted to have bank borrowings for temporary or emergency purposes to fund shareholder redemptions. The Fund has established borrowing arrangements with certain banks. The interest rate on the borrowings is the bank's base rate, as revised from time to time. The average daily loan balance during the period for which loans were outstanding amounted to $11,495,000. The weighted average interest rate was 5.56%. At period end, there were no bank borrowings outstanding.
8. Expense Reductions.
Many of the brokers with whom FMR places trades on behalf of the Fund provided services to the Fund in addition to trade execution. These services included payments of certain expenses on behalf of the Fund totaling $60,975 for the period. In addition, through arrangements with each class' transfer agent, credits realized as a result of uninvested cash balances were used to reduce the Fund's expenses. During the period, credits reduced each class' transfer agent expense as noted in the table below.
| Transfer Agent
expense reduction |
Strategic Dividend and Income | $ 4,613 |
Annual Report
9. Other.
The Fund's organizational documents provide former and current trustees and officers with a limited indemnification against liabilities arising in connection with the performance of their duties to the Fund. In the normal course of business, the Fund may also enter into contracts that provide general indemnifications. The Fund's maximum exposure under these arrangements is unknown as this would be dependent on future claims that may be made against the Fund. The risk of material loss from such claims is considered remote.
During the period, the Fund's transfer agent, Fidelity Investments Institutional Operations Company, Inc. (FIIOC), an affiliate of Fidelity Management & Research Company, notified the Fund that the fund's books and records did not reflect a conversion of certain Class B to Class A shares upon their conversion date. Management has determined that this did not have a material impact to the Fund's reported net assets or results of operations in the accompanying financial statements. FIIOC will cause the books and records of the Fund to reflect a conversion of the relevant Class B shares to Class A and is in the process of determining the impact to affected shareholder accounts for purposes of its remediation.
The United States Securities and Exchange Commission ("SEC") is conducting an investigation of FMR (covering the years 2002 to 2004) arising from gifts, gratuities and business entertainment provided by certain brokers to certain individuals who were employed on FMR's domestic equity trading desk during that period. FMR is in discussions with the SEC staff regarding the possible resolution of the matter, but as of period-end no final resolution has been reached.
In December 2006, the Independent Trustees completed their own investigation of the matter with the assistance of independent counsel. The Independent Trustees and FMR agree that, despite the absence of proof that the Fidelity mutual funds experienced diminished execution quality as a result of the improper receipt of gifts and business entertainment, the conduct at issue was serious and is worthy of redress. Accordingly, the Independent Trustees have requested and FMR has agreed to pay $42 million to Fidelity mutual funds, plus interest to be determined at the time that payment is made. A method of allocating this payment among the funds has not yet been determined. In addition, subsequent to period-end, FMR has reimbursed related legal expenses. The total payment to the Fund is not anticipated to have a material impact on the Fund's net assets.
Annual Report
Notes to Financial Statements - continued
10. Distributions to Shareholders.
Distributions to shareholders of each class were as follows:
Years ended November 30, | 2006 | 2005 |
From net investment income | | |
Class A | $ 755,007 | $ 475,907 |
Class T | 1,207,524 | 830,178 |
Class B | 136,347 | 141,821 |
Class C | 455,492 | 339,138 |
Strategic Dividend and Income | 16,844,509 | 12,270,157 |
Institutional Class | 195,845 | 137,414 |
Total | $ 19,594,724 | $ 14,194,615 |
From net realized gain | | |
Class A | $ 422,135 | $ - |
Class T | 869,186 | - |
Class B | 212,465 | - |
Class C | 535,091 | - |
Strategic Dividend and Income | 8,542,657 | - |
Institutional Class | 104,371 | - |
Total | $ 10,685,905 | $ - |
Annual Report
11. Share Transactions.
Transactions for each class of shares were as follows:
| Shares | Dollars |
Years ended November 30, | 2006 | 2005 | 2006 | 2005 |
Class A | | | | |
Shares sold | 2,652,278 | 1,768,977 | $ 33,771,371 | $ 20,345,648 |
Reinvestment of distributions | 74,313 | 30,595 | 927,356 | 349,961 |
Shares redeemed | (785,506) | (589,953) | (9,972,783) | (6,809,260) |
Net increase (decrease) | 1,941,085 | 1,209,619 | $ 24,725,944 | $ 13,886,349 |
Class T | | | | |
Shares sold | 3,093,279 | 3,882,259 | $ 39,401,358 | $ 44,416,238 |
Reinvestment of distributions | 142,542 | 59,648 | 1,774,211 | 681,858 |
Shares redeemed | (1,016,565) | (669,970) | (12,945,160) | (7,729,006) |
Net increase (decrease) | 2,219,256 | 3,271,937 | $ 28,230,409 | $ 37,369,090 |
Class B | | | | |
Shares sold | 651,095 | 744,114 | $ 8,286,669 | $ 8,505,041 |
Reinvestment of distributions | 22,168 | 9,782 | 273,978 | 111,311 |
Shares redeemed | (535,951) | (344,455) | (6,733,248) | (3,964,823) |
Net increase (decrease) | 137,312 | 409,441 | $ 1,827,399 | $ 4,651,529 |
Class C | | | | |
Shares sold | 2,077,679 | 2,014,501 | $ 26,455,087 | $ 23,123,712 |
Reinvestment of distributions | 59,230 | 19,942 | 735,267 | 227,493 |
Shares redeemed | (696,643) | (545,060) | (8,845,742) | (6,287,937) |
Net increase (decrease) | 1,440,266 | 1,489,383 | $ 18,344,612 | $ 17,063,268 |
Strategic Dividend and Income | | | |
Shares sold | 36,957,213 | 36,814,600 | $ 472,572,702 | $ 424,067,244 |
Reinvestment of distributions | 1,804,449 | 944,881 | 22,539,587 | 10,819,574 |
Shares redeemed | (25,574,480) | (15,256,951) | (325,330,308) | (176,595,063) |
Net increase (decrease) | 13,187,182 | 22,502,530 | $ 169,781,981 | $ 258,291,755 |
Institutional Class | | | | |
Shares sold | 358,059 | 398,296 | $ 4,585,437 | $ 4,580,059 |
Reinvestment of distributions | 10,004 | 5,438 | 124,626 | 62,299 |
Shares redeemed | (164,319) | (48,869) | (2,080,022) | (567,988) |
Net increase (decrease) | 203,744 | 354,865 | $ 2,630,041 | $ 4,074,370 |
Annual Report
Report of Independent Registered Public Accounting Firm
To the Trustees of Fidelity Financial Trust and the Shareholders of Fidelity Strategic Dividend & Income Fund:
In our opinion, the accompanying statement of assets and liabilities, including the schedule of investments, and the related statements of operations and of changes in net assets and the financial highlights present fairly, in all material respects, the financial position of Fidelity Strategic Dividend & Income Fund (a fund of Fidelity Financial Trust) at November 30, 2006, the results of its operations for the year then ended, the changes in its net assets for each of the two years in the period then ended and the financial highlights for each of the three years in the period then ended, in conformity with accounting principles generally accepted in the United States of America. These financial statements and financial highlights (hereafter referred to as "financial statements") are the responsibility of the Fidelity Strategic Dividend & Income Fund's management; our responsibility is to express an opinion on these financial statements based on our audits. We conducted our audits of these financial statements in accordance with the standards of the Public Company Accounting Oversight Board (United States). Those standards require that we plan and perform the audit to obtain reasonable assurance about whether the financial statements are free of material misstatement. An audit includes examining, on a test basis, evidence supporting the amounts and disclosures in the financial statements, assessing the accounting principles used and significant estimates made by management, and evaluating the overall financial statement presentation. We believe that our audits, which included confirmation of securities at November 30, 2006 by correspondence with the custodian and brokers, provide a reasonable basis for our opinion.
PricewaterhouseCoopers LLP
Boston, Massachusetts
January 18, 2007
Annual Report
Trustees and Officers
The Trustees, Member of the Advisory Board, and executive officers of the trust and fund, as applicable, are listed below. The Board of Trustees governs the fund and is responsible for protecting the interests of shareholders. The Trustees are experienced executives who meet periodically throughout the year to oversee the fund's activities, review contractual arrangements with companies that provide services to the fund, and review the fund's performance. Except for William O. McCoy, each of the Trustees oversees 348 funds advised by FMR or an affiliate. Mr. McCoy oversees 350 funds advised by FMR or an affiliate.
The Trustees hold office without limit in time except that (a) any Trustee may resign; (b) any Trustee may be removed by written instrument, signed by at least two-thirds of the number of Trustees prior to such removal; (c) any Trustee who requests to be retired or who has become incapacitated by illness or injury may be retired by written instrument signed by a majority of the other Trustees; and (d) any Trustee may be removed at any special meeting of shareholders by a two-thirds vote of the outstanding voting securities of the trust. Each Trustee who is not an interested person (as defined in the 1940 Act) (Independent Trustee), shall retire not later than the last day of the calendar year in which his or her 72nd birthday occurs. The Independent Trustees may waive this mandatory retirement age policy with respect to individual Trustees. The executive officers and Advisory Board Member hold office without limit in time, except that any officer and Advisory Board Member may resign or may be removed by a vote of a majority of the Trustees at any regular meeting or any special meeting of the Trustees. Except as indicated, each individual has held the office shown or other offices in the same company for the past five years.
The fund's Statement of Additional Information (SAI) includes more information about the Trustees. To request a free copy, call Fidelity at 1-877-208-0098.
Interested Trustees*:
Correspondence intended for each Trustee who is an interested person may be sent to Fidelity Investments, 82 Devonshire Street, Boston, Massachusetts 02109.
Name, Age; Principal Occupation |
Edward C. Johnson 3d (76) |
| Year of Election or Appointment: 1982 Mr. Johnson is Chairman of the Board of Trustees. Mr. Johnson serves as President (2006-present), Chief Executive Officer, Chairman, and a Director of FMR Corp.; Chairman and a Director of FMR; Chairman and a Director of Fidelity Research & Analysis Company (FRAC); Chairman and a Director of Fidelity Investments Money Management, Inc.; and Chairman (2001-present) and a Director of FMR Co., Inc. In addition, Mr. Johnson serves as Chairman and Director of Fidelity International Limited (FIL). |
Robert L. Reynolds (54) |
| Year of Election or Appointment: 2003 Mr. Reynolds is President and a Director of FMR (2005-present), Fidelity Investments Money Management, Inc. (2005-present), and FMR Co., Inc. (2005-present). Mr. Reynolds also serves as Vice Chairman (2006-present), a Director (2003-present), and Chief Operating Officer of FMR Corp. and a Director of Strategic Advisers, Inc. (2005-present). He also serves on the Board at Fidelity Investments Canada, Ltd. |
* Trustees have been determined to be "Interested Trustees" by virtue of, among other things, their affiliation with the trust or various entities under common control with FMR.
Annual Report
Independent Trustees:
Correspondence intended for each Independent Trustee (that is, the Trustees other than the Interested Trustees) may be sent to Fidelity Investments, P.O. Box 55235, Boston, Massachusetts 02205-5235.
Name, Age; Principal Occupation |
Dennis J. Dirks (58) |
| Year of Election or Appointment: 2005 Prior to his retirement in May 2003, Mr. Dirks was Chief Operating Officer and a member of the Board of The Depository Trust & Clearing Corporation (DTCC) (1999-2003). He also served as President, Chief Operating Officer, and Board member of The Depository Trust Company (DTC) (1999-2003) and President and Board member of the National Securities Clearing Corporation (NSCC) (1999-2003). In addition, Mr. Dirks served as Chief Executive Officer and Board member of the Government Securities Clearing Corporation (2001-2003) and Chief Executive Officer and Board member of the Mortgage-Backed Securities Clearing Corporation (2001-2003). Mr. Dirks also serves as a Trustee and a member of the Finance Committee of Manhattan College (2005-present) and a Trustee and a member of the Finance Committee of AHRC of Nassau County (2006-present). |
Albert R. Gamper, Jr. (64) |
| Year of Election or Appointment: 2006 Prior to his retirement in December 2004, Mr. Gamper served as Chairman of the Board of CIT Group Inc. (commercial finance). During his tenure with CIT Group Inc. Mr. Gamper served in numerous senior management positions, including Chairman (1987-1989; 1999-2001; 2002-2004), Chief Executive Officer (1987-2004), and President (1989-2002). He currently serves as a member of the Board of Directors of Public Service Enterprise Group (utilities, 2001-present), Chairman of the Board of Governors, Rutgers University (2004-present), and Chairman of the Board of Saint Barnabas Health Care System. |
George H. Heilmeier (70) |
| Year of Election or Appointment: 2004 Dr. Heilmeier is Chairman Emeritus of Telcordia Technologies (communication software and systems), where prior to his retirement, he served as company Chairman and Chief Executive Officer. He currently serves on the Boards of Directors of The Mitre Corporation (systems engineering and information technology support for the government), and HRL Laboratories (private research and development, 2004-present). He is Chairman of the General Motors Science & Technology Advisory Board and a Life Fellow of the Institute of Electrical and Electronics Engineers (IEEE). Dr. Heilmeier is a member of the Defense Science Board and the National Security Agency Advisory Board. He is also a member of the National Academy of Engineering, the American Academy of Arts and Sciences, and the Board of Overseers of the School of Engineering and Applied Science of the University of Pennsylvania. Previously, Dr. Heilmeier served as a Director of TRW Inc. (automotive, space, defense, and information technology, 1992-2002), Compaq (1994-2002), Automatic Data Processing, Inc. (ADP) (technology-based business outsourcing, 1995-2002), INET Technologies Inc. (telecommunications network surveillance, 2001-2004), and Teletech Holdings (customer management services). He is the recipient of the 2005 Kyoto Prize in Advanced Technology for his invention of the liquid crystal display, and a member of the Consumer Electronics Hall of Fame. |
James H. Keyes (66) |
| Year of Election or Appointment: 2007 Prior to his retirement in 2003, Mr. Keyes was Chairman, President, and Chief Executive Officer of Johnson Controls, Inc. (automotive supplier, 1993-2003). He currently serves as a member of the boards of LSI Logic Corporation (semiconductor technologies), Navistar International Corporation (manufacture and sale of trucks, buses, and diesel engines, 2002-present), and Pitney Bowes, Inc. (integrated mail, messaging, and document management solutions). |
Marie L. Knowles (60) |
| Year of Election or Appointment: 2001 Prior to Ms. Knowles' retirement in June 2000, she served as Executive Vice President and Chief Financial Officer of Atlantic Richfield Company (ARCO) (diversified energy, 1996-2000). From 1993 to 1996, she was a Senior Vice President of ARCO and President of ARCO Transportation Company. She served as a Director of ARCO from 1996 to 1998. She currently serves as a Director of Phelps Dodge Corporation (copper mining and manufacturing) and McKesson Corporation (healthcare service, 2002-present). Ms. Knowles is a Trustee of the Brookings Institution and the Catalina Island Conservancy and also serves as a member of the Advisory Board for the School of Engineering of the University of Southern California. |
Ned C. Lautenbach (62) |
| Year of Election or Appointment: 2000 Mr. Lautenbach is Chairman of the Independent Trustees (2006-present). Mr. Lautenbach has been a partner of Clayton, Dubilier & Rice, Inc. (private equity investment firm) since September 1998. Previously, Mr. Lautenbach was with the International Business Machines Corporation (IBM) from 1968 until his retirement in 1998. Mr. Lautenbach serves as a Director of Sony Corporation (2006-present) and Eaton Corporation (diversified industrial) as well as the Philharmonic Center for the Arts in Naples, Florida. He also is a member of the Board of Trustees of Fairfield University (2005-present), as well as a member of the Council on Foreign Relations. |
William O. McCoy (73) |
| Year of Election or Appointment: 1997 Prior to his retirement in December 1994, Mr. McCoy was Vice Chairman of the Board of BellSouth Corporation (telecommunications) and President of BellSouth Enterprises. He is currently a Director of Duke Realty Corporation (real estate). He is also a partner of Franklin Street Partners (private investment management firm). In addition, Mr. McCoy served as the Interim Chancellor (1999-2000) and a member of the Board of Visitors for the University of North Carolina at Chapel Hill and currently serves as Chairman of the Board of Directors of the University of North Carolina Health Care System. He also served as Vice President of Finance for the University of North Carolina (16-school system). |
Cornelia M. Small (62) |
| Year of Election or Appointment: 2005 Ms. Small is a member (2000-present) and Chairperson (2002-present) of the Investment Committee, and a member (2002-present) of the Board of Trustees of Smith College. Previously, she served as Chief Investment Officer (1999-2000), Director of Global Equity Investments (1996-1999), and a member of the Board of Directors of Scudder, Stevens & Clark (1990-1997) and Scudder Kemper Investments (1997-1999). In addition, Ms. Small served as Co-Chair (2000-2003) of the Annual Fund for the Fletcher School of Law and Diplomacy. |
William S. Stavropoulos (67) |
| Year of Election or Appointment: 2002 Mr. Stavropoulos is Chairman Emeritus of the Board of Directors of The Dow Chemical Company. Since joining The Dow Chemical Company in 1967, Mr. Stavropoulos served in numerous senior management positions, including President (1993-2000; 2002-2003), CEO (1995-2000; 2002-2004), and Chairman of the Executive Committee (2000-2004). Currently, he is a Director of NCR Corporation (data warehousing and technology solutions), BellSouth Corporation (telecommunications), Chemical Financial Corporation, Maersk Inc. (industrial conglomerate, 2002-present), and Metalmark Capital (private equity investment firm, 2005-present). He also serves as a member of the Board of Trustees of the American Enterprise Institute for Public Policy Research. In addition, Mr. Stavropoulos is a member of The Business Council, J.P. Morgan International Council and the University of Notre Dame Advisory Council for the College of Science. |
Kenneth L. Wolfe (67) |
| Year of Election or Appointment: 2005 Prior to his retirement in 2001, Mr. Wolfe was Chairman and Chief Executive Officer of Hershey Foods Corporation (1993-2001). He currently serves as a member of the boards of Adelphia Communications Corporation (2003-present), Bausch & Lomb, Inc., and Revlon Inc. (2004-present). |
Annual Report
Advisory Board Member and Executive Officers:
Correspondence intended for each executive officer and Mr. Lynch may be sent to Fidelity Investments, 82 Devonshire Street, Boston, Massachusetts 02109.
Name, Age; Principal Occupation |
Peter S. Lynch (62) |
| Year of Election or Appointment: 2003 Member of the Advisory Board of Fidelity Financial Trust. Mr. Lynch is Vice Chairman and a Director of FMR, and Vice Chairman (2001-present) and a Director of FMR Co., Inc. Previously, Mr. Lynch served as a Trustee of the Fidelity funds (1990-2003). In addition, he serves as a Trustee of Boston College and as the Chairman of the Inner-City Scholarship Fund. |
Walter C. Donovan (44) |
| Year of Election or Appointment: 2005 Vice President of the fund. Mr. Donovan also serves as Vice President of Fidelity's High Income Funds (2005-present). Mr. Donovan also serves as Executive Vice President of FMR (2005-present) and FMR Co., Inc. (2005-present). Previously, Mr. Donovan served as Vice President of Fidelity's Fixed-Income Funds (2005-2006), certain Asset Allocation Funds (2005-2006), certain Balanced Funds (2005-2006), and as Vice President and Director of Fidelity's International Equity Trading group (1998-2005). |
Robert A. Lawrence (54) |
| Year of Election or Appointment: 2006 Vice President of the fund. Mr. Lawrence also serves as Vice President of the High Income Funds. Mr. Lawrence is Senior Vice President of FMR (2006-present) and FMR Co., Inc. (2006-present). Previously, Mr. Lawrence served as President of Fidelity Strategic Investments (2002-2005). |
Christopher L. Sharpe (38) |
| Year of Election or Appointment: 2005
Vice President of the fund. Mr. Sharpe also serves as Vice President of other funds advised by FMR. Prior to assuming his current responsibilities, Mr. Sharpe worked as an associate investment policy officer for John Hancock Financial Services, Inc. in Boston. From 1990 to 2000 he was with William M. Mercer, Inc. in Boston. Mr. Sharpe also serves as Vice President of FMR (2006) and FMR Co., Inc. (2006). |
Derek L. Young (42) |
| Year of Election or Appointment: 2005
Vice President of the fund. Mr. Young also serves as Vice President of other funds advised by FMR. Prior to assuming his current responsibilities, Mr. Young worked as director of Risk Management, senior vice president of Strategic Services and portfolio manager. Mr. Young also serves as Vice President of FMR and FMR Co., Inc (2004). |
|
Eric D. Roiter (58) |
| Year of Election or Appointment: 2003 Secretary of the fund. He also serves as Secretary of other Fidelity funds; Vice President, General Counsel, and Secretary of FMR Co., Inc. (2001-present) and FMR; Assistant Secretary of Fidelity Management & Research (U.K.) Inc. (2001-present), Fidelity Research & Analysis Company (2001-present), and Fidelity Investments Money Management, Inc. (2001-present). Mr. Roiter is an Adjunct Member, Faculty of Law, at Boston College Law School (2003-present). Previously, Mr. Roiter served as Vice President and Secretary of Fidelity Distributors Corporation (FDC) (1998-2005). |
Stuart Fross (47) |
| Year of Election or Appointment: 2003 Assistant Secretary of the fund. Mr. Fross also serves as Assistant Secretary of other Fidelity funds (2003-present), Vice President and Secretary of FDC (2005-present), and is an employee of FMR. |
R. Stephen Ganis (40) |
| Year of Election or Appointment: 2006 Anti-Money Laundering (AML) officer of the fund. Mr. Ganis also serves as AML officer of other Fidelity funds (2006-present) and FMR Corp. (2003-present). Before joining Fidelity Investments, Mr. Ganis practiced law at Goodwin Procter, LLP (2000-2002). |
Joseph B. Hollis (58) |
| Year of Election or Appointment: 2006 Chief Financial Officer of the fund. Mr. Hollis also serves as Chief Financial Officer of other Fidelity funds. Mr. Hollis is President of Fidelity Pricing and Cash Management Services (FPCMS) (2005-present). Mr. Hollis also serves as President and Director of Fidelity Service Company, Inc. (2006-present). Previously, Mr. Hollis served as Senior Vice President of Cash Management Services (1999-2002) and Investment Management Operations (2002-2005). |
Kenneth A. Rathgeber (59) |
| Year of Election or Appointment: 2004 Chief Compliance Officer of the fund. Mr. Rathgeber also serves as Chief Compliance Officer of other Fidelity funds (2004-present) and Executive Vice President of Risk Oversight for Fidelity Investments (2002-present). He is Chief Compliance Officer of FMR (2005-present), FMR Co., Inc. (2005-present), Fidelity Management & Research (U.K.) Inc. (2005-present), Fidelity Research & Analysis Company (2005-present), Fidelity Investments Money Management, Inc. (2005-present), and Strategic Advisers, Inc. (2005-present). Previously, Mr. Rathgeber served as Executive Vice President and Chief Operating Officer for Fidelity Investments Institutional Services Company, Inc. (1998-2002). |
Bryan A. Mehrmann (45) |
| Year of Election or Appointment: 2005 Deputy Treasurer of the fund. Mr. Mehrmann also serves as Deputy Treasurer of other Fidelity funds (2005-present) and is an employee of FMR. Previously, Mr. Mehrmann served as Vice President of Fidelity Investments Institutional Services Group (FIIS)/Fidelity Investments Institutional Operations Corporation, Inc. (FIIOC) Client Services (1998-2004). |
Kimberley H. Monasterio (42) |
| Year of Election or Appointment: 2007 President and Treasurer of the fund. Ms. Monasterio also serves as President and Treasurer of other Fidelity funds (2007-present) and is an employee of FMR (2004-present). Previously, Ms. Monasterio served as Deputy Treasurer of the Fidelity funds (2004-2006). Before joining Fidelity Investments, Ms. Monasterio served as Treasurer (2000-2004) and Chief Financial Officer (2002-2004) of the Franklin Templeton Funds and Senior Vice President of Franklin Templeton Services, LLC (2000-2004). |
Kenneth B. Robins (37) |
| Year of Election or Appointment: 2005 Deputy Treasurer of the fund. Mr. Robins also serves as Deputy Treasurer of other Fidelity funds (2005-present) and is an employee of FMR (2004-present). Before joining Fidelity Investments, Mr. Robins worked at KPMG LLP, where he was a partner in KPMG's department of professional practice (2002-2004) and a Senior Manager (1999-2000). In addition, Mr. Robins served as Assistant Chief Accountant, United States Securities and Exchange Commission (2000-2002). |
Robert G. Byrnes (39) |
| Year of Election or Appointment: 2005 Assistant Treasurer of the fund. Mr. Byrnes also serves as Assistant Treasurer of other Fidelity funds (2005-present) and is an employee of FMR (2005-present). Previously, Mr. Byrnes served as Vice President of FPCMS (2003-2005). Before joining Fidelity Investments, Mr. Byrnes worked at Deutsche Asset Management where he served as Vice President of the Investment Operations Group (2000-2003). |
John H. Costello (60) |
| Year of Election or Appointment: 2003 Assistant Treasurer of the fund. Mr. Costello also serves as Assistant Treasurer of other Fidelity funds and is an employee of FMR. |
Peter L. Lydecker (52) |
| Year of Election or Appointment: 2004 Assistant Treasurer of the fund. Mr. Lydecker also serves as Assistant Treasurer of other Fidelity funds (2004) and is an employee of FMR. |
Mark Osterheld (51) |
| Year of Election or Appointment: 2003 Assistant Treasurer of the fund. Mr. Osterheld also serves as Assistant Treasurer of other Fidelity funds (2002) and is an employee of FMR. |
Gary W. Ryan (48) |
| Year of Election or Appointment: 2005 Assistant Treasurer of the fund. Mr. Ryan also serves as Assistant Treasurer of other Fidelity funds (2005-present) and is an employee of FMR (2005-present). Previously, Mr. Ryan served as Vice President of Fund Reporting in FPCMS (1999-2005). |
Salvatore Schiavone (41) |
| Year of Election or Appointment: 2005 Assistant Treasurer of the fund. Mr. Schiavone also serves as Assistant Treasurer of other Fidelity funds (2005-present) and is an employee of FMR (2005-present). Before joining Fidelity Investments, Mr. Schiavone worked at Deutsche Asset Management, where he most recently served as Assistant Treasurer (2003-2005) of the Scudder Funds and Vice President and Head of Fund Reporting (1996-2003). |
Annual Report
Distributions
The Board of Trustees of Fidelity Advisor Strategic Dividend & Income Fund voted to pay to shareholders of record at the opening of business on record date, the following distributions per share derived from capital gains realized from sales of portfolio securities, and dividends derived from net investment income:
| Pay Date | Record Date | Dividends | Capital Gains |
Class A | 12/18/2006 | 12/15/2006 | $ 0.054 | $0.61 |
| 01/08/2007 | 01/05/2007 | $ - | $0.05 |
Class T | 12/18/2006 | 12/15/2006 | $ 0.047 | $0.61 |
| 01/08/2007 | 01/05/2007 | $ - | $0.05 |
Class B | 12/18/2006 | 12/15/2006 | $ 0.026 | $0.61 |
| 01/08/2007 | 01/05/2007 | $ - | $0.05 |
Class C | 12/18/2006 | 12/15/2006 | $ 0.028 | $0.61 |
| 01/08/2007 | 01/05/2007 | $ - | $0.05 |
The fund hereby designates as capital gain dividend with respect to the taxable year ended November 30, 2006, $63,595,262, or, if subsequently determined to be different, the net capital gain of such year.
A total of .17% of the dividends distributed during the fiscal year was derived from interest on U.S. Government securities which is generally exempt from state income tax.
Class A designates 33%, 100%, 100%, and 96% and Class T designates 38%, 100%, 100%, and 96% and Class B designates 63%, 100%, 0%, and 100% and Class C designates 58%, 100%, 0%, and 100% of the dividends distributed in December 2005 and April, July and October 2006, respectively during the fiscal year as qualifying for the dividends-received deduction for corporate shareholders.
Class A, Class T, Class B, and Class C designates 100% of the dividends distributed during the fiscal year as amounts which may be taken into account as a dividend for purposes of the maximum rate under section 1(h)(11) of the Internal Revenue Code.
The fund will notify shareholders in January 2007 of amounts for use in preparing 2006 income tax returns.
Annual Report
Proxy Voting Results
A special meeting of the fund's shareholders was held on September 20, 2006. The results of votes taken among shareholders on the proposal before them are reported below. Each vote reported represents one dollar of net asset value held on the record date for the meeting.
PROPOSAL 1 |
To elect a Board of Trustees. A |
| # of
Votes | % of
Votes |
Dennis J. Dirks |
Affirmative | 10,327,434,641.22 | 95.770 |
Withheld | 456,199,004.95 | 4.230 |
TOTAL | 10,783,633,646.17 | 100.000 |
Albert R. Gamper, Jr. |
Affirmative | 10,322,116,523.07 | 95.720 |
Withheld | 461,517,123.10 | 4.280 |
TOTAL | 10,783,633,646.17 | 100.000 |
Robert M. Gates |
Affirmative | 10,288,766,799.53 | 95.411 |
Withheld | 494,866,846.64 | 4.589 |
TOTAL | 10,783,633,646.17 | 100.000 |
George H. Heilmeier |
Affirmative | 10,298,619,061.42 | 95.502 |
Withheld | 485,014,584.75 | 4.498 |
TOTAL | 10,783,633,646.17 | 100.000 |
Edward C. Johnson 3d |
Affirmative | 10,257,561,582.55 | 95.122 |
Withheld | 526,072,063.62 | 4.878 |
TOTAL | 10,783,633,646.17 | 100.000 |
Stephen P. Jonas |
Affirmative | 10,317,222,628.79 | 95.675 |
Withheld | 466,411,017.38 | 4.325 |
TOTAL | 10,783,633,646.17 | 100.000 |
James H. Keyes B |
Affirmative | 10,318,195,711.25 | 95.684 |
Withheld | 465,437,934.92 | 4.316 |
TOTAL | 10,783,633,646.17 | 100.000 |
| # of
Votes | % of
Votes |
Marie L. Knowles |
Affirmative | 10,317,835,129.19 | 95.681 |
Withheld | 465,798,516.98 | 4.319 |
TOTAL | 10,783,633,646.17 | 100.000 |
Ned C. Lautenbach |
Affirmative | 10,317,039,890.90 | 95.673 |
Withheld | 466,593,755.27 | 4.327 |
TOTAL | 10,783,633,646.17 | 100.000 |
William O. McCoy |
Affirmative | 10,278,036,936.38 | 95.311 |
Withheld | 505,596,709.79 | 4.689 |
TOTAL | 10,783,633,646.17 | 100.000 |
Robert L. Reynolds |
Affirmative | 10,320,662,459.03 | 95.707 |
Withheld | 462,971,187.14 | 4.293 |
TOTAL | 10,783,633,646.17 | 100.000 |
Cornelia M. Small |
Affirmative | 10,329,731,930.45 | 95.791 |
Withheld | 453,901,715.72 | 4.209 |
TOTAL | 10,783,633,646.17 | 100.000 |
William S. Stavropoulos |
Affirmative | 10,298,039,656.66 | 95.497 |
Withheld | 485,593,989.51 | 4.503 |
TOTAL | 10,783,633,646.17 | 100.000 |
Kenneth L. Wolfe |
Affirmative | 10,310,583,687.33 | 95.613 |
Withheld | 473,049,958.84 | 4.387 |
TOTAL | 10,783,633,646.17 | 100.000 |
A Denotes trust-wide proposal and voting results. B Effective on or about January 1, 2007. |
Annual Report
Board Approval of Investment Advisory Contracts and Management Fees
Fidelity Strategic Dividend & Income Fund
Each year, typically in July, the Board of Trustees, including the Independent Trustees (together, the Board), votes on the renewal of the management contract and sub-advisory agreements (together, the Advisory Contracts) for the fund. The Board, assisted by the advice of fund counsel and Independent Trustees' counsel, requests and considers a broad range of information throughout the year.
The Board meets regularly each month except August and takes into account throughout the year matters bearing on Advisory Contracts. The Board, acting directly and through its separate committees, considers at each of its meetings factors that are relevant to the annual renewal of the fund's Advisory Contracts, including the services and support provided to the fund and its shareholders. At the time of the renewal, the Board had 12 standing committees, each composed of Independent Trustees with varying backgrounds, to which the Board has assigned specific subject matter responsibilities in order to enhance effective decision-making by the Board. Each committee has adopted a written charter outlining the structure and purposes of the committee. One such committee, the Equity Contract Committee, meets periodically as needed throughout the year to consider matters specifically related to the annual renewal of Advisory Contracts. The committee requests and receives information on, and makes recommendations to the Independent Trustees concerning, the approval and annual review of the Advisory Contracts.
At its July 2006 meeting, the Board of Trustees, including the Independent Trustees, unanimously determined to renew the Advisory Contracts for the fund. In reaching its determination, the Board considered all factors it believed relevant, including (i) the nature, extent, and quality of the services to be provided to the fund and its shareholders (including the investment performance of the fund); (ii) the competitiveness of the management fee and total expenses of the fund; (iii) the total costs of the services to be provided by and the profits to be realized by the investment adviser and its affiliates from the relationship with the fund; (iv) the extent to which economies of scale would be realized as the fund grows; and (v) whether fee levels reflect these economies of scale, if any, for the benefit of fund shareholders.
In determining whether to renew the Advisory Contracts for the fund, the Board ultimately reached a determination, with the assistance of fund counsel and Independent Trustees' counsel, that the renewal of the Advisory Contracts and the compensation to be received by Fidelity under the management contract is consistent with Fidelity's fiduciary duty under applicable law. In addition to evaluating the specific factors noted above, the Board, in reaching its determination, is aware that shareholders in the fund have a broad range of investment choices available to them, including a wide choice among mutual funds offered by competitors to Fidelity, and that the fund's shareholders, with the opportunity to review and weigh the disclosure provided by the fund in its prospectus and other public disclosures, have chosen to invest in this fund, managed by Fidelity.
Annual Report
Board Approval of Investment Advisory Contracts and
Management Fees - continued
Nature, Extent, and Quality of Services Provided. The Board considered staffing within the investment adviser, FMR, and the sub-advisers (together, the Investment Advisers), including the background of the fund's portfolio manager and the fund's investment objective and discipline. The Independent Trustees also had discussions with senior management of Fidelity's investment operations and investment groups. The Board considered the structure of the portfolio manager compensation program and whether this structure provides appropriate incentives.
Resources Dedicated to Investment Management and Support Services. The Board reviewed the size, education, and experience of the Investment Advisers' investment staff, their use of technology, and the Investment Advisers' approach to recruiting, training, and retaining portfolio managers and other research, advisory, and management personnel. The Board considered Fidelity's extensive global research capabilities that enable the Investment Advisers to aggregate data from various sources in an effort to produce positive investment results. The Board noted that Fidelity's analysts have access to a variety of technological tools that enable them to perform both fundamental and quantitative analysis and to specialize in various disciplines. The Board also considered that Fidelity's portfolio managers and analysts have access to daily portfolio attribution that allows for monitoring of a fund's portfolio, as well as an electronic communication system that provides immediate real-time access to research concerning issuers and credit enhancers.
Shareholder and Administrative Services. The Board considered (i) the nature, extent, quality, and cost of administrative, distribution, and shareholder services performed by the Investment Advisers and their affiliates under the Advisory Contracts and under separate agreements covering transfer agency, pricing and bookkeeping, and securities lending services for the fund; (ii) the nature and extent of the Investment Advisers' supervision of third party service providers, principally custodians and subcustodians; and (iii) the resources devoted to, and the record of compliance with, the fund's compliance policies and procedures. The Board reviewed the allocation of fund brokerage, including allocations to brokers affiliated with the Investment Advisers, the use of brokerage commissions to pay fund expenses, and the use of "soft" commission dollars to pay for research services. The Board also considered that Fidelity voluntarily pays for market data out of its own resources.
The Board noted that the growth of fund assets across the complex allows Fidelity to reinvest in the development of services designed to enhance the value or convenience of the Fidelity funds as investment vehicles. These services include 24-hour access to account information and market information through phone representatives and over the Internet, and investor education materials and asset allocation tools.
Annual Report
Investment in a Large Fund Family. The Board considered the benefits to shareholders of investing in a Fidelity fund, including the benefits of investing in a fund that is part of a large family of funds offering a variety of investment disciplines and providing for a large variety of mutual fund investor services. For example, fund shareholders are offered the privilege of exchanging shares of the fund for shares of other Fidelity funds, as set forth in the fund's prospectus, without paying an additional sales charge. The Board noted that, since the last Advisory Contract renewals in July 2005, Fidelity has taken a number of actions that benefited particular funds, including (i) dedicating additional resources to investment research and to restructure the investment research teams; (ii) voluntarily entering into contractual arrangements with certain brokers pursuant to which Fidelity pays for research products and services separately out of its own resources, rather than bundling with fund commissions; (iii) launching the Fidelity Advantage Class of its five Spartan stock index funds and three Spartan bond index funds, which is a lower-fee class available to shareholders with higher account balances; (iv) contractually agreeing to impose expense limitations on Fidelity U.S. Bond Index Fund and reducing the fund's initial investment minimum; and (v) offering shareholders of each of the Fidelity Institutional Money Market Funds the privilege of exchanging shares of the fund for shares of other Fidelity funds.
Investment Performance and Compliance. The Board considered whether the fund has operated within its investment objective, as well as its record of compliance with its investment restrictions. It also reviewed the fund's absolute investment performance for each class, as well as the fund's relative investment performance for each class measured against (i) a proprietary custom index, and (ii) a peer group of mutual funds deemed appropriate by the Board. Because the fund had been in existence less than three calendar years, the following chart considered by the Board shows, for the one-year period ended December 31, 2005, the total returns of Class C and Fidelity Strategic Dividend & Income (retail class), the total return of a proprietary custom index ("benchmark"), and a range of total returns of a peer group of mutual funds identified by Lipper Inc. as having an investment objective similar to that of the fund. The returns of Class C and Fidelity Strategic Dividend & Income (retail class) represent the performance of classes with the highest and lowest 12b-1 fees, respectively (not necessarily with the highest and lowest total expenses). The box within the chart shows the 25th percentile return (bottom of box) and the 75th percentile return (top of box) of the Lipper peer group. Returns shown above the box are in the first quartile and returns shown below the box are in the fourth quartile. The percentage beaten numbers noted below the chart correspond to the percentile box and represent the percentage of funds in the Lipper peer group whose performance was equal to or lower than that of the class indicated. The fund's proprietary custom index is an index developed by FMR that represents the performance of the fund's four general investment categories according to their respective weightings in the fund's neutral mix.
Annual Report
Board Approval of Investment Advisory Contracts and
Management Fees - continued
Fidelity Strategic Dividend & Income Fund
The Board reviewed the fund's relative investment performance against its Lipper peer group and stated that the performance of Fidelity Strategic Dividend & Income (retail class) was in the first quartile for the period shown. The Board also stated that the relative investment performance of Fidelity Strategic Dividend & Income (retail class) compared favorably to its benchmark for the period shown. The Board considered that the variations in performance among the fund's classes reflect the variations in class expenses, which result in lower performance for higher expense classes. The Board stated that it is difficult to evaluate in any comprehensive fashion the performance of the fund, in light of its relatively recent launch. The Board also reviewed the fund's relative investment performance against a peer group defined by Morningstar.
The Board considered that FMR has taken steps to refocus and strengthen equity research, equity portfolio management, and compliance. The Board noted with favor FMR's reorganization of its senior management team in 2005 and FMR's dedication of additional resources to investment research, and participated in the process that led to those changes.
Based on its review, and giving particular weight to the nature and quality of the resources dedicated by the Investment Advisers to maintain and improve relative performance, the Board concluded that the nature, extent, and quality of the services provided to the fund will benefit the fund's shareholders, particularly in light of the Board's view that the fund's shareholders benefit from investing in a fund that is part of a large family of funds offering a variety of investment disciplines and services.
Annual Report
Competitiveness of Management Fee and Total Fund Expenses. The Board considered the fund's management fee and total expenses compared to "mapped groups" of competitive funds and classes. Fidelity creates "mapped groups" by combining similar Lipper investment objective categories that have comparable management fee characteristics. Combining Lipper investment objective categories aids the Board's management fee and total expense comparisons by broadening the competitive group used for comparison and by reducing the number of universes to which various Fidelity funds are compared.
The Board considered two proprietary management fee comparisons for the 12-month (or shorter) periods shown in the chart below. The group of Lipper funds used by the Board for management fee comparisons is referred to below as the "Total Mapped Group" and, for the reasons explained above, is broader than the Lipper peer group used by the Board for performance comparisons. The Total Mapped Group comparison focuses on a fund's standing relative to the total universe of comparable funds available to investors, in terms of gross management fees before expense reimbursements or caps. "TMG %" represents the percentage of funds in the Total Mapped Group that had management fees that were lower than the fund's. For example, a TMG % of 21% means that 79% of the funds in the Total Mapped Group had higher management fees than the fund. The "Asset-Size Peer Group" (ASPG) comparison focuses on a fund's standing relative to non-Fidelity funds similar in size to the fund within the Total Mapped Group. The ASPG represents at least 15% of the funds in the Total Mapped Group with comparable asset size and management fee characteristics, subject to a minimum of 50 funds (or all funds in the Total Mapped Group if fewer than 50). Additional information, such as the ASPG quartile in which the fund's management fee ranked, is also included in the chart and considered by the Board.
Annual Report
Board Approval of Investment Advisory Contracts and
Management Fees - continued
Fidelity Strategic Dividend & Income Fund

The Board noted that the fund's management fee ranked below the median of its Total Mapped Group and below the median of its ASPG for 2005.
Based on its review, the Board concluded that the fund's management fee was fair and reasonable in light of the services that the fund receives and the other factors considered.
In its review of each class's total expenses, the Board considered the fund's management fee as well as other fund or class expenses, as applicable, such as transfer agent fees, pricing and bookkeeping fees, fund-paid 12b-1 fees, and custodial, legal, and audit fees. The Board also noted the effects of any waivers and reimbursements on fees and expenses. As part of its review, the Board also considered current and historical total expenses of each class of the fund compared to competitive fund median expenses. Each class of the fund is compared to those funds and classes in the Total Mapped Group (used by the Board for management fee comparisons) that have a similar sales load structure.
The Board noted that the total expenses of each of Class A, Class B, Class C, Institutional Class and Fidelity Strategic Dividend & Income (retail class) ranked below its competitive median for 2005, and the total expenses of Class T ranked above its competitive median for 2005. The Board noted that the fund offers multiple classes, each of which has a different sales load and 12b-1 fee structure, and that the multiple structures are intended to offer a range of pricing options for the intermediary market. The Board also noted that the total expenses of the classes vary primarily by the level of their 12b-1 fees, although differences in transfer agent fees may also cause expenses to vary from class to class.
Annual Report
In its review of total expenses, the Board also considered Fidelity fee structures and other information on clients that FMR and its affiliates service in other competitive markets, such as other mutual funds advised or subadvised by FMR or its affiliates, pension plan clients, and other institutional clients.
Based on its review, the Board concluded that the total expenses of each class of the fund were reasonable, although in one case above the median of the universe presented for comparison, in light of the services that the fund and its shareholders receive and the other factors considered.
Costs of the Services and Profitability. The Board considered the revenues earned and the expenses incurred by Fidelity in conducting the business of developing, marketing, distributing, managing, administering and servicing the fund and its shareholders. The Board also considered the level of Fidelity's profits in respect of all the Fidelity funds.
On an annual basis, FMR presents to the Board Fidelity's profitability for the fund. Fidelity calculates the profitability for each fund, as well as aggregate profitability for groups of Fidelity funds and all Fidelity funds, using a series of detailed revenue and cost allocation methodologies which originate with the audited books and records of Fidelity. The Audit Committee of the Board reviews any significant changes from the prior year's methodologies.
PricewaterhouseCoopers LLP (PwC), independent registered accounting firm and auditor to Fidelity and certain Fidelity funds, has been engaged annually by the Board as part of the Board's assessment of the results of Fidelity's profitability analysis. PwC's engagement includes the review and assessment of Fidelity's methodologies used in determining the revenues and expenses attributable to Fidelity's mutual fund business, and completion of agreed-upon procedures surrounding the mathematical accuracy of fund profitability and its conformity to allocation methodologies. After considering PwC's reports issued under the engagement and information provided by Fidelity, the Board believes that while other allocation methods may also be reasonable, Fidelity's profitability methodologies are reasonable in all material respects.
The Board has also reviewed Fidelity's non-fund businesses and any fall-out benefits related to the mutual fund business as well as cases where Fidelity's affiliates may benefit from or be related to the fund's business.
The Board considered the costs of the services provided by and the profits realized by Fidelity in connection with the operation of the fund and determined that the amount of profit is a fair entrepreneurial profit for the management of the fund.
Annual Report
Board Approval of Investment Advisory Contracts and
Management Fees - continued
Economies of Scale. The Board considered whether there have been economies of scale in respect of the management of the Fidelity funds, whether the Fidelity funds (including the fund) have appropriately benefited from any such economies of scale, and whether there is potential for realization of any further economies of scale. The Board considered the extent to which the fund will benefit from economies of scale through increased services to the fund, through waivers or reimbursements, or through fee or expense reductions, including reductions that occur through operation of the transfer agent agreement. The transfer agent fee varies in part based on the number of accounts in the fund. If the number of accounts decreases or the average account size increases, the overall transfer agent fee rate decreases.
The Board recognized that the fund's management contract incorporates a "group fee" structure, which provides for lower fee rates as total fund assets under FMR's management increase, and for higher fee rates as total fund assets under FMR's management decrease. The Board considered that the group fee is designed to deliver the benefits of economies of scale to fund shareholders when total fund assets increase, even if assets of any particular fund are unchanged or have declined, because some portion of Fidelity's costs are attributable to services provided to all Fidelity funds, and all funds benefit if those costs can be allocated among more assets. The Board concluded that, given the group fee structure, fund shareholders will achieve a certain level of economies of scale as assets under FMR's management increase at the fund complex level, regardless of whether Fidelity achieves any such economies of scale.
The Board further concluded that any potential economies of scale are being shared between fund shareholders and Fidelity in an appropriate manner.
Additional Information Requested by the Board. In order to develop fully the factual basis for consideration of the Advisory Contracts, the Board requested additional information on several topics, including (i) Fidelity's fund profitability methodology and profitability trends within certain funds; (ii) portfolio manager compensation; (iii) the extent to which any economies of scale exist and are shared between the funds and Fidelity; (iv) the total expenses of certain funds and classes relative to competitors, including the extent to which the expenses of certain funds have been or could be capped; (v) fund performance trends; and (vi) Fidelity's fee structures, including use of performance fees.
Based on its evaluation of all of the conclusions noted above, and after considering all material factors, the Board ultimately concluded that the advisory fee structures are fair and reasonable, and that the fund's Advisory Contracts should be renewed.
Annual Report
Annual Report
Annual Report
Investment Adviser
Fidelity Management & Research Company
Boston, MA
Investment Sub-Advisers
FMR Co., Inc.
Fidelity Management & Research
(U.K.) Inc.
Fidelity Research & Analysis Company
(formerly Fidelity Management &
Research (Far East) Inc.)
Fidelity International Investment Advisors
Fidelity Investments Japan Limited
Fidelity International Investment Advisors (U.K.) Limited
General Distributor
Fidelity Distributors Corporation
Boston, MA
Transfer and Service Agents
Fidelity Investments Institutional
Operations Company, Inc.
Boston, MA
Fidelity Service Company, Inc.
Boston, MA
Custodian
Citibank, N.A.
New York, NY
ASDI-UANN-0107
1.802529.102
(Fidelity Investment logo)(registered trademark)
Corporate Headquarters
82 Devonshire St., Boston, MA 02109
www.fidelity.com
(Fidelity Investment logo)(registered trademark)
Fidelity Advisor
Strategic Dividend & Income
Fund - Institutional Class
Annual Report
November 30, 2006
(2_fidelity_logos) (Registered_Trademark)
Institutional Class
is a class of Fidelity®
Strategic Dividend &
Income® Fund
Contents
Chairman's Message | <Click Here> | Ned Johnson's message to shareholders. |
Performance | <Click Here> | How the fund has done over time. |
Management's Discussion | <Click Here> | The managers' review of fund performance, strategy and outlook. |
Shareholder Expense Example | <Click Here> | An example of shareholder expenses. |
Investment Changes | <Click Here> | A summary of major shifts in the fund's investments over the past six months. |
Investments | <Click Here> | A complete list of the fund's investments with their market values. |
Financial Statements | <Click Here> | Statements of assets and liabilities, operations, and changes in net assets,
as well as financial highlights. |
Notes | <Click Here> | Notes to the financial statements. |
Report of Independent Registered Public Accounting Firm | <Click Here> | |
Trustees and Officers | <Click Here> | |
Distributions | <Click Here> | |
Proxy Voting Results | <Click Here> | |
Board Approval of Investment Advisory Contracts and Management Fees | <Click Here> | |
To view a fund's proxy voting guidelines and proxy voting record for the 12-month period ended June 30, visit www.fidelity.com/proxyvotingresults or visit the Securities and Exchange Commission's (SEC) web site at www.sec.gov. You may also call 1-877-208-0098 to request a free copy of the proxy voting guidelines.
Standard & Poor's, S&P and S&P 500 are registered service marks of The McGraw-Hill Companies, Inc. and have been licensed for use by Fidelity Distributors Corporation.
Other third party marks appearing herein are the property of their respective owners.
All other marks appearing herein are registered or unregistered trademarks or service marks of FMR Corp. or an affiliated company.
Annual Report
This report and the financial statements contained herein are submitted for the general information of the shareholders of the fund. This report is not authorized for distribution to prospective investors in the fund unless preceded or accompanied by an effective prospectus.
A fund files its complete schedule of portfolio holdings with the SEC for the first and third quarters of each fiscal year on Form N-Q. Forms N-Q are available on the SEC's web site at http://www.sec.gov. A fund's Forms N-Q may be reviewed and copied at the SEC's Public Reference Room in Washington, DC. Information regarding the operation of the SEC's Public Reference Room may be obtained by calling 1-800-SEC-0330. For a complete list of a fund's portfolio holdings, view the most recent quarterly holdings report, semiannual report, or annual report on Fidelity's web site at http://www.advisor.fidelity.com.
NOT FDIC INSURED · MAY LOSE VALUE · NO BANK GUARANTEE
Neither the fund nor Fidelity Distributors Corporation is a bank.
Annual Report
Chairman's Message
(photo_of_Edward_C_Johnson_3d)
Dear Shareholder:
Stock and bond markets around the world have seen largely positive results year to date, although weakness in the technology sector and growth stocks in general have tempered performance. While financial markets are always unpredictable, there are a number of time-tested principles that can put the historical odds in your favor.
One of the basic tenets is to invest for the long term. Over time, riding out the markets' inevitable ups and downs has proven much more effective than selling into panic or chasing the hottest trend. Even missing only a few of the markets' best days can significantly diminish investor returns. Patience also affords the benefits of compounding - of earning interest on additional income or reinvested dividends and capital gains. There are tax advantages and cost benefits to consider as well. The more you sell, the more taxes you pay, and the more you trade, the higher the costs. While staying the course doesn't eliminate risk, it can considerably lessen the effect of short-term declines.
You can further manage your investing risk through diversification. And today, more than ever, geographic diversification should be taken into account. Studies indicate that asset allocation is the single most important determinant of a portfolio's long-term success. The right mix of stocks, bonds and cash - aligned to your particular risk tolerance and investment objective - is very important. Age-appropriate rebalancing is also an essential aspect of asset allocation. For younger investors, an emphasis on equities - which historically have been the best performing asset class over time - is encouraged. As investors near their specific goal, such as retirement or sending a child to college, consideration may be given to replacing volatile assets (e.g. common stocks) with more-stable fixed investments (bonds or savings plans).
A third investment principle - investing regularly - can help lower the average cost of your purchases. Investing a certain amount of money each month or quarter helps ensure you won't pay for all your shares at market highs. This strategy - known as dollar cost averaging - also reduces unconstructive "emotion" from investing, helping shareholders avoid selling weak performers just prior to an upswing, or chasing a hot performer just before a correction.
We invite you to contact us via the Internet, through our Investor Centers or over the phone. It is our privilege to provide you the information you need to make the investments that are right for you.
Sincerely,
/s/Edward C. Johnson 3d
Edward C. Johnson 3d
Annual Report
Performance: The Bottom Line
Average annual total return reflects the change in the value of an investment, assuming reinvestment of the class' dividend income and capital gains (the profits earned upon the sale of securities that have grown in value) and assuming a constant rate of performance each year. The $10,000 table and the fund's returns do not reflect the deduction of taxes that a shareholder would pay on fund distributions or the redemption of fund shares. During periods of reimbursement by Fidelity, a fund's total return will be greater than it would be had the reimbursement not occurred. How a fund did yesterday is no guarantee of how it will do tomorrow.
Average Annual Total Returns
Periods ended November 30, 2006 | | | Past 1
year | Life of
fundA |
Institutional Class | | | 15.24% | 13.48% |
A From December 23, 2003.
$10,000 Over Life of Fund
Let's say hypothetically that $10,000 was invested in Fidelity Advisor Strategic Dividend & Income Fund - Institutional Class on December 23, 2003, when the fund started. The chart shows how the value of your investment would have changed, and also shows how the Standard & Poor's 500SM Index (S&P 500®) performed over the same period.
Annual Report
Management's Discussion of Fund Performance
Comments from Christopher Sharpe and Derek Young, Lead Co-Portfolio Managers of Fidelity Advisor Strategic Dividend & Income Fund
There were a number of reasons why the overall U.S. stock market could have had subpar results during the 12-month period that ended on November 30, 2006, including rising interest rates, inflation concerns, historically high energy prices, unrest in the Middle East, North Korea's nuclear test and a worse-than-expected housing slump. Despite these negative conditions, though, U.S. stocks fared well. In fact, several bellwether market benchmarks reached record highs, including the larger-cap Dow Jones Industrial AverageSM - a gauge of 30 mega-cap, blue-chip stocks - and the small-cap-oriented Russell 2000® Index. The strength in equities was sparked in large part by two major factors: the double-digit earnings growth achieved by U.S. corporations, and steady economic growth that was neither overheated nor recessionary, thanks primarily to the Federal Reserve Board's monetary policy. For the 12 months overall, the Dow rose 15.76%, the Russell 2000 checked in with a 17.43% advance, the Standard & Poor's 500SM Index gained 14.23% and the NASDAQ Composite® Index returned 9.78%.
During the fiscal year, the fund's Institutional Class shares gained 15.24%, compared with 19.64% for the Fidelity Strategic Dividend & Income Composite Index. All four of the fund's subportfolios achieved strong absolute returns. Our asset allocation strategy of overweighting common stocks, underweighting real estate investment trusts (REITs) and preferred stocks, and neutrally weighting convertible securities was basically sound. The fund lagged its benchmark mostly due to unfavorable selection in common stocks, especially in energy and health care, and the subportfolio underperformed relative to its benchmark. Underweighting the robust REIT group also hurt a bit, despite relative outperformance driven by good security selection in the industrial, lodging/resorts and office segments. The preferred stock subportfolio outperformed, driven by strong selection in food/beverage/tobacco and energy, as well as by favoring high-yield issues and the more equity-like convertible preferreds. Underweighting preferred stocks overall also helped. Meanwhile, unfavorable picks in information technology and energy caused the convertible bond subportfolio to underperform slightly.
Note to shareholders: On October 1, 2006, the fund's common stock subportfolio changed its benchmark from the Russell 1000® Value Index to the Russell 3000® Value Index, which conforms more closely to the fund's investment strategy.
The views expressed above reflect those of the portfolio manager(s) only through the end of the period as stated on the cover of this report and do not necessarily represent the views of Fidelity or any other person in the Fidelity organization. Any such views are subject to change at any time based upon market or other conditions and Fidelity disclaims any responsibility to update such views. These views may not be relied on as investment advice and, because investment decisions for a Fidelity fund are based on numerous factors, may not be relied on as an indication of trading intent on behalf of any Fidelity fund.
Annual Report
Shareholder Expense Example
As a shareholder of the Fund, you incur two types of costs: (1) transaction costs, including sales charges (loads) on purchase payments or redemption proceeds, and (2) ongoing costs, including management fees, distribution and/or service (12b-1) fees and other Fund expenses. This Example is intended to help you understand your ongoing costs (in dollars) of investing in the Fund and to compare these costs with the ongoing costs of investing in other mutual funds.
The Example is based on an investment of $1,000 invested at the beginning of the period and held for the entire period (June 1, 2006 to November 30, 2006).
Actual Expenses
The first line of the accompanying table for each class of the Fund provides information about actual account values and actual expenses. You may use the information in this line, together with the amount you invested, to estimate the expenses that you paid over the period. Simply divide your account value by $1,000.00 (for example, an $8,600 account value divided by $1,000.00 = 8.6), then multiply the result by the number in the first line for a class of the Fund under the heading entitled "Expenses Paid During Period" to estimate the expenses you paid on your account during this period.
Hypothetical Example for Comparison Purposes
The second line of the accompanying table for each class of the Fund provides information about hypothetical account values and hypothetical expenses based on a Class' actual expense ratio and an assumed rate of return of 5% per year before expenses, which is not the Class' actual return. The hypothetical account values and expenses may not be used to estimate the actual ending account balance or expenses you paid for the period. You may use this information to compare the ongoing costs of investing in the Fund and other funds. To do so, compare this 5% hypothetical example with the 5% hypothetical examples that appear in the shareholder reports of the other funds.
Annual Report
Investments - continued
Please note that the expenses shown in the table are meant to highlight your ongoing costs only and do not reflect any transaction costs. Therefore, the second line of the table is useful in comparing ongoing costs only, and will not help you determine the relative total costs of owning different funds. In addition, if these transactional costs were included, your costs would have been higher.
| Beginning
Account Value
June 1, 2006 | Ending
Account Value
November 30, 2006 | Expenses Paid
During Period*
June 1, 2006 to
November 30, 2006 |
Class A | | | |
Actual | $ 1,000.00 | $ 1,096.00 | $ 5.99 |
HypotheticalA | $ 1,000.00 | $ 1,019.35 | $ 5.77 |
Class T | | | |
Actual | $ 1,000.00 | $ 1,095.00 | $ 7.09 |
HypotheticalA | $ 1,000.00 | $ 1,018.30 | $ 6.83 |
Class B | | | |
Actual | $ 1,000.00 | $ 1,091.10 | $ 10.33 |
HypotheticalA | $ 1,000.00 | $ 1,015.19 | $ 9.95 |
Class C | | | |
Actual | $ 1,000.00 | $ 1,091.50 | $ 9.91 |
HypotheticalA | $ 1,000.00 | $ 1,015.59 | $ 9.55 |
Strategic Dividend and Income | | | |
Actual | $ 1,000.00 | $ 1,098.40 | $ 4.16 |
HypotheticalA | $ 1,000.00 | $ 1,021.11 | $ 4.00 |
Institutional Class | | | |
Actual | $ 1,000.00 | $ 1,096.70 | $ 4.31 |
HypotheticalA | $ 1,000.00 | $ 1,020.96 | $ 4.15 |
A 5% return per year before expenses
* Expenses are equal to each Class' annualized expense ratio (shown in the table below); multiplied by the average account value over the period, multiplied by 183/365 (to reflect the one-half year period).
| Annualized
Expense Ratio |
Class A | 1.14% |
Class T | 1.35% |
Class B | 1.97% |
Class C | 1.89% |
Strategic Dividend and Income | .79% |
Institutional Class | .82% |
Annual Report
Investment Changes
Top Ten Investments as of November 30, 2006 |
(excluding cash equivalents) | % of fund's
net assets | % of fund's net assets
6 months ago |
Valero Energy Corp. | 1.7 | 0.3 |
Equity Residential (SBI) | 1.4 | 0.7 |
JPMorgan Chase & Co. | 1.4 | 1.3 |
National Oilwell Varco, Inc. | 1.2 | 0.7 |
General Growth Properties, Inc. | 1.2 | 0.7 |
Noble Corp. | 1.1 | 0.0 |
Smith International, Inc. | 1.0 | 0.2 |
AT&T, Inc. | 1.0 | 1.0 |
American International Group, Inc. | 1.0 | 2.1 |
El Paso Corp. 4.99% | 0.9 | 1.1 |
| 11.9 | |
Top Five Market Sectors as of November 30, 2006 |
| % of fund's
net assets | % of fund's net assets
6 months ago |
Financials | 34.2 | 30.8 |
Information Technology | 14.8 | 11.9 |
Energy | 13.4 | 11.6 |
Consumer Discretionary | 7.3 | 8.7 |
Industrials | 6.6 | 10.8 |
Asset Allocation (% of fund's net assets) |
As of November 30, 2006 * | As of May 31, 2006 ** |
| Common Stocks 66.8% | | | Common Stocks 68.2% | |
| Preferred Stocks 13.0% | | | Preferred Stocks 12.8% | |
| Convertible Bonds 13.5% | | | Convertible Bonds 14.4% | |
| Other Investments 0.9% | | | Other Investments 0.3% | |
| Short-Term
Investments and
Net Other Assets 5.8% | | | Short-Term
Investments and
Net Other Assets 4.3% | |
* Foreign investments | 10.8% | | ** Foreign investments | 8.4% | |

Annual Report
Investments November 30, 2006
Showing Percentage of Net Assets
Corporate Bonds - 14.4% |
| Principal Amount | | Value
(Note 1) |
Convertible Bonds - 13.5% |
CONSUMER DISCRETIONARY - 1.0% |
Hotels, Restaurants & Leisure - 0.6% |
Carnival Corp. 1.132% 4/29/33 (c) | | $ 5,820,000 | | $ 4,237,426 |
Six Flags, Inc. 4.5% 5/15/15 | | 3,300,000 | | 3,522,750 |
| | 7,760,176 |
Media - 0.4% |
Charter Communications, Inc.: | | | | |
5.875% 11/16/09 (d) | | 70,000 | | 97,230 |
5.875% 11/16/09 | | 4,013,000 | | 5,574,057 |
| | 5,671,287 |
TOTAL CONSUMER DISCRETIONARY | | 13,431,463 |
CONSUMER STAPLES - 0.0% |
Food & Staples Retailing - 0.0% |
Nash-Finch Co. 1.6314% 3/15/35 (c) | | 1,520,000 | | 631,864 |
ENERGY - 2.4% |
Energy Equipment & Services - 1.2% |
Grey Wolf, Inc. 5.3216% 4/1/24 (e) | | 2,300,000 | | 2,992,875 |
Halliburton Co. 3.125% 7/15/23 | | 4,260,000 | | 7,859,700 |
Hornbeck Offshore Services, Inc. 1.625% 11/15/26 (c)(d) | | 1,000,000 | | 1,037,200 |
Maverick Tube Corp. 1.875% 11/15/25 | | 3,000,000 | | 4,804,920 |
| | 16,694,695 |
Oil, Gas & Consumable Fuels - 1.2% |
Chesapeake Energy Corp.: | | | | |
2.75% 11/15/35 (d) | | 5,000,000 | | 5,564,500 |
2.75% 11/15/35 | | 6,600,000 | | 7,345,140 |
McMoRan Exploration Co. 6% 7/2/08 | | 3,000,000 | | 3,813,900 |
| | 16,723,540 |
TOTAL ENERGY | | 33,418,235 |
FINANCIALS - 0.5% |
Consumer Finance - 0.4% |
American Express Co.: | | | | |
1.85% 12/1/33 (c)(d) | | 1,800,000 | | 1,798,920 |
1.85% 12/1/33 (c) | | 3,850,000 | | 3,847,690 |
| | 5,646,610 |
Corporate Bonds - continued |
| Principal Amount | | Value
(Note 1) |
Convertible Bonds - continued |
FINANCIALS - continued |
Real Estate Investment Trusts - 0.1% |
Ventas, Inc. 3.875% 11/15/11 (d) | | $ 1,000,000 | | $ 997,300 |
TOTAL FINANCIALS | | 6,643,910 |
HEALTH CARE - 1.0% |
Biotechnology - 0.4% |
Amgen, Inc. 0.375% 2/1/13 (d) | | 5,000,000 | | 5,017,500 |
Life Sciences Tools & Services - 0.6% |
Charles River Laboratories International, Inc. 2.25% 6/15/13 (d) | | 1,000,000 | | 1,059,600 |
Fisher Scientific International, Inc.: | | | | |
2.5% 10/1/23 (d) | | 995,000 | | 1,910,002 |
2.5% 10/1/23 | | 2,400,000 | | 4,607,040 |
Nektar Therapeutics 3.25% 9/28/12 | | 1,000,000 | | 1,030,460 |
| | 8,607,102 |
TOTAL HEALTH CARE | | 13,624,602 |
INDUSTRIALS - 2.1% |
Aerospace & Defense - 0.1% |
AAR Corp. 1.75% 2/1/26 (d) | | 1,000,000 | | 1,099,180 |
Airlines - 0.4% |
UAL Corp. 4.5% 6/30/21 (d) | | 2,000,000 | | 2,695,200 |
US Airways Group, Inc. 7% 9/30/20 (d) | | 960,000 | | 2,489,069 |
| | 5,184,269 |
Commercial Services & Supplies - 0.1% |
FTI Consulting, Inc. 3.75% 7/15/12 (d) | | 1,000,000 | | 1,129,949 |
Construction & Engineering - 0.2% |
Quanta Services, Inc. 3.75% 4/30/26 (d) | | 3,000,000 | | 3,270,006 |
Electrical Equipment - 0.2% |
GrafTech International Ltd. 1.625% 1/15/24 | | 2,720,000 | | 2,244,000 |
Industrial Conglomerates - 0.5% |
Tyco International Group SA yankee 3.125% 1/15/23 | | 5,310,000 | | 7,467,984 |
Machinery - 0.1% |
Greenbrier Companies, Inc. 2.375% 5/15/26 (d) | | 1,000,000 | | 1,041,311 |
Trinity Industries, Inc. 3.875% 6/1/36 | | 1,000,000 | | 1,050,842 |
| | 2,092,153 |
Corporate Bonds - continued |
| Principal Amount | | Value
(Note 1) |
Convertible Bonds - continued |
INDUSTRIALS - continued |
Marine - 0.5% |
OMI Corp. 2.875% 12/1/24 | | $ 6,300,000 | | $ 6,252,750 |
TOTAL INDUSTRIALS | | 28,740,291 |
INFORMATION TECHNOLOGY - 5.9% |
Communications Equipment - 1.2% |
Ciena Corp. 0.25% 5/1/13 | | 1,560,000 | | 1,355,172 |
Finisar Corp. 2.5% 10/15/10 | | 6,920,000 | | 8,978,700 |
JDS Uniphase Corp. 1% 5/15/26 (d) | | 5,000,000 | | 4,528,500 |
Symmetricom, Inc. 3.25% 6/15/25 | | 2,000,000 | | 2,012,600 |
| | 16,874,972 |
Computers & Peripherals - 0.3% |
Maxtor Corp. 2.375% 8/15/12 | | 1,200,000 | | 1,909,008 |
SanDisk Corp. 1% 5/15/13 | | 2,000,000 | | 1,777,800 |
| | 3,686,808 |
Electronic Equipment & Instruments - 1.7% |
Coherent, Inc. 2.75% 3/1/11 (d) | | 1,110,000 | | 1,200,021 |
Flextronics International Ltd. 1% 8/1/10 | | 13,420,000 | | 12,974,456 |
Itron, Inc. 2.5% 8/1/26 | | 3,000,000 | | 3,115,200 |
Merix Corp. 4% 5/15/13 (d) | | 1,000,000 | | 928,750 |
Solectron Corp. 0.5% 2/15/34 | | 1,000,000 | | 813,750 |
Vishay Intertechnology, Inc. 3.625% 8/1/23 | | 4,600,000 | | 4,582,888 |
| | 23,615,065 |
Internet Software & Services - 0.4% |
aQuantive, Inc. 2.25% 8/15/24 | | 2,800,000 | | 5,461,680 |
IT Services - 0.5% |
DST Systems, Inc.: | | | | |
Series A, 4.125% 8/15/23 (d) | | 1,240,000 | | 1,718,190 |
4.125% 8/15/23 | | 3,470,000 | | 4,808,160 |
| | 6,526,350 |
Semiconductors & Semiconductor Equipment - 1.7% |
Amkor Technology, Inc. 2.5% 5/15/11 | | 2,000,000 | | 1,977,200 |
Conexant Systems, Inc. 4% 3/1/26 | | 3,000,000 | | 2,737,500 |
Credence Systems Corp. 1.5% 5/15/08 | | 2,000,000 | | 1,825,000 |
EMCORE Corp. 5% 5/15/11 | | 1,000,000 | | 1,052,500 |
Intel Corp. 2.95% 12/15/35 | | 6,000,000 | | 5,543,460 |
Corporate Bonds - continued |
| Principal Amount | | Value
(Note 1) |
Convertible Bonds - continued |
INFORMATION TECHNOLOGY - continued |
Semiconductors & Semiconductor Equipment - continued |
ON Semiconductor Corp.: | | | | |
0% 4/15/24 | | $ 6,500,000 | | $ 5,882,500 |
1.875% 12/15/25 (d) | | 1,250,000 | | 1,417,188 |
Photronics, Inc. 2.25% 4/15/08 | | 3,000,000 | | 3,385,860 |
| | 23,821,208 |
Software - 0.1% |
Symantec Corp. 1% 6/15/13 (d) | | 1,000,000 | | 1,225,000 |
TOTAL INFORMATION TECHNOLOGY | | 81,211,083 |
TELECOMMUNICATION SERVICES - 0.6% |
Diversified Telecommunication Services - 0.6% |
Broadwing Corp. 3.125% 5/15/26 (d) | | 3,000,000 | | 3,307,500 |
Level 3 Communications, Inc. 3.5% 6/15/12 | | 2,000,000 | | 2,392,260 |
Time Warner Telecom, Inc. 2.375% 4/1/26 | | 2,000,000 | | 2,378,800 |
| | 8,078,560 |
TOTAL CONVERTIBLE BONDS | | 185,780,008 |
Nonconvertible Bonds - 0.9% |
CONSUMER DISCRETIONARY - 0.2% |
Media - 0.2% |
Charter Communications Holdings II LLC/Charter Communications Holdings II Capital Corp. 10.25% 9/15/10 | | 3,176,000 | | 3,310,980 |
FINANCIALS - 0.7% |
Commercial Banks - 0.4% |
PNC Preferred Funding Trust I 6.517% 12/31/49 (c)(d) | | 3,000,000 | | 3,031,800 |
SunTrust Preferred Capital I 5.853% 12/15/49 (e) | | 1,000,000 | | 1,015,420 |
Wells Fargo Capital X 5.95% 12/15/36 | | 1,000,000 | | 1,005,446 |
| | 5,052,666 |
Diversified Financial Services - 0.2% |
Wachovia Capital Trust III 5.8% (e) | | 2,000,000 | | 2,026,884 |
Corporate Bonds - continued |
| Principal Amount | | Value
(Note 1) |
Nonconvertible Bonds - continued |
FINANCIALS - continued |
Thrifts & Mortgage Finance - 0.1% |
Washington Mutual Preferred Funding Trust I 6.534% (d)(e) | | $ 2,000,000 | | $ 1,984,320 |
TOTAL FINANCIALS | | 9,063,870 |
TOTAL NONCONVERTIBLE BONDS | | 12,374,850 |
TOTAL CORPORATE BONDS (Cost $185,691,579) | 198,154,858 |
Common Stocks - 66.8% |
| Shares | | |
CONSUMER DISCRETIONARY - 5.7% |
Automobiles - 0.2% |
Renault SA | 20,900 | | 2,504,658 |
Diversified Consumer Services - 0.3% |
Coinmach Service Corp. unit | 156,800 | | 2,765,952 |
Service Corp. International | 155,800 | | 1,537,746 |
| | 4,303,698 |
Hotels, Restaurants & Leisure - 2.0% |
Accor SA | 23,500 | | 1,708,417 |
Applebee's International, Inc. | 19,600 | | 445,900 |
Aristocrat Leisure Ltd. | 197,300 | | 2,418,954 |
Boyd Gaming Corp. | 40,700 | | 1,723,645 |
Centerplate, Inc. unit | 318,800 | | 5,531,180 |
Domino's Pizza, Inc. | 99,100 | | 2,721,286 |
Greek Organization of Football Prognostics SA | 11,300 | | 424,962 |
McDonald's Corp. | 101,749 | | 4,270,406 |
Minor International PCL (For. Reg.) | 1,212,900 | | 391,967 |
Starwood Hotels & Resorts Worldwide, Inc. | 79,300 | | 5,088,681 |
WMS Industries, Inc. (a) | 63,400 | | 2,205,052 |
| | 26,930,450 |
Household Durables - 0.6% |
Bassett Furniture Industries, Inc. | 51,605 | | 913,409 |
Cyrela Brazil Realty SA | 35,000 | | 669,446 |
La-Z-Boy, Inc. | 95,477 | | 1,124,719 |
The Stanley Works | 38,010 | | 1,939,270 |
Common Stocks - continued |
| Shares | | Value (Note 1) |
CONSUMER DISCRETIONARY - continued |
Household Durables - continued |
Urbi, Desarrollos Urbanos, SA de CV (a) | 144,300 | | $ 454,053 |
Whirlpool Corp. | 42,000 | | 3,582,600 |
| | 8,683,497 |
Leisure Equipment & Products - 0.2% |
Eastman Kodak Co. | 120,400 | | 3,132,808 |
Media - 0.8% |
Charter Communications, Inc. Class A (a) | 977,700 | | 2,884,215 |
Gannett Co., Inc. | 4,000 | | 238,080 |
Grupo Televisa SA de CV (CPO) sponsored ADR | 21,500 | | 565,020 |
Idearc, Inc. (a) | 8,300 | | 228,582 |
News Corp. Class A | 86,700 | | 1,786,020 |
R.H. Donnelley Corp. | 55,100 | | 3,416,200 |
Viacom, Inc. Class B (non-vtg.) (a) | 39,965 | | 1,499,087 |
| | 10,617,204 |
Multiline Retail - 0.7% |
Federated Department Stores, Inc. | 74,800 | | 3,148,332 |
JCPenney Co., Inc. | 38,800 | | 3,000,792 |
Lojas Renner SA | 21,000 | | 276,443 |
Sears Holdings Corp. (a) | 17,200 | | 2,948,424 |
Tuesday Morning Corp. | 25,400 | | 447,040 |
| | 9,821,031 |
Specialty Retail - 0.3% |
AutoZone, Inc. (a) | 3,400 | | 386,274 |
OfficeMax, Inc. | 92,400 | | 4,349,268 |
| | 4,735,542 |
Textiles, Apparel & Luxury Goods - 0.6% |
Brown Shoe Co., Inc. | 48,800 | | 2,315,072 |
Liz Claiborne, Inc. | 91,800 | | 3,924,450 |
Polo Ralph Lauren Corp. Class A | 7,400 | | 578,680 |
VF Corp. | 21,000 | | 1,646,190 |
| | 8,464,392 |
TOTAL CONSUMER DISCRETIONARY | | 79,193,280 |
CONSUMER STAPLES - 2.6% |
Beverages - 0.2% |
Fomento Economico Mexicano SA de CV sponsored ADR | 3,300 | | 347,325 |
Pernod Ricard SA | 7,800 | | 1,726,969 |
| | 2,074,294 |
Common Stocks - continued |
| Shares | | Value (Note 1) |
CONSUMER STAPLES - continued |
Food & Staples Retailing - 0.6% |
Rite Aid Corp. | 380,300 | | $ 1,806,425 |
Safeway, Inc. | 173,400 | | 5,342,454 |
Wal-Mart de Mexico SA de CV Series V | 189,700 | | 708,968 |
| | 7,857,847 |
Food Products - 0.6% |
B&G Foods, Inc. unit | 156,900 | | 3,075,240 |
Chiquita Brands International, Inc. | 139,500 | | 1,994,850 |
Del Monte Foods Co. | 61,500 | | 694,335 |
Tyson Foods, Inc. Class A | 170,500 | | 2,709,245 |
| | 8,473,670 |
Personal Products - 0.5% |
Avon Products, Inc. | 165,600 | | 5,405,184 |
Playtex Products, Inc. (a) | 144,000 | | 2,139,840 |
| | 7,545,024 |
Tobacco - 0.7% |
Altria Group, Inc. | 112,600 | | 9,482,046 |
TOTAL CONSUMER STAPLES | | 35,432,881 |
ENERGY - 9.5% |
Energy Equipment & Services - 4.9% |
Grant Prideco, Inc. (a) | 80,300 | | 3,518,746 |
Halliburton Co. | 320,700 | | 10,820,418 |
National Oilwell Varco, Inc. (a) | 252,489 | | 16,793,043 |
Noble Corp. | 191,763 | | 14,813,692 |
Pride International, Inc. (a) | 110,700 | | 3,574,503 |
Rowan Companies, Inc. | 100,100 | | 3,605,602 |
Smith International, Inc. | 341,300 | | 14,457,468 |
| | 67,583,472 |
Oil, Gas & Consumable Fuels - 4.6% |
Alpha Natural Resources, Inc. (a) | 77,158 | | 1,215,239 |
Aurora Oil & Gas Corp. (a) | 480,572 | | 1,638,751 |
Cabot Oil & Gas Corp. | 63,200 | | 3,926,616 |
CONSOL Energy, Inc. | 99,300 | | 3,645,303 |
Foundation Coal Holdings, Inc. | 97,000 | | 3,599,670 |
Peabody Energy Corp. | 109,900 | | 5,056,499 |
Plains Exploration & Production Co. (a) | 41,200 | | 1,939,696 |
Quicksilver Resources, Inc. (a) | 88,700 | | 3,752,897 |
Range Resources Corp. | 29,100 | | 904,719 |
Common Stocks - continued |
| Shares | | Value (Note 1) |
ENERGY - continued |
Oil, Gas & Consumable Fuels - continued |
Teekay Shipping Corp. | 142,050 | | $ 5,949,054 |
Ultra Petroleum Corp. (a) | 137,200 | | 7,395,080 |
Valero Energy Corp. | 435,961 | | 24,008,366 |
| | 63,031,890 |
TOTAL ENERGY | | 130,615,362 |
FINANCIALS - 26.8% |
Capital Markets - 1.8% |
Ameriprise Financial, Inc. | 8,400 | | 454,440 |
Bank of New York Co., Inc. | 48,200 | | 1,713,028 |
Franklin Resources, Inc. | 17,900 | | 1,910,646 |
KKR Private Equity Investors, LP | 64,700 | | 1,436,340 |
Merrill Lynch & Co., Inc. | 68,200 | | 5,962,726 |
Merrill Lynch & Co., Inc. (depositary shares) Series 1, unit | 277,700 | | 7,147,998 |
Morgan Stanley | 81,000 | | 6,168,960 |
State Street Corp. | 9,400 | | 584,022 |
| | 25,378,160 |
Commercial Banks - 1.1% |
Cathay General Bancorp | 21,219 | | 729,085 |
East West Bancorp, Inc. | 52,000 | | 1,851,720 |
UCBH Holdings, Inc. | 117,400 | | 1,979,364 |
Wachovia Corp. | 102,709 | | 5,565,801 |
Wells Fargo & Co. | 159,700 | | 5,627,828 |
| | 15,753,798 |
Consumer Finance - 0.1% |
Capital One Financial Corp. | 21,900 | | 1,705,572 |
Diversified Financial Services - 2.3% |
Bank of America Corp. | 224,214 | | 12,073,924 |
JPMorgan Chase & Co. | 410,704 | | 19,007,381 |
| | 31,081,305 |
Insurance - 5.4% |
ACE Ltd. | 94,800 | | 5,388,432 |
AFLAC, Inc. | 77,600 | | 3,425,264 |
Allied World Assurance Co. Holdings Ltd. | 18,800 | | 798,060 |
American International Group, Inc. | 194,400 | | 13,670,208 |
Aspen Insurance Holdings Ltd. | 270,300 | | 7,284,585 |
Axis Capital Holdings Ltd. | 216,656 | | 7,416,135 |
Endurance Specialty Holdings Ltd. | 188,171 | | 7,062,058 |
Common Stocks - continued |
| Shares | | Value (Note 1) |
FINANCIALS - continued |
Insurance - continued |
Everest Re Group Ltd. | 38,700 | | $ 3,808,467 |
Hartford Financial Services Group, Inc. | 35,900 | | 3,078,784 |
Marsh & McLennan Companies, Inc. | 31,500 | | 989,730 |
MetLife, Inc. | 52,500 | | 3,083,325 |
Platinum Underwriters Holdings Ltd. | 220,400 | | 6,706,772 |
Scottish Re Group Ltd. | 97,111 | | 577,810 |
The St. Paul Travelers Companies, Inc. | 116,800 | | 6,051,408 |
W.R. Berkley Corp. | 124,050 | | 4,355,396 |
| | 73,696,434 |
Real Estate Investment Trusts - 15.3% |
Alexandria Real Estate Equities, Inc. | 53,500 | | 5,514,780 |
AMB Property Corp. (SBI) | 8,000 | | 490,160 |
American Financial Realty Trust (SBI) | 140,800 | | 1,655,808 |
Apartment Investment & Management Co. Class A | 20,000 | | 1,152,800 |
AvalonBay Communities, Inc. | 40,460 | | 5,384,417 |
BioMed Realty Trust, Inc. | 22,900 | | 691,580 |
Boston Properties, Inc. | 60,014 | | 7,024,639 |
CBL & Associates Properties, Inc. | 121,540 | | 5,238,374 |
CBRE Realty Finance, Inc. | 28,800 | | 465,120 |
Columbia Equity Trust, Inc. | 67,900 | | 1,279,915 |
Corporate Office Properties Trust (SBI) | 177,900 | | 8,843,409 |
Developers Diversified Realty Corp. | 89,500 | | 5,797,810 |
Douglas Emmett, Inc. (a) | 97,700 | | 2,569,510 |
Duke Realty Corp. | 290,488 | | 12,642,038 |
Education Realty Trust, Inc. | 6,800 | | 106,964 |
Equity Lifestyle Properties, Inc. | 33,260 | | 1,728,522 |
Equity Office Properties Trust | 243,310 | | 11,727,542 |
Equity One, Inc. | 88,900 | | 2,425,192 |
Equity Residential (SBI) | 357,380 | | 19,034,059 |
Federal Realty Investment Trust (SBI) | 44,500 | | 3,790,510 |
General Growth Properties, Inc. | 293,125 | | 16,104,288 |
GMH Communities Trust | 107,200 | | 1,330,352 |
Health Care Property Investors, Inc. | 26,100 | | 946,647 |
Health Care REIT, Inc. | 17,300 | | 725,389 |
Home Properties of New York, Inc. | 13,600 | | 840,616 |
HomeBanc Mortgage Corp., Georgia | 191,600 | | 806,636 |
Host Hotels & Resorts, Inc. | 363,445 | | 9,166,083 |
Inland Real Estate Corp. | 140,600 | | 2,727,640 |
Innkeepers USA Trust (SBI) | 44,100 | | 705,600 |
Kilroy Realty Corp. | 16,300 | | 1,333,340 |
Common Stocks - continued |
| Shares | | Value (Note 1) |
FINANCIALS - continued |
Real Estate Investment Trusts - continued |
Kimco Realty Corp. | 230,638 | | $ 10,696,990 |
Longview Fibre Co. | 44,000 | | 916,080 |
Mission West Properties, Inc. | 81,500 | | 1,018,750 |
Newcastle Investment Corp. | 12,100 | | 362,395 |
Potlatch Corp. | 10,230 | | 426,489 |
ProLogis Trust | 141,165 | | 9,199,723 |
Public Storage, Inc. | 98,936 | | 9,525,558 |
Rayonier, Inc. | 34,320 | | 1,431,144 |
Reckson Associates Realty Corp. | 7,800 | | 377,364 |
Simon Property Group, Inc. | 81,110 | | 8,271,598 |
SL Green Realty Corp. | 41,200 | | 5,571,888 |
Sovran Self Storage, Inc. | 47,900 | | 2,802,150 |
Tanger Factory Outlet Centers, Inc. | 84,800 | | 3,342,816 |
Taubman Centers, Inc. | 29,500 | | 1,459,070 |
United Dominion Realty Trust, Inc. (SBI) | 275,040 | | 9,235,843 |
Ventas, Inc. | 64,550 | | 2,514,223 |
Vornado Realty Trust | 77,650 | | 9,792,442 |
Washington (REIT) (SBI) | 27,000 | | 1,157,490 |
Weingarten Realty Investors (SBI) | 4,100 | | 195,652 |
| | 210,547,405 |
Real Estate Management & Development - 0.2% |
Brookfield Properties Corp. | 8,000 | | 321,200 |
GAGFAH SA | 9,700 | | 303,136 |
Mitsubishi Estate Co. Ltd. | 112,000 | | 2,766,387 |
| | 3,390,723 |
Thrifts & Mortgage Finance - 0.6% |
Countrywide Financial Corp. | 48,200 | | 1,914,504 |
Fannie Mae | 64,000 | | 3,649,920 |
Hudson City Bancorp, Inc. | 204,100 | | 2,708,407 |
| | 8,272,831 |
TOTAL FINANCIALS | | 369,826,228 |
HEALTH CARE - 3.1% |
Biotechnology - 0.1% |
Alkermes, Inc. (a) | 12,000 | | 182,160 |
Amgen, Inc. (a) | 24,100 | | 1,711,100 |
| | 1,893,260 |
Common Stocks - continued |
| Shares | | Value (Note 1) |
HEALTH CARE - continued |
Health Care Equipment & Supplies - 0.9% |
Baxter International, Inc. | 107,400 | | $ 4,805,076 |
Becton, Dickinson & Co. | 47,700 | | 3,421,044 |
C.R. Bard, Inc. | 46,700 | | 3,842,943 |
| | 12,069,063 |
Health Care Providers & Services - 0.7% |
Acibadem Saglik Hizmetleri AS | 57,000 | | 627,343 |
Brookdale Senior Living, Inc. | 105,000 | | 4,793,250 |
Bumrungrad Hospital PCL (For. Reg.) | 346,100 | | 351,933 |
Capital Senior Living Corp. (a) | 17,000 | | 174,420 |
DaVita, Inc. (a) | 56,400 | | 3,001,044 |
| | 8,947,990 |
Life Sciences Tools & Services - 0.1% |
Thermo Fisher Scientific, Inc. (a) | 31,300 | | 1,371,879 |
Pharmaceuticals - 1.3% |
Merck & Co., Inc. | 71,500 | | 3,182,465 |
Novartis AG sponsored ADR | 50,800 | | 2,967,228 |
Pfizer, Inc. | 380,400 | | 10,457,196 |
Teva Pharmaceutical Industries Ltd. sponsored ADR | 51,800 | | 1,660,708 |
| | 18,267,597 |
TOTAL HEALTH CARE | | 42,549,789 |
INDUSTRIALS - 4.3% |
Aerospace & Defense - 0.8% |
General Dynamics Corp. | 46,800 | | 3,502,512 |
Honeywell International, Inc. | 135,400 | | 5,819,492 |
Precision Castparts Corp. | 25,100 | | 1,894,046 |
| | 11,216,050 |
Air Freight & Logistics - 0.2% |
United Parcel Service, Inc. Class B | 42,100 | | 3,280,432 |
Building Products - 0.2% |
Masco Corp. | 73,000 | | 2,094,370 |
Commercial Services & Supplies - 0.4% |
Allied Waste Industries, Inc. | 129,700 | | 1,644,596 |
The Brink's Co. | 29,300 | | 1,644,902 |
The Geo Group, Inc. (a) | 21,250 | | 798,150 |
Waste Management, Inc. | 48,400 | | 1,771,924 |
| | 5,859,572 |
Common Stocks - continued |
| Shares | | Value (Note 1) |
INDUSTRIALS - continued |
Construction & Engineering - 0.8% |
Fluor Corp. | 84,035 | | $ 7,317,768 |
Shaw Group, Inc. (a) | 113,100 | | 3,380,559 |
| | 10,698,327 |
Electrical Equipment - 0.1% |
Cooper Industries Ltd. Class A | 14,200 | | 1,298,448 |
Industrial Conglomerates - 0.2% |
Tyco International Ltd. | 65,100 | | 1,971,879 |
Machinery - 0.5% |
Deere & Co. | 41,300 | | 3,964,800 |
Flowserve Corp. (a) | 21,206 | | 1,141,731 |
Oshkosh Truck Co. | 42,300 | | 2,030,823 |
| | 7,137,354 |
Road & Rail - 1.1% |
AMERCO (a) | 21,774 | | 1,891,072 |
Burlington Northern Santa Fe Corp. | 36,700 | | 2,758,372 |
Con-way, Inc. | 67,400 | | 3,108,488 |
CSX Corp. | 82,700 | | 2,965,622 |
Laidlaw International, Inc. | 110,500 | | 3,210,025 |
Landstar System, Inc. | 39,600 | | 1,783,584 |
| | 15,717,163 |
TOTAL INDUSTRIALS | | 59,273,595 |
INFORMATION TECHNOLOGY - 8.9% |
Communications Equipment - 0.1% |
Comverse Technology, Inc. (a) | 88,200 | | 1,721,664 |
Computers & Peripherals - 2.2% |
Dell, Inc. (a) | 124,000 | | 3,377,760 |
Hewlett-Packard Co. | 78,200 | | 3,085,772 |
Imation Corp. | 62,682 | | 2,902,803 |
International Business Machines Corp. | 66,300 | | 6,094,296 |
Komag, Inc. (a) | 83,200 | | 3,284,736 |
NCR Corp. (a) | 147,900 | | 6,346,389 |
Seagate Technology (a) | 211,000 | | 5,435,360 |
| | 30,527,116 |
Electronic Equipment & Instruments - 2.0% |
Agilent Technologies, Inc. (a) | 80,400 | | 2,559,936 |
Amphenol Corp. Class A | 117,500 | | 8,005,275 |
Arrow Electronics, Inc. (a) | 119,500 | | 3,795,320 |
Common Stocks - continued |
| Shares | | Value (Note 1) |
INFORMATION TECHNOLOGY - continued |
Electronic Equipment & Instruments - continued |
Flextronics International Ltd. (a) | 211,000 | | $ 2,373,750 |
FLIR Systems, Inc. (a) | 59,100 | | 1,903,611 |
Ingram Micro, Inc. Class A (a) | 83,100 | | 1,693,578 |
Molex, Inc. | 91,500 | | 2,928,000 |
Solectron Corp. (a) | 382,700 | | 1,274,391 |
Vishay Intertechnology, Inc. (a) | 166,900 | | 2,186,390 |
| | 26,720,251 |
Internet Software & Services - 0.1% |
VeriSign, Inc. (a) | 55,100 | | 1,438,661 |
IT Services - 0.4% |
Infosys Technologies Ltd. sponsored ADR | 12,500 | | 669,125 |
Mastercard, Inc. Class A | 25,400 | | 2,584,450 |
Satyam Computer Services Ltd. sponsored ADR | 86,200 | | 2,012,770 |
| | 5,266,345 |
Office Electronics - 0.2% |
Xerox Corp. | 180,700 | | 2,981,550 |
Semiconductors & Semiconductor Equipment - 2.4% |
Analog Devices, Inc. | 40,800 | | 1,326,816 |
Applied Materials, Inc. | 168,600 | | 3,031,428 |
ASML Holding NV (NY Shares) (a) | 129,600 | | 3,227,040 |
Atmel Corp. (a) | 433,400 | | 2,193,004 |
Axcelis Technologies, Inc. (a) | 242,800 | | 1,551,492 |
Broadcom Corp. Class A (a) | 27,500 | | 902,825 |
Brooks Automation, Inc. (a) | 106,500 | | 1,487,805 |
Cypress Semiconductor Corp. (a) | 9,500 | | 165,205 |
DSP Group, Inc. (a) | 8,996 | | 194,224 |
Fairchild Semiconductor International, Inc. (a) | 116,000 | | 1,893,120 |
Hittite Microwave Corp. (a) | 33,600 | | 1,312,752 |
Intel Corp. | 145,400 | | 3,104,290 |
Intersil Corp. Class A | 79,800 | | 1,976,646 |
Linear Technology Corp. | 39,000 | | 1,253,460 |
Maxim Integrated Products, Inc. | 97,000 | | 3,053,560 |
National Semiconductor Corp. | 127,300 | | 3,079,387 |
ON Semiconductor Corp. (a) | 439,100 | | 2,827,804 |
PMC-Sierra, Inc. (a) | 49,800 | | 378,978 |
Verigy Ltd. | 10,639 | | 189,800 |
| | 33,149,636 |
Software - 1.5% |
BEA Systems, Inc. (a) | 115,622 | | 1,592,115 |
Common Stocks - continued |
| Shares | | Value (Note 1) |
INFORMATION TECHNOLOGY - continued |
Software - continued |
Compuware Corp. (a) | 34,500 | | $ 289,455 |
Hyperion Solutions Corp. (a) | 44,000 | | 1,617,440 |
Microsoft Corp. | 301,600 | | 8,845,928 |
Nintendo Co. Ltd. | 8,900 | | 2,121,427 |
Quest Software, Inc. (a) | 121,600 | | 1,740,096 |
Symantec Corp. (a) | 133,300 | | 2,825,960 |
Ubisoft Entertainment SA (a) | 29,052 | | 1,827,356 |
| | 20,859,777 |
TOTAL INFORMATION TECHNOLOGY | | 122,665,000 |
MATERIALS - 1.4% |
Chemicals - 0.7% |
Agrium, Inc. | 66,400 | | 2,038,426 |
Ashland, Inc. | 43,300 | | 2,927,513 |
Celanese Corp. Class A | 43,300 | | 952,600 |
Cytec Industries, Inc. | 9,300 | | 495,969 |
Monsanto Co. | 63,600 | | 3,057,252 |
| | 9,471,760 |
Metals & Mining - 0.7% |
Alcoa, Inc. | 96,900 | | 3,020,373 |
Titanium Metals Corp. | 237,300 | | 7,586,481 |
| | 10,606,854 |
TOTAL MATERIALS | | 20,078,614 |
TELECOMMUNICATION SERVICES - 2.7% |
Diversified Telecommunication Services - 2.0% |
AT&T, Inc. | 415,600 | | 14,092,996 |
BellSouth Corp. | 113,700 | | 5,069,883 |
CenturyTel, Inc. | 48,689 | | 2,071,717 |
Citizens Communications Co. | 16,900 | | 239,473 |
Verizon Communications, Inc. | 154,500 | | 5,398,230 |
| | 26,872,299 |
Wireless Telecommunication Services - 0.7% |
America Movil SA de CV Series L sponsored ADR | 20,800 | | 924,976 |
American Tower Corp. Class A (a) | 76,200 | | 2,885,694 |
Bharti Airtel Ltd. (a) | 26,731 | | 390,926 |
Crown Castle International Corp. (a) | 70,200 | | 2,419,092 |
Common Stocks - continued |
| Shares | | Value (Note 1) |
TELECOMMUNICATION SERVICES - continued |
Wireless Telecommunication Services - continued |
MTN Group Ltd. | 50,200 | | $ 512,931 |
SBA Communications Corp. Class A (a) | 104,500 | | 2,964,665 |
| | 10,098,284 |
TOTAL TELECOMMUNICATION SERVICES | | 36,970,583 |
UTILITIES - 1.8% |
Electric Utilities - 0.7% |
Edison International | 57,500 | | 2,643,850 |
Exelon Corp. | 48,500 | | 2,945,405 |
FPL Group, Inc. | 30,200 | | 1,609,660 |
PPL Corp. | 81,100 | | 2,947,985 |
| | 10,146,900 |
Independent Power Producers & Energy Traders - 0.7% |
AES Corp. (a) | 388,100 | | 9,069,897 |
Multi-Utilities - 0.4% |
CMS Energy Corp. (a) | 193,300 | | 3,133,393 |
Duke Energy Corp. | 72,400 | | 2,296,528 |
| | 5,429,921 |
TOTAL UTILITIES | | 24,646,718 |
TOTAL COMMON STOCKS (Cost $772,358,048) | 921,252,050 |
Preferred Stocks - 13.0% |
| | | |
Convertible Preferred Stocks - 3.7% |
CONSUMER DISCRETIONARY - 0.3% |
Automobiles - 0.3% |
General Motors Corp.: | | | |
Series A, 4.50% | 41,400 | | 1,035,000 |
Series C, 6.25% | 98,500 | | 2,217,235 |
| | 3,252,235 |
Media - 0.0% |
Emmis Communications Corp. Series A, 6.25% | 10,100 | | 401,071 |
TOTAL CONSUMER DISCRETIONARY | | 3,653,306 |
Preferred Stocks - continued |
| Shares | | Value (Note 1) |
Convertible Preferred Stocks - continued |
ENERGY - 1.3% |
Oil, Gas & Consumable Fuels - 1.3% |
Chesapeake Energy Corp.: | | | |
4.50% | 20,500 | | $ 2,085,875 |
6.25% | 8,000 | | 2,246,720 |
El Paso Corp. 4.99% | 10,000 | | 12,988,987 |
| | 17,321,582 |
FINANCIALS - 0.2% |
Diversified Financial Services - 0.1% |
Carriage Services Capital Trust 7.00% TIDES | 45,000 | | 1,845,000 |
Real Estate Investment Trusts - 0.1% |
HRPT Properties Trust 6.50% (a) | 40,000 | | 1,045,920 |
TOTAL FINANCIALS | | 2,890,920 |
INDUSTRIALS - 0.2% |
Road & Rail - 0.2% |
Kansas City Southern: | | | |
4.25% | 1,370 | | 1,239,182 |
5.125% | 1,000 | | 1,176,950 |
| | 2,416,132 |
MATERIALS - 0.8% |
Chemicals - 0.6% |
Celanese Corp. 4.25% | 252,600 | | 7,997,316 |
Containers & Packaging - 0.1% |
Owens-Illinois, Inc. 4.75% | 63,510 | | 2,337,168 |
Metals & Mining - 0.1% |
Freeport-McMoRan Copper & Gold, Inc. 5.50% | 1,050 | | 1,466,594 |
TOTAL MATERIALS | | 11,801,078 |
UTILITIES - 0.9% |
Electric Utilities - 0.5% |
AES Trust VII 6.00% | 140,500 | | 6,884,500 |
Preferred Stocks - continued |
| Shares | | Value (Note 1) |
Convertible Preferred Stocks - continued |
UTILITIES - continued |
Independent Power Producers & Energy Traders - 0.4% |
NRG Energy, Inc.: | | | |
4.00% (d) | 3,900 | | $ 5,890,599 |
Series A, 5.75% | 1,000 | | 273,100 |
| | 6,163,699 |
TOTAL UTILITIES | | 13,048,199 |
TOTAL CONVERTIBLE PREFERRED STOCKS | | 51,131,217 |
Nonconvertible Preferred Stocks - 9.3% |
CONSUMER DISCRETIONARY - 0.1% |
Household Durables - 0.1% |
Hovnanian Enterprises, Inc. Series A, 7.625% | 40,000 | | 979,600 |
CONSUMER STAPLES - 0.1% |
Food Products - 0.1% |
H.J. Heinz Finance Co. 6.226% | 10 | | 1,024,500 |
ENERGY - 0.2% |
Oil, Gas & Consumable Fuels - 0.2% |
Apache Corp. (depositary shares) Series B, 5.68% | 9,875 | | 982,563 |
Devon Energy Corp. 6.49% | 13,750 | | 1,400,781 |
| | 2,383,344 |
FINANCIALS - 6.1% |
Capital Markets - 1.4% |
Bear Stearns Companies, Inc.: | | | |
Series E, 6.155% | 15,000 | | 759,750 |
Series G, 5.49% | 15,000 | | 723,900 |
Goldman Sachs Group, Inc.: | | | |
Series A, 3.9106% | 120,000 | | 3,156,000 |
Series C, 4.9931% | 40,000 | | 1,042,400 |
Series D | 160,000 | | 4,192,000 |
Lehman Brothers Holdings, Inc. (depositary shares) Series F, 6.50% | 169,015 | | 4,360,587 |
Merrill Lynch & Co., Inc. Series H, 3.97% | 120,000 | | 3,060,000 |
Morgan Stanley Capital Trust IV 6.60% | 80,000 | | 2,056,000 |
| | 19,350,637 |
Preferred Stocks - continued |
| Shares | | Value (Note 1) |
Nonconvertible Preferred Stocks - continued |
FINANCIALS - continued |
Commercial Banks - 1.0% |
ABN AMRO Capital Funding Trust V 5.90% | 20,000 | | $ 493,200 |
ABN Amro Capital Funding Trust VII 6.08% | 40,400 | | 1,018,484 |
Barclays Bank PLC Series 2, 6.625% | 40,000 | | 1,046,000 |
First Tennessee Bank NA, Memphis 3.90% (d) | 5,000 | | 5,175,000 |
Keycorp Capital IX 6.75% | 40,000 | | 1,010,000 |
Santander Finance Preferred SA Unipersonal: | | | |
6.41% | 69,400 | | 1,728,060 |
6.80% (d) | 80,000 | | 2,048,000 |
U.S. Bancorp, Delaware Series B, 0.00% | 40,000 | | 1,042,000 |
| | 13,560,744 |
Consumer Finance - 0.5% |
HSBC USA, Inc.: | | | |
Series G, 4.9175% | 80,000 | | 2,088,800 |
Series H, 6.50% | 40,000 | | 1,064,000 |
SLM Corp.: | | | |
4.07% | 10,000 | | 1,037,500 |
Series A, 6.97% | 43,400 | | 2,363,564 |
| | 6,553,864 |
Diversified Financial Services - 0.5% |
Bank of America Corp.: | | | |
Series D | 20,000 | | 526,400 |
Series E | 40,000 | | 1,005,600 |
CIT Group, Inc. Series B, 5.189% | 15,000 | | 1,504,950 |
Citigroup Capital XVI Series C, 6.45% | 120,000 | | 3,012,000 |
Deutsche Bank Capital Funding Trust VIII 6.375% | 40,000 | | 1,028,000 |
| | 7,076,950 |
Insurance - 0.1% |
MetLife, Inc. Series A, 4.39% | 40,000 | | 1,046,000 |
Real Estate Investment Trusts - 0.4% |
Apartment Investment & Management Co. Series V, 8.00% | 79,000 | | 2,034,250 |
Duke Realty Corp. (depositary shares) Series K, 6.50% | 95,800 | | 2,402,664 |
Host Hotels & Resorts, Inc. Series E, 8.875% | 20,000 | | 551,400 |
Vornado Realty Trust Series E, 7.00% | 40,000 | | 1,040,000 |
| | 6,028,314 |
Thrifts & Mortgage Finance - 2.2% |
Countrywide Capital V 7.00% | 80,000 | | 2,020,000 |
Preferred Stocks - continued |
| Shares | | Value (Note 1) |
Nonconvertible Preferred Stocks - continued |
FINANCIALS - continued |
Thrifts & Mortgage Finance - continued |
Fannie Mae: | | | |
5.10% | 11,400 | | $ 477,375 |
7.00% | 42,200 | | 2,270,360 |
Series H, 5.81% | 71,200 | | 3,552,880 |
Series L, 5.125% | 90,900 | | 4,272,300 |
Series N, 5.50% | 71,650 | | 3,489,355 |
Freddie Mac: | | | |
5.90% | 40,000 | | 1,038,000 |
Series F, 5.00% | 58,500 | | 2,705,625 |
Series H, 5.10% | 10,300 | | 479,980 |
Series K, 5.79% | 35,200 | | 1,837,440 |
Series O, 5.81% | 19,500 | | 1,004,250 |
Series R, 5.70% | 97,000 | | 4,762,700 |
Series S, adj. rate | 10,000 | | 523,200 |
Series T 6.42% | 10,000 | | 545,000 |
Sovereign Bancorp, Inc. Series C, 7.30% | 80,000 | | 2,224,000 |
| | 31,202,465 |
TOTAL FINANCIALS | | 84,818,974 |
MATERIALS - 0.1% |
Chemicals - 0.1% |
E.I. du Pont de Nemours & Co. Series B, 4.50% | 9,900 | | 856,350 |
Metals & Mining - 0.0% |
Alcoa, Inc. 3.75% | 6,400 | | 472,960 |
TOTAL MATERIALS | | 1,329,310 |
UTILITIES - 2.7% |
Electric Utilities - 2.4% |
Alabama Power Co.: | | | |
5.20% | 120,000 | | 2,889,600 |
5.30% | 88,600 | | 2,210,570 |
Baltimore Gas & Electric Co. Series 1993, 6.70% | 10,000 | | 1,033,750 |
Duquesne Light Co. 6.50% | 106,050 | | 5,355,525 |
Entergy Louisiana LLC 6.95% | 7,500 | | 746,250 |
FPL Group Capital Trust I 5.875% | 20,000 | | 488,200 |
Preferred Stocks - continued |
| Shares | | Value (Note 1) |
Nonconvertible Preferred Stocks - continued |
UTILITIES - continued |
Electric Utilities - continued |
Pacific Gas & Electric Co.: | | | |
Series A, 5.00% | 16,900 | | $ 376,025 |
Series B, 5.50% | 61,900 | | 1,519,645 |
Series D 5.00% | 69,200 | | 1,532,780 |
PPL Electric Utilities Corp. 6.25% | 80,000 | | 2,116,000 |
Southern California Edison Co.: | | | |
4.78% | 46,500 | | 1,029,975 |
5.349% | 40,000 | | 4,050,000 |
6.125% | 35,000 | | 3,640,000 |
Series B, 4.08% | 27,271 | | 524,967 |
Series C: | | | |
4.24% | 94,600 | | 1,787,940 |
6.00% | 20,000 | | 2,000,000 |
Series D, 4.32% | 70,000 | | 1,393,000 |
| | 32,694,227 |
Independent Power Producers & Energy Traders - 0.0% |
Heco Capital Trust III 6.50% | 12,000 | | 302,760 |
Multi-Utilities - 0.3% |
Consolidated Edison Co. of New York, Inc. Series A, 5.00% | 28,705 | | 2,596,367 |
San Diego Gas & Electric Co. 1.70% | 67,548 | | 1,758,362 |
| | 4,354,729 |
TOTAL UTILITIES | | 37,351,716 |
TOTAL NONCONVERTIBLE PREFERRED STOCKS | | 127,887,444 |
TOTAL PREFERRED STOCKS (Cost $169,816,748) | 179,018,661 |
Money Market Funds - 6.5% |
| Shares | | Value (Note 1) |
Fidelity Cash Central Fund, 5.35% (b)
(Cost $88,981,514) | 88,981,514 | | $ 88,981,514 |
TOTAL INVESTMENT PORTFOLIO - 100.7% (Cost $1,216,847,889) | | 1,387,407,083 |
NET OTHER ASSETS - (0.7)% | | (9,077,038) |
NET ASSETS - 100% | $ 1,378,330,045 |
Security Type Abbreviations |
TIDES - | Term Income Deferred
Equity Securities |
Legend |
(a) Non-income producing |
(b) Affiliated fund that is available only to investment companies and other accounts managed by Fidelity Investments. The rate quoted is the annualized seven-day yield of the fund at period end. A complete unaudited listing of the fund's holdings as of its most recent quarter end is available upon request. |
(c) Security initially issued at one coupon which converts to a higher coupon at a specified date. The rate shown is the rate at period end. |
(d) Security exempt from registration under Rule 144A of the Securities Act of 1933. These securities may be resold in transactions exempt from registration, normally to qualified institutional buyers. At the end of the period, the value of these securities amounted to $61,661,835 or 4.5% of net assets. |
(e) The coupon rate shown on floating or adjustable rate securities represents the rate at period end. |
Affiliated Central Funds |
Information regarding fiscal year to date income earned by the Fund from investments in Fidelity Central Funds is as follows: |
Fund | Income earned |
Fidelity Cash Central Fund | $ 3,249,017 |
Fidelity Securities Lending Cash Central Fund | 51,351 |
Total | $ 3,300,368 |
Other Information |
The composition of credit quality ratings as a percentage of net assets is as follows (ratings are unaudited): |
AAA,AA,A | 1.9% |
BBB | 1.5% |
BB | 2.6% |
B | 2.7% |
CCC,CC,C | 1.6% |
Not Rated | 4.1% |
Equities | 79.8% |
Short-Term Investments and Net Other Assets | 5.8% |
| 100.0% |
We have used ratings from Moody's Investors Services, Inc. Where Moody's ratings are not available, we have used S&P ratings. Percentages are adjusted for the effect of futures contracts, if applicable. |
Distribution of investments by country of issue, as a percentage of total net assets, is as follows: |
United States of America | 89.2% |
Bermuda | 2.5% |
Cayman Islands | 2.1% |
Singapore | 1.1% |
Others (individually less than 1%) | 5.1% |
| 100.0% |
See accompanying notes which are an integral part of the financial statements.
Annual Report
Financial Statements
Statement of Assets and Liabilities
| November 30, 2006 |
Assets | | |
Investment in securities, at value - See accompanying schedule: Unaffiliated issuers (cost $1,127,866,375) | $ 1,298,425,569 | |
Fidelity Central Funds (cost $88,981,514) | 88,981,514 | |
Total Investments (cost $1,216,847,889) | | $ 1,387,407,083 |
Cash | | 47 |
Receivable for investments sold | | 16,147,882 |
Receivable for fund shares sold | | 2,347,267 |
Dividends receivable | | 1,340,393 |
Interest receivable | | 1,594,639 |
Other receivables | | 23,825 |
Total assets | | 1,408,861,136 |
| | |
Liabilities | | |
Payable for investments purchased | $ 27,918,850 | |
Payable for fund shares redeemed | 1,487,938 | |
Accrued management fee | 637,172 | |
Distribution fees payable | 143,036 | |
Other affiliated payables | 245,895 | |
Other payables and accrued expenses | 98,200 | |
Total liabilities | | 30,531,091 |
| | |
Net Assets | | $ 1,378,330,045 |
Net Assets consist of: | | |
Paid in capital | | $ 1,131,281,652 |
Undistributed net investment income | | 4,371,372 |
Accumulated undistributed net realized gain (loss) on investments and foreign currency transactions | | 72,129,753 |
Net unrealized appreciation (depreciation) on investments and assets and liabilities in foreign currencies | | 170,547,268 |
Net Assets | | $ 1,378,330,045 |
See accompanying notes which are an integral part of the financial statements.
Annual Report
Financial Statements - continued
Statement of Assets and Liabilities - continued
| November 30, 2006 |
Calculation of Maximum Offering Price
Class A:
Net Asset Value and redemption price per share
($70,083,256 ÷ 5,132,404 shares) | | $ 13.66 |
| | |
Maximum offering price per share (100/94.25 of $13.66) | | $ 14.49 |
Class T:
Net Asset Value and redemption price per share
($119,834,346 ÷ 8,786,457 shares) | | $ 13.64 |
| | |
Maximum offering price per share (100/96.50 of $13.64) | | $ 14.13 |
Class B:
Net Asset Value and offering price per share
($23,992,457 ÷ 1,763,110 shares)A | | $ 13.61 |
| | |
Class C:
Net Asset Value and offering price per share
($75,300,889 ÷ 5,532,242 shares)A | | $ 13.61 |
| | |
Strategic Dividend and Income:
Net Asset Value, offering price and redemption price per
share ($1,075,348,259 ÷ 78,520,803 shares) | | $ 13.70 |
| | |
Institutional Class:
Net Asset Value, offering price and redemption price per
share ($13,770,838 ÷ 1,006,276 shares) | | $ 13.68 |
A Redemption price per share is equal to net asset value less any applicable contingent deferred sales charge.
See accompanying notes which are an integral part of the financial statements.
Annual Report
Statement of Operations
| Year ended November 30, 2006 |
Investment Income | | |
Dividends | | $ 23,830,075 |
Interest | | 5,031,742 |
Income from Fidelity Central Funds | | 3,300,368 |
Total income | | 32,162,185 |
| | |
Expenses | | |
Management fee | $ 6,835,128 | |
Transfer agent fees | 2,267,385 | |
Distribution fees | 1,438,280 | |
Accounting and security lending fees | 413,694 | |
Custodian fees and expenses | 64,831 | |
Independent trustees' compensation | 4,468 | |
Registration fees | 115,137 | |
Audit | 48,141 | |
Legal | 22,215 | |
Interest | 5,328 | |
Miscellaneous | 51,182 | |
Total expenses before reductions | 11,265,789 | |
Expense reductions | (65,588) | 11,200,201 |
Net investment income (loss) | | 20,961,984 |
Realized and Unrealized Gain (Loss) Net realized gain (loss) on: | | |
Investment securities: | | |
Unaffiliated issuers (net of foreign taxes of $2,605) | 74,081,652 | |
Foreign currency transactions | (23,442) | |
Total net realized gain (loss) | | 74,058,210 |
Change in net unrealized appreciation (depreciation) on: Investment securities (net of increase in deferred foreign taxes of $13,035) | 71,875,386 | |
Assets and liabilities in foreign currencies | 1,109 | |
Total change in net unrealized appreciation (depreciation) | | 71,876,495 |
Net gain (loss) | | 145,934,705 |
Net increase (decrease) in net assets resulting from operations | | $ 166,896,689 |
See accompanying notes which are an integral part of the financial statements.
Annual Report
Financial Statements - continued
Statement of Changes in Net Assets
| Year ended
November 30, 2006 | Year ended
November 30, 2005 |
Increase (Decrease) in Net Assets | | |
Operations | | |
Net investment income (loss) | $ 20,961,984 | $ 14,989,949 |
Net realized gain (loss) | 74,058,210 | 18,712,281 |
Change in net unrealized appreciation (depreciation) | 71,876,495 | 59,561,296 |
Net increase (decrease) in net assets resulting
from operations | 166,896,689 | 93,263,526 |
Distributions to shareholders from net investment income | (19,594,724) | (14,194,615) |
Distributions to shareholders from net realized gain | (10,685,905) | - |
Total distributions | (30,280,629) | (14,194,615) |
Share transactions - net increase (decrease) | 245,540,386 | 335,336,361 |
Total increase (decrease) in net assets | 382,156,446 | 414,405,272 |
| | |
Net Assets | | |
Beginning of period | 996,173,599 | 581,768,327 |
End of period (including undistributed net investment income of $4,371,372 and undistributed net investment income of $3,125,667, respectively) | $ 1,378,330,045 | $ 996,173,599 |
See accompanying notes which are an integral part of the financial statements.
Annual Report
Financial Highlights - Class A
Years ended November 30, | 2006 | 2005 | 2004 H |
Selected Per-Share Data | | | |
Net asset value, beginning of period | $ 12.18 | $ 11.09 | $ 10.00 |
Income from Investment Operations | | | |
Net investment income (loss) E | .19 | .18 | .16 |
Net realized and unrealized gain (loss) | 1.61 | 1.10 | 1.04 |
Total from investment operations | 1.80 | 1.28 | 1.20 |
Distributions from net investment income | (.19) | (.19) | (.11) |
Distributions from net realized gain | (.13) | - | - |
Total distributions | (.32) | (.19) | (.11) |
Net asset value, end of period | $ 13.66 | $ 12.18 | $ 11.09 |
Total Return B, C, D | 15.01% | 11.63% | 12.01% |
Ratios to Average Net Assets F, I | | | |
Expenses before reductions | 1.14% | 1.16% | 1.20% A |
Expenses net of fee waivers, if any | 1.14% | 1.16% | 1.20% A |
Expenses net of all reductions | 1.14% | 1.13% | 1.17% A |
Net investment income (loss) | 1.52% | 1.60% | 1.67% A |
Supplemental Data | | | |
Net assets, end of period (000 omitted) | $ 70,083 | $ 38,886 | $ 21,985 |
Portfolio turnover rate G | 125% | 64% | 66% A |
A Annualized
B Total returns for periods of less than one year are not annualized.
C Total returns would have been lower had certain expenses not been reduced during the periods shown.
D Total returns do not include the effect of the sales charges.
E Calculated based on average shares outstanding during the period.
F Fees and expenses of the underlying Fidelity Central Funds are not included in the Fund's expense ratio. The Fund indirectly bears its proportionate share of the expenses of any underlying Fidelity Central Funds.
G Amount does not include the portfolio activity of any underlying Fidelity Central Funds.
H For the period December 23, 2003 (commencement of operations) to November 30, 2004.
I Expense ratios reflect operating expenses of the class. Expenses before reductions do not reflect amounts reimbursed by the investment adviser or reductions from brokerage service arrangements or other expense offset arrangements and do not represent the amount paid by the class during periods when reimbursements or reductions occur. Expense ratios before reductions for start-up periods may not be representative of longer-term operating periods. Expenses net of fee waivers reflect expenses after reimbursement by the investment adviser but prior to reductions from brokerage service arrangements or other expense offset arrangements. Expenses net of all reductions represent the net expenses paid by the class.
See accompanying notes which are an integral part of the financial statements.
Annual Report
Financial Highlights - Class T
Years ended November 30, | 2006 | 2005 | 2004 H |
Selected Per-Share Data | | | |
Net asset value, beginning of period | $ 12.17 | $ 11.08 | $ 10.00 |
Income from Investment Operations | | | |
Net investment income (loss) E | .17 | .16 | .13 |
Net realized and unrealized gain (loss) | 1.59 | 1.09 | 1.04 |
Total from investment operations | 1.76 | 1.25 | 1.17 |
Distributions from net investment income | (.16) | (.16) | (.09) |
Distributions from net realized gain | (.13) | - | - |
Total distributions | (.29) | (.16) | (.09) |
Net asset value, end of period | $ 13.64 | $ 12.17 | $ 11.08 |
Total Return B, C, D | 14.70% | 11.43% | 11.75% |
Ratios to Average Net Assets F, I | | | |
Expenses before reductions | 1.35% | 1.38% | 1.45% A |
Expenses net of fee waivers, if any | 1.35% | 1.38% | 1.45% A |
Expenses net of all reductions | 1.35% | 1.35% | 1.42% A |
Net investment income (loss) | 1.31% | 1.38% | 1.43% A |
Supplemental Data | | | |
Net assets, end of period (000 omitted) | $ 119,834 | $ 79,920 | $ 36,526 |
Portfolio turnover rate G | 125% | 64% | 66% A |
A Annualized
B Total returns for periods of less than one year are not annualized.
C Total returns would have been lower had certain expenses not been reduced during the periods shown.
D Total returns do not include the effect of the sales charges.
E Calculated based on average shares outstanding during the period.
F Fees and expenses of the underlying Fidelity Central Funds are not included in the Fund's expense ratio. The Fund indirectly bears its proportionate share of the expenses of any underlying Fidelity Central Funds.
G Amount does not include the portfolio activity of any underlying Fidelity Central Funds.
H For the period December 23, 2003 (commencement of operations) to November 30, 2004.
I Expense ratios reflect operating expenses of the class. Expenses before reductions do not reflect amounts reimbursed by the investment adviser or reductions from brokerage service arrangements or other expense offset arrangements and do not represent the amount paid by the class during periods when reimbursements or reductions occur. Expense ratios before reductions for start-up periods may not be representative of longer-term operating periods. Expenses net of fee waivers reflect expenses after reimbursement by the investment adviser but prior to reductions from brokerage service arrangements or other expense offset arrangements. Expenses net of all reductions represent the net expenses paid by the class.
See accompanying notes which are an integral part of the financial statements.
Annual Report
Financial Highlights - Class B
Years ended November 30, | 2006 | 2005 | 2004 H |
Selected Per-Share Data | | | |
Net asset value, beginning of period | $ 12.14 | $ 11.06 | $ 10.00 |
Income from Investment Operations | | | |
Net investment income (loss) E | .09 | .09 | .09 |
Net realized and unrealized gain (loss) | 1.59 | 1.09 | 1.03 |
Total from investment operations | 1.68 | 1.18 | 1.12 |
Distributions from net investment income | (.08) | (.10) | (.06) |
Distributions from net realized gain | (.13) | - | - |
Total distributions | (.21) | (.10) | (.06) |
Net asset value, end of period | $ 13.61 | $ 12.14 | $ 11.06 |
Total Return B, C, D | 14.05% | 10.73% | 11.24% |
Ratios to Average Net Assets F, I | | | |
Expenses before reductions | 1.96% | 1.96% | 1.99% A |
Expenses net of fee waivers, if any | 1.96% | 1.95% | 1.95% A |
Expenses net of all reductions | 1.96% | 1.93% | 1.92% A |
Net investment income (loss) | .70% | .81% | .92% A |
Supplemental Data | | | |
Net assets, end of period (000 omitted) | $ 23,992 | $ 19,744 | $ 13,457 |
Portfolio turnover rate G | 125% | 64% | 66% A |
A Annualized
B Total returns for periods of less than one year are not annualized.
C Total returns would have been lower had certain expenses not been reduced during the periods shown.
D Total returns do not include the effect of the contingent deferred sales charge.
E Calculated based on average shares outstanding during the period.
F Fees and expenses of the underlying Fidelity Central Funds are not included in the Fund's expense ratio. The Fund indirectly bears its proportionate share of the expenses of any underlying Fidelity Central Funds.
G Amount does not include the portfolio activity of any underlying Fidelity Central Funds.
H For the period December 23, 2003 (commencement of operations) to November 30, 2004.
I Expense ratios reflect operating expenses of the class. Expenses before reductions do not reflect amounts reimbursed by the investment adviser or reductions from brokerage service arrangements or other expense offset arrangements and do not represent the amount paid by the class during periods when reimbursements or reductions occur. Expense ratios before reductions for start-up periods may not be representative of longer-term operating periods. Expenses net of fee waivers reflect expenses after reimbursement by the investment adviser but prior to reductions from brokerage service arrangements or other expense offset arrangements. Expenses net of all reductions represent the net expenses paid by the class.
See accompanying notes which are an integral part of the financial statements.
Annual Report
Financial Highlights - Class C
Years ended November 30, | 2006 | 2005 | 2004 H |
Selected Per-Share Data | | | |
Net asset value, beginning of period | $ 12.15 | $ 11.06 | $ 10.00 |
Income from Investment Operations | | | |
Net investment income (loss) E | .10 | .10 | .09 |
Net realized and unrealized gain (loss) | 1.58 | 1.09 | 1.03 |
Total from investment operations | 1.68 | 1.19 | 1.12 |
Distributions from net investment income | (.09) | (.10) | (.06) |
Distributions from net realized gain | (.13) | - | - |
Total distributions | (.22) | (.10) | (.06) |
Net asset value, end of period | $ 13.61 | $ 12.15 | $ 11.06 |
Total Return B, C, D | 14.05% | 10.85% | 11.24% |
Ratios to Average Net Assets F, I | | | |
Expenses before reductions | 1.89% | 1.90% | 1.94% A |
Expenses net of fee waivers, if any | 1.89% | 1.90% | 1.94% A |
Expenses net of all reductions | 1.88% | 1.87% | 1.92% A |
Net investment income (loss) | .78% | .86% | .93% A |
Supplemental Data | | | |
Net assets, end of period (000 omitted) | $ 75,301 | $ 49,713 | $ 28,795 |
Portfolio turnover rate G | 125% | 64% | 66% A |
A Annualized
B Total returns for periods of less than one year are not annualized.
C Total returns would have been lower had certain expenses not been reduced during the periods shown.
D Total returns do not include the effect of the contingent deferred sales charge.
E Calculated based on average shares outstanding during the period.
F Fees and expenses of the underlying Fidelity Central Funds are not included in the Fund's expense ratio. The Fund indirectly bears its proportionate share of the expenses of any underlying Fidelity Central Funds.
G Amount does not include the portfolio activity of any underlying Fidelity Central Funds.
H For the period December 23, 2003 (commencement of operations) to November 30, 2004.
I Expense ratios reflect operating expenses of the class. Expenses before reductions do not reflect amounts reimbursed by the investment adviser or reductions from brokerage service arrangements or other expense offset arrangements and do not represent the amount paid by the class during periods when reimbursements or reductions occur. Expense ratios before reductions for start-up periods may not be representative of longer-term operating periods. Expenses net of fee waivers reflect expenses after reimbursement by the investment adviser but prior to reductions from brokerage service arrangements or other expense offset arrangements. Expenses net of all reductions represent the net expenses paid by the class.
See accompanying notes which are an integral part of the financial statements.
Annual Report
Financial Highlights - Strategic Dividend and Income
Years ended November 30, | 2006 | 2005 | 2004 G |
Selected Per-Share Data | | | |
Net asset value, beginning of period | $ 12.22 | $ 11.11 | $ 10.00 |
Income from Investment Operations | | | |
Net investment income (loss) D | .24 | .22 | .19 |
Net realized and unrealized gain (loss) | 1.60 | 1.11 | 1.04 |
Total from investment operations | 1.84 | 1.33 | 1.23 |
Distributions from net investment income | (.23) | (.22) | (.12) |
Distributions from net realized gain | (.13) | - | - |
Total distributions | (.36) | (.22) | (.12) |
Net asset value, end of period | $ 13.70 | $ 12.22 | $ 11.11 |
Total Return B, C | 15.33% | 12.08% | 12.32% |
Ratios to Average Net Assets E, H | | | |
Expenses before reductions | .80% | .82% | .90% A |
Expenses net of fee waivers, if any | .80% | .82% | .90% A |
Expenses net of all reductions | .79% | .79% | .87% A |
Net investment income (loss) | 1.87% | 1.94% | 1.98% A |
Supplemental Data | | | |
Net assets, end of period (000 omitted) | $ 1,075,348 | $ 798,113 | $ 476,032 |
Portfolio turnover rate F | 125% | 64% | 66% A |
A Annualized
B Total returns for periods of less than one year are not annualized.
C Total returns would have been lower had certain expenses not been reduced during the periods shown.
D Calculated based on average shares outstanding during the period.
E Fees and expenses of the underlying Fidelity Central Funds are not included in the Fund's expense ratio. The Fund indirectly bears its proportionate share of the expenses of any underlying Fidelity Central Funds.
F Amount does not include the portfolio activity of any underlying Fidelity Central Funds.
G For the period December 23, 2003 (commencement of operations) to November 30, 2004.
H Expense ratios reflect operating expenses of the class. Expenses before reductions do not reflect amounts reimbursed by the investment adviser or reductions from brokerage service arrangements or other expense offset arrangements and do not represent the amount paid by the class during periods when reimbursements or reductions occur. Expense ratios before reductions for start-up periods may not be representative of longer-term operating periods. Expenses net of fee waivers reflect expenses after reimbursement by the investment adviser but prior to reductions from brokerage service arrangements or other expense offset arrangements. Expenses net of all reductions represent the net expenses paid by the class.
See accompanying notes which are an integral part of the financial statements.
Annual Report
Financial Highlights - Institutional Class
Years ended November 30, | 2006 | 2005 | 2004 G |
Selected Per-Share Data | | | |
Net asset value, beginning of period | $ 12.21 | $ 11.11 | $ 10.00 |
Income from Investment Operations | | | |
Net investment income (loss) D | .23 | .22 | .19 |
Net realized and unrealized gain (loss) | 1.59 | 1.10 | 1.04 |
Total from investment operations | 1.82 | 1.32 | 1.23 |
Distributions from net investment income | (.22) | (.22) | (.12) |
Distributions from net realized gain | (.13) | - | - |
Total distributions | (.35) | (.22) | (.12) |
Net asset value, end of period | $ 13.68 | $ 12.21 | $ 11.11 |
Total Return B, C | 15.24% | 11.98% | 12.38% |
Ratios to Average Net Assets E, H | | | |
Expenses before reductions | .82% | .83% | .88% A |
Expenses net of fee waivers, if any | .82% | .83% | .88% A |
Expenses net of all reductions | .82% | .81% | .85% A |
Net investment income (loss) | 1.84% | 1.93% | 2.00% A |
Supplemental Data | | | |
Net assets, end of period (000 omitted) | $ 13,771 | $ 9,798 | $ 4,973 |
Portfolio turnover rate F | 125% | 64% | 66% A |
A Annualized
B Total returns for periods of less than one year are not annualized.
C Total returns would have been lower had certain expenses not been reduced during the periods shown.
D Calculated based on average shares outstanding during the period.
E Fees and expenses of the underlying Fidelity Central Funds are not included in the Fund's expense ratio. The Fund indirectly bears its proportionate share of the expenses of any underlying Fidelity Central Funds.
F Amount does not include the portfolio activity of any underlying Fidelity Central Funds.
G For the period December 23, 2003 (commencement of operations) to November 30, 2004.
H Expense ratios reflect operating expenses of the class. Expenses before reductions do not reflect amounts reimbursed by the investment adviser or reductions from brokerage service arrangements or other expense offset arrangements and do not represent the amount paid by the class during periods when reimbursements or reductions occur. Expense ratios before reductions for start-up periods may not be representative of longer-term operating periods. Expenses net of fee waivers reflect expenses after reimbursement by the investment adviser but prior to reductions from brokerage service arrangements or other expense offset arrangements. Expenses net of all reductions represent the net expenses paid by the class.
See accompanying notes which are an integral part of the financial statements.
Annual Report
Notes to Financial Statements
For the period ended November 30, 2006
1. Significant Accounting Policies.
Fidelity Strategic Dividend & Income Fund (the Fund) is a fund of Fidelity Financial Trust (the trust) and is authorized to issue an unlimited number of shares. The trust is registered under the Investment Company Act of 1940, as amended (the 1940 Act), as an open-end management investment company organized as a Massachusetts business trust.
The Fund offers Class A, Class T, Class B, Class C, Strategic Dividend & Income, and Institutional Class shares, each of which has equal rights as to assets and voting privileges. Each class has exclusive voting rights with respect to matters that affect that class. Class B shares will automatically convert to Class A shares after a holding period of seven years from the initial date of purchase. Investment income, realized and unrealized capital gains and losses, the common expenses of the Fund, and certain fund-level expense reductions, if any, are allocated on a pro rata basis to each class based on the relative net assets of each class to the total net assets of the Fund. Each class differs with respect to transfer agent and distribution and service plan fees incurred. Certain expense reductions also differ by class.
The Fund may invest in Fidelity Central Funds which are open-end investment companies available to investment companies and other accounts managed by Fidelity Management & Research Company (FMR) and its affiliates. The financial statements have been prepared in conformity with accounting principles generally accepted in the United States of America, which require management to make certain estimates and assumptions at the date of the financial statements. The following summarizes the significant accounting policies of the Fund, which are also consistently followed by the Fidelity Central Funds:
Security Valuation. Investments are valued and net asset value (NAV) per share is calculated (NAV calculation) as of the close of business of the New York Stock Exchange (NYSE), normally 4:00 p.m. Eastern time. Wherever possible, the Fund uses independent pricing services approved by the Board of Trustees to value its investments.
Equity securities, including restricted securities, for which market quotations are readily available, are valued at the last reported sale price or official closing price as reported by an independent pricing service on the primary market or exchange on which they are traded. In the event there were no sales during the day or closing prices are not available, securities are valued at the last quoted bid price. Debt securities, including restricted securities, for which quotations are readily available, are valued by independent pricing services or by dealers who make markets in such securities. Pricing services consider yield or price of bonds of comparable quality, coupon, maturity and type as well as dealer supplied prices. Investments in open-end mutual funds, including the Fidelity Central Funds, are valued at their closing net asset value each business day. Short-term
Annual Report
Notes to Financial Statements - continued
1. Significant Accounting Policies - continued
Security Valuation - continued
securities with remaining maturities of sixty days or less for which quotations are not readily available are valued at amortized cost, which approximates value.
When current market prices or quotations are not readily available or do not accurately reflect fair value, valuations may be determined in accordance with procedures adopted by the Board of Trustees. For example, when developments occur between the close of a market and the close of the NYSE that may materially affect the value of some or all of the securities, or when trading in a security is halted, those securities may be fair valued. Factors used in the determination of fair value may include monitoring news to identify significant market or security specific events such as changes in the value of U.S. securities markets, reviewing developments in foreign markets and evaluating the performance of ADRs, futures contracts and exchange-traded funds. Because the Fund's utilization of fair value pricing depends on market activity, the frequency with which fair value pricing is used can not be predicted and may be utilized to a significant extent. The value of securities used for NAV calculation under fair value pricing may differ from published prices for the same securities.
Foreign Currency. The Fund uses foreign currency contracts to facilitate transactions in foreign-denominated securities. Losses from these transactions may arise from changes in the value of the foreign currency or if the counterparties do not perform under the contracts' terms.
Foreign-denominated assets, including investment securities, and liabilities are translated into U.S. dollars at the exchange rate at period end. Purchases and sales of investment securities, income and dividends received and expenses denominated in foreign currencies are translated into U.S. dollars at the exchange rate in effect on the transaction date.
The effects of exchange rate fluctuations on investments are included with the net realized and unrealized gain (loss) on investment securities. Other foreign currency transactions resulting in realized and unrealized gain (loss) are disclosed separately.
Investment Transactions and Income. Security transactions, including the Fund's investment activity in the Fidelity Central Funds, are accounted for as of trade date. Gains and losses on securities sold are determined on the basis of identified cost. Dividend income is recorded on the ex-dividend date, except for certain dividends from foreign securities where the ex-dividend date may have passed, which are recorded as soon as the Fund is informed of the ex-dividend date. Non-cash dividends included in dividend income, if any, are recorded at the fair market value of the securities received. Distributions received on securities that represent a return of capital or capital gain are recorded as a reduction of cost of investments and/or as a realized gain. The Fund
Annual Report
1. Significant Accounting Policies - continued
Investment Transactions and Income - continued
estimates the components of distributions received that may be considered return of capital distributions or capital gain distributions. Interest income and income distributions from the Fidelity Central Funds are accrued as earned, with any income distributions receivable as of period end included in Interest Receivable on the Statement of Assets and Liabilities. Interest income includes coupon interest and amortization of premium and accretion of discount on debt securities. Investment income is recorded net of foreign taxes withheld where recovery of such taxes is uncertain.
Expenses. Most expenses of the trust can be directly attributed to a fund. Expenses which cannot be directly attributed are apportioned among each Fund in the trust. Expense estimates are accrued in the period to which they relate and adjustments are made when actual amounts are known.
Income Tax Information and Distributions to Shareholders. Each year, the Fund intends to qualify as a regulated investment company by distributing all of its taxable income and realized gains under Subchapter M of the Internal Revenue Code. As a result, no provision for income taxes is required in the accompanying financial statements. Foreign taxes are provided for based on the Fund's understanding of the tax rules and rates that exist in the foreign markets in which it invests.
Distributions are recorded on the ex-dividend date. Income dividends and capital gain distributions are declared separately for each class. Income and capital gain distributions are determined in accordance with income tax regulations, which may differ from generally accepted accounting principles. In addition, the Fund will claim a portion of the payment made to redeeming shareholders as a distribution for income tax purposes.
Capital accounts within the financial statements are adjusted for permanent book-tax differences. These adjustments have no impact on net assets or the results of operations. Temporary book-tax differences will reverse in a subsequent period.
Book-tax differences are primarily due to foreign currency transactions, passive foreign investment companies (PFIC), market discount and losses deferred due to wash sales.
The tax-basis components of distributable earnings and the federal tax cost as of period end were as follows:
Unrealized appreciation | $ 180,327,420 |
Unrealized depreciation | (12,101,011) |
Net unrealized appreciation (depreciation) | 168,226,409 |
Undistributed ordinary income | 6,925,686 |
Undistributed long-term capital gain | 63,595,262 |
| |
Cost for federal income tax purposes | $ 1,219,180,674 |
Annual Report
Notes to Financial Statements - continued
1. Significant Accounting Policies - continued
Income Tax Information and Distributions to Shareholders - continued
The tax character of distributions paid was as follows:
| November 30, 2006 | November 30, 2005 |
Ordinary Income | $ 19,594,724 | $ 14,194,615 |
Long-term Capital Gains | 10,685,905 | - |
Total | $ 30,280,629 | $ 14,194,615 |
New Accounting Pronouncements. In July 2006, Financial Accounting Standards Board Interpretation No. 48, Accounting for Uncertainty in Income Taxes - an interpretation of FASB Statement 109 (FIN 48), was issued and is effective for fiscal years beginning after December 15, 2006. FIN 48 sets forth a threshold for financial statement recognition, measurement and disclosure of a tax position taken or expected to be taken on a tax return. Management is currently evaluating the impact, if any, the adoption of FIN 48 will have on the Fund's net assets, results of operations and financial statement disclosures.
In addition, in September 2006, Statement of Financial Accounting Standards No. 157, Fair Value Measurements (SFAS 157), was issued and is effective for fiscal years beginning after November 15, 2007. SFAS 157 defines fair value, establishes a framework for measuring fair value and expands disclosures about fair value measurements. Management is currently evaluating the impact the adoption of SFAS 157 will have on the Fund's financial statement disclosures.
2. Operating Policies.
Repurchase Agreements. FMR has received an Exemptive Order from the Securities and Exchange Commission (the SEC) which permits the Fund and other affiliated entities of FMR to transfer uninvested cash balances into joint trading accounts which are then invested in repurchase agreements. The Fund may also invest directly with institutions in repurchase agreements. Repurchase agreements are collateralized by government or non-government securities. Upon settlement date, collateral is held in segregated accounts with custodian banks and may be obtained in the event of a default of the counterparty. The Fund monitors, on a daily basis, the value of the collateral to ensure it is at least equal to the principal amount of the repurchase agreement (including accrued interest). In the event of a default by the counterparty, realization of the collateral proceeds could be delayed, during which time the value of the collateral may decline.
Restricted Securities. The Fund may invest in securities that are subject to legal or contractual restrictions on resale. These securities generally may be resold in transactions exempt from registration or to the public if the securities are registered. Disposal of
Annual Report
2. Operating Policies - continued
Restricted Securities - continued
these securities may involve time-consuming negotiations and expense, and prompt sale at an acceptable price may be difficult. Information regarding restricted securities is included at the end of the Fund's Schedule of Investments.
3. Purchases and Sales of Investments.
Purchases and sales of securities, other than short-term securities, aggregated $1,623,471,419 and $1,440,513,795, respectively.
4. Fees and Other Transactions with Affiliates.
Management Fee. FMR and its affiliates provide the Fund with investment management related services for which the Fund pays a monthly management fee. The management fee is the sum of an individual fund fee rate that is based on an annual rate of .30% of the Fund's average net assets and a group fee rate that averaged ..27% during the period. The group fee rate is based upon the average net assets of all the mutual funds advised by FMR. The group fee rate decreases as assets under management increase and increases as assets under management decrease. For the period, the total annual management fee rate was .56% of the Fund's average net assets.
Distribution and Service Plan. In accordance with Rule 12b-1 of the 1940 Act, the Fund has adopted separate Distribution and Service Plans for each class of shares. Certain classes pay Fidelity Distributors Corporation (FDC), an affiliate of FMR, separate Distribution and Service Fees, each of which is based on an annual percentage of each class' average net assets. In addition, FDC may pay financial intermediaries for selling shares of the Fund and providing shareholder support services. For the period, the Distribution and Service Fee rates and the total amounts paid to and retained by FDC were as follows:
| Distribution
Fee | Service
Fee | Paid to
FDC | Retained
by FDC |
Class A | 0% | .25% | $ 131,994 | $ 3,829 |
Class T | .25% | .25% | 488,194 | 27,702 |
Class B | .75% | .25% | 206,600 | 155,348 |
Class C | .75% | .25% | 611,492 | 170,452 |
| | | $ 1,438,280 | $ 357,331 |
Sales Load. FDC receives a front-end sales charge of up to 5.75% for selling Class A shares, and 3.50% for selling Class T shares, some of which is paid to financial intermediaries for selling shares of the Fund. FDC receives the proceeds of contingent deferred sales charges levied on Class A, Class T, Class B, and Class C redemptions. These charges depend on the holding period. The deferred sales charges range from 5% to 1% for
Annual Report
Notes to Financial Statements - continued
4. Fees and Other Transactions with Affiliates - continued
Sales Load - continued
Class B, 1% for Class C, 1.00% to .50% for certain purchases of Class A shares (.25% prior to February 24, 2006) and .25% for certain purchases of Class T shares.
For the period, sales charge amounts retained by FDC were as follows:
| Retained
by FDC |
Class A | $ 101,404 |
Class T | 40,021 |
Class B* | 35,066 |
Class C* | 7,583 |
| $ 184,074 |
* When Class B and Class C shares are initially sold, FDC pays commissions from its own resources to financial intermediaries through which the sales are made.
Transfer Agent Fees. Fidelity Investments Institutional Operations Company, Inc. (FIIOC), an affiliate of FMR, is the transfer, dividend disbursing and shareholder servicing agent for each class of the Fund, except for Strategic Dividend & Income. Fidelity Service Company, Inc. (FSC), an affiliate of FMR, is the transfer agent for Strategic Dividend & Income shares. FIIOC and FSC receive account fees and asset-based fees that vary according to the account size and type of account of the shareholders of the respective classes of the Fund. FIIOC and FSC pay for typesetting, printing and mailing of shareholder reports, except proxy statements. For the period, the total transfer agent fees paid by each class to FIIOC or FSC, were as follows:
| Amount | % of
Average
Net Assets |
Class A | $ 141,182 | .27 |
Class T | 224,910 | .23 |
Class B | 70,224 | .34 |
Class C | 160,748 | .26 |
Strategic Dividend and Income | 1,647,958 | .17 |
Institutional Class | 22,363 | .20 |
| $ 2,267,385 | |
Annual Report
4. Fees and Other Transactions with Affiliates - continued
Accounting and Security Lending Fees. FSC maintains the Fund's accounting records. The accounting fee is based on the level of average net assets for the month. Under a separate contract, FSC administers the security lending program. The security lending fee is based on the number and duration of lending transactions.
Investments in Fidelity Central Funds. The Fund may invest in Fidelity Central Funds. The Fund's Schedule of Investments lists each of the Fidelity Central Funds as an investment of the Fund but does not include the underlying holdings of each Fidelity Central Fund. As an Investing Fund, the Fund indirectly bears its proportionate share of the expenses of the underlying Fidelity Central Funds. A complete unaudited list of holdings for each Fidelity Central Fund is available upon request. In addition, the financial statements of the Fidelity Central Funds, which are not covered by the Fund's Report of Independent Registered Public Accounting Firm, are available on the EDGAR Database on the SEC's web site, www.sec.gov, or upon request.
The Money Market Central Funds seek preservation of capital and current income and are managed by Fidelity Investments Money Management, Inc. (FIMM), an affiliate of FMR.
Brokerage Commissions. The Fund placed a portion of its portfolio transactions with brokerage firms which are affiliates of the investment adviser. The commissions paid to these affiliated firms were $12,265 for the period.
5. Committed Line of Credit.
The Fund participates with other funds managed by FMR in a $4.2 billion credit facility (the "line of credit") to be utilized for temporary or emergency purposes to fund shareholder redemptions or for other short-term liquidity purposes. The Fund has agreed to pay commitment fees on its pro rata portion of the line of credit, which amounts to $3,149 and is reflected in Miscellaneous Expense on the Statement of Operations. During the period, there were no borrowings on this line of credit.
Annual Report
Notes to Financial Statements - continued
6. Security Lending.
The Fund lends portfolio securities from time to time in order to earn additional income. On the settlement date of the loan, the Fund receives collateral (in the form of U.S. Treasury obligations, letters of credit and/or cash) against the loaned securities and maintains collateral in an amount not less than 100% of the market value of the loaned securities during the period of the loan. The market value of the loaned securities is determined at the close of business of the Fund and any additional required collateral is delivered to the Fund on the next business day. If the borrower defaults on its obligation to return the securities loaned because of insolvency or other reasons, a fund could experience delays and costs in recovering the securities loaned or in gaining access to the collateral. Any cash collateral received is invested in the Fidelity Securities Lending Cash Central Fund. At period end, there were no security loans outstanding. Security lending income represents the income earned on investing cash collateral, less fees and expenses associated with the loan, plus any premium payments that may be received on the loan of certain types of securities. Security lending income is presented in the Statement of Operations as a component of income from Fidelity Central Funds. Net income from lending portfolio securities during the period amounted to $51,351.
7. Bank Borrowings.
The Fund is permitted to have bank borrowings for temporary or emergency purposes to fund shareholder redemptions. The Fund has established borrowing arrangements with certain banks. The interest rate on the borrowings is the bank's base rate, as revised from time to time. The average daily loan balance during the period for which loans were outstanding amounted to $11,495,000. The weighted average interest rate was 5.56%. At period end, there were no bank borrowings outstanding.
8. Expense Reductions.
Many of the brokers with whom FMR places trades on behalf of the Fund provided services to the Fund in addition to trade execution. These services included payments of certain expenses on behalf of the Fund totaling $60,975 for the period. In addition, through arrangements with each class' transfer agent, credits realized as a result of uninvested cash balances were used to reduce the Fund's expenses. During the period, credits reduced each class' transfer agent expense as noted in the table below.
| Transfer Agent
expense reduction |
Strategic Dividend and Income | $ 4,613 |
Annual Report
9. Other.
The Fund's organizational documents provide former and current trustees and officers with a limited indemnification against liabilities arising in connection with the performance of their duties to the Fund. In the normal course of business, the Fund may also enter into contracts that provide general indemnifications. The Fund's maximum exposure under these arrangements is unknown as this would be dependent on future claims that may be made against the Fund. The risk of material loss from such claims is considered remote.
During the period, the Fund's transfer agent, Fidelity Investments Institutional Operations Company, Inc. (FIIOC), an affiliate of Fidelity Management & Research Company, notified the Fund that the fund's books and records did not reflect a conversion of certain Class B to Class A shares upon their conversion date. Management has determined that this did not have a material impact to the Fund's reported net assets or results of operations in the accompanying financial statements. FIIOC will cause the books and records of the Fund to reflect a conversion of the relevant Class B shares to Class A and is in the process of determining the impact to affected shareholder accounts for purposes of its remediation.
The United States Securities and Exchange Commission ("SEC") is conducting an investigation of FMR (covering the years 2002 to 2004) arising from gifts, gratuities and business entertainment provided by certain brokers to certain individuals who were employed on FMR's domestic equity trading desk during that period. FMR is in discussions with the SEC staff regarding the possible resolution of the matter, but as of period-end no final resolution has been reached.
In December 2006, the Independent Trustees completed their own investigation of the matter with the assistance of independent counsel. The Independent Trustees and FMR agree that, despite the absence of proof that the Fidelity mutual funds experienced diminished execution quality as a result of the improper receipt of gifts and business entertainment, the conduct at issue was serious and is worthy of redress. Accordingly, the Independent Trustees have requested and FMR has agreed to pay $42 million to Fidelity mutual funds, plus interest to be determined at the time that payment is made. A method of allocating this payment among the funds has not yet been determined. In addition, subsequent to period-end, FMR has reimbursed related legal expenses. The total payment to the Fund is not anticipated to have a material impact on the Fund's net assets.
Annual Report
Notes to Financial Statements - continued
10. Distributions to Shareholders.
Distributions to shareholders of each class were as follows:
Years ended November 30, | 2006 | 2005 |
From net investment income | | |
Class A | $ 755,007 | $ 475,907 |
Class T | 1,207,524 | 830,178 |
Class B | 136,347 | 141,821 |
Class C | 455,492 | 339,138 |
Strategic Dividend and Income | 16,844,509 | 12,270,157 |
Institutional Class | 195,845 | 137,414 |
Total | $ 19,594,724 | $ 14,194,615 |
From net realized gain | | |
Class A | $ 422,135 | $ - |
Class T | 869,186 | - |
Class B | 212,465 | - |
Class C | 535,091 | - |
Strategic Dividend and Income | 8,542,657 | - |
Institutional Class | 104,371 | - |
Total | $ 10,685,905 | $ - |
Annual Report
11. Share Transactions.
Transactions for each class of shares were as follows:
| Shares | Dollars |
Years ended November 30, | 2006 | 2005 | 2006 | 2005 |
Class A | | | | |
Shares sold | 2,652,278 | 1,768,977 | $ 33,771,371 | $ 20,345,648 |
Reinvestment of distributions | 74,313 | 30,595 | 927,356 | 349,961 |
Shares redeemed | (785,506) | (589,953) | (9,972,783) | (6,809,260) |
Net increase (decrease) | 1,941,085 | 1,209,619 | $ 24,725,944 | $ 13,886,349 |
Class T | | | | |
Shares sold | 3,093,279 | 3,882,259 | $ 39,401,358 | $ 44,416,238 |
Reinvestment of distributions | 142,542 | 59,648 | 1,774,211 | 681,858 |
Shares redeemed | (1,016,565) | (669,970) | (12,945,160) | (7,729,006) |
Net increase (decrease) | 2,219,256 | 3,271,937 | $ 28,230,409 | $ 37,369,090 |
Class B | | | | |
Shares sold | 651,095 | 744,114 | $ 8,286,669 | $ 8,505,041 |
Reinvestment of distributions | 22,168 | 9,782 | 273,978 | 111,311 |
Shares redeemed | (535,951) | (344,455) | (6,733,248) | (3,964,823) |
Net increase (decrease) | 137,312 | 409,441 | $ 1,827,399 | $ 4,651,529 |
Class C | | | | |
Shares sold | 2,077,679 | 2,014,501 | $ 26,455,087 | $ 23,123,712 |
Reinvestment of distributions | 59,230 | 19,942 | 735,267 | 227,493 |
Shares redeemed | (696,643) | (545,060) | (8,845,742) | (6,287,937) |
Net increase (decrease) | 1,440,266 | 1,489,383 | $ 18,344,612 | $ 17,063,268 |
Strategic Dividend and Income | | | |
Shares sold | 36,957,213 | 36,814,600 | $ 472,572,702 | $ 424,067,244 |
Reinvestment of distributions | 1,804,449 | 944,881 | 22,539,587 | 10,819,574 |
Shares redeemed | (25,574,480) | (15,256,951) | (325,330,308) | (176,595,063) |
Net increase (decrease) | 13,187,182 | 22,502,530 | $ 169,781,981 | $ 258,291,755 |
Institutional Class | | | | |
Shares sold | 358,059 | 398,296 | $ 4,585,437 | $ 4,580,059 |
Reinvestment of distributions | 10,004 | 5,438 | 124,626 | 62,299 |
Shares redeemed | (164,319) | (48,869) | (2,080,022) | (567,988) |
Net increase (decrease) | 203,744 | 354,865 | $ 2,630,041 | $ 4,074,370 |
Annual Report
Report of Independent Registered Public Accounting Firm
To the Trustees of Fidelity Financial Trust and the Shareholders of Fidelity Strategic Dividend & Income Fund:
In our opinion, the accompanying statement of assets and liabilities, including the schedule of investments, and the related statements of operations and of changes in net assets and the financial highlights present fairly, in all material respects, the financial position of Fidelity Strategic Dividend & Income Fund (a fund of Fidelity Financial Trust) at November 30, 2006, the results of its operations for the year then ended, the changes in its net assets for each of the two years in the period then ended and the financial highlights for each of the three years in the period then ended, in conformity with accounting principles generally accepted in the United States of America. These financial statements and financial highlights (hereafter referred to as "financial statements") are the responsibility of the Fidelity Strategic Dividend & Income Fund's management; our responsibility is to express an opinion on these financial statements based on our audits. We conducted our audits of these financial statements in accordance with the standards of the Public Company Accounting Oversight Board (United States). Those standards require that we plan and perform the audit to obtain reasonable assurance about whether the financial statements are free of material misstatement. An audit includes examining, on a test basis, evidence supporting the amounts and disclosures in the financial statements, assessing the accounting principles used and significant estimates made by management, and evaluating the overall financial statement presentation. We believe that our audits, which included confirmation of securities at November 30, 2006 by correspondence with the custodian and brokers, provide a reasonable basis for our opinion.
PricewaterhouseCoopers LLP
Boston, Massachusetts
January 18, 2007
Annual Report
Trustees and Officers
The Trustees, Member of the Advisory Board, and executive officers of the trust and fund, as applicable, are listed below. The Board of Trustees governs the fund and is responsible for protecting the interests of shareholders. The Trustees are experienced executives who meet periodically throughout the year to oversee the fund's activities, review contractual arrangements with companies that provide services to the fund, and review the fund's performance. Except for William O. McCoy, each of the Trustees oversees 348 funds advised by FMR or an affiliate. Mr. McCoy oversees 350 funds advised by FMR or an affiliate.
The Trustees hold office without limit in time except that (a) any Trustee may resign; (b) any Trustee may be removed by written instrument, signed by at least two-thirds of the number of Trustees prior to such removal; (c) any Trustee who requests to be retired or who has become incapacitated by illness or injury may be retired by written instrument signed by a majority of the other Trustees; and (d) any Trustee may be removed at any special meeting of shareholders by a two-thirds vote of the outstanding voting securities of the trust. Each Trustee who is not an interested person (as defined in the 1940 Act) (Independent Trustee), shall retire not later than the last day of the calendar year in which his or her 72nd birthday occurs. The Independent Trustees may waive this mandatory retirement age policy with respect to individual Trustees. The executive officers and Advisory Board Member hold office without limit in time, except that any officer and Advisory Board Member may resign or may be removed by a vote of a majority of the Trustees at any regular meeting or any special meeting of the Trustees. Except as indicated, each individual has held the office shown or other offices in the same company for the past five years.
The fund's Statement of Additional Information (SAI) includes more information about the Trustees. To request a free copy, call Fidelity at 1-877-208-0098.
Interested Trustees*:
Correspondence intended for each Trustee who is an interested person may be sent to Fidelity Investments, 82 Devonshire Street, Boston, Massachusetts 02109.
Name, Age; Principal Occupation |
Edward C. Johnson 3d (76) |
| Year of Election or Appointment: 1982 Mr. Johnson is Chairman of the Board of Trustees. Mr. Johnson serves as President (2006-present), Chief Executive Officer, Chairman, and a Director of FMR Corp.; Chairman and a Director of FMR; Chairman and a Director of Fidelity Research & Analysis Company (FRAC); Chairman and a Director of Fidelity Investments Money Management, Inc.; and Chairman (2001-present) and a Director of FMR Co., Inc. In addition, Mr. Johnson serves as Chairman and Director of Fidelity International Limited (FIL). |
Robert L. Reynolds (54) |
| Year of Election or Appointment: 2003 Mr. Reynolds is President and a Director of FMR (2005-present), Fidelity Investments Money Management, Inc. (2005-present), and FMR Co., Inc. (2005-present). Mr. Reynolds also serves as Vice Chairman (2006-present), a Director (2003-present), and Chief Operating Officer of FMR Corp. and a Director of Strategic Advisers, Inc. (2005-present). He also serves on the Board at Fidelity Investments Canada, Ltd. |
* Trustees have been determined to be "Interested Trustees" by virtue of, among other things, their affiliation with the trust or various entities under common control with FMR.
Annual Report
Independent Trustees:
Correspondence intended for each Independent Trustee (that is, the Trustees other than the Interested Trustees) may be sent to Fidelity Investments, P.O. Box 55235, Boston, Massachusetts 02205-5235.
Name, Age; Principal Occupation |
Dennis J. Dirks (58) |
| Year of Election or Appointment: 2005 Prior to his retirement in May 2003, Mr. Dirks was Chief Operating Officer and a member of the Board of The Depository Trust & Clearing Corporation (DTCC) (1999-2003). He also served as President, Chief Operating Officer, and Board member of The Depository Trust Company (DTC) (1999-2003) and President and Board member of the National Securities Clearing Corporation (NSCC) (1999-2003). In addition, Mr. Dirks served as Chief Executive Officer and Board member of the Government Securities Clearing Corporation (2001-2003) and Chief Executive Officer and Board member of the Mortgage-Backed Securities Clearing Corporation (2001-2003). Mr. Dirks also serves as a Trustee and a member of the Finance Committee of Manhattan College (2005-present) and a Trustee and a member of the Finance Committee of AHRC of Nassau County (2006-present). |
Albert R. Gamper, Jr. (64) |
| Year of Election or Appointment: 2006 Prior to his retirement in December 2004, Mr. Gamper served as Chairman of the Board of CIT Group Inc. (commercial finance). During his tenure with CIT Group Inc. Mr. Gamper served in numerous senior management positions, including Chairman (1987-1989; 1999-2001; 2002-2004), Chief Executive Officer (1987-2004), and President (1989-2002). He currently serves as a member of the Board of Directors of Public Service Enterprise Group (utilities, 2001-present), Chairman of the Board of Governors, Rutgers University (2004-present), and Chairman of the Board of Saint Barnabas Health Care System. |
George H. Heilmeier (70) |
| Year of Election or Appointment: 2004 Dr. Heilmeier is Chairman Emeritus of Telcordia Technologies (communication software and systems), where prior to his retirement, he served as company Chairman and Chief Executive Officer. He currently serves on the Boards of Directors of The Mitre Corporation (systems engineering and information technology support for the government), and HRL Laboratories (private research and development, 2004-present). He is Chairman of the General Motors Science & Technology Advisory Board and a Life Fellow of the Institute of Electrical and Electronics Engineers (IEEE). Dr. Heilmeier is a member of the Defense Science Board and the National Security Agency Advisory Board. He is also a member of the National Academy of Engineering, the American Academy of Arts and Sciences, and the Board of Overseers of the School of Engineering and Applied Science of the University of Pennsylvania. Previously, Dr. Heilmeier served as a Director of TRW Inc. (automotive, space, defense, and information technology, 1992-2002), Compaq (1994-2002), Automatic Data Processing, Inc. (ADP) (technology-based business outsourcing, 1995-2002), INET Technologies Inc. (telecommunications network surveillance, 2001-2004), and Teletech Holdings (customer management services). He is the recipient of the 2005 Kyoto Prize in Advanced Technology for his invention of the liquid crystal display, and a member of the Consumer Electronics Hall of Fame. |
James H. Keyes (66) |
| Year of Election or Appointment: 2007 Prior to his retirement in 2003, Mr. Keyes was Chairman, President, and Chief Executive Officer of Johnson Controls, Inc. (automotive supplier, 1993-2003). He currently serves as a member of the boards of LSI Logic Corporation (semiconductor technologies), Navistar International Corporation (manufacture and sale of trucks, buses, and diesel engines, 2002-present), and Pitney Bowes, Inc. (integrated mail, messaging, and document management solutions). |
Marie L. Knowles (60) |
| Year of Election or Appointment: 2001 Prior to Ms. Knowles' retirement in June 2000, she served as Executive Vice President and Chief Financial Officer of Atlantic Richfield Company (ARCO) (diversified energy, 1996-2000). From 1993 to 1996, she was a Senior Vice President of ARCO and President of ARCO Transportation Company. She served as a Director of ARCO from 1996 to 1998. She currently serves as a Director of Phelps Dodge Corporation (copper mining and manufacturing) and McKesson Corporation (healthcare service, 2002-present). Ms. Knowles is a Trustee of the Brookings Institution and the Catalina Island Conservancy and also serves as a member of the Advisory Board for the School of Engineering of the University of Southern California. |
Ned C. Lautenbach (62) |
| Year of Election or Appointment: 2000 Mr. Lautenbach is Chairman of the Independent Trustees (2006-present). Mr. Lautenbach has been a partner of Clayton, Dubilier & Rice, Inc. (private equity investment firm) since September 1998. Previously, Mr. Lautenbach was with the International Business Machines Corporation (IBM) from 1968 until his retirement in 1998. Mr. Lautenbach serves as a Director of Sony Corporation (2006-present) and Eaton Corporation (diversified industrial) as well as the Philharmonic Center for the Arts in Naples, Florida. He also is a member of the Board of Trustees of Fairfield University (2005-present), as well as a member of the Council on Foreign Relations. |
William O. McCoy (73) |
| Year of Election or Appointment: 1997 Prior to his retirement in December 1994, Mr. McCoy was Vice Chairman of the Board of BellSouth Corporation (telecommunications) and President of BellSouth Enterprises. He is currently a Director of Duke Realty Corporation (real estate). He is also a partner of Franklin Street Partners (private investment management firm). In addition, Mr. McCoy served as the Interim Chancellor (1999-2000) and a member of the Board of Visitors for the University of North Carolina at Chapel Hill and currently serves as Chairman of the Board of Directors of the University of North Carolina Health Care System. He also served as Vice President of Finance for the University of North Carolina (16-school system). |
Cornelia M. Small (62) |
| Year of Election or Appointment: 2005 Ms. Small is a member (2000-present) and Chairperson (2002-present) of the Investment Committee, and a member (2002-present) of the Board of Trustees of Smith College. Previously, she served as Chief Investment Officer (1999-2000), Director of Global Equity Investments (1996-1999), and a member of the Board of Directors of Scudder, Stevens & Clark (1990-1997) and Scudder Kemper Investments (1997-1999). In addition, Ms. Small served as Co-Chair (2000-2003) of the Annual Fund for the Fletcher School of Law and Diplomacy. |
William S. Stavropoulos (67) |
| Year of Election or Appointment: 2002 Mr. Stavropoulos is Chairman Emeritus of the Board of Directors of The Dow Chemical Company. Since joining The Dow Chemical Company in 1967, Mr. Stavropoulos served in numerous senior management positions, including President (1993-2000; 2002-2003), CEO (1995-2000; 2002-2004), and Chairman of the Executive Committee (2000-2004). Currently, he is a Director of NCR Corporation (data warehousing and technology solutions), BellSouth Corporation (telecommunications), Chemical Financial Corporation, Maersk Inc. (industrial conglomerate, 2002-present), and Metalmark Capital (private equity investment firm, 2005-present). He also serves as a member of the Board of Trustees of the American Enterprise Institute for Public Policy Research. In addition, Mr. Stavropoulos is a member of The Business Council, J.P. Morgan International Council and the University of Notre Dame Advisory Council for the College of Science. |
Kenneth L. Wolfe (67) |
| Year of Election or Appointment: 2005 Prior to his retirement in 2001, Mr. Wolfe was Chairman and Chief Executive Officer of Hershey Foods Corporation (1993-2001). He currently serves as a member of the boards of Adelphia Communications Corporation (2003-present), Bausch & Lomb, Inc., and Revlon Inc. (2004-present). |
Annual Report
Advisory Board Member and Executive Officers:
Correspondence intended for each executive officer and Mr. Lynch may be sent to Fidelity Investments, 82 Devonshire Street, Boston, Massachusetts 02109.
Name, Age; Principal Occupation |
Peter S. Lynch (62) |
| Year of Election or Appointment: 2003 Member of the Advisory Board of Fidelity Financial Trust. Mr. Lynch is Vice Chairman and a Director of FMR, and Vice Chairman (2001-present) and a Director of FMR Co., Inc. Previously, Mr. Lynch served as a Trustee of the Fidelity funds (1990-2003). In addition, he serves as a Trustee of Boston College and as the Chairman of the Inner-City Scholarship Fund. |
Walter C. Donovan (44) |
| Year of Election or Appointment: 2005 Vice President of the fund. Mr. Donovan also serves as Vice President of Fidelity's High Income Funds (2005-present). Mr. Donovan also serves as Executive Vice President of FMR (2005-present) and FMR Co., Inc. (2005-present). Previously, Mr. Donovan served as Vice President of Fidelity's Fixed-Income Funds (2005-2006), certain Asset Allocation Funds (2005-2006), certain Balanced Funds (2005-2006), and as Vice President and Director of Fidelity's International Equity Trading group (1998-2005). |
Robert A. Lawrence (54) |
| Year of Election or Appointment: 2006 Vice President of the fund. Mr. Lawrence also serves as Vice President of the High Income Funds. Mr. Lawrence is Senior Vice President of FMR (2006-present) and FMR Co., Inc. (2006-present). Previously, Mr. Lawrence served as President of Fidelity Strategic Investments (2002-2005). |
Christopher L. Sharpe (38) |
| Year of Election or Appointment: 2005
Vice President of the fund. Mr. Sharpe also serves as Vice President of other funds advised by FMR. Prior to assuming his current responsibilities, Mr. Sharpe worked as an associate investment policy officer for John Hancock Financial Services, Inc. in Boston. From 1990 to 2000 he was with William M. Mercer, Inc. in Boston. Mr. Sharpe also serves as Vice President of FMR (2006) and FMR Co., Inc. (2006). |
Derek L. Young (42) |
| Year of Election or Appointment: 2005
Vice President of the fund. Mr. Young also serves as Vice President of other funds advised by FMR. Prior to assuming his current responsibilities, Mr. Young worked as director of Risk Management, senior vice president of Strategic Services and portfolio manager. Mr. Young also serves as Vice President of FMR and FMR Co., Inc (2004). |
|
Eric D. Roiter (58) |
| Year of Election or Appointment: 2003 Secretary of the fund. He also serves as Secretary of other Fidelity funds; Vice President, General Counsel, and Secretary of FMR Co., Inc. (2001-present) and FMR; Assistant Secretary of Fidelity Management & Research (U.K.) Inc. (2001-present), Fidelity Research & Analysis Company (2001-present), and Fidelity Investments Money Management, Inc. (2001-present). Mr. Roiter is an Adjunct Member, Faculty of Law, at Boston College Law School (2003-present). Previously, Mr. Roiter served as Vice President and Secretary of Fidelity Distributors Corporation (FDC) (1998-2005). |
Stuart Fross (47) |
| Year of Election or Appointment: 2003 Assistant Secretary of the fund. Mr. Fross also serves as Assistant Secretary of other Fidelity funds (2003-present), Vice President and Secretary of FDC (2005-present), and is an employee of FMR. |
R. Stephen Ganis (40) |
| Year of Election or Appointment: 2006 Anti-Money Laundering (AML) officer of the fund. Mr. Ganis also serves as AML officer of other Fidelity funds (2006-present) and FMR Corp. (2003-present). Before joining Fidelity Investments, Mr. Ganis practiced law at Goodwin Procter, LLP (2000-2002). |
Joseph B. Hollis (58) |
| Year of Election or Appointment: 2006 Chief Financial Officer of the fund. Mr. Hollis also serves as Chief Financial Officer of other Fidelity funds. Mr. Hollis is President of Fidelity Pricing and Cash Management Services (FPCMS) (2005-present). Mr. Hollis also serves as President and Director of Fidelity Service Company, Inc. (2006-present). Previously, Mr. Hollis served as Senior Vice President of Cash Management Services (1999-2002) and Investment Management Operations (2002-2005). |
Kenneth A. Rathgeber (59) |
| Year of Election or Appointment: 2004 Chief Compliance Officer of the fund. Mr. Rathgeber also serves as Chief Compliance Officer of other Fidelity funds (2004-present) and Executive Vice President of Risk Oversight for Fidelity Investments (2002-present). He is Chief Compliance Officer of FMR (2005-present), FMR Co., Inc. (2005-present), Fidelity Management & Research (U.K.) Inc. (2005-present), Fidelity Research & Analysis Company (2005-present), Fidelity Investments Money Management, Inc. (2005-present), and Strategic Advisers, Inc. (2005-present). Previously, Mr. Rathgeber served as Executive Vice President and Chief Operating Officer for Fidelity Investments Institutional Services Company, Inc. (1998-2002). |
Bryan A. Mehrmann (45) |
| Year of Election or Appointment: 2005 Deputy Treasurer of the fund. Mr. Mehrmann also serves as Deputy Treasurer of other Fidelity funds (2005-present) and is an employee of FMR. Previously, Mr. Mehrmann served as Vice President of Fidelity Investments Institutional Services Group (FIIS)/Fidelity Investments Institutional Operations Corporation, Inc. (FIIOC) Client Services (1998-2004). |
Kimberley H. Monasterio (42) |
| Year of Election or Appointment: 2007 President and Treasurer of the fund. Ms. Monasterio also serves as President and Treasurer of other Fidelity funds (2007-present) and is an employee of FMR (2004-present). Previously, Ms. Monasterio served as Deputy Treasurer of the Fidelity funds (2004-2006). Before joining Fidelity Investments, Ms. Monasterio served as Treasurer (2000-2004) and Chief Financial Officer (2002-2004) of the Franklin Templeton Funds and Senior Vice President of Franklin Templeton Services, LLC (2000-2004). |
Kenneth B. Robins (37) |
| Year of Election or Appointment: 2005 Deputy Treasurer of the fund. Mr. Robins also serves as Deputy Treasurer of other Fidelity funds (2005-present) and is an employee of FMR (2004-present). Before joining Fidelity Investments, Mr. Robins worked at KPMG LLP, where he was a partner in KPMG's department of professional practice (2002-2004) and a Senior Manager (1999-2000). In addition, Mr. Robins served as Assistant Chief Accountant, United States Securities and Exchange Commission (2000-2002). |
Robert G. Byrnes (39) |
| Year of Election or Appointment: 2005 Assistant Treasurer of the fund. Mr. Byrnes also serves as Assistant Treasurer of other Fidelity funds (2005-present) and is an employee of FMR (2005-present). Previously, Mr. Byrnes served as Vice President of FPCMS (2003-2005). Before joining Fidelity Investments, Mr. Byrnes worked at Deutsche Asset Management where he served as Vice President of the Investment Operations Group (2000-2003). |
John H. Costello (60) |
| Year of Election or Appointment: 2003 Assistant Treasurer of the fund. Mr. Costello also serves as Assistant Treasurer of other Fidelity funds and is an employee of FMR. |
Peter L. Lydecker (52) |
| Year of Election or Appointment: 2004 Assistant Treasurer of the fund. Mr. Lydecker also serves as Assistant Treasurer of other Fidelity funds (2004) and is an employee of FMR. |
Mark Osterheld (51) |
| Year of Election or Appointment: 2003 Assistant Treasurer of the fund. Mr. Osterheld also serves as Assistant Treasurer of other Fidelity funds (2002) and is an employee of FMR. |
Gary W. Ryan (48) |
| Year of Election or Appointment: 2005 Assistant Treasurer of the fund. Mr. Ryan also serves as Assistant Treasurer of other Fidelity funds (2005-present) and is an employee of FMR (2005-present). Previously, Mr. Ryan served as Vice President of Fund Reporting in FPCMS (1999-2005). |
Salvatore Schiavone (41) |
| Year of Election or Appointment: 2005 Assistant Treasurer of the fund. Mr. Schiavone also serves as Assistant Treasurer of other Fidelity funds (2005-present) and is an employee of FMR (2005-present). Before joining Fidelity Investments, Mr. Schiavone worked at Deutsche Asset Management, where he most recently served as Assistant Treasurer (2003-2005) of the Scudder Funds and Vice President and Head of Fund Reporting (1996-2003). |
Annual Report
Distributions
The Board of Trustees of Fidelity Advisor Strategic Dividend & Income Fund voted to pay to shareholders of record at the opening of business on record date, the following distributions per share derived from capital gains realized from sales of portfolio securities, and dividends derived from net investment income:
| Pay Date | Record Date | Dividends | Capital Gains |
Institutional Class: | 12/18/2006 | 12/15/2006 | $ 0.065 | $0.61 |
Institutional Class: | 01/08/2007 | 01/05/2007 | $ - | $0.05 |
The fund hereby designates as capital gain dividend with respect to the taxable year ended November 30, 2006, $63,595,262 or, if subsequently determined to be different, the net capital gain of such year.
A total of .17% of the dividends distributed during the fiscal year was derived from interest on U.S. Government securities which is generally exempt from state income tax.
Institutional Class designates 28%, 95%, 95%, and 93% of the dividends distributed in December 2005 and April, July and October 2006, respectively during the fiscal year as qualifying for the dividends-received deduction for corporate shareholders.
Institutional Class designates 41%, 99%, 99% and 96% of the dividends distributed in December 2005, April, July, and October 2006, respectively during the fiscal year as amounts which may be taken into account as a dividend for purposes of the maximum rate under section 1(h)(11) of the Internal Revenue Code.
The fund will notify shareholders in January 2007 of amounts for use in preparing 2006 income tax returns.
Annual Report
Proxy Voting Results
A special meeting of the fund's shareholders was held on September 20, 2006. The results of votes taken among shareholders on the proposal before them are reported below. Each vote reported represents one dollar of net asset value held on the record date for the meeting.
PROPOSAL 1 |
To elect a Board of Trustees. A |
| # of
Votes | % of
Votes |
Dennis J. Dirks |
Affirmative | 10,327,434,641.22 | 95.770 |
Withheld | 456,199,004.95 | 4.230 |
TOTAL | 10,783,633,646.17 | 100.000 |
Albert R. Gamper, Jr. |
Affirmative | 10,322,116,523.07 | 95.720 |
Withheld | 461,517,123.10 | 4.280 |
TOTAL | 10,783,633,646.17 | 100.000 |
Robert M. Gates |
Affirmative | 10,288,766,799.53 | 95.411 |
Withheld | 494,866,846.64 | 4.589 |
TOTAL | 10,783,633,646.17 | 100.000 |
George H. Heilmeier |
Affirmative | 10,298,619,061.42 | 95.502 |
Withheld | 485,014,584.75 | 4.498 |
TOTAL | 10,783,633,646.17 | 100.000 |
Edward C. Johnson 3d |
Affirmative | 10,257,561,582.55 | 95.122 |
Withheld | 526,072,063.62 | 4.878 |
TOTAL | 10,783,633,646.17 | 100.000 |
Stephen P. Jonas |
Affirmative | 10,317,222,628.79 | 95.675 |
Withheld | 466,411,017.38 | 4.325 |
TOTAL | 10,783,633,646.17 | 100.000 |
James H. Keyes B |
Affirmative | 10,318,195,711.25 | 95.684 |
Withheld | 465,437,934.92 | 4.316 |
TOTAL | 10,783,633,646.17 | 100.000 |
| # of
Votes | % of
Votes |
Marie L. Knowles |
Affirmative | 10,317,835,129.19 | 95.681 |
Withheld | 465,798,516.98 | 4.319 |
TOTAL | 10,783,633,646.17 | 100.000 |
Ned C. Lautenbach |
Affirmative | 10,317,039,890.90 | 95.673 |
Withheld | 466,593,755.27 | 4.327 |
TOTAL | 10,783,633,646.17 | 100.000 |
William O. McCoy |
Affirmative | 10,278,036,936.38 | 95.311 |
Withheld | 505,596,709.79 | 4.689 |
TOTAL | 10,783,633,646.17 | 100.000 |
Robert L. Reynolds |
Affirmative | 10,320,662,459.03 | 95.707 |
Withheld | 462,971,187.14 | 4.293 |
TOTAL | 10,783,633,646.17 | 100.000 |
Cornelia M. Small |
Affirmative | 10,329,731,930.45 | 95.791 |
Withheld | 453,901,715.72 | 4.209 |
TOTAL | 10,783,633,646.17 | 100.000 |
William S. Stavropoulos |
Affirmative | 10,298,039,656.66 | 95.497 |
Withheld | 485,593,989.51 | 4.503 |
TOTAL | 10,783,633,646.17 | 100.000 |
Kenneth L. Wolfe |
Affirmative | 10,310,583,687.33 | 95.613 |
Withheld | 473,049,958.84 | 4.387 |
TOTAL | 10,783,633,646.17 | 100.000 |
A Denotes trust-wide proposal and voting results. B Effective on or about January 1, 2007. |
Annual Report
Board Approval of Investment Advisory Contracts and Management Fees
Fidelity Strategic Dividend & Income Fund
Each year, typically in July, the Board of Trustees, including the Independent Trustees (together, the Board), votes on the renewal of the management contract and sub-advisory agreements (together, the Advisory Contracts) for the fund. The Board, assisted by the advice of fund counsel and Independent Trustees' counsel, requests and considers a broad range of information throughout the year.
The Board meets regularly each month except August and takes into account throughout the year matters bearing on Advisory Contracts. The Board, acting directly and through its separate committees, considers at each of its meetings factors that are relevant to the annual renewal of the fund's Advisory Contracts, including the services and support provided to the fund and its shareholders. At the time of the renewal, the Board had 12 standing committees, each composed of Independent Trustees with varying backgrounds, to which the Board has assigned specific subject matter responsibilities in order to enhance effective decision-making by the Board. Each committee has adopted a written charter outlining the structure and purposes of the committee. One such committee, the Equity Contract Committee, meets periodically as needed throughout the year to consider matters specifically related to the annual renewal of Advisory Contracts. The committee requests and receives information on, and makes recommendations to the Independent Trustees concerning, the approval and annual review of the Advisory Contracts.
At its July 2006 meeting, the Board of Trustees, including the Independent Trustees, unanimously determined to renew the Advisory Contracts for the fund. In reaching its determination, the Board considered all factors it believed relevant, including (i) the nature, extent, and quality of the services to be provided to the fund and its shareholders (including the investment performance of the fund); (ii) the competitiveness of the management fee and total expenses of the fund; (iii) the total costs of the services to be provided by and the profits to be realized by the investment adviser and its affiliates from the relationship with the fund; (iv) the extent to which economies of scale would be realized as the fund grows; and (v) whether fee levels reflect these economies of scale, if any, for the benefit of fund shareholders.
In determining whether to renew the Advisory Contracts for the fund, the Board ultimately reached a determination, with the assistance of fund counsel and Independent Trustees' counsel, that the renewal of the Advisory Contracts and the compensation to be received by Fidelity under the management contract is consistent with Fidelity's fiduciary duty under applicable law. In addition to evaluating the specific factors noted above, the Board, in reaching its determination, is aware that shareholders in the fund have a broad range of investment choices available to them, including a wide choice among mutual funds offered by competitors to Fidelity, and that the fund's shareholders, with the opportunity to review and weigh the disclosure provided by the fund in its prospectus and other public disclosures, have chosen to invest in this fund, managed by Fidelity.
Annual Report
Board Approval of Investment Advisory Contracts and
Management Fees - continued
Nature, Extent, and Quality of Services Provided. The Board considered staffing within the investment adviser, FMR, and the sub-advisers (together, the Investment Advisers), including the background of the fund's portfolio manager and the fund's investment objective and discipline. The Independent Trustees also had discussions with senior management of Fidelity's investment operations and investment groups. The Board considered the structure of the portfolio manager compensation program and whether this structure provides appropriate incentives.
Resources Dedicated to Investment Management and Support Services. The Board reviewed the size, education, and experience of the Investment Advisers' investment staff, their use of technology, and the Investment Advisers' approach to recruiting, training, and retaining portfolio managers and other research, advisory, and management personnel. The Board considered Fidelity's extensive global research capabilities that enable the Investment Advisers to aggregate data from various sources in an effort to produce positive investment results. The Board noted that Fidelity's analysts have access to a variety of technological tools that enable them to perform both fundamental and quantitative analysis and to specialize in various disciplines. The Board also considered that Fidelity's portfolio managers and analysts have access to daily portfolio attribution that allows for monitoring of a fund's portfolio, as well as an electronic communication system that provides immediate real-time access to research concerning issuers and credit enhancers.
Shareholder and Administrative Services. The Board considered (i) the nature, extent, quality, and cost of administrative, distribution, and shareholder services performed by the Investment Advisers and their affiliates under the Advisory Contracts and under separate agreements covering transfer agency, pricing and bookkeeping, and securities lending services for the fund; (ii) the nature and extent of the Investment Advisers' supervision of third party service providers, principally custodians and subcustodians; and (iii) the resources devoted to, and the record of compliance with, the fund's compliance policies and procedures. The Board reviewed the allocation of fund brokerage, including allocations to brokers affiliated with the Investment Advisers, the use of brokerage commissions to pay fund expenses, and the use of "soft" commission dollars to pay for research services. The Board also considered that Fidelity voluntarily pays for market data out of its own resources.
The Board noted that the growth of fund assets across the complex allows Fidelity to reinvest in the development of services designed to enhance the value or convenience of the Fidelity funds as investment vehicles. These services include 24-hour access to account information and market information through phone representatives and over the Internet, and investor education materials and asset allocation tools.
Annual Report
Investment in a Large Fund Family. The Board considered the benefits to shareholders of investing in a Fidelity fund, including the benefits of investing in a fund that is part of a large family of funds offering a variety of investment disciplines and providing for a large variety of mutual fund investor services. For example, fund shareholders are offered the privilege of exchanging shares of the fund for shares of other Fidelity funds, as set forth in the fund's prospectus, without paying an additional sales charge. The Board noted that, since the last Advisory Contract renewals in July 2005, Fidelity has taken a number of actions that benefited particular funds, including (i) dedicating additional resources to investment research and to restructure the investment research teams; (ii) voluntarily entering into contractual arrangements with certain brokers pursuant to which Fidelity pays for research products and services separately out of its own resources, rather than bundling with fund commissions; (iii) launching the Fidelity Advantage Class of its five Spartan stock index funds and three Spartan bond index funds, which is a lower-fee class available to shareholders with higher account balances; (iv) contractually agreeing to impose expense limitations on Fidelity U.S. Bond Index Fund and reducing the fund's initial investment minimum; and (v) offering shareholders of each of the Fidelity Institutional Money Market Funds the privilege of exchanging shares of the fund for shares of other Fidelity funds.
Investment Performance and Compliance. The Board considered whether the fund has operated within its investment objective, as well as its record of compliance with its investment restrictions. It also reviewed the fund's absolute investment performance for each class, as well as the fund's relative investment performance for each class measured against (i) a proprietary custom index, and (ii) a peer group of mutual funds deemed appropriate by the Board. Because the fund had been in existence less than three calendar years, the following chart considered by the Board shows, for the one-year period ended December 31, 2005, the total returns of Class C and Fidelity Strategic Dividend & Income (retail class), the total return of a proprietary custom index ("benchmark"), and a range of total returns of a peer group of mutual funds identified by Lipper Inc. as having an investment objective similar to that of the fund. The returns of Class C and Fidelity Strategic Dividend & Income (retail class) represent the performance of classes with the highest and lowest 12b-1 fees, respectively (not necessarily with the highest and lowest total expenses). The box within the chart shows the 25th percentile return (bottom of box) and the 75th percentile return (top of box) of the Lipper peer group. Returns shown above the box are in the first quartile and returns shown below the box are in the fourth quartile. The percentage beaten numbers noted below the chart correspond to the percentile box and represent the percentage of funds in the Lipper peer group whose performance was equal to or lower than that of the class indicated. The fund's proprietary custom index is an index developed by FMR that represents the performance of the fund's four general investment categories according to their respective weightings in the fund's neutral mix.
Annual Report
Board Approval of Investment Advisory Contracts and
Management Fees - continued
Fidelity Strategic Dividend & Income Fund

The Board reviewed the fund's relative investment performance against its Lipper peer group and stated that the performance of Fidelity Strategic Dividend & Income (retail class) was in the first quartile for the period shown. The Board also stated that the relative investment performance of Fidelity Strategic Dividend & Income (retail class) compared favorably to its benchmark for the period shown. The Board considered that the variations in performance among the fund's classes reflect the variations in class expenses, which result in lower performance for higher expense classes. The Board stated that it is difficult to evaluate in any comprehensive fashion the performance of the fund, in light of its relatively recent launch. The Board also reviewed the fund's relative investment performance against a peer group defined by Morningstar.
The Board considered that FMR has taken steps to refocus and strengthen equity research, equity portfolio management, and compliance. The Board noted with favor FMR's reorganization of its senior management team in 2005 and FMR's dedication of additional resources to investment research, and participated in the process that led to those changes.
Based on its review, and giving particular weight to the nature and quality of the resources dedicated by the Investment Advisers to maintain and improve relative performance, the Board concluded that the nature, extent, and quality of the services provided to the fund will benefit the fund's shareholders, particularly in light of the Board's view that the fund's shareholders benefit from investing in a fund that is part of a large family of funds offering a variety of investment disciplines and services.
Annual Report
Competitiveness of Management Fee and Total Fund Expenses. The Board considered the fund's management fee and total expenses compared to "mapped groups" of competitive funds and classes. Fidelity creates "mapped groups" by combining similar Lipper investment objective categories that have comparable management fee characteristics. Combining Lipper investment objective categories aids the Board's management fee and total expense comparisons by broadening the competitive group used for comparison and by reducing the number of universes to which various Fidelity funds are compared.
The Board considered two proprietary management fee comparisons for the 12-month (or shorter) periods shown in the chart below. The group of Lipper funds used by the Board for management fee comparisons is referred to below as the "Total Mapped Group" and, for the reasons explained above, is broader than the Lipper peer group used by the Board for performance comparisons. The Total Mapped Group comparison focuses on a fund's standing relative to the total universe of comparable funds available to investors, in terms of gross management fees before expense reimbursements or caps. "TMG %" represents the percentage of funds in the Total Mapped Group that had management fees that were lower than the fund's. For example, a TMG % of 21% means that 79% of the funds in the Total Mapped Group had higher management fees than the fund. The "Asset-Size Peer Group" (ASPG) comparison focuses on a fund's standing relative to non-Fidelity funds similar in size to the fund within the Total Mapped Group. The ASPG represents at least 15% of the funds in the Total Mapped Group with comparable asset size and management fee characteristics, subject to a minimum of 50 funds (or all funds in the Total Mapped Group if fewer than 50). Additional information, such as the ASPG quartile in which the fund's management fee ranked, is also included in the chart and considered by the Board.
Annual Report
Board Approval of Investment Advisory Contracts and
Management Fees - continued
Fidelity Strategic Dividend & Income Fund
The Board noted that the fund's management fee ranked below the median of its Total Mapped Group and below the median of its ASPG for 2005.
Based on its review, the Board concluded that the fund's management fee was fair and reasonable in light of the services that the fund receives and the other factors considered.
In its review of each class's total expenses, the Board considered the fund's management fee as well as other fund or class expenses, as applicable, such as transfer agent fees, pricing and bookkeeping fees, fund-paid 12b-1 fees, and custodial, legal, and audit fees. The Board also noted the effects of any waivers and reimbursements on fees and expenses. As part of its review, the Board also considered current and historical total expenses of each class of the fund compared to competitive fund median expenses. Each class of the fund is compared to those funds and classes in the Total Mapped Group (used by the Board for management fee comparisons) that have a similar sales load structure.
The Board noted that the total expenses of each of Class A, Class B, Class C, Institutional Class and Fidelity Strategic Dividend & Income (retail class) ranked below its competitive median for 2005, and the total expenses of Class T ranked above its competitive median for 2005. The Board noted that the fund offers multiple classes, each of which has a different sales load and 12b-1 fee structure, and that the multiple structures are intended to offer a range of pricing options for the intermediary market. The Board also noted that the total expenses of the classes vary primarily by the level of their 12b-1 fees, although differences in transfer agent fees may also cause expenses to vary from class to class.
Annual Report
In its review of total expenses, the Board also considered Fidelity fee structures and other information on clients that FMR and its affiliates service in other competitive markets, such as other mutual funds advised or subadvised by FMR or its affiliates, pension plan clients, and other institutional clients.
Based on its review, the Board concluded that the total expenses of each class of the fund were reasonable, although in one case above the median of the universe presented for comparison, in light of the services that the fund and its shareholders receive and the other factors considered.
Costs of the Services and Profitability. The Board considered the revenues earned and the expenses incurred by Fidelity in conducting the business of developing, marketing, distributing, managing, administering and servicing the fund and its shareholders. The Board also considered the level of Fidelity's profits in respect of all the Fidelity funds.
On an annual basis, FMR presents to the Board Fidelity's profitability for the fund. Fidelity calculates the profitability for each fund, as well as aggregate profitability for groups of Fidelity funds and all Fidelity funds, using a series of detailed revenue and cost allocation methodologies which originate with the audited books and records of Fidelity. The Audit Committee of the Board reviews any significant changes from the prior year's methodologies.
PricewaterhouseCoopers LLP (PwC), independent registered accounting firm and auditor to Fidelity and certain Fidelity funds, has been engaged annually by the Board as part of the Board's assessment of the results of Fidelity's profitability analysis. PwC's engagement includes the review and assessment of Fidelity's methodologies used in determining the revenues and expenses attributable to Fidelity's mutual fund business, and completion of agreed-upon procedures surrounding the mathematical accuracy of fund profitability and its conformity to allocation methodologies. After considering PwC's reports issued under the engagement and information provided by Fidelity, the Board believes that while other allocation methods may also be reasonable, Fidelity's profitability methodologies are reasonable in all material respects.
The Board has also reviewed Fidelity's non-fund businesses and any fall-out benefits related to the mutual fund business as well as cases where Fidelity's affiliates may benefit from or be related to the fund's business.
The Board considered the costs of the services provided by and the profits realized by Fidelity in connection with the operation of the fund and determined that the amount of profit is a fair entrepreneurial profit for the management of the fund.
Annual Report
Board Approval of Investment Advisory Contracts and
Management Fees - continued
Economies of Scale. The Board considered whether there have been economies of scale in respect of the management of the Fidelity funds, whether the Fidelity funds (including the fund) have appropriately benefited from any such economies of scale, and whether there is potential for realization of any further economies of scale. The Board considered the extent to which the fund will benefit from economies of scale through increased services to the fund, through waivers or reimbursements, or through fee or expense reductions, including reductions that occur through operation of the transfer agent agreement. The transfer agent fee varies in part based on the number of accounts in the fund. If the number of accounts decreases or the average account size increases, the overall transfer agent fee rate decreases.
The Board recognized that the fund's management contract incorporates a "group fee" structure, which provides for lower fee rates as total fund assets under FMR's management increase, and for higher fee rates as total fund assets under FMR's management decrease. The Board considered that the group fee is designed to deliver the benefits of economies of scale to fund shareholders when total fund assets increase, even if assets of any particular fund are unchanged or have declined, because some portion of Fidelity's costs are attributable to services provided to all Fidelity funds, and all funds benefit if those costs can be allocated among more assets. The Board concluded that, given the group fee structure, fund shareholders will achieve a certain level of economies of scale as assets under FMR's management increase at the fund complex level, regardless of whether Fidelity achieves any such economies of scale.
The Board further concluded that any potential economies of scale are being shared between fund shareholders and Fidelity in an appropriate manner.
Additional Information Requested by the Board. In order to develop fully the factual basis for consideration of the Advisory Contracts, the Board requested additional information on several topics, including (i) Fidelity's fund profitability methodology and profitability trends within certain funds; (ii) portfolio manager compensation; (iii) the extent to which any economies of scale exist and are shared between the funds and Fidelity; (iv) the total expenses of certain funds and classes relative to competitors, including the extent to which the expenses of certain funds have been or could be capped; (v) fund performance trends; and (vi) Fidelity's fee structures, including use of performance fees.
Based on its evaluation of all of the conclusions noted above, and after considering all material factors, the Board ultimately concluded that the advisory fee structures are fair and reasonable, and that the fund's Advisory Contracts should be renewed.
Annual Report
Annual Report
Annual Report
Annual Report
Annual Report
Annual Report
Investment Adviser
Fidelity Management & Research Company
Boston, MA
Investment Sub-Advisers
FMR Co., Inc.
Fidelity Management & Research
(U.K.) Inc.
Fidelity Research & Analysis Company
(formerly Fidelity Management &
Research (Far East) Inc.)
Fidelity International Investment Advisors
Fidelity Investments Japan Limited
Fidelity International Investment Advisors (U.K.) Limited
General Distributor
Fidelity Distributors Corporation
Boston, MA
Transfer and Service Agents
Fidelity Investments Institutional
Operations Company, Inc.
Boston, MA
Fidelity Service Company, Inc.
Boston, MA
Custodian
Citibank, N.A.
New York, NY
ASDII-UANN-0107
1.802531.102
(Fidelity Investment logo)(registered trademark)
Corporate Headquarters
82 Devonshire St., Boston, MA 02109
www.fidelity.com
Item 2. Code of Ethics
As of the end of the period, November 30, 2006, Fidelity Financial Trust (the trust) has adopted a code of ethics, as defined in Item 2 of Form N-CSR, that applies to its President and Treasurer and its Chief Financial Officer. A copy of the code of ethics is filed as an exhibit to this Form N-CSR.
Item 3. Audit Committee Financial Expert
The Board of Trustees of the trust has determined that Marie L. Knowles is an audit committee financial expert, as defined in Item 3 of Form N-CSR. Ms. Knowles is independent for purposes of Item 3 of Form N-CSR.
Item 4. Principal Accountant Fees and Services
(a) Audit Fees.
For the fiscal years ended November 30, 2006 and November 30, 2005, the aggregate Audit Fees billed by PricewaterhouseCoopers LLP (PwC) for professional services rendered for the audits of the financial statements, or services that are normally provided in connection with statutory and regulatory filings or engagements for those fiscal years, for the Fidelity Convertible Securities Fund, Fidelity Equity-Income II Fund, Fidelity Independence Fund and Fidelity Strategic Dividend & Income Fund (the funds) and for all funds in the Fidelity Group of Funds are shown in the table below.
Fund | 2006A | 2005A |
Fidelity Convertible Securities Fund | $73,000 | $66,000 |
Fidelity Equity-Income II Fund | $96,000 | $96,000 |
Fidelity Independence Fund | $67,000 | $64,000 |
Fidelity Strategic Dividend & Income Fund | $40,000 | $33,000 |
All funds in the Fidelity Group of Funds audited by PwC | $13,500,000 | $12,100,000 |
A | Aggregate amounts may reflect rounding. |
(b) Audit-Related Fees.
In each of the fiscal years ended November 30, 2006 and November 30, 2005 the aggregate Audit-Related Fees billed by PwC for services rendered for assurance and related services to each fund that are reasonably related to the performance of the audit or review of the fund's financial statements, but not reported as Audit Fees, are shown in the table below.
Fund | 2006A | 2005A |
Fidelity Convertible Securities Fund | $0 | $0 |
Fidelity Equity-Income II Fund | $0 | $0 |
Fidelity Independence Fund | $0 | $0 |
Fidelity Strategic Dividend & Income Fund | $0 | $0 |
A | Aggregate amounts may reflect rounding. |
In each of the fiscal years ended November 30, 2006 and November 30, 2005, the aggregate Audit-Related Fees that were billed by PwC that were required to be approved by the Audit Committee for services rendered on behalf of Fidelity Management & Research Company (FMR) and entities controlling, controlled by, or under common control with FMR (not including any sub-adviser whose role is primarily portfolio management and is subcontracted with or overseen by another investment adviser) that provide ongoing services to the funds ("Fund Service Providers") for assurance and related services that relate directly to the operations and financial reporting of each fund that are reasonably related to the performance of the audit or review of the fund's financial statements, but not reported as Audit Fees, are shown in the table below.
Billed By | 2006A | 2005A |
PwC | $0 | $0 |
A | Aggregate amounts may reflect rounding. |
Fees included in the audit-related category comprise assurance and related services (e.g., due diligence services) that are traditionally performed by the independent registered public accounting firm. These audit-related services include due diligence related to mergers and acquisitions, accounting consultations and audits in connection with acquisitions, internal control reviews, attest services that are not required by statute or regulation and consultation concerning financial accounting and reporting standards.
(c) Tax Fees.
In each of the fiscal years ended November 30, 2006 and November 30, 2005, the aggregate Tax Fees billed by PwC for professional services rendered for tax compliance, tax advice, and tax planning for each fund is shown in the table below.
Fund | 2006A | 2005A |
Fidelity Convertible Securities Fund | $3,600 | $3,400 |
Fidelity Equity-Income II Fund | $3,600 | $3,400 |
Fidelity Independence Fund | $3,600 | $3,400 |
Fidelity Strategic Dividend & Income Fund | $2,600 | $2,200 |
A | Aggregate amounts may reflect rounding. |
In each of the fiscal years ended November 30, 2006 and November 30, 2005, the aggregate Tax Fees billed by PwC that were required to be approved by the Audit Committee for professional services rendered on behalf of the Fund Service Providers for tax compliance, tax advice, and tax planning that relate directly to the operations and financial reporting of each fund is shown in the table below.
Billed By | 2006A | 2005A |
PwC | $0 | $0 |
A | Aggregate amounts may reflect rounding. |
Fees included in the Tax Fees category comprise all services performed by professional staff in the independent registered public accounting firm's tax division except those services related to the audit. Typically, this category would include fees for tax compliance, tax planning, and tax advice. Tax compliance, tax advice, and tax planning services include preparation of original and amended tax returns, claims for refund and tax payment-planning services, assistance with tax audits and appeals, tax advice related to mergers and acquisitions and requests for rulings or technical advice from taxing authorities.
(d) All Other Fees.
In each of the fiscal years ended November 30, 2006 and November 30, 2005, the aggregate Other Fees billed by PwC for all other non-audit services rendered to the funds is shown in the table below.
Fund | 2006A | 2005A |
Fidelity Convertible Securities Fund | $2,600 | $2,900 |
Fidelity Equity-Income II Fund | $9,800 | $12,200 |
Fidelity Independence Fund | $4,500 | $5,300 |
Fidelity Strategic Dividend & Income Fund | $2,000 | $2,000 |
A | Aggregate amounts may reflect rounding. |
In each of the fiscal years ended November 30, 2006 and November 30, 2005, the aggregate Other Fees billed by PwC that were required to be approved by the Audit Committee for all other non-audit services rendered on behalf of the Fund Service Providers that relate directly to the operations and financial reporting of each fund is shown in the table below.
Billed By | 2006A | 2005A |
PwC | $145,000 | $170,000 |
A | Aggregate amounts may reflect rounding. |
Fees included in the All Other Fees category include services related to internal control reviews, strategy and other consulting, financial information systems design and implementation, consulting on other information systems, and other tax services unrelated to the fund.
(e) (1) | Audit Committee Pre-Approval Policies and Procedures: |
The trust's Audit Committee must pre-approve all audit and non-audit services provided by the independent registered public accounting firm relating to the operations or financial reporting of the funds. Prior to the commencement of any audit or non-audit services to a fund, the Audit Committee reviews the services to determine whether they are appropriate and permissible under applicable law.
The trust's Audit Committee has adopted policies and procedures to, among other purposes, provide a framework for the Committee's consideration of non-audit services by the audit firms that audit the Fidelity funds. The policies and procedures require that any non-audit service provided by a fund audit firm to a Fidelity Fund and any non-audit service provided by a fund auditor to a Fund Service Provider that relates directly to the operations and financial reporting of a Fidelity fund (Covered Service) are subject to approval by the Audit Committee before such service is provided. Non-audit services provided by a fund audit firm for a Fund Service Provider that do not relate directly to the operations and financial reporting of a Fidelity fund (Non-Covered Service) but that are expected to exceed $50,000 are also subject to pre-approval by the Audit Committee.
All Covered Services, as well as Non-Covered Services that are expected to exceed $50,000, must be approved in advance of provision of the service either: (i) by formal resolution of the Audit Committee, or (ii) by oral or written approval of the service by the Chair of the Audit Committee (or if the Chair is unavailable, such other member of the Audit Committee as may be designated by the Chair to act in the Chair's absence). The approval contemplated by (ii) above is permitted where the Treasurer determines that action on such an engagement is necessary before the next meeting of the Audit Committee. Neither pre-approval nor advance notice of Non-Covered Service engagements for which fees are not expected to exceed $50,000 is required; such engagements are to be reported to the Audit Committee monthly.
(e) (2) | Services approved pursuant to paragraph (c)(7)(i)(C) of Rule 2-01 of Regulation S-X: |
Audit-Related Fees:
There were no amounts that were approved by the Audit Committee pursuant to the de minimis exception for the fiscal years ended November 30, 2006 and November 30, 2005 on behalf of each fund.
There were no amounts that were required to be approved by the Audit Committee pursuant to the de minimis exception for the fiscal years ended November 30, 2006 and November 30, 2005 on behalf of the Fund Service Providers that relate directly to the operations and financial reporting of each fund.
Tax Fees:
There were no amounts that were approved by the Audit Committee pursuant to the de minimis exception for the fiscal years ended November 30, 2006 and November 30, 2005 on behalf of each fund.
There were no amounts that were required to be approved by the Audit Committee pursuant to the de minimis exception for the fiscal years ended November 30, 2006 and November 30, 2005 on behalf of the Fund Service Providers that relate directly to the operations and financial reporting of each fund.
All Other Fees:
There were no amounts that were approved by the Audit Committee pursuant to the de minimis exception for the fiscal years ended November 30, 2006 and November 30, 2005 on behalf of each fund.
There were no amounts that were required to be approved by the Audit Committee pursuant to the de minimis exception for the fiscal years ended November 30, 2006 and November 30, 2005 on behalf of the Fund Service Providers that relate directly to the operations and financial reporting of each fund.
(f) Not applicable.
(g) For the fiscal years ended November 30, 2006 and November 30, 2005, the aggregate fees billed by PwC of $1,320,000A and $1,275,000A,B for non-audit services rendered on behalf of the funds, FMR (not including any sub-adviser whose role is primarily portfolio management and is subcontracted with or overseen by another investment adviser) and Fund Service Providers relating to Covered Services and Non-Covered Services are shown in the table below.
| 2006A | 2005A |
Covered Services | $180,000 | $200,000 |
Non-Covered Services | $1,140,000 | $1,075,000B |
A | Aggregate amounts may reflect rounding. |
B | Reflects current period presentation. |
(h) The trust's Audit Committee has considered Non-Covered Services that were not pre-approved that were provided by PwC to Fund Service Providers to be compatible with maintaining the independence of PwC in its audit of the funds, taking into account representations from PwC, in accordance with Independence Standards Board Standard No.1, regarding its independence from the funds and their related entities.
Item 5. Audit Committee of Listed Registrants
Not applicable.
Item 6. Schedule of Investments
Not applicable.
Item 7. Disclosure of Proxy Voting Policies and Procedures for Closed-End Management Investment Companies
Not applicable.
Item 8. Portfolio Managers of Closed-End Management Investment Companies
Not applicable.
Item 9. Purchase of Equity Securities by Closed-End Management Investment Company and Affiliated Purchasers
Not applicable.
Item 10. Submission of Matters to a Vote of Security Holders
There were no material changes to the procedures by which shareholders may recommend nominees to the trust's Board of Trustees.
Item 11. Controls and Procedures
(a)(i) The President and Treasurer and the Chief Financial Officer have concluded that the trust's disclosure controls and procedures (as defined in Rule 30a-3(c) under the Investment Company Act) provide reasonable assurances that material information relating to the trust is made known to them by the appropriate persons, based on their evaluation of these controls and procedures as of a date within 90 days of the filing date of this report.
(a)(ii) There was no change in the trust's internal control over financial reporting (as defined in Rule 30a-3(d) under the Investment Company Act) that occurred during the second fiscal quarter of the period covered by this report that has materially affected, or is reasonably likely to materially affect, the trust's internal control over financial reporting.
Item 12. Exhibits
(a) | (1) | Code of Ethics pursuant to Item 2 of Form N-CSR is filed and attached hereto as EX-99.CODE ETH. |
(a) | (2) | Certification pursuant to Rule 30a-2(a) under the Investment Company Act of 1940 (17 CFR 270.30a-2(a)) is filed and attached hereto as Exhibit 99.CERT. |
(a) | (3) | Not applicable. |
(b) | | Certification pursuant to Rule 30a-2(b) under the Investment Company Act of 1940 (17 CFR 270.30a-2(b)) is furnished and attached hereto as Exhibit 99.906CERT. |
SIGNATURES
Pursuant to the requirements of the Securities Exchange Act of 1934 and the Investment Company Act of 1940, the registrant has duly caused this report to be signed on its behalf by the undersigned, thereunto duly authorized.
Fidelity Financial Trust
By: | /s/Kimberley Monasterio |
| Kimberley Monasterio |
| President and Treasurer |
| |
Date: | January 24, 2007 |
Pursuant to the requirements of the Securities Exchange Act of 1934 and the Investment Company Act of 1940, this report has been signed below by the following persons on behalf of the registrant and in the capacities and on the dates indicated.
By: | /s/Kimberley Monasterio |
| Kimberley Monasterio |
| President and Treasurer |
| |
Date: | January 24, 2007 |
By: | /s/Joseph B. Hollis |
| Joseph B. Hollis |
| Chief Financial Officer |
| |
Date: | January 24, 2007 |