UNITED STATES
SECURITIES AND EXCHANGE COMMISSION
Washington, D.C. 20549
FORM N-CSR
CERTIFIED SHAREHOLDER REPORT OF REGISTERED MANAGEMENT INVESTMENT COMPANIES
Investment Company Act file number 811-3651
Touchstone Strategic Trust
(Exact name of registrant as specified in charter)
303 Broadway, Suite 1100
Cincinnati, Ohio 45202
(Address of principal executive offices) (Zip code)
Jill T. McGruder
303 Broadway, Suite 1100
Cincinnati, Ohio 45202
(Name and address of agent for service)
Registrant's telephone number, including area code: 800-638-8194
Date of fiscal year end: March 31
Date of reporting period: March 31, 2012
Form N-CSR is to be used by management investment companies to file reports with the Commission not later than 10 days after the transmission to stockholders of any report that is required to be transmitted to stockholders under Rule 30e-1 under the Investment Company Act of 1940 (17 CFR 270.30e-1). The Commission may use the information provided on Form N-CSR in its regulatory, disclosure review, inspection, and policymaking roles.
A registrant is required to disclose the information specified by Form N-CSR, and the Commission will make this information public. A registrant is not required to respond to the collection of information contained in Form N-CSR unless the Form displays a currently valid Office of Management and Budget ("OMB") control number. Please direct comments concerning the accuracy of the information collection burden estimate and any suggestions for reducing the burden to Secretary, Securities and Exchange Commission, 100 F Street, NE, Washington, DC 20549. The OMB has reviewed this collection of information under the clearance requirements of 44 U.S.C. § 3507.
Item 1. Reports to Stockholders.
The Report to Shareholders is attached herewith.
March 31, 2012
Annual Report
Touchstone Strategic Trust
Touchstone Diversified Small Cap Growth Fund
Touchstone Growth Opportunities Fund
Touchstone Large Cap Growth Fund
Touchstone Mid Cap Growth Fund

Table of Contents
| | Page |
| Letter from the President | 3 |
| Management's Discussion of Fund Performance (Unaudited) | 4 |
| Tabular Presentation of Portfolios of Investments (Unaudited) | 18 |
| Portfolio Investments: | |
| Touchstone Diversified Small Cap Growth Fund | 19 |
| Touchstone Growth Opportunities Fund | 21 |
| Touchstone Large Cap Growth Fund | 23 |
| Touchstone Mid Cap Growth Fund | 24 |
| Statement of Assets and Liabilities | 26 - 27 |
| Statement of Operations | 28 |
| Statement of Changes in Net Assets | 30 - 33 |
| Financial Highlights | 34 - 42 |
| Notes to Financial Statements | 43 - 55 |
| Report of Independent Registered Public Accounting Firm | 56 |
| Other Items (Unaudited) | 57 - 64 |
| Management of the Trust (Unaudited) | 65 - 67 |
| Privacy Protection Policy | 68 |
Letter from the President
Dear Fellow Shareholder,
We are pleased to provide you with the Touchstone Strategic Trust Annual Report. Inside you will find key financial information and manager commentaries for the twelve months ended March 31, 2012.
There is little doubt that the U.S. economy is on more solid footing today than it was a year ago. While fiscal uncertainty and a recessionary perspective marked the first 6 months of the fiscal year, the last 6 months saw U.S. economic data improve. Better than expected economic reports have propped up the markets, which in turn, have boosted confidence that has spurred additional spending by households and hiring by businesses.
The U.S. equity markets posted positive performance for the fiscal year; results were mixed during the period. The markets suffered their worst losses since the 2008-09 financial crisis in the third quarter of 2011. In a reversal of that trend, the first quarter of 2012 proved to be an exceptionally strong one, with the S&P 500 Index posting a total return of 12.6%, its strongest first quarter since 1998.
For the year, the U.S. equity markets outperformed both the developed and emerging international markets. From a market capitalization and style perspective, large cap stocks outpaced both small- and mid-cap stocks, while growth outperformed across most asset classes. Interest rates remain low, and are forecasted to stay low throughout the next two years.
Touchstone is committed to helping investors achieve their financial goals by providing access to a distinctive selection of institutional asset managers who are known and respected for proficiency in their specific area of expertise. We hope that you will find the enclosed commentaries helpful.
We greatly appreciate your continued support. Thank you for including Touchstone as part of your investment plan.
Sincerely,

Jill T. McGruder
President
Touchstone Strategic Trust
Management's Discussion of Fund Performance
Touchstone Diversified Small Cap Growth Fund
Sub-Advised by Fort Washington Investment Advisors, Inc.
Investment Philosophy and Process
The Touchstone Diversified Small Cap Growth Fund seeks long-term growth of capital by investing primarily in stocks of small-cap companies. Fund management focuses on companies that are experiencing improving secular or cyclical fundamental trends and high-quality, well-managed companies with competitive business models.
Fund Performance and Market Overview
The total return of the Touchstone Diversified Small Cap Growth Fund was -1.97% for the year ended March 31, 2012. The total return of the Russell 2000®Growth Index was 0.68% for the same period.
If one looked only at the unchanged level of returns for either the market or the Fund, it would appear an uneventful year. Yet the fiscal year period was far from uneventful. The volatility in the equity markets was significant as fiscal quarters two, three and four all were up or down greater than ten percent. The spring of 2011 was marked by the Japanese earthquake and tsunami followed by heightened concerns regarding European debt problems, especially Greece, followed by the fears of an economic slowdown and the debt ceiling battle in the U.S. However, the dramatic drop in the market in the third calendar quarter created some bargains and that, combined with the European Central Banks’ further monetary stimulus and the apparent economic improvement in the U.S. in the fourth quarter, drove stocks to two consecutive double digit quarterly returns.
The U.S. economy does seem to be building a firmer foundation upon which to grow. In addition, the European debt concerns have moderated. The Federal Reserve and the other major central banks of the world will likely continue to apply extraordinary monetary measures should the global economy appear to slow appreciably or the financial markets weaken significantly as occurred in the second and third quarters of 2010 and 2011.
Portfolio Review
Several sectors contributed to relative performance in the year including Health Care, Consumer Discretionary and Energy. Sectors with the largest negative impact on the Fund’s relative performance were Information Technology, Industrials and Consumer Staples.
As of the end of the first quarter of 2012, the Fund’s largest sector overweight position was in Consumer Discretionary while the Industrials, Information Technology and Health Care sectors were very slightly overweight. The Fund’s largest underweight sector was Financials with the Consumer Staples, Energy and Materials sectors modestly underweight.
The Fund’s Consumer Discretionary holdings are generally focused on companies that serve value-conscious consumers and/or have strong organic top line growth driven by domestic geographic expansion and/or recurring revenue. The Fund’s Health Care theme continues to be in orphan-drug producers and device manufacturers with new product introductions. The Fund’s positioning in the Industrials sector is in companies with recurring revenue, transportation, niche capital goods, aerospace and defense and electrical equipment companies. In the Information Technology sector, the Fund is positioned in companies benefitting from the concept of a networked society accomplished through constant connection, mobility, wireless and software as a service.
In the Financials sector we believe the Fund’s holdings in pawn brokers should benefit from the continued contraction in consumer credit and higher gold prices. At this point, the Fund’s portfolio is void of banks and Real Estate Investment Trusts (REITs) as we still consider the risk/return profile for these groups unattractive. In the Energy sector, the Fund is positioned in companies that should benefit from domestic onshore shale plays and international offshore oil & gas drilling. Increased exposure in the Materials sector is more in the form of growth-cyclicals rather than those that have more volatile businesses. In the Consumer Staples sector, the Fund is positioned in a combination of companies with growth product niches or geographic expansion opportunities and traditional food and beverage names.
Management's Discussion of Fund Performance (Continued)
Individual stocks that contributed to performance included SonoSite Inc., Alexion Pharmaceuticals, Inc., Spectranetics Corp., BioMarin Pharmaceutical Inc., Salix Pharmaceuticals, Ltd., and Genomic Health Inc.(Health Care sector); Brigham Exploration Co. (Energy sector), Tractor Supply, Coinstar Inc. and DSW Inc. (Consumer Discretionary sector); and Mellanox Technologies Ltd. and Taleo Corp. (Information Technology sector).
Individual stocks that detracted from performance included NetScout Systems Inc., Riverbed Technology Inc., Cavium Inc., VistaPrint Ltd., Skyworks Solutions Inc., and Acme Packet Inc., (Information Technology sector), Vera Bradley, Inc. and WMS Industrials, Inc.(Consumer Discretionary sector); United Therapeutics Corp. (Health Care sector); and PetroQuest Energy Inc. (Energy sector).
Strategy and Outlook
Going into the new fiscal year (starting April 2012), the Fund generally continues to be positioned in companies that we believe can increase sales and profits in spite of a difficult economic environment. If we find the U.S. economy continues to gain momentum, we will look to add to growth-cyclical companies that should benefit from this uptick.
Management's Discussion of Fund Performance (Continued)
Comparison of the Change in Value of a $10,000 Investment in the Touchstone
Diversified Small Cap Growth Fund - Class A* and the Russell 2000® Growth Index

| * | The chart above represents performance of Class A shares only, which will vary from the performance of Class C shares and Class Y shares based on the differences in loads and fees paid by shareholders in the different classes. The initial public offering of Class A shares and Class Y shares commenced on September 6, 2006. The initial public offering of Class C shares commenced on August 1, 2007. The returns for Class C shares include performance of the Fund that was achieved prior to the creation of Class C shares (August 1, 2007), which is the same as the performance for Class A shares through August 1, 2007. The returns have been restated for sales charges and for fees applicable to Class C shares. |
| ** | The average annual total returns shown above are adjusted for maximum applicable sales charges. |
The performance of the above Fund does not reflect the deduction of taxes that a shareholder would pay on Fund distributions or the redemption of Fund shares. The past performance is not predictive of future results.
Management's Discussion of Fund Performance (Continued)
Touchstone Growth Opportunities Fund
Sub-Advised by Westfield Capital Management LP
Investment Philosophy and Process
The Touchstone Growth Opportunities Fund seeks long-term capital appreciation by primarily investing in stocks of U.S. companies with large, medium and small market capitalizations. Fund management places focus on companies that are believed to have demonstrated records of achievement with excellent prospects for earnings growth over a 1- to 3-year period and incorporates a proprietary, research driven, bottom-up approach that seeks to identify quality growth companies with strong management teams, sustainable business models and solid financials.
Fund Performance and Market Overview
The total return of the Touchstone Growth Opportunities Fund was 1.47% for the twelve month period ended March 31, 2012. The total return of the Russell 3000® Growth Index was 10.14% for the same period. While successful stock picking was evidenced across a range of economic sub-industries, dramatic weakness in select positions led to the performance shortfall. The Consumer Discretionary, Energy, and Health Care sectors were the greatest detractors from relative returns.
Optimism about global economic expansion faded in the spring of 2011, giving way to worries that the “soft patch” of data could be indicative of a more protracted slowdown. The effects of the natural disaster in Japan on the global supply chain were indeed disruptive to industrial production. At the same time, efforts to curb inflation in emerging economies had a negative impact on global demand for various commodities. A decline in crude prices and a 20-plus percent retreat in certain agricultural commodities helped to pressure more cyclically sensitive stocks. A change in investor confidence was also evident in the slowdown in Mergers & Acquisitions (M&A) activity as uncertainty of economic prospects overwhelmed positive factors like record levels of cash on balance sheets and attractive interest rates. Concerns about a double-dip recession intensified during the second half of last year, prompting a retreat from risky assets of all types. Instead, investors were looking for visible, protected growth even if it came at very high price-to-earnings multiples. In general terms, the stocks that worked best in 2011 were either income-producing or those we believe were too expensive. The market dynamics reversed sharply with the start of 2012, when strengthening domestic economy and accommodative monetary policy around the globe helped revive investor appetite for stocks. Most domestic equity indices posted double-digit gains in the first three months of the year, staging the biggest first quarter advance in fourteen years.
Portfolio Review
The Consumer Discretionary sector detracted from relative returns. Solid performance within the Internet retail and department stores sub-industries was overshadowed by declines elsewhere, most notably within auto parts & equipment. Lack of exposure to such areas of strength as restaurants, apparel accessories & luxury goods, and apparel retail also hindered excess returns. The maker of automotive equipment for emissions and ride control Tenneco Inc. was the biggest source of the performance weakness. We viewed the company as one of the best beneficiaries of the ongoing cyclical recovery in the auto market; however, the stock languished in the second half of the year, hurt by concerns over the company’s exposure to Europe and China. Our research indicated that while the U.S. auto trend continued to be strong, European production schedules began to weaken. As we do not anticipate a pick-up in global Seasonally Adjusted Annual Rate (SAAR) growth in 2012, the stock was sold. In addition, sector performance was held by an underweight in the traditional “brick-&-mortar” retail space and restaurants industries. New investments were made in these industries in the last calendar quarter of 2011, and these trades leave the Fund’s portfolio less underweight in the Consumer Discretionary sector. Home Depot Inc., for example, was added to the Fund’s portfolio, as were the home goods retailer Williams-Sonoma Inc. and specialty coffee retailer Starbucks Corp.
Management's Discussion of Fund Performance (Continued)
Investments in the Energy sector had a negative impact on relative results. We witnessed extreme volatility in the Energy sector in the past 12 months. Unrest in the Middle East in the early part of 2011 was a key factor, as Libya’s civil war alone decreased world oil production by 1.3 million barrels a day in an already tight capacity market. As oil prices rose, Energy sector stocks were hit with market trepidations about multiple macro risks including the effect of commodity inflation on the economy. Weatherford International Ltd., in particular, was a disappointing holding for the Fund’s portfolio over the past year. Weatherford International provides oilfield-related services globally, and its growth is correlated with a rising global Gross Domestic Product (GDP), particularly in emerging economies. Middle East and North Africa dislocations and weather across several regions had a significant negative impact on Weatherford’s international revenues and margins. Complicating matters, the company surprised investors during the fourth quarter reporting period by disclosing that it was not able to settle its material accounting weaknesses for certain tax accounts. While the company’s weak financial controls for income taxes is unfortunate, this fact does not overshadow Weatherford’s solid operational results, with revenues growing 27% year-over-year and better-than-expected pre-tax income. We applaud the company’s improving business fundamentals and believe that Weatherford will continue to benefit from its significant exposure to international drilling and significant margin improvement in its North American segment. The Fund portfolio’s holdings within the coal & consumable fuels sub-industry, which drastically lagged the index sector overall, also negatively impacted relative performance. Alpha Natural Resources Inc. underperformed due in part to the perceived risk associated with Alpha Natural finalizing its Massey Energy Co. acquisition. While we remain bullish on the prospects for secular demand growth for coal given its importance to power generation in emerging markets, we sold our shares in the stock.
Investments within the Health Care sector detracted from relative results. An overweight to the sector and positive performance within the healthcare equipment sub-industry helped incrementally, but were offset by turmoil in certain securities such as hospital operating company Community Health Systems Inc. and biotechnology company Vertex Pharmaceuticals Inc. Community Health made a hostile bid for competitor Tenet Healthcare Corp. at the end of 2010, and in April of last year, Tenet Healthcare alleged that Community Health engaged in practices that resulted in its overbilling Medicare. Community Health assembled an immense amount of data and analyses that supported its rebuttal of these claims. While Community Health’s first quarter financials corroborated our thesis that Earnings Before Interest, Taxes, Depreciation and Amortization (EBITDA) margins were widening while improving employment should drive higher volumes, the litigation impacted the near-term outlook for the stock. As a result, we sold our shares in June. Vertex Pharmaceuticals, which has been primarily focused on developing therapies for the treatment of Hepatitis C, launched Invicek, its first product in this indication in May of 2011. The company’s pipeline is broader than Hepatits C, with two product candidates for Cystic Fibrosis in Phase III trials. However, later in 2011, a competitor presented scientific data that pointed to potential competition for Incivek, which will likely arrest Vertex’s plans for trial activity in combination therapies. We continue to hold the stock, as we believe that doctors are unlikely to hold off on putting patients on Incivek in anticipation of better therapies. Further trials of the competitor’s drug will take many years, and while the market potential may be reduced for Incivek, there are patients who simply cannot wait years for a new treatment while effective and safe medication is available now. Our analysis of prescription trends for Incivek shows that Vertex should demonstrate strong earnings growth, at least for the next several years and we expect that the cash flow generated will be used prudently to reinvest in the company’s product pipeline.
Management's Discussion of Fund Performance (Continued)
The Industrials sector added to relative returns. Sector outperformance was primarily driven by investments within the aerospace & defense sub-industry. The lion’s share of the gains was the result of the Fund’s portfolio owning Goodrich Corp, a supplier of aerospace components and services. In late September, conglomerate United Technologies Corp. offered $127.50 per share to purchase aftermarket-focused Goodrich, representing a 47% premium to Goodrich’s price before the deal. BE Aerospace Inc. also contributed meaningfully to positive results. The company, which supplies cabin interior products both to original equipment manufacturers and aftermarket clients, benefited from an ongoing cyclical recovery within the aerospace industry. BE Aerospace has multiple catalysts for growth, in our opinion, including the industry’s increased focus on aircraft maintenance after the lean years of the downturn and a shift towards more wide-body aircraft. Among other performance drivers within the sector were investments in trucking, industrial machinery, and industrial conglomerates. With China slowing and Europe likely in a recession, our positioning will most likely be more U.S. centric in the next several months. We added shares of Tyco International Ltd. into the portfolio in late 2011, when the company’s fourth fiscal quarter conference call confirmed our thinking that the U.S. economic recovery was taking hold. The company’s diversified group of businesses demonstrated significant year-over-year acceleration in organic growth. Earlier in 2011, Tyco’s management had announced plans to spin off its three businesses into independent entities and the stock’s valuation looked even more attractive when applying sum-of-the-parts analysis to calculate the company’s intrinsic value. Financial results for the first quarter of 2012 were also solidly above consensus expectations, with organic orders growth of 7% from the prior quarter, despite a tougher comparison. We also purchased J.B. HuntTransport Services Inc., a premier intermodal (truck and rail combination) freight carrier in the U.S. In our opinion, this is the secular growth segment of the trucking market and the company’s early entry into the intermodal freight market has allowed it to lock in favorable contracts with its railroad partners. Over the past few years, the company has de-emphasized its legacy truck-load segment to build out its intermodal business. This strategic positioning has produced higher returns on capital but muted revenue growth. Now at the low point of the truck-load decommissioning effort, we believe top line growth is likely to reaccelerate.
Strategy and Outlook
An equity market consolidation is not unlikely given the torrid advance experienced year-to-date. Indeed, fund flows into equity mutual funds would suggest that the average investor remains bearish on the outlook for U.S. stocks. We believe, however, that stock market valuation remains reasonable, earnings growth for U.S. corporations will be steady and increasing evidence of cyclical traction in housing, construction and capital spending should provide a positive backdrop for stocks. U.S. corporations are currently benefiting from a positive business environment domestically. Unit labor costs are well contained and the proliferation of natural gas should provide a cheap source of energy for many years to come. While risk of exogenous shocks persist like the intensifying of the European Financial Crisis or an oil shock from Middle East conflict – we believe the balance of risks favor further upside in U.S. stocks and a fundamentally-driven investment process can deliver excess returns in this environment.
Management's Discussion of Fund Performance (Continued)
Comparison of the Change in Value of a $10,000 Investment in the
Touchstone Growth Opportunities Fund - Class A* and the Russell 3000® Growth Index
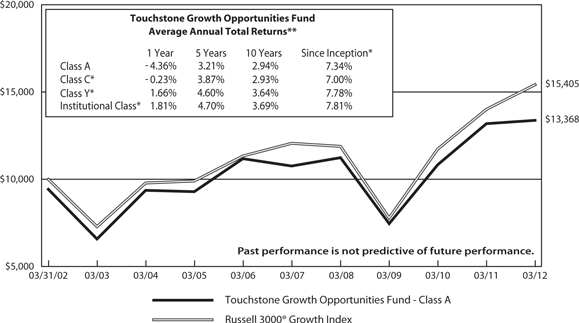
| * | The chart above represents performance of Class A shares only, which will vary from the performance of Class C shares, Class Y shares and Institutional Class shares based on the differences in loads and fees paid by shareholders in the different classes. The initial public offering of Class A shares commenced on September 29, 1995, the initial public offering of Class C shares commenced on August 2, 1999 and the initial public offering of Class Y shares and Institutional Class shares commenced on February 2, 2009, respectively. The returns for Class C, Class Y and Institutional Class shares include performance of the Fund that was achieved prior to the creation of Class C, Class Y and Institutional Class shares (August 2, 1999 and February 2, 2009, respectively), which is the same as the performance for Class A shares through August 2, 1999 and February 2, 2009, respectively. The returns have been restated for sales charge and for fees applicable to Class C, Class Y and Institutional Class shares. |
| ** | The average annual total returns shown above are adjusted for maximum applicable sales charges. |
The performance of the above Fund does not reflect the deduction of taxes that a shareholder would pay on Fund distributions or the redemption of Fund shares. The past performance is not predictive of future results.
Management's Discussion of Fund Performance (Continued)
Touchstone Large Cap Growth Fund
Sub-Advised by Navellier & Associates, Inc.
Investment Philosophy and Process
The Touchstone Large Cap Growth Fund seeks long-term growth of capital. The Fund primarily invests in common stocks of large-cap U.S. companies believed to possess strong appreciation potential.
Fund Performance and Market Overview
The total return of the Touchstone Large Cap Growth Fund was 11.18% for the year ended March 31, 2012. The total return of the Russell 1000® Growth Index was 11.02% for the same period.
The investment environment for the period can be described as somewhat conflicting. A major reason for that assessment can be found in the reaction from the market to news emanating from the ongoing travails of European debt deal announcements and monetary rescue funds. Recall that the market sold off and produced negative returns for the months of May through September, then moved to the upside by double digits in October. It then was essentially flat for November and December, and went on to finish the 12-month period with respectable monthly returns for the first quarter of 2012. We believe such market behavior is one reason why it is so important to mitigate risk.
Portfolio Review
For the past 12 months, the Touchstone Large Cap Growth Fund outperformed its benchmark. At the sector level, Consumer Discretionary, Consumer Staples, and Energy contributed to the Fund’s outperformance for the year. Consumer Discretionary was the largest overweight sector in the Fund relative to the Index and Consumer Staples was the second largest overweight relative to the Index. The Fund held a relatively large, average underweight position in the Energy sector. Sectors that detracted from Fund performance for the year were Industrials, Information Technology and Utilities.
At an individual stock level, contribution to Fund performance for the past 12 months was driven by Consumer Discretionary stocks, Chipotle Mexican Grill Inc., Dollar Tree Stores Inc., TJX Companies, and AutoZone Inc. Chipotle Mexican Grill’s outperformance during the period was driven by strong U.S. and international expansion, with revenues up 23.2 percent year-over-year (YOY) in the latest quarter. Chipotle has seen some pressure on margins due to the higher quality of its ingredients and overall food inflation, but management has chosen to absorb some of the margin pressure and selectively raise prices in some regions, resulting in no slowdown in same-store sales. What is more interesting is that Chipotle successfully tested in Washington, D.C., an Asian version of its patented made-to-order, higher-quality fast Mexican cuisine restaurant concept, which we believe may give the company a whole new restaurant division. Finally, AutoZone contributed to performance, as the auto part chain continues on its aggressive share repurchase program that has resulted in the retirement of 70 percent of shares outstanding since 1998. Similar aggressive buybacks have been tried in the auto parts and other retail sectors, but the fact remains that AutoZone also has an industry-leading operating margin of 18.67 percent, which gives it more money than any competitor for aggressive buybacks, further helping the share price.
Dollar Tree outperformed for the year, despite an improving economy; historically, dollar stores do well in recessions. The key has been the slower-than-normal recovery in employment, keeping many consumers in penny-pinching mode, which is perfect for Dollar Tree; however, there is also Dollar Tree’s superior distribution as the largest such single-price-point retailer, allowing for an industry-leading operating margin of 11.81 percent. Wal-Mart, by comparison, has an operating margin of only 5.94 percent. Another contributor to Fund performance was TJX Companies. TJX has had remarkably consistent earnings-per-share (EPS) growth over time with a 5-year compounded annual growth rate (CAGR) of 19 percent, a 10-year CAGR of 16 percent, and a 15-year CAGR of 19 percent. Discounted brand name merchandise is popular with consumers in penny-pinching mode, but the company has discovered over the years that every recession generates new customers who had not shopped there before and who keep returning after the recession is over, as they like the value proposition of top brands at discounted prices. Management has also made the company more efficient by increasing the pre-tax operating margin by 400 basis points. As the company generated $9 billion in cash over the past 10 years, management returned cash to shareholders via dividends and buybacks.
Management's Discussion of Fund Performance (Continued)
Stocks that detracted from performance included Green Mountain Coffee Roasters Inc. (Consumer Staples sector), Deere & Co., Rockwell Automation, and Caterpillar Inc. (Industrials sector), and Cognizant Technology Solutions Corp. (Information Technology sector). We believe the only one that seemed truly problematic was Green Mountain, while the rest experienced sharp corrections without seeing much deterioration in fundamentals. The Fund’s position in Green Mountain Coffee Roasters came under serious pressure in October 2011 after fund manager David Einhorn shared his skeptical opinion of the company’s growth prospects with the public. Green Mountain had the misfortune to miss quarterly estimates shortly after that but, in the fourth quarter as reported in January 2012, it beat Earnings per Share (EPS) estimates, so we believe the miss was likely more a spike in wholesale coffee prices and overbooking from vendors than anything else. Green Mountain has again come under pressure of late due to Starbucks Corp.’s expected entry into the single-serving coffee brewer market. The position was sold due to the excessive volatility.
The Fund’s position in Rockwell Automation declined in the July-October correction in 2011 due to a growth scare emanating from Europe. Paradoxically, the company kept beating EPS estimates the entire time during the selloff as it has excellent exposure to faster-industrializing emerging markets without the macro problems of Europe. The position in Deere declined in the past 12 months, while also beating EPS estimates but, unfortunately, showing that share prices can substantially deviate from the fundamentals that typically support prices. Deere equipment sales are directly correlated with the level of agricultural commodity prices, which reached records in 2011. The company is on track for record EPS in 2012 and 2013 if agricultural commodity prices stay elevated. Caterpillar declined over the past 12 months due to a 13 percent EPS miss in the June 2011 quarter, which was reversed in the next two quarters. As a blue chip stock, Caterpillar came under significant pressure with worries about the European crisis spilling over into the U.S. and China, which we believe have been unsubstantiated, so the shares have largely recovered. Finally, the Fund’s position in Information Technology outsourcing company, Cognizant, declined with the general market correction last summer even though the company had been reporting higher revenues and EPS than the industry. Cognizant’s management made a decision to aggressively take market share and undercut competitors, which resulted in a lot of repeat business while some competitors struggled during 2011.
Strategy and Outlook
We are optimistic for the coming year. We believe many of the Touchstone Large Cap Growth Fund’s stocks have strong fundamental foundations underneath their respective share prices due to factors such as high dividend yields, stock buyback programs, and a weak U.S. dollar boosting sales and earnings for multi-international stocks. Since overall sales and earnings are now decelerating due to more difficult year-over-year comparisons, the S&P 500 Index’s earnings are expected to grow under 10 percent for all of 2012. In our opinion, the Fund’s stocks that can sustain stronger sales and earnings momentum in a decelerating environment should be able to emerge as market leaders.
In conclusion, we believe we are now in an attractive environment for many growth stocks, and the Navellier stock selection methodology is focused on the 5 percent to 10 percent of stocks that may outperform the overall stock market in the coming months. It remains our belief that the Touchstone Large Cap Growth Fund’s stocks will stand out in 2012, especially as earnings decelerate for the overall stock market.
Management's Discussion of Fund Performance (Continued)
Comparison of the Change in Value of a $10,000 Investment in the
Touchstone Large Cap Growth Fund - Class A* and the Russell 1000® Growth Index

| * | The chart above represents performance of Class A shares only, which will vary from the performance of Class B, Class C and Class Y shares based on the differences in loads and fees paid by shareholders in the different classes. The initial public offering of Class A shares commenced on December 19, 1997 and the initial public offering of Class B and Class C shares commenced on October 4, 2003. The initial public offering of Class Y shares commenced on November 10, 2004. The returns for Class B, Class C and Class Y shares include performance of the Fund that was achieved prior to the creation of Class B, Class C and Class Y shares (October 4, 2003 and November 10, 2004, respectively), which is the same performance for Class A shares through October 4, 2003 and November 10, 2004, respectively. The returns have been restated for sales charges and for fees applicable to Class B, Class C and Class Y shares. |
| ** | The average annual total returns shown above are adjusted for maximum applicable sales charges. |
The performance of the above Fund does not reflect the deduction of taxes that a shareholder would pay on Fund distributions or the redemption of Fund shares. The past performance is not predictive of future results.
Management's Discussion of Fund Performance (Continued)
Touchstone Mid Cap Growth Fund
Sub-Advised by Westfield Capital Management LP
Investment Philosophy and Process
The Touchstone Mid Cap Growth Fund invests primarily in stocks of domestic mid-cap companies that are believed to have a demonstrated record of achievement with excellent prospects for earnings growth over a 1 to 3 year period. Fund management believes that companies that exhibit faster earnings growth offer the best opportunity for superior real rates of return and that reasonably priced stocks of companies with high forecasted earnings potential are best identified through in-depth, fundamental research and first-hand knowledge of company operations derived through on-site visits and meetings with management.
Fund Performance and Market Overview
The total return of the Touchstone Mid Cap Growth Fund was -3.68% for the twelve month period ended March 31, 2012. The total return of the Russell Midcap® Growth Index was 4.43% for the same period. Weakness within the Health Care, Energy, Materials, and Telecommunication Services sectors overwhelmed relative strength in the Information Technology, Industrials, and Financials sectors.
Optimism about global economic expansion faded in the spring of 2011, giving way to worries that the “soft patch” of data could be indicative of a more protracted slowdown. The effects of the natural disaster in Japan on the global supply chain were indeed disruptive to industrial production. At the same time, efforts to curb inflation in emerging economies had a negative impact on global demand for various commodities. A decline in crude prices and a 20-plus percent retreat in certain agricultural commodities helped to pressure more cyclically sensitive stocks. A change in investor confidence was also evident in the slowdown in Merger & Acquisition (M&A) activity as uncertainty of economic prospects overwhelmed positive factors like record levels of cash on balance sheets and attractive interest rates. Concerns about a double-dip recession intensified during the second half of last year, prompting a retreat from risky assets of all types. Instead, investors were looking for visible, protected growth even if it came at very high price-to-earnings multiples. In general terms, the stocks that worked best in 2011 were either income-producing or those we believe were too expensive. The market dynamics reversed sharply with the start of 2012, when strengthening domestic economy and accommodative monetary policy around the globe helped revive investor appetite for stocks. Most domestic equity indices posted double-digit gains in the first three months of the year, staging the biggest first quarter advance in fourteen years.
Portfolio Review
The Health Care sector detracted from relative returns. Dendreon Corp., which discovers, develops and commercializes novel products for the treatment of cancer, reported disappointing results in August. We sold the position in September after meeting with the company’s CEO and determining that he lacked the skills necessary to communicate effectively with Wall Street, but not before the stock negatively impacted the Fund’s portfolio. United Therapeutics Corp., whose primary focus is to develop therapies for the treatment of pulmonary arterial hypertension (PAH), traded lower. The company reported revenues for its PAH drugs Remodulin and Tyvaso below consensus expectations as inventories continued to work down the supply channel. Our thesis on the stock centers on the potential for the oral version of Remodulin to drive increased sales against very low expectations. We consider the stock’s valuation to be reasonable relative to its growth prospects and believe United Therapeutic Inc.’s cash flows will exhibit significant durability given that the company’s key drugs are difficult to replicate in generic form. Biotechnology company Vertex Pharmaceuticals Inc. also traded lower. A competitor presented positive data that pointed to potential competition for Vertex Pharmaceutical Inc.’s lead drug, Incivek. However, we believe any competition should be delayed given Incivek’s effectiveness and safety profile. Our analysis of prescription trends for Incivek shows that Vertex should demonstrate strong earnings growth, at least for the next several years. We expect that the cash flow generated will be used prudently to reinvest in the company’s product pipeline.
Management's Discussion of Fund Performance (Continued)
The Energy sector detracted from relative returns. Despite trading lower, we believe global oil & gas technology and service provider Weatherford International Ltd. should benefit from its management team’s ability to execute at least well enough to drive a reversion to the company’s historical average margins—a core premise of our investment. Coal & consumable fuel company Alpha Natural Resources Inc. was a detractor during the year due in part to the perceived risk associated with Alpha Natural Resources finalizing its Massey Energy Co. acquisition. The deal was closed in June after shareholders approved all merger-related proposals and the combination of Massey and Alpha created the largest met coal supplier in North America. We sold the stock in December as it bounced with the rest of its peers in the sector and provided a more attractive exit price. While we remain bullish on the prospects for secular demand growth for coal given its importance to power generation in emerging markets, moderating global growth had overwhelmed the secular outlook, in our opinion.
The Materials sector detracted from relative returns. Rare earth mineral producer Molycorp Inc. hindered returns. The company reported disappointing production results and lowered forward guidance. Focusing on the company-specific competitive advantages, we underestimated the pace and severity of price declines due to global growth deceleration and customer inventory drawdowns. As a result, the stock was sold. Scotts Miracle-Gro Co., a manufacturer, marketer, and distributor of lawn and garden products, was sold after we learned the company may delay or cancel outright its launch of a new product from its 2012 fertilizer product line due to toxicity concerns. Investors expected the product to be the next big driver of fertilizer revenue growth with a premium price point and margin, and its exclusion from the pipeline lowers the stock’s risk/reward, in our opinion. Crown Holdings Inc. designs, manufactures and sells packaging products for consumer goods. Working capital has been a massive drag on the company’s cash flows recently driven by higher aluminum and steel prices as well as inventory for new plant startups; the trend in free cash flow going forward will be key for the stock, especially given the decline in raw material prices. We believe the company should benefit as emerging markets enter a growth stage for consumer goods, strengthening beverage can end markets.
The Information Technology sector contributed to relative returns. Alliance Data Systems Corp., a provider of data-driven and transaction-based marketing/customer loyalty solutions, reported better than expected earnings results and raised forward guidance. The company is executing well and showcases business momentum in each of its segments. Red Hat Inc., a developer of open source software solutions, traded higher after reporting operational results ahead of consensus expectations. We have confidence in the company’s management team and remain attracted to its product positioning. NXP Semiconductors N.V., a manufacturer of high-performance mixed-signal semiconductors, also reported better-than-expected results and posted forward guidance that was ahead of Wall Street estimates. NXP should benefit from several product cycles including that of near-field communications technologies, which are used by mobile payment platforms and are driving significant year-over-year growth in the company’s mobility segment.
The Industrials sector contributed to relative returns. Precision Castparts Corp., which manufactures complex components for aerospace and industrial gas turbine applications, benefited from Boeing aircraft production rate increases. The company’s strong balance sheet allows it to grow through strategic acquisitions, such as its deal with Unison Engine Components (Tru-Form), which expands Precision Castparts’ capabilities into the forging segment, and should be accretive to fiscal 2012 earnings. Stanley Black & Decker Inc., which produces and sells tools, hardware, and security products, has significant leverage to improvements in the U.S. construction market. The company is transforming from a building products supplier to a diversified industrial company. We expect substantial sales and earnings in 2012. The stock has forty-four consecutive years of dividend growth, and should participate in stock buybacks.
Management's Discussion of Fund Performance (Continued)
The Financials sector contributed to relative returns. Credit card services provider Discover Financial Services continued to benefit from improving consumer credit metrics. We are comfortable with the company’s decision to diversify the business by growing its student loan segment. We initially purchased commercial bank SunTrust Banks Inc. given its desirable high-growth footprint in the American Southeast and the fact that three key earnings drivers – credit trends, loan growth, and fee income – were becoming more robust. We also believed the stock traded at a meaningful discount to tangible book value per share and that the company was significantly overcapitalized and would be likely to raise its dividend. However, we sold the stock based on concerns over the company’s mortgage servicing business.
Strategy and Outlook
An equity market consolidation is not unlikely given the torrid advance experienced thus far in 2012. Indeed, fund flows into equity mutual funds would suggest that the average investor remains bearish on the outlook for U.S. stocks. We believe, however, that stock market valuation remains reasonable, earnings growth for U.S. corporations will be steady and increasing evidence of cyclical traction in housing, construction and capital spending should provide a positive backdrop for stocks. U.S. corporations are currently benefiting from a positive business environment domestically. Unit labor costs are well contained and the proliferation of natural gas should provide a cheap source of energy for many years to come. While risk of exogenous shocks persist like the intensifying of the European Financial Crisis or an oil shock from Middle East conflict – we believe the balance of risks favor further upside in U.S. stocks and a fundamentally-driven investment process can deliver excess returns in this environment.
Management's Discussion of Fund Performance (Continued)
Comparison of the Change in Value of a $10,000 Investment in the Touchstone Mid Cap
Growth Fund - Class A* and the Russell Mid Cap® Growth Index

| * | The chart above represents performance of Class A shares only, which will vary from the performance of Class B shares, Class C shares, Class Y shares and Institutional Class shares based on the differences in loads and fees paid by shareholders in the different classes. The initial public offering of Class A shares and Class C shares commenced on October 3, 1994; the initial public offering of Class B shares commenced on May 1, 2001; the initial public offering of Class Y shares commenced on February 2, 2009 and the initial public offering of Institutional Class shares commenced on April 1, 2011. The returns for Class B, Class Y and Institutional Class shares include performance of the Fund that was achieved prior to the creation of Class B, Class Y and Institutional Class shares (May 1, 2001, February 2, 2009 and April 1, 2011, respectively), which is the same performance for Class A shares through May 1, 2001, February 2, 2009 and April 1, 2011, respectively. The returns have been restated for sales charges and for fees applicable to Class B, Class Y, and Institutional Class shares. |
| ** | The average annual total returns shown above are adjusted for maximum applicable sales charges. |
The performance of the above Fund does not reflect the deduction of taxes that a shareholder would pay on Fund distributions or the redemption of Fund shares. The past performance is not predictive of future results.
Tabular Presentation of Portfolios of Investments
March 31, 2012
| Touchstone Diversified Small Cap Growth Fund |
| Sector Allocation* | | (% of Net Assets) | |
| Information Technology | | | 23.3 | % |
| Health Care | | | 19.9 | |
| Consumer Discretionary | | | 17.5 | |
| Industrials | | | 14.7 | |
| Financials | | | 7.9 | |
| Energy | | | 7.4 | |
| Materials | | | 3.5 | |
| Consumer Staples | | | 3.0 | |
| Investment Funds | | | 9.1 | |
| Other Assets/Liabilities (Net) | | | (6.3 | ) |
| Total | | | 100.0 | % |
| Touchstone Growth Opportunities Fund |
| Sector Allocation* | | (% of Net Assets) | |
| Information Technology | | | 34.4 | % |
| Industrials | | | 19.5 | |
| Consumer Discretionary | | | 10.1 | |
| Health Care | | | 8.9 | |
| Energy | | | 8.2 | |
| Financials | | | 6.1 | |
| Materials | | | 5.5 | |
| Consumer Staples | | | 5.5 | |
| Investment Funds | | | 1.6 | |
| Other Assets/Liabilities (Net) | | | 0.2 | |
| Total | | | 100.0 | % |
| Touchstone Large Cap Growth Fund |
| Sector Allocation* | | (% of Net Assets) | |
| Consumer Discretionary | | | 32.4 | % |
| Information Technology | | | 28.6 | |
| Consumer Staples | | | 16.1 | |
| Health Care | | | 8.7 | |
| Telecommunication Services | | | 4.1 | |
| Utilities | | | 3.9 | |
| Industrials | | | 2.5 | |
| Financials | | | 2.1 | |
| Energy | | | 1.1 | |
| Investment Funds | | | 2.4 | |
| Other Assets/Liabilities (Net) | | | (1.9 | ) |
| Total | | | 100.0 | % |
| Touchstone Mid Cap Growth Fund |
| Sector Allocation* | | (% of Net Assets) | |
| Information Technology | | | 25.9 | % |
| Consumer Discretionary | | | 17.3 | |
| Industrials | | | 15.2 | |
| Energy | | | 10.9 | |
| Health Care | | | 9.5 | |
| Materials | | | 9.1 | |
| Financials | | | 6.9 | |
| Consumer Staples | | | 2.1 | |
| Telecommunication Services | | | 1.0 | |
| Investment Funds | | | 1.5 | |
| Other Assets/Liabilities (Net) | | | 0.6 | |
| Total | | | 100.0 | % |
* Sector classifications are based upon the Global Industry Classification Standard (GICS®)
Portfolio of Investments
Touchstone Diversified Small Cap Growth Fund – March 31, 2012
| | | | | | Market | |
| | | Shares | | | Value | |
| Common Stocks — 97.2% | | | | | | | | |
| | | | | | | | | |
| Information Technology — 23.3% | | | | | | | | |
| Ancestry.com, Inc.†* | | | 8,645 | | | $ | 196,587 | |
| Aruba Networks, Inc.* | | | 11,891 | | | | 264,931 | |
| Aspen Technology, Inc.* | | | 19,625 | | | | 402,901 | |
| Blackbaud, Inc. | | | 8,610 | | | | 286,110 | |
| Cadence Design Systems, Inc.* | | | 31,850 | | | | 377,104 | |
| Cavium, Inc.* | | | 9,252 | | | | 286,258 | |
| comScore, Inc.* | | | 16,547 | | | | 353,940 | |
| Constant Contact, Inc.* | | | 10,254 | | | | 305,467 | |
| FEI Co.* | | | 8,275 | | | | 406,385 | |
| Finisar Corp.* | | | 14,234 | | | | 286,815 | |
| j2 Global Communications, Inc.† | | | 11,770 | | | | 337,564 | |
| MAXIMUS, Inc. | | | 10,550 | | | | 429,068 | |
| Mellanox Technologies Ltd. (Israel)* | | | 9,200 | | | | 384,836 | |
| MICROS Systems, Inc.* | | | 6,858 | | | | 379,180 | |
| Microsemi Corp.* | | | 19,362 | | | | 415,121 | |
| Multi-Fineline Electronix, Inc.* | | | 6,021 | | | | 165,276 | |
| Parametric Technology Corp.* | | | 19,363 | | | | 541,002 | |
| Polycom, Inc.* | | | 9,805 | | | | 186,981 | |
| RF Micro Devices, Inc.* | | | 47,980 | | | | 238,940 | |
| Riverbed Technology, Inc.* | | | 6,417 | | | | 180,189 | |
| Skyworks Solutions, Inc.* | | | 12,081 | | | | 334,040 | |
| Synaptics, Inc.* | | | 6,580 | | | | 240,236 | |
| VeriFone Systems, Inc.* | | | 8,161 | | | | 423,311 | |
| Virtusa Corp.* | | | 18,595 | | | | 321,136 | |
| VistaPrint NV (Netherlands)†* | | | 8,165 | | | | 315,577 | |
| Vocera Communications, Inc.* | | | 7,318 | | | | 171,241 | |
| | | | | | | | 8,230,196 | |
| | | | | | | | | |
| Health Care — 19.9% | | | | | | | | |
| Acorda Therapeutics, Inc.* | | | 21,615 | | | | 573,878 | |
| Auxilium Pharmaceuticals, Inc.* | | | 21,805 | | | | 404,920 | |
| BioMarin Pharmaceutical, Inc.* | | | 15,276 | | | | 523,203 | |
| DexCom, Inc.* | | | 21,060 | | | | 219,656 | |
| Endologix, Inc.* | | | 9,717 | | | | 142,354 | |
| Fluidigm Corp.* | | | 15,253 | | | | 239,930 | |
| Genomic Health, Inc.†* | | | 16,503 | | | | 505,158 | |
| HMS Holdings Corp.* | | | 15,625 | | | | 487,656 | |
| Impax Laboratories, Inc.* | | | 17,620 | | | | 433,100 | |
| Insulet Corp.* | | | 25,741 | | | | 492,683 | |
| NxStage Medical, Inc.* | | | 30,884 | | | | 595,135 | |
| Onyx Pharmaceuticals, Inc.* | | | 12,415 | | | | 467,797 | |
| RTI Biologics, Inc.* | | | 76,765 | | | | 284,030 | |
| Salix Pharmaceuticals Ltd.* | | | 9,865 | | | | 517,912 | |
| Spectranetics Corp. (The)* | | | 47,040 | | | | 489,216 | |
| Thoratec Corp.* | | | 14,620 | | | | 492,840 | |
| United Therapeutics Corp.* | | | 3,765 | | | | 177,444 | |
| | | | | | | | 7,046,912 | |
| | | | | | | | | |
| Consumer Discretionary — 17.5% | | | | | | | | |
| American Public Education, Inc.* | | | 9,498 | | | | 360,924 | |
| Big Lots, Inc.* | | | 8,469 | | | | 364,336 | |
| BJ's Restaurants, Inc.* | | | 8,439 | | | | 424,904 | |
| Body Central Corp.* | | | 21,840 | | | | 633,797 | |
| Buffalo Wild Wings, Inc.* | | | 4,885 | | | | 443,021 | |
| Cato Corp. (The) - Class A | | | 11,448 | | | | 316,423 | |
| Chico's FAS, Inc. | | | 27,677 | | | | 417,923 | |
| Coinstar, Inc.†* | | | 8,450 | | | | 536,998 | |
| Deckers Outdoor Corp.* | | | 6,113 | | | | 385,425 | |
| DSW, Inc. - Class A | | | 7,485 | | | | 409,953 | |
| Steiner Leisure Ltd. (Bahamas)* | | | 6,040 | | | | 294,933 | |
| Texas Roadhouse, Inc. | | | 23,735 | | | | 394,950 | |
| Tractor Supply Co. | | | 4,847 | | | | 438,944 | |
| Tupperware Brands Corp. | | | 6,730 | | | | 427,355 | |
| Vera Bradley, Inc.†* | | | 11,085 | | | | 334,656 | |
| | | | | | | | 6,184,542 | |
| | | | | | | | | |
| Industrials — 14.7% | | | | | | | | |
| Aerovironment, Inc.* | | | 9,370 | | | | 251,210 | |
| American Science & Engineering, Inc. | | | 298 | | | | 19,982 | |
| Applied Industrial Technologies, Inc. | | | 10,085 | | | | 414,796 | |
| Ceradyne, Inc. | | | 7,981 | | | | 259,861 | |
| CLARCOR, Inc. | | | 7,920 | | | | 388,793 | |
| Clean Harbors, Inc.* | | | 6,302 | | | | 424,314 | |
| ESCO Technologies, Inc. | | | 9,832 | | | | 361,523 | |
| Forward Air Corp. | | | 3,465 | | | | 127,062 | |
| Landstar System, Inc. | | | 4,250 | | | | 245,310 | |
| Lindsay Corp. | | | 5,168 | | | | 342,483 | |
| MasTec, Inc.* | | | 2,772 | | | | 50,145 | |
| Middleby Corp.* | | | 3,362 | | | | 340,167 | |
| Raven Industries, Inc. | | | 4,249 | | | | 259,231 | |
| Rollins, Inc. | | | 17,030 | | | | 362,398 | |
| Toro Co. | | | 4,329 | | | | 307,835 | |
| Triumph Group, Inc. | | | 4,605 | | | | 288,549 | |
| Wabtec Corp. | | | 4,598 | | | | 346,551 | |
| Woodward, Inc. | | | 9,822 | | | | 420,676 | |
| | | | | | | | 5,210,886 | |
| | | | | | | | | |
| Financials — 7.9% | | | | | | | | |
| Cash America International, Inc. | | | 7,910 | | | | 379,126 | |
| Encore Capital Group, Inc.* | | | 16,308 | | | | 367,745 | |
| Ezcorp, Inc. - Class A* | | | 21,230 | | | | 689,020 | |
| Financial Engines, Inc.* | | | 6,685 | | | | 149,477 | |
| First Cash Financial Services, Inc.* | | | 16,190 | | | | 694,389 | |
| Portfolio Recovery Associates, Inc.* | | | 7,363 | | | | 528,074 | |
| | | | | | | | 2,807,831 | |
| | | | | | | | | |
| Energy — 7.4% | | | | | | | | |
| Dril-Quip, Inc.* | | | 4,800 | | | | 312,096 | |
| Energy XXI Bermuda Ltd.* | | | 8,065 | | | | 291,227 | |
| Gulfport Energy Corp.* | | | 12,485 | | | | 363,563 | |
| Lufkin Industries, Inc. | | | 3,220 | | | | 259,693 | |
| Newpark Resources, Inc.* | | | 47,495 | | | | 388,984 | |
| Oasis Petroleum, Inc.* | | | 11,825 | | | | 364,565 | |
| Petroquest Energy, Inc.†* | | | 41,327 | | | | 253,748 | |
| World Fuel Services Corp. | | | 9,329 | | | | 382,489 | |
| | | | | | | | 2,616,365 | |
| | | | | | | | | |
| Materials — 3.5% | | | | | | | | |
| Balchem Corp. - Class B | | | 9,862 | | | | 298,326 | |
| Buckeye Technologies, Inc. | | | 7,885 | | | | 267,853 | |
| Hecla Mining Co. | | | 17,625 | | | | 81,428 | |
| LSB Industries, Inc.* | | | 8,472 | | | | 329,730 | |
Touchstone Diversified Small Cap Growth Fund (Continued)
| | | | | | Market | |
| | | Shares | | | Value | |
| Common Stocks — 97.2% (Continued) | | | | | | | | |
| | | | | | | | | |
| Materials — (Continued) | | | | | | | | |
| NewMarket Corp. | | | 1,316 | | | $ | 246,618 | |
| | | | | | | | 1,223,955 | |
| | | | | | | | | |
| Consumer Staples — 3.0% | | | | | | | | |
| Boston Beer Co., Inc. (The) - Class A†* | | | 1,079 | | | | 115,226 | |
| Darling International, Inc.* | | | 16,020 | | | | 279,068 | |
| Flowers Foods, Inc. | | | 4,100 | | | | 83,517 | |
| Lancaster Colony Corp. | | | 2,077 | | | | 138,037 | |
| Nu Skin Enterprises, Inc. - Class A | | | 3,000 | | | | 173,730 | |
| Pricesmart, Inc. | | | 3,885 | | | | 282,868 | |
| | | | | | | | 1,072,446 | |
| Total Common Stocks | | | | | | $ | 34,393,133 | |
| | | | | | | | | |
| Investment Funds — 9.1% | | | | | | | | |
| Invesco Liquid Assets Portfolio** | | | 2,036,444 | | | | 2,036,444 | |
| Touchstone Institutional Money Market Fund^ | | | 1,196,631 | | | | 1,196,631 | |
| Total Investment Funds | | | | | | $ | 3,233,075 | |
| | | | | | | | | |
| Total Investment Securities —106.3% | | | | | | | | |
| (Cost $32,395,497) | | | | | | $ | 37,626,208 | |
| | | | | | | | | |
| Liabilities in Excess of Other Assets — (6.3%) | | | | | | | (2,222,545 | ) |
| | | | | | | | | |
| Net Assets — 100.0% | | | | | | $ | 35,403,663 | |
| † | All or a portion of the security is on loan. The total value of the securites on loan as of March 31, 2012 was $1,983,956. |
| * | Non-income producing security. |
| ** | Represents collateral for securities loaned. |
| ^ | Affiliated Fund, sub-advised by Fort Washington Investment Advisors, Inc. See Note 4 in Notes to Financial Statements. |
Other Information:
The inputs or methodology used for valuing securities may not be an indication of the risk associated with investing in those securities. For more information on valuation inputs, and their aggregation into the levels used in the table below, please refer to the security valuation section in the accompanying notes to financial statements.
Valuation inputs at Reporting Date:
| Description | | Level 1 | | | Level 2 | | | Level 3 | | | Total | |
| Common Stocks | | $ | 34,393,133 | | | $ | — | | | $ | — | | | $ | 34,393,133 | |
| Investment Funds | | | 3,233,075 | | | | — | | | | — | | | | 3,233,075 | |
| | | | | | | | | | | | | | | $ | 37,626,208 | |
See accompanying notes to financial statements.
Portfolio of Investments
Touchstone Growth Opportunities Fund – March 31, 2012
| | | | | | Market | |
| | | Shares | | | Value | |
| | | | | | | |
| Common Stocks — 98.2% | | | | | | | | |
| | | | | | | | | |
| Information Technology — 34.4% | | | | | | | | |
| Alliance Data Systems Corp.* | | | 31,640 | | | $ | 3,985,374 | |
| Apple, Inc.* | | | 19,490 | | | | 11,683,670 | |
| Broadcom Corp. - Class A* | | | 59,880 | | | | 2,353,284 | |
| Check Point Software Technologies Ltd. (Israel) | | | 47,490 | | | | 3,031,762 | |
| Cisco Systems, Inc. | | | 172,853 | | | | 3,655,841 | |
| EMC Corp.* | | | 116,620 | | | | 3,484,606 | |
| Google, Inc. - Class A* | | | 7,010 | | | | 4,495,092 | |
| Mastercard, Inc. - Class A | | | 7,480 | | | | 3,145,639 | |
| MoneyGram International, Inc.* | | | 111,899 | | | | 2,014,182 | |
| NICE Systems Ltd. ADR (Israel)* | | | 63,847 | | | | 2,509,187 | |
| Nuance Communications, Inc.* | | | 95,700 | | | | 2,448,006 | |
| Qualcomm, Inc. | | | 43,589 | | | | 2,964,924 | |
| Red Hat, Inc.* | | | 60,040 | | | | 3,595,796 | |
| Salesforce.com, Inc.* | | | 18,740 | | | | 2,895,517 | |
| Teradyne, Inc.* | | | 45,250 | | | | 764,272 | |
| | | | | | | | 53,027,152 | |
| | | | | | | | | |
| Industrials — 19.5% | | | | | | | | |
| BE Aerospace, Inc.* | | | 66,050 | | | | 3,069,344 | |
| Danaher Corp. | | | 54,780 | | | | 3,067,680 | |
| Dover Corp. | | | 35,100 | | | | 2,209,194 | |
| General Electric Co. | | | 122,980 | | | | 2,468,209 | |
| Hexcel Corp.* | | | 96,243 | | | | 2,310,794 | |
| IDEX Corp. | | | 71,230 | | | | 3,000,920 | |
| JB Hunt Transport Services, Inc. | | | 37,660 | | | | 2,047,574 | |
| Landstar System, Inc. | | | 41,650 | | | | 2,404,038 | |
| Stanley Black & Decker, Inc. | | | 28,930 | | | | 2,226,453 | |
| Tyco International Ltd. (Switzerland) | | | 42,210 | | | | 2,371,358 | |
| United Technologies Corp. | | | 39,640 | | | | 3,287,742 | |
| WESCO International, Inc.* | | | 25,470 | | | | 1,663,446 | |
| | | | | | | | 30,126,752 | |
| | | | | | | | | |
| Consumer Discretionary — 10.1% | | | | | | | | |
| Amazon.com, Inc.* | | | 8,200 | | | | 1,660,582 | |
| Home Depot, Inc. | | | 31,470 | | | | 1,583,256 | |
| Nordstrom, Inc. | | | 49,410 | | | | 2,753,125 | |
| NVR, Inc.* | | | 4,221 | | | | 3,065,839 | |
| O'Reilly Automotive, Inc.* | | | 16,920 | | | | 1,545,642 | |
| Starbucks Corp. | | | 43,660 | | | | 2,440,157 | |
| Stewart Enterprises, Inc. - Class A | | | 18,540 | | | | 112,538 | |
| Williams-Sonoma, Inc. | | | 63,520 | | | | 2,380,730 | |
| | | | | | | | 15,541,869 | |
| | | | | | | | | |
| Health Care — 8.9% | | | | | | | | |
| Celgene Corp.* | | | 54,220 | | | | 4,203,134 | |
| DENTSPLY International, Inc. | | | 76,390 | | | | 3,065,531 | |
| Mettler-Toledo International, Inc.* | | | 12,183 | | | | 2,250,809 | |
| Thermo Fisher Scientific, Inc. | | | 47,310 | | | | 2,667,338 | |
| Vertex Pharmaceuticals, Inc.* | | | 37,650 | | | | 1,544,026 | |
| | | | | | | | 13,730,838 | |
| | | | | | | | | |
| Energy — 8.2% | | | | | | | | |
| Alpha Natural Resources, Inc.* | | | 73,640 | | | | 1,120,064 | |
| Halliburton Co. | | | 60,970 | | | | 2,023,594 | |
| National Oilwell VarCo., Inc. | | | 29,840 | | | | 2,371,385 | |
| Suncor Energy, Inc. (Canada) | | | 44,220 | | | | 1,445,994 | |
| Tesoro Corp.* | | | 60,063 | | | | 1,612,091 | |
| Valero Energy Corp. | | | 77,310 | | | | 1,992,279 | |
| Weatherford International Ltd. | | | | | | | | |
| (Switzerland) | | | 144,290 | | | | 2,177,336 | |
| | | | | | | | 12,742,743 | |
| | | | | | | | | |
| Financials — 6.1% | | | | | | | | |
| Ameriprise Financial, Inc. | | | 37,820 | | | | 2,160,657 | |
| CBRE Group, Inc. - Class A* | | | 117,920 | | | | 2,353,683 | |
| Citigroup, Inc. | | | 89,350 | | | | 3,265,742 | |
| Wells Fargo & Co. | | | 48,390 | | | | 1,652,035 | |
| | | | | | | | 9,432,117 | |
| | | | | | | | | |
| Materials — 5.5% | | | | | | | | |
| Celanese Corp. | | | 59,880 | | | | 2,765,258 | |
| International Paper Co. | | | 66,760 | | | | 2,343,276 | |
| Westlake Chemical Corp.† | | | 52,491 | | | | 3,400,892 | |
| | | | | | | | 8,509,426 | |
| | | | | | | | | |
| Consumer Staples — 5.5% | | | | | | | | |
| General Mills, Inc. | | | 71,140 | | | | 2,806,473 | |
| Hershey Co. (The) | | | 43,470 | | | | 2,666,015 | |
| Ralcorp Holdings, Inc.* | | | 40,010 | | | | 2,964,341 | |
| | | | | | | | 8,436,829 | |
| Total Common Stocks | | | | | | $ | 151,547,726 | |
| | | | | | | | | |
| Investment Fund — 1.6% | | | | | | | | |
| Invesco Liquid Assets Portfolio** | | | 2,376,000 | | | | 2,376,000 | |
| | | | | | | | | |
| Total Investment Securities —99.8% | | | | | | | | |
| (Cost $150,110,317) | | | | | | $ | 153,923,726 | |
| | | | | | | | | |
| Other Assets in Excess of Liabilities — 0.2% | | | | | | | 378,366 | |
| | | | | | | | | |
| Net Assets — 100.0% | | | | | | $ | 154,302,092 | |
| † | All or a portion of the security is on loan. The total value of the securites on loan as of March 31, 2012 was $2,332,440. |
| * | Non-income producing security. |
| ** | Represents collateral for securities loaned. |
Portfolio Abbreviations:
ADR - American Depositary Receipt
Touchstone Growth Opportunities Fund (Continued)
Other Information:
The inputs or methodology used for valuing securities may not be an indication of the risk associated with investing in those securities. For more information on valuation inputs, and their aggregation into the levels used in the table below, please refer to the security valuation section in the accompanying notes to financial statements.
| Valuation inputs at Reporting Date: | |
| Description | | Level 1 | | | Level 2 | | | Level 3 | | | Total | |
| Common Stocks | | $ | 151,547,726 | | | $ | — | | | $ | — | | | $ | 151,547,726 | |
| InvestmentFund | | | 2,376,000 | | | | — | | | | — | | | | 2,376,000 | |
| | | | | | | | | | | | | | | $ | 153,923,726 | |
See accompanying notes to financial statements.
Portfolio of Investments
Touchstone Large Cap Growth Fund – March 31, 2012
| | | | | | Market | |
| | | Shares | | | Value | |
| | | | | | | | | |
| Common Stocks — 99.5% | | | | | | | | |
| | | | | | | | | |
| Consumer Discretionary — 32.4% | | | | | | | | |
| AutoZone, Inc.* | | | 50,575 | | | $ | 18,803,785 | |
| Chipotle Mexican Grill, Inc.* | | | 60,470 | | | | 25,276,460 | |
| Coach, Inc. | | | 194,600 | | | | 15,038,687 | |
| DISH Network Corp. - Class A | | | 589,290 | | | | 19,405,320 | |
| Dollar Tree, Inc.* | | | 164,365 | | | | 15,530,849 | |
| Macy's, Inc. | | | 470,000 | | | | 18,673,100 | |
| McDonald's Corp. | | | 206,140 | | | | 20,222,334 | |
| Ralph Lauren Corp. | | | 92,350 | | | | 16,099,376 | |
| Ross Stores, Inc. | | | 351,815 | | | | 20,440,452 | |
| Starbucks Corp. | | | 341,370 | | | | 19,079,169 | |
| TJX Cos, Inc. | | | 511,230 | | | | 20,300,943 | |
| Ulta Salon Cosmetics & Fragrance, Inc. | | | 201,475 | | | | 18,715,013 | |
| Wyndham Worldwide Corp. | | | 340,270 | | | | 15,825,958 | |
| | | | | | | | 243,411,446 | |
| | | | | | | | | |
| Information Technology — 28.6% | | | | | | | | |
| Alliance Data Systems Corp.†* | | | 192,400 | | | | 24,234,704 | |
| Apple, Inc.* | | | 43,975 | | | | 26,361,693 | |
| Baidu, Inc. ADR (China)* | | | 106,095 | | | | 15,465,468 | |
| Dell, Inc.* | | | 799,830 | | | | 13,277,177 | |
| Equinix, Inc.* | | | 123,242 | | | | 19,404,453 | |
| Intel Corp. | | | 667,900 | | | | 18,774,669 | |
| International Business Machines Corp. | | | 118,190 | | | | 24,660,344 | |
| Mastercard, Inc. - Class A | | | 38,480 | | | | 16,182,379 | |
| Motorola Solutions, Inc. | | | 291,345 | | | | 14,809,066 | |
| Nuance Communications, Inc.* | | | 844,355 | | | | 21,598,601 | |
| Visa, Inc. - Class A | | | 170,959 | | | | 20,173,162 | |
| | | | | | | | 214,941,716 | |
| | | | | | | | | |
| Consumer Staples — 16.1% | | | | | | | | |
| Altria Group, Inc. | | | 470,005 | | | | 14,509,054 | |
| Cia de Bebidas das Americas ADR (Brazil) | | | 368,305 | | | | 15,218,363 | |
| Costco Wholesale Corp. | | | 161,065 | | | | 14,624,701 | |
| Mead Johnson Nutrition Co. | | | 266,610 | | | | 21,989,993 | |
| Monster Beverage Corp.* | | | 325,430 | | | | 20,205,949 | |
| Reynolds American, Inc. | | | 324,330 | | | | 13,440,235 | |
| Whole Foods Market, Inc. | | | 250,000 | | | | 20,800,000 | |
| | | | | | | | 120,788,295 | |
| | | | | | | | | |
| Health Care — 8.7% | | | | | | | | |
| Biogen Idec, Inc.* | | | 140,175 | | | | 17,657,845 | |
| Cerner Corp.* | | | 252,865 | | | | 19,258,198 | |
| Perrigo Co. | | | 134,680 | | | | 13,913,791 | |
| UnitedHealth Group, Inc. | | | 247,370 | | | | 14,579,988 | |
| | | | | | | | 65,409,822 | |
| | | | | | | | | |
| Telecommunication Services — 4.1% | | | | | | | | |
| BCE, Inc. (Canada) | | | 360,060 | | | | 14,424,004 | |
| Tim Participacoes SA ADR (Brazil)† | | | 510,000 | | | | 16,452,600 | |
| | | | | | | | 30,876,604 | |
| | | | | | | | | |
| Utilities — 3.9% | | | | | | | | |
| NiSource, Inc. | | | 612,930 | | | | 14,924,846 | |
| Southern Co. (The) | | | 311,135 | | | | 13,979,296 | |
| | | | | | | | 28,904,142 | |
| | | | | | | | | |
| Industrials — 2.5% | | | | | | | | |
| Fastenal Co. | | | 352,000 | | | | 19,043,200 | |
| | | | | | | | | |
| Financials — 2.1% | | | | | | | | |
| Moody's Corp. | | | 366,660 | | | | 15,436,385 | |
| | | | | | | | | |
| Energy — 1.1% | | | | | | | | |
| Marathon Oil Corp. | | | 261,115 | | | | 8,277,346 | |
| Total Common Stocks | | | | | | $ | 747,088,956 | |
| | | | | | | | | |
| Investment Funds — 2.4% | | | | | | | | |
| Invesco Liquid Assets Portfolio** | | | 10,474,500 | | | | 10,474,500 | |
| Touchstone Institutional Money Market Fund^ | | | 7,532,678 | | | | 7,532,678 | |
| Total Investment Funds | | | | | | $ | 18,007,178 | |
| | | | | | | | | |
| Total Investment Securities —101.9% | | | | | | | | |
| (Cost $582,317,698) | | | | | | $ | 765,096,134 | |
| | | | | | | | | |
| Liabilities in Excess of Other Assets — (1.9%) | | | | | | | (13,898,436 | ) |
| | | | | | | | | |
| Net Assets — 100.0% | | | | | | $ | 751,197,698 | |
| † | All or a portion of the security is on loan. The total value of the securites on loan as of March 31, 2012 was $10,244,740. |
| * | Non-income producing security. |
| ** | Represents collateral for securities loaned. |
| ^ | Affiliated Fund, sub-advised by Fort Washington Investment Advisors, Inc. See Note 4 in Notes to Financial Statements. |
Portfolio Abbreviations:
ADR - American Depositary Receipt
Other Information:
The inputs or methodology used for valuing securities may not be an indication of the risk associated with investing in those securities. For more information on valuation inputs, and their aggregation into the levels used in the table below, please refer to the security valuation section in the accompanying notes to financial statements.
| Valuation inputs at Reporting Date: | |
| Description | | Level 1 | | | Level 2 | | | Level 3 | | | Total | |
| Common Stocks | | $ | 747,088,956 | | | $ | — | | | $ | — | | | $ | 747,088,956 | |
| Investment Funds | | | 18,007,178 | | | | — | | | | — | | | | 18,007,178 | |
| | | | | | | | | | | | | | | $ | 765,096,134 | |
See accompanying notes to financial statements.
Portfolio of Investments
Touchstone Mid Cap Growth Fund – March 31, 2012
| | | | | | Market | |
| | | Shares | | | Value | |
| | | | | | | |
| Common Stocks — 97.9% | | | | | | | | |
| | | | | | | | | |
| Information Technology — 25.9% | | | | | | | | |
| Alliance Data Systems Corp.* | | | 143,120 | | | $ | 18,027,395 | |
| Analog Devices, Inc. | | | 156,460 | | | | 6,320,983 | |
| Autodesk, Inc.* | | | 405,220 | | | | 17,148,910 | |
| Avago Technologies Ltd. (Singapore) | | | 187,464 | | | | 7,305,472 | |
| Check Point Software Technologies Ltd. (Israel) | | | 253,800 | | | | 16,202,592 | |
| Gartner, Inc.* | | | 249,476 | | | | 10,637,657 | |
| JDS Uniphase Corp.* | | | 232,890 | | | | 3,374,576 | |
| Lam Research Corp.†* | | | 147,090 | | | | 6,563,156 | |
| NetApp, Inc.* | | | 152,134 | | | | 6,811,039 | |
| NICE Systems Ltd. ADR (Israel)* | | | 381,430 | | | | 14,990,199 | |
| NXP Semiconductor NV* | | | 336,000 | | | | 8,940,960 | |
| ON Semiconductor Corp.* | | | 499,680 | | | | 4,502,117 | |
| Red Hat, Inc.* | | | 258,130 | | | | 15,459,406 | |
| Salesforce.com, Inc.* | | | 114,645 | | | | 17,713,799 | |
| Teradata Corp.* | | | 221,360 | | | | 15,085,684 | |
| | | | | | | | 169,083,945 | |
| | | | | | | | | |
| Consumer Discretionary — 17.3% | | | | | | | | |
| Bed Bath & Beyond, Inc.* | | | 131,230 | | | | 8,630,997 | |
| Coach, Inc. | | | 204,771 | | | | 15,824,703 | |
| Discovery Communications, Inc.- Class A* | | | 327,350 | | | | 16,563,910 | |
| Dollar General Corp.* | | | 208,380 | | | | 9,627,156 | |
| Lear Corp. | | | 209,820 | | | | 9,754,532 | |
| Mattel, Inc. | | | 294,180 | | | | 9,902,099 | |
| Nordstrom, Inc. | | | 216,310 | | | | 12,052,793 | |
| NVR, Inc.* | | | 17,813 | | | | 12,938,116 | |
| Penn National Gaming, Inc.* | | | 257,048 | | | | 11,047,923 | |
| Wynn Resorts Ltd. | | | 51,910 | | | | 6,482,521 | |
| | | | | | | | 112,824,750 | |
| | | | | | | | | |
| Industrials — 15.2% | | | | | | | | |
| Cooper Industries PLC | | | 237,940 | | | | 15,216,263 | |
| Dover Corp. | | | 154,300 | | | | 9,711,642 | |
| Embraer SA ADR (Brazil) | | | 312,210 | | | | 9,984,476 | |
| IDEX Corp. | | | 311,490 | | | | 13,123,074 | |
| IHS, Inc. - Class A* | | | 69,575 | | | | 6,515,699 | |
| JB Hunt Transport Services, Inc. | | | 205,490 | | | | 11,172,491 | |
| Precision Castparts Corp. | | | 82,920 | | | | 14,336,868 | |
| Stanley Black & Decker, Inc. | | | 163,670 | | | | 12,596,043 | |
| Triumph Group, Inc. | | | 108,150 | | | | 6,776,679 | |
| | | | | | | | 99,433,235 | |
| | | | | | | | | |
| Energy — 10.9% | | | | | | | | |
| CONSOL Energy, Inc. | | | 242,270 | | | | 8,261,407 | |
| Denbury Resources, Inc.* | | | 651,810 | | | | 11,882,496 | |
| Ensco PLC ADR (United Kingdom) | | | 196,120 | | | | 10,380,632 | |
| Tesoro Corp.* | | | 439,830 | | | | 11,805,037 | |
| Valero Energy Corp. | | | 658,300 | | | | 16,964,391 | |
| Weatherford International Ltd. (Switzerland)* | | | 776,550 | | | | 11,718,140 | |
| | | | | | | | 71,012,103 | |
| | | | | | | | | |
| Health Care — 9.5% | | | | | | | | |
| DENTSPLY International, Inc. | | | 405,940 | | | | 16,290,372 | |
| Mettler-Toledo International, Inc.* | | | 89,409 | | | | 16,518,313 | |
| United Therapeutics Corp.* | | | 284,085 | | | | 13,388,926 | |
| Vertex Pharmaceuticals, Inc.* | | | 236,500 | | | | 9,698,865 | |
| Warner Chilcott PLC - Class A (Ireland)* | | | 385,030 | | | | 6,472,354 | |
| | | | | | | | 62,368,830 | |
| | | | | | | | | |
| Materials — 9.1% | | | | | | | | |
| Albemarle Corp. | | | 199,730 | | | | 12,766,742 | |
| Crown Holdings, Inc.* | | | 297,787 | | | | 10,967,495 | |
| Ecolab, Inc. | | | 264,620 | | | | 16,332,346 | |
| Solutia, Inc. | | | 682,818 | | | | 19,077,935 | |
| | | | | | | | 59,144,518 | |
| | | | | | | | | |
| Financials — 6.9% | | | | | | | | |
| Ameriprise Financial, Inc. | | | 273,270 | | | | 15,611,915 | |
| CBRE Group, Inc.- Class A* | | | 503,283 | | | | 10,045,529 | |
| Discover Financial Services | | | 328,070 | | | | 10,937,854 | |
| Willis Group Holdings PLC (United Kingdom) | | | 248,760 | | | | 8,701,625 | |
| | | | | | | | 45,296,923 | |
| | | | | | | | | |
| Consumer Staples — 2.1% | | | | | | | | |
| Ralcorp Holdings, Inc.* | | | 186,030 | | | | 13,782,963 | |
| | | | | | | | | |
| Telecommunication Services — 1.0% | | | | | | | | |
| NII Holdings, Inc.* | | | 361,240 | | | | 6,614,304 | |
| Total Common Stocks | | | | | | $ | 639,561,571 | |
| | | | | | | | | |
| Investment Funds — 1.5% | | | | | | | | |
| Invesco Liquid Assets Portfolio** | | | 6,609,283 | | | | 6,609,283 | |
| Touchstone Institutional Money Market Fund^ | | | 3,494,953 | | | | 3,494,953 | |
| Total Investment Funds | | | | | | $ | 10,104,236 | |
| | | | | | | | | |
| Total Investment Securities —99.4% | | | | | | | | |
| (Cost $564,957,220) | | | | | | $ | 649,665,807 | |
| | | | | | | | | |
| Other Assets in Excess of Liabilities — 0.6% | | | | | | | 3,659,624 | |
| | | | | | | | | |
| Net Assets — 100.0% | | | | | | $ | 653,325,431 | |
| † | All or a portion of the security is on loan. The total value of the securites on loan as of March 31, 2012 was $6,531,699. |
| * | Non-income producing security. |
| ** | Represents collateral for securities loaned. |
| ^ | Affiliated Fund, sub-advised by Fort Washington Investment Advisors, Inc. See Note 4 in Notes to Financial Statements. |
Touchstone Mid Cap Growth Fund (Continued)
Portfolio Abbreviations:
ADR - American Depositary Receipt
PLC - Public Limited Company
Other Information:
The inputs or methodology used for valuing securities may not be an indication of the risk associated with investing in those securities. For more information on valuation inputs, and their aggregation into the levels used in the table below, please refer to the security valuation section in the accompanying notes to financial statements.
| Valuation inputs at Reporting Date: | |
| Description | | Level 1 | | | Level 2 | | | Level 3 | | | Total | |
| Common Stocks | | $ | 639,561,571 | | | $ | — | | | $ | — | | | $ | 639,561,571 | |
| Investment Funds | | | 10,104,236 | | | | — | | | | — | | | | 10,104,236 | |
| | | | | | | | | | | | | | | $ | 649,665,807 | |
See accompanying notes to financial statements .
Statements of Assets and Liabilities
March 31, 2012
| | | Touchstone | | | | | | | | | | |
| | | Diversified | | | Touchstone | | | Touchstone | | | Touchstone | |
| | | Small Cap | | | Growth | | | Large Cap | | | Mid Cap | |
| | | Growth | | | Opportunities | | | Growth | | | Growth | |
| | | Fund | | | Fund | | | Fund | | | Fund | |
| Assets | | | | | | | | | | | | | | | | |
| Investments, at cost | | $ | 32,395,497 | | | $ | 150,110,317 | | | $ | 582,317,698 | | | $ | 564,957,220 | |
| Affiliated securities, at market value | | $ | 1,196,631 | | | $ | — | | | $ | 7,532,678 | | | $ | 3,494,953 | |
| Non-affiliated securities, at market value | | | 36,429,577 | | | | 153,923,726 | | | | 757,563,456 | | | | 646,170,854 | |
| Investments, at value (A) | | $ | 37,626,208 | | | $ | 153,923,726 | | | $ | 765,096,134 | | | $ | 649,665,807 | |
| Dividends and interest receivable | | | 5,908 | | | | 33,826 | | | | 924,604 | | | | 328,746 | |
| Receivable for capital shares sold | | | 34,890 | | | | 177,811 | | | | 2,515,592 | | | | 641,555 | |
| Receivable for investments sold | | | 766,687 | | | | 4,309,940 | | | | — | | | | 12,972,327 | |
| Receivable for securities lending income | | | 2,515 | | | | 208 | | | | 18,782 | | | | 115 | |
| Other assets | | | 11,649 | | | | 21,209 | | | | 27,420 | | | | 19,152 | |
| Total Assets | | | 38,447,857 | | | | 158,466,720 | | | | 768,582,532 | | | | 663,627,702 | |
| | | | | | | | | | | | | | | | | |
| Liabilities | | | | | | | | | | | | | | | | |
| Bank overdrafts | | | — | | | | 1,018,020 | | | | — | | | | — | |
| Payable for return of collateral for securities on loan | | | 2,036,444 | | | | 2,376,000 | | | | 10,474,500 | | | | 6,609,283 | |
| Payable for capital shares redeemed | | | 74,536 | | | | 583,624 | | | | 2,355,760 | | | | 2,565,561 | |
| Payable for investments purchased | | | 863,781 | | | | — | | | | 3,518,761 | | | | — | |
| Payable to Investment Advisor | | | 11,315 | | | | 63,036 | | | | 444,806 | | | | 423,607 | |
| Payable to other affiliates | | | 9,413 | | | | 40,804 | | | | 273,914 | | | | 326,706 | |
| Payable to Trustees | | | 2,183 | | | | 2,183 | | | | 2,143 | | | | 2,139 | |
| Payable for professional services | | | 18,551 | | | | 19,448 | | | | 13,370 | | | | 23,189 | |
| Other accrued expenses and liabilities | | | 27,971 | | | | 61,513 | | | | 301,580 | | | | 351,786 | |
| Total Liabilities | | | 3,044,194 | | | | 4,164,628 | | | | 17,384,834 | | | | 10,302,271 | |
| | | | | | | | | | | | | | | | | |
| Net Assets | | $ | 35,403,663 | | | $ | 154,302,092 | | | $ | 751,197,698 | | | $ | 653,325,431 | |
| | | | | | | | | | | | | | | | | |
| Net assets consist of: | | | | | | | | | | | | | | | | |
| Paid-in capital | | $ | 44,915,683 | | | $ | 168,046,432 | | | $ | 687,906,963 | | | $ | 559,686,822 | |
| Accumulated net investment income | | | — | | | | — | | | | 639,110 | | | | — | |
| Accumulated net realized gains (losses) on investments and foreign currency | | | (14,742,731 | ) | | | (17,557,749 | ) | | | (120,126,811 | ) | | | 8,930,022 | |
| Net unrealized appreciation on investments and foreign currency transactions | | | 5,230,711 | | | | 3,813,409 | | | | 182,778,436 | | | | 84,708,587 | |
| Net Assets | | $ | 35,403,663 | | | $ | 154,302,092 | | | $ | 751,197,698 | | | $ | 653,325,431 | |
| | | | | | | | | | | | | | | | | |
| (A) Includes market value of securities on loan of: | | $ | 1,983,956 | | | $ | 2,332,440 | | | $ | 10,244,740 | | | $ | 6,531,699 | |
See accompanying notes to financial statements.
Statements of Assets and Liabilities (Continued)
| | | Touchstone | | | | | | | | | | |
| | | Diversified | | | Touchstone | | | Touchstone | | | Touchstone | |
| | | Small Cap | | | Growth | | | Large Cap | | | Mid Cap | |
| | | Growth | | | Opportunities | | | Growth | | | Growth | |
| | | Fund | | | Fund | | | Fund | | | Fund | |
| Pricing of Class A Shares | | | | | | | | | | | | | | | | |
| Net assets applicable to Class A shares | | $ | 7,710,691 | | | $ | 62,273,770 | | | $ | 238,488,459 | | | $ | 330,807,749 | |
Shares of beneficial interest outstanding
(unlimited number of shares authorized, no par value) | | | 675,005 | | | | 2,428,627 | | | | 8,596,465 | | | | 14,762,619 | |
| Net asset value and redemption price per share | | $ | 11.42 | | | $ | 25.64 | | | $ | 27.74 | | | $ | 22.41 | |
| Maximum offering price per share | | $ | 12.12 | | | $ | 27.20 | | | $ | 29.43 | | | $ | 23.78 | |
| | | | | | | | | | | | | | | | | |
| Pricing of Class B Shares | | | | | | | | | | | | | | | | |
| Net assets applicable to Class B shares | | $ | — | | | $ | — | | | $ | 10,948,629 | | | $ | 10,680,508 | |
Shares of beneficial interest outstanding
(unlimited number of shares authorized, no par value) | | | — | | | | — | | | | 413,628 | | | | 577,974 | |
| Net asset value and offering price per share* | | $ | — | | | $ | — | | | $ | 26.47 | | | $ | 18.48 | |
| | | | | | | | | | | | | | | | | |
| Pricing of Class C Shares | | | | | | | | | | | | | | | | |
| Net assets applicable to Class C shares | | $ | 2,015,498 | | | $ | 9,131,503 | | | $ | 116,349,698 | | | $ | 162,693,445 | |
Shares of beneficial interest outstanding
(unlimited number of shares authorized, no par value) | | | 182,587 | | | | 385,572 | | | | 4,422,281 | | | | 8,883,646 | |
| Net asset value and offering price per share* | | $ | 11.04 | | | $ | 23.68 | | | $ | 26.31 | | | $ | 18.31 | |
| | | | | | | | | | | | | | | | | |
| Pricing of Class Y Shares | | | | | | | | | | | | | | | | |
| Net assets applicable to Class Y shares | | $ | 25,677,474 | | | $ | 12,253,766 | | | $ | 385,410,912 | | | $ | 123,593,411 | |
Shares of beneficial interest outstanding
(unlimited number of shares authorized, no par value) | | | 2,218,136 | | | | 474,890 | | | | 13,722,982 | | | | 5,460,947 | |
| Net asset value, offering price and redemption price per share | | $ | 11.58 | | | $ | 25.80 | | | $ | 28.09 | | | $ | 22.63 | |
| | | | | | | | | | | | | | | | | |
| Pricing of Institutional Class shares | | | | | | | | | | | | | | | | |
| Net assets applicable to Institutional Class shares | | $ | — | | | $ | 70,643,053 | | | $ | — | | | $ | 25,550,318 | |
Shares of beneficial interest outstanding
(unlimited number of shares authorized, no par value) | | | — | | | | 2,725,293 | | | | — | | | | 1,127,845 | |
| Net asset value, offering price and redemption price per share | | $ | — | | | $ | 25.92 | | | $ | — | | | $ | 22.65 | |
* Redemption price per share varies by length of time shares are held.
See accompanying notes to financial statements.
Statements of Operations
For the Year Ended March 31, 2012
| | | Touchstone | | | Touchstone | | | Touchstone | | | Touchstone | |
| | | Diversified | | | Growth | | | Large Cap | | | Mid Cap | |
| | | Small Cap | | | Opportunities | | | Growth | | | Growth | |
| | | Growth Fund | | | Fund | | | Fund | | | Fund | |
| Investment Income | | | | | | | | | | | | | | | | |
| Dividends from affiliated securities | | $ | 1,015 | | | $ | 4,507 | | | $ | 16,113 | | | $ | 20,106 | |
| Dividends from non-affiliated securities(A) | | | 127,922 | | | | 1,082,138 | | | | 9,466,472 | | | | 4,296,333 | |
| Income from securities loaned | | | 17,535 | | | | 10,861 | | | | 80,465 | | | | 94,433 | |
| Total Investment Income | | | 146,472 | | | | 1,097,506 | | | | 9,563,050 | | | | 4,410,872 | |
| Expenses | | | | | | | | | | | | | | | | |
| Investment advisory fees | | | 355,015 | | | | 1,189,339 | | | | 5,137,889 | | | | 5,252,372 | |
| Administration fees | | | 67,555 | | | | 316,755 | | | | 1,437,625 | | | | 1,428,522 | |
| Compliance fees and expenses | | | 1,814 | | | | 1,814 | | | | 1,814 | | | | 1,814 | |
| Custody fees | | | 398 | | | | 3,156 | | | | 11,236 | | | | 14,857 | |
| Professional fees | | | 20,751 | | | | 29,798 | | | | 46,196 | | | | 52,806 | |
| Transfer Agent fees, Class A | | | 19,727 | | | | 74,663 | | | | 317,178 | | | | 639,740 | |
| Transfer Agent fees, Class B | | | — | | | | — | | | | 12,621 | | | | 39,066 | |
| Transfer Agent fees, Class C | | | 6,449 | | | | 19,098 | | | | 123,527 | | | | 313,540 | |
| Transfer Agent fees, Class Y | | | 19,379 | | | | 5,839 | | | | 634,270 | | | | 116,722 | |
| Transfer Agent fees, Institutional Class | | | — | | | | 1,206 | | | | — | | | | 1,784 | |
| Registration fees, Class A | | | 16,180 | | | | 37,456 | | | | 22,207 | | | | 37,119 | |
| Registration fees, Class B | | | — | | | | — | | | | 17,259 | | | | 12,655 | |
| Registration fees, Class C | | | 13,445 | | | | 12,354 | | | | 29,619 | | | | 17,319 | |
| Registration fees, Class Y | | | 19,354 | | | | 21,192 | | | | 27,959 | | | | 25,437 | |
| Registration fees, Institutional Class | | | — | | | | 18,346 | | | | — | | | | 3,350 | |
| Reports to Shareholders, Class A | | | 5,613 | | | | 12,641 | | | | 36,429 | | | | 53,260 | |
| Reports to Shareholders, Class B | | | — | | | | — | | | | 7,144 | | | | 7,831 | |
| Reports to Shareholders, Class C | | | 5,687 | | | | 6,393 | | | | 19,977 | | | | 34,682 | |
| Reports to Shareholders, Class Y | | | 6,278 | | | | 6,446 | | | | 69,967 | | | | 10,761 | |
| Reports to Shareholders, Institutional Class | | | — | | | | 6,288 | | | | — | | | | 13,544 | |
| Distribution expenses, Class A | | | 19,096 | | | | 193,109 | | | | 578,328 | | | | 1,001,708 | |
| Distribution expenses, Class B | | | — | | | | — | | | | 22,563 | | | | 37,524 | |
| Distribution expenses, Class C | | | 20,874 | | | | 88,827 | | | | 1,144,685 | | | | 1,810,647 | |
| Trustee fees | | | 8,575 | | | | 8,650 | | | | 11,026 | | | | 8,985 | |
| Other expenses | | | 19,037 | | | | 65,090 | | | | 101,364 | | | | 167,439 | |
| Total Expenses | | | 625,227 | | | | 2,118,460 | | | | 9,810,883 | | | | 11,103,484 | |
| Fees waived and/or reimbursed by the Advisor and/or Affiliates(B) | | | (196,755 | ) | | | (410,640 | ) | | | (886,943 | ) | | | (13,157 | ) |
| Net Expenses | | | 428,472 | | | | 1,707,820 | | | | 8,923,940 | | | | 11,090,327 | |
| Net Investment Income (Loss) | | | (282,000 | ) | | | (610,314 | ) | | | 639,110 | | | | (6,679,455 | ) |
| Realized and Unrealized Gain (Loss) on Investments | | | | | | | | | | | | | | | | |
| Net realized gain on investments | | | 4,197,671 | | | | 9,529,797 | | | | 103,254,141 | | | | 29,614,594 | |
| Net change in unrealized depreciation on investments(C) | | | (4,682,853 | ) | | | (11,239,370 | ) | | | (27,105,080 | ) | | | (63,726,763 | ) |
| | | | | | | | | | | | | | | | | |
| Net Realized and Unrealized Gain (Loss) on Investments | | | (485,182 | ) | | | (1,709,573 | ) | | | 76,149,061 | | | | (34,112,169 | ) |
| | | | | | | | | | | | | | | | | |
| Change in Net Assets Resulting from Operations | | $ | (767,182 | ) | | $ | (2,319,887 | ) | | $ | 76,788,171 | | | $ | (40,791,624 | ) |
| | | | | | | | | | | | | | | | | |
| (A) Net of foreign tax withholding of: | | $ | — | | | $ | 756 | | | $ | 138,252 | | | $ | 5,478 | |
(B) See Note 4 in Notes to Financial Statements.
(C) Change in unrealized depreciation does not include unrealized appreciation of $7,230,578 for the Large Cap Growth Fund, in connection with the Fund merger. See Note 8 in Notes to Financial Statements.
See accompanying notes to financial statements.
This page intentionally left blank.
Statements of Changes in Net Assets
| | | Touchstone | | | Touchstone | |
| | | Diversified Small Cap | | | Growth Opporunities | |
| | | Growth Fund | | | Fund | |
| | | Year | | | Year | | | Year | | | Year | |
| | | Ended | | | Ended | | | Ended | | | Ended | |
| | | March 31,2012 | | | March 31,2011 | | | March 31,2012 | | | March 31,2011 | |
| From Operations | | | | | | | | | | | | | | | | |
| Net investment income (loss) | | $ | (282,000 | ) | | $ | (302,234 | ) | | $ | (610,314 | ) | | $ | 312,483 | |
| Net realized gain on investments | | | 4,197,671 | | | | 4,216,821 | | | | 9,529,797 | | | | 23,052,227 | |
| Net change in unrealized appreciation (depreciation) on investments | | | (4,682,853 | ) | | | 3,970,060 | | | | (11,239,370 | ) | | | 3,780,887 | |
| Change in Net Assets from Operations | | | (767,182 | ) | | | 7,884,647 | | | | (2,319,887 | ) | | | 27,145,597 | |
| | | | | | | | | | | | | | | | | |
| Distributions to Shareholders from: | | | | | | | | | | | | | | | | |
| Net investment income, Class A | | | — | | | | — | | | | — | | | | (242,350 | ) |
| Net investment income, Class C | | | — | | | | — | | | | — | | | | (15,748 | ) |
| From net investment income, Class Y | | | — | | | | — | | | | — | | | | (14,894 | ) |
| Net investment income, Institutional Class | | | — | | | | — | | | | — | | | | (272,661 | ) |
| Net realized gains, Class A | | | — | | | | — | | | | — | | | | — | |
| Net realized gains, Class B | | | — | | | | — | | | | — | | | | — | |
| Net realized gains, Class C | | | — | | | | — | | | | — | | | | — | |
| Net realized gains, Class Y | | | — | | | | — | | | | — | | | | — | |
| Net realized gains, Institutional Class | | | — | | | | — | | | | — | | | | — | |
| Total Distributions | | | — | | | | — | | | | — | | | | (545,653 | ) |
| Class A | | | | | | | | | | | | | | | | |
| Proceeds from shares sold | | | 844,906 | | | | 3,783,539 | | | | 14,956,666 | | | | 13,611,156 | |
| Reinvestment of distributions | | | — | | | | — | | | | — | | | | 220,719 | |
| Proceeds from shares issued in connection with merger(A) | | | — | | | | — | | | | — | | | | 45,986,668 | |
| Cost of shares redeemed | | | (8,654,791 | ) | | | (4,104,649 | ) | | | (44,968,032 | ) | | | (10,856,965 | ) |
| Change in Net Assets from Class A Share Transactions | | | (7,809,885 | ) | | | (321,110 | ) | | | (30,011,366 | ) | | | 48,961,578 | |
| Class B | | | | | | | | | | | | | | | | |
| Proceeds from shares sold | | | — | | | | — | | | | — | | | | — | |
| Reinvestment of distributions | | | — | | | | — | | | | — | | | | — | |
| Cost of shares redeemed | | | — | | | | — | | | | — | | | | — | |
| Change in Net Assets from Class B Share Transactions | | | — | | | | — | | | | — | | | | — | |
| Class C | | | | | | | | | | | | | | | | |
| Proceeds from shares sold | | | 28,834 | | | | 20,300 | | | | 841,612 | | | | 1,362,141 | |
| Reinvestment of distributions | | | — | | | | — | | | | — | | | | 12,062 | |
| Proceeds from shares issued in connection with merger(A) | | | — | | | | — | | | | — | | | | 1,443,130 | |
| Cost of shares redeemed | | | (386,880 | ) | | | (683,371 | ) | | | (2,237,050 | ) | | | (2,017,847 | ) |
| Change in Net Assets from Class C Share Transactions | | | (358,046 | ) | | | (663,071 | ) | | | (1,395,438 | ) | | | 799,486 | |
(A)See footnote 8 in the notes to financial statements.
See accompanyong notes to financial statements.
Statements of Changes in Net Assets (Continued)
| | Touchstone | | | Touchstone | |
| | Large Cap | | | Mid Cap | |
| | Growth Fund | | | Growth Fund | |
| | Year | | | Year | | | Year | | | Year | |
| | Ended | | | Ended | | | Ended | | | Ended | |
| | March 31,2012 | | | March 31,2011 | | | March 31,2012 | | | March 31,2011 | |
| | | | | | | | | | | | | | | | |
| | $ | 639,110 | | | $ | (2,895,744 | ) | | $ | (6,679,455 | ) | | $ | (2,646,368 | ) |
| | | 103,254,141 | | | | 124,890,601 | | | | 29,614,594 | | | | 159,538,973 | |
| | | (27,105,080 | ) | | | 4,787,430 | | | | (63,726,763 | ) | | | 10,043,161 | |
| | | 76,788,171 | | | | 126,782,287 | | | | (40,791,624 | ) | | | 166,935,766 | |
| | | | | | | | | | | | | | | | |
| | | | | | | | | | | | | | | | |
| | | — | | | | — | | | | — | | | | — | |
| | | — | | | | — | | | | — | | | | — | |
| | | — | | | | — | | | | — | | | | — | |
| | | — | | | | — | | | | — | | | | — | |
| | | — | | | | — | | | | (21,193,881 | ) | | | — | |
| | | — | | | | — | | | | (951,498 | ) | | | — | |
| | | — | | | | — | | | | (11,853,901 | ) | | | — | |
| | | — | | | | — | | | | (6,874,624 | ) | | | — | |
| | | — | | | | — | | | | (1,141,754 | ) | | | — | |
| | | — | | | | — | | | | (42,015,658 | ) | | | — | |
| | | | | | | | | | | | | | | | |
| | | 59,405,827 | | | | 37,525,420 | | | | 84,121,277 | | | | 101,107,970 | |
| | | — | | | | — | | | | 19,830,612 | | | | — | |
| | | 23,922,198 | | | | — | | | | — | | | | — | |
| | | (156,470,510 | ) | | | (132,218,091 | ) | | | (309,991,242 | ) | | | (214,719,417 | ) |
| | | (73,142,485 | ) | | | (94,692,671 | ) | | | (206,039,353 | ) | | | (113,611,447 | ) |
| | | | | | | | | | | | | | | | |
| | | 32,460 | | | | 11,132 | | | | 263,887 | | | | 87,874 | |
| | | — | | | | — | | | | 701,743 | | | | — | |
| | | (3,787,039 | ) | | | (3,810,505 | ) | | | (11,038,406 | ) | | | (14,031,080 | ) |
| | | (3,754,579 | ) | | | (3,799,373 | ) | | | (10,072,776 | ) | | | (13,943,206 | ) |
| | | | | | | | | | | | | | | | |
| | | 8,640,062 | | | | 6,672,654 | | | | 9,987,636 | | | | 12,270,665 | |
| | | — | | | | — | | | | 7,913,771 | | | | — | |
| | | 1,730,818 | | | | — | | | | — | | | | — | |
| | | (33,431,998 | ) | | | (43,406,395 | ) | | | (53,094,928 | ) | | | (49,103,632 | ) |
| | | (23,061,118 | ) | | | (36,733,741 | ) | | | (35,193,521 | ) | | | (36,832,967 | ) |
Statements of Changes in Net Assets (Continued)
| | | Touchstone | | | Touchstone | |
| | | Diversified Small Cap | | | Growth Opporunities | |
| | | Growth Fund | | | Fund | |
| | | Year | | | Year | | | Year | | | Year | |
| | | Ended | | | Ended | | | Ended | | | Ended | |
| | | March 31,2012 | | | March 31,2011 | | | March 31,2012 | | | March 31,2011 | |
| Class Y | | | | | | | | | | | | | | | | |
| Proceeds from shares sold | | | 13,511,349 | | | | 3,210,329 | | | | 22,419,776 | | | | 889,888 | |
| Reinvestment of distributions | | | — | | | | — | | | | — | | | | 7,659 | |
| Cost of shares redeemed | | | (6,645,104 | ) | | | (8,778,069 | ) | | | (14,363,604 | ) | | | (604,582 | ) |
| Change in Net Assets from Class Y Share Transactions | | | 6,866,245 | | | | (5,567,740 | ) | | | 8,056,172 | | | | 292,965 | |
| Institutional Class | | | | | | | | | | | | | | | | |
| Proceeds from shares sold | | | — | | | | — | | | | 25,061,590 | | | | 34,236,952 | |
| Reinvestment of distributions | | | — | | | | — | | | | — | | | | 252,307 | |
| Cost of shares redeemed | | | — | | | | — | | | | (11,940,126 | ) | | | (8,589,836 | ) |
| Change in Net Assets from Institutional Class Share Transactions | | | — | | | | — | | | | 13,121,464 | | | | 25,899,423 | |
| Net Increase (Decrease) from Share Transactions | | | (1,301,686 | ) | | | (6,551,921 | ) | | | (10,229,168 | ) | | | 75,953,452 | |
| | | | | | | | | | | | | | | | | |
| Total Increase (Decrease) in Net Assets | | | (2,068,868 | ) | | | 1,332,726 | | | | (12,549,055 | ) | | | 102,553,396 | |
| | | | | | | | | | | | | | | | | |
| Net Assets | | | | | | | | | | | | | | | | |
| Beginning of period | | | 37,472,531 | | | | 36,139,805 | | | | 166,851,147 | | | | 64,297,751 | |
| End of period | | $ | 35,403,663 | | | $ | 37,472,531 | | | $ | 154,302,092 | | | $ | 166,851,147 | |
| | | | | | | | | | | | | | | | | |
| Accumulated Net Investment Income | | $ | — | | | $ | — | | | $ | — | | | $ | — | |
See accompanying notes to financial statements.
Statements of Changes in Net Assets (Continued)
| | Touchstone | | | Touchstone | |
| | Large Cap | | | Mid Cap | |
| | Growth Fund | | | Growth Fund | |
| | Year | | | Year | | | Year | | | Year | |
| | Ended | | | Ended | | | Ended | | | Ended | |
| | March 31,2012 | | | March 31,2011 | | | March 31,2012 | | | March 31,2011 | |
| | | | | | | | | | | | | | | | |
| | | 161,647,798 | | | | 68,406,858 | | | | 119,526,286 | | | | 27,508,300 | |
| | | — | | | | — | | | | 5,866,970 | | | | — | |
| | | (151,479,192 | ) | | | (140,151,719 | ) | | | (39,821,226 | ) | | | (12,625,487 | ) |
| | | 10,168,606 | | | | (71,744,861 | ) | | | 85,572,030 | | | | 14,882,813 | |
| | | | | | | | | | | | | | | | |
| | | — | | | | — | | | | 23,806,747 | | | | — | |
| | | — | | | | — | | | | 1,141,754 | | | | — | |
| | | — | | | | — | | | | (1,393,203 | ) | | | — | |
| | | — | | | | — | | | | 23,555,298 | | | | — | |
| | | (89,789,576 | ) | | | (206,970,646 | ) | | | (142,178,322 | ) | | | (149,504,807 | ) |
| | | | | | | | | | | | | | | | |
| | | (13,001,405 | ) | | | (80,188,359 | ) | | | (224,985,604 | ) | | | 17,430,959 | |
| | | | | | | | | | | | | | | | |
| | | | | | | | | | | | | | | | |
| | | 764,199,103 | | | | 844,387,462 | | | | 878,311,035 | | | | 860,880,076 | |
| | $ | 751,197,698 | | | $ | 764,199,103 | | | $ | 653,325,431 | | | $ | 878,311,035 | |
| | | | | | | | | | | | | | | | |
| | $ | 639,110 | | | $ | 76,385 | | | $ | — | | | $ | 58,040 | |
Financial Highlights
Touchstone Diversified Small Cap Growth Fund — Class A
Selected Data for a Share Outstanding
| | | Year Ended March 31, | |
| | | 2012 | | | 2011 | | | 2010 | | | 2009 | | | 2008 | |
| Net asset value at beginning of period | | $ | 11.65 | | | $ | 9.09 | | | $ | 6.27 | | | $ | 9.80 | | | $ | 11.64 | |
| Income (loss) from investment operations: | | | | | | | | | | | | | | | | | | | | |
| Net investment income (loss) | | | (0.11 | ) | | | (0.09 | ) | | | (0.08 | ) | | | (0.02 | ) | | | 0.50 | |
| Net realized and unrealized gains (losses) on investments | | | (0.12 | ) | | | 2.65 | | | | 2.90 | | | | (3.51 | ) | | | (1.15 | ) |
| Total from investment operations | | | (0.23 | ) | | | 2.56 | | | | 2.82 | | | | (3.53 | ) | | | (0.65 | ) |
| Distributions from: | | | | | | | | | | | | | | | | | | | | |
| Realized capital gains | | | — | | | | — | | | | — | | | | — | | | | (1.19 | ) |
| Net asset value at end of period | | $ | 11.42 | | | $ | 11.65 | | | $ | 9.09 | | | $ | 6.27 | | | $ | 9.80 | |
| Total return(A) | | | (1.97 | )% | | | 28.16 | % | | | 44.98 | % | | | (36.02 | )% | | | (7.28 | )% |
| Ratios and supplemental data: | | | | | | | | | | | | | | | | | | | | |
| Net assets at end of period (000's) | | $ | 7,711 | | | $ | 15,686 | | | $ | 12,708 | | | $ | 9,054 | | | $ | 22,955 | |
| Ratio to average net assets: | | | | | | | | | | | | | | | | | | | | |
| Net expenses | | | 1.40 | % | | | 1.40 | % | | | 1.40 | % | | | 1.40 | % | | | 1.40 | % |
| Gross expenses | | | 2.19 | % | | | 2.06 | % | | | 2.24 | % | | | 2.25 | % | | | 2.03 | % |
| Net investment income (loss) | | | (0.97 | )% | | | (0.99 | )% | | | (0.99 | )% | | | (0.22 | )% | | | 0.33 | % |
| Portfolio turnover rate | | | 65 | % | | | 63 | % | | | 76 | % | | | 113 | % | | | 99 | % |
Touchstone Diversified Small Cap Growth Fund — Class C
Selected Data for a Share Outstanding
| | | | | | | | | | | | | | | Period | |
| | | | | | | | | | | | | | | Ended | |
| | | Year Ended March 31, | | | March 31, | |
| | | 2012 | | | 2011 | | | 2010 | | | 2009 | | | 2008(B) | |
| Net asset value at beginning of period | | $ | 11.35 | | | $ | 8.91 | | | $ | 6.20 | | | $ | 9.75 | | | $ | 12.44 | |
| Income (loss) from investment operations: | | | | | | | | | | | | | | | | | | | | |
| Net investment loss | | | (0.20 | ) | | | (0.19 | ) | | | (0.15 | ) | | | (0.08 | ) | | | (0.22 | ) |
| Net realized and unrealized gains (losses) on investments | | | (0.11 | ) | | | 2.63 | | | | 2.86 | | | | (3.47 | ) | | | (1.28 | ) |
| Total from investment operations | | | (0.31 | ) | | | 2.44 | | | | 2.71 | | | | (3.55 | ) | | | (1.50 | ) |
| Distributions from: | | | | | | | | | | | | | | | | | | | | |
| Realized capital gains | | | — | | | | — | | | | — | | | | — | | | | (1.19 | ) |
| Net asset value at end of period | | $ | 11.04 | | | $ | 11.35 | | | $ | 8.91 | | | $ | 6.20 | | | $ | 9.75 | |
| Total return(A) | | | (2.73 | )% | | | 27.38 | % | | | 43.71 | % | | | (36.41 | )% | | | (13.66 | )%(C) |
| Ratios and supplemental data: | | | | | | | | | | | | | | | | | | | | |
| Net assets at end of period (000's) | | $ | 2,015 | | | $ | 2,452 | | | $ | 2,576 | | | $ | 2,267 | | | $ | 4,228 | |
| Ratio to average net assets: | | | | | | | | | | | | | | | | | | | | |
| Net expenses | | | 2.15 | % | | | 2.15 | % | | | 2.15 | % | | | 2.15 | % | | | 0.84 | %(D) |
| Gross expenses | | | 3.63 | % | | | 3.58 | % | | | 3.32 | % | | | 3.54 | % | | | 1.35 | %(D) |
| Net investment loss | | | (1.72 | )% | | | (1.74 | )% | | | (1.74 | )% | | | (0.98 | )% | | | (17.70 | )%(D) |
| Portfolio turnover rate | | | 65 | % | | | 63 | % | | | 76 | % | | | 113 | % | | | 99 | %(C) |
(A) Total returns shown exclude the effect of applicable sales loads. If these charges were included, the return would be lower.
(B) Represents the period from commencement of operations (August 1, 2007) through March 31, 2008.
(C) Not annualized.
(D) Annualized.
See accompanying notes to financial statements.
Financial Highlights (Continued)
Touchstone Diversified Small Cap Growth Fund — Class Y
Selected Data for a Share Outstanding
| | | Year Ended March 31, | |
| | | 2012 | | | 2011 | | | 2010 | | | 2009 | | | 2008 | |
| Net asset value at beginning of period | | $ | 11.78 | | | $ | 9.16 | | | $ | 6.30 | | | $ | 9.84 | | | $ | 11.66 | |
| Income (loss) from investment operations: | | | | | | | | | | | | | | | | | | | | |
| Net investment income (loss) | | | (0.08 | ) | | | (0.08 | ) | | | (0.05 | ) | | | — | (A) | | | 0.04 | |
| Net realized and unrealized gains (losses) on investments | | | (0.12 | ) | | | 2.70 | | | | 2.91 | | | | (3.54 | ) | | | (0.67 | ) |
| Total from investment operations | | | (0.20 | ) | | | 2.62 | | | | 2.86 | | | | (3.54 | ) | | | (0.63 | ) |
| Distributions from: | | | | | | | | | | | | | | | | | | | | |
| Realized capital gains | | | — | | | | — | | | | — | | | | — | | | | (1.19 | ) |
| Net asset value at end of period | | $ | 11.58 | | | $ | 11.78 | | | $ | 9.16 | | | $ | 6.30 | | | $ | 9.84 | |
| Total return | | | (1.70 | )% | | | 28.60 | % | | | 45.40 | % | | | (35.98 | )% | | | (7.09 | )% |
| Ratios and supplemental data: | | | | | | | | | | | | | | | | | | | | |
| Net assets at end of period (000's) | | $ | 25,677 | | | $ | 19,334 | | | $ | 20,856 | | | $ | 8,808 | | | $ | 14,509 | |
| Ratio to average net assets: | | | | | | | | | | | | | | | | | | | | |
| Net expenses | | | 1.15 | % | | | 1.15 | % | | | 1.15 | % | | | 1.15 | % | | | 1.15 | % |
| Gross expenses | | | 1.59 | % | | | 1.58 | % | | | 1.66 | % | | | 1.67 | % | | | 1.81 | % |
| Net investment income (loss) | | | (0.72 | )% | | | (0.73 | )% | | | (0.74 | )% | | | 0.02 | % | | | (0.52 | )% |
| Portfolio turnover rate | | | 65 | % | | | 63 | % | | | 76 | % | | | 113 | % | | | 99 | % |
(A) Amount rounds to less than $0.005 per share.
See accompanying notes to financial statements.
Financial Highlights (Continued)
Touchstone Growth Opportunities Fund — Class A
Selected Data for a Share Outstanding
| | | Year Ended March 31, | |
| | | 2012 | | | 2011 | | | 2010 | | | 2009 | | | 2008 | |
| Net asset value at beginning of period | | $ | 25.27 | | | $ | 20.88 | | | $ | 14.41 | | | $ | 21.68 | | | $ | 20.75 | |
| Income (loss) from investment operations: | | | | | | | | | | | | | | | | | | | | |
| Net investment income (loss) | | | (0.16 | ) | | | 0.07 | | | | (0.03 | ) | | | (0.15 | ) | | | (0.24 | ) |
| Net realized and unrealized gains (losses) on investments | | | 0.53 | | | | 4.44 | | | | 6.50 | | | | (7.12 | ) | | | 1.17 | |
| Total from investment operations | | | 0.37 | | | | 4.51 | | | | 6.47 | | | | (7.27 | ) | | | 0.93 | |
| Distributions from: | | | | | | | | | | | | | | | | | | | | |
| Net investment income | | | — | | | | (0.12 | ) | | | — | | | | — | | | | — | |
| Net asset value at end of period | | $ | 25.64 | | | $ | 25.27 | | | $ | 20.88 | | | $ | 14.41 | | | $ | 21.68 | |
| Total return(A) | | | 1.47 | % | | | 21.71 | % | | | 44.90 | % | | | (33.53 | )% | | | 4.48 | % |
| Ratios and supplemental data: | | | | | | | | | | | | | | | | | | | | |
| Net assets at end of period (000's) | | $ | 62,274 | | | $ | 96,930 | | | $ | 32,182 | | | $ | 17,973 | | | $ | 26,349 | |
| Ratio to average net assets: | | | | | | | | | | | | | | | | | | | | |
| Net expenses | | | 1.21 | % | | | 1.16 | % | | | 1.24 | % | | | 1.51 | % | | | 1.55 | % |
| Gross expenses | | | 1.43 | % | | | 1.50 | % | | | 1.85 | % | | | 2.04 | % | | | 1.91 | % |
| Net investment income (loss) | | | (0.52 | )% | | | 0.10 | % | | | (0.22 | )% | | | (0.70 | )% | | | (0.89 | )% |
| Portfolio turnover rate | | | 204 | % | | | 130 | % | | | 100 | % | | | 60 | % | | | 82 | % |
Touchstone Growth Opportunities Fund — Class C
Selected Data for a Share Outstanding
| | | Year Ended March 31, | |
| | | 2012 | | | 2011 | | | 2010 | | | 2009 | | | 2008 | |
| Net asset value at beginning of period | | $ | 23.50 | | | $ | 19.49 | | | $ | 13.55 | | | $ | 20.42 | | | $ | 19.63 | |
| Income (loss) from investment operations: | | | | | | | | | | | | | | | | | | | | |
| Net investment loss | | | (0.29 | ) | | | (0.07 | ) | | | (0.17 | ) | | | (0.29 | ) | | | (0.35 | ) |
| Net realized and unrealized gains (losses) on investments | | | 0.47 | | | | 4.12 | | | | 6.11 | | | | (6.58 | ) | | | 1.14 | |
| Total from investment operations | | | 0.18 | | | | 4.05 | | | | 5.94 | | | | (6.87 | ) | | | 0.79 | |
| Distributions from: | | | | | | | | | | | | | | | | | | | | |
| Net investment income | | | — | | | | (0.04 | ) | | | — | | | | — | | | | — | |
| Net asset value at end of period | | $ | 23.68 | | | $ | 23.50 | | | $ | 19.49 | | | $ | 13.55 | | | $ | 20.42 | |
| Total return(A) | | | 0.77 | % | | | 20.82 | % | | | 43.84 | % | | | (33.64 | )% | | | 4.02 | % |
| Ratios and supplemental data: | | | | | | | | | | | | | | | | | | | | |
| Net assets at end of period (000's) | | $ | 9,132 | | | $ | 10,592 | | | $ | 8,085 | | | $ | 6,262 | | | $ | 11,115 | |
| Ratio to average net assets: | | | | | | | | | | | | | | | | | | | | |
| Net expenses | | | 1.96 | % | | | 1.93 | % | | | 1.99 | % | | | 2.27 | % | | | 2.30 | % |
| Gross expenses | | | 2.45 | % | | | 2.58 | % | | | 2.63 | % | | | 2.82 | % | | | 2.71 | % |
| Net investment loss | | | (1.27 | )% | | | (0.43 | )% | | | (0.96 | )% | | | (1.46 | )% | | | (1.60 | )% |
| Portfolio turnover rate | | | 204 | % | | | 130 | % | | | 100 | % | | | 60 | % | | | 82 | % |
| (A) | Total returns shown exclude the effect of applicable sales loads. If these charges were included, the return would be lower. |
See accompanying notes to financial statements.
Financial Highlights (Continued)
Touchstone Growth Opportunities Fund — Class Y
Selected Data for a Share Outstanding
| | | | | | | | | | | | Period | |
| | | | | | | | | | | | Ended | |
| | | Year Ended March 31, | | | March 31, | |
| | | 2012 | | | 2011 | | | 2010 | | | 2009 (A) | |
| Net asset value at beginning of period | | $ | 25.38 | | | $ | 20.94 | | | $ | 14.41 | | | $ | 14.37 | |
| Income (loss) from investment operations: | | | | | | | | | | | | | | | | |
| Net investment income (loss) | | | (0.05 | ) | | | 0.14 | | | | — | (B) | | | — | (B) |
| Net realized and unrealized gains on investments | | | 0.47 | | | | 4.45 | | | | 6.53 | | | | 0.04 | |
| Total from investment operations | | | 0.42 | | | | 4.59 | | | | 6.53 | | | | 0.04 | |
| Distributions from: | | | | | | | | | | | | | | | | |
| Net investment income | | | — | | | | (0.15 | ) | | | — | | | | — | |
| Net asset value at end of period | | $ | 25.80 | | | $ | 25.38 | | | $ | 20.94 | | | $ | 14.41 | |
| Total return | | | 1.66 | % | | | 22.06 | % | | | 45.32 | % | | | 0.28 | %(C) |
| Ratios and supplemental data: | | | | | | | | | | | | | | | | |
| Net assets at end of period (000's) | | $ | 12,254 | | | $ | 2,947 | | | $ | 2,223 | | | $ | 3 | |
| Ratio to average net assets: | | | | | | | | | | | | | | | | |
| Net expenses | | | 0.96 | % | | | 0.93 | % | | | 0.98 | % | | | 0.97 | %(D) |
| Gross expenses | | | 1.42 | % | | | 1.73 | % | | | 3.73 | % | | | 1.82 | %(D) |
| Net investment income (loss) | | | (0.27 | )% | | | 0.63 | % | | | (0.04 | )% | | | (0.21 | )%(D) |
| Portfolio turnover rate | | | 204 | % | | | 130 | % | | | 100 | % | | | 60 | %(C) |
Touchstone Growth Opportunities Fund — Institutional Class
Selected Data for a Share Outstanding
| | | | | | | | | | | | Period | |
| | | | | | Ended | |
| | | Year Ended March 31, | | | March 31, | |
| | | 2012 | | | 2011 | | | 2010 | | | 2009 (A) | |
| Net asset value at beginning of period | | $ | 25.46 | | | $ | 20.98 | | | $ | 14.42 | | | $ | 14.37 | |
| Income (loss) from investment operations: | | | | | | | | | | | | | | | | |
| Net Investment income (loss) | | | (0.03 | ) | | | 0.16 | | | | 0.01 | | | | — | (B) |
| Net realized and unrealized gains on investments | | | 0.49 | | | | 4.48 | | | | 6.55 | | | | 0.05 | |
| Total from investment operations | | | 0.46 | | | | 4.64 | | | | 6.56 | | | | 0.05 | |
| Distributions from: | | | | | | | | | | | | | | | | |
| Net investment income | | | — | | | | (0.16 | ) | | | — | | | | — | |
| Net asset value at end of period | | $ | 25.92 | | | $ | 25.46 | | | $ | 20.98 | | | $ | 14.42 | |
| Total return | | | 1.81 | % | | | 22.25 | % | | | 45.49 | % | | | 0.35 | %(C) |
| Ratios and supplemental data: | | | | | | | | | | | | | | | | |
| Net assets at end of period (000's) | | $ | 70,643 | | | $ | 56,381 | | | $ | 21,807 | | | $ | 3 | |
| Ratio to average net assets: | | | | | | | | | | | | | | | | |
| Net expenses | | | 0.81 | % | | | 0.75 | % | | | 0.84 | % | | | 0.82 | %(D) |
| Gross expenses | | | 1.06 | % | | | 1.15 | % | | | 1.49 | % | | | 1.82 | %(D) |
| Net investment income (loss) | | | (0.12 | )% | | | 0.78 | % | | | 0.15 | % | | | 0.36 | %(D) |
| Portfolio turnover rate | | | 204 | % | | | 130 | % | | | 100 | % | | | 60 | %(C) |
| (A) | Represents the period from commencement of operations (February 2, 2009) through March 31, 2009. |
| (B) | Amount rounds to less than $0.005. |
See accompanying notes to financial statements.
Financial Highlights (Continued)
Touchstone Large Cap Growth Fund — Class A
Selected Data for a Share Outstanding
| | | Year Ended March 31, | |
| | | 2012 | | | 2011 | | | 2010 | | | 2009 | | | 2008 | |
| Net asset value at beginning of period | | $ | 24.95 | | | $ | 20.74 | | | $ | 14.73 | | | $ | 24.45 | | | $ | 22.06 | |
| Income (loss) from investment operations: | | | | | | | | | | | | | | | | | | | | |
| Net investment income (loss) | | | 0.02 | (A) | | | (0.09 | ) | | | (0.02 | ) | | | 0.09 | | | | 0.02 | |
| Net realized and unrealized gains (losses) on investments | | | 2.77 | | | | 4.30 | | | | 6.08 | | | | (9.80 | ) | | | 2.37 | |
| Total from investment operations | | | 2.79 | | | | 4.21 | | | | 6.06 | | | | (9.71 | ) | | | 2.39 | |
| Less distributions: | | | | | | | | | | | | | | | | | | | | |
| Net investment income | | | — | | | | — | | | | (0.04 | ) | | | (0.01 | ) | | | — | |
| Realized capital gains | | | — | | | | — | | | | (0.01 | ) | | | — | | | | — | |
| Total distributions | | | — | | | | — | | | | (0.05 | ) | | | (0.01 | ) | | | — | |
| Net asset value at end of period | | $ | 27.74 | | | $ | 24.95 | | | $ | 20.74 | | | $ | 14.73 | | | $ | 24.45 | |
| Total return(B) | | | 11.18 | % | | | 20.30 | % | | | 41.15 | % | | | (39.71 | )% | | | 10.83 | % |
| Ratios and supplemental data: | | | | | | | | | | | | | | | | | | | | |
| Net assets at end of period (000's) | | $ | 238,488 | | | $ | 291,827 | | | $ | 334,465 | | | $ | 418,808 | | | $ | 719,488 | |
| Ratio to average net assets: | | | | | | | | | | | | | | | | | | | | |
| Net expenses | | | 1.25 | % | | | 1.25 | % | | | 1.25 | % | | | 1.25 | % | | | 1.25 | % |
| Gross expenses | | | 1.35 | % | | | 1.36 | % | | | 1.37 | % | | | 1.33 | % | | | 1.33 | % |
| Net investment income (loss) | | | 0.08 | % | | | (0.36 | )% | | | (0.29 | )% | | | 0.41 | % | | | 0.06 | % |
| Portfolio turnover rate | | | 91 | % | | | 76 | % | | | 83 | % | | | 126 | % | | | 72 | % |
Touchstone Large Cap Growth Fund — Class B
Selected Data for a Share Outstanding
| | | Year Ended March 31, | |
| | | 2012 | | | 2011 | | | 2010 | | | 2009 | | | 2008 | |
| Net asset value at beginning of period | | $ | 23.85 | | | $ | 19.93 | | | $ | 14.22 | | | $ | 23.68 | | | $ | 21.46 | |
| Income (loss) from investment operations: | | | | | | | | | | | | | | | | | | | | |
| Net investment loss | | | (0.03 | )(A) | | | (0.20 | ) | | | (0.44 | ) | | | (0.08 | ) | | | (0.15 | ) |
| Net realized gains (losses) on investments | | | 2.65 | | | | 4.12 | | | | 6.15 | | | | (9.38 | ) | | | 2.37 | |
| Total from investment operations | | | 2.62 | | | | 3.92 | | | | 5.71 | | | | (9.46 | ) | | | 2.22 | |
| Net asset value at end of period | | $ | 26.47 | | | $ | 23.85 | | | $ | 19.93 | | | $ | 14.22 | | | $ | 23.68 | |
| Total return(B) | | | 10.99 | % | | | 19.67 | % | �� | | 40.15 | % | | | (39.95 | )% | | | 10.34 | % |
| Ratios and supplemental data: | | | | | | | | | | | | | | | | | | | | |
| Net assets at end of period (000's) | | $ | 10,949 | | | $ | 13,467 | | | $ | 14,897 | | | $ | 14,186 | | | $ | 29,829 | |
| Ratio to average net assets: | | | | | | | | | | | | | | | | | | | | |
| Net expenses | | | 1.45 | % | | | 1.74 | % | | | 2.00 | % | | | 2.00 | % | | | 2.00 | % |
| Gross expenses | | | 1.45 | % | | | 1.83 | % | | | 2.29 | % | | | 2.20 | % | | | 2.18 | % |
| Net investment loss | | | (0.12 | )% | | | (0.85 | )% | | | (1.05 | )% | | | (0.35 | )% | | | (0.65 | )% |
| Portfolio turnover rate | | | 91 | % | | | 76 | % | | | 83 | % | | | 126 | % | | | 72 | % |
| (A) | The net investment income per share is based on average shares outstanding for the period. |
| (B) | Total returns shown exclude the effect of applicable sales loads. If these charges were included, the return would be lower. |
See accompanying notes to financial statements.
Financial Highlights (Continued)
Touchstone Large Cap Growth Fund — Class C
Selected Data for a Share Outstanding
| | | Year Ended March 31, | |
| | | 2012 | | | 2011 | | | 2010 | | | 2009 | | | 2008 | |
| Net asset value at beginning of period | | $ | 23.84 | | | $ | 19.97 | | | $ | 14.25 | | | $ | 23.74 | | | $ | 21.52 | |
| Income (loss) from investment operations: | | | | | | | | | | | | | | | | | | | | |
| Net investment loss | | | (0.16 | )(A) | | | (0.27 | ) | | | (0.22 | ) | | | (0.07 | ) | | | (0.14 | ) |
| Net realized and unrealized gains (losses) on investments | | | 2.63 | | | | 4.14 | | | | 5.94 | | | | (9.42 | ) | | | 2.36 | |
| Total from investment operations | | | 2.47 | | | | 3.87 | | | | 5.72 | | | | (9.49 | ) | | | 2.22 | |
| Net asset value at end of period | | $ | 26.31 | | | $ | 23.84 | | | $ | 19.97 | | | $ | 14.25 | | | $ | 23.74 | |
| Total return(B) | | | 10.36 | % | | | 19.38 | % | | | 40.14 | % | | | (39.97 | )% | | | 10.32 | % |
| Ratios and supplemental data: | | | | | | | | | | | | | | | | | | | | |
| Net assets at end of period (000's) | | $ | 116,350 | | | $ | 127,172 | | | $ | 142,179 | | | $ | 137,641 | | | $ | 236,582 | |
| Ratio to average net assets: | | | | | | | | | | | | | | | | | | | | |
| Net expenses | | | 2.00 | % | | | 2.00 | % | | | 2.00 | % | | | 2.00 | % | | | 2.00 | % |
| Gross expenses | | | 2.09 | % | | | 2.13 | % | | | 2.16 | % | | | 2.11 | % | | | 2.09 | % |
| Net investment loss | | | (0.67 | )% | | | (1.11 | )% | | | (1.05 | )% | | | (0.33 | )% | | | (0.66 | )% |
| Portfolio turnover rate | | | 91 | % | | | 76 | % | | | 83 | % | | | 126 | % | | | 72 | % |
Touchstone Large Cap Growth Fund — Class Y
Selected Data for a Share Outstanding
| | | Year Ended March 31, | |
| | | 2012 | | | 2011 | | | 2010 | | | 2009 | | | 2008 | |
| Net asset value at beginning of period | | $ | 25.19 | | | $ | 20.89 | | | $ | 14.84 | | | $ | 24.64 | | | $ | 22.19 | |
| Income (loss) from investment operations: | | | | | | | | | | | | | | | | | | | | |
| Net investment income (loss) | | | 0.09 | (A) | | | (0.02 | ) | | | (0.01 | ) | | | 0.10 | | | | 0.05 | |
| Net realized and unrealized gains (losses) on investments | | | 2.81 | | | | 4.32 | | | | 6.17 | | | | (9.85 | ) | | | 2.40 | |
| Total from investment operations | | | 2.90 | | | | 4.30 | | | | 6.16 | | | | (9.75 | ) | | | 2.45 | |
| Distributions from: | | | | | | | | | | | | | | | | | | | | |
| Net investment income | | | — | | | | — | | | | (0.10 | ) | | | (0.05 | ) | | | — | |
| Realized capital gains | | | — | | | | — | | | | (0.01 | ) | | | — | | | | — | |
| Total distributions | | | — | | | | — | | | | (0.11 | ) | | | (0.05 | ) | | | — | |
| Net asset value at end of period | | $ | 28.09 | | | $ | 25.19 | | | $ | 20.89 | | | $ | 14.84 | | | $ | 24.64 | |
| Total return | | | 11.47 | % | | | 20.58 | % | | | 41.53 | % | | | (39.58 | )% | | | 11.04 | % |
| Ratios and supplemental data: | | | | | | | | | | | | | | | | | | | | |
| Net assets at end of period (000's) | | $ | 385,411 | | | $ | 331,733 | | | $ | 352,847 | | | $ | 206,369 | | | $ | 31,679 | |
| Ratio to average net assets: | | | | | | | | | | | | | | | | | | | | |
| Net expenses | | | 0.99 | % | | | 0.99 | % | | | 0.99 | % | | | 0.97 | % | | | 1.00 | % |
| Gross expenses | | | 1.14 | % | | | 1.13 | % | | | 1.06 | % | | | 1.06 | % | | | 1.04 | % |
| Net investment income (loss) | | | 0.34 | % | | | (0.10 | )% | | | (0.06 | )% | | | 0.95 | % | | | 0.21 | % |
| Portfolio turnover rate | | | 91 | % | | | 76 | % | | | 83 | % | | | 126 | % | | | 72 | % |
| (A) | The net investment income per share is based on average shares outstanding for the period. |
| (B) | Total returns shown exclude the effect of applicable sales loads. If these charges were included, the return would be lower. |
See accompanying notes to financial statements.
Financial Highlights (Continued)
Touchstone Mid Cap Growth Fund — Class A
Selected Data for a Share Outstanding
| | | Year Ended March 31, | |
| | | 2012 | | | 2011 | | | 2010 | | | 2009 | | | 2008 | |
| Net asset value at beginning of period | | $ | 24.91 | | | $ | 20.18 | | | $ | 12.95 | | | $ | 21.16 | | | $ | 24.17 | |
| Income (loss) from investment operations: | | | | | | | | | | | | | | | | | | | | |
| Net investment loss | | | (0.16 | ) | | | (0.03 | ) | | | (0.03 | ) | | | (0.01 | ) | | | (0.12 | ) |
| Net realized and unrealized gains (losses) on investments | | | (1.05 | ) | | | 4.76 | | | | 7.26 | | | | (7.96 | ) | | | 0.01 | |
| Total from investment operations | | | (1.21 | ) | | | 4.73 | | | | 7.23 | | | | (7.97 | ) | | | (0.11 | ) |
| Distributions from: | | | | | | | | | | | | | | | | | | | | |
| Realized capital gains | | | (1.29 | ) | | | — | | | | — | | | | (0.24 | ) | | | (2.90 | ) |
| Net asset value at end of period | | $ | 22.41 | | | $ | 24.91 | | | $ | 20.18 | | | $ | 12.95 | | | $ | 21.16 | |
| Total return(A) | | | (3.68 | )% | | | 23.44 | % | | | 55.83 | % | | | (37.67 | )% | | | (1.53 | )% |
| Ratios and supplemental data: | | | | | | | | | | | | | | | | | | | | |
| Net assets at end of period (000's) | | $ | 330,808 | | | $ | 584,089 | | | $ | 583,543 | | | $ | 397,756 | | | $ | 649,891 | |
| Ratio to average net assets: | | | | | | | | | | | | | | | | | | | | |
| Net expenses | | | 1.40 | % | | | 1.47 | % | | | 1.50 | % | | | 1.50 | % | | | 1.47 | % |
| Gross expenses | | | 1.40 | % | | | 1.47 | % | | | 1.51 | % | | | 1.53 | % | | | 1.47 | % |
| Net investment loss | | | (0.79 | )% | | | (0.13 | )% | | | (0.15 | )% | | | (0.70 | )% | | | (0.53 | )% |
| Portfolio turnover rate | | | 64 | % | | | 99 | % | | | 62 | % | | | 71 | % | | | 64 | % |
Touchstone Mid Cap Growth Fund — Class B
Selected Data for a Share Outstanding
| | | Year Ended March 31, | |
| | | 2012 | | | 2011 | | | 2010 | | | 2009 | | | 2008 | |
| Net asset value at beginning of period | | $ | 20.89 | | | $ | 16.98 | | | $ | 10.98 | | | $ | 18.13 | | | $ | 21.25 | |
| Income (loss) from investment operations: | | | | | | | | | | | | | | | | | | | | |
| Net investment loss | | | (0.48 | ) | | | (0.10 | ) | | | (0.16 | ) | | | (0.15 | ) | | | (0.28 | ) |
| Net realized and unrealized gains (losses) on investments | | | (0.64 | ) | | | 4.01 | | | | 6.16 | | | | (6.76 | ) | | | 0.06 | |
| Total from investment operations | | | (1.12 | ) | | | 3.91 | | | | 6.00 | | | | (6.91 | ) | | | (0.22 | ) |
| Distributions from: | | | | | | | | | | | | | | | | | | | | |
| Realized capital gains | | | (1.29 | ) | | | — | | | | — | | | | (0.24 | ) | | | (2.90 | ) |
| Net asset value at end of period | | $ | 18.48 | | | $ | 20.89 | | | $ | 16.98 | | | $ | 10.98 | | | $ | 18.13 | |
| Total return(A) | | | (3.99 | )% | | | 23.03 | % | | | 54.64 | % | | | (38.12 | )% | | | (2.29 | )% |
| Ratios and supplemental data: | | | | | | | | | | | | | | | | | | | | |
| Net assets at end of period (000's) | | $ | 10,681 | | | $ | 23,376 | | | $ | 32,762 | | | $ | 29,521 | | | $ | 61,977 | |
| Ratio to average net assets: | | | | | | | | | | | | | | | | | | | | |
| Net expenses | | | 1.59 | % | | | 1.77 | % | | | 2.25 | % | | | 2.25 | % | | | 2.25 | % |
| Gross expenses | | | 1.59 | % | | | 1.82 | % | | | 2.38 | % | | | 2.34 | % | | | 2.27 | % |
| Net investment loss | | | (0.97 | )% | | | (0.43 | )% | | | (0.90 | )% | | | (0.85 | )% | | | (1.31 | )% |
| Portfolio turnover rate | | | 64 | % | | | 99 | % | | | 62 | % | | | 71 | % | | | 64 | % |
| (A) | Total returns shown exclude the effect of applicable sales loads. If these charges were included, the return would be lower. |
See accompanying notes to financial statements.
Financial Highlights (Continued)
Touchstone Mid Cap Growth Fund — Class C
Selected Data for a Share Outstanding
| | | Year Ended March 31, | |
| | | 2012 | | | 2011 | | | 2010 | | | 2009 | | | 2008 | |
| Net asset value at beginning of period | | $ | 20.81 | | | $ | 17.00 | | | $ | 10.99 | | | $ | 18.15 | | | $ | 21.27 | |
| Income (loss) from investment operations: | | | | | | | | | | | | | | | | | | | | |
| Net investment loss | | | (0.36 | ) | | | (0.17 | ) | | | (0.14 | ) | | | (0.14 | ) | | | (0.27 | ) |
| Net realized and unrealized gains (losses) on investments | | | (0.85 | ) | | | 3.98 | | | | 6.15 | | | | (6.78 | ) | | | 0.05 | |
| Total from investment operations | | | (1.21 | ) | | | 3.81 | | | | 6.01 | | | | (6.92 | ) | | | (0.22 | ) |
| Distributions from: | | | | | | | | | | | | | | | | | | | | |
| Realized capital gains | | | (1.29 | ) | | | — | | | | — | | | | (0.24 | ) | | | (2.90 | ) |
| Net asset value at end of period | | $ | 18.31 | | | $ | 20.81 | | | $ | 17.00 | | | $ | 10.99 | | | $ | 18.15 | |
| Total return(A) | | | (4.43 | )% | | | 22.41 | % | | | 54.69 | % | | | (38.14 | )% | | | (2.28 | )% |
| Ratios and supplemental data: | | | | | | | | | | | | | | | | | | | | |
| Net assets at end of period (000's) | | $ | 162,693 | | | $ | 223,376 | | | $ | 218,413 | | | $ | 158,782 | | | $ | 302,422 | |
| Ratio to average net assets: | | | | | | | | | | | | | | | | | | | | |
| Net expenses | | | 2.17 | % | | | 2.24 | % | | | 2.25 | % | | | 2.25 | % | | | 2.24 | % |
| Gross expenses | | | 2.17 | % | | | 2.27 | % | | | 2.31 | % | | | 2.31 | % | | | 2.24 | % |
| Net investment loss | | | (1.56 | )% | | | (0.90 | )% | | | (0.90 | )% | | | (0.84 | )% | | | (1.30 | )% |
| Portfolio turnover rate | | | 64 | % | | | 99 | % | | | 62 | % | | | 71 | % | | | 64 | % |
Touchstone Mid Cap Growth Fund — Class Y
Selected Data for a Share Outstanding
| | | | | | | | | | | | Period | |
| | | Year Ended | | | Ended | |
| | | March 31, | | | March 31, | |
| | | 2012 | | | 2011 | | | 2010 | | | 2009 (B) | |
| Net asset value at beginning of period | | $ | 25.07 | | | $ | 20.27 | | | $ | 12.96 | | | $ | 13.20 | |
| Income (loss) from investment operations: | | | | | | | | | | | | | | | | |
| Net investment income (loss) | | | (0.10 | ) | | | 0.01 | | | | 0.01 | | | | 0.02 | |
| Net realized and unrealized gains (losses) on investments | | | (1.05 | ) | | | 4.79 | | | | 7.30 | | | | (0.26 | ) |
| Total from investment operations | | | (1.15 | ) | | | 4.80 | | | | 7.31 | | | | (0.24 | ) |
| Distributions from: | | | | | | | | | | | | | | | | |
| Realized capital gains | | | (1.29 | ) | | | — | | | | — | | | | — | |
| Net asset value at end of period | | $ | 22.63 | | | $ | 25.07 | | | $ | 20.27 | | | $ | 12.96 | |
| Total return(A) | | | (3.42 | )% | | | 23.68 | % | | | 56.40 | % | | | (1.82 | )%(C) |
| Ratios and supplemental data: | | | | | | | | | | | | | | | | |
| Net assets at end of period (000's) | | $ | 123,593 | | | $ | 47,470 | | | $ | 26,162 | | | $ | 3 | |
| Ratio to average net assets: | | | | | | | | | | | | | | | | |
| Net expenses | | | 1.11 | % | | | 1.24 | % | | | 1.25 | % | | | 1.25 | %(D) |
| Gross expenses | | | 1.11 | % | | | 1.24 | % | | | 1.26 | % | | | 1.63 | %(D) |
| Net investment loss | | | (0.49 | )% | | | 0.05 | % | | | 0.14 | % | | | 1.11 | %(D) |
| Portfolio turnover rate | | | 64 | % | | | 99 | % | | | 62 | % | | | 71 | %(C) |
| (A) | Total returns shown exclude the effect of applicable sales loads. If these charges were included, the return would be lower. |
| (B) | Represents the period from commencement of operations (February 2, 2009) through March 31, 2009. |
See accompanying notes to financial statements.
Financial Highlights (Continued)
Touchstone Mid Cap Growth Fund — Class Institutional
Selected Data for a Share Outstanding
| | | Period Ended | |
| | | March 31, | |
| | | 2012 (A) | |
| Net asset value at beginning of period | | $ | 25.30 | |
| Income (loss) from investment operations: | | | | |
| Net investment loss | | | (0.03 | ) |
| Net realized and unrealized loss on investments | | | (1.33 | ) |
| Total from investment operations | | | (1.36 | ) |
| Distributions from: | | | | |
| Realized capital gains | | | (1.29 | ) |
| Net asset value at end of period | | $ | 22.65 | |
| Total return | | | (4.22 | )%(B) |
| Ratios and supplemental data: | | | | |
| Net assets at end of period (000's) | | $ | 25,550 | |
| Ratio to average net assets: | | | | |
| Net expenses | | | 1.03 | %(C) |
| Gross expenses | | | 1.17 | %(C) |
| Net investment loss | | | (0.41 | )%(C) |
| Portfolio turnover rate | | | 64 | %(B) |
| (A) | Represents the period from commencement of operations (April 1, 2011) through March 31, 2012. |
See accompanying notes to financial statements.
Notes to Financial Statements
March 31, 2012
1. Organization
The Touchstone Strategic Trust (the “Trust”) is registered under the Investment Company Act of 1940, as amended, (the “1940 Act”) as an open-end management investment company. The Trust was established as a Massachusetts business trust under a Declaration of Trust dated November 18, 1982. The Trust consists of the following four funds, individually, a “Fund”, and collectively, the “Funds”:
Touchstone Diversified Small Cap Growth Fund (“Diversified Small Cap Growth Fund”)
Touchstone Growth Opportunities Fund (“Growth Opportunities Fund”)
Touchstone Large Cap Growth Fund (“Large Cap Growth Fund”)
Touchstone Mid Cap Growth Fund (“Mid Cap Growth Fund”)
The Diversified Small Cap Growth Fund and the Mid Cap Growth Fund are each an open-end, diversified, management investment company. The Growth Opportunities Fund and the Large Cap Growth Fund are each an open-end, non-diversified management investment company.
The Declaration of Trust permits the Trust to issue an unlimited number of shares of beneficial interest of each Fund. The Funds are registered to offer different classes of shares: Class A shares, Class B shares, Class C shares, Class Y shares, and Institutional Class shares. The assets of each Fund are segregated, and a shareholder’s interest is limited to the Fund in which shares are held. The Funds’ prospectus provides a description of each Fund’s investment objectives, policies, and strategies along with information on the classes of shares currently being offered.
2. Significant Accounting Policies
The following is a summary of the Funds’ significant accounting policies:
Security valuation and fair value measurements — All investments in securities are recorded at their estimated fair value. The Funds use various methods to measure fair value of their portfolio securities on a recurring basis. U.S. GAAP establishes a hierarchy that prioritizes inputs to valuation methods. These inputs are summarized in the three broad levels listed below:
| • | Level 1 – | quoted prices in active markets for identical securities |
| | | |
| • | Level 2 – | other significant observable inputs (including quoted prices for similar securities, interest rates, prepayment speeds, credit risk, etc.) |
| | | |
| • | Level 3 – | significant unobservable inputs (including the Fund’s own assumptions in determining the fair value of investments) |
The inputs or methodology used for valuing securities are not necessarily an indication of the risk associated with investing in those securities. For example, money market instruments are valued using amortized cost, in accordance with rules under the 1940 Act. Generally, amortized cost approximates the current fair value of a security, but since the value is not obtained from a quoted price in an active market, such securities are reflected as Level 2. Transfers in and out of the levels are recognized at the value at the end of the period. During the period ended March 31, 2012, there were no transfers between Levels 1, 2 and 3.
The aggregate value by input level, as of March 31, 2012, for each Fund’s investments, as well as a reconciliation of assets for which significant unobservable inputs (Level 3) were used in determining value, if applicable, is included in each Fund’s Portfolio of Investments, which also includes a breakdown of the Fund’s investments by geographic/industry concentration.
Notes to Financial Statements (Continued)
The Funds’ portfolio securities are valued as of the close of the regular session of trading on the New York Stock Exchange (currently 4:00 p.m., Eastern time). Portfolio securities traded on stock exchanges are valued at the last sale price, and to the extent these securities are actively traded, they are categorized in Level 1 of the fair value hierarchy. Portfolio securities quoted by NASDAQ are valued at the NASDAQ Official Closing Price (“NOCP”). Securities not traded on a particular day, or for which the last sale price is not readily available, are valued at their last broker-quoted bid prices as obtained from one or more of the major market makers for such securities by an independent pricing service and are categorized in Level 2. Money market instruments and other debt securities with a remaining maturity of less than 60 days are valued at amortized cost, which approximates market value and are categorized in Level 2. Securities for which market quotations or the NOCP are not readily available are valued based on fair value as determined by or under the direction of the Board of Trustees and are categorized in Level 3. Shares of open end mutual funds in which the Funds invest are valued at their respective net asset values as reported by the underlying funds and are categorized in Level 1. The prices for foreign securities are reported in local currency and converted to U.S. dollars using currency exchange rates.
For securities that principally trade on a foreign market or exchange, a significant gap in time can exist between the time of a particular security’s last trade and the time at which a Fund calculates its net asset value. The closing prices of such securities may no longer reflect their market value at the time the Fund calculates its net asset value if an event that could materially affect the value of those securities (a “Significant Event”) has occurred between the time of the security’s last close and the time that the Fund calculates its net asset value.
A Significant Event may relate to a single issuer or to an entire market sector. If the Advisor or Sub-Advisor of a Fund becomes aware of a Significant Event that has occurred with respect to a security or group of securities after the closing of the exchange or market on which the security or securities principally trade, but before the time at which the Fund calculates its net asset value, it may request that a Fair Value Committee Meeting be called. In addition, the Funds’ Administrator or Sub-Administrator monitors price movements among certain selected indices, securities and/or baskets of securities that may be an indicator that the closing prices received earlier from foreign exchanges or markets may not reflect market value at the time the Fund calculates its net asset value. If price movements in a monitored index or security exceed levels established by the Advisor, the Sub-Administrator notifies the Advisor or Sub-Advisor for any Fund holding the relevant securities that such limits have been exceeded. In such event, the Advisor makes the determination whether a Fair Value Committee meeting should be called based on the information provided. These securities are categorized in Level 2.
New accounting pronouncements — In May 2011, the Financial Accounting Standards Board (FASB) issued Accounting Standards Update (ASU) No. 2011-04, “Amendments to Achieve Common Fair Value Measurement and Disclosure Requirements in GAAP and the International Financial Reporting Standards (IFRS).” ASU 2011-04 includes common requirements for measurement of and disclosure about fair value between U.S. GAAP and IFRS. ASU 2011-04 will require reporting entities to categorize within Level 3 of the fair value hierarchy: quantitative information about the unobservable inputs used in the fair value measurement; the valuation processes used by the reporting entity; and a narrative description of the sensitivity of the fair value measurement to changes in unobservable inputs and the interrelationships between those unobservable inputs. In addition, ASU 2011-04 will require reporting entities to make disclosures about amounts and reasons for all transfers in and out of Level 1 and Level 2 fair value measurements. The new and revised dsisclosures are effective for fiscal years beginning after December 15, 2011 and for interim periods within those fiscal years. Management is currently evaluating the implications of ASU 2011-04 and its impact on the financial statements.
In December 2011, the FASB issued Accounting Standards Update No. 2011-11, Disclosures about Offsetting Assets and Liabilities (“ASU 2011-11”). ASU 2011-11 requires disclosures to make financial statements that are prepared under U.S. GAAP more comparable to those prepared under IFRS. The new disclosure requirements mandate that entities disclose both gross and net informantion about instruments and transactions eligible for offset in the statement of assets and liabilities as well as instruments and transactions subject to an agreement similar to a master netting arrangement. In addition, ASU 2011-11 requires disclosure of collateral received and posted in connection with master netting agreements or similar arrangements. New disclosures are required for annual reporting periods beginning on or after January 1, 2013, and interim periods within those annual periods. Management is evaluating the impact of ASU 2011-11 on the financial statements and disclosures.
Notes to Financial Statements (Continued)
Foreign currency translation — The books and records of the Funds are maintained in U.S. dollars and translated into U.S. dollars on the following basis:
| (1) | market value of investment securities, assets and liabilities at the current rate of exchange on the valuation date; and |
| (2) | purchases and sales of investment securities, income and expenses at the relevant rates of exchange prevailing on the respective dates of such transactions. |
The Funds do not isolate that portion of gains and losses on investments in equity securities that is due to changes in the foreign exchange rates from that which is due to changes in market prices of equity securities.
Portfolio securities loaned — Each Fund may lend its portfolio securities. Lending portfolio securities exposes a Fund to the risk that the borrower may fail to return the loaned securities or may not be able to provide additional collateral or that the Fund may experience delays in recovery of the loaned securities or loss of rights in the collateral if the borrower fails financially. To minimize these risks, the borrower must agree to maintain cash collateral with the Funds’ custodian in an amount at least equal to the market value of the loaned securities. The cash collateral is reinvested by the Funds’ custodian into an approved investment vehicle.
As of March 31, 2012, the following Funds loaned securities and received collateral as follows:
| | | Fair Value of | | | Value of | |
| | | Securities | | | Collateral | |
| Fund | | Loaned | | | Received | |
| Diversified Small Cap Growth Fund | | $ | 1,983,956 | | | $ | 2,036,444 | |
| Growth Opportunities Fund | | | 2,332,440 | | | | 2,376,000 | |
| Large Cap Growth Fund | | | 10,244,740 | | | | 10,474,500 | |
| Mid Cap Growth Fund | | | 6,531,699 | | | | 6,609,283 | |
All collateral received as cash is received, held and administered by the Funds’ custodian for the benefit of the Funds in the applicable custody account or other account established for the purpose of holding collateral.
Funds participating in securities lending receive compensation in the form of fees, or retain a portion of interest or dividends on the investment of any cash received as collateral. The Funds also continue to receive interest or dividends on the securities loaned. The loaned securities are secured by collateral valued at least equal, at all times, to the fair value of the securities loaned plus accrued interest.
Unrealized gain or loss on the fair value of the securities loaned that may occur during the term of the loan is recognized by the Funds. The Funds have the right under the lending agreement to recover the securities from the borrower on demand.
Share valuation — The net asset value per share of each class of shares of each Fund is calculated daily by dividing the total value of a Fund’s assets attributable to that class, less liabilities attributable to that class, by the number of outstanding shares of that class.
The maximum offering price per share of Class A shares of the Funds is equal to the net asset value per share plus a sales load equal to 6.10% of the net asset value (or 5.75% of the offering price). The maximum offering price per share of Class B, Class C, Class Y, and Institutional Class shares of the Funds is equal to the net asset value per share.
Notes to Financial Statements (Continued)
The redemption price per share of each class of shares of the Funds is equal to the net asset value per share. However, Class B shares of the Funds are subject to a contingent deferred sales load of 5.00% in the event of a shareholder redemption within a one-year period of purchase. The contingent deferred sales load will be incrementally reduced over time. After the 6th year, there is no contingent deferred sales load. Class C shares of the Funds are subject to a contingent deferred sales load of 1.00% of the original purchase price if redeemed within a one-year period from the date of purchase.
Investment income — Dividend income from securities is recognized on the ex-dividend date, net of foreign withholding taxes, if any, which are reduced by any amounts reclaimable by the Funds, where applicable. Interest income from securities is recorded on the basis of interest accrued, premium amortized and discount accreted.
Distributions to shareholders — Each Fund declares and distributes net investment income, if any, annually, as a dividend to shareholders. Any net realized capital gains on sales of securities for all Funds are distributed to shareholders at least annually. Income distributions and capital gain distributions are determined in accordance with income tax regulations.
Allocations — Investment income earned, realized capital gains and losses, and unrealized appreciation and depreciation for the Funds are allocated daily to each class of shares based upon its proportionate share of total net assets of the Fund. Class specific expenses are charged directly to the class incurring the expense. Common expenses, which are not attributable to a specific class, are allocated daily to each class of shares based upon their proportionate share of total net assets of the Fund. Expenses not directly billed to a Fund are allocated proportionally among all Funds daily in relation to net assets of each Fund or another reasonable measure.
Security transactions — Security transactions are reflected for financial reporting purposes as of the trade date, which may cause the net asset value (“NAV”) as stated in the accompanying financial statements to be different than the NAV applied to Fund share transactions. Realized gains and losses on sales of portfolio securities are calculated using the identified cost basis.
Estimates — The preparation of financial statements in conformity with U.S. GAAP requires management to make estimates and assumptions that affect the reported amounts of assets and liabilities and disclosure of contingent assets and liabilities at the date of the financial statements and the reported amounts of income and expenses during the reporting period. Actual results could differ from those estimates.
3. Investment Transactions
Investment transactions (excluding short-term investments and U.S. Government securities) were as follows for the period ended March 31, 2012:
| | | Diversified | | | Growth | | | Large Cap | | | Mid Cap | |
| | | Small Cap | | | Opportunities | | | Growth | | | Growth | |
| | | Growth Fund | | | Fund | | | Fund | | | Fund | |
| Purchases of investment securities | | $ | 21,755,406 | | | $ | 319,256,674 | | | $ | 647,834,035 | | | $ | 458,520,422 | |
| Proceeds from sales and maturities | | $ | 23,835,713 | | | $ | 326,634,102 | | | $ | 731,168,516 | | | $ | 640,060,310 | |
4. Transactions with Affiliates and Other Related Parties
Certain officers of the Trust are also officers of the Advisor (Touchstone Advisors, Inc.), the Underwriter (Touchstone Securities, Inc.) and/or BNY Mellon Investment Servicing (U.S) Inc. (“BNY Mellon”) the Sub-Administrator and Transfer Agent to the Funds. The Advisor and Underwriter are each wholly owned, indirect subsidiaries of The Western and Southern Life Insurance Company (“Western-Southern”).
Notes to Financial Statements (Continued)
MANAGEMENT & EXPENSE LIMITATIONS AGREEMENTS
The Advisor provides general investment supervisory services for the Funds, under terms of an Advisory Agreement. Under the Advisory Agreement, the Funds pay the Advisor a fee, which is computed and accrued daily and paid monthly, at an annual rate based on average daily net assets as shown in the table below.
| Diversified Small Cap Growth Fund | 1.05% |
| Growth Opportunities Fund | 0.75% on the first $500 million |
| | 0.70% of the next $500 million |
| | 0.65% of such assets in excess of $1 billion |
| Large Cap Growth Fund | 0.75% on the first $200 million |
| | 0.70% of the next $800 million |
| | 0.65% of such assets in excess of $1 billion |
| Mid Cap Growth Fund | 0.75% on the first $500 million |
| | 0.70% of the next $500 million |
| | 0.65% of such assets in excess of $1 billion |
The Advisor has entered into investment sub-advisory agreements with the following parties:
Fort Washington Investment Advisors, Inc.*
Diversified Small Cap Growth Fund
Navellier & Associates, Inc.
Large Cap Growth Fund
Westfield Capital Management Company, L.P.
Growth Opportunities Fund
Mid Cap Growth Fund
| * | Affiliate of the Advisor |
The Advisor, not the Funds, pays sub-advisory fees to each Sub-Advisor.
The Advisor entered into an Expense Limitation Agreement to contractually limit operating expenses of the Funds. The maximum operating expense limit in any year with respect to the Funds is based on a percentage of the average daily net assets of the Funds. The Advisor has agreed to waive advisory fees, administration fees and reimburse expenses in order to maintain expense limitations for the Funds as follows:
| | | | | | | | | | | | | | | Institutional | |
| | | Class A | | | Class B | | | Class C | | | Class Y | | | Class | |
| Diversified Small Cap Growth Fund | | | 1.40 | % | | | — | | | | 2.15 | % | | | 1.15 | % | | | — | |
| Growth Opportunities Fund* | | | 1.24 | % | | | — | | | | 1.99 | % | | | 0.99 | % | | | 0.84 | % |
| Large Cap Growth Fund | | | 1.25 | % | | | 2.00 | % | | | 2.00 | % | | | 0.99 | % | | | — | |
| Mid Cap Growth Fund | | | 1.43 | % | | | 2.18 | % | | | 2.18 | % | | | 1.18 | % | | | 1.03 | % |
| * | Prior to July 29, 2011, the expense limitations for Class A, Class C, Class Y, and Institutional Class shares of Growth Opportunities Fund were 1.15%, 1.90%, 0.90%, and 0.75%, respectively. |
These expense limitations will remain in effect until at least July 28, 2012.
Notes to Financial Statements (Continued)
During the period ended March 31, 2012, the Advisor waived investment advisory fees and administration fees and/or reimbursed expenses of the Funds as follows:
| | | Investment | | | | | | Other Operating | |
| | | Advisory | | | Administration | | | Expenses | |
| | | Fees Waived | | | Fees Waived | | | Reimbursed | |
| Diversified Small Cap Growth Fund | | $ | 17,190 | | | $ | 67,555 | | | $ | 112,010 | |
| Growth Opportunities Fund | | | 12,627 | | | | 316,755 | | | | 81,258 | |
| Large Cap Growth Fund | | | — | | | | — | | | | 886,943 | |
| Mid Cap Growth Fund | | | — | | | | — | | | | 13,157 | |
ADMINISTRATION AGREEMENT
The Advisor entered into an Administration and Accounting Services Agreement with the Trust, whereby the Advisor is responsible for: supplying executive and regulatory compliance services; supervising the preparation of tax returns; coordinating the preparation of reports to shareholders and reports to, and filings with, the Securities and Exchange Commission and state securities authorities, as well as materials for meetings of the Board of Trustees; calculating the daily net asset value per share; and maintaining the financial books and records of each Fund. For its services, the Advisor receives an annual fee of 0.20% of the aggregate average daily net assets of the Trust, Touchstone Investment Trust (excluding Institutional Money Market Fund), Touchstone Funds Group Trust, and Touchstone Tax-Free Trust up to and including $6 billion; 0.16% of the next $4 billion of aggregate average daily net assets; and 0.12% of the aggregate average daily net assets of all such assets in excess of $10 billion. The fee is allocated among the Funds on the basis of relative daily net assets.
Effective November 5, 2011, the Advisor has engaged BNY Mellon as the Sub-Administrator to the Trust. BNY Mellon provides administrator and accounting services to the Trust and is compensated directly by the Advisor, not the Trust. Prior to November 5, 2011, JPMorgan Chase Bank, N.A.(“JPMorgan”) served as the Sub-Administrator and was compensated directly by the Advisor, not the Trust.
TRANSFER AGENT AGREEMENT
Effective December 5, 2011, under the terms of the Transfer Agent Agreement between the Trust and BNY Mellon, BNY Mellon maintains the records of each shareholder’s account, answers shareholders’ inquiries concerning their accounts, processes purchases and redemptions of each Fund’s shares, acts as dividend and distribution disbursing agent and performs other shareholder service functions. For these services, BNY Mellon receives a monthly fee per shareholder account from each Fund. In addition, each Fund pays out-of-pocket expenses incurred by BNY Mellon, including, but not limited to, postage and supplies.
Prior to December 5, 2011, under the terms of the Transfer Agent Agreement between the Trust and JPMorgan, JPMorgan maintained the records of each shareholder’s account, answered shareholders’ inquiries concerning their accounts, processed purchases and redemptions of each Fund’s shares, acted as dividend and distribution disbursing agent and performed other shareholder service functions. For these services, JPMorgan received a monthly fee per shareholder account from each Fund. In addition, each Fund paid out-of-pocket expenses incurred by JPMorgan, including, but not limited to, postage and supplies.
PLANS OF DISTRIBUTION
The Trust has a Plan of Distribution (Class A Plan) under which Class A shares of each Fund may directly incur or reimburse the Advisor or the Underwriter for expenses related to the distribution and promotion of shares. The annual limitation for payment of such expenses under the Class A Plan is 0.25% of average daily net assets attributable to such shares.
Notes to Financial Statements (Continued)
The Trust also has a Plan of Distribution (Class B and Class C Plan) under which Class B and Class C shares of each Fund may directly incur or reimburse the Advisor or the Underwriter for expenses related to the distribution and promotion of shares. The annual limitation for payment of such expenses under the Class B and Class C Plan is 1.00% of average daily net assets attributable to Class B and Class C shares.
UNDERWRITING AGREEMENT
The Underwriter is the Funds’ principal underwriter and, as such, acts as exclusive agent for distribution of the Funds’ shares. Under the terms of the Underwriting Agreement between the Trust and Underwriter, the Underwriter earned the following from underwriting and broker commissions on the sale of shares of the following Funds during the period ended March 31, 2012:
| | | Amount | |
| Diversified Small Cap Growth Fund | | $ | 1,144 | |
| Growth Opportunities Fund | | | 5,228 | |
| Large Cap Growth Fund | | | 34,685 | |
| Mid Cap Growth Fund | | | 36,310 | |
In addition, the Underwriter collected contingent deferred sales charges on the redemption of Class C shares of the following Funds during the period ended March 31, 2012:
| | | Amount | |
| Diversified Small Cap Growth Fund | | $ | — | |
| Growth Opportunities Fund | | | — | |
| Large Cap Growth Fund | | | 2,971 | |
| Mid Cap Growth Fund | | | 5,587 | |
AFFILIATED INVESTMENTS
Each Fund may invest in the Touchstone Institutional Money Market Fund, subject to compliance with several conditions set forth in an order received by the Trust from the Securities and Exchange Commission. To the extent that the other Touchstone Funds are invested in the Touchstone Institutional Money Market Fund, the Advisor and Administrator will be paid additional fees from the Touchstone Institutional Money Market Fund that will not be waived or reimbursed.
A summary of each Fund’s investment, as applicable, in the Touchstone Institutional Money Market Fund for the period ended March 31, 2012, is as follows:
| | | Share Activity | | | | | | | |
| | | Balance | | | | | | | | | Balance | | | | | | Value | |
| | | 03/31/11 | | | Purchases | | | Sales | | | 03/31/12 | | | Dividends | | | 03/31/12 | |
| Diversified Small Cap Growth Fund | | | 570,303 | | | | 8,528,247 | | | | (7,901,919 | ) | | | 1,196,631 | | | $ | 1,015 | | | $ | 1,196,631 | |
| Growth Opportunities Fund | | | 5,960,100 | | | | 100,333,343 | | | | (106,293,443 | ) | | | - | | | $ | 4,507 | | | | - | |
| Large Cap Growth Fund | | | 18,843,499 | | | | 411,241,791 | | | | (422,552,612 | ) | | | 7,532,678 | | | $ | 16,113 | | | $ | 7,532,678 | |
| Mid Cap Growth Fund | | | 31,921,928 | | | | 345,222,850 | | | | (373,649,825 | ) | | | 3,494,953 | | | $ | 20,106 | | | $ | 3,494,953 | |
Notes to Financial Statements (Continued)
5. Capital Share Transactions
Proceeds and payments on capital shares as shown in the Statements of Changes in Net Assets are the result of the following capital share transactions for the periods shown:
| | | Diversified Small Cap | | | Growth | |
| | | Growth Fund | | | Opportunities Fund | |
| | | Year | | | Year | | | Year | | | Year | |
| | | Ended | | | Ended | | | Ended | | | Ended | |
| | | March 31, | | | March 31, | | | March 31, | | | March 31, | |
| | | 2012 | | | 2011 | | | 2012 | | | 2011 | |
| Class A | | | | | | | | | | | | | | | | |
| Shares issued | | | 77,886 | | | | 378,384 | | | | 638,852 | | | | 623,347 | |
| Shares reinvested | | | — | | | | — | | | | — | | | | 10,304 | |
| Shares issued in connection with merger (A) | | | — | | | | — | | | | — | | | | 2,139,892 | |
| Shares redeemed | | | (749,232 | ) | | | (430,679 | ) | | | (2,045,498 | ) | | | (479,910 | ) |
| Change in shares outstanding | | | (671,346 | ) | | | (52,295 | ) | | | (1,406,646 | ) | | | 2,293,633 | |
| Shares outstanding, beginning of period | | | 1,346,351 | | | | 1,398,646 | | | | 3,835,273 | | | | 1,541,640 | |
| Shares outstanding, end of period | | | 675,005 | | | | 1,346,351 | | | | 2,428,627 | | | | 3,835,273 | |
| Class C | | | | | | | | | | | | | | | | |
| Shares issued | | | 2,670 | | | | 2,077 | | | | 38,297 | | | | 63,300 | |
| Shares reinvested | | | — | | | | — | | | | — | | | | 604 | |
| Shares issued in connection with merger (A) | | | — | | | | — | | | | — | | | | 71,974 | |
| Shares redeemed | | | (36,230 | ) | | | (74,947 | ) | | | (103,410 | ) | | | (100,133 | ) |
| Change in shares outstanding | | | (33,560 | ) | | | (72,870 | ) | | | (65,113 | ) | | | 35,745 | |
| Shares outstanding, beginning of period | | | 216,147 | | | | 289,017 | | | | 450,685 | | | | 414,940 | |
| Shares outstanding, end of period | | | 182,587 | | | | 216,147 | | | | 385,572 | | | | 450,685 | |
| Class Y | | | | | | | | | | | | | | | | |
| Shares issued | | | 1,185,403 | | | | 321,331 | | | | 994,535 | | | | 38,582 | |
| Shares reinvested | | | — | | | | — | | | | — | | | | 356 | |
| Shares redeemed | | | (609,016 | ) | | | (956,921 | ) | | | (635,775 | ) | | | (28,974 | ) |
| Change in shares outstanding | | | 576,387 | | | | (635,590 | ) | | | 358,760 | | | | 9,964 | |
| Shares outstanding, beginning of period | | | 1,641,749 | | | | 2,277,339 | | | | 116,130 | | | | 106,166 | |
| Shares outstanding, end of period | | | 2,218,136 | | | | 1,641,749 | | | | 474,890 | | | | 116,130 | |
| Institutional Class | | | | | | | | | | | | | | | | |
| Shares issued | | | — | | | | — | | | | 1,026,245 | | | | 1,534,668 | |
| Shares reinvested | | | — | | | | — | | | | — | | | | 11,714 | |
| Shares redeemed | | | — | | | | — | | | | (515,131 | ) | | | (371,672 | ) |
| Change in shares outstanding | | | — | | | | — | | | | 511,114 | | | | 1,174,710 | |
| Shares outstanding, beginning of period | | | — | | | | — | | | | 2,214,179 | | | | 1,039,469 | |
| Shares outstanding, end of period | | | — | | | | — | | | | 2,725,293 | | | | 2,214,179 | |
Notes to Financial Statements (Continued)
| | | Large Cap | | | Mid Cap | |
| | | Growth Fund | | | Growth Fund | |
| | | Year | | | Year | | | Year | | | Year | |
| | | Ended | | | Ended | | | Ended | | | Ended | |
| | | March 31, | | | March 31, | | | March 31, | | | March 31, | |
| | | 2012 | | | 2011 | | | 2012 | | | 2011 | |
| Class A | | | | | | | | | | | | | | | | |
| Shares issued | | | 2,082,450 | | | | 1,717,578 | | | | 3,738,408 | | | | 4,762,956 | |
| Shares reinvested | | | — | | | | — | | | | 1,081,869 | | | | — | |
| Shares issued in connection with merger(A) | | | 955,798 | | | | — | | | | — | | | | — | |
| Shares redeemed | | | (6,139,459 | ) | | | (6,145,961 | ) | | | (13,508,107 | ) | | | (10,222,948 | ) |
| Change in shares outstanding | | | (3,101,211 | ) | | | (4,428,383 | ) | | | (8,687,830 | ) | | | (5,459,992 | ) |
| Shares outstanding, beginning of period | | | 11,697,676 | | | | 16,126,059 | | | | 23,450,449 | | | | 28,910,441 | |
| Shares outstanding, end of period | | | 8,596,465 | | | | 11,697,676 | | | | 14,762,619 | | | | 23,450,449 | |
| Class B | | | | | | | | | | | | | | | | |
| Shares issued | | | 1,323 | | | | 497 | | | | 15,934 | | | | 3,047 | |
| Shares reinvested | | | — | | | | — | | | | 46,289 | | | | — | |
| Shares redeemed | | | (152,370 | ) | | | (183,395 | ) | | | (603,136 | ) | | | (813,490 | ) |
| Change in shares outstanding | | | (151,047 | ) | | | (182,898 | ) | | | (540,913 | ) | | | (810,443 | ) |
| Shares outstanding, beginning of period | | | 564,675 | | | | 747,573 | | | | 1,118,887 | | | | 1,929,330 | |
| Shares outstanding, end of period | | | 413,628 | | | | 564,675 | | | | 577,974 | | | | 1,118,887 | |
| Class C | | | | | | | | | | | | | | | | |
| Shares issued | | | 365,654 | | | | 307,981 | | | | 573,022 | | | | 691,203 | |
| Shares reinvested | | | — | | | | — | | | | 526,882 | | | | — | |
| Shares issued in connection with merger(A) | | | 72,432 | | | | — | | | | — | | | | — | |
| Shares redeemed | | | (1,350,857 | ) | | | (2,093,465 | ) | | | (2,948,567 | ) | | | (2,807,974 | ) |
| Change in shares outstanding | | | (912,771 | ) | | | (1,785,484 | ) | | | (1,848,663 | ) | | | (2,116,771 | ) |
| Shares outstanding, beginning of period | | | 5,335,052 | | | | 7,120,536 | | | | 10,732,309 | | | | 12,849,080 | |
| Shares outstanding, end of period | | | 4,422,281 | | | | 5,335,052 | | | | 8,883,646 | | | | 10,732,309 | |
| Class Y | | | | | | | | | | | | | | | | |
| Shares issued | | | 6,346,782 | | | | 2,946,985 | | | | 5,086,300 | | | | 1,211,907 | |
| Shares reinvested | | | — | | | | — | | | | 317,134 | | | | — | |
| Shares redeemed | | | (5,793,403 | ) | | | (6,670,020 | ) | | | (1,836,070 | ) | | | (608,943 | ) |
| Change in shares outstanding | | | 553,379 | | | | (3,723,035 | ) | | | 3,567,364 | | | | 602,964 | |
| Shares outstanding, beginning of period | | | 13,169,603 | | | | 16,892,638 | | | | 1,893,583 | | | | 1,290,619 | |
| Shares outstanding, end of period | | | 13,722,982 | | | | 13,169,603 | | | | 5,460,947 | | | | 1,893,583 | |
| Institutional Class | | | | | | | | | | | | | | | | |
| Shares issued | | | — | | | | — | | | | 1,132,638 | | | | — | |
| Shares reinvested | | | — | | | | — | | | | 61,683 | | | | — | |
| Shares redeemed | | | — | | | | — | | | | (66,476 | ) | | | — | |
| Change in shares outstanding | | | — | | | | — | | | | 1,127,845 | | | | — | |
| Shares outstanding, beginning of period | | | — | | | | — | | | | — | | | | — | |
| Shares outstanding, end of period | | | — | | | | — | | | | 1,127,845 | | | | — | |
| (A) | See footnote 8 in the notes to financial statements |
Notes to Financial Statements (Continued)
6. Federal Tax Information
Federal income tax — It is each Fund’s policy to continue to comply with the special provisions of the Internal Revenue Code applicable to regulated investment companies. As provided therein, in any fiscal year in which a Fund so qualifies and distributes at least 90% of its investment company taxable income, the Fund (but not the shareholders) will be relieved of federal income tax on the income distributed. Accordingly, no provision for income taxes has been made.
In order to avoid imposition of the excise tax applicable to regulated investment companies, it is also each Fund’s intention to declare and pay as dividends in each calendar year at least 98% of its investment company taxable income (earned during the calendar year) and 98.2% of its net realized capital gains (earned during the twelve months ending October 31) plus undistributed amounts from prior years.
The tax character of distributions paid for the years ended March 31, 2012 and 2011 was as follows:
| | | Diversified Small Cap | | | Growth | |
| | | Growth Fund | | | Opportunities Fund | |
| | | Year | | | Year | | | Year | | | Year | |
| | | Ended | | | Ended | | | Ended | | | Ended | |
| | | March 31, | | | March 31, | | | March 31, | | | March 31, | |
| | | 2012 | | | 2011 | | | 2012 | | | 2011 | |
| From ordinary income | | $ | — | | | $ | — | | | $ | — | | | $ | 545,653 | |
| | | Large Cap | | | Mid Cap | |
| | | Growth Fund | | | Growth Fund | |
| | | Year | | | Year | | | Year | | | Year | |
| | | Ended | | | Ended | | | Ended | | | Ended | |
| | | March 31, | | | March 31, | | | March 31, | | | March 31, | |
| | | 2012 | | | 2011 | | | 2012 | | | 2011 | |
| From long-term capital gains | | $ | — | | | $ | — | | | $ | 42,015,658 | | | $ | — | |
The following information is computed on a tax basis for each item as of March 31, 2012:
| | | Diversified | | | Growth | | | Large Cap | | | Mid Cap | |
| | | Small Cap | | | Opportunities | | | Growth | | | Growth | |
| | | Growth Fund | | | Fund | | | Fund | | | Fund | |
| Tax cost of portfolio investments | | $ | 32,923,405 | | | $ | 151,033,572 | | | $ | 583,214,521 | | | $ | 570,019,947 | |
| Gross unrealized appreciation | | | 6,207,252 | | | | 5,772,771 | | | | 186,957,367 | | | | 99,866,053 | |
| Gross unrealized depreciation | | | (1,504,449 | ) | | | (2,882,617 | ) | | | (5,075,754 | ) | | | (20,220,193 | ) |
| Net unrealized appreciation | | | 4,702,803 | | | | 2,890,154 | | | | 181,881,613 | | | | 79,645,860 | |
| Accumulated capital and other losses | | | (14,161,623 | ) | | | (16,634,494 | ) | | | (107,859,196 | ) | | | — | |
| Undistributed ordinary income | | | — | | | | — | | | | 639,110 | | | | — | |
| Post - October and Qualified Late-Year losses | | | (53,200 | ) | | | — | | | | (11,370,792 | ) | | | — | |
| Undistributed capital gains | | | — | | | | — | | | | — | | | | 13,992,749 | |
| Accumulated earnings | | $ | (9,512,020 | ) | | $ | (13,744,340 | ) | | $ | 63,290,735 | | | $ | 93,638,609 | |
The difference between the tax cost of portfolio investments and the financial statement cost is primarily due to wash sale loss deferrals.
Notes to Financial Statements (Continued)
As of March 31, 2012, the Funds had the following capital loss carryforwards for federal income tax purposes:
| | | 2012 | | | 2013 | | | 2014 | | | 2016 | | | 2017 | | | 2018 | | | Total | |
| Diversified Small Cap Growth Fund | | $ | — | | | $ | — | | | $ | 4,602,156 | | | $ | 3,627,106 | | | $ | 5,932,361 | | | $ | — | | | $ | 14,161,623 | |
| Growth Opportunities Fund | | | — | | | | 1,976,702 | | | | — | | | | 1,053,666 | * | | | 12,174,612 | * | | | 1,429,514 | * | | | 16,634,494 | |
| Large Cap Growth Fund | | | — | | | | — | | | | — | | | | 3,059,206 | * | | | 3,580,263 | * | | | 101,219,727 | | | | 107,859,196 | |
| * | Amount may be limited by current income tax regulations. |
The capital loss carryforwards may be utilized in future years to offset net realized capital gains, if any, prior to distributing such gains to shareholders.
During the year ended March 31, 2012, the following Funds utilized capital loss carryforwards:
| Fund | | Amount | |
| Diversified Small Cap Growth Fund | | $ | 4,034,227 | |
| Growth Opportunities Fund | | | 10,152,308 | |
| Large Cap Growth Fund | | | 113,424,611 | |
| Mid Cap Growth Fund | | | — | |
The Growth Opportunities Fund had $6,945,824 of capital losses expire unutilized during the year ended March 31, 2012.
The Funds have analyzed their tax positions taken on Federal income tax returns for all open tax years (tax years ended March 31, 2008 through 2011) and have concluded that no provision for income tax is required in their financial statements.
The Regulated Investment Company Modernization Act of 2010 (the “Act”) was enacted on December 22, 2010. The Act makes changes to several tax rules impacting the Funds. In general, the provisions of the Act will be effective for the Funds’ fiscal year ending March 31, 2012. Although the Act provides several benefits, including the unlimited carryover of future capital losses, there may be a greater likelihood that all or a portion of each fund’s pre-enactment capital loss carryovers may expire without being utilized due to the fact that post-enactment capital losses get utilized before pre-enactment capital loss carryovers. Under the Act, new capital losses may now be carried forward indefinetly, and retain the character of the original loss as compared with pre-enactment law, where capital losses could be carried forward for eight years, and caried forward as short-term capital losses, irrespective of the character of the original loss.
Certain reclassifications, the result of permanent differences between financial statement and income tax reporting requirements, have been made to the components of capital. These reclassifications have no impact on the net assets or net asset value per share of the Funds and are designed to present the Funds’ capital accounts on a tax basis. The following reclassifications, which are primarily attributed to the tax treatment of net investment loss, REIT distributions, partnership investments, expiration of prior year capital loss carryovers, non-taxable distributions from underlying investments and carryovers of temporary differences due to mergers have been made to the following Funds for the year ended March 31, 2012:
| | | | | | Accumulated | | | Accumulated | |
| | | Paid-In | | | Net Investment | | | Net Realized | |
| | | Capital | | | Income(Loss) | | | Gains(Losses) | |
| Diversified Small Cap Growth Fund | | $ | (282,000 | ) | | $ | 282,000 | | | $ | — | |
| Growth Opportunities Fund | | | (7,556,138 | ) | | | 610,314 | | | | 6,945,824 | |
| Large Cap Growth Fund | | | 7,744,496 | | | | (76,385 | ) | | | (7,668,111 | ) |
| Mid Cap Growth Fund | | | (6,692,627 | ) | | | 6,621,415 | | | | 71,212 | |
Notes to Financial Statements (Continued)
7. Commitments and Contingencies
The Funds indemnify the Trust’s officers and Trustees for certain liabilities that might arise from their performance of their duties to the Funds. Additionally, in the normal course of business, the Funds enter into contracts that contain a variety of representations and warranties and which provide general indemnifications. The Funds’ maximum exposure under these arrangements is unknown, as this would involve future claims that may be made against the Funds that have not yet occurred. However, based on experience, the Funds expect the risk of loss to be remote.
8. Fund Mergers
On October 8, 2010, a Special Meeting of Shareholders was held to approve or disapprove an Agreement and Plan of Reorganization providing for the transfer of all of assets and liabilities of the Touchstone Large Cap Core Equity Fund to the Growth Opportunities Fund in exchange for shares of the Growth Opportunities Fund and the subsequent liquidation of the Touchstone Large Cap Core Equity Fund. The Agreement and Plan of Reorganization was approved and the merger took place on October 22, 2010.
The merger was approved as follows:
| | | Number of Votes | |
| | | For | | | Against | | | Abstain | |
| Large Cap Core Equity Fund | | | 3,045,776 | | | | 22,222 | | | | 699,621 | |
The following is a summary of shares outstanding, net assets, net asset value per share, unrealized appreciation and realized gain (loss) immediately before and after the reorganization:
| | | | | | | | | After | |
| | | Before Reorganization | | | Reorganization | |
| | | | | | Growth | | | Growth | |
| | | Large Cap Core | | | Opportunities | | | Opportunities | |
| | | Equity Fund | | | Fund | | | Fund | |
| Shares | | | 5,507,436 | | | | 4,221,102 | | | | 6,432,968 | |
| Net Assets | | $ | 47,429,798 | | | $ | 90,373,406 | | | $ | 137,803,204 | |
| Net Asset Value | | | 8.61 | | | | 21.41 | | | | 21.42 | |
| Unrealized Appreciation | | | 5,752,014 | | | | 8,993,620 | | | | 14,745,634 | |
| Accumulated Net Realized Gain (Loss) | | | (19,856 | ) | | | 133,833 | | | | 113,977 | |
On April 21, 2011, a Special Meeting of Shareholders was held to approve or disapprove an Agreement and Plan of Reorganization providing for the transfer of all assets and liabilities of the Touchstone Healthcare and Biotechnology Fund, a series of Touchstone Funds Group Trust, to the Large Cap Growth Fund in exchange for shares of the Large Cap Growth Fund and the subsequent liquidation of the Touchstone Healthcare and Biotechnology Fund. The Agreement and Plan of Reorganization was approved and the merger took place on May 6, 2011.
The merger was approved as follows:
| | | Number of Votes | |
| | | For | | | Against | | | Abstain | |
| Healthcare and Biotechnology Fund | | | 756,446 | | | | 79,632 | | | | 28,822 | |
Notes to Financial Statements (Continued)
The following is a summary of shares outstanding, net assets, net asset value per share, unrealized appreciation (depreciation) and realized gain (loss) immediately before and after the reorganization:
| | | | | | | | | After | |
| | | Before Reorganization | | | Reorganization | |
| | | Healthcare and | | | | | | | |
| | | Biotechnology | | | Large Cap | | | Large Cap | |
| | | Fund | | | Growth Fund | | | Growth Fund | |
| Shares | | | 1,487,602 | | | | 29,733,726 | | | | 30,761,803 | |
| Net Assets | | $ | 25,653,016 | | | $ | 741,478,177 | | | $ | 767,131,193 | |
| Net Asset Value | | | 17.24 | | | | 24.94 | | | | 24.94 | |
| Unrealized Appreciation | | | 7,230,578 | | | | 184,155,041 | | | | 191,385,619 | |
| Accumulated Net Realized Gain (Loss) | | | (7,746,291 | ) | | | (193,595,589 | ) | | | (193,595,589 | ) |
9. Subsequent Events
Touchstone Investments and Fifth Third Asset Management announced on April 5, 2012 that Touchstone Advisors, Inc., a wholly owned subsidiary of Western & Southern Financial Group, has entered into a definitive agreement with Fifth Third Asset Management, for Touchstone to acquire selected assets of Fifth Third Asset Management’s mutual fund business.
Consummation of the transaction is subject to certain conditions and approvals and is expected to be completed early in the third quarter of 2012. Upon the completion of the transaction, sixteen Fifth Third Funds will be reorganized into Touchstone Funds with FifthThird Asset Management’s affiliated investment managers continuing as sub-advisors for certain Funds.
There were no other subsequent events that necessitated recognition or disclosure.
Report of Independent Registered Public Accounting Firm
To the Board of Trustees and Shareholders of Touchstone Strategic Trust
We have audited the accompanying statements of assets and liabilities, including the portfolios of investments, of Touchstone Strategic Trust, comprised of the Touchstone Diversified Small Cap Growth Fund, Touchstone Growth Opportunities Fund, Touchstone Large Cap Growth Fund, and Touchstone Mid Cap Growth Fund (the “Funds”), as of March 31, 2012, and the related statements of operations for the year then ended, the statements of changes in net assets for each of the two years then ended, and the financial highlights for each of the periods indicated therein. These financial statements and financial highlights are the responsibility of the Funds’ management. Our responsibility is to express an opinion on these financial statements and financial highlights based on our audits.
We conducted our audits in accordance with the standards of the Public Company Accounting Oversight Board (United States). Those standards require that we plan and perform the audits to obtain reasonable assurance about whether the financial statements are free of material misstatement. We were not engaged to perform an audit of the Funds’ internal control over financial reporting. Our audits included consideration of internal control over financial reporting as a basis for designing audit procedures that are appropriate in the circumstances, but not for the purpose of expressing an opinion on the effectiveness of the Funds’ internal control over financial reporting. Accordingly, we express no such opinion. An audit also includes examining, on a test basis, evidence supporting the amounts and disclosures in the financial statements, assessing the accounting principles used and significant estimates made by management, and evaluating the overall financial statement presentation. Our procedures included confirmation of securities owned as of March 31, 2012, by correspondence with the custodian and brokers, or by other appropriate auditing procedures where replies from brokers were not received. We believe that our audits provide a reasonable basis for our opinion.
In our opinion, the financial statements and financial highlights referred to above present fairly, in all material respects, the financial position of each of the respective Funds comprising the Touchstone Strategic Trust at March 31, 2012, the results of their operations for the year then ended, the changes in their net assets for each of the two years then ended, and their financial highlights for each of the periods indicated therein, in conformity with U.S. generally accepted accounting principles.

Cincinnati, Ohio
May 29, 2012
Other Items (Unaudited)
Qualified Dividend Income
Under the Jobs and Growth Tax Relief Reconciliation Act of 2003 (the “Act”), the following percentages of ordinary dividends paid during the fiscal year ended March 31, 2012 are designed as “qualified dividend income,” as defined in the Act, and are subject to reduced tax rates in 2011. The Funds intend to pass through the maximum allowable percentage for 1099s.
| Growth Opportunities Fund | | | — | |
| Diversified Small Cap Growth Fund | | | — | |
| Large Cap Growth Fund | | | — | |
| Mid Cap Growth Fund | | | 100 | % |
Dividend Received Deduction
For corporate shareholders, the following ordinary distributions paid during the current fiscal period ended March 31, 2012 qualify for the corporate dividends received deduction. The Funds intend to pass through the maximum allowable percentage for 1099s.
| Growth Opportunities Fund | | | — | |
| Diversified Small Cap Growth Fund | | | — | |
| Large Cap Growth Fund | | | — | |
| Mid Cap Growth Fund | | | 100 | % |
For the fiscal year ended March 31, 2012, the Mid Cap Growth Fund designates $42,015,658 as long-term capital gains.
Proxy Voting Guidelines
The Sub-Advisors are responsible for exercising the voting rights associated with the securities purchased and held by the Funds. A description of the policies and procedures that the Sub-Advisors use in fulfilling this responsibility and information regarding how those proxies were voted during the twelve month period ended June 30 are available without charge upon request by calling toll free 1.800.543.0407. These items are also available on the Securities and Exchange Commission’s (the Commission) website at http://www.sec.gov.
Quarterly Portfolio Disclosure
The Trust files a complete listing of portfolio holdings for each Fund as of the end of the first and third quarters of each fiscal year on Form N-Q. The complete listing: (i) is available on the Commission’s website; (ii) may be reviewed and copied at the Commission’s Public Reference Room in Washington, DC; and (iii) will be made available to shareholders upon request by calling 1.800.543.0407. Information on the operation of the Public Reference Room may be obtained by calling 1-800-SEC-0330.
Schedule of Shareholder Expenses
As a shareholder of the Funds, you incur two types of costs: (1) transaction costs, including reinvested dividends or other distributions; and (2) ongoing costs, including investment advisory fees, shareholder servicing fees, and other Fund expenses. This example is intended to help you understand your ongoing costs (in dollars) of investing in the Funds and to compare these costs with the ongoing costs of investing in other mutual funds.
The example is based on an investment of $1,000 invested at the beginning of the period and held for the entire period October 1, 2011 through March 31, 2012.
Actual Expenses
The first line of the table below provides information about actual account values and actual expenses. You may use the information in this line, together with the amount you invested, to estimate the expenses that you paid over the period. Simply divide your account value by $1,000 (for example, an $8,600 account value divided by $1,000 = 8.6), then multiply the result by the number in the first line under the heading entitled “Expenses Paid During the Six Months Ended March 31, 2012” to estimate the expenses you paid on your account during this period.
Other Items (Unaudited) (Continued)
Schedule of Shareholder Expenses (Continued)
Hypothetical Example for Comparison Purposes
The second line of the table below provides information about hypothetical account values and hypothetical expenses based on the Funds’ actual expense ratio and an assumed rate of return of 5% per year before expenses, which is not the Funds’ actual return. The hypothetical account values and expenses may not be used to estimate the actual ending account balance or expenses you paid for the period. You may use this information to compare the ongoing costs of investing in the Funds and other funds. To do so, compare this 5% hypothetical example with the 5% hypothetical examples that appear in the shareholder reports of the other funds.
| | | | | | | | | | | | | | Expenses | |
| | | | | Net Expense | | | Beginning | | | Ending | | | Paid During | |
| | | | | Rato | | | Account | | | Account | | | the Six Months | |
| | | | | Annualized | | | Value | | | Value | | | Ended | |
| | | | | March 31, | | | October 1, | | | March 31, | | | March 31, | |
| | | | | 2012 | | | 2011 | | | 2012 | | | 2012* | |
| Touchstone Diversified Small Cap Growth Fund | | | | | | | | | | | | | | | | |
| Class A | | Actual | | | 1.40 | % | | $ | 1,000.00 | | | $ | 1,234.60 | | | $ | 7.82 | |
| Class A | | Hypothetical | | | 1.40 | % | | $ | 1,000.00 | | | $ | 1,018.00 | | | $ | 7.06 | |
| | | | | | | | | | | | | | | | | | | |
| Class C | | Actual | | | 2.15 | % | | $ | 1,000.00 | | | $ | 1,230.80 | | | $ | 11.99 | |
| Class C | | Hypothetical | | | 2.15 | % | | $ | 1,000.00 | | | $ | 1,014.25 | | | $ | 10.83 | |
| | | | | | | | | | | | | | | | | | | |
| Class Y | | Actual | | | 1.15 | % | | $ | 1,000.00 | | | $ | 1,237.20 | | | $ | 6.43 | |
| Class Y | | Hypothetical | | | 1.15 | % | | $ | 1,000.00 | | | $ | 1,019.25 | | | $ | 5.81 | |
| | | | | | | | | | | | | | | | | | | |
| Touchstone Growth Opportunities Fund | | | | | | | | | | | | | | | | |
| Class A | | Actual | | | 1.24 | % | | $ | 1,000.00 | | | $ | 1,281.40 | | | $ | 7.07 | |
| Class A | | Hypothetical | | | 1.24 | % | | $ | 1,000.00 | | | $ | 1,018.80 | | | $ | 6.26 | |
| | | | | | | | | | | | | | | | | | | |
| Class C | | Actual | | | 1.99 | % | | $ | 1,000.00 | | | $ | 1,277.20 | | | $ | 11.33 | |
| Class C | | Hypothetical | | | 1.99 | % | | $ | 1,000.00 | | | $ | 1,015.05 | | | $ | 10.02 | |
| | | | | | | | | | | | | | | | | | | |
| Class Y | | Actual | | | 0.99 | % | | $ | 1,000.00 | | | $ | 1,283.20 | | | $ | 4.79 | |
| Class Y | | Hypothetical | | | 0.99 | % | | $ | 1,000.00 | | | $ | 1,020.80 | | | $ | 4.24 | |
| | | | | | | | | | | | | | | | | | | |
| Institutional Class | | Actual | | | 0.84 | % | | $ | 1,000.00 | | | $ | 1,282.30 | | | $ | 5.65 | |
| Institutional Class | | Hypothetical | | | 0.84 | % | | $ | 1,000.00 | | | $ | 1,020.05 | | | $ | 5.00 | |
| | | | | | | | | | | | | | | | | | | |
| Touchstone Large Cap Growth Fund | | | | | | | | | | | | | | | | |
| Class A | | Actual | | | 1.25 | % | | $ | 1,000.00 | | | $ | 1,214.00 | | | $ | 6.92 | |
| Class A | | Hypothetical | | | 1.25 | % | | $ | 1,000.00 | | | $ | 1,018.75 | | | $ | 6.31 | |
| | | | | | | | | | | | | | | | | | | |
| Class B | | Actual | | | 1.45 | % | | $ | 1,000.00 | | | $ | 1,212.00 | | | $ | 8.02 | |
| Class B | | Hypothetical | | | 1.45 | % | | $ | 1,000.00 | | | $ | 1,017.75 | | | $ | 7.31 | |
| | | | | | | | | | | | | | | | | | | |
| Class C | | Actual | | | 2.00 | % | | $ | 1,000.00 | | | $ | 1,209.10 | | | $ | 11.05 | |
| Class C | | Hypothetical | | | 2.00 | % | | $ | 1,000.00 | | | $ | 1,015.00 | | | $ | 10.08 | |
| | | | | | | | | | | | | | | | | | | |
| Class Y | | Actual | | | 0.99 | % | | $ | 1,000.00 | | | $ | 1,215.10 | | | $ | 5.48 | |
| Class Y | | Hypothetical | | | 0.99 | % | | $ | 1,000.00 | | | $ | 1,020.05 | | | $ | 5.00 | |
Other Items (Unaudited) (Continued)
| | | | | | | | | | | | | | Expenses | |
| | | | | Net Expense | | | Beginning | | | Ending | | | Paid During | |
| | | | | Rato | | | Account | | | Account | | | the Six Months | |
| | | | | Annualized | | | Value | | | Value | | | Ended | |
| | | | | March 31, | | | October 1, | | | March 31, | | | March 31, | |
| | | | | 2012 | | | 2011 | | | 2012 | | | 2012* | |
| Touchstone Mid Cap Growth Fund | | | | | | | | | | | | | | | | | | |
| Class A | | Actual | | | 1.40 | % | | $ | 1,000.00 | | | $ | 1,259.40 | | | $ | 7.91 | |
| Class A | | Hypothetical | | | 1.40 | % | | $ | 1,000.00 | | | $ | 1,018.00 | | | $ | 7.06 | |
| | | | | | | | | | | | | | | | | | | |
| Class B | | Actual | | | 1.59 | % | | $ | 1,000.00 | | | $ | 1,254.40 | | | $ | 8.96 | |
| Class B | | Hypothetical | | | 1.59 | % | | $ | 1,000.00 | | | $ | 1,017.05 | | | $ | 8.02 | |
| | | | | | | | | | | | | | | | | | | |
| Class C | | Actual | | | 2.17 | % | | $ | 1,000.00 | | | $ | 1,253.90 | | | $ | 12.23 | |
| Class C | | Hypothetical | | | 2.17 | % | | $ | 1,000.00 | | | $ | 1,014.15 | | | $ | 10.93 | |
| | | | | | | | | | | | | | | | | | | |
| Class Y | | Actual | | | 1.11 | % | | $ | 1,000.00 | | | $ | 1,260.40 | | | $ | 6.27 | |
| Class Y | | Hypothetical | | | 1.11 | % | | $ | 1,000.00 | | | $ | 1,019.45 | | | $ | 5.60 | |
| | | | | | | | | | | | | | | | | | | |
| Institutional Class | | Actual | | | 1.03 | % | | $ | 1,000.00 | | | $ | 1,261.50 | | | $ | 5.82 | |
| Institutional Class | | Hypothetical | | | 1.03 | % | | $ | 1,000.00 | | | $ | 1,019.45 | | | $ | 5.20 | |
| * | Expenses are equal to the Fund's annualized expense ratio, multiplied by the average account value over the period, multiplied by [number of days in most recent fiscal half-year/365 [or 366]] (to reflect one-half year period). |
Other Items (Unaudited) (Continued)
Annual renewal of Investment Advisory and Sub-Advisory Agreements
Advisory Agreement Approval Disclosure
At a meeting held on November 17, 2011, the Board of Trustees (the “Board” or “Trustees”) of the Touchstone Strategic Trust (the “Trust”), and by a separate vote, the Independent Trustees of the Trust, approved the continuance of the Investment Advisory Agreement between the Trust and the Advisor with respect to each Fund of the Trust, and the continuance of each Sub-Advisory Agreement between the Advisor and each Fund’s respective Sub-Advisor.
In determining whether to approve the continuation of the Investment Advisory Agreement and the Sub-Advisory Agreements, the Advisor furnished information necessary for a majority of the Independent Trustees to make the determination that the continuance of the Investment Advisory Agreement and each Sub-Advisory Agreement was in the best interests of the respective Funds and their shareholders. The information provided to the Board included: (1) industry data comparing advisory fees and expense ratios of comparable investment companies; (2) comparative performance information; (3) the Advisor’s and its affiliates’ revenues and costs of providing services to the Funds; and (4) information about the Advisor’s and Sub-Advisors’ personnel. Prior to voting, the Independent Trustees reviewed the proposed continuance of the Investment Advisory Agreement and the Sub-Advisory Agreements with management and with experienced independent legal counsel and received materials from such counsel discussing the legal standards for their consideration of the proposed continuation of the Investment Advisory Agreement and each Sub-Advisory Agreement. The Independent Trustees also reviewed the proposed continuation of the Investment Advisory Agreement and each Sub-Advisory Agreement with independent legal counsel in private sessions at which no representatives of management were present.
In approving the Funds’ Investment Advisory Agreement, the Board considered various factors, among them: (1) the nature, extent and quality of services provided to the Funds, including the personnel providing services; (2) the Advisor’s compensation and profitability; (3) a comparison of fees and performance with other advisers; (4) economies of scale; and (5) the terms of the Investment Advisory Agreement. The Board’s analysis of these factors is set forth below. The Independent Trustees were advised by independent legal counsel throughout the process.
Nature, Extent and Quality of Advisor Services. The Board considered the level and depth of knowledge of the Advisor, including the professional experience and qualifications of senior personnel. In evaluating the quality of services provided by the Advisor, the Board took into account its familiarity with the Advisor’s senior management through Board meetings, discussions and reports during the preceding year. The Board also took into account the Advisor’s compliance policies and procedures. The quality of administrative and other services, including the Advisor’s role in coordinating the activities of the Funds’ other service providers, was also considered. The Board also considered the Advisor’s relationship with its affiliates and the resources available to them, as well as any potential conflicts of interest.
The Board discussed the Advisor’s effectiveness in monitoring the performance of each Sub-Advisor, including those that were affiliates of the Advisor, and the Advisor’s timeliness in responding to performance issues. The Board considered the Advisor’s process for monitoring each of the Sub-Advisors, which includes an examination of both qualitative and quantitative elements of the Sub-Advisor’s organization, personnel, procedures, investment discipline, infrastructure and performance. The Board considered that the Advisor conducts regular on-site compliance visits with each Sub-Advisor, during which the Advisor examines a wide variety of factors, such as the financial condition of the Sub-Advisor, the quality of the Sub-Advisor’s systems, the effectiveness of the Sub-Advisor’s disaster recovery programs,trade allocation and execution procedures, compliance with the Sub-Advisor’s policies and procedures, results of regulatory examinations and any other factors that might affect the quality of services that the Sub-Advisor provides to the applicable Fund(s). The Board noted that the Advisor’s compliance monitoring processes also include quarterly reviews of compliance reports, and that any issues arising from such reports and the Advisor’s compliance visits to the Sub-Advisors are reported to the Board.
Other Items (Unaudited) (Continued)
The Trustees concluded that they were satisfied with the nature, extent and quality of services provided to each Fund by the Advisor under the Investment Advisory Agreement.
Advisor’s Compensation and Profitability. The Board took into consideration the financial condition and profitability of the Advisor and its affiliates (including the Sub-Advisor to one of the Funds) and the direct and indirect benefits derived by the Advisor and its affiliates from the Advisor’s relationship with the Funds. The information considered by the Board included operating profit margin information for the Advisor’s business as a whole. The Board noted that the Advisor waived a portion of the fees and/or reimbursed a portion of the operating expenses of the Funds. The Board also noted that the Advisor pays the Sub-Advisors’ sub-advisory fees out of the advisory fees the Advisor receives from the Funds. The Board reviewed the profitability of the Advisor’s relationship with the Funds both before and after tax expenses, and also considered whether the Advisor has the financial wherewithal to continue to provide a high level of services to the Funds, noting the ongoing commitment of the Advisor’s parent company with respect to providing support and resources as needed. The Board considered that the Funds’ distributor, an affiliate of the Advisor, receives Rule 12b-1 distribution fees from the Funds and receives a portion of the sales charges on sales or redemptions of certain classes of shares. The Board also noted that the Advisor derives benefits to its reputation and other benefits from its association with the Funds.
The Board recognized that the Advisor should be entitled to earn a reasonable level of profits in exchange for the level of services it provides to each Fund and the entrepreneurial risk that it assumes as Advisor. Based upon their review, the Trustees concluded that the Advisor’s and its affiliates’ level of profitability, if any, from their relationship with each Fund was reasonable and not excessive.
Expenses and Performance. The Board compared the respective advisory fees and total expense ratios for each of the Funds with various comparative data, including the median and average advisory fees and total expense ratios of each Fund’s respective peer group. The Board also considered, among other data, the Funds’ respective performance results during the six-month, twelve-month and thirty-six-month periods ended June 30, 2011 and noted that the Board reviews on a quarterly basis detailed information about each Fund’s performance results, portfolio composition and investment strategies. The Board also took into account current market conditions and their effect on the Funds’ performance.
The Board also considered the effect of each Fund’s growth and size on its performance and expenses. The Board noted that the Advisor had waived a portion of the fees and/or reimbursed a portion of the operating expenses of the Funds in order to reduce the Funds’ respective operating expenses to targeted levels. The Board noted that the sub-advisory fees under the Sub-Advisory Agreement with respect to each Fund were paid by the Advisor out of the advisory fees it receives from the Fund and considered the impact of such sub-advisory fees on the profitability of the Advisor. In reviewing the respective expense ratios and performance of each of the Funds, the Board also took into account the nature, extent and quality of the services provided to the Funds by the Advisor and its affiliates.
The Board also discussed with management certain factors as set forth in the conditions to the Funds’ exemptive order issued by the Securities and Exchange Commission relating to investments by the non-money market Funds in the Touchstone Institutional Money Market Fund. The Board considered the nature and extent of the services provided by the Advisor and the Sub-Advisors to each Fund and a discussion by management with respect to the costs to the Advisor and Sub-Advisors of the portion of the advisory fee and sub-advisory fee attributable to the portion of the non-money market Funds’ assets to be invested in the Touchstone Institutional Money Market Fund. Based on these factors, the Board concluded that the advisory fee and the sub-advisory fee associated with the management of each non-money market Fund were based on services that were in addition to, rather than duplicative of, services provided under the Investment Advisory and Sub-Advisory Agreements with respect to the Touchstone Institutional Money Market Fund.
Other Items (Unaudited) (Continued)
The Board considered, among other data, the specific factors and related conclusions set forth below with respect to each Fund:
Touchstone Diversified Small Cap Growth. The Fund’s advisory fee and total expense ratio (net of applicable expense waivers and reimbursements) were above the median and below the median, respectively, of its peer group. The Board noted that the Advisor was currently waiving a portion of the Fund’s fees as well as reimbursing a portion of the Fund’s operating expenses. The Board took into account the impact that the relatively small size of the Fund has upon expenses. The Fund’s performance was in the 4th quintile of its peer group for the six- and twelve-month periods ended June 30, 2011, and the Fund’s performance was in the 5th quintile for the thirty-six-month period ended June 30, 2011. The Board noted management’s discussion of the Fund’s performance, including the recent improvement in the Fund’s performance, and management’s continued monitoring of the Fund’s performance. Based upon their review, the Trustees concluded that the Fund’s performance was being addressed and also found that the advisory fee was reasonable in light of the high quality of services received by the Fund and the other factors considered.
Touchstone Growth Opportunities Fund. The Fund’s advisory fee and total expense ratio (net of applicable expense waivers and reimbursements) were at the median and below the median, respectively, of its peer group. The Board noted that the Advisor was currently waiving a portion of the Fund’s fees as well as reimbursing a portion of the Fund’s operating expenses. The Fund’s performance was in the 5th quintile of the Fund’s peer group for the six-month period ended June 30, 2011, the Fund’s performance was in the 1st quintile for the twelve-month period ended June 30, 2011, and the Fund’s performance was in the 4th quintile for the thirty-six-month period ended June 30, 2011. The Board noted management’s discussion of the Fund’s recent underperformance. Based upon their review, the Trustees concluded that the Fund’s overall performance was satisfactory and also found that the advisory fee was reasonable in light of the high quality of services received by the Fund and the other factors considered.
Touchstone Large Cap Growth Fund. The Fund’s advisory fee and total expense ratio (net of applicable expense waivers) were at the median and above the median, respectively, of its peer group. The Board noted that the Advisor was currently waiving a portion of the Fund’s fees. The Fund’s performance was in the 2nd quintile of the Fund’s peer group for the six- and twelve-month periods ended June 30, 2011, and the Fund’s performance was in the 5th quintile for the thirty-six-month period ended June 30, 2011. Based upon their review, the Trustees concluded that the Fund’s overall performance was satisfactory and that the Fund’s advisory fee was reasonable in light of the high quality of services received by the Fund and the other factors considered.
Touchstone Mid Cap Growth Fund. The Fund’s advisory fee and total expense ratio (net of applicable expense waivers) were below the median and above the median, respectively, of its peer group. The Board noted that the Advisor was currently waiving a portion of the Fund’s fees. The Board also noted the recent addition of breakpoints to the Fund’s advisory fee. The Fund’s performance was in the 3rd quintile of the Fund’s peer group for the six- and twelve-month periods ended June 30, 2011, and the Fund’s performance was in the 4th quintile for the thirty-six-month period ended June 30, 2011. The Board noted management’s explanation for the Fund’s underperformance and management’s continued monitoring of the Fund’s performance. Based upon their review, the Trustees concluded that the Fund’s performance was being addressed and that the advisory fee was reasonable in light of the high quality of services received by the Fund and the other factors considered.
Other Items (Unaudited) (Continued)
Economies of Scale. The Board considered the effect of each Fund’s current size and potential growth on its performance and expenses. The Board took into account management’s discussion of the Funds’ advisory fee structure. The Board considered the effective advisory fees under the Investment Advisory Agreement as a percentage of assets at different asset levels and possible economies of scale that might be realized if the assets of each Fund increase. The Board noted that the advisory fee schedule for each of Touchstone Growth Opportunities Fund, Touchstone Large Cap Growth Fund and Touchstone Mid Cap Growth Fund contain breakpoints that would reduce the respective advisory fee rate on assets above specified levels as the respective Fund’s assets increased and considered the necessity of adding breakpoints with respect to the Touchstone Diversified Small Cap Growth Fund, which did not currently have such breakpoints in its advisory fee schedule. The Board noted that the advisory fee for the Touchstone Large Cap Growth Fund and the Touchstone Mid Cap Growth Fund currently reflected such economies of scale. The Board determined that adding breakpoints at specified levels to the advisory fee schedule of Touchstone Diversified Small Cap Growth Fund was not appropriate at that time. The Board also noted that if a Fund’s assets increase over time, the Fund might realize other economies of scale if assets increase proportionally more than certain other expenses. The Board also considered the fact that, under the Investment Advisory Agreement, the advisory fee payable to the Advisor by a Fund was reduced by the total sub-advisory fee paid by the Advisor to the Fund’s Sub-Advisor.
Conclusion. In considering the renewal of the Funds’ Investment Advisory Agreement, the Board, including the Independent Trustees, did not identify any single factor as controlling, and each Trustee may have attributed different weights to the various factors. The Trustees evaluated all information available to them on a Fund-by-Fund basis, and their determinations were made separately with respect to each Fund. The Board reached the following conclusions regarding the Funds’ Investment Advisory Agreement with the Advisor, among others: (a) the Advisor demonstrated that it possesses the capability and resources to perform the duties required of it under the Investment Advisory Agreement; (b) the Advisor maintains an appropriate compliance program; (c) the performance of each Fund is satisfactory relative to the performance of funds with similar investment objectives and relevant indices or, as discussed above, is being addressed; and (d) each Fund’s advisory fee is reasonable relative to those of similar funds and the services to be provided by the Advisor. Based on their conclusions, the Trustees determined with respect to each Fund that continuation of the Investment Advisory Agreement was in the best interests of the Fund and its shareholders.
In approving the Funds’ respective Sub-Advisory Agreements, the Board considered various factors with respect to each Fund and the applicable Sub-Advisory Agreement, among them: (1) the nature, extent and quality of services provided to the Fund, including the personnel providing such services; (2) the Sub-Advisor’s compensation; (3) a comparison of the sub-advisory fee and performance with other advisers; and (4) the terms of the Sub-Advisory Agreement. The Board’s analysis of these factors is set forth below. The Independent Trustees were advised by independent legal counsel throughout the process.
Nature, Extent and Quality of Services Provided; Investment Personnel. The Board considered information provided by the Advisor regarding the services provided by each Sub-Advisor, including information presented periodically throughout the previous year. The Board noted the affiliation of the Sub-Advisor to one of the Funds with the Advisor, noting any potential conflicts of interest. The Board also noted that, on a periodic basis, the Board meets with portfolio managers of the Sub-Advisors to discuss their respective performance and investment processes and strategies. The Board considered each Sub-Advisor’s level of knowledge and investment style. The Board reviewed the experience and credentials of the applicable investment personnel who are responsible for managing the investment of portfolio securities with respect to the Funds. The Board also noted each Sub-Advisor’s brokerage practices.
Other Items (Unaudited) (Continued)
Sub-Advisor’s Compensation. The Board also took into consideration the financial condition of each Sub-Advisor and any indirect benefits derived by each Sub-Advisor and its affiliates from the Sub-Advisor’s relationship with the Funds. In considering the profitability to each Sub-Advisor of its relationship with the Funds, the Board noted the undertakings of the Advisor to maintain expense limitations for the Funds and also noted that the sub-advisory fees under the Sub-Advisory Agreements were paid by the Advisor out of the advisory fees that it receives under the Investment Advisory Agreement and in addition, with respect to the unaffiliated Sub-Advisors, are negotiated at arm’s length. As a consequence, the profitability to each Sub-Advisor of its relationship with a Fund was not a substantial factor in the Board’s deliberations. For similar reasons, the Board did not consider the potential economies of scale in each Sub-Advisor’s management of the applicable Fund to be a substantial factor in its consideration, although the Board noted that the sub-advisory fee schedule for each of Touchstone Growth Opportunities Fund, Touchstone Large Cap Growth Fund and Touchstone Mid Cap Growth Fund contained breakpoints that would reduce the sub-advisory fee rate on assets above specified levels as the applicable Fund’s assets increased.
Sub-Advisory Fees and Fund Performance. The Board considered that each Fund pays an advisory fee to the Advisor and that the Advisor pays the sub-advisory fee to the Sub-Advisor out of the advisory fee it receives from the respective Fund. The Board also compared the sub-advisory fees paid by the Advisor to fees charged by the Sub-Advisors to manage comparable institutional separate accounts. The Board considered the amount retained by the Advisor and the sub-advisory fee paid to each Sub-Advisor with respect to the various services provided by the Advisor and the Sub-Advisor. The Board also noted that the Advisor negotiated the sub-advisory fee with each of the unaffiliated Sub-Advisors at arm’s length. The Board reviewed the sub-advisory fee for each Fund in relation to various comparative data, including the median and average sub-advisory fees of each Fund’s peer group, and considered the following information:
Touchstone Diversified Small Cap Growth Fund. The Fund’s sub-advisory fee was above the median of its peer group. Based upon their review, the Trustees concluded that the Fund’s sub-advisory fee was reasonable in light of the high quality of services received by the Fund and the other factors considered.
Touchstone Growth Opportunities Fund. The Fund’s sub-advisory fee was above the median of its peer group. Based upon their review, the Trustees concluded that the sub-advisory fee was reasonable in light of the high quality of services received by the Fund and the other factors considered.
Touchstone Large Cap Growth Fund. The Fund’s sub-advisory fee was above the median of its peer group. Based upon their review, the Trustees concluded that the sub-advisory fee was reasonable in light of the high quality of services received by the Fund and the other factors considered.
Touchstone Mid Cap Growth Fund. The Fund’s sub-advisory fees were at the median of its peer group. The Board took into account the recent addition of breakpoints to the Fund’s sub-advisory fee. Based upon their review, the Trustees concluded that the sub-advisory fees were reasonable in light of the high quality of services received by the Fund and the other factors considered.
As noted above, the Board considered each Fund’s performance during the six-month, twelve-month and thirty-six-month periods ended June 30, 2011 as compared to each Fund’s peer group and noted that the Board reviews on a quarterly basis detailed information about each Fund’s performance results, portfolio composition and investment strategies. The Board noted the Advisor’s expertise and resources in monitoring the performance, investment style and risk-adjusted performance of each Sub-Advisor. The Board was mindful of the Advisor’s focus on each Sub-Advisor’s performance and the Advisor’s ways of addressing underperformance.
Conclusion. In considering the renewal of the Sub-Advisory Agreement with respect to each Fund, the Board, including the Independent Trustees, did not identify any single factor as controlling, and each Trustee may have attributed different weights to the various factors. The Board reached the following conclusions regarding each Sub-Advisory Agreement, among others: (a) the Sub-Advisor is qualified to manage each Fund’s assets in accordance with the Fund’s investment objectives and policies; (b) the Sub-Advisor maintains an appropriate compliance program; (c) the performance of each Fund is satisfactory relative to the performance of funds with similar investment objectives and relevant indices or, as discussed above, is being addressed; (d) each Fund’s advisory fees are reasonable relative to those of similar funds and the services to be provided by the Advisor and the Sub-Advisor; and (e) the Sub-Advisor’s investment strategies are appropriate for pursuing the investment objectives of each Fund. Based on its conclusions, the Board determined that approval of the Sub-Advisory Agreement with respect to each Fund was in the best interests of the Fund and its shareholders.
Management of the Trust (Unaudited)
Listed below is basic information regarding the Trustees and principal officers of the Trust. The Trust’s Statement of Additional Information includes additional information about the Trustees and is available, without charge, upon request by calling 1.800.543.0407.
Interested Trustees1:
Name
Address
Age | | Position(s)
Held with
Trust | | Term of
Office2 And
Length of
Time Served | | Principal Occupation(s)
During Past 5 Years | | Number
of Funds
Overseen
in the
Touchstone
Fund
Complex3 | | Other
Directorships
Held4 |
Jill T. McGruder
Touchstone Advisors, Inc
303 Broadway
Cincinnati, OH
Year of Birth: 1955 | | Trustee and President | | Until retirement at age 75 or until she resigns or is removed Trustee since 1999 | | President and CEO of IFS Financial Services, Inc. (a holding company). | | 42 | | Director of LaRosa’s (a restaurant chain), Capital Analysts Incorporated (an investment advisor and broker- dealer), IFS Financial Services, Inc. (a holding company), Integrity and National Integrity Life Insurance Co., Touchstone Securities (the Trust’s distributor), Touchstone Advisors (the Trust’s investment advisor and administrator) and W&S Financial Group Distributors (a distribution company). |
| | | | | | | | | | | |
| Independent Trustees: | | | | | | | | | | |
Phillip R. Cox
105 East Fourth Street
Cincinnati, OH
Year of Birth: 1947 | | Trustee | | Until retirement at age 75 or until he resigns or is removed Trustee since 1999 | | President and Chief Executive Officer of Cox Financial Corp. (a financial services company). | | 42 | | Director of Cincinnati Bell (a communications company), Bethesda Inc. (a hospital), Timken Co. (a manufacturing company), Diebold (a technology solutions company), and Ohio Business Alliance for Higher Education. Director of Duke Energy from 1994-2008. |
| | | | | | | | | | | |
H. Jerome Lerner
c/o Touchstone Advisors, Inc.
303 Broadway
Cincinnati, OH
Year of Birth: 1938 | | Trustee | | Until retirement at age 75 or until he resigns or is removed Trustee since 1989 | | Principal of HJL Enterprises (a privately held investment company). | | 42 | | None |
Management of the Trust (Unaudited) (Continued)
Independent Trustees (Continued):
Name
Address
Age | | Position(s)
Held with
Trust | | Term of
Office2 And
Length of
Time Served | | Principal Occupation(s)
During Past 5 Years | | Number
of Funds
Overseen
in the
Touchstone
Fund
Complex3 | | Other
Directorships
Held4 |
| Donald C. Siekmann c/o Touchstone Advisors, Inc. 303 Broadway Cincinnati, OH Year of Birth: 1938 | | Trustee | | Until retirement at age 75 or until he resigns or is removed Trustee since 2005 | | Executive for Duro Bag Manufacturing Co. (a bag manufacturer) from 2002-2008. | | 42 | | None |
| | | | | | | | | | | |
| John P. Zanotti c/o Touchstone Advisors, Inc. 303 Broadway Cincinnati, OH Year of Birth: 1948 | | Trustee | | Until retirement at age 75 or until he resigns or is removed Trustee since 2002 | | Private Investor. President of Cincinnati Biomedical (a life science and economic development company) from 2003-2007. Chairman of Integrated Media Technologies (a media company) | | 42 | | None |
| | | | | | | | | | | |
| Susan J. Hickenlooper c/o Touchstone Advisors, Inc. 303 Broadway Cincinnati, OH Year of Birth: 1946 | | Trustee | | Until retirement at age 75 or until he resigns or is removed Trustee since 2009 | | Trustee of Episcopal Retirement Homes Foundation from 1998 to 2011. | | 42 | | Trustee of Gateway Trust (a mutual fund) from 2006- 2008 and Trustee of Cincinnati Parks Foundation (a charitable organization). |
| 1 | Ms. McGruder, as a director of the Advisor and the Trust's Distributor, and an officer of affiliates of the Advisor and theTrust's Distributor, is an “interested person” of the Trust within the meaning of Section 2(a)(19) of the 1940 Act. |
| 2 | Each Trustee is elected to serve until the age of 75 or until he or she sooner resigns or is removed. |
| 3 | The Touchstone Fund Complex consists of 4 series of the Trust, 3 series of Touchstone Tax-Free Trust, 19 series of Touchstone Funds Group Trust, 4 series of Touchstone Investment Trust, 1 series of Touchstone Institutional Funds Trust, and 11 variable annuity series of Touchstone Variable Series Trust. |
| 4 | Each Trustee is also a Trustee of Touchstone Funds Group Trust, Touchstone Tax-Free Trust, Touchstone Investment Trust, Touchstone Institutional Funds Trust, and Touchstone Variable Series Trust. |
Management of the Trust (Unaudited) (Continued)
| Principal Officers1: | | | | | |
| | | | | | | | | Number | | |
| | | | | | | | | of Funds | | |
| | | | | | | | | Overseen | | |
| | | | | Term of | | | | in the | | |
| Name | | Position(s) | | Office2 And | | | | Touchstone | | Other |
| Address | | Held with | | Length of | | Principal Occupation(s) | | Fund | | Directorships |
| Age | | Trust | | Time Served | | During Past 5 Years | | Complex2 | | Held |
Jill T. McGruder Touchstone Advisors, Inc.
303 Broadway Cincinnati, OH Year of Birth: 1955 | | President | | Until resignation, removal or disqualification President since 2004; President from 2000-2002 | | See biography above. | | 42 | | See biography above. |
| | | | | | | | | | | |
Steven M. Graziano Touchstone Advisors, Inc.
303 Broadway Cincinnati, OH
Year of Birth: 1954 | | Vice President | | Until resignation, removal or disqualification Vice President since 2009 | | President of Touchstone Advisors, Inc.; Executive Vice President of Pioneer Investment Management, Head of Retail Distribution and Strategic Marketing 2007- 2008; Executive Vice President of Pioneer Investment Management, Chief Marketing Officer 2002-2007. | | 42 | | None |
| | | | | | | | | | | |
Timothy D. Paulin Touchstone Advisors, Inc.
303 Broadway Cincinnati, OH
Year of Birth: 1963 | | Vice President | | Until resignation, removal or disqualification Vice President since 2010 | | Senior Vice President of Investment Research; Principal of Klein Decisions | | 42 | | None |
| | | | | | | | | | | |
Joseph Melcher Touchstone Advisors, Inc.
303 Broadway Cincinnati, OH
Year of Birth: 1973 | | Chief Compliance Officer | | Until resignation, removal or disqualification Chief Compliance Officer since 2010 | | Vice President of Compliance of IFS Financial Services (a holding company); Assistant Vice President of Compliance of IFS Financial Services 2005-2010. | | 42 | | None |
| | | | | | | | | | | |
Terrie A. Wiedenheft Touchstone Advisors, Inc.
303 Broadway Cincinnati, OH
Year of Birth: 1962 | | Controller and Treasurer | | Until resignation, removal or disqualification Controller since 2000 Treasurer since 2003 | | Chief Financial Officer and Senior Vice President of IFS Financial Services, Inc. | | 42 | | None |
| | | | | | | | | | | |
Elizabeth R. Freeman BNY Mellon
201 Washington Street Boston, MA
Year of Birth: 1962 | | Secretary | | Until resignation, removal or disqualification Secretary since 2011 | | Managing Director and Senior Counsel at BNY Mellon Investment Servicing (US) Inc. | | 42 | | None |
| 1 | Each officer also holds the same office with Touchstone Funds Group Trust, Touchstone Tax-Free Trust, Touchstone Investment Trust, Touchstone Institutional Funds Trust, and Touchstone Variable Series Trust. |
| 2 | The Touchstone Fund Complex consists of 4 series of the Trust, 3 series of Touchstone Tax-Free Trust, 19 series of Touchstone Funds Group Trust, 4 series of Touchstone Investment Trust, 1 series of Touchstone Institutional Funds Trust, and 11 variable annuity series of Touchstone Variable Series Trust. |
PRIVACY PROTECTION POLICY
We Respect Your Privacy
Thank you for your decision to invest with us. Touchstone and its affiliates have always placed a high value on the trust and confidence our clients place in us. We believe that confidence must be earned and validated through time. In today’s world, when technology allows the sharing of information at light speeds, trust must be reinforced by our sincere pledge to take the steps necessary to ensure that the information you share with us is treated with respect and confidentiality.
Our Pledge to Our Clients
| • | We collect only the information we need to service your account and administer our business. |
| • | We are committed to keeping your information confidential and we place strict limits and controls on the use and sharing of your information. |
| • | We make every effort to ensure the accuracy of your information. |
We Collect the Following Nonpublic Personal Information About You:
| • | Information we receive from you on or in applications or other forms, correspondence, or conversations, including, but not limited to, your name, address, phone number, social security number, assets, income and date of birth; and |
| • | Information about your transactions with us, our affiliates, or others, including, but not limited to, your account number and balance, payment history, parties to transactions, cost basis information, and other financial information. |
Categories of Information We Disclose and Parties to Whom We Disclose
We do not disclose any nonpublic personal information about our current or former clients to nonaffiliated third parties, except as required or permitted by law.
We Place Strict Limits and Controls on the Use and Sharing of Your Information
| • | We restrict access to nonpublic personal information about you to authorized employees who need the information to administer your business. |
| • | We maintain physical, electronic and procedural safeguards that comply with federal standards to protect this information. |
| • | We do not disclose any nonpublic personal information about our current or former clients to anyone, except as required or permitted by law or as described in this document. |
| • | We will not sell your personal information to anyone. |
We May Provide Information to Service Your Account
Sometimes it is necessary to provide information about you to various companies such as transfer agents, custodians, broker-dealers and marketing service firms to facilitate the servicing of your account. These organizations have a legitimate business need to see some of your personal information in order for us to provide service to you. We may disclose to these various companies the information that we collect as described above. We require that these companies, including our own subsidiaries and affiliates, strictly maintain the confidentiality of this information and abide by all applicable laws. Companies within our corporate family that may receive this information are financial service providers and insurance companies. We do not permit these associated companies to sell the information for their own purposes, and we never sell our customer information.
This policy is applicable to the following affiliated companies: Touchstone Funds Group Trust, Touchstone Investment Trust, Touchstone Strategic Trust, Touchstone Tax-Free Trust, Touchstone Variable Series Trust, Touchstone Institutional Funds Trust, Touchstone Securities, Inc.,* Capital Analysts Incorporated and W&S Brokerage Services, Inc.
* Touchstone Securities, Inc. serves as the underwriter to the Touchstone Funds.
A Member of Western & Southern Financial Group®
The Privacy Protection Policy is not part of the Annual Report.
This page intentionally left blank.
This page intentionally left blank.


Go paperless, sign up today at:
www.touchstoneinvestments.com/home
Touchstone Investments
Distributor
Touchstone Securities, Inc.*
303 Broadway
Cincinnati, Ohio 45202-4203 800.638.8194
www.touchstoneinvestments.com
Investment Advisor
Touchstone Advisors, Inc.*
303 Broadway
Cincinnati, Ohio 45202-4203
Transfer Agent
BNY Mellon Investment Servicing (US) Inc.
4400 Computer Drive
Westborough, MA 01581
Shareholder Service
800.543.0407
* A Member of Western & Southern Financial Group
TSF-54-TST-AR-1203
Item 2. Code of Ethics.
| (a) | The registrant, as of the end of the period covered by this report, has adopted a code of ethics that applies to the registrant’s principal executive officer, principal financial officer, principal accounting officer or controller, or persons performing similar functions, regardless of whether these individuals are employed by the registrant or a third party. |
| (c) | There have been no amendments, during the period covered by this report, to a provision of the code of ethics that applies to the registrant’s principal executive officer, principal financial officer, principal accounting officer or controller, or persons performing similar functions, regardless of whether these individuals are employed by the registrant or a third party, and that relates to any element of the code of ethics description. |
| (d) | The registrant has not granted any waivers, including an implicit waiver, from a provision of the code of ethics that applies to the registrant’s principal executive officer, principal financial officer, principal accounting officer or controller, or persons performing similar functions, regardless of whether these individuals are employed by the registrant or a third party, that relates to one or more of the items set forth in paragraph (b) of this item’s instructions. |
Item 3. Audit Committee Financial Expert.
The registrant’s Board of Trustees has determined that the registrant has at least one audit committee financial expert serving on its audit committee. Mr. Donald Siekmann is the registrant’s audit committee financial expert and is an independent trustee within the meaning of the Investment Company Act of 1940, as amended (the “1940 Act”).
Item 4. Principal Accountant Fees and Services.
Audit Fees
| (a) | The aggregate fees billed for each of the last two fiscal years for professional services rendered by the principal accountant for the audit of the registrant's annual financial statements or services that are normally provided by the accountant in connection with statutory and regulatory filings or engagements for those fiscal years 2011 and 2012 are $54,000 and $54,000, respectively, including fees associated with the annual audits and filings of Form N-1A and Form N-SAR. |
Audit-Related Fees
| (b) | The aggregate fees billed in each of the last two fiscal years for assurance and related services by the principal accountant that are reasonably related to the performance of the audit of the registrant's financial statements and are not reported under paragraph (a) of this Item for fiscal years 2011 and 2012 are $12,000 and $15,600, respectively, including fees associated with N-1A, N-14 filings and Conversion testing. |
Tax Fees
| (c) | The fees for tax compliance services for fiscal years 2011 and 2012 are $26,250 and $16,200, respectively. |
All Other Fees
| (d) | There were no other fees for the March 31, 2011 and March 31, 2012 fiscal years. |
| (e)(1) | The Audit Committee’s pre-approval policies describe the types of audit, audit-related, tax and other services that have the general pre-approval of the Audit Committee. The pre-approval policies provide that annual audit service fees, tax services not specifically granted pre-approval, services exceeding pre-approved cost levels and other services that have not received general pre-approval will be subject to specific pre-approval by the Audit Committee. The pre-approval policies further provide that the Committee may grant general pre-approval to other audit services (statutory audits and services associated with SEC registration statements, periodic reports and other documents filed with the SEC or other documents issued in connection with securities offerings), audit-related services (accounting consultations related to accounting, financial reporting or disclosure matters not classified as “audit services,” assistance with understanding and implementing new accounting and financial reporting guidance from rulemaking authorities, agreed-upon or expanded audit procedures related to accounting and/or billing records required to respond to or comply with financial, accounting or regulatory reporting matters and assistance with internal control reporting requirements under Form N-SAR and Form N-CSR), tax services that have historically been provided by the auditor that the Committee believes would not impair the independence of the auditor and are consistent with the SEC’s rules on auditor independence and permissible non-audit services classified as “all other services” that are routine and recurring services. |
| (e)(2) | All services described in paragraphs (b) through (d) of Item 4 were approved by the Audit Committee. |
| (f) | The percentage of hours expended on the principal accountant's engagement to audit the registrant's financial statements for the most recent fiscal year that were attributed to work performed by persons other than the principal accountant's full-time, permanent employees was less than fifty percent. |
| (g) | The aggregate non-audit fees billed by the registrant's accountant for services rendered to the registrant, and rendered to the registrant's investment adviser (not including any sub-adviser whose role is primarily portfolio management and is subcontracted with or overseen by another investment adviser), and any entity controlling, controlled by, or under common control with the adviser that provides ongoing services to the registrant for each of the last two fiscal years of the registrant for 2011 and 2012 are $26,250 and $16,200, respectively. |
| (h) | The registrant's audit committee of the board of trustees has considered whether the provision of non-audit services that were rendered to the registrant's investment adviser (not including any sub-adviser whose role is primarily portfolio management and is subcontracted with or overseen by another investment adviser), and any entity controlling, controlled by, or under common control with the investment adviser that provides ongoing services to the registrant that were not pre-approved pursuant to paragraph (c)(7)(ii) of Rule 2-01 of Regulation S-X is compatible with maintaining the principal accountant's independence. |
Item 5. Audit Committee of Listed registrants.
Not applicable.
Item 6. Investments.
| (a) | Schedule of Investments in securities of unaffiliated issuers as of the close of the reporting period is included as part of the report to shareholders filed under Item 1 of this form. |
Item 7. Disclosure of Proxy Voting Policies and Procedures for Closed-End Management Investment Companies.
Not applicable.
Item 8. Portfolio Managers of Closed-End Management Investment Companies.
Not applicable.
Item 9. Purchases of Equity Securities by Closed-End Management Investment Company and Affiliated Purchasers.
Not applicable.
Item 10. Submission of Matters to a Vote of Security Holders.
There have been no material changes to the procedures by which the shareholders may recommend nominees to the registrant’s board of trustees, where those changes were implemented after the registrant last provided disclosure in response to the requirements of Item 407(c)(2)(iv) of Regulation S-K (17 CFR 229.407) (as required by Item 22(b)(15) of Schedule 14A (17 CFR 240.14a-101)), or this Item.
Item 11. Controls and Procedures.
| (a) | The registrant’s principal executive and principal financial officers, or persons performing similar functions, have concluded that the registrant’s disclosure controls and procedures (as defined in Rule 30a-3(c) under the Investment Company Act of 1940, as amended (the “1940 Act”) (17 CFR 270.30a-3(c))) are effective, as of a date within 90 days of the filing date of the report that includes the disclosure required by this paragraph, based on their evaluation of these controls and procedures required by Rule 30a-3(b) under the 1940 Act (17 CFR 270.30a-3(b)) and Rules 13a-15(b) or 15d-15(b) under the Securities Exchange Act of 1934, as amended (17 CFR 240.13a-15(b) or 240.15d-15(b)). |
| (b) | There were no changes in the registrant’s internal control over financial reporting (as defined in Rule 30a-3(d) under the 1940 Act (17 CFR 270.30a-3(d)) that occurred during the registrant’s second fiscal quarter of the period covered by this report that has materially affected, or is reasonably likely to materially affect, the registrant’s internal control over financial reporting. |
Item 12. Exhibits.
| (a)(1) | Code of ethics, or any amendment thereto, that is the subject of disclosure required by Item 2 is attached hereto. |
| (a)(2) | Certifications pursuant to Rule 30a-2(a) under the 1940 Act and Section 302 of the Sarbanes-Oxley Act of 2002 are attached hereto. |
| (b) | Certifications pursuant to Rule 30a-2(b) under the 1940 Act and Section 906 of the Sarbanes-Oxley Act of 2002 are attached hereto. |
SIGNATURES
Pursuant to the requirements of the Securities Exchange Act of 1934 and the Investment Company Act of 1940, the registrant has duly caused this report to be signed on its behalf by the undersigned, thereunto duly authorized.
(Registrant) Touchstone Strategic Trust
| By (Signature and Title)* | /s/ Jill T. McGruder |
| | Jill T. McGruder, President |
| | (principal executive officer) |
Date 5/29/12
Pursuant to the requirements of the Securities Exchange Act of 1934 and the Investment Company Act of 1940, this report has been signed below by the following persons on behalf of the registrant and in the capacities and on the dates indicated.
| By (Signature and Title)* | /s/ Jill T. McGruder |
| | Jill T. McGruder, President |
| | (principal executive officer) |
Date 5/29/12
| By (Signature and Title)* | /s/ Terrie A. Wiedenheft |
| | Terrie A. Wiedenheft, Controller and Treasurer |
| | (principal financial officer) |
Date 5/29/12
* Print the name and title of each signing officer under his or her signature.