UNITED STATES
SECURITIES AND EXCHANGE COMMISSION
Washington, D.C. 20549
FORM N-CSR
CERTIFIED SHAREHOLDER REPORT OF REGISTERED MANAGEMENT INVESTMENT COMPANIES
Investment Company Act file number 811-03651
Touchstone Strategic Trust – July Funds
(Exact name of registrant as specified in charter)
303 Broadway, Suite 1100
Cincinnati, Ohio 45202-4203
(Address of principal executive offices) (Zip code)
Jill T. McGruder
303 Broadway, Suite 1100
Cincinnati, Ohio 45202-4203
(Name and address of agent for service)
Registrant's telephone number, including area code: 800-638-8194
Date of fiscal year end: July 31
Date of reporting period: July 31, 2012
Form N-CSR is to be used by management investment companies to file reports with the Commission not later than 10 days after the transmission to stockholders of any report that is required to be transmitted to stockholders under Rule 30e-1 under the Investment Company Act of 1940 (17 CFR 270.30e-1). The Commission may use the information provided on Form N-CSR in its regulatory, disclosure review, inspection, and policymaking roles.
A registrant is required to disclose the information specified by Form N-CSR, and the Commission will make this information public. A registrant is not required to respond to the collection of information contained in Form N-CSR unless the Form displays a currently valid Office of Management and Budget ("OMB") control number. Please direct comments concerning the accuracy of the information collection burden estimate and any suggestions for reducing the burden to Secretary, Securities and Exchange Commission, 100 F Street, NE, Washington, DC 20549. The OMB has reviewed this collection of information under the clearance requirements of 44 U.S.C. § 3507.
Item 1. Reports to Stockholders.
The Report to Shareholders is attached herewith.
July 31, 2012
Annual Report
Touchstone Strategic Trust
Touchstone Dynamic Equity Fund
Touchstone Emerging Growth Fund
Touchstone International Equity Fund
Touchstone Balanced Allocation Fund
Touchstone Conservative Allocation Fund
Touchstone Growth Allocation Fund
Touchstone Moderate Growth Allocation Fund

Table of Contents
| | Page |
| Letter from the President | 3 |
| Management's Discussion of Fund Performance (Unaudited) | 4 - 25 |
| Tabular Presentation of Portfolios of Investments (Unaudited) | 26 - 28 |
| Portfolios of Investments: | |
| Touchstone Dynamic Equity Fund | 29 |
| Touchstone Emerging Growth Fund | 32 |
| Touchstone International Equity Fund | 34 |
| Touchstone Balanced Allocation Fund | 38 |
| Touchstone Conservative Allocation Fund | 39 |
| Touchstone Growth Allocation Fund | 40 |
| Touchstone Moderate Growth Allocation Fund | 41 |
| Statements of Assets and Liabilities | 42 - 45 |
| Statements of Operations | 46 - 47 |
| Statements of Changes in Net Assets | 48 - 51 |
| Statements of Changes in Net Assets - Capital Stock Activity | 52 - 57 |
| Statement of Cash Flows | 58 |
| Financial Highlights | 60 - 73 |
| Notes to Financial Statements | 74 - 95 |
| Report of Independent Registered Public Accounting Firm | 96 |
| Other Items (Unaudited) | 97 - 105 |
| Management of the Trust (Unaudited) | 106 - 109 |
| Privacy Protection Policy | 111 |
Letter from the President
Dear Shareholder:
We are pleased to provide you with the Touchstone Strategic Trust Annual Report. Inside you will find key financial information and manager commentaries for the twelve months ended July 31, 2012.
While the U.S. economy continues to recover from the depths of the 2008-2009 recession, the pace of growth has been uneven as reflected by the past 12 months. Major events — including the European debt crisis, a slowdown in emerging-market economies, U.S. deficit concerns, a slow recovery in the housing market, and stagnant unemployment and consumer confidence — have challenged the recovery. Interest rates remained at historic lows while the U.S. Federal Reserve Board (the “Fed”) remained undecided about a third round of quantitative easing (QE3).
After enduring last year’s debt-ceiling debate and Standard & Poor’s downgrade of U.S. debt, stocks enjoyed a healthy start in 2012, but then retracted by mid-year as corporate earnings were mixed, unemployment figures remained elevated, and consumers and businesses alike lowered spending in a cautious move. Dividends and low price-to earnings ratios made equities relatively cheaper versus other fixed income securities such as U.S. Treasuries — as yields on the 10-year note fell to record lows. Against this backdrop of market volatility, political uncertainty, and challenging growth, the U.S. economy continued to prove its resiliency.
Overall, U.S. equities outperformed fixed income securities in this timeframe. Investment grade bonds lagged non-investment grade bonds and both of those lagged U.S. Treasuries. Large-capitalization stocks outperformed small-capitalization stocks, and from a style perspective, growth outperformed value. Developed international equities outperformed emerging market equities, and both were negative.
Remember to pursue a long-term investment strategy to help you navigate future market conditions. Consult with your financial professional to build a diversified asset allocation portfolio of stock, bond, alternative investments and money market mutual funds. We greatly appreciate your continued support.
As always, thank you for including Touchstone as part of your investment plan.
Sincerely,

Jill T. McGruder
President
Touchstone Strategic Trust
Management's Discussion of Fund Performance (Unaudited)
Touchstone Dynamic Equity Fund
Sub-Advised by Analytic Investors, LLC
Investment Philosophy and Process
The Fund seeks long-term capital appreciation from hedged equity investments with less risk than a fully invested, unhedged equity portfolio. A proprietary system that ranks stocks according to a mathematical model is utilized in an attempt to create a diversified and hedged portfolio, which invests in a combination of stocks and options including covered calls. A security’s intrinsic value is determined by evaluating variables such as relative valuation, price momentum, company fundamentals, liquidity and risk. Portfolio optimization is utilized to select securities that are expected to maximize return, minimize volatility and diversify assets.
Fund Performance and Market Overview
The total return which has been adjusted for sales charges of the Touchstone Dynamic Equity Fund, Class A Shares, was 10.00% for the fiscal year ended July 31, 2012. The S&P 500 Index returned 9.13% for the same period.
The period started down sharply as fear and uncertainty sent markets lower. A major concern among investors was that the European debt crisis was spreading and could lead to recession. Compounding the concern was the political paralysis seen in both Europe and the U.S., which sent investor confidence spiraling further downward.
However, markets rose after a plan was announced to support many struggling European banks and create a stronger fiscal union. In addition, economic reports coming from the U.S. were fairly positive, which was much better than the growth seen at the start of the calendar year. For example, in the U.S., employment and housing markets began to show signs of life, consumer spending was robust, and corporations continued to grow. These factors moved markets higher, but stocks still struggled during the second calendar quarter of 2012 as European headwinds resurfaced and China reported slower growth.
Overall, the uncertainty surrounding Europe continued to dominate the headlines and influence investors, although encouraging news from the U.S. helped domestic equities post positive results for the fiscal year end. In addition, the announcement of the plan to create a stronger fiscal union in Europe also helped push overall returns higher during the 12-month period.
Portfolio Review
The Fund is a hedged equity fund, comprised of equities and options. During the fiscal year, the equity component slightly outperformed the S&P 500 Index and the options component posted positive returns. A positive performing market is often a difficult environment to sell call options, yet during the period the equity market had three large negative returning months where the calls contributed to performance and allowed the Fund to outperform its benchmark.
During the period, the Fund’s emphasis on companies with quality characteristics — such as companies with above-average return on assets and strong profit margins — helped returns, as investors sought relative safety in high-quality companies. As a result, stocks with the highest profit margins outperformed those companies with the weakest profits. In addition, the Fund’s overweight position to stocks of companies with certain growth characteristics positively impacted performance during the period. Specifically, an emphasis on companies with strong recent earnings-per-share growth helped performance, as investors emphasized growth over value during the 12-month period.
Management's Discussion of Fund Performance (Unaudited) (Continued)
On the other hand, since the Fund’s process is style neutral (meaning the portfolio is constructed to have a balance of growth and value characteristics), particular tilts toward certain valuation characteristics negatively impacted results. For example, an emphasis on companies with strong cash flow-to-price ratios negatively impacted results.
Among the individual stocks that contributed to the Fund’s performance were Apple, Inc., Amgen, Inc., Expedia, Inc., Alpha Natural Resources, Inc., and Arch Coal, Inc. An overweight position in Apple, a designer and manufacturer of computers and mobile communication devices, helped Fund performance, as the company reported record sales that far exceeded analyst and investor expectations. An overweight position in Amgen, a biotechnology medicines company, also helped performance as the company’s stock moved higher after Amgen launched an aggressive buyback program. Expedia, an online travel company, posted strong profit and revenue results that exceeded analyst expectations. The company was also an overweight position in the Fund. A short position in Alpha Natural Resources, a supplier and exporter of metallurgical coal, was positive to the Fund after the company’s stock was negatively impacted by the collapse in U.S. coal prices. A short position in Arch Coal, the second-largest U.S. coal producer, also helped relative returns after Arch Coal saw its shares fall after the company announced lower earnings as a result of the weaker demand for fuel.
Among the top detractors from Fund performance were Freeport-McMoRan Copper & Gold, Inc., Tyson Foods, Inc., Ford Motor Co., and Smithfield Foods, Inc. Shares of Freeport-McMoRan Copper & Gold, an international mining company, moved lower as the company is expected to lose production at its Indonesian mine due to labor problems. The dispute would likely entail a loss in production of approximately three million to five million pounds of copper and approximately 5,000 ounces of gold per day. Shares of Tyson Foods, a meat protein and food production company, suffered after the company cut its annual sales forecast and reported that earnings would be lower than projected, as costs of animal feed rose during the period. Ford Motor, a producer of cars and trucks, also suffered after the company reported substantially lower operating profits in the second quarter, primarily due to operations outside the of the U.S. Shares of Smithfield Foods, a producer and marketer of fresh and packaged meats, declined after the company missed analyst earnings expectations and reported a 14% drop in profits during the fourth quarter of 2011.
Outlook and Conclusion
Our process is based on the fundamental belief that there is persistency in the types of characteristics investors prefer. If this holds going forward, we expect the Fund to benefit from being properly positioned toward stocks with characteristics favored by investors.
With regard to market factors, we continue to favor certain valuation characteristics, such as companies with attractive sales-to-price and cash flow-to-price ratios, and deemphasize stocks with above-average dividend yields. In addition, we expect to continue to position the Fund toward stocks with certain quality metrics, such as companies with strong return on assets and above-average profit margins. Within growth, we expect to favor an emphasis on stocks with above-average recent earnings-per-share growth and growth in profitability. Finally, we expect to continue to avoid certain risk factors such as stocks with above-average trading volume and stocks with wide-ranging earnings estimates from analysts.
We intend for the equity portion of the Fund to be fully invested with similar risk exposures as the S&P 500, such as similar sector weights, style tilts, and market capitalization. This equity exposure will be hedged with options. As a result, if the market experiences a strong rally going forward, it may be difficult for the Fund to keep pace with the unhedged index (S&P 500). On the other hand, if the market is flat or moves lower, the options component of the Fund should provide some protection.
Management's Discussion of Fund Performance (Unaudited) (Continued)
Comparison of the Change in Value of a $10,000 Investment in the Touchstone Dynamic
Equity Fund - Class A*, the S&P 500 Index and the Citigroup 3-Month T-Bill Index
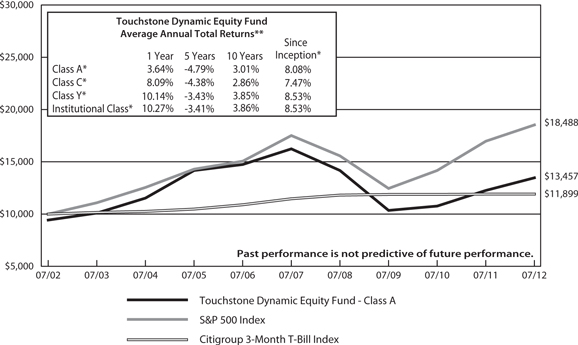
| * | The chart above represents performance of Class A shares only, which will vary from the performance of Class C shares, Class Y shares and Institutional Class shares based on the differences in loads and fees paid by shareholders in the different classes. Class Y shares commenced operations on July 1, 1978, Class A shares and Class C shares commenced operations on March 31, 2005 and Institutional Class shares commenced operations on December 9, 2005. The Class A and Class C shares performance information is calculated using the historical performance of Class Y shares for periods prior to March 31, 2005 and Institutional Class shares performance information is calculated using the historical performance of Class Y shares for periods prior to December 9, 2005. The returns have been restated for sales charges and for fees applicable to Class A, Class C, and Institutional Class shares. |
| ** | The average annual total returns shown above are adjusted for maximum applicable sales charges. |
The performance of the above Fund does not reflect the deduction of taxes that a shareholder would pay on Fund distributions or the redemption of Fund shares. The past performance is not predictive of future results.
Management's Discussion of Fund Performance (Unaudited)
Touchstone Emerging Growth Fund
Sub-Advised by Copper Rock Capital Partners, LLC
Investment Philosophy and Process
The Fund seeks capital appreciation by investing primarily in equity securities of emerging growth companies of any size, emphasizing small- to mid-cap companies diversified across sectors and industries. A fundamental, bottom-up approach is employed. The approach focuses on companies that exhibit strong management teams, the potential for strong and sustainable revenue and earnings growth, and strong financial and competitive positions.
Fund Performance and Market Overview
The total return which has been adjusted for sales charges of the Touchstone Emerging Growth Fund, Class A Shares, was -6.58% for the fiscal year ended July 31, 2012. The total return of the Russell 2500 Growth Index was -0.28% for the same period.
During the 12-month period ending July 2012, investors saw wide swings in the financial markets, even as optimism over the U.S. employment picture grew and efforts by central banks in Europe and Asia to support economic growth appeared to stave off further debt crises.
Investors continued to take on risk at the start of 2012 as stocks finally started to separate from other asset classes. However, by the end of the second quarter of 2012, world markets declined again with most of the dip registering in May when fears of bond defaults in Europe intensified. Efforts by the European Central Bank and the European Union to recapitalize the Spanish banks eased those fears in early June, which helped markets rally worldwide in the final month of the quarter. In response to the uncertainty across the Atlantic, investors in the U.S. followed suit with a strong sell-off of stocks. This growth scare was compounded by signals that the employment recovery would remain slow throughout the remainder of 2012 and led companies to reign in outlooks and present more cautious guidance for the rest of the year. In response, lower-quality stocks — generally defined as non-earning stocks, stocks with lower long-term earnings, and the lowest return on equity — continued to outperform through the end of June, thereby creating an overall difficult backdrop for the Fund’s holdings to outperform.
Portfolio Review
The Fund’s underperformance during the 12-month period stemmed from a combination of some stock disappointments coupled with headwinds resulting from a low-quality stock rally. Segments like biotechnology, where the Fund had limited exposure, helped boost returns for the Index. The Fund benefited from stock selection in individual positions within sectors that underperformed on the whole, including Information Technology, Health Care and Industrials.
Overall, the Fund’s strategy continued to have a modest overweight in the Industrials sector, preferring to own more secular ideas. Some of these holdings have declined amid concerns over the economic outlook, but we anticipate these prices will come back as short-term fear subsides. We continued to maintain the Fund’s relative underweight position in the Health Care sector, again preferring not to own non-earning biotechnology stocks with very low visibility. Finally, the Fund had a modest overweight relative to the benchmark Index in the Financials sector, and tended to own specialty financial services stocks in lieu of banks.
Among the individual stocks that contributed most to the Fund’s performance were SuccessFactors, Inc., Catamaran Corp., and Air Methods Corp. During the period, SuccessFactors, a provider of cloud-based software solutions, was acquired by SAP AG and the Fund benefited. Catamaran Corp. (formerly SXC Health Solutions Corp.), a provider of pharmacy benefit management services, saw its shares continue to move higher in response to
Management's Discussion of Fund Performance (Unaudited) (Continued)
the disruption caused by the recently completed merger between Medco Health Solutions, Inc. and Express Scripts Holding Co. In addition, Catamaran acquired its closest competitor during the second quarter of 2012, which is expected to be accretive going forward. The Fund also benefited from its position in Air Methods Corp., a provider of air medical emergency transport systems. During the period, Air Methods announced the acquisition of a large competitor, OmniFlight, which was highly accretive.
Among the stocks that detracted from Fund performance were Green Mountain Coffee Roasters, Inc., Cooper Companies, Inc., and Acme Packet, Inc. During the period, Green Mountain Coffee Roasters, a specialty coffee and coffee maker business, was in the news again when a hedge fund questioned accounting practices that had already been resolved. More importantly, however, the company missed its fourth-quarter sales expectations, and the stock moved significantly lower. We eventually exited the position. Cooper Companies, a global medical products company, was a significant detractor in the Fund during the fourth quarter of 2011 and a leading underperformer over the 12-month period. The Fund owned the stock because of the company’s generally recession-resistant business model and strong growth opportunities from its silicone hydrogel lens products, which had previously led to consistent margin expansion and strong earnings. However, we believe that shares of Cooper Companies were overly punished when a recall of one of the company’s contact lens products, which accounted for less than 1% of sales, spread to a limited recall on a product line that totaled close to 20% of sales. As a result of concern that sales could be significantly impacted while Cooper Companies worked to resolve manufacturing issues surrounding the recall, we took an overly cautious stance and reduced the position. Upon confirmation from Cooper Companies that the manufacturing concerns were resolved, and good visibility that the underlying growth prospects remained strong, we added to the position. Finally, the Fund’s position in Acme Packet, a provider of session delivery network solutions, negatively impacted performance. Acme Packet was affected by a slowing wireline buildout of IP networks by carriers, along with the emerging 4G wireless buildout that will require even more session border controls.
Outlook and Conclusion
Recent economic data is consistent with the belief that we will see a slow but gradual recovery in the global economy. While Europe is contracting, and uncertainty regarding sovereign debt and even the future of the euro persist, there have been nascent signs of an uptick in China. The U.S. recovery is being led by corporate productivity investments along with a slow and steady housing recovery. Additionally, we expect the recent decline in oil prices to serve as a stimulus for retail consumption in the upcoming fall and holiday buying seasons, which should help to lift the gross domestic product. The upcoming U.S. presidential election and expiration of the Bush-era tax cuts are expected to create continued volatility in the stock market; however, we do not believe that such rhetoric will have enough of an impact on personal consumption or corporate productivity investments in which to derail the U.S. recovery.
In spite of these near-term and generally short-lived growth scares, we will continue to manage the Fund with a bottom-up, fundamentals-first approach. Through diligent analysis, we continue to expect good earnings growth from company managements that embrace improving incremental operating margins and sustained revenue growth through focused execution.
Management's Discussion of Fund Performance (Unaudited) (Continued)
Comparison of the Change in Value of a $10,000 Investment in the
Touchstone Emerging Growth Fund - Class A* and the Russell 2500™ Growth Index
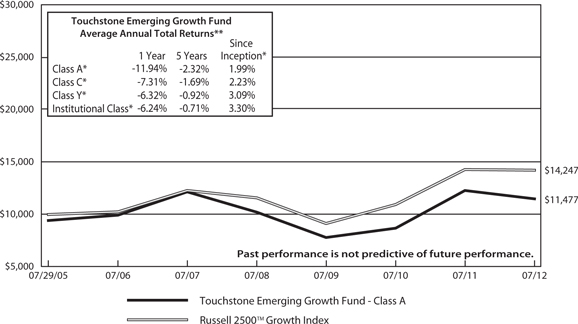
| * | The chart above represents performance of Class A shares only, which will vary from the performance of Class C shares, Class Y shares and Institutional Class shares based on the differences in loads and fees paid by shareholders in the different classes. Class A shares and Institutional Class shares commenced operations on July 29, 2005, Class Y shares commenced operations on December 9, 2005, and Class C shares commenced operations on April 12, 2012. Class Y shares performance information is calculated using the historical performance of Class A shares for periods prior to December 9, 2005 and Class C shares performance information is calculated using the historical performance of Class A shares for periods prior to April 12, 2012 . The returns have been restated for sales charges and for fees applicable to Class C and Class Y shares. |
| ** | The average annual total returns shown above are adjusted for maximum applicable sales charges. |
The performance of the above Fund does not reflect the deduction of taxes that a shareholder would pay on Fund distributions or the redemption of Fund shares. The past performance is not predictive of future results.
Management's Discussion of Fund Performance (Unaudited)
Touchstone International Equity Fund
Sub-Advised by Acadian Asset Management LLC
Investment Philosophy and Process
The Fund seeks long-term capital appreciation by primarily investing in equity securities of non-U.S. issuers. Stock factors are utilized in an effort to predict how well each security will perform relative to its region and industry peer groups, and forecasts are combined to determine a world-relative return forecast for each stock in the allowable universe. A sophisticated portfolio optimization system is employed to trade off the expected return of the stocks with such considerations as the benchmark Index, desired level of risk, transaction cost estimates, available liquidity, and other requirements. A disciplined process is utilized, which is based on the belief that it is crucial to avoid emotional decision-making, and focus on potential returns and risk control.
Fund Performance and Market Review
The total return which has been adjusted for sales charges of the Touchstone International Equity Fund, Class A Shares, was -11.40% for the fiscal year ended July 31, 2012. The total return of the MSCI EAFE Index was -10.99% for the same period.
The second half of 2011 began with sharp losses in the global equity market amid apprehensions about a potential Greek default, mounting fears about weakness in Europe’s banking system, and generally deteriorating economic conditions worldwide. The U.S. in particular grappled with a number of disappointing indicators, including a persistently bleak employment picture and a still-struggling housing market. Toward the end of the calendar year there was some moderation of this downward trajectory, and many markets regained ground. Investors perceived some hopeful economic signals in the U.S., and responded positively to Europe’s progress on liquidity injections, greater economic integration and tighter budget oversight. Overall however, it was a volatile period with frequent large market swings. And, while there were signs of improving economic conditions and generally higher equity returns, deep concerns persisted about the sustainability of a recovery — especially considering the complexity of the European debt crisis and uncertainty about China.
The early part of 2012 saw a strong upward trajectory for global equities, as investors were encouraged by a number of positive developments in the U.S., including improving unemployment figures, stronger consumer data, and signs of stabilization in the housing market. European markets were less strong but still made significant gains, which were buoyed by better-than-expected economic news and indications that a resolution to the Greek debt crisis was moving forward. The Asia-Pacific region was the strongest developed market region in the first calendar quarter of 2012. Japan was the leading country in that region, as its industrial production continued to recover and successful yen intervention credited for delivering a necessary boost to corporate profitability.
As 2012 progressed, market momentum in Europe dampened as intensifying concerns about Greece, Spain and Italy reignited worries about the euro. While a successful European Union summit in June and the election of a pro-reform government in Greece helped to somewhat temper fears, economic indicators in Europe were gloomy as employment and manufacturing growth were threatened by the region’s financial turmoil. The Asia-Pacific region was also weak, with Japan experiencing contraction in its industrial production and China’s economy showing signs of continued slowing. U.S. indicators told a mixed story however. While mounting unease about the strength and sustainability of a recovery in the labor market appeared to weigh on consumer confidence and spending, a number of positive signs emerged from the long-beleaguered housing market. Furthermore, the U.S. Federal Reserve Board toned down its assessment of the economy’s performance and reaffirmed its plans to keep interest rates near zero through late 2014.
Management's Discussion of Fund Performance (Unaudited) (Continued)
Portfolio Review
During the fiscal period, solid gains from stock selection contributed to Fund performance, which helped to offset losses from country allocations. Stock selection in Japan performed strongly and contributed to the majority of Fund performance. Within Japan, key contributors featured holdings in the Industrials and Financials sectors, such as J. Trust Co. Ltd., Daiwa House Industry Co. Ltd., Mitsubishi UFJ Financial Group Inc., Nippo Electric Co. Ltd., and Nippon Road Co. Ltd. A number of financial stocks, including Mitsubishi UFJ Financial Group, rose in mid-February after the Bank of Japan unexpectedly increased asset purchases to stimulate growth. Outside of Japan, the Fund also realized positive active return from its selections in Austria, Germany and Hong Kong. Stock selection in Australia, Sweden and the U.K. detracted from performance during the period.
From a country perspective, detractors from Fund performance resulted from its overweight positions to Japan and Greece, underweight positions to Australia and the U.K., and an overweight to France. This positioning negatively offset the successful underweight to Spain and overweights to Denmark and Singapore.
Among the individual stocks that contributed to the Fund’s performance were J. Trust Co. Ltd. (Financials), Totetsu Kogyo Co. Ltd. and Daiwa House Industry Co. (Industrials), ImperialTobacco Group PLC (Consumer Staples) and Otsuka Holdings Co. Ltd. (Health Care). Shares of the Japan-based Financial Services sector company J. Trust Co. rallied in the first quarter of 2012 after the company purchased assets from bankrupt consumer lender Takefuji Corp. (Financials) without having to assume Takefuji’s liabilities. The purchase also included data on more than eight million borrowers. Totetsu Kogyo Co., a Japan-based company engaged in the operation of construction-related businesses, saw its shares tick upward after the company announced in November 2011, that it raised its consolidated mid-year outlook for revenue, profit, and earnings-per-share for its fiscal year ending March 2012, due to decreased administrative expenses and increased construction. Shares of Imperial Tobacco Group, a U.K.-based tobacco company, received a boost in December 2011, as investors rewarded such companies whose earnings had fewer ties to economic growth. Shares of Daiwa House Industry Co., a Japan-based construction company, rose in the second quarter of 2012 after Deutsche Bank AG (Financials) reaffirmed its “buy” rating and raised its price target for the company’s stock.
Among the largest detractors from Fund performance were Enel S.p.A. (Utilities), Eurasian Natural Resources Corp. PLC and Rio Tinto plc (Materials), BNP Paribas SA (Financials), and OPAP S.A. (Consumer Discretionary). The Italy-based electric utility company, Enel, saw its shares slide after Standard & Poor’s downgraded the company’s credit early in 2012. Eurasian Natural Resources Corp., a Kazakhstan-based diversified natural resources company, saw its shares fall sharply late in the reporting period based on speculation that the company was close to an agreement to buy out Dan Gertler, who is owner of a 49.5% stake in a copper mine in the Democratic Republic of Congo. In August 2011, shares of BNP Paribas, a France-based banking group, declined alongside other European banks amid concerns that lenders will likely face challenges funding themselves and increasing profit as the region’s debt crisis continues to stifle economic growth. The stock saw further losses in September 2011, based on reports that the company’s rating would possibly be cut by Moody’s Investor Services amid concerns over its holdings of Greek sovereign debt. Rio Tinto, an Australia-based company engaged in minerals exploration, development, production and processing, saw its shares move in tandem with copper prices, which dropped to a one-year low late in the third quarter of 2011. This was based on concerns that a weaker global economy will likely dampen demand for industrial metals. Shares of OPAP, a Greek-based gambling company, fell sharply on fears that the country would not be able to uphold the austerity commitments needed to obtain further financial aid.
Outlook and Conclusion
While earlier in the year the expectation was for a decoupled environment with a mix of growth and contraction in key economies, some now worry there will be a more synchronized cooling across the globe. The more uncertain macroeconomic picture has led key central banks to consider further policy accommodations. We believe that
Management's Discussion of Fund Performance (Unaudited) (Continued)
while much of Europe should remain in a recession for the balance of 2012, the U.S. should see a continuation of its modest recovery. In addition, we believe that emerging markets should realize positive but decelerating growth. Coupled with the deep uncertainties in Europe, the U.S. election cycle, and geopolitical stresses in the Middle East and Asia, we believe that the risk of sell-off has risen and that equity markets are likley to be volatile in the months ahead.
Although U.S. data for the second quarter of 2012 has indicated some slowing in the key areas of employment and business surveys, job growth and industrial production continue to show improvement from levels of one year ago— and overall, we believe the growth rate of the U.S. economy appears solid. In Europe, the continuing crisis has caused financial market distress that will likely motivate major central banks to undertake new action. European data continues to slow, with even Germany showing vulnerability of late. With minimal progress toward meaningful fiscal integration thus far, we expect Europe will remain in reaction mode, responding mainly to current crises, and working only within the limitations of the existing political framework. Implementing structural reforms in Greece and other indebted countries will be a slow process, and we believe the realities of implementation are likely to be underestimated by financial markets.
Japan continues to demonstrate moderate recovery, particularly in terms of production and consumer demand — which has been fueled by the reconstruction resulting from damage caused by the earthquake and tsunami. However, going forward, we believe a stronger yen is likely to continue to pose challenges for the country’s export sector, amid the periodic surges of investor demand for safe-haven securities.
Management's Discussion of Fund Performance (Unaudited) (Continued)
Comparison of the Change in Value of a $10,000 Investment in the
Touchstone International Equity Fund - Class A* and the MSCI EAFE Index
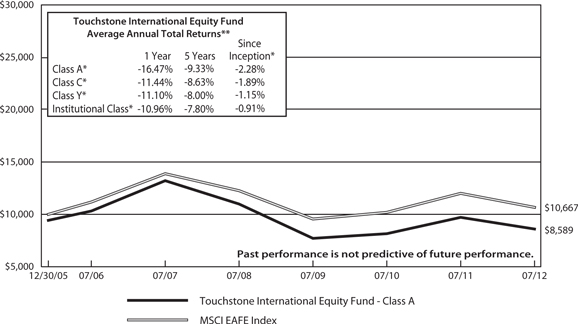
| * | The chart above represents performance of Class A shares only, which will vary from the performance of Class C shares, Class Y shares and Institutional Class shares based on the differences in loads and fees paid by shareholders in the different classes. Class A shares, Class Y shares and Insitutional Class shares commenced operations on December 30, 2005 and Class C shares commenced operations on April 12, 2012. Class C shares performance information is calculated using the historical performance of Class A shares for periods prior to April 12, 2012. The returns have been restated for sales charges and for fees applicable to Class C shares. |
| ** | The average annual total returns shown above are adjusted for maximum applicable sales charges. |
The performance of the above Fund does not reflect the deduction of taxes that a shareholder would pay on Fund distributions or the redemption of Fund shares. The past performance is not predictive of future results.
Management's Discussion of Fund Performance (Unaudited)
Touchstone Balanced Allocation Fund
Sub-Advised by Ibbotson Associates, Inc.
Investment Philosophy and Process
The Fund seeks to provide investors with capital appreciation and current income. The Fund is a fund of funds and therefore the value of an investment in the Fund is based on the performance of the underlying funds in which it invests and the allocation of its assets among those funds. This fund of funds primarily invests in a diversified portfolio of underlying equity and fixed income funds. The underlying funds, in turn, invest in a variety of U.S. and foreign equity and fixed income securities and may hold cash, cash equivalents and money market funds. An optimal model allocation among underlying funds is sought, by using an analysis that looks at forecasted returns, standard deviations in historical returns, and the correlation of the performance of different market sectors. The underlying funds are selected and weighted based on historical returns-based style analysis, holdings-based style analysis, manager interviews, relative and absolute performance, including correlations with other underlying funds as well as corresponding benchmarks, and historical volatility (the variability of returns from one period to the next). Under normal circumstances, the Fund expects to allocate its assets among equity and fixed income funds as follows: Equity Fund Allocation: 50–70%, Fixed Income Fund Allocation: 30–50%.
Fund Performance and Market Overview
The total return which has been adjusted for sales charges of the Touchstone Balanced Allocation Fund, Class A Shares, was 2.89% for the fiscal year ended July 31, 2012. The total return of the Barclays U.S. Aggregate Bond Index was 7.25% and the total return of the S&P Composite 1500 Index was 8.27% for this same period. The total return of the 40% Barclays U.S. Aggregate Bond Index / 60% S&P Composite 1500 Index was 8.32% for the period.
During the 12-month period, market volatility persisted as concerns about the global economy and the eurozone crisis continued to dominate headlines. Overall, it was a challenging period given low interest rates and sluggish economic activity. Investors sought safety in U.S. Treasury securities, driving yields down to historic lows, while also bidding up real estate investment trusts (REITs), corporate bonds and high-yield bonds in search of yield. Outside the U.S., worsening conditions in China and Brazil weighed down on emerging market stocks while the eurozone situation affected returns across developed markets.
Portfolio Review
The Fund underperformed its benchmark during the period due to considerable exposure to short-term bonds, small- and mid-cap stocks, and foreign markets. As yields declined during the period, shorter-term bonds and cash lagged as the broad market rose, while foreign bonds were relatively flat. Small- and mid-cap stocks fared considerably worse than large-cap stocks, while foreign equities significantly underperformed the U.S. market, further weighing down on performance. Exposure to global REITs helped to offset these negative effects, as their performance surpassed all asset classes.
During the period, the Fund held multiple dynamic asset allocation positions. In particular, the Fund was underweight equities versus short-term bonds, underweight small/mid-cap stocks versus large-cap stocks, overweight international equities versus domestic equities, underweight global REITs versus large-cap stocks, and overweight short-term bonds versus intermediate-term bonds. Overall, the Fund’s defensive positioning was a slight detractor from performance. This was partially offset by the effects of manager selection, as the underlying managers in aggregate beat their assigned benchmarks.
Management's Discussion of Fund Performance (Unaudited) (Continued)
Outlook and Conclusion
We believe the economic environment is likely to be one of continued apathy as opposed to a plunge into global recession, at least in the near term. In particular, resource utilization rates remain at depressed levels in most advanced economies, and, outside of the eurozone, there is little evidence of a “smoking gun” to warrant immediate concern. It is our view that business cycles do not die of old age and, in the past, recessions have been triggered by a variety of factors: a persistent spike in the price of oil, a large natural disaster, a massive fiscal or monetary policy tightening, or the bursting of an asset bubble. Nothing of that magnitude has happened over the last six to twelve months. Moreover, economic data are not reflecting an abrupt decline in the pace of activity, but rather a lazy descent.
Going forward, we believe the investment outlook continues to be unusually uncertain, and the risks are tilted to the downside. In addition, we believe that a misstep in the handling of China’s banking problems, the exit of Greece from the eurozone, or the always-present threat of a spike in the price of oil could all be factors that may potentially wreck the economy’s wobbly ship. Furthermore, near the end of the year the U.S. government must deal with the “fiscal cliff” dilemma, which would cause an increase in taxes and a reduction in government expenditures worth potentially 3–5% of gross domestic product in 2013 alone. That said, we remain cautious about markets going forward and intend to maintain our defensive positioning accordingly.
Management's Discussion of Fund Performance (Unaudited) (Continued)
Comparison of the Change in Value of a $10,000 Investment in the
Touchstone Balanced Allocation Fund - Class A*, the S&P Composite 1500 Index and
the Barclays U.S. Aggregate Bond Index
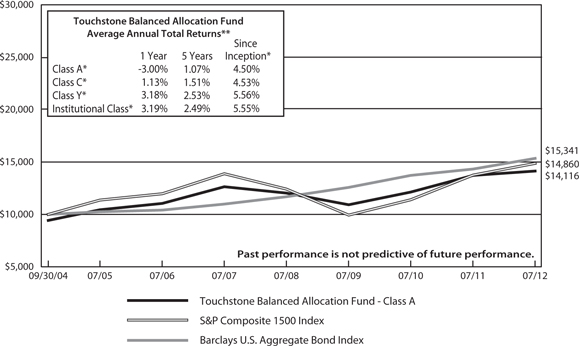
| * | The chart above represents performance of Class A shares only, which will vary from the performance of Class C shares, Class Y shares and Institutional Class shares based on the differences in loads and fees paid by shareholders in the different classes. Class A shares, Class C shares and Institutional Class shares commenced operations on September 30, 2004 and Class Y shares commenced operations on December 9, 2005. Class Y shares performance information is calculated using the historical performance of Institutional Class shares for periods prior to December 9, 2005. The returns have been restated for sales charges and for fees applicable to Class Y shares. |
| ** | The average annual total returns shown above are adjusted for maximum applicable sales chagres. |
The performance of the above Fund does not reflect the deduction of taxes that a shareholder would pay on Fund distributions or the redemption of Fund shares. The past performance is not predictive of future results.
Management's Discussion of Fund Performance (Unaudited)
Touchstone Conservative Allocation Fund
Sub-Advised by Ibbotson Associates, Inc.
Investment Philosophy and Process
The Fund seeks to provide investors with current income and preservation of capital. The Fund is a fund of funds and therefore the value of an investment in the Fund is based on the performance of the underlying funds in which it invests and the allocation of its assets among those funds. This fund of funds primarily invests in a diversified portfolio of underlying equity and fixed income funds. The underlying funds, in turn, invest in a variety of U.S. and foreign equity and fixed income securities and may hold cash, cash equivalents and money market funds. An optimal model allocation among underlying funds is sought by using an analysis that looks at forecasted returns, standard deviations in historical returns, and the correlation of the performance of different market sectors. The underlying funds are selected and weighted based on historical returns-based style analysis, holdings-based style analysis, manager interviews, relative and absolute performance, including correlations with other underlying funds as well as corresponding benchmarks, and historical volatility (the variability of returns from one period to the next). Under normal circumstances, the Fund expects to allocate its assets among equity and fixed income funds as follows: Equity Fund Allocation: 20–40%, Fixed Income Fund Allocation: 60–80%.
Fund Performance and Market Overview
The total return which has been adjusted for sales charges of the Touchstone Conservative Allocation Fund, Class A Shares, was 3.23% for the fiscal year ended July 31, 2012.The total return of the Barclays U.S. Aggregate Bond Index was 7.25% and the total return of the S&P Composite 1500 Index was 8.27% for this same period. The total return of the 70% Barclays U.S. Aggregate Bond Index / 30% S&P Composite 1500 Index was 7.96% for the period.
During the 12-month period, market volatility persisted as concerns about the global economy and the eurozone crisis continued to dominate headlines. Overall, it was a challenging period given low interest rates and sluggish economic activity. Investors sought safety in U.S. Treasury securities, driving yields down to historic lows, while also bidding up real estate investment trusts (REITs), corporate bonds and high-yield bonds in search of yield. Outside the U.S., worsening conditions in China and Brazil weighed down on emerging market stocks while the eurozone situation affected returns across developed markets.
Portfolio Review
The Fund underperformed its benchmark during the period due to considerable exposure to short-term bonds and foreign markets. As yields declined during the period, shorter-term bonds and cash lagged as the broad market rose. Foreign bonds and stocks significantly underperformed the U.S. market, further weighing down on performance. Exposure to global REITs helped to offset these negative effects, as their performance surpassed all asset classes.
During the period, the Fund held multiple dynamic asset allocation positions. In particular, the Fund was underweight equities versus short-term bonds, underweight small/mid-cap stocks versus large-cap stocks, overweight international equities versus domestic equities, underweight global REITs versus large-cap stocks, and overweight short-term bonds versus intermediate-term bonds. Overall, the Fund’s defensive positioning was a slight detractor from performance. While several managers performed well versus their assigned benchmarks, in aggregate they did not add value to performance.
Management's Discussion of Fund Performance (Unaudited) (Continued)
Outlook and Conclusion
We believe the economic environment is likely to be one of continued apathy as opposed to a plunge into global recession, at least in the near term. In particular, resource utilization rates remain at depressed levels in most advanced economies, and, outside of the eurozone, there is little evidence of a “smoking gun” to warrant immediate concern. It is our view that business cycles do not die of old age and, in the past, recessions have been triggered by a variety of factors: a persistent spike in the price of oil, a large natural disaster, a massive fiscal or monetary policy tightening, or the bursting of an asset bubble. Nothing of that magnitude has happened over the last six to twelve months. Moreover, economic data are not reflecting an abrupt decline in the pace of activity, but rather a lazy descent.
Going forward, we believe the investment outlook continues to be unusually uncertain, and the risks are tilted to the downside. In addition, we believe that a misstep in the handling of China’s banking problems, the exit of Greece from the eurozone, or the always-present threat of a spike in the price of oil could all be factors that may potentially wreck the economy’s wobbly ship. Furthermore, near the end of the year the U.S. government must deal with the “fiscal cliff” dilemma, which would cause an increase in taxes and a reduction in government expenditures worth potentially 3–5% of gross domestic product in 2013 alone. That said, we remain cautious about markets going forward and intend to maintain our defensive positioning accordingly.
Management's Discussion of Fund Performance (Unaudited) (Continued)
Comparison of the Change in Value of a $10,000 Investment in the
Touchstone Conservative Allocation Fund Class - A*, the S&P Composite 1500 Index and
the Barclays U.S. Aggregate Bond Index
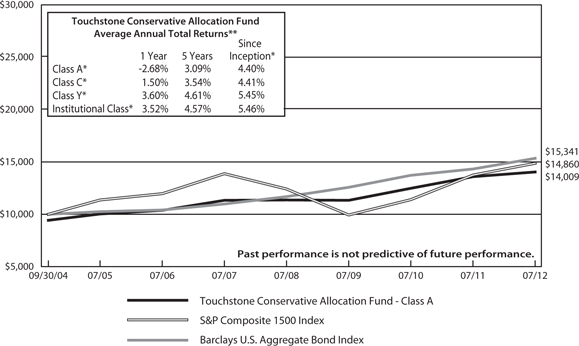
| * | The chart above represents performance of Class A shares only, which will vary from the performance of Class C shares, Class Y shares and Institutional Class shares based on the differences in loads and fees paid by shareholders in the different classes. Class A shares, Class C shares and Institutional Class shares commenced operations on September 30, 2004 and Class Y shares commenced operations on December 9, 2005. Class Y shares performance information is calculated using the historical performance of Institutional Class shares for periods prior to December 9, 2005. The returns have been restated for sales charges and for fees applicable to Class Y shares. |
| ** | The average annual total returns shown above are adjusted for maximum applicable sales charges. |
The performance of the above Fund does not reflect the deduction of taxes that a shareholder would pay on Fund distributions or the redemption of Fund shares. The past performance is not predictive of future results.
Management's Discussion of Fund Performance (Unaudited)
Touchstone Growth Allocation Fund
Sub-Advised by Ibbotson Associates, Inc.
Investment Philosophy and Process
The Fund seeks to provide investors with capital appreciation. The Fund is a fund of funds and therefore the value of an investment in the Fund is based on the performance of the underlying funds in which it invests and the allocation of its assets among those funds. This fund of funds primarily invests in a diversified portfolio of underlying equity and fixed income funds. The underlying funds, in turn, invest in a variety of U.S. and foreign equity and fixed income securities and may hold cash, cash equivalents and money market funds. An optimal model allocation among underlying funds is sought, by using an analysis that looks at forecasted returns, standard deviations in historical returns, and the correlation of the performance of different market sectors. The underlying funds are selected and weighted based on historical returns-based style analysis, holdings-based style analysis, manager interviews, relative and absolute performance, including correlations with other underlying funds as well as corresponding benchmarks, and historical volatility (the variability of returns from one period to the next). Under normal circumstances, the Fund expects to allocate its assets among equity and fixed income funds as follows: Equity Fund Allocation: 90–100%, Fixed Income Fund Allocation: 0–10%.
Fund Performance and Market Overview
The total return which has been adjusted for sales charges of the Touchstone Growth Allocation Fund, Class A Shares, was -0.04% for the fiscal year ended July 31, 2012. The total return of the S&P Composite 1500 Index was 8.27% for the same period.
During the 12-month period, market volatility persisted as concerns about the global economy and the eurozone crisis continued to dominate headlines. Overall, it was a challenging period given low interest rates and sluggish economic activity. Investors sought safety in U.S. Treasury securities, driving yields down to historic lows, while also bidding up real estate investment trusts (REITs), corporate bonds and high-yield bonds in search of yield. Outside the U.S., worsening conditions in China and Brazil weighed down on emerging market stocks while the eurozone situation affected returns across developed markets.
Portfolio Review
The Fund underperformed its benchmark during the period due to considerable exposure to small- and mid-cap stocks and foreign equities. Small- and mid-cap stocks fared considerably worse than large-cap stocks, while foreign equities significantly underperformed the U.S. market, further weighing down on performance. Exposure to global REITs helped to offset these negative effects, as their performance surpassed all asset classes.
During the period, the Fund held multiple dynamic asset allocation positions. In particular, the Fund was underweight equities versus short-term bonds, underweight small/mid-cap stocks versus large-cap stocks, overweight international equities versus domestic equities, and underweight global REITs versus large-cap stocks. Overall, the Fund’s defensive positioning was a detractor from performance. While several managers performed well versus their assigned benchmarks, in aggregate they did not add value to performance.
Outlook and Conclusion
We believe the economic environment is likely to be one of continued apathy as opposed to a plunge into global recession, at least in the near term. In particular, resource utilization rates remain at depressed levels in most advanced economies, and, outside of the eurozone, there is little evidence of a “smoking gun” to warrant immediate concern. It is our view that business cycles do not die of old age and, in the past, recessions have been triggered by a variety of factors: a persistent spike in the price of oil, a large natural disaster, a massive fiscal or monetary policy tightening, or the bursting of an asset bubble. Nothing of that magnitude has happened
Management's Discussion of Fund Performance (Unaudited) (Continued)
over the last six to twelve months. Moreover, economic data are not reflecting an abrupt decline in the pace of activity, but rather a lazy descent.
Going forward, we believe the investment outlook continues to be unusually uncertain, and the risks are tilted to the downside. In addition, we believe that a misstep in the handling of China’s banking problems, the exit of Greece from the eurozone, or the always-present threat of a spike in the price of oil could all be factors that may potentially wreck the economy’s wobbly ship. Furthermore, near the end of the year the U.S. government must deal with the “fiscal cliff” dilemma, which would cause an increase in taxes and a reduction in government expenditures worth potentially 3–5% of gross domestic product in 2013 alone. That said, we remain cautious about markets going forward and intend to maintain our defensive positioning accordingly.
Management's Discussion of Fund Performance (Unaudited) (Continued)
Comparison of the Change in Value of a $10,000 Investment in the
Touchstone Growth Allocation Fund Class - A* and the S&P Composite 1500 Index

| * | The chart above represents performance of Class A shares only, which will vary from the performance of Class C shares, Class Y shares and Institutional Class shares based on the differences in loads and fees paid by shareholders in the different classes. Class A shares, Class C shares and Institutional Class shares commenced operations on September 30, 2004 and Class Y shares commenced operations on December 9, 2005. Class Y shares performance information is calculated using the historical performance of Institutional Class shares for periods prior to December 9, 2005. The returns have been restated for sales charges and for fees applicable to Class Y shares. |
| ** | The average annual total returns shown above are adjusted for maximum applicable sales charges. |
The performance of the above Fund does not reflect the deduction of taxes that a shareholder would pay on Fund distributions or the redemption of Fund shares. The past performance is not predictive of future results.
Management's Discussion of Fund Performance (Unaudited)
Touchstone Moderate Growth Allocation Fund
Sub-Advised by Ibbotson Associates, Inc.
Investment Philosophy and Process
The Fund seeks to provide investors with capital appreciation. The Fund is a fund of funds and therefore the value of an investment in the Fund is based on the performance of the underlying funds in which it invests and the allocation of its assets among those funds. This fund of funds primarily invests in a diversified portfolio of underlying equity and fixed income funds. The underlying funds, in turn, invest in a variety of U.S. and foreign equity and fixed income securities and may hold cash, cash equivalents and money market funds. An optimal model allocation among underlying funds is sought, by using an analysis that looks at forecasted returns, standard deviations in historical returns, and the correlation of the performance of different market sectors. The underlying funds are selected and weighted based on historical returns-based style analysis, holdings-based style analysis, manager interviews, relative and absolute performance, including correlations with other underlying funds as well as corresponding benchmarks, and historical volatility (the variability of returns from one period to the next). Under normal circumstances, the Fund expects to allocate its assets among equity and fixed income funds as follows: Equity Fund Allocation: 70–90%, Fixed Income Fund Allocation: 10–30%.
Fund Performance and Market Overview
The total return which has been adjusted for sales charges of the Touchstone Moderate Growth Allocation Fund, Class A Shares, was 1.65% for the fiscal year ended July 31, 2012. The total return of the Barclays U.S. Aggregate Bond Index was 7.25% and the total return of the S&P Composite 1500 Index was 8.27% for this same period. The total return of the 20% Barclays U.S. Aggregate Bond Index / 80% S&P Composite 1500 Index was 8.37% for the period.
During the 12-month period, market volatility persisted as concerns about the global economy and the eurozone crisis continued to dominate headlines. Overall, it was a challenging period given low interest rates and sluggish economic activity. Investors sought safety in U.S. Treasury securities, driving yields down to historic lows, while also bidding up real estate investment trusts (REITs), corporate bonds and high-yield bonds in search of yield. Outside the U.S., worsening conditions in China and Brazil weighed down on emerging market stocks while the eurozone situation affected returns across developed markets.
Portfolio Review
The Fund underperformed its benchmark during the period due to considerable exposure to small- and mid-cap stocks and foreign equities. Small- and mid-cap stocks fared considerably worse than large-cap stocks, while foreign equities significantly underperformed the U.S. market, further weighing down on performance. Exposure to global REITs helped to offset these negative effects, as their performance surpassed all asset classes.
During the period, the Fund held multiple dynamic asset allocation positions. In particular, the Fund was underweight equities versus short-term bonds, underweight small/mid-cap stocks versus large-cap stocks, overweight international equities versus domestic equities, underweight global REITs versus large-cap stocks, and overweight short-term bonds versus intermediate-term bonds. Overall, the Fund’s defensive positioning was a detractor from performance. This was partially offset by the effects of manager selection, as the underlying managers in aggregate beat their assigned benchmarks.
Outlook and Conclusion
We believe the economic environment is likely to be one of continued apathy as opposed to a plunge into global recession, at least in the near term. In particular, resource utilization rates remain at depressed levels in most advanced economies, and, outside of the eurozone, there is little evidence of a “smoking gun” to warrant
Management's Discussion of Fund Performance (Unaudited) (Continued)
immediate concern. It is our view that business cycles do not die of old age and, in the past, recessions have been triggered by a variety of factors: a persistent spike in the price of oil, a large natural disaster, a massive fiscal or monetary policy tightening, or the bursting of an asset bubble. Nothing of that magnitude has happened over the last six to twelve months. Moreover, economic data are not reflecting an abrupt decline in the pace of activity, but rather a lazy descent.
Going forward, we believe the investment outlook continues to be unusually uncertain, and the risks are tilted to the downside. In addition, we believe that a misstep in the handling of China’s banking problems, the exit of Greece from the eurozone, or the always-present threat of a spike in the price of oil could all be factors that may potentially wreck the economy’s wobbly ship. Furthermore, near the end of the year the U.S. government must deal with the “fiscal cliff” dilemma, which would cause an increase in taxes and a reduction in government expenditures worth potentially 3–5% of gross domestic product in 2013 alone. That said, we remain cautious about markets going forward and intend to maintain our defensive positioning accordingly.
Management's Discussion of Fund Performance (Unaudited) (Continued)
Comparison of the Change in Value of a $10,000 Investment in the
Touchstone Moderate Growth Allocation Fund Class-A*, the S&P Composite 1500 Index and
the Barclays U.S. Aggregate Bond Index
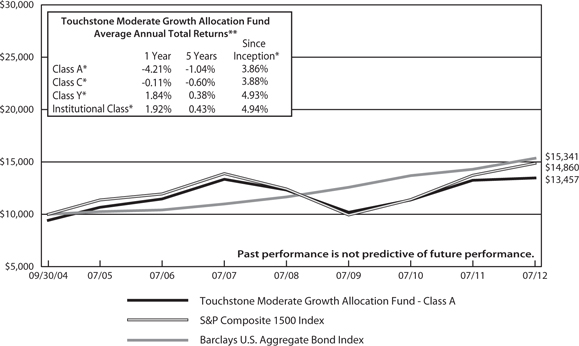
| * | The chart above represents performance of Class A shares only, which will vary from the performance of Class C shares, Class Y shares and Institutional Class shares based on the differences in loads and fees paid by shareholders in the different classes. Class A shares, Class C shares and Institutional Class shares commenced operations on September 30, 2004 and Class Y shares commenced operations on December 9, 2005. Class Y shares performance information is calculated using the historical performance of Institutional Class shares for periods prior to December 9, 2005. The returns have been restated for sales charges and for fees applicable to Class Y shares. |
| ** | The average annual total returns shown above are adjusted for maximum applicable sales sharges. |
The performance of the above Fund does not reflect the deduction of taxes that a shareholder would pay on Fund distributions or the redemption of Fund shares. The past performance is not predictive of future results.
Tabular Presentation of Portfolios of Investments (Unaudited)
July 31, 2012
The tables below provide each Fund’s sector allocation. We hope it will be useful to shareholders as it summarizes key information about each Fund’s investments.
| Touchstone Dynamic Equity Fund |
| Sector Allocation* | | | (% of Net Assets) | |
| Long Positions | | | | |
| Information Technology | | | 24.0 | % |
| Consumer Discretionary | | | 20.3 | |
| Financials | | | 18.1 | |
| Energy | | | 13.4 | |
| Health Care | | | 12.3 | |
| Consumer Staples | | | 11.5 | |
| Industrials | | | 8.4 | |
| Materials | | | 5.0 | |
| Utilities | | | 5.0 | |
| Telecommunication Services | | | 2.3 | |
| Investment Funds | | | 1.1 | |
| Cash Collateral for Securities Sold Short | | | 0.6 | |
| Other Assets/Liabilities (Net) | | | (0.6 | ) |
| | | | 121.4 | |
| | | | | |
| Short Positions and Written Options | | | | |
| Information Technology | | | (6.8 | ) |
| Consumer Discretionary | | | (4.8 | ) |
| Energy | | | (2.5 | ) |
| Call Options | | | (2.5 | ) |
| Health Care | | | (1.9 | ) |
| Financials | | | (1.3 | ) |
| Industrials | | | (1.0 | ) |
| Utilities | | | (0.5 | ) |
| Put Options | | | (0.1 | ) |
| Materials | | | 0.0 | |
| | | | (21.4 | ) |
| Total | | | 100.0 | % |
| Touchstone Emerging Growth Fund |
| Sector Allocation* | | | (% of Net Assets) | |
| Information Technology | | | 21.5 | % |
| Industrials | | | 21.2 | |
| Consumer Discretionary | | | 17.6 | |
| Health Care | | | 12.0 | |
| Financials | | | 8.6 | |
| Energy | | | 7.9 | |
| Materials | | | 6.9 | |
| Exchange Traded Funds | | | 2.0 | |
| Consumer Staples | | | 1.5 | |
| Investment Funds | | | 3.6 | |
| Other Assets/Liabilities (Net) | | | (2.8 | ) |
| Total | | | 100.0 | % |
* Sector classifications are based upon the Global Industry Classification Standard (GICS®).
Tabular Presentation of Portfolios of Investments (Unaudited) (Continued)
| Touchstone International Equity Fund | | | | |
| Sector Allocation* | | | (% of Net Assets) | |
| Financials | | | 17.6 | % |
| Industrials | | | 16.7 | |
| Energy | | | 13.0 | |
| Materials | | | 12.4 | |
| Health Care | | | 12.2 | |
| Consumer Discretionary | | | 11.7 | |
| Consumer Staples | | | 7.2 | |
| Information Technology | | | 4.0 | |
| Telecommunication Services | | | 3.0 | |
| Utilities | | | 1.0 | |
| Investment Funds | | | 1.3 | |
| Other Assets/Liabilities (Net) | | | (0.1 | ) |
| Total | | | 100.0 | % |
| Touchstone Balanced Allocation Fund | | | | |
| Sector Allocation | | | (% of Net Assets) | |
| Government/Corporate | | | 25.4 | % |
| Value | | | 11.1 | |
| International Equity | | | 10.2 | |
| International Debt | | | 6.1 | |
| Growth | | | 6.0 | |
| Global Equity | | | 5.6 | |
| Emerging Market-Equity | | | 4.1 | |
| Corporate/Preferred-High Yield | | | 4.0 | |
| Blue Chip | | | 4.0 | |
| Value Large-Cap | | | 4.0 | |
| Sector Fund Real-Estate | | | 4.0 | |
| Growth Mid-Cap | | | 4.0 | |
| Various Assets | | | 3.0 | |
| Taxable Govt/Agency-Money Market | | | 3.0 | |
| Value Mid-Cap | | | 2.0 | |
| Growth Large-Cap | | | 2.0 | |
| Value Small-Cap | | | 2.0 | |
| Other Assets/Liabilities (Net) | | | (0.5 | ) |
| Total | | | 100.0 | % |
* Sector classifications are based upon the Global Industry Classification Standard (GICS®).
Tabular Presentation of Portfolios of Investments (Unaudited) (Continued)
| Touchstone Conservative Allocation Fund | | | | |
| Sector Allocation | | | (% of Net Assets) | |
| Government/Corporate | | | 46.4 | % |
| International Debt | | | 9.1 | |
| Value | | | 6.0 | |
| Corporate/Preferred-High Yield | | | 5.0 | |
| Taxable Govt/Agency-Money Market | | | 5.0 | |
| Growth | | | 4.9 | |
| International Equity | | | 4.1 | |
| Blue Chip | | | 4.0 | |
| Various Assets | | | 4.0 | |
| Value Large-Cap | | | 3.0 | |
| Global Equity | | | 2.4 | |
| Sector Fund Real-Estate | | | 2.0 | |
| Value Small-Cap | | | 2.0 | |
| Emerging Market-Equity | | | 1.0 | |
| Growth Mid-Cap | | | 1.0 | |
| Other Assets/Liabilities (Net) | | | 0.1 | |
| Total | | | 100.0 | % |
| Touchstone Moderate Growth Allocation Fund | | | | |
| Sector Allocation | | | (% of Net Assets) | |
| Government/Corporate | | | 16.0 | % |
| Value | | | 14.2 | |
| International Equity | | | 13.3 | |
| Growth | | | 9.0 | |
| Emerging Market-Equity | | | 7.1 | |
| Global Equity | | | 5.4 | |
| Growth Mid-Cap | | | 5.1 | |
| Value Large-Cap | | | 5.0 | |
| Sector Fund Real-Estate | | | 4.1 | |
| Value Small-Cap | | | 4.1 | |
| Blue Chip | | | 3.1 | |
| Value Mid-Cap | | | 3.0 | |
| International Debt | | | 3.0 | |
| Corporate/Preferred-High Yield | | | 3.0 | |
| Various Assets | | | 3.0 | |
| Growth Large-Cap | | | 2.0 | |
| Other Assets/Liabilities (Net) | | | (0.4 | ) |
| Total | | | 100.0 | % |
| Touchstone Growth Allocation Fund | | | | |
| Sector Allocation | | | (% of Net Assets) | |
| International Equity | | | 17.3 | % |
| Value | | | 14.1 | |
| Growth | | | 10.9 | |
| Emerging Market-Equity | | | 10.2 | |
| Global Equity | | | 7.7 | |
| Sector Fund Real-Estate | | | 6.1 | |
| Value Small-Cap | | | 6.0 | |
| Growth Mid-Cap | | | 5.0 | |
| Value Large-Cap | | | 5.0 | |
| Government/Corporate | | | 5.0 | |
| Value Mid-Cap | | | 4.0 | |
| Blue Chip | | | 3.0 | |
| Growth Large-Cap | | | 3.0 | |
| Various Assets | | | 3.0 | |
| Other Assets/Liabilities (Net) | | | (0.3 | ) |
| Total | | | 100.0 | % |
Portfolio of Investments
Touchstone Dynamic Equity Fund – July 31, 2012
| | | | | | Market | |
| | | Shares | | | Value | |
| | | | | | | |
| Common Stocks† — 120.3% | | | | | | | | |
| | | | | | | | | |
| Information Technology — 24.0% | | | | | | | | |
| Akamai Technologies, Inc.* | | | 6,036 | | | $ | 212,346 | |
| Apple, Inc.* | | | 5,020 | | | | 3,066,015 | |
| Avnet, Inc.* | | | 18,039 | | | | 568,228 | |
| CA, Inc. | | | 39,036 | | | | 939,597 | |
| Cisco Systems, Inc. | | | 91,814 | | | | 1,464,433 | |
| FleetCor Technologies, Inc.* | | | 2,681 | | | | 98,983 | |
| Intel Corp. | | | 80,752 | | | | 2,075,326 | |
| International Business Machines Corp. | | | 13,211 | | | | 2,589,092 | |
| LSI Corp.* | | | 70,683 | | | | 487,713 | |
| Microsoft Corp. | | | 96,173 | | | | 2,834,218 | |
| Vishay Intertechnology, Inc.* | | | 3,716 | | | | 36,677 | |
| | | | | | | | 14,372,628 | |
| | | | | | | | | |
| Consumer Discretionary — 20.3% | | | | | | | | |
| Advance Auto Parts, Inc. | | | 9,379 | | | | 657,937 | |
| Brinker International, Inc. | | | 6,354 | | | | 205,933 | |
| Comcast Corp. - Class A | | | 14,086 | | | | 458,499 | |
| Delphi Automotive PLC (United Kingdom)* | | | 31,656 | | | | 898,714 | |
| Dillard's, Inc. - Class A | | | 682 | | | | 44,487 | |
| DIRECTV - Class A* | | | 10,743 | | | | 533,497 | |
| Expedia, Inc. | | | 16,328 | | | | 930,533 | |
| Ford Motor Co. | | | 82,217 | | | | 759,685 | |
| Gannett Co., Inc. | | | 84,815 | | | | 1,196,740 | |
| Garmin Ltd. (Switzerland) | | | 12,486 | | | | 482,084 | |
| General Motors Co.* | | | 12,427 | | | | 244,936 | |
| Home Depot, Inc. (The) | | | 40,821 | | | | 2,130,040 | |
| Macy's, Inc. | | | 30,452 | | | | 1,091,400 | |
| Marriott International, Inc. - Class A | | | 13,129 | | | | 478,158 | |
| priceline.com, Inc.* | | | 1,788 | | | | 1,183,191 | |
| Viacom, Inc. - Class B | | | 18,099 | | | | 845,404 | |
| | | | | | | | 12,141,238 | |
| | | | | | | | | |
| Financials — 18.1% | | | | | | | | |
| American Capital Agency Corp. REIT | | | 46,790 | | | | 1,644,201 | |
| American International Group, Inc.* | | | 45,024 | | | | 1,407,900 | |
| Capital One Financial Corp. | | | 19,598 | | | | 1,107,091 | |
| Citigroup, Inc. | | | 17,754 | | | | 481,666 | |
| Hospitality Properties Trust REIT | | | 15,178 | | | | 368,370 | |
| Invesco Ltd. ADR | | | 15,757 | | | | 348,702 | |
| KeyCorp. | | | 72,321 | | | | 577,122 | |
| MFA Financial, Inc. REIT | | | 54,094 | | | | 437,080 | |
| Plum Creek Timber Co., Inc. REIT | | | 11,280 | | | | 457,855 | |
| Popular, Inc. (Puerto Rico)* | | | 11,655 | | | | 175,641 | |
| Regions Financial Corp. | | | 56,191 | | | | 391,089 | |
| Wells Fargo & Co. | | | 46,659 | | | | 1,577,541 | |
| Weyerhaeuser Co. REIT | | | 78,215 | | | | 1,826,320 | |
| | | | | | | | 10,800,578 | |
| | | | | | | | | |
| Energy — 13.4% | | | | | | | | |
| Chevron Corp. | | | 1,637 | | | | 179,382 | |
| Cobalt International Energy, Inc.* | | | 15,548 | | | | 390,255 | |
| ConocoPhillips | | | 9,668 | | | | 526,326 | |
| Diamond Offshore Drilling, Inc. | | | 9,669 | | | | 632,546 | |
| Exxon Mobil Corp. | | | 37,856 | | | | 3,287,794 | |
| Marathon Oil Corp. | | | 51,729 | | | | 1,369,267 | |
| Phillips 66 | | | 2 | | | | 75 | |
| Sunoco, Inc. | | | 3,569 | | | | 171,990 | |
| Tesoro Corp.* | | | 8,483 | | | | 234,555 | |
| Valero Energy Corp. | | | 40,602 | | | | 1,116,555 | |
| Williams Cos., Inc. (The) | | | 3,664 | | | | 116,479 | |
| | | | | | | | 8,025,224 | |
| | | | | | | | | |
| Health Care — 12.3% | | | | | | | | |
| Agilent Technologies, Inc. | | | 12,435 | | | | 476,136 | |
| Alexion Pharmaceuticals, Inc.* | | | 85 | | | | 8,912 | |
| AmerisourceBergen Corp. | | | 29,158 | | | | 1,157,573 | |
| Amgen, Inc. | | | 26,485 | | | | 2,187,661 | |
| Boston Scientific Corp.* | | | 43,953 | | | | 227,237 | |
| Cardinal Health, Inc. | | | 30,450 | | | | 1,312,090 | |
| Eli Lilly & Co. | | | 1,656 | | | | 72,914 | |
| Forest Laboratories, Inc.* | | | 10,294 | | | | 345,364 | |
| HCA Holdings, Inc. | | | 5,873 | | | | 155,517 | |
| Johnson & Johnson | | | 4,252 | | | | 294,323 | |
| McKesson Corp. | | | 8,079 | | | | 733,008 | |
| UnitedHealth Group, Inc. | | | 7,108 | | | | 363,148 | |
| | | | | | | | 7,333,883 | |
| | | | | | | | | |
| Consumer Staples — 11.5% | | | | | | | | |
| Archer-Daniels-Midland Co. | | | 32,437 | | | | 846,281 | |
| Coca-Cola Enterprises, Inc. | | | 1,530 | | | | 44,860 | |
| Herbalife Ltd. (Cayman Islands) | | | 11,434 | | | | 627,612 | |
| Monster Beverage Corp.* | | | 12,478 | | | | 829,413 | |
| Philip Morris International, Inc. | | | 27,414 | | | | 2,506,736 | |
| Safeway, Inc. | | | 65,127 | | | | 1,012,725 | |
| Tyson Foods, Inc. - Class A | | | 68,297 | | | | 1,025,138 | |
| | | | | | | | 6,892,765 | |
| | | | | | | | | |
| Industrials — 8.4% | | | | | | | | |
| Cooper Industries PLC (Ireland) | | | 369 | | | | 26,524 | |
| Delta Air Lines, Inc.* | | | 57,139 | | | | 551,391 | |
| Landstar System, Inc. | | | 2,024 | | | | 100,006 | |
| Pitney Bowes, Inc. | | | 14,858 | | | | 198,503 | |
| Robert Half International, Inc. | | | 50,177 | | | | 1,355,281 | |
| United Parcel Service, Inc. - Class B | | | 7,604 | | | | 574,938 | |
| Waste Management, Inc. | | | 36,550 | | | | 1,257,320 | |
| WESCO International, Inc.* | | | 17,713 | | | | 986,791 | |
| | | | | | | | 5,050,754 | |
| | | | | | | | | |
| Materials — 5.0% | | | | | | | | |
| Ball Corp. | | | 11,823 | | | | 491,364 | |
| Commercial Metals Co. | | | 8,505 | | | | 109,629 | |
| Freeport-McMoRan Copper & Gold, Inc. | | | 33,704 | | | | 1,134,814 | |
| Kronos Worldwide, Inc. | | | 7,767 | | | | 131,418 | |
| Royal Gold, Inc. | | | 14,924 | | | | 1,129,448 | |
| | | | | | | | 2,996,673 | |
| | | | | | | | | |
| Utilities — 5.0% | | | | | | | | |
| AES Corp. (The)* | | | 130,460 | | | | 1,573,348 | |
| Duke Energy Corp. | | | 825 | | | | 55,918 | |
| NextEra Energy, Inc. | | | 19,259 | | | | 1,365,463 | |
| | | | | | | | 2,994,729 | |
Touchstone Dynamic Equity Fund (Continued)
| | | | | | Market | |
| | | Shares | | | Value | |
| | | | | | | |
| Common Stocks† — 120.3% (Continued) | | | | | | | | |
| | | | | | | | | |
| Telecommunication Services — 2.3% | | | | | | | | |
| AT&T, Inc. | | | 16,476 | | | $ | 624,770 | |
| Verizon Communications, Inc. | | | 16,408 | | | | 740,657 | |
| | | | | | | | 1,365,427 | |
| Total Common Stocks | | | | | | $ | 71,973,899 | |
| | | | | | | | | |
| Investment Fund — 1.1% | | | | | | | | |
| Touchstone Institutional Money Market Fund^ | | | 645,981 | | | | 645,981 | |
| | | | | | | | | |
| Total Long Positions | | | | | | | | |
| (Cost $65,116,021) | | | | | | $ | 72,619,880 | |
| | | | | | | | | |
| Securities Sold Short — (18.8%) | | | | | | | | |
| | | | | | | | | |
| Common Stocks — (18.8%) | | | | | | | | |
| | | | | | | | | |
| Information Technology — (6.8%) | | | | | | | | |
| Acme Packet, Inc.* | | | (40,357 | ) | | | (639,658 | ) |
| Computer Sciences Corp. | | | (21,462 | ) | | | (528,394 | ) |
| Global Payments, Inc. | | | (16,670 | ) | | | (713,809 | ) |
| Itron, Inc.* | | | (9,784 | ) | | | (381,283 | ) |
| Salesforce.com, Inc.* | | | (2,708 | ) | | | (336,767 | ) |
| Solera Holdings, Inc. | | | (17,199 | ) | | | (671,621 | ) |
| VeriFone Systems, Inc.* | | | (21,197 | ) | | | (769,239 | ) |
| | | | | | | | (4,040,771 | ) |
| | | | | | | | | |
| Consumer Discretionary — (4.8%) | | | | | | | | |
| DeVry, Inc. | | | (13,319 | ) | | | (261,452 | ) |
| Federal-Mogul Corp.* | | | (6,401 | ) | | | (63,690 | ) |
| Gentex Corp. | | | (52,439 | ) | | | (839,548 | ) |
| Hyatt Hotels Corp. - Class A* | | | (11,348 | ) | | | (403,421 | ) |
| Netflix, Inc.* | | | (2,733 | ) | | | (155,371 | ) |
| Visteon Corp.* | | | (32,309 | ) | | | (1,047,781 | ) |
| Washington Post Co. (The) - Class B | | | (287 | ) | | | (97,150 | ) |
| | | | | | | | (2,868,413 | ) |
| | | | | | | | | |
| Energy — (2.5%) | | | | | | | | |
| Alpha Natural Resources, Inc.* | | | (65,750 | ) | | | (460,908 | ) |
| Cheniere Energy, Inc.* | | | (6,397 | ) | | | (87,191 | ) |
| Kosmos Energy Ltd. (Bermuda)* | | | (2,111 | ) | | | (20,139 | ) |
| Range Resources Corp. | | | (5,347 | ) | | | (334,722 | ) |
| Teekay Corp. (Bermuda) | | | (19,686 | ) | | | (604,951 | ) |
| | | | | | | | (1,507,911 | ) |
| | | | | | | | | |
| Health Care — (1.9%) | | | | | | | | |
| Allscripts Healthcare Solutions, Inc.* | | | (48,471 | ) | | | (445,933 | ) |
| Brookdale Senior Living, Inc.* | | | (5,384 | ) | | | (88,621 | ) |
| Endo Health Solutions, Inc.* | | | (13,870 | ) | | | (412,355 | ) |
| Incyte Corp. Ltd.* | | | (1,943 | ) | | | (48,556 | ) |
| Vertex Pharmaceuticals, Inc.* | | | (3,301 | ) | | | (160,132 | ) |
| | | | | | | | (1,155,597 | ) |
| | | | | | | | | |
| Financials — (1.3%) | | | | | | | | |
| Assured Guaranty Ltd. (Bermuda) | | | (15,320 | ) | | | (183,534 | ) |
| Bank of Hawaii Corp. | | | (6,808 | ) | | | (318,002 | ) |
| Jones Lang LaSalle, Inc. | | | (734 | ) | | | (48,950 | ) |
| TCF Financial Corp. | | | (19,761 | ) | | | (204,131 | ) |
| | | | | | | | (754,617 | ) |
| | | | | | | | | |
| Industrials — (1.0%) | | | | | | | | |
| IHS, Inc.* | | | (1,709 | ) | | | (188,451 | ) |
| ITT Corp.* | | | (22,296 | ) | | | (417,827 | ) |
| | | | | | | | (606,278 | ) |
| | | | | | | | | |
| Utilities — (0.5%) | | | | | | | | |
| National Fuel Gas Co. | | | (6,695 | ) | | | (327,653 | ) |
| | | | | | | | | |
| Materials — 0.0% | | | | | | | | |
| Allied Nevada Gold Corp.* | | | (707 | ) | | | (18,276 | ) |
| Total Common Stocks | | | | | | $ | (11,279,516 | ) |
| | | | | | | | | |
| Total Securities Sold Short | | | | | | | | |
| (Proceeds $(12,702,818)) | | | | | | $ | (11,279,516 | ) |
| | | Number | | | | |
| | | of | | | | |
| | | Contracts | | | | |
| | | | | | | |
| Written Options Contracts — (2.6%) | | | | | | |
| | | | | | | | | |
| Call Options — (2.5%) | | | | | | | | |
| iShares Russell 2000 Index Fund | | | | | | | | |
| August 2012 | | | | | | | | |
| Strike Price $76 | | | (900 | ) | | | (283,500 | ) |
| NovaDx Ventures Corp. | | | | | | | | |
| August 2012 | | | | | | | | |
| Strike Price $2,510 | | | (10 | ) | | | (136,700 | ) |
| Oil Service Sector Index Fund | | | | | | | | |
| August 2012 | | | | | | | | |
| Strike Price $235 | | | (80 | ) | | | (4,000 | ) |
| Oilex Ltd. | | | | | | | | |
| August 2012 | | | | | | | | |
| Strike Price $600 | | | (280 | ) | | | (1,030,400 | ) |
| SPDR Dow Jones Industrial Average ETF Trust | | | | | | | | |
| August 2012 | | | | | | | | |
| Strike Price $135 | | | (820 | ) | | | (15,580 | ) |
| Spirax-Sarco Engineering PLC | | | | | | | | |
| August 2012 | | | | | | | | |
| Strike Price $1,440 | | | (145 | ) | | | (23,200 | ) |
| Total Call Options | | | | | | | (1,493,380 | ) |
| | | | | | | | | |
| Put Options — (0.1%) | | | | | | | | |
| Spirax-Sarco Engineering PLC | | | | | | | | |
| August 2012 | | | | | | | | |
| Strike Price $1,370 | | | (25 | ) | | | (44,875 | ) |
| | | | | | | | | |
| Total Written Options Contracts | | | | | | | | |
| (Proceeds $(1,419,538)) | | | | | | $ | (1,538,255 | ) |
Touchstone Dynamic Equity Fund (Continued)
| | | Market | |
| | | Value | |
| | | | |
| Total Investment Securities —100.0% | | | | |
| (Cost $50,993,665) | | $ | 59,802,109 | |
| | | | | |
| Cash Collateral for Securities | | | | |
| Sold Short— 0.6% | | | 367,934 | |
| | | | | |
| Liabilities in Excess of Other Assets — (0.6%) | | | (344,583 | ) |
| | | | | |
| Net Assets — 100.0% | | $ | 59,825,460 | |
| † | All or a portion of these securities are held as collateral for securities sold short and written options. The total value of the securites held as collateral as of July 31, 2012 was $71,973,899. |
| * | Non-income producing security. |
| ^ | Affiliated Fund. See Note 4 in Notes to Financial Statements. |
Portfolio Abbreviations:
ADR - American Depositary Receipt
ETF - Exchange Traded Fund
PLC - Public Limited Company
REIT - Real Estate Investment Trust
Other Information:
The inputs or methodology used for valuing securities may not be an indication of the risk associated with investing in those securities. For more information on valuation inputs, and their aggregation into the levels used in the table below, please refer to the security valuation section in the accompanying notes to Financial Statements.
Valuation inputs at Reporting Date:
| Description | | Level 1 | | | Level 2 | | | Level 3 | | | Total | |
| | | | | | | | | | | | | |
| Assets: | | | | | | | | | | | | | | | | |
| Common Stocks | | $ | 71,973,899 | | | $ | — | | | $ | — | | | $ | 71,973,899 | |
| Investment Fund | | | 645,981 | | | | — | | | | — | | | | 645,981 | |
| | | | | | | | | | | | | | | $ | 72,619,880 | |
Valuation inputs at Reporting Date:
| Description | | Level 1 | | | Level 2 | | | Level 3 | | | Total | |
| | | | | | | | | | | | | |
| Liabilities: | | | | | | | | | | | | | | | | |
| Securities Sold Short | | | | | | | | | | | | | | | | |
| Common Stocks | | $ | (11,279,516 | ) | | $ | — | | | $ | — | | | $ | (11,279,516 | ) |
| Other Financial Instruments* | | | | | | | | | | | | | | | | |
| Liabilities: | | | | | | | | | | | | | | | | |
| Equity Contracts | | | (1,538,255 | ) | | | — | | | | — | | | | (1,538,255 | ) |
| | | | | | | | | | | | | | | $ | (12,817,771 | ) |
| * | Other Financial Instruments are derivative instruments not reflected in total investments |
Transactions in written options for the period ended July 31, 2012
| | | Number of
Contracts | | | Premium | |
| Beginning of Period | | | 935 | | | $ | 2,095,242 | |
| Call Options Written | | | 26,538 | | | | 22,903,449 | |
| Put Options Written | | | 545 | | | | 1,526,607 | |
| Call Options Closed | | | (9,518 | ) | | | (16,114,950 | ) |
| Put Options Closed | | | (133 | ) | | | (458,049 | ) |
| Call Options Expired | | | (8,782 | ) | | | (3,194,749 | ) |
| Put Options Expired | | | (3,792 | ) | | | (3,771,398 | ) |
| Call Options Exercised | | | (3,533 | ) | | | (1,566,614 | ) |
| Outstanding, July 31, 2012 | | | 2,260 | | | $ | 1,419,538 | |
See accompanying Notes to Financial Statements.
Portfolio of Investments
Touchstone Emerging Growth Fund – July 31, 2012
| | | | | | Market | |
| | | Shares | | | Value | |
| | | | | | | |
| Common Stocks — 97.2% | | | | | | | | |
| | | | | | | | | |
| Information Technology — 21.5% | | | | | | | | |
| ACI Worldwide, Inc.* | | | 8,410 | | | $ | 370,124 | |
| Cadence Design Systems, Inc.* | | | 30,672 | | | | 374,812 | |
| Fortinet, Inc.* | | | 9,831 | | | | 236,042 | |
| Gartner, Inc.* | | | 7,279 | | | | 323,115 | |
| Heartland Payment Systems, Inc. | | | 14,652 | | | | 464,468 | |
| IPG Photonics Corp.†* | | | 5,715 | | | | 296,209 | |
| Manhattan Associates, Inc.* | | | 4,100 | | | | 191,429 | |
| MICROS Systems, Inc.* | | | 6,900 | | | | 329,406 | |
| NCR Corp.* | | | 16,685 | | | | 389,094 | |
| NETGEAR, Inc.* | | | 8,656 | | | | 299,757 | |
| OSI Systems, Inc.* | | | 4,090 | | | | 263,969 | |
| Rackspace Hosting, Inc.* | | | 2,060 | | | | 90,393 | |
| Tangoe, Inc.* | | | 11,993 | | | | 230,146 | |
| Teradyne, Inc.* | | | 18,467 | | | | 271,650 | |
| Trimble Navigation Ltd.* | | | 8,067 | | | | 357,045 | |
| Ultimate Software Group, Inc.* | | | 4,220 | | | | 377,563 | |
| Ultratech, Inc.* | | | 5,175 | | | | 164,617 | |
| VeriFone Systems, Inc.* | | | 6,767 | | | | 245,574 | |
| Wright Express Corp.* | | | 3,645 | | | | 234,665 | |
| | | | | | | | 5,510,078 | |
| | | | | | | | | |
| Industrials — 21.2% | | | | | | | | |
| Acacia Research Corp.* | | | 9,736 | | | | 275,626 | |
| Alaska Air Group, Inc.* | | | 6,706 | | | | 233,704 | |
| AMETEK, Inc. | | | 8,661 | | | | 268,491 | |
| BE Aerospace, Inc.* | | | 13,747 | | | | 539,295 | |
| Beacon Roofing Supply, Inc.* | | | 8,322 | | | | 220,616 | |
| Clean Harbors, Inc.* | | | 6,096 | | | | 369,052 | |
| Equifax, Inc. | | | 4,162 | | | | 194,948 | |
| Lincoln Electric Holdings, Inc. | | | 8,664 | | | | 345,520 | |
| Mistras Group, Inc.* | | | 7,938 | | | | 178,446 | |
| Old Dominion Freight Line, Inc.* | | | 6,746 | | | | 286,030 | |
| Portfolio Recovery Associates, Inc.* | | | 3,887 | | | | 329,151 | |
| Robbins & Myers, Inc. | | | 5,100 | | | | 233,783 | |
| Roper Industries, Inc. | | | 2,457 | | | | 244,349 | |
| Spirit Airlines, Inc.* | | | 5,780 | | | | 124,328 | |
| Titan Machinery, Inc.* | | | 5,983 | | | | 170,157 | |
| Toro Co. (The) | | | 7,899 | | | | 297,002 | |
| TransDigm Group, Inc.* | | | 3,953 | | | | 487,642 | |
| United Rentals, Inc.* | | | 5,783 | | | | 167,187 | |
| Verisk Analytics, Inc. - Class A* | | | 3,938 | | | | 197,884 | |
| WESCO International, Inc.* | | | 4,977 | | | | 277,269 | |
| | | | | | | | 5,440,480 | |
| | | | | | | | | |
| Consumer Discretionary — 17.6% | | | | | | | | |
| Brunswick Corp. | | | 13,400 | | | | 294,665 | |
| Dana Holding Corp. | | | 16,153 | | | | 212,897 | |
| Dick's Sporting Goods, Inc. | | | 11,110 | | | | 545,723 | |
| DSW, Inc. - Class A | | | 4,920 | | | | 290,870 | |
| Ethan Allen Interiors, Inc. | | | 10,906 | | | | 224,991 | |
| Express, Inc.* | | | 9,056 | | | | 145,802 | |
| Genesco, Inc.* | | | 3,557 | | | | 235,545 | |
| GNC Holdings, Inc. - Class A | | | 3,948 | | | | 152,116 | |
| Grand Canyon Education, Inc.* | | | 8,185 | | | | 136,198 | |
| PetSmart, Inc. | | | 4,186 | | | | 276,736 | |
| Polaris Industries, Inc. | | | 4,585 | | | | 344,609 | |
| Pool Corp. | | | 7,366 | | | | 271,511 | |
| PVH Corp. | | | 4,866 | | | | 386,506 | |
| Steven Madden Ltd.* | | | 5,813 | | | | 235,020 | |
| Tenneco, Inc.* | | | 6,732 | | | | 197,180 | |
| Tractor Supply Co. | | | 3,803 | | | | 345,579 | |
| Zumiez, Inc.* | | | 5,766 | | | | 209,479 | |
| | | | | | | | 4,505,427 | |
| | | | | | | | | |
| Health Care — 12.0% | | | | | | | | |
| Air Methods Corp.* | | | 3,867 | | | | 421,619 | |
| Align Technology, Inc.* | | | 14,608 | | | | 496,088 | |
| Catamaran Corp.* | | | 1,990 | | | | 168,175 | |
| Cooper Cos, Inc. (The) | | | 4,873 | | | | 366,742 | |
| Cyberonics, Inc.* | | | 7,759 | | | | 335,965 | |
| Insulet Corp.* | | | 6,873 | | | | 134,436 | |
| Medicis Pharmaceutical Corp. - Class A | | | 5,523 | | | | 181,817 | |
| MWI Veterinary Supply, Inc.* | | | 4,384 | | | | 399,339 | |
| Perrigo Co. | | | 2,653 | | | | 302,495 | |
| Team Health Holdings, Inc.* | | | 9,889 | | | | 264,036 | |
| | | | | | | | 3,070,712 | |
| | | | | | | | | |
| Financials — 8.6% | | | | | | | | |
| Affiliated Managers Group, Inc.* | | | 5,027 | | | | 560,963 | |
| DFC Global Corp.* | | | 9,179 | | | | 175,961 | |
| Extra Space Storage, Inc. REIT | | | 9,785 | | | | 320,361 | |
| HFF, Inc. - Class A* | | | 14,576 | | | | 190,363 | |
| MarketAxess Holdings, Inc. | | | 9,605 | | | | 290,263 | |
| Signature Bank* | | | 8,215 | | | | 529,868 | |
| Zillow, Inc. - Class A†* | | | 3,612 | | | | 136,028 | |
| | | | | | | | 2,203,807 | |
| | | | | | | | | |
| Energy — 7.9% | | | | | | | | |
| Core Laboratories N.V. (Netherlands) | | | 1,479 | | | | 164,997 | |
| Energy XXI Bermuda Ltd. (Bermuda) | | | 8,128 | | | | 253,431 | |
| Hornbeck Offshore Services, Inc.* | | | 4,442 | | | | 188,119 | |
| Oasis Petroleum, Inc.†* | | | 11,870 | | | | 310,757 | |
| Oceaneering International, Inc. | | | 7,139 | | | | 369,015 | |
| Oil States International, Inc.* | | | 3,585 | | | | 260,630 | |
| OYO Geospace Corp.* | | | 2,341 | | | | 221,880 | |
| Rosetta Resources, Inc.* | | | 6,237 | | | | 260,208 | |
| | | | | | | | 2,029,037 | |
| | | | | | | | | |
| Materials — 6.9% | | | | | | | | |
| Airgas, Inc. | | | 5,134 | | | | 407,229 | |
| Albemarle Corp. | | | 5,558 | | | | 323,587 | |
| Eagle Materials, Inc. | | | 5,704 | | | | 198,213 | |
| FMC Corp. | | | 5,536 | | | | 302,819 | |
| Haynes International, Inc. | | | 5,333 | | | | 256,997 | |
| Koppers Holdings, Inc. | | | 7,986 | | | | 263,059 | |
| | | | | | | | 1,751,904 | |
| | | | | | | | | |
| Consumer Staples — 1.5% | | | | | | | | |
| Fresh Market, Inc. (The)* | | | 2,794 | | | | 164,539 | |
| Hain Celestial Group, Inc. (The)* | | | 4,091 | | | | 227,828 | |
| | | | | | | | 392,367 | |
| Total Common Stocks | | | | | | $ | 24,903,812 | |
Touchstone Emerging Growth Fund (Continued)
| | | | | | Market | |
| | | Shares | | | Value | |
| | | | | | | |
| Exchange Traded Funds — 2.0% | | | | | | | | |
| iShares Russell 2000 Growth Index Fund | | | 1,996 | | | $ | 179,201 | |
| iShares Russell Midcap Growth Index Fund | | | 5,700 | | | | 337,098 | |
| Total Exchange Traded Funds | | | | | | $ | 516,299 | |
| | | | | | | | | |
| Investment Funds — 3.6% | | | | | | | | |
| Invesco Government & Agency Portfolio, Institutional Class** | | | 664,614 | | | | 664,614 | |
| Touchstone Institutional Money Market Fund*^ | | | 247,376 | | | | 247,376 | |
| Total Investment Funds | | | | | | $ | 911,990 | |
| | | | | | | | | |
| Total Investment Securities — 102.8% | | | | | | | | |
| (Cost $22,806,303) | | | | | | $ | 26,332,101 | |
| | | | | | | | | |
| Liabilities in Excess of Other Assets — (2.8%) | | | | | | | (711,929 | ) |
| | | | | | | | | |
| Net Assets — 100.0% | | | | | | $ | 25,620,172 | |
| † | All or a portion of the security is on loan. The total value of the securities on loan as of July 31, 2012 was $650,709. |
| * | Non-income producing security. |
| ** | Represents collateral for securities loaned. |
| ^ | Affiliated Fund. See Note 4 in Notes to Financial Statements. |
Portfolio Abbreviations:
REIT - Real Estate Investment Trust
Other Information:
The inputs or methodology used for valuing securities may not be an indication of the risk associated with investing in those securities. For more information on valuation inputs, and their aggregation into the levels used in the table below, please refer to the security valuation section in the accompanying notes to financial statements.
| Valuation inputs at Reporting Date: | |
| Description | | Level 1 | | | Level 2 | | | Level 3 | | | Total | |
| | | | | | | | | | | | | |
| Common Stocks | | $ | 24,903,812 | | | $ | — | | | $ | — | | | $ | 24,903,812 | |
| Exchange Traded Funds | | | 516,299 | | | | — | | | | — | | | | 516,299 | |
| Investment Funds | | | 911,990 | | | | — | | | | — | | | | 911,990 | |
| | | | | | | | | | | | | | | $ | 26,332,101 | |
See accompanying Notes to Financial Statements.
Portfolio of Investments
Touchstone International Equity Fund – July 31, 2012
| | | | | | Market | |
| | | Shares | | | Value | |
| | | | | | | |
| Common Stocks — 98.7% | | | | | | | | |
| | | | | | | | | |
| Japan — 26.2% | | | | | | | | |
| Ahresty Corp. | | | 500 | | | $ | 3,424 | |
| Airport Facilities Co. Ltd. | | | 3,900 | | | | 18,021 | |
| Alfresa Holdings Corp. | | | 200 | | | | 10,675 | |
| Alpen Co. Ltd. | | | 5,300 | | | | 100,268 | |
| Bando Chemical Industries Ltd. | | | 8,000 | | | | 28,570 | |
| Belluna Co. Ltd. | | | 7,550 | | | | 60,883 | |
| Chubu Steel Plate Co. Ltd. | | | 300 | | | | 1,140 | |
| Coca-Cola Central Japan Co. Ltd. | | | 6,000 | | | | 77,261 | |
| Daihatsu Diesel Manufacturing Co. Ltd. | | | 13,000 | | | | 36,941 | |
| Daito Pharmaceutical Co. Ltd. | | | 800 | | | | 11,264 | |
| Daito Trust Construction Co. Ltd. | | | 900 | | | | 86,976 | |
| Daiwa House Industry Co. Ltd. | | | 27,000 | | | | 386,381 | |
| Faith, Inc. | | | 1,381 | | | | 147,778 | |
| Fuji Soft, Inc. | | | 700 | | | | 10,913 | |
| Fujimori Kogyo Co. Ltd. | | | 1,000 | | | | 19,827 | |
| Fujitsu Broad Solution & Consulting, Inc. | | | 500 | | | | 4,499 | |
| Fujitsu Frontech Ltd. | | | 1,100 | | | | 6,054 | |
| Fukuda Denshi Co. Ltd. | | | 1,300 | | | | 41,018 | |
| Gamecard-Joyco Holdings, Inc. | | | 3,300 | | | | 53,222 | |
| Geo Holdings Corp. | | | 53 | | | | 59,156 | |
| Happinet Corp. | | | 3,200 | | | | 30,802 | |
| Haruyama Trading Co. Ltd. | | | 1,500 | | | | 8,429 | |
| Haseko Corp.* | | | 500 | | | | 346 | |
| Hitachi Ltd. | | | 27,000 | | | | 160,704 | |
| Hokkaido Co.ca-Cola Bottling Co. Ltd. | | | 2,000 | | | | 10,086 | |
| Hokkan Holdings Ltd. | | | 4,000 | | | | 11,264 | |
| IMI Co. Ltd. | | | 600 | | | | 10,752 | |
| IT Holdings Corp. | | | 11,800 | | | | 122,796 | |
| Japan Tobacco, Inc. | | | 3,600 | | | | 113,541 | |
| JMS Co. Ltd. | | | 3,000 | | | | 10,099 | |
| Kamei Corp. | | | 4,000 | | | | 37,632 | |
| Kasai Kogyo Co. Ltd. | | | 10,000 | | | | 52,224 | |
| Kawasumi Laboratories, Inc. | | | 10,000 | | | | 57,856 | |
| Koike Sanso Kogyo Co. Ltd. | | | 6,000 | | | | 15,590 | |
| Komatsu Seiren Co. Ltd. | | | 10,000 | | | | 47,872 | |
| Komatsu Wall Industry Co. Ltd. | | | 700 | | | | 9,032 | |
| KRS Corp. | | | 800 | | | | 8,817 | |
| Mac House Co. Ltd. | | | 500 | | | | 3,840 | |
| Macnica, Inc. | | | 900 | | | | 19,123 | |
| Mikuni Co.ca-Cola Bottling Co. Ltd. | | | 600 | | | | 5,199 | |
| Mimasu Semiconductor Industry Co. Ltd. | | | 1,500 | | | | 11,770 | |
| Mitani Corp. | | | 2,300 | | | | 27,703 | |
| Mitsubishi UFJ Financial Group, Inc. | | | 94,900 | | | | 462,808 | |
| Mitsui High-Tec, Inc.* | | | 2,400 | | | | 11,612 | |
| Mitsui Home Co. Ltd. | | | 2,000 | | | | 11,008 | |
| Namura Shipbuilding Co. Ltd. | | | 26,500 | | | | 82,086 | |
| Nichireki Co. Ltd. | | | 12,000 | | | | 61,133 | |
| NIFTY Corp. | | | 59 | | | | 93,645 | |
| Nihon Plast Co. Ltd. | | | 1,200 | | | | 8,755 | |
| Nippo Corp. | | | 15,000 | | | | 179,904 | |
| Nippon Steel Corp. | | | 700 | | | | 1,416 | |
| Nippon Steel Trading Co. Ltd. | | | 1,000 | | | | 2,637 | |
| Nippon Telegraph & Telephone Corp. | | | 9,500 | | | | 442,016 | |
| NIS Group Co. Ltd.* | | | 24,287 | | | | 311 | |
| Nissan Motor Co. Ltd. | | | 32,700 | | | | 311,409 | |
| Nisshin Fudosan Co. | | | 5,600 | | | | 32,901 | |
| Nissin Sugar Holdings Co. Ltd. | | | 700 | | | | 13,315 | |
| Nojima Corp. | | | 1,128 | | | | 7,652 | |
| Otsuka Holdings Co. Ltd. | | | 12,200 | | | | 372,442 | |
| Pacific Industrial Co. Ltd. | | | 4,000 | | | | 23,245 | |
| Piolax, Inc. | | | 1,000 | | | | 21,299 | |
| Raysum Co. Ltd.* | | | 3 | | | | 697 | |
| Relo Holdings, Inc. | | | 200 | | | | 6,994 | |
| Riken Technos Corp. | | | 3,000 | | | | 8,448 | |
| Saison Information Systems Co. Ltd. | | | 1,100 | | | | 14,502 | |
| Shidax Corp. | | | 5,000 | | | | 22,656 | |
| Shinsho Corp. | | | 2,000 | | | | 4,147 | |
| Soken Chemical & Engineering Co. Ltd. | | | 700 | | | | 6,344 | |
| Sumikin Bussan Corp. | | | 2,000 | | | | 4,864 | |
| Sumitomo Densetsu Co. Ltd. | | | 3,500 | | | | 24,550 | |
| Suncall Corp. | | | 4,000 | | | | 18,330 | |
| T&K Toka Co. Ltd. | | | 400 | | | | 5,222 | |
| Tachibana Eletech Co. Ltd. | | | 400 | | | | 3,538 | |
| Tokai Corp./Gifu | | | 1,600 | | | | 41,062 | |
| Tokyu Co.nstruction Co. Ltd. | | | 10,170 | | | | 19,396 | |
| Totetsu Kogyo Co. Ltd. | | | 24,700 | | | | 315,844 | |
| UKC Holdings Corp. | | | 300 | | | | 3,679 | |
| Usen Corp.* | | | 15,940 | | | | 14,282 | |
| Vital KSK Holdings, Inc. | | | 600 | | | | 5,952 | |
| VT Holdings Co. Ltd. | | | 4,800 | | | | 42,209 | |
| Warabeya Nichiyo Co. Ltd. | | | 1,200 | | | | 20,874 | |
| Watabe Wedding Corp. | | | 3,377 | | | | 30,777 | |
| Yachiyo Industry Co. Ltd. | | | 1,400 | | | | 7,974 | |
| Yellow Hat Ltd. | | | 200 | | | | 3,238 | |
| Zojirushi Corp. | | | 12,000 | | | | 42,240 | |
| | | | | | | | 4,747,161 | |
| | | | | | | | | |
| United Kingdom — 19.4% | | | | | | | | |
| AstraZeneca PLC | | | 8,355 | | | | 391,211 | |
| AstraZeneca PLC | | | 317 | | | | 14,865 | |
| Barclays PLC | | | 63,379 | | | | 166,938 | |
| Berendsen PLC | | | 31,578 | | | | 252,250 | |
| BHP Billiton PLC | | | 2,801 | | | | 82,078 | |
| BP PLC | | | 11,216 | | | | 74,745 | |
| BP PLC ADR | | | 3,288 | | | | 131,191 | |
| British Polythene Industries PLC | | | 2,378 | | | | 14,168 | |
| BT Group PLC | | | 7,113 | | | | 24,233 | |
| Character Group PLC (The) | | | 242 | | | | 478 | |
| Dart Group PLC | | | 40,418 | | | | 48,398 | |
| Eurasian Natural Resources Corp. PLC | | | 29,375 | | | | 180,997 | |
| Greggs PLC | | | 656 | | | | 5,297 | |
| Hilton Food Group Ltd. | | | 1,087 | | | | 4,593 | |
| HSBC Holdings PLC | | | 63,486 | | | | 531,422 | |
| Imperial Tobacco Group PLC | | | 5,494 | | | | 213,534 | |
| Kazakhmys PLC | | | 12,168 | | | | 134,496 | |
| Legal & General Group PLC | | | 2,142 | | | | 4,282 | |
| National Grid PLC | | | 3,422 | | | | 35,544 | |
| Rio Tinto PLC | | | 8,702 | | | | 402,001 | |
| Royal Dutch Shell PLC - Class A | | | 23,826 | | | | 812,337 | |
| Vitec Group PLC (The) | | | 162 | | | | 1,587 | |
| | | | | | | | 3,526,645 | |
Touchstone International Equity Fund (Continued)
| | | | | | Market | |
| | | Shares | | | Value | |
| | | | | | | |
| Common Stocks — 98.7% (Continued) | | | | | | |
| | | | | | | | | |
| France — 7.1% | | | | | | | | |
| AXA SA | | | 17,317 | | | $ | 212,004 | |
| BNP Paribas SA | | | 5,922 | | | | 219,833 | |
| Cegid Group | | | 578 | | | | 9,673 | |
| Etam Developpement SA* | | | 427 | | | | 6,278 | |
| France Telecom SA | | | 370 | | | | 4,958 | |
| LDC | | | 91 | | | | 9,512 | |
| Linedata Services | | | 447 | | | | 6,952 | |
| Maisons France Confort | | | 1,060 | | | | 28,628 | |
| Nexity SA | | | 7,179 | | | | 170,479 | |
| Parrot SA* | | | 760 | | | | 23,144 | |
| Tessi SA | | | 8 | | | | 703 | |
| Total SA | | | 12,951 | | | | 599,235 | |
| | | | | | | | 1,291,399 | |
| | | | | | | | | |
| Singapore — 5.9% | | | | | | | | |
| DBS Group Holdings Ltd. | | | 38,000 | | | | 450,112 | |
| Elec & Eltek International Co. Ltd. | | | 9,745 | | | | 25,337 | |
| Golden Agri-Resources Ltd. | | | 229,000 | | | | 136,178 | |
| GP Batteries International Ltd. | | | 5,000 | | | | 3,978 | |
| Great Eastern Holdings Ltd. | | | 1,000 | | | | 11,258 | |
| Jardine Cycle & Carriage Ltd. | | | 9,526 | | | | 357,493 | |
| Lian Beng Group Ltd. | | | 266,000 | | | | 82,297 | |
| New Toyo International Holdings Ltd. | | | 32,000 | | | | 7,200 | |
| QAF Ltd. | | | 7,000 | | | | 3,994 | |
| | | | | | | | 1,077,847 | |
| | | | | | | | | |
| Switzerland — 5.3% | | | | | | | | |
| Advanced Digital Broadcast Holdings SA* | | | 2,822 | | | | 34,542 | |
| Bell AG | | | 28 | | | | 54,434 | |
| Clariant AG* | | | 418 | | | | 4,423 | |
| Emmi AG | | | 575 | | | | 118,970 | |
| OC Oerlikon Corp. AG* | | | 5,123 | | | | 41,926 | |
| Roche Holding AG | | | 3,651 | | | | 648,078 | |
| Swiss Life Holding AG* | | | 648 | | | | 62,158 | |
| | | | | | | | 964,531 | |
| | | | | | | | | |
| Germany — 5.2% | | | | | | | | |
| BASF SE | | | 3,111 | | | | 227,677 | |
| Bavaria Industriekapital AG* | | | 483 | | | | 6,537 | |
| Bayer AG | | | 3,194 | | | | 243,301 | |
| Cewe Color Holding AG | | | 701 | | | | 25,375 | |
| Deutsche Post AG | | | 5,994 | | | | 107,971 | |
| Freenet AG | | | 62 | | | | 910 | |
| Muenchener Rueckversicherungs AG | | | 294 | | | | 41,817 | |
| OHB AG | | | 400 | | | | 6,767 | |
| Schuler AG | | | 1,677 | | | | 41,206 | |
| Volkswagen AG | | | 1,495 | | | | 238,762 | |
| | | | | | | | 940,323 | |
| | | | | | | | | |
| Australia — 5.1% | | | | | | | | |
| Australia & New Zealand Banking Group Ltd. | | | 2,755 | | | | 68,153 | |
| BHP Billiton Ltd. | | | 17,862 | | | | 599,361 | |
| Rio Tinto Ltd. | | | 4,369 | | | | 244,260 | |
| Wesfarmers Ltd. | | | 385 | | | | 13,186 | |
| | | | | | | | 924,960 | |
| | | | | | | | | |
| Hong Kong — 4.2% | | | | | | | | |
| Champion Technology Holdings Ltd. | | | 1,542,000 | | | | 20,481 | |
| CLP Holdings Ltd. | | | 500 | | | | 4,320 | |
| CSI Properties Ltd. | | | 1,200,000 | | | | 54,934 | |
| Dickson Concepts International Ltd. | | | 7,500 | | | | 4,043 | |
| DMX Technologies Group Ltd. | | | 38,000 | | | | 6,718 | |
| Global Sources Ltd. | | | 319 | | | | 1,914 | |
| Hongkong Land Holdings Ltd. | | | 1,000 | | | | 6,000 | |
| Hutchison Whampoa Ltd. | | | 43,000 | | | | 387,597 | |
| Jardine Strategic Holdings Ltd. | | | 5,500 | | | | 172,755 | |
| Kantone Holdings Ltd. | | | 60,000 | | | | 487 | |
| Keck Seng Investments | | | 8,900 | | | | 3,592 | |
| Luen Thai Holdings Ltd. | | | 28,000 | | | | 3,430 | |
| Next Media Ltd.* | | | 124,000 | | | | 7,995 | |
| Orient Overseas International Ltd. | | | 1,500 | | | | 8,550 | |
| Pacific Textile Holdings Ltd. | | | 33,000 | | | | 23,065 | |
| Sun Hung Kai Properties Ltd. | | | 1,000 | | | | 12,502 | |
| TAI Cheung Holdings | | | 29,000 | | | | 20,194 | |
| Victory City International Holdings Ltd. | | | 170,000 | | | | 16,442 | |
| Wing On Co. International Ltd. | | | 6,000 | | | | 13,153 | |
| Wuling Motors Holdings Ltd. | | | 20,000 | | | | 1,096 | |
| | | | | | | | 769,268 | |
| | | | | | | | | |
| Denmark — 3.8% | | | | | | | | |
| AP Moeller - Maersk A/S - Class B | | | 47 | | | | 326,070 | |
| Novo Nordisk A/S - Class B | | | 2,362 | | | | 364,953 | |
| | | | | | | | 691,023 | |
| | | | | | | | | |
| Canada — 3.6% | | | | | | | | |
| Agrium, Inc. | | | 2,600 | | | | 247,309 | |
| BCE, Inc. | | | 1,478 | | | | 62,874 | |
| Brookfield Asset Management, Inc. - Class A | | | 4,170 | | | | 140,988 | |
| QLT, Inc.* | | | 153 | | | | 1,286 | |
| Suncor Energy, Inc. | | | 6,400 | | | | 195,666 | |
| | | | | | | | 648,123 | |
| | | | | | | | | |
| Sweden — 3.4% | | | | | | | | |
| Bilia AB | | | 6,770 | | | | 80,137 | |
| Hennes & Mauritz AB - Class B | | | 3,176 | | | | 117,547 | |
| Nordea Bank AB | | | 11,655 | | | | 108,998 | |
| Saab AB - Class B | | | 18,784 | | | | 314,050 | |
| | | | | | | | 620,732 | |
| | | | | | | | | |
| Belgium — 3.0% | | | | | | | | |
| Anheuser-Busch InBev NV | | | 6,409 | | | | 506,024 | |
| Euronav NV* | | | 40 | | | | 256 | |
| Recticel SA | | | 6,764 | | | | 42,278 | |
| | | | | | | | 548,558 | |
| | | | | | | | | |
| Netherlands — 2.5% | | | | | | | | |
| BE Semiconductor Industries N.V. | | | 1,789 | | | | 13,427 | |
| European Aeronautic Defence and Space Co. NV | | | 10,135 | | | | 364,877 | |
| ING Groep NV GDR* | | | 11,298 | | | | 74,802 | |
Touchstone International Equity Fund (Continued)
| | | | | | Market | |
| | | Shares | | | Value | |
| | | | | | | |
| Common Stocks — 98.7% (Continued) | | | | | | | | |
| | | | | | | | | |
| Netherlands — (Continued) | | | | | | | | |
| PostNL NV | | | 55 | | | $ | 225 | |
| | | | | | | | 453,331 | |
| | | | | | | | | |
| Austria — 1.8% | | | | | | | | |
| OMV AG | | | 10,194 | | | | 320,844 | |
| Telekom Austria AG | | | 200 | | | | 1,821 | |
| Voestalpine AG | | | 127 | | | | 3,461 | |
| | | | | | | | 326,126 | |
| | | | | | | | | |
| Norway — 1.3% | | | | | | | | |
| Statoil ASA | | | 9,749 | | | | 232,745 | |
| | | | | | | | | |
| Spain — 0.6% | | | | | | | | |
| Endesa SA | | | 7,162 | | | | 115,263 | |
| | | | | | | | | |
| Italy — 0.2% | | | | | | | | |
| Banca Popolare dell'Emilia Romagna | | | 171 | | | | 746 | |
| Enel SPA | | | 9,040 | | | | 25,872 | |
| Exor SPA | | | 635 | | | | 14,087 | |
| Milano Assicurazioni SPA* | | | 521 | | | | 173 | |
| | | | | | | | 40,878 | |
| | | | | | | | | |
| Finland — 0.1% | | | | | | | | |
| Digia PLC | | | 3,602 | | | | 10,415 | |
| | | | | | | | | |
| Portugal — 0.0% | | | | | | | | |
| Novabase SGPS SA | | | 1,343 | | | | 2,892 | |
| | | | | | | | | |
| New Zealand — 0.0% | | | | | | | | |
| Sky Network Television Ltd. | | | 210 | | | | 845 | |
| | | | | | | | | |
| China — 0.0% | | | | | | | | |
| SunVic Chemical Holdings Ltd.* | | | 1,000 | | | | 249 | |
| Total Common Stocks | | | | | | $ | 17,933,314 | |
| | | | | | | | | |
| Preferred Stock — 0.1% | | | | | | | | |
| | | | | | | | | |
| Germany — 0.1% | | | | | | | | |
| Volkswagen AG | | | 115 | | | | 19,668 | |
| | | | | | | | | |
| Investment Fund — 1.3% | | | | | | | | |
| Touchstone Institutional Money Market Fund^ | | | 228,830 | | | | 228,830 | |
| | | | | | | | | |
| Total Investment Securities —100.1% | | | | | | | | |
| (Cost $17,160,855) | | | | | | $ | 18,181,812 | |
| | | | | | | | | |
| Liabilities in Excess of Other Assets — (0.1%) | | | | | | | (19,388 | ) |
| | | | | | | | | |
| Net Assets — 100.0% | | | | | | $ | 18,162,424 | |
| * | Non-income producing security. |
| ^ | Affiliated Fund. See Note 4 in Notes to Financial Statements. |
Portfolio Abbreviations:
ADR - American Depositary Receipt
GDR - Global Depositary Receipt
PLC - Public Limited Company
Other Information:
The inputs or methodology used for valuing securities may not be an indication of the risk associated with investing in those securities. For more information on valuation inputs, and their aggregation into the levels used in the table below, please refer to the security valuation section in the accompanying Notes to Financial Statements.
| Valuation inputs at Reporting Date: | |
| Description | | Level 1 | | | Level 2 | | | Level 3 | | | Total | |
| | | | | | | | | | | | | |
| Common Stocks | | $ | 17,933,003 | | | $ | — | | | $ | 311 | | | $ | 17,933,314 | |
| Preferred Stock | | | 19,668 | | | | — | | | | — | | | | 19,668 | |
| Investment Fund | | | 228,830 | | | | — | | | | — | | | | 228,830 | |
| | | | | | | | | | | | | | | $ | 18,181,812 | |
At July 31, 2012, equity securities valued at $13,291,618 were transferred from Level 2 to Level 1. At July 31, 2012, these securities were valued using inputs that reflected quoted prices in active markets. At July 31, 2011, these securities were valued using observable inputs other than quoted prices.
Touchstone International Equity Fund (Continued)
The following is a rollforward of the Fund's investments that were valued using unobservable inputs for the year ended July 31, 2012:
Measurements Using Unobservable Inputs (Level 3)
| | | Common Stock | | | | |
| | | United | | | | |
| Assets | | States | | | Total | |
| | | | | | | |
| Beginning balance | | $ | 1,972 | | | $ | 1,972 | |
| Sales | | | (1,972 | ) | | | (1,972 | ) |
| Gross Transfer into Level 3 | | | 311 | (a) | | | 311 | |
| Ending balance | | $ | 311 | | | $ | 311 | |
| (a) | Transferred from Level 1 to Level 3 due to lack of observable valuation inputs. |
See accompanying Notes to Financial Statements.
Portfolio of Investments
Touchstone Balanced Allocation Fund – July 31, 2012
| | | | | | Market | |
| | | Shares | | | Value | |
| | | | | | | |
| Affiliated Mutual Funds^ — 100.5% | | | | | | | | |
| | | | | | | | | |
| Government/Corporate — 25.4% | | | | | | | | |
| Touchstone Core Bond Fund | | | 183,349 | | | $ | 1,994,840 | |
| Touchstone Short Duration Fixed Income Fund, Class Y | | | 419,781 | | | | 4,122,249 | |
| Touchstone Total Return Bond Fund | | | 618,129 | | | | 6,477,995 | |
| | | | | | | | 12,595,084 | |
| | | | | | | | | |
| Value — 11.1% | | | | | | | | |
| Touchstone Focused Fund | | | 44,610 | | | | 997,485 | |
| Touchstone Value Fund | | | 632,364 | | | | 4,477,134 | |
| | | | | | | | 5,474,619 | |
| | | | | | | | | |
| International Equity — 10.2% | | | | | | | | |
| Touchstone International Equity Fund | | | 561,014 | | | | 4,527,385 | |
| Touchstone International Small Cap Fund | | | 47,228 | | | | 500,617 | |
| | | | | | | | 5,028,002 | |
| | | | | | | | | |
| International Debt — 6.1% | | | | | | | | |
| Touchstone International Fixed Income Fund | | | 290,560 | | | | 3,010,204 | |
| | | | | | | | | |
| Growth — 6.0% | | | | | | | | |
| Touchstone Sands Capital Institutional Growth Fund* | | | 177,158 | | | | 2,949,680 | |
| | | | | | | | | |
| Global Equity — 5.6% | | | | | | | | |
| Touchstone Global Equity Fund | | | 279,501 | | | | 2,764,259 | |
| | | | | | | | | |
| Emerging Market-Equity — 4.1% | | | | | | | | |
| Touchstone Emerging Markets Equity Fund II | | | 228,800 | | | | 2,006,578 | |
| | | | | | | | | |
| Corporate/Preferred-High Yield — 4.0% | | | | | | | | |
| Touchstone High Yield Fund | | | 223,482 | | | | 2,004,630 | |
| | | | | | | | | |
| Blue Chip — 4.0% | | | | | | | | |
| Touchstone Dynamic Equity Fund | | | 176,186 | | | | 2,001,470 | |
| | | | | | | | | |
| Value Large-Cap — 4.0% | | | | | | | | |
| Touchstone Large Cap Relative Value Fund | | | 166,363 | | | | 1,993,030 | |
| | | | | | | | | |
| Sector Fund Real-Estate — 4.0% | | | | | | | | |
| Touchstone Global Real Estate Fund | | | 168,040 | | | | 1,992,955 | |
| | | | | | | | | |
| Growth Mid-Cap — 4.0% | | | | | | | | |
| Touchstone Mid Cap Fund | | | 61,627 | | | | 995,267 | |
| Touchstone Mid Cap Growth Fund* | | | 47,055 | | | | 990,981 | |
| | | | | | | | 1,986,248 | |
| | | | | | | | | |
| Various Assets — 3.0% | | | | | | | | |
| Touchstone Merger Arbitrage Fund | | | 141,349 | | | | 1,496,886 | |
| | | | | | | | | |
| Taxable Govt/Agency-Money Market — 3.0% | | | | | | | | |
| Touchstone Institutional Money Market Fund | | | 1,494,646 | | | | 1,494,647 | |
| | | | | | | | | |
| Value Mid-Cap — 2.0% | | | | | | | | |
| Touchstone Mid Cap Value Fund | | | 80,711 | | | | 1,000,015 | |
| | | | | | | | | |
| Growth Large-Cap — 2.0% | | | | | | | | |
| Touchstone Large Cap Growth Fund, Class Y* | | | 36,068 | | | | 991,152 | |
| | | | | | | | | |
| Value Small-Cap — 2.0% | | | | | | | | |
| Touchstone Small Cap Core Fund | | | 63,835 | | | | 989,446 | |
| Total Affiliated Mutual Funds | | | | | | $ | 49,778,905 | |
| | | | | | | | | |
| Total Investment Securities — 100.5% | | | | | | | | |
| (Cost $47,397,615) | | | | | | $ | 49,778,905 | |
| | | | | | | | | |
| Liabilities in Excess of Other Assets — (0.5%) | | | | | | | (235,084 | ) |
| | | | | | | | | |
| Net Assets — 100.0% | | | | | | $ | 49,543,821 | |
| * | Non-income producing security. |
| ^ | Affiliated Fund. All affiliated funds are invested in Institutional Class, unless otherwise indicated. See Note 4 in Notes to Financial Statements. |
Other Information:
The inputs or methodology used for valuing securities may not be an indication of the risk associated with investing in those securities. For more information on valuation inputs, and their aggregation into the levels used in the table below, please refer to the security valuation section in the accompanying Notes to Financial Statements.
| Valuation inputs at Reporting Date: | |
| Description | | Level 1 | | | Level 2 | | | Level 3 | | | Total | |
| | | | | | | | | | | | | | | | | |
| Affiliated Mutual Funds | | $ | 49,778,905 | | | $ | — | | | $ | — | | | $ | 49,778,905 | |
See accompanying Notes to Financial Statements.
Portfolio of Investments
Touchstone Conservative Allocation Fund – July 31, 2012
| | | | | | Market | |
| | | Shares | | | Value | |
| | | | | | | |
| Affiliated Mutual Funds^ — 99.9% | | | | | | | | |
| | | | | | | | | |
| Government/Corporate — 46.4% | | | | | | | | |
| Touchstone Core Bond Fund | | | 159,941 | | | $ | 1,740,155 | |
| Touchstone Short Duration Fixed Income Fund, Class Y | | | 546,392 | | | | 5,365,566 | |
| Touchstone Total Return Bond Fund | | | 608,814 | | | | 6,380,367 | |
| | | | | | | | 13,486,088 | |
| | | | | | | | | |
| International Debt — 9.1% | | | | | | | | |
| Touchstone International Fixed Income Fund | | | 253,995 | | | | 2,631,387 | |
| | | | | | | | | |
| Value — 6.0% | | | | | | | | |
| Touchstone Value Fund | | | 247,594 | | | | 1,752,963 | |
| | | | | | | | | |
| Corporate/Preferred-High Yield — 5.0% | | | | | | | | |
| Touchstone High Yield Fund | | | 162,314 | | | | 1,455,959 | |
| | | | | | | | | |
| Taxable Govt/Agency-Money Market — 5.0% | | | | | | | | |
| Touchstone Institutional Money Market Fund | | | 1,445,861 | | | | 1,445,861 | |
| | | | | | | | | |
| Growth — 4.9% | | | | | | | | |
| Touchstone Sands Capital Institutional Growth Fund* | | | 85,932 | | | | 1,430,773 | |
| | | | | | | | | |
| International Equity — 4.1% | | | | | | | | |
| Touchstone International Equity Fund | | | 145,185 | | | | 1,171,642 | |
| | | | | | | | | |
| Blue Chip — 4.0% | | | | | | | | |
| Touchstone Dynamic Equity Fund | | | 102,886 | | | | 1,168,789 | |
| | | | | | | | | |
| Various Assets — 4.0% | | | | | | | | |
| Touchstone Merger Arbitrage Fund | | | 109,166 | | | | 1,156,072 | |
| | | | | | | | | |
| Value Large-Cap — 3.0% | | | | | | | | |
| Touchstone Large Cap Relative Value Fund | | | 72,635 | | | | 870,165 | |
| | | | | | | | | |
| Global Equity — 2.4% | | | | | | | | |
| Touchstone Global Equity Fund | | | 71,106 | | | | 703,234 | |
| | | | | | | | | |
| Sector Fund Real-Estate — 2.0% | | | | | | | | |
| Touchstone Global Real Estate Fund | | | 49,662 | | | | 588,995 | |
| | | | | | | | | |
| Value Small-Cap — 2.0% | | | | | | | | |
| Touchstone Small Cap Core Fund | | | 37,432 | | | | 580,192 | |
| | | | | | | | | |
| Emerging Market-Equity — 1.0% | | | | | | | | |
| Touchstone Emerging Markets Equity Fund II | | | 33,371 | | | | 292,662 | |
| | | | | | | | | |
| Growth Mid-Cap — 1.0% | | | | | | | | |
| Touchstone Mid Cap Fund | | | 18,109 | | | | 292,467 | |
| Total Affiliated Mutual Funds | | | | | | $ | 29,027,249 | |
| | | | | | | | | |
| Total Investment Securities — 99.9% | | | | | | | | |
| (Cost $27,824,562) | | | | | | $ | 29,027,249 | |
| | | | | | | | | |
| Other Assets in Excess of Liabilities — 0.1% | | | | | | | 40,468 | |
| | | | | | | | | |
| Net Assets — 100.0% | | | | | | $ | 29,067,717 | |
| * | Non-income producing security. |
| ^ | Affiliated Fund. All affiliated funds are invested in Institutional Class, unless otherwise indicated. See Note 4 in Notes to Financial Statements. |
Other Information:
The inputs or methodology used for valuing securities may not be an indication of the risk associated with investing in those securities. For more information on valuation inputs, and their aggregation into the levels used in the table below, please refer to the security valuation section in the accompanying notes to finanial statements.
| Valuation inputs at Reporting Date: | |
| Description | | Level 1 | | | Level 2 | | | Level 3 | | | Total | |
| | | | | | | | | | | | | | | | | |
| Affiliated Mutual Funds | | $ | 29,027,249 | | | $ | — | | | $ | — | | | $ | 29,027,249 | |
See accompanying Notes to Financial Statements.
Portfolio of Investments
Touchstone Growth Allocation Fund – July 31, 2012
| | | | | | Market | |
| | | Shares | | | Value | |
| | | | | | | |
| Affiliated Mutual Funds^ — 100.3% | | | | | | | | |
| | | | | | | | | |
| International Equity — 17.3% | | | | | | | | |
| Touchstone International Equity Fund | | | 576,652 | | | $ | 4,653,582 | |
| Touchstone International Small Cap Fund | | | 134,494 | | | | 1,425,634 | |
| | | | | | | | 6,079,216 | |
| | | | | | | | | |
| Value — 14.1% | | | | | | | | |
| Touchstone Focused Fund | | | 79,285 | | | | 1,772,815 | |
| Touchstone Value Fund | | | 451,154 | | | | 3,194,168 | |
| | | | | | | | 4,966,983 | |
| | | | | | | | | |
| Growth — 10.9% | | | | | | | | |
| Touchstone Emerging Growth Fund* | | | 90,056 | | | | 1,055,454 | |
| Touchstone Sands Capital Institutional Growth Fund* | | | 167,888 | | | | 2,795,339 | |
| | | | | | | | 3,850,793 | |
| | | | | | | | | |
| Emerging Market-Equity — 10.2% | | | | | | | | |
| Touchstone Emerging Markets Equity Fund II | | | 409,418 | | | | 3,590,598 | |
| | | | | | | | | |
| Global Equity — 7.7% | | | | | | | | |
| Touchstone Global Equity Fund | | | 275,019 | | | | 2,719,940 | |
| | | | | | | | | |
| Sector Fund Real-Estate — 6.1% | | | | | | | | |
| Touchstone Global Real Estate Fund | | | 180,510 | | | | 2,140,854 | |
| | | | | | | | | |
| Value Small-Cap — 6.0% | | | | | | | | |
| Touchstone Small Cap Core Fund | | | 91,198 | | | | 1,413,563 | |
| Touchstone Small Cap Value Fund | | | 40,596 | | | | 698,257 | |
| | | | | | | | 2,111,820 | |
| | | | | | | | | |
| Growth Mid-Cap — 5.0% | | | | | | | | |
| Touchstone Mid Cap Fund | | | 65,836 | | | | 1,063,249 | |
| Touchstone Mid Cap Growth Fund* | | | 33,529 | | | | 706,120 | |
| | | | | | | | 1,769,369 | |
| | | | | | | | | |
| Value Large-Cap — 5.0% | | | | | | | | |
| Touchstone Large Cap Relative Value Fund | | | 147,501 | | | | 1,767,061 | |
| | | | | | | | | |
| Government/Corporate — 5.0% | | | | | | | | |
| Touchstone Short Duration Fixed Income Fund, Class Y | | | 177,235 | | | | 1,740,451 | |
| | | | | | | | | |
| Value Mid-Cap — 4.0% | | | | | | | | |
| Touchstone Mid Cap Value Fund | | | 114,425 | | | | 1,417,723 | |
| | | | | | | | | |
| Blue Chip — 3.0% | | | | | | | | |
| Touchstone Dynamic Equity Fund | | | 93,418 | | | | 1,061,228 | |
| | | | | | | | | |
| Growth Large-Cap — 3.0% | | | | | | | | |
| Touchstone Large Cap Growth Fund, Class Y* | | | 37,987 | | | | 1,043,880 | |
| | | | | | | | | |
| Various Assets — 3.0% | | | | | | | | |
| Touchstone Merger Arbitrage Fund | | | 98,375 | | | | 1,041,795 | |
| Total Affiliated Mutual Funds | | | | | | $ | 35,301,711 | |
| | | | | | | | | |
| Total Investment Securities — 100.3% | | | | | | | | |
| (Cost $33,681,674) | | | | | | $ | 35,301,711 | |
| | | | | | | | | |
| Liabilities in Excess of Other Assets — (0.3%) | | | | | | | (119,946 | ) |
| | | | | | | | | |
| Net Assets — 100.0% | | | | | | $ | 35,181,765 | |
| * | Non-income producing security. |
| ^ | Affiliated Fund. All affiliated funds are invested in Institutional Class, unless otherwise indicated. See Note 4 in Notes to Financial Statements. |
Other Information:
The inputs or methodology used for valuing securities may not be an indication of the risk associated with investing in those securities. For more information on valuation inputs, and their aggregation into the levels used in the table below, please refer to the security valuation section in the accompanying Notes to Financial Statements.
| Valuation inputs at Reporting Date: | |
| Description | | Level 1 | | | Level 2 | | | Level 3 | | | Total | |
| | | | | | | | | | | | | | | | | |
| Affiliated Mutual Funds | | $ | 35,301,711 | | | $ | — | | | $ | — | | | $ | 35,301,711 | |
See accompanying Notes to Financial Statements.
Portfolio of Investments
Touchstone Moderate Growth Allocation Fund – July 31, 2012
| | | | | | Market | |
| | | Shares | | | Value | |
| | | | | | | |
| Affiliated Mutual Funds^ — 100.4% | | | | | | | | |
| | | | | | | | | |
| Government/Corporate — 16.0% | | | | | | | | |
| Touchstone Short Duration Fixed Income Fund, Class Y | | | 260,823 | | | $ | 2,561,284 | |
| Touchstone Total Return Bond Fund | | | 726,144 | | | | 7,609,988 | |
| | | | | | | | 10,171,272 | |
| | | | | | | | | |
| Value — 14.2% | | | | | | | | |
| Touchstone Focused Fund | | | 142,763 | | | | 3,192,187 | |
| Touchstone Value Fund | | | 822,664 | | | | 5,824,458 | |
| | | | | | | | 9,016,645 | |
| | | | | | | | | |
| International Equity — 13.3% | | | | | | | | |
| Touchstone International Equity Fund | | | 882,279 | | | | 7,119,995 | |
| Touchstone International Small Cap Fund | | | 121,070 | | | | 1,283,338 | |
| | | | | | | | 8,403,333 | |
| | | | | | | | | |
| Growth — 9.0% | | | | | | | | |
| Touchstone Emerging Growth Fund* | | | 54,262 | | | | 635,949 | |
| Touchstone Sands Capital Institutional Growth Fund* | | | 303,868 | | | | 5,059,404 | |
| | | | | | | | 5,695,353 | |
| | | | | | | | | |
| Emerging Market-Equity — 7.1% | | | | | | | | |
| Touchstone Emerging Markets Equity Fund II | | | 516,161 | | | | 4,526,730 | |
| | | | | | | | | |
| Global Equity — 5.4% | | | | | | | | |
| Touchstone Global Equity Fund | | | 345,534 | | | | 3,417,333 | |
| | | | | | | | | |
| Growth Mid-Cap — 5.1% | | | | | | | | |
| Touchstone Mid Cap Fund | | | 120,578 | | | | 1,947,330 | |
| Touchstone Mid Cap Growth Fund* | | | 59,674 | | | | 1,256,726 | |
| | | | | | | | 3,204,056 | |
| | | | | | | | | |
| Value Large-Cap — 5.0% | | | | | | | | |
| Touchstone Large Cap Relative Value Fund | | | 266,540 | | | | 3,193,147 | |
| | | | | | | | | |
| Sector Fund Real-Estate — 4.1% | | | | | | | | |
| Touchstone Global Real Estate Fund | | | 221,247 | | | | 2,623,991 | |
| | | | | | | | | |
| Value Small-Cap — 4.1% | | | | | | | | |
| Touchstone Small Cap Core Fund | | | 125,013 | | | | 1,937,706 | |
| Touchstone Small Cap Value Fund | | | 36,938 | | | | 635,342 | |
| | | | | | | | 2,573,048 | |
| | | | | | | | | |
| Blue Chip — 3.1% | | | | | | | | |
| Touchstone Dynamic Equity Fund | | | 170,233 | | | | 1,933,844 | |
| | | | | | | | | |
| Value Mid-Cap — 3.0% | | | | | | | | |
| Touchstone Mid Cap Value Fund | | | 155,604 | | | | 1,927,936 | |
| | | | | | | | | |
| International Debt — 3.0% | | | | | | | | |
| Touchstone International Fixed Income Fund | | | 185,882 | | | | 1,925,741 | |
| | | | | | | | | |
| Corporate/Preferred-High Yield — 3.0% | | | | | | | | |
| Touchstone High Yield Fund | | | 214,492 | | | | 1,923,991 | |
| | | | | | | | | |
| Various Assets — 3.0% | | | | | | | | |
| Touchstone Merger Arbitrage Fund | | | 178,694 | | | | 1,892,368 | |
| | | | | | | | | |
| Growth Large-Cap — 2.0% | | | | | | | | |
| Touchstone Large Cap Growth Fund, Class Y* | | | 45,700 | | | | 1,255,828 | |
| Total Affiliated Mutual Funds | | | | | | $ | 63,684,616 | |
| | | | | | | | | |
| Total Investment Securities — 100.4% | | | | | | | | |
| (Cost $60,840,528) | | | | | | $ | 63,684,616 | |
| | | | | | | | | |
| Liabilities in Excess of Other Assets — (0.4%) | | | | | | | (224,882 | ) |
| | | | | | | | | |
| Net Assets — 100.0% | | | | | | $ | 63,459,734 | |
| * | Non-income producing security. |
| ^ | Affiliated Fund. All affiliated funds are invested in Institutional Class, unless otherwise indicated. See Note 4 in Notes to Financial Statements. |
Other Information:
The inputs or methodology used for valuing securities may not be an indication of the risk associated with investing in those securities. For more information on valuation inputs, and their aggregation into the levels used in the table below, please refer to the security valuation section in the accompanying notes to portfolios of investments.
| Valuation inputs at Reporting Date: | |
| Description | | Level 1 | | | Level 2 | | | Level 3 | | | Total | |
| | | | | | | | | | | | | | | | | |
| Affiliated Mutual Funds | | $ | 63,684,616 | | | $ | — | | | $ | — | | | $ | 63,684,616 | |
See accompanying Notes to Financial Statements.
Statements of Assets and Liabilities
July 31, 2012
| | | Touchstone | | | Touchstone | | | Touchstone | |
| | | Dynamic | | | Emerging | | | International | |
| | | Equity | | | Growth | | | Equity | |
| | | Fund | | | Fund | | | Fund | |
| Assets | | | | | | | | | |
| Investments, at cost | | $ | 65,116,021 | | | $ | 22,806,303 | | | $ | 17,160,855 | |
| Affiliated securities, at market value | | $ | 645,981 | | | $ | 247,376 | | | $ | 228,830 | |
| Non-affiliated securities, at market value | | | 71,973,899 | | | | 26,084,725 | | | | 17,952,982 | |
| Investments, at value (A) | | $ | 72,619,880 | | | $ | 26,332,101 | | | $ | 18,181,812 | |
| Cash deposits held at prime broker | | | 367,934 | | | | — | | | | — | |
| Foreign Currency (B) | | | — | | | | — | | | | 35,472 | |
| Dividends and interest receivable | | | 52,410 | | | | 1,483 | | | | 6,839 | |
| Receivable for capital shares sold | | | 1,121 | | | | — | | | | 16,000 | |
| Receivable for investments sold | | | — | | | | — | | | | 10,579 | |
| Receivable for securities lending income | | | — | | | | 354 | | | | 11 | |
| Receivable from other affiliates | | | — | | | | 5,499 | | | | — | |
| Receivable from Investment Advisor | | | — | | | | — | | | | 15,611 | |
| Tax reclaim receivable | | | — | | | | — | | | | 17,502 | |
| Other assets | | | 35,269 | | | | 15,651 | | | | 13,794 | |
| Total Assets | | | 73,076,614 | | | | 26,355,088 | | | | 18,297,620 | |
| | | | | | | | | | | | | |
| Liabilities | | | | | | | | | | | | |
| Written options, at market value (C) | | | 1,538,255 | | | | — | | | | — | |
| Securities sold short (D) | | | 11,279,516 | | | | — | | | | — | |
| Dividends for securities sold short payable | | | 239,034 | | | | — | | | | — | |
| Bank overdrafts | | | — | | | | — | | | | — | |
| Payable to Transfer Agent | | | 23,874 | | | | 6,429 | | | | 468 | |
| Payable for reports to shareholders | | | 9,102 | | | | 16,144 | | | | 6,028 | |
| Payable for return of collateral for securities on loan | | | — | | | | 664,614 | | | | — | |
| Payable for capital shares redeemed | | | 61,803 | | | | 6,549 | | | | 65,901 | |
| Payable to Investment Advisor | | | 38,900 | | | | 11,999 | | | | — | |
| Payable to other affiliates | | | 30,245 | | | | — | | | | 163 | |
| Payable to Trustees | | | 2,235 | | | | 2,198 | | | | 2,202 | |
| Payable for professional services | | | 27,521 | | | | 26,766 | | | | 29,240 | |
| Other accrued expenses and liabilities | | | 669 | | | | 217 | | | | 31,194 | |
| Total Liabilities | | | 13,251,154 | | | | 734,916 | | | | 135,196 | |
| | | | | | | | | | | | | |
| Net Assets | | $ | 59,825,460 | | | $ | 25,620,172 | | | $ | 18,162,424 | |
| | | | | | | | | | | | | |
| Net assets consist of: | | | | | | | | | | | | |
| Paid-in capital | | $ | 201,557,595 | | | $ | 21,850,233 | | | $ | 59,991,945 | |
| Accumulated net investment income (loss) | | | (386,369 | ) | | | (179,955 | ) | | | 342,867 | |
| Accumulated net realized gains (losses) on investments, written options, foreign currency transactions and short positions | | | (150,154,210 | ) | | | 424,096 | | | | (43,192,072 | ) |
| Net unrealized appreciation on investments, written options, foreign currency transactions and short positions | | | 8,808,444 | | | | 3,525,798 | | | | 1,019,684 | |
| Net Assets | | $ | 59,825,460 | | | $ | 25,620,172 | | | $ | 18,162,424 | |
| | | | | | | | | | | | | |
| (A) Includes market value of securities on loan of: | | $ | — | | | $ | 650,709 | | | $ | — | |
| (B) Cost of foreign currency: | | $ | — | | | $ | — | | | $ | 35,832 | |
| (C) Proceeds received for written options: | | $ | 1,419,538 | | | $ | — | | | $ | — | |
| (D) Proceeds received for securities sold short: | | $ | 12,702,818 | | | $ | — | | | $ | — | |
See accompanying Notes to Financial Statements.
Statements of Assets and Liabilities (Continued)
| | | | | | | | | | Touchstone | |
| Touchstone | | | Touchstone | | | Touchstone | | | Moderate | |
| Balanced | | | Conservative | | | Growth | | | Growth | |
| Allocation | | | Allocation | | | Allocation | | | Allocation | |
| Fund | | | Fund | | | Fund | | | Fund | |
| | | | | | | | | | | | | | | |
| $ | 47,397,615 | | | $ | 27,824,562 | | | $ | 33,681,674 | | | $ | 60,840,528 | |
| $ | 49,778,905 | | | $ | 29,027,249 | | | $ | 35,301,711 | | | $ | 63,684,616 | |
| | — | | | | — | | | | — | | | | — | |
| $ | 49,778,905 | | | $ | 29,027,249 | | | $ | 35,301,711 | | | $ | 63,684,616 | |
| | — | | | | — | | | | — | | | | — | |
| | — | | | | — | | | | — | | | | — | |
| | — | | | | — | | | | — | | | | — | |
| | 11,013 | | | | 82,361 | | | | 9,101 | | | | 10,101 | |
| | 116,399 | | | | 59,595 | | | | 1,858 | | | | 52,405 | |
| | — | | | | — | | | | — | | | | — | |
| | — | | | | — | | | | — | | | | — | |
| | — | | | | 2,139 | | | | — | | | | — | |
| | — | | | | — | | | | — | | | | — | |
| | 18,435 | | | | 18,165 | | | | 18,173 | | | | 18,597 | |
| | 49,924,752 | | | | 29,189,509 | | | | 35,330,843 | | | | 63,765,719 | |
| | | | | | | | | | | | | | | |
| | | | | | | | | | | | | | | |
| | — | | | | — | | | | — | | | | — | |
| | — | | | | — | | | | — | | | | — | |
| | — | | | | — | | | | — | | | | — | |
| | 116,399 | | | | 59,595 | | | | 1,858 | | | | 52,084 | |
| | 10,161 | | | | 4,250 | | | | 10,185 | | | | 16,482 | |
| | 7,008 | | | | 6,351 | | | | 7,433 | | | | 8,058 | |
| | — | | | | — | | | | — | | | | — | |
| | 160,041 | | | | 534 | | | | 68,566 | | | | 130,253 | |
| | 2,508 | | | | — | | | | 943 | | | | 5,557 | |
| | 55,753 | | | | 22,506 | | | | 31,365 | | | | 64,381 | |
| | 2,231 | | | | 2,170 | | | | 2,182 | | | | 2,209 | |
| | 26,672 | | | | 26,295 | | | | 26,423 | | | | 26,726 | |
| | 158 | | | | 91 | | | | 123 | | | | 235 | |
| | 380,931 | | | | 121,792 | | | | 149,078 | | | | 305,985 | |
| | | | | | | | | | | | | | | |
| $ | 49,543,821 | | | $ | 29,067,717 | | | $ | 35,181,765 | | | $ | 63,459,734 | |
| | | | | | | | | | | | | | | |
| | | | | | | | | | | | | | | |
| $ | 69,008,836 | | | $ | 28,469,023 | | | $ | 71,513,517 | | | $ | 100,667,507 | |
| | 271,112 | | | | 359,301 | | | | 269,645 | | | | 392,606 | |
| | | | | | | | | | | | | | | |
| | (22,117,417 | ) | | | (963,294 | ) | | | (38,221,434 | ) | | | (40,444,467 | ) |
| | | | | | | | | | | | | | | |
| | 2,381,290 | | | | 1,202,687 | | | | 1,620,037 | | | | 2,844,088 | |
| $ | 49,543,821 | | | $ | 29,067,717 | | | $ | 35,181,765 | | | $ | 63,459,734 | |
| | | | | | | | | | | | | | | |
| $ | — | | | $ | — | | | $ | — | | | $ | — | |
| $ | — | | | $ | — | | | $ | — | | | $ | — | |
| $ | — | | | $ | — | | | $ | — | | | $ | — | |
| $ | — | | | $ | — | | | $ | — | | | $ | — | |
Statements of Assets and Liabilities (Continued)
| | | Touchstone | | | Touchstone | | | Touchstone | |
| | | Dynamic | | | Emerging | | | International | |
| | | Equity | | | Growth | | | Equity | |
| | | Fund | | | Fund | | | Fund | |
| | | | | | | | | | |
| Pricing of Class A Shares | | | | | | | | | |
| Net assets applicable to Class A shares | | $ | 17,919,342 | | | $ | 2,031,816 | | | $ | 233,241 | |
| Shares of beneficial interest outstanding | | | | | | | | | | | | |
| (unlimited number of shares authorized, no par value) | | | 1,600,274 | | | | 178,843 | | | | 29,006 | |
| Net asset value price per share* | | $ | 11.20 | | | $ | 11.36 | | | $ | 8.04 | |
| Maximum offering price per share | | $ | 11.88 | | | $ | 12.05 | | | $ | 8.53 | |
| | | | | | | | | | | | | |
| Pricing of Class C Shares | | | | | | | | | | | | |
| Net assets applicable to Class C shares | | $ | 11,684,077 | | | $ | 2,394 | | | $ | 2,447 | |
| Shares of beneficial interest outstanding | | | | | | | | | | | | |
| (unlimited number of shares authorized, no par value) | | | 1,099,296 | | | | 211 | | | | 305 | |
| Net asset value, offering price per share** | | $ | 10.63 | | | $ | 11.35 | | | $ | 8.03 | |
| | | | | | | | | | | | | |
| Pricing of Class Y Shares | | | | | | | | | | | | |
| Net assets applicable to Class Y shares | | $ | 24,054,073 | | | $ | 6,936,059 | | | $ | 423,764 | |
| Shares of beneficial interest outstanding | | | | | | | | | | | | |
| (unlimited number of shares authorized, no par value) | | | 2,118,985 | | | | 600,033 | | | | 52,504 | |
| Net asset value, offering price and redemption price per share | | $ | 11.35 | | | $ | 11.56 | | | $ | 8.07 | |
| | | | | | | | | | | | | |
| Pricing of Institutional Class Shares | | | | | | | | | | | | |
| Net assets applicable to Institutional Class Shares | | $ | 6,167,968 | | | $ | 16,649,903 | | | $ | 17,502,972 | |
| Shares of beneficial interest outstanding | | | | | | | | | | | | |
| (unlimited number of shares authorized, no par value) | | | 542,732 | | | | 1,420,293 | | | | 2,169,924 | |
| Net asset value, offering price and redemption price per share | | $ | 11.36 | | | $ | 11.72 | | | $ | 8.07 | |
* There is no sales load on subscriptions of $ 1 million or more. Redemptions that were part of a $ 1 million or more subscription maybe subject to a contingent deferred sales load.
** Redemption price per share varies by length of time shares are held.
See accompanying Notes to Financial Statements.
Statements of Assets and Liabilities (Continued)
| | | | | | | | | | Touchstone | |
| Touchstone | | | Touchstone | | | Touchstone | | | Moderate | |
| Balanced | | | Conservative | | | Growth | | | Growth | |
| Allocation | | | Allocation | | | Allocation | | | Allocation | |
| Fund | | | Fund | | | Fund | | | Fund | |
| | | | | | | | | | | |
| | | | | | | | | | | |
| $ | 9,838,792 | | | $ | 8,466,115 | | | $ | 10,319,709 | | | $ | 15,181,138 | |
| | | | | | | | | | | | | | | |
| | 880,028 | | | | 771,020 | | | | 914,700 | | | | 1,364,118 | |
| $ | 11.18 | | | $ | 10.98 | | | $ | 11.28 | | | $ | 11.13 | |
| $ | 11.86 | | | $ | 11.65 | | | $ | 11.97 | | | $ | 11.81 | |
| | | | | | | | | | | | | | | |
| | | | | | | | | | | | | | | |
| $ | 38,388,128 | | | $ | 17,103,702 | | | $ | 23,968,319 | | | $ | 47,507,558 | |
| | | | | | | | | | | | | | | |
| | 3,446,854 | | | | 1,565,641 | | | | 2,219,869 | | | | 4,364,414 | |
| $ | 11.14 | | | $ | 10.92 | | | $ | 10.80 | | | $ | 10.89 | |
| | | | | | | | | | | | | | | |
| | | | | | | | | | | | | | | |
| $ | 1,287,225 | | | $ | 2,156,307 | | | $ | 880,723 | | | $ | 762,902 | |
| | | | | | | | | | | | | | | |
| | 114,877 | | | | 196,252 | | | | 77,052 | | | | 67,887 | |
| $ | 11.21 | | | $ | 10.99 | | | $ | 11.43 | | | $ | 11.24 | |
| | | | | | | | | | | | | | | |
| | | | | | | | | | | | | | | |
| $ | 29,676 | | | $ | 1,341,593 | | | $ | 13,014 | | | $ | 8,136 | |
| | | | | | | | | | | | | | | |
| | 2,660 | | | | 122,039 | | | | 1,230 | | | | 728 | |
| $ | 11.16 | | | $ | 10.99 | | | $ | 10.58 | | | $ | 11.18 | |
Statements of Operations
For the Year Ended July 31, 2012
| | | Touchstone | | | Touchstone | | | Touchstone | |
| | | Dynamic | | | Emerging | | | International | |
| | | Equity | | | Growth | | | Equity | |
| | | Fund | | | Fund | | | Fund | |
| Investment Income | | | | | | | | | | | | |
| Dividends from affiliated funds | | $ | 1,207 | | | $ | 226 | | | $ | 138 | |
| Dividends from non-affiliated securities(A) | | | 1,353,780 | | | | 109,169 | | | | 795,322 | |
| Interest(B) | | | 887 | | | | — | | | | — | |
| Income from securities loaned | | | — | | | | 455 | | | | 982 | |
| Total Investment Income | | | 1,355,874 | | | | 109,850 | | | | 796,442 | |
| Expenses | | | | | | | | | | | | |
| Investment advisory fees | | | 529,397 | | | | 349,447 | | | | 245,005 | |
| Administration fees | | | 77,610 | | | | 45,921 | | | | 29,908 | |
| Compliance fees and expenses | | | 425 | | | | 425 | | | | 425 | |
| Custody fees | | | 19,651 | | | | 8,806 | | | | 56,690 | |
| Professional fees | | | 52,581 | | | | 40,187 | | | | 57,592 | |
| Transfer Agent fees, Class A | | | 72,310 | | | | 8,189 | | | | 1,796 | |
| Transfer Agent fees, Class C | | | 31,465 | | | | 5 | | | | 5 | |
| Transfer Agent fees, Class Y | | | 42,660 | | | | 16,229 | | | | 3,510 | |
| Transfer Agent fees, Institutional Class | | | 651 | | | | 7,674 | | | | 890 | |
| Registration Fees, Class A | | | 8,055 | | | | 8,544 | | | | 11,800 | |
| Registration Fees, Class C | | | 6,624 | | | | 92 | | | | 108 | |
| Registration Fees, Class Y | | | 6,972 | | | | 11,893 | | | | 11,832 | |
| Registration Fees, Institutional Class | | | 6,538 | | | | 8,276 | | | | 10,458 | |
| Dividend expense on securities sold short | | | 781,980 | | | | — | | | | — | |
| Reports to Shareholders, Class A | | | 4,447 | | | | 13,651 | | | | 3,231 | |
| Reports to Shareholders, Class C | | | 5,958 | | | | 2,151 | | | | 2,236 | |
| Reports to Shareholders, Class Y | | | 6,872 | | | | 6,480 | | | | 3,717 | |
| Reports to Shareholders, Institutional Class | | | 2,461 | | | | 3,916 | | | | 2,840 | |
| Distribution expenses, Class A | | | 49,819 | | | | 6,155 | | | | 632 | |
| Distribution and shareholder servicing expenses, Class C | | | 125,778 | | | | 7 | | | | 7 | |
| Trustee fees | | | 13,342 | | | | 9,113 | | | | 6,715 | |
| Other expenses | | | 21,984 | | | | 14,653 | | | | 67,114 | |
| Total Expenses | | | 1,867,580 | | | | 561,814 | | | | 516,511 | |
| Fees waived and/or reimbursed by the Advisor and/or Affiliates(C) | | | (101,748 | ) | | | (89,253 | ) | | | (260,879 | ) |
| Net Expenses | | | 1,765,832 | | | | 472,561 | | | | 255,632 | |
| Net Investment Income (Loss) | | | (409,958 | ) | | | (362,711 | ) | | | 540,810 | |
| Realized and Unrealized Gain (Loss) on Investments | | | | | | | | | | | | |
| Net realized gain on investments from non-affiliated securities | | | 1,517,094 | | | | 7,475,767 | | | | 295,168 | |
| Net realized gain on investments from affiliated securities | | | — | | | | — | | | | — | |
| Net realized gain on warrants | | | 638 | | | | — | | | | — | |
| Net realized gain on written options | | | 2,823,456 | | | | — | | | | — | |
| Net realized loss on foreign currency | | | — | | | | — | | | | (34,598 | ) |
| Net realized loss on securities sold short | | | (513,766 | ) | | | — | | | | — | |
| Capital Gain Distributions Received from Affiliated Funds | | | — | | | | — | | | | — | |
| Net change in unrealized appreciation (depreciation) on investments | | | 2,052,589 | | | | (9,272,185 | ) | | | (4,822,699 | ) |
| Net change in unrealized depreciation on written options | | | (350,810 | ) | | | — | | | | — | |
| Net change in unrealized depreciation on foreign currency transactions | | | — | | | | — | | | | (11,182 | ) |
| Net change in unrealized appreciation on securities sold short | | | 729,261 | | | | — | | | | — | |
| Net Realized and Unrealized Gain (Loss) on Investments | | | 6,258,462 | | | | (1,796,418 | ) | | | (4,573,311 | ) |
| Change in Net Assets Resulting from Operations | | $ | 5,848,504 | | | $ | (2,159,129 | ) | | $ | (4,032,501 | ) |
| | | | | | | | | | | | | |
| (A) Net of foreign tax withholding of: | | $ | 221 | | | $ | 386 | | | $ | 60,016 | |
| (B) Net of foreign tax withholding of: | | $ | — | | | $ | — | | | $ | — | |
| (C)See Note 4 in Notes to Financial Statements. | | | | | | | | | | | | |
See accompanying Notes to Financial Statements.
Statements of Operations (Continued)
| | | | | | | | | | Touchstone | |
| Touchstone | | | Touchstone | | | Touchstone | | | Moderate | |
| Balanced | | | Conservative | | | Growth | | | Growth | |
| Allocation | | | Allocation | | | Allocation | | | Allocation | |
| Fund | | | Fund | | | Fund | | | Fund | |
| | | | | | | | | | | | | | | |
| $ | 1,251,707 | | | $ | 858,368 | | | $ | 697,138 | | | $ | 1,352,741 | |
| | — | | | | — | | | | — | | | | — | |
| | — | | | | — | | | | — | | | | — | |
| | — | | | | — | | | | — | | | | — | |
| | 1,251,707 | | | | 858,368 | | | | 697,138 | | | | 1,352,741 | |
| | | | | | | | | | | | | | | |
| | 112,509 | | | | 67,153 | | | | 100,148 | | | | 173,457 | |
| | 69,348 | | | | 41,885 | | | | 49,298 | | | | 85,813 | |
| | 425 | | | | 452 | | | | 425 | | | | 425 | |
| | 376 | | | | 256 | | | | 353 | | | | 432 | |
| | 45,929 | | | | 37,651 | | | | 40,500 | | | | 50,528 | |
| | 15,918 | | | | 8,402 | | | | 31,314 | | | | 29,563 | |
| | 55,004 | | | | 19,776 | | | | 62,340 | | | | 93,075 | |
| | 2,643 | | | | 4,414 | | | | 2,909 | | | | 1,813 | |
| | 612 | | | | 721 | | | | 724 | | | | 610 | |
| | 5,784 | | | | 6,417 | | | | 6,031 | | | | 6,062 | |
| | 7,884 | | | | 6,385 | | | | 7,485 | | | | 7,360 | |
| | 8,873 | | | | 9,477 | | | | 9,399 | | | | 8,974 | |
| | 5,134 | | | | 5,872 | | | | 5,421 | | | | 5,421 | |
| | — | | | | — | | | | — | | | | — | |
| | 7,021 | | | | 5,504 | | | | 10,619 | | | | 10,119 | |
| | 17,894 | | | | 9,939 | | | | 18,461 | | | | 25,230 | |
| | 3,034 | | | | 3,641 | | | | 2,927 | | | | 2,802 | |
| | 2,500 | | | | 2,657 | | | | 2,492 | | | | 2,512 | |
| | 27,329 | | | | 18,813 | | | | 28,710 | | | | 40,971 | |
| | 437,396 | | | | 183,602 | | | | 270,363 | | | | 520,093 | |
| | 12,310 | | | | 8,138 | | | | 9,569 | | | | 14,653 | |
| | 18,172 | | | | 12,473 | | | | 17,431 | | | | 23,133 | |
| | 856,095 | | | | 453,628 | | | | 676,919 | | | | 1,103,046 | |
| | (171,947 | ) | | | (130,332 | ) | | | (249,437 | ) | | | (319,765 | ) |
| | 684,148 | | | | 323,296 | | | | 427,482 | | | | 783,281 | |
| | 567,559 | | | | 535,072 | | | | 269,656 | | | | 569,460 | |
| | | | | | | | | | | | | | | |
| | — | | | | — | | | | — | | | | — | |
| | 4,106,492 | | | | 2,007,543 | | | | 2,049,149 | | | | 2,672,895 | |
| | — | | | | — | | | | — | | | | — | |
| | — | | | | — | | | | — | | | | — | |
| | — | | | | — | | | | — | | | | — | |
| | — | | | | — | | | | — | | | | — | |
| | 1,356,115 | | | | 1,104,985 | | | | 483,641 | | | | 1,434,017 | |
| | (5,042,105 | ) | | | (2,902,390 | ) | | | (3,917,579 | ) | | | (4,637,598 | ) |
| | — | | | | — | | | | — | | | | — | |
| | — | | | | — | | | | — | | | | — | |
| | — | | | | — | | | | — | | | | — | |
| | 420,502 | | | | 210,138 | | | | (1,384,789 | ) | | | (530,686 | ) |
| $ | 988,061 | | | $ | 745,210 | | | $ | (1,115,133 | ) | | $ | 38,774 | |
| | | | | | | | | | | | | | | |
| $ | — | | | $ | — | | | $ | — | | | $ | — | |
| $ | — | | | $ | — | | | $ | — | | | $ | 303 | |
Statements of Changes in Net Assets
| | | Touchstone | |
| | | Dynamic Equity | |
| | | Fund | |
| | | For the | | | For the | |
| | | Year | | | Year | |
| | | Ended | | | Ended | |
| | | July 31, 2012 | | | July 31, 2011 | |
| From Operations | | | | | | | | |
| Net investment income (loss) | | $ | (409,958 | ) | | $ | 382,949 | |
| Net realized gain (loss) on investments, written options, foreign currency transactions and securities sold short | | | 3,827,422 | | | | 10,031,159 | |
| Net change in unrealized appreciation (depreciation) on investments, written options, foreign currency transactions and securities sold short | | | 2,431,040 | | | | (1,046,590 | ) |
| Change in Net Assets from Operations | | | 5,848,504 | | | | 9,367,518 | |
| | | | | | | | | |
| Distributions to Shareholders from: | | | | | | | | |
| Net investment income, Class A | | | (151,828 | ) | | | — | |
| Net investment income, Class C | | | (59,199 | ) | | | — | |
| Net investment income, Class Z | | | (303,846 | ) | | | — | |
| Net investment income, Institutional Class | | | (17 | ) | | | — | |
| Total Distributions | | | (514,890 | ) | | | — | |
| | | | | | | | | |
| Net Decrease from Share Transactions(A) | | | (13,768,800 | ) | | | (22,288,278 | ) |
| | | | | | | | | |
| Total Decrease in Net Assets | | | (8,435,186 | ) | | | (12,920,760 | ) |
| | | | | | | | | |
| Net Assets | | | | | | | | |
| Beginning of period | | | 68,260,646 | | | | 81,181,406 | |
| End of period | | $ | 59,825,460 | | | $ | 68,260,646 | |
| Accumulated Net Investment Income (Loss) | | $ | (386,369 | ) | | $ | 514,875 | |
(A) For details on share transaction by class, see statements of changes in net assets - capital stock activity on pages 52 and 53.
See accompanying Notes to Financial Statements.
Statements of Changes in Net Assets (Continued)
| Touchstone | | | Touchstone | |
| Emerging Growth | | | International Equity | |
| Fund | | | Fund | |
| For the | | | For the | | | For the | | | For the | |
| Year | | | Year | | | Year | | | Year | |
| Ended | | | Ended | | | Ended | | | Ended | |
| July 31, 2012 | | | July 31, 2011 | | | July 31, 2012 | | | July 31, 2011 | |
| | | | | | | | | | | | | | | |
| $ | (362,711 | ) | | $ | (657,692 | ) | | $ | 540,810 | | | $ | 888,925 | |
| | 7,475,767 | | | | 13,660,970 | | | | 260,570 | | | | 4,379,909 | |
| | (9,272,185 | ) | | | 9,619,386 | | | | (4,833,881 | ) | | | 3,213,593 | |
| | (2,159,129 | ) | | | 22,622,664 | | | | (4,032,501 | ) | | | 8,482,427 | |
| | | | | | | | | | | | | | | |
| | | | | | | | | | | | | | | |
| | — | | | | — | | | | (8,085 | ) | | | (4,775 | ) |
| | — | | | | — | | | | — | | | | — | |
| | — | | | | — | | | | (16,541 | ) | | | (10,456 | ) |
| | — | | | | — | | | | (942,626 | ) | | | (874,978 | ) |
| | — | | | | — | | | | (967,252 | ) | | | (890,209 | ) |
| | | | | | | | | | | | | | | |
| | (22,571,750 | ) | | | (35,834,842 | ) | | | (12,908,076 | ) | | | (20,659,354 | ) |
| | | | | | | | | | | | | | | |
| | (24,730,879 | ) | | | (13,212,178 | ) | | | (17,907,829 | ) | | | (13,067,136 | ) |
| | | | | | | | | | | | | | | |
| | | | | | | | | | | | | | | |
| | 50,351,051 | | | | 63,563,229 | | | | 36,070,253 | | | | 49,137,389 | |
| $ | 25,620,172 | | | $ | 50,351,051 | | | $ | 18,162,424 | | | $ | 36,070,253 | |
| $ | (179,955 | ) | | $ | — | | | $ | 342,867 | | | $ | 778,589 | |
Statements of Changes in Net Assets (Continued)
| | | Touchstone | |
| | | Balanced Allocation | |
| | | Fund | |
| | | For the | | | For the | |
| | | Year | | | Year | |
| | | Ended | | | Ended | |
| | | July 31, 2012 | | | July 31, 2011 | |
| From Operations | | | | | | | | |
| Net investment income | | $ | 567,559 | | | $ | 832,993 | |
| Net realized gain (loss) on investments | | | 5,462,607 | | | | (73,744 | ) |
| Net change in unrealized appreciation (depreciation) on investments | | | (5,042,105 | ) | | | 7,941,193 | |
| Change in Net Assets from Operations | | | 988,061 | | | | 8,700,442 | |
| | | | | | | | | |
| Distributions to Shareholders from: | | | | | | | | |
| Net investment income, Class A | | | (164,728 | ) | | | (368,940 | ) |
| Net investment income, Class C | | | (414,996 | ) | | | (975,077 | ) |
| Net investment income, Class Y | | | — | | | | — | |
| Net investment income, Class Z | | | (27,150 | ) | | | (47,450 | ) |
| Net investment income, Institutional Class | | | (477 | ) | | | (817 | ) |
| Total Distributions | | | (607,351 | ) | | | (1,392,284 | ) |
| | | | | | | | | |
| Net Decrease from Share Transactions(A) | | | (15,492,104 | ) | | | (24,401,338 | ) |
| | | | | | | | | |
| Total Decrease in Net Assets | | | (15,111,394 | ) | | | (17,093,180 | ) |
| | | | | | | | | |
| Net Assets | | | | | | | | |
| Beginning of period | | | 64,655,215 | | | | 81,748,395 | |
| End of period | | $ | 49,543,821 | | | $ | 64,655,215 | |
| Accumulated Net Investment Income (Loss) | | $ | 271,112 | | | $ | 25,032 | |
(A) For details on share transaction by class, see statements of changes in net assets - capital stock activity on pages 54 to 57.
See accompanying Notes to Financial Statements.
Statements of Changes in Net Assets (Continued)
| Touchstone | | | Touchstone | | | Touchstone | |
| Conservative Allocation | | | Growth Allocation | | | Moderate Growth Allocation | |
| Fund | | | Fund | | | Fund | |
| For the | | | For the | | | For the | | | For the | | | For the | | | For the | |
| Year | | | Year | | | Year | | | Year | | | Year | | | Year | |
| Ended | | | Ended | | | Ended | | | Ended | | | Ended | | | Ended | |
| July 31, 2012 | | | July 31, 2011 | | | July 31, 2012 | | | July 31, 2011 | | | July 31, 2012 | | | July 31, 2011 | |
| | | | | | | | | | | | | | | | | | | | | | | |
| $ | 535,072 | | | $ | 875,122 | | | $ | 269,656 | | | $ | 170,509 | | | $ | 569,460 | | | $ | 584,373 | |
| | 3,112,528 | | | | 525,578 | | | | 2,532,790 | | | | (1,537,576 | ) | | | 4,106,912 | | | | (98,699 | ) |
| | (2,902,390 | ) | | | 2,017,091 | | | | (3,917,579 | ) | | | 11,238,436 | | | | (4,637,598 | ) | | | 13,302,810 | |
| | 745,210 | | | | 3,417,791 | | | | (1,115,133 | ) | | | 9,871,369 | | | | 38,774 | | | | 13,788,484 | |
| | | | | | | | | | | | | | | | | | | | | | | |
| | | | | | | | | | | | | | | | | | | | | | | |
| | (135,704 | ) | | | (440,204 | ) | | | (114,772 | ) | | | (84,082 | ) | | | (237,914 | ) | | | (285,883 | ) |
| | (266,757 | ) | | | (683,075 | ) | | | (44,632 | ) | | | — | | | | (314,758 | ) | | | (398,121 | ) |
| | (7,041 | ) | | | — | | | | — | | | | — | | | | — | | | | — | |
| | (43,132 | ) | | | (54,125 | ) | | | (20,102 | ) | | | (28,354 | ) | | | (20,136 | ) | | | (22,700 | ) |
| | (136,455 | ) | | | (260,494 | ) | | | (983 | ) | | | (5,997 | ) | | | (127 | ) | | | (155 | ) |
| | (589,089 | ) | | | (1,437,898 | ) | | | (180,489 | ) | | | (118,433 | ) | | | (572,935 | ) | | | (706,859 | ) |
| | | | | | | | | | | | | | | | | | | | | | | |
| | (10,055,229 | ) | | | (6,426,082 | ) | | | (14,968,001 | ) | | | (14,679,907 | ) | | | (17,225,588 | ) | | | (26,178,377 | ) |
| | | | | | | | | | | | | | | | | | | | | | | |
| | (9,899,108 | ) | | | (4,446,189 | ) | | | (16,263,623 | ) | | | (4,926,971 | ) | | | (17,759,749 | ) | | | (13,096,752 | ) |
| | | | | | | | | | | | | | | | | | | | | | | |
| | | | | | | | | | | | | | | | | | | | | | | |
| | 38,966,825 | | | | 43,413,014 | | | | 51,445,388 | | | | 56,372,359 | | | | 81,219,483 | | | | 94,316,235 | |
| $ | 29,067,717 | | | $ | 38,966,825 | | | $ | 35,181,765 | | | $ | 51,445,388 | | | $ | 63,459,734 | | | $ | 81,219,483 | |
| $ | 359,301 | | | $ | 69,789 | | | $ | 269,645 | | | $ | 177,476 | | | $ | 392,606 | | | $ | 191,574 | |
Statements of Changes in Net Assets - Capital Stock Activity
| | | Touchstone Dynamic | |
| | | Equity Fund | |
| | | For the Year | | | For the Year | |
| | | Ended | | | Ended | |
| | | July 31, 2012 | | | July 31, 2011 | |
| | | Shares | | | Dollars | | | Shares | | | Dollars | |
| Class A | | | | | | | | | | | | |
| Proceeds from Shares sold | | | 97,187 | | | $ | 1,023,913 | | | | 112,957 | | | $ | 1,091,204 | |
| Reinvestment of distributions | | | 12,141 | | | | 127,964 | | | | — | | | | — | |
| Redemption fees | | | — | | | | 22 | | | | — | | | | — | |
| Cost of Shares redeemed | | | (799,021 | ) | | | (8,368,813 | ) | | | (2,065,760 | ) | | | (19,823,671 | ) |
| Change in Net Assets from Class A Share Transactions | | | (689,693 | ) | | | (7,216,914 | ) | | | (1,952,803 | ) | | | (18,732,467 | ) |
| Class C(A) | | | | | | | | | | | | | | | | |
| Proceeds from Shares sold | | | 38,462 | | | | 411,299 | | | | 16,406 | | | | 155,336 | |
| Reinvestment of distributions | | | 2,418 | | | | 24,273 | | | | — | | | | — | |
| Redemption fees | | | — | | | | 14 | | | | — | | | | — | |
| Cost of Shares redeemed | | | (396,981 | ) | | | (3,980,527 | ) | | | (933,294 | ) | | | (8,682,644 | ) |
| Change in Net Assets from Class C Share Transactions | | | (356,101 | ) | | | (3,544,941 | ) | | | (916,888 | ) | | | (8,527,308 | ) |
| Class Y | | | | | | | | | | | | | | | | |
| Proceeds from Shares sold | | | 115,845 | | | | 1,254,036 | | | | — | | | | — | |
| Proceeds from Shares issued in connection with merger(B) | | | 2,239,679 | | | | 21,354,181 | | | | — | | | | — | |
| Reinvestment of distributions | | | — | | | | — | | | | — | | | | — | |
| Redemption fees | | | — | | | | — | | | | — | | | | — | |
| Cost of Shares redeemed | | | (236,539 | ) | | | (2,604,497 | ) | | | — | | | | — | |
| Change in Net Assets from Class Y Share Transactions | | | 2,118,985 | | | | 20,003,720 | | | | — | | | | — | |
| Class Z | | | | | | | | | | | | | | | | |
| Proceeds from Shares sold | | | 685,868 | | | | 7,058,978 | | | | 1,298,184 | | | | 13,149,589 | |
| Reinvestment of distributions | | | 26,540 | | | | 283,182 | | | | — | | | | — | |
| Redemption fees | | | — | | | | 30 | | | | — | | | | 73 | |
| Cost of Shares redeemed | | | (1,407,539 | ) | | | (14,954,589 | ) | | | (815,371 | ) | | | (8,178,165 | ) |
| Cost of Shares redeemed in connection with merger(B) | | | (2,239,679 | ) | | | (21,354,181 | ) | | | — | | | | — | |
| Change in Net Assets from Class Z Share Transactions | | | (2,934,810 | ) | | | (28,966,580 | ) | | | 482,813 | | | | 4,971,497 | |
| Institutional Class | | | | | | | | | | | | | | | | |
| Proceeds from Shares sold | | | 623,310 | | | | 6,847,071 | | | | — | | | | — | |
| Reinvestment of distributions | | | 1 | | | | 17 | | | | — | | | | — | |
| Redemption fees | | | — | | | | 8 | | | | — | | | | — | |
| Cost of Shares redeemed | | | (80,747 | ) | | | (891,181 | ) | | | — | | | | — | |
| Change in Net Assets from Institutional Class Share Transactions | | | 542,564 | | | | 5,955,915 | | | | — | | | | — | |
| | | | | | | | | | | | | | | | | |
| Net Decrease from Share Transactions | | | (1,319,055 | ) | | $ | (13,768,800 | ) | | | (2,386,878 | ) | | $ | (22,288,278 | ) |
| (A) | Touchstone Emerging Growth Fund and Touchstone International Equity Fund began issuing Class C shares on April 12, 2012. |
| (B) | See Note 7 in the Notes to Financial Statements. |
See accompanying Notes to Financial Statements.
Statements of Changes in Net Assets - Capital Stock Activity (Continued)
| Touchstone Emerging | | | Touchstone International | |
| Growth Fund | | | Equity Fund | |
| For the Year | | | For the Year | | | For the Year | | | For the Year | |
| Ended | | | Ended | | | Ended | | | Ended | |
| July 31, 2012 | | | July 31, 2011 | | | July 31, 2012 | | | July 31, 2011 | |
| Shares | | | Dollars | | | Shares | | | Dollars | | | Shares | | | Dollars | | | Shares | | | Dollars | |
| | | | | | | | | | | | | | | | | | | | | | | | | | | | | | | |
| | 16,997 | | | $ | 185,270 | | | | 106,046 | | | $ | 1,152,722 | | | | 13,241 | | | $ | 108,234 | | | | 2,383 | | | $ | 21,950 | |
| | — | | | | — | | | | — | | | | — | | | | 1,019 | | | | 7,582 | | | | 506 | | | | 4,474 | |
| | — | | | | — | | | | — | | | | 995 | | | | — | | | | — | | | | — | | | | — | |
| | (171,955 | ) | | | (1,881,656 | ) | | | (130,176 | ) | | | (1,426,226 | ) | | | (12,417 | ) | | | (98,803 | ) | | | (21,064 | ) | | | (193,932 | ) |
| | (154,958 | ) | | | (1,696,386 | ) | | | (24,130 | ) | | | (272,509 | ) | | | 1,843 | | | | 17,013 | | | | (18,175 | ) | | | (167,508 | ) |
| | | | | | | | | | | | | | | | | | | | | | | | | | | | | | | |
| | 211 | | | | 2,500 | | | | — | | | | — | | | | 305 | | | | 2,499 | | | | — | | | | — | |
| | — | | | | — | | | | — | | | | — | | | | — | | | | — | | | | — | | | | — | |
| | — | | | | — | | | | — | | | | — | | | | — | | | | — | | | | — | | | | — | |
| | — | | | | — | | | | — | | | | — | | | | — | | | | — | | | | — | | | | — | |
| | 211 | | | | 2,500 | | | | — | | | | — | | | | 305 | | | | 2,499 | | | | — | | | | — | |
| | | | | | | | | | | | | | | | | | | | | | | | | | | | | | | |
| | 3,419 | | | | 40,251 | | | | — | | | | — | | | | 241 | | | | 1,642 | | | | — | | | | — | |
| | 657,674 | | | | 7,620,741 | | | | — | | | | — | | | | 55,599 | | | | 923,556 | | | | — | | | | — | |
| | — | | | | — | | | | — | | | | — | | | | — | | | | — | | | | — | | | | — | |
| | — | | | | — | | | | — | | | | — | | | | — | | | | — | | | | — | | | | — | |
| | (61,060 | ) | | | (713,249 | ) | | | — | | | | — | | | | (3,336 | ) | | | (25,612 | ) | | | — | | | | — | |
| | 600,033 | | | | 6,947,743 | | | | — | | | | — | | | | 52,504 | | | | 899,586 | | | | — | | | | — | |
| | | | | | | | | | | | | | | | | | | | | | | | | | | | | | | |
| | 77,510 | | | | 876,449 | | | | 264,276 | | | | 3,076,410 | | | | 3,681 | | | | 30,192 | | | | 30,109 | | | | 274,127 | |
| | — | | | | — | | | | — | | | | — | | | | 2,144 | | | | 15,971 | | | | 1,145 | | | | 10,157 | |
| | — | | | | — | | | | — | | | | 318 | | | | — | | | | — | | | | — | | | | — | |
| | (155,247 | ) | | | (1,745,912 | ) | | | (1,077,898 | ) | | | (11,562,495 | ) | | | (7,613 | ) | | | (63,817 | ) | | | (39,590 | ) | | | (357,275 | ) |
| | (657,674 | ) | | | (7,620,741 | ) | | | — | | | | — | | | | (55,599 | ) | | | (923,556 | ) | | | — | | | | — | |
| | (735,411 | ) | | | (8,490,204 | ) | | | (813,622 | ) | | | (8,485,767 | ) | | | (57,387 | ) | | | (941,210 | ) | | | (8,336 | ) | | | (72,991 | ) |
| | | | | | | | | | | | | | | | | | | | | | | | | | | | | | | |
| | 542,787 | | | | 6,268,110 | | | | 435,840 | | | | 4,874,795 | | | | 592,217 | | | | 4,975,354 | | | | 79,358 | | | | 700,603 | |
| | — | | | | — | | | | — | | | | — | | | | 126,697 | | | | 942,626 | | | | 98,645 | | | | 874,978 | |
| | — | | | | — | | | | — | | | | 56 | | | | — | | | | — | | | | — | | | | — | |
| | (2,100,648 | ) | | | (25,603,513 | ) | | | (2,797,123 | ) | | | (31,951,417 | ) | | | (2,277,576 | ) | | | (18,803,944 | ) | | | (2,436,524 | ) | | | (21,994,436 | ) |
| | (1,557,861 | ) | | | (19,335,403 | ) | | | (2,361,283 | ) | | | (27,076,566 | ) | | | (1,558,662 | ) | | | (12,885,964 | ) | | | (2,258,521 | ) | | | (20,418,855 | ) |
| | | | | | | | | | | | | | | | | | | | | | | | | | | | | | | |
| | (1,847,986 | ) | | $ | (22,571,750 | ) | | | (3,199,035 | ) | | $ | (35,834,842 | ) | | | (1,561,397 | ) | | $ | (12,908,076 | ) | | | (2,285,032 | ) | | $ | (20,659,354 | ) |
Statements of Changes in Net Assets - Capital Stock Activity (Continued)
| | | Touchstone Balanced | |
| | | Allocation Fund | |
| | | For the Year | | | For the Year | |
| | | Ended | | | Ended | |
| | | July 31, 2012 | | | July 31, 2011 | |
| | | Shares | | | Dollars | | | Shares | | | Dollars | |
| Class A | | | | | | | | | | | | | | | | |
| Proceeds from Shares sold | | | 51,372 | | | $ | 555,561 | | | | 107,825 | | | $ | 1,134,540 | |
| Reinvestment of distributions | | | 11,764 | | | | 124,335 | | | | 26,608 | | | | 283,451 | |
| Redemption fees | | | — | | | | — | | | | — | | | | — | |
| Cost of Shares redeemed | | | (329,730 | ) | | | (3,549,105 | ) | | | (1,120,890 | ) | | | (11,626,588 | ) |
| Change in Net Assets from Class A Share Transactions | | | (266,594 | ) | | | (2,869,209 | ) | | | (986,457 | ) | | | (10,208,597 | ) |
| Class C | | | | | | | | | | | | | | | | |
| Proceeds from Shares sold | | | 111,052 | | | | 1,192,025 | | | | 255,749 | | | | 2,713,585 | |
| Reinvestment of distributions | | | 24,035 | | | | 254,301 | | | | 54,153 | | | | 576,525 | |
| Redemption fees | | | — | | | | 9 | | | | — | | | | 11 | |
| Cost of Shares redeemed | | | (1,239,184 | ) | | | (13,462,919 | ) | | | (1,723,353 | ) | | | (18,313,299 | ) |
| Change in Net Assets from Class C Share Transactions | | | (1,104,097 | ) | | | (12,016,584 | ) | | | (1,413,451 | ) | | | (15,023,178 | ) |
| Class Y | | | | | | | | | | | | | | | | |
| Proceeds from Shares sold | | | 4,552 | | | | 49,425 | | | | — | | | | — | |
| Proceeds from Shares issued in connection with merger(A) | | | 114,668 | | | | 1,301,456 | | | | — | | | | — | |
| Reinvestment of distributions | | | — | | | | — | | | | — | | | | — | |
| Redemption fees | | | — | | | | — | | | | — | | | | — | |
| Cost of Shares redeemed | | | (4,343 | ) | | | (47,913 | ) | | | — | | | | — | |
| Change in Net Assets from Class Y Share Transactions | | | 114,877 | | | | 1,302,968 | | | | — | | | | — | |
| Class Z | | | | | | | | | | | | | | | | |
| Proceeds from Shares sold | | | 8,853 | | | | 96,418 | | | | 125,842 | | | | 1,354,208 | |
| Reinvestment of distributions | | | 1,293 | | | | 13,562 | | | | 2,227 | | | | 23,787 | |
| Redemption fees | | | — | | | | — | | | | — | | | | — | |
| Cost of Shares redeemed | | | (64,331 | ) | | | (716,348 | ) | | | (52,042 | ) | | | (548,375 | ) |
| Cost of Shares redeemed in connection with merger(A) | | | (114,668 | ) | | | (1,301,456 | ) | | | — | | | | — | |
| Change in Net Assets from Class Z Share Transactions | | | (168,853 | ) | | | (1,907,824 | ) | | | 76,027 | | | | 829,620 | |
| Institutional Class | | | | | | | | | | | | | | | | |
| Proceeds from Shares sold | | | 35 | | | | 372 | | | | — | | | | — | |
| Reinvestment of distributions | | | 19 | | | | 205 | | | | 77 | | | | 817 | |
| Redemption fees | | | — | | | | — | | | | — | | | | — | |
| Cost of Shares redeemed | | | (197 | ) | | | (2,032 | ) | | | — | | | | — | |
| Change in Net Assets from Institutional Class Share Transactions | | | (143 | ) | | | (1,455 | ) | | | 77 | | | | 817 | |
| | | | | | | | | | | | | | | | | |
| Net Decrease from Share Transactions | | | (1,424,810 | ) | | $ | (15,492,104 | ) | | | (2,323,804 | ) | | $ | (24,401,338 | ) |
(A)See Note 7 in the Notes to Financial Statements.
See accompanying Notes to Financial Statements.
Statements of Changes in Net Assets - Capital Stock Activity (Continued)
| Touchstone Conservative | |
| Allocation Fund | |
| For the Year | | | For the Year | |
| Ended | | | Ended | |
| July 31, 2012 | | | July 31, 2011 | |
| Shares | | | Dollars | | | Shares | | | Dollars | |
| | | | | | | | | | | | | | | |
| | 435,959 | | | $ | 4,679,336 | | | | 469,086 | | | $ | 4,910,814 | |
| | 8,431 | | | | 89,062 | | | | 32,731 | | | | 346,890 | |
| | — | | | | — | | | | — | | | | 2,501 | |
| | (698,325 | ) | | | (7,410,892 | ) | | | (646,598 | ) | | | (6,848,583 | ) |
| | (253,935 | ) | | | (2,642,494 | ) | | | (144,781 | ) | | | (1,588,378 | ) |
| | | | | | | | | | | | | | | |
| | 120,414 | | | | 1,289,950 | | | | 139,547 | | | | 1,463,986 | |
| | 15,629 | | | | 163,870 | | | | 39,670 | | | | 418,257 | |
| | — | | | | — | | | | — | | | | — | |
| | (419,692 | ) | | | (4,493,992 | ) | | | (651,300 | ) | | | (6,912,341 | ) |
| | (283,649 | ) | | | (3,040,172 | ) | | | (472,083 | ) | | | (5,030,098 | ) |
| | | | | | | | | | | | | | | |
| | 6,373 | | | | 68,638 | | | | — | | | | — | |
| | 197,512 | | | | 2,081,642 | | | | — | | | | — | |
| | 527 | | | | 5,686 | | | | — | | | | — | |
| | — | | | | — | | | | — | | | | — | |
| | (8,160 | ) | | | (88,920 | ) | | | — | | | | — | |
| | 196,252 | | | | 2,067,046 | | | | — | | | | — | |
| | | | | | | | | | | | | | | |
| | 169,193 | | | | 1,789,083 | | | | 73,005 | | | | 788,093 | |
| | 3,396 | | | | 35,873 | | | | 3,946 | | | | 41,838 | |
| | — | | | | — | | | | — | | | | 1 | |
| | (101,097 | ) | | | (1,080,371 | ) | | | (59,660 | ) | | | (642,737 | ) |
| | (197,512 | ) | | | (2,081,642 | ) | | | — | | | | — | |
| | (126,020 | ) | | | (1,337,057 | ) | | | 17,291 | | | | 187,195 | |
| | | | | | | | | | | | | | | |
| | 12,061 | | | | 130,383 | | | | 76,058 | | | | 816,440 | |
| | 12,914 | | | | 136,455 | | | | 24,550 | | | | 260,493 | |
| | — | | | | — | | | | — | | | | — | |
| | (496,227 | ) | | | (5,369,390 | ) | | | (99,534 | ) | | | (1,071,734 | ) |
| | (471,252 | ) | | | (5,102,552 | ) | | | 1,074 | | | | 5,199 | |
| | | | | | | | | | | | | | | |
| | (938,604 | ) | | $ | (10,055,229 | ) | | | (598,499 | ) | | $ | (6,426,082 | ) |
Statements of Changes in Net Assets - Capital Stock Activity (Continued)
| | | Touchstone Growth | |
| | | Allocation Fund | |
| | | For the Year | | | For the Year | |
| | | Ended | | | Ended | |
| | | July 31, 2012 | | | July 31, 2011 | |
| | | Shares | | | Dollars | | | Shares | | | Dollars | |
| Class A | | | | | | | | | | | | | | | | |
| Proceeds from Shares sold | | | 55,210 | | | $ | 587,614 | | | | 97,155 | | | $ | 1,068,075 | |
| Reinvestment of distributions | | | 9,788 | | | | 101,796 | | | | 6,822 | | | | 74,091 | |
| Redemption Fees | | | — | | | | 2 | | | | — | | | | 12 | |
| Cost of Shares redeemed | | | (344,708 | ) | | | (3,716,622 | ) | | | (654,642 | ) | | | (7,043,329 | ) |
| Change in Net Assets from Class A Share Transactions | | | (279,710 | ) | | | (3,027,210 | ) | | | (550,665 | ) | | | (5,901,151 | ) |
| Class C | | | | | | | | | | | | | | | | |
| Proceeds from Shares sold | | | 66,499 | | | | 633,936 | | | | 139,720 | | | | 1,445,033 | |
| Reinvestment of distributions | | | 3,080 | | | | 30,774 | | | | — | | | | — | |
| Redemption Fees | | | — | | | | — | | | | — | | | | 577 | |
| Cost of Shares redeemed | | | (920,431 | ) | | | (9,388,471 | ) | | | (1,062,299 | ) | | | (10,929,585 | ) |
| Change in Net Assets from Class C Share Transactions | | | (850,852 | ) | | | (8,723,761 | ) | | | (922,579 | ) | | | (9,483,975 | ) |
| Class Y | | | | | | | | | | | | | | | | |
| Proceeds from Shares sold | | | 9,691 | | | | 107,236 | | | | — | | | | — | |
| Proceeds from Shares issued in connection with merger(A) | | | 68,967 | | | | 732,300 | | | | — | | | | — | |
| Reinvestment of distributions | | | — | | | | — | | | | — | | | | — | |
| Redemption Fees | | | — | | | | — | | | | — | | | | — | |
| Cost of Shares redeemed | | | (1,606 | ) | | | (17,612 | ) | | | — | | | | — | |
| Change in Net Assets from Class Y Share Transactions | | | 77,052 | | | | 821,924 | | | | — | | | | — | |
| Class Z | | | | | | | | | | | | | | | | |
| Proceeds from Shares sold | | | 7,102 | | | | 75,977 | | | | 125,398 | | | | 1,356,454 | |
| Reinvestment of distributions | | | 1,071 | | | | 11,260 | | | | 1,926 | | | | 21,185 | |
| Redemption Fees | | | — | | | | — | | | | — | | | | — | |
| Cost of Shares redeemed | | | (246,979 | ) | | | (2,681,751 | ) | | | (58,423 | ) | | | (660,062 | ) |
| Cost of Shares redeemed in connection with merger(A) | | | (68,967 | ) | | | (732,300 | ) | | | — | | | | — | |
| Change in Net Assets from Class Z Share Transactions | | | (307,773 | ) | | | (3,326,814 | ) | | | 68,901 | | | | 717,577 | |
| Institutional Class | | | | | | | | | | | | | | | | |
| Proceeds from Shares sold | | | 623 | | | | 6,895 | | | | 9,836 | | | | 108,725 | |
| Reinvestment of distributions | | | 100 | | | | 983 | | | | 546 | | | | 5,997 | |
| Redemption Fees | | | — | | | | — | | | | — | | | | 3 | |
| Cost of Shares redeemed | | | (67,704 | ) | | | (720,018 | ) | | | (11,594 | ) | | | (127,083 | ) |
| Change in Net Assets from Institutional Class Share Transactions | | | (66,981 | ) | | | (712,140 | ) | | | (1,212 | ) | | | (12,358 | ) |
| | | | | | | | | | | | | | | | | |
| Net Decrease from Share Transactions | | | (1,428,264 | ) | | $ | (14,968,001 | ) | | | (1,405,555 | ) | | $ | (14,679,907 | ) |
(A)See Note 7 in the Notes to Financial Statements.
See accompanying Notes to Financial Statements.
Statements of Changes in Net Assets - Capital Stock Activity (Continued)
| Touchstone Moderate Growth | |
| Allocation Fund | |
| For the Year | | | For the Year | |
| Ended | | | Ended | |
| July 31, 2012 | | | July 31, 2011 | |
| Shares | | | Dollars | | | Shares | | | Dollars | |
| | | | | | | | | | | | | | | |
| | 97,822 | | | $ | 1,064,952 | | | | 276,734 | | | $ | 2,958,325 | |
| | 19,053 | | | | 196,629 | | | | 22,915 | | | | 243,124 | |
| | — | | | | 2 | | | | — | | | | 4 | |
| | (448,546 | ) | | | (4,814,500 | ) | | | (957,821 | ) | | | (10,240,936 | ) |
| | (331,671 | ) | | | (3,552,917 | ) | | | (658,172 | ) | | | (7,039,483 | ) |
| | | | | | | | | | | | | | | |
| | 133,586 | | | | 1,407,737 | | | | 236,158 | | | | 2,457,625 | |
| | 18,947 | | | | 192,127 | | | | 22,961 | | | | 239,020 | |
| | — | | | | 1 | | | | — | | | | 47 | |
| | (1,411,866 | ) | | | (14,742,597 | ) | | | (2,152,558 | ) | | | (22,352,790 | ) |
| | (1,259,333 | ) | | | (13,142,732 | ) | | | (1,893,439 | ) | | | (19,656,098 | ) |
| | | | | | | | | | | | | | | |
| | 14,400 | | | | 155,956 | | | | — | | | | — | |
| | 59,133 | | | | 690,081 | | | | — | | | | — | |
| | — | | | | — | | | | — | | | | — | |
| | — | | | | — | | | | — | | | | — | |
| | (5,646 | ) | | | (61,748 | ) | | | — | | | | — | |
| | 67,887 | | | | 784,289 | | | | — | | | | — | |
| | | | | | | | | | | | | | | |
| | 5,102 | | | | 56,108 | | | | 96,286 | | | | 1,030,308 | |
| | 1,101 | | | | 11,461 | | | | 967 | | | | 10,340 | |
| | — | | | | — | | | | — | | | | — | |
| | (61,849 | ) | | | (691,938 | ) | | | (47,614 | ) | | | (523,599 | ) |
| | (59,133 | ) | | | (690,081 | ) | | | — | | | | — | |
| | (114,779 | ) | | | (1,314,450 | ) | | | 49,639 | | | | 517,049 | |
| | | | | | | | | | | | | | | |
| | 9 | | | | 100 | | | | — | | | | — | |
| | 12 | | | | 127 | | | | 15 | | | | 155 | |
| | — | | | | — | | | | — | | | | — | |
| | — | | | | (5 | ) | | | — | | | | — | |
| | 21 | | | | 222 | | | | 15 | | | | 155 | |
| | | | | | | | | | | | | | | |
| | (1,637,875 | ) | | $ | (17,225,588 | ) | | | (2,501,957 | ) | | $ | (26,178,377 | ) |
Statement of Cash Flows
For the Year Ended July 31, 2012
| | | Touchstone | |
| | | Dynamic Equity | |
| | | Fund | |
| | | For the | |
| | | Year | |
| | | Ended | |
| | | July 31, 2012 | |
| Cash Flows Provided by (Used in) Operating Activities | | | | |
| | | | | |
| Net increase in net assets resulting from operations | | $ | 5,848,504 | |
| | | | | |
| Adjustments to reconcile net increase (decrease) in net assets derived from operations to net cash provided by operating activities: | | | | |
| Purchases of investments | | | (175,622,762 | ) |
| Proceeds from disposition of investments | | | 190,676,934 | |
| Premiums on call options written | | | 24,430,056 | |
| Costs to cover written options | | | (22,282,305 | ) |
| Proceeds from securities sold short | | | 150,000,584 | |
| Covers of securities sold short | | | (152,514,398 | ) |
| Net sales of short term securities | | | (23,865 | ) |
| Decrease in deposits with Prime Broker | | | 31,532 | |
| Decrease in dividends and interest receivable | | | 31,630 | |
| Increase in dividends for securities sold short payable | | | 239,034 | |
| Decrease in receivable from Investment Advisor | | | 6,099 | |
| Increase in payable to Trustees | | | 622 | |
| Increase in payable to other affiliates | | | 6,865 | |
| Decrease in other accrued expenses and liabilities | | | (25,508 | ) |
| Increase in other assets | | | (27,824 | ) |
| Net realized gain from investments and warrants | | | (1,517,732 | ) |
| Net realized gain from written options | | | (2,823,456 | ) |
| Net realized loss from securities sold short | | | 513,766 | |
| Net change in unrealized appreciation (depreciation) on investments and warrants | | | (2,052,589 | ) |
| Net change in unrealized appreciation (depreciation) on written options | | | 350,810 | |
| Net change in unrealized appreciation (depreciation) on securities sold short | | | (729,261 | ) |
| Net cash provided by operating activities | | | 14,516,736 | |
| | | | | |
| Cash Flows from Financing Activities | | | | |
| Proceeds from shares sold | | | 16,444,205 | |
| Cash distributions paid | | | (79,454 | ) |
| Payment of shares redeemed | | | (30,881,487 | ) |
| Net cash used in financing activities | | | (14,516,736 | ) |
| Net change in cash | | | — | |
| | | | | |
| Cash - beginning of the period | | | — | |
| Cash - end of period | | $ | — | |
| | | | | |
| Supplemental disclosure of cash flow information: | | | | |
| Reinvestment of dividends and distributions | | $ | 435,436 | |
See accompanying Notes to Financial Statements.
This page intentionally left blank.
Financial Highlights
Touchstone Dynamic Equity Fund—Class A
Selected Data for a Share Outstanding Throughout Each Period
| | | Year Ended July 31, | |
| | | 2012 | | | 2011 | | | 2010 | | | 2009 | | | 2008 | |
| Net asset value at beginning of period | | $ | 10.26 | | | $ | 9.02 | | | $ | 8.68 | | | $ | 11.88 | | | $ | 14.51 | |
| Income (loss) from investment operations: | | | | | | | | | | | | | | | | | | | | |
| Net investment income (loss)(A) | | | (0.07 | ) | | | 0.06 | | | | 0.05 | | | | 0.02 | | | | 0.05 | |
| Net realized and unrealized gains (losses) on investments | | | 1.09 | | | | 1.18 | | | | 0.29 | | | | (3.22 | ) | | | (1.80 | ) |
| Total from investment operations | | | 1.02 | | | | 1.24 | | | | 0.34 | | | | (3.20 | ) | | | (1.75 | ) |
| Distributions from: | | | | | | | | | | | | | | | | | | | | |
| Net investment income | | | (0.08 | ) | | | — | | | | — | | | | — | | | | (0.18 | ) |
| Realized capital gains | | | — | | | | — | | | | — | | | | — | | | | (0.70 | ) |
| Total distributions | | | (0.08 | ) | | | — | | | | — | | | | — | | | | (0.88 | ) |
| Net asset value at end of period | | $ | 11.20 | | | $ | 10.26 | | | $ | 9.02 | | | $ | 8.68 | | | $ | 11.88 | |
| Total return(B) | | | 10.00 | % | | | 13.75 | % | | | 3.92 | % | | | (26.94 | )% | | | (12.60 | )% |
| Ratios and supplemental data: | | | | | | | | | | | | | | | | | | | | |
| Net assets at end of period (000's) | | $ | 17,919 | | | $ | 23,505 | | | $ | 38,274 | | | $ | 83,169 | | | $ | 285,305 | |
| Ratio to average net assets: | | | | | | | | | | | | | | | | | | | | |
| Net expenses (including dividend expense on securities sold short)(C) | | | 2.80 | % | | | 1.82 | % | | | 1.78 | % | | | 2.07 | % | | | 1.92 | % |
| Gross expenses (including dividend expense on securities sold short)(D) | | | 3.08 | % | | | 2.16 | % | | | 2.27 | % | | | 2.41 | % | | | 2.13 | % |
| Net investment income (loss) | | | (0.63 | )% | | | 0.66 | % | | | 0.52 | % | | | 0.24 | % | | | 0.40 | % |
| Portfolio turnover rate | | | 233.99 | % | | | 231.43 | % | | | 168.45 | % | | | 195.35 | % | | | 171.50 | % |
Touchstone Dynamic Equity Fund—Class C
Selected Data for a Share Outstanding Throughout Each Period
| | | Year Ended July 31, | |
| | | 2012 | | | 2011 | | | 2010 | | | 2009 | | | 2008 | |
| Net asset value at beginning of period | | $ | 9.79 | | | $ | 8.67 | | | $ | 8.40 | | | $ | 11.59 | | | $ | 14.32 | |
| Income (loss) from investment operations: | | | | | | | | | | | | | | | | | | | | |
| Net investment loss(A) | | | (0.14 | ) | | | (0.01 | ) | | | (0.02 | ) | | | (0.05 | ) | | | (0.04 | ) |
| Net realized and unrealized gains (losses) on investments | | | 1.03 | | | | 1.13 | | | | 0.29 | | | | (3.14 | ) | | | (1.77 | ) |
| Total from investment operations | | | 0.89 | | | | 1.12 | | | | 0.27 | | | | (3.19 | ) | | | (1.81 | ) |
| Distributions from: | | | | | | | | | | | | | | | | | | | | |
| Net investment income | | | (0.05 | ) | | | — | | | | — | | | | — | | | | (0.22 | ) |
| Realized capital gains | | | — | | | | — | | | | — | | | | — | | | | (0.70 | ) |
| Total distributions | | | (0.05 | ) | | | — | | | | — | | | | — | | | | (0.92 | ) |
| Net asset value at end of period | | $ | 10.63 | | | $ | 9.79 | | | $ | 8.67 | | | $ | 8.40 | | | $ | 11.59 | |
| Total return(B) | | | 9.09 | % | | | 12.92 | % | | | 3.21 | % | | | (27.52 | )% | | | (13.23 | )% |
| Ratios and supplemental data: | | | | | | | | | | | | | | | | | | | | |
| Net assets at end of period (000's) | | $ | 11,684 | | | $ | 14,243 | | | $ | 20,558 | | | $ | 51,879 | | | $ | 158,508 | |
| Ratio to average net assets: | | | | | | | | | | | | | | | | | | | | |
| Net expenses (including dividend expense on securities sold short)(E) | | | 3.55 | % | | | 2.57 | % | | | 2.53 | % | | | 2.82 | % | | | 2.65 | % |
| Gross expenses (including dividend expense on securities sold short)(F) | | | 3.75 | % | | | 2.78 | % | | | 2.91 | % | | | 2.97 | % | | | 2.85 | % |
| Net investment loss | | | (1.38 | )% | | | (0.10 | )% | | | (0.23 | )% | | | (0.52 | )% | | | (0.34 | )% |
| Portfolio turnover rate | | | 233.99 | % | | | 231.43 | % | | | 168.45 | % | | | 195.35 | % | | | 171.50 | % |
| (A) | The net investment income per share is based on average shares outstanding for the period or year. |
| (B) | Total returns shown exclude the effect of applicable sales loads. If these charges were included, the returns would be lower. |
| (C) | The ratio of net expenses to average net assets excluding dividend expense on securities sold short is 1.55%, 1.66%, 1.65%, 1.71% and 1.53% for the years ended July 2012, 2011, 2010,2009 and 2008, respectively. |
| (D) | The ratio of gross expenses to average net assets excluding dividend expense on securities sold short is 1.82%, 2.00%, 2.14%, 2.05% and 1.74% for the years ended July 2012, 2011, 2010,2009 and 2008, respectively. |
| (E) | The ratio of net expenses to average net assets excluding dividend expense on securities sold short is 2.30%, 2.41%, 2.40%, 2.46% and 2.26% for the years ended July 2012, 2011, 2010,2009 and 2008, respectively. |
| (F) | The ratio of gross expenses to average net assets excluding dividend expense on securities sold short is 2.50%, 2.62%, 2.78%, 2.61% and 2.46% for the years ended July 2012, 2011, 2010,2009 and 2008, respectively. |
See accompanying notes to financial statements.
Financial Highlights (Continued)
Touchstone Dynamic Equity Fund—Class Y
Selected Data for a Share Outstanding Throughout Each Period
| | | Year Ended July 31, | |
| | | 2012 | | | 2011 | | | 2010 | | | 2009 | | | 2008 | |
| Net asset value at beginning of period | | $ | 10.40 | | | $ | 9.11 | | | $ | 8.75 | | | $ | 11.94 | | | $ | 14.54 | |
| Income (loss) from investment operations: | | | | | | | | | | | | | | | | | | | | |
| Net investment income (loss)(A) | | | (0.04 | ) | | | 0.08 | | | | 0.07 | | | | 0.04 | | | | 0.09 | |
| Net realized and unrealized gains (losses) on investments | | | 1.09 | | | | 1.21 | | | | 0.29 | | | | (3.23 | ) | | | (1.82 | ) |
| Total from investment operations | | | 1.05 | | | | 1.29 | | | | 0.36 | | | | (3.19 | ) | | | (1.73 | ) |
| Distributions from: | | | | | | | | | | | | | | | | | | | | |
| Net investment income | | | (0.10 | ) | | | — | | | | — | | | | — | | | | (0.17 | ) |
| Realized capital gains | | | — | | | | — | | | | — | | | | — | | | | (0.70 | ) |
| Total distributions | | | (0.10 | ) | | | — | | | | — | | | | — | | | | (0.87 | ) |
| Net asset value at end of period | | $ | 11.35 | | | $ | 10.40 | | | $ | 9.11 | | | $ | 8.75 | | | $ | 11.94 | |
| Total return | | | 10.14 | % | | | 14.16 | % | | | 4.11 | % | | | (26.72 | )% | | | (12.46 | )% |
| Ratios and supplemental data: | | | | | | | | | | | | | | | | | | | | |
| Net assets at end of period (000's) | | $ | 24,054 | | | $ | 30,511 | | | $ | 22,347 | | | $ | 29,734 | | | $ | 58,107 | |
| Ratio to average net assets: | | | | | | | | | | | | | | | | | | | | |
| Net expenses (including dividend expense on securities sold short)(B) | | | 2.56 | % | | | 1.59 | % | | | 1.52 | % | | | 1.81 | % | | | 1.64 | % |
| Gross expenses (including dividend expense on securities sold short)(C) | | | 2.60 | % | | | 1.68 | % | | | 1.68 | % | | | 1.97 | % | | | 1.86 | % |
| Net investment income (loss) | | | (0.38 | )% | | | 0.77 | % | | | 0.81 | % | | | 0.45 | % | | | 0.68 | % |
| Portfolio turnover rate | | | 233.99 | % | | | 231.43 | % | | | 168.45 | % | | | 195.35 | % | | | 171.50 | % |
Touchstone Dynamic Equity Fund—Institutional Class
Selected Data for a Share Outstanding Throughout Each Period
| | | Year Ended July 31, | |
| | | 2012 | | | 2011 | | | 2010 | | | 2009 | | | 2008 | |
| Net asset value at beginning of period | | $ | 10.40 | | | $ | 9.12 | | | $ | 8.76 | | | $ | 11.96 | | | $ | 14.54 | |
| Income (loss) from investment operations: | | | | | | | | | | | | | | | | | | | | |
| Net investment income (loss)(A) | | | (0.04 | ) | | | 0.09 | | | | 0.11 | | | | 0.05 | | | | 0.09 | |
| Net realized and unrealized gains (losses) on investments | | | 1.10 | | | | 1.19 | | | | 0.25 | | | | (3.25 | ) | | | (1.81 | ) |
| Total from investment operations | | | 1.06 | | | | 1.28 | | | | 0.36 | | | | (3.20 | ) | | | (1.72 | ) |
| Distributions from: | | | | | | | | | | | | | | | | | | | | |
| Net investment income | | | (0.10 | ) | | | — | | | | — | | | | — | | | | (0.16 | ) |
| Realized capital gains | | | — | | | | — | | | | — | | | | — | | | | (0.70 | ) |
| Total distributions | | | (0.10 | ) | | | — | | | | — | | | | — | | | | (0.86 | ) |
| Net asset value at end of period | | $ | 11.36 | | | $ | 10.40 | | | $ | 9.12 | | | $ | 8.76 | | | $ | 11.96 | |
| Total return | | | 10.27 | % | | | 14.04 | % | | | 4.11 | % | | | (26.76 | )% | | | (12.33 | )% |
| Ratios and supplemental data: | | | | | | | | | | | | | | | | | | | | |
| Net assets at end of period (000's) | | $ | 6,168 | | | $ | 2 | | | $ | 2 | | | $ | 12,547 | | | $ | 29,025 | |
| Ratio to average net assets: | | | | | | | | | | | | | | | | | | | | |
| Net expenses (including dividend expense on securities sold short)(D) | | | 2.50 | % | | | 1.52 | % | | | 1.41 | % | | | 1.77 | % | | | 1.63 | % |
| Gross expenses (including dividend expense on securities sold short)(E) | | | 2.95 | % | | | 816.82 | % | | | 2.84 | % | | | 1.87 | % | | | 1.89 | % |
| Net investment income (loss) | | | (0.33 | )% | | | 0.92 | % | | | 1.31 | % | | | 0.55 | % | | | 0.70 | % |
| Portfolio turnover rate | | | 233.99 | % | | | 231.43 | % | | | 168.45 | % | | | 195.35 | % | | | 171.50 | % |
| (A) | The net investment income per share is based on average shares outstanding for the period or year. |
| (B) | The ratio of net expenses to average net assets excluding dividend expense on securities sold short is 1.30%, 1.42%, 1.40%, 1.46% and 1.25% for the years ended July 2012, 2011, 2010,2009 and 2008, respectively. |
| (C) | The ratio of gross expenses to average net assets excluding dividend expense on securities sold short is 1.35%, 1.51%, 1.56%, 1.62% and 1.47% for the years ended July 2012, 2011, 2010,2009 and 2008, respectively. |
| (D) | The ratio of net expenses to average net assets excluding dividend expense on securities sold short is 1.25%, 1.35%, 1.36%, 1.41% and 1.21% for the years ended July 2012, 2011, 2010,2009 and 2008, respectively. |
| (E) | The ratio of gross expenses to average net assets excluding dividend expense on securities sold short is 1.70%, 816.65%, 2.79%, 1.51% and 1.47% for the years ended July 2012, 2011, 2010,2009 and 2008, respectively. |
See accompanying notes to financial statements.
Financial Highlights (Continued)
Touchstone Emerging Growth Fund—Class A
Selected Data for a Share Outstanding Throughout Each Period
| | | Year Ended July 31, | |
| | | 2012 | | | 2011 | | | 2010 | | | 2009 | | | 2008 | |
| Net asset value at beginning of period | | $ | 12.16 | | | $ | 8.60 | | | $ | 7.71 | | | $ | 10.10 | | | $ | 12.90 | |
| Income (loss) from investment operations: | | | | | | | | | | | | | | | | | | | | |
| Net investment loss(A) | | | (0.14 | ) | | | (0.16 | ) | | | (0.07 | ) | | | (0.10 | ) | | | (0.16 | ) |
| Net realized and unrealized gains (losses) on investments | | | (0.66 | ) | | | 3.72 | | | | 0.96 | | | | (2.29 | )(B) | | | (1.71 | ) |
| Total from investment operations | | | (0.80 | ) | | | 3.56 | | | | 0.89 | | | | (2.39 | ) | | | (1.87 | ) |
| Distributions from: | | | | | | | | | | | | | | | | | | | | |
| Realized capital gains | | | — | | | | — | | | | — | | | | — | | | | (0.93 | ) |
| Net asset value at end of period | | $ | 11.36 | | | $ | 12.16 | | | $ | 8.60 | | | $ | 7.71 | | | $ | 10.10 | |
| Total return(C) | | | (6.58 | )% | | | 41.40 | % | | | 11.54 | % | | | (23.66 | )%(B) | | | (16.08 | )% |
| Ratios and supplemental data: | | | | | | | | | | | | | | | | | | | | |
| Net assets at end of period (000's) | | $ | 2,032 | | | $ | 4,060 | | | $ | 3,079 | | | $ | 3,480 | | | $ | 11,213 | |
| Ratio to average net assets: | | | | | | | | | | | | | | | | | | | | |
| Net expenses | | | 1.59 | % | | | 1.67 | % | | | 1.67 | % | | | 1.67 | % | | | 1.67 | % |
| Gross expenses | | | 2.69 | % | | | 2.13 | % | | | 2.37 | % | | | 1.90 | % | | | 1.88 | % |
| Net investment loss | | | (1.31 | )% | | | (1.49 | )% | | | (0.87 | )% | | | (1.35 | )% | | | (1.33 | )% |
| Portfolio turnover rate | | | 172.76 | % | | | 194.26 | % | | | 248.88 | % | | | 283.83 | % | | | 260.79 | % |
Touchstone Emerging Growth Fund—Class C(D)
| Selected Data for a Share Outstanding Throughout Each Period | | | |
| | | Period Ended | |
| | | July 31, | |
| | | 2012 | |
| Net asset value at beginning of period | | $ | 11.85 | |
| Loss from investment operations: | | | | |
| Net investment loss(A) | | | (0.06 | ) |
| Net realized and unrealized losses on investments | | | (0.44 | ) |
| Total from investment operations | | | (0.50 | ) |
| Net asset value at end of period | | $ | 11.35 | |
| Total return(C) | | | (4.30 | )%(E) |
| Ratios and supplemental data: | | | | |
| Net assets at end of period (000's) | | $ | 2 | |
| Ratio to average net assets: | | | | |
| Net expenses | | | 2.14 | %(F) |
| Gross expenses | | | 324.29 | %(F) |
| Net investment loss | | | (1.86 | )%(F) |
| Portfolio turnover rate | | | 172.76 | % |
| (A) | The net investment income per share is based on average shares outstanding for the period or year. |
| (B) | Impact of payment from affiliate was less then $0.01 per share and 0.01%, respectively. |
| (C) | Total returns shown exclude the effect of applicable sales loads. If these charges were included, the returns would be lower. |
| (D) | The Fund began issuing Class C shares on April 12, 2012. |
See accompanying notes to financial statements.
Financial Highlights (Continued)
Touchstone Emerging Growth Fund—Class Y
Selected Data for a Share Outstanding Throughout Each Period
| | | Year Ended July 31, | |
| | 2012 | | | 2011 | | | 2010 | | | 2009 | | | 2008 | |
| Net asset value at beginning of period | | $ | 12.34 | | | $ | 8.71 | | | $ | 7.79 | | | $ | 10.18 | | | $ | 12.97 | |
| Income (loss) from investment operations: | | | | | | | | | | | | | | | | | | | | |
| Net investment loss(A) | | | (0.12 | ) | | | (0.13 | ) | | | (0.05 | ) | | | (0.08 | ) | | | (0.13 | ) |
| Net realized and unrealized gains (losses) on investments | | | (0.66 | ) | | | 3.76 | | | | 0.97 | | | | (2.31 | )(B) | | | (1.73 | ) |
| Total from investment operations | | | (0.78 | ) | | | 3.63 | | | | 0.92 | | | | (2.39 | ) | | | (1.86 | ) |
| Distributions from: | | | | | | | | | | | | | | | | | | | | |
| Realized capital gains | | | — | | | | — | | | | — | | | | — | | | | (0.93 | ) |
| Net asset value at end of period | | $ | 11.56 | | | $ | 12.34 | | | $ | 8.71 | | | $ | 7.79 | | | $ | 10.18 | |
| Total return | | | (6.32 | )% | | | 41.68 | % | | | 11.81 | % | | | (23.48 | )%(B) | | | (15.90 | )% |
| Ratios and supplemental data: | | | | | | | | | | | | | | | | | | | | |
| Net assets at end of period (000's) | | $ | 6,936 | | | $ | 9,079 | | | $ | 13,498 | | | $ | 19,771 | | | $ | 15,510 | |
| Ratio to average net assets: | | | | | | | | | | | | | | | | | | | | |
| Net expenses | | | 1.34 | % | | | 1.42 | % | | | 1.42 | % | | | 1.42 | % | | | 1.42 | % |
| Gross expenses | | | 1.66 | % | | | 1.46 | % | | | 1.51 | % | | | 1.57 | % | | | 1.65 | % |
| Net investment loss | | | (1.06 | )% | | | (1.22 | )% | | | (0.54 | )% | | | (1.09 | )% | | | (1.11 | )% |
| Portfolio turnover rate | | | 172.76 | % | | | 194.26 | % | | | 248.88 | % | | | 283.83 | % | | | 260.79 | % |
Touchstone Emerging Growth Fund—Institutional Class
Selected Data for a Share Outstanding Throughout Each Period
| | | Year Ended July 31, | |
| | 2012 | | | 2011 | | | 2010 | | | 2009 | | | 2008 | |
| Net asset value at beginning of period | | $ | 12.50 | | | $ | 8.80 | | | $ | 7.86 | | | $ | 10.24 | | | $ | 13.01 | |
| Income (loss) from investment operations: | | | | | | | | | | | | | | | | | | | | |
| Net investment loss(A) | | | (0.10 | ) | | | (0.11 | ) | | | (0.05 | ) | | | (0.07 | ) | | | (0.11 | ) |
| Net realized and unrealized gains (losses) on investments | | | (0.68 | ) | | | 3.81 | | | | 0.99 | | | | (2.31 | )(B) | | | (1.73 | ) |
| Total from investment operations | | | (0.78 | ) | | | 3.70 | | | | 0.94 | | | | (2.38 | ) | | | (1.84 | ) |
| Distributions from: | | | | | | | | | | | | | | | | | | | | |
| Realized capital gains | | | — | | | | — | | | | — | | | | — | | | | (0.93 | ) |
| Net asset value at end of period | | $ | 11.72 | | | $ | 12.50 | | | $ | 8.80 | | | $ | 7.86 | | | $ | 10.24 | |
| Total return | | | (6.24 | )% | | | 42.05 | % | | | 11.96 | % | | | (23.24 | )%(B) | | | (15.69 | )% |
| Ratios and supplemental data: | | | | | | | | | | | | | | | | | | | | |
| Net assets at end of period (000's) | | $ | 16,650 | | | $ | 37,212 | | | $ | 46,986 | | | $ | 35,660 | | | $ | 34,651 | |
| Ratio to average net assets: | | | | | | | | | | | | | | | | | | | | |
| Net expenses | | | 1.15 | % | | | 1.22 | % | | | 1.22 | % | | | 1.22 | % | | | 1.17 | % |
| Gross expenses | | | 1.28 | % | | | 1.20 | % | | | 1.22 | % | | | 1.18 | % | | | 1.35 | % |
| Net investment loss | | | (0.87 | )% | | | (1.03 | )% | | | (0.51 | )% | | | (0.89 | )% | | | (0.85 | )% |
| Portfolio turnover rate | | | 172.76 | % | | | 194.26 | % | | | 248.88 | % | | | 283.83 | % | | | 260.79 | % |
| (A) | The net investment income per share is based on average shares outstanding for the period or year. |
| (B) | Impact of payment from affiliate was less then $0.01 per share and 0.01%, respectively. |
See accompanying notes to financial statements.
Financial Highlights (Continued)
Touchstone International Equity Fund—Class A
Selected Data for a Share Outstanding Throughout Each Period
| | Year Ended July 31, | |
| | | 2012 | | | 2011 | | | 2010 | | | 2009 | | | 2008 | |
| Net asset value at beginning of period | | $ | 9.40 | | | $ | 8.00 | | | $ | 7.67 | | | $ | 11.12 | | | $ | 13.51 | |
| Income (loss) from investment operations: | | | | | | | | | | | | | | | | | | | | |
| Net investment income(A) | | | 0.14 | | | | 0.12 | | | | 0.11 | | | | 0.12 | | | | 0.17 | |
| Net realized and unrealized gains (losses) on investments | | | (1.23 | ) | | | 1.41 | | | | 0.34 | | | | (3.46 | )(B) | | | (2.45 | ) |
| Total from investment operations | | | (1.09 | ) | | | 1.53 | | | | 0.45 | | | | (3.34 | ) | | | (2.28 | ) |
| Distributions from: | | | | | | | | | | | | | | | | | | | | |
| Net investment income | | | (0.27 | ) | | | (0.13 | ) | | | (0.12 | ) | | | (0.11 | ) | | | (0.03 | ) |
| Realized capital gains | | | — | | | | — | | | | — | | | | — | | | | (0.08 | ) |
| Total distributions | | | (0.27 | ) | | | (0.13 | ) | | | (0.12 | ) | | | (0.11 | ) | | | (0.11 | ) |
| Net asset value at end of period | | $ | 8.04 | | | $ | 9.40 | | | $ | 8.00 | | | $ | 7.67 | | | $ | 11.12 | |
| Total return(C) | | | (11.40 | )% | | | 19.24 | % | | | 5.89 | % | | | (29.95 | )%(B) | | | (17.04 | )% |
| Ratios and supplemental data: | | | | | | | | | | | | | | | | | | | | |
| Net assets at end of period (000's) | | $ | 233 | | | $ | 255 | | | $ | 363 | | | $ | 617 | | | $ | 1,875 | |
| Ratio to average net assets: | | | | | | | | | | | | | | | | | | | | |
| Net expenses | | | 1.48 | % | | | 1.52 | % | | | 1.52 | % | | | 1.52 | % | | | 1.60 | % |
| Gross expenses | | | 8.75 | % | | | 6.85 | % | | | 5.59 | % | | | 3.43 | % | | | 2.76 | % |
| Net investment income | | | 1.70 | % | | | 1.33 | % | | | 1.30 | % | | | 1.62 | % | | | 1.34 | % |
| Portfolio turnover rate | | | 54.85 | % | | | 39.69 | % | | | 92.20 | % | | | 151.84 | % | | | 180.69 | % |
Touchstone International Equity Fund—Class C(D)
| Selected Data for a Share Outstanding Throughout Each Period | | | |
| | Period Ended | |
| | July 31, | |
| | 2012 | |
| Net asset value at beginning of period | | $ | 8.20 | |
| Income (loss) from investment operations: | | | | |
| Net investment income(A) | | | 0.02 | |
| Net realized and unrealized losses on investments | | | (0.19 | ) |
| Total from investment operations | | | (0.17 | ) |
| Net asset value at end of period | | $ | 8.03 | |
| Total return(C) | | | (2.07 | )%(E) |
| Ratios and supplemental data: | | | | |
| Net assets at end of period (000's) | | $ | 2 | |
| Ratio to average net assets: | | | | |
| Net expenses | | | 2.14 | %(F) |
| Gross expenses | | | 342.38 | %(F) |
| Net investment income | | | 1.02 | %(F) |
| Portfolio turnover rate | | | 54.85 | % |
| (A) | The net investment income per share is based on average shares outstanding for the period or year. |
| (B) | Impact of payment from affiliate was less then $0.01 per share and 0.01%, respectively. |
| (C) | Total returns shown exclude the effect of applicable sales loads. If these charges were included, the returns would be lower. |
| (D) | The Fund began issuing Class C shares on April 12, 2012. |
See accompanying notes to financial statements.
Financial Highlights (Continued)
Touchstone International Equity Fund—Class Y
Selected Data for a Share Outstanding Throughout Each Period
| | Year Ended July 31, | |
| | 2012 | | | 2011 | | | 2010 | | | 2009 | | | 2008 | |
| Net asset value at beginning of period | | $ | 9.44 | | | $ | 8.03 | | | $ | 7.70 | | | $ | 11.20 | | | $ | 13.57 | |
| Income (loss) from investment operations: | | | | | | | | | | | | | | | | | | | | |
| Net investment income(A) | | | 0.16 | | | | 0.15 | | | | 0.13 | | | | 0.14 | | | | 0.22 | |
| Net realized and unrealized gains (losses) on investments | | | (1.24 | ) | | | 1.41 | | | | 0.34 | | | | (3.49 | )(B) | | | (2.49 | ) |
| Total from investment operations | | | (1.08 | ) | | | 1.56 | | | | 0.47 | | | | (3.35 | ) | | | (2.27 | ) |
| Distributions from: | | | | | | | | | | | | | | | | | | | | |
| Net investment income | | | (0.29 | ) | | | (0.15 | ) | | | (0.14 | ) | | | (0.15 | ) | | | (0.02 | ) |
| Realized capital gains | | | — | | | | — | | | | — | | | | — | | | | (0.08 | ) |
| Total distributions | | | (0.29 | ) | | | (0.15 | ) | | | (0.14 | ) | | | (0.15 | ) | | | (0.10 | ) |
| Net asset value at end of period | | $ | 8.07 | | | $ | 9.44 | | | $ | 8.03 | | | $ | 7.70 | | | $ | 11.20 | |
| Total return | | | (11.10 | )% | | | 19.57 | % | | | 6.07 | % | | | (29.70 | )%(B) | | | (16.88 | )% |
| Ratios and supplemental data: | | | | | | | | | | | | | | | | | | | | |
| Net assets at end of period (000's) | | $ | 424 | | | $ | 541 | | | $ | 528 | | | $ | 513 | | | $ | 1,269 | |
| Ratio to average net assets: | | | | | | | | | | | | | | | | | | | | |
| Net expenses | | | 1.23 | % | | | 1.27 | % | | | 1.27 | % | | | 1.27 | % | | | 1.34 | % |
| Gross expenses | | | 5.98 | % | | | 4.65 | % | | | 4.77 | % | | | 3.85 | % | | | 3.44 | % |
| Net investment income | | | 1.95 | % | | | 1.64 | % | | | 1.64 | % | | | 1.94 | % | | | 1.74 | % |
| Portfolio turnover rate | | | 54.85 | % | | | 39.69 | % | | | 92.20 | % | | | 151.84 | % | | | 180.69 | % |
Touchstone International Equity Fund — Institutional Class
Selected Data for a Share Outstanding Throughout Each Period
| | Year Ended July 31, | |
| | 2012 | | | 2011 | | | 2010 | | | 2009 | | | 2008 | |
| Net asset value at beginning of period | | $ | 9.46 | | | $ | 8.06 | | | $ | 7.73 | | | $ | 11.27 | | | $ | 13.61 | |
| Income (loss) from investment operations: | | | | | | | | | | | | | | | | | | | | |
| Net investment income(A) | | | 0.18 | | | | 0.18 | | | | 0.15 | | | | 0.16 | | | | 0.25 | |
| Net realized and unrealized gains (losses) on investments | | | (1.24 | ) | | | 1.40 | | | | 0.35 | | | | (3.52 | )(B) | | | (2.49 | ) |
| Total from investment operations | | | (1.06 | ) | | | 1.58 | | | | 0.50 | | | | (3.36 | ) | | | (2.24 | ) |
| Distributions from: | | | | | | | | | | | | | | | | | | | | |
| Net investment income | | | (0.33 | ) | | | (0.18 | ) | | | (0.17 | ) | | | (0.18 | ) | | | (0.02 | ) |
| Realized capital gains | | | — | | | | — | | | | — | | | | — | | | | (0.08 | ) |
| Total distributions | | | (0.33 | ) | | | (0.18 | ) | | | (0.17 | ) | | | (0.18 | ) | | | (0.10 | ) |
| Net asset value at end of period | | $ | 8.07 | | | $ | 9.46 | | | $ | 8.06 | | | $ | 7.73 | | | $ | 11.27 | |
| Total return | | | (10.96 | )% | | | 19.75 | % | | | 6.43 | % | | | (29.58 | )%(B) | | | (16.61 | )% |
| Ratios and supplemental data: | | | | | | | | | | | | | | | | | | | | |
| Net assets at end of period (000's) | | $ | 17,503 | | | $ | 35,274 | | | $ | 48,246 | | | $ | 72,759 | | | $ | 113,297 | |
| Ratio to average net assets: | | | | | | | | | | | | | | | | | | | | |
| Net expenses | | | 1.01 | % | | | 1.02 | % | | | 1.02 | % | | | 1.02 | % | | | 1.06 | % |
| Gross expenses | | | 1.91 | % | | | 1.45 | % | | | 1.52 | % | | | 1.55 | % | | | 1.32 | % |
| Net investment income | | | 2.17 | % | | | 2.02 | % | | | 1.80 | % | | | 2.15 | % | | | 1.96 | % |
| Portfolio turnover rate | | | 54.85 | % | | | 39.69 | % | | | 92.20 | % | | | 151.84 | % | | | 180.69 | % |
| (A) | The net investment income per share is based on average shares outstanding for the period or year. |
| (B) | Impact of payment from affiliate was less then $0.01 per share and 0.01%, respectively. |
See accompanying notes to financial statements.
Financial Highlights (Continued)
Touchstone Balanced Allocation Fund—Class A
Selected Data for a Share Outstanding Throughout Each Period
| | Year Ended July 31, | |
| | 2012 | | | 2011 | | | 2010 | | | 2009 | | | 2008 | |
| Net asset value at beginning of period | | $ | 11.03 | | | $ | 9.99 | | | $ | 9.28 | | | $ | 11.27 | | | $ | 12.68 | |
| Income (loss) from investment operations: | | | | | | | | | | | | | | | | | | | | |
| Net investment income(A) | | | 0.17 | | | | 0.18 | | | | 0.22 | | | | 0.29 | | | | 0.21 | |
| Net realized and unrealized gains (losses) on investments | | | 0.14 | | | | 1.13 | | | | 0.80 | | | | (1.46 | ) | | | (0.74 | )(B) |
| Total from investment operations | | | 0.31 | | | | 1.31 | | | | 1.02 | | | | (1.17 | ) | | | (0.53 | ) |
| Distributions from: | | | | | | | | | | | | | | | | | | | | |
| Net investment income | | | (0.16 | ) | | | (0.27 | ) | | | (0.31 | ) | | | (0.36 | ) | | | (0.26 | ) |
| Realized capital gains | | | — | | | | — | | | | — | | | | (0.46 | ) | | | (0.62 | ) |
| Total distributions | | | (0.16 | ) | | | (0.27 | ) | | | (0.31 | ) | | | (0.82 | ) | | | (0.88 | ) |
| Net asset value at end of period | | $ | 11.18 | | | $ | 11.03 | | | $ | 9.99 | | | $ | 9.28 | | | $ | 11.27 | |
| Total return(C) | | | 2.89 | % | | | 13.21 | % | | | 10.99 | % | | | (9.30 | )% | | | (4.59 | )%(B) |
| Ratios and supplemental data: | | | | | | | | | | | | | | | | | | | | |
| Net assets at end of period (000's) | | $ | 9,839 | | | $ | 12,650 | | | $ | 21,312 | | | $ | 25,356 | | | $ | 44,959 | |
| Ratio to average net assets: | | | | | | | | | | | | | | | | | | | | |
| Net expenses(D) | | | 0.64 | % | | | 0.64 | % | | | 0.64 | % | | | 0.65 | % | | | 0.94 | % |
| Gross expenses(D) | | | 0.97 | % | | | 0.94 | % | | | 0.93 | % | | | 0.79 | % | | | 1.13 | % |
| Net investment income(D) | | | 1.58 | % | | | 1.71 | % | | | 2.26 | % | | | 3.30 | % | | | 1.71 | % |
| Portfolio turnover rate | | | 75.77 | % | | | 5.65 | % | | | 32.67 | % | | | 29.74 | % | | | 51.96 | % |
Touchstone Balanced Allocation Fund—Class C
Selected Data for a Share Outstanding Throughout Each Period
| | Year Ended July 31, | |
| | 2012 | | | 2011 | | | 2010 | | | 2009 | | | 2008 | |
| Net asset value at beginning of period | | $ | 11.01 | | | $ | 9.97 | | | $ | 9.26 | | | $ | 11.17 | | | $ | 12.64 | |
| Income (loss) from investment operations: | | | | | | | | | | | | | | | | | | | | |
| Net investment income(A) | | | 0.09 | | | | 0.10 | | | | 0.15 | | | | 0.22 | | | | 0.11 | |
| Net realized and unrealized gains (losses) on investments | | | 0.14 | | | | 1.13 | | | | 0.79 | | | | (1.44 | ) | | | (0.73 | )(B) |
| Total from investment operations | | | 0.23 | | | | 1.23 | | | | 0.94 | | | | (1.22 | ) | | | (0.62 | ) |
| Distributions from: | | | | | | | | | | | | | | | | | | | | |
| Net investment income | | | (0.10 | ) | | | (0.19 | ) | | | (0.23 | ) | | | (0.23 | ) | | | (0.23 | ) |
| Realized capital gains | | | — | | | | — | | | | — | | | | (0.46 | ) | | | (0.62 | ) |
| Total distributions | | | (0.10 | ) | | | (0.19 | ) | | | (0.23 | ) | | | (0.69 | ) | | | (0.85 | ) |
| Net asset value at end of period | | $ | 11.14 | | | $ | 11.01 | | | $ | 9.97 | | | $ | 9.26 | | | $ | 11.17 | |
| Total return(C) | | | 2.13 | % | | | 12.41 | % | | | 10.19 | % | | | (10.00 | )% | | | (5.34 | )%(B) |
| Ratios and supplemental data: | | | | | | | | | | | | | | | | | | | | |
| Net assets at end of period (000's) | | $ | 38,388 | | | $ | 50,108 | | | $ | 59,480 | | | $ | 77,330 | | | $ | 120,085 | |
| Ratio to average net assets: | | | | | | | | | | | | | | | | | | | | |
| Net expenses(D) | | | 1.39 | % | | | 1.39 | % | | | 1.39 | % | | | 1.40 | % | | | 1.67 | % |
| Gross expenses(D) | | | 1.65 | % | | | 1.59 | % | | | 1.62 | % | | | 1.51 | % | | | 1.85 | % |
| Net investment income(D) | | | 0.84 | % | | | 0.98 | % | | | 1.51 | % | | | 2.46 | % | | | 0.92 | % |
| Portfolio turnover rate | | | 75.77 | % | | | 5.65 | % | | | 32.67 | % | | | 29.74 | % | | | 51.96 | % |
| (A) | The net investment income per share is based on average shares outstanding for the period or year. |
| (B) | Impact of payment from affiliate was less then $0.01 per share and 0.01%, respectively. |
| (C) | Total returns shown exclude the effect of applicable sales loads. If these charges were included, the returns would be lower. |
| (D) | Ratio does not include expenses of the underlying funds. |
See accompanying notes to financial statements.
Financial Highlights (Continued)
Touchstone Balanced Allocation Fund—Class Y
Selected Data for a Share Outstanding Throughout Each Period
| | Year Ended July 31, | |
| | 2012 | | | 2011 | | | 2010 | | | 2009 | | | 2008 | |
| Net asset value at beginning of period | | $ | 11.05 | | | $ | 10.01 | | | $ | 9.30 | | | $ | 11.31 | | | $ | 12.70 | |
| Income (loss) from investment operations: | | | | | | | | | | | | | | | | | | | | |
| Net investment income(A) | | | 0.20 | | | | 0.23 | | | | 0.24 | | | | 0.31 | | | | 0.23 | |
| Net realized and unrealized gains (losses) on investments | | | 0.14 | | | | 1.11 | | | | 0.80 | | | | (1.46 | ) | | | (0.74 | )(B) |
| Total from investment operations | | | 0.34 | | | | 1.34 | | | | 1.04 | | | | (1.15 | ) | | | (0.51 | ) |
| Distributions from: | | | | | | | | | | | | | | | | | | | | |
| Net investment income | | | (0.18 | ) | | | (0.30 | ) | | | (0.33 | ) | | | (0.40 | ) | | | (0.26 | ) |
| Realized capital gains | | | — | | | | — | | | | — | | | | (0.46 | ) | | | (0.62 | ) |
| Total distributions | | | (0.18 | ) | | | (0.30 | ) | | | (0.33 | ) | | | (0.86 | ) | | | (0.88 | ) |
| Net asset value at end of period | | $ | 11.21 | | | $ | 11.05 | | | $ | 10.01 | | | $ | 9.30 | | | $ | 11.31 | |
| Total return | | | 3.18 | % | | | 13.49 | % | | | 11.25 | % | | | (9.00 | )% | | | (4.40 | )%(B) |
| Ratios and supplemental data: | | | | | | | | | | | | | | | | | | | | |
| Net assets at end of period (000's) | | $ | 1,287 | | | $ | 1,866 | | | $ | 929 | | | $ | 672 | | | $ | 732 | |
| Ratio to average net assets: | | | | | | | | | | | | | | | | | | | | |
| Net expenses(C) | | | 0.39 | % | | | 0.39 | % | | | 0.39 | % | | | 0.40 | % | | | 0.65 | % |
| Gross expenses(C) | | | 1.40 | % | | | 1.41 | % | | | 2.28 | % | | | 1.41 | % | | | 5.13 | % |
| Net investment income(C) | | | 1.84 | % | | | 2.11 | % | | | 2.46 | % | | | 3.53 | % | | | 1.91 | % |
| Portfolio turnover rate | | | 75.77 | % | | | 5.65 | % | | | 32.67 | % | | | 29.74 | % | | | 51.96 | % |
Touchstone Balanced Allocation Fund—Institutional Class
Selected Data for a Share Outstanding Throughout Each Period
| | Year Ended July 31, | |
| | 2012 | | | 2011 | | | 2010 | | | 2009 | | | 2008 | |
| Net asset value at beginning of period | | $ | 11.00 | | | $ | 9.97 | | | $ | 9.26 | | | $ | 11.28 | | | $ | 12.71 | |
| Income (loss) from investment operations: | | | | | | | | | | | | | | | | | | | | |
| Net investment income(A) | | | 0.20 | | | | 0.21 | | | | 0.35 | | | | 0.30 | | | | 0.27 | |
| Net realized and unrealized gains (losses) on investments | | | 0.14 | | | | 1.12 | | | | 0.69 | | | | (1.46 | ) | | | (0.78 | )(B) |
| Total from investment operations | | | 0.34 | | | | 1.33 | | | | 1.04 | | | | (1.16 | ) | | | (0.51 | ) |
| Distributions from: | | | | | | | | | | | | | | | | | | | | |
| Net investment income | | | (0.18 | ) | | | (0.30 | ) | | | (0.33 | ) | | | (0.40 | ) | | | (0.30 | ) |
| Realized capital gains | | | — | | | | — | | | | — | | | | (0.46 | ) | | | (0.62 | ) |
| Total distributions | | | (0.18 | ) | | | (0.30 | ) | | | (0.33 | ) | | | (0.86 | ) | | | (0.92 | ) |
| Net asset value at end of period | | $ | 11.16 | | | $ | 11.00 | | | $ | 9.97 | | | $ | 9.26 | | | $ | 11.28 | |
| Total return | | | 3.19 | % | | | 13.44 | % | | | 11.29 | % | | | (9.13 | )% | | | (4.46 | )%(B) |
| Ratios and supplemental data: | | | | | | | | | | | | | | | | | | | | |
| Net assets at end of period (000's) | | $ | 30 | | | $ | 31 | | | $ | 27 | | | $ | 2,011 | | | $ | 6,196 | |
| Ratio to average net assets: | | | | | | | | | | | | | | | | | | | | |
| Net expenses(C) | | | 0.39 | % | | | 0.39 | % | | | 0.39 | % | | | 0.40 | % | | | 0.85 | % |
| Gross expenses(C) | | | 28.86 | % | | | 46.94 | % | | | 2.29 | % | | | 0.58 | % | | | 1.41 | % |
| Net investment income(C) | | | 1.85 | % | | | 1.97 | % | | | 3.55 | % | | | 3.35 | % | | | 2.24 | % |
| Portfolio turnover rate | | | 75.77 | % | | | 5.65 | % | | | 32.67 | % | | | 29.74 | % | | | 51.96 | % |
| (A) | The net investment income per share is based on average shares outstanding for the period or year. |
| (B) | Impact of payment from affiliate was less then $0.01 per share and 0.01%, respectively. |
| (C) | Ratio does not include expenses of the underlying funds. |
See accompanying notes to financial statements.
Financial Highlights (Continued)
Touchstone Conservative Allocation Fund—Class A
Selected Data for a Share Outstanding Throughout Each Period
| | Year Ended July 31, | |
| | 2012 | | | 2011 | | | 2010 | | | 2009 | | | 2008 | |
| Net asset value at beginning of period | | $ | 10.87 | | | $ | 10.38 | | | $ | 9.84 | | | $ | 10.76 | | | $ | 11.30 | |
| Income (loss) from investment operations: | | | | | | | | | | | | | | | | | | | | |
| Net investment income(A) | | | 0.21 | | | | 0.26 | | | | 0.34 | | | | 0.48 | | | | 0.29 | |
| Net realized and unrealized gains (losses) on investments | | | 0.13 | | | | 0.64 | | | | 0.66 | | | | (0.61 | ) | | | (0.25 | ) |
| Total from investment operations | | | 0.34 | | | | 0.90 | | | | 1.00 | | | | (0.13 | ) | | | 0.04 | |
| Distributions from: | | | | | | | | | | | | | | | | | | | | |
| Net investment income | | | (0.23 | ) | | | (0.41 | ) | | | (0.46 | ) | | | (0.57 | ) | | | (0.31 | ) |
| Realized capital gains | | | — | | | | — | | | | — | | | | (0.22 | ) | | | (0.27 | ) |
| Total distributions | | | (0.23 | ) | | | (0.41 | ) | | | (0.46 | ) | | | (0.79 | ) | | | (0.58 | ) |
| Net asset value at end of period | | $ | 10.98 | | | $ | 10.87 | | | $ | 10.38 | | | $ | 9.84 | | | $ | 10.76 | |
| Total return(B) | | | 3.23 | % | | | 8.81 | % | | | 10.27 | % | | | (0.49 | )% | | | 0.24 | % |
| Ratios and supplemental data: | | | | | | | | | | | | | | | | | | | | |
| Net assets at end of period (000's) | | $ | 8,466 | | | $ | 11,138 | | | $ | 12,141 | | | $ | 13,632 | | | $ | 15,858 | |
| Ratio to average net assets: | | | | | | | | | | | | | | | | | | | | |
| Net expenses(C) | | | 0.61 | % | | | 0.61 | % | | | 0.61 | % | | | 0.65 | % | | | 0.93 | % |
| Gross expenses(C) | | | 1.02 | % | | | 0.91 | % | | | 0.94 | % | | | 0.86 | % | | | 1.31 | % |
| Net investment income(C) | | | 1.95 | % | | | 2.43 | % | | | 3.36 | % | | | 5.09 | % | | | 2.62 | % |
| Portfolio turnover rate | | | 88.66 | % | | | 12.81 | % | | | 32.70 | % | | | 39.55 | % | | | 49.27 | % |
Touchstone Conservative Allocation Fund—Class C
Selected Data for a Share Outstanding Throughout Each Period
| | Year Ended July 31, | |
| | 2012 | | | 2011 | | | 2010 | | | 2009 | | | 2008 | |
| Net asset value at beginning of period | | $ | 10.81 | | | $ | 10.33 | | | $ | 9.80 | | | $ | 10.66 | | | $ | 11.25 | |
| Income (loss) from investment operations: | | | | | | | | | | | | | | | | | | | | |
| Net investment income(A) | | | 0.13 | | | | 0.18 | | | | 0.27 | | | | 0.39 | | | | 0.21 | |
| Net realized and unrealized gains (losses) on investments | | | 0.13 | | | | 0.63 | | | | 0.64 | | | | (0.58 | ) | | | (0.25 | ) |
| Total from investment operations | | | 0.26 | | | | 0.81 | | | | 0.91 | | | | (0.19 | ) | | | (0.04 | ) |
| Distributions from: | | | | | | | | | | | | | | | | | | | | |
| Net investment income | | | (0.15 | ) | | | (0.33 | ) | | | (0.38 | ) | | | (0.45 | ) | | | (0.28 | ) |
| Realized capital gains | | | — | | | | — | | | | — | | | | (0.22 | ) | | | (0.27 | ) |
| Total distributions | | | (0.15 | ) | | | (0.33 | ) | | | (0.38 | ) | | | (0.67 | ) | | | (0.55 | ) |
| Net asset value at end of period | | $ | 10.92 | | | $ | 10.81 | | | $ | 10.33 | | | $ | 9.80 | | | $ | 10.66 | |
| Total return(B) | | | 2.50 | % | | | 7.93 | % | | | 9.37 | % | | | (1.20 | )% | | | (0.47 | )% |
| Ratios and supplemental data: | | | | | | | | | | | | | | | | | | | | |
| Net assets at end of period (000's) | | $ | 17,104 | | | $ | 20,000 | | | $ | 23,985 | | | $ | 31,465 | | | $ | 34,242 | |
| Ratio to average net assets: | | | | | | | | | | | | | | | | | | | | |
| Net expenses(C) | | | 1.36 | % | | | 1.36 | % | | | 1.36 | % | | | 1.41 | % | | | 1.67 | % |
| Gross expenses(C) | | | 1.70 | % | | | 1.61 | % | | | 1.65 | % | | | 1.54 | % | | | 1.95 | % |
| Net investment income(C) | | | 1.20 | % | | | 1.72 | % | | | 2.61 | % | | | 4.23 | % | | | 1.86 | % |
| Portfolio turnover rate | | | 88.66 | % | | | 12.81 | % | | | 32.70 | % | | | 39.55 | % | | | 49.27 | % |
| (A) | The net investment income per share is based on average shares outstanding for the period or year. |
| (B) | Total returns shown exclude the effect of applicable sales loads. If these charges were included, the returns would be lower. |
| (C) | Ratio does not include expenses of the underlying funds. |
See accompanying notes to financial statements.
Financial Highlights (Continued)
Touchstone Conservative Allocation Fund—Class Y
Selected Data for a Share Outstanding Throughout Each Period
| | Year Ended July 31, | |
| | 2012 | | | 2011 | | | 2010 | | | 2009 | | | 2008 | |
| Net asset value at beginning of period | | $ | 10.87 | | | $ | 10.39 | | | $ | 9.85 | | | $ | 10.78 | | | $ | 11.30 | |
| Income (loss) from investment operations: | | | | | | | | | | | | | | | | | | | | |
| Net investment income(A) | | | 0.24 | | | | 0.29 | | | | 0.35 | | | | 0.44 | | | | 0.32 | |
| Net realized and unrealized gains (losses) on investments | | | 0.14 | | | | 0.62 | | | | 0.67 | | | | (0.54 | ) | | | (0.25 | ) |
| Total from investment operations | | | 0.38 | | | | 0.91 | | | | 1.02 | | | | (0.10 | ) | | | 0.07 | |
| Distributions from: | | | | | | | | | | | | | | | | | | | | |
| Net investment income | | | (0.26 | ) | | | (0.43 | ) | | | (0.48 | ) | | | (0.61 | ) | | | (0.32 | ) |
| Realized capital gains | | | — | | | | — | | | | — | | | | (0.22 | ) | | | (0.27 | ) |
| Total distributions | | | (0.26 | ) | | | (0.43 | ) | | | (0.48 | ) | | | (0.83 | ) | | | (0.59 | ) |
| Net asset value at end of period | | $ | 10.99 | | | $ | 10.87 | | | $ | 10.39 | | | $ | 9.85 | | | $ | 10.78 | |
| Total return | | | 3.60 | % | | | 8.97 | % | | | 10.54 | % | | | (0.17 | )% | | | 0.54 | % |
| Ratios and supplemental data: | | | | | | | | | | | | | | | | | | | | |
| Net assets at end of period (000's) | | $ | 2,156 | | | $ | 1,370 | | | $ | 1,129 | | | $ | 234 | | | $ | 640 | |
| Ratio to average net assets: | | | | | | | | | | | | | | | | | | | | |
| Net expenses(B) | | | 0.36 | % | | | 0.36 | % | | | 0.34 | % | | | 0.40 | % | | | 0.67 | % |
| Gross expenses(B) | | | 1.38 | % | | | 1.65 | % | | | 1.65 | % | | | 7.77 | % | | | 4.34 | % |
| Net investment income(B) | | | 2.20 | % | | | 2.72 | % | | | 3.40 | % | | | 4.56 | % | | | 2.86 | % |
| Portfolio turnover rate | | | 88.66 | % | | | 12.81 | % | | | 32.70 | % | | | 39.55 | % | | | 49.27 | % |
Touchstone Conservative Allocation Fund—Institutional Class
Selected Data for a Share Outstanding Throughout Each Period
| | Year Ended July 31, | |
| | 2012 | | | 2011 | | | 2010 | | | 2009 | | | 2008 | |
| Net asset value at beginning of period | | $ | 10.89 | | | $ | 10.40 | | | $ | 9.86 | | | $ | 10.79 | | | $ | 11.32 | |
| Income (loss) from investment operations: | | | | | | | | | | | | | | | | | | | | |
| Net investment income(A) | | | 0.24 | | | | 0.29 | | | | 0.37 | | | | 0.47 | | | | 0.32 | |
| Net realized and unrealized gains (losses) on investments | | | 0.12 | | | | 0.63 | | | | 0.65 | | | | (0.58 | ) | | | (0.26 | ) |
| Total from investment operations | | | 0.36 | | | | 0.92 | | | | 1.02 | | | | (0.11 | ) | | | 0.06 | |
| Distributions from: | | | | | | | | | | | | | | | | | | | | |
| Net investment income | | | (0.26 | ) | | | (0.43 | ) | | | (0.48 | ) | | | (0.60 | ) | | | (0.32 | ) |
| Realized capital gains | | | — | | | | — | | | | — | | | | (0.22 | ) | | | (0.27 | ) |
| Total distributions | | | (0.26 | ) | | | (0.43 | ) | | | (0.48 | ) | | | (0.82 | ) | | | (0.59 | ) |
| Net asset value at end of period | | $ | 10.99 | | | $ | 10.89 | | | $ | 10.40 | | | $ | 9.86 | | | $ | 10.79 | |
| Total return | | | 3.52 | % | | | 9.06 | % | | | 10.52 | % | | | (0.19 | )% | | | 0.41 | % |
| Ratios and supplemental data: | | | | | | | | | | | | | | | | | | | | |
| Net assets at end of period (000's) | | $ | 1,342 | | | $ | 6,459 | | | $ | 6,158 | | | $ | 6,017 | | | $ | 6,816 | |
| Ratio to average net assets: | | | | | | | | | | | | | | | | | | | | |
| Net expenses(B) | | | 0.36 | % | | | 0.36 | % | | | 0.36 | % | | | 0.40 | % | | | 0.69 | % |
| Gross expenses(B) | | | 0.66 | % | | | 0.63 | % | | | 0.56 | % | | | 1.43 | % | | | 1.05 | % |
| Net investment income(B) | | | 2.20 | % | | | 2.70 | % | | | 3.62 | % | | | 4.85 | % | | | 2.87 | % |
| Portfolio turnover rate | | | 88.66 | % | | | 12.81 | % | | | 32.70 | % | | | 39.55 | % | | | 49.27 | % |
| (A) | The net investment income per share is based on average shares outstanding for the period or year. |
| (B) | Ratio does not include expenses of the underlying funds. |
See accompanying notes to financial statements.
Financial Highlights (Continued)
Touchstone Growth Allocation Fund—Class A
Selected Data for a Share Outstanding Throughout Each Period
| | Year Ended July 31, | |
| | 2012 | | | 2011 | | | 2010 | | | 2009 | | | 2008 | |
| Net asset value at beginning of period | | $ | 11.40 | | | $ | 9.58 | | | $ | 8.66 | | | $ | 12.33 | | | $ | 14.82 | |
| Income (loss) from investment operations: | | | | | | | | | | | | | | | | | | | | |
| Net investment income(A) | | | 0.13 | | | | 0.08 | | | | 0.12 | | | | 0.10 | | | | 0.07 | |
| Net realized and unrealized gains (losses) on investments | | | (0.14 | ) | | | 1.80 | | | | 0.99 | | | | (3.12 | ) | | | (1.67 | )(B) |
| Total from investment operations | | | (0.01 | ) | | | 1.88 | | | | 1.11 | | | | (3.02 | ) | | | (1.60 | ) |
| Distributions from: | | | | | | | | | | | | | | | | | | | | |
| Net investment income | | | (0.11 | ) | | | (0.06 | ) | | | (0.19 | ) | | | — | | | | (0.20 | ) |
| Realized capital gains | | | — | | | | — | | | | — | | | | (0.65 | ) | | | (0.69 | ) |
| Total distributions | | | (0.11 | ) | | | (0.06 | ) | | | (0.19 | ) | | | (0.65 | ) | | | (0.89 | ) |
| Net asset value at end of period | | $ | 11.28 | | | $ | 11.40 | | | $ | 9.58 | | | $ | 8.66 | | | $ | 12.33 | |
| Total return(C) | | | (0.04 | )% | | | 19.65 | % | | | 12.78 | % | | | (23.55 | )% | | | (11.45 | )%(B) |
| Ratios and supplemental data: | | | | | | | | | | | | | | | | | | | | |
| Net assets at end of period (000's) | | $ | 10,320 | | | $ | 13,619 | | | $ | 16,721 | | | $ | 20,556 | | | $ | 43,129 | |
| Ratio to average net assets: | | | | | | | | | | | | | | | | | | | | |
| Net expenses(D) | | | 0.57 | % | | | 0.57 | % | | | 0.57 | % | | | 0.56 | % | | | 0.91 | % |
| Gross expenses(D) | | | 1.21 | % | | | 1.13 | % | | | 1.18 | % | | | 1.03 | % | | | 1.26 | % |
| Net investment income(D) | | | 1.17 | % | | | 0.77 | % | | | 1.26 | % | | | 1.14 | % | | | 0.48 | % |
| Portfolio turnover rate | | | 76.54 | % | | | 7.78 | % | | | 41.29 | % | | | 27.09 | % | | | 45.80 | % |
Touchstone Growth Allocation Fund—Class C
Selected Data for a Share Outstanding Throughout Each Period
| | Year Ended July 31, | |
| | 2012 | | | 2011 | | | 2010 | | | 2009 | | | 2008 | |
| Net asset value at beginning of period | | $ | 10.90 | | | $ | 9.18 | | | $ | 8.30 | | | $ | 11.95 | | | $ | 14.53 | |
| Income (loss) from investment operations: | | | | | | | | | | | | | | | | | | | | |
| Net investment income (loss)(A) | | | 0.04 | | | | — | (E) | | | 0.04 | | | | 0.03 | | | | (0.04 | ) |
| Net realized and unrealized gains (losses) on investments | | | (0.12 | ) | | | 1.72 | | | | 0.96 | | | | (3.03 | ) | | | (1.61 | )(B) |
| Total from investment operations | | | (0.08 | ) | | | 1.72 | | | | 1.00 | | | | (3.00 | ) | | | (1.65 | ) |
| Distributions from: | | | | | | | | | | | | | | | | | | | | |
| Net investment income | | | (0.02 | ) | | | — | | | | (0.12 | ) | | | — | | | | (0.24 | ) |
| Realized capital gains | | | — | | | | — | | | | — | | | | (0.65 | ) | | | (0.69 | ) |
| Total distributions | | | (0.02 | ) | | | — | | | | (0.12 | ) | | | (0.65 | ) | | | (0.93 | ) |
| Net asset value at end of period | | $ | 10.80 | | | $ | 10.90 | | | $ | 9.18 | | | $ | 8.30 | | | $ | 11.95 | |
| Total return(C) | | | (0.75 | )% | | | 18.74 | % | | | 12.03 | % | | | (24.16 | )% | | | (12.08 | )%(B) |
| Ratios and supplemental data: | | | | | | | | | | | | | | | | | | | | |
| Net assets at end of period (000's) | | $ | 23,968 | | | $ | 33,477 | | | $ | 36,655 | | | $ | 48,126 | | | $ | 83,127 | |
| Ratio to average net assets: | | | | | | | | | | | | | | | | | | | | |
| Net expenses(D) | | | 1.32 | % | | | 1.32 | % | | | 1.32 | % | | | 1.31 | % | | | 1.66 | % |
| Gross expenses(D) | | | 1.87 | % | | | 1.75 | % | | | 1.84 | % | | | 1.75 | % | | | 2.01 | % |
| Net investment income (loss)(D) | | | 0.42 | % | | | 0.02 | % | | | 0.47 | % | | | 0.42 | % | | | (0.29 | )% |
| Portfolio turnover rate | | | 76.54 | % | | | 7.78 | % | | | 41.29 | % | | | 27.09 | % | | | 45.80 | % |
| (A) | The net investment income per share is based on average shares outstanding for the period or year. |
| (B) | Impact of payment from affiliate was less then $0.01 per share and 0.01%, respectively. |
| (C) | Total returns shown exclude the effect of applicable sales loads. If these charges were included, the returns would be lower. |
| (D) | Ratio does not include expenses of the underlying funds. |
| (E) | Less than $0.005 per share. |
See accompanying notes to financial statements.
Financial Highlights (Continued)
Touchstone Growth Allocation Fund—Class Y
Selected Data for a Share Outstanding Throughout Each Period
| | Year Ended July 31, | |
| | 2012 | | | 2011 | | | 2010 | | | 2009 | | | 2008 | |
| Net asset value at beginning of period | | $ | 11.57 | | | $ | 9.72 | | | $ | 8.77 | | | $ | 12.45 | | | $ | 14.91 | |
| Income (loss) from investment operations: | | | | | | | | | | | | | | | | | | | | |
| Net investment income(A) | | | 0.15 | | | | 0.12 | | | | 0.05 | | | | 0.12 | | | | 0.09 | |
| Net realized and unrealized gains (losses) on investments | | | (0.14 | ) | | | 1.81 | | | | 1.11 | | | | (3.15 | ) | | | (1.67 | )(B) |
| Total from investment operations | | | 0.01 | | | | 1.93 | | | | 1.16 | | | | (3.03 | ) | | | (1.58 | ) |
| Distributions from: | | | | | | | | | | | | | | | | | | | | |
| Net investment income | | | (0.15 | ) | | | (0.08 | ) | | | (0.21 | ) | | | — | | | | (0.19 | ) |
| Realized capital gains | | | — | | | | — | | | | — | | | | (0.65 | ) | | | (0.69 | ) |
| Total distributions | | | (0.15 | ) | | | (0.08 | ) | | | (0.21 | ) | | | (0.65 | ) | | | (0.88 | ) |
| Net asset value at end of period | | $ | 11.43 | | | $ | 11.57 | | | $ | 9.72 | | | $ | 8.77 | | | $ | 12.45 | |
| Total return | | | 0.22 | % | | | 19.94 | % | | | 13.22 | % | | | (23.40 | )% | | | (11.25 | )%(B) |
| Ratios and supplemental data: | | | | | | | | | | | | | | | | | | | | |
| Net assets at end of period (000's) | | $ | 881 | | | $ | 3,561 | | | $ | 2,322 | | | $ | 667 | | | $ | 750 | |
| Ratio to average net assets: | | | | | | | | | | | | | | | | | | | | |
| Net expenses(C) | | | 0.32 | % | | | 0.32 | % | | | 0.32 | % | | | 0.32 | % | | | 0.61 | % |
| Gross expenses(C) | | | 1.62 | % | | | 1.13 | % | | | 1.33 | % | | | 3.50 | % | | | 5.47 | % |
| Net investment income(C) | | | 1.42 | % | | | 1.11 | % | | | 0.56 | % | | | 1.46 | % | | | 0.68 | % |
| Portfolio turnover rate | | | 76.54 | % | | | 7.78 | % | | | 41.29 | % | | | 27.09 | % | | | 45.80 | % |
Touchstone Growth Allocation Fund—Institutional Class
Selected Data for a Share Outstanding Throughout Each Period
| | Year Ended July 31, | |
| | 2012 | | | 2011 | | | 2010 | | | 2009 | | | 2008 | |
| Net asset value at beginning of period | | $ | 11.56 | | | $ | 9.71 | | | $ | 8.77 | | | $ | 12.44 | | | $ | 14.91 | |
| Income (loss) from investment operations: | | | | | | | | | | | | | | | | | | | | |
| Net investment income(A) | | | 0.15 | | | | 0.11 | | | | 0.32 | | | | 0.12 | | | | 0.09 | |
| Net realized and unrealized gains (losses) on investments | | | (0.25 | ) | | | 1.83 | | | | 0.83 | | | | (3.14 | ) | | | (1.68 | )(B) |
| Total from investment operations | | | (0.10 | ) | | | 1.94 | | | | 1.15 | | | | (3.02 | ) | | | (1.59 | ) |
| Distributions from: | | | | | | | | | | | | | | | | | | | | |
| Net investment income | | | (0.88 | ) | | | (0.09 | ) | | | (0.21 | ) | | | — | | | | (0.19 | ) |
| Realized capital gains | | | — | | | | — | | | | — | | | | (0.65 | ) | | | (0.69 | ) |
| Total distributions | | | (0.88 | ) | | | (0.09 | ) | | | (0.21 | ) | | | (0.65 | ) | | | (0.88 | ) |
| Net asset value at end of period | | $ | 10.58 | | | $ | 11.56 | | | $ | 9.71 | | | $ | 8.77 | | | $ | 12.44 | |
| Total return | | | (0.26 | )% | | | 20.01 | % | | | 13.10 | % | | | (23.34 | )% | | | (11.32 | )%(B) |
| Ratios and supplemental data: | | | | | | | | | | | | | | | | | | | | |
| Net assets at end of period (000's) | | $ | 13 | | | $ | 788 | | | $ | 674 | | | $ | 17,845 | | | $ | 24,509 | |
| Ratio to average net assets: | | | | | | | | | | | | | | | | | | | | |
| Net expenses(C) | | | 0.32 | % | | | 0.32 | % | | | 0.32 | % | | | 0.31 | % | | | 0.64 | % |
| Gross expenses(C) | | | 7.68 | % | | | 2.29 | % | | | 0.67 | % | | | 0.50 | % | | | 0.84 | % |
| Net investment income(C) | | | 1.42 | % | | | 0.96 | % | | | 3.37 | % | | | 1.39 | % | | | 0.67 | % |
| Portfolio turnover rate | | | 76.54 | % | | | 7.78 | % | | | 41.29 | % | | | 27.09 | % | | | 45.80 | % |
Amounts designated as “—” are either $0 or have been rounded to $0.
| (A) | The net investment income per share is based on average shares outstanding for the period or year. |
| (B) | Impact of payment from affiliate was less then $0.01 per share and 0.01%, respectively. |
| (C) | Ratio does not include expenses of the underlying funds. |
See accompanying notes to financial statements.
Financial Highlights (Continued)
Touchstone Moderate Growth Allocation Fund—Class A
Selected Data for a Share Outstanding Throughout Each Period
| | Year Ended July 31, | |
| | 2012 | | | 2011 | | | 2010 | | | 2009 | | | 2008 | |
| Net asset value at beginning of period | | $ | 11.11 | | | $ | 9.66 | | | $ | 8.87 | | | $ | 11.91 | | | $ | 13.76 | |
| Income (loss) from investment operations: | | | | | | | | | | | | | | | | | | | | |
| Net investment income(A) | | | 0.15 | | | | 0.12 | | | | 0.15 | | | | 0.17 | | | | 0.10 | |
| Net realized and unrealized gains (losses) on investments | | | 0.02 | (B) | | | 1.47 | | | | 0.87 | | | | (2.37 | ) | | | (1.11 | )(C) |
| Total from investment operations | | | 0.17 | | | | 1.59 | | | | 1.02 | | | | (2.20 | ) | | | (1.01 | ) |
| Distributions from: | | | | | | | | | | | | | | | | | | | | |
| Net investment income | | | (0.15 | ) | | | (0.14 | ) | | | (0.23 | ) | | | (0.16 | ) | | | (0.15 | ) |
| Realized capital gains | | | — | | | | — | | | | — | | | | (0.68 | ) | | | (0.69 | ) |
| Total distributions | | | (0.15 | ) | | | (0.14 | ) | | | (0.23 | ) | | | (0.84 | ) | | | (0.84 | ) |
| Net asset value at end of period | | $ | 11.13 | | | $ | 11.11 | | | $ | 9.66 | | | $ | 8.87 | | | $ | 11.91 | |
| Total return(D) | | | 1.65 | % | | | 16.56 | % | | | 11.52 | %(C) | | | (17.27 | )% | | | (7.86 | )%(C) |
| Ratios and supplemental data: | | | | | | | | | | | | | | | | | | | | |
| Net assets at end of period (000's) | | $ | 15,181 | | | $ | 18,848 | | | $ | 22,740 | | | $ | 25,782 | | | $ | 52,854 | |
| Ratio to average net assets: | | | | | | | | | | | | | | | | | | | | |
| Net expenses(E) | | | 0.57 | % | | | 0.57 | % | | | 0.57 | % | | | 0.57 | % | | | 0.89 | % |
| Gross expenses(E) | | | 1.03 | % | | | 1.01 | % | | | 1.08 | % | | | 0.99 | % | | | 1.26 | % |
| Net investment income(E) | | | 1.38 | % | | | 1.17 | % | | | 1.53 | % | | | 2.00 | % | | | 0.74 | % |
| Portfolio turnover rate | | | 77.44 | % | | | 8.53 | % | | | 37.54 | % | | | 31.90 | % | | | 43.04 | % |
Touchstone Moderate Growth Allocation Fund—Class C
Selected Data for a Share Outstanding Throughout Each Period
| | Year Ended July 31, | |
| | 2012 | | | 2011 | | | 2010 | | | 2009 | | | 2008 | |
| Net asset value at beginning of period | | $ | 10.86 | | | $ | 9.44 | | | $ | 8.67 | | | $ | 11.63 | | | $ | 13.59 | |
| Income (loss) from investment operations: | | | | | | | | | | | | | | | | | | | | |
| Net investment income(A) | | | 0.07 | | | | 0.05 | | | | 0.07 | | | | 0.11 | | | | — | (F) |
| Net realized and unrealized gains (losses) on investments | | | 0.02 | (B) | | | 1.43 | | | | 0.86 | | | | (2.31 | ) | | | (1.08 | )(C) |
| Total from investment operations | | | 0.09 | | | | 1.48 | | | | 0.93 | | | | (2.20 | ) | | | (1.08 | ) |
| Distributions from: | | | | | | | | | | | | | | | | | | | | |
| Net investment income | | | (0.06 | ) | | | (0.06 | ) | | | (0.16 | ) | | | (0.08 | ) | | | (0.19 | ) |
| Realized capital gains | | | — | | | | — | | | | — | | | | (0.68 | ) | | | (0.69 | ) |
| Total distributions | | | (0.06 | ) | | | (0.06 | ) | | | (0.16 | ) | | | (0.76 | ) | | | (0.88 | ) |
| Net asset value at end of period | | $ | 10.89 | | | $ | 10.86 | | | $ | 9.44 | | | $ | 8.67 | | | $ | 11.63 | |
| Total return(D) | | | 0.89 | % | | | 15.70 | % | | | 10.71 | % | | | (17.90 | )% | | | (8.55 | )%(C) |
| Ratios and supplemental data: | | | | | | | | | | | | | | | | | | | | |
| Net assets at end of period (000's) | | $ | 47,508 | | | $ | 61,074 | | | $ | 70,934 | | | $ | 92,373 | | | $ | 154,281 | |
| Ratio to average net assets: | | | | | | | | | | | | | | | | | | | | |
| Net expenses(E) | | | 1.32 | % | | | 1.32 | % | | | 1.32 | % | | | 1.32 | % | | | 1.63 | % |
| Gross expenses(E) | | | 1.74 | % | | | 1.69 | % | | | 1.74 | % | | | 1.69 | % | | | 1.88 | % |
| Net investment income (loss)(E) | | | 0.63 | % | | | 0.46 | % | | | 0.78 | % | | | 1.33 | % | | | (0.02 | )% |
| Portfolio turnover rate | | | 77.44 | % | | | 8.53 | % | | | 37.54 | % | | | 31.90 | % | | | 43.04 | % |
| (A) | The net investment income per share is based on average shares outstanding for the period or year. |
| (B) | The amounts shown for a share outstanding throughout the period does not accord with the change in net realized and unrealized gains (losses) on investments for the period due to the timing of purchases and sales of fund shares in relation to fluctuating market values during the period. |
| (C) | Impact of payment from affiliate was less then $0.01 per share and 0.01%, respectively. |
| (D) | Total returns shown exclude the effect of applicable sales loads. If these charges were included, the returns would be lower. |
| (E) | Ratio does not include expenses of the underlying funds. |
| (F) | Less than $0.005 per share. |
See accompanying notes to financial statements.
Financial Highlights (Continued)
Touchstone Moderate Growth Allocation Fund—Class Y
Selected Data for a Share Outstanding Throughout Each Period
| | | Year Ended July 31, | |
| | | 2012 | | | 2011 | | | 2010 | | | 2009 | | | 2008 | |
| Net asset value at beginning of period | | $ | 11.23 | | | $ | 9.75 | | | $ | 8.95 | | | $ | 12.02 | | | $ | 13.84 | |
| Income (loss) from investment operations: | | | | | | | | | | | | | | | | | | | | |
| Net investment income(A) | | | 0.18 | | | | 0.18 | | | | 0.17 | | | | 0.20 | | | | 0.13 | |
| Net realized and unrealized gains (losses) on investments | | | 0.01 | (B) | | | 1.46 | | | | 0.88 | | | | (2.40 | ) | | | (1.11 | )(C) |
| Total from investment operations | | | 0.19 | | | | 1.64 | | | | 1.05 | | | | (2.20 | ) | | | (0.98 | ) |
| Distributions from: | | | | | | | | | | | | | | | | | | | | |
| Net investment income | | | (0.18 | ) | | | (0.16 | ) | | | (0.25 | ) | | | (0.19 | ) | | | (0.15 | ) |
| Realized capital gains | | | — | | | | — | | | | — | | | | (0.68 | ) | | | (0.69 | ) |
| Total distributions | | | (0.18 | ) | | | (0.16 | ) | | | (0.25 | ) | | | (0.87 | ) | | | (0.84 | ) |
| Net asset value at end of period | | $ | 11.24 | | | $ | 11.23 | | | $ | 9.75 | | | $ | 8.95 | | | $ | 12.02 | |
| Total return | | | 1.84 | % | | | 16.93 | % | | | 11.77 | %(C) | | | (17.07 | )% | | | (7.64 | )%(C) |
| Ratios and supplemental data: | | | | | | | | | | | | | | | | | | | | |
| Net assets at end of period (000's) | | $ | 763 | | | $ | 1,289 | | | $ | 635 | | | $ | 508 | | | $ | 600 | |
| Ratio to average net assets: | | | | | | | | | | | | | | | | | | | | |
| Net expenses(D) | | | 0.32 | % | | | 0.32 | % | | | 0.32 | % | | | 0.32 | % | | | 0.61 | % |
| Gross expenses(D) | | | 1.89 | % | | | 1.65 | % | | | 2.59 | % | | | 2.64 | % | | | 4.40 | % |
| Net investment income(D) | | | 1.63 | % | | | 1.63 | % | | | 1.72 | % | | | 2.34 | % | | | 0.97 | % |
| Portfolio turnover rate | | | 77.44 | % | | | 8.53 | % | | | 37.54 | % | | | 31.90 | % | | | 43.04 | % |
Touchstone Moderate Growth Allocation Fund—Institutional Class
Selected Data for a Share Outstanding Throughout Each Period
| | | Year Ended July 31, | |
| | | 2012 | | | 2011 | | | 2010 | | | 2009 | | | 2008 | |
| Net asset value at beginning of period | | $ | 11.16 | | | $ | 9.75 | | | $ | 8.95 | | | $ | 12.01 | | | $ | 13.82 | |
| Income (loss) from investment operations: | | | | | | | | | | | | | | | | | | | | |
| Net investment income(A) | | | 0.18 | | | | 0.15 | | | | 0.28 | | | | 0.19 | | | | 0.13 | |
| Net realized and unrealized gains (losses) on investments | | | 0.02 | (B) | | | 1.48 | | | | 0.78 | | | | (2.38 | ) | | | (1.11 | )(C) |
| Total from investment operations | | | 0.20 | | | | 1.63 | | | | 1.06 | | | | (2.19 | ) | | | (0.98 | ) |
| Distributions from: | | | | | | | | | | | | | | | | | | | | |
| Net investment income | | | (0.18 | ) | | | (0.22 | ) | | | (0.26 | ) | | | (0.19 | ) | | | (0.14 | ) |
| Realized capital gains | | | — | | | | — | | | | — | | | | (0.68 | ) | | | (0.69 | ) |
| Total distributions | | | (0.18 | ) | | | (0.22 | ) | | | (0.26 | ) | | | (0.87 | ) | | | (0.83 | ) |
| Net asset value at end of period | | $ | 11.18 | | | $ | 11.16 | | | $ | 9.75 | | | $ | 8.95 | | | $ | 12.01 | |
| Total return | | | 1.92 | % | | | 16.88 | % | | | 11.79 | %(C) | | | (16.99 | )% | | | (7.59 | )%(C) |
| Ratios and supplemental data: | | | | | | | | | | | | | | | | | | | | |
| Net assets at end of period (000's) | | $ | 8 | | | $ | 8 | | | $ | 7 | | | $ | 7,948 | | | $ | 8,836 | |
| Ratio to average net assets: | | | | | | | | | | | | | | | | | | | | |
| Net expenses(D) | | | 0.32 | % | | | 0.32 | % | | | 0.32 | % | | | 0.32 | % | | | 0.70 | % |
| Gross expenses(D) | | | 111.34 | % | | | 183.59 | % | | | 0.99 | % | | | 0.61 | % | | | 0.99 | % |
| Net investment income(D) | | | 1.63 | % | | | 1.43 | % | | | 2.99 | % | | | 2.21 | % | | | 0.98 | % |
| Portfolio turnover rate | | | 77.44 | % | | | 8.53 | % | | | 37.54 | % | | | 31.90 | % | | | 43.04 | % |
| (A) | The net investment income per share is based on average shares outstanding for the period or year. |
| (B) | The amounts shown for a share outstanding throughout the period does not accord with the change in net realized and unrealized gains (losses) on investments for the period due to the timing of purchases and sales of fund shares in relation to fluctuating market values during the period. |
| (C) | Impact of payment from affiliate was less then $0.01 per share and 0.01%, respectively. |
| (D) | Ratio does not include expenses of the underlying funds. |
See accompanying notes to financial statements.
Notes to Financial Statements
July 31, 2012
1. Organization
The Touchstone Strategic Trust (the “Trust”) is registered under the Investment Company Act of 1940, as amended, (the “1940 Act”) as an open-end management investment company. The Trust was established as a Massachusetts business trust under a Declaration of Trust dated November 18, 1982. The Trust consists of eighteen funds including the following seven funds, individually, a “Fund”, and collectively, the “Funds”:
Touchstone Dynamic Equity Fund (“Dynamic Equity Fund”)
Touchstone Emerging Growth Fund (“Emerging Growth Fund”)
Touchstone International Equity Fund (“International Equity Fund”)
Touchstone Balanced Allocation Fund (“Balanced Allocation Fund”)
Touchstone Conservative Allocation Fund (“Conservative Allocation Fund”)
Touchstone Growth Allocation Fund (“Growth Allocation Fund”)
Touchstone Moderate Growth Allocation Fund (“Moderate Growth Allocation Fund”)
Each Fund is an open end, diversified management investment company. Additionally, the Balanced Allocation Fund, Conservative Allocation Fund, Growth Allocation Fund and Moderate Growth Allocation Fund (collectively, the “Allocation Funds”) are “Fund of Funds”, which seek to achieve its investment objective by primarily investing in a diversified portfolio of affiliated underlying equity and fixed income funds that are sub-advised by Ibbotson Associates, Inc. These underlying funds, in turn, invest in a variety of U.S. and foreign equity and fixed income securities. Under normal circumstances, the funds expect to invest their assets among equity and fixed income funds in the following ranges:
| | | Equity | | Fixed Income | |
| | | Allocation Fund | | Allocation Fund | |
| Balanced Allocation Fund | | 50-70% | | 30-50% | |
| Conservative Allocation Fund | | 20-40% | | 60-80% | |
| Growth Allocation Fund | | 90-100% | | 0-10% | |
| Moderate Growth Allocation Fund | | 70-90% | | 10-30% | |
The investment objective of each of the underlying funds that the funds invest in is as follows:
| Fund | | Investment Objective |
| | | |
| Touchstone Core Bond Fund | | Seeks to provide a high level of current income by primarily investing in investment-grade securities. Capital appreciation is a secondary objective. |
| | | |
| Touchstone Dynamic Equity Fund | | Seeks to obtain long-term capital appreciation from hedged equity investments with less risk than a fully invested, unhedged equity portfolio. |
| | | |
| Touchstone Emerging Growth Fund | | Seeks capital appreciation by investing primarily in equity securities of emerging growth companies of any size, emphasizing small-to mid-cap companies diversified across sectors and industries. |
| | | |
| Touchstone Emerging Markets Equity Fund II | | Seeks capital appreciation by primarily investing in equity securities of companies in emerging markets. |
| | | |
| Touchstone Focused Fund | | Seeks capital appreciation by investing in equity securities of companies of any size. |
| | | |
| Touchstone Global Equity Fund | | Seeks capital appreciation by primarily investing in U.S. and foreign equity securities including those of emerging market countries, without regard to market capitalizations. |
| | | |
| Touchstone Global Real Estate Fund | | Seeks capital appreciation by primarily investing in common stocks and other equity securities of U.S. and foreign real estate companies. |
| | | |
| Touchstone High Yield Fund | | Seeks to achieve a high level of income by primarily investing in non-investment grade debt securities of U.S. companies. Capital appreciation is a secondary consideration. |
| | | |
| Touchstone Institutional Money Market Fund | | Seeks high current income, consistent with liquidity and stability of principal. It primarily invests in high-quality, U.S. dollar-denominated money market instruments, including Certificates of Deposit, Bankers' Acceptances, Time Deposits, U.S. Government Obligations and Commercial Paper. |
| | | |
| Touchstone International Equity Fund | | Seeks long-term capital appreciation by primarily investing in equity securities of non-U.S. issuers. |
Notes to Financial Statements (Continued)
| Fund | | Investment Objective |
| | | |
| Touchstone International Fixed Income Fund | | Seeks total return by investing primarily in fixed income securities of issuers located outside the United States. |
| | | |
| Touchstone International Small Cap Fund | | Seeks capital appreciation by investing primarily in equity securities of non-U.S. small-cap companies, diversified across sectors and industries. |
| | | |
| Touchstone Large Cap Growth Fund | | Seeks long-term growth of capital and is designed to achieve the highest possible returns while minimizing risk. It primarily invests in large-cap growth companies with superior reward/risk characteristics. |
| | | |
| Touchstone Large Cap Relative Value Fund | | Seeks capital appreciation by investing in stocks of large capitalization companies. |
| | | |
| Touchstone Merger Arbitrage Fund | | Seeks to achieve positive absolute returns regardless of market conditions over the long-term. It primarily invests in securities of companies that are involved in publicly announced mergers and other corporate reorganizations. Merger arbitrage is an investment strategy that Seeks to capture the “arbitrage spread” represented by the difference between the market price of the securities of the company that is being purchased and the value that is offered for these securities by the acquiring company. |
| | | |
| Touchstone Mid Cap Fund | | Seeks long-term capital appreciation by primarily investing in common stocks of medium capitalization companies. |
| | | |
| Touchstone Mid Cap Growth Fund | | Seeks to invest primarily in stocks of domestic mid-cap growth companies that are believed to have a demonstrated record of achievement with excellent prospects for earnings growth over a 1 to 3 year period. |
| | | |
| Touchstone Mid Cap Value Fund | | Seeks capital appreciation by investing in common stocks of medium capitalization companies. |
| | | |
| Touchstone Sands Capital Institutional Growth Fund | | Seeks long-term capital appreciation by primarily investing in common stocks of U.S. companies believed to have above average potential for earnings or revenue growth. |
| | | |
| Touchstone Short Duration Fixed Income Fund | | Seeks maximum total return consistent with the preservation of capital by primarily investing at least 80% of its assets in investment grade debt securities that it believes are attractively priced relative to the market or to similar instruments, including U.S. Treasury securities, U.S. government agency securities, securities of U.S. government-sponsored enterprises, corporate bonds, mortgage-backed securities, and asset-backed securities. While may invest in securities of any maturity, Seeks to maintain an effective duration of one to three years under normal market conditions. |
| | | |
| Touchstone Small Cap Core Fund | | Seeks long-term capital appreciation by primarily investing in stocks of small capitalization U.S. companies. |
| | | |
| Touchstone Small Cap Value Fund | | Seeks long-term capital appreciation by primarily investing in common stocks of small-cap companies that appear to be trading below their perceived value. |
| | | |
| Touchstone Total Return Bond Fund | | Seeks to provide current income. Capital appreciation is a secondary goal. |
| | | |
| Touchstone Value Fund | | Seeks long-term capital growth by primarily investing in U.S. equity securities of large- and mid-cap companies believed to be undervalued. |
The Declaration of Trust permits the Trust to issue an unlimited number of shares of beneficial interest of each Fund. The Funds are registered to offer different classes of shares: Class A shares, Class C shares, Class Y shares, and Institutional Class shares. The assets of each Fund are segregated, and a shareholder’s interest is limited to the Fund in which shares are held. The Funds’ prospectus provides a description of each Fund’s investment objectives, policies, and strategies along with information on the classes of shares currently being offered.
Notes to Financial Statements (Continued)
2. Significant Accounting Policies
The following is a summary of the Funds’ significant accounting policies:
Security valuation and fair value measurements — All investments in securities are recorded at their estimated fair value. The Funds use various methods to measure fair value of their portfolio securities on a recurring basis. U.S. GAAP establishes a hierarchy that prioritizes inputs to valuation methods. These inputs are summarized in the three broad levels listed below:
| · Level 1 | – | quoted prices in active markets for identical securities |
| | | |
| · Level 2 | – | other significant observable inputs (including quoted prices for similar securities, interest rates, prepayment speeds, credit risk, etc.) |
| | | |
| · Level 3 | – | significant unobservable inputs (including the Fund’s own assumptions in determining the fair value of investments) |
The inputs or methodology used for valuing securities are not necessarily an indication of the risk associated with investing in those securities. For example, money market instruments are valued using amortized cost, in accordance with rules under the 1940 Act. Generally, amortized cost approximates the current fair value of a security, but since the value is not obtained from a quoted price in an active market, such securities are reflected as Level 2. Transfers in and out of the levels are recognized at the value at the end of the period.
The aggregate value by input level, as of July 31, 2012, for each Fund’s investments, as well as a reconciliation of assets for which significant unobservable inputs (Level 3) were used in determining value, if applicable, is included in each Fund’s Portfolio of Investments, which also includes a breakdown of the Fund’s investments by geographic/industry concentration. There were no material Level 3 securities during the period.
During the period ended July 31, 2012, there were no transfers between Levels 1, 2 and 3 for all Funds except as shown in the Portfolio of Investments for the International Equity Fund.
The Funds’ portfolio securities are valued as of the close of the regular session of trading on the New York Stock Exchange (currently 4:00 p.m., Eastern time). Portfolio securities traded on stock exchanges are valued at the last sale price, and to the extent these securities are actively traded, they are categorized in Level 1 of the fair value hierarchy. Portfolio securities quoted by NASDAQ are valued at the NASDAQ Official Closing Price (“NOCP”). Securities not traded on a particular day, or for which the last sale price is not readily available, are valued at their last broker-quoted bid prices as obtained from one or more of the major market makers for such securities by an independent pricing service and are categorized in Level 2. While this method provides consistency in valuation (and may only be used if it approximates market value), it may result in periods during which value, as determined by amortized cost, is higher or lower than the price that would be received if the Fund sold the investment. Money market instruments and other debt securities with a remaining maturity of less than 60 days are valued at amortized cost, which approximates market value and are categorized in Level 2. Securities for which market quotations or the NOCP are not readily available are valued based on fair value as determined by or under the direction of the Board of Trustees and are categorized in Level 3. Shares of open end mutual funds in which the Funds invest are valued at their respective net asset values as reported by the underlying funds and are categorized in Level 1. The prices for foreign securities are reported in local currency and converted to U.S. dollars using currency exchange rates.
For securities that principally trade on a foreign market or exchange, a significant gap in time can exist between the time of a particular security’s last trade and the time at which a Fund calculates its net asset value. The closing prices of such securities may no longer reflect their market value at the time the Fund calculates its net asset value if an event that could materially affect the value of those securities (a “Significant Event”) has occurred between the time of the security’s last close and the time that the Fund calculates its net asset value.
Notes to Financial Statements (Continued)
The Allocation Funds invest in securities of affiliated mutual funds (“underlying funds”). The value of an investment in the Allocation Funds is based on the performance of the underlying funds in which they invest and the allocation of their assets among those funds. Because the Allocation Funds invest in mutual funds, they bear a proportionate share of the expenses charged by the underlying funds in which they invest as well as their share of the funds’ fees and expenses. The principal risks of an investment in the Allocation Funds include the principal risks of investing in the underlying funds. Investments in the underlying funds are valued at the net asset value per share of each class of the underlying funds and are categorized as Level 1.
Certain Funds invest in securities of other investment companies, including exchange traded funds (“ETFs”), open-end funds and closed-end funds. Open-end funds are investment companies that issue new shares continuously and redeem shares daily. Closed-end funds are investment companies that typically issue a fixed number of shares that trade on a securities exchange or over-the-counter. An ETF is an investment company that seeks to track the performance of an index by holding in its portfolio shares of all the companies, or a representative sample of the companies, that are components of a particular index. ETFs are traded on a securities exchange based on their market value. The risks of investment in other investment companies typically reflect the risks of the types of securities in which investment companies invest. Investments in ETFs and closed-end funds are subject to the additional risk that shares of the fund may trade at a premium or discount to their NAV per share. When a Fund invests in another investment company, shareholders of the Fund bear their proportionate share of the other investment company’s fees and expenses, including operating, registration, trustee, licensing and marketing, as well as their share of the Fund’s fees and expenses.
A Significant Event may relate to a single issuer or to an entire market sector. If the Advisor or Sub-Advisor of a Fund becomes aware of a Significant Event that has occurred with respect to a security or group of securities after the closing of the exchange or market on which the security or securities principally trade, but before the time at which the Fund calculates its net asset value, it may request that a Fair Value Committee Meeting be called. In addition, the Funds’ Administrator or Sub-Administrator monitors price movements among certain selected indices, securities and/or baskets of securities that may be an indicator that the closing prices received earlier from foreign exchanges or markets may not reflect market value at the time the Fund calculates its net asset value. If price movements in a monitored index or security exceed levels established by the Advisor, the Sub-Administrator notifies the Advisor or Sub-Advisor for any Fund holding the relevant securities that such limits have been exceeded. In such event, the Advisor makes the determination whether a Fair Value Committee meeting should be called based on the information provided. These securities are categorized in Level 2.
New accounting pronouncements — In December 2011, the Financial Accounting Standards Board (“FASB”) issued Accounting Standards Update (ASU) No. 2011-11,“Disclosures about Offsetting Assets and Liabilities” (ASU2011-11). ASU2011-11 requires disclosures to make financial statements that are prepared under U.S. generally accepted accounting principals (GAAP) more comparable to those prepared under the International Financial Reporting Standards (“IFRS”).The new disclosure requirements mandate that entities disclose both gross and net information about instruments and transactions eligible for offset in the statement of assets and liabilities as well as instruments and transactions subject to an agreement similar to a master netting arrangement. In addition, ASU 2011-11 requires disclosure of collateral received and posted in connection with master netting agreements or similar arrangements. New disclosures are required for annual reporting periods beginning on or after January 1, 2013, and interim periods within those annual periods. Management is evaluating the impact of ASU 2011-11 on the financial statements and disclosures.
In May 2011, FASB issued Accounting Standards Update (“ASUNo.2011-04”), “Amendments to Achieve Common Fair Value Measurement and Disclosure Requirements in GAAP and IFRS.” ASU 2011-04 includes common requirements for measurement of and disclosure about fair value between U.S. GAAP and IFRS. ASU 2011-04 which requires reporting entities to categorize within Level 3 of the fair value hierarchy: quantitative information about the unobservable inputs used in the fair value measurement; the valuation processes used by the reporting
Notes to Financial Statements (Continued)
entity; and a narrative description of the sensitivity of the fair value measurement to changes in unobservable inputs and the interrelationships between those unobservable inputs. In addition, ASU 2011-04 requires reporting entities to make disclosures about amounts and reasons for all transfers in and out of Level 1 and Level 2 fair value measurements. The new and revised disclosures were effective for fiscal years beginning after December 15, 2011 and for interim periods within those fiscal years.
Cash and cash equivalents — The Funds consider liquid assets deposited with a bank, money market funds, and certain short term debt instruments with maturities of 3 months or less to be cash equivalents and are included in the investments on the financial statements. These investments represent amounts held with financial institutions that are readily accessible to pay Fund expenses or investments. Cash and cash equivalents are valued at cost plus accrued interest, which approximates market value. The value of cash equivalents denominated in foreign currencies is determined by converting to U. S. dollars on the date of the statement of assets and liabilities.
Securities sold short — The Dynamic Equity Fund periodically engages in selling securities short, which obligates the Fund to replace a security borrowed by purchasing the same security at the current market value. The Fund would incur a loss if the price of the security increases between the date of the short sale and the date on which the Fund replaces the borrowed security. The Fund would realize a gain if the price of the security declines between those dates. As of July 31, 2012, the Fund held securities sold short with a fair value of $11,279,516 and had securities with a fair value of $71,973,899 held as collateral for the securities sold short and options written.
Options — The Funds may write or purchase financial option contracts primarily to hedge against changes in the value of equity securities (or securities that the Funds intend to purchase), against fluctuations in fair value caused by changes in prevailing market interest rates or foreign currency exchange rates and against changes in overall equity market volatility. In addition, the Funds may utilize options in an attempt to generate gains from option premiums or to reduce overall portfolio risk. The Funds’ option strategy primarily focuses on the use of writing call options on equity indexes. When the Funds write or purchase an option, an amount equal to the premium received or paid by the Funds is recorded as a liability or an asset and is subsequently adjusted to the current market value of the option written or purchased. Premiums received or paid from writing or purchasing options which expire unexercised are treated by the Funds on the expiration date as realized gains or losses. The difference between the premium and the amount paid or received on effecting a closing purchase or sale transaction, including brokerage commissions, is also treated as a realized gain or loss. If an option is exercised, the premium paid or received is added to the cost of the purchase or proceeds from the sale in determining whether the Funds have realized a gain or loss on investment transactions. The Funds, as writers of an option, may have no control over whether the underlying securities may be sold (call) or purchased (put) and as a result bear the market risk of an unfavorable change in the price of the security underlying the written option. The Funds, as purchasers of an option, bear the risk that the counterparties to the option may not have the ability to meet the terms of the option contracts. There is minimal counterparty credit risk involved in entering into option contracts since they are exchanged-traded instruments and the exchange’s clearinghouse, as counterparty to all exchange-traded options, guarantees the options against default. Options are valued at the last quoted sales price. If there is no such reported sale on the valuation date, long option positions are valued at the most recent bid price, and short option positions are valued at the most recent ask price. As of July 31, 2012, the Dynamic Equity Fund held written options with a fair value of $1,538,255 and had securities with a fair value of $71,973,899 held as collateral for options written and securities sold short.
Foreign currency translation — The books and records of the Funds are maintained in U.S. dollars and translated into U.S. dollars on the following basis:
| (1) | fair value of investment securities, assets and liabilities at the current rate of exchange on the valuation date; and |
Notes to Financial Statements (Continued)
| (2) | purchases and sales of investment securities, income and expenses at the relevant rates of exchange prevailing on the respective dates of such transactions. |
The Funds do not isolate that portion of gains and losses on investments in equity securities that is due to changes in the foreign exchange rates from that which is due to changes in market prices of equity securities.
Derivative instruments and hedging activities — The following table sets forth the fair value of the Funds’ derivative financial instruments by primary risk exposure as of July 31, 2012:
| Fair Value of Derivative Investments | |
| As of July 31, 2012 | |
| | | | | | Asset | | | Liability | |
| | | | | | Derivatives | | | Derivatives | |
| | | Derivatives not accounted for as hedging | | | Unrealized | | | Unrealized | |
| Fund | | instruments under ASC 815 | | | Appreciation | | | Depreciation* | |
| Dynamic Equity Fund | | Options - Equity Contracts | | $ | — | | $ | 118,717 | |
* Statements of Assets and Liabilities Location: Written option contract, at value
For the year ended July 31, 2012, the average balances of outstanding derivative financial instruments were as follows:
| | | Dynamic | |
| | | Equity | |
| | | Fund | |
| Equity contracts: | | | | |
| Options - Average number of contracts (quarterly) | | | 1,334 | |
| Warrant - Average number of contracts (daily) | | | 157 | |
| The Effect of Derivative Investments on the Statement of Operations | |
| for the Year Ended July 31, 2012 | |
| | | | | | | | | Change in | |
| | | | | | | | | Unrealized | |
| | | Derivatives not accounted for as hedging | | | Realized Gain | | | Depreciation | |
| Fund | | instruments under ASC 815 | | | on Derivatives* | | | on Derivatives** | |
| Dynamic Equity Fund | | Options - Equity Contacts | | $ | 2,823,456 | | $ | (350,810 | ) |
| | | Warrants - Equity Contacts | | | 638 | | | — | |
| * | Statements of Operations Location: Net realized gain from written options and net realized gains from warrants |
| | | |
| ** | Statements of Operations Location: Net change in unrealized appreciation (depreciation) on written options |
Portfolio securities loaned — Each Fund may lend its portfolio securities. Lending portfolio securities exposes a Fund to the risk that the borrower may fail to return the loaned securities or may not be able to provide additional collateral or that the Fund may experience delays in recovery of the loaned securities or loss of rights in the collateral if the borrower fails financially. To minimize these risks, the borrower must agree to maintain cash collateral with the Funds’ custodian in an amount at least equal to the market value of the securities loaned plus accrued interest. The cash collateral is reinvested by the Funds’ custodian into an approved investment vehicle.
As of July 31, 2012, the following Funds loaned securities and received collateral as follows:
| | | Fair Value of | | | Value of | |
| | | Securities | | | Collateral | |
| Fund | | Loaned | | | Received | |
| Emerging Growth Fund | | $ | 650,709 | | | $ | 664,614 | |
Notes to Financial Statements (Continued)
All collateral received as cash is received, held and administered by the Funds’ custodian for the benefit of the Funds in the applicable custody account or other account established for the purpose of holding collateral.
Funds participating in securities lending receive compensation in the form of fees, or retain a portion of interest or dividends on the investment of any cash received as collateral. The Funds also continue to receive interest or dividends on the securities loaned. The loaned securities are secured by collateral valued at least equal, at all times, to the fair value of the securities loaned plus accrued interest. When the collateral falls below specified amounts the lending agent will use its best effort to obtain additional collateral on the next business day to meet required amounts under the security lending agreement.
Unrealized gain or loss on the fair value of the securities loaned that may occur during the term of the loan is recognized by the Funds. The Funds have the right under the lending agreement to recover the securities from the borrower on demand.
Share valuation — The net asset value per share of each class of shares of each Fund is calculated daily by dividing the total value of a Fund’s assets attributable to that class, less liabilities attributable to that class, by the number of outstanding shares of that class. There is no sales load on purchases of $1 million or more of Class A shares.
The maximum offering price per share of Class A shares of the Funds is equal to the net asset value per share plus a sales load equal to 6.10% of the net asset value (or 5.75% of the offering price). The maximum offering price per share of Class C, Class Y, and Institutional Class shares of the Funds is equal to the net asset value per share.
The redemption price per share of each class of shares of the Funds is generally equal to the net asset value per share. However, Class A redemptions that were part of no load $1 million subscriptions may be subject to a contingent deferred sales charge (“CDSC”) of up to 1%. Purchases of Class C shares of the Funds are subject to a CDSC of 1.00% of the original purchase price if redeemed within a one-year period from the date of purchase.
Investment income — Dividend income from securities is recognized on the ex-dividend date, net of foreign withholding taxes, if any, which are reduced by any amounts reclaimable by the Funds, where applicable. Interest income from securities is recorded on the basis of interest accrued, premium amortized and discount accreted.
Distributions to shareholders — Each Fund, except for Balanced Allocation Fund and Conservative Allocation Fund, declares and distributes net investment income, if any, annually, as a dividend to shareholders. The Balanced Allocation Fund and the Conservative Allocation Fund declare and distribute net investment income, if any, quarterly, as a dividend to shareholders. Any net realized capital gains on sales of securities for all Funds are distributed to shareholders at least annually. Income distributions and capital gain distributions are determined in accordance with income tax regulations. Recognition of the funds net investment income that invests in underlying funds is affected by the timing of dividend declarations by investee funds. Effective August 16, 2012, the Growth Allocation Fund and the Moderate Growth Allocation Fund will distribute net investment income, if any, quarterly.
Allocations — Investment income earned, realized capital gains and losses, and unrealized appreciation and depreciation for the Funds are allocated daily to each class of shares based upon its proportionate share of total net assets of the Fund. Class specific expenses are charged directly to the class incurring the expense. Common expenses, which are not attributable to a specific class, are allocated daily to each class of shares based upon their proportionate share of total net assets of the Fund. Expenses not directly billed to a Fund are allocated proportionally among all Funds daily in relation to net assets of each Fund or another reasonable measure.
Notes to Financial Statements (Continued)
Security transactions — Security transactions are reflected for financial reporting purposes as of the trade date, which may cause the net asset value (“NAV”) as stated in the accompanying financial statements to be different than the NAV applied to Fund share transactions. Realized gains and losses on sales of portfolio securities are calculated using the identified cost basis.
Estimates — The preparation of financial statements in conformity with U.S. GAAP requires management to make estimates and assumptions that affect the reported amounts of assets and liabilities and disclosure of contingent assets and liabilities at the date of the financial statements and the reported amounts of income and expenses during the reporting period. Actual results could differ from those estimates.
Redemption Fees — Prior to April 16, 2012, the Funds imposed a 2% redemption/exchange fee on total redemption proceeds (after applicable deferred sales charges) of any shareholder redeeming shares (including redemptions by exchange) of the Funds within 10 calendar days of their purchase. The Funds charged the redemption/exchange fee to discourage market timing by those shareholders initiating redemptions or exchanges to take advantage of short-term market movements. The redemption fee was imposed to the extent that the number of Fund shares redeemed exceeded the number of the Fund shares that had been held for more than 10 calendar days. In determining how long shares of the Fund had been held, shares held by the investor for the longest period of time were sold first. The Funds retained the redemption/exchange fee by crediting Paid-in Capital. The redemption Fees can be found on the Statement of Changes in Net Assets. Effective April 16, 2012, the redemption fee plan was terminated.
3. Investment Transactions
Investment transactions (excluding short-term investments and U.S. Government securities) were as follows for the year ended July 31, 2012:
| | | Dynamic | | | Emerging | | | | |
| | | Equity | | | Growth | | | International | |
| | | Fund | | | Fund | | | Equity Fund | |
| Purchases of investment securities | | $ | 175,622,762 | | | $ | 66,274,031 | | | $ | 13,668,352 | |
| Proceeds from sales and maturities | | $ | 190,676,934 | | | $ | 89,713,233 | | | $ | 27,072,349 | |
| | | | | | | | | | | | Moderate | |
| | | Balanced | | | Conservative | | | Growth | | | Growth | |
| | | Allocation | | | Allocation | | | Allocation | | | Allocation | |
| | | Fund | | | Fund | | | Fund | | | Fund | |
| Purchases of investment securities | | $ | 42,704,098 | | | $ | 29,693,341 | | | $ | 31,017,457 | | | $ | 54,096,220 | |
| Proceeds from sales and maturities | | $ | 57,705,592 | | | $ | 40,170,560 | | | $ | 44,894,985 | | | $ | 69,398,015 | |
4. Transactions with Affiliates and Other Related Parties
Certain officers of the Trust are also officers of the Advisor (Touchstone Advisors, Inc.), the Underwriter (Touchstone Securities, Inc.) and/or BNY Mellon Investment Servicing (U.S) Inc. (“BNY Mellon”) the Sub-Administrator and Transfer Agent to the Funds. The Advisor and Underwriter are each wholly owned, indirect subsidiaries of The Western and Southern Life Insurance Company (“Western-Southern”).
MANAGEMENT & EXPENSE LIMITATIONS AGREEMENTS
The Advisor provides general investment supervisory services for the Funds, under terms of an Advisory Agreement. Effective April 16, 2012, under the Advisory Agreement, the Funds pay the Advisor a fee, which is computed and accrued daily and paid monthly, at an annual rate based on average daily net assets as shown in the table below.
Notes to Financial Statements (Continued)
| Touchstone Dynamic Equity Fund | 0.85% on the first $300 million of assets |
| | 0.80% on the next $200 million of assets |
| | 0.75% on the next $250 million of assets |
| | 0.70% on the next $250 million of assets |
| | 0.65% on the next $500 million of assets |
| | 0.60% on the next $500 million of assets |
| | 0.55% on such assets in excess of $2 billion |
| Touchstone Emerging Growth Fund | 0.90% |
| Touchstone International Equity Fund | 0.90% on the first $300 million of assets |
| | 0.85% on the next $200 million of assets |
| | 0.80% of such assets in excess of $500 million |
| Touchstone Balanced Allocation Fund | 0.20% on the first $1 billion of assets |
| | 0.175% on the next $1 billion of assets |
| | 0.150% on the next $1 billion of assets |
| | 0.125% of such assets in excess of $3 billion |
| Touchstone Conservative Allocation Fund | 0.20% on the first $1 billion of assets |
| | 0.175% on the next $1 billion of assets |
| | 0.150% on the next $1 billion of assets |
| | 0.125% of such assets in excess of $3 billion |
| Touchstone Growth Allocation Fund | 0.25% on the first $1 billion of assets |
| | 0.225% on the next $1 billion of assets |
| | 0.20% on the next $1 billion of assets |
| | 0.175% of such assets in excess of $3 billion |
| Touchstone Moderate Growth Allocation Fund | 0.25% on the first $1 billion of assets |
| | 0.225% on the next $1 billion of assets |
| | 0.20% on the next $1 billion of assets |
| | 0.175% of such assets in excess of $3 billion |
Prior to April 16, 2012, Old Mutual Capital, Inc. (the “Former Advisor”) served as the adviser and administrator to the Funds. For its services, the Funds paid the Former Adviser the same fees listed above with the exception of the following:
| Touchstone Dynamic Equity Fund | 0.85 % |
| Touchstone International Equity Fund | 1.00% on the first $1 billion of assets |
| | 0.975% on the next $1 billion of assets |
| | 0.950% on the next $1 billion of assets |
| | 0.925% of such assets in excess of $3 billion |
Effective April 16, 2012, the Advisor has entered into investment sub-advisory agreements with the following parties:
| Acadian Asset Management LLC | Ibbotson Associates, Inc |
| International Equity Fund | Balanced Allocation Fund |
| | Conservative Allocation Fund |
| Analytic Investors, LLC | Growth Allocation Fund |
| Dynamic Equity Fund | Moderate Growth Allocation Fund |
| | |
| Copper Rock Capital Partners LLC | |
| Emerging Growth Fund | |
The Advisor, not the Funds, pays sub-advisory fees to each Sub-Advisor.
Notes to Financial Statements (Continued)
Prior to April 16, 2012, the Former Advisor had sub-advisory agreements with the above listed Sub-Advisors. The Former Advisor, not the Funds, paid sub-advisory fees to each Sub-Advisor.
Effective April 16, 2012, the Advisor entered into an expense limitation agreement (“Expense Limitation Agreement”) to contractually limit operating expenses of the Funds which excludes dividend and interest expense on short sales. The maximum operating expense limit in any year with respect to the Funds is based on a percentage of the average daily net assets of the Funds. The Advisor has agreed to separately waive class level expenses, administration fees and reimburse expenses in order to maintain expense limitations for the Funds as follows:
| | | | | | | | | | | | Institutional | |
| Fund | | Class A | | | Class C | | | Class Y | | | Class | |
| Dynamic Equity Fund | | | 1.55 | % | | | 2.30 | % | | | 1.30 | % | | | 1.25 | % |
| Emerging Growth Fund | | | 1.39 | % | | | 2.14 | % | | | 1.14 | % | | | 0.99 | % |
| International Equity Fund | | | 1.39 | % | | | 2.14 | % | | | 1.14 | % | | | 0.99 | % |
| Balanced Allocation Fund | | | 0.64 | % | | | 1.39 | % | | | 0.39 | % | | | 0.39 | % |
| Conservative Allocation Fund | | | 0.61 | % | | | 1.36 | % | | | 0.36 | % | | | 0.36 | % |
| Growth Allocation Fund | | | 0.57 | % | | | 1.32 | % | | | 0.32 | % | | | 0.32 | % |
| Moderate Growth Allocation Fund | | | 0.57 | % | | | 1.32 | % | | | 0.32 | % | | | 0.32 | % |
These expense limitations will remain in effect until at least April 16, 2014.
Prior to April 16, 2012, the Former Advisor was also contractually obligated to maintain the expense limitations as listed above with the exception of the following:
| | | | | | | | | | | Institutional | |
| Fund | | Class A | | | Class C* | | Class Z** | | | Class | |
| Emerging Growth Fund | | | 1.67 | % | | N/A | | | 1.42 | % | | | 1.22 | % |
| International Equity Fund | | | 1.52 | % | | N/A | | | 1.27 | % | | | 1.02 | % |
| * | Prior to April 16, 2012, the Emerging Growth Fund and the International Equity Fund did not issue Class C Shares. |
| ** | Funds had Class Z shares outstanding immediately prior to the reorganization, which were exchanged for Class Y Shares of the corresponding Touchstone Fund. |
During the period April 16, 2012 through July 31, 2012, the Advisor waived investment advisory fees and administration fees and/or reimbursed expenses of the Funds as follows:
| | | Investment | | | | | | Other | | |
| | | Advisory | | | Administration | | | Operating | | |
| | | Fees | | | Fees | | | Expenses | | |
| Fund | | Waived | | | Waived | | | Reimbursed | | |
| Dynamic Equity Fund | | $ | — | | | $ | — | | | $ | — | | |
| Emerging Growth Fund | | | 16,287 | | | | 15,230 | | | | 15,669 | | |
| International Equity Fund | | | 19,493 | | | | 10,415 | | | | 39,208 | | |
| Balanced Allocation Fund | | | — | | | | 17,060 | | | | 5,486 | | |
| Conservative Allocation Fund | | | 3,550 | | | | 17,834 | | | | 7,296 | | |
| Growth Allocation Fund | | | 11,431 | | | | 19,834 | | | | 11,921 | | |
| Moderate Growth Allocation Fund | | | — | | | | 30,284 | | | | 18,599 | | |
For the period August 1, 2011 through April 15, 2012, the Former Advisor earned and waived investment advisory fees of the funds, which are included in the Investment Advisory and Administration Fees and fees waived and/or reimbursed by the Advisor and/or Affiliated on the Statement of Operations, as follows:
Notes to Financial Statements (Continued)
| | | | | | | | | Investment | |
| | | | | | | | | Advisory | |
| | | Investment | | | Investment | | | and | |
| | | Advisory | | | Administration | | | Administration | |
| Fund | | Fees Accrued | | | Fees Accrued | | | Fees Waived | |
| Dynamic Equity Fund | | $ | 380,016 | | | $ | 44,708 | | | $ | 101,748 | |
| Emerging Growth Fund | | | 276,216 | | | | 30,691 | | | | 42,067 | |
| International Equity Fund | | | 194,928 | | | | 19,493 | | | | 191,763 | |
| Balanced Allocation Fund | | | 82,483 | | | | 41,241 | | | | 149,401 | |
| Conservative Allocation Fund | | | 48,102 | | | | 24,051 | | | | 101,652 | |
| Growth Allocation Fund | | | 73,661 | | | | 29,464 | | | | 206,251 | |
| Moderate Growth Allocation Fund | | | 126,357 | | | | 50,543 | | | | 270,882 | |
Effective April 16, 2012, under the terms of the Expense Limitation Agreement the Advisor is entitled to recover, subject to approval by the Funds’ Board of Trustees, such amounts waived or reimbursed for a period of up to three years from the year in which the Advisor reduced its compensation and/or assumed expenses for a Fund. No recoupment will occur unless a Fund’s operating expenses are below the expense limitation amount. At July 31, 2012, the Adviser may seek recoupment of previously waived and reimbursed fees as follows:
| | | Expiration | | |
| | | July 31, | | |
| Fund | | 2015 | | |
| Dynamic Equity Fund | | $ | - | | |
| Emerging Growth Fund | | | 47,186 | | |
| International Equity Fund | | | 69,116 | | |
| Balanced Allocation Fund | | | 22,546 | | |
| Conservative Allocation Fund | | | 28,680 | | |
| Growth Allocation Fund | | | 43,186 | | |
| Moderate Growth Allocation Fund | | | 48,883 | | |
The advisor did not recover any recoupment for the period April 16, 2012 through July 31, 2012. For the period August 1, 2012 through April 15, 2012, the Former Advisor did not recover waived and reimbursed fees on the Funds.
ADMINISTRATION AGREEMENT
Effective April 16, 2012, the Advisor entered into an Administration and Accounting Services Agreement with the Trust, whereby the Advisor is responsible for: supplying executive and regulatory compliance services; supervising the preparation of tax returns; coordinating the preparation of reports to shareholders and reports to, and filings with, the Securities and Exchange Commission and state securities authorities, as well as materials for meetings of the Board of Trustees; calculating the daily net asset value per share; and maintaining the financial books and records of each Fund. For its services, the Advisor receives an annual fee of 0.20% of the aggregate average daily net assets of the Trust, Touchstone Investment Trust (excluding Institutional Money Market Fund), Touchstone Funds Group Trust, and Touchstone Tax-Free Trust up to and including $6 billion; 0.16% of the next $4 billion of aggregate average daily net assets; and 0.12% of the aggregate average daily net assets of all such assets in excess of $10 billion. The fee is allocated among the Funds on the basis of relative daily net assets.
The Advisor has engaged BNY Mellon as the Sub-Administrator to the Trust. BNY Mellon provides administrator and accounting services to the Trust and is compensated directly by the Advisor, not the Trust.
Notes to Financial Statements (Continued)
TRANSFER AGENT AGREEMENT
Effective April 16, 2012, under the terms of the Transfer Agent Agreement between the Trust and BNY Mellon, BNY Mellon maintains the records of each shareholder’s account, answers shareholders’ inquiries concerning their accounts, processes purchases and redemptions of each Fund’s shares, acts as dividend and distribution disbursing agent and performs other shareholder service functions. For these services, BNY Mellon receives a monthly fee per shareholder account from each Fund. In addition, each Fund pays out-of-pocket expenses incurred by BNY Mellon, including, but not limited to, postage and supplies.
Prior to April 16, 2012, under the terms of the Transfer Agent Agreement between the Old Mutual Funds’ Trust and DST Systems, Inc. (“DST”), DST maintained the records of each shareholder’s account, answered shareholders’ inquiries concerning their accounts, processed purchases and redemptions of each Fund’s shares, acted as dividend and distribution disbursing agent and performed other shareholder service functions. For these services, DSTreceived a monthly fee per shareholder account from each Fund. In addition, each Fund paid out-of-pocket expenses incurred by DST, including, but not limited to, postage and supplies.
PLANS OF DISTRIBUTION
Effective April 16, 2012, the Trust has a Plan of Distribution (“Class A Plan”) under which Class A shares of each Fund may directly incur or reimburse the Advisor or the Underwriter for expenses related to the distribution and promotion of shares. The annual limitation for payment of such expenses under the Class A Plan is 0.25% of average daily net assets attributable to such shares.
Effective April 16, 2012, the Trust also has a Plan of Distribution (“Class C Plan”) under which Class C shares of each Fund may directly incur or reimburse the Advisor or the Underwriter for expenses related to the distribution and promotion of shares. The annual limitation for payment of such expenses under the Class C Plan is 1.00% of average daily net assets attributable to Class C shares. For the period ended April 16, 2012 through July 31, 2012, the Funds accrued the following distributions for Class A and distributions and shareholder servicing for Class C, respectively.
| | | | | | Distribution | | |
| | | | | | and | | |
| | | | | | Shareholder | | |
| | | Distribution | | | Servicing | | |
| | | Expenses | | | Expenses | | |
| Fund | | Class A | | | Class C | | |
| Dynamic Equity Fund | | $ | 13,401 | | | $ | 34,236 | | |
| Emerging Growth Fund | | | 1,517 | | | | 7 | | |
| International Equity Fund | | | 180 | | | | 7 | | |
| Balanced Allocation Fund | | | 7,425 | | | | 116,647 | | |
| Conservative Allocation Fund | | | 6,229 | | | | 50,701 | | |
| Growth Allocation Fund | | | 7,838 | | | | 72,204 | | |
| Moderate Growth Allocation Fund | | | 11,213 | | | | 141,456 | | |
Prior to April 16, 2012, the Trust had a Plan of Distribution (“Former Class A Plan”) under which Class A shares of each Fund could directly incur or reimburse the Advisor or the Underwriter for expenses related to the distribution and promotion of shares. The annual limitation for payment of such expenses under the Former Class A Plan was 0.25% of average daily net assets attributable to such shares. Prior to April 16, 2012, the Trust also had a Plan of Distribution (“Former Class C Plan”) under which Class C shares for all Funds except Emerging Growth and International Equity Funds could directly incur or reimburse the Advisor or the Underwriter for expenses related to the distribution and promotion of shares. The annual limitation for payment of such expenses under the Former Class C Plan was 0.75% of average daily net assets attributable to such shares.
Notes to Financial Statements (Continued)
For the period August 1, 2011 through April 15, 2012, the Funds paid expenses under the Former Class A and Class C Plans, which is included in the Distribution expenses, Class A and Distributions and Shareholder servicing expenses Class C, respectively on the Statements of Operations as follows:
| | | | | | Distribution | | |
| | | | | | and | | |
| | | | | | Shareholder | | |
| | | Distribution | | | Servicing | | |
| | | Expenses | | | Expenses | | |
| Fund | | Class A | | | Class C | | |
| Dynamic Equity Fund | | $ | 36,418 | | | $ | 91,542 | | |
| Emerging Growth Fund | | | 4,638 | | | | — | | |
| International Equity Fund | | | 452 | | | | — | | |
| Balanced Allocation Fund | | | 19,904 | | | | 320,749 | | |
| Conservative Allocation Fund | | | 12,584 | | | | 132,901 | | |
| Growth Allocation Fund | | | 20,872 | | | | 198,159 | | |
| Moderate Growth Allocation Fund | | | 29,758 | | | | 378,637 | | |
UNDERWRITING AGREEMENT
The Underwriter is the Funds’ principal underwriter and, as such, acts as exclusive agent for distribution of the Funds’ shares. Under the terms of the Underwriting Agreement between the Trust and Underwriter, the Underwriter earned the following from underwriting and broker commissions on the sale of shares of the following Funds during the year ended July 31, 2012:
| Fund | | Amount | | |
| Dynamic Equity Fund | | $ | 9,841 | | |
| Emerging Growth Fund | | | 1,960 | | |
| International Equity Fund | | | 271 | | |
| Balanced Allocation Fund | | | 3,522 | | |
| Conservative Allocation Fund | | | 80 | | |
| Growth Allocation Fund | | | 3,918 | | |
| Moderate Growth Allocation Fund | | | 8,077 | | |
In addition, the Underwriter collected contingent deferred sales charges on the redemption of Class C shares of the following Funds during the year ended July 31, 2012:
| Fund | | Amount | | |
| Dynamic Equity Fund | | $ | 3 | | |
| Balanced Allocation Fund | | | 408 | | |
| Conservative Allocation Fund | | | 228 | | |
| Growth Allocation Fund | | | 348 | | |
| Moderate Growth Allocation Fund | | | 556 | | |
AFFILIATED INVESTMENTS
Each Fund may invest in the Touchstone Institutional Money Market Fund, subject to compliance with several conditions set forth in an exemptive order received by the Trust from the Securities and Exchange Commission. To the extent that the other Touchstone Funds are invested in the Touchstone Institutional Money Market Fund, the Advisor and Administrator will be paid additional fees from the Touchstone Institutional Money Market Fund that will not be waived or reimbursed.
Notes to Financial Statements (Continued)
A summary of each Fund’s investment, as applicable, in the Old Mutual Cash Reserves Fund and theTouchstone Institutional Money Market Fund for the year ended July 31, 2012, is as follows:
| | | Share Activity | | | | | | | |
| | | Balance | | | | | | | | | Balance | | | | | | Value | |
| Fund | | 07/31/11 | | | Purchases | | | Sales | | | 07/31/12 | | | Dividends | | | 07/31/12 | |
| Dynamic Equity Fund | | | 594,282 | | | | 40,038,758 | | | | (39,987,059 | ) | | | 645,981 | | | $ | 1,207 | | | $ | 645,981 | |
| Emerging Growth Fund | | | 262,400 | | | | 27,448,148 | | | | (27,463,172 | ) | | | 247,376 | | | | 226 | | | | 247,376 | |
| International Equity Fund | | | 456,154 | | | | 10,340,150 | | | | (10,567,474 | ) | | | 228,830 | | | | 138 | | | | 228,830 | |
A summary of the Fund’s transactions in affiliated underlying funds during the year ended July 31, 2012 is as follows:
Balanced Allocation Fund
| | | Purchases at | | | Proceeds | | | Value at | | | Dividend | | | Net Realized | |
| Underlying Fund | | cost | | | from sale | | | 07/31/12 | | | Income | | | Gain/Loss * | |
| Touchstone Core Bond Fund ^ | | $ | 396,661 | | | $ | 2,463,462 | | | $ | 1,994,840 | | | $ | 89,542 | | | $ | 104,005 | |
| Touchstone Short Duration Fixed Income Fund | | | 4,947,996 | | | | 833,494 | | | | 4,122,249 | | | | 26,577 | | | | (640 | ) |
| Touchstone Total Return Bond Fund ^ | | | 2,056,695 | | | | 9,988,141 | | | | 6,477,995 | | | | 359,042 | | | | 1,028,654 | |
| Touhstone Focused Fund ^ | | | 658,210 | | | | 3,981,703 | | | | 997,485 | | | | 75,384 | | | | 165,400 | |
| Touchstone Value Fund ^ | | | 269,758 | | | | 4,057,138 | | | | 4,477,134 | | | | 120,981 | | | | 1,093,888 | |
| Touchstone International Equity Fund ^ | | | 1,370,314 | | | | 2,970,635 | | | | 4,527,385 | | | | 201,627 | | | | (501,104 | ) |
| Touchstone International Small Cap Fund ^ | | | 50,125 | | | | 742,935 | | | | 500,617 | | | | 31,053 | | | | (51,906 | ) |
| Touchstone International Fixed Income Fund | | | 3,290,729 | | | | 311,983 | | | | 3,010,204 | | | | 14,079 | | | | (1,877 | ) |
| Touchstone Sands Capital Institutional Growth Fund | | | 3,280,105 | | | | 157,743 | | | | 2,949,680 | | | | — | | | | (5,176 | ) |
| Touchstone Global Equity Fund | | | 2,809,493 | | | | 9,551 | | | | 2,764,259 | | | | — | | | | (244 | ) |
| Touchstone Emerging Markets Equity Fund II | | | 2,191,400 | | | | 105,597 | | | | 2,006,578 | | | | — | | | | (4,797 | ) |
| Touchstone High Yield Fund | | | 2,231,734 | | | | 237,298 | | | | 2,004,630 | | | | 46,368 | | | | (904 | ) |
| Touchstone Dynamic Equity Fund ^ | | | 2,182,150 | | | | 248,109 | | | | 2,001,470 | | | | — | | | | 951 | |
| Touchstone Large Cap Relative Value Fund | | | 2,190,658 | | | | 145,901 | | | | 1,993,030 | | | | 6,463 | | | | (2,580 | ) |
| Touchstone Global Real Estate Fund | | | 2,197,156 | | | | 299,351 | | | | 1,992,955 | | | | 14,279 | | | | 2,259 | |
| Touchstone Mid Cap Fund | | | 1,090,701 | | | | 106,988 | | | | 995,267 | | | | — | | | | (1,579 | ) |
| Touchstone Mid Cap Growth Fund | | | 1,093,172 | | | | 48,399 | | | | 990,981 | | | | — | | | | (1,539 | ) |
| Touchstone Merger Arbitrage Fund | | | 1,639,687 | | | | 144,394 | | | | 1,496,886 | | | | — | | | | (416 | ) |
| Touchstone Mid Cap Value Fund ^ | | | 1,093,577 | | | | 69,228 | | | | 1,000,015 | | | | 72,957 | | | | (1,611 | ) |
| Touchstone Large Cap Growth Fund | | | 1,090,855 | | | | 83,040 | | | | 991,152 | | | | — | | | | (689 | ) |
| Touchstone Small Cap Core Fund | | | 1,091,451 | | | | 89,768 | | | | 989,446 | | | | — | | | | (1,862 | ) |
| Touchstone Capital Growth Fund ^ | | | 907,621 | | | | 4,095,559 | | | | — | | | | 7,621 | | | | 1,201,314 | |
| Touchstone Emerging Growth Fund ^ | | | 500,000 | | | | 2,539,762 | | | | — | | | | — | | | | 691,208 | |
Notes to Financial Statements (Continued)
Balanced Allocation Fund
| | | Purchases at | | | Proceeds | | | Value at | | | Dividend | | | Net Realized | |
| Underlying Fund | | cost | | | from sale | | | 07/31/12 | | | Income | | | Gain/Loss * | |
| Touchstone Mid Cap Value Opportunities Fund ^ | | $ | 417,019 | | | $ | 6,641,504 | | | $ | — | | | $ | — | | | $ | 260,975 | |
| Touchstone Institutional Money Market Fund | | | 1,641,212 | | | | 146,566 | | | | 1,494,647 | | | | 739 | | | | — | |
| Touchstone Small Cap Value Fund | | | 152,331 | | | | 3,119,704 | | | | — | | | | — | | | | 957,703 | |
| Touchstone Ultra Short Fixed Income Fund ^ | | | 2,616,494 | | | | 7,410,715 | | | | — | | | | 79,465 | | | | 33,348 | |
| Touchstone U.S. Long/Short Fund ^ | | | 571,946 | | | | 2,894,127 | | | | — | | | | 21,946 | | | | (147,274 | ) |
| Old Mutual Cash Reserves Fund + | | | 7,683,041 | | | | 8,074,670 | | | | — | | | | — | | | | — | |
| Old Mutual Dwight High Yield Fund + | | | 106,631 | | | | 2,514,412 | | | | — | | | | 74,155 | | | | 158,462 | |
| Old Mutual Heitman REIT Fund + | | | 209,429 | | | | 1,394,951 | | | | — | | | | 9,429 | | | | 475,424 | |
| Total: | | $ | 52,028,351 | | | $ | 65,926,828 | | | $ | 49,778,905 | | | $ | 1,251,707 | | | $ | 5,449,393 | |
* Litigation income from investments held by securities within the underlying funds of $13,124 is not included in this table.
Conservative Allocation Fund
| | | Purchases at | | | Proceeds | | | Value at | | | Dividend | | | Net Realized | |
| Underlying Fund | | cost | | | from sale | | | 07/31/12 | | | Income | | | Gain/Loss ** | |
| Touchstone Core Bond Fund ^ | | $ | 775,477 | | | $ | 4,572,497 | | | $ | 1,740,155 | | | $ | 99,633 | | | $ | 100,957 | |
| Touchstone Short Duration Fixed Income Fund | | | 6,826,065 | | | | 1,471,142 | | | | 5,365,566 | | | | 36,741 | | | | (269 | ) |
| Touchstone Total Return Bond Fund ^ | | | 3,240,739 | | | | 10,473,277 | | | | 6,380,367 | | | | 370,720 | | | | 929,827 | |
| Touchstone International Fixed Income Fund | | | 3,226,312 | | | | 621,386 | | | | 2,631,387 | | | | 13,685 | | | | (4,149 | ) |
| Touchstone Value Fund ^ | | | 761,678 | | | | 1,310,371 | | | | 1,752,963 | | | | 41,971 | | | | 67,367 | |
| Touchstone High Yield Fund | | | 1,822,240 | | | | 372,216 | | | | 1,455,959 | | | | 37,487 | | | | (2,461 | ) |
| Touchstone Institutional Money Market Fund | | | 1,787,145 | | | | 341,284 | | | | 1,445,861 | | | | 793 | | | | — | |
| Touchstone Sands Capital Institutional Growth Fund | | | 1,828,441 | | | | 299,282 | | | | 1,430,773 | | | | — | | | | (17,009 | ) |
| Touchstone International Equity Fund ^ | | | 652,826 | | | | 1,494,203 | | | | 1,171,642 | | | | 65,293 | | | | (310,015 | ) |
| Touchstone Dynamic Equity Fund ^ | | | 1,427,787 | | | | 302,001 | | | | 1,168,789 | | | | — | | | | 3,907 | |
| Touchstone Merger Arbitrage Fund | | | 1,427,828 | | | | 274,100 | | | | 1,156,072 | | | | — | | | | 161 | |
| Touchstone Large Cap Relative Value Fund | | | 1,084,091 | | | | 187,637 | | | | 870,165 | | | | 3,196 | | | | (5,061 | ) |
| Touchstone Global Equity Fund | | | 830,786 | | | | 116,035 | | | | 703,234 | | | | — | | | | (7,430 | ) |
| Touchstone Global Real Estate Fund | | | 718,618 | | | | 157,988 | | | | 588,995 | | | | 4,730 | | | | 458 | |
| Touchstone Small Cap Core Fund | | | 723,866 | | | | 133,905 | | | | 580,192 | | | | — | | | | (5,298 | ) |
| Touchstone Small Cap Value Fund | | | 3,291 | | | | 24,268 | | | | — | | | | — | | | | 5,193 | |
| Touchstone Emerging Markets Equity Fund II | | | 359,045 | | | | 52,020 | | | | 292,662 | | | | — | | | | (3,525 | ) |
Notes to Financial Statements (Continued)
Conservative Allocation Fund
| | | Purchases at | | | Proceeds | | | Value at | | | Dividend | | | Net Realized | |
| Underlying Fund | | cost | | | from sale | | | 07/31/12 | | | Income | | | Gain/Loss ** | |
| Touchstone Mid Cap Fund | | $ | 358,262 | | | $ | 68,446 | | | $ | 292,467 | | | $ | — | | | $ | (1,589 | ) |
| Touchstone Ultra Short Duration Fixed Income Fund ^ | | | 2,045,579 | | | | 7,586,059 | | | | — | | | | 84,530 | | | | 112,444 | |
| Touchstone Capital Growth Fund ^ | | | 362,161 | | | | 1,628,277 | | | | — | | | | 2,109 | | | | 554,281 | |
| Touchstone Emerging Growth Fund ^ | | | 91,101 | | | | 1,030,121 | | | | — | | | | — | | | | 284,533 | |
| Touchstone Focused Fund ^ | | | 392,992 | | | | 1,812,219 | | | | — | | | | 20,619 | | | | 415,237 | |
| Touchstone Mid Cap Value Opportunities Fund ^ | | | 403,349 | | | | 2,841,388 | | | | — | | | | 27,161 | | | | 582,759 | |
| Touchstone U.S. Long/Short Fund ^ | | | 269,663 | | | | 1,013,172 | | | | — | | | | 5,769 | | | | 256,310 | |
| Old Mutual Cash Reserves Fund + | | | 4,998,675 | | | | 5,221,409 | | | | — | | | | — | | | | — | |
| Old Mutual Dwight High Yield Fund + | | | 61,144 | | | | 2,328,550 | | | | — | | | | 43,931 | | | | 152,797 | |
| Total: | | $ | 36,479,161 | | | $ | 45,733,253 | | | $ | 29,027,249 | | | $ | 858,368 | | | $ | 3,109,425 | |
** Litigation income from investments held by securities within the underlying funds of $3,103 is not included in this table.
Growth Allocation Fund
| | | Purchases at | | | Proceeds | | | Value at | | | Dividend | | | Net Realized | |
| Underlying Fund | | cost | | | from sale | | | 07/31/12 | | | Income | | | Gain/Loss *** | |
| Touchstone International Equity Fund ^ | | $ | 1,822,059 | | | $ | 7,926,888 | | | $ | 4,653,582 | | | $ | 311,151 | | | $ | (2,295,517 | ) |
| Touchstone International Small Cap Fund ^ | | | 144,865 | | | | 475,944 | | | | 1,425,634 | | | | 50,176 | | | | (50,672 | ) |
| Touchstone Focused Fund ^ | | | 191,487 | | | | 3,145,031 | | | | 1,772,815 | | | | 69,182 | | | | (175,475 | ) |
| Touchstone Value Fund ^ | | | 321,274 | | | | 6,195,544 | | | | 3,194,168 | | | | 108,226 | | | | 638,564 | |
| Touchstone Emerging Growth Fund ^ | | | 71,016 | | | | 2,021,901 | | | | 1,055,454 | | | | — | | | | 629,060 | |
| Touchstone Sands Capital Institutional Growth Fund | | | 3,130,447 | | | | 169,042 | | | | 2,795,339 | | | | — | | | | (8,436 | ) |
| Touchstone Emerging Markets Equity Fund II | | | 3,917,462 | | | | 182,320 | | | | 3,590,598 | | | | — | | | | (10,648 | ) |
| Touchstone Global Equity Fund | | | 2,759,835 | | | | 1,930 | | | | 2,719,940 | | | | — | | | | (188 | ) |
| Touchstone Global Real Estate Fund | | | 2,365,986 | | | | 323,795 | | | | 2,140,854 | | | | 15,093 | | | | (977 | ) |
| Touchstone Small Cap Core Fund | | | 1,568,216 | | | | 136,129 | | | | 1,413,563 | | | | — | | | | (4,004 | ) |
| Touchstone Mid Cap Fund | | | 1,174,498 | | | | 122,199 | | | | 1,063,249 | | | | — | | | | (3,108 | ) |
| Touchstone Mid Cap Growth Fund | | | 782,893 | | | | 38,372 | | | | 706,120 | | | | — | | | | (1,209 | ) |
| Touchstone Large Cap Relative Value Fund | | | 1,963,209 | | | | 148,678 | | | | 1,767,061 | | | | 5,696 | | | | (4,067 | ) |
| Touchstone Short Duration Fixed Income Fund | | | 2,366,465 | | | | 629,015 | | | | 1,740,451 | | | | 20,385 | | | | (535 | ) |
| Touchstone Mid Cap Value Fund | | | 1,570,058 | | | | 117,031 | | | | 1,417,723 | | | | 4,033 | | | | (3,261 | ) |
| Touchstone Dynamic Equity Fund ^ | | | 1,175,306 | | | | 148,511 | | | | 1,061,228 | | | | — | | | | (760 | ) |
Notes to Financial Statements (Continued)
Growth Allocation Fund
| | | Purchases at | | | Proceeds | | | Value at | | | Dividend | | | Net Realized | |
| Underlying Fund | | cost | | | from sale | | | 07/31/12 | | | Income | | | Gain/Loss *** | |
| Touchstone Large Cap Growth Fund | | $ | 1,176,070 | | | $ | 113,470 | | | $ | 1,043,880 | | | $ | — | | | $ | (1,887 | ) |
| Touchstone Merger Arbitrage Fund | | | 1,177,492 | | | | 136,454 | | | | 1,041,795 | | | | — | | | | (544 | ) |
| Touchstone Capital Growth Fund ^ | | | 358,211 | | | | 4,978,087 | | | | — | | | | 8,211 | | | | 1,371,989 | |
| Touchstone Mid Cap Value Opportunities Fund ^ | | | 380,073 | | | | 7,442,621 | | | | — | | | | 63,881 | | | | 731,660 | |
| Touchstone Small Cap Value Fund | | | 1,080,320 | | | | 3,833,476 | | | | 698,257 | | | | 3,262 | | | | 1,096,849 | |
| Touchstone Ultra Short Duration Fixed Income Fund ^ | | | 1,207,711 | | | | 1,210,331 | | | | — | | | | 339 | | | | 2,620 | |
| Touchstone U.S. Long/Short Fund ^ | | | 21,143 | | | | 2,955,265 | | | | — | | | | 21,143 | | | | (310,625 | ) |
| Old Mutual Cash Reserves Fund + | | | 7,223,219 | | | | 7,740,562 | | | | — | | | | — | | | | — | |
| Old Mutual Heitman REIT Fund + | | | 291,361 | | | | 2,442,951 | | | | — | | | | 16,360 | | | | 909,765 | |
| Total: | | $ | 38,240,676 | | | $ | 52,635,547 | | | $ | 35,301,711 | | | $ | 697,138 | | | $ | 2,508,594 | |
*** Litigation income from investments held by securities within the underlying funds of $24,196 is not included in this table.
Moderate Growth Allocation Fund
| | | | | | | | | | | | | | | Net Realized | |
| | | Purchases at | | | Proceeds | | | Value at | | | Dividend | | | Gain/Loss | |
| Underlying Fund | | cost | | | from sale | | | 07/31/12 | | | Income | | | **** | |
| Touchstone Short Duration Fixed Income Fund | | $ | 3,452,764 | | | $ | 895,951 | | | $ | 2,561,284 | | | $ | 17,470 | | | $ | (740 | ) |
| Touchstone Total Return Bond Fund ^ | | | 1,306,135 | | | | 7,569,673 | | | | 7,609,988 | | | | 340,840 | | | | 891,359 | |
| Touchstone Focused Fund ^ | | | 251,584 | | | | 3,926,510 | | | | 3,192,187 | | | | 106,631 | | | | (226,139 | ) |
| Touchstone Value Fund ^ | | | 427,322 | | | | 6,016,597 | | | | 5,824,458 | | | | 166,407 | | | | 1,673,234 | |
| Touchstone International Equity Fund ^ | | | 2,081,643 | | | | 6,403,564 | | | | 7,119,995 | | | | 362,747 | | | | (3,044,693 | ) |
| Touchstone International Small Cap Fund ^ | | | 124,735 | | | | 1,354,181 | | | | 1,283,338 | | | | 66,755 | | | | (93,022 | ) |
| Touchstone Emerging Growth Fund ^ | | | 828,990 | | | | 4,591,882 | | | | 635,949 | | | | — | | | | 1,033,881 | |
| Touchstone Sands Capital Institutional Growth Fund | | | 5,493,404 | | | | 143,903 | | | | 5,059,404 | | | | — | | | | (3,052 | ) |
| Touchstone Emerging Markets Equity Fund II | | | 4,808,515 | | | | 106,981 | | | | 4,526,730 | | | | — | | | | (5,367 | ) |
| Touchstone Global Equity Fund | | | 3,469,635 | | | | 4,758 | | | | 3,417,333 | | | | — | | | | (4 | ) |
| Touchstone Mid Cap Fund | | | 2,060,737 | | | | 135,802 | | | | 1,947,330 | | | | — | | | | (2,858 | ) |
| Touchstone Mid Cap Growth Fund | | | 1,373,696 | | | | 49,235 | | | | 1,256,726 | | | | — | | | | (1,337 | ) |
| Touchstone Large Cap Relative Value Fund | | | 3,444,788 | | | | 168,289 | | | | 3,193,147 | | | | 10,206 | | | | (4,580 | ) |
| Touchstone Global Real Estate Fund | | | 2,765,905 | | | | 264,258 | | | | 2,623,991 | | | | 18,081 | | | | 792 | |
Notes to Financial Statements (Continued)
Moderate Growth Allocation Fund
| | | | | | | | | | | | | | | Net Realized | |
| | | Purchases at | | | Proceeds | | | Value at | | | Dividend | | | Gain/Loss | |
| Underlying Fund | | cost | | | from sale | | | 07/31/12 | | | Income | | | **** | |
| Touchstone Small Cap Core Fund | | $ | 2,059,993 | | | $ | 99,058 | | | $ | 1,937,706 | | | $ | — | | | $ | (2,181 | ) |
| Touchstone Dynamic Equity Fund ^ | | | 2,061,727 | | | | 190,699 | | | | 1,933,844 | | | | — | | | | (1,311 | ) |
| Touchstone Mid Cap Value Fund | | | 2,066,168 | | | | 92,516 | | | | 1,927,936 | | | | 5,405 | | | | (1,872 | ) |
| Touchstone International Fixed Income Fund | | | 2,070,458 | | | | 164,556 | | | | 1,925,741 | | | | 8,859 | | | | (1,275 | ) |
| Touchstone High Yield Fund | | | 2,105,025 | | | | 190,794 | | | | 1,923,991 | | | | 44,589 | | | | (843 | ) |
| Touchstone Merger Arbitrage Fund | | | 2,061,340 | | | | 170,760 | | | | 1,892,368 | | | | — | | | | (581 | ) |
| Touchstone Large Cap Growth Fund | | | 1,374,097 | | | | 96,390 | | | | 1,255,828 | | | | — | | | | (1,562 | ) |
| Touchstone Capital Growth Fund ^ | | | 1,010,499 | | | | 5,478,868 | | | | — | | | | 31,414 | | | | 1,771,581 | |
| Touchstone Core Bond Fund ^ | | | 84,621 | | | | 1,926,461 | | | | — | | | | 10,500 | | | | 30,869 | |
| Touchstone Mid Cap Value Opportunities Fund ^ | | | 515,301 | | | | 9,718,916 | | | | — | | | | 86,610 | | | | 2,415 | |
| Touchstone Small Cap Value Fund | | | 1,028,811 | | | | 7,515,475 | | | | 635,342 | | | | 2,925 | | | | 2,025,135 | |
| Touchstone U.S. Long/Short Fund | | | 31,414 | | | | 4,839,493 | | | | — | | | | — | | | | (645,876 | ) |
| Touchstone Ultra Short Duration Fixed Income Fund | | | 4,620,000 | | | | 4,625,633 | | | | — | | | | 56,389 | | | | 5,633 | |
| Old Mutual Cash Reserves Fund + | | | 10,707,799 | | | | 11,207,540 | | | | — | | | | — | | | | — | |
| Old Mutual Heitman REIT Fund + | | | 1,116,913 | | | | 2,656,812 | | | | — | | | | 16,913 | | | | 680,224 | |
| Total: | | $ | 64,804,019 | | | $ | 80,605,555 | | | $ | 63,684,616 | | | $ | 1,352,741 | | | $ | 4,077,830 | |
**** Litigation income from investments held by securities within the underlying funds of $29,082 is not included in this table.
| + | Underlying Fund is no longer held by the Fund at July 31, 2012. The underlyung Fund was affiliated with Old Mutual Funds I (See Note 7). |
| ^ | Includes activity of the Reorganizing Funds, prior to the merger (See Note 7). |
5. Federal Tax Information
Federal income tax — It is each Fund’s policy to continue to comply with the special provisions of the Internal Revenue Code applicable to regulated investment companies. As provided therein, in any fiscal year in which a Fund so qualifies and distributes at least 90% of its investment company taxable income, the Fund (but not the shareholders) will be relieved of federal income tax on the income distributed. Accordingly, no provision for income taxes has been made.
In order to avoid imposition of the excise tax applicable to regulated investment companies, it is also each Fund’s intention to declare and pay as dividends in each calendar year at least 98% of its investment company taxable income (earned during the calendar year) and 98.2% of its net realized capital gains (earned during the twelve months ending October 31) plus undistributed amounts from prior years.
Notes to Financial Statements (Continued)
The tax character of distributions paid for the years ended July 31, 2012 and 2011 was as follows:
| | | Dynamic | | | Emerging | | | International | |
| | | Equity Fund | | | Growth Fund | | | Equity Fund | |
| | | Year Ended | | | Year Ended | | | Year Ended | | | Year Ended | | | Year Ended | | | Year Ended | |
| | | July 31, | | | July 31, | | | July 31, | | | July 31, | | | July 31, | | | July 31, | |
| | | 2012 | | | 2011 | | | 2012 | | | 2011 | | | 2012 | | | 2011 | |
| From ordinary income | | $ | 514,890 | | | $ | — | | | $ | — | | | $ | — | | | $ | 967,252 | | | $ | 890,209 | |
| | | $ | 514,890 | | | $ | — | | | $ | — | | | $ | — | | | $ | 967,252 | | | $ | 890,209 | |
| | | Balanced | | | Conservative | | | Growth | |
| | | Allocation Fund | | | Allocation Fund | | | Allocation Fund | |
| | | Year Ended | | | Year Ended | | | Year Ended | | | Year Ended | | | Year Ended | | | Year Ended | |
| | | July 31, | | | July 31, | | | July 31, | | | July 31, | | | July 31, | | | July 31, | |
| | | 2012 | | | 2011 | | | 2012 | | | 2011 | | | 2012 | | | 2011 | |
| From ordinary income | | $ | 607,351 | | | $ | 1,392,283 | | | $ | 589,089 | | | $ | 1,437,898 | | | $ | 180,489 | | | $ | 118,434 | |
| | | $ | 607,351 | | | $ | 1,392,283 | | | $ | 589,089 | | | $ | 1,437,898 | | | $ | 180,489 | | | $ | 118,434 | |
| | | Moderate Growth | | | | |
| | | Allocation Fund | | | | |
| | | Year Ended | | | Year Ended | | | | |
| | | July 31, | | | July 31, | | | | |
| | | 2012 | | | 2011 | | | | |
| From ordinary income | | $ | 572,935 | | | $ | 706,859 | | | | | |
| | | $ | 572,935 | | | $ | 706,859 | | | | | |
The following information is computed on a tax basis for each item as of July 31, 2012:
| | | Dynamic | | | Emerging | | | International | |
| | | Equity Fund | | | Growth Fund | | | Equity Fund | |
| Tax cost of portfolio investments | | $ | 65,741,557 | | | $ | 23,185,346 | | | $ | 17,282,507 | |
| Gross unrealized appreciation | | | 9,096,536 | | | | 4,220,604 | | | | 2,611,895 | |
| Gross unrealized depreciation | | | (2,218,213 | ) | | | (1,073,849 | ) | | | (1,712,590 | ) |
| Net unrealized appreciation (depreciation) | | | 6,878,323 | | | | 3,146,755 | | | | 899,305 | |
| Net unrealized appreciation (depreciation) on written options, short sales and foreign currency and translation of other assets and liablilities denominated in foreign currency | | | 1,304,585 | | | | — | | | | (1,273 | ) |
| Accumulated capital and other losses | | | (149,699,504 | ) | | | — | | | | (42,867,968 | ) |
| Post-October and qualified late-year losses | | | (386,369 | ) | | | (179,955 | ) | | | (253,361 | ) |
| Other temporary differences | | | 170,830 | | | | — | | | | — | |
| Undistributed ordinary income | | | — | | | | — | | | | 393,776 | |
| Undistributed capital gains | | | — | | | | 803,139 | | | | — | |
| Accumulated earnings (deficit) | | $ | (141,732,135 | ) | | $ | 3,769,939 | | | $ | (41,829,521 | ) |
Notes to Financial Statements (Continued)
| | | | | | | | | | | | Moderate | |
| | | Balanced | | | Conservative | | | Growth | | | Growth | |
| | | Allocation Fund | | | Allocation Fund | | | Allocation Fund | | | Allocation Fund | |
| Tax cost of portfolio investments | | $ | 48,926,428 | | | $ | 28,198,591 | | | $ | 35,294,685 | | | $ | 63,793,969 | |
| Gross unrealized appreciation | | | 2,868,240 | | | | 1,324,688 | | | | 2,299,691 | | | | 3,772,191 | |
| Gross unrealized depreciation | | | (2,015,763 | ) | | | (496,030 | ) | | | (2,292,665 | ) | | | (3,881,544 | ) |
| Net unrealized appreciation (depreciation) | | | 852,477 | | | | 828,658 | | | | 7,026 | | | | (109,353 | ) |
| Accumulated capital and other losses | | | (20,588,604 | ) | | | (589,265 | ) | | | (36,608,423 | ) | | | (37,491,026 | ) |
| Undistributed ordinary income | | | 271,112 | | | | 359,301 | | | | 269,645 | | | | 392,606 | |
| Accumulated earnings (deficit) | | $ | (19,465,015 | ) | | $ | 598,694 | | | $ | (36,331,752 | ) | | $ | (37,207,773 | ) |
The difference between the tax cost of portfolio investments and the financial statement cost is primarily due to wash sale loss deferrals.
As of July 31, 2012, the Funds had the following capital loss carryforwards for federal income tax purposes:
| | | | | | | | | | | | | | | No | | | No | | | | |
| | | | | | | | | | | | | | | Expiration | | | Expiration | | | | |
| Fund | | 2016 | | | 2017 | | | 2018 | | | 2019 | | | Short Term * | | | Long Term * | | | Total | |
| Dynamic Equity Fund’ | | $ | 40,530,541 | | | $ | 31,726,954 | | | $ | 77,442,009 | | | $ | — | | | $ | — | | | $ | — | | | $ | 149,699,504 | |
| International Equity Fund | | | — | | | | 20,588,339 | | | | 22,279,629 | | | | — | | | | — | | | | — | | | | 42,867,968 | |
| Balanced Allocation Fund | | | — | | | | — | | | | 15,787,238 | | | | 4,801,366 | | | | — | | | | — | | | | 20,588,604 | |
| Conservative Allocation Fund | | | — | | | | — | | | | 281,115 | | | | 308,150 | | | | — | | | | — | | | | 589,265 | |
| Growth Allocation Fund | | | — | | | | 4,343,007 | | | | 21,601,697 | | | | 10,663,719 | | | | — | | | | — | | | | 36,608,423 | |
| Moderate Growth Allocation Fund | | | — | | | | 576,539 | | | | 27,786,830 | | | | 9,127,657 | | | | — | | | | — | | | | 37,491,026 | |
* The Regulated Investment Company Modernization Act of 2010 (the “Act”) was enacted on December 22, 2010. The Act makes changes to several tax rules impacting the Funds. In general, the provisions of the Act will be effective for the Funds’ fiscal year ending July 31, 2012. Although the Act provides several benefits, including the unlimited carryover of future capital losses, there may be a greater likelihood that all or a portion of each Fund’s pre-enactment capital loss carryovers may expire without being utilized due to the fact that post-enactment capital losses must be utilized before pre-enactment capital loss carryovers may be utilized. Under the Act, new capital losses may now be carried forward indefinitely, and retain the character of the original loss as compared with pre-enactment law, where capital losses could be carried forward for up to eight years, and carried forward as short-term capital losses, irrespective of the character of the original loss.
The capital loss carryforwards may be utilized in future years to offset net realized capital gains, if any, prior to distributing such gains to shareholders.
During the year ended July 31, 2012, the following Funds utilized capital loss carryforwards:
| Fund | | Amount | |
| Dynamic Equity Fund | | $ | 2,879,366 | |
| Emerging Growth Fund | | | 6,350,719 | |
| International Equity Fund | | | 484,551 | |
| Balanced Allocation Fund | | | 4,939,054 | |
| Conservative Allocation Fund | | | 2,437,276 | |
| Growth Allocation Fund | | | 833,478 | |
| Moderate Growth Allocation Fund | | | 4,883,402 | |
Under current laws, certain capital losses realized after October 31 may be deferred (and certain ordinary losses after January 1st may be deferred) and treated as occuring on the first day of the following fiscal year. For the fiscal year ended July 31, 2012, the Funds elected to defer the following losses incurred from November 1, 2011, for realized capital losses and January 2012, for ordinary losses through July 31, 2012:
Notes to Financial Statements (Continued)
| | | Realized | | | | |
| | | Short-Term | | | | |
| | | Capital | | | Ordinary | |
| Fund | | Losses | | | Losses | |
| Dynamic Equity Fund | | $ | — | | | $ | 386,369 | |
| Emerging Growth Fund | | | — | | | | 179,955 | |
| International Equity Fund | | | 253,361 | | | | — | |
The Funds have analyzed their tax positions taken on Federal income tax returns for all open tax years (tax years ended July 31, 2009 through 2012) and have concluded that no provision for income tax is required in their financial statements.
Certain reclassifications, the result of permanent differences between financial statement and income tax reporting requirements, have been made to the components of capital. These reclassifications have no impact on the net assets or net asset value per share of the Funds and are designed to present the Funds’ capital accounts on a tax basis. The following reclassifications, which are primarily attributed to the tax treatment of net investment loss, reclassifications on short sales, reclassifications from underlying funds, partnership investments, PFIC adjustments, and reclassifications from capital gains to ordinary income have been made to the following Funds for the year ended July 31, 2012:
| | | | | | Accumulated | | | Accumulated | |
| | | Paid-In | | | Net Investment | | | Net Realized | |
| Fund | | Capital | | | Income(Loss) | | | Gains(Losses) | |
| Dynamic Equity Fund | | $ | (7,687 | ) | | $ | 23,604 | | | $ | (15,917 | ) |
| Emerging Growth Fund | | | (182,756 | ) | | | 182,756 | | | | — | |
| International Equity Fund | | | 9,102 | | | | (9,280 | ) | | | 178 | |
| Balanced Allocation Fund | | | 3,002 | | | | 285,872 | | | | (288,874 | ) |
| Conservative Allocation Fund | | | 2 | | | | 343,529 | | | | (343,531 | ) |
| Growth Allocation Fund | | | 2,001 | | | | 3,002 | | | | (5,003 | ) |
| Moderate Growth Allocation Fund | | | 600 | | | | 204,507 | | | | (205,107 | ) |
6. Commitments and Contingencies
The Funds indemnify the Trust’s officers and Trustees for certain liabilities that might arise from their performance of their duties to the Funds. Additionally, in the normal course of business, the Funds enter into contracts that contain a variety of representations and warranties and which provide general indemnifications. The Funds’ maximum exposure under these arrangements is unknown, as this would involve future claims that may be made against the Funds that have not yet occurred. However, based on experience, the Funds expect the risk of loss to be remote.
7. Fund Mergers
On February 10, 2012, the Shareholders of the Old Mutual Funds I (the “Reorganizing Funds”) approved an Agreement and Plan of Reorganization (the “Plan”) providing for the transfer of all assets and liabilities of each Reorganizing Fund to the corresponding Touchstone Fund as noted below. The merger took place on April 13, 2012.
| | | | | Net | | | Shares | |
| Reorganizing Funds* | | Touchstone Funds | | Assets | | | Outstanding | |
| Old Mutual Analytic Fund | | Dynamic Equity Fund | | $ | 56,128,406 | | | | 5,182,646 | |
| Old Mutual Copper Rock Emerging Growth Fund | | Emerging Growth Fund | | | 43,528,427 | | | | 3,579,888 | |
| Old Mutual International Equity Fund | | International Equity Fund | | | 28,419,782 | | | | 3,455,688 | |
| Old Mutual Asset Allocation Balanced Portfolio | | Balanced Allocation Fund | | | 54,581,260 | | | | 4,909,161 | |
| Old Mutual Asset Allocation Conservative Portfolio | | Conservative Allocation Fund | | | 35,536,596 | | | | 3,274,555 | |
| Old Mutual Asset Allocation Growth Portfolio | | Growth Allocation Fund | | | 38,970,804 | | | | 3,527,780 | |
Notes to Financial Statements (Continued)
| | | | | Net | | | Shares | |
| Reorganizing Funds* | | Touchstone Funds | | Assets | | | Outstanding | |
| Old Mutual Asset Allocation Moderate Growth Portfolio | | Moderate Growth Allocation Fund | | | 68,462,430 | | | | 6,232,923 | |
| * | Funds had Class Z shares outstanding immediately prior to the reorganization, which were exchanged for Class Y Shares of the corresponding Touchstone Fund. |
8. Subsequent Events
Subsequent events occurring after the date of this report have been evaluated for potential impact to this report through the date the financial statements were issued.
Touchstone Investments and Fifth Third Asset Management announced on April 5, 2012 that Touchstone Advisors, Inc., a wholly owned subsidiary of Western & Southern Financial Group, has entered into a definitive agreement with Fifth Third Asset Management, for Touchstone to acquire selected assets of Fifth Third Asset Management’s mutual fund business.
Consummation of the transaction is subject to certain conditions and approvals and was completed September 10, 2012. Sixteen Fifth Third Funds were reorganized into Touchstone Funds with Fifth Third Asset Management’s affiliated investment managers continuing as sub-advisors for certain Funds.
At a meeting held on March 13, 2012, the Board of Trustees of the Trust approved Agreements and Plans of Reorganization (the “Plans”) providing for the transfer of all of the assets and liabilities of the Fifth Third LifeModel Moderate Fund, Fifth Third LifeModel Conservative Fund, Fifth Third LifeModel Moderately Conservative Fund, Fifth Third LifeModel Aggressive Fund and Fifth Third LifeModel Moderately Aggressive Fund (the “Acquired Funds”), each a series of Fifth Third Funds (“Fifth Third”) to the corresponding Touchstone Funds shown below in exchange for shares of corresponding Touchstone Funds as noted below. The Board of Trustees of Fifth Third also voted to approve the Plans and to submit it to shareholders of each Acquired Fund for their approval. On September 5, 2012, the shareholders of each Acquired Fund approved the Plans. The reorganizations closed on September 10, 2012.
| Acquired Funds | | Touchstone Funds |
| Fifth Third LifeModel Moderate Fund | | Balanced Allocation Fund |
| Fifth Third LifeModel Conservative Fund | | Conservative Allocation Fund |
| Fifth Third LifeModel Moderately Conservative Fund | | Conservative Allocation Fund |
| Fifth Third LifeModel Aggressive Fund | | Growth Allocation Fund |
| Fifth Third LifeModel Moderately Aggressive Fund | | Moderate Growth Allocation Fund |
The fiscal year end of the Funds included in this annual report will be changed to December 31 which was approved by the Board of Trustees on September 5, 2012.
There were no other subsequent events that necessitated recognition or disclosure.
Report of Independent Registered Public Accounting Firm

To the members of the Audit Committee of the Board of Trustees and Shareholders of Touchstone Strategic
Trust
In our opinion, the accompanying statements of assets and liabilities, including the schedules of investments, and the related statements of operations and of changes in net assets, and of cash flows for Touchstone Dynamic Equity Fund, and the financial highlights present fairly, in all material respects, the financial position of Touchstone Dynamic Equity Fund (formerly Old Mutual Defensive Equity Fund), Touchstone Emerging Growth Fund (formerly Old Mutual Copper Rock Emerging Growth Fund),Touchstone International Equity Fund (formerly Old Mutual International Equity Fund), Touchstone Balanced Allocation Fund (formerly Old Mutual Asset Allocation Balanced Portfolio),Touchstone Conservative Allocation Fund (formerly Old Mutual Asset Allocation Conservative Portfolio), Touchstone Growth Allocation Fund (formerly Old Mutual Asset Allocation Growth Portfolio) and Touchstone Moderate Growth Allocation Fund (formerly Old Mutual Asset Allocation Moderate Growth Portfolio) (seven of the funds constituting the Touchstone Strategic Trust, hereafter referred to as the “Funds”) at July 31, 2012 and the results of each of their operations, the changes in each of their net assets, and of the cash flows for Touchstone Dynamic Equity Fund, and the financial highlights for the periods indicated, in conformity with accounting principles generally accepted in the United States of America. These financial statements and financial highlights (hereafter referred to as “financial statements”) are the responsibility of the Funds’ management; our responsibility is to express an opinion on these financial statements based on our audits. We conducted our audits of these financial statements in accordance with the standards of the Public Company Accounting Oversight Board (United States). Those standards require that we plan and perform the audits to obtain reasonable assurance about whether the financial statements are free of material misstatement. An audit includes examining, on a test basis, evidence supporting the amounts and disclosures in the financial statements, assessing the accounting principles used and significant estimates made by management, and evaluating the overall financial statement presentation. We believe that our audits, which included confirmation of securities at July 31, 2012 by correspondence with the custodian, transfer agent, and brokers, provide a reasonable basis for our opinion.

PricewaterhouseCoopers LLP
Denver, Colorado
September 21, 2012
Other Items (Unaudited)
Qualified Dividend Income
Under the Jobs and Growth Tax Relief Reconciliation Act of 2003 (the “Act”), the following percentages of ordinary dividends paid during the fiscal year ended July 31, 2012 are designated as “qualified dividend income,” as defined in the Act, and are subject to reduced tax rates. The Funds intend to pass through the maximum allowable percentage for 1099s.
| International Equity Fund | | | 100 | % |
| Balanced Allocation Fund | | | 61.93 | % |
| Conservative Allocation Fund | | | 18.04 | % |
| Growth Allocation Fund | | | 100 | % |
| Moderate Growth Allocation Fund | | | 97.05 | % |
Dividend Received Deduction
For corporate shareholders, the following ordinary distributions paid during the current fiscal year ended July 31, 2012 qualify for the corporate dividends received deduction. The Funds intend to pass through the maximum allowable percentage for 1099s.
| Balanced Allocation Fund | | | 38.08 | % |
| Conservative Allocation Fund | | | 11.02 | % |
| Growth Allocation Fund | | | 52.69 | % |
| Moderate Growth Allocation Fund | | | 60.63 | % |
For the fiscal year ended July 31, 2012, the Emerging Growth Fund designates $803, 139 as long-term capital gains.
Foreign Tax Income & Foreign Tax Credit
International Equity Fund intends to pass through a foreign tax credit to the shareholders. For the fiscal year ended July 31, 2012, the total amount of foreign source income is $850,814 or $0.38 per share. The total amount of foreign taxes to be paid is $44,970 or $0.02 per share. Your allocable share of the foreign tax credit will be reported on Form 1099 Div.
Proxy Voting
The Sub-Advisors are responsible for exercising the voting rights associated with the securities purchased and held by the Funds. A description of the policies and procedures that the Sub-Advisors use in fulfilling this responsibility and information regarding how those proxies were voted during the twelve month period ended June 30 are available without charge upon request by calling toll free 1.800.543.0407. These items are also available on the Securities and Exchange Commission’s (the Commission) website at http://www.sec.gov.
Quarterly Portfolio Disclosure
The Trust files a complete listing of portfolio holdings for each Fund as of the end of the first and third quarters of each fiscal year on Form N-Q. The complete listing (i) is available on the Commission’s website; (ii) may be reviewed and copied at the Commission’s Public Reference Room in Washington, DC; and (iii) will be made available to shareholders upon request by calling 1.800.543.0407. Information on the operation of the Public Reference Room may be obtained by calling 1-800-SEC-0330.
Schedule of Shareholder Expenses
As a shareholder of the Funds, you incur two types of costs: (1) transaction costs, including reinvested dividends or other distributions; and (2) ongoing costs, including investment advisory fees; distribution (12b-1) fees;
Other Items (Unaudited) (Continued)
and other Fund expenses. This example is intended to help you understand your ongoing costs (in dollars) of investing in the Funds and to compare these costs with the ongoing costs of investing in other mutual funds.
The example is based on an investment of $1,000 invested at the beginning of the period and held for the entire period, (February 1, 2012 through July 31, 2012).
Actual Expenses
The first line for each class of a Fund in the table below provides information about actual account values and actual expenses. You may use the information in this line, together with the amount you invested, to estimate the expenses that you paid over the period. Simply divide your account value by $1,000 (for example, an $8,600 account value divided by $1,000 = 8.6), then multiply the result by the number in the first line under the heading entitled “Expenses Paid During the Six Months Ended July 31, 2012” to estimate the expenses you paid on your account during this period.
Hypothetical Example for Comparison Purposes
The second line for each class of a Fund in the table below provides information about hypothetical account values and hypothetical expenses based on the Funds’ actual expense ratio and an assumed rate of return of 5% per year before expenses, which is not the Funds’ actual return. The hypothetical account values and expenses may not be used to estimate the actual ending account balance or expenses you paid for the period. You may use this information to compare the ongoing costs of investing in the Funds and other funds. To do so, compare this 5% hypothetical example with the 5% hypothetical examples that appear in the shareholder reports of the other funds.
| | | | | Net Expense | | | Beginning | | | Ending | | | Expenses | |
| | | | | Ratio | | | Account | | | Account | | | Paid During | |
| | | | | Annualized | | | Value | | | Value | | | the Period | |
| | | | | July 31, | | | February 1, | | | July 31, | | | Ended | |
| | | | | 2012 | | | 2012 | | | 2012 | | | July 31, 2012* | |
| Touchstone Dynamic Equity Fund | | | | | | | | | | | | | | | | | | |
| Class A | | Actual | | | 2.31 | % | | $ | 1,000.00 | | | $ | 1,063.63 | | | $ | 11.85 | *** |
| Class A | | Hypothetical | | | 2.31 | % | | $ | 1,000.00 | | | $ | 1,013.38 | | | $ | 11.56 | |
| | | | | | | | | | | | | | | | | | | |
| Class C | | Actual | | | 3.06 | % | | $ | 1,000.00 | | | $ | 1,059.82 | | | $ | 15.67 | *** |
| Class C | | Hypothetical | | | 3.06 | % | | $ | 1,000.00 | | | $ | 1,009.65 | | | $ | 15.29 | |
| | | | | | | | | | | | | | | | | | | |
| Class Y | | Actual | | | 2.06 | % | | $ | 1,000.00 | | | $ | 1,064.73 | | | $ | 10.58 | *** |
| Class Y | | Hypothetical | | | 2.06 | % | | $ | 1,000.00 | | | $ | 1,014.62 | | | $ | 10.32 | |
| | | | | | | | | | | | | | | | | | | |
| Institutional Class | | Actual | | | 2.01 | % | | $ | 1,000.00 | | | $ | 1,064.67 | | | $ | 10.32 | *** |
| Institutional Class | | Hypothetical | | | 2.01 | % | | $ | 1,000.00 | | | $ | 1,014.87 | | | $ | 10.07 | |
| | | | | | | | | | | | | | | | | | | |
| Touchstone Emerging Growth Fund | | | | | | | | | | | | | | | | | | |
| Class A | | Actual | | | 1.51 | % | | $ | 1,000.00 | | | $ | 1,018.83 | | | $ | 7.58 | |
| Class A | | Hypothetical | | | 1.51 | % | | $ | 1,000.00 | | | $ | 1,017.35 | | | $ | 7.57 | |
| | | | | | | | | | | | | | | | | | | |
| Class C | | Actual** | | | 2.14 | % | | $ | 1,000.00 | | | $ | 1,024.98 | | | $ | 6.33 | |
| Class C | | Hypothetical | | | 2.14 | % | | $ | 1,000.00 | | | $ | 1,014.22 | | | $ | 10.72 | |
| | | | | | | | | | | | | | | | | | | |
| Class Y | | Actual | | | 1.26 | % | | $ | 1,000.00 | | | $ | 1,020.30 | | | $ | 6.33 | |
| Class Y | | Hypothetical | | | 1.26 | % | | $ | 1,000.00 | | | $ | 1,018.60 | | | $ | 6.32 | |
| | | | | | | | | | | | | | | | | | | |
| Institutional Class | | Actual | | | 1.08 | % | | $ | 1,000.00 | | | $ | 1,020.91 | | | $ | 5.43 | |
| Institutional Class | | Hypothetical | | | 1.08 | % | | $ | 1,000.00 | | | $ | 1,019.49 | | | $ | 5.42 | |
| | | | | | | | | | | | | | | | | | | |
| Touchstone International Equity Fund | | | | | | | | | | | | | | | | | | |
| Class A | | Actual | | | 1.44 | % | | $ | 1,000.00 | | | $ | 973.36 | | | $ | 7.07 | |
| Class A | | Hypothetical | | | 1.44 | % | | $ | 1,000.00 | | | $ | 1,017.70 | | | $ | 7.22 | |
| | | | | | | | | | | | | | | | | | | |
| Class C | | Actual** | | | 2.14 | % | | $ | 1,000.00 | | | $ | 986.12 | | | $ | 6.21 | |
| Class C | | Hypothetical | | | 2.14 | % | | $ | 1,000.00 | | | $ | 1,014.22 | | | $ | 10.72 | |
Other Items (Unaudited) (Continued)
| | | | | Net Expense | | | Beginning | | | Ending | | | Expenses | |
| | | | | Ratio | | | Account | | | Account | | | Paid During | |
| | | | | Annualized | | | Value | | | Value | | | the Period | |
| | | | | July 31, | | | February 1, | | | July 31, | | | Ended | |
| | | | | 2012 | | | 2012 | | | 2012 | | | July 31, 2012* | |
| | | | | | | | | | | | | | | |
| Class Y | | Actual | | | 1.19 | % | | $ | 1,000.00 | | | $ | 975.85 | | | $ | 5.85 | |
| Class Y | | Hypothetical | | | 1.19 | % | | $ | 1,000.00 | | | $ | 1,018.95 | | | $ | 5.97 | |
| | | | | | | | | | | | | | | | | | | |
| Institutional Class | | Actual | | | 1.00 | % | | $ | 1,000.00 | | | $ | 975.82 | | | $ | 4.91 | |
| Institutional Class | | Hypothetical | | | 1.00 | % | | $ | 1,000.00 | | | $ | 1,019.89 | | | $ | 5.02 | |
| | | | | | | | | | | | | | | | | | | |
| Touchstone Balanced Allocation Fund | | | | | | | | | | | | | | | | | | |
| Class A | | Actual | | | 0.64 | % | | $ | 1,000.00 | | | $ | 1,025.32 | | | $ | 3.22 | |
| Class A | | Hypothetical | | | 0.64 | % | | $ | 1,000.00 | | | $ | 1,021.68 | | | $ | 3.22 | |
| | | | | | | | | | | | | | | | | | | |
| Class C | | Actual | | | 1.39 | % | | $ | 1,000.00 | | | $ | 1,021.72 | | | $ | 6.99 | |
| Class C | | Hypothetical | | | 1.39 | % | | $ | 1,000.00 | | | $ | 1,017.95 | | | $ | 6.97 | |
| | | | | | | | | | | | | | | | | | | |
| Class Y | | Actual | | | 0.39 | % | | $ | 1,000.00 | | | $ | 1,026.80 | | | $ | 1.96 | |
| Class Y | | Hypothetical | | | 0.39 | % | | $ | 1,000.00 | | | $ | 1,022.93 | | | $ | 1.96 | |
| | | | | | | | | | | | | | | | | | | |
| Institutional Class | | Actual | | | 0.39 | % | | $ | 1,000.00 | | | $ | 1,026.90 | | | $ | 1.98 | |
| Institutional Class | | Hypothetical | | | 0.39 | % | | $ | 1,000.00 | | | $ | 1,022.91 | | | $ | 1.97 | |
| | | | | | | | | | | | | | | | | | | |
| Touchstone Conservative Allocation Fund | | | | | | | | | | | | | | | | | | |
| Class A | | Actual | | | 0.61 | % | | $ | 1,000.00 | | | $ | 1,023.30 | | | $ | 3.07 | |
| Class A | | Hypothetical | | | 0.61 | % | | $ | 1,000.00 | | | $ | 1,021.83 | | | $ | 3.07 | |
| | | | | | | | | | | | | | | | | | | |
| Class C | | Actual | | | 1.36 | % | | $ | 1,000.00 | | | $ | 1,018.73 | | | $ | 6.83 | |
| Class C | | Hypothetical | | | 1.36 | % | | $ | 1,000.00 | | | $ | 1,018.10 | | | $ | 6.82 | |
| | | | | | | | | | | | | | | | | | | |
| Class Y | | Actual | | | 0.36 | % | | $ | 1,000.00 | | | $ | 1,024.47 | | | $ | 1.81 | |
| Class Y | | Hypothetical | | | 0.36 | % | | $ | 1,000.00 | | | $ | 1,023.07 | | | $ | 1.81 | |
| | | | | | | | | | | | | | | | | | | |
| Institutional Class | | Actual | | | 0.36 | % | | $ | 1,000.00 | | | $ | 1,024.65 | | | $ | 1.81 | |
| Institutional Class | | Hypothetical | | | 0.36 | % | | $ | 1,000.00 | | | $ | 1,023.07 | | | $ | 1.81 | |
| | | | | | | | | | | | | | | | | | | |
| Touchstone Growth Allocation Fund | | | | | | | | | | | | | | | | | | |
| Class A | | Actual | | | 0.57 | % | | $ | 1,000.00 | | | $ | 1,019.89 | | | $ | 2.87 | |
| Class A | | Hypothetical | | | 0.57 | % | | $ | 1,000.00 | | | $ | 1,022.02 | | | $ | 2.87 | |
| | | | | | | | | | | | | | | | | | | |
| Class C | | Actual | | | 1.32 | % | | $ | 1,000.00 | | | $ | 1,016.95 | | | $ | 6.62 | |
| Class C | | Hypothetical | | | 1.32 | % | | $ | 1,000.00 | | | $ | 1,018.30 | | | $ | 6.62 | |
| | | | | | | | | | | | | | | | | | | |
| Class Y | | Actual | | | 0.32 | % | | $ | 1,000.00 | | | $ | 1,021.45 | | | $ | 1.61 | |
| Class Y | | Hypothetical | | | 0.32 | % | | $ | 1,000.00 | | | $ | 1,023.27 | | | $ | 1.61 | |
| | | | | | | | | | | | | | | | | | | |
| Institutional Class | | Actual | | | 0.32 | % | | $ | 1,000.00 | | | $ | 1,018.28 | | | $ | 1.61 | |
| Institutional Class | | Hypothetical | | | 0.32 | % | | $ | 1,000.00 | | | $ | 1,023.27 | | | $ | 1.61 | |
| | | | | | | | | | | | | | | | | | | |
| Touchstone Moderate Growth Allocation Fund | | | | | | | | | | | | | | | | | | |
| Class A | | Actual | | | 0.57 | % | | $ | 1,000.00 | | | $ | 1,023.92 | | | $ | 2.87 | |
| Class A | | Hypothetical | | | 0.57 | % | | $ | 1,000.00 | | | $ | 1,022.03 | | | $ | 2.87 | |
| | | | | | | | | | | | | | | | | | | |
| Class C | | Actual | | | 1.32 | % | | $ | 1,000.00 | | | $ | 1,020.62 | | | $ | 3.90 | |
| Class C | | Hypothetical | | | 1.32 | % | | $ | 1,000.00 | | | $ | 1,018.30 | | | $ | 6.62 | |
| | | | | | | | | | | | | | | | | | | |
| Class Y | | Actual | | | 0.32 | % | | $ | 1,000.00 | | | $ | 1,025.55 | | | $ | 1.61 | |
| Class Y | | Hypothetical | | | 0.32 | % | | $ | 1,000.00 | | | $ | 1,023.27 | | | $ | 1.61 | |
Other Items (Unaudited) (Continued)
| | | | | Net Expense | | | Beginning | | | Ending | | | Expenses | |
| | | | | Ratio | | | Account | | | Account | | | Paid During | |
| | | | | Annualized | | | Value | | | Value | | | the Period | |
| | | | | July 31, | | | February 1, | | | July 31, | | | Ended | |
| | | | | 2012 | | | 2012 | | | 2012 | | | July 31, 2012* | |
| Institutional Class | | Actual | | | 0.32 | % | | $ | 1,000.00 | | | $ | 1,025.69 | | | $ | 1.61 | |
| Institutional Class | | Hypothetical | | | 0.32 | % | | $ | 1,000.00 | | | $ | 1,023.27 | | | $ | 1.61 | |
| * | Expenses are equal to the Fund's annualized expense ratio, multiplied by the average account value over the period, multiplied by 182/366 (to reflect one-half year period). |
| ** | The Fund began issuing Class C shares on April 16, 2012. Expenses are equal to the fund's annualized expense ratio multiplied by the expense ratio multiplied by the average account value over the period, multiplied by 107/366 (to reflect the period April 16, 2012 through July 31, 2012). Actual returns are for the period April 16, 2012 through July 31, 2012. |
| *** | Excluding interest and dividend expenses on securities sold short, your actual cost of investment in Class A, Class C, Class Y and Institutional Class would be $7.94, $11.77, $6.68 and $6.40, respectively. |
Other Items (Unaudited) (Continued)
Approval of Investment Advisory and Sub-Advisory Agreements
At a meeting held on February 15-16, 2012, the Board of Trustees (the “Board” or “Trustees”) of the Touchstone Strategic Trust (the “Trust”), and by a separate vote, the Independent Trustees of the Trust, approved an amendment to the Investment Advisory Agreement between the Trust and the Advisor adding each Fund and also initially approved a Sub-Advisory Agreement between the Advisor and each Fund’s respective Sub-Advisor.
In determining whether to approve the amendment to the Investment Advisory Agreement and the Sub-Advisory Agreements, the Advisor furnished information necessary for a majority of the Independent Trustees to make the determination that approval of the amendment to the Investment Advisory Agreement and each Sub-Advisory Agreement was in the best interests of the respective Funds and their shareholders. The information provided to the Board included: (1) a comparison of the Funds’ proposed advisory fee and other fees and anticipated expense ratios with those of comparable funds; (2) performance information of comparable investment products; (3) the Advisor’s and its affiliates’ estimated revenues and costs of providing services to the Funds; and (4) information about the Advisor’s and Sub-Advisors’ personnel. Prior to voting, the Independent Trustees reviewed the proposed approval of the amendment to the Investment Advisory Agreement and the Sub-Advisory Agreements with management and with experienced independent legal counsel and received materials from such counsel discussing the legal standards for their consideration of the Investment Advisory Agreement and each Sub-Advisory Agreement with respect to the Funds. The Independent Trustees also reviewed the proposed approval of the amendment to the Investment Advisory Agreement and each Sub-Advisory Agreement with independent legal counsel in private sessions at which no representatives of management were present.
In approving the amendment to the Investment Advisory Agreement, the Board considered various factors, among them: (1) the nature, extent and quality of services to be provided to the Funds, including the personnel that will provide such services; (2) the Advisor’s anticipated compensation and profitability; (3) a comparison of fees of comparable funds managed by the Advisor; (4) anticipated economies of scale; and (5) the terms of the Investment Advisory Agreement. The Board’s analysis of these factors is set forth below. The Independent Trustees were advised by independent legal counsel throughout the process.
Nature, Extent and Quality of Advisor Services. The Board considered the level and depth of knowledge of the Advisor, including the professional experience and qualifications of senior personnel. In evaluating the quality of services to be provided by the Advisor, the Board took into account its familiarity with the Advisor’s senior management through Board meetings, discussions and reports during the preceding year. The Board also took into account the Advisor’s compliance policies and procedures. The quality of administrative and other services provided to other funds managed by the Advisor, including the Advisor’s role in coordinating the activities of those funds’ other service providers, was also considered. The Board also considered the Advisor’s relationship with its affiliates and the resources available to them, as well as any potential conflicts of interest. The Board discussed the Advisor’s effectiveness in monitoring the performance of the Trust’s other subadvisors, and the Advisor’s timeliness in responding to performance issues. The Board considered the Advisor’s process for monitoring the Sub-Advisors, which would include an examination of both qualitative and quantitative elements of each Sub-Advisor’s organization, personnel, procedures, investment discipline, infrastructure and performance. The Board considered that the Advisor would conduct regular on-site compliance visits with each Sub-Advisor, during which the Advisor would examine a wide variety of factors, such as the financial condition of each Sub-Advisor, the quality of each Sub-Advisor’s systems, the effectiveness of each Sub-Advisor’s disaster recovery programs, trade allocation and execution procedures, compliance with each Sub-Advisor’s policies and procedures, results of regulatory examinations and any other factors that might affect the quality of services that each Sub-Advisor provides to the applicable Fund. The Board noted that the Advisor’s compliance monitoring processes also would include quarterly reviews of compliance reports, and that any issues arising from such reports and the Advisor’s compliance visits to each Sub-Advisor would be reported to the Board.
Other Items (Unaudited) (Continued)
The Trustees concluded that they were satisfied with the nature, extent and quality of services to be provided to each Fund by the Advisor under the Investment Advisory Agreement.
Advisor’s Compensation and Profitability. The Board took into consideration the financial condition and anticipated profitability of the Advisor and its affiliates and the direct and indirect benefits to be derived by the Advisor and its affiliates from the Advisor’s relationship with the Funds. The Board noted that the Advisor had contractually agreed to waive advisory fees and administrative fees and/or reimburse expenses in order to limit the Funds’ net operating expenses and will pay sub-advisory fees out of the advisory fees the Advisor receives from the Funds. The Board reviewed the anticipated profitability of the Advisor’s relationship with the Funds and also considered whether the Advisor has the financial wherewithal to provide a high level of services to the Funds, noting the ongoing commitment of the Advisor’s parent company with respect to providing support and resources as needed. The Board also considered that the Funds’ prospective distributor, an affiliate of the Advisor, will receive Rule 12b-1 distribution fees from the Funds and will receive a portion of the sales charges on sales or redemptions of certain classes of shares. The Board also noted that the Advisor will derive benefits to its reputation and other benefits from its association with the Funds.
The Board recognized that the Advisor should be entitled to earn a reasonable level of profits in exchange for the level of services it will provide to each Fund and the entrepreneurial risk that it will assume as Advisor. Based upon their review, the Trustees concluded that the Advisor’s and its affiliates’ level of profitability, if any, to be derived from their relationship with each Fund was reasonable and not excessive.
Expenses and Performance. The Board compared each Fund’s proposed advisory fees and total expense ratios with those of comparable funds. The Board took into account the Funds’ estimated total expenses for its Class A, Class C, Class Y and Institutional Shares after estimated reimbursements. The Board also took into account that the Advisor had contractually agreed to limit the Funds’ net operating expenses until at least April 16, 2014.
The Board also considered the effect of each Fund’s potential growth and size on its performance and expenses. The Board noted that the Advisor had agreed to wave a portion of its fees and/or reimburse expenses of the Funds in order to reduce each Fund’s operating expenses to targeted levels. The Board noted that the sub-advisory fees under the Sub-Advisory Agreement with respect to each Fund will be paid by the Advisor out of the advisory fee it receives from the Fund and considered the impact of such sub-advisory fees on the profitability of the Advisor. In reviewing the proposed expense ratios and performance of the respective Acquired Funds, the Board also took into account the nature, extent and quality of the services to be provided to the Funds by the Advisor and its affiliates.
The Board considered, among other data, the specific factors set forth below with respect to each Fund:
Touchstone Dynamic Equity Fund. The Fund’s proposed total expense ratio (net of applicable expense waivers and reimbursements) was below the median of its peer group. The Board took into account that the Old Mutual Analytic Fund (the “Acquired Fund”), a series of Old Mutual Funds I, was expected to be merged into the Fund on or about April 16, 2012. Accordingly, the Board considered the performance of the Acquired Fund under the management of the Sub-Advisor, the Acquired Fund’s current investment advisor. The Board took into account that the portfolio management team currently managing the Acquired Fund was expected to manage the Fund following the merger of the Acquired Fund into the Fund.
Touchstone Emerging Growth Fund. The Fund’s proposed total expense ratio (net of applicable expense waivers and reimbursements) was below the median of its peer group. The Board took into account that the Old Mutual Copper Rock Emerging Growth Fund (the “Acquired Fund”), a series of Old Mutual Funds I, was expected to be merged into the Fund on or about April 16, 2012. Accordingly, the Board considered the performance of the Acquired Fund under the management of the Sub-Advisor, the Acquired Fund’s current investment
Other Items (Unaudited) (Continued)
advisor. The Board took into account that the portfolio management team currently managing the Acquired Fund was expected to manage the Fund following the merger of the Acquired Fund into the Fund.
Touchstone International Equity Fund. The Fund’s proposed total expense ratio (net of applicable expense waivers and reimbursements) was below the median of its peer group. The Board took into account that the Old Mutual International Equity Fund (the “Acquired Fund”), a series of Old Mutual Funds I, was expected to be merged into the Fund on or about April 16, 2012. Accordingly, the Board considered the performance of the Acquired Fund under the management of the Sub-Advisor, the Acquired Fund’s current investment advisor. The Board took into account that the portfolio management team currently managing the Acquired Fund was expected to manage the Fund following the merger of the Acquired Fund into the Fund.
Touchstone Conservative Allocation Fund. The Fund’s proposed total expense ratio (net of applicable expense waivers and reimbursements) was at the median of its peer group. The Board took into account that the Old Mutual Asset Allocation Conservative Portfolio (the “Acquired Fund”), a series of Old Mutual Funds I, was expected to be merged into the Fund on or about April 16, 2012. Accordingly, the Board considered the performance of the Acquired Fund under the management of the Sub-Advisor, the Acquired Fund’s current investment advisor. The Board took into account that the portfolio management team currently managing the Acquired Fund was expected to manage the Fund following the merger of the Acquired Fund into the Fund.
Touchstone Balanced Allocation Fund. The Fund’s proposed total expense ratio (net of applicable expense waivers and reimbursements) was below the median of its peer group. The Board took into account that the Old Mutual Asset Allocation Balanced Portfolio (the “Acquired Fund”), a series of Old Mutual Funds I, was expected to be merged into the Fund on or about April 16, 2012. Accordingly, the Board considered the performance of the Acquired Fund under the management of the Sub-Advisor, the Acquired Fund’s current investment advisor. The Board took into account that the portfolio management team currently managing the Acquired Fund was expected to manage the Fund following the merger of the Acquired Fund into the Fund.
Touchstone Moderate Growth Allocation Fund. The Fund’s proposed total expense ratio (net of applicable expense waivers and reimbursements) was slightly above the median of its peer group. The Board took into account that the Old Mutual Asset Allocation Moderate Growth Portfolio (the “Acquired Fund”), a series of Old Mutual Funds I, was expected to be merged into the Fund on or about April 16, 2012. Accordingly, the Board considered the performance of the Acquired Fund under the management of the Sub-Advisor, the Acquired Fund’s current investment advisor. The Board took into account that the portfolio management team currently managing the Acquired Fund was expected to manage the Fund following the merger of the Acquired Fund into the Fund.
Touchstone Growth Allocation Fund. The Fund’s proposed total expense ratio (net of applicable expense waivers and reimbursements) was above the median of its peer group. The Board took into account that the Old Mutual Asset Allocation Growth Portfolio (the “Acquired Fund”), a series of Old Mutual Funds I, was expected to be merged into the Fund on or about April 16, 2012. Accordingly, the Board considered the performance of the Acquired Fund under the management of the Sub-Advisor, the Acquired Fund’s current investment advisor. The Board took into account that the portfolio management team currently managing the Acquired Fund was expected to manage the Fund following the merger of the Acquired Fund into the Fund.
Economies of Scale. The Board considered the effect of each Fund’s potential growth and size on its performance and expenses. The Board took into account management’s discussion of the Funds’ advisory fee structure. The Board considered the proposed advisory fees under the Investment Advisory Agreement as a percentage of assets at different asset levels and possible economies of scale that might be realized if the assets of each Fund increase. The Board noted that, with the exception of the Touchstone Emerging Growth Fund, the proposed advisory fee schedule for the Funds contained breakpoints that would reduce the advisory fee rate on assets above specified levels as each Fund’s assets increased. The Board also noted that if a Fund’s assets increase over
Other Items (Unaudited) (Continued)
time, the Fund might realize other economies of scale if assets increase proportionally more than certain other expenses. The Board also considered the fact that, under the Investment Advisory Agreement, the advisory fee payable to the Advisor by a Fund will be reduced by the total sub-advisory fee paid by the Advisor to the Fund’s Sub-Advisor.
Conclusion. In considering the approval of the amendment to the Funds’ Investment Advisory Agreement, the Board, including the Independent Trustees, did not identify any single factor as controlling, and each Trustee may have attributed different weights to the various factors. The Trustees evaluated all information available to them on a Fund-by-Fund basis, and their determinations were made separately with respect to each Fund. The Board reached the following conclusions regarding the Investment Advisory Agreement with the Advisor, among others: (a) the Advisor demonstrated that it possesses the capability and resources to perform the duties required of it under the Investment Advisory Agreement; (b) the Advisor maintains an appropriate compliance program; (c) each Fund’s proposed advisory fee is reasonable relative to those of similar funds and the services to be provided by the Advisor. Based on their conclusions, the Trustees determined with respect to each Fund that approval of the amendment to the Investment Advisory Agreement was in the best interests of the Fund and its shareholders.
In approving the Funds’ respective Sub-Advisory Agreements, the Board considered various factors with respect to each Fund and the applicable Sub-Advisory Agreement, among them: (1) the nature, extent and quality of services to be provided to the Fund, including the personnel providing such services; (2) the Sub-Advisor’s proposed compensation; (3) a comparison of the proposed sub-advisory fee and the performance of the respective Acquired Funds, which were to be merged into the Funds; and (4) the terms of the Sub-Advisory Agreement. The Board’s analysis of these factors is set forth below. The Independent Trustees were advised by independent legal counsel throughout the process.
Nature, Extent and Quality of Services Provided; Investment Personnel. The Board considered information provided by the Advisor regarding the services to be provided by each Sub-Advisor. The Board also considered each Sub-Advisor’s level of knowledge and investment style. The Board reviewed the experience and credentials of the applicable investment personnel who will be responsible for managing the investment of portfolio securities with respect to the Funds. The Board also noted each Sub-Advisor’s brokerage practices.
Sub-Advisor’s Compensation. The Board also took into consideration the financial condition of each Sub-Advisor and any indirect benefits to be derived by each Sub-Advisor and its affiliates from the Sub-Advisor’s relationship with the Funds. In considering the anticipated profitability to each Sub-Advisor of its relationship with the Funds, the Board noted the undertaking of the Advisor to maintain expense limitations for the Funds and also noted that the sub-advisory fees under the Sub-Advisory Agreements will be paid by the Advisor out of the advisory fees that it will receive under the Investment Advisory Agreement and are negotiated at arm’s-length. As a consequence, the anticipated profitability to each Sub-Advisor of its relationship with a Fund was not a substantial factor in the Board’s deliberations. For similar reasons, the Board did not consider the potential economies of scale in each Sub-Advisor’s management of the applicable Fund to be a substantial factor in its consideration, although the Board noted that, with the exception of the Touchstone Emerging Growth Fund, the proposed sub-advisory fee schedule for each Fund contained breakpoints that would reduce the sub-advisory fee rate on assets above specified levels as the applicable Fund’s assets increased.
Sub-Advisory Fees and Fund Performance. The Board considered that each Fund will pay an advisory fee to the Advisor and that the Advisor will pay a sub-advisory fee to the Sub-Advisor out of the advisory fee it receives from the respective Fund. The Board considered the amount to be retained by the Advisor and the sub-advisory fee to be paid to each Sub-Advisor with respect to the various services to be provided by the Advisor and the Sub-Advisor. The Board also noted that the Advisor negotiated the sub-advisory fee with each of the Sub-Advisors at arm’s-length. The Board considered the proposed sub-advisory fee for each Fund and concluded that each
Other Items (Unaudited) (Continued)
Fund’s proposed sub-advisory fee was reasonable in light of the services to be received by the Fund and the other factors considered.
As noted above, the Board considered the Sub-Advisors’ long-term performance record in managing the respective Acquired Funds, which were each to be merged into the Funds. The Board also noted the Advisor’s expertise and resources in monitoring the performance, investment style and risk-adjusted performance of the Trust’s other sub-advisors. The Board was mindful of the Advisor’s focus on the performance of sub-advisors and the Advisor’s ways of addressing underperformance.
Conclusion. In considering the approval of the Sub-Advisory Agreement with respect to each Fund, the Board, including the Independent Trustees, did not identify any single factor as controlling, and each Trustee may have attributed different weights to the various factors. The Board reached the following conclusions regarding each Sub-Advisory Agreement, among others: (a) the Sub-Advisor is qualified to manage each Fund’s assets in accordance with the Fund’s investment goals and policies; (b) the Sub-Advisor maintains an appropriate compliance program; (c) each Fund’s proposed advisory fee is reasonable relative to those of similar funds and to the services to be provided by the Advisor and the Sub-Advisor; and (e) the Sub-Advisor’s proposed investment strategies are appropriate for pursuing the investment goals of each Fund. Based on its conclusions, the Board determined that approval of the Sub-Advisory Agreement with respect to each Fund was in the best interests of the Fund and its shareholders.
Management of the Trust (Unaudited)
Listed below is basic information regarding the Trustees and principal officers of the Trust. The Trust’s Statement of Additional Information includes additional information about the Trustees and is available, without charge, upon request by calling 1.800.543.0407.
| Interested Trustees1: | | | | | | |
| | | | | | | | | Number | | |
| | | | | | | | | of Funds | | |
| | | | | | | | | Overseen | | |
| | | | | Term of | | | | in the | | |
| Name | | Position(s) | | Office2 And | | | | Touchstone | | Other |
| Address | | Held with | | Length of | | Principal Occupation(s) | | Fund | | Directorships |
| Age | | Trust | | Time Served | | During Past 5 Years | | Complex3 | | Held4 |
Jill T. McGruder Touchstone Advisors, Inc 303 Broadway Cincinnati, OH Year of Birth: 1955 | | Trustee and President | | Until retirement at age 75 or until she resigns or is removed Trustee since 1999 | | President and CEO of IFS Financial Services, Inc. (a holding company). | | 56 | | Director of LaRosa’s (a restaurant chain), Capital Analysts Incorporated (an investment advisor and broker-dealer), IFS Financial Services, Inc. (a holding company), Integrity and National Integrity Life Insurance Co., Touchstone Securities (the Trust’s distributor), Touchstone Advisors (the Trust’s investment advisor and administrator) and W&S Financial Group Distributors (a distribution company). |
| Independent Trustees: | | | | | | | | | | |
Phillip R. Cox 105 East Fourth Street Cincinnati, OH Year of Birth: 1947 | | Trustee | | Until retirement at age 75 or until he resigns or is removed Trustee since 1999 | | President and Chief Executive Officer of Cox Financial Corp. (a financial services company). | | 56 | | Director of Cincinnati Bell (a communications company), Bethesda Inc. (a hospital), Timken Co. (a manufacturing company), Diebold (a technology solutions company), and Ohio Business Alliance for Higher Education. Director of Duke Energy from 1994-2008. |
H. Jerome Lerner c/o Touchstone Advisors, Inc. 303 Broadway Cincinnati, OH Year of Birth: 1938 | | Trustee | | Until retirement at age 75 or until he resigns or is removed Trustee since 1989 | | Principal of HJL Enterprises (a privately held investment company). | | 56 | | BASCO Shower Enclosures (a design and manufacturing company); Hebrew Union College - Jewish Institute of Religion. |
Management of the Trust (Continued)
| Independent Trustees (Continued): | | | | |
| | | | | | | | | Number | | |
| | | | | | | | | of Funds | | |
| | | | | | | | | Overseen | | |
| | | | | Term of | | | | in the | | |
| Name | | Position(s) | | Office2 And | | | | Touchstone | | Other |
| Address | | Held with | | Length of | | Principal Occupation(s) | | Fund | | Directorships |
| Age | | Trust | | Time Served | | During Past 5 Years | | Complex3 | | Held4 |
Donald C. Siekmann c/o Touchstone Advisors, Inc. 303 Broadway Cincinnati, OH Year of Birth: 1938 | | Trustee | | Until retirement at age 75 or until he resigns or is removed Trustee since 2005 | | Executive for Duro Bag Manufacturing Co. (a bag manufacturer) from 2002-2008. | | 56 | | Society for Preservation of Music Hall; Riverfront Mutual Funds (until 2008). |
John P. Zanotti c/o Touchstone Advisors, Inc. 303 Broadway Cincinnati, OH Year of Birth: 1948 | | Trustee | | Until retirement at age 75 or until he resigns or is removed Trustee since 2002 | | Chairman of Integrated Media Technologies (a media company). | | 56 | | Cincinnati Children’s Hospital from 1994-2010. |
Susan J. Hickenlooper c/o Touchstone Advisors, Inc. 303 Broadway Cincinnati, OH Year of Birth: 1946 | | Trustee | | Until retirement at age 75 or until she resigns or is removed Trustee since 2009 | | Trustee of Episcopal Retirement Homes Foundation. | | 56 | | Trustee of Cincinnati Parks Foundation (a charitable organization) from 2000-present; Trustee of Episcopal Retirement Homes Foundation from 1998-2011. |
1 Ms. McGruder, as a director of the Advisor and the Trust’s Distributor, and an officer of affiliates of the Advisor and the Trust’s Distributor, is an “interested person” of the Trust within the meaning of Section 2(a)(19) of the 1940 Act.
2 Each Trustee is elected to serve until the age of 75 or until he or she sooner resigns or is removed.
3 The Touchstone Fund Complex consists of 18 series of the Trust, 3 series of Touchstone Tax-Free Trust, 19 series of Touchstone Funds Group Trust, 4 series of Touchstone Investment Trust, 1 series of Touchstone Institutional Funds Trust, and 11 variable annuity series of Touchstone Variable Series Trust.
4 Each Trustee is also a Trustee of Touchstone Funds Group Trust, Touchstone Tax-Free Trust, Touchstone Investment Trust, Touchstone Institutional Funds Trust, and Touchstone Variable Series Trust.
Management of the Trust (Continued)
| Principal Officers1: | | | | | | |
| | | | | | | | | Number | | |
| | | | | | | | | of Funds | | |
| | | | | | | | | Overseen | | |
| | | | | Term of | | | | in the | | |
| Name | | Position(s) | | Office2 And | | | | Touchstone | | Other |
| Address | | Held with | | Length of | | Principal Occupation(s) | | Fund | | Directorships |
| Age | | Trust | | Time Served | | During Past 5 Years | | Complex2 | | Held |
Jill T. McGruder Touchstone Advisors, Inc. 303 Broadway Cincinnati, OH Year of Birth: 1955 | | President | | Until resignation, removal or disqualification President since 2004; President from 2000-2002 | | See biography above. | | 56 | | See biography above. |
Steven M. Graziano Touchstone Advisors, Inc. 303 Broadway Cincinnati, OH Year of Birth: 1954 | | Vice President | | Until resignation, removal or disqualification Vice President since 2009 | | President of Touchstone Advisors, Inc.; Executive Vice President of Pioneer Investment Management, Head of Retail Distribution and Strategic Marketing 2007- 2008; Executive Vice President of Pioneer Investment Management, Chief Marketing Officer 2002-2007. | | 56 | | None |
Timothy D. Paulin Touchstone Advisors, Inc. 303 Broadway Cincinnati, OH Year of Birth: 1963 | | Vice President | | Until resignation, removal or disqualification Vice President since 2010 | | Senior Vice President of Investment Research and Product Management of Touchstone Advisors, Inc.; Principal of Klein Decisions. | | 56 | | None |
Michael R. Moser3 Western & Southern Financial Group 400 Broadway Cincinnati, OH Year of Birth: 1968 | | Chief Compliance Officer | | Until resignation, removal or disqualification Chief Compliance Officer since September 2012 | | Vice President and Chief Compliance Officer of the Western & Southern Financial Group and Chief Compliance Officer of Touchstone Advisors. | | 56 | | None |
Terrie A. Wiedenheft Touchstone Advisors, Inc. 303 Broadway Cincinnati, OH Year of Birth: 1962 | | Controller and Treasurer | | Until resignation, removal or disqualification Controller since 2000 Treasurer since 2003 | | Chief Financial Officer and Senior Vice President of IFS Financial Services, Inc. | | 56 | | None |
Management of the Trust (Continued)
| Principal Officers1 (Continued): | | | | |
| | | | | | | | | Number | | |
| | | | | | | | | of Funds | | |
| | | | | | | | | Overseen | | |
| | | | | Term of | | | | in the | | |
| Name | | Position(s) | | Office2 And | | | | Touchstone | | Other |
| Address | | Held with | | Length of | | Principal Occupation(s) | | Fund | | Directorships |
| Age | | Trust | | Time Served | | During Past 5 Years | | Complex2 | | Held |
Elizabeth R. Freeman BNY Mellon 201 Washington Street Boston, MA Year of Birth: 1962 | | Secretary | | Until resignation, removal or disqualification. Secretary since 2011 | | Managing Director and Senior Counsel at BNY Mellon Investment Servicing (US) Inc. | | 56 | | None |
1 Each officer also holds the same office with Touchstone Funds Group Trust, Touchstone Tax-Free Trust, Touchstone Investment Trust, Touchstone Institutional Funds Trust, and Touchstone Variable Series Trust.
2 The Touchstone Fund Complex consists of 18 series of the Trust, 3 series of Touchstone Tax-Free Trust, 19 series of Touchstone Funds Group Trust, 4 series of Touchstone Investment Trust, 1 series of Touchstone Institutional Funds Trust, and 11 variable annuity series of Touchstone Variable Series Trust.
3 Joseph Melcher resigned as Chief Compliance Officer effective September 5, 2012.
This page intentionally left blank.
PRIVACY PROTECTION POLICY
We Respect Your Privacy
Thank you for your decision to invest with us. Touchstone and its affiliates have always placed a high value on the trust and confidence our clients place in us. We believe that confidence must be earned and validated through time. In today’s world, when technology allows the sharing of information at light speeds, trust must be reinforced by our sincere pledge to take the steps necessary to ensure that the information you share with us is treated with respect and confidentiality.
Our Pledge to Our Clients
| · | We collect only the information we need to service your account and administer our business. |
| · | We are committed to keeping your information confidential and we place strict limits and controls on the use and sharing of your information. |
| · | We make every effort to ensure the accuracy of your information. |
We Collect the Following Nonpublic Personal Information About You:
| · | Information we receive from you on or in applications or other forms, correspondence, or conversations, including, but not limited to, your name, address, phone number, social security number, assets, income and date of birth; and |
| · | Information about your transactions with us, our affiliates, or others, including, but not limited to, your account number and balance, payment history, parties to transactions, cost basis information, and other financial information. |
Categories of Information We Disclose and Parties to Whom We Disclose
We do not disclose any nonpublic personal information about our current or former clients to nonaffiliated third parties, except as required or permitted by law.
We Place Strict Limits and Controls on the Use and Sharing of Your Information
| · | We restrict access to nonpublic personal information about you to authorized employees who need the information to administer your business. |
| · | We maintain physical, electronic and procedural safeguards that comply with federal standards to protect this information. |
| · | We do not disclose any nonpublic personal information about our current or former clients to anyone, except as required or permitted by law or as described in this document. |
| · | We will not sell your personal information to anyone. |
We May Provide Information to Service Your Account
Sometimes it is necessary to provide information about you to various companies such as transfer agents, custodians, broker-dealers and marketing service firms to facilitate the servicing of your account. These organizations have a legitimate business need to see some of your personal information in order for us to provide service to you. We may disclose to these various companies the information that we collect as described above. We require that these companies, including our own subsidiaries and affiliates, strictly maintain the confidentiality of this information and abide by all applicable laws. Companies within our corporate family that may receive this information are financial service providers and insurance companies. We do not permit these associated companies to sell the information for their own purposes, and we never sell our customer information.
This policy is applicable to the following affiliated companies: Touchstone Funds Group Trust, Touchstone Investment Trust, Touchstone Strategic Trust, Touchstone Tax-Free Trust, Touchstone Variable Series Trust, Touchstone Institutional Funds Trust, Touchstone Securities, Inc.* and W&S Brokerage Services, Inc.
* Touchstone Securities, Inc. serves as the underwriter to the Touchstone Funds.
A Member of Western & Southern Financial Group®
The Privacy Protection Policy is not part of the Annual Report.
 |
| 303 Broadway, Suite 1100 |
| Cincinnati, OH 45202-4203 |
| |
| |
| |
| |
| |
| |
| |
| |
| |
| |
| |
| |
| |
 |
| Go paperless, sign up today at: |
| www.touchstoneinvestments.com/home |
| |
| Touchstone Investments |
| |
| Distributor |
| Touchstone Securities, Inc.* |
| 303 Broadway |
| Cincinnati, Ohio 45202-4203 800.638.8194 |
| www.touchstoneinvestments.com |
| |
| Investment Advisor |
| Touchstone Advisors, Inc.* |
| 303 Broadway |
| Cincinnati, Ohio 45202-4203 |
| |
| Transfer Agent |
| BNY Mellon Investment Servicing (US) Inc. |
| 4400 Computer Drive |
| Westborough, MA 01581 |
| |
| Shareholder Service |
| 800.543.0407 |
| |
| * A Member of Western & Southern Financial Group |
Item 2. Code of Ethics.
| (a) | The registrant, as of the end of the period covered by this report, has adopted a code of ethics that applies to the registrant’s principal executive officer, principal financial officer, principal accounting officer or controller, or persons performing similar functions, regardless of whether these individuals are employed by the registrant or a third party. |
| (c) | There have been no amendments, during the period covered by this report, to a provision of the code of ethics that applies to the registrant’s principal executive officer, principal financial officer, principal accounting officer or controller, or persons performing similar functions, regardless of whether these individuals are employed by the registrant or a third party, and that relates to any element of the code of ethics description. |
| (d) | The registrant has not granted any waivers, including an implicit waiver, from a provision of the code of ethics that applies to the registrant’s principal executive officer, principal financial officer, principal accounting officer or controller, or persons performing similar functions, regardless of whether these individuals are employed by the registrant or a third party, that relates to one or more of the items set forth in paragraph (b) of this item’s instructions. |
Item 3. Audit Committee Financial Expert.
The registrant’s Board of Trustees has determined that the registrant has at least one audit committee financial expert serving on its audit committee. Mr. Donald Siekmann is the registrant’s audit committee financial expert and is an independent trustee within the meaning of the Investment Company Act of 1940, as amended (the “1940 Act”).
Item 4. Principal Accountant Fees and Services.
Audit Fees
| (a) | The aggregate fees billed for professional services rendered by the principal accountant for the audit of the registrant's annual financial statements or services that are normally provided by the accountant in connection with statutory and regulatory filings or engagements from the period April 1, 2012 through fiscal year ended July 31, 2012 is $153,800. The Funds were acquired by Touchstone Strategic Trust on April 16, 2012. |
Audit-Related Fees
| (b) | The aggregate fees billed for assurance and related services by the principal accountant that are reasonably related to the performance of the audit of the registrant's financial statements and are not reported under paragraph (a) of this Item from the period April 1, 2012 through fiscal year ended July 31, 2012 is $0. The Funds were acquired by Touchstone Strategic Trust on April 16, 2012. |
Tax Fees
| (c) | The fees for tax compliance services from the period April 1, 2012 through fiscal year ended July 31, 2012 is $25,000. The Funds were acquired by Touchstone Strategic Trust on April 16, 2012. Fees for 2012 relate to the preparation of federal income and excise tax returns and review of capital gains distribution calculations. |
All Other Fees
| (d) | There were no other fees for all other services from the period April 1, 2012 through fiscal year end July 31, 2012. The Funds were acquired by Touchstone Strategic Trust on April 16, 2012. |
| (e)(1) | Disclose the audit committee's pre-approval policies and procedures described in paragraph (c)(7) of Rule 2-01 of Regulation S-X. |
The Audit Committee’s pre-approval policies describe the types of audit, audit-related, tax and other services that have the general pre-approval of the Audit Committee. The pre-approval policies provide that annual audit service fees, tax services not specifically granted pre-approval, services exceeding pre-approved cost levels and other services that have not received general pre-approval will be subject to specific pre-approval by the Audit Committee. The pre-approval policies further provide that the Committee may grant general pre-approval to other audit services (statutory audits and services associated with SEC registration statements, periodic reports and other documents filed with the SEC or other documents issued in connection with securities offerings), audit-related services (accounting consultations related to accounting, financial reporting or disclosure matters not classified as “audit services,” assistance with understanding and implementing new accounting and financial reporting guidance from rulemaking authorities, agreed-upon or expanded audit procedures related to accounting and/or billing records required to respond to or comply with financial, accounting or regulatory reporting matters and assistance with internal control reporting requirements under Form N-SAR and Form N-CSR), tax services that have historically been provided by the auditor that the Committee believes would not impair the independence of the auditor and are consistent with the SEC’s rules on auditor independence and permissible non-audit services classified as “all other services” that are routine and recurring services.
| (e)(2) | All services described in paragraphs (c) through (d) of Item 4 were approved by the Audit Committee. Not applicable for paragraph (b) of Item 4. |
| (f) | The percentage of hours expended on the principal accountant's engagement to audit the registrant's financial statements for the most recent fiscal year that were attributed to work performed by persons other than the principal accountant's full-time, permanent employees was less than fifty percent. |
| (g) | The aggregate non-audit fees billed by the registrant's accountant for services rendered to the registrant, and rendered to the registrant's investment adviser (not including any sub-adviser whose role is primarily portfolio management and is subcontracted with or overseen by another investment adviser), and any entity controlling, controlled by, or under common control with the adviser that provides ongoing services to the registrant from the period April 1, 2012 through fiscal year ended July 31, 2012 is $25,000. The Funds were acquired by Touchstone Strategic Trust on April 16, 2012. |
| (h) | The registrant's audit committee of the board of trustees has considered whether the provision of non-audit services that were rendered to the registrant's investment adviser (not including any sub-adviser whose role is primarily portfolio management and is subcontracted with or overseen by another investment adviser), and any entity controlling, controlled by, or under common control with the investment adviser that provides ongoing services to the registrant that were not pre-approved pursuant to paragraph (c)(7)(ii) of Rule 2-01 of Regulation S-X is compatible with maintaining the principal accountant's independence. |
Item 5. Audit Committee of Listed registrants.
Not applicable.
Item 6. Investments.
| (a) | Schedule of Investments in securities of unaffiliated issuers as of the close of the reporting period is included as part of the report to shareholders filed under Item 1 of this form. |
Item 7. Disclosure of Proxy Voting Policies and Procedures for Closed-End Management Investment Companies.
Not applicable.
Item 8. Portfolio Managers of Closed-End Management Investment Companies.
Not applicable.
Item 9. Purchases of Equity Securities by Closed-End Management Investment Company and Affiliated Purchasers.
Not applicable.
Item 10. Submission of Matters to a Vote of Security Holders.
There have been no material changes to the procedures by which the shareholders may recommend nominees to the registrant’s board of trustees, where those changes were implemented after the registrant last provided disclosure in response to the requirements of Item 407(c)(2)(iv) of Regulation S-K (17 CFR 229.407) (as required by Item 22(b)(15) of Schedule 14A (17 CFR 240.14a-101)), or this Item.
Item 11. Controls and Procedures.
| (a) | The registrant’s principal executive and principal financial officers, or persons performing similar functions, have concluded that the registrant’s disclosure controls and procedures (as defined in Rule 30a-3(c) under the Investment Company Act of 1940, as amended (the “1940 Act”) (17 CFR 270.30a-3(c))) are effective, as of a date within 90 days of the filing date of the report that includes the disclosure required by this paragraph, based on their evaluation of these controls and procedures required by Rule 30a-3(b) under the 1940 Act (17 CFR 270.30a-3(b)) and Rules 13a-15(b) or 15d-15(b) under the Securities Exchange Act of 1934, as amended (17 CFR 240.13a-15(b) or 240.15d-15(b)). |
| (b) | There were no changes in the registrant’s internal control over financial reporting (as defined in Rule 30a-3(d) under the 1940 Act (17 CFR 270.30a-3(d)) that occurred during the registrant’s second fiscal quarter of the period covered by this report that has materially affected, or is reasonably likely to materially affect, the registrant’s internal control over financial reporting. |
Item 12. Exhibits.
| (a)(1) | Code of ethics, or any amendment thereto, that is the subject of disclosure required by Item 2 is attached hereto. |
| (a)(2) | Certifications pursuant to Rule 30a-2(a) under the 1940 Act and Section 302 of the Sarbanes-Oxley Act of 2002 are attached hereto. |
| (b) | Certifications pursuant to Rule 30a-2(b) under the 1940 Act and Section 906 of the Sarbanes-Oxley Act of 2002 are attached hereto. |
SIGNATURES
Pursuant to the requirements of the Securities Exchange Act of 1934 and the Investment Company Act of 1940, the registrant has duly caused this report to be signed on its behalf by the undersigned, thereunto duly authorized.
(Registrant) Touchstone Strategic Trust
By (Signature and Title)* /s/ Jill T. McGruder
Jill T. McGruder, President
(principal executive officer)
Date 9/24/12
Pursuant to the requirements of the Securities Exchange Act of 1934 and the Investment Company Act of 1940, this report has been signed below by the following persons on behalf of the registrant and in the capacities and on the dates indicated.
By (Signature and Title)* /s/ Jill T. McGruder
Jill T. McGruder, President
(principal executive officer)
Date 9/24/12
By (Signature and Title)* /s/ Terrie A. Wiedenheft
Terrie A. Wiedenheft, Controller and Treasurer
(principal financial officer)
Date 9/24/12
* Print the name and title of each signing officer under his or her signature.