UNITED STATES
SECURITIES AND EXCHANGE COMMISSION
Washington, D.C. 20549
FORM N-CSR
CERTIFIED SHAREHOLDER REPORT OF REGISTERED MANAGEMENT INVESTMENT COMPANIES
Investment Company Act file number 811-03651
Touchstone Strategic Trust-December Funds
(Exact name of registrant as specified in charter)
303 Broadway, Suite 1100
Cincinnati, Ohio 45202-4203
(Address of principal executive offices) (Zip code)
Jill T. McGruder
303 Broadway, Suite 1100
Cincinnati, Ohio 45202-4203
(Name and address of agent for service)
Registrant's telephone number, including area code: 800-638-8194
Date of fiscal year end: December 31
Date of reporting period: December 31, 2012
Form N-CSR is to be used by management investment companies to file reports with the Commission not later than 10 days after the transmission to stockholders of any report that is required to be transmitted to stockholders under Rule 30e-1 under the Investment Company Act of 1940 (17 CFR 270.30e-1). The Commission may use the information provided on Form N-CSR in its regulatory, disclosure review, inspection, and policymaking roles.
A registrant is required to disclose the information specified by Form N-CSR, and the Commission will make this information public. A registrant is not required to respond to the collection of information contained in Form N-CSR unless the Form displays a currently valid Office of Management and Budget ("OMB") control number. Please direct comments concerning the accuracy of the information collection burden estimate and any suggestions for reducing the burden to Secretary, Securities and Exchange Commission, 100 F Street, NE, Washington, DC 20549. The OMB has reviewed this collection of information under the clearance requirements of 44 U.S.C. § 3507.
Item 1. Reports to Stockholders.
The Report to Shareholders is attached herewith.
December 31, 2012
Annual Report
Touchstone Strategic Trust
Touchstone Dynamic Equity Fund
Touchstone Emerging Growth Fund
Touchstone International Equity Fund
Touchstone Balanced Allocation Fund
Touchstone Conservative Allocation Fund
Touchstone Growth Allocation Fund
Touchstone Moderate Growth Allocation Fund

Table of Contents
| | Page |
| Letter from the President | 3 |
| Management's Discussion of Fund Performance (Unaudited) | 4 - 24 |
| Tabular Presentation of Portfolios of Investments (Unaudited) | 25 - 27 |
| Portfolios of Investments: | |
| Touchstone Dynamic Equity Fund | 28 |
| Touchstone Emerging Growth Fund | 31 |
| Touchstone International Equity Fund | 33 |
| Touchstone Balanced Allocation Fund | 37 |
| Touchstone Conservative Allocation Fund | 38 |
| Touchstone Growth Allocation Fund | 39 |
| Touchstone Moderate Growth Allocation Fund | 40 |
| Statements of Assets and Liabilities | 42 - 45 |
| Statements of Operations | 46 - 49 |
| Statements of Changes in Net Assets | 50 - 55 |
| Statements of Changes in Net Assets - Capital Stock Activity | 56 - 62 |
| Statements of Cash Flows | 63 |
| Financial Highlights | 64 - 87 |
| Notes to Financial Statements | 89 - 120 |
| Report of Independent Registered Public Accounting Firm | 121 |
| Other Items (Unaudited) | 122 - 125 |
| Management of the Trust (Unaudited) | 126 |
| Privacy Protection Policy | 131 |
Letter from the President
Dear Shareholder:
We are pleased to provide you with the Touchstone Strategic Trust Annual Report. Inside you will find key financial information and manager commentaries for the five months ended December 31, 2012.
Against a backdrop of stagnant unemployment and economic growth, historically low interest rates, the European debt crisis, U.S. political uncertainty, and the fears of a “fiscal cliff,” the U.S. economy managed sparse growth over the previous five-month period.
The outset of the period witnessed an equity market resurgence in the third quarter following news of strong company earnings and positive outlooks. The fourth quarter was dominated by the U.S. Presidential election and concern over the “fiscal cliff,” keeping the markets on edge.
Overall, equities outperformed fixed income investments during the period, as historically low interest rates remained intact. The Federal Reserve (Fed) announced a third round of quantitative easing at the outset of the period, thus affirming low rates for the long-term. Investors turned to equities as a result, though fears of volatility and political uncertainty prevailed.
Among equities, developed international stocks slightly outperformed their emerging market counterparts during the period. U.S. value stocks bested growth stocks, while small-capitalization stocks outperformed mid- and large-capitalization stocks. Within fixed income, non-investment grade bonds outperformed investment grade bonds. U.S. Treasury securities lagged both due to the unprecedented low-yield environment.
As unforeseen events and uncertainty continue to impact the markets, a long-term investment strategy continues to be the best course for weathering future market environments. Consult with your financial professional to build a diversified asset allocation portfolio of stock, bond, alternative and money market mutual funds.
Touchstone is committed to helping investors achieve their financial goals by providing access to a distinctive selection of institutional asset managers who are known and respected for proficiency in their specific area of expertise. We hope that you will find the enclosed commentaries to be helpful and informative.
We thank you for including Touchstone as part of your investment plan.
Sincerely,

Jill T. McGruder
President
Touchstone Strategic Trust
Management's Discussion of Fund Performance (Unaudited)
Touchstone Dynamic Equity Fund
Sub-Advised by Analytic Investors, LLC
Investment Philosophy
The Fund seeks long-term capital appreciation from hedged equity investments with less risk than a fully invested, unhedged equity portfolio. A proprietary system that ranks stocks according to a mathematical model is utilized in an attempt to create a diversified and hedged portfolio, which invests in a combination of stocks and options, including covered calls. A security’s intrinsic value is determined by evaluating variables such as relative valuation, price momentum, company fundamentals, liquidity and risk. Portfolio optimization is utilized to select securities that are expected to maximize return, minimize volatility and diversify assets.
Fund Performance
The Touchstone Dynamic Equity Fund (Class A Shares) underperformed its benchmark the S&P 500 Index for the five-month period ended December 31, 2012. The Fund’s total return was -1.34 percent (calculated excluding the maximum sales charge) while the total return of the benchmark was 4.50 percent for the same period.
Market Environment and Portfolio Review
Equities moved higher for the five-month period, as represented by the S&P 500. This occurred early in the period as the bond-buying programs by the U.S. Federal Reserve Board and the European Central Bank were well-received by investors. Markets ended the period flat, however, as politics dominated the headlines during the final quarter of 2012 as news about the U.S. Presidential election quickly turned into widespread worry over the impact of the “fiscal cliff.”
The Fund is a hedged equity fund, comprised of equities and options. During the period, the equity component of the Fund posted positive returns but underperformed the S&P 500, while the options component posted negative total returns but outperformed the passive option component of the Chicago Board Options Exchange (CBOE) S&P 500 BuyWrite Index (BXM Index). The negative total return primarily occurred in November when the market experienced a strong rally after options positions were reset. (Options expire the third Friday of each month.)
The Fund is structured to be sector, style and beta1neutral relative to the S&P 500 Index. During the period, stock selection within the Health Care and Financial Services sectors contributed to Fund performance, while stock selection within the Information Technology and Consumer Staples sectors negatively impacted Fund performance. Options written on broad-based indices, such as the S&P 500 and the S&P 100 Index, were the primary sources of negative option returns, while options sold on the PHLX Semiconductor Index produced positive results.
The Fund’s investment process uses a multi-characteristic approach when valuing securities. During the period, the Fund’s overweight to certain valuation characteristics helped performance, as did exposure to certain quality characteristics. Specifically, investors rewarded stocks with strong cash flow and sales relative to the company’s price per share. From a quality perspective, stocks with strong return on equity outperformed. This helped performance, as the Fund was tilted toward these types of stocks. On the other hand, the Fund’s emphasis to certain technical characteristics negatively impacted performance during the period. Specifically, stocks with strong price momentum underperformed, while stocks with negative momentum shifted course and posted positive returns. The Fund was not properly positioned to take advantage of these price trends.
Among the stocks that contributed to Fund performance during the period were overweight positions in Mylan Inc., Delta Air Lines Inc., Safeway Inc., and Home Depot Inc. A position in pharmaceutical company Mylan helped Fund performance, as the company’s stock moved higher after Moody’s Investors Service Inc. upgraded the company’s rating to investment grade. Delta Air Lines’ shares also moved higher as investors applauded the company’s purchase of a 49% stake in Virgin Atlantic Airways Ltd. Safeway rallied after the grocer announced it would pay its regular quarterly dividend early, which investors viewed as a sign of confidence that the company’s cash flow was strong. Finally, home improvement retailer Home Depot delivered profits that surpassed analyst estimates as customer spending increased at company stores.
Management's Discussion of Fund Performance (Unaudited) (Continued)
Among the stocks that detracted from Fund performance were short positions in Solera Holdings Inc. and Visteon Corp., and long positions in CA, Inc. and Intel Corp. Shares of Solera Holdings, a software provider to the automobile industry, rallied after the company posted a strong fiscal quarter and its revenues beat analysts’ estimates. Visteon, a supplier of components to automobile manufacturers, reported strong results and also announced a restructuring program aimed at reducing expenses. CA, a provider of IT management solutions, saw its stock price fall the most in three years after the company cut its 2013 forecasts as a result of lower-than-anticipated sales of new products. Shares of semiconductor manufacturer Intel moved lower after the company cut its third-quarter sales forecasts, citing weak demand.
Outlook
Our process is based on the fundamental belief that there is persistency in the types of characteristics investors prefer. If this holds going forward, we expect the Fund to benefit from being properly positioned toward stocks with characteristics favored by investors.
Going forward, if the market has a strong rally, it will be difficult for the Fund to keep pace with the unhedged index (S&P 500). But, over time, a disciplined covered call strategy has historically kept pace with the broad market with lower volatility than the market as measured by standard deviation.2 We intend to emphasize stocks with certain attractive valuation characteristics, such as stocks with above-average cash flow-to-price ratios and above-average earnings-to-price ratios. We also intend to focus on companies with strong quality metrics, such as stocks with above-average asset utilization and return on assets. Furthermore, we anticipate continuing to underweight companies with above-average insider selling and underweight stocks where analysts vary widely in their earnings predictions.
1 Beta is a measure of the volatility of a fund relative to its benchmark. The Beta of a benchmark is 1.00.
2Standard Deviation is a measure of how closely a fund's return moves above or below its average. It is a measure of total risk, including both market and security-specific risks.
Management's Discussion of Fund Performance (Unaudited) (Continued)
Comparison of the Change in Value of a $10,000 Investment in the Touchstone Dynamic
Equity Fund - Class A*, the S&P 500 Index and the Citigroup 3-Month T-Bill Index
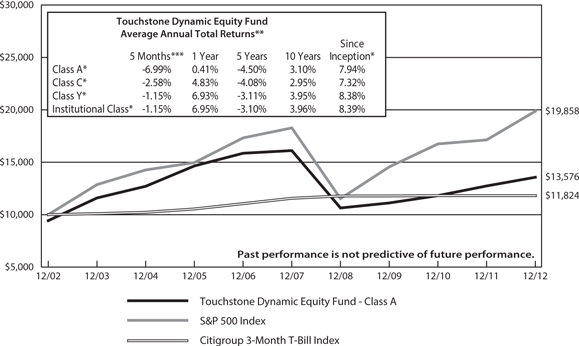
| * | The chart above represents performance of Class A shares only, which will vary from the performance of Class C shares, Class Y shares and Institutional Class shares based on the differences in loads and fees paid by shareholders in the different classes. Class Y shares commenced operations on July 1, 1978, Class A shares and Class C shares commenced operations on March 31, 2005 and Institutional Class shares commenced operations on December 9, 2005. The Class A and Class C shares performance information is calculated using the historical performance of Class Y shares for periods prior to March 31, 2005 and Institutional Class shares performance information is calculated using the historical performance of Class Y shares for periods prior to December 9, 2005. The returns have been restated for sales charges and for fees applicable to Class A, Class C, and Institutional Class shares. |
| ** | The average annual total returns shown above are adjusted for maximum applicable sales charges. |
The performance of the above Fund does not reflect the deduction of taxes that a shareholder would pay on Fund distributions or the redemption of Fund shares.
Notes to Chart
S&P 500 Index is a group of 500 widely held stocks and is commonly regarded to be representative of the large capitalization stock universe.
Citigroup 3-Month T-Bill Index tracks the performance of U.S. Treasury Bills with a remaining maturity of three months.
Management's Discussion of Fund Performance (Unaudited)
Touchstone Emerging Growth Fund
Sub-Advised by Copper Rock Capital Partners, LLC
Investment Philosophy
The Fund seeks capital appreciation by investing primarily in equity securities of emerging growth companies of any size, emphasizing small- to mid-cap companies diversified across sectors and industries. A fundamental, bottom-up approach is employed. The approach focuses on companies that exhibit strong management teams, the potential for strong and sustainable revenue and earnings growth, and strong financial and competitive positions.
Fund Performance
The Touchstone Emerging Growth Fund (Class A Shares) underperformed its benchmark the Russell 2500™ Growth Index (Index) for the five-month period ended December 31, 2012. The Fund’s total return was 7.62 percent (calculated excluding the maximum sales charge) while the total return of the benchmark was 8.16 percent for the same period.
Market Environment and Portfolio Review
The small-cap and small- to mid-cap markets generally continued their positive climb during the five month period (as represented by the Russell 2000® Growth Index and Russell 2500™ Growth Index, respectively). This translated into outperformance of small-cap stocks over large-cap stocks during the period. Stimulative monetary policy action by the Federal Reserve (Fed) during the period contributed to the positive returns of the market as a whole, and markets rose even in the face of uncertainty about the U.S. Presidential election and “fiscal cliff ” negotiations. There continued to be swift rotations from one sector to another, culminating with the rise of the Industrials sector in early October through the end of the period. As a result, the Industrials and Materials sectors outperformed at the end of the period. In addition, growth remained out of favor and Real Estate Investment Trusts (REITs) and the Financials sectors rallied performance.
Stock selection in the Financials, Industrials, and Health Care sectors contributed to Fund performance during the period. The Fund also benefited from an underweight position relative to the Index in the Health Care sector. Stock selection in the Consumer Discretionary and Information Technology sectors detracted from relative return in the period, with the modest underperformance stemming from specific circumstances related to a few specific holdings that occurred near period end. The Consumer Discretionary sector underperformed due to lighter-than-expected holiday sales and weak consumer sentiment surrounding the impact of the “fiscal cliff ” negotiations.
Eagle Materials, Inc. (Materials sector), B/E Aerospace Inc. (Industrials sector), and PVH Corp. (Consumer Discretionary sector) were among the individual stocks that contributed to performance. Eagle Materials, a wallboard and cement manufacturer, reported another strong quarter as wallboard demand continued to improve and pricing rose as the industry focused on profitability over share gains. In addition, the company made an accretive acquisition during the period that contributed to gains for the stock. B/E Aerospace is a manufacturer of seats, food and beverage storage equipment, and other interior systems for the commercial-aircraft industry. B/E Aerospace reported strong earnings in the third and fourth quarters of the year, which contributed to the stock’s rise. The company also made positive comments about its long-term outlook, including a projection of 20%+ EPS (earnings per share) growth over the next several years. In addition, B/E Aerospace management and industry peers cited improvements in the commercial aftermarket and OEM (original equipment manufacturer)-build, which is expected to provide a good backdrop for future growth. Despite overall underperformance from the Consumer Discretionary sector, PVH Corp., a designer and marketer of clothing brands including Van Heusen, IZOD, and Kenneth Cole, contributed to the Fund’s positive relative return in the period. PVH Corp. announced its acquisition of Warnaco Group Inc. during the month of October, which sent shares higher. Warnaco previously held the license to Calvin Klein Jeans and Underwear, and by bringing both brands in-house, PVH Corp. is expected to realize significant synergies on both expenses and sales. The company raised 2013 earnings estimates based on strong stock performance during the period.
Among the individual stocks that detracted from performance were Align Technology, Inc. (Health Care sector) and Tangoe Inc. (Information Technology sector). Despite overall positive contribution within the Health Care
Management's Discussion of Fund Performance (Unaudited) (Continued)
sector, the portfolio’s position in Align Technology detracted from Fund performance. Align Technology, the manufacturer and marketer of the Invisalign orthodontic system, underperformed in the fourth quarter after reporting quarterly earnings below expectations. In addition, the company made an acquisition that we felt was not synergistic or accretive to existing operations and thus exited the position. Tangoe is a global provider of communications lifecycle management (CLM) and was among the leading detractors to relative return within the InformationTechnology sector. Tangoe’s stock underperformed primarily due to questions about the company’s true organic growth rate and the credibility of its management team. We are not in agreement with these reports and the Fund continues to own the stock, as we believe Tangoe is positioned for robust growth and profitability in the near term.
Outlook
We remain optimistic that U.S. equity market performance is sustainable. U.S. gross domestic product (GDP) growth expectations are mixed, but corporate earnings expectations continue to fluctuate within historical bands. We even saw earnings growth accelerate in the fourth quarter despite a general economic slowing. This factor remains a core component to our investment process as we look to find stocks where estimates are higher than Wall Street forecasts over the next 12 to 18 months. When the economy is less certain, we believe stocks with strong secular growth and a sharp focus on improving incremental operating margins have a better chance to outperform. We do not anticipate macro headlines or headwinds to go by the wayside in 2013, but we continue to believe the market reaction to headline-grabbing statements and news events remains short-lived.
Within the Fund, our bottom-up, fundamentals-first approach to stock selection has led to modest overweight positions relative to the Index in the Energy, Information Technology, and Consumer Discretionary sectors where Fund holdings benefit from strong secular growth drivers. The Fund maintains an underweight relative to the Index in the Health Care, Telecommunications Services, Materials, Consumer Staples and Utilities sectors.
Through diligent analysis, we continue to expect good earnings growth from company management that embrace improving incremental operating margins and sustained revenue growth through focused execution. We are pleased that current markets are differentiating between successful and unsuccessful business models, thus offering stock pickers like ourselves ample opportunity to add alpha.1
1Alpha is the portion of a fund's total return that is unique to that fund and is independent of movements in the benchmark.
Management's Discussion of Fund Performance (Unaudited) (Continued)
Comparison of the Change in Value of a $10,000 Investment in the
Touchstone Emerging Growth Fund - Class A* and the Russell 2500™ Growth Index
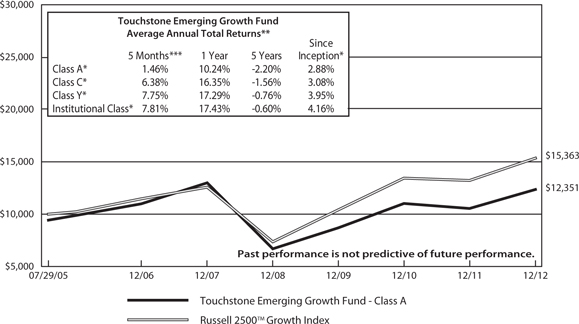
| * | The chart above represents performance of Class A shares only, which will vary from the performance of Class C shares, Class Y shares and Institutional Class shares based on the differences in loads and fees paid by shareholders in the different classes. Class A shares and Institutional Class shares commenced operations on July 29, 2005, Class Y shares commenced operations on December 9, 2005, and Class C shares commenced operations on April 12, 2012. Class Y shares performance information is calculated using the historical performance of Class A shares for periods prior to December 9, 2005 and Class C shares performance information is calculated using the historical performance of Class A shares for periods prior to April 12, 2012 . The returns have been restated for sales charges and for fees applicable to Class C and Class Y shares. |
| ** | The average annual total returns shown above are adjusted for maximum applicable sales charges. |
The performance of the above Fund does not reflect the deduction of taxes that a shareholder would pay on Fund distributions or the redemption of Fund shares.
Note to Chart
Russell 2500™ Growth Index measures the performance of the small to mid-cap growth segment of the U.S. equity universe. It includes those Russell 2500 Index companies with higher price-to-book ratios and higher forecasted growth values.
Management's Discussion of Fund Performance (Unaudited)
Touchstone International Equity Fund
Sub-Advised by Acadian Asset Management LLC
Investment Philosophy
The Fund seeks long-term capital appreciation by primarily investing in equity securities of non-U.S. issues. Stock factors are utilized in an effort to predict how well each security will perform relative to its region and industry peer groups, and forecasts are combined to determine a world-relative return forecast for each stock in the allowable universe. A sophisticated portfolio optimization system is employed to trade off the expected return of the stocks with such considerations as the benchmark index, desired level of risk, transaction cost estimates, available liquidity, and other requirements. A disciplined process is utilized, which is based on the belief that it is crucial to avoid emotional decision-making, and focus on potential returns and risk control.
Fund Performance
The Touchstone International Equity Fund (Class A Shares) underperformed its benchmark the MSCI EAFE Index for the five-month period ended December 31, 2012. The Fund’s total return was 12.30 percent (calculated excluding the maximum sales charge) while the total return of the benchmark was 12.67 percent for the same period.
Market Environment and Portfolio Review
The five-month period ended December 31, 2012 was generally a strong period for world markets despite softening economic data in some regions. Optimism was driven in part by perceived progress on stabilizing Europe’s economy. Although indicators for the eurozone continued to reflect deep worries about the region’s fiscal and economic health, European equity markets rose as the European Central Bank (ECB) made a strong show of support for the euro. The Asia-Pacific region was sluggish early in the period as exports slowed amid faltering global growth, and Japan struggled with a persistently strong currency and the tailing-off of disaster-driven recovery spending. However, Asian markets rebounded in the fourth quarter amid expectations for strong stimulus. In the emerging markets, the picture was also quite positive, as brighter sentiment out of the eurozone and solid U.S. equity returns boosted investors’ appetite for riskier assets. Investors were also encouraged by signs that the Chinese economy had bottomed and appeared poised for a relatively swift recovery.
During the five-month period, gains from stock selection contributed to the Fund’s performance, but this was offset by the negative effects of active country allocations. Among the most significant of the country impacts were the underweights in Spain and Italy, which detracted from returns as these markets rose sharply on improved eurozone sentiment. Overweights in Japan, Singapore and Canada also detracted from performance. The stock side was more positive, with performance contribution coming from the U.K., France, the Netherlands, Australia, Sweden, Switzerland and Hong Kong. Among the best performing sectors for active stock selection were Health Care and Energy. From an individual holdings perspective, however, stocks in the Financials sector were the largest contributors during the period.
Among the individual stocks that contributed to performance were Barclays plc, BNP Paribas S.A. and Heineken N.V. Shares of Barclays, a U.K.-based banking and financial services company, rose after Goldman Sachs Group Inc. upgraded the company’s rating to “buy” in advance of releasing details of a strategic review in February 2013. BNP Paribas, a France-based lender, saw its stock jump on reports that finance ministers in the eurozone reached a deal on reducing Greece’s debt — a move needed in order for the nation to receive its next loan disbursement. Heineken, a Netherlands-based brewer, saw its stock rally after Deutsche Bank AG raised its recommendation for the company to “buy,” after predicting the brewer’s expansion into Africa would bolster growth.
Among the individual stocks that detracted from performance were Otsuka Holdings Co., Ltd., Central Japan Railway Co., and NipponTelegraph &Telephone Corp. Otsuka Holdings, a Japan-based pharmaceutical company, reported fiscal first-half results that disappointed some analysts, which sent shares lower. Central Japan Railway, a Japan-based rail operator, saw its shares slide after Mitsubishi UFJ Morgan Stanley Securities downgraded its rating for the company to “neutral” from “outperform,” predicting softer shinkansen (i.e., high-speed passenger train) demand among business travelers. Shares of NipponTelegraph &Telephone, a Japan-based telecommunications
Management's Discussion of Fund Performance (Unaudited) (Continued)
company, retreated after the company’s regional units (NTT East and NTT West) announced plans to reduce monthly fees for their fiber-optic Internet connection services.
Outlook
Macroeconomic data in the world’s major markets have presented a mixed picture in recent months, with the U.S. exhibiting moderate growth, Europe showing signs of bottoming, and Japan looking more uneven in its growth patterns. Overall, we expect that reacceleration in China and the emerging markets, and a pickup in Europe will help offset more sluggish growth in the U.S. and Japan in the months ahead. Key central banks have remained committed to stimulative policy, particularly in the U.S., where the U.S. Federal Reserve Board has embarked on a third round of quantitative easing and strengthened its pledge to grow employment and control inflation and, in Japan, where additional easing is expected following the change in government leadership. These monetary measures are expected to underpin global growth prospects in 2013.
With worries of an even deeper eurozone crisis now largely assuaged, U.S. austerity has taken center stage as the major source of global investor uncertainty. Although tax issues have been addressed with the New Year’s Day congressional deal, negotiations with the White House relating to spending cuts and the debt-ceiling limit will likely loom through the first quarter of 2013. We believe geopolitical tensions, particularly surrounding the Middle East and relations in China and Japan, also present some risk to market sentiment in the months ahead. In the U.S., the corporate earnings outlook is clouded by a recent decline in profits as businesses and consumers react to fiscal uncertainty by spending less, a trend that is expected to continue. Business activity has already retrenched, as evidenced by a sharp drop in new orders late in the year, with U.S. consumer spending expected to follow suit. However, we believe the potential for continued strong growth in the emerging-market consumer and the re-emergence of European consumption should at least partially offset these effects in the year ahead.
Management's Discussion of Fund Performance (Unaudited) (Continued)
Comparison of the Change in Value of a $10,000 Investment in the
Touchstone International Equity Fund - Class A* and the MSCI EAFE Index
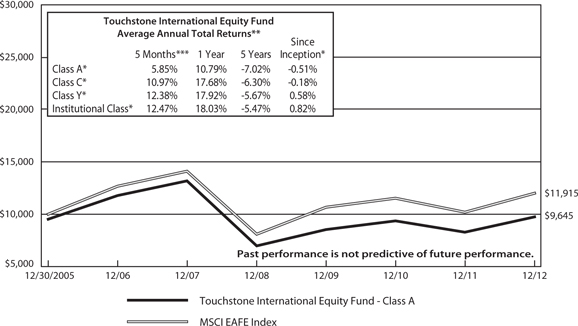
| * | The chart above represents performance of Class A shares only, which will vary from the performance of Class C shares, Class Y shares and Institutional Class shares based on the differences in loads and fees paid by shareholders in the different classes. Class A shares, Class Y shares and Institutional Class shares commenced operations on December 30, 2005 and Class C shares commenced operations on April 12, 2012. Class C shares performance information is calculated using the historical performance of Class A shares for periods prior to April 12, 2012. The returns have been restated for sales charges and for fees applicable to Class C shares. |
| ** | The average annual total returns shown above are adjusted for maximum applicable sales charges. |
The performance of the above Fund does not reflect the deduction of taxes that a shareholder would pay on Fund distributions or the redemption of Fund shares.
Note to Chart
MSCI EAFE Index is a free float-adjusted market capitalization index that is designed to measure developed market equity performance excluding the U.S. and Canada.
Management's Discussion of Fund Performance (Unaudited)
Touchstone Balanced Allocation Fund
Sub-Advised by Ibbotson Associates, Inc.
Investment Philosophy
The Fund seeks to provide investors with capital appreciation and current income. The Fund is a fund of funds and therefore the value of an investment in the Fund is based on the performance of the underlying funds in which it invests and the allocation of its assets among those funds. This fund of funds primarily invests in a diversified portfolio of underlying equity and fixed income funds. The underlying funds, in turn, invest in a variety of U.S. and foreign equity and fixed income securities and may hold cash, cash equivalents and money market funds. An optimal model allocation among underlying funds is sought, by using an analysis that looks at forecasted returns, standard deviations in historical returns, and the correlation of the performance of different market sectors. The underlying funds are selected and weighted based on historical returns-based style analysis, holdings-based style analysis, manager interviews, relative and absolute performance, including correlations with other underlying funds as well as corresponding benchmarks, and historical volatility (the variability of returns from one period to the next). Under normal circumstances, the Fund expects to allocate its assets among equity and fixed income funds as follows: Equity Fund Allocation: 50–70%, Fixed Income Fund Allocation: 30–50%.
Fund Performance
The Touchstone Balanced Allocation Fund (Class A Shares) outperformed its benchmark the 40% Barclays U.S. Aggregate Bond Index / 60% S&P Composite 1500 Index for the five-month period ended December 31, 2012. The Fund’s total return was 4.37 percent (calculated excluding the maximum sales charge) while the total return of the benchmark was 3.17 percent for the same period.
Market Environment and Portfolio Review
Risk assets rose during the period despite uncertainty surrounding a resolution to the “fiscal cliff.” Amidst a slowing economy and downward trending earnings guidance, stocks rose sharply to surpass bonds by a considerable margin as the S&P Composite 1500 Index outperformed the Barclays U.S. Aggregate Bond Index. U.S. equity returns were strong for the period, with the exception of large-cap growth equities, which lagged due to a few poor-performing technology issues. Mid- and small-cap stocks outperformed large-cap stocks, while value outperformed growth. Foreign equity markets dominated during the period, as the MSCI EAFE Index outpaced Real Estate Investment Trusts (REITs) and U.S. stocks by a large margin. In addition, interest rates rose slightly over the period, which dragged down U.S. Treasuries and muted bond returns. Furthermore, investors were rewarded for taking on credit risk, particularly in high yield bonds, as the Barclays U.S. Corporate High Yield Index posted strong returns.
Strategic asset allocation decisions contributed to Fund performance for the period, which outpaced the detractions from manager selection and defensive dynamic positioning. Returns were boosted by exposure to foreign equities and mid- and small-cap stocks, as they all significantly outpaced the broad market. High yield bond exposure contributed to Fund performance as returns surpassed the effects from lackluster performance of cash and short-term bonds.
During the period, the Fund held multiple tactical asset allocation positions. In particular, the Fund was underweight equities versus short-term bonds, underweight small- and mid-cap stocks versus large-cap stocks, overweight international equities versus domestic equities, underweight global REITs versus large-cap stocks, and overweight short-term bonds versus intermediate-term bonds. In mid-September, the Fund decreased its exposure to high yield bonds as yield spreads lowered to levels that significantly raised downside risk potential. Short-term bond and core bond positions were increased accordingly. Also, in mid-November, the Fund decreased its exposure to equities in favor of short-term bonds as a result of concerns over earnings in the near term. Overall, the Fund’s defensive positioning had a slightly negative impact on performance as the returns to risk assets were strong over the period.
Performance was mixed among individual funds within the portfolio versus their respective benchmarks, but in aggregate they detracted from performance. Touchstone Sands Capital Institutional Growth Fund, Touchstone Focused Equity Fund, Touchstone International Fixed Income Fund and Touchstone Total Return Bond Fund
Management's Discussion of Fund Performance (Unaudited) (Continued)
were the largest contributors to relative performance, while Touchstone Value Fund, Touchstone Large Cap Relative Value Fund, Touchstone Global Equity Fund and Touchstone Large Cap Growth Fund were the greatest detractors from relative performance. During the period, the Fund allocated a portion of its assets to Touchstone Strategic Income Fund and Touchstone International Value Fund.
Outlook
The intervention of the European Central Bank (ECB) in 2012 did stop the escalation of the debt crisis. And, the most positive potential outcome in 2013 is that the bond markets do not actually test the ECB’s mettle, and that the central bank’s promise of unlimited bond purchases is sufficient to keep sovereign borrowing costs at a moderate level. On the other hand, if the markets do test the ECB, the size of its purchases will likely disappoint and a flare-up of the sovereign crisis will ensue. In the meantime, we believe the recession in Spain, Greece and Italy will continue. However, if Germany manages to continue growing throughout the year, the southern periphery might see some light at the end of the 2013 tunnel.
The U.S. averted a ruthless fiscal contraction on January 1, 2013, only to set the stage for another fiscal crisis with pending Congressional debt negotiations at the beginning of March. We expect Congress to reach an agreement that will raise the debt limit and allow only a fraction of the sequester to go into effect. However in our opinion, the deal will probably only be reached in the nick of time (late February or early March), and the resulting legislation will simply postpone the day of fiscal reckoning for another year, at most, rather than offer long-term solutions.
In 2013, we believe U.S. private businesses will not have strong incentives to make large, long-term commitments to investing and hiring based on: (1) uncertainty about taxes and about the implementation of health care reform, and (2) the fact that profit margins, overall, are not growing.
We believe that with regard to oil, the dominant factor over the next five years will likely be an increase in supply, even though renewed tensions with Iran are possible in 2013 and the market seems to be placing a premium on short-term prices over medium-term prices related to supply disruptions. In addition, development of unconventional sources of oil and gas in North America is likely to cap prices in the near future. Nevertheless, we do not expect these new supplies to lower prices — after all, it is high prices (greater than $80 per barrel) that make shale oil and gas viable from an economic standpoint. In the next few months, however, we believe that the price of oil will still be sensitive to developments in volatile places such as Iran, Iraq and Libya.
Finally, one additional factor that may shape 2013 is deleveraging (i.e., fiscal tightening). The private sector has meaningfully reduced its debt burden in the U.S., U.K., and Australia, and although rapid credit growth is not expected in the near term, we believe the slog of reducing debts should prove to be a smaller drag than in the last three years. However, in continental Europe and in Canada, the private sector has barely made a dent into its debt load, so deleveraging there should continue to be a burden. Moreover, public sector deleveraging is expected to begin in the medium term almost everywhere in the advanced world, if public finances are to be set on a sustainable path.
The economic environment remains uncertain, with both U.S. stocks and U.S. bonds priced for potential disappointment. On balance, the Fund is positioned to remain defensive and more focused on preserving capital, as we find ourselves with greater international equity exposure and holding more short-term bonds than usual. Going forward, we will continue to monitor valuations and sentiment, and will reduce equities further should the opportunity present itself.
Management's Discussion of Fund Performance (Unaudited) (Continued)
Comparison of the Change in Value of a $10,000 Investment in the
Touchstone Balanced Allocation Fund - Class A*, the S&P Composite 1500 Index and
the Barclays U.S. Aggregate Bond Index
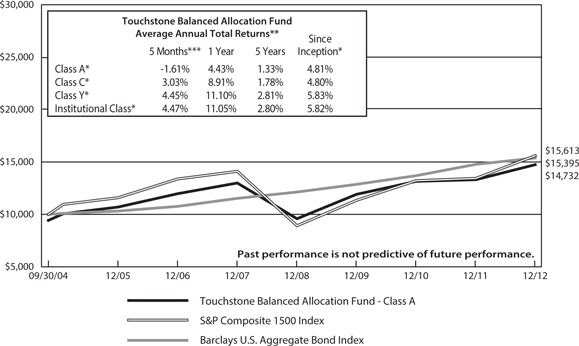
| * | The chart above represents performance of Class A shares only, which will vary from the performance of Class C shares, Class Y shares and Institutional Class shares based on the differences in loads and fees paid by shareholders in the different classes. Class A shares, Class C shares and Institutional Class shares commenced operations on September 30, 2004 and Class Y shares commenced operations on December 9, 2005. Class Y shares performance information is calculated using the historical performance of Institutional Class shares for periods prior to December 9, 2005. The returns have been restated for sales charges and for fees applicable to Class Y shares. |
| ** | The average annual total returns shown above are adjusted for maximum applicable sales charges. |
The performance of the above Fund does not reflect the deduction of taxes that a shareholder would pay on Fund distributions or the redemption of Fund shares.
Notes to Chart
S&P Composite 1500 Index is an unmanaged, broad market index representing the large-cap, mid-cap, and small-cap segments of the U.S. equity market.
Barclays U.S. Aggregate Bond Index is an unmanaged index comprised of U.S. investment grade, fixed rate bond market securities, including government, government agency, corporate and mortgage-backed securities between one and ten years.
Management's Discussion of Fund Performance (Unaudited)
Touchstone Conservative Allocation Fund
Sub-Advised by Ibbotson Associates, Inc.
Investment Philosophy
The Fund seeks to provide investors with current income and preservation of capital. The Fund is a fund of funds and therefore the value of an investment in the Fund is based on the performance of the underlying funds in which it invests and the allocation of its assets among those funds. This fund of funds primarily invests in a diversified portfolio of underlying equity and fixed income funds. The underlying funds, in turn, invest in a variety of U.S. and foreign equity and fixed income securities and may hold cash, cash equivalents and money market funds. An optimal model allocation among underlying funds in sought, by using an analysis that looks at forecasted returns, standard deviations in historical returns, and the correlation of the performance of different market sectors. The underlying funds are selected and weighted based on historical returns-based style analysis, holdings-based style analysis, manager interviews, relative and absolute performance, including correlations with other underlying funds as well as corresponding benchmarks, and historical volatility (the variability of returns from one period to the next). Under normal circumstances, the Fund expects to allocate its assets among equity and fixed income funds as follows: Equity Fund Allocation: 20–40%, Fixed Income Fund Allocation: 60–80%.
Fund Performance
The Touchstone Conservative Allocation Fund (Class A Shares) outperformed its benchmark the 70% Barclays U.S. Aggregate Bond Index / 30% S&P Composite 1500 Index for the five-month period ended December 31, 2012. The Fund’s total return was 2.47 percent (calculated excluding the maximum sales charge) while the total return of the benchmark was 1.79 percent for the same period.
Market Environment and Portfolio Review
Risk assets rose during the period despite uncertainty surrounding a resolution to the “fiscal cliff.” Amidst a slowing economy and downward trending earnings guidance, stocks rose sharply to surpass bonds by a considerable margin as the S&P Composite 1500 Index outperformed the Barclays U.S. Aggregate Bond Index. U.S. equity returns were strong for the period, with the exception of large-cap growth equities, which lagged due to a few poor-performing technology issues. Mid- and small-cap stocks outperformed large-cap stocks, while value outperformed growth. Foreign equity markets dominated during the period, as the MSCI EAFE Index outpaced Real Estate Investment Trusts (REITs) and U.S. stocks by a large margin. In addition, interest rates rose slightly over the period, which dragged down U.S. Treasuries and muted bond returns. Furthermore, investors were rewarded for taking on credit risk, particularly in high yield bonds, as the Barclays U.S. Corporate High Yield Index posted strong returns.
Strategic asset allocation decisions contributed to Fund performance for the period, which outpaced the detractions from manager selection and defensive dynamic positioning. Returns were boosted by exposure to foreign equities and mid- and small-cap stocks, as they all significantly outpaced the broad market. High yield bond exposure contributed to Fund performance as returns surpassed the effects from lackluster performance of cash and short-term bonds.
During the period, the Fund held multiple tactical asset allocation positions. In particular, the Fund was underweight equities versus short-term bonds, underweight small- and mid-cap stocks versus large-cap stocks, overweight international equities versus domestic equities, underweight global REITs versus large-cap stocks, and overweight short-term bonds versus intermediate-term bonds. In mid-September, the Fund decreased its exposure to high yield bonds as yield spreads lowered to levels that significantly raised downside risk potential. Short-term bond and core bond positions were increased accordingly. Also, in mid-November, the Fund decreased its exposure to equities in favor of short-term bonds as a result of concerns over earnings in the near term. Overall, the Fund’s defensive positioning detracted from performance as the returns to risk assets were strong over the period.
Performance was mixed among individual funds within the portfolio versus their respective benchmarks, but in aggregate they detracted from performance. Touchstone Sands Capital Institutional Growth Fund, Touchstone International Fixed Income Fund and Touchstone Total Return Bond Fund were the largest contributors to
Management's Discussion of Fund Performance (Unaudited) (Continued)
relative performance, while Touchstone Value Fund, Touchstone Large Cap Relative Value Fund and Touchstone Dynamic Equity Fund were the greatest detractors from relative performance. During the period, the Fund allocated a portion of its assets to Touchstone Strategic Income Fund and Touchstone International Value Fund.
Outlook
The intervention of the European Central Bank (ECB) in 2012 did stop the escalation of the debt crisis. And, the most positive potential outcome in 2013 is that the bond markets do not actually test the ECB’s mettle, and that the central bank’s promise of unlimited bond purchases is sufficient to keep sovereign borrowing costs at a moderate level. On the other hand, if the markets do test the ECB, the size of its purchases will likely disappoint and a flare-up of the sovereign crisis will ensue. In the meantime, we believe the recession in Spain, Greece and Italy will continue. However, if Germany manages to continue growing throughout the year, the southern periphery might see some light at the end of the 2013 tunnel.
The U.S. averted a ruthless fiscal contraction on January 1, 2013, only to set the stage for another fiscal crisis with pending Congressional debt negotiations at the beginning of March. We expect Congress to reach an agreement that will raise the debt limit and allow only a fraction of the sequester to go into effect. However in our opinion, the deal will probably only be reached in the nick of time (late February or early March), and the resulting legislation will simply postpone the day of fiscal reckoning for another year, at most, rather than offer long-term solutions.
In 2013, we believe U.S. private businesses will not have strong incentives to make large, long-term commitments to investing and hiring based on: (1) uncertainty about taxes and about the implementation of health care reform, and (2) the fact that profit margins, overall, are not growing.
We believe that with regard to oil, the dominant factor over the next five years will likely be an increase in supply, even though renewed tensions with Iran are possible in 2013 and the market seems to be placing a premium on short-term prices over medium-term prices related to supply disruptions. In addition, development of unconventional sources of oil and gas in North America is likely to cap prices in the near future. Nevertheless, we do not expect these new supplies to lower prices — after all, it is high prices (greater than $80 per barrel) that make shale oil and gas viable from an economic standpoint. In the next few months, however, we believe that the price of oil will still be sensitive to developments in volatile places such as Iran, Iraq and Libya.
Finally, one additional factor that may shape 2013 is deleveraging (i.e., fiscal tightening). The private sector has meaningfully reduced its debt burden in the U.S., U.K., and Australia, and although rapid credit growth is not expected in the near term, we believe the slog of reducing debts should prove to be a smaller drag than in the last three years. However, in continental Europe and in Canada, the private sector has barely made a dent into its debt load, so deleveraging there should continue to be a burden. Moreover, public sector deleveraging is expected to begin in the medium term almost everywhere in the advanced world, if public finances are to be set on a sustainable path.
The economic environment remains uncertain, with both U.S. stocks and U.S. bonds priced for potential disappointment. On balance, the Fund is positioned to remain defensive and more focused on preserving capital, as we find ourselves with greater international equity exposure and holding more short-term bonds than usual. Going forward, we will continue to monitor valuations and sentiment, and will reduce equities further should the opportunity present itself.
Management's Discussion of Fund Performance (Unaudited) (Continued)
Comparison of the Change in Value of a $10,000 Investment in the
Touchstone Conservative Allocation Fund Class - A*, the S&P Composite 1500 Index and
the Barclays U.S. Aggregate Bond Index
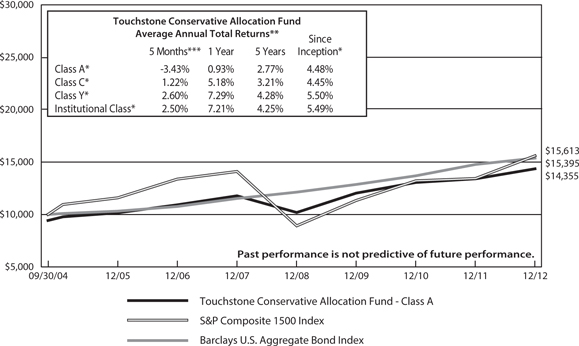
| * | The chart above represents performance of Class A shares only, which will vary from the performance of Class C shares, Class Y shares and Institutional Class shares based on the differences in loads and fees paid by shareholders in the different classes. Class A shares, Class C shares and Institutional Class shares commenced operations on September 30, 2004 and Class Y shares commenced operations on December 9, 2005. Class Y shares performance information is calculated using the historical performance of Institutional Class shares for periods prior to December 9, 2005. The returns have been restated for sales charges and for fees applicable to Class Y shares. |
| ** | The average annual total returns shown above are adjusted for maximum applicable sales charges. |
The performance of the above Fund does not reflect the deduction of taxes that a shareholder would pay on Fund distributions or the redemption of Fund shares.
Notes to Chart
S&P Composite 1500 Index is an unmanaged, broad market index representing the large-cap, mid-cap, and small-cap segments of the U.S. equity market.
Barclays U.S. Aggregate Bond Index is an unmanaged index comprised of U.S. investment grade, fixed rate bond market securities, including government, government agency, corporate and mortgage-backed securities between one and ten years.
Management's Discussion of Fund Performance (Unaudited)
Touchstone Growth Allocation Fund
Sub-Advised by Ibbotson Associates, Inc.
Investment Philosophy
The Fund seeks to provide investors with capital appreciation. The Fund is a fund of funds and therefore the value of an investment in the Fund is based on the performance of the underlying funds in which it invests and the allocation of its assets among those funds. This fund of funds primarily invests in a diversified portfolio of underlying equity and fixed income funds. The underlying funds, in turn, invest in a variety of U.S. and foreign equity and fixed income securities and may hold cash, cash equivalents and money market funds. An optimal model allocation among underlying funds is sought, by using an analysis that looks at forecasted returns, standard deviations in historical returns, and the correlation of the performance of different market sectors. The underlying funds are selected and weighted based on historical returns-based style analysis, holdings-based style analysis, manager interviews, relative and absolute performance, including correlations with other underlying funds as well as corresponding benchmarks, and historical volatility (the variability of returns from one period to the next). Under normal circumstances, the Fund expects to allocate its assets among equity and fixed income funds as follows: Equity Fund Allocation: 90–100%, Fixed Income Fund Allocation: 0–10%.
Fund Performance
The Touchstone Growth Allocation Fund (Class A Shares) outperformed its benchmark the S&P Composite 1500 Index for the five-month period ended December 31, 2012. The Fund’s total return was 7.29 percent (calculated excluding the maximum sales charge) while the total return of the benchmark was 5.02 percent for the same period.
Market Environment and Portfolio Review
Risk assets rose during the period despite uncertainty surrounding a resolution to the “fiscal cliff.” Amidst a slowing economy and downward trending earnings guidance, stocks rose sharply to surpass bonds by a considerable margin as the S&P Composite 1500 Index outperformed the Barclays U.S. Aggregate Bond Index. U.S. equity returns were strong for the period, with the exception of large-cap growth equities, which lagged due to a few poor-performing technology issues. Mid- and small-cap stocks outperformed large-cap stocks, while value outperformed growth. Foreign equity markets dominated during the period, as the MSCI EAFE Index outpaced real estate investment trusts (REITs) and U.S. stocks by a large margin. In addition, interest rates rose slightly over the period, which dragged down U.S. Treasuries and muted bond returns. Furthermore, investors were rewarded for taking on credit risk, particularly in high yield bonds, as the Barclays U.S. Corporate High Yield Index posted strong returns.
Strategic asset allocation decisions contributed to Fund performance for the period, which outpaced the detractions from manager selection and defensive dynamic positioning. Returns were boosted by exposure to foreign equities and mid- and small-cap stocks, as they all significantly outpaced the broad market.
During the period, the Fund held multiple tactical asset allocation positions. In particular, the Fund was underweight equities versus short-term bonds, underweight small- and mid-cap stocks versus large-cap stocks, overweight international equities versus domestic equities, and underweight global REITs versus large-cap stocks. In mid-November, the Fund decreased its exposure to equities in favor of short-term bonds as a result of concerns over earnings in the near term. Overall, the Fund’s defensive positioning had a slightly negative impact on performance as the returns to risk assets were very strong over the period.
Performance was mixed among individual funds within the portfolio versus their respective benchmarks, but in aggregate they detracted from performance. Touchstone Sands Capital Institutional Growth Fund andTouchstone Focused Equity Fund were the largest contributors to relative performance, while Touchstone Value Fund, Touchstone Global Equity Fund, Touchstone Large Cap Relative Value Fund and Touchstone Large Cap Growth Fund were the greatest detractors from relative performance. During the period, the Fund allocated a portion of its assets to the Touchstone International Value Fund.
Management's Discussion of Fund Performance (Unaudited) (Continued)
Outlook
The intervention of the European Central Bank (ECB) in 2012 did stop the escalation of the debt crisis. And, the most positive potential outcome in 2013 is that the bond markets do not actually test the ECB’s mettle, and that the central bank’s promise of unlimited bond purchases is sufficient to keep sovereign borrowing costs at a moderate level. On the other hand, if the markets do test the ECB, the size of its purchases will likely disappoint and a flare-up of the sovereign crisis will ensue. In the meantime, we believe the recession in Spain, Greece and Italy will continue. However, if Germany manages to continue growing throughout the year, the southern periphery might see some light at the end of the 2013 tunnel.
The U.S. averted a ruthless fiscal contraction on January 1, 2013, only to set the stage for another fiscal crisis with pending Congressional debt negotiations at the beginning of March. We expect Congress to reach an agreement that will raise the debt limit and allow only a fraction of the sequester to go into effect. However in our opinion, the deal will probably only be reached in the nick of time (late February or early March), and the resulting legislation will simply postpone the day of fiscal reckoning for another year, at most, rather than offer long-term solutions.
In 2013, we believe U.S. private businesses will not have strong incentives to make large, long-term commitments to investing and hiring based on: (1) uncertainty about taxes and about the implementation of health care reform, and (2) the fact that profit margins, overall, are not growing.
We believe that with regard to oil, the dominant factor over the next five years will likely be an increase in supply, even though renewed tensions with Iran are possible in 2013 and the market seems to be placing a premium on short-term prices over medium-term prices related to supply disruptions. In addition, development of unconventional sources of oil and gas in North America is likely to cap prices in the near future. Nevertheless, we do not expect these new supplies to lower prices — after all, it is high prices (greater than $80 per barrel) that make shale oil and gas viable from an economic standpoint. In the next few months, however, we believe that the price of oil will still be sensitive to developments in volatile places such as Iran, Iraq and Libya.
Finally, one additional factor that may shape 2013 is deleveraging (i.e., fiscal tightening). The private sector has meaningfully reduced its debt burden in the U.S., U.K., and Australia, and although rapid credit growth is not expected in the near term, we believe the slog of reducing debts should prove to be a smaller drag than in the last three years. However, in continental Europe and in Canada, the private sector has barely made a dent into its debt load, so deleveraging there should continue to be a burden. Moreover, public sector deleveraging is expected to begin in the medium term almost everywhere in the advanced world, if public finances are to be set on a sustainable path.
The economic environment remains uncertain, with both U.S. stocks and U.S. bonds priced for potential disappointment. On balance, the Fund is positioned to remain defensive and more focused on preserving capital, as we find ourselves with greater international equity exposure and holding more short-term bonds than usual. Going forward, we will continue to monitor valuations and sentiment, and will reduce equities further should the opportunity present itself.
Management's Discussion of Fund Performance (Unaudited) (Continued)
Comparison of the Change in Value of a $10,000 Investment in the
Touchstone Growth Allocation Fund Class - A* and the S&P Composite 1500 Index
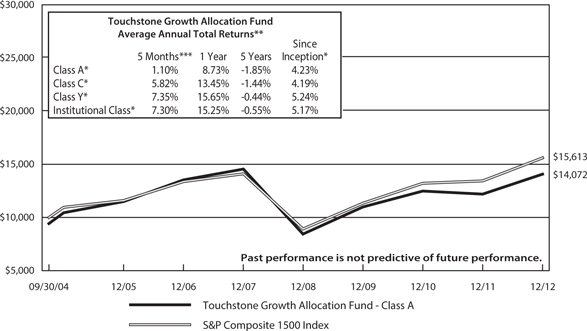
| * | The chart above represents performance of Class A shares only, which will vary from the performance of Class C shares, Class Y shares and Institutional Class shares based on the differences in loads and fees paid by shareholders in the different classes. Class A shares, Class C shares and Institutional Class shares commenced operations on September 30, 2004 and Class Y shares commenced operations on December 9, 2005. Class Y shares performance information is calculated using the historical performance of Institutional Class shares for periods prior to December 9, 2005. The returns have been restated for sales charges and for fees applicable to Class Y shares. |
| ** | The average annual total returns shown above are adjusted for maximum applicable sales charges. |
The performance of the above Fund does not reflect the deduction of taxes that a shareholder would pay on Fund distributions or the redemption of Fund shares.
Note to Chart
S&P Composite 1500 Index is an unmanaged, broad market index representing the large-cap, mid-cap, and small-cap segments of the U.S. equity market.
Management's Discussion of Fund Performance (Unaudited)
Touchstone Moderate Growth Allocation Fund
Sub-Advised by Ibbotson Associates, Inc.
Investment Philosophy
The Fund seeks to provide investors with capital appreciation. The Fund is a fund of funds and therefore the value of an investment in the Fund is based on the performance of the underlying funds in which it invests and the allocation of its assets among those funds. This fund of funds primarily invests in a diversified portfolio of underlying equity and fixed income funds. The underlying funds, in turn, invest in a variety of U.S. and foreign equity and fixed income securities and may hold cash, cash equivalents and money market funds. An optimal model allocation among underlying funds is sought, by using an analysis that looks at forecasted returns, standard deviations in historical returns, and the correlation of the performance of different market sectors. The underlying funds are selected and weighted based on historical returns-based style analysis, holdings-based style analysis, manager interviews, relative and absolute performance, including correlations with other underlying funds as well as corresponding benchmarks, and historical volatility (the variability of returns from one period to the next). Under normal circumstances, the Fund expects to allocate its assets among equity and fixed income funds as follows: Equity Fund Allocation: 70–90%, Fixed Income Fund Allocation: 10–30%.
Fund Performance
The Touchstone Moderate Growth Allocation Fund (Class A Shares) outperformed its benchmark the 20% Barclays U.S. Aggregate Bond Index / 80% S&P Composite 1500 Index for the five-month period ended December 31, 2012. The Fund’s total return was 5.96 percent (calculated excluding the maximum sales charge) while the total return of the benchmark was 4.10 percent for the same period.
Market Environment and Portfolio Review
Risk assets rose during the period despite uncertainty surrounding a resolution to the “fiscal cliff.” Amidst a slowing economy and downward trending earnings guidance, stocks rose sharply to surpass bonds by a considerable margin as the S&P Composite 1500 Index outperformed the Barclays U.S. Aggregate Bond Index. U.S. equity returns were strong for the period, with the exception of large-cap growth equities, which lagged due to a few poor-performing technology issues. Mid- and small-cap stocks outperformed large-cap stocks, while value outperformed growth. Foreign equity markets dominated during the period, as the MSCI EAFE Index outpaced real estate investment trusts (REITs) and U.S. stocks by a large margin. In addition, interest rates rose slightly over the period, which dragged down U.S. Treasuries and muted bond returns. Furthermore, investors were rewarded for taking on credit risk, particularly in high yield bonds, as the Barclays U.S. Corporate High Yield Index posted strong returns.
Strategic asset allocation decisions contributed to Fund performance for the period, which outpaced the detractions from manager selection and defensive dynamic positioning. Returns were boosted by exposure to foreign equities and mid- and small-cap stocks, as they all significantly outpaced the broad market. High yield bond exposure also contributed to Fund performance.
During the period, the Fund held multiple tactical asset allocation positions. In particular, the Fund was underweight equities versus short-term bonds, underweight small- and mid-cap stocks versus large-cap stocks, overweight international equities versus domestic equities, underweight global REITs versus large-cap stocks, and overweight short-term bonds versus intermediate-term bonds. In mid-September, the Fund decreased its exposure to high yield bonds as yield spreads lowered to levels that significantly raised downside risk potential. Short-term bond and core bond positions were increased accordingly. Also, in mid-November, the Fund decreased its exposure to equities in favor of short-term bonds as a result of concerns over earnings in the near term. Overall, the Fund’s defensive positioning detracted from performance as the returns to risk assets were strong over the period.
Performance was mixed among individual funds within the portfolio versus their respective benchmarks, but in aggregate they detracted from performance. Touchstone Sands Capital Institutional Growth Fund, Touchstone Focused Equity Fund andTouchstoneTotal Return Bond Fund were the largest contributors to relative performance, while Touchstone Value Fund, Touchstone Global Equity Fund, Touchstone Large Cap Relative Value Fund
Management's Discussion of Fund Performance (Unaudited) (Continued)
and Touchstone Large Cap Growth Fund were the greatest detractors from relative performance. During the period, the Fund allocated a portion of its assets toTouchstone Strategic Income Fund andTouchstone International Value Fund.
Outlook
The intervention of the European Central Bank (ECB) in 2012 did stop the escalation of the debt crisis. And, the most positive potential outcome in 2013 is that the bond markets do not actually test the ECB’s mettle, and that the central bank’s promise of unlimited bond purchases is sufficient to keep sovereign borrowing costs at a moderate level. On the other hand, if the markets do test the ECB, the size of its purchases will likely disappoint and a flare-up of the sovereign crisis will ensue. In the meantime, we believe the recession in Spain, Greece and Italy will continue. However, if Germany manages to continue growing throughout the year, the southern periphery might see some light at the end of the 2013 tunnel.
The U.S. averted a ruthless fiscal contraction on January 1, 2013, only to set the stage for another fiscal crisis with pending Congressional debt negotiations at the beginning of March. We expect Congress to reach an agreement that will raise the debt limit and allow only a fraction of the sequester to go into effect. However in our opinion, the deal will probably only be reached in the nick of time (late February or early March), and the resulting legislation will simply postpone the day of fiscal reckoning for another year, at most, rather than offer long-term solutions.
In 2013, we believe U.S. private businesses will not have strong incentives to make large, long-term commitments to investing and hiring based on: (1) uncertainty about taxes and about the implementation of health care reform, and (2) the fact that profit margins, overall, are not growing.
We believe that with regard to oil, the dominant factor over the next five years will likely be an increase in supply, even though renewed tensions with Iran are possible in 2013 and the market seems to be placing a premium on short-term prices over medium-term prices related to supply disruptions. In addition, development of unconventional sources of oil and gas in North America is likely to cap prices in the near future. Nevertheless, we do not expect these new supplies to lower prices — after all, it is high prices (greater than $80 per barrel) that make shale oil and gas viable from an economic standpoint. In the next few months, however, we believe that the price of oil will still be sensitive to developments in volatile places such as Iran, Iraq and Libya.
Finally, one additional factor that may shape 2013 is deleveraging (i.e., fiscal tightening). The private sector has meaningfully reduced its debt burden in the U.S., U.K., and Australia, and although rapid credit growth is not expected in the near term, we believe the slog of reducing debts should prove to be a smaller drag than in the last three years. However, in continental Europe and in Canada, the private sector has barely made a dent into its debt load, so deleveraging there should continue to be a burden. Moreover, public sector deleveraging is expected to begin in the medium term almost everywhere in the advanced world, if public finances are to be set on a sustainable path.
The economic environment remains uncertain, with both U.S. stocks and U.S. bonds priced for potential disappointment. On balance, the Fund is positioned to remain defensive and more focused on preserving capital, as we find ourselves with greater international equity exposure and holding more short-term bonds than usual. Going forward, we will continue to monitor valuations and sentiment, and will reduce equities further should the opportunity present itself.
Management's Discussion of Fund Performance (Unaudited) (Continued)
Comparison of the Change in Value of a $10,000 Investment in the
Touchstone Moderate Growth Allocation Fund Class-A*, the S&P Composite 1500 Index and
the Barclays U.S. Aggregate Bond Index
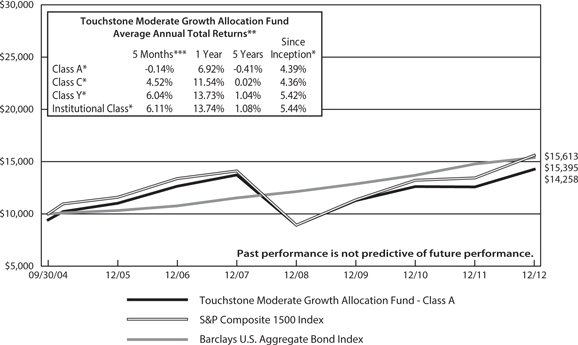
| * | The chart above represents performance of Class A shares only, which will vary from the performance of Class C shares, Class Y shares and Institutional Class shares based on the differences in loads and fees paid by shareholders in the different classes. Class A shares, Class C shares and Institutional Class shares commenced operations on September 30, 2004 and Class Y shares commenced operations on December 9, 2005. Class Y shares performance information is calculated using the historical performance of Institutional Class shares for periods prior to December 9, 2005. The returns have been restated for sales charges and for fees applicable to Class Y shares. |
| ** | The average annual total returns shown above are adjusted for maximum applicable sales charges. |
The performance of the above Fund does not reflect the deduction of taxes that a shareholder would pay on Fund distributions or the redemption of Fund shares.
Notes to Chart
S&P Composite 1500 Index is an unmanaged, broad market index representing the large-cap, mid-cap, and small-cap segments of the U.S. equity market.
Barclays U.S. Aggregate Bond Index is an unmanaged index comprised of U.S. investment grade, fixed rate bond market securities, including government, government agency, corporate and mortgage-backed securities between one and ten years.
Tabular Presentation of Portfolios of Investments (Unaudited)
December 31, 2012
The tables below provide each Fund’s sector allocation. We hope it will be useful to shareholders as it summarizes key information about each Fund’s investments.
| Touchstone Dynamic Equity Fund | | | |
| Sector Allocation* | | (% of Net Assets) | |
| Long Positions | | | | |
| Information Technology | | | 24.9 | % |
| Consumer Discretionary | | | 18.6 | |
| Financials | | | 16.7 | |
| Energy | | | 13.6 | |
| Health Care | | | 13.2 | |
| Consumer Staples | | | 11.7 | |
| Industrials | | | 6.9 | |
| Utilities | | | 4.7 | |
| Telecommunication Services | | | 4.1 | |
| Materials | | | 3.2 | |
| Investment Fund | | | 4.5 | |
| Other Assets/Liabilities (Net) | | | 0.3 | |
| | | | 122.4 | |
| Short Positions and Written Options | | | | |
| Consumer Discretionary | | | (6.3 | ) |
| Energy | | | (4.2 | ) |
| Information Technology | | | (3.2 | ) |
| Call and Put Options | | | (2.6 | ) |
| Financials | | | (2.2 | ) |
| Health Care | | | (1.4 | ) |
| Materials | | | (1.3 | ) |
| Industrials | | | (1.2 | ) |
| | | | (22.4 | ) |
| Total | | | 100.0 | % |
| Touchstone Emerging Growth Fund | | | |
| Sector Allocation* | | (% of Net Assets) | |
| Information Technology | | | 23.0 | % |
| Industrials | | | 19.6 | |
| Consumer Discretionary | | | 19.2 | |
| Health Care | | | 12.1 | |
| Exchange Traded Funds | | | 11.1 | |
| Financials | | | 9.1 | |
| Energy | | | 7.2 | |
| Materials | | | 6.2 | |
| Consumer Staples | | | 2.9 | |
| Investment Funds | | | 3.6 | |
| Other Assets/Liabilities (Net) | | | (14.0 | ) |
| Total | | | 100.0 | % |
| * | Sector classifications are based upon the Global Industry Classification Standard (GICS®). |
Tabular Presentation of Portfolios of Investments (Unaudited) (Continued)
| Touchstone International Equity Fund | | | |
| Sector Allocation* | | (% of Net Assets) | |
| Financials | | | 19.9 | % |
| Consumer Discretionary | | | 14.1 | |
| Health Care | | | 13.3 | |
| Industrials | | | 11.9 | |
| Energy | | | 11.4 | |
| Materials | | | 11.3 | |
| Consumer Staples | | | 6.0 | |
| Information Technology | | | 5.2 | |
| Utilities | | | 1.9 | |
| Telecommunication Services | | | 1.9 | |
| Other Assets/Liabilities (Net) | | | 3.1 | |
| Total | | | 100.0 | % |
| Touchstone Balanced Allocation Fund | | | |
| Sector Allocation | | (% of Net Assets) | |
| Government/Corporate | | | 27.8 | % |
| International Equity | �� | | 16.4 | |
| Value | | | 12.7 | |
| Growth | | | 7.0 | |
| International Debt | | | 5.7 | |
| Balanced | | | 5.2 | |
| Emerging Market-Equity | | | 4.7 | |
| Growth Mid-Cap | | | 4.6 | |
| Blue Chip | | | 4.6 | |
| Value Large-Cap | | | 4.1 | |
| Sector Fund Real-Estate | | | 3.5 | |
| Various Assets | | | 3.5 | |
| Taxable-Money Market | | | 3.4 | |
| Corporate/Preferred-High Yield | | | 2.9 | |
| Value Mid-Cap | | | 2.3 | |
| Global Equity | | | 2.3 | |
| Value Small-Cap | | | 2.3 | |
| Growth Large-Cap | | | 2.3 | |
| Other Assets/Liabilities (Net) | | | (15.3 | ) |
| Total | | | 100.0 | % |
| * | Sector classifications are based upon the Global Industry Classification Standard (GICS®). |
Tabular Presentation of Portfolios of Investments (Unaudited) (Continued)
| Touchstone Conservative Allocation Fund | | | |
| Sector Allocation | | (% of Net Assets) | |
| Government/Corporate | | | 46.4 | % |
| International Debt | | | 8.2 | |
| Value | | | 6.2 | |
| Balanced | | | 5.7 | |
| Growth | | | 5.2 | |
| International Equity | | | 5.2 | |
| Taxable-Money Market | | | 5.2 | |
| Blue Chip | | | 4.1 | |
| Various Assets | | | 4.1 | |
| Corporate/Preferred-High Yield | | | 3.1 | |
| Value Large-Cap | | | 2.6 | |
| Value Small-Cap | | | 2.1 | |
| Sector Fund Real-Estate | | | 2.1 | |
| Emerging Market-Equity | | | 1.1 | |
| Global Equity | | | 1.0 | |
| Growth Mid-Cap | | | 1.0 | |
| Other Assets/Liabilities (Net) | | | (3.3 | ) |
| Total | | | 100.0 | % |
| Touchstone Moderate Growth Allocation Fund | | | |
| Sector Allocation | | (% of Net Assets) | |
| International Equity | | | 16.6 | % |
| Government/Corporate | | | 15.6 | |
| Value | | | 15.2 | |
| Growth | | | 9.8 | |
| Emerging Market-Equity | | | 7.7 | |
| Growth Mid-Cap | | | 5.5 | |
| Sector Fund Real-Estate | | | 4.4 | |
| Value Large-Cap | | | 4.4 | |
| Value Small-Cap | | | 4.4 | |
| Global Equity | | | 4.4 | |
| Blue Chip | | | 4.3 | |
| Balanced | | | 3.8 | |
| Value Mid-Cap | | | 3.3 | |
| Corporate/Preferred-High Yield | | | 2.2 | |
| Various Assets | | | 2.2 | |
| International Debt | | | 2.1 | |
| Growth Large-Cap | | | 2.1 | |
| Other Assets/Liabilities (Net) | | | (8.0 | ) |
| Total | | | 100.0 | % |
| Touchstone Growth Allocation Fund | | | |
| Sector Allocation | | (% of Net Assets) | |
| International Equity | | | 20.7 | % |
| Value | | | 14.3 | |
| Growth | | | 11.3 | |
| Emerging Market-Equity | | | 10.4 | |
| Sector Fund Real-Estate | | | 6.2 | |
| Value Small-Cap | | | 6.2 | |
| Global Equity | | | 5.1 | |
| Growth Mid-Cap | | | 5.1 | |
| Government/Corporate | | | 4.9 | |
| Value Mid-Cap | | | 4.1 | |
| Value Large-Cap | | | 4.1 | |
| Blue Chip | | | 4.0 | |
| Growth Large-Cap | | | 3.1 | |
| Various Assets | | | 2.0 | |
| Other Assets/Liabilities (Net) | | | (1.5 | ) |
| Total | | | 100.0 | % |
Portfolio of Investments
Touchstone Dynamic Equity Fund – December 31, 2012
| | | | | | Market | |
| | | Shares | | | Value | |
| | | | | | | |
| Common Stocks† — 117.6% | | | | | | | | |
| | | | | | | | | |
| Information Technology — 24.9% | | | | | | | | |
| AOL, Inc. | | | 42,755 | | | $ | 1,265,976 | |
| Apple, Inc. | | | 4,653 | | | | 2,480,189 | |
| Arrow Electronics, Inc.* | | | 15,913 | | | | 605,967 | |
| Avnet, Inc.* | | | 18,039 | | | | 552,174 | |
| Booz Allen Hamilton Holding Corp. | | | 22,154 | | | | 308,384 | |
| CA, Inc. | | | 2,004 | | | | 44,048 | |
| eBay, Inc.* | | | 1,540 | | | | 78,571 | |
| FleetCor Technologies, Inc.* | | | 4,047 | | | | 217,122 | |
| Freescale Semiconductor Ltd. (Bermuda)* | | | 1,873 | | | | 20,622 | |
| Harris Corp. | | | 25,851 | | | | 1,265,665 | |
| IAC/InterActiveCorp | | | 1,612 | | | | 76,248 | |
| Intel Corp. | | | 63,211 | | | | 1,304,043 | |
| International Business Machines Corp. | | | 15,522 | | | | 2,973,239 | |
| Microsoft Corp. | | | 85,315 | | | | 2,280,470 | |
| Rackspace Hosting, Inc. (Puerto Rico)* | | | 5,437 | | | | 403,806 | |
| Seagate Technology PLC (Ireland) | | | 49,567 | | | | 1,510,802 | |
| Symantec Corp.* | | | 34,530 | | | | 649,509 | |
| VeriSign, Inc.* | | | 17,047 | | | | 661,765 | |
| | | | | | | | 16,698,600 | |
| | | | | | | | | |
| Consumer Discretionary — 18.6% | | | | | | | | |
| Advance Auto Parts, Inc. | | | 7,461 | | | | 539,803 | |
| Best Buy Co., Inc. | | | 13,150 | | | | 155,828 | |
| Brinker International, Inc. | | | 62,309 | | | | 1,930,956 | |
| Comcast Corp. - Class A | | | 7,159 | | | | 267,603 | |
| Darden Restaurants, Inc. | | | 264 | | | | 11,898 | |
| Delphi Automotive PLC (Channel Islands)* | | | 22,277 | | | | 852,095 | |
| Expedia, Inc. | | | 5,540 | | | | 340,433 | |
| Ford Motor Co. | | | 6,834 | | | | 88,500 | |
| Gap, Inc. (The) | | | 10,904 | | | | 338,460 | |
| General Motors Co.* | | | 28,039 | | | | 808,364 | |
| Goodyear Tire & Rubber Co. (The)* | | | 9,915 | | | | 136,926 | |
| Home Depot, Inc. (The) | | | 32,378 | | | | 2,002,579 | |
| Kohl's Corp. | | | 1,174 | | | | 50,459 | |
| Liberty Interactive Corp. - Class A* | | | 57,321 | | | | 1,128,077 | |
| Macy's, Inc. | | | 39,610 | | | | 1,545,582 | |
| Sears Holdings Corp.* | | | 1,384 | | | | 57,242 | |
| Viacom, Inc. - Class B | | | 38,915 | | | | 2,052,377 | |
| Virgin Media, Inc. | | | 4,331 | | | | 159,164 | |
| | | | | | | | 12,466,346 | |
| | | | | | | | | |
| Financials — 16.7% | | | | | | | | |
| Allstate Corp. (The) | | | 1,799 | | | | 72,266 | |
| American Express Co. | | | 16,075 | | | | 923,991 | |
| American International Group, Inc.* | | | 59,014 | | | | 2,083,194 | |
| Bank of America Corp. | | | 205,671 | | | | 2,385,784 | |
| BB&T Corp. | | | 1,364 | | | | 39,706 | |
| CBL & Associates Properties, Inc. REIT | | | 5,189 | | | | 110,059 | |
| CIT Group, Inc.* | | | 6,664 | | | | 257,497 | |
| Citigroup, Inc. | | | 25,999 | | | | 1,028,521 | |
| New York Community Bancorp, Inc. | | | 57,301 | | | | 750,643 | |
| Popular, Inc. (Puerto Rico)* | | | 10,041 | | | | 208,752 | |
| Regions Financial Corp. | | | 136,055 | | | | 968,712 | |
| SLM Corp. | | | 2,503 | | | | 42,876 | |
| Wells Fargo & Co. | | | 9,907 | | | | 338,621 | |
| Weyerhaeuser Co. REIT | | | 71,597 | | | | 1,991,829 | |
| | | | | | | | 11,202,451 | |
| | | | | | | | | |
| Energy — 13.6% | | | | | | | | |
| Chevron Corp. | | | 27,715 | | | | 2,997,100 | |
| ConocoPhillips | | | 4,650 | | | | 269,654 | |
| Exxon Mobil Corp. | | | 45,868 | | | | 3,969,875 | |
| Marathon Oil Corp. | | | 11,006 | | | | 337,444 | |
| Noble Corp. (Switzerland) | | | 417 | | | | 14,520 | |
| Tesoro Corp. | | | 34,608 | | | | 1,524,482 | |
| | | | | | | | 9,113,075 | |
| | | | | | | | | |
| Health Care — 13.2% | | | | | | | | |
| AmerisourceBergen Corp. | | | 10,520 | | | | 454,254 | |
| Amgen, Inc. | | | 26,176 | | | | 2,259,512 | |
| Cardinal Health, Inc. | | | 47,839 | | | | 1,970,010 | |
| Charles River Laboratories International, Inc.* | | | 2,627 | | | | 98,434 | |
| Community Health Systems, Inc. | | | 335 | | | | 10,298 | |
| Eli Lilly & Co. | | | 6,049 | | | | 298,337 | |
| HCA Holdings, Inc. | | | 19,944 | | | | 601,710 | |
| Illumina, Inc.* | | | 2,640 | | | | 146,758 | |
| Mylan, Inc.* | | | 71,738 | | | | 1,971,360 | |
| Myriad Genetics, Inc.* | | | 15,196 | | | | 414,091 | |
| Onyx Pharmaceuticals, Inc.* | | | 3,917 | | | | 295,851 | |
| ResMed, Inc. | | | 1,483 | | | | 61,648 | |
| St Jude Medical, Inc. | | | 4,914 | | | | 177,592 | |
| Zimmer Holdings, Inc. | | | 1,341 | | | | 89,391 | |
| | | | | | | | 8,849,246 | |
| | | | | | | | | |
| Consumer Staples — 11.7% | | | | | | | | |
| Altria Group, Inc. | | | 22,286 | | | | 700,226 | |
| Bunge Ltd. (Bermuda) | | | 24,553 | | | | 1,784,758 | |
| Dean Foods Co.* | | | 39,884 | | | | 658,485 | |
| Herbalife Ltd. (Cayman Islands) | | | 11,271 | | | | 371,267 | |
| Nu Skin Enterprises, Inc. Class A | | | 16,041 | | | | 594,319 | |
| Philip Morris International, Inc. | | | 22,290 | | | | 1,864,336 | |
| Safeway, Inc. | | | 59,780 | | | | 1,081,420 | |
| Wal-Mart Stores, Inc. | | | 11,879 | | | | 810,504 | |
| | | | | | | | 7,865,315 | |
| | | | | | | | | |
| Industrials — 6.9% | | | | | | | | |
| Delta Air Lines, Inc.* | | | 80,376 | | | | 954,063 | |
| General Electric Co. | | | 65,957 | | | | 1,384,437 | |
| Pitney Bowes, Inc. | | | 56,985 | | | | 606,320 | |
| Southwest Airlines Co. | | | 16,077 | | | | 164,628 | |
| Waste Management, Inc. | | | 45,814 | | | | 1,545,764 | |
| | | | | | | | 4,655,212 | |
| | | | | | | | | |
| Utilities — 4.7% | | | | | | | | |
| AES Corp. (The) | | | 110,802 | | | | 1,185,582 | |
| American Electric Power Co., Inc. | | | 688 | | | | 29,364 | |
| Calpine Corp.* | | | 49,775 | | | | 902,421 | |
| NextEra Energy, Inc. | | | 10,671 | | | | 738,326 | |
| PPL Corp. | | | 9,600 | | | | 274,848 | |
| | | | | | | | 3,130,541 | |
Touchstone Dynamic Equity Fund (Continued)
| | | | | | Market | |
| | | Shares | | | Value | |
| | | | | | | |
| Common Stocks† — 117.6% (Continued) | | | | | | | | |
| | | | | | | | | |
| Telecommunication Services — 4.1% | | | | | | | | |
| Sprint Nextel Corp.* | | | 139,024 | | | $ | 788,266 | |
| Verizon Communications, Inc. | | | 45,981 | | | | 1,989,598 | |
| | | | | | | | 2,777,864 | |
| | | | | | | | | |
| Materials — 3.2% | | | | | | | | |
| Freeport-McMoRan Copper & Gold, Inc. | | | 17,372 | | | | 594,122 | |
| Huntsman Corp. | | | 38,508 | | | | 612,277 | |
| Royal Gold, Inc. | | | 11,093 | | | | 901,972 | |
| | | | | | | | 2,108,371 | |
| Total Common Stocks | | | | | | $ | 78,867,021 | |
| | | | | | | | | |
| Investment Fund — 4.5% | | | | | | | | |
| Touchstone Institutional Money Market Fund^ | | | 2,985,549 | | | | 2,985,549 | |
| | | | | | | | | |
| Total Long Positions | | | | | | | | |
| (Cost $73,880,970) | | | | | | $ | 81,852,570 | |
| | | | | | | | | |
| Securities Sold Short — (19.8%) | | | | | | | | |
| | | | | | | | | |
| Common Stocks — (19.8%) | | | | | | | | |
| | | | | | | | | |
| Consumer Discretionary — (6.3%) | | | | | | | | |
| Gentex Corp. | | | (69,933 | ) | | | (1,316,139 | ) |
| Hyatt Hotels Corp. - Class A* | | | (29,800 | ) | | | (1,149,386 | ) |
| Pandora Media, Inc.* | | | (49,782 | ) | | | (456,999 | ) |
| Visteon Corp.* | | | (23,972 | ) | | | (1,290,173 | ) |
| | | | | | | | (4,212,697 | ) |
| | | | | | | | | |
| Energy — (4.2%) | | | | | | | | |
| Alpha Natural Resources, Inc.* | | | (31,299 | ) | | | (304,852 | ) |
| Cheniere Energy, Inc.* | | | (49,797 | ) | | | (935,188 | ) |
| EXCO Resources, Inc. | | | (7,720 | ) | | | (52,264 | ) |
| Golar LNG Ltd. (Bermuda) | | | (9,822 | ) | | | (361,253 | ) |
| Range Resources Corp. | | | (5,347 | ) | | | (335,952 | ) |
| Spectra Energy Corp. | | | (7,952 | ) | | | (217,726 | ) |
| Ultra Petroleum Corp. (Canada)* | | | (31,932 | ) | | | (578,927 | ) |
| | | | | | | | (2,786,162 | ) |
| | | | | | | | | |
| Information Technology — (3.2%) | | | | | | | | |
| Acme Packet, Inc.* | | | (37,282 | ) | | | (824,678 | ) |
| Informatica Corp.* | | | (25,617 | ) | | | (776,708 | ) |
| Solera Holdings, Inc. | | | (10,261 | ) | | | (548,656 | ) |
| | | | | | | | (2,150,042 | ) |
| | | | | | | | | |
| Financials — (2.2%) | | | | | | | | |
| American National Insurance Co. | | | (3,601 | ) | | | (245,912 | ) |
| Howard Hughes Corp. (The)* | | | (3,764 | ) | | | (274,847 | ) |
| Interactive Brokers Group, Inc. - Class A | | | (13,433 | ) | | | (183,763 | ) |
| StanCorp Financial Group, Inc. | | | (1,428 | ) | | | (52,365 | ) |
| Torchmark Corp. | | | (6,673 | ) | | | (344,794 | ) |
| Unum Group | | | (17,940 | ) | | | (373,511 | ) |
| | | | | | | | (1,475,192 | ) |
| | | | | | | | | |
| Health Care — (1.4%) | | | | | | | | |
| Incyte Corp. Ltd.* | | | (46,107 | ) | | | (765,837 | ) |
| Salix Pharmaceuticals Ltd.* | | | (2,171 | ) | | | (87,882 | ) |
| Warner Chilcott PLC - Class A (Ireland) | | | (6,955 | ) | | | (83,738 | ) |
| | | | | | | | (937,457 | ) |
| | | | | | | | | |
| Materials — (1.3%) | | | | | | | | |
| Sealed Air Corp. | | | (3,866 | ) | | | (67,694 | ) |
| Walter Energy, Inc. | | | (22,975 | ) | | | (824,343 | ) |
| | | | | | | | (892,037 | ) |
| | | | | | | | | |
| Industrials — (1.2%) | | | | | | | | |
| Colfax Corp.* | | | (3,432 | ) | | | (138,481 | ) |
| Engility Holdings, Inc.* | | | (1,032 | ) | | | (19,877 | ) |
| ITT Corp. | | | (14,553 | ) | | | (341,413 | ) |
| Joy Global, Inc. | | | (945 | ) | | | (60,272 | ) |
| Owens Corning* | | | (805 | ) | | | (29,777 | ) |
| Towers Watson & Co. - Class A | | | (3,706 | ) | | | (208,314 | ) |
| | | | | | | | (798,134 | ) |
| Total Common Stocks | | | | | | $ | (13,251,721 | ) |
| | | | | | | | | |
| Total Securities Sold Short | | | | | | | | |
| (Proceeds $(13,044,518)) | | | | | | $ | (13,251,721 | ) |
| | | Number | | | | |
| | | of | | | | |
| | | Contracts | | | | |
| | | | | | | |
| Written Options Contracts† — (2.6%) | | | | | | | | |
| | | | | | | | | |
| Call Options — (2.5%) | | | | | | | | |
| Russell 2000 Index | | | | | | | | |
| January2013 | | | | | | | | |
| Strike Price $800 | | | (60 | ) | | | (328,080 | ) |
| S&P 100 Index | | | | | | | | |
| January 2013 | | | | | | | | |
| Strike Price $630 | | | (620 | ) | | | (1,376,400 | ) |
| S&P 100 Index | | | | | | | | |
| January 2013 | | | | | | | | |
| Strike Price $685 | | | (135 | ) | | | (2,700 | ) |
| S&P 500 Index | | | | | | | | |
| January 2013 | | | | | | | | |
| Strike Price $1,505 | | | (85 | ) | | | (5,100 | ) |
| Total Call Options | | | | | | | (1,712,280 | ) |
| | | | | | | | | |
| Put Options — (0.1%) | | | | | | | | |
| S&P 500 Index | | | | | | | | |
| January 2013 | | | | | | | | |
| Strike Price $1,430 | | | (30 | ) | | | (62,700 | ) |
| | | | | | | | | |
| Total Written Options Contracts | | | | | | | | |
| (Proceeds $(1,799,847)) | | | | | | $ | (1,774,980 | ) |
Touchstone Dynamic Equity Fund (Continued)
| | | Market | |
| | | Value | |
| | | | |
| Total Investment Securities —99.7% | | | | |
| (Cost $59,036,605) | | $ | 66,825,869 | |
| | | | | |
| Other Assets in Excess of Liabilities — 0.3% | | | 233,255 | |
| | | | | |
| Net Assets — 100.0% | | $ | 67,059,124 | |
| † | All or a portion of these securities are held as collateral for securities sold short and written options. The total value of thesecuritiesheldascollateralasofDecember31,2012was $63,823,809. |
| * | Non-income producing security. |
| ^ | AffiliatedFund. SeeNote4inNotestoFinancialStatements. |
Portfolio Abbreviations:
PLC - Public Limited Company
REIT - Real Estate Investment Trust
Other Information:
The inputs or methodology used for valuing securities may not be an indication of the risk associated with investing in those securities. For more information on valuation inputs, and their aggregation into the levels used in the table below, please refer to the security valuation section in the accompanying Notes to Financial Statements.
Valuation inputs at Reporting Date:
| Description | | Level 1 | | | Level 2 | | | Level 3 | | | Total | |
| Assets: | | | | | | | | | | | | | | | | |
| Common Stocks | | $ | 78,867,021 | | | $ | — | | | $ | — | | | $ | 78,867,021 | |
| Investment Fund | | | 2,985,549 | | | | — | | | | — | | | | 2,985,549 | |
| | | | | | | | | | | | | | | $ | 81,852,570 | |
| | | | | | | | | | | | | | | | | |
| Liabilities: | | | | | | | | | | | | | | | | |
| Securities Sold Short | | | | | | | | | | | | | | | | |
| Common Stocks | | $ | (13,251,721 | ) | | $ | — | | | $ | — | | | $ | (13,251,721 | ) |
| Other Financial Instruments(A) | | | | | | | | | | | | | | | | |
| Liabilities: | | | | | | | | | | | | | | | | |
| Written Option Contracts | | | — | | | | (1,774,980 | ) | | | — | | | | (1,774,980 | ) |
| | | | | | | | | | | | | | | $ | (15,026,701 | ) |
| (A) | OtherFinancialInstrumentsarederivativeinstrumentsnot reflected in total investments. |
Transactions in written options for the period ended December 31, 2012
| | | Number of | | | | |
| | | Contracts | | | Premium | |
| Beginning of Period, July 31, 2012 | | | 2,260 | | | $ | 1,419,538 | |
| Call Options Written | | | 8,559 | | | | 8,960,565 | |
| Put Options Written | | | 136 | | | | 351,414 | |
| Call Options Closed | | | (3,041 | ) | | | (6,307,714 | ) |
| Put Options Closed | | | (60 | ) | | | (133,453 | ) |
| Call Options Expired | | | (5,097 | ) | | | (1,129,017 | ) |
| Put Options Expired | | | (71 | ) | | | (200,215 | ) |
| Call Options Exercised | | | (1,756 | ) | | | (1,161,271 | ) |
| December 31, 2012 | | | 930 | | | $ | 1,799,847 | |
See accompanying Notes to Financial Statements.
Portfolio of Investments
Touchstone Emerging Growth Fund – December 31, 2012
| | | | | | Market | |
| | | Shares | | | Value | |
| | | | | | | |
| Common Stocks — 99.3% | | | | | | | | |
| | | | | | | | | |
| Information Technology — 23.0% | | | | | | | | |
| ACI Worldwide, Inc.* | | | 5,332 | | | $ | 232,955 | |
| Cadence Design Systems, Inc.* | | | 19,589 | | | | 264,647 | |
| CommVault Systems, Inc.* | | | 3,462 | | | | 241,336 | |
| CoStar Group, Inc.* | | | 1,498 | | | | 133,876 | |
| FEI Co. | | | 4,474 | | | | 248,128 | |
| Gartner, Inc.* | | | 5,192 | | | | 238,936 | |
| Heartland Payment Systems, Inc. | | | 9,322 | | | | 274,999 | |
| IPG Photonics Corp.† | | | 3,997 | | | | 266,400 | |
| Manhattan Associates, Inc.* | | | 2,618 | | | | 157,970 | |
| MICROS Systems, Inc.* | | | 5,039 | | | | 213,855 | |
| NETGEAR, Inc.* | | | 3,526 | | | | 138,995 | |
| OpenTable, Inc.†* | | | 4,706 | | | | 229,653 | |
| OSI Systems, Inc.* | | | 2,273 | | | | 145,563 | |
| Tangoe, Inc.* | | | 8,052 | | | | 95,577 | |
| TIBCO Software, Inc.* | | | 5,440 | | | | 119,734 | |
| Trimble Navigation Ltd.* | | | 5,851 | | | | 349,773 | |
| Ultimate Software Group, Inc.* | | | 2,695 | | | | 254,435 | |
| Ultratech, Inc.* | | | 4,820 | | | | 179,786 | |
| WEX, Inc.* | | | 2,714 | | | | 204,554 | |
| | | | | | | | 3,991,172 | |
| | | | | | | | | |
| Industrials — 19.6% | | | | | | | | |
| Alaska Air Group, Inc.* | | | 4,267 | | | | 183,865 | |
| AMETEK, Inc. | | | 5,529 | | | | 207,725 | |
| BE Aerospace, Inc.* | | | 8,748 | | | | 432,151 | |
| Beacon Roofing Supply, Inc.* | | | 5,314 | | | | 176,850 | |
| Equifax, Inc. | | | 2,672 | | | | 144,609 | |
| Lincoln Electric Holdings, Inc. | | | 4,448 | | | | 216,529 | |
| Mistras Group, Inc.* | | | 5,432 | | | | 134,116 | |
| Old Dominion Freight Line, Inc.* | | | 10,487 | | | | 359,494 | |
| Portfolio Recovery Associates, Inc.* | | | 2,482 | | | | 265,227 | |
| Roper Industries, Inc. | | | 1,585 | | | | 176,696 | |
| Toro Co. (The) | | | 4,769 | | | | 204,972 | |
| TransDigm Group, Inc. | | | 2,516 | | | | 343,082 | |
| United Rentals, Inc.* | | | 4,760 | | | | 216,675 | |
| Verisk Analytics, Inc. - Class A* | | | 2,530 | | | | 129,030 | |
| WESCO International, Inc.* | | | 3,180 | | | | 214,427 | |
| | | | | | | | 3,405,448 | |
| | | | | | | | | |
| Consumer Discretionary — 19.2% | | | | | | | | |
| Brunswick Corp. DE | | | 8,557 | | | | 248,923 | |
| Buffalo Wild Wings, Inc.* | | | 1,663 | | | | 121,100 | |
| Cheesecake Factory, Inc. (The) | | | 5,605 | | | | 183,396 | |
| Dick's Sporting Goods, Inc. | | | 7,091 | | | | 322,570 | |
| DSW, Inc. - Class A | | | 2,109 | | | | 138,540 | |
| Genesco, Inc.* | | | 2,294 | | | | 126,170 | |
| GNC Holdings, Inc. - Class A | | | 3,239 | | | | 107,794 | |
| Jarden Corp. | | | 2,267 | | | | 117,204 | |
| LKQ Corp.* | | | 8,817 | | | | 186,039 | |
| Penske Automotive Group, Inc. | | | 4,123 | | | | 124,061 | |
| PetSmart, Inc. | | | 2,673 | | | | 182,673 | |
| Polaris Industries, Inc. | | | 2,927 | | | | 246,307 | |
| Pool Corp. | | | 4,752 | | | | 201,105 | |
| PVH Corp. | | | 3,107 | | | | 344,908 | |
| Steven Madden Ltd.* | | | 3,712 | | | | 156,906 | |
| Tenneco, Inc.* | | | 4,300 | | | | 150,973 | |
| Tractor Supply Co. | | | 2,443 | | | | 215,863 | |
| Under Armour, Inc. - Class A* | | | 3,370 | | | | 163,546 | |
| | | | | | | | 3,338,078 | |
| | | | | | | | | |
| Health Care — 12.1% | | | | | | | | |
| Air Methods Corp. | | | 7,410 | | | | 273,355 | |
| Catamaran Corp. (Canada)* | | | 2,372 | | | | 111,745 | |
| Cooper Cos., Inc. (The) | | | 3,721 | | | | 344,118 | |
| Cyberonics, Inc.* | | | 4,955 | | | | 260,286 | |
| Insulet Corp.* | | | 4,387 | | | | 93,092 | |
| IPC Hospitalist Co., Inc. (The)* | | | 3,859 | | | | 153,241 | |
| Mettler-Toledo International, Inc.* | | | 1,068 | | | | 206,444 | |
| MWI Veterinary Supply, Inc.* | | | 2,801 | | | | 308,110 | |
| Perrigo Co. | | | 1,695 | | | | 176,331 | |
| Team Health Holdings, Inc.* | | | 6,316 | | | | 181,711 | |
| | | | | | | | 2,108,433 | |
| | | | | | | | | |
| Financials — 9.1% | | | | | | | | |
| Affiliated Managers Group, Inc.* | | | 3,198 | | | | 416,220 | |
| DFC Global Corp.* | | | 5,857 | | | | 108,413 | |
| Extra Space Storage, Inc. REIT | | | 6,246 | | | | 227,292 | |
| HFF, Inc. - Class A | | | 9,890 | | | | 147,361 | |
| MarketAxess Holdings, Inc. | | | 6,134 | | | | 216,530 | |
| Signature Bank* | | | 5,245 | | | | 374,178 | |
| Zillow, Inc. - Class A†* | | | 3,468 | | | | 96,237 | |
| | | | | | | | 1,586,231 | |
| | | | | | | | | |
| Energy — 7.2% | | | | | | | | |
| Core Laboratories N.V. (Netherlands) | | | 1,200 | | | | 131,172 | |
| Energy XXI Bermuda Ltd. (Bermuda) | | | 5,850 | | | | 188,312 | |
| Oasis Petroleum, Inc.* | | | 10,520 | | | | 334,536 | |
| Oceaneering International, Inc. | | | 4,559 | | | | 245,229 | |
| Oil States International, Inc.* | | | 2,290 | | | | 163,827 | |
| Rosetta Resources, Inc.* | | | 4,065 | | | | 184,388 | |
| | | | | | | | 1,247,464 | |
| | | | | | | | | |
| Materials — 6.2% | | | | | | | | |
| Airgas, Inc. | | | 2,287 | | | | 208,780 | |
| Cytec Industries, Inc. | | | 2,880 | | | | 198,230 | |
| Eagle Materials, Inc. | | | 1,528 | | | | 89,387 | |
| FMC Corp. | | | 3,536 | | | | 206,927 | |
| Haynes International, Inc. | | | 3,393 | | | | 175,995 | |
| Koppers Holdings, Inc. | | | 5,100 | | | | 194,565 | |
| | | | | | | | 1,073,884 | |
| | | | | | | | | |
| Consumer Staples — 2.9% | | | | | | | | |
| Elizabeth Arden, Inc.* | | | 4,034 | | | | 181,570 | |
| Prestige Brands Holdings, Inc.* | | | 4,086 | | | | 81,843 | |
| Snyders-Lance, Inc. | | | 10,079 | | | | 243,005 | |
| | | | | | | | 506,418 | |
| Total Common Stocks | | | | | | $ | 17,257,128 | |
Touchstone Emerging Growth Fund (Continued)
| | | | | | Market | |
| | | Shares | | | Value | |
| | | | | | | |
| Exchange Traded Funds — 11.1% | | | | | | | | |
| iShares Russell 2000 Growth Index Fund | | | 10,192 | | | $ | 971,400 | |
| iShares Russell Midcap Growth Index Fund | | | 15,391 | | | | 966,555 | |
| Total Exchange Traded Funds | | | | | | $ | 1,937,955 | |
| | | | | | | | | |
| Investment Funds — 3.6% | | | | | | | | |
| Invesco Government & Agency Portfolio** | | | 605,474 | | | | 605,474 | |
| Touchstone Institutional Money Market Fund^ | | | 17,682 | | | | 17,682 | |
| Total Investment Funds | | | | | | $ | 623,156 | |
| | | | | | | | | |
| Total Investment Securities —114.0% | | | | | | | | |
| (Cost $15,976,337) | | | | | | $ | 19,818,239 | |
| | | | | | | | | |
| Liabilities in Excess of Other Assets — (14.0%) | | | | | | | (2,430,003 | ) |
| | | | | | | | | |
| Net Assets — 100.0% | | | | | | $ | 17,388,236 | |
| † | All or a portion of the security is on loan. The total value of the securities on loan as of December 31, 2012 was $602,579. |
| * | Non-income producing security. |
| ** | Represents collateral for securities loaned. |
| ^ | AffiliatedFund. SeeNote4inNotestoFinancialStatements. |
Portfolio Abbreviations:
REIT - Real Estate Investment Trust
Other Information:
The inputs or methodology used for valuing securities may not be an indication of the risk associated with investing in those securities. For more information on valuation inputs, and their aggregation into the levels used in the table below, please refer to the security valuation section in the accompanying Notes to Financial Statements.
Valuation inputs at Reporting Date:
| Description | | Level 1 | | | Level 2 | | | Level 3 | | | Total | |
| Common Stocks | | $ | 17,257,128 | | | $ | — | | | $ | — | | | $ | 17,257,128 | |
| Exchange Traded Funds | | | 1,937,955 | | | | — | | | | — | | | | 1,937,955 | |
| Investment Funds | | | 623,156 | | | | — | | | | — | | | | 623,156 | |
| | | | | | | | | | | | | | | $ | 19,818,239 | |
See accompanying Notes to Financial Statements.
Portfolio of Investments
Touchstone International Equity Fund – December 31, 2012
| | | | | | Market | |
| | | Shares | | | Value | |
| | | | | | | |
| Common Stocks — 96.2% | | | | | | | | |
| | | | | | | | | |
| Japan — 22.1% | | | | | | | | |
| Ahresty Corp. | | | 500 | | | $ | 2,786 | |
| Airport Facilities Co. Ltd. | | | 3,400 | | | | 15,894 | |
| Alpen Co. Ltd. | | | 800 | | | | 14,060 | |
| AOI Electronic Co. Ltd. | | | 300 | | | | 4,712 | |
| Arnest One Corp. | | | 1,800 | | | | 29,486 | |
| Bando Chemical Industries Ltd. | | | 8,000 | | | | 26,881 | |
| Belluna Co. Ltd. | | | 7,550 | | | | 53,553 | |
| Bunka Shutter Co. Ltd. | | | 2,000 | | | | 9,331 | |
| Central Japan Railway Co. | | | 4,100 | | | | 332,754 | |
| Chubu Steel Plate Co. Ltd. | | | 300 | | | | 1,169 | |
| Cleanup Corp. | | | 900 | | | | 6,421 | |
| Coca-Cola Central Japan Co. Ltd. | | | 2,800 | | | | 34,646 | |
| Daihatsu Diesel Manufacturing Co. Ltd. | | | 13,000 | | | | 38,591 | |
| Daito Pharmaceutical Co. Ltd. | | | 800 | | | | 12,486 | |
| Daito Trust Construction Co. Ltd. | | | 400 | | | | 37,804 | |
| Daiwa House Industry Co. Ltd. | | | 27,000 | | | | 464,205 | |
| Faith, Inc. | | | 928 | | | | 96,895 | |
| Fuji Heavy Industries Ltd. | | | 19,000 | | | | 239,596 | |
| Fuji Soft, Inc. | | | 700 | | | | 13,316 | |
| Fujimori Kogyo Co. Ltd. | | | 400 | | | | 10,789 | |
| Fujitsu Frontech Ltd. | | | 1,100 | | | | 5,826 | |
| Fujitsu Ltd. | | | 54,000 | | | | 226,475 | |
| Fukuda Denshi Co. Ltd. | | | 1,300 | | | | 40,195 | |
| Fukushima Industries Corp. | | | 300 | | | | 6,253 | |
| Gamecard-Joyco Holdings, Inc. | | | 3,300 | | | | 52,985 | |
| Geo Holdings Corp. | | | 53 | | | | 55,448 | |
| Happinet Corp. | | | 3,100 | | | | 25,130 | |
| Haruyama Trading Co. Ltd. | | | 1,500 | | | | 8,706 | |
| Haseko Corp.* | | | 500 | | | | 398 | |
| Hitachi Ltd. | | | 59,000 | | | | 347,186 | |
| Hokkaido Coca-Cola Bottling Co. Ltd. | | | 2,000 | | | | 9,165 | |
| Hokkan Holdings Ltd. | | | 4,000 | | | | 11,392 | |
| Ichikoh Industries Ltd.* | | | 3,000 | | | | 4,766 | |
| IMI Co. Ltd. | | | 300 | | | | 5,194 | |
| IT Holdings Corp. | | | 11,800 | | | | 142,449 | |
| Japan Digital Laboratory Co. Ltd. | | | 800 | | | | 8,982 | |
| JMS Co. Ltd. | | | 2,000 | | | | 7,174 | |
| Kamei Corp. | | | 4,000 | | | | 36,167 | |
| Kasai Kogyo Co. Ltd. | | | 8,000 | | | | 37,566 | |
| Kawasumi Laboratories, Inc. | | | 5,800 | | | | 34,300 | |
| Kenko Mayonnaise Co. Ltd. | | | 800 | | | | 7,010 | |
| Koike Sanso Kogyo Co. Ltd. | | | 6,000 | | | | 12,931 | |
| Komatsu Seiren Co. Ltd. | | | 10,000 | | | | 45,671 | |
| Komatsu Wall Industry Co. Ltd. | | | 1,400 | | | | 18,764 | |
| KRS Corp. | | | 800 | | | | 8,424 | |
| Mac House Co. Ltd. | | | 1,800 | | | | 13,907 | |
| Macnica, Inc. | | | 900 | | | | 17,864 | |
| Maeda Road Construction Co. Ltd. | | | 2,000 | | | | 30,557 | |
| Maezawa Kyuso Industries Co. Ltd. | | | 700 | | | | 8,688 | |
| Marubun Corp. | | | 1,000 | | | | 4,304 | |
| Mimasu Semiconductor Industry Co. Ltd. | | | 1,500 | | | | 12,255 | |
| Mitani Corp. | | | 2,300 | | | | 29,342 | |
| Mitsubishi UFJ Financial Group, Inc. | | | 93,200 | | | | 504,316 | |
| Mitsui High-Tec, Inc.* | | | 2,400 | | | | 17,134 | |
| Mitsui Home Co. Ltd. | | | 2,000 | | | | 11,694 | |
| Nagawa Co. Ltd. | | | 500 | | | | 8,689 | |
| Nakano Refrigerators Co. Ltd. | | | 200 | | | | 3,486 | |
| Namura Shipbuilding Co. Ltd. | | | 22,000 | | | | 72,037 | |
| Nichireki Co. Ltd. | | | 10,289 | | | | 60,321 | |
| NIFTY Corp. | | | 59 | | | | 92,351 | |
| Nippo Corp. | | | 5,000 | | | | 69,140 | |
| Nippon Steel Trading Co. Ltd. | | | 1,000 | | | | 2,674 | |
| Nippon Telegraph & Telephone Corp. | | | 9,400 | | | | 395,768 | |
| NIS Group Co. Ltd.*± | | | 24,287 | | | | — | |
| Nisshin Fudosan Co. | | | 5,600 | | | | 34,981 | |
| Nissin Sugar Holdings Co. Ltd.* | | | 700 | | | | 13,511 | |
| Nojima Corp. | | | 828 | | | | 5,018 | |
| Nomura Real Estate Holdings, Inc. | | | 2,000 | | | | 38,245 | |
| Otsuka Holdings Co. Ltd. | | | 4,800 | | | | 135,222 | |
| Pacific Industrial Co. Ltd. | | | 4,000 | | | | 21,916 | |
| Piolax, Inc. | | | 500 | | | | 11,530 | |
| Raysum Co. Ltd.* | | | 3 | | | | 1,910 | |
| Relo Holdings, Inc. | | | 200 | | | | 7,461 | |
| Saison Information Systems Co. Ltd. | | | 992 | | | | 11,966 | |
| Shidax Corp. | | | 5,000 | | | | 24,363 | |
| Shin Nippon Air Technologies Co. Ltd. | | | 800 | | | | 4,475 | |
| Shinsho Corp. | | | 2,000 | | | | 3,936 | |
| Sinko Industries Ltd. | | | 1,000 | | | | 6,460 | |
| Soken Chemical & Engineering Co. Ltd. | | | 700 | | | | 6,474 | |
| Sumikin Bussan Corp. | | | 2,000 | | | | 5,177 | |
| Sumitomo Densetsu Co. Ltd. | | | 7,200 | | | | 78,497 | |
| Suncall Corp. | | | 4,000 | | | | 19,217 | |
| T&K Toka Co. Ltd. | | | 400 | | | | 5,754 | |
| Tachibana Eletech Co. Ltd. | | | 400 | | | | 3,240 | |
| Tact Home Co. Ltd. | | | 16 | | | | 19,963 | |
| TKC Corp. | | | 1,900 | | | | 33,087 | |
| Totetsu Kogyo Co. Ltd. | | | 13,400 | | | | 183,580 | |
| UKC Holdings Corp. | | | 300 | | | | 5,977 | |
| Vital KSK Holdings, Inc. | | | 1,600 | | | | 14,782 | |
| Warabeya Nichiyo Co. Ltd. | | | 1,200 | | | | 22,240 | |
| Watabe Wedding Corp. | | | 3,377 | | | | 25,063 | |
| Yachiyo Industry Co. Ltd. | | | 1,400 | | | | 9,242 | |
| Yellow Hat Ltd. | | | 200 | | | | 3,026 | |
| Zojirushi Corp. | | | 12,000 | | | | 38,078 | |
| | | | | | | | 4,752,850 | |
| | | | | | | | | |
| United Kingdom — 18.3% | | | | | | | | |
| AstraZeneca PLC | | | 9,749 | | | | 462,005 | |
| AstraZeneca PLC | | | 317 | | | | 14,965 | |
| Barclays PLC | | | 63,379 | | | | 275,318 | |
| Berendsen PLC | | | 31,578 | | | | 307,093 | |
| BHP Billiton PLC | | | 3,718 | | | | 131,147 | |
| BP PLC | | | 11,216 | | | | 77,984 | |
| BP PLC ADR | | | 4,024 | | | | 167,559 | |
| British American Tobacco PLC | | | 69 | | | | 3,508 | |
| British Polythene Industries PLC | | | 2,378 | | | | 15,355 | |
| Dart Group PLC | | | 40,418 | | | | 82,728 | |
| Eurasian Natural Resources Corp. PLC | | | 29,375 | | | | 138,929 | |
| Hilton Food Group Ltd. | | | 1,087 | | | | 4,856 | |
| HSBC Holdings PLC | | | 58,814 | | | | 623,242 | |
| Johnson Service Group PLC | | | 13,568 | | | | 7,880 | |
| Kazakhmys PLC | | | 8,817 | | | | 113,957 | |
Touchstone International Equity Fund (Continued)
| | | | | | Market | |
| | | Shares | | | Value | |
| | | | | | | |
| Common Stocks — 96.2% (Continued) | | | | | | | | |
| | | | | | | | | |
| United Kingdom — (Continued) | | | | | | | | |
| Rio Tinto PLC | | | 7,990 | | | $ | 466,024 | |
| Royal Dutch Shell PLC - Class A | | | 22,949 | | | | 789,914 | |
| Taylor Wimpey PLC | | | 222,700 | | | | 241,560 | |
| | | | | | | | 3,924,024 | |
| | | | | | | | | |
| France — 9.6% | | | | | | | | |
| Air France-KLM* | | | 9,394 | | | | 88,082 | |
| BNP Paribas SA | | | 4,977 | | | | 283,342 | |
| Boiron SA | | | 462 | | | | 15,959 | |
| Cegid Group | | | 578 | | | | 11,673 | |
| Cie Generale des Etablissements Michelin | | | 3,323 | | | | 318,408 | |
| Credit Agricole SA* | | | 3,198 | | | | 26,045 | |
| Etam Developpement SA* | | | 427 | | | | 9,429 | |
| EuropaCorp* | | | 2,186 | | | | 12,090 | |
| France Telecom SA | | | 370 | | | | 4,105 | |
| L.D.C. SA | | | 91 | | | | 9,837 | |
| Linedata Services | | | 20 | | | | 316 | |
| Maisons France Confort | | | 1,060 | | | | 33,639 | |
| Nexity SA | | | 4,300 | | | | 145,860 | |
| Sanofi | | | 6,181 | | | | 586,147 | |
| Tessi SA | | | 8 | | | | 839 | |
| Total SA | | | 9,998 | | | | 520,228 | |
| | | | | | | | 2,065,999 | |
| | | | | | | | | |
| Germany — 6.8% | | | | | | | | |
| BASF SE | | | 3,428 | | | | 324,153 | |
| Bayer AG | | | 4,084 | | | | 389,460 | |
| Borussia Dortmund GmbH & Co. KGaA | | | 7,713 | | | | 27,725 | |
| Cewe Color Holding AG | | | 456 | | | | 18,738 | |
| Deutsche Post AG | | | 3,330 | | | | 73,345 | |
| Freenet AG | | | 62 | | | | 1,149 | |
| Muenchener Rueckversicherungs AG | | | 1,649 | | | | 297,692 | |
| Schuler AG | | | 343 | | | | 8,807 | |
| Volkswagen AG | | | 1,495 | | | | 324,323 | |
| | | | | | | | 1,465,392 | |
| | | | | | | | | |
| Sweden — 6.0% | | | | | | | | |
| Bilia AB | | | 6,770 | | | | 97,589 | |
| Electrolux AB | | | 7,974 | | | | 210,629 | |
| Nordea Bank AB | | | 27,023 | | | | 259,932 | |
| Saab AB | | | 18,784 | | | | 391,243 | |
| Semcon AB* | | | 1,898 | | | | 14,102 | |
| Skandinaviska Enskilda Banken AB - Class A | | | 4,775 | | | | 40,853 | |
| Swedbank AB - Class A | | | 13,466 | | | | 264,545 | |
| | | | | | | | 1,278,893 | |
| | | | | | | | | |
| Australia — 5.1% | | | | | | | | |
| Australia & New Zealand Banking Group Ltd. | | | 1,577 | | | | 41,533 | |
| BHP Billiton Ltd. | | | 13,600 | | | | 530,952 | |
| Commonwealth Bank of Australia | | | 7,572 | | | | 493,139 | |
| Troy Resources Ltd. | | | 5,541 | | | | 21,048 | |
| | | | | | | | 1,086,672 | |
| | | | | | | | | |
| Switzerland — 4.8% | | | | | | | | |
| Advanced Digital Broadcast Holdings SA* | | | 2,822 | | | | 39,647 | |
| Bell AG | | | 28 | | | | 61,379 | |
| Emmi AG | | | 472 | | | | 118,690 | |
| OC Oerlikon Corp. AG* | | | 5,123 | | | | 58,343 | |
| Roche Holding AG | | | 3,272 | | | | 661,537 | |
| Swiss Life Holding AG | | | 648 | | | | 86,493 | |
| | | | | | | | 1,026,089 | |
| | | | | | | | | |
| Canada — 3.3% | | | | | | | | |
| Agrium, Inc. | | | 3,300 | | | | 328,905 | |
| Exco Technologies Ltd. | | | 2,900 | | | | 17,988 | |
| Norbord, Inc.* | | | 3,609 | | | | 109,536 | |
| Pulse Seismic, Inc. | | | 3,600 | | | | 9,844 | |
| Saputo, Inc. | | | 2,400 | | | | 121,387 | |
| Suncor Energy, Inc. | | | 3,500 | | | | 115,095 | |
| | | | | | | | 702,755 | |
| | | | | | | | | |
| Norway — 3.0% | | | | | | | | |
| DNB ASA | | | 19,577 | | | | 250,227 | |
| Statoil ASA | | | 15,664 | | | | 394,805 | |
| | | | | | | | 645,032 | |
| | | | | | | | | |
| Netherlands — 2.9% | | | | | | | | |
| BE Semiconductor Industries NV | | | 1,789 | | | | 13,673 | |
| European Aeronautic Defence and Space Co. NV | | | 8,634 | | | | 340,365 | |
| Heineken NV | | | 3,783 | | | | 253,627 | |
| ING Groep NV* | | | 2,193 | | | | 20,829 | |
| PostNL NV* | | | 58 | | | | 226 | |
| | | | | | | | 628,720 | |
| | | | | | | | | |
| Belgium — 2.7% | | | | | | | | |
| Anheuser-Busch InBev N.V. | | | 6,094 | | | | 530,696 | |
| Euronav N.V.* | | | 40 | | | | 242 | |
| Recticel SA | | | 5,366 | | | | 37,481 | |
| | | | | | | | 568,419 | |
| | | | | | | | | |
| Singapore — 2.5% | | | | | | | | |
| GP Batteries International Ltd. | | | 2,405 | | | | 1,877 | |
| Jardine Cycle & Carriage Ltd. | | | 9,526 | | | | 379,419 | |
| Metro Holdings Ltd. | | | 22,992 | | | | 15,603 | |
| New Toyo International Holdings Ltd. | | | 32,000 | | | | 7,075 | |
| QAF Ltd. | | | 7,000 | | | | 4,423 | |
| Sim Lian Group Ltd. | | | 50,000 | | | | 31,401 | |
| STX OSV Holdings Ltd. | | | 97,000 | | | | 104,818 | |
| SunVic Chemical Holdings Ltd.* | | | 1,000 | | | | 363 | |
| | | | | | | | 544,979 | |
| | | | | | | | | |
| Denmark — 2.2% | | | | | | | | |
| Novo Nordisk A/S - Class B | | | 2,932 | | | | 477,437 | |
| | | | | | | | | |
| Austria — 1.8% | | | | | | | | |
| OMV AG | | | 10,194 | | | | 369,392 | |
| Telekom Austria AG | | | 200 | | | | 1,519 | |
| Voestalpine AG | | | 127 | | | | 4,666 | |
| | | | | | | | 375,577 | |
Touchstone International Equity Fund (Continued)
| | | | | | Market | |
| | | Shares | | | Value | |
| | | | | | | |
| Common Stocks — 96.2% (Continued) | | | | | | | | |
| | | | | | | | | |
| Italy — 1.6% | | | | | | | | |
| Banca Popolare dell'Emilia Romagna Scrl | | | 171 | | | $ | 1,188 | |
| Enel SpA | | | 60,866 | | | | 253,172 | |
| Exor SpA | | | 635 | | | | 16,003 | |
| Fiat SpA* | | | 14,988 | | | | 75,501 | |
| Milano Assicurazioni SpA* | | | 521 | | | | 217 | |
| | | | | | | | 346,081 | |
| | | | | | | | | |
| Bermuda — 1.0% | | | | | | | | |
| Champion Technology Holdings Ltd. | | | 1,542,000 | | | | 22,725 | |
| CSI Properties Ltd. | | | 1,690,000 | | | | 69,341 | |
| Dickson Concepts International Ltd. | | | 7,500 | | | | 4,001 | |
| DMX Technologies Group Ltd. | | | 38,000 | | | | 6,940 | |
| Global Sources Ltd.* | | | 319 | | | | 2,067 | |
| Hongkong Land Holdings Ltd. | | | 1,000 | | | | 7,063 | |
| TAI Cheung Holdings | | | 74,000 | | | | 60,992 | |
| Victory City International Holdings Ltd. | | | 170,000 | | | | 17,081 | |
| Wing On Co. International Ltd. | | | 6,000 | | | | 16,526 | |
| Wuling Motors Holdings Ltd.* | | | 20,000 | | | | 1,379 | |
| | | | | | | | 208,115 | |
| | | | | | | | | |
| New Zealand — 0.8% | | | | | | | | |
| Briscoe Group Ltd. | | | 4,926 | | | | 8,954 | |
| Fletcher Building Ltd. | | | 23,480 | | | | 164,813 | |
| Sky Network Television Ltd. | | | 210 | | | | 853 | |
| | | | | | | | 174,620 | |
| | | | | | | | | |
| Hong Kong — 0.7% | | | | | | | | |
| CLP Holdings Ltd. | | | 500 | | | | 4,201 | |
| Galaxy Entertainment Group Ltd.* | | | 34,000 | | | | 136,333 | |
| Keck Seng Investments | | | 8,900 | | | | 4,570 | |
| Sun Hung Kai Properties Ltd. | | | 1,000 | | | | 15,165 | |
| | | | | | | | 160,269 | |
| | | | | | | | | |
| Spain — 0.7% | | | | | | | | |
| Endesa SA | | | 7,162 | | | | 159,693 | |
| | | | | | | | | |
| Cayman Islands — 0.2% | | | | | | | | |
| Kantone Holdings Ltd. | | | 60,000 | | | | 564 | |
| Luen Thai Holdings Ltd. | | | 69,000 | | | | 10,513 | |
| Pacific Textile Holdings Ltd. | | | 33,000 | | | | 29,834 | |
| | | | | | | | 40,911 | |
| | | | | | | | | |
| Finland — 0.1% | | | | | | | | |
| Digia PLC | | | 3,602 | | | | 12,457 | |
| | | | | | | | | |
| Portugal — 0.0% | | | | | | | | |
| Novabase SGPS SA | | | 1,343 | | | | 4,077 | |
| Total Common Stocks | | | | | | $ | 20,649,061 | |
| | | | | | | | | |
| Preferred Stocks — 0.7% | | | | | | | | |
| | | | | | | | | |
| Germany — 0.7% | | | | | | | | |
| Henkel AG & Co. KGaA | | | 976 | | | | 80,297 | |
| Volkswagen AG | | | 346 | | | | 79,390 | |
| | | | | | | | 159,687 | |
| | | | | | | | | |
| Investment Fund — 0.0% | | | | | | | | |
| Touchstone Institutional Money Market Fund^ | | | 2 | | | $ | 2 | |
| | | | | | | | | |
| Total Investment Securities —96.9% | | | | | | | | |
| (Cost $18,011,801) | | | | | | $ | 20,808,750 | |
| | | | | | | | | |
| Other Assets in Excess of Liabilities — 3.1% | | | | | | | 662,647 | |
| | | | | | | | | |
| Net Assets — 100.0% | | | | | | $ | 21,471,397 | |
| * | Non-income producing security. |
| ^ | AffiliatedFund. SeeNote4inNotestoFinancialStatements. |
| ± | Fair valued security by Fund's Investment Advisor. |
Portfolio Abbreviations:
ADR - American Depositary Receipt
PLC - Public Limited Company
Other Information:
The inputs or methodology used for valuing securities may not be an indication of the risk associated with investing in those securities. For more information on valuation inputs, and their aggregation into the levels used in the table below, please refer to the security valuation section in the accompanying Notes to Financial Statements.
Touchstone International Equity Fund (Continued)
Valuation inputs at Reporting Date:
| Description | | Level 1 | | | Level 2 | | | Level 3 | | | Total | |
| Common Stocks | | | | | | | | | | | | | | | | |
| Japan | | | 24,617 | | | | 4,728,233 | | | | — | ** | | | 4,752,850 | |
| United Kingdom | | | 278,378 | | | | 3,645,646 | | | | — | | | | 3,924,024 | |
| France | | | 49,151 | | | | 2,016,848 | | | | — | | | | 2,065,999 | |
| Germany | | | — | | | | 1,465,392 | | | | — | | | | 1,465,392 | |
| Sweden | | | — | | | | 1,278,893 | | | | — | | | | 1,278,893 | |
| Australia | | | — | | | | 1,086,672 | | | | — | | | | 1,086,672 | |
| Switzerland | | | 219,716 | | | | 806,373 | | | | — | | | | 1,026,089 | |
| Canada | | | 702,755 | | | | — | | | | — | | | | 702,755 | |
| Norway | | | — | | | | 645,032 | | | | — | | | | 645,032 | |
| Netherlands | | | 13,673 | | | | 615,047 | | | | — | | | | 628,720 | |
| Belgium | | | 242 | | | | 568,177 | | | | — | | | | 568,419 | |
| Singapore | | | 104,818 | | | | 440,161 | | | | — | | | | 544,979 | |
| Denmark | | | — | | | | 477,437 | | | | — | | | | 477,437 | |
| Austria | | | — | | | | 375,577 | | | | — | | | | 375,577 | |
| Italy | | | — | | | | 346,081 | | | | — | | | | 346,081 | |
| Bermuda | | | 2,067 | | | | 206,048 | | | | — | | | | 208,115 | |
| New Zealand | | | — | | | | 174,620 | | | | — | | | | 174,620 | |
| Hong Kong | | | 4,570 | | | | 155,699 | | | | — | | | | 160,269 | |
| Spain | | | — | | | | 159,693 | | | | — | | | | 159,693 | |
| Cayman Islands | | | — | | | | 40,911 | | | | — | | | | 40,911 | |
| Finland | | | 12,457 | | | | — | | | | — | | | | 12,457 | |
| Portugal | | | 4,077 | | | | — | | | | — | | | | 4,077 | |
| Preferred Stocks | | | — | | | | 159,687 | | | | — | | | | 159,687 | |
| Investment Fund | | | 2 | | | | — | | | | — | | | | 2 | |
| | | | | | | | | | | | | | | $ | 20,808,750 | |
At December 31, 2012, equity securities valued at $15,009,426 were transferred from Level 1 to Level 2. At December 31, 2012, these securities were valued using observable inputs other than quoted prices. At July 31, 2012, these securities were valued using inputs that reflected quoted prices in active markets.
Level 3 Rollfoward Disclosure:
The following is a rollforward of the Fund's investments that were valued using unobservable inputs for the period ended December 31, 2012:
Measurements Using Unobservable Inputs (Level 3)
| | | Common Stock | | | | |
| Assets | | Japan | | | Total | |
| Beginning balance | | $ | 311 | | | $ | 311 | |
| Unrealized Appreciation (Depreciation) | | | (311 | ) | | | (311 | ) |
| Ending balance | | $ | — | | | $ | — | |
The change in unrealized appreciation/depreciation relating to the Level 3 investments held at December 31, 2012 was ($311).
| ** | Level 3 Security held with $0 market value. |
See accompanying Notes to Financial Statements.
Portfolio of Investments
Touchstone Balanced Allocation Fund – December 31, 2012
| | | | | | Market | |
| | | Shares | | | Value | |
| | | | | | | |
| Affiliated Mutual Funds^ — 115.3% | | | | | | | | |
| | | | | | | | | |
| Government/Corporate — 27.8% | | | | | | | | |
| Touchstone Core Bond Fund | | | 575,758 | | | $ | 6,177,880 | |
| Touchstone Short Duration Fixed Income Fund, Class Y | | | 1,529,748 | | | | 14,991,535 | |
| Touchstone Total Return Bond Fund | | | 1,540,367 | | | | 16,189,261 | |
| | | | | | | | 37,358,676 | |
| | | | | | | | | |
| International Equity — 16.4% | | | | | | | | |
| Touchstone International Equity Fund | | | 710,594 | | | | 6,302,967 | |
| Touchstone International Small Cap Fund | | | 394,333 | | | | 4,700,450 | |
| Touchstone International Value Fund | | | 1,449,437 | | | | 11,030,219 | |
| | | | | | | | 22,033,636 | |
| | | | | | | | | |
| Value — 12.7% | | | | | | | | |
| Touchstone Focused Equity | | | 270,165 | | | | 3,142,016 | |
| Touchstone Value Fund | | | 1,989,745 | | | | 13,987,910 | |
| | | | | | | | 17,129,926 | |
| | | | | | | | | |
| Growth — 7.0% | | | | | | | | |
| Touchstone Sands Capital Institutional Growth Fund | | | 545,987 | | | | 9,347,300 | |
| | | | | | | | | |
| International Debt — 5.7% | | | | | | | | |
| Touchstone International Fixed Income Fund | | | 732,482 | | | | 7,713,033 | |
| | | | | | | | | |
| Balanced — 5.2% | | | | | | | | |
| Touchstone Strategic Income Fund | | | 647,744 | | | | 6,982,686 | |
| | | | | | | | | |
| Emerging Market-Equity — 4.7% | | | | | | | | |
| Touchstone Emerging Markets Equity Fund | | | 484,537 | | | | 6,303,825 | |
| | | | | | | | | |
| Growth Mid-Cap — 4.6% | | | | | | | | |
| Touchstone Mid Cap Fund | | | 182,107 | | | | 3,104,921 | |
| Touchstone Mid Cap Growth Fund* | | | 145,145 | | | | 3,129,330 | |
| | | | | | | | 6,234,251 | |
| | | | | | | | | |
| Blue Chip — 4.6% | | | | | | | | |
| Touchstone Dynamic Equity Fund | | | 547,990 | | | | 6,153,930 | |
| | | | | | | | | |
| Value Large-Cap — 4.1% | | | | | | | | |
| Touchstone Large Cap Relative Value Fund - Class Y | | | 448,575 | | | | 5,445,697 | |
| | | | | | | | | |
| Sector Fund Real-Estate — 3.5% | | | | | | | | |
| Touchstone Global Real Estate Fund | | | 380,201 | | | | 4,741,109 | |
| | | | | | | | | |
| Various Assets — 3.5% | | | | | | | | |
| Touchstone Merger Arbitrage Fund | | | 435,339 | | | | 4,645,072 | |
| | | | | | | | | |
| Taxable-Money Market — 3.4% | | | | | | | | |
| Touchstone Institutional Money Market Fund | | | 4,624,881 | | | | 4,624,881 | |
| | | | | | | | | |
| Corporate/Preferred-High Yield — 2.9% | | | | | | | | |
| Touchstone High Yield Fund | | | 421,628 | | | | 3,878,975 | |
| | | | | | | | | |
| Value Mid-Cap — 2.3% | | | | | | | | |
| Touchstone Mid Cap Value Fund | | | 236,276 | | | | 3,130,656 | |
| | | | | | | | | |
| Global Equity — 2.3% | | | | | | | | |
| Touchstone Global Equity Fund | | | 304,102 | | | | 3,129,207 | |
| | | | | | | | | |
| Value Small-Cap — 2.3% | | | | | | | | |
| Touchstone Small Cap Core Fund | | | 191,322 | | | | 3,118,541 | |
| | | | | | | | | |
| Growth Large-Cap — 2.3% | | | | | | | | |
| Touchstone Large Cap Growth Fund, Class Y | | | 115,090 | | | | 3,079,810 | |
| Total Affiliated Mutual Funds | | | | | | $ | 155,051,211 | |
| | | | | | | | | |
| Total Investment Securities —115.3% | | | | | | | | |
| (Cost $150,780,948) | | | | | | $ | 155,051,211 | |
| | | | | | | | | |
| Liabilities in Excess of Other Assets — (15.3%) | | | | | | | (20,584,136 | ) |
| | | | | | | | | |
| Net Assets — 100.0% | | | | | | $ | 134,467,075 | |
| * | Non-income producing security. |
| ^ | All affiliated funds are invested in Institutional Class,unless otherwise indicated. The financial statements of the underlying funds can be found on the SEC website. See Note 4 in Notes to Financial Statements. |
Other Information:
The inputs or methodology used for valuing securities may not be an indication of the risk associated with investing in those securities. For more information on valuation inputs, and their aggregation into the levels used in the table below, please refer to the security valuation section in the accompanying Notes to Financial Statements.
Valuation inputs at Reporting Date:
| Description | | Level 1 | | | Level 2 | | | Level 3 | | | Total | |
| Affiliated Mutual Funds | | $ | 155,051,211 | | | $ | — | | | $ | — | | | $ | 155,051,211 | |
See accompanying Notes to Financial Statements.
Portfolio of Investments
Touchstone Conservative Allocation Fund – December 31, 2012
| | | | | | Market | |
| | | Shares | | | Value | |
| | | | | | | |
| Affiliated Mutual Funds^ — 103.3% | | | | | | | | |
| | | | | | | | | |
| Government/Corporate — 46.4% | | | | | | | | |
| Touchstone Core Bond Fund | | | 492,656 | | | $ | 5,286,194 | |
| Touchstone Short Duration Fixed Income Fund, Class Y | | | 1,796,803 | | | | 17,608,669 | |
| Touchstone Total Return Bond Fund | | | 1,591,222 | | | | 16,723,746 | |
| | | | | | | | 39,618,609 | |
| | | | | | | | | |
| International Debt — 8.2% | | | | | | | | |
| Touchstone International Fixed Income Fund | | | 666,714 | | | | 7,020,502 | |
| | | | | | | | | |
| Value — 6.2% | | | | | | | | |
| Touchstone Value Fund | | | 755,252 | | | | 5,309,423 | |
| | | | | | | | | |
| Balanced — 5.7% | | | | | | | | |
| Touchstone Strategic Income Fund | | | 450,478 | | | | 4,856,148 | |
| | | | | | | | | |
| Growth — 5.2% | | | | | | | | |
| Touchstone Sands Capital Institutional Growth Fund | | | 259,802 | | | | 4,447,805 | |
| | | | | | | | | |
| International Equity — 5.2% | | | | | | | | |
| Touchstone International Small Cap Fund | | | 74,321 | | | | 885,908 | |
| Touchstone International Value Fund | | | 467,343 | | | | 3,556,478 | |
| | | | | | | | 4,442,386 | |
| | | | | | | | | |
| Taxable-Money Market — 5.2% | | | | | | | | |
| Touchstone Institutional Money Market Fund | | | 4,399,148 | | | | 4,399,148 | |
| | | | | | | | | |
| Blue Chip — 4.1% | | | | | | | | |
| Touchstone Dynamic Equity Fund | | | 315,098 | | | | 3,538,549 | |
| | | | | | | | | |
| Various Assets — 4.1% | | | | | | | | |
| Touchstone Merger Arbitrage Fund | | | 330,513 | | | | 3,526,575 | |
| | | | | | | | | |
| Corporate/Preferred-High Yield — 3.1% | | | | | | | | |
| Touchstone High Yield Fund | | | 287,461 | | | | 2,644,642 | |
| | | | | | | | | |
| Value Large-Cap — 2.6% | | | | | | | | |
| Touchstone Large Cap Relative Value Fund | | | 182,309 | | | | 2,213,230 | |
| | | | | | | | | |
| Value Small-Cap — 2.1% | | | | | | | | |
| Touchstone Small Cap Core Fund | | | 109,221 | | | | 1,780,296 | |
| | | | | | | | | |
| Sector Fund Real-Estate — 2.1% | | | | | | | | |
| Touchstone Global Real Estate Fund | | | 142,273 | | | | 1,774,138 | |
| | | | | | | | | |
| Emerging Market-Equity — 1.1% | | | | | | | | |
| Touchstone Emerging Markets Equity Fund | | | 68,640 | | | | 893,014 | |
| | | | | | | | | |
| Global Equity — 1.0% | | | | | | | | |
| Touchstone Global Equity Fund | | | 86,389 | | | | 888,940 | |
| | | | | | | | | |
| Growth Mid-Cap — 1.0% | | | | | | | | |
| Touchstone Mid Cap Fund | | | 52,047 | | | | 887,405 | |
| Total Affiliated Mutual Funds | | | | | | $ | 88,240,810 | |
| | | | | | | | | |
| Total Investment Securities —103.3% | | | | | | | | |
| (Cost $86,542,394) | | | | | | $ | 88,240,810 | |
| | | | | | | | | |
| Liabilities in Excess of Other Assets — (3.3%) | | | | | | | (2,778,042 | ) |
| | | | | | | | | |
| Net Assets — 100.0% | | | | | | $ | 85,462,768 | |
| ^ | All affiliated funds are invested in Institutional Class,unless otherwise indicated. The financial statements of the underlying funds can be found on the SEC website. See Note 4 in Notes to Financial Statements. |
Other Information:
The inputs or methodology used for valuing securities may not be an indication of the risk associated with investing in those securities. For more information on valuation inputs, and their aggregation into the levels used in the table below, please refer to the security valuation section in the accompanying Notes to Financial Statements.
Valuation inputs at Reporting Date:
| Description | | Level 1 | | | Level 2 | | | Level 3 | | | Total | |
| Affiliated Mutual Funds | | $ | 88,240,810 | | | $ | — | | | $ | — | | | $ | 88,240,810 | |
See accompanying Notes to Financial Statements.
Portfolio of Investments
Touchstone Growth Allocation Fund – December 31, 2012
| | | | | | Market | |
| | | Shares | | | Value | |
| | | | | | | |
| Affiliated Mutual Funds^ — 101.5% | | | | | | | | |
| | | | | | | | | |
| International Equity — 20.7% | | | | | | | | |
| Touchstone International Equity Fund | | | 584,378 | | | $ | 5,183,432 | |
| Touchstone International Small Cap Fund | | | 359,710 | | | | 4,287,749 | |
| Touchstone International Value Fund | | | 1,024,053 | | | | 7,793,043 | |
| | | | | | | | 17,264,224 | |
| | | | | | | | | |
| Value — 14.3% | | | | | | | | |
| Touchstone Focused Equity | | | 369,501 | | | | 4,297,300 | |
| Touchstone Value Fund | | | 1,090,552 | | | | 7,666,581 | |
| | | | | | | | 11,963,881 | |
| | | | | | | | | |
| Growth — 11.3% | | | | | | | | |
| Touchstone Emerging Growth Fund | | | 221,508 | | | | 2,578,351 | |
| Touchstone Sands Capital Institutional Growth Fund | | | 398,989 | | | | 6,830,699 | |
| | | | | | | | 9,409,050 | |
| | | | | | | | | |
| Emerging Market-Equity — 10.4% | | | | | | | | |
| Touchstone Emerging Markets Equity Fund | | | 663,266 | | | | 8,629,095 | |
| | | | | | | | | |
| Sector Fund Real-Estate — 6.2% | | | | | | | | |
| Touchstone Global Real Estate Fund | | | 416,010 | | | | 5,187,649 | |
| | | | | | | | | |
| Value Small-Cap — 6.2% | | | | | | | | |
| Touchstone Small Cap Core Fund | | | 209,900 | | | | 3,421,373 | |
| Touchstone Small Company Value Fund | | | 105,316 | | | | 1,725,072 | |
| | | | | | | | 5,146,445 | |
| | | | | | | | | |
| Global Equity — 5.1% | | | | | | | | |
| Touchstone Global Equity Fund | | | 416,068 | | | | 4,281,335 | |
| | | | | | | | | |
| Growth Mid-Cap — 5.1% | | | | | | | | |
| Touchstone Mid Cap Fund | | | 149,814 | | | | 2,554,320 | |
| Touchstone Mid Cap Growth Fund* | | | 79,428 | | | | 1,712,471 | |
| | | | | | | | 4,266,791 | |
| | | | | | | | | |
| Government/Corporate — 4.9% | | | | | | | | |
| Touchstone Short Duration Fixed Income Fund, Class Y | | | 420,890 | | | | 4,124,718 | |
| | | | | | | | | |
| Value Mid-Cap — 4.1% | | | | | | | | |
| Touchstone Mid Cap Value Fund | | | 258,556 | | | | 3,425,871 | |
| | | | | | | | | |
| Value Large-Cap — 4.1% | | | | | | | | |
| Touchstone Large Cap Relative Value Fund | | | 280,689 | | | | 3,407,567 | |
| | | | | | | | | |
| Blue Chip — 4.0% | | | | | | | | |
| Touchstone Dynamic Equity Fund | | | 299,251 | | | | 3,360,589 | |
| | | | | | | | | |
| Growth Large-Cap — 3.1% | | | | | | | | |
| Touchstone Large Cap Growth Fund, Class Y | | | 95,072 | | | | 2,544,130 | |
| | | | | | | | | |
| Various Assets — 2.0% | | | | | | | | |
| Touchstone Merger Arbitrage Fund | | | 156,887 | | | | 1,673,988 | |
| Total Affiliated Mutual Funds | | | | | | $ | 84,685,333 | |
| | | | | | | | | |
| Total Investment Securities —101.5% | | | | | | | | |
| (Cost $81,072,772) | | | | | | $ | 84,685,333 | |
| | | | | | | | | |
| Liabilities in Excess of Other Assets — (1.5%) | | | | | | | (1,286,418 | ) |
| | | | | | | | | |
| Net Assets — 100.0% | | | | | | $ | 83,398,915 | |
| * | Non-income producing security. |
| ^ | All affiliated funds are invested in Institutional Class,unless otherwise indicated. The financial statements of the underlying funds can be found on the SEC website. See Note 4 in Notes to Financial Statements. |
Other Information:
The inputs or methodology used for valuing securities may not be an indication of the risk associated with investing in those securities. For more information on valuation inputs, and their aggregation into the levels used in the table below, please refer to the security valuation section in the accompanying Notes to Financial Statements.
Valuation inputs at Reporting Date:
| Description | | Level 1 | | | Level 2 | | | Level 3 | | | Total | |
| Affiliated Mutual Funds | | $ | 84,685,333 | | | $ | — | | | $ | — | | | $ | 84,685,333 | |
See accompanying Notes to Financial Statements.
Portfolio of Investments
Touchstone Moderate Growth Allocation Fund – December 31, 2012
| | | | | | Market | |
| | | Shares | | | Value | |
| | | | | | | |
| Affiliated Mutual Funds^ — 108.0% | | | | | | | | |
| | | | | | | | | |
| International Equity — 16.6% | | | | | | | | |
| Touchstone International Equity Fund | | | 1,023,425 | | | $ | 9,077,781 | |
| Touchstone International Small Cap Fund | | | 452,357 | | | | 5,392,096 | |
| Touchstone International Value Fund | | | 1,670,644 | | | | 12,713,598 | |
| | | | | | | | 27,183,475 | |
| | | | | | | | | |
| Government/Corporate — 15.6% | | | | | | | | |
| Touchstone Short Duration Fixed Income Fund, Class Y | | | 765,381 | | | | 7,500,729 | |
| Touchstone Total Return Bond Fund | | | 1,712,395 | | | | 17,997,268 | |
| | | | | | | | 25,497,997 | |
| | | | | | | | | |
| Value — 15.2% | | | | | | | | |
| Touchstone Focused Equity | | | 773,765 | | | | 8,998,887 | |
| Touchstone Value Fund | | | 2,274,135 | | | | 15,987,166 | |
| | | | | | | | 24,986,053 | |
| | | | | | | | | |
| Growth — 9.8% | | | | | | | | |
| Touchstone Emerging Growth Fund | | | 154,988 | | | | 1,804,063 | |
| Touchstone Sands Capital Institutional Growth Fund | | | 834,830 | | | | 14,292,292 | |
| | | | | | | | 16,096,355 | |
| | | | | | | | | |
| Emerging Market-Equity — 7.7% | | | | | | | | |
| Touchstone Emerging Markets Equity Fund | | | 976,000 | | | | 12,697,765 | |
| | | | | | | | | |
| Growth Mid-Cap — 5.5% | | | | | | | | |
| Touchstone Mid Cap Fund | | | 313,337 | | | | 5,342,402 | |
| Touchstone Mid Cap Growth Fund* | | | 166,538 | | | | 3,590,562 | |
| | | | | | | | 8,932,964 | |
| | | | | | | | | |
| Sector Fund Real-Estate — 4.4% | | | | | | | | |
| Touchstone Global Real Estate Fund | | | 582,815 | | | | 7,267,697 | |
| | | | | | | | | |
| Value Large-Cap — 4.4% | | | | | | | | |
| Touchstone Large Cap Relative Value Fund | | | 591,303 | | | | 7,178,423 | |
| | | | | | | | | |
| Value Small-Cap — 4.4% | | | | | | | | |
| Touchstone Small Cap Core Fund | | | 329,066 | | | | 5,363,774 | |
| Touchstone Small Company Value Fund | | | 110,430 | | | | 1,808,838 | |
| | | | | | | | 7,172,612 | |
| | | | | | | | | |
| Global Equity — 4.4% | | | | | | | | |
| Touchstone Global Equity Fund | | | 696,592 | | | | 7,167,931 | |
| | | | | | | | | |
| Blue Chip — 4.3% | | | | | | | | |
| Touchstone Dynamic Equity Fund | | | 624,647 | | | | 7,014,788 | |
| | | | | | | | | |
| Balanced — 3.8% | | | | | | | | |
| Touchstone Strategic Income Fund | | | 573,073 | | | | 6,177,725 | |
| | | | | | | | | |
| Value Mid-Cap — 3.3% | | | | | | | | |
| Touchstone Mid Cap Value Fund | | | 407,063 | | | | 5,393,583 | |
| | | | | | | | | |
| Corporate/Preferred-High Yield — 2.2% | | | | | | | | |
| Touchstone High Yield Fund | | | 386,042 | | | | 3,551,584 | |
| | | | | | | | | |
| Various Assets — 2.2% | | | | | | | | |
| Touchstone Merger Arbitrage Fund | | | 331,576 | | | | 3,537,913 | |
| | | | | | | | | |
| International Debt — 2.1% | | | | | | | | |
| Touchstone International Fixed Income Fund | | | 334,329 | | | | 3,520,481 | |
| | | | | | | | | |
| Growth Large-Cap — 2.1% | | | | | | | | |
| Touchstone Large Cap Growth Fund, Class Y | | | 131,179 | | | �� | 3,510,342 | |
| Total Affiliated Mutual Funds | | | | | | $ | 176,887,688 | |
| | | | | | | | | |
| Total Investment Securities —108.0% | | | | | | | | |
| (Cost $169,605,353) | | | | | | $ | 176,887,688 | |
| | | | | | | | | |
| Liabilities in Excess of Other Assets — (8.0%) | | | | | | | (13,074,718 | ) |
| | | | | | | | | |
| Net Assets — 100.0% | | | | | | $ | 163,812,970 | |
| * | Non-income producing security. |
| ^ | All affiliated funds are invested in Institutional Class,unless otherwise indicated. The financial statements of the underlying funds can be found on the SEC website. See Note 4 in Notes to Financial Statements. |
Other Information:
The inputs or methodology used for valuing securities may not be an indication of the risk associated with investing in those securities. For more information on valuation inputs, and their aggregation into the levels used in the table below, please refer to the security valuation section in the accompanying Notes to Financial Statements.
Valuation inputs at Reporting Date:
| Description | | Level 1 | | | Level 2 | | | Level 3 | | | Total | |
| Affiliated Mutual Funds | | $ | 176,887,688 | | | $ | — | | | $ | — | | | $ | 176,887,688 | |
See accompanying Notes to Financial Statements.
This page intentionally left blank.
Statements of Assets and Liabilities
December 31, 2012
| | | Touchstone | | | Touchstone | | | Touchstone | |
| | | Dynamic | | | Emerging | | | International | |
| | | Equity | | | Growth | | | Equity | |
| | | Fund | | | Fund | | | Fund | |
| Assets | | | | | | | | | | | | |
| Investments, at cost | | $ | 73,880,970 | | | $ | 15,976,337 | | | $ | 18,011,801 | |
| Affiliated securities, at market value | | $ | 2,985,549 | | | $ | 17,682 | | | $ | 2 | |
| Non-affiliated securities, at market value | | | 78,867,021 | | | | 19,800,557 | | | | 20,808,748 | |
| Investments, at market value (A) | | $ | 81,852,570 | | | $ | 19,818,239 | | | $ | 20,808,750 | |
| Cash | | | — | | | | — | | | | — | |
| Cash deposits held at prime broker | | | 159,153 | | | | — | | | | — | |
| Foreign currency (B) | | | — | | | | — | | | | 49,792 | |
| Dividends and interest receivable | | | 72,666 | | | | 2,127 | | | | 7,432 | |
| Receivable for capital shares sold | | | 145,370 | | | | 13,833 | | | | 14,317 | |
| Receivable for investments sold | | | — | | | | 2,494,232 | | | | 1,838,022 | |
| Receivable for securities lending income | | | — | | | | 594 | | | | 718 | |
| Receivable from Investment Advisor | | | — | | | | 48 | | | | 10,295 | |
| Tax reclaim receivable | | | — | | | | — | | | | 22,210 | |
| Other assets | | | 33,308 | | | | 28,785 | | | | 26,736 | |
| Total Assets | | | 82,263,067 | | | | 22,357,858 | | | | 22,778,272 | |
| | | | | | | | | | | | | |
| Liabilities | | | | | | | | | | | | |
| Written options, at market value (C) | | | 1,774,980 | | | | — | | | | — | |
| Securities sold short (D) | | | 13,251,721 | | | | — | | | | — | |
| Dividends for securities sold short payable | | | 4,116 | | | | — | | | | — | |
| Bank overdrafts | | | — | | | | — | | | | 109,407 | |
| Payable for return of collateral for securities on loan | | | — | | | | 605,474 | | | | — | |
| Payable for capital shares redeemed | | | 44,491 | | | | 2,390,992 | | | | 97,744 | |
| Payable for investments purchased | | | — | | | | 1,917,873 | | | | 1,028,055 | |
| Payable to Investment Advisor | | | 37,851 | | | | — | | | | — | |
| Payable to other affiliates | | | 23,244 | | | | 1,059 | | | | 881 | |
| Payable to Trustees | | | 896 | | | | 963 | | | | 1,112 | |
| Payable for professional services | | | 15,826 | | | | 15,751 | | | | 28,309 | |
| Other accrued expenses and liabilities | | | 50,818 | | | | 37,510 | | | | 41,367 | |
| Total Liabilities | | | 15,203,943 | | | | 4,969,622 | | | | 1,306,875 | |
| | | | | | | | | | | | | |
| Net Assets | | $ | 67,059,124 | | | $ | 17,388,236 | | | $ | 21,471,397 | |
| | | | | | | | | | | | | |
| Net assets consist of: | | | | | | | | | | | | |
| Paid-in capital | | $ | 209,858,860 | | | $ | 13,174,099 | | | $ | 61,448,538 | |
| Accumulated net investment income (loss) | | | 15,903 | | | | — | | | | (36,085 | ) |
| Accumulated net realized gains (losses) on investments, written options, foreign currency transactions and short positions | | | (150,604,903 | ) | | | 372,235 | | | | (42,737,691 | ) |
| Net unrealized appreciation on investments, written options, foreign currency transactions and short positions | | | 7,789,264 | | | | 3,841,902 | | | | 2,796,635 | |
| Net Assets | | $ | 67,059,124 | | | $ | 17,388,236 | | | $ | 21,471,397 | |
| (A) Includes market value of securities on loan of: | | $ | — | | | $ | 602,579 | | | $ | — | |
| (B) Cost of foreign currency: | | $ | — | | | $ | — | | | $ | 50,556 | |
| (C) Proceeds received for written options: | | $ | 1,799,847 | | | $ | — | | | $ | — | |
| (D) Proceeds received for securities sold short: | | $ | 13,044,518 | | | $ | — | | | $ | — | |
See accompanying Notes to Financial Statements.
Statements of Assets and Liabilities (Continued)
| | | | | | | | | | Touchstone | |
| Touchstone | | | Touchstone | | | Touchstone | | | Moderate | |
| Balanced | | | Conservative | | | Growth | | | Growth | |
| Allocation | | | Allocation | | | Allocation | | | Allocation | |
| Fund | | | Fund | | | Fund | | | Fund | |
| | | | | | | | | | | |
| $ | 150,780,948 | | | $ | 86,542,394 | | | $ | 81,072,772 | | | $ | 169,605,353 | |
| $ | 155,051,211 | | | $ | 88,240,810 | | | $ | 84,685,333 | | | $ | 176,887,688 | |
| | — | | | | — | | | | — | | | | — | |
| $ | 155,051,211 | | | $ | 88,240,810 | | | $ | 84,685,333 | | | $ | 176,887,688 | |
| | — | | | | 172,529 | | | | — | | | | — | |
| | — | | | | — | | | | — | | | | — | |
| | — | | | | — | | | | — | | | | — | |
| | — | | | | — | | | | — | | | | — | |
| | 98,173 | | | | 127,047 | | | | 60,463 | | | | 33,191 | |
| | 154,173 | | | | — | | | | 219,840 | | | | 263,588 | |
| | — | | | | — | | | | — | | | | — | |
| | 27,076 | | | | 19,297 | | | | 34,523 | | | | 38,598 | |
| | — | | | | — | | | | — | | | | — | |
| | 36,644 | | | | 36,107 | | | | 35,648 | | | | 37,992 | |
| | 155,367,277 | | | | 88,595,790 | | | | 85,035,807 | | | | 177,261,057 | |
| | | | | | | | | | | | | | | |
| | | | | | | | | | | | | | | |
| | — | | | | — | | | | — | | | | — | |
| | — | | | | — | | | | — | | | | — | |
| | — | | | | — | | | | — | | | | — | |
| | 152,139 | | | | — | | | | 220,078 | | | | 262,537 | |
| | — | | | | — | | | | — | | | | — | |
| | 20,664,656 | | | | 2,919,174 | | | | 1,346,895 | | | | 13,068,897 | |
| | — | | | | 170,622 | | | | — | | | | — | |
| | — | | | | — | | | | — | | | | — | |
| | 47,665 | | | | 25,198 | | | | 29,960 | | | | 63,074 | |
| | 951 | | | | 968 | | | | 886 | | | | 949 | |
| | 5,853 | | | | — | | | | 3,987 | | | | 4,522 | |
| | 28,938 | | | | 17,060 | | | | 35,086 | | | | 48,108 | |
| | 20,900,202 | | | | 3,133,022 | | | | 1,636,892 | | | | 13,448,087 | |
| | | | | | | | | | | | | | | |
| $ | 134,467,075 | | | $ | 85,462,768 | | | $ | 83,398,915 | | | $ | 163,812,970 | |
| | | | | | | | | | | | | | | |
| | | | | | | | | | | | | | | |
| $ | 174,626,681 | | | $ | 88,896,170 | | | $ | 126,560,757 | | | $ | 205,016,828 | |
| | — | | | | — | | | | — | | | | — | |
| | (44,429,869 | ) | | | (5,131,818 | ) | | | (46,774,403 | ) | | | (48,486,193 | ) |
| | 4,270,263 | | | | 1,698,416 | | | | 3,612,561 | | | | 7,282,335 | |
| $ | 134,467,075 | | | $ | 85,462,768 | | | $ | 83,398,915 | | | $ | 163,812,970 | |
| $ | — | | | $ | — | | | $ | — | | | $ | — | |
| $ | — | | | $ | — | | | $ | — | | | $ | — | |
| $ | — | | | $ | — | | | $ | — | | | $ | — | |
| $ | — | | | $ | — | | | $ | — | | | $ | — | |
Statements of Assets and Liabilities (Continued)
| | | Touchstone | | | Touchstone | | | Touchstone | |
| | | Dynamic | | | Emerging | | | International | |
| | | Equity | | | Growth | | | Equity | |
| | | Fund | | | Fund | | | Fund | |
| | | | | | | | | | |
| Pricing of Class A Shares | | | | | | | | | | | | |
| Net assets applicable to Class A shares | | $ | 16,156,458 | | | $ | 1,857,165 | | | $ | 267,872 | |
| Shares of beneficial interest outstanding (unlimited number of shares authorized, no par value) | | | 1,461,673 | | | | 165,343 | | | | 30,306 | |
| Net asset value price per share* | | $ | 11.05 | | | $ | 11.23 | | | $ | 8.84 | |
| Maximum offering price per share | | $ | 11.72 | | | $ | 11.92 | | | $ | 9.38 | |
| | | | | | | | | | | | | |
| Pricing of Class C Shares | | | | | | | | | | | | |
| Net assets applicable to Class C shares | | $ | 10,420,478 | | | $ | 2,569 | | | $ | 202,767 | |
| Shares of beneficial interest outstanding (unlimited number of shares authorized, no par value) | | | 996,420 | | | | 230 | | | | 23,013 | |
| Net asset value, offering price per share** | | $ | 10.46 | | | $ | 11.18 | | | $ | 8.81 | |
| | | | | | | | | | | | | |
| Pricing of Class Y Shares | | | | | | | | | | | | |
| Net assets applicable to Class Y shares | | $ | 20,397,264 | | | $ | 6,509,790 | | | $ | 410,654 | |
| Shares of beneficial interest outstanding (unlimited number of shares authorized, no par value) | | | 1,818,509 | | | | 568,162 | | | | 46,236 | |
| Net asset value, offering price and redemption price per share | | $ | 11.22 | | | $ | 11.46 | | | $ | 8.88 | |
| | | | | | | | | | | | | |
| Pricing of Institutional Class Shares | | | | | | | | | | | | |
| Net assets applicable to Institutional Class Shares | | $ | 20,084,924 | | | $ | 9,018,712 | | | $ | 20,590,104 | |
| Shares of beneficial interest outstanding (unlimited number of shares authorized, no par value) | | | 1,788,002 | | | | 774,630 | | | | 2,322,854 | |
| Net asset value, offering price and redemption price per share | | $ | 11.23 | | | $ | 11.64 | | | $ | 8.86 | |
* There is no sales load on subscriptions of $ 1 million or more. Redemptions that were part of a $ 1 million or more subscription may be subject to a contingent deferred sales load.
** Redemption price per share varies by length of time shares are held.
See accompanying Notes to Financial Statements.
Statements of Assets and Liabilities (Continued)
| | | | | | | | | | Touchstone | |
| Touchstone | | | Touchstone | | | Touchstone | | | Moderate | |
| Balanced | | | Conservative | | | Growth | | | Growth | |
| Allocation | | | Allocation | | | Allocation | | | Allocation | |
| Fund | | | Fund | | | Fund | | | Fund | |
| | | | | | | | | | | |
| $ | 49,118,090 | | | $ | 32,965,045 | | | $ | 31,431,765 | | | $ | 71,234,803 | |
| | 4,412,691 | | | | 3,138,810 | | | | 2,675,942 | | | | 6,306,359 | |
| $ | 11.13 | | | $ | 10.50 | | | $ | 11.75 | | | $ | 11.30 | |
| $ | 11.81 | | | $ | 11.14 | | | $ | 12.47 | | | $ | 11.99 | |
| | | | | | | | | | | | | | | |
| | | | | | | | | | | | | | | |
| $ | 38,225,674 | | | $ | 17,971,537 | | | $ | 24,064,663 | | | $ | 48,984,801 | |
| | 3,437,689 | | | | 1,719,321 | | | | 2,124,942 | | | | 4,399,733 | |
| $ | 11.12 | | | $ | 10.45 | | | $ | 11.32 | | | $ | 11.13 | |
| | | | | | | | | | | | | | | |
| | | | | | | | | | | | | | | |
| $ | 47,092,302 | | | $ | 33,328,617 | | | $ | 27,873,461 | | | $ | 43,584,738 | |
| | 4,223,790 | | | | 3,172,104 | | | | 2,350,332 | | | | 3,830,705 | |
| $ | 11.15 | | | $ | 10.51 | | | $ | 11.86 | | | $ | 11.38 | |
| | | | | | | | | | | | | | | |
| | | | | | | | | | | | | | | |
| $ | 31,009 | | | $ | 1,197,569 | | | $ | 29,026 | | | $ | 8,628 | |
| | 2,794 | | | | 113,909 | | | | 2,683 | | | | 762 | |
| $ | 11.10 | | | $ | 10.51 | | | $ | 10.82 | | | $ | 11.33 | |
Statements of Operations
For the Period Ended December 31, 2012 and the Year Ended July 31, 2012
| | | Touchstone | |
| | | Dynamic | |
| | | Equity | |
| | | Fund | |
| | | For the | | | | |
| | | Five Months | | | For the | |
| | | Ended | | | Year | |
| | | December 31, | | | Ended | |
| | | 2012(D) | | | July 31, 2012 | |
| Investment Income | | | | | | | | |
| Dividends from affiliated funds | | $ | 1,322 | | | $ | 1,207 | |
| Dividends from non-affiliated securities(A) | | | 942,602 | | | | 1,353,780 | |
| Interest | | | — | | | | 887 | |
| Income from securities loaned | | | — | | | | — | |
| Total Investment Income | | | 943,924 | | | | 1,355,874 | |
| Expenses | | | | | | | | |
| Investment advisory fees | | | 239,904 | | | | 529,397 | |
| Administration fees | | | 50,297 | | | | 77,610 | |
| Compliance fees and expenses | | | 915 | | | | 425 | |
| Custody fees | | | 460 | | | | 19,651 | |
| Professional fees | | | 19,145 | | | | 52,581 | |
| Transfer Agent fees, Class A | | | 10,416 | | | | 72,310 | |
| Transfer Agent fees, Class C | | | 8,839 | | | | 31,465 | |
| Transfer Agent fees, Class Y | | | 11,888 | | | | 42,660 | |
| Transfer Agent fees, Institutional Class | | | 18 | | | | 651 | |
| Pricing Expense | | | 3,935 | | | | 2,061 | |
| Registration Fees, Class A | | | 3,903 | | | | 8,055 | |
| Registration Fees, Class C | | | 3,242 | | | | 6,624 | |
| Registration Fees, Class Y | | | 3,362 | | | | 6,972 | |
| Registration Fees, Institutional Class | | | 4,350 | | | | 6,538 | |
| Dividend expense on securities sold short | | | 255,937 | | | | 781,980 | |
| Reports to Shareholders, Class A | | | 9,298 | | | | 4,447 | |
| Reports to Shareholders, Class C | | | 7,053 | | | | 5,958 | |
| Reports to Shareholders, Class Y | | | 7,412 | | | | 6,872 | |
| Reports to Shareholders, Institutional Class | | | 2,743 | | | | 2,461 | |
| Distribution expenses, Class A | | | 17,984 | | | | 49,819 | |
| Distribution and shareholder servicing expenses, Class C | | | 46,472 | | | | 125,778 | |
| Trustee fees | | | 3,860 | | | | 13,342 | |
| Other expenses | | | 10,717 | | | | 19,923 | |
| Total Expenses | | | 722,150 | | | | 1,867,580 | |
| Fees waived and/or reimbursed by the Advisor and/or Affiliates(B) | | | (37,575 | ) | | | (101,748 | ) |
| Net Expenses | | | 684,575 | | | | 1,765,832 | |
| Net Investment Income (Loss) | | | 259,349 | | | | (409,958 | ) |
| Net Realized and Unrealized Gain (Loss) on Investments | | | | | | | | |
| Net realized gain on investments from non-affiliated securities | | | 2,431,895 | | | | 1,517,094 | |
| Net realized gain on investments from affiliated securities | | | — | | | | — | |
| Net realized gain on warrants | | | — | | | | 638 | |
| Net realized gain (loss) on written options | | | (1,102,848 | ) | | | 2,823,456 | |
| Net realized loss on foreign currency | | | — | | | | — | |
| Net realized loss on securities sold short | | | (1,636,817 | ) | | | (513,766 | ) |
| Capital gain distributions received from affiliated funds | | | — | | | | — | |
| Net change in unrealized appreciation (depreciation) on investments(C) | | | 467,741 | | | | 2,052,589 | |
| Net change in unrealized appreciation (depreciation) on written options | | | 143,584 | | | | (350,810 | ) |
| Net change in unrealized depreciation on foreign currency transactions | | | — | | | | — | |
| Net change in unrealized appreciation (depreciation) on securities sold short | | | (1,630,505 | ) | | | 729,261 | |
| Net Realized and Unrealized Gain (Loss) on Investments | | | (1,326,950 | ) | | | 6,258,462 | |
| Change in Net Assets Resulting from Operations | | $ | (1,067,601 | ) | | $ | 5,848,504 | |
| (A) Net of foreign tax withholding of: | | $ | — | | | $ | 221 | |
| (B) See Note 4 in Notes to Financial Statements. | | | | | | | | |
(C) Change in unrealized appreciation does not include net appreciation of $5,211,794 for the Balanced Allocation Fund in the connection with the Fund's merger. See Note 7 in the Notes to Financial Statements.
(D) The Fund changed its fiscal year from July 31 to December 31. See Note 7 in the Notes to Financial Statements.
See accompanying Notes to Financial Statements.
Statements of Operations (Continued)
| Touchstone | | | Touchstone | | | Touchstone | |
| Emerging | | | International | | | Balanced | |
| Growth | | | Equity | | | Allocation | |
| Fund | | | Fund | | | Fund | |
| For the | | | | | | For the | | | | | | For the | | | | |
| Five Months | | | For the | | | Five Months | | | For the | | | Five Months | | | For the | |
| Ended | | | Year | | | Ended | | | Year | | | Ended | | | Year | |
| December 31, | | | Ended | | | December 31, | | | Ended | | | December 31, | | | Ended | |
| 2012(D) | | | July 31, 2012 | | | 2012(D) | | | July 31, 2012 | | | 2012(D) | | | July 31, 2012 | |
| | | | | | | | | | | | | | | | | |
| $ | 122 | | | $ | 226 | | | $ | 153 | | | $ | 138 | | | $ | 1,709,367 | | | $ | 1,251,707 | |
| | 153,139 | | | | 109,169 | | | | 192,474 | | | | 795,322 | | | | — | | | | — | |
| | — | | | | — | | | | — | | | | — | | | | — | | | | — | |
| | 2,038 | | | | 455 | | | | 2,341 | | | | 982 | | | | — | | | | — | |
| | 155,299 | | | | 109,850 | | | | 194,968 | | | | 796,442 | | | | 1,709,367 | | | | 1,251,707 | |
| | | | | | | | | | | | | | | | | | | | | | | |
| | 81,949 | | | | 349,447 | | | | 77,356 | | | | 245,005 | | | | 108,104 | | | | 112,509 | |
| | 16,303 | | | | 45,921 | | | | 15,316 | | | | 29,908 | | | | 95,684 | | | | 69,348 | |
| | 915 | | | | 425 | | | | 915 | | | | 425 | | | | 915 | | | | 425 | |
| | 211 | | | | 8,806 | | | | 4,411 | | | | 56,690 | | | | 2,964 | | | | 376 | |
| | 17,040 | | | | 40,187 | | | | 31,854 | | | | 57,592 | | | | 14,427 | | | | 45,929 | |
| | 1,229 | | | | 8,189 | | | | 539 | | | | 1,796 | | | | 14,347 | | | | 15,918 | |
| | 5 | | | | 5 | | | | 78 | | | | 5 | | | | 12,593 | | | | 55,004 | |
| | 8,521 | | | | 16,229 | | | | 1,935 | | | | 3,510 | | | | 11,571 | | | | 2,643 | |
| | — | | | | 7,674 | | | | 243 | | | | 890 | | | | 11 | | | | 612 | |
| | 2,689 | | | | 1,467 | | | | 22,180 | | | | 55,766 | | | | — | | | | — | |
| | 5,048 | | | | 8,544 | | | | 4,419 | | | | 11,800 | | | | 5,621 | | | | 5,784 | |
| | 101 | | | | 92 | | | | 121 | | | | 108 | | | | 5,666 | | | | 7,884 | |
| | 4,744 | | | | 11,893 | | | | 7,417 | | | | 11,832 | | | | 5,078 | | | | 8,873 | |
| | 4,801 | | | | 8,276 | | | | 4,247 | | | | 10,458 | | | | 4,596 | | | | 5,134 | |
| | — | | | | — | | | | — | | | | — | | | | — | | | | — | |
| | 2,198 | | | | 13,651 | | | | 3,689 | | | | 3,231 | | | | 3,963 | | | | 7,021 | |
| | 3,808 | | | | 2,151 | | | | 2,785 | | | | 2,236 | | | | 8,512 | | | | 17,894 | |
| | 5,723 | | | | 6,480 | | | | 3,817 | | | | 3,717 | | | | 1,328 | | | | 3,034 | |
| | 3,687 | | | | 3,916 | | | | 3,166 | | | | 2,840 | | | | 2,483 | | | | 2,500 | |
| | 2,024 | | | | 6,155 | | | | 255 | | | | 632 | | | | 41,454 | | | | 27,329 | |
| | 11 | | | | 7 | | | | 546 | | | | 7 | | | | 162,770 | | | | 437,396 | |
| | 3,960 | | | | 9,113 | | | | 4,104 | | | | 6,715 | | | | 3,921 | | | | 12,310 | |
| | 4,180 | | | | 13,186 | | | | 2,508 | | | | 11,348 | | | | 8,146 | | | | 18,172 | |
| | 169,147 | | | | 561,814 | | | | 191,901 | | | | 516,511 | | | | 514,154 | | | | 856,095 | |
| | (71,563 | ) | | | (89,253 | ) | | | (105,331 | ) | | | (260,879 | ) | | | (222,749 | ) | | | (171,947 | ) |
| | 97,584 | | | | 472,561 | | | | 86,570 | | | | 255,632 | | | | 291,405 | | | | 684,148 | |
| | 57,715 | | | | (362,711 | ) | | | 108,398 | | | | 540,810 | | | | 1,417,962 | | | | 567,559 | |
| | | | | | | | | | | | | | | | | | | | | | | |
| | 1,619,043 | | | | 7,475,767 | | | | 474,649 | | | | 295,168 | | | | — | | | | — | |
| | — | | | | — | | | | — | | | | — | | | | 4,341,627 | | | | 4,106,492 | |
| | — | | | | — | | | | — | | | | — | | | | — | | | | — | |
| | — | | | | — | | | | — | | | | — | | | | — | | | | — | |
| | — | | | | — | | | | (17,032 | ) | | | (34,598 | ) | | | — | | | | — | |
| | — | | | | — | | | | — | | | | — | | | | — | | | | — | |
| | — | | | | — | | | | — | | | | — | | | | 1,290,443 | | | | 1,356,115 | |
| | 316,104 | | | | (9,272,185 | ) | | | 1,775,992 | | | | (4,822,699 | ) | | | (3,322,821 | ) | | | (5,042,105 | ) |
| | — | | | | — | | | | — | | | | — | | | | — | | | | — | |
| | — | | | | — | | | | 959 | | | | (11,182 | ) | | | — | | | | — | |
| | — | | | | — | | | | — | | | | — | | | | — | | | | — | |
| | 1,935,147 | | | | (1,796,418 | ) | | | 2,234,568 | | | | (4,573,311 | ) | | | 2,309,249 | | | | 420,502 | |
| $ | 1,992,862 | | | $ | (2,159,129 | ) | | $ | 2,342,966 | | | $ | (4,032,501 | ) | | $ | 3,727,211 | | | $ | 988,061 | |
| $ | 45 | | | $ | 386 | | | $ | 9,661 | | | $ | 60,016 | | | $ | — | | | $ | — | |
Statements of Operations (Continued)
| | | Touchstone | |
| | | Conservative | |
| | | Allocation | |
| | | Fund | |
| | | For the | | | | |
| | | Five Months | | | For the | |
| | | Ended | | | Year | |
| | | December 31, | | | Ended | |
| | | 2012(D) | | | July 31, 2012 | |
| Investment Income | | | | | | | | |
| Dividends from affiliated funds(A) | | $ | 845,376 | | | $ | 858,368 | |
| Total Investment Income | | | 845,376 | | | | 858,368 | |
| Expenses | | | | | | | | |
| Investment advisory fees | | | 63,040 | | | | 67,153 | |
| Administration fees | | | 55,804 | | | | 41,885 | |
| Compliance fees and expenses | | | 734 | | | | 452 | |
| Custody fees | | | 1,236 | | | | 256 | |
| Professional fees | | | 12,421 | | | | 37,651 | |
| Transfer Agent fees, Class A | | | 9,580 | | | | 8,402 | |
| Transfer Agent fees, Class C | | | 5,785 | | | | 19,776 | |
| Transfer Agent fees, Class Y | | | 6,108 | | | | 4,414 | |
| Transfer Agent fees, Institutional Class | | | 31 | | | | 721 | |
| Registration Fees, Class A | | | 5,438 | | | | 6,417 | |
| Registration Fees, Class C | | | 5,443 | | | | 6,385 | |
| Registration Fees, Class Y | | | 5,229 | | | | 9,477 | |
| Registration Fees, Institutional Class | | | 4,838 | | | | 5,872 | |
| Reports to Shareholders, Class A | | | 3,501 | | | | 5,504 | |
| Reports to Shareholders, Class C | | | 5,379 | | | | 9,939 | |
| Reports to Shareholders, Class Y | | | 2,747 | | | | 3,641 | |
| Reports to Shareholders, Institutional Class | | | 3,002 | | | | 2,657 | |
| Distribution expenses, Class A | | | 28,323 | | | | 18,813 | |
| Distribution and shareholder servicing expenses, Class C | | | 75,425 | | | | 183,602 | |
| Trustee fees | | | 3,996 | | | | 8,138 | |
| Other expenses | | | 5,020 | | | | 12,473 | |
| Total Expenses | | | 303,080 | | | | 453,628 | |
| Fees waived and/or reimbursed by the Advisor and/or Affiliates(B) | | | (150,975 | ) | | | (130,332 | ) |
| Net Expenses | | | 152,105 | | | | 323,296 | |
| Net Investment Income | | | 693,271 | | | | 535,072 | |
| Net Realized and Unrealized Gain (Loss) on Investments | | | | | | | | |
| Net realized gain on investments from affiliated securities | | | 3,320,847 | | | | 2,007,543 | |
| Capital Gain Distributions Received from Affiliated Funds | | | 523,504 | | | | 1,104,985 | |
| Net change in unrealized appreciation (depreciation) on investments(C) | | | (3,335,699 | ) | | | (2,902,390 | ) |
| Net Realized and Unrealized Gain (Loss) on Investments | | | 508,652 | | | | 210,138 | |
| Change in Net Assets Resulting from Operations | | $ | 1,201,923 | | | $ | 745,210 | |
| (A) Net of foreign tax withholding of: | | $ | — | | | $ | — | |
| (B) See Note 4 in Notes to Financial Statements. | | | | | | | | |
(C) Change in unrealized appreciation does not include net unrealized appreciation of $3,831,428, $3,817,238, $13,091,873 for the Conservative Allocation Fund, Growth Allocation Fund and Moderate Growth Allocation Fund, respectively, in connection with each Fund's merger. See Note 7 in the Notes to Financial Statements..
(D) The Fund changed its fiscal year from July 31 to December 31. See Note 7 in the Notes to Financial Statements.
See accompanying Notes to Financial Statements.
Statements of Operations (Continued)
| Touchstone | | | Touchstone | |
| Growth | | | Moderate Growth | |
| Allocation | | | Allocation | |
| Fund | | | Fund | |
| For the | | | | | | For the | | | | |
| Five Months | | | For the | | | Five Months | | | For the | |
| Ended | | | Year | | | Ended | | | Year | |
| December 31, | | | Ended | | | December 31, | | | Ended | |
| 2012(D) | | | July 31, 2012 | | | 2012(D) | | | July 31, 2012 | |
| | | | | | | | | | | |
| $ | 1,024,423 | | | $ | 697,138 | | | $ | 2,053,601 | | | $ | 1,352,741 | |
| | 1,024,423 | | | | 697,138 | | | | 2,053,601 | | | | 1,352,741 | |
| | | | | | | | | | | | | | | |
| | 76,439 | | | | 100,148 | | | | 155,819 | | | | 173,457 | |
| | 54,207 | | | | 49,298 | | | | 110,407 | | | | 85,813 | |
| | 915 | | | | 425 | | | | 915 | | | | 425 | |
| | 2,540 | | | | 353 | | | | 2,940 | | | | 432 | |
| | 12,580 | | | | 40,500 | | | | 13,342 | | | | 50,528 | |
| | 18,608 | | | | 31,314 | | | | 31,219 | | | | 29,563 | |
| | 15,479 | | | | 62,340 | | | | 23,022 | | | | 93,075 | |
| | 4,923 | | | | 2,909 | | | | 3,839 | | | | 1,813 | |
| | 27 | | | | 724 | | | | 6 | | | | 610 | |
| | 5,383 | | | | 6,031 | | | | 5,093 | | | | 6,062 | |
| | 5,439 | | | | 7,485 | | | | 5,568 | | | | 7,360 | |
| | 4,957 | | | | 9,399 | | | | 5,104 | | | | 8,974 | |
| | 4,774 | | | | 5,421 | | | | 4,768 | | | | 5,421 | |
| | 5,512 | | | | 10,619 | | | | 3,609 | | | | 10,119 | |
| | 8,433 | | | | 18,461 | | | | 11,186 | | | | 25,230 | |
| | 1,723 | | | | 2,927 | | | | 880 | | | | 2,802 | |
| | 3,057 | | | | 2,492 | | | | 3,321 | | | | 2,512 | |
| | 27,881 | | | | 28,710 | | | | 61,087 | | | | 40,971 | |
| | 102,504 | | | | 270,363 | | | | 205,519 | | | | 520,093 | |
| | 3,901 | | | | 9,569 | | | | 3,943 | | | | 14,653 | |
| | 10,073 | | | | 17,431 | | | | 14,783 | | | | 23,133 | |
| | 369,355 | | | | 676,919 | | | | 666,370 | | | | 1,103,046 | |
| | (195,156 | ) | | | (249,437 | ) | | | (310,489 | ) | | | (319,765 | ) |
| | 174,199 | | | | 427,482 | | | | 355,881 | | | | 783,281 | |
| | 850,224 | | | | 269,656 | | | | 1,697,720 | | | | 569,460 | |
| | | | | | | | | | | | | | | |
| | 3,528,548 | | | | 2,049,149 | | | | 11,049,411 | | | | 2,672,895 | |
| | 1,243,874 | | | | 483,641 | | | | 1,989,086 | | | | 1,434,017 | |
| | (1,824,714 | ) | | | (3,917,579 | ) | | | (8,653,626 | ) | | | (4,637,598 | ) |
| | 2,947,708 | | | | (1,384,789 | ) | | | 4,384,871 | | | | (530,686 | ) |
| $ | 3,797,932 | | | $ | (1,115,133 | ) | | $ | 6,082,591 | | | $ | 38,774 | |
| $ | — | | | $ | — | | | $ | — | | | $ | 303 | |
Statements of Changes in Net Assets
| | | | | | Touchstone | | | | |
| | | | | | Dynamic Equity | | | | |
| | | | | | Fund | | | | |
| | | For the | | | | | | | |
| | | Five Months | | | For the | | | For the | |
| | | Ended | | | Year | | | Year | |
| | | December 31, | | | Ended | | | Ended | |
| | | 2012(B) | | | July 31, 2012 | | | July 31, 2011 | |
| From Operations | | | | | | | | | | | | |
| Net investment income (loss) | | $ | 259,349 | | | $ | (409,958 | ) | | $ | 382,949 | |
| Net realized gain (loss) on investments, written options, foreign currency transactions and securities sold short | | | (307,770 | ) | | | 3,827,422 | | | | 10,031,159 | |
| Net change in unrealized appreciation (depreciation) on investments, written options, foreign currency transactions and securities sold short | | | (1,019,180 | ) | | | 2,431,040 | | | | (1,046,590 | ) |
| Change in Net Assets from Operations | | | (1,067,601 | ) | | | 5,848,504 | | | | 9,367,518 | |
| | | | | | | | | | | | | |
| Distributions to Shareholders from: | | | | | | | | | | | | |
| Net investment income, Class A | | | — | | | | (151,828 | ) | | | — | |
| Net investment income, Class C | | | — | | | | (59,199 | ) | | | — | |
| Net investment income, Class Y | | | — | | | | — | | | | — | |
| Net investment income, Class Z | | | — | | | | (303,846 | ) | | | — | |
| Net investment income, Institutional Class | | | — | | | | (17 | ) | | | — | |
| Net realized gains, Class A | | | — | | | | — | | | | — | |
| Net realized gains, Class C | | | — | | | | — | | | | — | |
| Net realized gains, Class Y | | | — | | | | — | | | | — | |
| Net realized gains, Institutional Class | | | — | | | | — | | | | — | |
| Total Distributions | | | — | | | | (514,890 | ) | | | — | |
| | | | | | | | | | | | | |
| Net Increase (Decrease) from Share Transactions(A) | | | 8,301,265 | | | | (13,768,800 | ) | | | (22,288,278 | ) |
| | | | | | | | | | | | | |
| Total Increase (Decrease) in Net Assets | | | 7,233,664 | | | | (8,435,186 | ) | | | (12,920,760 | ) |
| | | | | | | | | | | | | |
| Net Assets | | | | | | | | | | | | |
| Beginning of period | | | 59,825,460 | | | | 68,260,646 | | | | 81,181,406 | |
| End of period | | $ | 67,059,124 | | | $ | 59,825,460 | | | $ | 68,260,646 | |
| Accumulated Net Investment Income (Loss) | | $ | 15,903 | | | $ | (386,369 | ) | | $ | 514,875 | |
(A) For details on share transaction by class, see statements of changes in net assets - capital stock activity on pages 56 and 58.
(B) The Fund changed its fiscal year from July 31 to December 31. See Note 7 in the Notes to Financial Statements.
See accompanying Notes to Financial Statements.
Statements of Changes in Net Assets (Continued)
| | | | Touchstone | | | | | | | | | Touchstone | | | | |
| | | | Emerging Growth | | | | | | | | | International Equity | | | | |
| | | | Fund | | | | | | | | | Fund | | | | |
| For the | | | | | | | | | For the | | | | | | | |
| Five Months | | | For the | | | For the | | | Five Months | | | For the | | | For the | |
| Ended | | | Year | | | Year | | | Ended | | | Year | | | Year | |
| December 31, | | | Ended | | | Ended | | | December 31, | | | Ended | | | Ended | |
| 2012(B) | | | July 31, 2012 | | | July 31, 2011 | | | 2012(B) | | | July 31, 2012 | | | July 31, 2011 | |
| | | | | | | | | | | | | | | | | |
| $ | 57,715 | | | $ | (362,711 | ) | | $ | (657,692 | ) | | $ | 108,398 | | | $ | 540,810 | | | $ | 888,925 | |
| | | | | | | | | | | | | | | | | | | | | | | |
| | 1,619,043 | | | | 7,475,767 | | | | 13,660,970 | | | | 457,617 | | | | 260,570 | | | | 4,379,909 | |
| | | | | | | | | | | | | | | | | | | | | | | |
| | 316,104 | | | | (9,272,185 | ) | | | 9,619,386 | | | | 1,776,951 | | | | (4,833,881 | ) | | | 3,213,593 | |
| | 1,992,862 | | | | (2,159,129 | ) | | | 22,622,664 | | | | 2,342,966 | | | | (4,032,501 | ) | | | 8,482,427 | |
| | | | | | | | | | | | | | | | | | | | | | | |
| | | | | | | | | | | | | | | | | | | | | | | |
| | — | | | | — | | | | — | | | | (5,339 | ) | | | (8,085 | ) | | | (4,775 | ) |
| | — | | | | — | | | | — | | | | (3,850 | ) | | | — | | | | — | |
| | — | | | | — | | | | — | | | | (9,512 | ) | | | — | | | | — | |
| | — | | | | — | | | | — | | | | — | | | | (16,541 | ) | | | (10,456 | ) |
| | — | | | | — | | | | — | | | | (471,885 | ) | | | (942,626 | ) | | | (874,978 | ) |
| | (152,618 | ) | | | — | | | | — | | | | — | | | | — | | | | — | |
| | (206 | ) | | | — | | | | — | | | | — | | | | — | | | | — | |
| | (523,647 | ) | | | — | | | | — | | | | — | | | | — | | | | — | |
| | (872,193 | ) | | | — | | | | — | | | | — | | | | — | | | | — | |
| | (1,548,664 | ) | | | — | | | | — | | | | (490,586 | ) | | | (967,252 | ) | | | (890,209 | ) |
| | | | | | | | | | | | | | | | | | | | | | | |
| | (8,676,134 | ) | | | (22,571,750 | ) | | | (35,834,842 | ) | | | 1,456,593 | | | | (12,908,076 | ) | | | (20,659,354 | ) |
| | | | | | | | | | | | | | | | | | | | | | | |
| | (8,231,936 | ) | | | (24,730,879 | ) | | | (13,212,178 | ) | | | 3,308,973 | | | | (17,907,829 | ) | | | (13,067,136 | ) |
| | | | | | | | | | | | | | | | | | | | | | | |
| | | | | | | | | | | | | | | | | | | | | | | |
| | 25,620,172 | | | | 50,351,051 | | | | 63,563,229 | | | | 18,162,424 | | | | 36,070,253 | | | | 49,137,389 | |
| $ | 17,388,236 | | | $ | 25,620,172 | | | $ | 50,351,051 | | | $ | 21,471,397 | | | $ | 18,162,424 | | | $ | 36,070,253 | |
| $ | — | | | $ | (179,955 | ) | | $ | — | | | $ | (36,085 | ) | | $ | 342,867 | | | $ | 778,589 | |
Statements of Changes in Net Assets (Continued)
| | | Touchstone | |
| | | Balanced Allocation | |
| | | Fund | |
| | | For the | | | | | | | |
| | | Five Months | | | For the | | | For the | |
| | | Ended | | | Year | | | Year | |
| | | December 31, | | | Ended | | | Ended | |
| | | 2012(B) | | | July 31, 2012 | | | July 31, 2011 | |
| From Operations | | | | | | | | | | | | |
| Net investment income | | $ | 1,417,962 | | | $ | 567,559 | | | $ | 832,993 | |
| Net realized gain (loss) on investments and capital gain distributions received | | | 5,632,070 | | | | 5,462,607 | | | | (73,744 | ) |
| Net change in unrealized appreciation (depreciation) on investments | | | (3,322,821 | ) | | | (5,042,105 | ) | | | 7,941,193 | |
| Change in Net Assets from Operations | | | 3,727,211 | | | | 988,061 | | | | 8,700,442 | |
| | | | | | | | | | | | | |
| Distributions to Shareholders from: | | | | | | | | | | | | |
| Net investment income, Class A | | | (751,006 | ) | | | (164,728 | ) | | | (368,940 | ) |
| Net investment income, Class C | | | (585,993 | ) | | | (414,996 | ) | | | (975,077 | ) |
| Net investment income, Class Y | | | (998,571 | ) | | | — | | | | — | |
| Net investment income, Class Z | | | — | | | | (27,150 | ) | | | (47,450 | ) |
| Net investment income, Institutional Class | | | (707 | ) | | | (477 | ) | | | (817 | ) |
| Net realized gains, Class A | | | (1,250,595 | ) | | | — | | | | — | |
| Net realized gains, Class C | | | (989,596 | ) | | | — | | | | — | |
| Net realized gains, Class Y | | | (1,701,479 | ) | | | — | | | | — | |
| Net realized gains, Institutional Class | | | (783 | ) | | | — | | | | — | |
| Total Distributions | | | (6,278,730 | ) | | | (607,351 | ) | | | (1,392,284 | ) |
| | | | | | | | | | | | | |
| Net Increase (Decrease) from Share Transactions(A) | | | 87,474,773 | | | | (15,492,104 | ) | | | (24,401,338 | ) |
| | | | | | | | | | | | | |
| Total Increase (Decrease) in Net Assets | | | 84,923,254 | | | | (15,111,394 | ) | | | (17,093,180 | ) |
| | | | | | | | | | | | | |
| Net Assets | | | | | | | | | | | | |
| Beginning of period | | | 49,543,821 | | | | 64,655,215 | | | | 81,748,395 | |
| End of period | | $ | 134,467,075 | | | $ | 49,543,821 | | | $ | 64,655,215 | |
| Accumulated Net Investment Income | | $ | — | | | $ | 271,112 | | | $ | 25,032 | |
(A) For details on share transaction by class, see statements of changes in net assets - capital stock activity on pages 59 to 60.
(B) The Fund changed its fiscal year from July 31 to December 31. See Note 7 in the Notes to Financial Statements.
See accompanying Notes to Financial Statements.
Statements of Changes in Net Assets (Continued)
| Touchstone | |
| Conservative Allocation | |
| Fund | |
| For the | | | | | | | |
| Five Months | | | For the | | | For the | |
| Ended | | | Year | | | Year | |
| December 31, | | | Ended | | | Ended | |
| 2012(B) | | | July 31, 2012 | | | July 31, 2011 | |
| | | | | | | | |
| $ | 693,271 | | | $ | 535,072 | | | $ | 875,122 | |
| | 3,844,351 | | | | 3,112,528 | | | | 525,578 | |
| | (3,335,699 | ) | | | (2,902,390 | ) | | | 2,017,091 | |
| | 1,201,923 | | | | 745,210 | | | | 3,417,791 | |
| | | | | | | | | | | |
| | | | | | | | | | | |
| | (479,405 | ) | | | (135,704 | ) | | | (440,204 | ) |
| | (376,396 | ) | | | (266,757 | ) | | | (683,075 | ) |
| | (456,004 | ) | | | (7,041 | ) | | | — | |
| | — | | | | (43,132 | ) | | | (54,125 | ) |
| | (34,395 | ) | | | (136,455 | ) | | | (260,494 | ) |
| | (1,422,514 | ) | | | — | | | | — | |
| | (773,349 | ) | | | — | | | | — | |
| | (1,620,816 | ) | | | — | | | | — | |
| | (52,524 | ) | | | — | | | | — | |
| | (5,215,403 | ) | | | (589,089 | ) | | | (1,437,898 | ) |
| | | | | | | | | | | |
| | 60,408,531 | | | | (10,055,229 | ) | | | (6,426,082 | ) |
| | | | | | | | | | | |
| | 56,395,051 | | | | (9,899,108 | ) | | | (4,446,189 | ) |
| | | | | | | | | | | |
| | | | | | | | | | | |
| | 29,067,717 | | | | 38,966,825 | | | | 43,413,014 | |
| $ | 85,462,768 | | | $ | 29,067,717 | | | $ | 38,966,825 | |
| $ | — | | | $ | 359,301 | | | $ | 69,789 | |
Statements of Changes in Net Assets (Continued)
| | | Touchstone | |
| | | Growth Allocation | |
| | | Fund | |
| | | For the | | | | | | | |
| | | Five Months | | | For the | | | For the | |
| | | Ended | | | Year | | | Year | |
| | | December 31, | | | Ended | | | Ended | |
| | | 2012(B) | | | July 31, 2012 | | | July 31, 2011 | |
| From Operations | | | | | | | | | | | | |
| Net investment income | | $ | 850,224 | | | $ | 269,656 | | | $ | 170,509 | |
| Net realized gain (loss) on investments and capital gain distributions received | | | 4,772,422 | | | | 2,532,790 | | | | (1,537,576 | ) |
| Net change in unrealized appreciation (depreciation) on investments | | | (1,824,714 | ) | | | (3,917,579 | ) | | | 11,238,436 | |
| Change in Net Assets from Operations | | | 3,797,932 | | | | (1,115,133 | ) | | | 9,871,369 | |
| | | | | | | | | | | | | |
| Distributions to Shareholders from: | | | | | | | | | | | | |
| Net investment income, Class A | | | (646,035 | ) | | | (114,772 | ) | | | (84,082 | ) |
| Net investment income, Class C | | | (450,497 | ) | | | (44,632 | ) | | | — | |
| Net investment income, Class Y | | | (503,325 | ) | | | — | | | | — | |
| Net investment income, Class Z | | | — | | | | (20,102 | ) | | | (28,354 | ) |
| Net investment income, Institutional Class | | | (901 | ) | | | (983 | ) | | | (5,997 | ) |
| Net realized gains, Class A | | | — | | | | — | | | | — | |
| Net realized gains, Class C | | | — | | | | — | | | | — | |
| Net realized gains, Class Y | | | — | | | | — | | | | — | |
| Net realized gains, Institutional Class | | | — | | | | — | | | | — | |
| Total Distributions | | | (1,600,758 | ) | | | (180,489 | ) | | | (118,433 | ) |
| | | | | | | | | | | | | |
| Net Decrease from Share Transactions(A) | | | 46,019,976 | | | | (14,968,001 | ) | | | (14,679,907 | ) |
| | | | | | | | | | | | | |
| Total Decrease in Net Assets | | | 48,217,150 | | | | (16,263,623 | ) | | | (4,926,971 | ) |
| | | | | | | | | | | | | |
| Net Assets | | | | | | | | | | | | |
| Beginning of period | | | 35,181,765 | | | | 51,445,388 | | | | 56,372,359 | |
| End of period | | $ | 83,398,915 | | | $ | 35,181,765 | | | $ | 51,445,388 | |
| Accumulated Net Investment Income | | $ | — | | | $ | 269,645 | | | $ | 177,476 | |
(A) For details on share transaction by class, see statements of changes in net assets - capital stock activity on pages 61 and 62.
(B) The Fund changed its fiscal year from July 31 to December 31. See Note 7 in the Notes to Financial Statements.
See accompanying Notes to Financial Statements.
Statements of Changes in Net Assets (Continued)
| Touchstone | |
| Moderate Growth Allocation | |
| Fund | |
| For the | | | | | | | |
| Five Months | | | For the | | | For the | |
| Ended | | | Year | | | Year | |
| December 31, | | | Ended | | | Ended | |
| 2012(B) | | | July 31, 2012 | | | July 31, 2011 | |
| | | | | | | | |
| $ | 1,697,720 | | | $ | 569,460 | | | $ | 584,373 | |
| | 13,038,497 | | | | 4,106,912 | | | | (98,699 | ) |
| | (8,653,626 | ) | | | (4,637,598 | ) | | | 13,302,810 | |
| | 6,082,591 | | | | 38,774 | | | | 13,788,484 | |
| | | | | | | | | | | |
| | | | | | | | | | | |
| | (1,238,170 | ) | | | (237,914 | ) | | | (285,883 | ) |
| | (772,314 | ) | | | (314,758 | ) | | | (398,121 | ) |
| | (880,957 | ) | | | — | | | | — | |
| | — | | | | (20,136 | ) | | | (22,700 | ) |
| | (254 | ) | | | (127 | ) | | | (155 | ) |
| | (1,119,959 | ) | | | — | | | | — | |
| | (769,189 | ) | | | — | | | | — | |
| | (855,859 | ) | | | — | | | | — | |
| | (131 | ) | | | — | | | | — | |
| | (5,636,833 | ) | | | (572,935 | ) | | | (706,859 | ) |
| | | | | | | | | | | |
| | 99,907,478 | | | | (17,225,588 | ) | | | (26,178,377 | ) |
| | | | | | | | | | | |
| | 100,353,236 | | | | (17,759,749 | ) | | | (13,096,752 | ) |
| | | | | | | | | | | |
| | | | | | | | | | | |
| | 63,459,734 | | | | 81,219,483 | | | | 94,316,235 | |
| $ | 163,812,970 | | | $ | 63,459,734 | | | $ | 81,219,483 | |
| $ | — | | | $ | 392,606 | | | $ | 191,574 | |
Statements of Changes in Net Assets - Capital Stock Activity
| | | Touchstone Dynamic | |
| | | Equity Fund | |
| | | For the Five Months | | | For the Year | | | For the Year | |
| | | Ended | | | Ended | | | Ended | |
| | | December 31, 2012(C) | | | July 31, 2012 | | | July 31, 2011 | |
| | | Shares | | | Dollars | | | Shares | | | Dollars | | | Shares | | | Dollars | |
| Class A | | | | | | | | | | | | | | | | | | | | | | | | |
| Proceeds from Shares sold | | | 113,667 | | | $ | 1,270,554 | | | | 97,187 | | | $ | 1,023,913 | | | | 112,957 | | | $ | 1,091,204 | |
| Reinvestment of distributions | | | — | | | | — | | | | 12,141 | | | | 127,964 | | | | — | | | | — | |
| Redemption fees | | | — | | | | — | | | | — | | | | 22 | | | | — | | | | — | |
| Cost of Shares redeemed | | | (252,268 | ) | | | (2,812,907 | ) | | | (799,021 | ) | | | (8,368,813 | ) | | | (2,065,760 | ) | | | (19,823,671 | ) |
| Change in Net Assets from Class A Share Transactions | | | (138,601 | ) | | | (1,542,353 | ) | | | (689,693 | ) | | | (7,216,914 | ) | | | (1,952,803 | ) | | | (18,732,467 | ) |
| Class C(A) | | | | | | | | | | | | | | | | | | | | | | | | |
| Proceeds from Shares sold | | | 11,073 | | | | 118,005 | | | | 38,462 | | | | 411,299 | | | | 16,406 | | | | 155,336 | |
| Reinvestment of distributions | | | — | | | | — | | | | 2,418 | | | | 24,273 | | | | — | | | | — | |
| Redemption fees | | | — | | | | — | | | | — | | | | 14 | | | | — | | | | — | |
| Cost of Shares redeemed | | | (113,949 | ) | | | (1,211,134 | ) | | | (396,981 | ) | | | (3,980,527 | ) | | | (933,294 | ) | | | (8,682,644 | ) |
| Change in Net Assets from Class C Share Transactions | | | (102,876 | ) | | | (1,093,129 | ) | | | (356,101 | ) | | | (3,544,941 | ) | | | (916,888 | ) | | | (8,527,308 | ) |
| Class Y | | | | | | | | | | | | | | | | | | | | | | | | |
| Proceeds from Shares sold | | | 17,727 | | | | 201,695 | | | | 115,845 | | | | 1,254,036 | | | | — | | | | — | |
| Proceeds from Shares issued in connection with merger(B) | | | — | | | | — | | | | 2,239,679 | | | | 21,354,181 | | | | — | | | | — | |
| Reinvestment of distributions | | | — | | | | — | | | | — | | | | — | | | | — | | | | — | |
| Cost of Shares redeemed | | | (318,203 | ) | | | (3,604,761 | ) | | | (236,539 | ) | | | (2,604,497 | ) | | | — | | | | — | |
| Change in Net Assets from Class Y Share Transactions | | | (300,476 | ) | | | (3,403,066 | ) | | | 2,118,985 | | | | 20,003,720 | | | | — | | | | — | |
| Class Z | | | | | | | | | | | | | | | | | | | | | | | | |
| Proceeds from Shares sold | | | — | | | | — | | | | 685,868 | | | | 7,058,978 | | | | 1,298,184 | | | | 13,149,589 | |
| Reinvestment of distributions | | | — | | | | — | | | | 26,540 | | | | 283,182 | | | | — | | | | — | |
| Redemption fees | | | — | | | | — | | | | — | | | | 30 | | | | — | | | | 73 | |
| Cost of Shares redeemed | | | — | | | | — | | | | (1,407,539 | ) | | | (14,954,589 | ) | | | (815,371 | ) | | | (8,178,165 | ) |
| Cost of Shares redeemed in connection with merger(B) | | | — | | | | — | | | | (2,239,679 | ) | | | (21,354,181 | ) | | | — | | | | — | |
| Change in Net Assets from Class Z Share Transactions | | | — | | | | — | | | | (2,934,810 | ) | | | (28,966,580 | ) | | | 482,813 | | | | 4,971,497 | |
| Institutional Class | | | | | | | | | | | | | | | | | | | | | | | | |
| Proceeds from Shares sold | | | 1,329,419 | | | | 15,304,513 | | | | 623,310 | | | | 6,847,071 | | | | — | | | | — | |
| Reinvestment of distributions | | | — | | | | — | | | | 1 | | | | 17 | | | | — | | | | — | |
| Redemption fees | | | — | | | | — | | | | — | | | | 8 | | | | — | | | | — | |
| Cost of Shares redeemed | | | (84,149 | ) | | | (964,700 | ) | | | (80,747 | ) | | | (891,181 | ) | | | — | | | | — | |
| Change in Net Assets from Institutional Class Share Transactions | | | 1,245,270 | | | | 14,339,813 | | | | 542,564 | | | | 5,955,915 | | | | — | | | | — | |
| Net Increase (Decrease) from Share Transactions | | | 703,317 | | | $ | 8,301,265 | | | | (1,319,055 | ) | | $ | (13,768,800 | ) | | | (2,386,878 | ) | | $ | (22,288,278 | ) |
| (A) | Touchstone Emerging Growth Fund began issuing Class C shares on April 12, 2012. |
| (B) | See Note 7 in the Notes to Financial Statements. |
| (C) | The Fund changed its fiscal year from July 31 to December 31. See Note 7 in the Notes to Financial Statements. |
See accompanying Notes to Financial Statements.
Statements of Changes in Net Assets - Capital Stock Activity (Continued)
| Touchstone Emerging | |
| Growth Fund | |
| For the Five Months | | | For the Year | | | For the Year | |
| Ended | | | Ended | | | Ended | |
| December 31, 2012(C) | | | July 31, 2012 | | | July 31, 2011 | |
| Shares | | | Dollars | | | Shares | | | Dollars | | | Shares | | | Dollars | |
| | | | | | | | | | | | | | | | | |
| | 1,248 | | | $ | 14,397 | | | | 16,997 | | | $ | 185,270 | | | | 106,046 | | | $ | 1,152,722 | |
| | 12,500 | | | | 137,628 | | | | — | | | | — | | | | — | | | | — | |
| | — | | | | — | | | | — | | | | — | | | | — | | | | 995 | |
| | (27,248 | ) | | | (320,242 | ) | | | (171,955 | ) | | | (1,881,656 | ) | | | (130,176 | ) | | | (1,426,226 | ) |
| | (13,500 | ) | | | (168,217 | ) | | | (154,958 | ) | | | (1,696,386 | ) | | | (24,130 | ) | | | (272,509 | ) |
| | | | | | | | | | | | | | | | | | | | | | | |
| | — | | | | — | | | | 211 | | | | 2,500 | | | | — | | | | — | |
| | 19 | | | | 206 | | | | — | | | | — | | | | — | | | | — | |
| | — | | | | — | | | | — | | | | — | | | | — | | | | — | |
| | — | | | | — | | | | — | | | | — | | | | — | | | | — | |
| | 19 | | | | 206 | | | | 211 | | | | 2,500 | | | | — | | | | — | |
| | | | | | | | | | | | | | | | | | | | | | | |
| | 23,199 | | | | 270,256 | | | | 3,419 | | | | 40,251 | | | | — | | | | — | |
| | — | | | | — | | | | 657,674 | | | | 7,620,741 | | | | — | | | | — | |
| | 38,445 | | | | 431,742 | | | | — | | | | — | | | | — | | | | — | |
| | (93,515 | ) | | | (1,106,710 | ) | | | (61,060 | ) | | | (713,249 | ) | | | — | | | | — | |
| | (31,871 | ) | | | (404,712 | ) | | | 600,033 | | | | 6,947,743 | | | | — | | | | — | |
| | | | | | | | | | | | | | | | | | | | | | | |
| | — | | | | — | | | | 77,510 | | | | 876,449 | | | | 264,276 | | | | 3,076,410 | |
| | — | | | | — | | | | — | | | | — | | | | — | | | | — | |
| | — | | | | — | | | | — | | | | — | | | | — | | | | 318 | |
| | — | | | | — | | | | (155,247 | ) | | | (1,745,912 | ) | | | (1,077,898 | ) | | | (11,562,495 | ) |
| | — | | | | — | | | | (657,674 | ) | | | (7,620,741 | ) | | | — | | | | — | |
| | — | | | | — | | | | (735,411 | ) | | | (8,490,204 | ) | | | (813,622 | ) | | | (8,485,767 | ) |
| | | | | | | | | | | | | | | | | | | | | | | |
| | 279,545 | | | | 3,518,735 | | | | 542,787 | | | | 6,268,110 | | | | 435,840 | | | | 4,874,795 | |
| | 66,813 | | | | 762,336 | | | | — | | | | — | | | | — | | | | — | |
| | — | | | | — | | | | — | | | | — | | | | — | | | | 56 | |
| | (992,021 | ) | | | (12,384,482 | ) | | | (2,100,648 | ) | | | (25,603,513 | ) | | | (2,797,123 | ) | | | (31,951,417 | ) |
| | (645,663 | ) | | | (8,103,411 | ) | | | (1,557,861 | ) | | | (19,335,403 | ) | | | (2,361,283 | ) | | | (27,076,566 | ) |
| | (691,015 | ) | | $ | (8,676,134 | ) | | | (1,847,986 | ) | | $ | (22,571,750 | ) | | | (3,199,035 | ) | | $ | (35,834,842 | ) |
Statements of Changes in Net Assets - Capital Stock Activity (Continued)
| | | | | | | | | Touchstone International | | | | | | | |
| | | | | | | | | Equity Fund | | | | | | | |
| | | For the Five Months | | | For the Year | | | For the Year | |
| | | Ended | | | Ended | | | Ended | |
| | | December 31, 2012(C) | | | July 31, 2012 | | | July 31, 2011 | |
| | | Shares | | | Dollars | | | Shares | | | Dollars | | | Shares | | | Dollars | |
| Class A | | | | | | | | | | | | | | | | | | | | | | | | |
| Proceeds from Shares sold | | | 3,357 | | | $ | 28,942 | | | | 13,241 | | | $ | 108,234 | | | | 2,383 | | | $ | 21,950 | |
| Cost of Shares redeemed in connection with merger(B) | | | — | | | | — | | | | — | | | | — | | | | — | | | | — | |
| Reinvestment of distributions | | | 550 | | | | 4,851 | | | | 1,019 | | | | 7,582 | | | | 506 | | | | 4,474 | |
| Cost of Shares redeemed | | | (2,607 | ) | | | (22,367 | ) | | | (12,417 | ) | | | (98,803 | ) | | | (21,064 | ) | | | (193,932 | ) |
| Change in Net Assets from Class A Share Transactions | | | 1,300 | | | | 11,426 | | | | 1,843 | | | | 17,013 | | | | (18,175 | ) | | | (167,508 | ) |
| Class C(A) | | | | | | | | | | | | | | | | | | | | | | | | |
| Proceeds from Shares sold | | | 22,283 | | | | 188,301 | | | | 305 | | | | 2,499 | | | | — | | | | — | |
| Cost of Shares redeemed in connection with merger(B) | | | — | | | | — | | | | — | | | | — | | | | — | | | | — | |
| Reinvestment of distributions | | | 425 | | | | 3,733 | | | | — | | | | — | | | | | | | | | |
| Redemption fees | | | — | | | | — | | | | — | | | | — | | | | — | | | | — | |
| Cost of Shares redeemed | | | — | | | | — | | | | — | | | | — | | | | — | | | | — | |
| Change in Net Assets from Class C Share Transactions | | | 22,708 | | | | 192,034 | | | | 305 | | | | 2,499 | | | | — | | | | — | |
| Class Y | | | | | | | | | | | | | | | | | | | | | | | | |
| Proceeds from Shares sold | | | 588 | | | | 5,084 | | | | 241 | | | | 1,642 | | | | — | | | | — | |
| Proceeds from Shares issued in connection with merger(B) | | | — | | | | — | | | | 55,599 | | | | 923,556 | | | | — | | | | — | |
| Reinvestment of distributions | | | 927 | | | | 8,201 | | | | — | | | | — | | | | — | | | | — | |
| Cost of Shares redeemed | | | (7,783 | ) | | | (68,320 | ) | | | (3,336 | ) | | | (25,612 | ) | | | — | | | | — | |
| Change in Net Assets from Class Y Share Transactions | | | (6,268 | ) | | | (55,035 | ) | | | 52,504 | | | | 899,586 | | | | — | | | | — | |
| Class Z | | | | | | | | | | | | | | | | | | | | | | | | |
| Proceeds from Shares sold | | | — | | | | — | | | | 3,681 | | | | 30,192 | | | | 30,109 | | | | 274,127 | |
| Reinvestment of distributions | | | — | | | | — | | | | 2,144 | | | | 15,971 | | | | 1,145 | | | | 10,157 | |
| Cost of Shares redeemed | | | — | | | | — | | | | (7,613 | ) | | | (63,817 | ) | | | (39,590 | ) | | | (357,275 | ) |
| Cost of Shares redeemed in connection with merger(B) | | | — | | | | — | | | | (55,599 | ) | | | (923,556 | ) | | | — | | | | — | |
| Change in Net Assets from Class Z Share Transactions | | | — | | | | — | | | | (57,387 | ) | | | (941,210 | ) | | | (8,336 | ) | | | (72,991 | ) |
| Institutional Class | | | | | | | | | | | | | | | | | | | | | | | | |
| Proceeds from Shares sold | | | 548,360 | | | | 4,694,082 | | | | 592,217 | | | | 4,975,354 | | | | 79,358 | | | | 700,603 | |
| Reinvestment of distributions | | | 53,441 | | | | 471,885 | | | | 126,697 | | | | 942,626 | | | | 98,645 | | | | 874,978 | |
| Cost of Shares redeemed | | | (448,871 | ) | | | (3,857,799 | ) | | | (2,277,576 | ) | | | (18,803,944 | ) | | | (2,436,524 | ) | | | (21,994,436 | ) |
| Change in Net Assets from Institutional Class | | | | | | | | | | | | | | | | | | | | | | | | |
| Share Transactions | | | 152,930 | | | | 1,308,168 | | | | (1,558,662 | ) | | | (12,885,964 | ) | | | (2,258,521 | ) | | | (20,418,855 | ) |
| Net Increase (Decrease) from Share Transactions | | | 170,670 | | | $ | 1,456,593 | | | | (1,561,397 | ) | | $ | (12,908,076 | ) | | | (2,285,032 | ) | | $ | (20,659,354 | ) |
(A) Touchstone International Equity Fund began issuing Class C shares on April 12, 2012.
(B) See Note 7 in the Notes to Financial Statements.
(C) The Fund changed its fiscal year from July 31 to December 31. See Note 7 in the Notes to Financial Statements.
See accompanying Notes to Financial Statements.
Statements of Changes in Net Assets - Capital Stock Activity (Continued)
| Touchstone Balanced | |
| Allocation Fund | |
| For the Five Months | | | For the Year | | | For the Year | |
| Ended | | | Ended | | | Ended | |
| December 31,2012(C) | | | July 31, 2012 | | | July 31, 2011 | |
| Shares | | | Dollars | | | Shares | | | Dollars | | | Shares | | | Dollars | |
| | | | | | | | | | | | | | | | | |
| | 133,156 | | | | 1,512,715 | | | | 51,372 | | | | 555,561 | | | | 107,825 | | | | 1,134,540 | |
| | | | | | | | | | | | | | | | | | | | | | | |
| | 3,650,589 | | | | 41,600,137 | | | | — | | | | — | | | | — | | | | — | |
| | 160,880 | | | | 1,794,307 | | | | 11,764 | | | | 124,335 | | | | 26,608 | | | | 283,451 | |
| | (411,962 | ) | | | (4,677,019 | ) | | | (329,730 | ) | | | (3,549,105 | ) | | | (1,120,890 | ) | | | (11,626,588 | ) |
| | | | | | | | | | | | | | | | | | | | | | | |
| | 3,532,663 | | | | 40,230,140 | | | | (266,594 | ) | | | (2,869,209 | ) | | | (986,457 | ) | | | (10,208,597 | ) |
| | | | | | | | | | | | | | | | | | | | | | | |
| | 93,366 | | | | 1,049,120 | | | | 111,052 | | | | 1,192,025 | | | | 255,749 | | | | 2,713,585 | |
| | | | | | | | | | | | | | | | | | | | | | | |
| | 191,231 | | | | 2,174,823 | | | | — | | | | — | | | | — | | | | — | |
| | 91,476 | | | | 1,018,509 | | | | 24,035 | | | | 254,301 | | | | 54,153 | | | | 576,525 | |
| | — | | | | — | | | | — | | | | 9 | | | | — | | | | 11 | |
| | | | | | | | | | | | | | | | | | | | | | | |
| | (385,238 | ) | | | (4,344,101 | ) | | | (1,239,184 | ) | | | (13,462,919 | ) | | | (1,723,353 | ) | | | (18,313,299 | ) |
| | | | | | | | | | | | | | | | | | | | | | | |
| | (9,165 | ) | | | (101,649 | ) | | | (1,104,097 | ) | | | (12,016,584 | ) | | | (1,413,451 | ) | | | (15,023,178 | ) |
| | | | | | | | | | | | | | | | | | | | | | | |
| | 301,709 | | | | 3,426,829 | | | | 4,552 | | | | 49,425 | | | | — | | | | — | |
| | | | | | | | | | | | | | | | | | | | | | | |
| | 6,276,974 | | | | 71,649,327 | | | | 114,668 | | | | 1,301,456 | | | | — | | | | — | |
| | 234,665 | | | | 2,620,777 | | | | — | | | | — | | | | — | | | | — | |
| | (2,704,435 | ) | | | (30,352,141 | ) | | | (4,343 | ) | | | (47,913 | ) | | | — | | | | — | |
| | | | | | | | | | | | | | | | | | | | | | | |
| | 4,108,913 | | | | 47,344,792 | | | | 114,877 | | | | 1,302,968 | | | | — | | | | — | |
| | | | | | | | | | | | | | | | | | | | | | | |
| | — | | | | — | | | | 8,853 | | | | 96,418 | | | | 125,842 | | | | 1,354,208 | |
| | — | | | | — | | | | 1,293 | | | | 13,562 | | | | 2,227 | | | | 23,787 | |
| | — | | | | — | | | | (64,331 | ) | | | (716,348 | ) | | | (52,042 | ) | | | (548,375 | ) |
| | — | | | | — | | | | (114,668 | ) | | | (1,301,456 | ) | | | — | | | | — | |
| | | | | | | | | | | | | | | | | | | | | | | |
| | — | | | | — | | | | (168,853 | ) | | | (1,907,824 | ) | | | 76,027 | | | | 829,620 | |
| | | | | | | | | | | | | | | | | | | | | | | |
| | — | | | | — | | | | 35 | | | | 372 | | | | — | | | | — | |
| | 134 | | | | 1,490 | | | | 19 | | | | 205 | | | | 77 | | | | 817 | |
| | — | | | | — | | | | (197 | ) | | | (2,032 | ) | | | — | | | | — | |
| | 134 | | | | 1,490 | | | | (143 | ) | | | (1,455 | ) | | | 77 | | | | 817 | |
| | 7,632,545 | | | $ | 87,474,773 | | | | (1,424,810 | ) | | $ | (15,492,104 | ) | | | (2,323,804 | ) | | $ | (24,401,338 | ) |
Statements of Changes in Net Assets - Capital Stock Activity (Continued)
| | | | | | Touchstone Conservative | | | | |
| | | | | | Allocation Fund | | | | |
| | | For the Five Months | | | For the Year | | | For the Year | |
| | | Ended | | | Ended | | | Ended | |
| | | December 31, 2012(B) | | | July 31, 2012 | | | July 31, 2011 | |
| | | Shares | | | Dollars | | | Shares | | | Dollars | | | Shares | | | Dollars | |
| Class A | | | | | | | | | | | | | | | | | | | | | | | | |
| Proceeds from Shares sold | | | 182,352 | | | $ | 1,984,226 | | | | 435,959 | | | $ | 4,679,336 | | | | 469,086 | | | $ | 4,910,814 | |
| Proceeds from Shares issued in connection with merger(A) | | | 2,370,245 | | | | 26,062,498 | | | | — | | | | — | | | | — | | | | — | |
| Reinvestment of distributions | | | 140,042 | | | | 1,482,044 | | | | 8,431 | | | | 89,062 | | | | 32,731 | | | | 346,890 | |
| Redemption fees | | | — | | | | — | | | | — | | | | — | | | | — | | | | 2,501 | |
| Cost of Shares redeemed | | | (324,849 | ) | | | (3,545,483 | ) | | | (698,325 | ) | | | (7,410,892 | ) | | | (646,598 | ) | | | (6,848,583 | ) |
| Change in Net Assets from Class A Share Transactions | | | 2,367,790 | | | | 25,983,285 | | | | (253,935 | ) | | | (2,642,494 | ) | | | (144,781 | ) | | | (1,588,378 | ) |
| Class C | | | | | | | | | | | | | | | | | | | | | | | | |
| Proceeds from Shares sold | | | 87,113 | | | | 933,883 | | | | 120,414 | | | | 1,289,950 | | | | 139,547 | | | | 1,463,986 | |
| Proceeds from Shares issued in connection with merger(A) | | | 161,697 | | | | 1,770,015 | | | | — | | | | — | | | | — | | | | — | |
| Reinvestment of distributions | | | 75,779 | | | | 801,084 | | | | 15,629 | | | | 163,870 | | | | 39,670 | | | | 418,257 | |
| Redemption fees | | | — | | | | — | | | | — | | | | — | | | | — | | | | — | |
| Cost of Shares redeemed | | | (170,909 | ) | | | (1,856,950 | ) | | | (419,692 | ) | | | (4,493,992 | ) | | | (651,300 | ) | | | (6,912,341 | ) |
| Change in Net Assets from Class C Share Transactions | | | 153,680 | | | | 1,648,032 | | | | (283,649 | ) | | | (3,040,172 | ) | | | (472,083 | ) | | | (5,030,098 | ) |
| Class Y | | | | | | | | | | | | | | | | | �� | | | | | | | |
| Proceeds from Shares sold | | | 170,254 | | | | 1,861,753 | | | | 6,373 | | | | 68,638 | | | | — | | | | — | |
| Proceeds from Shares issued in connection with merger(A) | | | 3,465,392 | | | | 38,120,235 | | | | 197,512 | | | | 2,081,642 | | | | — | | | | — | |
| Reinvestment of distributions | | | 191,804 | | | | 2,030,304 | | | | 527 | | | | 5,686 | | | | — | | | | — | |
| Cost of Shares redeemed | | | (851,598 | ) | | | (9,144,512 | ) | | | (8,160 | ) | | | (88,920 | ) | | | — | | | | — | |
| Change in Net Assets from Class Y Share Transactions | | | 2,975,852 | | | | 32,867,780 | | | | 196,252 | | | | 2,067,046 | | | | — | | | | — | |
| Class Z | | | | | | | | | | | | | | | | | | | | | | | | |
| Proceeds from Shares sold | | | — | | | | — | | | | 169,193 | | | | 1,789,083 | | | | 73,005 | | | | 788,093 | |
| Reinvestment of distributions | | | — | | | | — | | | | 3,396 | | | | 35,873 | | | | 3,946 | | | | 41,838 | |
| Redemption fees | | | — | | | | — | | | | — | | | | — | | | | — | | | | 1 | |
| Cost of Shares redeemed | | | — | | | | — | | | | (101,097 | ) | | | (1,080,371 | ) | | | (59,660 | ) | | | (642,737 | ) |
| Cost of Shares redeemed in connection with merger(A) | | | — | | | | — | | | | (197,512 | ) | | | (2,081,642 | ) | | | — | | | | — | |
| Change in Net Assets from Class Z Share Transactions | | | — | | | | — | | | | (126,020 | ) | | | (1,337,057 | ) | | | 17,291 | | | | 187,195 | |
| Institutional Class | | | | | | | | | | | | | | | | | | | | | | | | |
| Proceeds from Shares sold | | | — | | | | — | | | | 12,061 | | | | 130,383 | | | | 76,058 | | | | 816,440 | |
| Reinvestment of distributions | | | 8,105 | | | | 86,416 | | | | 12,914 | | | | 136,455 | | | | 24,550 | | | | 260,493 | |
| Redemption fees | | | — | | | | — | | | | — | | | | — | | | | — | | | | — | |
| Cost of Shares redeemed | | | (16,235 | ) | | | (176,982 | ) | | | (496,227 | ) | | | (5,369,390 | ) | | | (99,534 | ) | | | (1,071,734 | ) |
| Change in Net Assets from Institutional Class Share Transactions | | | (8,130 | ) | | | (90,566 | ) | | | (471,252 | ) | | | (5,102,552 | ) | | | 1,074 | | | | 5,199 | |
| Net Increase (Decrease) from Share Transactions | | | 5,489,192 | | | $ | 60,408,531 | | | | (938,604 | ) | | $ | (10,055,229 | ) | | | (598,499 | ) | | $ | (6,426,082 | ) |
(A) See Note 7 in the Notes to Financial Statements.
(B) The Fund changed its fiscal year from July 31 to December 31. See Note 7 in the Notes to Financial Statements.
See accompanying Notes to Financial Statements.
Statements of Changes in Net Assets - Capital Stock Activity (Continued)
| Touchstone Growth | |
| Allocation Fund | |
| For the Five Months | | | For the Year | | | For the Year | |
| Ended | | | Ended | | | Ended | |
| December 31, 2012(B) | | | July 31, 2012 | | | July 31, 2011 | |
| Shares | | | Dollars | | | Shares | | | Dollars | | | Shares | | | Dollars | |
| | | | | | | | | | | | | | | | | |
| | 83,538 | | | $ | 975,036 | | | | 55,210 | | | $ | 587,614 | | | | 97,155 | | | $ | 1,068,075 | |
| | 1,982,555 | | | | 23,010,705 | | | | — | | | | — | | | | — | | | | — | |
| | 50,396 | | | | 581,838 | | | | 9,788 | | | | 101,796 | | | | 6,822 | | | | 74,091 | |
| | — | | | | — | | | | — | | | | 2 | | | | — | | | | 12 | |
| | (355,247 | ) | | | (4,130,048 | ) | | | (344,708 | ) | | | (3,716,622 | ) | | | (654,642 | ) | | | (7,043,329 | ) |
| | 1,761,242 | | | | 20,437,531 | | | | (279,710 | ) | | | (3,027,210 | ) | | | (550,665 | ) | | | (5,901,151 | ) |
| | | | | | | | | | | | | | | | | | | | | | | |
| | 25,816 | | | | 286,872 | | | | 66,499 | | | | 633,936 | | | | 139,720 | | | | 1,445,033 | |
| | 86,836 | | | | 971,379 | | | | — | | | | — | | | | — | | | | — | |
| | 29,133 | | | | 323,605 | | | | 3,080 | | | | 30,774 | | | | — | | | | — | |
| | — | | | | — | | | | — | | | | — | | | | — | | | | 577 | |
| | (236,712 | ) | | | (2,642,774 | ) | | | (920,431 | ) | | | (9,388,471 | ) | | | (1,062,299 | ) | | | (10,929,585 | ) |
| | (94,927 | ) | | | (1,060,918 | ) | | | (850,852 | ) | | | (8,723,761 | ) | | | (922,579 | ) | | | (9,483,975 | ) |
| | | | | | | | | | | | | | | | | | | | | | | |
| | 92,145 | | | | 1,085,271 | | | | 9,691 | | | | 107,236 | | | | — | | | | — | |
| | 2,547,823 | | | | 29,855,473 | | | | 68,967 | | | | 732,300 | | | | — | | | | — | |
| | 40,877 | | | | 478,642 | | | | — | | | | — | | | | — | | | | — | |
| | (407,565 | ) | | | (4,791,580 | ) | | | (1,606 | ) | | | (17,612 | ) | | | — | | | | — | |
| | 2,273,280 | | | | 26,627,806 | | | | 77,052 | | | | 821,924 | | | | — | | | | — | |
| | | | | | | | | | | | | | | | | | | | | | | |
| | — | | | | — | | | | 7,102 | | | | 75,977 | | | | 125,398 | | | | 1,356,454 | |
| | — | | | | — | | | | 1,071 | | | | 11,260 | | | | 1,926 | | | | 21,185 | |
| | — | | | | — | | | | — | | | | — | | | | — | | | | — | |
| | — | | | | — | | | | (246,979 | ) | | | (2,681,751 | ) | | | (58,423 | ) | | | (660,062 | ) |
| | — | | | | — | | | | (68,967 | ) | | | (732,300 | ) | | | — | | | | — | |
| | — | | | | — | | | | (307,773 | ) | | | (3,326,814 | ) | | | 68,901 | | | | 717,577 | |
| | | | | | | | | | | | | | | | | | | | | | | |
| | 1,400 | | | | 15,008 | | | | 623 | | | | 6,895 | | | | 9,836 | | | | 108,725 | |
| | 85 | | | | 901 | | | | 100 | | | | 983 | | | | 546 | | | | 5,997 | |
| | — | | | | — | | | | — | | | | — | | | | — | | | | 3 | |
| | (32 | ) | | | (352 | ) | | | (67,704 | ) | | | (720,018 | ) | | | (11,594 | ) | | | (127,083 | ) |
| | 1,453 | | | | 15,557 | | | | (66,981 | ) | | | (712,140 | ) | | | (1,212 | ) | | | (12,358 | ) |
| | 3,941,048 | | | $ | 46,019,976 | | | | (1,428,264 | ) | | $ | (14,968,001 | ) | | | (1,405,555 | ) | | $ | (14,679,907 | ) |
Statements of Changes in Net Assets - Capital Stock Activity (Continued)
| | | Touchstone Moderate Growth | |
| | | Allocation Fund | |
| | | For the Five Months | | | For the Year | | | For the Year | |
| | | Ended | | | Ended | | | Ended | |
| | | December 31, 2012(B) | | | July 31, 2012 | | | July 31, 2011 | |
| | | Shares | | | Dollars | | | Shares | | | Dollars | | | Shares | | | Dollars | |
| Class A | | | | | | | | | | | | | | | | | | | | | | | | |
| Proceeds from Shares sold | | | 129,646 | | | $ | 1,475,971 | | | | 97,822 | | | $ | 1,064,952 | | | | 276,734 | | | $ | 2,958,325 | |
| Proceeds from Shares issued in connection with merger(A) | | | 5,396,673 | | | | 61,461,849 | | | | — | | | | — | | | | — | | | | — | |
| Reinvestment of distributions | | | 187,033 | | | | 2,104,863 | | | | 19,053 | | | | 196,629 | | | | 22,915 | | | | 243,124 | |
| Redemption fees | | | — | | | | — | | | | — | | | | 2 | | | | — | | | | 4 | |
| Cost of Shares redeemed | | | (771,111 | ) | | | (8,774,777 | ) | | | (448,546 | ) | | | (4,814,500 | ) | | | (957,821 | ) | | | (10,240,936 | ) |
| Change in Net Assets from Class A Share Transactions | | | 4,942,241 | | | | 56,267,906 | | | | (331,671 | ) | | | (3,552,917 | ) | | | (658,172 | ) | | | (7,039,483 | ) |
| Class C | | | | | | | | | | | | | | | | | | | | | | | | |
| Proceeds from Shares sold | | | 106,912 | | | | 1,194,059 | | | | 133,586 | | | | 1,407,737 | | | | 236,158 | | | | 2,457,625 | |
| Proceeds from Shares issued in connection with merger(A) | | | 221,281 | | | | 2,482,569 | | | | — | | | | — | | | | — | | | | — | |
| Reinvestment of distributions | | | 88,949 | | | | 985,199 | | | | 18,947 | | | | 192,127 | | | | 22,961 | | | | 239,020 | |
| Redemption fees | | | — | | | | — | | | | — | | | | 1 | | | | — | | | | 47 | |
| Cost of Shares redeemed | | | (381,823 | ) | | | (4,268,695 | ) | | | (1,411,866 | ) | | | (14,742,597 | ) | | | (2,152,558 | ) | | | (22,352,790 | ) |
| Change in Net Assets from Class C Share Transactions | | | 35,319 | | | | 393,132 | | | | (1,259,333 | ) | | | (13,142,732 | ) | | | (1,893,439 | ) | | | (19,656,098 | ) |
| Class Y | | | | | | | | | | | | | | | | | | | | | | | | |
| Proceeds from Shares sold | | | 214,196 | | | | 2,459,768 | | | | 14,400 | | | | 155,956 | | | | — | | | | — | |
| Proceeds from Shares issued in connection with merger(A) | | | 4,909,444 | | | | 56,310,746 | | | | 59,133 | | | | 690,081 | | | | — | | | | — | |
| Reinvestment of distributions | | | 146,774 | | | | 1,665,234 | | | | — | | | | — | | | | — | | | | — | |
| Cost of Shares redeemed | | | (1,507,596 | ) | | | (17,189,693 | ) | | | (5,646 | ) | | | (61,748 | ) | | | — | | | | — | |
| Change in Net Assets from Class Y Share Transactions | | | 3,762,818 | | | | 43,246,055 | | | | 67,887 | | | | 784,289 | | | | — | | | | — | |
| Class Z | | | | | | | | | | | | | | | | | | | | | | | | |
| Proceeds from Shares sold | | | — | | | | — | | | | 5,102 | | | | 56,108 | | | | 96,286 | | | | 1,030,308 | |
| Reinvestment of distributions | | | — | | | | — | | | | 1,101 | | | | 11,461 | | | | 967 | | | | 10,340 | |
| Cost of Shares redeemed | | | — | | | | — | | | | (61,849 | ) | | | (691,938 | ) | | | (47,614 | ) | | | (523,599 | ) |
| Cost of Shares redeemed in connection with merger(A) | | | — | | | | — | | | | (59,133 | ) | | | (690,081 | ) | | | — | | | | — | |
| Change in Net Assets from Class Z Share Transactions | | | — | | | | — | | | | (114,779 | ) | | | (1,314,450 | ) | | | 49,639 | | | | 517,049 | |
| Institutional Class | | | | | | | | | | | | | | | | | | | | | | | | |
| Proceeds from Shares sold | | | — | | | | — | | | | 9 | | | | 100 | | | | — | | | | — | |
| Reinvestment of distributions | | | 34 | | | | 385 | | | | 12 | | | | 127 | | | | 15 | | | | 155 | |
| Cost of Shares redeemed | | | — | | | | — | | | | — | | | | (5 | ) | | | — | | | | — | |
| Change in Net Assets from Institutional Class Share Transactions | | | 34 | | | | 385 | | | | 21 | | | | 222 | | | | 15 | | | | 155 | |
| | | | | | | | | | | | | | | | | | | | | | | | | |
| Net Increase (Decrease) from Share Transactions | | | 8,740,412 | | | $ | 99,907,478 | | | | (1,637,875 | ) | | $ | (17,225,588 | ) | | | (2,501,957 | ) | | $ | (26,178,377 | ) |
(A) See Note 7 in the Notes to Financial Statements.
(B) The Fund changed its fiscal year from July 31 to December 31. See Note 7 in the Notes to Financial Statements.
See accompanying Notes to Financial Statements.
Statements of Cash Flows
For the Period Ended December 31, 2012 and the Year Ended July 31, 2012
| | | Touchstone |
| | | Dynamic Equity |
| | | Fund |
| | | For the | | |
| | | Five Months | | |
| | | Ended | | For the |
| | | December 31, | | Year Ended |
| | | 2012(A) | | July 31, 2012 |
| Cash Flows Provided by/ Used in Operating Activities | | | | | | | | |
| | | | | | | | | |
| Change in net assets resulting from operations | | $ | (1,067,601 | ) | | $ | 5,848,504 | |
| | | | | | | | | |
| Adjustments to reconcile net increase (decrease) in net assets derived from operations to net cash (used in) provided by operating activities: | | | | | | | | |
| Purchases of investments | | | (86,832,779 | ) | | | (175,622,762 | ) |
| Proceeds from disposition of investments | | | 82,839,295 | | | | 190,676,934 | |
| Premiums on call and put options written | | | 9,311,979 | | | | 24,430,056 | |
| Costs to cover written options | | | (10,034,518 | ) | | | (22,282,305 | ) |
| Proceeds from securities sold short | | | 42,464,801 | | | | 150,000,584 | |
| Covers of securities sold short | | | (43,759,919 | ) | | | (152,514,398 | ) |
| Net sales of short term securities | | | (2,339,569 | ) | | | (23,865 | ) |
| Decrease in deposits with Prime Broker | | | 208,781 | | | | 31,532 | |
| (Increase) decrease in dividends and interest receivable | | | (20,256 | ) | | | 31,630 | |
| Increase (decrease) in dividends for securities sold short payable | | | (234,918 | ) | | | 239,034 | |
| Decrease in receivable from Investment Advisor | | | — | | | | 6,099 | |
| Increase (decrease) in payable to Trustees | | | (1,339 | ) | | | 622 | |
| Increase (decrease) in payable to other affiliates | | | (8,050 | ) | | | 6,865 | |
| Increase (decrease) in other accrued expenses and liabilities | | | 5,478 | | | | (25,508 | ) |
| (Increase) decrease in other assets | | | 1,961 | | | | (27,824 | ) |
| Net realized (gain) from investments and warrants | | | (2,431,895 | ) | | | (1,517,732 | ) |
| Net realized (gain) loss from written options | | | 1,102,848 | | | | (2,823,456 | ) |
| Net realized loss from securities sold short | | | 1,636,817 | | | | 513,766 | |
| Net change in unrealized (appreciation) depreciation on investments and warrants | | | (467,741 | ) | | | (2,052,589 | ) |
| Net change in unrealized (appreciation) depreciation on written options | | | (143,584 | ) | | | 350,810 | |
| Net change in unrealized (appreciation) depreciation on securities sold short | | | 1,630,505 | | | | (729,261 | ) |
| Net cash used in operating activities | | | (8,139,704 | ) | | | (14,516,736 | ) |
| | | | | | | | | |
| Cash Flows from Financing Activities | | | | | | | | |
| Proceeds from shares sold | | | 16,750,518 | | | | 16,444,205 | |
| Cash distributions paid | | | — | | | | (79,454 | ) |
| Payment of shares redeemed | | | (8,610,814 | ) | | | (30,881,487 | ) |
| Net cash provided by (used in) financing activities | | | 8,139,704 | | | | (14,516,736 | ) |
| Net change in cash | | | — | | | | — | |
| | | | | | | | | |
| Cash - beginning of the period | | | — | | | | — | |
| Cash - end of period | | $ | — | | | | — | |
| | | | | | | | | |
| Supplemental disclosure of cash flow information: | | | | | | | | |
| Reinvestment of dividends and distributions | | $ | — | | | $ | 435,436 | |
(A) The Fund changed its fiscal year end from July 31 to December 31. See Note 7 in Notes to Financial Statements.
See accompanying Notes to Financial Statements.
Financial Highlights
Touchstone Dynamic Equity Fund—Class A
Selected Data for a Share Outstanding Throughout Each Period
| | | Five Months | | | | | | | | | | | | | | | | |
| | | Ended | | | | | | | | | | | | | | | | |
| | | December 31, | | | Year Ended July 31, | |
| | | 2012(A) | | | 2012 | | | 2011 | | | 2010 | | | 2009 | | | 2008 | |
| Net asset value at beginning of period | | $ | 11.20 | | | $ | 10.26 | | | $ | 9.02 | | | $ | 8.68 | | | $ | 11.88 | | | $ | 14.51 | |
| Income (loss) from investment operations: | | | | | | | | | | | | | | | | | | | | | | | | |
| Net investment income (loss)(B) | | | 0.04 | | | | (0.07 | ) | | | 0.06 | | | | 0.05 | | | | 0.02 | | | | 0.05 | |
| Net realized and unrealized gains (losses) on investments | | | (0.19 | ) | | | 1.09 | | | | 1.18 | | | | 0.29 | | | | (3.22 | ) | | | (1.80 | ) |
| Total from investment operations | | | (0.15 | ) | | | 1.02 | | | | 1.24 | | | | 0.34 | | | | (3.20 | ) | | | (1.75 | ) |
| Distributions from: | | | | | | | | | | | | | | | | | | | | | | | | |
| Net investment income | | | — | | | | (0.08 | ) | | | — | | | | — | | | | — | | | | (0.18 | ) |
| Realized capital gains | | | — | | | | — | | | | — | | | | — | | | | — | | | | (0.70 | ) |
| Total distributions | | | — | | | | (0.08 | ) | | | — | | | | — | | | | — | | | | (0.88 | ) |
| Net asset value at end of period | | $ | 11.05 | | | $ | 11.20 | | | $ | 10.26 | | | $ | 9.02 | | | $ | 8.68 | | | $ | 11.88 | |
| Total return(C) | | | (1.34 | %)(D) | | | 10.00 | % | | | 13.75 | % | | | 3.92 | % | | | (26.94 | %) | | | (12.60 | %) |
| Ratios and supplemental data: | | | | | | | | | | | | | | | | | | | | | | | | |
| Net assets at end of period (000's) | | $ | 16,156 | | | $ | 17,919 | | | $ | 23,505 | | | $ | 38,274 | | | $ | 83,169 | | | $ | 285,305 | |
| Ratio to average net assets: | | | | | | | | | | | | | | | | | | | | | | | | |
| Net expenses (including dividend expense on securities sold short)(E) | | | 2.46 | %(F) | | | 2.80 | % | | | 1.82 | % | | | 1.78 | % | | | 2.07 | % | | | 1.92 | % |
| Gross expenses (including dividend expense on securities sold short)(G) | | | 2.65 | %(F) | | | 3.08 | % | | | 2.16 | % | | | 2.27 | % | | | 2.41 | % | | | 2.13 | % |
| Net investment income (loss) | | | 0.88 | %(F) | | | (0.63 | %) | | | 0.66 | % | | | 0.52 | % | | | 0.24 | % | | | 0.40 | % |
| Portfolio turnover rate | | | 105 | %(D) | | | 234 | % | | | 231 | % | | | 168 | % | | | 195 | % | | | 172 | % |
| (A) | The Fund changed its fiscal year end from July 31 to December 31. See Note 7 in Notes to Financial Statements. |
| (B) | Per share amounts for the year or period are calculated based on average outstanding shares. |
| (C) | Total returns shown exclude the effect of applicable sales loads. If these charges were included, the returns would be lower. |
| (E) | The ratio of net expenses to average net assets excluding dividend expense on securities sold short is 1.55%, 1.55%, 1.66%, 1.65%, 1.71% and 1.53% for the period ended December 31, 2012 and years ended July 2012, 2011, 2010, 2009 and 2008, respectively. |
| (G) | The ratio of gross expenses to average net assets excluding dividend expense on securities sold short is 1.74%, 1.82%, 2.00%, 2.14%, 2.05% and 1.74% for the period ended December 31, 2012 and years ended July 2012, 2011, 2010, 2009 and 2008, respectively. |
See accompanying Notes to Financial Statements.
Financial Highlights (Continued)
Touchstone Dynamic Equity Fund—Class C
Selected Data for a Share Outstanding Throughout Each Period
| | | Five Months | | | | | | | | | | | | | | | | |
| | | Ended | | | | | | | | | | | | | | | | |
| | | December 31, | | | Year Ended July 31, | |
| | | 2012(A) | | | 2012 | | | 2011 | | | 2010 | | | 2009 | | | 2008 | |
| Net asset value at beginning of period | | $ | 10.63 | | | $ | 9.79 | | | $ | 8.67 | | | $ | 8.40 | | | $ | 11.59 | | | $ | 14.32 | |
| Income (loss) from investment operations: | | | | | | | | | | | | | | | | | | | | | | | | |
| Net investment income (loss)(B) | | | 0.01 | | | | (0.14 | ) | | | (0.01 | ) | | | (0.02 | ) | | | (0.05 | ) | | | (0.04 | ) |
| Net realized and unrealized gains (losses) on investments | | | (0.18 | ) | | | 1.03 | | | | 1.13 | | | | 0.29 | | | | (3.14 | ) | | | (1.77 | ) |
| Total from investment operations | | | (0.17 | ) | | | 0.89 | | | | 1.12 | | | | 0.27 | | | | (3.19 | ) | | | (1.81 | ) |
| Distributions from: | | | | | | | | | | | | | | | | | | | | | | | | |
| Net investment income | | | — | | | | (0.05 | ) | | | — | | | | — | | | | — | | | | (0.22 | ) |
| Realized capital gains | | | — | | | | — | | | | — | | | | — | | | | — | | | | (0.70 | ) |
| Total distributions | | | — | | | | (0.05 | ) | | | — | | | | — | | | | — | | | | (0.92 | ) |
| Net asset value at end of period | | $ | 10.46 | | | $ | 10.63 | | | $ | 9.79 | | | $ | 8.67 | | | $ | 8.40 | | | $ | 11.59 | |
| Total return(C) | | | (1.60 | %)(D) | | | 9.09 | % | | | 12.92 | % | | | 3.21 | % | | | (27.52 | %) | | | (13.23 | %) |
| Ratios and supplemental data: | | | | | | | | | | | | | | | | | | | | | | | | |
| Net assets at end of period (000's) | | $ | 10,420 | | | $ | 11,684 | | | $ | 14,243 | | | $ | 20,558 | | | $ | 51,879 | | | $ | 158,508 | |
| Ratio to average net assets: | | | | | | | | | | | | | | | | | | | | | | | | |
| Net expenses (including dividend expense on securities sold short)(E) | | | 3.21 | %(F) | | | 3.55 | % | | | 2.57 | % | | | 2.53 | % | | | 2.82 | % | | | 2.65 | % |
| Gross expenses (including dividend expense on securities sold short)(G) | | | 3.48 | %(F) | | | 3.75 | % | | | 2.78 | % | | | 2.91 | % | | | 2.97 | % | | | 2.85 | % |
| Net investment income (loss) | | | 0.13 | %(F) | | | (1.38 | %) | | | (0.10 | %) | | | (0.23 | %) | | | (0.52 | %) | | | (0.34 | %) |
| Portfolio turnover rate | | | 105 | %(D) | | | 234 | % | | | 231 | % | | | 168 | % | | | 195 | % | | | 172 | % |
| (A) | The Fund changed its fiscal year end from July 31 to December 31. See Note 7 in Notes to Financial Statements. |
| (B) | Per share amounts for the year or period are calculated based on average outstanding shares. |
| (C) | Total returns shown exclude the effect of applicable sales loads. If these charges were included, the returns would be lower. |
| (E) | The ratio of net expenses to average net assets excluding dividend expense on securities sold short is 2.30%, 2.30%, 2.41%, 2.40%, 2.46% and 2.26% for the period ended December 31, 2012 and years ended July 2012, 2011, 2010, 2009 and 2008, respectively. |
| (G) | The ratio of gross expenses to average net assets excluding dividend expense on securities sold short is 2.57%, 2.50%, 2.62%, 2.78%, 2.61% and 2.46% for the period ended December 31, 2012 and years ended July 2012, 2011, 2010, 2009 and 2008, respectively. |
See accompanying Notes to Financial Statements.
Financial Highlights (Continued)
Touchstone Dynamic Equity Fund—Class Y
Selected Data for a Share Outstanding Throughout Each Period
| | | Five Months | | | | | | | | | | | | | | | | |
| | | Ended | | | | | | | | | | | | | | | | |
| | | December 31, | | | Year Ended July 31, | |
| | | 2012(A) | | | 2012 | | | 2011 | | | 2010 | | | 2009 | | | 2008 | |
| Net asset value at beginning of period | | $ | 11.35 | | | $ | 10.40 | | | $ | 9.11 | | | $ | 8.75 | | | $ | 11.94 | | | $ | 14.54 | |
| Income (loss) from investment operations: | | | | | | | | | | | | | | | | | | | | | | | | |
| Net investment income (loss)(B) | | | 0.05 | | | | (0.04 | ) | | | 0.08 | | | | 0.07 | | | | 0.04 | | | | 0.09 | |
| Net realized and unrealized gains (losses) on | | | | | | | | | | | | | | | | | | | | | | | | |
| investments | | | (0.18 | ) | | | 1.09 | | | | 1.21 | | | | 0.29 | | | | (3.23 | ) | | | (1.82 | ) |
| Total from investment operations | | | (0.13 | ) | | | 1.05 | | | | 1.29 | | | | 0.36 | | | | (3.19 | ) | | | (1.73 | ) |
| Distributions from: | | | | | | | | | | | | | | | | | | | | | | | | |
| Net investment income | | | — | | | | (0.10 | ) | | | — | | | | — | | | | — | | | | (0.17 | ) |
| Realized capital gains | | | — | | | | — | | | | — | | | | — | | | | — | | | | (0.70 | ) |
| Total distributions | | | — | | | | (0.10 | ) | | | — | | | | — | | | | — | | | | (0.87 | ) |
| Net asset value at end of period | | $ | 11.22 | | | $ | 11.35 | | | $ | 10.40 | | | $ | 9.11 | | | $ | 8.75 | | | $ | 11.94 | |
| Total return | | | (1.15 | %)(C) | | | 10.14 | % | | | 14.16 | % | | | 4.11 | % | | | (26.72 | %) | | | (12.46 | %) |
| Ratios and supplemental data: | | | | | | | | | | | | | | | | | | | | | | | | |
| Net assets at end of period (000's) | | $ | 20,397 | | | $ | 24,054 | | | $ | 30,511 | | | $ | 22,347 | | | $ | 29,734 | | | $ | 58,107 | |
| Ratio to average net assets: | | | | | | | | | | | | | | | | | | | | | | | | |
| Net expenses (including dividend expense on securities sold short)(D) | | | 2.21 | %(E) | | | 2.56 | % | | | 1.59 | % | | | 1.52 | % | | | 1.81 | % | | | 1.64 | % |
| Gross expenses (including dividend expense on securities sold short)(F) | | | 2.31 | %(E) | | | 2.60 | % | | | 1.68 | % | | | 1.68 | % | | | 1.97 | % | | | 1.86 | % |
| Net investment income (loss) | | | 1.13 | %(E) | | | (0.38 | %) | | | 0.77 | % | | | 0.81 | % | | | 0.45 | % | | | 0.68 | % |
| Portfolio turnover rate | | | 105 | %(C) | | | 234 | % | | | 231 | % | | | 168 | % | | | 195 | % | | | 172 | % |
| (A) | The Fund changed its fiscal year end from July 31 to December 31. See Note 7 in Notes to Financial Statements. |
| (B) | Per share amounts for the year or period are calculated based on average outstanding shares. |
| (D) | The ratio of net expenses to average net assets excluding dividend expense on securities sold short is 1.30%, 1.30%, 1.42%, 1.40%, 1.46% and 1.25% for the period ended December 31, 2012 and years ended July 2012, 2011, 2010, 2009 and 2008, respectively. |
| (F) | The ratio of gross expenses to average net assets excluding dividend expense on securities sold short is 1.40%, 1.35%, 1.51%, 1.56%, 1.62% and 1.47% for the period ended December 31, 2012 and years ended July 2012, 2011, 2010, 2009 and 2008, respectively. |
See accompanying Notes to Financial Statements.
Financial Highlights (Continued)
Touchstone Dynamic Equity Fund—Institutional Class
Selected Data for a Share Outstanding Throughout Each Period
| | | Five Months | | | | | | | | | | | | | | | | |
| | | Ended | | | | | | | | | | | | | | | | |
| | | December 31, | | | Year Ended July 31, | |
| | | 2012(A) | | | 2012 | | | 2011 | | | 2010 | | | 2009 | | | 2008 | |
| Net asset value at beginning of period | | $ | 11.36 | | | $ | 10.40 | | | $ | 9.12 | | | $ | 8.76 | | | $ | 11.96 | | | $ | 14.54 | |
| Income (loss) from investment operations: | | | | | | | | | | | | | | | | | | | | | | | | |
| Net investment income (loss)(B) | | | 0.06 | | | | (0.04 | ) | | | 0.09 | | | | 0.11 | | | | 0.05 | | | | 0.09 | |
| Net realized and unrealized gains (losses) on investments | | | (0.19 | ) | | | 1.10 | | �� | | 1.19 | | | | 0.25 | | | | (3.25 | ) | | | (1.81 | ) |
| Total from investment operations | | | (0.13 | ) | | | 1.06 | | | | 1.28 | | | | 0.36 | | | | (3.20 | ) | | | (1.72 | ) |
| Distributions from: | | | | | | | | | | | | | | | | | | | | | | | | |
| Net investment income | | | — | | | | (0.10 | ) | | | — | | | | — | | | | — | | | | (0.16 | ) |
| Realized capital gains | | | — | | | | — | | | | — | | | | — | | | | — | | | | (0.70 | ) |
| Total distributions | | | — | | | | (0.10 | ) | | | — | | | | — | | | | — | | | | (0.86 | ) |
| Net asset value at end of period | | $ | 11.23 | | | $ | 11.36 | | | $ | 10.40 | | | $ | 9.12 | | | $ | 8.76 | | | $ | 11.96 | |
| Total return | | | (1.15 | %)(C) | | | 10.27 | % | | | 14.04 | % | | | 4.11 | % | | | (26.76 | %) | | | (12.33 | %) |
| Ratios and supplemental data: | | | | | | | | | | | | | | | | | | | | | | | | |
| Net assets at end of period (000's) | | $ | 20,085 | | | $ | 6,168 | | | $ | 2 | | | $ | 2 | | | $ | 12,547 | | | $ | 29,025 | |
| Ratio to average net assets: | | | | | | | | | | | | | | | | | | | | | | | | |
| Net expenses (including dividend expense on securities sold short)(D) | | | 2.16 | %(E) | | | 2.50 | % | | | 1.52 | % | | | 1.41 | % | | | 1.77 | % | | | 1.63 | % |
| Gross expenses (including dividend expense on securities sold short)(F) | | | 2.18 | %(E) | | | 2.95 | % | | | 816.82 | % | | | 2.84 | % | | | 1.87 | % | | | 1.89 | % |
| Net investment income (loss) | | | 1.18 | %(E) | | | (0.33 | %) | | | 0.92 | % | | | 1.31 | % | | | 0.55 | % | | | 0.70 | % |
| Portfolio turnover rate | | | 105 | %(C) | | | 234 | % | | | 231 | % | | | 168 | % | | | 195 | % | | | 172 | % |
| (A) | The Fund changed its fiscal year end from July 31 to December 31. See Note 7 in Notes to Financial Statements. |
| (B) | Per share amounts for the year or period are calculated based on average outstanding shares. |
| (D) | The ratio of net expenses to average net assets excluding dividend expense on securities sold short is 1.25%, 1.25%, 1.35%, 1.36%, 1.41% and 1.21% for the period ended December 31, 2012 and years ended July 2012, 2011, 2010, 2009 and 2008, respectively. |
| (F) | The ratio of gross expenses to average net assets excluding dividend expense on securities sold short is 1.27%, 1.70%, 816.65%, 2.79%, 1.51% and 1.47% for the period ended December 31, 2012 and years ended July 2012, 2011, 2010, 2009 and 2008, respectively. |
See accompanying Notes to Financial Statements.
Financial Highlights (Continued)
Touchstone Emerging Growth Fund—Class A
Selected Data for a Share Outstanding Throughout Each Period
| | | Five Months | | | | | | | | | | | | | | | | |
| | | Ended | | | | | | | | | | | | | | | | |
| | | December 31, | | | Year Ended July 31, | |
| | | 2012(A) | | | 2012 | | | 2011 | | | 2010 | | | 2009 | | | 2008 | |
| Net asset value at beginning of period | | $ | 11.36 | | | $ | 12.16 | | | $ | 8.60 | | | $ | 7.71 | | | $ | 10.10 | | | $ | 12.90 | |
| Income (loss) from investment operations: | | | | | | | | | | | | | | | | | | | | | | | | |
| Net investment income (loss)(B) | | | 0.02 | | | | (0.14 | ) | | | (0.16 | ) | | | (0.07 | ) | | | (0.10 | ) | | | (0.16 | ) |
| Net realized and unrealized gains (losses) on investments | | | 0.83 | | | | (0.66 | ) | | | 3.72 | | | | 0.96 | | | | (2.29 | )(C) | | | (1.71 | ) |
| Total from investment operations | | | 0.85 | | | | (0.80 | ) | | | 3.56 | | | | 0.89 | | | | (2.39 | ) | | | (1.87 | ) |
| Distributions from: | | | | | | | | | | | | | | | | | | | | | | | | |
| Realized capital gains | | | (0.98 | ) | | | — | | | | — | | | | — | | | | — | | | | (0.93 | ) |
| Net asset value at end of period | | $ | 11.23 | | | $ | 11.36 | | | $ | 12.16 | | | $ | 8.60 | | | $ | 7.71 | | | $ | 10.10 | |
| Total return(D) | | | 7.62 | %(E) | | | (6.58 | %) | | | 41.40 | % | | | 11.54 | % | | | (23.66 | %)(C) | | | (16.08 | %) |
| Ratios and supplemental data: | | | | | | | | | | | | | | | | | | | | | | | | |
| Net assets at end of period (000's) | | $ | 1,857 | | | $ | 2,032 | | | $ | 4,060 | | | $ | 3,079 | | | $ | 3,480 | | | $ | 11,213 | |
| Ratio to average net assets: | | | | | | | | | | | | | | | | | | | | | | | | |
| Net expenses | | | 1.39 | %(F) | | | 1.59 | % | | | 1.67 | % | | | 1.67 | % | | | 1.67 | % | | | 1.67 | % |
| Gross expenses | | | 2.69 | %(F) | | | 2.69 | % | | | 2.13 | % | | | 2.37 | % | | | 1.90 | % | | | 1.88 | % |
| Net investment income (loss) | | | 0.32 | %(F) | | | (1.31 | %) | | | (1.49 | %) | | | (0.87 | %) | | | (1.35 | %) | | | (1.33 | %) |
| Portfolio turnover rate | | | 51 | %(E) | | | 173 | % | | | 194 | % | | | 249 | % | | | 284 | % | | | 261 | % |
Touchstone Emerging Growth Fund—Class C
Selected Data for a Share Outstanding Throughout Each Period
| | |
Five Months | | | Period | |
| | | Ended | | | Ended | |
| | | December 31, | | | July 31, | |
| | | 2012(A) | | | 2012(G) | |
| Net asset value at beginning of period | | $ | 11.35 | | | $ | 11.85 | |
| Income (loss) from investment operations: | | | | | | | | |
| Net investment loss(B) | | | (0.02 | ) | | | (0.06 | ) |
| Net realized and unrealized gains (losses) on investments | | | 0.83 | | | | (0.44 | ) |
| Total from investment operations | | | 0.81 | | | | (0.50 | ) |
| Distributions from: | | | | | | | | |
| Realized capital gains | | | (0.98 | ) | | | — | |
| Net asset value at end of period | | $ | 11.18 | | | $ | 11.35 | |
| Total return(D) | | | 7.37 | %(E) | | | (4.30 | %)(E) |
| Ratios and supplemental data: | | | | | | | | |
| Net assets at end of period (000's) | | $ | 3 | | | $ | 2 | |
| Ratio to average net assets: | | | | | | | | |
| Net expenses | | | 2.13 | %(F) | | | 2.14 | %(F) |
| Gross expenses | | | 375.77 | %(F) | | | 324.29 | %(F) |
| Net investment loss | | | (0.43 | %)(F) | | | (1.86 | %)(F) |
| Portfolio turnover rate | | | 51 | %(E) | | | 173 | % |
| (A) | The Fund changed its fiscal year end from July 31 to December 31. See Note 7 in Notes to Financial Statements. |
| (B) | The net investment income per share is based on average shares outstanding for the period or year. |
| (C) | Impact of payment from affiliate was less then $0.01 per share and 0.01%, respectively. |
| (D) | Total returns shown exclude the effect of applicable sales loads. If these charges were included, the returns would be lower. |
| (G) | The Fund began issuing Class C shares on April 12, 2012. |
See accompanying Notes to Financial Statements.
Financial Highlights (Continued)
Touchstone Emerging Growth Fund—Class Y
Selected Data for a Share Outstanding Throughout Each Period
| | | Five Months | | | | | | | | | | | | | | | | |
| | | Ended | | | | | | | | | | | | | | | | |
| | | December 31, | | | Year Ended July 31, | |
| | | 2012(A) | | | 2012 | | | 2011 | | | 2010 | | | 2009 | | | 2008 | |
| Net asset value at beginning of period | | $ | 11.56 | | | $ | 12.34 | | | $ | 8.71 | | | $ | 7.79 | | | $ | 10.18 | | | $ | 12.97 | |
| Income (loss) from investment operations: | | | | | | | | | | | | | | | | | | | | | | | | |
| Net investment income (loss)(B) | | | 0.03 | | | | (0.12 | ) | | | (0.13 | ) | | | (0.05 | ) | | | (0.08 | ) | | | (0.13 | ) |
| Net realized and unrealized gains (losses) on investments | | | 0.85 | | | | (0.66 | ) | | | 3.76 | | | | 0.97 | | | | (2.31 | )(C) | | | (1.73 | ) |
| Total from investment operations | | | 0.88 | | | | (0.78 | ) | | | 3.63 | | | | 0.92 | | | | (2.39 | ) | | | (1.86 | ) |
| Distributions from: | | | | | | | | | | | | | | | | | | | | | | | | |
| Realized capital gains | | | (0.98 | ) | | | — | | | | — | | | | — | | | | — | | | | (0.93 | ) |
| Net asset value at end of period | | $ | 11.46 | | | $ | 11.56 | | | $ | 12.34 | | | $ | 8.71 | | | $ | 7.79 | | | $ | 10.18 | |
| Total return | | | 7.75 | %(D) | | | (6.32 | %) | | | 41.68 | % | | | 11.81 | % | | | (23.48 | %)(C) | | | (15.90 | %) |
| Ratios and supplemental data: | | | | | | | | | | | | | | | | | | | | | | | | |
| Net assets at end of period (000's) | | $ | 6,510 | | | $ | 6,936 | | | $ | 9,079 | | | $ | 13,498 | | | $ | 19,771 | | | $ | 15,510 | |
| Ratio to average net assets: | | | | | | | | | | | | | | | | | | | | | | | | |
| Net expenses | | | 1.14 | %(E) | | | 1.34 | % | | | 1.42 | % | | | 1.42 | % | | | 1.42 | % | | | 1.42 | % |
| Gross expenses | | | 2.08 | %(E) | | | 1.66 | % | | | 1.46 | % | | | 1.51 | % | | | 1.57 | % | | | 1.65 | % |
| Net investment income (loss) | | | 0.57 | %(E) | | | (1.06 | %) | | | (1.22 | %) | | | (0.54 | %) | | | (1.09 | %) | | | (1.11 | %) |
| Portfolio turnover rate | | | 51 | %(D) | | | 173 | % | | | 194 | % | | | 249 | % | | | 284 | % | | | 261 | % |
Touchstone Emerging Growth Fund—Institutional Class
Selected Data for a Share Outstanding Throughout Each Period
| | | Five Months | | | | | | | | | | | | | | | | |
| | | Ended | | | | | | | | | | | | | | | | |
| | | December 31, | | | Year Ended July 31, | |
| | | 2012(A) | | | 2012 | | | 2011 | | | 2010 | | | 2009 | | | 2008 | |
| Net asset value at beginning of period | | $ | 11.72 | | | $ | 12.50 | | | $ | 8.80 | | | $ | 7.86 | | | $ | 10.24 | | | $ | 13.01 | |
| Income (loss) from investment operations: | | | | | | | | | | | | | | | | | | | | | | | | |
| Net investment income (loss)(B) | | | 0.04 | | | | (0.10 | ) | | | (0.11 | ) | | | (0.05 | ) | | | (0.07 | ) | | | (0.11 | ) |
| Net realized and unrealized gains (losses) on investments | | | 0.86 | | | | (0.68 | ) | | | 3.81 | | | | 0.99 | | | | (2.31 | )(C) | | | (1.73 | ) |
| Total from investment operations | | | 0.90 | | | | (0.78 | ) | | | 3.70 | | | | 0.94 | | | | (2.38 | ) | | | (1.84 | ) |
| Distributions from: | | | | | | | | | | | | | | | | | | | | | | | | |
| Realized capital gains | | | (0.98 | ) | | | — | | | | — | | | | — | | | | — | | | | (0.93 | ) |
| Net asset value at end of period | | $ | 11.64 | | | $ | 11.72 | | | $ | 12.50 | | | $ | 8.80 | | | $ | 7.86 | | | $ | 10.24 | |
| Total return | | | 7.81 | %(D) | | | (6.24 | %) | | | 42.05 | % | | | 11.96 | % | | | (23.24 | %)(C) | | | (15.69 | %) |
| Ratios and supplemental data: | | | | | | | | | | | | | | | | | | | | | | | | |
| Net assets at end of period (000's) | | $ | 9,019 | | | $ | 16,650 | | | $ | 37,212 | | | $ | 46,986 | | | $ | 35,660 | | | $ | 34,651 | |
| Ratio to average net assets: | | | | | | | | | | | | | | | | | | | | | | | | |
| Net expenses | | | 0.99 | %(E) | | | 1.15 | % | | | 1.22 | % | | | 1.22 | % | | | 1.22 | % | | | 1.17 | % |
| Gross expenses | | | 1.53 | %(E) | | | 1.28 | % | | | 1.20 | % | | | 1.22 | % | | | 1.18 | % | | | 1.35 | % |
| Net investment income (loss) | | | 0.71 | %(E) | | | (0.87 | %) | | | (1.03 | %) | | | (0.51 | %) | | | (0.89 | %) | | | (0.85 | %) |
| Portfolio turnover rate | | | 51 | %(D) | | | 173 | % | | | 194 | % | | | 249 | % | | | 284 | % | | | 261 | % |
| (A) | The Fund changed its fiscal year end from July 31 to December 31. See Note 7 in Notes to Financial Statements. |
| (B) | The net investment income per share is based on average shares outstanding for the period or year. |
| (C) | Impact of payment from affiliate was less then $0.01 per share and 0.01%, respectively. |
See accompanying Notes to Financial Statements.
Financial Highlights (Continued)
Touchstone International Equity Fund—Class A
Selected Data for a Share Outstanding Throughout Each Period
| | | Five Months | | | | | | | | | | | | | | | | |
| | | Ended | | | | | | | | | | | | | | | | |
| | | December 31, | | | Year Ended July 31, | |
| | | 2012(A) | | | 2012 | | | 2011 | | | 2010 | | | 2009 | | | 2008 | |
| Net asset value at beginning of period | | $ | 8.04 | | | $ | 9.40 | | | $ | 8.00 | | | $ | 7.67 | | | $ | 11.12 | | | $ | 13.51 | |
| Income (loss) from investment operations: | | | | | | | | | | | | | | | | | | | | | | | | |
| Net investment income(B) | | | 0.03 | | | | 0.14 | | | | 0.12 | | | | 0.11 | | | | 0.12 | | | | 0.17 | |
| Net realized and unrealized gains (losses) on investments | | | 0.96 | | | | (1.23 | ) | | | 1.41 | | | | 0.34 | | | | (3.46 | )(C) | | | (2.45 | ) |
| Total from investment operations | | | 0.99 | | | | (1.09 | ) | | | 1.53 | | | | 0.45 | | | | (3.34 | ) | | | (2.28 | ) |
| Distributions from: | | | | | | | | | | | | | | | | | | | | | | | | |
| Net investment income | | | (0.19 | ) | | | (0.27 | ) | | | (0.13 | ) | | | (0.12 | ) | | | (0.11 | ) | | | (0.03 | ) |
| Realized capital gains | | | — | | | | — | | | | — | | | | — | | | | — | | | | (0.08 | ) |
| Total distributions | | | (0.19 | ) | | | (0.27 | ) | | | (0.13 | ) | | | (0.12 | ) | | | (0.11 | ) | | | (0.11 | ) |
| Net asset value at end of period | | $ | 8.84 | | | $ | 8.04 | | | $ | 9.40 | | | $ | 8.00 | | | $ | 7.67 | | | $ | 11.12 | |
| Total return(D) | | | 12.30 | %(E) | | | (11.40 | %) | | | 19.24 | % | | | 5.89 | % | | | (29.95 | %)(C) | | | (17.04 | %) |
| Ratios and supplemental data: | | | | | | | | | | | | | | | | | | | | | | | | |
| Net assets at end of period (000's) | | $ | 268 | | | $ | 233 | | | $ | 255 | | | $ | 363 | | | $ | 617 | | | $ | 1,875 | |
| Ratio to average net assets: | | | | | | | | | | | | | | | | | | | | | | | | |
| Net expenses | | | 1.39 | %(F) | | | 1.48 | % | | | 1.52 | % | | | 1.52 | % | | | 1.52 | % | | | 1.60 | % |
| Gross expenses | | | 10.54 | %(F) | | | 8.75 | % | | | 6.85 | % | | | 5.59 | % | | | 3.43 | % | | | 2.76 | % |
| Net investment income | | | 0.87 | %(F) | | | 1.70 | % | | | 1.33 | % | | | 1.30 | % | | | 1.62 | % | | | 1.34 | % |
| Portfolio turnover rate | | | 45 | %(E) | | | 55 | % | | | 40 | % | | | 92 | % | | | 152 | % | | | 181 | % |
Touchstone International Equity Fund—Class C
Selected Data for a Share Outstanding Throughout Each Period
| | |
Five Months | | | Period | |
| | | Ended | | | Ended | |
| | | December 31, | | | July 31, | |
| | | 2012(A) | | | 2012(G) | |
| Net asset value at beginning of period | | $ | 8.03 | | | $ | 8.20 | |
| Income (loss) from investment operations: | | | | | | | | |
| Net investment income(B) | | | — | (H) | | | 0.02 | |
| Net realized and unrealized gains (losses) on investments | | | 0.95 | | | | (0.19 | ) |
| Total from investment operations | | | 0.95 | | | | (0.17 | ) |
| Distributions from: | | | | | | | | |
| Net investment income | | | (0.17 | ) | | | — | |
| Net asset value at end of period | | $ | 8.81 | | | $ | 8.03 | |
| Total return(D) | | | 11.97 | %(E) | | | (2.07 | %)(E) |
| Ratios and supplemental data: | | | | | | | | |
| Net assets at end of period (000's) | | $ | 203 | | | $ | 2 | |
| Ratio to average net assets: | | | | | | | | |
| Net expenses | | | 2.14 | %(F) | | | 2.14 | %(F) |
| Gross expenses | | | 8.30 | %(F) | | | 342.38 | %(F) |
| Net investment income | | | 0.12 | %(F) | | | 1.02 | %(F) |
| Portfolio turnover rate | | | 45 | %(E) | | | 55 | % |
| (A) | The Fund changed its fiscal year end from July 31 to December 31. See Note 7 in Notes to Financial Statements. |
| (B) | The net investment income per share is based on average shares outstanding for the period or year. |
| (C) | Impact of payment from affiliate was less then $0.01 per share and 0.01%, respectively. |
| (D) | Total returns shown exclude the effect of applicable sales loads. If these charges were included, the returns would be lower. |
| (G) | The Fund began issuing Class C shares on April 12, 2012. |
| (H) | Less than $0.005 per share. |
See accompanying Notes to Financial Statements.
Financial Highlights (Continued)
Touchstone International Equity Fund—Class Y
Selected Data for a Share Outstanding Throughout Each Period
| | | Five Months | | | | | | | | | | | | | | | | |
| | | Ended | | | | | | | | | | | | | | | | |
| | | December 31, | | | Year Ended July 31, | |
| | | 2012(A) | | | 2012 | | | 2011 | | | 2010 | | | 2009 | | | 2008 | |
| Net asset value at beginning of period | | $ | 8.07 | | | $ | 9.44 | | | $ | 8.03 | | | $ | 7.70 | | | $ | 11.20 | | | $ | 13.57 | |
| Income (loss) from investment operations: | | | | | | | | | | | | | | | | | | | | | | | | |
| Net investment income(B) | | | 0.04 | | | | 0.16 | | | | 0.15 | | | | 0.13 | | | | 0.14 | | | | 0.22 | |
| Net realized and unrealized gains (losses) on investments | | | 0.96 | | | | (1.24 | ) | | | 1.41 | | | | 0.34 | | | | (3.49 | )(C) | | | (2.49 | ) |
| Total from investment operations | | | 1.00 | | | | (1.08 | ) | | | 1.56 | | | | 0.47 | | | | (3.35 | ) | | | (2.27 | ) |
| Distributions from: | | | | | | | | | | | | | | | | | | | | | | | | |
| Net investment income | | | (0.19 | ) | | | (0.29 | ) | | | (0.15 | ) | | | (0.14 | ) | | | (0.15 | ) | | | (0.02 | ) |
| Realized capital gains | | | — | | | | — | | | | — | | | | — | | | | — | | | | (0.08 | ) |
| Total distributions | | | (0.19 | ) | | | (0.29 | ) | | | (0.15 | ) | | | (0.14 | ) | | | (0.15 | ) | | | (0.10 | ) |
| Net asset value at end of period | | $ | 8.88 | | | $ | 8.07 | | | $ | 9.44 | | | $ | 8.03 | | | $ | 7.70 | | | $ | 11.20 | |
| Total return | | | 12.38 | %(D) | | | (11.10 | %) | | | 19.57 | % | | | 6.07 | % | | | (29.70 | %)(C) | | | (16.88 | %) |
| Ratios and supplemental data: | | | | | | | | | | | | | | | | | | | | | | | | |
| Net assets at end of period (000's) | | $ | 411 | | | $ | 424 | | | $ | 541 | | | $ | 528 | | | $ | 513 | | | $ | 1,269 | |
| Ratio to average net assets: | | | | | | | | | | | | | | | | | | | | | | | | |
| Net expenses | | | 1.14 | %(E) | | | 1.23 | % | | | 1.27 | % | | | 1.27 | % | | | 1.27 | % | | | 1.34 | % |
| Gross expenses | | | 8.97 | %(E) | | | 5.98 | % | | | 4.65 | % | | | 4.77 | % | | | 3.85 | % | | | 3.44 | % |
| Net investment income | | | 1.12 | %(E) | | | 1.95 | % | | | 1.64 | % | | | 1.64 | % | | | 1.94 | % | | | 1.74 | % |
| Portfolio turnover rate | | | 45 | %(D) | | | 55 | % | | | 40 | % | | | 92 | % | | | 152 | % | | | 181 | % |
Touchstone International Equity Fund — Institutional Class
Selected Data for a Share Outstanding Throughout Each Period
| | | Five Months | | | | | | | | | | | | | | | | |
| | | Ended | | | | | | | | | | | | | | | | |
| | | December 31, | | | Year Ended July 31, | |
| | | 2012(A) | | | 2012 | | | 2011 | | | 2010 | | | 2009 | | | 2008 | |
| Net asset value at beginning of period | | $ | 8.07 | | | $ | 9.46 | | | $ | 8.06 | | | $ | 7.73 | | | $ | 11.27 | | | $ | 13.61 | |
| Income (loss) from investment operations: | | | | | | | | | | | | | | | | | | | | | | | | |
| Net investment income(B) | | | 0.05 | | | | 0.18 | | | | 0.18 | | | | 0.15 | | | | 0.16 | | | | 0.25 | |
| Net realized and unrealized gains (losses) on investments | | | 0.95 | | | | (1.24 | ) | | | 1.40 | | | | 0.35 | | | | (3.52 | )(C) | | | (2.49 | ) |
| Total from investment operations | | | 1.00 | | | | (1.06 | ) | | | 1.58 | | | | 0.50 | | | | (3.36 | ) | | | (2.24 | ) |
| Distributions from: | | | | | | | | | | | | | | | | | | | | | | | | |
| Net investment income | | | (0.21 | ) | | | (0.33 | ) | | | (0.18 | ) | | | (0.17 | ) | | | (0.18 | ) | | | (0.02 | ) |
| Realized capital gains | | | — | | | | — | | | | — | | | | — | | | | — | | | | (0.08 | ) |
| Total distributions | | | (0.21 | ) | | | (0.33 | ) | | | (0.18 | ) | | | (0.17 | ) | | | (0.18 | ) | | | (0.10 | ) |
| Net asset value at end of period | | $ | 8.86 | | | $ | 8.07 | | | $ | 9.46 | | | $ | 8.06 | | | $ | 7.73 | | | $ | 11.27 | |
| Total return | | | 12.47 | %(D) | | | (10.96 | %) | | | 19.75 | % | | | 6.43 | % | | | (29.58 | %)(C) | | | (16.61 | %) |
| Ratios and supplemental data: | | | | | | | | | | | | | | | | | | | | | | | | |
| Net assets at end of period (000's) | | $ | 20,590 | | | $ | 17,503 | | | $ | 35,274 | | | $ | 48,246 | | | $ | 72,759 | | | $ | 113,297 | |
| Ratio to average net assets: | | | | | | | | | | | | | | | | | | | | | | | | |
| Net expenses | | | 0.99 | %(E) | | | 1.01 | % | | | 1.02 | % | | | 1.02 | % | | | 1.02 | % | | | 1.06 | % |
| Gross expenses | | | 1.94 | %(E) | | | 1.91 | % | | | 1.45 | % | | | 1.52 | % | | | 1.55 | % | | | 1.32 | % |
| Net investment income | | | 1.27 | %(E) | | | 2.17 | % | | | 2.02 | % | | | 1.80 | % | | | 2.15 | % | | | 1.96 | % |
| Portfolio turnover rate | | | 45 | %(D) | | | 55 | % | | | 40 | % | | | 92 | % | | | 152 | % | | | 181 | % |
| (A) | The Fund changed its fiscal year end from July 31 to December 31. See Note 7 in Notes to Financial Statements. |
| (B) | The net investment income per share is based on average shares outstanding for the period or year. |
| (C) | Impact of payment from affiliate was less then $0.01 per share and 0.01%, respectively. |
See accompanying Notes to Financial Statements.
Financial Highlights (Continued)
Touchstone Balanced Allocation Fund—Class A
Selected Data for a Share Outstanding Throughout Each Period
| | | Five Months | | | | | | | | | | | | | | | | |
| | | Ended | | | | | | | | | | | | | | | | |
| | | December 31, | | | Year Ended July 31, | |
| | | 2012(A) | | | 2012 | | | 2011 | | | 2010 | | | 2009 | | | 2008 | |
| Net asset value at beginning of period | | $ | 11.18 | | | $ | 11.03 | | | $ | 9.99 | | | $ | 9.28 | | | $ | 11.27 | | | $ | 12.68 | |
| Income (loss) from investment operations: | | | | | | | | | | | | | | | | | | | | | | | | |
| Net investment income(B) | | | 0.13 | | | | 0.17 | | | | 0.18 | | | | 0.22 | | | | 0.29 | | | | 0.21 | |
| Net realized and unrealized gains (losses) on investments | | | 0.35 | | | | 0.14 | | | | 1.13 | | | | 0.80 | | | | (1.46 | ) | | | (0.74 | )(C) |
| Total from investment operations | | | 0.48 | | | | 0.31 | | | | 1.31 | | | | 1.02 | | | | (1.17 | ) | | | (0.53 | ) |
| Distributions from: | | | | | | | | | | | | | | | | | | | | | | | | |
| Net investment income | | | (0.24 | ) | | | (0.16 | ) | | | (0.27 | ) | | | (0.31 | ) | | | (0.36 | ) | | | (0.26 | ) |
| Realized capital gains | | | (0.29 | ) | | | — | | | | — | | | | — | | | | (0.46 | ) | | | (0.62 | ) |
| Total distributions | | | (0.53 | ) | | | (0.16 | ) | | | (0.27 | ) | | | (0.31 | ) | | | (0.82 | ) | | | (0.88 | ) |
| Net asset value at end of period | | $ | 11.13 | | | $ | 11.18 | | | $ | 11.03 | | | $ | 9.99 | | | $ | 9.28 | | | $ | 11.27 | |
| Total return(D) | | | 4.37 | %(E) | | | 2.89 | % | | | 13.21 | % | | | 10.99 | % | | | (9.30 | %) | | | (4.59 | %)(C) |
| Ratios and supplemental data: | | | | | | | | | | | | | | | | | | | | | | | | |
| Net assets at end of period (000's) | | $ | 49,118 | | | $ | 9,839 | | | $ | 12,650 | | | $ | 21,312 | | | $ | 25,356 | | | $ | 44,959 | |
| Ratio to average net assets: | | | | | | | | | | | | | | | | | | | | | | | | |
| Net expenses(F) | | | 0.41 | %(G) | | | 0.64 | % | | | 0.64 | % | | | 0.64 | % | | | 0.65 | % | | | 0.94 | % |
| Gross expenses(F) | | | 0.83 | %(G) | | | 0.97 | % | | | 0.94 | % | | | 0.93 | % | | | 0.79 | % | | | 1.13 | % |
| Net investment income(F) | | | 2.75 | %(G) | | | 1.58 | % | | | 1.71 | % | | | 2.26 | % | | | 3.30 | % | | | 1.71 | % |
| Portfolio turnover rate | | | 74 | %(E)(H) | | | 76 | % | | | 6 | % | | | 33 | % | | | 30 | % | | | 52 | % |
| (A) | The Fund changed its fiscal year end from July 31 to December 31. See Note 7 in Notes to Financial Statements. |
| (B) | Per share amounts for the year or period are calculated based on average outstanding shares. |
| (C) | Impact of payment from affiliate was less then $0.01 per share and 0.01%, respectively. |
| (D) | Total returns shown exclude the effect of applicable sales loads. If these charges were included, the returns would be lower. |
| (F) | Ratio does not include income and expenses of the underlying funds. |
| (H) | Portfolio turnover excludes the purchase and sales of the Acquired Funds (see Note 7). If these transactions were included, portfolio turnover would have been higher. |
See accompanying Notes to Financial Statements.
Financial Highlights (Continued)
Touchstone Balanced Allocation Fund—Class C
Selected Data for a Share Outstanding Throughout Each Period
| | | Five Months | | | | | | | | | | | | | | | | |
| | | Ended | | | | | | | | | | | | | | | | |
| | | December 31, | | | Year Ended July 31, | |
| | | 2012(A) | | | 2012 | | | 2011 | | | 2010 | | | 2009 | | | 2008 | |
| Net asset value at beginning of period | | $ | 11.14 | | | $ | 11.01 | | | $ | 9.97 | | | $ | 9.26 | | | $ | 11.17 | | | $ | 12.64 | |
| Income (loss) from investment operations: | | | | | | | | | | | | | | | | | | | | | | | | |
| Net investment income(B) | | | 0.09 | | | | 0.09 | | | | 0.10 | | | | 0.15 | | | | 0.22 | | | | 0.11 | |
| Net realized and unrealized gains (losses) on investments | | | 0.35 | | | | 0.14 | | | | 1.13 | | | | 0.79 | | | | (1.44 | ) | | | (0.73 | )(C) |
| Total from investment operations | | | 0.44 | | | | 0.23 | | | | 1.23 | | | | 0.94 | | | | (1.22 | ) | | | (0.62 | ) |
| Distributions from: | | | | | | | | | | | | | | | | | | | | | | | | |
| Net investment income | | | (0.17 | ) | | | (0.10 | ) | | | (0.19 | ) | | | (0.23 | ) | | | (0.23 | ) | | | (0.23 | ) |
| Realized capital gains | | | (0.29 | ) | | | — | | | | — | | | | — | | | | (0.46 | ) | | | (0.62 | ) |
| Total distributions | | | (0.46 | ) | | | (0.10 | ) | | | (0.19 | ) | | | (0.23 | ) | | | (0.69 | ) | | | (0.85 | ) |
| Net asset value at end of period | | $ | 11.12 | | | $ | 11.14 | | | $ | 11.01 | | | $ | 9.97 | | | $ | 9.26 | | | $ | 11.17 | |
| Total return(D) | | | 4.03 | %(E) | | | 2.13 | % | | | 12.41 | % | | | 10.19 | % | | | (10.00 | %) | | | (5.34 | %)(C) |
| Ratios and supplemental data: | | | | | | | | | | | | | | | | | | | | | | | | |
| Net assets at end of period (000's) | | $ | 38,226 | | | $ | 38,388 | | | $ | 50,108 | | | $ | 59,480 | | | $ | 77,330 | | | $ | 120,085 | |
| Ratio to average net assets: | | | | | | | | | | | | | | | | | | | | | | | | |
| Net expenses(F) | | | 1.16 | %(G) | | | 1.39 | % | | | 1.39 | % | | | 1.39 | % | | | 1.40 | % | | | 1.67. | % |
| Gross expenses(F) | | | 1.60 | %(G) | | | 1.59 | % | | | 1.59 | % | | | 1.62 | % | | | 1.51 | % | | | 1.85 | % |
| Net investment income(F) | | | 2.00 | %(G) | | | 0.84 | % | | | 0.98 | % | | | 1.51 | % | | | 2.46 | % | | | 0.92 | % |
| Portfolio turnover rate | | | 74 | %(E)(H) | | | 76 | % | | | 6 | % | | | 33 | % | | | 30 | % | | | 52 | % |
| (A) | The Fund changed its fiscal year end from July 31 to December 31. See Note 7 in Notes to Financial Statements. |
| (B) | Per share amounts for the year or period are calculated based on average outstanding shares. |
| (C) | Impact of payment from affiliate was less then $0.01 per share and 0.01%, respectively. |
| (D) | Total returns shown exclude the effect of applicable sales loads. If these charges were included, the returns would be lower. |
| (F) | Ratio does not include income and expenses of the underlying funds. |
| (H) | Portfolio turnover excludes the purchase and sales of the Acquired Funds (see Note 7). If these transactions were included, portfolio turnover would have been higher. |
See accompanying Notes to Financial Statements.
Financial Highlights (Continued)
Touchstone Balanced Allocation Fund—Class Y
Selected Data for a Share Outstanding Throughout Each Period
| | | Five Months | | | | | | | | | | | | | | | | |
| | | Ended | | | | | | | | | | | | | | | | |
| | | December 31, | | | Year Ended July 31, | |
| | | 2012(A) | | | 2012 | | | 2011 | | | 2010 | | | 2009 | | | 2008 | |
| Net asset value at beginning of period | | $ | 11.21 | | | $ | 11.05 | | | $ | 10.01 | | | $ | 9.30 | | | $ | 11.31 | | | $ | 12.70 | |
| Income (loss) from investment operations: | | | | | | | | | | | | | | | | | | | | | | | | |
| Net investment income(B) | | | 0.14 | | | | 0.20 | | | | 0.23 | | | | 0.24 | | | | 0.31 | | | | 0.23 | |
| Net realized and unrealized gains (losses) on investments | | | 0.35 | | | | 0.14 | | | | 1.11 | | | | 0.80 | | | | (1.46 | ) | | | (0.74 | )(C) |
| Total from investment operations | | | 0.49 | | | | 0.34 | | | | 1.34 | | | | 1.04 | | | | (1.15 | ) | | | (0.51 | ) |
| Distributions from: | | | | | | | | | | | | | | | | | | | | | | | | |
| Net investment income | | | (0.26 | ) | | | (0.18 | ) | | | (0.30 | ) | | | (0.33 | ) | | | (0.40 | ) | | | (0.26 | ) |
| Realized capital gains | | | (0.29 | ) | | | — | | | | — | | | | — | | | | (0.46 | ) | | | (0.62 | ) |
| Total distributions | | | (0.55 | ) | | | (0.18 | ) | | | (0.30 | ) | | | (0.33 | ) | | | (0.86 | ) | | | (0.88 | ) |
| Net asset value at end of period | | $ | 11.15 | | | $ | 11.21 | | | $ | 11.05 | | | $ | 10.01 | | | $ | 9.30 | | | $ | 11.31 | |
| Total return | | | 4.45 | %(D) | | | 3.18 | % | | | 13.49 | % | | | 11.25 | % | | | (9.00 | %) | | | (4.40 | %)(C) |
| Ratios and supplemental data: | | | | | | | | | | | | | | | | | | | | | | | | |
| Net assets at end of period (000's) | | $ | 47,092 | | | $ | 1,287 | | | $ | 1,866 | | | $ | 929 | | | $ | 672 | | | $ | 732 | |
| Ratio to average net assets: | | | | | | | | | | | | | | | | | | | | | | | | |
| Net expenses(E) | | | 0.16 | %(F) | | | 0.39 | % | | | 0.39 | % | | | 0.39 | % | | | 0.40 | % | | | 0.65 | % |
| Gross expenses(E) | | | 0.52 | %(F) | | | 1.40 | % | | | 1.41 | % | | | 2.28 | % | | | 1.41 | % | | | 5.13 | % |
| Net investment income(E) | | | 3.00 | %(F) | | | 1.84 | % | | | 2.11 | % | | | 2.46 | % | | | 3.53 | % | | | 1.91 | % |
| Portfolio turnover rate | | | 74 | %(D)(G) | | | 76 | % | | | 6 | % | | | 33 | % | | | 30 | % | | | 52 | % |
| (A) | The Fund changed its fiscal year end from July 31 to December 31. See Note 7 in Notes to Financial Statements. |
| (B) | Per share amounts for the year or period are calculated based on average outstanding shares. |
| (C) | Impact of payment from affiliate was less then $0.01 per share and 0.01%, respectively. |
| (E) | Ratio does not include income and expenses of the underlying funds. |
| (G) | Portfolio turnover excludes the purchase and sales of the Acquired Funds (see Note 7). If these transactions were included, portfolio turnover would have been higher. |
See accompanying Notes to Financial Statements.
Financial Highlights (Continued)
Touchstone Balanced Allocation Fund—Institutional Class
Selected Data for a Share Outstanding Throughout Each Period
| | | Five Months | | | | | | | | | | | | | | | | |
| | | Ended | | | | | | | | | | | | | | | | |
| | | December 31, | | | Year Ended July 31, | |
| | | 2012(A) | | | 2012 | | | 2011 | | | 2010 | | | 2009 | | | 2008 | |
| Net asset value at beginning of period | | $ | 11.16 | | | $ | 11.00 | | | $ | 9.97 | | | $ | 9.26 | | | $ | 11.28 | | | $ | 12.71 | |
| Income (loss) from investment operations: | | | | | | | | | | | | | | | | | | | | | | | | |
| Net investment income(B) | | | 0.14 | | | | 0.20 | | | | 0.21 | | | | 0.35 | | | | 0.30 | | | | 0.27 | |
| Net realized and unrealized gains (losses) on investments | | | 0.35 | | | | 0.14 | | | | 1.12 | | | | 0.69 | | | | (1.46 | ) | | | (0.78 | )(C) |
| Total from investment operations | | | 0.49 | | | | 0.34 | | | | 1.33 | | | | 1.04 | | | | (1.16 | ) | | | (0.51 | ) |
| Distributions from: | | | | | | | | | | | | | | | | | | | | | | | | |
| Net investment income | | | (0.26 | ) | | | (0.18 | ) | | | (0.30 | ) | | | (0.33 | ) | | | (0.40 | ) | | | (0.30 | ) |
| Realized capital gains | | | (0.29 | ) | | | — | | | | — | | | | — | | | | (0.46 | ) | | | (0.62 | ) |
| Total distributions | | | (0.55 | ) | | | (0.18 | ) | | | (0.30 | ) | | | (0.33 | ) | | | (0.86 | ) | | | (0.92 | ) |
| Net asset value at end of period | | $ | 11.10 | | | $ | 11.16 | | | $ | 11.00 | | | $ | 9.97 | | | $ | 9.26 | | | $ | 11.28 | |
| Total return | | | 4.47 | %(D) | | | 3.19 | % | | | 13.44 | % | | | 11.29 | % | | | (9.13 | %) | | | (4.46 | %)(C) |
| Ratios and supplemental data: | | | | | | | | | | | | | | | | | | | | | | | | |
| Net assets at end of period (000's) | | $ | 31 | | | $ | 30 | | | $ | 31 | | | $ | 27 | | | $ | 2,011 | | | $ | 6,196 | |
| Ratio to average net assets: | | | | | | | | | | | | | | | | | | | | | | | | |
| Net expenses(E) | | | 0.16 | %(F) | | | 0.39 | % | | | 0.39 | % | | | 0.39 | % | | | 0.40 | % | | | 0.85 | % |
| Gross expenses(E) | | | 56.07 | %(F) | | | 28.86 | % | | | 46.94 | % | | | 2.29 | % | | | 0.58 | % | | | 1.41 | % |
| Net investment income(E) | | | 3.00 | %(F) | | | 1.85 | % | | | 1.97 | % | | | 3.55 | % | | | 3.35 | % | | | 2.24 | % |
| Portfolio turnover rate | | | 74 | %(D)(G) | | | 76 | % | | | 6 | % | | | 33 | % | | | 30 | % | | | 52 | % |
| (A) | The Fund changed its fiscal year end from July 31 to December 31. See Note 7 in Notes to Financial Statements. |
| (B) | Per share amounts for the year or period are calculated based on average outstanding shares. |
| (C) | Impact of payment from affiliate was less then $0.01 per share and 0.01%, respectively. |
| (E) | Ratio does not include income and expenses of the underlying funds. |
| (G) | Portfolio turnover excludes the purchase and sales of the Acquired Funds (see Note 7). If these transactions were included, portfolio turnover would have been higher. |
See accompanying Notes to Financial Statements.
Financial Highlights (Continued)
Touchstone Conservative Allocation Fund—Class A
Selected Data for a Share Outstanding Throughout Each Period
| | | Five Months | | | | | | | | | | | | | | | | |
| | | Ended | | | | | | | | | | | | | | | | |
| | | December 31, | | | Year Ended July 31, | |
| | | 2012(A) | | | 2012 | | | 2011 | | | 2010 | | | 2009 | | | 2008 | |
| Net asset value at beginning of period | | $ | 10.98 | | | $ | 10.87 | | | $ | 10.38 | | | $ | 9.84 | | | $ | 10.76 | | | $ | 11.30 | |
| Income (loss) from investment operations: | | | | | | | | | | | | | | | | | | | | | | | | |
| Net investment income(B) | | | 0.10 | | | | 0.21 | | | | 0.26 | | | | 0.34 | | | | 0.48 | | | | 0.29 | |
| Net realized and unrealized gains (losses) on investments | | | 0.17 | | | | 0.13 | | | | 0.64 | | | | 0.66 | | | | (0.61 | ) | | | (0.25 | ) |
| Total from investment operations | | | 0.27 | | | | 0.34 | | | | 0.90 | | | | 1.00 | | | | (0.13 | ) | | | 0.04 | |
| Distributions from: | | | | | | | | | | | | | | | | | | | | | | | | |
| Net investment income | | | (0.28 | ) | | | (0.23 | ) | | | (0.41 | ) | | | (0.46 | ) | | | (0.57 | ) | | | (0.31 | ) |
| Realized capital gains | | | (0.47 | ) | | | — | | | | — | | | | — | | | | (0.22 | ) | | | (0.27 | ) |
| Total distributions | | | (0.75 | ) | | | (0.23 | ) | | | (0.41 | ) | | | (0.46 | ) | | | (0.79 | ) | | | (0.58 | ) |
| Net asset value at end of period | | $ | 10.50 | | | $ | 10.98 | | | $ | 10.87 | | | $ | 10.38 | | | $ | 9.84 | | | $ | 10.76 | |
| Total return(C) | | | 2.47 | %(D) | | | 3.23 | % | | | 8.81 | % | | | 10.27 | % | | | (0.49 | %) | | | 0.24 | % |
| Ratios and supplemental data: | | | | | | | | | | | | | | | | | | | | | | | | |
| Net assets at end of period (000's) | | $ | 32,965 | | | $ | 8,466 | | | $ | 11,138 | | | $ | 12,141 | | | $ | 13,632 | | | $ | 15,858 | |
| Ratio to average net assets: | | | | | | | | | | | | | | | | | | | | | | | | |
| Net expenses(E) | | | 0.40 | %(F) | | | 0.61 | % | | | 0.61 | % | | | 0.61 | % | | | 0.65 | % | | | 0.93 | % |
| Gross expenses(E) | | | 0.85 | %(F) | | | 1.02 | % | | | 0.91 | % | | | 0.94 | % | | | 0.86 | % | | | 1.31 | % |
| Net investment income(E) | | | 2.28 | %(F) | | | 1.95 | % | | | 2.43 | % | | | 3.36 | % | | | 5.09 | % | | | 2.62 | % |
| Portfolio turnover rate | | | 79 | %(D)(G) | | | 89 | % | | | 13 | % | | | 33 | % | | | 40 | % | | | 49 | % |
| (A) | The Fund changed its fiscal year end from July 31 to December 31. See Note 7 in Notes to Financial Statements. |
| (B) | Per share amounts for the year or period are calculated based on average outstanding shares. |
| (C) | Total returns shown exclude the effect of applicable sales loads. If these charges were included, the returns would be lower. |
| (E) | Ratio does not include income and expenses of the underlying funds. |
| (G) | Portfolio turnover excludes the purchase and sales of the Acquired Funds (see Note 7). If these transactions were included, portfolio turnover would have been higher. |
See accompanying Notes to Financial Statements.
Financial Highlights (Continued)
Touchstone Conservative Allocation Fund—Class C
Selected Data for a Share Outstanding Throughout Each Period
| | | Five Months | | | | | | | | | | | | | | | | |
| | | Ended | | | | | | | | | | | | | | | | |
| | | December 31, | | | Year Ended July 31, | |
| | | 2012(A) | | | 2012 | | | 2011 | | | 2010 | | | 2009 | | | 2008 | |
| Net asset value at beginning of period | | $ | 10.92 | | | $ | 10.81 | | | $ | 10.33 | | | $ | 9.80 | | | $ | 10.66 | | | $ | 11.25 | |
| Income (loss) from investment operations: | | | | | | | | | | | | | | | | | | | | | | | | |
| Net investment income(B) | | | 0.07 | | | | 0.13 | | | | 0.18 | | | | 0.27 | | | | 0.39 | | | | 0.21 | |
| Net realized and unrealized gains (losses) on investments | | | 0.17 | | | | 0.13 | | | | 0.63 | | | | 0.64 | | | | (0.58 | ) | | | (0.25 | ) |
| Total from investment operations | | | 0.24 | | | | 0.26 | | | | 0.81 | | | | 0.91 | | | | (0.19 | ) | | | (0.04 | ) |
| Distributions from: | | | | | | | | | | | | | | | | | | | | | | | | |
| Net investment income | | | (0.24 | ) | | | (0.15 | ) | | | (0.33 | ) | | | (0.38 | ) | | | (0.45 | ) | | | (0.28 | ) |
| Realized capital gains | | | (0.47 | ) | | | — | | | | — | | | | — | | | | (0.22 | ) | | | (0.27 | ) |
| Total distributions | | | (0.71 | ) | | | (0.15 | ) | | | (0.33 | ) | | | (0.38 | ) | | | (0.67 | ) | | | (0.55 | ) |
| Net asset value at end of period | | $ | 10.45 | | | $ | 10.92 | | | $ | 10.81 | | | $ | 10.33 | | | $ | 9.80 | | | $ | 10.66 | |
| Total return(C) | | | 2.18 | %(D) | | | 2.50 | % | | | 7.93 | % | | | 9.37 | % | | | (1.20 | %) | | | (0.47 | %) |
| Ratios and supplemental data: | | | | | | | | | | | | | | | | | | | | | | | | |
| Net assets at end of period (000's) | | $ | 17,972 | | | $ | 17,104 | | | $ | 20,000 | | | $ | 23,985 | | | $ | 31,465 | | | $ | 34,242 | |
| Ratio to average net assets: | | | | | | | | | | | | | | | | | | | | | | | | |
| Net expenses(E) | | | 1.15 | %(F) | | | 1.36 | % | | | 1.36 | % | | | 1.36 | % | | | 1.41 | % | | | 1.67 | % |
| Gross expenses(E) | | | 1.67 | %(F) | | | 1.70 | % | | | 1.61 | % | | | 1.65 | % | | | 1.54 | % | | | 1.95 | % |
| Net investment income(E) | | | 1.53 | %(F) | | | 1.20 | % | | | 1.72 | % | | | 2.61 | % | | | 4.23 | % | | | 1.86 | % |
| Portfolio turnover rate | | | 79 | %(D)(G) | | | 89 | % | | | 13 | % | | | 33 | % | | | 40 | % | | | 49 | % |
| (A) | The Fund changed its fiscal year end from July 31 to December 31. See Note 7 in Notes to Financial Statements. |
| (B) | Per share amounts for the year or period are calculated based on average outstanding shares. |
| (C) | Total returns shown exclude the effect of applicable sales loads. If these charges were included, the returns would be lower. |
| (E) | Ratio does not include income and expenses of the underlying funds. |
| (G) | Portfolio turnover excludes the purchase and sales of the Acquired Funds (see Note 7). If these transactions were included, portfolio turnover would have been higher. |
See accompanying Notes to Financial Statements.
Financial Highlights (Continued)
Touchstone Conservative Allocation Fund—Class Y
Selected Data for a Share Outstanding Throughout Each Period
| | | Five Months | | | | | | | | | | | | | | | | |
| | | Ended | | | | | | | | | | | | | | | | |
| | | December 31, | | | Year Ended July 31, | |
| | | 2012(A) | | | 2012 | | | 2011 | | | 2010 | | | 2009 | | | 2008 | |
| Net asset value at beginning of period | | $ | 10.99 | | | $ | 10.87 | | | $ | 10.39 | | | $ | 9.85 | | | $ | 10.78 | | | $ | 11.30 | |
| Income (loss) from investment operations: | | | | | | | | | | | | | | | | | | | | | | | | |
| Net investment income(B) | | | 0.12 | | | | 0.24 | | | | 0.29 | | | | 0.35 | | | | 0.44 | | | | 0.32 | |
| Net realized and unrealized gains (losses) on investments | | | 0.16 | | | | 0.14 | | | | 0.62 | | | | 0.67 | | | | (0.54 | ) | | | (0.25 | ) |
| Total from investment operations | | | 0.28 | | | | 0.38 | | | | 0.91 | | | | 1.02 | | | | (0.10 | ) | | | 0.07 | |
| Distributions from: | | | | | | | | | | | | | | | | | | | | | | | | |
| Net investment income | | | (0.29 | ) | | | (0.26 | ) | | | (0.43 | ) | | | (0.48 | ) | | | (0.61 | ) | | | (0.32 | ) |
| Realized capital gains | | | (0.47 | ) | | | — | | | | — | | | | — | | | | (0.22 | ) | | | (0.27 | ) |
| Total distributions | | | (0.76 | ) | | | (0.26 | ) | | | (0.43 | ) | | | (0.48 | ) | | | (0.83 | ) | | | (0.59 | ) |
| Net asset value at end of period | | $ | 10.51 | | | $ | 10.99 | | | $ | 10.87 | | | $ | 10.39 | | | $ | 9.85 | | | $ | 10.78 | |
| Total return | | | 2.60 | %(C) | | | 3.60 | % | | | 8.97 | % | | | 10.54 | % | | | (0.17 | %) | | | 0.54 | % |
| Ratios and supplemental data: | | | | | | | | | | | | | | | | | | | | | | | | |
| Net assets at end of period (000's) | | $ | 33,329 | | | $ | 2,156 | | | $ | 1,370 | | | $ | 1,129 | | | $ | 234 | | | $ | 640 | |
| Ratio to average net assets: | | | | | | | | | | | | | | | | | | | | | | | | |
| Net expenses(D) | | | 0.15 | %(E) | | | 0.36 | % | | | 0.36 | % | | | 0.34 | % | | | 0.40 | % | | | 0.67 | % |
| Gross expenses(D) | | | 0.57 | %(E) | | | 1.38 | % | | | 1.65 | % | | | 1.65 | % | | | 7.77 | % | | | 4.34 | % |
| Net investment income(D) | | | 2.53 | %(E) | | | 2.20 | % | | | 2.72 | % | | | 3.40 | % | | | 4.56 | % | | | 2.86 | % |
| Portfolio turnover rate | | | 79 | %(C)(F) | | | 89 | % | | | 13 | % | | | 33 | % | | | 40 | % | | | 49 | % |
| (A) | The Fund changed its fiscal year end from July 31 to December 31. See Note 7 in Notes to Financial Statements. |
| (B) | Per share amounts for the year or period are calculated based on average outstanding shares. |
| (D) | Ratio does not include income and expenses of the underlying funds. |
| (F) | Portfolio turnover excludes the purchase and sales of the Acquired Funds (see Note 7). If these transactions were included, portfolio turnover would have been higher. |
See accompanying Notes to Financial Statements.
Financial Highlights (Continued)
Touchstone Conservative Allocation Fund—Institutional Class
Selected Data for a Share Outstanding Throughout Each Period
| | | Five Months | | | | | | | | | | | | | | | | |
| | | Ended | | | | | | | | | | | | | | | | |
| | | December 31, | | | Year Ended July 31, | |
| | | 2012(A) | | | 2012 | | | 2011 | | | 2010 | | | 2009 | | | 2008 | |
| Net asset value at beginning of period | | $ | 10.99 | | | $ | 10.89 | | | $ | 10.40 | | | $ | 9.86 | | | $ | 10.79 | | | $ | 11.32 | |
| Income (loss) from investment operations: | | | | | | | | | | | | | | | | | | | | | | | | |
| Net investment income(B) | | | 0.12 | | | | 0.24 | | | | 0.29 | | | | 0.37 | | | | 0.47 | | | | 0.32 | |
| Net realized and unrealized gains (losses) on investments | | | 0.16 | | | | 0.12 | | | | 0.63 | | | | 0.65 | | | | (0.58 | ) | | | (0.26 | ) |
| Total from investment operations | | | 0.28 | | | | 0.36 | | | | 0.92 | | | | 1.02 | | | | (0.11 | ) | | | 0.06 | |
| Distributions from: | | | | | | | | | | | | | | | | | | | | | | | | |
| Net investment income | | | (0.29 | ) | | | (0.26 | ) | | | (0.43 | ) | | | (0.48 | ) | | | (0.60 | ) | | | (0.32 | ) |
| Realized capital gains | | | (0.47 | ) | | | — | | | | — | | | | — | | | | (0.22 | ) | | | (0.27 | ) |
| Total distributions | | | (0.76 | ) | | | (0.26 | ) | | | (0.43 | ) | | | (0.48 | ) | | | (0.82 | ) | | | (0.59 | ) |
| Net asset value at end of period | | $ | 10.51 | | | $ | 10.99 | | | $ | 10.89 | | | $ | 10.40 | | | $ | 9.86 | | | $ | 10.79 | |
| Total return | | | 2.50 | %(C) | | | 3.52 | % | | | 9.06 | % | | | 10.52 | % | | | (0.19 | %) | | | 0.41 | % |
| Ratios and supplemental data: | | | | | | | | | | | | | | | | | | | | | | | | |
| Net assets at end of period (000's) | | $ | 1,198 | | | $ | 1,342 | | | $ | 6,459 | | | $ | 6,158 | | | $ | 6,017 | | | $ | 6,816 | |
| Ratio to average net assets: | | | | | | | | | | | | | | | | | | | | | | | | |
| Net expenses(D) | | | 0.15 | %(E) | | | 0.36 | % | | | 0.36 | % | | | 0.36 | % | | | 0.40 | % | | | 0.69 | % |
| Gross expenses(D) | | | 1.93 | %(E) | | | 0.66 | % | | | 0.63 | % | | | 0.56 | % | | | 1.43 | % | | | 1.05 | % |
| Net investment income(D) | | | 2.53 | %(E) | | | 2.20 | % | | | 2.70 | % | | | 3.62 | % | | | 4.85 | % | | | 2.87 | % |
| Portfolio turnover rate | | | 79 | %(C)(F) | | | 89 | % | | | 13 | % | | | 33 | % | | | 40 | % | | | 49 | % |
| (A) | The Fund changed its fiscal year end from July 31 to December 31. See Note 7 in Notes to Financial Statements. |
| (B) | Per share amounts for the year or period are calculated based on average outstanding shares. |
| (D) | Ratio does not include income and expenses of the underlying funds. |
| (F) | Portfolio turnover excludes the purchase and sales of the Acquired Funds (see Note 7). If these transactions were included, portfolio turnover would have been higher. |
See accompanying Notes to Financial Statements.
Financial Highlights (Continued)
Touchstone Growth Allocation Fund—Class A
Selected Data for a Share Outstanding Throughout Each Period
| | | Five Months | | | | | | | | | | | | | | | | |
| | | Ended | | | | | | | | | | | | | | | | |
| | | December 31, | | | Year Ended July 31, | |
| | | 2012(A) | | | 2012 | | | 2011 | | | 2010 | | | 2009 | | | 2008 | |
| Net asset value at beginning of period | | $ | 11.28 | | | $ | 11.40 | | | $ | 9.58 | | | $ | 8.66 | | | $ | 12.33 | | | $ | 14.82 | |
| Income (loss) from investment operations: | | | | | | | | | | | | | | | | | | | | | | | | |
| Net investment income(B) | | | 0.14 | | | | 0.13 | | | | 0.08 | | | | 0.12 | | | | 0.10 | | | | 0.07 | |
| Net realized and unrealized gains (losses) on investments | | | 0.67 | | | | (0.14 | ) | | | 1.80 | | | | 0.99 | | | | (3.12 | ) | | | (1.67 | )(C) |
| Total from investment operations | | | 0.81 | | | | (0.01 | ) | | | 1.88 | | | | 1.11 | | | | (3.02 | ) | | | (1.60 | ) |
| Distributions from: | | | | | | | | | | | | | | | | | | | | | | | | |
| Net investment income | | | (0.34 | ) | | | (0.11 | ) | | | (0.06 | ) | | | (0.19 | ) | | | — | | | | (0.20 | ) |
| Realized capital gains | | | — | | | | — | | | | — | | | | — | | | | (0.65 | ) | | | (0.69 | ) |
| Total distributions | | | (0.34 | ) | | | (0.11 | ) | | | (0.06 | ) | | | (0.19 | ) | | | (0.65 | ) | | | (0.89 | ) |
| Net asset value at end of period | | $ | 11.75 | | | $ | 11.28 | | | $ | 11.40 | | | $ | 9.58 | | | $ | 8.66 | | | $ | 12.33 | |
| Total return(D) | | | 7.29 | %(E) | | | (0.04 | %) | | | 19.65 | % | | | 12.78 | % | | | (23.55 | %) | | | (11.45 | %)(C) |
| Ratios and supplemental data: | | | | | | | | | | | | | | | | | | | | | | | | |
| Net assets at end of period (000's) | | $ | 31,432 | | | $ | 10,320 | | | $ | 13,619 | | | $ | 16,721 | | | $ | 20,556 | | | $ | 43,129 | |
| Ratio to average net assets: | | | | | | | | | | | | | | | | | | | | | | | | |
| Net expenses(F) | | | 0.39 | %(G) | | | 0.57 | % | | | 0.57 | % | | | 0.57 | % | | | 0.56 | % | | | 0.91 | % |
| Gross expenses(F) | | | 1.04 | %(G) | | | 1.21 | % | | | 1.13 | % | | | 1.18 | % | | | 1.03 | % | | | 1.26 | % |
| Net investment income(F) | | | 2.95 | %(G) | | | 1.17 | % | | | 0.77 | % | | | 1.26 | % | | | 1.14 | % | | | 0.48 | % |
| Portfolio turnover rate | | | 65 | %(E)(H) | | | 77 | % | | | 8 | % | | | 41 | % | | | 27 | % | | | 46 | % |
| (A) | The Fund changed its fiscal year end from July 31 to December 31. See Note 7 in Notes to Financial Statements. |
| (B) | The net investment income per share is based on average shares outstanding for the period or year. |
| (C) | Impact of payment from affiliate was less then $0.01 per share and 0.01%, respectively. |
| (D) | Total returns shown exclude the effect of applicable sales loads. If these charges were included, the returns would be lower. |
| (F) | Ratio does not include income and expenses of the underlying funds. |
| (H) | Portfolio turnover excludes the purchase and sales of the Acquired Funds (see Note 7). If these transactions were included, portfolio turnover would have been higher. |
See accompanying Notes to Financial Statements.
Financial Highlights (Continued)
Touchstone Growth Allocation Fund—Class C
Selected Data for a Share Outstanding Throughout Each Period
| | | Five Months | | | | | | | | | | | | | | | | |
| | | Ended | | | | | | | | | | | | | | | | |
| | | December 31, | | | Year Ended July 31, | |
| | | 2012(A) | | | 2012 | | | 2011 | | | 2010 | | | 2009 | | | 2008 | |
| Net asset value at beginning of period | | $ | 10.80 | | | $ | 10.90 | | | $ | 9.18 | | | $ | 8.30 | | | $ | 11.95 | | | $ | 14.53 | |
| Income (loss) from investment operations: | | | | | | | | | | | | | | | | | | | | | | | | |
| Net investment income (loss)(B) | | | 0.10 | | | | 0.04 | | | | — | (C) | | | 0.04 | | | | 0.03 | | | | (0.04 | ) |
| Net realized and unrealized gains (losses) on investments | | | 0.63 | | | | (0.12 | ) | | | 1.72 | | | | 0.96 | | | | (3.03 | ) | | | (1.61 | )(D) |
| Total from investment operations | | | 0.73 | | | | (0.08 | ) | | | 1.72 | | | | 1.00 | | | | (3.00 | ) | | | (1.65 | ) |
| Distributions from: | | | | | | | | | | | | | | | | | | | | | | | | |
| Net investment income | | | (0.21 | ) | | | (0.02 | ) | | | — | | | | (0.12 | ) | | | — | | | | (0.24 | ) |
| Realized capital gains | | | — | | | | — | | | | — | | | | — | | | | (0.65 | ) | | | (0.69 | ) |
| Total distributions | | | (0.21 | ) | | | (0.02 | ) | | | — | | | | (0.12 | ) | | | (0.65 | ) | | | (0.93 | ) |
| Net asset value at end of period | | $ | 11.32 | | | $ | 10.80 | | | $ | 10.90 | | | $ | 9.18 | | | $ | 8.30 | | | $ | 11.95 | |
| Total return(E) | | | 6.82 | %(F) | | | (0.75 | %) | | | 18.74 | % | | | 12.03 | % | | | (24.16 | %) | | | (12.08 | %)(D) |
| Ratios and supplemental data: | | | | | | | | | | | | | | | | | | | | | | | | |
| Net assets at end of period (000's) | | $ | 24,065 | | | $ | 23,968 | | | $ | 33,477 | | | $ | 36,655 | | | $ | 48,126 | | | $ | 83,127 | |
| Ratio to average net assets: | | | | | | | | | | | | | | | | | | | | | | | | |
| Net expenses(G) | | | 1.14 | %(H) | | | 1.32 | % | | | 1.32 | % | | | 1.32 | % | | | 1.31 | % | | | 1.66 | % |
| Gross expenses(G) | | | 1.81 | %(H) | | | 1.87 | % | | | 1.75 | % | | | 1.84 | % | | | 1.75 | % | | | 2.01 | % |
| Net investment income (loss)(G) | | | 2.20 | %(H) | | | 0.42 | % | | | 0.02 | % | | | 0.47 | % | | | 0.42 | % | | | (0.29 | %) |
| Portfolio turnover rate | | | 65 | %(F)(I) | | | 77 | % | | | 8 | % | | | 41 | % | | | 27 | % | | | 46 | % |
| (A) | The Fund changed its fiscal year end from July 31 to December 31. See Note 7 in Notes to Financial Statements. |
| (B) | The net investment income per share is based on average shares outstanding for the period or year. |
| (C) | Less than $0.005 per share. |
| (D) | Impact of payment from affiliate was less then $0.01 per share and 0.01%, respectively. |
| (E) | Total returns shown exclude the effect of applicable sales loads. If these charges were included, the returns would be lower. |
| (G) | Ratio does not include income and expenses of the underlying funds. |
| (I) | Portfolio turnover excludes the purchase and sales of the Acquired Funds (see Note 7). If these transactions were included, portfolio turnover would have been higher. |
See accompanying Notes to Financial Statements.
Financial Highlights (Continued)
Touchstone Growth Allocation Fund—Class Y
Selected Data for a Share Outstanding Throughout Each Period
| | | Five Months | | | | | | | | | | | | | | | | |
| | | Ended | | | | | | | | | | | | | | | | |
| | | December 31, | | | Year Ended July 31, | |
| | | 2012(A) | | | 2012 | | | 2011 | | | 2010 | | | 2009 | | | 2008 | |
| Net asset value at beginning of period | | $ | 11.43 | | | $ | 11.57 | | | $ | 9.72 | | | $ | 8.77 | | | $ | 12.45 | | | $ | 14.91 | |
| Income (loss) from investment operations: | | | | | | | | | | | | | | | | | | | | | | | | |
| Net investment income(B) | | | 0.16 | | | | 0.15 | | | | 0.12 | | | | 0.05 | | | | 0.12 | | | | 0.09 | |
| Net realized and unrealized gains (losses) on investments | | | 0.67 | | | | (0.14 | ) | | | 1.81 | | | | 1.11 | | | | (3.15 | ) | | | (1.67 | )(C) |
| Total from investment operations | | | 0.83 | | | | 0.01 | | | | 1.93 | | | | 1.16 | | | | (3.03 | ) | | | (1.58 | ) |
| Distributions from: | | | | | | | | | | | | | | | | | | | | | | | | |
| Net investment income | | | (0.40 | ) | | | (0.15 | ) | | | (0.08 | ) | | | (0.21 | ) | | | — | | | | (0.19 | ) |
| Realized capital gains | | | — | | | | — | | | | — | | | | — | | | | (0.65 | ) | | | (0.69 | ) |
| Total distributions | | | (0.40 | ) | | | (0.15 | ) | | | (0.08 | ) | | | (0.21 | ) | | | (0.65 | ) | | | (0.88 | ) |
| Net asset value at end of period | | $ | 11.86 | | | $ | 11.43 | | | $ | 11.57 | | | $ | 9.72 | | | $ | 8.77 | | | $ | 12.45 | |
| Total return | | | 7.35 | %(D) | | | 0.22 | % | | | 19.94 | % | | | 13.22 | % | | | (23.40 | %) | | | (11.25 | %)(C) |
| Ratios and supplemental data: | | | | | | | | | | | | | | | | | | | | | | | | |
| Net assets at end of period (000's) | | $ | 27,873 | | | $ | 881 | | | $ | 3,561 | | | $ | 2,322 | | | $ | 667 | | | $ | 750 | |
| Ratio to average net assets: | | | | | | | | | | | | | | | | | | | | | | | | |
| Net expenses(E) | | | 0.14 | %(F) | | | 0.32 | % | | | 0.32 | % | | | 0.32 | % | | | 0.32 | % | | | 0.61 | % |
| Gross expenses(E) | | | 0.65 | %(F) | | | 1.62 | % | | | 1.13 | % | | | 1.33 | % | | | 3.50 | % | | | 5.47 | % |
| Net investment income(E) | | | 3.20 | %(F) | | | 1.42 | % | | | 1.11 | % | | | 0.56 | % | | | 1.46 | % | | | 0.68 | % |
| Portfolio turnover rate | | | 65 | %(D)(G) | | | 77 | % | | | 8 | % | | | 41 | % | | | 27 | % | | | 46 | % |
| (A) | The Fund changed its fiscal year end from July 31 to December 31. See Note 7 in Notes to Financial Statements. |
| (B) | The net investment income per share is based on average shares outstanding for the period or year. |
| (C) | Impact of payment from affiliate was less then $0.01 per share and 0.01%, respectively. |
| (E) | Ratio does not include income and expenses of the underlying funds. |
| (G) | Portfolio turnover excludes the purchase and sales of the Acquired Funds (see Note 7). If these transactions were included, portfolio turnover would have been higher. |
See accompanying Notes to Financial Statements.
Financial Highlights (Continued)
Touchstone Growth Allocation Fund—Institutional Class
Selected Data for a Share Outstanding Throughout Each Period
| | | Five Months | | | | | | | | | | | | | | | | |
| | | Ended | | | | | | | | | | | | | | | | |
| | | December 31, | | | Year Ended July 31, | |
| | | 2012(A) | | | 2012 | | | 2011 | | | 2010 | | | 2009 | | | 2008 | |
| Net asset value at beginning of period | | $ | 10.58 | | | $ | 11.56 | | | $ | 9.71 | | | $ | 8.77 | | | $ | 12.44 | | | $ | 14.91 | |
| Income (loss) from investment operations: | | | | | | | | | | | | | | | | | | | | | | | | |
| Net investment income(B) | | | 0.14 | | | | 0.15 | | | | 0.11 | | | | 0.32 | | | | 0.12 | | | | 0.09 | |
| Net realized and unrealized gains (losses) on investments | | | 0.61 | | | | (0.25 | ) | | | 1.83 | | | | 0.83 | | | | (3.14 | ) | | | (1.68 | )(C) |
| Total from investment operations | | | 0.75 | | | | (0.10 | ) | | | 1.94 | | | | 1.15 | | | | (3.02 | ) | | | (1.59 | ) |
| Distributions from: | | | | | | | | | | | | | | | | | | | | | | | | |
| Net investment income | | | (0.51 | ) | | | (0.88 | ) | | | (0.09 | ) | | | (0.21 | ) | | | — | | | | (0.19 | ) |
| Realized capital gains | | | — | | | | — | | | | — | | | | — | | | | (0.65 | ) | | | (0.69 | ) |
| Total distributions | | | (0.51 | ) | | | (0.88 | ) | | | (0.09 | ) | | | (0.21 | ) | | | (0.65 | ) | | | (0.88 | ) |
| Net asset value at end of period | | $ | 10.82 | | | $ | 10.58 | | | $ | 11.56 | | | $ | 9.71 | | | $ | 8.77 | | | $ | 12.44 | |
| Total return | | | 7.30 | %(D) | | | (0.26 | %) | | | 20.01 | % | | | 13.10 | % | | | (23.34 | %) | | | (11.32 | %)(C) |
| Ratios and supplemental data: | | | | | | | | | | | | | | | | | | | | | | | | |
| Net assets at end of period (000's) | | $ | 29 | | | $ | 13 | | | $ | 788 | | | $ | 674 | | | $ | 17,845 | | | $ | 24,509 | |
| Ratio to average net assets: | | | | | | | | | | | | | | | | | | | | | | | | |
| Net expenses(E) | | | 0.14 | %(F) | | | 0.32 | % | | | 0.32 | % | | | 0.32 | % | | | 0.31 | % | | | 0.64 | % |
| Gross expenses(E) | | | 94.73 | %(F) | | | 7.68 | % | | | 2.29 | % | | | 0.67 | % | | | 0.50 | % | | | 0.84 | % |
| Net investment income(E) | | | 3.20 | %(F) | | | 1.42 | % | | | 0.96 | % | | | 3.37 | % | | | 1.39 | % | | | 0.67 | % |
| Portfolio turnover rate | | | 65 | %(D)(G) | | | 77 | % | | | 8 | % | | | 41 | % | | | 27 | % | | | 46 | % |
| (A) | The Fund changed its fiscal year end from July 31 to December 31. See Note 7 in Notes to Financial Statements. |
| (B) | The net investment income per share is based on average shares outstanding for the period or year. |
| (C) | Impact of payment from affiliate was less then $0.01 per share and 0.01%, respectively. |
| (E) | Ratio does not include income and expenses of the underlying funds. |
| (G) | Portfolio turnover excludes the purchase and sales of the Acquired Funds (see Note 7). If these transactions were included, portfolio turnover would have been higher. |
See accompanying Notes to Financial Statements.
Financial Highlights (Continued)
Touchstone Moderate Growth Allocation Fund—Class A
Selected Data for a Share Outstanding Throughout Each Period
| | | Five Months | | | | | | | | | | | | | | | | |
| | | Ended | | | | | | | | | | | | | | | | |
| | | December 31, | | | Year Ended July 31, | |
| | | 2012(A) | | | 2012 | | | 2011 | | | 2010 | | | 2009 | | | 2008 | |
| Net asset value at beginning of period | | $ | 11.13 | | | $ | 11.11 | | | $ | 9.66 | | | $ | 8.87 | | | $ | 11.91 | | | $ | 13.76 | |
| Income (loss) from investment operations: | | | | | | | | | | | | | | | | | | | | | | | | |
| Net investment income(B) | | | 0.14 | | | | 0.15 | | | | 0.12 | | | | 0.15 | | | | 0.17 | | | | 0.10 | |
| Net realized and unrealized gains (losses) on investments | | | 0.51 | | | | 0.02 | (C) | | | 1.47 | | | | 0.87 | | | | (2.37 | ) | | | (1.11 | )(D) |
| Total from investment operations | | | 0.65 | | | | 0.17 | | | | 1.59 | | | | 1.02 | | | | (2.20 | ) | | | (1.01 | ) |
| Distributions from: | | | | | | | | | | | | | | | | | | | | | | | | |
| Net investment income | | | (0.30 | ) | | | (0.15 | ) | | | (0.14 | ) | | | (0.23 | ) | | | (0.16 | ) | | | (0.15 | ) |
| Realized capital gains | | | (0.18 | ) | | | — | | | | — | | | | — | | | | (0.68 | ) | | | (0.69 | ) |
| Total distributions | | | (0.48 | ) | | | (0.15 | ) | | | (0.14 | ) | | | (0.23 | ) | | | (0.84 | ) | | | (0.84 | ) |
| Net asset value at end of period | | $ | 11.30 | | | $ | 11.13 | | | $ | 11.11 | | | $ | 9.66 | | | $ | 8.87 | | | $ | 11.91 | |
| Total return(E) | | | 5.96 | %(F) | | | 1.65 | % | | | 16.56 | % | | | 11.52 | %(D) | | | (17.27 | %) | | | (7.86 | %)(D) |
| Ratios and supplemental data: | | | | | | | | | | | | | | | | | | | | | | | | |
| Net assets at end of period (000's) | | $ | 71,235 | | | $ | 15,181 | | | $ | 18,848 | | | $ | 22,740 | | | $ | 25,782 | | | $ | 52,854 | |
| Ratio to average net assets: | | | | | | | | | | | | | | | | | | | | | | | | |
| Net expenses(G) | | | 0.39 | %(H) | | | 0.57 | % | | | 0.57 | % | | | 0.57 | % | | | 0.57 | % | | | 0.89 | % |
| Gross expenses(G) | | | 0.90 | %(H) | | | 1.03 | % | | | 1.01 | % | | | 1.08 | % | | | 0.99 | % | | | 1.26 | % |
| Net investment income(G) | | | 2.90 | %(H) | | | 1.38 | % | | | 1.17 | % | | | 1.53 | % | | | 2.00 | % | | | 0.74 | % |
| Portfolio turnover rate | | | 73 | %(F)(I) | | | 77 | % | | | 9 | % | | | 38 | % | | | 32 | % | | | 43 | % |
| (A) | The Fund changed its fiscal year end from July 31 to December 31. See Note 7 in Notes to Financial Statements. |
| (B) | The net investment income per share is based on average shares outstanding for the period or year. |
| (C) | The amounts shown for a share outstanding throughout the period does not accord with the change in net realized and unrealized gains (losses) on investments for the period due to the timing of purchases and sales of fund shares in relation to fluctuating market values during the period. |
| (D) | Impact of payment from affiliate was less then $0.01 per share and 0.01%, respectively. |
| (E) | Total returns shown exclude the effect of applicable sales loads. If these charges were included, the returns would be lower. |
| (G) | Ratio does not include income and expenses of the underlying funds. |
| (I) | Portfolio turnover excludes the purchase and sales of the Acquired Funds (see Note 7). If these transactions were included, portfolio turnover would have been higher. |
See accompanying Notes to Financial Statements.
Financial Highlights (Continued)
Touchstone Moderate Growth Allocation Fund—Class C
Selected Data for a Share Outstanding Throughout Each Period
| | | Five Months | | | | | | | | | | | | | | | | |
| | | Ended | | | | | | | | | | | | | | | | |
| | | December 31, | | | Year Ended July 31, | |
| | | 2012(A) | | | 2012 | | | 2011 | | | 2010 | | | 2009 | | | 2008 | |
| Net asset value at beginning of period | | $ | 10.89 | | | $ | 10.86 | | | $ | 9.44 | | | $ | 8.67 | | | $ | 11.63 | | | $ | 13.59 | |
| Income (loss) from investment operations: | | | | | | | | | | | | | | | | | | | | | | | | |
| Net investment income(B) | | | 0.10 | | | | 0.07 | | | | 0.05 | | | | 0.07 | | | | 0.11 | | | | — | (C) |
| Net realized and unrealized gains (losses) on investments | | | 0.50 | | | | 0.02 | (D) | | | 1.43 | | | | 0.86 | | | | (2.31 | ) | | | (1.08 | )(E) |
| Total from investment operations | | | 0.60 | | | | 0.09 | | | | 1.48 | | | | 0.93 | | | | (2.20 | ) | | | (1.08 | ) |
| Distributions from: | | | | | | | | | | | | | | | | | | | | | | | | |
| Net investment income | | | (0.18 | ) | | | (0.06 | ) | | | (0.06 | ) | | | (0.16 | ) | | | (0.08 | ) | | | (0.19 | ) |
| Realized capital gains | | | (0.18 | ) | | | — | | | | — | | | | — | | | | (0.68 | ) | | | (0.69 | ) |
| Total distributions | | | (0.36 | ) | | | (0.06 | ) | | | (0.06 | ) | | | (0.16 | ) | | | (0.76 | ) | | | (0.88 | ) |
| Net asset value at end of period | | $ | 11.13 | | | $ | 10.89 | | | $ | 10.86 | | | $ | 9.44 | | | $ | 8.67 | | | $ | 11.63 | |
| Total return(F) | | | 5.52 | %(G) | | | 0.89 | % | | | 15.70 | % | | | 10.71 | % | | | (17.90 | %) | | | (8.55 | %)(E) |
| Ratios and supplemental data: | | | | | | | | | | | | | | | | | | | | | | | | |
| Net assets at end of period (000's) | | $ | 48,985 | | | $ | 47,508 | | | $ | 61,074 | | | $ | 70,934 | | | $ | 92,373 | | | $ | 154,281 | |
| Ratio to average net assets: | | | | | | | | | | | | | | | | | | | | | | | | |
| Net expenses(H) | | | 1.14 | %(I) | | | 1.32 | % | | | 1.32 | % | | | 1.32 | % | | | 1.32 | % | | | 1.63 | % |
| Gross expenses(H) | | | 1.68 | %(I) | | | 1.74 | % | | | 1.69 | % | | | 1.74 | % | | | 1.69 | % | | | 1.88 | % |
| Net investment income (loss)(H) | | | 2.15 | %(I) | | | 0.63 | % | | | 0.46 | % | | | 0.78 | % | | | 1.33 | % | | | (0.02 | %) |
| Portfolio turnover rate | | | 73 | %(G)(J) | | | 77 | % | | | 9 | % | | | 38 | % | | | 32 | % | | | 43 | % |
| (A) | The Fund changed its fiscal year end from July 31 to December 31. See Note 7 in Notes to Financial Statements. |
| (B) | The net investment income per share is based on average shares outstanding for the period or year. |
| (C) | Less than $0.005 per share. |
| (D) | The amounts shown for a share outstanding throughout the period does not accord with the change in net realized and unrealized gains (losses) on investments for the period due to the timing of purchases and sales of fund shares in relation to fluctuating market values during the period. |
| (E) | Impact of payment from affiliate was less then $0.01 per share and 0.01%, respectively. |
| (F) | Total returns shown exclude the effect of applicable sales loads. If these charges were included, the returns would be lower. |
| (H) | Ratio does not include income and expenses of the underlying funds. |
| (J) | Portfolio turnover excludes the purchase and sales of the Acquired Funds (see Note 7). If these transactions were included, portfolio turnover would have been higher. |
See accompanying Notes to Financial Statements.
Financial Highlights (Continued)
Touchstone Moderate Growth Allocation Fund—Class Y
Selected Data for a Share Outstanding Throughout Each Period
| | | Five Months | | | | | | | | | | | | | | | | |
| | | Ended | | | | | | | | | | | | | | | | |
| | | December 31, | | | Year Ended July 31, | |
| | | 2012(A) | | | 2012 | | | 2011 | | | 2010 | | | 2009 | | | 2008 | |
| Net asset value at beginning of period | | $ | 11.24 | | | $ | 11.23 | | | $ | 9.75 | | | $ | 8.95 | | | $ | 12.02 | | | $ | 13.84 | |
| Income (loss) from investment operations: | | | | | | | | | | | | | | | | | | | | | | | | |
| Net investment income(B) | | | 0.15 | | | | 0.18 | | | | 0.18 | | | | 0.17 | | | | 0.20 | | | | 0.13 | |
| Net realized and unrealized gains (losses) on investments | | | 0.52 | | | | 0.01 | (C) | | | 1.46 | | | | 0.88 | | | | (2.40 | ) | | | (1.11 | )(D) |
| Total from investment operations | | | 0.67 | | | | 0.19 | | | | 1.64 | | | | 1.05 | | | | (2.20 | ) | | | (0.98 | ) |
| Distributions from: | | | | | | | | | | | | | | | | | | | | | | | | |
| Net investment income | | | (0.35 | ) | | | (0.18 | ) | | | (0.16 | ) | | | (0.25 | ) | | | (0.19 | ) | | | (0.15 | ) |
| Realized capital gains | | | (0.18 | ) | | | — | | | | — | | | | — | | | | (0.68 | ) | | | (0.69 | ) |
| Total distributions | | | (0.53 | ) | | | (0.18 | ) | | | (0.16 | ) | | | (0.25 | ) | | | (0.87 | ) | | | (0.84 | ) |
| Net asset value at end of period | | $ | 11.38 | | | $ | 11.24 | | | $ | 11.23 | | | $ | 9.75 | | | $ | 8.95 | | | $ | 12.02 | |
| Total return | | | 6.04 | %(E) | | | 1.84 | % | | | 16.93 | % | | | 11.77 | %(D) | | | (17.07 | %) | | | (7.64 | %)(D) |
| Ratios and supplemental data: | | | | | | | | | | | | | | | | | | | | | | | | |
| Net assets at end of period (000's) | | $ | 43,585 | | | $ | 763 | | | $ | 1,289 | | | $ | 635 | | | $ | 508 | | | $ | 600 | |
| Ratio to average net assets: | | | | | | | | | | | | | | | | | | | | | | | | |
| Net expenses(F) | | | 0.14 | %(G) | | | 0.32 | % | | | 0.32 | % | | | 0.32 | % | | | 0.32 | % | | | 0.61 | % |
| Gross expenses(F) | | | 0.54 | %(G) | | | 1.89 | % | | | 1.65 | % | | | 2.59 | % | | | 2.64 | % | | | 4.40 | % |
| Net investment income(F) | | | 3.15 | %(G) | | | 1.63 | % | | | 1.63 | % | | | 1.72 | % | | | 2.34 | % | | | 0.97 | % |
| Portfolio turnover rate | | | 73 | %(E)(H) | | | 77 | % | | | 9 | % | | | 38 | % | | | 32 | % | | | 43 | % |
| (A) | The Fund changed its fiscal year end from July 31 to December 31. See Note 7 in Notes to Financial Statements. |
| (B) | The net investment income per share is based on average shares outstanding for the period or year. |
| (C) | The amounts shown for a share outstanding throughout the period does not accord with the change in net realized and unrealized gains (losses) on investments for the period due to the timing of purchases and sales of fund shares in relation to fluctuating market values during the period. |
| (D) | Impact of payment from affiliate was less then $0.01 per share and 0.01%, respectively. |
| (F) | Ratio does not include income and expenses of the underlying funds. |
| (H) | Portfolio turnover excludes the purchase and sales of the Acquired Funds (see Note 7). If these transactions were included, portfolio turnover would have been higher. |
See accompanying Notes to Financial Statements.
Financial Highlights (Continued)
Touchstone Moderate Growth Allocation Fund—Institutional Class
Selected Data for a Share Outstanding Throughout Each Period
| | | Five Months | | | | | | | | | | | | | | | | |
| | | Ended | | | | | | | | | | | | | | | | |
| | | December 31, | | | Year Ended July 31, | |
| | | 2012(A) | | | 2012 | | | 2011 | | | 2010 | | | 2009 | | | 2008 | |
| Net asset value at beginning of period | | $ | 11.18 | | | $ | 11.16 | | | $ | 9.75 | | | $ | 8.95 | | | $ | 12.01 | | | $ | 13.82 | |
| Income (loss) from investment operations: | | | | | | | | | | | | | | | | | | | | | | | | |
| Net investment income(B) | | | 0.15 | | | | 0.18 | | | | 0.15 | | | | 0.28 | | | | 0.19 | | | | 0.13 | |
| Net realized and unrealized gains (losses) on investments | | | 0.52 | | | | 0.02 | (C) | | | 1.48 | | | | 0.78 | | | | (2.38 | ) | | | (1.11 | )(D) |
| Total from investment operations | | | 0.67 | | | | 0.20 | | | | 1.63 | | | | 1.06 | | | | (2.19 | ) | | | (0.98 | ) |
| Distributions from: | | | | | | | | | | | | | | | | | | | | | | | | |
| Net investment income | | | (0.34 | ) | | | (0.18 | ) | | | (0.22 | ) | | | (0.26 | ) | | | (0.19 | ) | | | (0.14 | ) |
| Realized capital gains | | | (0.18 | ) | | | — | | | | — | | | | — | | | | (0.68 | ) | | | (0.69 | ) |
| Total distributions | | | (0.52 | ) | | | (0.18 | ) | | | (0.22 | ) | | | (0.26 | ) | | | (0.87 | ) | | | (0.83 | ) |
| Net asset value at end of period | | $ | 11.33 | | | $ | 11.18 | | | $ | 11.16 | | | $ | 9.75 | | | $ | 8.95 | | | $ | 12.01 | |
| Total return | | | 6.11 | %(E) | | | 1.92 | % | | | 16.88 | % | | | 11.79 | %(D) | | | (16.99 | %) | | | (7.59 | %)(D) |
| Ratios and supplemental data: | | | | | | | | | | | | | | | | | | | | | | | | |
| Net assets at end of period (000's) | | $ | 9 | | | $ | 8 | | | $ | 8 | | | $ | 7 | | | $ | 7,948 | | | $ | 8,836 | |
| Ratio to average net assets: | | | | | | | | | | | | | | | | | | | | | | | | |
| Net expenses(F) | | | 0.14 | %(G) | | | 0.32 | % | | | 0.32 | % | | | 0.32 | % | | | 0.32 | % | | | 0.70 | % |
| Gross expenses(F) | | | 230.25 | %(G) | | | 111.34 | % | | | 183.59 | % | | | 0.99 | % | | | 0.61 | % | | | 0.99 | % |
| Net investment income(F) | | | 3.15 | %(G) | | | 1.63 | % | | | 1.43 | % | | | 2.99 | % | | | 2.21 | % | | | 0.98 | % |
| Portfolio turnover rate | | | 73 | %(E)(H) | | | 77 | % | | | 9 | % | | | 38 | % | | | 32 | % | | | 43 | % |
| (A) | The Fund changed its fiscal year end from July 31 to December 31. See Note 7 in Notes to Financial Statements. |
| (B) | The net investment income per share is based on average shares outstanding for the period or year. |
| (C) | The amounts shown for a share outstanding throughout the period does not accord with the change in net realized and unrealized gains (losses) on investments for the period due to the timing of purchases and sales of fund shares in relation to fluctuating market values during the period. |
| (D) | Impact of payment from affiliate was less then $0.01 per share and 0.01%, respectively. |
| (F) | Ratio does not include income and expenses of the underlying funds. |
| (H) | Portfolio turnover excludes the purchase and sales of the Acquired Funds (see Note 7). If these transactions were included, portfolio turnover would have been higher. |
See accompanying Notes to Financial Statements.
This page intentionally left blank.
Notes to Financial Statements
December 31, 2012
1. Organization
The Touchstone Strategic Trust (the “Trust”) is registered under the Investment Company Act of 1940, as amended, (the “1940 Act”) as an open-end management investment company. The Trust was established as a Massachusetts business trust under a Declaration of Trust dated November 18, 1982. The Trust consists of twenty two funds, including the following seven funds, individually, a “Fund”, and collectively, the “Funds”:
Touchstone Dynamic Equity Fund (“Dynamic Equity Fund”)
Touchstone Emerging Growth Fund (“Emerging Growth Fund”)
Touchstone International Equity Fund (“International Equity Fund”)
Touchstone Balanced Allocation Fund (“Balanced Allocation Fund”)
Touchstone Conservative Allocation Fund (“Conservative Allocation Fund”)
Touchstone Growth Allocation Fund (“Growth Allocation Fund”)
Touchstone Moderate Growth Allocation Fund (“Moderate Growth Allocation Fund”)
Each Fund is an open end, diversified management investment company. Additionally, the Balanced Allocation Fund, Conservative Allocation Fund, Growth Allocation Fund and Moderate Growth Allocation Fund (collectively, the “Allocation Funds”) are “Funds of Funds”, which seek to achieve their investment objective by primarily investing in a diversified portfolio of affiliated underlying equity and fixed income funds that are sub-advised by Ibbotson Associates, Inc. These underlying funds, in turn, invest in a variety of U.S. and foreign equity and fixed income securities. Under normal circumstances, the funds expect to invest their assets among equity and fixed income funds in the following ranges:
| | | Equity | | | Fixed Income | |
| | | Allocation Fund | | | Allocation Fund | |
| Balanced Allocation Fund | | 50-70% | | | 30-50% | |
| Conservative Allocation Fund | | 20-40% | | | 60-80% | |
| Growth Allocation Fund | | 90-100% | | | 0-10% | |
| Moderate Growth Allocation Fund | | 70-90% | | | 10-30% | |
The investment objective of each of the underlying funds that the Funds invest in is as follows:
| Fund | | Investment Objective |
| | | |
| Touchstone Core Bond Fund | | Seeks to provide as high level of current income as is consistent with the preservation of capital. Capital appreciation is a secondary objective. |
| | | |
| Touchstone Dynamic Equity Fund | | Seeks to obtain long-term capital appreciation from hedged equity investments with less risk than a fully invested, unhedged equity portfolio. |
| | | |
| Touchstone Emerging Growth Fund | | Seeks to provide investors with capital appreciation by investing in equity securities of emerging growth companies. |
| | | |
| Touchstone Emerging Markets Equity Fund | | Seeks capital appreciation by primarily investing in equity securities of companies in emerging markets. |
| | | |
| Touchstone Focused Fund | | Seeks capital appreciation by investing in equity securities of companies of any size. |
| | | |
| Touchstone Focused Equity Fund | | Seeks capital appreciation by investing in equity securities of companies of any size. |
| | | |
| Touchstone Global Equity Fund | | Seeks capital appreciation by primarily investing in U.S. and foreign equity securities, including those of emerging market countries. |
| | | |
| Touchstone Global Real Estate Fund | | Seeks capital appreciation by primarily investing in common stocks and other equity securities of U.S. and foreign real estate companies without regard to market capitalization. |
| | | |
| Touchstone High Yield Fund | | Seeks to achieve a high level of income by primarily investing in non-investment grade debt securities. Capital appreciation is a secondary consideration. |
| | | |
| Touchstone Institutional Money Market Fund | | Seeks high current income, consistent with the protection of capital. It primarily invests in U.S. Government securities and high quality money market instruments rated in one of the top short-term rating categories or determined to be of comparable quality. |
| | | |
| Touchstone International Equity Fund | | Seeks long-term capital appreciation by primarily investing in equity securities of non-U.S. issuers. |
Notes to Financial Statements (Continued)
| Fund | | Investment Objective |
| | | |
| Touchstone International Fixed Income Fund | | Seeks total return by investing primarily in fixed income securities of issuers located outside the United States. |
| | | |
| Touchstone International Small Cap Fund | | Seeks capital appreciation by investing primarily in equity securities of non-U.S. small-cap companies, including companies located in countries with emerging markets. |
| | |
| Touchstone International Value Fund | | Seeks long-term capital growth by investing primarily in equity securities of non-U.S. small-cap companies. |
| | | |
| Touchstone Large Cap Growth Fund | | Seeks long-term growth of capital and primarily invests in common stocks of large-capitalization U.S. companies. |
| | | |
| Touchstone Large Cap Relative Value Fund | | Seeks capital appreciation by investing in stocks of large capitalization companies. |
| | | |
| Touchstone Merger Arbitrage Fund | | Seeks to achieve positive absolute returns regardless of market conditions over the long-term. It primarily invests, under normal market conditions, in equity securities of U.S. and foreign issuers. |
| | | |
| Touchstone Mid Cap Fund | | Seeks long-term capital growth by investing primarily in common stocks of mid-cap U.S. listed companies. |
| | | |
| Touchstone Mid Cap Growth Fund | | Seeks to increase the value of Fund shares as a primary goal and to earn income as a secondary goal by investing in common stocks of mid-capitalization U.S. companies. |
| | | |
| Touchstone Mid Cap Value Fund | | Seeks capital appreciation by investing in common stocks of medium capitalization companies. |
| | | |
| Touchstone Sands Capital Institutional Growth Fund | | Seeks long-term capital appreciation by primarily investing in common stocks of U.S. companies believed to have above average potential for earnings or revenue growth. |
| | | |
| Touchstone Short Duration Fixed Income Fund | | Seeks maximum total return consistent with the preservation of capital by primarily investing at least 80% of its assets in fixed income securities. |
| | | |
| Touchstone Small Cap Core Fund | | Seeks capital appreciation by primarily investing in stocks of small capitalization U.S. companies. |
| | | |
| Touchstone Small Cap Value Fund | | Seeks long-term capital growth by primarily investing in small-capitalization companies have potential for growth and appear to be trading below their perceived value. |
| | | |
| Touchstone Small Company Value Fund | | Seeks long-term capital growth by investing primarily in stocks of small-cap companies. |
| | | |
| Touchstone Strategic Income Fund | | Seeks a high level of income consistent with reasonable risk by investing primarily in income producing securities. |
| | | |
| Touchstone Total Return Bond Fund | | Seeks to provide current income, by primarily investing in fixed-income securities. Capital appreciation is a secondary goal. |
| | | |
| Touchstone Value Fund | | Seeks long-term capital growth by primarily investing in U.S. equity securities of large- and mid-cap companies believed to be undervalued. |
The Declaration of Trust permits the Trust to issue an unlimited number of shares of beneficial interest of each Fund. The Funds are registered to offer the following classes of shares: Class A shares, Class C shares, Class Y shares, and Institutional Class shares. The assets of each Fund are segregated, and a shareholder’s interest is limited to the Fund in which shares are held. The Funds’ prospectus provides a description of each Fund’s investment goals, policies, and strategies along with information on the classes of shares currently being offered.
Notes to Financial Statements (Continued)
2. Significant Accounting Policies
The following is a summary of the Funds’ significant accounting policies:
Security valuation and fair value measurements — All investments in securities are recorded at their estimated fair value. The Funds define the term “market value”, as used throughout this report, as the estimated fair value. The Funds use various methods to measure fair value of its portfolio securities on a recurring basis. Generally accepted accounting principles in the United States (“U.S. GAAP”) establish a hierarchy that prioritizes inputs to valuation methods. These inputs are summarized in the three broad levels listed below:
| • Level 1 – | quoted prices in active markets for identical securities |
| • Level 2 – | other significant observable inputs (including quoted prices for similar securities, interest rates, prepayment speeds, credit risk, etc.) |
| • Level 3 – | significant unobservable inputs (including the Fund’s own assumptions in determining the fair value of investments) |
The inputs or methodology used for valuing securities are not necessarily an indication of the risk associated with investing in those securities. For example, money market instruments are valued using amortized cost, in accordance with rules under the 1940 Act. Generally, amortized cost approximates the current fair value of a security, but since the value is not obtained from a quoted price in an active market, such securities are reflected as Level 2.
The aggregate value by input level, as of December 31, 2012, for each Fund’s investments, as well as a reconciliation of assets for which significant unobservable inputs (Level 3) were used in determining value, if applicable, is included in each Fund’s Portfolio of Investments, which also includes a breakdown of the Fund’s investments by sector concentration. There were no material Level 3 securities during the period.
All transfers in and out of the levels are recognized at the value at the end of the period. During the five months ended December 31, 2012, there were no transfers between Levels 1, 2 and 3 for all Funds except as shown in the Portfolios of Investments for the International Equity Fund.
The Funds’ portfolio securities are valued as of the close of the regular session of trading on the New York Stock Exchange (“NYSE”) (currently 4:00 p.m., Eastern time). Portfolio securities traded on stock exchanges are valued at the last sale price, and to the extent these securities are actively traded, they are categorized in Level 1 of the fair value hierarchy. Portfolio securities quoted by NASDAQ are valued at the NASDAQ Official Closing Price (“NOCP”). Securities not traded on a particular day, or for which the last sale price is not readily available, are valued at their last broker-quoted bid prices as obtained from one or more of the major market makers for such securities by an independent pricing service and are categorized in Level 2. Debt securities for which market quotations are readily available are valued at their most recent bid prices as obtained from one or more of the major market makers for such securities by an independent pricing service and are categorized in Level 2. Money market instruments and other debt securities with a remaining maturity of less than 60 days are valued at amortized cost, which approximates market value and are categorized in Level 2. While this method provides consistency in valuation (and may only be used if it approximates market value), it may result in periods during which value, as determined by amortized cost, is higher or lower than the price that would be received if the Fund sold the investment. Securities for which market quotations or the NOCP are not readily available are fair valued as determined by or under the direction of the Board of Trustees and are categorized in Level 3. Shares of open end mutual funds in which the Funds invest are valued at their respective net asset values as reported by the underlying funds and are categorized in Level 1. The prices for foreign securities are reported in local currency and translated into U.S. dollars using currency exchange rates.
Notes to Financial Statements (Continued)
Level 2 Valuation — Securities mainly traded on a non-U.S. exchange are generally valued according to the preceding closing values on that exchange. However, if an event that may change the value of a security occurs after the time that the closing value on the non-U.S. exchange was determined, but before the close of regular trading on the NYSE, the security may be priced based on fair value. This may cause the value of the security on the books of the Funds to be significantly different from the closing value on the non-U.S. exchange and may affect the calculation of the net asset value (“NAV”) of a Fund. Any debt securities held by the Funds for which market quotations are not readily available are generally priced at their most recent bid prices as obtained from one or more of the major market makers for such securities.
Level 3 Valuation — Securities held by the Funds that do not have readily available market quotations, or securities for which the available market quotations are not reliable, are priced at their fair value using procedures approved by the Funds’ Board of Trustees. The Funds may use fair value pricing under the following circumstances, among others:
| • | If the value of a security has been materially affected by events occurring before the Fund’s pricing time but after the close of the primary markets on which the security is traded. |
| • | If the exchange on which a portfolio security is principally traded closes early or if trading in a particular portfolio security was halted during the day and did not resume prior to the Fund’s NAV calculation. |
| • | If a security is so thinly traded that reliable market quotations are unavailable due to infrequent trading. |
| • | If the validity of market quotations is not reliable. |
The Allocation Funds invest in securities of affiliated mutual funds (“underlying funds”). The value of an investment in the Allocation Funds is based on the performance of the underlying funds in which they invest and the allocation of their assets among those funds. Because the Allocation Funds invest in mutual funds, shareholders of the Allocation Funds indirectly bear a proportionate share of the expenses charged by the underlying funds in which they invest as well as their share of the Allocation Funds’ fees and expenses. The principal risks of an investment in the Allocation Funds include the principal risks of investing in the underlying funds. Investments in the underlying funds are valued at the NAV per share of each class of the underlying funds and are categorized as Level 1.
Certain Funds invest in securities of other investment companies, including exchange traded funds (“ETFs”), open-end funds and closed-end funds. Open-end funds are investment companies that issue new shares continuously and redeem shares daily. Closed-end funds are investment companies that typically issue a fixed number of shares that trade on a securities exchange or over-the-counter. An ETF is an investment company that seeks to track the performance of an index by holding in its portfolio shares of all the companies, or a representative sample of the companies, that are components of a particular index. ETFs are traded on a securities exchange based on their market value. The risks of investment in other investment companies typically reflect the risks of the types of securities in which investment companies invest. Investments in ETFs and closed-end funds are subject to the additional risk that shares of the fund may trade at a premium or discount to their NAV per share. When a Fund invests in another investment company, shareholders of the Fund indirectly bear their proportionate share of the other investment company’s fees and expenses, including operating, registration, trustee, licensing and marketing, as well as their share of the Fund’s fees and expenses.
New accounting pronouncements — In December 2011, the Financial Accounting Standards Board (“FASB”) issued Accounting Standards Update ASU No. 2011-11,“Disclosures about Offsetting Assets and Liabilities”. ASU No.2011-11 requires disclosures to make financial statements that are prepared under U.S.GAAP more comparable to those prepared under the International Financial Reporting Standards (“IFRS”).The new disclosure requirements mandate that entities disclose both gross and net information about instruments and transactions eligible for offset in the statement of assets and liabilities, as well as instruments and transactions subject to an agreement similar to a master netting arrangement. In addition, ASU No.2011-11 requires disclosure of collateral
Notes to Financial Statements (Continued)
received and posted in connection with master netting agreements or similar arrangements. New disclosures are required for annual reporting periods beginning on or after January 1, 2013, and interim periods within those annual periods. Management is evaluating the impact of ASU No.2011-11 on the financial statements and disclosures.
Cash and cash equivalents — The Funds consider liquid assets deposited with a bank, money market funds, and certain short term debt instruments with maturities of 3 months or less to be cash equivalents and are included in the investments on the financial statements. These investments represent amounts held with financial institutions that are readily accessible to pay Fund expenses or investments. Cash and cash equivalents are valued at cost plus accrued interest, which approximates market value. The value of cash equivalents denominated in foreign currencies is determined by converting to U.S. dollars on the date of the Statement of Assets and Liabilities.
Securities sold short — The Dynamic Equity Fund engages in selling securities short, which obligates the Fund to replace a security borrowed by purchasing the same security at the current market value. The Fund would incur a loss if the price of the security increases between the date of the short sale and the date on which the Fund replaces the borrowed security. The Fund would realize a gain if the price of the security declines between those dates. As of December 31, 2012, the Fund held securities sold short with a fair value of $13,251,721 and had securities with a fair value of $65,603,039 held as collateral for the securities sold short.
Options — The Funds may write or purchase financial option contracts primarily to hedge against changes in the value of equity securities (or securities that the Funds intend to purchase), against fluctuations in fair value caused by changes in prevailing market interest rates or foreign currency exchange rates and against changes in overall equity market volatility. In addition, the Funds may utilize options in an attempt to generate gains from option premiums or to reduce overall portfolio risk. The Funds’ option strategy primarily focuses on the use of writing call options on equity indexes. When the Funds write or purchase an option, an amount equal to the premium received or paid by the Funds is recorded as a liability or an asset and is subsequently adjusted to the current market value of the option written or purchased. Premiums received or paid from writing or purchasing options which expire unexercised are treated by the Funds on the expiration date as realized gains or losses. The difference between the premium and the amount paid or received on effecting a closing purchase or sale transaction, including brokerage commissions, is also treated as a realized gain or loss. If an option is exercised, the premium paid or received is added to the cost of the purchase or proceeds from the sale in determining whether the Funds have realized a gain or loss on investment transactions. The Funds, as writers of an option, may have no control over whether the underlying securities may be sold (call) or purchased (put) and as a result bear the market risk of an unfavorable change in the price of the security underlying the written option. The Funds, as purchasers of an option, bear the risk that the counterparties to the option may not have the ability to meet the terms of the option contracts. There is minimal counterparty credit risk involved in entering into option contracts since they are exchanged-traded instruments and the exchange’s clearinghouse, as counterparty to all exchange-traded options, guarantees the options against default. Options are valued at the last quoted sales price. If there is no such reported sale on the valuation date, long option positions are valued at the most recent bid price, and short option positions are valued at the most recent ask price. As of December 31, 2012, the Dynamic Equity Fund held written options with a fair value of $1,774,980 and had securities with a fair value of $1,779,230 held as collateral for options written. Additionally, as of December 31, 2012, the Dynamic Equity Fund also had cash collateral in the amount of $159,152 for both securities sold short and options written.
Foreign currency translation — The books and records of the Funds are maintained in U.S. dollars and translated into U.S. dollars on the following basis:
Notes to Financial Statements (Continued)
| (1) | market value of investment securities, assets and liabilities at the current rate of exchange on the valuation date; and |
| (2) | purchases and sales of investment securities, income and expenses at the relevant rates of exchange prevailing on the respective dates of such transactions. |
The Funds do not isolate that portion of gains and losses on investments in equity securities that is due to changes in the foreign exchange rates from that which is due to changes in market prices of equity securities.
Derivative instruments and hedging activities — The following table sets forth the fair value of the Funds’ derivative financial instruments by primary risk exposure as of December 31, 2012:
| | | Fair Value of Derivative Investments
As of December 31, 2012 | | | | | | |
| | | | | Asset | | | Liability | |
| | | | | Derivatives | | | Derivatives* | |
| | | Derivatives not accounted for as hedging | | Unrealized | | | Unrealized | |
| Fund | | instruments under ASC 815 | | Appreciation | | | Depreciation | |
| Dynamic Equity Fund | | Options - Equity Contracts | | $ | 24,867 | | | $ | — | |
* Statements of Assets and Liabilities Location: Written option contract, at value
For the five months ended December 31, 2012, the average balances of outstanding derivative financial instruments were as follows:
| | | Dynamic | |
| | | Equity | |
| | | Fund | |
| Equity contracts: | | | | |
| Options - Average number of contracts (quarterly) | | | 1,380 | |
| | | The Effect of Derivative Investments on the Statement of Operations | | | |
| | | for the Five Months Ended December 31, 2012 | | | |
| | | | | | | | Change in | |
| | | | | | | | Unrealized | |
| | | Derivatives not accounted for as hedging | | Realized Loss | | | Appreciation | |
| Fund | | instruments under ASC 815 | | on Derivatives* | | | | on Derivatives** | |
| Dynamic Equity Fund | | Options - Equity Contacts | | $ | (1,102,848 | ) | | $ | 143,584 | |
* Statements of Operations Location: Net realized gain from written options
** Statements of Operations Location: Net change in unrealized appreciation (depreciation) on written options
For the year ended July 31, 2012, the average balances of outstanding derivative financial instruments were as follows:
| The Effect of Derivative Investments on the Statement of Operations |
| for the Year Ended July 31, 2012 |
| | | | | | | | Change in | |
| | | | | | | | Unrealized | |
| | | Derivatives not accounted for as hedging | | Realized Gain | | | Depreciation | |
| Fund | | instruments under ASC 815 | | on Derivatives* | | | | on Derivatives** | |
| Dynamic Equity Fund | | Options - Equity Contacts | | $ | 2,823,456 | | | $ | (350,810 | ) |
| | | Warrants - Equity Contacts | | | 638 | | | | — | |
* Statements of Operations Location: Net realized gain from written options and net realized gains from warrants
** Statements of Operations Location: Net change in unrealized appreciation (depreciation) on written options
Notes to Financial Statements (Continued)
Portfolio securities loaned — Each Fund may lend its portfolio securities. Lending portfolio securities exposes a Fund to the risk that the borrower may fail to return the loaned securities or may not be able to provide additional collateral or that the Fund may experience delays in recovery of the loaned securities or loss of rights in the collateral if the borrower fails financially. To minimize these risks, the borrower must agree to maintain cash collateral with the Funds’ custodian in an amount at least equal to the market value of the loaned securities. The loaned securities are secured by collateral valued at least equal, at all times, to the market value of the securities loaned plus accrued interest, if any. When the collateral falls below specified amounts the lending agent will use its best effort to obtain additional collateral on the next business day to meet required amounts under the security lending agreement. The cash collateral is reinvested by the Funds’ custodian into an approved investment vehicle.
As of December 31, 2012, the following Funds loaned securities and received collateral as follows:
| | | Market Value of | | | Market Value of | |
| | | Securities | | | Collateral | |
| Fund | | Loaned | | | Received | |
| Emerging Growth Fund | | $ | 602,579 | | | $ | 605,474 | |
All collateral received as cash is received, held and administered by the Funds’ custodian for the benefit of the Funds in the applicable custody account or other account established for the purpose of holding collateral.
Funds participating in securities lending receive compensation in the form of fees, or retain a portion of interest or dividends on the investment of any cash received as collateral. The Funds also continue to receive interest or dividends on the securities loaned.
Unrealized gain or loss on the market value of the securities loaned that may occur during the term of the loan is recognized by the Funds. The Funds have the right under the lending agreement to recover the securities from the borrower on demand.
Share valuation — The NAV per share of each class of shares of each Fund is calculated daily by dividing the total value of a Fund’s assets attributable to that class, less liabilities attributable to that class, by the number of outstanding shares of that class.
The maximum offering price per share of Class A shares of the Funds is equal to the NAV per share plus a sales load equal to 6.10% of the NAV (or 5.75% of the offering price). There is no sales load on purchases of $1 million or more of Class A shares. The maximum offering price per share of Class C, Class Y, and Institutional Class shares of the Funds is equal to the NAV per share.
The redemption price per share of each class of shares of the Funds is generally equal to the NAV per share. However, Class A redemptions that were part of no load $1 million subscriptions may be subject to a contingent deferred sales charge (“CDSC”) of up to 1%. Additionally, purchases of Class C shares of the Funds are subject to a CDSC of 1.00% of the original purchase price if redeemed within a one-year period from the date of purchase.
Investment income — Dividend income from securities is recognized on the ex-dividend date, net of foreign withholding taxes, if any, which are reduced by any amounts reclaimable by the Funds, where applicable. Interest income from securities is recorded on the basis of interest accrued, premium amortized and discount accreted.
Distributions to shareholders — Each Fund intends to distribute to its shareholders substantially all of its income and capital gains. The Touchstone Dynamic Equity Fund, Touchtone Emerging Growth Fund and Touchstone International Equity Fund distribute their income, if any, annually to shareholders. The Touchstone Conservative Allocation Fund, Touchstone Balanced Allocation Fund, Touchstone Moderate Growth Allocation Fund, and Touchstone Growth Allocation Fund distribute their income, if any, quarterly. Each Fund makes distributions of capital gains, if any, at least annually, net of applicable capital loss carryforwards. Income distributions
Notes to Financial Statements (Continued)
and capital gain distributions are determined in accordance with income tax regulations. Recognition of the funds net investment income that invests in underlying funds is affected by the timing of dividend declarations by investee funds. Effective August 16, 2012, the Growth Allocation Fund and the Moderate Growth Allocation Fund adopted to distribute net investment income, if any, quarterly.
Allocations — Investment income earned, realized capital gains and losses, and unrealized appreciation and depreciation for a Fund are allocated daily to each class of shares based upon its proportionate share of total net assets of the Fund. Class specific expenses are charged directly to the class incurring the expense. Common expenses, which are not attributable to a specific class, are allocated daily to each class of shares based upon their proportionate share of total net assets of the Fund. Expenses not directly billed to a Fund are allocated proportionally among all Funds daily in relation to net assets of each Fund or another reasonable measure.
Security transactions — Security transactions are reflected for financial reporting purposes as of the trade date, which may cause the NAV as stated in the accompanying financial statements to be different than the NAV applied to Fund share transactions. Realized gains and losses on sales of portfolio securities are calculated using the identified cost basis.
Estimates — The preparation of financial statements in conformity with U.S. GAAP requires management to make estimates and assumptions that affect the reported amounts of assets and liabilities and disclosure of contingent assets and liabilities at the date of the financial statements and the reported amounts of income and expenses during the reporting period. Actual results could differ from those estimates.
Redemption Fees — Prior to April 16, 2012, the Funds imposed a 2% redemption/exchange fee on total redemption proceeds (after applicable deferred sales charges) of any shareholder redeeming shares (including redemptions by exchange) of the Funds within 10 calendar days of their purchase. The Funds charged the redemption/exchange fee to discourage market timing by those shareholders initiating redemptions or exchanges to take advantage of short-term market movements. The redemption fee was imposed to the extent that the number of Fund shares redeemed exceeded the number of the Fund shares that had been held for more than 10 calendar days. In determining how long shares of the Fund had been held, shares held by the shareholder for the longest period of time were sold first. The redemption Fees can be found on the Statement of Changes in Net Assets. Effective April 16, 2012, the redemption fee plan was terminated.
3. Investment Transactions
Investment transactions (excluding short-term investments and US. Government securities) were as follows for the five months ended December 31, 2012:
| | | Dynamic | | | Emerging | | | | |
| | | Equity | | | Growth | | | International | |
| | | Fund | | | Fund | | | Equity Fund | |
| Purchases of investment securities | | $ | 86,832,779 | | | $ | 11,004,513 | | | $ | 9,590,063 | |
| Proceeds from sales and maturities | | $ | 82,839,295 | | | $ | 19,162,326 | | | $ | 8,984,937 | |
| | | | | | | | | | | | Moderate | |
| | | Balanced | | | Conservative | | | Growth | | | Growth | |
| | | Allocation | | | Allocation | | | Allocation | | | Allocation | |
| | | Fund | | | Fund | | | Fund | | | Fund | |
| Purchases of investment securities* | | $ | 89,504,810 | | | $ | 55,586,944 | | | $ | 45,170,732 | | | $ | 102,694,269 | |
| Proceeds from sales and maturities | | $ | 100,716,282 | | | $ | 62,348,492 | | | $ | 51,362,472 | | | $ | 112,203,453 | |
* The cost of purchases excludes $110,262,435, $62,169,461, $50,055,561 and $107,226,200 on Balanced Allocation Fund, Conservative Allocation Fund, Growth Allocation Fund and Moderate Growth Allocation Fund, respectively, from securities received from Acquired Funds (as defined in Note 7). See Note 7 in the Notes to Financial Statements.
Notes to Financial Statements (Continued)
There were no purchases or sales of U.S. Government securities for the Funds for the five months ended December 31, 2012.
4. Transactions with Affiliates and Other Related Parties
Certain officers of Trust are also officers of Touchstone Advisors, Inc. (the “Advisor”), the Touchstone Securities, Inc. (the “Underwriter”) and/or BNY Mellon Investment Servicing (US) Inc. (“BNY Mellon”), the Sub-Administrator and Transfer Agent to the Funds. The Advisor and Underwriter are each wholly owned, indirect subsidiaries of The Western and Southern Life Insurance Company (“Western-Southern”).
MANAGEMENT & EXPENSE LIMITATIONS AGREEMENTS
The Advisor provides general investment supervisory services for the Funds, under terms of an (“Advisory Agreement”). Under the Advisory Agreement, the Funds pay the Advisor a fee, which is computed and accrued daily and paid monthly, at an annual rate based on average daily net assets as shown in the table below.
| Touchstone Dynamic Equity Fund | | 0.85% on the first $300 million of assets |
| | | 0.80% on the next $200 million of assets |
| | | 0.75% on the next $250 million of assets |
| | | 0.70% on the next $250 million of assets |
| | | 0.65% on the next $500 million of assets |
| | | 0.60% on the next $500 million of assets |
| | | 0.55% on such assets in excess of $2 billion |
| Touchstone Emerging Growth Fund | | 0.90% |
| Touchstone International Equity Fund | | 0.90% on the first $300 million of assets |
| | | 0.85% on the next $200 million of assets |
| | | 0.80% of such assets in excess of $500 million |
| Touchstone Balanced Allocation Fund | | 0.20% on the first $1 billion of assets |
| | | 0.175% on the next $1 billion of assets |
| | | 0.150% on the next $1 billion of assets |
| | | 0.125% of such assets in excess of $3 billion |
| Touchstone Conservative Allocation Fund | | 0.20% on the first $1 billion of assets |
| | | 0.175% on the next $1 billion of assets |
| | | 0.150% on the next $1 billion of assets |
| | | 0.125% of such assets in excess of $3 billion |
| Touchstone Growth Allocation Fund | | 0.25% on the first $1 billion of assets |
| | | 0.225% on the next $1 billion of assets |
| | | 0.20% on the next $1 billion of assets |
| | | 0.175% of such assets in excess of $3 billion |
| Touchstone Moderate Growth Allocation Fund | | 0.25% on the first $1 billion of assets |
| | | 0.225% on the next $1 billion of assets |
| | | 0.20% on the next $1 billion of assets |
| | | 0.175% of such assets in excess of $3 billion |
Prior to April 16, 2012, Old Mutual Capital, Inc. (the “Former Advisor”) served as the adviser and administrator to the Funds. For its services, the Funds paid the Former Adviser the same fees listed above with the exception of the following:
| Touchstone Dynamic Equity Fund | | 0.85% |
| Touchstone International Equity Fund | | 1.00% on the first $1 billion of assets |
| | | 0.975% on the next $1 billion of assets |
| | | 0.950% on the next $1 billion of assets |
| | | 0.925% of such assets in excess of $3 billion |
Notes to Financial Statements (Continued)
The Advisor has entered into investment sub-advisory agreements with the following parties (each a “Sub-Advisor”):
| Acadian Asset Management LLC | Ibbotson Associates, Inc |
| International Equity Fund | Balanced Allocation Fund |
| | Conservative Allocation Fund |
| Analytic Investors, LLC | Growth Allocation Fund |
| Dynamic Equity Fund | Moderate Growth Allocation Fund |
| | |
| Copper Rock Capital Partners LLC | |
| Emerging Growth Fund | |
The Advisor, not the Funds, pays sub-advisory fees to each Sub-Advisor.
Prior to April 16, 2012, the Former Advisor had sub-advisory agreements with the above listed Sub-Advisors. The Former Advisor, not the Funds, paid sub-advisory fees to each Sub-Advisor.
Effective April 16, 2012, the Advisor entered into an Expense Limitation Agreement (“Expense Limitation Agreement”) to contractually limit operating expenses of the Funds, excluding dividend expenses on short sales, interest, taxes, brokerage commissions, other expenditures which are capitalized in accordance with generally accepted accounting principles, the cost of “Acquired Fund Fees and Expenses”, if any and other extraordinary expenses not incurred in the ordinary course of business. The maximum operating expense limit in any year with respect to the Funds is based on a percentage of the average daily net assets of the Funds. The Advisor has agreed to separately waive class level expenses, administration fees and reimburse expenses in order to maintain expense limitations for the Funds as follows:
| | | | | | | | | | | | Institutional | |
| Fund | | Class A | | | Class C | | | Class Y | | | Class | |
| Dynamic Equity Fund | | | 1.55 | % | | | 2.30 | % | | | 1.30 | % | | | 1.25 | % |
| Emerging Growth Fund | | | 1.39 | % | | | 2.14 | % | | | 1.14 | % | | | 0.99 | % |
| International Equity Fund | | | 1.39 | % | | | 2.14 | % | | | 1.14 | % | | | 0.99 | % |
| Balanced Allocation Fund | | | 0.64 | % | | | 1.39 | % | | | 0.39 | % | | | 0.39 | % |
| Conservative Allocation Fund | | | 0.61 | % | | | 1.36 | % | | | 0.36 | % | | | 0.36 | % |
| Growth Allocation Fund | | | 0.57 | % | | | 1.32 | % | | | 0.32 | % | | | 0.32 | % |
| Moderate Growth Allocation Fund | | | 0.57 | % | | | 1.32 | % | | | 0.32 | % | | | 0.32 | % |
The expense limitations in the Expense Limitation Agreement were to remain in effect until at least April 16, 2014.
Effective September 10, 2012, the Advisor amended the Expense Limitation Agreement. In accordance with the Expense Limitation Agreement, the Advisor agreed to contractually limit operating expenses of the Funds, excluding dividend expenses on short sales, interest, taxes, brokerage commissions, other expenditures which are capitalized in accordance with generally accepted accounting principles, the cost of “Acquired Fund Fees and Expenses”, if any and other extraordinary expenses not incurred in the ordinary course of business. The maximum operating expense limit in any year with respect to the Funds is based on a percentage of the average daily net assets of the Funds. The Advisor has agreed to separately waive class level expenses, administration fees and reimburse expenses in order to maintain expense limitations for the Funds as follows:
| | | | | | | | | | | | Institutional | |
| Fund | | Class A | | | Class C | | | Class Y | | | Class | |
| Dynamic Equity Fund | | | 1.55 | % | | | 2.30 | % | | | 1.30 | % | | | 1.25 | % |
| Emerging Growth Fund | | | 1.39 | % | | | 2.14 | % | | | 1.14 | % | | | 0.99 | % |
| International Equity Fund | | | 1.39 | % | | | 2.14 | % | | | 1.14 | % | | | 0.99 | % |
Notes to Financial Statements (Continued)
| | | | | | | | | | | | Institutional | |
| Fund | | Class A | | | Class C | | | Class Y | | | Class | |
| Balanced Allocation Fund | | | 0.33 | %* | | | 1.08 | %* | | | 0.08 | %* | | | 0.08 | %* |
| Balanced Allocation Fund | | | 0.41 | %** | | | 1.16 | %** | | | 0.16 | %** | | | 0.16 | %** |
| Conservative Allocation Fund | | | 0.33 | %* | | | 1.08 | %* | | | 0.08 | %* | | | 0.08 | %* |
| Conservative Allocation Fund | | | 0.41 | %** | | | 1.16 | %** | | | 0.16 | %** | | | 0.16 | %** |
| Growth Allocation Fund | | | 0.33 | %* | | | 1.08 | %* | | | 0.08 | %* | | | 0.08 | %* |
| Growth Allocation Fund | | | 0.41 | %** | | | 1.16 | %** | | | 0.16 | %** | | | 0.16 | %** |
| Moderate Growth Allocation Fund | | | 0.33 | %* | | | 1.08 | %* | | | 0.08 | %* | | | 0.08 | %* |
| Moderate Growth Allocation Fund | | | 0.41 | %** | | | 1.16 | %** | | | 0.16 | %** | | | 0.16 | %** |
* The expense limitation will remain in effect until at least September 10, 2013.
** The expense limitation will remain in effect until at least April 16, 2014.
Where multiple caps are in effect, the lower of the two amounts will apply.
For Dynamic Equity, Emerging Growth and International Equity Funds these expense limitations will remain in effect until at least April 16, 2014.
Prior to April 16, 2012, the Former Advisor was also contractually obligated to maintain the expense limitations as listed above with the exception of the following:
| | | | | | | | | | | Institutional | |
| Fund | | Class A | | | Class C* | | Class Z** | | | Class | |
| Emerging Growth Fund | | | 1.67 | % | | N/A | | | 1.42 | % | | | 1.22 | % |
| International Equity Fund | | | 1.52 | % | | N/A | | | 1.27 | % | | | 1.02 | % |
| * | Prior to April 16, 2012, the Emerging Growth Fund and the International Equity Fund did not issue Class C Shares. |
| ** | Funds had Class Z shares outstanding immediately prior to the reorganization, which were exchanged for Class Y Shares of the corresponding Touchstone Fund. |
During the five months ended December 31, 2012, the Advisor waived investment advisory fees and administration fees and/or reimbursed expenses of the Funds as follows:
| | | | | | | | | Other | |
| | | Investment | | | | | | Operating | |
| | | Advisory | | | Administration | | | Expenses | |
| | | Fees Waived | | | Fees Waived | | | Reimbursed | |
| Dynamic Equity Fund | | $ | — | | | $ | — | | | $ | 37,575 | |
| Emerging Growth Fund | | | 21,239 | | | | 16,303 | | | | 34,021 | |
| International Equity Fund | | | 58,461 | | | | 15,316 | | | | 31,554 | |
| Balanced Allocation Fund | | | 51,770 | | | | 95,684 | | | | 75,295 | |
| Conservative Allocation Fund | | | 38,330 | | | | 55,804 | | | | 56,841 | |
| Growth Allocation Fund | | | 63,547 | | | | 54,207 | | | | 77,402 | |
| Moderate Growth Allocation Fund | | | 103,088 | | | | 110,407 | | | | 96,994 | |
At December 31, 2012, the Advisor may seek recoupment of previously waived and reimbursed fees as follows:
| | | Expiration | | | Expiration | |
| | | July 31, | | | December | |
| Fund | | 2015 | | | 31, 2015 | |
| Dynamic Equity Fund | | $ | - | | | $ | 10,969 | |
| Emerging Growth Fund | | | 45,846 | | | | 68,508 | |
| International Equity Fund | | | 68,877 | | | | 104,529 | |
| Balanced Allocation Fund | | | 18,241 | | | | 172,469 | |
| Conservative Allocation Fund | | | 24,108 | | | | 115,995 | |
| Growth Allocation Fund | | | 32,481 | | | | 138,241 | |
| Moderate Growth Allocation Fund | | | 31,679 | | | | 231,358 | |
Notes to Financial Statements (Continued)
During the period April 16, 2012 through July 31, 2012, the Advisor waived investment advisory fees and administration fees and/or reimbursed expenses of the Funds as follows:
| | | Investment | | | | | | Other | |
| | | Advisory | | | Administration | | | Operating | |
| | | Fees | | | Fees | | | Expenses | |
| Fund | | Waived | | | Waived | | | Reimbursed | |
| Emerging Growth Fund | | $ | 16,287 | | | $ | 15,230 | | | $ | 15,669 | |
| International Equity Fund | | | 19,493 | | | | 10,415 | | | | 39,208 | |
| Balanced Allocation Fund | | | — | | | | 17,060 | | | | 5,486 | |
| Conservative Allocation Fund | | | 3,550 | | | | 17,834 | | | | 7,296 | |
| Growth Allocation Fund | | | 11,431 | | | | 19,834 | | | | 11,921 | |
| Moderate Growth Allocation Fund | | | — | | | | 30,284 | | | | 18,599 | |
For the period August 1, 2011 through April 15, 2012, the Former Advisor earned and waived investment advisory fees of the funds, which are included in the Investment Advisory and Administration Fees and fees waived and/or reimbursed by the Advisor and/or Affiliated on the Statement of Operations, as follows:
| | | | | | | | | Former | |
| | | | | | | | | Investment | |
| | | Former | | | Former | | | Advisory | |
| | | Investment | | | Investment | | | and | |
| | | Advisory | | | Administration | | | Administration | |
| Fund | | Fees Accrued | | | Fees Accrued | | | Fees Waived | |
| Dynamic Equity Fund | | $ | 380,016 | | | $ | 44,708 | | | $ | 101,748 | |
| Emerging Growth Fund | | | 276,216 | | | | 30,691 | | | | 42,067 | |
| International Equity Fund | | | 194,928 | | | | 19,493 | | | | 191,763 | |
| Balanced Allocation Fund | | | 82,483 | | | | 41,241 | | | | 149,401 | |
| Conservative Allocation Fund | | | 48,102 | | | | 24,051 | | | | 101,652 | |
| Growth Allocation Fund | | | 73,661 | | | | 29,464 | | | | 206,251 | |
| Moderate Growth Allocation Fund | | | 126,357 | | | | 50,543 | | | | 270,882 | |
Under the terms of the Expense Limitations Agreement the Advisor is entitled to recover, subject to approval by the Funds’ Board of Trustees, such amounts waived or reimbursed for a period of up to three years from the year in which the Advisor reduced its compensation and/or assumed expenses for a Fund. No recoupment will occur unless the Fund’s operating expenses are below the expense limitation amount.
The Advisor did not recoup any amounts it previously waived or reimbursed for the period April 16, 2012 through December 31, 2012. For the period August 1, 2011 through April 15, 2012, the Former Advisor did not recover waived and reimbursed fees on the Funds.
ADMINISTRATION AGREEMENT
The Advisor entered into an Administration and Accounting Services Agreement with the Trust, whereby the Advisor is responsible for: supplying executive and regulatory compliance services; supervising the preparation of tax returns; coordinating the preparation of reports to shareholders and reports to, and filings with, the Securities and Exchange Commission and state securities authorities, as well as materials for meetings of the Board of Trustees; calculating the daily NAV per share; and maintaining the financial books and records of each Fund. For its services, the Advisor receives an annual fee of 0.20% of the aggregate average daily net assets of the Trust, Touchstone Investment Trust (excluding Institutional Money Market Fund), Touchstone Funds Group Trust, and Touchstone Tax-Free Trust up to and including $6 billion; 0.16% of the next $4 billion of aggregate average daily net assets; and 0.12% of the aggregate average daily net assets of all such assets in excess of $10 billion. The fee is allocated among the Funds on the basis of relative daily net assets.
Notes to Financial Statements (Continued)
The Advisor has engaged BNY Mellon as the Sub-Administrator to the Trust. BNY Mellon provides administrator and accounting services to the Trust and is compensated directly by the Advisor, not the Trust.
TRANSFER AGENT AGREEMENT
Under the terms of the Transfer Agent Agreement between the Trust and BNY Mellon, BNY Mellon maintains the records of each shareholder’s account, answers shareholders’ inquiries concerning their accounts, processes purchases and redemptions of each Fund’s shares, acts as dividend and distribution disbursing agent and performs other shareholder service functions. For these services, BNY Mellon receives a monthly fee per shareholder account from each Fund. In addition, each Fund pays out-of-pocket expenses incurred by BNY Mellon, including, but not limited to, postage and supplies.
PLANS OF DISTRIBUTION
Effective April 16, 2012, the Trust has adopted distribution plans pursuant to Rule 12b-1 under the 1940 Act for each class of shares it offers that are subject to 12b-1 distribution fees. The plans allow each Fund to pay distribution and other fees for the sale and distribution of its shares and for services provided to shareholders. Under the Class A plan, each Fund offering Class A shares pays an annual fee of up to 0.25% of average daily net assets that are attributable to Class A shares. Under the Class C plan, each Fund pays an annual fee of up to 1.00% of average daily net assets that are attributable to Class C shares (of which up to 0.75% is a distribution fee and up to 0.25% is a shareholder servicing fee).
For the period ended April 16, 2012 through July 31, 2012, the Funds accrued the following distributions for Class A and distributions and shareholder servicing for Class C, respectively.
| | | | | | Distribution | |
| | | | | | and | |
| | | | | | Shareholder | |
| | | Distribution | | | Servicing | |
| | | Expenses | | | Expenses | |
| Fund | | Class A | | | Class C | |
| Dynamic Equity Fund | | $ | 13,401 | | | $ | 34,236 | |
| Emerging Growth Fund | | | 1,517 | | | | 7 | |
| International Equity Fund | | | 180 | | | | 7 | |
| Balanced Allocation Fund | | | 7,425 | | | | 116,647 | |
| Conservative Allocation Fund | | | 6,229 | | | | 50,701 | |
| Growth Allocation Fund | | | 7,838 | | | | 72,204 | |
| Moderate Growth Allocation Fund | | | 11,213 | | | | 141,456 | |
Prior to April 16, 2012, the Fund’s had a Plan of Distribution (“Former Class A Plan”) under which Class A shares of each Fund could directly incur or reimburse the former Advisor or the Underwriter for expenses related to the distribution and promotion of shares. The annual limitation for payment of such expenses under the Former Class A Plan was 0.25% of average daily net assets attributable to such shares. Prior to April 16, 2012, the Trust also had a Plan of Distribution (“Former Class C Plan”) under which Class C shares for all Funds except Emerging Growth and International Equity Funds could directly incur or reimburse the Advisor or the Underwriter for expenses related to the distribution and promotion of shares. The annual limitation for payment of such expenses under the Former Class C Plan was 0.75% of average daily net assets attributable to such shares. For the period August 1, 2011 through April 15, 2012, the Funds paid expenses under the Former Class A and Class C Plans, which is included in the Distribution expenses, Class A and Distributions and Shareholder servicing expenses Class C, respectively on the Statements of Operations as follows:
Notes to Financial Statements (Continued)
| | | | | | Distribution | |
| | | | | | and | |
| | | | | | Shareholder | |
| | | Distribution | | | Servicing | |
| | | Expenses | | | Expenses | |
| Fund | | Class A | | | Class C | |
| Dynamic Equity Fund | | $ | 36,418 | | | $ | 91,542 | |
| Emerging Growth Fund | | | 4,638 | | | | — | |
| International Equity Fund | | | 452 | | | | — | |
| Balanced Allocation Fund | | | 19,904 | | | | 320,749 | |
| Conservative Allocation Fund | | | 12,584 | | | | 132,901 | |
| Growth Allocation Fund | | | 20,872 | | | | 198,159 | |
| Moderate Growth Allocation Fund | | | 29,758 | | | | 378,637 | |
UNDERWRITING AGREEMENT
The Underwriter is the Funds’ principal underwriter and, as such, acts as exclusive agent for distribution of the Funds’ shares.
Under the terms of the Underwriting Agreement between the Trust and Underwriter, the Underwriter earned the following from underwriting and broker commissions on the sale of shares of the following Funds during the five months ended December 31, 2012:
| Fund | | Amount | |
| Dynamic Equity Fund | | $ | 27,356 | |
| Emerging Growth Fund | | | 589 | |
| International Equity Fund | | | 1,391 | |
| Balanced Allocation Fund | | | 10,911 | |
| Conservative Allocation Fund | | | 6,325 | |
| Growth Allocation Fund | | | 10,798 | |
| Moderate Growth Allocation Fund | | | 18,782 | |
In addition, the Underwriter collected contingent deferred sales charges on the redemption of Class C shares of the following Funds during the five months ended December 31, 2012:
| Fund | | Amount | |
| Dynamic Equity Fund | | $ | 398 | |
| Balanced Allocation Fund | | | 90 | |
| Conservative Allocation Fund | | | 12 | |
| Growth Allocation Fund | | | 580 | |
| Moderate Growth Allocation Fund | | | 112 | |
The Underwriter earned the following from underwriting and broker commissions on the sale of shares of the following Funds during the year ended July 31, 2012:
| Fund | | Amount | |
| Dynamic Equity Fund | | $ | 9,841 | |
| Emerging Growth Fund | | | 1,960 | |
| International Equity Fund | | | 271 | |
| Balanced Allocation Fund | | | 3,522 | |
| Conservative Allocation Fund | | | 80 | |
| Growth Allocation Fund | | | 3,918 | |
| Moderate Growth Allocation Fund | | | 8,077 | |
Notes to Financial Statements (Continued)
The Underwriter collected contingent deferred sales charges on the redemption of Class C shares of the following Funds during the year ended July 31, 2012:
| Fund | | Amount | |
| Dynamic Equity Fund | | $ | 3 | |
| Balanced Allocation Fund | | | 408 | |
| Conservative Allocation Fund | | | 228 | |
| Growth Allocation Fund | | | 348 | |
| Moderate Growth Allocation Fund | | | 556 | |
AFFILIATED INVESTMENTS
Each Fund may invest in the Touchstone Institutional Money Market Fund, subject to compliance with several conditions set forth in an exemptive order received by the Trust from the Securities and Exchange Commission. To the extent that the other Touchstone Funds are invested in the Touchstone Institutional Money Market Fund, the Advisor and Administrator will be paid additional fees from the Touchstone Institutional Money Market Fund that will not be waived or reimbursed.
A summary of each Fund’s investment, as applicable, in the Touchstone Institutional Money Market Fund for the five months ended December 31, 2012, is as follows:
| | | Share Activity | | | | | | | |
| | | Balance | | | | | | | | | Balance | | | | | | Value | |
| Fund | | 07/31/12 | | | Purchases | | | Sales | | | 12/31/12 | | | Dividends | | | 12/31/12 | |
| Dynamic Equity Fund | | | 645,981 | | | | 27,511,693 | | | | (25,172,125 | ) | | | 2,985,549 | | | $ | 1,322 | | | $ | 2,985,549 | |
| Emerging Growth Fund | | | 247,376 | | | | 5,235,173 | | | | (5,464,867 | ) | | | 17,682 | | | | 122 | | | | 17,682 | |
| International Equity Fund | | | 228,830 | | | | 5,823,097 | | | | (6,051,925 | ) | | | 2 | | | | 153 | | | | 2 | |
A summary of each Allocation Fund’s transactions in affiliated underlying funds during the five months ended December 31, 2012 is as follows:
| Balanced Allocation Fund | | | | | | | | | | | | | | | |
| | | Purchases at | | | | Proceeds | | | | Value at | | | | Dividend | | | | Net Realized | |
| Underlying Fund | | | cost | | | | from sale | | | | 12/31/12 | | | | Income | | | | Gain/Loss | |
| Ttouchstone Core Bond Fund | | $ | 69,593,448 | | | $ | 30,230,776 | | | $ | 6,177,880 | | | $ | 85,116 | | | $ | (470,085 | ) |
| Touchstone Short Duration Fixed Income Fund, Class Y | | | 11,991,501 | | | | 1,092,188 | | | | 14,991,535 | | | | 88,570 | | | | 69 | |
| Touchstone Total Return Bond Fund | | | 11,121,264 | | | | 1,471,854 | | | | 16,189,261 | | | | 169,267 | | | | 19,210 | |
| Touchstone International Equity Fund | | | 2,188,844 | | | | 901,300 | | | | 6,302,967 | | | | 144,540 | | | | 29,847 | |
| Touchstone International Small Cap Fund | | | 4,501,378 | | | | 461,035 | | | | 4,700,450 | | | | 76,393 | | | | (18,352 | ) |
| Touchstone International Value Fund | | | 12,423,385 | | | | 1,008,399 | | | | 11,030,219 | | | | 353,286 | | | | (62,869 | ) |
| Touchstone Focused Fund | | | 5,446,947 | | | | 3,444,489 | | | | 3,142,016 | | | | 24,512 | | | | 266,538 | |
| Touchstone Value Fund | | | 40,657,469 | | | | 12,746,367 | | | | 13,987,910 | | | | 128,232 | | | | 1,442,475 | |
| Touchstone Sands Capital Institutional Growth | | | 7,348,960 | | | | 698,760 | | | | 9,347,300 | | | | 4,177 | | | | 326,871 | |
| Touchstone International Fixed Income Fund | | | 5,308,140 | | | | 552,829 | | | | 7,713,033 | | | | 35,151 | | | | 26,907 | |
| Touchstone Strategic Income Fund | | | 7,322,214 | | | | 499,455 | | | | 6,982,686 | | | | 133,152 | | | | (2,108 | ) |
Notes to Financial Statements (Continued)
| Balanced Allocation Fund | | | | | | | | | | | | | | | |
| | | Purchases at | | | Proceeds | | | Value at | | | Dividend | | | Net Realized | |
| Underlying Fund | | cost | | | from sale | | | 12/31/12 | | | Income | | | Gain/Loss | |
| Touchstone Emerging Markets Equity Fund | | $ | 6,763,888 | | | $ | 838,980 | | | $ | 6,303,825 | | | $ | 48,304 | | | $ | 16,026 | |
| Touchstone Mid Cap Fund | | | 2,370,923 | | | | 323,919 | | | | 3,104,921 | | | | 67,019 | | | | (139 | ) |
| Touchstone Mid Cap Growth Fund | | | 2,492,483 | | | | 252,473 | | | | 3,129,330 | | | | — | | | | 195,917 | |
| Touchstone Dynamic Equity Fund | | | 4,633,206 | | | | 350,251 | | | | 6,153,930 | | | | — | | | | 2,039 | |
| Touchstone Large Cap Relative Value Fund, Class Y | | | 4,717,274 | | | | 1,075,664 | | | | 5,445,697 | | | | 31,769 | | | | (11,133 | ) |
| Touchstone Global Real Estate Fund | | | 3,142,264 | | | | 518,322 | | | | 4,741,109 | | | | 124,103 | | | | 34,789 | |
| Touchstone Merger Arbitrage Fund | | | 3,516,830 | | | | 370,907 | | | | 4,645,072 | | | | — | | | | 47,977 | |
| Touchstone Institutional Money Market Fund | | | 3,470,638 | | | | 340,403 | | | | 4,624,881 | | | | 2,103 | | | | — | |
| Touchstone High Yield Fund | | | 2,211,698 | | | | 400,408 | | | | 3,878,975 | | | | 90,592 | | | | 52 | |
| Touchstone Mid Cap Value Fund | | | 2,360,661 | | | | 271,478 | | | | 3,130,656 | | | | 11,160 | | | | 30,238 | |
| Touchstone Global Equity Fund | | | 478,193 | | | | 224,235 | | | | 3,129,207 | | | | 28,261 | | | | 17,574 | |
| Touchstone Small Cap Core Fund | | | 2,375,199 | | | | 272,740 | | | | 3,118,541 | | | | 43,773 | | | | 21,001 | |
| Touchstone Large Cap Growth Fund, Class Y | | | 14,839,834 | | | | 14,570,207 | | | | 3,079,810 | | | | 19,887 | | | | 1,096,170 | |
| Touchstone Growth Opportunities | | | 14,809,135 | | | | 9,074,460 | | | | — | | | | — | | | | 1,672,788 | |
| Touchstone Small Company Value Fund | | | 2,382,662 | | | | 3,015,660 | | | | — | | | | — | | | | 632,997 | |
| Touchstone Ultra Short Duration Fixed Income Fund | | | 25,271,625 | | | | 12,953,084 | | | | — | | | | — | | | | 317,271 | |
| Total: | | $ | 273,740,063 | | | $ | 97,960,643 | | | $ | 155,051,211 | | | $ | 1,709,367 | | | $ | 5,632,070 | |
Conservative Allocation Fund
| | | Purchases at | | | Proceeds | | | Value at | | | Dividend | | | Net Realized | |
| Underlying Fund | | cost | | | from sale | | | 12/31/12 | | | Income | | | Gain/Loss | |
| Touchstone Core Bond Fund | | $ | 57,037,870 | | | $ | 25,209,579 | | | $ | 5,286,194 | | | $ | 74,254 | | | $ | (80,275 | ) |
| Touchstone Short Duration Fixed Income Fund, Class Y | | | 13,458,732 | | | | 1,179,416 | | | | 17,608,669 | | | | 107,625 | | | | (340 | ) |
| Touchstone Total Return Bond Fund | | | 11,996,626 | | | | 1,719,976 | | | | 16,723,746 | | | | 177,547 | | | | 19,836 | |
| Touchstone International Fixed Income Fund | | | 5,055,461 | | | | 614,419 | | | | 7,020,502 | | | | 32,521 | | | | 23,853 | |
| Touchstone Value Fund | | | 13,998,740 | | | | 4,575,206 | | | | 5,309,423 | | | | 48,627 | | | | 634,340 | |
| Touchstone Strategic Income Fund | | | 5,202,613 | | | | 426,368 | | | | 4,856,148 | | | | 94,035 | | | | (2,092 | ) |
| Touchstone Sands Capital Institutional Growth Fund | | | 3,624,405 | | | | 490,511 | | | | 4,447,805 | | | | 1,959 | | | | 151,774 | |
| Touchstone International Small Cap Fund | | | 968,688 | | | | 105,142 | | | | 885,908 | | | | 14,319 | | | | 1,765 | |
Notes to Financial Statements (Continued)
Conservative Allocation Fund
| | | Purchases at | | | Proceeds | | | Value at | | | Dividend | | | Net Realized | |
| Underlying Fund | | cost | | | from sale | | | 12/31/12 | | | Income | | | Gain/Loss | |
| Touchstone International Value Fund | | $ | 3,987,596 | | | $ | 425,409 | | | $ | 3,556,478 | | | $ | 113,037 | | | $ | (17,814 | ) |
| Touchstone Institutional Money Market Fund | | | 3,761,186 | | | | 807,898 | | | | 4,399,148 | | | | 2,028 | | | | — | |
| Touchstone Dynamic Equity Fund | | | 2,679,186 | | | | 233,363 | | | | 3,538,549 | | | | — | | | | (975 | ) |
| Touchstone Merger Arbitrage Fund | | | 2,699,765 | | | | 331,310 | | | | 3,526,575 | | | | — | | | | 37,566 | |
| Touchstone High Yield Fund | | | 1,457,906 | | | | 315,847 | | | | 2,644,642 | | | | 63,678 | | | | 1,418 | |
| Touchstone Large Cap Relative Value Fund | | | 2,051,736 | | | | 627,364 | | | | 2,213,230 | | | | 13,036 | | | | (14,261 | ) |
| Touchstone Small Cap Core Fund | | | 1,388,829 | | | | 207,301 | | | | 1,780,296 | | | | 24,781 | | | | 14,001 | |
| Touchstone Global Real Estate Fund | | | 1,388,463 | | | | 245,714 | | | | 1,774,138 | | | | 46,160 | | | | 15,766 | |
| Touchstone Emerging Markets Equity Fund | | | 996,055 | | | | 146,091 | | | | 893,014 | | | | 6,989 | | | | 3,723 | |
| Touchstone Global Equity Fund | | | 256,561 | | | | 98,822 | | | | 888,940 | | | | 8,004 | | | | 4,679 | |
| Touchstone Mid Cap Fund | | | 688,185 | | | | 113,529 | | | | 887,405 | | | | 16,776 | | | | 1,931 | |
| Touchstone Growth Opportunities Fund | | | 4,521,196 | | | | 3,209,955 | | | | — | | | | — | | | | 949,357 | |
| Touchstone International Equity Fund | | | 104,880 | | | | 1,354,117 | | | | — | | | | — | | | | 329,421 | |
| Touchstone Large Cap Growth Fund | | | 4,499,588 | | | | 5,790,885 | | | | — | | | | — | | | | 1,293,297 | |
| Touchstone Small Company Value Fund | | | 829,213 | | | | 1,066,722 | | | | — | | | | — | | | | 237,510 | |
| Touchstone Ultra Short Duration Fixed Income Fund | | | 20,284,081 | | | | 10,381,912 | | | | — | | | | — | | | | 239,871 | |
| Total: | | $ | 162,937,561 | | | $ | 59,676,856 | | | $ | 88,240,810 | | | $ | 845,376 | | | $ | 3,844,351 | |
Growth Allocation Fund
| | | Purchases at | | | Proceeds | | | Value at | | | Dividend | | | Net Realized | |
| Underlying Fund | | cost | | | from sale | | | 12/31/12 | | | Income | | | Gain/Loss | |
| Touchstone International Equity Fund | | $ | 728,362 | | | $ | 664,480 | | | $ | 5,183,432 | | | $ | 119,433 | | | $ | 17,303 | |
| Touchstone International Small Cap Fund | | | 3,069,254 | | | | 446,679 | | | | 4,287,749 | | | | 69,895 | | | | (22,095 | ) |
| Touchstone International Value Fund | | | 8,929,772 | | | | 809,130 | | | | 7,793,043 | | | | 250,755 | | | | (49,181 | ) |
| Touchstone Focused Equity Fund | | | 6,978,582 | | | | 4,695,690 | | | | 4,297,300 | | | | 33,617 | | | | 377,685 | |
| Touchstone Value Fund | | | 34,243,973 | | | | 13,899,642 | | | | 7,666,581 | | | | 74,637 | | | | 1,028,975 | |
| Touchstone Emerging Growth Fund | | | 1,825,237 | | | | 164,356 | | | | 2,578,351 | | | | — | | | | 204,909 | |
| Touchstone Sands Capital Institutional Growth Fund | | | 4,520,194 | | | | 352,501 | | | | 6,830,699 | | | | 3,058 | | | | 240,085 | |
| Touchstone Emerging Markets Equity Fund | | | 9,280,392 | | | | 1,101,697 | | | | 8,629,095 | | | | 74,960 | | | | 20,172 | |
| Touchstone Global Real Estate Fund | | | 3,420,932 | | | | 509,694 | | | | 5,187,649 | | | | 136,064 | | | | 37,335 | |
Notes to Financial Statements (Continued)
Growth Allocation Fund
| | | Purchases at | | | Proceeds | | | Value at | | | Dividend | | | Net Realized | |
| Underlying Fund | | cost | | | from sale | | | 12/31/12 | | | Income | | | Gain/Loss | |
| Touchstone Small Cap Core Fund | | $ | 2,210,684 | | | $ | 253,681 | | | $ | 3,421,373 | | | $ | 48,024 | | | $ | 23,136 | |
| Touchstone Small Company Value Fund | | | 2,271,187 | | | | 803,882 | | | | 1,725,072 | | | | 41,730 | | | | 407,053 | |
| Touchstone Global Equity Fund | | | 1,713,106 | | | | 238,007 | | | | 4,281,335 | | | | 38,793 | | | | 21,213 | |
| Touchstone Mid Cap Fund | | | 1,658,239 | | | | 232,286 | | | | 2,554,320 | | | | 48,775 | | | | (2 | ) |
| Touchstone Mid Cap Growth Fund | | | 1,173,698 | | | | 125,898 | | | | 1,712,471 | | | | — | | | | 106,684 | |
| Touchstone Short Duration Fixed Income Fund | | | 2,774,440 | | | | 381,762 | | | | 4,124,718 | | | | 26,761 | | | | (10 | ) |
| Touchstone Mid Cap Value Fund | | | 2,193,257 | | | | 257,301 | | | | 3,425,871 | | | | 20,717 | | | | 32,363 | |
| Touchstone Large Cap Relative Value Fund | | | 2,735,641 | | | | 985,763 | | | | 3,407,567 | | | | 20,403 | | | | (31,890 | ) |
| Touchstone Dynamic Equity Fund | | | 2,526,788 | | | | 157,497 | | | | 3,360,589 | | | | — | | | | (1,103 | ) |
| Touchstone Large Cap Growth Fund | | | 11,844,208 | | | | 11,855,213 | | | | 2,544,130 | | | | 16,801 | | | | 864,222 | |
| Touchstone Merger Arbitrage Fund | | | 1,049,305 | | | | 421,254 | | | | 1,673,988 | | | | — | | | | 18,099 | |
| Touchstone Growth Opportunities Fund | | | 12,348,655 | | | | 7,485,071 | | | | — | | | | — | | | | 1,311,776 | |
| Touchstone Small Cap Value Opportunities Fund | | | 31,999 | | | | 804,965 | | | | — | | | | — | | | | 60,964 | |
| Touchstone Ultra Short Duration Fixed Income Fund | | | 1,046,327 | | | | 538,397 | | | | — | | | | — | | | | 15,234 | |
| Touchstone Core Bond Fund | | | 2,062,055 | | | | 1,076,740 | | | | — | | | | — | | | | 45,713 | |
| Touchstone Strategic Income Fund | | | 1,043,119 | | | | 1,086,900 | | | | — | | | | — | | | | 43,782 | |
| Total: | | $ | 121,679,406 | | | $ | 49,348,489 | | | $ | 84,685,333 | | | $ | 1,024,423 | | | $ | 4,772,422 | |
Moderate Growth Allocation Fund
| | | Purchases at | | | Proceeds | | | Value at | | | Dividend | | | Net Realized | |
| Underlying Fund | | cost | | | from sale | | | 12/31/12 | | | Income | | | Gain/Loss | |
| Touchstone International Equity Fund | | $ | 2,142,983 | | | $ | 934,152 | | | $ | 9,077,781 | | | $ | 207,013 | | | $ | 4,419 | |
| Touchstone International Small Cap Fund | | | 4,274,111 | | | | 419,136 | | | | 5,392,096 | | | | 87,496 | | | | (17,815 | ) |
| Touchstone International Value Fund | | | 15,374,405 | | | | 2,797,809 | | | | 12,713,598 | | | | 405,856 | | | | (134,975 | ) |
| Touchstone Short Duration Fixed Income Fund | | | 5,363,868 | | | | 409,217 | | | | 7,500,729 | | | | 46,178 | | | | 70 | |
| Touchstone Total Return Bond Fund | | | 11,540,237 | | | | 1,219,824 | | | | 17,997,268 | | | | 188,961 | | | | 16,245 | |
| Touchstone Focused Equity Fund | | | 14,913,510 | | | | 9,560,451 | | | | 8,998,887 | | | | 69,845 | | | | 690,196 | |
| Touchstone Value Fund | | | 54,789,462 | | | | 21,010,468 | | | | 15,987,166 | | | | 150,710 | | | | 2,642,179 | |
| Touchstone Emerging Growth Fund | | | 1,334,172 | | | | 62,660 | | | | 1,804,063 | | | | — | | | | 141,725 | |
| Touchstone Sands Capital Institutional Growth Fund | | | 10,021,718 | | | | 451,980 | | | | 14,292,292 | | | | 6,393 | | | | 509,921 | |
Notes to Financial Statements (Continued)
Moderate Growth Allocation Fund
| | | Purchases at | | | Proceeds | | | Value at | | | Dividend | | | Net Realized | |
| Underlying Fund | | cost | | | from sale | | | 12/31/12 | | | Income | | | Gain/Loss | |
| Touchstone Emerging Markets Equity Fund | | $ | 13,298,598 | | | $ | 1,304,703 | | | $ | 12,697,765 | | | $ | 57,948 | | | $ | 25,873 | |
| Touchstone Mid Cap Fund | | | 3,674,015 | | | | 401,936 | | | | 5,342,402 | | | | 102,014 | | | | 2,570 | |
| Touchstone Mid Cap Growth Fund | | | 2,601,209 | | | | 163,475 | | | | 3,590,562 | | | | — | | | | 226,290 | |
| Touchstone Global Real Estate Fund | | | 5,039,443 | | | | 572,514 | | | | 7,267,697 | | | | 188,703 | | | | 57,848 | |
| Touchstone Large Cap Relative Value Fund | | | 6,083,075 | | | | 1,853,256 | | | | 7,178,423 | | | | 42,675 | | | | (45,929 | ) |
| Touchstone Small Cap Core Fund | | | 3,668,422 | | | | 304,949 | | | | 5,363,774 | | | | 75,288 | | | | 37,989 | |
| Touchstone Small Company Value Fund | | | 3,768,111 | | | | 2,593,723 | | | | 1,808,838 | | | | — | | | | 780,611 | |
| Touchstone Global Equity Fund | | | 3,923,627 | | | | 258,645 | | | | 7,167,931 | | | | 64,722 | | | | 39,372 | |
| Touchstone Dynamic Equity Fund | | | 5,453,906 | | | | 223,588 | | | | 7,014,788 | | | | — | | | | (290 | ) |
| Touchstone Strategic Income Fund | | | 6,452,888 | | | | 354,219 | | | | 6,177,725 | | | | 117,244 | | | | (1,264 | ) |
| Touchstone Mid Cap Value Fund | | | 3,649,300 | | | | 278,040 | | | | 5,393,583 | | | | 32,217 | | | | 56,652 | |
| Touchstone High Yield Fund | | | 1,821,600 | | | | 254,294 | | | | 3,551,584 | | | | 83,328 | | | | 114 | |
| Touchstone Merger Arbitrage Fund | | | 2,258,906 | | | | 620,595 | | | | 3,537,913 | | | | — | | | | 38,347 | |
| Touchstone International Fixed Income Fund | | | 1,752,648 | | | | 156,398 | | | | 3,520,481 | | | | 16,773 | | | | 12,264 | |
| Touchstone Large Cap Growth Fund | | | 18,542,792 | | | | 21,066,758 | | | | 3,510,342 | | | | 22,892 | | | | 3,635,507 | |
| Touchstone Growth Opportunities Fund | | | 20,073,300 | | | | 13,127,134 | | | | — | | | | — | | | | 3,090,484 | |
| Touchstone Core Bond Fund | | | 37,938,955 | | | | 19,943,408 | | | | — | | | | — | | | | 973,931 | |
| Touchstone Small Cap Value Fund | | | 26,064 | | | | 729,318 | | | | — | | | | 43,140 | | | | 53,390 | |
| Touchstone Ultra Short Duration Fixed Income Fund | | | 14,099,986 | | | | 7,252,766 | | | | — | | | | — | | | | 202,773 | |
| Touchstone Emerging Markets Equity Fund II | | | — | | | | — | | | | — | | | | 44,205 | | | | — | |
| Total: | | $ | 273,881,311 | | | $ | 108,325,416 | | | $ | 176,887,688 | | | $ | 2,053,601 | | | $ | 13,038,497 | |
A summary of each Fund’s investment, as applicable, in the Old Mutual Cash Reserves Fund and the Touchstone Institutional Money Market Fund for the year ended July 31, 2012, is as follows:
| | | Share Activity | | | | | | | |
| | | Balance | | | | | | | | | Balance | | | | | | Value | |
| Fund | | 07/31/11 | | | Purchases | | | Sales | | | 07/31/12 | | | Dividends | | | 07/31/12 | |
| Dynamic Equity Fund | | | 594,282 | | | | 40,038,758 | | | | (39,987,059 | ) | | | 645,981 | | | $ | 1,207 | | | $ | 645,981 | |
| Emerging Growth Fund | | | 262,400 | | | | 27,448,148 | | | | (27,463,172 | ) | | | 247,376 | | | | 226 | | | | 247,376 | |
| International Equity Fund | | | 456,154 | | | | 10,340,150 | | | | 10,567,474 | | | | 228,830 | | | | 138 | | | | 228,830 | |
Notes to Financial Statements (Continued)
A summary of the Fund’s transactions in affiliated underlying funds during the year ended July 31, 2012 is as follows:
Balanced Allocation Fund
| | | Purchases at | | | Proceeds | | | Value at | | | Dividend | | | Net Realized | |
| Underlying Fund | | cost | | | from sale | | | 07/31/12 | | | Income | | | Gain/Loss * | |
| Touchstone Core Bond Fund ^ | | $ | 396,661 | | | $ | 2,463,462 | | | $ | 1,994,840 | | | $ | 89,542 | | | $ | 104,005 | |
| Touchstone Short Duration Fixed Income Fund | | | 4,947,996 | | | | 833,494 | | | | 4,122,249 | | | | 26,577 | | | | (640 | ) |
| Touchstone Total Return Bond Fund ^ | | | 2,056,695 | | | | 9,988,141 | | | | 6,477,995 | | | | 359,042 | | | | 1,028,654 | |
| Touchstone Focused Fund ^ | | | 658,210 | | | | 3,981,703 | | | | 997,485 | | | | 75,384 | | | | 165,400 | |
| Touchstone Value Fund ^ | | | 269,758 | | | | 4,057,138 | | | | 4,477,134 | | | | 120,981 | | | | 1,093,888 | |
| Touchstone International Equity Fund ^ | | | 1,370,314 | | | | 2,970,635 | | | | 4,527,385 | | | | 201,627 | | | | (501,104 | ) |
| Touchstone International Small Cap Fund ^ | | | 50,125 | | | | 742,935 | | | | 500,617 | | | | 31,053 | | | | (51,906 | ) |
| Touchstone International Fixed Income Fund | | | 3,290,729 | | | | 311,983 | | | | 3,010,204 | | | | 14,079 | | | | (1,877 | ) |
| Touchstone Sands Capital Institutional Growth Fund | | | 3,280,105 | | | | 157,743 | | | | 2,949,680 | | | | — | | | | (5,176 | ) |
| Touchstone Global Equity Fund | | | 2,809,493 | | | | 9,551 | | | | 2,764,259 | | | | — | | | | (244 | ) |
| Touchstone Emerging Markets Equity Fund II | | | 2,191,400 | | | | 105,597 | | | | 2,006,578 | | | | — | | | | (4,797 | ) |
| Touchstone High Yield Fund | | | 2,231,734 | | | | 237,298 | | | | 2,004,630 | | | | 46,368 | | | | (904 | ) |
| Touchstone Dynamic Equity Fund ^ | | | 2,182,150 | | | | 248,109 | | | | 2,001,470 | | | | — | | | | 951 | |
| Touchstone Large Cap Relative Value Fund | | | 2,190,658 | | | | 145,901 | | | | 1,993,030 | | | | 6,463 | | | | (2,580 | ) |
| Touchstone Global Real Estate Fund | | | 2,197,156 | | | | 299,351 | | | | 1,992,955 | | | | 14,279 | | | | 2,259 | |
| Touchstone Mid Cap Fund | | | 1,090,701 | | | | 106,988 | | | | 995,267 | | | | — | | | | (1,579 | ) |
| Touchstone Mid Cap Growth Fund | | | 1,093,172 | | | | 48,399 | | | | 990,981 | | | | — | | | | (1,539 | ) |
| Touchstone Merger Arbitrage Fund | | | 1,639,687 | | | | 144,394 | | | | 1,496,886 | | | | — | | | | (416 | ) |
| Touchstone Mid Cap Value Fund ^ | | | 1,093,577 | | | | 69,228 | | | | 1,000,015 | | | | 72,957 | | | | (1,611 | ) |
| Touchstone Large Cap Growth Fund | | | 1,090,855 | | | | 83,040 | | | | 991,152 | | | | — | | | | (689 | ) |
| Touchstone Small Cap Core Fund | | | 1,091,451 | | | | 89,768 | | | | 989,446 | | | | — | | | | (1,862 | ) |
| Touchstone Capital Growth Fund ^ | | | 907,621 | | | | 4,095,559 | | | | — | | | | 7,621 | | | | 1,201,314 | |
| Touchstone Emerging Growth Fund ^ | | | 500,000 | | | | 2,539,762 | | | | — | | | | — | | | | 691,208 | |
| Touchstone Mid Cap Value Opportunities Fund ^ | | | 417,019 | | | | 6,641,504 | | | | — | | | | — | | | | 260,975 | |
| Touchstone Institutional Money Market Fund | | | 1,641,212 | | | | 146,566 | | | | 1,494,647 | | | | 739 | | | | — | |
| Touchstone Small Cap Value Fund | | | 152,331 | | | | 3,119,704 | | | | — | | | | — | | | | 957,703 | |
| Touchstone Ultra Short Fixed Income Fund ^ | | | 2,616,494 | | | | 7,410,715 | | | | — | | | | 79,465 | | | | 33,348 | |
Notes to Financial Statements (Continued)
Balanced Allocation Fund
| | | Purchases at | | | Proceeds | | | Value at | | | Dividend | | | Net Realized | |
| Underlying Fund | | cost | | | from sale | | | 07/31/12 | | | Income | | | Gain/Loss * | |
| Touchstone U.S. Long/Short Fund ^ | | $ | 571,946 | | | $ | 2,894,127 | | | $ | — | | | $ | 21,946 | | | $ | (147,274 | ) |
| Old Mutual Cash Reserves Fund + | | | 7,683,041 | | | | 8,074,670 | | | | — | | | | — | | | | — | |
| Old Mutual Dwight High Yield Fund + | | | 106,631 | | | | 2,514,412 | | | | — | | | | 74,155 | | | | 158,462 | |
| Old Mutual Heitman REIT Fund + | | | 209,429 | | | | 1,394,951 | | | | — | | | | 9,429 | | | | 475,424 | |
| Total: | | $ | 52,028,351 | | | $ | 65,926,828 | | | $ | 49,778,905 | | | $ | 1,251,707 | | | $ | 5,449,393 | |
* Litigation income from investments held by securities within the underlying funds of $13,124 is not included in this table.
Conservative Allocation Fund
| | | Purchases at | | | Proceeds | | | Value at | | | Dividend | | | Net Realized | |
| Underlying Fund | | cost | | | from sale | | | 07/31/12 | | | Income | | | Gain/Loss ** | |
| Touchstone Core Bond Fund ^ | | $ | 775,477 | | | $ | 4,572,497 | | | $ | 1,740,155 | | | $ | 99,633 | | | $ | 100,957 | |
| Touchstone Short Duration Fixed Income Fund | | | 6,826,065 | | | | 1,471,142 | | | | 5,365,566 | | | | 36,741 | | | | (269 | ) |
| Touchstone Total Return Bond Fund ^ | | | 3,240,739 | | | | 10,473,277 | | | | 6,380,367 | | | | 370,720 | | | | 929,827 | |
| Touchstone International Fixed Income Fund | | | 3,226,312 | | | | 621,386 | | | | 2,631,387 | | | | 13,685 | | | | (4,149 | ) |
| Touchstone Value Fund ^ | | | 761,678 | | | | 1,310,371 | | | | 1,752,963 | | | | 41,971 | | | | 67,367 | |
| Touchstone High Yield Fund | | | 1,822,240 | | | | 372,216 | | | | 1,455,959 | | | | 37,487 | | | | (2,461 | ) |
| Touchstone Institutional Money Market Fund | | | 1,787,145 | | | | 341,284 | | | | 1,445,861 | | | | 793 | | | | — | |
| Touchstone Sands Capital Institutional Growth Fund | | | 1,828,441 | | | | 299,282 | | | | 1,430,773 | | | | — | | | | (17,009 | ) |
| Touchstone International Equity Fund ^ | | | 652,826 | | | | 1,494,203 | | | | 1,171,642 | | | | 65,293 | | | | (310,015 | ) |
| Touchstone Dynamic Equity Fund ^ | | | 1,427,787 | | | | 302,001 | | | | 1,168,789 | | | | — | | | | 3,907 | |
| Touchstone Merger Arbitrage Fund | | | 1,427,828 | | | | 274,100 | | | | 1,156,072 | | | | — | | | | 161 | |
| Touchstone Large Cap Relative Value Fund | | | 1,084,091 | | | | 187,637 | | | | 870,165 | | | | 3,196 | | | | (5,061 | ) |
| Touchstone Global Equity Fund | | | 830,786 | | | | 116,035 | | | | 703,234 | | | | — | | | | (7,430 | ) |
| Touchstone Global Real Estate Fund | | | 718,618 | | | | 157,988 | | | | 588,995 | | | | 4,730 | | | | 458 | |
| Touchstone Small Cap Core Fund | | | 723,866 | | | | 133,905 | | | | 580,192 | | | | — | | | | (5,298 | ) |
| Touchstone Small Cap Value Fund | | | 3,291 | | | | 24,268 | | | | — | | | | — | | | | 5,193 | |
| Touchstone Emerging Markets Equity Fund II | | | 359,045 | | | | 52,020 | | | | 292,662 | | | | — | | | | (3,525 | ) |
| Touchstone Mid Cap Fund | | | 358,262 | | | | 68,446 | | | | 292,467 | | | | — | | | | (1,589 | ) |
| Touchstone Ultra Short Duration Fixed Income Fund ^ | | | 2,045,579 | | | | 7,586,059 | | | | — | | | | 84,530 | | | | 112,444 | |
| Touchstone Capital Growth Fund ^ | | | 362,161 | | | | 1,628,277 | | | | — | | | | 2,109 | | | | 554,281 | |
| Touchstone Emerging Growth Fund ^ | | | 91,101 | | | | 1,030,121 | | | | — | | | | — | | | | 284,533 | |
Notes to Financial Statements (Continued)
Conservative Allocation Fund
| | | Purchases at | | | Proceeds | | | Value at | | | Dividend | | | Net Realized | |
| Underlying Fund | | cost | | | from sale | | | 07/31/12 | | | Income | | | Gain/Loss ** | |
| Touchstone Focused Fund ^ | | $ | 392,992 | | | $ | 1,812,219 | | | $ | — | | | $ | 20,619 | | | $ | 415,237 | |
| Touchstone Mid Cap Value Opportunities Fund ^ | | | 403,349 | | | | 2,841,388 | | | | — | | | | 27,161 | | | | 582,759 | |
| Touchstone U.S. Long/Short Fund ^ | | | 269,663 | | | | 1,013,172 | | | | — | | | | 5,769 | | | | 256,310 | |
| Old Mutual Cash Reserves Fund + | | | 4,998,675 | | | | 5,221,409 | | | | — | | | | — | | | | — | |
| Old Mutual Dwight High Yield Fund + | | | 61,144 | | | | 2,328,550 | | | | — | | | | 43,931 | | | | 152,797 | |
| Total: | | $ | 36,479,161 | | | $ | 45,733,253 | | | $ | 29,027,249 | | | $ | 858,368 | | | $ | 3,109,425 | |
** Litigation income from investments held by securities within the underlying funds of $3,103 is not included in this table.
Growth Allocation Fund
| | | Purchases at | | | Proceeds | | | Value at | | | Dividend | | | Net Realized | |
| Underlying Fund | | cost | | | from sale | | | 07/31/12 | | | Income | | | Gain/Loss *** | |
| Touchstone International Equity Fund ^ | | $ | 1,822,059 | | | $ | 7,926,888 | | | $ | 4,653,582 | | | $ | 311,151 | | | $ | (2,295,517 | ) |
| Touchstone International Small Cap Fund ^ | | | 144,865 | | | | 475,944 | | | | 1,425,634 | | | | 50,176 | | | | (50,672 | ) |
| Touchstone Focused Fund ^ | | | 191,487 | | | | 3,145,031 | | | | 1,772,815 | | | | 69,182 | | | | (175,475 | ) |
| Touchstone Value Fund ^ | | | 321,274 | | | | 6,195,544 | | | | 3,194,168 | | | | 108,226 | | | | 638,564 | |
| Touchstone Emerging Growth Fund ^ | | | 71,016 | | | | 2,021,901 | | | | 1,055,454 | | | | — | | | | 629,060 | |
| Touchstone Sands Capital Institutional Growth Fund | | | 3,130,447 | | | | 169,042 | | | | 2,795,339 | | | | — | | | | (8,436 | ) |
| Touchstone Emerging Markets Equity Fund II | | | 3,917,462 | | | | 182,320 | | | | 3,590,598 | | | | — | | | | (10,648 | ) |
| Touchstone Global Equity Fund | | | 2,759,835 | | | | 1,930 | | | | 2,719,940 | | | | — | | | | (188 | ) |
| Touchstone Global Real Estate Fund | | | 2,365,986 | | | | 323,795 | | | | 2,140,854 | | | | 15,093 | | | | (977 | ) |
| Touchstone Small Cap Core Fund | | | 1,568,216 | | | | 136,129 | | | | 1,413,563 | | | | — | | | | (4,004 | ) |
| Touchstone Mid Cap Fund | | | 1,174,498 | | | | 122,199 | | | | 1,063,249 | | | | — | | | | (3,108 | ) |
| Touchstone Mid Cap Growth Fund | | | 782,893 | | | | 38,372 | | | | 706,120 | | | | — | | | | (1,209 | ) |
| Touchstone Large Cap Relative Value Fund | | | 1,963,209 | | | | 148,678 | | | | 1,767,061 | | | | 5,696 | | | | (4,067 | ) |
| Touchstone Short Duration Fixed Income Fund | | | 2,366,465 | | | | 629,015 | | | | 1,740,451 | | | | 20,385 | | | | (535 | ) |
| Touchstone Mid Cap Value Fund | | | 1,570,058 | | | | 117,031 | | | | 1,417,723 | | | | 4,033 | | | | (3,261 | ) |
| Touchstone Dynamic Equity Fund ^ | | | 1,175,306 | | | | 148,511 | | | | 1,061,228 | | | | — | | | | (760 | ) |
| Touchstone Large Cap Growth Fund | | | 1,176,070 | | | | 113,470 | | | | 1,043,880 | | | | — | | | | (1,887 | ) |
| Touchstone Merger Arbitrage Fund | | | 1,177,492 | | | | 136,454 | | | | 1,041,795 | | | | — | | | | (544 | ) |
| Touchstone Capital Growth Fund ^ | | | 358,211 | | | | 4,978,087 | | | | — | | | | 8,211 | | | | 1,371,989 | |
Notes to Financial Statements (Continued)
Growth Allocation Fund
| | | Purchases at | | | Proceeds | | | Value at | | | Dividend | | | Net Realized | |
| Underlying Fund | | cost | | | from sale | | | 07/31/12 | | | Income | | | Gain/Loss *** | |
| Touchstone Mid Cap Value Opportunities Fund ^ | | $ | 380,073 | | | $ | 7,442,621 | | | $ | — | | | $ | 63,881 | | | $ | 731,660 | |
| Touchstone Small Cap Value Fund | | | 1,080,320 | | | | 3,833,476 | | | | 698,257 | | | | 3,262 | | | | 1,096,849 | |
| Touchstone Ultra Short Duration Fixed Income Fund ^ | | | 1,207,711 | | | | 1,210,331 | | | | — | | | | 339 | | | | 2,620 | |
| Touchstone U.S. Long/Short Fund ^ | | | 21,143 | | | | 2,955,265 | | | | — | | | | 21,143 | | | | (310,625 | ) |
| Old Mutual Cash Reserves Fund + | | | 7,223,219 | | | | 7,740,562 | | | | — | | | | — | | | | — | |
| Old Mutual Heitman REIT Fund + | | | 291,361 | | | | 2,442,951 | | | | — | | | | 16,360 | | | | 909,765 | |
| Total: | | $ | 38,240,676 | | | $ | 52,635,547 | | | $ | 35,301,711 | | | $ | 697,138 | | | $ | 2,508,594 | |
*** Litigation income from investments held by securities within the underlying funds of $24,196 is not included in this table.
Moderate Growth Allocation Fund
| | | | | | | | | | | | | | | Net Realized | |
| | | Purchases at | | | Proceeds | | | Value at | | | Dividend | | | Gain/Loss | |
| Underlying Fund | | cost | | | from sale | | | 07/31/12 | | | Income | | | **** | |
| Touchstone Short Duration Fixed Income Fund | | $ | 3,452,764 | | | $ | 895,951 | | | $ | 2,561,284 | | | $ | 17,470 | | | $ | (740 | ) |
| Touchstone Total Return Bond Fund ^ | | | 1,306,135 | | | | 7,569,673 | | | | 7,609,988 | | | | 340,840 | | | | 891,359 | |
| Touchstone Focused Fund ^ | | | 251,584 | | | | 3,926,510 | | | | 3,192,187 | | | | 106,631 | | | | (226,139 | ) |
| Touchstone Value Fund ^ | | | 427,322 | | | | 6,016,597 | | | | 5,824,458 | | | | 166,407 | | | | 1,673,234 | |
| Touchstone International Equity Fund ^ | | | 2,081,643 | | | | 6,403,564 | | | | 7,119,995 | | | | 362,747 | | | | (3,044,693 | ) |
| Touchstone International Small Cap Fund ^ | | | 124,735 | | | | 1,354,181 | | | | 1,283,338 | | | | 66,755 | | | | (93,022 | ) |
| Touchstone Emerging Growth Fund ^ | | | 828,990 | | | | 4,591,882 | | | | 635,949 | | | | — | | | | 1,033,881 | |
| Touchstone Sands Capital Institutional Growth Fund | | | 5,493,404 | | | | 143,903 | | | | 5,059,404 | | | | — | | | | (3,052 | ) |
| Touchstone Emerging Markets Equity Fund II | | | 4,808,515 | | | | 106,981 | | | | 4,526,730 | | | | — | | | | (5,367 | ) |
| Touchstone Global Equity Fund | | | 3,469,635 | | | | 4,758 | | | | 3,417,333 | | | | — | | | | (4 | ) |
| Touchstone Mid Cap Fund | | | 2,060,737 | | | | 135,802 | | | | 1,947,330 | | | | — | | | | (2,858 | ) |
| Touchstone Mid Cap Growth Fund | | | 1,373,696 | | | | 49,235 | | | | 1,256,726 | | | | — | | | | (1,337 | ) |
| Touchstone Large Cap Relative Value Fund | | | 3,444,788 | | | | 168,289 | | | | 3,193,147 | | | | 10,206 | | | | (4,580 | ) |
| Touchstone Global Real Estate Fund | | | 2,765,905 | | | | 264,258 | | | | 2,623,991 | | | | 18,081 | | | | 792 | |
| Touchstone Small Cap Core Fund | | | 2,059,993 | | | | 99,058 | | | | 1,937,706 | | | | — | | | | (2,181 | ) |
| Touchstone Dynamic Equity Fund ^ | | | 2,061,727 | | | | 190,699 | | | | 1,933,844 | | | | — | | | | (1,311 | ) |
| Touchstone Mid Cap Value Fund | | | 2,066,168 | | | | 92,516 | | | | 1,927,936 | | | | 5,405 | | | | (1,872 | ) |
| Touchstone International Fixed Income Fund | | | 2,070,458 | | | | 164,556 | | | | 1,925,741 | | | | 8,859 | | | | (1,275 | ) |
Notes to Financial Statements (Continued)
Moderate Growth Allocation Fund
| | | | | | | | | | | | | | | Net Realized | |
| | | Purchases at | | | Proceeds | | | Value at | | | Dividend | | | Gain/Loss | |
| Underlying Fund | | cost | | | from sale | | | 07/31/12 | | | Income | | | **** | |
| Touchstone High Yield Fund | | $ | 2,105,025 | | | $ | 190,794 | | | $ | 1,923,991 | | | $ | 44,589 | | | $ | (843 | ) |
| Touchstone Merger Arbitrage Fund | | | 2,061,340 | | | | 170,760 | | | | 1,892,368 | | | | — | | | | (581 | ) |
| Touchstone Large Cap Growth Fund | | | 1,374,097 | | | | 96,390 | | | | 1,255,828 | | | | — | | | | (1,562 | ) |
| Touchstone Capital Growth Fund ^ | | | 1,010,499 | | | | 5,478,868 | | | | — | | | | 31,414 | | | | 1,771,581 | |
| Touchstone Core Bond Fund ^ | | | 84,621 | | | | 1,926,461 | | | | — | | | | 10,500 | | | | 30,869 | |
| Touchstone Mid Cap Value Opportunities Fund ^ | | | 515,301 | | | | 9,718,916 | | | | — | | | | 86,610 | | | | 2,415 | |
| Touchstone Small Cap Value Fund | | | 1,028,811 | | | | 7,515,475 | | | | 635,342 | | | | 2,925 | | | | 2,025,135 | |
| Touchstone U.S. Long/Short Fund | | | 31,414 | | | | 4,839,493 | | | | — | | | | — | | | | (645,876 | ) |
| Touchstone Ultra Short Duration Fixed Income Fund | | | 4,620,000 | | | | 4,625,633 | | | | — | | | | 56,389 | | | | 5,633 | |
| Old Mutual Cash Reserves Fund + | | | 10,707,799 | | | | 11,207,540 | | | | — | | | | — | | | | — | |
| Old Mutual Heitman REIT Fund + | | | 1,116,913 | | | | 2,656,812 | | | | — | | | | 16,913 | | | | 680,224 | |
| Total: | | $ | 64,804,019 | | | $ | 80,605,555 | | | $ | 63,684,616 | | | $ | 1,352,741 | | | $ | 4,077,830 | |
**** Litigation income from investments held by securities within the underlying funds of $29,082 is not included in this table.
| + | Underlying Fund is no longer held by the Fund at July 31, 2012. The underlying Fund was affiliated with Old Mutual Funds I (See Note 7). |
^ Includes activity of the Reorganizing Funds (as defined in Note 7), prior to the merger (See Note 7).
5. Federal Tax Information
Federal income tax — It is each Fund’s policy to continue to comply with the special provisions of the Internal Revenue Code applicable to regulated investment companies. As provided therein, in any fiscal year in which a Fund so qualifies and distributes at least 90% of its investment company taxable income, the Fund (but not the shareholders) will be relieved of federal income tax on the income distributed. Accordingly, no provision for income taxes has been made.
In order to avoid imposition of the excise tax applicable to regulated investment companies, it is also each Fund’s intention to declare and pay as dividends in each calendar year at least 98% of its investment company taxable income (earned during the calendar year) and 98.2% of its net realized capital gains (earned during the twelve months ending October 31) plus undistributed amounts from prior years.
Notes to Financial Statements (Continued)
The tax character of distributions paid for the five months ended December 31, 2012 and years ended July 31, 2012 and July 31, 2011 was as follows:
| | | Dynamic | | | Emerging | |
| | | Equity Fund | | | Growth Fund | |
| | | Five Months | | | | | | | | | Five Months | | | | | | | |
| | | Ended | | | Year Ended | | | Year Ended | | | Ended | | | Year Ended | | | Year Ended | |
| | | December 31, | | | July 31, | | | July 31, | | | December 31, | | | July 31, | | | July 31, | |
| | | 2012 | | | 2012 | | | 2011 | | | 2012 | | | 2012 | | | 2011 | |
| From ordinary income | | $ | — | | | $ | 514,890 | | | $ | — | | | $ | 435,878 | | | $ | — | | | $ | — | |
| From long-term capital gains | | | | | | | — | | | | — | | | | 1,112,786 | | | | — | | | | — | |
| | | $ | — | | | $ | 514,890 | | | $ | — | | | $ | 1,548,664 | | | $ | — | | | $ | — | |
| | | International | | | Balanced | |
| | | Equity Fund | | | Allocation Fund | |
| | | Five Months | | | | | | | | | Five Months | | | | | | | |
| | | Ended | | | Year Ended | | | Year Ended | | | Ended | | | Year Ended | | | Year Ended | |
| | | December 31, | | | July 31, | | | July 31, | | | December 31, | | | July 31, | | | July 31, | |
| | | 2012 | | | 2012 | | | 2011 | | | 2012 | | | 2012 | | | 2011 | |
| From ordinary income | | $ | 490,586 | | | $ | 967,252 | | | $ | 890,209 | | | $ | 6,140,882 | | | $ | 607,351 | | | $ | 1,392,283 | |
| From long-term capital gains | | | — | | | | — | | | | — | | | | 137,848 | | | | — | | | | — | |
| | | $ | 490,586 | | | $ | 967,252 | | | $ | 890,209 | | | $ | 6,278,730 | | | $ | 607,351 | | | $ | 1,392,283 | |
| | | Conservative | | | Growth | |
| | | Allocation Fund | | | Allocation Fund | |
| | | Five Months | | | | | | | | | Five Months | | | | | | | |
| | | Ended | | | Year Ended | | | Year Ended | | | Ended | | | Year Ended | | | Year Ended | |
| | | December 31, | | | July 31, | | | July 31, | | | December 31, | | | July 31, | | | July 31, | |
| | | 2012 | | | 2012 | | | 2011 | | | 2012 | | | 2012 | | | 2011 | |
| From ordinary income | | $ | 5,215,403 | | | $ | 589,089 | | | $ | 1,437,898 | | | $ | 1,600,296 | | | $ | 180,489 | | | $ | 118,434 | |
| From long-term capital gains | | | — | | | | — | | | | — | | | | 462 | | | | — | | | | — | |
| | | $ | 5,215,403 | | | $ | 589,089 | | | $ | 1,437,898 | | | $ | 1,600,758 | | | $ | 180,489 | | | $ | 118,434 | |
| | | Moderate Growth | |
| | | Allocation Fund | |
| | | Five Months | | | | | | | |
| | | Ended | | | Year Ended | | | Year Ended | |
| | | December 31, | | | July 31, | | | July 31, | |
| | 2012 | | | 2012 | | | 2011 | |
| From ordinary income | | $ | 3,961,419 | | | $ | 572,935 | | | $ | 706,859 | |
| From long-term capital gains | | | 1,675,414 | | | | — | | | | — | |
| | | $ | 5,636,833 | | | $ | 572,935 | | | $ | 706,859 | |
The following information is computed on a tax basis for each item as of December 31, 2012:
| | | Dynamic | | | Emerging | | | International | |
| | | Equity Fund | | | Growth Fund | | | Equity Fund | |
| Tax cost of portfolio investments | | $ | 74,694,953 | | | $ | 16,259,562 | | | $ | 18,145,102 | |
| Gross unrealized appreciation | | | 8,882,208 | | | | 4,018,883 | | | | 3,584,792 | |
| Gross unrealized depreciation | | | (1,724,591 | ) | | | (460,206 | ) | | | (921,144 | ) |
| Net unrealized appreciation (depreciation) | | | 7,157,617 | | | | 3,558,677 | | | | 2,663,648 | |
| Net unrealized appreciation (depreciation) on written options, short sales and foreign currency and translation of other assets and liabilities denominated in foreign currency | | | (182,336 | ) | | | — | | | | (314 | ) |
| Accumulated capital and other losses | | | (148,826,198 | ) | | | — | | | | (42,665,961 | ) |
| Post-October and qualified late-year losses | | | (933,316 | ) | | | — | | | | — | |
Notes to Financial Statements (Continued)
| | | Dynamic | | | Emerging | | | International | |
| | | Equity Fund | | | Growth Fund | | | Equity Fund | |
| Undistributed ordinary income | | $ | 15,903 | | | $ | 123,718 | | | $ | 24,059 | |
| Undistributed capital gains | | | — | | | | 531,742 | | | | — | |
| Other temporary differences | | | (31,406 | ) | | | — | | | | 1,427 | |
| Accumulated earnings (deficit) | | $ | (142,799,736 | ) | | $ | 4,214,137 | | | $ | (39,977,141 | ) |
| | | | | | | | | | | | Moderate | |
| | | Balanced | | | Conservative | | | Growth | | | Growth | |
| | | Allocation Fund | | | Allocation Fund | | | Allocation Fund | | | Allocation Fund | |
| Tax cost of portfolio investments | | $ | 152,721,699 | | | $ | 88,036,474 | | | $ | 83,860,637 | | | $ | 173,227,179 | |
| Gross unrealized appreciation | | | 5,437,347 | | | | 2,033,192 | | | | 4,381,174 | | | | 8,377,699 | |
| Gross unrealized depreciation | | | (3,107,835 | ) | | | (1,828,856 | ) | | | (3,556,478 | ) | | | (4,717,190 | ) |
| Net unrealized appreciation (depreciation) | | | 2,329,512 | | | | 204,336 | | | | 824,696 | | | | 3,660,509 | |
| Accumulated capital and other losses | | | (42,487,158 | ) | | | (3,634,373 | ) | | | (44,481,926 | ) | | | (44,872,260 | ) |
| Post-October and qualified late-year losses | | | (1,960 | ) | | | (3,365 | ) | | | (2,937 | ) | | | (31,574 | ) |
| Undistributed ordinary income | | | — | | | | — | | | | — | | | | — | |
| Undistributed capital gains | | | — | | | | — | | | | 498,325 | | | | — | |
| Other temporary differences | | | — | | | | — | | | | — | | | | 39,467 | |
| Accumulated earnings (deficit) | | $ | (40,159,606 | ) | | $ | (3,433,402 | ) | | $ | (43,161,842 | ) | | $ | (41,203,858 | ) |
The difference between the tax cost of portfolio investments and the financial statement cost is primarily due to wash sale loss and passive foreign investment company deferrals.
As of December 31, 2012, the Funds had the following capital loss carryforwards for federal income tax purposes:
| | | | | | | | | | | | No | | | | | | | |
| | | | | | | | | | | | Expiration | | | No | | | | |
| | | Short Term Expiring On | | | Short | | | Expiration | | | | |
| | | 2015 | | | 2016 | | | 2017 | | | 2018 | | | 2019 | | | Term* | | | Long Term* | | | Total | |
| Dynamic Equity Fund | | $ | 39,657,235 | | | $ | 31,726,954 | | | $ | 77,442,009 | | | $ | — | | | $ | — | | | $ | — | | | $ | — | | | $ | 148,826,198 | |
| International Equity Fund | | | — | | | | 20,386,332 | | | | 22,279,629 | | | | — | | | | — | | | | — | | | | — | | | | 42,665,961 | |
| Balanced Allocation Fund | | | — | | | | 13,311,819 | | | | 24,373,973 | ** | | | 4,801,366 | ** | | | — | | | | — | | | | — | | | | 42,487,158 | |
| Conservative Allocation Fund | | | — | | | | — | | | | 3,611,052 | ** | | | 23,321 | | | | — | | | | — | | | | — | | | | 3,634,373 | |
| Growth Allocation Fund | | | — | | | | 3,557,561 | ** | | | 30,260,646 | ** | | | 10,663,719 | ** | | | — | | | | — | | | | — | | | | 44,481,926 | |
| Moderate Growth Allocation Fund | | | — | | | | — | | | | 35,744,603 | ** | | | 9,127,657 | ** | | | — | | | | — | | | | — | | | | 44,872,260 | |
* The Regulated Investment Company Modernization Act of 2010 (the “Act”) was enacted on December 22, 2010. The Act makes changes to several tax rules impacting the Funds. In general, the provisions of the Act are in effect for the Funds’ fiscal year ending December 31, 2012. Although the Act provides several benefits, including the unlimited carryover of future capital losses, there may be a greater likelihood that all or a portion of each Fund’s pre-enactment capital loss carryovers may expire without being utilized due to the fact that post-enactment capital losses must be utilized before pre-enactment capital loss carryovers may be utilized. Under the Act, new capital losses may now be carried forward indefinitely, and retain the character of the original loss as compared with pre-enactment law, where capital losses could be carried forward for up to eight years, and carried forward as short-term capital losses, irrespective of the character of the original loss.
** Subject to usage limitation.
The capital loss carryforwards may be utilized in future years to offset net realized capital gains, if any, prior to distributing such gains to shareholders.
During the five months ended December 31, 2012, the following Funds utilized capital loss carryforwards:
| Fund | | Amount | |
| Dynamic Equity Fund | | $ | 873,307 | |
| International Equity Fund | | | 202,007 | |
| Balanced Allocation Fund | | | 4,312,696 | |
Notes to Financial Statements (Continued)
| Fund | | Amount | |
| Conservative Allocation Fund | | $ | 2,010,956 | |
| Growth Allocation Fund | | | 3,035,969 | |
| Moderate Growth Allocation Fund | | | 9,574,279 | |
Under current laws, certain capital losses realized after October 31 and ordinary losses realized after January 1 may be deferred (and certain ordinary losses after January 1st may be deferred ) and treated as occurring on the first day of the following fiscal year. For the five months ended December 31, 2012, the Funds elected to defer the following losses:
| | | Realized | | | Realized | | | | |
| | | Short-Term | | | Long-Term | | | | |
| | | Capital | | | Capital | | | Ordinary | |
| Fund | | Losses | | | Losses | | | Losses | |
| Dynamic Equity Fund | | $ | 933,316 | | | $ | — | | | $ | — | |
| Balanced Allocation Fund | | | 1,960 | | | | — | | | | — | |
| Conservative Allocation Fund | | | 3,365 | | | | — | | | | — | |
| Growth Allocation Fund | | | 2,937 | | | | — | | | | — | |
| Moderate Growth Allocation Fund | | | 31,574 | | | | — | | | | — | |
The Funds have analyzed their tax positions taken on Federal income tax returns for all open tax years (tax years ended December 31, 2012 and July 31, 2009 through 2012) and have concluded that no provision for income tax is required in their financial statements.
Certain reclassifications, the result of permanent differences between financial statement and income tax reporting requirements, have been made to the components of capital. These reclassifications have no impact on the net assets or NAV per share of the Funds and are designed to present the Funds’ capital accounts on a tax basis. The following reclassifications, which are primarily attributed to the tax treatment of net investment losses, foreign currency gains/losses, gains/losses and dividend expenses on short sales, gains/losses on passive foreign investment companies, reclassifications of distributions, expiration of prior year capital loss carryovers and carryovers of temporary differences due to mergers have been made to the following Funds for the five months ended December 31, 2012:
| | | | | | Accumulated | | | Accumulated | |
| | | Paid-In | | | Net Investment | | | Net Realized | |
| Fund | | Capital | | | Income(Loss) | | | Gains(Losses) | |
| Dynamic Equity Fund | | $ | — | | | $ | 142,923 | | | $ | (142,923 | ) |
| Emerging Growth Fund | | | — | | | | 122,240 | | | | (122,240 | ) |
| International Equity Fund | | | — | | | | 3,236 | | | | (3,236 | ) |
| Balanced Allocation Fund | | | 23,354,866 | | | | 647,203 | | | | (24,002,069 | ) |
| Conservative Allocation Fund | | | 3,850,044 | | | | 293,628 | | | | (4,143,672 | ) |
| Growth Allocation Fund | | | 12,844,502 | | | | 480,889 | | | | (13,325,391 | ) |
| Moderate Growth Allocation Fund | | | 17,533,716 | | | | 801,369 | | | | (18,335,085 | ) |
6. Commitments and Contingencies
The Funds indemnify the Trust’s officers and Trustees for certain liabilities that might arise from their performance of their duties to the Funds. Additionally, in the normal course of business, the Funds enter into contracts that contain a variety of representations and warranties and which provide general indemnifications. The Funds’ maximum exposure under these arrangements is unknown, as this would involve future claims that may be made against the Funds that have not yet occurred. However, based on experience, the Funds expect the risk of loss to be remote.
Notes to Financial Statements (Continued)
7. Fund Mergers
On February 10, 2012, the Shareholders of the Old Mutual Funds I (the “Reorganizing Funds”) approved an Agreement and Plan of Reorganization (the “Plan”) providing for the transfer of all assets and liabilities of each Reorganizing Fund to the corresponding Touchstone Fund as noted below. The merger took place on April 13, 2012. The fiscal year end of the Reorganizing Funds was July 31. After the fiscal year end July 31, 2012, the Funds year end changed to December 31.
| | | | | Net | | | Shares | |
| Reorganizing Funds* | | Touchstone Funds | | Assets | | | Outstanding | |
| Old Mutual Analytic Fund | | Dynamic Equity Fund | | $ | 56,128,406 | | | | 5,182,646 | |
| Old Mutual Copper Rock Emerging Growth Fund | | Emerging Growth Fund | | | 43,528,427 | | | | 3,579,888 | |
| Old Mutual International Equity Fund | | International Equity Fund | | | 28,419,782 | | | | 3,455,688 | |
| Old Mutual Asset Allocation Balanced Portfolio | | Balanced Allocation Fund | | | 54,581,260 | | | | 4,909,161 | |
| Old Mutual Asset Allocation Conservative Portfolio | | Conservative Allocation Fund | | | 35,536,596 | | | | 3,274,555 | |
| Old Mutual Asset Allocation Growth Portfolio | | Growth Allocation Fund | | | 38,970,804 | | | | 3,527,780 | |
| Old Mutual Asset Allocation Moderate Growth Portfolio | | Moderate Growth Allocation Fund | | | 68,462,430 | | | | 6,232,923 | |
| * | Funds had Class Z shares outstanding immediately prior to the reorganization, which were exchanged for Class Y Shares of the corresponding Touchstone Fund. |
At the meeting held on March 13, 2012, the Board of Trustees approved an Agreement and Plan of Reorganization (the “Plans”) providing for the transfer of all the assets and liabilities of the Fifth Third LifeModel Moderate Fund, Fifth Third LifeModel Conservative Fund, Fifth Third LifeModel Moderately Conservative Fund, Fifth Third LifeModel Aggressive Fund and FifthThird LifeModel Moderately Aggressive Fund (the “Acquired Funds”) to the corresponding Touchstone Funds shown below. The merger took place on September 10, 2012.
| Acquired Funds | | Touchstone Funds |
| Fifth Third LifeModel Moderate Fund | | Balanced Allocation Fund |
| Fifth Third LifeModel Conservative Fund | | Conservative Allocation Fund |
| Fifth Third LifeModel Moderately Conservative Fund | | Conservative Allocation Fund |
| Fifth Third LifeModel Aggressive Fund | | Growth Allocation Fund |
| Fifth Third LifeModel Moderately Aggressive Fund | | Moderate Growth Allocation Fund |
The following is a summary of shares outstanding, net assets, net assets value per share and unrealized appreciation (depreciation) immediately before and after the September 10, 2012 reorganization for the Allocation Funds:
| | | | | | After | |
| | | Before Reorganization | | | Reorganization | |
| | | Fifth Third | | | | | | | |
| | | LifeModel | | | Touchstone | | | Touchstone | |
| | | Moderate | | | Balanced | | | Balanced | |
| | | Fund | | | Allocation Fund | | | Allocation Fund | |
| Class A* | | | | | | | | | | | | |
| Shares | | | 3,650,589 | (A) | | | 856,628 | | | | 4,507,217 | |
| Net Assets | | $ | 41,600,137 | | | $ | 9,761,746 | | | $ | 51,361,883 | |
| Net Asset Value | | $ | 11.40 | (A) | | $ | 11.40 | | | $ | 11.40 | |
| Class C | | | | | | | | | | | | |
| Shares | | | 191,231 | (B) | | | 3,356,100 | | | | 3,547,331 | |
| Net Assets | | $ | 2,174,823 | | | $ | 38,167,906 | | | $ | 40,342,729 | |
| Net Asset Value | | $ | 11.37 | (B) | | $ | 11.37 | | | $ | 11.37 | |
| Class Y** | | | | | | | | | | | | |
| Shares | | | 6,276,974 | (C) | | | 132,241 | | | | 6,409,215 | |
| Net Assets | | $ | 71,649,327 | | | $ | 1,509,480 | | | $ | 73,158,807 | |
| Net Asset Value | | $ | 11.41 | (C) | | $ | 11.41 | | | $ | 11.41 | |
Notes to Financial Statements (Continued)
| | | | | | After | |
| | | Before Reorganization | | | Reorganization | |
| | | Fifth Third | | | | | | | |
| | | LifeModel | | | Touchstone | | | Touchstone | |
| | | Moderate | | | Balanced | | | Balanced | |
| | | Fund | | | Allocation Fund | | | Allocation Fund | |
| Institutional Class | | | | | | | | | | | | |
| Shares | | | — | | | | 2,683 | | | | 2,683 | |
| Net Assets | | $ | — | | | $ | 30,489 | | | $ | 30,489 | |
| Net Asset Value | | $ | — | | | $ | 11.36 | | | $ | 11.36 | |
| Fund Total | | | | | | | | | | | | |
| Shares Outstanding | | | 10,277,468 | | | | 4,347,652 | | | | 14,466,446 | |
| Net Assets | | $ | 115,424,287 | | | $ | 49,469,621 | | | $ | 164,893,908 | |
| Unrealized Appreciation (Depreciation) | | $ | 5,211,794 | | | $ | 3,570,090 | | | $ | 8,781,884 | |
(A) Reflects a 0.9853:1 stock split on Class A Shares and a 0.9807:1 stock split on Class B Shares which occurred on the date of reorganization, September 10, 2012.
| (B) | Reflects a 0.9820:1 stock split which occurred on the date of reorganization, September 10, 2012. |
| (C) | Reflects a 0.9845:1 stock split which occurred on the date of reorganization, September 10, 2012. |
* The Acquired Fund had Class B Shares outstanding immediately prior to the reorganization, which were exchanged for Class A Shares of the Acquiring Fund.
** The Acquired Fund had Institutional Class Shares outstanding immediately prior to the reorganization, which were exchanged for Class Y Shares of the Acquiring Fund.
| | | | | | | | | | | | After | |
| | | | | | Before Reorganization | | | | | | Reorganization | |
| | | | | | Fifth Third | | | | | | | |
| | | Fifth Third | | | LifeModel | | | Touchstone | | | Touchstone | |
| | | LifeModel | | | Moderately | | | Conservative | | | Conservative | |
| | | Conservative | | | Conservative | | | Allocation | | | Allocation | |
| | | Fund | | | Fund | | | Fund | | | Fund | |
| Class A* | | | | | | | | | | | | | | | | |
| Shares | | | 912,961 | (A) | | | 1,457,284 | (B) | | | 778,704 | | | | 3,148,949 | |
| Net Assets | | $ | 10,038,678 | | | $ | 16,023,820 | | | $ | 8,562,424 | | | $ | 34,624,922 | |
| Net Asset Value | | $ | 11.00 | (A) | | $ | 11.00 | (B) | | $ | 11.00 | | | $ | 11.00 | |
| Class C | | | | | | | | | | | | | | | | |
| Shares | | | 72,314 | (C) | | | 89,383 | (D) | | | 1,541,709 | | | | 1,703,406 | |
| Net Assets | | $ | 791,586 | | | $ | 978,429 | | | $ | 16,876,314 | | | $ | 18,646,329 | |
| Net Asset Value | | $ | 10.95 | (C) | | $ | 10.95 | (D) | | $ | 10.95 | | | $ | 10.95 | |
| Class Y** | | | | | | | | | | | | | | | | |
| Shares | | | 1,658,986 | (E) | | | 1,806,406 | (F) | | | 198,245 | | | | 3,663,637 | |
| Net Assets | | $ | 18,249,300 | | | $ | 19,870,935 | | | $ | 2,180,756 | | | $ | 40,300,991 | |
| Net Asset Value | | $ | 11.00 | (E) | | $ | 11.00 | (F) | | $ | 11.00 | | | $ | 11.00 | |
| Institutional Class | | | | | | | | | | | | | | | | |
| Shares | | | — | | | | ��� | | | | 119,726 | | | | 119,726 | |
| Net Assets | | $ | — | | | $ | — | | | $ | 1,318,057 | | | $ | 1,318,057 | |
| Net Asset Value | | $ | — | | | $ | — | | | $ | 11.01 | | | $ | 11.01 | |
| Fund Total | | | | | | | | | | | | | | | | |
| Shares Outstanding | | | 2,869,464 | | | | 3,603,186 | | | | 2,638,384 | | | | 8,635,718 | |
| Net Assets | | $ | 29,079,564 | | | $ | 36,873,184 | | | $ | 28,937,551 | | | $ | 94,890,299 | |
| Unrealized Appreciation | | | | | | | | | | | | | | | | |
| (Depreciation) | | $ | 705,303 | | | $ | 3,126,125 | | | $ | 1,614,689 | | | $ | 5,446,117 | |
(A) Reflects a 0.9206:1 stock split on Class A Shares and a 0.9190:1 stock split on Class B Shares which occurred on the date of reorganization, September 10, 2012.
(B) Reflects a 0.9301:1 stock split on Class A Shares and a 0.9270:1 stock split on Class B Shares which occurred on the date of reorganization, September 10, 2012.
Notes to Financial Statements (Continued)
| (C) | Reflects a 0.9235:1 stock split which occurred on the date of reorganization, September 10, 2012. |
| (D) | Reflects a 0.9309:1 stock split which occurred on the date of reorganization, September 10, 2012. |
| (E) | Reflects a 0.92200:1 stock split which occurred on the date of reorganization, September 10, 2012. |
| (F) | Reflects a 0.9311:1 stock split which occurred on the date of reorganization, September 10, 2012. |
* The Acquired Fund had Class B Shares outstanding immediately prior to the reorganization, which were exchanged for Class A Shares of the Acquiring Fund.
** The Acquired Fund had Institutional Class Shares outstanding immediately prior to the reorganization, which were exchanged for Class Y Shares of the Acquiring Fund.
| | | | | | | | | After | |
| | | Before Reorganization | | | Reorganization | |
| | | Fifth Third | | | Touchstone | | | Touchstone | |
| | | LifeModel | | | Growth | | | Growth | |
| | | Aggressive | | | Allocation | | | Allocation | |
| | | Fund | | | Fund | | | Fund | |
| Class A* | | | | | | | | | | | | |
| Shares | | | 1,982,555 | (A) | | | 905,293 | | | | 2,887,848 | |
| Net Assets | | $ | 23,010,705 | | | $ | 10,507,403 | | | $ | 33,518,108 | |
| Net Asset Value | | $ | 11.61 | (A) | | $ | 11.61 | | | $ | 11.61 | |
| Class C | | | | | | | | | | | | |
| Shares | | | 86,836 | (B) | | | 2,187,151 | | | | 2,273,987 | |
| Net Assets | | $ | 971,379 | | | $ | 24,466,210 | | | $ | 25,437,589 | |
| Net Asset Value | | $ | 11.19 | (B) | | $ | 11.19 | | | $ | 11.19 | |
| Class Y** | | | | | | | | | | | | |
| Shares | | | 2,547,823 | (C) | | | 73,550 | | | | 2,621,373 | |
| Net Assets | | $ | 29,855,473 | | | $ | 861,864 | | | $ | 30,717,337 | |
| Net Asset Value | | $ | 11.72 | (C) | | $ | 11.72 | | | $ | 11.72 | |
| Institutional Class | | | | | | | | | | | | |
| Shares | | | — | | | | 1,267 | | | | 1,267 | |
| Net Assets | | $ | — | | | $ | 13,568 | | | $ | 13,568 | |
| Net Asset Value | | $ | — | | | $ | 10.71 | | | $ | 10.71 | |
| Fund Total | | | | | | | | | | | | |
| Shares Outstanding | | | 4,576,737 | | | | 3,167,261 | | | | 7,784,475 | |
| Net Assets | | $ | 53,837,557 | | | $ | 35,849,045 | | | $ | 89,686,602 | |
| Unrealized Appreciation (Depreciation) | | $ | 3,817,238 | | | $ | 3,056,427 | | | $ | 6,873,665 | |
(A) Reflects a 1.0117:1 reverse stock on Class A Shares and a 0.9675:1 stock split on Class B Shares which occurred on the date of reorganization, September 10, 2012.
| (B) | Reflects a 1.0019:1 reverse stock split which occurred on the date of reorganization, September 10, 2012. |
| (C) | Reflects a 1.010:1 reverse stock split which occurred on the date of reorganization, September 10, 2012. |
* The Acquired Fund had Class B Shares outstanding immediately prior to the reorganization, which were exchanged for Class A Shares of the Acquiring Fund.
** The Acquired Fund had Institutional Class Shares outstanding immediately prior to the reorganization, which were exchanged for Class Y Shares of the Acquiring Fund.
| | | | | | | | | After | |
| | | Before Reorganization | | | Reorganization | |
| | | Fifth Third | | | Touchstone | | | Touchstone | |
| | | LifeModel | | | Moderate | | | Moderate | |
| | | Moderately | | | Growth | | | Growth | |
| | | Aggressive | | | Allocation | | | Allocation | |
| | | Fund | | | Fund | | | Fund | |
| Class A* | | | | | �� | | | | | | | |
| Shares | | | 5,396,673 | (A) | | | 1,340,687 | | | | 6,737,360 | |
| Net Assets | | $ | 61,461,849 | | | $ | 15,268,777 | | | $ | 76,730,626 | |
| Net Asset Value | | $ | 11.39 | (A) | | $ | 11.39 | | | $ | 11.39 | |
Notes to Financial Statements (Continued)
| | | | | | | | | After | |
| | | Before Reorganization | | | Reorganization | |
| | | Fifth Third | | | Touchstone | | | Touchstone | |
| | | LifeModel | | | Moderate | | | Moderate | |
| | | Moderately | | | Growth | | | Growth | |
| | | Aggressive | | | Allocation | | | Allocation | |
| | | Fund | | | Fund | | | Fund | |
| Class C | | | | | | | | | | | | |
| Shares | | | 221,281 | (B) | | | 4,305,668 | | | | 4,526,949 | |
| Net Assets | | $ | 2,482,569 | | | $ | 48,305,735 | | | $ | 50,788,304 | |
| Net Asset Value | | $ | 11.22 | (B) | | $ | 11.22 | | | $ | 11.22 | |
| Class Y** | | | | | | | | | | | | |
| Shares | | | 4,909,444 | (C) | | | 78,182 | | | | 4,987,626 | |
| Net Assets | | $ | 56,310,746 | | | $ | 896,739 | | | $ | 57,207,485 | |
| Net Asset Value | | $ | 11.47 | (C) | | $ | 11.47 | | | $ | 11.47 | |
| Institutional Class | | | | | | | | | | | | |
| Shares | | | — | | | | 738 | | | | 738 | |
| Net Assets | | $ | — | | | $ | 8,431 | | | $ | 8,431 | |
| Net Asset Value | | $ | — | | | $ | 11.42 | | | $ | 11.42 | |
| Fund Total | | | | | | | | | | | | |
| Shares Outstanding | | | 10,118,280 | | | | 5,725,275 | | | | 16,252,673 | |
| Net Assets | | $ | 120,255,164 | | | $ | 64,479,682 | | | $ | 184,734,846 | |
| Unrealized Appreciation (Depreciation) | | $ | 13,091,873 | | | $ | 5,016,633 | | | $ | 18,108,506 | |
(A) Reflects a 1.0437:1 reverse stock split on Class A Shares and a 1.0329:1 reverse stock split on Class B Shares which occurred on the date of reorganization, September 10, 2012.
| (B) | Reflects a 1.0475:1 reverse stock split which occurred on the date of reorganization, September 10, 2012. |
| (C) | Reflects a 1.0378:1 reverse stock split which occurred on the date of reorganization, September 10, 2012. |
* The Acquired Fund had Class B Shares outstanding immediately prior to the reorganization, which were exchanged for Class A Shares of the Acquiring Fund.
** The Acquired Fund had Institutional Class Shares outstanding immediately prior to the reorganization, which were exchanged for Class Y Shares of the Acquiring Fund.
Assuming these September 10, 2012 reorganizations had been completed on August 1, 2012, the Balanced Allocation Fund, Conservative Allocation Fund, Growth Allocation Fund and Moderate Growth Allocation Fund results of operations for the five months ended December 31, 2012, would have been as follows:
| | | | | | | | | | | | Touchstone | |
| | | Touchstone | | | Touchstone | | | Touchstone | | | Moderate | |
| | | Balanced | | | Conservative | | | Growth | | | Growth | |
| | | Allocation | | | Allocation | | | Allocation | | | Allocation | |
| (Unaudited) | | Fund | | | Fund | | | Fund | | | Fund | |
| Net investment income | | $ | 2,451,480 | | | $ | 1,210,897 | | | $ | 1,323,552 | | | $ | 2,716,948 | |
| Net realized and unrealized gain (loss) on investments | | | 11,632,977 | | | | 5,230,795 | | | | 10,153,370 | | | | 22,183,410 | |
| Net increase (decrease) in asset from operations | | | 14,084,457 | | | | 6,441,692 | | | | 11,476,922 | | | | 24,900,358 | |
Because the combined investment portfolios have been managed as single portfolios since the reorganizations were completed, it is not practical to separate the amounts of revenue and earnings to the Acquiring Funds that have been included in their statements of operations since the reorganizations.
8. Risks Associated with Foreign Investments
Some of the Funds may invest in the securities of foreign issuers. Investing in securities issued by companies whose principal business activities are outside the U.S. may involve significant risks not present in domestic
Notes to Financial Statements (Continued)
investments. For example, there is generally less publicly available information about foreign companies, particularly those not subject to the disclosure and reporting requirements of the U.S. securities laws. Foreign issuers are generally not bound by uniform accounting, auditing, and financial reporting requirements and standards of practice comparable to those applicable to domestic issuers. Investments in foreign securities also involve the risk of possible adverse changes in investment or exchange control regulations, expropriation or confiscatory taxation, limitations on the removal of funds or other assets of the Fund, political or financial instability or diplomatic and other developments which could affect such investments. Foreign stock markets, while growing in volume and sophistication, are generally not as developed as those in the U.S., and securities of some foreign issuers (particularly those located in developing countries) may be less liquid and more volatile than securities of comparable U.S. companies. In general, there is less overall governmental supervision and regulation of foreign securities markets, broker-dealers, and issuers than in the U.S.
9. Risks Associated with Leverage
By investing the proceeds received from selling securities short, the Dynamic Equity Fund is employing leverage, which creates special risks. The use of leverage may increase the Fund’s exposure to long or short equity positions and may cause the Fund’s NAV to be more volatile than if the Fund had not used leverage. This could result in increased volatility of returns.
10. Subsequent Events
Subsequent events occurring after the date of this report have been evaluated for potential impact to this report through the date the financial statements were issued.
At a meeting of the Board of Trustees (the “Board”) of Touchstone Strategic Trust held on February 21, 2013, the Board approved a plan to close and liquidate the Touchstone International Equity Fund and the Touchstone Emerging Growth Fund (the “Liquidation Funds”). The Liquidation Funds will be closed and liquidated on or about March 26, 2013.
There were no other subsequent events that necessitated recognition or disclosure on the Funds’ financial statements.
Report of Independent Registered Public Accounting Firm
To the Board of Trustees and Shareholders of Touchstone Dynamic Equity Fund, Touchstone Emerging Growth Equity Fund,Touchstone International Equity Fund,Touchstone Balanced Allocation Fund,Touchstone Conservative Allocation Fund, Touchstone Growth Allocation Fund, and Touchstone Moderate Growth Allocation Fund
We have audited the accompanying statements of assets and liabilities, including the portfolios of investments, of Touchstone Dynamic Equity Fund, Touchstone Emerging Growth Equity Fund, Touchstone International Equity Fund, Touchstone Balanced Allocation Fund, Touchstone Conservative Allocation Fund, Touchstone Growth Allocation Fund, and Touchstone Moderate Growth Allocation Fund (the “Funds”) (seven of the funds constituting the Touchstone Strategic Trust), as of December 31, 2012, and the related statement of operations, the statement of cash flows for the Touchstone Dynamic Equity Fund, the statement of changes in net assets, and the financial highlights for the period then ended. These financial statements and financial highlights are the responsibility of the Funds’ management. Our responsibility is to express an opinion on these financial statements and financial highlights based on our audits. The statements of operations for the year ended July 31, 2012, the statement of cash flows for the Touchstone Dynamic Equity Fund for the year then ended, the statements of changes in net assets for each of the two years in the period then ended, and the financial highlights for each of the periods indicated in the period then ended, of the Touchstone Dynamic Equity Fund, Touchstone Emerging Growth Equity Fund, Touchstone International Equity Fund, Touchstone Balanced Allocation Fund, Touchstone Conservative Allocation Fund, Touchstone Growth Allocation Fund, and Touchstone Moderate Growth Allocation Fund were audited by other auditors whose report dated September 21, 2012, expressed an unqualified opinion on those financial statements and financial highlights.
We conducted our audits in accordance with the standards of the Public Company Accounting Oversight Board (United States). Those standards require that we plan and perform the audits to obtain reasonable assurance about whether the financial statements are free of material misstatement. We were not engaged to perform an audit of the Funds’ internal control over financial reporting. Our audits included consideration of internal control over financial reporting as a basis for designing audit procedures that are appropriate in the circumstances, but not for the purpose of expressing an opinion on the effectiveness of the Funds’ internal control over financial reporting. Accordingly, we express no such opinion. An audit also includes examining, on a test basis, evidence supporting the amounts and disclosures in the financial statements, assessing the accounting principles used and significant estimates made by management, and evaluating the overall financial statement presentation. Our procedures included confirmation of securities owned as of December 31, 2012, by correspondence with the custodian, transfer agent, and brokers or by other appropriate auditing procedures where replies from brokers were not received. We believe that our audits provide a reasonable basis for our opinion.
In our opinion, the financial statements and financial highlights referred to above present fairly, in all material respects, the financial position of Touchstone Dynamic Equity Fund, Touchstone Emerging Growth Equity Fund, Touchstone International Equity Fund, Touchstone Balanced Allocation Fund, Touchstone Conservative Allocation Fund, Touchstone Growth Allocation Fund, and Touchstone Moderate Growth Allocation Fund (seven of the funds constituting the Touchstone Strategic Trust) at December 31, 2012, the results of their operations, the cash flows for the Touchstone Dynamic Equity Fund, the changes in their net assets, and the financial highlights for the period then ended, in conformity with accounting principles generally accepted in the United States.

Cincinnati, Ohio
February 25, 2013
Other Items (Unaudited)
Qualified Dividend Income
Under the Jobs and Growth Tax Relief Reconciliation Act of 2003 (the “Act”), the following percentages of ordinary dividends paid during the fiscal year ended December 31, 2012 are designated as “qualified dividend income,” as defined in the Act, and are subject to reduced tax rates. The Funds intend to pass through the maximum allowable percentage for 1099s.
| Dynamic Equity Fund | | | 100.00 | % |
| Emerging Growth Fund | | | 47.62 | % |
| International Equity Fund | | | 100.00 | % |
| Balanced Allocation Fund | | | 18.87 | % |
| Conservative Allocation Fund | | | 6.22 | % |
| Growth Allocation Fund | | | 70.72 | % |
| Moderate Growth Allocation Fund | | | 41.06 | % |
Dividend Received Deduction
For corporate shareholders, the following ordinary distributions paid during the current fiscal year ended December 31, 2012 qualify for the corporate dividends received deduction. The Funds intend to pass through the maximum allowable percentage for 1099s.
| Dynamic Equity Fund | | | 100.00 | % |
| Emerging Growth Fund | | | 46.22 | % |
| International Equity Fund | | | 0.09 | % |
| Balanced Allocation Fund | | | 10.92 | % |
| Conservative Allocation Fund | | | 4.35 | % |
| Growth Allocation Fund | | | 38.02 | % |
| Moderate Growth Allocation Fund | | | 23.65 | % |
For the fiscal year ended December 31, 2012, the Emerging Growth Fund, Balanced Allocation Fund, Growth Allocation Fund and Moderate Growth Allocation designates $1,112,786, $137,848, $498,787 and $1,675,414, respectively as long-term capital gains.
Foreign Tax Income & Foreign Tax Credit
International Equity Fund, Balanced Allocation Fund, Conservative Allocation Fund, Growth Allocation Fund and Moderate Growth Allocation Fund intend to pass through a foreign tax credit to their respective shareholders. For the fiscal year ended December 31, 2012, the total amount of foreign source income is $504,665 or $0.21 per share, $688,817 or $0.05, $194,048 or $0.02 per share, $560,528 or $0.08 per share and $881,949 or $0.06 per share, respectively. The total amount of foreign taxes to be paid is $45,263 or $0.019 per share, $81,415 or $0.006 per share, $19,620 or $0.002 per share, $70,100 or $0.01 per share and $109,210 or $0.01 per share, respectively. Shareholders’ allocable share of the foreign tax credit will be reported on Form 1099 Div.
Proxy Voting Guidelines
The Sub-Advisors are responsible for exercising the voting rights associated with the securities purchased and held by the Funds. A description of the policies and procedures that the Sub-Advisors use in fulfilling this responsibility and information regarding how those proxies were voted during the twelve month period ended June 30 are available as an exhibit to the most recent Statement of Additional Information, which can be obtained without charge upon request by calling toll free 1.800.543.0407. These items are also available on the Securities and Exchange Commission’s (the Commission) website at http://www.sec.gov.
Other Items (Unaudited) (Continued)
Quarterly Portfolio Disclosure
The Trust files a complete listing of portfolio holdings for each Fund as of the end of the first and third quarters of each fiscal year on Form N-Q. The complete listing (i) is available on the Commission’s website; (ii) may be reviewed and copied at the Commission’s Public Reference Room in Washington, DC; and (iii) will be made available to shareholders upon request by calling 1.800.543.0407. Information on the operation of the Public Reference Room may be obtained by calling 1.800.SEC.0330.
Schedule of Shareholder Expenses
As a shareholder of the Funds, you incur two types of costs: (1) transaction costs, including reinvested dividends or other distributions; and (2) ongoing costs, including investment advisory fees; distribution (12b-1) fees; and other Fund expenses. This example is intended to help you understand your ongoing costs (in dollars) of investing in the Funds and to compare these costs with the ongoing costs of investing in other mutual funds.
The example is based on an investment of $1,000 invested at the beginning of the period and held for the entire period, (July 1, 2012 through December 31, 2012).
Actual Expenses
The first line for each share class of a Fund in the table below provides information about actual account values and actual expenses. You may use the information in this line, together with the amount you invested, to estimate the expenses that you paid over the period. Simply divide your account value by $1,000 (for example, an $8,600 account value divided by $1,000 = 8.6), then multiply the result by the number in the first line under the heading entitled “Expenses Paid During the Six Months Ended December 31, 2012” to estimate the expenses you paid on your account during this period.
Hypothetical Example for Comparison Purposes
The second line for each share class of a Fund in the table below provides information about hypothetical account values and hypothetical expenses based on the Funds’ actual expense ratio and an assumed rate of return of 5% per year before expenses, which is not the Funds’ actual return. The hypothetical account values and expenses may not be used to estimate the actual ending account balance or expenses you paid for the period. You may use this information to compare the ongoing costs of investing in the Funds and other funds. To do so, compare this 5% hypothetical example with the 5% hypothetical examples that appear in the shareholder reports of the other funds.
| | | | | | | | | | | | | | | Expenses | |
| | | | | | Net Expense | | | Beginning | | | Ending | | | Paid During | |
| | | | | | Ratio | | | Account | | | Account | | | the Period | |
| | | | | | Annualized | | | Value | | | Value | | | Ended | |
| | | | | | December 31, | | | July 1, | | | December 31, | | | December 31, | |
| | | | | | 2012 | | | 2012 | | | 2012 | | | 2012 | |
| Touchstone Dynamic Equity Fund | | | | | | | | | | | | | | | | | | | | |
| Class A | | | Actual* | | | | 2.46 | % | | $ | 1,000.00 | | | $ | 986.60 | | | $ | 10.24 | *** |
| Class A | | | Hypothetical** | | | | 2.46 | % | | $ | 1,000.00 | | | $ | 1,012.80 | | | $ | 12.48 | |
| | | | | | | | | | | | | | | | | | | | | |
| Class C | | | Actual* | | | | 3.21 | % | | $ | 1,000.00 | | | $ | 984.00 | | | $ | 13.35 | *** |
| Class C | | | Hypothetical** | | | | 3.21 | % | | $ | 1,000.00 | | | $ | 1,009.02 | | | $ | 16.25 | |
| | | | | | | | | | | | | | | | | | | | | |
| Class Y | | | Actual* | | | | 2.21 | % | | $ | 1,000.00 | | | $ | 988.50 | | | $ | 9.21 | *** |
| Class Y | | | Hypothetical** | | | | 2.21 | % | | $ | 1,000.00 | | | $ | 1,014.06 | | | $ | 11.22 | |
| | | | | | | | | | | | | | | | | | | | | |
| Institutional Class | | | Actual* | | | | 2.16 | % | | $ | 1,000.00 | | | $ | 988.50 | | | $ | 9.00 | *** |
| Institutional Class | | | Hypothetical** | | | | 2.16 | % | | $ | 1,000.00 | | | $ | 1,014.32 | | | $ | 10.97 | |
| | | | | | | | | | | | | | | | | | | | | |
| Touchstone Emerging Growth Fund | | | | | | | | | | | | | | | | | | | | |
| Class A | | | Actual* | | | | 1.39 | % | | $ | 1,000.00 | | | $ | 1,076.20 | | | $ | 6.05 | |
| Class A | | | Hypothetical** | | | | 1.39 | % | | $ | 1,000.00 | | | $ | 1,018.20 | | | $ | 7.07 | |
Other Items (Unaudited) (Continued)
| | | | | | | | | | | | | | | Expenses | |
| | | | | | Net Expense | | | Beginning | | | Ending | | | Paid During | |
| | | | | | Ratio | | | Account | | | Account | | | the Period | |
| | | | | | Annualized | | | Value | | | Value | | | Ended | |
| | | | | | December 31, | | | July 1, | | | December 31, | | | December 31, | |
| | | | | | 2012 | | | 2012 | | | 2012 | | | 2012 | |
| Class C | | | Actual* | | | | 2.14 | % | | $ | 1,000.00 | | | $ | 1,073.70 | | | $ | 9.30 | |
| Class C | | | Hypothetical** | | | | 2.14 | % | | $ | 1,000.00 | | | $ | 1,014.42 | | | $ | 10.87 | |
| | | | | | | | | | | | | | | | | | | | | |
| Class Y | | | Actual* | | | | 1.14 | % | | $ | 1,000.00 | | | $ | 1,077.50 | | | $ | 4.96 | |
| Class Y | | | Hypothetical** | | | | 1.14 | % | | $ | 1,000.00 | | | $ | 1,019.46 | | | $ | 5.80 | |
| | | | | | | | | | | | | | | | | | | | | |
| Institutional Class | | | Actual* | | | | 0.99 | % | | $ | 1,000.00 | | | $ | 1,078.10 | | | $ | 4.31 | |
| Institutional Class | | | Hypothetical** | | | | 0.99 | % | | $ | 1,000.00 | | | $ | 1,020.21 | | | $ | 5.04 | |
| | | | | | | | | | | | | | | | | | | | | |
| Touchstone International Equity Fund | | | | | | | | | | | | | | | | | | | | |
| Class A | | | Actual* | | | | 1.39 | % | | $ | 1,000.00 | | | $ | 1,123.00 | | | $ | 6.18 | |
| Class A | | | Hypothetical** | | | | 1.39 | % | | $ | 1,000.00 | | | $ | 1,018.20 | | | $ | 7.07 | |
| | | | | | | | | | | | | | | | | | | | | |
| Class C | | | Actual* | | | | 2.14 | % | | $ | 1,000.00 | | | $ | 1,119.70 | | | $ | 9.51 | |
| Class C | | | Hypothetical** | | | | 2.14 | % | | $ | 1,000.00 | | | $ | 1,014.42 | | | $ | 10.87 | |
| | | | | | | | | | | | | | | | | | | | | |
| Class Y | | | Actual* | | | | 1.14 | % | | $ | 1,000.00 | | | $ | 1,123.80 | | | $ | 5.07 | |
| Class Y | | | Hypothetical** | | | | 1.14 | % | | $ | 1,000.00 | | | $ | 1,019.46 | | | $ | 5.80 | |
| | | | | | | | | | | | | | | | | | | | | |
| Institutional Class | | | Actual* | | | | 0.99 | % | | $ | 1,000.00 | | | $ | 1,124.70 | | | $ | 4.41 | |
| Institutional Class | | | Hypothetical** | | | | 0.99 | % | | $ | 1,000.00 | | | $ | 1,020.21 | | | $ | 5.04 | |
| | | | | | | | | | | | | | | | | | | | | |
| Touchstone Balanced Allocation Fund | | | | | | | | | | | | | | | | | | | | |
| Class A | | | Actual* | | | | 0.41 | % | | $ | 1,000.00 | | | $ | 1,043.70 | | | $ | 1.76 | |
| Class A | | | Hypothetical** | | | | 0.41 | % | | $ | 1,000.00 | | | $ | 1,023.14 | | | $ | 2.09 | |
| | | | | | | | | | | | | | | | | | | | | |
| Class C | | | Actual* | | | | 1.16 | % | | $ | 1,000.00 | | | $ | 1,040.30 | | | $ | 4.96 | |
| Class C | | | Hypothetical** | | | | 1.16 | % | | $ | 1,000.00 | | | $ | 1,019.36 | | | $ | 5.90 | |
| | | | | | | | | | | | | | | | | | | | | |
| Class Y | | | Actual* | | | | 0.16 | % | | $ | 1,000.00 | | | $ | 1,044.50 | | | $ | 0.69 | |
| Class Y | | | Hypothetical** | | | | 0.16 | % | | $ | 1,000.00 | | | $ | 1,024.40 | | | $ | 0.82 | |
| | | | | | | | | | | | | | | | | | | | | |
| Institutional Class | | | Actual* | | | | 0.16 | % | | $ | 1,000.00 | | | $ | 1,044.70 | | | $ | 0.69 | |
| Institutional Class | | | Hypothetical** | | | | 0.16 | % | | $ | 1,000.00 | | | $ | 1,024.40 | | | $ | 0.82 | |
| | | | | | | | | | | | | | | | | | | | | |
| Touchstone Conservative Allocation Fund | | | | | | | | | | | | | | | | | | | | |
| Class A | | | Actual* | | | | 0.40 | % | | $ | 1,000.00 | | | $ | 1,024.70 | | | $ | 1.70 | |
| Class A | | | Hypothetical** | | | | 0.40 | % | | $ | 1,000.00 | | | $ | 1,023.19 | | | $ | 2.04 | |
| | | | | | | | | | | | | | | | | | | | | |
| Class C | | | Actual* | | | | 1.15 | % | | $ | 1,000.00 | | | $ | 1,021.80 | | | $ | 4.87 | |
| Class C | | | Hypothetical** | | | | 1.15 | % | | $ | 1,000.00 | | | $ | 1,019.41 | | | $ | 5.85 | |
| | | | | | | | | | | | | | | | | | | | | |
| Class Y | | | Actual* | | | | 0.15 | % | | $ | 1,000.00 | | | $ | 1,026.00 | | | $ | 0.64 | |
| Class Y | | | Hypothetical** | | | | 0.15 | % | | $ | 1,000.00 | | | $ | 1,024.45 | | | $ | 0.77 | |
| | | | | | | | | | | | | | | | | | | | | |
| Institutional Class | | | Actual* | | | | 0.15 | % | | $ | 1,000.00 | | | $ | 1,025.00 | | | $ | 0.64 | |
| Institutional Class | | | Hypothetical** | | | | 0.15 | % | | $ | 1,000.00 | | | $ | 1,024.45 | | | $ | 0.77 | |
| | | | | | | | | | | | | | | | | | | | | |
| Touchstone Growth Allocation Fund | | | | | | | | | | | | | | | | | | | | |
| Class A | | | Actual* | | | | 0.39 | % | | $ | 1,000.00 | | | $ | 1,072.90 | | | $ | 1.69 | |
| Class A | | | Hypothetical** | | | | 0.39 | % | | $ | 1,000.00 | | | $ | 1,023.24 | | | $ | 1.99 | |
| | | | | | | | | | | | | | | | | | | | | |
| Class C | | | Actual* | | | | 1.14 | % | | $ | 1,000.00 | | | $ | 1,068.20 | | | $ | 4.94 | |
| Class C | | | Hypothetical** | | | | 1.14 | % | | $ | 1,000.00 | | | $ | 1,019.46 | | | $ | 5.80 | |
Other Items (Unaudited) (Continued)
| | | | | | | | | | | | | | | Expenses | |
| | | | | | Net Expense | | | Beginning | | | Ending | | | Paid During | |
| | | | | | Ratio | | | Account | | | Account | | | the Period | |
| | | | | | Annualized | | | Value | | | Value | | | Ended | |
| | | | | | December 31, | | | July 1, | | | December 31, | | | December 31, | |
| | | | | | 2012 | | | 2012 | | | 2012 | | | 2012 | |
| Class Y | | | Actual* | | | | 0.14 | % | | $ | 1,000.00 | | | $ | 1,073.50 | | | $ | 0.61 | |
| Class Y | | | Hypothetical** | | | | 0.14 | % | | $ | 1,000.00 | | | $ | 1,024.50 | | | $ | 0.71 | |
| | | | | | | | | | | | | | | | | | | | | |
| Institutional Class | | | Actual* | | | | 0.14 | % | | $ | 1,000.00 | | | $ | 1,073.00 | | | $ | 0.61 | |
| Institutional Class | | | Hypothetical** | | | | 0.14 | % | | $ | 1,000.00 | | | $ | 1,024.50 | | | $ | 0.71 | |
| | | | | | | | | | | | | | | | | | | | | |
| Touchstone Moderate Growth Allocation Fund | | | | | | | | | | | | | | | | | |
| Class A | | | Actual* | | | | 0.39 | % | | $ | 1,000.00 | | | $ | 1,059.60 | | | $ | 1.68 | |
| Class A | | | Hypothetical** | | | | 0.39 | % | | $ | 1,000.00 | | | $ | 1,023.24 | | | $ | 1.99 | |
| | | | | | | | | | | | | | | | | | | | | |
| Class C | | | Actual* | | | | 1.14 | % | | $ | 1,000.00 | | | $ | 1,055.20 | | | $ | 4.91 | |
| Class C | | | Hypothetical** | | | | 1.14 | % | | $ | 1,000.00 | | | $ | 1,019.46 | | | $ | 5.80 | |
| | | | | | | | | | | | | | | | | | | | | |
| Class Y | | | Actual* | | | | 0.14 | % | | $ | 1,000.00 | | | $ | 1,060.40 | | | $ | 0.60 | |
| Class Y | | | Hypothetical** | | | | 0.14 | % | | $ | 1,000.00 | | | $ | 1,024.50 | | | $ | 0.71 | |
| | | | | | | | | | | | | | | | | | | | | |
| Institutional Class | | | Actual* | | | | 0.14 | % | | $ | 1,000.00 | | | $ | 1,061.10 | | | $ | 0.60 | |
| Institutional Class | | | Hypothetical** | | | | 0.14 | % | | $ | 1,000.00 | | | $ | 1,024.50 | | | $ | 0.71 | |
| * | Actual Expenses are equal to fund's annualized expense ratio multiplied by the average account value over the period, multiplied by 153/365 ( to reflect a five month period). Actual returns are for the period August 1, 2012 through December 31, 2012. |
| | | |
| ** | Hypothetical Expenses are equal to the Fund's annualized expense ratio, multiplied by the average account value over the period, multiplied by 184/365 (to reflect one-half year period). |
| | | |
| *** | Excluding interest and dividend expenses on securities sold short, your actual cost of investment in Class A, Class C, Class Y and Institutional Class would be $6.45, $9.55, $5.42 and $5.20, respectively. |
Management of the Trust (Unaudited)
Listed below is basic information regarding the Trustees and principal officers of the Trust. The Trust’s Statement of Additional Information includes additional information about the Trustees and is available, without charge, upon request by calling 1.800.543.0407.
Interested Trustees1:
| | | | | | | | | Number | | |
| | | | | | | | | of Funds | | |
| | | | | | | | | Overseen | | Other |
| | | | | Term of | | | | in the | | Directorships |
| Name | | Position(s) | | Office2 And | | | | Touchstone | | Held During |
| Address | | Held with | | Length of | | Principal Occupation(s) | | Fund | | the Past |
| Age | | Trust | | Time Served | | During Past 5 Years | | Complex3 | | 5 Years4 |
Jill T. McGruder
Touchstone Advisors, Inc
303 Broadway Cincinnati, OH
Year of Birth: 1955 | | President and Trustee | | Until retirement at age 75 or until she resigns or is removed Trustee since 1999 | | President and CEO of IFS Financial Services, Inc. (a holding company). | | 58 | | Director of LaRosa’s (a restaurant chain), Capital Analysts Incorporated (an investment advisor and broker- dealer), IFS Financial Services, Inc. (a holding company), Integrity and National Integrity Life Insurance Co., Touchstone Securities (the Trust’s distributor), Touchstone Advisors (the Trust’s investment advisor and administrator), W&S Brokerage Services (a brokerage company) and W&S Financial Group Distributors (a distribution company). |
| | | | | | | | | | |
| Independent Trustees: | | | | | | | | | | |
Phillip R. Cox
105 East Fourth Street Cincinnati, OH
Year of Birth: 1947 | | Trustee | | Until retirement at age 75 or until he resigns or is removed Trustee since 1994 | | President and Chief Executive Officer of Cox Financial Corp. (a financial services company). | | 58 | | Director of Cincinnati Bell (a communications company), Bethesda Inc. (a hospital), Timken Co. (a manufacturing company), Diebold (a technology solutions company), and Ohio Business Alliance for Higher Education. Director of Duke Energy from 1994-2008. |
| | | | | | | | | | | |
H. Jerome Lerner
c/o Touchstone Advisors, Inc.
303 Broadway Cincinnati, OH
Year of Birth: 1938 | | Trustee | | Until retirement at age 75 or until he resigns or is removed Trustee since 1999 | | None | | 58 | | BASCO Shower Enclosures (a design and manufacturing company) from 2000 to present; Hebrew Union College-Jewish Institute of Religior from 1990 to present. |
Management of the Trust (Unaudited) (Continued)
Independent Trustees (Continued):
| | | | | | | | | Number | | |
| | | | | | | | | of Funds | | |
| | | | | | | | | Overseen | | |
| | | | | Term of | | | | in the | | |
| Name | | Position(s) | | Office2 And | | | | Touchstone | | Other |
| Address | | Held with | | Length of | | Principal Occupation(s) | | Fund | | Directorships |
| Age | | Trust | | Time Served | | During Past 5 Years | | Complex3 | | Held4 |
Donald C. Siekmann
c/o Touchstone Advisors, Inc.
303 Broadway Cincinnati, OH
Year of Birth: 1938 | | Trustee | | Until retirement at age 75 or until he resigns or is removed Trustee since 2005 | | Executive for Duro Bag Manufacturing Co. (a bag manufacturer) from 2002-2008. | | 58 | | Riverfront Mutual Funds (until 2008). |
John P. Zanotti
c/o Touchstone Advisors, Inc.
303 Broadway Cincinnati, OH
Year of Birth: 1948 | | Trustee | | Until retirement at age 75 or until he resigns or is removed Trustee since 2002 | | Chairman of Integrated Media Technologies (a media company) from 2007 to present. | | 58 | | Cincinnati Children’s Hospital from 1994-2010. |
| | | | | | | | | | | |
Susan J. Hickenlooper
c/o Touchstone Advisors, Inc.
303 Broadway Cincinnati, OH
Year of Birth: 1946 | | Trustee | | Until retirement at age 75 or until he resigns or is removed Trustee since 2009 | | Financial Analyst for Impact 100 (Charitable Organization) from 11/ 2012 to present. | | 58 | | Trustee of Gateway Trust (a mutual fund) from 2006-2009, Trustee of Cincinnati Parks Foundation (a charitable organization) from 2000- present; Trustee of Episcopal Retirement Homes Foundation from 1998-2011. |
| 1 | Ms. McGruder, as a director of the Advisor and Touchstone Securities, and an officer of various affiliates of the Advisor, is an “interested person” of the Trust within the meaning of Section 2(a)(19) of the 1940 Act. |
2 Each Trustee is elected to serve until the age of 75 or until he or she sooner resigns or is removed.
| 3 | The Touchstone Fund Complex consists of 22 series of the Trust, 3 series of Touchstone Tax-Free Trust, 17 series of Touchstone Funds Group Trust, 4 series of Touchstone Investment Trust, 1 series of Touchstone Institutional Funds Trust and 11 variable annuity series of Touchstone Variable Series Trust. |
| 4 | Each Trustee is also a Trustee of Touchstone Funds Group Trust, Touchstone Tax-Free Trust, Touchstone Investment Trust, Touchstone Institutional Trust, and Touchstone Variable Series Trust. |
Management of the Trust (Unaudited) (Continued)
Principal Officers1:
| | | | | Term of | | |
| Name | | Position(s) | | Office2 And | | |
| Address | | Held with | | Length of | | Principal Occupation(s) |
| Age | | Trust | | Time Served | | During Past 5 Years |
Jill T. McGruder
Touchstone Advisors, Inc.
303 Broadway Cincinnati, OH
Year of Birth: 1955 | | President | | Until resignation, removal or disqualification President since 2004; President from 2000-2002 | | See biography above. |
| | | | | | | |
Steven M. Graziano
Touchstone Advisors, Inc.
303 Broadway Cincinnati, OH
Year of Birth: 1954 | | Vice President | | Until resignation, removal or disqualification Vice President since 2009 | | President of Touchstone Advisors, Inc.; Executive Vice President of Pioneer Investment Management, Head of Retail Distribution and Strategic Marketing 2007- 2008; Executive Vice President of Pioneer Investment Management, Chief Marketing Officer 2002-2007. |
| | | | | | | |
Timothy D. Paulin
Touchstone Advisors, Inc.
303 Broadway Cincinnati, OH
Year of Birth: 1963 | | Vice President | | Until resignation, removal or disqualification Vice President since 2010 | | Senior Vice President of Investment Research and Product Management of Touchstone Advisors, Inc.; Principal of Klein Decisions, Inc. 2003-2010. |
| | | | | | | |
Michael Moser3
Western & Southern Financial Group
400 Broadway Cincinnati, OH
Year of Birth: 1968 | | Chief Compliance Officer | | Until resignation, removal or disqualification Chief Compliance Officer since 2012 | | Vice President and Chief Compliance Officer of the Western & Southern Financial Group and Chief Compliance Officer of Touchstone Advisors. |
| | | | | | | |
Terrie A. Wiedenheft
Touchstone Advisors, Inc.
303 Broadway Cincinnati, OH
Year of Birth: 1962 | | Controller and Treasurer | | Until resignation, removal or disqualification Controller and Treasurer since 2006 | | Chief Operating Officer, Chief Financial Officer and Senior Vice President of IFS Financial Services, Inc. |
| Principal Officers1 (Continued): |
| | | | | | | | | Number | | |
| | | | | | | | | of Funds | | |
| | | | | | | | | Overseen | | |
| | | | | Term of | | | | in the | | |
| Name | | Position(s) | | Office2 And | | | | Touchstone | | Other |
| Address | | Held with | | Length of | | Principal Occupation(s) | | Fund | | Directorships |
| Age | | Trust | | Time Served | | During Past 5 Years | | Complex2 | | Held |
Elizabeth R. Freeman
BNY Mellon 201 Washington Street Boston, MA
Year of Birth: 1962 | | Secretary | | Until resignation, Managing Director and Senior Counsel at BNY removal or disqualification. Secretary since 2011 | | Mellon Investment Servicing (US) Inc. | | 58 | | None |
| 1 | Each officer also holds the same office with Touchstone Funds Group Trust, Touchstone Institutional Funds Trust, Touchstone Investment Trust, Touchstone Tax-Free Trust, and Touchstone Tax-Free Trust. |
| 2 | The Touchstone Fund Complex consists of 22 series of the Trust, 3 series of Touchstone Tax-Free Trust, 17 series of Touchstone Funds Group Trust, 4 series of Touchstone Investment Trust, 1 series of Touchstone Institutional Funds Trust and 11 variable annuity series of Touchstone Variable Series. |
3 Joseph Melcher resigned as Chief Compliance Officer effective September 5, 2012.
This page intentionally left blank.
This page intentionally left blank.
PRIVACY PROTECTION POLICY
We Respect Your Privacy
Thank you for your decision to invest with us. Touchstone and its affiliates have always placed a high value on the trust and confidence our clients place in us. We believe that confidence must be earned and validated through time. In today’s world, when technology allows the sharing of information at light speeds, trust must be reinforced by our sincere pledge to take the steps necessary to ensure that the information you share with us is treated with respect and confidentiality.
Our Pledge to Our Clients
| | · | We collect only the information we need to service your account and administer our business. |
| | · | We are committed to keeping your information confidential and we place strict limits and controls on the use and sharing of your information. |
| | · | We make every effort to ensure the accuracy of your information. |
We Collect the Following Nonpublic Personal Information About You:
| | · | Information we receive from you on or in applications or other forms, correspondence, or conversations, including, but not limited to, your name, address, phone number, social security number, assets, income and date of birth; and |
| | · | Information about your transactions with us, our affiliates, or others, including, but not limited to, your account number and balance, payment history, parties to transactions, cost basis information, and other financial information. |
Categories of Information We Disclose and Parties to Whom We Disclose
We do not disclose any nonpublic personal information about our current or former clients to nonaffiliated third parties, except as required or permitted by law.
We Place Strict Limits and Controls on the Use and Sharing of Your Information
| | · | We restrict access to nonpublic personal information about you to authorized employees who need the information to administer your business. |
| | · | We maintain physical, electronic and procedural safeguards that comply with federal standards to protect this information. |
| | · | We do not disclose any nonpublic personal information about our current or former clients to anyone, except as required or permitted by law or as described in this document. |
| | · | We will not sell your personal information to anyone. |
We May Provide Information to Service Your Account
Sometimes it is necessary to provide information about you to various companies such as transfer agents, custodians, broker-dealers and marketing service firms to facilitate the servicing of your account. These organizations have a legitimate business need to see some of your personal information in order for us to provide service to you. We may disclose to these various companies the information that we collect as described above. We require that these companies, including our own subsidiaries and affiliates, strictly maintain the confidentiality of this information and abide by all applicable laws. Companies within our corporate family that may receive this information are financial service providers and insurance companies. We do not permit these associated companies to sell the information for their own purposes, and we never sell our customer information.
This policy is applicable to the following affiliated companies: Touchstone Funds Group Trust, Touchstone Investment Trust, Touchstone Strategic Trust, Touchstone Tax-Free Trust, Touchstone Variable Series Trust, Touchstone Institutional Funds Trust, Touchstone Securities, Inc.* and W&S Brokerage Services, Inc.
* Touchstone Securities, Inc. serves as the underwriter to the Touchstone Funds.
A Member of Western & Southern Financial Group®
The Privacy Protection Policy is not part of the Annual Report.


Touchstone Investments
Distributor
Touchstone Securities, Inc.*
303 Broadway
Cincinnati, Ohio 45202-4203 800.638.8194
www.touchstoneinvestments.com
Investment Advisor
Touchstone Advisors, Inc.*
303 Broadway
Cincinnati, Ohio 45202-4203
Transfer Agent
BNY Mellon Investment Servicing (US) Inc.
4400 Computer Drive
Westborough, MA 01581
Shareholder Service
800.543.0407
* A Member of Western & Southern Financial Group
TSF-54CC-TST-AR-1212
Item 2. Code of Ethics.
| (a) | The registrant, as of the end of the period covered by this report, has adopted a code of ethics that applies to the registrant’s principal executive officer, principal financial officer, principal accounting officer or controller, or persons performing similar functions, regardless of whether these individuals are employed by the registrant or a third party. |
| (c) | There have been no amendments, during the period covered by this report, to a provision of the code of ethics that applies to the registrant’s principal executive officer, principal financial officer, principal accounting officer or controller, or persons performing similar functions, regardless of whether these individuals are employed by the registrant or a third party, and that relates to any element of the code of ethics description. |
| (d) | The registrant has not granted any waivers, including an implicit waiver, from a provision of the code of ethics that applies to the registrant’s principal executive officer, principal financial officer, principal accounting officer or controller, or persons performing similar functions, regardless of whether these individuals are employed by the registrant or a third party, that relates to one or more of the items set forth in paragraph (b) of this item’s instructions. |
Item 3. Audit Committee Financial Expert.
The registrant’s Board of Trustees has determined that the registrant has at least one audit committee financial expert serving on its audit committee. Mr. Donald Siekmann is the registrant’s audit committee financial expert and is an independent trustee within the meaning of the Investment Company Act of 1940, as amended (the “1940 Act”).
Item 4. Principal Accountant Fees and Services.
Audit Fees
| (a) | The Audit fees for Touchstone Strategic Trust (December Funds) totaled $85,680 for the fiscal year ended December 31, 2012, including fees associated with the annual audit and filing of Form N-1A and Form N-SAR. |
| | The aggregate fees billed for professional services rendered by the principal accountant for the audit of the registrant's annual financial statements or services that are normally provided by the accountant in connection with statutory and regulatory filings or engagements from the period April 1, 2012 through fiscal year ended July 31, 2012 is $153,800. The Funds were acquired by Touchstone Strategic Trust on April 16, 2012. |
Audit-Related Fees
| (b) | There were no audit-related fees for the fiscal year end December 31, 2012 and for the period April 1, 2012 through the fiscal year ended July 31, 2012 for the Touchstone Strategic Trust (December Funds). The Funds were acquired by Touchstone Strategic Trust on April 16, 2012. |
Tax Fees
| (c) | Fees for tax compliance services totaled $25,000 for the fiscal year ended December 31, 2012 and $25,000 from the period April 1, 2012 through fiscal year ended July 31, 2012. The Funds were acquired by Touchstone Strategic Trust on April 16, 2012. Fees for 2012 relate to the preparation of federal income and excise tax returns and review of capital gains distribution calculations. |
All Other Fees
| (d) | There were no fees for all other services to Touchstone Strategic Trust (December Funds) not included above. The Funds were acquired by Touchstone Strategic Trust on April 16, 2012. |
| (e)(1) | Disclose the audit committee's pre-approval policies and procedures described in paragraph (c)(7) of Rule 2-01 of Regulation S-X. |
| | The Audit Committee’s pre-approval policies describe the types of audit, audit-related, tax and other services that have the general pre-approval of the Audit Committee. The pre-approval policies provide that annual audit service fees, tax services not specifically granted pre-approval, services exceeding pre-approved cost levels and other services that have not received general pre-approval will be subject to specific pre-approval by the Audit Committee. The pre-approval policies further provide that the Committee may grant general pre-approval to other audit services (statutory audits and services associated with SEC registration statements, periodic reports and other documents filed with the SEC or other documents issued in connection with securities offerings), audit-related services (accounting consultations related to accounting, financial reporting or disclosure matters not classified as “audit services,” assistance with understanding and implementing new accounting and financial reporting guidance from rulemaking authorities, agreed-upon or expanded audit procedures related to accounting and/or billing records required to respond to or comply with financial, accounting or regulatory reporting matters and assistance with internal control reporting requirements under Form N-SAR and Form N-CSR), tax services that have historically been provided by the auditor that the Committee believes would not impair the independence of the auditor and are consistent with the SEC’s rules on auditor independence and permissible non-audit services classified as “all other services” that are routine and recurring services. |
| (e)(2) | All services described in paragraphs (c) through (d) of Item 4 were approved by the Audit Committee. Not applicable for paragraph (b) of Item 4. |
| (f) | The percentage of hours expended on the principal accountant's engagement to audit the registrant's financial statements for the most recent fiscal year that were attributed to work performed by persons other than the principal accountant's full-time, permanent employees was less than fifty percent. |
| (g) | The aggregate non-audit fees for Touchstone Strategic Trust (December Funds) and certain entities*, totaled approximately $66,500 for the fiscal year ended December 31, 2012 and $25,000 from the period April 1, 2012 through fiscal year ended July 31, 2012. The Funds were acquired by Touchstone Strategic Trust on April 16, 2012. |
| | * These include the advisors (excluding sub-advisors) and any entity controlling, controlled by or under common control with the advisors that provides ongoing services to the registrant (Funds) |
| (h) | The registrant's audit committee of the board of trustees has considered whether the provision of non-audit services that were rendered to the registrant's investment adviser (not including any sub-adviser whose role is primarily portfolio management and is subcontracted with or overseen by another investment adviser), and any entity controlling, controlled by, or under common control with the investment adviser that provides ongoing services to the registrant that were not pre-approved pursuant to paragraph (c)(7)(ii) of Rule 2-01 of Regulation S-X is compatible with maintaining the principal accountant's independence. |
Item 5. Audit Committee of Listed registrants.
Not applicable.
Item 6. Investments.
| (a) | Schedule of Investments in securities of unaffiliated issuers as of the close of the reporting period is included as part of the report to shareholders filed under Item 1 of this form. |
Item 7. Disclosure of Proxy Voting Policies and Procedures for Closed-End Management Investment Companies.
Not applicable.
Item 8. Portfolio Managers of Closed-End Management Investment Companies.
Not applicable.
Item 9. Purchases of Equity Securities by Closed-End Management Investment Company and Affiliated Purchasers.
Not applicable.
Item 10. Submission of Matters to a Vote of Security Holders.
There have been no material changes to the procedures by which the shareholders may recommend nominees to the registrant’s board of trustees, where those changes were implemented after the registrant last provided disclosure in response to the requirements of Item 407(c)(2)(iv) of Regulation S-K (17 CFR 229.407) (as required by Item 22(b)(15) of Schedule 14A (17 CFR 240.14a-101)), or this Item.
Item 11. Controls and Procedures.
| (a) | The registrant’s principal executive and principal financial officers, or persons performing similar functions, have concluded that the registrant’s disclosure controls and procedures (as defined in Rule 30a-3(c) under the Investment Company Act of 1940, as amended (the “1940 Act”) (17 CFR 270.30a-3(c))) are effective, as of a date within 90 days of the filing date of the report that includes the disclosure required by this paragraph, based on their evaluation of these controls and procedures required by Rule 30a-3(b) under the 1940 Act (17 CFR 270.30a-3(b)) and Rules 13a-15(b) or 15d-15(b) under the Securities Exchange Act of 1934, as amended (17 CFR 240.13a-15(b) or 240.15d-15(b)). |
| (b) | There were no changes in the registrant’s internal control over financial reporting (as defined in Rule 30a-3(d) under the 1940 Act (17 CFR 270.30a-3(d)) that occurred during the registrant’s second fiscal quarter of the period covered by this report that has materially affected, or is reasonably likely to materially affect, the registrant’s internal control over financial reporting. |
Item 12. Exhibits.
| (a)(1) | Code of ethics, or any amendment thereto, that is the subject of disclosure required by Item 2 is attached hereto. |
| (a)(2) | Certifications pursuant to Rule 30a-2(a) under the 1940 Act and Section 302 of the Sarbanes-Oxley Act of 2002 are attached hereto. |
| (b) | Certifications pursuant to Rule 30a-2(b) under the 1940 Act and Section 906 of the Sarbanes- Oxley Act of 2002 are attached hereto. |
SIGNATURES
Pursuant to the requirements of the Securities Exchange Act of 1934 and the Investment Company Act of 1940, the registrant has duly caused this report to be signed on its behalf by the undersigned, thereunto duly authorized.
| (Registrant) | Touchstone Strategic Trust | |
| By (Signature and Title)* | /s/ Jill T. McGruder | |
| | Jill T. McGruder, President | |
| | (principal executive officer) | |
Pursuant to the requirements of the Securities Exchange Act of 1934 and the Investment Company Act of 1940, this report has been signed below by the following persons on behalf of the registrant and in the capacities and on the dates indicated.
| By (Signature and Title)* | /s/ Jill T. McGruder | |
| | Jill T. McGruder, President | |
| | (principal executive officer) | |
| By (Signature and Title)* | /s/ Terrie A. Wiedenheft | |
| | Terrie A. Wiedenheft, Controller and Treasurer | |
| | (principal financial officer) | |
* Print the name and title of each signing officer under his or her signature.