UNITED STATES
SECURITIES AND EXCHANGE COMMISSION
Washington, D.C. 20549
FORM N-CSR
CERTIFIED SHAREHOLDER REPORT OF REGISTERED MANAGEMENT INVESTMENT COMPANIES
Investment Company Act file number 811-03651
Touchstone Strategic Trust – June Funds
(Exact name of registrant as specified in charter)
303 Broadway, Suite 1100
Cincinnati, Ohio 45202-4203
(Address of principal executive offices) (Zip code)
Jill T. McGruder
303 Broadway, Suite 1100
Cincinnati, Ohio 45202-4203
(Name and address of agent for service)
Registrant's telephone number, including area code: 800-638-8194
Date of fiscal year end: June 30
Date of reporting period: June 30, 2012
Form N-CSR is to be used by management investment companies to file reports with the Commission not later than 10 days after the transmission to stockholders of any report that is required to be transmitted to stockholders under Rule 30e-1 under the Investment Company Act of 1940 (17 CFR 270.30e-1). The Commission may use the information provided on Form N-CSR in its regulatory, disclosure review, inspection, and policymaking roles.
A registrant is required to disclose the information specified by Form N-CSR, and the Commission will make this information public. A registrant is not required to respond to the collection of information contained in Form N-CSR unless the Form displays a currently valid Office of Management and Budget ("OMB") control number. Please direct comments concerning the accuracy of the information collection burden estimate and any suggestions for reducing the burden to Secretary, Securities and Exchange Commission, 100 F Street, NE, Washington, DC 20549. The OMB has reviewed this collection of information under the clearance requirements of 44 U.S.C. § 3507.
Item 1. Reports to Stockholders.
The Report to Shareholders is attached herewith.
June 30, 2012
Annual Report
Touchstone Strategic Trust
Touchstone Capital Growth Fund
Touchstone International Small Cap Fund
Touchstone Mid Cap Value Opportunities Fund
Touchstone Small Cap Value Opportunities Fund
Touchstone U.S. Long/Short Fund
Touchstone Value Fund

Table of Contents
| | Page |
| Letter from the President | 3 |
| Tabular Presentation of Portfolios of Investments (Unaudited) | 28 - 29 |
| Portfolio of Investments: | |
| Touchstone Capital Growth Fund | 30 |
| Touchstone International Small Cap Fund | 32 |
| Touchstone Mid Cap Value Opportunities Fund | 35 |
| Touchstone Small Cap Value Opportunities Fund | 37 |
| Touchstone U.S. Long/Short Fund | 39 |
| Touchstone Value Fund | 41 |
| Statements of Assets and Liabilities | 44 - 47 |
| Statements of Operations | 48 - 49 |
| Statements of Changes in Net Assets | 50 - 53 |
| Statements of Changes in Net Assets - Capital Stock Activity | 54 - 59 |
| Statement of Cash Flows | 60 |
| Financial Highlights | 61 - 76 |
| Notes to Financial Statements | 77 - 91 |
| Report of Independent Registered Public Accounting Firm | 92 |
| Other Items (Unaudited) | 93 - 100 |
| Management of the Trust (Unaudited) | 101 - 103 |
| Privacy Protection Policy | 104 |
Letter from the President
Dear Fellow Shareholder,
We are pleased to provide you with the Touchstone Strategic Trust Annual Report. You are receiving this “shortened” annual report because when Touchstone announced the completed acquisition of the Old Mutual Funds in April, the fiscal year end of the newly acquired Old Mutual Fund Trust was changed from March 31 to June 30. Inside you will find key financial information and manager commentaries that cover the period from April 1, 2012 to June 30, 2012.
During the period, risk aversion was the dominant sentiment from investors throughout the world. Global and domestic market volatility continued, with headwinds blowing in from seemingly every direction due to unrelenting global developments. Emerging markets were particularly hard hit as weak economic data from China raised concerns about the country’s ability to continue to be the engine for global growth. Europe was once again thrust in the limelight as sovereign debt issues came to the forefront once more and data continued to show anemic economic activity across the continent. The U.S. was the relative bright spot but still lost ground as weak data, particularly stagnant employment figures, raised concerns of a faltering economic recovery. Additionally, concerns in the U.S. regarding the pending fiscal cliff at year-end led many economists to reduce their GDP growth forecasts.
In June, the Federal Reserve voted to extend “Operation Twist,” which was initiated in September 2011, by selling short-term Treasury securities and purchasing an equal amount of longer-term Treasuries, with a goal of ultimately providing additional stimulus to the economy. The Fed also kept interest rates low at a target range of 0% to 0.25% and indicated its expectation that economic conditions would warrant this exceptionally low range until late 2014.
For the period, the U.S. equity market outperformed both developed and emerging international markets. Value stocks declined less than their growth counterparts and large cap stocks marginally performed better than their small- and mid-cap counterparts.
It is more important than ever to focus on the long-term composition of your investment portfolio as we believe that diversification is essential to balancing risk and return. We recommend that you continue to work with your financial professional on a sound asset allocation strategy to help keep your financial goals on course.
We greatly appreciate your continued support. Thank you for including Touchstone as part of your investment plan.
Sincerely,

Jill T. McGruder
President
Touchstone Strategic Trust
Management's Discussion of Fund Performance (Unaudited)
Touchstone Capital Growth Fund
Sub-Advised by Ashfield Capital Partners, LLC
Investment Philosophy and Process
The Fund seeks long-term capital growth by primarily investing in equity securities of large capitalization companies believed to possess above average growth potential by utilizing an integrated systematic investment process that combines quantitative and fundamental analysis with a top-down, thematic overlay to construct the Fund’s portfolio.
Performance and Market Recap
The total return of the Touchstone Capital Growth Fund Class A Shares was -7.47% for the quarter ended June 30, 2012. The total return of the Russell 1000® Growth Index was -4.02% for the same period.
The second quarter of 2012 began with April’s earnings season and, in the U.S., relatively healthy corporations continued to show earnings strength. Which provided support to a rally. However, equity markets experienced a reversal of fortunes as the reasonably healthy earnings reports of U.S. corporations did little to assuage the fears of a global slowdown, which arose from the suspicions of a eurozone contagion and a Chinese economic deceleration. Furthermore, in May, voters in France and Greece signaled to global markets that, while the problems in Europe may be solvable, austerity-driven low employment and economic growth was not going to be the solution. The result was the sharpest pullback that equity markets have seen year to date. In June, the fear of contagion in peripheral Europe was once again put to ease, as Spanish banks received a bailout and voters in Greece ultimately decided to remain in the European Union. Meanwhile, the global stimulus continued as central banks provided monetary stimulus in order to combat the weakening economic data coming from several regions.
Portfolio Review
The Fund’s focus on global growth detracted from performance during the quarter, which was a reversal of last quarter. On a relative basis, the Fund’s best performing sectors from an allocation standpoint were Health Care, Information Technology and Materials. The Fund had overweight positions to the Health Care and Information Technology sectors, and an underweight position to the Materials sector. On a relative basis, the Fund’s worst performing sector was Consumer Staples where both an underweight to the sector as well as stock selection detracted from returns. Specific underperforming stocks in the sector included Estee Lauder Cos. Inc. and Companhia de Bebidas das Americas Ambev. Overall, stocks election detracted the most from the Fund’s performance; specifically, stock selection within the Health Care and Energy sectors.
Sector allocation also detracted from the Fund’s performance. Characteristically, the better performing sectors were those with higher yields, higher price-to-earnings ratios, lower long-term future growth rates and higher capitalization ranges. Alternatively, the market was decidedly risk averse as sectors with the larger, slower growing companies — especially those with high income to offset risk — were in vogue, while the faster growing, relatively smaller companies were punished regardless of their balance-sheet fundamentals or potential growth profiles. As a result, the Fund’s allocation of faster growing, smaller companies detracted from its performance.
Stocks that contributed most positively to Fund performance during the period included Equinix Inc., eBay Inc. (Information Technology), and Diageo plc (Consumer Staples). Equinix, a provider of global data center services, announced the launch of its second international data center in Singapore, which is expected to accommodate the increasing market demand from cloud and financial service providers. The company’s successful string of earnings, and guidance reports on future earnings, also drove the stock higher. Shares of eBay, an Internet software and services company, saw an increase after the company raised its fiscal 2012 earnings guidance. In addition, the company now provides video sessions to better inform sellers on beginner and advanced topics,
Management's Discussion of Fund Performance (Unaudited) (Continued)
which was seen as a positive for the stock. Shares of Diageo, a worldwide beverage company, also performed well during the quarter. Diageo saw widening margins and an overall improvement in its U.S. business. Additionally, growth remained very strong in its international and emerging markets, and the company made a number of accretive and strategic acquisitions in the growth markets of Turkey, China, Vietnam and Africa.
The Fund’s long-term investment themes were focused on six major areas during the period: United States: companies that embrace the re-emergence of America as the global leader in innovation, brand awareness and manufacturing; Essentials: companies that can supply the input needs for a developing global economy;Technology: companies that can successfully provide mobile, connectivity and “big data” solutions; Global Development: companies that believe in the premise that consumers rule, from the third world to the first world; Health Care: companies that can do more for less and are successful in cost containment, innovation and scientific progress; and Infrastructure: companies that are active in capital spending.
Outlook and Conclusion
During the second quarter in particular, domestic earnings growth reconnected with stock price performance and fundamental factors garnered attention at the company level; however, the correction in May widened the gap between these historically high-correlated items. And, while the massive government intervention helped, the issues facing the global economy are many. Though at times market participants began to look further into the future and pay attention to more fundamental, company-specific factors when determining the validity of an investment, other times macroeconomic concerns drove participants’ emotional buy and sell decisions. The markets have seen this before and, while policy makers search for the right answers, equities continue to remain cheaper than they have been in many years. In fact, we believe the Fund has the opportunity to own globally positioned earnings streams at discounted prices in the safest equity markets in the world, which does not come along very often. However, we note, the continued proof of an ongoing profits recovery, sustainability of margins and organic growth are still concerns, and recent geopolitical and global events have reminded participants that these economic gains can be fleeting. That said, China and the developing world continue to grow while the U.S. reaches for higher levels of austerity within federal and state budgets, all of which are longer-term positives. On a cyclical basis, we note that investors may soon become attracted to growth-oriented investments, owing to their strong balance sheets, significant cash flows and lack of debt reliance. We believe international sources of revenues should also continue to grow, primarily to the benefit of large-cap and growth companies. Going forward, we believe that, as the economy continues to gain solid footing and uncertainties continue to subside, companies of this nature are expected to once again garner premium pricing in the market.
Overall, in our opinion, both the global and U.S. economies have seemed to successfully navigate a very fragile phase of the recovery. However, while the expected stabilization arising from the revitalization efforts of the past 18 months has helped, questions remain domestically about the housing sector and labor markets. While housing data is starting to turn positive, recent employment data has begun to fall short of expectations, which has caused investors to speculate whether the U.S. Federal Reserve Board will continue with further action. In addition, U.S. politicians will be forced to address the “fiscal cliff” that could have drastic implications in terms of the trade-off between gross domestic product (GDP) growth and deficit growth at the end of the year. Meanwhile, Europe continues its reactionary attitude of dealing with impending crises as they come along, and ultimately doing what is necessary to avert a sovereign default and preserving the European Union. At the same time, the response to softening global economic data appears to be focused on monetary stimulus going forward, as central banks cut rates around the world. As the markets continue through this period of transition— where recovering economies are endeavoring to move into a more sustainable, albeit slower, growth trajectory — we expect to see some variability in investor sentiment and expectations as market participants digest these recurring issues and subsequent solutions.
Management's Discussion of Fund Performance (Unaudited) (Continued)
Though we remain wary of the issues at hand, we are also cognizant that any attempts to predict exactly when the solution will present itself can often lead to poor long-term performance at the expense of short-term relief. As such, our goal remains the purchase and continued ownership of companies exhibiting positive earnings and revenue trends with the potential to sustain those trends. As a result, during this highly volatile second quarter, the Fund was marginally repositioned to a higher earnings growth rate than that of the Index while maintaining a price-to-earnings ratio similar to that of the Index. As such, we believe that the Fund is positioned to potentially benefit when stock price performance again reconnects to the underlying earnings trajectory and this should provide an advantage.
Management's Discussion of Fund Performance (Unaudited) (Continued)
Comparison of the Change in Value of a $10,000 Investment in the
Touchstone Capital Growth Fund - Class A* and the Russell 1000® Growth Index
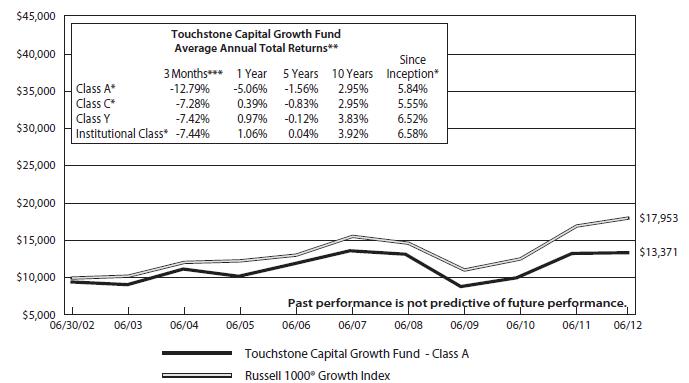
| * | The chart above represents performance for Class A shares only, which will vary from the performance of Class C shares, Class Y shares and Institutional Class shares based on the differences in loads and fees paid by shareholders in the different classes. Class A, Class C, Class Y and Institutional Class shares commenced operations on September 30, 2003, April 12, 2012, November 29, 1996 and December 20, 2006, respectively. Class A shares, Class C shares and Institutional shares performance was calculated using the historical performance of Class Y shares for the periods prior to September 30, 2003, April 12, 2012 and December 20, 2006, respectively. The returns have been restated for sales charges and for fees applicable to Class A, Class C and Institutional Class shares. |
| ** | The average annual total returns shown above are adjusted for maximum applicable sales charges. |
The performance of the above Fund does not reflect the deduction of taxes that a shareholder would pay on Fund distributions or the redemption of Fund shares. The past performance is not predictive of future results.
Management's Discussion of Fund Performance (Unaudited) (Continued)
Touchstone International Small Cap Fund
Sub-Advised by Copper Rock Capital Partners LLC
Investment Philosophy and Process
The Touchstone International Small Cap Fund seeks capital appreciation by primarily investing in equity securities of non-U.S. small-cap companies diversified across sectors and industries. The Fund’s investment process seeks to add value through bottom-up stock selection and in-depth fundamental research and searches for companies believed to have strong management, superior earnings growth prospects and attractive relative valuations.
Fund Performance and Market Recap
The total return of the Touchstone International Small Cap Fund Class A Shares was -7.28% for the quarter ended June 30, 2012. The total return of the S&P Developed Ex-U.S. Small Cap Index was -8.47% for the same period.
World markets declined during the second quarter of 2012. Most of the decline was registered in the middle of the quarter when fears of bond defaults in Europe intensified. Efforts by the European Central Bank and the European Union to recapitalize the Spanish banks eased those fears in early June, allowing markets to rally worldwide in the final month of the quarter. (Spanish banks were previously at risk of default as a result of losses incurred by Spain’s housing bubble that escalated from 2002 to 2008.) However, the market’s awareness of broader debt burdens in Italy and France muted the recovery, and the corporate world responded to the near-defaults in Spain and to other increases in global bond risk by trimming inventories and imposing more cautious positions on new production.
During the period, regions around the world performed similarly to Spain, as the prospect of Europe’s stalled growth impacted all economies. As such, all world regions declined during the quarter. North America, the most consumer-driven economy, was impacted the least by market performance. The Pacific ex-Japan region, a major supplier of industrial inputs, was most negatively impacted.
With regard to sectors, those with high visibility and stable demand such as Consumer Staples, Health Care, and Telecommunications were hurt the least during the quarter. The Energy and Materials sectors, which represent input factors for industrial production, were impacted most negatively by the cautious outlook of producers, as evidenced at the end of the quarter.
Portfolio Review
Despite the extreme volatility and stream of negative news stemming from Europe during the middle of the period, the Fund’s stock selection in the Consumer Discretionary, Materials, Energy, Industrials, and Financials sectors contributed to the Fund’s outperformance versus its benchmark. In addition, despite the macroeconomic headwinds that persisted on the European continent, stock selection in growth companies based in Canada and Continental Europe led all other regions, with the exception of stock selection in the Pacific ex-Japan and United Kingdom regions, which detracted from relative return.
Among the individual stocks that contributed most to performance were Dollarama Inc., Andritz AG, and Black Diamond Group Ltd.
Dollarama, a Canadian discount retailer, reported solid revenue and earnings momentum during the period, which was driven by strong same-store sales comparables, good product gross margins, and effective expense control and productivity improvements. Andritz AG is an engineering company that is primarily involved in hydro energy and pulp mill construction. The company’s stock outperformed as a result of highly visible sales growth in its consistently growing backlog, which was supported by the continuous renovation demands at hydro plants and pulp mills globally. Finally, shares of Black Diamond Group, a Canadian provider of rented
Management's Discussion of Fund Performance (Unaudited) (Continued)
modular structures for the resources sector, advanced as a result of continued growth in the oil-rich area of western Canada. Black Diamond Group has continued to report results ahead of consensus estimates, and the company has also continued to expand its geographical footprint and diversify its customer base.
Among the stocks that impacted the Fund most negatively were NRW Holdings Ltd., Computacenter PLC, and Atlas Iron Ltd.
NRW Holdings, a mining services and civil contracting company in Australia, was a previous outperformer for the Fund. However, the stock traded lower along with its peers due to fears over Chinese and global growth, and weak underlying commodity prices. That said, given the Fund’s constructive outlook on the global economy and fundamental research approach, we expect contract volume growth to continue and have chosen to remain owners of the stock. Computacenter PLC, a U.K.-based company that provides IT infrastructure services to the private and public sector, warned that its profits could move lower due to higher-than-expected new contracts on boarding costs, which led to a lower forecasted return on investment for the company. Furthermore, given the company’s exposure to Europe, associated risks with IT spending, and a declining euro, we exited the position. Shares of Atlas Iron, an Australian-based iron ore producer, moved lower in tandem with stocks like NRW Holdings, as concerns over global growth and mineral prices put pressure on the share price. However, we believe the stock remains highly rated in its quantitative model because of the company’s attractive valuation and, as such, the stock’s position was increased to reflect our constructive outlook for growth.
In addition, a handful of other stocks in the Information Technology and Materials sectors moved lower during the period, primarily in response to the macroeconomic headwinds and uncertainty over the pace of global growth and economic recovery.
Outlook and Conclusion
Despite the constant barrage of weak economic news since the early part of May, we maintain our thesis that the global economy is recovering, albeit slowly. The news that has battered markets focuses on slowing rates of recovery, rather than negative growth rates for the full global economy.
Regional differences have also become more pronounced. For example, Europe is contracting, but North America, Japan, Asia ex-Japan, Latin America, Middle East and Africa continue to grow. And, we believe the fact that the rest of the world is able to continue climbing despite the stall in Europe is testimony to the underlying strength of the continuing growth of consumer demand.
We believe there are two major obstacles to strong global economic expansion, 1) the defense of the euro, and 2) the fiscal uncertainties in the U.S. that have intensified because of the presidential campaign. Neither obstacle will be quickly removed. However, continued progress in global economic growth and in U.S. employment growth should create a platform for corporate growth. And, although we are still in a period of recovery for the overall global economy, albeit slower than anticipated, we believe broadening retail consumption around the world and corporate investment in productivity will remain the drivers going forward.
We maintain our position that growth rates for the European countries will be close to zero (small positives or small negatives) for the near term and will slowly improve over the upcoming two-year period. We believe Germany will continue to pressure other European countries to make the national cost adjustments that it made nearly ten years ago to enhance the country’s competitiveness.
Management's Discussion of Fund Performance (Unaudited) (Continued)
Furthermore, China’s transition from rural to urban, and from an export focus to a consumption emphasis, will determine the pace of growth.
Finally, we are still finding attractive opportunities in the emerging markets arena and will continue to carefully select those companies that meet the Fund’s underlying investment criteria regardless of their home base. We will also continue to search for growth in unique, entrepreneurial companies that show margin expansion and the ability to self-finance during all market environments due to strength demonstrated from a bottom-up perspective.
Management's Discussion of Fund Performance (Unaudited) (Continued)
Comparison of the Change in Value of a $10,000 Investment in the
Touchstone International Small Cap Fund - Class A* and the S&P Developed Ex-U.S. Small Cap Index
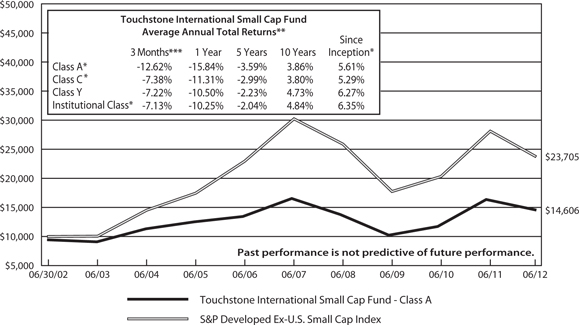
| | * | The chart above represents performance for Class A shares only, which will vary from the performance of Class C shares, Class Y shares and Institutional Class shares based on the differences in loads and fees paid by shareholders in the different classes. Class A, Class C, Class Y and Institutional Class shares commenced operations on July 31, 2003, April 12, 2012, December 31, 1996 and December 20, 2006, respectively. Class A shares, Class C shares and Institutional shares performance was calculated using the historical performance of Class Y shares for the periods prior to July 31, 2003, April 12, 2012 and December 20, 2006, respectively. The returns have been restated for sales charges and for fees applicable to Class A, Class C and Institutional Class shares. |
| | ** | The average annual total returns shown above are adjusted for maximum applicable sales charges. |
The performance of the above Fund does not reflect the deduction of taxes that a shareholder would pay on Fund distributions or the redemption of Fund shares. The past performance is not predictive of future results.
Management's Discussion of Fund Performance (Unaudited) (Continued)
Touchstone Mid Cap Value Opportunities Fund
Sub-Advised by Thompson Siegel & Walmsley LLC
Investment Philosophy and Process
The Fund seeks long-term capital growth by primarily investing in equity securities of mid-cap companies that are believed to present value that is not reflected by prevailing market prices or that have experienced fundamental changes and are intrinsically undervalued by the investment community. Using a combination of quantitative and qualitative methods, a company’s attractiveness is assessed in an effort to understand why the market may be mispricing the stocks, what factors are changing that can return the stock to fair value and whether those changes are sustainable over a medium term investment horizon based on both absolute and sector-relative valuation of cash flows, the relative earnings prospects of the company and the stock’s recent price action.
Fund Performance and Market Recap
The total return of the Touchstone Mid Cap Value Opportunities Fund Class A Shares was -2.21% for the quarter ended June 30, 2012. The total return of the Russell Midcap® Value Index was -3.26% for the same period.
During the second quarter, volatility and stock correlations rose, and risk assets retreated, as global macroeconomic concerns reasserted their dominance over market returns. Investors seemed to ignore valuation and the majority of fundamentals, and focused primarily on the shrinking group of already expensive stocks exhibiting stable growth such as those in the Utilities and Consumer Staples sectors.
Portfolio Review
The Fund was able to outperform its benchmark as a result of its more defensive posture. The Fund’s relative return was attributable to stock selection, which was positive in nine out of ten sectors and especially additive in higher beta1 sectors such as Energy, Materials and Financials. On the other hand, sector allocation was a detractor, which was mainly due to an overweight position in the Information Technology sector. The sector, with its higher exposure to foreign sales and greater market sensitivity, was by far the Fund’s worst performing sector during the period.
Though the Energy and Materials sectors were each down nearly ten percent as a result of the sharp decline in commodity prices, these sectors were among the top contributors to relative returns during the quarter. Within the Energy sector, a takeover involving Sunoco, Inc. and another takeover involving Holly Frontier Corp. contributed to returns. Within the Materials sector, the Fund’s strong stock selection in the paper, fertilizer and packaging industries — as well as avoidance of steel and building materials — provided solid downside protection.
Additions to the Information Technology and Consumer Discretionary sectors, funded by small reductions in most other sectors, constituted the most notable changes to portfolio positioning during the second quarter. As a result, the Consumer Discretionary sector replaced Health Care as the second-largest sector relative to the Russell Midcap Value® Index weight. Even with these changes, the Fund’s portfolio structure remained relatively stable.
During the quarter, the Fund was most underweight the Financials and Industrials sectors. Within the Financials sector, banks and real estate investment trusts (REITs) continued to face headwinds as a result of their vulnerability to regulatory reform and other earnings growth challenges. The Fund’s underweight position in the Industrials sector was derived from higher valuations among some cyclical stocks and concern about reductions in government spending for defense-related companies. The engineering and construction industry was an exception in this sector with its high cash-flow yields and exposure to growth in energy and transportation infrastructure. Stock
Management's Discussion of Fund Performance (Unaudited) (Continued)
selection in the more defensive Consumer Staples sector was positive during the period, but the Fund’s underweight to the sector detracted from performance.
Among the individual stocks that contributed to the Fund’s performance were Sunoco Inc. (Energy sector), Annaly Capital Management Inc. (Financials sector) and NRG Energy Inc., Wisconsin Energy Corp., and CMS Energy Corp. (Utilities sector). Oil refiner Sunoco was acquired by Energy Transfer Partners L.P. at an attractive premium during the period, which positively impacted the stock. Annaly Capital Management, a mortgage real estate investment trust (REIT), continued to benefit from the low interest rate environment. Additionally, investors were attracted to the REIT because of its dividend yield as they searched for safety during the quarter. Shares of NRG Energy, an independent power company, rose higher during the period as the company ramped up production in Texas as it anticipated a summer of high-energy usage. Wisconsin Energy Group, an electric utility provider, surpassed earnings expectations as a result of cost controls and operational efficiencies, despite a mild winter and lower-than-expected utilization rates. CMS Energy, a Michigan-based electric utility, attracted investors because of its dividend yield and defensive earnings visibility.
On the other side of the equation, stocks that detracted from Fund performance included Symantec Corp., Western Digital Corp., Endo Pharmaceutical Holdings Inc. and SanDisk Corp. (Information Technology sector), and Lear Corp. (Consumer Discretionary sector). Symantec, security software provider was weighed down during the period by its exposure to European markets. Western Digital, a hard-drive maker, experienced a decline in personal computer (PC) sales as consumers awaited the release of Windows 8, and its stock was negatively impacted as a result. Endo Health Solutions, a specialty drug maker, was under pressure during the quarter after the Food and Drug Administration instructed the company to transition its painkiller drug to a crush-resistant material. Shares of SanDisk, a chipmaker and designer of data storage solutions, declined in sympathy with its group, as weakness in Europe and concerns about PC sales weighed on the industry. Lear, an automobile parts maker, saw its shares being weighed down by uncertainty revolving Europe’s economy, despite surpassing earnings expectations and reaffirming full-year guidance.
Outlook and Conclusion
Signs of a global slowdown continued to accumulate during the quarter. Economic reports were weak and company managements provided increasingly conservative earnings guidance. Investors seemed to respond by chasing the dwindling cohort of stocks that managed to maintain growth, which kept their valuations high. It also positioned those companies that reported disappointing earnings for steep declines. Going forward, we believe the market will be volatile characterized by short-term sentiment changes and odd individual stock behavior. While this can be frustrating to watch, we believe it can be an exciting environment for the longer-term investor seeking mispriced stocks. We note that in many cases, current valuations fairly reflect the widespread, deeply pessimistic macroeconomic outlook. However, these valuations do not fully credit companies for the factors that differentiate them from their peers and for investment catalysts that have the potential to generate better-than-expected growth. We believe that valuation is the key to long-term success and the Fund exhibits a significant discount on earnings and cash-flow valuation compared to its value style benchmark. It is also finding companies with sustainable positive change as evidenced by the Fund’s growth characteristics.
As we look to the future, we share our insights on the market and various investment opportunities going forward. We believe that the Information Technology sector is arguably the least expensive economic sector today, especially following this quarter’s market-leading declines. Some industries mature and others are affected by the halted pace of economic recovery, growth has become less uniform across this sector than it once was. We note that this can create opportunities for value investors focused on catalysts such as industry consolidation and capacity rationalization, or on companies poised to capitalize on changes in production technology. With regard to the Consumer Discretionary sector, we believe that, while the sector is not inexpensive, there are several company-specific situations where management initiatives or other circumstances can generate better
Management's Discussion of Fund Performance (Unaudited) (Continued)
earnings than what the market anticipates in the upcoming years. Furthermore, we view the American natural gas story as under-recognized both for the economic opportunities it affords — in the form of increased exports of liquefied natural gas and as an alternative to foreign energy sources — and also for the variety of investment themes it presents for companies involved with energy infrastructure, pipelines, refiners, etc.
As always, the Fund’s portfolio structure is driven by our stock selection process, which emphasizes inexpensive companies experiencing sustainable positive change. We seek to overweight economic sectors where this process uncovers concentrations of such companies and underweight the sectors where they are scarce.
| | 1 | Beta is a measure of the volatility of a portfolio relative to its benchmark. |
Management's Discussion of Fund Performance (Unaudited) (Continued)
Comparison of the Change in Value of a $10,000 Investment in the Touchstone Mid Cap Value
Opportunities Fund - Class A* and the Russell Midcap® Value Index
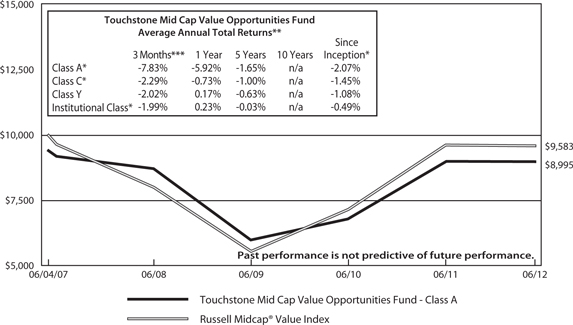
| * | The chart above represents performance for Class A shares only, which will vary from the performance of Class C shares, Class Y shares and Institutional Class shares based on the differences in loads and fees paid by shareholders in the different classes. Class A, Class C, Class Y and Institutional Class shares commenced operations on June 4, 2007, April 12, 2012, December 9, 2008 and June 4, 2007, respectively. Class C shares and Class Y shares performance was calculated using the historical performance of Class A shares for the periods prior to April 12, 2012 and December 9, 2008, resepectively. The returns have been restated for sales charges and for fees applicable to Class C and Class Y shares. |
| | |
| ** | The average annual total returns shown above are adjusted for maximum applicable sales charges. |
| | |
| *** | Not annualized. |
The performance of the above Fund does not reflect the deduction of taxes that a shareholder would pay on Fund distributions or the redemption of Fund shares. The past performance is not predictive of future results.
Management's Discussion of Fund Performance (Unaudited) (Continued)
Touchstone Small Cap Value Opportunities Fund
Sub-Advised by Thompson, Siegel & Walmsley LLC
Investment Philosophy and Process
The Fund seeks long-term capital growth by primarily investing in equity securities of small-cap companies that are believed to present value that is not reflected by prevailing market prices or that have experienced fundamental changes and are intrinsically undervalued by the investment community. Using a combination of quantitative and qualitative methods, a company’s attractiveness is assessed in an effort to understand why the market may be mispricing the stocks, what factors are changing that can return the stock to fair value and whether those changes are sustainable of a medium term investment horizon based on both absolute and sector-relative valuation of cash flows, the relative earnings prospects of the company and the stock’s recent price action.
Fund Performance and Market Recap
The total return of the Touchstone Small Cap Value Opportunities Fund Class A Shares was -3.09% for the quarter ended June 30, 2012. The total return of the Russell 2000® Value Index was -3.01% for the same period.
The second quarter of 2012 was again dominated by headlines about global economic concerns and sovereign debt crises, which weighed heavily on investors and pushed market returns into negative territory. During the period, equity correlations and market volatility were on the rise, as the overhang from the European debt crisis, lackluster economic reports, and the continued political uncertainty were major drivers of equity returns, rather than differentiating characteristics of individual companies. The decline in the equity markets during the second quarter essentially erased much of the gains from the previous quarter. Furthermore, investors reverted to the risk-off trade, thereby causing less cyclical stocks to outperform.
Portfolio Review
Among the sectors that contributed most to the Fund’s performance relative to the benchmark were Health Care and Consumer Staples. Within the Health Care sector, one of the portfolio’s drug makers, Questcor Pharmaceuticals Inc., continued to profit during the quarter as a result of increased utilization of its anti-seizure drug. Also within the Health Care sector, the Supreme Court of the United States largely upheld the Affordable Care Act late in the three-month period, and the Fund’s medical facility positions rallied. Within the Consumer Staples sector, the Fund benefited from company-specific events. In particular, Susser Holdings Corp., one of the Fund’s convenience-store operators, announced plans to spin off its fuel operations, thereby unlocking shareholder value. In addition, Hain Celestial Group Inc., an organic food manufacturer, experienced increased demand, which drove the company’s stock higher. On the mergers and acquisitions front, Charming Shoppes Inc., a women’s apparel retailer, was acquired at an attractive premium, which drove the stock higher. Also, oil refiner CVR Energy Inc. was the target of activist investor, Carl Icahn, which positively impacted the company’s stock.
During the quarter, the primary detractor from the Fund’s relative returns was stock selection in the Consumer Discretionary and Industrials sectors. Macroeconomic woes weighed on the outlook for consumer discretionary spending in general and, in particular, the consumer electronics segment, where the portfolio had exposure. In addition, Select Comfort Corp., traded off in sympathy with a major competitor that issued markedly lower guidance during the quarter. While the Fund’s underweight exposure to the Industrials sector was additive to performance, fears of a slowing global demand negatively affected the Fund’s industrial machinery positions.
Among the individual stocks that contributed to the Fund’s performance were Western Refining Inc. (Energy sector), Charming Shoppes Inc. (Consumer Discretionary sector), Ocwen Financial Corp. (Financials sector), Questcor Pharmaceuticals Inc. (Health Care sector), and Cardtronics Inc. (Information Technology sector). Western
Management's Discussion of Fund Performance (Unaudited) (Continued)
Refining, an independent crude oil producer, benefited from cost controls and lower-priced crude, which helped the company’s profit margins. Charming Shoppes Inc., a women’s specialty apparel retailer was acquired by Ascena Retail Group Inc. at an attractive premium, which sent the company’s stock higher. Ocwen Financial, a provider of mortgage loan servicing that specializes in distressed loans, continued to capitalize from historic levels from a nationwide foreclosure backlog. Questcor Pharmaceuticals, a specialty biopharmaceutical company, benefited from its primary multiple sclerosis drug, H.P. Acthar® Gel, which was also proven to be effective in the rheumatology market. Cardtronics, a provider of automated consumer financial services, posted better-than-expected earnings and raised full-year guidance as the company continued to grow its pipeline of contracts.
Among the top detractors from Fund performance were Select Comfort Corp. and Men’sWearhouse Inc. (Consumer Discretionary sector), Kulicke & Soffa Industries Inc. and TiVo Inc. (Information Technology sector), and Twin Disc Inc. (Industrials sector). Select Comfort Corp., a specialty mattress manufacturer and retailer, traded off in sympathy after a major competitor,Tempur-Pedic International Inc., reported a revised downward outlook. Shares of Kulicke & Soffa Industries, a maker of technology equipment, were weighed down by their exposure to European markets during the quarter. And, while TiVo, a developer and provider of television technology, recently won legal cases against Dish Network Corp. and AT&T Inc. for use of TiVo’s patented technology, ongoing litigation with Verizon Communications Inc.,Time Warner Cable Inc., and Cisco Systems Inc. hindered the stock during the quarter. Twin Disc Inc., an industrial equipment maker, saw its shares decline as a result of an uncertain outlook in oil and gas-pumping demand due to falling natural gas prices. Shares of Men’s Wearhouse Inc., a men’s clothing retailer, declined in sympathy with consumer spending-related positions, as global economic concerns weighed on the market.
During the quarter, the Health Care and Consumer Discretionary sectors were the portfolio’s largest overweight positions. Within the Health Care sector, the Fund was overweight cash-flow rich pharmaceutical companies with unique catalysts, in addition to facility companies, which are expected to benefit from greater utilization rates. Stocks within the Consumer Discretionary sector are typically not inexpensive overall, but we believe we continued to find isolated pockets where valuations were attractive and consumer trends or business initiatives appeared promising.
The portfolio’s positioning changed modestly during the period, as additions were made to the Information Technology sector and reductions were made to the Industrials sector weighting. Within the Information Technology sector, we took advantage of valuation opportunities stemming from the sell-off of internationally exposed companies. Conversely, we trimmed the portfolio’s Industrials sector weighting after many of the Fund’s holdings rallied during the first quarter. Overall, the market experienced a reversal in momentum, which favored less-cyclical positions, along with a lessening concern with valuation — both of which detracted from performance.
Although the Fund remained underweight the Financials sector, we added to its banking holdings that exhibited solid balance sheets and stable or growing loan portfolios. We also continued to see value in consumer finance companies that serve the non-bank consumer. The portfolio remained underweight the Industrials sector, partly due to uncertainty surrounding the outlook for government spending and its impact on aerospace and defense-related positions.
Outlook and Conclusion
Overall, we believe the market’s preoccupation with global headlines has created opportunities for its disciplined, value-investing process, especially in companies with foreign sales exposure. For example, small companies with foreign sales exposure have been unduly punished in the market, and, as a result, we have added a couple of these stocks to the Fund’s portfolio and are researching other opportunities. Going forward, we expect to look closely at a number of technology companies in faster growing niche industries, as we believe the Information Technology sector appears to be at historically attractive valuation levels — partly due to its higher foreign sales. While the short-term market picture may continue to be obscured by headlines of global economic uncertainty,
Management's Discussion of Fund Performance (Unaudited) (Continued)
we believe there are also a number of more positive developments: employment levels have remained stable, the housing sector appears to show improvement, and conditions appear fertile for increased mergers and acquisitions activity.
As always, the Fund’s portfolio structure is driven by our stock selection process, which emphasizes inexpensive companies experiencing sustainable positive change. We seek to overweight economic sectors where this process uncovers concentrations of such companies and underweight the sectors where they are scarce.
Management's Discussion of Fund Performance (Unaudited) (Continued)
Comparison of the Change in Value of a $10,000 Investment in the Touchstone
Small Cap Value Opportunities Fund - Class A* and the Russell 2000® Value Index

| | * | The chart above represents performance for Class A shares only, which will vary from the performance of Class C shares, Class Y shares and Institutional Class shares based on the differences in loads and fees paid by shareholders in the different classes. Class A, Class C, Class Y and Institutional Class shares commenced operations on July 31, 2003 April 12, 2012, July 25, 2003 and December 9, 2008, respectively. Performance information presented prior to July 25, 2003 for Class Y shares includes performance of a predecessor fund whose inception date was July 31, 2000. Class A shares, Class C shares and Institutional Class shares performance was calculated using the historical performance of Class Y shares for periods prior to July 31, 2003, April 12, 2012 and December 9, 2008, respectively. The returns have been restated for sales charges and for fees applicable to Class A, Class C and Institutional Class shares. |
| | ** | The average annual total returns shown above are adjusted for maximum applicable sales charges. |
The performance of the above Fund does not reflect the deduction of taxes that a shareholder would pay on Fund distributions or the redemption of Fund shares. The past performance is not predictive of future results.
Management's Discussion of Fund Performance (Unaudited) (Continued)
Touchstone U.S. Long/Short Fund
Sub-Advised by Analytic Investors, LLC
Investment Philosophy and Process
The Touchstone U.S. Long/Short Fund seeks to provide investors with above-average returns by investing primarily in equity securities of large and mid-cap companies whose securities are traded in U.S. markets and are tied economically to the United States. The Fund buys securities “long” on the belief that they will outperform and sells securities “short” on the belief that they will underperform. Fund management utilizes a proprietary system that ranks stocks according to a mathematical model and seeks to determine a security’s intrinsic value by evaluating variables such as relative valuation, price momentum, company fundamentals, liquidity and risk. The investment process utilizes portfolio optimization to select securities that it believes will maximize return, minimize volatility, and diversify assets.
Fund Performance and Market Recap
The total return of the Touchstone U.S. Long/Short Fund Class A Shares was -2.50% for the quarter ended June 30, 2012. The total return of the S&P 500 Index was -2.75% for the same period.
Despite a good corporate earnings season during the second quarter, the strong negative headwinds from the Euro zone, a slowdown in China, and the U.S. policy stalemate kept investors on edge and impacted equity markets globally. Apparent progress on the policy front in Europe helped drive a relief rally in June, but all major global equity indexes still finished the second quarter in negative territory. In general, the more defensive sectors of the economy such as Telecommunications, Utilities, and Consumer Staples performed well during the second quarter, while more cyclical sectors such as Financials, Energy, and Information Technology lagged.
Portfolio Review
The Fund’s investment process is based on the premise that investor behavior changes, but changes slowly, and is fairly persistent from month to month. The Fund’s investment process uses a multi-characteristic approach when valuing securities. During the quarter, an emphasis on stocks with above-average quality characteristics — such as strong asset utilization and above-average profit margins — helped performance, as investors rewarded these quality traits. In addition, an emphasis on price momentum also helped, as stocks continued their return path, especially over the six-month-return period. For example, stocks with positive six-month returns generally continued to outperform, whereas stocks with negative six-month returns continued to underperform. During the period, the Fund was negatively impacted as a result of avoiding companies with above-average analyst dispersion — which is when analysts differ in opinion regarding future earnings — as these companies performed well during the quarter.
The Fund is structured to be sector, style and beta1 neutral relative to the S&P 500, and attempts to deliver outperformance from stock selection. Stock selection was particularly strong within the Consumer Discretionary sector.
Among the stocks that contributed most during the quarter were Expedia Inc., Alpha Natural Resources Inc., Rovi Corp., MEMC Electronic Materials Inc., and Dendreon Corp. Expedia, an online travel company, posted strong profit and revenue results that exceeded analyst expectations. A short position in Alpha Natural Resources, a supplier and exporter of metallurgical coal, contributed to Fund performance after the company’s stock was negatively impacted by the collapse in U.S. coal prices. A short position in Rovi, a digital entertainment solutions company, helped performance after the company reported earnings that were in-line with expectations but missed its revenue number. In addition, Rovi’s chief financial officer announced he was leaving, which weighed further on the stock price. A short position in MEMC Electronic Materials, a developer and manufacturer of
Management's Discussion of Fund Performance (Unaudited) (Continued)
silicon wafers, positively impacted the Fund after the company suffered its worst market decline in more than 10 years after posting a large first-quarter loss and revenue that dropped over 30 percent versus the prior year.
Among the stocks that detracted from Fund performance were Human Genome Sciences Inc., Jabil Circuit Inc., Marathon Oil Corp., and Ariba Inc. A short position in Human Genome Sciences, a biopharmaceutical company, had the largest negative impact to relative performance. Shares of Human Genome Sciences rallied after the biotechnology company rejected a $2.59 billion acquisition offer from GlaxoSmithKline PLC. Jabil Circuit, a provider of worldwide electronic manufacturing services and solutions, reported earnings and revenue that were lower than analyst expectations. In addition, one of Jabil Circuit’s major manufacturing partners, Research in Motion Ltd., suffered from a deteriorating smartphone market position, which also hurt Jabil Circuit. Marathon Oil, an integrated energy company engaged in exploration and production, reported lower-than-expected first-quarter results. A short position in Ariba, a provider of collaborative business commerce solutions, negatively impacted performance after it was announced that SAP AG, the largest maker of enterprise applications software, agreed to buy the company.
Outlook and Conclusion
We practice an investment process that is based on the fundamental belief that there is persistency in the types of characteristics investors prefer. If this holds going forward, we believe the Fund should benefit from being properly positioned toward stocks with characteristics favored by investors.
With regard to market factors, we continue to favor certain valuation characteristics, such as companies with attractive sales-to-price and cash flow-to-price ratios, and deemphasize stocks with above-average dividend yields. In addition, we expect to continue to position the Fund toward stocks with certain quality metrics, such as companies with strong return on equity and above-average profit margins. With regard to growth, we expect to favor an emphasis on stocks with above-average recent earnings-per-share growth and growth in profitability. Finally, we expect to continue to avoid certain risk factors, such as stocks with above-average trading volume and stocks with wide-ranging earnings estimates from analysts.
| | 1 | Beta is a measure of the volatility of a portfolio relative to its benchmark. |
Management's Discussion of Fund Performance (Unaudited) (Continued)
Comparison of the Change in Value of a $10,000 Investment in the
Touchstone U.S. Long/Short Fund - Class A* and the
S&P 500 Index
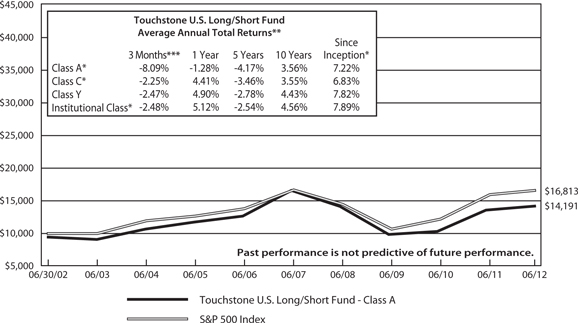
| * | The chart above represents performance for Class A shares only, which will vary from the performance of Class C shares, Class Y shares and Institutional Class shares based on the differences in loads and fees paid by shareholders in the different classes. Class A, Class C, Class Y and Institutional Class shares commenced operations on July 31, 2003, April 12, 2012, July 1, 1993 and December 20, 2006, respectively. Class A shares, Class C shares and Institutional Class shares performance was calculated using the historical performance of Class Y shares for the periods prior to July 31, 2003, April 12, 2012 and December 20, 2006, respectively. The returns have been restated for sales charges and for fees applicable to Class A, Class C and Institutional Class shares. |
| | |
| ** | The average annual total returns shown above are adjusted for maximum applicable sales charges. |
| | |
| *** | Not annualized. |
The performance of the above Fund does not reflect the deduction of taxes that a shareholder would pay on Fund distributions or the redemption of Fund shares. The past performance is not predictive of future results.
Management's Discussion of Fund Performance (Unaudited) (Continued)
Touchstone Value Fund
Sub-Advised by Barrow, Hanley, Mewhinney & Strauss, LLC
Investment Philosophy and Process
The Touchstone Value Fund seeks long-term growth by primarily investing in equity securities of large- and mid-cap companies believed to be undervalued. The Fund uses traditional methods of stock selection - research and analysis - to identify companies that have price-to-earnings and price-to-book ratios below the market, that also have above average dividend yields and focuses on companies that are out of favor due to internal or external challenges judged to be short-term in nature. Stock selection is driven by fundamental analysis on individual companies rather than by broad market themes.
Fund Performance and Market Recap
The total return of the Touchstone Value Fund Class A Shares was -1.83% for the quarter ended June 30, 2012. The total return of the Russell 1000® Value Index was -2.20% for the same period.
Global stock markets endured ongoing concerns about Europe and growth prospects for the world’s largest economies during the second quarter. As such, risk aversion was the dominant sentiment from investors throughout the world. The U.S. stock market, however, was viewed as a relative safe haven during the period even though performance was down for the quarter, based on the S&P 500 Index. This viewpoint was due to investors’ preference for U.S. dollar-denominated assets and the perception that U.S. economic growth, while painfully slow, was relatively better than many other regions of the world. Nevertheless, investor sentiment was tested during the quarter, as economic readings slowed, thereby increasing investor fears of a slowdown in corporate earnings.
Within U.S. markets, value benchmarks outperformed growth benchmarks for the quarter. Large-cap stocks outperformed small-cap stocks for the second calendar quarter. Returns for the S&P 500, as well as the NASDAQ and Russell 1000® Growth Index, continued to be strongly influenced by their largest component, Apple Inc. For example, the weighting of Apple within the S&P 500 was so large at the end of the period that it singularly outweighed the market capitalization of three individual sectors: Utilities, Materials, and Telecommunication Services.
Investor preference for yield remained a dominant theme during the quarter. Retail investors continued to shift more assets from equities to the perceived safety of bonds, despite the already historically low fixed income yields. Within domestic equity markets, sectors that are normally associated with higher dividend yields, Telecommunications Services and Utilities in particular, were strong performers during the quarter.
Portfolio Review
Stock selection and an overweight position in the Consumer Staples sector were significant contributors to outperformance relative to the Index, in part due to strong returns by the tobacco company Altria Group Inc. and beverage producer Diageo PLC. Altria Group, the largest tobacco company in the U.S., gained for the quarter, as investors rewarded high-dividend companies who also have the ability to raise their dividend over time. There were also positive industry and company-specific developments for Altria Group. Voters in California, a politically important state for the company, defeated Proposition 29, which would have resulted in an excise tax increase of $1 per pack on cigarette sales — an increase of 115 percent. As a result, the decline in cigarette consumption eased and the pricing environment remained favorable. Atria Group also led the way as it and its closest competitors, RJ ReynoldsTobacco Company and Lorillard Inc., raised prices on cigarettes and smokeless products, which more than offset unit declines and resulted in steadily rising revenues and profits. In addition, Altria Group’s flagship brand, Marlboro, achieved market share gains as the company successfully rolled out line extensions to the brand. There were also positive developments on the legal front, in particular with the
Management's Discussion of Fund Performance (Unaudited) (Continued)
so-called Engle progeny cases in Florida. Finally, the company executed a smooth transition to a new Chairman and CEO as the former head of Altria Group retired, which was well-received by investors.
Diageo was another defensive, high-yielding stock in the Fund’s portfolio, which also performed well during the quarter. Diageo’s prospects improved in its U.S. business, which some considered directly related to the traffic increase in its high-margin, on-premise restaurant and bar business. During the last several recession years, the company implemented a successful plan to increase promotional spending in an effort to maintain market share. Diageo recently eased off on these promotions and has been successful in raising prices. As such, the company’s margins in the U.S. have widened, and the continued strength of the U.S. dollar against the British pound has been an added positive. Furthermore, Diageo made a number of accretive and strategic acquisitions in the growth markets of Turkey, China, Vietnam and Africa. Another contributor to Fund performance during the quarter was Industrials sector stock, Cooper Industries PLC, which is a Dublin-based company that manufactures electrical components and tools. Shares of Cooper Industries ticked higher after the company agreed to be acquired by Eaton Corp. at a significant premium to where the stock was trading prior to the announcement.
On the other hand, stocks within the Financials sector, which had a very strong first quarter, generally sold off during the second quarter. The Fund’s underweight position in the sector versus the Index contributed to the Fund’s relative performance. Primary reasons for the weakness included continuing fears surrounding the Eurozone debt crisis and a slowdown in the U.S. economy. Fears also continued to mount over a breakup in Europe, pressuring financial stocks with exposure to capital markets. Fund holdings with large capital markets operations — Citigroup Inc., JPMorgan Chase & Co., and Bank of America Corp. — were all weak performers during the quarter which detracted from performance. It appeared that investors’ fears of the unknown, particularly surrounding counterparty risk, pressured shares of these capital markets participants while concerns over the euro were on the rise. In reality, the average exposure that these three banks have to Europe is currently less than one percent of their respective assets. Furthermore, in our opinion, their average valuations reflect much of the breakup fears. Shares of JPMorgan Chase & Co. were under additional pressure as a result of the company’s well-publicized trading loss. The trading loss appeared to damage management’s credibility and ignite a new political incentive to punish large banks, which could likely keep a cap on price multiples for the time being. However, we note that even if the trading loss reaches the highest estimate in print ($9 billion), it should not be a capital issue for the bank and may likely only impact the pace of buybacks this year. We expect the Fund to continue to hold these financial stocks due to their attractive valuations and opportunities for future earnings growth. In addition, the majority of the Fund’s companies in the Financials sector are consumer finance companies and regional banks, which do not have large capital markets operations.
The major detractor from the Fund’s relative performance was stock selection within the Health Care sector. Many Health Care stocks exhibited higher-than-normal volatility during the quarter, as expectations grew for the U.S. Supreme Court to overturn the health reform act. The court largely upheld the law and WellPoint Inc., a managed-care company in the Fund, fell sharply during the last few days of the quarter as a result. WellPoint faced additional pressure due to its higher-than-average consumer and small group exposure, where the proposed health exchanges could erode some of its market share. Additionally, the company suffered from management missteps in executing its overall strategy during the period. However, we believe pricing in the industry remains rational and WellPoint’s size and strong brand should continue to provide meaningful advantages. Additionally, WellPoint recently announced it will acquire a best-in-class Medicaid insurer, Amerigroup Corp., and will be able to leverage their process to enhance its own. Another Health Care company, Baxter International Inc., fell during the quarter. Baxter International, which refines blood donations into several drugs, continued to recover from a cyclical downturn in the plasma therapeutics business. The stock also suffered when the Food and Drug Administration requested more data before approving one of the company’s new pipeline drugs. We believe the near-term earnings impact is not significant, as the clinical trial data appears to be positive. We
Management's Discussion of Fund Performance (Unaudited) (Continued)
note that though the plasma therapeutics business continues to recover, the core hospital supply business continues to perform well, and Baxter International’s pipeline of new products is improving rapidly overall.
We believe there are some unique situations within the Utilities sector that are attractive to the Fund, even though the sector is typically seen as expensive. Public Service Enterprise Group Inc. fits that definition, and was a new position and relative contributor during the quarter. Public Service Enterprise Group is a merchant and regulated utility with its primary regulated operations in New Jersey. Though the stock declined along with electricity and natural gas prices, management has plans to grow its regulated business from 20 percent of earnings in 2009 to more than 50 percent of earnings in 2012–2014. This growth is being funded internally with debt to maintain leverage at the regulated business level and with cash flow from the merchant business, which translates into no equity issuance that would dilute existing shareholders. Accordingly, we believe there are two ways to benefit with the holding: investors may get excited about the regulated business and price the stock more in line with other traditional regulated utilities, or electricity prices could recover and drive stronger earnings in the merchant power business earnings.
Within the Energy sector, we initiated a Fund position in Seadrill Ltd. during the period. Seadrill is an international offshore drilling contractor with 50 of the most modern drilling units in the world. The youth of its fleet relative to its peers has resulted in a high percentage of its rigs contracted through 2012 — a period in which many expected to see the greatest softness in rig pricing and utilization. As a result of strong build demand for its rigs, Seadrill’s order backlog is reminiscent of 2008 levels. In addition, most of this backlog is in deep-water, semi-submersible rigs and drillships, which command long-term contracts. Moreover, Seadrill could benefit in the post-Macondo spill environment as increased safety and integrity regulations could raise demand for the high-specification, modern rigs that Seadrill employs. Furthermore,we believe the industry is ripe for consolidation. As previously discussed, we believe Seadrill is capable of weathering the storm of low energy prices because most of its backlog has been secured. We also believe Seadrill’s potential lies in its opportunity to acquire some of the high-quality rigs that may come available because they are owned by operationally inexperienced or financially unstable entities. Seadrill has the opportunity to use its shares, cash and debt capacity for selective acquisitions of assets and companies. On the other hand, Seadrill could become a target for bigger rivals looking to acquire its young fleet and strong operational track record.
The Telecommunication Services sector was a bright spot for the Fund in the second quarter. It posted the highest return of any sector in the benchmark Index, and provided the greatest contribution to the Fund’s absolute performance. The continued growth of wireless data usage along with an improved pricing environment drove earnings growth expectations higher within the sector. Reasonable valuations and high-dividend yields also attracted investors. Two of the Fund’s contributors during the period were Verizon Communications Inc. and AT&T Inc. Both companies continued to gain market share and were far ahead of competitors in offering high-speed wireless data.
Outlook and Conclusion
The list of macro concerns dampening equity markets remains long. Concerns include the European debt crisis, slowing growth in major economies such as the U.S. and China, and the looming elections, to name a few. Additionally, there is a growing concern that, given the exceptionally low levels of interest rates, central banks are running out of levers to stimulate growth. Given the previously mentioned concerns and continued lack of clarity, sentiment among many strategists and investors is decidedly negative. However, to value investors like Barrow Hanley, negative sentiment and a lack of clarity are often starting points for exploiting market inefficiencies. When confronted with uncertainty, we look for a margin of safety, which can be seen in the form of discounted valuations with strong (and growing) free-cash-flow and dividend yields. Going forward, we believe the bond market remains the most significant competitor to equities. As investors have oscillated between “risk-on” and “risk-off” sentiments, there has been a massive flight to U.S. Treasuries. The one-year
Management's Discussion of Fund Performance (Unaudited) (Continued)
correlation between stocks and U.S. Treasuries also reached an all-time low during the quarter. As a result, the competitive environment for domestic equities is continuing to improve, as most stocks now yield more than U.S. Treasury bonds. Within the Fund, the vast majority of stocks have higher yields than Treasuries. More importantly, some of the Fund’s holdings have an advantage over the fixed income alternatives because of their ability to increase dividends going forward. As we have noted in the past, companies that can effectively produce and return capital to shareholders should outperform over time. That said, a significant number of companies within the Fund have implemented meaningful dividend increases over the past year and we expect the trend to continue.
Management's Discussion of Fund Performance (Unaudited) (Continued)
Comparison of the Change in Value of a $10,000 Investment in the
Touchstone Value Fund - Class A* and the Russell 1000® Value Index

| | * | The chart above represents performance for Class A shares only, which will vary from the performance of Class C shares, Class Y shares and Institutional Class shares based on the differences in loads and fees paid by shareholders in the different classes. Class A, Class C, Class Y and Institutional Class shares commenced operations on July 31, 2003, April 12, 2012, September 10, 1998 and December 20, 2006, respectively. Class A shares, Class C shares and Institutional Class shares performance was calculated using the historical performance of Class Y shares for the periods prior to July 31, 2003, April 12, 2012 and December 20, 2006, respectively. The returns have been restated for sales charges and for fees applicable to Class A, Class C and Institutional Class shares. |
| | ** | The average annual total returns shown above are adjusted for maximum applicable sales charges. |
The performance of the above Fund does not reflect the deduction of taxes that a shareholder would pay on Fund distributions or the redemption of Fund shares. The past performance is not predictive of future results.
Tabular Presentation of Portfolios of Investments (Unaudited)
June 30, 2012
The tables below provide each Fund’s sector allocation. We hope it will be useful to shareholders as it summarizes key information about each Fund’s investments.
| Touchstone Capital Growth Fund | | | |
| Sector Allocation* | | (% of Net Assets) | |
| Information Technology | | | 34.2 | % |
| Consumer Discretionary | | | 18.0 | |
| Industrials | | | 13.5 | |
| Health Care | | | 12.5 | |
| Energy | | | 10.5 | |
| Consumer Staples | | | 6.5 | |
| Financials | | | 2.6 | |
| Materials | | | 1.5 | |
| Investment Funds | | | 1.7 | |
| Other Assets/Liabilities (Net) | | | (1.0 | ) |
| Total | | | 100.0 | % |
| Touchstone International Small Cap Fund | | | |
| Sector Allocation* | | (% of Net Assets) | |
| Industrials | | | 23.2 | % |
| Consumer Discretionary | | | 15.7 | |
| Financials | | | 14.9 | |
| Information Technology | | | 11.8 | |
| Materials | | | 9.1 | |
| Energy | | | 6.9 | |
| Consumer Staples | | | 4.9 | |
| Health Care | | | 4.1 | |
| Exchange Traded Funds | | | 3.6 | |
| Telecommunication Services | | | 2.3 | |
| Utilities | | | 1.7 | |
| Investment Funds | | | 5.6 | |
| Other Assets/Liabilities (Net) | | | (3.8 | ) |
| Total | | | 100.0 | % |
| Touchstone Mid Cap Value Opportunities Fund | | | |
| Sector Allocation* | | (% of Net Assets) | |
| Information Technology | | | 20.7 | % |
| Financials | | | 16.7 | |
| Consumer Discretionary | | | 15.0 | |
| Utilities | | | 13.3 | |
| Health Care | | | 12.1 | |
| Industrials | | | 7.6 | |
| Materials | | | 5.1 | |
| Energy | | | 3.0 | |
| Telecommunication Services | | | 2.2 | |
| Consumer Staples | | | 1.0 | |
| Investment Funds | | | 7.7 | |
| Other Assets/Liabilities (Net) | | | (4.4 | ) |
| Total | | | 100.0 | % |
| Touchstone Small Cap Value Opportunities Fund | | | |
| Sector Allocation* | | (% of Net Assets) | |
| Financials | | | 25.9 | % |
| Industrials | | | 15.7 | |
| Consumer Discretionary | | | 14.7 | |
| Information Technology | | | 12.9 | |
| Health Care | | | 9.0 | |
| Utilities | | | 5.4 | |
| Energy | | | 5.1 | |
| Consumer Staples | | | 4.0 | |
| Materials | | | 3.4 | |
| Exchange Traded Fund | | | 1.4 | |
| Investment Funds | | | 9.0 | |
| Other Assets/Liabilities (Net) | | | (6.5 | ) |
| Total | | | 100.0 | % |
| | * | Sector classifications are based upon the Global Industry Classification Standard (GICS®). |
Tabular Presentation of Portfolios of Investments (Unaudited) (Continued)
| Touchstone U.S. Long/Short Fund | | | |
| Sector Allocation* | | (% of Net Assets) | |
| Long Positions | | | | |
| Information Technology | | | 25.3 | % |
| Consumer Discretionary | | | 18.1 | |
| Financials | | | 16.9 | |
| Health Care | | | 13.2 | |
| Energy | | | 11.6 | |
| Consumer Staples | | | 10.3 | |
| Materials | | | 6.3 | |
| Industrials | | | 5.9 | |
| Utilities | | | 4.0 | |
| Telecommunication Services | | | 2.1 | |
| Exchange Traded Fund | | | 3.4 | |
| Investment Fund | | | 1.2 | |
| Other Assets/Liabilities (Net) | | | (0.6 | ) |
| | | | 117.7 | % |
| Short Positions | | | | |
| Information Technology | | | (7.2 | ) |
| Health Care | | | (3.2 | ) |
| Energy | | | (2.9 | ) |
| Consumer Discretionary | | | (1.8 | ) |
| Financials | | | (1.6 | ) |
| Utilities | | | (1.0 | ) |
| | | | (17.7 | ) |
| Total | | | 100.0 | % |
| Touchstone Value Fund | | | |
| Sector Allocation* | | (% of Net Assets) | |
| Financials | | | 20.2 | % |
| Health Care | | | 13.2 | |
| Consumer Staples | | | 13.0 | |
| Industrials | | | 12.8 | |
| Energy | | | 12.7 | |
| Utilities | | | 8.0 | |
| Information Technology | | | 7.0 | |
| Telecommunication Services | | | 6.4 | |
| Consumer Discretionary | | | 4.2 | |
| Materials | | | 1.0 | |
| Investment Funds | | | 7.7 | |
| Other Assets/Liabilities (Net) | | | (6.2 | ) |
| Total | | | 100.0 | % |
| | * | Sector classifications are based upon the Global Industry Classification Standard (GICS®). |
Portfolio of Investments
Touchstone Capital Growth Fund – June 30, 2012
| | | | | | Market | |
| | | Shares | | | Value | |
| | | | | | | | | |
| Common Stocks — 99.3% | | | | | | | | |
| | | | | | | | | |
| Information Technology — 34.2% | | | | | | | | |
| Accenture PLC - Class A | | | 38,140 | | | $ | 2,291,833 | |
| Apple, Inc.* | | | 20,890 | | | | 12,199,759 | |
| Baidu, Inc., ADR* | | | 18,315 | | | | 2,105,859 | |
| Broadcom Corp. - Class A | | | 80,615 | | | | 2,724,787 | |
| Cisco Systems, Inc. | | | 133,315 | | | | 2,289,019 | |
| Cognizant Technology Solutions Corp. - Class A* | | | 36,990 | | | | 2,219,399 | |
| eBay, Inc.* | | | 87,270 | | | | 3,666,213 | |
| EMC Corp.* | | | 127,551 | | | | 3,269,132 | |
| Equinix, Inc.* | | | 23,805 | | | | 4,181,348 | |
| Google, Inc. - Class A* | | | 7,829 | | | | 4,541,368 | |
| International Business Machines Corp. | | | 26,007 | | | | 5,086,449 | |
| Microsoft Corp. | | | 190,076 | | | | 5,814,425 | |
| NetEase, Inc., ADR* | | | 31,005 | | | | 1,824,644 | |
| Texas Instruments, Inc. | | | 76,355 | | | | 2,190,625 | |
| VMware, Inc. - Class A* | | | 24,570 | | | | 2,236,853 | |
| | | | | | | | 56,641,713 | |
| | | | | | | | | |
| Consumer Discretionary — 18.0% | | | | | | | | |
| Amazon.Com, Inc.* | | | 9,485 | | | | 2,165,900 | |
| BorgWarner, Inc.* | | | 48,520 | | | | 3,182,427 | |
| DIRECTV - Class A* | | | 43,804 | | | | 2,138,511 | |
| Gap, Inc. (The) | | | 104,870 | | | | 2,869,243 | |
| Lululemon Athletica, Inc.†* | | | 23,380 | | | | 1,394,149 | |
| McDonald's Corp. | | | 29,980 | | | | 2,654,129 | |
| Michael Kors Holdings Ltd.* | | | 42,390 | | | | 1,773,598 | |
| NIKE, Inc. - Class B | | | 38,760 | | | | 3,402,353 | |
| priceline.com, Inc.* | | | 6,850 | | | | 4,551,961 | |
| Ralph Lauren Corp. | | | 15,480 | | | | 2,168,129 | |
| Walt Disney Co. (The) | | | 38,970 | | | | 1,890,045 | |
| Williams-Sonoma, Inc. | | | 45,640 | | | | 1,596,031 | |
| | | | | | | | 29,786,476 | |
| | | | | | | | | |
| Industrials — 13.5% | | | | | | | | |
| Caterpillar, Inc. | | | 18,125 | | | | 1,538,994 | |
| Danaher Corp. | | | 55,345 | | | | 2,882,368 | |
| Deere & Co. | | | 27,065 | | | | 2,188,747 | |
| Dover Corp. | | | 30,130 | | | | 1,615,269 | |
| Flowserve Corp. | | | 17,965 | | | | 2,061,484 | |
| Fluor Corp. | | | 44,280 | | | | 2,184,775 | |
| Rockwell Automation, Inc. | | | 44,125 | | | | 2,914,898 | |
| Union Pacific Corp. | | | 29,190 | | | | 3,482,659 | |
| United Technologies Corp. | | | 44,900 | | | | 3,391,297 | |
| | | | | | | | 22,260,491 | |
| | | | | | | | | |
| Health Care — 12.5% | | | | | | | | |
| Allergan, Inc. | | | 32,929 | | | | 3,048,238 | |
| Celgene Corp.* | | | 33,656 | | | | 2,159,369 | |
| Cerner Corp.* | | | 46,729 | | | | 3,862,619 | |
| Express Scripts Holding Co.* | | | 43,331 | | | | 2,419,170 | |
| Henry Schein, Inc.* | | | 51,486 | | | | 4,041,136 | |
| Thermo Fisher Scientific, Inc. | | | 41,335 | | | | 2,145,700 | |
| Varian Medical Systems, Inc.* | | | 50,836 | | | | 3,089,304 | |
| | | | | | | | 20,765,536 | |
| | | | | | | | | |
| Energy — 10.5% | | | | | | | | |
| Anadarko Petroleum Corp. | | | 34,310 | | | | 2,271,321 | |
| Cameron International Corp.* | | | 62,040 | | | | 2,649,728 | |
| Chevron Corp. | | | 20,585 | | | | 2,171,718 | |
| CNOOC Ltd., ADR | | | 11,510 | | | | 2,316,388 | |
| Halliburton Co. | | | 60,647 | | | | 1,721,768 | |
| Pioneer Natural Resources Co. | | | 41,418 | | | | 3,653,482 | |
| Schlumberger Ltd. | | | 39,361 | | | | 2,554,923 | |
| | | | | | | | 17,339,328 | |
| | | | | | | | | |
| Consumer Staples — 6.5% | | | | | | | | |
| Cia de Bebidas das Americas, ADR | | | 75,970 | | | | 2,911,930 | |
| Diageo PLC, ADR | | | 40,390 | | | | 4,162,997 | |
| Estee Lauder Cos., Inc. (The) - Class A | | | 67,345 | | | | 3,644,711 | |
| | | | | | | | 10,719,638 | |
| | | | | | | | | |
| Financials — 2.6% | | | | | | | | |
| Aflac, Inc. | | | 62,225 | | | | 2,650,163 | |
| Ameriprise Financial, Inc. | | | 31,042 | | | | 1,622,255 | |
| | | | | | | | 4,272,418 | |
| | | | | | | | | |
| Materials — 1.5% | | | | | | | | |
| EI du Pont de Nemours & Co. | | | 47,995 | | | | 2,427,107 | |
| Total Common Stocks | | | | | | $ | 164,212,707 | |
| | | | | | | | | |
| Investment Funds — 1.7% | | | | | | | | |
| Invesco Government & Agency Portfolio** | | | 1,374,436 | | | | 1,374,436 | |
| Touchstone Institutional Money Market Fund^ | | | 1,389,986 | | | | 1,389,986 | |
| Total Investment Funds | | | | | | $ | 2,764,422 | |
| | | | | | | | | |
| Total Investment Securities —101.0% | | | | | | | | |
| (Cost $118,644,304) | | | | | | $ | 166,977,129 | |
| | | | | | | | | |
| Liabilities in Excess of Other Assets — (1.0%) | | | | | | | (1,674,806 | ) |
| | | | | | | | | |
| Net Assets — 100.0% | | | | | | $ | 165,302,323 | |
| | † | All or a portion of the security is on loan. The total value of the securites on loan as of June 30, 2012 was $1,375,127. |
| | * | Non-income producing security. |
| | ** | Represents collateral for securities loaned. |
| | ^ | Affiliated Fund. See Note 4 in Notes to Financial Statements. |
Portfolio Abbreviations:
ADR - American Depositary Receipt
PLC - Public Limited Company
Touchstone Capital Growth Fund (Continued)
Other Information:
The inputs or methodology used for valuing securities may not be an indication of the risk associated with investing in those securities. For more information on valuation inputs, and their aggregation into the levels used in the table below, please refer to the security valuation section in the accompanying Notes to Financial Statements.
| Valuation inputs at Reporting Date: | |
| | |
| Description | | Level 1 | | | Level 2 | | | Level 3 | | | Total | |
| Common Stocks | | $ | 164,212,707 | | | $ | — | | | $ | — | | | $ | 164,212,707 | |
| Investment Funds | | | 2,764,422 | | | | — | | | | — | | | | 2,764,422 | |
| | | | | | | | | | | | | | | $ | 166,977,129 | |
See accompanying Notes to Financial Statements.
Portfolio of Investments
Touchstone International Small Cap Fund – June 30, 2012
| | | | | | Market | |
| | | Shares | | | Value | |
| | | | | | | | | |
| Common Stocks — 94.6% | | | | | | | | |
| | | | | | | | | |
| United Kingdom — 22.6% | | | | | | | | |
| Ashtead Group PLC | | | 158,200 | | | $ | 645,652 | |
| Babcock International Group PLC | | | 60,800 | | | | 814,309 | |
| Bodycote PLC | | | 170,556 | | | | 891,568 | |
| Dialight PLC | | | 25,800 | | | | 420,992 | |
| Dialog Semiconductor PLC* | | | 53,181 | | | | 965,419 | |
| Elementis PLC | | | 309,844 | | | | 965,871 | |
| Hargreaves Lansdown PLC | | | 86,000 | | | | 714,092 | |
| IG Group Holdings PLC | | | 83,383 | | | | 626,716 | |
| ITV PLC | | | 724,000 | | | | 871,182 | |
| Jazztel PLC* | | | 108,967 | | | | 618,497 | |
| Majestic Wine PLC | | | 143,669 | | | | 1,023,025 | |
| Melrose PLC | | | 152,302 | | | | 889,006 | |
| Micro Focus International PLC | | | 100,000 | | | | 832,457 | |
| Moneysupermarket.com Group PLC | | | 386,594 | | | | 758,457 | |
| Paragon Group of Cos. PLC | | | 312,686 | | | | 819,638 | |
| Provident Financial PLC | | | 54,105 | | | | 1,030,156 | |
| RPC Group PLC | | | 149,711 | | | | 910,861 | |
| Savills PLC | | | 191,155 | | | | 1,050,035 | |
| Senior PLC | | | 272,000 | | | | 801,168 | |
| Spectris PLC | | | 42,639 | | | | 1,025,084 | |
| Spirax-Sarco Engineering PLC | | | 32,049 | | | | 998,811 | |
| Travis Perkins PLC | | | 38,376 | | | | 584,302 | |
| TUI Travel PLC | | | 222,671 | | | | 591,970 | |
| WS Atkins PLC | | | 29,847 | | | | 322,459 | |
| | | | | | | | 19,171,727 | |
| | | | | | | | | |
| Japan — 19.7% | | | | | | | | |
| Alpen Co. Ltd. | | | 35,500 | | | | 694,755 | |
| Anritsu Corp. | | | 67,000 | | | | 759,386 | |
| Avex Group Holdings, Inc. | | | 45,100 | | | | 666,504 | |
| Credit Saison Co. Ltd. | | | 25,500 | | | | 566,967 | |
| Dena Co. Ltd. | | | 24,100 | | | | 634,349 | |
| Fields Corp. | | | 406 | | | | 705,342 | |
| FP Corp. | | | 13,300 | | | | 824,996 | |
| Fuji Media Holdings, Inc. | | | 598 | | | | 1,027,992 | |
| Hoshizaki Electric Co. Ltd. | | | 27,900 | | | | 706,171 | |
| Itochu Techno-Solutions Corp. | | | 19,100 | | | | 921,840 | |
| Iwatani Corp. | | | 176,000 | | | | 686,786 | |
| Japan Petroleum Exploration Co. | | | 17,200 | | | | 654,875 | |
| Konami Corp. | | | 29,800 | | | | 675,232 | |
| Megane TOP Co. Ltd. | | | 63,000 | | | | 691,061 | |
| Sawai Pharmaceutical Co. Ltd. | | | 6,100 | | | | 656,248 | |
| Shinko Electric Industries Co. Ltd. | | | 82,400 | | | | 658,101 | |
| Ship Healthcare Holdings, Inc. | | | 27,700 | | | | 667,578 | |
| Suzuken Co. Ltd. | | | 23,100 | | | | 779,773 | |
| Tokyo Ohka Kogyo Co. Ltd. | | | 38,900 | | | | 866,372 | |
| Toshiba Machine Co. Ltd. | | | 170,000 | | | | 885,886 | |
| Toyo Engineering Corp. | | | 212,000 | | | | 922,084 | |
| Weathernews, Inc.† | | | 32,800 | | | | 1,053,067 | |
| | | | | | | | 16,705,365 | |
| | | | | | | | | |
| Canada — 8.3% | | | | | | | | |
| Black Diamond Group Ltd.† | | | 42,355 | | | | 948,942 | |
| Canyon Services Group, Inc. | | | 76,913 | | | | 751,680 | |
| Dollarama, Inc. | | | 21,604 | | | | 1,298,235 | |
| Horizon North Logistics, Inc. | | | 104,000 | | | | 593,498 | |
| Mullen Group Ltd. | | | 56,328 | | | | 1,206,673 | |
| Onex Corp. | | | 25,773 | | | | 1,000,694 | |
| Pinecrest Energy, Inc.* | | | 181,927 | | | | 316,286 | |
| Westjet Airlines Ltd. | | | 60,000 | | | | 948,238 | |
| | | | | | | | 7,064,246 | |
| | | | | | | | | |
| Australia — 5.8% | | | | | | | | |
| Atlas Iron Ltd. | | | 344,901 | | | | 726,466 | |
| Ausdrill Ltd. | | | 278,718 | | | | 987,830 | |
| DuluxGroup Ltd. | | | 289,660 | | | | 899,318 | |
| FlexiGroup Ltd. | | | 170,200 | | | | 454,879 | |
| iiNET Ltd. | | | 208,458 | | | | 659,964 | |
| NRW Holdings Ltd. | | | 380,151 | | | | 1,190,611 | |
| | | | | | | | 4,919,068 | |
| | | | | | | | | |
| Germany — 5.3% | | | | | | | | |
| Axel Springer AG | | | 19,899 | | | | 854,942 | |
| Freenet AG | | | 45,198 | | | | 656,849 | |
| Gerresheimer AG* | | | 18,193 | | | | 856,368 | |
| Gerry Weber International AG | | | 18,288 | | | | 756,437 | |
| Jungheinrich AG | | | 46,430 | | | | 1,353,026 | |
| | | | | | | | 4,477,622 | |
| | | | | | | | | |
| Austria — 4.1% | | | | | | | | |
| Ams AG | | | 19,234 | | | | 1,289,782 | |
| Andritz AG | | | 28,614 | | | | 1,471,470 | |
| Oesterreichische Post AG | | | 22,457 | | | | 754,117 | |
| | | | | | | | 3,515,369 | |
| | | | | | | | | |
| Sweden — 3.4% | | | | | | | | |
| Betsson AB* | | | 37,902 | | | | 1,131,316 | |
| Boliden AB | | | 49,272 | | | | 687,533 | |
| Fastighets AB Balder, Class B* | | | 238,304 | | | | 1,082,845 | |
| | | | | | | | 2,901,694 | |
| | | | | | | | | |
| Finland — 3.3% | | | | | | | | |
| Kemira OYJ | | | 80,467 | | | | 943,475 | |
| Outotec OYJ | | | 26,910 | | | | 1,229,542 | |
| Pohjola Bank PLC, Class A | | | 56,852 | | | | 663,451 | |
| | | | | | | | 2,836,468 | |
| | | | | | | | | |
| Bermuda — 3.3% | | | | | | | | |
| Biosensors International Group Ltd.* | | | 619,000 | | | | 559,250 | |
| Catlin Group Ltd. | | | 97,596 | | | | 651,297 | |
| Golar LNG Ltd. | | | 17,800 | | | | 679,308 | |
| Lancashire Holdings Ltd. | | | 71,065 | | | | 888,022 | |
| | | | | | | | 2,777,877 | |
| | | | | | | | | |
| France — 3.0% | | | | | | | | |
| Plastic Omnium SA | | | 36,897 | | | | 926,585 | |
| SCOR SE | | | 43,303 | | | | 1,049,775 | |
| UBISOFT Entertainment* | | | 85,847 | | | | 575,522 | |
| | | | | | | | 2,551,882 | |
| | | | | | | | | |
| Norway — 2.9% | | | | | | | | |
| Det Norske Oljeselskap ASA* | | | 40,744 | | | | 542,766 | |
| Marine Harvest ASA* | | | 990,100 | | | | 704,750 | |
Touchstone International Small Cap Fund (Continued)
| | | | | | Market | |
| | | Shares | | | Value | |
| | | | | | | | | |
| Common Stocks — 94.6% (Continued) | | | | | | | | |
| | | | | | | | | |
| Norway — (Continued) | | | | | | | | |
| TGS Nopec Geophysical Co. ASA | | | 44,500 | | | $ | 1,201,531 | |
| | | | | | | | 2,449,047 | |
| | | | | | | | | |
| Luxembourg — 2.2% | | | | | | | | |
| AZ Electronic Materials SA | | | 193,296 | | | | 869,849 | |
| Samsonite International SA | | | 573,300 | | | | 969,134 | |
| | | | | | | | 1,838,983 | |
| | | | | | | | | |
| Denmark — 2.2% | | | | | | | | |
| Royal UNIBREW AS | | | 9,700 | | | | 615,450 | |
| Topdanmark AS* | | | 7,105 | | | | 1,218,215 | |
| | | | | | | | 1,833,665 | |
| | | | | | | | | |
| Switzerland — 2.1% | | | | | | | | |
| Aryzta AG* | | | 18,950 | | | | 943,231 | |
| Banque Cantonale Vaudoise | | | 1,600 | | | | 847,947 | |
| | | | | | | | 1,791,178 | |
| | | | | | | | | |
| Ireland — 1.1% | | | | | | | | |
| Paddy Power PLC | | | 13,929 | | | | 908,299 | |
| | | | | | | | | |
| Spain — 1.0% | | | | | | | | |
| Viscofan SA | | | 20,000 | | | | 859,419 | |
| | | | | | | | | |
| Hong Kong — 1.0% | | | | | | | | |
| Towngas China Co. Ltd. | | | 1,177,118 | | | | 850,704 | |
| | | | | | | | | |
| South Africa — 0.9% | | | | | | | | |
| Mr Price Group Ltd. | | | 58,748 | | | | 805,442 | |
| | | | | | | | | |
| Thailand — 0.7% | | | | | | | | |
| Thai Tap Water Supply PCL | | | 3,000,000 | | | | 622,528 | |
| | | | | | | | | |
| Cyprus — 0.6% | | | | | | | | |
| ProSafe SE | | | 72,582 | | | | 526,922 | |
| | | | | | | | | |
| Belgium — 0.6% | | | | | | | | |
| Barco NV | | | 9,192 | | | | 466,166 | |
| | | | | | | | | |
| Italy — 0.5% | | | | | | | | |
| De'Longhi SPA | | | 41,809 | | | | 402,547 | |
| Total Common Stocks | | | | | | $ | 80,276,218 | |
| | | | | | | | | |
| Exchange Traded Funds — 3.6% | | | | | | | | |
| iShares MSCI EAFE Small Cap Index Fund† | | | 47,844 | | | | 1,729,082 | |
| iShares MSCI South Korea Index Fund† | | | 23,306 | | | | 1,277,402 | |
| Total Exchange Traded Funds | | | | | | $ | 3,006,484 | |
| | | | | | | | | |
| Warrant — 0.0% | | | | | | | | |
| UBISOFT Entertainment, Expires 10/10/13 | | | 85,837 | | | | 2,824 | |
| | | | | | | | | |
| Investment Funds — 5.6% | | | | | | | | |
| Invesco Government & Agency Portfolio** | | | 2,983,985 | | | | 2,983,985 | |
| Touchstone Institutional Money Market Fund^ | | | 1,743,433 | | | | 1,743,433 | |
| Total Investment Funds | | | | | | $ | 4,727,418 | |
| | | | | | | | | |
| Total Investment Securities —103.8% | | | | | | | | |
| (Cost $88,255,549) | | | | | | | 88,012,944 | |
| | | | | | | | | |
| Liabilities in Excess of Other Assets — (3.8%) | | | | | | | (3,188,841 | ) |
| | | | | | | | | |
| Net Assets — 100.0% | | | | | | $ | 84,824,103 | |
| † | All or a portion of the security is on loan. The total value of the securites on loan as of June 30, 2012 was $2,960,754. |
| | |
| * | Non-income producing security. |
| | |
| ** | Represents collateral for securities loaned. |
| | |
| ^ | Affiliated Fund. See Note 4 in Notes to Financial Statements. |
Portfolio Abbreviations:
PLC - Public Limited Company
Other Information:
The inputs or methodology used for valuing securities may not be an indication of the risk associated with investing in those securities. For more information on valuation inputs, and their aggregation into the levels used in the table below, please refer to the security valuation section in the accompanying Notes to Financial Statements.
Touchstone International Small Cap Fund (Continued)
| Valuation inputs at Reporting Date: | |
| | |
| Country | | Level 1 | | | Level 2 | | | Level 3 | | | Total | |
| Australia | | $ | — | | | $ | 4,919,068 | | | $ | — | | | $ | 4,919,068 | |
| Austria | | | — | | | | 3,515,369 | | | | — | | | | 3,515,369 | |
| Belguim | | | — | | | | 466,166 | | | | — | | | | 466,166 | |
| Bermuda | | | — | | | | 2,777,877 | | | | — | | | | 2,777,877 | |
| Canada | | | 7,064,246 | | | | — | | | | — | | | | 7,064,246 | |
| Cyprus | | | — | | | | 526,922 | | | | — | | | | 526,922 | |
| Denmark | | | — | | | | 1,833,665 | | | | — | | | | 1,833,665 | |
| Finland | | | — | | | | 2,836,468 | | | | — | | | | 2,836,468 | |
| France | | | 2,824 | | | | 2,551,882 | | | | — | | | | 2,554,706 | |
| Germany | | | — | | | | 4,477,622 | | | | — | | | | 4,477,622 | |
| Hong Kong | | | — | | | | 850,704 | | | | — | | | | 850,704 | |
| Ireland | | | — | | | | 908,299 | | | | — | | | | 908,299 | |
| Italy | | | — | | | | 402,547 | | | | — | | | | 402,547 | |
| Japan | | | — | | | | 16,705,365 | | | | — | | | | 16,705,365 | |
| Luxembourg | | | — | | | | 1,838,983 | | | | — | | | | 1,838,983 | |
| Norway | | | — | | | | 2,449,047 | | | | — | | | | 2,449,047 | |
| South Africa | | | — | | | | 805,442 | | | | — | | | | 805,442 | |
| Spain | | | — | | | | 859,419 | | | | — | | | | 859,419 | |
| Sweden | | | — | | | | 2,901,694 | | | | — | | | | 2,901,694 | |
| Switzerland | | | — | | | | 1,791,178 | | | | — | | | | 1,791,178 | |
| Thailand | | | — | | | | 622,528 | | | | — | | | | 622,528 | |
| United Kingdom | | | — | | | | 19,171,727 | | | | — | | | | 19,171,727 | |
| United States | | | 7,733,902 | | | | — | | | | — | | | | 7,733,902 | |
| | | $ | 14,800,972 | | | $ | 73,211,972 | | | $ | — | | | $ | 88,012,944 | |
See accompanying Notes to Financial Statements.
Portfolio of Investments
Touchstone Mid Cap Value Opportunities Fund – June 30, 2012
| | | | | | Market | |
| | | Shares | | | Value | |
| | | | | | | | | |
| Common Stocks — 96.7% | | | | | | | | |
| | | | | | | | | |
| Information Technology — 20.7% | | | | | | | | |
| Activision Blizzard, Inc. | | | 150,000 | | | $ | 1,798,500 | |
| Amdocs Ltd. (Guernsey)* | | | 77,300 | | | | 2,297,356 | |
| Applied Materials, Inc. | | | 97,500 | | | | 1,117,350 | |
| CA, Inc. | | | 39,300 | | | | 1,064,637 | |
| Dolby Laboratories, Inc. - Class A* | | | 30,100 | | | | 1,243,130 | |
| FleetCor Technologies, Inc.* | | | 35,700 | | | | 1,250,928 | |
| Global Payments, Inc. | | | 35,000 | | | | 1,513,050 | |
| KLA-Tencor Corp. | | | 33,100 | | | | 1,630,175 | |
| Lam Research Corp.* | | | 39,900 | | | | 1,505,826 | |
| Micron Technology, Inc.* | | | 133,900 | | | | 844,909 | |
| SanDisk Corp.* | | | 30,800 | | | | 1,123,584 | |
| Symantec Corp.* | | | 152,000 | | | | 2,220,720 | |
| Western Digital Corp.* | | | 43,400 | | | | 1,322,832 | |
| Western Union Co. (The) | | | 115,200 | | | | 1,939,968 | |
| | | | | | | | 20,872,965 | |
| | | | | | | | | |
| Financials — 16.7% | | | | | | | | |
| Allstate Corp. (The) | | | 53,300 | | | | 1,870,297 | |
| Annaly Capital Management, Inc. REIT | | | 149,400 | | | | 2,506,932 | |
| Aon PLC (Great Britain) | | | 54,009 | | | | 2,526,541 | |
| Everest Re Group Ltd. (Bermuda) | | | 14,600 | | | | 1,510,954 | |
| Fidelity National Financial, Inc. - Class A | | | 26,400 | | | | 508,464 | |
| First Republic Bank | | | 72,300 | | | | 2,429,280 | |
| HCC Insurance Holdings, Inc. | | | 32,700 | | | | 1,026,780 | |
| Loews Corp. | | | 24,800 | | | | 1,014,568 | |
| Progressive Corp. (The) | | | 100,400 | | | | 2,091,332 | |
| Willis Group Holdings PLC (Ireland) | | | 35,120 | | | | 1,281,529 | |
| | | | | | | | 16,766,677 | |
| | | | | | | | | |
| Consumer Discretionary — 15.0% | | | | | | | | |
| Bed Bath & Beyond, Inc.* | | | 8,300 | | | | 512,940 | |
| Best Buy Co., Inc. | | | 50,200 | | | | 1,052,192 | |
| Delphi Automotive PLC (Jersey)* | | | 18,200 | | | | 464,100 | |
| DeVry, Inc. | | | 47,251 | | | | 1,463,363 | |
| DISH Network Corp. | | | 47,600 | | | | 1,358,980 | |
| GameStop Corp. - Class A† | | | 100,232 | | | | 1,840,260 | |
| H&R Block, Inc. | | | 141,634 | | | | 2,263,311 | |
| Lear Corp. | | | 39,900 | | | | 1,505,427 | |
| Liberty Interactive Corp. - Class A* | | | 110,900 | | | | 1,972,911 | |
| Liberty Media Corp. - Liberty Capital - Class A* | | | 18,700 | | | | 1,643,917 | |
| Sirius XM Radio, Inc.* | | | 538,300 | | | | 995,855 | |
| | | | | | | | 15,073,256 | |
| | | | | | | | | |
| Utilities — 13.3% | | | | | | | | |
| Alliant Energy Corp. | | | 60,100 | | | | 2,738,757 | |
| American Water Works Co., Inc. | | | 40,900 | | | | 1,402,052 | |
| CenterPoint Energy, Inc. | | | 85,150 | | | | 1,760,050 | |
| CMS Energy Corp. | | | 106,400 | | | | 2,500,400 | |
| NRG Energy, Inc.* | | | 115,600 | | | | 2,006,816 | |
| Wisconsin Energy Corp. | | | 32,200 | | | | 1,274,154 | |
| Xcel Energy, Inc. | | | 61,100 | | | | 1,735,851 | |
| | | | | | | | 13,418,080 | |
| | | | | | | | | |
| Health Care — 12.1% | | | | | | | | |
| AmerisourceBergen Corp. | | | 67,200 | | | | 2,644,320 | |
| Endo Health Solutions, Inc.* | | | 58,956 | | | | 1,826,458 | |
| Forest Laboratories, Inc.* | | | 58,900 | | | | 2,060,911 | |
| Humana, Inc. | | | 9,600 | | | | 743,424 | |
| MEDNAX, Inc.* | | | 24,100 | | | | 1,651,814 | |
| Quest Diagnostics, Inc. | | | 22,600 | | | | 1,353,740 | |
| Questcor Pharmaceuticals, Inc.†* | | | 9,800 | | | | 521,752 | |
| Zimmer Holdings, Inc. | | | 21,100 | | | | 1,357,996 | |
| | | | | | | | 12,160,415 | |
| | | | | | | | | |
| Industrials — 7.6% | | | | | | | | |
| Dun & Bradstreet Corp. (The) | | | 38,500 | | | | 2,740,045 | |
| EMCor Group, Inc. | | | 20,329 | | | | 565,553 | |
| Northrop Grumman Corp. | | | 10,100 | | | | 644,279 | |
| Towers Watson & Co. - Class A | | | 39,100 | | | | 2,342,090 | |
| URS Corp. | | | 39,500 | | | | 1,377,760 | |
| | | | | | | | 7,669,727 | |
| | | | | | | | | |
| Materials — 5.1% | | | | | | | | |
| Bemis Co., Inc. | | | 39,600 | | | | 1,241,064 | |
| CF Industries Holdings, Inc. | | | 5,200 | | | | 1,007,448 | |
| Crown Holdings, Inc.* | | | 51,700 | | | | 1,783,133 | |
| MeadWestvaco. Corp. | | | 27,800 | | | | 799,250 | |
| Westlake Chemical Corp.† | | | 4,900 | | | | 256,074 | |
| | | | | | | | 5,086,969 | |
| | | | | | | | | |
| Energy — 3.0% | | | | | | | | |
| HollyFrontier Corp. | | | 25,800 | | | | 914,094 | |
| Valero Energy Corp. | | | 23,800 | | | | 574,770 | |
| Williams Co, Inc. (The) | | | 54,000 | | | | 1,556,280 | |
| | | | | | | | 3,045,144 | |
| | | | | | | | | |
| Telecommunication Services — 2.2% | | | | | | | | |
| Windstream Corp.† | | | 225,500 | | | | 2,178,330 | |
| | | | | | | | | |
| Consumer Staples — 1.0% | | | | | | | | |
| Dr Pepper Snapple Group, Inc. | | | 23,200 | | | | 1,015,000 | |
| Total Common Stocks | | | | | | $ | 97,286,563 | |
| | | | | | | | | |
| Investment Funds — 7.7% | | | | | | | | |
| Invesco Government & Agency Portfolio** | | | 4,646,582 | | | | 4,646,582 | |
| Touchstone Institutional Money Market Fund^ | | | 3,046,587 | | | | 3,046,587 | |
| Total Investment Funds | | | | | | $ | 7,693,169 | |
| | | | | | | | | |
| Total Investment Securities —104.4% | | | | | | | | |
| (Cost $94,509,008) | | | | | | $ | 104,979,732 | |
| | | | | | | | | |
| Liabilities in Excess of Other Assets — (4.4%) | | | | | | | (4,399,102 | ) |
| | | | | | | | | |
| Net Assets — 100.0% | | | | | | $ | 100,580,630 | |
| | † | All or a portion of the security is on loan. The total value of the securites on loan as of June 30, 2012 was $4,699,420. |
Touchstone Mid Cap Value Opportunities Fund (Continued)
| | * | Non-income producing security. |
| | ** | Represents collateral for securities loaned. |
| | ^ | Affiliated Fund. See Note 4 in Notes to Financial Statements. |
Portfolio Abbreviations:
PLC - Public Liability Company
REIT - Real Estate Investment Trust
Other Information:
The inputs or methodology used for valuing securities may not be an indication of the risk associated with investing in those securities. For more information on valuation inputs, and their aggregation into the levels used in the table below, please refer to the security valuation section in the accompanying Notes to Financial Statements.
| Valuation inputs at Reporting Date: | |
| Description | | Level 1 | | | Level 2 | | | Level 3 | | | Total | |
| Common Stocks | | $ | 97,286,563 | | | $ | — | | | $ | — | | | $ | 97,286,563 | |
| Investment Funds | | | 7,693,169 | | | | — | | | | — | | | | 7,693,169 | |
| | | | | | | | | | | | | | | $ | 104,979,732 | |
At June 30, 2012 securities valued at $1,513,050 were transferred from Level 2 to Level 1 pursuant to the Funds's fair valuation policy.
See accompanying Notes to Financial Statements.
Portfolio of Investments
Touchstone Small Cap Value Opportunities Fund – June 30, 2012
| | | | | | Market | |
| | | Shares | | | Value | |
| | | | | | | | | |
| Common Stocks — 96.1% | | | | | | | | |
| | | | | | | | | |
| Financials — 25.9% | | | | | | | | |
| Alterra Capital Holdings Ltd. | | | 49,800 | | | $ | 1,162,830 | |
| Altisource Portfolio Solutions SA (Luxembourg)* | | | 7,866 | | | | 576,027 | |
| American Equity Investment Life Holding Co. | | | 83,400 | | | | 918,234 | |
| Amtrust Financial Services, Inc. | | | 21,500 | | | | 638,765 | |
| Ashford Hospitality Trust, Inc. REIT | | | 47,700 | | | | 402,111 | |
| Astoria Financial Corp. | | | 79,200 | | | | 776,160 | |
| Bank of Ozarks, Inc. | | | 24,600 | | | | 739,968 | |
| Brandywine Realty Trust REIT | | | 65,600 | | | | 809,504 | |
| Capstead Mortgage Corp. REIT | | | 102,800 | | | | 1,429,948 | |
| Cash America International, Inc. | | | 20,850 | | | | 918,234 | |
| CBL & Associates Properties, Inc. REIT | | | 28,400 | | | | 554,936 | |
| First Cash Financial Services, Inc.* | | | 31,400 | | | | 1,261,338 | |
| First Financial Bancorp | | | 27,400 | | | | 437,852 | |
| First Financial Bankshares, Inc.† | | | 11,750 | | | | 406,080 | |
| Iberiabank Corp. | | | 36,900 | | | | 1,861,605 | |
| LaSalle Hotel Properties REIT | | | 35,700 | | | | 1,040,298 | |
| Meadowbrook Insurance Group, Inc. | | | 47,300 | | | | 415,767 | |
| Ocwen Financial Corp.* | | | 95,100 | | | | 1,785,978 | |
| Omega Healthcare Investors, Inc. REIT | | | 68,300 | | | | 1,536,750 | |
| Oriental Financial Group, Inc. (Puerto Rico) | | | 38,100 | | | | 422,148 | |
| Protective Life Corp. | | | 22,200 | | | | 652,902 | |
| SVB Financial Group* | | | 29,400 | | | | 1,726,368 | |
| Texas Capital Bancshares, Inc.* | | | 21,100 | | | | 852,229 | |
| Union First Market Bankshares Corp. | | | 31,400 | | | | 453,730 | |
| Wintrust Financial Corp. | | | 55,800 | | | | 1,980,900 | |
| | | | | | | | 23,760,662 | |
| | | | | | | | | |
| Industrials — 15.7% | | | | | | | | |
| Acacia Research Corp.* | | | 35,800 | | | | 1,333,192 | |
| ACCO Brands Corp.* | | | 82,900 | | | | 857,186 | |
| Actuant Corp. - Class A | | | 64,850 | | | | 1,761,326 | |
| Apogee Enterprises, Inc. | | | 32,000 | | | | 514,240 | |
| Atlas Air Worldwide Holdings, Inc.* | | | 20,700 | | | | 900,657 | |
| Avis Budget Group, Inc.* | | | 47,000 | | | | 714,400 | |
| Consolidated Graphics, Inc.* | | | 9,900 | | | | 287,595 | |
| Con-way, Inc. | | | 12,900 | | | | 465,819 | |
| DigitalGlobe, Inc.* | | | 69,900 | | | | 1,059,684 | |
| EnerSys* | | | 19,500 | | | | 683,865 | |
| FTI Consulting, Inc.* | | | 11,000 | | | | 316,250 | |
| Hexcel Corp.* | | | 55,200 | | | | 1,423,608 | |
| NACCO Industries, Inc. - Class A | | | 4,900 | | | | 569,625 | |
| Old Dominion Freight Line, Inc.* | | | 41,950 | | | | 1,816,016 | |
| Republic Airways Holdings, Inc.* | | | 111,000 | | | | 616,050 | |
| TAL International Group, Inc. | | | 16,700 | | | | 559,283 | |
| Watsco, Inc. | | | 7,800 | | | | 575,640 | |
| | | | | | | | 14,454,436 | |
| | | | | | | | | |
| Consumer Discretionary — 14.7% | | | | | | | | |
| Ameristar Casinos, Inc. | | | 34,300 | | | | 609,511 | |
| Asbury Automotive Group, Inc.* | | | 45,600 | | | | 1,080,264 | |
| Capella Education Co.* | | | 2,900 | | | | 100,803 | |
| Churchill Downs, Inc. | | | 7,500 | | | | 440,925 | |
| Coinstar, Inc.†* | | | 15,300 | | | | 1,050,498 | |
| Einstein Noah Restaurant Group, Inc. | | | 36,500 | | | | 640,940 | |
| EW Scripps Co. - Class A* | | | 43,400 | | | | 417,074 | |
| Finish Line, Inc. (The) - Class A | | | 32,200 | | | | 673,302 | |
| G-III Apparel Group Ltd.* | | | 19,600 | | | | 464,324 | |
| iRobot Corp.* | | | 39,500 | | | | 874,925 | |
| JAKKS Pacific, Inc.† | | | 27,900 | | | | 446,679 | |
| Men's Wearhouse, Inc. (The) | | | 44,500 | | | | 1,252,230 | |
| Nutrisystem, Inc. | | | 29,400 | | | | 339,864 | |
| Red Robin Gourmet Burgers, Inc.* | | | 15,100 | | | | 460,701 | |
| Rent-A-Center, Inc. | | | 55,200 | | | | 1,862,448 | |
| Select Comfort Corp.* | | | 50,500 | | | | 1,056,460 | |
| Shuffle Master, Inc.* | | | 60,200 | | | | 830,760 | |
| Shutterfly, Inc.†* | | | 31,100 | | | | 954,459 | |
| | | | | | | | 13,556,167 | |
| | | | | | | | | |
| Information Technology — 12.9% | | | | | | | | |
| Cardtronics, Inc.* | | | 62,400 | | | | 1,885,104 | |
| Ceragon Networks Ltd. (Israel)* | | | 18,707 | | | | 160,319 | |
| Cirrus Logic, Inc.* | | | 23,400 | | | | 699,192 | |
| CSG Systems International, Inc.* | | | 21,400 | | | | 369,792 | |
| Diodes, Inc.* | | | 17,300 | | | | 324,721 | |
| Emulex Corp.* | | | 127,800 | | | | 920,160 | |
| GT Advanced Technologies, Inc.†* | | | 79,100 | | | | 417,648 | |
| Heartland Payment Systems, Inc. | | | 24,500 | | | | 736,960 | |
| International Rectifier Corp.* | | | 19,400 | | | | 387,806 | |
| Kulicke & Soffa Industries, Inc.* | | | 76,550 | | | | 682,826 | |
| magicJack VocalTec Ltd. (Israel)†* | | | 52,600 | | | | 999,400 | |
| MKS Instruments, Inc. | | | 15,500 | | | | 448,415 | |
| RF Micro Devices, Inc.* | | | 187,800 | | | | 798,150 | |
| SYNNEX Corp.* | | | 16,200 | | | | 558,738 | |
| TiVo, Inc.* | | | 109,400 | | | | 904,738 | |
| Unisys Corp.* | | | 39,100 | | | | 764,405 | |
| Wright Express Corp.* | | | 12,300 | | | | 759,156 | |
| | | | | | | | 11,817,530 | |
| | | | | | | | | |
| Health Care — 9.0% | | | | | | | | |
| Air Methods Corp.* | | | 14,100 | | | | 1,385,325 | |
| Health Management Associates, Inc. - Class A* | | | 206,400 | | | | 1,620,240 | |
| Kindred Healthcare, Inc.* | | | 17,700 | | | | 173,991 | |
| LifePoint Hospitals, Inc.* | | | 11,700 | | | | 479,466 | |
| Medicis Pharmaceutical Corp. - Class A | | | 43,800 | | | | 1,495,770 | |
| Momenta Pharmaceuticals, Inc.* | | | 33,600 | | | | 454,272 | |
| Par Pharmaceutical Cos., Inc.* | | | 14,700 | | | | 531,258 | |
| PDL BioPharma, Inc. | | | 68,900 | | | | 456,807 | |
| Questcor Pharmaceuticals, Inc.†* | | | 20,000 | | | | 1,064,800 | |
| WellCare Health Plans, Inc.* | | | 10,700 | | | | 567,100 | |
| | | | | | | | 8,229,029 | |
| | | | | | | | | |
| Utilities — 5.4% | | | | | | | | |
| Cleco Corp. | | | 33,400 | | | | 1,397,122 | |
| NorthWestern Corp. | | | 36,400 | | | | 1,335,880 | |
| Southwest Gas Corp. | | | 20,300 | | | | 886,095 | |
| UNS Energy Corp. | | | 34,600 | | | | 1,328,986 | |
| | | | | | | | 4,948,083 | |
Touchstone Small Cap Value Opportunities Fund (Continued)
| | | | | Market |
| | | Shares | | Value |
| | | | | | | | | |
| Common Stocks — 96.1% (Continued) | | | | | | | | |
| | | | | | | | | |
| Energy — 5.1% | | | | | | | | |
| Basic Energy Services, Inc.* | | | 16,500 | | | $ | 170,280 | |
| Energy XXI Bermuda Ltd. (Bermuda) | | | 33,100 | | | | 1,035,699 | |
| Gulfmark Offshore, Inc. - Class A* | | | 12,300 | | | | 418,692 | |
| Helix Energy Solutions Group, Inc.* | | | 31,500 | | | | 516,915 | |
| Newpark Resources, Inc.* | | | 123,100 | | | | 726,290 | |
| Stone Energy Corp.* | | | 17,200 | | | | 435,848 | |
| Western Refining, Inc. | | | 63,400 | | | | 1,411,918 | |
| | | | | | | | 4,715,642 | |
| | | | | | | | | |
| Consumer Staples — 4.0% | | | | | | | | |
| Andersons, Inc. (The) | | | 31,200 | | | | 1,330,992 | |
| Boston Beer Co., Inc. (The) - Class A†* | | | 4,700 | | | | 568,700 | |
| Hain Celestial Group, Inc. (The)* | | | 7,900 | | | | 434,816 | |
| Pricesmart, Inc. | | | 9,100 | | | | 614,341 | |
| Susser Holdings Corp.* | | | 20,600 | | | | 765,702 | |
| | | | | | | | 3,714,551 | |
| | | | | | | | | |
| Materials — 3.4% | | | | | | | | |
| American Vanguard Corp. | | | 51,700 | | | | 1,374,703 | |
| Omnova Solutions, Inc.* | | | 81,800 | | | | 616,772 | |
| Schweitzer-Mauduit International, Inc. | | | 16,664 | | | | 1,135,485 | |
| | | | | | | | 3,126,960 | |
| Total Common Stocks | | | | | | $ | 88,323,060 | |
| | | | | | | | | |
| Exchange Traded Fund — 1.4% | | | | | | | | |
| iShares Russell 2000 Value Index Fund† | | | 18,700 | | | | 1,316,293 | |
| | | | | | | | | |
| Investment Funds — 9.0% | | | | | | | | |
| Invesco Government & Agency Portfolio** | | | 5,686,998 | | | | 5,686,998 | |
| Touchstone Institutional Money Market Fund^ | | | 2,600,391 | | | | 2,600,391 | |
| Total Investment Funds | | | | | | $ | 8,287,389 | |
| | | | | | | | | |
| Total Investment Securities —106.5% | | | | | | | | |
| (Cost $82,958,442) | | | | | | $ | 97,926,742 | |
| | | | | | | | | |
| Liabilities in Excess of Other Assets — (6.5%) | | | | | | | (6,017,598 | ) |
| | | | | | | | | |
| Net Assets — 100.0% | | | | | | $ | 91,909,144 | |
| † | All or a portion of the security is on loan. The total value of the securites on loan as of June 30, 2012 was $5,682,317. |
| | |
| * | Non-income producing security. |
| | |
| ** | Represents collateral for securities loaned. |
| | |
| ^ | Affiliated Fund. See Note 4 in Notes to Financial Statements. |
Portfolio Abbreviations:
REIT - Real Estate Investment Trust
Other Information:
The inputs or methodology used for valuing securities may not be an indication of the risk associated with investing in those securities. For more information on valuation inputs, and their aggregation into the levels used in the table below, please refer to the security valuation section in the accompanying Notes to Financial Statements.
| Valuation inputs at Reporting Date: | |
| | |
| Description | | Level 1 | | | Level 2 | | | Level 3 | | | Total | |
| Common Stocks | | $ | 88,323,060 | | | $ | — | | | $ | — | | | $ | 88,323,060 | |
| Exchanged Traded Fund | | | 1,316,293 | | | | — | | | | — | | | | 1,316,293 | |
| Investment Funds | | | 8,287,389 | | | | — | | | | — | | | | 8,287,389 | |
| | | | | | | | | | | | | | | $ | 97,926,742 | |
See accompanying Notes to Financial Statements.
Portfolio of Investments
Touchstone U.S. Long/Short Fund – June 30, 2012
| | | | | Market |
| | | Shares | | Value |
| | | | | | | | | |
| Common Stocks — 113.7% | | | | | | | | |
| | | | | | | | | |
| Information Technology — 25.3% | | | | | | | | |
| Accenture PLC - Class A† | | | 2,518 | | | $ | 151,307 | |
| Apple, Inc.†* | | | 1,327 | | | | 774,968 | |
| CA, Inc.† | | | 6,576 | | | | 178,144 | |
| Intel Corp.† | | | 17,127 | | | | 456,435 | |
| International Business Machines Corp.† | | | 2,555 | | | | 499,707 | |
| Jabil Circuit, Inc.† | | | 16,762 | | | | 340,771 | |
| LSI Corp.†* | | | 31,474 | | | | 200,489 | |
| Microsoft Corp.† | | | 26,346 | | | | 805,924 | |
| | | | | | | | 3,407,745 | |
| | | | | | | | | |
| Consumer Discretionary — 18.1% | | | | | | | | |
| DIRECTV - Class A†* | | | 7,874 | | | | 384,409 | |
| Ford Motor Co.† | | | 7,189 | | | | 68,942 | |
| Gannett Co., Inc.† | | | 20,338 | | | | 299,579 | |
| Garmin Ltd.†* | | | 7,831 | | | | 299,849 | |
| General Motors Co.†* | | | 16,167 | | | | 318,813 | |
| Home Depot, Inc.† | | | 12,270 | | | | 650,187 | |
| Jarden Corp.† | | | 874 | | | | 36,725 | |
| Macy's, Inc.† | | | 1,369 | | | | 47,025 | |
| priceline.com, Inc.†* | | | 259 | | | | 172,111 | |
| Time Warner, Inc.† | | | 1,148 | | | | 44,197 | |
| Viacom, Inc. - Class B† | | | 2,449 | | | | 115,152 | |
| | | | | | | | 2,436,989 | |
| | | | | | | | | |
| Financials — 16.9% | | | | | | | | |
| American International Group, Inc.†* | | | 11,255 | | | | 361,173 | |
| Capital One Financial Corp.† | | | 7,953 | | | | 434,711 | |
| Citigroup, Inc.† | | | 7,147 | | | | 195,899 | |
| Discover Financial Services† | | | 4,198 | | | | 145,167 | |
| Hospitality Properties Trust REIT† | | | 13,975 | | | | 346,161 | |
| Invesco Ltd.† | | | 5,016 | | | | 113,362 | |
| KeyCorp† | | | 12,188 | | | | 94,335 | |
| Protective Life Corp.† | | | 10,963 | | | | 322,422 | |
| SL Green Realty Corp. REIT† | | | 1,726 | | | | 138,494 | |
| Wells Fargo & Co.† | | | 2,140 | | | | 71,562 | |
| Weyerhaeuser Co. REIT† | | | 2,688 | | | | 60,104 | |
| | | | | | | | 2,283,390 | |
| | | | | | | | | |
| Health Care — 13.2% | | | | | | | | |
| AmerisourceBergen Corp.† | | | 7,463 | | | | 293,669 | |
| Amgen, Inc.† | | | 8,619 | | | | 629,532 | |
| Cardinal Health, Inc.† | | | 13,424 | | | | 563,808 | |
| Celgene Corp.†* | | | 293 | | | | 18,799 | |
| Johnson & Johnson† | | | 882 | | | | 59,588 | |
| UnitedHealth Group, Inc.† | | | 3,624 | | | | 212,004 | |
| | | | | | | | 1,777,400 | |
| | | | | | | | | |
| Energy — 11.6% | | | | | | | | |
| ConocoPhillips† | | | 9,159 | | | | 511,805 | |
| Exxon Mobil Corp.† | | | 6,787 | | | | 580,764 | |
| Marathon Oil Corp.† | | | 15,309 | | | | 391,451 | |
| Valero Energy Corp.† | | | 3,325 | | | | 80,299 | |
| | | | | | | | 1,564,319 | |
| | | | | | | | | |
| Consumer Staples — 10.3% | | | | | | | | |
| Church & Dwight Co., Inc.† | | | 1,313 | | | | 72,832 | |
| Coca-Cola Enterprises, Inc.† | | | 4,051 | | | $ | 113,590 | |
| Monster Beverage Corp.†* | | | 4,391 | | | | 312,639 | |
| Philip Morris International, Inc.† | | | 5,837 | | | | 509,337 | |
| Tyson Foods, Inc. - Class A† | | | 19,920 | | | | 375,094 | |
| | | | | | | | 1,383,492 | |
| | | | | | | | | |
| Materials — 6.3% | | | | | | | | |
| Ball Corp.† | | | 3,941 | | | | 161,778 | |
| Commercial Metals Co.† | | | 18,552 | | | | 234,497 | |
| Freeport-McMoRan Copper & Gold, Inc.† | | | 10,097 | | | | 344,005 | |
| Kronos Worldwide, Inc.† | | | 1,363 | | | | 21,522 | |
| Westlake Chemical Corp.† | | | 1,594 | | | | 83,302 | |
| | | | | | | | 845,104 | |
| | | | | | | | | |
| Industrials — 5.9% | | | | | | | | |
| Chicago Bridge & Iron Co. NV† | | | 901 | | | | 34,202 | |
| Cooper Industries PLC† | | | 80 | | | | 5,454 | |
| Cummins, Inc.† | | | 1,912 | | | | 185,292 | |
| Goodrich Corp.† | | | 129 | | | | 16,370 | |
| Landstar System, Inc.† | | | 2,565 | | | | 132,662 | |
| Robert Half International, Inc.† | | | 2,902 | | | | 82,910 | |
| WESCO International, Inc.†* | | | 5,875 | | | | 338,106 | |
| | | | | | | | 794,996 | |
| | | | | | | | | |
| Utilities — 4.0% | | | | | | | | |
| AES Corp. (The)†* | | | 40,745 | | | | 522,758 | |
| Progress Energy, Inc.* | | | 301 | | | | 18,111 | |
| | | | | | | | 540,869 | |
| | | | | | | | | |
| Telecommunication Services — 2.1% | | | | | | | | |
| Crown Castle International Corp.†* | | | 4,910 | | | | 288,021 | |
| Total Common Stocks | | | | | | $ | 15,322,325 | |
| | | | | | | | | |
| Exchange Traded Fund — 3.4% | | | | | | | | |
| SPDR S&P 500 ETF Trust† | | | 3,408 | | | | 464,408 | |
| Total Exchange Traded Funds | | | | | | $ | 464,408 | |
| | | | | | | | | |
| Investment Fund — 1.2% | | | | | | | | |
| Touchstone Institutional Money Market Fund^ | | | 159,830 | | | | 159,830 | |
| Total Investment Funds | | | | | | $ | 159,830 | |
| | | | | | | | | |
| Total Long Positions | | | | | | | | |
| (Cost $14,357,651) | | | | | | $ | 15,946,563 | |
| | | | | | | | | |
| Securities Sold Short — (17.7%) | | | | | | | | |
| | | | | | | | | |
| Common Stocks — (17.7%) | | | | | | | | |
| | | | | | | | | |
| Information Technology — (7.2%) | | | | | | | | |
| Acme Packet, Inc.* | | | (4,500 | ) | | | (83,925 | ) |
| Ciena Corp.* | | | (203 | ) | | | (3,323 | ) |
| Computer Sciences Corp. | | | (4,409 | ) | | | (109,431 | ) |
| Fusion-io, Inc.* | | | (8,222 | ) | | | (171,758 | ) |
| Global Payments, Inc. | | | (4,677 | ) | | | (202,187 | ) |
| MEMC Electronic Materials, Inc.* | | | (53,899 | ) | | | (116,961 | ) |
| Rovi Corp.* | | | (9,838 | ) | | | (193,022 | ) |
Touchstone U.S. Long/Short Fund (Continued)
| | | | | Market |
| | | Shares | | Value |
| | | | | |
| Common Stocks — (17.7%) (Continued) | | | | |
| | | | | |
| Information Technology — (Continued) | | | | |
| SunPower Corp.* | | | (17,489 | ) | | $ | (84,122 | ) |
| | | | | | | | (964,729 | ) |
| | | | | | | | | |
| Health Care — (3.2%) | | | | | | | | |
| Allscripts Healthcare Solutions, Inc.* | | | (9,880 | ) | | | (107,988 | ) |
| Dendreon Corp.* | | | (17,331 | ) | | | (128,249 | ) |
| Vertex Pharmaceuticals, Inc.* | | | (3,578 | ) | | | (200,082 | ) |
| | | | | | | | (436,319 | ) |
| | | | | | | | | |
| Energy — (2.9%) | | | | | | | | |
| Alpha Natural Resources, Inc.* | | | (14,720 | ) | | | (128,211 | ) |
| Arch Coal, Inc. | | | (25,056 | ) | | | (172,636 | ) |
| Range Resources Corp. | | | (1,486 | ) | | | (91,939 | ) |
| | | | | | | | (392,786 | ) |
| | | | | | | | | |
| Consumer Discretionary — (1.8%) | | | | | | | | |
| Deckers Outdoor Corp.* | | | (559 | ) | | | (24,602 | ) |
| Gentex Corp. | | | (5,289 | ) | | | (110,381 | ) |
| Netflix, Inc.* | | | (1,317 | ) | | | (90,175 | ) |
| Visteon Corp.* | | | (473 | ) | | | (17,737 | ) |
| | | | | | | | (242,895 | ) |
| | | | | | | | | |
| Financials — (1.6%) | | | | | | | | |
| Bank of Hawaii Corp. | | | (4,527 | ) | | | (208,016 | ) |
| CapitalSource, Inc. | | | (545 | ) | | | (3,662 | ) |
| Hudson City Bancorp, Inc. | | | (859 | ) | | | (5,472 | ) |
| | | | | | | | (217,150 | ) |
| | | | | | | | | |
| Utilities — (1.0%) | | | | | | | | |
| GenOn Energy, Inc.* | | | (80,738 | ) | | | (138,062 | ) |
| Total Common Stocks | | | | | | $ | (2,391,941 | ) |
| | | | | | | | | |
| Total Securities Sold Short | | | | | | | | |
| (Proceeds $(3,232,993)) | | | | | | $ | (2,391,941 | ) |
| | | | | | | | | |
| Total Investment Securities —100.6% | | | | | | | | |
| (Cost $11,124,658) | | | | | | $ | 13,554,622 | |
| | | | | | | | | |
| Liabilities in Excess of Other Assets — (0.6%) | | | | | | | (77,324 | ) |
| | | | | | | | | |
| Net Assets — 100.0% | | | | | | $ | 13,477,298 | |
| | † | All or a portion of these securities are held as collateral for securities sold short. The total value of the securities held as collateral as of June 30, 2012 was $15,768,622. |
| | * | Non-income producing security. |
| | ^ | Affiliated Fund. See Note 4 in Notes to Financial Statements. |
Portfolio Abbreviations:
PLC - Public Limited Company
REIT - Real Estate Investment Trust
Other Information:
The inputs or methodology used for valuing securities may not be an indication of the risk associated with investing in those securities. For more information on valuation inputs, and their aggregation into the levels used in the table below, please refer to the security valuation section in the accompanying Notes to Financial Statements.
| Valuation inputs at Reporting Date: | |
| Description | | Level 1 | | | Level 2 | | | Level 3 | | | Total | |
| Assets: | | | | | | | | | | | | | | | | |
| Common Stocks | | $ | 15,322,325 | | | $ | — | | | $ | — | | | $ | 15,322,325 | |
| Exchanged Traded Fund | | | 464,408 | | | | — | | | | — | | | | 464,408 | |
| Investment Fund | | | 159,830 | | | | — | | | | — | | | | 159,830 | |
| | | | | | | | | | | | | | | $ | 15,946,563 | |
| | | | | | | | | | | | | | | | | |
| Liabilities: | | | | | | | | | | | | | | | | |
| Securities Sold Short | | | | | | | | | | | | | | | | |
| Common Stocks | | $ | (2,391,941 | ) | | $ | — | | | $ | — | | | $ | (2,391,941 | ) |
See accompanying Notes to Financial Statements.
Portfolio of Investments
Touchstone Value Fund – June 30, 2012
| | | | | Market |
| | | Shares | | Value |
| | | | | | | | | |
| Common Stocks — 98.5% | | | | | | | | |
| | | | | | | | | |
| Financials — 20.2% | | | | | | | | |
| American Express Co. | | | 69,462 | | | $ | 4,043,383 | |
| Bank of America Corp. | | | 167,163 | | | | 1,367,393 | |
| Capital One Financial Corp. | | | 47,440 | | | | 2,593,070 | |
| Citigroup, Inc. | | | 72,370 | | | | 1,983,662 | |
| JPMorgan Chase & Co. | | | 97,057 | | | | 3,467,847 | |
| PNC Financial Services Group, Inc. | | | 58,136 | | | | 3,552,691 | |
| SLM Corp. | | | 121,788 | | | | 1,913,289 | |
| Wells Fargo & Co. | | | 121,215 | | | | 4,053,430 | |
| XL Group PLC | | | 85,761 | | | | 1,804,411 | |
| | | | | | | | 24,779,176 | |
| | | | | | | | | |
| Health Care — 13.2% | | | | | | | | |
| Baxter International, Inc. | | | 60,958 | | | | 3,239,918 | |
| Johnson & Johnson | | | 50,000 | | | | 3,378,000 | |
| Medtronic, Inc. | | | 89,800 | | | | 3,477,954 | |
| Pfizer, Inc. | | | 181,804 | | | | 4,181,492 | |
| WellPoint, Inc. | | | 30,512 | | | | 1,946,360 | |
| | | | | | | | 16,223,724 | |
| | | | | | | | | |
| Consumer Staples — 13.0% | | | | | | | | |
| Altria Group, Inc. | | | 61,932 | | | | 2,139,751 | |
| CVS Caremark Corp. | | | 20,600 | | | | 962,638 | |
| Diageo PLC ADR | | | 36,172 | | | | 3,728,248 | |
| Imperial Tobacco Group PLC ADR | | | 46,047 | | | | 3,561,275 | |
| Philip Morris International, Inc. | | | 63,800 | | | | 5,567,188 | |
| | | | | | | | 15,959,100 | |
| | | | | | | | | |
| Industrials — 12.8% | | | | | | | | |
| Cooper Industries PLC | | | 30,100 | | | | 2,052,218 | |
| Exelis, Inc. | | | 57,000 | | | | 562,020 | |
| General Electric Co. | | | 162,230 | | | | 3,380,873 | |
| Honeywell International, Inc. | | | 50,038 | | | | 2,794,122 | |
| Illinois Tool Works, Inc. | | | 35,355 | | | | 1,869,926 | |
| ITT Corp.* | | | 25,150 | | | | 442,640 | |
| Raytheon Co. | | | 56,300 | | | | 3,186,017 | |
| Xylem, Inc. | | | 57,000 | | | | 1,434,690 | |
| | | | | | | | 15,722,506 | |
| | | | | | | | | |
| Energy — 12.7% | | | | | | | | |
| ConocoPhillips | | | 57,295 | | | | 3,201,645 | |
| Marathon Oil Corp. | | | 22,800 | | | | 582,996 | |
| Marathon Petroleum Corp. | | | 33,650 | | | | 1,511,558 | |
| Occidental Petroleum Corp. | | | 40,622 | | | | 3,484,149 | |
| Phillips 66* | | | 64,147 | | | | 2,132,246 | |
| Seadrill Ltd. | | | 33,300 | | | | 1,182,816 | |
| Spectra Energy Corp. | | | 121,372 | | | | 3,527,070 | |
| | | | | | | | 15,622,480 | |
| | | | | | | | | |
| Utilities — 8.0% | | | | | | | | |
| CenterPoint Energy, Inc. | | | 137,100 | | | | 2,833,857 | |
| Dominion Resources, Inc. | | | 15,424 | | | | 832,896 | |
| Entergy Corp. | | | 45,800 | | | | 3,109,362 | |
| Public Service Enterprise Group, Inc. | | | 92,400 | | | | 3,003,000 | |
| | | | | | | | 9,779,115 | |
| | | | | | | | | |
| Information Technology — 7.0% | | | | | | | | |
| Intel Corp. | | | 54,400 | | | | 1,449,760 | |
| International Business Machines Corp. | | | 17,450 | | | | 3,412,871 | |
| Microsoft Corp. | | | 119,600 | | | | 3,658,564 | |
| | | | | | | | 8,521,195 | |
| | | | | | | | | |
| Telecommunication Services — 6.4% | | | | | | | | |
| AT&T, Inc. | | | 102,014 | | | | 3,637,819 | |
| Verizon Communications, Inc. | | | 52,958 | | | | 2,353,454 | |
| Vodafone Group PLC ADR | | | 65,400 | | | | 1,842,972 | |
| | | | | | | | 7,834,245 | |
| | | | | | | | | |
| Consumer Discretionary — 4.2% | | | | | | | | |
| Carnival Corp. | | | 57,358 | | | | 1,965,659 | |
| CBS Corp. - Class B | | | 9,500 | | | | 311,410 | |
| Service Corp. International | | | 134,600 | | | | 1,665,002 | |
| Target Corp. | | | 21,300 | | | | 1,239,447 | |
| | | | | | | | 5,181,518 | |
| | | | | | | | | |
| Materials — 1.0% | | | | | | | | |
| EI du Pont de Nemours & Co. | | | 23,300 | | | | 1,178,281 | |
| Total Common Stocks | | | | | | $ | 120,801,340 | |
| | | | | | | | | |
| Investment Fund — 7.7% | | | | | | | | |
| Touchstone Institutional Money Market Fund^ | | | 9,429,223 | | | | 9,429,223 | |
| | | | | | | | | |
| Total Investment Securities —106.2% | | | | | | | | |
| (Cost $104,096,656) | | | | | | $ | 130,230,563 | |
| | | | | | | | | |
| Liabilities in Excess of Other Assets — (6.2%) | | | | | | | (7,648,713 | ) |
| | | | | | | | | |
| Net Assets — 100.0% | | | | | | $ | 122,581,850 | |
| | * | Non-income producing security. |
| | ^ | Affiliated Fund. See Note 4 in Notes to Financial Statements. |
Portfolio Abbreviations:
ADR - American Depositary Receipt
PLC - Public Limited Company
Other Information:
The inputs or methodology used for valuing securities may not be an indication of the risk associated with investing in those securities. For more information on valuation inputs, and their aggregation into the levels used in the table below, please refer to the security valuation section in the accompanying Notes to Financial Statements.
Touchstone Value Fund (Continued)
| Valuation inputs at Reporting Date: | |
| | |
| Description | | Level 1 | | | Level 2 | | | Level 3 | | | Total | |
| Common Stocks | | $ | 120,801,340 | | | $ | — | | | $ | — | | | $ | 120,801,340 | |
| Investment Fund | | | 9,429,223 | | | | — | | | | — | | | | 9,429,223 | |
| | | | | | | | | | | | | | | $ | 130,230,563 | |
See accompanying Notes to Financial Statements.
This page intentionally left blank.
Statements of Assets and Liabilities
June 30, 2012
| | | Touchstone | | Touchstone |
| | | Capital | | International |
| | | Growth | | Small Cap |
| | | Fund | | Fund |
| Assets | | | | |
| Investments, at cost | | $ | 118,644,304 | | | $ | 88,255,549 | |
| Affiliated securities, at market value | | $ | 1,389,986 | | | $ | 1,743,433 | |
| Non-affiliated securities, at market value | | | 165,587,143 | | | | 86,269,511 | |
| Investments, at value (A) | | $ | 166,977,129 | | | $ | 88,012,944 | |
| Cash | | | — | | | | 19,440 | |
| Dividends and interest receivable | | | 147,373 | | | | 146,572 | |
| Receivable for capital shares sold | | | 20,383 | | | | 1,895 | |
| Receivable for investments sold | | | — | | | | 1,620,112 | |
| Receivable for securities lending income | | | 29 | | | | 4,251 | |
| Receivable from Investment Advisor | | | — | | | | — | |
| Tax reclaim receivable | | | — | | | | 56,493 | |
| Other assets | | | 14,071 | | | | 17,332 | |
| Total Assets | | | 167,158,985 | | | | 89,879,039 | |
| | | | | | | | | |
| Liabilities | | | | | | | | |
| Securities sold short (C) | | | — | | | | — | |
| Dividends for securities sold short payable | | | — | | | | — | |
| Bank overdrafts(B) | | | — | | | | 184,481 | |
| Dividends payable | | | — | | | | — | |
| Payable to Transfer Agent | | | 105,971 | | | | 50,822 | |
| Payable for return of collateral for securities on loan | | | 1,374,436 | | | | 2,983,985 | |
| Payable for capital shares redeemed | | | 209,124 | | | | 28,268 | |
| Payable for investments purchased | | | — | | | | 1,669,086 | |
| Payable to Investment Advisor | | | 80,128 | | | | 41,572 | |
| Payable to other affiliates | | | 539 | | | | 408 | |
| Payable to Trustees | | | 1,700 | | | | 1,688 | |
| Payable for professional services | | | 26,775 | | | | 30,842 | |
| Other accrued expenses and liabilities | | | 57,989 | | | | 63,784 | |
| Total Liabilities | | | 1,856,662 | | | | 5,054,936 | |
| | | | | | | | | |
| Net Assets | | $ | 165,302,323 | | | $ | 84,824,103 | |
| | | | | | | | | |
| Net assets consist of: | | | | | | | | |
| Paid-in capital | | $ | 160,499,176 | | | $ | 113,705,333 | |
| Accumulated net investment income | | | 112,598 | | | | 618,914 | |
| Accumulated net realized gains (losses) on investments, warrants, foreign currency transactions, securities sold short and futures transactions | | | (43,642,276 | ) | | | (29,251,315 | ) |
| Net unrealized appreciation (depreciation) on investments, warrants, foreign currency transactions, securities sold short and futures transactions | | | 48,332,825 | | | | (248,829 | ) |
| | | | | | | | | |
| Net Assets | | $ | 165,302,323 | | | $ | 84,824,103 | |
| (A) Includes market value of securities on loan of: | | $ | 1,375,127 | | | $ | 2,960,754 | |
| (B) Cost of foreign currency: | | $ | — | | | $ | (184,997 | ) |
| (C) Proceeds received for securities sold short: | | $ | — | | | $ | — | |
See accompanying Notes to Financial Statements.
Statements of Assets and Liabilities (Continued)
| | Touchstone | | Touchstone | | | | |
| | Mid Cap | | Small Cap | | | | |
| | Value | | Value | | Touchstone | | Touchstone |
| | Opportunities | | Opportunities | | U.S. Long/Short | | Value |
| | Fund | | Fund | | Fund | | Fund |
| | | | | | | | |
| | $ | 94,509,008 | | | $ | 82,958,442 | | | $ | 14,357,651 | | | $ | 104,096,656 | |
| | $ | 3,046,587 | | | $ | 2,600,391 | | | $ | 159,830 | | | $ | 9,429,223 | |
| | | 101,933,145 | | | | 95,326,351 | | | | 15,786,733 | | | | 120,801,340 | |
| | $ | 104,979,732 | | | $ | 97,926,742 | | | $ | 15,946,563 | | | $ | 130,230,563 | |
| | | — | | | | — | | | | — | | | | — | |
| | | 255,954 | | | | 124,854 | | | | 13,642 | | | | 240,885 | |
| | | 13,777 | | | | 18,930 | | | | 10,000 | | | | 537,619 | |
| | | 585,707 | | | | 5,319,083 | | | | — | | | | 140,583 | |
| | | 4,411 | | | | 34,305 | | | | — | | | | — | |
| | | — | | | | — | | | | 20,176 | | | | — | |
| | | — | | | | — | | | | — | | | | — | |
| | | 25,314 | | | | 15,683 | | | | 16,986 | | | | 18,796 | |
| | | 105,864,895 | | | | 103,439,597 | | | | 16,007,367 | | | | 131,168,446 | |
| | | | | | | | | | | | | | | | |
| | | | | | | | | | | | | | | | |
| | | — | | | | — | | | | 2,391,941 | | | | — | |
| | | — | | | | — | | | | 1,325 | | | | — | |
| | | 170,098 | | | | — | | | | 82,356 | | | | — | |
| | | 69 | | | | — | | | | — | | | | — | |
| | | 31,286 | | | | 18,825 | | | | 6,858 | | | | 25,100 | |
| | | 4,646,582 | | | | 5,686,998 | | | | — | | | | — | |
| | | 69,743 | | | | 129,234 | | | | 2,812 | | | | 312,100 | |
| | | 271,937 | | | | 5,595,327 | | | | — | | | | 8,154,564 | |
| | | 48,331 | | | | 54,331 | | | | — | | | | 55,395 | |
| | | 4,737 | | | | 978 | | | | 2,499 | | | | 830 | |
| | | 1,695 | | | | 1,689 | | | | 1,679 | | | | 1,691 | |
| | | 22,077 | | | | 27,559 | | | | 27,392 | | | | 26,903 | |
| | | 17,710 | | | | 15,512 | | | | 13,207 | | | | 10,013 | |
| | | 5,284,265 | | | | 11,530,453 | | | | 2,530,069 | | | | 8,586,596 | |
| | | | | | | | | | | | | | | | |
| | $ | 100,580,630 | | | $ | 91,909,144 | | | $ | 13,477,298 | | | $ | 122,581,850 | |
| | | | | | | | | | | | | | | | |
| | | | | | | | | | | | | | | | |
| | $ | 88,846,021 | | | $ | 75,286,654 | | | $ | 73,947,242 | | | $ | 113,367,140 | |
| | | 257,446 | | | | 29,097 | | | | 30,656 | | | | 24,961 | |
| | | 1,006,439 | | | | 1,625,093 | | | | (62,930,564 | ) | | | (16,944,158 | ) |
| | | 10,470,724 | | | | 14,968,300 | | | | 2,429,964 | | | | 26,133,907 | |
| | | | | | | | | | | | | | | | |
| | $ | 100,580,630 | | | $ | 91,909,144 | | | $ | 13,477,298 | | | $ | 122,581,850 | |
| | $ | 4,699,420 | | | $ | 5,682,317 | | | $ | — | | | $ | — | |
| | $ | — | | | $ | — | | | $ | — | | | $ | — | |
| | $ | — | | | $ | — | | | $ | 3,232,993 | | | $ | — | |
Statements of Assets and Liabilities (Continued)
| | | Touchstone | | Touchstone |
| | | Capital | | International |
| | | Growth | | Small Cap |
| | | Fund | | Fund |
| Pricing of Class A Shares | | | | |
| Net assets applicable to Class A shares | | $ | 559,061 | | | $ | 199,029 | |
| Shares of beneficial interest outstanding (unlimited number of shares authorized, no par value) | | | 29,482 | | | | 19,491 | |
| Net asset value price per share* | | $ | 18.96 | | | $ | 10.21 | |
| Maximum offering price per share | | $ | 20.12 | | | $ | 10.83 | |
| | | | | | | | | |
| Pricing of Class C Shares | | | | | | | | |
| Net assets applicable to Class C shares | | $ | 2,360 | | | $ | 2,354 | |
| Shares of beneficial interest outstanding (unlimited number of shares authorized, no par value) | | | 125 | | | | 231 | |
| Net asset value, offering price per share** | | $ | 18.93 | | | $ | 10.19 | |
| | | | | | | | | |
| Pricing of Class Y Shares | | | | | | | | |
| Net assets applicable to Class Y shares | | $ | 164,589,110 | | | $ | 80,753,532 | |
| Shares of beneficial interest outstanding (unlimited number of shares authorized, no par value) | | | 8,533,977 | | | | 7,764,306 | |
| Net asset value, offering price and redemption price per share | | $ | 19.29 | | | $ | 10.40 | |
| | | | | | | | | |
| Pricing of Institutional Class Shares | | | | | | | | |
| Net assets applicable to Institutional Class shares | | $ | 151,792 | | | $ | 3,869,188 | |
| Shares of beneficial interest outstanding (unlimited number of shares authorized, no par value) | | | 7,831 | | | | 370,253 | |
| Net asset value, offering price and redemption price per share | | $ | 19.38 | | | $ | 10.45 | |
| | * | There is no sales load on subscriptions of $1 million or more. Redemptions that were part of a $1 million or more subscription may be subject to a contingent deferred sales load. |
| | ** | Redemption price per share varies by length of time shares are held. |
See accompanying Notes to Financial Statements.
Statements of Assets and Liabilities (Continued)
| | Touchstone | | Touchstone | | | | |
| | Mid Cap Value | | Small Cap Value | | Touchstone | | Touchstone |
| | Opportunities | | Opportunities | | U.S. Long/Short | | Value |
| | Fund | | Fund | | Fund | | Fund |
| | | | | | | | |
| | $ | 1,412,416 | | | $ | 2,022,763 | | | $ | 1,609,752 | | | $ | 1,582,921 | |
| | | 166,875 | | | | 119,162 | | | | 128,912 | | | | 227,744 | |
| | $ | 8.46 | | | $ | 16.97 | | | $ | 12.49 | | | $ | 6.95 | |
| | $ | 8.98 | | | $ | 18.01 | | | $ | 13.25 | | | $ | 7.37 | |
| | | | | | | | | | | | | | | | |
| | | | | | | | | | | | | | | | |
| | $ | 2,511 | | | $ | 2,487 | | | $ | 2,503 | | | $ | 2,538 | |
| | | 298 | | | | 147 | | | | 201 | | | | 365 | |
| | $ | 8.44 | | | $ | 16.95 | | | $ | 12.47 | | | $ | 6.95 | |
| | | | | | | | | | | | | | | | |
| | | | | | | | | | | | | | | | |
| | $ | 64,370,651 | | | $ | 82,860,928 | | | $ | 11,807,815 | | | $ | 51,447,429 | |
| | | 7,576,237 | | | | 4,733,454 | | | | 934,805 | | | | 7,382,558 | |
| | $ | 8.50 | | | $ | 17.51 | | | $ | 12.63 | | | $ | 6.97 | |
| | | | | | | | | | | | | | | | |
| | | | | | | | | | | | | | | | |
| | $ | 34,795,052 | | | $ | 7,022,966 | | | $ | 57,228 | | | $ | 69,548,962 | |
| | | 4,097,872 | | | | 398,242 | | | | 4,543 | | | | 9,996,920 | |
| | $ | 8.49 | | | $ | 17.63 | | | $ | 12.60 | | | $ | 6.96 | |
Statements of Operations
| | | Touchstone | | Touchstone |
| | | Capital Growth | | International |
| | | Fund | | | Small Cap Fund | |
| | | | For the | | | | | | | | For the | | | | | |
| | | | Three Months | | | | For the | | | | Three Months | | | | For the | |
| | | | Ended | | | | Year Ended | | | | Ended | | | | Year Ended | |
| | | | June 30, | | | | March 31, | | | | June 30, | | | | March 31, | |
| | | | 2012 | | | | 2012* | | | | 2012 | | | | 2012* | |
| Investment Income | | | | | | | | | | | | | | | | |
| Dividends from affiliated securities | | $ | 830 | | | $ | 130 | | | $ | 669 | | | $ | 181 | |
| Dividends from non-affiliated securities(A) | | | 540,018 | | | | 1,912,671 | | | | 1,073,658 | | | | 1,939,997 | |
| Interest | | | — | | | | — | | | | — | | | | — | |
| Income from securities loaned | | | 29 | | | | — | | | | 4,251 | | | | — | |
| Total Investment Income | | | 540,877 | | | | 1,912,801 | | | | 1,078,578 | | | | 1,940,178 | |
| Expenses | | | | | | | | | | | | | | | | |
| Investment advisory fees | | | 304,807 | | | | 1,311,719 | | | | 208,375 | | | | 963,033 | |
| Administration fees | | | 66,438 | | | | — | | | | 33,783 | | | | — | |
| Compliance fees and expenses | | | 348 | | | | — | | | | 348 | | | | — | |
| Custody fees | | | 595 | | | | 7,890 | | | | 15,194 | | | | 76,259 | |
| Professional fees | | | 32,055 | | | | 84,479 | | | | 32,300 | | | | 60,241 | |
| Transfer Agent fees, Class A | | | 291 | | | | 2,799 | | | | 127 | | | | 1,856 | |
| Transfer Agent fees, Class C | | | 7 | | | | — | | | | 7 | | | | — | |
| Transfer Agent fees, Class Y | | | 98,212 | | | | — | | | | 50,718 | | | | — | |
| Transfer Agent fees, Institutional Class | | | 26 | | | | 1,107 | | | | 103 | | | | 1,470 | |
| Transfer Agent fees, Class Z | | | — | | | | 738,353 | | | | — | | | | 422,246 | |
| Registration Fees, Fund Level | | | — | | | | 42,869 | | | | — | | | | 41,998 | |
| Registration Fees, Class A | | | 4,411 | | | | — | | | | 2,778 | | | | — | |
| Registration Fees, Class C | | | 65 | | | | — | | | | 65 | | | | — | |
| Registration Fees, Class Y | | | 1,125 | | | | — | | | | 1,700 | | | | — | |
| Registration Fees, Institutional Class | | | 3,073 | | | | — | | | | 2,436 | | | | — | |
| Dividend expense and stock loan expense on securities sold short | | | — | | | | — | | | | — | | | | — | |
| Interest expense on securities sold short | | | — | | | | — | | | | — | | | | — | |
| Reports to Shareholders, Fund Level | | | — | | | | 118,431 | | | | — | | | | 64,653 | |
| Reports to Shareholders, Class A | | | 4,695 | | | | — | | | | 4,676 | | | | — | |
| Reports to Shareholders, Class C | | | 4,648 | | | | — | | | | 4,648 | | | | — | |
| Reports to Shareholders, Class Y | | | 21,346 | | | | — | | | | 15,264 | | | | — | |
| Reports to Shareholders, Institutional Class | | | 4,652 | | | | — | | | | 4,653 | | | | — | |
| Distribution expenses, Class A | | | 406 | | | | 2,132 | | | | 107 | | | | 411 | |
| Distribution expenses, Class C | | | 5 | | | | — | | | | 5 | | | | — | |
| Trustee fees | | | 1,700 | | | | 46,669 | | | | 1,688 | | | | 25,981 | |
| Other expenses | | | 21,967 | | | | 39,151 | | | | 18,386 | | | | 54,581 | |
| Total Expenses | | | 570,872 | | | | 2,395,599 | | | | 397,361 | | | | 1,712,729 | |
| Fees waived and/or reimbursed by the Advisor and/or Affiliates (B) | | | (142,767 | ) | | | (729,952 | ) | | | (114,600 | ) | | | (407,778 | ) |
| Net Expenses | | | 428,105 | | | | 1,665,647 | | | | 282,761 | | | | 1,304,951 | |
| Net Investment Income (Loss) | | | 112,772 | | | | 247,154 | | | | 795,817 | | | | 635,227 | |
| Realized and Unrealized Gain (Loss) on Investments | | | | | | | | | | | | | | | | |
| Net realized gain (loss) on investments | | | 6,540,076 | | | | 11,638,448 | | | | (2,674,325 | ) | | | 16,855,421 | |
| Net realized gain on warrants | | | — | | | | — | | | | — | | | | — | |
| Net realized loss on foreign currency | | | — | | | | — | | | | (31,211 | ) | | | (57,018 | ) |
| Net realized loss on securities sold short | | | — | | | | — | | | | — | | | | — | |
| Net realized gain (loss) on futures | | | — | | | | — | | | | — | | | | — | |
| Net change in unrealized appreciation (depreciation) on investments | | | (20,410,114 | ) | | | 3,017,037 | | | | (4,808,216 | ) | | | (25,627,027 | ) |
| Net change in unrealized appreciation (depreciation) on foreign currency transactions | | | — | | | | — | | | | (4,542 | ) | | | (1,682 | ) |
| Net change in unrealized appreciation on securities sold short | | | — | | | | — | | | | — | | | | — | |
| Net change in unrealized (depreciation) on futures | | | — | | | | — | | | | — | | | | — | |
| Net Realized and Unrealized Gain (Loss) on Investments | | | (13,870,038 | ) | | | 14,655,485 | | | | (7,518,294 | ) | | | (8,830,306 | ) |
| Change in Net Assets Resulting from Operations | | $ | (13,757,266 | ) | | $ | 14,902,639 | | | $ | (6,722,477 | ) | | $ | (8,195,079 | ) |
| (A) Net of foreign tax withholding of: | | $ | 4,892 | | | $ | 9,494 | | | $ | 108,989 | | | $ | 152,382 | |
| | | (B)See note 4 in Notes to Financial Statements |
| | * | Certain prior year amounts have been reclassified to conform with current year presentation
|
See accompanying Notes to Financial Statements.
Statements of Operations (Continued)
| | Touchstone | | | Touchstone | | | Touchstone | | | Touchstone | |
| | Mid Cap Value | | | Small Cap Value | | | U.S. Long/Short | | | Value | |
| | Opportunities Fund | | | Opportunities Fund | | | Fund | | | Fund | |
| | For the | | | | | | For the | | | | | | For the | | | | | | For the | | | | |
| | Three Months | | | For the | | | Three Months | | | For the | | | Three Months | | | For the | | | Three Months | | | For the | |
| | Ended | | | Year Ended | | | Ended | | | Year Ended | | | Ended | | | Year Ended | | | Ended | | | Year Ended | |
| | June 30, | | | March 31, | | | June 30, | | | March 31, | | | June 30, | | | March 31, | | | June 30, | | | March 31, | |
| | 2012 | | | 2012* | | | 2012 | | | 2012* | | | 2012 | | | 2012* | | | 2012 | | | 2012* | |
| | | | | | | | | | | | | | | | | | | | | | | | | | | | | | | | |
| | $ | 1,486 | | | $ | 478 | | | $ | 811 | | | $ | 191 | | | $ | 89 | | | $ | 128 | | | $ | 1,484 | | | $ | — | |
| | | 545,303 | | | | 3,985,428 | | | | 280,400 | | | | 1,230,302 | | | | 85,854 | | | | 605,931 | | | | 825,646 | | | | 3,539,190 | |
| | | — | | | | — | | | | — | | | | — | | | | — | | | | 724 | | | | — | | | | — | |
| | | 4,411 | | | | — | | | | 34,305 | | | | — | | | | — | | | | — | | | | — | | | | — | |
| | | 551,200 | | | | 3,985,906 | | | | 315,516 | | | | 1,230,493 | | | | 85,943 | | | | 606,783 | | | | 827,130 | | | | 3,539,190 | |
| | | | | | | | | | | | | | | | | | | | | | | | | | | | | | | | |
| | | 257,561 | | | | 2,008,659 | | | | 225,695 | | | | 1,062,965 | | | | 31,160 | | | | 258,977 | | | | 214,939 | | | | 930,207 | |
| | | 42,298 | | | | — | | | | 35,772 | | | | — | | | | 5,585 | | | | — | | | | 44,352 | | | | — | |
| | | 348 | | | | — | | | | 348 | | | | — | | | | 348 | | | | — | | | | 348 | | | | — | |
| | | 474 | | | | 16,711 | | | | 322 | | | | 7,235 | | | | 3,662 | | | | 10,884 | | | | 372 | | | | 8,214 | |
| | | 30,099 | | | | 103,182 | | | | 29,773 | | | | 48,185 | | | | 27,088 | | | | 15,884 | | | | 29,987 | | | | 54,750 | |
| | | 559 | | | | 8,494 | | | | 913 | | | | 8,744 | | | | 627 | | | | 7,920 | | | | 804 | | | | 5,412 | |
| | | 7 | | | | — | | | | 7 | | | | — | | | | 7 | | | | — | | | | 7 | | | | — | |
| | | 24,659 | | | | — | | | | 16,092 | | | | — | | | | 5,477 | | | | — | | | | 22,131 | | | | — | |
| | | 1,295 | | | | 12,923 | | | | 352 | | | | 1,825 | | | | 53 | | | | 667 | | | | 66 | | | | 1,475 | |
| | | — | | | | 164,586 | | | | — | | | | 112,581 | | | | — | | | | 40,949 | | | | — | | | | 117,282 | |
| | | — | | | | 42,830 | | | | — | | | | 43,503 | | | | — | | | | 39,173 | | | | — | | | | 41,731 | |
| | | 3,801 | | | | — | | | | 3,391 | | | | — | | | | 3,854 | | | | — | | | | 2,986 | | | | — | |
| | | 65 | | | | — | | | | 65 | | | | — | | | | 65 | | | | — | | | | 65 | | | | — | |
| | | 2,518 | | | | — | | | | 2,588 | | | | — | | | | 1,537 | | | | — | | | | 1,454 | | | | — | |
| | | 2,558 | | | | — | | | | 2,735 | | | | — | | | | 3,194 | | | | — | | | | 1,752 | | | | — | |
| | | — | | | | — | | | | — | | | | — | | | | 13,929 | | | | 58,302 | | | | — | | | | — | |
| | | — | | | | — | | | | — | | | | — | | | | — | | | | 57,083 | | | | — | | | | — | |
| | | — | | | | 32,844 | | | | — | | | | 15,131 | | | | — | | | | 7,655 | | | | — | | | | 18,248 | |
| | | 4,757 | | | | — | | | | 4,914 | | | | — | | | | 4,824 | | | | — | | | | 4,723 | | | | — | |
| | | 4,648 | | | | — | | | | 4,648 | | | | — | | | | 4,648 | | | | — | | | | 4,648 | | | | — | |
| | | 7,988 | | | | — | | | | 6,912 | | | | — | | | | 5,296 | | | | — | | | | 6,379 | | | | — | |
| | | 4,687 | | | | — | | | | 4,457 | | | | — | | | | 4,656 | | | | — | | | | 4,665 | | | | — | |
| | | 901 | | | | 5,192 | | | | 1,292 | | | | 6,289 | | | | 1,122 | | | | 5,540 | | | | 963 | | | | 5,450 | |
| | | 5 | | | | — | | | | 5 | | | | — | | | | 5 | | | | — | | | | 5 | | | | — | |
| | | 1,695 | | | | 56,767 | | | | 1,689 | | | | 26,464 | | | | 1,679 | | | | 5,218 | | | | 1,691 | | | | 29,940 | |
| | | 9,514 | | | | 48,486 | | | | 6,366 | | | | 25,719 | | | | 2,933 | | | | 14,801 | | | | 5,259 | | | | 27,580 | |
| | | 400,437 | | | | 2,500,674 | | | | 348,336 | | | | 1,358,641 | | | | 121,749 | | | | 523,053 | | | | 347,596 | | | | 1,240,289 | |
| | | (107,255 | ) | | | (294,969 | ) | | | (61,917 | ) | | | (50,147 | ) | | | (66,257 | ) | | | (65,656 | ) | | | (87,108 | ) | | | (94,450 | ) |
| | | 293,182 | | | | 2,205,705 | | | | 286,419 | | | | 1,308,494 | | | | 55,492 | | | | 457,397 | | | | 260,488 | | | | 1,145,839 | |
| | | 258,018 | | | | 1,780,201 | | | | 29,097 | | | | (78,001 | ) | | | 30,451 | | | | 149,386 | | | | 566,642 | | | | 2,393,351 | |
| | | | | | | | | | | | | | | | | | | | | | | | | | | | | | | | |
| | | 12,269,428 | | | | 30,556,486 | | | | 5,243,556 | | | | 4,981,033 | | | | 1,519,911 | | | | 2,853,501 | | | | 3,049,444 | | | | 3,679,428 | |
| | | — | | | | — | | | | — | | | | — | | | | 177 | | | | — | | | | — | | | | — | |
| | | — | | | | — | | | | — | | | | — | | | | — | | | | — | | | | — | | | | — | |
| | | — | | | | — | | | | — | | | | — | | | | (53,346 | ) | | | (723,669 | ) | | | — | | | | — | |
| | | — | | | | — | | | | — | | | | — | | | | (12 | ) | | | 130,406 | | | | — | | | | — | |
| | | (15,845,639 | ) | | | (31,885,780 | ) | | | (8,565,429 | ) | | | (4,671,365 | ) | | | (2,420,236 | ) | | | (2,243,394 | ) | | | (5,520,709 | ) | | | 5,418,074 | |
| | | — | | | | — | | | | — | | | | — | | | | — | | | | — | | | | — | | | | — | |
| | | — | | | | — | | | | — | | | | — | | | | 253,075 | | | | 1,679,709 | | | | — | | | | — | |
| | | — | | | | — | | | | — | | | | — | | | | (26,806 | ) | | | (37,622 | ) | | | — | | | | — | |
| | | (3,576,211 | ) | | | (1,329,294 | ) | | | (3,321,873 | ) | | | 309,668 | | | | (727,237 | ) | | | 1,658,931 | | | | (2,471,265 | ) | | | 9,097,502 | |
| | $ | (3,318,193 | ) | | $ | 450,907 | | | $ | (3,292,776 | ) | | $ | 231,667 | | | $ | (696,786 | ) | | $ | 1,808,317 | | | $ | (1,904,623 | ) | | $ | 11,490,853 | |
| | $ | — | | | $ | 14,250 | | | $ | 229 | | | $ | — | | | $ | 7 | | | $ | 196 | | | $ | — | | | $ | 11,030 | |
Statements of Changes in Net Assets
| | Touchstone Capital |
| | Growth Fund |
| | | | For the | | | | | | | | | |
| | | | Three Months | | | | For the | | | | For the | |
| | | | Ended | | | | Year Ended | | | | Year Ended | |
| | | | June 30, 2012 | | | | March 31, 2012 | | | | March 31, 2011 | |
| From Operations | | | | | | | | | | | | |
| Net investment income (loss) | | $ | 112,772 | | | $ | 247,154 | | | $ | 387,558 | |
| Net realized gain (loss) on investments and foreign currency transactions | | | 6,540,076 | | | | 11,638,448 | | | | 9,758,135 | |
| Net change in unrealized appreciation (depreciation) on investments and foreign currency transactions | | | (20,410,114 | ) | | | 3,017,037 | | | | 25,792,482 | |
| Change in Net Assets from Operations | | | (13,757,266 | ) | | | 14,902,639 | | | | 35,938,175 | |
| Distributions to Shareholders from: | | | | | | | | | | | | |
| Net investment income, Class A | | | — | | | | — | | | | — | |
| Net investment income, Class C | | | (1 | ) | | | — | | | | — | |
| Net investment income, Class Y | | | (31,764 | ) | | | — | | | | — | |
| Net investment income, Class Z | | | — | | | | (186,919 | ) | | | (376,520 | ) |
| Net investment income, Institutional Class | | | (84 | ) | | | (28,443 | ) | | | (84,279 | ) |
| Net realized gains, Class A | | | — | | | | — | | | | — | |
| Net realized gains, Class C | | | — | | | | — | | | | — | |
| Net realized gains, Class Y | | | — | | | | — | | | | — | |
| Net realized gains, Class Z | | | — | | | | — | | | | — | |
| Net realized gains, Institutional Class | | | — | | | | — | | | | — | |
| Total Distributions | | | (31,849 | ) | | | (215,362 | ) | | | (460,799 | ) |
| Net Increase (Decrease) from Share Transactions(A) | | | (19,077,394 | ) | | | (25,723,783 | ) | | | (33,255,568 | ) |
| Total Increase (Decrease) in Net Assets | | | (32,866,509 | ) | | | (11,036,506 | ) | | | 2,221,808 | |
| Net Assets | | | | | | | | | | | | |
| Beginning of period | | | 198,168,832 | | | | 209,205,338 | | | | 206,983,530 | |
| End of period | | $ | 165,302,323 | | | $ | 198,168,832 | | | $ | 209,205,338 | |
| Accumulated Net Investment Income (Loss) | | $ | 112,598 | | | $ | 31,675 | | | $ | — | |
| | (A) | For details on share transactions by class, see Statements of Changes in Net Assets - Capital Stock Activity on pages 55-57 |
See accompanying Notes to Financial Statements.
Statements of Changes in Net Assets (Continued)
| | Touchstone International | | Touchstone Mid Cap |
| | Small Cap Fund | | Value Opportunities Fund |
| | | For the | | | | | | | | | | | | For the | | | | | | | | | |
| | | Three Months | | | | For the | | | | For the | | | | Three Months | | | | For the | | | | For the | |
| | | Ended | | | | Year Ended | | | | Year Ended | | | | Ended | | | | Year Ended | | | | Year Ended | |
| | | June 30, 2012 | | | | March 31, 2012 | | | | March 31, 2011 | | | | June 30, 2012 | | | | March 31, 2012 | | | | March 31, 2011 | |
| | | | | | | | | | | | | | | | | | | | | | | | |
| | $ | 795,817 | | | $ | 635,227 | | | $ | (849,364 | ) | | $ | 258,018 | | | $ | 1,780,201 | | | $ | 2,482,376 | |
| | | (2,705,536 | ) | | | 16,798,403 | | | | 19,371,152 | | | | 12,269,428 | | | | 30,556,486 | | | | 30,521,598 | |
| | | (4,812,758 | ) | | | (25,628,709 | ) | | | 8,514,342 | | | | (15,845,639 | ) | | | (31,885,780 | ) | | | 26,013,589 | |
| | | (6,722,477 | ) | | | (8,195,079 | ) | | | 27,036,130 | | | | (3,318,193 | ) | | | 450,907 | | | | 59,017,563 | |
| | | | | | | | | | | | | | | | | | | | | | | | |
| | | (1,870 | ) | | | (2,138 | ) | | | — | | | | (7,739 | ) | | | (5,292 | ) | | | (12,266 | ) |
| | | (24 | ) | | | — | | | | — | | | | (16 | ) | | | — | | | | — | |
| | | (761,702 | ) | | | — | | | | — | | | | (390,339 | ) | | | — | | | | — | |
| | | — | | | | (1,710,699 | ) | | | (186,904 | ) | | | — | | | | (733,074 | ) | | | (387,738 | ) |
| | | (38,728 | ) | | | (129,464 | ) | | | (2,396 | ) | | | (229,480 | ) | | | (1,432,706 | ) | | | (1,499,445 | ) |
| | | — | | | | — | | | | — | | | | (48,352 | ) | | | (85,531 | ) | | | — | |
| | | — | | | | — | | | | — | | | | (85 | ) | | | — | | | | — | |
| | | — | | | | — | | | | — | | | | (2,162,086 | ) | | | — | | | | — | |
| | | — | | | | — | | | | — | | | | — | | | | (4,048,591 | ) | | | — | |
| | | — | | | | — | | | | — | | | | (1,208,407 | ) | | | (7,091,468 | ) | | | — | |
| | | (802,324 | ) | | | (1,842,301 | ) | | | (189,300 | ) | | | (4,046,504 | ) | | | (13,396,662 | ) | | | (1,899,449 | ) |
| | | (4,110,935 | ) | | | (13,562,188 | ) | | | (18,351,420 | ) | | | (64,948,800 | ) | | | (100,560,408 | ) | | | (24,898,272 | ) |
| | | (11,635,736 | ) | | | (23,599,568 | ) | | | 8,495,410 | | | | (72,313,497 | ) | | | (113,506,163 | ) | | | 32,219,842 | |
| | | | | | | | | | | | | | | | | | | | | | | | |
| | | 96,459,839 | | | | 120,059,407 | | | | 111,563,997 | | | | 172,894,127 | | | | 286,400,290 | | | | 254,180,448 | |
| | $ | 84,824,103 | | | $ | 96,459,839 | | | $ | 120,059,407 | | | $ | 100,580,630 | | | $ | 172,894,127 | | | $ | 286,400,290 | |
| | $ | 618,914 | | | $ | 654,028 | | | $ | (1 | ) | | $ | 257,446 | | | $ | 627,003 | | | $ | 582,928 | |
Statements of Changes in Net Assets (Continued)
| | | Touchstone Small Cap |
| | | Value Opportunities Fund |
| | | | For the | | | | | | | | | |
| | | | Three Months | | | | For the | | | | For the | |
| | | | Ended | | | | Year Ended | | | | Year Ended | |
| | | | June 30, 2012 | | | | March 31, 2012 | | | | March 31, 2011 | |
| From Operations | | | | | | | | | | | | |
| Net investment income (loss) | | $ | 29,097 | | | $ | (78,001 | ) | | $ | (232,402 | ) |
| Net realized gain (loss) on investments, warrants, foreign currency transactions, securities sold short and futures transactions | | | 5,243,556 | | | | 4,981,033 | | | | 16,885,248 | |
| Net change in unrealized appreciation (depreciation) on investments, warrants, foreign currency transactions, securities sold short and futures transactions | | | (8,565,429 | ) | | | (4,671,365 | ) | | | (135,829 | ) |
| Change in Net Assets from Operations | | | (3,292,776 | ) | | | 231,667 | | | | 16,517,017 | |
| Distributions to Shareholders from: | | | | | | | | | | | | |
| Net investment income, Class A | | | — | | | | — | | | | — | |
| Net investment income, Class C | | | — | | | | — | | | | — | |
| Net investment income, Class Y | | | — | | | | — | | | | — | |
| Net investment income, Class Z | | | — | | | | — | | | | — | |
| Net investment income, Institutional Class | | | — | | | | — | | | | — | |
| Net realized gains, Class A | | | (61,018 | ) | | | (128,052 | ) | | | — | |
| Net realized gains, Class C | | | (75 | ) | | | — | | | | — | |
| Net realized gains, Class Y | | | (2,424,199 | ) | | | — | | | | — | |
| Net realized gains, Class Z | | | — | | | | (4,410,675 | ) | | | — | |
| Net realized gains, Institutional Class | | | (206,182 | ) | | | (957,098 | ) | | | — | |
| Total Distributions | | | (2,691,474 | ) | | | (5,495,825 | ) | | | — | |
| Net Increase (Decrease) from Share Transactions(A) | | | (11,407,982 | ) | | | (6,890,909 | ) | | | (13,527,872 | ) |
| Total Increase (Decrease) in Net Assets | | | (17,392,232 | ) | | | (12,155,067 | ) | | | 2,989,145 | |
| Net Assets | | | | | | | | | | | | |
| Beginning of period | | | 109,301,376 | | | | 121,456,443 | | | | 118,467,298 | |
| End of period | | $ | 91,909,144 | | | $ | 109,301,376 | | | $ | 121,456,443 | |
| Accumulated Net Investment Income | | $ | 29,097 | | | $ | — | | | $ | — | |
| | (A) | For details on share transactions by class, see Statements of Changes in Net Assets - Capital Stock Activity on pages 55-57 |
See accompanying Notes to Financial Statements.
Statements of Changes in Net Assets (Continued)
| | Touchstone U.S. | | Touchstone |
| | Long/Short Fund | | Value Fund |
| | | For the | | | | | | | | | | | | For the | | | | | | | | | |
| | | Three Months | | | | For the | | | | For the | | | | Three Months | | | | For the | | | | For the | |
| | | Ended | | | | Year Ended | | | | Year Ended | | | | Ended | | | | Year Ended | | | | Year Ended | |
| | | June 30, 2012 | | | | March 31, 2012 | | | | March 31, 2011 | | | | June 30, 2012 | | | | March 31, 2012 | | | | March 31, 2011 | |
| | | | | | | | | | | | | | | | | | | | | | | | |
| | $ | 30,451 | | | $ | 149,386 | | | $ | 872,572 | | | $ | 566,642 | | | $ | 2,393,351 | | | $ | 2,131,536 | |
| | | 1,466,730 | | | | 2,260,238 | | | | 13,532,314 | | | | 3,049,444 | | | | 3,679,428 | | | | 51,333 | |
| | | (2,193,967 | ) | | | (601,307 | ) | | | (14,587,646 | ) | | | (5,520,709 | ) | | | 5,418,074 | | | | 9,206,136 | |
| | | (696,786 | ) | | | 1,808,317 | | | | (182,760 | ) | | | (1,904,623 | ) | | | 11,490,853 | | | | 11,389,005 | |
| | | | | | | | | | | | | | | | | | | | | | | | |
| | | — | | | | (5,962 | ) | | | (80,256 | ) | | | (13,015 | ) | | | (35,067 | ) | | | (29,301 | ) |
| | | — | | | | — | | | | — | | | | (20 | ) | | | — | | | | — | |
| | | — | | | | — | | | | — | | | | (495,472 | ) | | | — | | | | — | |
| | | — | | | | (83,770 | ) | | | (1,041,032 | ) | | | — | | | | (1,506,155 | ) | | | (1,390,387 | ) |
| | | — | | | | (84,271 | ) | | | (313,781 | ) | | | (719,710 | ) | | | (746,586 | ) | | | (726,202 | ) |
| | | — | | | | — | | | | — | | | | — | | | | — | | | | — | |
| | | — | | | | — | | | | — | | | | — | | | | — | | | | — | |
| | | — | | | | — | | | | — | | | | — | | | | — | | | | — | |
| | | — | | | | — | | | | — | | | | — | | | | — | | | | — | |
| | | — | | | | — | | | | — | | | | — | | | | — | | | | — | |
| | | — | | | | (174,003 | ) | | | (1,435,069 | ) | | | (1,228,217 | ) | | | (2,287,808 | ) | | | (2,145,890 | ) |
| | | (8,346,710 | ) | | | (27,364,223 | ) | | | (95,819,317 | ) | | | 2,836,068 | | | | (17,414,538 | ) | | | (20,707,408 | ) |
| | | (9,043,496 | ) | | | (25,729,909 | ) | | | (97,437,146 | ) | | | (296,772 | ) | | | (8,211,493 | ) | | | (11,464,293 | ) |
| | | | | | | | | | | | | | | | | | | | | | | | |
| | | 22,520,794 | | | | 48,250,703 | | | | 145,687,849 | | | | 122,878,622 | | | | 131,090,115 | | | | 142,554,408 | |
| | $ | 13,477,298 | | | $ | 22,520,794 | | | $ | 48,250,703 | | | $ | 122,581,850 | | | $ | 122,878,622 | | | $ | 131,090,115 | |
| | $ | 30,656 | | | $ | — | | | $ | 20,717 | | | $ | 24,961 | | | $ | 686,536 | | | $ | 580,924 | |
Statements of Changes in Net Assets - Capital Stock Activity
| | | Touchstone Capital |
| | | Growth Fund |
| | | For the Three Months | | For the Year | | For the |
| | | Ended | | Ended | | Year Ended |
| | | June 30, 2012 | | March 31, 2012 | | March 31, 2011 |
| | | Shares | | Dollars | | Shares | | Dollars | | Shares | | Dollars |
| Class A | | | | | | | | | | | | | | | | | | | | | | | | |
| Proceeds from Shares sold | | | 1,530 | | | $ | 29,519 | | | | 3,459 | | | $ | 66,930 | | | | 18,425 | | | $ | 309,896 | |
| Reinvestment of distributions | | | — | | | | — | | | | — | | | | — | | | | — | | | | — | |
| Redemption fees | | | — | | | | — | | | | — | | | | — | | | | — | | | | — | |
| Capital contribution | | | — | | | | — | | | | — | | | | — | | | | — | | | | — | |
| Cost of Shares redeemed | | | (6,429 | ) | | | (120,348 | ) | | | (27,739 | ) | | | (501,671 | ) | | | (26,500 | ) | | | (446,433 | ) |
| Change in Net Assets from Class A Share Transactions | | | (4,899 | ) | | | (90,829 | ) | | | (24,280 | ) | | | (434,741 | ) | | | (8,075 | ) | | | (136,537 | ) |
| Class C(A) | | | | | | | | | | | | | | | | | | | | | | | | |
| Proceeds from Shares sold | | | 125 | | | | 2,500 | | | | — | | | | — | | | | — | | | | — | |
| Reinvestment of distributions | | | — | | | | — | | | | — | | | | — | | | | — | | | | — | |
| Change in Net Assets from Class C Share Transactions | | | 125 | | | | 2,500 | | | | — | | | | — | | | | — | | | | — | |
| Class Y | | | | | | | | | | | | | | | | | | | | | | | | |
| Proceeds from Shares sold | | | 35,435 | | | | 708,926 | | | | — | | | | — | | | | — | | | | — | |
| Proceeds from shares issued in connection with merger(B) | | | 8,733,626 | | | | 176,870,346 | | | | — | | | | — | | | | — | | | | — | |
| Reinvestment of distributions | | | 1,636 | | | | 30,619 | | | | — | | | | �� | | | | — | | | | — | |
| Cost of Shares redeemed | | | (236,720 | ) | | | (4,678,976 | ) | | | — | | | | — | | | | — | | | | — | |
| Change in Net Assets from Class Y Share Transactions | | | 8,533,977 | | | | 172,930,915 | | | | — | | | | — | | | | — | | | | — | |
| Class Z | | | | | | | | | | | | | | | | | | | | | | | | |
| Proceeds from Shares sold | | | 10,516 | | | | 217,602 | | | | 250,864 | | | | 4,663,886 | | | | 270,536 | | | | 4,625,504 | |
| Reinvestment of distributions | | | — | | | | — | | | | 10,082 | | | | 180,476 | | | | 20,247 | | | | 364,454 | |
| Redemption fees | | | — | | | | — | | | | — | | | | 60 | | | | — | | | | 6,572 | |
| Capital contribution | | | — | | | | — | | | | — | | | | — | | | | — | | | | — | |
| Cost of Shares redeemed | | | (52,391 | ) | | | (1,084,808 | ) | | | (1,292,604 | ) | | | (24,178,763 | ) | | | (1,519,623 | ) | | | (25,959,248 | ) |
| Cost of shares redeemed in connection with merger(B) | | | (8,733,626 | ) | | | (176,870,346 | ) | | | — | | | | — | | | | — | | | | — | |
| Change in Net Assets from Class Z Share Transactions | | | (8,775,501 | ) | | | (177,737,552 | ) | | | (1,031,658 | ) | | | (19,334,341 | ) | | | (1,228,840 | ) | | | (20,962,718 | ) |
| Institutional Class | | | | | | | | | | | | | | | | | | | | | | | | |
| Proceeds from Shares sold | | | 7,466 | | | | 153,843 | | | | 173,498 | | | | 3,067,390 | | | | 12,210 | | | | 186,715 | |
| Reinvestment of distributions | | | 4 | | | | 84 | | | | 1,581 | | | | 28,442 | | | | 4,656 | | | | 84,279 | |
| Capital contribution | | | — | | | | — | | | | — | | | | — | | | | — | | | | — | |
| Cost of Shares redeemed | | | (698,268 | ) | | | (14,336,355 | ) | | | (480,349 | ) | | | (9,050,533 | ) | | | (667,446 | ) | | | (12,427,307 | ) |
| Change in Net Assets from Institutional Class Share Transactions | | | (690,798 | ) | | | (14,182,428 | ) | | | (305,270 | ) | | | (5,954,701 | ) | | | (650,580 | ) | | | (12,156,313 | ) |
| Net Decrease from Share Transcations | | | (937,096 | ) | | $ | (19,077,394 | ) | | | (1,361,208 | ) | | $ | (25,723,783 | ) | | | (1,887,495 | ) | | $ | (33,255,568 | ) |
| (A) | The Fund began issuing Class C shares on April 12, 2012. |
| (B) | See Note 7 in the Notes to Financial Statements. |
| (C) | During each of the years ended March 31, 2012 and March 31, 2011, the Touchstone International Small Cap Fund received a one time distribution of settlement funds from Bank of America Fair Fund and Zurich Financial Services Ltd, respectively. |
See accompanying Notes to Financial Statements.
Statements of Changes in Net Assets - Capital Stock Activity (Continued)
| | Touchstone International |
| | Small Cap Fund |
| | For the Three Months | | For the Year | | For the |
| | Ended | | Ended | | Year Ended |
| | June 30, 2012 | | March 31, 2012 | | March 31, 2011 |
| | Shares | | Dollars | | Shares | | Dollars | | Shares | | Dollars |
| | | | | | | | | | | | | | | | | | | | | | | | |
| | | 6,837 | | | $ | 74,411 | | | | 8,346 | | | $ | 94,756 | | | | 22,771 | | | $ | 236,219 | |
| | | 171 | | | | 1,686 | | | | 189 | | | | 1,850 | | | | — | | | | — | |
| | | — | | | | — | | | | — | | | | 49 | | | | — | | | | — | |
| | | — | | | | — | | | | — | | | | 2,779 | (C) | | | — | | | | 346 | (C) |
| | | (381 | ) | | | (3,852 | ) | | | (13,135 | ) | | | (149,178 | ) | | | (104,546 | ) | | | (1,119,498 | ) |
| | | 6,627 | | | | 72,245 | | | | (4,600 | ) | | | (49,744 | ) | | | (81,775 | ) | | | (882,933 | ) |
| | | | | | | | | | | | | | | | | | | | | | | | |
| | | 229 | | | | 2,500 | | | | — | | | | — | | | | — | | | | — | |
| | | 2 | | | | 24 | | | | — | | | | — | | | | — | | | | — | |
| | | 231 | | | | 2,524 | | | | — | | | | — | | | | — | | | | — | |
| | | | | | | | | | | | | | | | | | | | | | | | |
| | | 34,312 | | | | 375,239 | | | | — | | | | — | | | | — | | | | — | |
| | | 7,920,316 | | | | 108,468,743 | | | | — | | | | — | | | | — | | | | — | |
| | | 73,475 | | | | 736,947 | | | | — | | | | — | | | | — | | | | — | |
| | | (263,797 | ) | | | (2,859,596 | ) | | | — | | | | — | | | | — | | | | — | |
| | | 7,764,306 | | | | 106,721,333 | | | | — | | | | — | | | | — | | | | — | |
| | | | | | | | | | | | | | | | | | | | | | | | |
| | | 4,918 | | | | 55,160 | | | | 297,008 | | | | 3,274,383 | | | | 498,266 | | | | 5,175,630 | |
| | | — | | | | — | | | | 166,235 | | | | 1,659,021 | | | | 17,042 | | | | 180,738 | |
| | | — | | | | — | | | | — | | | | 143 | | | | — | | | | — | |
| | | — | | | | — | | | | — | | | | 1,690,684 | (C) | | | — | | | | 41,037 | (C) |
| | | (36,040 | ) | | | (400,660 | ) | | | (2,288,637 | ) | | | (25,808,164 | ) | | | (2,119,678 | ) | | | (20,747,125 | ) |
| | | (7,920,316 | ) | | | (108,468,743 | ) | | | — | | | | — | | | | — | | | | — | |
| | | (7,951,438 | ) | | | (108,814,243 | ) | | | (1,825,394 | ) | | | (19,183,933 | ) | | | (1,604,370 | ) | | | (15,349,720 | ) |
| | | | | | | | | | | | | | | | | | | | | | | | |
| | | 17,760 | | | | 199,592 | | | | 469,209 | | | | 5,699,848 | | | | 37,533 | | | | 414,520 | |
| | | 3,788 | | | | 38,182 | | | | 12,933 | | | | 129,464 | | | | 220 | | | | 2,397 | |
| | | — | | | | — | | | | — | | | | 109,786 | (C) | | | — | | | | 261 | (C) |
| | | (204,182 | ) | | | (2,330,568 | ) | | | (25,444 | ) | | | (267,609 | ) | | | (275,468 | ) | | | (2,535,945 | ) |
| | | (182,634 | ) | | | (2,092,794 | ) | | | 456,698 | | | | 5,671,489 | | | | (237,715 | ) | | | (2,118,767 | ) |
| | | (362,908 | ) | | $ | (4,110,935 | ) | | | (1,373,296 | ) | | $ | (13,562,188 | ) | | | (1,923,860 | ) | | $ | (18,351,420 | ) |
Statements of Changes in Net Assets - Capital Stock Activity (Continued)
| | | Touchstone Mid Cap |
| | | Value Opportunities Fund |
| | | For the Three Months | | For the Year | | For the |
| | | Ended | | Ended | | Year Ended |
| | | June 30, 2012 | | March 31, 2012 | | March 31, 2011 |
| | | Shares | | Dollars | | Shares | | Dollars | | Shares | | Dollars |
| Class A | | | | | | | | | | | | | | | | | | | | | | | | |
| Proceeds from Shares sold | | | 996 | | | $ | 8,613 | | | | 34,843 | | | $ | 320,329 | | | | 109,206 | | | $ | 884,528 | |
| Reinvestment of distributions | | | 5,030 | | | | 41,752 | | | | 8,236 | | | | 66,381 | | | | 1,215 | | | | 10,277 | |
| Redemption fees | | | — | | | | — | | | | — | | | | 37 | | | | — | | | | — | |
| Cost of Shares redeemed | | | (7,099 | ) | | | (60,859 | ) | | | (324,638 | ) | | | (2,983,666 | ) | | | (349,012 | ) | | | (2,917,357 | ) |
| Change in Net Assets from Class A Share Transactions | | | (1,073 | ) | | | (10,494 | ) | | | (281,559 | ) | | | (2,596,919 | ) | | | (238,591 | ) | | | (2,022,552 | ) |
| Class C(A) | | | | | | | | | | | | | | | | | | | | | | | | |
| Proceeds from Shares sold | | | 286 | | | | 2,500 | | | | — | | | | — | | | | — | | | | — | |
| Reinvestment of distributions | | | 12 | | | | 101 | | | | — | | | | — | | | | — | | | | — | |
| Change in Net Assets from Class C Share Transactions | | | 298 | | | | 2,601 | | | | — | | | | — | | | | — | | | | — | |
| Class Y | | | | | | | | | | | | | | | | | | | | | | | | |
| Proceeds from Shares sold | | | 47,328 | | | | 408,654 | | | | — | | | | — | | | | — | | | | — | |
| Proceeds from shares issued in connection with merger(B) | | | 7,523,299 | | | | 82,084,306 | | | | — | | | | — | | | | — | | | | — | |
| Reinvestment of distributions | | | 300,246 | | | | 2,501,049 | | | | — | | | | — | | | | — | | | | — | |
| Cost of Shares redeemed | | | (294,636 | ) | | | (2,568,229 | ) | | | — | | | | — | | | | — | | | | — | |
| Change in Net Assets from Class Y Share Transactions | | | 7,576,237 | | | | 82,425,780 | | | | — | | | | — | | | | — | | | | — | |
| Class Z | | | | | | | | | | | | | | | | | | | | | | | | |
| Proceeds from Shares sold | | | 4,778 | | | | 43,126 | | | | 261,278 | | | | 2,339,714 | | | | 463,599 | | | | 3,827,248 | |
| Reinvestment of distributions | | | — | | | | — | | | | 579,040 | | | | 4,678,646 | | | | 44,473 | | | | 378,786 | |
| Redemption fees | | | — | | | | — | | | | — | | | | 178 | | | | — | | | | — | |
| Cost of Shares redeemed | | | (45,504 | ) | | | (407,047 | ) | | | (1,359,346 | ) | | | (12,097,655 | ) | | | (2,137,603 | ) | | | (17,441,033 | ) |
| Cost of shares redeemed in connection with merger(B) | | | (7,523,299 | ) | | | (82,084,306 | ) | | | — | | | | — | | | | — | | | | — | |
| Change in Net Assets from Class Z Share Transactions | | | (7,564,025 | ) | | | (82,448,227 | ) | | | (519,028 | ) | | | (5,079,117 | ) | | | (1,629,531 | ) | | | (13,234,999 | ) |
| Institutional Class | | | | | | | | | | | | | | | | | | | | | | | | |
| Proceeds from Shares sold | | | 65,074 | | | | 567,568 | | | | 1,685,177 | | | | 15,296,264 | | | | 11,903,545 | | | | 97,001,600 | |
| Reinvestment of distributions | | | 26,841 | | | | 223,314 | | | | 233,931 | | | | 1,887,820 | | | | 174,837 | | | | 1,490,854 | |
| Redemption fees | | | — | | | | — | | | | — | | | | 805 | | | | — | | | | — | |
| Cost of Shares redeemed | | | (7,398,449 | ) | | | (65,709,342 | ) | | | (12,153,913 | ) | | | (110,069,261 | ) | | | (12,122,597 | ) | | | (108,133,175 | ) |
| Change in Net Assets from Institutional Class Share Transactions | | | (7,306,534 | ) | | | (64,918,460 | ) | | | (10,234,805 | ) | | | (92,884,372 | ) | | | (44,215 | ) | | | (9,640,721 | ) |
| Net Decrease from Share Transactions | | | (7,295,097 | ) | | $ | (64,948,800 | ) | | | (11,035,392 | ) | | $ | (100,560,408 | ) | | | (1,912,337 | ) | | $ | (24,898,272 | ) |
| | (A) | The Fund began issuing Class C shares on April 12, 2012. |
| | (B) | See Note 7 in the Notes to Financial Statements. |
See accompanying Notes to Financial Statements.
Statements of Changes in Net Assets - Capital Stock Activity (Continued)
| | Touchstone Small Cap |
| | Value Opportunities Fund |
| | For the Three Months | | For the Year | | For the |
| | Ended | | Ended | | Year Ended |
| | June 30, 2012 | | March 31, 2012 | | March 31, 2011 |
| | Shares | | Dollars | | Shares | | Dollars | | Shares | | Dollars |
| | | | | | | | | | | | | | | | | | | | | | | | |
| | | 267 | | | $ | 4,630 | | | | 8,333 | | | $ | 148,894 | | | | 26,481 | | | $ | 444,287 | |
| | | 3,355 | | | | 55,414 | | | | 7,338 | | | | 116,008 | | | | — | | | | — | |
| | | — | | | | — | | | | — | | | | 40 | | | | — | | | | — | |
| | | (8,917 | ) | | | (153,524 | ) | | | (52,141 | ) | | | (903,971 | ) | | | (158,659 | ) | | | (2,623,329 | ) |
| | | (5,295 | ) | | | (93,480 | ) | | | (36,470 | ) | | | (639,029 | ) | | | (132,178 | ) | | | (2,179,042 | ) |
| | | | | | | | | | | | | | | | | | | | | | | | |
| | | 142 | | | | 2,500 | | | | — | | | | — | | | | — | | | | — | |
| | | 5 | | | | 75 | | | | — | | | | — | | | | — | | | | — | |
| | | 147 | | | | 2,575 | | | | — | | | | — | | | | — | | | | — | |
| | | | | | | | | | | | | | | | | | | | | | | | |
| | | 99,840 | | | | 1,789,027 | | | | — | | | | — | | | | — | | | | — | |
| | | 4,703,562 | | | | 71,625,574 | | | | — | | | | — | | | | — | | | | — | |
| | | 140,421 | | | | 2,392,767 | | | | — | | | | — | | | | — | | | | — | |
| | | (210,369 | ) | | | (3,739,581 | ) | | | — | | | | — | | | | — | | | | — | |
| | | 4,733,454 | | | | 72,067,787 | | | | — | | | | — | | | | — | | | | — | |
| | | | | | | | | | | | | | | | | | | | | | | | |
| | | 28,256 | | | | 520,312 | | | | 877,947 | | | | 15,758,310 | | | | 979,581 | | | | 16,232,950 | |
| | | — | | | | — | | | | 263,593 | | | | 4,286,016 | | | | — | | | | — | |
| | �� | — | | | | — | | | | — | | | | 5,729 | | | | — | | | | 57 | |
| | | (50,553 | ) | | | (941,857 | ) | | | (1,442,108 | ) | | | (26,119,117 | ) | | | (1,115,182 | ) | | | (18,736,527 | ) |
| | | (4,703,562 | ) | | | (71,625,574 | ) | | | — | | | | — | | | | — | | | | — | |
| | | (4,725,859 | ) | | | (72,047,119 | ) | | | (300,568 | ) | | | (6,069,062 | ) | | | (135,601 | ) | | | (2,503,520 | ) |
| | | | | | | | | | | | | | | | | | | | | | | | |
| | | 63,682 | | | | 1,120,571 | | | | 55,531 | | | | 1,007,117 | | | | 96,370 | | | | 1,624,188 | |
| | | 9,660 | | | | 165,858 | | | | 53,990 | | | | 883,809 | | | | — | | | | — | |
| | | — | | | | — | | | | — | | | | 37 | | | | — | | | | — | |
| | | (691,859 | ) | | | (12,624,174 | ) | | | (116,381 | ) | | | (2,073,781 | ) | | | (668,418 | ) | | | (10,469,498 | ) |
| | | (618,517 | ) | | | (11,337,745 | ) | | | (6,860 | ) | | | (182,818 | ) | | | (572,048 | ) | | | (8,845,310 | ) |
| | | (616,070 | ) | | $ | (11,407,982 | ) | | | (343,898 | ) | | $ | (6,890,909 | ) | | | (839,827 | ) | | $ | (13,527,872 | ) |
Statements of Changes in Net Assets - Capital Stock Activity (Continued)
| | | Touchstone U.S. |
| | | Long/Short Fund |
| | | For the Three Months | | For the Year | | For the |
| | | Ended | | Ended | | Year Ended |
| | | June 30, 2012 | | March 31, 2012 | | March 31, 2011 |
| | | Shares | | Dollars | | Shares | | Dollars | | Shares | | Dollars |
| Class A | | | | | | | | | | | | | | | | | | | | | | | | |
| Proceeds from Shares sold | | | 4,175 | | | $ | 51,173 | | | | 17,988 | | | $ | 201,924 | | | | 21,108 | | | $ | 222,554 | |
| Reinvestment of distributions | | | — | | | | — | | | | 342 | | | | 3,777 | | | | 5,273 | | | | 56,363 | |
| Redemption fees | | | — | | | | — | | | | — | | | | — | | | | — | | | | 9 | |
| Cost of Shares redeemed | | | (35,974 | ) | | | (432,202 | ) | | | (83,628 | ) | | | (979,054 | ) | | | (233,061 | ) | | | (2,424,887 | ) |
| Change in Net Assets from Class A Share Transactions | | | (31,799 | ) | | | (381,029 | ) | | | (65,298 | ) | | | (773,353 | ) | | | (206,680 | ) | | | (2,145,961 | ) |
| Class C(A) | | | | | | | | | | | | | | | | | | | | | | | | |
| Proceeds from Shares issued | | | 201 | | | | 2,500 | | | | — | | | | — | | | | — | | | | — | |
| Reinvestment of distributions | | | — | | | | — | | | | — | | | | — | | | | — | | | | — | |
| Change in Net Assets from Class C Share Transactions | | | 201 | | | | 2,500 | | | | — | | | | — | | | | — | | | | — | |
| Class Y | | | | | | | | | | | | | | | | | | | | | | | | |
| Proceeds from Shares sold | | | 5,137 | | | | 64,376 | | | | — | | | | — | | | | — | | | | — | |
| Proceeds from shares issued in connection with merger(B) | | | 977,090 | | | | 56,262,298 | | | | — | | | | — | | | | — | | | | — | |
| Reinvestment of distributions | | | — | | | | — | | | | — | | | | — | | | | — | | | | — | |
| Cost of Shares redeemed | | | (47,422 | ) | | | (595,087 | ) | | | — | | | | — | | | | — | | | | — | |
| Change in Net Assets from Class Y Share Transactions | | | 934,805 | | | | 55,731,587 | | | | — | | | | — | | | | — | | | | — | |
| Class Z | | | | | | | | | | | | | | | | | | | | | | | | |
| Proceeds from Shares sold | | | 1,196 | | | | 15,441 | | | | 160,906 | | | | 1,951,968 | | | | 397,337 | | | | 4,230,419 | |
| Reinvestment of distributions | | | — | | | | — | | | | 7,191 | | | | 80,177 | | | | 87,074 | | | | 940,394 | |
| Redemption fees | | | — | | | | — | | | | — | | | | — | | | | — | | | | 1 | |
| Cost of Shares redeemed | | | (8,811 | ) | | | (114,032 | ) | | | (2,159,360 | ) | | | (25,308,685 | ) | | | (9,153,811 | ) | | | (92,824,874 | ) |
| Cost of shares redeemed in connection with merger(B) | | | (977,090 | ) | | | (56,262,298 | ) | | | — | | | | — | | | | — | | | | — | |
| Change in Net Assets from Class Z Share Transactions | | | (984,705 | ) | | | (56,360,889 | ) | | | (1,991,263 | ) | | | (23,276,540 | ) | | | (8,669,400 | ) | | | (87,654,060 | ) |
| Institutional Class | | | | | | | | | | | | | | | | | | | | | | | | |
| Proceeds from Shares sold | | | 8 | | | | 601 | | | | 135,280 | | | | 1,563,565 | | | | 120,357 | | | | 1,273,519 | |
| Reinvestment of distributions | | | — | | | | — | | | | 7,404 | | | | 82,262 | | | | 29,108 | | | | 313,781 | |
| Cost of Shares redeemed | | | (592,071 | ) | | | (7,339,480 | ) | | | (412,853 | ) | | | (4,960,157 | ) | | | (743,744 | ) | | | (7,606,596 | ) |
| Change in Net Assets from Institutional Class Share Transactions | | | (592,063 | ) | | | (7,338,879 | ) | | | (270,169 | ) | | | (3,314,330 | ) | | | (594,279 | ) | | | (6,019,296 | ) |
| Net Increase (Decrease) from Share Transactions | | | (673,561 | ) | | $ | (8,346,710 | ) | | | (2,326,730 | ) | | $ | (27,364,223 | ) | | | (9,470,359 | ) | | $ | (95,819,317 | ) |
| | (A) | The Fund began issuing Class C shares on April 12, 2012. |
| | (B) | See Note 7 in the Notes to Financial Statements. |
See accompanying Notes to Financial Statements.
Statements of Changes in Net Assets - Capital Stock Activity (Continued)
| | Touchstone |
| | Value Fund |
| | For the Three Months | | For the Year | | For the |
| | Ended | | Ended | | Year Ended |
| | June 30, 2012 | | March 31, 2012 | | March 31, 2011 |
| | Shares | | Dollars | | Shares | | Dollars | | Shares | | Dollars |
| | | | | | | | | | | | | | | | | | | | | | | | |
| | | 17,290 | | | $ | 116,995 | | | | 93,237 | | | $ | 618,049 | | | | 53,860 | | | $ | 315,041 | |
| | | 1,686 | | | | 11,468 | | | | 5,515 | | | | 34,944 | | | | 4,744 | | | | 28,830 | |
| | | — | | | | — | | | | — | | | | — | | | | — | | | | 2 | |
| | | (16,190 | ) | | | (109,738 | ) | | | (222,483 | ) | | | (1,508,451 | ) | | | (117,573 | ) | | | (722,598 | ) |
| | | 2,786 | | | | 18,725 | | | | (123,731 | ) | | | (855,458 | ) | | | (58,969 | ) | | | (378,725 | ) |
| | | | | | | | | | | | | | | | | | | | | | | | |
| | | 362 | | | | 2,500 | | | | — | | | | — | | | | — | | | | — | |
| | | 3 | | | | 20 | | | | — | | | | — | | | | — | | | | — | |
| | | 365 | | | | 2,520 | | | | — | | | | — | | | | — | | | | — | |
| | | | | | | | | | | | | | | | | | | | | | | | |
| | | 72,824 | | | | 503,826 | | | | — | | | | — | | | | — | | | | — | |
| | | 12,199,491 | | | | 61,217,913 | | | | — | | | | — | | | | — | | | | — | |
| | | 71,221 | | | | 485,728 | | | | — | | | | — | | | | — | | | | — | |
| | | (4,960,978 | ) | | | (34,377,298 | ) | | | — | | | | — | | | | — | | | | — | |
| | | 7,382,558 | | | | 27,830,169 | | | | — | | | | — | | | | — | | | | — | |
| | | | | | | | | | | | | | | | | | | | | | | | |
| | | 147,280 | | | | 1,057,827 | | | | 3,259,081 | | | | 20,953,779 | | | | 3,933,684 | | | | 23,641,857 | |
| | | — | | | | — | | | | 191,652 | | | | 1,217,319 | | | | 194,267 | | | | 1,174,398 | |
| | | — | | | | — | | | | — | | | | 82 | | | | — | | | | 394 | |
| | | (170,728 | ) | | | (1,202,700 | ) | | | (4,181,411 | ) | | | (28,151,691 | ) | | | (5,516,733 | ) | | | (33,212,466 | ) |
| | | (12,199,491 | ) | | | (61,217,913 | ) | | | — | | | | — | | | | — | | | | — | |
| | | (12,222,939 | ) | | | (61,362,786 | ) | | | (730,678 | ) | | | (5,980,511 | ) | | | (1,388,782 | ) | | | (8,395,817 | ) |
| | | | | | | | | | | | | | | | | | | | | | | | |
| | | 6,249,356 | | | | 43,073,243 | | | | 565,867 | | | | 3,618,510 | | | | 359,111 | | | | 2,169,627 | |
| | | 58,289 | | | | 396,950 | | | | 117,670 | | | | 746,586 | | | | 120,452 | | | | 726,231 | |
| | | (1,025,855 | ) | | | (7,122,753 | ) | | | (2,271,367 | ) | | | (14,943,665 | ) | | | (2,472,960 | ) | | | (14,828,724 | ) |
| | | 5,281,790 | | | | 36,347,440 | | | | (1,587,830 | ) | | | (10,578,569 | ) | | | (1,993,397 | ) | | | (11,932,866 | ) |
| | | 444,560 | | | $ | 2,836,068 | | | | (2,442,239 | ) | | $ | (17,414,538 | ) | | | (3,441,148 | ) | | $ | (20,707,408 | ) |
Statement of Cash Flows
For the Year Ended June 30, 2012
| | | Touchstone |
| | | U.S. Long/Short |
| | | Fund |
| | | | For the | | | | For the | |
| | | | Three Months | | | | Year Ended | |
| | | | Ended | | | | March 31, | |
| | | | June 30, 2012 | | | | 2012* | |
| Cash Flows Provided by (Used in) Operating Activities | | | | | | | | |
| | | | | | | | | |
| Net increase (decrease) in net assets resulting from operations | | $ | (696,786 | ) | | $ | 1,808,317 | |
| | | | | | | | | |
| Adjustments to reconcile net increase (decrease) in net assets derived from operations to net cash used in operating activities: | | | | | | | | |
| Purchases of investments | | | (12,793,725 | ) | | | (86,156,982 | ) |
| Proceeds from disposition of investments | | | 22,257,436 | | | | 110,987,237 | |
| Proceeds from securities sold short | | | 2,654,635 | | | | 24,152,651 | |
| Covers of securities sold short | | | (4,211,169 | ) | | | (27,838,918 | ) |
| Net sales of short term securities | | | 242,570 | | | | 5,960,000 | |
| Increase (decrease) in variation margin on futures contracts | | | 2,000 | | | | (16,645 | ) |
| Decrease in segregated cash | | | 139,436 | | | | 186,936 | |
| (Increase) decrease in receivable for investments sold | | | 234 | | | | (234 | ) |
| Decrease in dividends and interest receivable | | | 19,633 | | | | 12,221 | |
| Increase in dividends for securities sold short payable | | | 1,325 | | | | — | |
| Increase in receivable from Investment Advisor | | | (13,334 | ) | | | (5,302 | ) |
| Increase (decrease) in payable to Trustees | | | 415 | | | | (3,599 | ) |
| Decrease in payable to other affiliates | | | (12,986 | ) | | | (32,627 | ) |
| Increase (decrease) in other accrued expenses and liabilities | | | 32,265 | | | | (17,147 | ) |
| Increase (decrease) in other assets | | | (16,061 | ) | | | 4,637 | |
| Net realized gain from investments and warrants | | | (1,520,088 | ) | | | (2,853,501 | ) |
| Net realized loss from securities sold short | | | 53,346 | | | | 723,669 | |
| Net change in unrealized appreciation (depreciation) on investments and warrants | | | 2,420,236 | | | | 2,243,394 | |
| Net change in unrealized appreciation (depreciation) on securities sold short | | | (253,075 | ) | | | (1,679,709 | ) |
| Net cash used in operating activities | | | 8,306,307 | | | | 27,474,398 | |
| | | | | | | | | |
| Cash Flows from Financing Activities | | | | | | | | |
| Increase in bank overdrafts | | | 82,356 | | | | — | |
| Proceeds from shares sold | | | 124,299 | | | | 3,757,249 | |
| Payment of dividends | | | — | | | | (7,787 | ) |
| Payment of shares redeemed | | | (8,512,962 | ) | | | (31,223,860 | ) |
| Net cash provided by financing activities | | | (8,306,307 | ) | | | (27,474,398 | ) |
| | | | | | | | | |
| Cash - beginning of the period | | | — | | | | — | |
| Cash - end of period | | | — | | | | — | |
| | * | Certain prior year amounts have been reclassified to conform with current year presentation. |
See accompanying Notes to Financial Statements.
Financial Highlights
Touchstone Capital Growth Fund—Class A
Selected Data for a Share Outstanding Throughout Each Period
| | | Three Months | | |
| | | Ended | | |
| | | June 30, | | Year Ended March 31, |
| | | 2012 | | 2012 | | 2011 | | 2010 | | 2009 | | 2008 |
| Net asset value at beginning of period | | $ | 20.49 | | | $ | 18.95 | | | $ | 15.98 | | | $ | 11.01 | | | $ | 18.69 | | | $ | 18.11 | |
| Income (loss) from investment operations: | | | | | | | | | | | | | | | | | | | | | | | | |
| Net investment income (loss)(A) | | | — | (B) | | | (0.03 | ) | | | (0.01 | ) | | | — | | | | (0.01 | ) | | | (0.10 | ) |
| Net realized and unrealized gains (losses) on investments | | | (1.53 | ) | | | 1.57 | | | | 2.98 | | | | 4.98 | | | | (7.67 | ) | | | 0.68 | |
| Total from investment operations | | | (1.53 | ) | | | 1.54 | | | | 2.97 | | | | 4.98 | | | | (7.68 | ) | | | 0.58 | |
| Distributions from: | | | | | | | | | | | | | | | | | | | | | | | | |
| Net investment income | | | — | | | | — | | | | — | | | | (0.01 | ) | | | — | | | | — | |
| Net asset value at end of period | | $ | 18.96 | | | $ | 20.49 | | | $ | 18.95 | | | $ | 15.98 | | | $ | 11.01 | | | $ | 18.69 | |
| Total return(C) | | | (7.47 | )%(D) | | | 8.13 | % | | | 18.59 | % | | | 45.22 | % | | | (41.09 | )% | | | 3.20 | % |
| Ratios and supplemental data: | | | | | | | | | | | | | | | | | | | | | | | | |
| Net assets at end of period (000's) | | $ | 559 | | | $ | 705 | | | $ | 1,111 | | | $ | 1,066 | | | $ | 1,700 | | | $ | 2,002 | |
| Ratio to average net assets: | | | | | | | | | | | | | | | | | | | | | | | | |
| Net expenses | | | 1.23 | %(E) | | | 1.14 | % | | | 1.23 | % | | | 1.36 | % | | | 1.50 | % | | | 1.50 | % |
| Gross expenses | | | 7.09 | %(E) | | | 2.93 | %(F) | | | 2.70 | %(F) | | | 0.36 | %(F) | | | 2.44 | %(F) | | | 3.31 | %(F) |
| Net investment income (loss) | | | 0.01 | %(E) | | | (0.15 | )% | | | (0.07 | )% | | | 0.01 | % | | | (0.06 | )% | | | (0.51 | )% |
| Portfolio turnover rate | | | 6 | %(D) | | | 27 | % | | | 33 | % | | | 99 | % | | | 161 | % | | | 113 | % |
Touchstone Capital Growth Fund—Class C
Selected Data for a Share Outstanding Throughout Each Period
| | | Period Ended |
| | | June 30, |
| | | 2012 (G) |
| Net asset value at beginning of period | | $ | 20.06 | |
| Loss from investment operations: | | | | |
| Net investment loss(A) | | | (0.03 | ) |
| Net realized and unrealized losses on investments | | | (1.09 | ) |
| Total from investment operations | | | (1.12 | ) |
| Distributions from: | | | | |
| Net investment income | | | (0.01 | ) |
| Net asset value at end of period | | $ | 18.93 | |
| Total return(C) | | | (5.59 | )%(D) |
| Ratios and supplemental data: | | | | |
| Net assets at end of period (000's) | | $ | 2 | |
| Ratio to average net assets: | | | | |
| Net expenses | | | 2.00 | %(E) |
| Gross expenses | | | 962.52 | %(E) |
| Net investment loss | | | (0.76 | )%(E) |
| Portfolio turnover rate | | | 6 | %(D) |
| | (A) | The net investment income per share is based on average shares outstanding for the period or year. |
| | (B) | Less than $0.005 per share. |
| | (C) | Total returns shown exclude the effect of applicable sales loads. If these charges were included, the returns would be lower. |
| | (F) | Legal, printing and/or compliance audit expenses relating to civil litigation and certain regulatory actions in connection with market timing allegations were incurred, and the Former Adviser paid these expenses on behalf of the Funds. Had the Former Adviser not paid these expenses, the expenses for the Funds would have been higher than what is reflected in the financial highlights for the years ended March 31, 2012, 2011, 2010, 2009 and 2008. |
| | (G) | The Fund began issuing Class C shares on April 12, 2012. |
See accompanying Notes to Financial Statements.
Financial Highlights (Continued)
Touchstone Capital Growth Fund—Class Y
Selected Data for a Share Outstanding Throughout Each Period
| | | Three Months | | |
| | | Ended | | |
| | | June 30, | | Year Ended March 31, |
| | | 2012 | | 2012 | | 2011 | | 2010 | | 2009 | | 2008 |
| Net asset value at beginning of period | | $ | 20.83 | | | $ | 19.24 | | | $ | 16.21 | | | $ | 11.18 | | | $ | 18.91 | | | $ | 18.28 | |
| Income (loss) from investment operations: | | | | | | | | | | | | | | | | | | | | | | | | |
| Net investment income (loss)(A) | | | 0.01 | | | | 0.02 | | | | 0.03 | | | | 0.04 | | | | 0.02 | | | | (0.06 | ) |
| Net realized and unrealized gains (losses) on investments | | | (1.55 | ) | | | 1.59 | | | | 3.04 | | | | 5.05 | | | | (7.75 | ) | | | 0.69 | |
| Total from investment operations | | | (1.54 | ) | | | 1.61 | | | | 3.07 | | | | 5.09 | | | | (7.73 | ) | | | 0.63 | |
| Distributions from: | | | | | | | | | | | | | | | | | | | | | | | | |
| Net investment income | | | — | (B) | | | (0.02 | ) | | | (0.04 | ) | | | (0.05 | ) | | | — | | | | — | |
| Return of capital | | | — | | | | — | | | | — | | | | (0.01 | ) | | | — | | | | — | |
| Total distributions | | | — | | | | (0.02 | ) | | | (0.04 | ) | | | (0.06 | ) | | | — | | | | — | |
| Net asset value at end of period | | $ | 19.29 | | | $ | 20.83 | | | $ | 19.24 | | | $ | 16.21 | | | $ | 11.18 | | | $ | 18.91 | |
| Total return | | | (7.42 | )%(C) | | | 8.39 | % | | | 18.93 | % | | | 45.52 | % | | | (40.88 | %) | | | 3.45 | % |
| Ratios and supplemental data: | | | | | | | | | | | | | | | | | | | | | | | | |
| Net assets at end of period (000's) | | $ | 164,589 | | | $ | 182,828 | | | $ | 188,671 | | | $ | 178,941 | | | $ | 136,809 | | | $ | 94,245 | |
| Ratio to average net assets: | | | | | | | | | | | | | | | | | | | | | | | | |
| Net expenses | | | 0.98 | %(D) | | | 0.89 | % | | | 0.98 | % | | | 1.08 | % | | | 1.25 | % | | | 1.25 | % |
| Gross expenses | | | 1.27 | %(D) | | | 1.30 | %(E) | | | 1.32 | %(E) | | | 1.44 | %(E) | | | 1.61 | %(E) | | | 1.68 | %(E) |
| Net investment income (loss) | | | 0.26 | %(D) | | | 0.13 | % | | | 0.18 | % | | | 0.27 | % | | | 0.14 | % | | | (0.31 | )% |
| Portfolio turnover rate | | | 6 | %(C) | | | 27 | % | | | 33 | % | | | 99 | % | | | 161 | % | | | 113 | % |
| Touchstone Capital Growth Fund—Institutional Class |
| Selected Data for a Share Outstanding Throughout Each Period |
| | | Three Months | | |
| | | Ended | | |
| | | June 30, | | Year Ended March 31, |
| | | 2012 | | 2012 | | 2011 | | 2010 | | 2009 | | 2008 |
| Net asset value at beginning of period | | $ | 20.95 | | | $ | 19.35 | | | $ | 16.31 | | | $ | 11.25 | | | $ | 18.96 | | | $ | 18.29 | |
| Income (loss) from investment operations: | | | | | | | | | | | | | | | | | | | | | | | | |
| Net investment income (loss)(A) | | | 0.02 | | | | 0.04 | | | | 0.05 | | | | 0.06 | | | | 0.19 | | | | (0.01 | ) |
| Net realized and unrealized gains (losses) on investments | | | (1.58 | ) | | | 1.60 | | | | 3.04 | | | | 5.07 | | | | (7.90 | ) | | | 0.68 | |
| Total from investment operations | | | (1.56 | ) | | | 1.64 | | | | 3.09 | | | | 5.13 | | | | (7.71 | ) | | | 0.67 | |
| Distributions from: | | | | | | | | | | | | | | | | | | | | | | | | |
| Net investment income | | | (0.01 | ) | | | (0.04 | ) | | | (0.05 | ) | | | (0.05 | ) | | | — | | | | — | |
| Return of capital | | | — | | | | — | | | | — | | | | (0.02 | ) | | | — | | | | — | |
| Total distributions | | | (0.01 | ) | | | (0.04 | ) | | | (0.05 | ) | | | (0.07 | ) | | | — | | | | — | |
| Net asset value at end of period | | $ | 19.38 | | | $ | 20.95 | | | $ | 19.35 | | | $ | 16.31 | | | $ | 11.25 | | | $ | 18.96 | |
| Total return | | | (7.44 | )%(C) | | | 8.51 | % | | | 18.99 | % | | | 45.69 | % | | | (40.66 | %) | | | 3.66 | % |
| Ratios and supplemental data: | | | | | | | | | | | | | | | | | | | | | | | | |
| Net assets at end of period (000's) | | $ | 152 | | | $ | 14,636 | | | $ | 19,423 | | | $ | 26,977 | | | $ | 1,610 | | | $ | — | |
| Ratio to average net assets: | | | | | | | | | | | | | | | | | | | | | | | | |
| Net expenses | | | 0.88 | %(D) | | | 0.79 | % | | | 0.88 | % | | | 0.90 | % | | | 0.95 | % | | | 0.95 | % |
| Gross expenses | | | 1.83 | %(D) | | | 0.90 | %(E) | | | 0.85 | %(E) | | | 0.79 | %(E) | | | 8.98 | %(E) | | | 3758.64 | %(E) |
| Net investment income (loss) | | | 0.36 | %(D) | | | 0.20 | % | | | 0.28 | % | | | 0.41 | % | | | 1.74 | % | | | (0.05 | )% |
| Portfolio turnover rate | | | 6 | %(C) | | | 27 | % | | | 33 | % | | | 99 | % | | | 161 | % | | | 113 | % |
| | (A) | The net investment income per share is based on average shares outstanding for the period or year. |
| | (B) | Less than $0.005 per share. |
| | (E) | Legal, printing and/or compliance audit expenses relating to civil litigation and certain regulatory actions in connection with market timing allegations were incurred, and the Former Adviser paid these expenses on behalf of the Funds. Had the Former Adviser not paid these expenses, the expenses for the Funds would have been higher than what is reflected in the financial highlights for the years ended March 31, 2012, 2011, 2010, 2009 and 2008. |
See accompanying Notes to Financial Statements.
Financial Highlights (Continued)
| Touchstone International Small Cap Fund—Class A |
| Selected Data for a Share Outstanding Throughout Each Period |
| | | Three Months | | | | | | | | | | |
| | | Ended June | | | | | | | | | | |
| | | 30, | | Year Ended March 31, |
| | | 2012 | | 2012 | | 2011 | | 2010 | | 2009 | | 2008 |
| Net asset value at beginning of period | | $ | 11.12 | | | $ | 11.88 | | | $ | 9.25 | | | $ | 6.25 | | | $ | 9.61 | | | $ | 13.31 | |
| Income (loss) from investment operations: | | | | | | | | | | | | | | | | | | | | | | | | |
| Net investment income (loss)(A) | | | 0.09 | | | | 0.03 | | | | (0.10 | ) | | | (0.08 | ) | | | (0.03 | ) | | | (0.06 | ) |
| Net realized and unrealized gains (losses) on investments | | | (0.90 | ) | | | (0.84 | ) | | | 2.73 | | | | 3.09 | (B) | | | (3.33 | )(B) | | | (0.94 | ) |
| Total from investment operations | | | (0.81 | ) | | | (0.81 | ) | | | 2.63 | | | | 3.01 | | | | (3.36 | ) | | | (1.00 | ) |
| Distributions from: | | | | | | | | | | | | | | | | | | | | | | | | |
| Net investment income | | | (0.10 | ) | | | (0.15 | ) | | | — | | | | (0.01 | ) | | | — | | | | — | |
| Realized capital gains | | | — | | | | — | | | | — | | | | — | | | | — | | | | (2.70 | ) |
| Total distributions | | | (0.10 | ) | | | (0.15 | ) | | | — | | | | (0.01 | ) | | | — | | | | (2.70 | ) |
| Capital contribution | | | — | | | | 0.20 | (C) | | | — | | | | — | | | | — | | | | — | |
| Net asset value at end of period | | $ | 10.21 | | | $ | 11.12 | | | $ | 11.88 | | | $ | 9.25 | | | $ | 6.25 | | | $ | 9.61 | |
| Total return(D) | | | (7.28 | )%(E) | | | (4.96 | )%(C) | | | 28.43 | % | | | 48.12 | %(B) | | | (34.96 | )%(B) | | | (11.22 | )% |
| Ratios and supplemental data: | | | | | | | | | | | | | | | | | | | | | | | | |
| Net assets at end of period (000's) | | $ | 199 | | | $ | 143 | | | $ | 207 | | | $ | 918 | | | $ | 720 | | | $ | 1,261 | |
| Ratio to average net assets: | | | | | | | | | | | | | | | | | | | | | | | | |
| Net expenses | | | 1.55 | %(F) | | | 1.55 | % | | | 1.55 | % | | | 1.55 | % | | | 1.36 | % | | | 1.60 | % |
| Gross expenses | | | 19.37 | %(F) | | | 10.50 | %(G) | | | 3.23 | %(G) | | | 0.44 | %(G) | | | 4.20 | %(G) | | | 3.03 | %(G) |
| Net investment income (loss) | | | 3.36 | %(F) | | | 0.26 | % | | | (1.02 | )% | | | (0.97 | )% | | | (0.32 | )% | | | (0.49 | )% |
| Portfolio turnover rate | | | 21 | %(E) | | | 207 | % | | | 152 | % | | | 172 | % | | | 290 | % | | | 143 | % |
| | (A) | The net investment income per share is based on average shares outstanding for the period or year. |
| | (B) | Impact of payment from affiliate was less then $0.01 per share and 0.01%, respectively. |
| | (C) | Impact of one time distribution of settlement funds from the Bank of America Fair Fund. If the distribution had not occurred the total return would have been lower. |
| | (D) | Total returns shown exclude the effect of applicable sales loads. If these charges were included, the returns would be lower. |
| | (G) | Legal, printing and/or compliance audit expenses relating to civil litigation and certain regulatory actions in connection with market timing allegations were incurred, and the Former Adviser paid these expenses on behalf of the Funds. Had the Former Adviser not paid these expenses, the expenses for the Funds would have been higher than what is reflected in the financial highlights for the years ended March 31, 2012, 2011, 2010, 2009 and 2008. |
See accompanying Notes to Financial Statements.
Financial Highlights (Continued)
| Touchstone International Small Cap Fund—Class C |
| Selected Data for a Share Outstanding Throughout Each Period |
| | | Three Months |
| | | Ended June |
| | | 30, |
| | | | 2012(A) |
| Net asset value at beginning of period | | $ | 10.94 | |
| Income (loss) from investment operations: | | | | |
| Net investment income(B) | | | 0.05 | |
| Net realized and unrealized losses on investments | | | (0.69 | ) |
| Total from investment operations | | | (0.64 | ) |
| Distributions from: | | | | |
| Net investment income | | | (0.11 | ) |
| Capital contribution | | | — | |
| Net asset value at end of period | | $ | 10.19 | |
| Total return | | | (5.84 | )%(C) |
| Ratios and supplemental data: | | | | |
| Net assets at end of period (000's) | | $ | 2 | |
| Ratio to average net assets: | | | | |
| Net expenses | | | 2.30 | %(D) |
| Gross expenses | | | 968.58 | %(D) |
| Net investment income | | | 2.12 | %(D) |
| Portfolio turnover rate | | | 21 | %(C) |
| | (A) | The Fund began issuing Class C shares on April 12, 2012. |
| | (B) | The net investment income per share is based on average shares outstanding for the period or year. |
See accompanying Notes to Financial Statements.
Financial Highlights (Continued)
| Touchstone International Small Cap Fund—Class Y |
| Selected Data for a Share Outstanding Throughout Each Period |
| | | Three Months | | | | | | | | | | |
| | | Ended June | | | | | | | | | | |
| | | 30, | | Year Ended March 31, |
| | | 2012 | | 2012 | | 2011 | | 2010 | | 2009 | | 2008 |
| Net asset value at beginning of period | | $ | 11.32 | | | $ | 12.14 | | | $ | 9.44 | | | $ | 6.37 | | | $ | 9.78 | | | $ | 13.47 | |
| Income (loss) from investment operations: | | | | | | | | | | | | | | | | | | | | | | | | |
| Net investment income (loss)(A) | | | 0.10 | | | | 0.07 | | | | (0.08 | ) | | | (0.05 | ) | | | — | | | | (0.03 | ) |
| Net realized and unrealized gains (losses) on investments | | | (0.92 | ) | | | (0.88 | ) | | | 2.80 | | | | 3.14 | (B) | | | (3.41 | )(B) | | | (0.96 | ) |
| Total from investment operations | | | (0.82 | ) | | | (0.81 | ) | | | 2.72 | | | | 3.09 | | | | (3.41 | ) | | | (0.99 | ) |
| Distributions from: | | | | | | | | | | | | | | | | | | | | | | | | |
| Net investment income | | | (0.10 | ) | | | (0.21 | ) | | | (0.02 | ) | | | (0.02 | ) | | | — | | | | — | |
| Realized capital gains | | | — | | | | — | | | | — | | | | — | | | | — | | | | (2.70 | ) |
| Total distributions | | | (0.10 | ) | | | (0.21 | ) | | | (0.02 | ) | | | (0.02 | ) | | | — | | | | (2.70 | ) |
| Capital contribution | | | — | | | | 0.20 | (C) | | | — | | | | — | | | | — | | | | — | |
| Net asset value at end of period | | $ | 10.40 | | | $ | 11.32 | | | $ | 12.14 | | | $ | 9.44 | | | $ | 6.37 | | | $ | 9.78 | |
| Total return | | | (7.22 | )%(D) | | | (4.81 | )%(C) | | | 28.82 | % | | | 48.56 | %(B) | | | (34.87 | )%(B) | | | (11.00 | )% |
| Ratios and supplemental data: | | | | | | | | | | | | | | | | | | | | | | | | |
| Net assets at end of period (000's) | | $ | 80,754 | | | $ | 90,029 | | | $ | 118,679 | | | $ | 107,478 | | | $ | 79,518 | | | $ | 24,156 | |
| Ratio to average net assets: | | | | | | | | | | | | | | | | | | | | | | | | |
| Net expenses | | | 1.30 | %(E) | | | 1.30 | % | | | 1.30 | % | | | 1.30 | % | | | 1.10 | % | | | 1.35 | % |
| Gross expenses | | | 1.74 | %(E) | | | 1.69 | %(F) | | | 1.59 | %(F) | | | 1.74 | %(F) | | | 1.75 | %(F) | | | 1.74 | %(F) |
| Net investment income (loss) | | | 3.61 | %(E) | | | 0.60 | % | | | (0.80 | )% | | | (0.65 | )% | | | (0.01 | )% | | | (0.19 | )% |
| Portfolio turnover rate | | | 21 | %(D) | | | 207 | % | | | 152 | % | | | 172 | % | | | 290 | % | | | 143 | % |
| | (A) | The net investment income per share is based on average shares outstanding for the period or year. |
| | (B) | Impact of payment from affiliate was less then $0.01 per share and 0.01%, respectively. |
| | (C) | Impact of one time distribution of settlement funds from the Bank of America Fair Fund. If the distribution had not occurred the total return would have been lower. |
| | (F) | Legal, printing and/or compliance audit expenses relating to civil litigation and certain regulatory actions in connection with market timing allegations were incurred, and the Former Adviser paid these expenses on behalf of the Funds. Had the Former Adviser not paid these expenses, the expenses for the Funds would have been higher than what is reflected in the financial highlights for the years ended March 31, 2012, 2011, 2010, 2009 and 2008. |
See accompanying Notes to Financial Statements.
Financial Highlights (Continued)
| Touchstone International Small Cap Fund—Institutional Class |
| Selected Data for a Share Outstanding Throughout Each Period |
| | | Three Months | | | | | | | | | | |
| | | Ended June | | | | | | | | | | |
| | | 30, | | Year Ended March 31, |
| | | 2012 | | 2012 | | 2011 | | 2010 | | 2009 | | 2008 |
| Net asset value at beginning of period | | $ | 11.37 | | | $ | 12.20 | | | $ | 9.49 | | | $ | 6.39 | | | $ | 9.80 | | | $ | 13.48 | |
| Income (loss) from investment operations: | | | | | | | | | | | | | | | | | | | | | | | | |
| Net investment income (loss)(A) | | | 0.10 | | | | 0.13 | | | | (0.06 | ) | | | (0.03 | ) | | | (0.02 | ) | | | — | |
| Net realized and unrealized gains (losses) on investments | | | (0.91 | ) | | | (0.93 | ) | | | 2.81 | | | | 3.16 | (B) | | | (3.39 | )(B) | | | (0.98 | ) |
| Total from investment operations | | | (0.81 | ) | | | (0.80 | ) | | | 2.75 | | | | 3.13 | | | | (3.41 | ) | | | (0.98 | ) |
| Distributions from: | | | | | | | | | | | | | | | | | | | | | | | | |
| Net investment income | | | (0.11 | ) | | | (0.24 | ) | | | (0.04 | ) | | | (0.03 | ) | | | — | | | | — | |
| Realized capital gains | | | — | | | | — | | | | — | | | | — | | | | — | | | | (2.70 | ) |
| Total distributions | | | (0.11 | ) | | | (0.24 | ) | | | (0.04 | ) | | | (0.03 | ) | | | — | | | | (2.70 | ) |
| Capital contribution | | | — | | | | 0.21 | (C) | | | — | | | | — | | | | — | | | | — | |
| Net asset value at end of period | | $ | 10.45 | | | $ | 11.37 | | | $ | 12.20 | | | $ | 9.49 | | | $ | 6.39 | | | $ | 9.80 | |
| Total return | | | (7.13 | )%(D) | | | (4.55 | )%(C) | | | 29.00 | % | | | 49.05 | %(B) | | | (34.80 | )%(B) | | | (10.92 | )% |
| Ratios and supplemental data: | | | | | | | | | | | | | | | | | | | | | | | | |
| Net assets at end of period (000's) | | $ | 3,869 | | | $ | 6,288 | | | $ | 1,173 | | | $ | 3,168 | | | $ | 11,923 | | | $ | — | |
| Ratio to average net assets: | | | | | | | | | | | | | | | | | | | | | | | | |
| Net expenses | | | 1.05 | %(E) | | | 1.05 | % | | | 1.05 | % | | | 1.05 | % | | | 1.06 | % | | | 1.10 | % |
| Gross expenses | | | 2.05 | %(E) | | | 1.46 | %(F) | | | 2.22 | %(F) | | | 1.14 | %(F) | | | 18.23 | %(F) | | | 3,635.24 | %(F) |
| Net investment income (loss) | | | 3.86 | %(E) | | | 1.15 | % | | | (0.61 | )% | | | (0.35 | )% | | | (0.32 | )% | | | (0.02 | )% |
| Portfolio turnover rate | | | 21 | %(D) | | | 207 | % | | | 152 | % | | | 172 | % | | | 290 | % | | | 143 | % |
| | (A) | The net investment income per share is based on average shares outstanding for the period or year. |
| | (B) | Impact of payment from affiliate was less then $0.01 per share and 0.01%, respectively. |
| | (C) | Impact of one time distribution of settlement funds from the Bank of America Fair Fund. If the distribution had not occurred the total return would have been lower. |
| | (F) | Legal, printing and/or compliance audit expenses relating to civil litigation and certain regulatory actions in connection with market timing allegations were incurred, and the Former Adviser paid these expenses on behalf of the Funds. Had the Former Adviser not paid these expenses, the expenses for the Funds would have been higher than what is reflected in the financial highlights for the years ended March 31, 2012, 2011, 2010, 2009 and 2008. |
See accompanying Notes to Financial Statements.
Financial Highlights (Continued)
| Touchstone Mid Cap Value Opportunities Fund—Class A |
| Selected Data for a Share Outstanding Throughout Each Period |
| | | Three Months | | | | | | | | | | |
| | | Ended | | | | | | | | | | |
| | | June 30, | | Year Ended March 31, |
| | | 2012 | | 2012 | | 2011 | | 2010 | | 2009 | | 2008 |
| Net asset value at beginning of period | | $ | 9.01 | | | $ | 9.42 | | | $ | 7.86 | | | $ | 5.61 | | | $ | 8.69 | | | $ | 10.00 | |
| Income (loss) from investment operations: | | | | | | | | | | | | | | | | | | | | | | | | |
| Net investment income(A) | | | 0.01 | | | | 0.03 | | | | 0.04 | | | | 0.03 | | | | 0.02 | | | | 0.01 | |
| Net realized and unrealized gains (losses) on investments | | | (0.21 | )(B) | | | 0.14 | | | | 1.54 | | | | 2.24 | | | | (3.07 | ) | | | (1.32 | ) |
| Total from investment operations | | | (0.20 | ) | | | 0.17 | | | | 1.58 | | | | 2.27 | | | | (3.05 | ) | | | (1.31 | ) |
| Distributions from: | | | | | | | | | | | | | | | | | | | | | | | | |
| Net investment income | | | (0.05 | ) | | | (0.03 | ) | | | (0.02 | ) | | | (0.02 | ) | | | (0.03 | ) | | | — | |
| Realized capital gains | | | (0.30 | ) | | | (0.55 | ) | | | — | | | | — | | | | — | | | | — | |
| Total distributions | | | (0.35 | ) | | | (0.58 | ) | | | (0.02 | ) | | | (0.02 | ) | | | (0.03 | ) | | | — | |
| Net asset value at end of period | | $ | 8.46 | | | $ | 9.01 | | | $ | 9.42 | | | $ | 7.86 | | | $ | 5.61 | | | $ | 8.69 | |
| Total return(C) | | | (2.21 | )%(D) | | | 2.54 | % | | | 20.14 | % | | | 40.41 | % | | | (35.07 | )% | | | (13.10 | )% |
| Ratios and supplemental data: | | | | | | | | | | | | | | | | | | | | | | | | |
| Net assets at end of period (000's) | | $ | 1,412 | | | $ | 1,512 | | | $ | 4,234 | | | $ | 5,408 | | | $ | 5,304 | | | $ | 2,340 | |
| Ratio to average net assets: | | | | | | | | | | | | | | | | | | | | | | | | |
| Net expenses | | | 1.31 | %(E) | | | 1.40 | % | | | 1.40 | % | | | 1.40 | % | | | 1.40 | % | | | 1.40 | % |
| Gross expenses | | | 3.93 | %(E) | | | 2.34 | %(F) | | | 2.10 | %(F) | | | 1.94 | %(F) | | | 2.53 | %(F) | | | 3.69 | %(F) |
| Net investment income | | | 0.55 | %(E) | | | 0.32 | % | | | 0.53 | % | | | 0.36 | % | | | 0.29 | % | | | 0.17 | % |
| Portfolio turnover rate | | | 20 | %(D) | | | 101 | % | | | 89 | % | | | 125 | % | | | 163 | % | | | 67 | % |
| Touchstone Mid Cap Value Opportunities Fund—Class C |
| Selected Data for a Share Outstanding Throughout Each Period |
| | | Period Ended | |
| | | June 30, | |
| | | 2012 (G) | |
| Net asset value at beginning of period | | $ | 8.76 | | |
| Income (loss) from investment operations: | | | | | |
| Net investment loss(A) | | | (— | )(H) | |
| Net realized and unrealized gains on investments | | | 0.04 | (B) | |
| Total from investment operations | | | 0.04 | | |
| Distributions from: | | | | | |
| Net investment income | | | (0.06 | ) | |
| Realized capital gains | | | (0.30 | ) | |
| Total distributions | | | (0.36 | ) | |
| Net asset value at end of period | | $ | 8.44 | | |
| Total return | | | 0.46 | %(D) | |
| Ratios and supplemental data: | | | | | |
| Net assets at end of period (000's) | | $ | 3 | | |
| Ratio to average net assets: | | | | | |
| Net expenses | | | 2.04 | %(E) | |
| Gross expenses | | | 931.83 | %(E) | |
| Net investment loss | | | (0.21 | )%(E) | |
| Portfolio turnover rate | | | 20 | %(D) | |
| | (A) | The net investment income per share is based on average shares outstanding for the period or year. |
| | (B) | For the period ended June 30, 2012, the Fund received a corporate action payment that resulted in a one-time increase to realized gains. If the corporate action event had not occurred, the net realized and unrealized gains (losses) per share would have been lower by approximately $0.05 per share. |
| | (C) | Total returns shown exclude the effect of applicable sales loads. If these charges were included, the returns would be lower. |
| | (F) | Legal, printing and/or compliance audit expenses relating to civil litigation and certain regulatory actions in connection with market timing allegations were incurred, and the Former Adviser paid these expenses on behalf of the Funds. Had the Former Adviser not paid these expenses, the expenses for the Funds would have been higher than what is reflected in the financial highlights for the years ended March 31, 2012, 2011, 2010, 2009 and 2008. |
| | (G) | The Fund began issuing Class C shares on April 12, 2012. |
| | (H) | Less than $0.005 per share. |
Financial Highlights (Continued)
| Touchstone Mid Cap Value Opportunities Fund—Class Y |
| Selected Data for a Share Outstanding Throughout Each Period |
| | | | Three Months | | | | | | | | | | | | | | | | | |
| | | | Ended | | | | | | | | | | | | | | | | | |
| | | | June 30, | | | Year Ended March 31, |
| | | | 2012 | | | | 2012 | | | | 2011 | | | | 2010 | | | | 2009(A) | |
| Net asset value at beginning of period | | $ | 9.04 | | | $ | 9.50 | | | $ | 7.92 | | | $ | 5.65 | | | $ | 6.02 | |
| Income (loss) from investment operations: | | | | | | | | | | | | | | | | | | | | |
| Net investment income(B) | | | 0.02 | | | | 0.07 | | | | 0.07 | | | | 0.05 | | | | 0.07 | |
| Net realized and unrealized gains (losses) on investments | | | (0.21 | )(C) | | | 0.12 | | | | 1.56 | | | | 2.26 | | | | (0.41 | ) |
| Total from investment operations | | | (0.19 | ) | | | 0.19 | | | | 1.63 | | | | 2.31 | | | | (0.34 | ) |
| Distributions from: | | | | | | | | | | | | | | | | | | | | |
| Net investment income | | | (0.05 | ) | | | (0.10 | ) | | | (0.05 | ) | | | (0.04 | ) | | | (0.03 | ) |
| Realized capital gains | | | (0.30 | ) | | | (0.55 | ) | | | — | | | | — | | | | — | |
| Total distributions | | | (0.35 | ) | | | (0.65 | ) | | | (0.05 | ) | | | (0.04 | ) | | | (0.03 | ) |
| Net asset value at end of period | | $ | 8.50 | | | $ | 9.04 | | | $ | 9.50 | | | $ | 7.92 | | | $ | 5.65 | |
| Total return | | | (2.02 | )%(D) | | | 2.77 | % | | | 20.59 | % | | | 40.90 | % | | | (5.60 | )% |
| Ratios and supplemental data: | | | | | | | | | | | | | | | | | | | | |
| Net assets at end of period (000's) | | $ | 64,371 | | | $ | 68,366 | | | $ | 76,756 | | | $ | 76,965 | | | $ | 60,618 | |
| Ratio to average net assets: | | | | | | | | | | | | | | | | | | | | |
| Net expenses | | | 1.05 | %(E) | | | 1.12 | % | | | 1.12 | % | | | 1.12 | % | | | 1.12 | % |
| Gross expenses | | | 1.38 | %(E) | | | 1.36 | %(F) | | | 1.37 | %(F) | | | 1.38 | %(F) | | | 3.20 | %(F) |
| Net investment income | | | 0.81 | %(E) | | | 0.83 | % | | | 0.80 | % | | | 0.64 | % | | | 1.29 | % |
| Portfolio turnover rate | | | 20 | %(D) | | | 101 | % | | | 89 | % | | | 125 | % | | | 163 | % |
| Touchstone Mid Cap Value Opportunities Fund—Institutional Class |
| Selected Data for a Share Outstanding Throughout Each Period |
| | | Three Months | | | | | | | | | | |
| | | Ended | | | | | | | | | | |
| | | June 30, | | Year Ended March 31, |
| | | 2012 | | 2012 | | 2011 | | 2010 | | 2009 | | 2008 |
| Net asset value at beginning of period | | $ | 9.03 | | | $ | 9.49 | | | $ | 7.92 | | | $ | 5.65 | | | $ | 8.72 | | | $ | 10.00 | |
| Income (loss) from investment operations: | | | | | | | | | | | | | | | | | | | | | | | | |
| Net investment income(B) | | | 0.02 | | | | 0.08 | | | | 0.08 | | | | 0.06 | | | | 0.05 | | | | 0.04 | |
| Net realized and unrealized gains (losses) on investments | | | (0.20 | )(C) | | | 0.12 | | | | 1.55 | | | | 2.25 | | | | (3.08 | ) | | | (1.31 | ) |
| Total from investment operations | | | (0.18 | ) | | | 0.20 | | | | 1.63 | | | | 2.31 | | | | (3.03 | ) | | | (1.27 | ) |
| Distributions from: | | | | | | | | | | | | | | | | | | | | | | | | |
| Net investment income | | | (0.06 | ) | | | (0.11 | ) | | | (0.06 | ) | | | (0.04 | ) | | | (0.04 | ) | | | (0.01 | ) |
| Realized capital gains | | | (0.30 | ) | | | (0.55 | ) | | | — | | | | — | | | | — | | | | — | |
| Total distributions | | | (0.36 | ) | | | (0.66 | ) | | | (0.06 | ) | | | (0.04 | ) | | | (0.04 | ) | | | (0.01 | ) |
| Net asset value at end of period | | $ | 8.49 | | | $ | 9.03 | | | $ | 9.49 | | | $ | 7.92 | | | $ | 5.65 | | | $ | 8.72 | |
| Total return | | | (1.99 | )%(D) | | | 2.91 | % | | | 20.61 | % | | | 41.01 | % | | | (34.81 | )% | | | (12.75 | )% |
| Ratios and supplemental data: | | | | | | | | | | | | | | | | | | | | | | | | |
| Net assets at end of period (000's) | | $ | 34,795 | | | $ | 103,016 | | | $ | 205,410 | | | $ | 171,807 | | | $ | 57,430 | | | $ | 56,426 | |
| Ratio to average net assets: | | | | | | | | | | | | | | | | | | | | | | | | |
| Net expenses | | | 0.91 | %(E) | | | 1.00 | % | | | 1.00 | % | | | 1.00 | % | | | 1.00 | % | | | 1.00 | % |
| Gross expenses | | | 1.22 | %(E) | | | 1.08 | %(F) | | | 1.06 | %(F) | | | 1.06 | %(F) | | | 1.18 | %(F) | | | 1.10 | %(F) |
| Net investment income | | | 0.96 | %(E) | | | 0.85 | % | | | 0.91 | % | | | 0.82 | % | | | 0.58 | % | | | 0.57 | % |
| Portfolio turnover rate | | | 20 | %(D) | | | 101 | % | | | 89 | % | | | 125 | % | | | 163 | % | | | 67 | % |
| | (A) | Classed commenced operations on December 9, 2008. |
| | (B) | The net investment income per share is based on average shares outstanding for the period or year. |
| | (C) | For the period ended June 30, 2012, the Fund received a corporate action payment that resulted in a one-time increase to realized gains. If the corporate action event had not occurred, the net realized and unrealized gains (losses) per share would have been lower by approximately $0.05 per share. |
| | (F) | Legal, printing and/or compliance audit expenses relating to civil litigation and certain regulatory actions in connection with market timing allegations were incurred, and the Former Adviser paid these expenses on behalf of the Funds. Had the Former Adviser not paid these expenses, the expenses for the Funds would have been higher than what is reflected in the financial highlights for the years ended March 31, 2012, 2011, 2010, 2009 and 2008. |
See accompanying Notes to Financial Statements.
Financial Highlights (Continued)
| Touchstone Small Cap Value Opportunities Fund—Class A |
| Selected Data for a Share Outstanding Throughout Each Period |
| | | Three Months | | | | | | | | | | | |
| | | Ended | | | | | | | | | | | |
| | | June 30, | | Year Ended March 31, |
| | | 2012 | | 2012 | | 2011 | | 2010 | | 2009 | | | 2008 |
| Net asset value at beginning of period | | $ | 18.08 | | | $ | 19.06 | | | $ | 16.43 | | | $ | 11.05 | | | $ | 19.43 | | | | $ | 25.99 | |
| Income (loss) from investment operations: | | | | | | | | | | | | | | | | | | | | | | | | | |
| Net investment loss | | | (0.01 | ) | | | (0.06 | )(A) | | | (0.08 | )(A) | | | (0.01 | )(A) | | | (— | )(A) | | | | (0.16 | )(A) |
| Net realized and unrealized gains (losses) on investments | | | (0.57 | ) | | | 0.04 | | | | 2.71 | | | | 5.39 | | | | (6.66 | )(B) | | | | (2.51 | ) |
| Total from investment operations | | | (0.58 | ) | | | (0.02 | ) | | | 2.63 | | | | 5.38 | | | | (6.66 | ) | | | | (2.67 | ) |
| Distributions from: | | | | | | | | | | | | | | | | | | | | | | | | | |
| Net investment income | | | — | | | | — | | | | — | | | | — | | | | (0.02 | ) | | | | — | |
| Realized capital gains | | | (0.53 | ) | | | (0.96 | ) | | | — | | | | — | | | | (1.70 | ) | | | | (3.89 | ) |
| Total distributions | | | (0.53 | ) | | | (0.96 | ) | | | — | | | | — | | | | (1.72 | ) | | | | (3.89 | ) |
| Net asset value at end of period | | $ | 16.97 | | | $ | 18.08 | | | $ | 19.06 | | | $ | 16.43 | | | $ | 11.05 | | | | $ | 19.43 | |
| Total return(C) | | | (3.09 | )%(D) | | | 0.60 | % | | | 16.01 | % | | | 48.71 | % | | | (34.71 | )%(B) | | | | (11.75 | )% |
| Ratios and supplemental data: | | | | | | | | | | | | | | | | | | | | | | | | | |
| Net assets at end of period (000's) | | $ | 2,023 | | | $ | 2,251 | | | $ | 3,068 | | | $ | 4,815 | | | $ | 2,160 | | | | $ | 1,137 | |
| Ratio to average net assets: | | | | | | | | | | | | | | | | | | | | | | | | | |
| Net expenses | | | 1.50 | %(E) | | | 1.50 | % | | | 1.50 | % | | | 1.50 | % | | | 1.53 | % | | | | 1.55 | % |
| Gross expenses | | | 3.31 | %(E) | | | 2.27 | %(F) | | | 2.10 | %(F) | | | 1.47 | %(F) | | | 3.25 | %(F) | | | | 4.57 | %(F) |
| Net investment loss | | | (0.16 | )%(E) | | | (0.34 | )% | | | (0.46 | )% | | | (0.08 | )% | | | (0.01 | )% | | | | (0.71 | )% |
| Portfolio turnover rate | | | 18 | %(D) | | | 49 | % | | | 55 | % | | | 83 | % | | | 140 | % | | | | 40 | % |
| Touchstone Small Cap Value Opportunities Fund—Class C |
| Selected Data for a Share Outstanding Throughout Each Period |
| | | Period Ended |
| | | June 30, |
| | | 2012(G) |
| Net asset value at beginning of period | | $ | 17.58 | |
| Loss from investment operations: | | | | |
| Net investment loss | | | (0.03 | ) |
| Net realized and unrealized losses on investments | | | (0.07 | ) |
| Total from investment operations | | | (0.10 | ) |
| Distributions from: | | | | |
| Realized capital gains | | | (0.53 | ) |
| Net asset value at end of period | | $ | 16.95 | |
| Total return | | | (0.51 | )%(D) |
| Ratios and supplemental data: | | | | |
| Net assets at end of period (000's) | | $ | 2 | |
| Ratio to average net assets: | | | | |
| Net expenses | | | 2.25 | %(E) |
| Gross expenses | | | 942.58 | %(E) |
| Net investment loss | | | (0.95 | )%(E) |
| Portfolio turnover rate | | | 18 | %(D) |
| | (A) | The net investment income per share is based on average shares outstanding for the period or year. |
| | (B) | Impact of payment from affiliate was less then $0.01 per share and 0.01%, respectively. |
| | (C) | Total returns shown exclude the effect of applicable sales loads. If these charges were included, the returns would be lower. |
| | (F) | Legal, printing and/or compliance audit expenses relating to civil litigation and certain regulatory actions in connection with market timing allegations were incurred, and the Former Adviser paid these expenses on behalf of the Funds. Had the Former Adviser not paid these expenses, the expenses for the Funds would have been higher than what is reflected in the financial highlights for the years ended March 31, 2012, 2011, 2010, 2009 and 2008. |
| | (G) | The Fund began issuing Class C shares on April 12, 2012. |
See accompanying Notes to Financial Statements.
Financial Highlights (Continued)
| Touchstone Small Cap Value Opportunities Fund— Class Y |
| Selected Data for a Share Outstanding Throughout Each Period |
| | | Three Months | | | | | | | | | | |
| | | Ended | | | | | | | | | | |
| | | June 30, | | Year Ended March 31, |
| | | 2012 | | 2012 | | 2011 | | 2010 | | 2009 | | 2008 |
| Net asset value at beginning of period | | $ | 18.62 | | | $ | 19.55 | | | $ | 16.80 | | | $ | 11.29 | | | $ | 19.76 | | | $ | 26.30 | |
| Income (loss) from investment operations: | | | | | | | | | | | | | | | | | | | | | | | | |
| Net investment income (loss) | | | 0.01 | | | | (0.02 | )(A) | | | (0.04 | )(A) | | | 0.03 | (A) | | | 0.02 | (A) | | | (0.13 | )(A) |
| Net realized and unrealized gains (losses) on investments | | | (0.59 | ) | | | 0.05 | | | | 2.79 | | | | 5.51 | | | | (6.77 | )(B) | | | (2.52 | ) |
| Total from investment operations | | | (0.58 | ) | | | 0.03 | | | | 2.75 | | | | 5.54 | | | | (6.75 | ) | | | (2.65 | ) |
| Distributions from: | | | | | | | | | | | | | | | | | | | | | | | | |
| Net investment income | | | — | | | | — | | | | — | | | | (0.03 | ) | | | (0.02 | ) | | | — | |
| Realized capital gains | | | (0.53 | ) | | | (0.96 | ) | | | — | | | | — | | | | (1.70 | ) | | | (3.89 | ) |
| Total distributions | | | (0.53 | ) | | | (0.96 | ) | | | — | | | | (0.03 | ) | | | (1.72 | ) | | | (3.89 | ) |
| Net asset value at end of period | | $ | 17.51 | | | $ | 18.62 | | | $ | 19.55 | | | $ | 16.80 | | | $ | 11.29 | | | $ | 19.76 | |
| Total return | | | (3.05 | )%(C) | | | 0.85 | % | | | 16.37 | % | | | 49.10 | % | | | (34.57 | )%(B) | | | (11.53 | )% |
| Ratios and supplemental data: | | | | | | | | | | | | | | | | | | | | | | | | |
| Net assets at end of period (000's) | | $ | 82,861 | | | $ | 87,984 | | | $ | 98,269 | | | $ | 86,737 | | | $ | 55,976 | | | $ | 45,862 | |
| Ratio to average net assets: | | | | | | | | | | | | | | | | | | | | | | | | |
| Net expenses | | | 1.22 | %(D) | | | 1.25 | % | | | 1.25 | % | | | 1.25 | % | | | 1.23 | % | | | 1.30 | % |
| Gross expenses | | | 1.40 | %(D) | | | 1.27 | %(E) | | | 1.26 | %(E) | | | 1.30 | %(E) | | | 1.37 | %(E) | | | 1.49 | %(E) |
| Net investment income (loss) | | | 0.12 | %(D) | | | (0.09 | )% | | | (0.23 | )% | | | 0.18 | % | | | 0.15 | % | | | (0.51 | )% |
| Portfolio turnover rate | | | 18 | %(C) | | | 49 | % | | | 55 | % | | | 83 | % | | | 140 | % | | | 40 | % |
| Touchstone Small Cap Value Opportunities Fund—Institutional Class |
| Selected Data for a Share Outstanding Throughout Each Period |
| | | Three Months | | | | | | | | |
| | | Ended | | | | | | | | |
| | | June 30, | | Year Ended March 31, |
| | | | 2012 | | | | 2012 | | | | 2011 | | | | 2010 | | | | 2009(F) |
| Net asset value at beginning of period | | $ | 18.75 | | | $ | 19.65 | | | $ | 16.87 | | | $ | 11.32 | | | $ | 14.28 | |
| Income (loss) from investment operations: | | | | | | | | | | | | | | | | | | | | |
| Net investment income (loss) | | | 0.01 | | | | 0.01 | (A) | | | (0.01 | )(A) | | | 0.05 | (A) | | | 0.02 | (A) |
| Net realized and unrealized gains (losses) on investments | | | (0.60 | ) | | | 0.05 | | | | 2.79 | | | | 5.54 | | | | (1.26 | )(B) |
| Total from investment operations | | | (0.59 | ) | | | 0.06 | | | | 2.78 | | | | 5.59 | | | | (1.24 | ) |
| Distributions from: | | | | | | | | | | | | | | | | | | | | |
| Net investment income | | | — | | | | — | | | | — | | | | (0.04 | ) | | | (0.02 | ) |
| Realized capital gains | | | (0.53 | ) | | | (0.96 | ) | | | — | | | | — | | | | (1.70 | ) |
| Total distributions | | | (0.53 | ) | | | (0.96 | ) | | | — | | | | (0.04 | ) | | | (1.72 | ) |
| Net asset value at end of period | | $ | 17.63 | | | $ | 18.75 | | | $ | 19.65 | | | $ | 16.87 | | | $ | 11.32 | |
| Total return | | | (3.04 | )%(C) | | | 1.00 | % | | | 16.48 | % | | | 49.46 | % | | | (9.52 | )%(B) |
| Ratios and supplemental data: | | | | | | | | | | | | | | | | | | | | |
| Net assets at end of period (000's) | | $ | 7,023 | | | $ | 19,066 | | | $ | 20,119 | | | $ | 26,915 | | | $ | — | |
| Ratio to average net assets: | | | | | | | | | | | | | | | | | | | | |
| Net expenses | | | 1.10 | %(D) | | | 1.10 | % | | | 1.10 | % | | | 1.10 | % | | | 1.09 | % |
| Gross expenses | | | 1.60 | %(D) | | | 1.18 | %(E) | | | 1.18 | %(E) | | | 1.16 | %(E) | | | 24873.11 | %(E) |
| Net investment income (loss) | | | 0.24 | %(D) | | | 0.06 | % | | | (0.08 | )% | | | 0.34 | % | | | 0.15 | % |
| Portfolio turnover rate | | | 18 | %(C) | | | 49 | % | | | 55 | % | | | 83 | % | | | 140 | % |
| | (A) | The net investment income per share is based on average shares outstanding for the period or year. |
| | (B) | Impact of payment from affiliate was less then $0.01 per share and 0.01%, respectively. |
| | (E) | Legal, printing and/or compliance audit expenses relating to civil litigation and certain regulatory actions in connection with market timing allegations were incurred, and the Former Adviser paid these expenses on behalf of the Funds. Had the Former Adviser not paid these expenses, the expenses for the Funds would have been higher than what is reflected in the financial highlights for the years ended March 31, 2012, 2011, 2010, 2009 and 2008. |
| | (F) | Classed commenced operations on December 9, 2008. |
Financial Highlights (Continued)
| Touchstone U.S. Long/Short Fund—Class A |
| Selected Data for a Share Outstanding Throughout Each Period |
| | | Three Months | | | | | | | | | | |
| | | Ended | | | | | | | | | | |
| | | June 30, | | Year Ended March 31, |
| | | 2012 | | 2012 | | 2011 | | 2010 | | 2009 | | 2008 |
| Net asset value at beginning of period | | $ | 12.81 | | | $ | 11.74 | | | $ | 10.67 | | | $ | 7.77 | | | $ | 13.02 | | | $ | 14.15 | |
| Income (loss) from investment operations: | | | | | | | | | | | | | | | | | | | | | | | | |
| Net investment income (loss)(A) | | | 0.02 | | | | 0.02 | | | | 0.09 | | | | 0.07 | | | | 0.01 | | | | (0.03 | ) |
| Net realized and unrealized gains (losses) on investments | | | (0.34 | ) | | | 1.08 | | | | 1.30 | | | | 2.89 | | | | (5.23 | ) | | | (1.05 | ) |
| Total from investment operations | | | (0.32 | ) | | | 1.10 | | | | 1.39 | | | | 2.96 | | | | (5.22 | ) | | | (1.08 | ) |
| Distributions from: | | | | | | | | | | | | | | | | | | | | | | | | |
| Net investment income | | | — | | | | (0.03 | ) | | | (0.32 | ) | | | (0.06 | ) | | | (0.03 | ) | | | (0.05 | ) |
| Net asset value at end of period | | $ | 12.49 | | | $ | 12.81 | | | $ | 11.74 | | | $ | 10.67 | | | $ | 7.77 | | | $ | 13.02 | |
| Total return(B) | | | (2.50 | )%(C) | | | 9.44 | % | | | 13.29 | % | | | 38.09 | % | | | (40.12 | )% | | | (7.66 | )% |
| Ratios and supplemental data: | | | | | | | | | | | | | | | | | | | | | | | | |
| Net assets at end of period (000's) | | $ | 1,610 | | | $ | 2,059 | | | $ | 2,654 | | | $ | 4,616 | | | $ | 5,222 | | | $ | 14,468 | |
| Ratio to average net assets: | | | | | | | | | | | | | | | | | | | | | | | | |
| Net expenses (including dividend expense on securities sold short) | | | 1.67 | %(D) | | | 1.71 | % | | | 1.47 | % | | | 1.53 | % | | | 2.03 | % | | | 1.87 | % |
| Net expenses (excluding dividend expense on securities sold short) | | | 1.31 | %(D) | | | 1.53 | % | | | 1.45 | % | | | 1.45 | % | | | 1.49 | % | | | 1.60 | % |
| Gross expenses (including dividend expense on securities sold short) | | | 4.54 | %(D) | | | 2.59 | %(E) | | | 2.20 | %(E) | | | 1.97 | %(E) | | | 2.59 | %(E) | | | 2.75 | %(E) |
| Gross expenses (excluding dividend expense on securities sold short) | | | 4.18 | %(D) | | | 2.41 | %(E) | | | 2.18 | %(E) | | | 1.89 | %(E) | | | 2.05 | %(E) | | | 2.48 | %(E) |
| Net investment income (loss) | | | 0.54 | %(D) | | | 0.17 | % | | | 0.91 | % | | | 0.76 | % | | | 0.07 | % | | | (0.19 | )% |
| Portfolio turnover rate | | | 69 | %(C) | | | 231 | % | | | 218 | % | | | 200 | % | | | 184 | % | | | 236 | % |
| | (A) | The net investment income per share is based on average shares outstanding for the period or year. |
| | (B) | Total returns shown exclude the effect of applicable sales loads. If these charges were included, the returns would be lower. |
| | (E) | Legal, printing and/or compliance audit expenses relating to civil litigation and certain regulatory actions in connection with market timing allegations were incurred, and the Former Adviser paid these expenses on behalf of the Funds. Had the Former Adviser not paid these expenses, the expenses for the Funds would have been higher than what is reflected in the financial highlights for the years ended March 31, 2012, 2011, 2010, 2009 and 2008. |
See accompanying Notes to Financial Statements.
Financial Highlights (Continued)
| Touchstone U.S. Long/Short Fund—Class C |
| Selected Data for a Share Outstanding Throughout Each Period |
| | | Period Ended |
| | | June 30, |
| | | | 2012(A) |
| Net asset value at beginning of period | | $ | 12.45 | |
| Income (loss) from investment operations: | | | | |
| Net investment loss(B) | | | (0.01 | ) |
| Net realized and unrealized gains on investments | | | 0.03 | |
| Total from investment operations | | | 0.02 | |
| Net asset value at end of period | | $ | 12.47 | |
| Total return(C) | | | 0.16 | %(D) |
| Ratios and supplemental data: | | | | |
| Net assets at end of period (000's) | | $ | 3 | |
| Ratio to average net assets: | | | | |
| Net expenses (including dividend expense on securities sold short) | | | 2.41 | %(E) |
| Net expenses (excluding dividend expense on securities sold short) | | | 2.05 | %(E) |
| Gross expenses (including dividend expense on securities sold short) | | | 944.77 | %(E) |
| Gross expenses (excluding dividend expense on securities sold short) | | | 944.41 | %(E) |
| Net investment loss | | | (0.21 | )%(E) |
| Portfolio turnover rate | | | 69 | %(D) |
| | (A) | The Fund began issuing Class C shares on April 12, 2012. |
| | (B) | The net investment income per share is based on average shares outstanding for the period or year. |
| | (C) | Total returns shown exclude the effect of applicable sales loads. If these charges were included, the returns would be lower. |
See accompanying Notes to Financial Statements.
Financial Highlights (Continued)
| Touchstone U.S. Long/Short Fund—Class Y |
| Selected Data for a Share Outstanding Throughout Each Period |
| | | Three Months | | | | | | | | | | |
| | | Ended | | | | | | | | | | |
| | | June 30, | | Year Ended March 31, |
| | | 2012 | | 2012 | | 2011 | | 2010 | | 2009 | | 2008 |
| Net asset value at beginning of period | | $ | 12.95 | | | $ | 11.87 | | | $ | 10.76 | | | $ | 7.85 | | | $ | 13.11 | | | $ | 14.20 | |
| Income (loss) from investment operations: | | | | | | | | | | | | | | | | | | | | | | | | |
| Net investment income(A) | | | 0.02 | | | | 0.05 | | | | 0.12 | | | | 0.10 | | | | 0.06 | | | | 0.03 | |
| Net realized and unrealized gains (losses) on investments | | | (0.34 | ) | | | 1.09 | | | | 1.32 | | | | 2.90 | | | | (5.29 | ) | | | (1.09 | ) |
| Total from investment operations | | | (0.32 | ) | | | 1.14 | | | | 1.44 | | | | 3.00 | | | | (5.23 | ) | | | (1.06 | ) |
| Distributions from: | | | | | | | | | | | | | | | | | | | | | | | | |
| Net investment income | | | — | | | | (0.06 | ) | | | (0.33 | ) | | | (0.09 | ) | | | (0.03 | ) | | | (0.03 | ) |
| Net asset value at end of period | | $ | 12.63 | | | $ | 12.95 | | | $ | 11.87 | | | $ | 10.76 | | | $ | 7.85 | | | $ | 13.11 | |
| Total return | | | (2.47 | )%(B) | | | 9.64 | % | | | 13.66 | % | | | 38.30 | % | | | (39.91 | )% | | | (7.47 | )% |
| Ratios and supplemental data: | | | | | | | | | | | | | | | | | | | | | | | | |
| Net assets at end of period (000's) | | $ | 11,808 | | | $ | 12,755 | | | $ | 35,321 | | | $ | 125,337 | | | $ | 149,755 | | | $ | 46,374 | |
| Ratio to average net assets: | | | | | | | | | | | | | | | | | | | | | | | | |
| Net expenses (including dividend expense on securities sold short) | | | 1.41 | %(C) | | | 1.45 | % | | | 1.22 | % | | | 1.28 | % | | | 1.83 | % | | | 1.45 | % |
| Net expenses (excluding dividend expense on securities sold short) | | | 1.06 | %(C) | | | 1.27 | % | | | 1.20 | % | | | 1.20 | % | | | 1.25 | % | | | 1.19 | % |
| Gross expenses (including dividend expense on securities sold short) | | | 2.63 | %(C) | | | 1.59 | %(D) | | | 1.24 | %(D) | | | 1.23 | %(D) | | | 1.69 | %(D) | | | 1.83 | %(D) |
| Gross expenses (excluding dividend expense on securities sold short) | | | 2.28 | %(C) | | | 1.41 | %(D) | | | 1.22 | %(D) | | | 1.15 | %(D) | | | 1.11 | %(D) | | | 1.57 | %(D) |
| Net investment income | | | 0.79 | %(C) | | | 0.41 | % | | | 1.14 | % | | | 1.01 | % | | | 0.57 | % | | | 0.18 | % |
| Portfolio turnover rate | | | 69 | %(B) | | | 231 | % | | | 218 | % | | | 200 | % | | | 184 | % | | | 236 | % |
| | (A) | The net investment income per share is based on average shares outstanding for the period or year. |
| | (D) | Legal, printing and/or compliance audit expenses relating to civil litigation and certain regulatory actions in connection with market timing allegations were incurred, and the Former Adviser paid these expenses on behalf of the Funds. Had the Former Adviser not paid these expenses, the expenses for the Funds would have been higher than what is reflected in the financial highlights for the years ended March 31, 2012, 2011, 2010, 2009 and 2008. |
See accompanying Notes to Financial Statements.
Financial Highlights (Continued)
| Touchstone U.S. Long/Short Fund—Institutional Class |
| Selected Data for a Share Outstanding Throughout Each Period |
| | | Three Months | | | | | | | | | | |
| | | Ended | | | | | | | | | | |
| | | June 30, | | Year Ended March 31, |
| | | 2012 | | 2012 | | 2011 | | 2010 | | 2009 | | 2008 |
| Net asset value at beginning of period | | $ | 12.92 | | | $ | 11.86 | | | $ | 10.77 | | | $ | 7.86 | | | $ | 13.09 | | | $ | 14.20 | |
| Income (loss) from investment operations: | | | | | | | | | | | | | | | | | | | | | | | | |
| Net investment income(A) | | | 0.03 | | | | 0.07 | | | | 0.14 | | | | 0.11 | | | | 0.05 | | | | 0.02 | |
| Net realized and unrealized gains (losses) on investments | | | (0.35 | ) | | | 1.09 | | | | 1.34 | | | | 2.92 | | | | (5.25 | ) | | | (1.05 | ) |
| Total from investment operations | | | (0.32 | ) | | | 1.16 | | | | 1.48 | | | | 3.03 | | | | (5.20 | ) | | | (1.03 | ) |
| Distributions from: | | | | | | | | | | | | | | | | | | | | | | | | |
| Net investment income | | | — | | | | (0.10 | ) | | | (0.39 | ) | | | (0.12 | ) | | | (0.03 | ) | | | (0.08 | ) |
| Net asset value at end of period | | $ | 12.60 | | | $ | 12.92 | | | $ | 11.86 | | | $ | 10.77 | | | $ | 7.86 | | | $ | 13.09 | |
| Total return | | | (2.48 | )%(B) | | | 9.88 | % | | | 14.07 | % | | | 38.60 | % | | | (39.73 | )% | | | (7.32 | )% |
| Ratios and supplemental data: | | | | | | | | | | | | | | | | | | | | | | | | |
| Net assets at end of period (000's) | | $ | 57 | | | $ | 7,707 | | | $ | 10,276 | | | $ | 15,735 | | | $ | 24,956 | | | $ | 44,322 | |
| Ratio to average net assets: | | | | | | | | | | | | | | | | | | | | | | | | |
| Net expenses (including dividend expense on securities sold short) | | | 1.26 | %(C) | | | 1.27 | % | | | 1.02 | % | | | 1.09 | % | | | 1.60 | % | | | 1.47 | % |
| Net expenses (excluding dividend expense on securities sold short) | | | 0.90 | %(C) | | | 1.09 | % | | | 1.00 | % | | | 1.01 | % | | | 1.05 | % | | | 1.21 | % |
| Gross expenses (including dividend expense on securities sold short) | | | 3.80 | %(C) | | | 1.45 | %(D) | | | 1.24 | %(D) | | | 1.18 | %(D) | | | 1.71 | %(D) | | | 1.63 | %(D) |
| Gross expenses (excluding dividend expense on securities sold short) | | | 3.44 | %(C) | | | 1.27 | %(D) | | | 1.22 | %(D) | | | 1.10 | %(D) | | | 1.16 | %(D) | | | 1.37 | %(D) |
| Net investment income | | | 0.94 | %(C) | | | 0.64 | % | | | 1.33 | % | | | 1.16 | % | | | 0.50 | % | | | 0.18 | % |
| Portfolio turnover rate | | | 69 | %(B) | | | 231 | % | | | 218 | % | | | 200 | % | | | 184 | % | | | 236 | % |
| | (A) | The net investment income per share is based on average shares outstanding for the period or year. |
| | (D) | Legal, printing and/or compliance audit expenses relating to civil litigation and certain regulatory actions in connection with market timing allegations were incurred, and the Former Adviser paid these expenses on behalf of the Funds. Had the Former Adviser not paid these expenses, the expenses for the Funds would have been higher than what is reflected in the financial highlights for the years ended March 31, 2012, 2011, 2010, 2009 and 2008. |
See accompanying Notes to Financial Statements.
Financial Highlights (Continued)
| Touchstone Value Fund—Class A |
| Selected Data for a Share Outstanding Throughout Each Period |
| | | Three Months | | | | | | | | | | |
| | | Ended | | | | | | | | | | |
| | | June 30, | | Year Ended March 31, |
| | | 2012 | | 2012 | | 2011 | | 2010 | | 2009 | | 2008 |
| Net asset value at beginning of period | | $ | 7.14 | | | $ | 6.67 | | | $ | 6.17 | | | $ | 4.00 | | | $ | 6.64 | | | $ | 8.80 | |
| Income (loss) from investment operations: | | | | | | | | | | | | | | | | | | | | | | | | |
| Net investment income(A) | | | 0.03 | | | | 0.12 | | | | 0.08 | | | | 0.09 | | | | 0.14 | | | | 0.12 | |
| Net realized and unrealized gains (losses) on investments | | | (0.16 | ) | | | 0.45 | | | | 0.50 | | | | 2.17 | | | | (2.66 | ) | | | (0.97 | ) |
| Total from investment operations | | | (0.13 | ) | | | 0.57 | | | | 0.58 | | | | 2.26 | | | | (2.52 | ) | | | (0.85 | ) |
| Distributions from: | | | | | | | | | | | | | | | | | | | | | | | | |
| Net investment income | | | (0.06 | ) | | | (0.10 | ) | | | (0.08 | ) | | | (0.09 | ) | | | (0.12 | ) | | | (0.17 | ) |
| Realized capital gains | | | — | | | | — | | | | — | | | | — | | | | — | | | | (1.14 | ) |
| Total distributions | | | (0.06 | ) | | | (0.10 | ) | | | (0.08 | ) | | | (0.09 | ) | | | (0.12 | ) | | | (1.31 | ) |
| Net asset value at end of period | | $ | 6.95 | | | $ | 7.14 | | | $ | 6.67 | | | $ | 6.17 | | | $ | 4.00 | | | $ | 6.64 | |
| Total return(B) | | | (1.83 | )%(C) | | | 8.77 | % | | | 9.59 | % | | | 57.05 | % | | | (38.39 | )% | | | (11.68 | )% |
| Ratios and supplemental data: | | | | | | | | | | | | | | | | | | | | | | | | |
| Net assets at end of period (000's) | | $ | 1,583 | | | $ | 1,606 | | | $ | 2,325 | | | $ | 2,514 | | | $ | 2,530 | | | $ | 2,379 | |
| Ratio to average net assets: | | | | | | | | | | | | | | | | | | | | | | | | |
| Net expenses | | | 1.20 | %(D) | | | 1.20 | % | | | 1.20 | % | | | 1.26 | % | | | 1.35 | % | | | 1.35 | % |
| Gross expenses | | | 3.49 | %(D) | | | 1.96 | %(E) | | | 2.04 | %(E) | | | 1.76 | %(E) | | | 2.23 | %(E) | | | 2.38 | %(E) |
| Net investment income | | | 1.68 | %(D) | | | 1.84 | % | | | 1.31 | % | | | 1.72 | % | | | 2.76 | % | | | 1.36 | % |
| Portfolio turnover rate | | | 13 | %(C) | | | 15 | % | | | 13 | % | | | 25 | % | | | 17 | % | | | 10 | % |
| Touchstone Value Fund—Class C |
| Selected Data for a Share Outstanding Throughout Each Period |
| | | Period Ended |
| | | June 30, |
| | | | 2012(F) |
| Net asset value at beginning of period | | $ | 6.90 | |
| Income from investment operations: | | | | |
| Net investment income(A) | | | 0.01 | |
| Net realized and unrealized gains on investments | | | 0.10 | |
| Total from investment operations | | | 0.11 | |
| Distributions from: | | | | |
| Net investment income | | | (0.06 | ) |
| Net asset value at end of period | | $ | 6.95 | |
| Total return(B) | | | 1.56 | %(C) |
| Ratios and supplemental data: | | | | |
| Net assets at end of period (000's) | | $ | 3 | |
| Ratio to average net assets: | | | | |
| Net expenses | | | 1.95 | %(D) |
| Gross expenses | | | 929.36 | %(D) |
| Net investment income | | | 0.93 | %(D) |
| Portfolio turnover rate | | | 13 | %(C) |
| | (A) | The net investment income per share is based on average shares outstanding for the period or year. |
| | (B) | Total returns shown exclude the effect of applicable sales loads. If these charges were included, the returns would be lower. |
| | (E) | Legal, printing and/or compliance audit expenses relating to civil litigation and certain regulatory actions in connection with market timing allegations were incurred, and the Former Adviser paid these expenses on behalf of the Funds. Had the Former Adviser not paid these expenses, the expenses for the Funds would have been higher than what is reflected in the financial highlights for the years ended March 31, 2012, 2011, 2010, 2009 and 2008. |
| | (F) | The Fund began issuing Class C shares on April 12, 2012. |
See accompanying Notes to Financial Statements.
Financial Highlights (Continued)
| Touchstone Value Fund—Class Y |
| Selected Data for a Share Outstanding Throughout Each Period |
| | | Three Months | | | | | | | | | | |
| | | Ended | | | | | | | | | | |
| | | June 30, | | Year Ended March 31, |
| | | 2012 | | 2012 | | 2011 | | 2010 | | 2009 | | 2008 |
| Net asset value at beginning of period | | $ | 7.16 | | | $ | 6.69 | | | $ | 6.19 | | | $ | 4.01 | | | $ | 6.65 | | | $ | 8.82 | |
| Income (loss) from investment operations: | | | | | | | | | | | | | | | | | | | | | | | | |
| Net investment income(A) | | | 0.03 | | | | 0.12 | | | | 0.09 | | | | 0.10 | | | | 0.16 | | | | 0.14 | |
| Net realized and unrealized gains (losses) on investments | | | (0.15 | ) | | | 0.47 | | | | 0.51 | | | | 2.19 | | | | (2.68 | ) | | | (0.97 | ) |
| Total from investment operations | | | (0.12 | ) | | | 0.59 | | | | 0.60 | | | | 2.29 | | | | (2.52 | ) | | | (0.83 | ) |
| Distributions from: | | | | | | | | | | | | | | | | | | | | | | | | |
| Net investment income | | | (0.07 | ) | | | (0.12 | ) | | | (0.10 | ) | | | (0.11 | ) | | | (0.12 | ) | | | (0.20 | ) |
| Realized capital gains | | | — | | | | — | | | | — | | | | — | | | | — | | | | (1.14 | ) |
| Total distributions | | | (0.07 | ) | | | (0.12 | ) | | | (0.10 | ) | | | (0.11 | ) | | | (0.12 | ) | | | (1.34 | ) |
| Net asset value at end of period | | $ | 6.97 | | | $ | 7.16 | | | $ | 6.69 | | | $ | 6.19 | | | $ | 4.01 | | | $ | 6.65 | |
| Total return | | | (1.69 | )%(B) | | | 9.01 | % | | | 9.86 | % | | | 57.65 | % | | | (38.29 | )% | | | (11.49 | )% |
| Ratios and supplemental data: | | | | | | | | | | | | | | | | | | | | | | | | |
| Net assets at end of period (000's) | | $ | 51,447 | | | $ | 87,546 | | | $ | 86,659 | | | $ | 88,766 | | | $ | 67,325 | | | $ | 86,801 | |
| Ratio to average net assets: | | | | | | | | | | | | | | | | | | | | | | | | |
| Net expenses | | | 0.95 | %(C) | | | 0.95 | % | | | 0.95 | % | | | 1.00 | % | | | 1.10 | % | | | 1.10 | % |
| Gross expenses | | | 1.23 | %(C) | | | 1.03 | %(D) | | | 1.04 | %(D) | | | 1.07 | %(D) | | | 1.22 | %(D) | | | 1.37 | %(D) |
| Net investment income | | | 1.93 | %(C) | | | 1.90 | % | | | 1.58 | % | | | 1.87 | % | | | 3.03 | % | | | 1.59 | % |
| Portfolio turnover rate | | | 13 | %(B) | | | 15 | % | | | 13 | % | | | 25 | % | | | 17 | % | | | 10 | % |
| Touchstone Value Fund—Institutional Class |
| Selected Data for a Share Outstanding Throughout Each Period |
| | | Three Months | | | | | | | | | | |
| | | Ended | | | | | | | | | | |
| | | June 30, | | Year Ended March 31, |
| | | 2012 | | 2012 | | 2011 | | 2010 | | 2009 | | 2008 |
| Net asset value at beginning of period | | $ | 7.15 | | | $ | 6.68 | | | $ | 6.18 | | | $ | 4.01 | | | $ | 6.63 | | | $ | 8.83 | |
| Income (loss) from investment operations: | | | | | | | | | | | | | | | | | | | | | | | | |
| Net investment income(A) | | | 0.03 | | | | 0.13 | | | | 0.10 | | | | 0.11 | | | | 0.17 | | | | 0.41 | |
| Net realized and unrealized gains (losses) on investments | | | (0.16 | ) | | | 0.46 | | | | 0.51 | | | | 2.18 | | | | (2.66 | ) | | | (1.25 | ) |
| Total from investment operations | | | (0.13 | ) | | | 0.59 | | | | 0.61 | | | | 2.29 | | | | (2.49 | ) | | | (0.84 | ) |
| Distributions from: | | | | | | | | | | | | | | | | | | | | | | | | |
| Net investment income | | | (0.06 | ) | | | (0.12 | ) | | | (0.11 | ) | | | (0.12 | ) | | | (0.13 | ) | | | (0.22 | ) |
| Realized capital gains | | | — | | | | — | | | | — | | | | — | | | | — | | | | (1.14 | ) |
| Total distributions | | | (0.06 | ) | | | (0.12 | ) | | | (0.11 | ) | | | (0.12 | ) | | | (0.13 | ) | | | (1.36 | ) |
| Net asset value at end of period | | $ | 6.96 | | | $ | 7.15 | | | $ | 6.68 | | | $ | 6.18 | | | $ | 4.01 | | | $ | 6.63 | |
| Total return | | | (1.62 | )%(B) | | | 9.13 | % | | | 9.99 | % | | | 57.64 | % | | | (38.06 | )% | | | (11.57 | )% |
| Ratios and supplemental data: | | | | | | | | | | | | | | | | | | | | | | | | |
| Net assets at end of period (000's) | | $ | 69,549 | | | $ | 33,727 | | | $ | 42,106 | | | $ | 51,274 | | | $ | 44,011 | | | $ | 51,690 | |
| Ratio to average net assets: | | | | | | | | | | | | | | | | | | | | | | | | |
| Net expenses | | | 0.85 | %(C) | | | 0.85 | % | | | 0.85 | % | | | 0.87 | % | | | 0.90 | % | | | 0.90 | % |
| Gross expenses | | | 1.09 | %(C) | | | 0.88 | %(D) | | | 0.89 | %(D) | | | 0.90 | %(D) | | | 1.02 | %(D) | | | 1.02 | %(D) |
| Net investment income | | | 2.04 | %(C) | | | 2.00 | % | | | 1.67 | % | | | 2.01 | % | | | 3.24 | % | | | 2.00 | % |
| Portfolio turnover rate | | | 13 | %(B) | | | 15 | % | | | 13 | % | | | 25 | % | | | 17 | % | | | 10 | % |
| | (A) | The net investment income per share is based on average shares outstanding for the period or year. |
| | (D) | Legal, printing and/or compliance audit expenses relating to civil litigation and certain regulatory actions in connection with market timing allegations were incurred, and the Former Adviser paid these expenses on behalf of the Funds. Had the Former Adviser not paid these expenses, the expenses for the Funds would have been higher than what is reflected in the financial highlights for the years ended March 31, 2012, 2011, 2010, 2009 and 2008. |
See accompanying Notes to Financial Statements.
Notes to Financial Statements
June 30, 2012
1. Organization
The Touchstone Strategic Trust (the “Trust”) is registered under the Investment Company Act of 1940, as amended, (the “1940 Act”) as an open-end management investment company. The Trust was established as a Massachusetts business trust under a Declaration of Trust dated November 18, 1982. The Trust consists of eighteen funds including the following six funds, individually, a “Fund”, and collectively, the “Funds”:
Touchstone Capital Growth Fund (“Capital Growth Fund”)
Touchstone International Small Cap Fund (“International Small Cap Fund”)
Touchstone Mid Cap Value Opportunities Fund (“Mid Cap Value Opportunities Fund”)
Touchstone Small Cap Value Opportunities Fund (“Small Cap Value Opportunities Fund”)
Touchstone U.S. Long/Short Fund (“U.S. Long/Short Fund”)
Touchstone Value Fund (“Value Fund”)
Each Fund is an open-end, diversified management investment company, with the exception of Capital Growth Fund and Value Fund, each of which is an open-end, non-diversified management investment company.
The Declaration of Trust permits the Trust to issue an unlimited number of shares of beneficial interest of each Fund. The Funds are registered to offer different classes of shares: Class A shares, Class C shares, Class Y shares, and Institutional Class shares. The assets of each Fund are segregated, and a shareholder’s interest is limited to the Fund in which shares are held. The Funds’ prospectus provides a description of each Fund’s investment objectives, policies, and strategies along with information on the classes of shares currently being offered.
2. Significant Accounting Policies
The following is a summary of the Funds’ significant accounting policies:
Security valuation and fair value measurements — All investments in securities are recorded at their estimated fair value. The Funds use various methods to measure fair value of their portfolio securities on a recurring basis. U.S. GAAP establishes a hierarchy that prioritizes inputs to valuation methods. These inputs are summarized in the three broad levels listed below:
| • | Level 1 – | quoted prices in active markets for identical securities |
| | | |
| • | Level 2 – | other significant observable inputs (including quoted prices for similar securities, interest rates, prepayment speeds, credit risk, etc.) |
| | | |
| • | Level 3 – | significant unobservable inputs (including a Fund’s own assumptions in determining the fair value of investments) |
The inputs or methodology used for valuing securities are not necessarily an indication of the risk associated with investing in those securities. For example, money market instruments are valued using amortized cost, in accordance with rules under the 1940 Act. Generally, amortized cost approximates the current fair value of a security, but since the value is not obtained from a quoted price in an active market, such securities are reflected as Level 2. Transfers in and out of the levels are recognized at the value at the end of the period. During the period ended June 30, 2012, there were no transfers between Levels 1, 2 and 3 except as shown in the Portfolio of Investments for the Mid Cap Value Opportunities Fund.
The aggregate value by input level, as of June 30, 2012, for each Fund’s investments, as well as a reconciliation of assets for which significant unobservable inputs (Level 3) were used in determining value, if applicable, is included in each Fund’s Portfolio of Investments, which also includes a breakdown of the Fund’s investments by sector allocation. There were no Level 3 securities during the period.
Notes to Financial Statements (Continued)
The Funds’ portfolio securities are valued as of the close of the regular session of trading on the New York Stock Exchange (currently 4:00 p.m., Eastern time). Portfolio securities traded on stock exchanges are valued at the last sale price, and to the extent these securities are actively traded, they are categorized in Level 1 of the fair value hierarchy. Portfolio securities quoted by NASDAQ are valued at the NASDAQ Official Closing Price (“NOCP”). Securities not traded on a particular day, or for which the last sale price is not readily available, are valued at their last broker-quoted bid prices as obtained from one or more of the major market makers for such securities by an independent pricing service and are categorized in Level 2. While this method provides consistency in valuation (and may only be used if it approximates market value), it may result in periods during which value, as determined by amortized cost, is higher or lower than the price that would be received if the Fund sold the investment. Money market instruments and other debt securities with a remaining maturity of less than 60 days are valued at amortized cost, which approximates market value and are categorized in Level 2. Securities for which market quotations or the NOCP are not readily available are valued based on fair value as determined by or under the direction of the Board of Trustees and are categorized in Level 3. Shares of open end mutual funds in which the Funds invest are valued at their respective net asset values as reported by the underlying funds and are categorized in Level 1. The prices for foreign securities are reported in local currency and translated into U.S. dollars using currency exchange rates.
For securities that principally trade on a foreign market or exchange, a significant gap in time can exist between the time of a particular security’s last trade and the time at which a Fund calculates its net asset value. The closing prices of such securities may no longer reflect their market value at the time the Fund calculates its net asset value if an event that could materially affect the value of those securities (a “Significant Event”) has occurred between the time of the security’s last close and the time that the Fund calculates its net asset value.
A Significant Event may relate to a single issuer or to an entire market sector. If the Advisor or Sub-Advisor of a Fund becomes aware of a Significant Event that has occurred with respect to a security or group of securities after the closing of the exchange or market on which the security or securities principally trade, but before the time at which the Fund calculates its net asset value, it may request that a Fair Value Committee Meeting be called. In addition, the Funds’ Administrator or Sub-Administrator monitors price movements among certain selected indices, securities and/or baskets of securities that may be an indicator that the closing prices received earlier from foreign exchanges or markets may not reflect market value at the time the Fund calculates its net asset value. If price movements in a monitored index or security exceed levels established by the Advisor, the Sub-Administrator notifies the Advisor or Sub-Advisor for any Fund holding the relevant securities that such limits have been exceeded. In such event, the Advisor makes the determination whether a Fair Value Committee meeting should be called based on the information provided. These securities are categorized in Level 2.
New accounting pronouncements — In December 2011, the Financial Accounting Standards Board (FASB) issued Accounting Standards Update (ASU) No. 2011-11, “Disclosures about Offsetting Assets and Liabilities” (ASU2011-11). ASU2011-11 requires disclosures to make financial statements that are prepared under U.S. generally accepted accounting principals (GAAP) more comparable to those prepared under the International Financial Reporting Standards (IFRS). The new disclosure requirements mandate that entities disclose both gross and net informantion about instruments and transactions eligible for offset in the statement of assets and liabilities as well as instruments and transactions subject to an agreement similar to a master netting arrangement. In addition, ASU 2011-11 requires disclosure of collateral received and posted in connection with master netting agreements or similar arrangements. New disclosures are required for annual reporting periods beginning on or after January 1, 2013, and interim periods within those annual periods. Management is evaluating the impact of ASU 2011-11 on the financial statements and disclosures.
In May 2011, the Financial Accounting Standards Board (“FASB”) issued Accounting StandardsUpdate (“ASUNo. 2011-04”), “Amendments to Achieve Common Fair Value Measurement and Disclosure Requirements in GAAP and the International Financial Reporting Standards (“IFRS”).” ASU 2011-04 includes common requirements
Notes to Financial Statements (Continued)
for measurement of and disclosure about fair value between U.S. GAAP and IFRS. ASU 2011-04 which requires reporting entities to categorize within Level 3 of the fair value hierarchy: quantitative information about the unobservable inputs used in the fair value measurement; the valuation processes used by the reporting entity; and a narrative description of the sensitivity of the fair value measurement to changes in unobservable inputs and the interrelationships between those unobservable inputs. In addition, ASU 2011-04 requires reporting entities to make disclosures about amounts and reasons for all transfers in and out of Level 1 and Level 2 fair value measurements. The new and revised disclosures were effective for fiscal years beginning after December 15, 2011 and for interim periods within those fiscal years.
Cash and Cash Equivalents — The Funds consider liquid assets deposited with a bank,money market funds, and certain short term debt instruments with maturities of 3 months or less to be cash equivalents. These investments represent amounts held with financial institutions that are readily accessible to pay Fund expenses or investments. Cash and cash equivalents are valued at cost plus accrued interest, which approximates market value. The value of cash equivalents denominated in foreign currencies is determined by converting to U. S. dollars on the date of the statement of assets and liabilities.
Futures Contracts — A fund may buy and sell futures contracts and related options to manage its exposure to changing interest rates and securities prices. Some strategies reduce a Fund’s exposure to price fluctuations, while others tend to increase its market exposure. Futures and options on futures can be volatile instruments and involve certain risks that could negatively impact a Fund’s return. In order to avoid leveraging and related risks, when a Fund purchases futures contracts, it will collateralize its position by depositing an amount of cash or liquid securities, equal to the market value of the futures positions held, less margin deposits, in a segregated account with its custodian or otherwise “cover” its position in a manner consistent with the 1940 Act or the rules of the Securities and Exchange Commission interpretations thereunder. Collateral equal to the current market value of the futures position will be marked to market on a daily basis.
When the contract is closed, the Fund records a realized gain or loss equal to the difference between the proceeds from (or cost of) the closing transactions and the Fund’s basis in the contract. Risks of entering into futures contracts include the possibility that a change in the value of the contract may not correlate with the changes in the value of the underlying instruments. Second, it is possible that a lack of liquidity for futures contracts could exist in the secondary market resulting in an inability to close a futures position prior to its maturity date. Third, the purchase of a futures contract involves the risk that the funds could lose more than the original margin deposit required to initiate the futures transaction. Finally, the risk exists that losses could exceed amounts disclosed on the Statements of Assets and Liabilities. There is minimal counterparty credit risk involved in entering into futures contracts since they are exchange-traded instruments and the exchange’s clearinghouse, as counterparty to all exchange-traded futures, guarantees the futures against default.
Securities sold short — The U.S. Long/Short Fund periodically engages in selling securities short, which obligates the Fund to replace a security borrowed by purchasing the same security at the current market value. The Fund would incur a loss if the price of the security increases between the date of the short sale and the date on which the Fund replaces the borrowed security. The Fund would realize a gain if the price of the security declines between those dates. As of June 30, 2012, the Fund had securities sold short with a fair value of ($2,391,941) and had securities with a fair value of $15,768,622 held as collateral for securities sold short.
Foreign currency translation — The books and records of the Funds are maintained in U.S. dollars and translated into U.S. dollars on the following basis:
| | (1) | fair value of investment securities, assets and liabilities at the current rate of exchange on the valuation date; and |
Notes to Financial Statements (Continued)
| | (2) | purchases and sales of investment securities, income and expenses at the relevant rates of exchange prevailing on the respective dates of such transactions. |
The Funds do not isolate that portion of gains and losses on investments in equity securities that is due to changes in the foreign exchange rates from that which is due to changes in market prices of equity securities.
Derivative instruments and hedging activities — The following table sets forth the fair value of the Funds’ derivative financial instruments by primary risk exposure as of June 30, 2012:
| Fair Value of Derivative Investments | |
| As of June 30, 2012 | |
| | | | | | Asset | | | Liability | |
| | | | | | Derivatives | | | Derivatives | |
| | | Derivatives not accounted for as hedging | | | Unrealized | | | Unrealized | |
| Fund | | instruments under ASC 815 | | | Appreciation* | | | Depreciation | |
| International Small Cap Fund | | | Warrants - Equity Contracts | | | $ | 2,824 | | | $ | — | |
* Statements of Assets and Liabilites Location: Investments, at value.
For the period ended June 30, 2012, the average quarterly balance of outstanding derivative financial instruments was as follows:
| | | International | | | U.S. | |
| | | Small Cap | | | Long/Short | |
| | | Fund | | | Fund | |
| Equity Contracts: | | | | | | | | |
| Futures - Average number of contracts | | $ | — | | | $ | 4 | |
| Warrants -Average number of contracts | | | 42,919 | | | | — | |
| The Effect of Derivative Investments on the Statement of Operations |
| for the Period Ended June 30, 2012 |
| | | | | | | | | Change in | |
| | | | | | | | | Unrealized | |
| | | | | | | | | Appreciation | |
| | | | Derivatives not accounted for as hedging | | | Realized Loss | | | (Depreciation) | |
| Fund | | | instruments under ASC 815 | | | on Derivatives* | | | on Derivatives** | |
| International Small Cap Value Fund | | | Warrants - Equity Contracts | | | $ | — | | | $ | 2,824 | |
| U.S. Long/Short Fund | | | Futures -Equity Contracts | | | | (12 | ) | | | (26,806 | ) |
| U.S. Long/Short Fund | | | Warrants - Equity Contracts | | | | 177 | | | | N/A | |
| | * | Statements of Operations Location: Net realized gain on warrants and net realized gain (loss) on future transactions |
| | ** | Statements of Operations Location: Net change in unrealized appreciation (depreciation) on investments and net change in unrealized appreciation(depreciation) on future transactions |
Portfolio securities loaned — Each Fund may lend its portfolio securities. Lending portfolio securities exposes a Fund to the risk that the borrower may fail to return the loaned securities or may not be able to provide additional collateral or that the Fund may experience delays in recovery of the loaned securities or loss of rights in the collateral if the borrower fails financially. To minimize these risks, the borrower must agree to maintain cash collateral with the Funds’ custodian in an amount at least equal to the fair value of the securities loaned plus accrued interest. The cash collateral is reinvested by the Funds’ custodian into an approved investment vehicle.
Notes to Financial Statements (Continued)
As of June 30, 2012, the following Funds loaned securities and received collateral as follows:
| | | Fair Value of | | | Value of | |
| | | Securities | | | Collateral | |
| Fund | | Loaned | | | Received | |
| Capital Growth Fund | | $ | 1,375,127 | | | $ | 1,374,436 | |
| International Small Cap Fund | | | 2,960,754 | | | | 2,983,985 | |
| Mid Cap Value Opportunities Fund | | | 4,699,420 | | | | 4,646,582 | |
| Small Cap Value Opportunities Fund | | | 5,682,317 | | | | 5,686,998 | |
All collateral received as cash is received, held and administered by the Funds’ custodian for the benefit of the Funds in the applicable custody account or other account established for the purpose of holding collateral.
Funds participating in securities lending receive compensation in the form of fees, or retain a portion of interest or dividends on the investment of any cash received as collateral. The Funds also continue to receive interest or dividends on the securities loaned. The loaned securities are secured by collateral valued at least equal, at all times, to the fair value of the securities loaned plus accrued interest. When the collateral falls below specified amounts, the lending agent will use its best effort to obtain additional collateral on the next business day to meet required amounts under the security lending agreement.
Unrealized gain or loss on the fair value of the securities loaned that may occur during the term of the loan is recognized by the Funds. The Funds have the right under the lending agreement to recover the securities from the borrower on demand.
Share valuation — The net asset value per share of each class of shares of each Fund is calculated daily by dividing the total value of a Fund’s assets attributable to that class, less liabilities attributable to that class, by the number of outstanding shares of that class.
The maximum offering price per share of Class A shares of the Funds is equal to the net asset value per share plus a sales load equal to 6.10% of the net asset value (or 5.75% of the offering price). There is no sales load on purchases of $1 million or more of Class A shares. The maximum offering price per share of Class C, Class Y, and Institutional Class shares of the Funds is equal to the net asset value per share.
The redemption price per share of each class of shares of the Funds is generally equal to the net asset value per share. However, Class A redemptions that were part of a no load $1 million subscription may be subject to a contingent deferred sales charge (“CDSC”) of up to 1%. Additionally, Class C shares of the Funds are subject to a CDSC of 1.00% of the original purchase price if redeemed within a one-year period from the date of purchase.
Investment income — Dividend income from securities is recognized on the ex-dividend date, net of foreign withholding taxes, if any, which are reduced by any amounts reclaimable by the Funds, where applicable. Interest income from securities is recorded on the basis of interest accrued, premium amortized and discount accreted.
Distributions to shareholders — Each Fund, except the Value Fund, declares and distributes net investment income, if any, annually, as a dividend to shareholders. The Value Fund declares and distributes net investment income, if any, semi-annually, as a dividend to shareholders. Any net realized capital gains on sales of securities for all Funds are distributed to shareholders at least annually. Income distributions and capital gain distributions are determined in accordance with income tax regulations.
Allocations — Investment income earned, realized capital gains and losses, and unrealized appreciation and depreciation for the Funds are allocated daily to each class of shares based upon its proportionate share of total net assets of the Fund. Class specific expenses are charged directly to the class incurring the expense. Common expenses, which are not attributable to a specific class, are allocated daily to each class of shares based upon
Notes to Financial Statements (Continued)
their proportionate share of total net assets of the Fund. Expenses not directly billed to a Fund are allocated proportionally among all Funds daily in relation to net assets of each Fund or another reasonable measure.
Security transactions — Security transactions are reflected for financial reporting purposes as of the trade date, which may cause the net asset value (“NAV”) as stated in the accompanying financial statements to be different than the NAV applied to Fund share transactions. Realized gains and losses on sales of portfolio securities are calculated using the identified cost basis.
Estimates — The preparation of financial statements in conformity with U.S. GAAP requires management to make estimates and assumptions that affect the reported amounts of assets and liabilities and disclosure of contingent assets and liabilities at the date of the financial statements and the reported amounts of income and expenses during the reporting period. Actual results could differ from those estimates.
Redemption fees — Prior to April 16, 2012, each Fund imposed a 2% redemption/exchange fee on total redemption proceeds (after applicable deferred sales charges) of any shareholder redeeming shares (including redemption by exchange) of the Funds within 10 calendar days of their purchase. The Funds charged the redemption/exchange fee to discourage market timing by those shareholders initiating redemptions or exchanges to take advantage of short-term market movements. The redemption/exchange fee was imposed to the extent that the number of Fund shares redeemed exceeded the number of Fund shares that were held for more than 10 calendar days. In determining how long shares of the Fund have been held, shares held by the investor for the longest period of time were sold first. The Funds retained the redemption/exchange fee for the benefit of the remaining shareholders by crediting Paid-in-Capital. The redemption fees can be found on the Statement of Changes in Net Assets. Effective April 16, 2012, the redemption fee plan was terminated. For the three months ended June 30, 2012, the Funds had no redemption fees.
3. Investment Transactions
Investment transactions (excluding short-term investments and U.S. Government securities) were as follows for the period ended June 30, 2012:
| | | | | | International | | | Mid Cap Value | |
| | | Capital Growth | | | Small Cap | | | Opportunities | |
| | | Fund | | | Fund | | | Fund | |
| Purchases of investment securities | | $ | 9,898,087 | | | $ | 18,706,966 | | | $ | 23,078,556 | |
| Proceeds from sales and maturities | | $ | 30,959,892 | | | $ | 21,921,278 | | | $ | 94,182,596 | |
| | | Small Cap | | | | | | | |
| | | Value | | | U.S. | | | | |
| | | Opportunities | | | Long/Short | | | Value | |
| | | Fund | | | Fund | | | Fund | |
| Purchases of investment securities | | $ | 17,177,956 | | | $ | 12,793,725 | | | $ | 15,786,945 | |
| Proceeds from sales and maturities | | $ | 32,706,377 | | | $ | 22,257,436 | | | $ | 15,405,304 | |
4. Transactions with Affiliates and Other Related Parties
Certain officers of the Trust are also officers of the Advisor (Touchstone Advisors, Inc.), the Underwriter (Touchstone Securities, Inc.) and/or BNY Mellon Investment Servicing (U.S) Inc. (“BNY Mellon”), the Sub-Administrator and Transfer Agent to the Funds. The Advisor and Underwriter are each wholly owned, indirect subsidiaries of The Western and Southern Life Insurance Company (“Western-Southern”).
Notes to Financial Statements (Continued)
MANAGEMENT & EXPENSE LIMITATIONS AGREEMENTS
The Advisor provides general investment supervisory services for the Funds under terms of an Advisory Agreement. Effective April 16, 2012, under the Advisory Agreement, the Funds pay the Advisor a fee, which is computed and accrued daily and paid monthly, at an annual rate based on average daily net assets as shown in the table below.
| Touchstone Capital Growth Fund | | 0.70% on the first $300 million |
| | | 0.685% on the next $200 million |
| | | 0.675% on the next $250 million |
| | | 0.675% on the next $250 million |
| | | 0.625% on the next $500 million |
| | | 0.575% on the next $500 million |
| | | 0.525% of such assets over $2 billion |
| Touchstone International Small Cap Fund | | 0.95% on the first $300 million |
| | | 0.90% on the next $200 million |
| | | 0.85% on the next $250 million |
| | | 0.80% on the next $250 million |
| | | 0.75% on the next $500 million |
| | | 0.70% on the next $500 million |
| | | 0.65% of such assets over $2 billion |
| Touchstone Mid Cap Value Opportunities Fund | | 0.85% on the first $300 million |
| | | 0.80% on the next $200 million |
| | | 0.75% of such assets over $500 million |
| Touchstone Small Cap Value Opportunities Fund | | 0.95% on the first $300 million |
| | | 0.90% on the next $200 million |
| | | 0.85% of such assets over $500 million |
| Touchstone U.S. Long/Short Fund | | 0.80% on the first $300 million |
| | | 0.75% on the next $200 million |
| | | 0.70% on the next $250 million |
| | | 0.65% on the next $250 million |
| | | 0.60% on the next $500 million |
| | | 0.55% on the next $500 million |
| | | 0.50% of such assets over $2 billion |
| Touchstone Value Fund | | 0.75% on the first $300 million |
| | | 0.73% on the next $200 million |
| | | 0.72% on the next $250 million |
| | | 0.70% on the next $250 million |
| | | 0.68% on the next $500 million |
| | | 0.67% on the next $500 million |
| | | 0.66% of such assets over $2 billion |
Prior to April 16, 2012, Old Mutual Capital, Inc. (the “Former Advisor”) served as the adviser and administrator to the Funds. For its services, the Funds paid the Former Advisor the same fees listed above with the exception of the following:
| Touchstone Mid Cap Value Opportunities Fund | | 0.95% on the first $500 million |
| | | 0.90% on the next $500 million |
| | | 0.85% of such assets over $1 billion |
Notes to Financial Statements (Continued)
| Touchstone Small Cap Value Opportunities Fund | | 1.00% on the first $300 million |
| | | 0.95% on the next $200 million |
| | | 0.90% on the next $250 million |
| | | 0.85% on the next $250 million |
| | | 0.80% on the next $500 million |
| | | 0.75% on the next $500 million |
| | | 0.70% of such assets over $2 billion |
Effective April 16, 2012, the Advisor has entered into investment sub-advisory agreements with the following parties:
| Analytic Investors, LLC | Copper Rock Capital Partners LLC |
| U.S. Long/Short Fund | International Small Cap Fund |
| | |
| Ashfield Capital Partners | |
| Capital Growth Fund | Thompson Siegel & Walmsley LLC |
| | Mid Cap Value Opportunities Fund |
| Barrow, Hanley, Mewhinney & Strauss, LLC | Small Cap Value Opportunties Fund |
| Value Fund | |
The Advisor, not the Funds, pays sub-advisory fees to each Sub-Advisor.
Prior to April 16, 2012, the Former Advisor had sub-advisory agreements with the above listed Sub-Advisors. The Former Advisor, not the Funds, paid sub-advisory fees to each Sub-Advisor.
Effective April 16, 2012, the Advisor entered into an expense limitation agreement (“Expense Limitation Agreement”)to contractually limit operating expenses of the Funds. The maximum operating expense limit in any year with respect to the Funds is based on a percentage of the average daily net assets of the Funds. The Advisor has agreed to separately waive class level expenses , administration fees and reimburse expenses in order to maintain expense limitations for the Funds as follows:
| | | | | | | | | | | | Institutional | |
| | | Class A | | | Class C | | | Class Y | | | Class | |
| Capital Growth Fund | | | 1.25 | % | | | 2.00 | % | | | 1.00 | % | | | 0.90 | % |
| International Small Cap Fund | | | 1.55 | % | | | 2.30 | % | | | 1.30 | % | | | 1.05 | % |
| Mid Cap Value Opportunities Fund | | | 1.29 | % | | | 2.04 | % | | | 1.04 | % | | | 0.89 | % |
| Small Cap Value Opportunities Fund | | | 1.50 | % | | | 2.25 | % | | | 1.25 | % | | | 1.10 | % |
| U.S. Long/Short Fund | | | 1.30 | % | | | 2.05 | % | | | 1.05 | % | | | 0.90 | % |
| Value Fund | | | 1.20 | % | | | 1.95 | % | | | 0.95 | % | | | 0.85 | % |
These expense limitations will remain in effect until at least April 16, 2014.
Prior to April 16, 2012, the Former Advisor was also contractually obligated to maintain the expense limitations as listed above with the exception of the following:
| | | | | | | | | | | | Institutional | |
| | | Class A | | | Class C* | | | Class Z** | | | Class | |
| Mid Cap Value Opportunities Fund | | | 1.40 | % | | | N/A | | | | 1.12 | % | | | 1.00 | % |
| U.S. Long/Short Fund | | | 1.35 | % | | | N/A | | | | 1.10 | % | | | 0.90 | % |
| | * | Prior to April 16, 2012, the Mid Cap Value Opportunities Fund and the U.S. Long/Short Fund did not issue Class C Shares. |
| | ** | Funds had Class Z shares outstanding immediately prior to the reorganization, which were exchanged for Class Y Shares of the corresponding Touchstone Fund. |
Notes to Financial Statements (Continued)
During the period April 16, 2012 through June 30, 2012, the Advisor waived investment advisory fees and administration fees and/or reimbursed expenses of the Funds as follows:
| | | | | | | | | Other | |
| | | Investment | | | | | | Operating | |
| | | Advisory | | | Administration | | | Expenses | |
| | | Fees Waived | | | Fees Waived | | | Reimbursed | |
| Capital Growth Fund | | $ | — | | | $ | 20,877 | | | $ | 97,478 | |
| International Small Cap Fund | | | 42,014 | | | | 33,783 | | | | 32,890 | |
| Mid Cap Value Opportunities Fund | | | 23,047 | | | | 42,298 | | | | 33,698 | |
| Small Cap Value Opportunities Fund | | | 4,103 | | | | 35,772 | | | | 20,702 | |
| U.S. Long/Short Fund | | | 28,258 | | | | 5,585 | | | | 28,901 | |
| Value Fund | | | 3,967 | | | | 44,352 | | | | 33,569 | |
For the period April 1, 2012 through April 15, 2012 the Former Adviser accrued and waived investment advisory fees of the Funds, which are included in the Investment advisory fees and Fees waived and/or reimbursed by the Advisor and/or Affiliates on the Statements of Operations as follows:
| | | Investment | | | Investment | |
| | | Advisory | | | Advisory | |
| | | and | | | and | |
| | | Administration | | | Administration | |
| | | Fees Accrued | | | Fees Waived | |
| Capital Growth Fund | | $ | 56,549 | | | $ | 24,412 | |
| International Small Cap Fund | | | 37,026 | | | | 5,913 | |
| Mid Cap Value Opportunities Fund | | | 65,623 | | | | 8,212 | |
| Small Cap Value Opportunities Fund | | | 44,291 | | | | 1,340 | |
| U.S. Long/Short Fund | | | 7,308 | | | | 3,513 | |
| Value Fund | | | 37,388 | | | | 5,220 | |
Effective April 16, 2012, under the terms of the Expense Limitation Agreement the Advisor is entitled to recover, subject to approval by the Funds’ Board of Trustees, such amounts waived or reimbursed for a period of up to three years from the year in which the Advisor reduced its compensation and/or assumed expenses for a Fund. No recoupment will occur unless a Fund’s operating expenses are below the expense limitation amount.
At June 30, 2012, the Advisor may seek recoupment of previously waived and reimbursed fees as follows:
| | | Expiration | |
| | | June 30, 2015 | |
| Capital Growth Fund | | $ | 118,355 | |
| International Small Cap Fund | | | 108,687 | |
| Mid Cap Value Opportunities Fund | | | 99,043 | |
| Small Cap Value Opportunities Fund | | | 60,577 | |
| U.S. Long/Short Fund | | | 62,744 | |
| Value Fund | | | 81,888 | |
For the period April 1, 2012 through April 16, 2012, the Former Adviser did not recover waived and reimbursed fees on the Funds.
ADMINISTRATION AGREEMENT
Effective April 16, 2012, the Advisor entered into an Administration and Accounting Services Agreement with the Trust, whereby the Advisor is responsible for: supplying executive and regulatory compliance services; supervising the preparation of tax returns; coordinating the preparation of reports to shareholders and reports to, and filings with, the Securities and Exchange Commission and state securities authorities, as well as materials for meetings
Notes to Financial Statements (Continued)
of the Board of Trustees; calculating the daily net asset value per share; and maintaining the financial books and records of each Fund. For its services, the Advisor receives an annual fee of 0.20% of the aggregate average daily net assets of the Trust,Touchstone InvestmentTrust (excluding Institutional Money Market Fund),Touchstone Funds Group Trust, and Touchstone Tax-Free Trust up to and including $6 billion; 0.16% of the next $4 billion of aggregate average daily net assets; and 0.12% of the aggregate average daily net assets of all such assets in excess of $10 billion. The fee is allocated among the Funds on the basis of relative daily net assets.
The Advisor has engaged BNY Mellon as the Sub-Administrator to the Trust. BNY Mellon provides administrator and accounting services to the Trust and is compensated directly by the Advisor, not the Trust.
TRANSFER AGENT AGREEMENT
Effective April 16, 2012, under the terms of the Transfer Agent Agreement between the Trust and BNY Mellon, BNY Mellon maintains the records of each shareholder’s account, answers shareholders’ inquiries concerning their accounts, processes purchases and redemptions of each Fund’s shares, acts as dividend and distribution disbursing agent and performs other shareholder service functions. For these services, BNY Mellon receives a monthly fee per shareholder account from each Fund. In addition, each Fund pays out-of-pocket expenses incurred by BNY Mellon, including, but not limited to, postage and supplies.
Prior to April 16, 2012, under the terms of the Transfer Agent Agreement between the Old Mutual Funds’ Trust and DTS Systems, Inc. (“DTS”), DTS maintained the records of each shareholder’s account, answered shareholders’ inquiries concerning their accounts, processed purchases and redemptions of each Fund’s shares, acted as dividend and distribution disbursing agent and performed other shareholder service functions. For these services, DTS received a monthly fee per shareholder account from each Fund. In addition, each Fund paid out-of-pocket expenses incurred by DTS, including, but not limited to, postage and supplies.
PLANS OF DISTRIBUTION
Effective April 16, 2012, the Trust has a Plan of Distribution (“Class A Plan”) under which Class A shares of each Fund may directly incur or reimburse the Advisor or the Underwriter for expenses related to the distribution and promotion of shares. The annual limitation for payment of such expenses under the Class A Plan is 0.25% of average daily net assets attributable to such shares.
Effective April 16, 2012, the Trust also has a Plan of Distribution (“Class C Plan”) under which Class C shares of each Fund may directly incur or reimburse the Advisor or the Underwriter for expenses related to the distribution and promotion of shares. The annual limitation for payment of such expenses under the Class C Plan is 1.00% of average daily net assets attributable to Class C shares.
For the period April 16, 2012 through June 30, 2012 the Funds accrued the following distributions for Class A and Class C.
| | | Distribution | | | Distribution | |
| | | Expenses | | | Expenses | |
| | | Accrued | | | Accrued | |
| | | Class A | | | Class C | |
| Capital Growth Fund | | $ | 329 | | | $ | 5 | |
| International Small Cap Fund | | | 93 | | | | 5 | |
| Mid Cap Value Opportunities Fund | | | 747 | | | | 5 | |
| Small Cap Value Opportunities Fund | | | 1,065 | | | | 5 | |
| U.S. Long/Short Fund | | | 913 | | | | 5 | |
| Value Fund | | | 800 | | | | 5 | |
Notes to Financial Statements (Continued)
Prior to April 16, 2012, the Trust had a Plan of Distribution (“Former Class A Plan”) under which Class A shares of each Fund may directly incur or reimburse the Advisor or the Underwriter for expenses related to the distribution and promotion of shares. The annual limitation for payment of such expenses under the Former Class A Plan was 0.25% of average daily net assets attributable to such shares. For the period April 1, 2012 through April 15, 2012, the Funds paid expenses under the Former Class A Plan, which is included in the Distribution expenses, Class A on the Statements of Operations as follows:
| | | Distribution | |
| | | Expenses | |
| | | Accrued | |
| Capital Growth Fund | | $ | 77 | |
| International Small Cap Fund | | | 14 | |
| Mid Cap Value Opportunities Fund | | | 154 | |
| Small Cap Value Opportunities Fund | | | 227 | |
| U.S. Long/Short Fund | | | 209 | |
| Value Fund | | | 163 | |
Prior to April 16, 2012, the Funds did not offer Class C shares.
UNDERWRITING AGREEMENT
The Underwriter is the Funds’ principal underwriter and, as such, acts as exclusive agent for distribution of the Funds’ shares. Effective April 16, 2012, under the terms of the Underwriting Agreement between the Trust and Underwriter, the Underwriter earned the following from underwriting and broker commissions on the sale of shares of the following Funds during the period April 16, 2012 through June 30, 2012:
| | | Amount | |
| Capital Growth Fund | | $ | 144 | |
| U.S. Long/Short Fund | | | 57 | |
| Value Fund | | | 4,405 | |
In addition, the Underwriter collected contingent deferred sales charges on the redemption of Class C shares of the following Funds during the period April 16, 2012 through June 30, 2012:
| | | Amount | |
| Mid Cap Value Opportunities Fund | | $ | 13 | |
During the period April 1, 2012 through April 15, 2012, the Funds did not pay any underwriting or broker commissions on the sale of shares of the Funds.
AFFILIATED INVESTMENTS
Each Fund may invest in the Touchstone Institutional Money Market Fund, subject to compliance with several conditions set forth in an exemptive order received by the Trust from the Securities and Exchange Commission. To the extent that the other Touchstone Funds are invested in the Touchstone Institutional Money Market Fund, the Advisor and Administrator will be paid additional fees from the Touchstone Institutional Money Market Fund that will not be waived or reimbursed.
A summary of each Fund’s investment, as applicable, in the Touchstone Institutional Money Market Fund for the period ended June 30, 2012, is as follows:
Notes to Financial Statements (Continued)
| | | Share Activity | | | | | | | |
| | | Balance | | | | | | | | | Balance | | | | | | Value | |
| | | 03/31/12 | | | Purchases | | | Sales | | | 06/30/12 | | | Dividends | | | 06/30/12 | |
| Capital Growth Fund | | | — | | | | 10,620,777 | | | | (9,230,791 | ) | | | 1,389,986 | | | $ | 830 | | | $ | 1,389,986 | |
| International Small Cap Fund | | | — | | | | 9,851,359 | | | | (8,107,926 | ) | | | 1,743,433 | | | $ | 669 | | | $ | 1,743,433 | |
| Mid Cap Value Opportunities Fund | | | — | | | | 32,053,049 | | | | (29,006,462 | ) | | | 3,046,587 | | | $ | 1,486 | | | $ | 3,046,587 | |
| Small Cap Value Opportunities Fund | | | — | | | | 11,148,779 | | | | (8,548,388 | ) | | | 2,600,391 | | | $ | 811 | | | $ | 2,600,391 | |
| U.S. Long/Short Fund | | | — | | | | 2,722,439 | | | | (2,562,609 | ) | | | 159,830 | | | $ | 89 | | | $ | 159,830 | |
| Value Fund | | | — | | | | 20,345,577 | | | | (10,916,354 | ) | | | 9,429,223 | | | $ | 1,484 | | | $ | 9,429,223 | |
5. Federal Tax Information
Federal income tax — It is each Fund’s policy to continue to comply with the special provisions of the Internal Revenue Code applicable to regulated investment companies. As provided therein, in any fiscal year in which a Fund so qualifies and distributes at least 90% of its investment company taxable income, the Fund (but not the shareholders) will be relieved of federal income tax on the income distributed. Accordingly, no provision for income taxes has been made.
In order to avoid imposition of the excise tax applicable to regulated investment companies, it is also each Fund’s intention to declare and pay as dividends in each calendar year at least 98% of its investment company taxable income (earned during the calendar year) and 98.2% of its net realized capital gains (earned during the twelve months ending October 31) plus undistributed amounts from prior years.
The tax character of distributions paid for the years ended June 30, 2012, March 31, 2012 and March 31, 2011 was as follows:
| | | | | | International | |
| | | Capital Growth | | | Small Cap | |
| | | Fund | | | Fund | |
| | | Period Ended | | | Year Ended | | | Year Ended | | | Period Ended | | | Year Ended | | | Year Ended | |
| | | June 30, | | | March 31, | | | March 31, | | | June 30, | | | March 31, | | | March 31, | |
| | | 2012 | | | 2012 | | | 2011 | | | 2012 | | | 2012 | | | 2011 | |
| From ordinary income | | $ | 31,849 | | | $ | 215,362 | | | $ | 460,798 | | | $ | 802,324 | | | $ | 1,842,301 | | | $ | 189,300 | |
| | | $ | 31,849 | | | $ | 215,362 | | | $ | 460,798 | | | $ | 802,324 | | | $ | 1,842,301 | | | $ | 189,300 | |
| | | Mid Cap Value | | | Small Cap Value | |
| | | Opportunities | | | Opportunities | |
| | | Fund | | | Fund | |
| | | Period Ended | | | Year Ended | | | Year Ended | | | Period Ended | | | Period Ended | | | Year Ended | |
| | | June 30, | | | March 31, | | | March 31, | | | June 30, | | | March 31, | | | March 31, | |
| | | 2012 | | | 2012 | | | 2011 | | | 2012 | | | 2012 | | | 2011 | |
| From ordinary income | | $ | 627,574 | | | $ | 2,171,072 | | | $ | 1,899,448 | | | $ | — | | | $ | — | | | $ | — | |
| From long-term capital gains | | | 3,418,930 | | | | 11,225,590 | | | | — | | | | 2,691,474 | | | | 5,495,825 | | | | — | |
| | | $ | 4,046,504 | | | $ | 13,396,662 | | | $ | 1,899,448 | | | $ | 2,691,474 | | | $ | 5,495,825 | | | $ | — | |
| | | U.S. Long/Short | | | Value | |
| | | Fund | | | Fund | |
| | | Period Ended | | | Year Ended | | | Year Ended | | | Period Ended | | | Year Ended | | | Year Ended | |
| | | June 30, | | | March 31, | | | March 31, | | | June 30, | | | March 31, | | | March 31, | |
| | | 2012 | | | 2012 | | | 2011 | | | 2012 | | | 2012 | | | 2011 | |
| From ordinary income | | $ | — | | | $ | 174,003 | | | $ | 1,435,069 | | | $ | 1,228,217 | | | $ | 2,287,808 | | | $ | 2,145,890 | |
| | | $ | — | | | $ | 174,003 | | | $ | 1,435,069 | | | $ | 1,228,217 | | | $ | 2,287,808 | | | $ | 2,145,890 | |
Notes to Financial Statements (Continued)
The following information is computed on a tax basis for each item as of June 30, 2012:
| | | | | | International | | | Mid Cap Value | |
| | | Capital | | | Small Cap | | | Opportunities | |
| | | Growth Fund | | | Fund | | | Fund | |
| Tax cost of portfolio investments | | $ | 119,308,259 | | | $ | 88,430,245 | | | $ | 97,252,111 | |
| Gross unrealized appreciation | | | 52,337,517 | | | | 4,891,983 | | | | 11,932,198 | |
| Gross unrealized depreciation | | | (4,668,647 | ) | | | (5,309,284 | ) | | | (4,204,577 | ) |
| Net portfolio unrealized appreciation (depreciation) | | | 47,668,870 | | | | (417,301 | ) | | | 7,727,621 | |
| Net other unrealized appreciation (depreciation) | | | — | | | | (6,224 | ) | | | — | |
| Total net unrealized appreciation (depreciation) | | | 47,668,870 | | | | (423,525 | ) | | | 7,727,621 | |
| Accumulated capital and other losses | | | (42,978,321 | ) | | | (29,152,825 | ) | | | (6,598,290 | ) |
| Undistributed Ordinary Income | | | 112,598 | | | | 695,120 | | | | 1,658,438 | |
| Undistributed capital gains | | | — | | | | — | | | | 8,946,909 | |
| Accumulated earnings (deficit) | | $ | 4,803,147 | | | $ | (28,881,230 | ) | | $ | 11,734,678 | |
| | | Small Cap Value | | | U.S. | | | | |
| | | Opportunities | | | Long/Short | | | Value | |
| | | Fund | | | Fund | | | Fund | |
| Tax cost of portfolio investments | | $ | 83,158,057 | | | $ | 11,410,132 | | | $ | 104,831,200 | |
| Gross unrealized appreciation | | | 19,203,092 | | | | 2,883,332 | | | | 30,944,442 | |
| Gross unrealized depreciation | | | (4,434,407 | ) | | | (738,842 | ) | | | (5,545,079 | ) |
| Net unrealized appreciation (depreciation) | | | 14,768,685 | | | | 2,144,490 | | | | 25,399,363 | |
| Accumulated capital and other losses | | | (3,116,992 | ) | | | (62,645,090 | ) | | | (16,209,614 | ) |
| Undistributed ordinary income | | | 715,088 | | | | 30,656 | | | | 24,961 | |
| Undistributed capital gains | | | 4,255,709 | | | | — | | | | — | |
| Accumulated earnings (deficit) | | $ | 16,622,490 | | | $ | (60,469,944 | ) | | $ | 9,214,710 | |
The difference between the tax cost of portfolio investments and the financial statement cost is primarily due to wash sale loss deferrals and passive foreign investment company (“PFIC”) adjustments.
As of June 30, 2012, the Funds had the following capital loss carryforwards for federal income tax purposes:
| | | | | | | | | | | | | | | No | | | No | | | | |
| | | | | | | | | | | | | | | Expiration | | | Expiration | | | | |
| | | 2015 | | | 2016 | | | 2017 | | | 2018 | | | Short Term * | | | Long Term * | | | Total | |
| Capital Growth Fund ** | | $ | 8,648,358 | | | $ | 19,833,889 | | | $ | 14,496,074 | | | $ | — | | | $ | — | | | $ | — | | | $ | 42,978,321 | |
| International Small Cap Fund ** | | | 10,436,336 | | | | 4,523,327 | | | | 4,884,304 | | | | — | | | | 8,711,422 | | | | 597,436 | | | | 29,152,825 | |
| Mid Cap Value Opportunities Fund ** | | | — | | | | — | | | | 6,598,290 | | | | — | | | | — | | | | — | | | | 6,598,290 | |
| Small Cap Value Opportunities Fund | | | 3,116,992 | | | | — | | | | — | | | | — | | | | — | | | | — | | | | 3,116,992 | |
| U.S. Long/Short Fund | | | 1,646,478 | | | | 19,657,724 | | | | 41,340,888 | | | | — | | | | — | | | | — | | | | 62,645,090 | |
| Value Fund | | | — | | | | — | | | | 12,709,067 | | | | 3,500,547 | | | | — | | | | — | | | | 16,209,614 | |
*The Regulated Investment Company Modernization Act of 2010 (the “Act”) was enacted on December 22, 2010. The Act makes changes to several tax rules impacting the Funds. In general, the provisions of the Act will be effective for the Funds’ fiscal year ending June 30, 2012. Although the Act provides several benefits, including the unlimited carryover of future capital losses, there may be a greater likelihood that all or a portion of each Fund’s pre-enactment capital loss carryovers may expire without being utilized due to the fact that post-enactment capital losses must be utilized before pre-enactment capital loss carryovers may be utilized. Under the Act, new capital losses may now be carried forward indefinetly, and retain the character of the original loss as compared with pre-enactment law, where capital losses could be carried forward for up to eight years, and carried forward as short-term capital losses, irrespective of the character of the original loss.
**May be subject to usage limitations.
Notes to Financial Statements (Continued)
The capital loss carryforwards may be utilized in future years to offset net realized capital gains, if any, prior to distributing such gains to shareholders.
During the period ended June 30, 2012, the following Funds utilized capital loss carryforwards:
| Fund | | Amount | |
| Capital Growth Fund | | $ | 6,344,781 | |
| Mid Cap Value Opportunities Fund | | | 824,586 | |
| Small Cap Value Opportunities Fund | | | 321,990 | |
| U.S. Long/Short Fund | | | 1,239,085 | |
| Value Fund | | | 3,048,089 | |
The Funds have analyzed their tax positions taken on Federal income tax returns for all open tax years (tax years ended June 30, 2012 and March 31, 2008 through 2012) and have concluded that no provision for income tax is required in their financial statements.
Certain reclassifications, the result of permanent differences between financial statement and income tax reporting requirements, have been made to the components of capital. These reclassifications have no impact on the net assets or net asset value per share of the Funds and are designed to present the Funds’ capital accounts on a tax basis. The following reclassifications, which are primarily attributed to the tax treatment of net investment loss, partnership investments, write-off of prior year capital loss carryovers due to limitations, non-taxable distributions from underlying investments and carryovers of temporary differences due to mergers have been made to the following Funds for the period ended June 30, 2012:
| | | | | | Accumulated | | | Accumulated | |
| | | Paid-In | | | Net Investment | | | Net Realized | |
| | | Capital | | | Income(Loss) | | | Gains(Losses) | |
| Capital Growth Fund | | $ | (2,162,090 | ) | | $ | — | | | $ | 2,162,090 | |
| International Small Cap Fund | | | — | | | | (28,607 | ) | | | 28,607 | |
| Small Cap Value Opportunities Fund | | | (1 | ) | | | — | | | | 1 | |
| U.S. Long/Short Fund | | | (11,038 | ) | | | 205 | | | | 10,833 | |
| Value Fund | | | (369 | ) | | | — | | | | 369 | |
6. Commitments and Contingencies
The Funds indemnify the Trust’s officers and Trustees for certain liabilities that might arise from their performance of their duties to the Funds. Additionally, in the normal course of business, the Funds enter into contracts that contain a variety of representations and warranties and which provide general indemnifications. The Funds’ maximum exposure under these arrangements is unknown, as this would involve future claims that may be made against the Funds that have not yet occurred. However, based on experience, the Funds expect the risk of loss to be remote.
7. Fund Mergers
On February 10, 2012, the shareholders of the Old Mutual Funds II (the “Reorganizing Funds”), with the exception of the Old Mutual Large Cap Growth Fund, approved an Agreement and Plan of Reorganization (the “Plan”) providing for the transfer of all assets and libilities of each Reorganizing Fund to the corresponding Touchstone Fund as noted below. The Old Mutual Large Cap Growth Fund shareholders approved the Plan on March 9, 2012. The mergers took place on April 13, 2012. The fiscal year end of the Reorganizing Funds was March 31. After the merger, the Funds year end changed to June 30.
Notes to Financial Statements (Continued)
| | | | | Net | | | Shares | |
| Reorganizing Funds* | | Touchstone Funds | | Assets | | | Outstanding | |
| Old Mutual Large Cap Growth Fund | | Capital Growth Fund | | $ | 193,000,739 | | | | 9,458,968 | |
| Old Mutual Copper Rock International Small Cap Fund | | International Small Cap Fund | | | 94,539,664 | | | | 8,488,001 | |
| Old Mutual TS&W Mid Cap Value Fund | | Mid Cap Value Opportunities Fund | | | 163,004,026 | | | | 18,535,707 | |
| Old Mutual TS&W Small Cap Value Fund | | Small Cap Value Opportunities Fund | | | 105,855,279 | | | | 5,843,115 | |
| Old Mutual Analytic U.S. Long/Short Fund | | U.S. Long/Short Fund | | | 21,638,731 | | | | 1,722,142 | |
| Old Mutual Barrow Hanley Value Fund | | Value Fund | | | 118,385,619 | | | | 17,118,623 | |
| | * | Funds had Class Z shares outstanding immediately prior to the reorganization, which were exchanged for Class Y Shares of the corresponding Touchstone Fund. |
8. Litigation
In January 2012, the Old Mutual Mid-Cap Fund (which reorganized into the TS&W Mid-Cap Value Fund in March 2009 and reorganized into the Touchstone Mid Cap Value Opportunities Fund in April 2012) was served with a summons and complaint in an action brought by Edward S. Weisfelner, as Trustee of the LB Creditor Trust, in the case captioned Weisfelner v. Fund 1, et al. (U.S. Bankruptcy Court, Southern District of New York, Adv. Pro No. 10-4609) (the “Action”). The Action seeks to recover all payments made to shareholders in the December 2007 leveraged buyout of Lyondell Chemical Company as alleged fraudulent transfers, by means of intentional and constructive fraudulent transfer causes of action under state law. The amount sought to be disgorged is what the Fund received in payments in connection with the leveraged buyout, $3,784,800. The Fund (along with thousands of other defendants) has filed a joinder to the currently pending motion to dismiss and awaits the court’s ruling on that motion. The path the litigation will follow (including whether it will proceed at all) depends on the outcome of that ruling; it is uncertain when that ruling will come down, however. At this nascent stage of the litigation, it is not possible to assess likely outcome. The Fund is currently assessing the case and has not yet determined the potential effect, if any, on its net asset value.
9. Subsequent Events
Touchstone Investments and Fifth Third Asset Management announced on April 5, 2012 that Touchstone Advisors, Inc., a wholly owned subsidiary of Western & Southern Financial Group, has entered into a definitive agreement with Fifth Third Asset Management, for Touchstone to acquire selected assets of Fifth Third Asset Management’s mutual fund business.
Consummation of the transaction is subject to certain conditions and approvals and is expected to be completed in the third quarter of 2012. Upon the completion of the transaction, sixteen FifthThird Funds will be reorganized into Touchstone Funds with Fifth Third Asset Management’s affiliated investment managers continuing as sub-advisors for certain Funds.
At a meeting held on March 13, 2012, the Board of Trustees of the Trust approved an Agreement and Plan of Reorganization (the “Plan”) providing for the transfer of all of the assets of the Fifth Third Disciplined Large Cap Value Fund and the Fifth Third All Cap Value Fund (each an “Acquired Fund”), each a series of Fifth Third Funds (“FifthThird”), by the Value Fund, in exchange solely for shares of the Value Fund and the assumption by the Value Fund of the liabilities of each Acquiring Fund. The Board of Trustees of Fifth Third also voted to approve the Plan and to submit it to shareholders of each Acquired Fund for their approval. On or about September 5, 2012, the shareholders of each Acquired Fund are expected to consider the approval of the Plan. If the Plan is approved by shareholders of each Acquired Fund, the reorganizations are expected to close on or about September 10, 2012.
There were no other subsequent events that necessitated recognition or disclosure.
Report of Independent Registered Public Accounting Firm

To the members of the Audit Committee of the Board of Trustees of Touchstone Strategic Trust
In our opinion, the accompanying statement of assets and liabilities, including the schedule of investments, and the related statements of operations and of changes in net assets, and of cash flows for the Touchstone U.S. Long/Short Fund and the financial highlights present fairly, in all material respects, the financial position of Touchstone U.S. Long/Short Fund (formerly Old Mutual Analytic Long/Short Fund), Touchstone Value Fund (formerly Old Mutual Barrow Hanley Value Fund), Touchstone Capital Growth Fund (formerly Old Mutual Large Cap Growth Fund), Touchstone International Small Cap Fund (formerly Old Mutual Small Cap International Fund), Touchstone Mid Cap Value Opportunities Fund (formerly Old Mutual TS&W Mid Cap Value Fund) and Touchstone Small Cap Value Opportunities Fund (formerly Old Mutual TS&W Small Cap Value Fund) (six of the funds constituting the Touchstone Strategic Trust, hereafter referred to as the “Funds”) at June 30, 2012 and the results of each of their operations, the changes in each of their net assets, and of the cash flows for the Touchstone U.S. Long/Short Fund and the financial highlights for the periods indicated, in conformity with accounting principles generally accepted in the United States of America. These financial statements and financial highlights (hereafter referred to as “financial statements”) are the responsibility of the Funds’ management; our responsibility is to express an opinion on these financial statements based on our audits. We conducted our audits of these financial statements in accordance with the standards of the Public Company Accounting Oversight Board (United States). Those standards require that we plan and perform the audits to obtain reasonable assurance about whether the financial statements are free of material misstatement. An audit includes examining, on a test basis, evidence supporting the amounts and disclosures in the financial statements, assessing the accounting principles used and significant estimates made by management, and evaluating the overall financial statement presentation. We believe that our audits, which included confirmation of securities at June 30, 2012 by correspondence with the custodian and brokers, provide a reasonable basis for our opinion.

PricewaterhouseCoopers LLP
Denver, Colorado
August 20, 2012
Other Items (Unaudited) (Unaudited)
Qualified Dividend Income
Under the Jobs and Growth Tax Relief Reconciliation Act of 2003 (the “Act”), the following percentages of ordinary dividends paid during the fiscal period ended June 30, 2012 are designated as “qualified dividend income,” as defined in the Act, and are subject to reduced tax rates in 2011. The Funds intend to pass through the maximum allowable percentage for 1099s.
| Touchstone Capital Growth Fund | | | 100 | % |
| Touchstone International Small Cap Fund | | | 99.91 | % |
| Touchstone Mid Cap Value Opportunities Fund | | | 99.94 | % |
| Touchstone Value Fund | | | 100 | % |
Dividend Received Deduction
For corporate shareholders, the following ordinary distributions paid during the current fiscal period ended June 30, 2012 qualify for the corporate dividends received deduction. The Funds intend to pass through the maximum allowable percentage for 1099s.
| Touchstone Capital Growth Fund | | | 100 | % |
| Touchstone International Small Cap Fund | | | 2.06 | % |
| Touchstone Mid Cap Value Opportunities Fund | | | 99.94 | % |
| Touchstone Value Fund | | | 100 | % |
For the period ended June 30, 2012, the Small Cap Value Opportunites Fund and Mid Cap Value Opportunities Fund designates $4,255,964 and $8,947,482, respectively, as long-term capital gains.
Foreign Tax Income & Foreign Tax Credit
International Small Cap Fund intends to pass through a foreign tax credit to the shareholders. For the fiscal year ended June 30, 2012, the total amount of foreign source income is $1,152,174 or $0.15 per share. The total amount of foreign taxes to be paid is $102,334 or $0.01. Your allocable share of the foreign tax credit will be reported on Form 1099 Div.
Proxy Voting Guidelines
The Sub-Advisors are responsible for exercising the voting rights associated with the securities purchased and held by the Funds. A description of the policies and procedures that the Sub-Advisors use in fulfilling this responsibility and information regarding how those proxies were voted during the twelve month period ended June 30 are available without charge upon request by calling toll free 1.800.543.0407. These items are also available on the Securities and Exchange Commission’s (the Commission) website at http://www.sec.gov.
Quarterly Portfolio Disclosure
The Trust files a complete listing of portfolio holdings for each Fund as of the end of the first and third quarters of each fiscal year on Form N-Q. The complete listing (i) is available on the Commission’s website; (ii) may be reviewed and copied at the Commission’s Public Reference Room in Washington, DC; and (iii) will be made available to shareholders upon request by calling 1.800.543.0407. Information on the operation of the Public Reference Room may be obtained by calling 1-800-SEC-0330.
Schedule of Shareholder Expenses
As a shareholder of the Funds, you incur two types of costs: (1) transaction costs, including reinvested dividends or other distributions; and (2) ongoing costs, including investment advisory fees; distribution (12b-1) fees; and other Fund expenses. This example is intended to help you understand your ongoing costs (in dollars) of investing in the Funds and to compare these costs with the ongoing costs of investing in other mutual funds.
The example is based on an investment of $1,000 invested at April 1, 2012 for Actual Expenses, and January 1, 2012 for Hypothetical Expenses, and held for the entire period through June 30, 2012.
Other Items (Unaudited) (Continued)
Schedule of Shareholder Expenses (Continued)
Actual Expenses
The first line for each class of a Fund in the table below provides information about actual account values and actual expenses. You may use the information in this line, together with the amount you invested, to estimate the expenses that you paid over the period. Simply divide your account value by $1,000 (for example, an $8,600 account value divided by $1,000 = 8.6), then multiply the result by the number in the first line under the heading entitled “Expenses Paid During the Period” to estimate the expenses you paid on your account during this period.
Hypothetical Example for Comparison Purposes
The second line for each class of a Fund in the table below provides information about hypothetical account values and hypothetical expenses based on the Funds’ actual expense ratio and an assumed rate of return of 5% per year before expenses, which is not the Funds’ actual return. The hypothetical account values and expenses may not be used to estimate the actual ending account balance or expenses you paid for the period. You may use this information to compare the ongoing costs of investing in the Funds and other funds. To do so, compare this 5% hypothetical example with the 5% hypothetical examples that appear in the shareholder reports of the other funds.
| | | | | | Net Expense | | | | | | Ending | | | | |
| | | | | | Ratio | | | | | | Account | | | | |
| | | | | | Annualized | | | Beginning | | | Value | | | Expenses | |
| | | | | | June 30, | | | Account | | | June 30, | | | Paid During | |
| | | | | | 2012 | | | Value | | | 2012 | | | the Period | |
| Touchstone Capital Growth Fund | | | | | | | | | | | | | | | | | |
| Class A | | | Actual* | | | | 1.23 | % | | $ | 1,000.00 | | | $ | 925.30 | | | $ | 2.95 | |
| Class A | | | Hypothetical** | | | | 1.23 | % | | $ | 1,000.00 | | | $ | 1,018.80 | | | $ | 6.19 | |
| | | | | | | | | | | | | | | | | | | | | |
| Class C | | | Actual*** | | | | 2.00 | % | | $ | 1,000.00 | | | $ | 944.10 | | | $ | 4.05 | |
| Class C | | | Hypothetical** | | | | 2.00 | % | | $ | 1,000.00 | | | $ | 1,014.96 | | | $ | 10.05 | |
| | | | | | | | | | | | | | | | | | | | | |
| Class Y | | | Actual* | | | | 0.98 | % | | $ | 1,000.00 | | | $ | 925.80 | | | $ | 2.35 | |
| Class Y | | | Hypothetical** | | | | 0.98 | % | | $ | 1,000.00 | | | $ | 1,020.04 | | | $ | 4.94 | |
| | | | | | | | | | | | | | | | | | | | | |
| Institutional Class | | | Actual* | | | | 0.88 | % | | $ | 1,000.00 | | | $ | 925.60 | | | $ | 2.11 | |
| Institutional Class | | | Hypothetical** | | | | 0.88 | % | | $ | 1,000.00 | | | $ | 1,020.54 | | | $ | 4.43 | |
| | | | | | | | | | | | | | | | | | | | | |
| Touchstone International Small Cap Fund | | | | | | | | | | | | | | | | | |
| Class A | | | Actual* | | | | 1.55 | % | | $ | 1,000.00 | | | $ | 927.20 | | | $ | 3.72 | |
| Class A | | | Hypothetical** | | | | 1.55 | % | | $ | 1,000.00 | | | $ | 1,017.20 | | | $ | 7.80 | |
| | | | | | | | | | | | | | | | | | | | | |
| Class C | | | Actual*** | | | | 2.30 | % | | $ | 1,000.00 | | | $ | 941.60 | | | $ | 4.65 | |
| Class C | | | Hypothetical** | | | | 2.30 | % | | $ | 1,000.00 | | | $ | 1,013.46 | | | $ | 11.55 | |
| | | | | | | | | | | | | | | | | | | | | |
| Class Y | | | Actual* | | | | 1.30 | % | | $ | 1,000.00 | | | $ | 927.80 | | | $ | 3.12 | |
| Class Y | | | Hypothetical** | | | | 1.30 | % | | $ | 1,000.00 | | | $ | 1,018.45 | | | $ | 6.54 | |
| | | | | | | | | | | | | | | | | | | | | |
| Institutional Class | | | Actual* | | | | 1.05 | % | | $ | 1,000.00 | | | $ | 928.70 | | | $ | 2.52 | |
| Institutional Class | | | Hypothetical** | | | | 1.05 | % | | $ | 1,000.00 | | | $ | 1,019.70 | | | $ | 5.29 | |
| | | | | | | | | | | | | | | | | | | | | |
| Touchstone Mid Cap Value Opportunities Fund | | | | | | | | | | | | | | | | | |
| Class A | | | Actual* | | | | 1.31 | % | | $ | 1,000.00 | | | $ | 977.90 | | | $ | 3.23 | |
| Class A | | | Hypothetical** | | | | 1.31 | % | | $ | 1,000.00 | | | $ | 1,018.40 | | | $ | 6.59 | |
| | | | | | | | | | | | | | | | | | | | | |
| Class C | | | Actual*** | | | | 2.04 | % | | $ | 1,000.00 | | | $ | 1,004.60 | | | $ | 4.26 | |
| Class C | | | Hypothetical** | | | | 2.04 | % | | $ | 1,000.00 | | | $ | 1,014.76 | | | $ | 10.25 | |
| | | | | | | | | | | | | | | | | | | | | |
| Class Y | | | Actual* | | | | 1.05 | % | | $ | 1,000.00 | | | $ | 979.80 | | | $ | 2.59 | |
| Class Y | | | Hypothetical** | | | | 1.05 | % | | $ | 1,000.00 | | | $ | 1,019.70 | | | $ | 5.29 | |
Other Items (Unaudited) (Continued)
Schedule of Shareholder Expenses (Continued)
| | | | | Net Expense | | | | | | Ending | | | | |
| | | | | Ratio | | | | | | Account | | | | |
| | | | | Annualized | | | Beginning | | | Value | | | Expenses | |
| | | | | June 30, | | | Account | | | June 30, | | | Paid During | |
| | | | | 2012 | | | Value | | | 2012 | | | the Period | |
| Institutional Class | | Actual* | | | 0.91 | % | | $ | 1,000.00 | | | $ | 980.10 | | | $ | 2.25 | |
| Institutional Class | | Hypothetical** | | | 0.91 | % | | $ | 1,000.00 | | | $ | 1,020.39 | | | $ | 4.58 | |
| | | | | | | | | | | | | | | | | | | |
| Touchstone Small Cap Value Opportunities Fund | | | | | | | | | | | | | | | | |
| Class A | | Actual* | | | 1.50 | % | | $ | 1,000.00 | | | $ | 969.10 | | | $ | 3.68 | |
| Class A | | Hypothetical** | | | 1.50 | % | | $ | 1,000.00 | | | $ | 1,017.45 | | | $ | 7.54 | |
| | | | | | | | | | | | | | | | | | | |
| Class C | | Actual*** | | | 2.25 | % | | $ | 1,000.00 | | | $ | 994.90 | | | $ | 4.67 | |
| Class C | | Hypothetical** | | | 2.25 | % | | $ | 1,000.00 | | | $ | 1,013.71 | | | $ | 11.30 | |
| | | | | | | | | | | | | | | | | | | |
| Class Y | | Actual* | | | 1.22 | % | | $ | 1,000.00 | | | $ | 969.50 | | | $ | 3.00 | |
| Class Y | | Hypothetical** | | | 1.22 | % | | $ | 1,000.00 | | | $ | 1,018.85 | | | $ | 6.14 | |
| | | | | | | | | | | | | | | | | | | |
| Institutional Class | | Actual* | | | 1.10 | % | | $ | 1,000.00 | | | $ | 969.60 | | | $ | 2.70 | |
| Institutional Class | | Hypothetical** | | | 1.10 | % | | $ | 1,000.00 | | | $ | 1,019.45 | | | $ | 5.54 | |
| | | | | | | | | | | | | | | | | | | |
| Touchstone U.S. Long/Short Fund | | | | | | | | | | | | | | | | |
| Class A | | Actual* | | | 1.67 | % | | $ | 1,000.00 | | | $ | 975.00 | | | $ | 4.11 | **** |
| Class A | | Hypothetical** | | | 1.67 | % | | $ | 1,000.00 | | | $ | 1,010.60 | | | $ | 8.40 | |
| | | | | | | | | | | | | | | | | | | |
| Class C | | Actual*** | | | 2.41 | % | | $ | 1,000.00 | | | $ | 1,001.60 | | | $ | 5.02 | **** |
| Class C | | Hypothetical** | | | 2.41 | % | | $ | 1,000.00 | | | $ | 1,012.81 | | | $ | 12.09 | |
| | | | | | | | | | | | | | | | | | | |
| Class Y | | Actual* | | | 1.26 | % | | $ | 1,000.00 | | | $ | 975.30 | | | $ | 3.47 | **** |
| Class Y | | Hypothetical** | | | 1.26 | % | | $ | 1,000.00 | | | $ | 1,018.65 | | | $ | 6.34 | |
| | | | | | | | | | | | | | | | | | | |
| Institutional Class | | Actual* | | | 1.41 | % | | $ | 1,000.00 | | | $ | 975.20 | | | $ | 3.10 | **** |
| Institutional Class | | Hypothetical** | | | 1.41 | % | | $ | 1,000.00 | | | $ | 1,017.90 | | | $ | 7.09 | |
| | | | | | | | | | | | | | | | | | | |
| Touchstone Value Fund | | | | | | | | | | | | | | | | |
| Class A | | Actual* | | | 1.20 | % | | $ | 1,000.00 | | | $ | 981.70 | | | $ | 2.96 | |
| Class A | | Hypothetical** | | | 1.20 | % | | $ | 1,000.00 | | | $ | 1,018.95 | | | $ | 6.04 | |
| | | | | | | | | | | | | | | | | | | |
| Class C | | Actual*** | | | 1.95 | % | | $ | 1,000.00 | | | $ | 1,015.60 | | | $ | 4.09 | |
| Class C | | Hypothetical** | | | 1.95 | % | | $ | 1,000.00 | | | $ | 1,015.21 | | | $ | 9.80 | |
| | | | | | | | | | | | | | | | | | | |
| Class Y | | Actual* | | | 0.95 | % | | $ | 1,000.00 | | | $ | 983.10 | | | $ | 2.35 | |
| Class Y | | Hypothetical** | | | 0.95 | % | | $ | 1,000.00 | | | $ | 1,020.19 | | | $ | 4.78 | |
| | | | | | | | | | | | | | | | | | | |
| Institutional Class | | Actual* | | | 0.85 | % | | $ | 1,000.00 | | | $ | 983.80 | | | $ | 2.10 | |
| Institutional Class | | Hypothetical** | | | 0.85 | % | | $ | 1,000.00 | | | $ | 1,020.69 | | | $ | 4.28 | |
| | * | Expenses are equal to the fund's annualized expense ratio multiplied by the average account value over the period, multiplied by 91/365 (to reflect a three month period). Actual returns are for three months. |
| | ** | Expenses are equal to the fund's annualized expense ratio multiplied by the average account value over the period, multiplied by 182/365 (to reflect the one half year period). |
| | *** | The Fund began issuing Class C shares on April 16, 2012. Expenses are equal to the fund's annualized expense ratio multiplied by the expense ratio multiplied by the average account value over the period, multiplied by 76/365 (to reflect the period April 16, 2012 through June 30, 2012). Actual returns are for the period April 16, 2012 through June 30, 2012. |
| | **** | Excluding interest and dividend expenses on securities sold short, your actual cost of investment in Class A, Class C, Class Y and Institutional Class would be $3.23, $4.27, $2.61 and $2.22, respectively. |
Other Items (Unaudited) (Continued)
Approval of Investment Advisory and Sub-Advisory Agreements
At a meeting held on February 15-16, 2012, the Board of Trustees (the “Board” or “Trustees”) of the Touchstone Strategic Trust (the “Trust”), and by a separate vote, the Independent Trustees of the Trust, approved an amendment to the Investment Advisory Agreement between the Trust and the Advisor adding each Fund and also initially approved a Sub-Advisory Agreement between the Advisor and each Fund’s respective Sub-Advisor.
In determining whether to approve the amendment to the Investment Advisory Agreement and the Sub-Advisory Agreements, the Advisor furnished information necessary for a majority of the Independent Trustees to make the determination that approval of the amendment to the Investment Advisory Agreement and each Sub-Advisory Agreement was in the best interests of the respective Funds and their shareholders. The information provided to the Board included: (1) a comparison of the Funds’ proposed advisory fee and other fees and anticipated expense ratios with those of comparable funds; (2) performance information of comparable investment products; (3) the Advisor’s and its affiliates’ estimated revenues and costs of providing services to the Funds; and (4) information about the Advisor’s and Sub-Advisors’ personnel. Prior to voting, the IndependentTrustees reviewed the proposed approval of the amendment to the Investment Advisory Agreement and the Sub-Advisory Agreements with management and with experienced independent legal counsel and received materials from such counsel discussing the legal standards for their consideration of the Investment Advisory Agreement and each Sub-Advisory Agreement with respect to the Funds. The Independent Trustees also reviewed the proposed approval of the amendment to the Investment Advisory Agreement and each Sub-Advisory Agreement with independent legal counsel in private sessions at which no representatives of management were present.
In approving the amendment to the Investment Advisory Agreement, the Board considered various factors, among them: (1) the nature, extent and quality of services to be provided to the Funds, including the personnel that will provide such services; (2) the Advisor’s anticipated compensation and profitability; (3) a comparison of fees of comparable funds managed by the Advisor; (4) anticipated economies of scale; and (5) the terms of the Investment Advisory Agreement. The Board’s analysis of these factors is set forth below. The Independent Trustees were advised by independent legal counsel throughout the process.
Nature, Extent and Quality of Advisor Services. The Board considered the level and depth of knowledge of the Advisor, including the professional experience and qualifications of senior personnel. In evaluating the quality of services to be provided by the Advisor, the Board took into account its familiarity with the Advisor’s senior management through Board meetings, discussions and reports during the preceding year. The Board also took into account the Advisor’s compliance policies and procedures. The quality of administrative and other services provided to other funds managed by the Advisor, including the Advisor’s role in coordinating the activities of those funds’ other service providers, was also considered. The Board also considered the Advisor’s relationship with its affiliates and the resources available to them, as well as any potential conflicts of interest. The Board discussed the Advisor’s effectiveness in monitoring the performance of the Trust’s other subadvisors, and the Advisor’s timeliness in responding to performance issues. The Board considered the Advisor’s process for monitoring the Sub-Advisors, which would include an examination of both qualitative and quantitative elements of each Sub-Advisor’s organization, personnel, procedures, investment discipline, infrastructure and performance. The Board considered that the Advisor would conduct regular compliance due diligence reviews with each Sub-Advisor, during which the Advisor would examine a wide variety of factors, such as the quality of each Sub-Advisor’s systems, the effectiveness of each Sub-Advisor’s disaster recovery programs, trade allocation and execution procedures, compliance with each Sub-Advisor’s policies and procedures, results of regulatory examinations and any other factors that might affect the quality of services that each Sub-Advisor provides to the applicable Fund. The Board noted that the Advisor’s compliance monitoring processes also would include quarterly reviews of compliance reports, and that any issues arising from such reports and the Advisor’s compliance reviews of each Sub-Advisor would be reported to the Board.
Other Items (Unaudited) (Continued)
The Trustees concluded that they were satisfied with the nature, extent and quality of services to be provided to each Fund by the Advisor under the Investment Advisory Agreement.
Advisor’s Compensation and Profitability. The Board took into consideration the financial condition and anticipated profitability of the Advisor and its affiliates and the direct and indirect benefits to be derived by the Advisor and its affiliates from the Advisor’s relationship with the Funds. The Board noted that the Advisor had contractually agreed to waive advisory fees and administrative fees and/or reimburse expenses in order to limit the Funds’ net operating expenses and will pay sub-advisory fees out of the advisory fees the Advisor receives from the Funds. The Board reviewed the anticipated profitability of the Advisor’s relationship with the Funds and also considered whether the Advisor has the financial wherewithal to provide a high level of services to the Funds, noting the ongoing commitment of the Advisor’s parent company with respect to providing support and resources as needed. The Board also considered that the Funds’ prospective distributor, an affiliate of the Advisor, will receive Rule 12b-1 distribution fees from the Funds and will receive a portion of the sales charges on sales or redemptions of certain classes of shares. The Board also noted that the Advisor will derive benefits to its reputation and other benefits from its association with the Funds.
The Board recognized that the Advisor should be entitled to earn a reasonable level of profits in exchange for the level of services it will provide to each Fund and the entrepreneurial risk that it will assume as Advisor. Based upon their review, the Trustees concluded that the Advisor’s and its affiliates’ level of profitability, if any, to be derived from their relationship with each Fund was reasonable and not excessive.
Expenses and Performance. The Board compared each Fund’s proposed advisory fees and total expense ratios with those of comparable funds. The Board took into account the Funds’ estimated total expenses for its Class A, Class C, Class Y and Institutional Shares after estimated reimbursements. The Board also took into account that the Advisor had contractually agreed to limit the Funds’ net operating expenses until at least April 16, 2014.
The Board also considered the effect of each Fund’s potential growth and size on its performance and expenses. The Board noted that the Advisor had agreed to wave a portion of its fees and/or reimburse expenses of the Funds in order to reduce each Fund’s operating expenses to targeted levels. The Board noted that the sub-advisory fees under the Sub-Advisory Agreement with respect to each Fund will be paid by the Advisor out of the advisory fee it receives from the Fund and considered the impact of such sub-advisory fees on the profitability of the Advisor. In reviewing the proposed expense ratios and performance of the respective Acquired Funds, the Board also took into account the nature, extent and quality of the services to be provided to the Funds by the Advisor and its affiliates.
The Board considered, among other data, the specific factors set forth below with respect to each Fund:
Touchstone Capital Growth Fund. The Fund’s proposed total expense ratio (net of applicable expense waivers and reimbursements) was below the median of its peer group. The Board took into account that the Old Mutual Large Cap Growth Fund (the “Acquired Fund”), a series of Old Mutual Funds II, was expected to be merged into the Fund on or about April 16, 2012. Accordingly, the Board considered the performance of the Acquired Fund under the management of the applicable Sub-Advisor, the Acquired Fund’s current investment sub-advisor. The Board took into account that the portfolio management team currently managing the Acquired Fund was expected to manage the Fund following the merger of the Acquired Fund into the Fund.
Touchstone International Small Cap Fund. The Fund’s proposed total expense ratio (net of applicable expense waivers and reimbursements) was below the median of its peer group. The Board took into account that the Old Mutual Copper Rock International Small Cap Fund (the “Acquired Fund”), a series of Old Mutual Funds II, was expected to be merged into the Fund on or about April 16, 2012. Accordingly, the Board considered the performance of the Acquired Fund under the management of the applicable Sub-Advisor, the Acquired
Other Items (Unaudited) (Continued)
Fund’s current investment sub-advisor. The Board took into account that the portfolio management team currently managing the Acquired Fund was expected to manage the Fund following the merger of the Acquired Fund into the Fund.
Touchstone Mid Cap Value Opportunities Fund. The Fund’s proposed total expense ratio (net of applicable expense waivers and reimbursements) was above the median of its peer group. The Board took into account that the Old Mutual TS&W Mid-Cap Value Fund (the “Acquired Fund”), a series of Old Mutual Funds II, was expected to be merged into the Fund on or about April 16, 2012. Accordingly, the Board considered the performance of the Acquired Fund under the management of the applicable Sub-Advisor, the Acquired Fund’s current investment sub-advisor. The Board took into account that the portfolio management team currently managing the Acquired Fund was expected to manage the Fund following the merger of the Acquired Fund into the Fund.
Touchstone Small Cap Value Opportunities Fund. The Fund’s proposed total expense ratio (net of applicable expense waivers and reimbursements) was above the median of its peer group. The Board took into account that the Old Mutual TS&W Small Cap Value Fund (the “Acquired Fund”), a series of Old Mutual Funds II, was expected to be merged into the Fund on or about April 16, 2012. Accordingly, the Board considered the performance of the Acquired Fund under the management of the applicable Sub-Advisor, the Acquired Fund’s current investment sub-advisor. The Board took into account that the portfolio management team currently managing the Acquired Fund was expected to manage the Fund following the merger of the Acquired Fund into the Fund.
Touchstone U.S. Long/Short Fund. The Fund’s proposed total expense ratio (net of applicable expense waivers and reimbursements) was below the median of its peer group. The Board took into account that the Old Mutual Analytic U.S. Long/Short Fund (the “Acquired Fund”), a series of Old Mutual Funds II, was expected to be merged into the Fund on or about April 16, 2012. Accordingly, the Board considered the performance of the Acquired Fund under the management of the applicable Sub-Advisor, the Acquired Fund’s current investment sub-advisor. The Board took into account that the portfolio management team currently managing the Acquired Fund was expected to manage the Fund following the merger of the Acquired Fund into the Fund.
Touchstone Value Fund. The Fund’s proposed total expense ratio (net of applicable expense waivers and reimbursements) was below the median of its peer group. The Board took into account that the Old Mutual Barrow Hanley Value Fund (the “Acquired Fund”), a series of Old Mutual Funds II, was expected to be merged into the Fund on or about April 16, 2012. Accordingly, the Board considered the performance of the Acquired Fund under the management of the applicable Sub-Advisor, the Acquired Fund’s current investment sub-advisor. The Board took into account that the portfolio management team currently managing the Acquired Fund was expected to manage the Fund following the merger of the Acquired Fund into the Fund.
Economies of Scale. The Board considered the effect of each Fund’s potential growth and size on its performance and expenses. The Board took into account management’s discussion of the Funds’ advisory fee structure. The Board considered the proposed advisory fees under the Investment Advisory Agreement as a percentage of assets at different asset levels and possible economies of scale that might be realized if the assets of each Fund increase. The Board noted that the proposed advisory fee schedule for the Funds contained breakpoints that would reduce the advisory fee rate on assets above specified levels as each Fund’s assets increased. The Board also noted that if a Fund’s assets increase over time, the Fund might realize other economies of scale if assets increase proportionally more than certain other expenses. The Board also considered the fact that, under the Investment Advisory Agreement, the advisory fee payable to the Advisor by a Fund will be reduced by the total sub-advisory fee paid by the Advisor to the Fund’s Sub-Advisor.
Conclusion. In considering the approval of the amendment to the Funds’ Investment Advisory Agreement, the Board, including the Independent Trustees, did not identify any single factor as controlling, and each Trustee
Other Items (Unaudited) (Continued)
may have attributed different weights to the various factors. The Trustees evaluated all information available to them on a Fund-by-Fund basis, and their determinations were made separately with respect to each Fund. The Board reached the following conclusions regarding the Investment Advisory Agreement with the Advisor, among others: (a) the Advisor demonstrated that it possesses the capability and resources to perform the duties required of it under the Investment Advisory Agreement; (b) the Advisor maintains an appropriate compliance program; (c) each Fund’s proposed advisory fee is reasonable relative to those of similar funds and the services to be provided by the Advisor. Based on their conclusions, the Trustees determined with respect to each Fund that approval of the amendment to the Investment Advisory Agreement was in the best interests of the Fund and its shareholders.
In approving the Funds’ respective Sub-Advisory Agreements, the Board considered various factors with respect to each Fund and the applicable Sub-Advisory Agreement, among them: (1) the nature, extent and quality of services to be provided to the Fund, including the personnel providing such services; (2) the Sub-Advisor’s proposed compensation; (3) a comparison of the proposed sub-advisory fee and the performance of the respective Acquired Funds, which were to be merged into the Funds; and (4) the terms of the Sub-Advisory Agreement. The Board’s analysis of these factors is set forth below. The Independent Trustees were advised by independent legal counsel throughout the process.
Nature, Extent and Quality of Services Provided; Investment Personnel. The Board considered information provided by the Advisor regarding the services to be provided by each Sub-Advisor. The Board also considered each Sub-Advisor’s level of knowledge and investment style. The Board reviewed the experience and credentials of the applicable investment personnel who will be responsible for managing the investment of portfolio securities with respect to the Funds. The Board also noted each Sub-Advisor’s brokerage practices.
Sub-Advisor’s Compensation. The Board also took into consideration the financial condition of each Sub-Advisor and any indirect benefits to be derived by each Sub-Advisor and its affiliates from the Sub-Advisor’s relationship with the Funds. In considering the anticipated profitability to each Sub-Advisor of its relationship with the Funds, the Board noted the undertaking of the Advisor to maintain expense limitations for the Funds and also noted that the sub-advisory fees under the Sub-Advisory Agreements will be paid by the Advisor out of the advisory fees that it will receive under the Investment Advisory Agreement and are negotiated at arm’s-length. As a consequence, the anticipated profitability to each Sub-Advisor of its relationship with a Fund was not a substantial factor in the Board’s deliberations. For similar reasons, the Board did not consider the potential economies of scale in each Sub-Advisor’s management of the applicable Fund to be a substantial factor in its consideration, although the Board noted that the proposed sub-advisory fee schedule for each Fund contained breakpoints that would reduce the sub-advisory fee rate on assets above specified levels as the applicable Fund’s assets increased.
Sub-Advisory Fees and Fund Performance. The Board considered that each Fund will pay an advisory fee to the Advisor and that the Advisor will pay a sub-advisory fee to the Sub-Advisor out of the advisory fee it receives from the respective Fund. The Board considered the amount to be retained by the Advisor and the sub-advisory fee to be paid to each Sub-Advisor with respect to the various services to be provided by the Advisor and the Sub-Advisor. The Board also noted that the Advisor negotiated the sub-advisory fee with each of the Sub-Advisors at arm’s-length. The Board considered the proposed sub-advisory fee for each Fund and concluded that each Fund’s proposed sub-advisory fee was reasonable in light of the services to be received by the Fund and the other factors considered.
As noted above, the Board considered the Sub-Advisors’ long-term performance record in managing the respective Acquired Funds, which were each to be merged into the Funds. The Board also noted the Advisor’s expertise and resources in monitoring the performance, investment style and risk-adjusted performance of the Trust’s
Other Items (Unaudited) (Continued)
other sub-advisors. The Board was mindful of the Advisor’s focus on the performance of sub-advisors and the Advisor’s ways of addressing underperformance.
Conclusion. In considering the approval of the Sub-Advisory Agreement with respect to each Fund, the Board, including the Independent Trustees, did not identify any single factor as controlling, and each Trustee may have attributed different weights to the various factors. The Board reached the following conclusions regarding each Sub-Advisory Agreement, among others: (a) the Sub-Advisor is qualified to manage each Fund’s assets in accordance with the Fund’s investment goals and policies; (b) the Sub-Advisor maintains an appropriate compliance program; (c) each Fund’s proposed advisory fee is reasonable relative to those of similar funds and to the services to be provided by the Advisor and the Sub-Advisor; and (e) the Sub-Advisor’s proposed investment strategies are appropriate for pursuing the investment goals of each Fund. Based on its conclusions, the Board determined that approval of the Sub-Advisory Agreement with respect to each Fund was in the best interests of the Fund and its shareholders.
Management of the Trust (Unaudited)
Listed below is basic information regarding the Trustees and principal officers of the Trust. The Trust’s Statement of Additional Information includes additional information about the Trustees and is available, without charge, upon request by calling 1.800.543.0407.
Interested Trustees1:
| | | | | | | | | Number | | |
| | | | | | | | | of Funds | | |
| | | | | | | | | Overseen | | |
| | | | | Term of | | | | in the | | |
| Name | | Position(s) | | Office2 And | | | | Touchstone | | Other |
| Address | | Held with | | Length of | | Principal Occupation(s) | | Fund | | Directorships |
| Age | | Trust | | Time Served | | During Past 5 Years | | Complex3 | | Held4 |
| Jill T. McGruder | | Trustee and | | Until retirement | | President and CEO of IFS Financial | | 56 | | Director of LaRosa’s (a restaurant |
| Touchstone Advisors, Inc | | President | | at age 75 or until | | Services, Inc. (a holding company). | | | | chain), Capital Analysts Incorporated |
| 303 Broadway | | | | she resigns or is | | | | | | (an investment advisor and broker- |
| Cincinnati, OH | | | | removed | | | | | | dealer), IFS Financial Services, Inc. (a |
| Year of Birth: 1955 | | | | Trustee since | | | | | | holding company), Integrity and |
| | | | | 1999 | | | | | | National Integrity Life Insurance Co., |
| | | | | | | | | | | Touchstone Securities (the Trust’s |
| | | | | | | | | | | distributor), Touchstone Advisors (the |
| | | | | | | | | | | Trust’s investment advisor and |
| | | | | | | | | | | administrator) and W&S Financial |
| | | | | | | | | | | Group Distributors (a distribution |
| | | | | | | | | | | company). |
| | | | | | | | | | | |
| Independent Trustees: | | | | | | | | | | |
| | | | | | | | | | | |
| Phillip R. Cox | | Trustee | | Until retirement | | President and Chief Executive | | 56 | | Director of Cincinnati Bell (a |
| 105 East Fourth Street | | | | at age 75 or until | | Officer of Cox Financial Corp. (a | | | | communications company), Bethesda |
| Cincinnati, OH | | | | he resigns or is | | financial services company). | | | | Inc. (a hospital), Timken Co. (a |
| Year of Birth: 1947 | | | | removed | | | | | | manufacturing company), Diebold (a |
| | | | | Trustee since | | | | | | technology solutions company), and |
| | | | | 1999 | | | | | | Ohio Business Alliance for Higher |
| | | | | | | | | | | Education. Director of Duke Energy |
| | | | | | | | | | | from 1994-2008. |
| | | | | | | | | | | |
| H. Jerome Lerner | | Trustee | | Until retirement | | Principal of HJL Enterprises (a | | 56 | | BASCO Shower Enclosures (a design |
| c/o Touchstone Advisors, Inc. | | | | at age 75 or until | | privately held investment company). | | | | and manufacturing company); |
| 303 Broadway | | | | he resigns or is | | | | | | Hebrew Union College - Jewish |
| Cincinnati, OH | | | | removed | | | | | | Institute of Religion. |
| Year of Birth: 1938 | | | | Trustee since | | | | | | |
| | | | | 1989 | | | | | | |
Management of the Trust (Unaudited) (Continued)
Independent Trustees (Continued):
| | | | | | | | | Number | | |
| | | | | | | | | of Funds | | |
| | | | | | | | | Overseen | | |
| | | | | Term of | | | | in the | | |
| Name | | Position(s) | | Office2 And | | | | Touchstone | | Other |
| Address | | Held with | | Length of | | Principal Occupation(s) | | Fund | | Directorships |
| Age | | Trust | | Time Served | | During Past 5 Years | | Complex3 | | Held4 |
| | | | | | | | | | | |
| Donald C. Siekmann | | Trustee | | Until retirement | | Executive for Duro Bag | | 56 | | Society for Preservation of Music |
| c/o Touchstone Advisors, Inc. | | | | at age 75 or until | | Manufacturing Co. (a bag | | | | Hall; Riverfront Mutual Funds (until |
| 303 Broadway | | | | he resigns or is | | manufacturer) from 2002-2008. | | | | 2008). |
| Cincinnati, OH | | | | removed | | | | | | |
| Year of Birth: 1938 | | | | Trustee since | | | | | | |
| | | | | 2005 | | | | | | |
| | | | | | | | | | | |
| John P. Zanotti | | Trustee | | Until retirement | | Chairman of Integrated Media | | 56 | | Cincinnati Children’s Hospital from |
| c/o Touchstone Advisors, Inc. | | | | at age 75 or until | | Technologies (a media company). | | | | 1994-2010. |
| 303 Broadway | | | | he resigns or is | | | | | | |
| Cincinnati, OH | | | | removed | | | | | | |
| Year of Birth: 1948 | | | | Trustee since | | | | | | |
| | | | | 2002 | | | | | | |
| | | | | | | | | | | |
| Susan J. Hickenlooper | | Trustee | | Until retirement | | Trustee of Gateway Trust from 2006 | | 56 | | Trustee of Cincinnati Parks |
| c/o Touchstone Advisors, Inc. | | | | at age 75 or until | | to 2009. | | | | Foundation (a charitable |
| 303 Broadway | | | | she resigns or is | | | | | | organization) from 2000-present; |
| Cincinnati, OH | | | | removed | | | | | | Trustee of Episcopal Retirement |
| Year of Birth: 1946 | | | | Trustee since | | | | | | Homes Foundation from 1998-2011. |
| | | | | 2009 | | | | | | |
| | 1 | Ms. McGruder, as a director of the Advisor and the Trust's Distributor, and an officer of affiliates of the Advisor and the Trust's Distributor, is an “interested person” of the Trust within the meaning of Section 2(a)(19) of the 1940 Act. |
| | 2 | Each Trustee is elected to serve until the age of 75 or until he or she sooner resigns or is removed. |
| | 3 | The Touchstone Fund Complex consists of 18 series of the Trust, 3 series of Touchstone Tax-Free Trust, 19 series of Touchstone Funds Group Trust, 4 series of Touchstone Investment Trust, 1 series of Touchstone Institutional Funds Trust, and 11 variable annuity series of Touchstone Variable Series Trust. |
| | 4 | Each Trustee is also a Trustee of Touchstone Funds Group Trust, Touchstone Tax-Free Trust, Touchstone Investment Trust, Touchstone Institutional Funds Trust, and Touchstone Variable Series Trust. |
Management of the Trust (Unaudited) (Continued)
Principal Officers1:
| | | | | | | | | Number | | |
| | | | | | | | | of Funds | | |
| | | | | | | | | Overseen | | |
| | | | | Term of | | | | in the | | |
| Name | | Position(s) | | Office2 And | | | | Touchstone | | Other |
| Address | | Held with | | Length of | | Principal Occupation(s) | | Fund | | Directorships |
| Age | | Trust | | Time Served | | During Past 5 Years | | Complex2 | | Held |
| Jill T. McGruder | | President | | Until resignation, | | See biography above. | | 56 | | See biography |
| Touchstone Advisors, Inc. | | | | removal or | | | | | | above. |
| 303 Broadway | | | | disqualification | | | | | | |
| Cincinnati, OH | | | | President since | | | | | | |
| Year of Birth: 1955 | | | | 2004; President | | | | | | |
| | | | | from 2000-2002 | | | | | | |
| | | | | | | | | | | |
| Steven M. Graziano | | Vice | | Until resignation, | | President of Touchstone Advisors, Inc.; Executive Vice | | 56 | | None |
| Touchstone Advisors, Inc. | | President | | removal or | | President of Pioneer Investment Management, Head of | | | | |
| 303 Broadway | | | | disqualification | | Retail Distribution and Strategic Marketing 2007- | | | | |
| Cincinnati, OH | | | | Vice President | | 2008; Executive Vice President of Pioneer Investment | | | | |
| Year of Birth: 1954 | | | | since 2009 | | Management, Chief Marketing Officer 2002-2007. | | | | |
| | | | | | | | | | | |
| Timothy D. Paulin | | Vice | | Until resignation, | | Senior Vice President of Investment Research and | | 56 | | None |
| Touchstone Advisors, Inc. | | President | | removal or | | Product Management of Touchstone Advisors, Inc.; | | | | |
| 303 Broadway | | | | disqualification | | Principal of Klein Decisions | | | | |
| Cincinnati, OH | | | | Vice President | | | | | | |
| Year of Birth: 1963 | | | | since 2010 | | | | | | |
| | | | | | | | | | | |
| Joseph Melcher | | Chief | | Until resignation, | | Vice President of Compliance of IFS Financial Services | | 56 | | None |
| Touchstone Advisors, Inc. | | Compliance | | removal or | | (a holding company); Assistant Vice President of | | | | |
| 303 Broadway | | Officer | | disqualification | | Compliance of IFS Financial Services 2005-2010. | | | | |
| Cincinnati, OH | | | | Chief | | | | | | |
| Year of Birth: 1973 | | | | Compliance | | | | | | |
| | | | | Officer since | | | | | | |
| | | | | 2010 | | | | | | |
| | | | | | | | | | | |
| Terrie A. Wiedenheft | | Controller | | Until resignation, | | Senior Vice President, Chief Financial Officer and | | 56 | | None |
| Touchstone Advisors, Inc. | | and | | removal or | | Chief Operations Officer of IFS Financial Services, Inc. | | | | |
| 303 Broadway | | Treasurer | | disqualification | | | | | | |
| Cincinnati, OH | | | | Controller since | | | | | | |
| Year of Birth: 1962 | | | | 2000 Treasurer | | | | | | |
| | | | | since 2003 | | | | | | |
| | | | | | | | | | | |
| Elizabeth R. Freeman | | Secretary | | Until resignation, | | Managing Director and Senior Counsel at BNY | | 56 | | None |
| BNY Mellon | | | | removal or | | Mellon Investment Servicing (US) Inc. | | | | |
| 201 Washington Street | | | | disqualification | | | | | | |
| Boston, MA | | | | Secretary since | | | | | | |
| Year of Birth: 1962 | | | | 2011 | | | | | | |
| | 1 | Each officer also holds the same office with Touchstone Funds Group Trust, Touchstone Tax-Free Trust, Touchstone Investment Trust, Touchstone Institutional Funds Trust, and Touchstone Variable Series Trust. |
| | 2 | The Touchstone Fund Complex consists of 18 series of the Trust, 3 series of Touchstone Tax-Free Trust, 19 series of Touchstone Funds Group Trust, 4 series of Touchstone Investment Trust, 1 series of Touchstone Institutional Funds Trust, and 11 variable annuity series of Touchstone Variable Series Trust. |
PRIVACY PROTECTION POLICY
We Respect Your Privacy
Thank you for your decision to invest with us. Touchstone and its affiliates have always placed a high value on the trust and confidence our clients place in us. We believe that confidence must be earned and validated through time. In today’s world, when technology allows the sharing of information at light speeds, trust must be reinforced by our sincere pledge to take the steps necessary to ensure that the information you share with us is treated with respect and confidentiality.
Our Pledge to Our Clients
| | • | We collect only the information we need to service your account and administer our business. |
| | • | We are committed to keeping your information confidential and we place strict limits and controls on the use and sharing of your information. |
| | • | We make every effort to ensure the accuracy of your information. |
We Collect the Following Nonpublic Personal Information About You:
| | • | Information we receive from you on or in applications or other forms, correspondence, or conversations, including, but not limited to, your name, address, phone number, social security number, assets, income and date of birth; and |
| | • | Information about your transactions with us, our affiliates, or others, including, but not limited to, your account number and balance, payment history, parties to transactions, cost basis information, and other financial information. |
Categories of Information We Disclose and Parties to Whom We Disclose
We do not disclose any nonpublic personal information about our current or former clients to nonaffiliated third parties, except as required or permitted by law.
We Place Strict Limits and Controls on the Use and Sharing of Your Information
| | • | We restrict access to nonpublic personal information about you to authorized employees who need the information to administer your business. |
| | • | We maintain physical, electronic and procedural safeguards that comply with federal standards to protect this information. |
| | • | We do not disclose any nonpublic personal information about our current or former clients to anyone, except as required or permitted by law or as described in this document. |
| | • | We will not sell your personal information to anyone. |
We May Provide Information to Service Your Account
Sometimes it is necessary to provide information about you to various companies such as transfer agents, custodians, broker-dealers and marketing service firms to facilitate the servicing of your account. These organizations have a legitimate business need to see some of your personal information in order for us to provide service to you. We may disclose to these various companies the information that we collect as described above. We require that these companies, including our own subsidiaries and affiliates, strictly maintain the confidentiality of this information and abide by all applicable laws. Companies within our corporate family that may receive this information are financial service providers and insurance companies. We do not permit these associated companies to sell the information for their own purposes, and we never sell our customer information.
This policy is applicable to the following affiliated companies: Touchstone Funds Group Trust, Touchstone Investment Trust, Touchstone Strategic Trust, Touchstone Tax-Free Trust, Touchstone Variable Series Trust, Touchstone Institutional Funds Trust, Touchstone Securities, Inc.,* and W&S Brokerage Services, Inc.
* Touchstone Securities, Inc. serves as the underwriter to the Touchstone Funds.
A Member of Western & Southern Financial Group®
The Privacy Protection Policy is not part of the Annual Report.
This page intentionally left blank.
This page intentionally left blank.
This page intentionally left blank.

Touchstone Investments
Distributor
Touchstone Securities, Inc.*
303 Broadway
Cincinnati, Ohio 45202-4203 800.638.8194
www.touchstoneinvestments.com
Investment Advisor
Touchstone Advisors, Inc.*
303 Broadway
Cincinnati, Ohio 45202-4203
Transfer Agent
BNY Mellon Investment Servicing (US) Inc.
4400 Computer Drive
Westborough, MA 01581
Shareholder Service
800.543.0407
* A Member of Western & Southern Financial Group
TSF-54-TST-ARII-1206
Item 2. Code of Ethics.
| (a) | The registrant, as of the end of the period covered by this report, has adopted a code of ethics that applies to the registrant’s principal executive officer, principal financial officer, principal accounting officer or controller, or persons performing similar functions, regardless of whether these individuals are employed by the registrant or a third party. |
| (c) | There have been no amendments, during the period covered by this report, to a provision of the code of ethics that applies to the registrant’s principal executive officer, principal financial officer, principal accounting officer or controller, or persons performing similar functions, regardless of whether these individuals are employed by the registrant or a third party, and that relates to any element of the code of ethics description. |
| (d) | The registrant has not granted any waivers, including an implicit waiver, from a provision of the code of ethics that applies to the registrant’s principal executive officer, principal financial officer, principal accounting officer or controller, or persons performing similar functions, regardless of whether these individuals are employed by the registrant or a third party, that relates to one or more of the items set forth in paragraph (b) of this item’s instructions. |
Item 3. Audit Committee Financial Expert.
The registrant’s Board of Trustees has determined that the registrant has at least one audit committee financial expert serving on its audit committee. Mr. Donald Siekmann is the registrant’s audit committee financial expert and is an independent trustee within the meaning of the Investment Company Act of 1940, as amended (the “1940 Act”).
Item 4. Principal Accountant Fees and Services.
Audit Fees
| (a) | The aggregate fees billed for professional services rendered by the principal accountant for the audit of the registrant's annual financial statements or services that are normally provided by the accountant in connection with statutory and regulatory filings or engagements from the period April 1, 2012 through fiscal year ended June 30, 2012 is $133,600. The Funds were acquired by the Touchstone Strategic Trust on April 16, 2012. |
Audit-Related Fees
| (b) | The aggregate fees billed for assurance and related services by the principal accountant that are reasonably related to the performance of the audit of the registrant's financial statements and are not reported under paragraph (a) of this Item from the period April 1, 2012 through fiscal year ended June 30, 2012 is $0. The Funds were acquired by the Touchstone Strategic Trust on April 16, 2012. |
Tax Fees
| (c) | The fees for tax compliance services from the period April 1, 2012 through fiscal year ended June 30, 2012 is $23,200. The Funds were acquired by the Touchstone Strategic Trust on April 16, 2012. |
Fees for 2012 relate to the preparation of federal income and excise tax returns and review of capital gains distribution calculations.
All Other Fees
| (d) | There were no other fees for all other services for the period of April 1, 2012 through fiscal year end. The funds were acquired by the Touchstone Strategic Trust on April 16, 2012. |
| (e)(1) | Disclose the audit committee's pre-approval policies and procedures described in paragraph (c)(7) of Rule 2-01 of Regulation S-X. |
The Audit Committee’s pre-approval policies describe the types of audit, audit-related, tax and other services that have the general pre-approval of the Audit Committee. The pre-approval policies provide that annual audit service fees, tax services not specifically granted pre-approval, services exceeding pre-approved cost levels and other services that have not received general pre-approval will be subject to specific pre-approval by the Audit Committee. The pre-approval policies further provide that the Committee may grant general pre-approval to other audit services (statutory audits and services associated with SEC registration statements, periodic reports and other documents filed with the SEC or other documents issued in connection with securities offerings), audit-related services (accounting consultations related to accounting, financial reporting or disclosure matters not classified as “audit services,” assistance with understanding and implementing new accounting and financial reporting guidance from rulemaking authorities, agreed-upon or expanded audit procedures related to accounting and/or billing records required to respond to or comply with financial, accounting or regulatory reporting matters and assistance with internal control reporting requirements under Form N-SAR and Form N-CSR), tax services that have historically been provided by the auditor that the Committee believes would not impair the independence of the auditor and are consistent with the SEC’s rules on auditor independence and permissible non-audit services classified as “all other services” that are routine and recurring services.
| (e)(2) | All services described in paragraphs (c) and (d) of Item 4 were approved by the Audit Committee. Not applicable for paragraph (b) of Item 4. |
| (f) | The percentage of hours expended on the principal accountant's engagement to audit the registrant's financial statements for the most recent fiscal year that were attributed to work performed by persons other than the principal accountant's full-time, permanent employees was less than fifty percent. |
| (g) | The aggregate non-audit fees billed by the registrant's accountant for services rendered to the registrant, and rendered to the registrant's investment adviser (not including any sub-adviser whose role is primarily portfolio management and is subcontracted with or overseen by another investment adviser), and any entity controlling, controlled by, or under common control with the adviser that provides ongoing services to the registrant from the period April 1, 2012 through fiscal year ended June 30, 2012 is $23,200. The Funds were acquired by the Touchstone Strategic Trust on April 16, 2012. |
| (h) | The registrant's audit committee of the board of trustees has considered whether the provision of non-audit services that were rendered to the registrant's investment adviser (not including any sub-adviser whose role is primarily portfolio management and is subcontracted with or overseen by another investment adviser), and any entity controlling, controlled by, or under common control with the investment adviser that provides ongoing services to the registrant that were not pre-approved pursuant to paragraph (c)(7)(ii) of Rule 2-01 of Regulation S-X is compatible with maintaining the principal accountant's independence. |
Item 5. Audit Committee of Listed registrants.
Not applicable.
Item 6. Investments.
| (a) | Schedule of Investments in securities of unaffiliated issuers as of the close of the reporting period is included as part of the report to shareholders filed under Item 1 of this form. |
Item 7. Disclosure of Proxy Voting Policies and Procedures for Closed-End Management Investment Companies.
Not applicable.
Item 8. Portfolio Managers of Closed-End Management Investment Companies.
Not applicable.
Item 9. Purchases of Equity Securities by Closed-End Management Investment Company and Affiliated Purchasers.
Not applicable.
Item 10. Submission of Matters to a Vote of Security Holders.
There have been no material changes to the procedures by which the shareholders may recommend nominees to the registrant’s board of trustees, where those changes were implemented after the registrant last provided disclosure in response to the requirements of Item 407(c)(2)(iv) of Regulation S-K (17 CFR 229.407) (as required by Item 22(b)(15) of Schedule 14A (17 CFR 240.14a-101)), or this Item.
Item 11. Controls and Procedures.
| (a) | The registrant’s principal executive and principal financial officers, or persons performing similar functions, have concluded that the registrant’s disclosure controls and procedures (as defined in Rule 30a-3(c) under the Investment Company Act of 1940, as amended (the “1940 Act”) (17 CFR 270.30a-3(c))) are effective, as of a date within 90 days of the filing date of the report that includes the disclosure required by this paragraph, based on their evaluation of these controls and procedures required by Rule 30a-3(b) under the 1940 Act (17 CFR 270.30a-3(b)) and Rules 13a-15(b) or 15d-15(b) under the Securities Exchange Act of 1934, as amended (17 CFR 240.13a-15(b) or 240.15d-15(b)). |
| (b) | There were no changes in the registrant’s internal control over financial reporting (as defined in Rule 30a-3(d) under the 1940 Act (17 CFR 270.30a-3(d)) that occurred during the registrant’s second fiscal quarter of the period covered by this report that has materially affected, or is reasonably likely to materially affect, the registrant’s internal control over financial reporting. |
Item 12. Exhibits.
| (a)(1) | Code of ethics, or any amendment thereto, that is the subject of disclosure required by Item 2 is attached hereto. |
| (a)(2) | Certifications pursuant to Rule 30a-2(a) under the 1940 Act and Section 302 of the Sarbanes-Oxley Act of 2002 are attached hereto. |
| (b) | Certifications pursuant to Rule 30a-2(b) under the 1940 Act and Section 906 of the Sarbanes-Oxley Act of 2002 are attached hereto. |
SIGNATURES
Pursuant to the requirements of the Securities Exchange Act of 1934 and the Investment Company Act of 1940, the registrant has duly caused this report to be signed on its behalf by the undersigned, thereunto duly authorized.
| (Registrant) | Touchstone Strategic Trust |
| | |
| By (Signature and Title)* | /s/ Jill T. McGruder |
| | Jill T. McGruder, President |
| | (principal executive officer) |
| | |
| Date | 8/30/12 |
Pursuant to the requirements of the Securities Exchange Act of 1934 and the Investment Company Act of 1940, this report has been signed below by the following persons on behalf of the registrant and in the capacities and on the dates indicated.
| By (Signature and Title)* | /s/ Jill T. McGruder |
| | Jill T. McGruder, President |
| | (principal executive officer) |
| | |
| Date | 8/30/12 |
| | |
| | |
| By (Signature and Title)* | /s/ Terrie A. Wiedenheft |
| | Terrie A. Wiedenheft, Controller and Treasurer |
| | (principal financial officer) |
| | |
| Date | 8/30/12 |
| | |
* Print the name and title of each signing officer under his or her signature.