UNITED STATES
SECURITIES AND EXCHANGE COMMISSION
Washington, D.C. 20549
FORM N-CSR
CERTIFIED SHAREHOLDER REPORT OF REGISTERED MANAGEMENT
INVESTMENT COMPANIES
| |
| Investment Company Act file number | 811- 3721 |
DREYFUS INTERMEDIATE MUNICIPAL BOND FUND, INC.
(Exact name of Registrant as specified in charter)
c/o The Dreyfus Corporation
200 Park Avenue
New York, New York 10166
(Address of principal executive offices) (Zip code)
Michael A. Rosenberg, Esq.
200 Park Avenue
New York, New York 10166
(Name and address of agent for service)
| |
| Registrant's telephone number, including area code: | (212) 922-6000 |
| |
| Date of fiscal year end: | 5/31 |
| Date of reporting period: | 5/31/10 |
FORM N-CSR
| |
| Item 1. | Reports to Stockholders. |
|
| Dreyfus |
| Intermediate Municipal |
| Bond Fund, Inc. |
ANNUAL REPORT May 31, 2007

Save time. Save paper. View your next shareholder report online as soon as it’s available. Log into www.dreyfus.com and sign up for Dreyfus eCommunications. It’s simple and only takes a few minutes.
The views expressed in this report reflect those of the portfolio manager only through the end of the period covered and do not necessarily represent the views of Dreyfus or any other person in the Dreyfus organization. Any such views are subject to change at any time based upon market or other conditions and Dreyfus disclaims any responsibility to update such views.These views may not be relied on as investment advice and, because investment decisions for a Dreyfus fund are based on numerous factors, may not be relied on as an indication of trading intent on behalf of any Dreyfus fund.

| | Contents |
| | THE FUND |
| 2 | A Letter from the CEO |
| 3 | Discussion of Fund Performance |
| 6 | Fund Performance |
| 7 | Understanding Your Fund’s Expenses |
| 7 | Comparing Your Fund’s Expenses With Those of Other Funds |
| 8 | Statement of Investments |
| 29 | Statement of Assets and Liabilities |
| 30 | Statement of Operations |
| 31 | Statement of Changes in Net Assets |
| 32 | Financial Highlights |
| 33 | Notes to Financial Statements |
| 39 | Report of Independent Registered Public Accounting Firm |
| 40 | Important Tax Information |
| 41 | Information About the Review and Approval of the Fund’s Investment Management Agreement |
| 46 | Board Members Information |
| 49 | Officers of the Fund |
| | FOR MORE INFORMATION |
| | Back Cover |
Dreyfus Intermediate Municipal
Bond Fund, Inc.
The Fund

A LETTER FROM THE CEO
Dear Shareholder:
We are pleased to present this annual report for Dreyfus Intermediate Municipal Bond Fund, Inc., covering the 12-month period from June 1, 2006, through May 31, 2007.
The U.S. economy continued to moderate during the reporting period as cooling housing markets took their toll on consumer and business spending. Labor markets, however, remained quite strong, and key measures of inflation have stayed stubbornly above the Federal Reserve’s stated “comfort zone.” Our economists believe that the anemic rate of U.S. economic growth recorded in the first quarter of 2007 should be the weakest reading of the current midcycle slowdown, and economic growth is likely to recover eventually to a near-trend pace.
The likely implications of our economic outlook include a long pause in Fed policy, a modest drop in 10-year Treasury bond yields (and consequent rise in price) and, in the absence of an as-yet unforeseen event, persistently tight yield spreads throughout the municipal bond market sectors.We expect these developments to produce both challenges and opportunities for fixed-income investors. As always, your financial advisor can help you position your investments for these trends.
For information about how the fund performed during the reporting period, as well as market perspectives, we have provided a Discussion of Fund Performance given by the fund’s Portfolio Manager.
Thank you for your continued confidence and support.

Thomas F. Eggers
Chief Executive Officer
The Dreyfus Corporation
June 15, 2007
2

DISCUSSION OF FUND PERFORMANCE
For the reporting period of June 1, 2006, through May 31, 2007, as provided by Monica S.Wieboldt, Senior Portfolio Manager
Fund and Market Performance Overview
Strong performance among municipal bonds over much of the period was offset by bouts of heightened volatility stemming from economic and inflation concerns.The fund’s return approximated the return of its benchmark, however, the fund produced a higher return than its Lipper category average return, due mainly to its core holdings of seasoned, income-oriented securities.
For the 12-month period ended May 31, 2007, the fund achieved a total return of 4.03%.1 The Lehman Brothers 7-Year Municipal Bond Index (the “Index”), the fund’s benchmark, achieved a total return of 4.10% for the same period.2 In addition, the average total return for all funds reported in the Lipper Intermediate Municipal Debt Funds category was 3.57%.3
The Fund’s Investment Approach
The fund seeks the maximum amount of current income exempt from federal income tax as is consistent with the preservation of capital.To pursue this goal, the fund normally invests substantially all of its assets in municipal bonds that provide income exempt from federal personal income tax.
The fund invests at least 80% of its assets in municipal bonds rated A or higher, or the unrated equivalent as determined by Dreyfus. The fund may invest up to 20% of its assets in municipal bonds rated below A, including bonds rated below investment grade (“high yield” or “junk” bonds) or the unrated equivalent as determined by Dreyfus. The dollar-weighted average maturity of the fund’s portfolio ranges between three and 10 years.
We may buy and sell bonds based on credit quality, market outlook and yield potential. In selecting municipal bonds for investment, we may
DISCUSSION OF FUND PERFORMANCE (continued)
assess the current interest-rate environment and the municipal bond’s potential volatility in different rate environments. We focus on bonds with the potential to offer attractive current income, typically looking for bonds that can provide consistently attractive current yields or that are trading at competitive market prices. A portion of the fund’s assets may be allocated to“discount”bonds,which are bonds that sell at a price below their face value, or to “premium” bonds, which are bonds that sell at a price above their face value.The fund’s allocation to either discount bonds or to premium bonds will change along with our changing views of the current interest-rate and market environment.We also may look to select bonds that are most likely to obtain attractive prices when sold.
Early Market Rally Erased by Economic and Inflation Concerns
Although the reporting began in an environment of robust economic growth and intensifying inflationary pressures, conditions changed dramatically over the summer and fall of 2006. Short-term interest rates stabilized and energy prices declined, supporting a bond market rally. Most of the market’s strength was concentrated among longer-term securities, leading to narrower yield differences along the market’s maturity range.
Soon after 2007 began, slower U.S. economic growth and persistent inflationary concerns caused the outlook for the Federal Reserve Board’s (the “Fed”) interest-rate policy to become murkier. Market volatility intensified in late February, sparked by turmoil in overseas equity markets and the U.S. sub-prime mortgage sector. From March through April, unexpectedly robust labor markets, resurgent energy prices and comments from the Fed regarding the risk of inflation caused bond prices to fall, erasing previous gains.
An increase in the supply of newly issued municipal bonds also contributed to heightened market volatility. Some states began to see tax receipts fall below budget estimates, in part because of the slowdown in housing market. While municipal bond issuance volume increased compared to the same period one year earlier, the additional supply was readily absorbed by robust investor demand, including from non-traditional investors such as hedge funds and foreign governments.
4
Income-Oriented Bonds Helped Drive Performance
Because bond prices ended the reporting period close to where they began, the market’s and fund’s returns were generally derived from current income.The fund’s relative performance benefited from its core holdings of income-oriented bonds, especially those with maturities of 15 years or less. Securities with relatively little time left until their expected early redemptions helped protect the fund from the full brunt of market volatility. Lower-rated bonds fared well, including credits issued on behalf of airlines and the state’s settlement of litigation with U.S. tobacco companies. Finally, the fund received strong contributions from bonds that were scheduled for early redemption by their issuers, with funds set aside for principal repayments. Due to uncertainty regarding Fed policy, we generally maintained the fund’s average duration in the neutral range.
Fund Remains Positioned for Steady Fed Policy
With the economy slowing and inflation still above the Fed’s comfort zone, short-term interest rates seem likely to us to remain at current levels for some time.Therefore, we have maintained a neutral average duration and a focus on income-oriented bonds. Of course, we remain prepared to adjust our strategies as market conditions change.
June 15, 2007
| |
| 1 | Total return includes reinvestment of dividends and any capital gains paid. Past performance is no |
| | guarantee of future results. Share price, yield and investment return fluctuate such that upon |
| | redemption, fund shares may be worth more or less than their original cost. Income may be subject |
| | to state and local taxes, and some income may be subject to the federal alternative minimum tax |
| | (AMT) for certain investors. Capital gains, if any, are fully taxable. Return figure provided reflects |
| | the absorption of certain fund expenses by The Dreyfus Corporation pursuant to an undertaking |
| | in effect that may be extended, terminated or modified at any time. Had these expenses not been |
| | absorbed, the fund’s return would have been lower. |
| 2 | SOURCE: LIPPER INC. — Reflects reinvestment of dividends and, where applicable, capital |
| | gain distributions.The Lehman Brothers 7-Year Municipal Bond Index is an unmanaged total |
| | return performance benchmark for the investment-grade, geographically unrestricted 7-year tax- |
| | exempt bond market, consisting of municipal bonds with maturities of 6-8 years. Index returns do |
| | not reflect fees and expenses associated with operating a mutual fund. |
| 3 | Source: Lipper Inc. |
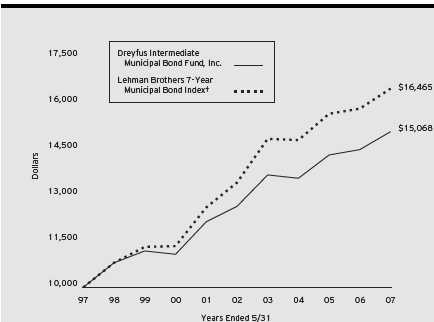
Comparison of change in value of $10,000 investment in Dreyfus Intermediate Municipal Bond Fund, Inc. and the Lehman Brothers 7-Year Municipal Bond Index
| | | |
| Average Annual Total Returns as of 5/31/07 | | | |
| | 1 Year | 5 Years | 10 Years |
| Fund | 4.03% | 3.58% | 4.19% |
|
| † Source: Lipper Inc. |
| Past performance is not predictive of future performance.The fund’s performance shown in the graph and table does not |
| reflect the deduction of taxes that a shareholder would pay on fund distributions or the redemption of fund shares. |
| The above graph compares a $10,000 investment made in Dreyfus Intermediate Municipal Bond Fund, Inc. on |
| 5/31/97 to a $10,000 investment made in the Lehman Brothers 7-Year Municipal Bond Index (the “Index”) on that |
| date.All dividends and capital gain distributions are reinvested. |
| The fund invests primarily in municipal securities and maintains a portfolio with a weighted average maturity ranging |
| between 3 and 10 years.The fund’s performance shown in the line graph above takes into account fees and expenses.The |
| Index, unlike the fund, is an unmanaged total return performance benchmark for the investment-grade, geographically |
| unrestricted 7-year tax-exempt bond market, consisting of municipal bonds with maturities of 6-8 years.The Index does |
| not take into account charges, fees and other expenses.These factors can contribute to the Index potentially outperforming |
| or underperforming the fund. Further information relating to fund performance, including expense reimbursements, if |
| applicable, is contained in the Financial Highlights section of the prospectus and elsewhere in this report. |
6
UNDERSTANDING YOUR FUND’S EXPENSES (Unaudited)
As a mutual fund investor, you pay ongoing expenses, such as management fees and other expenses. Using the information below, you can estimate how these expenses affect your investment and compare them with the expenses of other funds.You also may pay one-time transaction expenses, including sales charges (loads) and redemption fees, which are not shown in this section and would have resulted in higher total expenses. For more information, see your fund’s prospectus or talk to your financial adviser.
Review your fund’s expenses
The table below shows the expenses you would have paid on a $1,000 investment in Dreyfus Intermediate Municipal Bond Fund, Inc. from December 1, 2006 to May 31, 2007. It also shows how much a $1,000 investment would be worth at the close of the period, assuming actual returns and expenses.
Expenses and Value of a $1,000 Investment
assuming actual returns for the six months ended May 31, 2007
| |
| Expenses paid per $1,000† | $ 4.09 |
| Ending value (after expenses) | $1,002.20 |
COMPARING YOUR FUND’S EXPENSES
WITH THOSE OF OTHER FUNDS (Unaudited)
Using the SEC’s method to compare expenses
The Securities and Exchange Commission (SEC) has established guidelines to help investors assess fund expenses. Per these guidelines, the table below shows your fund’s expenses based on a $1,000 investment, assuming a hypothetical 5% annualized return. You can use this information to compare the ongoing expenses (but not transaction expenses or total cost) of investing in the fund with those of other funds.All mutual fund shareholder reports will provide this information to help you make this comparison. Please note that you cannot use this information to estimate your actual ending account balance and expenses paid during the period.
Expenses and Value of a $1,000 Investment
assuming a hypothetical 5% annualized return for the six months ended May 31, 2007
| |
| Expenses paid per $1,000† | $ 4.13 |
| Ending value (after expenses) | $1,020.84 |
|
| † Expenses are equal to the fund’s annualized expense ratio of .82%; multiplied by the average account value over the |
| period, multiplied by 182/365 (to reflect the one-half year period). |
|
| STATEMENT OF INVESTMENTS |
| May 31, 2007 |
| | | | | |
| Long-Term Municipal | Coupon | Maturity | Principal | | |
| Investments—101.5% | Rate (%) | Date | Amount ($) | | Value ($) |
| Alabama—1.8% | | | | | |
| Alabama Port Authority, | | | | | |
| Docks Facilities Revenue | | | | | |
| (Insured; MBIA) | 5.00 | 10/1/22 | 5,000,000 | | 5,276,300 |
| Huntsville Health Care Authority, | | | | | |
| Revenue (Insured; MBIA) | 5.00 | 6/1/13 | 1,600,000 | | 1,680,864 |
| Jefferson County, | | | | | |
| Limited Obligation School | | | | | |
| Warrants | 5.25 | 1/1/23 | 5,500,000 | | 5,804,700 |
| McIntosh Industrial Development | | | | | |
| Board, Environmental | | | | | |
| Facilities Revenue (Ciba | | | | | |
| Specialty Chemicals | | | | | |
| Corporation Project) | 4.65 | 6/1/08 | 375,000 | | 377,340 |
| Alaska—4.6% | | | | | |
| Alaska International Airports, | | | | | |
| Revenue (Insured; AMBAC) | 5.50 | 10/1/11 | 2,560,000 | | 2,724,326 |
| Alaska International Airports, | | | | | |
| Revenue (Insured; AMBAC) | 5.50 | 10/1/12 | 1,620,000 | | 1,742,018 |
| Alaska Student Loan Corporation, | | | | | |
| Student Loan Revenue (Insured; | | | | | |
| AMBAC) | 6.00 | 7/1/16 | 6,380,000 | | 6,712,398 |
| Anchorage | | | | | |
| (Insured; FGIC) | 5.88 | 12/1/10 | 2,365,000 | a | 2,522,414 |
| Anchorage | | | | | |
| (Insured; FGIC) | 5.88 | 12/1/10 | 1,500,000 | a | 1,599,840 |
| Anchorage, | | | | | |
| Electric Utility Revenue | | | | | |
| (Insured; MBIA) | 6.50 | 12/1/08 | 2,755,000 | | 2,863,492 |
| Anchorage, | | | | | |
| Electric Utility Revenue | | | | | |
| (Insured; MBIA) | 6.50 | 12/1/09 | 2,910,000 | | 3,094,145 |
| Anchorage, | | | | | |
| GO (Schools) (Insured; FGIC) | 5.25 | 9/1/13 | 2,000,000 | a | 2,147,780 |
| Anchorage, | | | | | |
| LR, Correctional Facility | | | | | |
| (Insured; FSA) | 5.88 | 2/1/10 | 3,175,000 | a | 3,338,322 |
| Northern Tobacco Securitization | | | | | |
| Corporation, Tobacco | | | | | |
| Settlement Asset-Backed Bonds | 6.00 | 6/1/10 | 4,745,000 | a | 5,027,992 |
8
| | | | | |
| Long-Term Municipal | Coupon | Maturity | Principal | | |
| Investments (continued) | Rate (%) | Date | Amount ($) | | Value ($) |
| Alaska (continued) | | | | | |
| Northern Tobacco Securitization | | | | | |
| Corporation, Tobacco | | | | | |
| Settlement Asset-Backed Bonds | 6.20 | 6/1/10 | 1,920,000 | a | 2,002,234 |
| California—7.8% | | | | | |
| ABAG Finance Authority for | | | | | |
| Nonprofit Corporations, | | | | | |
| Revenue (San Diego Hospital | | | | | |
| Association) | 5.13 | 3/1/18 | 1,000,000 | | 1,029,800 |
| Arcadia Unified School District, | | | | | |
| GO (Insured; FSA) | 0.00 | 8/1/20 | 1,635,000 | | 888,377 |
| Bay Area Infrastructure Financing | | | | | |
| Authority, State Payment | | | | | |
| Acceleration Notes (Insured; | | | | | |
| XLCA) | 5.00 | 8/1/17 | 3,000,000 | | 3,165,720 |
| California, | | | | | |
| GO | 5.00 | 8/1/22 | 5,000,000 | | 5,229,850 |
| California Health Facilities | | | | | |
| Financing Authority, Revenue | | | | | |
| (Cedars-Sinai Medical Center) | 5.00 | 11/15/19 | 1,500,000 | | 1,546,905 |
| California Housing Finance Agency, | | | | | |
| Home Mortgage Revenue | 4.55 | 8/1/21 | 5,000,000 | | 4,940,600 |
| California Infrastructure and | | | | | |
| Economic Development Bank, Bay | | | | | |
| Area Toll Bridges Seismic | | | | | |
| Retrofit Revenue (First Lien) | | | | | |
| (Insured; FSA) | 5.25 | 7/1/13 | 3,300,000 | a | 3,556,674 |
| California State Public Works | | | | | |
| Board, LR (Department of | | | | | |
| Mental Health-Coalinga State | | | | | |
| Hospital) | 5.50 | 6/1/18 | 3,000,000 | | 3,276,420 |
| California Statewide Communities | | | | | |
| Development Authority, Revenue | | | | | |
| (Huntington Memorial Hospital) | 5.00 | 7/1/17 | 2,895,000 | | 3,012,971 |
| Elsinore Valley Municipal Water | | | | | |
| District, COP (Insured; FGIC) | 5.38 | 7/1/16 | 3,295,000 | | 3,653,002 |
| Foothill/Eastern Transportation | | | | | |
| Corridor Agency, Toll Road | | | | | |
| Revenue | 7.00 | 1/1/08 | 5,000,000 | | 5,098,950 |
STATEMENT OF INVESTMENTS (continued)
| | | | |
| Long-Term Municipal | Coupon | Maturity | Principal | |
| Investments (continued) | Rate (%) | Date | Amount ($) | Value ($) |
| California (continued) | | | | |
| Golden State Tobacco | | | | |
| Securitization Corporation, | | | | |
| Enhanced Tobacco Settlement | | | | |
| Asset-Backed Bonds | 5.75 | 6/1/08 | 6,950,000 a | 7,093,795 |
| Golden State Tobacco | | | | |
| Securitization Corporation, | | | | |
| Enhanced Tobacco Settlement | | | | |
| Asset-Backed Bonds | 5.00 | 6/1/19 | 2,000,000 | 2,042,520 |
| Golden State Tobacco | | | | |
| Securitization Corporation, | | | | |
| Tobacco Settlement | | | | |
| Asset-Backed Bonds | 4.50 | 6/1/27 | 5,000,000 | 4,893,450 |
| Los Angeles County Public Works | | | | |
| Financing Authority, Revenue | | | | |
| (Regional Park and Open Space | | | | |
| District) | 5.00 | 10/1/07 | 1,915,000 a | 1,942,212 |
| Sacramento County Sanitation | | | | |
| District Financing Authority, | | | | |
| Revenue (Sacramento Regional | | | | |
| County Sanitation District) | | | | |
| (Insured; FGIC) | 5.25 | 12/1/23 | 3,125,000 | 3,510,750 |
| Tobacco Securitization Authority | | | | |
| of Southern California, | | | | |
| Tobacco Settlement | | | | |
| Asset-Backed Bonds (San Diego | | | | |
| County Tobacco Asset | | | | |
| Securitization Corporation) | 4.75 | 6/1/25 | 2,500,000 | 2,479,100 |
| Colorado—.7% | | | | |
| El Paso County School District | | | | |
| (Number 11 Colorado Springs) | 6.25 | 12/1/09 | 1,000,000 | 1,058,890 |
| El Paso County School District | | | | |
| (Number 11 Colorado Springs) | 6.50 | 12/1/10 | 2,000,000 | 2,174,800 |
| El Paso County School District | | | | |
| (Number 11 Colorado Springs) | 6.50 | 12/1/11 | 2,040,000 | 2,263,196 |
| Connecticut—.1% | | | | |
| Mashantucket Western Pequot Tribe, | | | | |
| Special Revenue | 5.60 | 9/1/09 | 1,000,000 b | 1,022,610 |
| District of Columbia—1.2% | | | | |
| District of Columbia | | | | |
| (Insured; MBIA) | 6.00 | 6/1/12 | 3,280,000 | 3,586,286 |
10
| | | | |
| Long-Term Municipal | Coupon | Maturity | Principal | |
| Investments (continued) | Rate (%) | Date | Amount ($) | Value ($) |
| District of Columbia (continued) | | | | |
| District of Columbia, | | | | |
| Revenue (Howard University | | | | |
| Issue) (Insured; AMBAC) | 5.00 | 10/1/21 | 2,545,000 | 2,691,668 |
| District of Columbia, | | | | |
| Revenue (Howard University | | | | |
| Issue) (Insured; AMBAC) | 5.00 | 10/1/22 | 2,660,000 | 2,806,992 |
| Florida—4.2% | | | | |
| Collier County, | | | | |
| Gas Tax Revenue (Insured; | | | | |
| AMBAC) | 5.25 | 6/1/19 | 2,190,000 | 2,328,145 |
| Florida Hurricane Catastrophe Fund | | | | |
| Finance Corporation, Revenue | 5.00 | 7/1/12 | 5,000,000 | 5,238,300 |
| Hillsborough County Industrial | | | | |
| Development Authority, PCR | | | | |
| (Tampa Electric Company Project) | 5.10 | 10/1/13 | 5,000,000 | 5,199,150 |
| Lee County Industrial Development | | | | |
| Authority, Healthcare | | | | |
| Facilities Revenue (Cypress | | | | |
| Cove at Healthpark Florida, | | | | |
| Inc. Project) | 4.75 | 10/1/08 | 1,155,000 | 1,155,959 |
| Miami-Dade County School Board, | | | | |
| COP (Master Lease Purchase | | | | |
| Agreement) (Insured; FGIC) | 5.00 | 8/1/15 | 5,000,000 | 5,290,200 |
| Miami-Dade County School Board, | | | | |
| COP (Master Lease Purchase | | | | |
| Agreement) (Insured; FGIC) | 5.25 | 10/1/17 | 5,000,000 | 5,350,900 |
| Palm Beach County School Board, | | | | |
| COP (Insured; AMBAC) | 5.38 | 8/1/14 | 4,000,000 | 4,340,320 |
| Polk County, | | | | |
| Utility System Revenue | | | | |
| (Insured; FGIC) | 5.25 | 10/1/18 | 2,000,000 | 2,135,660 |
| Georgia—3.0% | | | | |
| Athens Housing Authority, | | | | |
| Student Housing LR (UGAREF | | | | |
| East Campus Housing, LLC | | | | |
| Project) (Insured; AMBAC) | 5.25 | 12/1/15 | 2,560,000 | 2,711,014 |
| Athens Housing Authority, | | | | |
| Student Housing LR (UGAREF | | | | |
| East Campus Housing, LLC | | | | |
| Project) (Insured; AMBAC) | 5.25 | 12/1/16 | 2,700,000 | 2,855,196 |
STATEMENT OF INVESTMENTS (continued)
| | | | |
| Long-Term Municipal | Coupon | Maturity | Principal | |
| Investments (continued) | Rate (%) | Date | Amount ($) | Value ($) |
| Georgia (continued) | | | | |
| Atlanta, | | | | |
| Water and Wastewater Revenue | | | | |
| (Insured; FSA) | 5.25 | 11/1/15 | 5,000,000 | 5,400,200 |
| Milledgeville and Baldwin County | | | | |
| Development Authority, Revenue | | | | |
| (Georgia College and State | | | | |
| University Foundation Property | | | | |
| III, LLC Student Housing | | | | |
| System Project) | 6.00 | 9/1/10 | 1,275,000 | 1,344,347 |
| Milledgeville and Baldwin County | | | | |
| Development Authority, Revenue | | | | |
| (Georgia College and State | | | | |
| University Foundation Property | | | | |
| III, LLC Student Housing | | | | |
| System Project) | 5.25 | 9/1/19 | 1,710,000 | 1,807,385 |
| Municipal Electric Authority of | | | | |
| Georgia, Combustion Turbine | | | | |
| Project Revenue (Insured; MBIA) | 5.25 | 11/1/12 | 2,735,000 | 2,917,479 |
| Municipal Electric Authority of | | | | |
| Georgia, Combustion Turbine | | | | |
| Project Revenue (Insured; MBIA) | 5.25 | 11/1/16 | 5,000,000 | 5,322,050 |
| Hawaii—.4% | | | | |
| Kuakini Health System, | | | | |
| Special Purpose Revenue | 5.50 | 7/1/12 | 2,575,000 | 2,702,076 |
| Illinois—3.8% | | | | |
| Chicago Housing Authority, | | | | |
| Revenue (Capital Program) | 5.00 | 7/1/09 | 2,500,000 | 2,560,225 |
| Chicago Housing Authority, | | | | |
| Revenue (Capital Program) | 5.25 | 7/1/10 | 2,420,000 | 2,518,615 |
| Chicago O’Hare International | | | | |
| Airport, General Airport Third | | | | |
| Lien Revenue (Insured; CIFG) | 5.50 | 1/1/15 | 6,450,000 | 6,983,544 |
| Chicago O’Hare International | | | | |
| Airport, Second Lien Passenger | | | | |
| Facility Charge Revenue | | | | |
| (Insured; AMBAC) | 5.25 | 1/1/10 | 3,095,000 | 3,187,417 |
| Chicago Park District, | | | | |
| GO Limited Tax Park (Insured; | | | | |
| FGIC) | 5.50 | 7/1/11 | 4,005,000 a | 4,251,588 |
12
| | | | |
| Long-Term Municipal | Coupon | Maturity | Principal | |
| Investments (continued) | Rate (%) | Date | Amount ($) | Value ($) |
| Illinois (continued) | | | | |
| Chicago Park District, | | | | |
| GO Limited Tax Park (Insured; | | | | |
| FGIC) | 5.50 | 1/1/20 | 1,300,000 | 1,373,996 |
| Illinois Health Facilities | | | | |
| Authority, Revenue (The | | | | |
| Passavant Memorial Area | | | | |
| Hospital Association Project) | 5.65 | 10/1/10 | 4,850,000 a | 5,154,483 |
| Metropolitan Pier and Exposition | | | | |
| Authority, Dedicated State Tax | | | | |
| Revenue (McCormick Place | | | | |
| Expansion Project) (Insured; | | | | |
| MBIA) | 0/5.55 | 6/15/21 | 2,500,000 c | 2,108,750 |
| Indiana—1.1% | | | | |
| Indiana Health Facility Financing | | | | |
| Authority, Revenue (Ascension | | | | |
| Health Subordinate Credit Group) | 5.00 | 5/1/13 | 1,000,000 | 1,047,250 |
| Indianapolis Local Public | | | | |
| Improvement Bond Bank | | | | |
| (Insured; FSA) | 6.50 | 1/1/11 | 6,415,000 | 6,973,105 |
| Kansas—1.9% | | | | |
| Wyandotte County/Kansas City | | | | |
| Unified Government, Tax-Exempt | | | | |
| Sales Tax Special Obligation | | | | |
| Revenue (Redevelopment Project | | | | |
| Area B) | 4.75 | 12/1/16 | 3,800,000 | 3,888,046 |
| Wyandotte County/Kansas City | | | | |
| Unified Government, Utility | | | | |
| System Revenue (Insured; AMBAC) | 5.65 | 9/1/18 | 9,130,000 | 10,355,520 |
| Kentucky—.6% | | | | |
| Ashland, | | | | |
| PCR (Ashland Inc. Project) | 5.70 | 11/1/09 | 4,000,000 | 4,172,360 |
| Louisiana—.3% | | | | |
| Morehouse Parish, | | | | |
| PCR (International Paper | | | | |
| Company Project) | 5.25 | 11/15/13 | 2,000,000 | 2,086,040 |
| Maine—.6% | | | | |
| Maine Housing Authority, | �� | | | |
| Mortgage Purchase | 4.75 | 11/15/21 | 4,100,000 | 4,112,669 |
STATEMENT OF INVESTMENTS (continued)
| | | | | |
| Long-Term Municipal | Coupon | Maturity | Principal | | |
| Investments (continued) | Rate (%) | Date | Amount ($) | | Value ($) |
| Massachusetts—3.2% | | | | | |
| Massachusetts, | | | | | |
| Consolidated Loan | 5.00 | 12/1/10 | 3,000,000 | | 3,113,460 |
| Massachusetts Bay Transportation | | | | | |
| Authority, Senior Sales Tax | | | | | |
| Revenue | 5.25 | 7/1/19 | 2,500,000 | | 2,767,950 |
| Massachusetts Educational | | | | | |
| Financing Authority, Education | | | | | |
| Loan Revenue (Insured; AMBAC) | 4.60 | 1/1/22 | 5,000,000 | | 4,936,050 |
| Massachusetts Industrial Finance | | | | | |
| Agency, RRR (Ogden Haverhill | | | | | |
| Project) | 5.35 | 12/1/10 | 3,000,000 | | 3,113,160 |
| Massachusetts Water Resource | | | | | |
| Authority, General Revenue | | | | | |
| (Insured; MBIA) | 5.25 | 8/1/19 | 8,420,000 | | 9,239,266 |
| Michigan—4.6% | | | | | |
| Detroit, | | | | | |
| Water Supply System Revenue | | | | | |
| (Insured; FSA) | 5.00 | 7/1/22 | 5,000,000 | | 5,270,350 |
| Detroit Local Development Finance | | | | | |
| Authority, Tax Increment | | | | | |
| Revenue | 5.20 | 5/1/10 | 5,745,000 | | 5,834,622 |
| Greater Detroit Resource Recovery | | | | | |
| Authority, RRR (Insured; AMBAC) | 6.25 | 12/13/08 | 7,755,000 | | 8,039,376 |
| Michigan Building Authority, | | | | | |
| Revenue (State Police | | | | | |
| Communications System) | 5.25 | 10/1/13 | 1,945,000 | | 2,083,659 |
| Michigan Hospital Finance | | | | | |
| Authority, Revenue (Oakwood | | | | | |
| Obligation Group) | 5.50 | 11/1/11 | 3,500,000 | | 3,678,675 |
| Michigan Hospital Finance | | | | | |
| Authority, Revenue (Sparrow | | | | | |
| Obligation Group) | 5.25 | 11/15/11 | 2,500,000 | | 2,602,525 |
| Michigan Hospital Finance | | | | | |
| Authority, Revenue (Sparrow | | | | | |
| Obligation Group) | 5.75 | 11/15/11 | 3,250,000 | a | 3,515,493 |
| Michigan Municipal Bond Authority, | | | | | |
| Revenue (Drinking Water | | | | | |
| Revolving Fund) | 5.25 | 10/1/09 | 2,370,000 | a | 2,448,328 |
14
| | | | |
| Long-Term Municipal | Coupon | Maturity | Principal | |
| Investments (continued) | Rate (%) | Date | Amount ($) | Value ($) |
| Minnesota—1.3% | | | | |
| Lakeville Independent School | | | | |
| District Number 194, GO | | | | |
| (Insured; FSA) | 5.00 | 2/1/18 | 5,000,000 | 5,244,550 |
| Saint Paul Housing and | | | | |
| Redevelopment Authority, | | | | |
| Hospital Facility Revenue | | | | |
| (HealthEast Project) | 5.00 | 11/15/17 | 3,000,000 | 3,052,710 |
| Saint Paul Housing and | | | | |
| Redevelopment Authority, | | | | |
| Hospital Facility Revenue | | | | |
| (HealthEast Project) | 5.75 | 11/15/21 | 1,000,000 | 1,071,460 |
| Mississippi—1.0% | | | | |
| Mississippi Development Bank, | | | | |
| Special Obligation Revenue | | | | |
| (Madison County Highway | | | | |
| Construction Project) | | | | |
| (Insured; FGIC) | 5.00 | 1/1/22 | 5,000,000 | 5,258,800 |
| Walnut Grove Correctional | | | | |
| Authority, COP (Insured; AMBAC) | 5.50 | 11/1/07 | 1,855,000 | 1,868,337 |
| Missouri—.9% | | | | |
| Missouri Development Finance | | | | |
| Board, Infrastructure | | | | |
| Facilities Revenue (Branson | | | | |
| Landing Project) | 6.00 | 6/1/20 | 3,160,000 | 3,590,929 |
| Saint Louis, | | | | |
| Airport Revenue (Airport | | | | |
| Development Program) (Insured; | | | | |
| MBIA) | 5.63 | 7/1/11 | 2,500,000 a | 2,662,700 |
| Nevada—.7% | | | | |
| Director of the State of Nevada | | | | |
| Department of Business and | | | | |
| Industry, SWDR (Republic | | | | |
| Services, Inc. Project) | 5.63 | 6/1/18 | 5,000,000 | 5,382,650 |
| New Hampshire—.6% | | | | |
| New Hampshire Higher Educational | | | | |
| and Health Facilities | | | | |
| Authority, HR (The Cheshire | | | | |
| Medical Center Issue) | 5.13 | 7/1/18 | 4,125,000 | 4,190,876 |
STATEMENT OF INVESTMENTS (continued)
| | | | | |
| Long-Term Municipal | Coupon | Maturity | Principal | | |
| Investments (continued) | Rate (%) | Date | Amount ($) | | Value ($) |
| New Jersey—4.0% | | | | | |
| Camden County Improvement | | | | | |
| Authority, Health Care | | | | | |
| Redevelopment Project Revenue | | | | | |
| (The Cooper Health System | | | | | |
| Obligated Group Issue) | 5.25 | 2/15/20 | 3,000,000 | | 3,114,270 |
| Casino Reinvestment Development | | | | | |
| Authority, Revenue (Insured; | | | | | |
| MBIA) | 5.25 | 6/1/19 | 5,000,000 | | 5,403,350 |
| New Jersey Economic Development | | | | | |
| Authority, Cigarette Tax | | | | | |
| Revenue | 5.38 | 6/15/15 | 3,300,000 | | 3,514,665 |
| New Jersey Economic Development | | | | | |
| Authority, Cigarette Tax | | | | | |
| Revenue | 5.50 | 6/15/16 | 1,000,000 | | 1,077,810 |
| New Jersey Educational Facilities | | | | | |
| Authority, Revenue (Rider | | | | | |
| University Issue) (Insured; | | | | | |
| Radian) | 5.00 | 7/1/10 | 1,880,000 | | 1,924,913 |
| New Jersey Educational Facilities | | | | | |
| Authority, Revenue (Rider | | | | | |
| University Issue) (Insured; | | | | | |
| Radian) | 5.00 | 7/1/11 | 1,970,000 | | 2,029,632 |
| New Jersey Health Care Facilities | | | | | |
| Financing Authority, Revenue | | | | | |
| (South Jersey Hospital Issue) | 6.00 | 7/1/12 | 3,425,000 | | 3,603,066 |
| New Jersey Turnpike Authority, | | | | | |
| Revenue (Insured; MBIA) | 5.63 | 1/1/10 | 3,910,000 | a | 4,083,369 |
| Tobacco Settlement Financing | | | | | |
| Corporation of New Jersey, | | | | | |
| Tobacco Settlement | | | | | |
| Asset-Backed Bonds | 4.50 | 6/1/23 | 5,000,000 | | 4,896,650 |
| New Mexico—.6% | | | | | |
| Jicarilla, | | | | | |
| Apache Nation Revenue | 5.00 | 9/1/11 | 1,500,000 | | 1,532,100 |
| Jicarilla, | | | | | |
| Apache Nation Revenue | 5.00 | 9/1/13 | 2,905,000 | | 2,984,917 |
| New York—8.5% | | | | | |
| Long Island Power Authority, | | | | | |
| Electric System General | | | | | |
| Revenue (Insured; MBIA) | 3.31 | 9/1/15 | 3,000,000 | d | 2,993,490 |
| New York City | 5.00 | 4/1/20 | 2,500,000 | | 2,619,425 |
16
| | | | |
| Long-Term Municipal | Coupon | Maturity | Principal | |
| Investments (continued) | Rate (%) | Date | Amount ($) | Value ($) |
| New York (continued) | | | | |
| New York City | 5.00 | 4/1/22 | 5,110,000 | 5,340,257 |
| New York City | | | | |
| (Insured; FSA) | 5.00 | 6/1/16 | 3,395,000 | 3,627,150 |
| New York City Industrial | | | | |
| Development Agency, Special | | | | |
| Facility Revenue (American | | | | |
| Airlines, Inc. John F. Kennedy | | | | |
| International Airport Project) | 7.13 | 8/1/11 | 2,000,000 | 2,109,760 |
| New York City Industrial | | | | |
| Development Agency, Special | | | | |
| Facility Revenue (American | | | | |
| Airlines, Inc. John F. Kennedy | | | | |
| International Airport Project) | 7.50 | 8/1/16 | 3,500,000 | 4,050,550 |
| New York City Municipal Water | | | | |
| Finance Authority, Water and | | | | |
| Sewer System Revenue (Insured; | | | | |
| FGIC) | 5.13 | 6/15/07 | 4,830,000 a | 4,880,618 |
| New York State Dormitory | | | | |
| Authority, FHA-Insured | | | | |
| Mortgage HR (The Long Island | | | | |
| College Hospital) | 6.00 | 8/15/15 | 5,005,000 | 5,437,532 |
| New York State Dormitory | | | | |
| Authority, Revenue (State | | | | |
| University Educational | | | | |
| Facilities) | 5.50 | 5/15/10 | 2,000,000 | 2,089,320 |
| New York State Local Government | | | | |
| Assistance Corporation | 5.25 | 4/1/16 | 3,425,000 | 3,727,736 |
| New York State Local Government | | | | |
| Assistance Corporation | | | | |
| (Insured; FSA) | 5.25 | 4/1/16 | 2,200,000 | 2,387,814 |
| New York State Thruway Authority, | | | | |
| Local Highway and Bridge | | | | |
| Service Contract Revenue | 5.50 | 4/1/12 | 3,950,000 | 4,229,344 |
| New York State Thruway Authority, | | | | |
| Local Highway and Bridge | | | | |
| Service Contract Revenue | | | | |
| (Insured; XLCA) | 5.50 | 4/1/13 | 5,000,000 | 5,359,950 |
| New York State Thruway Authority, | | | | |
| Second General Highway and | | | | |
| Bridge Trust Fund (Insured; | | | | |
| AMBAC) | 5.00 | 4/1/18 | 5,000,000 b,e | 5,336,500 |
STATEMENT OF INVESTMENTS (continued)
| | | | |
| Long-Term Municipal | Coupon | Maturity | Principal | |
| Investments (continued) | Rate (%) | Date | Amount ($) | Value ($) |
| New York (continued) | | | | |
| New York State Urban Development | | | | |
| Corporation, Corporate Purpose | | | | |
| Subordinate Lien | 5.13 | 7/1/19 | 2,000,000 | 2,114,140 |
| New York State Urban Development | | | | |
| Corporation, State Personal | | | | |
| Income Tax Revenue (State | | | | |
| Facilities and Equipment) | 5.25 | 3/15/11 | 1,565,000 | 1,641,748 |
| Tobacco Settlement Financing | | | | |
| Corporation of New York, | | | | |
| Asset-Backed Revenue Bonds | | | | |
| (State Contingency Contract | | | | |
| Secured) | 5.50 | 6/1/18 | 4,000,000 | 4,268,560 |
| North Carolina—5.2% | | | | |
| North Carolina Eastern Municipal | | | | |
| Power Agency, Power System | | | | |
| Revenue | 5.13 | 1/1/14 | 3,000,000 | 3,142,800 |
| North Carolina Eastern Municipal | | | | |
| Power Agency, Power System | | | | |
| Revenue | 5.00 | 1/1/21 | 1,200,000 | 1,298,688 |
| North Carolina Eastern Municipal | | | | |
| Power Agency, Power System | | | | |
| Revenue (Insured; AMBAC) | 5.00 | 1/1/20 | 5,000,000 | 5,291,150 |
| North Carolina Eastern Municipal | | | | |
| Power Agency, Power System | | | | |
| Revenue (Insured; AMBAC) | 5.25 | 1/1/20 | 5,000,000 | 5,395,450 |
| North Carolina Medical Care | | | | |
| Commission, FHA Insured | | | | |
| Mortgage Revenue (Morehead | | | | |
| Memorial Hospital Project) | | | | |
| (Insured; FSA) | 5.00 | 11/1/20 | 5,000,000 | 5,237,700 |
| North Carolina Medical Care | | | | |
| Commission, Retirement | | | | |
| Facilities First Mortgage | | | | |
| Revenue (The United Methodist | | | | |
| Retirement Homes Project) | 4.75 | 10/1/13 | 1,000,000 | 1,011,220 |
| North Carolina Medical Care | | | | |
| Commission, Retirement | | | | |
| Facilities First Mortgage | | | | |
| Revenue (The United Methodist | | | | |
| Retirement Homes Project) | 5.13 | 10/1/19 | 1,250,000 | 1,286,200 |
18
| | | | |
| Long-Term Municipal | Coupon | Maturity | Principal | |
| Investments (continued) | Rate (%) | Date | Amount ($) | Value ($) |
| North Carolina (continued) | | | | |
| North Carolina Municipal Power | | | | |
| Agency Number 1, Catawba | | | | |
| Electric Revenue (Insured; FSA) | 5.25 | 1/1/16 | 2,540,000 | 2,703,906 |
| North Carolina Municipal Power | | | | |
| Agency Number 1, Catawba | | | | |
| Electric Revenue (Insured; FSA) | 5.25 | 1/1/17 | 10,000,000 | 10,593,900 |
| Raleigh Durham Airport Authority, | | | | |
| Airport Revenue (Insured; FGIC) | 5.25 | 11/1/12 | 2,365,000 | 2,502,667 |
| Ohio—1.4% | | | | |
| Cuyahoga County, | | | | |
| Revenue (Cleveland Clinic | | | | |
| Health System) | 6.00 | 1/1/17 | 5,000,000 | 5,506,700 |
| Knox County, | | | | |
| Hospital Facilities Revenue | | | | |
| (Knox Community Hospital) | | | | |
| (Insured; Radian) | 5.00 | 6/1/12 | 1,500,000 | 1,539,465 |
| Ohio Higher Educational Facility | | | | |
| Commission, Higher Educational | | | | |
| Facility Revenue (Xavier | | | | |
| University Project) (Insured; | | | | |
| CIFG) | 5.25 | 5/1/20 | 3,230,000 | 3,478,710 |
| Oregon—1.4% | | | | |
| Tri-County Metropolitan | | | | |
| Transportation District, | | | | |
| Payroll Tax and Grant Receipt | | | | |
| Revenue (Insured; MBIA) | 4.00 | 5/1/14 | 4,000,000 | 4,001,200 |
| Washington County Unified | | | | |
| Sewerage Agency, | | | | |
| Senior Lien Sewer | | | | |
| Revenue (Insured; FGIC) | 5.75 | 10/1/12 | 5,670,000 | 6,184,609 |
| Pennsylvania—6.1% | | | | |
| Allegheny County, | | | | |
| Airport Revenue (Pittsburgh | | | | |
| International Airport) | | | | |
| (Insured; MBIA) | 5.75 | 1/1/11 | 5,000,000 | 5,282,400 |
| Allegheny County Hospital | | | | |
| Development Authority, Health | | | | |
| System Revenue (West Penn | | | | |
| Allegheny Health System) | 5.00 | 11/15/28 | 5,000,000 f | 4,935,100 |
STATEMENT OF INVESTMENTS (continued)
| | | | |
| Long-Term Municipal | Coupon | Maturity | Principal | |
| Investments (continued) | Rate (%) | Date | Amount ($) | Value ($) |
| Pennsylvania (continued) | | | | |
| Allegheny County Industrial | | | | |
| Development Authority, PCR | | | | |
| (Duquesne Light Company | | | | |
| Project) (Insured; AMBAC) | 4.05 | 9/1/11 | 2,000,000 | 2,018,960 |
| Delaware River Joint Toll Bridge | | | | |
| Commission, Bridge Revenue | 5.25 | 7/1/13 | 2,500,000 | 2,666,475 |
| Delaware Valley Regional Finance | | | | |
| Authority, Local Government | | | | |
| Revenue | 5.75 | 7/1/17 | 6,830,000 | 7,668,792 |
| Erie County Industrial Development | | | | |
| Authority, EIR (International | | | | |
| Paper Company Project) | 5.25 | 9/1/10 | 2,100,000 | 2,152,395 |
| Montgomery County Higher Education | | | | |
| and Health Authority, HR | | | | |
| (Abington Memorial Hospital) | | | | |
| (Insured; AMBAC) | 6.10 | 6/1/12 | 5,000,000 | 5,475,600 |
| Pennsylvania Higher Educational | | | | |
| Facilities Authority, Revenue | | | | |
| (UPMC Health System) | 6.25 | 1/15/15 | 3,660,000 | 3,966,635 |
| Philadelphia, | | | | |
| GO (Insured; XLCA) | 5.25 | 2/15/13 | 5,535,000 | 5,894,664 |
| Sayre Health Care Facilities | | | | |
| Authority, Revenue (Guthrie | | | | |
| Health Issue) | 6.00 | 12/1/11 | 1,475,000 a | 1,612,706 |
| Sayre Health Care Facilities | | | | |
| Authority, Revenue (Guthrie | | | | |
| Health Issue) | 6.00 | 12/1/12 | 525,000 | 568,748 |
| State Public School Building | | | | |
| Authority, School LR (Colonial | | | | |
| Intermediate Unit Number 20) | | | | |
| (Insured; FGIC) | 5.25 | 5/15/19 | 2,175,000 | 2,344,976 |
| Rhode Island—1.1% | | | | |
| Rhode Island Health and | | | | |
| Educational Building | | | | |
| Corporation, Health Facilities | | | | |
| Revenue (Saint Antoine | | | | |
| Residence Issue) (LOC; Allied | | | | |
| Irish Bank) | 5.50 | 11/15/09 | 2,095,000 | 2,141,823 |
20
| | | | |
| Long-Term Municipal | Coupon | Maturity | Principal | |
| Investments (continued) | Rate (%) | Date | Amount ($) | Value ($) |
| Rhode Island (continued) | | | | |
| Rhode Island Health and | | | | |
| Educational Building | | | | |
| Corporation, Hospital | | | | |
| Financing Revenue (Lifespan | | | | |
| Obligation Group Issue) | | | | |
| (Insured; MBIA) | 5.75 | 5/15/08 | 560,000 | 570,377 |
| Rhode Island Health and | | | | |
| Educational Building | | | | |
| Corporation, Revenue (Roger | | | | |
| Williams University) (Insured; Radian) | 5.00 | 11/15/21 | 1,360,000 | 1,401,929 |
| Rhode Island Student Loan | | | | |
| Authority, Student Loan | | | | |
| Program Revenue (Insured; | | | | |
| AMBAC) | 4.80 | 12/1/21 | 3,600,000 | 3,657,672 |
| South Carolina—3.6% | | | | |
| Anderson County, | | | | |
| IDR (Federal Paper Board | | | | |
| Company, Inc. Project) | 4.75 | 8/1/10 | 4,520,000 | 4,544,679 |
| Berkeley County School District, | | | | |
| Installment Purchase Revenue | | | | |
| (Securing Assets for Education) | 5.25 | 12/1/21 | 9,395,000 | 9,853,006 |
| Charleston Educational Excellence | | | | |
| Financing Corporation, | | | | |
| Installment Purchase Revenue | | | | |
| (Charleston County School | | | | |
| District, South Carolina Project) | 5.25 | 12/1/21 | 5,000,000 | 5,322,400 |
| Dorchester County School District | | | | |
| Number 2, Installment Purchase | | | | |
| Revenue (Growth Remedy | | | | |
| Opportunity Without Tax Hike) | 5.25 | 12/1/21 | 5,000,000 | 5,272,250 |
| Hilton Head Island Public | | | | |
| Facilities Corporation, COP | | | | |
| (Insured; AMBAC) | 5.00 | 3/1/13 | 1,065,000 | 1,121,115 |
| Tennessee—1.5% | | | | |
| Johnson City Health and | | | | |
| Educational Facility Board, HR | | | | |
| (Medical Center Hospital | | | | |
| Improvement) (Insured; MBIA) | 5.13 | 7/1/11 | 6,720,000 | 6,920,726 |
STATEMENT OF INVESTMENTS (continued)
| | | | |
| Long-Term Municipal | Coupon | Maturity | Principal | |
| Investments (continued) | Rate (%) | Date | Amount ($) | Value ($) |
| Tennessee (continued) | | | | |
| Tennessee Housing Development | | | | |
| Agency (Homeownership Program) | 5.20 | 7/1/10 | 1,815,000 | 1,866,020 |
| Tennessee Housing Development | | | | |
| Agency (Homeownership Program) | 5.30 | 7/1/11 | 2,140,000 | 2,199,299 |
| Texas—11.4% | | | | |
| Alliance Airport Authority Inc., | | | | |
| Special Facilities Revenue | | | | |
| (Federal Express Corporation | | | | |
| Project) | 4.85 | 4/1/21 | 8,870,000 b,e | 8,889,647 |
| Austin Convention Enterprises, | | | | |
| Inc., Convention Center Hotel | | | | |
| Second Tier Revenue | 6.00 | 1/1/17 | 1,935,000 | 2,076,236 |
| Austin Convention Enterprises, | | | | |
| Inc., Convention Center Hotel | | | | |
| Second Tier Revenue | 6.00 | 1/1/18 | 1,125,000 | 1,202,704 |
| Austin Convention Enterprises, | | | | |
| Inc., Convention Center Hotel | | | | |
| Second Tier Revenue | 6.00 | 1/1/20 | 1,555,000 | 1,662,404 |
| Bexar County, | | | | |
| Revenue (Venue Project) | | | | |
| (Insured; MBIA) | 5.75 | 8/15/13 | 5,000,000 | 5,281,100 |
| Cities of Dallas and Fort Worth, | | | | |
| Dallas/Fort Worth | | | | |
| International Airport, | | | | |
| Facility Improvement | | | | |
| Corporation Revenue (Learjet | | | | |
| Inc. Project) | 6.15 | 1/1/16 | 4,000,000 | 4,026,520 |
| Cypress-Fairbanks Independent | | | | |
| School District, Unlimited Tax | | | | |
| Schoolhouse Bonds (Permanent | | | | |
| School Fund Guarantee Program) | 6.75 | 2/15/10 | 1,700,000 a | 1,826,072 |
| Deer Park Independent School | | | | |
| District, Limited Tax School | | | | |
| Building Bonds (Permanent | | | | |
| School Fund Guarantee Program) | 5.25 | 2/15/21 | 2,235,000 | 2,426,830 |
| Gulf Coast Waste Disposal | | | | |
| Authority, Bayport Area System | | | | |
| Revenue (Insured; AMBAC) | 5.00 | 10/1/14 | 2,065,000 | 2,192,328 |
22
| | | | |
| Long-Term Municipal | Coupon | Maturity | Principal | |
| Investments (continued) | Rate (%) | Date | Amount ($) | Value ($) |
| Texas (continued) | | | | |
| Harris County Health Facilities | | | | |
| Development Corporation, HR | | | | |
| (Memorial Hermann Hospital | | | | |
| System) (Insured; FSA) | 5.50 | 6/1/12 | 8,295,000 | 8,860,387 |
| Houston, | | | | |
| Airport System Special | | | | |
| Facilities Revenue | | | | |
| (Continental Airlines, Inc. | | | | |
| Terminal E Project) | 6.75 | 7/1/21 | 5,000,000 | 5,368,800 |
| Houston, | | | | |
| Combined Utility System, First | | | | |
| Lien Revenue (Insured; FSA) | 5.25 | 11/15/17 | 5,000,000 | 5,483,050 |
| Houston, | | | | |
| Combined Utility System, First | | | | |
| Lien Revenue (Insured; MBIA) | 5.25 | 5/15/12 | 2,750,000 | 2,916,402 |
| Lewisville, | | | | |
| Combination Tax and Revenue | | | | |
| Certificates of Obligation | | | | |
| (Insured; MBIA) | 5.25 | 2/15/20 | 1,230,000 | 1,311,377 |
| Lower Colorado River Authority, | | | | |
| Transmission Contract Revenue | | | | |
| (LCRA Transmission Services | | | | |
| Corporation Project) (Insured; | | | | |
| FGIC) | 5.00 | 5/15/20 | 4,200,000 | 4,334,316 |
| North Central Texas Health | | | | |
| Facilities Development | | | | |
| Corporation, HR | | | | |
| (Baylor Health | | | | |
| Care System Project) | 5.00 | 5/15/17 | 3,965,000 | 4,055,006 |
| Port of Corpus Christi Industrial | | | | |
| Development Corporation, | | | | |
| Revenue (Valero Refining and | | | | |
| Marketing Company Project) | 5.13 | 4/1/09 | 2,250,000 | 2,316,893 |
| Port of Corpus Christi Industrial | | | | |
| Development Corporation, | | | | |
| Revenue (Valero Refining and | | | | |
| Marketing Company Project) | 5.40 | 4/1/18 | 1,500,000 | 1,547,415 |
STATEMENT OF INVESTMENTS (continued)
| | | | | |
| Long-Term Municipal | Coupon | Maturity | Principal | | |
| Investments (continued) | Rate (%) | Date | Amount ($) | | Value ($) |
| Texas (continued) | | | | | |
| Tarrant County Health Facilities | | | | | |
| Development Corporation, | | | | | |
| Health Resources System | | | | | |
| Revenue (Insured; MBIA) | 5.75 | 2/15/14 | 5,000,000 | | 5,523,800 |
| Tarrant County Health Facilities | | | | | |
| Development Corporation, | | | | | |
| Health System Revenue (Harris | | | | | |
| Methodist Health System) | 6.00 | 9/1/10 | 7,725,000 | | 8,091,088 |
| Texas Municipal Gas Acquisition | | | | | |
| and Supply Corporation I, Gas | | | | | |
| Supply Revenue | 4.15 | 12/15/17 | 4,000,000 | b,e | 3,995,000 |
| Texas Municipal Power Agency, | | | | | |
| Revenue (Insured; AMBAC) | 0.00 | 9/1/09 | 170,000 | | 156,091 |
| Utah—1.4% | | | | | |
| Jordanelle Special Service | | | | | |
| District (Special Assessment | | | | | |
| Improvement District) | 8.00 | 10/1/11 | 3,865,000 | | 4,060,453 |
| Orem, | | | | | |
| Sales Tax Revenue (Insured; | | | | | |
| AMBAC) | 5.00 | 4/15/18 | 3,325,000 | | 3,466,978 |
| Utah Building Ownership Authority, | | | | | |
| LR (State Facilities Master | | | | | |
| Lease Program) | 5.00 | 5/15/17 | 2,950,000 | | 3,103,371 |
| Virginia—3.1% | | | | | |
| Greater Richmond Convention | | | | | |
| Center Authority, | | | | | |
| Hotel Tax Revenue | | | | | |
| (Convention Center | | | | | |
| Expansion Project) | 6.00 | 6/15/10 | 2,000,000 | a | 2,139,100 |
| Henrico County Economic | | | | | |
| Development Authority, | | | | | |
| Residential Care Facility | | | | | |
| Mortgage Revenue (Westminster | | | | | |
| Canterbury of Richmond) | 5.00 | 10/1/21 | 1,000,000 | | 1,016,720 |
| Newport News, | | | | | |
| GO General Improvement Bonds | 5.00 | 3/1/21 | 2,000,000 | | 2,129,280 |
| Peninsula Ports Authority, | | | | | |
| Revenue (Port Facility-CSX | | | | | |
| Transportation Project) | 6.00 | 12/15/12 | 4,150,000 | | 4,489,055 |
24
| | | | | |
| Long-Term Municipal | Coupon | Maturity | Principal | | |
| Investments (continued) | Rate (%) | Date | Amount ($) | | Value ($) |
| Virginia (continued) | | | | | |
| Tobacco Settlement Financing | | | | | |
| Corporation of Virginia, | | | | | |
| Tobacco Settlement | | | | | |
| Asset-Backed Bonds | 4.00 | 6/1/13 | 5,605,000 | | 5,604,664 |
| Tobacco Settlement Financing | | | | | |
| Corporation of Virginia, | | | | | |
| Tobacco Settlement | | | | | |
| Asset-Backed Bonds | 5.25 | 6/1/19 | 3,000,000 | | 3,124,140 |
| Virginia Port Authority, | | | | | |
| Commonwealth Port Fund Revenue | 5.00 | 7/1/19 | 4,415,000 | | 4,584,006 |
| Washington—5.3% | | | | | |
| Energy Northwest, | | | | | |
| Columbia Generating Station | | | | | |
| Electric Revenue | 5.00 | 7/1/23 | 5,000,000 | | 5,270,350 |
| Franklin County, | | | | | |
| GO (Pasco School District | | | | | |
| Number 1) (Insured; FSA) | 5.25 | 12/1/19 | 5,000,000 | | 5,309,950 |
| Goat Hill Properties, | | | | | |
| LR (Government Office Building | | | | | |
| Project) (Insured; MBIA) | 5.25 | 12/1/20 | 2,710,000 | | 2,888,752 |
| Port of Seattle, | | | | | |
| Limited Tax GO (Insured; FSA) | 5.00 | 11/1/16 | 5,000,000 | | 5,231,950 |
| Seattle, | | | | | |
| Municipal Light and Power | | | | | |
| Improvements Revenue | | | | | |
| (Insured; FSA) | 5.25 | 3/1/10 | 50,000 | | 51,854 |
| Seattle, | | | | | |
| Municipal Light and Power | | | | | |
| Improvements Revenue | | | | | |
| (Insured; FSA) | 5.25 | 3/1/10 | 13,000,000 | b,e | 13,481,845 |
| Washington | 5.75 | 10/1/12 | 20,000 | | 21,229 |
| Washington | 5.75 | 10/1/12 | 2,305,000 | | 2,434,287 |
| Washington, | | | | | |
| Various Purpose GO | 5.50 | 7/1/09 | 2,000,000 | a | 2,069,240 |
| Washington Housing Finance | | | | | |
| Commission (Single Family | | | | | |
| Program) (Collateralized: | | | | | |
| FHLMC, FNMA and GNMA) | 5.75 | 12/1/37 | 2,000,000 | | 2,121,640 |
STATEMENT OF INVESTMENTS (continued)
| | | | | |
| Long-Term Municipal | Coupon | Maturity | Principal | | |
| Investments (continued) | Rate (%) | Date | Amount ($) | | Value ($) |
| West Virginia—.4% | | | | | |
| West Virginia Economic Development | | | | | |
| Authority, LR (Department of | | | | | |
| Environmental Protection) | 5.50 | 11/1/22 | 2,895,000 | | 3,138,672 |
| Wisconsin—.5% | | | | | |
| Wisconsin Health and Educational | | | | | |
| Facilities Authority, Revenue | | | | | |
| (Aurora Medical Group, Inc. | | | | | |
| Project) (Insured; FSA) | 6.00 | 11/15/11 | 3,500,000 | | 3,793,405 |
| U.S. Related—1.6% | | | | | |
| Children’s Trust Fund of Puerto | | | | | |
| Rico, Tobacco Settlement | | | | | |
| Asset-Backed Bonds | 5.75 | 7/1/10 | 2,500,000 | | 2,646,100 |
| Children’s Trust Fund of Puerto | | | | | |
| Rico, Tobacco Settlement | | | | | |
| Asset-Backed Bonds | 5.75 | 7/1/10 | 5,000,000 | a | 5,292,200 |
| Children’s Trust Fund of Puerto | | | | | |
| Rico, Tobacco Settlement | | | | | |
| Asset-Backed Bonds | 5.75 | 7/1/10 | 3,300,000 | a | 3,492,852 |
| |
| Total Investments (cost $736,660,645) | | | 101.5% | | 745,234,925 |
| Liabilities, Less Cash and Receivables | | | (1.5%) | | (11,187,116) |
| Net Assets | | | 100.0% | | 734,047,809 |
|
| a These securities are prerefunded; the date shown represents the prerefunded date. Bonds which are prerefunded are |
| collateralized by U.S. Government securities which are held in escrow and are used to pay principal and interest on |
| the municipal issue and to retire the bonds in full at the earliest refunding date. |
| b Securities exempt from registration under Rule 144A of the Securities Act of 1933.These securities may be resold in |
| transactions exempt from registration, normally to qualified institutional buyers.At May 31, 2007, these securities |
| amounted to $32,725,602 or 4.5% of net assets. |
| c Zero coupon until a specified date at which time the stated coupon rate becomes effective until maturity. |
| d Variable rate security—interest rate subject to periodic change. |
| e Collateral for floating rate borrowings. |
| f Purchased on a delayed delivery basis. |
26
| | | |
| Summary of Abbreviations | | |
| |
| ACA | American Capital Access | AGC | ACE Guaranty Corporation |
| AGIC | Asset Guaranty Insurance | AMBAC | American Municipal Bond |
| | Company | | Assurance Corporation |
| ARRN | Adjustable Rate Receipt Notes | BAN | Bond Anticipation Notes |
| BIGI | Bond Investors Guaranty Insurance | BPA | Bond Purchase Agreement |
| CGIC | Capital Guaranty Insurance | CIC | Continental Insurance |
| | Company | | Company |
| CIFG | CDC Ixis Financial Guaranty | CMAC | Capital Market Assurance |
| | | | Corporation |
| COP | Certificate of Participation | CP | Commercial Paper |
| EDR | Economic Development Revenue | EIR | Environmental Improvement |
| | | | Revenue |
| FGIC | Financial Guaranty Insurance | | |
| | Company | FHA | Federal Housing Administration |
| FHLB | Federal Home Loan Bank | FHLMC | Federal Home Loan Mortgage |
| | | | Corporation |
| FNMA | Federal National | | |
| | Mortgage Association | FSA | Financial Security Assurance |
| GAN | Grant Anticipation Notes | GIC | Guaranteed Investment Contract |
| GNMA | Government National | | |
| | Mortgage Association | GO | General Obligation |
| HR | Hospital Revenue | IDB | Industrial Development Board |
| IDC | Industrial Development Corporation | IDR | Industrial Development Revenue |
| LOC | Letter of Credit | LOR | Limited Obligation Revenue |
| LR | Lease Revenue | MBIA | Municipal Bond Investors Assurance |
| | | | Insurance Corporation |
| MFHR | Multi-Family Housing Revenue | MFMR | Multi-Family Mortgage Revenue |
| PCR | Pollution Control Revenue | PILOT | Payment in Lieu of Taxes |
| RAC | Revenue Anticipation Certificates | RAN | Revenue Anticipation Notes |
| RAW | Revenue Anticipation Warrants | RRR | Resources Recovery Revenue |
| SAAN | State Aid Anticipation Notes | SBPA | Standby Bond Purchase Agreement |
| SFHR | Single Family Housing Revenue | SFMR | Single Family Mortgage Revenue |
| SONYMA | State of New York Mortgage Agency | SWDR | Solid Waste Disposal Revenue |
| TAN | Tax Anticipation Notes | TAW | Tax Anticipation Warrants |
| TRAN | Tax and Revenue Anticipation Notes | XLCA | XL Capital Assurance |
STATEMENT OF INVESTMENTS (continued)
| | | | | |
| Summary of Combined Ratings (Unaudited) | |
| |
| Fitch | or | Moody’s | or | Standard & Poor’s | Value (%)† |
| AAA | | Aaa | | AAA | 58.8 |
| AA | | Aa | | AA | 14.0 |
| A | | A | | A | 9.0 |
| BBB | | Baa | | BBB | 12.1 |
| BB | | Ba | | BB | 2.7 |
| B | | B | | B | .8 |
| Not Rated g | | Not Rated g | | Not Rated g | 2.6 |
| | | | | | 100.0 |
|
| † Based on total investments. |
| g Securities which, while not rated by Fitch, Moody’s and Standard & Poor’s, have been determined by the Manager to |
| be of comparable quality to those rated securities in which the fund may invest. |
See notes to financial statements.
28
|
| STATEMENT OF ASSETS AND LIABILITIES |
| May 31, 2007 |
| | |
| | Cost | Value |
| Assets ($): | | |
| Investments in securities—See Statement of Investments | 736,660,645 | 745,234,925 |
| Interest receivable | | 12,353,529 |
| Receivable for investment securities sold | | 2,647,147 |
| Receivable for shares of Common Stock subscribed | | 2,948 |
| Prepaid expenses and other assets | | 81,924 |
| | | 760,320,473 |
| Liabilities ($): | | |
| Due to The Dreyfus Corporation and affiliates—Note 3(b) | | 420,993 |
| Payable for floating rate note issued | | 15,435,000 |
| Payable for investment securities purchased | | 9,619,404 |
| Payable for shares of Common Stock redeemed | | 372,550 |
| Interest and related expenses payable | | 143,657 |
| Cash overdraft due to Custodian | | 135,917 |
| Accrued expenses | | 145,143 |
| | | 26,272,664 |
| Net Assets ($) | | 734,047,809 |
| Composition of Net Assets ($): | | |
| Paid-in capital | | 729,572,146 |
| Accumulated net realized gain (loss) on investments | | (4,098,617) |
| Accumulated net unrealized appreciation | | |
| (depreciation) on investments | | 8,574,280 |
| Net Assets ($) | | 734,047,809 |
| Shares Outstanding | | |
| (300 million shares of $.001 par value Common Stock authorized) | 55,556,024 |
| Net Asset Value, offering and redemption price per share—Note 3(d) ($) | 13.21 |
| See notes to financial statements. | | |
|
| STATEMENT OF OPERATIONS |
| Year Ended May 31, 2007 |
| |
| Investment Income ($): | |
| Interest Income | 34,638,248 |
| Expenses: | |
| Management fee—Note 3(a) | 4,598,523 |
| Shareholder servicing costs—Note 3(b) | 769,181 |
| Interest expense and related expenses | 479,963 |
| Professional fees | 74,599 |
| Custodian fees | 66,872 |
| Directors’ fees and expenses—Note 3(c) | 48,169 |
| Propspectus and shareholders’ reports | 40,317 |
| Registration fees | 28,649 |
| Loan commitment fees—Note 2 | 4,124 |
| Miscellaneous | 59,141 |
| Total Expenses | 6,169,538 |
| Less—reduction in management fee due to undertaking—Note 3(a) | (6,025) |
| Net Expenses | 6,163,513 |
| Investment Income—Net | 28,474,735 |
| Realized and Unrealized Gain (Loss) on Investments—Note 4 ($): | |
| Net realized gain (loss) on investments | 1,555,300 |
| Net unrealized appreciation (depreciation) on investments | 1,036,245 |
| Net Realized and Unrealized Gain (Loss) on Investments | 2,591,545 |
| Net Increase in Net Assets Resulting from Operations | 31,066,280 |
| |
| See notes to financial statements. | |
30
STATEMENT OF CHANGES IN NET ASSETS
| | |
| | | Year Ended May 31, |
| | 2007 | 2006 |
| Operations ($): | | |
| Investment income—net | 28,474,735 | 30,847,491 |
| Net realized gain (loss) on investments | 1,555,300 | 2,705,421 |
| Net unrealized appreciation | | |
| (depreciation) on investments | 1,036,245 | (23,272,865) |
| Net Increase (Decrease) in Net Assets | | |
| Resulting from Operations | 31,066,280 | 10,280,047 |
| Dividends to Shareholders from ($): | | |
| Investment income—net | (28,452,297) | (30,843,247) |
| Net realized gain on investments | (132,065) | — |
| Total Dividends | (28,584,362) | (30,843,247) |
| Capital Stock Transactions ($): | | |
| Net proceeds from shares sold | 31,568,888 | 32,995,777 |
| Dividends reinvested | 21,527,545 | 22,893,560 |
| Cost of shares redeemed | (110,907,578) | (118,987,218) |
| Increase (Decrease) in Net Assets | | |
| from Capital Stock Transactions | (57,811,145) | (63,097,881) |
| Total Increase (Decrease) in Net Assets | (55,329,227) | (83,661,081) |
| Net Assets ($): | | |
| Beginning of Period | 789,377,036 | 873,038,117 |
| End of Period | 734,047,809 | 789,377,036 |
| Capital Share Transactions (Shares): | | |
| Shares sold | 2,373,529 | 2,475,627 |
| Shares issued for dividends reinvested | 1,619,101 | 1,717,414 |
| Shares redeemed | (8,340,483) | (8,932,879) |
| Net Increase (Decrease) in Shares Outstanding | (4,347,853) | (4,739,838) |
| |
| See notes to financial statements. | | |
FINANCIAL HIGHLIGHTS
The following table describes the performance for the fiscal periods indicated. Total return shows how much your investment in the fund would have increased (or decreased) during each period, assuming you had reinvested all dividends and distributions.These figures have been derived from the fund’s financial statements.
| | | | | |
| | | Year Ended May 31, | |
| | 2007 | 2006 | 2005 | 2004 | 2003 |
| Per Share Data ($): | | | | | |
| Net asset value, beginning of period | 13.18 | 13.51 | 13.28 | 13.91 | 13.42 |
| Investment Operations: | | | | | |
| Investment income—neta | .49 | .49 | .50 | .52 | .57 |
| Net realized and unrealized | | | | | |
| gain (loss) on investments | .03 | (.33) | .23 | (.63) | .49 |
| Total from Investment Operations | .52 | .16 | .73 | (.11) | 1.06 |
| Distributions: | | | | | |
| Dividends from investment income—net | (.49) | (.49) | (.50) | (.52) | (.57) |
| Net asset value, end of period | 13.21 | 13.18 | 13.51 | 13.28 | 13.91 |
| Total Return (%) | 4.03 | 1.23 | 5.59 | (.81) | 8.09 |
| Ratios/Supplemental Data (%): | | | | | |
| Ratio of total expenses | | | | | |
| to average net assets | .80 | .74 | .73 | .74 | .74 |
| Ratio of net expenses | | | | | |
| to average net assets | .80 | .74 | .73 | .74 | .74 |
| Ratio of net investment income | | | | | |
| to average net assets | 3.72 | 3.70 | 3.70 | 3.86 | 4.23 |
| Portfolio Turnover Rate | 23.87 | 28.51 | 37.33 | 35.07 | 41.30 |
| Net Assets, end of period ($ x 1,000) | 734,048 | 789,377 | 873,038 | 904,217 | 1,047,752 |
| |
| a Based on average shares outstanding at each month end. | | | | |
| See notes to financial statements. | | | | | |
32
NOTES TO FINANCIAL STATEMENTS
NOTE 1—Significant Accounting Policies:
Dreyfus Intermediate Municipal Bond Fund, Inc. (the “fund”) is registered under the Investment Company Act of 1940, as amended (the “Act”), as a diversified open-end management investment company. The fund’s investment objective is to provide the maximum amount of current income exempt from federal income tax as is consistent with the preservation of capital. The Dreyfus Corporation (the “Manager” or “Dreyfus”) serves as the fund’s investment adviser. During the reporting period, the Manager was a wholly-owned subsidiary of Mellon Financial Corporation (“Mellon Financial”). Dreyfus Service Corporation (the “Distributor”), a wholly-owned subsidiary of the Manager, is the distributor of the fund’s shares, which are sold to the public without a sales charge. Effective June 30, 2007, the Distributor will be known as MBSC Securities Corporation.
On July 1, 2007, Mellon Financial andThe Bank of NewYork Company, Inc. merged, forming The Bank of NewYork Mellon Corporation.As part of this transaction, Dreyfus became a wholly-owned subsidiary of The Bank of New York Mellon Corporation.
The fund’s financial statements are prepared in accordance with U.S. generally accepted accounting principles, which may require the use of management estimates and assumptions. Actual results could differ from those estimates.
The fund enters into contracts that contain a variety of indemnifications. The fund’s maximum exposure under these arrangements is unknown.The fund does not anticipate recognizing any loss related to these arrangements.
(a) Portfolio valuation: Investments in securities are valued each business day by an independent pricing service (the “Service”) approved by the Board of Directors. Investments for which quoted bid prices are readily available and are representative of the bid side of the market in the judgment of the Service are valued at the mean between the quoted bid prices (as obtained by the Service from dealers in such securities)
NOTES TO FINANCIAL STATEMENTS (continued)
and asked prices (as calculated by the Service based upon its evaluation of the market for such securities). Other investments (which constitute a majority of the portfolio securities) are carried at fair value as determined by the Service, based on methods which include consideration of: yields or prices of municipal securities of comparable quality, coupon, maturity and type; indications as to values from dealers; and general market conditions. Options and financial futures on municipal and U.S.Treasury securities are valued at the last sales price on the securities exchange on which such securities are primarily traded or at the last sales price on the national securities market on each business day.
On September 20, 2006, the Financial Accounting Standards Board (FASB) released Statement of Financial Accounting Standards No. 157 “Fair Value Measurements” (“FAS 157”). FAS 157 establishes an authoritative definition of fair value, sets out a framework for measuring fair value, and requires additional disclosures about fair-value mea-surements.The application of FAS 157 is required for fiscal years beginning after November 15, 2007 and interim periods within those fiscal years. Management does not believe that the application of this standard will have a material impact on the financial statements of the fund.
(b) Securities transactions and investment income: Securities transactions are recorded on a trade date basis. Realized gain and loss from securities transactions are recorded on the identified cost basis. Interest income, adjusted for accretion of discount and amortization of premium on investments, is earned from settlement date and recognized on the accrual basis. Securities purchased or sold on a when-issued or delayed-delivery basis may be settled a month or more after the trade date.
The fund has an arrangement with the custodian bank whereby the fund receives earnings credits from the custodian when positive cash balances are maintained, which are used to offset custody fees. For financial reporting purposes, the fund includes net earnings credits, if any, as an expense offset in the Statement of Operations.
(c) Dividends to shareholders: It is the policy of the fund to declare dividends daily from investment income-net. Such dividends are paid
34
monthly. Dividends from net realized capital gain, if any, are normally declared and paid annually, but the fund may make distributions on a more frequent basis to comply with the distribution requirements of the Internal Revenue Code of 1986, as amended (the “Code”).To the extent that net realized capital gain can be offset by capital loss carryovers, it is the policy of the fund not to distribute such gain.Income and capital gain distributions are determined in accordance with income tax regulations, which may differ from U.S. generally accepted accounting principles.
(d) Federal income taxes: It is the policy of the fund to continue to qualify as a regulated investment company, which can distribute tax exempt dividends, by complying with the applicable provisions of the Code, and to make distributions of income and net realized capital gain sufficient to relieve it from substantially all federal income and excise taxes.
On July 13, 2006, the FASB released FASB Interpretation No. 48 “Accounting for Uncertainty in Income Taxes” (FIN 48). FIN 48 provides guidance for how uncertain tax positions should be recognized, measured, presented and disclosed in the financial statements. FIN 48 requires the evaluation of tax positions taken or expected to be taken in the course of preparing the fund’s tax returns to determine whether the tax positions are “more-likely-than-not” of being sustained by the applicable tax authority. Tax positions not deemed to meet the more likely-than-not threshold would be recorded as a tax benefit or expense in the current year. Adoption of FIN 48 is required for fiscal years beginning after December 15, 2006 and is to be applied to all open tax years as of the effective date. Management does not believe that the application of this standard will have a material impact on the financial statements of the fund.
At May 31,2007,the components of accumulated earnings on a tax basis were as follows: undistributed tax-exempt income $426,796, accumulated capital losses $3,876,985 and unrealized appreciation $8,352,648.
The accumulated capital loss carryover is available to be applied against future net securities profits, if any, realized subsequent to May 31, 2007. If not applied, the carryover expires in fiscal 2011.
NOTES TO FINANCIAL STATEMENTS (continued)
The tax character of distributions paid to shareholders during the fiscal period ended May 31, 2007 and May 31, 2006 were as follows: tax exempt income $28,452,297 and $30,843,247, ordinary income $132,065 and $0, respectively.
During the period ended May 31, 2007, as a result of permanent book to tax differences primarily due to the tax treatment for amortization adjustments, the fund decreased accumulated undistributed investment income-net by $22,438, increased accumulated net realized gain (loss) on investments by $27,354 and decreased paid-in capital by $4,916. Net assets were not affected by this reclassification.
NOTE 2—Bank Line of Credit:
The fund participates with other Dreyfus-managed funds in a $350 million redemption credit facility (the “Facility”) to be utilized for temporary or emergency purposes, including the financing of redemptions. In connection therewith, the fund has agreed to pay commitment fees on its pro rata portion of the Facility. Interest is charged to the fund based on prevailing market rates in effect at the time of borrowing. During the period ended May 31, 2007, the fund did not borrow under the Facility.
NOTE 3—Management Fee and Other Transactions With Affiliates:
(a) Pursuant to a management agreement (“Agreement”) with the Manager, the management fee is computed at the annual rate of .60% of the value of the fund’s average daily net assets and is payable monthly. The Manager had undertaken from June 1, 2006 through May 31, 2007 to reduce the management fee paid by the fund, to the extent that the fund’s aggregate annual expenses, exclusive of taxes, brokerage fees, interest on borrowings, commitment fees and extraordinary expenses, exceed an annual rate of .75% of the value of the fund’s average daily net assets.The reduction in management fee, pursuant to the undertaking, amounted to $6,025 during the period ended May 31, 2007.
(b) Under the Shareholder Services Plan, the fund reimburses the Distributor an amount not to exceed an annual rate of .25% of the
36
value of the fund’s average daily net assets for certain allocated expenses of providing personal services and/or maintaining shareholder accounts.The services provided may include personal services relating to shareholder accounts, such as answering shareholder inquires regarding the fund and providing reports and other information, and services related to the maintenance of shareholder accounts. During the period ended May 31, 2007, the fund was charged $394,124 pursuant to the Shareholder Services Plan.
The fund compensates Dreyfus Transfer, Inc., a wholly-owned subsidiary of the Manager, under a transfer agency agreement for providing personnel and facilities to perform transfer agency services for the fund. During the period ended May 31, 2007, the fund was charged $248,721 pursuant to the transfer agency agreement.
During the period ended May 31, 2007, the fund was charged $4,089 for services performed by the Chief Compliance Officer.
The components of “Due to The Dreyfus Corporation and affiliates” in the Statement of Assets and Liabilities consist of: management fees $376,245, chief compliance officer fees $3,748 and transfer agency per account fees $41,000.
(c) Each Board member also serves as a Board member of other funds within the Dreyfus complex. Annual retainer fees and attendance fees are allocated to each fund based on net assets.
(d) A .10% redemption fee is charged and retained by the fund on certain shares redeemed within thirty days following the date of their issuance, including redemptions made through the use of the fund’s exchange privilege. During the period ended May 31, 2007, redemption fee charged and retained by the fund amounted to $60.
NOTE 4—Securities Transactions:
The aggregate amount of purchases and sales of investment securities, excluding short-term securities, during the period ended May 31, 2007, amounted to $183,208,237 and $231,946,963, respectively.
NOTES TO FINANCIAL STATEMENTS (continued)
The fund may purchase floating rate notes. A floating rate note is a Municipal Bond or other debt obligation (generally held pursuant to a custodial arrangement) having a relatively long maturity and bearing interest at a fixed rate substantially higher than prevailing short-term tax exempt rates, that has been coupled with the agreement of a third party, such as a bank, broker-dealer or other financial institution, pursuant to which such institution grants the security holders the option, at periodic intervals, to tender their securities to the institution and receive the face value thereof. As consideration for providing the option, the financial institution receives periodic fees equal to the difference between the obligation’s fixed coupon rate and the rate, as determined by a remarketing or similar agent at or near the commencement of such period, that would cause the securities, coupled with the tender option, to tra de at par on the date of such determination.Thus, after payment of this fee, the security holder effectively holds a demand obligation that bears interest at the prevailing short-term tax exempt rate.
At May 31,2007,the cost of investments for federal income tax purposes was $721,447,277; accordingly, accumulated net unrealized appreciation on investments was $8,352,648, consisting of $11,340,381 gross unrealized appreciation and $2,987,733 gross unrealized depreciation.
38
|
| REPORT OF INDEPENDENT REGISTERED |
| PUBLIC ACCOUNTING FIRM |
Shareholders and Board of Directors
Dreyfus Intermediate Municipal Bond Fund, Inc.
We have audited the accompanying statement of assets and liabilities, including the statement of investments, of Dreyfus Intermediate Municipal Bond Fund, Inc., as of May 31, 2007, and the related statement of operations for the year then ended, the statement of changes in net assets for each of the two years in the period then ended, and financial highlights for each of the years indicated therein.These financial statements and financial highlights are the responsibility of the fund’s management. Our responsibility is to express an opinion on these financial statements and financial highlights based on our audits.
We conducted our audits in accordance with the standards of the Public Company Accounting Oversight Board (United States).Those standards require that we plan and perform the audit to obtain reasonable assurance about whether the financial statements and financial highlights are free of material misstatement.We were not engaged to perform an audit of the Fund’s internal control over financial reporting.Our audits included consideration of internal control over financial reporting as a basis for designing audit procedures that are appropriate in the circumstances,but not for the purpose of expressing an opinion on the effectiveness of the Fund’s internal control over financial reporting.Accordingly, we express no such opinion.An audit also includes examining, on a test basis, evidence supporting the amounts and disclosures in the financial statements and financial highlights, assessing the accounting principles used an d significant estimates made by management, and evaluating the overall financial statement presentation. Our procedures included confirmation of securities owned May 31, 2007 by correspondence with the custodian.We believe that our audits provide a reasonable basis for our opinion.
In our opinion, the financial statements and financial highlights referred to above present fairly, in all material respects, the financial position of the Dreyfus Intermediate Municipal Bond Fund, Inc. at May 31, 2007, the results of its operations for the year then ended, the changes in its net assets for each of the two years in the period then ended, and the financial highlights for each of the indicated years, in conformity with U.S. generally accepted accounting principles.

|
| New York, New York |
| July 16, 2007 |
IMPORTANT TAX INFORMATION (Unaudited)
In accordance with federal tax law, the fund hereby makes the following designations regarding its fiscal year ended May 31, 2007:

As required by federal tax law rules, shareholders will receive notification of their portion of the fund’s taxable ordinary dividends (if any) and capital gains distributions (if any) paid for the 2007 calendar year on Form 1099-DIV and their portion of the fund’s exempt-interest dividends paid for 2007 calendar year on Form 1099-INT, both which will be mailed by January 31, 2008.
40
|
| INFORMATION ABOUT THE REVIEW AND APPROVAL OF THE |
| FUND’S INVESTMENT MANAGEMENT AGREEMENT (Unaudited) |
At a meeting of the fund’s Board of Directors held on May 8, 2007, the Board considered the re-approval of the fund’s Management Agreement through November 30, 2007, pursuant to which the Manager provides the fund with investment advisory and administrative services. The Board members, none of whom are “interested persons” (as defined in the Investment Company Act of 1940, as amended) of the fund, were assisted in their review by independent legal counsel and met with counsel in executive session separate from representatives of the Manager.
Analysis of Nature, Extent, and Quality of Services Provided to the Fund. The Board members received a presentation from representatives of the Manager regarding services provided to the fund and other funds in the Dreyfus fund complex, and discussed the nature, extent, and quality of the services provided to the fund pursuant to its Management Agreement.The Manager’s representatives reviewed the fund’s distribution of accounts and the relationships the Manager has with various intermediaries and the different needs of each.The Manager’s representatives noted the diversity of distribution of the fund as well as among the funds in the Dreyfus fund complex, and the Manager’s corresponding need for broad, deep, and diverse resources to be able to provide ongoing shareholder services in each distribution channel, including those of the fund.The Board also reviewed the number of shareholder accounts in the fund, as well as the fund’s asset size.
The Board members also considered the Manager’s research and portfolio management capabilities, as well as the Manager’s oversight of day-to-day fund operations, including fund accounting and administration and assistance in meeting legal and regulatory requirements, and the Manager’s extensive administrative, accounting, and compliance infrastructure.
Comparative Analysis of the Fund’s Management Fee and Expense Ratio and Performance. The Board members reviewed reports prepared by Lipper, Inc., an independent provider of investment company data, which included information comparing the fund’s management
|
| INFORMATION ABOUT THE REVIEW AND APPROVAL OF THE FUND’S |
| INVESTMENT MANAGEMENT AGREEMENT (Unaudited) (continued) |
fee and expense ratio with a group of comparable funds (the “Expense Group”) and with a broader group of funds (the “Expense Universe”) that were selected by Lipper. Included in these reports were comparisons of contractual and actual management fee rates and total operating expenses. The Manager also provided a comparison of the fund’s total returns to the fund’s Lipper category average returns for the past 10 calendar years.
The Board reviewed the results of the Expense Group and Expense Universe comparisons based on financial statements currently available to Lipper as of February 28, 2007. The Board reviewed the range of management fees and expense ratios of the funds in the Expense Group and Expense Universe, and noted that the fund’s contractual and actual management fees were higher than the respective Expense Group and Expense Universe medians.The Board also noted that the fund’s total expense ratio was at the Expense Group median and lower than the Expense Universe median.
The Board members also reviewed the reports prepared by Lipper that presented the fund’s performance for various periods ended February 28, 2007, and placed significant emphasis on comparisons of yield and total return performance among the same group of funds as the Expense Group (the “Performance Group”) and to a group of funds that was broader than the Expense Universe (the “Performance Universe”) that also was selected by Lipper.The Board noted the fund’s improved total return performance in the most recent four years and that the fund’s total return was at or higher than the medians of the Performance Group and Performance Universe for the 1-, 2-, 3-, and 4-year time periods, although total return performance was lower than the medians for longer-term periods except as to the Performance Universe median for the 5-year period. On a yield performance basis, the Board noted that the fund� 6;s 1-year yield performance for the past 10 calendar years was at or higher than the Performance Group and Performance Universe medians for each reported time period.
42
Representatives of the Manager reviewed with the Board members the fees paid to the Manager or its affiliates by mutual funds managed by the Manager or its affiliates reported in the same Lipper category as the fund (the “Similar Funds”), and explained the nature of the Similar Funds and any differences, from the Manager’s perspective, in providing services to the Similar Funds as compared to the fund.The Manager’s representatives also reviewed the costs associated with distribution through intermediaries. The Board analyzed differences in fees paid to the Manager and discussed the relationship of the management fees paid in light of the services provided.The Board members considered the relevance of the fee information provided for the Similar Funds, to evaluate the appropriateness and reasonableness of the fund’s management fee.
Representatives of the Manager noted that there were no similarly managed institutional separate accounts or wrap fee accounts managed by the Manager or its affiliates with similar investment objectives, policies, and strategies as the fund.
Analysis of Profitability and Economies of Scale. The Manager’s representatives reviewed the dollar amount of expenses allocated and profit received by the Manager and the method used to determine such expenses and profit.The Board considered information, previously provided and discussed, prepared by an independent consulting firm regarding the Manager’s approach to allocating costs to, and determining the profitability of, individual funds and the entire Dreyfus mutual fund complex.The Board members also considered that the methodology had also been reviewed by an independent registered public accounting firm which, like the consultant, found the methodology to be reasonable.The consulting firm also analyzed where any economies of scale might emerge in connection with the management of the fund. The Board members evaluated the profitability analysis in light of the relevant circumstances for the fund, including the decline in fund assets
|
| INFORMATION ABOUT THE REVIEW AND APPROVAL OF THE FUND’S |
| INVESTMENT MANAGEMENT AGREEMENT (Unaudited) (continued) |
from the prior year, and the extent to which economies of scale would be realized if the fund grows and whether fee levels reflect these economies of scale for the benefit of fund shareholders. The Board members also considered potential benefits to the Manager from acting as investment adviser to the fund and noted that there were no soft dollar arrangements in effect with respect to trading the fund’s portfolio.
It was noted that the Board members should consider the Manager’s profitability with respect to the fund as part of their evaluation of whether the fees under the Management Agreement bear a reasonable relationship to the mix of services provided by the Manager, including the nature, extent, and quality of such services and that a discussion of economies of scale is predicated on increasing assets and that, if a fund’s assets had been decreasing, the possibility that the Manager may have realized any economies of scale would be less. It was noted that the profitability percentage for managing the fund was within the range determined by appropriate court cases to be reasonable given the services rendered and that the profitability percentage for managing the fund was reasonable given the fund’s overall performance and generally superior service levels provided.
At the conclusion of these discussions, the Board agreed that it had been furnished with sufficient information to make an informed business decision with respect to continuation of the fund’s Management Agreement. Based on the discussions and considerations as described above, the Board made the following conclusions and determinations.
The Board concluded that the nature, extent, and quality of the ser- vices provided by the Manager are adequate and appropriate.
The Board was satisfied with the fund’s overall performance.
The Board concluded that the fee paid to the Manager by the fund was reasonable in light of the services provided, comparative perfor- mance and expense and advisory fee information, costs of the ser- vices provided, and profits to be realized and benefits derived or to be derived by the Manager from its relationship with the fund.
44
The Board determined that the economies of scale which may accrue to the Manager and its affiliates in connection with the management of the fund had been adequately considered by the Manager in con- nection with the management fee rate charged to the fund, and that, to the extent in the future it were to be determined that material economies of scale had not been shared with the fund, the Board would seek to have those economies of scale shared with the fund.
The Board members considered these conclusions and determinations, along with the information received on a routine and regular basis throughout the year, and, without any one factor being dispositive, the Board determined that re-approval of the fund’s Management Agreement was in the best interests of the fund and its shareholders.
BOARD MEMBERS INFORMATION (Unaudited)

46
BOARD MEMBERS INFORMATION (Unaudited) (continued)
Once elected all Board Members serve for an indefinite term, but achieve Emeritus status upon reaching age 80.The address of the Board Members and Officers is in c/o The Dreyfus Corporation, 200 Park Avenue, NewYork, NewYork 10166.Additional information about the Board Members is available in the fund’s Statement of Additional Information which can be obtained from Dreyfus free of charge by calling this toll free number: 1-800-554-4611.
Arnold S. Hiatt, Emeritus Board Member
48
OFFICERS OF THE FUND (Unaudited)
OFFICERS OF THE FUND (Unaudited) (continued)
50
For More Information
Ticker Symbol: DITEX
Telephone 1-800-645-6561
Mail The Dreyfus Family of Funds, 144 Glenn Curtiss Boulevard, Uniondale, NY 11556-0144 E-mail Send your request to info@dreyfus.com Internet Information can be viewed online or downloaded at: http://www.dreyfus.com
The fund files its complete schedule of portfolio holdings with the Securities and Exchange Commission (“SEC”) for the first and third quarters of each fiscal year on Form N-Q. The fund's Forms N-Q are available on the SEC’s website at http://www.sec.gov and may be reviewed and copied at the SEC’s Public Reference Room in Washington, DC. Information on the operation of the Public Reference Room may be obtained by calling 1-202-551-8090.
Information regarding how the fund voted proxies relating to portfolio securities for the 12-month period ended June 30, 2006, is available on the SEC’s website at http://www.sec.gov and without charge, upon request, by calling 1-800-645-6561.

Item 2. Code of Ethics.
The Registrant has adopted a code of ethics that applies to the Registrant's principal executive officer, principal financial officer, principal accounting officer or controller, or persons performing similar functions. There have been no amendments to, or waivers in connection with, the Code of Ethics during the period covered by this Report.
Item 3. Audit Committee Financial Expert.
The Registrant's Board has determined that Ehud Houminer, a member of the Audit Committee of the Board, is an audit committee financial expert as defined by the Securities and Exchange Commission (the "SEC"). Mr. Houminer is "independent" as defined by the SEC for purposes of audit committee financial expert determinations.
Item 4. Principal Accountant Fees and Services.
(a) Audit Fees. The aggregate fees billed for each of the last two fiscal years (the "Reporting Periods") for professional services rendered by the Registrant's principal accountant (the "Auditor") for the audit of the Registrant's annual financial statements or services that are normally provided by the Auditor in connection with the statutory and regulatory filings or engagements for the Reporting Periods, were $44,719 in 2009 and $44,719 in 2010.
(b) Audit-Related Fees. The aggregate fees billed in the Reporting Periods for assurance and related services by the Auditor that are reasonably related to the performance of the audit of the Registrant's financial statements and are not reported under paragraph (a) of this Item 4 were $5,276 in 2009 and $5,382 in 2010. These services consisted of one or more of the following: (i) agreed upon procedures related to compliance with Internal Revenue Code section 817(h), (ii) security counts required by Rule 17f-2 under the Investment Company Act of 1940, as amended, (iii) advisory services as to the accounting or disclosure treatment of Registrant transactions or events and (iv) advisory services to the accounting or disclosure treatment of the actual or potential impact to the Registrant of final or proposed rules, standards or interpretations by the Securities and Exchange Commission, the Financial Accounting Standards Boards or other regulatory or standard-setting bodies.
The aggregate fees billed in the Reporting Periods for non-audit assurance and related services by the Auditor to the Registrant's investment adviser (not including any sub-investment adviser whose role is primarily portfolio management and is subcontracted with or overseen by another investment adviser), and any entity controlling, controlled by or under common control with the investment adviser that provides ongoing services to the Registrant ("Service Affiliates"), that were reasonably related to the performance of the annual audit of the Service Affiliate, which required pre-approval by the Audit Committee were $0 in 2009 and $0 in 2010.
(c) Tax Fees. The aggregate fees billed in the Reporting Periods for professional services rendered by the Auditor for tax compliance, tax advice, and tax planning ("Tax Services") were $3,234 in 2009 and $3,184 in 2010. These services consisted of: (i) review or preparation of U.S. federal, state, local and excise tax returns; (ii) U.S. federal, state and local tax planning, advice and assistance regarding statutory, regulatory or administrative developments; (iii) tax advice regarding tax qualification matters and/or treatment of various financial instruments held or proposed to be acquired or held. The aggregate fees billed in the Reporting Periods for Tax Services by the Auditor to Service Affiliates, which required pre-approval by the Audit Committee were $0 in 2009 and $0 in 2010.
(d) All Other Fees. The aggregate fees billed in the Reporting Periods for products and services provided by the Auditor, other than the services reported in paragraphs (a) through (c) of this Item, were $225 in 2009 and $0 in 2010. These services consisted of a review of the Registrant's anti-money laundering program.
The aggregate fees billed in the Reporting Periods for Non-Audit Services by the Auditor to Service Affiliates, other than the services reported in paragraphs (b) through (c) of this Item, which required pre-approval by the Audit Committee, were $0 in 2009 and $0 in 2010.
(e)(1) Audit Committee Pre-Approval Policies and Procedures. The Registrant's Audit Committee has established policies and procedures (the "Policy") for pre-approval (within specified fee limits) of the Auditor's engagements for non-audit services to the Registrant and Service Affiliates without specific case-by-case consideration. The pre-approved services in the Policy can include pre-approved audit services, pre-approved audit-related services, pre-approved tax services and pre-approved all other services. Pre-approval considerations include whether the proposed services are compatible with maintaining the Auditor's independence. Pre-approvals pursuant to the Policy are considered annually.
(e)(2) Note: None of the services described in paragraphs (b) through (d) of this Item 4 were approved by the Audit Committee pursuant to paragraph (c)(7)(i)(C) of Rule 2-01 of Regulation S-X.
(f) None of the hours expended on the principal accountant's engagement to audit the registrant's financial statements for the most recent fiscal year were attributed to work performed by persons other than the principal account's full-time, permanent employees.
Non-Audit Fees. The aggregate non-audit fees billed by the Auditor for services rendered to the Registrant, and rendered to Service Affiliates, for the Reporting Periods were $20,898,574 in 2009 and $28,017,293 in 2010.
Auditor Independence. The Registrant's Audit Committee has considered whether the provision of non-audit services that were rendered to Service Affiliates, which were not pre-approved (not requiring pre-approval), is compatible with maintaining the Auditor's independence.
| |
| Item 5. | Audit Committee of Listed Registrants. |
| | Not applicable. [CLOSED-END FUNDS ONLY] |
| Item 6. | Investments. |
| (a) | Not applicable. |
| Item 7. | Disclosure of Proxy Voting Policies and Procedures for Closed-End Management |
| | Investment Companies. |
| | Not applicable. [CLOSED-END FUNDS ONLY] |
| Item 8. | Portfolio Managers of Closed-End Management Investment Companies. |
| | Not applicable. [CLOSED-END FUNDS ONLY, beginning with reports for periods ended |
| | on and after December 31, 2005] |
| |
| Item 9. | Purchases of Equity Securities by Closed-End Management Investment Companies and |
| | Affiliated Purchasers. |
| | Not applicable. [CLOSED-END FUNDS ONLY] |
| Item 10. | Submission of Matters to a Vote of Security Holders. |
| There have been no material changes to the procedures applicable to Item 10. |
| Item 11. | Controls and Procedures. |
(a) The Registrant's principal executive and principal financial officers have concluded, based on their evaluation of the Registrant's disclosure controls and procedures as of a date within 90 days of the filing date of this report, that the Registrant's disclosure controls and procedures are reasonably designed to ensure that information required to be disclosed by the Registrant on Form N-CSR is recorded, processed, summarized and reported within the required time periods and that information required to be disclosed by the Registrant in the reports that it files or submits on Form N-CSR is accumulated and communicated to the Registrant's management, including its principal executive and principal financial officers, as appropriate to allow timely decisions regarding required disclosure.
(b) There were no changes to the Registrant's internal control over financial reporting that occurred during the second fiscal quarter of the period covered by this report that have materially affected, or are reasonably likely to materially affect, the Registrant's internal control over financial reporting.
(a)(1) Code of ethics referred to in Item 2.
(a)(2) Certifications of principal executive and principal financial officers as required by Rule 30a-2(a) under the Investment Company Act of 1940.
(a)(3) Not applicable.
(b) Certification of principal executive and principal financial officers as required by Rule 30a-2(b) under the Investment Company Act of 1940.
SIGNATURES
Pursuant to the requirements of the Securities Exchange Act of 1934 and the Investment Company Act of 1940, the Registrant has duly caused this Report to be signed on its behalf by the undersigned, thereunto duly authorized.
DREYFUS INTERMEDIATE MUNICIPAL BOND FUND, INC.
| |
| By: | /s/ Bradley J. Skapyak |
| | Bradley J. Skapyak, |
| | President |
| |
| Date: | July 23, 2010 |
Pursuant to the requirements of the Securities Exchange Act of 1934 and the Investment Company Act of 1940, this Report has been signed below by the following persons on behalf of the Registrant and in the capacities and on the dates indicated.
| |
| By: | /s/ Bradley J. Skapyak |
| | Bradley J. Skapyak, |
| | President |
| |
| Date: | July 23 2010 |
| |
| By: | /s/ James Windels |
| James Windels, |
| | Treasurer |
| |
| Date: | July 23, 2010 |
EXHIBIT INDEX
(a)(1) Code of ethics referred to in Item 2.
(a)(2) Certifications of principal executive and principal financial officers as required by Rule 30a-2(a) under the Investment Company Act of 1940. (EX-99.CERT)
(b) Certification of principal executive and principal financial officers as required by Rule 30a-2(b) under the Investment Company Act of 1940. (EX-99.906CERT)