UNITED STATES
SECURITIES AND EXCHANGE COMMISSION
Washington, D.C. 20549
FORMN-CSR
CERTIFIED SHAREHOLDER REPORT OF
REGISTERED MANAGEMENT INVESTMENT COMPANIES
Investment Company Act file number:811-03752
AMG FUNDS III
(Exact name of registrant as specified in charter)
600 Steamboat Road, Suite 300, Greenwich, Connecticut 06830
(Address of principal executive offices) (Zip code)
AMG Funds LLC
600 Steamboat Road, Suite 300, Greenwich, Connecticut 06830
(Name and address of agent for service)
Registrant’s telephone number, including area code: (203)299-3500
Date of fiscal year end: DECEMBER 31
Date of reporting period: JANUARY 1, 2019 – DECEMBER 31, 2019
(Annual Shareholder Report)
| Item 1. | Reports to Shareholders |
| | |
 | | ANNUAL REPORT |
| | | | | | | | |
| | | AMG Funds | | | | |
| | | | |
| | | December 31, 2019 | | | | |
| | |
| | | AMG Managers Loomis Sayles Bond Fund |
| | | Class N: MGFIX | | Class I: MGBIX | | | | |
| | |
| | | AMG Managers Global Income Opportunity Fund |
| | | Class N:MGGBX |
| | |
| | | AMG Managers Special Equity Fund |
| | | Class N: MGSEX | | Class I: MSEIX | | | | |
| | | | | | | | | |
Beginning on January 1, 2021, as permitted by regulations adopted by the Securities and Exchange Commission, paper copies of the Funds’ shareholder reports like this one will no longer be sent by mail, unless you specifically request paper copies of the reports from the Funds or from your financial intermediary, such as a broker-dealer or bank. Instead, the reports will be made available on the Funds’ website (https://www.amgfunds.com/resources/order_literature.html), and you will be notified by mail each time a report is posted and provided with a website link to access the report.
If you already elected to receive shareholder reports electronically, you will not be affected by this change and you need not take any action. You may elect to receive shareholder reports and other communications from the Funds electronically at any time by contacting your financial intermediary or, if you invest directly with the Funds, by logging into your account at www.amgfunds.com.
You may elect to receive all future reports in paper free of charge. If you invest through a financial intermediary, you can contact your financial intermediary to request that you continue to receive paper copies of your shareholder reports. If you invest directly with the Funds, you can call 1.800.548.4539 to inform the Funds that you wish to continue receiving paper copies of your shareholder reports. Your election to receive reports in paper will apply to all funds in the AMG Funds Family of Funds held in your account if you invest through your financial intermediary or all funds in the AMG Funds Family of Funds held with the fund complex if you invest directly with the Funds.
| | | | | | |
amgfunds.com | | | | 123119 | | AR078 |
|
AMG Funds Annual Report – December 31, 2019 |
| | | | | | |
| | | TABLE OF CONTENTS | | PAGE | |
| | | |
| | | LETTER TO SHAREHOLDERS | | | 2 | |
| | | |
| | | ABOUT YOUR FUND’S EXPENSES | | | 3 | |
| | | |
| | | PORTFOLIO MANAGER’S COMMENTS, FUND SNAPSHOTS AND SCHEDULES OF PORTFOLIO INVESTMENTS | | | | |
| | | |
| | | AMG Managers Loomis Sayles Bond Fund | | | 4 | |
| | | |
| | | AMG Managers Global Income Opportunity Fund | | | 14 | |
| | | |
| | | AMG Managers Special Equity Fund | | | 23 | |
| | | |
| | | FINANCIAL STATEMENTS | | | | |
| | | |
| | | Statement of Assets and Liabilities | | | 35 | |
| | | |
| | | Balance sheets, net asset value (NAV) per share computations and cumulative distributable earnings (loss) | | | | |
| | | |
| | | Statement of Operations | | | 37 | |
| | | |
| | | Detail of sources of income, expenses, and realized and unrealized gains (losses) during the fiscal year | | | | |
| | | |
| | | Statements of Changes in Net Assets | | | 38 | |
| | | |
| | | Detail of changes in assets for the past two fiscal years | | | | |
| | | |
| | | Financial Highlights | | | 39 | |
| | | |
| | | Historical net asset values per share, distributions, total returns, income and expense ratios, turnover ratios and net assets | | | | |
| | | |
| | | Notes to Financial Statements | | | 44 | |
| | | |
| | | Accounting and distribution policies, details of agreements and transactions with Fund management and affiliates, and descriptions of certain investment risks | | | | |
| | | |
| | | REPORT OF INDEPENDENT REGISTERED PUBLIC ACCOUNTING FIRM | | | 53 | |
| | | |
| | | OTHER INFORMATION | | | 54 | |
| | | |
| | | TRUSTEES AND OFFICERS | | | 55 | |
Nothing contained herein is to be considered an offer, sale or solicitation of an offer to buy shares of any series of the AMG Funds Family of Funds. Such offering is made only by prospectus, which includes details as to offering price and other material information.
| | | | |
| | Letter to Shareholders | | |
Dear Shareholder:
The U.S. bull market celebrated its10-year anniversary during the fiscal year ended December 31, 2019, as stocks proved resilient in the face of global economic weakness, rising geopolitical tensions, and the ongoing trade war. After a painful selloff in late 2018, a dovish pivot from global central banks rescued investors and fueled a strong rebound early in 2019. The rally picked up steam in the final months of the year, as trade tensions eased when the U.S. and China agreed to a limited “phase one” deal in December following months of tenseback-and-forth negotiations. The yield curve, which had inverted earlier in the year and raised investor anxiety given its track record for predicting an impending recession, was no longer inverted byyear-end as the U.S. Federal Reserve (the Fed) cut short-term rates. Worries over a near-term recession lifted while the yield curve steepened and trade developments improved, leading to a wave of investor confidence and strong equity returns, with the S&P 500® Index returning 31.49%. International equities were also resistant to pressures facing the global economy and generated a 21.51% return as measured by the MSCI All Country World ex USA Index.
In total, all eleven sectors of the S&P 500® Index were strongly positive during the prior twelve months, each producing double-digit returns. The higher growth information technology sector led the way with a 50.31% return while the communication services and financial sectors followed closely behind. Energy was the worst performing sector during the fiscal year, yet still produced a very respectable 11.81% return. Growth stocks outperformed Value stocks for the full fiscal year with returns of 36.39% and 26.54% for the Russell 1000® Growth and Russell 1000® Value Indexes, respectively. The cycle of U.S. outperformance over international equities continued but international developed and emerging markets still produced solid positive returns, with the MSCI EAFE and MSCI Emerging Markets Index returning 22.01% and 18.42%, respectively.
Interest rates fell dramatically over the fiscal year and led to strong returns for bond investors as the Fed shifted to a more dovish policy stance early in 2019 and eventually cut short-term rates three times during the year. The10-year Treasury yield fell from its recent high of 3.24% last November to a low of 1.47% in early September and then edged slightly higher to finish the year at 1.92%. The plunge in long-term interest rates caused the yield curve to briefly invert with2-year yields rising higher than the10-year yields. The Bloomberg Barclays U.S. Aggregate Bond Index, a broad measure of U.S. bond market performance, ended the fiscal year with an 8.72% return. High yield bonds outperformed the broader bond market and returned 14.32% as measured by the return of the Bloomberg Barclays U.S. Corporate High Yield Bond Index. Municipal bonds also performed strongly with a 7.54% return for the Bloomberg Barclays Municipal Bond Index.
AMG Funds appreciates the privilege of providing investment tools to you and your clients. Our foremost goal is to provide investment solutions that help our shareholders successfully reach their long-term investment goals. AMG Funds provides access to a distinctive array of actively managed return-oriented investment strategies. We thank you for your continued confidence and investment in AMG Funds. You can rest assured that under all market conditions our team is focused on delivering excellent investment management services for your benefit.
Respectfully,

Keitha Kinne
President
AMG Funds
| | | | | | | | | | | | | | |
Average Annual Total Returns | | Periods ended December 31, 2019* | |
| | | | |
| Stocks: | | | | 1 Year | | | 3 Years | | | 5 Years | |
| | | | |
Large Cap | | (S&P 500® Index) | | | 31.49% | | | | 15.27% | | | | 11.70% | |
| | | | |
Small Cap | | (Russell 2000® Index) | | | 25.52% | | | | 8.59% | | | | 8.23% | |
| | | | |
International | | (MSCI All Country World ex USA Index) | | | 21.51% | | | | 9.87% | | | | 5.51% | |
Bonds: | | | | | | | | | | | | | | |
| | | | |
Investment Grade | | (Bloomberg Barclays U.S. Aggregate Bond Index) | | | 8.72% | | | | 4.03% | | | | 3.05% | |
| | | | |
High Yield | | (Bloomberg Barclays U.S. Corporate High Yield Bond Index) | | | 14.32% | | | | 6.37% | | | | 6.13% | |
| | | | |
Tax-exempt | | (Bloomberg Barclays Municipal Bond Index) | | | 7.54% | | | | 4.72% | | | | 3.53% | |
| | | | |
Treasury Bills | | (ICE BofAML U.S. 6-Month Treasury Bill Index) | | | 2.57% | | | | 1.81% | | | | 1.26% | |
*Source: FactSet. Past performance is no guarantee of future results.
2
|
About Your Fund’s Expenses |
| | | | | | | | | | | | |
As a shareholder of a Fund, you may incur two types of costs: (1) transaction costs, which may include sales charges (loads) on purchase payments; redemption fees; and exchange fees; and (2) ongoing costs, including management fees; distribution(12b-1) fees; and other Fund expenses. This example is intended to help you understand your ongoing costs (in dollars) of investing in the Fund and to compare these costs with the ongoing costs of investing in other mutual funds. The example is based on $1,000 invested at the beginning of the period and held for the entire period as indicated below. ACTUAL EXPENSES The first line of the following table provides information about the actual account values and | | | | | | actual expenses. You may use the information in this line, together with the amount you invested, to estimate the expenses that you paid over the period. Simply divide your account value by $1,000 (for example, an $8,600 account value divided by $1,000 = 8.6), then multiply the result by the number in the first line under the heading entitled “Expenses Paid During Period” to estimate the expenses you paid on your account during this period. HYPOTHETICAL EXAMPLE FOR COMPARISON PURPOSES The second line of the following table provides information about hypothetical account values and hypothetical expenses based on the Fund’s actual expense ratio and an assumed annual rate of return of 5% before expenses, which is not the Fund’s | | | | | | actual return. The hypothetical account values and expenses may not be used to estimate the actual ending account balance or expenses you paid for the period. You may use this information to compare the ongoing costs of investing in the Fund and other funds by comparing this 5% hypothetical example with the 5% hypothetical examples that appear in the shareholder reports of other funds. Please note that the expenses shown in the table are meant to highlight your ongoing costs only and do not reflect any transactional costs, such as sales charges (loads), redemption fees, or exchange fees. Therefore, the second line of the table is useful in comparing ongoing costs only, and will not help you determine the relative total costs of owning different funds. |
| | | | | | | | | | | | | | | | |
Six Months Ended December 31, 2019 | | Expense
Ratio for the Period | | | Beginning
Account
Value
07/01/19 | | | Ending
Account
Value
12/31/19 | | | Expenses
Paid
During
the Period* |
AMG Managers Loomis Sayles Bond Fund | |
|
Based on Actual Fund Return | |
| | | | |
Class N | | | 0.72% | | | | $1,000 | | | | $1,034 | | | | $3.69 | |
| | | | |
Class I | | | 0.53% | | | | $1,000 | | | | $1,035 | | | | $2.72 | |
|
Based on Hypothetical 5% Annual Return | |
| | | | |
Class N | | | 0.72% | | | | $1,000 | | | | $1,022 | | | | $3.67 | |
| | | | |
Class I | | | 0.53% | | | | $1,000 | | | | $1,023 | | | | $2.70 | |
| | | | | | | | | | | | | | | | |
AMG Managers Global Income Opportunity Fund | |
|
Based on Actual Fund Return | |
| | | | |
Class N | | | 0.89% | | | | $1,000 | | | | $1,010 | | | | $4.51 | |
|
Based on Hypothetical 5% Annual Return | |
| | | | |
Class N | | | 0.89% | | | | $1,000 | | | | $1,021 | | | | $4.53 | |
| | | | | | | | | | | | | | | | |
Six Months Ended December 31, 2019 | | Expense
Ratio for the Period | | | Beginning
Account
Value
07/01/19 | | | Ending
Account
Value
12/31/19 | | | Expenses
Paid
During
the Period* |
AMG Managers Special Equity Fund | |
|
Based on Actual Fund Return | |
| | | | |
Class N | | | 1.36% | | | | $1,000 | | | | $1,016 | | | | $6.91 | |
| | | | |
Class I | | | 1.11% | | | | $1,000 | | | | $1,017 | | | | $5.64 | |
|
Based on Hypothetical 5% Annual Return | |
| | | | |
Class N | | | 1.36% | | | | $1,000 | | | | $1,018 | | | | $6.92 | |
| | | | |
Class I | | | 1.11% | | | | $1,000 | | | | $1,020 | | | | $5.65 | |
| * | Expenses are equal to the Fund’s annualized expense ratio multiplied by the average account value over the period, multiplied by the number of days in the most recent fiscal half-year (184), then divided by 365. |
3
| | |
| | AMG Managers Loomis Sayles Bond Fund Portfolio Manager’s Comments(unaudited) |
| | | | | | | | | | | | |
THE YEAR IN REVIEW AMG Managers Loomis Sayles Bond Fund (Class N shares) (the Fund) returned 11.10% for the year ended December 31, 2019, outperforming the Bloomberg Barclays U.S. Government/Credit Bond Index, which returned 9.71%. The Fund posted absolute positive returns for the year. The relative outperformance can be largely attributed to strong security selection in high yield and investment grade corporates, as well as positive sector allocation. Our slightly longer-than-benchmark duration detracted from returns. Investment grade corporates boosted returns, as credit spreads tightened throughout the year. Strong security selection within the sector contributed nicely, with credits in banking, communications, and consumer cyclicals leading the charge. Strong security selection within the high yield sector outweighed the slightly negative allocation effects and also contributed to returns. Relative to the benchmark, the strategy maintained a meaningful underweight to U.S. Treasurys. The underweight contributed to the Fund’s outperformance as risk assets rallied throughout the year. The U.S. Treasury position was also longer duration than the benchmark, which contributed to performance as interest rates fell.Net-net, the Treasury/duration impact was the largest contributor to excess returns for the year. Our allocation tonon-U.S. dollar denominated issues produced positive returns during the year. Holdings denominated in the Mexican peso were the largest drivers to excess performance. A small allocation to equities and convertibles contributed to performance, with the S&P 500® Index ending 2019 with the highest return since 2013 of 31.49%. An allocation to and weak security selection within the emerging market credit sector detracted from relative returns. Positioning within securitized credit also limited returns. The Fund’s large cash & equivalents positioning was the largest drag on performance for the year. | | | | | | LOOKING FORWARD We continue to believe we are late in the credit cycle1 rather than at the end of it. Probabilities of a shift to a downturn in the cycle declined over the fourth quarter as the U.S. Federal Reserve (the “Fed”) provided additional rate cuts, a phase one deal with China became increasingly likely, and odds of ano-deal Brexit declined. We do not see the U.S. economy sliding into recession in 2020. These developments fueled further support for corporate bonds and risk assets, driving valuations up and delivering a strong year for fixed income assets in 2019. Our macro outlook remains benign and the market backdrop has largely remained supportive. We believe that Fed rate cuts and relatively good news on trade and Brexit will allow the U.S. to emerge from a third “mini cycle” slowdown within this long-running late cycle phase without a recession. We expect global manufacturing to continue to improve into 2020 as uncertainty regarding global trade declines. We anticipate that slow but positive global growth will continue and that this will help supportmid-single digit corporate profit growth and allow for reasonably strong corporate credit metrics in 2020. We expect the Fed to remain on hold for most, if not all, of 2020. Inflation remains well contained. Overall yield levels in the U.S. should remain within current established ranges, although there could be some modest upward pressure on yields should the global macro environment firm more quickly on better-than-expected news on the trade front. From a duration perspective, the Fund remains modestly short relative to the broad market. Nonetheless, global developed market yields will likely remain low and relatively high U.S. yields should be a supportive technical factor for U.S. bonds. The double-barreled market rally of lower yields and tighter spreads has pushed valuations on corporate bonds higher. High yield and investment grade corporate bond risk premiums declined over the course of 2019. While we believe that the global demand for yield and a continued late cycle environment can support spreads at current levels, we expect returns to be based more on carry in 2020. We believe corporate credit quality will | | | | | | continue to marginally decline but not enough to cause a dramatic move wider in spreads or a large uptick in corporate defaults. That said, we retain a cautious and “up in quality” bias. By historic standards we have less exposure to high yield bonds than usual, while retaining relatively high liquidity which can be deployed should opportunities develop within the sector. We continue to strive for positive issue selection through our credit research efforts. The Fund is by credits we believe are attractively priced relative to the credit quality we assign them. Communications and cable and media issues account for the bulk of this exposure, along with select areas within consumer cyclical. We believe that opportunities for positive carry in emerging market corporate bonds could expand should global growth strengthen. While we have pulled back some of our energy exposure, we believe sentiment regarding the sector has become too negative relative to the actual fundamentals. Accordingly, we believe there is upside potential for some of our best picks in this sector. We also remain comfortable with the securitized sector, which largely lagged the bigger moves in other fixed income sectors in 2019. We still like the defensive nature of the sector based on good carry for higher quality. Overall, we believe that the large rally seen in 2019 presents a challenge to fixed income return potential in 2020. However, some of those same market drivers could provide support as we enter a new year. These include global demand for yield, reduced uncertainty on global trade and Brexit, and positive global growth. The late cycle environment is likely to continue. We remain focused on maintaining favorable carry/yield, seeking to identify attractively priced bonds, and retaining the liquidity and flexibility to adapt should the benign market conditions deteriorate. 1A credit cycle is a cyclical pattern that follows credit availability and corporate health. This commentary reflects the viewpoints of Loomis, Sayles & Company, L.P. and is not intended as a forecast or guarantee of future results. |
4
| | |
| | AMG Managers Loomis Sayles Bond Fund Portfolio Manager’s Comments(continued) |
CUMULATIVE TOTAL RETURN PERFORMANCE
AMG Managers Loomis Sayles Bond Fund’s cumulative total return is based on the daily change in net asset value (NAV), and assumes that all dividends and distributions were reinvested. The graph compares a hypothetical $10,000 investment made in the AMG Managers Loomis Sayles Bond Fund’s Class N Shares on December 31, 2009, to a $10,000 investment made in the Bloomberg Barclays U.S. Government/Credit Bond Index for the same time period. The graph and table do not reflect the deduction of taxes that a shareholder would pay on a Fund distribution or redemption of shares. The listed returns for the Fund are net expenses and the returns for the index exclude expenses. Total returns would have been lower had certain expenses not been reduced.
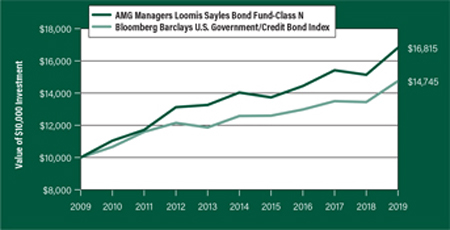
The table below shows the average annual total returns for the AMG Managers Loomis Sayles Bond Fund and the Bloomberg Barclays U.S. Government/Credit Bond Index for the same time periods ended December 31, 2019.
| | | | | | | | | | | | | | | | | | | | |
| Average Annual Total Returns1 | | One Year | | | Five
Years | | | Ten Years | | | Since
Inception | | | Inception
Date | |
| |
AMG Managers Loomis Sayles Bond Fund2, 3, 4, 5, 6, 7, 8 | | | | | |
| | | | | |
Class N | | | 11.10% | | | | 3.68 | % | | | 5.34% | | | | 7.99% | | | | 06/01/84 | |
| | | | | |
Class I | | | 11.32% | | | | 3.81 | % | | | — | | | | 3.61% | | | | 04/01/13 | |
Bloomberg Barclays U.S. Government/ Credit Bond Index9 | | | 9.71% | | | | 3.23 | % | | | 3.96% | | | | 7.19% | | | | 06/01/84 | † |
The performance data shown represents past performance. Past performance is not a guarantee of future results. Current performance may be lower or higher than the performance data quoted. The investment return and principal value of an investment will fluctuate so that an investor’s shares, when redeemed, may be worth more or less than their original cost.
Investors should carefully consider the Fund’s investment objectives, risks, charges and expenses before investing. For performance information through the most recent month end, current net asset values per share for the Fund and other information, please call 800.548.4539 or visit our website at amgfunds.com for a free prospectus. Read it carefully before investing or sending money.
Distributed by AMG Distributors, Inc., member FINRA/SIPC.
| † | Date reflects inception date of the Fund, not the index. |
| 1 | Total return equals income yield plus share price change and assumes reinvestment of all dividends and capital gain distributions. Returns are net of fees and may reflect offsets of Fund expenses as described in the prospectus. No adjustment has been made for taxes payable by shareholders on their reinvested dividends and |
|
capital gain distributions. Returns for periods greater than one year are annualized. The listed returns on the Fund are net of expenses and based on the published NAV as of December 31, 2019. All returns are in U.S. dollars($). 2 From time to time, the Fund’s advisor has waived fees and/or absorbed Fund expenses, which has resulted in higher returns. 3 The Fund is subject to the risks associated with investments in debt securities, such as default risk and fluctuations in the perception of the debtor’s ability to pay its creditors. Changing interest rates may adversely affect the value of an investment. An increase in interest rates typically causes the value of bonds and other fixed income securities to fall. 4 To the extent that the Fund invests in asset-backed or mortgage-backed securities, its exposure to prepayment and extension risks may be greater than investments in other fixed income securities. 5 The Fund may invest in derivatives such as options and futures; the complexity and rapidly changing structure of derivatives markets may increase the possibility of market losses. 6 High-yield bonds (also known as “junk bonds”) may be subject to greater levels of interest rate, credit, and liquidity risk than investments in higher rated securities. These securities are considered predominantly speculative with respect to the issuer’s continuing ability to make principal and interest payments. The issuers of the Fund’s holdings may be involved in bankruptcy proceedings, reorganizations, or financial restructurings, and are not as strong financially as higher-rated issuers. 7 Investments in international securities are subject to certain risks of overseas investing including currency fluctuations and changes in political and economic conditions, which could result in significant market fluctuations. These risks are magnified in emerging markets. |
8 The Fund is subject to currency risk resulting from fluctuations in exchange rates that may affect the total loss or gain on anon-U.S. Dollar investment when converted back to U.S. Dollars. 9 The Bloomberg Barclays U.S. Government/Credit Bond Index is an index of investment grade government and corporate bonds with a maturity date of more than one year. Unlike the Fund, the Bloomberg Barclays U.S. Government/Credit Bond Index is unmanaged, is not available for investment and does not incur expenses. Bloomberg Index Services Limited. BLOOMBERG® is a trademark and service mark of Bloomberg Finance L.P. and its affiliates (collectively “Bloomberg”). BARCLAYS® is a trademark and service mark of Barclays Bank Plc (collectively with its affiliates, |
5
| | |
| | AMG Managers Loomis Sayles Bond Fund Portfolio Manager’s Comments(continued) |
| | | | | | | | | | | | |
“Barclays”), used under license. Bloomberg or Bloomberg’s licensors, including Barclays, own all proprietary rights in the Bloomberg Barclays Indices. Neither Bloomberg nor Barclays approves or endorses this material, or guarantees the accuracy or completeness of any information herein, or makes | | | | | | any warranty, express or implied, as to the results to be obtained therefrom and, to the maximum extent allowed by law, neither shall have any liability or responsibility for injury or damages arising in connection therewith. | | | | | | Not FDIC insured, nor bank guaranteed. May lose value. |
6
| | |
| | AMG Managers Loomis Sayles Bond Fund Fund Snapshots(unaudited) December 31, 2019 |
PORTFOLIO BREAKDOWN
| | | | | |
| Category | | % of Net Assets |
| | |
Corporate Bonds and Notes | | | | 60.3 | |
| | |
U.S. Government and Agency Obligations | | | | 17.4 | |
| | |
Foreign Government Obligations | | | | 4.7 | |
| | |
Common Stocks | | | | 2.2 | |
| | |
Municipal Bonds | | | | 1.2 | |
| | |
Preferred Stocks | | | | 1.0 | |
| | |
Asset-Backed Securities | | | | 0.7 | |
| | |
Mortgage-Backed Securities | | | | 0.0 | 1 |
| | |
Short-Term Investments | | | | 13.3 | |
| | |
Other Assets Less Liabilities | | | | (0.8 | ) |
1 Less than 0.05%
| | | | | |
| |
| Rating | | % of Market Value1 |
| | |
U.S. Government and Agency Obligations | | | | 20.4 | |
| | |
Aaa/AAA | | | | 1.6 | |
| | |
Aa/AA | | | | 2.9 | |
| | |
A | | | | 31.9 | |
| | |
Baa/BBB | | | | 33.8 | |
| | |
Ba/BB | | | | 7.7 | |
| | |
B | | | | 1.4 | |
| | |
Caa/CCC & lower | | | | 0.3 | |
1 Includes market value of long-term fixed-income securities only.
TOP TEN HOLDINGS
| | | | |
| Security Name | | % of Net Assets |
| | |
U.S. Treasury Bonds, 1.500%, 10/31/21 | | | 8.0 | |
| | |
U.S. Treasury Bonds, 1.500%, 09/30/21 | | | 6.1 | |
| | |
Verizon Communications, Inc., 3.500%, 11/01/24 | | | 2.4 | |
| | |
Ford Motor Credit Co. LLC, 4.389%, 01/08/26 | | | 2.3 | |
| | |
Mexican Bonos Bonds, Series M 20, 10.000%, 12/05/24 (Mexico) | | | 2.3 | |
| | |
U.S. Treasury Bonds, 3.000%, 08/15/48 | | | 2.0 | |
| | |
Lloyds Banking Group PLC, 4.582%, 12/10/25 (United Kingdom) | | | 1.8 | |
| | |
Banco Santander, S.A., 5.179%, 11/19/25 (Spain) | | | 1.6 | |
| | |
Transcontinental Gas Pipe Line Co. LLC, 7.850%, 02/01/26 | | | 1.6 | |
| | |
American Airlines2016-2 Class B Pass Through Trust, 4.375%, 06/15/24 | | | 1.5 | |
| | | | | |
Top Ten as a Group | | | 29.6 | |
| | | | | |
| | | | | |
Credit quality ratings shown above reflect the highest rating assigned by either Standard & Poor’s (“S&P”), Moody’s Investors Service, Inc. (“Moody’s”) or Fitch. These rating agencies are independent, nationally recognized statistical rating organizations and are widely used. Investment grade ratings are credit ratings of BBB/Baa or higher. Below investment grade ratings are credit ratings of BB/Ba or lower. Investments designated N/R are not rated by either rating agency. Unrated investments do not necessarily indicate low credit quality. Credit quality ratings are subject to change.
Because a fund’s strategy may result in multiple investments in particular sectors of the economy, its performance may depend on the performance of those sectors and may fluctuate more widely than investments diversified across more sectors. For additional information on these and other risk considerations, please see the Fund’s prospectus.
Any sectors, industries, or securities discussed should not be perceived as investment recommendations. Mention of a specific security should not be considered a recommendation to buy or solicitation to sell that security. Specific securities mentioned in this report may have been sold from the Fund’s portfolio of investments by the time you receive this report.
7
| | |
| | AMG Managers Loomis Sayles Bond Fund Schedule of Portfolio Investments December 31, 2019 |
| | | | | | | | |
| | | Principal
Amount† | | | Value | |
| |
Corporate Bonds and Notes - 60.3% | | | | | |
| | |
Financials - 21.3% | | | | | | | | |
| | |
Ally Financial, Inc. | | | | | | | | |
4.125%, 02/13/22 | | | $7,915,000 | | | | $8,172,237 | |
8.000%, 11/01/31 | | | 1,267,000 | | | | 1,758,723 | |
| | |
Alta Wind Holdings LLC | | | | | | | | |
7.000%, 06/30/351 | | | 4,642,717 | | | | 5,178,646 | |
| | |
American International Group, Inc. | | | | | | | | |
4.875%, 06/01/22 | | | 560,000 | | | | 597,869 | |
| | |
Banco Santander, S.A. (Spain) | | | | | | | | |
5.179%, 11/19/252 | | | 17,200,000 | | | | 19,272,322 | |
| | |
Bank of America Corp. | | | | | | | | |
(3 month LIBOR + 1.040%) | | | | | | | | |
3.419%, 12/20/283 | | | 12,410,000 | | | | 13,032,284 | |
| | |
Brighthouse Financial Inc. | | | | | | | | |
4.700%, 06/22/472 | | | 890,000 | | | | 824,683 | |
| | |
Cooperatieve Centrale | | | | | | | | |
Raiffeisen-Boerenleenbank (Netherlands) | | | | | | | | |
3.875%, 02/08/22 | | | 9,090,000 | | | | 9,467,139 | |
3.950%, 11/09/22 | | | 2,190,000 | | | | 2,289,878 | |
| | |
Equifax, Inc. | | | | | | | | |
7.000%, 07/01/37 | | | 4,421,000 | | | | 5,687,654 | |
| | |
The Goldman Sachs Group, Inc. | | | | | | | | |
6.750%, 10/01/37 | | | 9,880,000 | | | | 13,724,592 | |
| | |
iStar, Inc. | | | | | | | | |
3.125%, 09/15/224 | | | 2,055,000 | | | | 2,304,325 | |
| | |
Jefferies Group LLC | | | | | | | | |
5.125%, 01/20/23 | | | 8,800,000 | | | | 9,503,812 | |
| | |
JPMorgan Chase & Co. | | | | | | | | |
4.125%, 12/15/26 | | | 11,005,000 | | | | 12,056,448 | |
| | |
Lloyds Banking Group PLC (United Kingdom) | | | | | | | | |
4.582%, 12/10/25 | | | 20,972,000 | | | | 22,714,838 | |
| | |
Marsh & McLennan Cos., Inc. | | | | | | | | |
5.875%, 08/01/33 | | | 8,295,000 | | | | 10,816,551 | |
| | |
MBIA Insurance Corp. | | | | | | | | |
13.261%, 01/15/331,3 | | | 525,000 | | | | 359,260 | |
| | |
Morgan Stanley | | | | | | | | |
3.950%, 04/23/27 | | | 17,265,000 | | | | 18,523,729 | |
GMTN, 4.350%, 09/08/26 | | | 5,000,000 | | | | 5,469,419 | |
MTN, 6.250%, 08/09/26 | | | 11,000,000 | | | | 13,398,361 | |
| | |
National Life Insurance Co. | | | | | | | | |
10.500%, 09/15/391 | | | 5,000,000 | | | | 8,252,107 | |
| | |
Navient Corp. | | | | | | | | |
5.500%, 01/25/23 | | | 14,070,000 | | | | 15,019,725 | |
| | |
Old Republic International Corp. | | | | | | | | |
4.875%, 10/01/24 | | | 4,915,000 | | | | 5,390,185 | |
| | |
Quicken Loans, Inc. | | | | | | | | |
5.250%, 01/15/281 | | | 2,080,000 | | | | 2,152,800 | |
5.750%, 05/01/251 | | | 1,815,000 | | | | 1,876,256 | |
| | |
Realty Income Corp. | | | | | | | | |
5.750%, 01/15/212 | | | 2,125,000 | | | | 2,186,070 | |
| | | | | | | | |
| | | Principal
Amount† | | | Value | |
| | |
Royal Bank of Scotland Group PLC (United Kingdom) | | | | | | | | |
6.125%, 12/15/22 | | | $4,650,000 | | | | $5,089,945 | |
| | |
Societe Generale, S.A. (France) | | | | | | | | |
4.750%, 11/24/251 | | | 11,000,000 | | | | 11,923,268 | |
5.200%, 04/15/211 | | | 7,000,000 | | | | 7,280,431 | |
| | |
Springleaf Finance Corp. | | | | | | | | |
8.250%, 10/01/23 | | | 8,015,000 | | | | 9,337,475 | |
| | |
Weyerhaeuser Co. | | | | | | | | |
6.875%, 12/15/33 | | | 12,890,000 | | | | 17,069,268 | |
| | |
Total Financials | | | | | | | 260,730,300 | |
| | |
Industrials - 36.7% | | | | | | | | |
| | |
America Movil SAB de CV (Mexico) | | | | | | | | |
6.450%, 12/05/22 | | | 169,300,000 | MXN | | | 8,674,302 | |
| | |
American Airlines2016-2 Class B Pass Through Trust | | | | | | | | |
4.375%, 06/15/241 | | | 18,250,000 | | | | 18,710,104 | |
| | |
American Airlines2016-3 Class B Pass Through Trust | | | | | | | | |
3.750%, 10/15/25 | | | 6,631,142 | | | | 6,705,870 | |
| | |
American Airlines2017-1B Class B Pass Through Trust | | | | | | | | |
Series B | | | | | | | | |
4.950%, 02/15/25 | | | 3,191,285 | | | | 3,369,576 | |
| | |
American Airlines2017-2 Class B Pass Through Trust | | | | | | | | |
Series B | | | | | | | | |
3.700%, 10/15/25 | | | 2,455,946 | | | | 2,482,679 | |
| | |
APL, Ltd. | | | | | | | | |
8.000%, 01/15/24 | | | 250,000 | | | | 222,525 | |
| | |
Apple, Inc. | | | | | | | | |
1.800%, 05/11/20 | | | 18,480,000 | | | | 18,463,415 | |
| | |
ArcelorMittal, S.A. (Luxembourg) | | | | | | | | |
6.750%, 03/01/41 | | | 11,065,000 | | | | 13,180,100 | |
7.000%, 10/15/39 | | | 6,604,000 | | | | 8,049,795 | |
| | |
AT&T, Inc. | | | | | | | | |
3.400%, 05/15/25 | | | 13,530,000 | | | | 14,169,596 | |
4.300%, 02/15/30 | | | 14,685,000 | | | | 16,317,840 | |
| | |
Booking Holdings, Inc. | | | | | | | | |
0.900%, 09/15/212,4 | | | 10,970,000 | | | | 12,641,548 | |
| | |
CenturyLink, Inc. | | | | | | | | |
Series S | | | | | | | | |
6.450%, 06/15/21 | | | 5,900,000 | | | | 6,175,825 | |
| | |
Chesapeake Energy Corp. | | | | | | | | |
5.500%, 09/15/264 | | | 3,580,000 | | | | 1,705,455 | |
8.000%, 06/15/272 | | | 965,000 | | | | 598,300 | |
| | |
Continental Airlines, Inc.2000-1Class A-1 | | | | | | | | |
Pass Through Trust | | | | | | | | |
Series 00A1 | | | | | | | | |
8.048%, 11/01/20 | | | 14,509 | | | | 14,785 | |
The accompanying notes are an integral part of these financial statements.
8
| | |
| | AMG Managers Loomis Sayles Bond Fund Schedule of Portfolio Investments(continued) |
| | | | | | | | |
| | | Principal
Amount† | | | Value | |
| |
Industrials - 36.7%(continued) | | | | | |
| | |
Continental Airlines, Inc.2007-1 Class A | | | | | | | | |
Pass Through Trust | | | | | | | | |
Series 071A | | | | | | | | |
5.983%, 04/19/22 | | | $11,737,143 | | | | $12,347,118 | |
| | |
Continental Airlines, Inc.2007-1 Class B | | | | | | | | |
Pass Through Trust | | | | | | | | |
Series 071B | | | | | | | | |
6.903%, 04/19/22 | | | 738,367 | | | | 777,217 | |
| | |
Continental Resources, Inc. | | | | | | | | |
3.800%, 06/01/24 | | | 2,025,000 | | | | 2,094,432 | |
4.500%, 04/15/23 | | | 385,000 | | | | 402,265 | |
| | |
Corning, Inc. | | | | | | | | |
6.850%, 03/01/29 | | | 9,142,000 | | | | 11,393,618 | |
| | |
Cox Communications, Inc. | | | | | | | | |
4.800%, 02/01/351 | | | 3,369,000 | | | | 3,732,021 | |
| | |
Cummins, Inc. | | | | | | | | |
5.650%, 03/01/98 | | | 6,460,000 | | | | 8,183,572 | |
| | |
Dell International LLC / EMC Corp. | | | | | | | | |
6.020%, 06/15/261 | | | 3,270,000 | | | | 3,764,424 | |
8.100%, 07/15/361 | | | 3,110,000 | | | | 4,089,457 | |
8.350%, 07/15/461 | | | 2,990,000 | | | | 4,120,032 | |
| | |
Delta Air Lines, Inc. | | | | | | | | |
Series 071B | | | | | | | | |
8.021%, 08/10/22 | | | 2,481,495 | | | | 2,714,409 | |
| | |
Dillard’s, Inc. | | | | | | | | |
7.000%, 12/01/28 | | | 225,000 | | | | 250,119 | |
| | |
Embraer Netherlands Finance BV (Netherlands) | | | | | | | | |
5.400%, 02/01/27 | | | 2,325,000 | | | | 2,616,811 | |
| | |
Enable Midstream Partners, LP | | | | | | | | |
5.000%, 05/15/44 | | | 2,725,000 | | | | 2,501,370 | |
| | |
Enbridge Energy Partners, LP | | | | | | | | |
7.375%, 10/15/45 | | | 1,870,000 | | | | 2,793,723 | |
| | |
Energy Transfer Partners, LP/Regency | | | | | | | | |
Energy Finance Corp. | | | | | | | | |
4.500%, 11/01/23 | | | 700,000 | | | | 741,688 | |
| | |
EnLink Midstream Partners, LP | | | | | | | | |
4.150%, 06/01/25 | | | 6,145,000 | | | | 5,776,300 | |
| | |
Enterprise Products Operating LLC | | | | | | | | |
4.050%, 02/15/22 | | | 2,219,000 | | | | 2,311,280 | |
| | |
ERAC USA Finance LLC | | | | | | | | |
7.000%, 10/15/371 | | | 12,000,000 | | | | 16,975,457 | |
| | |
Ford Motor Co. | | | | | | | | |
6.375%, 02/01/29 | | | 1,990,000 | | | | 2,145,072 | |
| | |
Ford Motor Credit Co. LLC, GMTN | | | | | | | | |
4.389%, 01/08/26 | | | 28,075,000 | | | | 28,535,065 | |
| | |
General Motors Co. | | | | | | | | |
5.200%, 04/01/45 | | | 2,760,000 | | | | 2,787,606 | |
| | |
General Motors Financial Co., Inc. | | | | | | | | |
5.250%, 03/01/26 | | | 9,680,000 | | | | 10,735,321 | |
| | | | | | | | |
| | | Principal
Amount† | | | Value | |
| | |
Georgia-Pacific LLC | | | | | | | | |
5.400%, 11/01/201 | | | $5,175,000 | | | | $5,318,650 | |
| | |
HCA, Inc. | | | | | | | | |
4.500%, 02/15/27 | | | 3,040,000 | | | | 3,278,612 | |
7.500%, 11/06/33 | | | 75,000 | | | | 94,500 | |
| | |
Hewlett Packard Enterprise Co. | | | | | | | | |
6.350%, 10/15/45 | | | 2,243,000 | | | | 2,700,870 | |
| | |
International Business Machines Corp. | | | | | | | | |
1.625%, 05/15/20 | | | 5,980,000 | | | | 5,978,069 | |
| | |
Kinder Morgan Energy Partners, LP | | | | | | | | |
3.500%, 09/01/23 | | | 6,685,000 | | | | 6,928,306 | |
4.150%, 03/01/22 | | | 5,620,000 | | | | 5,829,370 | |
5.800%, 03/01/21 | | | 4,320,000 | | | | 4,497,224 | |
| | |
KLA Corp. | | | | | | | | |
5.650%, 11/01/34 | | | 4,590,000 | | | | 5,501,721 | |
| | |
Marks & Spencer PLC (United Kingdom) | | | | | | | | |
7.125%, 12/01/371 | | | 4,725,000 | | | | 5,337,284 | |
| | |
Masco Corp. | | | | | | | | |
6.500%, 08/15/32 | | | 254,000 | | | | 311,838 | |
7.750%, 08/01/29 | | | 499,000 | | | | 647,624 | |
| | |
Noble Energy, Inc. | | | | | | | | |
3.900%, 11/15/24 | | | 3,670,000 | | | | 3,879,707 | |
| | |
Nuance Communications, Inc. | | | | | | | | |
1.000%, 12/15/354 | | | 2,140,000 | | | | 2,152,035 | |
1.250%, 04/01/254 | | | 1,585,000 | | | | 1,760,622 | |
1.500%, 11/01/354 | | | 50,000 | | | | 52,697 | |
| | |
ONEOK Partners, LP | | | | | | | | |
4.900%, 03/15/25 | | | 13,736,000 | | | | 15,129,173 | |
6.200%, 09/15/43 | | | 245,000 | | | | 310,275 | |
| | |
Owens Corning | | | | | | | | |
7.000%, 12/01/36 | | | 2,715,000 | | | | 3,382,514 | |
| | |
PulteGroup, Inc. | | | | | | | | |
6.000%, 02/15/35 | | | 8,860,000 | | | | 9,878,900 | |
6.375%, 05/15/33 | | | 5,135,000 | | | | 5,995,112 | |
| | |
Qwest Corp. | | | | | | | | |
7.250%, 09/15/252 | | | 990,000 | | | | 1,139,046 | |
| | |
Reliance Holding USA, Inc. | | | | | | | | |
5.400%, 02/14/221 | | | 3,250,000 | | | | 3,439,410 | |
| | |
Samsung Electronics Co., Ltd. (South Korea) | | | | | | | | |
7.700%, 10/01/271 | | | 1,760,000 | | | | 2,020,026 | |
| | |
Sealed Air Corp. | | | | | | | | |
5.500%, 09/15/251 | | | 1,580,000 | | | | 1,738,000 | |
| | |
SM Energy Co. | | | | | | | | |
6.625%, 01/15/272 | | | 2,155,000 | | | | 2,118,052 | |
| | |
Telecom Italia Capital, S.A. (Luxembourg) | | | | | | | | |
6.000%, 09/30/34 | | | 4,665,000 | | | | 5,003,212 | |
6.375%, 11/15/33 | | | 3,530,000 | | | | 3,918,300 | |
| | |
Telefonica Emisiones SAU (Spain) | | | | | | | | |
4.570%, 04/27/23 | | | 900,000 | | | | 968,529 | |
| | |
Time Warner Cable LLC | | | | | | | | |
5.500%, 09/01/412 | | | 805,000 | | | | 899,271 | |
The accompanying notes are an integral part of these financial statements.
9
| | |
| | AMG Managers Loomis Sayles Bond Fund Schedule of Portfolio Investments(continued) |
| | | | | | | | |
| | | Principal
Amount† | | | Value | |
| |
Industrials - 36.7%(continued) | | | | | |
| | |
The Toro Co. | | | | | | | | |
6.625%, 05/01/37 | | | $6,810,000 | | | | $8,741,348 | |
| | |
Transcontinental Gas Pipe Line Co. LLC | | | | | | | | |
7.850%, 02/01/26 | | | 15,140,000 | | | | 19,242,318 | |
| | |
UAL2007-1 Pass Through Trust | | | | | | | | |
Series 071A | | | | | | | | |
6.636%, 07/02/22 | | | 7,845,901 | | | | 8,330,935 | |
| | |
United Airlines2016-2 Class B | | | | | | | | |
Pass Through Trust | | | | | | | | |
Series16-2 | | | | | | | | |
3.650%, 10/07/25 | | | 1,949,111 | | | | 1,967,818 | |
| | |
United States Steel Corp. | | | | | | | | |
6.650%, 06/01/372 | | | 3,120,000 | | | | 2,527,200 | |
| | |
US Airways2011-1 Class A Pass Through | | | | | | | | |
Series A | | | | | | | | |
7.125%, 10/22/23 | | | 1,893,105 | | | | 2,126,166 | |
| | |
Vale Overseas, Ltd. (Brazil) | | | | | | | | |
6.875%, 11/21/36 | | | 1,759,000 | | | | 2,286,700 | |
| | |
Verizon Communications, Inc. | | | | | | | | |
3.500%, 11/01/24 | | | 27,900,000 | | | | 29,587,163 | |
| | |
WestRock MWV LLC | | | | | | | | |
7.550%, 03/01/47 | | | 970,000 | | | | 1,334,639 | |
| | |
Total Industrials | | | | | | | 449,623,328 | |
| | |
Utilities - 2.3% | | | | | | | | |
| | |
DCP Midstream Operating, LP | | | | | | | | |
6.450%, 11/03/361 | | | 870,000 | | | | 913,500 | |
| | |
Empresa Nacional de Electricidad S.A. | | | | | | | | |
(Cayman Islands) | | | | | | | | |
7.875%, 02/01/27 | | | 2,900,000 | | | | 3,369,324 | |
| | |
Enel Finance International, N.V. (Netherlands) | | | | | | | | |
6.000%, 10/07/391 | | | 11,152,000 | | | | 14,051,783 | |
| | |
Enterprise Products Operating LLC | | | | | | | | |
3.900%, 02/15/24 | | | 6,400,000 | | | | 6,791,527 | |
| | |
Tenaga Nasional Bhd (Malaysia) | | | | | | | | |
7.500%, 11/01/251 | | | 2,000,000 | | | | 2,465,612 | |
| | |
Total Utilities | | | | | | | 27,591,746 | |
| |
Total Corporate Bonds and Notes
(Cost $648,747,456) | | | | 737,945,374 | |
| |
Asset-Backed Security - 0.7% | | | | | |
| | |
FAN Engine Securitization, Ltd. (Ireland) | | | | | | | | |
Series2013-1A, Class 1A | | | | | | | | |
4.625%, 10/15/431 | | | 8,351,435 | | | | 8,351,200 | |
| |
Total Asset-Backed Security
(Cost $8,261,888) | | | | 8,351,200 | |
| |
Mortgage-Backed Securities - 0.0%# | | | | | |
| | |
Commercial Mortgage Trust | | | | | | | | |
Series 2014-UBS4, Class A2 | | | | | | | | |
2.963%, 08/10/47 | | | 91,095 | | | | 91,395 | |
| | | | | | | | |
| | | Principal
Amount† | | | Value | |
| | |
WFRBS Commercial Mortgage Trust | | | | | | | | |
Series2011-C3, Class D | | | | | | | | |
5.683%, 03/15/441,3 | | | $435,000 | | | | $332,460 | |
| |
Total Mortgage-Backed Securities
(Cost $491,696) | | | | 423,855 | |
| |
Municipal Bonds - 1.2% | | | | | |
| | |
Illinois State | | | | | | | | |
5.100%, 06/01/33 | | | 1,070,000 | | | | 1,153,492 | |
| | |
Michigan Tobacco Settlement Finance Authority | | | | | | | | |
7.309%, 06/01/46 | | | 1,950,000 | | | | 2,018,270 | |
| | |
Virginia Tobacco Settlement Financing Corp. | | | | | | | | |
6.706%, 06/01/46 | | | 11,510,000 | | | | 11,085,856 | |
| |
Total Municipal Bonds
(Cost $13,925,387) | | | | 14,257,618 | |
| |
U.S. Government and Agency
Obligations - 17.4% | | | | | |
| |
Fannie Mae - 0.1% | | | | | |
| | |
FNMA, | | | | | | | | |
3.000%, 07/01/27 | | | 1,111,176 | | | | 1,140,349 | |
6.000%, 07/01/29 | | | 782 | | | | 876 | |
| | |
Total Fannie Mae | | | | | | | 1,141,225 | |
| |
Freddie Mac - 0.0%# | | | | | |
| | |
FHLMC Gold, | | | | | | | | |
5.000%, 12/01/31 | | | 14,760 | | | | 15,887 | |
| |
U.S. Treasury Obligations - 17.3% | | | | | |
| | |
U.S. Treasury Bonds, | | | | | | | | |
1.500%, 09/30/21 to 11/30/212 | | | 187,710,000 | | | | 187,442,232 | |
3.000%, 08/15/482 | | | 21,295,000 | | | | 24,044,218 | |
| |
Total U.S. Treasury Obligations | | | | 211,486,450 | |
| |
Total U.S. Government and Agency Obligations
(Cost $208,136,317) | | | | 212,643,562 | |
| |
Foreign Government Obligations - 4.7% | | | | | |
| | |
Brazilian Government International Bonds | | | | | | | | |
8.500%, 01/05/24 | | | 6,650,000 | BRL | | | 1,768,837 | |
10.250%, 01/10/28 | | | 5,750,000 | BRL | | | 1,681,032 | |
| | |
Canadian When Issued Government Bond | | | | | | | | |
Series 0001 | | | | | | | | |
0.750%, 09/01/20 | | | 15,225,000 | CAD | | | 11,646,296 | |
| | |
European Investment Bank Bonds | | | | | | | | |
0.000%, 03/10/215 | | | 5,000,000 | AUD | | | 3,452,441 | |
| | |
Mexican Bonos | | | | | | | | |
Series M | | | | | | | | |
8.000%, 12/07/23 | | | 122,500,000 | MXN | | | 6,748,368 | |
| | |
Mexican Bonos Bonds | | | | | | | | |
Series M 7.750%, 05/29/31 | | | 49,000,000 | MXN | | | 2,764,551 | |
Series M 20 10.000%, 12/05/24 | | | 461,500,000 | MXN | | | 27,703,181 | |
| | |
Norway Government Bonds | | | | | | | | |
Series 474 | | | | | | | | |
3.750%, 05/25/211 | | | 13,210,000 | NOK | | | 1,554,780 | |
| |
Total Foreign Government Obligations
(Cost $79,185,683) | | | | 57,319,486 | |
The accompanying notes are an integral part of these financial statements.
10
| | |
| | AMG Managers Loomis Sayles Bond Fund Schedule of Portfolio Investments(continued) |
| | | | | | | | |
| | |
Shares | | | Value | |
Common Stocks - 2.2% | | | | | | | | |
| |
Communication Services - 1.0% | | | | | |
| | |
AT&T, Inc. | | | 314,704 | | | | $12,298,633 | |
| | |
Health Care - 0.5% | | | | | | | | |
| | |
Bristol-Myers Squibb Co. | | | 91,569 | | | | 5,877,814 | |
| |
Information Technology - 0.7% | | | | | |
| | |
Corning, Inc.2 | | | 281,220 | | | | 8,186,314 | |
| |
Total Common Stocks
(Cost $21,594,608) | | | | 26,362,761 | |
| | |
Preferred Stocks - 1.0% | | | | | | | | |
| | |
Financials - 1.0% | | | | | | | | |
| | |
Bank of America Corp., 7.25% 2,4 | | | 7,808 | | | | 11,313,792 | |
| | |
Navient Corp., 6.00% | | | 41,250 | | | | 990,412 | |
| | |
Total Financials | | | | | | | 12,304,204 | |
| | |
Utilities - 0.0%# | | | | | | | | |
| | |
Wisconsin Electric Power Co., 3.60% | | | 3,946 | | | | 355,140 | |
| |
Total Preferred Stocks
(Cost $8,303,212) | | | | 12,659,344 | |
| | |
| | | Principal
Amount | | | | |
Short-Term Investments - 13.3% | | | | | |
| |
Joint Repurchase Agreements - 1.4%6 | | | | | |
| | |
Cantor Fitzgerald Securities, Inc., dated 12/31/19, due 01/02/20, 1.580% total to be received $4,035,140 (collateralized by various U.S. Government Agency Obligations and U.S. Treasuries, 0.000% - 8.500%, 01/25/20 - 10/15/60, totaling $4,115,482) | | | $4,034,786 | | | | 4,034,786 | |
| | |
Citadel Securities LLC, dated 12/31/19, due 01/02/20, 1.600% total to be received $2,688,592 (collateralized by various U.S. Treasuries, 0.000% - 8.500%, 01/15/20 - 11/15/48, totaling $2,742,364) | | | 2,688,353 | | | | 2,688,353 | |
| | |
Citigroup Global Markets, Inc., dated 12/31/19, due 01/02/20, 1.570% total to be received $4,035,138 (collateralized by various U.S. Government Agency Obligations and U.S. Treasuries, 0.000% - 9.000%, 02/13/20 - 09/20/69, totaling $4,115,482) | | | 4,034,786 | | | | 4,034,786 | |
| | | | | | | | |
| | | Principal
Amount | | | Value | |
| | |
RBC Dominion Securities, Inc., dated 12/31/19, due 01/02/20, 1.570% total to be received $4,035,138 (collateralized by various U.S. Government Agency Obligations and U.S. Treasuries, 0.000% - 6.500%, 06/30/21 - 12/01/49, totaling $4,115,482) | | | $4,034,786 | | | | $4,034,786 | |
| | |
State of Wisconsin Investment Board, dated 12/31/19, due 01/02/20, 1.750% total to be received $2,195,331 (collateralized by various U.S. Treasuries, 0.125% - 3.875%, 04/15/21 - 02/15/47, totaling $2,239,081) | | | 2,195,118 | | | | 2,195,118 | |
| |
Total Joint Repurchase Agreements | | | | 16,987,829 | |
| |
U.S. Government Obligations - 10.4% | | | | | |
| | |
U.S. Treasury Bills, 0.257%, 01/23/202,7 | | | 24,915,000 | | | | 24,883,909 | |
| | |
U.S. Treasury Bills, 0.448%, 01/30/207 | | | 5,000,000 | | | | 4,993,632 | |
| | |
U.S. Treasury Bills, 0.584%, 02/27/207 | | | 59,265,000 | | | | 59,093,092 | |
| | |
U.S. Treasury Bills, 0.796%, 04/02/202,7 | | | 18,670,000 | | | | 18,598,030 | |
| | |
U.S. Treasury Bills, 0.867%, 04/09/202,7 | | | 20,000,000 | | | | 19,916,958 | |
| |
Total U.S. Government Obligations | | | | 127,485,621 | |
| | |
| | | Shares | | | | |
Other Investment Companies - 1.5% | | | | | |
| | |
Dreyfus Government Cash Management Fund, Institutional Shares, 1.51%8 | | | 6,104,693 | | | | 6,104,693 | |
| | |
Dreyfus Institutional Preferred Government Money Market Fund, Institutional Shares, 1.55%8 | | | 6,104,693 | | | | 6,104,693 | |
| | |
JPMorgan U.S. Government Money Market Fund, IM Shares, 1.53%8 | | | 6,289,685 | | | | 6,289,685 | |
| |
Total Other Investment Companies | | | | 18,499,071 | |
| |
Total Short-Term Investments
(Cost $162,962,129) | | | | 162,972,521 | |
| | |
Total Investments - 100.8%
(Cost $1,151,608,376) | | | | | | | 1,232,935,721 | |
| |
Other Assets, less Liabilities - (0.8)% | | | | (9,202,459 | ) |
| | |
Net Assets - 100.0% | | | | | | | $1,223,733,262 | |
| † | Principal amount stated in U.S. dollars unless otherwise stated. |
| 1 | Security exempt from registration under Rule 144A of the Securities Act of 1933. This security may be resold in transactions exempt from registration, normally to qualified buyers. At December 31, 2019, the value of these securities amounted to $133,936,968 or 10.9% of net assets. |
| 2 | Some of these securities, amounting to $180,616,082 or 14.8% of net assets, were out on loan to various borrowers and are collateralized by cash and various U.S. Treasury Obligations and U.S. Government Agency Obligations. See Note 4 of Notes to Financial Statements. |
| 3 | Variable rate security. The rate shown is based on the latest available information as of December 31, 2019. Certain variable rate securities are not based on a published reference rate and spread but are determined by the issuer or agent and are based on current market conditions. These securities do not indicate a reference rate and spread in their description above. |
| 4 | Convertible Security. A corporate bond or preferred stock, usually a junior debenture, that can be converted, at the option of the holder, for a specific number of shares of the company’s preferred stock or common stock. The market value of convertible bonds and convertible preferred stocks at December 31, 2019, amounted to $31,930,474 or 2.6% of net assets. |
The accompanying notes are an integral part of these financial statements.
11
| | |
| | AMG Managers Loomis Sayles Bond Fund Schedule of Portfolio Investments(continued) |
| 6 | Cash collateral received for securities lending activity was invested in these joint repurchase agreements. |
| 7 | Represents yield to maturity at December 31, 2019. |
| 8 | Yield shown represents the December 31, 2019, seven day average yield, which refers to the sum of the previous seven days’ dividends paid, expressed as an annual percentage. |
| GMTN | Global Medium-Term Notes |
| LIBOR | London Interbank Offered Rate |
CURRENCY ABBREVIATIONS:
The following table summarizes the inputs used to value the Fund’s investments by the fair value hierarchy levels as of December 31, 2019:
| | | | | | | | | | | | | | | | |
| | | Level 1 | | | Level 21 | | | Level 3 | | | Total | |
Investments in Securities | | | | | | | | | | | | | | | | |
| | | | |
Corporate Bonds and Notes† | | | — | | | | $737,945,374 | | | | — | | | | $737,945,374 | |
| | | | |
Asset-Backed Security | | | — | | | | 8,351,200 | | | | — | | | | 8,351,200 | |
| | | | |
Mortgage-Backed Securities | | | — | | | | 423,855 | | | | — | | | | 423,855 | |
| | | | |
Municipal Bonds | | | — | | | | 14,257,618 | | | | — | | | | 14,257,618 | |
| | | | |
U.S. Government and Agency Obligations† | | | — | | | | 212,643,562 | | | | — | | | | 212,643,562 | |
| | | | |
Foreign Government Obligations | | | — | | | | 57,319,486 | | | | — | | | | 57,319,486 | |
| | | | |
Common Stocks†† | | | $26,362,761 | | | | — | | | | — | | | | 26,362,761 | |
| | | | |
Preferred Stocks†† | | | 12,659,344 | | | | — | | | | — | | | | 12,659,344 | |
| | | | |
Short-Term Investments | | | | | | | | | | | | | | | | |
| | | | |
Joint Repurchase Agreements | | | — | | | | 16,987,829 | | | | — | | | | 16,987,829 | |
| | | | |
U.S. Government Obligations | | | — | | | | 127,485,621 | | | | — | | | | 127,485,621 | |
| | | | |
Other Investment Companies | | | 18,499,071 | | | | — | | | | — | | | | 18,499,071 | |
| | | | | | | | | | | | | | | | |
Total Investments in Securities | | | $57,521,176 | | | | $1,175,414,545 | | | | — | | | | $1,232,935,721 | |
| | | | | | | | | | | | | | | | |
| † | All corporate bonds and notes and U.S. government and agency obligations held in the Fund are Level 2 securities. For a detailed breakout of corporate bonds and notes and U.S. government and agency obligations by major industry or agency classification, please refer to the Fund’s Schedule of Portfolio Investments. |
| †† | All common stocks and preferred stocks held in the Fund are Level 1 securities. For a detailed breakout of common stocks and preferred stocks by major industry classification, please refer to the Fund’s Schedule of Portfolio Investments. |
| 1 | An external pricing service is used to reflect any impact on security value due to market movements between the time the Fund valued such foreign securities and the earlier closing of foreign markets. |
For the fiscal year ended December 31, 2019, there were no transfers in or out of Level 3.
The accompanying notes are an integral part of these financial statements.
12
| | |
| | AMG Managers Loomis Sayles Bond Fund Schedule of Portfolio Investments(continued) |
The following table below is a reconciliation of investments in which significant unobservable inputs (Level 3) were used in determining fair value at December 31, 2019:
| | | | |
| | | Asset-Backed Securities |
| |
Balance as of December 31, 2018 | | | $11,579,866 | |
| |
Accrued discounts (premiums) | | | (953 | ) |
| |
Realized gain (loss) | | | (65,955 | ) |
| |
Change in unrealized appreciation/depreciation | | | 425,049 | |
| |
Purchases | | | — | |
| |
Sales | | | — | |
| |
Paydowns | | | (11,938,007 | ) |
| |
Transfers in to Level 3 | | | — | |
| |
Transfers out of Level 3 | | | — | |
| |
Balance as of December 31, 2019 | | | — | |
| | | — | |
Net change in unrealized appreciation/depreciation on investments still held at December 31, 2019 | | | — | |
The country allocation in the Schedule of Portfolio Investments at December 31, 2019, was as follows:
| | | | |
| Country | | % of Long-Term
Investments |
| |
Brazil | | | 0.5 | |
| |
Canada | | | 1.1 | |
| |
Cayman Islands | | | 0.3 | |
| |
France | | | 1.8 | |
| |
Ireland | | | 0.8 | |
| |
Luxembourg | | | 3.1 | |
| |
Malaysia | | | 0.2 | |
| |
Mexico | | | 4.3 | |
| |
Netherlands | | | 2.7 | |
| |
Norway | | | 0.2 | |
| |
South Korea | | | 0.2 | |
| |
Spain | | | 1.9 | |
| |
United Kingdom | | | 3.1 | |
| |
United States | | | 79.8 | |
| | | | |
| | | 100.0 | |
| | | | |
The accompanying notes are an integral part of these financial statements.
13
| | |
| |
AMG Managers Global Income Opportunity Fund Portfolio Manager’s Comments(unaudited) |
| | | | | | | | | | | | |
THE YEAR IN REVIEW AMG Managers Global Income Opportunity Fund (Class N shares) (the “Fund”) returned 7.67% during the year ended December 31, 2019, compared with the 6.84% return for the Bloomberg Barclays Global Aggregate Bond Index. Allocation to select corporate credit sectors and issuers, including high yield bonds, were the main contributor to performance over the past 12 months. Despite the slowdown in global growth and weaker corporate profits, investment grade credit spreads tightened and significantly outperformed duration-matched global treasuries. In response to the weaker economic growth backdrop, major central banks adopted more accommodative monetary policies. Choices in the banking sector positively contributed to overall performance. Favored U.K. and European banks were among the top credit picks. We remain focused on well-diversified institutions with excellent liquidity, high quality assets, and healthy balance sheets. Issuer selections in the electric utility space added value, particularly in European names. Underweight positioning in Eurozone treasuries and Agency MBS sectors did hold back performance somewhat. Duration and yield curve positioning was a source of positive excess returns. Curve positioning in the5-and10-year part of the U.S.dollar-pay curves proved most beneficial. The allocation of duration into select emerging markets such as Mexico and Colombia also proved beneficial. Although a small exposure to duration, our small overweight to South African rand contributed positively to overall yield curve performance. Overall currency allocation was a drag on results. Overweight positions in the Japanese yen and euro and an underweight position in the Chilean peso | | | | | | represent the main detractors. On the other hand, overweight allocations in the Canadian dollar and Australian dollar were moderate contributors to relative performance. The Fund uses currency forwards in order to gain exposure to select currencies without investing in the underlying bond market or to hedge certain currency positions based on our strategic view during a certain period. The portfolio’s currency forward positions detracted from relative performance by roughly 165 bps over the past 12 months, largely due to layering in FX forwards to gain exposure to the euro in order to risk control the portfolio’s EUR relative position versus benchmark. The hedging costs to hedge Mexican peso exposure detracted as well, as we were comfortable with the local Mexican bond market although we were cautious on the currency volatility due to ongoing slowing global growth and geopolitical uncertainties. Although the Mexican Peso rallied into year end to finish the year as the best performing Latin America EM currency, risks remain elevated due to erratic policy decisions by President Lopez Obrador . In addition, FX forwards used to hedge the portfolio’s underweight to JPY hurt relative performance as the risk sentiment improved. LOOKING FORWARD We believe the U.S. will exit the manufacturing slowdown without dipping into recession. The three FOMC (Federal Open Market Committee) rate cuts will provide support to an economy that has been hampered by trade conflict, slumping exports, and abuild-up in inventories. Global Purchasing Manager Indicies (PMIs) have been improving and we are seeing green shoots in other survey-based economic indicators, but we need to see more evidence for stabilization in hard data. | | | | | | Credit spreads are tight, but should continue to receive support. Improvement in economic data and the U.S. Federal Reserve (the Fed) remaining relaxed and accommodative in a low growth, low inflation environment should enable credit spreads to stay well contained. Higher wages and employment costs are pressuring profit margins, buttop-line revenue growth has been respectable. We expect the U.S. dollar to stay in a relatively tight band in the near term, which should help emerging market currencies and risk assets in general. While there has been some recent weakness in the dollar, there hasn’t been a substantial breakout in either direction. We are watching for more convincing evidence that economic activity is accelerating at a faster pace outside the U.S., which would apply greater downward pressure on the dollar. Stability in economic growth should lead to better profit growth in 2020, albeit in the low single-digit range. We expect S&P 500® Index profits to grow around 5% in 2020, up from low single digits in 2019. A profits recession—with profits down 10% or more—would substantially increase recession risks, but that is not our base case. We do not expect further escalation in the trade conflict between the U.S. and China. The phase one trade agreement is an important step in the right direction and a key support to risk appetite. The deal could deliver upside surprise if it is more comprehensive than expected, but the general truce has been enough to keep risk assets moving in a positive direction. This commentary reflects the viewpoints of Loomis, Sayles & Company and is not intended as a forecast or guarantee of future results. |
14
| | |
| | AMG Managers Global Income Opportunity Fund Portfolio Manager’s Comments(continued) |
CUMULATIVE TOTAL RETURN PERFORMANCE
AMG Managers Global Income Opportunity Fund’s cumulative total return is based on the daily change in net asset value (NAV), and assumes that all dividends and distributions were reinvested. The graph compares a hypothetical $10,000 investment made in the AMG Managers Global Income Opportunity Fund’s Class N shares on December 31, 2009, to a $10,000 investment made in the Bloomberg Barclays Global Aggregate Bond Index for the same time period. The graph and table do not reflect the deduction of taxes that a shareholder would pay on a Fund distribution or redemption of shares. The listed returns for the Fund are net expenses and the returns for the index exclude expenses. Total returns would have been lower had certain expenses not been reduced.
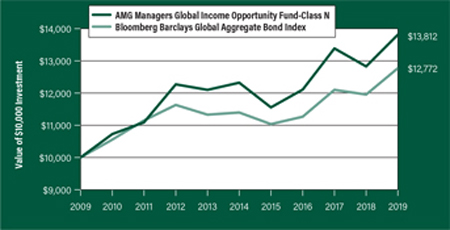
The table below shows the average annual total returns for the AMG Managers Global Income Opportunity Fund and the Bloomberg Barclays Global Aggregate Bond Index for the same time periods ended December 31, 2019.
| | | | | | | | | | | | |
| Average Annual Total Returns1 | | One Year | | | Five
Years | | | Ten Years | |
| |
AMG Managers Global Income Opportunity Fund2, 3, 4, 5, 6,7 | | | | | |
Class N | | | 7.67% | | | | 2.31% | | | | 3.28% | |
Bloomberg Barclays Global Aggregate Bond Index8 | | | 6.84% | | | | 2.31% | | | | 2.48% | |
The performance data shown represents past performance. Past performance is not a guarantee of future results. Current performance may be lower or higher than the performance data quoted. The investment return and principal value of an investment will fluctuate so that an investor’s shares, when redeemed, may be worth more or less than their original cost.
Investors should carefully consider the Fund’s investment objectives, risks, charges and expenses before investing. For performance information through the most recent month end, current net asset values per share for the Fund and other information, please call 800.548.4539 or visit our website at amgfunds.com for a free prospectus. Read it carefully before investing or sending money.
Distributed by AMG Distributors, Inc., member FINRA/SIPC.
| 1 | Total return equals income yield plus share price change and assumes reinvestment of all dividends and capital gain distributions. Returns are net of fees and may reflect offsets of Fund expenses as described in the prospectus. No adjustment has been made for taxes payable by shareholders on their reinvested dividends and capital gain distributions. Returns for periods greater than one year are annualized. The listed returns on the Fund are net of expenses and based on the published NAV as of December 31, 2019. All returns are in U.S. dollars($). |
| 2 | From time to time the Fund’s advisor has waived it’s fees and/or absorbed Fund expenses, which has resulted in higher returns. |
|
3 The Fund is subject to currency risk resulting from fluctuations in exchange rates that may affect the total loss or gain on anon-U.S. Dollar investment when converted back to U.S. Dollars. 4 The Fund is subject to the risks associated with investments in debt securities, such as default risk and fluctuations in the perception of the debtor’s ability to pay its creditors. Changing interest rates may adversely affect the value of an investment. An increase in interest rates typically causes the value of bonds and other fixed income securities to fall. 5 High-yield bonds (also known as “junk bonds”) may be subject to greater levels of interest rate, credit, and liquidity risk than investments in higher rated securities. These securities are considered predominantly speculative with respect to the issuer’s continuing ability to make principal and interest payments. The issuers of the Fund’s holdings may be involved in bankruptcy proceedings, reorganizations, or financial restructurings, and are not as strong financially as higher-rated issuers. 6 Investments in international securities are subject to certain risks of overseas investing including currency fluctuations and changes in political and economic conditions, which could result in significant market fluctuations. These risks are magnified in emerging markets. 7 The Fund is subject to the risks associated with investments in emerging markets, such as erratic earnings patterns, economic and political instability, changing exchange controls, limitations on repatriation of foreign capital and changes in local government attitudes toward private investment, possibly leading to nationalization or confiscation of investor assets. |
8 The Bloomberg Barclays Global Aggregate Bond Index provides a broad-based measure of the global investment-grade fixed income markets. The three major components of this index are the U.S. Aggregate, thePan-European Aggregate, and the Asian-Pacific Aggregate Indices. The Index also includes Eurodollar andEuro-Yen corporate bonds, Canadian government, agency and corporate securities, and USD investment grade 144A securities. Unlike the Fund, the Bloomberg Barclays Global Aggregate Bond Index is unmanaged, is not available for investment and does not incur expenses. |
| |
Bloomberg Index Services Limited. BLOOMBERG® is a trademark and service mark of Bloomberg Finance L.P. and its affiliates (collectively “Bloomberg”). BARCLAYS® is a trademark and service mark of Barclays Bank Plc (collectively with its affiliates, “Barclays”), used under license. Bloomberg or Bloomberg’s licensors, including Barclays, own all proprietary rights in the Bloomberg Barclays Indices. |
15
| | |
| | AMG Managers Global Income Opportunity Fund Portfolio Manager’s Comments(continued) |
| | | | | | | | | | | | |
| Neither Bloomberg nor Barclays approves or endorses this material, or guarantees the accuracy or completeness of any information herein, or makes any warranty, express or implied, as to the results to | | | | | | be obtained therefrom and, to the maximum extent allowed by law, neither shall have any liability or responsibility for injury or damages arising in connection therewith. | | | | | | Not FDIC insured, nor bank guaranteed. May lose value |
16
| | |
| | AMG Managers Global Income Opportunity Fund Fund Snapshots(unaudited) December 31, 2019 |
PORTFOLIO BREAKDOWN
| | | | | |
| Category | | % of Net Assets |
| | |
Corporate Bonds and Notes | | | | 44.2 | |
| | |
Foreign Government Obligations | | | | 34.0 | |
| | |
U.S. Government and Agency Obligations | | | | 19.0 | |
| | |
Short-Term Investments | | | | 2.5 | |
| | |
Other Assets Less Liabilities | | | | 0.3 | |
| | | | | |
| Rating | | % of Market Value1 |
| | |
U.S. Government and Agency Obligations | | | | 19.6 | |
| | |
Aaa/AAA | | | | 7.0 | |
| | |
Aa/AA | | | | 8.4 | |
| | |
A | | | | 30.8 | |
| | |
Baa/BBB | | | | 29.0 | |
| | |
Ba/BB | | | | 4.7 | |
| | |
B | | | | 0.3 | |
| | |
Caa/CCC & lower | | | | 0.2 | |
| 1 | Includes market value of long-term fixed-income securities only. |
TOP TEN HOLDINGS
| | | | |
| Security Name | | % of
Net Assets |
| | |
U.S. Treasury Notes, 1.625%, 08/15/29 | | | 6.2 | |
| | |
U.S. Treasury Notes, 3.125%, 11/15/28 | | | 4.0 | |
| | |
FNMA, 3.500%, 07/01/49 | | | 3.8 | |
| | |
French Republic Government Bond OAT, 4.250%, 10/25/23 (France) | | | 2.8 | |
| | |
Indonesia Government International Bonds, 4.750%, 01/08/26 (Indonesia) | | | 2.3 | |
| | |
Energy Transfer Partners, LP, 4.050%, 03/15/25 | | | 2.3 | |
| | |
Enel Finance International NV, 4.625%, 09/14/25 (Netherlands) | | | 2.3 | |
| | |
Alfa, SAB de CV, 5.250%, 03/25/24 (Mexico) | | | 2.2 | |
| | |
Lloyds Banking Group PLC, 4.500%, 11/04/24 (United Kingdom) | | | 2.2 | |
| | |
Barclays PLC, 3.650%, 03/16/25 (United Kingdom) | | | 2.2 | |
| | | | | |
Top Ten as a Group | | | 30.3 | |
| | | | | |
| | | | | |
Credit quality ratings shown above reflect the highest rating assigned by either Standard & Poor’s (“S&P”), Moody’s Investors Service, Inc. (“Moody’s”) or Fitch. These rating agencies are independent, nationally recognized statistical rating organizations and are widely used. Investment grade ratings are credit ratings of BBB/Baa or higher. Below investment grade ratings are credit ratings of BB/Ba or lower. Investments designated N/R are not rated by either rating agency. Unrated investments do not necessarily indicate low credit quality. Credit quality ratings are subject to change.
Because a fund’s strategy may result in multiple investments in particular sectors of the economy, its performance may depend on the performance of those sectors and may fluctuate more widely than investments diversified across more sectors. For additional information on these and other risk considerations, please see the Fund’s prospectus.
Any sectors, industries, or securities discussed should not be perceived as investment recommendations. Mention of a specific security should not be considered a recommendation to buy or solicitation to sell that security. Specific securities mentioned in this report may have been sold from the Fund’s portfolio of investments by the time you receive this report.
17
| | |
| | AMG Managers Global Income Opportunity Fund Schedule of Portfolio Investments December 31, 2019 |
| | | | | | | | |
| | | Principal
Amount†
| | | Value | |
| | |
Corporate Bonds and Notes - 44.2% | | | | | | | | |
| | |
Financials - 15.0% | | | | | | | | |
| | |
American Homes 4 Rent LP | | | | | | | | |
4.900%, 02/15/29 | | | $25,000 | | | | $28,002 | |
| | |
Bank of America Corp. | | | | | | | | |
Series MTN | | | | | | | | |
4.200%, 08/26/24 | | | 130,000 | | | | 139,596 | |
| | |
Barclays PLC (United Kingdom) | | | | | | | | |
3.650%, 03/16/25 | | | 200,000 | | | | 208,175 | |
| | |
Brookfield Finance, Inc. (Canada) | | | | | | | | |
4.850%, 03/29/29 | | | 25,000 | | | | 28,628 | |
| | |
Citigroup, Inc. | | | | | | | | |
4.400%, 06/10/25 | | | 75,000 | | | | 81,532 | |
| | |
Goodman Australia Industrial Fund Bond Issuer Pty, Ltd. (Australia) | | | | | | | | |
3.400%, 09/30/261 | | | 60,000 | | | | 60,842 | |
| | |
HSBC Holdings PLC (United Kingdom) | | | | | | | | |
Series EMTN | | | | | | | | |
5.750%, 12/20/27 | | | 55,000 | GBP | | | 89,221 | |
| | |
JPMorgan Chase & Co. | | | | | | | | |
3.875%, 02/01/24 | | | 25,000 | | | | 26,685 | |
3.900%, 07/15/25 | | | 50,000 | | | | 54,004 | |
Series X, (3 month LIBOR + 3.330%), 6.100%, 04/01/682,3 | | | 65,000 | | | | 70,934 | |
| | |
Lloyds Banking Group PLC (United Kingdom) | | | | | | | | |
4.500%, 11/04/24 | | | 200,000 | | | | 213,913 | |
| | |
Mid-America Apartments, LP | | | | | | | | |
4.200%, 06/15/28 | | | 95,000 | | | | 104,825 | |
| | |
Old Republic International Corp. | | | | | | | | |
4.875%, 10/01/24 | | | 100,000 | | | | 109,668 | |
| | |
Royal Bank of Canada, GMTN (Canada) | | | | | | | | |
2.250%, 11/01/24 | | | 50,000 | | | | 50,212 | |
| | |
Santander Holdings USA, Inc. | | | | | | | | |
2.650%, 04/17/20 | | | 110,000 | | | | 110,125 | |
| | |
Ventas Realty, LP | | | | | | | | |
3.100%, 01/15/23 | | | 70,000 | | | | 71,652 | |
| | |
Total Financials | | | | | | | 1,448,014 | |
| | |
Industrials - 22.9% | | | | | | | | |
| | |
Air Canada2017-1 Class AA Pass Through Trust (Canada) | | | | | | | | |
3.300%, 01/15/301 | | | 47,440 | | | | 48,359 | |
| | |
Alfa, SAB de CV (Mexico) | | | | | | | | |
5.250%, 03/25/241 | | | 200,000 | | | | 216,002 | |
| | |
Anheuser-Busch InBev Worldwide, Inc. | | | | | | | | |
4.750%, 01/23/29 | | | 45,000 | | | | 52,163 | |
| | |
BMW US Capital LLC | | | | | | | | |
3.150%, 04/18/241 | | | 25,000 | | | | 25,862 | |
| | |
Broadcom Inc. | | | | | | | | |
4.250%, 04/15/261 | | | 25,000 | | | | 26,554 | |
| | | | | | | | |
| | | Principal
Amount†
| | | Value | |
| | |
Burlington Northern Santa Fe LLC | | | | | | | | |
4.050%, 06/15/48 | | | $65,000 | | | | $73,719 | |
| | |
Covanta Holding Corp. | | | | | | | | |
5.875%, 07/01/25 | | | 30,000 | | | | 31,650 | |
| | |
CSX Corp. | | | | | | | | |
3.800%, 03/01/28 | | | 70,000 | | | | 76,396 | |
| | |
CVS Health Corp. | | | | | | | | |
4.100%, 03/25/25 | | | 50,000 | | | | 53,683 | |
4.300%, 03/25/28 | | | 25,000 | | | | 27,311 | |
| | |
Delta Air Lines2015-1 Class B Pass | | | | | | | | |
Through Trust | | | | | | | | |
Series15-1 | | | | | | | | |
4.250%, 07/30/23 | | | 51,335 | | | | 53,477 | |
| | |
Embraer Netherlands Finance BV (Netherlands) | | | | | | | | |
5.050%, 06/15/25 | | | 70,000 | | | | 76,738 | |
| | |
Enbridge, Inc. (Canada) | | | | | | | | |
2.900%, 07/15/22 | | | 25,000 | | | | 25,469 | |
| | |
Energy Transfer Partners, LP | | | | | | | | |
4.050%, 03/15/25 | | | 210,000 | | | | 220,790 | |
| | |
General Motors Financial Co., Inc. | | | | | | | | |
4.000%, 01/15/25 | | | 120,000 | | | | 126,147 | |
| | |
Hyundai Capital America | | | | | | | | |
2.750%, 09/27/261,4 | | | 85,000 | | | | 82,583 | |
| | |
Intel Corp. | | | | | | | | |
3.700%, 07/29/25 | | | 100,000 | | | | 108,172 | |
| | |
Kinder Morgan Energy Partners, LP | | | | | | | | |
4.250%, 09/01/24 | | | 110,000 | | | | 117,817 | |
| | |
KT Corp. (South Korea) | | | | | | | | |
2.500%, 07/18/261 | | | 200,000 | | | | 196,114 | |
| | |
Latam Airlines2015-1 Pass Through | | | | | | | | |
Trust A (Chile) | | | | | | | | |
4.200%, 11/15/27 | | | 42,938 | | | | 44,215 | |
| | |
Nissan Motor Acceptance Corp. | | | | | | | | |
3.650%, 09/21/211 | | | 60,000 | | | | 61,251 | |
| | |
Petrobras Global Finance BV (Netherlands) | | | | | | | | |
5.999%, 01/27/28 | | | 15,000 | | | | 17,116 | |
| | |
Southern Copper Corp. (Peru) | | | | | | | | |
3.875%, 04/23/25 | | | 130,000 | | | | 136,436 | |
| | |
Toyota Motor Credit Corp. MTN | | | | | | | | |
2.650%, 04/12/22 | | | 35,000 | | | | 35,625 | |
| | |
Videotron, Ltd. (Canada) | | | | | | | | |
5.125%, 04/15/271 | | | 30,000 | | | | 32,100 | |
| | |
Weibo Corp. (China) | | | | | | | | |
3.500%, 07/05/24 | | | 200,000 | | | | 203,351 | |
| | |
Whiting Petroleum Corp. | | | | | | | | |
6.250%, 04/01/234 | | | 40,000 | | | | 33,500 | |
6.625%, 01/15/264 | | | 10,000 | | | | 6,815 | |
| | |
Total Industrials | | | | | | | 2,209,415 | |
The accompanying notes are an integral part of these financial statements.
18
| | |
| | AMG Managers Global Income Opportunity Fund Schedule of Portfolio Investments(continued) |
| | | | | | | | |
| | | Principal Amount† | | | Value | |
| | |
Utilities - 6.3% | | | | | | | | |
| | |
CenterPoint Energy, Inc. | | | | | | | | |
3.850%, 02/01/24 | | | $30,000 | | | | $31,648 | |
| | |
Duke Energy Corp. | | | | | | | | |
3.150%, 08/15/27 | | | 70,000 | | | | 72,141 | |
| | |
Emgesa, S.A. ESP (Colombia) | | | | | | | | |
8.750%, 01/25/211 | | | 320,000,000 | COP | | | 100,267 | |
| | |
Enel Chile, S.A. (Chile) | | | | | | | | |
4.875%, 06/12/28 | | | 20,000 | | | | 22,100 | |
| | |
Enel Finance International NV (Netherlands) | | | | | | | | |
1.375%, 06/01/26 | | | 100,000 | EUR | | | 119,036 | |
4.625%, 09/14/251 | | | 200,000 | | | | 218,257 | |
| | |
Virginia Electric & Power Co. | | | | | | | | |
Series A | | | | | | | | |
3.800%, 04/01/28 | | | 40,000 | | | | 43,527 | |
| | |
Total Utilities | | | | | | | 606,976 | |
| | |
Total Corporate Bonds and Notes | | | | | | | | |
(Cost $4,113,994) | | | | | | | 4,264,405 | |
| | |
U.S. Government and Agency Obligations - 19.0% | | | | | | | | |
| | |
Fannie Mae - 3.8% | | | | | | | | |
| | |
FNMA, | | | | | | | | |
3.500%, 07/01/49 | | | 352,286 | | | | 362,116 | |
| | |
U.S. Treasury Obligations - 15.2% | | | | | | | | |
| | |
U.S. Treasury Bonds, | | | | | | | | |
2.875%, 05/15/49 | | | 85,000 | | | | 93,941 | |
| | |
U.S. Treasury Notes, | | | | | | | | |
1.625%, 08/15/29 | | | 615,000 | | | | 599,601 | |
1.750%, 11/15/29 | | | 145,000 | | | | 142,927 | |
1.875%, 03/31/22 | | | 190,000 | | | | 191,210 | |
2.875%, 10/15/21 | | | 45,000 | | | | 46,009 | |
3.125%, 11/15/285 | | | 355,000 | | | | 390,597 | |
| | |
Total U.S. Treasury Obligations | | | | | | | 1,464,285 | |
| | |
Total U.S. Government and Agency Obligations
(Cost $1,809,895) | | | | | | | 1,826,401 | |
| | |
Foreign Government Obligations - 34.0% | | | | | | | | |
| | |
Argentine Republic Government International Bond | | | | | | | | |
7.125%, 06/28/17 | | | 45,000 | | | | 22,635 | |
| | |
Australia Government Bond | | | | | | | | |
Series 133 | | | | | | | | |
5.500%, 04/21/23 | | | 75,000 | AUD | | | 60,403 | |
| | |
Brazil Notas Do Tesouro Nacional | | | | | | | | |
10.000%, 01/01/21 | | | 460,000 | BRL | | | 120,216 | |
10.000%, 01/01/27 | | | 165,000 | BRL | | | 48,375 | |
| | |
Bundesrepublik Deutschland Bundesanleihe | | | | | | | | |
0.500%, 08/15/27 | | | 20,000 | EUR | | | 23,851 | |
| | |
Colombian TES | | | | | | | | |
Series B | | | | | | | | |
6.250%, 11/26/25 | | | 189,000,000 | COP | | | 59,163 | |
| | | | | | | | |
| | | | | | | | |
| | | Principal
Amount† | | | Value | |
| | |
Dominican Republic International, Bonds | | | | | | | | |
8.625%, 04/20/271 | | | $100,000 | | | | $121,375 | |
| | |
Export Development Canada | | | | | | | | |
1.800%, 09/01/22 | | | 55,000 | CAD | | | 42,313 | |
| | |
French Republic Government Bond OAT | | | | | | | | |
1.750%, 11/25/24 | | | 20,000 | EUR | | | 24,759 | |
4.250%, 10/25/23 | | | 205,000 | EUR | | | 271,852 | |
| | |
Hellenic Republic Government Bond | | | | | | | | |
3.750%, 01/30/28 | | | 45,000 | EUR | | | 59,644 | |
| | |
Indonesia Government International Bonds | | | | | | | | |
4.750%, 01/08/261 | | | 200,000 | | | | 222,141 | |
| | |
Indonesia Treasury Bond | | | | | | | | |
Series FR78 | | | | | | | | |
8.250%, 05/15/29 | | | 380,000,000 | IDR | | | 29,517 | |
| | |
Italy Buoni Poliennali Del Tesoro | | | | | | | | |
2.000%, 02/01/28 | | | 115,000 | EUR | | | 137,807 | |
5.000%, 03/01/22 | | | 90,000 | EUR | | | 111,835 | |
| | |
Japan Government Thirty Year Bond | | | | | | | | |
Series 62 | | | | | | | | |
0.500%, 03/20/49 | | | 21,900,000 | JPY | | | 205,983 | |
| | |
Korea Treasury Bond | | | | | | | | |
Series 2209 | | | | | | | | |
2.000%, 09/10/22 | | | 189,070,000 | KRW | | | 165,860 | |
| | |
Mexican Bonos | | | | | | | | |
Series M 5.750%, 03/05/26 | | | 3,630,000 | MXN | | | 181,889 | |
Series M 6.500%, 06/10/21 | | | 850,000 | MXN | | | 44,781 | |
Series M 8.000%, 12/07/23 | | | 1,600,000 | MXN | | | 88,142 | |
| | |
New South Wales Treasury Corp., Bonds | | | | | | | | |
Series 22 | | | | | | | | |
6.000%, 03/01/22 | | | 150,000 | AUD | | | 116,242 | |
| | |
Norway Government Bonds | | | | | | | | |
Series 474 | | | | | | | | |
3.750%, 05/25/211 | | | 485,000 | NOK | | | 57,083 | |
| | |
South Africa Government Bond | | | | | | | | |
Series R213 | | | | | | | | |
7.000%, 02/28/31 | | | 2,680,000 | ZAR | | | 161,877 | |
| | |
Spain Government Bond | | | | | | | | |
Series 30Y | | | | | | | | |
2.700%, 10/31/481 | | | 60,000 | EUR | | | 89,112 | |
| | |
Spain Government Bonds | | | | | | | | |
1.600%, 04/30/251 | | | 95,000 | EUR | | | 115,601 | |
4.400%, 10/31/231 | | | 105,000 | EUR | | | 138,421 | |
| | |
Thailand Government Bonds | | | | | | | | |
2.125%, 12/17/26 | | | 5,000,000 | THB | | | 175,164 | |
| | |
Turkey Government Bond | | | | | | | | |
12.400%, 03/08/28 | | | 300,000 | TRY | | | 51,815 | |
| | |
United Kingdom Gilt | | | | | | | | |
1.500%, 07/22/26 | | | 130,000 | GBP | | | 181,746 | |
2.750%, 09/07/24 | | | 100,000 | GBP | | | 145,519 | |
| | |
Total Foreign Government Obligations
(Cost $3,269,642) | | | | | | | 3,275,121 | |
| | |
| | | | | | | | |
The accompanying notes are an integral part of these financial statements.
19
| | |
| | AMG Managers Global Income Opportunity Fund Schedule of Portfolio Investments(continued) |
| | | | | | | | |
| | | Principal
Amount | | | Value | |
| | |
Short-Term Investments - 2.5% | | | | | | | | |
| | |
Joint Repurchase
Agreements - 1.3%6 | | | | | | | | |
| | |
RBC Dominion Securities, Inc., dated 12/31/19, due 01/02/20, 1.570% total to be received $126,384 (collateralized by various U.S. Government Agency Obligations and U.S. Treasuries, 0.000% - 6.500%, 06/30/21 - 12/01/49, totaling $128,900) | | | $126,373 | | | | $126,373 | |
| | |
| | | Shares | | | | |
| | |
Other Investment
Companies - 1.2% | | | | | | | | |
| | |
Dreyfus Government Cash Management Fund, Institutional Shares, 1.51%7 | | | 38,219 | | | | 38,219 | |
| | |
| | | | | | | | |
| | | | | | | | |
Shares | | | Value | |
| | |
Dreyfus Institutional Preferred Government Money Market Fund, Institutional Shares, 1.55%7 | | | 38,219 | | | | $38,219 | |
| | |
JPMorgan U.S. Government Money Market Fund, IM Shares, 1.53%7 | | | 39,377 | | | | 39,377 | |
| | |
Total Other Investment Companies | | | | | | | 115,815 | |
| | |
Total Short-Term Investments | | | | | | | | |
(Cost $242,188) | | | | | | | 242,188 | |
| | |
Total Investments - 99.7% | | | | | | | | |
(Cost $9,435,719) | | | | | | | 9,608,115 | |
| | |
Other Assets, less Liabilities - 0.3% | | | | | | | 29,726 | |
| | |
Net Assets - 100.0% | | | | | | | $9,637,841 | |
| † | Principal amount stated in U.S. dollars unless otherwise stated. |
| 1 | Security exempt from registration under Rule 144A of the Securities Act of 1933. This security may be resold in transactions exempt from registration, normally to qualified buyers. At December 31, 2019, the value of these securities amounted to $1,811,924 or 18.8% of net assets. |
| 2 | Perpetuity Bond. The date shown is the final call date. |
| 3 | Variable rate security. The rate shown is based on the latest available information as of December 31, 2019. Certain variable rate securities are not based on a published reference rate and spread but are determined by the issuer or agent and are based on current market conditions. These securities do not indicate a reference rate and spread in their description above. |
| 4 | Some of these securities, amounting to $121,669 or 1.3% of net assets, were out on loan to various borrowers and are collateralized by cash. See Note 4 of Notes to Financial Statements. |
| 5 | Some or all of this security is held as collateral for futures contracts. The market value of collateral at December 31, 2019, amounted to $11,003, or 0.1% of net assets. |
| 6 | Cash collateral received for securities lending activity was invested in these joint repurchase agreements. |
| 7 | Yield shown represents the December 31, 2019, seven day average yield, which refers to the sum of the previous seven days’ dividends paid, expressed as an annual percentage. |
| EMTN | European Medium Term Note |
| GMTN | Global Medium-Term Notes |
| LIBOR | London Interbank Offered Rate |
CURRENCY ABBREVIATIONS:
Open Futures Contracts
| | | | | | | | | | | | | | | | | | | | | | |
| Description | | Currency | | | | Number of
Contracts | | | | Position | | | | Expiration
Date | | | | Current
Notional
Amount | | | | Value and
Unrealized
Gain/(Loss) |
| | | | | | | | | | | |
10-Year U.S. Treasury Note | | USD | | | | 4 | | | | Long | | | | 03/20/20 | | | | $513,688 | | | | $(4,541) |
CURRENCY ABBREVIATIONS:
The accompanying notes are an integral part of these financial statements.
20
| | |
| | AMG Managers Global Income Opportunity Fund Schedule of Portfolio Investments(continued) |
Open Forward Foreign Currency Contracts
| | | | | | | | | | | | |
Currency
Purchased | | Amount | | Currency
Sold | | Amount | | Expiration | | Counterparty | | Unrealized Appreciation/ Depreciation |
| | | | | | |
Canadian Dollar | | 515,000 | | U.S. Dollar | | 389,473 | | 03/18/20 | | UBS Securities | | $7,232 |
| | | | | | |
Chinese Offshore Yuan | | 410,000 | | U.S. Dollar | | 58,128 | | 03/18/20 | | JPMorgan | | 664 |
| | | | | | |
Euro | | 1,035,000 | | U.S. Dollar | | 1,152,362 | | 03/18/20 | | Morgan Stanley | | 14,269 |
| | | | | | |
Japanese Yen | | 178,300,000 | | U.S. Dollar | | 1,652,206 | | 03/18/20 | | Credit Suisse | | (3,955) |
| | | | | | |
Korean Won | | 113,000,000 | | U.S. Dollar | | 97,079 | | 03/18/20 | | Merrill Lynch | | 823 |
| | | | | | |
Swedish Krona | | 580,000 | | U.S. Dollar | | 61,354 | | 03/18/20 | | UBS Securities | | 802 |
| | | | | | |
U.S. Dollar | | 76,592 | | Australian Dollar | | 112,000 | | 03/18/20 | | Credit Suisse | | (2,156) |
| | | | | | |
U.S. Dollar | | 80,626 | | Brazilian Real | | 345,000 | | 03/03/20 | | Merrill Lynch | | (4,930) |
| | | | | | |
U.S. Dollar | | 163,671 | | Colombian Peso | | 557,710,000 | | 03/18/20 | | Credit Suisse | | (5,350) |
| | | | | | |
Australian Dollar | | 140,000 | | Japanese Yen | | 10,530,870 | | 03/18/20 | | BNP Paribas | | 1,084 |
| | | | | | |
U.S. Dollar | | 193,936 | | Japanese Yen | | 21,140,000 | | 03/18/20 | | Credit Suisse | | (1,487) |
| | | | | | |
U.S. Dollar | | 288,709 | | Mexican Peso | | 5,655,000 | | 03/18/20 | | UBS Securities | | (6,942) |
| | | | | | |
U.S. Dollar | | 159,324 | | Thai Baht | | 4,825,000 | | 03/18/20 | | UBS Securities | | (2,055) |
| | | | | | |
U.S. Dollar | | 154,342 | | South African Rand | | 2,305,000 | | 03/18/20 | | Citibank | | (8,552) |
Net Unrealized Appreciation/Depreciation on Forward Foreign Currency Contracts | | $(10,553) |
| | | | | | | | | | | | |
The following table summarizes the inputs used to value the Fund’s investments by the fair value hierarchy levels as of December 31, 2019:
| | | | | | | | | | | | | | | | |
| | | Level 1 | | | Level 21 | | | Level 3 | | | Total | |
| | | | |
Investments in Securities | | | | | | | | | | | | | | | | |
Corporate Bonds and Notes† | | | — | | | $ | 4,264,405 | | | | — | | | $ | 4,264,405 | |
| | | | |
U.S. Government and Agency Obligations† | | | — | | | | 1,826,401 | | | | — | | | | 1,826,401 | |
| | | | |
Foreign Government Obligations | | | — | | | | 3,275,121 | | | | — | | | | 3,275,121 | |
| | | | |
Short-Term Investments | | | | | | | | | | | | | | | | |
| | | | |
Joint Repurchase Agreements | | | — | | | | 126,373 | | | | — | | | | 126,373 | |
| | | | |
Other Investment Companies | | $ | 115,815 | | | | — | | | | — | | | | 115,815 | |
| | | | | | | | | | | | | | | | |
Total Investments in Securities | | $ | 115,815 | | | $ | 9,492,300 | | | | — | | | $ | 9,608,115 | |
| | | | | | | | | | | | | | | | |
| | | | |
Financial Derivative Instruments - Assets | | | | | | | | | | | | | | | | |
| | | | |
Foreign Currency Exchange Contracts | | | — | | | | $24,874 | | | | — | | | | $24,874 | |
| | | | |
Financial Derivative Instruments - Liabilities | | | | | | | | | | | | | | | | |
| | | | |
Foreign Currency Exchange Contracts | | | — | | | | (35,427 | ) | | | — | | | | (35,427 | ) |
| | | | |
Interest Rate Futures Contracts | | | $(4,541 | ) | | | — | | | | — | | | | (4,541 | ) |
| | | | | | | | | | | | | | | | |
Total Financial Derivative Instruments | | | $(4,541 | ) | | | $(10,553 | ) | | | — | | | | $(15,094 | ) |
| | | | | | | | | | | | | | | | |
| † | All corporate bonds and notes and U.S. government and agency obligations held in the Fund are Level 2 securities. For a detailed breakout of corporate bonds and notes and U.S. government and agency obligations by major industry or agency classification, please refer to the Fund’s Schedule of Portfolio Investments. |
| 1 | An external pricing service is used to reflect any impact on security value due to market movements between the time the Fund valued such foreign securities and the earlier closing of foreign markets. |
For the fiscal year ended December 31, 2019, there were no transfers in or out of Level 3.
The accompanying notes are an integral part of these financial statements.
21
| | |
| | AMG Managers Global Income Opportunity Fund Schedule of Portfolio Investments(continued) |
The following schedule shows the value of derivative instruments at December 31, 2019.
| | | | | | | | | | | | |
| | | Asset Derivatives | | | | | Liability Derivatives | |
| | | | |
Derivatives not accounted for as hedging instruments | | Statement of Assets and Liabilities Location | | | Fair Value | | | Statement of Assets and Liabilities Location | | | Fair Value | |
Foreign currency exchange contracts | | Unrealized appreciation on foreign currency contracts | | | $24,874 | | | Unrealized depreciation on foreign currency contracts | | | $35,427 | |
| | | | |
Interest rate contracts | | Receivable for variation margin | | | — | | | Payable for variation margin1 | | | 438 | |
| | | | | | | | | | | | |
| | Totals | | | $24,874 | | | | | | $35,865 | |
| | | | | | | | | | | | |
For the fiscal year ended December 31, 2019, the effect of derivative instruments on the Statement of Operations for the Fund and the amount of realized gain/loss and unrealized appreciation/depreciation on derivatives recognized in income was as follows:
| | | | | | | | | | | | |
| | | Realized Gain/Loss | | | | | Change in Unrealized Appreciation/Depreciation | |
| | | | |
Derivatives not accounted for as hedging instruments | | Statement of Operations Location | |
| Realized
Gain/Loss |
| | Statement of Operations Location | |
| Change in
Unrealized
Appreciation/
Depreciation |
|
Foreign currency exchange contracts | | Net realized loss on forward contracts | | | $(74,094 | ) | | Net change in unrealized appreciation/ depreciation on forward contracts | | | $(77,587 | ) |
| | | | |
Interest rate contracts | | Net realized gain on futures contracts | | | 21,788 | | | Net change in unrealized appreciation/ depreciation on futures contracts | | | (4,541 | ) |
| | | | | | | | | | | | |
| | Totals | | | $(52,306 | ) | | | | | $(82,128 | ) |
| | | | | | | | | | | | |
| 1 | Only current day’s variation margin is reported within the Statement of Assets and Liabilities. The variation margin is included in the open futures cumulative depreciation of $(4,541). |
The country allocation in the Schedule of Portfolio Investments at December 31, 2019, was as follows:
| | |
Country | | % of Long-Term
Investments |
| |
Argentina | | 0.2 |
| |
Australia | | 2.5 |
| |
Brazil | | 1.8 |
| |
Canada | | 2.4 |
| |
Chile | | 0.7 |
| |
China | | 2.2 |
| |
Colombia | | 1.7 |
| |
Dominican Republic | | 1.3 |
| |
France | | 3.2 |
| |
Germany | | 0.3 |
| |
Greece | | 0.6 |
| |
Indonesia | | 2.7 |
| |
Italy | | 2.7 |
| |
Japan | | 2.2 |
| | |
Country | | % of Long-Term
Investments |
| |
Mexico | | 5.7 |
| |
Netherlands | | 4.6 |
| |
Norway | | 0.6 |
| |
Peru | | 1.5 |
| |
South Africa | | 1.7 |
| |
South Korea | | 3.9 |
| |
Spain | | 3.7 |
| |
Thailand | | 1.9 |
| |
Turkey | | 0.5 |
| |
United Kingdom | | 8.9 |
| |
United States | | 42.5 |
| | |
| | 100.0 |
| | |
The accompanying notes are an integral part of these financial statements.
22
|
AMG Managers Special Equity Fund Portfolio Manager’s Comments(unaudited) |
| | | | | | | | | | | | |
For the fiscal year ended December 31, 2019, the AMG Managers Special Equity Fund (Class N shares) (the “Fund”) returned 25.7%, compared to the 28.5% return for the Russell 2000® Growth Index. FEDERATED MDT LLC 2019 was a strong year for the market and the first quarter alone nearly offset the disastrous fourth quarter of 2018. For the full year, the Russell 2000® Growth Index, the benchmark for the MDTA sleeve of the Fund, returned 28.48%. While the MDTA sleeve had strong returns, its return of 20.11% trailed the benchmark substantially. It was a year of dislocation when the market did not trade according to the historical norms on which MDTA bases its models. Most notably, in both the first and fourth quarters the market seemed to prefer lower cash flow companies to higher cash flow companies, and it seemed to prefer companies that needed more external financing (equity or debt offerings) to those that didn’t. Long term, our research shows that companies with weaker financial characteristics such as these do not outperform, so we avoid most of the companies with these characteristics and we weren’t in the sweet spot of the market in the first and last quarters. As a systematic manager, there are years like this when our models do not do well. We stay focused on what we do, because over the long run the market returns to its usual patterns and we can offset losses. Notwithstanding the market environment, MDTA continued to follow its disciplined investment process in 2019. The MDTA sleeve did benefit from the stronger risk controls that have been added to the strategy over the last decade to make it more robust to changes in the market environment. The sleeve is now much better diversified: it is roughly sector-neutral, it is less concentrated, and it holds companies with varied fundamental and technical characteristics. Because of our tighter risk constraints, the underperformance in 2019 was less severe than it was in 2009 – another year in which we underperformed a strong bull market - and leaves us with less to offset Stocks that contributed positively to the performance of the MDTA sleeve relative to the benchmark during the year included Array BioPharma, Inc., Loxo Oncology, Inc., and Coupa Software, Inc. Specific | | | | | | Corp., and Cimpress PLC. At the end of the year, the MDTA sleeve’s sector exposures were all roughly neutral to the benchmark. In years like this, it is important to note that MDTA’s model-based process has three important aspects that are very different from most qualitative processes. First, it is virtually impossible for us to be whip-sawed by chasing the latest “thing” or factor that happened to work last year. By using a robust investment model based on years of research, our process does not allow an emotional response that might cause one poor year to be followed by a second or even a third. Second, our process, though slow moving, is in fact dynamic. Our stock selections, driven by our factors, adjust over time if the key drivers of market returns have shifted. Third, our research approach is continuous, with each update taking into account the latest data from the market and the latest thinking in academic circles. The outcome of this continuous research is typically a new model implementation every six months, which allows the investment model to adjust well to changing environments. That is why, we think, in the long history of MDTA’s investment approach, the last time that our small cap growth product has missed its benchmark substantially was 2009, when the situation (and our model) was very different. LORD, ABBETT & CO., LLC PERFORMANCE SUMMARY For the fiscal year ended December 31, 2019, Lord Abbett’s sleeve of the Fund returned 33.0%, outperforming its benchmark, the Russell 2000 Growth® Index, which returned 28.5% over the same period. MARKET REVIEW Domestic equity returns were positive over the past year, with large cap stocks, as represented by the S&P 500® Index, rising 31.5% during the period, while small cap stocks, as represented by the Russell 2000® Index, were up 25.5%. Following a tumultuous fourth quarter of 2018, where trade tensions and monetary policy uncertainty sent many investors toward safety, the market staged a strong recovery. After the worst December since 1931, the | | | | | | notable shifts over the year was the U.S. Federal Reserve’s (the “Fed”) transition to a more dovish policy stance, with Chairman Jerome Powell stating that the Fed will act appropriately to sustain economic growth. Given an uncertain market outlook and muted inflation pressures, the Fed announced its decision to cut interest rates by 25 basis points on July 31, 2019, to a range of 2.00–2.25%. This was the first time that the Fed cut interest rates since December 2008. The Fed followed that decision with two more 25 basis point rate cuts in September and October, citing “implications of global developments for the economic outlook as well as muted inflation pressures.” After the October rate cut, Fed Chairman Powell signaled a likely pause on future rate cuts, resulting in the market-based probability of a fourth rate cut dipping below 25%. The combination of a dovish Fed, trade pressures, and slowing economic growth resulted in falling rates across the U.S. Treasury yield curve. In fact, in July, the yield on the10-year U.S. Treasury fell to its lowest level since 2016. Bond yields continued to fall, and in August, the spread between the U.S.10-year Treasury and the2-year Treasury temporarily inverted. In September, a large rotation from growth into value took place and continued through November. Geopolitics also contributed to market volatility. Following a coordinated drone strike on Saudi Arabia in the third quarter, Brent crude oil prices increased 20% in one trading session. Despite the record increase, oil prices retracted their gains within weeks. Investor sentiment was buoyed in November as the market grew optimistic about the possibility of a “phase one” trade deal between the U.S. and China, which was ultimately reached in December. The agreement included structural reforms to China’s trade regime in areas such as intellectual property and agriculture as well as a commitment from China to make additional purchases of U.S. goods and services going forward. In return, the U.S. will not proceed with tariffs that were scheduled to go into effect in December on nearly $160 billion worth of Chinese goods and will cut the tariff rate imposed on September 1, 2019, on $120 billion worth of Chinese goods to 7.5%. |
| stocks which detracted the most from relative performance included Green Dot Corp class A shares, USANA Health Sciences, Inc., Vanda Pharmaceuticals, Inc., National General Holdings | | | | | | S&P 500® posted its best January since 1987. Trade tensions continued to dominate headlines, as trade negotiations between the U.S. and China remained volatile throughout the period. Since the beginning of 2019, both the U.S. and China have imposed tariffs of roughly $550 billion and $185 billion on each country’s products, respectively. One of the more | | | | | | PORTFOLIO REVIEW The Lord Abbett Sleeve of the Fund outperformed the benchmark during the fiscal year. The leading contributor to the Sleeve’s absolute and relative performance during the period was security selection and positioning in the information technology sector. Within this sector, the Sleeve’s holdings of Coupa Software, Inc. (“Coupa”), a |
23
|
AMG Managers Special Equity Fund Portfolio Manager’s Comments(continued) |
| | | | | | | | | | | | |
provider of business spend management solutions, contributed most. Shares of Coupa appreciated rapidly as the company emerged as a leading platform for business spend management and began to enhance itsbusiness-to-business capabilities. Another contributor within this sector during the reporting period was the Sleeve’s position in Okta, Inc. (“Okta”), a provider of identity and access management solutions in the cloud. Shares of Okta rose throughout the period as the addressable market for identity and access management grew rapidly, while the company added large clients and increased billings. Security selection within the health care sector also contributed to the Sleeve’s relative performance during the reporting period. Within this sector, the Sleeve’s holdings of Repligen Corp., a provider of bioprocessing solutions for the development of biologic drugs, contributed as the company posted its best organic growth rate in over three years with all segments contributing to its substantial growth. The leading detractor from the Sleeve’s performance relative to the benchmark during the reporting period was security selection and positioning within the industrial sector. Within this sector, the Sleeve’s position in NV5 Global, Inc. (“NV5”), a provider of consulting services, detracted. Shares of NV5 fell as the company reported third quarter results that missed expectations as three projects were delayed. Another detractor within the sector was the Sleeve’s position in Herman Miller, Inc., a designer of interior furnishings, which reported revenue and third quarter earnings per share guidance below expectations. Security selection in the communication services sector also detracted from the Sleeve’s performance relative to the benchmark during the reporting period. Within this sector, the Sleeve’s holdings of Eventbrite, Inc., (“Evenbrite”) an operator of a self-service online ticketing platform, detracted. Shares of Eventbrite declined precipitously as execution issues and challenges surrounding its migration of Ticketfly weighed on the company’s performance. RANGER INVESTMENT MANAGEMENT, L.P. In late 2018 and early 2019, we were given the rare opportunity to initiate twelve new positions into the Sleeve when the Russell 2000® Growth Index declined 29%. As a result, we entered 2019 feeling particularly excited about the Sleeve’s prospects. As we look back on the year, it’s fair to say that returns for both the market and the Sleeve exceeded our “expectations.” | | | | | | The core of Ranger’s process is original research on companies that have both attractive quantitative and qualitative characteristics that serve as the foundation of our investment philosophy. When a significant market decline occurs, it affords us the opportunity from a risk/reward perspective to selectively bring quality companies into the Sleeve. While the investment team’s cumulative tenure in the business serves as a key asset and we take advantage of our respective sector and individual company expertise, we understand clearly the risk associated “from our preconceptions.” No one individual can completely divorce themselves from the intellectual and emotional attachment that they have to their own work. This inherent natural bias is exactly why Ranger implements its proprietary risk management tools: Long Manager, Suspect List, and Earnings Quality Report. Each of these products has been enhanced over the past sixteen years to serve as institutionalized, independent prompts on individual holdings that help mitigate the risk associated with “seeing our expectations.” The tools rely on observations that make us more self-aware and ultimately better investors. Further enhancing both the core of our investment philosophy and risk management tools was the formalization of Ranger’s proprietary ESG Assessment Model. This analysis deepens our commitment to identifying the highest quality small capitalization growth companies. Despite the litany of worries over the past decade, the small cap market, as measured by the Russell 2000® Growth index, advanced at a 13% annualized return. While concerns were ever present and must be evaluated in company selection and sector positioning, ultimately the “what is” was a growing economy and liquidity that was accommodative and plentiful. These coupled to provide a market backdrop conducive for strong returns and stock selection. As we closed out 2019, the U.S. equity markets advanced strongly during the fourth quarter as concerns about slowing economic growth dissipated on hopes that global central bank stimulus could reaccelerate global growth in 2020. Additionally, trade tensions with China deescalated in anticipation that a trade deal will be signed in early 2020, and further tariffs avoided. Despite the slower economic data and lower corporate financial results, domestic markets enjoyed robust quarter andyear-to-date returns. One striking feature of the recent market advance is the reemergence of leadership by the small cap indices. As recently as the third quarter, the Russell | | | | | | 2000® Growth Index was 10% below the highs achieved in August of 2018 and lagged the S&P 500® by over 500 basis points year to date. The fourth quarter gains by the Russell 2000® Growth Index brought the index to a52-week high and narrowed the relative underperformance versus the S&P 500® to just 300 basis points. While trade conflicts and uncertainty seem poised to continue to weigh on global growth, policy, and animal spirits can change quickly as demonstrated this past quarter with volatility dropping to an annual low and riskier industries assuming market leadership PORTFOLIO COMMMENTARY The Ranger Sleeve’s increase of 30.7% outperformed the Russell 2000® Growth Index gain of 28.49% this past year. Market strength was broad this year as all sectors advanced double-digit percentages except energy. Volatility diminished as the year progressed. The VIX® (CBOE Volatility Index®) averaged 15, which is below the historic average of 19. Factor analysis demonstrated performance leadership by low quality, high valuation factors in 2019. This factor leadership occurred during the first and fourth quarters of 2019. Despite this factor headwind, the Ranger sleeve significantly outperformed during the June and September quarters, which favored quality characteristics and led to the annual outperformance.Non-earning companies, which represented 30.4% of the index, gained 34.3%, far outpacing the 26.2% return of companies with earnings.Non-earning biotech and pharmaceutical companies, which were 12.8% of the index total and 42% of thenon-earning component, increased by 46.9%.Non-earning technology companies, which were 7.6% of the index total and 25% of thenon-earning component, increased by 31.3%. High valuation factors demonstrated strong leadership. On both a trailing and forward twelve-month basis, companies with negative value P/E meaningfully outperformed the Russell 2000 Growth, returning 33.9% and 38.9%, respectively. For companies with positive earnings, the highest P/E quintile on a trailing and forward twelve-month basis outperformed, gaining 44.3% and 44.5%. The two highest price/sales quintiles outperformed, increasing 29.1% and 54.0%. Companies with |
24
|
AMG Managers Special Equity Fund Portfolio Manager’s Comments(continued) |
| | | | | | | | | | | | |
negative price/cash flow, which represented 17.6% of the index, gained 35.3%. The two highest price/cash flow quintiles outperformed, increasing 35.8% and 40.7%. The producer durables sector was the largest outperforming sector in the Sleeve this past year. These positions gained 46.3% compared with the 30.8% increase by the index component. Four positions gained greater than 60% for the year. Technology (inclusive of Cogent Communications Holdings, Inc. which is categorized by Russell as a utility) was the second largest relative contributor to performance. These positions increased 32.5% compared with the 27.3% gain by the index component. Healthcare was the largest underperforming sector as these positions increased 27.7% compared with the 32.4% increase by the index component. While five of these holdings gained more than 50%, declines by four of the holdings detracted from the sector’s performance. Strong gains bynon-earning biotech and pharmaceutical companies, which represent 47% of the sector weight, drove the index components’ return. Materials & processing was the second largest underperforming sector as these positions increased 14.8% compared with the 33.9% return by the index component. As the market advanced over the course of the year, we made 47 valuation-based trims or sells. Six Sleeve companies were acquired during 2019: Integrated Device Technology, Inc., WildHorse Resource Development, Corp., and MINDBODY were announced in 2018 and closed at the start of the year, while Cambrex cCorp., LegacyTexas Financial Group, Inc and Medidata Solutions, Inc. occurred and closed during the year. LOOKING FORWARD With the Russell 2000® Growth index advancing 28.5% for the year and near52-week highs, some sector valuations elevated relative to historical averages, and volatility below long-term levels, we believe selectivity and caution is the best approach for investors. As outlined earlier in the letter, much of the index gains over the past year were driven bynon-earning companies. | | | | | | navigate fourth quarter earnings reports and initial 2020 company financial guidance. Earnings for the Russell 2000® Growth Index are estimated to decline 4.7% for 2019, which we believe is the result of an economy, both at home and around the world, that is slowing. Five consecutive months of domestic manufacturing PMIs below 50 has led to weaker corporate financial results throughout the year. Here “we are seeing what is.” We believe market “expectations” for a quick industrial recovery coupled with the multiple expansion that drove market performance in 2019 could set up for a more volatile backdrop as we progress through the first half of 2020. Most critically, the ongoingChina-U.S. geopolitical rivalry represents both the greatest risk and opportunity for the integrated global economy. The current trade truce is incrementally better as additional tariffs are not poised to increase, which could serve to bolster corporate confidence and capital spending plans. This capital investment is particularly important as the U.S. economy is in a late-cycle phase and companies with 20%+ EPS growth are at adecade-low level. As noted earlier in the letter, six portfolio companies were acquired during 2019. Over the past fifteen quarters, fifteen portfolio companies have been acquired. This high level of acquisitions is reflective of Ranger successfully identifying companies with superior sustained growth and high-return profiles. As we are in the latter stages of the economic cycle, with growth harder to come by, we believe small capitalization companies that continue to distinguish themselves with differentiated growth should continue to be attractive candidates for consolidation. SMITH ASSET MANAGEMENT GROUP, L.P. For the fiscal year ended December 31, 2019, the Smith Group sleeve of the Fund returned 16.20%. During the same period, the Russell 2000® Growth Index posted a return of 28.5%. | | | | | | capital spending. The labor market was surprisingly robust given the aging expansion, while wages have been steadily climbing. This combination has helped consumers stay optimistic, making them the primary support for tepid economic results. Smith Group’s primary focus is to find companies that can sustainably grow high quality earnings faster than expectations and that also possess reasonable valuations. Over the past year the Sleeve has not kept pace with its benchmarks as the return to companies beating earnings expectations and valuation was not rewarded. Underperformance began coincident with the sharp marketsell-off of late 2018 and the subsequent plummeting of global corporate earnings forecasts for 2019. The return associated with perfect foresight on corporate earnings over the past year has been well below average. This underperformance is generally experienced in an earnings recession, and has been repeated over the past year, indicating that the markets believe corporate earnings are either already in or clearly headed for a recessionary period. The reward to unexpected growth has a large influence on the relative performance of Smith Group’s investment process. Stock selection was unfavorable versus the Russell 2000® Growth Index. Sector and industry weighting decisions, primarily an underweight to biotechnology companies, were also a drag on relative performance. Health care stock selection accounted for the largest component of underperformance. Information technology holdings were the best absolute performers in the Fund, returning 33.3% for the year. Among Fund holdings with a significant impact on relative portfolio returns, Atkore International Group, Inc. (“Atkore”) and Yeti Holdings, Inc. (“Yeti”) were the top performers. Atkore is an electrical equipment manufacturer with a portfolio of integrated electrical raceway solutions that deploy and protect a structure’s electrical circuitry from source to outlet. Atkore is benefiting from a ramp up in renewable energy projects and a firming pricing environment. Yeti, the manufacturer of iconic products for the outdoor and recreation market, reported earnings for the year that were 26% above expectations. The position was eventually sold from the Sleeve due to valuation concerns as the price/earnings multiple of the stock increased by over 50% over the course of 2019. |
The 2019 equity market move was due in large part to the Fed reducing rates and, to a lesser extent, a recovery from the lows of late 2018. If we were to see industrial activity stimulated by rate cuts coupled with clarity on current trade disputes, then small cap companies could benefit disproportionately from this environment. However, in the near term we need to | | | | | | 2019 ended in spectacular fashion as a strong final quarter capped off an annual return for U.S. small cap stock indices that ranks in the top 20% historically. The investor mood today is 180 degrees from the extreme pessimism of a year ago. With little earnings growth during 2019, the surge in market performance was almost wholly due to an increase in valuations. The U.S. economy in 2019 was surprisingly resilient considering the multitude of headwinds. Trade tensions and a global slowdown hurt business confidence, which in turn slowed | | | | | | The largest detractors in the Sleeve were pharmaceutical companies Assertio Therapeutics, Inc. (“Assertio”) and Akorn, Inc. (“Akorn”). Assertio is a specialty pharmaceutical company focused on |
25
|
AMG Managers Special Equity Fund Portfolio Manager’s Comments(continued) |
| | | | | | | | | | | | |
pain and other central nervous system conditions. The company is expanding beyond its current neurology portfolio but uncertainty around the timing of FDA approval of a key pipeline drug led to a significantsell-off in the shares of the company. Akorn develops generic and branded prescription pharmaceuticals fordifficult-to-manufacture sterile andnon-sterile dosage forms including ophthalmic, injectables, oral liquids, and nasal sprays. The position was sold off after a deal to take the company private fell through and a delay in a line of credit financing. Headlines tend to be sensational, but the U.S. economy looks poised to muddle through 2020 at a tepid pace without tipping into recession. | | | | | | Consumers are liquid and debt service manageable. Home building is on the rise due to low mortgage rates. Less trade uncertainty may give businesses more confidence to invest. The Fed looks to be on hold for the immediate future and central banks around the world are providing a tsunami of liquidity. However, more business investment is needed for the U.S. economy to meet the administration’s growth targets. We continue to believe that equities should be able to generate healthy returns going forward as economic growth and supportive monetary policy | | | | | | provide a solid foundation for continued earnings growth by the companies held by the Sleeve. We continue to believe our focus on high quality companies where earnings will exceed market expectations is the key to generating excess returns over the long term. This commentary reflects the viewpoints of the portfolio managers, Federated MDTA LLC., Lord, Abbett & Co., LLC, Ranger Investment Management, L.P. and Smith Asset Management Group, L.P. and is not intended as a forecast or guarantee of future results. |
26
| | |
| | AMG Managers Special Equity Fund Portfolio Manager’s Comments(continued) |
CUMULATIVE TOTAL RETURN PERFORMANCE
AMG Managers Special Equity Fund’s cumulative total return is based on the daily change in net asset value (NAV), and assumes that all dividends and distributions were reinvested. The graph compares a hypothetical $10,000 investment made in the AMG Managers Special Equity Fund’s Class N Shares on December 31, 2009, to a $10,000 investment made in the Russell 2000® Growth Index for the same time period. The graph and table do not reflect the deduction of taxes that a shareholder would pay on a Fund distribution or redemption of shares. The listed returns for the Fund are net expenses and the returns for the index exclude expenses. Total returns would have been lower had certain expenses not been reduced.
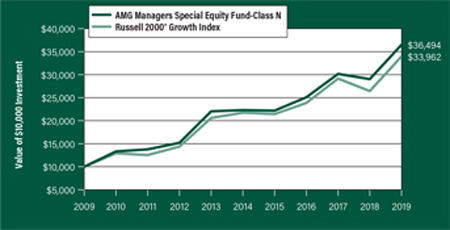
The table below shows the average annual total returns for the AMG Managers Special Equity Fund and the Russell 2000® Growth Index for the same time periods ended December 31, 2019.
| | | | | | | | | | | | |
| Average Annual Total Returns1 | | One Year | | | Five Years | | | Ten Years | |
|
AMG Managers Special Equity Fund2, 3, 4, 5, 6, 7 | |
| | | |
Class N | | | 25.69% | | | | 10.35% | | | | 13.82% | |
| | | |
Class I | | | 26.02% | | | | 10.63% | | | | 14.07% | |
| | | |
Russell 2000® Growth Index8 | | | 28.48% | | | | 9.34% | | | | 13.01% | |
The performance data shown represents past performance. Past performance is not a guarantee of future results. Current performance may be lower or higher than the performance data quoted. The investment return and principal value of an investment will fluctuate so that an investor’s shares, when redeemed, may be worth more or less than their original cost.
Investors should carefully consider the Fund’s investment objectives, risks, charges and expenses before investing. For performance information through the most recent month end, current net asset values per share for the Fund and other information, please call 800.548.4539 or visit our website at amgfunds.com for a free prospectus. Read it carefully before investing or sending money.
Distributed by AMG Distributors, Inc., member FINRA/SIPC.
| 1 | Total return equals income yield plus share price change and assumes reinvestment of all dividends and capital gain distributions. Returns are net of fees and may reflect offsets of Fund expenses as described in the prospectus. No adjustment has been made for taxes payable by shareholders on their reinvested dividends and capital gain distributions. Returns for periods greater than one year are annualized. The listed returns on the Fund are net of expenses and based on the published NAV as of December 31, 2019. All returns are in U.S. dollars ($). |
|
2 From time to time, the Fund’s advisor has waived its fees and/or absorbed Fund expenses, which has resulted in higher returns. 3 The Fund is subject to risks associated with investments in small-capitalization companies, such as erratic earnings patterns, competitive conditions, limited earnings history and a reliance on one or a limited number of products. 4 The Fund is subject to risks associated with investments inmid-capitalization companies such as greater price volatility, lower trading volume, and less liquidity than the stocks of larger, more established companies. 5 The Fund invests in growth stocks, which may be more sensitive to market movements because their prices tend to reflect future investor expectations rather than just current profits. Growth stocks may underperform value stocks during given periods. 6 Investments in international securities are subject to certain risks of overseas investing including currency fluctuations and changes in political and economic conditions, which could result in significant market fluctuations. These risks are magnified in emerging markets. 7 Companies that are in similar businesses may be similarly affected by particular economic or market events; to the extent the Fund has substantial holdings within a particular sector, the risks associated with that sector increase. 8 The Russell 2000® Growth Index measures the performance of the Russell 2000® companies with higherprice-to-book ratios and higher forecasted growth values. Unlike the Fund, the Russell 2000® Growth Index is unmanaged, is not available for investment and does not incur expenses. The Russell Indices are trademarks of the London Stock Exchange Group companies. Not FDIC insured, nor bank guaranteed. May lose value. |
27
| | |
| | AMG Managers Special Equity Fund Fund Snapshots(unaudited) December 31, 2019 |
PORTFOLIO BREAKDOWN
| | |
| Sector | | % of
Net Assets |
| | |
Health Care | | 29.0 |
| | |
Information Technology | | 26.1 |
| | |
Industrials | | 14.0 |
| | |
Consumer Discretionary | | 12.8 |
| | |
Financials | | 6.2 |
| | |
Consumer Staples | | 4.5 |
| | |
Real Estate | | 1.9 |
| | |
Communication Services | | 1.4 |
| | |
Materials | | 1.2 |
| | |
Energy | | 0.8 |
| | |
Utilities | | 0.1 |
| | |
Short-Term Investments | | 6.5 |
| | |
Other Assets Less Liabilities | | (4.5) |
TOP TEN HOLDINGS
| | |
| Security Name | | % of
Net Assets |
| | |
Repligen Corp. | | 2.4 |
| | |
WNS Holdings, Ltd., ADR (India) | | 1.8 |
| | |
Pegasystems, Inc. | | 1.6 |
| | |
Medpace Holdings, Inc. | | 1.5 |
| | |
Inter Parfums, Inc. | | 1.4 |
| | |
MAXIMUS, Inc. | | 1.4 |
| | |
Qualys, Inc. | | 1.4 |
| | |
PRA Health Sciences, Inc. | | 1.3 |
| | |
Chegg, Inc. | | 1.2 |
| | |
Skyline Champion Corp. | | 1.2 |
| | | |
| | |
Top Ten as a Group | | 15.2 |
| | | |
| | | |
Because a fund’s strategy may result in multiple investments in particular sectors of the economy, its performance may depend on the performance of those sectors and may fluctuate more widely than investments diversified across more sectors. For additional information on these and other risk considerations, please see the Fund’s prospectus.
Any sectors, industries, or securities discussed should not be perceived as investment recommendations. Mention of a specific security should not be considered a recommendation to buy or solicitation to sell that security. Specific securities mentioned in this report may have been sold from the Fund’s portfolio of investments by the time you receive this report.
28
| | |
| | AMG Managers Special Equity Fund Schedule of Portfolio Investments December 31, 2019 |
| | | | | | | | |
| | | Shares | | | Value | |
| | |
Common Stocks - 98.0% | | | | | | | | |
| | |
Communication Services - 1.4% | | | | | | | | |
| | |
Cardlytics, Inc.* | | | 2,780 | | | | $174,751 | |
| | |
Cogent Communications Holdings, Inc. | | | 19,229 | | | | 1,265,461 | |
| | |
EverQuote, Inc., Class A*,1 | | | 2,938 | | | | 100,920 | |
| | |
HUYA, Inc., ADR (China)* | | | 16,112 | | | | 289,210 | |
| | |
IMAX Corp. (Canada)* | | | 6,117 | | | | 124,970 | |
| | |
Meredith Corp. | | | 3,640 | | | | 118,191 | |
| | |
National CineMedia, Inc.1 | | | 53,339 | | | | 388,841 | |
| | |
Sinclair Broadcast Group, Inc., Class A1 | | | 10,100 | | | | 336,734 | |
| | |
The Meet Group, Inc.*,1 | | | 31,062 | | | | 155,621 | |
| | |
Total Communication Services | | | | | | | 2,954,699 | |
| | |
Consumer Discretionary - 12.8% | | | | | | | | |
| | |
Asbury Automotive Group, Inc.*,1 | | | 9,661 | | | | 1,080,003 | |
| | |
BJ’s Restaurants, Inc.1 | | | 20,598 | | | | 781,900 | |
| | |
Boot Barn Holdings, Inc.* | | | 1,994 | | | | 88,793 | |
| | |
Bright Horizons Family Solutions, Inc.* | | | 5,336 | | | | 801,948 | |
| | |
Brinker International, Inc. | | | 11,730 | | | | 492,660 | |
| | |
Chegg, Inc.*,1 | | | 69,553 | | | | 2,636,754 | |
| | |
Crocs, Inc.* | | | 11,127 | | | | 466,110 | |
| | |
Deckers Outdoor Corp.*,1 | | | 7,313 | | | | 1,234,873 | |
| | |
Denny’s Corp.* | | | 13,118 | | | | 260,786 | |
| | |
Dick’s Sporting Goods, Inc. | | | 11,500 | | | | 569,135 | |
| | |
Everi Holdings, Inc.* | | | 62,144 | | | | 834,594 | |
| | |
Fox Factory Holding Corp.*,1 | | | 6,344 | | | | 441,352 | |
| | |
Helen of Troy, Ltd.* | | | 1,679 | | | | 301,867 | |
| | |
Hibbett Sports, Inc.* | | | 18,411 | | | | 516,244 | |
| | |
Installed Building Products, Inc.* | | | 3,609 | | | | 248,552 | |
| | |
iRobot Corp.*,1 | | | 11,644 | | | | 589,536 | |
| | |
La-Z-Boy, Inc. | | | 10,320 | | | | 324,874 | |
| | |
LGI Homes, Inc.* | | | 10,056 | | | | 710,456 | |
| | |
Libbey,Inc.* | | | 7,093 | | | | 10,285 | |
| | |
Lithia Motors, Inc., Class A1 | | | 7,467 | | | | 1,097,649 | |
| | |
Malibu Boats, Inc., Class A* | | | 14,636 | | | | 599,344 | |
| | |
National Vision Holdings, Inc.* | | | 9,045 | | | | 293,329 | |
| | |
PetMed Express, Inc. | | | 19,724 | | | | 463,909 | |
| | |
Planet Fitness, Inc., Class A* | | | 12,160 | | | | 908,109 | |
| | |
The RealReal, Inc.*,1 | | | 16,022 | | | | 302,015 | |
| | |
Rent-A-Center, Inc. | | | 26,711 | | | | 770,345 | |
| | |
RH*,1 | | | 5,366 | | | | 1,145,641 | |
| | |
Scientific Games Corp.*,1 | | | 822 | | | | 22,013 | |
| | |
SeaWorld Entertainment, Inc.*,1 | | | 20,292 | | | | 643,459 | |
| | |
Skyline Champion Corp.* | | | 81,454 | | | | 2,582,092 | |
| | |
| | | | | | | | |
| | | | | | | | |
| | | Shares | | | Value | |
| | |
Sleep Number Corp.*,1 | | | 4,533 | | | | $223,205 | |
| | |
Steven Madden, Ltd. | | | 30,665 | | | | 1,318,902 | |
| | |
Strategic Education, Inc. | | | 3,006 | | | | 477,653 | |
| | |
Tailored Brands, Inc. | | | 14,973 | | | | 61,988 | |
| | |
TopBuild Corp.* | | | 11,311 | | | | 1,165,938 | |
| | |
Wingstop, Inc. | | | 12,923 | | | | 1,114,350 | |
| | |
YETI Holdings, Inc.*,1 | | | 40,000 | | | | 1,391,200 | |
| | |
Total Consumer Discretionary | | | | | | | 26,971,863 | |
| | |
Consumer Staples - 4.5% | | | | | | | | |
| | |
B&G Foods, Inc.1 | | | 4,597 | | | | 82,424 | |
| | |
The Boston Beer Co., Inc., Class A*,1 | | | 1,589 | | | | 600,404 | |
| | |
Calavo Growers, Inc.1 | | | 15,638 | | | | 1,416,646 | |
| | |
The Chefs’ Warehouse, Inc.* | | | 781 | | | | 29,764 | |
| | |
Coca-Cola Consolidated, Inc. | | | 178 | | | | 50,561 | |
| | |
elf Beauty, Inc.* | | | 24,700 | | | | 398,411 | |
| | |
Freshpet, Inc.* | | | 13,711 | | | | 810,183 | |
| | |
Grocery Outlet Holding Corp.*,1 | | | 8,467 | | | | 274,754 | |
| | |
Inter Parfums, Inc. | | | 39,608 | | | | 2,879,898 | |
| | |
J&J Snack Foods Corp. | | | 13,667 | | | | 2,518,418 | |
| | |
John B Sanfilippo & Son, Inc. | | | 282 | | | | 25,741 | |
| | |
Performance Food Group Co.* | | | 5,109 | | | | 263,011 | |
| | |
USANA Health Sciences, Inc.*,1 | | | 676 | | | | 53,100 | |
| | |
Vector Group, Ltd.1 | | | 2,276 | | | | 30,476 | |
| | |
Total Consumer Staples | | | | | | | 9,433,791 | |
| | |
Energy - 0.8% | | | | | | | | |
| | |
CONSOL Energy, Inc.*,1 | | | 6,022 | | | | 87,379 | |
| | |
CVR Energy, Inc. | | | 6,665 | | | | 269,466 | |
| | |
Denbury Resources, Inc.* | | | 115,689 | | | | 163,121 | |
| | |
Mammoth Energy Services, Inc. | | | 17,114 | | | | 37,651 | |
| | |
Select Energy Services, Inc., Class A* | | | 117,106 | | | | 1,086,744 | |
| | |
Total Energy | | | | | | | 1,644,361 | |
| | |
Financials - 6.2% | | | | | | | | |
| | |
Artisan Partners Asset Management, Inc., Class A | | | 6,700 | | | | 216,544 | |
| | |
Assetmark Financial Holdings, Inc.* | | | 20,619 | | | | 598,363 | |
| | |
Banc of California, Inc. | | | 84,071 | | | | 1,444,340 | |
| | |
CenterState Bank Corp. | | | 81,066 | | | | 2,025,029 | |
| | |
eHealth, Inc.*,1 | | | 5,649 | | | | 542,756 | |
| | |
Enova International, Inc.* | | | 8,481 | | | | 204,053 | |
| | |
Essent Group, Ltd. | | | 16,094 | | | | 836,727 | |
| | |
FS Bancorp,Inc. | | | 4,300 | | | | 274,297 | |
| | |
Goosehead Insurance, Inc., Class A1 | | | 27,385 | | | | 1,161,124 | |
| | |
Green Dot Corp., Class A* | | | 15,417 | | | | 359,216 | |
| | |
Heritage Insurance Holdings, Inc. | | | 9,075 | | | | 120,244 | |
| | |
| | | | | | | | |
The accompanying notes are an integral part of these financial statements.
29
| | |
| | AMG Managers Special Equity Fund Schedule of Portfolio Investments(continued) |
| | | | | | | | |
| | | Shares | | | Value | |
| | |
Financials - 6.2%(continued) | | | | | | | | |
| | |
Kinsale Capital Group,Inc.1 | | | 6,077 | | | | $617,788 | |
| | |
LendingTree, Inc.*,1 | | | 4,375 | | | | 1,327,550 | |
| | |
Meta Financial Group, Inc. | | | 852 | | | | 31,106 | |
| | |
National General Holdings Corp. | | | 38,374 | | | | 848,065 | |
| | |
NMI Holdings, Inc., Class A* | | | 15,057 | | | | 499,591 | |
| | |
Palomar Holdings, Inc.* | | | 1,359 | | | | 68,616 | |
| | |
Selective Insurance Group,Inc. | | | 3,651 | | | | 238,009 | |
| | |
Stock Yards Bancorp, Inc. | | | 9,278 | | | | 380,955 | |
| | |
Walker & Dunlop, Inc. | | | 7,600 | | | | 491,568 | |
| | |
Western Alliance Bancorp. | | | 14,330 | | | | 816,810 | |
| | |
Total Financials | | | | | | | 13,102,751 | |
| | |
Health Care - 29.0% | | | | | | | | |
| | |
10X Genomics, Inc., Class A*,1 | | | 6,970 | | | | 531,463 | |
| | |
ACADIA Pharmaceuticals, Inc.*,1 | | | 21,415 | | | | 916,134 | |
| | |
Acceleron Pharma, Inc.*,1 | | | 1,300 | | | | 68,926 | |
| | |
Acer Therapeutics, Inc.* | | | 1,455 | | | | 5,835 | |
| | |
Addus HomeCare Corp.* | | | 4,505 | | | | 437,976 | |
| | |
Adeptus Health,Inc.2,3 | | | 24,574 | | | | 0 | |
| | |
ADMA Biologics, Inc.* | | | 1,965 | | | | 7,860 | |
| | |
Aimmune Therapeutics, Inc.*,1 | | | 3,837 | | | | 128,424 | |
| | |
Allakos, Inc.*,1 | | | 630 | | | | 60,077 | |
| | |
Alphatec Holdings, Inc.* | | | 998 | | | | 7,081 | |
| | |
Amarin Corp. PLC, ADR (Ireland)*,1 | | | 17,643 | | | | 378,266 | |
| | |
Amedisys, Inc.* | | | 3,654 | | | | 609,926 | |
| | |
Amicus Therapeutics, Inc.* | | | 7,900 | | | | 76,946 | |
| | |
Amneal Pharmaceuticals, Inc.* | | | 14,936 | | | | 71,992 | |
| | |
Applied Therapeutics, Inc.* | | | 1,296 | | | | 35,355 | |
| | |
Arena Pharmaceuticals, Inc.* | | | 6,113 | | | | 277,652 | |
| | |
Argenx SE, ADR (Netherlands)* | | | 4,322 | | | | 693,767 | |
| | |
Arrowhead Pharmaceuticals, Inc.*,1 | | | 10,844 | | | | 687,835 | |
| | |
Assertio Therapeutics, Inc.* | | | 39,920 | | | | 49,900 | |
| | |
Audentes Therapeutics, Inc.* | | | 1,500 | | | | 89,760 | |
| | |
Axsome Therapeutics, Inc.* | | | 1,610 | | | | 166,410 | |
| | |
BioDelivery Sciences International,Inc.* | | | 64,113 | | | | 405,194 | |
| | |
Biohaven Pharmaceutical Holding Co., Ltd.* | | | 1,100 | | | | 59,884 | |
| | |
BioTelemetry, Inc.*,1 | | | 35,306 | | | | 1,634,668 | |
| | |
Blueprint Medicines Corp.* | | | 8,013 | | | | 641,921 | |
| | |
Bridgebio Pharma, Inc.*,1 | | | 20,453 | | | | 716,878 | |
| | |
Cardiovascular Systems, Inc.* | | | 2,822 | | | | 137,121 | |
| | |
CareDx, Inc.*,1 | | | 14,557 | | | | 313,994 | |
| | |
Chemed Corp. | | | 1,265 | | | | 555,664 | |
| | |
ChemoCentryx, Inc.* | |
| 8,168
|
| |
| 323,044
|
|
| | |
| | | | | | | | |
| | | | | | | | |
| | | Shares | | | Value | |
| | |
Clovis Oncology, Inc.*,1 | | | 2,290 | | | | $23,873 | |
| | |
Coherus Biosciences, Inc.*,1 | | | 50,484 | | | | 908,964 | |
| | |
Collegium Pharmaceutical,Inc.* | | | 15,830 | | | | 325,781 | |
| | |
CONMED Corp. | | | 17,907 | | | | 2,002,540 | |
| | |
CRISPR Therapeutics AG (Switzerland)* | | | 6,255 | | | | 380,961 | |
| | |
Cutera, Inc.* | | | 1,006 | | | | 36,025 | |
| | |
Cytokinetics Inc.*,1 | | | 7,626 | | | | 80,912 | |
| | |
Deciphera Pharmaceuticals, Inc.* | | | 11,200 | | | | 697,088 | |
| | |
Dicerna Pharmaceuticals, Inc.* | | | 10,672 | | | | 235,104 | |
| | |
Diplomat Pharmacy,Inc.* | | | 2,723 | | | | 10,892 | |
| | |
Emergent BioSolutions, Inc.* | | | 1,700 | | | | 91,715 | |
| | |
Enanta Pharmaceuticals, Inc.* | | | 700 | | | | 43,246 | |
| | |
Encompass Health Corp. | | | 6,600 | | | | 457,182 | |
| | |
Epizyme, Inc.* | | | 1,580 | | | | 38,868 | |
| | |
Esperion Therapeutics, Inc.*,1 | | | 477 | | | | 28,444 | |
| | |
Evofem Biosciences, Inc.* | | | 2,927 | | | | 18,060 | |
| | |
FibroGen, Inc.* | | | 2,300 | | | | 98,647 | |
| | |
Flexion Therapeutics, Inc.*,1 | | | 3,783 | | | | 78,308 | |
| | |
Forty Seven, Inc.* | | | 7,744 | | | | 304,881 | |
| | |
Glaukos Corp.*,1 | | | 4,817 | | | | 262,382 | |
| | |
Global Blood Therapeutics, Inc.*,1 | | | 6,113 | | | | 485,922 | |
| | |
Globus Medical, Inc., Class A* | | | 6,309 | | | | 371,474 | |
| | |
GlycoMimetics, Inc.* | | | 1,426 | | | | 7,544 | |
| | |
Guardant Health, Inc.*,1 | | | 6,046 | | | | 472,434 | |
| | |
GW Pharmaceuticals PLC, ADR (United Kingdom)*,1 | | | 2,584 | | | | 270,183 | |
| | |
Haemonetics Corp.* | | | 2,737 | | | | 314,481 | |
| | |
Halozyme Therapeutics, Inc.* | | | 24,172 | | | | 428,570 | |
| | |
HealthStream, Inc.* | | | 7,700 | | | | 209,440 | |
| | |
Heron Therapeutics, Inc.*,1 | | | 2,700 | | | | 63,450 | |
| | |
Heska Corp.*,1 | | | 10,148 | | | | 973,599 | |
| | |
HMS Holdings Corp.* | | | 13,900 | | | | 411,440 | |
| | |
Horizon Therapeutics PLC* | | | 4,000 | | | | 144,800 | |
| | |
ImmunoGen, Inc.* | | | 2,540 | | | | 12,967 | |
| | |
Immunomedics, Inc.*,1 | | | 17,040 | | | | 360,566 | |
| | |
Innoviva, Inc.* | | | 7,160 | | | | 101,386 | |
| | |
Inogen, Inc.* | | | 10,088 | | | | 689,313 | |
| | |
Inovalon Holdings, Inc., Class A*,1 | | | 7,912 | | | | 148,904 | |
| | |
Insmed, Inc.*,1 | | | 3,000 | | | | 71,640 | |
| | |
Inspire Medical Systems, Inc.* | | | 15,162 | | | | 1,125,172 | |
| | |
Insulet Corp.* | | | 3,908 | | | | 669,050 | |
| | |
| | | | | | | | |
| | |
Integer Holdings Corp.* | | | 22,041 | | | | 1,772,758 | |
| | |
Intercept Pharmaceuticals, Inc.*,1 | | | 2,861 | | | | 354,535 | |
| | |
| | | | | | | | |
The accompanying notes are an integral part of these financial statements.
30
| | |
| | AMG Managers Special Equity Fund Schedule of Portfolio Investments(continued) |
| | | | | | | | |
| | | Shares | | | Value | |
| | |
Health Care - 29.0%(continued) | | | | | | | | |
| | |
Intra-Cellular Therapies, Inc.* | | | 667 | | | | $22,885 | |
| | |
Invitae Corp.*,1 | | | 3,300 | | | | 53,229 | |
| | |
Iovance Biotherapeutics, Inc.*,1 | | | 4,000 | | | | 110,720 | |
| | |
iRhythm Technologies, Inc.*,1 | | | 3,911 | | | | 266,300 | |
| | |
Ironwood Pharmaceuticals, Inc.*,1 | | | 16,417 | | | | 218,510 | |
| | |
Kadmon Holdings, Inc.*,1 | | | 2,895 | | | | 13,114 | |
| | |
Karuna Therapeutics, Inc.* | | | 2,158 | | | | 162,584 | |
| | |
Karyopharm Therapeutics, Inc.* | | | 20,173 | | | | 386,716 | |
| | |
Kodiak Sciences, Inc.*,1 | | | 735 | | | | 52,883 | |
| | |
Kura Oncology, Inc.* | | | 2,285 | | | | 31,419 | |
| | |
Lantheus Holdings, Inc.* | | | 19,950 | | | | 409,175 | |
| | |
LeMaitre Vascular, Inc.1 | | | 43,365 | | | | 1,558,972 | |
| | |
Lexicon Pharmaceuticals, Inc.*,1 | | | 2,624 | | | | 10,890 | |
| | |
LHC Group, Inc.* | | | 667 | | | | 91,886 | |
| | |
MacroGenics, Inc.* | | | 799 | | | | 8,693 | |
| | |
Magellan Health, Inc.* | | | 6,200 | | | | 485,150 | |
| | |
Masimo Corp.* | | | 3,681 | | | | 581,819 | |
| | |
Medpace Holdings, Inc.*,1 | | | 38,406 | | | | 3,228,408 | |
| | |
Mesa Laboratories, Inc.1 | | | 8,514 | | | | 2,123,392 | |
| | |
Mirati Therapeutics, Inc.*,1 | | | 8,466 | | | | 1,090,929 | |
| | |
Molecular Templates, Inc.* | | | 598 | | | | 8,363 | |
| | |
Molina Healthcare, Inc.* | | | 3,600 | | | | 488,484 | |
| | |
Momenta Pharmaceuticals Inc.* | | | 3,010 | | | | 59,387 | |
| | |
MyoKardia, Inc.*,1 | | | 212 | | | | 15,452 | |
| | |
Myovant Sciences, Ltd. (United Kingdom)* | | | 17,170 | | | | 266,478 | |
| | |
Natera, Inc.* | | | 19,014 | | | | 640,582 | |
| | |
Neogen Corp.* | | | 23,323 | | | | 1,522,059 | |
| | |
NeoGenomics, Inc.*,1 | | | 67,800 | | | | 1,983,150 | |
| | |
Nevro Corp.*,1 | | | 12,125 | | | | 1,425,173 | |
| | |
NextCure, Inc.*,1 | | | 4,083 | | | | 229,995 | |
| | |
Novocure, Ltd. (Jersey)* | | | 379 | | | | 31,938 | |
| | |
NuVasive, Inc.* | | | 4,710 | | | | 364,271 | |
| | |
Paratek Pharmaceuticals, Inc.* | | | 73,190 | | | | 294,956 | |
| | |
PDL BioPharma, Inc.* | | | 55,287 | | | | 179,406 | |
| | |
Penumbra, Inc.*,1 | | | 3,831 | | | | 629,318 | |
| | |
Portola Pharmaceuticals, Inc.*,1 | | | 1,900 | | | | 45,372 | |
| | |
PRA Health Sciences, Inc.* | | | 23,823 | | | | 2,647,926 | |
| | |
PTC Therapeutics, Inc.* | | | 3,775 | | | | 181,313 | |
| | |
Puma Biotechnology, Inc.*,1 | | | 16,665 | | | | 145,819 | |
| | |
R1 RCM, Inc.* | | | 44,900 | | | | 582,802 | |
| | |
Radius Health, Inc.*,1 | | | 11,422 | | | | 230,268 | |
| | |
Reata Pharmaceuticals, Inc., Class A* | | | 917 | | | | 187,462 | |
| | |
| | | | | | | | |
| | | | | | | | |
| | | Shares | | | Value | |
| | |
Recro Pharma, Inc.* | | | 9,871 | | | | $180,935 | |
| | |
REGENXBIO, Inc.*,1 | | | 1,100 | | | | 45,067 | |
| | |
Repligen Corp.*,1 | | | 53,667 | | | | 4,964,197 | |
| | |
Rocket Pharmaceuticals, Inc.* | | | 14,607 | | | | 332,455 | |
| | |
Sarepta Therapeutics, Inc.*,1 | | | 3,071 | | | | 396,282 | |
| | |
Select Medical Holdings Corp.* | | | 24,180 | | | | 564,361 | |
| | |
Simulations Plus, Inc. | | | 292 | | | | 8,488 | |
| | |
Supernus Pharmaceuticals, Inc.* | | | 6,568 | | | | 155,793 | |
| | |
Syneos Health, Inc.* | | | 7,800 | | | | 463,905 | |
| | |
Tabula Rasa HealthCare, Inc.*,1 | | | 34,631 | | | | 1,685,837 | |
| | |
Tactile Systems Technology, Inc.*,1 | | | 600 | | | | 40,506 | |
| | |
Tandem Diabetes Care, Inc.*,1 | | | 4,673 | | | | 278,558 | |
| | |
Teladoc Health, Inc.*,1 | | | 11,784 | | | | 986,556 | |
| | |
Tenet Healthcare Corp.*,1 | | | 11,681 | | | | 444,228 | |
| | |
Turning Point Therapeutics, Inc.*,1 | | | 7,447 | | | | 463,874 | |
| | |
Ultragenyx Pharmaceutical, Inc.*,1 | | | 1,900 | | | | 81,149 | |
| | |
uniQure, N.V. (Netherlands)* | | | 6,391 | | | | 457,979 | |
| | |
US Physical Therapy, Inc.1 | | | 330 | | | | 37,736 | |
| | |
Vanda Pharmaceuticals, Inc.* | | | 4,886 | | | | 80,179 | |
| | |
Voyager Therapeutics, Inc.* | | | 25,464 | | | | 355,223 | |
| | |
Xencor, Inc.* | | | 1,700 | | | | 58,463 | |
| | |
Total Health Care | | | | | | | 60,822,873 | |
| | |
Industrials - 14.0% | | | | | | | | |
| | |
Aerojet Rocketdyne Holdings, Inc.*,1 | | | 7,081 | | | | 323,318 | |
| | |
AeroVironment, Inc.*,1 | | | 5,589 | | | | 345,065 | |
| | |
Albany International Corp., Class A | | | 366 | | | | 27,787 | |
| | |
Allegiant Travel Co. | | | 1,312 | | | | 228,340 | |
| | |
Astronics Corp.* | | | 1,158 | | | | 32,366 | |
| | |
Atkore International Group,Inc.* | | | 31,055 | | | | 1,256,485 | |
| | |
Axon Enterprise, Inc.* | | | 33,038 | | | | 2,421,025 | |
| | |
Barrett Business Services, Inc. | | | 5,800 | | | | 524,668 | |
| | |
BMC Stock Holdings, Inc.* | | | 18,100 | | | | 519,289 | |
| | |
Builders FirstSource, Inc.* | | | 35,450 | | | | 900,785 | |
| | |
Casella Waste Systems, Inc., Class A* | | | 6,249 | | | | 287,641 | |
| | |
Cimpress PLC (Ireland)*,1 | | | 4,567 | | | | 574,392 | |
| | |
Columbus McKinnon Corp. | | | 2,195 | | | | 87,866 | |
| | |
Covanta Holding Corp. | | | 1,117 | | | | 16,576 | |
| | |
CSW Industrials, Inc. | | | 1,224 | | | | 94,248 | |
| | |
Cubic Corp. | | | 8,289 | | | | 526,932 | |
| | |
Curtiss-Wright Corp. | | | 2,000 | | | | 281,780 | |
| | |
Deluxe Corp. | | | 14,134 | | | | 705,569 | |
| | |
EMCOR Group,Inc. | | | 11,096 | | | | 957,585 | |
| | |
Exponent, Inc. | | | 12,358 | | | | 852,826 | |
| | |
| | | | | | | | |
The accompanying notes are an integral part of these financial statements.
31
| | |
| | AMG Managers Special Equity Fund Schedule of Portfolio Investments(continued) |
| | | | | | | | |
| | | Shares | | Value | |
| | |
Industrials - 14.0%(continued) | | | | | | | | |
| | |
Federal Signal Corp. | | | 28,788 | | | | $928,413 | |
| | |
Foundation Building Materials, Inc.* | | | 25,200 | | | | 487,620 | |
| | |
FTI Consulting, Inc.* | | | 1,200 | | | | 132,792 | |
| | |
Generac Holdings, Inc.* | | | 21,159 | | | | 2,128,384 | |
| | |
GMS, Inc.* | | | 26,036 | | | | 705,055 | |
| | |
Great Lakes Dredge & Dock Corp.* | | | 13,214 | | | | 149,715 | |
| | |
Herman Miller, Inc. | | | 21,531 | | | | 896,766 | |
| | |
John Bean Technologies Corp.1 | | | 174 | | | | 19,603 | |
| | |
Knoll, Inc. | | | 18,221 | | | | 460,262 | |
| | |
Kratos Defense & Security Solutions, Inc.*,1 | | | 109,135 | | | | 1,965,521 | |
| | |
Marten Transport, Ltd. | | | 43,753 | | | | 940,252 | |
| | |
MasTec, Inc.*,1 | | | 22,562 | | | | 1,447,578 | |
| | |
Mercury Systems, Inc.* | | | 18,992 | | | | 1,312,537 | |
| | |
MSA Safety, Inc.1 | | | 446 | | | | 56,357 | |
| | |
Quanta Services, Inc. | | | 6,488 | | | | 264,126 | |
| | |
RBC Bearings, Inc.* | | | 1,548 | | | | 245,110 | |
| | |
Rush Enterprises, Inc., Class A | | | 7,832 | | | | 364,188 | |
| | |
Saia, Inc.* | | | 15,079 | | | | 1,404,156 | |
| | |
SiteOne Landscape Supply, Inc.*,1 | | | 20,060 | | | | 1,818,439 | |
| | |
Spartan Motors, Inc. | | | 5,338 | | | | 96,511 | |
| | |
SPX Corp.* | | | 278 | | | | 14,145 | |
| | |
Tetra Tech, Inc. | | | 12,884 | | | | 1,110,085 | |
| | |
Trex Co., Inc.*,1 | | | 6,843 | | | | 615,049 | |
| | |
Universal Forest Products, Inc. | | | 10,300 | | | | 491,310 | |
| | |
Upwork, Inc.* | | | 4,277 | | | | 45,636 | |
| | |
Wabash National Corp.1 | | | 15,900 | | | | 233,571 | |
| | |
Total Industrials | | | | | | | 29,297,724 | |
| | |
Information Technology - 26.1% | | | | | | | | |
| | |
ACI Worldwide, Inc.* | | | 4,317 | | | | 163,550 | |
| | |
Alteryx, Inc., Class A*,1 | | | 6,288 | | | | 629,240 | |
| | |
Ambarella, Inc.* | | | 5,766 | | | | 349,189 | |
| | |
Anaplan, Inc.* | | | 12,509 | | | | 655,472 | |
| | |
Appfolio, Inc., Class A*,1 | | | 9,073 | | | | 997,576 | |
| | |
Appian Corp.*,1 | | | 11,738 | | | | 448,509 | |
| | |
Avalara, Inc.* | | | 10,122 | | | | 741,437 | |
| | |
Blackbaud, Inc. | | | 552 | | | | 43,939 | |
| | |
Box, Inc., Class A* | | | 60,763 | | | | 1,019,603 | |
| | |
Cabot Microelectronics Corp. | | | 5,968 | | | | 861,302 | |
| | |
Cardtronics PLC, Class A (United Kingdom)*,1 | | | 24,351 | | | | 1,087,272 | |
| | |
Cirrus Logic, Inc.* | | | 7,553 | | | | 622,443 | |
| | |
CommVault Systems, Inc.* | | | 7,931 | | | | 354,040 | |
| | |
Comtech Telecommunications Corp. | | | 12,114 | | | | 429,926 | |
| | |
| | | | | | | | |
| | | | | | | | |
| | | Shares | | | Value | |
| | |
Cornerstone OnDemand, Inc.* | | | 15,635 | | | | $915,429 | |
| | |
Coupa Software, Inc.*,1 | | | 4,632 | | | | 677,430 | |
| | |
CSG Systems International, Inc. | | | 1,008 | | | | 52,194 | |
| | |
Diebold Nixdorf, Inc.*,1 | | | 1,277 | | | | 13,485 | |
| | |
Digital Turbine, Inc.* | | | 5,524 | | | | 39,386 | |
| | |
Diodes, Inc.*,1 | | | 9,028 | | | | 508,908 | |
| | |
Endava PLC, ADR (United Kingdom)* | | | 25,926 | | | | 1,208,152 | |
| | |
Everbridge, Inc.* | | | 3,356 | | | | 262,036 | |
| | |
EVERTEC, Inc. (Puerto Rico) | | | 30,218 | | | | 1,028,621 | |
| | |
Evo Payments, Inc., Class A* | | | 85,643 | | | | 2,261,832 | |
| | |
ExlService Holdings, Inc.* | | | 406 | | | | 28,201 | |
| | |
Five9, Inc.* | | | 16,920 | | | | 1,109,614 | |
| | |
Globant SA (Argentina)* | | | 5,578 | | | | 591,547 | |
| | |
GTT Communications, Inc.*,1 | | | 5,353 | | | | 60,757 | |
| | |
HubSpot, Inc.* | | | 1,814 | | | | 287,519 | |
| | |
I3 Verticals, Inc., Class A* | | | 40,580 | | | | 1,146,385 | |
| | |
Inphi Corp.* | | | 23,757 | | | | 1,758,493 | |
| | |
Insight Enterprises, Inc.* | | | 10,693 | | | | 751,611 | |
| | |
Intelligent Systems Corp.* | | | 733 | | | | 29,276 | |
| | |
Itron,Inc.* | | | 5,015 | | | | 421,009 | |
| | |
j2 Global, Inc.1 | | | 12,895 | | | | 1,208,390 | |
| | |
Lattice Semiconductor Corp.* | | | 8,153 | | | | 156,048 | |
| | |
LivePerson, Inc.*,1 | | | 9,605 | | | | 355,385 | |
| | |
Lumentum Holdings, Inc.*,1 | | | 5,382 | | | | 426,793 | |
| | |
MAXIMUS, Inc. | | | 38,520 | | | | 2,865,503 | |
| | |
Medallia, Inc.*,1 | | | 12,927 | | | | 402,159 | |
| | |
Mimecast, Ltd.* | | | 39,639 | | | | 1,719,540 | |
| | |
MKS Instruments, Inc. | | | 6,921 | | | | 761,379 | |
| | |
Model N, Inc.* | | | 17,367 | | | | 609,061 | |
| | |
Monolithic Power Systems, Inc. | | | 4,751 | | | | 845,773 | |
| | |
NIC, Inc. | | | 22,315 | | | | 498,740 | |
| | |
nLight, Inc.*,1 | | | 39,044 | | | | 791,812 | |
| | |
Novanta, Inc.* | | | 3,614 | | | | 319,622 | |
| | |
OSI Systems, Inc.* | | | 10,311 | | | | 1,038,730 | |
| | |
Paylocity Holding Corp.* | | | 8,785 | | | | 1,061,404 | |
| | |
Pegasystems, Inc.1 | | | 42,109 | | | | 3,353,982 | |
| | |
Perficient, Inc.* | | | 19,702 | | | | 907,671 | |
| | |
Power Integrations, Inc. | | | 2,563 | | | | 253,506 | |
| | |
Progress Software Corp. | | | 11,793 | | | | 489,999 | |
| | |
Q2 Holdings, Inc.*,1 | | | 5,223 | | | | 423,481 | |
| | |
Qualys, Inc.*,1 | | | 34,273 | | | | 2,857,340 | |
| | |
Sanmina Corp.* | | | 4,200 | | | | 143,808 | |
| | |
Semtech Corp.* | | | 8,319 | | | | 440,075 | |
| | |
| | | | | | | | |
The accompanying notes are an integral part of these financial statements.
32
| | |
| | AMG Managers Special Equity Fund Schedule of Portfolio Investments(continued) |
| | | | | | | | |
| | |
Shares | | | Value | |
| | |
Information Technology - 26.1%(continued) | | | | | | | | |
| | |
ShotSpotter, Inc.* | | | 4,489 | | | | $114,470 | |
| | |
Silicon Laboratories, Inc.* | | | 18,651 | | | | 2,163,143 | |
| | |
SolarEdge Technologies, Inc.
(Israel)*,1 | | | 5,936 | | | | 564,454 | |
| | |
SPS Commerce, Inc.* | | | 17,034 | | | | 944,024 | |
| | |
SVMK, Inc.* | | | 36,379 | | | | 650,093 | |
| | |
Verra Mobility Corp.*,1 | | | 54,010 | | | | 755,600 | |
| | |
Wix.com, Ltd. (Israel)* | | | 2,296 | | | | 280,984 | |
| | |
WNS Holdings, Ltd., ADR (India)* | | | 58,089 | | | | 3,842,587 | |
| | |
Workiva, Inc.* | | | 46,253 | | | | 1,944,939 | |
| | |
Total Information Technology | | | | | | | 54,745,878 | |
| | |
Materials - 1.2% | | | | | | | | |
| | |
Boise Cascade Co. | | | 2,050 | | | | 74,886 | |
| | |
Compass Minerals International, Inc.1 | | | 3,104 | | | | 189,220 | |
| | |
Forterra, Inc.* | | | 8,650 | | | | 99,994 | |
| | |
HB Fuller Co.1 | | | 4,448 | | | | 229,383 | |
| | |
Kaiser Aluminum Corp. | | | 1,239 | | | | 137,393 | |
| | |
Koppers Holdings, Inc.* | | | 335 | | | | 12,804 | |
| | |
Materion Corp. | | | 4,600 | | | | 273,470 | |
| | |
Quaker Chemical Corp.1 | | | 6,835 | | | | 1,124,494 | |
| | |
Ryerson Holding Corp.* | | | 472 | | | | 5,584 | |
| | |
Trinseo, S.A. | | | 11,519 | | | | 428,622 | |
| | |
Total Materials | | | | | | | 2,575,850 | |
| | |
Real Estate - 1.9% | | | | | | | | |
| | |
American Assets Trust, Inc., REIT | | | 5,488 | | | | 251,899 | |
| | |
EastGroup Properties, Inc., REIT | | | 7,006 | | | | 929,486 | |
| | |
National Health Investors, Inc., REIT | | | 2,518 | | | | 205,167 | |
| | |
National Storage Affiliates Trust, REIT | | | 2,287 | | | | 76,889 | |
| | |
Newmark Group, Inc., Class A | | | 60,109 | | | | 808,767 | |
| | |
NexPoint Residential Trust, Inc., REIT | | | 2,787 | | | | 125,415 | |
| | |
QTS Realty Trust, Inc., Class A,
REIT1 | | | 14,289 | | | | 775,464 | |
| | |
Redfin Corp.*,1 | | | 20,266 | | | | 428,423 | |
| | |
The RMR Group, Inc., Class A | | | 9,000 | | | | 410,760 | |
| | |
Total Real Estate | | | | | | | 4,012,270 | |
| | |
Utilities - 0.1% | | | | | | | | |
| | |
TerraForm Power, Inc., Class A | | | 15,938 | | | | 245,286 | |
| | |
Total Common Stocks
(Cost $178,296,326) | | | | | | | 205,807,346 | |
| | |
| | | | | | | | |
| | | | | | | | |
| | | Principal
Amount | | | Value | |
Short-Term Investments - 6.5% | | | | | | | | |
| | |
Joint Repurchase Agreements - 4.3%4 | | | | | | | | |
| | |
Cantor Fitzgerald Securities, Inc., dated 12/31/19, due 01/02/20, 1.580% total to be received $2,112,391 (collateralized by various U.S. Government Agency Obligations and U.S. Treasuries, 0.000% - 8.500%, 01/25/20 - 10/15/60, totaling $2,154,450) | | | $2,112,206 | | | | $2,112,206 | |
| | |
Citadel Securities LLC, dated 12/31/19, due 01/02/20, 1.600% total to be received $2,095,802 (collateralized by various U.S. Treasuries, 0.000% - 8.500%, 01/15/20 - 11/15/48, totaling $2,137,718) | | | 2,095,616 | | | | 2,095,616 | |
| | |
Citigroup Global Markets, Inc., dated 12/31/19, due 01/02/20, 1.570% total to be received $2,112,390 (collateralized by various U.S. Government Agency Obligations and U.S. Treasuries, 0.000% - 9.000%, 02/13/20 - 09/20/69, totaling $2,154,450) | | | 2,112,206 | | | | 2,112,206 | |
| | |
Jefferies LLC, dated 12/31/19, due 01/02/20, 1.580% total to be received $460,932 (collateralized by various U.S. Treasuries, 0.000% - 2.875%, 01/28/20 - 05/15/27, totaling $470,110) | | | 460,892 | | | | 460,892 | |
| | |
RBC Dominion Securities, Inc., dated 12/31/19, due 01/02/20, 1.570% total to be received $2,112,390 (collateralized by various U.S. Government Agency Obligations and U.S. Treasuries, 0.000% - 6.500%, 06/30/21 - 12/01/49, totaling $2,154,450) | | | 2,112,206 | | | | 2,112,206 | |
| | |
Total Joint Repurchase Agreements | | | | | | | 8,893,126 | |
| | |
| | | Shares | | | | |
Other InvestmentCompanies - 2.2% | | | | | | | | |
| | |
Dreyfus Government Cash Management Fund,
Institutional Shares, 1.51%5 | | | 4,680,855 | | | | 4,680,855 | |
| | |
Total Short-Term Investments
(Cost $13,573,981) | | | | | | | 13,573,981 | |
| | |
Total Investments - 104.5%
(Cost $191,870,307) | | | | | | | 219,381,327 | |
| | |
Other Assets, less Liabilities - (4.5)% | | | | | | | (9,487,185 | ) |
| | |
Net Assets - 100.0% | | | | | | | $209,894,142 | |
| | |
| | | | | | | | |
| * | Non-income producing security. |
| 1 | Some of these securities, amounting to $56,021,838 or 26.7% of net assets, were out on loan to various borrowers and are collateralized by cash and various U.S. Treasury Obligations. See Note 4 of Notes to Financial Statements. |
| 3 | Security’s value was determined by using significant unobservable inputs. |
| 4 | Cash collateral received for securities lending activity was invested in these joint repurchase agreements. |
The accompanying notes are an integral part of these financial statements.
33
| | |
| | AMG Managers Special Equity Fund Schedule of Portfolio Investments(continued) |
| 5 | Yield shown represents the December 31, 2019, seven day average yield, which refers to the sum of the previous seven days’ dividends paid, expressed as an annual percentage. |
| ADR | American Depositary Receipt |
| REIT | Real Estate Investment Trust |
The following table summarizes the inputs used to value the Fund’s investments by the fair value hierarchy levels as of December 31, 2019:
| | | | | | | | | | | | | | | | |
| | | Level 1 | | | Level 2 | | | Level 3 | | | Total | |
Investments in Securities | | | | | | | | | | | | | | | | |
| | | | |
Common Stocks | | | | | | | | | | | | | | | | |
| | | | |
Health Care | | | $60,822,873 | | | | — | | | | $0 | | | | $60,822,873 | |
| | | | |
Information Technology | | | 54,745,878 | | | | — | | | | — | | | | 54,745,878 | |
| | | | |
Industrials | | | 29,297,724 | | | | — | | | | — | | | | 29,297,724 | |
| | | | |
Consumer Discretionary | | | 26,971,863 | | | | — | | | | — | | | | 26,971,863 | |
| | | | |
Financials | | | 13,102,751 | | | | — | | | | — | | | | 13,102,751 | |
| | | | |
Consumer Staples | | | 9,433,791 | | | | — | | | | — | | | | 9,433,791 | |
| | | | |
Real Estate | | | 4,012,270 | | | | — | | | | — | | | | 4,012,270 | |
| | | | |
Communication Services | | | 2,954,699 | | | | — | | | | — | | | | 2,954,699 | |
| | | | |
Materials | | | 2,575,850 | | | | — | | | | — | | | | 2,575,850 | |
| | | | |
Energy | | | 1,644,361 | | | | — | | | | — | | | | 1,644,361 | |
| | | | |
Utilities | | | 245,286 | | | | — | | | | — | | | | 245,286 | |
| | | | |
Short-Term Investments | | | | | | | | | | | | | | | | |
| | | | |
Joint Repurchase Agreements | | | — | | | | $8,893,126 | | | | — | | | | 8,893,126 | |
| | | | |
Other Investment Companies | | | 4,680,855 | | | | — | | | | — | | | | 4,680,855 | |
| | | | | | | | | | | | | | | | |
Total Investments in Securities | | | $210,488,201 | | | | $8,893,126 | | | | $0 | | | | $219,381,327 | |
| | | | | | | | | | | | | | | | |
At December 31, 2019, the Level 3 common stock was received as a result of a corporate action. The security’s value was determined by using significant unobservable inputs.
For the fiscal year ended December 31, 2019, there were no transfers in or out of Level 3.
The accompanying notes are an integral part of these financial statements.
34
|
Statement of Assets and Liabilities December 31, 2019 |
| | | | | | | | | | | | |
| | | AMG Managers
Loomis
Sayles
Bond Fund | | | AMG Managers
Global Income
Opportunity Fund | | | AMG Managers
Special
Equity Fund | |
Assets: | | | | | | | | | | | | |
| | | |
Investments at value1 (including securities on loan valued at $180,616,082, $121,669, and $56,021,838, respectively) | | | $1,232,935,721 | | | | $9,608,115 | | | | $219,381,327 | |
| | | |
Cash | | | — | | | | — | | | | 704 | |
| | | |
Foreign currency2 | | | — | | | | 85,987 | | | | — | |
| | | |
Receivable for investments sold | | | — | | | | — | | | | 443,396 | |
| | | |
Dividend, interest and other receivables | | | 10,078,056 | | | | 109,283 | | | | 86,193 | |
| | | |
Receivable for Fund shares sold | | | 492,985 | | | | 4,122 | | | | 75,690 | |
| | | |
Receivable from affiliate | | | — | | | | 8,672 | | | | 16,773 | |
| | | |
Unrealized appreciation on foreign currency contracts | | | — | | | | 24,874 | | | | — | |
| | | |
Prepaid expenses and other assets | | | 44,238 | | | | 10,601 | | | | 15,686 | |
| | | |
Total assets | | | 1,243,551,000 | | | | 9,851,654 | | | | 220,019,769 | |
| | | |
Liabilities: | | | | | | | | | | | | |
| | | |
Payable upon return of securities loaned | | | 16,987,829 | | | | 126,373 | | | | 8,893,126 | |
| | | |
Payable for investments purchased | | | — | | | | — | | | | 381,016 | |
| | | |
Payable for Fund shares repurchased | | | 1,899,239 | | | | 13 | | | | 567,011 | |
| | | |
Payable for variation margin | | | — | | | | 438 | | | | — | |
| | | |
Unrealized depreciation on foreign currency contracts | | | — | | | | 35,427 | | | | — | |
| | | |
Accrued expenses: | | | | | | | | | | | | |
| | | |
Investment advisory and management fees | | | 332,795 | | | | 4,463 | | | | 162,666 | |
| | | |
Administrative fees | | | 155,225 | | | | 1,217 | | | | 27,111 | |
| | | |
Shareholder service fees | | | 146,263 | | | | — | | | | 37,014 | |
| | | |
Other | | | 296,387 | | | | 45,882 | | | | 57,683 | |
| | | |
Total liabilities | | | 19,817,738 | | | | 213,813 | | | | 10,125,627 | |
| | | | | | | | | | | | |
| | | |
Net Assets | | | $1,223,733,262 | | | | $9,637,841 | | | | $209,894,142 | |
| | | |
1Investments at cost | | | $1,151,608,376 | | | | $9,435,719 | | | | $191,870,307 | |
| | | |
2Foreign currency at cost | | | — | | | | $85,146 | | | | — | |
The accompanying notes are an integral part of these financial statements.
35
| | |
| | Statement of Assets and Liabilities(continued) |
| | | | | | | | | | | | |
| | | AMG Managers
Loomis
Sayles
Bond Fund | | AMG Managers
Global Income
Opportunity Fund | | AMG Managers
Special
Equity Fund |
Net Assets Represent: | | | | | | | | | | | | |
| | | |
Paid-in capital | | | $1,142,864,565 | | | | $9,913,454 | | | | $184,595,709 | |
| | | |
Total distributable earnings (loss) | | | 80,868,697 | | | | (275,613 | ) | | | 25,298,433 | |
| | | |
Net Assets | | | $1,223,733,262 | | | | $9,637,841 | | | | $209,894,142 | |
| | | |
Class N: | | | | | | | | | | | | |
| | | |
Net Assets | | | $618,380,550 | | | | $9,637,841 | | | | $171,801,429 | |
| | | |
Shares outstanding | | | 22,785,339 | | | | 447,868 | | | | 1,545,620 | |
| | | |
Net asset value, offering and redemption price per share | | | $27.14 | | | | $21.52 | | | | $111.15 | |
| | | |
Class I: | | | | | | | | | | | | |
| | | |
Net Assets | | | $605,352,712 | | | | — | | | | $38,092,713 | |
| | | |
Shares outstanding | | | 22,302,313 | | | | — | | | | 328,171 | |
| | | |
Net asset value, offering and redemption price per share | | | $27.14 | | | | — | | | | $116.08 | |
The accompanying notes are an integral part of these financial statements.
36
| | |
| | Statement of Operations For the fiscal year ended December 31, 2019 |
| | | | | | | | | | | | |
| | | AMG Managers
Loomis
Sayles
Bond Fund | | | AMG Managers
Global Income
Opportunity Fund | | | AMG Managers
Special
Equity Fund | |
| | | |
Investment Income: | | | | | | | | | | | | |
| | | |
Dividend income | | | $2,390,335 | | | | $3,136 | | | | $1,037,354 | |
| | | |
Interest income | | | 54,815,795 | | | | 344,318 | | | | — | |
| | | |
Securities lending income | | | 318,410 | | | | 394 | | | | 245,171 | |
| | | |
Foreign withholding tax | | | — | | | | (489 | ) | | | — | |
| | | |
Total investment income | | | 57,524,540 | | | | 347,359 | | | | 1,282,525 | |
| | | |
Expenses: | | | | | | | | | | | | |
| | | |
Investment advisory and management fees | | | 3,525,064 | | | | 53,228 | | | | 1,943,140 | |
| | | |
Administrative fees | | | 2,033,691 | | | | 14,517 | | | | 323,857 | |
| | | |
Shareholder servicing fees - Class N | | | 1,728,652 | | | | — | | | | 445,024 | |
| | | |
Shareholder servicing fees - Class I | | | 332,167 | | | | — | | | | — | |
| | | |
Professional fees | | | 167,145 | | | | 44,011 | | | | 43,726 | |
| | | |
Trustee fees and expenses | | | 130,624 | | | | 880 | | | | 20,071 | |
| | | |
Custodian fees | | | 125,328 | | | | 38,846 | | | | 84,699 | |
| | | |
Reports to shareholders | | | 121,254 | | | | 3,115 | | | | 19,422 | |
| | | |
Registration fees | | | 72,125 | | | | 23,823 | | | | 49,615 | |
| | | |
Transfer agent fees | | | 67,590 | | | | 1,034 | | | | 23,754 | |
| | | |
Miscellaneous | | | 159,565 | | | | 1,169 | | | | 11,803 | |
| | | |
Total expenses before offsets | | | 8,463,205 | | | | 180,623 | | | | 2,965,111 | |
| | | |
Expense reimbursements | | | (67,260 | ) | | | (94,471 | ) | | | (121,521 | ) |
| | | |
Expense reductions | | | — | | | | — | | | | (6,439 | ) |
| | | |
Net expenses | | | 8,395,945 | | | | 86,152 | | | | 2,837,151 | |
| | | | | | | | | | | | |
| | | |
Net investment income (loss) | | | 49,128,595 | | | | 261,207 | | | | (1,554,626 | ) |
| | | |
Net Realized and Unrealized Gain: | | | | | | | | | | | | |
| | | |
Net realized gain on investments | | | 27,980,046 | | | | 21,179 | | | | 12,387,467 | |
| | | |
Net realized loss on forward contracts | | | — | | | | (74,094 | ) | | | — | |
| | | |
Net realized gain on futures contracts | | | — | | | | 21,788 | | | | — | |
| | | |
Net realized loss on foreign currency transactions | | | (16,639,565 | ) | | | (321,693 | ) | | | — | |
| | | |
Net change in unrealized appreciation/depreciation on investments | | | 88,161,073 | | | | 889,175 | | | | 37,417,823 | |
| | | |
Net change in unrealized appreciation/depreciation on forward contracts | | | — | | | | (77,587 | ) | | | — | |
| | | |
Net change in unrealized appreciation/depreciation on futures contracts | | | — | | | | (4,541 | ) | | | — | |
| | | |
Net change in unrealized appreciation/depreciation on foreign currency translations | | | 2,640 | | | | 2,459 | | | | — | |
| | | |
Net realized and unrealized gain | | | 99,504,194 | | | | 456,686 | | | | 49,805,290 | |
| | | | | | | | | | | | |
| | | |
Net increase in net assets resulting from operations | | | $148,632,789 | | | | $717,893 | | | | $48,250,664 | |
The accompanying notes are an integral part of these financial statements.
37
|
Statements of Changes in Net Assets For the fiscal years ended December 31, |
| | | | | | | | | | | | | | | | | | | | | | | | |
| | | AMG Managers Loomis
Sayles Bond Fund | | | AMG Managers Global Income
Opportunity Fund | | AMG Managers
Special Equity Fund | |
| | | | | | |
| | | 2019 | | | 2018 | | | 2019 | | 2018 | | 2019 | | | 2018 | |
| | | | | | |
Increase (Decrease) in Net Assets Resulting From Operations: | | | | | | | | | | | | | | | | | | | | | | | | |
| | | | | | |
Net investment income (loss) | | | $49,128,595 | | | | $62,742,254 | | | | $261,207 | | | | $428,790 | | | | $(1,554,626) | | | | $(1,475,110) | |
| | | | | | |
Net realized gain (loss) on investments | | | 11,340,481 | | | | 2,920,546 | | | | (352,820 | ) | | | (367,723 | ) | | | 12,387,467 | | | | 37,113,545 | |
| | | | | | |
Net change in unrealized appreciation/depreciation on investments | | | 88,163,713 | | | | (100,845,545 | ) | | | 809,506 | | | | (628,907 | ) | | | 37,417,823 | | | | (49,499,109 | ) |
| | | | | | |
Net increase (decrease) in net assets resulting from operations | | | 148,632,789 | | | | (35,182,745 | ) | | | 717,893 | | | | (567,840 | ) | | | 48,250,664 | | | | (13,860,674 | ) |
| | | | | | |
Distributions to Shareholders: | | | | | | | | | | | | | | | | | | | | | | | | |
| | | | | | |
Class N | | | (28,980,193 | ) | | | (29,374,441 | ) | | | (29,806 | ) | | | (76,366 | ) | | | (40,634,625 | ) | | | — | |
| | | | | | |
Class I | | | (27,807,755 | ) | | | (44,150,295 | ) | | | — | | | | — | | | | (8,707,900 | ) | | | — | |
| | | | | | |
Total distributions to shareholders | | | (56,787,948 | ) | | | (73,524,736 | ) | | | (29,806 | ) | | | (76,366 | ) | | | (49,342,525 | ) | | | — | |
| | | | | | |
Capital Share Transactions:1 | | | | | | | | | | | | | | | | | | | | | | | | |
| | | | | | |
Net increase (decrease) from capital share transactions | | | (678,399,950 | ) | | | (79,839,855 | ) | | | (1,415,728 | ) | | | (3,064,783 | ) | | | 8,988,862 | | | | 15,385,576 | |
| | | | | | |
| | | | | | | | | | | | | | | | | | | | | | | | |
| | | | | | |
Total increase (decrease) in net assets | | | (586,555,109 | ) | | | (188,547,336 | ) | | | (727,641 | ) | | | (3,708,989 | ) | | | 7,897,001 | | | | 1,524,902 | |
| | | | | | |
Net Assets: | | | | | | | | | | | | | | | | | | | | | | | | |
| | | | | | |
Beginning of year | | | 1,810,288,371 | | | | 1,998,835,707 | | | | 10,365,482 | | | | 14,074,471 | | | | 201,997,141 | | | | 200,472,239 | |
| | | | | | |
End of year | | | $1,223,733,262 | | | | $1,810,288,371 | | | | $9,637,841 | | | | $10,365,482 | | | | $209,894,142 | | | | $201,997,141 | |
| 1 | See Note 1(g) of the Notes to Financial Statements. |
The accompanying notes are an integral part of these financial statements.
38
| | |
| | AMG Managers Loomis Sayles Bond Fund Financial Highlights For a share outstanding throughout each fiscal year |
| | | | | | | | | | | | | | | | | | | | |
| | | For the fiscal years ended December 31, | |
| | | | | |
Class N | | | 2019 | | | | 2018 | | | | 20171 | | | | 20162 | | | | 2015 | |
| | | | | |
Net Asset Value, Beginning of Year | | | $25.49 | | | | $26.97 | | | | $26.24 | | | | $26.19 | | | | $27.88 | |
| | | | | |
Income (loss) from Investment Operations: | | | | | | | | | | | | | | | | | | | | |
| | | | | |
Net investment income3,4 | | | 0.94 | | | | 0.84 | | | | 0.91 | | | | 0.95 | | | | 0.74 | |
| | | | | |
Net realized and unrealized gain (loss) on investments | | | 1.85 | | | | (1.33 | ) | | | 0.85 | | | | 0.40 | | | | (1.34 | ) |
| | | | | |
Total income (loss) from investment operations | | | 2.79 | | | | (0.49 | ) | | | 1.76 | | | | 1.35 | | | | (0.60 | ) |
| | | | | |
Less Distributions to Shareholders from: | | | | | | | | | | | | | | | | | | | | |
| | | | | |
Net investment income | | | (0.98 | ) | | | (0.80 | ) | | | (0.87 | ) | | | (0.96 | ) | | | (0.71 | ) |
| | | | | |
Net realized gain on investments | | | (0.16 | ) | | | (0.19 | ) | | | (0.16 | ) | | | (0.34 | ) | | | (0.38 | ) |
| | | | | |
Total distributions to shareholders | | | (1.14 | ) | | | (0.99 | ) | | | (1.03 | ) | | | (1.30 | ) | | | (1.09 | ) |
| | | | | |
Net Asset Value, End of Year | | | $27.14 | | | | $25.49 | | | | $26.97 | | | | $26.24 | | | | $26.19 | |
| | | | | |
Total Return4 | | | 11.10 | %5 | | | (1.82 | )%5 | | | 6.77 | %5 | | | 5.19 | % | | | (2.19 | )% |
| | | | | |
Ratio of net expenses to average net assets | | | 0.72 | %6 | | | 0.98 | % | | | 0.99 | % | | | 1.00 | % | | | 0.99 | % |
| | | | | |
Ratio of gross expenses to average net assets7 | | | 0.73 | %6 | | | 0.98 | %8 | | | 0.99 | %8 | | | 1.02 | % | | | 1.02 | % |
| | | | | |
Ratio of net investment income to average net assets4 | | | 3.53 | % | | | 3.19 | % | | | 3.38 | % | | | 3.52 | % | | | 2.69 | % |
| | | | | |
Portfolio turnover | | | 20 | % | | | 9 | % | | | 4 | % | | | 27 | % | | | 10 | % |
| | | | | |
Net assets end of year (000’s) omitted | | | $618,381 | | | | $715,468 | | | | $971,359 | | | | $1,234,229 | | | | $1,575,246 | |
| | |
39
| | |
| | AMG Managers Loomis Sayles Bond Fund Financial Highlights For a share outstanding throughout each fiscal year |
| | | | | | | | | | | | | | | | | | | | |
| | | For the fiscal years ended December 31, | |
| | | | | |
Class I | | | 2019 | | | | 2018 | | | | 2017 | | | | 20162 | | | | 2015 | |
| | | | | |
Net Asset Value, Beginning of Year | | | $25.49 | | | | $26.97 | | | | $26.24 | | | | $26.19 | | | | $27.87 | |
| | | | | |
Income (loss) from Investment Operations: | | | | | | | | | | | | | | | | | | | | |
| | | | | |
Net investment income3,4 | | | 0.99 | | | | 0.86 | | | | 0.94 | | | | 0.97 | | | | 0.77 | |
| | | | | |
Net realized and unrealized gain (loss) on investments | | | 1.85 | | | | (1.32 | ) | | | 0.85 | | | | 0.40 | | | | (1.33 | ) |
| | | | | |
Total income (loss) from investment operations | | | 2.84 | | | | (0.46 | ) | | | 1.79 | | | | 1.37 | | | | (0.56 | ) |
| | | | | |
Less Distributions to Shareholders from: | | | | | | | | | | | | | | | | | | | | |
| | | | | |
Net investment income | | | (1.03 | ) | | | (0.83 | ) | | | (0.90 | ) | | | (0.98 | ) | | | (0.74 | ) |
| | | | | |
Net realized gain on investments | | | (0.16 | ) | | | (0.19 | ) | | | (0.16 | ) | | | (0.34 | ) | | | (0.38 | ) |
| | | | | |
Total distributions to shareholders | | | (1.19 | ) | | | (1.02 | ) | | | (1.06 | ) | | | (1.32 | ) | | | (1.12 | ) |
| | | | | |
Net Asset Value, End of Year | | | $27.14 | | | | $25.49 | | | | $26.97 | | | | $26.24 | | | | $26.19 | |
| | | | | |
Total Return4,5 | | | 11.32 | % | | | (1.72 | )% | | | 6.87 | % | | | 5.29 | % | | | (2.05 | )% |
| | | | | |
Ratio of net expenses to average net assets | | | 0.52 | %6 | | | 0.88 | % | | | 0.89 | % | | | 0.90 | % | | | 0.89 | % |
| | | | | |
Ratio of gross expenses to average net assets7 | | | 0.53 | %6 | | | 0.88 | %8 | | | 0.89 | %8 | | | 0.93 | % | | | 0.92 | % |
| | | | | |
Ratio of net investment income to average net assets4 | | | 3.73 | % | | | 3.29 | % | | | 3.48 | % | | | 3.61 | % | | | 2.79 | % |
| | | | | |
Portfolio turnover | | | 20 | % | | | 9 | % | | | 4 | % | | | 27 | % | | | 10 | % |
| | | | | |
Net assets end of year (000’s) omitted | | | $605,353 | | | | $1,094,820 | | | | $1,027,477 | | | | $771,782 | | | | $897,526 | |
| | |
| 1 | Effective February 27, 2017, Class S shares were renamed Class N shares. |
| 2 | Effective October 1, 2016, the Service Class and Institutional Class were renamed Class S and Class I, respectively. |
| 3 | Per share numbers have been calculated using average shares. |
| 4 | Total returns and net investment income would have been lower had certain expenses not been offset. |
| 5 | The total return is calculated using the published Net Asset Value as of fiscal year end. |
| 6 | Includes 0.01% of extraordinary expense related to legal expense in support of an investment held in the portfolio. |
| 7 | Excludes the impact of expense reimbursement or fee waivers and expense reductions such as brokerage credits, but includes expense repayments andnon-reimbursable expenses, if any, such as interest, taxes, and extraordinary expenses. (See Note 1(c) and 2 in the Notes to Financial Statements.) |
| 8 | Ratio includes recapture of reimbursed fees from prior years amounting to 0.04% and 0.07% for the fiscal year ended December 31, 2018 and December 31, 2017, respectively. |
40
| | |
| | AMG Managers Global Income Opportunity Fund Financial Highlights For a share outstanding throughout each fiscal year |
| | | | | | | | | | | | | | | | | | | | |
| | | For the fiscal years ended December 31, | |
| | | | | |
| Class N | | 2019 | | | 2018 | | | 20171 | | | 20162 | | | 2015 | |
| | | | | |
Net Asset Value, Beginning of Year | | | $20.04 | | | | $21.06 | | | | $19.05 | | | | $18.18 | | | | $19.68 | |
| | | | | |
Income (loss) from Investment Operations: | | | | | | | | | | | | | | | | | | | | |
| | | | | |
Net investment income3,4 | | | 0.57 | | | | 0.69 | | | | 0.75 | | | | 0.72 | | | | 0.65 | |
| | | | | |
Net realized and unrealized gain (loss) on investments | | | 0.98 | | | | (1.57 | ) | | | 1.26 | | | | 0.15 | | | | (1.87 | ) |
Total income (loss) from investment operations | | | 1.55 | | | | (0.88 | ) | | | 2.01 | | | | 0.87 | | | | (1.22 | ) |
| | | | | |
Less Distributions to Shareholders from: | | | | | | | | | | | | | | | | | | | | |
| | | | | |
Net investment income | | | (0.07 | ) | | | (0.14 | ) | | | — | | | | — | | | | (0.28 | ) |
| | | | | |
Net Asset Value, End of Year | | | $21.52 | | | | $20.04 | | | | $21.06 | | | | $19.05 | | | | $18.18 | |
Total Return4,5 | | | 7.67 | % | | | (4.18 | )% | | | 10.55 | % | | | 4.79 | % | | | (6.22 | )% |
| | | | | |
Ratio of net expenses to average net assets | | | 0.89 | % | | | 0.89 | % | | | 0.89 | % | | | 0.89 | % | | | 0.89 | % |
| | | | | |
Ratio of gross expenses to average net assets6 | | | 1.87 | % | | | 1.52 | % | | | 1.39 | % | | | 1.46 | % | | | 1.29 | % |
| | | | | |
Ratio of net investment income to average net assets4 | | | 2.70 | % | | | 3.34 | % | | | 3.71 | % | | | 3.75 | % | | | 3.36 | % |
| | | | | |
Portfolio turnover | | | 52 | % | | | 60 | % | | | 55 | % | | | 34 | % | | | 53 | % |
| | | | | |
Net assets end of year (000’s) omitted | | | $9,638 | | | | $10,365 | | | | $14,074 | | | | $15,434 | | | | $32,141 | |
| | | | | | | | | | | | | | | | | | | | | |
| 1 | Effective February 27, 2017, Class S was renamed Class N. |
| 2 | Effective October 1, 2016, the shares were reclassified and redesignated as Class S shares. |
| 3 | Per share numbers have been calculated using average shares. |
| 4 | Total returns and net investment income would have been lower had certain expenses not been offset. |
| 5 | The total return is calculated using the published Net Asset Value as of fiscal year end. |
| 6 | Excludes the impact of expense reimbursement or fee waivers and expense reductions such as brokerage credits, but includes expense repayments andnon-reimbursable expenses, if any, such as interest, taxes, and extraordinary expenses. (See Note 1(c) and 2 in the Notes to Financial Statements.) |
41
| | |
| | AMG Managers Special Equity Fund Financial Highlights For a share outstanding throughout each fiscal year |
| | | | | | | | | | | | | | | | | | | | |
| | | For the fiscal years ended December 31, | |
| | | | | |
| Class N | | 2019 | | | 2018 | | | 20171 | | | 20162 | | | 2015 | |
| | | | | |
Net Asset Value, Beginning of Year | | | $114.95 | | | | $119.45 | | | | $99.33 | | | | $87.84 | | | | $88.30 | |
| | | | | |
Income (loss) from Investment Operations: | | | | | | | | | | | | | | | | | | | | |
| | | | | |
Net investment loss3,4 | | | (1.03 | ) | | | (0.91 | ) | | | (0.79 | )5 | | | (0.43 | )6 | | | (0.47 | )7 |
| | | | | |
Net realized and unrealized gain (loss) on investments | | | 30.19 | | | | (3.59 | ) | | | 20.91 | | | | 11.92 | | | | 0.01 | |
Total income (loss) from investment operations | | | 29.16 | | | | (4.50 | ) | | | 20.12 | | | | 11.49 | | | | (0.46 | ) |
| | | | | |
Less Distributions to Shareholders from: | | | | | | | | | | | | | | | | | | | | |
| | | | | |
Net realized gain on investments | | | (32.96 | ) | | | — | | | | — | | | | — | | | | — | |
| | | | | |
Net Asset Value, End of Year | | | $111.15 | | | | $114.95 | | | | $119.45 | | | | $99.33 | | | | $87.84 | |
Total Return4 | | | 25.69 | %8 | | | (3.76 | )%8 | | | 20.25 | %8 | | | 13.08 | % | | | (0.52 | )% |
| | | | | |
Ratio of net expenses to average net assets9 | | | 1.36 | % | | | 1.36 | % | | | 1.36 | % | | | 1.36 | % | | | 1.35 | % |
| | | | | |
Ratio of gross expenses to average net assets10 | | | 1.42 | % | | | 1.38 | % | | | 1.41 | % | | | 1.50 | % | | | 1.51 | % |
| | | | | |
Ratio of net investment loss to average net assets4 | | | (0.76 | )% | | | (0.69 | )% | | | (0.73 | )% | | | (0.49 | )% | | | (0.51 | )% |
| | | | | |
Portfolio turnover | | | 96 | % | | | 113 | % | | | 81 | % | | | 120 | % | | | 116 | % |
| | | | | |
Net assets end of year (000’s) omitted | | | $171,801 | | | | $170,744 | | | | $173,607 | | | | $180,008 | | | | $181,862 | |
| | | | | | | | | | | | | | | | | | | | | |
42
| | |
| | AMG Managers Special Equity Fund Financial Highlights For a share outstanding throughout each fiscal year |
| | | | | | | | | | | | | | | | | | | | |
| | | For the fiscal years ended December 31, | |
| | | | | |
| Class I | | 2019 | | | 2018 | | | 2017 | | | 20162 | | | 2015 | |
| | | | | |
Net Asset Value, Beginning of Year | | | $118.57 | | | | $122.90 | | | | $101.95 | | | | $89.92 | | | | $90.18 | |
| | | | | |
Income (loss) from Investment Operations: | | | | | | | | | | | | | | | | | | | | |
| | | | | |
Net investment loss3,4 | | | (0.72 | ) | | | (0.60 | ) | | | (0.54 | )5 | | | (0.22 | )6 | | | (0.26 | )7 |
| | | | | |
Net realized and unrealized gain (loss) on investments | | | 31.19 | | | | (3.73 | ) | | | 21.49 | | | | 12.25 | | | | 0.00 | 11 |
Total income (loss) from investment operations | | | 30.47 | | | | (4.33 | ) | | | 20.95 | | | | 12.03 | | | | (0.26 | ) |
| | | | | |
Less Distributions to Shareholders from: | | | | | | | | | | | | | | | | | | | | |
| | | | | |
Net realized gain on investments | | | (32.96 | ) | | | — | | | | — | | | | — | | | | — | |
| | | | | |
Net Asset Value, End of Year | | | $116.08 | | | | $118.57 | | | | $122.90 | | | | $101.95 | | | | $89.92 | |
Total Return4 | | | 26.02 | %8 | | | (3.52 | )%8 | | | 20.55 | %8 | | | 13.38 | % | | | (0.29 | )% |
| | | | | |
Ratio of net expenses to average net assets9 | | | 1.11 | % | | | 1.11 | % | | | 1.11 | % | | | 1.11 | % | | | 1.10 | % |
| | | | | |
Ratio of gross expenses to average net assets10 | | | 1.17 | % | | | 1.13 | % | | | 1.16 | % | | | 1.25 | % | | | 1.26 | % |
| | | | | |
Ratio of net investment loss to average net assets4 | | | (0.51 | )% | | | (0.44 | )% | | | (0.48 | )% | | | (0.24 | )% | | | (0.27 | )% |
| | | | | |
Portfolio turnover | | | 96 | % | | | 113 | % | | | 81 | % | | | 120 | % | | | 116 | % |
| | | | | |
Net assets end of year (000’s) omitted | | | $38,093 | | | | $31,253 | | | | $26,865 | | | | $19,647 | | | | $18,536 | |
| | | | | | | | | | | | | | | | | | | | | |
| 1 | Effective February 27, 2017, Class S shares were renamed Class N shares. |
| 2 | Effective October 1, 2016, the Service Class and Institutional Class were renamed Class S and Class I, respectively. |
| 3 | Per share numbers have been calculated using average shares. |
| 4 | Total returns and net investment loss would have been lower had certain expenses not been offset. |
| 5 | Includesnon-recurring dividends. Without these dividends, net investment loss per share would have been $(0.84) and $(0.59) for Class N and Class I respectively. |
| 6 | Includesnon-recurring dividends. Without these dividends, net investment loss per share would have been $(0.49) and $(0.28) for Class N and Class I respectively. |
| 7 | Includesnon-recurring dividends. Without these dividends, net investment loss per share would have been $(0.69) and $(0.48) for Class N and Class I, respectively. |
| 8 | The total return is calculated using the published Net Asset Value as of fiscal year end. |
| 9 | Includes reduction from broker recapture amounting to less than 0.01% for the years ended 2019, 2018, 2017, 2016 and 2015, respectively. |
| 10 | Excludes the impact of expense reimbursement or fee waivers and expense reductions such as brokerage credits, but includes expense repayments andnon-reimbursable expenses, if any, such as interest, taxes, and extraordinary expenses. (See Note 1(c) and 2 in the Notes to Financial Statements.) |
43
| | |
| | | Notes to Financial Statements December 31, 2019 |
1. ORGANIZATION AND SUMMARY OF SIGNIFICANT ACCOUNTING POLICIES
AMG Funds III (the “Trust”) is anopen-end management investment company, organized as a Massachusetts business trust, and registered under the Investment Company Act of 1940, as amended (the “1940 Act”). Currently, the Trust consists of a number of different funds, each having distinct investment management objectives, strategies, risks, and policies. Included in this report are AMG Managers Loomis Sayles Bond Fund (“Bond”), AMG Managers Global Income Opportunity Fund (“Global Income Opportunity”) and AMG Managers Special Equity Fund (“Special Equity”), each a “Fund” and collectively, the “Funds”.
Each Fund offers different classes of shares. Both Bond and Special Equity offer Class N and Class I shares. Global Income Opportunity offers Class N shares. Each class represents an interest in the same assets of the respective Fund. Although all share classes generally have identical voting rights, each share class votes separately when required by law. Different share classes may have different net asset values per share to the extent the share classes pay different distribution amounts and/or the expenses of such share classes differ. Each share class has its own expense structure. Please refer to a current prospectus for additional information on each share class.
The Funds’ financial statements are prepared in accordance with accounting principles generally accepted in the United States of America (“U.S. GAAP”), including accounting and reporting guidance pursuant to Accounting Standards Codification Topic 946 applicable to investment companies. U.S. GAAP requires management to make estimates and assumptions that affect the reported amounts of assets and liabilities and disclosure of contingent assets and liabilities at the date of the financial statements and the reported amounts of income and expenses during the reporting period. Actual results could differ from those estimates and such differences could be material. The following is a summary of significant accounting policies followed by the Funds in the preparation of their financial statements:
a. VALUATION OF INVESTMENTS
Equity securities traded on a national securities exchange or reported on the NASDAQ national market system (“NMS”) are valued at the last quoted sales price on the primary exchange or, if applicable, the NASDAQ official closing price or the official closing price of the relevant exchange or, lacking any sales, at the last quoted bid price or the mean between the last quoted bid and ask prices (the “exchange mean price”). Equity securities traded in theover-the-counter market (other than NMS securities) are valued at the mean price. Foreign equity securities (securities principally traded in markets other than U.S. markets) are valued at the official closing price on the primary exchange or, for markets that either do not offer an official closing price or where the official closing price may not be representative of the overall market, the last quoted sale price.
Fixed income securities purchased with a remaining maturity exceeding 60 days are valued at the evaluated mean price provided by an authorized pricing service or, if an evaluated price is not available, by reference to other securities which are considered comparable in credit rating, interest rate, due date and other features (generally referred to as “matrix pricing”) or other similar pricing methodologies. Investments in certain mortgage-backed and stripped mortgage-backed securities, preferred stocks, convertible securities, derivatives and other debt securities not traded on an organized securities market are valued on the basis of valuations provided by dealers or by a pricing service which uses information with
respect to transactions in such securities and various relationships between such securities and yield to maturity in determining value.
Fixed income securities purchased with a remaining maturity of 60 days or less are valued at amortized cost, provided that the amortized cost value is approximately the same as the fair value of the security valued without the use of amortized cost. Investments in otheropen-end registered investment companies are valued at their end of day net asset value per share.
Futures contracts for which market quotations are readily available are valued at the settlement price as of the close of the futures exchange.
The Funds’ portfolio investments are generally valued based on independent market quotations or prices or, if none, “evaluative” or other market based valuations provided by third party pricing services approved by the Board of Trustees of the Trust (the “Board”). Under certain circumstances, the value of certain Fund portfolio investments (including derivatives) may be based on an evaluation of fair value, pursuant to procedures established by and under the general supervision of the Board. The Valuation Committee, which is comprised of the Independent Trustees of the Board, and the Pricing Committee, which is comprised of representatives from AMG Funds LLC (the “Investment Manager”) are the committees appointed by the Board to make fair value determinations. Each Fund may use the fair value of a portfolio investment to calculate its net asset value (“NAV”) in the event that the market quotation, price or market based valuation for the portfolio investment is not readily available or otherwise not determinable pursuant to the Board’s valuation procedures, if the Investment Manager or the Pricing Committee believes the quotation, price or market based valuation to be unreliable, or in certain other circumstances. When determining the fair value of an investment, the Pricing Committee and, if required under the Trust’s securities valuation procedures, the Valuation Committee, seeks to determine the price that the Fund might reasonably expect to receive from current sale of that portfolio investment in an arms-length transaction. Fair value determinations shall be based upon consideration of all available facts and information, including, but not limited to (i) attributes specific to the investment; (ii) fundamental and analytical data relating to the investment; and (iii) the value of other comparable securities or relevant financial instruments, including derivative securities, traded on other markets or among dealers.
The values assigned to fair value portfolio investments are based on available information and do not necessarily represent amounts that might ultimately be realized in the future, since such amounts depend on future developments inherent in long-term investments. Because of the inherent uncertainty of valuation, those estimated values may differ significantly from the values that would have been used had a ready market for the investments existed, and the differences could be material. The Board will be presented with a quarterly report showing as of the most recent quarter end, all outstanding securities fair valued by the Funds, including a comparison with the prior quarter end and the percentage of the Funds that the security represents at each quarter end.
With respect to foreign equity securities and certain foreign fixed income securities, the Board has adopted a policy that securities held in the Funds that can be fair valued by the applicable fair value pricing service are fair valued on each business day provided that each individual price exceeds apre-established confidence level.
U.S. GAAP defines fair value as the price that a fund would receive to sell an asset or pay to transfer a liability in an orderly transaction between market participants at the measurement date. U.S. GAAP also establishes a framework for measuring fair value, and a three level hierarchy for fair value measurements based upon the
44
| | |
| | | Notes to Financial Statements(continued) |
transparency of inputs to the valuation of an asset or liability. Inputs may be observable or unobservable and refer broadly to the assumptions that market participants would use in pricing the asset or liability. Observable inputs reflect the assumptions market participants would use in pricing the asset or liability based on market data obtained from sources independent of the Funds. Unobservable inputs reflect the Funds’ own assumptions about the assumptions that market participants would use in pricing the asset or liability developed based on the best information available in the circumstances. Each investment is assigned a level based upon the observability of the inputs which are significant to the overall valuation.
The three-tier hierarchy of inputs is summarized below:
Level 1 – inputs are quoted prices in active markets for identical investments (e.g., equity securities,open-end investment companies, futures contracts)
Level 2 – other observable inputs (including, but not limited to: quoted prices for similar assets or liabilities in markets that are active, quoted prices for identical or similar assets or liabilities in markets that are not active, inputs other than quoted prices that are observable for the assets or liabilities (such as interest rates, yield curves, volatilities, prepayment speeds, loss severities, credit risks and default rates) or other market corroborated inputs) (e.g., debt securities, government securities, foreign currency exchange contracts, swaps, foreign securities utilizing international fair value pricing, fair valued securities with observable inputs)
Level 3 – inputs are significant unobservable inputs (including the Fund’s own assumptions used to determine the fair value of investments) (e.g., fair valued securities with unobservable inputs)
Changes in inputs or methodologies used for valuing investments may result in a transfer in or out of levels within the fair value hierarchy. The inputs or methodologies used for valuing investments may not necessarily be an indication of the risk associated with investing in those investments.
b. SECURITY TRANSACTIONS
Security transactions are accounted for as of trade date. Realized gains and losses on securities sold are determined on the basis of identified cost.
c. INVESTMENT INCOME AND EXPENSES
Dividend income is recorded on theex-dividend date. Dividends from foreign securities are recorded on theex-dividend date, and if after the fact, as soon as the Funds become aware of theex-dividend date. Interest income, which includes amortization of premium and accretion of discount on debt securities, is accrued as earned. Dividend and interest income on foreign securities is recorded gross of any withholding tax.Non-cash dividends included in dividend income, if any, are reported at the fair market value of the securities received. Other income and expenses are recorded on an accrual basis. Expenses that cannot be directly attributed to a Fund are apportioned among the funds in the Trusts and other trusts or funds within the AMG Funds Family of Funds (collectively the “AMG Funds Family”) based upon their relative average net assets or number of shareholders. Investment income, realized and unrealized capital gains and losses, the common expenses of each Fund, and certain fund level expense reductions, if any, are allocated on apro-rata basis to each class based on the relative net assets of each class to the total net assets of each Fund.
Special Equity had certain portfolio trades directed to various brokers under a brokerage recapture program. Credits received from the brokerage recapture program are earned and paid on a monthly basis, and are recorded as expense offsets, which serve to reduce the Funds’ overall expense ratio. For the fiscal year ended December 31, 2019, the impact on the expenses and expense ratios, were as follows: Special Equity - $6,439 or less than 0.01%.
d. DIVIDENDS AND DISTRIBUTIONS
Fund distributions resulting from either net investment income or realized net capital gains, if any, will normally be declared and paid at least annually in December. Distributions to shareholders are recorded on theex-dividend date. Distributions are determined in accordance with federal income tax regulations, which may differ from net investment income and net realized capital gains for financial statement purposes (U.S. GAAP). Differences may be permanent or temporary. Permanent differences are reclassified among capital accounts in the financial statements to reflect their tax character. Permanent book and tax basis differences, if any, relating to shareholder distributions will result in reclassifications topaid-in capital. Temporary differences arise when certain items of income, expense and gain or loss are recognized in different periods for financial statement and tax purposes; these differences will reverse at some time in the future. Permanent differences are due to tax equalization utilized and current yearwrite-off of a net operating loss. Temporary differences are due to straddles, IRS Section 1256 market to market, wash sale loss deferrals, the deferral of qualified late year losses, convertible bonds, contingent payment debt instrument adjustments and capital loss carryforwards.
The tax character of distributions paid during the fiscal years ended December 31, 2019 and December 31, 2018 were as follows:
| | | | | | | | | | | | | | | | | | | | | | | | |
| | | Bond | | | | Global Income Opportunity | | | | Special Equity | |
Distributions paid from: | | | 2019 | | | | 2018 | | | | 2019 | | | | 2018 | | | | 2019 | | | | 2018 | |
| | | | | | |
Ordinary income | | | $34,681,294 | | | | $60,110,954 | | | | $29,806 | | | | $76,366 | | | | — | | | | — | |
| | | | | | |
Short-term capital gains | | | 2,129,709 | | | | 21,180 | | | | — | | | | — | | | | $7,505,091 | | | | — | |
| | | | | | |
Long-term capital gains | | | 19,976,945 | | | | 13,392,602 | | | | — | | | | — | | | | 41,837,434 | | | | — | |
| | | | | | | | | | | | | | | | | | | | | | | | |
| | | | | | |
| | | $56,787,948 | | | | $73,524,736 | | | | $29,806 | | | | $76,366 | | | | $49,342,525 | | | | — | |
| | | | | | | | | | | | | | | | | | | | | | | | |
45
| | |
| | | Notes to Financial Statements(continued) |
As of December 31, 2019, the components of distributable earnings (excluding unrealized appreciation/depreciation) on a tax basis consisted of:
| | | | | | | | | | | | |
| | | Bond | | | Global Income Opportunity | | | Special Equity | |
| | | |
Capital loss carryforward | | | — | | | | $319,810 | | | | — | |
| | | |
Undistributed long-term capital gains | | | $465,864 | | | | — | | | | — | |
| | | |
Late-year loss deferral | | | 827,964 | | | | 51,425 | | | | $616,908 | |
At December 31, 2019, the cost of investments and the aggregate gross unrealized appreciation and depreciation for federal income tax purposes were as follows:
| | | | | | | | | | | | | | | | |
Fund | | Cost | | | Appreciation | | | Depreciation | | | Net | |
| | | | |
Bond | | $ | 1,151,707,347 | | | $ | 109,573,543 | | | | $(28,342,746 | ) | | $ | 81,230,797 | |
| | | | |
Global Income Opportunity | | | 9,436,184 | | | | 403,532 | | | | (232,493 | ) | | | 171,039 | |
| | | | |
Special Equity | | | 193,465,986 | | | | 34,005,861 | | | | (8,090,520 | ) | | | 25,915,341 | |
e. FEDERAL TAXES
Each Fund currently qualifies as an investment company and intends to comply with the requirements under Subchapter M of the Internal Revenue Code of 1986, as amended, and to distribute substantially all of its taxable income and gains to its shareholders and to meet certain diversification and income requirements with respect to investment companies. Therefore, no provision for federal income or excise tax is included in the accompanying financial statements.
Additionally, based on each Fund’s understanding of the tax rules and rates related to income, gains and transactions for the foreign jurisdictions in which it invests, each Fund will provide for foreign taxes, and where appropriate, deferred foreign taxes.
Management has analyzed the Funds’ tax positions taken on federal income tax returns as of December 31, 2019, and for all open tax years (generally, the three prior taxable years), and has concluded that no provision for federal income tax is required in the Funds’ financial statements. Additionally, Management is not aware of any tax position for which it is reasonably possible that the total amounts of unrecognized tax benefits will change materially in the next twelve months.
f. CAPITAL LOSS CARRYOVERS AND DEFERRALS
As of December 31, 2019, the following Fund had capital loss carryovers for federal income tax purposes as shown in the following chart. These amounts may be used to offset future realized capital gains indefinitely, and retain their character as short-term and/or long-term.
| | | | |
Capital Loss Carryover Amounts |
| | |
Fund | | Short-Term | | Long-Term |
| | |
Global Income Opportunity | | $319,209 | | $601 |
As of December 31, 2019, Bond and Special Equity had no capital loss carryovers for federal income tax purposes. Should the Funds incur net capital losses for the fiscal year ended December 31, 2020, such amounts may be used to offset future realized capital gains indefinitely, and retain their character as either short-term and/or long-term.
For the fiscal year ended December 31, 2019, the following Fund utilized capital loss carryovers in the amount of:
| | | | |
Capital Loss Carryover Utilized |
| | |
Fund | | Short-Term | | Long-Term |
| | |
Global Income Opportunity | | $39,423 | | — |
g. CAPITAL STOCK
The Trust’s Declaration of Trust authorizes for each Fund the issuance of an unlimited number of shares of beneficial interest, without par value. Each Fund records sales and repurchases of its capital stock on the trade date.
For the fiscal years ended December 31, 2019 and December 31, 2018, the capital stock transactions by class for the Funds were as follows:
| | | | | | | | | | | | | | | | | | | | | | | | | | | | | | | | |
| | | Bond | | | Special Equity | |
| | | | |
| | | December 31, 2019 | | | December 31, 2018 | | | December 31, 2019 | | | December 31, 2018 | |
| | | | | | | | |
| | | Shares | | | Amount | | | Shares | | | Amount | | | Shares | | | Amount | | | Shares | | | Amount | |
| | | | | | | | |
Class N: | | | | | | | | | | | | | | | | | | | | | | | | | | | | | | | | |
| | | | | | | | |
Proceeds from sale of shares | | | 3,416,998 | | | | $90,763,873 | | | | 4,780,688 | | | | $126,127,019 | | | | 65,788 | | | | $8,856,577 | | | | 329,518 | | | | $46,939,577 | |
| | | | | | | | |
Reinvestment of distributions | | | 1,051,262 | | | | 28,038,056 | | | | 1,081,213 | | | | 28,139,782 | | | | 354,078 | | | | 38,909,669 | | | | — | | | | — | |
| | | | | | | | |
Cost of shares repurchased | | | (9,751,128 | ) | | | (261,380,964 | ) | | | (13,810,521 | ) | | | (364,150,946 | ) | | | (359,581 | ) | | | (46,144,528 | ) | | | (297,568 | ) | | | (38,178,984 | ) |
| | | | | | | | | | | | | | | | | | | | | | | | | | | | | | | | |
| | | | | | | | |
Net increase (decrease) | | | (5,282,868 | ) | | | $(142,579,035 | ) | | | (7,948,620 | ) | | | $(209,884,145 | ) | | | 60,285 | | | | $1,621,718 | | | | 31,950 | | | | $8,760,593 | |
| | | | | | | | | | | | | | | | | | | | | | | | | | | | | | | | |
46
| | |
| | | Notes to Financial Statements(continued) |
| | | | | | | | | | | | | | | | | | | | | | | | | | | | | | | | |
| | | Bond | | | Special Equity | |
| | | | |
| | | December 31, 2019 | | | December 31, 2018 | | | December 31, 2019 | | | December 31, 2018 | |
| | | | | | | | |
| | | Shares | | | Amount | | | Shares | | | Amount | | | Shares | | | Amount | | | Shares | | | Amount | |
| | | | | | | | |
Class I: | | | | | | | | | | | | | | | | | | | | | | | | | | | | | | | | |
| | | | | | | | |
Proceeds from sale of shares | | | 8,666,428 | | | | $231,939,268 | | | | 14,478,048 | | | | $382,352,852 | | | | 53,673 | | | | $7,476,323 | | | | 88,902 | | | | $12,497,553 | |
| | | | | | | | |
Reinvestment of distributions | | | 1,007,830 | | | | 26,817,303 | | | | 1,652,948 | | | | 42,974,754 | | | | 75,043 | | | | 8,611,172 | | | | — | | | | — | |
| | | | | | | | |
Cost of shares repurchased | | | (30,324,739 | ) | | | (794,577,486 | ) | | | (11,278,671 | ) | | | (295,283,316 | ) | | | (64,117 | ) | | | (8,720,351 | ) | | | (43,918 | ) | | | (5,872,570 | ) |
| | | | | | | | | | | | | | | | | | | | | | | | | | | | | | | | |
| | | | | | | | |
Net increase (decrease) | | | (20,650,481 | ) | | | $(535,820,915 | ) | | | 4,852,325 | | | | $130,044,290 | | | | 64,599 | | | | $7,367,144 | | | | 44,984 | | | | $6,624,983 | |
| | | | | | | | | | | | | | | | | | | | | | | | | | | | | | | | |
| | | | | | | | | | | | | | | | |
| | | Global Income Opportunity | |
| | |
| | | December 31, 2019 | | | December 31, 2018 | |
| | | | |
| | | Shares | | | Amount | | | Shares | | | Amount | |
| | | | |
Class N: | | | | | | | | | | | | | | | | |
| | | | |
Proceeds from sale of shares | | | 47,899 | | | | $1,005,926 | | | | 124,370 | | | | $2,598,624 | |
| | | | |
Reinvestment of distributions | | | 1,347 | | | | 28,845 | | | | 3,383 | | | | 67,386 | |
| | | | |
Cost of shares repurchased | | | (118,585 | ) | | | (2,450,499 | ) | | | (278,715 | ) | | | (5,730,793 | ) |
| | | | | | | | | | | | | | | | |
| | | | |
Net decrease | | | (69,339 | ) | | | $(1,415,728 | ) | | | (150,962 | ) | | | $(3,064,783 | ) |
| | | | | | | | | | | | | | | | |
h. REPURCHASE AGREEMENTS AND JOINT REPURCHASE AGREEMENTS
The Funds may enter into third-party repurchase agreements for temporary cash management purposes and third-party or bilateral joint repurchase agreements for reinvestment of cash collateral on securities lending transactions under the securities lending program offered by The Bank of New York Mellon (“BNYM”) (the “Program”) (collectively, “Repurchase Agreements”). The value of the underlying collateral, including accrued interest, must equal or exceed the value of the Repurchase Agreements during the term of the agreement. For joint repurchase agreements, the Funds participate on a pro rata basis with other clients of BNYM in its share of the underlying collateral under such joint repurchase agreements and in its share of proceeds from any repurchase or other disposition of the underlying collateral. The underlying collateral for all Repurchase Agreements is held in safekeeping by the Funds’ custodian or at the Federal Reserve Bank. If the seller defaults and the value of the collateral declines, or if bankruptcy proceedings commence with respect to the seller of the security, realization of the collateral by the Funds may be delayed or limited. Pursuant to the Program, the Funds are indemnified for such losses by BNYM on joint repurchase agreements.
At December 31, 2019, the market value of Repurchase Agreements outstanding for Bond, Global Income Opportunity and Special Equity was $16,987,829, $126,373 and $8,893,126, respectively.
i. FOREIGN CURRENCY TRANSLATION
The books and records of the Funds are maintained in U.S. dollars. The value of investments, assets and liabilities denominated in currencies other than U.S. dollars are translated into U.S. dollars based upon current foreign exchange rates. Purchases and sales of foreign investments, income and expenses are converted into U.S. dollars based on currency exchange rates prevailing on the respective dates of such transactions. Net realized and unrealized gain (loss) on foreign currency transactions represent: (1) foreign exchange gains and losses from the sale and holdings of foreign currencies; (2) gains and losses between trade date
and settlement date on investment securities transactions and foreign currency exchange contracts; and (3) gains and losses from the difference between amounts of interest and dividends recorded and the amounts actually received.
The Funds do not isolate the net realized and unrealized gain or loss resulting from changes in exchange rates from the fluctuations in market prices of securities held. Such fluctuations are included with the net realized and unrealized gain or loss on investments.
2. AGREEMENTS AND TRANSACTIONS WITH AFFILIATES
For each of the Funds, the Trust has entered into an investment advisory agreement under which the Investment Manager, a subsidiary and the U.S. retail distribution arm of Affiliated Managers Group, Inc. (“AMG”), serves as investment manager to the Funds and is responsible for the Funds’ overall administration and operations. The Investment Manager selects one or more subadvisers for the Funds (subject to Board approval) and monitors each subadviser’s investment performance, security holdings and investment strategies. Each Fund’s investment portfolio is managed by one or more portfolio managers who serve pursuant to a subadvisory agreement with the Investment Manager. Bond and Global Income Opportunity are managed by Loomis, Sayles & Company, L.P. and Special Equity is managed by Ranger Investment Management, L.P., Lord, Abbett & Co. LLC (“Lord Abbett”), Smith Asset Management Group, L.P. and Federated MDTA LLC.
47
| | |
| | | Notes to Financial Statements(continued) |
Investment management fees are paid directly by the Funds to the Investment Manager based on average daily net assets. For the fiscal year ended December 31, 2019, the Funds’ investment management fees were paid at the following annual rates of each Fund’s respective average daily net assets:
| | | | |
| |
Bond1 | | | 0.26 | % |
| |
Global Income Opportunity | | | 0.55 | % |
| |
Special Equity | | | 0.90 | % |
| 1 | Prior to January 1, 2019, the annual rate for Bond’s investment management fee was 0.625% of the Fund’s average daily net assets. |
The Investment Manager has contractually agreed, through at least May 1, 2020, to waive management fees and/or pay or reimburse fund expenses in order to limit total annual Fund operating expenses after fee waiver and expense reimbursements (exclusive of taxes, interest (including interest incurred in connection with bank and custody overdrafts, and in connection with securities sold short), shareholder servicing fees, distribution and service(12b-1) fees, brokerage commissions and other transaction costs, dividends payable with respect to securities sold short, acquired fund fees and expenses and extraordinary expenses) of Bond, Global Income Opportunity and Special Equity to the annual rate of 0.46%, 0.89% and 1.11%, respectively, of each Fund’s average daily net assets (this annual rate or such other annual rate that may be in effect from time to time, the “Expense Cap”), subject to later reimbursement by the Funds in certain circumstances. Prior to January 1, 2019, Bond expense limitation was 0.89%.
The contractual expense limitation may only be terminated in the event the Investment Manager or a successor ceases to be the investment manager of a Fund or a successor fund, by mutual agreement between the Investment Manager and the Board, or in the event of a Fund’s liquidation unless the Fund is reorganized or is a party to a merger in which the surviving entity is successor to the accounting and performance information of a Fund.
In general, for a period of up to 36 months, the Investment Manager may recover from each Fund fees waived and expenses paid pursuant to this contractual agreement, provided that such repayment would not cause a Fund’s total annual operating expenses after fee waiver and expense reimbursements (exclusive of the items noted in the parenthetical above) to exceed the contractual expense limitation amount.
At December 31, 2019, the Funds’ expiration of reimbursements subject to recoupment is as follows:
| | | | | | | | | | | | |
Expiration Period | | Bond | | | Global Income Opportunity | | | Special Equity | |
| | | |
Less than 1 year | | | — | | | | $71,340 | | | | $94,177 | |
| | | |
1-2 years | | | — | | | | 81,291 | | | | 54,349 | |
| | | |
2-3 years | | | $67,260 | | | | 94,471 | | | | 121,521 | |
| | | | | | | | | | | | |
| | | |
Total | | | $67,260 | | | | $247,102 | | | | $270,047 | |
| | | | | | | | | | | | |
The Trust, on behalf of the Funds, has entered into an amended and restated Administration Agreement under which the Investment Manager serves as the Funds’ administrator (the “Administrator”) and is responsible for allnon-portfolio management aspects of managing the Funds’ operations, including administration
and shareholder services to each Fund. Each Fund pays a fee to the Administrator at the rate of 0.15% per annum of the Fund’s average daily net assets for this service.
The Funds are distributed by AMG Distributors, Inc. (the “Distributor”), a wholly-owned subsidiary of the Investment Manager. The Distributor serves as the distributor and underwriter for each Fund and is a registered broker-dealer and member of the Financial Industry Regulatory Authority, Inc. (“FINRA”). Shares of each Fund will be continuously offered and will be sold directly to prospective purchasers and through brokers, dealers or other financial intermediaries who have executed selling agreements with the Distributor. Generally the Distributor bears all or a portion of the expenses of providing services pursuant to the distribution agreement, including the payment of the expenses relating to the distribution of prospectuses for sales purposes and any advertising or sales literature.
For Class N shares of Bond and Special Equity and for Class I shares of Bond, the Board has approved reimbursement payments to the Investment Manager for shareholder servicing expenses (“shareholder servicing fees”) incurred. Shareholder servicing fees include payments to financial intermediaries, such as broker-dealers (including fund supermarket platforms), banks, and trust companies who provide shareholder recordkeeping, account servicing and other services. The Class N shares of Bond and Special Equity and Class I shares of Bond may reimburse the Investment Manager for the actual amount incurred up to a maximum annual rate of each Class’s average daily net assets as shown in the table below.
The impact on the annualized expense ratios for the fiscal year ended December 31, 2019, were as follows:
| | | | | | | | |
| Fund | | Maximum Annual
Amount
Approved | | | Actual
Amount
Incurred | |
| | |
Bond | | | | | | | | |
| | |
Class N* | | | 0.25% | | | | 0.25% | |
| | |
Class I | | | 0.05% | | | | 0.05% | |
| | |
Special Equity | | | | | | | | |
| | |
Class N | | | 0.25% | | | | 0.25% | |
| * | Prior to January 1, 2019, the maximum annual amount approved was 0.15%. |
The Board provides supervision of the affairs of the Trust and other trusts within the AMG Funds family. The Trustees of the Trust who are not affiliated with the Investment Manager receive an annual retainer and per meeting fees for regular, special and telephonic meetings, and they are reimbursed forout-of-pocket expenses incurred while carrying out their duties as Board members. The Chairman of the Board and the Audit Committee Chair receive additional annual retainers. Certain Trustees and Officers of the Funds are Officers and/or Directors of the Investment Manager, AMG and/or the Distributor.
The Securities and Exchange Commission (the “SEC”)granted an exemptive order that permits the Funds to lend and borrow money for certain temporary purposes directly to and from other eligible funds in the AMG Funds family. Participation in this interfund lending program is voluntary for both the borrowing and lending funds, and an interfund loan is only made if it benefits each participating fund. The Administrator manages the program according to procedures approved by the Board, and the Board monitors the operation of the program. An interfund loan
48
| | |
| | | Notes to Financial Statements(continued) |
must comply with certain conditions set out in the exemptive order, which are designed to assure fairness and protect all participating funds. For the fiscal year ended December 31, 2019, Special Equity borrowed a maximum of $3,644,504, for seven days paying interest of $1,880. The interest expense amount is included in the Statement of Operations as miscellaneous expense. Bond and Global Income Opportunity neither borrowed from nor lent to other funds in the AMG Funds family. At December 31, 2019, the Funds had no interfund loans outstanding.
For the fiscal year ended December 31, 2019, Special Equity executed security transactions with other funds affiliated with Lord, Abbett. Each of the transactions were executed at the closing price of the security transacted and with no commissions in accordance with Rule17a-7 of the 1940 Act and procedures approved by the Board. The amounts purchased and sold during the fiscal year ended December 31, 2019, are reflected in the following chart:
| | | | | | |
| | | Number of
Transactions | | Total
Quantity | | Cost/Proceeds |
| | | |
Purchases | | 6 | | 7,220 | | $461,205 |
| | | |
Sales* | | 5 | | 10,135 | | 351,780 |
*Realized gain was $165,378.
3. PURCHASES AND SALES OF SECURITIES
Purchases and sales of securities (excluding short-term securities and U.S. Government Obligations) for the fiscal year ended December 31, 2019, were as follows:
| | | | | | |
| | | Long Term Securities | |
| | |
| Fund | | Purchases | | Sales |
| | |
Bond | | $13,459,109 | | | $525,727,181 | |
| | |
Global Income Opportunity | | 1,765,089 | | | 4,761,763 | |
| | |
Special Equity | | 201,366,952 | | | 244,322,999 | |
Purchases and sales of U.S. Government Obligations for the fiscal year ended December 31, 2019 were as follows:
| | | | | | |
| | | U.S. Government Obligations | |
| | |
| Fund | | Purchases | | Sales |
| | |
Bond | | $187,266,003 | | | $10,826,463 | |
| | |
Global Income Opportunity | | 3,143,416 | | | 1,998,035 | |
| | |
Special Equity | | — | | | — | |
4. PORTFOLIO SECURITIES LOANED
The Funds participate in the Program providing for the lending of securities to qualified borrowers. Securities lending income includes earnings of such temporary cash investments, plus or minus any rebate to a borrower. These earnings (after any rebate) are then divided between BNYM, as a fee for its services under the Program, and the Funds, according to agreed-upon rates. Collateral on all securities loaned is accepted in cash, U.S. Treasury Obligations or U.S. Government Agency Obligations. Collateral is maintained at a minimum level of 102% (105% in the case of certain foreign securities) of the market value, plus interest, if applicable, of investments on loan. It is the Funds’ policy to obtain additional collateral from or return excess collateral to the borrower by the end of
the next business day, following the valuation date of the securities loaned. Therefore, the value of the collateral held may be temporarily less than the value of the securities on loan. Lending securities entails a risk of loss to the Funds if and to the extent that the market value of the securities loaned were to increase and the borrower did not increase the collateral accordingly, and the borrower fails to return the securities. Under the terms of the Program, the Funds are indemnified for such losses by BNYM. Cash collateral is held in separate omnibus accounts managed by BNYM, who is authorized to exclusively enter into joint repurchase agreements for that cash collateral. Securities collateral is held in separate omnibus accounts managed by BNYM that cannot be sold or pledged. BNYM bears the risk of any deficiency in the amount of the cash collateral available for return to the borrower due to any loss on the collateral invested.
The value of securities loaned on positions held, cash collateral and securities collateral received at December 31, 2019, were as follows:
| | | | | | | | | | | | | | | | |
| Fund | | Securities
Loaned | | | Cash
Collateral
Received | | | Securities
Collateral
Received | | | Total
Collateral
Received | |
Bond | | | $180,616,082 | | | | $16,987,829 | | | | $167,810,175 | | | | $184,798,004 | |
Global Income Opportunity | | | 121,669 | | | | 126,373 | | | | — | | | | 126,373 | |
Special Equity | | | 56,021,838 | | | | 8,893,126 | | | | 48,213,549 | | | | 57,106,675 | |
The following table summarizes the securities received as collateral for securities lending at December 31, 2019:
| | | | | | |
| Fund | | Collateral
Type | | Coupon
Range | | Maturity
Date Range |
| | | |
Bond | | U.S.
Government
Agency
Obligations | | 0.000%-11.000% | | 01/20/20-09/20/69 |
| | | |
| | U.S.
Treasury
Obligations | | 0.000%-8.500% | | 01/09/20-11/15/49 |
| | | |
Special Equity | | U.S.
Treasury
Obligations | | 0.000%-8.500% | | 01/09/20-11/15/49 |
5. FOREIGN SECURITIES
Bond and Global Income Opportunity invest in securities of foreign entities and in instruments denominated in foreign currencies which involve risks not typically associated with investments in domestic securities.Non-domestic securities carry special risks, such as exposure to currency fluctuations, less developed or less efficient trading markets, political instability, a lack of company information, differing auditing and legal standards, and, potentially, less liquidity. Realized gains in certain countries may be subject to foreign taxes at the Fund level and the Fund would pay such foreign taxes at the appropriate rate for each jurisdiction.
6. COMMITMENTS AND CONTINGENCIES
Under the Trust’s organizational documents, its trustees and officers are indemnified against certain liabilities arising out of the performance of their duties to the Trust. In addition, in the normal course of business, the Funds may enter into contracts and agreements that contain a variety of representations and warranties, which provide general indemnifications. The maximum exposure to the Funds under these arrangements is unknown, as this would involve future claims that may be made against a Fund that have not yet occurred. However, based on experience, the Funds had no prior claims or losses and expect the risks of loss to be remote.
49
| | |
| | | Notes to Financial Statements(continued) |
7. RISKS ASSOCIATED WITH HIGH YIELD SECURITIES
Investing in high yield securities involves greater risks and considerations not typically associated with U.S. Government and other high quality/investment grade securities. High yield securities are generally below investment grade securities and do not have an established retail secondary market. Economic downturns may disrupt the high yield market and impair the issuer’s ability to repay principal and interest. Also, an increase in interest rates would likely have an adverse impact on the value of such obligations and could cause the securities to become less liquid.
8. FORWARD COMMITMENTS
Certain transactions, such as futures and forward transactions, dollar roll agreements, or purchases of when-issued or delayed delivery securities may have a similar effect on a Fund’s net asset value as if a Fund had created a degree of leverage in its portfolio. However, if a Fund enters into such a transaction, a Fund will establish a segregated account with its custodian in which it will maintain cash, U.S. government securities or other liquid securities equal in value to its obligations in respect to such transaction. Securities and other assets held in the segregated account may not be sold while the transaction is outstanding, unless other suitable assets are substituted.
9. DERIVATIVE INSTRUMENTS
The following disclosures contain information on how and why certain Funds use derivative instruments, the credit risk and how derivative instruments affect the Funds’ financial position, and results of operations. The location and fair value amounts of these instruments on the Statement of Assets and Liabilities, and the realized gains and losses and changes in unrealized gains and losses on the Statement of Operations, each categorized by type of derivative contract, are included in a table at the end of the applicable Fund’s Schedule of Portfolio Investments. For the fiscal year ended December 31, 2019, the average quarterly balances of derivative financial instruments outstanding were as follows:
| | | | |
| | | Global Income Opportunity | |
|
Foreign Currency Exchange Contracts: | |
| |
Average U.S. Dollar amount purchased/sold | | | $4,538,745 | |
|
Financial Futures Contracts | |
| |
Average number of contracts purchased | | | 3 | |
| |
Average notional value of contracts purchased | | | $383,894 | |
10. FORWARD FOREIGN CURRENCY CONTRACTS
During the fiscal year ended December 31, 2019, Global Income Opportunity invested in forward foreign currency contracts to facilitate transactions in foreign securities and to hedge against foreign currency exchange rate risk on itsnon-U.S. dollar denominated investment securities.
A forward foreign currency contract is an agreement between a fund and another party to buy or sell a currency at a set price at a future date. The market value of the contract will fluctuate with changes in currency exchange rates. The contract ismarked-to-market daily, and the change in market value is recorded as an unrealized gain or loss. Risks may arise upon entering into these contracts from the potential inability of counterparties to meet the terms of their contracts and from unanticipated movements in the value of a foreign currency relative to the U.S. dollar.
11. FUTURES CONTRACTS
Global Income Opportunities purchased futures contracts to achieve a desired level of investment, whether to accommodate portfolio turnover or cash flows from capital shares transactions. There are certain risks associated with futures contracts. Prices may not move as expected or the Fund may not be able to close out the contract when it desires to do so, resulting in losses.
On entering into a futures contract, either cash or securities in an amount equal to a certain percentage of the contract value (initial margin) must be deposited with the futures broker. Subsequent variation margin payments are made or received by the Funds depending on the fluctuations in the value of the futures contracts and the value of cash or securities on deposit with the futures broker. The Fund must have total value at the futures broker consisting of either net unrealized gains, cash or securities collateral to meet the initial margin requirement, and any value over the initial margin requirement may be transferred to the Fund.
Variation margin on future contracts is recorded as unrealized appreciation or depreciation until the futures contract is closed or expired. The Funds recognize a realized gain or loss when the contract is closed or expires equal to the difference between the value of the contract at the time it was opened and the value at the time it was closed. Fluctuations in the value of the contracts are recorded in the Statement of Assets and Liabilities as an asset (liability) and in the Statement of Operations as unrealized appreciation (depreciation) until the contracts. are closed, when they are recorded as realized gains (losses) on futures contracts.
12. MASTER NETTING AGREEMENTS
The Funds may enter into master netting agreements with their counterparties for the securities lending program, Repurchase Agreements and derivative instruments, which provide the right, in the event of default (including bankruptcy or insolvency) for thenon-defaulting party to liquidate the collateral and calculate net exposure to the defaulting party or request additional collateral. For financial reporting purposes, the Funds do not offset financial assets and financial liabilities that are subject to master netting agreements in the Statement of Assets and Liabilities. For securities lending transactions, see Note 4.
The following table is a summary of the Funds’ open Repurchase Agreements and derivatives that are subject to a master netting agreement as of December 31, 2019:
50
| | |
| | | Notes to Financial Statements(continued) |
| | | | | | | | | | | | | | | | | | | | | | | | | | | | | | | | | | | | |
| | | | | | | Gross Amount Not Offset in the
Statement of Assets and Liabilities | | |
| | | | | | | | | |
Fund | | Gross Amounts of
Assets Presented in
the Statement of
Assets and Liabilities | | | | Offset
Amount | | | | Net Asset
Balance | | | | Collateral
Received | | | | Net
Amount |
| | | | | | | | | | | | | | | | | | | | | | | | | | | | | | | | | | | | |
| | | | | | | | | |
Bond | | | | | | | | | | | | | | | | | | | | | | | | | | | | | | | | | | | | |
| | | | | | | | | |
Cantor Fitzgerald Securities, Inc. | | | $4,034,786 | | | | | | | | — | | | | | | | | $4,034,786 | | | | | | | | $4,034,786 | | | | | | | | — | |
| | | | | | | | | |
Citadel Securities LLC, | | | 2,688,353 | | | | | | | | — | | | | | | | | 2,688,353 | | | | | | | | 2,688,353 | | | | | | | | — | |
| | | | | | | | | |
Citigroup Global Markets, Inc. | | | 4,034,786 | | | | | | | | — | | | | | | | | 4,034,786 | | | | | | | | 4,034,786 | | | | | | | | — | |
| | | | | | | | | |
RBC Dominion Securities, Inc. | | | 4,034,786 | | | | | | | | — | | | | | | | | 4,034,786 | | | | | | | | 4,034,786 | | | | | | | | — | |
| | | | | | | | | |
State of Wisconsin Investment Board | | | 2,195,118 | | | | | | | | — | | | | | | | | 2,195,118 | | | | | | | | 2,195,118 | | | | | | | | — | |
| | | | | | | | | | | | | | | | | | | | | | | | | | | | | | | | | | | | |
| | | | | | | | | |
Total | | | $16,987,829 | | | | | | | | — | | | | | | | | $16,987,829 | | | | | | | | $16,987,829 | | | | | | | | — | |
| | | | | | | | | | | | | | | | | | | | | | | | | | | | | | | | | | | | |
| | | | | | | | | |
Global Income Opportunity | | | | | | | | | | | | | | | | | | | | | | | | | | | | | | | | | | | | |
| | | | | | | | | |
RBC Dominion Securities, Inc. | | | $126,373 | | | | | | | | — | | | | | | | | $126,373 | | | | | | | | $126,373 | | | | | | | | — | |
| | | | | | | | | |
BNP Paribas | | | 1,084 | | | | | | | | — | | | | | | | | 1,084 | | | | | | | | — | | | | | | | | $1,084 | |
| | | | | | | | | |
JPMorgan | | | 664 | | | | | | | | — | | | | | | | | 664 | | | | | | | | — | | | | | | | | 664 | |
| | | | | | | | | |
Merrill Lynch | | | 823 | | | | | | | | $(823) | | | | | | | | — | | | | | | | | — | | | | | | | | — | |
| | | | | | | | | |
Morgan Stanley | | | 14,269 | | | | | | | | — | | | | | | | | 14,269 | | | | | | | | — | | | | | | | | 14,269 | |
| | | | | | | | | |
UBS Securities | | | 8,034 | | | | | | | | (8,034 | ) | | | | | | | — | | | | | | | | — | | | | | | | | — | |
| | | | | | | | | | | | | | | | | | | | | | | | | | | | | | | | | | | | |
| | | | | | | | | |
Total | | | $151,247 | | | | | | | | $(8,857 | ) | | | | | | | $142,390 | | | | | | | | $126,373 | | | | | | | | $16,017 | |
| | | | | | | | | | | | | | | | | | | | | | | | | | | | | | | | | | | | |
| | | | | | | | | |
Special Equity | | | | | | | | | | | | | | | | | | | | | | | | | | | | | | | | | | | | |
| | | | | | | | | |
Cantor Fitzgerald Securities, Inc. | | | $2,112,206 | | | | | | | | — | | | | | | | | $2,112,206 | | | | | | | | $2,112,206 | | | | | | | | — | |
| | | | | | | | | |
Citadel Securities LLC | | | 2,095,616 | | | | | | | | — | | | | | | | | 2,095,616 | | | | | | | | 2,095,616 | | | | | | | | — | |
| | | | | | | | | |
Citigroup Global Markets, Inc. | | | 2,112,206 | | | | | | | | — | | | | | | | | 2,112,206 | | | | | | | | 2,112,206 | | | | | | | | — | |
| | | | | | | | | |
Jefferies LLC | | | 460,892 | | | | | | | | — | | | | | | | | 460,892 | | | | | | | | 460,892 | | | | | | | | — | |
| | | | | | | | | |
RBC Dominion Securities, Inc. | | | 2,112,206 | | | | | | | | — | | | | | | | | 2,112,206 | | | | | | | | 2,112,206 | | | | | | | | — | |
| | | | | | | | | | | | | | | | | | | | | | | | | | | | | | | | | | | | |
| | | | | | | | | |
Total | | | $8,893,126 | | | | | | | | — | | | | | | | | $8,893,126 | | | | | | | | $8,893,126 | | | | | | | | — | |
| | | | | | | | | | | | | | | | | | | | | | | | | | | | | | | | | | | | |
| | | | | | | | | |
Fund | | Gross Amounts of
Liabilities Presented in
the Statement of
Assets and Liabilities | | | | Offset
Amount | | | | Net
Asset
Balance | | | | Collateral
Received | | | | Net
Amount |
| | | | | | | | | | | | | | | | | | | | | | | | | | | | | | | | | | | | |
| | | | | | | | | |
Global Income Opportunity | | | | | | | | | | | | | | | | | | | | | | | | | | | | | | | | | | | | |
| | | | | | | | | |
Citibank | | | $(8,552) | | | | | | | | — | | | | | | | | $(8,552) | | | | | | | | — | | | | | | | | $(8,552) | |
| | | | | | | | | |
Credit Suisse | | | (12,948) | | | | | | | | — | | | | | | | | (12,948) | | | | | | | | — | | | | | | | | (12,948) | |
| | | | | | | | | |
Merrill Lynch | | | (4,930) | | | | | | | | $823 | | | | | | | | (4,107) | | | | | | | | — | | | | | | | | (4,107) | |
| | | | | | | | | |
UBS Securities | | | (8,997) | | | | | | | | 8,034 | | | | | | | | (963) | | | | | | | | — | | | | | | | | (963) | |
| | | | | | | | | | | | | | | | | | | | | | | | | | | | | | | | | | | | |
| | | | | | | | | |
Total | | | $(35,427) | | | | | | | | $8,857 | | | | | | | | $(26,570) | | | | | | | | — | | | | | | | | $(26,570) | |
| | | | | | | | | | | | | | | | | | | | | | | | | | | | | | | | | | | | |
51
| | |
| | | Notes to Financial Statements(continued) |
13. SUBSEQUENT EVENTS
The Funds have determined that no material events or transactions occurred through the issuance date of the Funds’ financial statements which require an additional disclosure in or adjustment of the Funds’ financial statements.
52
| | |
| | Report of Independent Registered Public Accounting Firm |
TO THE BOARD OF TRUSTEES OF AMG FUNDS III AND SHAREHOLDERS OF AMG MANAGERS LOOMIS SAYLES BOND FUND, AMG MANAGERS GLOBAL INCOME OPPORTUNITY FUND, AND AMG MANAGERS SPECIAL EQUITY FUND
Opinions on the Financial Statements
We have audited the accompanying statements of assets and liabilities, including the schedules of portfolio investments, of AMG Managers Loomis Sayles Bond Fund, AMG Managers Global Income Opportunity Fund, and AMG Managers Special Equity Fund (three of the funds constituting AMG Funds III, hereafter collectively referred to as the “Funds”) as of December 31, 2019, the related statements of operations for the year ended December 31, 2019, the statements of changes in net assets for each of the two years in the period ended December 31, 2019, including the related notes, and the financial highlights for each of the five years in the period ended December 31, 2019 (collectively referred to as the “financial statements”). In our opinion, the financial statements present fairly, in all material respects, the financial position of each of the Funds as of December 31, 2019, the results of each of their operations for the year then ended, the changes in each of their net assets for each of the two years in the period ended December 31, 2019 and the financial highlights for each of the periods of the five years in the period ended December 31, 2019 in conformity with accounting principles generally accepted in the United States of America.
Basis for Opinions
These financial statements are the responsibility of the Funds’ management. Our responsibility is to express an opinion on the Funds’ financial statements based on our audits. We are a public accounting firm registered with the Public Company Accounting Oversight Board (United States) (PCAOB) and are required to be independent with respect to the Funds in accordance with the U.S. federal securities laws and the applicable rules and regulations of the Securities and Exchange Commission and the PCAOB.
We conducted our audits of these financial statements in accordance with the standards of the PCAOB. Those standards require that we plan and perform the audit to obtain reasonable assurance about whether the financial statements are free of material misstatement, whether due to error or fraud.
Our audits included performing procedures to assess the risks of material misstatement of the financial statements, whether due to error or fraud, and performing procedures that respond to those risks. Such procedures included examining, on a test basis, evidence regarding the amounts and disclosures in the financial statements. Our audits also included evaluating the accounting principles used and significant estimates made by management, as well as evaluating the overall presentation of the financial statements. Our procedures included confirmation of securities owned as of December 31, 2019 by correspondence with the custodian and brokers; when replies were not received from brokers, we performed other auditing procedures. We believe that our audits provide a reasonable basis for our opinions.
PricewaterhouseCoopers
LLP Boston, Massachusetts
February 26, 2020
We have served as the auditor of one or more investment companies in AMG Funds Family since 1993.
53
TAX INFORMATION
AMG Managers Loomis Sayles Bond Fund, AMG Managers Global Income Opportunity Fund and AMG Managers Special Equity Fund each hereby designates the maximum amount allowable of its net taxable income as qualified dividends as provided in the Jobs and Growth Tax Relief Reconciliation Act of 2003. The 2019 Form1099-DIV you receive for each Fund will show the tax status of all distributions paid to you during the year.
Pursuant to section 852 of the Internal Revenue Code, AMG Managers Loomis Sayles Bond Fund, AMG Managers Global Income Opportunity Fund and AMG Managers Special Equity Fund each hereby designates $25,267,267, $0, and $41,837,434, respectively, as a capital gain distribution with respect to the taxable year ended December 31, 2019, or if subsequently determined to be different, the net capital gains of such fiscal year.
54
| | |
| | AMG Funds Trustees and Officers |
| | | | | | | | |
The Trustees and Officers of the Trust, their business addresses, principal occupations for the past five years and ages are listed below. The Trustees provide broad supervision over the affairs of the Trust and the Funds. The Trustees are experienced executives who meet periodically throughout the year to oversee the Funds’ activities, review contractual arrangements with companies that provide services to the Funds, and | | | | review the Funds’ performance. Unless otherwise noted, the address of each Trustee or Officer is the address of the Trust: 600 Steamboat Road, Suite 300, Greenwich, Connecticut 06830. There is no stated term of office for Trustees. Trustees serve until their resignation, retirement or removal in | | | | accordance with the Trust’s organizational documents and policies adopted by the Board from time to time. The Chairman of the Trustees, President, Treasurer and Secretary of the Trust are elected by the Trustees annually. Other officers hold office at the pleasure of the Trustees. |
Independent Trustees
The following Trustees are not “interested persons” of the Trust within the meaning of the 1940 Act:
| | |
Number of Funds Overseen in Fund Complex | | Name, Age, Principal Occupation(s) During Past 5 Years and Other Directorships Held by Trustee |
| |
• Trustee since 2012 • Oversees 49 Funds in Fund Complex | | Bruce B. Bingham, 71 Partner, Hamilton Partners (real estate development firm) (1987-Present); Director of The Yacktman Funds (2000-2012). |
| |
• Trustee since 1999 • Oversees 49 Funds in Fund Complex | | Edward J. Kaier, 74 Attorney at Law and Partner, Teeters Harvey Marrone & Kaier LLP (2007-Present); Attorney at Law and Partner, Hepburn Willcox Hamilton & Putnam, LLP (1977-2007); Trustee of Third Avenue Trust (2002-2019); Trustee of Third Avenue Variable Trust (2002-2019). |
| |
• Trustee since 2013 • Oversees 52 Funds in Fund Complex | | Kurt A. Keilhacker, 56 Managing Partner, TechFund Capital (1997-Present); Managing Partner, TechFund Europe (2000-Present); Board Member, 6wind SA, (2002-Present); Managing Partner, Elementum Ventures (2013-Present); Director, MetricStory, Inc. (2017-Present); Trustee, Wheaton College (2018-Present); Trustee, Gordon College (2001-2016). |
| |
• Trustee since 2000 • Oversees 49 Funds in Fund Complex | | Steven J. Paggioli, 69 Independent Consultant (2002-Present); Trustee, Professionally Managed Portfolios (28 portfolios); Advisory Board Member, Sustainable Growth Advisors, LP; Independent Director, Muzinich BDC, Inc. (business development company) (2019-Present); Independent Director, Chase Investment Counsel (2008–2019); Executive Vice President, Secretary and Director, Investment Company Administration, LLC (1990-2001). |
| |
• Trustee since 2013 • Oversees 49 Funds in Fund Complex | | Richard F. Powers III, 73 Adjunct Professor, U.S. Naval War College (2016-Present); Adjunct Professor, Boston College (2010-2013); President and CEO of Van Kampen Investments Inc. (1998-2003). |
| |
• Independent Chairman • Trustee since 2000 • Oversees 52 Funds in Fund Complex | | Eric Rakowski, 61 Professor of Law, University of California at Berkeley School of Law - Boalt Hall (1990-Present); Director of Harding, Loevner Funds, Inc. (9 portfolios); Trustee of Third Avenue Trust (2002-2019); Trustee of Third Avenue Variable Trust (2002-2019). |
| |
• Trustee since 2013 • Oversees 52 Funds in Fund Complex | | Victoria L. Sassine, 54 Adjunct Professor, Babson College (2007–Present); Director, Board of Directors, PRG Group (2017-Present); CEO, Founder, Scale Smarter Partners, LLC (2018-Present); Chairperson, Board of Directors, Business Management Associates (2018-Present). |
| |
• Trustee since 1987 • Oversees 49 Funds in Fund Complex | | Thomas R. Schneeweis, 72 Professor Emeritus, University of Massachusetts (2013-Present); President, TRS Associates (1982-Present); Board Member, Chartered Alternative Investment Association (“CAIA”) (2002-Present); Director, Institute for Global Asset and Risk Management (Education) (2010-Present);Co-Owner, Quantitative Investment Technologies (2014-Present); Director of Research, Yes Wealth Management (2018-Present); Partner, S Capital Wealth Advisors (2015-2018); Partner, S Capital Management, LLC (2007-2015); President, Alternative Investment Analytics, LLC, (formerly Schneeweis Partners, LLC) (2001-2013). |
55
| | |
| | AMG Funds Trustees and Officers(continued) |
Interested Trustees
Each Trustee in the following table is an “interested person” of the Trust within the meaning of the 1940 Act. Ms. Carsman is an interested person of the Trust within the meaning of the 1940 Act by virtue of her position with, and interest in securities of, AMG.
| | |
Number of Funds Overseen in Fund Complex | | Name, Age, Principal Occupation(s) During Past 5 Years and Other Directorships Held by Trustee |
• Trustee since 2011 • Oversees 52 Funds in Fund Complex | | Christine C. Carsman, 67 Senior Policy Advisor, Affiliated Managers Group, Inc. (2019-Present); Director of Harding, Loevner Funds, Inc. (9 portfolios); Executive Vice President, Deputy General Counsel and Chief Regulatory Counsel, Affiliated Managers Group, Inc. (2017-2018); Director (2010-2018) and Chair of the Board of Directors (2015-2018), AMG Funds plc; Senior Vice President and Deputy General Counsel, Affiliated Managers Group, Inc. (2011-2016); Senior Vice President and Chief Regulatory Counsel, Affiliated Managers Group, Inc. (2007-2011); Vice President and Chief Regulatory Counsel, Affiliated Managers Group, Inc. (2004-2007); Secretary and Chief Legal Officer, AMG Funds, AMG Funds I, AMG Funds II and AMG Funds III (2004-2011); Senior Counsel, Vice President and Director of Operational Risk Management and Compliance, Wellington Management Company, LLP (1995-2004). |
|
| Officers |
Position(s) Held with Fund and Length of Time Served | | Name, Age, Principal Occupation(s) During Past 5 Years |
• President since 2018 • Principal Executive Officer since 2018 • Chief Executive Officer since 2018 • Chief Operating Officer since 2007 | | Keitha L. Kinne, 61 Chief Operating Officer, AMG Funds LLC (2007-Present); Chief Investment Officer, AMG Funds LLC (2008-Present); President and Principal, AMG Distributors, Inc. (2018-Present); Chief Operating Officer, AMG Distributors, Inc. (2007-Present); President, Chief Executive Officer and Principal Executive Officer, AMG Funds, AMG Funds I, AMG Funds II, AMG Funds III and AMG Funds IV (2018-Present); Chief Operating Officer, AMG Funds, AMG Funds I, AMG Funds II, and AMG Funds III (2007-Present); Chief Operating Officer, AMG Funds IV (2016-Present); Chief Operating Officer and Chief Investment Officer, Aston Asset Management, LLC (2016); President and Principal Executive Officer, AMG Funds, AMG Funds I, AMG Funds II and AMG Funds III (2012-2014); Managing Partner, AMG Funds LLC (2007-2014); President and Principal, AMG Distributors, Inc. (2012-2014); Managing Director, Legg Mason & Co., LLC (2006-2007); Managing Director, Citigroup Asset Management (2004-2006). |
• Secretary since 2015 • Chief Legal Officer since 2015 | | Mark J. Duggan, 54 Senior Vice President and Senior Counsel, AMG Funds LLC (2015-Present); Secretary and Chief Legal Officer, AMG Funds, AMG Funds I, AMG Funds II, AMG Funds III and AMG Funds IV (2015-Present); Attorney, K&L Gates, LLP (2009-2015). |
• Chief Financial Officer since 2017 • Treasurer since 2017 • Principal Financial Officer since 2017 • Principal Accounting Officer since 2017 | | Thomas G. Disbrow, 53 Vice President, Mutual Fund Treasurer & CFO, AMG Funds, AMG Funds LLC (2017-Present); Chief Financial Officer, Principal Financial Officer, Treasurer and Principal Accounting Officer, AMG Funds, AMG Funds I, AMG Funds II, AMG Funds III and AMG Funds IV (2017-Present); Managing Director - Global Head of Traditional Funds Product Control, UBS Asset Management (Americas), Inc. (2015-2017); Managing Director - Head of North American Funds Treasury, UBS Asset Management (Americas), Inc. (2011-2015). |
• Deputy Treasurer since 2017 | | John A. Starace, 49 Director, Mutual Fund Accounting, AMG Funds LLC (2017-Present); Vice President, Deputy Treasurer of Mutual Funds Services, AMG Funds LLC (2014-2017); Deputy Treasurer, AMG Funds, AMG Funds I, AMG Funds II, AMG Funds III and AMG Funds IV (2017-Present); Vice President, Citi Hedge Fund Services (2010-2014); Audit Senior Manager (2005-2010) and Audit Manager (2001-2005), Deloitte & Touche LLP. |
• Chief Compliance Officer since 2019 | | Patrick J. Spellman, 45 Vice President, Chief Compliance Officer, AMG Funds LLC (2017-Present); Chief Compliance Officer and Sarbanes-Oxley Code of Ethics Compliance Officer, AMG Funds, AMG Funds I, AMG Funds II, AMG Funds III and AMG Funds IV (2019-Present); Chief Compliance Officer, AMG Distributors, Inc., (2010-Present) Senior Vice President, Chief Compliance Officer, AMG Funds LLC (2011-2017); Anti-Money Laundering Compliance Officer, AMG Funds, AMG Funds I, AMG Funds II, and AMG Funds III (2014-2019); Anti-Money Laundering Officer, AMG Funds IV, (2016-2019); Compliance Manager, Legal and Compliance, Affiliated Managers Group, Inc. (2005-2011). |
• Assistant Secretary since 2016 | | Maureen A. Meredith, 34 Vice President, Counsel, AMG Funds LLC (2019-Present); Director, Counsel, AMG Funds LLC (2017-2018); Vice President, Counsel, AMG Funds LLC (2015-2017); Assistant Secretary, AMG Funds, AMG Funds I, AMG Funds II, AMG Funds III and AMG Funds IV (2016-Present); Associate, Ropes & Gray LLP (2011-2015); Law Fellow, Massachusetts Appleseed Center for Law and Justice (2010-2011). |
• Anti-Money Laundering Compliance Officer since 2019 | | Hector D. Roman, 42 Director, Legal and Compliance, AMG Funds LLC (2020-Present); Manager, Legal and Compliance, AMG Funds LLC (2017-2019); Director of Compliance, Morgan Stanley Investment Management (2015-2017); Senior Advisory, PricewaterhouseCoopers LLP (2014-2015); Risk Manager, Barclays Investment Bank (2008-2014); Anti-Money Laundering Compliance Officer, AMG Funds, AMG Funds I, AMG Funds II, AMG Funds III and AMG Funds IV (2019-Present). |
56
| | | | |
INVESTMENT MANAGER AND ADMINISTRATOR AMG Funds LLC 600 Steamboat Road, Suite 300 Greenwich, CT 06830 800.548.4539 DISTRIBUTOR AMG Distributors, Inc. 600 Steamboat Road, Suite 300 Greenwich, CT 06830 800.548.4539 CUSTODIAN The Bank of New York Mellon 111 Sanders Creek Parkway East Syracuse, NY 13057 | | LEGAL COUNSEL Ropes & Gray LLP Prudential Tower, 800 Boylston Street Boston, MA 02199-3600 TRANSFER AGENT BNY Mellon Investment Servicing (US) Inc. Attn: AMG Funds P.O. Box 9769 Providence, RI 02940 800.548.4539 | | This report is prepared for the Funds’ shareholders. It is authorized for distribution to prospective investors only when preceded or accompanied by an effective prospectus. To receive a free copy of the prospectus or Statement of Additional Information, which includes additional information about Fund Trustees, please contact us by calling 800.548.4539. Distributed by AMG Distributors, Inc., member FINRA/SIPC. Current net asset values per share for each Fund are available on the Funds’ website at amgfunds.com. A description of the policies and procedures each Fund uses to vote its proxies is available: (i) without charge, upon request, by calling 800.548.4539, or (ii) on the Securities and Exchange Commission’s (SEC) website at sec.gov. For information regarding each Fund’s proxy voting record for the12-month period ended June 30, call 800.548.4539 or visit the SEC website at sec.gov. The Funds file their complete schedule of portfolio holdings with the SEC for the first and third quarters of each fiscal year as an exhibit to their reports on FormN-PORT, which has replaced FormN-Q. The Funds’ portfolio holdings on FormN-PORT are available on the SEC’s website at sec.gov. To review a complete list of the Funds’ portfolio holdings, or to view the most recent semiannual report or annual report, please visit amgfunds.com. |
| | |
| | | | | |
| | | | | | | | | | | | |
| | | AFFILIATE SUBADVISED FUNDS BALANCED FUNDS AMG Chicago Equity Partners Balanced Chicago Equity Partners, LLC AMG FQ Global Risk-Balanced First Quadrant, L.P. EQUITY FUNDS AMG FQ Tax-Managed U.S. Equity AMG FQ Long-Short Equity First Quadrant, L.P. AMG Frontier Small Cap Growth Frontier Capital Management Co., LLC AMG GW&K Small Cap Core AMG GW&K Small/Mid Cap AMG GW&K Trilogy Emerging Markets Equity AMG GW&K Trilogy Emerging Wealth Equity GW&K Investment Management, LLC AMG Renaissance Large Cap Growth The Renaissance Group LLC AMG River Road Dividend All Cap Value AMG River Road Dividend All Cap Value II AMG River Road Focused Absolute Value AMG River Road Long-Short AMG River Road Small-Mid Cap Value AMG River Road Small Cap Value River Road Asset Management, LLC AMG SouthernSun Small Cap AMG SouthernSun U.S. Equity SouthernSun Asset Management, LLC | | | | AMG TimesSquare Emerging Markets Small Cap AMG TimesSquare Global Small Cap AMG TimesSquare International Small Cap AMG TimesSquare Mid Cap Growth AMG TimesSquare Small Cap Growth TimesSquare Capital Management, LLC AMG Yacktman AMG Yacktman Focused AMG Yacktman Focused Fund - Security Selection Only AMG Yacktman Special Opportunities Yacktman Asset Management LP FIXED INCOME FUNDS AMG GW&K Core Bond ESG AMG GW&K Enhanced Core Bond ESG AMG GW&K Municipal Bond AMG GW&K Municipal Enhanced Yield GW&K Investment Management, LLC OPEN-ARCHITECTURE FUNDS EQUITY FUNDS AMG Managers Brandywine AMG Managers Brandywine Advisors Mid Cap Growth AMG Managers Brandywine Blue Friess Associates, LLC AMG Managers Cadence Emerging Companies AMG Managers Cadence Mid Cap Cadence Capital Management LLC AMG Managers CenterSquare Real Estate CenterSquare Investment Management LLC | | | | AMG Managers Emerging Opportunities WEDGE Capital Management L.L.P. Next Century Growth Investors LLC RBC Global Asset Management (U.S.) Inc. AMG Managers Fairpointe ESG Equity AMG Managers Fairpointe Mid Cap Fairpointe Capital LLC AMG Managers LMCG Small Cap Growth LMCG Investments, LLC AMG Managers Montag & Caldwell Growth Montag & Caldwell, LLC AMG Managers Pictet International Pictet Asset Management Limited AMG Managers Silvercrest Small Cap Silvercrest Asset Management Group LLC AMG Managers Skyline Special Equities Skyline Asset Management, L.P. AMG Managers Special Equity Ranger Investment Management, L.P. Lord, Abbett & Co. LLC Smith Asset Management Group, L.P. Federated MDTA LLC FIXED INCOME FUNDS AMG Managers Doubleline Core Plus Bond DoubleLine Capital LP AMG Managers Global Income Opportunity AMG Managers Loomis Sayles Bond Loomis, Sayles & Company, L.P. | | |
| | | | |
| | | | |
amgfunds.com | | | | 123119 AR078 |
Registrant has adopted a Code of Ethics. See attached Exhibit (a)(1).
| Item 3. | AUDIT COMMITTEE FINANCIAL EXPERT |
Registrant’s Board of Trustees has determined that independent Trustee Mr. Steven J. Paggioli qualifies as an Audit Committee Financial Expert. Mr. Paggioli is “independent” as such term is defined in FormN-CSR.
| Item 4. | PRINCIPAL ACCOUNTANT FEES AND SERVICES |
The aggregate fees billed by the Funds’ independent registered public accounting firm, PricewaterhouseCoopers LLP (“PwC”), to the Funds for the Funds’ two most recent fiscal years for professional services rendered for audits of annual financial statements, or services that are normally provided in connection with statutory and regulatory filings or engagements (“Audit Fees”) were as follows:
| | | | | | | | |
Fund - AMG Funds III | | Fiscal 2019 | | | Fiscal 2018 | |
AMG Managers Special Equity Fund | | $ | 23,678 | | | $ | 20,208 | |
AMG Managers Loomis Sayles Bond Fund | | $ | 47,310 | | | $ | 48,998 | |
AMG Managers Global Income Opportunity Fund | | $ | 33,930 | | | $ | 31,648 | |
There were no fees billed by PwC to the Funds in their two recent fiscal years for services rendered for assurance and related services that are reasonably related to the performance of the audit or review of the Fund’s financial statements, but are not reported as Audit Fees (“Audit-Related Fees”).
For the Funds’ two most recent fiscal years, there were no Audit-Related Fees billed by PwC for engagements related directly to the operations and financial reporting of one or more Funds by a Fund Service Provider. A Fund Service Provider is (a) any investment adviser to the Fund (not including any Subadvisor whose role is primarily portfolio management and is subcontracted with or overseen by another investment adviser) or (b) any entity that provides ongoing services to the Fund and is controlling, controlled by or under common control with a Fund investment adviser described in (a).
The aggregate fees billed by PwC to the Funds for the two most recent fiscal years for professional services rendered for tax compliance, tax advice, and tax planning (“Tax Fees”) were as follows:
| | | | | | | | |
Fund - AMG Funds III | | Fiscal 2019 | | | Fiscal 2018 | |
AMG Managers Special Equity Fund | | $ | 6,250 | | | $ | 7,369 | |
AMG Managers Loomis Sayles Bond Fund | | $ | 8,400 | | | $ | 9,425 | |
AMG Managers Global Income Opportunity Fund | | $ | 8,400 | | | $ | 9,425 | |
For the Funds’ two most recent fiscal years, Tax Fees billed by PwC for engagements by Fund Service Providers that related directly to the operations and financial reporting of the Funds were $0 for fiscal 2019 and $0 for fiscal 2018, respectively.
The services for which Tax Fees were charged comprise all services performed by professional staff in PwC’s tax division except those services related to the audit. Typically, this category would include fees for tax compliance, tax planning, and tax advice. Tax compliance, tax advice, and tax planning services include preparation of original and amended tax returns, claims for refund and tax payment-planning services, assistance with tax audits and appeals, tax advice related to mergers and acquisitions and requests for rulings or technical advice from taxing authorities.
There were no other fees billed by PwC to the Funds for all othernon-audit services (“Other Fees”) during the Funds’ two most recent fiscal years. During the same period, there were no Other Fees billed by PwC for engagements by Fund Service Providers that related directly to the operations and financial reporting of the Funds.
(e)(1)According to policies adopted by the Audit Committee, services provided by PwC to the Funds must bepre-approved by the Audit Committee. On an annual basis, the Audit Committee reviews andpre-approves various types of services that PwC may perform for the Funds without specific approval of each engagement, subject to specified budget limitations. As contemplated by the Sarbanes-Oxley Act of 2002 and related SEC rules, the Audit Committee alsopre-approvesnon-audit services provided by PwC to any Fund Service Provider for any engagement that relates directly to the operations and financial reporting of the Funds. Any engagement that is not alreadypre-approved or that will exceed apre-approved budget must be submitted to the Audit Committee forpre-approval. The Chairman of the Audit Committee is authorized on behalf of the Board of Trustees and the Audit Committee to approve the engagement of PwC to performnon-audit services subject to certain conditions, including notification to the Audit Committee of suchpre-approval not later than the next meeting of the Audit Committee following the date of suchpre-approval.
(e)(2) None.
(f) Not applicable.
(g) The aggregate fees billed by PwC in 2019 and 2018 fornon-audit services rendered to the Funds and Fund Service Providers were $72,550 and $75,719, respectively. For the fiscal year ended December 31, 2019, this amount reflects the amounts disclosed above in Item 4(b),(c),(d), plus $49,500 in fees billed to the Fund Service Providers fornon-audit services that did not relate directly to the operations and financial reporting of the Funds. For the fiscal year ended December 31, 2018, this amount reflects the amounts disclosed above in Item 4(b),(c),(d), plus $49,500 in fees billed to the Fund Service Providers fornon-audit services that did not relate directly to the operations and financial reporting of the Funds.
(h) The Trust’s Audit Committee has considered whether the provision ofnon-audit services by registrant’s independent registered public accounting firm to the registrant’s investment adviser, and any entity controlling, controlled by, or under common control with the investment adviser that provided ongoing services to the registrant that were notpre-approved by the Committee (because such services did not relate directly to the operations and financial reporting of the registrant) was compatible with maintaining the independence of the independent registered public accounting firm.
| Item 5. | AUDIT COMMITTEE OF LISTED REGISTRANTS |
Not applicable.
| Item 6. | SCHEDULE OF INVESTMENTS |
The schedule of investments in securities of unaffiliated issuers as of the close of the reporting period is included as part of the report to shareholders filed under Item 1 of this form.
| Item 7. | DISCLOSURE OF PROXY VOTING POLICIES AND PROCEDURES FORCLOSED-END MANAGEMENT INVESTMENT COMPANIES |
Not applicable.
| Item 8. | PORTFOLIO MANAGERS OFCLOSED-END MANAGEMENT INVESTMENT COMPANIES |
Not applicable.
| Item 9. | PURCHASES OF EQUITY SECURITIES BYCLOSED-END MANAGEMENT INVESTMENT COMPANIES AND AFFILIATED PURCHASERS |
Not applicable.
| Item 10. | SUBMISSION OF MATTERS TO A VOTE OF SECURITY HOLDERS |
Not applicable.
| Item 11. | CONTROLS AND PROCEDURES |
(a) The Registrant’s principal executive and principal financial officers have concluded, based on their evaluation of the registrant’s disclosure controls and procedures as of a date within 90 days of the filing of this report, that the Registrant’s disclosure controls and procedures are reasonably designed to ensure that
information required to be disclosed by the Registrant on FormN-CSR is recorded, processed, summarized and reported within the required time periods and that information required to be disclosed by the registrant in the reports that it files or submits on FormN-CSR is accumulated and communicated to the Registrant’s management, including its principal executive and principal financial officers, as appropriate to allow timely decisions regarding required disclosure.
(b) There were no changes in the Registrant’s internal control over financial reporting during the period covered by this report that have materially affected, or are reasonably likely to materially affect, the internal control over financial reporting.
| Item 12. | DISCLOSURE OF SECURITIES LENDING ACTIVITIES FORCLOSED-END MANAGEMENT INVESTMENT COMPANIES |
Not applicable.
| | |
| (a)(1) | | Any Code of Ethics or amendments hereto. Filed herewith. |
| |
| (a)(2) | | Certifications pursuant to Rule30a-2(a) under the Investment Company Act of 1940 - Filed herewith. |
| |
| (a)(3) | | Not applicable. |
| |
| (b) | | Certifications pursuant to Rule30a-2(b) under the Investment Company Act of 1940 - Filed herewith. |
SIGNATURES
Pursuant to the requirements of the Securities Exchange Act of 1934 and the Investment Company Act of 1940, the registrant has duly caused this report to be signed on its behalf by the undersigned, thereunto duly authorized.
| | |
| AMG FUNDS III |
| |
| By: | | /s/ Keitha L. Kinne |
| | Keitha L. Kinne, Principal Executive Officer |
| |
| Date: | | March 6, 2020 |
Pursuant to the requirements of the Securities Exchange Act of 1934 and the Investment Company Act of 1940, this report has been signed below by the following persons on behalf of the registrant and in the capacities and on the dates indicated.
| | |
| By: | | /s/ Keitha L. Kinne |
| | Keitha L. Kinne, Principal Executive Officer |
| |
| Date: | | March 6, 2020 |
| | |
| By: | | /s/ Thomas Disbrow |
| | Thomas Disbrow, Principal Financial Officer |
| |
| Date: | | March 6, 2020 |