UNITED STATES
SECURITIES AND EXCHANGE COMMISSION
Washington, D.C. 20549
FORMN-CSR
CERTIFIED SHAREHOLDER REPORT OF
REGISTERED MANAGEMENT INVESTMENT COMPANIES
Investment Company Act file number:811-03752
AMG Funds III
(Exact name of registrant as specified in charter)
600 Steamboat Road, Suite 300, Greenwich, Connecticut 06830
(Address of principal executive offices) (Zip code)
AMG Funds LLC
600 Steamboat Road, Suite 300, Greenwich, Connecticut 06830
(Name and address of agent for service)
Registrant’s telephone number, including area code: (203)299-3500
Date of fiscal year end: May 31
Date of reporting period: June 1, 2018 – May 31, 2019
(Annual Shareholder Report)
| Item 1. | Reports to Shareholders |
| | |

| | ANNUAL REPORT |
| | | | | | |
| | | AMG Funds | | |
| | | | |
| | | May 31, 2019 | | | | |
| | |
| | | AMG Managers Cadence Mid Cap Fund |
| | | Class N: MCMAX | | | Class I: MCMYX | | | Class Z: MCMFX |
| | |
| | | AMG Managers Cadence Emerging Companies Fund |
| | | Class N: MECAX | | | Class I: MECIX | | | Class Z:MECZX |
| | |
| | | |
Beginning on January 1, 2021, as permitted by regulations adopted by the Securities and Exchange Commission, paper copies of the Funds’ shareholder reports like this one will no longer be sent by mail, unless you specifically request paper copies of the reports from the Funds or from your financial intermediary, such as a broker-dealer or bank. Instead, the reports will be made available on the Funds’ website (https://www.amgfunds.com/resources/order_literature.html), and you will be notified by mail each time a report is posted and provided with a website link to access the report.
If you already elected to receive shareholder reports electronically, you will not be affected by this change and you need not take any action. You may elect to receive shareholder reports and other communications from the Funds electronically at any time by contacting your financial intermediary or, if you invest directly with the Funds, by logging into your account at www.amgfunds.com.
You may elect to receive all future reports in paper free of charge. If you invest through a financial intermediary, you can contact your financial intermediary to request that you continue to receive paper copies of your shareholder reports. If you invest directly with the Funds, you can call 1.800.548.4539 to inform the Funds that you wish to continue receiving paper copies of your shareholder reports. Your election to receive reports in paper will apply to all funds in the AMG Funds Family of Funds held in your account if you invest through your financial intermediary or all funds in the AMG Funds Family of Funds held with the fund complex if you invest directly with the Funds.
| | |
| | |
| | | |
amgfunds.com | | 053119 AR065 |
| | |
|
| |
AMG Funds |
| Annual Report — May 31, 2019 |
| | | | | | | | |
| | TABLE OF CONTENTS | | | PAGE | | | |
| | | LETTER TO SHAREHOLDERS | | | 2 | | | |
| | | | |
| | | ABOUT YOUR FUND’S EXPENSES | | | 3 | | | |
| | | | |
| | | PORTFOLIO MANAGER’S COMMENTS, FUND SNAPSHOTS AND SCHEDULES OF PORTFOLIO INVESTMENTS | | | | | | |
| | | | |
| | | AMG Managers Cadence Mid Cap Fund | | | 4 | | | |
| | | | |
| | | AMG Managers Cadence Emerging Companies Fund | | | 9 | | | |
| | | | |
| | | FINANCIAL STATEMENTS | | | | | | |
| | | | |
| | | Statement of Assets and Liabilities | | | 15 | | | |
| | | Balance sheets, net asset value (NAV) per share computations and cumulative distributable earnings (loss) | | | | | | |
| | | | |
| | | Statement of Operations | | | 17 | | | |
| | | Detail of sources of income, expenses, and realized and unrealized gains (losses) during the fiscal year | | | | | | |
| | | | |
| | | Statements of Changes in Net Assets | | | 18 | | | |
| | | Detail of changes in assets for the past two fiscal years | | | | | | |
| | | | |
| | | Financial Highlights | | | 19 | | | |
| | | Historical net asset values per share, distributions, total returns, income and expense ratios, turnover ratios and net assets | | | | | | |
| | | | |
| | | Notes to Financial Statements | | | 25 | | | |
| | | Accounting and distribution policies, details of agreements and transactions with Fund management and affiliates, and descriptions of certain investment risks | | | | | | |
| | | | |
| | | REPORT OF INDEPENDENT REGISTERED PUBLIC ACCOUNTING FIRM | | | 31 | | | |
| | | | |
| | | OTHER INFORMATION | | | 32 | | | |
| | | | |
| | | TRUSTEES AND OFFICERS | | | 33 | | | |
Nothing contained herein is to be considered an offer, sale or solicitation of an offer to buy shares of any series of the AMG Funds family of mutual funds. Such offering is made only by prospectus, which includes details as to offering price and other material information.
| | | | |
| | | | |
| | Letter to Shareholders | | |
| | | | |
Dear Shareholder:
The fiscal year ended May 31, 2019, was a volatile period for financial markets and led to mixed returns for investors. U.S. stock markets climbed to new record highs through the summer of 2018 as a strong domestic economy enabled investors to shrug off rising interest rates and mounting global macro risks. Resiliency gave way to volatility as hawkish U.S. Federal Reserve (“Fed”) policy and an escalation of the U.S./China trade war triggered a global selloff late in 2018. A dovish pivot from global central banks fueled a strong rebound in 2019 as the U.S. bull market celebrated its10-year anniversary. However, trade tensions resurfaced in May and remained a key risk for global investors. The S&P 500® Index returned a modestly positive 3.78% during the fiscal year period. International equities were less resistant to pressures facing the global economy and returned-6.26% as measured by the MSCI All Country World ex USA Index.
In total, only seven out of eleven sectors of the S&P 500® Index were positive during the prior 12 months. There was significant dispersion in the Index as defensive stocks significantly outperformed more cyclical stocks. The real estate and utilities sectors led the Index with returns of 19.88% and 18.17%, respectively. Companies within the energy and materials sectors lagged other sectors with returns of-20.00% and-6.94%, respectively. Growth stocks outperformed value with returns of 5.39% and 1.45%, respectively, for the Russell 1000® Growth and Russell 1000® Value Indexes. International developed and emerging markets demonstrated significantly weaker returns, with the MSCI EAFE and MSCI Emerging Markets Index returning-5.75% and-8.70%, respectively, in the 12 months ending May 31, 2019.
The Fed raised short-term interest rates four times over the course of the year to end at a target rate of 2.25%–2.50%. The yield on the10-year U.S. Treasury note crossed above 3% at the end of September but fell dramatically as investors sought to insulate themselves from market volatility. As the Fed shifted to a more dovish stance in 2019, the10-year Treasury yield fell more than 1% to a yield of 2.14% as of May 31, 2019. The plunge in long-term interest rates caused the yield curve to partially invert with3-month yields rising higher than the10-year yield. By the end of the fiscal year, federal funds futures probabilities were signaling a strong likelihood the Fed would cut their target interest rate at the July meeting1.The Bloomberg Barclays U.S. Aggregate Bond Index, a broad measure of U.S. bond market performance, ended the fiscal year with a 6.40% return. High yield bonds lagged the broader bond market and returned 5.51% as measured by the return of the Bloomberg Barclays U.S. Corporate High Yield Bond Index. Municipal bonds performed strongly with a 6.40% return for the Bloomberg Barclays Municipal Bond Index.
AMG Funds appreciates the privilege of providing investment tools to you and your clients. Our foremost goal is to provide investment solutions that help our
shareholders successfully reach their long-term investment goals. AMG Funds provides access to a distinctive array of actively managed capital appreciation investment strategies. We thank you for your continued confidence and investment in AMG Funds. You can rest assured that under all market conditions our team is focused on delivering excellent investment management services for your benefit.
Respectfully,

Keitha Kinne
President
AMG Funds
| | | | | | | | |
| Average Annual Total Returns | | Periods ended
May 31, 2019* |
| | | | |
Stocks: | | | | 1 Year | | 3 Years | | 5 Years |
| | | | |
| Large Caps | | (S&P 500® Index) | | 3.78% | | 11.72% | | 9.66% |
| | | | |
Small Caps | | (Russell 2000® Index) | | -9.04% | | 9.75% | | 6.71% |
| | | | |
International | | (MSCI All Country World Ex USA Index) | | -6.26% | | 6.72% | | 1.31% |
Bonds: | | | | | | | | |
| Investment Grade | | (Bloomberg Barclays U.S. Aggregate Bond Index) | | 6.40% | | 2.50% | | 2.70% |
| | | | |
| High Yield | | (Bloomberg Barclays U.S. Corporate High Yield Bond Index) | | 5.51% | | 7.04% | | 4.40% |
| | | | |
| Tax-exempt | | (Bloomberg Barclays Municipal Bond Index) | | 6.40% | | 2.96% | | 3.58% |
| | | | |
| Treasury Bills | | (ICE BofAML U.S.6-Month Treasury Bill Index) | | 2.40% | | 1.46% | | 0.99% |
1 CME FedWatch tool
*Source: FactSet. Past performance is no guarantee of future results.
| | | | |
| | | | | |
| | | About Your Fund’s Expenses | | |
| | | | |
| | | | |
As a shareholder of a Fund, you may incur two types of costs: (1) transaction costs, which may include sales charges (loads) on purchase payments; redemption fees; and exchange fees; and (2) ongoing costs, including management fees; distribution(12b-1) fees; and other Fund expenses. This example is intended to help you understand your ongoing costs (in dollars) of investing in the Fund and to compare these costs with the ongoing costs of investing in other mutual funds. The example is based on $1,000 invested at the beginning of the period and held for the entire period as indicated below. ACTUAL EXPENSES The first line of the following table provides information about the actual account values and | | actual expenses. You may use the information in this line, together with the amount you invested, to estimate the expenses that you paid over the period. Simply divide your account value by $1,000 (for example, an $8,600 account value divided by $1,000 = 8.6), then multiply the result by the number in the first line under the heading entitled “Expenses Paid During Period” to estimate the expenses you paid on your account during this period. HYPOTHETICAL EXAMPLE FOR COMPARISON PURPOSES The second line of the following table provides information about hypothetical account values and hypothetical expenses based on the Fund’s actual expense ratio and an assumed annual rate of return of 5% before expenses, which is not the Fund’s | | actual return. The hypothetical account values and expenses may not be used to estimate the actual ending account balance or expenses you paid for the period. You may use this information to compare the ongoing costs of investing in the Fund and other funds by comparing this 5% hypothetical example with the 5% hypothetical examples that appear in the shareholder reports of other funds. Please note that the expenses shown in the table are meant to highlight your ongoing costs only and do not reflect any transactional costs, such as sales charges (loads), redemption fees, or exchange fees. Therefore, the second line of the table is useful in comparing ongoing costs only, and will not help you determine the relative total costs of owning different funds. |
| | | | | |
| | | | | | | | | | |
Six Months Ended May 31, 2019 | | Expense
Ratio for
the Period | | Beginning
Account
Value 12/01/18 | | Ending
Account
Value
05/31/19 | | Expenses Paid
During
the Period* | |
AMG Managers Cadence Mid Cap Fund | |
| |
| Based on Actual Fund Return | | | | |
| | | | |
| Class N | | 1.06% | | $1,000 | | $985 | | | $5.25 | |
| | | | |
| Class I | | 0.87% | | $1,000 | | $986 | | | $4.31 | |
| | | | |
| Class Z | | 0.72% | | $1,000 | | $987 | | | $3.57 | |
| |
| Based on Hypothetical 5% Annual Return | | | | |
| | | | |
| Class N | | 1.06% | | $1,000 | | $1,020 | | | $5.34 | |
| | | | |
| Class I | | 0.87% | | $1,000 | | $1,021 | | | $4.38 | |
| | | | |
Class Z | | 0.72% | | $1,000 | | $1,021 | | | $3.63 | |
|
| AMG Managers Cadence Emerging Companies Fund | |
| |
| Based on Actual Fund Return | | | | |
| | | | |
| Class N | | 1.15% | | $1,000 | | $925 | | | $5.52 | |
| | | | |
| Class I | | 1.00% | | $1,000 | | $925 | | | $4.80 | |
| | | | |
| Class Z | | 0.89% | | $1,000 | | $926 | | | $4.27 | |
| |
| Based on Hypothetical 5% Annual Return | | | | |
| | | | |
| Class N | | 1.15% | | $1,000 | | $1,019 | | | $5.79 | |
| | | | |
| Class I | | 1.10% | | $1,000 | | $1,020 | | | $5.04 | |
| | | | |
| Class Z | | 0.89% | | $1,000 | | $1,020 | | | $4.48 | |
| * | Expenses are equal to the Fund’s annualized expense ratio multiplied by the average account value over the period, multiplied by the number of days in the most recent fiscal half-year (182), then divided by 365. | |
| | | | |
| | | | | |
| | | AMG Managers Cadence Mid Cap Fund | | |
| | | Portfolio Manager’s Comments(unaudited) | | |
| | | | | | | | |
For the fiscal year ended May 31, 2019, the AMG Managers Cadence Mid Cap Fund (Class Z) (the “Fund” or “Portfolio”) returned (3.73%), lagging its benchmark, the Russell Midcap® Growth Index, which returned 6.87%. PERFORMANCE SUMMARY The fiscal year ending May 31, 2019, was a volatile time in U.S. markets. Early strength was followed by near bear market conditions for the broad market in the fourth quarter of 2018, driven by fears of a Chinese trade war and indications of prolonged interest rate hikes from the U.S. Federal Reserve (the “Fed”). Trade deal optimism and a dovish pivot by the Fed spawned a strong recovery in Q1, leading the broad market (Russell 3000® Index) to almost hit new highs by early May 2019, before a breakdown in trade talks sent the market south bymonth-end. Smaller companies did not recover as strongly as larger-caps and remain well below their 2018 highs. As mentioned, the fiscal year ended May 31, 2019, was a very volatile time in U.S. markets with a great deal of performance dispersion across styles and capitalization. Within themid-cap space growth trounced value with the Russell Midcap Growth Index up 6.87%, outperforming value by nearly 9%. The Fund’s disciplined growth strategy invests in stocks that exhibit a combination of growth, quality, and valuation. For the second year in a row, these attributes in our process served as a drag on results. Valuation underperformed as investors placed a strong premium on growth at any price. For example, our analysis shows the grouping ofmid-cap growth stocks with a price-earnings ratio less than 24x (bottom two quintiles) strongly lagged the overall benchmark. When viewed from a price to cashflow perspective, results were even more revealing, with stocks with a P/CF of under 14x (again the bottom two quintiles) falling for the period while those with a P/CF over 18x (the top two quintiles) rose over 14% in the benchmark. In keeping with our approach, the Fund was overweight the more attractively valued stocks (lower valuation ratios) and underweight the more expensive ones (higher ratios). This pattern of | | | | reasonably valued stocks underperforming more expensive ones was pervasive across sectors, broadly hurting stock selection. Thus, our more conservative growth approach faced strong headwinds, whereas aggressive growth strategies once again had a strong tailwind. While the valuation component of our process has not been rewarded during this period, we believe consistent inclusion of valuation in our strategy is an important underpinning of sound investing over longer investment horizons. At the sector level, technology was the dominant sector over this period and accounted for 65% of the Russell Midcap Growth’s performance. This sector detracted over-2% from relative performance, due to both allocation (underweighting a strong sector) and stock selection. Almost all of the strong returns in the benchmark were derived from the software and services industry group, which at approximately 21% of the benchmark was by far the largest weighting of all 24 industry groups. The Portfolio’s software and services holdings rose 22%, better than the benchmark’s 21%. Nevertheless, the Portfolio’s underallocation (11% vs. 21%) detracted from relative performance. Many of this fiscal year’s top performing software and services stocks have elevated valuations and thus are beyond the reach of our disciplined growth process, accounting for much of the underweight. Stock selection in the semiconductor space also contributed to underperformance as this group was hurt most by sentiment around trade tensions, global growth worries, and supply chain concerns. The consumer discretionary sector was also a large detractor with overweights in the auto industry and stock selection in retailing hurting performance. Stock performance in auto and auto parts was also a detractor, with all four of our holdings falling more than-25% for the year. At the other end of the spectrum, healthcare and energy were top contributors to performance. While we held a market weight in healthcare, stock selection helped us outperform the benchmark by over 15% in the sector. Energy (the poorest | | | | performing sector in the index) was a different story in that we outperformed by avoiding the group altogether. MARKET OUTLOOK Looking ahead, economic statistics from employment to consumer spending continue to be healthy, although some, like industrial production, have retreated from recent highs. We wrote last year that trade policy has now taken center stage, and there it remains. The recent failure to strike a deal with China and the subsequenttit-for-tat tariff volleys have the market on edge. An escalation of tensions could negatively impact corporate earnings, and business confidence could suffer. The combination of cooling economic statistics and tariff uncertainty has not only paused the Fed’s pattern of rate increases over the last several years but has led to rising expectations for a Fed rate cut. Despite recent machinations, we are optimistic about a trade resolution byyear-end (as it is in the best interest of all parties) and continue to anticipate a generally favorable economic backdrop of modest growth. We remain optimistic regarding the potential impact of other fiscal or regulatory actions which would be beneficial for prospective earnings growth. Tax cuts have been favorable for corporate earnings and M&A activity. While gridlock rules Washington, bipartisan infrastructure-related initiatives may be still to come. While overall market valuations have risen broadly with 2019’s sharp market bounce, they continue to look reasonable given the low interest rate environment. Going forward, we remain focused on the implementation of our disciplined investment process, centered aroundbottom-up investment decision making, which over the long term has generated alpha from stock selection. Thank you for your continued support. This commentary reflects the viewpoints of the Cadence Capital Management, LLC. as of May 31, 2019, and is not intended as a forecast or guarantee of future results. |
| | | | |
| | | | | |
| | | AMG Managers Cadence Mid Cap Fund | | |
| | | Portfolio Manager’s Comments(continued) | | |
CUMULATIVE TOTAL RETURN PERFORMANCE
AMG Managers Cadence Mid Cap Fund’s cumulative total return is based on the daily change in net asset value (NAV), and assumes that all dividends and distributions were reinvested. This graph compares a hypothetical $10,000 investment made in the AMG Managers Cadence Mid Cap Fund’s Class Z shares on May 31, 2009, to a $10,000 investment made in the Russell Midcap® Growth Index for the same time period. The graph and table do not reflect the deduction of taxes that a shareholder would pay on a Fund distribution or redemption of shares. The listed returns for the Fund are net of expenses and the returns for the index exclude expenses. Total returns would have been lower had certain expenses not been reduced.
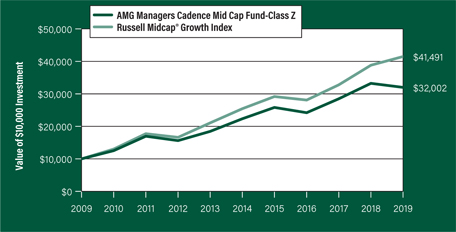
The table below shows the average annual total returns for the AMG Managers Cadence Mid Cap Fund and the Russell Midcap® Growth Index for the same time periods ended May 31, 2019.
| | | | | | | | | | | | |
| Average Annual Total Returns1 | | One Year | | | Five
Years | | | Ten Years | |
AMG Managers Cadence Mid Cap Fund2,3, 4, 5, 6, 7 | |
Class N | | | (4.06% | ) | | | 7.05% | | | | 11.90% | |
| | | |
Class I | | | (3.90% | ) | | | 7.24% | | | | 12.07% | |
| | | |
Class Z | | | (3.73% | ) | | | 7.46% | | | | 12.34% | |
| | | | |
Russell Midcap® Growth Index8 | | | 6.87% | | | | 10.28% | | | | 15.29% | |
The performance data shown represents past performance. Past performance is not a guarantee of future results. Current performance may be lower or higher than the performance data quoted. The investment return and principal value of an investment will fluctuate so that an investor’s shares, when redeemed, may be worth more or less than their original cost.
Investors should carefully consider the Fund’s investment objectives, risks, charges and expenses before investing. For performance information through the most recent month end, current net asset values per share for the Fund and other information, please call 800.548.4539 or visit our website at amgfunds.com for a free prospectus. Read it carefully before investing or sending money.
Distributed by AMG Distributors, Inc., member FINRA/SIPC.
| 1 | Total return equals income yield plus share price change and assumes reinvestment of all dividends and capital gain distributions. Returns are net of fees and may reflect offsets of Fund expenses as described in the prospectus. No adjustment has been made for taxes payable by shareholders on their reinvested dividends and capital gain distributions. Returns for periods greater than one year are annualized. The listed returns on the Fund are net of expenses and based on the published NAV as of May 31, 2019. All returns are in U.S. dollars ($). |
| | |
| | | 2 From time to time, the Fund’s advisor has waived its fees and/or absorbed Fund expenses, which has resulted in higher returns. |
| | | 3 The Fund is subject to risks associated with investments inmid-capitalization companies such as greater price volatility, lower trading volume, and less liquidity than the stocks of larger, more established companies. |
| | | 4 Active and frequent trading of a fund may result in higher transaction costs and increased tax liability. |
| | | 5 The Fund is subject to special risk considerations similar to those associated with the direct ownership of real estate. Real estate valuations may be subject to factors such as changing general and local economic, financial, competitive, and environmental conditions. |
| | | 6 The Fund invests in growth stocks, which may be more sensitive to market movements because their prices tend to reflect future investor expectations rather than just current profits. Growth stocks may underperform value stocks during given periods. |
| | | 7 Companies that are in similar businesses may be similarly affected by particular economic or market events; to the extent the Fund has substantial holdings within a particular sector, the risks associated with that sector increase. |
| | | 8 The Russell Midcap® Growth Index measures the performance of those Russell Midcap® companies with higher price/book ratios and higher forecasted growth values. The stocks are also members of the Russell 1000® Growth Index. Unlike the Fund, the Russell Midcap® Growth Index is unmanaged, is not available for investment, and does not incur expenses. |
| | | The Russell Indices are trademarks of the London Stock Exchange Group companies. |
| | | Not FDIC insured, nor bank guaranteed. May lose value. |
| | |
| | | |
| | |
| | | |
| | |
| | | |
| | |
| | | |
| | | | |
| | | | | |
| | | AMG Managers Cadence Mid Cap Fund | | |
| | | Fund Snapshots(unaudited) May 31, 2019 | | |
PORTFOLIO BREAKDOWN
| | | | | | |
| Sector | | %of
Net Assets | | | |
| | | |
Information Technology | | 29.3 | | | | |
| | | |
Consumer Discretionary | | 20.2 | | | | |
| | | |
Health Care | | 15.3 | | | | |
| | | |
Industrials | | 11.6 | | | | |
| | | |
Financials | | 10.2 | | | | |
| | | |
Consumer Staples | | 4.7 | | | | |
| | | |
Communication Services | | 3.4 | | | | |
| | | |
Real Estate | | 1.4 | | | | |
| | | |
Utilities | | 1.4 | | | | |
| | | |
Materials | | 0.9 | | | | |
| | | |
Short-Term Investments | | 1.6 | | | | |
| | | |
Other Assets Less Liabilities | | 0.01 | | | | |
TOP TEN HOLDINGS
| | |
| Security Name | | %of
Net Assets |
| | |
VeriSign, Inc. | | 2.1 |
| | |
Veeva Systems, Inc., Class A | | 1.9 |
| | |
Aspen Technology, Inc. | | 1.8 |
| | |
Cadence Design Systems, Inc. | | 1.8 |
| | |
Motorola Solutions, Inc. | | 1.8 |
| | |
Credit Acceptance Corp. | | 1.6 |
| | |
Broadridge Financial Solutions, Inc. | | 1.6 |
| | |
KLA-Tencor Corp. | | 1.6 |
| | |
Paychex, Inc. | | 1.5 |
| | |
Fortinet, Inc. | | 1.5 |
| | | |
| | |
Top Ten as a Group | | 17.2 |
| | |
Because a fund’s strategy may result in multiple investments in particular sectors of the economy, its performance may depend on the performance of those sectors and may fluctuate more widely than investments diversified across more sectors. For additional information on these and other risk considerations, please see the Fund’s prospectus.
Any sectors, industries, or securities discussed should not be perceived as investment recommendations. Mention of a specific security should not be considered a recommendation to buy or solicitation to sell that security. Specific securities mentioned in this report may have been sold from the Fund’s portfolio of investments by the time you receive this report.
| | | | |
| | | | |
| | | AMG Managers Cadence Mid Cap Fund Schedule of Portfolio Investments | | |
| | | May 31, 2019 | | |
| | | | | | | | |
| | | | Shares | | | | Value | |
| | |
Common Stocks - 98.4% | | | | | | | | |
| | |
Communication Services - 3.4% | | | | | | | | |
| | |
AMC Networks, Inc., Class A*,1 | | | 22,292 | | | | $1,176,349 | |
| | |
Lions Gate Entertainment Corp., Class B | | | 73,920 | | | | 1,017,139 | |
| | |
Omnicom Group, Inc. | | | 15,493 | | | | 1,198,539 | |
| | |
Total Communication Services | | | | | | | 3,392,027 | |
| | |
Consumer Discretionary - 20.2% | | | | | | | | |
| | |
AutoZone, Inc.* | | | 1,353 | | | | 1,389,680 | |
| | |
Best Buy Co., Inc. | | | 16,438 | | | | 1,030,169 | |
| | |
BorgWarner, Inc. | | | 23,946 | | | | 849,604 | |
| | |
Burlington Stores, Inc.* | | | 8,043 | | | | 1,259,373 | |
| | |
Choice Hotels International, Inc.1 | | | 15,928 | | | | 1,310,715 | |
| | |
Columbia Sportswear Co. | | | 14,375 | | | | 1,348,087 | |
| | |
Darden Restaurants, Inc. | | | 12,814 | | | | 1,490,524 | |
| | |
Foot Locker, Inc.1 | | | 20,110 | | | | 791,329 | |
| | |
Kontoor Brands, Inc.* | | | 1,919 | | | | 56,227 | |
| | |
Lear Corp. | | | 8,294 | | | | 987,235 | |
| | |
Lennar Corp., Class A | | | 18,326 | | | | 910,069 | |
| | |
Lululemon Athletica, Inc. (Canada)* | | | 9,227 | | | | 1,527,899 | |
| | |
Nordstrom, Inc. | | | 30,865 | | | | 966,074 | |
| | |
PulteGroup, Inc. | | | 41,051 | | | | 1,272,581 | |
| | |
Ross Stores, Inc. | | | 15,913 | | | | 1,479,750 | |
| | |
Thor Industries, Inc.1 | | | 11,909 | | | | 614,981 | |
| | |
Under Armour, Inc., Class C*,1 | | | 57,899 | | | | 1,171,297 | |
| | |
Urban Outfitters, Inc.* | | | 27,280 | | | | 612,982 | |
| | |
VF Corp. | | | 13,436 | | | | 1,100,140 | |
| | |
Total Consumer Discretionary | | | | | | | 20,168,716 | |
| | |
Consumer Staples - 4.7% | | | | | | | | |
| | |
Church & Dwight Co., Inc. | | | 18,190 | | | | 1,353,518 | |
| | |
Herbalife Nutrition, Ltd.*,1 | | | 22,551 | | | | 942,181 | |
| | |
Nu Skin Enterprises, Inc., Class A | | | 19,523 | | | | 911,529 | |
| | |
Sysco Corp. | | | 20,965 | | | | 1,442,811 | |
| | |
Total Consumer Staples | | | | | | | 4,650,039 | |
| | |
Financials - 10.2% | | | | | | | | |
| | |
Ameriprise Financial, Inc. | | | 8,863 | | | | 1,225,132 | |
| | |
Arch Capital Group, Ltd. (Bermuda)* | | | 38,600 | | | | 1,328,998 | |
| | |
Credit Acceptance Corp.* | | | 3,536 | | | | 1,613,795 | |
| | |
E*TRADE Financial Corp. | | | 20,292 | | | | 909,082 | |
| | |
Evercore, Inc., Class A | | | 10,959 | | | | 846,364 | |
| | |
OneMain Holdings, Inc. | | | 35,796 | | | | 1,069,226 | |
| | |
SVB Financial Group* | | | 4,608 | | | | 928,051 | |
| | |
Synchrony Financial | | | 39,144 | | | | 1,316,413 | |
| | | | | | | | |
| | | | Shares | | | | Value | |
| | |
Western Alliance Bancorp.* | | | 23,589 | | | | $970,687 | |
| | |
Total Financials | | | | | | | 10,207,748 | |
| | |
Health Care - 15.3% | | | | | | | | |
| | |
Agilent Technologies, Inc. | | | 17,757 | | | | 1,190,607 | |
| | |
Bruker Corp. | | | 30,741 | | | | 1,284,052 | |
| | |
Centene Corp.* | | | 21,030 | | | | 1,214,483 | |
| | |
Charles River Laboratories International, Inc.* | | | 8,812 | | | | 1,105,465 | |
| | |
Encompass Health Corp. | | | 16,098 | | | | 948,494 | |
| | |
Jazz Pharmaceuticals PLC (Ireland)* | | | 8,220 | | | | 1,032,021 | |
| | |
Molina Healthcare, Inc.* | | | 7,830 | | | | 1,113,896 | |
| | |
PerkinElmer, Inc.1 | | | 12,804 | | | | 1,105,497 | |
| | |
PRA Health Sciences, Inc.* | | | 11,397 | | | | 988,462 | |
| | |
Premier, Inc., Class A* | | | 29,936 | | | | 1,100,148 | |
| | |
Veeva Systems, Inc., Class A* | | | 12,235 | | | | 1,887,738 | |
| | |
Waters Corp.* | | | 5,528 | | | | 1,109,525 | |
| | |
Zoetis, Inc. | | | 11,963 | | | | 1,208,861 | |
| | |
Total Health Care | | | | | | | 15,289,249 | |
| | |
Industrials - 11.6% | | | | | | | | |
| | |
Allison Transmission Holdings, Inc. | | | 30,148 | | | | 1,247,826 | |
| | |
CH Robinson Worldwide, Inc. | | | 14,619 | | | | 1,164,111 | |
| | |
Cummins, Inc. | | | 6,770 | | | | 1,020,645 | |
| | |
Expeditors International of Washington, Inc. | | | 16,760 | | | | 1,166,328 | |
| | |
HD Supply Holdings, Inc.* | | | 25,175 | | | | 1,044,511 | |
| | |
Landstar System, Inc. | | | 10,280 | | | | 989,450 | |
| | |
Masco Corp. | | | 27,535 | | | | 961,522 | |
| | |
Parker-Hannifin Corp. | | | 6,365 | | | | 969,517 | |
| | |
Robert Half International, Inc. | | | 18,007 | | | | 966,256 | |
| | |
Rockwell Automation, Inc. | | | 7,514 | | | | 1,118,459 | |
| | |
WW Grainger, Inc. | | | 3,540 | | | | 926,382 | |
| | |
Total Industrials | | | | | | | 11,575,007 | |
| | |
Information Technology - 29.3% | | | | | | | | |
| | |
Arista Networks, Inc.* | | | 6,111 | | | | 1,494,689 | |
| | |
Aspen Technology, Inc.* | | | 15,757 | | | | 1,790,153 | |
| | |
Booz Allen Hamilton Holding Corp. | | | 23,514 | | | | 1,485,379 | |
| | |
Broadridge Financial Solutions, Inc. | | | 12,762 | | | | 1,593,591 | |
| | |
Cadence Design Systems, Inc.* | | | 28,137 | | | | 1,788,669 | |
| | |
Citrix Systems, Inc. | | | 14,198 | | | | 1,336,316 | |
| | |
Dell Technologies, Inc., Class C* | | | 20,630 | | | | 1,228,517 | |
| | |
F5 Networks, Inc.* | | | 7,254 | | | | 958,108 | |
| | |
Fortinet, Inc.* | | | 21,367 | | | | 1,548,680 | |
| | |
KLA-Tencor Corp. | | | 15,241 | | | | 1,570,890 | |
| | |
Motorola Solutions, Inc. | | | 11,801 | | | | 1,769,560 | |
| | |
NetApp, Inc. | | | 23,377 | | | | 1,383,918 | |
|
|
The accompanying notes are an integral part of these financial statements. 7 |
| | | | |
| | | | | |
| | | AMG Managers Cadence Mid Cap Fund | | |
| | | Schedule of Portfolio Investments(continued) | | |
| | | | | | | | |
| | | Shares | | | Value | |
| |
Information Technology - 29.3%
(continued) | | | | | |
| | |
ON Semiconductor Corp.* | | | 24,117 | | | | $428,318 | |
| | |
Palo Alto Networks, Inc.* | | | 5,420 | | | | 1,084,759 | |
| | |
Paychex, Inc. | | | 18,271 | | | | 1,567,469 | |
| | |
Skyworks Solutions, Inc. | | | 13,109 | | | | 873,453 | |
| | |
Teradyne, Inc. | | | 27,937 | | | | 1,177,265 | |
| | |
Ubiquiti Networks, Inc. | | | 11,659 | | | | 1,402,694 | |
| | |
VeriSign, Inc.* | | | 10,642 | | | | 2,074,977 | |
| | |
Xilinx, Inc. | | | 13,003 | | | | 1,330,337 | |
| | |
Zebra Technologies Corp., Class A* | | | 7,990 | | | | 1,369,806 | |
| | |
Total Information Technology | | | | | | | 29,257,548 | |
| |
Materials - 0.9% | | | | | |
| | |
Element Solutions, Inc.*,1 | | | 100,650 | | | | 952,149 | |
| | |
Real Estate - 1.4% | | | | | | | | |
| | |
CBRE Group, Inc., Class A* | | | 30,979 | | | | 1,415,740 | |
| | |
Utilities - 1.4% | | | | | | | | |
| | |
NRG Energy, Inc. | | | 40,883 | | | | 1,391,657 | |
| | |
Total Common Stocks
(Cost $89,598,320) | | | | | | | 98,299,880 | |
| | | | | | | | |
| | | Shares | | | Value | |
| |
Short-Term Investments - 1.6% | | | | | |
| |
Other Investment Companies - 1.6% | | | | | |
| | |
Dreyfus Government Cash Management Fund, Institutional Shares, 2.28%2 | | | 524,826 | | | | $524,826 | |
| | |
Dreyfus Institutional Preferred Government Money Market Fund, Institutional Shares, 2.34%2 | | | 524,827 | | | | 524,827 | |
| | |
JPMorgan U.S. Government Money Market Fund, IM Shares, 2.34%2 | | | 540,731 | | | | 540,731 | |
| |
Total Short-Term Investments
(Cost $1,590,384) | | | | 1,590,384 | |
| |
Total Investments - 100.0%
(Cost $91,188,704) | | | | 99,890,264 | |
| |
Other Assets, less Liabilities - (0.0)%# | | | | (30,003 | ) |
| | |
Net Assets - 100.0% | | | | | | | $99,860,261 | |
| * | Non-income producing security. |
| 1 | Some or all of these securities, amounting to $6,025,915 or 6.0% of net assets, were out on loan to various borrowers and are collateralized by various U.S. Treasury Obligations. See Note 4 of Notes to Financial Statements. |
| 2 | Yield shown represents the May 31, 2019, seven day average yield, which refers to the sum of the previous seven days’ dividends paid, expressed as an annual percentage. |
The following table summarizes the inputs used to value the Fund’s investments by the fair value hierarchy levels as of May 31, 2019:
| | | | | | | | | | | | | | | | |
| | | Level 1 | | | Level 2 | | | Level 3 | | | Total | |
| | | |
| Investments in Securities | | | | | | | | | | |
| | | | |
Common Stocks† | | $ | 98,299,880 | | | | — | | | | — | | | $ | 98,299,880 | |
| | | | |
Short-Term Investments | | | | | | | | | | | | | | | | |
| | | | |
Other Investment Companies | | | 1,590,384 | | | | — | | | | — | | | | 1,590,384 | |
| | | | | | | | | | | | | | | | |
| | | | |
Total Investments in Securities | | $ | 99,890,264 | | | | — | | | | — | | | $ | 99,890,264 | |
| | | | | | | | | | | | | | | | |
| † | All common stocks held in the Fund are Level 1 securities. For a detailed breakout of common stocks by major industry classification, please refer to the Fund’s Schedule of Portfolio Investments. |
For the fiscal year ended May 31, 2019, there were no transfers in or out of Level 3.
|
|
The accompanying notes are an integral part of these financial statements. 8 |
| | | | |
| | | | | |
| | | AMG Managers Cadence Emerging Companies Fund | | |
| | | Portfolio Manager’s Comments(unaudited) | | |
| | | | | | | | |
For the fiscal year ended May 31, 2019, the AMG Managers Cadence Emerging Companies Fund (Class I) (the “Fund” or “Portfolio”) returned (10.82%), outperforming its benchmark, the Russell Microcap® Growth Index, which returned (14.25%). PERFORMANCE SUMMARY The fiscal year ending May 31, 2019, was a volatile time in U.S. markets. Early strength was followed by near bear market conditions for the broad market in the fourth quarter of 2018, driven by fears of a Chinese trade war and indications of prolonged interest rate hikes from the U.S. Federal Reserve (the “Fed”).Smaller-cap names did indeed enter bear market territory, falling over 25% from their highs in early September. Trade deal optimism and a dovish pivot by the Fed spawned a strong recovery in Q1, leading the broad market (Russell 3000® Index) to almost hit new highs by early May 2019, before a breakdown in trade talks sent the market south bymonth-end.Small-cap companies did not recover as strongly as larger-caps and remain well below their 2018 highs. As mentioned, the fiscal year ended May 31, 2019, was a very volatile time in U.S. markets with a great deal of performance dispersion across styles and capitalization. The Fund’s primary benchmark, the Russell Microcap Growth Index, fell-14.25% for the period. This loss trailed well behind the Fund’s secondary benchmark, the Russell 2000® Growth Index, which fell-6.88%. Small cap indices underperformed larger cap indices for the year. The Russell 1000® Growth Index and Russell Midcap® Growth Index rose 5.39% and 6.87%, respectively, as growth indices continued to trounce value benchmarks across the broad market. The Fund’s focus on smaller small cap stocks (from the bottom half of the Russell 2000®) worked against Portfolio returns given the notable underperformance of microcap stocks. The Fund’s outperformance vs. its primary benchmark was driven by positive stock selection. At the sector level, healthcare, industrials, and information technology accounted for much of the Fund’s outperformance. Consumer discretionary detracted from relative performance. Healthcare had the strongest contribution to relative outperformance. The Portfolio’s holdings in the pharmaceuticals, biotechnology, and life sciences industry group outpaced the benchmark’s-20.3% decline due to strong stock selection and an | | | | underweight position. We remind Fund investors that the Portfolio is historically underweight this industry group, as it is comprised of many companies which lose money, are not self-financing, and have business models predicated on scientific breakthroughs and regulatory approvals. This Portfolio positioning has added value over the long run, as it did this year. Nevertheless, there are periods, such as fiscal year 2018’s strong up market, when the underweight hurts results. It is gratifying that this year’s +385 basis point relative contribution in the sector more than offset last year’s-331 basis point hit. Industrials were also a notable contributor to outperformance. Fund holdings in the capital goods industry group rose 5.5% compared to the benchmark’s capital goods position which fell-14.0%. Portfolio holdings ranged from industrial distributors to engineering & construction. There were no significant losers among the Fund’s holdings in this sector. Information technology was another contributor to outperformance. Hardware stocks were top contributors, paced by manufacturers of optical components and wireless equipment. The Portfolio’s allocation to this sector rose during the year from approximately 15% to 20%, with attractive investments viewed across each of the three industry groups. Fund holdings in defensive sectors contributed modestly to outperformance. The market peaked roughly around the beginning of the Fund’s fiscal year and closed the fiscal year with a negative return. The benchmark’s three top performing sectors were utilities, real estate, and consumer staples, with gains of 16% to 26%. These buoyant sectors also likely benefited from falling interest rates during the period. The Portfolio’s allocation to these three sectors represented only 7.5% of the Portfolio, yet it was overweight the benchmark’s 4.7%, and this over-allocation contributed modestly to outperformance. Consumer discretionary was a notable detractor from relative performance, primarily due to poor stock selection in consumer durables and apparel. Several holdings, ranging from housing-related to electronics accessories, declined during the period and were sold from the Fund. These sales contributed to the decline in the Portfolio’s sector allocation during the year from approximately 11% to 8%. Cyclicality weighed on performance, as many | | | | stocks of economically sensitive companies were weak during the fiscal year as investors grappled with a potential peak in growth rates. This year’s performance in consumer discretionary is a bit of a give-back of 2018 performance, during which the sector was the top contributor. The sector has been strong contributor over the recent three- and five-year period, and longer. MARKET OUTLOOK Looking ahead, we intend to maintain the Portfolio’spro-cyclical positioning. Economic statistics from employment to consumer spending continue to be healthy though some, like industrial production, have retreated from recent highs. We wrote last year that trade policy has now taken center stage, and there it remains. The recent failure to strike a deal with China and the subsequenttit-for-tat tariff volleys have the market on edge. An escalation of tensions could negatively impact corporate earnings and business confidence could suffer. The combination of cooling economic statistics and tariff uncertainty has not only paused the Fed’s pattern of rate increases over the last several years but has led to rising expectations for a Fed rate cut. Despite recent machinations, we are optimistic about a trade resolution byyear-end (as it is in the best interest of all parties) and continue to anticipate a generally favorable economic backdrop of modest growth. We remain optimistic regarding the potential impact of other fiscal or regulatory actions which would be beneficial for prospective earnings growth. Tax cuts have been favorable for corporate earnings and M&A activity. While gridlock rules in Washington, bipartisan infrastructure-related initiatives may be still to come. While valuations have risen broadly with 2019’s sharp market bounce, they continue to look reasonable given the low interest rate environment, and small caps trade at a discount to large cap stocks. Going forward, we remain focused on the implementation of our disciplined investment process, centered aroundbottom-up investment decision making, which over the long term and short term has generated alpha from strong stock selection. Thank you for your continued support. This commentary reflects the viewpoints of the Cadence Capital Management, LLC as of May 31, 2019, and is not intended as a forecast or guarantee of future results. |
| | | | |
| | | | | |
| | | AMG Managers Cadence Emerging Companies Fund | | |
| | | Portfolio Manager’s Comments(continued) | | |
CUMULATIVE TOTAL RETURN PERFORMANCE
AMG Managers Cadence Emerging Companies Fund’s cumulative total return is based on the daily change in net asset value (NAV), and assumes that all dividends and distributions were reinvested. This graph compares a hypothetical $10,000 investment made in the AMG Managers Cadence Emerging Companies Fund’s Class I shares on May 31, 2009, to a $10,000 investment made in the Russell Microcap® Growth Index and the Russell 2000® Growth Index for the same time period. The graph and table do not reflect the deduction of taxes that a shareholder would pay on a Fund distribution or redemption of shares. The listed returns for the Fund are net of expenses and the returns for the index exclude expenses. Total returns would have been lower had certain expenses not been reduced.
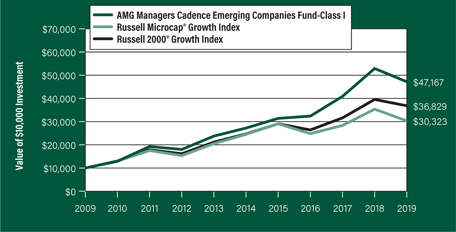
The table below shows the average annual total returns for the AMG Managers Cadence Emerging Companies Fund and the Russell Microcap® Growth Index and the Russell 2000® Growth Index for the same time periods ended May 31, 2019.
| | | | | | | | | | | | | | | | | | | | | | |
Average Annual Total Returns1 | | One
Year | | | Five
Years | | | Ten
Years | | | Since
Inception | | | Inception
Date | |
AMG Managers Cadence Emerging Companies Fund2, 3, 4, 5, 6, 7 | |
| | | | | | |
| | Class N | | | (10.92% | ) | | | 11.41% | | | | 16.52% | | | | 10.37% | | | | 04/01/96 | |
| | | | | | |
| | Class I | | | (10.82% | ) | | | 11.62% | | | | 16.78% | | | | 11.74% | | | | 06/25/93 | |
| | | | | | |
| | Class Z | | | (10.73% | ) | | | — | | | | — | | | | 7.53% | | | | 05/31/17 | |
| | | | | | | |
| | Russell Microcap® Growth Index8,10 | | | (14.25% | ) | | | 4.34% | | | | 11.73% | | | | — | | | | — | |
| | | | | | |
| | | Russell 2000® Growth Index9,10 | | | (6.88% | ) | | | 8.32% | | | | 13.93% | | | | 7.71% | | | | 06/25/93 | † |
The performance data shown represents past performance. Past performance is not a guarantee of future results. Current performance may be lower or higher than the performance data quoted. The investment return and principal value of an investment will fluctuate so that an investor’s shares, when redeemed, may be worth more or less than their original cost.
Investors should carefully consider the Fund’s investment objectives, risks, charges and expenses before investing. For performance information through the most recent month end, current net asset values per share for the Fund and other information, please call 800.548.4539 or visit our website at amgfunds.com for a free prospectus. Read it carefully before investing or sending money.
Distributed by AMG Distributors, Inc., member FINRA/SIPC.
| † | Date reflects the inception date of the Fund, not the index. |
| 1 | Total return equals income yield plus share price change and assumes reinvestment of all dividends and capital gain distributions. Returns are net of fees and may reflect offsets of Fund expenses as described in the prospectus. No adjustment has been made for taxes payable by shareholders on their reinvested dividends and capital gain distributions. Returns for periods greater than one year are annualized. The listed returns on the Fund are net of expenses and based on the published NAV as of May 31, 2019. All returns are in U.S. dollars ($). |
| | |
| | | 2 From time to time, the Fund’s advisor has waived its fees and/or absorbed Fund expenses, which has resulted in higher returns. |
| | | 3 The Fund is subject to the special risks associated with investments inmicro-cap companies, such as relatively short earnings history, competitive conditions, less publicly available corporate information, and reliance on a limited number of products. |
| | | 4 The Fund is subject to risks associated with investments in small-capitalization companies, such as erratic earnings patterns, competitive conditions, limited earnings history and a reliance on one or a limited number of products. |
| | | 5 The Fund is subject to special risk considerations similar to those associated with the direct ownership of real estate. Real estate valuations may be subject to factors such as changing general and local economic, financial, competitive, and environmental conditions. |
| | | 6 The Fund invests in growth stocks, which may be more sensitive to market movements because their prices tend to reflect future investor expectations rather than just current profits. Growth stocks may underperform value stocks during given periods. |
| | | 7 Companies that are in similar businesses may be similarly affected by particular economic or market events; to the extent the Fund has substantial holdings within a particular sector, the risks associated with that sector increase. |
| | | 8 The Russell Microcap® Growth Index measures the performance of the microcap growth segment of the U.S. Equity market. It includes those Russell Microcap® Index companies with higherprice-to-book ratios and higher forecasted growth values. |
| | | 9 The Russell 2000® Growth Index measures the performance of the Russell 2000® companies with higherprice-to-book ratios and higher forecasted growth values. |
| | | 10 Unlike the Fund, the indices are unmanaged, are not available for investment, and do not incur expenses. |
| | | The Russell Indices are trademarks of the London Stock Exchange Group companies. Not FDIC insured, nor bank guaranteed. May lose value. |
| | | | |
| | | | |
| | | AMG Managers Cadence Emerging Companies Fund | | |
| | | Fund Snapshots(unaudited) May 31, 2019 | | |
PORTFOLIO BREAKDOWN
| | | | | | |
| Sector | | % of
Net Assets | | | |
| | | |
Health Care | | 30.3 | | | | |
| | | |
Information Technology | | 23.0 | | | | |
| | | |
Industrials | | 14.8 | | | | |
| | | |
Financials | | 10.7 | | | | |
| | | |
Consumer Discretionary | | 6.6 | | | | |
| | | |
Real Estate | | 3.8 | | | | |
| | | |
Consumer Staples | | 3.5 | | | | |
| | | |
Communication Services | | 2.7 | | | | |
| | | |
Energy | | 2.6 | | | | |
| | | |
Utilities | | 1.9 | | | | |
| | | |
Short-Term Investments | | 3.5 | | | | |
| | | |
Other Assets Less Liabilities | | (3.4) | | | | |
TOP TEN HOLDINGS
| | |
| Security Name | | % of
Net Assets |
| | |
NMI Holdings, Inc., Class A | | 1.9 |
| | |
Blue Bird Corp. | | 1.7 |
| | |
Addus HomeCare Corp. | | 1.6 |
| | |
Fluidigm Corp. | | 1.6 |
| | |
American Software, Inc., Class A | | 1.6 |
| | |
UMH Properties, Inc. | | 1.6 |
| | |
Zix Corp. | | 1.6 |
| | |
Simulations Plus, Inc. | | 1.6 |
| | |
Energy Recovery, Inc. | | 1.6 |
| | |
BioLife Solutions, Inc. | | 1.5 |
| | | |
| | |
Top Ten as a Group | | 16.3 |
| | |
Because a fund’s strategy may result in multiple investments in particular sectors of the economy, its performance may depend on the performance of those sectors and may fluctuate more widely than investments diversified across more sectors. For additional information on these and other risk considerations, please see the Fund’s prospectus.
Any sectors, industries, or securities discussed should not be perceived as investment recommendations. Mention of a specific security should not be considered a recommendation to buy or solicitation to sell that security. Specific securities mentioned in this report may have been sold from the Fund’s portfolio of investments by the time you receive this report.
| | | | |
| | | | |
| | | AMG Managers Cadence Emerging Companies Fund | | |
| | | Schedule of Portfolio Investments May 31, 2019 | | |
| | | | | | | | |
| | | | Shares | | | | Value | |
| | |
Common Stocks - 99.9% | | | | | | | | |
| | |
Communication Services - 2.7% | | | | | | | | |
| | |
QuinStreet, Inc.*,1 | | | 163,284 | | | | $2,503,144 | |
| | |
TechTarget, Inc.* | | | 122,027 | | | | 2,306,310 | |
| | |
Total Communication Services | | | | | | | 4,809,454 | |
| | |
Consumer Discretionary - 6.6% | | | | | | | | |
| | |
Century Communities, Inc.* | | | 34,359 | | | | 917,385 | |
| | |
Crocs, Inc.*,1 | | | 112,229 | | | | 2,168,264 | |
| | |
Denny’s Corp.* | | | 90,203 | | | | 1,775,195 | |
| | |
Lindblad Expeditions Holdings, Inc.* | | | 145,369 | | | | 2,372,422 | |
| | |
Malibu Boats, Inc., Class A* | | | 38,572 | | | | 1,384,735 | |
| | |
RTW RetailWinds, Inc.* | | | 561,587 | | | | 1,072,631 | |
| | |
Ruth’s Hospitality Group, Inc. | | | 78,373 | | | | 1,792,391 | |
| | |
Total Consumer Discretionary | | | | | | | 11,483,023 | |
| | |
Consumer Staples - 3.5% | | | | | | | | |
| | |
Calavo Growers, Inc.1 | | | 26,462 | | | | 2,314,102 | |
| | |
The Chefs’ Warehouse, Inc.* | | | 59,131 | | | | 1,872,679 | |
| | |
Turning Point Brands, Inc. | | | 40,572 | | | | 1,997,359 | |
| | |
Total Consumer Staples | | | | | | | 6,184,140 | |
| | |
Energy - 2.6% | | | | | | | | |
| | |
Profire Energy, Inc.* | | | 560,084 | | | | 840,126 | |
| | |
Renewable Energy Group, Inc.*,1 | | | 69,204 | | | | 1,082,351 | |
| | |
Solaris Oilfield Infrastructure, Inc., Class A1 | | | 116,370 | | | | 1,655,945 | |
| | |
Vertex Energy, Inc.* | | | 810,971 | | | | 1,054,262 | |
| | |
Total Energy | | | | | | | 4,632,684 | |
| | |
Financials - 10.7% | | | | | | | | |
| | |
Bryn Mawr Bank Corp. | | | 54,605 | | | | 1,996,359 | |
| | |
Enova International, Inc.* | | | 95,300 | | | | 2,034,655 | |
| | |
Kinsale Capital Group, Inc. | | | 26,675 | | | | 2,235,098 | |
| | |
NMI Holdings, Inc., Class A* | | | 121,459 | | | | 3,310,972 | |
| | |
On Deck Capital, Inc.* | | | 261,326 | | | | 1,050,531 | |
| | |
Pacific City Financial Corp. | | | 58,495 | | | | 998,510 | |
| | |
Preferred Bank | | | 38,678 | | | | 1,692,936 | |
| | |
Pzena Investment Management, Inc., Class A | | | 132,593 | | | | 1,172,122 | |
| | |
Silvercrest Asset Management Group, Inc., Class A | | | 122,309 | | | | 1,632,825 | |
| | |
Veritex Holdings, Inc. | | | 100,131 | | | | 2,546,331 | |
| | |
Total Financials | | | | | | | 18,670,339 | |
| | |
Health Care - 30.3% | | | | | | | | |
| | |
Addus HomeCare Corp.*,1 | | | 42,240 | | | | 2,888,371 | |
| | |
ANI Pharmaceuticals, Inc.*,1 | | | 32,417 | | | | 2,258,168 | |
| | |
BioDelivery Sciences International, Inc.* | | | 412,548 | | | | 1,790,458 | |
| | |
BioLife Solutions, Inc.* | | | 152,173 | | | | 2,698,027 | |
| | | | | | | | |
| | | | Shares | | | | Value | |
| | |
BioSpecifics Technologies Corp.* | | | 28,801 | | | | $1,703,579 | |
| | |
CareDx, Inc.*,1 | | | 54,300 | | | | 1,716,966 | |
| | |
Champions Oncology, Inc.* | | | 213,370 | | | | 1,997,143 | |
| | |
Fluidigm Corp.* | | | 213,503 | | | | 2,794,754 | |
| | |
Harvard Bioscience, Inc.* | | | 406,101 | | | | 921,849 | |
| | |
HealthStream, Inc.* | | | 103,343 | | | | 2,583,575 | |
| | |
iRadimed Corp.*,1 | | | 101,533 | | | | 2,118,994 | |
| | |
Lantheus Holdings, Inc.* | | | 80,791 | | | | 1,938,176 | |
| | |
MTBC, Inc.*,1 | | | 175,458 | | | | 842,199 | |
| | |
Orthofix Medical, Inc.* | | | 45,116 | | | | 2,225,572 | |
| | |
The Providence Service Corp.* | | | 37,489 | | | | 2,424,789 | |
| | |
R1 RCM, Inc.* | | | 187,901 | | | | 2,205,958 | |
| | |
RadNet, Inc.*,1 | | | 196,286 | | | | 2,371,135 | |
| | |
Recro Pharma, Inc.* | | | 107,254 | | | | 1,025,348 | |
| | |
Simulations Plus, Inc. | | | 108,953 | | | | 2,731,452 | |
| | |
STAAR Surgical Co.*,1 | | | 88,278 | | | | 2,045,401 | |
| | |
Tabula Rasa HealthCare, Inc.*,1 | | | 39,509 | | | | 1,784,622 | |
| | |
US Physical Therapy, Inc. | | | 21,279 | | | | 2,377,077 | |
| | |
Vanda Pharmaceuticals, Inc.* | | | 145,044 | | | | 2,129,246 | |
| | |
Veracyte, Inc.* | | | 94,134 | | | | 2,133,077 | |
| | |
Vericel Corp.*,1 | | | 96,462 | | | | 1,509,630 | |
| | |
Vocera Communications, Inc.* | | | 59,978 | | | | 1,940,888 | |
| | |
Total Health Care | | | | | | | 53,156,454 | |
| | |
Industrials - 14.8% | | | | | | | | |
| | |
BG Staffing, Inc. | | | 58,332 | | | | 992,811 | |
| | |
Blue Bird Corp.* | | | 160,635 | | | | 3,023,151 | |
| | |
CRA International, Inc. | | | 53,397 | | | | 1,999,184 | |
| | |
Douglas Dynamics, Inc. | | | 59,334 | | | | 2,201,291 | |
| | |
Energy Recovery, Inc.*,1 | | | 288,055 | | | | 2,722,120 | |
| | |
Heritage-Crystal Clean, Inc.* | | | 97,090 | | | | 2,427,250 | |
| | |
Kadant, Inc. | | | 22,002 | | | | 1,786,122 | |
| | |
Kforce, Inc. | | | 52,122 | | | | 1,811,240 | |
| | |
Lawson Products, Inc.* | | | 57,555 | | | | 2,111,117 | |
| | |
NV5 Global, Inc.*,1 | | | 23,105 | | | | 1,796,414 | |
| | |
PGT Innovations, Inc.* | | | 121,570 | | | | 1,818,687 | |
| | |
Rush Enterprises, Inc., Class A | | | 48,990 | | | | 1,727,877 | |
| | |
Willdan Group, Inc.*,1 | | | 48,426 | | | | 1,507,017 | |
| | |
Total Industrials | | | | | | | 25,924,281 | |
| | |
Information Technology - 23.0% | | | | | | | | |
| | |
Adesto Technologies Corp.* | | | 224,764 | | | | 1,692,473 | |
| | |
Airgain, Inc.* | | | 147,392 | | | | 1,889,565 | |
| | |
American Software, Inc., Class A | | | 218,380 | | | | 2,766,875 | |
| | |
Blucora, Inc.* | | | 83,473 | | | | 2,585,159 | |
|
|
The accompanying notes are an integral part of these financial statements. 12 |
| | | | |
| | | | | |
| | | AMG Managers Cadence Emerging Companies Fund Schedule of Portfolio Investments(continued) | | |
| | | | | | | | |
| | | Shares | | | Value | |
| |
Information Technology - 23.0%
(continued) | | | | | |
| | |
CalAmp Corp.* | | | 120,938 | | | | $1,228,730 | |
| | |
Carbonite, Inc.*,1 | | | 89,500 | | | | 2,118,465 | |
| | |
Clearfield, Inc.*,1 | | | 65,397 | | | | 869,126 | |
| | |
CyberOptics Corp.* | | | 89,444 | | | | 1,372,965 | |
| | |
eGain Corp.* | | | 177,629 | | | | 1,399,717 | |
| | |
Everi Holdings, Inc.* | | | 177,440 | | | | 1,976,682 | |
| | |
The Hackett Group, Inc. | | | 120,639 | | | | 1,941,082 | |
| | |
inTEST Corp.* | | | 186,379 | | | | 935,623 | |
| | |
Lantronix, Inc.* | | | 372,903 | | | | 1,312,619 | |
| | |
PAR Technology Corp.*,1 | | | 78,490 | | | | 2,206,354 | |
| | |
PCM, Inc.* | | | 94,957 | | | | 2,426,151 | |
| | |
PRGX Global, Inc.*,1 | | | 207,375 | | | | 1,354,159 | |
| | |
Rudolph Technologies, Inc.* | | | 86,799 | | | | 2,002,453 | |
| | |
Silicom, Ltd. (Israel)* | | | 64,430 | | | | 1,942,564 | |
| | |
TTEC Holdings, Inc. | | | 50,880 | | | | 2,018,918 | |
| | |
Unisys Corp.* | | | 142,523 | | | | 1,382,473 | |
| | |
Upland Software, Inc.* | | | 47,675 | | | | 2,230,713 | |
| | |
Zix Corp.* | | | 304,967 | | | | 2,732,504 | |
| | |
Total Information Technology | | | | | | | 40,385,370 | |
| |
Real Estate - 3.8% | | | | | |
| | |
Clipper Realty, Inc., REIT | | | 147,532 | | | | 1,883,984 | |
| | |
NexPoint Residential Trust, Inc., REIT | | | 47,966 | | | | 1,922,477 | |
| | |
UMH Properties, Inc., REIT | | | 207,463 | | | | 2,761,333 | |
| | |
Total Real Estate | | | | | | | 6,567,794 | |
| |
Utilities - 1.9% | | | | | |
| | |
Pure Cycle Corp.* | | | 192,380 | | | | 1,812,219 | |
| | |
The York Water Co. | | | 41,268 | | | | 1,422,921 | |
| | |
Total Utilities | | | | | | | 3,235,140 | |
| | |
Total Common Stocks
(Cost $179,802,660) | | | | | | | 175,048,679 | |
| | |
| | | Principal
Amount | | | | |
| |
Short-Term Investments - 3.5% | | | | | |
| |
Joint Repurchase Agreements - 3.0%2 | | | | | |
| | |
BNP Paribas S.A., dated 05/31/19, due 06/03/19, 2.480% total to be received $259,909 (collateralized by various U.S. Treasuries, 0.000% - 7.250%,
06/04/19 -09/09/49, totaling $265,052) | | | $259,855 | | | | 259,855 | |
| | | | | | | | |
| | | Principal
Amount | | | Value | |
| | |
Citigroup Global Markets, Inc., dated 05/31/19, due 06/03/19, 2.500% total to be received $1,236,267 (collateralized by various U.S. Government Agency Obligations and U.S. Treasuries, 0.000% - 10.000%, 06/11/19 -04/20/69, totaling $1,260,729) | | | $1,236,009 | | | | $1,236,009 | |
| | |
Daiwa Capital Markets America, dated 05/31/19, due 06/03/19, 2.500% total to be received $1,236,267 (collateralized by various U.S. Government Agency Obligations and U.S. Treasuries, 0.000% - 6.500%, 06/13/19 -05/20/49, totaling $1,260,729) | | | 1,236,009 | | | | 1,236,009 | |
| | |
HSBC Securities USA, Inc., dated 05/31/19, due 06/03/19, 2.500% total to be received $1,236,267 (collateralized by various U.S. Government Agency Obligations, 3.000% -5.500%, 07/01/26 - 05/01/49, totaling $1,260,729) | | | 1,236,009 | | | | 1,236,009 | |
| | |
Morgan, Stanley & Co. LLC, dated 05/31/19, due 06/03/19, 2.510% total to be received $1,236,268 (collateralized by various U.S. Government Agency Obligations and U.S. Treasuries, 0.000% - 9.000%, 06/04/19 -05/20/49, totaling $1,260,729) | | | 1,236,009 | | | | 1,236,009 | |
| |
Total Joint Repurchase Agreements | | | | 5,203,891 | |
| | |
| | | Shares | | | | | |
| |
Other Investment Companies - 0.5% | | | | | |
| | |
Dreyfus Government Cash Management Fund, Institutional Shares, 2.28%3 | | | 325,698 | | | | 325,698 | |
| | |
Dreyfus Institutional Preferred Government Money Market Fund, Institutional Shares, 2.34%3 | | | 325,698 | | | | 325,698 | |
| | |
JPMorgan U.S. Government Money Market Fund, IM Shares, 2.34%3 | | | 335,567 | | | | 335,567 | |
| |
Total Other Investment Companies | | | | 986,963 | |
| |
Total Short-Term Investments
(Cost $6,190,854) | | | | 6,190,854 | |
| |
Total Investments - 103.4%
(Cost $185,993,514) | | | | 181,239,533 | |
| |
Other Assets, less Liabilities - (3.4)% | | | | (5,974,424 | ) |
| |
Net Assets - 100.0% | | | | $175,265,109 | |
|
|
| The accompanying notes are an integral part of these financial statements. |
13 |
| | | | |
| | | | | |
| | | AMG Managers Cadence Emerging Companies Fund | | |
| | | Schedule of Portfolio Investments(continued) | | |
| * | Non-income producing security. |
| 1 | Some or all of these securities, amounting to $24,078,486 or 13.7% of net assets, were out on loan to various borrowers and are collateralized by cash and various U.S. Treasury Obligations. See Note 4 of Notes to Financial Statements. |
| 2 | Cash collateral received for securities lending activity was invested in these joint repurchase agreements. |
| 3 | Yield shown represents the May 31, 2019, seven day average yield, which refers to the sum of the previous seven days’ dividends paid, expressed as an annual percentage. |
| REIT | Real Estate Investment Trust |
The following table summarizes the inputs used to value the Fund’s investments by the fair value hierarchy levels as of May 31, 2019:
| | | | | | | | | | | | | | | | |
| | | Level 1 | | | Level 2 | | | Level 3 | | | Total | |
| | | |
| Investments in Securities | | | | | | | | | | |
| | | | |
Common Stocks† | | | $175,048,679 | | | | — | | | | — | | | | $175,048,679 | |
| | | | |
Short-Term Investments | | | | | | | | | | | | | | | | |
| | | | |
Joint Repurchase Agreements | | | — | | | | $5,203,891 | | | | — | | | | 5,203,891 | |
| | | | |
Other Investment Companies | | | 986,963 | | | | — | | | | — | | | | 986,963 | |
| | | | | | | | | | | | | | | | |
| | | | |
Total Investments in Securities | | | $176,035,642 | | | | $5,203,891 | | | | — | | | | $181,239,533 | |
| | | | | | | | | | | | | | | | |
| † | All common stocks held in the Fund are Level 1 securities. For a detailed breakout of common stocks by major industry classification, please refer to the Fund’s Schedule of Portfolio Investments. |
For the fiscal year ended May 31, 2019, there were no transfers in or out of Level 3.
|
|
The accompanying notes are an integral part of these financial statements. |
14 |
| | | | |
| | | | | |
| | | Statement of Assets and Liabilities | | |
| | | May 31, 2019 | | |
| | | | | | | | |
| | | AMG
Managers
Cadence Mid
Cap Fund | | | AMG
Managers Cadence
Emerging
Companies Fund | |
| | |
Assets: | | | | | | | | |
| | |
Investments at value1(including securities on loan valued at $6,025,915, and $24,078,486, respectively) | | | $99,890,264 | | | | $181,239,533 | |
| | |
Receivable for investments sold | | | — | | | | 551,362 | |
| | |
Dividend, interest and other receivables | | | 113,367 | | | | 101,792 | |
| | |
Receivable for Fund shares sold | | | 13,127 | | | | 44,510 | |
| | |
Receivable from affiliate | | | 4,477 | | | | 23,476 | |
| | |
Prepaid expenses and other assets | | | 24,720 | | | | 32,215 | |
| | |
Total assets | | | 100,045,955 | | | | 181,992,888 | |
| | |
Liabilities: | | | | | | | | |
| | |
Payable upon return of securities loaned | | | — | | | | 5,203,891 | |
| | |
Payable for investments purchased | | | — | | | | 1,108,207 | |
| | |
Payable for Fund shares repurchased | | | 46,777 | | | | 178,348 | |
| | |
Accrued expenses: | | | | | | | | |
| | |
Investment advisory and management fees | | | 40,463 | | | | 109,351 | |
| | |
Administrative fees | | | 13,488 | | | | 23,772 | |
| | |
Distribution fees | | | 14,504 | | | | — | |
| | |
Shareholder service fees | | | 5,021 | | | | 30,797 | |
| | |
Other | | | 65,441 | | | | 73,413 | |
| | |
Total liabilities | | | 185,694 | | | | 6,727,779 | |
| | | | | | | | |
| | |
Net Assets | | | $99,860,261 | | | | $175,265,109 | |
| | |
1Investments at cost | | | $91,188,704 | | | | $185,993,514 | |
|
|
| The accompanying notes are an integral part of these financial statements. |
| 15 |
| | | | |
| | | | | |
| | | Statement of Assets and Liabilities(continued) | | |
| | | | | |
| | | | | | | | |
| | | AMG
Managers
Cadence Mid
Cap Fund | | | AMG
Managers Cadence
Emerging
Companies Fund | |
| | |
Net Assets Represent: | | | | | | | | |
| | |
Paid-in capital | | | $90,079,953 | | | | $188,140,919 | |
| | |
Total distributable earnings (loss) | | | 9,780,308 | | | | (12,875,810) | |
| | |
Net Assets | | | $99,860,261 | | | | $175,265,109 | |
| | |
Class N: | | | | | | | | |
| | |
Net Assets | | | $64,332,965 | | | | $32,440,224 | |
| | |
Shares outstanding | | | 2,658,558 | | | | 678,053 | |
| | |
Net asset value, offering and redemption price per share | | | $24.20 | | | | $47.84 | |
| | |
Class I: | | | | | | | | |
| | |
Net Assets | | | $14,737,685 | | | | $116,100,591 | |
| | |
Shares outstanding | | | 584,963 | | | | 2,219,104 | |
| | |
Net asset value, offering and redemption price per share | | | $25.19 | | | | $52.32 | |
| | |
Class Z: | | | | | | | | |
| | |
Net Assets | | | $20,789,611 | | | | $26,724,294 | |
| | |
Shares outstanding | | | 780,145 | | | | 509,704 | |
| | |
Net asset value, offering and redemption price per share | | | $26.65 | | | | $52.43 | |
|
|
| The accompanying notes are an integral part of these financial statements. |
| 16 |
| | | | |
| | | | | |
| | | Statement of Operations | | |
| | | For the fiscal year ended May 31, 2019 | | |
| | | | | | | | |
| | | AMG
Managers
Cadence Mid
Cap Fund | | | AMG
Managers Cadence
Emerging
Companies Fund | |
Investment Income: | | | | | | | | |
| | |
Dividend income | | | $1,335,825 | | | | $983,953 | |
| | |
Interest income | | | — | | | | 715 | |
| | |
Securities lending income | | | 26,023 | | | | 41,700 | |
| | |
Total investment income | | | 1,361,848 | | | | 1,026,368 | |
Expenses: | | | | | | | | |
| | |
Investment advisory and management fees | | | 520,926 | | | | 1,246,974 | |
| | |
Administrative fees | | | 173,642 | | | | 271,081 | |
| | |
Distribution fees - Class N | | | 188,474 | | | | — | |
| | |
Shareholder servicing fees - Class N | | | 74,706 | | | | 83,585 | |
| | |
Shareholder servicing fees - Class I | | | 24,204 | | | | 115,307 | |
| | |
Registration fees | | | 52,675 | | | | 60,601 | |
| | |
Professional fees | | | 35,218 | | | | 38,595 | |
| | |
Reports to shareholders | | | 28,533 | | | | 40,047 | |
| | |
Custodian fees | | | 23,010 | | | | 42,529 | |
| | |
Transfer agent fees | | | 20,894 | | | | 6,943 | |
| | |
Trustee fees and expenses | | | 8,378 | | | | 11,569 | |
| | |
Miscellaneous | |
| 5,182
|
| |
| 5,982
|
|
| | |
Total expenses before offsets | | | 1,155,842 | | | | 1,923,213 | |
| | |
Expense reimbursements | | | (34,975) | | | | (115,905) | |
| | |
Net expenses | | | 1,120,867 | | | | 1,807,308 | |
| | | | | | | | |
Net investment income (loss) | | | 240,981 | | | | (780,940) | |
Net Realized and Unrealized Loss: | | | | | | | | |
| | |
Net realized gain (loss) on investments | | | 8,978,011 | | | | (734,635) | |
| | |
Net change in unrealized appreciation/depreciation on investments | | | (13,958,181) | | | | (22,994,817) | |
| | |
Net realized and unrealized loss | | | (4,980,170) | | | | (23,729,452)�� | |
| | | | | | | | |
Net decrease in net assets resulting from operations | | | $(4,739,189) | | | | $(24,510,392) | |
|
|
| The accompanying notes are an integral part of these financial statements. |
| 17 |
| | | | |
| | | | | |
| | | Statements of Changes in Net Assets | | |
| | | For the fiscal years ended May 31, | | |
| | | | | | | | | | | | | | | | |
| | | AMG | | | AMG | |
| | | Managers | | | Managers Cadence | |
| | | Cadence Mid Cap Fund | | | Emerging Companies Fund | |
| | | | |
| | | 2019 | | | 2018 | | | 2019 | | | 2018 | |
| | | |
Increase (Decrease) in Net Assets Resulting From Operations: | | | | | | | | | | | | | |
| | | | |
Net investment income (loss) | | | $240,981 | | | | $147,767 | | | | $(780,940 | ) | | | $(372,051 | ) |
| | | | |
Net realized gain (loss) on investments | | | 8,978,011 | | | | 13,993,660 | | | | (734,635 | ) | | | 14,455,489 | |
| | | | |
Net change in unrealized appreciation/depreciation on investments | | | (13,958,181 | ) | | | 5,322,340 | | | | (22,994,817 | ) | | | 10,412,277 | |
| | | | |
Net increase (decrease) in net assets resulting from operations | | | (4,739,189 | ) | | | 19,463,767 | | | | (24,510,392 | ) | | | 24,495,715 | |
| | | |
Distributions to Shareholders:1 | | | | | | | | | | | | | |
| | | | |
Class N | | | (11,671,054 | ) | | | (9,470,697 | ) | | | (3,105,279 | ) | | | — | |
| | | | |
Class I | | | (2,512,248 | ) | | | (1,635,519 | ) | | | (8,893,635 | ) | | | — | |
| | | | |
Class Z | | | (3,599,803 | ) | | | (2,690,280 | ) | | | (2,214,428 | ) | | | — | |
| | | | |
Total distributions to shareholders | | | (17,783,105 | ) | | | (13,796,496 | ) | | | (14,213,342 | ) | | | — | |
| | | |
Capital Share Transactions:2 | | | | | | | | | | | | | |
| | | | |
Net increase (decrease) from capital share transactions | | | (6,080,790 | ) | | | (2,318,922 | ) | | | 81,488,589 | | | | 37,608,483 | |
| | | | | | | | | | | | | | | | |
Total increase (decrease) in net assets | | | (28,603,084 | ) | | | 3,348,349 | | | | 42,764,855 | | | | 62,104,198 | |
| | | |
Net Assets:3 | | | | | | | | | | | | | |
| | | | |
Beginning of year | | | 128,463,345 | | | | 125,114,996 | | | | 132,500,254 | | | | 70,396,056 | |
| | | | |
End of year | | | $99,860,261 | | | | $128,463,345 | | | | $175,265,109 | | | | $132,500,254 | |
| | | | |
| | | | | | | | | | | | | | | | |
| 1 | See Note 1(d) of the Notes to Financial Statements. |
| 2 | See Note 1(g) of the Notes to Financial Statements. |
| 3 | Net assets - End of year includes undistributed (distributions in excess of) net investment income of $159,559 and $(188,620) for AMG Managers Cadence Mid Cap Fund and AMG Managers Cadence Emerging Companies Fund, respectively, in 2018. During the fiscal year ended May 31, 2019, the requirement to disclose undistributed (distribution in excess of) net investment income was eliminated. |
|
|
| The accompanying notes are an integral part of these financial statements. |
| 18 |
| | | | |
| | | | |
| | | AMG Managers Cadence Mid Cap Fund | | |
| | | Financial Highlights | | |
| | | For a share outstanding throughout each fiscal year | | |
| | | | | | | | | | | | | | | | | | | | |
| | | For the fiscal years ended May 31, | |
| | | | | |
| Class N | | 2019 | | | 2018 | | | 20171 | | | 2016 | | | 2015 | |
| | | | | |
Net Asset Value, Beginning of Year | | | $30.86 | | | | $29.66 | | | | $26.87 | | | | $32.15 | | | | $34.15 | |
| | | | | |
Income (loss) from Investment Operations: | | | | | | | | | | | | | | | | | | | | |
| | | | | |
Net investment income (loss)2,3 | | | 0.03 | | | | 0.01 | | | | (0.09) | | | | 0.19 | 4 | | | (0.06) | |
| | | | | |
Net realized and unrealized gain (loss) on investments | | | (1.78) | | | | 4.75 | | | | 4.58 | | | | (2.32) | | | | 4.88 | |
| | | | | |
Total income (loss) from investment operations | | | (1.75) | | | | 4.76 | | | | 4.49 | | | | (2.13) | | | | 4.82 | |
| | | | | |
| Less Distributions to Shareholders from: | | | | | | | | | | | | | | | |
| | | | | |
Net investment income | | | (0.03) | | | | — | | | | (0.16) | | | | — | | | | — | |
| | | | | |
Net realized gain on investments | | | (4.88) | | | | (3.56) | | | | (1.54) | | | | (3.15) | | | | (6.82) | |
| | | | | |
Total distributions to shareholders | | | (4.91) | | | | (3.56) | | | | (1.70) | | | | (3.15) | | | | (6.82) | |
| | | | | |
Net Asset Value, End of Year | | | $24.20 | | | | $30.86 | | | | $29.66 | | | | $26.87 | | | | $32.15 | |
| | | | | |
Total Return3,5 | | | (4.06) | % | | | 16.25 | % | | | 17.23 | % | | | (6.64) | % | | | 15.14 | % |
| | | | | |
Ratio of net expenses to average net assets6 | | | 1.07 | % | | | 1.08 | % | | | 1.10 | % | | | 1.11 | % | | | 1.12 | % |
| | | | | |
Ratio of gross expenses to average net assets7 | | | 1.10 | % | | | 1.09 | % | | | 1.14 | % | | | 1.21 | % | | | 1.19 | % |
| | | | | |
Ratio of net investment income (loss) to average net assets3 | | | 0.11 | % | | | 0.02 | % | | | (0.31) | % | | | 0.67 | % | | | (0.16) | % |
| | | | | |
Portfolio turnover | | | 46 | % | | | 72 | % | | | 141 | % | | | 149 | % | | | 130 | % |
| | | | | |
Net assets end of year (000’s) omitted | | | $64,333 | | | | $86,096 | | | | $84,873 | | | | $89,179 | | | | $116,666 | |
| | | | | | | | | | | | | | | | | | | | | |
| | | | | | | | | | | | | | | | | | | | | |
| | | | |
| | | AMG Managers Cadence Mid Cap Fund | | |
| | | Financial Highlights | | |
| | | For a share outstanding throughout each fiscal year | | |
| | | | | | | | | | | | | | | | | | | | |
| | | For the fiscal years ended May 31, | |
| | | | | |
Class I | | 2019 | | | 2018 | | | 20171 | | | 2016 | | | 2015 | |
Net Asset Value, Beginning of Year | | | $31.93 | | | | $30.52 | | | | $27.65 | | | | $33.07 | | | | $35.04 | |
Income (loss) from Investment Operations: | | | | | | | | | | | | | | | | | | | | |
Net investment income (loss)2,3 | | | 0.09 | | | | 0.07 | | | | (0.03 | ) | | | 0.25 | 4 | | | (0.01 | ) |
Net realized and unrealized gain (loss) on investments | | | (1.85 | ) | | | 4.90 | | | | 4.70 | | | | (2.39 | ) | | | 5.02 | |
Total income (loss) from investment operations | | | (1.76 | ) | | | 4.97 | | | | 4.67 | | | | (2.14 | ) | | | 5.01 | |
Less Distributions to Shareholders from: | | | | | | | | | | | | | | | | | | | | |
Net investment income | | | (0.10 | ) | | | — | | | | (0.21 | ) | | | (0.03 | ) | | | — | |
Net realized gain on investments | | | (4.88 | ) | | | (3.56 | ) | | | (1.59 | ) | | | (3.25 | ) | | | (6.98 | ) |
Total distributions to shareholders | | | (4.98 | ) | | | (3.56 | ) | | | (1.80 | ) | | | (3.28 | ) | | | (6.98 | ) |
Net Asset Value, End of Year | | | $25.19 | | | | $31.93 | | | | $30.52 | | | | $27.65 | | | | $33.07 | |
Total Return3,5 | | | (3.90 | )% | | | 16.49 | % | | | 17.44 | % | | | (6.50 | )% | | | 15.34 | % |
Ratio of net expenses to average net assets6 | | | 0.87 | % | | | 0.87 | % | | | 0.90 | % | | | 0.97 | % | | | 0.97 | % |
Ratio of gross expenses to average net assets7 | | | 0.90 | % | | | 0.88 | % | | | 0.95 | % | | | 1.07 | % | | | 1.04 | % |
Ratio of net investment income (loss) to average net assets3 | | | 0.31 | % | | | 0.22 | % | | | (0.11 | )% | | | 0.86 | % | | | (0.01 | )% |
Portfolio turnover | | | 46 | % | | | 72 | % | | | 141 | % | | | 149 | % | | | 130 | % |
Net assets end of year (000’s) omitted | | | $14,738 | | | | $16,516 | | | | $15,245 | | | | $13,715 | | | | $14,809 | |
| | | | | | | | | | | | | | | | | | | | | |
| | | | | | | | | | | | | | | | | | | | | |
| | | | |
| | | AMG Managers Cadence Mid Cap Fund | | |
| | | Financial Highlights | | |
| | | For a share outstanding throughout each fiscal year | | |
| | | | | | | | | | | | | | | | | | | | |
| | | For the fiscal years ended May 31, | |
| | | | | |
Class Z | | 2019 | | | 2018 | | | 20171 | | | 2016 | | | 2015 | |
Net Asset Value, Beginning of Year | | | $33.45 | | | | $31.78 | | | | $28.79 | | | | $34.45 | | | | $36.44 | |
Income (loss) from Investment Operations: | | | | | | | | | | | | | | | | | | | | |
Net investment income2,3 | | | 0.14 | | | | 0.12 | | | | 0.02 | | | | 0.33 | 4 | | | 0.09 | |
Net realized and unrealized gain (loss) on investments | | | (1.91 | ) | | | 5.11 | | | | 4.92 | | | | (2.49 | ) | | | 5.21 | |
Total income (loss) from investment operations | | | (1.77 | ) | | | 5.23 | | | | 4.94 | | | | (2.16 | ) | | | 5.30 | |
Less Distributions to Shareholders from: | | | | | | | | | | | | | | | | | | | | |
Net investment income | | | (0.15 | ) | | | — | | | | (0.29 | ) | | | (0.11 | ) | | | — | |
Net realized gain on investments | | | (4.88 | ) | | | (3.56 | ) | | | (1.66 | ) | | | (3.39 | ) | | | (7.29 | ) |
Total distributions to shareholders | | | (5.03 | ) | | | (3.56 | ) | | | (1.95 | ) | | | (3.50 | ) | | | (7.29 | ) |
Net Asset Value, End of Year | | | $26.65 | | | | $33.45 | | | | $31.78 | | | | $28.79 | | | | $34.45 | |
Total Return3,5 | | | (3.73 | )% | | | 16.66 | % | | | 17.71 | % | | | (6.28 | )% | | | 15.62 | % |
Ratio of net expenses to average net assets6 | | | 0.72 | % | | | 0.72 | % | | | 0.72 | % | | | 0.72 | % | | | 0.72 | % |
Ratio of gross expenses to average net assets7 | | | 0.75 | % | | | 0.73 | % | | | 0.76 | % | | | 0.82 | % | | | 0.79 | % |
Ratio of net investment income to average net assets3 | | | 0.46 | % | | | 0.37 | % | | | 0.07 | % | | | 1.07 | % | | | 0.24 | % |
Portfolio turnover | | | 46 | % | | | 72 | % | | | 141 | % | | | 149 | % | | | 130 | % |
Net assets end of year (000’s) omitted | | | $20,790 | | | | $25,851 | | | | $24,997 | | | | $26,636 | | | | $33,693 | |
| | | | | | | | | | | | | | | | | | | | | |
| | | | | | | | | | | | | | | | | | | | | |
| 1 | Effective October 1, 2016, the Investor Class, Service Class and Institutional Class were renamed Class N, Class I and Class Z, respectively. |
| 2 | Per share numbers have been calculated using average shares. |
| 3 | Total returns and net investment income (loss) would have been lower had certain expenses not been offset. |
| 4 | Includesnon-recurring dividends. Without these dividends, net investment income per share would have been $0.01, $0.07, and $0.13 for Class N, Class I, and Class Z, respectively. |
| 5 | The total return is calculated using the published Net Asset Value as of fiscal year end. |
| 6 | Includes reduction from broker recapture amounting to 0.01% for the fiscal year ended 2015. |
| 7 | Excludes the impact of expense reimbursement or fee waivers and expense reductions such as brokerage credits, but includes expense repayments andnon-reimbursable expenses, if any, such as interest, taxes, and extraordinary expenses. (See Note 1(c) and 2 in the Notes to Financial Statements.) |
| | | | |
| | | AMG Managers Cadence Emerging Companies Fund | | |
| | | Financial Highlights | | |
| | | For a share outstanding throughout each fiscal year | | |
| | | | | | | | | | | | | | | | | | | | |
| | | For the fiscal years ended May 31, | |
| | | | | |
| Class N | | 2019 | | | 2018 | | | 20171 | | | 2016 | | | 2015 | |
Net Asset Value, Beginning of Year | | | $59.14 | | | | $45.76 | | | | $36.33 | | | | $35.29 | | | | $30.70 | |
Income (loss) from Investment Operations: | | | | | | | | | | | | | | | | | | | | |
Net investment loss2,3 | | | (0.30 | ) | | | (0.25 | )4 | | | (0.36 | )5 | | | (0.33 | )6 | | | (0.32 | )7 |
Net realized and unrealized gain (loss) on investments | | | (6.47 | ) | | | 13.63 | | | | 9.79 | | | | 1.37 | | | | 4.91 | |
Total income (loss) from investment operations | | | (6.77 | ) | | | 13.38 | | | | 9.43 | | | | 1.04 | | | | 4.59 | |
Less Distributions to Shareholders from: | | | | | | | | | | | | | | | | | | | | |
Net realized gain on investments | | | (4.53 | ) | | | — | | | | — | | | | — | | | | — | |
Net Asset Value, End of Year | | | $47.84 | | | | $59.14 | | | | $45.76 | | | | $36.33 | | | | $35.29 | |
Total Return3 | |
| (10.92
| )%8
| | | 29.24 | %8 | |
| 25.92
| %
| | | 2.95 | % | | | 14.95 | %8 |
Ratio of net expenses to average net assets9 | | | 1.11 | % | | | 1.08 | % | | | 1.62 | % | | | 1.65 | % | | | 1.66 | % |
Ratio of gross expenses to average net assets10 | | | 1.17 | % | | | 1.20 | % | | | 1.79 | % | | | 1.97 | % | | | 1.96 | % |
Ratio of net investment loss to average net assets3 | | | (0.54 | )% | | | (0.47 | )% | | | (0.83 | )% | | | (0.96 | )% | | | (0.98 | )% |
Portfolio turnover | | | 96 | % | | | 89 | % | | | 90 | % | | | 150 | % | | | 146 | % |
Net assets end of year (000’s) omitted | | $ | 32,440 | | | $ | 23,759 | | | $ | 13,446 | | | | $3,099 | | | | $3,143 | |
| | | | | | | | | | | | | | | | | | | | | |
| | | | | | | | | | | | | | | | | | | | | |
| | | | |
| | | AMG Managers Cadence Emerging Companies Fund | | |
| | | Financial Highlights | | |
| | | For a share outstanding throughout each fiscal year | | |
| | | | | | | | | | | | | | | | | | | | |
| | | For the fiscal years ended May 31, | |
| | | | | |
Class I | | 2019 | | | 2018 | | | 20171 | | | 2016 | | | 2015 | |
Net Asset Value, Beginning of Year | | | $64.10 | | | | $49.54 | | | | $39.25 | | | | $38.04 | | | | $33.00 | |
Income (loss) from Investment Operations: | | | | | | | | | | | | | | | | | | | | |
Net investment loss2,3 | | | (0.25 | ) | | | (0.21 | )4 | | | (0.29 | )5 | | | (0.27 | )6 | | | (0.25 | )7 |
Net realized and unrealized gain (loss) on investments | | | (7.00 | ) | | | 14.77 | | | | 10.58 | | | | 1.48 | | | | 5.29 | |
| | | | | |
Total income (loss) from investment operations | | | (7.25 | ) | | | 14.56 | | | | 10.29 | | | | 1.21 | | | | 5.04 | |
Less Distributions to Shareholders from: | | | | | | | | | | | | | | | | | | | | |
| | | | | |
Net realized gain on investments | | | (4.53 | ) | | | — | | | | — | | | | — | | | | — | |
Net Asset Value, End of Year | | | $52.32 | | | | $64.10 | | | | $49.54 | | | | $39.25 | | | | $38.04 | |
| | | | | |
Total Return3,8 | | | (10.82 | )% | | | 29.39 | % | | | 26.22 | % | | | 3.18 | % | | | 15.27 | % |
| | | | | |
Ratio of net expenses to average net assets9 | | | 0.99 | % | | | 0.98 | % | | | 1.42 | % | | | 1.42 | % | | | 1.41 | % |
Ratio of gross expenses to average net assets10 | | | 1.05 | % | | | 1.10 | % | | | 1.60 | % | | | 1.74 | % | | | 1.71 | % |
Ratio of net investment loss to average net assets3 | | | (0.42 | )% | | | (0.37 | )% | | | (0.64 | )% | | | (0.71 | )% | | | (0.73 | )% |
Portfolio turnover | | | 96 | % | | | 89 | % | | | 90 | % | | | 150 | % | | | 146 | % |
Net assets end of year (000’s) omitted | | | $116,101 | | | | $85,329 | | | | $56,850 | | | | $36,064 | | | | $34,566 | |
| | | | | | | | | | | | | | | | | | | | | |
| | | | | | | | | | | | | | | | | | | | | |
| | | | |
| | | AMG Managers Cadence Emerging Companies Fund | | |
| | | Financial Highlights | | |
| | | For a share outstanding throughout each fiscal year | | |
| | | | | | | | |
| | | For the fiscal years ended May 31, | |
| | |
| Class Z | | 2019 | | | 201811 | |
Net Asset Value, Beginning of Year | | | $64.16 | | | | $49.54 | |
Income (loss) from Investment Operations: | | | | | | | | |
Net investment loss2,3 | | | (0.19 | ) | | | (0.17 | )4 |
Net realized and unrealized gain (loss) on investments | | | (7.01 | ) | | | 14.79 | |
Total income (loss) from investment operations | | | (7.20 | ) | | | 14.62 | |
Less Distributions to Shareholders from: | | | | | | | | |
Net realized gain on investments | | | (4.53 | ) | | | — | |
Net Asset Value, End of Year | | | $52.43 | | | | $64.16 | |
Total Return3,8 | | | (10.73 | )% | | | 29.51 | % |
Ratio of net expenses to average net assets | | | 0.89 | % | | | 0.89 | % |
Ratio of gross expenses to average net assets10 | | | 0.95 | % | | | 1.01 | % |
Ratio of net investment loss to average net assets3 | | | (0.32 | )% | | | (0.28 | )% |
Portfolio turnover | | | 96 | % | | | 89 | % |
Net assets end of year (000’s) omitted | | | $26,724 | | | | $23,412 | |
| | | | | | | | | |
| 1 | Effective October 1, 2016, the Service Class and Institutional Class were renamed Class S and Class I, respectively. Effective February 27, 2017, Class S was renamed Class N. |
| 2 | Per share numbers have been calculated using average shares. |
| 3 | Total returns and net investment loss would have been lower had certain expenses not been offset. |
| 4 | Includesnon-recurring dividends. Without these dividends, net investment loss per share would have been $(0.26), $(0.23), and $(0.19) for Class N, Class I and Class Z shares, respectively. |
| 5 | Includesnon-recurring dividends. Without these dividends, net investment loss per share would have been $(0.38) and $(0.31) for Class N and Class I, respectively. |
| 6 | Includesnon-recurring dividends. Without these dividends, net investment loss per share would have been $(0.36) and $(0.29) for Class N and Class I, respectively. |
| 7 | Includesnon-recurring dividends. Without these dividends, net investment loss per share would have been $(0.33) and $(0.27) for Class N and Class I, respectively. |
| 8 | The total return is calculated using the published Net Asset Value as of fiscal year end. |
| 9 | Includes reduction from broker recapture amounting to 0.01% for the fiscal year ended 2015. |
| 10 | Excludes the impact of expense reimbursement or fee waivers and expense reductions such as brokerage credits, but includes expense repayments andnon-reimbursable expenses, if any, such as interest, taxes, and extraordinary expenses. (See Note 1(c) and 2 in the Notes to Financial Statements.) |
| 11 | Commencement of operations was on May 31, 2017. |
| | | | |
| | | | | |
| | | Notes to Financial Statements | | |
| | | May 31, 2019 | | |
1. SUMMARY OF SIGNIFICANT ACCOUNTING POLICIES
AMG Funds III (the “Trust”) is anopen-end management investment company, organized as a Massachusetts business trust, and registered under the Investment Company Act of 1940, as amended (the “1940 Act”). Currently, the Trust consists of a number of different funds, each having distinct investment management objectives, strategies, risks, and policies. Included in this report are AMG Managers Cadence Mid Cap Fund (“Mid Cap”) and AMG Managers Cadence Emerging Companies Fund (“Emerging Companies”), each a “Fund” and collectively, the “Funds.”
Each Fund offers different classes of shares. Mid Cap offers Class N, Class I and Class Z shares. Emerging Companies offers Class N, Class I and, effective May 31, 2017, Class Z shares. Each class represents an interest in the same assets of the respective Fund. Although all share classes generally have identical voting rights, each share class votes separately when required by law. Different share classes may have different net asset values per share to the extent the share classes pay different distribution amounts and/or the expenses of such share classes differ. Each share class has its own expense structure. Please refer to a current prospectus for additional information on each share class.
The Funds’ financial statements are prepared in accordance with accounting principles generally accepted in the United States of America (“U.S. GAAP”), including accounting and reporting guidance pursuant to Accounting Standards Codification Topic 946 applicable to investment companies. U.S. GAAP requires management to make estimates and assumptions that affect the reported amounts of assets and liabilities and disclosure of contingent assets and liabilities at the date of the financial statements and the reported amounts of income and expenses during the reporting period. Actual results could differ from those estimates and such differences could be material. The following is a summary of significant accounting policies followed by the Funds in the preparation of their financial statements:
a. VALUATION OF INVESTMENTS
Equity securities traded on a national securities exchange or reported on the NASDAQ national market system (“NMS”) are valued at the last quoted sales price on the primary exchange or, if applicable, the NASDAQ official closing price or the official closing price of the relevant exchange or, lacking any sales, at the last quoted bid price or the mean between the last quoted bid and ask prices (the “exchange mean price”). Equity securities traded in theover-the-counter market (other than NMS securities) are valued at the exchange mean price. Foreign equity securities (securities principally traded in markets other than U.S. markets) are valued at the official closing price on the primary exchange or, for markets that either do not offer an official closing price or where the official closing price may not be representative of the overall market, the last quoted sale price.
Fixed income securities purchased with a remaining maturity of 60 days or less are valued at amortized cost, provided that the amortized cost value is approximately the same as the fair value of the security valued without the use of amortized cost. Investments in otheropen-end regulated investment companies are valued at their end of day net asset value per share.
The Funds’ portfolio investments are generally valued based on independent market quotations or prices or, if none, “evaluative” or other market based valuations provided by third party pricing services approved by the Board of Trustees of the Trust (the “Board”). Under certain circumstances, the value of certain Fund portfolio investments may be based on an evaluation of fair value,
pursuant to procedures established by and under the general supervision of the Board. The Valuation Committee, which is comprised of the Independent Trustees of the Board, and the Pricing Committee, which is comprised of representatives from AMG Funds LLC (the “Investment Manager”) are the committees appointed by the Board to make fair value determinations. Each Fund may use the fair value of a portfolio investment to calculate its net asset value (“NAV”) in the event that the market quotation, price or market based valuation for the portfolio investment is not readily available or otherwise not determinable pursuant to the Board’s valuation procedures, if the Investment Manager or the Pricing Committee believes the quotation, price or market based valuation to be unreliable, or in certain other circumstances. When determining the fair value of an investment, the Pricing Committee and, if required under the Trust’s securities valuation procedures, the Valuation Committee, seeks to determine the price that the Fund might reasonably expect to receive from current sale of that portfolio investment in an arms-length transaction. Fair value determinations shall be based upon consideration of all available facts and information, including, but not limited to (i) attributes specific to the investment; (ii) fundamental and analytical data relating to the investment; and (iii) the value of other comparable securities or relevant financial instruments, including derivative securities, traded on other markets or among dealers.
The values assigned to fair value portfolio investments are based on available information and do not necessarily represent amounts that might ultimately be realized in the future, since such amounts depend on future developments inherent in long-term investments. Because of the inherent uncertainty of valuation, those estimated values may differ significantly from the values that would have been used had a ready market for the investments existed, and the differences could be material. The Board will be presented with a quarterly report showing as of the most recent quarter end, all outstanding securities fair valued by the Funds, including a comparison with the prior quarter end and the percentage of the Funds that the security represents at each quarter end.
With respect to foreign equity securities and certain foreign fixed income securities, the Board has adopted a policy that securities held in a Fund that can be fair valued by the applicable fair value pricing service are fair valued on each business day provided that each individual price exceeds apre-established confidence level.
U.S. GAAP defines fair value as the price that a fund would receive to sell an asset or pay to transfer a liability in an orderly transaction between market participants at the measurement date. U.S. GAAP also establishes a framework for measuring fair value, and a three level hierarchy for fair value measurements based upon the transparency of inputs to the valuation of an asset or liability. Inputs may be observable or unobservable and refer broadly to the assumptions that market participants would use in pricing the asset or liability. Observable inputs reflect the assumptions market participants would use in pricing the asset or liability based on market data obtained from sources independent of the Funds. Unobservable inputs reflect the Funds’ own assumptions about the assumptions that market participants would use in pricing the asset or liability developed based on the best information available in the circumstances. Each investment is assigned a level based upon the observability of the inputs which are significant to the overall valuation.
The three-tier hierarchy of inputs is summarized below:
Level 1 – inputs are quoted prices in active markets for identical investments (e.g., equity securities,open-end investment companies)
Level 2 – other observable inputs (including, but not limited to: quoted prices for similar assets or liabilities in markets that are active, quoted prices for identical or
| | | | |
| | | | | |
| | | Notes to Financial Statements(continued) | | |
| | | | |
similar assets or liabilities in markets that are not active, inputs other than quoted prices that are observable for the assets or liabilities (such as interest rates, yield curves, volatilities, prepayment speeds, loss severities, credit risks and default rates) or other market corroborated inputs) (e.g., debt securities, government securities, foreign currency exchange contracts, swaps, foreign securities utilizing international fair value pricing, fair valued securities with observable inputs)
Level 3 – inputs are significant unobservable inputs (including the Fund’s own assumptions used to determine the fair value of investments) (e.g., fair valued securities with unobservable inputs)
Changes in inputs or methodologies used for valuing investments may result in a transfer in or out of levels within the fair value hierarchy. The inputs or methodologies used for valuing investments may not necessarily be an indication of the risk associated with investing in those investments.
b. SECURITY TRANSACTIONS
Security transactions are accounted for as of trade date. Realized gains and losses on securities sold are determined on the basis of identified cost.
c. INVESTMENT INCOME AND EXPENSES
Dividend income is recorded on theex-dividend date. Interest income, which includes amortization of premium and accretion of discount on debt securities, is accrued as earned. Dividend and interest income on foreign securities is recorded gross of any withholding tax.Non-cash dividends included in dividend income, if any, are reported at the fair market value of the securities received. Upon notification from issuers, distributions received from a real estate investment trust (“REIT”) may be redesignated as a reduction of cost of investments and/or realized gain. Other income and expenses are recorded on an accrual basis. Expenses that cannot be directly attributed to a Fund are apportioned among the funds in the Trust and other trusts or funds within the AMG Funds family of mutual funds (collectively the “AMG Funds Family”) based upon their relative average net assets or number of shareholders. Investment income, realized and unrealized capital gains and losses, the common expenses of each Fund, and certain fund level
expense reductions, if any, are allocated on apro-rata basis to each class based on the relative net assets of each class to the total net assets of each Fund.
d. DIVIDENDS AND DISTRIBUTIONS
Fund distributions resulting from either net investment income or realized net capital gains, if any, will normally be declared and paid at least annually in December. Distributions to shareholders are recorded on theex-dividend date. Distributions are determined in accordance with federal income tax regulations, which may differ from net investment income and net realized capital gains for financial statement purposes (U.S. GAAP). Differences may be permanent or temporary. Permanent differences are reclassified among capital accounts in the financial statements to reflect their tax character. Permanent book and tax basis differences, if any, relating to shareholder distributions will result in reclassifications topaid-in capital. Temporary differences arise when certain items of income, expense and gain or loss are recognized in different periods for financial statement and tax purposes; these differences will reverse at some time in the future. Permanent differences are primarily due to net operating losses, partnerships and distributions in excess of accumulated realized gain. Temporary differences are due to differing treatments for losses deferred due to excise tax regulations, partnerships, and wash sales.
The distributions disclosed on the Statements of Changes in Net Assets for the fiscal year ended May 31, 2018 were from the following sources:
| | | | | | |
| Fund | | Realized Gain on
Investments |
Mid Cap | | | | | |
| | |
Class N | | | $9,470,697 | | | |
| | |
Class I | | | 1,635,519 | | | |
| | |
Class Z | | | 2,690,280 | | | |
| | | | | | |
| | |
Total | | | $13,796,496 | | | |
| | | | | | |
The tax character of distributions paid during the fiscal years ended May 31, 2019 and May 31, 2018 were as follows:
| | | | | | | | | | | | | | | | |
| | | Mid Cap | | | Emerging Companies | |
Distributions paid from: | | 2019 | | | 2018 | | | 2019 | | | 2018 | |
| | | | |
Ordinary income | | | $217,239 | | | | — | | | | — | | | | — | |
| | | | |
Short-term capital gains | | | 1,399,791 | | | | $3,519,352 | | | | $1,420,874 | | | | — | |
| | | | |
Long-term capital gains | | | 16,166,075 | | | | 10,277,144 | | | | 12,792,468 | | | | — | |
| | | | | | | | | | | | | | | | |
| | | | |
| | | $17,783,105 | | | | $13,796,496 | | | | $14,213,342 | | | | — | |
| | | | | | | | | | | | | | | | |
| | | | | |
As of May 31, 2019, the components of distributable earnings (excluding unrealized appreciation/depreciation) on a tax basis consisted of:
| | | | | | | | |
| | | Mid Cap | | | Emerging Companies | |
| | |
Capital loss carryforward | | | — | | | | — | |
| | |
Undistributed ordinary income | | | $252,800 | | | | — | |
| | |
Undistributed short-term capital gains | | | — | | | | — | |
| | |
Undistributed long-term capital gains | | | 850,853 | | | | — | |
| | |
Late-year loss deferral | | | — | | | | $8,011,749 | |
| | | | |
| | | | | |
| | | Notes to Financial Statements(continued) | | |
| | | | |
At May 31, 2019, the cost of investments and the aggregate gross unrealized appreciation and depreciation for federal income tax purposes were as follows:
| | | | | | | | | | | | | | | | |
Fund | | Cost | | | Appreciation | | | Depreciation | | | Net | |
Mid Cap | | | $91,213,609 | | | | $15,669,469 | | | | $(6,992,814) | | | | $8,676,655 | |
| | | | |
Emerging Companies | | | 186,103,594 | | | | 13,234,140 | | | | (18,098,201) | | | | (4,864,061) | |
e. FEDERAL TAXES
Each Fund currently qualifies as an investment company and intends to comply with the requirements under Subchapter M of the Internal Revenue Code of 1986, as amended, and to distribute substantially all of its taxable income and gains to its shareholders and to meet certain diversification and income requirements with respect to investment companies. Therefore, no provision for federal income or excise tax is included in the accompanying financial statements.
Additionally, based on each Fund’s understanding of the tax rules and rates related to income, gains and transactions for the foreign jurisdictions in which it invests, each Fund will provide for foreign taxes, and where appropriate, deferred foreign taxes.
Management has analyzed the Funds’ tax positions taken on federal income tax returns as of May 31, 2019, and for all open tax years (generally, the three prior taxable years), and has concluded that no provision for federal income tax is required in the Funds’ financial statements. Additionally, Management is not aware of any tax position for which it is reasonably possible that the total amounts of unrecognized tax benefits will change materially in the next twelve months.
f. CAPITAL LOSS CARRYOVERS AND DEFERRALS
As of May 31, 2019, the Funds had no accumulated net realized capital loss carryovers from securities transactions for federal income tax purposes. Should the Funds incur net capital losses for the fiscal year ended May 31, 2020, such amounts may be used to offset future realized capital gains indefinitely, and retain their character as short-term and/or long-term.
g. CAPITAL STOCK
The Trust’s Declaration of Trust authorizes for each Fund the issuance of an unlimited number of shares of beneficial interest, without par value. Each Fund records sales and repurchases of its capital stock on the trade date.
For the fiscal years ended May 31, 2019 and May 31, 2018, the capital stock transactions by class for the Funds were as follows:
| | | | | | | | | | | | | | | | | | | | | | | | | | | | | | | | |
| | | Mid Cap | | | Emerging Companies | |
| | | May 31, 2019 | | | May 31, 2018 | | | May 31, 2019 | | | May 31, 2018 | |
| | | Shares | | | Amount | | | Shares | | | Amount | | | Shares | | | Amount | | | Shares | | | Amount | |
Class N: | | | | | | | | | | | | | | | | | | | | | | | | | | | | | | | | |
Proceeds from sale of shares | | | 76,652 | | | | $2,046,041 | | | | 79,386 | | | | $2,468,248 | | | | 553,435 | | | | $32,853,873 | | | | 203,266 | | | | $10,809,102 | |
Reinvestment of distributions | | | 498,568 | | | | 10,938,587 | | | | 283,917 | | | | 8,616,888 | | | | 69,190 | | | | 3,097,621 | | | | — | | | | — | |
Cost of shares repurchased | | | (706,402) | | | | (19,940,058) | | | | (434,937) | | | | (13,456,952) | | | | (346,279) | | | | (18,720,758) | | | | (95,372) | | | | (4,974,586) | |
| | | | | | | | | | | | | | | | | | | | | | | | | | | | | | | | |
Net increase (decrease) | | | (131,182) | | | | $(6,955,430) | | | | (71,634) | | | | $(2,371,816) | | | | 276,346 | | | | $17,230,736 | | | | 107,894 | | | | $5,834,516 | |
| | | | | | | | | | | | | | | | | | | | | | | | | | | | | | | | |
Class I: | | | | | | | | | | | | | | | | | | | | | | | | | | | | | | | | |
Proceeds from sale of shares | | | 95,778 | | | | $2,937,073 | | | | 94,171 | | | | $3,030,852 | | | | 1,555,248 | | | | $95,289,101 | | | | 999,353 | | | | $57,934,341 | |
Reinvestment of distributions | | | 109,623 | | | | 2,501,590 | | | | 51,845 | | | | 1,626,363 | | | | 181,635 | | | | 8,885,595 | | | | — | | | | — | |
Cost of shares repurchased | | | (137,754) | | | | (4,015,046) | | | | (128,235) | | | | (4,114,931) | | | | (849,043) | | | | (48,666,379) | | | | (815,553) | | | | (47,238,166) | |
| | | | | | | | | | | | | | | | | | | | | | | | | | | | | | | | |
Net increase | | | 67,647 | | | | $1,423,617 | | | | 17,781 | | | | $542,284 | | | | 887,840 | | | | $55,508,317 | | | | 183,800 | | | | $10,696,175 | |
| | | | | | | | | | | | | | | | | | | | | | | | | | | | | | | | |
Class Z: | | | | | | | | | | | | | | | | | | | | | | | | | | | | | | | | |
Proceeds from sale of shares | | | 101,826 | | | | $3,055,443 | | | | 66,413 | | | | $2,199,000 | | | | 197,498 | | | | $12,164,785 | | | | 394,060 | | | | $22,907,969 | |
Reinvestment of distributions | | | 125,549 | | | | 3,028,249 | | | | 68,772 | | | | 2,259,153 | | | | 44,817 | | | | 2,196,036 | | | | — | | | | — | |
Cost of shares repurchased | | | (220,047) | | | | (6,632,669) | | | | (148,964) | | | | (4,947,543) | | | | (97,530) | | | | (5,611,285) | | | | (31,160) | | | | (1,830,177) | |
| | | | | | | | | | | | | | | | | | | | | | | | | | | | | | | | |
Net increase (decrease) | | | 7,328 | | | | $(548,977) | | | | (13,779) | | | | $(489,390) | | | | 144,785 | | | | $8,749,536 | | | | 362,900 | | | | $21,077,792 | |
| | | | | | | | | | | | | | | | | | | | | | | | | | | | | | | | |
| | | | |
| | | | | |
| | | Notes to Financial Statements(continued) | | |
| | | | |
h. REPURCHASE AGREEMENTS AND JOINT REPURCHASE AGREEMENTS
The Funds may enter into third-party repurchase agreements for temporary cash management purposes and third-party or bilateral joint repurchase agreements for reinvestment of cash collateral on securities lending transactions under the securities lending program offered by The Bank of New York Mellon (“BNYM”) (the “Program”) (collectively, “Repurchase Agreements”). The value of the underlying collateral, including accrued interest, must equal or exceed the value of the Repurchase Agreements during the term of the agreement. For joint repurchase agreements, the Funds participate on a pro rata basis with other clients of BNYM in its share of the underlying collateral under such joint repurchase agreements and in its share of proceeds from any repurchase or other disposition of the underlying collateral. The underlying collateral for all Repurchase Agreements is held in safekeeping by the Funds’ custodian or at the Federal Reserve Bank. If the seller defaults and the value of the collateral declines, or if bankruptcy proceedings commence with respect to the seller of the security, realization of the collateral by the Funds may be delayed or limited. Pursuant to the Program, the Funds are indemnified for such losses by BNYM on joint repurchase agreements.
At May 31, 2019, the market value of Repurchase Agreements outstanding for Emerging Companies was $5,203,891.
2. AGREEMENTS AND TRANSACTIONS WITH AFFILIATES
For each of the Funds, the Trust has entered into an investment advisory agreement under which the Investment Manager, a subsidiary and the U.S. retail distribution arm of Affiliated Managers Group, Inc. (“AMG”), serves as investment manager to the Funds and is responsible for the Funds’ overall administration and operations. The Investment Manager selects one or more subadvisers for the Funds (subject to Board approval) and monitors each subadviser’s investment performance, security holdings and investment strategies. Each Fund’s investment portfolio is managed by Cadence Capital Management, LLC. who serve pursuant to a subadvisory agreement with the Investment Manager.
Investment management fees are paid directly by the Funds to the Investment Manager based on average daily net assets. For the fiscal year ended May 31, 2019, the Funds’ investment management fees were paid at the following annual rate of each Fund’s respective average daily net assets:
| | |
Mid Cap | | 0.45% |
| |
Emerging Companies | | 0.69% |
| | | |
The Investment Manager has contractually agreed, through at least October 1, 2019, to waive management fees and/or reimburse fund expenses in order to limit total annual Fund operating expenses after fee waiver and expense reimbursements (exclusive of taxes, interest (including interest incurred in connection with bank and custody overdrafts, and in connection with securities sold short), shareholder servicing fees, distribution and service(12b-1) fees, brokerage commissions and other transaction costs, dividends payable with respect to securities sold short, acquired fund fees and expenses and extraordinary expenses) of Mid Cap and Emerging Companies to 0.72% and 0.89%, respectively, of each Fund’s average daily net assets subject to later reimbursement by the Funds in certain circumstances.
The contractual expense limitation may only be terminated in the event the Investment Manager or a successor ceases to be the investment manager of the
Fund or a successor fund, by mutual agreement between the Investment Manager and the Board, or in the event of the Fund’s liquidation unless the Fund is reorganized or is a party to a merger in which the surviving entity is successor to the accounting and performance information of the Fund.
In general, for a period of up to 36 months, the Investment Manager may recover from each Fund fees waived and expenses paid pursuant to this contractual agreement, provided that such repayment would not cause the Fund’s total annual operating expenses after fee waiver and expense reimbursements (exclusive of the items noted in the parenthetical above) to exceed the contractual expense limitation amount.
At May 31, 2019, the Funds’ expiration of reimbursements subject to recoupment is as follows:
| | | | | | | | |
Expiration Period | | Mid Cap | | | Emerging Companies | |
Less than 1 year | | | $55,919 | | | | $90,648 | |
1-2 years | | | 17,753 | | | | 119,512 | |
2-3 years | | | 34,975 | | | | 115,905 | |
| | | | | | | | |
Total | | | $108,647 | | | | $326,065 | |
| | | | | | | | |
The Trust, on behalf of the Funds, has entered into an amended and restated Administration Agreement under which the Investment Manager serves as the Funds’ administrator (the “Administrator”) and is responsible for allnon-portfolio management aspects of managing the Funds’ operations, including administration and shareholder services to each Fund. Each Fund pays a fee to the Administrator at the rate of 0.15% per annum of the Fund’s average daily net assets for this service.
The Funds are distributed by AMG Distributors, Inc. (the “Distributor”), a wholly-owned subsidiary of the Investment Manager. The Distributor serves as the distributor and underwriter for each Fund and is a registered broker-dealer and member of the Financial Industry Regulatory Authority, Inc. (“FINRA”). Shares of each Fund will be continuously offered and will be sold directly to prospective purchasers and through brokers, dealers or other financial intermediaries who have executed selling agreements with the Distributor. Generally the Distributor bears all or a portion of the expenses of providing services pursuant to the distribution agreement, including the payment of the expenses relating to the distribution of prospectuses for sales purposes and any advertising or sales literature.
Mid Cap has adopted a distribution and service plan (the “Plan”) with respect to the Class N shares, in accordance with the requirements of Rule12b-1 under the 1940 Act and the requirements of the applicable rules of FINRA regarding asset-based sales charges. Pursuant to the Plan, the Fund may make payments to the Distributor for its expenditures in financing any activity primarily intended to result in the sale of the Fund’s Class N shares and for maintenance and personal service provided to existing shareholders of that class. The Plan authorizes payments to the Distributor up to 0.25% annually of the Fund’s average daily net assets attributable to the Class N shares.
For each of the Class N and Class I shares, the Board has approved reimbursement payments to the Investment Manager for shareholder servicing expenses (“shareholder servicing fees”) incurred. Shareholder servicing fees include payments to financial intermediaries, such as broker-dealers (including fund supermarket platforms), banks, any trust companies who provide shareholder
| | | | |
| | | | | |
| | | Notes to Financial Statements(continued) | | |
| | | | |
recordkeeping, account servicing and other services. The Class N and Class I shares may reimburse the Investment Manager for the actual amount incurred up to a maximum annual rate of each Class’s average daily net assets as shown in the table below.
The impact on the annualized expense ratio for the fiscal year ended May 31, 2019, was as follows:
| | | | | | | | | | |
| | | Maximum Annual | | | Actual | | | |
| | | Amount | | | Amount | | | |
| Fund | | Approved | | | Incurred | | | |
Mid Cap | | | | | | | | | | |
| | | |
Class N | | | 0.15% | | | | 0.10% | | | |
| | | |
Class I | | | 0.15% | | | | 0.15% | | | |
Emerging Companies | | | | | | | | | | |
| | | |
Class N | | | 0.25% | | | | 0.22% | | | |
| | | |
Class I | | | 0.10% | | | | 0.10% | | | |
The Board provides supervision of the affairs of the Trust and other trusts within the AMG Funds family. The Trustees of the Trust who are not affiliated with the Investment Manager receive an annual retainer and per meeting fees for regular, special and telephonic meetings, and they are reimbursed forout-of-pocket expenses incurred while carrying out their duties as Board members. The Chairman of the Board and the Audit Committee Chair receive additional annual retainers. Certain Trustees and Officers of the Funds are Officers and/or Directors of the Investment Manager, AMG and/or the Distributor.
The Securities and Exchange Commission (the “SEC”) granted an exemptive order that permits the Funds to lend and borrow money for certain temporary purposes directly to and from other eligible funds in the AMG Funds family. Participation in this interfund lending program is voluntary for both the borrowing and lending funds, and an interfund loan is only made if it benefits each participating fund. The Administrator manages the program according to procedures approved by the Board, and the Board monitors the operation of the program. An interfund loan must comply with certain conditions set out in the exemptive order, which are designed to assure fairness and protect all participating funds. For the fiscal year ended May 31, 2019, Emerging Companies lent a maximum of $2,284,459 for four days earning interest of $715. The interest earned is included in the Statement of Operations as interest income. At May 31, 2019, the Funds had no interfund loans outstanding.
3. PURCHASES AND SALES OF SECURITIES
Purchases and sales of securities (excluding short-term securities and U.S. Government Obligations) for the fiscal year ended May 31, 2019, were as follows:
| | | | | | | | |
| | | Long Term Securities | |
| | |
| Fund | | Purchases | | | Sales | |
| | |
Mid Cap | | | $51,947,315 | | | | $75,576,253 | |
| | |
Emerging Companies | | | 238,514,885 | | | | 167,049,291 | |
| |
The Funds had no purchases or sales of U.S. Government Obligations during the fiscal year ended May 31, 2019.
4. PORTFOLIO SECURITIES LOANED
The Funds participate in the Program providing for the lending of securities to qualified borrowers. Securities lending income includes earnings of such temporary cash investments, plus or minus any rebate to a borrower. These earnings (after any rebate) are then divided between BNYM, as a fee for its services under the Program, and the Funds, according to agreed-upon rates. Collateral on all securities loaned is accepted in cash or U.S. Government and Agency Obligations. Collateral is maintained at a minimum level of 102% (105% in the case of certain foreign securities) of the market value, plus interest, if applicable, of investments on loan. It is the Funds’ policy to obtain additional collateral from or return excess collateral to the borrower by the end of the next business day, following the valuation date of the securities loaned. Therefore, the value of the collateral held may be temporarily less than the value of the securities on loan. Lending securities entails a risk of loss to the Funds if and to the extent that the market value of the securities loaned were to increase and the borrower did not increase the collateral accordingly, and the borrower fails to return the securities. Under the terms of the Program, the Funds are indemnified for such losses by BNYM. Cash collateral is held in separate omnibus accounts managed by BNYM, who is authorized to exclusively enter into joint repurchase agreements for that cash collateral. Securities collateral is held in separate omnibus accounts managed by BNYM that cannot be sold or pledged. BNYM bears the risk of any deficiency in the amount of the cash collateral available for return to the borrower due to any loss on the collateral invested.
The value of securities loaned on positions held, cash and securities collateral received at May 31, 2019, were as follows:
| | | | | | | | | | | | | | | | |
Fund | | Securities
Loaned | | | Cash
Collateral
Received | | | Securities
Collateral
Received | | | Total
Collateral
Received | |
Mid Cap | | | $6,025,915 | | | | — | | | | $6,277,360 | | | | $6,277,360 | |
| | | | |
Emerging Companies | | | 24,078,486 | | | $ | 5,203,891 | | | | 19,789,947 | | | | 24,993,838 | |
The following table summarizes the securities received as collateral for securities lending at May 31, 2019:
| | | | | | | | | | |
| Fund | | Collateral
Type | | Coupon
Range | | | Maturity Date
Range | |
Mid Cap | | U.S. Treasury Obligations | | | 0.000%-8.750% | | | | 06/04/19-02/15/49 | |
| | | |
Emerging Companies | | U.S. Treasury Obligations | | | 0.000%-8.750% | | | | 06/04/19-02/15/49 | |
5. COMMITMENTS AND CONTINGENCIES
Under the Trust’s organizational documents, its trustees and officers are indemnified against certain liabilities arising out of the performance of their duties to the Trust. In addition, in the normal course of business, the Funds may enter into contracts and agreements that contain a variety of representations and warranties, which provide general indemnifications. The maximum exposure to the Funds under these arrangements is unknown, as this would involve future claims that may be made against a Fund that have not yet occurred. However, based on experience, the Funds had no prior claims or losses and expect the risks of loss to be remote.
| | | | |
| | | | | |
| | | Notes to Financial Statements(continued) | | |
| | | | | |
6. MASTER NETTING AGREEMENTS
The Funds may enter into master netting agreements with their counterparties for the securities lending program and Repurchase Agreements, which provide the right, in the event of default (including bankruptcy or insolvency) for thenon-defaulting party to liquidate the collateral and calculate net exposure to the
defaulting party or request additional collateral. For financial reporting purposes, the Funds do not offset financial assets and financial liabilities that are subject to master netting agreements in the Statement of Assets and Liabilities. For securities lending transactions, see Note 4.
The following table is a summary of the Funds’ open Repurchase Agreements that are subject to a master netting agreement as of May 31, 2019:
| | | | | | | | | | |
| | | | | Gross Amount Not Offset in the | | | | |
| | | | | Statement of Assets and Liabilities | | | | |
| Fund | | Gross Amounts of
Assets Presented in
the Statement of
Assets and Liabilities | | Offset Amount | | Net Asset Balance | | Collateral Received | | Net Amount |
Emerging Companies | | | | | | | | | | |
| | | | | |
BNP Paribas S.A. | | $259,855 | | — | | $259,855 | | $259,855 | | — |
| | | | | |
Citigroup Global Markets, Inc. | | 1,236,009 | | — | | 1,236,009 | | 1,236,009 | | — |
| | | | | |
Daiwa Capital Markets America | | 1,236,009 | | — | | 1,236,009 | | 1,236,009 | | — |
| | | | | |
HSBC Securities USA, Inc. | | 1,236,009 | | — | | 1,236,009 | | 1,236,009 | | — |
| | | | | |
Morgan, Stanley & Co. LLC | | 1,236,009 | | — | | 1,236,009 | | 1,236,009 | | — |
| | | | | | | | | | |
| | | | | |
Total | | $5,203,891 | | — | | $5,203,891 | | $5,203,891 | | — |
| | | | | | | | | | |
7. REGULATORY UPDATES
In August 2018, the FASB issued Accounting Standards UpdateNo. 2018-13, Fair Value Measurement (Topic 820), Disclosure Framework - Changes to the Disclosure Requirements for Fair Value Measurement (“ASU2018-13”) which is effective for periods starting after December 15, 2019. The primary focus of the update is to improve the effectiveness of ASC 820’s disclosure in the notes to financial statements. The Funds have early adopted these changes and there was no significant impact on the financial statements and accompanying notes.
Effective November 15, 2018, the SEC amended existing rules intended to modernize reporting and disclosure of information. These amendments relate to RegulationS-X which sets forth the form and content of financial statements. The
amendment requires collapsing the components of distributable earnings on the Statement of Assets and Liabilities and collapsing the distributions paid to shareholders on the Statements of Changes in Net Assets. The Funds have adopted these amendments and there was no significant impact on the financial statements and accompanying notes.
8. SUBSEQUENT EVENTS
The Funds have determined that no material events or transactions occurred through the issuance date of the Funds’ financial statements which require an additional disclosure in or adjustment of the Funds’ financial statements.
| | | | |
| | | | | |
| | | Report of Independent Registered Public Accounting Firm | | |
| | | | |
TO THE BOARD OF TRUSTEES OF AMG FUNDS III AND SHAREHOLDERS OF AMG MANAGERS CADENCE EMERGING COMPANIES FUND AND AMG MANAGERS CADENCE MID CAP FUND
Opinions on the Financial Statements
We have audited the accompanying statements of assets and liabilities, including the schedules of portfolio investments, of AMG Managers Cadence Emerging Companies Fund and AMG Managers Cadence Mid Cap Fund, (two of the funds constituting AMG Funds III, hereafter collectively referred to as the “Funds”) as of May 31, 2019, the related statements of operations for the year ended May 31, 2019, the statements of changes in net assets for each of the two years in the period ended May 31, 2019, including the related notes, and the financial highlights for each of the periods indicated therein (collectively referred to as the “financial statements”). In our opinion, the financial statements present fairly, in all material respects, the financial position of each of the Funds as of May 31, 2019, the results of each of their operations for the year then ended, the changes in each of their net assets for each of the two years in the period ended May 31, 2019 and each of the financial highlights for each of the periods indicated therein in conformity with accounting principles generally accepted in the United States of America.
Basis for Opinions
These financial statements are the responsibility of the Funds’ management. Our responsibility is to express an opinion on the Funds’ financial statements based on our audits. We are a public accounting firm registered with the Public Company Accounting Oversight Board (United States) (PCAOB) and are required to be independent with respect to the Funds in accordance with the U.S. federal securities laws and the applicable rules and regulations of the Securities and Exchange Commission and the PCAOB.
We conducted our audits of these financial statements in accordance with the standards of the PCAOB. Those standards require that we plan and perform the audit to obtain reasonable assurance about whether the financial statements are free of material misstatement, whether due to error or fraud.
Our audits included performing procedures to assess the risks of material misstatement of the financial statements, whether due to error or fraud, and performing procedures that respond to those risks. Such procedures included examining, on a test basis, evidence regarding the amounts and disclosures in the financial statements. Our audits also included evaluating the accounting principles used and significant estimates made by management, as well as evaluating the overall presentation of the financial statements. Our procedures included confirmation of securities owned as of May 31, 2019 by correspondence with the custodian and brokers; when replies were not received from brokers, we performed other auditing procedures. We believe that our audits provide a reasonable basis for our opinions.
PricewaterhouseCoopers LLP
Boston, Massachusetts
July 26, 2019
We have served as the auditor of one or more investment companies in the AMG Funds Family since 1993.
TAX INFORMATION
The AMG Managers Cadence Mid Cap Fund and AMG Managers Cadence Emerging Companies Fund each hereby designates the maximum amount allowable of its net taxable income as qualified dividends as provided in the Jobs and Growth Tax Relief Reconciliation Act of 2003. The 2019 Form1099-DIV you receive for each Fund will show the tax status of all distributions paid to you during the year.
Pursuant to section 852 of the Internal Revenue Code, AMG Managers Cadence Mid Cap Fund and AMG Managers Cadence Emerging Companies Fund each hereby designates $16,166,075, and $12,792,468 respectively, as a capital gain distribution with respect to the taxable year ended May 31, 2019, or if subsequently determined to be different, the net capital gains of such fiscal year.
| | | | |
| | | | | |
| | | AMG Funds | | |
| | | Trustees and Officers | | |
| | | | |
| The Trustees and Officers of the Trust, their business addresses, principal occupations for the past five years and ages are listed below. The Trustees provide broad supervision over the affairs of the Trust and the Funds. The Trustees are experienced executives who meet periodically throughout the year to oversee the Funds’ activities, review contractual arrangements with companies that provide services to the Funds, and | | review the Funds’ performance. Unless otherwise noted, the address of each Trustee or Officer is the address of the Trust: 600 Steamboat Road, Suite 300, Greenwich, Connecticut 06830. There is no stated term of office for Trustees. Trustees serve until their resignation, retirement or removal in | | accordance with the Trust’s organizational documents and policies adopted by the Board from time to time. The Chairman of the Trustees, President, Treasurer and Secretary of the Trust are elected by the Trustees annually. Other officers hold office at the pleasure of the Trustees. |
Independent Trustees
The following Trustees are not “interested persons” of the Trust within the meaning of the 1940 Act:
| | |
| | |
Number of Funds Overseen
in Fund Complex | | Name, Age, Principal Occupation(s) During Past 5 Years and Other Directorships Held by Trustee |
| |
• Trustee since 2012 • Oversees 53 Funds in Fund Complex | | Bruce B. Bingham, 70 Partner, Hamilton Partners (real estate development firm) (1987-Present); Director of The Yacktman Funds (2000-2012). |
| |
• Trustee since 1999 • Oversees 53 Funds in Fund Complex | | Edward J. Kaier, 73 Attorney at Law and Partner, Teeters Harvey Marrone & Kaier LLP (2007-Present); Attorney at Law and Partner, Hepburn Willcox Hamilton & Putnam, LLP (1977-2007); Trustee of Third Avenue Trust (3 portfolios); Trustee of Third Avenue Variable Trust (1 portfolio). |
| |
• Trustee since 2013 • Oversees 56 Funds in Fund Complex | | Kurt A. Keilhacker, 55 Managing Partner, TechFund Capital (1997-Present); Managing Partner, TechFund Europe (2000-Present); Board Member, 6wind SA, (2002-Present); Managing Partner, Elementum Ventures (2013-Present); Director, MetricStory, Inc. (2017-Present); Trustee, Wheaton College (2018-Present); Trustee, Gordon College (2001-2016). |
| |
• Trustee since 2000 • Oversees 53 Funds in Fund Complex | | Steven J. Paggioli, 69 Independent Consultant (2002-Present); Trustee, Professionally Managed Portfolios (32 portfolios); Advisory Board Member, Sustainable Growth Advisors, LP; Independent Director, Chase Investment Counsel (2008–Present); Executive Vice President, Secretary and Director, Investment Company Administration, LLC (1990-2001). |
| |
• Trustee since 2013 • Oversees 53 Funds in Fund Complex | | Richard F. Powers III, 73 Adjunct Professor, U.S. Naval War College (2016-Present); Adjunct Professor, Boston College (2010-2013); President and CEO of Van Kampen Investments Inc. (1998-2003). |
| |
• Independent Chairman • Trustee since 2000 • Oversees 56 Funds in Fund Complex | | Eric Rakowski, 61 Professor of Law, University of California at Berkeley School of Law - Boalt Hall (1990-Present); Director of Harding, Loevner Funds, Inc. (9 portfolios); Trustee of Third Avenue Trust (3 portfolios); Trustee of Third Avenue Variable Trust (1 portfolio). |
| |
• Trustee since 2013 • Oversees 56 Funds in Fund Complex | | Victoria L. Sassine, 53 Adjunct Professor, Babson College (2007-Present); Director, Board of Directors, PRG Group (2017-Present); CEO, Founder, Scale Smarter Partners, LLC (2018-Present); Chairperson, Board of Directors, Business Management Associates (2018-Present). |
| |
• Trustee since 2004 • Oversees 53 Funds in Fund Complex | | Thomas R. Schneeweis, 72 Professor Emeritus, University of Massachusetts (2013-Present); President, TRS Associates (1982-Present); Board Member, Chartered Alternative Investment Association (“CAIA”) (2002-Present); Director, Institute for Global Asset and Risk Management (Education) (2010-Present);Co-Owner, Quantitative Investment Technologies (2014-Present); Director of Research, Yes Wealth Management (2018-Present); Partner, S Capital Wealth Advisors (2015-2018); Partner, S Capital Management, LLC (2007-2015); President, Alternative Investment Analytics, LLC, (formerly Schneeweis Partners, LLC) (2001-2013). |
| | | | |
| | | | | |
| | | AMG Funds | | |
| | | Trustees and Officers(continued) | | |
Interested Trustees
Each Trustee in the following table is an “interested person” of the Trust within the meaning of the 1940 Act. Ms. Carsman is an interested person of the Trust within the meaning of the 1940 Act by virtue of her position with, and interest in securities of, AMG.
| | |
Number of Funds Overseen in
Fund Complex | | Name, Age, Principal Occupation(s) During Past 5 Years and Other Directorships Held by Trustee |
| |
• Trustee since 2011 • Oversees 56 Funds in Fund Complex | | Christine C. Carsman, 67 Senior Policy Advisor, Affiliated Managers Group, Inc. (2019-Present); Director of Harding, Loevner Funds, Inc. (9 portfolios); Executive Vice President, Deputy General Counsel and Chief Regulatory Counsel, Affiliated Managers Group, Inc. (2017-2018); Director (2010-2018) and Chair of the Board of Directors (2015-2018), AMG Funds plc; Senior Vice President and Deputy General Counsel, Affiliated Managers Group, Inc.(2011-2016); Senior Vice President and Chief Regulatory Counsel, Affiliated Managers Group, Inc. (2007-2011); Vice President and Chief Regulatory Counsel, Affiliated Managers Group, Inc. (2004-2007); Secretary and Chief Legal Officer, AMG Funds, AMG Funds I, AMG Funds II and AMG Funds III (2004-2011); Senior Counsel, Vice President and Director of Operational Risk Management and Compliance, Wellington Management Company, LLP (1995-2004). |
Officers |
| | |
Position(s) Held with Fund and
Length of Time Served | | Name, Age, Principal Occupation(s) During Past 5 Years |
| |
• President since 2018 • Principal Executive Officer since 2018 • Chief Executive Officer since 2018 • Chief Operating Officer since 2007 | | Keitha L. Kinne, 61 Chief Operating Officer, AMG Funds LLC (2007-Present); Chief Investment Officer, AMG Funds LLC (2008-Present); President and Principal, AMG Distributors, Inc. (2018-Present); Chief Operating Officer, AMG Distributors, Inc. (2007-Present); President, Chief Executive Officer and Principal Executive Officer, AMG Funds, AMG Funds I, AMG Funds II, AMG Funds III and AMG Funds IV (2018-Present); Chief Operating Officer, AMG Funds, AMG Funds I, AMG Funds II, and AMG Funds III (2007-Present); Chief Operating Officer, AMG Funds IV (2016-Present); Chief Operating Officer and Chief Investment Officer, Aston Asset Management, LLC (2016); President and Principal Executive Officer, AMG Funds, AMG Funds I, AMG Funds II and AMG Funds III (2012-2014); Managing Partner, AMG Funds LLC (2007-2014); President and Principal, AMG Distributors, Inc. (2012-2014); Managing Director, Legg Mason & Co., LLC (2006-2007); Managing Director, Citigroup Asset Management (2004-2006). |
| |
• Secretary since 2015 • Chief Legal Officer since 2015 | | Mark J. Duggan, 54 Senior Vice President and Senior Counsel, AMG Funds LLC (2015-Present); Secretary and Chief Legal Officer, AMG Funds, AMG Funds I, AMG Funds II, AMG Funds III and AMG Funds IV (2015-Present); Attorney, K&L Gates, LLP (2009-2015). |
| |
• Chief Financial Officer since 2017 • Treasurer since 2017 • Principal Financial Officer since 2017 • Principal Accounting Officer since 2017 | | Thomas G. Disbrow, 53 Vice President, Mutual Fund Treasurer & CFO, AMG Funds, AMG Funds LLC (2017-Present); Chief Financial Officer, Principal Financial Officer, Treasurer and Principal Accounting Officer, AMG Funds, AMG Funds I, AMG Funds II, AMG Funds III and AMG Funds IV (2017-Present); Managing Director - Global Head of Traditional Funds Product Control, UBS Asset Management (Americas), Inc. (2015-2017); Managing Director - Head of North American Funds Treasury, UBS Asset Management (Americas), Inc. (2011-2015). |
| |
• Deputy Treasurer since 2017 | | John A. Starace, 48 Director, Mutual Fund Accounting, AMG Funds LLC (2017-Present); Vice President, Deputy Treasurer of Mutual Funds Services, AMG Funds LLC (2014-2017); Deputy Treasurer, AMG Funds, AMG Funds I, AMG Funds II, AMG Funds III and AMG Funds IV (2017-Present); Vice President, Citi Hedge Fund Services (2010-2014); Audit Senior Manager (2005-2010) and Audit Manager (2001-2005), Deloitte & Touche LLP. |
| | |
• Chief Compliance Officer since 2016 | | Gerald F. Dillenburg, 52 Vice President, Chief Compliance Officer AMG Funds, AMG Funds LLC (2017-Present); Chief Compliance Officer AMG Funds, AMG Funds LLC (2016-2017); Chief Compliance Officer and Sarbanes-Oxley Code of Ethics Compliance Officer, AMG Funds, AMG Funds I, AMG Funds II and AMG Funds III (2016-Present); Chief Compliance Officer, AMG Funds IV (1996-Present); Sarbanes-Oxley Code of Ethics Compliance Officer, AMG Funds IV (2016-Present); Chief Compliance Officer, Aston Asset Management, LLC (2006-2016); Chief Operating Officer, Aston Funds (2003-2016); Secretary, Aston Funds (1996-2015); Chief Financial Officer, Aston Funds (1997-2010); Chief Financial Officer, Aston Asset Management, LLC (2006-2010); Treasurer, Aston Funds (1996-2010). |
| | |
• Anti-Money Laundering Compliance Officer since 2014 | | Patrick J. Spellman, 45 Vice President, Chief Compliance Officer, AMG Funds LLC (2017-Present); Senior Vice President, Chief Compliance Officer, AMG Funds LLC (2011-2017); Chief Compliance Officer, AMG Distributors, Inc., (2010-Present); Anti-Money Laundering Compliance Officer, AMG Funds, AMG Funds I, AMG Funds II, and AMG Funds III (2014-Present); Anti-Money Laundering Officer, AMG Funds IV, (2016-Present); Compliance Manager, Legal and Compliance, Affiliated Managers Group, Inc. (2005-2011). |
| |
• Assistant Secretary since 2016 | | Maureen A. Meredith, 34 Vice President, Counsel, AMG Funds LLC (2019-Present); Director, Counsel, AMG Funds LLC (2017-2018); Vice President, Counsel, AMG Funds LLC (2015-2017); Assistant Secretary, AMG Funds, AMG Funds I, AMG Funds II, AMG Funds III and AMG Funds IV (2016-Present); Associate, Ropes & Gray LLP (2011-2015); Law Fellow, Massachusetts Appleseed Center for Law and Justice (2010-2011). |
THIS PAGE INTENTIONALLY LEFT BLANK
THIS PAGE INTENTIONALLY LEFT BLANK
| | | | |
| | | |
INVESTMENT MANAGER AND ADMINISTRATOR AMG Funds LLC 600 Steamboat Road, Suite 300 Greenwich, CT 06830 800.835.3879 DISTRIBUTOR AMG Distributors, Inc. 600 Steamboat Road, Suite 300 Greenwich, CT 06830 800.835.3879 SUBADVISER Cadence Capital Management, LLC 265 Franklin Street, 11th Floor Boston, MA 02110 | | CUSTODIAN The Bank of New York Mellon 111 Sanders Creek Parkway East Syracuse, NY 13057 LEGAL COUNSEL Ropes & Gray LLP Prudential Tower, 800 Boylston Street
Boston, MA 02199-3600 TRANSFER AGENT BNY Mellon Investment Servicing (US) Inc.
Attn: AMG Funds P.O. Box 9769 Providence, RI 02940 800.548.4539 | | This report is prepared for the Funds’ shareholders. It is authorized for distribution to prospective investors only when preceded or accompanied by an effective prospectus. To receive a free copy of the prospectus or Statement of Additional Information, which includes additional information about Fund Trustees, please contact us by calling 800.548.4539. Distributed by AMG Distributors, Inc., member FINRA/SIPC. Current net asset values per share for each Fund are available on the Funds’ website at amgfunds.com. A description of the policies and procedures each Fund uses to vote its proxies is available: (i) without charge, upon request, by calling 800.548.4539, or (ii) on the Securities and Exchange Commission’s (SEC) website at sec.gov. For information regarding each Fund’s proxy voting record for the12-month period ended June 30, call 800.548.4539 or visit the SEC website at sec.gov. The Funds file their complete schedule of portfolio holdings with the SEC for the first and third quarters of each fiscal year as an exhibit to their reports on FormN-PORT, which has replaced Form NQ. The Funds’ portfolio holdings on FormN-PORT are available on the SEC’s website at sec.gov. To review a complete list of the Funds’ portfolio holdings, or to view the semiannual report, or annual report, please visit amgfunds.com. |
| | | | | | | | | | |
| | | AFFILIATE SUBADVISED FUNDS BALANCED FUNDS AMG Chicago Equity Partners Balanced Chicago Equity Partners, LLC AMG FQ Global Risk-Balanced First Quadrant, L.P. EQUITY FUNDS AMG FQTax-Managed U.S. Equity AMG FQ Long-Short Equity First Quadrant, L.P. AMG Frontier Small Cap Growth Frontier Capital Management Co., LLC AMG GW&K Small Cap Core AMG GW&K Small/Mid Cap AMG GW&K Trilogy Emerging Markets Equity AMG GW&K Trilogy Emerging Wealth Equity AMG GW&K U.S. Small Cap Growth GW&K Investment Management, LLC AMG Renaissance Large Cap Growth The Renaissance Group LLC AMG River Road Dividend All Cap Value AMG River Road Dividend All Cap Value II AMG River Road Focused Absolute Value AMG River Road Long-Short AMG River RoadSmall-Mid Cap Value AMG River Road Small Cap Value River Road Asset Management, LLC AMG SouthernSun Small Cap AMG SouthernSun U.S. Equity SouthernSun Asset Management, LLC | | | | AMG TimesSquare Emerging Markets Small Cap AMG TimesSquare Global Small Cap AMG TimesSquare International Small Cap AMG TimesSquare Mid Cap Growth AMG TimesSquare Small Cap Growth TimesSquare Capital Management, LLC AMG Yacktman AMG Yacktman Focused AMG Yacktman Focused Fund - Security Selection Only AMG Yacktman Special Opportunities Yacktman Asset Management LP FIXED INCOME FUNDS AMG GW&K Core Bond ESG AMG GW&K Enhanced Core Bond ESG AMG GW&K Municipal Bond AMG GW&K Municipal Enhanced Yield GW&K Investment Management, LLC OPEN-ARCHITECTURE FUNDS EQUITY FUNDS AMG Managers Brandywine AMG Managers Brandywine Advisors Mid Cap Growth AMG Managers Brandywine Blue Friess Associates, LLC AMG Managers Cadence Emerging Companies AMG Managers Cadence Mid Cap Cadence Capital Management LLC AMG Managers CenterSquare Real Estate CenterSquare Investment Management LLC AMG Managers Emerging Opportunities WEDGE Capital Management L.L.P. Next Century Growth Investors LLC RBC Global Asset Management (U.S.) Inc. | | | | AMG Managers Essex Small/Micro Cap Growth Essex Investment Management Company, LLC AMG Managers Fairpointe ESG Equity AMG Managers Fairpointe Mid Cap Fairpointe Capital LLC AMG Managers LMCG Small Cap Growth LMCG Investments, LLC AMG Managers Montag & Caldwell Growth Montag & Caldwell, LLC AMG Managers Pictet International Pictet Asset Management Limited AMG Managers Silvercrest Small Cap Silvercrest Asset Management Group LLC AMG Managers Skyline Special Equities Skyline Asset Management, L.P. AMG Managers Special Equity Ranger Investment Management, L.P. Lord, Abbett & Co. LLC Smith Asset Management Group, L.P. Federated MDTA LLC FIXED INCOME FUNDS AMG Managers Amundi Intermediate Government AMG Managers Amundi Short Duration Government Amundi Pioneer Institutional Asset Management, Inc. AMG Managers Doubleline Core Plus Bond DoubleLine Capital LP AMG Managers Global Income Opportunity AMG Managers Loomis Sayles Bond Loomis, Sayles & Company, L.P. |
| | |
| | |
| | |
| |
amgfunds.com | | 053119 AR065 |
Item 2. CODE OF ETHICS
Registrant has adopted a Code of Ethics. See attached Exhibit (a)(1).
Item 3. AUDIT COMMITTEE FINANCIAL EXPERT
Registrant’s Board of Trustees has determined that independent Trustee Mr. Steven J. Paggioli qualifies as the Audit Committee Financial expert. Mr. Paggioli is “independent” as such term is defined in FormN-CSR.
Item 4. PRINCIPAL ACCOUNTANT FEES AND SERVICES
(a)Audit Fees
The aggregate fees billed by the Funds’ independent registered public accounting firm, PricewaterhouseCoopers LLP (“PwC”), to the Funds for the Funds’ two most recent fiscal years for professional services rendered for audits of annual financial statements, or services that are normally provided in connection with statutory and regulatory filings or engagements (“Audit Fees”) were as follows:
| | | | | | | | |
| | | Fiscal 2019 | | | Fiscal 2018 | |
AMG Managers Cadence Emerging Companies Fund | | $ | 24,314 | | | $ | 32,040 | |
AMG Managers CadenceMid-Cap Fund | | $ | 24,550 | | | $ | 28,200 | |
(b)Audit-Related Fees
There were no fees billed by PwC to the Funds in its two recent fiscal years for services rendered for assurance and related services that are reasonably related to the performance of the audit or review of the Fund’s financial statements, but are not reported as Audit Fees (“Audit-Related Fees”).
For the Funds’ two most recent fiscal years, there were no Audit-Related Fees billed by PwC for engagements related directly to the operations and financial reporting of one or more Funds by a Fund Service Provider. A Fund Service Provider is (a) any investment adviser to the Fund (not including any Subadvisor whose role is primarily portfolio management and is subcontracted with or overseen by another investment adviser) or (b) any entity that provides ongoing services to the Fund and is controlling, controlled by or under common control with a Fund investment adviser described in (a).
(c)Tax Fees
The aggregate fees billed by PwC to the Funds for the two most recent fiscal years for professional services rendered for tax compliance, tax advice, and tax planning (“Tax Fees”) were as follows:
| | | | | | | | |
| | | Fiscal 2019 | | | Fiscal 2018 | |
AMG Managers Cadence Emerging Companies Fund | | $ | 6,219 | | | $ | 7,369 | |
AMG Managers Cadence Mid Cap Fund | | $ | 6,219 | | | $ | 7,369 | |
For the Funds’ two most recent fiscal years, Tax Fees billed by PwC for engagements by Fund Service Providers that related directly to the operations and financial reporting of the Funds were $0 for fiscal 2019 and $0 for fiscal 2018, respectively.
The services for which Tax Fees were charged comprise all services performed by professional staff in PwC’s tax division except those services related to the audit. Typically, this category would include fees for tax compliance, tax planning, and tax advice. Tax compliance, tax advice, and tax planning services include preparation of original and amended tax returns, claims for refund and tax payment-planning services, assistance with tax audits and appeals, tax advice related to mergers and acquisitions and requests for rulings or technical advice from taxing authorities.
(d)All Other Fees
There were no other fees billed by PwC to the Funds for all othernon-audit services (“Other Fees”) during the Funds’ two most recent fiscal years. During the same period, there were no Other Fees billed by PwC for engagements by Fund Service Providers that related directly to the operations and financial reporting of the Funds.
(e)(1) According to policies adopted by the Audit Committee, services provided by PwC to the Funds must bepre-approved by the Audit Committee. On an annual basis, the Audit Committee reviews andpre-approves various types of services that PwC may perform for the Funds without specific approval of each engagement, subject to specified budget limitations. As contemplated by the Sarbanes-Oxley Act of 2002 and related SEC rules, the Audit Committee alsopre-approvesnon-audit services provided by PwC to any Fund Service Provider for any engagement that relates directly to the operations and financial reporting of the Funds. Any engagement that is not alreadypre-approved or that will exceed apre-approved budget must be submitted to the Audit Committee forpre-approval. The Chairman of the Audit Committee is authorized on behalf of the Board of Trustees and the Audit Committee to approve the engagement of PwC to performnon-audit services subject to certain conditions, including notification to the Audit Committee of suchpre-approval not later than the next meeting of the Audit Committee following the date of suchpre-approval.
(e)(2) None.
(f) Not applicable.
(g) The aggregate fees billed by PwC in 2019 and 2018 fornon-audit services rendered to the Funds and Fund Service Providers were $61,938 and $64,238, respectively. For the fiscal year ended May 31, 2019, this amount reflects the amounts disclosed above in Item 4(b),(c),(d), plus $49,500 in fees billed to the Fund Service Providers fornon-audit services that did not relate directly to the operations and financial reporting of the Funds. For the fiscal year ended May 31, 2018, this amount reflects the amounts disclosed above in Item 4(b),(c),(d), plus $49,500 in fees billed to the Fund Service Providers fornon-audit services that did not relate directly to the operations and financial reporting of the Funds.
(h) The Trust’s Audit Committee has considered whether the provision ofnon-audit services by registrant’s independent registered public accounting firm to the registrant’s investment advisor, and any entity controlling, controlled, or under common control with the investment advisor that provided ongoing services to the registrant that were notpre-approved by the Committee (because such services did not relate directly to the operations and financial reporting of the registrant) was compatible with maintaining the independence of the independent registered public accounting firm.
Item 5. AUDIT COMMITTEE OF LISTED REGISTRANTS
Not applicable.
Item 6. SCHEDULE OF INVESTMENTS
The schedule of investments in unaffiliated issuers as of the close of the reporting period is included as part of the shareholder report contained in Item 1 hereof.
Item 7. DISCLOSURE OF PROXY VOTING POLICIES AND PROCEDURES FORCLOSED-END MANAGEMENT INVESTMENT COMPANIES
Not applicable.
Item 8. PORTFOLIO MANAGERS OFCLOSED-END MANAGEMENT INVESTMENT COMPANIES
Not applicable.
Item 9. PURCHASES OF EQUITY SECURITIES BYCLOSED-END MANAGEMENT INVESTMENT COMPANIES AND AFFILIATED PURCHASERS
Not applicable.
Item 10. SUBMISSION OF MATTERS TO A VOTE OF SECURITY HOLDERS
Not applicable.
Item 11. CONTROLS AND PROCEDURES
(a) The Registrant’s principal executive and principal financial officers have concluded, based on their evaluation of the registrant’s disclosure controls and procedures as of a date within 90 days of the filing of this report, that the Registrant’s disclosure controls and procedures are reasonably designed to ensure that information required to be disclosed by the Registrant on FormN-CSR is recorded, processed, summarized and reported within the required time periods and that information required to be disclosed by the registrant in the reports that it files or submits on FormN-CSR is accumulated and communicated to the Registrant’s management, including its principal executive and principal financial officers, as appropriate to allow timely decisions regarding required disclosure.
(b) There were no changes in the Registrant’s internal control over financial reporting during the Registrant’s fourth fiscal quarter of the period covered by this report that have materially affected, or are reasonably likely to affect, the internal control over financial reporting.
Item 12. DISCLOSURE OF SECURITIES LENDING ACTIVITIES FORCLOSED-END MANAGEMENT INVESTMENT COMPANIES
Not applicable.
Item 13. EXHIBITS
| | |
| |
| (a)(1) | | Any Code of Ethics or amendments hereto. Filed herewith. |
| |
| (a)(2) | | Certifications pursuant to Rule30a-2(a) under the Investment Company Act of 1940—Filed herewith. |
| |
| (a)(3) | | Not applicable. |
| |
| (b) | | Certifications pursuant to Rule30a-2(b) under the Investment Company Act of 1940—Filed herewith. |
SIGNATURES
Pursuant to the requirements of the Securities Exchange Act of 1934 and the Investment Company Act of 1940, the registrant has duly caused this report to be signed on its behalf by the undersigned, thereunto duly authorized.
| | |
| AMG FUNDS III |
| |
| By: | | /s/ Keitha L. Kinne |
| | Keitha L. Kinne, Principal Executive Officer |
Date: August 2, 2019
Pursuant to the requirements of the Securities Exchange Act of 1934 and the Investment Company Act of 1940, this report has been signed below by the following persons on behalf of the registrant and in the capacities and on the dates indicated.
| | |
| By: | | /s/ Keitha L. Kinne |
| | Keitha L. Kinne, Principal Executive Officer |
Date: August 2, 2019
| | |
| By: | | /s/ Thomas Disbrow |
| | Thomas Disbrow, Principal Financial Officer |
Date: August 2, 2019