UNITED STATES
SECURITIES AND EXCHANGE COMMISSION
Washington, D.C. 20549
FORM N-CSR
CERTIFIED SHAREHOLDER REPORT OF REGISTERED
MANAGEMENT INVESTMENT COMPANIES
Investment Company Act file number: 811-03752
AMG FUNDS III
(Exact name of registrant as specified in charter)
600 Steamboat Road, Suite 300, Greenwich, Connecticut 06830
(Address of principal executive offices) (Zip code)
AMG Funds LLC
600 Steamboat Road, Suite 300, Greenwich, Connecticut 06830
(Name and address of agent for service)
Registrant’s telephone number, including area code: (203) 299-3500
Date of fiscal year end: DECEMBER 31
Date of reporting period: JANUARY 1, 2017 – DECEMBER 31, 2017
(Annual Shareholder Report)
| Item 1. | Reports to Shareholders |
| | |
 | | ANNUAL REPORT |
| | | | |
| | | AMG Funds |
| | |
| | | December 31, 2017 |
| | |
| | | AMG Managers Loomis Sayles Bond Fund |
| | | Class N: MGFIX | | Class I: MGBIX |
| | |
| | | AMG Managers Global Income Opportunity Fund |
| | | Class N: MGGBX | | |
| | |
| | | AMG Managers Special Equity Fund |
| | | Class N: MGSEX | | Class I: MSEIX |
| | | | | |
| | | | | |
| | | | | |
| | |
| | | |
| amgfunds.com | | 123117 AR078 |
|
AMG Funds Annual Report — December 31, 2017 |
| |
| |
| | | | | | |
| | | TABLE OF CONTENTS | | | PAGE | |
| | | LETTER TO SHAREHOLDERS | | | 2 | |
| | | |
| | | ABOUT YOUR FUND’S EXPENSES | | | 3 | |
| | | |
| | | PORTFOLIO MANAGER’S COMMENTS, FUND SNAPSHOTS AND SCHEDULES OF PORTFOLIO INVESTMENTS | | | | |
| | | |
| | | AMG Managers Loomis Sayles Bond Fund | | | 4 | |
| | | |
| | | AMG Managers Global Income Opportunity Fund | | | 14 | |
| | | |
| | | AMG Managers Special Equity Fund | | | 22 | |
| | | |
| | | FINANCIAL STATEMENTS | | | | |
| | | |
| | | Statement of Assets and Liabilities | | | 32 | |
| | | |
| | | Balance sheets, net asset value (NAV) per share computations and cumulative undistributed amounts | | | | |
| | | |
| | | Statement of Operations | | | 34 | |
| | | |
| | | Detail of sources of income, expenses, and realized and unrealized gains (losses) during the fiscal year | | | | |
| | | |
| | | Statements of Changes in Net Assets | | | 35 | |
| | | |
| | | Detail of changes in assets for the past two fiscal years | | | | |
| | | |
| | | Financial Highlights | | | 36 | |
| | | |
| | | Historical net asset values per share, distributions, total returns, income and expense ratios, turnover ratios and net assets | | | | |
| | | |
| | | Notes to Financial Statements | | | 41 | |
| | | |
| | | Accounting and distribution policies, details of agreements and transactions with Fund management and affiliates, and descriptions of certain investment risks | | | | |
| | | |
| | | REPORT OF INDEPENDENT REGISTERED PUBLIC ACCOUNTING FIRM | | | 49 | |
| | | |
| | | OTHER INFORMATION | | | 50 | |
| | | |
| | | TRUSTEES AND OFFICERS | | | 51 | |
| | | | | | | |
Nothing contained herein is to be considered an offer, sale or solicitation of an offer to buy shares of any series of the AMG Funds family of mutual funds. Such offering is made only by prospectus, which includes details as to offering price and other material information.
| | |
| | Letter to Shareholders |
Dear Shareholder:
The last 12 months was a strong period for equity markets as the health of the global economy improved and positive investor sentiment helped extend the U.S. bull market into its ninth year. The S&P 500® Index, a widely followed barometer of the U.S. equity market, returned 21.83% during the fiscal year ended December 31, 2017. By comparison, small cap stocks underperformed large caps with a 14.65% return for the small cap Russell 2000® Index.
The S&P 500 Index has notched positive performance in every month since the U.S. presidential election amidst the backdrop of strong corporate earnings, improving global economic growth and the passage of sweeping tax reform. 2017 also marked a turning point for the broader global economy as growth accelerated in a more coordinated fashion around the world, global trade improved and commodities recovered. U.S. equity market volatility remained extremely low despite saber rattling in North Korea and a devastating hurricane season. In fact, the S&P 500 Index has not seen a pullback greater than 5% since the summer of 2016.
In total, all but two sectors of the S&P 500 Index were positive during the last 12 months; however, there was significant dispersion in performance across sectors. Information technology and materials stocks led the Index with returns of 38.87% and 23.25%, respectively, while companies within the energy and telecommunication services sectors were the laggards with returns of (1.11)% and (1.49)%, respectively. Growth stocks outperformed value during all four quarters of the year and ended 2017 with returns of 30.2% and 13.7% for the Russell 1000® Growth and Russell 1000® Value Indexes, respectively. International equities outperformed domestic equities for the first time since 2012 as the global economy picked up and international returns were boosted by a weaker U.S. Dollar with the MSCI All Country World ex-USA Index returning 27.19% during the year. Meanwhile, emerging markets had their strongest year since 2009 with a 37.3% return for the MSCI Emerging Markets Index.
The U.S. bond market produced modestly positive returns for the year, as measured by the 3.54% return for the Bloomberg Barclays U.S. Aggregate Bond Index, a broad measure of U.S. bond market performance. The yield curve flattened as the U.S. Federal Reserve (the Fed) continued to normalize monetary policy and short-term interest rates rose more than longer-term rates. The 2-year U.S. Treasury note rose 69 basis points during the year to yield 1.89% while the 10-year U.S. Treasury note ended 2017 at a 2.40% yield, five basis points lower than where it started. Investment grade corporates outperformed Treasuries and securitized credits with returns of 6.42%, 2.31% and 2.51%, respectively. Bond investors willing to accept more credit risk were rewarded with higher returns as high yield bonds performed strongly and credit spreads tightened. The Bloomberg Barclays U.S. Corporate High Yield Index ended the period with a 7.50% return.
AMG Funds appreciates the privilege of providing investment tools to you and your clients. Our foremost goal is to provide investment solutions that help our shareholders successfully reach their long-term investment goals. By partnering with AMG’s affiliated investment boutiques, AMG Funds provides access to a distinctive array of actively managed return-oriented investment strategies. Additionally, we oversee and distribute a number of complementary open-architecture mutual funds subadvised by unaffiliated investment managers. We thank you for your continued confidence and investment in AMG Funds. You can rest assured that under all market conditions our team is focused on delivering excellent investment management services for your benefit.
Respectfully,

Jeffery Cerutti
President
AMG Funds
| | | | | | | | |
| | | | | Periods ended |
| Average Annual Total Returns | | December 31, 2017* |
| | | | |
| Stocks: | | | | 1 Year | | 3 Years | | 5 Years |
| | | | |
Large Caps | | (S&P 500® Index) | | 21.83% | | 11.41% | | 15.79% |
| | | | |
Small Caps | | (Russell 2000® Index) | | 14.65% | | 9.96% | | 14.12% |
| | | | |
International | | (MSCI All Country World ex-USA Index) | | 27.19% | | 7.83% | | 6.80% |
Bonds: | | | | | | | | |
| | | | |
Investment Grade | | (Bloomberg Barclays U.S. Aggregate Bond Index) | | 3.54% | | 2.24% | | 2.10% |
| | | | |
High Yield | | (Bloomberg Barclays U.S. Corporate High Yield Index) | | 7.50% | | 6.35% | | 5.78% |
| | | | |
Tax-exempt | | (Bloomberg Barclays Municipal Bond Index) | | 5.45% | | 2.98% | | 3.02% |
| | | | |
Treasury Bills | | (ICE BofAML 6-Month U.S. Treasury Bill Index) | | 0.95% | | 0.62% | | 0.43% |
*Source: Factset. Past performance is no guarantee of future results.
.
|
About Your Fund’s Expenses |
| |
| |
| | | | | | | | |
As a shareholder of a Fund, you may incur two types of costs: (1) transaction costs, which may include sales charges (loads) on purchase payments; redemption fees; and exchange fees; and (2) ongoing costs, including management fees; distribution (12b-1) fees; and other Fund expenses. This example is intended to help you understand your ongoing costs (in dollars) of investing in the Fund and to compare these costs with the ongoing costs of investing in other mutual funds. The example is based on $1,000 invested at the beginning of the period and held for the entire period as indicated below. ACTUAL EXPENSES The first line of the following table provides information about the actual account values and | | | | actual expenses. You may use the information in this line, together with the amount you invested, to estimate the expenses that you paid over the period. Simply divide your account value by $1,000 (for example, an $8,600 account value divided by $1,000 = 8.6), then multiply the result by the number in the first line under the heading entitled “Expenses Paid During Period” to estimate the expenses you paid on your account during this period. HYPOTHETICAL EXAMPLE FOR COMPARISON PURPOSES The second line of the following table provides information about hypothetical account values and hypothetical expenses based on the Fund’s actual expense ratio and an assumed annual rate of return of 5% before expenses, which is not the Fund’s | | | | actual return. The hypothetical account values and expenses may not be used to estimate the actual ending account balance or expenses you paid for the period. You may use this information to compare the ongoing costs of investing in the Fund and other funds by comparing this 5% hypothetical example with the 5% hypothetical examples that appear in the shareholder reports of other funds. Please note that the expenses shown in the table are meant to highlight your ongoing costs only and do not reflect any transactional costs, such as sales charges (loads), redemption fees, or exchange fees. Therefore, the second line of the table is useful in comparing ongoing costs only, and will not help you determine the relative total costs of owning different funds. |
| | | | | | | | | | | | |
Six Months Ended
December 31, 2017 | | Expense
Ratio for
the Period | | Beginning
Account
Value
07/01/17 | | Ending
Account
Value
12/31/17 | | | Expenses
Paid
During
the Period* | |
AMG Managers Loomis Sayles Bond Fund | |
Based on Actual Fund Return | | | | | | | | |
Class N | | .99% | | $1,000 | | | $1,020 | | | | $5.04 | |
Class I | | .89% | | $1,000 | | | $1,021 | | | | $4.53 | |
Based on Hypothetical 5% Annual Return | | | | | |
Class N | | .99% | | $1,000 | | | $1,020 | | | | $5.04 | |
Class I | | .89% | | $1,000 | | | $1,021 | | | | $4.53 | |
| | | | | | | | | | | | |
AMG Managers Global Income Opportunity Fund | |
Based on Actual Fund Return | | | | | | | | |
Class N | | .89% | | $1,000 | | | $1,030 | | | | $4.55 | |
Based on Hypothetical 5% Annual Return | |
Class N | | .89% | | $1,000 | | | $1,021 | | | | $4.53 | |
| | | | | | | | |
Six Months Ended
December 31, 2017 | | Expense
Ratio for
the Period | | Beginning
Account
Value
07/01/17 | | Ending
Account
Value
12/31/17 | | Expenses
Paid
During
the Period* |
AMG Managers Special Equity Fund |
Based on Actual Fund Return |
Class N | | 1.36% | | $1,000 | | $1,111 | | $7.24 |
Class I | | 1.11% | | $1,000 | | $1,112 | | $5.91 |
Based on Hypothetical 5% Annual Return |
Class N | | 1.36% | | $1,000 | | $1,018 | | $6.92 |
Class I | | 1.11% | | $1,000 | | $1,020 | | $5.65 |
| | * | Expenses are equal to the Fund’s annualized expense ratio multiplied by the average account value over the period, multiplied by the number of days in the most recent fiscal half-year (184), then divided by 365. |
|
AMG Managers Loomis Sayles Bond Fund Portfolio Manager’s Comments (unaudited) |
| |
| |
| | | | | | | | |
THE YEAR IN REVIEW The AMG Managers Loomis Sayles Bond Fund (Class N) (the “Fund”) returned 6.77% for the year ended December 31, 2017, outperforming the Bloomberg Barclays U.S. Government/Credit Bond Index, which returned 4.00%. The Fund posted positive absolute returns for the year. Performance can be largely attributed to security selection in high yield and investment grade holdings and secondarily in sector allocation. Investment grade and below investment securities were again most beneficial for the period and, in general, outperformed duration-matched Treasuries. Security selection in both spaces was the main driver of outperformance. Corporate spreads ground tighter during the period on the back of positive effects of the tax plan, as well as strong global economic and commodity price momentum. Positioning among high yield credit also added value as the “risk-on” environment and search for yield continued throughout the quarter. Relative to the benchmark, the Fund maintained a meaningful underweight to U.S. Treasuries, which, combined with a shorter duration stance, proved beneficial to outperformance. From an industry perspective banking, metals and mining, consumer cyclical (Auto Credit Co’s) and insurance performed well. Our convertible holdings also contributed to overall performance and were led by select insurance and banking holdings. Our allocation to non-U.S. Dollar denominated issues produced positive returns during the period and was a large contributor of relative return within the strategy. In general the Dollar saw some depreciation during the year which was beneficial to our select currency allocations. Holdings denominated in the Mexican peso were the largest contributors to excess performance. Asset Backed Security (ABS) positions added to performance through good issue selection. A small allocation to Emerging Markets had minimal impact on performance for the year. | | | | LOOKING FORWARD Economic conditions in the U.S. and globally suggest that positive momentum continues to build, which we expect will lead to slightly higher GDP growth over the next year. Major indicators supporting growth include employment gains, strong manufacturing data, rising consumer confidence and the potential for fiscal stimulus. These trends, along with a gradual shift toward less accommodative central bank policies, favor higher growth conditions in 2018. Inflation has been below the Federal Reserve’s target level as wage pressures show some acceleration, but generally remain tame. We see the Fed’s preferred inflation measure, core PCE (personal consumption expenditures), approaching the Fed’s 2% target in 2018 and 2019, which should allow the Fed to maintain its current slow and steady approach to monetary policy. Given our inflation expectations, we are forecasting three interest rate hikes in the next year. Jerome Powell is set to succeed Janet Yellen as Fed Chair in February 2018, which introduces some uncertainty to our outlook. However, Powell’s views appear to be largely consistent with Yellen’s, which will likely translate to a continuation of recent market trends, including the growth-friendly environment for risk assets and demand for yield. The U.S. tax reform package is expected to be positive for asset classes like credit in 2018. Any reductions in corporate borrowing due to higher after-tax borrowing costs or foreign cash repatriation may help preserve balance sheet health for investment grade borrowers. Limited risk of a buildup in leverage among European corporates remains. Thus we are maintaining our exposure to credit; however, we have become more cautious as valuations have risen. As a result, our portfolio structure is positioned more defensively and we | | | | have been holding a higher reserve allocation over the past 12 to 18 months. Our strategy is to stay broadly diversified while maintaining a yield advantage and holding less duration risk than the broader market indices. Credit fundamentals are generally favorable; we believe low default risk and rising profits can extend the credit cycle and lead to additional upside. We are emphasizing security selection rather than broad sector themes, but we do see areas of opportunity in energy, financials, technology, insurance, communications and cable. These industries have stable to moderately improving outlooks, along with some defensive characteristics that could support performance in the later stages of the expansion. In addition, these industries could benefit from tax reform in varying degrees. Valuations are also elevated within convertible debt. We anticipate that convertibles can generate attractive returns in the year ahead, but we have reduced our exposure and shifted toward issues with a more balanced profile within the pharmaceutical, energy and technology industries. At this stage of the credit cycle, we believe balanced issues may offer better risk-adjusted return potential. Our non-U.S. Dollar allocation reflects a combination of developed market sovereign bonds and emerging market local- and hard-currency positions. We expect trade policy uncertainty, interest rate differentials and capital flows to contribute to volatility and the overall risk profile of the sector. In this environment, we anticipate the U.S. Dollar will be range bound. We remain highly selective, emphasizing undervalued currencies with improving fundamentals, relatively attractive yields and regions that offer potential for fiscal and economic reforms. This commentary reflects the viewpoints of the portfolio manager, Loomis, Sayles & Company, as of December 31, 2017 and is not intended as a forecast or guarantee of future results. |
|
AMG Managers Loomis Sayles Bond Fund Portfolio Manager’s Comments (continued) |
| |
| |
CUMULATIVE TOTAL RETURN PERFORMANCE
AMG Managers Loomis Sayles Bond Fund’s cumulative total return is based on the daily change in net asset value (NAV), and assumes that all dividends and distributions were reinvested. This graph compares a hypothetical $10,000 investment made in the Fund’s Class N Shares on December 31, 2007, to a $10,000 investment made in the Bloomberg Barclays U.S. Government/Credit Bond Index for the same time period. The graph and table do not reflect the deduction of taxes that a shareholder would pay on a Fund distribution or redemption of shares. The listed returns for the Fund are net expenses and the returns for the index exclude expenses. Total returns would have been lower had certain expenses not been reduced.
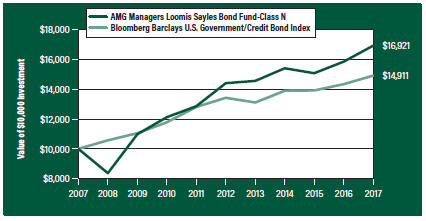
The table below shows the average annual total returns for the AMG Managers Loomis Sayles Bond Fund and the Bloomberg Barclays U.S. Government/Credit Bond Index for the same time periods ended December 31, 2017.
| | | | | | | | | | | | | | | | | | | | |
| Average Annual Total Returns1 | | One
Year | | | Five
Years | | | Ten
Years | | | Since
Inception | | | Inception
Date | |
AMG Managers Loomis Sayles Bond Fund2, 3, 4, 5, 6, 7 | |
Class N8 | | | 6.77% | | | | 3.27% | | | | 5.40% | | | | 8.20% | | | | 06/01/84 | |
| | | | | |
Class I | | | 6.87% | | | | — | | | | — | | | | 3.20% | | | | 04/01/13 | |
Bloomberg Barclays U.S. Government/Credit Bond Index9 | | | 4.00% | | | | 2.13% | | | | 4.08% | | | | 7.35% | | | | 06/01/84 | † |
The performance data shown represents past performance. Past performance is not a guarantee of future results. Current performance may be lower or higher than the performance data quoted. The investment return and principal value of an investment will fluctuate so that an investor’s shares, when redeemed, may be worth more or less than their original cost.
Investors should carefully consider the Fund’s investment objectives, risks, charges and expenses before investing. For performance information through the most recent month end, current net asset values per share for the Fund and other information, please call 800.835.3879 or visit our website at amgfunds.com for a free prospectus. Read it carefully before investing or sending money.
Distributed by AMG Distributors, Inc., member FINRA/SIPC.
| † | Date reflects inception date of the Fund, not the index. |
| 1 | Total return equals income yield plus share price change and assumes reinvestment of all dividends and capital gain distributions. Returns are net of fees and may reflect offsets of Fund expenses as described in the prospectus. No adjustment has been made for taxes payable by shareholders on their reinvested dividends and capital gain distributions. Returns for periods greater than one year are annualized. The listed returns on the Fund are net of expenses and based on the published NAV as of December 31, 2017. All returns are in U.S. dollars($). |
| 2 | From time to time, the Fund’s advisor has waived fees and/or absorbed Fund expenses, which has resulted in higher returns. |
| 3 | The Fund is subject to the risks associated with investments in debt securities, such as default risk and fluctuations in the perception of the debtor’s ability to pay its creditors. Changing interest rates may adversely affect the value of an investment. An increase in interest rates typically causes the value of bonds and other fixed income securities to fall. |
| 4 | To the extent that the Fund invests in asset-backed or mortgage-backed securities, its exposure to prepayment and extension risks may be greater than investments in other fixed income securities. |
| 5 | The Fund may invest in derivatives such as options and futures; the complexity and rapidly changing structure of derivatives markets may increase the possibility of market losses. |
| 6 | High-yield bonds (also known as “junk bonds”) may be subject to greater levels of interest rate, credit, and liquidity risk than investments in higher rated securities. These securities are considered predominantly speculative with respect to the issuer’s continuing ability to make principal and interest payments. The issuers of the Fund’s holdings may be involved in bankruptcy proceedings, reorganizations, or financial restructurings, and are not as strong financially as higher-rated issuers. |
| 7 | Investments in international securities are subject to certain risks of overseas investing including currency fluctuations and changes in political and economic conditions, which could result in significant market fluctuations. These risks are magnified in emerging markets. |
| 8 | Effective February 27, 2017, Class S was renamed Class N. |
| 9 | The Bloomberg Barclays U.S. Government/Credit Bond Index is an index of investment-grade government and corporate bonds with a maturity rate of more than one year. Unlike the Fund, the Bloomberg Barclays U.S. Government/Credit Bond index is unmanaged, is not available for investment and does not incur expenses. |
Not FDIC insured, nor bank guaranteed. May lose value.
|
AMG Managers Loomis Sayles Bond Fund Fund Snapshots (unaudited) December 31, 2017 |
| |
| |
PORTFOLIO BREAKDOWN
| | | | | |
| Category | | % of
Net Assets |
Corporate Bonds and Notes | | | | 64.6 | |
Foreign Government Obligations | | | | 5.4 | |
U.S. Government and Agency Obligations | | | | 3.9 | |
Asset-Backed Securities | | | | 3.8 | |
Municipal Bonds | | | | 0.9 | |
Preferred Stocks | | | | 0.6 | |
Common Stocks | | | | 0.2 | |
Short-Term Investments* | | | | 20.9 | |
Other Assets Less Liabilities** | | | | (0.3 | ) |
| * | Includes reinvestment of cash collateral into joint repurchase agreements on security lending transactions. |
| ** | Includes repayment of cash collateral on security lending transactions. |
| | | | | |
| Rating | | % of Market Value* |
U.S. Government and Agency Obligations | | | | 4.9 | |
Aaa | | | | 2.6 | |
Aa | | | | 2.8 | |
A | | | | 22.1 | |
Baa | | | | 55.7 | |
Ba | | | | 7.4 | |
B | | | | 4.3 | |
Caa & lower | | | | 0.2 | |
| * | Includes market value of fixed-income securities only. |
TOP TEN HOLDINGS
| | | | | |
| Security Name | | % of
Net Assets |
Ford Motor Credit Co. LLC, 4.389%, 01/08/26 | | | | 3.6 | |
Bank of America Corp., 6.110%, 01/29/37 | | | | 2.4 | |
U.S. Treasury Notes, 0.750%, 09/30/18 | | | | 2.3 | |
Mexican Bonos Bonds, Series M 20, 10.000%, 12/05/24 | | | | 2.2 | |
Shenton Aircraft Investment I, Ltd., Series 2015-1A, Class A, 4.750%, 10/15/42 | | | | 1.9 | |
AT&T, Inc., 4.125%, 02/17/26 | | | | 1.8 | |
ONEOK Partners, L.P., 4.900%, 03/15/25 | | | | 1.6 | |
Santander Issuances SAU, 5.179%, 11/19/25 | | | | 1.5 | |
U.S. Treasury Notes, 0.875%, 05/31/18 | | | | 1.5 | |
Verizon Communications, Inc., 3.500%, 11/01/24 | | | | 1.4 | |
| | | | | | |
Top Ten as a Group | | | | 20.2 | |
| | | | | | |
| | | | | | |
Credit quality ratings shown above reflect the highest rating assigned by either Standard & Poor’s (“S&P”) or Moody’s Investors Service, Inc. (“Moody’s”). These rating agencies are independent, nationally recognized statistical rating organizations and are widely used. Investment grade ratings are credit ratings of BBB/Baa or higher. Below investment grade ratings are credit ratings of BB/Ba or lower. Investments designated N/R are not rated by either rating agency. Unrated investments do not necessarily indicate low credit quality. Credit quality ratings are subject to change.
Because a fund’s strategy may result in multiple investments in particular sectors of the economy, its performance may depend on the performance of those sectors and may fluctuate more widely than investments diversified across more sectors. For additional information on these and other risk considerations, please see the Fund’s prospectus.
Any sectors, industries, or securities discussed should not be perceived as investment recommendations. Mention of a specific security should not be considered a recommendation to buy or solicitation to sell that security. Specific securities mentioned in this report may have been sold from the Fund’s portfolio of investments by the time you receive this report.
|
AMG Managers Loomis Sayles Bond Fund Schedule of Portfolio Investments December 31, 2017 |
| |
| |
| | | | | | | | |
| | | Shares | | | Value | |
| | |
Common Stock - 0.2% | | | | | | | | |
| | |
Industrials - 0.2% | | | | | | | | |
Arconic, Inc. | | | | | | | | |
(Cost $4,641,618) | | | 154,805 | | | | $4,218,436 | |
| | |
| | | Principal
Amount† | | | | |
Corporate Bonds and Notes - 64.6% | | | | | | | | |
| | |
Financials - 24.3% | | | | | | | | |
| | |
Ally Financial, Inc.
4.125%, 02/13/22 | | | $7,915,000 | | | | 8,091,506 | |
8.000%, 11/01/31 | | | 1,267,000 | | | | 1,647,100 | |
| | |
Alta Wind Holdings LLC
7.000%, 06/30/351 | | | 5,819,873 | | | | 6,815,027 | |
| | |
American International Group, Inc.
4.875%, 06/01/22 | | | 560,000 | | | | 608,934 | |
| | |
Bank of America Corp. | | | | | | | | |
(3-Month LIBOR plus 1.040%), 3.419%, 12/20/281,2 | | | 27,155,000 | | | | 27,160,836 | |
6.110%, 01/29/37 | | | 38,050,000 | | | | 48,645,216 | |
EMTN, 4.625%, 09/14/18 | | | 1,750,000 | EUR | | | 2,168,195 | |
MTN, 4.250%, 10/22/26 | | | 2,610,000 | | | | 2,750,508 | |
| | |
Canadian Imperial Bank of Commerce (Canada)
1.600%, 09/06/19 | | | 2,120,000 | | | | 2,098,151 | |
| | |
Citigroup, Inc.
5.130%, 11/12/19 | | | 5,835,000 | NZD | | | 4,309,318 | |
| | |
Cooperatieve Centrale | | | | | | | | |
Raiffeisen-Boerenleenbank (Netherlands) 3.875%, 02/08/22 | | | 9,090,000 | | | | 9,548,000 | |
3.950%, 11/09/22 | | | 2,190,000 | | | | 2,283,291 | |
1.700%, 03/19/18 | | | 2,000,000 | | | | 1,999,804 | |
| | |
Equifax, Inc.
7.000%, 07/01/37 | | | 4,421,000 | | | | 5,614,884 | |
| | |
General Electric Co., GMTN
4.250%, 01/17/18 | | | 5,010,000 | NZD | | | 3,552,401 | |
| | |
The Goldman Sachs Group, Inc.
6.750%, 10/01/37 | | | 14,590,000 | | | | 19,530,806 | |
MPLE, 3.375%, 02/01/18 | | | 1,700,000 | CAD | | | 1,354,239 | |
| | |
Highwoods Realty, L.P.
7.500%, 04/15/18 | | | 2,405,000 | | | | 2,441,393 | |
| | |
Jefferies Group LLC
5.125%, 01/20/23 | | | 8,800,000 | | | | 9,537,476 | |
| | |
JPMorgan Chase & Co. 4.125%, 12/15/26 | | | 14,350,000 | | | | 15,138,011 | |
4.250%, 11/02/18 | | | 7,360,000 | NZD | | | 5,286,428 | |
| | |
JPMorgan Chase Bank, N.A.
BKNT
1.650%, 09/23/19 | | | 8,457,000 | | | | 8,385,577 | |
| | |
Lloyds Banking Group PLC (United Kingdom)
4.500%, 11/04/24 | | | 18,500,000 | | | | 19,411,797 | |
4.582%, 12/10/25 | | | 20,972,000 | | | | 21,990,222 | |
| | |
Marsh & McLennan Cos., Inc.
5.875%, 08/01/33 | | | 8,295,000 | | | | 10,480,023 | |
| | | | | | | | |
| | | Principal
Amount† | | | Value | |
| | |
MBIA Insurance Corp. | | | | | | | | |
(3-Month LIBOR plus 11.260%) 12.619%, 01/15/331,2 | | | $525,000 | | | | $236,250 | |
| | |
Morgan Stanley
3.950%, 04/23/27 | | | 17,265,000 | | | | 17,532,265 | |
GMTN, 4.350%, 09/08/26 | | | 5,000,000 | | | | 5,239,293 | |
MTN, 4.100%, 05/22/23 | | | 12,910,000 | | | | 13,450,169 | |
MTN, 6.250%, 08/09/26 | | | 11,000,000 | | | | 13,128,949 | |
| | |
Mutual of Omaha Insurance Co.
6.800%, 06/15/361 | | | 13,925,000 | | | | 18,151,346 | |
| | |
National City Bank of Indiana
4.250%, 07/01/18 | | | 6,310,000 | | | | 6,381,226 | |
| | |
National City Corp.
6.875%, 05/15/19 | | | 1,905,000 | | | | 2,019,747 | |
| | |
National Life Insurance Co.
10.500%, 09/15/391 | | | 5,000,000 | | | | 8,280,492 | |
| | |
Navient Corp.
5.500%, 01/25/23 | | | 18,070,000 | | | | 18,024,825 | |
| | |
Old Republic International Corp.
3.750%, 03/15/183 | | | 10,400,000 | | | | 14,417,000 | |
4.875%, 10/01/24 | | | 4,915,000 | | | | 5,264,644 | |
| | |
The Penn Mutual Life Insurance Co.
7.625%, 06/15/401 | | | 8,885,000 | | | | 12,397,270 | |
| | |
Quicken Loans, Inc.
5.750%, 05/01/251 | | | 3,895,000 | | | | 4,031,364 | |
| | |
Realty Income Corp.
5.750%, 01/15/21 | | | 2,125,000 | | | | 2,300,917 | |
| | |
Royal Bank of Canada (Canada) | | | | | | | | |
Series GMTN 1.625%, 04/15/19 | | | 1,348,000 | | | | 1,338,551 | |
| | |
Royal Bank of Scotland Group PLC | | | | | | | | |
(United Kingdom) 6.125%, 12/15/22 | | | 4,650,000 | | | | 5,096,782 | |
| | |
Santander Issuances SAU (Spain)
5.179%, 11/19/25 | | | 27,800,000 | | | | 30,023,891 | |
| | |
Societe Generale, S.A. (France)
4.750%, 11/24/251,4 | | | 11,000,000 | | | | 11,575,023 | |
5.200%, 04/15/211 | | | 7,000,000 | | | | 7,539,232 | |
| | |
Springleaf Finance Corp.
5.250%, 12/15/19 | | | 12,890,000 | | | | 13,260,588 | |
8.250%, 10/01/23 | | | 10,865,000 | | | | 12,141,638 | |
| | |
Weyerhaeuser Co.
6.875%, 12/15/33 | | | 12,890,000 | | | | 16,951,008 | |
7.375%, 10/01/19 | | | 3,915,000 | | | | 4,242,705 | |
7.375%, 03/15/32 | | | 1,930,000 | | | | 2,665,871 | |
| | |
Total Financials | | | | | | | 486,540,189 | |
| | |
Industrials - 37.1% | | | | | | | | |
| | |
America Movil SAB de CV (Mexico)
6.450%, 12/05/22 | | | 169,300,000 | MXN | | | 7,951,955 | |
| | |
American Airlines 2013-1 Class A Pass Through Trust
4.000%, 07/15/25 | | | 1,922,500 | | | | 1,979,214 | |
| | |
| | | |
| The accompanying notes are an integral part of these financial statements. |
|
| 7 |
|
AMG Managers Loomis Sayles Bond Fund Schedule of Portfolio Investments (continued) |
| |
| |
| | | | | | | | |
| | | Principal
Amount† | | | Value | |
| | |
Industrials - 37.1% (continued) | | | | | | | | |
| | |
American Airlines 2016-1 Class B Pass Through Trust | | | | | | | | |
Series B 5.250%, 01/15/24 | | | $21,528,061 | | | | $22,709,951 | |
| | |
American Airlines 2016-2 Class B Pass Through Trust
4.375%, 06/15/241 | | | 22,750,000 | | | | 23,241,400 | |
| | |
American Airlines 2017-1B Class B Pass Through Trust
Series B
4.950%, 02/15/25 | | | 4,055,000 | | | | 4,250,046 | |
| | |
APL, Ltd.
8.000%, 01/15/24 | | | 250,000 | | | | 244,375 | |
| | |
Apple, Inc.
1.100%, 08/02/19 | | | 485,000 | | | | 478,329 | |
1.550%, 02/07/20 | | | 2,180,000 | | | | 2,156,087 | |
1.800%, 05/11/20 | | | 18,480,000 | | | | 18,323,497 | |
| | |
ArcelorMittal (Luxembourg)
7.250%, 03/01/415 | | | 11,065,000 | | | | 13,997,225 | |
7.500%, 10/15/395 | | | 6,604,000 | | | | 8,453,120 | |
| | |
AT&T, Inc.
3.400%, 05/15/25 | | | 13,530,000 | | | | 13,302,025 | |
3.950%, 01/15/25 | | | 4,345,000 | | | | 4,448,690 | |
4.125%, 02/17/26 | | | 35,605,000 | | | | 36,418,782 | |
| | |
CenturyLink, Inc. | | | | | | | | |
Series P, 7.600%, 09/15/39 | | | 9,335,000 | | | | 8,028,100 | |
Series S, 6.450%, 06/15/21 | | | 5,900,000 | | | | 5,959,000 | |
| | |
Chesapeake Energy Corp.
6.625%, 08/15/20 | | | 55,000 | | | | 57,200 | |
6.875%, 11/15/20 | | | 85,000 | | | | 88,400 | |
| | |
Choice Hotels International, Inc.
5.700%, 08/28/20 | | | 11,900,000 | | | | 12,733,000 | |
| | |
Continental Airlines, Inc. 1999-1 Class B Pass Through Trust, Series 991B, 6.795%, 08/02/18 | | | 1,088 | | | | 1,104 | |
2000-1 Class A-1 Pass Through Trust, Series 00A1, 8.048%, 11/01/20 | | | 35,108 | | | | 38,663 | |
2007-1 Class A Pass Through Trust, Series 071A, 5.983%, 04/19/22 | | | 13,038,073 | | | | 14,215,411 | |
2007-1 Class B Pass Through Trust, Series 071B, 6.903%, 04/19/22 | | | 1,854,497 | | | | 1,957,653 | |
| | |
Continental Resources, Inc.
3.800%, 06/01/24 | | | 2,025,000 | | | | 2,002,219 | |
4.500%, 04/15/23 | | | 385,000 | | | | 392,700 | |
| | |
Corning, Inc.
6.850%, 03/01/29 | | | 9,142,000 | | | | 11,457,884 | |
| | |
Cox Communications, Inc.
4.800%, 02/01/351 | | | 3,369,000 | | | | 3,433,200 | |
| | |
Cummins, Inc.
5.650%, 03/01/98 | | | 6,460,000 | | | | 7,649,325 | |
| | |
Darden Restaurants, Inc.
6.000%, 08/15/35 | | | 2,635,000 | | | | 3,150,477 | |
| | | | | | | | |
| | | Principal
Amount† | | | Value | |
| | |
Dell International LLC / EMC Corp.
6.020%, 06/15/261 | | | $3,270,000 | | | | $3,605,562 | |
8.100%, 07/15/361 | | | 5,470,000 | | | | 6,907,469 | |
8.350%, 07/15/461 | | | 2,990,000 | | | | 3,852,745 | |
| | |
Delta Air Lines, Inc.
2007-1 Class B Pass Through Trust, Series 071B
8.021%, 08/10/22 | | | 5,654,437 | | | | 6,342,582 | |
| | |
Devon Energy Corp.
3.250%, 05/15/22 | | | 5,256,000 | | | | 5,346,375 | |
| | |
Dillard’s, Inc.
7.000%, 12/01/28 | | | 225,000 | | | | 247,780 | |
| | |
Embarq Corp.
7.995%, 06/01/36 | | | 5,830,000 | | | | 5,669,675 | |
| | |
Embraer Netherlands Finance BV (Netherlands)
5.400%, 02/01/27 | | | 2,325,000 | | | | 2,511,000 | |
| | |
Enbridge Energy Partners L.P.
7.375%, 10/15/45 | | | 4,595,000 | | | | 6,105,671 | |
| | |
Energy Transfer L.P. / Regency Energy Finance Corp.
4.500%, 11/01/23 | | | 700,000 | | | | 723,759 | |
| | |
EnLink Midstream Partners L.P.
4.150%, 06/01/25 | | | 6,145,000 | | | | 6,209,100 | |
| | |
Enterprise Products Operating LLC
3.900%, 02/15/24 | | | 6,400,000 | | | | 6,668,807 | |
4.050%, 02/15/22 | | | 2,219,000 | | | | 2,321,982 | |
| | |
ERAC USA Finance LLC
6.700%, 06/01/341 | | | 1,250,000 | | | | 1,577,762 | |
7.000%, 10/15/371 | | | 19,033,000 | | | | 25,451,864 | |
| | |
Foot Locker, Inc.
8.500%, 01/15/22 | | | 435,000 | | | | 505,470 | |
| | |
Ford Motor Co.
6.375%, 02/01/29 | | | 1,990,000 | | | | 2,329,453 | |
| | |
Ford Motor Credit Co. LLC, GMTN
4.389%, 01/08/26 | | | 68,075,000 | | | | 71,423,944 | |
| | |
General Motors Co.
5.200%, 04/01/45 | | | 2,760,000 | | | | 2,916,324 | |
| | |
General Motors Financial Co., Inc.
5.250%, 03/01/26 | | | 9,680,000 | | | | 10,644,221 | |
| | |
Georgia-Pacific LLC
5.400%, 11/01/201 | | | 5,175,000 | | | | 5,581,328 | |
| | |
HCA, Inc.
4.500%, 02/15/27 | | | 3,040,000 | | | | 3,055,200 | |
7.500%, 11/06/33 | | | 75,000 | | | | 84,000 | |
| | |
Hewlett Packard Enterprise Co.
6.350%, 10/15/455 | | | 2,243,000 | | | | 2,374,583 | |
| | |
International Business Machines Corp.
1.625%, 05/15/20 | | | 5,980,000 | | | | 5,906,691 | |
| | |
INVISTA Finance LLC
4.250%, 10/15/191 | | | 14,000,000 | | | | 14,176,400 | |
| | |
Kinder Morgan Energy Partners, L.P.
3.500%, 09/01/23 | | | 6,685,000 | | | | 6,689,305 | |
| | |
| | | |
| The accompanying notes are an integral part of these financial statements. |
|
| 8 |
|
AMG Managers Loomis Sayles Bond Fund Schedule of Portfolio Investments (continued) |
| |
| |
| | | | | | | | |
| | | Principal
Amount† | | | Value | |
| | |
Industrials - 37.1% (continued) | | | | | | | | |
| | |
Kinder Morgan Energy Partners, L.P.
4.150%, 03/01/22 | | | $5,620,000 | | | | $5,833,728 | |
4.150%, 02/01/24 | | | 14,000,000 | | | | 14,519,619 | |
5.300%, 09/15/20 | | | 1,415,000 | | | | 1,508,155 | |
5.800%, 03/01/21 | | | 4,320,000 | | | | 4,686,577 | |
| | |
KLA-Tencor Corp.
5.650%, 11/01/34 | | | 4,590,000 | | | | 5,303,724 | |
| | |
Macy’s Retail Holdings, Inc.
4.500%, 12/15/34 | | | 170,000 | | | | 144,542 | |
| | |
Marks & Spencer PLC (United Kingdom)
7.125%, 12/01/371 | | | 4,725,000 | | | | 5,618,730 | |
| | |
Masco Corp.
6.500%, 08/15/32 | | | 254,000 | | | | 310,076 | |
7.125%, 03/15/20 | | | 357,000 | | | | 389,284 | |
7.750%, 08/01/29 | | | 499,000 | | | | 649,818 | |
| | |
Methanex Corp. (Canada)
5.250%, 03/01/22 | | | 350,000 | | | | 371,288 | |
| | |
Microsoft Corp.
1.100%, 08/08/19 | | | 3,819,000 | | | | 3,767,934 | |
| | |
Missouri Pacific Railroad Co.
5.000%, 01/01/45 | | | 825,000 | | | | 799,417 | |
| | |
New Albertson’s, Inc.
7.450%, 08/01/29 | | | 3,195,000 | | | | 2,811,600 | |
7.750%, 06/15/264 | | | 915,000 | | | | 823,500 | |
MTN, Series C,, 6.625%, 06/01/28 | | | 1,015,000 | | | | 801,850 | |
| | |
Newell Brands, Inc.
4.000%, 12/01/24 | | | 3,085,000 | | | | 3,203,619 | |
| | |
Noble Energy, Inc.
3.900%, 11/15/244 | | | 3,670,000 | | | | 3,773,434 | |
| | |
Nuance Communications, Inc.
1.000%, 12/15/353 | | | 1,025,000 | | | | 978,234 | |
1.250%, 04/01/251,3 | | | 895,000 | | | | 914,019 | |
1.500%, 11/01/353 | | | 50,000 | | | | 51,500 | |
| | |
ONEOK Partners, L.P.
4.900%, 03/15/25 | | | 28,736,000 | | | | 30,811,438 | |
6.200%, 09/15/43 | | | 245,000 | | | | 291,037 | |
| | |
Owens Corning
7.000%, 12/01/36 | | | 2,715,000 | | | | 3,584,311 | |
| | |
Panhandle Eastern Pipe Line Co., L.P.
7.000%, 06/15/18 | | | 26,505,000 | | | | 27,091,586 | |
| | |
Petrobras Global Finance BV (Netherlands)
5.625%, 05/20/43 | | | 580,000 | | | | 518,311 | |
| | |
Portugal Telecom International Finance, B.V., EMTN (Netherlands)
4.500%, 06/16/256 | | | 280,000 | EUR | | | 144,462 | |
| | |
The Priceline Group, Inc.
0.900%, 09/15/213,4 | | | 11,970,000 | | | | 13,997,419 | |
| | |
PulteGroup, Inc.
6.000%, 02/15/35 | | | 8,860,000 | | | | 9,524,500 | |
6.375%, 05/15/33 | | | 5,135,000 | | | | 5,751,200 | |
| | | | | | | | |
| | | Principal
Amount† | | | Value | |
| | |
Qwest Capital Funding, Inc.
6.500%, 11/15/18 | | | $620,000 | | | | $640,150 | |
6.875%, 07/15/28 | | | 1,190,000 | | | | 1,023,400 | |
7.625%, 08/03/21 | | | 2,135,000 | | | | 2,188,375 | |
| | |
Qwest Corp.
6.875%, 09/15/33 | | | 6,161,000 | | | | 5,906,330 | |
7.250%, 09/15/25 | | | 1,185,000 | | | | 1,271,946 | |
7.250%, 10/15/354 | | | 2,165,000 | | | | 2,073,544 | |
| | |
Reliance Holding USA, Inc.
5.400%, 02/14/221 | | | 3,250,000 | | | | 3,529,884 | |
| | |
Samsung Electronics Co., Ltd. (South Korea)
7.700%, 10/01/271 | | | 2,200,000 | | | | 2,595,480 | |
| | |
Sealed Air Corp.
5.500%, 09/15/251 | | | 1,580,000 | | | | 1,722,200 | |
| | |
Telecom Italia Capital, S.A. (Luxembourg)
6.000%, 09/30/34 | | | 4,665,000 | | | | 5,236,463 | |
6.375%, 11/15/33 | | | 3,530,000 | | | | 4,103,625 | |
| | |
Telefonica Emisiones SAU (Spain)
4.570%, 04/27/23 | | | 900,000 | | | | 973,357 | |
| | |
Telekom Malaysia Bhd (Malaysia)
7.875%, 08/01/251 | | | 250,000 | | | | 320,251 | |
| | |
Time Warner Cable LLC
5.500%, 09/01/41 | | | 805,000 | | | | 839,042 | |
| | |
The Toro Co.
6.625%, 05/01/37 | | | 6,810,000 | | | | 8,491,210 | |
| | |
Transcontinental Gas Pipe Line Co. LLC
7.850%, 02/01/26 | | | 15,140,000 | | | | 19,351,478 | |
| | |
UAL 2007-1 Pass Through Trust
Series 071A
6.636%, 07/02/22 | | | 9,542,702 | | | | 10,304,209 | |
| | |
United Airlines 2014-1 Class A Pass Through Trust
Series A
4.000%, 04/11/26 | | | 7,949,187 | | | | 8,324,071 | |
| | |
United States Steel Corp.
6.650%, 06/01/374 | | | 3,595,000 | | | | 3,523,100 | |
| | |
US Airways 2011-1 Class A Pass Through Trust
Series A
7.125%, 10/22/23 | | | 2,400,833 | | | | 2,755,628 | |
| | |
Vale Overseas, Ltd. (Brazil)
6.875%, 11/21/36 | | | 3,665,000 | | | | 4,489,625 | |
| | |
Verizon Communications, Inc.
3.500%, 11/01/24 | | | 27,900,000 | | | | 28,400,165 | |
4.862%, 08/21/46 | | | 25,890,000 | | | | 26,967,621 | |
| | |
Virgin Australia 2013-1A Trust (Australia)
5.000%, 10/23/231 | | | 725,784 | | | | 754,816 | |
| | |
Western Digital Corp.
7.375%, 04/01/231 | | | 5,845,000 | | | | 6,305,294 | |
| | |
| | | |
| The accompanying notes are an integral part of these financial statements. |
|
| 9 |
|
AMG Managers Loomis Sayles Bond Fund Schedule of Portfolio Investments (continued) |
| |
| |
| | | | | | | | |
| | | Principal
Amount† | | | Value | |
| | |
Industrials - 37.1% (continued) | | | | | | | | |
| | |
WestRock MWV LLC 7.550%, 03/01/47 | | | $970,000 | | | | $1,375,669 | |
| | |
Total Industrials | | | | | | | 740,789,929 | |
| | |
Utilities - 3.2% | | | | | | | | |
| | |
Abu Dhabi National Energy Co. PJSC
(United Arab Emirates)
7.250%, 08/01/181 | | | 21,130,000 | | | | 21,707,948 | |
| | |
Allegheny Energy Supply Co. LLC
6.750%, 10/15/391 | | | 3,285,000 | | | | 4,779,675 | |
| | |
Bruce Mansfield Unit 1 2007 Pass Through Trust
6.850%, 06/01/34 | | | 7,320,713 | | | | 2,415,835 | |
| | |
DCP Midstream Operating L.P.
6.450%, 11/03/361 | | | 870,000 | | | | 933,075 | |
| | |
EDP Finance, B.V. (Netherlands)
4.900%, 10/01/191 | | | 600,000 | | | | 624,557 | |
| | |
Empresa Nacional de Electricidad S.A.
(Cayman Islands)
7.875%, 02/01/27 | | | 2,900,000 | | | | 3,728,882 | |
| | |
Enel Finance International N.V., EMTN (Netherlands)
5.750%, 09/14/40 | | | 210,000 | GBP | | | 396,505 | |
6.000%, 10/07/391 | | | 18,382,000 | | | | 22,871,774 | |
| | |
Mackinaw Power LLC 6.296%, 10/31/231 | | | 3,633,807 | | | | 3,794,927 | |
| | |
Tenaga Nasional Bhd (Malaysia) 7.500%, 11/01/251 | | | 2,000,000 | | | | 2,526,554 | |
| | |
Total Utilities | | | | | | | 63,779,732 | |
| | |
Total Corporate Bonds and Notes | | | | | | | | |
(Cost $1,158,575,114) | | | | | | | 1,291,109,850 | |
| | |
Asset-Backed Securities - 3.8% | | | | | | | | |
| | |
FAN Engine Securitization, Ltd.
Series 2013-1A, Class 1A
4.625%, 10/15/431 | | | 11,689,940 | | | | 11,555,506 | |
| | |
John Deere Owner Trust | | | | | | | | |
Series 2015-A, Class A4 1.650%, 12/15/21 | | | 3,980,000 | | | | 3,974,294 | |
| | |
John Deere Owner Trust 2015 | | | | | | | | |
Series 2015-A, Class A3 1.320%, 06/17/19 | | | 3,033,131 | | | | 3,030,277 | |
| | |
Rise, Ltd. (Bermuda) | | | | | | | | |
Series 2014-1, Class A 4.750%, 02/15/397,8 | | | 14,056,869 | | | | 13,986,585 | |
| | |
Shenton Aircraft Investment I, Ltd. | | | | | | | | |
Series 2015-1A, Class A 4.750%, 10/15/421 | | | 37,428,781 | | | | 38,761,564 | |
| | |
Trinity Rail Leasing, L.P. | | | | | | | | |
Series 2009-1A, Class A
6.657%, 11/16/391 | | | 3,486,750 | | | | 4,051,865 | |
| | | | | | | | |
| | | Principal
Amount† | | | Value | |
| | |
Trinity Rail Leasing, L.P. | | | | | | | | |
Series 2012-1A, Class A1
2.266%, 01/15/431 | | | $1,696,417 | | | | $1,668,142 | |
| | |
Total Asset-Backed Securities | | | | | | | | |
(Cost $74,994,097) | | | | | | | 77,028,233 | |
| | |
Mortgage-Backed Security - 0.0%# | | | | | | | | |
| | |
WFRBS Commercial Mortgage Trust | | | | | | | | |
Series 2011-C3, Class D
5.640%, 03/15/441,8 (Cost $397,372) | | | 435,000 | | | | 381,114 | |
| | |
Municipal Bonds - 0.9% | | | | | | | | |
| | |
Illinois State 5.100%, 06/01/33 | | | 1,070,000 | | | | 1,068,224 | |
| | |
Michigan Tobacco Settlement Finance Authority 7.309%, 06/01/34 | | | 2,720,000 | | | | 2,714,342 | |
| | |
Virginia Tobacco Settlement Financing Corp. 6.706%, 06/01/46 | | | 16,290,000 | | | | 14,689,345 | |
| | |
Total Municipal Bonds | | | | | | | | |
(Cost $19,449,469) | | | | | | | 18,471,911 | |
| | |
U.S. Government and Agency Obligations -3.9% | | | | | | | | |
| | |
Fannie Mae - 0.1% | | | | | | | | |
| | |
FNMA,
3.000%, 07/01/27 | | | 1,796,757 | | | | 1,835,097 | |
6.000%, 07/01/29 | | | 1,295 | | | | 1,460 | |
Total Fannie Mae | | | 1,798,052 | | | | 1,836,557 | |
| | |
Freddie Mac - 0.0%# | | | | | | | | |
| | |
FHLMC Gold, 5.000%, 12/01/31 | | | 17,046 | | | | 18,383 | |
| | |
U.S. Treasury Obligations - 3.8% | | | | | | | | |
| | |
U.S. Treasury Notes,
0.750%, 09/30/18 | | | 46,000,000 | | | | 45,672,969 | |
0.875%, 05/31/18 | | | 30,000,000 | | | | 29,932,031 | |
| | |
Total U.S. Treasury Obligations | | | 76,000,000 | | | | 75,605,000 | |
| | |
Total U.S. Government and Agency Obligations | | | | | | | | |
(Cost $77,838,052) | | | | | | | 77,459,940 | |
| | |
Foreign Government Obligations - 5.4% | | | | | | | | |
| | |
Brazilian Government International Bonds
8.500%, 01/05/24 | | | 6,650,000 | BRL | | | 2,019,799 | |
10.250%, 01/10/28 | | | 5,750,000 | BRL | | | 1,860,312 | |
| | |
Canadian Government Notes
0.750%, 09/01/20 | | | 15,225,000 | CAD | | | 11,805,613 | |
| | |
European Investment Bank Bonds
0.000%, 03/10/219 | | | 5,000,000 | AUD | | | 3,559,393 | |
| | |
Mexican Bonos Bonds | | | | | | | | |
Series M 7.750%, 05/29/31 | | | 49,000,000 | MXN | | | 2,493,424 | |
Series M 8.000%, 12/07/23 | | | 122,500,000 | MXN | | | 6,330,812 | |
Series M 20 7.500%, 06/03/27 | | | 111,000,000 | MXN | | | 5,580,061 | |
Series M 20 8.500%, 05/31/29 | | | 36,000,000 | MXN | | | 1,939,029 | |
| | |
| | | |
| The accompanying notes are an integral part of these financial statements. |
|
| 10 |
|
AMG Managers Loomis Sayles Bond Fund Schedule of Portfolio Investments (continued) |
| |
| |
| | | | | | | | |
| | | Principal
Amount† | | | Value | |
| | |
Foreign Government Obligations - 5.4% (continued) | | | | | | | | |
| | |
Mexican Bonos Bonds | | | | | | | | |
Series M 20 10.000%, 12/05/24 | | | 761,500,000 | MXN | | | $43,654,040 | |
| | |
New Zealand Government Notes
Series 319
5.000%, 03/15/19 | | | 14,845,000 | NZD | | | 10,901,364 | |
| | |
Norway Government Bonds | | | | | | | | |
Series 473 4.500%, 05/22/191 | | | 18,955,000 | NOK | | | 2,437,137 | |
Series 474 3.750%, 05/25/211 | | | 13,210,000 | NOK | | | 1,761,738 | |
| | |
Saudi Government International Bond
2.375%, 10/26/211 | | | $4,045,000 | | | | 3,945,736 | |
3.250%, 10/26/261 | | | 8,995,000 | | | | 8,819,058 | |
| | |
Total Foreign Government Obligations | | | | | | | | |
(Cost $149,365,101) | | | | | | | 107,107,516 | |
| | |
| | | Shares | | | | |
Preferred Stocks - 0.6% | | | | | | | | |
| | |
Financials - 0.6% | | | | | | | | |
| | |
Bank of America Corp. 4 | | | 20,000 | | | | 519,800 | |
| | |
Bank of America Corp. 3 | | | 7,808 | | | | 10,298,752 | |
| | |
Navient Corp. 4 | | | 41,250 | | | | 980,512 | |
| | |
Total Financials | | | | | | | 11,799,064 | |
| | |
Utilities - 0.0%# | | | | | | | | |
| | |
Wisconsin Electric Power Co. | | | 3,946 | | | | 363,032 | |
| | |
Total Preferred Stocks | | | | | | | | |
(Cost $8,653,211) | | | | | | | 12,162,096 | |
| | |
| | | Principal
Amount† | | | | |
Short-Term Investments - 20.9% | | | | | | | | |
| | |
Joint Repurchase Agreements - 1.4%10 | | | | | | | | |
| | |
Bank of Nova Scotia, NY, dated 12/29/17, due 01/02/18, 1.380% total to be received $6,562,764 (collateralized by various U.S. Government Agency Obligations, 3.500% - 4.000%, 07/20/45 - 11/01/47, totaling $6,694,019) | | | $6,561,758 | | | | 6,561,758 | |
| | |
Jefferies LLC, dated 12/29/17, due 01/02/18, 1.650% total to be received $6,562,961 (collateralized by various U.S. Government Agency Obligations, 2.336% - 4.279%, 03/01/29 - 11/20/67, totaling $6,692,993) | | | 6,561,758 | | | | 6,561,758 | |
| | |
JPMorgan Securities LLC, dated 12/29/17, due 01/02/18, 1.410% total to be received $1,378,880 (collateralized by various U.S. Government Agency Obligations, 1.375% - 2.125%, 08/31/18 - 03/31/24, totaling $1,406,239) | | | 1,378,664 | | | | 1,378,664 | |
| | | | | | | | |
| | | Principal
Amount† | | | Value | |
| | |
Merrill Lynch, Pierce, Fenner & Smith, Inc., dated 12/29/17, due 01/02/18, 1.410% total to be received $6,562,786 (collateralized by various U.S. Government Agency Obligations, 1.982% - 10.500%, 01/15/18 - 08/01/48, totaling $6,692,993) | | | $6,561,758 | | | | $6,561,758 | |
| | |
Nomura Securities International, Inc., dated 12/29/17, due 01/02/18, 1.420% total to be received $6,562,793 (collateralized by various U.S. Government Agency Obligations, 0.000% - 7.500%, 04/05/18 - 11/20/67, totaling $6,692,993) | | | 6,561,758 | | | | 6,561,758 | |
| | |
Total Joint Repurchase Agreements | | | | | | | 27,625,696 | |
| | |
U.S. Government and Agency Obligations -2.1% | | | | | | | | |
| | |
Federal Home Loan Bank Discount Notes,
0.160%, 01/19/189 | | | 28,355,000 | | | | 28,339,972 | |
| | |
Freddie Mac Discount Notes, 0.585%, 03/05/189 | | | 6,995,000 | | | | 6,978,736 | |
| | |
Freddie Mac Discount Notes, 0.591%, 03/06/189 | | | 7,005,000 | | | | 6,988,447 | |
| | |
Total U.S. Government and Agency Obligations | | | | | | | | |
(Cost $42,311,820) | | | | | | | 42,307,155 | |
| | |
U.S. Government Obligations - 15.4% | | | | | | | | |
| | |
U.S. Treasury Bills, 0.820%, 03/01/189 | | | 33,725,000 | | | | 33,655,859 | |
| | |
U.S. Treasury Bills, 0.219%, 01/25/189 | | | 186,000,000 | | | | 185,872,409 | |
| | |
U.S. Treasury Bills, 1.033%, 04/05/189 | | | 6,275,000 | | | | 6,252,488 | |
| | |
U.S. Treasury Bills, 0.525%, 02/08/189 | | | 50,000,000 | | | | 49,936,535 | |
| | |
U.S. Treasury Bills, 1.171%, 03/22/184,9 | | | 10,000,000 | | | | 9,970,265 | |
| | |
U.S. Cash Management Bills, 0.010%, 01/02/189 | | | 21,645,000 | | | | 21,644,384 | |
| | |
Total U.S. Government Obligations | | | | | | | | |
(Cost $307,333,630) | | | | | | | 307,331,940 | |
| | |
| | | Shares | | | | |
| | |
Other Investment Companies - 2.0% | | | | | | | | |
| | |
Dreyfus Government Cash Management Fund, Institutional Class Shares,
1.18%11 | | | 40,354,910 | | | | 40,354,910 | |
| | |
Total Short-Term Investments | | | | | | | | |
(Cost $417,626,056) | | | | | | | 417,619,701 | |
| | |
Total Investments - 100.3% | | | | | | | | |
(Cost $1,911,540,090) | | | | | | | 2,005,558,797 | |
| | |
Other Assets, less Liabilities - (0.3)% | | | | | | | (6,723,090 | ) |
| | |
Net Assets - 100.0% | | | | | | | $1,998,835,707 | |
| | |
| | | |
| The accompanying notes are an integral part of these financial statements. |
|
| 11 |
|
AMG Managers Loomis Sayles Bond Fund Schedule of Portfolio Investments (continued) |
| |
| |
| † | Principal amount in U.S. dollars unless otherwise stated. |
| 1 | Security exempt from registration under Rule 144A of the Securities Act of 1933. This security may be resold in transactions exempt from registration, normally to qualified buyers. At December 31, 2017, the value of these securities amounted to $336,395,614 or 16.8% of net assets. |
| 2 | Variable rate security. The rate shown is based on the latest available information as of December 31, 2017. |
| 3 | Convertible Security. A corporate bond or preferred stock, usually a junior debenture, that can be converted, at the option of the holder, for a specific number of shares of the company’s preferred stock or common stock. The market value of convertible bonds and convertible preferred stocks at December 31, 2017, amounted to $40,656,924 or 2.1% percent of net assets. |
| 4 | Some or all of these securities, amounting to $26,821,640 or 1.3% of net assets, were out on loan to various brokers. |
| 5 | Step Bond: A debt instrument with either deferred interest payments or an interest rate that resets at specific times during its term. |
| 6 | Security is in default. Issuer has failed to make a timely payment of either principal or either interest or has failed to comply with some provision of the bond indenture. |
| 7 | Security’s value was determined by using significant unobservable inputs. |
| 8 | Certain variable rate securities are not based on a published reference rate and spread but are determined by the issuer or agent and are based on current market conditions. These securities do not indicate a reference rate and spread in their description above. |
| 9 | Represents yield to maturity at December 31, 2017. |
| 10 | Collateral received from brokers for securities lending was invested in these joint repurchase agreements. |
| 11 | Yield shown represents the December 31, 2017, seven day average yield, which refers to the sum of the previous seven days’ dividends paid, expressed as an annual percentage. |
| | |
| EMTN | | European Medium Term Note |
| FHLMC | | Freddie Mac |
| FNMA | | Fannie Mae |
| GMTN | | Global Medium-Term Notes |
| LIBOR | | London Interbank Offered Rate |
| MPLE | | A bond denominated in Canadian dollars that is sold in Canada by foreign institutions and companies. |
| MTN | | Medium-Term Note |
| SAU | | Saugus |
| CURRENCY ABBREVIATIONS: |
| AUD | | Australian Dollar |
| BRL | | Brazilian Real |
| CAD | | Canadian Dollar |
| EUR | | Euro Dollar |
| GBP | | British Pound |
| MXN | | Mexico Peso |
| NOK | | Norwegian Krone |
| NZD | | New Zealand Dollar |
| USD | | US Dollar |
The following table summarizes the inputs used to value the Fund’s investments by the fair value hierarchy levels as of December 31, 2017:
| | | | | | | | | | | | | | | | |
| | | Level 1 | | | Level 2 | | | Level 3 | | | Total | |
Investments in Securities | | | | | | | | | | | | | | | | |
| | | | |
Common Stock† | | | $4,218,436 | | | | — | | | | — | | | | $4,218,436 | |
| | | | |
Corporate Bonds and Notes†† | | | — | | | | $1,291,109,850 | | | | — | | | | 1,291,109,850 | |
| | | | |
Asset-Backed Securities | | | — | | | | 63,041,648 | | | | $13,986,585 | | | | 77,028,233 | |
| | | | |
Mortgage-Backed Security | | | — | | | | 381,114 | | | | — | | | | 381,114 | |
| | | | |
Municipal Bonds | | | — | | | | 18,471,911 | | | | — | | | | 18,471,911 | |
| | | | |
U.S. Government and Agency Obligations†† | | | — | | | | 77,459,940 | | | | — | | | | 77,459,940 | |
| | | | |
Foreign Government Obligations | | | — | | | | 107,107,516 | | | | — | | | | 107,107,516 | |
| | | | |
Preferred Stocks† | | | 12,162,096 | | | | — | | | | — | | | | 12,162,096 | |
| | | | |
Short-Term Investments | | | | | | | | | | | | | | | | |
| | | | |
U.S. Government and Agency Obligations | | | — | | | | 42,307,155 | | | | — | | | | 42,307,155 | |
| | | | |
U.S. Government Obligations | | | — | | | | 307,331,940 | | | | — | | | | 307,331,940 | |
| | | | |
Joint Repurchase Agreements | | | — | | | | 27,625,696 | | | | — | | | | 27,625,696 | |
| | | | |
Other Investment Companies | | | 40,354,910 | | | | — | | | | — | | | | 40,354,910 | |
| | | | | | | | | | | | | | | | |
Total Investments in Securities | | | $56,735,442 | | | | $1,934,836,770 | | | | $13,986,585 | | | | $2,005,558,797 | |
| | | | | | | | | | | | | | | | |
| † | All common and preferred stocks held in the Fund are Level 1 securities. For a detailed breakout of common and preferred stocks by major industry classification, please refer to the Fund’s Schedule of Portfolio Investments. |
| †† | All corporate bonds and notes and U.S. government and agency obligations held in the Fund are Level 2 securities. For a detailed breakout of corporate bonds and notes and U.S. government and agency obligations by major industry or agency classification, please refer to the Fund’s Schedule of Portfolio Investments. |
As of December 31, 2017, the Fund had no transfers between levels from the beginning of the reporting period.
| | |
| | | |
| The accompanying notes are an integral part of these financial statements. |
|
| 12 |
|
AMG Managers Loomis Sayles Bond Fund Schedule of Portfolio Investments (continued) |
| |
| |
The following table below is a reconciliation of investments in which significant unobservable inputs (Level 3) were used in determining fair value at December 31, 2017:
| | | | |
| | | Asset-Backed | |
| | | Securities | |
Balance as of December 31, 2016 | | | $18,843,935 | |
| |
Accrued discounts (premiums) | | | (6,375 | ) |
| |
Realized gain (loss) | | | (32,253 | ) |
| |
Change in unrealized appreciation/depreciation | | | 352,914 | |
| |
Purchases | | | — | |
| |
Sales/Paydowns | | | (5,171,636 | ) |
| |
Transfers in to Level 3 | | | — | |
| |
Transfers out of Level 3 | | | — | |
| |
Balance as of December 31, 2017 | | | $13,986,585 | |
| | | — | |
Net change in unrealized appreciation/depreciation on investments still held at December 31, 2017 | | | $213,520 | |
The Fund’s investment that is categorized as Level 3 is valued utilizing third party pricing information without adjustment (broker quote). Such valuations are based on unobservable inputs. A significant change in third party information inputs could result in a significantly lower or higher value of such Level 3 investment.
| | | | |
| Country | | % of Long-Term
Investments | |
| |
Bermuda | | | 0.9 | |
| |
Brazil | | | 0.5 | |
| |
Canada | | | 1.0 | |
| |
Cayman Islands | | | 2.7 | |
| |
France | | | 1.2 | |
| |
Ireland | | | 0.7 | |
| |
Luxembourg | | | 2.2 | |
| |
Malaysia | | | 0.2 | |
| |
Mexico | | | 4.3 | |
| |
Netherlands | | | 2.4 | |
| |
New Zealand | | | 0.7 | |
| |
Norway | | | 0.3 | |
| |
Saudi Arabia | | | 0.8 | |
| |
South Korea | | | 0.2 | |
| |
Spain | | | 1.9 | |
| |
United Arab Emirates | | | 1.4 | |
| |
United Kingdom | | | 3.3 | |
| |
United States | | | 75.3 | |
| |
| | | | |
| |
| | | 100.0 | |
| | | | |
| | |
| | | |
| The accompanying notes are an integral part of these financial statements. |
|
| 13 |
|
AMG Managers Global Income Opportunity Fund Portfolio Manager’s Comments (unaudited) |
| |
| |
| | | | |
THE YEAR IN REVIEW AMG Managers Global Income Opportunity Fund (Class N) (the “Fund”) returned 10.55% during the year ended December 31, 2017, compared with the 7.39% return for the Bloomberg Barclays Global Aggregate Bond Index. Allocation to select corporate credit sectors and issuers, including high yield bonds, were a strong source of positive returns for the Fund over the past 12 months. Corporate spreads ground tighter during the period on the back of positive effects of the tax plan, as well as strong global economic and commodity price momentum. Positioning among high yield credit also added value as the “risk-on” environment and search for yield continued throughout the quarter. Overweight allocation to the banking sector, which was one of the top performing sectors in 2017, was quite positive. Specifically, USD and euro pay subordinated banking names led the way due to attractive spread levels, improving balance sheets and the positive impact of expected higher rates. Off-benchmark allocation to high yield credit within basic industry and energy sectors were quite positive, particularly among metals & mining, and independent energy producers added value. Security selection among emerging markets (EM) hard currency issuers from Latin America also lifted results. The underweight to select peripheral Eurozone treasuries dampened results as the yield spread between Eurozone peripherals and German bunds narrowed. Underweight to Agency mortgage-backed securities (MBS) and insurance sectors also detracted slightly during the period. Duration and yield curve positioning was another source of positive excess returns. The shift in allocation to duration away from G4 markets and into select emerging markets such as Mexico, Indonesia and Colombia proved beneficial. Currency and hedging, however, weighed on relative returns during the year. Our underweight allocation to the euro, Japanese yen and Mexican peso were the primary detractors as these currencies strengthened over the year. Overweight allocation to | | select emerging market currencies such as the Argentine peso and Indonesia rupiah also weighed on returns as these currencies depreciated versus the U.S. Dollar over the period. However, as previously mentioned, bond positioning in the above-mentioned EM markets was very additive as our long duration stances drove strong returns and helped offset the negative currency performance. The Fund uses currency forwards in order to gain exposure to select currencies without investing in the underlying bond market or to hedge certain currency positions based on our strategic view during a certain period. All currency forward positions contributed positively to performance by roughly 40 bps over the past 12 months, largely due to layering in FX forwards to gain exposure to the euro in order to risk control the Fund’s euro relative position versus the benchmark. Conversely, the costs to hedge Mexican peso exposure detracted as we were comfortable with the local Mexican bond market although we were cautious on the currency volatility due to the ongoing NAFTA negotiations. LOOKING FORWARD Our 2018 outlook is for continued solid and synchronized global growth. Euro area GDP can be sustained at above-trend levels, even if it decelerates modestly, while the U.K. will likely lag the rest of Europe somewhat. China’s GDP is also expected to slow modestly due to slower property growth, tighter financial regulation, environmental cleanup and some fiscal discipline at the local government level. But non-China EM growth should prove resilient, with recovery continuing in Brazil and Russia and economic expansion remaining firm in the rest of Asia. The U.S. tax reform package is expected to be positive for asset classes like credit in 2018. Any reductions in corporate borrowing due to higher after-tax borrowing costs or foreign cash repatriation may help preserve balance sheet health for investment grade borrowers. Limited risk of a buildup in leverage among European corporates remains. | | We expect the combination of technical support and healthy fundamentals to continue driving spreads tighter in 2018, at least to start the year. We believe the primary risks to the credit markets include the pace of global growth, the pace and timing of Fed tightening, shareholder-friendly activity and commodity price volatility. We expect central banks to remain supportive of risk appetite. Developed market inflation has picked up; however, we expect it to remain benign, implying easier Fed policy than might otherwise be the case. Moreover, a stronger euro and limited underlying inflation pressure will likely encourage the European Central Bank (ECB) to cautiously proceed with reversing accommodative monetary policies. Government bond yields are expected to rise, but not substantially. We believe that the Fed will tighten monetary conditions in a gradual and measured way as aggregate demand remains healthy, with three hikes in 2018. The ECB may conclude quantitative easing in 2018, but we do not expect serious talk about rate hikes until 2019. A more hawkish than expected tone from central banks would likely add some volatility in the year, but we anticipate central banks will remain cautious as long as inflation rises only modestly. We expect the U.S. Dollar to be range bound relative to global peers, given limited currency valuation misalignments and generally attractive prospective returns on capital in the U.S. and globally. The Dollar should gain some support from higher short-term yields, tax cuts and repatriation. However, stronger growth in the U.S. may come hand-in-hand with a worsening trade, income and fiscal balance, which could weigh on the U.S. Dollar—especially if non-U.S. investors simultaneously increase their focus on investment opportunities in their home markets. This commentary reflects the viewpoints of the portfolio manager, Loomis, Sayles & Company, as of December 31, 2017 and is not intended as a forecast or guarantee of future results. |
|
AMG Managers Global Income Opportunity Fund Portfolio Manager’s Comments (continued) |
| |
| |
CUMULATIVE TOTAL RETURN PERFORMANCE
AMG Managers Global Income Opportunity Fund’s cumulative total return is based on the daily change in net asset value (NAV), and assumes that all dividends and distributions were reinvested. This graph compares a hypothetical $10,000 investment made in the Fund’s Class N ( formerly Class S) shares on December 31, 2007, to a $10,000 investment made in the Bloomberg Barclays Global Aggregate Bond Index for the same time period. The graph and table do not reflect the deduction of taxes that a shareholder would pay on a Fund distribution or redemption of shares. The listed returns for the Fund are net expenses and the returns for the index exclude expenses. Total returns would have been lower had certain expenses not been reduced.
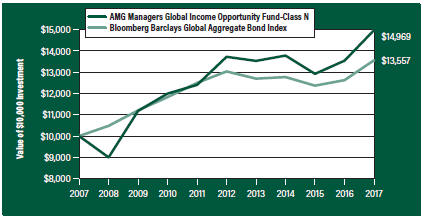
The table below shows the average annual total returns for the AMG Managers Global Income Opportunity Fund and the Bloomberg Barclays Global Aggregate Bond Index for the same time periods ended December 31, 2017.
| | | | | | | | | | | | |
| Average Annual Total Returns1 | | One
Year | | | Five
Years | | | Ten
Years | |
AMG Managers Global Income Opportunity Fund2, 3, 4, 5, 6, 7 | | | | | |
Class N8 | | | 10.55 | % | | | 1.76 | % | | | 4.12 | % |
Bloomberg Barclays Global Aggregate Bond Index9 | | | 7.39 | % | | | 0.79 | % | | | 3.09 | % |
The performance data shown represents past performance. Past performance is not a guarantee of future results. Current performance may be lower or higher than the performance data quoted. The investment return and principal value of an investment will fluctuate so that an investor’s shares, when redeemed, may be worth more or less than their original cost.
Investors should carefully consider the Fund’s investment objectives, risks, charges and expenses before investing. For performance information through the most recent month end, current net asset values per share for the Fund and other information, please call 800.835.3879 or visit our website at amgfunds.com for a free prospectus. Read it carefully before investing or sending money.
Distributed by AMG Distributors, Inc., member FINRA/SIPC.
| 1 | Total return equals income yield plus share price change and assumes reinvestment of all dividends and capital gain distributions. Returns are net of fees and may reflect offsets of Fund expenses as described in the prospectus. No adjustment has been made for taxes payable by shareholders on their reinvested dividends and capital gain distributions. Returns for periods greater than one year are annualized. The listed returns on the Fund are net of expenses and based on the published NAV as of December 31, 2017. All returns are in U.S. dollars($). |
| 2 | From time to time the Fund’s advisor has waived it’s fees and/or absorbed Fund expenses, which has resulted in higher returns. |
| 3 | A short-term redemption fee of 1% will be charged on redemptions of fund shares held for less than 60 days. |
| 4 | The Fund is subject to currency risk resulting from fluctuations in exchange rates that may affect the total loss or gain on a non-U.S. Dollar investment when converted back to U.S. Dollars. |
| 5 | The Fund is subject to the risks associated with investments in debt securities, such as default risk and fluctuations in the perception of the debtor’s ability to pay its creditors. Changing interest rates may adversely affect the value of an investment. An increase in interest rates typically causes the value of bonds and other fixed income securities to fall. |
| 6 | High-yield bonds (also known as “junk bonds”) may be subject to greater levels of interest rate, credit, and liquidity risk than investments in higher rated securities. These securities are considered predominantly speculative with respect to the issuer’s continuing ability to make principal and interest payments. The issuers of the Fund’s holdings may be involved in bankruptcy proceedings, reorganizations, or financial restructurings, and are not as strong financially as higher-rated issuers. |
| 7 | Investments in international securities are subject to certain risks of overseas investing including currency fluctuations and changes in political and economic conditions, which could result in significant market fluctuations. These risks are magnified in emerging markets. |
| 8 | Effective February 27, 2017, Class S was renamed Class N. |
| 9 | The Bloomberg Barclays Global Aggregate Bond Index provides a broad-based measure of the global investment-grade fixed income markets. The three major components of this index are the U.S. Aggregate, the Pan-European Aggregate, and the Asian-Pacific Aggregate Indices. The Index also includes Eurodollar and Euro-Yen corporate bonds, Canadian government, agency and corporate securities, and USD investment grade 144A securities. Unlike the Fund, the Bloomberg Barclays Global Aggregate Bond Index is unmanaged, is not available for investment, and does not incur expenses. |
Not FDIC insured, nor bank guaranteed. May lose value
|
AMG Managers Global Income Opportunity Fund Fund Snapshots (unaudited) December 31, 2017 |
| |
| |
PORTFOLIO BREAKDOWN
| | | | |
| Category | | % of Net Assets | |
Corporate Bonds and Notes | | | 49.8 | |
| | |
Foreign Government Obligations | | | 39.9 | |
| | |
U.S. Government and Agency Obligations | | | 7.1 | |
| | |
Asset-Backed Securities | | | 0.5 | |
| | |
Short-Term Investments* | | | 6.2 | |
| | |
Other Assets Less Liabilities** | | | (3.5) | |
| * | Includes reinvestment of cash collateral into joint repurchase agreements on security lending transactions. |
| ** | Includes repayment of cash collateral on security lending transactions, and net unrealized appreciation of $56,593 on open forward foreign currency contracts. |
| | | | |
| Rating | | % of Market Value* | |
U.S. Government and Agency Obligations | | | 7.4 | |
| | |
Aaa | | | 8.1 | |
| | |
Aa | | | 12.7 | |
| | |
A | | | 17.8 | |
| | |
Baa | | | 39.4 | |
| | |
Ba | | | 10.8 | |
| | |
B | | | 3.8 | |
* Includes market value of fixed-income securities only.
TOP TEN HOLDINGS
| | | | | | |
| Security Name | | | | % of
Net Assets | |
French Republic Government Bond OAT, 4.250%, 10/25/23 | | | | | 5.7 | |
| | | |
Mexican Bonos Bonds, Series M 30, 10.000%, 11/20/36 | | | | | 3.8 | |
| | | |
Indonesia Treasury Bonds, Series FR53, 8.250%, 07/15/21 | | | | | 2.7 | |
| | | |
New Zealand Government, Bonds, 2.000%, 09/20/25 | | | | | 2.6 | |
| | | |
Corp. Andina de Fomento, Notes, 4.375%, 06/15/22 | | | �� | | 2.1 | |
| | | |
U.S. Treasury Notes, 0.875%, 06/15/19 | | | | | 2.0 | |
| | | |
Mexican Bonos Bonds, Series M 20, 7.500%, 06/03/27 | | | | | 1.9 | |
| | | |
New South Wales Treasury Corp., Bonds, Series 22, 6.000%, 03/01/22 | | | | | 1.9 | |
| | | |
Vale, S.A., 5.625%, 09/11/42 | | | | | 1.9 | |
| | | |
Corp. Nacional del Cobre de Chile, 4.500%, 09/16/25 | | | | | 1.9 | |
| | | |
| | | | | | | |
| | | |
Top Ten as a Group | | | | | 26.5 | |
| | | | | | |
Credit quality ratings shown above reflect the highest rating assigned by either Standard & Poor’s (“S&P”) or Moody’s Investors Service, Inc. (“Moody’s”). These rating agencies are independent, nationally recognized statistical rating organizations and are widely used. Investment grade ratings are credit ratings of BBB/Baa or higher. Below investment grade ratings are credit ratings of BB/Ba or lower. Investments designated N/R are not rated by either rating agency. Unrated investments do not necessarily indicate low credit quality. Credit quality ratings are subject to change.
Because a fund’s strategy may result in multiple investments in particular sectors of the economy, its performance may depend on the performance of those sectors and may fluctuate more widely than investments diversified across more sectors. For additional information on these and other risk considerations, please see the Fund’s prospectus.
Any sectors, industries, or securities discussed should not be perceived as investment recommendations. Mention of a specific security should not be considered a recommendation to buy or solicitation to sell that security. Specific securities mentioned in this report may have been sold from the Fund’s portfolio of investments by the time you receive this report.
|
AMG Managers Global Income Opportunity Fund Schedule of Portfolio Investments December 31, 2017 |
| |
| |
| | | | | | | | |
| | | Principal
Amount† | | | Value | |
| |
Corporate Bonds and Notes - 49.8% | | | | | |
| | |
Financials - 15.6% | | | | | | | | |
| | |
Banco Latinoamericano de Comercio Exterior, S.A. (Panama)
3.250%, 05/07/201 | | | $150,000 | | | | $151,687 | |
| | |
Bank of America Corp., MTN
4.200%, 08/26/24 | | | 130,000 | | | | 136,899 | |
| | |
Barclays PLC (United Kingdom)
3.650%, 03/16/25 | | | 200,000 | | | | 199,643 | |
| | |
Citigroup, Inc.
4.400%, 06/10/25 | | | 75,000 | | | | 79,165 | |
| | |
Commerzbank AG (Germany) Series EMTN
4.000%, 03/23/26 | | | 40,000 | EUR | | | 54,494 | |
| | |
Credit Agricole, S.A. (France) (GBP Swap 5 Year plus 4.535%)
7.500%, 06/23/21662,3 | | | 100,000 | GBP | | | 161,343 | |
| | |
Goodman Australia Industrial Fund Bond Issuer Pty, Ltd. (Australia)
3.400%, 09/30/261 | | | 60,000 | | | | 58,813 | |
| | |
HSBC Holdings PLC, EMTN (United Kingdom)
5.750%, 12/20/27 | | | 55,000 | GBP | | | 93,425 | |
| | |
International Bank for Reconstruction & Development Series MTN
2.500%, 03/12/20 | | | 160,000 | AUD | | | 125,470 | |
| | |
JPMorgan Chase & Co.
3.875%, 02/01/24 | | | 75,000 | | | | 78,821 | |
Series X, (3-Month LIBOR plus 3.330%), 6.100%, 04/01/662,3 | | | 65,000 | | | | 71,422 | |
| | |
The Korea Development Bank (South Korea) Series MTN
4.500%, 11/22/19 | | | 60,000 | AUD | | | 48,004 | |
| | |
Lloyds Banking Group PLC (United Kingdom)
4.500%, 11/04/24 | | | 200,000 | | | | 209,857 | |
| | |
(USD Swap 5 Year plus 4.760%),
7.500%, 06/27/642,3,4 | | | 70,000 | | | | 79,362 | |
| | |
Old Republic International Corp.
4.875%, 10/01/24 | | | 100,000 | | | | 107,114 | |
| | |
Royal Bank of Scotland Group PLC (United Kingdom)
(USD Swap 5 Year plus 5.800%)
7.500%, 08/10/21652,3 | | | 200,000 | | | | 211,500 | |
| | |
Santander Holdings USA, Inc.
2.650%, 04/17/20 | | | 110,000 | | | | 109,942 | |
| | |
Societe Generale, S.A. (France) (EUR Swap 5 Year plus 5.538%)
6.750%, 04/07/21612,3 | | | 105,000 | EUR | | | 141,102 | |
| | | | | | | | |
| | | Principal Amount† | | | Value | |
| | |
Ventas Realty LP
3.100%, 01/15/23 | | | $70,000 | | | | $70,010 | |
| | |
Total Financials | | | | | | | 2,188,073 | |
| | |
Industrials - 31.0% | | | | | | | | |
| | |
Air Canada 2017-1 Class AA Pass Through Trust (Canada)
3.300%, 01/15/301 | | | 50,000 | | | | 49,864 | |
| | |
Alfa, SAB de CV (Mexico)
5.250%, 03/25/241,4 | | | 200,000 | | | | 211,500 | |
| | |
Alimentation Couche-Tard, Inc. (Canada)
3.550%, 07/26/271 | | | 30,000 | | | | 29,972 | |
| | |
America Movil SAB de CV (Mexico)
6.450%, 12/05/22 | | | 4,000,000 | MXN | | | 187,878 | |
| | |
Braskem Finance, Ltd. (Cayman Islands)
5.750%, 04/15/211 | | | 200,000 | | | | 212,000 | |
| | |
BRF, S.A. (Brazil)
7.750%, 05/22/181 | | | 300,000 | BRL | | | 89,762 | |
| | |
Cemex SAB de CV (Mexico)
5.700%, 01/11/251,4 | | | 200,000 | | | | 211,000 | |
| | |
Corp. Nacional del Cobre de Chile (Chile)
4.500%, 09/16/251 | | | 245,000 | | | | 262,284 | |
| | |
Covanta Holding Corp.
5.875%, 07/01/254 | | | 30,000 | | | | 30,150 | |
| | |
Delta Air Lines 2015-1 Class B Pass Through Trust
Series 15-1
4.250%, 07/30/23 | | | 60,742 | | | | 62,680 | |
| | |
Embraer Netherlands Finance BV (Netherlands)
5.050%, 06/15/25 | | | 70,000 | | | | 74,200 | |
| | |
Enbridge, Inc. (Canada)
2.900%, 07/15/22 | | | 25,000 | | | | 24,849 | |
| | |
Energy Transfer, L.P.
4.050%, 03/15/25 | | | 210,000 | | | | 209,843 | |
| | |
Freeport-McMoRan, Inc.
4.550%, 11/14/244 | | | 120,000 | | | | 122,004 | |
5.450%, 03/15/43 | | | 100,000 | | | | 99,875 | |
| | |
General Electric Co.
Series D (3-Month LIBOR plus 3.330%)
5.000%, 06/15/662,3 | | | 246,000 | | | | 253,528 | |
| | |
General Motors Financial Co., Inc.
4.000%, 01/15/25 | | | 120,000 | | | | 123,296 | |
| | |
Glencore Finance Canada, Ltd. (Canada)
5.550%, 10/25/421,5 | | | 115,000 | | | | 127,068 | |
| | |
Hyundai Capital America
2.750%, 09/27/261 | | | 85,000 | | | | 78,355 | |
| | |
Intel Corp.
3.700%, 07/29/25 | | | 100,000 | | | | 105,574 | |
| | |
INVISTA Finance LLC
4.250%, 10/15/191 | | | 130,000 | | | | 131,638 | |
| | |
| | | |
| The accompanying notes are an integral part of these financial statements. |
|
| 17 |
|
AMG Managers Global Income Opportunity Fund Schedule of Portfolio Investments (continued) |
| |
| |
| | | | | | | | |
| | | Principal Amount† | | | Value | |
| | |
Industrials - 31.0% (continued) | | | | | | | | |
| | |
Israel Chemicals, Ltd. (Israel)
4.500%, 12/02/241 | | | $125,000 | | | | $127,342 | |
| | |
Kinder Morgan Energy Partners L.P.
4.250%, 09/01/24 | | | 220,000 | | | | 227,850 | |
| | |
KT Corp. (South Korea)
2.500%, 07/18/261 | | | 200,000 | | | | 186,914 | |
| | |
Petroleos Mexicanos (Mexico)
Series 14-2
7.470%, 11/12/26 | | | 3,800,000 | MXN | | | 170,040 | |
| | |
Southern Copper Corp. (Peru)
3.875%, 04/23/25 | | | 130,000 | | | | 134,814 | |
| | |
Southwestern Energy Co.
6.700%, 01/23/255 | | | 10,000 | | | | 10,388 | |
| | |
Teva Pharmaceutical Finance Co. LLC
6.150%, 02/01/364 | | | 35,000 | | | | 35,062 | |
| | |
Union Andina de Cementos SAA (Peru)
5.875%, 10/30/211 | | | 250,000 | | | | 258,125 | |
| | |
Vale, S.A. (Brazil)
5.625%, 09/11/42 | | | 240,000 | | | | 262,800 | |
| | |
Whiting Petroleum Corp.
5.750%, 03/15/214 | | | 40,000 | | | | 41,050 | |
| | |
YPF, S.A. (Argentina)
8.500%, 07/28/251,4 | | | 180,000 | | | | 208,800 | |
| | |
Total Industrials | | | | | | | 4,360,505 | |
| | |
Utilities - 3.2% | | | | | | | | |
| | |
EDP Finance BV (Netherlands)
4.125%, 01/15/201 | | | 200,000 | | | | 206,103 | |
| | |
Emgesa, S.A. ESP (Colombia)
8.750%, 01/25/211 | | | 320,000,000 | COP | | | 112,541 | |
| | |
Empresas Publicas de Medellin ESP (Colombia)
8.375%, 02/01/211 | | | 390,000,000 | COP | | | 134,884 | |
| | |
Total Utilities | | | | | | | 453,528 | |
| | |
Total Corporate Bonds and Notes
(Cost $7,053,442) | | | | | | | 7,002,106 | |
| | |
Asset-Backed Security - 0.5% | | | | | | | | |
| | |
Trinity Rail Leasing, LLC, Series 2010-1A, Class A,
5.194%, 10/16/401
(Cost $72,295) | | | 72,295 | | | | 75,024 | |
| | |
U.S. Government and Agency Obligations -7.1% | | | | | | | | |
| | |
Freddie Mac - 0.5% | | | | | | | | |
| | |
Freddie Mac Multifamily Structured Pass Through Certificates Series K057, Class A2
2.570%, 07/25/26 | | | 70,000 | | | | 68,850 | |
| | | | | | | | |
| | | Principal
Amount† | | | Value | |
| |
U.S. Treasury Obligations - 6.6% | | | | | |
| | |
U.S. Treasury Inflation Indexed Bonds,
0.125%, 04/15/22 | | | $136,925 | | | | $135,961 | |
0.375%, 07/15/27 | | | 211,756 | | | | 210,628 | |
| | |
U.S. Treasury Notes,
0.875%, 06/15/19 | | | 280,000 | | | | 276,085 | |
1.375%, 05/31/20 | | | 140,000 | | | | 138,206 | |
1.500%, 11/30/19 | | | 175,000 | | | | 173,735 | |
| | |
Total U.S. Treasury Obligations | | | 943,681 | | | | 934,615 | |
| |
Total U.S. Government and Agency Obligations
(Cost $1,004,723) | | | | 1,003,465 | |
| |
Foreign Government Obligations - 39.9% | | | | | |
| | |
Argentine Bonos del Tesoro
15.500%, 10/17/26 | | | 1,050,000 | ARS | | | 57,491 | |
21.200%, 09/19/184 | | | 1,025,000 | ARS | | | 52,213 | |
| | |
Argentine Republic Government International Bond
7.625%, 04/22/46 | | | 150,000 | | | | 169,200 | |
| | |
Bonos de la Tesoreria de la Republica en pesos
4.500%, 03/01/26 | | | 45,000,000 | CLP | | | 72,921 | |
| | |
Brazil Notas do Tesouro Nacional Serie F, Notes
10.000%, 01/01/19 | | | 500,000 | BRL | | | 155,154 | |
| | |
Canadian Government Bond
0.500%, 03/01/22 | | | 320,000 | CAD | | | 241,087 | |
1.750%, 09/01/19 | | | 185,000 | CAD | | | 147,366 | |
| | |
Corp. Andina de Fomento, Notes
4.375%, 06/15/22 | | | 280,000 | | | | 298,309 | |
| | |
Dominican Republic International, Bonds
8.625%, 04/20/271 | | | 100,000 | | | | 122,500 | |
| | |
Export Development Canada
1.800%, 09/01/22 | | | 55,000 | CAD | | | 43,222 | |
| | |
French Republic Government Bond OAT
4.250%, 10/25/23 | | | 540,000 | EUR | | | 807,506 | |
| | |
Indonesia Government International Bonds
4.750%, 01/08/261 | | | 200,000 | | | | 217,268 | |
| | |
Indonesia Treasury Bonds | | | | | | | | |
Series FR53 8.250%, 07/15/21 | | | 1,070,000,000 | IDR | | | 84,796 | |
Series FR53 8.250%, 07/15/21 | | | 4,765,000,000 | IDR | | | 377,548 | |
| | |
Korea Treasury Bond | | | | | | | | |
Series 2209
2.000%, 09/10/22 | | | 78,000,000 | KRW | | | 71,749 | |
| | |
Mexican Bonos Bonds | | | | | | | | |
Series M 6.500%, 06/10/21 | | | 850,000 | MXN | | | 41,753 | |
Series M 8.000%, 12/07/23 | | | 1,600,000 | MXN | | | 82,688 | |
Series M 20 7.500%, 06/03/27 | | | 5,434,200 | MXN | | | 273,182 | |
Series M 30 10.000%, 11/20/36 | | | 8,655,400 | MXN | | | 537,227 | |
| | |
New South Wales Treasury Corp., Bonds | | | | | | | | |
Series
22 6.000%, 03/01/22 | | | 300,000 | AUD | | | 267,436 | |
| | |
New Zealand Government, Bonds
2.000%, 09/20/25 | | | 460,000 | NZD | | | 361,629 | |
| | |
| | | |
| The accompanying notes are an integral part of these financial statements. |
|
| 18 |
|
AMG Managers Global Income Opportunity Fund Schedule of Portfolio Investments (continued) |
| |
| |
| | | | | | | | |
| | | Principal Amount† | | | Value | |
| | |
Foreign Government Obligations - 39.9% (continued) | | | | | | | | |
| | |
New Zealand Government, Bonds | | | | | | | | |
Series 427 4.500%, 04/15/27 | | | 100,000 | NZD | | | $81,030 | |
| | |
Romanian Government International Bond
2.875%, 05/26/281 | | | 35,000 | EUR | | | 44,497 | |
| | |
South Africa Government Bond | | | | | | | | |
Series R213 7.000%, 02/28/31 | | | 2,685,000 | ZAR | | | 180,352 | |
| | |
Spain Government Bonds
0.750%, 07/30/21 | | | 75,000 | EUR | | | 91,485 | |
1.600%, 04/30/251 | | | 95,000 | EUR | | | 119,236 | |
4.400%, 10/31/231 | | | 105,000 | EUR | | | 153,348 | |
| | |
Thailand Government Bonds
2.125%, 12/17/26 | | | 5,000,000 | THB | | | 150,847 | |
| | |
U.K. Gilt Bonds
2.000%, 09/07/25 | | | 130,000 | GBP | | | 188,518 | |
4.000%, 03/07/22 | | | 50,000 | GBP | | | 76,921 | |
| | |
Uruguay Government International Bonds
9.875%, 06/20/221 | | | 1,040,000 | UYU | | | 38,253 | |
| | |
Total Foreign Government Obligations
(Cost $5,635,951) | | | | | | | 5,606,732 | |
| | | | | | | | |
| | | Principal Amount† | | | Value | |
| | |
Short-Term Investments - 6.2% | | | | | | | | |
| | |
Joint Repurchase Agreements - 5.4%6 | | | | | | | | |
| | |
State of Wisconsin Investment Board, dated 12/29/17, due 01/02/18, 1.630% total to be received $765,191 (collateralized by various U.S. Government Agency Obligations, 0.125% - 3.875%, 01/15/19 - 02/15/46, totaling $786,297) | | | $765,052 | | | | $765,052 | |
| | |
| | | Shares | | | | |
| | |
Other Investment Companies - 0.8% | | | | | | | | |
| | |
Dreyfus Preferred Government Money Market Fund, Institutional Class Shares, 1.25%7 | | | 110,756 | | | | 110,756 | |
| | |
Total Short-Term Investments | | | | | | | | |
(Cost $875,808) | | | | | | | 875,808 | |
| | |
Total Investments - 103.5% | | | | | | | | |
(Cost $14,642,219) | | | | | | | 14,563,135 | |
| | |
Other Assets, less Liabilities - (3.5)% | | | | | | | (488,664 | ) |
| | |
Net Assets - 100.0% | | | | | | | $14,074,471 | |
| † | Principal amount in U.S. dollars unless otherwise stated. |
| 1 | Security exempt from registration under Rule 144A of the Securities Act of 1933. This security may be resold in transactions exempt from registration, normally to qualified buyers. At December 31, 2017, the value of these securities amounted to $3,618,778 or 25.7% of net assets. |
| 2 | Variable rate security. The rate shown is based on the latest available information as of December 31, 2017. |
| 3 | Perpetuity Bond. The date shown is the final call date. |
| 4 | Some or all of these securities, amounting to $722,430 or 5.1% of net assets, were out on loan to various brokers. |
| 5 | Step Bond: A debt instrument with either deferred interest payments or an interest rate that resets at specific times during its term. |
| 6 | Collateral received from brokers for securities lending was invested in these joint repurchase agreements. |
| 7 | Yield shown represents the December 31, 2017, seven day average yield, which refers to the sum of the previous seven days’ dividends paid, expressed as an annual percentage. |
| | |
| EMTN | | European Medium Term Note |
| LIBOR | | London Interbank Offered Rate |
| MTN | | Medium-Term Note |
| | |
| CURRENCY ABBREVIATIONS: |
| ARS | | Argentina Peso |
| AUD | | Australian Dollar |
| BRL | | Brazilian Real |
| CAD | | Canadian Dollar |
| CLP | | Chile Peso |
| COP | | Colombia Peso |
| EUR | | Euro Dollar |
| GBP | | British Pound |
| IDR | | Indonesia Rupiah |
| KRW | | Korean Won |
| MXN | | Mexico Peso |
| NZD | | New Zealand Dollar |
| THB | | Thailand Baht |
| USD | | US Dollar |
| UYU | | Uruguay Peso |
| ZAR | | South Africa Rand |
Open Forwards Currency Contracts at December 31, 2017
| | | | | | | | | | | | | | | | | | | | |
Currency Purchased | | Currency Sold | | Expiration | | | | Counterparty | | | | Unrealized
Gain/(Loss) |
| | | | | | | | | | |
Brazilian Real | | 230,000 | | | | US Dollar | | 68,646 | | | | 03/21/18 | | | | ML | | | | $71 |
| | | | | | | | | | |
Euro Dollar | | 1,813,000 | | | | US Dollar | | 2,151,986 | | | | 03/21/18 | | | | MS | | | | 34,186 |
| | | | | | | | | | |
British Pound | | 100,000 | | | | US Dollar | | 134,105 | | | | 03/21/18 | | | | CS | | | | 1,281 |
| | | | | | | | | | |
Japanese Yen | | 246,500,000 | | | | US Dollar | | 2,181,769 | | | | 03/22/18 | | | | CS | | | | 15,405 |
| | | | | | | | | | |
Swedish Krona | | 580,000 | | | | US Dollar | | 69,141 | | | | 03/21/18 | | | | UBS | | | | 1,920 |
| | |
| | | |
| The accompanying notes are an integral part of these financial statements. |
|
| 19 |
|
AMG Managers Global Income Opportunity Fund Schedule of Portfolio Investments (continued) |
| |
| |
| | | | | | | | | | | | | | | | | | | | | | | | | | | | |
Currency Purchased | | | | | Currency Sold | | | | | Expiration | | | | | Counterparty | | | | Unrealized Gain/(Loss) | |
| | | | | | | | | | |
US Dollar | | | 449,399 | | | | | Australian Dollar | | | 587,000 | | | | | | 03/21/18 | | | | | CS | | | | | $(8,542 | ) |
| | | | | | | | | | |
US Dollar | | | 105,539 | | | | | Brazilian Real | | | 355,000 | | | | | | 03/21/18 | | | | | ML | | | | | (526 | ) |
| | | | | | | | | | |
US Dollar | | | 351,262 | | | | | Canadian Dollar | | | 450,000 | | | | | | 03/21/18 | | | | | HSBC | | | | | (7,117 | ) |
| | | | | | | | | | |
US Dollar | | | 61,137 | | | | | Swiss Franc | | | 60,000 | | | | | | 03/21/18 | | | | | UBS | | | | | (804 | ) |
| | | | | | | | | | |
US Dollar | | | 226,264 | | | | | Indonesia Rupiah | | | 3,110,000,000 | | | | | | 03/21/18 | | | | | CS | | | | | (1,246 | ) |
| | | | | | | | | | |
US Dollar | | | 1,321,902 | | | | | Mexico Peso | | | 25,440,000 | | | | | | 03/21/18 | | | | | UBS | | | | | 46,938 | |
| | | | | | | | | | |
US Dollar | | | 345,607 | | | | | New Zealand Dollar | | | 500,000 | | | | | | 03/21/18 | | | | | CS | | | | | (8,385 | ) |
| | | | | | | | | | |
US Dollar | | | 167,038 | | | | | South Africa Rand | | | 2,300,000 | | | | | | 03/22/18 | | | | | UBS | | | | | (16,588 | ) |
Total Forward Foreign Currency Contracts | | | | | | | | | | | | | | | | $56,593 | |
| | | | | | | | | | | | | | | | | | | | | | | | | | | | |
CS: Credit Suisse
HSBC: HSBC Securities Inc.
ML: Merrill Lynch
MS: Morgan Stanley
UBS: UBS Securities LLC
The following table summarizes the inputs used to value the Fund’s investments by the fair value hierarchy levels as of December 31, 2017:
| | | | | | | | | | | | | | | | |
| | | Level 1 | | | Level 2 | | | Level 3 | | | Total | |
Investments in Securities | | | | | | | | | | | | | | | | |
| | | | |
Corporate Bonds and Notes† | | | — | | | | $7,002,106 | | | | — | | | | $7,002,106 | |
| | | | |
Asset-Backed Security | | | — | | | | 75,024 | | | | — | | | | 75,024 | |
| | | | |
U.S. Government and Agency Obligations† | | | — | | | | 1,003,465 | | | | — | | | | 1,003,465 | |
| | | | |
Foreign Government Obligations | | | — | | | | 5,606,732 | | | | — | | | | 5,606,732 | |
| | | | |
Short-Term Investments | | | | | | | | | | | | | | | | |
| | | | |
Joint Repurchase Agreements | | | — | | | | 765,052 | | | | — | | | | 765,052 | |
| | | | |
Other Investment Companies | | | $110,756 | | | | — | | | | — | | | | 110,756 | |
| | | | | | | | | | | | | | | | |
| | | | |
Total Investments in Securities | | | $110,756 | | | | $14,452,379 | | | | — | | | | $14,563,135 | |
| | | | | | | | | | | | | | | | |
| | | | |
Financial Derivative Instruments - Assets | | | | | | | | | | | | | | | | |
| | | | |
Foreign Currency Exchange Contracts | | | — | | | | $99,801 | | | | — | | | | $99,801 | |
| | | | |
Financial Derivative Instruments - Liabilities | | | | | | | | | | | | | | | | |
| | | | |
Foreign Currency Exchange Contracts | | | — | | | | (43,208 | ) | | | — | | | | (43,208 | ) |
| | | | | | | | | | | | | | | | |
| | | | |
Total Financial Derivative Instruments | | | — | | | | $56,593 | | | | — | | | | $56,593 | |
| | | | | | | | | | | | | | | | |
| † | All corporate bonds and notes and U.S. government and agency obligations held in the Fund are Level 2 securities. For a detailed breakout of corporate bonds and notes and U.S. government and agency obligations by major industry or agency classification, please refer to the Fund’s Schedule of Portfolio Investments. |
As of December 31, 2017, the Fund had no transfers between levels from the beginning of the reporting period.
| | |
| | | |
| The accompanying notes are an integral part of these financial statements. |
|
| 20 |
|
AMG Managers Global Income Opportunity Fund Schedule of Portfolio Investments (continued) |
| |
| |
The following schedule shows the value of derivative instruments at December 31, 2017:
| | | | | | | | | | | | |
| | | Asset Derivatives | | | Liability Derivatives | |
Derivatives not accounted for as hedging instruments | | Statement of Assets and Liabilities Location | | Fair Value | | | Statement of Assets and Liabilities Location | | Fair Value | |
| Foreign currency exchange contracts | | Unrealized appreciation on foreign currency contracts | | | $99,801 | | | Unrealized depreciation on foreign currency contracts | | | $43,208 | |
| | | | | | | | | | | | |
For the fiscal year ended December 31, 2017, the effect of derivative instruments on the Statement of Operations for the Fund and the amount of realized gain (loss) and unrealized gain (loss) on derivatives recognized in income is as follows:
| | | | | | | | | | |
| | | Realized Gain (Loss) | | Change in Unrealized Gain (Loss) | |
Derivatives not accounted for as hedging instruments | | Statement of Operations Location | | Realized Gain/(Loss) | | Statement of Operations Location | | Change in Unrealized Gain (Loss) | |
| Foreign currency exchange contracts | | Net realized loss on forwards contracts | | $(25,747) | | Net change in unrealized appreciation (depreciation) on forwards contracts | | | $83,818 | |
| | | | | | | | | | |
| | | | |
| Country | | % of Long-Term
Investments | |
| |
Argentina | | | 3.6 | |
| |
Australia | | | 2.4 | |
| |
Brazil | | | 3.7 | |
| |
Canada | | | 4.8 | |
| |
Cayman Islands | | | 1.6 | |
| |
Chile | | | 2.5 | |
| |
Colombia | | | 1.8 | |
| |
Dominican Republic | | | 0.9 | |
| |
France | | | 8.1 | |
| |
Germany | | | 0.4 | |
| |
Indonesia | | | 5.0 | |
| |
Israel | | | 0.9 | |
| |
Mexico | | | 12.5 | |
| |
Netherlands | | | 2.0 | |
| | | | |
| Country | | % of Long-Term
Investments | |
| |
New Zealand | | | 3.2 | |
| |
Panama | | | 1.1 | |
| |
Peru | | | 2.9 | |
| |
Romania | | | 0.3 | |
| |
South Africa | | | 1.3 | |
| |
South Korea | | | 2.2 | |
| |
Spain | | | 2.7 | |
| |
Thailand | | | 1.1 | |
| |
United Kingdom | | | 7.7 | |
| |
United States | | | 24.8 | |
| |
Uruguay | | | 0.3 | |
| |
Venezuela | | | 2.2 | |
| |
| | | | |
| |
| | | 100.0 | |
| | | | |
| | |
| | | |
| The accompanying notes are an integral part of these financial statements. |
|
| 21 |
|
AMG Managers Special Equity Fund Portfolio Manager’s Comments (unaudited) |
| |
| |
| | | | | | | | |
For the fiscal year ended December 31, 2017, the AMG Managers Special Equity Fund (Class N) (the “Fund”) returned 20.25%, compared to the 22.17% return for the Russell 2000® Growth Index. FEDERATED MDTA, LLC 2017 was a very strong year for the domestic equity market with the Russell 3000® Index returning 29.59%. Across the year, growth dominated value and large caps dominated small, but the flavor of growth that the market liked in the first half was different from the flavor preferred in the second half. In the first half, the market was after growth and nothing but growth: some successful growth stocks became very expensive. In the second half, the market was more temperate in its choices: while it still favored growth over value, stocks with the strong value and quality characteristics that we track fared better than they had in the first half. In 2017, the Federated MDTA sleeve of the Fund returned 23.6%, outperforming the benchmark Russell 2000® Growth Index which returned 22.2%. MDTA has continued to follow its disciplined investment process in 2017 as before, and some features of the MDTA process allow the Fund sleeve to adapt to market changes. The sleeve holds a very diverse collection of stocks—not concentrated, roughly sector neutral, and including companies with a range of different fundamental and technical characteristics. The first half of 2017 was not advantageous for the MDTA process: the market’s tremendous appetite for nothing but growth during the first half meant that the market favored growth stocks that our process considered too expensive or too low in quality. While we profited from the companies that had the strongest growth characteristics (e.g., high analyst conviction and a rising price trend), that profit was offset by small cap growth companies that we held with relatively strong value or quality factors. The second half of 2017 improved for MDTA because the combinations of characteristics we overweight that were led by our value-oriented and quality-oriented stock selection factors did much better than in the first half. While stocks with high analyst conviction and a rising price trend still did well (the market still favored growth stocks among the small capitalization stocks), we also drew performance from stocks that didn’t have such strong growth characteristics. As the Fund sleeve is roughly sector-neutral, all of the outperformance was due to stock selection, as described above. | | | | Stocks that contributed significantly to the outperformance of the MDTA sleeve relative to the benchmark during the year included Kite Pharma, Inc., Scientific Games Corporation, Coherent, Inc., Cutera, Inc., and Dynavax Technologies Corporation. Specific stocks which detracted the most from relative performance included Libbey Inc., Hawaiian Holdings, Inc., and Argan, Inc. At the end of the year, the MDTA sleeve’s sector exposures remained neutral to the benchmark according to the Thomson Reuters I/B/E/S-based sector definitions used. The sleeve has no exposure to REITs. LORD, ABBETT & CO., LLC Domestic equity markets (as represented by the S&P 500® Index) returned 21.83%, ending calendar year 2017 with their strongest quarterly performance in two years and marking their first calendar year with 12 consecutive months of positive performance. Much of the market momentum was driven by the anticipation of supportive U.S. fiscal policies, as the passage of the Tax Cut and Jobs Act and the prospect of significant infrastructure spending drove the forecast for U.S. gross domestic product (GDP) growth incrementally higher. These forces persisted despite a myriad of geo-political and environmental headwinds, as threats from North Korea, U.S. political tensions, and Hurricanes Harvey, Irma and Maria all had the potential to derail the market’s forward progress. During the year, the National Federation of Independent Business (NFIB) Index of Small Business Optimism reached a 34-year high, marking its second-highest level in the history of the index. The University of Michigan’s average consumer confidence measure for the year was the highest since 2000, while consumer spending reached an all-time high in the third quarter. A reoccurring theme persisted throughout the year with large caps outperforming small caps and value stocks significantly outpacing their growth-oriented peers. The U.S. economy continued to expand during the trailing 12-month period. U.S. GDP grew at a 3.2% pace during the third quarter, a significant increase over the second quarter.1 The U.S. Bureau of Economic Analysis stated that during the third-quarter personal consumption and federal government spending increased, quarter over quarter. The Federal Reserve raised target rates three times during the year, changing the target range in December 2017 from 1.00–1.25% to | | | | 1.25–1.50%. In addition to GDP growth, the U.S. unemployment rate remained relatively steady throughout the period, and was reported at 4.1% in November 2017, a decline of 0.5% year-over-year.2 The Lord Abbett sleeve returned 29.9% during the period, outperforming the Russell 2000® Growth Index. The leading contributor to the Lord Abbett sleeve’s absolute and relative performance during the performance period was security selection in the information technology sector. Within this sector, the sleeve’s holdings of Shopify, Inc., an operator of a multi-faceted cloud-based commerce platform utilized by businesses, contributed most. Shares of Shopify rose as continued platform enhancements and better-than-expected new merchant growth fueled accelerated revenue growth and market share gains. Another contributor within this sector over the past year was the sleeve’s position in Universal Display Corp., a developer of organic light emitting technologies. Shares of Universal Display appreciated as it reported faster-than-expected revenue growth, which was driven by IPhone and OLED TV market penetration. Security selection within the health care sector also positively impacted the sleeve’s relative performance during the performance period. Within this sector, the sleeve’s holdings of Exact Sciences, Corp., a molecular diagnostics company, contributed most. Exact Sciences released results that displayed faster-than-expected adoption of non-invasive colorectal cancer screening. The leading detractor from the Lord Abbett sleeve’s performance relative to the benchmark during the performance period was stock selection within the materials sector. Within this sector, the sleeve’s position in AK Steel Holding Corp., an operator of steel making and metallurgical coal plants, detracted. Shares of AK Steel were adversely affected by increased raw material cost, which put near-term pressure on the company’s pricing and margins. Additionally, the lack of progress on an infrastructure spending bill and the current administration’s delay in prioritizing the Section 232 investigation into steel imports’ relation to national security, were also headwinds. Another detractor within the sector was the sleeve’s position in Cleveland-Cliffs, Inc., a mining and natural resources company. Shares of Cleveland-Cliffs declined as iron ore prices fell during the performance period. Stock selection and an overweight in the financials sector were detractors from the Lord Abbett sleeve’s performance relative to the benchmark during the |
|
AMG Managers Special Equity Fund Portfolio Manager’s Comments (continued) |
| |
| |
| | | | | | | | |
performance period. Within this sector, the sleeve’s holdings of WisdomTree Investments, Inc., an asset manager focused on exchange traded products, detracted. WisdomTree fell precipitously as higher-than-expected compensation expense, pessimism around the company’s international business and increasing industry pressure on fees weighed on the stock. RANGER INVESTMENT MANAGEMENT, L.P. As a reminder, Ranger’s focus is quality. Factors that are emphasized are growth, cash flow, balance sheet strength, returns and valuation. While our investment team does not intentionally avoid any sector, utility companies and real estate investment trusts seldom meet the growth requirements of the process we utilize to manage the Fund sleeve. Additionally, the sleeve avoids unprofitable companies, which are heavily represented in the biotechnology industry. As a disciplined growth manager that thrives on volatility in the market, we find the current environment particularly and historically interesting. We enter 2018 with the markets reaching new all-time highs and we ask ourselves a few fundamental questions: What industries and sectors do we find attractive and why? Conversely, what should we avoid? And are small cap equities overvalued? Much of the remainder of the letter shares our thoughts on these questions and our perspective on where we believe opportunity lies for 2018. The current environment is characterized by improved economic data, tight employment, higher rates and higher valuations. Leadership in the market over the past twelve months was by non-earning companies, which represented 25% of the Russell 2000® Growth index (the “benchmark” or the “Index”) and gained 32.6%. Conversely, earning companies lagged in the Index, gaining 19.3%.3 Despite the lack of near-term volatility in the markets, we continue to believe we are in the midst of a long-term rate normalization process and that higher interest rates should ultimately lead to higher volatility, which should align well with our focus on quality growth companies. Sell-offs and higher measures of volatility tend to benefit high-quality companies on a relative basis. The Ranger sleeve of the Fund returned 16.6% underperforming the Russell 2000® Growth Index gain of 22.2% by 560 basis points. The sleeve performed in line with the index during the first and fourth quarters. In the second and third quarters, the | | | | sleeve underperformed largely due to market leadership by low quality, high valuation factors. Historically low levels of volatility also provided a market environment with no significant declines, whereas sell-offs and higher measures of volatility tend to benefit high-quality companies on a relative basis. Factor analysis demonstrates performance leadership by low quality, high valuation factors in the Russell 2000® Growth index during 2017. Non-earning companies, which represented 25.1% of the index, gained 32.6%, far outpacing the 19.3% return of companies with earnings. More specifically, non-earning biotech companies, which were 8.2% of the total index and 33% of the non-earning component, increased by 66.3%. Similarly, companies with negative value ROE, which comprised 23.7% of the index, increased by 31.2%. The highest ROE quintile underperformed the benchmark, gaining only 18.1%.3 High valuation factors meaningfully outperformed this past year as demonstrated by price/earnings (P/E). Forward P/E performance at year end generally followed a trend across all five quintiles. Companies in the first quintile recorded a 6.2% loss while companies in the second quintile gained only 8.8%. Companies in the fourth and fifth quintiles with the highest projected P/E values gained 35.3% and 34.6%, respectively. Additionally, companies with a projected negative forward P/E, which were 14.3% of the index, gained 53.3%. Companies in the highest price/sales quintile outperformed the benchmark, increasing 30.5%. Companies with negative price/cash flow, which comprised 12.8% of the index, gained 49.9%, while the highest price/cash flow quintile outperformed by increasing 25.3%. Companies in the four lowest price/cash flow quintiles underperformed the index gain.3 The Ranger sleeve’s technology sector meaningfully outperformed this past year and was the largest contributor to performance. The sleeve’s technology positions increased 28.7% compared with the 21.9% gain by the index’s technology component. The key driver was good performance by software companies, which continue to demonstrate strong organic growth by providing software as a service (SAAS) and cloud-based product offerings. The sleeve’s materials & processing and consumer staples sectors were also significant contributors during 2017. The health care sector was the largest relative detractor from performance for the year. While the sleeve’s positions advanced 19.2%, they lagged the | | | | index component return of 37.3%. As already highlighted in the factor analysis section, non-earning biotech stocks gained over 66% for the year, which accounted for 57% of the sector’s total contribution to the index. The energy sector was the second largest relative detractor. While the sleeve’s positions outperformed, declining 8.6% compared with the 15.3% decline by the index component, our average overweight position of 3% caused a significant negative allocation effect on performance. The financial services sector was the third largest relative detractor from performance. The sleeve’s positions returned 0.6% compared to returns of 13.5% for the sector component of the index. SMITH ASSET MANAGEMENT GROUP, L.P. For the fiscal year ended December 31, 2017, the sleeve of the Fund managed by Smith Group returned 16.9%. During the same period, the Russell 2000® Growth Index posted a return of 22.2% and the Russell 2000® Index returned 14.7%. In some respects, 2017 ended as it began. A year ago, we were wondering how the market had rallied despite a president-elect who possessed no real legislative record to forecast a likely policy direction. Now the question could be asked how the S&P 500® Index rose nearly 22% in 2017 despite a GOP majority that failed to deliver a significant legislative win until the final week of the year. We have often contended that political headlines are a distraction, while the economy and markets ebb and flow in spite of Washington. While that may be an overstatement, history has proven that it is more profitable to filter out political noise and focus on what is going on with corporate earnings and why. This year has been a prime example. Throughout most of the year, the economic and earnings momentum that started in late 2016 continued. A broad-based, synchronized global expansion created a sweet spot for another leg up in the earnings cycle. It has been quite some time since economic growth was consistent across all major economies. U.S. companies benefited from that stronger nominal economic growth as well as a weaker U.S. Dollar. That combination produced growth in sharp contrast to the last few years. Global nominal GDP in U.S. Dollar terms is on pace to rise greater than 5% this year and over 6% next year. That compares to an average of 0.7% in the previous five years.4 Against that backdrop corporate earnings have seen good momentum following three years of stagnation. Earnings diffusion, the ratio of positive to negative revisions of earnings estimates for the next fiscal |
|
AMG Managers Special Equity Fund Portfolio Manager’s Comments (continued) |
| |
| |
| | | | | | | | |
year, has been above average for 42 of the last 52 weeks, and 24 of the last 26.5 This resulted in an upturn to 2018 expectations in September. Expectations for 2017 saw a similar change and 2017 now looks poised to deliver earnings close to what was expected at the beginning of the year. The norm is for expectations to persistently fall over time. Over the last twenty years there are only six years, 2003–2006 and 2010–2011, that have experienced rising expectations. Generally, rising expectations are reserved for a few years following recessions. Given the mini earnings recession we had in 2015/2016, maybe this improving pattern is not that unusual. It does however, help explain the strength in stock prices. S&P earnings are currently on pace to rise about 11% this year and prior to the tax bill were expected to rise about an equal amount in 2018.5 After a couple of years of very little growth this feels like a welcome respite for investors. For the first time in five years accelerating sales are a significant contributor to a rising bottom line. Sales are on track to be about 6% better than last year, then close to that rate again in 2018. That compares to an average of less than 2% for the previous four years. We are always encouraged about the sustainability of earnings growth when it is driven by rising sales instead of expanding margins. Any time there is a significant structural change like the tax bill there is a rotation within markets as investors sort out the winners and losers. The overall stimulus probably means an upward bias to stock prices. But we worry about the sustainability of the broad level of optimism across business, consumers and investors. Consumer confidence readings are in the top 14% of all time and the current institutional sentiment bull/bear ratio is in the top 3% of historical readings.6 While the individual investor bull/bear ratio is less extreme, it is still in the top 20% of historic readings. Couple that with high stock valuations, rising interest rates, inflationary pressures, lack of a meaningful correction, very low volatility and a general complacency about events that could cause economic disruption and there is plenty to worry about. While the market bias is still likely to be upward, we believe these factors will result in more volatility in the year ahead. | | | | Here at the Smith Group we are encouraged about the opportunities for stock selection due to structural changes, global economic momentum and an environment less impacted by Federal Reserve (Fed) policy. These changes will lead to business activity that has not been previously anticipated. In addition, Fed tightening will put pressure on companies that have survived mainly because of excess liquidity and low rates. In a rising rate environment, earnings quality will become more important and investors will increase differentiation between companies on that basis. Relative to the Russell 2000® Growth index, performance of the Smith Group sleeve struggled as the value tilt of the sleeve vs. the index proved a significant headwind. Small cap growth stocks outperformed small cap value stocks by more than 14% for the year. The sleeve’s primary focus is to find companies that can sustainably grow high quality earnings faster than expectations and that also possess reasonable valuations. Stock selection was favorable vs. the Russell 2000® Growth in health care, real estate and financials but trailed the index in consumer discretionary, information technology, industrials and consumer staples. An underweight to biotech companies was a significant hindrance to relative performance, despite sleeve holdings in the industry performing significantly better than the index. For the full year, health care delivered the strongest absolute performance as sleeve holdings returned 48%. The sleeve’s top contributor was Extreme Networks. Investors continued to celebrate a string of positive earnings surprises at the network infrastructure provider and their recent acquisitions that strengthen their position in their target enterprise markets. Interactive entertainment company Take-Two Interactive continued to deliver better-than-expected sales and earnings results. The company’s new management team has proven adept at managing a historically volatile revenue stream, improving its capital position, accumulating a cash hoard, making smart investments in development or acquisition of new releases and steadily improving earnings quality. | | | | The largest detractors in the sleeve were retail holdings Francesca’s Holdings and Pier 1 Imports. Fast-fashion boutique Francesca’s Holdings outpaced retail peers at the close of 2016, but struggled to carry the momentum into the new year. Investors did not see the operating metrics they needed and the stock fell in the midst of an industry-wide sell-off. Poor sales performance was attributed to a decrease in traffic and conversion. Additionally, atypical weather across the country translated into an incompatible product mix. Home & décor retailer Pier 1 Imports stock fell following the company issuing downward guidance on weaker-than-expected outdoor sales as competitive forces are pushing management to issue promotions and increase advertising expenditure to maintain market share. We continue to believe that equities in general, and our investment philosophy, should be able to generate healthy returns going forward as steady economic growth will provide a solid foundation for strong corporate profits. Thank you for placing your trust in Smith Group Asset Management. As always, we appreciate the opportunity to serve your investment needs. 1 U.S. Bureau of Economic Analysis. 2 U.S. Bureau of Labor Statistics. 3 FactSet 4 Organisation for Economic Co-operation and Development (OECD) 5 FactSet Earnings Insight 6 The Conference Board, Consumer Confidence Index This commentary reflects the viewpoints of the portfolio managers, Federated MDTA, LLC., Lord, Abbett & Co., LLC, Ranger Investment Management, L.P. and Smith Asset Management Group, L.P. as of December 31, 2017 and is not intended as a forecast or guarantee of future results, and is subject to change without notice. |
|
AMG Managers Special Equity Fund Portfolio Manager’s Comments (continued) |
| |
| |
CUMULATIVE TOTAL RETURN PERFORMANCE
AMG Managers Special Equity Fund’s cumulative total return is based on the daily change in net asset value (NAV), and assumes that all dividends and distributions were reinvested. This graph compares a hypothetical $10,000 investment made in the Fund’s Class N Shares on December 31, 2007, to a $10,000 investment made in the Russell 2000® Growth Index for the same time period. The graph and table do not reflect the deduction of taxes that a shareholder would pay on a Fund distribution or redemption of shares. The listed returns for the Fund are net expenses and the returns for the index exclude expenses. Total returns would have been lower had certain expenses not been reduced.
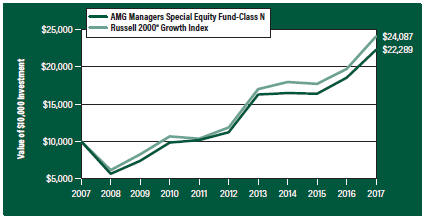
The table below shows the average annual total returns for the AMG Managers Special Equity Fund and the Russell 2000® Growth Index for the same time periods ended December 31, 2017.
| | | | | | | | | | | | |
| Average Annual Total Returns1 | | One Year | | | Five Year | | | Ten Year | |
AMG Managers Special Equity Fund2, 3, 4, 5, 6 | |
Class N7 | | | 20.25 | % | | | 14.71 | % | | | 8.35 | % |
| | | |
Class I | | | 20.55 | % | | | 14.91 | % | | | 8.58 | % |
Russell 2000® Growth Index8 | | | 22.17 | % | | | 15.21 | % | | | 9.19 | % |
The performance data shown represents past performance. Past performance is not a guarantee of future results. Current performance may be lower or higher than the performance data quoted. The investment return and principal value of an investment will fluctuate so that an investor’s shares, when redeemed, may be worth more or less than their original cost.
Investors should carefully consider the Fund’s investment objectives, risks, charges and expenses before investing. For performance information through the most recent month end, current net asset values per share for the Fund and other information, please call 800.835.3879 or visit our website at amgfunds.com for a free prospectus. Read it carefully before investing or sending money.
Distributed by AMG Distributors, Inc., member FINRA/SIPC.
| 1 | Total return equals income yield plus share price change and assumes reinvestment of all dividends and capital gain distributions. Returns are net of fees and may reflect offsets of Fund expenses as described in the prospectus. No adjustment has been made for taxes payable by shareholders on their reinvested dividends and capital gain distributions. Returns for periods greater than one year are annualized. The listed returns on the Fund are net of expenses and based on the published NAV as of December 31, 2017. All returns are in U.S. dollars($). |
| 2 | From time to time, the Fund’s advisor has waived its fees and/or absorbed Fund expenses, which has resulted in higher returns. |
| 3 | The Fund is subject to risks associated with investments in small capitalization companies, such as erratic earnings patterns, competitive conditions, limited earnings history, and a reliance on one or a limited number of products. |
| 4 | The Fund is subject to risks associated with investments in mid-capitalization companies such as greater price volatility, lower trading volume, and less liquidity than the stocks of larger, more established companies. |
| 5 | The Fund invests in growth stocks, which may be more sensitive to market movements because their prices tend to reflect future investor expectations rather than just current profits. |
| 6 | Investments in international securities are subject to certain risks of overseas investing including currency fluctuations and changes in political and economic conditions, which could result in significant market fluctuations. These risks are magnified in emerging markets. |
| 7 | Effective February 27, 2017, Class S was renamed Class N. |
| 8 | The Russell 2000® Growth Index measures the performance of the Russell 2000® companies with higher price-to-book ratios and higher forecasted growth values. Unlike the Fund, the Russell 2000® Growth Index is unmanaged, is not available for investment and does not incur expenses. |
The Russell Indices are trademarks of the London Stock Exchange Group companies.
Not FDIC insured, nor bank guaranteed. May lose value.
|
AMG Managers Special Equity Fund Fund Snapshots (unaudited) December 31, 2017 |
| |
| |
PORTFOLIO BREAKDOWN
| | | | | |
| Sector | | % of
Net Assets |
| | |
Information Technology | | | | 24.0 | |
| | |
Health Care | | | | 21.8 | |
| | |
Industrials | | | | 19.1 | |
| | |
Consumer Discretionary | | | | 12.9 | |
| | |
Financials | | | | 9.0 | |
| | |
Consumer Staples | | | | 4.1 | |
| | |
Materials | | | | 3.0 | |
| | |
Energy | | | | 2.1 | |
| | |
Telecommunication Services | | | | 0.6 | |
| | |
Real Estate | | | | 0.5 | |
| | |
Utilities | | | | 0.1 | |
| | |
Short-Term Investments* | | | | 13.9 | |
| | |
Other Assets Less Liabilities** | | | | (11.1 | ) |
| * | Includes reinvestment of cash collateral into joint repurchase agreements on security lending transactions. |
| ** | Includes repayment of cash collateral on security lending transactions. |
TOP TEN HOLDINGS
| | | | | | | | |
| Security Name | | | | | % of
Net Assets | |
| | | |
PRA Health Sciences, Inc. | | | | | | | 2.5 | |
| | | |
Saia, Inc. | | | | | | | 1.5 | |
| | | |
Banc of California, Inc. | | | | | | | 1.4 | |
| | | |
Qualys, Inc. | | | | | | | 1.4 | |
| | | |
Calavo Growers, Inc. | | | | | | | 1.3 | |
| | | |
Steven Madden, Ltd. | | | | | | | 1.3 | |
| | | |
Pegasystems, Inc. | | | | | | | 1.3 | |
| | | |
Knoll, Inc. | | | | | | | 1.2 | |
| | | |
SiteOne Landscape Supply, Inc. | | | | | | | 1.2 | |
| | | |
WageWorks, Inc. | | | | | | | 1.1 | |
| | | | | | | | | |
| | | |
Top Ten as a Group | | | | | | | 14.2 | |
| | | | | | | | | |
| | | | | | | | | |
Because a fund’s strategy may result in multiple investments in particular sectors of the economy, its performance may depend on the performance of those sectors and may fluctuate more widely than investments diversified across more sectors. For additional information on these and other risk considerations, please see the Fund’s prospectus.
Any sectors, industries, or securities discussed should not be perceived as investment recommendations. Mention of a specific security should not be considered a recommendation to buy or solicitation to sell that security. Specific securities mentioned in this report may have been sold from the Fund’s portfolio of investments by the time you receive this report.
|
AMG Managers Special Equity Fund Schedule of Portfolio Investments December 31, 2017 |
| |
| |
| | | | | | | | |
| | | Shares | | | Value | |
| | |
Common Stocks - 97.2% | | | | | | | | |
| | |
Consumer Discretionary - 12.9% | | | | | | | | |
| | |
American Outdoor Brands Corp.*,1 | | | 10,104 | | | | $129,735 | |
| | |
At Home Group, Inc.* | | | 12,436 | | | | 377,930 | |
| | |
Big Lots, Inc.1 | | | 20,870 | | | | 1,171,851 | |
| | |
Camping World Holdings, Inc., Class A | | | 11,607 | | | | 519,181 | |
| | |
Canada Goose Holdings, Inc. (Canada)* | | | 25,384 | | | | 801,119 | |
| | |
Chegg, Inc.* | | | 48,021 | | | | 783,703 | |
| | |
The Children’s Place, Inc.1 | | | 9,273 | | | | 1,347,831 | |
| | |
Cooper-Standard Holdings, Inc.* | | | 9,997 | | | | 1,224,633 | |
| | |
Dave & Buster’s Entertainment, Inc.* | | | 7,480 | | | | 412,672 | |
| | |
Deckers Outdoor Corp.* | | | 5,500 | | | | 441,375 | |
| | |
Dorman Products, Inc.* | | | 2,135 | | | | 130,534 | |
| | |
Etsy, Inc.* | | | 44,253 | | | | 904,974 | |
| | |
Express, Inc.* | | | 19,783 | | | | 200,797 | |
| | |
Floor & Decor Holdings, Inc., Class A* | | | 15,359 | | | | 747,676 | |
| | |
Grand Canyon Education, Inc.* | | | 8,574 | | | | 767,630 | |
| | |
iRobot Corp.*,1 | | | 10,705 | | | | 821,074 | |
| | |
LCI Industries | | | 12,630 | | | | 1,641,900 | |
| | |
Libbey, Inc. | | | 38,967 | | | | 293,032 | |
| | |
Liberty Tax, Inc. | | | 31,827 | | | | 350,097 | |
| | |
Live Nation Entertainment, Inc.* | | | 20,800 | | | | 885,456 | |
| | |
Malibu Boats, Inc., Class A* | | | 14,800 | | | | 440,004 | |
| | |
Marriott Vacations Worldwide Corp. | | | 4,068 | | | | 550,034 | |
| | |
MDC Holdings, Inc. | | | 11,988 | | | | 382,177 | |
| | |
MSG Networks, Inc., Class A* | | | 4,800 | | | | 97,200 | |
| | |
National Vision Holdings, Inc.* | | | 1,853 | | | | 75,250 | |
| | |
Noodles & Co.* | | | 12,704 | | | | 66,696 | |
| | |
Ollie’s Bargain Outlet Holdings, Inc.* | | | 4,507 | | | | 239,998 | |
| | |
Overstock.com, Inc.*,1 | | | 3,748 | | | | 239,497 | |
| | |
Penn National Gaming, Inc.* | | | 16,000 | | | | 501,280 | |
| | |
PetMed Express, Inc. | | | 10,100 | | | | 459,550 | |
| | |
Pier 1 Imports, Inc. | | | 20,324 | | | | 84,141 | |
| | |
Planet Fitness, Inc., Class A* | | | 41,013 | | | | 1,420,280 | |
| | |
Roku, Inc.*,1 | | | 13,880 | | | | 718,706 | |
| | |
Scientific Games Corp., Class A*,1 | | | 10,792 | | | | 553,630 | |
| | |
SodaStream International, Ltd. (Israel)* | | | 11,531 | | | | 811,091 | |
| | |
Sonic Corp. | | | 26,795 | | | | 736,327 | |
| | |
Steven Madden, Ltd.* | | | 56,840 | | | | 2,654,428 | |
| | |
Strayer Education, Inc. | | | 7,580 | | | | 679,016 | |
| | |
Tailored Brands, Inc. | | | 11,603 | | | | 253,293 | |
| | |
TopBuild Corp.* | | | 7,984 | | | | 604,708 | |
| | | | | | | | |
| | | Shares | | | Value | |
| | |
Weight Watchers International, Inc.* | | | 9,000 | | | | $398,520 | |
| | |
Total Consumer Discretionary | | | | | | | 25,919,026 | |
| | |
Consumer Staples - 4.1% | | | | | | | | |
| | |
The Boston Beer Co., Inc, Class A*,1 | | | 2,500 | | | | 477,750 | |
| | |
Calavo Growers, Inc.1 | | | 31,896 | | | | 2,692,022 | |
| | |
The Chefs’ Warehouse, Inc.* | | | 24,446 | | | | 501,143 | |
| | |
elf Beauty, Inc.*,1 | | | 21,233 | | | | 473,708 | |
| | |
Inter Parfums, Inc. | | | 44,001 | | | | 1,911,844 | |
| | |
J&J Snack Foods Corp. | | | 7,390 | | | | 1,122,024 | |
| | |
Medifast, Inc. | | | 9,684 | | | | 676,040 | |
| | |
Turning Point Brands, Inc. | | | 14,664 | | | | 309,850 | |
| | |
Total Consumer Staples | | | | | | | 8,164,381 | |
| | |
Energy - 2.1% | | | | | | | | |
| | |
Abraxas Petroleum Corp.* | | | 62,200 | | | | 153,012 | |
| | |
Callon Petroleum Co.*,1 | | | 85,115 | | | | 1,034,148 | |
| | |
GasLog, Ltd. (Monaco)1 | | | 39,505 | | | | 878,986 | |
| | |
Pioneer Energy Services Corp.* | | | 43,582 | | | | 132,925 | |
| | |
WildHorse Resource Development Corp.*,1 | | | 108,810 | | | | 2,003,192 | |
| | |
Total Energy | | | | | | | 4,202,263 | |
| | |
Financials - 9.0% | | | | | | | | |
| | |
Banc of California, Inc.1 | | | 133,470 | | | | 2,756,155 | |
| | |
Cadence BanCorp* | | | 15,137 | | | | 410,515 | |
| | |
CenterState Bank Corp. | | | 78,891 | | | | 2,029,865 | |
| | |
Cohen & Steers, Inc.1 | | | 2,500 | | | | 118,225 | |
| | |
Employers Holdings, Inc. | | | 2,200 | | | | 97,680 | |
| | |
Encore Capital Group, Inc.* | | | 10,502 | | | | 442,134 | |
| | |
Evercore, Inc., Class A | | | 19,398 | | | | 1,745,820 | |
| | |
Hamilton Lane, Inc., Class A1 | | | 1,307 | | | | 46,255 | |
| | |
Heritage Insurance Holdings, Inc. | | | 21,196 | | | | 381,952 | |
| | |
Houlihan Lokey, Inc. | | | 10,400 | | | | 472,472 | |
| | |
Infinity Property & Casualty Corp. | | | 1,900 | | | | 201,400 | |
| | |
LegacyTexas Financial Group, Inc. | | | 37,450 | | | | 1,580,765 | |
| | |
Moelis & Co., Class A | | | 11,012 | | | | 534,082 | |
| | |
Pinnacle Financial Partners, Inc. | | | 7,780 | | | | 515,814 | |
| | |
Primerica, Inc. | | | 13,389 | | | | 1,359,653 | |
| | |
South State Corp. | | | 10,290 | | | | 896,774 | |
| | |
Sterling Bancorp | | | 15,423 | | | | 379,406 | |
| | |
Texas Capital Bancshares, Inc.* | | | 5,756 | | | | 511,708 | |
| | |
Universal Insurance Holdings, Inc. | | | 21,623 | | | | 591,389 | |
| | |
Veritex Holdings, Inc.* | | | 24,660 | | | | 680,369 | |
| | |
Walker & Dunlop, Inc.* | | | 1,400 | | | | 66,500 | |
| | |
Webster Financial Corp.1 | | | 7,575 | | | | 425,412 | |
| | |
Western Alliance Bancorp* | | | 13,964 | | | | 790,642 | |
| | |
| | | |
| The accompanying notes are an integral part of these financial statements. |
|
| 27 |
|
AMG Managers Special Equity Fund Schedule of Portfolio Investments (continued) |
| |
| |
| | | | | | | | |
| | | Shares | | | Value | |
| | |
Financials - 9.0% (continued) | | | | | | | | |
| | |
Wintrust Financial Corp. | | | 5,311 | | | | $437,467 | |
| | |
World Acceptance Corp.* | | | 5,490 | | | | 443,153 | |
| | |
WSFS Financial Corp. | | | 2,316 | | | | 110,821 | |
| | |
Total Financials | | | | | | | 18,026,428 | |
| | |
Health Care - 21.8% | | | | | | | | |
| | |
ABIOMED, Inc.* | | | 948 | | | | 177,665 | |
| | |
Adeptus Health, Inc.*,2,3 | | | 24,574 | | | | 0 | |
| | |
Agios Pharmaceuticals, Inc.* | | | 7,562 | | | | 432,320 | |
| | |
Amicus Therapeutics, Inc.*,1 | | | 4,000 | | | | 57,560 | |
| | |
Anika Therapeutics, Inc.* | | | 2,340 | | | | 126,149 | |
| | |
Avexis, Inc.* | | | 6,876 | | | | 760,967 | |
| | |
Bluebird Bio, Inc.* | | | 5,783 | | | | 1,029,952 | |
| | |
Blueprint Medicines Corp.* | | | 13,410 | | | | 1,011,248 | |
| | |
Cambrex Corp.* | | | 38,352 | | | | 1,840,896 | |
| | |
Cantel Medical Corp. | | | 14,915 | | | | 1,534,306 | |
| | |
Cardiovascular Systems, Inc.* | | | 10,514 | | | | 249,077 | |
| | |
Catalent, Inc.* | | | 5,800 | | | | 238,264 | |
| | |
Chemed Corp. | | | 1,965 | | | | 477,534 | |
| | |
Clovis Oncology, Inc.* | | | 4,848 | | | | 329,664 | |
| | |
Corcept Therapeutics, Inc.*,1 | | | 26,400 | | | | 476,784 | |
| | |
Cotiviti Holdings, Inc.* | | | 42,891 | | | | 1,381,519 | |
| | |
Cutera, Inc.* | | | 17,602 | | | | 798,251 | |
| | |
Depomed, Inc.*,1 | | | 64,957 | | | | 522,904 | |
| | |
Emergent BioSolutions, Inc.* | | | 19,813 | | | | 920,710 | |
| | |
Exact Sciences Corp.*,1 | | | 21,607 | | | | 1,135,232 | |
| | |
FibroGen, Inc.* | | | 10,901 | | | | 516,707 | |
| | |
Foundation Medicine, Inc.* | | | 8,832 | | | | 602,342 | |
| | |
Haemonetics Corp.* | | | 7,300 | | | | 423,984 | |
| | |
Halozyme Therapeutics, Inc.*,1 | | | 13,815 | | | | 279,892 | |
| | |
HealthEquity, Inc.* | | | 8,036 | | | | 374,960 | |
| | |
Heron Therapeutics, Inc.* | | | 8,484 | | | | 153,560 | |
| | |
Heska Corp.* | | | 7,435 | | | | 596,361 | |
| | |
Innoviva, Inc.*,1 | | | 64,119 | | | | 909,849 | |
| | |
Inogen, Inc.*,1 | | | 12,141 | | | | 1,445,750 | |
| | |
Insmed, Inc.* | | | 17,460 | | | | 544,403 | |
| | |
Insulet Corp.* | | | 17,019 | | | | 1,174,311 | |
| | |
Intra-Cellular Therapies, Inc.* | | | 13,352 | | | | 193,337 | |
| | |
Ironwood Pharmaceuticals, Inc.* | | | 3,100 | | | | 46,469 | |
| | |
Kura Oncology, Inc.* | | | 13,122 | | | | 200,767 | |
| | |
Lantheus Holdings, Inc.* | | | 20,600 | | | | 421,270 | |
| | |
LeMaitre Vascular, Inc. | | | 31,958 | | | | 1,017,543 | |
| | |
LHC Group, Inc.* | | | 2,400 | | | | 147,000 | |
| | | | | | | | |
| | | Shares | | | Value | |
| | |
Ligand Pharmaceuticals, Inc.*,1 | | | 600 | | | | $82,158 | |
| | |
Lipocine, Inc.* | | | 18,022 | | | | 61,996 | |
| | |
Loxo Oncology, Inc.*,1 | | | 7,507 | | | | 631,939 | |
| | |
Luminex Corp. | | | 6,900 | | | | 135,930 | |
| | |
Magellan Health, Inc.* | | | 4,600 | | | | 444,130 | |
| | |
Masimo Corp.* | | | 4,600 | | | | 390,080 | |
| | |
Medidata Solutions, Inc.* | | | 22,560 | | | | 1,429,627 | |
| | |
MiMedx Group, Inc.*,1 | | | 19,087 | | | | 240,687 | |
| | |
Mirati Therapeutics, Inc.* | | | 8,353 | | | | 152,442 | |
| | |
Nektar Therapeutics* | | | 7,053 | | | | 421,205 | |
| | |
Neogen Corp.* | | | 9,235 | | | | 759,209 | |
| | |
Nevro Corp.* | | | 6,148 | | | | 424,458 | |
| | |
Ophthotech Corp.* | | | 32,158 | | | | 100,333 | |
| | |
PDL BioPharma, Inc.* | | | 106,678 | | | | 292,298 | |
| | |
Penumbra, Inc.* | | | 9,177 | | | | 863,556 | |
| | |
Portola Pharmaceuticals, Inc.*,1 | | | 1,300 | | | | 63,284 | |
| | |
PRA Health Sciences, Inc.* | | | 55,143 | | | | 5,021,873 | |
| | |
Prestige Brands Holdings, Inc.*,1 | | | 35,760 | | | | 1,588,102 | |
| | |
Protagonist Therapeutics, Inc.* | | | 10,378 | | | | 215,862 | |
| | |
Prothena Corp. PLC (Ireland)*,1 | | | 700 | | | | 26,243 | |
| | |
Puma Biotechnology, Inc.* | | | 800 | | | | 79,080 | |
| | |
Repligen Corp.* | | | 48,733 | | | | 1,768,033 | |
| | |
Sage Therapeutics, Inc.* | | | 9,094 | | | | 1,497,873 | |
| | |
Sangamo Therapeutics, Inc.* | | | 14,432 | | | | 236,685 | |
| | |
Sarepta Therapeutics, Inc.* | | | 16,143 | | | | 898,197 | |
| | |
Spark Therapeutics, Inc.*,1 | | | 5,912 | | | | 303,995 | |
| | |
Supernus Pharmaceuticals, Inc.* | | | 35,358 | | | | 1,409,016 | |
| | |
Tabula Rasa HealthCare, Inc.* | | | 38,324 | | | | 1,074,988 | |
| | |
TESARO, Inc.*,1 | | | 1,777 | | | | 147,260 | |
| | |
Tivity Health, Inc.* | | | 7,215 | | | | 263,708 | |
| | |
Ultragenyx Pharmaceutical, Inc.* | | | 1,100 | | | | 51,018 | |
| | |
Zafgen, Inc.* | | | 10,944 | | | | 50,561 | |
| | |
Total Health Care | | | | | | | 43,675,333 | |
| | |
Industrials - 19.1% | | | | | | | | |
| | |
Aerojet Rocketdyne Holdings, Inc.* | | | 11,370 | | | | 354,744 | |
| | |
Aerovironment, Inc.* | | | 8,146 | | | | 457,479 | |
| | |
Air Lease Corp. | | | 17,463 | | | | 839,796 | |
| | |
Alamo Group, Inc. | | | 4,200 | | | | 474,054 | |
| | |
Allison Transmission Holdings, Inc. | | | 12,141 | | | | 522,913 | |
| | |
Applied Industrial Technologies, Inc. | | | 5,700 | | | | 388,170 | |
| | |
Argan, Inc. | | | 14,797 | | | | 665,865 | |
| | |
Atlas Air Worldwide Holdings, Inc.* | | | 11,063 | | | | 648,845 | |
| | |
Beacon Roofing Supply, Inc.* | | | 12,793 | | | | 815,682 | |
| | |
| | | |
| The accompanying notes are an integral part of these financial statements. |
|
| 28 |
|
AMG Managers Special Equity Fund Schedule of Portfolio Investments (continued) |
| |
| |
| | | | | | | | |
| | | Shares | | | Value | |
| | |
Industrials - 19.1% (continued) | | | | | | | | |
| | |
Brady Corp., Class A | | | 5,700 | | | | $216,030 | |
| | |
The Brink’s Co. | | | 9,812 | | | | 772,204 | |
| | |
Builders FirstSource, Inc.* | | | 32,270 | | | | 703,163 | |
| | |
BWX Technologies, Inc. | | | 8,399 | | | | 508,055 | |
| | |
Chart Industries, Inc.* | | | 11,230 | | | | 526,238 | |
| | |
Comfort Systems USA, Inc. | | | 17,160 | | | | 749,034 | |
| | |
Curtiss-Wright Corp. | | | 6,523 | | | | 794,828 | |
| | |
Deluxe Corp. | | | 17,820 | | | | 1,369,289 | |
| | |
DXP Enterprises, Inc. * | | | 11,129 | | | | 329,085 | |
| | |
EMCOR Group, Inc. | | | 4,800 | | | | 392,400 | |
| | |
Essendant, Inc. | | | 9,456 | | | | 87,657 | |
| | |
Generac Holdings, Inc.* | | | 3,600 | | | | 178,272 | |
| | |
The Greenbrier Cos., Inc.1 | | | 5,526 | | | | 294,536 | |
| | |
Harsco Corp.* | | | 21,800 | | | | 406,570 | |
| | |
Hawaiian Holdings, Inc. | | | 10,155 | | | | 404,677 | |
| | |
Insperity, Inc. | | | 6,200 | | | | 355,570 | |
| | |
Insteel Industries, Inc. | | | 38,997 | | | | 1,104,395 | |
| | |
Interface, Inc. | | | 33,277 | | | | 836,917 | |
| | |
Kadant, Inc. | | | 4,300 | | | | 431,720 | |
| | |
Knoll, Inc. | | | 109,765 | | | | 2,528,986 | |
| | |
Kornit Digital, Ltd. (Israel)*,1 | | | 32,509 | | | | 525,020 | |
| | |
MasTec, Inc.* | | | 14,497 | | | | 709,628 | |
| | |
Mercury Systems, Inc.* | | | 23,615 | | | | 1,212,630 | |
| | |
Moog, Inc., Class A* | | | 2,800 | | | | 243,180 | |
| | |
PGT Innovations, Inc.* | | | 61,740 | | | | 1,040,319 | |
| | |
Ply Gem Holdings, Inc.* | | | 31,646 | | | | 585,451 | |
| | |
Proto Labs, Inc.* | | | 14,265 | | | | 1,469,295 | |
| | |
Quad/Graphics, Inc. | | | 31,095 | | | | 702,747 | |
| | |
Quanta Services, Inc.* | | | 16,638 | | | | 650,712 | |
| | |
RBC Bearings, Inc.* | | | 3,059 | | | | 386,658 | |
| | |
Rush Enterprises, Inc., Class A* | | | 18,270 | | | | 928,299 | |
| | |
Saia, Inc.* | | | 41,570 | | | | 2,941,077 | |
| | |
SiteOne Landscape Supply, Inc.*,1 | | | 30,558 | | | | 2,343,799 | |
| | |
SP Plus Corp.* | | | 10,000 | | | | 371,000 | |
| | |
SPX Corp.* | | | 26,704 | | | | 838,239 | |
| | |
Team, Inc.* | | | 27,588 | | | | 411,061 | |
| | |
Trex Co., Inc.* | | | 4,838 | | | | 524,391 | |
| | |
Vectrus, Inc.* | | | 4,700 | | | | 144,995 | |
| | |
Wabash National Corp.1 | | | 43,975 | | | | 954,257 | |
| | |
WageWorks, Inc.* | | | 35,911 | | | | 2,226,482 | |
| | | | | | | | |
| | | Shares | | | Value | |
| | |
XPO Logistics, Inc.* | | | 9,509 | | | | $870,929 | |
| | |
Total Industrials | | | | | | | 38,237,343 | |
| | |
Information Technology - 24.0% | | | | | | | | |
| | |
2U, Inc.*,1 | | | 17,518 | | | | 1,130,086 | |
| | |
Advanced Energy Industries, Inc.* | | | 17,757 | | | | 1,198,242 | |
| | |
Alarm.com Holdings, Inc.* | | | 6,695 | | | | 252,736 | |
| | |
Appfolio, Inc., Class A* | | | 10,616 | | | | 440,564 | |
| | |
Appian Corp.*,1 | | | 7,216 | | | | 227,160 | |
| | |
Aspen Technology, Inc.* | | | 2,800 | | | | 185,360 | |
| | |
Blackline, Inc.* | | | 8,331 | | | | 273,257 | |
| | |
Blucora, Inc.* | | | 17,200 | | | | 380,120 | |
| | |
Box, Inc., Class A* | | | 24,696 | | | | 521,580 | |
| | |
BroadSoft, Inc.* | | | 24,353 | | | | 1,336,980 | |
| | |
Cabot Microelectronics Corp. | | | 11,870 | | | | 1,116,730 | |
| | |
Care.com, Inc.* | | | 7,100 | | | | 128,084 | |
| | |
Cargurus, Inc.*,1 | | | 12,457 | | | | 373,461 | |
| | |
Cavium, Inc.* | | | 4,427 | | | | 371,115 | |
| | |
CEVA, Inc.* | | | 42,703 | | | | 1,970,744 | |
| | |
ChannelAdvisor Corp.* | | | 6,976 | | | | 62,784 | |
| | |
Cirrus Logic, Inc.* | | | 14,790 | | | | 767,009 | |
| | |
CommVault Systems, Inc.* | | | 11,150 | | | | 585,375 | |
| | |
Cornerstone OnDemand, Inc.* | | | 2,342 | | | | 82,743 | |
| | |
Coupa Software, Inc.* | | | 7,067 | | | | 220,632 | |
| | |
CPI Card Group, Inc. | | | 13,622 | | | | 49,993 | |
| | |
Diodes, Inc.* | | | 9,400 | | | | 269,498 | |
| | |
Ebix, Inc.1 | | | 4,748 | | | | 376,279 | |
| | |
Ellie Mae, Inc.*,1 | | | 12,240 | | | | 1,094,256 | |
| | |
EPAM Systems, Inc.* | | | 8,160 | | | | 876,629 | |
| | |
Everbridge, Inc.* | | | 11,629 | | | | 345,614 | |
| | |
Everi Holdings, Inc.* | | | 99,356 | | | | 749,144 | |
| | |
Five9, Inc.* | | | 42,155 | | | | 1,048,816 | |
| | |
GrubHub, Inc.*,1 | | | 22,307 | | | | 1,601,643 | |
| | |
The Hackett Group, Inc. | | | 36,123 | | | | 567,492 | |
| | |
HubSpot, Inc.*,1 | | | 12,434 | | | | 1,099,166 | |
| | |
Imperva, Inc.* | | | 8,200 | | | | 325,540 | |
| | |
Inphi Corp.*,1 | | | 33,844 | | | | 1,238,690 | |
| | |
LogMeIn, Inc. | | | 3,200 | | | | 366,400 | |
| | |
Lumentum Holdings, Inc.*,1 | | | 5,052 | | | | 247,043 | |
| | |
Materialise N.V., ADR (Belgium)* | | | 7,702 | | | | 97,893 | |
| | |
MAXIMUS, Inc. | | | 24,905 | | | | 1,782,700 | |
| | |
MaxLinear, Inc.* | | | 41,960 | | | | 1,108,583 | |
| | |
Methode Electronics, Inc. | | | 8,600 | | | | 344,860 | |
| | |
Mimecast, Ltd.* | | | 9,161 | | | | 262,646 | |
| | |
| | | |
| The accompanying notes are an integral part of these financial statements. |
|
| 29 |
|
AMG Managers Special Equity Fund Schedule of Portfolio Investments (continued) |
| |
| |
| | | | | | | | |
| | | Shares | | | Value | |
| | |
Information Technology - 24.0% (continued) | | | | | | | | |
| | |
MINDBODY, Inc., Class A* | | | 49,402 | | | | $1,504,291 | |
| | |
Mitek Systems, Inc.* | | | 25,056 | | | | 224,251 | |
| | |
Monolithic Power Systems, Inc. | | | 14,087 | | | | 1,582,815 | |
| | |
MuleSoft, Inc., Class A* | | | 5,166 | | | | 120,161 | |
| | |
Okta, Inc.*,1 | | | 6,244 | | | | 159,909 | |
| | |
Paycom Software, Inc.*,1 | | | 16,783 | | | | 1,348,178 | |
| | |
Paylocity Holding Corp.* | | | 11,720 | | | | 552,715 | |
| | |
Pegasystems, Inc. | | | 54,582 | | | | 2,573,541 | |
| | |
Progress Software Corp. | | | 24,398 | | | | 1,038,623 | |
| | |
Proofpoint, Inc.*,1 | | | 17,040 | | | | 1,513,322 | |
| | |
Qualys, Inc.* | | | 46,237 | | | | 2,744,166 | |
| | |
RingCentral, Inc., Class A* | | | 25,836 | | | | 1,250,462 | |
| | |
Rudolph Technologies, Inc.* | | | 15,200 | | | | 363,280 | |
| | |
Silicon Laboratories, Inc.* | | | 7,630 | | | | 673,729 | |
| | |
Stamps.com, Inc.* | | | 2,711 | | | | 509,668 | |
| | |
Syntel, Inc.* | | | 30,762 | | | | 707,218 | |
| | |
Tech Data Corp.* | | | 3,900 | | | | 382,083 | |
| | |
TeleTech Holdings, Inc. | | | 8,900 | | | | 358,225 | |
| | |
The Trade Desk, Inc., Class A*,1 | | | 7,781 | | | | 355,825 | |
| | |
Universal Display Corp. | | | 5,916 | | | | 1,021,397 | |
| | |
Varonis Systems, Inc.* | | | 7,843 | | | | 380,778 | |
| | |
Verint Systems, Inc.* | | | 5,983 | | | | 250,389 | |
| | |
Virtusa Corp.* | | | 9,100 | | | | 401,128 | |
| | |
Web.com Group, Inc.* | | | 20,250 | | | | 441,450 | |
| | |
WNS Holdings, Ltd., ADR (India)* | | | 35,462 | | | | 1,423,090 | |
| | |
Yelp, Inc.* | | | 20,374 | | | | 854,893 | |
| | |
Total Information Technology | | | | | | | 48,213,234 | |
| | |
Materials - 3.0% | | | | | | | | |
| | |
Boise Cascade Co. | | | 8,100 | | | | 323,190 | |
| | |
Eagle Materials, Inc. | | | 5,620 | | | | 636,746 | |
| | |
Ingevity Corp.* | | | 5,400 | | | | 380,538 | |
| | |
Innophos Holdings, Inc. | | | 1,900 | | | | 88,787 | |
| | |
KMG Chemicals, Inc. | | | 7,073 | | | | 467,384 | |
| | |
Kronos Worldwide, Inc. | | | 8,200 | | | | 211,314 | |
| | |
Louisiana-Pacific Corp.* | | | 15,200 | | | | 399,152 | |
| | |
Minerals Technologies, Inc. | | | 487 | | | | 33,530 | |
| | |
Myers Industries, Inc. | | | 4,300 | | | | 83,850 | |
| | |
PolyOne Corp. | | | 8,946 | | | | 389,151 | |
| | |
Quaker Chemical Corp. | | | 12,320 | | | | 1,857,733 | |
| | |
Trinseo, S.A. | | | 8,175 | | | | 593,505 | |
| | | | | | | | |
| | | Shares | | | Value | |
Worthington Industries, Inc. | | | 12,717 | | | | $560,311 | |
| | |
Total Materials | | | | | | | 6,025,191 | |
| | |
Real Estate - 0.5% | | | | | | | | |
| | |
Altisource Portfolio Solutions, S.A. (Luxembourg)* | | | 3,813 | | | | 106,764 | |
| | |
HFF, Inc., Class A | | | 11,800 | | | | 573,952 | |
| | |
Redfin Corp.*,1 | | | 8,507 | | | | 266,439 | |
| | |
Total Real Estate | | | | | | | 947,155 | |
| | |
Telecommunication Services - 0.6% | | | | | | | | |
| | |
Boingo Wireless, Inc.* | | | 4,200 | | | | 94,500 | |
| | |
Cogent Communications Holdings, Inc. | | | 24,880 | | | | 1,127,064 | |
| | |
Vonage Holdings Corp.* | | | 8,200 | | | | 83,394 | |
| | |
Total Telecommunication Services | | | | | | | 1,304,958 | |
| | |
Utilities - 0.1% | | | | | | | | |
| | |
Spark Energy, Inc., Class A1 | | | 10,210 | | | | 126,604 | |
| | |
Total Common Stocks
(Cost $155,249,610) | | | | | | | 194,841,916 | |
| | |
Rights - 0.0%# | | | | | | | | |
| | |
Health Care - 0.0% | | | | | | | | |
| | |
Dyax Corp. CVR Expiration 12/31/19*,3,4
(Cost $0) | | | 4,700 | | | | 0 | |
| | |
| | | Principal
Amount | | | | |
| | |
Short-Term Investments - 13.9% | | | | | | | | |
| | |
Joint Repurchase Agreements - 10.7%5 | | | | | | | | |
| | |
Cantor Fitzgerald Securities, Inc., dated 12/29/17, due 01/02/18, 1.410% total to be received $5,086,743 (collateralized by various U.S. Government Agency Obligations, 0.000% -8.500%, 01/31/18 - 06/20/63, totaling $5,187,665) | | | $5,085,946 | | | | 5,085,946 | |
| | |
Daiwa Capital Markets America, dated 12/29/17, due 01/02/18, 1.430% total to be received $5,086,754 (collateralized by various U.S. Government Agency Obligations, 0.000% -6.500%, 01/11/18 - 12/01/51, totaling $5,187,665) | | | 5,085,946 | | | | 5,085,946 | |
| | |
MUFG Securities America, Inc., dated 12/29/17, due 01/02/18, 1.400% total to be received $5,086,737 (collateralized by various U.S. Government Agency Obligations, 1.914% -5.370%, 08/01/19 - 11/20/65, totaling $5,187,665) | | | 5,085,946 | | | | 5,085,946 | |
| | |
RBC Capital Markets LLC, dated 12/29/17, due 01/02/18, 1.400% total to be received $1,069,961 (collateralized by various U.S. Government Agency Obligations, 1.875% -8.875%, 02/15/19 - 12/20/47, totaling $1,091,191) | | | 1,069,795 | | | | 1,069,795 | |
| | |
| | | |
| The accompanying notes are an integral part of these financial statements. |
|
| 30 |
|
AMG Managers Special Equity Fund Schedule of Portfolio Investments (continued) |
| |
| |
| | | | | | | | |
| | | Principal
Amount | | | Value | |
| | |
Joint Repurchase Agreements - 10.7% (continued) | | | | | | | | |
| | |
State of Wisconsin Investment Board, dated 12/29/17, due 01/02/18, 1.630% total to be received $5,086,867 (collateralized by various U.S. Government Agency Obligations, 0.125% -3.875%, 01/15/19 - 02/15/46, totaling $5,227,181) | | | $5,085,946 | | | | $5,085,946 | |
| | |
Total Joint Repurchase Agreements | | | | | | | 21,413,579 | |
| | |
| | | Shares | | | | |
| | |
Other Investment Companies - 3.2% | | | | | | | | |
Dreyfus Government Cash Management Fund, Institutional Class Shares, 1.18%6 | | | 6,377,660 | | | | 6,377,660 | |
| | |
Total Short-Term Investments
(Cost $27,791,239) | | | | | | | 27,791,239 | |
| | | | | | | | |
| | | | | | Value | |
| | |
Total Investments - 111.1%
(Cost $183,040,849) | | | | | | | $222,633,155 | |
| | |
Other Assets, less Liabilities - (11.1)% | | | | | | | (22,160,916 | ) |
| | |
Net Assets - 100.0% | | | | | | | $200,472,239 | |
| * | Non-income producing security. |
| 1 | Some or all of these securities, amounting to $20,744,161 or 10.3% of net assets, were out on loan to various brokers. |
| 3 | Security’s value was determined by using significant unobservable inputs. |
| 4 | This security is restricted and not available for re-sale. The security was received as part of a corporate action on January 22, 2016. |
| 5 | Collateral received from brokers for securities lending was invested in these joint repurchase agreements. |
| 6 | Yield shown represents the December 31, 2017, seven day average yield, which refers to the sum of the previous seven days’ dividends paid, expressed as an annual percentage. |
ADR American Depositary Receipt
CVR Contingent Value Rights
The following table summarizes the inputs used to value the Fund’s investments by the fair value hierarchy levels as of December 31, 2017:
| | | | | | | | | | | | | | | | |
| | | Level 1 | | | Level 2 | | | Level 3 | | | Total | |
| | | | |
Investments in Securities | | | | | | | | | | | | | | | | |
| | | | |
Common Stocks† | | | $194,841,916 | | | | — | | | | $0 | | | | $194,841,916 | |
| | | | |
Rights | | | — | | | | — | | | | 0 | | | | — | |
| | | | |
Short-Term Investments | | | | | | | | | | | | | | | | |
| | | | |
Joint Repurchase Agreements | | | — | | | | $21,413,579 | | | | — | | | | 21,413,579 | |
| | | | |
Other Investment Companies | | | 6,377,660 | | | | — | | | | — | | | | 6,377,660 | |
| | | | | | | | | | | | | | | | |
Total Investments in Securities | | | $201,219,576 | | | | $21,413,579 | | | | $0 | | | | $222,633,155 | |
| | | | | | | | | | | | | | | | |
| † | All common stocks held in the Fund are Level 1 securities. For a detailed breakout of common stocks by major industry classification, please refer to the Fund’s Schedule of Portfolio Investments. |
At December 31, 2017, the Level 3 securities were Common Stocks and Rights received as a result of corporate actions. The Common Stock’s value was determined by using a recoverability assessment which generated a change in unrealized depreciation of $197,701. The Rights’ value was determined by using significant unobservable inputs which generated a change in unrealized depreciation of $47.
As of December 31, 2017, the Fund had no transfers between levels from the beginning of the reporting period.
| | |
| | | |
| The accompanying notes are an integral part of these financial statements. |
|
| 31 |
|
Statement of Assets and Liabilities December 31, 2017 |
| |
| |
| | | | | | | | | | | | | | | |
| | | AMG Managers
Loomis Sayles Bond
Fund# | | AMG Managers
Global Income
Opportunity Fund# | | AMG Managers
Special
Equity Fund# |
| | | |
Assets: | | | | | | | | | | | | | | | |
| | | |
Investments at Value* (including securities on loan valued at $26,821,640, $722,430, and $20,744,161, respectively) | | | | $2,005,558,797 | | | | | $14,563,135 | | | | | $222,633,155 | |
| | | |
Cash | | | | 3,751,325 | | | | | — | | | | | — | |
| | | |
Foreign currency** | | | | — | | | | | 108,524 | | | | | — | |
| | | |
Receivable for investments sold | | | | 244,831 | | | | | — | | | | | 657,381 | |
| | | |
Dividend, interest and other receivables | | | | 17,900,715 | | | | | 165,609 | | | | | 112,793 | |
| | | |
Receivable for Fund shares sold | | | | 3,470,864 | | | | | 16,678 | | | | | 103,295 | |
| | | |
Unrealized appreciation on foreign currency contracts | | | | — | | | | | 99,801 | | | | | — | |
| | | |
Prepaid expenses | | | | 28,439 | | | | | 12,386 | | | | | 11,378 | |
| | | |
Total assets | | | | 2,030,954,971 | | | | | 14,966,133 | | | | | 223,518,002 | |
| | | |
Liabilities: | | | | | | | | | | | | | | | |
| | | |
Payable upon return of securities loaned | | | | 27,625,696 | | | | | 765,052 | | | | | 21,413,579 | |
| | | |
Payable for investments purchased | | | | — | | | | | — | | | | | 600,093 | |
| | | |
Payable for Fund shares repurchased | | | | 2,521,809 | | | | | 1,500 | | | | | 737,813 | |
| | | |
Cash collateral due to broker | | | | — | | | | | 10,000 | | | | | — | |
| | | |
Unrealized depreciation on foreign currency contracts | | | | — | | | | | 43,208 | | | | | — | |
| | | |
Accrued expenses: | | | | | | | | | | | | | | | |
| | | |
Investment advisory and management fees | | | | 1,239,523 | | | | | 11,742 | | | | | 147,337 | |
| | | |
Administrative fees | | | | 254,081 | | | | | 1,782 | | | | | 25,403 | |
| | | |
Shareholder service fees | | | | 82,403 | | | | | — | | | | | 36,661 | |
| | | |
Professional fees | | | | 89,046 | | | | | 41,327 | | | | | 31,317 | |
| | | |
Trustee fees and expenses | | | | 21,056 | | | | | 148 | | | | | 2,078 | |
| | | |
Other | | | | 285,650 | | | | | 16,903 | | | | | 51,482 | |
| | | |
Total liabilities | | | | 32,119,264 | | | | | 891,662 | | | | | 23,045,763 | |
| | | | | | | | | | | | | | | |
| | | |
Net Assets | | | | $1,998,835,707 | | | | | $14,074,471 | | | | | $200,472,239 | |
| | | |
* Investments at cost | | | | $1,911,540,090 | | | | | $14,642,219 | | | | | $183,040,849 | |
| | | |
** Foreign currency at cost | | | | — | | | | | $108,618 | | | | | — | |
| | |
| | | |
| The accompanying notes are an integral part of these financial statements. |
|
| 32 |
|
Statement of Assets and Liabilities (continued) |
| |
| |
| | | | | | | | | | | | | | | |
| | | AMG Managers
Loomis Sayles Bond
Fund# | | AMG Managers
Global Income
Opportunity Fund# | | AMG Managers
Special
Equity Fund# |
| | | |
Net Assets Represent: | | | | | | | | | | | | | | | |
| | | |
Paid-in capital | | | | $1,895,814,048 | | | | | $15,576,720 | | | | | $161,775,564 | |
| | | |
Undistributed (distribution in excess of) net investment income | | | | 1,218,065 | | | | | (98,684 | ) | | | | — | |
| | | |
Accumulated net realized gain (loss) from investments | | | | 7,791,994 | | | | | (1,381,431 | ) | | | | (895,631 | ) |
| | | |
Net unrealized appreciation (depreciation) on investments | | | | 94,011,600 | | | | | (22,134 | ) | | | | 39,592,306 | |
| | | | | | | | | | | | | | | |
Net Assets | | | | $1,998,835,707 | | | | | $14,074,471 | | | | | $200,472,239 | |
| | | |
Class N: | | | | | | | | | | | | | | | |
| | | | | | | | | | | | | | | |
Net Assets | | | | $971,358,618 | | | | | $14,074,471 | | | | | $173,606,805 | |
| | | | | | | | | | | | | | | |
Shares outstanding | | | | 36,016,827 | | | | | 668,169 | | | | | 1,453,385 | |
| | | | | | | | | | | | | | | |
Net asset value, offering and redemption price per share | | | | $26.97 | | | | | $21.06 | | | | | $119.45 | |
| | | | | | | | | | | | | | | |
Class I: | | | | | | | | | | | | | | | |
| | | | | | | | | | | | | | | |
Net Assets | | | | $1,027,477,089 | | | | | — | | | | | $26,865,434 | |
| | | | | | | | | | | | | | | |
Shares outstanding | | | | 38,100,469 | | | | | — | | | | | 218,588 | |
| | | | | | | | | | | | | | | |
Net asset value, offering and redemption price per share | | | | $26.97 | | | | | — | | | | | $122.90 | |
| # | Effective February 27, 2017, the Fund’s share classes were renamed as described in Note 1 of the Notes to the Financial Statements. |
| | |
| | | |
| The accompanying notes are an integral part of these financial statements. |
|
| 33 |
|
Statement of Operations For the fiscal year ended December 31, 2017 |
| |
| |
| | | | | | | | | | | | | | | |
| | | AMG Managers
Loomis Sayles Bond
Fund# | | AMG Managers
Global Income
Opportunity Fund#
| | AMG Managers
Special Equity
Fund# |
| | | |
Investment Income: | | | | | | | | | | | | | | | |
| | | |
Interest income | | | | $85,682,575 | | | | | $668,084 | | | | | $371 | |
| | | |
Dividend income | | | | 1,150,927 | | | | | 1,690 | | | | | 1,079,870 | 1 |
| | | |
Miscellaneous income | | | | 319,893 | | | | | 884 | | | | | 14,451 | |
| | | |
Securities lending income | | | | 113,090 | | | | | 4,696 | | | | | 128,606 | |
| | | |
Foreign withholding tax | | | | (137,911 | ) | | | | (14,421 | ) | | | | — | |
| | | | | | | | | | | | | | | |
Total investment income | | | | 87,128,574 | | | | | 660,933 | | | | | 1,223,298 | |
| | | |
Expenses: | | | | | | | | | | | | | | | |
| | | |
Investment advisory and management fees | | | | 12,448,256 | | | | | 79,062 | | | | | 1,774,097 | |
| | | |
Administrative fees | | | | 2,987,582 | | | | | 21,563 | | | | | 295,683 | |
| | | |
Shareholder servicing fees - Class N | | | | 1,120,667 | | | | | — | | | | | 436,090 | |
| | | |
Professional fees | | | | 209,731 | | | | | 42,189 | | | | | 42,882 | |
| | | |
Registration fees | | | | 86,191 | | | | | 25,916 | | | | | 43,966 | |
| | | |
Transfer agent fees | | | | 113,017 | | | | | 1,722 | | | | | 33,605 | |
| | | |
Custodian fees | | | | 147,169 | | | | | 21,639 | | | | | 51,028 | |
| | | |
Reports to shareholders | | | | 179,899 | | | | | 29 | | | | | 20,268 | |
| | | |
Trustee fees and expenses | | | | 138,930 | | | | | 1,070 | | | | | 13,664 | |
| | | |
Miscellaneous | | | | 42,771 | | | | | 878 | | | | | 7,509 | |
| | | |
Repayment of prior reimbursements | | | | 1,372,772 | | | | | 5,209 | | | | | — | |
| | | | | | | | | | | | | | | |
Total expenses before offsets | | | | 18,846,985 | | | | | 199,277 | | | | | 2,718,792 | |
| | | |
Expense reimbursements | | | | — | | | | | (71,340 | ) | | | | (94,177 | ) |
| | | |
Expense reductions | | | | — | | | | | — | | | | | (9,266 | ) |
| | | | | | | | | | | | | | | |
Net expenses | | | | 18,846,985 | | | | | 127,937 | | | | | 2,615,349 | |
| | | | | | | | | | | | | | | |
Net investment income (loss) | | | | 68,281,589 | | | | | 532,996 | | | | | (1,392,051 | ) |
| | | |
Net Realized and Unrealized Gain: | | | | | | | | | | | | | | | |
| | | |
Net realized gain on investments | | | | 25,140,289 | | | | | 110,388 | | | | | 35,304,292 | |
| | | |
Net realized loss on forwards contracts | | | | — | | | | | (25,747 | ) | | | | — | |
| | | |
Net realized gain (loss) on foreign currency transactions | | | | (9,900,443 | ) | | | | (352,056 | ) | | | | 4 | |
| | | |
Net change in unrealized appreciation/depreciation on investments | | | | 47,177,891 | | | | | 1,107,628 | | | | | 2,472,633 | |
| | | |
Net change in unrealized appreciation/depreciation on forwards contracts | | | | — | | | | | 83,818 | | | | | — | |
| | | |
Net change in unrealized appreciation/depreciation on foreign currency translations | | | | 32,663 | | | | | 3,105 | | | | | — | |
| | | | | | | | | | | | | | | |
Net realized and unrealized gain | | | | 62,450,400 | | | | | 927,136 | | | | | 37,776,929 | |
| | | | | | | | | | | | | | | |
Net increase in net assets resulting from operations | | | | $130,731,989 | | | | | $1,460,132 | | | | | $36,384,878 | |
| # | Effective February 27, 2017, the Fund’s share classes were renamed as described in Note 1 of the Notes to the Financial Statements. |
| 1 | Includes non-recurring dividends of $94,831. |
| | |
| | | |
| The accompanying notes are an integral part of these financial statements. |
|
| 34 |
|
Statements of Changes in Net Assets For the fiscal years ended December 31, |
| |
| |
| | | | | | | | | | | | | | | | | | | | | | | | |
| | | AMG Managers Loomis Sayles
Bond Fund# | | AMG Managers Global Income
Opportunity Fund# | | AMG Managers Special Equity Fund#
|
| | | | | | |
| | | 2017 | | 2016 | | 2017 | | 2016 | | 2017 | | 2016 |
| | | | | | |
Increase in Net Assets Resulting From Operations: | | | | | | | | | | | | | | | | | | | | | | | | |
| | | | | | |
Net investment income (loss) | | | $68,281,589 | | | | $81,971,956 | | | | $532,996 | | | | $800,755 | | | | $(1,392,051 | ) | | | $(894,152 | ) |
| | | | | | |
Net realized gain (loss) on investments, and foreign currency transactions | | | 15,239,846 | | | | 34,070,550 | | | | (267,415 | ) | | | (1,496,987 | ) | | | 35,304,296 | | | | 11,218,049 | |
| | | | | | |
Net change in unrealized appreciation/depreciation on investments | | | 47,210,554 | | | | 16,624,352 | | | | 1,194,551 | | | | 2,378,793 | | | | 2,472,633 | | | | 13,600,483 | |
| | | | | | | | | | | | | | | | | | | | | | | | |
Net increase in net assets resulting from operations | | | 130,731,989 | | | | 132,666,858 | | | | 1,460,132 | | | | 1,682,561 | | | | 36,384,878 | | | | 23,924,380 | |
| | | | | | |
Distributions to Shareholders: | | | | | | | | | | | | | | | | | | | | | | | | |
| | | | | | |
From net investment income: | | | | | | | | | | | | | | | | | | | | | | | | |
| | | | | | |
Class N | | | (35,817,018 | ) | | | (49,997,900 | ) | | | — | | | | — | | | | — | | | | — | |
| | | | | | |
Class I | | | (29,384,964 | ) | | | (31,758,536 | ) | | | — | | | | — | | | | — | | | | — | |
| | | | | | |
From net realized gain on investments: | | | | | | | | | | | | | | | | | | | | | | | | |
| | | | | | |
Class N | | | (5,570,672 | ) | | | (15,868,934 | ) | | | — | | | | — | | | | — | | | | — | |
| | | | | | |
Class I | | | (5,898,523 | ) | | | (9,886,994 | ) | | | — | | | | — | | | | — | | | | — | |
| | | | | | | | | | | | | | | | | | | | | | | | |
Total distributions to shareholders | | | (76,671,177 | ) | | | (107,512,364 | ) | | | — | | | | — | | | | — | | | | — | |
| | | | | | |
Capital Share Transactions:1 | | | | | | | | | | | | | | | | | | | | | | | | |
| | | | | | | | | | | | | | | | | | | | | | | | |
Net decrease from capital share transactions | | | (61,236,003 | ) | | | (491,914,996 | ) | | | (2,819,407 | ) | | | (18,389,441 | ) | | | (35,567,687 | ) | | | (24,667,658 | ) |
| | | | | | | | | | | | | | | | | | | | | | | | |
Total increase (decrease) in net assets | | | (7,175,191 | ) | | | (466,760,502 | ) | | | (1,359,275 | ) | | | (16,706,880 | ) | | | 817,191 | | | | (743,278 | ) |
| | | | | | |
Net Assets: | | | | | | | | | | | | | | | | | | | | | | | | |
| | | | | | |
Beginning of year | | | 2,006,010,898 | | | | 2,472,771,400 | | | | 15,433,746 | | | | 32,140,626 | | | | 199,655,048 | | | | 200,398,326 | |
| | | | | | | | | | | | | | | | | | | | | | | | |
End of year | | | $1,998,835,707 | | | | $2,006,010,898 | | | | $14,074,471 | | | | $15,433,746 | | | | $200,472,239 | | | | $199,655,048 | |
| | | | | | |
End of year undistributed (distribution in excess of) net investment income | | | $1,218,065 | | | | $(2,256,230 | ) | | | $(98,684 | ) | | | $(253,432 | ) | | | — | | | | — | |
| | | | | | | | | | | | | | | | | | | | | | | | |
| # | Effective October 1, 2016 and February 27, 2017, the Funds’ share classes were renamed as described in Note 1 of the Notes to the Financial Statements. |
| 1 | See Note 1(g) of the Notes to Financial Statements. |
| | |
| | | |
| The accompanying notes are an integral part of these financial statements. |
|
| 35 |
|
AMG Managers Loomis Sayles Bond Fund Financial Highlights For a share outstanding throughout each fiscal year |
| |
| |
| | | | | | | | | | | | | | | | | | | | |
| | | For the fiscal years ended December 31, |
| | | | | |
| Class N | | 2017# | | 2016## | | 2015 | | 2014 | | 20131 |
| | | | | | | | | | | |
Net Asset Value, Beginning of Year | | | $26.24 | | | | $26.19 | | | | $27.88 | | | | $27.33 | | | | $27.93 | |
| | | | | |
Income (loss) from Investment Operations: | | | | | | | | | | | | | | | | | | | | |
| | | | | |
Net investment income3,4 | | | 0.91 | | | | 0.95 | | | | 0.74 | | | | 0.80 | | | | 0.92 | |
| | | | | |
Net realized and unrealized gain (loss) on investments | | | 0.85 | | | | 0.40 | | | | (1.34 | ) | | | 0.78 | | | | (0.63 | ) |
| | | | | | | | | | | |
Total income (loss) from investment operations | | | 1.76 | | | | 1.35 | | | | (0.60 | ) | | | 1.58 | | | | 0.29 | |
| | | | | |
Less Distributions to Shareholders from: | | | | | | | | | | | | | | | | | | | | |
| | | | | |
Net investment income | | | (0.87 | ) | | | (0.96 | ) | | | (0.71 | ) | | | (0.85 | ) | | | (0.89 | ) |
| | | | | |
Net realized gain on investments | | | (0.16 | ) | | | (0.34 | ) | | | (0.38 | ) | | | (0.18 | ) | | | — | |
| | | | | | | | | | | |
Total distributions to shareholders | | | (1.03 | ) | | | (1.30 | ) | | | (1.09 | ) | | | (1.03 | ) | | | (0.89 | ) |
| | | | | |
Net Asset Value, End of Year | | | $26.97 | | | | $26.24 | | | | $26.19 | | | | $27.88 | | | | $27.33 | |
| | | | | | | | | | | |
Total Return4 | | | 6.77 | %5 | | | 5.19 | % | | | (2.19 | )% | | | 5.81 | %5 | | | 1.06 | %5 |
| | | | | |
Ratio of net expenses to average net assets | | | 0.99 | % | | | 1.00 | % | | | 0.99 | % | | | 0.99 | % | | | 1.01 | %7 |
| | | | | |
Ratio of gross expenses to average net assets9 | | | 0.99 | % | | | 1.02 | % | | | 1.02 | % | | | 1.02 | % | | | 1.05 | %7 |
| | | | | |
Ratio of net investment income to average net assets4 | | | 3.38 | % | | | 3.52 | % | | | 2.69 | % | | | 2.85 | % | | | 3.33 | %7 |
| | | | | |
Portfolio turnover | | | 4 | % | | | 27 | % | | | 10 | % | | | 26 | % | | | 19 | % |
| | | | | |
Net assets end of year (000’s) omitted | | | $971,359 | | | | $1,234,229 | | | | $1,575,246 | | | | $1,947,536 | | | | $1,545,765 | |
| | | | | | | | | | | | | | | | | | | | | |
|
AMG Managers Loomis Sayles Bond Fund Financial Highlights For a share outstanding throughout each fiscal period |
| |
| |
| | | | | | | | | | | | | | | | | | | | | | | | | |
| | | For the fiscal years ended December 31, | | For the fiscal period ended December 31, |
| | | | | |
| Class I | | 2017 | | 2016## | | 2015 | | 2014 | | 20132 |
| | | | | | | | | | | |
Net Asset Value, Beginning of Period | | | | $26.24 | | | | | $26.19 | | | | | $27.87 | | | | | $27.33 | | | | | $28.19 | |
| | | | | |
Income (loss) from Investment Operations: | | | | | | | | | | | | | | | | | | | | | | | | | |
| | | | | |
Net investment income3,4 | | | | 0.94 | | | | | 0.97 | | | | | 0.77 | | | | | 0.83 | | | | | 0.73 | |
| | | | | |
Net realized and unrealized gain (loss) on investments | | | | 0.85 | | | | | 0.40 | | | | | (1.33 | ) | | | | 0.77 | | | | | (0.88 | ) |
| | | | | | | | | | | |
Total income (loss) from investment operations | | | | 1.79 | | | | | 1.37 | | | | | (0.56 | ) | | | | 1.60 | | | | | (0.15 | ) |
| | | | | |
Less Distributions to Shareholders from: | | | | | | | | | | | | | | | | | | | | | | | | | |
| | | | | |
Net investment income | | | | (0.90 | ) | | | | (0.98 | ) | | | | (0.74 | ) | | | | (0.88 | ) | | | | (0.71 | ) |
| | | | | |
Net realized gain on investments | | | | (0.16 | ) | | | | (0.34 | ) | | | | (0.38 | ) | | | | (0.18 | ) | | | | — | |
| | | | | | | | | | | |
Total distributions to shareholders | | | | (1.06 | ) | | | | (1.32 | ) | | | | (1.12 | ) | | | | (1.06 | ) | | | | (0.71 | ) |
| | | | | |
Net Asset Value, End of Period | | | | $26.97 | | | | | $26.24 | | | | | $26.19 | | | | | $27.87 | | | | | $27.33 | |
| | | | | | | | | | | |
Total Return4 | | | | 6.87 | %5 | | | | 5.29 | %5 | | | | (2.05 | )%5 | | | | 5.88 | %5 | | | | (0.48 | )%5,6 |
| | | | | |
Ratio of net expenses to average net assets | | | | 0.89 | % | | | | 0.90 | % | | | | 0.89 | % | | | | 0.89 | % | | | | 0.91 | %7,8 |
| | | | | |
Ratio of gross expenses to average net assets9 | | | | 0.89 | % | | | | 0.93 | % | | | | 0.92 | % | | | | 0.92 | % | | | | 0.95 | %7,8 |
| | | | | |
Ratio of net investment income to average net assets4 | | | | 3.48 | % | | | | 3.61 | % | | | | 2.79 | % | | | | 2.93 | % | | | | 3.53 | %7,8 |
| | | | | |
Portfolio turnover | | | | 4 | % | | | | 27 | % | | | | 10 | % | | | | 26 | % | | | | 19 | %6 |
| | | | | |
Net assets end of period (000’s) omitted | | | | $1,027,477 | | | | | $771,782 | | | | | $897,526 | | | | | $1,061,280 | | | | | $745,121 | |
| | | | | | | | | | | | | | | | | | | | | | | | | | |
| # | Effective February 27, 2017, Class S shares were renamed Class N shares. |
| ## | Effective October 1, 2016, the Service Class and Institutional Class were renamed Class S and Class l, respectively. |
| 1 | Formerly shares of the Fund’s sole class, which were reclassified and redesignated as Service Class shares on April 1, 2013. |
| 2 | Commencement of operations was April 1, 2013. |
| 3 | Per share numbers have been calculated using average shares. |
| 4 | Total returns and net investment income would have been lower had certain expenses not been offset. |
| 5 | The total return is calculated using the published Net Asset Value as of fiscal year end. |
| 7 | Includes non-routine extraordinary expenses amounting to 0.023% and 0.015% of average net assets for Class N and Class l, respectively. |
| 9 | Excludes the impact of expense reimbursement or fee waivers and expense reductions such as brokerage credits, but includes expense repayments and non-reimbursable expenses, if any, such as interest, taxes, and extraordinary expenses. (See Note 1(c) and 2 in the Notes to Financial Statements.) |
|
AMG Managers Global Income Opportunity Fund Financial Highlights For a share outstanding throughout each fiscal year |
| |
| |
| | | | | | | | | | | | | | | | | | | | |
| | | For the fiscal years ended December 31, |
| | | | | |
Class N | | | 2017 | # | | | 2016 | ## | | | 2015 | | | | 2014 | | | | 2013 | |
| | | | | | | | | | | | | | | | | | | | |
Net Asset Value, Beginning of Year | | | $19.05 | | | | $18.18 | | | | $19.68 | | | | $19.69 | | | | $20.56 | |
| | | | | |
Income (loss) from Investment Operations: | | | | | | | | | | | | | | | | | | | | |
| | | | | |
Net investment income1,2 | | | 0.75 | | | | 0.72 | | | | 0.65 | | | | 0.57 | | | | 0.51 | |
| | | | | |
Net realized and unrealized gain (loss) on investments | | | 1.26 | | | | 0.15 | | | | (1.87 | ) | | | (0.21 | ) | | | (0.80 | ) |
| | | | | | | | | | | | | | | | | | | | |
Total income (loss) from investment operations | | | 2.01 | | | | 0.87 | | | | (1.22 | ) | | | 0.36 | | | | (0.29 | ) |
| | | | | |
Less Distributions to Shareholders from: | | | | | | | | | | | | | | | | | | | | |
| | | | | |
Net investment income | | | — | | | | — | | | | (0.28 | ) | | | (0.37 | ) | | | (0.58 | ) |
| | | | | |
Net Asset Value, End of Year | | | $21.06 | | | | $19.05 | | | | $18.18 | | | | $19.68 | | | | $19.69 | |
| | | | | | | | | | | | | | | | | | | | |
Total Return2,3 | | | 10.55 | % | | | 4.79 | % | | | (6.22 | )% | | | 1.84 | % | | | (1.40 | )% |
| | | | | |
Ratio of net expenses to average net assets | | | 0.89 | % | | | 0.89 | % | | | 0.89 | % | | | 0.89 | % | | | 0.91 | %4 |
| | | | | |
Ratio of gross expenses to average net assets5 | | | 1.39 | % | | | 1.46 | % | | | 1.29 | % | | | 1.26 | % | | | 1.23 | %4 |
| | | | | |
Ratio of net investment income to average net assets2 | | | 3.71 | % | | | 3.75 | % | | | 3.36 | % | | | 2.78 | % | | | 2.49 | %4 |
| | | | | |
Portfolio turnover | | | 55 | % | | | 34 | % | | | 53 | % | | | 56 | % | | | 40 | % |
| | | | | |
Net assets end of year (000’s) omitted | | | $14,074 | | | | $15,434 | | | | $32,141 | | | | $50,213 | | | | $48,295 | |
| | | | | | | | | | | | | | | | | | | | | |
| # | Effective February 27, 2017, Class S shares were renamed Class N shares. |
| ## | Effective October 1, 2016, the shares were reclassified and redesignated as Class S shares. |
| 1 | Per share numbers have been calculated using average shares. |
| 2 | Total returns and net investment income would have been lower had certain expenses not been offset. |
| 3 | The total return is calculated using the published Net Asset Value as of fiscal year end. |
| 4 | Includes non-routine extraordinary expenses amounting to 0.020% of average net assets. |
| 5 | Excludes the impact of expense reimbursement or fee waivers and expense reductions such as brokerage credits, but includes expense repayments and non-reimbursable expenses, if any, such as interest, taxes, and extraordinary expenses. (See Note 1(c) and 2 in the Notes to Financial Statements.) |
|
AMG Managers Special Equity Fund Financial Highlights For a share outstanding throughout each fiscal year |
| |
| |
| | | | | | | | | | | | | | | | | | | | |
| | | For the fiscal years ended December 31, |
| | | | | |
Class N | | | 2017 | # | | | 2016 | ## | | | 2015 | | | | 2014 | | | | 2013 | ### |
| | | | | | | | | | | | | | | | | | | | |
Net Asset Value, Beginning of Year | | | $99.33 | | | | $87.84 | | | | $88.30 | | | | $87.24 | | | | $60.14 | |
| | | | | |
Income (loss) from Investment Operations: | | | | | | | | | | | | | | | | | | | | |
| | | | | |
Net investment loss1,2 | | | (0.79 | )3 | | | (0.43 | )4 | | | (0.47 | )5 | | | (0.72 | ) | | | (0.52 | )6 |
| | | | | |
Net realized and unrealized gain on investments | | | 20.91 | | | | 11.92 | | | | 0.01 | | | | 1.78 | | | | 27.62 | |
| | | | | | | | | | | | | | | | | | | | |
Total income (loss) from investment operations | | | 20.12 | | | | 11.49 | | | | (0.46 | ) | | | 1.06 | | | | 27.10 | |
| | | | | |
Net Asset Value, End of Year | | | $119.45 | | | | $99.33 | | | | $87.84 | | | | $88.30 | | | | $87.24 | |
| | | | | | | | | | | | | | | | | | | | |
Total Return2 | | | 20.25 | %8 | | | 13.08 | % | | | (0.52 | )% | | | 1.22 | %8 | | | 45.06 | %8,9 |
| | | | | |
Ratio of net expenses to average net assets | | | 1.36 | %10 | | | 1.36 | % | | | 1.35 | %10 | | | 1.35 | %10 | | | 1.37 | %10,11 |
| | | | | |
Ratio of gross expenses to average net assets12 | | | 1.41 | % | | | 1.50 | % | | | 1.51 | % | | | 1.51 | % | | | 1.52 | %11 |
| | | | | |
Ratio of net investment loss to average net assets2 | | | (0.73 | )% | | | (0.49 | )% | | | (0.51 | )% | | | (0.83 | )% | | | (0.71 | )%11 |
| | | | | |
Portfolio turnover | | | 81 | % | | | 120 | % | | | 116 | % | | | 121 | % | | | 129 | % |
| | | | | |
Net assets end of year (000’s) omitted | | | $173,607 | | | | $180,008 | | | | $181,862 | | | | $205,362 | | | | $240,162 | |
| | | | | | | | | | | | | | | | | | | | | |
|
AMG Managers Special Equity Fund Financial Highlights For a share outstanding throughout each fiscal year |
| |
| |
| | | | | | | | | | | | | | | | | | | | |
| | | For the fiscal years ended December 31, |
| | | | | |
Class I | | | 2017 | | | | 2016 | ## | | | 2015 | | | | 2014 | | | | 2013 | |
| | | | | | | | | | | | | | | | | | | | |
Net Asset Value, Beginning of Year | | | $101.95 | | | | $89.92 | | | | $90.18 | | | | $88.87 | | | | $61.34 | |
| | | | | |
Income (loss) from Investment Operations: | | | | | | | | | | | | | | | | | | | | |
| | | | | |
Net investment loss1,2 | | | (0.54 | )3 | | | (0.22 | )4 | | | (0.26 | )5 | | | (0.51 | ) | | | (0.34 | )6 |
| | | | | |
Net realized and unrealized gain on investments | | | 21.49 | | | | 12.25 | | | | 0.00 | 7 | | | 1.82 | | | | 27.87 | |
| | | | | | | | | | | | | | | | | | | | |
Total income (loss) from investment operations | | | 20.95 | | | | 12.03 | | | | (0.26 | ) | | | 1.31 | | | | 27.53 | |
| | | | | |
Net Asset Value, End of Year | | | $122.90 | | | | $101.95 | | | | $89.92 | | | | $90.18 | | | | $88.87 | |
| | | | | | | | | | | | | | | | | | | | |
Total Return2 | | | 20.55 | %8 | | | 13.38 | % | | | (0.29 | )% | | | 1.47 | %8 | | | 44.88 | %8 |
| | | | | |
Ratio of net expenses to average net assets | | | 1.11 | %10 | | | 1.11 | % | | | 1.10 | %10 | | | 1.10 | %10 | | | 1.12 | %10,11 |
| | | | | |
Ratio of gross expenses to average net assets12 | | | 1.16 | % | | | 1.25 | % | | | 1.26 | % | | | 1.26 | % | | | 1.27 | %11 |
| | | | | |
Ratio of net investment loss to average net assets2 | | | (0.48 | )% | | | (0.24 | )% | | | (0.27 | )% | | | (0.58 | )% | | | (0.46 | )%11 |
| | | | | |
Portfolio turnover | | | 81 | % | | | 120 | % | | | 116 | % | | | 121 | % | | | 129 | % |
| | | | | |
Net assets end of year (000’s) omitted | | | $26,865 | | | | $19,647 | | | | $18,536 | | | | $18,917 | | | | $20,215 | |
| | | | | | | | | | | | | | | | | | | | | |
| # | Effective February 27, 2017, Class S shares were renamed Class N shares. |
| ## | Effective October 1, 2016, the Service Class and Institutional Class were renamed Class S and Class I, respectively. |
| ### | All Managers Class shares were renamed Service Class shares on April 1, 2013. |
| 1 | Per share numbers have been calculated using average shares. |
| 2 | Total returns and net investment income would have been lower had certain expenses not been offset. |
| 3 | Includes non-recurring dividends. Without these dividends, net investment income per share would have been $(0.84) and $(0.59) for Class N and Class I respectively. |
| 4 | Includes non-recurring dividends. Without these dividends, net investment income per share would have been $(0.49) and $(0.28) for Class N and Class I respectively. |
| 5 | Includes non-recurring dividends. Without these dividends, net investment loss per share would have been $(0.69) and $(0.48) for Class N and Class I, respectively. |
| 6 | Includes non-recurring dividends. Without these dividends, net investment loss per share would have been $(0.59) and $(0.41) for Class N and Class I shares, respectively. |
| 7 | Rounds to less than $0.01 per share. |
| 8 | The total return is calculated using the published Net Asset Value as of fiscal year end. |
| 9 | The total return would have been 44.56% had the capital contribution of $851,162 not been included. |
| 10 | Includes reduction from broker recapture amounting to less than 0.01% for the years ended 2017, 2015, 2014 and 2013. |
| 11 | Includes non-routine extraordinary expenses amounting to 0.018%, 0.018% of average net assets for the Class N and Class I, respectively. |
| 12 | Excludes the impact of expense reimbursement or fee waivers and expense reductions such as brokerage credits, but includes expense repayments and non-reimbursable expenses, if any, such as interest, taxes, and extraordinary expenses. (See Note 1(c) and 2 in the Notes to Financial Statements.) |
|
Notes to Financial Statements December 31, 2017 |
| |
| |
1. SUMMARY OF SIGNIFICANT ACCOUNTING POLICIES
AMG Funds III (the “Trust”) is an open-end management investment company, organized as a Massachusetts business trust, and registered under the Investment Company Act of 1940, as amended (the “1940 Act”). Currently, the Trust consists of a number of different funds, each having distinct investment management objectives, strategies, risks, and policies. Included in this report are AMG Managers Loomis Sayles Bond Fund (“Bond”), AMG Managers Global Income Opportunity Fund (“Global Income Opportunity”) and AMG Managers Special Equity Fund (“Special Equity”), each a “Fund” and collectively, the “Funds.”
Each Fund offers different classes of shares, which, effective October 1, 2016 were renamed or redesignated. Both Bond and Special Equity previously offered Service Class shares and Institutional Class shares which were renamed to Class S and Class I, respectively; and Global Income Opportunity shares were reclassified and redesignated Class S. Effective February 27, 2017, Class S shares were renamed to Class N shares. Each class represents an interest in the same assets of the respective Fund. Although all share classes generally have identical voting rights, each share class votes separately when required by law. Different share classes may pay different distribution amounts to the extent the net asset value per share and/or the expenses of such share classes differ. Each share class has its own expense structure. Please refer to a current prospectus for additional information on each share class.
The Funds’ financial statements are prepared in accordance with accounting principles generally accepted in the United States of America (“U.S. GAAP”), including accounting and reporting guidance pursuant to Accounting Standards Codification Topic 946 applicable to investment companies. U.S. GAAP requires management to make estimates and assumptions that affect the reported amounts of assets and liabilities and disclosure of contingent assets and liabilities at the date of the financial statements and the reported amounts of income and expenses during the reporting period. Actual results could differ from those estimates and such differences could be material. The following is a summary of significant accounting policies followed by the Funds in the preparation of their financial statements:
a. VALUATION OF INVESTMENTS
Equity securities traded on a national securities exchange or reported on the NASDAQ national market system (“NMS”) are valued at the last quoted sales price on the primary exchange or, if applicable, the NASDAQ official closing price or the official closing price of the relevant exchange or, lacking any sales, at the last quoted bid price or the mean between the last quoted bid and ask prices (the “exchange mean price”). Equity securities traded in the over-the-counter market (other than NMS securities) are valued at the exchange mean price. Foreign equity securities (securities principally traded in markets other than U.S. markets) are valued at the official closing price on the primary exchange or, for markets that either do not offer an official closing price or where the official closing price may not be representative of the overall market, the last quoted sale price.
Fixed income securities purchased with a remaining maturity exceeding 60 days are valued at the evaluated bid price or the mean price provided by an authorized pricing service or, if an evaluated price is not available, by reference to other securities which are considered comparable in credit rating, interest rate, due date and other features (generally referred to as “matrix pricing”) or other similar pricing methodologies. Investments in certain mortgage-backed and stripped mortgage-backed securities, preferred stocks, convertible securities, derivatives and other debt securities not traded on an organized securities market are valued
on the basis of valuations provided by dealers or by a pricing service which uses information with respect to transactions in such securities and various relationships between such securities and yield to maturity in determining value.
Fixed income securities purchased with a remaining maturity of 60 days or less are valued at amortized cost, provided that the amortized cost value is approximately the same as the fair value of the security valued without the use of amortized cost. Investments in other open-end regulated investment companies are valued at their end of day net asset value per share.
The Funds’ portfolio investments are generally valued based on independent market quotations or prices or, if none, “evaluative” or other market based valuations provided by third party pricing services approved by the Board of Trustees of the Trust (the “Board”). Under certain circumstances, the value of certain Fund portfolio investments (including derivatives) may be based on an evaluation of fair value, pursuant to procedures established by and under the general supervision of the Board. The Valuation Committee, which is comprised of the Independent Trustees of the Board, and the Pricing Committee, which is comprised of representatives from AMG Funds LLC (the “Investment Manager”) are the committees appointed by the Board to make fair value determinations. Each Fund may use the fair value of a portfolio investment to calculate its net asset value (“NAV”) in the event that the market quotation, price or market based valuation for the portfolio investment is not readily available or otherwise not determinable pursuant to the Board’s valuation procedures, if the Investment Manager or the Pricing Committee believes the quotation, price or market based valuation to be unreliable, or in certain other circumstances. When determining the fair value of an investment, the Pricing Committee and, if required under the Trust’s securities valuation procedures, the Valuation Committee, seeks to determine the price that the Fund might reasonably expect to receive from current sale of that portfolio investment in an arms-length transaction. Fair value determinations shall be based upon consideration of all available facts and information, including, but not limited to (i) attributes specific to the investment; (ii) fundamental and analytical data relating to the investment; and (iii) the value of other comparable securities or relevant financial instruments, including derivative securities, traded on other markets or among dealers.
The values assigned to fair value portfolio investments are based on available information and do not necessarily represent amounts that might ultimately be realized in the future, since such amounts depend on future developments inherent in long-term investments. Because of the inherent uncertainty of valuation, those estimated values may differ significantly from the values that would have been used had a ready market for the investments existed, and the differences could be material. The Board will be presented with a quarterly report showing as of the most recent quarter end, all outstanding securities fair valued by the Fund, including a comparison with the prior quarter end and the percentage of the Fund that the security represents at each quarter end.
With respect to foreign equity securities and certain foreign fixed income securities, the Board has adopted a policy that securities held in a Fund that can be fair valued by the applicable fair value pricing service are fair valued on each business day provided that each individual price exceeds a pre-established confidence level.
U.S. GAAP defines fair value as the price that a fund would receive to sell an asset or pay to transfer a liability in an orderly transaction between market participants at the measurement date. U.S. GAAP also establishes a framework for measuring fair value, and a three level hierarchy for fair value measurements based upon the transparency of inputs to the valuation of an asset or liability. Inputs may be
|
Notes to Financial Statements (continued) |
| |
| |
observable or unobservable and refer broadly to the assumptions that market participants would use in pricing the asset or liability. Observable inputs reflect the assumptions market participants would use in pricing the asset or liability based on market data obtained from sources independent of the Funds. Unobservable inputs reflect the Funds’ own assumptions about the assumptions that market participants would use in pricing the asset or liability developed based on the best information available in the circumstances. Each investment is assigned a level based upon the observability of the inputs which are significant to the overall valuation.
The three-tier hierarchy of inputs is summarized below:
Level 1 – inputs are quoted prices in active markets for identical investments (e.g., equity securities, open-end investment companies)
Level 2 – other observable inputs (including, but not limited to: quoted prices for similar assets or liabilities in markets that are active, quoted prices for identical or similar assets or liabilities in markets that are not active, inputs other than quoted prices that are observable for the assets or liabilities (such as interest rates, yield curves, volatilities, prepayment speeds, loss severities, credit risks and default rates) or other market corroborated inputs) (e.g., debt securities, government securities, foreign currency exchange contracts, foreign securities utilizing international fair value pricing, fair valued securities with observable inputs)
Level 3 – inputs are significant unobservable inputs (including the Fund’s own assumptions used to determine the fair value of investments) (e.g., fair valued securities with unobservable inputs)
Changes in inputs or methodologies used for valuing investments may result in a transfer in or out of levels within the fair value hierarchy. The inputs or methodologies used for valuing investments may not necessarily be an indication of the risk associated with investing in those investments. Transfers between different levels of the fair value disclosure hierarchy are deemed to have occurred as of the beginning of the reporting period.
b. SECURITY TRANSACTIONS
Security transactions are accounted for as of trade date. Realized gains and losses on securities sold are determined on the basis of identified cost.
c. INVESTMENT INCOME AND EXPENSES
Dividend income is recorded on the ex-dividend date. Dividends from foreign securities are recorded on the ex-dividend date, and if after the fact, as soon as the
Funds become aware of the ex-dividend date. Interest income, which includes amortization of premium and accretion of discount on debt securities, is accrued as earned. Dividend and interest income on foreign securities is recorded gross of any withholding tax. Non-cash dividends included in dividend income, if any, are reported at the fair market value of the securities received. Other income and expenses are recorded on an accrual basis. Expenses that cannot be directly attributed to a Fund are apportioned among the funds in the Trust and other trusts within the AMG Funds family of mutual funds (collectively the “AMG Funds Family”) based upon their relative average net assets or number of shareholders. Investment income, realized and unrealized capital gains and losses, the common expenses of each Fund, and certain fund level expense reductions, if any, are allocated on a pro-rata basis to each class based on the relative net assets of each class to the total net assets of each Fund.
Special Equity had certain portfolio trades directed to various brokers under a brokerage recapture program. Credits received from the brokerage recapture program are earned and paid on a monthly basis, and are recorded as expense offsets, which serve to reduce the Funds’ overall expense ratio. For the fiscal year ended December 31, 2017, the impact on the expense ratios, if any, was $9,266 or less than 0.01%.
d. DIVIDENDS AND DISTRIBUTIONS
Fund distributions resulting from either net investment income or realized net capital gains, if any, will normally be declared and paid at least annually in December. Distributions to shareholders are recorded on the ex-dividend date. Distributions are determined in accordance with federal income tax regulations, which may differ from net investment income and net realized capital gains for financial statement purposes (U.S. GAAP). Differences may be permanent or temporary. Permanent differences are reclassified among capital accounts in the financial statements to reflect their tax character. Permanent book and tax basis differences, if any, relating to shareholder distributions will result in reclassifications to paid-in capital. Temporary differences arise when certain items of income, expense and gain or loss are recognized in different periods for financial statement and tax purposes; these differences will reverse at some time in the future. Permanent differences are due to currency gains/losses, redesignation of dividends, capital loss carryforwards expired, contingent preferred debt instrument, and current year write-off of a net operating loss. Temporary differences are due to straddles, §1256 contracts, contingent preferred debt instruments, and wash sales.
The tax character of distributions paid during the fiscal years ended December 31, 2017 and December 31, 2016 were as follows:
| | | | | | | | | | | | | | | | | | | | | | | | |
| | | Bond | | | Global Income Opportunity | | | Special Equity | |
Distributions paid from: | | | 2017 | | | | 2016 | | | | 2017 | | | | 2016 | | | | 2017 | | | | 2016 | |
| | | | | | |
Ordinary income | | | $65,201,982 | | | | $81,756,436 | | | | — | | | | — | | | | — | | | | — | |
| | | | | | |
Short-term capital gains | | | 1,687,725 | | | | 3,914,961 | | | | — | | | | — | | | | — | | | | — | |
| | | | | | |
Long-term capital gains | | | 9,781,470 | | | | 21,840,967 | | | | — | | | | — | | | | — | | | | — | |
| | | | | | | | | | | | | | | | | | | | | | | | |
| | | | | | |
| | | $76,671,177 | | | | $107,512,364 | | | | — | | | | — | | | | — | | | | — | |
| | | | | | | | | | | | | | | | | | | | | | | | |
|
Notes to Financial Statements (continued) |
| |
| |
As of December 31, 2017, the components of distributable earnings (excluding unrealized appreciation/depreciation) on tax basis consisted of:
| | | | | | | | | | | | |
| | | Bond | | | Global Income Opportunity | | | Special Equity | |
Capital loss carryforward | | | – | | | | $1,381,278 | | | | – | |
| | | |
Undistributed ordinary income | | | $1,345,137 | | | | 76,391 | | | | – | |
| | | |
Undistributed short-term capital gains | | | 2,719 | | | | – | | | | – | |
| | | |
Undistributed long-term capital gains | | | 7,789,275 | | | | – | | | | – | |
| | | |
Late-year loss deferral | | | – | | | | – | | | | – | |
At December 31, 2017, the approximate cost of investments and the aggregate gross unrealized appreciation and depreciation for federal income tax were as follows:
| | | | | | | | | | | | | | | | |
Fund | | Cost | | | Appreciation | | | Depreciation | | | Net | |
Bond | | | $1,911,666,553 | | | | $155,215,468 | | | | $(61,330,331 | ) | | | $93,885,137 | |
| | | | |
Global Income Opportunity | | | 14,642,385 | | | | 733,115 | | | | (813,254 | ) | | | (80,139 | ) |
| | | | |
Special Equity | | | 183,936,480 | | | | 44,267,197 | | | | (5,570,522 | ) | | | 38,696,675 | |
e. FEDERAL TAXES
Each Fund currently qualifies as an investment company and intends to comply with the requirements under Subchapter M of the Internal Revenue Code of 1986, as amended, and to distribute substantially all of its taxable income and gains to its shareholders and to meet certain diversification and income requirements with respect to investment companies. Therefore, no provision for federal income or excise tax is included in the accompanying financial statements.
Additionally, based on each Fund’s understanding of the tax rules and rates related to income, gains and transactions for the foreign jurisdictions in which it invests, each Fund will provide for foreign taxes, and where appropriate, deferred foreign taxes.
Management has analyzed the Funds’ tax positions taken on federal income tax returns as of December 31, 2017, and for all open tax years (generally, the three prior taxable years), and has concluded that no provision for federal income tax is required in the Funds’ financial statements. Additionally, Management is not aware of any tax position for which it is reasonably possible that the total amounts of unrecognized tax benefits will change materially in the next twelve months.
Net capital losses incurred in taxable years beginning after the enactment of the Regulated Investment Company Modernization Act of 2010, may be carried forward for an unlimited time period, and retain their tax character as either short-term or long-term capital losses. Such losses will be required to be utilized prior to any loss carryovers incurred in pre-enactment taxable years, which generally expire eight years following the close of the taxable year in which they were incurred. As a result of this ordering rule, pre-enactment capital loss carryovers may be more likely to expire unused. Additionally, post-enactment capital losses that are carried forward retain their tax character as either short- term or long-term capital losses, unlike pre-enactment losses which are considered all short-term.
f. CAPITAL LOSS CARRYOVERS AND DEFERRALS
As of December 31, 2017, the following Fund had accumulated net realized capital loss carryovers from securities transactions for federal income tax purposes as shown in the following chart. These amounts may be used to offset future realized capital gains, if any, for an unlimited time period.
| | | | | | | | | | | | | | | |
| | | Capital Loss | | |
| | | Carryover Amounts | | |
| | | | | | | Expires |
Fund | | Short-Term | | Long-Term | | December 31, |
Global Income Opportunity | | | | | | | | | | | | | | | |
| | | |
(Pre-Enactment) | | | | $1,033,512 | | | | | – | | | | | 2018 | |
| | | |
(Post-Enactment) | | | | 347,766 | | | | | – | | | | | Unlimited | |
As of December 31, 2017, the Bond and Special Equity Funds had no accumulated net realized capital loss carryovers from securities transactions for federal income tax purposes. Should the Fund incur net capital losses for the fiscal year ended December 31, 2018, such amounts may be used to offset future realized capital gains, for an unlimited time period.
| | | | | | | | | | |
| | | Capital Loss Carryover | | |
| | | Utilized | | |
Fund | | Short-Term | | Long-Term |
Global Income Opportunity | | | | – | | | | | $287,528 | |
Special Equity | | | | $34,179,259 | | | | | – | |
g. CAPITAL STOCK
The Trust’s Declaration of Trust authorizes for each Fund the issuance of an unlimited number of shares of beneficial interest, without par value. Each Fund records sales and repurchases of its capital stock on the trade date.
Global Income Opportunity will deduct a 1.00% redemption fee from the proceeds of any redemption (including a redemption by exchange) of shares if the redemption occurs within 60 days of the purchase of those shares. For the fiscal year ended December 31, 2017, the Fund had redemption fees amounting to $856. This amount is netted against the cost of shares repurchased in the Statements of Changes in Net Assets.
|
Notes to Financial Statements (continued) |
| |
| |
For the fiscal years ended December 31, 2017 and December 31, 2016, the capital stock transactions by class for the Funds were as follows:
| | | | | | | | | | | | | | | | | | | | | | | | | | | | | | | | |
| | | Bond | | Special Equity |
| | | | |
| | | December 31, 2017 | | December 31, 2016 | | December 31, 2017 | | December 31, 2016 |
| | | | | | | | |
| | | Shares | | Amount | | Shares | | Amount | | Shares | | Amount | | Shares | | Amount |
Class N: | | | | | | | | | | | | | | | | | | | | | | | | | | | | | | | | |
| | | | | | | | |
Proceeds from sale of shares | | | 5,668,532 | | | | $152,614,451 | | | | 6,523,310 | | | | $175,284,993 | | | | 66,509 | | | | $7,066,821 | | | | 126,500 | | | | $11,516,306 | |
| | | | | | | | |
Reinvestment of distributions | | | 1,453,735 | | | | 39,098,655 | | | | 2,321,673 | | | | 61,868,454 | | | | — | | | | — | | | | — | | | | — | |
| | | | | | | | |
Cost of shares repurchased | | | (18,132,901 | ) | | | (489,153,758 | ) | | | (21,965,053 | ) | | | (593,062,194 | ) | | | (425,258 | ) | | | (45,599,506 | ) | | | (384,844 | ) | | | (34,882,192 | ) |
| | | | | | | | | | | | | | | | | | | | | | | | | | | | | | | | |
| | | | | | | | |
Net decrease | | | (11,010,634 | ) | | | $(297,440,652 | ) | | | (13,120,070 | ) | | | $(355,908,747 | ) | | | (358,749 | ) | | | $(38,532,685 | ) | | | (258,344 | ) | | | $(23,365,886 | ) |
| | | | | | | | | | | | | | | | | | | | | | | | | | | | | | | | |
| | | | | | | | | | | | | | | | | | | | | | | | | | | | | | | | |
Class I: | | | | | | | | | | | | | | | | | | | | | | | | | | | | | | | | |
| | | | | | | | |
Proceeds from sale of shares | | | 13,507,953 | | | | $365,791,317 | | | | 7,573,150 | | | | $203,628,450 | | | | 80,723 | | | | $9,052,722 | | | | 39,551 | | | | $3,646,169 | |
| | | | | | | | |
Reinvestment of distributions | | | 1,277,804 | | | | 34,407,050 | | | | 1,560,163 | | | | 41,599,594 | | | | — | | | | — | | | | — | | | | — | |
| | | | | | | | |
Cost of shares repurchased | | | (6,093,674 | ) | | | (163,993,718 | ) | | | (14,000,804 | ) | | | (381,234,293 | ) | | | (54,850 | ) | | | (6,087,724 | ) | | | (52,969 | ) | | | (4,947,941 | ) |
| | | | | | | | | | | | | | | | | | | | | | | | | | | | | | | | |
| | | | | | | | |
Net increase (decrease) | | | 8,692,083 | | | | $236,204,649 | | | | (4,867,491 | ) | | | $(136,006,249 | ) | | | 25,873 | | | | $2,964,998 | | | | (13,418 | ) | | | $(1,301,772 | ) |
| | | | | | | | | | | | | | | | | | | | | | | | | | | | | | | | |
| | | | | | | | | | | | | | | | |
| | | Global Income Opportunity |
| | | December 31, 2017 | | December 31, 2016 |
| | | | |
| | | Shares | | Amount | | Shares | | Amount |
Class N: | | | | | | | | | | | | | | | | |
| | | | |
Proceeds from sale of shares | | | 118,276 | | | | $2,383,354 | | | | 173,897 | | | | $3,342,225 | |
| | | | |
Cost of shares repurchased | | | (260,356 | ) | | | (5,202,761 | ) | | | (1,132,023 | ) | | | (21,731,666 | ) |
| | | | | | | | | | | | | | | | |
| | | | |
Net decrease | | | (142,080 | ) | | | $(2,819,407 | ) | | | (958,126 | ) | | | $(18,389,441 | ) |
| | | | | | | | | | | | | | | | |
h. REPURCHASE AGREEMENTS AND JOINT REPURCHASE AGREEMENTS
The Funds may enter into third-party repurchase agreements for temporary cash management purposes and third-party joint repurchase agreements for reinvestment of cash collateral on securities lending transactions under the securities lending program offered by The Bank of New York Mellon (“BNYM”) (the “Program”) (collectively, “Repurchase Agreements”). The value of the underlying collateral, including accrued interest, must equal or exceed the value of the Repurchase Agreements during the term of the agreement. For joint repurchase agreements, the Funds participate on a pro rata basis with other clients of BNYM in its share of the underlying collateral under such joint repurchase agreements and in its share of proceeds from any repurchase or other disposition of the underlying collateral. The underlying collateral for all Repurchase Agreements is held in safekeeping by the Funds’ custodian or at the Federal Reserve Bank. If the seller defaults and the value of the collateral declines, or if bankruptcy proceedings commence with respect to the seller of the security, realization of the collateral by the Funds may be delayed or limited. Pursuant to the Program, the Funds are indemnified for such losses by BNYM on joint repurchase agreements.
At December 31, 2017, the market value of Repurchase Agreements outstanding for Bond, Global Income Opportunity and Special Equity was $27,625,696, $765,052 and $21,413,579, respectively.
i. FOREIGN CURRENCY TRANSLATION
The books and records of the Funds are maintained in U.S. dollars. The value of investments, assets and liabilities denominated in currencies other than U.S. dollars are translated into U.S. dollars based upon current foreign exchange rates. Purchases and sales of foreign investments, income and expenses are converted into U.S. dollars based on currency exchange rates prevailing on the respective dates of such transactions. Net realized and unrealized gain (loss) on foreign currency transactions represent: (1) foreign exchange gains and losses from the sale and holdings of foreign currencies; (2) gains and losses between trade date and settlement date on investment securities transactions and forward foreign currency exchange contracts; and (3) gains and losses from the difference between amounts of interest and dividends recorded and the amounts actually received.
The Funds do not isolate the net realized and unrealized gain or loss resulting from changes in exchange rates from the fluctuations in market prices of securities held. Such fluctuations are included with the net realized and unrealized gain or loss on investments.
|
Notes to Financial Statements (continued) |
| |
| |
j. FOREIGN SECURITIES
Global Income Opportunity invests in securities of foreign entities and in instruments denominated in foreign currencies which involve risks not typically associated with investments in domestic securities. Non-domestic securities carry special risks, such as exposure to currency fluctuations, less developed or less efficient trading markets, political instability, a lack of company information, differing auditing and legal standards, and, potentially, less liquidity. Realized gains in certain countries may be subject to foreign taxes at the Fund level and would pay such foreign taxes at the appropriate rate for each jurisdiction.
2. AGREEMENTS AND TRANSACTIONS WITH AFFILIATES
For each of the Funds, the Trust has entered into an investment advisory agreement under which the Investment Manager, a subsidiary and the U.S. retail distribution arm of Affiliated Managers Group, Inc. (“AMG”), serves as investment manager to the Funds and is responsible for the Funds’ overall administration and operations. The Investment Manager selects one or more subadvisers for the Funds (subject to Board approval) and monitors each subadviser’s investment performance, security holdings and investment strategies. Each Fund’s investment portfolio is managed by one or more portfolio managers who serve pursuant to a subadvisory agreement with the Investment Manager.
Investment management fees are paid directly by the Funds to the Investment Manager based on average daily net assets. Effective October 1, 2016, the Fund’s investment management fees are paid at the following annual rate of each Fund’s respective average daily net assets:
| | | | |
Bond | | | 0.625% | |
Global Income Opportunity | | | 0.550% | |
Special Equity | | | 0.900% | |
Prior to October 1, 2016, the annual rate for the investment management fees was 0.625%, 0.700% and 0.900% of each Fund’s average daily net assets of Bond, Global Income Opportunity and Special Equity, respectively.
The Investment Manager has contractually agreed, through at least May 1, 2018, to waive management fees and/or reimburse fund expenses in order to limit total annual Fund operating expenses after fee waiver and expense reimbursements (exclusive of taxes, interest (including interest incurred in connection with bank and custody overdrafts), shareholder servicing fees, brokerage commissions and other transaction costs, acquired fund fees and expenses and extraordinary expenses) of Bond and Special Equity to 0.89% and 1.11%, respectively, and waive management fees and/or reimburse Fund expenses in order to limit total annual fund operating expenses after fee waiver and expense reimbursements (exclusive of taxes, interest (including interest incurred in connection with bank and custody overdrafts), brokerage commissions and other transaction costs, acquired fund fees and expenses, and extraordinary expenses) of Global Income Opportunity to 0.89%, of each Fund’s average daily net assets subject to later reimbursement by the Funds in certain circumstances.
The contractual expense limitation may only be terminated in the event the Investment Manager or a successor ceases to be the investment manager of the Fund or a successor fund, by mutual agreement between the Investment Manager and the Board, or in the event of the Fund’s liquidation unless the Fund is reorganized or is a party to a merger in which the surviving entity is successor to the accounting and performance information of the Fund.
In general, for a period of up to 36 months, the Investment Manager may recover from each Fund fees waived and expenses paid pursuant to this contractual agreement, provided that such repayment would not cause the Fund’s total annual operating expenses after fee waiver and expense reimbursements (exclusive of the items noted in the parenthetical above) to exceed the contractual expense limitation amount.
At December 31, 2017, the Funds’ expiration of recoupment is as follows:
| | | | | | | | | | | | |
Expiration Period | | Bond | | | Global Income Opportunity | | | Special Equity | |
Less than 1 year | | | $189,371 | | | | $161,352 | | | | $333,953 | |
Within 2 years | | | 576,764 | | | | 122,562 | | | | 267,272 | |
Within 3 years | | | — | | | | 71,340 | | | | 94,177 | |
| | | | | | | | | | | | |
Total Amount Subject to Recoupment | | | $766,135 | | | | $355,254 | | | | $695,402 | |
| | | | | | | | | | | | |
The Trust, on behalf of the Funds, has entered into an amended and restated Administration Agreement under which the Investment Manager serves as the Funds’ administrator (the “Administrator”) and is responsible for all non-portfolio management aspects of managing the Funds’ operations, including administration and shareholder services to each Fund. Each Fund pays a fee to the Administrator at the rate of 0.15% per annum of the Fund’s average daily net assets for this service. Prior to October 1, 2016, Bond, Global Income Opportunity and Special Equity paid an administration fee under a similar contract at an annual rate of 0.25%, 0.20% and 0.25%, respectively, of each Fund’s average daily net assets.
The Funds are distributed by AMG Distributors, Inc. (the “Distributor”), a wholly-owned subsidiary of the Investment Manager. The Distributor serves as the distributor and underwriter for each Fund and is a registered broker-dealer and member of the Financial Industry Regulatory Authority, Inc. (“FINRA”). Shares of each Fund will be continuously offered and will be sold directly to prospective purchasers and through brokers, dealers or other financial intermediaries who have executed selling agreements with the Distributor. Generally the Distributor bears all or a portion of the expenses of providing services pursuant to the distribution agreement, including the payment of the expenses relating to the distribution of prospectuses for sales purposes and any advertising or sales literature.
For Class N of Bond and Special Equity and for Class I of Bond, the Board has approved reimbursement payments to the Investment Manager for shareholder servicing expenses (“shareholder servicing fees”) incurred. Shareholder servicing fees include payments to financial intermediaries, such as broker-dealers (including fund supermarket platforms), banks, and trust companies who provide shareholder recordkeeping, account servicing and other services. Class N shares of Bond and Special Equity and Class I shares of Bond may reimburse the Investment Manager for the actual amount incurred up to a maximum annual rate of each Class’s average daily net assets as shown in the table below.
The impact on the annualized expense ratios for the fiscal year ended December 31, 2017, were as follows:
|
Notes to Financial Statements (continued) |
| |
| |
| | | | | | | | |
| | | Maximum Annual | | | Actual | |
| | | Amount | | | Amount | |
Fund | | Approved | | | Incurred | |
Bond | | | | | | | | |
Class N* | | | 0.15% | | | | 0.10% | |
Class I** | | | 0.05% | | | | — | |
Special Equity | | | | | | | | |
Class N* | | | 0.25% | | | | 0.25% | |
*Effective October 1, 2016, the maximum annual rate was increased to 0.15% from 0.10% for Class N Shares.
**Effective October 1, 2016, Class I shares were authorized, to reimburse up to a maximum annual rate of 0.05%.
The Board provides supervision of the affairs of the Trust and other trusts within the AMG Funds family. The Trustees of the Trust who are not affiliated with an Investment Manager receive an annual retainer and per meeting fees for regular, special and telephonic meetings, and they are reimbursed for out-of-pocket expenses incurred while carrying out their duties as Board members. The Chairman of the Board and the Audit Committee Chair receive additional annual retainers. Certain Trustees and Officers of the Funds are Officers and/or Directors of the Investment Manager, AMG and/or the Distributor.
The Securities and Exchange Commission (the “SEC”) granted an exemptive order that permits the Funds to lend and borrow money for certain temporary purposes directly to and from other eligible funds in the AMG Funds family. Participation in this interfund lending program is voluntary for both the borrowing and lending funds, and an interfund loan is only made if it benefits each participating fund. The Administrator manages the program according to procedures approved by the Board, and the Board monitors the operation of the program. An interfund loan must comply with certain conditions set out in the exemptive order, which are designed to assure fairness and protect all participating funds. For the fiscal year ended December 31, 2017, Bond lent a maximum of $1,376,463 for three days earning interest of $232, and Special Equity lent a maximum of $2,537,119 for four days earning interest of $371. The interest income amount is included in the Statement of Operations as interest income. Special Equity borrowed a maximum of $2,203,352 for six days paying interest of $472. The interest expense amount is included in the Statement of Operations as miscellaneous expense. At December 31, 2017, the Funds had no interfund loans outstanding.
For the six months ended December 31, 2017, Special Equity executed security transactions with other funds affiliated with Lord, Abbett & Co., LLC, one of the Fund’s subadvisers. Each of the transactions were executed at the closing price of the security transacted and with no commissions under Rule 17a-7 procedures approved by the Board. The amounts purchased and sold during the six months ended December 31, 2017, are reflected in the following chart:
| | | | | | |
| | | Number of
Transactions | | Total
Quantity | | Cost/Proceeds |
Purchases | | 7 | | 2,505 | | $125,200 |
Sales* | | 3 | | 3,595 | | 215,868 |
*Realized gain was $104,343.
3. PURCHASES AND SALES OF SECURITIES
Purchases and sales of securities (excluding short-term securities and U.S. Government Obligations) for the fiscal year ended December 31, 2017, were as follows:
| | | | | | | | | | |
| | | Long Term Securities |
| | |
Fund | | Purchases | | Sales |
Bond | | | | $80,759,272 | | | | | $324,788,346 | |
| | |
Global Income Opportunity | | | | 4,761,453 | | | | | 7,809,737 | |
| | |
Special Equity | | | | 156,327,348 | | | | | 192,725,981 | |
| |
| | | U.S. Government Obligations |
| | |
Fund | | Purchases | | Sales |
| | |
Bond | | | | — | | | | | $150,434,034 | |
| | |
Global Income Opportunity | | | | $2,929,793 | | | | | 1,929,305 | |
4. PORTFOLIO SECURITIES LOANED
The Funds participate in the Program providing for the lending of securities to qualified brokers. Securities lending income includes earnings of such temporary cash investments, plus or minus any rebate to a borrower. These earnings (after any rebate) are then divided between BNYM, as a fee for its services under the Program, and the Funds, according to agreed-upon rates. Collateral on all securities loaned is accepted in cash and is maintained at a minimum level of 102% (105% in the case of certain foreign securities) of the market value, plus interest, if applicable, of investments on loan. It is the Funds’ policy to obtain additional collateral from or return excess collateral to the borrower by the end of the next business day, following the valuation date of the securities loaned. Therefore, the value of the collateral held may be temporarily less than the value of the securities on loan. Lending securities entails a risk of loss to the Funds if and to the extent that the market value of the securities loaned were to increase and the borrower did not increase the collateral accordingly, and the borrower fails to return the securities. Under the terms of the Program, the Funds are indemnified for such losses by BNYM. Cash collateral is held in a separate omnibus account managed by BNYM, who is authorized to exclusively enter into joint repurchase agreements. BNYM bears the risk of any deficiency in the amount of the cash collateral available for return to the borrower due to any loss on the collateral invested.
The value of securities loaned on positions held and cash collateral received at December 31, 2017, were as follows:
| | | | | | | | | | |
| | | | | Cash |
| | | Securities | | Collateral |
Fund | | Loaned | | Received |
Bond | | | | $26,821,640 | | | | | $27,625,696 | |
Global Income Opportunity | | | | 722,430 | | | | | 765,052 | |
Special Equity | | | | 20,744,161 | | | | | 21,413,579 | |
5. COMMITMENTS AND CONTINGENCIES
Under the Trust’s organizational documents, its trustees and officers are indemnified against certain liabilities arising out of the performance of their duties to the Trust. In addition, in the normal course of business, the Funds may enter into
|
Notes to Financial Statements (continued) |
| |
| |
contracts and agreements that contain a variety of representations and warranties, which provide general indemnifications. The maximum exposure to the Funds under these arrangements is unknown, as this would involve future claims that may be made against a Fund that have not yet occurred. However, based on experience, the Funds had no prior claims or losses and expect the risks of loss to be remote.
6. RISKS ASSOCIATED WITH HIGH YIELD SECURITIES
Investing in high yield securities involves greater risks and considerations not typically associated with U.S. Government and other high quality/investment grade securities. High yield securities are generally below investment grade securities and do not have an established retail secondary market. Economic downturns may disrupt the high yield market and impair the issuer’s ability to repay principal and interest. Also, an increase in interest rates would likely have an adverse impact on the value of such obligations and could cause the securities to become less liquid.
7. FORWARD COMMITMENTS
Certain transactions, such as futures and forward transactions, dollar roll agreements, or purchases of when-issued or delayed delivery securities may have a similar effect on a Fund’s net asset value as if a Fund had created a degree of leverage in its portfolio. However, if a Fund enters into such a transaction, a Fund will establish a segregated account with its custodian in which it will maintain cash, U.S. government securities or other liquid securities equal in value to its obligations in respect to such transaction. Securities and other assets held in the segregated account may not be sold while the transaction is outstanding, unless other suitable assets are substituted.
8. DERIVATIVE INSTRUMENTS
The following disclosures contain information on how and why Global Income Opportunity uses derivative instruments, the credit risk and how derivative instruments affect the Fund’s financial position, and results of operations and cash flows. The location and fair value amounts of these instruments on the Statement of Assets and Liabilities, and the realized gains and losses and changes in unrealized gains and losses on the Statement of Operations, each categorized by type of derivative contract, are included in a table at the end of applicable Schedule of Portfolio Investments. For the fiscal year ended December 31, 2017, the average quarterly balances of derivative financial instruments outstanding were as follows:
| | | | |
| | | Global Income Opportunity | |
Foreign currency exchange contracts: | | | | |
Average U.S. Dollar amounts purchased/sold | | | $7,902,001 | |
9. FORWARD FOREIGN CURRENCY CONTRACTS
During the fiscal year ended December 31, 2017, Global Income Opportunity invested in forward foreign currency contracts to facilitate transactions in foreign securities and to hedge against foreign currency exchange rate risk on its non-U.S. dollar denominated investment securities.
A forward foreign currency contract is an agreement between a fund and another party to buy or sell a currency at a set price at a future date. The market value of the contract will fluctuate with changes in currency exchange rates. The contract is marked-to-market daily, and the change in market value is recorded as an unrealized gain or loss. Risks may arise upon entering into these contracts from the potential inability of counterparties to meet the terms of their contracts and from unanticipated movements in the value of a foreign currency relative to the U.S. dollar.
10. MASTER NETTING AGREEMENTS
The Funds may enter into master netting agreements with their counterparties for the securities lending program, Repurchase Agreements and derivative instruments, which provide the right, in the event of default (including bankruptcy or insolvency) for the non-defaulting party to liquidate the collateral and calculate net exposure to the defaulting party or request additional collateral. For financial reporting purposes, the Funds do not offset financial assets and financial liabilities that are subject to master netting agreements in the Statement of Assets and Liabilities. For securities lending transactions, see Note 4.
|
Notes to Financial Statements (continued) |
| |
| |
The following table is a summary of the Funds’ open Repurchase Agreements and derivatives that are subject to a master netting agreement as of December 31, 2017:
| | | | | | | | | | | | | | | | | | | | |
| |
| | | Gross Amount Not Offset in the Statement of Assets and Liabilities |
| | | | |
| Fund | | Net Amounts of Assets
Presented in the Statement
of Assets and Liabilities | | Financial
Instruments
Collateral | | Cash Collateral
Received (Pledged) | | Net Amount |
| | | | |
Bond | | | | | | | | | | | | | | | | | | | | |
| | | | |
Bank of Nova Scotia | | | | $6,561,758 | | | | | $6,561,758 | | | | | — | | | | | — | |
| | | | |
Jefferies LLC | | | | 6,561,758 | | | | | 6,561,758 | | | | | — | | | | | — | |
| | | | |
JPMorgan Securities LLC | | | | 1,378,664 | | | | | 1,378,664 | | | | | — | | | | | — | |
| | | | |
Merrill Lynch Pierce Fenner & Smith, Inc. | | | | 6,561,758 | | | | | 6,561,758 | | | | | — | | | | | — | |
| | | | |
Nomura Securities International, Inc. | | | | 6,561,758 | | | | | 6,561,758 | | | | | — | | | | | — | |
| | | | |
| | | | | | | | | | | | | | | | | | | | |
| | | | |
Total | | | | $27,625,696 | | | | | $27,625,696 | | | | | — | | | | | — | |
| | | | |
| | | | | | | | | | | | | | | | | | | | |
| | | | |
Global Income Opportunity Fund | | | | | | | | | | | | | | | | | | | | |
| | | | |
Credit Suisse | | | | $16,686 | | | | | $16,686 | | | | | — | | | | | — | |
| | | | |
State of Wisconsin Investment Board | | | | 765,052 | | | | | 765,052 | | | | | — | | | | | — | |
| | | | |
Merrill Lynch | | | | 71 | | | | | 71 | | | | | — | | | | | — | |
| | | | |
Morgan Stanley | | | | 34,186 | | | | | — | | | | | — | | | | | $34,186 | |
| | | | |
UBS Securities | | | | 48,858 | | | | | 17,392 | | | | | $10,000 | | | | | 21,466 | |
| | | | |
| | | | | | | | | | | | | | | | | | | | |
| | | | |
Total | | | | $864,853 | | | | | $799,201 | | | | | $10,000 | | | | | $55,652 | |
| | | | |
| | | | | | | | | | | | | | | | | | | | |
| | | | |
Special Equity | | | | | | | | | | | | | | | | | | | | |
| | | | |
Cantor Fitzgerald Securities, Inc. | | | | $5,085,946 | | | | | $5,085,946 | | | | | — | | | | | — | |
| | | | |
Daiwa Capital Markets America | | | | 5,085,946 | | | | | 5,085,946 | | | | | — | | | | | — | |
| | | | |
MUFG Securities America, Inc. | | | | 5,085,946 | | | | | 5,085,946 | | | | | — | | | | | — | |
| | | | |
RBC Capital Markets LLC | | | | 1,069,795 | | | | | 1,069,795 | | | | | — | | | | | — | |
| | | | |
State of Wisconsin Investment Board | | | | 5,085,946 | | | | | 5,085,946 | | | | | — | | | | | — | |
| | | | |
| | | | | | | | | | | | | | | | | | | | |
| | | | |
Total | | | | $21,413,579 | | | | | $21,413,579 | | | | | — | | | | | — | |
| | | | |
| | | | | | | | | | | | | | | | | | | | |
| | | | |
| | | Net Amounts of Liabilities
Presented in the Statement
of Assets and Liabilities | | Financial
Instruments | | | | Net Amount |
| | | | |
Global Income Opportunity Fund | | | | | | | | | | | | | | | | | | | | |
| | | | |
Credit Suisse | | | | $18,173 | | | | | $16,686 | | | | | — | | | | | $1,487 | |
| | | | |
HSBC Securities, Inc. | | | | 7,117 | | | | | — | | | | | — | | | | | 7,117 | |
| | | | |
Merrill Lynch | | | | 526 | | | | | 71 | | | | | — | | | | | 455 | |
| | | | |
UBS Securities | | | | 17,392 | | | | | 17,392 | | | | | — | | | | | — | |
| | | | |
| | | | | | | | | | | | | | | | | | | | |
| | | | |
Total | | | | $43,208 | | | | | $34,149 | | | | | — | | | | | $9,059 | |
| | | | |
| | | | | | | | | | | | | | | | | | | | |
11. REGULATORY UPDATES
On October 13, 2016, the SEC amended existing rules intended to modernize reporting and disclosure of information. These amendments relate to Regulation S-X, which sets forth the form and content of financial statements. Effective August 1, 2017, the Funds have adopted these amendments and noted no significant impact on the financial statements and accompanying notes.
12. SUBSEQUENT EVENTS
The Funds have determined that no material events or transactions occurred through the issuance date of the Funds’ financial statements, which require an additional disclosure in or adjustment of the Funds’ financial statements.
|
Report of Independent Registered Public Accounting Firm |
| |
| |
TO THE BOARD OF TRUSTEES OF AMG FUNDS III AND SHAREHOLDERS OF AMG MANAGERS LOOMIS SAYLES BOND FUND, AMG MANAGERS GLOBAL INCOME OPPORTUNITY FUND, AND AMG MANAGERS SPECIAL EQUITY FUND
Opinions on the Financial Statements
We have audited the accompanying statements of assets and liabilities, including the schedules of portfolio investments, of AMG Managers Loomis Sayles Bond Fund, AMG Managers Global Income Opportunity Fund, and AMG Managers Special Equity Fund (three of the funds constituting AMG Funds III, hereafter collectively referred to as the “Funds”) as of December 31, 2017, the related statements of operations for the year ended December 31, 2017, the statements of changes in net assets for each of the two years in the period ended December 31, 2017, including the related notes, and the financial highlights for each of the periods indicated therein (collectively referred to as the “financial statements”). In our opinion, the financial statements present fairly, in all material respects, the financial position of each of the Funds as of December 31, 2017, the results of each of their operations for the year then ended, the changes in each of their net assets for each of the two years in the period ended December 31, 2017 and each of the financial highlights for each of the periods indicated therein in conformity with accounting principles generally accepted in the United States of America.
Basis for Opinions
These financial statements are the responsibility of the Funds’ management. Our responsibility is to express an opinion on the Funds’ financial statements based on our audits. We are a public accounting firm registered with the Public Company Accounting Oversight Board (United States) (“PCAOB”) and are required to be independent with respect to the Funds in accordance with the U.S. federal securities laws and the applicable rules and regulations of the Securities and Exchange Commission and the PCAOB.
We conducted our audits of these financial statements in accordance with the standards of the PCAOB. Those standards require that we plan and perform the audit to obtain reasonable assurance about whether the financial statements are free of material misstatement, whether due to error or fraud.
Our audits included performing procedures to assess the risks of material misstatement of the financial statements, whether due to error or fraud, and performing procedures that respond to those risks. Such procedures included examining, on a test basis, evidence regarding the amounts and disclosures in the financial statements. Our audits also included evaluating the accounting principles used and significant estimates made by management, as well as evaluating the overall presentation of the financial statements. Our procedures included confirmation of securities owned as of December 31, 2017 by correspondence with the custodian and brokers; when replies were not received from brokers, we performed other auditing procedures. We believe that our audits provide a reasonable basis for our opinions.
PricewaterhouseCoopers LLP
Boston, Massachusetts
February 27, 2018
We have served as the auditor of one or more investment companies in AMG Funds Family since 1993.
TAX INFORMATION
The AMG Managers Loomis Sayles Bond Fund, AMG Managers Global Income Opportunity Fund and AMG Managers Special Equity Fund each hereby designates the maximum amount allowable of its net taxable income as qualified dividends as provided in the Jobs and Growth Tax Relief Reconciliation Act of 2003. The 2017 Form 1099-DIV you receive for each Fund will show the tax status of all distributions paid to you during the year.
Pursuant to section 852 of the Internal Revenue Code, AMG Managers Loomis Sayles Bond Fund, AMG Managers Global Income Opportunity Fund and AMG Managers Special Equity Fund each hereby designates $9,781,470, $0, and $0 respectively, as a capital gain distribution with respect to the taxable year ended December 31, 2017, or if subsequently determined to be different, the net capital gains of such fiscal year.
|
AMG Funds Trustees and Officers |
|
| | | | |
| The Trustees and Officers of the Trust, their business addresses, principal occupations for the past five years and ages are listed below. The Trustees provide broad supervision over the affairs of the Trust and the Funds. The Trustees are experienced executives who meet periodically throughout the year to oversee the Funds’ activities, review contractual arrangements with companies that provide services to the Funds, and | | review the Funds’ performance. Unless otherwise noted, the address of each Trustee or Officer is the address of the Trust: 600 Steamboat Road, Suite 300, Greenwich, Connecticut 06830. There is no stated term of office for Trustees. Trustees serve until their resignation, retirement or removal in | | accordance with the Trust’s organizational documents and policies adopted by the Board from time to time. The Chairman of the Trustees, President, Treasurer and Secretary of the Trust are elected by the Trustees annually. Other officers hold office at the pleasure of the Trustees. |
| | | | |
| | | | |
Independent Trustees
The following Trustees are not “interested persons” of the Trust within the meaning of the 1940 Act:
| | |
Number of Funds Overseen in Fund Complex | | Name, Age, Principal Occupation(s) During Past 5 Years and Other Directorships Held by Trustee |
| |
| | |
• Trustee since 2012 • Oversees 61 Funds in Fund Complex | | Bruce B. Bingham, 69 Partner, Hamilton Partners (real estate development firm) (1987-Present); Director of The Yacktman Funds (2000-2012). |
| |
| |
| | |
• Trustee since 1999 • Oversees 61 Funds in Fund Complex | | Edward J. Kaier, 72 Attorney at Law and Partner, Teeters Harvey Marrone & Kaier LLP (2007-Present); Attorney at Law and Partner, Hepburn Willcox Hamilton & Putnam, LLP (1977-2007); Trustee of Third Avenue Trust (5 portfolios); Trustee of Third Avenue Variable Trust (1 portfolio). |
| |
| |
| | |
• Trustee since 2013 • Oversees 63 Funds in Fund Complex | | Kurt A. Keilhacker, 54 Managing Member, TechFund Capital (1997-Present); Managing Member, TechFund Europe (2000-Present); Board Member, 6wind SA, (2002-Present); Managing Member, Elementum Ventures (2013-Present); Trustee, Gordon College (2001-2016). |
| |
| |
| | |
• Trustee since 1993 • Oversees 61 Funds in Fund Complex | | Steven J. Paggioli, 67 Independent Consultant (2002-Present); Formerly Executive Vice President and Director, The Wadsworth Group (1986-2001); Executive Vice President, Secretary and Director, Investment Company Administration, LLC (1990-2001); Vice President, Secretary and Director, First Fund Distributors, Inc. (1991-2001); Trustee, Professionally Managed Portfolios (32 portfolios); Advisory Board Member, Sustainable Growth Advisors, LP; Independent Director, Chase Investment Counsel (2008–Present). |
| |
| |
| |
| |
| | |
• Trustee since 2013 • Oversees 61 Funds in Fund Complex | | Richard F. Powers III, 72 Adjunct Professor, U.S. Naval War College (2016); Adjunct Professor, Boston College (2010-2013); President and CEO of Van Kampen Investments Inc. (1998-2003). |
| |
| |
| | |
• Independent Chairman • Trustee since 1999 • Oversees 63 Funds in Fund Complex | | Eric Rakowski, 59 Professor, University of California at Berkeley School of Law (1990-Present); Director of Harding, Loevner Funds, Inc. (9 portfolios); Trustee of Third Avenue Trust (5 portfolios); Trustee of Third Avenue Variable Trust (1 portfolio). |
| |
| |
| | |
| | |
• Trustee since 2013 • Oversees 63 Funds in Fund Complex | | Victoria L. Sassine, 52 Lecturer, Babson College (2007 – Present). |
| |
| | |
| | |
• Trustee since 1987 • Oversees 61 Funds in Fund Complex | | Thomas R. Schneeweis, 70 Professor Emeritus, University of Massachusetts (2013-Present); Partner, S Capital Wealth Advisors (2015-Present); President, TRS Associates (1982-Present); Board Member, Chartered Alternative Investment Association (“CAIA”) (2002-Present); Director, CAIA Foundation (Education) (2010-Present); Director, Institute for GlobalAsset and Risk Management (Education) (2010-Present); Partner, S Capital Management, LLC (2007-2015); Director, CISDM at the University of Massachusetts, (1996-2013); President, Alternative Investment Analytics, LLC, (formerly Schneeweis Partners, LLC) (2001-2013); Professor of Finance, University of Massachusetts (1977-2013). |
| |
| |
| |
| |
| |
| | | |
|
AMG Funds Trustees and Officers (continued) |
| |
| |
Interested Trustees
Each Trustee in the following table is an “interested person” of the Trust within the meaning of the 1940 Act. Ms. Carsman is an interested person of the Trust within the meaning of the 1940 Act by virtue of her position with, and interest in securities of, AMG.
| | |
Number of Funds Overseen in Fund Complex | | Name, Age, Principal Occupation(s) During Past 5 Years and Other Directorships Held by Trustee |
• Trustee since 2011 • Oversees 63 Funds in Fund Complex | | Christine C. Carsman, 65 Executive Vice President, Deputy General Counsel and Chief Regulatory Counsel, Affiliated Managers Group, Inc. (2017-Present); Director (2010-Present) and Chair of the Board of Directors (2015-Present), AMG Funds plc; Director of Harding, Loevner Funds, Inc. (9 portfolios); Senior Vice President and Deputy General Counsel, Affiliated Managers Group, Inc. (2011-2016); Senior Vice President and Chief Regulatory Counsel, Affiliated Managers Group, Inc. (2007-2011); Vice President and Chief Regulatory Counsel, Affiliated Managers Group, Inc. (2004-2007); Secretary and Chief Legal Officer, AMG Funds, AMG Funds I, AMG Funds II and AMG Funds III (2004-2011); Senior Counsel, Vice President and Director of Operational Risk Management and Compliance, Wellington Management Company, LLP (1995-2004). |
| | |
| Officers | | |
Position(s) Held with Fund and Length of Time Served | | Name, Age, Principal Occupation(s) During Past 5 Years |
• President since 2014 • Principal Executive Officer since 2014 • Chief Executive Officer since 2016 | | Jeffrey T. Cerutti, 50 Chief Executive Officer, AMG Funds LLC (2014-Present); Director, President and Principal, AMG Distributors, Inc. (2014-Present); President and Principal Executive Officer, AMG Funds, AMG Funds I, AMG Funds II and AMG Funds III (2014-Present); Chief Executive Officer, President and Principal Executive Officer, AMG Funds IV, (2015-Present); Chief Executive Officer, AMG Funds, AMG Funds I, AMG Funds II and AMG Funds III (2016-Present); Chief Executive Officer, Aston Asset Management, LLC (2016); President, VP Distributors, (2011-2014); Executive Vice President, Head of Distribution, Virtus Investment Partners, Inc. (2010-2014); Managing Director, Head of Sales, UBS Global Asset Management (2001-2010). |
• Chief Operating Officer since 2007 | | Keitha L. Kinne, 59 Chief Operating Officer, AMG Funds LLC (2007-Present); Chief Investment Officer, AMG Funds LLC (2008-Present); Chief Operating Officer, AMG Distributors, Inc. (2007-Present); Chief Operating Officer, AMG Funds, AMG Funds I, AMG Funds II, and AMG Funds III (2007-Present); Chief Operating Officer, AMG Funds IV, (2016-Present); Chief Operating Officer and Chief Investment Officer, Aston Asset Management, LLC (2016); President and Principal Executive Officer, AMG Funds, AMG Funds I, AMG Funds II and AMG Funds III (2012-2014); Managing Partner, AMG Funds LLC (2007-2014); President, AMG Funds (2012-2014); President, AMG Distributors, Inc. (2012-2014); Managing Director, Legg Mason & Co., LLC (2006-2007); Managing Director, Citigroup Asset Management (2004-2006). |
• Secretary since 2015 • Chief Legal Officer since 2015 | | Mark J. Duggan, 53 Senior Vice President and Senior Counsel, AMG Funds LLC (2015-Present); Secretary and Chief Legal Officer, AMG Funds, AMG Funds I, AMG Funds II and AMG Funds III (2015-Present); Secretary and Chief Legal Officer, AMG Funds IV, (2015-Present); Attorney, K&L Gates, LLP (2009-2015). |
• Chief Financial Officer since 2017 • Treasurer since 2017 • Principal Financial Officer since 2017 • Principal Accounting Officer since 2017 | | Thomas G. Disbrow, 52 Vice President, Mutual Fund Treasurer & CFO, AMG Funds, AMG Funds LLC (2017-Present); Chief Financial Officer, Principal Financial Officer, Treasurer and Principal Accounting Officer, AMG Funds, AMG Funds I, AMG Funds II, AMG Funds III and AMG Funds IV (2017-Present); Managing Director - Global Head of Traditional Funds Product Control, UBS Asset Management (Americas), Inc. (2015-2017); Managing Director - Head of North American Funds Treasury, UBS Asset Management (Americas), Inc. (2011-2015). |
• Deputy Treasurer since 2017 | | John A. Starace, 47 Director, Mutual Fund Accounting, AMG Funds LLC (2017-Present); Vice President, Deputy Treasurer of Mutual Funds Services, AMG Funds LLC (2014-2017); Deputy Treasurer, AMG Funds, AMG Funds I, AMG Funds II, AMG Funds III and AMG Funds IV (2017-Present); Vice President, Citi Hedge Fund Services (2010-2014); Audit Senior Manager (2005-2010) and Audit Manager (2001-2005), Deloitte & Touche LLP. |
• Controller since 2017 | | Christopher R. Townsend, 50 Vice President, Business Finance, AMG Funds LLC (2017-Present); Head of Business Finance, AMG Funds LLC (2015-2017); Chief Financial Officer and Financial and Operations Principal, AMG Distributors, Inc. (2016-Present); Controller, AMG Funds, AMG Funds I, AMG Funds II, AMG Funds III and AMG Funds IV (2017-Present); Treasurer, Chief Financial Officer, Principal Financial Officer, Principal Accounting Officer, AMG Funds, AMG Funds I, AMG Funds II, AMG Funds III and AMG Funds IV (2017); Chief Financial Officer, Aston Asset Management LLC (2016); Head of Finance and Accounting, Allianz Asset Management (2006-2015). |
|
AMG Funds Trustees and Officers (continued) |
| | |
Position(s) Held with Fund and Length of Time Served | | Name, Age, Principal Occupation(s) During Past 5 Years |
• Chief Compliance Officer since 2016 | | Gerald F. Dillenburg, 51 Vice President, Chief Compliance Officer AMG Funds, AMG Funds LLC (2017-Present); Chief Compliance Officer AMG Funds, AMG Funds LLC (2016-2017); Chief Compliance Officer and Sarbanes Oxley Code of Ethics Compliance Officer, AMG Funds, AMG Funds I, AMG Funds II and AMG Funds III (2016-Present); ChiefCompliance Officer, AMG Funds IV (1996-Present); Sarbanes-Oxley Code of Ethics Compliance Officer, AMG Funds IV (2016-Present); Chief Compliance Officer, AstonAsset Management, LLC (2006-2016); Chief Operating Officer, Aston Funds (2003-2016); Secretary, Aston Funds (1996-2015); Chief Financial Officer, Aston Funds(1997-2010); Chief Financial Officer, Aston Asset Management, LLC (2006-2010); Treasurer, Aston Funds (1996-2010). |
• Anti-Money Laundering Compliance Officer since 2014 | | Patrick J. Spellman, 43 Vice President, Chief Compliance Officer, AMG Funds LLC (2017-Present); Senior Vice President, Chief Compliance Officer, AMG Funds LLC (2011-2017); Chief Compliance Officer, AMG Distributors, Inc., (2010-Present); Anti-Money Laundering Compliance Officer, AMG Funds, AMG Funds I, AMG Funds II, and AMG Funds III (2014-Present); Anti-Money Laundering Officer, AMG Funds IV, (2016-Present); Compliance Manager, Legal and Compliance, Affiliated Managers Group, Inc. (2005-2011). |
• Assistant Secretary since 2016 | | Maureen A. Meredith, 32 Director, Counsel, AMG Funds LLC (2017-Present); Vice President, Counsel, AMG Funds LLC (2015-2017); Assistant Secretary, AMG Funds, AMG Funds I, AMG Funds II, AMG Funds III and AMG Funds IV (2016-Present); Associate, Ropes & Gray LLP (2011-2015); Law Fellow, Massachusetts Appleseed Center for Law and Justice (2010-2011). |
THIS PAGE INTENTIONALLY LEFT BLANK
THIS PAGE INTENTIONALLY LEFT BLANK
THIS PAGE INTENTIONALLY LEFT BLANK
| | |
 | | |
| | | | |
Investment Manager and Administrator AMG Funds LLC 600 Steamboat Road, Suite 300 Greenwich, CT 06830 800.835.3879 Distributor AMG Distributors, Inc. 600 Steamboat Road, Suite 300 Greenwich, CT 06830 800.835.3879 Custodian The Bank of New York Mellon 111 Sanders Creek Parkway East Syracuse, NY 13057 Legal Counsel Ropes & Gray LLP Prudential Tower, 800 Boylston Street Boston, MA 02199-3600 | | Transfer Agent BNY Mellon Investment Servicing (US) Inc. Attn: AMG Funds P.O. Box 9769 Providence, RI 02940 800.548.4539 | | This report is prepared for the Funds’ shareholders. It is authorized for distribution to prospective investors only when preceded or accompanied by an effective prospectus. To receive a free copy of the prospectus or Statement of Additional Information, which includes additional information about Fund Trustees, please contact us by calling 800.835.3879. Distributed by AMG Distributors, Inc., member FINRA/SIPC. Current net asset values per share for each Fund are available on the Funds’ website at amgfunds.com. A description of the policies and procedures each Fund uses to vote its proxies is available: (i) without charge, upon request, by calling 800.835.3879, or (ii) on the Securities and Exchange Commission’s (SEC) website at sec.gov. For information regarding each Fund’s proxy voting record for the 12-month period ended June 30, call 800.835.3879 or visit the SEC website at sec.gov. Each Fund files its complete schedule of portfolio holdings with the SEC for the first and third quarters of each fiscal year on Form N-Q. The Funds’ Forms N-Q are available on the SEC’s website at sec.gov. A Fund’s Forms N-Q may be reviewed and copied at the SEC’s Public Reference Room in Washington, DC. Information on the operation of the Public Reference Room may be obtained by calling 1-800-SEC-0330. To review a complete list of the Funds’ portfolio holdings, or to view the most recent quarterly holdings report, semiannual report, or annual report, please visit amgfunds.com. |
| | |
| | |
| | | | | | | | | | |
| | | AFFILIATE SUBADVISED FUNDS BALANCED FUNDS AMG Chicago Equity Partners Balanced Chicago Equity Partners, LLC AMG FQ Global Risk-Balanced First Quadrant, L.P. EQUITY FUNDS AMG Chicago Equity Partners Small Cap Value Chicago Equity Partners, LLC AMG FQ Tax-Managed U.S. Equity AMG FQ Long-Short Equity First Quadrant, L.P. AMG Frontier Small Cap Growth Frontier Capital Management Company, LLC AMG GW&K Small Cap Core AMG GW&K Small/Mid Cap AMG GW&K U.S. Small Cap Growth GW&K Investment Management, LLC AMG Renaissance International Equity AMG Renaissance Large Cap Growth The Renaissance Group LLC AMG River Road Dividend All Cap Value AMG River Road Dividend All Cap Value II AMG River Road Focused Absolute Value AMG River Road Long-Short AMG River Road Small-Mid Cap Value AMG River Road Small Cap Value River Road Asset Management, LLC AMG SouthernSun Small Cap AMG SouthernSun Global Opportunities AMG SouthernSun U.S. Equity SouthernSun Asset Management, LLC AMG Systematic Mid Cap Value Systematic Financial Management, L.P. AMG TimesSquare Emerging Markets Small Cap AMG TimesSquare International Small Cap AMG TimesSquare Mid Cap Growth AMG TimesSquare Small Cap Growth TimesSquare Capital Management, LLC | | | | AMG Trilogy Emerging Markets Equity AMG Trilogy Emerging Wealth Equity Trilogy Global Advisors, L.P. AMG Yacktman AMG Yacktman Focused AMG Yacktman Focused Fund - Security Selection Only AMG Yacktman Special Opportunities Yacktman Asset Management LP FIXED INCOME FUNDS AMG GW&K Core Bond AMG GW&K Enhanced Core Bond AMG GW&K Municipal Bond AMG GW&K Municipal Enhanced Yield GW&K Investment Management, LLC OPEN-ARCHITECTURE FUNDS ALTERNATIVE FUNDS AMG Managers Lake Partners LASSO Alternative Lake Partners, Inc. BALANCED FUNDS AMG Managers Montag & Caldwell Balanced Montag & Caldwell, LLC EQUITY FUNDS AMG Managers Brandywine AMG Managers Brandywine Advisors Mid Cap Growth AMG Managers Brandywine Blue Friess Associates, LLC AMG Managers Cadence Emerging Companies AMG Managers Cadence Mid Cap Cadence Capital Management, LLC AMG Managers CenterSquare Real Estate CenterSquare Investment Management, Inc. AMG Managers Emerging Opportunities Lord, Abbett & Co. LLC WEDGE Capital Management L.L.P. Next Century Growth Investors LLC RBC Global Asset Management (U.S.) Inc. | | | | AMG Managers Essex Small/Micro Cap Growth Essex Investment Management Co., LLC AMG Managers Fairpointe ESG Equity AMG Managers Fairpointe Mid Cap Fairpointe Capital LLC AMG Managers Guardian Capital Global Dividend Guardian Capital LP AMG Managers LMCG Small Cap Growth LMCG Investments, LLC AMG Managers Montag & Caldwell Growth AMG Managers Montag & Caldwell Mid Cap Growth Montag & Caldwell, LLC AMG Managers Pictet International Pictet Asset Management Limited AMG Managers Silvercrest Small Cap Silvercrest Asset Management Group LLC AMG Managers Skyline Special Equities Skyline Asset Management, L.P. AMG Managers Special Equity Ranger Investment Management, L.P. Lord, Abbett & Co. LLC Smith Asset Management Group, L.P. Federated MDTA LLC AMG Managers Value Partners Asia Dividend Value Partners Hong Kong Limited FIXED INCOME FUNDS AMG Managers Amundi Intermediate Government AMG Managers Amundi Short Duration Government Amundi Pioneer Institutional Asset Management, Inc. AMG Managers Doubleline Core Plus Bond DoubleLine Capital LP AMG Managers Global Income Opportunity AMG Managers Loomis Sayles Bond Loomis, Sayles & Co., L.P. |
| | | | |
| | | | | |
| amgfunds.com | | | | 123117 AR078 |
| | | | |
Registrant has adopted a Code of Ethics. See attached Exhibit (a)(1).
| Item 3. | AUDIT COMMITTEE FINANCIAL EXPERT |
Registrant’s Board of Trustees has determined that independent Trustee Mr. Steven J. Paggioli qualifies as an Audit Committee Financial Expert. Mr. Paggioli is “independent” as such term is defined in Form N-CSR.
| Item 4. | PRINCIPAL ACCOUNTANT FEES AND SERVICES |
(a) Audit Fees
The aggregate fees billed by the Funds’ independent registered public accounting firm, PricewaterhouseCoopers LLP (“PwC”), to the Funds for the Funds’ two most recent fiscal years for professional services rendered for audits of annual financial statements, or services that are normally provided in connection with statutory and regulatory filings or engagements (“Audit Fees”) were as follows:
| | | | | | | | |
Fund - AMG Funds III | | Fiscal 2017 | | | Fiscal 2016 | |
AMG Managers Special Equity Fund | | $ | 22,550 | | | $ | 20,471 | |
AMG Managers Loomis Sayles Bond Fund | | $ | 71,784 | | | $ | 50,294 | |
AMG Managers Global Income Opportunity Fund | | $ | 31,843 | | | $ | 31,539 | |
(b) Audit-Related Fees
There were no fees billed by PwC to the Funds in their two recent fiscal years for services rendered for assurance and related services that are reasonably related to the performance of the audit or review of the Fund’s financial statements, but are not reported as Audit Fees (“Audit-Related Fees”).
For the Funds’ two most recent fiscal years, there were no Audit-Related Fees billed by PwC for engagements related directly to the operations and financial reporting of one or more Funds by a Fund Service Provider. A Fund Service Provider is (a) any investment adviser to the Fund (not including any Subadvisor whose role is primarily portfolio management and is subcontracted with or overseen by another investment adviser) or (b) any entity that provides ongoing services to the Fund and is controlling, controlled by or under common control with a Fund investment adviser described in (a).
(c) Tax Fees
The aggregate fees billed by PwC to the Funds for the two most recent fiscal years for professional services rendered for tax compliance, tax advice, and tax planning (“Tax Fees”) were as follows:
| | | | | | | | |
Fund - AMG Funds III | | Fiscal 2017 | | | Fiscal 2016 | |
AMG Managers Special Equity Fund | | $ | 7,369 | | | $ | 7,369 | |
AMG Managers Loomis Sayles Bond Fund | | $ | 9,425 | | | $ | 9,425 | |
AMG Managers Global Income Opportunity Fund | | $ | 9,425 | | | $ | 9,425 | |
For the Funds’ two most recent fiscal years, Tax Fees billed by PwC for engagements by Fund Service Providers that related directly to the operations and financial reporting of the Funds were $0 for fiscal 2017 and $0 for fiscal 2016, respectively.
The services for which Tax Fees were charged comprise all services performed by professional staff in PwC’s tax division except those services related to the audit. Typically, this category would include fees for tax compliance, tax planning, and tax advice. Tax compliance, tax advice, and tax planning services include preparation of original and amended tax returns, claims for refund and tax payment-planning services, assistance with tax audits and appeals, tax advice related to mergers and acquisitions and requests for rulings or technical advice from taxing authorities.
(d) All Other Fees
There were no other fees billed by PwC to the Funds for all other non-audit services (“Other Fees”) during the Funds’ two most recent fiscal years. During the same period, there were no Other Fees billed by PwC for engagements by Fund Service Providers that related directly to the operations and financial reporting of the Funds.
(e)(1)According to policies adopted by the Audit Committee, services provided by PwC to the Funds must be pre-approved by the Audit Committee. On an annual basis, the Audit Committee reviews and pre-approves various types of services that PwC may perform for the Funds without specific approval of each engagement, subject to specified budget limitations. As contemplated by the Sarbanes-Oxley Act of 2002 and related SEC rules, the Audit Committee also pre-approves non-audit services provided by PwC to any Fund Service Provider for any engagement that relates directly to the operations and financial reporting of the Funds. Any engagement that is not already pre-approved or that will exceed a pre-approved budget must be submitted to the Audit Committee for pre-approval. The Chairman of the Audit Committee is authorized on behalf of the Board of Trustees and the Audit Committee to approve the engagement of PwC to perform non-audit services subject to certain conditions, including notification to the Audit Committee of such pre-approval not later than the next meeting of the Audit Committee following the date of such pre-approval.
(e)(2) None.
(f) Not applicable.
(g) The aggregate fees billed by PwC in 2017 and 2016 for non-audit services rendered to the Funds and Fund Service Providers were $109,919 and $58,619, respectively. For the fiscal year ended December 31, 2017, this amount reflects the amounts disclosed above in Item 4(b),(c),(d), plus $83,700 in fees billed to the Fund Service Providers for non-audit services that did not relate directly to the operations and financial reporting of the Funds. For the fiscal year ended December 31, 2016, this amount reflects the amounts disclosed above in Item 4(b),(c),(d), plus $32,400 in fees billed to the Fund Service Providers for non-audit services that did not relate directly to the operations and financial reporting of the Funds.
(h) The Trust’s Audit Committee has considered whether the provision of non-audit services by registrant’s independent registered public accounting firm to the registrant’s investment advisor, and any entity controlling, controlled, or under common control with the investment advisor that provided ongoing services to the registrant that were not pre-approved by the Committee (because such services did not relate directly to the operations and financial reporting of the registrant) was compatible with maintaining the independence of the independent registered public accounting firm.
| Item 5. | AUDIT COMMITTEE OF LISTED REGISTRANTS |
Not applicable.
| Item 6. | SCHEDULE OF INVESTMENTS |
The schedule of investments in unaffiliated issuers as of the close of the reporting period is included as part of the shareholder report contained in Item 1 hereof.
| Item 7. | DISCLOSURE OF PROXY VOTING POLICIES AND PROCEDURES FOR CLOSED-END MANAGEMENT INVESTMENT COMPANIES |
Not applicable.
| Item 8. | PORTFOLIO MANAGERS OF CLOSED-END MANAGEMENT INVESTMENT COMPANIES |
Not applicable.
| Item 9. | PURCHASES OF EQUITY SECURITIES BY CLOSED-END MANAGEMENT INVESTMENT COMPANIES AND AFFILIATED PURCHASERS |
Not applicable.
| Item 10. | SUBMISSION OF MATTERS TO A VOTE OF SECURITY HOLDERS |
Not applicable.
| Item 11. | CONTROLS AND PROCEDURES |
(a) The Registrant’s principal executive and principal financial officers have concluded, based on their evaluation of the registrant’s disclosure controls and procedures as of a date within 90 days of the filing of this report, that the Registrant’s disclosure controls and procedures are reasonably designed to ensure that information required to be disclosed by the Registrant on Form N-CSR is recorded, processed, summarized and reported within the required time periods and that information required to be disclosed by the registrant in the reports that it files or submits on Form N-CSR is accumulated and communicated to the Registrant’s management, including its principal executive and principal financial officers, as appropriate to allow timely decisions regarding required disclosure.
(b) There were no changes in the Registrant’s internal control over financial reporting during the Registrant’s fourth fiscal quarter of the period covered by this report that have materially affected, or are reasonably likely to affect, the internal control over financial reporting.
| Item 12. | DISCLOSURE OF SECURITIES LENDING ACTIVITIES FOR CLOSED-END MANAGEMENT INVESTMENT COMPANIES |
Not applicable.
| | |
| (a)(1) | | Any Code of Ethics or amendments hereto. Filed herewith. |
| |
| (a)(2) | | Certifications pursuant to Rule 30a-2(a) under the Investment Company Act of 1940 - Filed herewith. |
| |
| (a)(3) | | Not applicable. |
| |
| (b) | | Certifications pursuant to Rule 30a-2(b) under the Investment Company Act of 1940 - Filed herewith. |
SIGNATURES
Pursuant to the requirements of the Securities Exchange Act of 1934 and the Investment Company Act of 1940, the registrant has duly caused this report to be signed on its behalf by the undersigned, thereunto duly authorized.
AMG FUNDS III
| | |
| By: | | /s/ Jeffrey T. Cerutti |
| | Jeffrey T. Cerutti, Principal Executive Officer |
| |
| Date: | | March 9, 2018 |
Pursuant to the requirements of the Securities Exchange Act of 1934 and the Investment Company Act of 1940, this report has been signed below by the following persons on behalf of the registrant and in the capacities and on the dates indicated.
| | |
| By: | | /s/ Jeffrey T. Cerutti |
| | Jeffrey T. Cerutti, Principal Executive Officer |
| |
| Date: | | March 9, 2018 |
| |
| By: | | /s/ Thomas Disbrow |
| | Thomas Disbrow, Principal Financial Officer |
| |
| Date: | | March 9, 2018 |