UNITED STATES
SECURITIES AND EXCHANGE COMMISSION
Washington, D.C. 20549
FORM N-CSR
CERTIFIED SHAREHOLDER REPORT OF REGISTERED
MANAGEMENT INVESTMENT COMPANIES
Investment Company Act file number: 811-03752
AMG Funds III
(Exact name of registrant as specified in charter)
600 Steamboat Road, Suite 300, Greenwich, Connecticut 06830
(Address of principal executive offices) (Zip code)
AMG Funds LLC
600 Steamboat Road, Suite 300, Greenwich, Connecticut 06830
(Name and address of agent for service)
Registrant’s telephone number, including area code: (203) 299-3500
Date of fiscal year end: May 31
Date of reporting period: June 1, 2016 – May 31, 2017
(Annual Shareholder Report)
| Item | 1. Reports to Shareholders |
| | | | |
 | | | | ANNUAL REPORT |
| | | | | | |
| | | |
| | | AMG Funds | | |
| | | | |
| | | May 31, 2017 | | | | |
| | |
| | | AMG Managers Cadence Capital Appreciation Fund |
| | | Class N: MPAFX | | | Class I: MCFYX | | | Class Z: MPCIX |
| | |
| | | AMG Managers Cadence Mid Cap Fund |
| | | Class N: MCMAX | | | Class I: MCMYX | | | Class Z: MCMFX |
| | |
| | | AMG Managers Cadence Emerging Companies Fund |
| | | Class N: MECAX | | | Class I: MECIX | | | Class Z: MECZX |
| | |
| | | |
www.amgfunds.com | | AR065-0517 |
|
| AMG Funds |
| Annual Report—May 31, 2017 |
| | | | | | | | |
| | | TABLE OF CONTENTS | | | PAGE | | | |
| | | LETTER TO SHAREHOLDERS | | | 2 | | | |
| | | | |
| | | ABOUT YOUR FUND’S EXPENSES | | | 3 | | | |
| | | | |
| | | PORTFOLIO MANAGER’S COMMENTS, FUND SNAPSHOTS, AND SCHEDULES OF PORTFOLIO INVESTMENTS | | | | | | |
| | | | |
| | | AMG Managers Cadence Capital Appreciation Fund | | | 4 | | | |
| | | | |
| | | AMG Managers Cadence Mid Cap Fund | | | 9 | | | |
| | | | |
| | | AMG Managers Cadence Emerging Companies Fund | | | 14 | | | |
| | | | |
| | | NOTES TO SCHEDULES OF PORTFOLIO INVESTMENTS | | | 19 | | | |
| | | | |
| | | FINANCIAL STATEMENTS | | | | | | |
| | | | |
| | | Statement of Assets and Liabilities | | | 21 | | | |
| | | Balance sheets, net asset value (NAV) per share computations and cumulative undistributed amounts | | | | | | |
| | | | |
| | | Statement of Operations | | | 23 | | | |
| | | Detail of sources of income, expenses, and realized and unrealized gains (losses) during the fiscal year | | | | | | |
| | | | |
| | | Statements of Changes in Net Assets | | | 24 | | | |
| | | Detail of changes in net assets for the past two fiscal years | | | | | | |
| | | | |
| | | Financial Highlights | | | 25 | | | |
| | | Historical net asset values per share, distributions, total returns, income and expense ratios, turnover ratios and net assets | | | | | | |
| | | | |
| | | Notes to Financial Highlights | | | 30 | | | |
| | | | |
| | | Notes to Financial Statements | | | 31 | | | |
| | | Accounting and distribution policies, details of agreements and transactions with Fund management and affiliates, and descriptions of certain investment risks | | | | | | |
| | | | |
| | | REPORT OF INDEPENDENT REGISTERED PUBLIC ACCOUNTING FIRM | | | 39 | | | |
| | | | |
| | | TRUSTEES AND OFFICERS | | | 40 | | | |
Nothing contained herein is to be considered an offer, sale or solicitation of an offer to buy shares of any series of the AMG Funds family of mutual funds. Such offering is made only by prospectus, which includes details as to offering price and other material information.
| | | | |
| | | | |
| | | Letter to Shareholders | | |
| | | | |
DEAR SHAREHOLDER:
The last 12 months was a robust period for U.S. equity markets as investor confidence and the U.S. economy continued to expand. The S&P 500 Index, a widely followed barometer of the U.S. equity market, returned 17.5% over the last 12 months. Small cap stocks performed even better with a 20.4% return for the small cap Russell 2000®Index.
During the period, investors had to balance a number of noteworthy events, including the U.K.’s exit from the European Union (“Brexit”), a contentious U.S. presidential election and the U.S. Federal Reserve’s third interest rate increase. Following the surprising election results, pro-cyclical sectors rallied, especially financials, as the new administration’s plans for tax reform and increased fiscal spending drove a reflationary theme of stronger future economic growth. The first half of 2017 was marked by low volatility which further supported the rally in equity prices. Investors witnessed the S&P 500 Index, NASDAQ Composite Index® and Dow Jones Industrial Index® all post record highs, with very little volatility. So far this year, the S&P 500 Index has steadily risen without a drawdown greater than around (2.5)%.
In total, all but two sectors of the S&P 500 were positive during the prior 12 months; however, there was significant dispersion in performance across sectors. Information technology and financials stocks led the Index with returns of 33.8% and 23.1%, respectively, while companies within the energy and telecommunication services sectors were the laggards with returns of (0.8)% and (0.6)%, respectively. International stock performance significantly improved from the prior year (helped by a weakening U.S. Dollar over the last half of the year) with a return of 18.2%, as measured by the MSCI ACWI ex USA Index. Additionally, emerging markets stocks strongly outperformed developed market stocks, as the MSCI Emerging Market Index ended the period at 27.4%, against the MSCI EAFE Index’s 16.4%.
The Bloomberg Barclays U.S. Aggregate Bond Index, a broad U.S. bond market benchmark, returned 1.6% for the year ended May 31, 2017. Over the period, interest rates finished higher but did experience several pullbacks along the way. Following the Brexit vote in late June, investors briefly took shelter in U.S. Treasuries, sending the 10-year U.S. Treasury yield to a historical low of 1.37%. However, bond investors were negatively impacted when 10-year rates spiked more than 100 basis points from that low point following the presidential election. More recently, 10-year rates have fallen below their post-election highs to 2.21% as the yield curve has flattened. High yield bonds, on the other hand, have performed strongly, as investor risk appetite improved and credit spreads tightened during the fiscal year. The Bloomberg Barclays U.S. Corporate High Yield Index ended the period with a 13.6% return.
We are excited to announce that as of October 1, 2016, the AMG Funds family of mutual funds fully integrated the former Aston Funds. AMG Funds and Aston Funds shareholders now have access to the differentiated solutions of AMG
Funds, which represents a single point of access to one of the largest line-ups of boutique managers and products in the world.
AMG Funds appreciates the privilege of providing investment tools to you and your clients. Our foremost goal at AMG Funds is to provide investment solutions that help our shareholders successfully reach their long-term investment goals. By partnering with AMG’s affiliated investment boutiques, AMG Funds provides access to a distinctive array of actively managed return-oriented investment strategies. Additionally, we oversee and distribute a number of complementary open-architecture mutual funds subadvised by unaffiliated investment managers. We thank you for your continued confidence and investment in AMG Funds. You can rest assured that under all market conditions our team is focused on delivering excellent investment management services for your benefit.
Respectfully,

Jeffery Cerutti
President
AMG Funds
| | | | | | | | |
| Average Annual Total Returns | | Periods ended May 31, 2017* |
Stocks: | | | | 1 Year | | 3 Years | | 5 Years |
| Large Caps | | (S&P 500 Index) | | 17.47% | | 10.14% | | 15.42% |
| | | | |
| Small Caps | | (Russell 2000® Index) | | 20.36% | | 8.00% | | 14.04% |
| | | | |
| International | | (MSCI All Country World Index ex USA) | | 18.24% | | 1.26% | | 8.39% |
Bonds: | | | | | | | | |
| Investment Grade | | (Bloomberg Barclays U.S. Aggregate Bond Index) | | 1.58% | | 2.53% | | 2.24% |
| | | | |
| High Yield | | (Bloomberg Barclays U.S. Corporate High Yield Index) | | 13.58% | | 4.73% | | 7.31% |
| | | | |
| Tax-exempt | | (Bloomberg Barclays Municipal Bond Index) | | 1.46% | | 3.49% | | 3.31% |
| | | | |
| Treasury Bills | | (BofA Merrill Lynch 6-month U.S. Treasury Bill) | | 0.65% | | 0.41% | | 0.32% |
* Source: FactSet. Past performance is no guarantee of future results.
| | | | |
| | | | | |
| | | | | |
| | | About Your Fund’s Expenses | | |
| | |
As a shareholder of a Fund, you may incur two types of costs: (1) transaction costs, which may include sales charges (loads) on purchase payments; redemption fees; and exchange fees; and (2) ongoing costs, including management fees; distribution (12b-1) fees; and other Fund expenses. This example is intended to help you understand your ongoing costs (in dollars) of investing in the Fund and to compare these costs with the ongoing costs of investing in other mutual funds. The example is based on $1,000 invested at the beginning of the period and held for the entire period as indicated below. ACTUAL EXPENSES The first line of the following table provides information about the actual account values and actual expenses. You may use the information in this line, together with the amount you invested, to estimate the expenses that you paid over the period. Simply divide your account value by $1,000 (for example, an $8,600 account value divided by $1,000 = 8.6), then multiply the result by the number in the first line under the heading entitled “Expenses Paid During Period” to estimate the expenses you paid on your account during this period. HYPOTHETICAL EXAMPLE FOR COMPARISON PURPOSES The second line of the following table provides information about hypothetical account values and hypothetical expenses based on the Fund’s actual expense ratio and an assumed annual rate of return of 5% before expenses, which is not the Fund’s actual return. The hypothetical account values and expenses may not be used to estimate the actual ending account balance or expenses you paid for the period. You may use this information to compare the ongoing costs of investing in the Fund and other funds by comparing this 5% hypothetical example with the 5% hypothetical examples that appear in the shareholder reports of other funds. Please note that the expenses shown in the table are meant to highlight your ongoing costs only and do not reflect any transactional costs, such as sales charges (loads), redemption fees, or exchange fees. Therefore, the second line of the table is useful in comparing ongoing costs only, and will not help you determine the relative total costs of owning different funds. | | |
| | | | | | | | | | | | | | | | |
| Six Months Ended May 31, 2017 | | Expense
Ratio for
the Period | | | Beginning
Account Value
12/1/16 | | | Ending
Account Value
05/31/17 | | | Expenses
Paid During
the Period* | |
| AMG Managers Cadence Capital Appreciation Fund | |
| | | | |
| Class N | | | | | | | | | | | | | | | | |
| | | | |
| Based on Actual Fund Return | | | 1.07% | | | | $1,000 | | | | $1,151 | | | | $5.74 | |
| | | | |
| Hypothetical (5% return before expenses) | | | 1.07% | | | | $1,000 | | | | $1,020 | | | | $5.39 | |
| | | | |
| Class I | | | | | | | | | | | | | | | | |
| | | | |
| Based on Actual Fund Return | | | 0.91% | | | | $1,000 | | | | $1,152 | | | | $4.88 | |
| | | | |
| Hypothetical (5% return before expenses) | | | 0.91% | | | | $1,000 | | | | $1,020 | | | | $4.58 | |
| | | | |
| Class Z | | | | | | | | | | | | | | | | |
| | | | |
| Based on Actual Fund Return | | | 0.72% | | | | $1,000 | | | | $1,152 | | | | $3.86 | |
| | | | |
Hypothetical (5% return before expenses) | | | 0.72% | | | | $1,000 | | | | $1,021 | | | | $3.63 | |
| AMG Managers Cadence Mid Cap Fund | |
| | | | |
| Class N | | | | | | | | | | | | | | | | |
| | | | |
| Based on Actual Fund Return | | | 1.10% | | | | $1,000 | | | | $1,113 | | | | $5.80 | |
| | | | |
| Hypothetical (5% return before expenses) | | | 1.10% | | | | $1,000 | | | | $1,019 | | | | $5.54 | |
| | | | |
| Class I | | | | | | | | | | | | | | | | |
| | | | |
| Based on Actual Fund Return | | | 0.90% | | | | $1,000 | | | | $1,114 | | | | $4.74 | |
| | | | |
| Hypothetical (5% return before expenses) | | | 0.90% | | | | $1,000 | | | | $1,020 | | | | $4.53 | |
| | | | |
| Class Z | | | | | | | | | | | | | | | | |
| | | | |
| Based on Actual Fund Return | | | 0.72% | | | | $1,000 | | | | $1,115 | | | | $3.80 | |
| | | | |
Hypothetical (5% return before expenses) | | | 0.72% | | | | $1,000 | | | | $1,021 | | | | $3.63 | |
| AMG Managers Cadence Emerging Companies Fund** | |
| | | | |
| Class N | | | | | | | | | | | | | | | | |
| | | | |
| Based on Actual Fund Return | | | 1.62% | | | | $1,000 | | | | $1,068 | | | | $8.35 | |
| | | | |
| Hypothetical (5% return before expenses) | | | 1.62% | | | | $1,000 | | | | $1,017 | | | | $8.15 | |
| |
| Class I | | | | |
| | | | |
| Based on Actual Fund Return | | | 1.42% | | | | $1,000 | | | | $1,069 | | | | $7.33 | |
| | | | |
| Hypothetical (5% return before expenses) | | | 1.42% | | | | $1,000 | | | | $1,018 | | | | $7.14 | |
| * | Expenses are equal to the Fund’s annualized expense ratio multiplied by the average account value over the period, multiplied by the number of days in the most recent fiscal half-year (182), then divided by 365. |
| ** | Effective at the close of business May 31, 2017, Emerging Companies added Class Z shares. |
| | | | |
| | | | | |
| | | AMG Managers Cadence Capital Appreciation Fund | | |
| | | Portfolio Manager’s Comments (unaudited) | | |
| | | | | | | | |
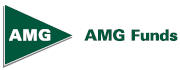
For the fiscal year ended May 31, 2017, the AMG Managers Cadence Capital Appreciation Fund (Class Z)1(the “Fund”) returned 21.97%, compared to its benchmark, the Russell 1000® Growth Index, which returned 20.27%. PERFORMANCE SUMMARY The fiscal year ended May 31, 2017, was filled with many market-moving events that gave investors reason to believe in stocks across the market cap spectrum. Within the growth sector, large cap stocks led their mid cap and small cap brethren for the twelve-month period ending May 31, 2017. Specifically, the Russell 1000®Growth Index was up 20.3% for the year, versus the Russell Midcap®Growth Index at 16.7% and the Russell 2000®Growth Index at 19.7%. The Fund outperformed its benchmark during the fiscal year. Industrials, health care and materials all contributed positively to absolute and relative performance, while financials, information technology and consumer staples detracted. An overweight position along with positive stock selection in the industrials sector was a contributor to relative performance. Likewise, an underweight position along with positive stock selection in the health care sector also contributed. The Fund had positive stock selection in the materials sector. Meanwhile, an overweight position and weak stock selection in financials and consumer staples detracted from performance. Stock selection in the information technology sector also modestly detracted from results. FISCAL YEAR IN REVIEW This fiscal year started with a loud thud across the Atlantic Ocean when the U.K. voted to exit the | | | | European Union (“Brexit”), an outcome that stock markets around the world had not accounted for. However, stocks recovered quickly and within a week had made up most, if not all, of the losses immediately following the historic vote. The next focus for investors was the looming U.S. presidential election in November, pitting Donald Trump against veteran politician Hillary Clinton. While Trump was handily beating his numerous Republican competitors for the party’s nomination, Clinton was in more of a dogfight with Bernie Sanders, though not many expected her to lose the Democratic vote. Politics being politics, former FBI head James Comey figured into the possible results with what amounted to an exoneration of Clinton’s use of a personal server while serving as U.S. Secretary of State under President Obama. However, Comey again surfaced closer to the election in late October with his implication that there might be more sensitive emails that could be incriminating. Lost in all of this was Donald Trump’s ability to stay relevant. Trump would eventually win a historic election on November 8, triggering a bounce in the stock market as the “Trump trade” pushed financial, industrial, material and commodity stocks higher on hopes of major infrastructure spending and lower individual and corporate taxes spurring more spending. Since that time, many of those stocks have pulled back as investors ponder President Trump’s ability to push through his agenda. Oil has also continued to be a story for investors as strength in the latter half of 2016 gave way to weakness so far in 2017. Despite OPEC cutbacks, the recovery in oil prices prompted U.S. shale producers to increase production, which has | | | | resulted in a supply/demand imbalance that could last longer than some experts have predicted. While these low oil prices are a positive for consumers, some worry that the weak price is signaling an economic slowdown. MARKET OUTLOOK Markets remain volatile within sectors, despite the overall market showing little, if any, true volatility. We believe the U.S. economy is on solid ground, and with three Fed hikes in the past year we believe the Fed feels the same way. Major European economies also appear to be on the mend, auguring well for U.S. companies with exposure to that part of the world. First quarter earnings were better than expected, in particular top-line growth, an important barometer for investors. Rates have come down since the election and easy money should continue to spur mergers and acquisitions. While macro factors will always sway stocks, we continue to try to identify companies with improving fundamentals and attractive valuations to provide long-term appreciation to shareholders. Thank you for your continued trust. 1 Priorto October 1, 2016, the Fund’s Class Z shares were known as Institutional Shares. This commentary reflects the viewpoints of the portfolio manager, Cadence Capital Management, LLC. as of May 31, 2017 and is not intended as a forecast or guarantee of future results and is subject to change without notice. |
| | | | |
| | | | | |
| | | AMG Managers Cadence Capital Appreciation Fund | | |
| | | Portfolio Manager’s Comments (continued) | | |
CUMULATIVE TOTAL RETURN PERFORMANCE
AMG Managers Cadence Capital Appreciation Fund’s cumulative total return is based on the daily change in net asset value (NAV), and assumes that all dividends and distributions were reinvested. This graph compares a hypothetical $10,000 investment made in AMG Managers Cadence Capital Appreciation Fund’s Class Z (formerly Institutional Class) on May 31, 2007, to a $10,000 investment made in the Russell 1000® Growth Index for the same time period. The graph and table do not reflect the deduction of taxes that a shareholder would pay on a Fund distribution or redemption of shares. The listed returns for the Fund are net of expenses and the returns for the index exclude expenses. Total returns would have been lower had certain expenses not been reduced.
The table below shows the average annual total returns for the AMG Managers Cadence Capital Appreciation Fund and the Russell 1000® Growth Index for the same time periods ended May 31, 2017.
| | | | | | | | | | | | |
Average Annual Total Returns1 | | One
Year | | | Five
Years | | | Ten
Years | |
AMG Managers Cadence Capital Appreciation Fund 2,3,4,5 | | | | | | | | | | | | |
Class N6 | | | 21.54 | % | | | 14.12 | % | | | 5.23% | |
| | | |
Class I6 | | | 21.77 | % | | | 14.27 | % | | | 5.39% | |
| | | |
Class Z6 | | | 21.97 | % | | | 14.53 | % | | | 5.64% | |
| | | | |
Russell 1000® Growth Index 7 | | | 20.27 | % | | | 15.98 | % | | | 8.77% | |
The performance data shown represents past performance. Past performance is not a guarantee of future results. Current performance may be lower or higher than the performance data quoted. The investment return and principal value of an investment will fluctuate so that an investor’s shares, when redeemed, may be worth more or less than their original cost.
Investors should carefully consider the Fund’s investment objectives, risks, charges, and expenses before investing. For performance information through the most recent month end, current net asset values per share for the Fund and other information, please call (800) 835-3879 or visit our website at www.amgfunds.com for a free prospectus. Read it carefully before investing or sending money.
Distributed by AMG Distributors, Inc., member FINRA/SIPC.
| | |
| | | 1 Total return equals income yield plus share price change and assumes reinvestment of all dividends and capital gain distributions. Returns are net of fees and may reflect offsets of Fund expenses as described in the prospectus. No adjustment has been made for taxes payable by shareholders on their reinvested dividends and capital gain distributions. Returns for periods greater than one year are annualized. The listed returns on the Fund are net of expenses and based on the published NAV as of May 31, 2017. All returns are in U.S. dollars ($). 2 From time to time, the Fund’s advisor has waived its fees and/or absorbed Fund expenses, which has resulted in higher returns. 3 The Fund invests in large-capitalization companies that may underperform other stock funds (such as funds that focus on small- and medium-capitalization companies) when stocks of large-capitalization companies are out of favor. 4 The Fund is subject to special risk considerations similar to those associated with the direct ownership of real estate. Real estate valuations may be subject to factors such as changing general and local economic, financial, competitive, and environmental conditions. 5 The Fund invests in growth stocks, which may be more sensitive to market movements because their prices tend to reflect future investor expectations rather than just current profits. Growth stocks may underperform value stocks during given periods. 6 Effective October 1, 2016, the Investor Class, Service Class and Institutional Class were renamed Class N, Class I and Class Z, respectively. 7 The Russell 1000® Growth Index is a market capitalization weighted index that measures the performance of those Russell 1000® companies with higher price-to-book ratios and higher forecasted growth values. Unlike the Fund, the Russell 1000® Growth Index is unmanaged, is not available for investment and does not incur expenses. The Russell 1000® Growth Index is a trademark of the London Stock Exchange Group Companies. Not FDIC insured, nor bank guaranteed. May lose value. |
| | | | |
| | | | | |
| | | AMG Managers Cadence Capital Appreciation Fund | | |
| | | Fund Snapshots (unaudited) May 31, 2017 | | |
PORTFOLIO BREAKDOWN
| | | | | | | | |
Sector | | AMG Managers Cadence Capital Appreciation Fund* | | Russell 1000®
Growth Index | | | |
Information Technology | | 30.8% | | 33.9% | | | | |
| | | | |
Consumer Discretionary | | 19.7% | | 20.8% | | | | |
| | | | |
Health Care | | 14.6% | | 15.5% | | | | |
| | | | |
Industrials | | 11.2% | | 10.5% | | | | |
| | | | |
Consumer Staples | | 11.1% | | 9.0% | | | | |
| | | | |
Financials | | 6.5% | | 2.8% | | | | |
| | | | |
Energy | | 2.3% | | 0.4% | | | | |
| | | | |
Materials | | 2.0% | | 3.5% | | | | |
| | | | |
Real Estate | | 1.8% | | 2.7% | | | | |
| | | | |
Telecommunication Services | | 0.0% | | 0.9% | | | | |
| * | As a percentage of net assets. |
TOP TEN HOLDINGS
| | | | | | |
| Security Name | | | | | % of Net
Assets |
Facebook, Inc., Class A** | | | | | | 3.9% |
| | | |
Apple, Inc.** | | | | | | 3.8 |
| | | |
Amazon.com, Inc. | | | | | | 3.4 |
| | | |
The Home Depot, Inc.** | | | | | | 3.4 |
| | | |
Microsoft Corp.** | | | | | | 3.2 |
| | | |
Alphabet, Inc., Class A** | | | | | | 3.1 |
| | | |
Alphabet, Inc., Class C** | | | | | | 2.6 |
| | | |
The Priceline Group, Inc. | | | | | | 2.2 |
| | | |
The Boeing Co.** | | | | | | 2.2 |
| | | |
MasterCard, Inc., Class A** | | | | | | 2.1 |
| | | | | | | |
| | |
Top Ten as a Group | | | 29.9% |
| | | | | | |
** Top Ten Holdings as of November 30, 2016.
Because a fund’s strategy may result in multiple investments in particular sectors of the economy, its performance may depend on the performance of those sectors and may fluctuate more widely than investments diversified across more sectors. For additional information on these and other risk considerations, please see the Fund’s prospectus.
Any sectors, industries, or securities discussed should not be perceived as investment recommendations. Mention of a specific security should not be considered a recommendation to buy or solicitation to sell that security. Specific securities mentioned in this report may have been sold from the Fund’s portfolio of investments by the time you receive this report.
| | | | |
| | | | | |
| | | AMG Managers Cadence Capital Appreciation Fund | | |
| | | Schedule of Portfolio Investments May 31, 2017 | | |
| | | | | | | | |
| | | | Shares | | | | Value | |
Common Stocks - 100.0% | | | | | | | | |
| | |
Consumer Discretionary - 19.7% | | | | | | | | |
| | |
Amazon.com, Inc.* | | | 3,811 | | | | $3,790,497 | |
| | |
Delphi Automotive PLC | | | 14,531 | | | | 1,278,292 | |
| | |
Dollar Tree, Inc.* | | | 11,604 | | | | 901,631 | |
| | |
Foot Locker, Inc. | | | 12,848 | | | | 763,300 | |
| | |
The Home Depot, Inc. | | | 24,643 | | | | 3,782,947 | |
| | |
Michael Kors Holdings, Ltd.* | | | 19,023 | | | | 631,183 | |
| | |
Omnicom Group, Inc. | | | 14,728 | | | | 1,233,028 | |
| | |
The Priceline Group, Inc.* | | | 1,314 | | | | 2,466,496 | |
| | |
Scripps Networks Interactive, Inc., Class A2 | | | 17,060 | | | | 1,129,713 | |
| | |
Starbucks Corp. | | | 31,251 | | | | 1,987,876 | |
| | |
The TJX Cos., Inc. | | | 21,372 | | | | 1,607,388 | |
| | |
Ulta Beauty, Inc.* | | | 2,800 | | | | 853,552 | |
| | |
Wyndham Worldwide Corp. | | | 14,018 | | | | 1,415,678 | |
| | |
Total Consumer Discretionary | | | | | | | 21,841,581 | |
| | |
Consumer Staples - 11.1% | | | | | | | | |
| | |
Church & Dwight Co., Inc. | | | 26,265 | | | | 1,356,850 | |
| | |
The Clorox Co. | | | 9,483 | | | | 1,287,128 | |
| | |
Colgate-Palmolive Co. | | | 16,402 | | | | 1,252,457 | |
| | |
Constellation Brands, Inc., Class A | | | 5,689 | | | | 1,039,665 | |
| | |
CVS Health Corp. | | | 15,582 | | | | 1,197,165 | |
| | |
General Mills, Inc. | | | 18,148 | | | | 1,029,717 | |
| | |
Mondelez International, Inc., Class A | | | 21,722 | | | | 1,012,028 | |
| | |
Philip Morris International, Inc. | | | 17,522 | | | | 2,099,136 | |
| | |
Spectrum Brands Holdings, Inc.2 | | | 7,680 | | | | 1,032,576 | |
| | |
Sysco Corp. | | | 17,653 | | | | 963,148 | |
| | |
Total Consumer Staples | | | | | | | 12,269,870 | |
| | |
Energy - 2.3% | | | | | | | | |
| | |
Anadarko Petroleum Corp. | | | 8,328 | | | | 420,814 | |
| | |
EOG Resources, Inc. | | | 8,934 | | | | 806,830 | |
| | |
Halliburton Co. | | | 17,644 | | | | 797,332 | |
| | |
Kinder Morgan, Inc. | | | 27,520 | | | | 516,275 | |
| | |
Total Energy | | | | | | | 2,541,251 | |
| | |
Financials - 6.5% | | | | | | | | |
| | |
American Express Co. | | | 19,739 | | | | 1,518,719 | |
| | |
JPMorgan Chase & Co. | | | 14,901 | | | | 1,224,117 | |
| | |
Marsh & McLennan Cos., Inc. | | | 20,322 | | | | 1,576,174 | |
| | |
S&P Global, Inc. | | | 7,978 | | | | 1,139,338 | |
| | |
T. Rowe Price Group, Inc. | | | 12,589 | | | | 886,769 | |
| | | | | | | | |
| | | | Shares | | | | Value | |
Wells Fargo & Co. | | | 18,182 | | | | $929,827 | |
| | |
Total Financials | | | | | | | 7,274,944 | |
| | |
Health Care - 14.6% | | | | | | | | |
| | |
Aetna, Inc. | | | 10,037 | | | | 1,453,960 | |
| | |
AmerisourceBergen Corp. | | | 11,398 | | | | 1,045,994 | |
| | |
Biogen, Inc.* | | | 4,592 | | | | 1,137,760 | |
| | |
Cardinal Health, Inc. | | | 13,144 | | | | 976,468 | |
| | |
Danaher Corp. | | | 15,533 | | | | 1,319,373 | |
| | |
Gilead Sciences, Inc. | | | 23,610 | | | | 1,532,053 | |
| | |
HCA Holdings, Inc.* | | | 16,234 | | | | 1,329,727 | |
| | |
Johnson & Johnson | | | 12,934 | | | | 1,658,785 | |
| | |
Mettler-Toledo International, Inc.* | | | 2,871 | | | | 1,673,247 | |
| | |
Quintiles IMS Holdings, Inc.*,2 | | | 15,454 | | | | 1,335,844 | |
| | |
UnitedHealth Group, Inc. | | | 7,519 | | | | 1,317,178 | |
| | |
Zoetis, Inc. | | | 22,072 | | | | 1,374,644 | |
| | |
Total Health Care | | | | | | | 16,155,033 | |
| | |
Industrials - 11.2% | | | | | | | | |
| | |
Alaska Air Group, Inc. | | | 13,215 | | | | 1,150,366 | |
| | |
The Boeing Co. | | | 12,985 | | | | 2,436,376 | |
| | |
Expeditors International of Washington, Inc. | | | 18,531 | | | | 989,185 | |
| | |
General Dynamics Corp. | | | 6,419 | | | | 1,304,662 | |
| | |
Huntington Ingalls Industries, Inc. | | | 7,145 | | | | 1,399,062 | |
| | |
Illinois Tool Works, Inc. | | | 9,258 | | | | 1,307,415 | |
| | |
Masco Corp. | | | 31,098 | | | | 1,158,400 | |
| | |
Rockwell Automation, Inc. | | | 8,469 | | | | 1,344,200 | |
| | |
United Parcel Service, Inc., Class B | | | 12,747 | | | | 1,350,800 | |
| | |
Total Industrials | | | | | | | 12,440,466 | |
| | |
Information Technology - 30.8% | | | | | | | | |
| | |
Accenture PLC, Class A | | | 16,101 | | | | 2,004,091 | |
| | |
Adobe Systems, Inc.* | | | 12,277 | | | | 1,741,615 | |
| | |
Alphabet, Inc., Class A* | | | 3,520 | | | | 3,474,557 | |
| | |
Alphabet, Inc., Class C* | | | 2,955 | | | | 2,851,161 | |
| | |
Apple, Inc. | | | 27,366 | | | | 4,180,430 | |
| | |
Broadcom, Ltd. | | | 9,512 | | | | 2,277,934 | |
| | |
Facebook, Inc., Class A* | | | 28,449 | | | | 4,308,886 | |
| | |
Intuit, Inc. | | | 12,218 | | | | 1,718,339 | |
| | |
Lam Research Corp. | | | 11,727 | | | | 1,819,679 | |
| | |
MasterCard, Inc., Class A | | | 18,830 | | | | 2,313,830 | |
| | |
Microsoft Corp. | | | 50,411 | | | | 3,520,704 | |
| | |
Paychex, Inc. | | | 20,348 | | | | 1,205,212 | |
|
|
The accompanying notes are an integral part of these financial statements. |
| 7 |
| | | | |
| | | | | |
| | | AMG Managers Cadence Capital Appreciation Fund | | |
| | | Schedule of Portfolio Investments (continued) | | |
| | | | | | | | |
| | | Shares | | | Value | |
Information Technology - 30.8% (continued) | | | | | | | | |
| | |
Red Hat, Inc.* | | | 15,105 | | | | $1,352,955 | |
| | |
Xilinx, Inc. | | | 20,182 | | | | 1,346,341 | |
| | |
Total Information Technology | | | | | | | 34,115,734 | |
| | |
Materials - 2.0% | | | | | | | | |
| | |
Celanese Corp., Series A | | | 12,821 | | | | 1,109,658 | |
| | |
Steel Dynamics, Inc. | | | 31,918 | | | | 1,084,893 | |
| | |
Total Materials | | | | | | | 2,194,551 | |
| | |
Real Estate - 1.8% | | | | | | | | |
| | |
American Tower Corp., REIT | | | 15,277 | | | | 2,004,190 | |
| | |
Total Common Stocks
(cost $80,028,641) | | | | | | | 110,837,620 | |
| |
Short-Term Investments - 2.5% | | | | | |
| |
Repurchase Agreements - 2.4%3 | | | | | |
| | |
Cantor Fitzgerald Securities, Inc., dated 05/31/17, due 06/01/17, 0.820% total to be received $1,000,023 (collateralized by various U.S. Government Agency Obligations, 0.000% - 10.500%, 06/15/17 - 03/20/67, totaling $1,020,000) | | | 1,000,000 | | | | 1,000,000 | |
| | | | | | | | |
| | | Principal
Amount | | | Value | |
Daiwa Capital Markets America, dated 05/31/17, due 06/01/17, 0.850% total to be received $1,000,024 (collateralized by various U.S. Government Agency Obligations, 0.000% - 6.500%, 06/08/17 - 12/01/51, totaling $1,020,000) | | | $1,000,000 | | | | $1,000,000 | |
| | |
Nomura Securities International, Inc., dated 05/31/17, due 06/01/17, 0.820% total to be received $666,061 (collateralized by various U.S. Government Agency Obligations, 0.000% - 9.500%, 06/01/17 - 05/20/67, totaling $679,367) | | | 666,046 | | | | 666,046 | |
| |
Total Repurchase Agreements | | | | 2,666,046 | |
| | |
| | | Shares | | | | |
| |
Other Investment Companies - 0.1% | | | | | |
| | |
Dreyfus Government Cash Management Fund, Institutional Class Shares, 0.70%1 | | | 72,809 | | | | $72,809 | |
| |
Total Short-Term Investments
(cost $2,738,855) | | | | 2,738,855 | |
| |
Total Investments - 102.5%
(cost $82,767,496) | | | | 113,576,475 | |
| |
Other Assets, less Liabilities - (2.5)% | | | | (2,811,283 | ) |
| | |
Net Assets - 100.0% | | | | | | | $110,765,192 | |
|
|
The accompanying notes are an integral part of these financial statements. |
| 8 |
| | | | |
| | | | | |
| | | AMG Managers Cadence Mid Cap Fund | | |
| | | Portfolio Manager’s Comments (unaudited) | | |
| | | | | | | | |
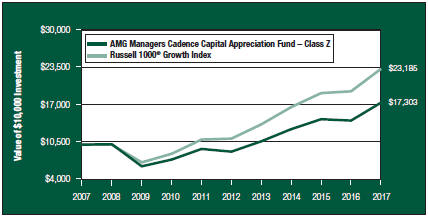
For the fiscal year ended May 31, 2017, the AMG Managers Cadence Mid Cap Fund (Class Z)1(the “Fund”) returned 17.71%, compared to its benchmark, the Russell Midcap® Growth Index, which returned 16.68%. PERFORMANCE SUMMARY The fiscal year ended May 31, 2017, was filled with many market-moving events that gave investors reason to believe in stocks across the market cap spectrum. Within the growth sector, mid-cap stocks trailed their large-cap and small-cap brethren. Said another way, mid-cap stocks underperformed both large-cap and small-cap stocks. Specifically, the Russell Midcap®Growth Index was up 16.7% in the 12 months ended May 31, 2017, but that trailed the Russell 1000®Growth Index return of 20.3% and the Russell 2000®Growth Index return of 19.7%. The Fund outperformed its benchmark during the period. Information technology, consumer discretionary and industrials all contributed positively to absolute and relative performance, while energy, real estate and financials detracted. An overweight position along with positive security selection benefitted performance in information technology. Likewise, the Fund also benefitted from an underweight and strong selection in the consumer discretionary sector. The main catalyst for the relative underweight in this sector was weak mall traffic and a hesitant consumer affecting many retail and specialty retail stocks. An overweight in the industrials sector also contributed to relative performance. Weak stock selection in energy, real estate and financials offset some of the positive attribution of information technology, consumer discretionary and industrials, but given their smaller weightings in the Russell Midcap®Growth Index and the AMG Managers Cadence Mid Cap Growth Fund, the | | | | overall impact did not completely offset the performance of those positive sectors. FISCAL YEAR IN REVIEW This fiscal year started with a loud thud across the Atlantic Ocean when the U.K. voted to exit the European Union (“Brexit”), an outcome that stock markets around the world had not accounted for. However, stocks recovered quickly and within a week had made up most, if not all, of the losses immediately following the historic vote. The next focus for investors was the looming U.S. presidential election in November, pitting Donald Trump against veteran politician Hillary Clinton. While Trump was handily beating his numerous Republican competitors for the party’s nomination, Clinton was in more of a dogfight with Bernie Sanders, though not many expected her to lose the Democratic vote. Politics being politics, former FBI head James Comey figured into the possible results with what amounted to an exoneration of Clinton’s use of a personal server while serving as U.S. Secretary of State under President Obama. However, Comey again surfaced closer to the election in late October with his implication that there might be more sensitive emails that could be incriminating. Lost in all of this was Donald Trump’s ability to stay relevant. Trump would eventually win a historic election on November 8, triggering a bounce in the stock market as the “Trump trade” pushed financial, industrial, material and commodity stocks higher on hopes of major infrastructure spending and lower individual and corporate taxes spurring more spending. Since that time, many of those stocks have pulled back as investors ponder President Trump’s ability to push through his agenda. Oil has also continued to be a story for investors as strength in the latter half of 2016 gave way to | | | | weakness so far in 2017. Despite OPEC cutbacks, the recovery in oil prices prompted U.S. shale producers to increase production, which has resulted in a supply/demand imbalance that could last longer than some experts have predicted. While these low oil prices are a positive for consumers, others worry that the weak price is signaling an economic slowdown. MARKET OUTLOOK Markets remain volatile within sectors, despite the overall market showing little, if any, true volatility. We believe the U.S. economy is on solid ground, and with three Fed hikes in this past year we believe the Fed feels the same way. Major European economies also appear to be on the mend, auguring well for U.S. companies with exposure to that part of the world. First quarter earnings were better than expected, in particular top-line growth, an important barometer for investors. Rates have come down since the election and easy money should continue to spur mergers and acquisitions. While macro factors will always sway stocks, we continue to try to identify companies with improving fundamentals and attractive valuations to provide long-term appreciation to shareholders. Thank you for your continued trust. 1 Prior to October 1, 2016, the Fund’s Class Z shares were known as Institutional Shares. This commentary reflects the viewpoints of the portfolio manager, Cadence Capital Management, LLC. as of May 31, 2017 and is not intended as a forecast or guarantee of future results and is subject to change without notice. |
| | | | |
| | | | | |
| | | AMG Managers Cadence Mid Cap Fund | | |
| | | Portfolio Manager’s Comments (continued) | | |
CUMULATIVE TOTAL RETURN PERFORMANCE
AMG Managers Cadence Mid Cap Fund’s cumulative total return is based on the daily change in net asset value (NAV), and assumes that all dividends and distributions were reinvested. This graph compares a hypothetical $10,000 investment made in AMG Managers Cadence Mid Cap Fund’s Class Z (formerly Institutional Class) on May 31, 2007, to a $10,000 investment made in the Russell Midcap® Growth Index for the same time period. The graph and table do not reflect the deduction of taxes that a shareholder would pay on a Fund distribution or redemption of shares. The listed returns for the Fund are net of expenses and the returns for the index exclude expenses. Total returns would have been lower had certain expenses not been reduced.
The table below shows the average annual total returns for the AMG Managers Cadence Mid Cap Fund and the Russell Midcap® Growth Index for the same time periods ended May 31, 2017.
| | | | | | |
| Average Annual Total Returns 1 | | One
Year | | Five
Years | | Ten
Years |
| | | |
AMG Managers Cadence Mid Cap Fund 2,3,4,5,6 | | | | | | |
| | | |
Class N7 | | 17.23% | | 12.33% | | 5.36% |
| | | |
Class I7 | | 17.44% | | 12.51% | | 5.53% |
| | | |
Class Z7 | | 17.71% | | 12.78% | | 5.78% |
|
| | | |
Russell Midcap® Growth Index 8 | | 16.68% | | 14.55% | | 7.65% |
|
|
The performance data shown represents past performance. Past performance is not a guarantee of future results. Current performance may be lower or higher than the performance data quoted. The investment return and principal value of an investment will fluctuate so that an investor’s shares, when redeemed, may be worth more or less than their original cost.
Investors should carefully consider the Fund’s investment objectives, risks, charges and expenses before investing. For performance information through the most recent month end, current net asset values per share for the Fund and other information, please call (800) 835-3879 or visit our website at www.amgfunds.com for a free prospectus. Read it carefully before investing or sending money.
Distributed by AMG Distributors, Inc., member FINRA/SIPC.
| | | | |
| | | | | 1 Total return equals income yield plus share price change and assumes reinvestment of all dividends and capital gain distributions. Returns are net of fees and may reflect offsets of Fund expenses as described in the prospectus. No adjustment has been made for taxes payable by shareholders on their reinvested dividends and capital gain distributions. Returns for periods greater than one year are annualized. The listed returns on the Fund are net of expenses and based on the published NAV as of May 31, 2017. All returns are in U.S. dollars ($). 2 From time to time, the Fund’s advisor has waived its fees and/or absorbed Fund expenses, which has resulted in higher returns. 3 Active and frequent trading of a Fund may result in higher transaction costs and increased tax liability. 4 The Fund is subject to risks associated with investments in mid-capitalization companies such as greater price volatility, lower trading volume, and less liquidity than the stocks of larger, more established companies. 5 The Fund is subject to special risk considerations similar to those associated with the direct ownership of real estate. Real estate valuations may be subject to factors such as changing general and local economic, financial, competitive, and environmental conditions. 6 The Fund invests in growth stocks, which may be more sensitive to market movements because their prices tend to reflect future investor expectations rather than just current profits. Growth stocks may underperform value stocks during given periods. 7 Effective October 1, 2016, the Investor Class, Service Class and Institutional Class were renamed Class N, Class I and Class Z, respectively. 8 The Russell Midcap® Growth Index measures the performance of the Russell Midcap companies with higher price/book ratios and higher forecasted growth values. The stocks are also members of the Russell 1000® Growth Index. Unlike the Fund, the Index is unmanaged, is not available for investment, and does not incur expenses. The Russell Midcap® Growth Index is a trademark of the London Stock Exchange group companies. Not FDIC insured, nor bank guaranteed. May lose value. |
| | | | |
| | | | | |
| | | AMG Managers Cadence Mid Cap Fund | | |
| | | Fund Snapshots (unaudited) May 31, 2017 | | |
PORTFOLIO BREAKDOWN
| | | | | | | | |
| Sector | | AMG Managers
Cadence Mid
Cap Fund* | | Russell Midcap®
Growth Index | | | |
Information Technology | | 25.7% | | 23.7% | | | | |
| | | | |
Industrials | | 17.8% | | 14.2% | | | | |
| | | | |
Consumer Discretionary | | 16.4% | | 22.2% | | | | |
| | | | |
Financials | | 11.8% | | 5.2% | | | | |
| | | | |
Health Care | | 11.5% | | 16.3% | | | | |
| | | | |
Consumer Staples | | 9.0% | | 6.5% | | | | |
| | | | |
Materials | | 6.0% | | 5.2% | | | | |
| | | | |
Real Estate | | 0.9% | | 5.3% | | | | |
| | | | |
Energy | | 0.0% | | 1.2% | | | | |
| | | | |
Telecommunication Services | | 0.0% | | 0.2% | | | | |
| | | | |
Other Assets and Liabilities | | 0.9% | | 0.0% | | | | |
| * | As a percentage of net assets. |
TOP TEN HOLDINGS
| | | | | | |
| Security Name | | | | | % of Net
Assets |
| | | |
Lamb Weston Holdings, Inc. | | | | | | 2.2% |
| | | |
First Data Corp. | | | | | | 2.1 |
| | | |
Eaton Vance Corp.** | | | | | | 2.0 |
| | | |
Ulta Beauty, Inc.** | | | | | | 1.9 |
| | | |
Cadence Design Systems, Inc. | | | | | | 1.8 |
| | | |
Omnicom Group, Inc.** | | | | | | 1.7 |
| | | |
Rockwell Automation, Inc. | | | | | | 1.7 |
| | | |
Zoetis, Inc. | | | | | | 1.7 |
| | | |
Xilinx, Inc. | | | | | | 1.6 |
| | | |
Scripps Networks Interactive, Inc., Class A** | | | | | | 1.6 |
| | | | | | | |
| | | |
Top Ten as a Group | | | | | | 18.3% |
| | | | | | | |
| ** | Top Ten Holdings as of November 30, 2016. |
Because a fund’s strategy may result in multiple investments in particular sectors of the economy, its performance may depend on the performance of those sectors and may fluctuate more widely than investments diversified across more sectors. For additional information on these and other risk considerations, please see the Fund’s prospectus.
Any sectors, industries, or securities discussed should not be perceived as investment recommendations. Mention of a specific security should not be considered a recommendation to buy or solicitation to sell that security. Specific securities mentioned in this report may have been sold from the Fund’s portfolio of investments by the time you receive this report.
| | | | |
| | | | | |
| | | AMG Managers Cadence Mid Cap Fund | | |
| | | Schedule of Portfolio Investments May 31, 2017 | | |
| | | | | | | | |
| | | | Shares | | | | Value | |
| | |
Common Stocks - 99.1% | | | | | | | | |
| | |
Consumer Discretionary - 16.4% | | | | | | | | |
| | |
AMC Networks, Inc., Class A* | | | 24,400 | | | | $1,292,712 | |
| | |
Burlington Stores, Inc.* | | | 13,120 | | | | 1,283,792 | |
| | |
Darden Restaurants, Inc. | | | 18,660 | | | | 1,659,434 | |
| | |
Foot Locker, Inc. | | | 18,460 | | | | 1,096,709 | |
| | |
Gentex Corp. | | | 21,269 | | | | 403,686 | |
| | |
Lear Corp. | | | 11,680 | | | | 1,740,787 | |
| | |
Lennar Corp., Class A | | | 30,100 | | | | 1,544,431 | |
| | |
Michael Kors Holdings, Ltd.* | | | 7,300 | | | | 242,214 | |
| | |
Omnicom Group, Inc. | | | 26,080 | | | | 2,183,418 | |
| | |
Ross Stores, Inc. | | | 9,940 | | | | 635,365 | |
| | |
Scripps Networks Interactive, Inc., Class A2 | | | 30,500 | | | | 2,019,710 | |
| | |
Thor Industries, Inc. | | | 16,510 | | | | 1,494,650 | |
| | |
Tupperware Brands Corp. | | | 13,370 | | | | 961,437 | |
| | |
Ulta Beauty, Inc.* | | | 7,920 | | | | 2,414,333 | |
| | |
Wyndham Worldwide Corp. | | | 15,700 | | | | 1,585,543 | |
| | |
Total Consumer Discretionary | | | | | | | 20,558,221 | |
| | |
Consumer Staples - 9.0% | | | | | | | | |
| | |
Church & Dwight Co., Inc. | | | 12,520 | | | | 646,783 | |
| | |
Energizer Holdings, Inc. | | | 22,700 | | | | 1,216,720 | |
| | |
Herbalife, Ltd.*,2 | | | 11,700 | | | | 839,826 | |
| | |
Lamb Weston Holdings, Inc. | | | 58,930 | | | | 2,734,941 | |
| | |
Nu Skin Enterprises, Inc., Class A | | | 17,320 | | | | 950,522 | |
| | |
Pilgrim’s Pride Corp.* | | | 32,980 | | | | 767,445 | |
| | |
Post Holdings, Inc.* | | | 15,930 | | | | 1,279,816 | |
| | |
Spectrum Brands Holdings, Inc.2 | | | 13,490 | | | | 1,813,730 | |
| | |
Sysco Corp. | | | 18,119 | | | | 988,573 | |
| | |
Total Consumer Staples | | | | | | | 11,238,356 | |
| | |
Financials - 11.8% | | | | | | | | |
| | |
Ameriprise Financial, Inc. | | | 5,660 | | | | 683,671 | |
| | |
Aon PLC | | | 15,234 | | | | 1,994,283 | |
| | |
Brown & Brown, Inc. | | | 35,180 | | | | 1,527,867 | |
| | |
CBOE Holdings, Inc. | | | 7,730 | | | | 667,640 | |
| | |
Citizens Financial Group, Inc. | | | 35,580 | | | | 1,213,278 | |
| | |
Eaton Vance Corp. | | | 52,490 | | | | 2,444,459 | |
| | |
Erie Indemnity Co., Class A | | | 6,510 | | | | 766,683 | |
| | |
Lincoln National Corp. | | | 11,460 | | | | 744,671 | |
| | |
MSCI, Inc. | | | 13,588 | | | | 1,382,307 | |
| | |
SVB Financial Group* | | | 9,760 | | | | 1,664,080 | |
| | |
TD Ameritrade Holding Corp. | | | 29,030 | | | | 1,084,561 | |
| | | | | | | | |
| | | | Shares | | | | Value | |
| | |
Western Alliance Bancorp* | | | 13,020 | | | | $595,274 | |
| | |
Total Financials | | | | | | | 14,768,774 | |
| | |
Health Care - 11.5% | | | | | | | | |
| | |
Agilent Technologies, Inc. | | | 27,940 | | | | 1,685,900 | |
| | |
Bruker Corp. | | | 42,110 | | | | 1,145,813 | |
| | |
Charles River Laboratories International, Inc.* | | | 17,500 | | | | 1,610,875 | |
| | |
HCA Holdings, Inc.* | | | 17,250 | | | | 1,412,947 | |
| | |
Premier, Inc., Class A* | | | 31,400 | | | | 1,083,928 | |
| | |
Quintiles IMS Holdings, Inc.* | | | 19,550 | | | | 1,689,902 | |
| | |
Veeva Systems, Inc., Class A* | | | 30,970 | | | | 1,967,834 | |
| | |
WellCare Health Plans, Inc.* | | | 9,770 | | | | 1,678,486 | |
| | |
Zoetis, Inc. | | | 34,600 | | | | 2,154,888 | |
| | |
Total Health Care | | | | | | | 14,430,573 | |
| | |
Industrials - 17.8% | | | | | | | | |
| | |
A. O. Smith Corp. | | | 25,190 | | | | 1,382,175 | |
| | |
Alaska Air Group, Inc. | | | 6,819 | | | | 593,594 | |
| | |
BWX Technologies, Inc. | | | 39,710 | | | | 1,929,906 | |
| | |
Donaldson Co., Inc. | | | 30,300 | | | | 1,453,188 | |
| | |
Equifax, Inc. | | | 9,110 | | | | 1,246,248 | |
| | |
Expeditors International of Washington, Inc. | | | 31,380 | | | | 1,675,064 | |
| | |
HD Supply Holdings, Inc.* | | | 30,000 | | | | 1,210,500 | |
| | |
Huntington Ingalls Industries, Inc. | | | 6,104 | | | | 1,195,224 | |
| | |
JetBlue Airways Corp.* | | | 56,380 | | | | 1,264,040 | |
| | |
Landstar System, Inc. | | | 17,010 | | | | 1,421,186 | |
| | |
Masco Corp. | | | 36,540 | | | | 1,361,115 | |
| | |
MSC Industrial Direct Co., Inc., Class A | | | 16,690 | | | | 1,400,959 | |
| | |
Nordson Corp. | | | 10,290 | | | | 1,192,405 | |
| | |
Rockwell Automation, Inc. | | | 13,680 | | | | 2,171,290 | |
| | |
Spirit AeroSystems Holdings, Inc., Class A | | | 23,790 | | | | 1,296,317 | |
| | |
United Rentals, Inc.* | | | 14,020 | | | | 1,524,395 | |
| | |
Total Industrials | | | | | | | 22,317,606 | |
| | |
Information Technology - 25.7% | | | | | | | | |
| | |
Analog Devices, Inc. | | | 22,840 | | | | 1,958,758 | |
| | |
Arista Networks, Inc.*,2 | | | 9,680 | | | | 1,426,638 | |
| | |
Broadridge Financial Solutions, Inc. | | | 13,970 | | | | 1,060,183 | |
| | |
Cadence Design Systems, Inc.* | | | 62,310 | | | | 2,189,573 | |
| | |
Citrix Systems, Inc.* | | | 12,580 | | | | 1,038,353 | |
| | |
CommScope Holding Co., Inc.* | | | 51,240 | | | | 1,895,368 | |
| | |
CSRA, Inc. | | | 21,420 | | | | 646,027 | |
| | |
F5 Networks, Inc.* | | | 4,987 | | | | 638,984 | |
| | |
First Data Corp., Class A* | | | 149,920 | | | | 2,568,130 | |
|
|
The accompanying notes are an integral part of these financial statements. |
| 12 |
| | | | |
| | | | | |
| | | AMG Managers Cadence Mid Cap Fund | | |
| | | Schedule of Portfolio Investments (continued) | | |
| | | | | | | | |
| | | Shares | | | Value | |
| |
Information Technology - 25.7% (continued) | | | | | |
| | |
Fortinet, Inc.* | | | 34,610 | | | | $1,361,557 | |
| | |
Intuit, Inc. | | | 10,640 | | | | 1,496,410 | |
| | |
Jack Henry & Associates, Inc. | | | 15,070 | | | | 1,600,585 | |
| | |
KLA-Tencor Corp. | | | 13,310 | | | | 1,384,240 | |
| | |
Lam Research Corp. | | | 12,200 | | | | 1,893,074 | |
| | |
Maxim Integrated Products, Inc. | | | 32,679 | | | | 1,562,056 | |
| | |
Microchip Technology, Inc.2 | | | 22,620 | | | | 1,884,246 | |
| | |
Paychex, Inc. | | | 8,545 | | | | 506,120 | |
| | |
Red Hat, Inc.* | | | 21,743 | | | | 1,947,521 | |
| | |
Synopsys, Inc.* | | | 20,540 | | | | 1,537,830 | |
| | |
VeriSign, Inc.*,2 | | | 16,670 | | | | 1,502,967 | |
| | |
Xilinx, Inc. | | | 30,596 | | | | 2,041,059 | |
| | |
Total Information Technology | | | | | | | 32,139,679 | |
| |
Materials - 6.0% | | | | | |
| | |
Celanese Corp., Series A | | | 14,050 | | | | 1,216,027 | |
| | |
Eagle Materials, Inc. | | | 12,880 | | | | 1,214,584 | |
| | |
FMC Corp. | | | 21,800 | | | | 1,643,066 | |
| | |
Packaging Corp. of America | | | 15,200 | | | | 1,552,832 | |
| | |
Steel Dynamics, Inc. | | | 53,210 | | | | 1,808,608 | |
| | |
Total Materials | | | | | | | 7,435,117 | |
| | |
Real Estate - 0.9% | | | | | | | | |
| | |
Outfront Media, Inc., REIT | | | 47,030 | | | | 1,074,636 | |
| | |
Total Common Stocks
(cost $106,625,561) | | | | | | | 123,962,962 | |
| | |
| | | Principal
Amount | | | | |
| |
Short-Term Investments - 4.6% | | | | | |
| |
Repurchase Agreements - 4.6%3 | | | | | |
| | |
BNP Paribas Securities Corp., dated 05/31/17, due 06/01/17, 0.820% total to be received $1,369,710 (collateralized by various U.S. Government Agency Obligations, 0.000% -10.000%, 06/30/17 - 07/20/63, totaling $1,397,073) | | | 1,369,679 | | | | 1,369,679 | |
| | | | | | | | |
| | | Principal
Amount | | | Value | |
| | |
Cantor Fitzgerald Securities, Inc., dated 05/31/17, due 06/01/17, 0.820% total to be received $1,369,710 (collateralized by various U.S. Government Agency Obligations, 0.000% - 10.500%, 06/15/17 - 03/20/67, totaling $1,397,072) | | | $1,369,679 | | | | $1,369,679 | |
| | |
Citigroup Global Markets, Inc., dated 05/31/17, due 06/01/17, 0.810% total to be received $1,369,710 (collateralized by various U.S. Government Agency Obligations, 0.750% - 11.500%, 06/01/17 - 05/15/57, totaling $1,397,072) | | | 1,369,679 | | | | 1,369,679 | |
| | |
Credit Suisse Securities (USA) LLC, dated 05/31/17, due 06/01/17, 0.750% total to be received $288,265 (collateralized by various U.S. Government Agency Obligations, 2.000% - 2.500%, 01/15/26 - 01/15/29, totaling $294,031) | | | 288,259 | | | | 288,259 | |
| | |
RBC Dominion Securities, Inc., dated 05/31/17, due 06/01/17, 0.800% total to be received $1,369,709 (collateralized by various U.S. Government Agency Obligations, 1.375% - 7.000%, 02/19/19 - 09/09/49, totaling $1,397,073) | | | 1,369,679 | | | | 1,369,679 | |
| |
Total Repurchase Agreements | | | | 5,766,975 | |
| | |
| | | Shares | | | | | |
| |
Other Investment Companies - 0.0%# | | | | | |
| | |
Dreyfus Government Cash Management Fund, Institutional Class Shares, 0.70%1 | | | 62,086 | | | | 62,086 | |
| |
Total Short-Term Investments
(cost $5,829,061) | | | | 5,829,061 | |
| |
Total Investments - 103.7% (cost $112,454,622) | | | | 129,792,023 | |
| |
Other Assets, less Liabilities - (3.7)% | | | | (4,677,027 | ) |
| | |
Net Assets - 100.0% | | | | | | | $125,114,996 | |
|
|
The accompanying notes are an integral part of these financial statements. |
| 13 |
| | | | |
| | | | | |
| | | AMG Managers Cadence Emerging Companies Fund | | |
| | | Portfolio Manager’s Comments (unaudited) | | |
| | | | | | | | |
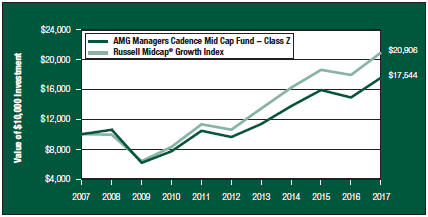
For the fiscal year ended May 31, 2017, the AMG Managers Cadence Emerging Companies Fund (Class I)1(the “Fund”) returned 26.22%, outperforming its benchmarks, the Russell Microcap® Growth Index, which returned 14.17%, and the Russell 2000® Growth Index, which returned 19.71%. PERFORMANCE SUMMARY The fiscal year ended May 31, 2017, was filled with many market-moving events that gave investors reason to believe in stocks across the market cap spectrum. The Fund’s primary benchmark, the Russell Microcap®Growth Index, rose 14.2%. Despite this healthy gain, the benchmark’s return nevertheless lagged other growth indices for the second year in a row. During the fiscal year, the Russell 1000®Growth and Russell Mid Cap®Growth rose 20.3% and 16.7%, respectively. The Fund’s secondary benchmark, the Russell 2000®Growth, advanced 19.7%. The Fund outperformed its benchmark over the period. Health care, industrials and financials accounted for much of the Fund’s outperformance. Materials and telecommunications services detracted from relative performance. Health care, the largest sector in the Russell Microcap®Growth Index at 37.5%, was the strongest contributor to relative performance. Two industry groups constitute the sector: pharmaceuticals & biotechnology, which represented approximately 24.4% of the index, and equipment & services with 13.1%. Biotechnology’s nearly 2.5 years of market leadership reversed during the fiscal year ended 2016, and its poor performance continued during the most recent fiscal year. The Fund’s holdings bucked the downtrend in the pharma & biotech group, gaining 8.0% on average versus the group’s (4.9)% decline in the Index. The Fund was also underweight the group at 11.0% compared with 24.4% in the Index, which also contributed to outperformance. The Fund’s holdings and positioning in health care equipment & services | | | | also contributed to relative performance. The portfolio achieved average gains of 28.3% versus the 17.6% advance in the index. Industrials also contributed to relative performance, with average gains of 55.1% compared with 17.2% for the benchmark. Similarly, financials contributed to relative performance, with average gains of 45.9% versus 17.8% for the benchmark. Materials and telecommunications services, which each amounted to less than 3% of the Fund and the benchmark, detracted from results. The Fund’s 60.8% gain on average in telecommunications services did not keep pace with the average gain of the group in the benchmark, +124.9%. In materials, the Fund’s (9.5)% loss on average fell below the index return for the group of 15.7%. FISCAL YEAR IN REVIEW This fiscal year started with a loud thud across the Atlantic Ocean when the U.K. voted to exit the European Union (“Brexit”), an outcome that stock markets around the world had not accounted for. However, stocks recovered quickly and within a week had made up most, if not all, of the losses immediately following the historic vote. The next focus for investors was the looming U.S. presidential election in November, pitting Donald Trump against veteran politician Hillary Clinton. While Trump was handily beating his numerous Republican competitors for the party’s nomination, Clinton was in more of a dogfight with Bernie Sanders, though not many expected her to lose the Democratic vote. Politics being politics, former FBI head James Comey figured into the possible results with what amounted to an exoneration of Clinton’s use of a personal server while serving as the U.S. Secretary of State under President Obama. However, Comey again surfaced closer to the election in late October with his implication that there might be more sensitive emails that could be incriminating. Lost in all of this was Donald Trump’s ability to stay relevant. Trump would eventually win a historic election on November 8, triggering a bounce in the stock market as the “Trump trade” pushed financial, industrial, material and commodity stocks higher | | | | on hopes of major infrastructure spending and lower individual and corporate taxes spurring more spending. Since that time, many of those stocks have pulled back as investors ponder President Trump’s ability to push through his agenda. Oil has also continued to be a story for investors as strength in the latter half of 2016 gave way to weakness so far in 2017. Despite OPEC cutbacks, the recovery in oil prices prompted U.S. shale producers to increase production, which has resulted in a supply/demand imbalance that could last longer than some experts have predicted. While these low oil prices are a positive for consumers, some worry that the weak price is signaling an economic slowdown. MARKET OUTLOOK Markets remain volatile within sectors, despite the overall market showing little, if any, true volatility. We believe the U.S. economy is on solid ground, and with three Fed hikes in this past year, we believe the Fed feels the same way. Major European economies also appear to be on the mend, auguring well for U.S. companies with exposure to that part of the world. First quarter earnings were better than expected, in particular top-line growth, an important barometer for investors. Rates have come down since the election and easy money should continue to spur mergers and acquisitions. While macro factors will always sway stocks, we continue to try to identify companies with improving fundamentals and attractive valuations to provide long-term appreciation to shareholders. Thank you for your continued trust. 1 Prior to October 1, 2016, the Fund’s Class I shares were known as Institutional Shares. This commentary reflects the viewpoints of the portfolio manager, Cadence Capital Management, LLC. as of May 31, 2017 and is not intended as a forecast or guarantee of future results and is subject to change without notice. |
| | | | |
| | | | | |
| | | AMG Managers Cadence Emerging Companies Fund | | |
| | | Portfolio Manager’s Comments (continued) | | |
CUMULATIVE TOTAL RETURN PERFORMANCE
AMG Managers Cadence Emerging Companies Fund’s cumulative total return is based on the daily change in net asset value (NAV), and assumes that all dividends and distributions were reinvested. This graph compares a hypothetical $10,000 investment made in AMG Managers Cadence Emerging Companies Fund’s Class I (formerly Institutional Class) on May 31, 2007, to a $10,000 investment made in the Russell Microcap® Growth Index and the Russell 2000® Growth Index for the same time period. The graph and table do not reflect the deduction of taxes that a shareholder would pay on a Fund distribution or redemption of shares. The listed returns for the Fund are net of expenses and the returns for the index exclude expenses. Total returns would have been lower had certain expenses not been reduced.
The table below shows the average annual total returns for the AMG Managers Cadence Emerging Companies Fund and the Russell Microcap® Growth Index and the Russell 2000® Growth Index for the same time periods ended May 31, 2017.
| | | | | | | | | | | | |
| Average Annual Total Returns1 | | One
Year | | | Five
Years | | | Ten
Years | |
|
AMG Managers Cadence Emerging Companies Fund 2,3,4,5,6 | |
| | | |
Class N7 | | | 25.92 | % | | | 17.55 | % | | | 9.03% | |
| | | |
Class I7 | | | 26.22 | % | | | 17.83 | % | | | 9.30% | |
| | | |
Russell Microcap® Growth Index8 | | | 14.17 | % | | | 13.03 | % | | | 4.97% | |
| | | |
Russell 2000® Growth Index9 | | | 19.71 | % | | | 14.36 | % | | | 7.39% | |
The performance data shown represents past performance. Past performance is not a guarantee of future results. Current performance may be lower or higher than the performance data quoted. The investment return and principal value of an investment will fluctuate so that an investor’s shares, when redeemed, may be worth more or less than their original cost.
Investors should carefully consider the Fund’s investment objectives, risks, charges and expenses before investing. For performance information through the most recent month end, current net asset values per share for the Fund and other information, please call (800) 835-3879 or visit our website at www.amgfunds.com for a free prospectus. Read it carefully before investing or sending money.
Distributed by AMG Distributors, Inc., member FINRA/SIPC.
| 1 | Total return equals income yield plus share price change and assumes reinvestment of all dividends and capital gain distributions. Returns are net of fees and may reflect offsets of Fund expenses as described in the prospectus. No |
| | |
| | | adjustment has been made for taxes payable by shareholders on their reinvested dividends and capital gain distributions. Returns for periods greater than one year are annualized. The listed returns on the Fund are net of expenses and based on the published NAV as of May 31, 2017. All returns are in U.S. dollars ($). 2 From time to time, the Fund’s advisor has waived its fees and/or absorbed Fund expenses, which has resulted in higher returns. 3 The Fund is subject to the special risks associated with investments in micro-cap companies, such as relatively short earnings history, competitive conditions, less publicly available corporate information and reliance on a limited number of products. 4 The Fund is subject to risks associated with investments in small-capitalization companies, such as erratic earnings patterns, competitive conditions, limited earnings history and a reliance on one or a limited number of products. 5 The Fund is subject to special risk considerations similar to those associated with the direct ownership of real estate. Real estate valuations may be subject to factors such as changing general and local economic, financial, competitive, and environmental conditions. 6 The Fund invests in growth stocks, which may be more sensitive to market movements because their prices tend to reflect future investor expectations rather than just current profits. Growth stocks may underperform value stocks during given periods. 7 Effective October 1, 2016, the Service Class and Institutional Class were renamed Class S and Class I, respectively. Effective February 27, 2017, Class S was renamed Class N. |
| | | 8 The Russell Microcap® Growth Index tracks the microcap segment of the U.S. equity market. It makes up less than 3% of the U.S. equity market and is represented by the smallest 1,000 securities in the small-cap Russell 2000® Index plus the next 1,000 securities. Unlike the Fund, the Russell Microcap®Growth Index is unmanaged, is not available for investment and does not incur expenses. 9 The Russell 2000® Growth Index measures the performance of the Russell 2000 companies with higher price-to-book ratios and higher forecasted growth values. Unlike the Fund, the Russell 2000® Growth Index is unmanaged, is not available for investment and does not incur expenses. |
| | | The Russell Indices are trademarks of the London Stock Exchange Group Companies. Not FDIC insured, nor bank guaranteed. May lose value. |
| | | | |
| | | | | |
| | | AMG Managers Cadence Emerging Companies Fund | | |
| | | Fund Snapshots (unaudited) May 31, 2017 | | |
PORTFOLIO BREAKDOWN
| | | | | | |
| Sector | | AMG
Managers
Cadence
Emerging
Companies
Fund* | | Russell
Microcap®
Growth
Index | | Russell 2000®
Growth Index |
Health Care | | 21.2% | | 37.3% | | 21.5% |
| | | | |
Information Technology | | 20.6% | | 19.5% | | 26.2% |
| | | | |
Industrials | | 20.4% | | 11.0% | | 15.5% |
| | | | |
Financials | | 11.9% | | 5.8% | | 5.3% |
| | | | |
Consumer Discretionary | | 11.3% | | 12.8% | | 14.7% |
| | | | |
Consumer Staples | | 5.1% | | 2.6% | | 3.0% |
| | | | |
Materials | | 2.0% | | 2.5% | | 5.1% |
| | | | |
Telecommunication Services | | 1.9% | | 1.8% | | 0.8% |
| | | | |
Real Estate | | 1.3% | | 3.3% | | 5.6% |
| | | | |
Energy | | 1.0% | | 2.2% | | 1.5% |
| | | | |
Utilities | | 0.0% | | 1.2% | | 0.8% |
| | | | |
Other assets and liabilities | | 3.3% | | 0.0% | | 0.0% |
| * | As a percentage of net assets. |
TOP TEN HOLDINGS
| | | | |
| Security Name | | | | % of Net
Assets |
| | | |
OraSure Technologies, Inc. | | | | 1.6% |
| | | |
Nutrisystem, Inc. | | | | 1.5 |
| | | |
Silicom, Ltd. | | | | 1.5 |
| | | |
CalAmp Corp. | | | | 1.5 |
| | | |
Cavco Industries, Inc. | | | | 1.4 |
| | | |
Corcept Therapeutics, Inc. | | | | 1.4 |
| | | |
Denny’s Corp. | | | | 1.4 |
| | | |
Kadant, Inc. | | | | 1.4 |
| | | |
GTT Communications, Inc. | | | | 1.4 |
| | | |
PRGX Global, Inc. | | | | 1.4 |
| | | | | |
| | | |
Top Ten as a Group | | | | 14.5% |
| | | | |
Because a fund’s strategy may result in multiple investments in particular sectors of the economy, its performance may depend on the performance of those sectors and may fluctuate more widely than investments diversified across more sectors. For additional information on these and other risk considerations, please see the Fund’s prospectus.
Any sectors, industries, or securities discussed should not be perceived as investment recommendations. Mention of a specific security should not be considered a recommendation to buy or solicitation to sell that security. Specific securities mentioned in this report may have been sold from the Fund’s portfolio of investments by the time you receive this report.
| | | | |
| | | | | |
| | | AMG Managers Cadence Emerging Companies Fund | | |
| | | Schedule of Portfolio Investments May 31, 2017 | | |
| | | | | | | | |
| | | | Shares | | | | Value | |
| | |
Common Stocks - 96.7% | | | | | | | | |
| | |
Consumer Discretionary - 11.3% | | | | | | | | |
| | |
Bassett Furniture Industries, Inc. | | | 22,700 | | | | $674,190 | |
| | |
Carriage Services, Inc.2 | | | 26,115 | | | | 686,563 | |
| | |
Cavco Industries, Inc.* | | | 9,168 | | | | 1,010,772 | |
| | |
Denny’s Corp.* | | | 82,892 | | | | 986,415 | |
| | |
Motorcar Parts of America, Inc.* | | | 30,706 | | | | 892,623 | |
| | |
Nautilus, Inc.* | | | 37,120 | | | | 673,728 | |
| | |
Nutrisystem, Inc. | | | 20,763 | | | | 1,080,714 | |
| | |
Pier 1 Imports, Inc. | | | 36,766 | | | | 184,198 | |
| | |
Ruth’s Hospitality Group, Inc. | | | 39,671 | | | | 856,894 | |
| | |
US Auto Parts Network, Inc.* | | | 72,967 | | | | 223,279 | |
| | |
Winnebago Industries, Inc.2 | | | 26,750 | | | | 655,375 | |
| | |
Total Consumer Discretionary | | | | | | | 7,924,751 | |
| | |
Consumer Staples - 5.1% | | | | | | | | |
| | |
Calavo Growers, Inc.2 | | | 11,961 | | | | 809,760 | |
| | |
The Chefs’ Warehouse, Inc.*,2 | | | 43,100 | | | | 652,965 | |
| | |
Lifeway Foods, Inc.* | | | 31,764 | | | | 311,923 | |
| | |
Medifast, Inc. | | | 16,319 | | | | 679,034 | |
| | |
MGP Ingredients, Inc.2 | | | 15,517 | | | | 794,626 | |
| | |
Orchids Paper Products Co.2 | | | 23,623 | | | | 337,573 | |
| | |
Total Consumer Staples | | | | | | | 3,585,881 | |
| | |
Energy - 1.0% | | | | | | | | |
| | |
Abraxas Petroleum Corp.* | | | 365,859 | | | | 673,181 | |
| | |
Financials - 11.9% | | | | | | | | |
| | |
Bryn Mawr Bank Corp. | | | 19,854 | | | | 811,036 | |
| | |
Crawford & Co., Class B2 | | | 52,108 | | | | 487,210 | |
| | |
First Foundation, Inc.* | | | 55,693 | | | | 853,774 | |
| | |
Health Insurance Innovations, Inc., Class A*,2 | | | 41,171 | | | | 916,055 | |
| | |
Kingstone Cos, Inc. | | | 48,161 | | | | 705,559 | |
| | |
Kinsale Capital Group, Inc. | | | 22,676 | | | | 821,778 | |
| | |
Meridian Bancorp, Inc. | | | 23,351 | | | | 378,286 | |
| | |
Meta Financial Group, Inc. | | | 7,869 | | | | 673,586 | |
| | |
Preferred Bank | | | 15,225 | | | | 759,880 | |
| | |
Pzena Investment Management, Inc., Class A | | | 51,773 | | | | 448,872 | |
| | |
Silvercrest Asset Management Group, Inc., Class A | | | 58,809 | | | | 720,410 | |
| | |
State National Cos, Inc. | | | 46,046 | | | | 809,028 | |
| | |
Total Financials | | | | | | | 8,385,474 | |
| | |
Health Care - 21.2% | | | | | | | | |
| | |
Addus HomeCare Corp.* | | | 20,447 | | | | 758,584 | |
| | | | | | | | |
| | | | Shares | | | | Value | |
| | |
Amphastar Pharmaceuticals, Inc.* | | | 23,762 | | | | $405,617 | |
| | |
ANI Pharmaceuticals, Inc.* | | | 3,844 | | | | 167,944 | |
| | |
Aratana Therapeutics, Inc.*,2 | | | 84,935 | | | | 489,226 | |
| | |
BioSpecifics Technologies Corp.* | | | 17,115 | | | | 887,070 | |
| | |
BioTelemetry, Inc.* | | | 26,027 | | | | 750,879 | |
| | |
Civitas Solutions, Inc.* | | | 22,434 | | | | 353,336 | |
| | |
Corcept Therapeutics, Inc.*,2 | | | 88,167 | | | | 997,169 | |
| | |
Cross Country Healthcare, Inc.* | | | 59,303 | | | | 684,950 | |
| | |
Cutera, Inc.* | | | 29,269 | | | | 667,333 | |
| | |
Heska Corp.* | | | 8,601 | | | | 848,575 | |
| | |
Landauer, Inc. | | | 13,554 | | | | 662,113 | |
| | |
LHC Group, Inc.* | | | 13,400 | | | | 806,680 | |
| | |
NeoGenomics, Inc.* | | | 91,799 | | | | 694,000 | |
| | |
OraSure Technologies, Inc.* | | | 76,029 | | | | 1,145,757 | |
| | |
Progenics Pharmaceuticals, Inc.*,2 | | | 116,747 | | | | 743,678 | |
| | |
RadNet, Inc.* | | | 110,401 | | | | 794,887 | |
| | |
Recro Pharma, Inc.*,2 | | | 75,774 | | | | 550,119 | |
| | |
Sharps Compliance Corp.*,2 | | | 102,441 | | | | 415,910 | |
| | |
Simulations Plus, Inc.2 | | | 67,359 | | | | 821,780 | |
| | |
Supernus Pharmaceuticals, Inc.* | | | 23,652 | | | | 889,315 | |
| | |
U.S. Physical Therapy, Inc. | | | 6,301 | | | | 398,538 | |
| | |
Total Health Care | | | | | | | 14,933,460 | |
| | |
Industrials - 20.4% | | | | | | | | |
| | |
Blue Bird Corp.* | | | 41,601 | | | | 759,218 | |
| | |
Commercial Vehicle Group, Inc.* | | | 96,505 | | | | 779,760 | |
| | |
CRA International, Inc. | | | 18,290 | | | | 632,285 | |
| | |
Douglas Dynamics, Inc. | | | 19,719 | | | | 600,444 | |
| | |
GEE Group, Inc.*,2 | | | 5,483 | | | | 29,718 | |
| | |
Global Brass & Copper Holdings, Inc. | | | 28,058 | | | | 850,157 | |
| | |
GP Strategies Corp.* | | | 38,190 | | | | 937,565 | |
| | |
Heritage-Crystal Clean, Inc.* | | | 59,171 | | | | 902,358 | |
| | |
Hudson Technologies, Inc.* | | | 85,360 | | | | 696,538 | |
| | |
Insteel Industries, Inc. | | | 21,147 | | | | 671,629 | |
| | |
Kadant, Inc. | | | 12,753 | | | | 980,068 | |
| | |
Lawson Products, Inc.* | | | 30,282 | | | | 645,007 | |
| | |
NV5 Global, Inc.* | | | 22,075 | | | | 810,153 | |
| | |
Patrick Industries, Inc.* | | | 14,371 | | | | 951,360 | |
| | |
PGT Innovations, Inc.* | | | 58,620 | | | | 671,199 | |
| | |
Radiant Logistics, Inc.* | | | 89,739 | | | | 527,665 | |
| | |
Sun Hydraulics Corp. | | | 17,879 | | | | 765,042 | |
| | |
Vectrus, Inc.* | | | 20,427 | | | | 602,597 | |
|
|
The accompanying notes are an integral part of these financial statements. |
| 17 |
| | | | |
| | | | | |
| | | AMG Managers Cadence Emerging Companies Fund | | |
| | | Schedule of Portfolio Investments (continued) | | |
| | | | | | | | |
| | | Shares | | | Value | |
Industrials - 20.4% (continued) | | | | | |
| | |
Vicor Corp.* | | | 43,774 | | | | $741,969 | |
| | |
Willdan Group, Inc.* | | | 23,972 | | | | 797,548 | |
| | |
Total Industrials | | | | | | | 14,352,280 | |
| |
Information Technology - 20.6% | | | | | |
| | |
8x8, Inc.* | | | 46,305 | | | | 632,063 | |
| | |
American Software, Inc., Class A | | | 55,855 | | | | 599,883 | |
| | |
Blucora, Inc.* | | | 41,012 | | | | 840,746 | |
| | |
CalAmp Corp.* | | | 54,534 | | | | 1,030,693 | |
| | |
Carbonite, Inc.* | | | 42,460 | | | | 789,756 | |
| | |
CEVA, Inc.* | | | 19,508 | | | | 824,213 | |
| | |
Exa Corp.* | | | 52,916 | | | | 735,003 | |
| | |
Extreme Networks, Inc.* | | | 90,993 | | | | 876,263 | |
| | |
FormFactor, Inc.* | | | 63,810 | | | | 938,007 | |
| | |
GTT Communications, Inc.*,2 | | | 30,216 | | | | 974,466 | |
| | |
The Hackett Group, Inc. | | | 34,696 | | | | 508,643 | |
| | |
Mitek Systems, Inc.*,2 | | | 91,186 | | | | 711,251 | |
| | |
MRV Communications, Inc.* | | | 29,686 | | | | 264,205 | |
| | |
Napco Security Technologies, Inc.* | | | 67,268 | | | | 642,409 | |
| | |
NVE Corp. | | | 10,111 | | | | 798,162 | |
| | |
PDF Solutions, Inc.* | | | 31,081 | | | | 504,755 | |
| | |
Planet Payment, Inc.* | | | 132,477 | | | | 457,046 | |
| | |
PRGX Global, Inc.* | | | 144,148 | | | | 965,792 | |
| | |
Radisys Corp.* | | | 87,712 | | | | 330,674 | |
| | |
Silicom, Ltd. | | | 20,705 | | | | 1,055,334 | |
| | |
Total Information Technology | | | | | | | 14,479,364 | |
| |
Materials - 2.0% | | | | | |
| | |
Haynes International, Inc. | | | 9,830 | | | | 351,914 | |
| | |
KMG Chemicals, Inc. | | | 7,451 | | | | 416,734 | |
| | |
Neenah Paper, Inc. | | | 8,683 | | | | 677,274 | |
| | |
Total Materials | | | | | | | 1,445,922 | |
| |
Real Estate - 1.3% | | | | | |
| | |
UMH Properties, Inc. | | | 55,036 | | | | 919,101 | |
| | |
Telecommunication Services - 1.9% | | | | | | | | |
| | |
Cogent Communications Holdings, Inc. | | | 16,746 | | | | 659,792 | |
| | |
Vonage Holdings Corp.* | | | 100,395 | | | | 693,729 | |
| | |
Total Telecommunication Services | | | | | | | 1,353,521 | |
| | |
Total Common Stocks
(cost $60,224,376) | | | | | | | 68,052,935 | |
| | | | | | | | |
| | | Principal
Amount | | | Value | |
Short-Term Investments - 7.5% | | | | | |
| |
Repurchase Agreements - 6.2%3 | | | | | |
| | |
Barclays Capital, Inc. dated 05/31/17, due 06/01/17, 0.790% total to be received $218,462 (collateralized by various U.S. Government Agency Obligations, 0.000% - 3.625%, 08/31/17 - 09/09/49, totaling $222,826) | | | $218,457 | | | | $218,457 | |
| | |
BNP Paribas SA, dated 05/31/17, due 06/01/17, 0.820% total to be received $1,038,180 (collateralized by various U.S. Government Agency Obligations, 0.000% - 10.000%, 06/30/17 - 07/20/63, totaling $1,058,919) | | | 1,038,156 | | | | 1,038,156 | |
| | |
Cantor Fitzgerald Securities, Inc., dated 05/31/17, due 06/01/17, 0.820% total to be received $1,038,180 (collateralized by various U.S. Government Agency Obligations, 0.000% - 10.500%, 06/15/17 - 03/20/67, totaling $1,058,919) | | | 1,038,156 | | | | 1,038,156 | |
| | |
Daiwa Capital Markets America, dated 05/31/17, due 06/01/17, 0.850% total to be received $1,038,181 (collateralized by various U.S. Government Agency Obligations, 0.000% - 6.500%, 06/08/17 - 12/01/51, totaling $1,058,919) | | | 1,038,156 | | | | 1,038,156 | |
| | |
Nomura Securities International, Inc., dated 05/31/17, due 06/01/17, 0.820% total to be received $1,038,180 (collateralized by various U.S. Government Agency Obligations, 0.000% - 9.500%, 06/01/17 - 05/20/67, totaling $1,058,919) | | | 1,038,156 | | | | 1,038,156 | |
| | |
Total Repurchase Agreements | | | | | | | 4,371,081 | |
| | |
| | | Shares | | | | | |
| |
Other Investment Companies - 1.3% | | | | | |
| | |
Dreyfus Government Cash Management Fund, Institutional Class Shares, 0.70%1 | | | 899,919 | | | | 899,919 | |
| |
Total Short-Term Investments
(cost $5,271,000) | | | | 5,271,000 | |
| |
Total Investments - 104.2%
(cost $65,495,376) | | | | 73,323,935 | |
| | |
Other Assets, less Liabilities - (4.2)% | | | | | | | (2,927,879 | ) |
| | |
Net Assets - 100.0% | | | | | | | $70,396,056 | |
|
|
The accompanying notes are an integral part of these financial statements. |
| 18 |
| | | | |
| | | | | |
| | | | | |
| | | Notes to Schedules of Portfolio Investments | | |
The following footnotes should be read in conjunction with each of the Schedules of Portfolio Investments previously presented in this report.
At May 31, 2017, the approximate cost of investments and the aggregate gross unrealized appreciation and depreciation for federal income tax were as follows:
| | | | | | | | | | | | | | | | |
| Fund | | Cost | | | Appreciation | | | Depreciation | | | Net | |
| | | | |
AMG Managers Cadence Capital Appreciation Fund | | | $83,201,767 | | | | $33,215,033 | | | | $(2,840,325) | | | | $30,374,708 | |
| | | | |
AMG Managers Cadence Mid Cap Fund | | | 112,541,262 | | | | 18,589,497 | | | | (1,338,736 | ) | | | 17,250,761 | |
| | | | |
AMG Managers Cadence Emerging Companies Fund | | | 65,762,404 | | | | 10,194,933 | | | | (2,633,402 | ) | | | 7,561,531 | |
| * | Non-income producing security. |
| 1 | Yield shown represents the May 31, 2017, seven-day average yield, which refers to the sum of the previous seven days’ dividends paid, expressed as an annual percentage. |
| 2 | Some or all of these securities were out on loan to various brokers as of May 31, 2017, amounting to the following: |
| | | | | | | | |
| Fund | | Market Value | | | % of Net Assets | |
| | |
AMG Managers Cadence Capital Appreciation Fund | | | $2,623,557 | | | | 2.4 | % |
| | |
AMG Managers Cadence Mid Cap Fund | | | 5,653,210 | | | | 4.5 | % |
| | |
AMG Managers Cadence Emerging Companies Fund | | | 4,191,132 | | | | 6.0 | % |
| 3 | Collateral received from brokers for securities lending was invested in these joint repurchase agreements. |
The following tables summarize the inputs used to value the Funds’ investments by the fair value hierarchy levels as of May 31, 2017: (See Note 1(a) in the Notes to Financial Statements.)
| | | | | | | | | | | | | | | | |
| | | Quoted Prices in Active
Markets for Identical
Investments Level 1 | | | Significant Other
Observable
Inputs Level 2 | | | Significant
Unobservable Inputs
Level 3 | | | Total | |
| | | |
| AMG Managers Cadence Capital Appreciation Fund | | | | | | | | | | |
| | | | |
Investments in Securities | | | | | | | | | | | | | | | | |
| | | | |
Common Stocks† | | | $110,837,620 | | | | — | | | | — | | | | $110,837,620 | |
| | | | |
Short-Term Investments | | | | | | | | | | | | | | | | |
| | | | |
Repurchase Agreements | | | — | | | | $2,666,046 | | | | — | | | | 2,666,046 | |
| | | | |
Other Investment Companies | | | 72,809 | | | | — | | | | — | | | | 72,809 | |
| | | | | | | | | | | | | | | | |
| | | | |
Total Investments in Securities | | | $110,910,429 | | | | $2,666,046 | | | | — | | | | $113,576,475 | |
| | | | | | | | | | | | | | | | |
| | | | |
| | | Quoted Prices in Active
Markets for Identical
Investments Level 1 | | | Significant Other
Observable
Inputs Level 2 | | | Significant
Unobservable Inputs
Level 3 | | | Total | |
| | | | |
| AMG Managers Cadence Mid Cap Fund | | | | | | | | | | | | |
| | | | |
Investments in Securities | | | | | | | | | | | | | | | | |
| | | | |
Common Stocks† | | | $123,962,962 | | | | — | | | | — | | | | $123,962,962 | |
| | | | |
Short-Term Investments | | | | | | | | | | | | | | | | |
| | | | |
Repurchase Agreements | | | — | | | | $5,766,975 | | | | — | | | | 5,766,975 | |
| | | | |
Other Investment Companies | | | 62,086 | | | | — | | | | — | | | | 62,086 | |
| | | | | | | | | | | | | | | | |
| | | | |
Total Investments in Securities | | | $124,025,048 | | | | $5,766,975 | | | | — | | | | $129,792,023 | |
| | | | | | | | | | | | | | | | |
|
|
The accompanying notes are an integral part of these financial statements. |
| 19 |
| | | | |
| | | | | |
| | | | | |
| | | Notes to Schedules of Portfolio Investments (continued) | | |
| | | | | | | | | | | | | | | | |
| | | Quoted Prices in Active Markets for Identical Investments Level 1 | | | Significant Other
Observable Inputs Level 2 | | | Significant
Unobservable Inputs
Level 3 | | | Total | |
AMG Managers Cadence Emerging Companies Fund | | | | | | | | | | | | | | | | |
Investments in Securities | | | | | | | | | | | | | | | | |
| |
Common Stocks† | | | $68,052,935 | | | | — | | | | — | | | | $68,052,935 | |
Short-Term Investments | | | | | | | | | | | | | | | | |
Repurchase Agreements | | | — | | | | $4,371,081 | | | | — | | | | 4,371,081 | |
Other Investment Companies | | | 899,919 | | | | — | | | | — | | | | 899,919 | |
| | | | | | | | | | | | | | | | |
Total Investments in Securities | | | $68,952,854 | | | | $4,371,081 | | | | — | | | | $73,323,935 | |
| | | | | | | | | | | | | | | | |
| † | All common stocks held in the Funds are level 1 securities. For a detailed break-out of the common stocks by major industry classification, please refer to the fund’s respective schedule of Portfolio Investments. |
As of May 31, 2017, the Funds had no transfers between levels from the beginning of the reporting period.
INVESTMENT DEFINITIONS AND ABBREVIATIONS:
REIT: Real Estate Investment Trust.
|
|
The accompanying notes are an integral part of these financial statements. |
20 |
| | | | |
| | | | | |
| | | Statement of Assets and Liabilities | | |
| | | May 31, 2017 | | |
| | | | | | | | | | | | |
| | | AMG Managers | | | | | | AMG Managers | |
| | | Cadence | | | AMG Managers | | | Cadence | |
| | | Capital | | | Cadence | | | Emerging | |
| | | Appreciation | | | Mid Cap | | | Companies | |
| | | Fund# | | | Fund# | | | Fund# | |
| |
Assets: | | | | | | | | | | | | |
Investments at value* (including securities on loan valued at $2,623,557, $5,653,210, and $4,191,132, respectively) | | | $113,576,475 | | | | $129,792,023 | | | | $73,323,935 | |
Receivable for investments sold | | | — | | | | 1,132,105 | | | | 21,009 | |
Dividends, interest and other receivables | | | 143,930 | | | | 139,846 | | | | 47,958 | |
Receivable from affiliate | | | 22,219 | | | | 8,333 | | | | 9,816 | |
Receivable for Fund shares sold | | | 1,326 | | | | 20,068 | | | | 1,664,803 | |
Prepaid expenses and other | | | 32,226 | | | | 34,351 | | | | 45,731 | |
Total assets | | | 113,776,176 | | | | 131,126,726 | | | | 75,113,252 | |
Liabilities: | | | | | | | | | | | | |
Payable upon return of securities loaned | | | 2,666,046 | | | | 5,766,975 | | | | 4,371,081 | |
Payable for Fund shares repurchased | | | 203,031 | | | | 80,577 | | | | 74,390 | |
Payable for investments purchased | | | — | | | | — | | | | 151,339 | |
Payable to affiliate | | | 1,474 | | | | 6,222 | | | | — | |
Accrued expenses: | | | | | | | | | | | | |
Investment advisory and management fees | | | 41,383 | | | | 47,432 | | | | 73,312 | |
Administrative fees | | | 13,794 | | | | 15,811 | | | | 8,797 | |
Shareholder servicing fees - Class I | | | 536 | | | | 1,903 | | | | — | |
Distribution fees - Class N | | | 13,908 | | | | 17,923 | | | | — | |
Professional fees | | | 27,730 | | | | 27,875 | | | | 25,694 | |
Trustees fees and expenses | | | 1,108 | | | | 1,314 | | | | 682 | |
Other | | | 41,974 | | | | 45,698 | | | | 11,901 | |
Total liabilities | | | 3,010,984 | | | | 6,011,730 | | | | 4,717,196 | |
| | | | | | | | | | | | |
Net Assets | | | $110,765,192 | | | | $125,114,996 | | | | $70,396,056 | |
Net Assets Represent: | | | | | | | | | | | | |
Paid-in capital | | | $130,386,337 | | | | $98,479,665 | | | | $76,471,366 | |
Undistributed (distribution in excess of income) net investment income | | | 266,582 | | | | — | | | | (165,948 | ) |
Accumulated net realized gain (loss) from investments | | | (50,696,706 | ) | | | 9,297,930 | | | | (13,737,921 | ) |
Net unrealized appreciation of investments | | | 30,808,979 | | | | 17,337,401 | | | | 7,828,559 | |
Net Assets | | | $110,765,192 | | | | $125,114,996 | | | | $70,396,056 | |
* Investments at cost | | | $82,767,496 | | | | $112,454,622 | | | | $65,495,376 | |
| # | Effective October 1, 2016, and February 27, 2017, the Fund’s share classes were renamed as described in Note 1 of the Notes to the Financial Statements. |
|
|
The accompanying notes are an integral part of these financial statements. |
21 |
| | | | |
| | | | | |
| | | | | |
| | | Statement of Assets and Liabilities (continued) | | |
| | | | | | | | | | | | |
| | | AMG Managers | | | | | | AMG Managers | |
| | | Cadence | | | AMG Managers | | | Cadence | |
| | | Capital | | | Cadence | | | Emerging | |
| | | Appreciation | | | Mid Cap | | | Companies | |
| | | Fund# | | | Fund# | | | Fund# | |
| |
Class N: | | | | | | | | | | | | |
Net Assets | | | $65,869,389 | | | | $84,872,960 | | | | $13,445,652 | |
Shares outstanding | | | 2,107,159 | | | | 2,861,374 | | | | 293,813 | |
Net asset value, offering and redemption price per share | | | $31.26 | | | | $29.66 | | | | $45.76 | |
Class I: | | | | | | | | | | | | |
Net Assets | | | $4,428,062 | | | | $15,244,562 | | | | $56,850,404 | |
Shares outstanding | | | 139,558 | | | | 499,535 | | | | 1,147,464 | |
Net asset value, offering and redemption price per share | | | $31.73 | | | | $30.52 | | | | $49.54 | |
Class Z: | | | | | | | | | | | | |
Net Assets | | | $40,467,741 | | | | $24,997,474 | | | | $100,000 | |
Shares outstanding | | | 1,247,742 | | | | 786,596 | | | | 2,019 | |
Net asset value, offering and redemption price per share | | | $32.43 | | | | $31.78 | | | | $49.54 | * |
| * | Net asset value calculated using shares outstanding out to three decimal places. |
| # | Effective October 1, 2016, and February 27, 2017, the Fund’s share classes were renamed as described in Note 1 of the Notes to the Financial Statements. |
|
|
The accompanying notes are an integral part of these financial statements. |
22 |
| | | | |
| | | | | |
| | | Statement of Operations | | |
| | | For the fiscal year ended May 31, 2017 | | |
| | | | | | | | | | | | |
| | | AMG Managers Cadence Capital Appreciation Fund# | | | AMG Managers Cadence Mid Cap Fund# | | | AMG Managers Cadence Emerging Companies Fund# | |
| |
Investment Income: | | | | | | | | | | | | |
Dividend income | | | $1,509,273 | | | | $979,209 | | | | $382,015 | 1 |
Securities lending income | | | 1,480 | | | | 21,870 | | | | 25,943 | |
Interest income | | | 187 | | | | 121 | | | | 417 | |
Miscellaneous income | | | 897 | | | | 1,136 | | | | 921 | |
Foreign withholding tax | | | — | | | | — | | | | (5,525 | ) |
Total investment income | | | 1,511,837 | | | | 1,002,336 | | | | 403,771 | |
Expenses: | | | | | | | | | | | | |
Investment advisory and management fees | | | 456,047 | | | | 569,572 | | | | 645,776 | |
Administrative fees | | | 185,604 | | | | 232,915 | | | | 91,651 | |
Distribution fees - Class N | | | 156,591 | | | | 217,573 | | | | — | |
Shareholder servicing fees - Class N | | | 63,390 | | | | 111,457 | | | | 13,485 | |
Shareholder servicing fees - Class I | | | 5,997 | | | | 25,304 | | | | — | |
Registration fees | | | 43,423 | | | | 43,112 | | | | 31,748 | |
Professional fees | | | 36,664 | | | | 38,422 | | | | 31,358 | |
Transfer agent fees | | | 24,518 | | | | 25,565 | | | | 2,006 | |
Reports to shareholders | | | 18,172 | | | | 23,089 | | | | 9,647 | |
Custodian fees | | | 10,153 | | | | 11,553 | | | | 6,816 | |
Trustees fees and expenses | | | 6,542 | | | | 8,251 | | | | 2,932 | |
Miscellaneous | | | 4,435 | | | | 5,023 | | | | 2,317 | |
Repayments for prior reimbursements | | | 1,474 | | | | 10,321 | | | | — | |
Total expenses before offsets/reductions | | | 1,013,010 | | | | 1,322,157 | | | | 837,736 | |
Expense reimbursements | | | (57,213 | ) | | | (55,919 | ) | | | (90,648 | ) |
Expense reductions | | | (2,525 | ) | | | — | | | | (1,396 | ) |
Net expenses | | | 953,272 | | | | 1,266,238 | | | | 745,692 | |
| | | | | | | | | | | | |
Net investment income (loss) | | | 558,565 | | | | (263,902 | ) | | | (341,921 | ) |
Net Realized and Unrealized Gain: | | | | | | | | | | | | |
Net realized gain on investments | | | 7,442,863 | | | | 15,434,562 | | | | 5,864,705 | |
Net change in unrealized appreciation of investments | | | 11,985,379 | | | | 5,000,430 | | | | 5,385,997 | |
Net realized and unrealized gain | | | 19,428,242 | | | | 20,434,992 | | | | 11,250,702 | |
| | | | | | | | | | | | |
Net increase in net assets resulting from operations | | | $19,986,807 | | | | $20,171,090 | | | | $10,908,781 | |
| # | Effective October 1, 2016, and February 27, 2017, the Fund’s share classes were renamed as described in Note 1 of the Notes to the Financial Statements. |
| 1 | Includes non-recurring dividends of $35,418 for AMG Managers Cadence Emerging Companies Fund. |
|
|
The accompanying notes are an integral part of these financial statements. |
| 23 |
| | | | |
| | | | | |
| | | Statements of Changes in Net Assets | | |
| | | For the fiscal years ended May 31, | | |
| | | | | | | | | | | | | | | | | | | | | | | | |
| | | AMG Managers Cadence | | | AMG Managers Cadence | | | AMG Managers Cadence | |
| | | Capital Appreciation Fund | | | Mid Cap Fund | | | Emerging Companies Fund | |
| | | 2017# | | | 2016 | | | 2017# | | | 2016 | | | 2017# | | | 2016 | |
| |
Increase (Decrease) in Net | | | | | | | | | | | | | | | | | | | | | | | | |
Assets Resulting From Operations: | | | | | | | | | | | | | | | | | | | | | | | | |
Net investment income (loss) | | | $558,565 | | | | $784,093 | | | | $(263,902) | | | | $1,095,508 | | | | $(341,921) | | | | $(286,591) | |
Net realized gain on investments | | | 7,442,863 | | | | 8,269,066 | | | | 15,434,562 | | | | 3,025,232 | | | | 5,864,705 | | | | 2,890,106 | |
Net change in unrealized appreciation (depreciation) of investments | | | 11,985,379 | | | | (11,579,523) | | | | 5,000,430 | | | | (15,089,387) | | | | 5,385,997 | | | | (1,759,644) | |
Net increase (decrease) in net assets resulting from operations | | | 19,986,807 | | | | (2,526,364) | | | | 20,171,090 | | | | (10,968,647) | | | | 10,908,781 | | | | 843,871 | |
| | | | | | |
Distributions to Shareholders: | | | | | | | | | | | | | | | | | | | | | | | | |
From net investment income: | | | | | | | | | | | | | | | | | | | | | | | | |
Class N | | | (262,713) | | | | (356,449) | | | | (472,527) | | | | — | | | | — | | | | — | |
Class I | | | (14,306) | | | | (53,559) | | | | (99,924) | | | | (13,249) | | | | — | | | | — | |
Class Z | | | (277,522) | | | | (325,307) | | | | (235,169) | | | | (100,817) | | | | — | | | | — | |
From net realized gain on investments: | | | | | | | | | | | | | | | | | | | | | | | | |
Class N | | | — | | | | — | | | | (4,689,069) | | | | (10,199,415) | | | | — | | | | — | |
Class I | | | — | | | | — | | | | (745,297) | | | | (1,508,909) | | | | — | | | | — | |
Class Z | | | — | | | | — | | | | (1,349,001) | | | | (3,048,088) | | | | — | | | | — | |
Total distributions to shareholders | | | (554,541) | | | | (735,315) | | | | (7,590,987) | | | | (14,870,478) | | | | — | | | | — | |
Capital Share Transactions:1 | | | | | | | | | | | | | | | | | | | | | | | | |
Net increase (decrease) from capital share transactions | | | (10,942,126) | | | | (26,432,738) | | | | (16,995,367) | | | | (9,797,749) | | | | 20,324,931 | | | | 609,600 | |
| | | | | | | | | | | | | | | | | | | | | | | | |
Total increase (decrease) in net assets | | | 8,490,140 | | | | (29,694,417) | | | | (4,415,264) | | | | (35,636,874) | | | | 31,233,712 | | | | 1,453,471 | |
Net Assets: | | | | | | | | | | | | | | | | | | | | | | | | |
Beginning of year | | | 102,275,052 | | | | 131,969,469 | | | | 129,530,260 | | | | 165,167,134 | | | | 39,162,344 | | | | 37,708,873 | |
End of year | | | $110,765,192 | | | | $102,275,052 | | | | $125,114,996 | | | | $129,530,260 | | | | $70,396,056 | | | | $39,162,344 | |
End of year undistributed (accumulated) net investment income (loss) | | | $266,582 | | | | $286,341 | | | | — | | | | $1,006,762 | | | | $(165,948) | | | | $(85,445) | |
| | | | | | | | | | | | | | | | | | | | | | | | |
| # | Effective October 1, 2016, and February 27, 2017, the Fund’s share classes were renamed as described in Note 1 of the Notes to the Financial Statements. |
| 1 | See Note 1(g) of the Notes to Financial Statements. |
|
|
The accompanying notes are an integral part of these financial statements. |
24 |
| | | | |
| | | AMG Managers Cadence Capital Appreciation Fund | | |
| | | Financial Highlights | | |
| | | For a share outstanding throughout each fiscal year | | |
| | | | | | | | | | | | | | | | | | | | |
| | | For the fiscal years ended May 31, | |
| Class N | | 2017# | | | 2016 | | | 2015 | | | 2014 | | | 2013 | |
Net Asset Value, Beginning of Year | | | $25.83 | | | | $26.49 | | | | $23.54 | | | | $19.78 | | | | $16.59 | |
Income (Loss) from Investment Operations: | | | | | | | | | | | | | | | | | | | | |
Net investment income1,2 | | | 0.12 | | | | 0.15 | 5 | | | 0.08 | | | | 0.13 | 6 | | | 0.15 | 7 |
Net realized and unrealized gain (loss) on investments | | | 5.43 | | | | (0.67 | ) | | | 3.01 | | | | 3.73 | | | | 3.17 | |
Total income (loss) from investment operations | | | 5.55 | | | | (0.52 | ) | | | 3.09 | | | | 3.86 | | | | 3.32 | |
Less Distributions to Shareholders from: | | | | | | | | | | | | | | | | | | | | |
Net investment income | | | (0.12 | ) | | | (0.14 | ) | | | (0.14 | ) | | | (0.10 | ) | | | (0.13 | ) |
Net Asset Value, End of Year | | | $31.26 | | | | $25.83 | | | | $26.49 | | | | $23.54 | | | | $19.78 | |
Total Return2 | | | 21.54 | % | | | (1.98 | )% | | | 13.16 | % | | | 19.53 | % | | | 20.12 | % |
Ratio of net expenses to average net assets3 | | | 1.07 | % | | | 1.02 | % | | | 1.12 | % | | | 1.09 | %8 | | | 1.12 | %9 |
Ratio of gross expenses to average net assets4 | | | 1.13 | % | | | 1.15 | % | | | 1.22 | % | | | 1.23 | %8 | | | 1.23 | %9 |
Ratio of net investment income to average net assets2 | | | 0.42 | % | | | 0.60 | % | | | 0.30 | % | | | 0.59 | %8 | | | 0.81 | %9 |
Portfolio turnover | | | 23 | % | | | 22 | % | | | 41 | % | | | 52 | % | | | 79 | % |
Net assets at end of year (000’s omitted) | | | $65,869 | | | | $62,760 | | | | $75,755 | | | | $81,866 | | | | $87,419 | |
| | | | | | | | | | | | | | | | | | | | | |
| | | | | |
| | | | | | | | | | | | | | | | | | | | |
| | | For the fiscal years ended May 31, | |
| Class I | | 2017# | | | 2016 | | | 2015 | | | 2014 | | | 2013 | |
Net Asset Value, Beginning of Year | | | $26.19 | | | | $26.88 | | | | $23.74 | | | | $19.99 | | | | $16.71 | |
Income (Loss) from Investment Operations: | | | | | | | | | | | | | | | | | | | | |
Net investment income1,2 | | | 0.17 | | | | 0.17 | 5 | | | 0.12 | | | | 0.16 | 6 | | | 0.14 | 7 |
Net realized and unrealized gain (loss) on investments | | | 5.51 | | | | (0.70 | ) | | | 3.06 | | | | 3.76 | | | | 3.24 | |
Total income (loss) from investment operations | | | 5.68 | | | | (0.53 | ) | | | 3.18 | | | | 3.92 | | | | 3.38 | |
Less Distributions to Shareholders from: | | | | | | | | | | | | | | | | | | | | |
Net investment income | | | (0.14 | ) | | | (0.16 | ) | | | (0.04 | ) | | | (0.17 | ) | | | (0.10 | ) |
Net Asset Value, End of Year | | | $31.73 | | | | $26.19 | | | | $26.88 | | | | $23.74 | | | | $19.99 | |
Total Return2 | | | 21.77 | % | | | (1.97 | )% | | | 13.41 | % | | | 19.63 | %10 | | | 20.31 | %10 |
Ratio of net expenses to average net assets3 | | | 0.91 | % | | | 0.96 | % | | | 0.97 | % | | | 0.94 | %8 | | | 0.95 | %9 |
Ratio of gross expenses to average net assets4 | | | 0.96 | % | | | 1.09 | % | | | 1.07 | % | | | 1.08 | %8 | | | 1.06 | %9 |
Ratio of net investment income to average net assets2 | | | 0.59 | % | | | 0.66 | % | | | 0.45 | % | | | 0.74 | %8 | | | 0.76 | %9 |
Portfolio turnover | | | 23 | % | | | 22 | % | | | 41 | % | | | 52 | % | | | 79 | % |
Net assets at end of year (000’s omitted) | | | $4,428 | | | | $4,842 | | | | $10,287 | | | | $42,245 | | | | $55,735 | |
| | | | | | | | | | | | | | | | | | | | | |
25
| | | | |
| | | AMG Managers Cadence Capital Appreciation Fund | | |
| | | Financial Highlights | | |
| | | For a share outstanding throughout each fiscal year | | |
| | | | | | | | | | | | | | | | | | | | |
| | | For the fiscal years ended May 31, | |
| Class Z | | 2017# | | | 2016 | | | 2015 | | | 2014 | | | 2013 | |
Net Asset Value, Beginning of Year | | | $26.80 | | | | $27.50 | | | | $24.44 | | | | $20.57 | | | | $17.21 | |
Income (Loss) from Investment Operations: | | | | | | | | | | | | | | | | | | | | |
Net investment income1,2 | | | 0.22 | | | | 0.24 | 5 | | | 0.18 | | | | 0.22 | 6 | | | 0.18 | 7 |
Net realized and unrealized gain (loss) on investments | | | 5.64 | | | | (0.70 | ) | | | 3.14 | | | | 3.88 | | | | 3.34 | |
Total income (loss) from investment operations | | | 5.86 | | | | (0.46 | ) | | | 3.32 | | | | 4.10 | | | | 3.52 | |
Less Distributions to Shareholders from: | | | | | | | | | | | | | | | | | | | | |
Net investment income | | | (0.23 | ) | | | (0.24 | ) | | | (0.26 | ) | | | (0.23 | ) | | | (0.16 | ) |
Net Asset Value, End of Year | | | $32.43 | | | | $26.80 | | | | $27.50 | | | | $24.44 | | | | $20.57 | |
Total Return2 | | | 21.97 | % | | | (1.67 | )% | | | 13.62 | % | | | 19.96 | % | | | 20.57 | % |
Ratio of net expenses to average net assets3 | | | 0.72 | % | | | 0.72 | % | | | 0.72 | % | | | 0.69 | %8 | | | 0.70 | %9 |
Ratio of gross expenses to average net assets4 | | | 0.78 | % | | | 0.85 | % | | | 0.82 | % | | | 0.83 | %8 | | | 0.81 | %9 |
Ratio of net investment income to average net assets2 | | | 0.77 | % | | | 0.90 | % | | | 0.70 | % | | | 1.00 | %8 | | | 1.00 | %9 |
Portfolio turnover | | | 23 | % | | | 22 | % | | | 41 | % | | | 52 | % | | | 79 | % |
Net assets at end of year (000’s omitted) | | | $40,468 | | | | $34,673 | | | | $45,927 | | | | $45,795 | | | | $37,536 | |
| | | | | | | | | | | | | | | | | | | | | |
26
| | | | |
| | | AMG Managers Cadence Mid Cap Fund | | |
| | | Financial Highlights | | |
| | | For a share outstanding throughout each fiscal year | | |
| | | | | | | | | | | | | | | | | | | | |
| | | For the fiscal years ended May 31, | |
| Class N | | 2017# | | | 2016 | | | 2015 | | | 2014 | | | 2013 | |
Net Asset Value, Beginning of Year | | | $26.87 | | | | $32.15 | | | | $34.15 | | | | $28.32 | | | | $24.10 | |
Income (Loss) from Investment Operations: | | | | | | | | | | | | | | | | | | | | |
Net investment income (loss)1,2 | | | (0.09 | ) | | | 0.19 | 5 | | | (0.06 | ) | | | (0.02 | )6 | | | 0.03 | 7 |
Net realized and unrealized gain (loss) on investments | | | 4.58 | | | | (2.32 | ) | | | 4.88 | | | | 5.85 | | | | 4.23 | |
Total income (loss) from investment operations | | | 4.49 | | | | (2.13 | ) | | | 4.82 | | | | 5.83 | | | | 4.26 | |
Less Distributions to Shareholders from: | | | | | | | | | | | | | | | | | | | | |
Net investment income | | | (0.16 | ) | | | — | | | | — | | | | — | | | | (0.04 | ) |
Net realized gain on investments | | | (1.54 | ) | | | (3.15 | ) | | | (6.82 | ) | | | — | | | | — | |
Total distributions to shareholders | | | (1.70 | ) | | | (3.15 | ) | | | (6.82 | ) | | | — | | | | (0.04 | ) |
Net Asset Value, End of Year | | | $29.66 | | | | $26.87 | | | | $32.15 | | | | $34.15 | | | | $28.32 | |
Total Return2 | | | 17.23 | % | | | (6.64 | )% | | | 15.14 | % | | | 20.59 | % | | | 17.70 | % |
Ratio of net expenses to average net assets11 | | | 1.10 | % | | | 1.11 | % | | | 1.12 | % | | | 1.11 | %12 | | | 1.13 | %13 |
Ratio of gross expenses to average net assets4 | | | 1.14 | % | | | 1.21 | % | | | 1.19 | % | | | 1.18 | %12 | | | 1.21 | %13 |
Ratio of net investment income (loss) to average net assets2 | | | (0.31 | )% | | | 0.67 | % | | | (0.16 | )% | | | (0.05 | )%12 | | | 0.13 | %13 |
Portfolio turnover | | | 141 | % | | | 149 | % | | | 130 | % | | | 203 | % | | | 121 | % |
Net assets at end of year (000’s omitted) | | | $84,873 | | | | $89,179 | | | | $116,666 | | | | $122,497 | | | | $163,088 | |
| | | | | | | | | | | | | | | | | | | | | |
| | | | | |
| | | | | | | | | | | | | | | | | | | | |
| | | For the fiscal years ended May 31, | |
| Class I | | 2017# | | | 2016 | | | 2015 | | | 2014 | | | 2013 | |
Net Asset Value, Beginning of Year | | | $27.65 | | | | $33.07 | | | | $35.04 | | | | $29.02 | | | | $24.67 | |
Income (Loss) from Investment Operations: | | | | | | | | | | | | | | | | | | | | |
Net investment income (loss)1,2 | | | (0.03 | ) | | | 0.25 | 5 | | | (0.01 | ) | | | 0.05 | 6 | | | 0.08 | 7 |
Net realized and unrealized gain (loss) on investments | | | 4.70 | | | | (2.39 | ) | | | 5.02 | | | | 5.97 | | | | 4.32 | |
Total income (loss) from investment operations | | | 4.67 | | | | (2.14 | ) | | | 5.01 | | | | 6.02 | | | | 4.40 | |
Less Distributions to Shareholders from: | | | | | | | | | | | | | | | | | | | | |
Net investment income | | | (0.21 | ) | | | (0.03 | ) | | | — | | | | — | | | | (0.05 | ) |
Net realized gain on investments | | | (1.59 | ) | | | (3.25 | ) | | | (6.98 | ) | | | — | | | | — | |
Total distributions to shareholders | | | (1.80 | ) | | | (3.28 | ) | | | (6.98 | ) | | | — | | | | (0.05 | ) |
Net Asset Value, End of Year | | | $30.52 | | | | $27.65 | | | | $33.07 | | | | $35.04 | | | | $29.02 | |
Total Return2 | | | 17.44 | % | | | (6.50 | )% | | | 15.34 | % | | | 20.74 | % | | | 17.88 | % |
Ratio of net expenses to average net assets11 | | | 0.90 | % | | | 0.97 | % | | | 0.97 | % | | | 0.96 | %12 | | | 0.98 | %13 |
Ratio of gross expenses to average net assets4 | | | 0.95 | % | | | 1.07 | % | | | 1.04 | % | | | 1.03 | %12 | | | 1.06 | %13 |
Ratio of net investment income (loss) to average net assets2 | | | (0.11 | )% | | | 0.86 | % | | | (0.01 | )% | | | 0.15 | %12 | | | 0.32 | %13 |
Portfolio turnover | | | 141 | % | | | 149 | % | | | 130 | % | | | 203 | % | | | 121 | % |
Net assets at end of year (000’s omitted) | | | $15,245 | | | | $13,715 | | | | $14,809 | | | | $33,215 | | | | $65,393 | |
| | | | | | | | | | | | | | | | | | | | | |
| | | | |
| | | AMG Managers Cadence Mid Cap Fund | | |
| | | Financial Highlights | | |
| | | For a share outstanding throughout each fiscal year | | |
| | | | | | | | | | | | | | | | | | | | |
| | | For the fiscal years ended May 31, | |
| Class Z | | 2017# | | | 2016 | | | 2015 | | | 2014 | | | 2013 | |
Net Asset Value, Beginning of Year | | | $28.79 | | | | $34.45 | | | | $36.44 | | | | $30.18 | | | | $25.66 | |
Income (Loss) from Investment Operations: | | | | | | | | | | | | | | | | | | | | |
Net investment income1,2 | | | 0.02 | | | | 0.33 | 5 | | | 0.09 | | | | 0.12 | 6 | | | 0.15 | 7 |
Net realized and unrealized gain (loss) on investments | | | 4.92 | | | | (2.49 | ) | | | 5.21 | | | | 6.23 | | | | 4.50 | |
Total income (loss) from investment operations | | | 4.94 | | | | (2.16 | ) | | | 5.30 | | | | 6.35 | | | | 4.65 | |
| | | | | |
Less Distributions to Shareholders from: | | | | | | | | | | | | | | | | | | | | |
Net investment income | | | (0.29 | ) | | | (0.11 | ) | | | — | | | | (0.09 | ) | | | (0.13 | ) |
Net realized gain on investments | | | (1.66 | ) | | | (3.39 | ) | | | (7.29 | ) | | | — | | | | — | |
Total distributions to shareholders | | | (1.95 | ) | | | (3.50 | ) | | | (7.29 | ) | | | (0.09 | ) | | | (0.13 | ) |
Net Asset Value, End of Year | | | $31.78 | | | | $28.79 | | | | $34.45 | | | | $36.44 | | | | $30.18 | |
Total Return2 | | | 17.71 | % | | | (6.28 | )% | | | 15.62 | % | | | 21.04 | % | | | 18.20 | % |
Ratio of net expenses to average net assets11 | | | 0.72 | % | | | 0.72 | % | | | 0.72 | % | | | 0.71 | %12 | | | 0.73 | %13 |
Ratio of gross expenses to average net assets4 | | | 0.76 | % | | | 0.82 | % | | | 0.79 | % | | | 0.78 | %12 | | | 0.81 | %13 |
Ratio of net investment income to average net assets2 | | | 0.07 | % | | | 1.07 | % | | | 0.24 | % | | | 0.35 | %12 | | | 0.56 | %13 |
Portfolio turnover | | | 141 | % | | | 149 | % | | | 130 | % | | | 203 | % | | | 121 | % |
Net assets at end of year (000’s omitted) | | | $24,997 | | | | $26,636 | | | | $33,693 | | | | $170,920 | | | | $194,755 | |
| | | | | | | | | | | | | | | | | | | | | |
| | | | |
| | | AMG Managers Cadence Emerging Companies Fund | | |
| | | Financial Highlights | | |
| | | For a share outstanding throughout each period | | |
| | | | | | | | | | | | | | | | | | | | |
| | | For the fiscal years ended May 31, | |
| Class N | | 2017# | | | 2016 | | | 2015 | | | 2014 | | | 2013 | |
Net Asset Value, Beginning of Year | | | $36.33 | | | | $35.29 | | | | $30.70 | | | | $26.84 | | | | $20.39 | |
Income (Loss) from Investment Operations: | | | | | | | | | | | | | | | | | | | | |
Net investment loss1,2 | | | (0.36 | )15 | | | (0.33 | )5 | | | (0.32 | )14 | | | (0.29 | )6 | | | (0.07 | )7 |
Net realized and unrealized gain on investments | | | 9.79 | | | | 1.37 | | | | 4.91 | | | | 4.15 | | | | 6.52 | |
Total income from investment operations | | | 9.43 | | | | 1.04 | | | | 4.59 | | | | 3.86 | | | | 6.45 | |
Net Asset Value, End of Year | | | $45.76 | | | | $36.33 | | | | $35.29 | | | | $30.70 | | | | $26.84 | |
Total Return2 | | | 25.92 | % | | | 2.95 | %10 | | | 14.95 | % | | | 14.38 | % | | | 31.63 | % |
Ratio of net expenses to average net assets16 | | | 1.62 | % | | | 1.65 | % | | | 1.66 | % | | | 1.61 | %17 | | | 1.63 | %18 |
Ratio of gross expenses to average net assets4 | | | 1.79 | % | | | 1.97 | % | | | 1.96 | % | | | 1.90 | %17 | | | 1.99 | %18 |
Ratio of net investment loss to average net assets2 | | | (0.83 | )% | | | (0.96 | )% | | | (0.98 | )% | | | (0.94 | )%17 | | | (0.31 | )%18 |
Portfolio turnover | | | 90 | % | | | 150 | % | | | 146 | % | | | 127 | % | | | 101 | % |
Net assets at end of year (000’s omitted) | | | $13,446 | | | | $3,099 | | | | $3,143 | | | | $3,540 | | | | $3,184 | |
| | | | | | | | | | | | | | | | | | | | | |
| | | | | |
| | | | | | | | | | | | | | | | | | | | |
| | | For the fiscal years ended May 31, | |
| Class I | | 2017# | | | 2016 | | | 2015 | | | 2014 | | | 2013 | |
Net Asset Value, Beginning of Year | | | $39.25 | | | | $38.04 | | | | $33.00 | | | | $28.80 | | | | $21.81 | |
Income (Loss) from Investment Operations: | | | | | | | | | | | | | | | | | | | | |
Net investment loss1,2 | | | (0.29 | )15 | | | (0.27 | )5 | | | (0.25 | )14 | | | (0.23 | )6 | | | (0.01 | )7 |
Net realized and unrealized gain on investments | | | 10.58 | | | | 1.48 | | | | 5.29 | | | | 4.43 | | | | 7.00 | |
Total income from investment operations | | | 10.29 | | | | 1.21 | | | | 5.04 | | | | 4.20 | | | | 6.99 | |
Net Asset Value, End of Year | | | $49.54 | | | | $39.25 | | | | $38.04 | | | | $33.00 | | | | $28.80 | |
Total Return2 | | | 26.22 | % | | | 3.18 | % | | | 15.27 | % | | | 14.58 | %10 | | | 32.05 | %10 |
Ratio of net expenses to average net assets16 | | | 1.42 | % | | | 1.42 | % | | | 1.41 | % | | | 1.38 | %17 | | | 1.38 | %18 |
Ratio of gross expenses to average net assets4 | | | 1.60 | % | | | 1.74 | % | | | 1.71 | % | | | 1.67 | %17 | | | 1.74 | %18 |
Ratio of net investment loss to average net assets2 | | | (0.64 | )% | | | (0.71 | )% | | | (0.73 | )% | | | (0.71 | )%17 | | | (0.05 | )%18 |
Portfolio turnover | | | 90 | % | | | 150 | % | | | 146 | % | | | 127 | % | | | 101 | % |
Net assets at end of year (000’s omitted) | | | $56,850 | | | | $36,064 | | | | $34,566 | | | | $39,463 | | | | $36,123 | |
| | | | | | | | | | | | | | | | | | | | | |
| | | | |
| | | | | |
| | | | | |
| | | Notes to Financial Highlights | | |
The following should be read in conjunction with the Financial Highlights of the Funds previously presented in this report.
| # | Effective October 1, 2016, the Investor Class, Service Class and Institutional Class of AMG Managers Cadence Capital Appreciation Fund and AMG Managers Cadence Mid-Cap Fund were renamed Class N, Class I and Class Z, respectively, and the Service Class and Institutional Class of AMG Managers Cadence Emerging Companies Fund were renamed Class S and Class I, respectively. Effective February 27, 2017, AMG Managers Cadence Emerging Companies Fund Class S was renamed Class N. |
| 1 | Per share numbers have been calculated using average shares. |
| 2 | Total returns and net investment income would have been lower had certain expenses not been offset. |
| 3 | Includes reduction from broker recapture amounting to 0.01%, 0.04%, and 0.02% for the years ended 2015, 2014 and 2013, respectively. |
| 4 | Excludes the impact of expense reimbursement or fee waivers and expense reductions such as brokerage credits, but includes expense repayments and non-reimbursable expenses, if any, such as interest, taxes and extraordinary expenses. (See Notes 1(c) and 2 in the Notes to Financial Statements.) |
| 5 | Includes non-recurring dividends. Without these dividends, net investment income (loss) per share would have been $0.14, $0.16, and $0.23 for AMG Managers Cadence Capital Appreciation Fund’s Class N, Class I, and Class Z, respectively, $0.01, $0.07, and $0.13 for AMG Managers Cadence Mid Cap Fund’s Class N, Class I, and Class Z, respectively, and $(0.36) and $(0.29) for AMG Managers Cadence Emerging Companies Fund’s Class N, and Class I, respectively. |
| 6 | Includes non-recurring dividends. Without these dividends, net investment income (loss) per share would have been $0.12, $0.15, and $0.21 for AMG Managers Cadence Capital Appreciation Fund’s Class N, Class I, and Class Z, respectively, $(0.03), $0.04, and $0.11 for AMG Managers Cadence Mid Cap Fund’s Class N, Class I, and Class Z, respectively, and $(0.32) and $(0.26) for AMG Managers Cadence Emerging Companies Fund’s Class N and Class I, respectively. |
| 7 | Includes non-recurring dividends. Without these dividends, net investment income (loss) per share would have been $0.09, $0.08, and $0.13 for AMG Managers Cadence Capital Appreciation Fund’s Class N, Class I, and Class Z, respectively, $(0.11), $(0.06), and $0.01 for AMG Managers Cadence Mid Cap Fund’s Class N, Class I, and Class Z, respectively, and $(0.31) and $(0.25) for AMG Managers Cadence Emerging Companies Fund’s Class N, and Class I, respectively. |
| 8 | Includes non-routine extraordinary expenses amounting to 0.007%, 0.007%, and 0.007% of average net assets for the Class N, Class I, and Class Z, respectively. |
| 9 | Includes non-routine extraordinary expenses amounting to 0.022%, 0.004%, and 0.003% of average net assets for the Class N, Class I, and Class Z, respectively. |
| 10 | The Total Return is based on the Financial Statement Net Asset Values as shown above. |
| 11 | Includes reduction from broker recapture amounting to 0.01%, 0.02% and 0.01% for the years ended 2015, 2014 and 2013, respectively. |
| 12 | Includes non-routine extraordinary expenses amounting to 0.008%, 0.007%, and 0.008% of average net assets for the Class N, Class I, and Class Z, respectively. |
| 13 | Includes non-routine extraordinary expenses amounting to 0.018%, 0.015%, and 0.016% of average net assets for the Class N, Class I, and Class Z, respectively. |
| 14 | Includes non-recurring dividends. Without these dividends, net investment income per share would have been $(0.33) and $(0.27) for the Class N, and Class I, respectively. |
| 15 | Includes non-recurring dividends. Without these dividends, net investment income per share would have been $(0.38) and $(0.31) for the Class N, and Class I, respectively. |
| 16 | Includes reduction from broker recapture amounting to 0.01%, 0.05% and 0.05% for the years ended 2015, 2014 and 2013, respectively. |
| 17 | Includes non-routine extraordinary expenses amounting to 0.009% and 0.009% of average net assets for the Class N and Class I, respectively. |
| 18 | Includes non-routine extraordinary expenses amounting to 0.014% and 0.014% of average net assets for the Class N and Class I, respectively |
| | | | |
| | | | | |
| | | Notes to Financial Statements | | |
| | | May 31, 2017 | | |
1. SUMMARY OF SIGNIFICANT ACCOUNTING POLICIES
AMG Funds III (the “Trust”) is an open-end management investment company, organized as a Massachusetts business trust and registered under the Investment Company Act of 1940, as amended (the “1940 Act”). Currently, the Trust consists of a number of different funds, each having distinct investment management objectives, strategies, risks, and policies. Included in this report are: AMG Managers Cadence Capital Appreciation Fund (“Capital Appreciation”), AMG Managers Cadence Mid Cap Fund (“Mid Cap”) and AMG Managers Cadence Emerging Companies Fund (“Emerging Companies”), each a “Fund” and collectively the “Funds.”
Effective at the close of business May 31,2017, Emerging Companies added Class Z shares, and issued approximately 2,019 shares to AMG Funds LLC (the “Investment Manager”) for $100,000.
Each Fund offers different classes of shares, which, effective October 1, 2016, were renamed. Capital Appreciation and Mid Cap previously offered Investor Class shares, Service Class shares and Institutional Class shares, which were renamed to Class N, Class I and Class Z, respectively, and Emerging Companies previously offered Service Class shares and Institutional Class shares, which were renamed Class S and Class I, respectively. Effective February 27, 2017, Emerging Companies Class S shares was renamed Class N. Each class represents an interest in the same assets of the respective Fund. Although all share classes generally have identical voting rights, each share class votes separately when required by law. Different share classes may pay different distribution amounts to the extent the net asset value per share and/or the expenses of such share classes differ. Each share class has its own expense structure. Please refer to a current prospectus for additional information on each share class.
The Funds’ financial statements are prepared in accordance with accounting principles generally accepted in the United States of America (“U.S. GAAP”), including accounting and reporting guidance pursuant to Accounting Standards Codification Topic 946 applicable to investment companies. U.S. GAAP requires management to make estimates and assumptions that affect the reported amounts of assets and liabilities and disclosure of contingent assets and liabilities at the date of the financial statements and the reported amounts of income and expenses during the reporting period. Actual results could differ from those estimates and such differences could be material. The following is a summary of significant accounting policies followed by the Funds in the preparation of their financial statements:
a. VALUATION OF INVESTMENTS
Equity securities traded on a national securities exchange or reported on the NASDAQ national market system (“NMS”) are valued at the last quoted sales price on the primary exchange or, if applicable, the NASDAQ official closing price or the official closing price of the relevant exchange or, lacking any sales, at the last quoted bid price or the mean between the last quoted bid and ask prices (the “exchange mean price”). Equity securities traded in the over-the-counter market (other than NMS securities) are valued at the exchange mean price. Foreign equity securities (securities principally traded in markets other than U.S. markets) are valued at the official closing price on the primary exchange or, for markets that either do not offer an official closing price or
where the official closing price may not be representative of the overall market, the last quoted sale price.
Fixed income securities purchased with a remaining maturity of 60 days or less are valued at amortized cost, provided that the amortized cost value is approximately the same as the fair value of the security valued without the use of amortized cost. Investments in other open-end regulated investment companies are valued at their end of day net asset value per share.
The Funds’ portfolio investments are generally valued based on independent market quotations or prices or, if none, “evaluative” or other market based valuations provided by third-party pricing services approved by the Board of Trustees of the Trust (the “Board”). Under certain circumstances, the value of certain Fund portfolio investments (including derivatives) may be based on an evaluation of fair value, pursuant to procedures established by and under the general supervision of the Board. The Valuation Committee, which is comprised of the Independent Trustees of the Board, and the Pricing Committee, which is comprised of representatives from the Investment Manager are the committees appointed by the Board to make fair value determinations. Each Fund may use the fair value of a portfolio investment to calculate its net asset value (“NAV”) in the event that the market quotation, price or market based valuation for the portfolio investment is not readily available or otherwise not determinable pursuant to the Board’s valuation procedures, if the Investment Manager or the Pricing Committee believes the quotation, price or market based valuation to be unreliable, or in certain other circumstances. When determining the fair value of an investment, the Pricing Committee and, if required under the Trust’s securities valuation procedures, the Valuation Committee, seeks to determine the price that the Fund might reasonably expect to receive from current sale of that portfolio investment in an arms-length transaction. Fair value determinations shall be based upon consideration of all available facts and information, including, but not limited to (i) attributes specific to the investment; (ii) fundamental and analytical data relating to the investment; and (iii) the value of other comparable securities or relevant financial instruments, including derivative securities, traded on other markets or among dealers.
The values assigned to fair value portfolio investments are based on available information and do not necessarily represent amounts that might ultimately be realized in the future, since such amounts depend on future developments inherent in long-term investments. Because of the inherent uncertainty of valuation, those estimated values may differ significantly from the values that would have been used had a ready market for the investments existed, and the differences could be material. The Board will be presented with a quarterly report showing as of the most recent quarter end, all outstanding securities fair valued by the Fund, including a comparison with the prior quarter end and the percentage of the Fund that the security represents at each quarter end.
With respect to foreign equity securities and certain foreign fixed income securities, the Board has adopted a policy that securities held in a Fund that can be fair valued by the applicable fair value pricing service are fair valued on each business day provided that each individual price exceeds a pre-established confidence level.
| | | | |
| | | | | |
| | | | | |
| | | Notes to Financial Statements (continued) | | |
U.S. GAAP defines fair value as the price that a fund would receive to sell an asset or pay to transfer a liability in an orderly transaction between market participants at the measurement date. U.S. GAAP also establishes a framework for measuring fair value, and a three-level hierarchy for fair value measurements based upon the transparency of inputs to the valuation of an asset or liability. Inputs may be observable or unobservable and refer broadly to the assumptions that market participants would use in pricing the asset or liability. Observable inputs reflect the assumptions market participants would use in pricing the asset or liability based on market data obtained from sources independent of the Funds. Unobservable inputs reflect the Funds’ own assumptions about the assumptions that market participants would use in pricing the asset or liability developed based on the best information available in the circumstances. Each investment is assigned a level based upon the observability of the inputs which are significant to the overall valuation.
The three-tier hierarchy of inputs is summarized below:
Level 1 – inputs are quoted prices in active markets for identical investments (e.g., equity securities, open-end investment companies)
Level 2 – other observable inputs (including, but not limited to: quoted prices for similar assets or liabilities in markets that are active, quoted prices for identical or similar assets or liabilities in markets that are not active, inputs other than quoted prices that are observable for the assets or liabilities (such as interest rates, yield curves, volatilities, prepayment speeds, loss severities, credit risks and default rates) or other market corroborated inputs) (e.g., debt securities, government securities, foreign currency exchange contracts, foreign securities utilizing international fair value pricing, broker-quoted securities, fair valued securities with observable inputs)
Level 3 – inputs are significant unobservable inputs (including the Fund’s own assumptions used to determine the fair value of investments) (e.g., fair valued securities with unobservable inputs)
Changes in inputs or methodologies used for valuing investments may result in a transfer in or out of levels within the fair value hierarchy. The inputs or methodologies used for valuing investments may not necessarily be an indication of the risk associated with investing in those investments. Transfers between different levels of the fair value disclosure hierarchy are deemed to have occurred as of the beginning of the reporting period.
b. SECURITY TRANSACTIONS
Security transactions are accounted for as of trade date. Realized gains and losses on securities sold are determined on the basis of identified cost.
c. INVESTMENT INCOME AND EXPENSES
Dividend income is recorded on the ex-dividend date. Dividends from foreign securities are recorded on the ex-dividend date, and if after the fact, as soon as the Fund becomes aware of the ex-dividend date. Interest income, which includes amortization of premium and accretion of discount on debt securities, is accrued as earned. Dividend and interest income on foreign securities is recorded gross of any withholding tax. Non-cash dividends included in dividend income, if any, are reported at the fair market value of the securities received. Upon notification from issuers, distributions received from a real estate
investment trust (“REIT”) may be redesignated as a reduction of cost of investments and/or realized gain. Other income and expenses are recorded on an accrual basis. Expenses that cannot be directly attributed to a Fund are apportioned among the funds in the Trust and other trusts within the AMG Funds family of mutual funds (collectively the “AMG Funds family”) based upon their relative average net assets or number of shareholders. Investment income, realized and unrealized gains and losses, the common expenses of each Fund, and certain Fund level expense reductions, if any, are allocated on a pro-rata basis to each class based on the relative net assets of each class to the total net assets of each Fund.
Capital Appreciation and Emerging Companies had certain portfolio trades directed to various brokers under a brokerage recapture program. Credits received from the brokerage recapture program are earned and paid on a monthly basis, and are recorded as expense offsets, which serve to reduce the Fund’s overall expense ratio. For the year ended May 31, 2017, the impact on the expense ratios, if any, were as follows: Capital Appreciation and Emerging Companies - $2,525 and $1,396, respectively, which were less than 0.01% of average net assets.
d. DIVIDEND AND DISTRIBUTIONS
Fund distributions resulting from either net investment income or realized net capital gains, if any, will normally be declared and paid at least annually in December, as described in the Funds’ prospectus. Distributions to shareholders are recorded on the ex-dividend date. Distributions are determined in accordance with federal income tax regulations, which may differ from net investment income and net realized capital gains for financial statement purposes (U.S. GAAP). Differences may be permanent or temporary. Permanent differences are reclassified among capital accounts in the financial statements to reflect their tax character. Permanent book and tax basis differences, if any, relating to shareholder distributions will result in reclassifications to paid-in capital. Temporary differences arise when certain items of income, expense and gain or loss are recognized in different periods for financial statement and tax purposes; these differences will reverse at some time in the future. Permanent differences are primarily due to net operating losses. Temporary differences are due to differing treatments for losses deferred due to excise tax regulations and wash sales.
The tax character of distributions paid during the fiscal years ended May 31, 2017 and May 31, 2016 were as follows:
| | | | | | | | | | | | | | | | |
| | | Capital Appreciation | | | Mid Cap | |
Distributions
paid from: | | 2017 | | | 2016 | | | 2017 | | | 2016 | |
| | | | |
Ordinary income | | | $554,541 | | | | $735,315 | | | | $1,006,762 | | | | $114,082 | |
| | | | |
Short-term capital gains | | | — | | | | — | | | | 452,218 | | | | 4,872,791 | |
| | | | |
Long-term capital gains | | | — | | | | — | | | | 6,132,007 | | | | 9,883,605 | |
| | | | |
Totals | | | $554,541 | | | | $735,315 | | | | $7,590,987 | | | | $14,870,478 | |
| | | | | | | | | | | | | | | | |
| | | | |
| | | | | |
| | | | | |
| | | Notes to Financial Statements (continued) | | |
As of May 31, 2017, the components of distributable earnings (excluding unrealized appreciation/depreciation) on a tax basis consisted of:
| | | | | | | | | | | | |
| | | Capital
Appreciation | | | Mid Cap | | | Emerging
Companies | |
Capital loss carryforward | | | $50,262,435 | | | | — | | | | $13,470,893 | |
| | | |
Undistributed ordinary income | | | 266,582 | | | | — | | | | — | |
Undistributed short-term capital gains | | | — | | | | $3,500,729 | | | | — | |
| | | |
Undistributed long-term capital gains | | | — | | | | 5,883,841 | | | | — | |
Late year loss deferral | | | — | | | | — | | | | 165,948 | |
e. FEDERAL TAXES
Each Fund currently qualifies as an investment company and intends to comply with the requirements under Subchapter M of the Internal Revenue Code of 1986, as amended, to distribute substantially all of its taxable income and gains to its shareholders and to meet certain diversification and income requirements with respect to investment companies. Therefore, no provision for federal income or excise tax is included in the accompanying financial statements.
Additionally, based on each Fund’s understanding of the tax rules and rates related to income, gains and transactions for the foreign jurisdictions in which it invests, each Fund will provide for foreign taxes, and where appropriate, deferred foreign taxes.
Management has analyzed the Funds’ tax positions taken on federal income tax returns as of May 31, 2017 and for all open tax years (generally, the three prior taxable years), and has concluded that no provision for federal income tax is required in the Funds’ financial statements. Additionally, management is not aware of any tax position for which it is reasonably possible that the total amounts of unrecognized tax benefits will change materially in the next twelve months.
Net capital losses incurred in taxable years beginning after the enactment of the Regulated Investment Company Modernization Act of 2010, may be carried forward for an unlimited time period. Such losses will be required to be utilized prior to any loss carryovers incurred in pre-enactment taxable years, which generally expire eight years following the close of the taxable year in which they were incurred. As a result of this ordering rule, pre-enactment capital loss carryovers may be more likely to expire unused. Additionally, post-enactment capital losses that are carried forward retain their tax character as either short-term or long-term capital losses, unlike pre-enactment losses which are considered all short-term.
f. CAPITAL LOSS CARRYOVERS AND DEFERRALS
As of May 31, 2017, the following Funds had accumulated net realized capital loss carryovers from securities transactions for federal income tax purposes as shown in the following chart. These amounts may be used to offset future realized capital gains, if any, through the expiration dates listed or in the case of post-enactment losses, for an unlimited time period.
| | | | | | | | | | | | |
| | | Capital Loss | | | | |
| | | Carryover Amounts | | | | |
| | | | | | | | | Expires | |
| Fund | | Short-Term | | | Long-Term | | | May 31, | |
| | | |
Capital Appreciation | | | | | | | | | | | | |
(Pre-Enactment) | | | $50,262,435 | | | | — | | | | 2018 | |
| | | |
Emerging Companies | | | | | | | | | | | | |
(Pre-Enactment) | | | $13,470,893 | | | | — | | | | 2018 | |
For the fiscal year ended May 31, 2017, the following Funds utilized capital loss carryovers in the amount of:
| | | | | | | | |
| | | Capital Loss Carryovers Utilized | |
| | |
| | | Short-Term | | | Long-Term | |
Capital Appreciation | | | $6,675,142 | | | | — | |
| | |
Emerging Companies | | | 5,515,911 | | | | — | |
As of May 31, 2017, Mid Cap had no accumulated net realized capital loss carryovers from securities transactions for federal income tax purposes. Should the Fund incur net capital losses for the fiscal year ended May 31, 2018, such amounts may be used to offset future realized capital gains, for an unlimited time period.
g. CAPITAL STOCK
The Trust’s Declaration of Trust authorizes for each Fund the issuance of an unlimited number of shares of beneficial interest, without par value. Each Fund records sales and repurchases of its capital stock on the trade date. The cost of securities contributed to the Funds in connection with the issuance of shares is based on the valuation of those securities in accordance with the Funds’ policy on investment valuation.
| | | | |
| | | | | |
| | | Notes to Financial Statements (continued) | | |
| | | | | |
For the fiscal years ended May 31, 2017 and May 31, 2016, the capital stock transactions by class for Capital Appreciation, Mid Cap and Emerging Companies were as follows:
| | | | | | | | | | | | | | | | |
| | | Capital Appreciation | |
| | | May 31, 2017 | | | May 31, 2016 | |
| | | Shares | | | Amount | | | Shares | | | Amount | |
Class N: | | | | | | | | | | | | | | | | |
Proceeds from sale of shares | | | 40,283 | | | | $1,140,367 | | | | 37,130 | | | | $955,633 | |
Reinvestment of distributions | | | 7,880 | | | | 219,236 | | | | 11,367 | | | | 294,737 | |
Cost of shares repurchased | | | (370,908) | | | | (10,270,833) | | | | (477,975) | | | | (12,266,387) | |
| | | | | | | | | | | | | | | | |
Net decrease | | | (322,745) | | | | $(8,911,230) | | | | (429,478) | | | | $(11,016,017) | |
| | | | | | | | | | | | | | | | |
Class I: | | | | | | | | | | | | | | | | |
Proceeds from sale of shares | | | 57,947 | | | | $1,744,023 | | | | 17,006 | | | | $436,281 | |
Reinvestment of distributions | | | 504 | | | | 14,228 | | | | 2,034 | | | | 53,472 | |
Cost of shares repurchased | | | (103,743) | | | | (2,765,528) | | | | (216,927) | | | | (5,726,406) | |
| | | | | | | | | | | | | | | | |
Net decrease | | | (45,292) | | | | $(1,007,277) | | | | (197,887) | | | | $(5,236,653) | |
| | | | | | | | | | | | | | | | |
Class Z: | | | | | | | | | | | | | | | | |
Proceeds from sale of shares | | | 169,553 | | | | $5,250,914 | | | | 111,888 | | | | $2,976,211 | |
Reinvestment of distributions | | | 9,368 | | | | 270,072 | | | | 11,785 | | | | 316,664 | |
Cost of shares repurchased | | | (225,127) | | | | (6,544,605) | | | | (499,525) | | | | (13,472,943) | |
| | | | | | | | | | | | | | | | |
Net decrease | | | (46,206) | | | | $(1,023,619) | | | | (375,852) | | | | $(10,180,068) | |
| | | | | | | | | | | | | | | | |
| |
| | | Mid Cap | |
| | | May 31, 2017 | | | May 31, 2016 | |
| | | Shares | | | Amount | | | Shares | | | Amount | |
Class N: | | | | | | | | | | | | | | | | |
Proceeds from sale of shares | | | 73,119 | | | | $2,033,216 | | | | 100,480 | | | | $2,851,927 | |
Reinvestment of distributions | | | 171,821 | | | | 4,700,519 | | | | 344,385 | | | | 9,270,856 | |
Cost of shares repurchased | | | (702,362) | | | | (19,675,532) | | | | (754,662) | | | | (21,649,721) | |
| | | | | | | | | | | | | | | | |
Net decrease | | | (457,422) | | | | $(12,941,797) | | | | (309,797) | | | | $(9,526,938) | |
| | | | | | | | | | | | | | | | |
Class I: | | | | | | | | | | | | | | | | |
Proceeds from sale of shares | | | 94,138 | | | | $2,740,584 | | | | 64,572 | | | | $1,951,956 | |
Reinvestment of distributions | | | 29,897 | | | | 840,690 | | | | 54,636 | | | | 1,512,326 | |
Cost of shares repurchased | | | (120,604) | | | | (3,435,578) | | | | (70,939) | | | | (2,038,365) | |
| | | | | | | | | | | | | | | | |
Net increase | | | 3,431 | | | | $145,696 | | | | 48,269 | | | | $1,425,917 | |
| | | | | | | | | | | | | | | | |
Class Z: | | | | | | | | | | | | | | | | |
Proceeds from sale of shares | | | 77,573 | | | | $2,304,346 | | | | 66,803 | | | | $2,080,580 | |
Reinvestment of distributions | | | 46,041 | | | | 1,347,641 | | | | 95,511 | | | | 2,750,719 | |
Cost of shares repurchased | | | (262,172) | | | | (7,851,253) | | | | (215,258) | | | | (6,528,027) | |
| | | | | | | | | | | | | | | | |
Net decrease | | | (138,558) | | | | $(4,199,266) | | | | (52,944) | | | | $(1,696,728) | |
| | | | | | | | | | | | | | | | |
| | | | |
| | | | | |
| | | | | |
| | | Notes to Financial Statements (continued) | | |
| | | | | | | | | | | | | | | | |
| | | Emerging Companies | |
| | | May 31, 2017 | | | May 31, 2016 | |
| | | Shares | | | Amount | | | Shares | | | Amount | |
Class N: | | | | | | | | | | | | | | | | |
Proceeds from sale of shares | | | 278,986 | | | | $12,325,880 | | | | 26,996 | | | | $944,985 | |
Cost of shares repurchased | | | (70,455) | | | | (3,114,220) | | | | (30,776) | | | | (1,056,913) | |
| | | | | | | | | | | | | | | | |
Net increase (decrease) | | | 208,531 | | | | $9,211,660 | | | | (3,780) | | | | $(111,928) | |
| | | | | | | | | | | | | | | | |
Class I: | | | | | | | | | | | | | | | | |
Proceeds from sale of shares | | | 505,091 | | | | $23,924,810 | | | | 407,411 | | | | $15,710,861 | |
Cost of shares repurchased | | | (276,445) | | | | (12,911,539) | | | | (397,306) | | | | (14,989,333) | |
| | | | | | | | | | | | | | | | |
Net increase | | | 228,646 | | | | $11,013,271 | | | | 10,105 | | | | $721,528 | |
| | | | | | | | | | | | | | | | |
Class Z: | | | | | | | | | | | | | | | | |
Proceeds from sale of shares | | | 2,019 | | | | $100,000 | | | | — | | | | — | |
| | | | | | | | | | | | | | | | |
Net increase | | | 2,019 | | | | $100,000 | | | | — | | | | — | |
| | | | | | | | | | | | | | | | |
At May 31, 2017, certain unaffiliated shareholders of record, including omnibus accounts, individually or collectively held greater than 10% of the net assets of the Funds as follows: Capital Appreciation – one owns 31%; Mid Cap – two own 23% and Emerging Companies – three own 50%. Transactions by these shareholders may have a material impact on their respective Funds.
h. REPURCHASE AGREEMENTS AND JOINT REPURCHASE AGREEMENTS
The Funds may enter into third-party repurchase agreements for temporary cash management purposes and third-party joint repurchase agreements for reinvestment of cash collateral on securities lending transactions under the securities lending program offered by The Bank of New York Mellon (“BNYM”) (the “Program”) (collectively, “Repurchase Agreements”). The value of the underlying collateral, including accrued interest, must equal or exceed the value of the Repurchase Agreements during the term of the agreement. For joint repurchase agreements, the Funds participate on a pro rata basis with other clients of BNYM in its share of the underlying collateral under such joint repurchase agreements and in its share of proceeds from any repurchase or other disposition of the underlying collateral. The underlying collateral for all Repurchase Agreements is held in safekeeping by the Fund’s custodian or at the Federal Reserve Bank. If the seller defaults and the value of the collateral declines, or if bankruptcy proceedings commence with respect to the seller of the security, realization of the collateral by the Funds may be delayed or limited. Pursuant to the Program, the Funds are indemnified for such losses by BNYM on joint repurchase agreements.
At May 31, 2017, the market value of Repurchase Agreements outstanding for Capital Appreciation, Mid Cap and Emerging Companies were $2,666,046, $5,766,975 and $4,371,081, respectively.
2. AGREEMENTS AND TRANSACTIONS WITH AFFILIATES
For each of the Funds, the Trust has entered into an investment advisory agreement under which the Investment Manager, a subsidiary and the U.S. retail distribution arm of Affiliated Managers Group, Inc. (“AMG”), serves as investment manager to the Funds and is responsible for the Funds’ overall
administration and operations. The Investment Manager selects one or more subadvisors for the Funds (subject to Board approval) and monitors each subadvisor’s investment performance, security holdings and investment strategies. Each Fund’s investment portfolio is managed by Cadence Capital Management, LLC. who serves pursuant to a subadvisory agreement with the Investment Manager.
Investment management fees are paid directly by the Funds to the Investment Manager based on average daily net assets. For the fiscal year ended May 31, 2017, the Funds’ investment management fees are paid at the following annual rate of each Fund’s average daily net assets:
| | | | |
Capital Appreciation | | | 0.45% | |
| |
Mid Cap | | | 0.45% | |
Emerging Companies* | | | 1.25% | |
| * | Effective June 1, 2017, the management fee was reduced to 0.69% from 1.25%. |
The Investment Manager has contractually agreed, through at least October 1, 2017, to waive management fees and/or reimburse fund expenses in order to limit total annual Fund operating expenses after fee waiver and expense reimbursements (exclusive of taxes, interest (including interest incurred in connection with bank and custody overdrafts), shareholder servicing fees, distribution and service (12b-1) fees, brokerage commissions and other transaction costs, acquired fund fees and expenses and extraordinary expenses) of Capital Appreciation, Mid Cap and Emerging Companies to 0.72%, 0.72% and 1.42%, respectively, of each Fund’s average daily net assets subject to later reimbursement by the Funds in certain circumstances. Effective June 1, 2017, Emerging Companies expense limitation was reduced to 0.89% from 1.42%. The contractual expense limitation may only be terminated in the event
| | | | |
| | | | | |
| | | | | |
| | | Notes to Financial Statements (continued) | | |
the Investment Manager or a successor ceases to be the Investment Manager of the Fund or a successor fund, by mutual agreement between the Investment Manager and the Board, or in the event of each Fund’s liquidation unless the Fund is reorganized or is a party to a merger in which the surviving entity is successor to the accounting and performance information of the Fund.
In general, for a period of up to 36 months, the Investment Manager may recover from each Fund, fees waived and expenses paid pursuant to this contractual agreement, provided that such repayment would not cause the Fund’s total annual operating expenses after fee waiver and expense reimbursements (exclusive of the items noted in the parenthetical above) to exceed the contractual expense limitation amount.
At May 31, 2017, each Fund’s expiration of recoupment are as follows:
| | | | | | | | | | | | |
| | | Capital | | | | | | Emerging | |
| Expiration Date | | Appreciation | | | Mid Cap | | | Companies | |
Less than 1 year | | | $136,660 | | | | $146,595 | | | | $108,830 | |
| | | |
Within 2 years | | | 138,122 | | | | 147,630 | | | | 126,216 | |
Within 3 years | | | 57,213 | | | | 55,919 | | | | 90,648 | |
| | | | | | | | | | | | |
| | | |
Total Amount Subject to Recoupment | | | $331,995 | | | | $350,144 | | | | $325,694 | |
| | | | | | | | | | | | |
The Trust, on behalf of the Funds, has entered into an amended and restated Administration Agreement under which the Investment Manager serves as the Funds’ administrator (the “Administrator”) and is responsible for all non-portfolio management aspects of managing the Funds’ operations, including administration and shareholder services to each Fund as further described in each Fund’s prospectus. Effective October 1, 2016, each Fund pays a fee to the Administrator at the rate of 0.15% per annum of the Fund’s average daily net assets for this service. Prior to October 1, 2016, Capital Appreciation, Mid Cap, and Emerging Companies paid an administration fee under a similar contract at an annual rate of 0.25%, respectively, of each Fund’s average daily net assets.
The Funds are distributed by AMG Distributors, Inc. (the “Distributor”), a wholly-owned subsidiary of the Investment Manager. The Distributor serves as the distributor and underwriter for each Fund and is a registered broker-dealer and member of the Financial Industry Regulatory Authority, Inc. (“FINRA”). Shares of each Fund will be continuously offered and will be sold directly to prospective purchasers and through brokers, dealers or other financial intermediaries who have executed selling agreements with the Distributor. Generally the Distributor bears all or a portion of the expenses of providing services pursuant to the distribution agreement, including the payment of the expenses relating to the distribution of prospectuses for sales purposes and any advertising or sales literature.
Capital Appreciation and Mid Cap have adopted a distribution and service plan (the “Plan”) with respect to the Class N shares, in accordance with the requirements of Rule 12b-1 under the 1940 Act and the requirements of the applicable rules of FINRA regarding asset-based sales charges. Pursuant to the Plan, each Fund may make payments to the Distributor for its expenditures in financing any activity primarily intended to result in the sale of each Fund’s Class N shares and for maintenance and personal service provided to existing
shareholders of that class. The Plan authorizes payments to the Distributor up to 0.25% annually of each Fund’s daily net assets attributable to the Class N shares.
Effective October 1, 2016, for each of the Class N and Class I shares, the Board has approved reimbursement payments to the Investment Manager for shareholder servicing expenses (“shareholder servicing fees”) incurred. Shareholder servicing fees include payments to each financial intermediary, such as broker-dealers (including fund supermarkets platforms), banks, and trust companies that provide shareholder recordkeeping, account servicing and other services. There are no shareholder servicing fees authorized for Class Z. The Class N and Class I shares may reimburse the Investment Manager for the actual amount incurred up to a maximum annual rate of each Class’s average daily net assets as shown in the table below.
The impact on the annualized expense ratios for the fiscal year ended May 31, 2017, were as follows:
| | | | | | | | |
| | | Maximum | | | | |
| | | Annual Amount | | | Actual | |
| Fund | | Approved | | | Amount Incurred | |
Capital Appreciation | | | | | | | | |
| | |
Class N | | | 0.15% | | | | 0.10% | |
| | |
Class I* | | | 0.25% | | | | 0.19% | |
| | |
Mid Cap | | | | | | | | |
| | |
Class N | | | 0.15% | | | | 0.13% | |
| | |
Class I* | | | 0.25% | | | | 0.18% | |
| | |
Emerging Companies | | | | | | | | |
| | |
Class N | | | 0.25% | | | | 0.20% | |
| |
| * | Effective October 1, 2016, the maximum annual rate was decreased to 0.15% from 0.25%. |
The Board provides supervision of the affairs of the Trust and other trusts within the AMG Funds family. The Trustees of the Trust who are not affiliated with an Investment Manager receive an annual retainer and per meeting fees for regular, special and telephonic meetings, and they are reimbursed for out-of-pocket expenses incurred while carrying out their duties as Board members. The Chairman of the Board and the Audit Committee Chair receive additional annual retainers. Certain Trustees and Officers of the Funds are Officers and/or Directors of the Investment Manager, AMG and/or the Distributor.
The Securities and Exchange Commission (the “SEC”) has granted an exemptive order that permits the Funds to lend and borrow money for certain temporary purposes directly to and from other eligible funds in the AMG Funds family. Participation in this interfund lending program is voluntary for both the borrowing and lending funds, and an interfund loan is only made if it benefits each participating fund. The Administrator manages the program according to procedures approved by the Board, and the Board monitors the operation of the program. An interfund loan must comply with certain conditions set out in the exemptive order, which are designed to assure fairness and protect all participating funds. For the fiscal year ended May 31, 2017, the following Funds either borrowed from or lent to other Funds in the AMG Funds family: Capital Appreciation lent a maximum of $1,706,662 for five days earning interest in the
| | | | |
| | | | | |
| | | | | |
| | | Notes to Financial Statements (continued) | | |
amount of $187, Mid Cap lent $1,269,518 for two days earning interest in the amount of $121 and Emerging Companies lent a maximum of $1,526,464 for eleven days earning interest in the amount of $417. The interest amount is included in the Statement of Operations as interest income. Capital Appreciation borrowed $1,190,199 for four days paying interest of $126 and Mid Cap borrowed $1,770,342 for four days paying interest of $211. The interest expense amount is included in the Statement of Operations as miscellaneous expense. At May 31, 2017, the Funds had no interfund loans outstanding.
3. PURCHASES AND SALES OF SECURITIES
Purchases and sales of securities (excluding short-term securities and U.S. Government Obligations) for the fiscal year ended May 31, 2017, were as follows:
| | | | | | | | |
Fund | | Purchases | | | Sales | |
Capital Appreciation | | | $23,194,118 | | | | $33,518,214 | |
| | |
Mid Cap | | | 175,270,735 | | | | 196,949,125 | |
Emerging Companies | | | 64,518,225 | | | | 45,436,197 | |
The Funds had no purchases or sales of U.S. Government Obligations during the fiscal year ended May 31, 2017.
4. PORTFOLIO SECURITIES LOANED
The Funds participate in the Program providing for the lending of securities to qualified brokers. Securities lending income includes earnings of such temporary cash investments, plus or minus any rebate to a borrower. These earnings (after any rebate) are then divided between BNYM, as a fee for its services under the Program, and the Funds, according to agreed-upon rates. Collateral on all securities loaned is accepted in cash and is maintained at a minimum level of 102% (105% in the case of certain foreign securities) of the market value, plus interest, if applicable, of investments on loan. It is the Funds’ policy to obtain additional collateral from or return excess collateral to the borrower by the end of the next business day, following the valuation date of the securities loaned. Therefore, the value of the collateral held may be temporarily less than the value of the securities on loan. Lending securities entails a risk of loss to the Funds if and to the extent that the market value of the securities loaned were to increase and the borrower did not increase the collateral accordingly, and the borrower fails to return the securities. Under the terms of the Program, the Funds are indemnified for such losses by BNYM. Cash collateral is held in a separate omnibus account managed by BNYM, who is authorized to exclusively enter into joint repurchase agreements. BNYM bears the risk of any deficiency in the amount of the cash collateral available for return to the borrower due to any loss on the collateral invested.
At May 31, 2017, the value of the securities loaned and cash collateral received, were as follows.
| | | | | | | | |
| | | Securities | | | Cash Collateral | |
Fund | | Loaned | | | Received | |
Capital Appreciation | | $ | 2,623,557 | | | | $2,666,046 | |
| | |
Mid Cap | | | 5,653,210 | | | | 5,766,975 | |
Emerging Companies | | | 4,191,132 | | | | 4,371,081 | |
5. COMMITMENTS AND CONTINGENCIES
Under the Trust’s organizational documents, its trustees and officers are indemnified against certain liabilities arising out of the performance of their duties to the Trust. In addition, in the normal course of business, the Funds may enter into contracts and agreements that contain a variety of representations and warranties, which provide general indemnifications. The maximum exposure to the Funds under these arrangements is unknown, as this would involve future claims that may be made against a Fund that have not yet occurred. However, based on experience, the Funds had no prior claims or losses and expect the risks of loss to be remote.
6. MASTER NETTING AGREEMENTS
The Funds may enter into master netting agreements with their counterparties for the securities lending program and Repurchase Agreements, which provide the right, in the event of default (including bankruptcy or insolvency) for the non-defaulting party to liquidate the collateral and calculate net exposure to the defaulting party or request additional collateral. For financial reporting purposes, the Funds do not offset financial assets and financial liabilities that are subject to master netting agreements in the Statement of Assets and Liabilities. For securities lending transactions, see Note 4.
| | | | |
| | | | | |
| | | | | |
| | | Notes to Financial Statements (continued) | | |
The following table is a summary of the Funds’ open Repurchase Agreements that are subject to a master netting agreement as of May 31, 2017:
| | | | | | | | | | | | | | | | |
| | | | | | Gross Amount Not Offset in the | | | | |
| | | | | | Statement of Assets and Liabilities | | | | |
| Fund | | Net Amounts of Assets
Presented in the Statement
of Assets and Liabilities | | | Financial
Instruments | | | Cash Collateral
Received | | | Net Amount | |
Capital Appreciation | | | | | | | | | | | | | | | | |
| | | | |
Cantor Fitzgerald Securities, Inc. | | | $1,000,000 | | | | $1,000,000 | | | | — | | | | — | |
| | | | |
Daiwa Capital Markets America | | | 1,000,000 | | | | 1,000,000 | | | | — | | | | — | |
| | | | |
Nomura Securities International, Inc. | | | 666,046 | | | | 666,046 | | | | — | | | | — | |
| | | | | | | | | | | | | | | | |
| | | | |
Totals | | | $2,666,046 | | | | $2,666,046 | | | | — | | | | — | |
| | | | | | | | | | | | | | | | |
| | | | |
Mid Cap | | | | | | | | | | | | | | | | |
| | | | |
BNP Paribas Securities Corp. | | | $1,369,679 | | | | $1,369,679 | | | | — | | | | — | |
| | | | |
Cantor Fitzgerald Securities, Inc. | | | 1,369,679 | | | | 1,369,679 | | | | — | | | | — | |
| | | | |
Citigroup Global Markets, Inc. | | | 1,369,679 | | | | 1,369,679 | | | | — | | | | — | |
| | | | |
Credit Suisse Securities (USA) LLC | | | 288,259 | | | | 288,259 | | | | — | | | | — | |
| | | | |
RBC Dominion Securities, Inc. | | | 1,369,679 | | | | 1,369,679 | | | | — | | | | — | |
| | | | | | | | | | | | | | | | |
| | | | |
Totals | | | $5,766,975 | | | | $5,766,975 | | | | — | | | | — | |
| | | | | | | | | | | | | | | | |
| | | | |
Emerging Companies | | | | | | | | | | | | | | | | |
| | | | |
Barclays Capital, Inc. | | | $218,457 | | | | $218,457 | | | | — | | | | — | |
| | | | |
BNP Paribas SA | | | 1,038,156 | | | | 1,038,156 | | | | — | | | | — | |
| | | | |
Cantor Fitzgerald Securities, Inc. | | | 1,038,156 | | | | 1,038,156 | | | | — | | | | — | |
| | | | |
Daiwa Capital Markets America | | | 1,038,156 | | | | 1,038,156 | | | | — | | | | — | |
| | | | |
Nomura Securities International, Inc. | | | 1,038,156 | | | | 1,038,156 | | | | — | | | | — | |
| | | | | | | | | | | | | | | | |
| | | | |
Totals | | | $4,371,081 | | | | $4,371,081 | | | | — | | | | — | |
| | | | | | | | | | | | | | | | |
7. REGULATORY UPDATES
On October 13, 2016, the SEC amended existing rules intended to modernize reporting and disclosure of information. These amendments relate to Regulation S-X which sets forth the form and content of financial statements. Management has evaluated the implications of adopting these amendments and has determined there is no material impact on the financial statements and accompanying notes.
8. SUBSEQUENT EVENTS
At a Board meeting held on March 15-16, 2017, the Board approved the reorganization of Capital Appreciation with and into AMG Renaissance Large Cap Growth Fund, subject to the approval of shareholders of Capital Appreciation. On July 20, 2017, shareholders of Capital Appreciation approved the reorganization. The reorganization is expected to close on July 31, 2017.
TAX INFORMATION (unaudited)
The AMG Managers Cadence Capital Appreciation Fund, AMG Managers Cadence Mid Cap Fund and AMG Managers Cadence Emerging Companies Fund each hereby designates the maximum amount allowable of its net taxable income as qualified dividends as provided in the Jobs and Growth Tax Relief Reconciliation Act of 2003. The 2016 Form 1099-DIV you received for each Fund shows the tax status of all distributions paid to you during the year.
Pursuant to section 852 of the Internal Revenue Code, AMG Managers Cadence Capital Appreciation Fund, AMG Managers Cadence Mid Cap Fund and AMG Managers Cadence Emerging Companies Fund each hereby designates $0, $6,132,007 and $0, respectively, as a capital gain distribution with respect to the taxable fiscal year ended May 31, 2017, or if subsequently determined to be different, the net capital gains of such year.
| | | | |
| | | | | |
| | | | | |
| | | Report of Independent Registered Public Accounting Firm | | |
TO THE BOARD OF TRUSTEES OF AMG FUNDS III AND THE SHAREHOLDERS OF AMG MANAGERS CADENCE CAPITAL APPRECIATION FUND, AMG MANAGERS CADENCE MID CAP FUND AND AMG MANAGERS CADENCE EMERGING COMPANIES FUND:
In our opinion, the accompanying statements of assets and liabilities, including the schedules of portfolio investments, and the related statements of operations and of changes in net assets and the financial highlights present fairly, in all material respects, the financial position of AMG Managers Cadence Capital Appreciation Fund, AMG Managers Cadence Mid Cap Fund and AMG Managers Cadence Emerging Companies Fund (the “Funds”) as of May 31, 2017, the results of each of their operations, the changes in each of their net assets and the financial highlights for each of the periods indicated, in conformity with accounting principles generally accepted in the United States of America. These financial statements and financial highlights (hereafter referred to as “financial statements”) are the responsibility of the Funds’ management. Our responsibility is to express an opinion on these financial statements based on our audits. We conducted our audits of these financial statements in accordance with the standards of the Public Company Accounting Oversight Board (United States). Those standards require that we plan and perform the audit to obtain reasonable assurance about whether the financial statements are free of material misstatement. An audit includes examining, on a test basis, evidence supporting the amounts and disclosures in the financial statements, assessing the accounting principles used and significant estimates made by management, and evaluating the overall financial statement presentation. We believe that our audits, which included confirmation of securities as of May 31, 2017 by correspondence with the custodian and brokers, and the application of alternative auditing procedures where securities purchased had not been received, provide a reasonable basis for our opinion.
PricewaterhouseCoopers LLP
Boston, Massachusetts
July 21, 2017
| | | | |
| | | | | |
| | | AMG Funds | | |
| | | Trustees and Officers | | |
| | | | |
| The Trustees and Officers of the Trust, their business addresses, principal occupations for the past five years and ages are listed below. The Trustees provide broad supervision over the affairs of the Trust and the Funds. The Trustees are experienced executives who meet periodically throughout the year to oversee the Funds’ activities, review contractual arrangements with | | companies that provide services to the Funds, and review the Funds’ performance. Unless otherwise noted, the address of each Trustee or Officer is the address of the Trust: 600 Steamboat Road, Suite 300, Greenwich, Connecticut 06830. There is no stated term of office for Trustees. Trustees serve until their resignation, retirement or removal in accordance with the Trust’s | | organizational documents and policies adopted by the Board from time to time. The Chairman of the Trustees, President, Treasurer and Secretary of the Trust are elected by the Trustees annually. Other officers hold office at the pleasure of the Trustees. |
| | |
Independent Trustees | | |
The following Trustees are not “interested persons” of the Trust within the meaning of the 1940 Act: |
Number of Funds
Overseen in Fund Complex | | Name, Age, Principal Occupation(s) During Past 5 Years and Other Directorships Held by Trustee |
• Trustee since 2012 • Oversees 67 Funds in Fund Complex | | Bruce B. Bingham, 68 Partner, Hamilton Partners (real estate development firm) (1987-Present); Director of The Yacktman Funds (2000-2012). |
• Trustee since 1999 • Oversees 67 Funds in Fund Complex | | Edward J. Kaier, 71 Attorney at Law and Partner, Teeters Harvey Marrone & Kaier LLP (2007-Present); Attorney at Law and Partner, Hepburn Willcox Hamilton & Putnam, LLP (1977-2007); Trustee of Third Avenue Trust (5 portfolios); Trustee of Third Avenue Variable Trust (1 portfolio). |
• Trustee since 2013 • Oversees 69 Funds in Fund Complex | | Kurt A. Keilhacker, 53 Managing Member, TechFund Capital (1997-Present); Managing Member, TechFund Europe (2000-Present); Board Member, 6wind SA, (2002-Present); Managing Member, Elementum Ventures (2013-Present); Trustee, Gordon College (2001-2016). |
• Trustee since 1993 • Oversees 67 Funds in Fund Complex | | Steven J. Paggioli, 67 Independent Consultant (2002-Present); Formerly Executive Vice President and Director, The Wadsworth Group (1986-2001); Executive Vice President, Secretary and Director, Investment Company Administration, LLC (1990-2001); Vice President, Secretary and Director, First Fund Distributors, Inc. (1991-2001); Trustee, Professionally Managed Portfolios (32 portfolios); Advisory Board Member, Sustainable Growth Advisors, LP; Independent Director, Chase Investment Counsel (2008 – Present). |
• Trustee since 2013 • Oversees 67 Funds in Fund Complex | | Richard F. Powers III, 71 Adjunct Professor, U.S. Naval War College (2016); Adjunct Professor, Boston College (2010-2013); President and CEO of Van Kampen Investments Inc. (1998-2003). |
• Independent Chairman • Trustee since 1999 • Oversees 69 Funds in Fund Complex | | Eric Rakowski, 59 Professor, University of California at Berkeley School of Law (1990-Present); Director of Harding, Loevner Funds, Inc. (9 portfolios); Trustee of Third Avenue Trust (5 portfolios); Trustee of Third Avenue Variable Trust (1 portfolio). |
• Trustee since 2013 • Oversees 69 Funds in Fund Complex | | Victoria L. Sassine, 51 Lecturer, Babson College (2007 – Present). |
• Trustee since 1987 • Oversees 67 Funds in Fund Complex | | Thomas R. Schneeweis, 70 Professor Emeritus, University of Massachusetts (2013-Present); Partner, S Capital Wealth Advisors (2015-Present); President, TRS Associates (1982-Present); Board Member, Chartered Alternative Investment Association (“CAIA”) (2002-Present); Director, CAIA Foundation (Education) (2010-Present); Director, Institute for Global Asset and Risk Management (Education) (2010-Present); Partner, S Capital Management, LLC (2007-2015); Director, CISDM at the University of Massachusetts, (1996-2013); President, Alternative Investment Analytics, LLC, (formerly Schneeweis Partners, LLC) (2001-2013); Professor of Finance, University of Massachusetts (1977-2013). |
| |
Interested Trustees | | |
Each Trustee in the following table is an “interested person” of the Trust within the meaning of the 1940 Act. Ms. Carsman is an interested person of the Trust within the meaning of the 1940 Act by virtue of her position with, and interest in securities of, AMG. |
Number of Funds Overseen
in Fund Complex | | Name, Age, Principal Occupation(s) During Past 5 Years and Other Directorships Held by Trustee |
• Trustee since 2011 • Oversees 69 Funds in Fund Complex | | Christine C. Carsman, 65 Executive Vice President, Deputy General Counsel and Chief Regulatory Counsel, Affiliated Managers Group, Inc. (2017-Present); Director (2010-Present) and Chair of the Board of Directors (2015-Present), AMG Funds plc; Director of Harding, Loevner Funds, Inc. (9 portfolios); Senior Vice President and Deputy General Counsel, Affiliated Managers Group, Inc. (2011-2016); Senior Vice President and Chief Regulatory Counsel, Affiliated Managers Group, Inc. (2007-2011); Vice President and Chief Regulatory Counsel, Affiliated Managers Group, Inc. (2004-2007); Secretary and Chief Legal Officer, AMG Funds, AMG Funds I, AMG Funds II and AMG Funds III (2004-2011); Senior Counsel, Vice President and Director of Operational Risk Management and Compliance, Wellington Management Company, LLP (1995-2004). |
| | | | |
| | | | | |
| | | AMG Funds | | |
| | | Trustees and Officers (continued) | | |
| | |
| Officers | | |
Position(s) Held with Fund
and Length of Time Served | | Name, Age, Principal Occupation(s) During Past 5 Years |
• President since 2014 • Principal Executive Officer since 2014 • Chief Executive Officer since 2016 | | Jeffrey T. Cerutti, 49 Chief Executive Officer, AMG Funds LLC (2014-Present); Director, President and Principal, AMG Distributors, Inc. (2014-Present); President and Principal Executive Officer, AMG Funds, AMG Funds I, AMG Funds II and AMG Funds III (2014-Present); Chief Executive Officer, President and Principal Executive Officer, AMG Funds IV, (2015-Present); Chief Executive Officer, AMG Funds, AMG Funds I, AMG Funds II and AMG Funds III (2016-Present); Chief Executive Officer, Aston Asset Management, LLC (2016); President, VP Distributors, (2011-2014); Executive Vice President, Head of Distribution, Virtus Investment Partners, Inc. (2010-2014); Managing Director, Head of Sales, UBS Global Asset Management (2001-2010). |
• Chief Operating Officer since 2007 | | Keitha L. Kinne, 59 Chief Operating Officer, AMG Funds LLC (2007-Present); Chief Investment Officer, AMG Funds LLC (2008-Present); Chief Operating Officer, AMG Distributors, Inc. (2007-Present); Chief Operating Officer, AMG Funds, AMG Funds I, AMG Funds II and AMG Funds III (2007-Present); Chief Operating Officer, AMG Funds IV, (2016-Present); Chief Operating Officer and Chief Investment Officer, Aston Asset Management, LLC (2016); President and Principal Executive Officer, AMG Funds, AMG Funds I, AMG Funds II and AMG Funds III (2012-2014); Managing Partner, AMG Funds LLC (2007-2014); President, AMG Funds (2012-2014); President, AMG Distributors, Inc. (2012-2014); Managing Director, Legg Mason & Co., LLC (2006-2007); Managing Director, Citigroup Asset Management (2004-2006). |
• Secretary since 2015 • Chief Legal Officer
since 2015 | | Mark J. Duggan, 52 Senior Vice President and Senior Counsel, AMG Funds LLC (2015-Present); Secretary and Chief Legal Officer, AMG Funds, AMG Funds I, AMG Funds II and AMG Funds III (2015-Present); Secretary and Chief Legal Officer, AMG Funds IV, (2015-Present); Attorney, K&L Gates, LLP (2009-2015). |
• Chief Financial Officer since 2007 • Treasurer since 1995 • Principal Financial Officer
since 2008 | | Donald S. Rumery, 59 Senior Vice President, Director of Mutual Funds Services, AMG Funds LLC (2005-Present); Principal Financial Officer, AMG Funds, AMG Funds I, AMG Funds II and AMG Funds III (2008-Present); Treasurer, Chief Financial Officer, Principal Financial Officer and Principal Accounting Officer, AMG Funds IV, (2016-Present); Treasurer, AMG Funds, (1999-Present); Treasurer, AMG Funds III (1995-Present); Treasurer, AMG Funds I and AMG Funds II (2000-Present); Chief Financial Officer, AMG Funds, AMG Funds I, AMG Funds II and AMG Funds III (2007-Present); Treasurer and Chief Financial Officer, AMG Distributors, Inc. (2000-2012); Vice President, AMG Funds LLC, (1994-2004). |
• Deputy Treasurer
since 2017 | | John A. Starace, 46 Vice President, Deputy Treasurer of Mutual Funds Services, AMG Funds LLC (2014-Present); Deputy Treasurer, AMG Funds, AMG Funds I, AMG Funds II, AMG Funds III and AMG Funds IV (2017-Present); Vice President, Citi Hedge Fund Services (2010-2014); Audit Senior Manager (2005-2010) and Audit Manager (2001-2005), Deloitte & Touche LLP. |
• Controller since 2017 | | Christopher R. Townsend, 50 Head of Business Finance, AMG Funds LLC (2015-Present); Chief Financial Officer and Financial and Operations Principal, AMG Distributors, Inc. (2016-Present); Controller, AMG Funds, AMG Funds I, AMG Funds II, AMG Funds III and AMG Funds IV (2017-Present); Chief Financial Officer, Aston Asset Management LLC (2016); Head of Finance and Accounting, Allianz Asset Management (2006-2015). |
• Chief Compliance Officer
since 2016 | | Gerald F. Dillenburg, 50 Chief Compliance Officer and Sarbanes Oxley Code of Ethics Compliance Officer, AMG Funds, AMG Funds I, AMG Funds II and AMG Funds III (2016-Present); Chief Compliance Officer, AMG Funds IV (1996-Present); Sarbanes-Oxley Code of Ethics Compliance Officer, AMG Funds IV (2016-Present); Chief Compliance Officer, Aston Asset Management, LLC (2006-2016); Chief Operating Officer, Aston Funds (2003-2016); Secretary, Aston Funds (1996-2015); Chief Financial Officer, Aston Funds (1997-2010); Chief Financial Officer, Aston Asset Management, LLC (2006-2010); Treasurer, Aston Funds (1996-2010). |
• Anti-Money Laundering Compliance Officer
since 2014 | | Patrick J. Spellman, 43 Senior Vice President, Chief Compliance Officer, AMG Funds LLC (2011-Present); Chief Compliance Officer, AMG Distributors, Inc., (2010-Present); Anti-Money Laundering Compliance Officer, AMG Funds, AMG Funds I, AMG Funds II, AMG Funds III (2014-Present); Anti-Money Laundering Compliance Officer, AMG Funds IV, (2016-Present); Compliance Manager, Legal and Compliance, Affiliated Managers Group, Inc. (2005-2011). |
• Assistant Secretary
since 2016 | | Maureen A. Meredith, 31 Vice President, Counsel, AMG Funds LLC (2015-Present); Assistant Secretary, AMG Funds, AMG Funds I, AMG Funds II, AMG Funds III and AMG Funds IV (2016-Present); Associate, Ropes & Gray LLP (2011-2015); Law Fellow, Massachusetts Appleseed Center for Law and Justice (2010-2011). |
• Assistant Secretary
since 2016 | | Diana M. Podgorny, 38 Vice President, Counsel, AMG Funds LLC (2016-Present); Assistant Secretary, AMG Funds, AMG Funds I, AMG Funds II and AMG Funds III (2016-Present); Assistant Secretary, AMG Funds IV (2010-Present); Vice President, Counsel, Aston Asset Management, LLC (2010-2016). |
• Assistant Secretary
since 2016 | | Marc J. Pierce, 55 Vice President, Compliance Officer, AMG Funds LLC (2016-Present); Assistant Secretary, AMG Funds IV (2001-Present); Assistant Secretary, AMG Funds, AMG Funds I, AMG Funds II and AMG Funds III (2016-Present); Vice President, Aston Asset Management, LLC (1998-2016); Assistant Chief Compliance Officer, Aston Asset Management, LLC (2006-2016). |
| | | | |
| | | | |
| | | |
| | | |
| | | | |
INVESTMENT MANAGER AND ADMINISTRATOR AMG Funds LLC 600 Steamboat Road, Suite 300 Greenwich, CT 06830 (800) 835-3879 DISTRIBUTOR AMG Distributors, Inc. 600 Steamboat Road, Suite 300 Greenwich, CT 06830 (800) 835-3879 SUBADVISOR Cadence Capital Management, LLC 265 Franklin Street, 11th Floor Boston, MA 02110 CUSTODIAN The Bank of New York Mellon 2 Hanson Place Brooklyn, NY 11217 LEGAL COUNSEL Ropes & Gray LLP Prudential Tower, 800 Boylston Street Boston, MA 02199-3600 | | TRANSFER AGENT BNY Mellon Investment Servicing (US) Inc. Attn: AMG P.O. Box 9769 Providence, RI 02940 (800) 548-4539 | | This report is prepared for the Funds’ shareholders. It is authorized for distribution to prospective investors only when preceded or accompanied by an effective prospectus. To receive a free copy of the prospectus or Statement of Additional Information, which includes additional information about Fund Trustees, please contact us by calling 800.835.3879. Distributed by AMG Distributors, Inc., member FINRA/SIPC. Current net asset values per share for each Fund are available on the Funds’ website at www.amgfunds.com. A description of the policies and procedures each Fund uses to vote its proxies is available: (i) without charge, upon request, by calling 800.835.3879, or (ii) on the Securities and Exchange Commission’s (SEC) website at www.sec.gov. For information regarding each Fund’s proxy voting record for the 12-month period ended June 30, call 800.835.3879 or visit the SEC website at www.sec.gov. Each Fund files its complete schedule of portfolio holdings with the SEC for the first and third quarters of each fiscal year on Form N-Q. The Funds’ Forms N-Q are available on the SEC’s website at www.sec.gov. A Fund’s Forms N-Q may be reviewed and copied at the SEC’s Public Reference Room in Washington, DC. Information on the operation of the Public Reference Room may be obtained by calling 1-800-SEC-0330. To review a complete list of the Funds’ portfolio holdings, or to view the most recent quarterly holdings report, semiannual report, or annual report, please visit www.amgfunds.com. |
| | | | |
| | |
| | | | |
AFFILIATE SUBADVISED FUNDS BALANCED FUNDS AMG Chicago Equity Partners Balanced Chicago Equity Partners, LLC AMG FQ Global Risk-Balanced First Quadrant, L.P. EQUITY FUNDS AMG Chicago Equity Partners Small Cap Value Chicago Equity Partners, LLC AMG FQ Tax-Managed U.S. Equity AMG FQ U.S. Equity First Quadrant, L.P. AMG Frontier Small Cap Growth Frontier Capital Management Company, LLC AMG GW&K Small Cap Core AMG GW&K Small/Mid Cap AMG GW&K U.S. Small Cap Growth GW&K Investment Management, LLC AMG Renaissance International Equity AMG Renaissance Large Cap Growth The Renaissance Group LLC AMG River Road Dividend All Cap Value AMG River Road Dividend All Cap Value II AMG River Road Focused Absolute Value AMG River Road Long-Short AMG River Road Small-Mid Cap Value AMG River Road Small Cap Value River Road Asset Management, LLC AMG SouthernSun Small Cap AMG SouthernSun Global Opportunities AMG SouthernSun U.S. Equity SouthernSun Asset Management, LLC AMG Systematic Large Cap Value AMG Systematic Mid Cap Value Systematic Financial Management, L.P. AMG TimesSquare Emerging Markets Small Cap AMG TimesSquare International Small Cap AMG TimesSquare Mid Cap Growth AMG TimesSquare Small Cap Growth TimesSquare Capital Management, LLC | | AMG Trilogy Emerging Markets Equity AMG Trilogy Emerging Wealth Equity Trilogy Global Advisors, L.P. AMG Yacktman AMG Yacktman Focused AMG Yacktman Focused Fund - Security Selection Only AMG Yacktman Special Opportunities Yacktman Asset Management LP FIXED INCOME FUNDS AMG GW&K Core Bond AMG GW&K Enhanced Core Bond AMG GW&K Municipal Bond AMG GW&K Municipal Enhanced Yield GW&K Investment Management, LLC OPEN-ARCHITECTURE FUNDS ALTERNATIVE FUNDS AMG Managers Lake Partners LASSO Alternative Lake Partners, Inc. BALANCED FUNDS AMG Managers Montag & Caldwell Balanced Montag & Caldwell, LLC EQUITY FUNDS AMG Managers Brandywine AMG Managers Brandywine Advisors Mid Cap Growth AMG Managers Brandywine Blue Friess Associates, LLC AMG Managers Cadence Capital Appreciation AMG Managers Cadence Emerging Companies AMG Managers Cadence Mid Cap Cadence Capital Management, LLC AMG Managers CenterSquare Real Estate CenterSquare Investment Management, Inc. AMG Managers Emerging Opportunities Lord, Abbett & Co. LLC WEDGE Capital Management L.L.P. Next Century Growth Investors LLC RBC Global Asset Management (U.S.) Inc. | | AMG Managers Essex Small/Micro Cap Growth Essex Investment Management Co., LLC AMG Managers Fairpointe Focused Equity AMG Managers Fairpointe Mid Cap Fairpointe Capital LLC AMG Managers Guardian Capital Global Dividend Guardian Capital LP AMG Managers LMCG Small Cap Growth LMCG Investments, LLC AMG Managers Montag & Caldwell Growth AMG Managers Montag & Caldwell Mid Cap Growth Montag & Caldwell, LLC AMG Managers Pictet International Pictet Asset Management Limited AMG Managers Silvercrest Small Cap Silvercrest Asset Management Group LLC AMG Managers Skyline Special Equities Skyline Asset Management, L.P. AMG Managers Special Equity Ranger Investment Management, L.P. Lord, Abbett & Co. LLC Smith Asset Management Group, L.P. Federated MDTA LLC AMG Managers Value Partners Asia Dividend Value Partners Hong Kong Limited FIXED INCOME FUNDS AMG Managers Amundi Intermediate Government AMG Managers Amundi Short Duration Government Amundi Smith Breeden LLC AMG Managers Doubleline Core Plus Bond DoubleLine Capital LP AMG Managers Global Income Opportunity AMG Managers Loomis Sayles Bond Loomis, Sayles & Co., L.P. |
| | |
| | |
| | |
| | |
| | |
| | |
| | |
| | |
| | |
| | |
| | |
| | |
| | |
| | |
| | |
| | |
| | |
| | |
| | |
| | |
| | |
| | |
| | |
| | |
| | |
| | |
| | |
| | |
| | |
| | |
| | |
| | |
| | |
| | |
| | |
| | |
| | |
| | |
| | |
| | |
| | |
| | |
| | |
| | |
| | |
| | |
| | |
| | |
| | |
| | |
| | |
| | |
| | |
| | |
| | |
| | |
| | |
| | |
| | |
| | |
| | |
| | | | | | |
AR065-0517  | | | | | www.amgfunds.com |
Item 2. CODE OF ETHICS
Registrant has adopted a Code of Ethics. See attached Exhibit (a)(1).
Item 3. AUDIT COMMITTEE FINANCIAL EXPERT
Registrant’s Board of Trustees has determined that independent Trustee Mr. Steven J. Paggioli qualifies as the Audit Committee Financial expert. Mr. Paggioli is “independent” as such term is defined in Form N-CSR.
Item 4. PRINCIPAL ACCOUNTANT FEES AND SERVICES
(a) Audit Fees
The aggregate fees billed by the Funds’ independent registered public accounting firm, PricewaterhouseCoopers LLP (“PwC”), to the Funds for the Funds’ two most recent fiscal years for professional services rendered for audits of annual financial statements, or services that are normally provided in connection with statutory and regulatory filings or engagements (“Audit Fees”) were as follows:
| | | | | | | | |
| | | Fiscal 2017 | | | Fiscal 2016 | |
AMG Managers Cadence Capital Appreciation Fund | | $ | 22,031 | | | $ | 23,257 | |
AMG Managers Cadence Emerging Companies Fund | | $ | 20,450 | | | $ | 23,347 | |
AMG Managers Cadence Mid-Cap Fund | | $ | 21,986 | | | $ | 25,390 | |
(b) Audit-Related Fees
There were no fees billed by PwC to the Funds in its two recent fiscal years for services rendered for assurance and related services that are reasonably related to the performance of the audit or review of the Fund’s financial statements, but are not reported as Audit Fees (“Audit-Related Fees”).
For the Funds’ two most recent fiscal years, there were no Audit-Related Fees billed by PwC for engagements related directly to the operations and financial reporting of one or more Funds by a Fund Service Provider. A Fund Service Provider is (a) any investment adviser to the Fund (not including any Subadvisor whose role is primarily portfolio management and is subcontracted with or overseen by another investment adviser) or (b) any entity that provides ongoing services to the Fund and is controlling, controlled by or under common control with a Fund investment adviser described in (a).
(c) Tax Fees
The aggregate fees billed by PwC to the Funds for the two most recent fiscal years for professional services rendered for tax compliance, tax advice, and tax planning (“Tax Fees”) were as follows:
| | | | | | | | |
| | | Fiscal 2017 | | | Fiscal 2016 | |
AMG Managers Cadence Capital Appreciation Fund | | $ | 7,369 | | | $ | 7,225 | |
AMG Managers Cadence Emerging Companies Fund | | $ | 7,369 | | | $ | 7,225 | |
AMG Managers Cadence Mid Cap Fund | | $ | 7,369 | | | $ | 7,225 | |
For the Funds’ two most recent fiscal years, Tax Fees billed by PwC for engagements by Fund Service Providers that related directly to the operations and financial reporting of the Funds were $0 for fiscal 2016 and $0 for fiscal 2015, respectively.
The services for which Tax Fees were charged comprise all services performed by professional staff in PwC’s tax division except those services related to the audit. Typically, this category would include fees for tax compliance, tax planning, and tax advice. Tax compliance, tax advice, and tax planning services include preparation of original and amended tax returns, claims for refund and tax payment-planning services, assistance with tax audits and appeals, tax advice related to mergers and acquisitions and requests for rulings or technical advice from taxing authorities.
(d) All Other Fees
There were no other fees billed by PwC to the Funds for all other non-audit services (“Other Fees”) during the Funds’ two most recent fiscal years. During the same period, there were no Other Fees billed by PwC for engagements by Fund Service Providers that related directly to the operations and financial reporting of the Funds.
(e)(1) According to policies adopted by the Audit Committee, services provided by PwC to the Funds must be pre-approved by the Audit Committee. On an annual basis, the Audit Committee reviews and pre-approves various types of services that PwC may perform for the Funds without specific approval of each engagement, subject to specified budget limitations. As contemplated by the Sarbanes-Oxley Act of 2002 and related SEC rules, the Audit Committee also pre-approves non-audit services provided by PwC to any Fund Service Provider for any engagement that relates directly to the operations and financial reporting of the Funds. Any engagement that is not already pre-approved or that will exceed a pre-approved budget must be submitted to the Audit Committee for pre-approval. The Chairman of the Audit Committee is authorized on behalf of the Board of Trustees and the Audit Committee to approve the engagement of PwC to perform non-audit services subject to certain conditions, including notification to the Audit Committee of such pre-approval not later than the next meeting of the Audit Committee following the date of such pre-approval.
(e)(2) None.
(f) Not applicable.
(g) The aggregate fees billed by PwC in 2017 and 2016 for non-audit services rendered to the Funds and Fund Service Providers were $54,507 and $87,675, respectively. For the fiscal year ended May 31, 2017, this amount reflects the amounts disclosed above in Item 4(b),(c),(d), plus $32,400 in fees billed to the Fund Service Providers for non-audit services that did not relate directly to the operations and financial reporting of the Funds. For the fiscal year ended May 31, 2016, this amount reflects the amounts disclosed above in Item 4(b),(c),(d), plus $66,000 in fees billed to the Fund Service Providers for non-audit services that did not relate directly to the operations and financial reporting of the Funds.
(h) The Trust’s Audit Committee has considered whether the provision of non-audit services by registrant’s independent registered public accounting firm to the registrant’s investment advisor, and any entity controlling, controlled, or under common control with the investment advisor that provided ongoing services to the registrant that were not pre-approved by the Committee (because such services did not relate directly to the operations and financial reporting of the registrant) was compatible with maintaining the independence of the independent registered public accounting firm.
Item 5. AUDIT COMMITTEE OF LISTED REGISTRANTS
Not applicable.
Item 6. SCHEDULE OF INVESTMENTS
The schedule of investments in unaffiliated issuers as of the close of the reporting period is included as part of the shareholder report contained in Item 1 hereof.
Item 7. DISCLOSURE OF PROXY VOTING POLICIES AND PROCEDURES FOR CLOSED-END MANAGEMENT INVESTMENT COMPANIES
Not applicable.
Item 8. PORTFOLIO MANAGERS OF CLOSED-END MANAGEMENT INVESTMENT COMPANIES
Not applicable.
Item 9. PURCHASES OF EQUITY SECURITIES BY CLOSED-END MANAGEMENT INVESTMENT COMPANIES AND AFFILIATED PURCHASERS
Not applicable.
Item 10. SUBMISSION OF MATTERS TO A VOTE OF SECURITY HOLDERS
Not applicable.
Item 11. CONTROLS AND PROCEDURES
(a) The Registrant’s principal executive and principal financial officers have concluded, based on their evaluation of the registrant’s disclosure controls and procedures as of a date within 90 days of the filing of this report, that the Registrant’s disclosure controls and procedures are reasonably designed to ensure that information required to be disclosed by the Registrant on Form N-CSR is recorded, processed, summarized and reported within the required time periods and that information required to be disclosed by the registrant in the reports that it files or submits on Form N-CSR is accumulated and communicated to the Registrant’s management, including its principal executive and principal financial officers, as appropriate to allow timely decisions regarding required disclosure.
(b) There were no changes in the Registrant’s internal control over financial reporting during the Registrant’s fourth fiscal quarter of the period covered by this report that have materially affected, or are reasonably likely to affect, the internal control over financial reporting.
| | |
| Item 12. | | EXHIBITS |
| |
| (a)(1) | | Any Code of Ethics or amendments hereto. Filed herewith. |
| |
| (a)(2) | | Certifications pursuant to Rule 30a-2(a) under the Investment Company Act of 1940 - Filed herewith. |
| |
| (a)(3) | | Not applicable. |
| |
| (b) | | Certifications pursuant to Rule 30a-2(b) under the Investment Company Act of 1940 - Filed herewith. |
SIGNATURES
Pursuant to the requirements of the Securities Exchange Act of 1934 and the Investment Company Act of 1940, the registrant has duly caused this report to be signed on its behalf by the undersigned, thereunto duly authorized.
| | |
| AMG FUNDS III |
| |
| By: | | /s/ Jeffrey T. Cerutti |
| | Jeffrey T. Cerutti, Principal Executive Officer |
| |
| Date: | | August 1, 2017 |
Pursuant to the requirements of the Securities Exchange Act of 1934 and the Investment Company Act of 1940, this report has been signed below by the following persons on behalf of the registrant and in the capacities and on the dates indicated.
| | |
| By: | | /s/ Jeffrey T. Cerutti |
| | Jeffrey T. Cerutti, Principal Executive Officer |
| |
| Date: | | August 1, 2017 |
| |
| By: | | /s/ Donald S. Rumery |
| | Donald S. Rumery, Principal Financial Officer |
| |
| Date: | | August 1, 2017 |