UNITED STATES
SECURITIES AND EXCHANGE COMMISSION
Washington, D.C. 20549
FORM N-CSR
CERTIFIED SHAREHOLDER REPORT OF REGISTERED
MANAGEMENT INVESTMENT COMPANIES
Investment Company Act file number: 811-03752
AMG Funds III
(Exact name of registrant as specified in charter)
600 Steamboat Road, Suite 300, Greenwich, Connecticut 06830
(Address of principal executive offices) (Zip code)
AMG Funds LLC
600 Steamboat Road, Suite 300, Greenwich, Connecticut 06830
(Name and address of agent for service)
Registrant’s telephone number, including area code: (203) 299-3500
Date of fiscal year end: May 31
Date of reporting period: June 1, 2017 – May 31, 2018
(Annual Shareholder Report)
Item 1. Reports to Shareholders
| | | | |
 | | | | ANNUAL REPORT |
| | | | | | |
| | | AMG Funds | | |
| | | | |
| | | May 31, 2018 | | | | |
| | |
| | | AMG Managers Cadence Mid Cap Fund |
| | | Class N: MCMAX | | | Class I: MCMYX | | | Class Z: MCMFX |
| | |
| | | AMG Managers Cadence Emerging Companies Fund |
| | | Class N: MECAX | | | Class I: MECIX | | | Class Z: MECZX |
| | |
| | | |
| | |
| | | |
amgfunds.com | | 053118 AR065 |
|
| AMG Funds |
| Annual Report — May 31, 2018 |
| | | | | | | | |
| | | TABLE OF CONTENTS | | | PAGE | | | |
| | | LETTER TO SHAREHOLDERS | | | 2 | | | |
| | | | |
| | | ABOUT YOUR FUND’S EXPENSES | | | 3 | | | |
| | | | |
| | | PORTFOLIO MANAGER’S COMMENTS, FUND SNAPSHOTS AND SCHEDULES OF PORTFOLIO INVESTMENTS | | | | | | |
| | | | |
| | | AMG Managers Cadence Mid Cap Fund | | | 4 | | | |
| | | | |
| | | AMG Managers Cadence Emerging Companies Fund | | | 10 | | | |
| | | | |
| | | FINANCIAL STATEMENTS | | | | | | |
| | | | |
| | | Statement of Assets and Liabilities | | | 16 | | | |
| | | Balance sheets, net asset value (NAV) per share computations and cumulative undistributed amounts | | | | | | |
| | | | |
| | | Statement of Operations | | | 18 | | | |
| | | Detail of sources of income, expenses, and realized and unrealized gains (losses) during the fiscal year | | | | | | |
| | | | |
| | | Statements of Changes in Net Assets | | | 19 | | | |
| | | Detail of changes in assets for the past two fiscal years | | | | | | |
| | | | |
| | | Financial Highlights | | | 20 | | | |
| | | Historical net asset values per share, distributions, total returns, income and expense ratios, turnover ratios and net assets | | | | | | |
| | | | |
| | | Notes to Financial Statements | | | 26 | | | |
| | | Accounting and distribution policies, details of agreements and transactions with Fund management and affiliates, and descriptions of certain investment risks | | | | | | |
| | | | |
| | | REPORT OF INDEPENDENT REGISTERED PUBLIC ACCOUNTING FIRM | | | 32 | | | |
| | | | |
| | | OTHER INFORMATION | | | 33 | | | |
| | | | |
| | | TRUSTEES AND OFFICERS | | | 34 | | | |
Nothing contained herein is to be considered an offer, sale or solicitation of an offer to buy shares of any series of the AMG Funds family of mutual funds. Such offering is made only by prospectus, which includes details as to offering price and other material information.
| | | | |
| | | Letter to Shareholders | | |
| | | | |
Dear Shareholder:
The fiscal year ended May 31, 2018, was a strong period for equity markets as the health of the global economy improved and positive investor sentiment stretched the U.S. bull market into its ninth year. The S&P 500® Index, a widely followed barometer of the U.S. equity market, returned 14.38% in the 12 month reporting period. During this time, small cap stocks outperformed large caps with a 20.76% return, as measured by the Russell 2000® Index.
With the support of a strong global economy, tax reform, and strong corporate profits, equities climbed higher in the second half of 2017 and into the beginning of 2018. Improving gross domestic product (GDP) growth in developed markets and falling unemployment rates helped bolster investor confidence. The past year also marked a turning point for the broader global economy as growth accelerated in a more coordinated fashion around the world and commodity prices recovered. Following a remarkably calm period, volatility returned to financial markets early in 2018, driven in part by concerns of rising inflation and the threat of trade wars. For the first time since early 2016, the U.S. equity market entered a correction, however, a subsequent rally helped the market close the fiscal year near all-time highs.
In total, eight out of eleven sectors of the S&P 500® Index were positive during the 12 month reporting period, but there was significant dispersion in performance across sectors. Information technology and financial stocks led the Index with returns of 28.16% and 18.97%, respectively. Consumer staples demonstrated the weakest performance followed by telecoms and utilities with (10.39)%, (3.60)% and (2.09)%, respectively. FAANG stocks continued to drive returns with Facebook, Amazon, Apple, Netflix and Alphabet (formerly Google Inc.) contributing 3.06% to overall returns. Overall, growth stocks significantly outperformed value with returns of 21.02% and 8.25% for the Russell 1000® Growth and Russell 1000® Value Indexes, respectively. International equities and emerging markets demonstrated strong returns, with the MSCI All Country World Index ex-USA and MSCI Emerging Markets Index returning 9.67% and 14.43%, respectively, in the 12 months ending May 31, 2018. Emerging market returns were tempered by the continue threat of trade wars and a strengthening USD, which impacted countries with high USD denominated debt.
Rising interest rates late in the fiscal year quickly eroded the returns for bonds, and the Bloomberg Barclays U.S. Aggregate Bond Index, a broad measure of U.S. bond market performance, turned negative with (0.37)% return for the 12 months ending May 31, 2018. The yield on the 10-year U.S. Treasury note increased 62 basis points (.62%) during the fiscal year period to yield 2.83% as the U.S. Federal Reserve continued to normalize monetary policy. Investment grade corporates significantly underperformed Treasuries and securitized credits with returns of (0.29)%, 1.32% and 0.90%, respectively. Bond investors willing to accept more credit risk were rewarded with higher returns as high yield bonds performed strongly and credit spreads tightened over most of the fiscal year. The Bloomberg Barclays U.S. Corporate High Yield Index ended the period with a 2.35% return.
AMG Funds appreciates the privilege of providing investment tools to you and your clients. Our foremost goal is to provide investment solutions that help our shareholders successfully reach their long-term investment goals. AMG Funds provides access to a distinctive array of actively managed return-oriented investment strategies.
We thank you for your continued confidence and investment in AMG Funds. You can rest assured that under all market conditions our team is focused on delivering excellent investment management services for your benefit.
Respectfully,

Keitha Kinne
President
AMG Funds
| | | | | | | | |
| Average Annual Total Returns | | Periods ended
May 31, 2018* |
Stocks: | | | | 1 Year | | 3 Years | | 5 Years |
Large Caps | | (S&P 500® Index) | | 14.38% | | 10.97% | | 12.98% |
Small Caps | | (Russell 2000® Index) | | 20.76% | | 10.98% | | 12.18% |
| International | | (MSCI All Country World ex-USA Index) | | 9.67% | | 4.74% | | 5.46% |
Bonds: | | | | | | | | |
| Investment Grade | | (Bloomberg Barclays U.S. Aggregate Bond Index) | | (0.37)% | | 1.39% | | 1.98% |
| | | | |
| High Yield | | (Bloomberg Barclays U.S. Corporate High Yield Index) | | 2.35% | | 4.86% | | 4.87% |
| | | | |
| Tax-exempt | | (Bloomberg Barclays Municipal Bond Index) | | 1.11% | | 2.79% | | 2.92% |
| | | | |
| Treasury Bills | | (ICE BofAML 6-Month U.S. Treasury Bill Index) | | 1.32% | | 0.80% | | 0.54% |
*Source: Factset. Past performance is no guarantee of future results.
| | | | |
| | | | | |
| | | | | |
| | | About Your Fund’s Expenses | | |
| | | | |
As a shareholder of a Fund, you may incur two types of costs: (1) transaction costs, which may include sales charges (loads) on purchase payments; redemption fees; and exchange fees; and (2) ongoing costs, including management fees; distribution (12b-1) fees; and other Fund expenses. This example is intended to help you understand your ongoing costs (in dollars) of investing in the Fund and to compare these costs with the ongoing costs of investing in other mutual funds. The example is based on $1,000 invested at the beginning of the period and held for the entire period as indicated below. ACTUAL EXPENSES The first line of the following table provides information about the actual account values and | | actual expenses. You may use the information in this line, together with the amount you invested, to estimate the expenses that you paid over the period. Simply divide your account value by $1,000 (for example, an $8,600 account value divided by $1,000 = 8.6), then multiply the result by the number in the first line under the heading entitled “Expenses Paid During Period” to estimate the expenses you paid on your account during this period. HYPOTHETICAL EXAMPLE FOR COMPARISON PURPOSES The second line of the following table provides information about hypothetical account values and hypothetical expenses based on the Fund’s actual expense ratio and an assumed annual rate of return of 5% before expenses, which is not the Fund’s | | actual return. The hypothetical account values and expenses may not be used to estimate the actual ending account balance or expenses you paid for the period. You may use this information to compare the ongoing costs of investing in the Fund and other funds by comparing this 5% hypothetical example with the 5% hypothetical examples that appear in the shareholder reports of other funds. Please note that the expenses shown in the table are meant to highlight your ongoing costs only and do not reflect any transactional costs, such as sales charges (loads), redemption fees, or exchange fees. Therefore, the second line of the table is useful in comparing ongoing costs only, and will not help you determine the relative total costs of owning different funds. |
| | | | | |
| | | | | | | | | | |
Six Months Ended
May 31, 2018 | | Expense
Ratio for
the Period | | Beginning
Account
Value
12/01/17 | | Ending
Account
Value
05/31/18 | | Expenses
Paid
During
the Period* | |
| AMG Managers Cadence Mid Cap Fund | |
| |
| Based on Actual Fund Return | | | | |
| | | | |
| Class N | | 1.08% | | $1,000 | | $1,031 | | | $5.47 | |
| | | | |
| Class I | | 0.87% | | $1,000 | | $1,033 | | | $4.41 | |
| | | | |
| Class Z | | 0.72% | | $1,000 | | $1,033 | | | $3.65 | |
| |
| Based on Hypothetical 5% Annual Return | | | | |
| | | | |
| Class N | | 1.08% | | $1,000 | | $1,020 | | | $5.44 | |
| | | | |
| Class I | | 0.87% | | $1,000 | | $1,021 | | | $4.38 | |
| | | | |
| Class Z | | 0.72% | | $1,000 | | $1,021 | | | $3.63 | |
| | | | |
| | | | | | | | | | |
| AMG Managers Cadence Emerging Companies Fund | |
| |
| Based on Actual Fund Return | | | | |
| | | | |
| Class N | | 1.08% | | $1,000 | | $1,091 | | | $5.63 | |
| | | | |
| Class I | | 0.98% | | $1,000 | | $1,091 | | | $5.11 | |
| | | | |
| Class Z | | 0.89% | | $1,000 | | $1,092 | | | $4.64 | |
| |
| Based on Hypothetical 5% Annual Return | | | | |
| | | | |
| Class N | | 1.08% | | $1,000 | | $1,020 | | | $5.44 | |
| | | | |
| Class I | | 0.98% | | $1,000 | | $1,020 | | | $4.94 | |
| | | | |
| Class Z | | 0.89% | | $1,000 | | $1,020 | | | $4.48 | |
| * | Expenses are equal to the Fund’s annualized expense ratio multiplied by the average account value over the period, multiplied by the number of days in the most recent fiscal half-year (182), then divided by 365. | |
| | | | |
| | | | | |
| | | AMG Managers Cadence Mid Cap Fund | | |
| | | Portfolio Manager’s Comments (unaudited) | | |
| | | | | | | | |
For the fiscal year ended May 31, 2018, the AMG Managers Cadence Mid Cap Fund (Class Z) (the “Fund”) returned 16.66%, lagging its benchmark, the Russell Midcap® Growth Index, which returned 18.42%. PERFORMANCE SUMMARY The fiscal year ended May 31, 2018, was filled with many market-moving events that gave investors reason to believe in stocks across the market cap spectrum. Within the growth sector, mid cap stocks trailed large cap and small cap indices. Specifically, the Russell Midcap® Growth Index was up 18.4% in the twelve months ended May 31, 2018, behind the Russell 1000® Growth Index return of 21.0% and the Russell 2000® Growth Index return of 25.1%. Growth indices handily outpaced value benchmarks across the market cap spectrum. The Fund’s disciplined growth strategy invests in stocks which exhibit a combination of growth, quality and valuation. During this period, the valuation component served as a drag on results. Valuation as a factor underperformed as investors placed a premium on growth. For example, our analysis shows the cheapest grouping of mid cap growth stocks, those with a price-earnings ratio below 20x, lagged the overall benchmark return as a group by over 200 basis points. Conversely, the most expensive grouping, those stocks with a price-earnings ratio above 40x, was the top performing grouping during the period, outpacing the benchmark return by over 400 basis points. In keeping with our approach, the Fund was overweight the more attractively valued stocks (lower price-earnings ratios) and underweight the more expensive cohort (higher ratios). Thus, we believe there were style headwinds for our conservative growth strategy, whereas aggressive growth strategies had a tailwind. Over longer periods, valuation works to the benefit of investors by helping protect downside risk as well as by facilitating capital appreciation through multiple expansions. Though this phenomenon was not in evidence during this period, we believe consistent inclusion of valuation in our strategy is an important underpinning of sound investing over long investment horizons. | | | | At the sector level, materials and financials contributed positively to performance. Our positive results in these sectors illustrate the benefit of our philosophy of being sector agnostic and willing to invest in sectors less trafficked by traditional growth managers. Information technology and industrials detracted from results. Strong stock selection in materials drove that sector’s positive relative results. Positions in metals and chemicals were top gainers for the portfolio. Approximately 6% of the portfolio was allocated to the sector, on par with the benchmark. The positive relative contribution from financials was led, in part, by an overweight allocation to the sector which was one of the best sectors overall, rising 32.5% for the benchmark. Strong stock selection in banks also was a positive driver, led by the Fund’s position in SVB Financial Group (Silicon Valley Bank), which was powered by strong earnings growth. Information technology was the Fund’s top detractor, due to both allocation (underweighting a strong sector) and stock selection. Most of the shortfall relating to under allocation was in the software & services industry group. At nearly 13%, this was the portfolio’s most heavily weighted industry group, yet nevertheless was below the benchmark’s 17%. Many expensive stocks are clustered in the information technology group, and their absence from the Fund detracted from relative returns by omission. Industrials was also a detractor, mostly due to stock selection. Equifax was the sector’s worst performer for the Fund, falling significantly upon the disclosure of a data breach. The position was sold, as the long-term impact to the business was uncertain. FISCAL YEAR IN REVIEW The fiscal year witnessed strong financial market returns. Many widely known technology stocks captivated headlines and led the market. Bitcoin and other crypto currencies exploded higher at the end of calendar 2017, echoing the speculative fever of the internet bubble with some smaller companies changing their names and/or hastily announcing blockchain initiatives. Volatility plumbed historic lows before jumping at the beginning of calendar 2018, only to retreat to low levels once again. Crude oil hit two-year highs in the autumn of 2017, turning | | | | into a tailwind for energy equities after the severe oil patch downturn which began in 2014. The market became accustomed to presidential commentary and policy communicated via Twitter. Economic statistics improved during the period, ushering forth the appearance and prospect of a global synchronized recovery. The U.S. tax cuts were a boost to corporate earnings as well as consumer and business confidence. MARKET OUTLOOK The portfolio’s pro-cyclical positioning continues. Economic statistics are healthy, ranging from employment to industrial production to consumer spending. Recession does not appear imminent, or even visible within the next twelve months. Trade policy has now taken center stage causing market volatility. This bears watching. Thus far, we have not made material changes to portfolio composition due to potential tariffs, retaliation, or other knock-on effects. We continue to anticipate a positive economic backdrop and additional Fed rate increases. We remain optimistic regarding the potential impact of other fiscal or regulatory actions which would be beneficial for prospective earnings growth. Certainly, the tax cuts are favorable for corporate earnings and possibly M&A. There may be Infrastructure-related initiatives still to come. We do observe, however, that valuations are not cheap on an absolute basis, and the bull market is old in calendar terms. There is also non-trivial risk stemming from possible geopolitical developments. While we acknowledge these macro considerations, we remain focused on the implementation of our disciplined investment process, centered around bottom-up investment decision making, driving into the portfolio a combination of growth, quality and valuation attributes which over the long term should result in attractive investment results. Thank you for your continued trust. This commentary reflects the viewpoints of Cadence Capital Management, LLC. as of May 31, 2018 and is not intended as a forecast or guarantee of future results. |
| | | | |
| | | | | |
| | | AMG Managers Cadence Mid Cap Fund | | |
| | | Portfolio Manager’s Comments (continued) | | |
CUMULATIVE TOTAL RETURN PERFORMANCE
AMG Managers Cadence Mid Cap Fund’s cumulative total return is based on the daily change in net asset value (NAV), and assumes that all dividends and distributions were reinvested. This graph compares a hypothetical $10,000 investment made in the AMG Managers Cadence Mid Cap Fund’s Class Z shares on May 31, 2008, to a $10,000 investment made in the Russell Midcap® Growth Index for the same time period. The graph and table do not reflect the deduction of taxes that a shareholder would pay on a Fund distribution or redemption of shares. The listed returns for the Fund are net of expenses and the returns for the index exclude expenses. Total returns would have been lower had certain expenses not been reduced.
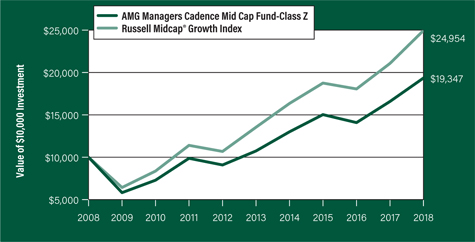
The table below shows the average annual total returns for the AMG Managers Cadence Mid Cap Fund and the Russell Midcap® Growth Index for the same time periods ended May 31, 2018.
| | | | | | | | | | | | |
Average Annual Total Returns1 | | One
Year | | | Five
Years | | | Ten
Years | |
AMG Managers Cadence Mid Cap Fund2, 3, 4, 5, 6 | | | | | | | | | | | | |
Class N | | | 16.25 | % | | | 12.06 | % | | | 6.40% | |
| | | |
Class I | | | 16.49 | % | | | 12.24 | % | | | 6.57% | |
| | | |
Class Z | | | 16.66 | % | | | 12.49 | % | | | 6.82% | |
| | | | |
Russell Midcap® Growth Index7 | | | 18.42 | % | | | 13.00 | % | | | 9.58% | |
The performance data shown represents past performance. Past performance is not a guarantee of future results. Current performance may be lower or higher than the performance data quoted. The investment return and principal value of an investment will fluctuate so that an investor’s shares, when redeemed, may be worth more or less than their original cost.
Investors should carefully consider the Fund’s investment objectives, risks, charges and expenses before investing. For performance information through the most recent month end, current net asset values per share for the Fund and other information, please call 800.835.3879 or visit our website at amgfunds.com for a free prospectus. Read it carefully before investing or sending money.
Distributed by AMG Distributors, Inc., member FINRA/SIPC.
| 1 | Total return equals income yield plus share price change and assumes reinvestment of all dividends and capital gain distributions. Returns are net of fees and may reflect offsets of Fund expenses as described in the prospectus. No adjustment has been made for taxes payable by shareholders on their reinvested dividends and capital gain distributions. Returns for periods greater than one year are annualized. The listed returns on the Fund are net of expenses and based on the published NAV as of May 31, 2018. All returns are in U.S. dollars ($). |
| | |
| | | 2 From time to time, the Fund’s advisor has waived its fees and/or absorbed Fund expenses, which has resulted in higher returns. 3 The Fund is subject to risks associated with investments in mid-capitalization companies such as greater price volatility, lower trading volume, and less liquidity than the stocks of larger, more established companies. 4 The Fund invests in growth stocks, which may be more sensitive to market movements because their prices tend to reflect future investor expectations rather than just current profits. Growth stocks may underperform value stocks during given periods. 5 The Fund is subject to special risk considerations similar to those associated with the direct ownership of real estate. Real estate valuations may be subject to factors such as changing general and local economic, financial, competitive, and environmental conditions. 6 Active and frequent trading of a fund may result in higher transaction costs and increased tax liability. 7 The Russell Midcap® Growth Index measures the performance of the Russell Midcap companies with higher price-to-book ratios and higher forecasted growth values. The stocks are also members of the Russell 1000® Growth Index. Unlike the Fund, the Index is unmanaged, is not available for investment, and does not incur expenses. The Russell Indices are trademarks of the London Stock Exchange Group companies. Not FDIC insured, nor bank guaranteed. May lose value. |
| | | | |
| | | | | |
| | | AMG Managers Cadence Mid Cap Fund | | |
| | | Fund Snapshots (unaudited) May 31, 2018 | | |
PORTFOLIO BREAKDOWN
| | | | | | |
| Sector | | % of
Net Assets | | | |
Information Technology | | 25.6 | | | | |
| | | |
Consumer Discretionary | | 20.8 | | | | |
| | | |
Industrials | | 15.0 | | | | |
| | | |
Financials | | 13.3 | | | | |
| | | |
Health Care | | 11.3 | | | | |
| | | |
Consumer Staples | | 5.9 | | | | |
| | | |
Materials | | 4.6 | | | | |
| | | |
Real Estate | | 1.2 | | | | |
| | | |
Utilities | | 1.2 | | | | |
| | | |
Short-Term Investments1 | | 5.5 | | | | |
| | | |
Other Assets Less Liabilities2 | | (4.4) | | | | |
| 1 | Includes reinvestment of cash collateral into joint repurchase agreements on security lending transactions. |
| 2 | Includes repayment of cash collateral on security lending transactions. |
TOP TEN HOLDINGS
| | | | |
| Security Name | | | | % of
Net Assets |
Microchip Technology, Inc. | | | | 1.7 |
| | | |
VeriSign, Inc. | | | | 1.6 |
| | | |
Red Hat, Inc. | | | | 1.6 |
| | | |
Fortinet, Inc. | | | | 1.6 |
| | | |
NetApp, Inc. | | | | 1.5 |
| | | |
Lam Research Corp. | | | | 1.5 |
| | | |
Landstar System, Inc. | | | | 1.5 |
| | | |
MSCI, Inc. | | | | 1.4 |
| | | |
Rockwell Automation, Inc. | | | | 1.4 |
| | | |
Synopsys, Inc. | | | | 1.4 |
| | | | | |
| | |
Top Ten as a Group | | 15.2 |
| | | | |
Because a fund’s strategy may result in multiple investments in particular sectors of the economy, its performance may depend on the performance of those sectors and may fluctuate more widely than investments diversified across more sectors. For additional information on these and other risk considerations, please see the Fund’s prospectus.
Any sectors, industries, or securities discussed should not be perceived as investment recommendations. Mention of a specific security should not be considered a recommendation to buy or solicitation to sell that security. Specific securities mentioned in this report may have been sold from the Fund’s portfolio of investments by the time you receive this report.
| | | | |
| | | | | |
| | | AMG Managers Cadence Mid Cap Fund | | |
| | | Schedule of Portfolio Investments May 31, 2018 | | |
| | | | | | | | |
| | | | Shares | | | | Value | |
Common Stocks - 98.9% | | | | | | | | |
| | |
Consumer Discretionary - 20.8% | | | | | | | | |
| | |
AMC Networks, Inc., Class A*,1 | | | 23,632 | | | | $1,351,041 | |
| | |
BorgWarner, Inc. | | | 25,386 | | | | 1,238,329 | |
| | |
Burlington Stores, Inc.* | | | 10,774 | | | | 1,575,698 | |
| | |
Choice Hotels International, Inc. | | | 16,885 | | | | 1,356,710 | |
| | |
Darden Restaurants, Inc. | | | 18,073 | | | | 1,579,761 | |
| | |
Foot Locker, Inc. | | | 26,960 | | | | 1,455,031 | |
| | |
Hilton Grand Vacations, Inc.* | | | 29,720 | | | | 1,181,667 | |
| | |
Lear Corp. | | | 8,793 | | | | 1,741,014 | |
| | |
Michael Kors Holdings, Ltd. (United Kingdom)* | | | 26,140 | | | | 1,500,175 | |
| | |
The Michaels Cos., Inc.* | | | 56,223 | | | | 1,032,254 | |
| | |
NVR, Inc.* | | | 426 | | | | 1,273,970 | |
| | |
Omnicom Group, Inc. | | | 16,425 | | | | 1,183,914 | |
| | |
Polaris Industries, Inc. | | | 10,315 | | | | 1,154,249 | |
| | |
Qurate Retail Group, Inc.* | | | 53,006 | | | | 1,077,612 | |
| | |
Ross Stores, Inc. | | | 16,870 | | | | 1,330,706 | |
| | |
Six Flags Entertainment Corp.1 | | | 20,470 | | | | 1,320,724 | |
| | |
The Gap, Inc. | | | 43,128 | | | | 1,206,721 | |
| | |
Thor Industries, Inc. | | | 12,625 | | | | 1,169,075 | |
| | |
VF Corp. | | | 16,060 | | | | 1,303,430 | |
| | |
Wyndham Worldwide Corp. | | | 15,205 | | | | 1,648,830 | |
| | |
Total Consumer Discretionary | | | | | | | 26,680,911 | |
| | |
Consumer Staples - 5.9% | | | | | | | | |
| | |
Church & Dwight Co., Inc. | | | 28,126 | | | | 1,320,516 | |
| | |
Energizer Holdings, Inc.1 | | | 26,644 | | | | 1,618,356 | |
| | |
Herbalife, Ltd.* | | | 23,906 | | | | 1,213,708 | |
| | |
Nu Skin Enterprises, Inc., Class A | | | 16,775 | | | | 1,373,705 | |
| | |
Pilgrim’s Pride Corp.* | | | 31,941 | | | | 622,530 | |
| | |
Sysco Corp. | | | 22,226 | | | | 1,445,357 | |
| | |
Total Consumer Staples | | | | | | | 7,594,172 | |
| | |
Financials - 13.3% | | | | | | | | |
| | |
Ameriprise Financial, Inc. | | | 9,395 | | | | 1,302,429 | |
| | |
Citizens Financial Group, Inc. | | | 34,460 | | | | 1,407,691 | |
| | |
Credit Acceptance Corp.*,1 | | | 3,748 | | | | 1,323,081 | |
| | |
East West Bancorp, Inc. | | | 9,371 | | | | 651,097 | |
| | |
Federated Investors, Inc., Class B | | | 40,532 | | | | 983,712 | |
| | |
Lazard, Ltd., Class A | | | 26,828 | | | | 1,380,032 | |
| | |
Legg Mason, Inc. | | | 32,881 | | | | 1,225,475 | |
| | |
Lincoln National Corp. | | | 17,395 | | | | 1,153,115 | |
| | |
MSCI, Inc. | | | 10,970 | | | | 1,783,393 | |
| | |
The Progressive Corp. | | | 25,056 | | | | 1,555,727 | |
| | |
SVB Financial Group* | | | 3,730 | | | | 1,164,245 | |
| | | | | | | | |
| | | | Shares | | | | Value | |
| | |
TD Ameritrade Holding Corp. | | | 28,116 | | | $ | 1,664,467 | |
| | |
Western Alliance Bancorp.* | | | 25,007 | | | | 1,506,922 | |
| | |
Total Financials | | | | | | | 17,101,386 | |
| | |
Health Care - 11.3% | | | | | | | | |
| | |
Agilent Technologies, Inc. | | | 27,060 | | | | 1,675,555 | |
| | |
Bruker Corp. | | | 40,784 | | | | 1,234,532 | |
| | |
Centene Corp.* | | | 14,305 | | | | 1,675,974 | |
| | |
Charles River Laboratories International, Inc.* | | | 12,269 | | | | 1,319,163 | |
| | |
PerkinElmer, Inc. | | | 17,650 | | | | 1,311,924 | |
| | |
Premier, Inc., Class A*,1 | | | 41,661 | | | | 1,358,982 | |
| | |
Veeva Systems, Inc., Class A* | | | 20,523 | | | | 1,587,659 | |
| | |
Waters Corp.* | | | 6,540 | | | | 1,259,735 | |
| | |
WellCare Health Plans, Inc.* | | | 6,642 | | | | 1,472,332 | |
| | |
Zoetis, Inc. | | | 19,951 | | | | 1,669,899 | |
| | |
Total Health Care | | | | | | | 14,565,755 | |
| | |
Industrials - 15.0% | | | | | | | | |
| | |
Allison Transmission Holdings, Inc. | | | 31,961 | | | | 1,320,309 | |
| | |
Copa Holdings, S.A., Class A (Panama) | | | 9,472 | | | | 1,049,498 | |
| | |
Copart, Inc.* | | | 28,794 | | | | 1,578,775 | |
| | |
Cummins, Inc. | | | 7,177 | | | | 1,021,933 | |
| | |
Graco, Inc. | | | 28,939 | | | | 1,313,831 | |
| | |
HD Supply Holdings, Inc.* | | | 36,570 | | | | 1,489,496 | |
| | |
Huntington Ingalls Industries, Inc. | | | 5,912 | | | | 1,306,966 | |
| | |
KAR Auction Services, Inc. | | | 25,480 | | | | 1,344,580 | |
| | |
Landstar System, Inc. | | | 16,475 | | | | 1,868,265 | |
| | |
Lincoln Electric Holdings, Inc. | | | 13,007 | | | | 1,165,427 | |
| | |
Masco Corp. | | | 21,049 | | | | 784,496 | |
| | |
Parker-Hannifin Corp. | | | 6,445 | | | | 1,101,450 | |
| | |
Rockwell Automation, Inc. | | | 10,092 | | | | 1,770,238 | |
| | |
Spirit AeroSystems Holdings, Inc., Class A | | | 14,933 | | | | 1,264,974 | |
| | |
WW Grainger, Inc. | | | 2,690 | | | | 831,183 | |
| | |
Total Industrials | | | | | | | 19,211,421 | |
| | |
Information Technology - 25.6% | | | | | | | | |
| | |
Arista Networks, Inc.* | | | 6,479 | | | | 1,629,857 | |
| | |
Broadridge Financial Solutions, Inc. | | | 13,530 | | | | 1,562,038 | |
| | |
CDK Global, Inc. | | | 19,913 | | | | 1,281,402 | |
| | |
Citrix Systems, Inc.* | | | 12,090 | | | | 1,276,946 | |
| | |
Coherent, Inc.* | | | 5,392 | | | | 900,734 | |
| | |
DXC Technology Co. | | | 17,723 | | | | 1,632,465 | |
| | |
F5 Networks, Inc.* | | | 7,690 | | | | 1,331,216 | |
| | |
Fortinet, Inc.* | | | 33,520 | | | | 2,050,754 | |
| | |
KLA-Tencor Corp. | | | 12,330 | | | | 1,396,126 | |
| | |
Lam Research Corp. | | | 9,866 | | | | 1,955,244 | |
|
|
| |
The accompanying notes are an integral part of these financial statements. |
| 7 |
| | | | |
| | | | | |
| | | AMG Managers Cadence Mid Cap Fund | | |
| | | Schedule of Portfolio Investments (continued) | | |
| | | | | | | | |
| | | Shares | | | Value | |
| |
Information Technology - 25.6%
(continued) | | | | | |
| | |
Microchip Technology, Inc.1 | | | 21,907 | | | | $2,133,304 | |
| | |
Motorola Solutions, Inc. | | | 12,510 | | | | 1,342,823 | |
| | |
NetApp, Inc. | | | 29,123 | | | | 1,989,683 | |
| | |
ON Semiconductor Corp.* | | | 59,067 | | | | 1,484,354 | |
| | |
Red Hat, Inc.* | | | 12,774 | | | | 2,074,753 | |
| | |
Skyworks Solutions, Inc. | | | 11,893 | | | | 1,172,769 | |
| | |
Synopsys, Inc.* | | | 19,893 | | | | 1,751,976 | |
| | |
Take-Two Interactive Software, Inc.* | | | 11,777 | | | | 1,319,966 | |
| | |
Teradyne, Inc. | | | 29,617 | | | | 1,122,780 | |
| | |
VeriSign, Inc.* | | | 16,145 | | | | 2,105,954 | |
| | |
Western Digital Corp. | | | 16,949 | | | | 1,415,411 | |
| | |
Total Information Technology | | | | | | | 32,930,555 | |
| |
Materials - 4.6% | | | | | |
| | |
FMC Corp. | | | 13,546 | | | | 1,179,721 | |
| | |
Freeport-McMoRan, Inc. | | | 90,399 | | | | 1,527,743 | |
| | |
Huntsman Corp. | | | 46,159 | | | | 1,475,703 | |
| | |
Steel Dynamics, Inc. | | | 35,053 | | | | 1,732,670 | |
| | |
Total Materials | | | | | | | 5,915,837 | |
| | |
Real Estate - 1.2% | | | | | | | | |
| | |
CBRE Group, Inc., Class A* | | | 32,842 | | | | 1,516,972 | |
| |
Utilities - 1.2% | | | | | |
| | |
NRG Energy, Inc. | | | 43,341 | | | | 1,483,562 | |
| | |
Total Common Stocks
(Cost $104,340,830) | | | | | | | 127,000,571 | |
| | |
| | | Principal
Amount | | | | |
| |
Short-Term Investments - 5.5% | | | | | |
| |
Joint Repurchase Agreements - 4.3%2 | | | | | |
| | |
Citigroup Global Markets, Inc., dated 05/31/18, due 06/01/18, 1.790% total to be received $1,304,047 (collateralized by various U.S. Government Agency Obligations, 0.000% - 8.500%, 07/01/18 - 05/20/67, totaling $1,330,062) | | | $1,303,982 | | | | 1,303,982 | |
| * | Non-income producing security. |
| 1 | Some or all of these securities, amounting to $5,298,919 or 4.1% of net assets, were out on loan to various brokers. |
| 2 | Collateral received from brokers for securities lending was invested in these joint repurchase agreements. |
| | | | | | | | |
| | | Principal
Amount | | | Value | |
| | |
Daiwa Capital Markets America, dated 05/31/18, due 06/01/18, 1.800% total to be received $1,304,047 (collateralized by various U.S. Government Agency Obligations, 0.000% - 6.500%, 06/15/18 - 12/01/51, totaling $1,330,062) | | | $1,303,982 | | | | $1,303,982 | |
| | |
Deutsche Bank Securities, Inc., dated 05/31/18, due 06/01/18, 1.780% total to be received $274,256 (collateralized by various U.S. Government Agency Obligations, 0.000% - 0.000%, 05/15/26 - 02/15/35, totaling $279,727) | | | 274,242 | | | | 274,242 | |
| | |
Merrill Lynch, Pierce, Fenner & Smith, Inc., dated 05/31/18, due 06/01/18, 1.790% total to be received $1,304,047 (collateralized by various U.S. Government Agency Obligations, 2.000% - 5.000%, 12/01/27 - 06/01/48, totaling $1,330,062) | | | 1,303,982 | | | | 1,303,982 | |
| | |
Nomura Securities International, Inc., dated 05/31/18, due 06/01/18, 1.800% total to be received $1,304,047 (collateralized by various U.S. Government Agency Obligations, 0.000% - 8.500%, 06/01/18 - 04/20/68, totaling $1,330,062) | | | 1,303,982 | | | | 1,303,982 | |
| |
Total Joint Repurchase Agreements | | | | 5,490,170 | |
| | |
| | | Shares | | | | | |
| |
Other Investment Companies - 1.2% | | | | | |
| | |
Dreyfus Government Cash Management Fund, Institutional Class Shares, 1.64%3 | | | 1,563,930 | | | | 1,563,930 | |
| |
Total Short-Term Investments
(Cost $7,054,100) | | | | 7,054,100 | |
| |
Total Investments - 104.4%
(Cost $111,394,930) | | | | 134,054,671 | |
| |
Other Assets, less Liabilities - (4.4)% | | | | (5,591,326 | ) |
| | |
Net Assets - 100.0% | | | | | | | $128,463,345 | |
| 3 | Yield shown represents the May 31, 2018, seven day average yield, which refers to the sum of the previous seven days’ dividends paid, expressed as an annual percentage. |
|
|
The accompanying notes are an integral part of these financial statements. |
| 8 |
| | | | |
| | | | | |
| | | AMG Managers Cadence Mid Cap Fund | | |
| | | Schedule of Portfolio Investments (continued) | | |
The following table summarizes the inputs used to value the Fund’s investments by the fair value hierarchy levels as of May 31, 2018:
| | | | | | | | | | | | | | | | |
| | | Level 1 | | | Level 2 | | | Level 3 | | | Total | |
| | | |
Investments in Securities | | | | | | | | | | |
| | | | |
Common Stocks† | | | $127,000,571 | | | | — | | | | — | | | | $127,000,571 | |
| | | | |
Short-Term Investments | | | | | | | | | | | | | | | | |
| | | | |
Joint Repurchase Agreements | | | — | | | | $5,490,170 | | | | — | | | | 5,490,170 | |
| | | | |
Other Investment Companies | | | 1,563,930 | | | | — | | | | — | | | | 1,563,930 | |
| | | | | | | | | | | | | | | | |
| | | | |
Total Investments in Securities | | | $128,564,501 | | | | $5,490,170 | | | | — | | | | $134,054,671 | |
| | | | | | | | | | | | | | | | |
| † | All common stocks held in the Fund are Level 1 securities. For a detailed breakout of common stocks by major industry classification, please refer to the Fund’s Schedule of Portfolio Investments. |
As of May 31, 2018, the Fund had no transfers between levels from the beginning of the reporting period.
|
|
The accompanying notes are an integral part of these financial statements. |
| 9 |
| | | | |
| | | | | |
| | | AMG Managers Cadence Emerging Companies Fund | | |
| | | Portfolio Manager’s Comments (unaudited) | | |
| | | | | | | | |
For the fiscal year ended May 31, 2018, the AMG Managers Cadence Emerging Companies Fund (Class I) (the “Fund”) returned 29.39%, outperforming its benchmarks, the Russell Microcap® Growth Index and the Russell 2000® Growth Index, which returned 24.82% and 25.08, respectively. PERFORMANCE SUMMARY The fiscal year ended May 31, 2018, was filled with many market-moving events that gave investors reason to believe in stocks across the market cap spectrum. The Fund’s primary benchmark, the Russell Microcap® Growth Index, rose 24.8%. This strong gain was closely behind the Fund’s secondary benchmark, the Russell 2000® Growth, which advanced 25.1%. Small cap indices beat larger cap indices for the year. The Russell 1000® Growth and Russell Mid Cap® Growth rose 21.0% and 18.4%, respectively. Growth indices handily outpaced value benchmarks across the board. The Fund outpaced both its primary and secondary performance benchmarks during the year. Strong stock selection accounted for the relative outperformance. At the sector level, consumer discretionary, information technology, and energy accounted for much of the Fund’s outperformance. Health care detracted from relative performance. Consumer discretionary was the strongest contributor to the Fund’s total outperformance. Stock selection drove the results, with performance of the Fund’s holdings in the sector rising 32.3% versus 8.6% for the benchmark. The Fund found winners in industries across the sector, ranging from manufactured housing to boats to restaurants. The Fund’s underweight of the sector, as well as its underweight of the retail industry group within the sector, helped relative performance as both were laggards for the benchmark. Information technology was the second leading contributor to the Fund’s total outperformance. Stock selection drove the results, with performance of the Fund’s holdings in the sector rising 29.8% versus 19.5% for the benchmark. The software & services industry group was the primary contributor; six holdings rose more than 50%. Two software stocks were acquired at premiums by strategic buyers during the period. The Fund captured the upside (and more) in this strong industry group. The fund’s weight in the industry group rose somewhat during | | | | the year, from 10.5% on May 31, 2017, to 11.8% at the end of this fiscal year. Despite this, the fund’s overall information technology sector weighting fell from 21.0% to 17.0%, as we found fewer attractive holdings in hardware and semiconductors. Energy also contributed strongly to relative performance despite having a small weight of only 2.1% during the year. Stock selection accounted for most of the outperformance. The fund’s holdings rose 50.9%. The benchmark’s energy holdings rose 21.1%, which, while trailing the benchmark overall, was still considerably better than the prior three years when the sector declined in absolute terms, and was the worst performer of all sectors. Health care was the Fund’s leading detractor from relative performance. It is instructive to evaluate this performance across the sector’s two industry groups. First, the healthcare equipment and services industry group was a positive contributor, mostly due to stock selection, as the fund’s holdings rose 46.0%, more than the benchmark’s 37.2%. Thus, all of the underperformance for the sector was concentrated in the other industry group, pharmaceuticals, biotechnology & life sciences. This industry group detracted from performance due to allocation (significantly underweighting a strong group) and sub-par stock selection. Parsing this one step further, virtually all of the underperformance was concentrated in the biotechnology industry, where the fund’s underweight was largest and the benchmark’s performance was strongest. The fund is historically underweight this industry, as it is comprised of many companies which lose money, are not self-financing, and have business models predicated on scientific breakthroughs and regulatory approvals. Strong performance periods like this one for the benchmark’s biotechnology position can be the fund’s Achilles’ heel in the short run. However, this year was only a partial give-back of the strong positive contribution to relative performance derived from this industry over the prior two years when it was a poor performer for the benchmark. FISCAL YEAR IN REVIEW The fiscal year witnessed strong financial market returns. Many widely known technology stocks captivated headlines and led the market. Bitcoin and other crypto currencies exploded higher at the end of calendar 2017, echoing the speculative fever of the | | | | internet bubble with some smaller companies changing their names and/or hastily announcing blockchain initiatives. Volatility plumbed historic lows before jumping at the beginning of calendar 2018, only to retreat to low levels once again. Crude oil hit two-year highs in the autumn of 2017, turning into a tailwind for energy equities after the severe oil patch downturn which began in 2014. The market became accustomed to presidential commentary and policy communicated via Twitter. Economic statistics improved during the period, ushering forth the appearance and prospect of a global synchronized recovery. The U.S. tax cuts were a boost to corporate earnings as well as consumer and business confidence. MARKET OUTLOOK The fund’s pro-cyclical positioning continues. Economic statistics are healthy, ranging from employment to industrial production to consumer spending. Recession does not appear imminent, or even visible within the next twelve months. Trade policy has now taken center stage, causing market volatility. This bears watching. Thus far, we have not made material changes to fund composition due to potential tariffs, retaliation, or other knock-on effects. We continue to anticipate a positive economic backdrop and additional Fed rate increases. We remain optimistic regarding the potential impact of other fiscal or regulatory actions which would be beneficial for prospective earnings growth. Certainly, the tax cuts are favorable for corporate earnings and possibly M&A. There may be Infrastructure-related initiatives still to come. We observe that small cap valuations are reasonable relative to bonds and large cap stocks. However, valuations are not cheap on an absolute basis, and the bull market is old in calendar terms. There is also non-trivial risk stemming from possible geopolitical developments. While we acknowledge these macro considerations, we remain focused on the implementation of our disciplined investment process, centered around bottom-up investment decision making, which over the long term and short term has generated alpha from strong stock selection. Thank you for your continued trust. This commentary reflects the viewpoints of Cadence Capital Management, LLC. as of May 31, 2018 and is not intended as a forecast or guarantee of future results. |
| | | | |
| | | | | |
| | | AMG Managers Cadence Emerging Companies Fund | | |
| | | Portfolio Manager’s Comments (continued) | | |
CUMULATIVE TOTAL RETURN PERFORMANCE
AMG Managers Cadence Emerging Companies Fund’s cumulative total return is based on the daily change in net asset value (NAV), and assumes that all dividends and distributions were reinvested. This graph compares a hypothetical $10,000 investment made in the AMG Managers Cadence Emerging Companies Fund’s Class I shares on May 31, 2008, to a $10,000 investment made in the Russell Microcap® Growth Index and the Russell 2000® Growth Index for the same time period. The graph and table do not reflect the deduction of taxes that a shareholder would pay on a Fund distribution or redemption of shares. The listed returns for the Fund are net of expenses and the returns for the index exclude expenses. Total returns would have been lower had certain expenses not been reduced.
The table below shows the average annual total returns for the AMG Managers Cadence Emerging Companies Fund and the Russell Microcap® Growth Index and the Russell 2000® Growth Index for the same time periods ended May 31, 2018.
| | | | | | | | | | | | | | | | | | | | |
| Average Annual Total Returns1 | | One
Year | | | Five
Years | | | Ten
Years | | | Since
Inception | | | Inception
Date | |
| | |
AMG Managers Cadence Emerging Companies Fund2, 3, 4, 5, 6 | | | | | | | | | |
| | | | | |
Class N | | | 29.24 | % | | | 17.12% | | | | 13.11% | | | | 11.45% | | | | 04/01/96 | |
| | | | | |
Class I | | | 29.39 | % | | | 17.36% | | | | 13.38% | | | | 12.75% | | | | 06/25/93 | |
| | | | | |
Class Z | | | 29.51 | % | | | — | | | | — | | | | 29.51% | | | | 05/30/17 | |
| | | | | |
Russell Microcap® Growth Index7 | | | 24.82 | % | | | 11.51% | | | | 9.35% | | | | — | | | | — | |
| | | | | |
Russell 2000® Growth Index8 | | | 25.08 | % | | | 13.33% | | | | 10.47% | | | | 8.34% | | |
| 06/25/93†
|
|
The performance data shown represents past performance. Past performance is not a guarantee of future results. Current performance may be lower or higher than the performance data quoted. The investment return and principal value of an investment will fluctuate so that an investor’s shares, when redeemed, may be worth more or less than their original cost.
Investors should carefully consider the Fund’s investment objectives, risks, charges and expenses before investing. For performance information through the most recent month end, current net asset values per share for the Fund and other information, please call 800.835.3879 or visit our website at amgfunds.com for a free prospectus. Read it carefully before investing or sending money.
Distributed by AMG Distributors, Inc., member FINRA/SIPC.
| † | Date reflects the inception date of the Fund, not the index. |
| | |
| | | 1 Total return equals income yield plus share price change and assumes reinvestment of all dividends and capital gain distributions. Returns are net of fees and may reflect offsets of Fund expenses as described in the prospectus. No adjustment has been made for taxes payable by shareholders on their reinvested dividends and capital gain distributions. Returns for periods greater than one year are annualized. The listed returns on the Fund are net of expenses and based on the published NAV as of May 31, 2018. All returns are in U.S. dollars ($). 2 From time to time, the Fund’s advisor has waived its fees and/or absorbed Fund expenses, which has resulted in higher returns. 3 The Fund invests in growth stocks, which may be more sensitive to market movements because their prices tend to reflect future investor expectations rather than just current profits. Growth stocks may underperform value stocks during given periods. 4 The Fund is subject to risks associated with investments in small-capitalization companies, such as erratic earnings patterns, competitive conditions, limited earnings history and a reliance on one or a limited number of products. 5 The Fund is subject to the special risks associated with investments in micro-cap companies, such as relatively short earnings history, competitive conditions, less publicly available corporate information, and reliance on a limited number of products. |
| | | 6 The Fund is subject to special risk considerations similar to those associated with the direct ownership of real estate. Real estate valuations may be subject to factors such as changing general and local economic, financial, competitive, and environmental conditions. 7 The Russell Microcap® Growth Index tracks the microcap segment of the U.S. equity market. It makes up less than 3% of the U.S. equity market and is represented by the smallest 1,000 securities in the small-cap Russell 2000® Index plus the next 1,000 securities. Unlike the Fund, the Russell Microcap® Growth Index is unmanaged, is not available for investment and does not incur expenses. 8 The Russell 2000® Growth Index measures the performance of the Russell 2000 companies with higher price-to-book ratios and higher forecasted growth values. Unlike the Fund, the Russell 2000® Index is unmanaged, is not available for investment, and does not incur expenses. The Russell Indices are trademarks of the London Stock Exchange Group companies. Not FDIC insured, nor bank guaranteed. May lose value. |
| | | | |
| | | | | |
| | | AMG Managers Cadence Emerging Companies Fund | | |
| | | Fund Snapshots (unaudited) May 31, 2018 | | |
PORTFOLIO BREAKDOWN
| | |
| Sector | | % of Net Assets |
| | |
Health Care | | 22.4 |
| | |
Industrials | | 17.3 |
| | |
Information Technology | | 17.0 |
| | |
Financials | | 14.5 |
| | |
Consumer Discretionary | | 11.0 |
| | |
Consumer Staples | | 5.5 |
| | |
Energy | | 3.5 |
| | |
Materials | | 2.4 |
| | |
Real Estate | | 1.5 |
| | |
Utilities | | 1.1 |
| | |
Short-Term Investments1 | | 7.8 |
| | |
Other Assets Less Liabilities2 | | (4.0) |
| 1 | Includes reinvestment of cash collateral into joint repurchase agreements on security lending transactions. |
| 2 | Includes repayment of cash collateral on security lending transactions. |
TOP TEN HOLDINGS
| | | | |
| Security Name | | | | % of
Net Assets |
| | | |
Upland Software, Inc. | | | | 1.7 |
| | | |
Carbonite, Inc. | | | | 1.7 |
| | | |
Vicor Corp. | | | | 1.7 |
| | | |
The Chefs’ Warehouse, Inc. | | | | 1.5 |
| | | |
PRGX Global, Inc. | | | | 1.5 |
| | | |
Simulations Plus, Inc. | | | | 1.5 |
| | | |
Cavco Industries, Inc. | | | | 1.5 |
| | | |
Tabula Rasa HealthCare, Inc. | | | | 1.4 |
| | | |
CRA International, Inc. | | | | 1.4 |
| | | |
Addus HomeCare Corp. | | | | 1.4 |
| | | | | |
| | | |
Top Ten as a Group | | | | 15.3 |
| | | | |
Because a fund’s strategy may result in multiple investments in particular sectors of the economy, its performance may depend on the performance of those sectors and may fluctuate more widely than investments diversified across more sectors. For additional information on these and other risk considerations, please see the Fund’s prospectus.
Any sectors, industries, or securities discussed should not be perceived as investment recommendations. Mention of a specific security should not be considered a recommendation to buy or solicitation to sell that security. Specific securities mentioned in this report may have been sold from the Fund’s portfolio of investments by the time you receive this report.
| | | | |
| | | | | |
| | | AMG Managers Cadence Emerging Companies Fund | | |
| | | Schedule of Portfolio Investments May 31, 2018 | | |
| | | | | | | | |
| | | | Shares | | | | Value | |
| | |
Common Stocks - 96.2% | | | | | | | | |
| | |
Consumer Discretionary - 11.0% | | | | | | | | |
| | |
Carriage Services, Inc. | | | 36,992 | | | | $930,349 | |
| | |
Cavco Industries, Inc.* | | | 9,460 | | | | 1,963,896 | |
| | |
Chuy’s Holdings, Inc.* | | | 42,624 | | | | 1,255,277 | |
| | |
Denny’s Corp.* | | | 104,472 | | | | 1,593,198 | |
| | |
Malibu Boats, Inc., Class A* | | | 24,699 | | | | 1,059,093 | |
| | |
MCBC Holdings, Inc.* | | | 47,269 | | | | 1,393,963 | |
| | |
RCI Hospitality Holdings, Inc. | | | 40,514 | | | | 1,294,422 | |
| | |
Ruth’s Hospitality Group, Inc. | | | 50,187 | | | | 1,332,465 | |
| | |
Skyline Champion Corp. | | | 45,707 | | | | 1,450,740 | |
| | |
Winnebago Industries, Inc. | | | 30,732 | | | | 1,114,035 | |
| | |
ZAGG, Inc.* | | | 74,501 | | | | 1,132,415 | |
| | |
Total Consumer Discretionary | | | | | | | 14,519,853 | |
| | |
Consumer Staples - 5.5% | | | | | | | | |
| | |
Calavo Growers, Inc.1 | | | 16,945 | | | | 1,491,160 | |
| | |
The Chefs’ Warehouse, Inc.*,1 | | | 74,143 | | | | 2,016,690 | |
| | |
Medifast, Inc. | | | 11,058 | | | | 1,619,886 | |
| | |
New Age Beverages Corp.* | | | 329,299 | | | | 589,445 | |
| | |
Primo Water Corp.* | | | 93,954 | | | | 1,595,339 | |
| | |
Total Consumer Staples | | | | | | | 7,312,520 | |
| | |
Energy - 3.5% | | | | | | | | |
| | |
Abraxas Petroleum Corp.* | | | 644,832 | | | | 1,741,046 | |
| | |
Profire Energy, Inc.* | | | 358,648 | | | | 1,678,473 | |
| | |
Solaris Oilfield Infrastructure, Inc., Class A*,1 | | | 81,389 | | | | 1,256,646 | |
| | |
Total Energy | | | | | | | 4,676,165 | |
| | |
Financials - 14.5% | | | | | | | | |
| | |
Bryn Mawr Bank Corp. | | | 28,124 | | | | 1,320,422 | |
| | |
Enova International, Inc.* | | | 40,029 | | | | 1,344,974 | |
| | |
FB Financial Corp. | | | 37,470 | | | | 1,533,273 | |
| | |
First Foundation, Inc.* | | | 81,622 | | | | 1,582,651 | |
| | |
Green Bancorp, Inc. | | | 53,536 | | | | 1,201,883 | |
| | |
Health Insurance Innovations, Inc.,
Class A* | | | 50,099 | | | | 1,598,158 | |
| | |
Heritage Insurance Holdings, Inc. | | | 73,431 | | | | 1,239,515 | |
| | |
Kingstone Cos., Inc. | | | 90,343 | | | | 1,576,485 | |
| | |
Kinsale Capital Group, Inc. | | | 24,249 | | | | 1,284,227 | |
| | |
Ladenburg Thalmann Financial Services, Inc. | | | 428,438 | | | | 1,529,524 | |
| | |
Meta Financial Group, Inc. | | | 13,958 | | | | 1,579,348 | |
| | |
Preferred Bank | | | 21,569 | | | | 1,373,945 | |
| | |
Pzena Investment Management, Inc., Class A | | | 84,907 | | | | 763,314 | |
| | |
Silvercrest Asset Management Group, Inc., Class A | | | 78,817 | | | | 1,253,190 | |
| | |
Total Financials | | | | | | | 19,180,909 | |
| | | | | | | | |
| | | | Shares | | | | Value | |
| | |
Health Care - 22.4% | | | | | | | | |
| | |
Aclaris Therapeutics, Inc.*,1 | | | 21,968 | | | | $396,962 | |
| | |
Addus HomeCare Corp.* | | | 32,142 | | | | 1,840,129 | |
| | |
American Renal Associates Holdings, Inc.*,1 | | | 79,026 | | | | 1,141,135 | |
| | |
ANI Pharmaceuticals, Inc.* | | | 24,542 | | | | 1,553,263 | |
| | |
Civitas Solutions, Inc.* | | | 16,267 | | | | 261,899 | |
| | |
Computer Programs & Systems, Inc.1 | | | 20,490 | | | | 666,950 | |
| | |
Concert Pharmaceuticals, Inc.* | | | 61,239 | | | | 1,251,113 | |
| | |
Enzo Biochem, Inc.* | | | 114,062 | | | | 741,403 | |
| | |
HealthStream, Inc. | | | 47,385 | | | | 1,319,672 | |
| | |
iRadimed Corp.*,1 | | | 81,999 | | | | 1,521,081 | |
| | |
Lantheus Holdings, Inc.* | | | 35,328 | | | | 494,592 | |
| | |
LeMaitre Vascular, Inc. | | | 35,684 | | | | 1,216,111 | |
| | |
LHC Group, Inc.* | | | 21,989 | | | | 1,692,493 | |
| | |
NeoGenomics, Inc.* | | | 130,032 | | | | 1,508,371 | |
| | |
Orthofix International, NV* | | | 31,519 | | | | 1,722,513 | |
| | |
Paratek Pharmaceuticals, Inc.*,1 | | | 52,224 | | | | 545,741 | |
| | |
Pieris Pharmaceuticals, Inc.* | | | 46,236 | | | | 259,846 | |
| | |
PTC Therapeutics, Inc.* | | | 39,101 | | | | 1,325,524 | |
| | |
RadNet, Inc.* | | | 92,294 | | | | 1,172,134 | |
| | |
Recro Pharma, Inc.*,1 | | | 103,409 | | | | 563,579 | |
| | |
Sangamo Therapeutics, Inc.* | | | 26,668 | | | | 438,689 | |
| | |
Sharps Compliance Corp.* | | | 154,085 | | | | 570,115 | |
| | |
Simulations Plus, Inc. | | | 103,454 | | | | 1,986,317 | |
| | |
Tabula Rasa HealthCare, Inc.* | | | 34,467 | | | | 1,880,175 | |
| | |
Triple-S Management Corp., Class B (Puerto Rico)* | | | 35,108 | | | | 1,286,708 | |
| | |
US Physical Therapy, Inc. | | | 6,766 | | | | 631,606 | |
| | |
Vanda Pharmaceuticals, Inc.* | | | 96,386 | | | | 1,696,394 | |
| | |
Total Health Care | | | | | | | 29,684,515 | |
| | |
Industrials - 17.3% | | | | | | | | |
| | |
Barrett Business Services, Inc. | | | 18,776 | | | | 1,618,867 | |
| | |
Blue Bird Corp.*,1 | | | 51,721 | | | | 969,769 | |
| | |
Commercial Vehicle Group, Inc.* | | | 131,247 | | | | 1,040,789 | |
| | |
CRA International, Inc. | | | 34,194 | | | | 1,849,895 | |
| | |
Daseke, Inc.* | | | 146,122 | | | | 1,391,081 | |
| | |
Douglas Dynamics, Inc. | | | 37,995 | | | | 1,749,670 | |
| | |
Energy Recovery, Inc.* | | | 145,381 | | | | 1,208,116 | |
| | |
Franklin Covey Co.* | | | 24,901 | | | | 698,473 | |
| | |
Heritage-Crystal Clean, Inc.* | | | 52,322 | | | | 1,062,137 | |
| | |
Kadant, Inc. | | | 9,906 | | | | 966,330 | |
| | |
Lawson Products, Inc.* | | | 65,634 | | | | 1,578,498 | |
| | |
Lydall, Inc.* | | | 25,877 | | | | 1,084,246 | |
|
|
The accompanying notes are an integral part of these financial statements. |
13 |
| | | | |
| | | | | |
| | | AMG Managers Cadence Emerging Companies Fund | | |
| | | Schedule of Portfolio Investments (continued) | | |
| | | | | | | | |
| | | | Shares | | | | Value | |
| | |
Industrials - 17.3% (continued) | | | | | | | | |
| | |
NV5 Global, Inc.*,1 | | | 21,577 | | | | $1,355,035 | |
| | |
PGT Innovations, Inc.* | | | 83,238 | | | | 1,723,026 | |
| | |
Sterling Construction Co., Inc.* | | | 76,084 | | | | 967,028 | |
| | |
Vicor Corp.*,1 | | | 50,209 | | | | 2,201,665 | |
| | |
Willdan Group, Inc.*,1 | | | 52,180 | | | | 1,487,130 | |
| | |
Total Industrials | | | | | | | 22,951,755 | |
| |
Information Technology - 17.0% | | | | | |
| | |
American Software, Inc., Class A | | | 124,994 | | | | 1,646,171 | |
| | |
Asure Software, Inc.* | | | 76,953 | | | | 1,348,986 | |
| | |
Blucora, Inc.* | | | 41,473 | | | | 1,573,900 | |
| | |
CalAmp Corp.* | | | 31,614 | | | | 670,849 | |
| | |
Carbonite, Inc.* | | | 57,310 | | | | 2,223,628 | |
| | |
Care.com, Inc.* | | | 61,989 | | | | 1,285,652 | |
| | |
Ichor Holdings, Ltd.*,1 | | | 17,512 | | | | 435,699 | |
| | |
KEMET Corp.* | | | 90,976 | | | | 1,817,700 | |
| | |
NVE Corp. | | | 14,323 | | | | 1,583,408 | |
| | |
Pixelworks, Inc.*,1 | | | 193,598 | | | | 803,432 | |
| | |
PRGX Global, Inc.* | | | 208,234 | | | | 2,009,458 | |
| | |
Silicom, Ltd. (Israel)*,1 | | | 19,898 | | | | 788,558 | |
| | |
TransAct Technologies, Inc. | | | 91,526 | | | | 993,057 | |
| | |
Upland Software, Inc.* | | | 63,481 | | | | 2,271,350 | |
| | |
Varonis Systems, Inc.* | | | 23,086 | | | | 1,792,628 | |
| | |
Zix Corp.* | | | 237,753 | | | | 1,286,244 | |
| | |
Total Information Technology | | | | | | | 22,530,720 | |
| |
Materials - 2.4% | | | | | |
| | |
KMG Chemicals, Inc. | | | 23,494 | | | | 1,570,574 | |
| | |
Trecora Resources* | | | 118,336 | | | | 1,650,787 | |
| | |
Total Materials | | | | | | | 3,221,361 | |
| |
Real Estate - 1.5% | | | | | |
| | |
The RMR Group, Inc., Class A | | | 8,459 | | | | 639,500 | |
| | |
UMH Properties, Inc., REIT | | | 92,095 | | | | 1,354,718 | |
| | |
Total Real Estate | | | | | | | 1,994,218 | |
| |
Utilities - 1.1% | | | | | |
| | |
Pure Cycle Corp.* | | | 154,427 | | | | 1,443,892 | |
| | |
Total Common Stocks
(Cost $109,275,072) | | | | | | | 127,515,908 | |
| * | Non-income producing security. |
| 1 | Some or all of these securities, amounting to $6,917,735 or 5.2% of net assets, were out on loan to various brokers. |
| 2 | Collateral received from brokers for securities lending was invested in these joint repurchase agreements. |
| | | | | | | | |
| | |
| Principal
Amount |
| | | Value | |
| |
Short-Term Investments - 7.8% | | | | | |
| |
Joint Repurchase Agreements - 5.5%2 | | | | | |
| | |
Bank of Montreal, dated 05/31/18, due 06/01/18, 1.770% total to be received $361,376 (collateralized by various U.S. Government Agency Obligations, 0.000% - 4.375%, 07/15/18 - 09/09/49, totaling $368,585) | | | $361,358 | | | | $361,358 | |
| | |
Cantor Fitzgerald Securities, Inc., dated 05/31/18, due 06/01/18, 1.800% total to be received $1,718,093 (collateralized by various U.S. Government Agency Obligations, 0.000% - 10.000%, 07/01/18 - 04/20/68, totaling $1,752,367) | | | 1,718,007 | | | | 1,718,007 | |
| | |
Daiwa Capital Markets America, dated 05/31/18, due 06/01/18, 1.800% total to be received $1,718,093 (collateralized by various U.S. Government Agency Obligations, 0.000% - 6.500%, 06/15/18 - 12/01/51, totaling $1,752,367) | | | 1,718,007 | | | | 1,718,007 | |
| | |
Merrill Lynch, Pierce, Fenner & Smith, Inc., dated 05/31/18, due 06/01/18, 1.790% total to be received $1,718,092 (collateralized by various U.S. Government Agency Obligations, 2.000% - 5.000%, 12/01/27 - 06/01/48, totaling $1,752,367) | | | 1,718,007 | | | | 1,718,007 | |
| | |
Nomura Securities International, Inc., dated 05/31/18, due 06/01/18, 1.800% total to be received $1,718,093 (collateralized by various U.S. Government Agency Obligations, 0.000% - 8.500%, 06/01/18 - 04/20/68, totaling $1,752,370) | | | 1,718,007 | | | | 1,718,007 | |
| |
Total Joint Repurchase Agreements | | | | 7,233,386 | |
| | |
| | | Shares | | | | | |
| |
Other Investment Companies - 2.3% | | | | | |
| | |
Dreyfus Government Cash Management Fund, Institutional Class Shares, 1.64%3 | | | 3,060,638 | | | | 3,060,638 | |
| |
Total Short-Term Investments
(Cost $10,294,024) | | | | 10,294,024 | |
| |
Total Investments - 104.0%
(Cost $119,569,096) | | | | 137,809,932 | |
| | |
Other Assets, less Liabilities - (4.0)% | | | | | | | (5,309,678 | ) |
| | |
Net Assets - 100.0% | | | | | | | $132,500,254 | |
| 3 | Yield shown represents the May 31, 2018, seven day average yield, which refers to the sum of the previous seven days’ dividends paid, expressed as an annual percentage. |
REIT Real Estate Investment Trust
|
|
The accompanying notes are an integral part of these financial statements. |
14 |
| | | | |
| | | | | |
| | | AMG Managers Cadence Emerging Companies Fund | | |
| | | Schedule of Portfolio Investments (continued) | | |
The following table summarizes the inputs used to value the Fund’s investments by the fair value hierarchy levels as of May 31, 2018:
| | | | | | | | | | | | | | | | |
| | | Level 1 | | | Level 2 | | | Level 3 | | | Total | |
| | | |
Investments in Securities | | | | | | | | | | |
| | | | |
Common Stocks† | | | $127,515,908 | | | | — | | | | — | | | | $127,515,908 | |
| | | | |
Short-Term Investments | | | | | | | | | | | | | | | | |
| | | | |
Joint Repurchase Agreements | | | — | | | | $7,233,386 | | | | — | | | | 7,233,386 | |
| | | | |
Other Investment Companies | | | 3,060,638 | | | | — | | | | — | | | | 3,060,638 | |
| | | | | | | | | | | | | | | | |
Total Investments in Securities | | | $130,576,546 | | | | $7,233,386 | | | | — | | | | $137,809,932 | |
| | | | | | | | | | | | | | | | |
| † | All common stocks held in the Fund are Level 1 securities. For a detailed breakout of common stocks by major industry classification, please refer to the Fund’s Schedule of Portfolio Investments. |
As of May 31, 2018, the Fund had no transfers between levels from the beginning of the reporting period.
|
|
The accompanying notes are an integral part of these financial statements. |
15 |
| | | | |
| | | | | |
| | | Statement of Assets and Liabilities | | |
| | | May 31, 2018 | | |
| | | | | | | | |
| | | AMG
Managers
Cadence Mid
Cap Fund | | | AMG
Managers Cadence
Emerging
Companies Fund | |
| | |
Assets: | | | | | | | | |
| | |
Investments at Value* (including securities on loan valued at $5,298,919, and $6,917,735, respectively) | | | $134,054,671 | | | | $137,809,932 | |
| | |
Receivable for investments sold | | | — | | | | 1,310,986 | |
| | |
Dividend, interest and other receivables | | | 115,807 | | | | 47,541 | |
| | |
Receivable for Fund shares sold | | | 14,506 | | | | 1,954,853 | |
| | |
Receivable from affiliate | | | — | | | | 7,771 | |
| | |
Prepaid expenses and other assets | | | 26,201 | | | | 29,582 | |
| | |
Total assets | | | 134,211,185 | | | | 141,160,665 | |
| | |
Liabilities: | | | | | | | | |
| | |
Payable upon return of securities loaned | | | 5,490,170 | | | | 7,233,386 | |
| | |
Payable for investments purchased | | | — | | | | 1,148,595 | |
| | |
Payable for Fund shares repurchased | | | 105,126 | | | | 132,807 | |
| | |
Accrued expenses: | | | | | | | | |
| | |
Investment advisory and management fees | | | 57,032 | | | | 72,636 | |
| | |
Administrative fees | | | 16,408 | | | | 15,790 | |
| | |
Distribution fees | | | 18,361 | | | | — | |
| | |
Shareholder service fees | | | 6,876 | | | | 12,476 | |
| | |
Professional fees | | | 33,231 | | | | 31,763 | |
| | |
Trustee fees and expenses | | | 1,387 | | | | 1,125 | |
| | |
Other | | | 19,249 | | | | 11,833 | |
| | |
Total liabilities | | | 5,747,840 | | | | 8,660,411 | |
| | | | | | | | |
| | |
Net Assets | | | $128,463,345 | | | | $132,500,254 | |
| | |
* Investments at cost | | | $111,394,930 | | | | $119,569,096 | |
|
|
The accompanying notes are an integral part of these financial statements. |
16 |
| | | | |
| | | | | |
| | | | | |
| | | Statement of Assets and Liabilities (continued) | | |
| | | | | | | | |
| | | AMG
Managers
Cadence Mid
Cap Fund | | | AMG
Managers Cadence
Emerging
Companies Fund | |
| | |
Net Assets Represent: | | | | | | | | |
| | |
Paid-in capital | | | $96,160,743 | | | | $113,730,470 | |
| | |
Undistributed (distribution in excess of) net investment income | | | 159,559 | | | | (188,620) | |
| | |
Accumulated net realized gain from investments | | | 9,483,302 | | | | 717,568 | |
| | |
Net unrealized appreciation on investments | | | 22,659,741 | | | | 18,240,836 | |
| | |
Net Assets | | | $128,463,345 | | | | $132,500,254 | |
| | |
Class N: | | | | | | | | |
| | |
Net Assets | | | $86,096,083 | | | | $23,758,735 | |
| | |
Shares outstanding | | | 2,789,740 | | | | 401,707 | |
| | |
Net asset value, offering and redemption price per share | | | $30.86 | | | | $59.14 | |
| | |
Class I: | | | | | | | | |
| | |
Net Assets | | | $16,516,250 | | | | $85,329,257 | |
| | |
Shares outstanding | | | 517,316 | | | | 1,331,264 | |
| | |
Net asset value, offering and redemption price per share | | | $31.93 | | | | $64.10 | |
| | |
Class Z: | | | | | | | | |
| | |
Net Assets | | | $25,851,012 | | | | $23,412,262 | |
| | |
Shares outstanding | | | 772,817 | | | | 364,919 | |
| | |
Net asset value, offering and redemption price per share | | | $33.45 | | | | $64.16 | |
|
|
The accompanying notes are an integral part of these financial statements. |
17 |
| | | | |
| | | | | |
| | | Statement of Operations | | |
| | | For the fiscal year ended May 31, 2018 | | |
| | | | | | | | |
| | | AMG
Managers
Cadence
Mid Cap
Fund | | | AMG
Managers Cadence
Emerging
Companies Fund | |
Investment Income: | | | | | | | | |
Dividend income | | | $1,377,361 | | | | $523,1971 | |
Interest income | | | — | | | | 261 | |
Securities lending income | | | 21,179 | | | | 58,114 | |
Miscellaneous income | | | 9,210 | | | | 6,590 | |
Total investment income | | | 1,407,750 | | | | 588,162 | |
Expenses: | | | | | | | | |
Investment advisory and management fees | | | 578,838 | | | | 669,475 | |
Administrative fees | | | 192,946 | | | | 145,538 | |
Distribution fees - Class N | | | 217,099 | | | | — | |
Shareholder servicing fees - Class N | | | 92,919 | | | | 32,924 | |
Shareholder servicing fees - Class I | | | 23,657 | | | | 63,763 | |
Registration fees | | | 52,928 | | | | 67,879 | |
Professional fees | | | 42,125 | | | | 44,434 | |
Reports to shareholders | | | 30,109 | | | | 27,144 | |
Transfer agent fees | | | 22,663 | | | | 4,078 | |
Trustee fees and expenses | | | 10,325 | | | | 6,716 | |
Custodian fees | | | 9,514 | | | | 13,558 | |
Miscellaneous | | | 4,613 | | | | 4,216 | |
Total expenses before offsets | | | 1,277,736 | | | | 1,079,725 | |
Expense reimbursements | | | (17,753 | ) | | | (119,512) | |
Net expenses | | | 1,259,983 | | | | 960,213 | |
| | | | | | | | |
Net investment income (loss) | | | 147,767 | | | | (372,051) | |
Net Realized and Unrealized Gain: | | | | | | | | |
Net realized gain on investments | | | 13,993,660 | | | | 14,455,489 | |
Net change in unrealized appreciation/depreciation on investments | | | 5,322,340 | | | | 10,412,277 | |
Net realized and unrealized gain | | | 19,316,000 | | | | 24,867,766 | |
| | | | | | | | |
Net increase in net assets resulting from operations | | | $19,463,767 | | | | $24,495,715 | |
| 1 | Includes non-recurring dividends of $30,011. |
|
|
| The accompanying notes are an integral part of these financial statements. |
| 18 |
| | | | |
| | | | | |
| | | Statements of Changes in Net Assets | | |
| | | For the fiscal years ended May 31, | | |
| | | | | | | | | | | | | | | | |
| | | AMG | | | AMG | |
| | | Managers | | | Managers Cadence | |
| | | Cadence Mid Cap Fund | | | Emerging Companies Fund | |
| | | 2018 | | | 20171 | | | 2018 | | | 20171 | |
Increase in Net Assets Resulting From Operations: | | | | | | | | | | | | | | | | |
Net investment income (loss) | | | $147,767 | | | | $(263,902) | | | | $(372,051) | | | | $(341,921) | |
Net realized gain on investments | | | 13,993,660 | | | | 15,434,562 | | | | 14,455,489 | | | | 5,864,705 | |
Net change in unrealized appreciation/depreciation on investments | | | 5,322,340 | | | | 5,000,430 | | | | 10,412,277 | | | | 5,385,997 | |
Net increase in net assets resulting from operations | | | 19,463,767 | | | | 20,171,090 | | | | 24,495,715 | | | | 10,908,781 | |
| | | | |
Distributions to Shareholders: | | | | | | | | | | | | | | | | |
From net investment income: | | | | | | | | | | | | | | | | |
Class N | | | — | | | | (472,527) | | | | — | | | | — | |
Class I | | | — | | | | (99,924) | | | | — | | | | — | |
Class Z | | | — | | | | (235,169) | | | | — | | | | — | |
From net realized gain on investments: | | | | | | | | | | | | | | | | |
Class N | | | (9,470,697) | | | | (4,689,069) | | | | — | | | | — | |
Class I | | | (1,635,519) | | | | (745,297) | | | | — | | | | — | |
Class Z | | | (2,690,280) | | | | (1,349,001) | | | | — | | | | — | |
Total distributions to shareholders | | | (13,796,496) | | | | (7,590,987) | | | | — | | | | — | |
Capital Share Transactions:2 | | | | | | | | | | | | | | | | |
Net increase (decrease) from capital share transactions | | | (2,318,922) | | | | (16,995,367) | | | | 37,608,483 | | | | 20,324,931 | |
| | | | | | | | | | | | | | | | |
Total increase (decrease) in net assets | | | 3,348,349 | | | | (4,415,264) | | | | 62,104,198 | | | | 31,233,712 | |
Net Assets: | | | | | | | | | | | | | | | | |
Beginning of year | | | 125,114,996 | | | | 129,530,260 | | | | 70,396,056 | | | | 39,162,344 | |
End of year | | | $128,463,345 | | | | $125,114,996 | | | | $132,500,254 | | | | $70,396,056 | |
End of year undistributed (distribution in excess of) net investment income | | | $159,559 | | | | — | | | | $(188,620) | | | | $(165,948) | |
| | | | | | | | | | | | | | | | |
| 1 | Effective October 1, 2016, and February 27, 2017, the Funds’ share classes were renamed as described in Note 1 of the Notes to the Financial Statements. |
| 2 | See Note 1(g) of the Notes to Financial Statements. |
|
|
| The accompanying notes are an integral part of these financial statements. |
| 19 |
| | | | |
| | | AMG Managers Cadence Mid Cap Fund | | |
| | | Financial Highlights | | |
| | | For a share outstanding throughout each fiscal year | | |
| | | | | | | | | | | | | | | | | | | | |
| | | For the fiscal years ended May 31, | |
| | | | | |
| Class N | | 2018 | | | 20171 | | | 2016 | | | 2015 | | | 2014 | |
Net Asset Value, Beginning of Year | | | $29.66 | | | | $26.87 | | | | $32.15 | | | | $34.15 | | | | $28.32 | |
Income (loss) from Investment Operations: | | | | | | | | | | | | | | | | | | | | |
Net investment income (loss)2,3 | | | 0.01 | | | | (0.09 | ) | | | 0.19 | 4 | | | (0.06 | ) | | | (0.02 | )5 |
Net realized and unrealized gain (loss) on investments | | | 4.75 | | | | 4.58 | | | | (2.32 | ) | | | 4.88 | | | | 5.85 | |
Total income (loss) from investment operations | | | 4.76 | | | | 4.49 | | | | (2.13 | ) | | | 4.82 | | | | 5.83 | |
Less Distributions to Shareholders from: | | | | | | | | | | | | | | | | | | | | |
Net investment income | | | — | | | | (0.16 | ) | | | — | | | | — | | | | — | |
Net realized gain on investments | | | (3.56 | ) | | | (1.54 | ) | | | (3.15 | ) | | | (6.82 | ) | | | — | |
Total distributions to shareholders | | | (3.56 | ) | | | (1.70 | ) | | | (3.15 | ) | | | (6.82 | ) | | | — | |
Net Asset Value, End of Year | | | $30.86 | | | | $29.66 | | | | $26.87 | | | | $32.15 | | | | $34.15 | |
Total Return3,6 | | | 16.25 | % | | | 17.23 | % | | | (6.64 | )% | | | 15.14 | % | | | 20.59 | % |
Ratio of net expenses to average net assets7 | | | 1.08 | % | | | 1.10 | % | | | 1.11 | % | | | 1.12 | % | | | 1.11 | %8 |
Ratio of gross expenses to average net assets9 | | | 1.09 | % | | | 1.14 | % | | | 1.21 | % | | | 1.19 | % | | | 1.18 | %8 |
Ratio of net investment income (loss) to average net assets3 | | | 0.02 | % | | | (0.31 | )% | | | 0.67 | % | | | (0.16 | )% | | | (0.05 | )%8 |
Portfolio turnover | | | 72 | % | | | 141 | % | | | 149 | % | | | 130 | % | | | 203 | % |
Net assets end of year (000’s) omitted | | | $86,096 | | | | $84,873 | | | | $89,179 | | | | $116,666 | | | | $122,497 | |
| | | | | | | | | | | | | | | | | | | | | |
| | | | |
| | | AMG Managers Cadence Mid Cap Fund | | |
| | | Financial Highlights | | |
| | | For a share outstanding throughout each fiscal year | | |
| | | | | | | | | | | | | | | | | | | | |
| | | For the fiscal years ended May 31, | |
| | | | | |
| Class I | | 2018 | | | 20171 | | | 2016 | | | 2015 | | | 2014 | |
Net Asset Value, Beginning of Year | | | $30.52 | | | | $27.65 | | | | $33.07 | | | | $35.04 | | | | $29.02 | |
Income (loss) from Investment Operations: | | | | | | | | | | | | | | | | | | | | |
Net investment income (loss)2,3 | | | 0.07 | | | | (0.03 | ) | | | 0.25 | 4 | | | (0.01 | ) | | | 0.05 | 5 |
Net realized and unrealized gain (loss) on investments | | | 4.90 | | | | 4.70 | | | | (2.39 | ) | | | 5.02 | | | | 5.97 | |
Total income (loss) from investment operations | | | 4.97 | | | | 4.67 | | | | (2.14 | ) | | | 5.01 | | | | 6.02 | |
Less Distributions to Shareholders from: | | | | | | | | | | | | | | | | | | | | |
Net investment income | | | — | | | | (0.21 | ) | | | (0.03 | ) | | | — | | | | — | |
Net realized gain on investments | | | (3.56 | ) | | | (1.59 | ) | | | (3.25 | ) | | | (6.98 | ) | | | — | |
Total distributions to shareholders | | | (3.56 | ) | | | (1.80 | ) | | | (3.28 | ) | | | (6.98 | ) | | | — | |
Net Asset Value, End of Year | | | $31.93 | | | | $30.52 | | | | $27.65 | | | | $33.07 | | | | $35.04 | |
Total Return3,6 | | | 16.49 | % | | | 17.44 | % | | | (6.50 | )% | | | 15.34 | % | | | 20.74 | % |
Ratio of net expenses to average net assets7 | | | 0.87 | % | | | 0.90 | % | | | 0.97 | % | | | 0.97 | % | | | 0.96 | %8 |
Ratio of gross expenses to average net assets9 | | | 0.88 | % | | | 0.95 | % | | | 1.07 | % | | | 1.04 | % | | | 1.03 | %8 |
Ratio of net investment income (loss) to average net assets3 | | | 0.22 | % | | | (0.11 | )% | | | 0.86 | % | | | (0.01 | )% | | | 0.15 | %8 |
Portfolio turnover | | | 72 | % | | | 141 | % | | | 149 | % | | | 130 | % | | | 203 | % |
Net assets end of year (000’s) omitted | | | $16,516 | | | | $15,245 | | | | $13,715 | | | | $14,809 | | | | $33,215 | |
| | | | | | | | | | | | | | | | | | | | | |
| | | | |
| | | AMG Managers Cadence Mid Cap Fund | | |
| | | Financial Highlights | | |
| | | For a share outstanding throughout each fiscal year | | |
| | | | | | | | | | | | | | | | | | | | |
| | | For the fiscal years ended May 31, | |
| | | | | |
| Class Z | | 2018 | | | 20171 | | | 2016 | | | 2015 | | | 2014 | |
Net Asset Value, Beginning of Year | | | $31.78 | | | | $28.79 | | | | $34.45 | | | | $36.44 | | | | $30.18 | |
Income (loss) from Investment Operations: | | | | | | | | | | | | | | | | | | | | |
Net investment income2,3 | | | 0.12 | | | | 0.02 | | | | 0.33 | 4 | | | 0.09 | | | | 0.12 | 5 |
Net realized and unrealized gain (loss) on investments | | | 5.11 | | | | 4.92 | | | | (2.49 | ) | | | 5.21 | | | | 6.23 | |
Total income (loss) from investment operations | | | 5.23 | | | | 4.94 | | | | (2.16 | ) | | | 5.30 | | | | 6.35 | |
Less Distributions to Shareholders from: | | | | | | | | | | | | | | | | | | | | |
Net investment income | | | — | | | | (0.29 | ) | | | (0.11 | ) | | | — | | | | (0.09 | ) |
Net realized gain on investments | | | (3.56 | ) | | | (1.66 | ) | | | (3.39 | ) | | | (7.29 | ) | | | — | |
Total distributions to shareholders | | | (3.56 | ) | | | (1.95 | ) | | | (3.50 | ) | | | (7.29 | ) | | | (0.09 | ) |
Net Asset Value, End of Year | | | $33.45 | | | | $31.78 | | | | $28.79 | | | | $34.45 | | | | $36.44 | |
Total Return3,6 | | | 16.66 | % | | | 17.71 | % | | | (6.28 | )% | | | 15.62 | % | | | 21.04 | % |
Ratio of net expenses to average net assets7 | | | 0.72 | % | | | 0.72 | % | | | 0.72 | % | | | 0.72 | % | | | 0.71 | %8 |
Ratio of gross expenses to average net assets9 | | | 0.73 | % | | | 0.76 | % | | | 0.82 | % | | | 0.79 | % | | | 0.78 | %8 |
Ratio of net investment income to average net assets3 | | | 0.37 | % | | | 0.07 | % | | | 1.07 | % | | | 0.24 | % | | | 0.35 | %8 |
Portfolio turnover | | | 72 | % | | | 141 | % | | | 149 | % | | | 130 | % | | | 203 | % |
Net assets end of year (000’s) omitted | | | $25,851 | | | | $24,997 | | | | $26,636 | | | | $33,693 | | | | $170,920 | |
| | | | | | | | | | | | | | | | | | | | | |
| 1 | Effective October 1, 2016, the Investor Class, Service Class and Institutional Class were renamed Class N, Class I and Class Z, respectively. |
| 2 | Per share numbers have been calculated using average shares. |
| 3 | Total returns and net investment income would have been lower had certain expenses not been offset. |
| 4 | Includes non-recurring dividends. Without these dividends, net investment income per share would have been $0.01, $0.07, and $0.13 for Class N, Class I, and Class Z, respectively. |
| 5 | Includes non-recurring dividends. Without these dividends, net investment income (loss) per share would have been $(0.03), $0.04, and $0.11 for Class N, Class I, and Class Z, respectively. |
| 6 | The total return is calculated using the published Net Asset Value as of fiscal year end. |
| 7 | Includes reduction from broker recapture amounting to 0.01% and 0.02% for the fiscal years ended 2015 and 2014, respectively. |
| 8 | Includes non-routine extraordinary expenses amounting to 0.008%, 0.007%, and 0.008% of average net assets for the Class N, Class I, and Class Z, respectively. |
| 9 | Excludes the impact of expense reimbursement or fee waivers and expense reductions such as brokerage credits, but includes expense repayments and non-reimbursable expenses, if any, such as interest, taxes, and extraordinary expenses. (See Note 1(c) and 2 in the Notes to Financial Statements.) |
| | | | |
| | | AMG Managers Cadence Emerging Companies Fund | | |
| | | Financial Highlights | | |
| | | For a share outstanding throughout each fiscal year | | |
| | | | | | | | | | | | | | | | | | | | |
| | | For the fiscal years ended May 31, | |
| | | | | |
| Class N | | 2018 | | | 20171 | | | 2016 | | | 2015 | | | 2014 | |
Net Asset Value, Beginning of Year | | | $45.76 | | | | $36.33 | | | | $35.29 | | | | $30.70 | | | | $26.84 | |
Income (loss) from Investment Operations: | | | | | | | | | | | | | | | | | | | | |
Net investment loss2,3 | | | (0.25 | )4 | | | (0.36 | )5 | | | (0.33 | )6 | | | (0.32 | )7 | | | (0.29 | )8 |
Net realized and unrealized gain on investments | | | 13.63 | | | | 9.79 | | | | 1.37 | | | | 4.91 | | | | 4.15 | |
Total income from investment operations | | | 13.38 | | | | 9.43 | | | | 1.04 | | | | 4.59 | | | | 3.86 | |
Less Distributions to Shareholders from: | | | | | | | | | | | | | | | | | | | | |
Net Asset Value, End of Year | | | $59.14 | | | | $45.76 | | | | $36.33 | | | | $35.29 | | | | $30.70 | |
Total Return3 | | | 29.24 | %9 | | | 25.92 | % | | | 2.95 | % | | | 14.95 | %9 | | | 14.38 | %9 |
Ratio of net expenses to average net assets10 | | | 1.08 | % | | | 1.62 | % | | | 1.65 | % | | | 1.66 | % | | | 1.61 | %11 |
Ratio of gross expenses to average net assets12 | | | 1.20 | % | | | 1.79 | % | | | 1.97 | % | | | 1.96 | % | | | 1.90 | %11 |
Ratio of net investment loss to average net assets3 | | | (0.47 | )% | | | (0.83 | )% | | | (0.96 | )% | | | (0.98 | )% | | | (0.94 | )%11 |
Portfolio turnover | | | 89 | % | | | 90 | % | | | 150 | % | | | 146 | % | | | 127 | % |
Net assets end of year (000’s) omitted | | | $23,759 | | | | $13,446 | | | | $3,099 | | | | $3,143 | | | | $3,540 | |
| | | | | | | | | | | | | �� | | | | | | | | |
| | | | | | | | | | | | | | | | | | | | | |
| | | | |
| | | AMG Managers Cadence Emerging Companies Fund | | |
| | | Financial Highlights | | |
| | | For a share outstanding throughout each fiscal year | | |
| | | | | | | | | | | | | | | | | | | | |
| | | For the fiscal years ended May 31, | |
| | | | | |
| Class I | | 2018 | | | 20171 | | | 2016 | | | 2015 | | | 2014 | |
Net Asset Value, Beginning of Year | | | $49.54 | | | | $39.25 | | | | $38.04 | | | | $33.00 | | | | $28.80 | |
Income (loss) from Investment Operations: | | | | | | | | | | | | | | | | | | | | |
Net investment loss2,3 | | | (0.21 | )4 | | | (0.29 | )5 | | | (0.27 | )6 | | | (0.25 | )7 | | | (0.23 | )8 |
Net realized and unrealized gain on investments | | | 14.77 | | | | 10.58 | | | | 1.48 | | | | 5.29 | | | | 4.43 | |
Total income from investment operations | | | 14.56 | | | | 10.29 | | | | 1.21 | | | | 5.04 | | | | 4.20 | |
Net Asset Value, End of Year | | | $64.10 | | | | $49.54 | | | | $39.25 | | | | $38.04 | | | | $33.00 | |
Total Return3 | | | 29.39 | %9 | | | 26.22 | %9 | | | 3.18 | %9 | | | 15.27 | %9 | | | 14.58 | % |
Ratio of net expenses to average net assets10 | | | 0.98 | % | | | 1.42 | % | | | 1.42 | % | | | 1.41 | % | | | 1.38 | %11 |
Ratio of gross expenses to average net assets12 | | | 1.10 | % | | | 1.60 | % | | | 1.74 | % | | | 1.71 | % | | | 1.67 | %11 |
Ratio of net investment loss to average net assets3 | | | (0.37 | )% | | | (0.64 | )% | | | (0.71 | )% | | | (0.73 | )% | | | (0.71 | )%11 |
Portfolio turnover | | | 89 | % | | | 90 | % | | | 150 | % | | | 146 | % | | | 127 | % |
Net assets end of year (000’s) omitted | | | $85,329 | | | | $56,850 | | | | $36,064 | | | | $34,566 | | | | $39,463 | |
| | | | | | | | | | | | | | | | | | | | | |
| | | | | | | | | | | | | | | | | | | | | |
| | | | |
| | | AMG Managers Cadence Emerging Companies Fund | | |
| | | Financial Highlights | | |
| | | For a share outstanding throughout each fiscal year | | |
| | | | | | | | |
| | | For the fiscal year ended May 31, | |
| |
Class Z | | | 201813 | |
| | |
Net Asset Value, Beginning of Year | | | $49.54 | | | | | |
Income from Investment Operations: | | | | | | | | |
Net investment loss2,3 | | | (0.17 | )4 | | | | |
Net realized and unrealized gain on investments | | | 14.79 | | | | | |
Total income from investment operations | | | 14.62 | | | | | |
Net Asset Value, End of Year | | | $64.16 | | | | | |
Total Return3 | | | 29.51 | %9 | | | | |
Ratio of net expenses to average net assets | | | 0.89 | % | | | | |
Ratio of gross expenses to average net assets12 | | | 1.01 | % | | | | |
Ratio of net investment loss to average net assets3 | | | (0.28 | )% | | | | |
Portfolio turnover | | | 89 | % | | | | |
Net assets end of year (000’s) omitted ` | | | $23,412 | | | | | |
| | | | | | | | | |
| 1 | Effective October 1, 2016, the Service Class and Institutional Class were renamed Class S and Class I, respectively. Effective February 27, 2017, Class S was renamed Class N. |
| 2 | Per share numbers have been calculated using average shares. |
| 3 | Total returns and net investment income would have been lower had certain expenses not been offset. |
| 4 | Includes non-recurring dividends. Without these dividends, net investment loss per share would have been $(0.26), $(0.23), and $(0.19) for Class N, Class I and Class Z shares, respectively. |
| 5 | Includes non-recurring dividends. Without these dividends, net investment loss per share would have been $(0.38) and $(0.31) for Class N, and Class I, respectively. |
| 6 | Includes non-recurring dividends. Without these dividends, net investment loss per share would have been $(0.36) and $(0.29) for Class N, and Class I, respectively. |
| 7 | Includes non-recurring dividends. Without these dividends, net investment loss per share would have been $(0.33) and $(0.27) for Class N, and Class I, respectively. |
| 8 | Includes non-recurring dividends. Without these dividends, net investment loss per share would have been $(0.32) and $(0.26) for Class N, and Class I, respectively. |
| 9 | The total return is calculated using the published Net Asset Value as of fiscal year end. |
| 10 | Includes reduction from broker recapture amounting to 0.01% and 0.05% for the fiscal years ended 2015 and 2014, respectively. |
| 11 | Includes non-routine extraordinary expenses amounting to 0.009% and 0.009% of average net assets for the Class N and Class I, respectively. |
| 12 | Excludes the impact of expense reimbursement or fee waivers and expense reductions such as brokerage credits, but includes expense repayments and non-reimbursable expenses, if any, such as interest, taxes, and extraordinary expenses. (See Note 1(c) and 2 in the Notes to Financial Statements.) |
| 13 | Commencement of operations was on May 31, 2017. |
| | | | |
| | | | | |
| | | Notes to Financial Statements | | |
| | | May 31, 2018 | | |
1. SUMMARY OF SIGNIFICANT ACCOUNTING POLICIES
AMG Funds III (the “Trust”) is an open-end management investment company, organized as a Massachusetts business trust, and registered under the Investment Company Act of 1940, as amended (the “1940 Act”). Currently, the Trust consists of a number of different funds, each having distinct investment management objectives, strategies, risks, and policies. Included in this report are AMG Managers Cadence Mid Cap Fund (“Mid Cap”) and AMG Managers Cadence Emerging Companies Fund (“Emerging Companies”), each a “Fund” and collectively, the “Funds.”
Effective at the close of business May 31,2017, Emerging Companies added Class Z shares, and issued approximately 2,019 shares to AMG Funds LLC (the “Investment Manager”) for $100,000.
Each Fund offers different classes of shares, which, effective October 1, 2016, were renamed. Mid Cap previously offered Investor Class shares, Service Class shares and Institutional Class shares, which were renamed to Class N, Class I and Class Z, respectively, and Emerging Companies previously offered Service Class shares and Institutional Class shares, which were renamed Class S and Class I, respectively. Effective February 27, 2017, Emerging Companies Class S shares were renamed Class N. Effective May 31, 2017, Emerging Companies began issuing Class Z shares. Each class represents an interest in the same assets of the respective Fund. Although all share classes generally have identical voting rights, each share class votes separately when required by law. Different share classes may pay different distribution amounts to the extent the net asset value per share and/or the expenses of such share classes differ. Each share class has its own expense structure. Please refer to a current prospectus for additional information on each share class.
The Funds’ financial statements are prepared in accordance with accounting principles generally accepted in the United States of America (“U.S. GAAP”), including accounting and reporting guidance pursuant to Accounting Standards Codification Topic 946 applicable to investment companies. U.S. GAAP requires management to make estimates and assumptions that affect the reported amounts of assets and liabilities and disclosure of contingent assets and liabilities at the date of the financial statements and the reported amounts of income and expenses during the reporting period. Actual results could differ from those estimates and such differences could be material. The following is a summary of significant accounting policies followed by the Funds in the preparation of their financial statements:
a. VALUATION OF INVESTMENTS
Equity securities traded on a national securities exchange or reported on the NASDAQ national market system (“NMS”) are valued at the last quoted sales price on the primary exchange or, if applicable, the NASDAQ official closing price or the official closing price of the relevant exchange or, lacking any sales, at the last quoted bid price or the mean between the last quoted bid and ask prices (the “exchange mean price”). Equity securities traded in the over-the-counter market (other than NMS securities) are valued at the exchange mean price. Foreign equity securities (securities principally traded in markets other than U.S. markets) are valued at the official closing price on the primary exchange or, for markets that either do not offer an official closing price or where the official closing price may not be representative of the overall market, the last quoted sale price.
Fixed income securities purchased with a remaining maturity of 60 days or less are valued at amortized cost, provided that the amortized cost value is
approximately the same as the fair value of the security valued without the use of amortized cost. Investments in other open-end regulated investment companies are valued at their end of day net asset value per share.
The Funds’ portfolio investments are generally valued based on independent market quotations or prices or, if none, “evaluative” or other market based valuations provided by third party pricing services approved by the Board of Trustees of the Trust (the “Board”). Under certain circumstances, the value of certain Fund portfolio investments may be based on an evaluation of fair value, pursuant to procedures established by and under the general supervision of the Board. The Valuation Committee, which is comprised of the Independent Trustees of the Board, and the Pricing Committee, which is comprised of representatives from the Investment Manager are the committees appointed by the Board to make fair value determinations. Each Fund may use the fair value of a portfolio investment to calculate its net asset value (“NAV”) in the event that the market quotation, price or market based valuation for the portfolio investment is not readily available or otherwise not determinable pursuant to the Board’s valuation procedures, if the Investment Manager or the Pricing Committee believes the quotation, price or market based valuation to be unreliable, or in certain other circumstances. When determining the fair value of an investment, the Pricing Committee and, if required under the Trust’s securities valuation procedures, the Valuation Committee, seeks to determine the price that the Fund might reasonably expect to receive from current sale of that portfolio investment in an arms-length transaction. Fair value determinations shall be based upon consideration of all available facts and information, including, but not limited to (i) attributes specific to the investment; (ii) fundamental and analytical data relating to the investment; and (iii) the value of other comparable securities or relevant financial instruments, including derivative securities, traded on other markets or among dealers.
The values assigned to fair value portfolio investments are based on available information and do not necessarily represent amounts that might ultimately be realized in the future, since such amounts depend on future developments inherent in long-term investments. Because of the inherent uncertainty of valuation, those estimated values may differ significantly from the values that would have been used had a ready market for the investments existed, and the differences could be material. The Board will be presented with a quarterly report showing as of the most recent quarter end, all outstanding securities fair valued by the Fund, including a comparison with the prior quarter end and the percentage of the Fund that the security represents at each quarter end.
With respect to foreign equity securities and certain foreign fixed income securities, the Board has adopted a policy that securities held in a Fund that can be fair valued by the applicable fair value pricing service are fair valued on each business day provided that each individual price exceeds a pre-established confidence level.
U.S. GAAP defines fair value as the price that a fund would receive to sell an asset or pay to transfer a liability in an orderly transaction between market participants at the measurement date. U.S. GAAP also establishes a framework for measuring fair value, and a three level hierarchy for fair value measurements based upon the transparency of inputs to the valuation of an asset or liability. Inputs may be observable or unobservable and refer broadly to the assumptions that market participants would use in pricing the asset or liability. Observable inputs reflect the assumptions market participants would use in pricing the asset or liability based on market data obtained from sources independent of the Funds.
Unobservable inputs reflect the Funds’ own assumptions about the assumptions that market participants would use in pricing the asset or liability developed based on the best information available in the circumstances. Each investment is
| | | | |
| | | | | |
| | | | | |
| | | Notes to Financial Statements (continued) | | |
assigned a level based upon the observability of the inputs which are significant to the overall valuation.
The three-tier hierarchy of inputs is summarized below:
Level 1 – inputs are quoted prices in active markets for identical investments (e.g., equity securities, open-end investment companies)
Level 2 – other observable inputs (including, but not limited to: quoted prices for similar assets or liabilities in markets that are active, quoted prices for identical or similar assets or liabilities in markets that are not active, inputs other than quoted prices that are observable for the assets or liabilities (such as interest rates, yield curves, volatilities, prepayment speeds, loss severities, credit risks and default rates) or other market corroborated inputs) (e.g., debt securities, government securities, foreign currency exchange contracts, foreign securities utilizing international fair value pricing, fair valued securities with observable inputs)
Level 3 – inputs are significant unobservable inputs (including the Fund’s own assumptions used to determine the fair value of investments) (e.g., fair valued securities with unobservable inputs)
Changes in inputs or methodologies used for valuing investments may result in a transfer in or out of levels within the fair value hierarchy. The inputs or methodologies used for valuing investments may not necessarily be an indication of the risk associated with investing in those investments. Transfers between different levels of the fair value disclosure hierarchy are deemed to have occurred as of the beginning of the reporting period.
b. SECURITY TRANSACTIONS
Security transactions are accounted for as of trade date. Realized gains and losses on securities sold are determined on the basis of identified cost.
c. INVESTMENT INCOME AND EXPENSES
Dividend income is recorded on the ex-dividend date. Interest income, which includes amortization of premium and accretion of discount on debt securities, is accrued as earned. Dividend and interest income on foreign securities is recorded gross of any withholding tax. Non-cash dividends included in dividend income, if any, are reported at the fair market value of the securities received. Other income and expenses are recorded on an accrual basis. Expenses that cannot be directly attributed to a Fund are apportioned among the funds in the Trust and other trusts within the AMG Funds family of mutual funds (collectively the “AMG Funds Family”) based upon their relative average net assets or number of shareholders. Investment income, realized and unrealized capital gains and losses, the common expenses of each Fund, and certain fund level expense reductions, if any, are allocated on a pro-rata basis to each class based on the relative net assets of each class to the total net assets of each Fund.
d. DIVIDENDS AND DISTRIBUTIONS
Fund distributions resulting from either net investment income or realized net capital gains, if any, will normally be declared and paid at least annually in December. Distributions to shareholders are recorded on the ex-dividend date. Distributions are determined in accordance with federal income tax regulations, which may differ from net investment income and net realized capital gains for financial statement purposes (U.S. GAAP). Differences may be permanent or temporary. Permanent differences are reclassified among capital accounts in the financial statements to reflect their tax character. Permanent book and tax basis differences, if any, relating to shareholder distributions will result in reclassifications to paid-in capital. Temporary differences arise when certain items of income, expense and gain or loss are recognized in different periods for financial statement and tax purposes; these differences will reverse at some time in the future. The permanent differences are primarily due to net operating losses and partnerships. The temporary differences are due to differing treatments for losses deferred due to excise tax regulations, partnerships, and wash sales.
The tax character of distributions paid during the fiscal years ended May 31, 2018 and May 31, 2017 were as follows:
| | | | | | | | |
| | | Mid Cap | |
Distributions paid from: | | 2018 | | | 2017 | |
| | |
Ordinary income | | | — | | | | $1,006,762 | |
| | |
Short-term capital gains | | | $3,519,352 | | | | 452,218 | |
| | |
Long-term capital gains | | | 10,277,144 | | | | 6,132,007 | |
| | | | | | | | |
| | |
| | | $13,796,496 | | | | $7,590,987 | |
| | | | | | | | |
As of May 31, 2018, the components of distributable earnings (excluding unrealized appreciation/depreciation) on tax basis consisted of:
| | | | | | | | |
| | | Mid Cap | | | Emerging Companies | |
| | |
Capital loss carryforward | | | — | | | | — | |
| | |
Undistributed ordinary income | | | $217,239 | | | | — | |
| | |
Undistributed short-term capital gains | | | 1,399,791 | | | | — | |
| | |
Undistributed long-term capital gains | | | 8,122,927 | | | | $837,074 | |
| | |
Late-year loss deferral | | | — | | | | 188,620 | |
| | | | |
| | | | | |
| | | | | |
| | | Notes to Financial Statements (continued) | | |
At May 31, 2018, the approximate cost of investments and the aggregate gross unrealized appreciation and depreciation were as follows:
| | | | | | | | | | | | | | | | |
Fund | | Cost | | | Appreciation | | | Depreciation | | | Net | |
Mid Cap | | | $111,492,026 | | | | $25,547,100 | | | | $(2,984,455) | | | | $22,562,645 | |
| | | | |
Emerging Companies | | | 119,688,602 | | | | 23,837,122 | | | | (5,715,792) | | | | 18,121,330 | |
e. FEDERAL TAXES
Each Fund currently qualifies as an investment company and intends to comply with the requirements under Subchapter M of the Internal Revenue Code of 1986, as amended, and to distribute substantially all of its taxable income and gains to its shareholders and to meet certain diversification and income requirements with respect to investment companies. Therefore, no provision for federal income or excise tax is included in the accompanying financial statements.
Additionally, based on each Fund’s understanding of the tax rules and rates related to income, gains and transactions for the foreign jurisdictions in which it invests, each Fund will provide for foreign taxes, and where appropriate, deferred foreign taxes.
Management has analyzed the Funds’ tax positions taken on federal income tax returns as of May 31, 2018, and for all open tax years (generally, the three prior taxable years), and has concluded that no provision for federal income tax is required in the Funds’ financial statements. Additionally, Management is not aware of any tax position for which it is reasonably possible that the total amounts of unrecognized tax benefits will change materially in the next twelve months.
Net capital losses incurred may be carried forward for an unlimited time period, and retain their tax character as either short-term or long-term capital losses.
f. CAPITAL LOSS CARRYOVERS AND DEFERRALS
As of May 31, 2018, the Funds had no accumulated net realized capital loss carryovers from securities transactions for federal income tax purposes. Should the Funds incur net capital losses for the fiscal year ended May 31, 2019, such amounts may be used to offset future realized capital gains, for an unlimited time period.
For the fiscal year ended May 31, 2018, the following Fund utilized capital loss carryovers in the amount of:
| | | | |
| | | Capital Loss Carryover Utilized |
| | |
Fund | | Short-Term | | Long-Term |
Emerging Companies | | $13,470,893 | | — |
g. CAPITAL STOCK
The Trust’s Declaration of Trust authorizes for each Fund the issuance of an unlimited number of shares of beneficial interest, without par value. Each Fund records sales and repurchases of its capital stock on the trade date.
For the fiscal years ended May 31, 2018 and May 31, 2017, the capital stock transactions by class for the Funds were as follows:
| | | | | | | | | | | | | | | | | | | | | | | | | | | | | | | | |
| | | Mid Cap | | | Emerging Companies | |
| | | May 31, 2018 | | | May 31, 2017 | | | May 31, 2018 | | | May 31, 2017 | |
| | | Shares | | | Amount | | | Shares | | | Amount | | | Shares | | | Amount | | | Shares | | | Amount | |
Class N: | | | | | | | | | | | | | | | | | | | | | | | | | | | | | | | | |
Proceeds from sale of shares | | | 79,386 | | | | $2,468,248 | | | | 73,119 | | | | $2,033,216 | | | | 203,266 | | | | $10,809,102 | | | | 278,986 | | | | $12,325,880 | |
Reinvestment of distributions | | | 283,917 | | | | 8,616,888 | | | | 171,821 | | | | 4,700,519 | | | | — | | | | — | | | | — | | | | — | |
Cost of shares repurchased | | | (434,937) | | | | (13,456,952) | | | | (702,362) | | | | (19,675,532) | | | | (95,372) | | | | (4,974,586) | | | | (70,455) | | | | (3,114,220) | |
| | | | | | | | | | | | | | | | | | | | | | | | | | | | | | | | |
Net increase (decrease) | | | (71,634) | | | | $(2,371,816) | | | | (457,422) | | | | $(12,941,797) | | | | 107,894 | | | | $5,834,516 | | | | 208,531 | | | | $9,211,660 | |
| | | | | | | | | | | | | | | | | | | | | | | | | | | | | | | | |
Class I: | | | | | | | | | | | | | | | | | | | | | | | | | | | | | | | | |
Proceeds from sale of shares | | | 94,171 | | | | $3,030,852 | | | | 94,138 | | | | $2,740,584 | | | | 999,353 | | | | $57,934,341 | | | | 505,091 | | | | $23,924,810 | |
Reinvestment of distributions | | | 51,845 | | | | 1,626,363 | | | | 29,897 | | | | 840,690 | | | | — | | | | — | | | | — | | | | — | |
Cost of shares repurchased | | | (128,235) | | | | (4,114,931) | | | | (120,604) | | | | (3,435,578) | | | | (815,553) | | | | (47,238,166) | | | | (276,445) | | | | (12,911,539) | |
| | | | | | | | | | | | | | | | | | | | | | | | | | | | | | | | |
Net increase | | | 17,781 | | | | $542,284 | | | | 3,431 | | | | $145,696 | | | | 183,800 | | | | $10,696,175 | | | | 228,646 | | | | $11,013,271 | |
| | | | | | | | | | | | | | | | | | | | | | | | | | | | | | | | |
| | | | |
| | | | | |
| | | | | |
| | | Notes to Financial Statements (continued) | | |
| | | | | | | | | | | | | | | | | | | | | | | | | | | | | | | | |
| | | Mid Cap | | | Emerging Companies | |
| | | May 31, 2018 | | | May 31, 2017 | | | May 31, 2018 | | | May 31, 2017 | |
| | | Shares | | | Amount | | | Shares | | | Amount | | | Shares | | | Amount | | | Shares | | | Amount | |
Class Z:1 | | | | | | | | | | | | | | | | | | | | | | | | | | | | | | | | |
Proceeds from sale of shares | | | 66,413 | | | | $2,199,000 | | | | 77,573 | | | | $2,304,346 | | | | 394,060 | | | | $22,907,969 | | | | 2,019 | | | | $100,000 | |
Reinvestment of distributions | | | 68,772 | | | | 2,259,153 | | | | 46,041 | | | | 1,347,641 | | | | — | | | | — | | | | — | | | | — | |
Cost of shares repurchased | | | (148,964) | | | | (4,947,543) | | | | (262,172) | | | | (7,851,253) | | | | (31,160) | | | | (1,830,177) | | | | — | | | | — | |
| | | | | | | | | | | | | | | | | | | | | | | | | | | | | | | | |
Net increase (decrease) | | | (13,779) | | | | $(489,390) | | | | (138,558) | | | | $(4,199,266) | | | | 362,900 | | | | $21,077,792 | | | | 2,019 | | | | $100,000 | |
| | | | | | | | | | | | | | | | | | | | | | | | | | | | | | | | |
1 Commencement of operations for Class Z of Emerging Companies was May 31, 2017.
h. REPURCHASE AGREEMENTS AND JOINT REPURCHASE AGREEMENTS
The Funds may enter into third-party repurchase agreements for temporary cash management purposes and third-party joint repurchase agreements for reinvestment of cash collateral on securities lending transactions under the securities lending program offered by The Bank of New York Mellon (“BNYM”) (the “Program”) (collectively, “Repurchase Agreements”). The value of the underlying collateral, including accrued interest, must equal or exceed the value of the Repurchase Agreements during the term of the agreement. For joint repurchase agreements, the Funds participate on a pro rata basis with other clients of BNYM in its share of the underlying collateral under such joint repurchase agreements and in its share of proceeds from any repurchase or other disposition of the underlying collateral. The underlying collateral for all Repurchase Agreements is held in safekeeping by the Funds’ custodian or at the Federal Reserve Bank. If the seller defaults and the value of the collateral declines, or if bankruptcy proceedings commence with respect to the seller of the security, realization of the collateral by the Funds may be delayed or limited. Pursuant to the Program, the Funds are indemnified for such losses by BNYM on joint repurchase agreements.
At May 31, 2018, the market value of Repurchase Agreements outstanding for Mid Cap and Emerging Companies were $5,490,170 and $7,233,386, respectively.
2. AGREEMENTS AND TRANSACTIONS WITH AFFILIATES
For each of the Funds, the Trust has entered into an investment advisory agreement under which the Investment Manager, a subsidiary and the U.S. retail distribution arm of Affiliated Managers Group, Inc. (“AMG”), serves as investment manager to the Funds and is responsible for the Funds’ overall administration and operations. The Investment Manager selects one or more subadvisers for the Funds (subject to Board approval) and monitors each subadviser’s investment performance, security holdings and investment strategies. Each Fund’s investment portfolio is managed by Cadence Capital Management, LLC. who serve pursuant to a subadvisory agreement with the Investment Manager.
Investment management fees are paid directly by the Funds to the Investment Manager based on average daily net assets. For the fiscal year ended May 31, 2018, the Funds’ investment management fees were paid at the following annual rate of each Fund’s respective average daily net assets:
| | |
Mid Cap | | 0.45% |
Emerging Companies1 | | 0.69% |
| | | |
| 1 | Prior to June 1, 2017, the annual rate was 1.25% of the Fund’s average net assets. |
The Investment Manager has contractually agreed, through at least October 1, 2018, to waive management fees and/or reimburse fund expenses in order to limit total annual Fund operating expenses after fee waiver and expense reimbursements (exclusive of taxes, interest (including interest incurred in connection with bank and custody overdrafts),shareholder servicing fees, distribution and service (12b-1) fees, brokerage commissions and other transaction costs, acquired fund fees and expenses and extraordinary expenses) of Mid Cap and Emerging Companies to 0.72% and 0.89%, respectively, of each Fund’s average daily net assets subject to later reimbursement by the Funds in certain circumstances. Prior to June 1, 2017, the Emerging Companies contractual expense limitation was 1.42%.
The contractual expense limitation may only be terminated in the event the Investment Manager or a successor ceases to be the investment manager of the Fund or a successor fund, by mutual agreement between the Investment Manager and the Board, or in the event of the Fund’s liquidation unless the Fund is reorganized or is a party to a merger in which the surviving entity is successor to the accounting and performance information of the Fund.
In general, for a period of up to 36 months, the Investment Manager may recover from each Fund fees waived and expenses paid pursuant to this contractual agreement, provided that such repayment would not cause the Fund’s total annual operating expenses after fee waiver and expense reimbursements (exclusive of the items noted in the parenthetical above) to exceed the contractual expense limitation amount.
At May 31, 2018, the Funds’ expiration of recoupment is as follows:
| | | | | | | | |
Expiration Period | | Mid Cap | | | Emerging Companies | |
Less than 1 year | | | $147,630 | | | | $126,216 | |
Within 2 years | | | 55,919 | | | | 90,648 | |
Within 3 years | | | 17,753 | | | | 119,512 | |
| | | | | | | | |
Total Amount Subject to Recoupment | | | $221,302 | | | | $336,376 | |
| | | | | | | | |
The Trust, on behalf of the Funds, has entered into an amended and restated Administration Agreement under which the Investment Manager serves as the Funds’ administrator (the “Administrator”) and is responsible for all non-portfolio management aspects of managing the Funds’ operations, including administration and shareholder services to each Fund. Each Fund pays a fee to the Administrator at the rate of 0.15% per annum of the Fund’s average daily net assets for this service.
| | | | |
| | | | | |
| | | | | |
| | | Notes to Financial Statements (continued) | | |
The Funds are distributed by AMG Distributors, Inc. (the “Distributor”), a wholly-owned subsidiary of the Investment Manager. The Distributor serves as the distributor and underwriter for each Fund and is a registered broker-dealer and member of the Financial Industry Regulatory Authority, Inc. (“FINRA”). Shares of each Fund will be continuously offered and will be sold directly to prospective purchasers and through brokers, dealers or other financial intermediaries who have executed selling agreements with the Distributor. Generally the Distributor bears all or a portion of the expenses of providing services pursuant to the distribution agreement, including the payment of the expenses relating to the distribution of prospectuses for sales purposes and any advertising or sales literature.
Mid Cap has adopted a distribution and service plan (the “Plan”) with respect to the Class N shares, in accordance with the requirements of Rule 12b-1 under the 1940 Act and the requirements of the applicable rules of FINRA regarding asset-based sales charges. Pursuant to the Plan, the Fund may make payments to the Distributor for its expenditures in financing any activity primarily intended to result in the sale of the Fund’s Class N shares and for maintenance and personal service provided to existing shareholders of that class. The Plan authorizes payments to the Distributor up to 0.25% annually of the Fund’s average daily net assets attributable to the Class N shares.
Effective October 1, 2016, for each of the Class N and Class I shares, the Board has approved reimbursement payments to the Investment Manager for shareholder servicing expenses (“shareholder servicing fees”) incurred. Shareholder servicing fees include payments to financial intermediaries, such as broker-dealers (including fund supermarket platforms), banks, any trust companies who provide shareholder recordkeeping, account servicing and other services. The Class N and Class I shares may reimburse the Investment Manager for the actual amount incurred up to a maximum annual rate of each Class’s average daily net assets as shown in the table below.
The impact on the annualized expense ratio for the fiscal year ended May 31, 2018, was as follows:
| | | | | | | | |
| | | Maximum Annual | | | Actual | |
| | | Amount | | | Amount | |
| Fund | | Approved | | | Incurred | |
Mid Cap | | | | | | | | |
| | |
Class N | | | 0.15% | | | | 0.11% | |
| | |
Class I | | | 0.15% | | | | 0.15% | |
Emerging Companies | | | | | | | | |
| | |
Class N | | | 0.25% | | | | 0.19% | |
| | |
Class I* | | | 0.10% | | | | 0.09% | |
| |
*Prior to June 1, 2017, Class I had no shareholder servicing fees.
The Board provides supervision of the affairs of the Trust and other trusts within the AMG Funds family. The Trustees of the Trust who are not affiliated with the Investment Manager receive an annual retainer and per meeting fees for regular, special and telephonic meetings, and they are reimbursed for out-of-pocket expenses incurred while carrying out their duties as Board members. The Chairman of the Board and the Audit Committee Chair receive additional annual retainers. Certain Trustees and Officers of the Funds are Officers and/or Directors of the Investment Manager, AMG and/or the Distributor.
The Securities and Exchange Commission (the “SEC”) granted an exemptive order that permits the Funds to lend and borrow money for certain temporary purposes directly to and from other eligible funds in the AMG Funds family. Participation in this interfund lending program is voluntary for both the borrowing and lending funds, and an interfund loan is only made if it benefits each participating fund. The Administrator manages the program according to procedures approved by the Board, and the Board monitors the operation of the program. An interfund loan must comply with certain conditions set out in the exemptive order, which are designed to assure fairness and protect all participating funds. For the fiscal year ended May 31, 2018, Mid Cap borrowed a maximum of $1,032,059 for 3 days paying interest of $167. The interest expense is included in the Statement of Operations as miscellaneous expense. Emerging Companies lent a maximum of $1,064,313 for six days earning interest of $261. The interest earned is included in the Statement of Operations as interest income. At May 31, 2018, the Funds had no interfund loans outstanding.
3. PURCHASES AND SALES OF SECURITIES
Purchases and sales of securities (excluding short-term securities and U.S. Government Obligations) for the fiscal year ended May 31, 2018, were as follows:
| | | | | | | | |
| | | Long Term Securities | |
| | |
| Fund | | Purchases | | | Sales | |
| | |
Mid Cap | | | $92,361,707 | | | | $108,374,743 | |
| | |
Emerging Companies | | | 118,946,270 | | | | 84,261,803 | |
| |
The Funds had no purchases or sales of U.S. Government Obligations during the fiscal year ended May 31, 2018.
4. PORTFOLIO SECURITIES LOANED
The Funds participate in the Program providing for the lending of securities to qualified brokers. Securities lending income includes earnings of such temporary cash investments, plus or minus any rebate to a borrower. These earnings (after any rebate) are then divided between BNYM, as a fee for its services under the Program, and the Funds, according to agreed-upon rates. Collateral on all securities loaned is accepted in cash and is maintained at a minimum level of 102% (105% in the case of certain foreign securities) of the market value, plus interest, if applicable, of investments on loan. It is the Funds’ policy to obtain additional collateral from or return excess collateral to the borrower by the end of the next business day, following the valuation date of the securities loaned. Therefore, the value of the collateral held may be temporarily less than the value of the securities on loan. Lending securities entails a risk of loss to the Funds if and to the extent that the market value of the securities loaned were to increase and the borrower did not increase the collateral accordingly, and the borrower fails to return the securities. Under the terms of the Program, the Funds are indemnified for such losses by BNYM. Cash collateral is held in a separate omnibus account managed by BNYM, who is authorized to exclusively enter into joint repurchase agreements. BNYM bears the risk of any deficiency in the amount of the cash collateral available for return to the borrower due to any loss on the collateral invested.
| | | | |
| | | | | |
| | | | | |
| | | Notes to Financial Statements (continued) | | |
The value of securities loaned on positions held and cash collateral received at May 31, 2018, were as follows:
| | | | | | | | |
| | | Securities | | | Cash Collateral | |
Fund | | Loaned | | | Received | |
Mid Cap | | $ | 5,298,919 | | | | $5,490,170 | |
| | |
Emerging Companies | | | 6,917,735 | | | | 7,233,386 | |
5. COMMITMENTS AND CONTINGENCIES
Under the Trust’s organizational documents, its trustees and officers are indemnified against certain liabilities arising out of the performance of their duties to the Trust. In addition, in the normal course of business, the Funds may enter into contracts and agreements that contain a variety of representations and warranties, which provide general indemnifications. The maximum exposure to the
Funds under these arrangements is unknown, as this would involve future claims that may be made against a Fund that have not yet occurred. However, based on experience, the Funds had no prior claims or losses and expect the risks of loss to be remote.
6. MASTER NETTING AGREEMENTS
The Funds may enter into master netting agreements with their counterparties for the securities lending program and Repurchase Agreements, which provide the right, in the event of default (including bankruptcy or insolvency) for the non-defaulting party to liquidate the collateral and calculate net exposure to the defaulting party or request additional collateral. For financial reporting purposes, the Funds do not offset financial assets and financial liabilities that are subject to master netting agreements in the Statement of Assets and Liabilities. For securities lending transactions, see Note 4.
The following table is a summary of the Funds’ open Repurchase Agreements that are subject to a master netting agreement as of May 31, 2018:
| | | | | | | | | | | | | | | | |
| | | | | | Gross Amount Not Offset in the | | | | |
| | | | | | Statement of Assets and Liabilities | | | | |
| | | Net Amounts of Assets
Presented in the Statement
of Assets and Liabilities | | | Financial
Instruments
Collateral | | | Cash Collateral
Received | | | Net Amount | |
Mid-Cap | | | | | | | | | | | | | | | | |
| | | | |
Citigroup Global Markets, Inc. | | | $1,303,982 | | | | $1,303,982 | | | | — | | | | — | |
| | | | |
Daiwa Capital Markets America | | | 1,303,982 | | | | 1,303,982 | | | | — | | | | — | |
| | | | |
Deutsche Bank Securities, Inc. | | | 274,242 | | | | 274,242 | | | | — | | | | — | |
| | | | |
Merrill Lynch, Pierce, Fenner & Smith, Inc. | | | 1,303,982 | | | | 1,303,982 | | | | — | | | | — | |
| | | | |
Nomura Securities International, Inc. | | | 1,303,982 | | | | 1,303,982 | | | | — | | | | — | |
| | | | | | | | | | | | | | | | |
| | | | |
Totals | | | $5,490,170 | | | | $5,490,170 | | | | — | | | | — | |
| | | | | | | | | | | | | | | | |
Emerging Companies | | | | | | | | | | | | | | | | |
| | | | |
Bank of Montreal | | | $361,358 | | | | $361,358 | | | | — | | | | — | |
| | | | |
Cantor Fitzgerald Securities, Inc. | | | 1,718,007 | | | | 1,718,007 | | | | — | | | | — | |
| | | | |
Daiwa Capital Markets America | | | 1,718,007 | | | | 1,718,007 | | | | — | | | | — | |
| | | | |
Merrill Lynch Pierce Fenner & Smith, Inc. | | | 1,718,007 | | | | 1,718,007 | | | | — | | | | — | |
| | | | |
Nomura Securities International, Inc. | | | 1,718,007 | | | | 1,718,007 | | | | — | | | | — | |
| | | | | | | | | | | | | | | | |
| | | | |
Totals | | | $7,233,386 | | | | $7,233,386 | | | | — | | | | — | |
| | | | | | | | | | | | | | | | |
7. SUBSEQUENT EVENTS
The Funds have determined that no other material events or transactions occurred through the issuance date of the Funds’ financial statements which require an additional disclosure in or adjustment of the Funds’ financial statements.
| | | | |
| | | | | |
| | | | | |
| | | Report of Independent Registered Public Accounting Firm | | |
TO THE BOARD OF TRUSTEES OF AMG FUNDS III AND SHAREHOLDERS OF AMG MANAGERS CADENCE MID CAP FUND AND AMG MANAGERS CADENCE EMERGING COMPANIES FUND
Opinions on the Financial Statements
We have audited the accompanying statement of assets and liabilities, including the schedule of portfolio investments, of AMG Managers Cadence Mid Cap Fund and AMG Managers Cadence Emerging Companies Fund, (two of the funds constituting AMG Funds III, referred to hereafter as the “Funds”) as of May 31, 2018, the related statement of operations for the year ended May 31, 2018, the statements of changes in net assets for each of the two years in the period ended May 31, 2018, including the related notes, and the financial highlights for each of the periods indicated therein (collectively referred to as the “financial statements”). In our opinion, the financial statements present fairly, in all material respects, the financial position of the Fund as of May 31, 2018, the results of its operations for the year then ended, the changes in its net assets for each of the two years in the period ended May 31, 2018 and the financial highlights for each of the periods indicated therein in conformity with accounting principles generally accepted in the United States of America.
Basis for Opinions
These financial statements are the responsibility of the Funds’ management. Our responsibility is to express an opinion on the Funds’ financial statements based on our audits. We are a public accounting firm registered with the Public Company Accounting Oversight Board (United States) (“PCAOB”) and are required to be independent with respect to the Fund in accordance with the U.S. federal securities laws and the applicable rules and regulations of the Securities and Exchange Commission and the PCAOB.
We conducted our audits of these financial statements in accordance with the standards of the PCAOB. Those standards require that we plan and perform the audit to obtain reasonable assurance about whether the financial statements are free of material misstatement, whether due to error or fraud.
Our audits included performing procedures to assess the risks of material misstatement of the financial statements, whether due to error or fraud, and performing procedures that respond to those risks. Such procedures included examining, on a test basis, evidence regarding the amounts and disclosures in the financial statements. Our audits also included evaluating the accounting principles used and significant estimates made by management, as well as evaluating the overall presentation of the financial statements. Our procedures included confirmation of securities owned as of May 31, 2018 by correspondence with the custodian and brokers; when replies were not received from brokers, we performed other auditing procedures. We believe that our audits provide a reasonable basis for our opinion.
PricewaterhouseCoopers LLP
Boston, Massachusetts
July 25, 2018
We have served as the auditor of one or more investment companies in AMG Funds Family since 1993.
TAX INFORMATION
The AMG Managers Cadence Mid Cap Fund and AMG Managers Cadence Emerging Companies Fund each hereby designates the maximum amount allowable of its net taxable income as qualified dividends as provided in the Jobs and Growth Tax Relief Reconciliation Act of 2003. The 2017/2018 Form 1099-DIV you receive for each Fund will show the tax status of all distributions paid to you during the year.
Pursuant to section 852 of the Internal Revenue Code, AMG Managers Cadence Mid Cap Fund and AMG Managers Cadence Emerging Companies Fund each hereby designates $10,277,144, and $0 as a capital gain distribution with respect to the taxable year ended May 31, 2018, or if subsequently determined to be different, the net capital gains of such fiscal year.
| | | | |
| | | | | |
| | | AMG Funds | | |
| | | Trustees and Officers | | |
| | | | |
| The Trustees and Officers of the Trust, their business addresses, principal occupations for the past five years and ages are listed below. The Trustees provide broad supervision over the affairs of the Trust and the Funds. The Trustees are experienced executives who meet periodically throughout the year to oversee the Funds’ activities, review contractual arrangements with companies that provide services to the Funds, and | | review the Funds’ performance. Unless otherwise noted, the address of each Trustee or Officer is the address of the Trust: 600 Steamboat Road, Suite 300, Greenwich, Connecticut 06830. There is no stated term of office for Trustees. Trustees serve until their resignation, retirement or removal in | | accordance with the Trust’s organizational documents and policies adopted by the Board from time to time. The Chairman of the Trustees, President, Treasurer and Secretary of the Trust are elected by the Trustees annually. Other officers hold office at the pleasure of the Trustees. |
Independent Trustees
The following Trustees are not “interested persons” of the Trust within the meaning of the 1940 Act:
| | |
Number of Funds Overseen
in Fund Complex | | Name, Age, Principal Occupation(s) During Past 5 Years and Other Directorships Held by Trustee |
• Trustee since 2012 • Oversees 61 Funds in Fund Complex | | Bruce B. Bingham, 69 Partner, Hamilton Partners (real estate development firm) (1987-Present); Director of The Yacktman Funds (2000-2012). |
• Trustee since 1999 • Oversees 61 Funds in Fund Complex | | Edward J. Kaier, 72 Attorney at Law and Partner, Teeters Harvey Marrone & Kaier LLP (2007-Present); Attorney at Law and Partner, Hepburn Willcox Hamilton & Putnam, LLP (1977-2007); Trustee of Third Avenue Trust (5 portfolios); Trustee of Third Avenue Variable Trust (1 portfolio). |
• Trustee since 2013 • Oversees 63 Funds in Fund Complex | | Kurt A. Keilhacker, 54 Managing Partner, TechFund Capital (1997-Present); Managing Partner, TechFund Europe (2000-Present); Board Member, 6wind SA, (2002-Present); Managing Partner, Elementum Ventures (2013-Present); Director, MetricStory, Inc. (2017-Present); Trustee, Gordon College (2001-2016). |
• Trustee since 2000 • Oversees 61 Funds in Fund Complex | | Steven J. Paggioli, 68 Independent Consultant (2002-Present); Trustee, Professionally Managed Portfolios (32 portfolios); Advisory Board Member, Sustainable Growth Advisors, LP; Independent Director, Chase Investment Counsel (2008–Present); Executive Vice President, Secretary and Director, Investment Company Administration, LLC (1990-2001). |
• Trustee since 2013 • Oversees 61 Funds in Fund Complex | | Richard F. Powers III, 72 Adjunct Professor, U.S. Naval War College (2016-Present); Adjunct Professor, Boston College (2010-2013); President and CEO of Van Kampen Investments Inc. (1998-2003). |
• Independent Chairman • Trustee since 2000 • Oversees 63 Funds in Fund Complex | | Eric Rakowski, 60 Professor of Law, University of California at Berkeley School of Law - Boalt Hall (1990-Present); Director of Harding, Loevner Funds, Inc. (9 portfolios); Trustee of Third Avenue Trust (5 portfolios); Trustee of Third Avenue Variable Trust (1 portfolio). |
• Trustee since 2013 • Oversees 63 Funds in Fund Complex | | Victoria L. Sassine, 52 Adjunct Professor, Babson College (2007 – Present). |
• Trustee since 1987 • Oversees 61 Funds in Fund Complex | | Thomas R. Schneeweis, 71 Professor Emeritus, University of Massachusetts (2013-Present); Partner, S Capital Wealth Advisors (2015-Present); President, TRS Associates (1982-Present); Board Member, Chartered Alternative Investment Association (“CAIA”) (2002-Present); Director, CAIA Foundation (Education) (2010-Present); Director, Institute for Global Asset and Risk Management (Education) (2010-Present); Partner, S Capital Management, LLC (2007-2015); Director, CISDM at the University of Massachusetts, (1996-2013); President, Alternative Investment Analytics, LLC, (formerly Schneeweis Partners, LLC) (2001-2013); Professor of Finance, University of Massachusetts (1977-2013). |
| | | | |
| | | | | |
| | | AMG Funds | | |
| | | Trustees and Officers (continued) | | |
Interested Trustees
Each Trustee in the following table is an “interested person” of the Trust within the meaning of the 1940 Act. Ms. Carsman is an interested person of the Trust within the meaning of the 1940 Act by virtue of her position with, and interest in securities of, AMG.
| | |
Number of Funds Overseen in Fund Complex | | Name, Age, Principal Occupation(s) During Past 5 Years and Other Directorships Held by Trustee |
• Trustee since 2011 • Oversees 63 Funds in Fund Complex | | Christine C. Carsman, 66 Executive Vice President, Deputy General Counsel and Chief Regulatory Counsel, Affiliated Managers Group, Inc. (2017-Present); Director (2010-Present) and Chair of the Board of Directors (2015-Present), AMG Funds plc; Director of Harding, Loevner Funds, Inc. (9 portfolios); Senior Vice President and Deputy General Counsel, Affiliated Managers Group, Inc. (2011-2016); Senior Vice President and Chief Regulatory Counsel, Affiliated Managers Group, Inc. (2007-2011); Vice President and Chief Regulatory Counsel, Affiliated Managers Group, Inc. (2004-2007); Secretary and Chief Legal Officer, AMG Funds, AMG Funds I, AMG Funds II and AMG Funds III (2004-2011); Senior Counsel, Vice President and Director of Operational Risk Management and Compliance, Wellington Management Company, LLP (1995-2004). |
Officers |
Position(s) Held with Fund and Length of Time Served | | Name, Age, Principal Occupation(s) During Past 5 Years |
• President since 2018 • Principal Executive Officer since 2018 • Chief Executive Officer since 2018 • Chief Operating Officer since 2007 | | Keitha L. Kinne, 60 Chief Operating Officer, AMG Funds LLC (2007-Present); Chief Investment Officer, AMG Funds LLC (2008-Present); President and Principal, AMG Distributors, Inc. (2018-Present); Chief Operating Officer, AMG Distributors, Inc. (2007-Present); President, Chief Executive Officer and Principal Executive Officer, AMG Funds, AMG Funds I, AMG Funds II, AMG Funds III and AMG Funds IV (2018-Present); Chief Operating Officer, AMG Funds, AMG Funds I, AMG Funds II, and AMG Funds III (2007-Present); Chief Operating Officer, AMG Funds IV (2016-Present); Chief Operating Officer and Chief Investment Officer, Aston Asset Management, LLC (2016); President and Principal Executive Officer, AMG Funds, AMG Funds I, AMG Funds II and AMG Funds III (2012-2014); Managing Partner, AMG Funds LLC (2007-2014); President and Principal, AMG Distributors, Inc. (2012-2014); Managing Director, Legg Mason & Co., LLC (2006-2007); Managing Director, Citigroup Asset Management (2004-2006). |
• Secretary since 2015 • Chief Legal Officer since 2015 | | Mark J. Duggan, 53 Senior Vice President and Senior Counsel, AMG Funds LLC (2015-Present); Secretary and Chief Legal Officer, AMG Funds, AMG Funds I, AMG Funds II, AMG Funds III and AMG Funds IV (2015-Present); Attorney, K&L Gates, LLP (2009-2015). |
• Chief Financial Officer since 2017 • Treasurer since 2017 • Principal Financial Officer since 2017 • Principal Accounting Officer since 2017 | | Thomas G. Disbrow, 52 Vice President, Mutual Fund Treasurer & CFO, AMG Funds, AMG Funds LLC (2017-Present); Chief Financial Officer, Principal Financial Officer, Treasurer and Principal Accounting Officer, AMG Funds, AMG Funds I, AMG Funds II, AMG Funds III and AMG Funds IV (2017-Present); Managing Director - Global Head of Traditional Funds Product Control, UBS Asset Management (Americas), Inc. (2015-2017); Managing Director - Head of North American Funds Treasury, UBS Asset Management (Americas), Inc. (2011-2015). |
• Deputy Treasurer since 2017 | | John A. Starace, 47 Director, Mutual Fund Accounting, AMG Funds LLC (2017-Present); Vice President, Deputy Treasurer of Mutual Funds Services, AMG Funds LLC (2014-2017); Deputy Treasurer, AMG Funds, AMG Funds I, AMG Funds II, AMG Funds III and AMG Funds IV (2017-Present); Vice President, Citi Hedge Fund Services (2010-2014); Audit Senior Manager (2005-2010) and Audit Manager (2001-2005), Deloitte & Touche LLP. |
• Controller since 2017 | | Christopher R. Townsend, 51 Vice President, Business Finance, AMG Funds LLC (2017-Present); Head of Business Finance, AMG Funds LLC (2015-2017); Chief Financial Officer and Financial and Operations Principal, AMG Distributors, Inc. (2016-Present); Controller, AMG Funds, AMG Funds I, AMG Funds II, AMG Funds III and AMG Funds IV (2017-Present); Treasurer, Chief Financial Officer, Principal Financial Officer, Principal Accounting Officer, AMG Funds, AMG Funds I, AMG Funds II, AMG Funds III and AMG Funds IV (2017); Chief Financial Officer, Aston Asset Management LLC (2016); Head of Finance and Accounting, Allianz Asset Management (2006-2015). |
• Chief Compliance Officer since 2016 | | Gerald F. Dillenburg, 51 Vice President, Chief Compliance Officer AMG Funds, AMG Funds LLC (2017-Present); Chief Compliance Officer AMG Funds, AMG Funds LLC (2016-2017); Chief Compliance Officer and Sarbanes-Oxley Code of Ethics Compliance Officer, AMG Funds, AMG Funds I, AMG Funds II and AMG Funds III (2016-Present); ChiefCompliance Officer, AMG Funds IV (1996-Present); Sarbanes-Oxley Code of Ethics Compliance Officer, AMG Funds IV (2016-Present); Chief Compliance Officer, AstonAsset Management, LLC (2006-2016); Chief Operating Officer, Aston Funds (2003-2016); Secretary, Aston Funds (1996-2015); Chief Financial Officer, Aston Funds(1997-2010); Chief Financial Officer, Aston Asset Management, LLC (2006-2010); Treasurer, Aston Funds (1996-2010). |
| | | | |
| | | | | |
| | | AMG Funds | | |
| | | Trustees and Officers (continued) | | |
| | |
Position(s) Held with Fund and Length of Time Served | | Name, Age, Principal Occupation(s) During Past 5 Years |
• Anti-Money Laundering Compliance Officer since 2014 | | Patrick J. Spellman, 44 Vice President, Chief Compliance Officer, AMG Funds LLC (2017-Present); Senior Vice President, Chief Compliance Officer, AMG Funds LLC (2011-2017); Chief Compliance Officer, AMG Distributors, Inc., (2010-Present); Anti-Money Laundering Compliance Officer, AMG Funds, AMG Funds I, AMG Funds II, and AMG Funds III (2014-Present); Anti-Money Laundering Officer, AMG Funds IV, (2016-Present); Compliance Manager, Legal and Compliance, Affiliated Managers Group, Inc. (2005-2011). |
• Assistant Secretary since 2016 | | Maureen A. Meredith, 33 Director, Counsel, AMG Funds LLC (2017-Present); Vice President, Counsel, AMG Funds LLC (2015-2017); Assistant Secretary, AMG Funds, AMG Funds I, AMG Funds II, AMG Funds III and AMG Funds IV (2016-Present); Associate, Ropes & Gray LLP (2011-2015); Law Fellow, Massachusetts Appleseed Center for Law and Justice (2010-2011). |
| | | | |
INVESTMENT MANAGER AND ADMINISTRATOR AMG Funds LLC 600 Steamboat Road, Suite 300 Greenwich, CT 06830 800.835.3879 DISTRIBUTOR AMG Distributors, Inc. 600 Steamboat Road, Suite 300 Greenwich, CT 06830 800.835.3879 SUBADVISER Cadence Capital Management, LLC 265 Franklin Street, 11th Floor Boston, MA 02110 | | CUSTODIAN The Bank of New York Mellon 111 Sanders Creek Parkway East Syracuse, NY 13057 LEGAL COUNSEL Ropes & Gray LLP Prudential Tower, 800 Boylston Street Boston, MA 02199-3600 TRANSFER AGENT BNY Mellon Investment Servicing (US) Inc. Attn: AMG Funds P.O. Box 9769 Providence, RI 02940 800.548.4539 | | This report is prepared for the Funds’ shareholders. It is authorized for distribution to prospective investors only when preceded or accompanied by an effective prospectus. To receive a free copy of the prospectus or Statement of Additional Information, which includes additional information about Fund Trustees, please contact us by calling 800.835.3879. Distributed by AMG Distributors, Inc., member FINRA/SIPC. Current net asset values per share for each Fund are available on the Funds’ website at amgfunds.com. A description of the policies and procedures each Fund uses to vote its proxies is available: (i) without charge, upon request, by calling 800.835.3879, or (ii) on the Securities and Exchange Commission’s (SEC) website at sec.gov. For information regarding each Fund’s proxy voting record for the 12-month period ended June 30, call 800.835.3879 or visit the SEC website at sec.gov. Each Fund files its complete schedule of portfolio holdings with the SEC for the first and third quarters of each fiscal year on Form N-Q. The Fund’s Forms N-Q are available on the SEC’s website at sec.gov. A Fund’s Forms N-Q may be reviewed and copied at the SEC’s Public Reference Room in Washington, DC. Information on the operation of the Public Reference Room may be obtained by calling 1.800.SEC.0330. To review a complete list of the Funds’ portfolio holdings, or to view the most recent quarterly holdings report, semiannual report, or annual report, please visit amgfunds.com. |
| | | | |
AFFILIATE SUBADVISED FUNDS BALANCED FUNDS AMG Chicago Equity Partners Balanced Chicago Equity Partners, LLC AMG FQ Global Risk-Balanced First Quadrant, L.P. EQUITY FUNDS AMG FQ Tax-Managed U.S. Equity AMG FQ Long-Short Equity First Quadrant, L.P. AMG Frontier Small Cap Growth Frontier Capital Management Company, LLC AMG GW&K Small Cap Core AMG GW&K Small/Mid Cap AMG GW&K U.S. Small Cap Growth GW&K Investment Management, LLC AMG Renaissance International Equity AMG Renaissance Large Cap Growth The Renaissance Group LLC AMG River Road Dividend All Cap Value AMG River Road Dividend All Cap Value II AMG River Road Focused Absolute Value AMG River Road Long-Short AMG River Road Small-Mid Cap Value AMG River Road Small Cap Value River Road Asset Management, LLC AMG SouthernSun Small Cap AMG SouthernSun Global Opportunities AMG SouthernSun U.S. Equity SouthernSun Asset Management, LLC AMG Systematic Mid Cap Value Systematic Financial Management, L.P. AMG TimesSquare Emerging Markets Small Cap AMG TimesSquare Global Small Cap AMG TimesSquare International Small Cap AMG TimesSquare Mid Cap Growth AMG TimesSquare Small Cap Growth TimesSquare Capital Management, LLC | | AMG Trilogy Emerging Markets Equity AMG Trilogy Emerging Wealth Equity Trilogy Global Advisors, L.P. AMG Yacktman AMG Yacktman Focused AMG Yacktman Focused Fund - Security Selection Only AMG Yacktman Special Opportunities Yacktman Asset Management LP FIXED INCOME FUNDS AMG GW&K Core Bond AMG GW&K Enhanced Core Bond AMG GW&K Municipal Bond AMG GW&K Municipal Enhanced Yield GW&K Investment Management, LLC OPEN-ARCHITECTURE FUNDS ALTERNATIVE FUNDS AMG Managers Lake Partners LASSO Alternative Lake Partners, Inc. BALANCED FUNDS AMG Managers Montag & Caldwell Balanced Montag & Caldwell, LLC EQUITY FUNDS AMG Managers Brandywine AMG Managers Brandywine Advisors Mid Cap Growth AMG Managers Brandywine Blue Friess Associates, LLC AMG Managers Cadence Emerging Companies AMG Managers Cadence Mid Cap Cadence Capital Management LLC AMG Managers CenterSquare Real Estate CenterSquare Investment Management, LLC AMG Managers Emerging Opportunities Lord, Abbett & Co. LLC WEDGE Capital Management L.L.P. Next Century Growth Investors LLC RBC Global Asset Management (U.S.) Inc. | | AMG Managers Essex Small/Micro Cap Growth Essex Investment Management Company, LLC AMG Managers Fairpointe ESG Equity AMG Managers Fairpointe Mid Cap Fairpointe Capital LLC AMG Managers Guardian Capital Global Dividend Guardian Capital LP AMG Managers LMCG Small Cap Growth LMCG Investments, LLC AMG Managers Montag & Caldwell Growth AMG Managers Montag & Caldwell Mid Cap Growth Montag & Caldwell, LLC AMG Managers Pictet International Pictet Asset Management Limited AMG Managers Silvercrest Small Cap Silvercrest Asset Management Group LLC AMG Managers Skyline Special Equities Skyline Asset Management, L.P. AMG Managers Special Equity Ranger Investment Management, L.P. Lord, Abbett & Co. LLC Smith Asset Management Group, L.P. Federated MDTA LLC AMG Managers Value Partners Asia Dividend Value Partners Hong Kong Limited FIXED INCOME FUNDS AMG Managers Amundi Intermediate Government AMG Managers Amundi Short Duration Government Amundi Pioneer Institutional Asset Management, Inc. AMG Managers Doubleline Core Plus Bond DoubleLine Capital LP AMG Managers Global Income Opportunity AMG Managers Loomis Sayles Bond Loomis, Sayles & Co., L.P. |
|
|
|
|
|
|
|
|
|
|
|
|
|
|
|
|
|
|
|
|
|
|
|
|
|
|
|
|
|
|
|
|
|
|
|
|
|
|
|
|
|
|
|
|
|
|
|
|
|
|
|
|
|
|
|
|
|
|
|
|
|
| | |
| | |
| | |
| |
amgfunds.com | | 053118 AR065 |
Item 2. CODE OF ETHICS
Registrant has adopted a Code of Ethics. See attached Exhibit (a)(1).
Item 3. AUDIT COMMITTEE FINANCIAL EXPERT
Registrant’s Board of Trustees has determined that independent Trustee Mr. Steven J. Paggioli qualifies as the Audit Committee Financial expert. Mr. Paggioli is “independent” as such term is defined in Form N-CSR.
Item 4. PRINCIPAL ACCOUNTANT FEES AND SERVICES
(a) Audit Fees
The aggregate fees billed by the Funds’ independent registered public accounting firm, PricewaterhouseCoopers LLP (“PwC”), to the Funds for the Funds’ two most recent fiscal years for professional services rendered for audits of annual financial statements, or services that are normally provided in connection with statutory and regulatory filings or engagements (“Audit Fees”) were as follows:
| | | | | | | | |
| | | Fiscal 2018 | | | Fiscal 2017 | |
AMG Managers Cadence Emerging Companies Fund | | $ | 32,040.28 | | | $ | 20,450 | |
AMG Managers Cadence Mid-Cap Fund | | $ | 28,200.17 | | | $ | 21,986 | |
(b) Audit-Related Fees
There were no fees billed by PwC to the Funds in its two recent fiscal years for services rendered for assurance and related services that are reasonably related to the performance of the audit or review of the Fund’s financial statements, but are not reported as Audit Fees (“Audit-Related Fees”).
For the Funds’ two most recent fiscal years, there were no Audit-Related Fees billed by PwC for engagements related directly to the operations and financial reporting of one or more Funds by a Fund Service Provider. A Fund Service Provider is (a) any investment adviser to the Fund (not including any Subadvisor whose role is primarily portfolio management and is subcontracted with or overseen by another investment adviser) or (b) any entity that provides ongoing services to the Fund and is controlling, controlled by or under common control with a Fund investment adviser described in (a).
(c) Tax Fees
The aggregate fees billed by PwC to the Funds for the two most recent fiscal years for professional services rendered for tax compliance, tax advice, and tax planning (“Tax Fees”) were as follows:
| | | | | | | | |
| | | Fiscal 2018 | | | Fiscal 2017 | |
AMG Managers Cadence Emerging Companies Fund | | $ | 7,369 | | | $ | 7,369 | |
AMG Managers Cadence Mid Cap Fund | | $ | 7,369 | | | $ | 7,369 | |
For the Funds’ two most recent fiscal years, Tax Fees billed by PwC for engagements by Fund Service Providers that related directly to the operations and financial reporting of the Funds were $0 for fiscal 2018 and $0 for fiscal 2017, respectively.
The services for which Tax Fees were charged comprise all services performed by professional staff in PwC’s tax division except those services related to the audit. Typically, this category would include fees for tax compliance, tax planning, and tax advice. Tax compliance, tax advice, and tax planning services include preparation of original and amended tax returns, claims for refund and tax payment-planning services, assistance with tax audits and appeals, tax advice related to mergers and acquisitions and requests for rulings or technical advice from taxing authorities.
(d) All Other Fees
There were no other fees billed by PwC to the Funds for all other non-audit services (“Other Fees”) during the Funds’ two most recent fiscal years. During the same period, there were no Other Fees billed by PwC for engagements by Fund Service Providers that related directly to the operations and financial reporting of the Funds.
(e)(1) According to policies adopted by the Audit Committee, services provided by PwC to the Funds must be pre-approved by the Audit Committee. On an annual basis, the Audit Committee reviews and pre-approves various types of services that PwC may perform for the Funds without specific approval of each engagement, subject to specified budget limitations. As contemplated by the Sarbanes-Oxley Act of 2002 and related SEC rules, the Audit Committee also pre-approves non-audit services provided by PwC to any Fund Service Provider for any engagement that relates directly to the operations and financial reporting of the Funds. Any engagement that is not already pre-approved or that will exceed a pre-approved budget must be submitted to the Audit Committee for pre-approval. The Chairman of the Audit Committee is authorized on behalf of the Board of Trustees and the Audit Committee to approve the engagement of PwC to perform non-audit services subject to certain conditions, including notification to the Audit Committee of such pre-approval not later than the next meeting of the Audit Committee following the date of such pre-approval.
(e)(2) None.
(f) Not applicable.
(g) The aggregate fees billed by PwC in 2018 and 2017 for non-audit services rendered to the Funds and Fund Service Providers were $64,238 and $54,507, respectively. For the fiscal year ended May 31, 2018, this amount reflects the amounts disclosed above in Item 4(b),(c),(d), plus $49,500 in fees billed to the Fund Service Providers for non-audit services that did not relate directly to the operations and financial reporting of the Funds. For the fiscal year ended May 31, 2017, this amount reflects the amounts disclosed above in Item 4(b),(c),(d), plus $32,400 in fees billed to the Fund Service Providers for non-audit services that did not relate directly to the operations and financial reporting of the Funds.
(h) The Trust’s Audit Committee has considered whether the provision of non-audit services by registrant’s independent registered public accounting firm to the registrant’s investment advisor, and any entity controlling, controlled, or under common control with the investment advisor that provided ongoing services to the registrant that were not pre-approved by the Committee (because such services did not relate directly to the operations and financial reporting of the registrant) was compatible with maintaining the independence of the independent registered public accounting firm.
Item 5. AUDIT COMMITTEE OF LISTED REGISTRANTS
Not applicable.
Item 6. SCHEDULE OF INVESTMENTS
The schedule of investments in unaffiliated issuers as of the close of the reporting period is included as part of the shareholder report contained in Item 1 hereof.
Item 7. DISCLOSURE OF PROXY VOTING POLICIES AND PROCEDURES FOR CLOSED-END MANAGEMENT INVESTMENT COMPANIES
Not applicable.
Item 8. PORTFOLIO MANAGERS OF CLOSED-END MANAGEMENT INVESTMENT COMPANIES
Not applicable.
Item 9. PURCHASES OF EQUITY SECURITIES BY CLOSED-END MANAGEMENT INVESTMENT COMPANIES AND AFFILIATED PURCHASERS
Not applicable.
Item 10. SUBMISSION OF MATTERS TO A VOTE OF SECURITY HOLDERS
Not applicable.
Item 11. CONTROLS AND PROCEDURES
(a) The Registrant’s principal executive and principal financial officers have concluded, based on their evaluation of the registrant’s disclosure controls and procedures as of a date within 90 days of the filing of this report, that the Registrant’s disclosure controls and procedures are reasonably designed to ensure that information required to be disclosed by the Registrant on Form N-CSR is recorded, processed, summarized and reported within the required time periods and that information required to be disclosed by the registrant in the reports that it files or submits on Form N-CSR is accumulated and communicated to the Registrant’s management, including its principal executive and principal financial officers, as appropriate to allow timely decisions regarding required disclosure.
(b) There were no changes in the Registrant’s internal control over financial reporting during the Registrant’s fourth fiscal quarter of the period covered by this report that have materially affected, or are reasonably likely to affect, the internal control over financial reporting.
Item 12. DISCLOSURE OF SECURITIES LENDING ACTIVITIES FOR CLOSED-END MANAGEMENT INVESTMENT COMPANIES
Not applicable.
Item 13. EXHIBITS
| | |
| |
| (a)(1) | | Any Code of Ethics or amendments hereto. Filed herewith. |
| |
| (a)(2) | | Certifications pursuant to Rule 30a-2(a) under the Investment Company Act of 1940—Filed herewith. |
| |
| (a)(3) | | Not applicable. |
| |
| (b) | | Certifications pursuant to Rule 30a-2(b) under the Investment Company Act of 1940—Filed herewith. |
SIGNATURES
Pursuant to the requirements of the Securities Exchange Act of 1934 and the Investment Company Act of 1940, the registrant has duly caused this report to be signed on its behalf by the undersigned, thereunto duly authorized.
| | |
| AMG FUNDS III |
| |
| By: | | /s/ Keitha L. Kinne |
| | Keitha L. Kinne, Principal Executive Officer |
| |
| Date: | | August 2, 2018 |
Pursuant to the requirements of the Securities Exchange Act of 1934 and the Investment Company Act of 1940, this report has been signed below by the following persons on behalf of the registrant and in the capacities and on the dates indicated.
| | |
| By: | | /s/ Keitha L. Kinne |
| | Keitha L. Kinne, Principal Executive Officer |
| |
| Date: | | August 2, 2018 |
| |
| By: | | /s/ Thomas Disbrow |
| | Thomas Disbrow, Principal Financial Officer |
| |
| Date: | | August 2, 2018 |