UNITED STATES
SECURITIES AND EXCHANGE COMMISSION
Washington, D.C. 20549
FORMN-CSR
CERTIFIED SHAREHOLDER REPORT OF REGISTERED
MANAGEMENT INVESTMENT COMPANIES
Investment Company Act file number:811-03752
AMG FUNDS III
(Exact name of registrant as specified in charter)
600 Steamboat Road, Suite 300, Greenwich, Connecticut 06830
(Address of principal executive offices) (Zip code)
AMG Funds LLC
600 Steamboat Road, Suite 300, Greenwich, Connecticut 06830
(Name and address of agent for service)
Registrant’s telephone number, including area code: (203)299-3500
Date of fiscal year end: DECEMBER 31
Date of reporting period: JANUARY 1, 2018 – DECEMBER 31, 2018
(Annual Shareholder Report)
| Item 1. | Reports to Shareholders |
| | |
 | | ANNUAL REPORT |
| | | | | | | | |
| | | AMG Funds | | | | |
| | | | |
| | | December 31, 2018 | | | | |
| | |
| | | AMG Managers Loomis Sayles Bond Fund |
| | | Class N: MGFIX | | Class I: MGBIX | | | | |
| | |
| | | AMG Managers Global Income Opportunity Fund |
| | | Class N:MGGBX |
| | |
| | | AMG Managers Special Equity Fund |
| | | Class N: MGSEX | | Class I: MSEIX | | | | |
| | | | | | | | | |
Beginning on January 1, 2021, as permitted by regulations adopted by the Securities and Exchange Commission, paper copies of the Funds’ shareholder reports like this one will no longer be sent by mail, unless you specifically request paper copies of the reports from the Funds or from your financial intermediary, such as a broker-dealer or bank. Instead, the reports will be made available on the Funds’ website (https://www.amgfunds.com/resources/order_literature.html), and you will be notified by mail each time a report is posted and provided with a website link to access the report.
If you already elected to receive shareholder reports electronically, you will not be affected by this change and you need not take any action. You may elect to receive shareholder reports and other communications from the Funds electronically at any time by contacting your financial intermediary or, if you invest directly with the Funds, by logging into your account at www.amgfunds.com.
You may elect to receive all future reports in paper free of charge. If you invest through a financial intermediary, you can contact your financial intermediary to request that you continue to receive paper copies of your shareholder reports. If you invest directly with the Funds, you can call 1-800-548-4539 to inform the Funds that you wish to continue receiving paper copies of your shareholder reports. Your election to receive reports in paper will apply to all funds in the AMG Funds Family of Funds held in your account if you invest through your financial intermediary or all funds in the AMG Funds Family of Funds held with the fund complex if you invest directly with the Funds.
| | | | | | |
amgfunds.com | | | | 123118 | | AR078 |
|
AMG Funds Annual Report — December 31, 2018 |
| | | | | | |
| | | TABLE OF CONTENTS | | PAGE | |
| | | LETTER TO SHAREHOLDERS | | | 2 | |
| | | |
| | | ABOUT YOUR FUND’S EXPENSES | | | 3 | |
| | | |
| | | PORTFOLIO MANAGER’S COMMENTS, FUND SNAPSHOTS AND SCHEDULES OF PORTFOLIO INVESTMENTS | | | | |
| | | |
| | | AMG Managers Loomis Sayles Bond Fund | | | 4 | |
| | | |
| | | AMG Managers Global Income Opportunity Fund | | | 15 | |
| | | |
| | | AMG Managers Special Equity Fund | | | 23 | |
| | | |
| | | FINANCIAL STATEMENTS | | | | |
| | | |
| | | Statement of Assets and Liabilities | | | 34 | |
| | | |
| | | Balance sheets, net asset value (NAV) per share computations and cumulative distributable earnings (loss) | | | | |
| | | |
| | | Statement of Operations | | | 36 | |
| | | |
| | | Detail of sources of income, expenses, and realized and unrealized gains (losses) during the fiscal year | | | | |
| | | |
| | | Statements of Changes in Net Assets | | | 37 | |
| | | |
| | | Detail of changes in assets for the past two fiscal years | | | | |
| | | |
| | | Financial Highlights | | | 38 | |
| | | |
| | | Historical net asset values per share, distributions, total returns, income and expense ratios, turnover ratios and net assets | | | | |
| | | |
| | | Notes to Financial Statements | | | 43 | |
| | | |
| | | Accounting and distribution policies, details of agreements and transactions with Fund management and affiliates, and descriptions of certain investment risks | | | | |
| | | |
| | | REPORT OF INDEPENDENT REGISTERED PUBLIC ACCOUNTING FIRM | | | 52 | |
| | | |
| | | OTHER INFORMATION | | | 53 | |
| | | |
| | | TRUSTEES AND OFFICERS | | | 54 | |
Nothing contained herein is to be considered an offer, sale or solicitation of an offer to buy shares of any series of the AMG Funds family of mutual funds. Such offering is made only by prospectus, which includes details as to offering price and other material information.
| | | | |
 | | Letter to Shareholders | | |
Dear Shareholder:
It was a difficult year for financial markets in 2018. Strong domestic economic growth fueled equity returns for the majority of the year, but a pullback in the fourth quarter reversed returns, leaving indices across market caps firmly in negative territory. Investors were driven by signs of deceleration in growth across the globe combined with political uncertainty and tighter monetary policy. The S&P 500® Index, a widely followed barometer of the U.S. equity market, returned +9.9% in the first three quarters of the year before a period of heightened volatility resulted in a fourth quarter return of -13.5% and a -4.4% return for the full fiscal year.
In 2018, there was wide performance dispersion across the eleven economic sectors of the S&P 500® Index. Despite a weak fourth quarter, health care, utilities, information technology, and consumer discretionary sectors ended the year on a positive note with returns of +6.4%, +4.1%, +3.4% and +1.9%, respectively. Corporate earnings are expected to continue growing at double digits for the fifth consecutive quarter. According to FactSet, fourth quarter earnings growth for S&P 500® companies is +10.9% (as of January 25, 2019). Growth stocks outperformed value for the first three quarters of the year until the fourth quarter’s risk off environment reversed the trend. Full year returns for the Russell 1000® Growth and Russell 1000® Value Indexes were -1.5% and -8.3%, respectively.
Despite skittish investor sentiment, the U.S. economy continued to show signs of growth, albeit at a slower pace with third quarter GDP growth ringing in at 3.4%. The Federal Reserve raised short-term interest rates four times over the course of the year to end the year at a target rate of 2.25%–2.50%. Higher interest rates eroded the performance of bonds in the first three quarters of the year and a risk off fourth quarter resulted in mixed results. The Bloomberg Barclays U.S. Aggregate Bond Index, a broad measure of U.S. bond market performance, ended the year where it began with a 0.0% return for 2018. The yield on the 10-year U.S. Treasury note crossed above 3% at the end of September but fell dramatically as investors sought to insulate themselves from market volatility. During the past year, the short end of the yield curve has risen faster than the longer end, resulting in the 2–10 year Treasury spread of 0.21%. As expected, high yield bonds held up in the rising interest rate environment but struggled in the fourth quarter as investors removed risk from their portfolios. As a result, spreads between investment grade and high yield corporate debt climbed past 300 bps. In 2018, the Bloomberg Barclays U.S. Aggregate Credit Index and Bloomberg Barclays U.S. Corporate High Yield Bond Index returned -2.1% and -2.1%, respectively.
Economic conditions outside the U.S. started the year with strong growth indicators but finished with signs of deceleration. At the European Central Bank’s most recent monetary policy meeting, the governing council issued guidance that quantitative easing measures would continue and interest rates would remain at their present levels through summer of 2019. This is a departure from guidance earlier in the year which indicated the asset repurchase program would come to an end in December 2018 and rates would rise in 2019. The Bank of England increased its target rate in August for the first time since 2009, but deceleration in growth and increased downside risks, including a disorderly Brexit, have halted discussion of additional hikes in the near future.
International equities and emerging markets demonstrated significantly weaker returns, with the MSCI EAFE and MSCI Emerging Markets Index returning -13.8% and -14.6%, respectively, in the 12 months ending December 31, 2018. In a recent speech at the Hudson Institute, Vice President Mike Pence acknowledged China’s
aggressive actions toward the United States and highlighted a dramatic shift in U.S foreign policy with China: “We seek a relationship grounded in fairness, reciprocity and respect for sovereignty, and we have taken strong and swift action to achieve that goal.” This new tone combined with two rounds of new U.S. tariffs for Chinese imports and signs of a slowing economy acted as a drag on the largest economy within the MSCI Emerging Markets Index. Concurrently, the U.S. Dollar strengthened against most major global currencies, particularly in emerging markets, where those with large current account deficits faced significant pressure, adding to the drag on performance for emerging markets.
AMG Funds appreciates the privilege of providing investment tools to you and your clients. Our foremost goal is to provide investment solutions that help our shareholders successfully reach their long-term investment goals. AMG Funds provides access to a distinctive array of actively managed return-oriented investment strategies. We thank you for your continued confidence and investment in AMG Funds. You can rest assured that under all market conditions our team is focused on delivering excellent investment management services for your benefit.
Respectfully,

Keitha Kinne
President
AMG Funds
| | | | | | | | | | | | | | |
| Average Annual Total Returns | | Periods ended December 31, 2018* | |
| | | | |
| Stocks: | | | | 1 Year | | | 3 Years | | | 5 Years | |
| | | | |
Large Caps | | (S&P 500® Index) | | | (4.38)% | | | | 9.26% | | | | 8.49% | |
| | | | |
Small Caps | | (Russell 2000® Index) | | | (11.01)% | | | | 7.36% | | | | 4.41% | |
| | | | |
International | | (MSCI All Country World Index ex USA) | | | (14.20)% | | | | 4.48% | | | | 0.68% | |
Bonds: | | | | | | | | | | | | | | |
| | | | |
Investment Grade | | (Bloomberg Barclays U.S. Aggregate Bond Index) | | | 0.01% | | | | 2.06% | | | | 2.52% | |
| | | | |
High Yield | | (Bloomberg Barclays U.S. Corporate High Yield Bond Index) | | | (2.08)% | | | | 7.23% | | | | 3.83% | |
| | | | |
Tax-exempt | | (Bloomberg Barclays Municipal Bond Index) | | | 1.28% | | | | 2.30% | | | | 3.82% | |
| | | | |
Treasury Bills | | (ICE BofAML U.S. 6-Month Treasury Bill Index) | | | 1.92% | | | | 1.18% | | | | 0.78% | |
*Source: FactSet. Past performance is no guarantee of future results.
2
|
About Your Fund’s Expenses |
| | | | | | | | | | | | |
As a shareholder of a Fund, you may incur two types of costs: (1) transaction costs, which may include sales charges (loads) on purchase payments; redemption fees; and exchange fees; and (2) ongoing costs, including management fees; distribution (12b-1) fees; and other Fund expenses. This example is intended to help you understand your ongoing costs (in dollars) of investing in the Fund and to compare these costs with the ongoing costs of investing in other mutual funds. The example is based on $1,000 invested at the beginning of the period and held for the entire period as indicated below. ACTUAL EXPENSES The first line of the following table provides information about the actual account values and | | | | | | actual expenses. You may use the information in this line, together with the amount you invested, to estimate the expenses that you paid over the period. Simply divide your account value by $1,000 (for example, an $8,600 account value divided by $1,000 = 8.6), then multiply the result by the number in the first line under the heading entitled “Expenses Paid During Period” to estimate the expenses you paid on your account during this period. HYPOTHETICAL EXAMPLE FOR COMPARISON PURPOSES The second line of the following table provides information about hypothetical account values and hypothetical expenses based on the Fund’s actual expense ratio and an assumed annual rate of return of 5% before expenses, which is not the Fund’s | | | | | | actual return. The hypothetical account values and expenses may not be used to estimate the actual ending account balance or expenses you paid for the period. You may use this information to compare the ongoing costs of investing in the Fund and other funds by comparing this 5% hypothetical example with the 5% hypothetical examples that appear in the shareholder reports of other funds. Please note that the expenses shown in the table are meant to highlight your ongoing costs only and do not reflect any transactional costs, such as sales charges (loads), redemption fees, or exchange fees. Therefore, the second line of the table is useful in comparing ongoing costs only, and will not help you determine the relative total costs of owning different funds. |
| | | | | | | | | | | | | | | | |
Six Months Ended December 31, 2018 | | Expense
Ratio for the Period | | | Beginning
Account
Value
07/01/18 | | | Ending
Account
Value
12/31/18 | | | Expenses
Paid
During
the Period* |
AMG Managers Loomis Sayles Bond Fund | |
Based on Actual Fund Return | |
Class N | | | 0.97% | | | | $1,000 | | | | $1,001 | | | | $4.89 | |
Class I | | | 0.87% | | | | $1,000 | | | | $1,001 | | | | $4.39 | |
Based on Hypothetical 5% Annual Return | |
Class N | | | 0.97% | | | | $1,000 | | | | $1,020 | | | | $4.94 | |
Class I | | | 0.87% | | | | $1,000 | | | | $1,021 | | | | $4.43 | |
| | | | | | | | | | | | | | | | |
AMG Managers Global Income Opportunity Fund | |
Based on Actual Fund Return | |
Class N | | | 0.89% | | | | $1,000 | | | | $991 | | | | $4.47 | |
Based on Hypothetical 5% Annual Return | |
Class N | | | 0.89% | | | | $1,000 | | | | $1,021 | | | | $4.53 | |
| | | | | | | | | | | | | | | | |
Six Months Ended December 31, 2018 | | Expense
Ratio for the Period | | | Beginning
Account
Value
07/01/18 | | | Ending
Account
Value
12/31/18 | | | Expenses
Paid
During
the Period* |
AMG Managers Special Equity Fund | |
Based on Actual Fund Return | |
Class N | | | 1.36% | | | | $1,000 | | | | $844 | | | | $6.32 | |
Class I | | | 1.11% | | | | $1,000 | | | | $845 | | | | $5.16 | |
Based on Hypothetical 5% Annual Return | |
Class N | | | 1.36% | | | | $1,000 | | | | $1,018 | | | | $6.92 | |
Class I | | | 1.11% | | | | $1,000 | | | | $1,020 | | | | $5.65 | |
| * | Expenses are equal to the Fund’s annualized expense ratio multiplied by the average account value over the period, multiplied by the number of days in the most recent fiscal half-year (184), then divided by 365. |
3
|
AMG Managers Loomis Sayles Bond Fund Portfolio Manager’s Comments(unaudited) |
| | | | | | | | | | | | |
THE YEAR IN REVIEW The AMG Managers Loomis Sayles Bond Fund (Class N) (the Fund) returned -1.82% for the year ended December 31, 2018, underperforming the Bloomberg Barclays U.S. Government/Credit Bond Index, which returned -0.42%. The Fund posted negative absolute returns for the year. The underperformance can be largely attributed to sector allocation followed by weak security selection in investment grade corporate bonds. Investment grade credit spreads widened throughout the year. Weak security selection within the sector due to a BBB quality bias hurt relative return. Credits in banking, automotive, and metals and mining were the largest contributors to underperformance. The allocation to high yield corporates had a minimal negative impact on returns as credit spreads widened significantly in the fourth quarter. Relative to the benchmark, the strategy maintained a meaningful underweight to U.S. Treasuries with the bulk of our Treasury holdings in short-duration cash equivalents. While the underweight contributed to underperformance as Treasury bond returns were greater than corporate bond returns last year, the short duration of both the fund and our Treasury holdings benefited performance for the year. The treasury/duration impact combined to have a small negative effect on relative return. Our allocation to non-U.S. Dollar-denominated issues produced slight negative returns during the period. Holdings denominated in the Canadian and New Zealand Dollars were the largest detractors to relative performance. A small exposure to equities and convertible bonds detracted from performance as equity markets were volatile and had negative returns in 2018. An allocation to Securitized proved beneficial, with strong security selection boosting return. A small allocation and positive issue election within | | | | | | emerging markets also aided performance as emerging market bonds were one of the few markets to generate a positive return for the year. LOOKING FORWARD Driven by market volatility, Federal Reserve (“Fed”) policy, and a fragile geopolitical environment, our outlook is evolving. While the U.S. economy has experienced positive growth and strong employment, business uncertainty is rising and the pace of growth is slowing at the periphery. The recent growth and strong employment has generated some wage pressures but inflation still appears contained and the dramatic move in oil should remove some inflationary pressures. Fed policy has been under pressure and rates have moved dramatically lower with markets appearing to price with no more hikes and possibly a rate cut. The market volatility and lowering growth expectations, we believe, may cause the Fed to pause with at most one more rate hike in 2019. Despite the volatility, we do believe the U.S. economy is strong and we are not in the camp of those who say “the cycle is turning.” We believe a fair amount of slowing growth is due to the inventory cycle and do see the potential for some pickup in growth after a slow first quarter. Given the move down in U.S. interest rates we remain cautious about taking on more interest rate risk at present levels; however, our forward looking view is that rates will be lower for this cycle. Geopolitical and political risks are rising and outcomes from trade negotiations, actual Fed policy, and developments abroad could have meaningful impacts on forward yield curve moves. As we enter 2019, our strategy is to maintain a higher quality bias within credit markets as a whole given the aging of the credit cycle. We continue to favor sectors that are exhibiting credit improvement, such as banking, and those with defensive characteristics, such as telecommunications and cable. We see more opportunity with the recent selloff in oil and have been selectively adding. We are limiting our | | | | | | exposure to industries with more challenging business trends, such as retail and home construction. In both investment grade and high yield markets, liquidity has been choppy. We remain very focused on liquidity conditions and strive to exploit opportunities. We reduced our exposure to convertible debt earlier this year following strong performance and elevated valuations, particularly in the biotechnology and pharmaceutical areas. Given the decline in the equity market, we have seen opportunities increase and have become a selective buyer. We have focused on higher quality issues in technology, industrials, and energy. Interest rates and the expected path for U.S. rates have adjusted down relative to the rest of the world. Most developed market central banks were becoming less accommodative but U.S. rate differentials were quite high. This is beginning to change. For the moment we remain cautious on non-U.S. Dollar exposure, but the backdrop favoring a stronger U.S. Dollar has diminished. A key risk to our outlook is the health of the global economy and markets outside of the United States, particularly Europe and parts of Asia, which have already experienced slowing growth. China is likely the most important economy to watch, given its large contribution to global growth. A negative outcome from trade policy discussions has the potential to significantly weaken risk appetite and accelerate an economic slowdown. Conversely, an agreement on trade could lead to a meaningful market recovery. As we enter the new year, we continue to favor an allocation to selected higher quality U.S. investment grade and below investment-grade bonds with an emphasis on solid fundamentals, attractive yield, and liquidity. This commentary reflects the viewpoints of the portfolio manager, Loomis, Sayles & Company, as of December 31, 2018 and is not intended as a forecast or guarantee of future results. |
4
| | |
| | AMG Managers Loomis Sayles Bond Fund Portfolio Manager’s Comments(continued) |
CUMULATIVE TOTAL RETURN PERFORMANCE
AMG Managers Loomis Sayles Bond Fund’s cumulative total return is based on the daily change in net asset value (NAV), and assumes that all dividends and distributions were reinvested. The graph compares a hypothetical $10,000 investment made in the AMG Managers Loomis Sayles Bond Fund’s Class N Shares on December 31, 2008, to a $10,000 investment made in the Bloomberg Barclays U.S. Government/Credit Bond Index for the same time period. The graph and table do not reflect the deduction of taxes that a shareholder would pay on a Fund distribution or redemption of shares. The listed returns for the Fund are net expenses and the returns for the index exclude expenses. Total returns would have been lower had certain expenses not been reduced.
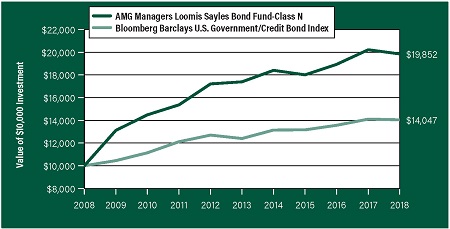
The table below shows the average annual total returns for the AMG Managers Loomis Sayles Bond Fund and the Bloomberg Barclays U.S. Government/Credit Bond Index for the same time periods ended December 31, 2018.
| | | | | | | | | | | | | | | | | | |
| Average Annual Total Returns1 | | One Year | | | Five
Years | | | Ten Years | | | Since
Inception | | | Inception
Date |
AMG Managers Loomis Sayles Bond Fund2, 3, 4, 5, 6, 7 | | | |
| | | | | |
Class N | | | (1.82%) | | | | 2.68 | % | | | 7.10% | | | | 7.90% | | | 06/01/84 |
| | | | | |
Class I | | | (1.72%) | | | | 2.78 | % | | | — | | | | 2.33% | | | 04/01/13 |
Bloomberg Barclays U.S. Government/ Credit Bond Index8 | | | (0.42%) | | | | 2.53 | % | | | 3.46% | | | | 7.12% | | | 06/01/84† |
The performance data shown represents past performance. Past performance is not a guarantee of future results. Current performance may be lower or higher than the performance data quoted. The investment return and principal value of an investment will fluctuate so that an investor’s shares, when redeemed, may be worth more or less than their original cost.
Investors should carefully consider the Fund’s investment objectives, risks, charges and expenses before investing. For performance information through the most recent month end, current net asset values per share for the Fund and other information, please call 800.835.3879 or visit our website at amgfunds.com for a free prospectus. Read it carefully before investing or sending money.
Distributed by AMG Distributors, Inc., member FINRA/SIPC.
| † | Date reflects inception date of the Fund, not the index. |
| 1 | Total return equals income yield plus share price change and assumes reinvestment of all dividends and capital gain distributions. Returns are net of fees and may reflect offsets of Fund expenses as described in the prospectus. No adjustment has been made for taxes payable by shareholders on their reinvested dividends and |
|
capital gain distributions. Returns for periods greater than one year are annualized. The listed returns on the Fund are net of expenses and based on the published NAV as of December 31, 2018. All returns are in U.S. dollars($). 2 From time to time, the Fund’s advisor has waived fees and/or absorbed Fund expenses, which has resulted in higher returns. 3 The Fund is subject to the risks associated with investments in debt securities, such as default risk and fluctuations in the perception of the debtor’s ability to pay its creditors. Changing interest rates may adversely affect the value of an investment. An increase in interest rates typically causes the value of bonds and other fixed income securities to fall. 4 To the extent that the Fund invests in asset-backed or mortgage-backed securities, its exposure to prepayment and extension risks may be greater than investments in other fixed income securities. 5 The Fund may invest in derivatives such as options and futures; the complexity and rapidly changing structure of derivatives markets may increase the possibility of market losses. 6 High-yield bonds (also known as “junk bonds”) may be subject to greater levels of interest rate, credit, and liquidity risk than investments in higher rated securities. These securities are considered predominantly speculative with respect to the issuer’s continuing ability to make principal and interest payments. The issuers of the Fund’s holdings may be involved in bankruptcy proceedings, reorganizations, or financial restructurings, and are not as strong financially as higher-rated issuers. |
7 Investments in international securities are subject to certain risks of overseas investing including currency fluctuations and changes in political and economic conditions, which could result in significant market fluctuations. 8 The Bloomberg Barclays U.S. Government/Credit Bond Index is an index of investment grade government and corporate bonds with a maturity date of more than one year. Unlike the Fund, the Bloomberg Barclays U.S. Government/Credit Bond Index is unmanaged, is not available for investment and does not incur expenses. Not FDIC insured, nor bank guaranteed. May lose value. |
5
| | |
| | | AMG Managers Loomis Sayles Bond Fund Fund Snapshots(unaudited) December 31, 2018 |
PORTFOLIO BREAKDOWN
| | | | | |
| Category | | % of Net Assets |
| | |
Corporate Bonds and Notes | | | | 59.8 | |
| | |
Foreign Government Obligations | | | | 5.1 | |
| | |
Asset-Backed Securities | | | | 2.2 | |
| | |
U.S. Government and Agency Obligations | | | | 1.8 | |
| | |
Common Stocks | | | | 1.4 | |
| | |
Municipal Bonds | | | | 0.8 | |
| | |
Preferred Stocks | | | | 0.6 | |
| | |
Mortgage-Backed Securities | | | | 0.5 | |
| | |
Short-Term Investments | | | | 28.1 | |
| | |
Other Assets Less Liabilities | | | | (0.3 | ) |
| | | | | |
| |
| Rating | | % of Market Value1 |
| | |
U.S. Government and Agency Obligations | | | | 2.6 | |
| | |
Aaa | | | | 3.0 | |
| | |
Aa | | | | 3.4 | |
| | |
A | | | | 23.4 | |
| | |
Baa | | | | 56.8 | |
| | |
Ba | | | | 5.0 | |
| | |
B | | | | 3.9 | |
| | |
N/R | | | | 1.9 | |
1 Includes market value of fixed-income securities only.
TOP TEN HOLDINGS
| | | | |
| Security Name | | % of Net Assets |
| | |
U.S. Treasury Bill, 0.992%, 02/07/19 | | | 11.0 | |
| | |
U.S. Treasury Bill, 1.129%, 02/14/19 | | | 5.5 | |
| | |
U.S. Treasury Bill, 1.984%, 05/30/19 | | | 5.5 | |
| | |
Ford Motor Credit Co. LLC, 4.389%, 01/08/26 | | | 3.4 | |
| | |
U.S. Treasury Bill, 0.059%, 01/03/19 | | | 2.6 | |
| | |
Bank of America Corp., 6.110%, 01/29/37 | | | 2.3 | |
| | |
Mexican Bonos Bonds, Series M 20, 10.000%, 12/05/24 (Mexico) | | | 2.3 | |
| | |
AT&T, Inc., 4.300%, 02/15/30 | | | 1.9 | |
| | |
U.S. Treasury Bonds, 3.000%, 08/15/48 | | | 1.7 | |
| | |
ONEOK Partners, LP, 4.900%, 03/15/25 | | | 1.6 | |
| | | | | |
Top Ten as a Group | | | 37.8 | |
| | | | | |
| | | | | |
Credit quality ratings shown above reflect the highest rating assigned by either Standard & Poor’s (“S&P”) or Moody’s Investors Service, Inc. (“Moody’s”). These rating agencies are independent, nationally recognized statistical rating organizations and are widely used. Investment grade ratings are credit ratings of BBB/Baa or higher. Below investment grade ratings are credit ratings of BB/Ba or lower. Investments designated N/R are not rated by either rating agency. Unrated investments do not necessarily indicate low credit quality. Credit quality ratings are subject to change.
Because a fund’s strategy may result in multiple investments in particular sectors of the economy, its performance may depend on the performance of those sectors and may fluctuate more widely than investments diversified across more sectors. For additional information on these and other risk considerations, please see the Fund’s prospectus.
Any sectors, industries, or securities discussed should not be perceived as investment recommendations. Mention of a specific security should not be considered a recommendation to buy or solicitation to sell that security. Specific securities mentioned in this report may have been sold from the Fund’s portfolio of investments by the time you receive this report.
6
|
AMG Managers Loomis Sayles Bond Fund |
Schedule of Portfolio Investments |
December 31, 2018 |
| | | | | | | | |
| | | Principal
Amount† | | | Value | |
| |
Corporate Bonds and Notes - 59.8% | | | | | |
| | |
Financials - 22.9% | | | | | | | | |
| | |
Ally Financial, Inc. | | | | | | | | |
4.125%, 02/13/22 | | | $7,915,000 | | | | $7,687,444 | |
8.000%, 11/01/311 | | | 1,267,000 | | | | 1,406,370 | |
| | |
Alta Wind Holdings LLC | | | | | | | | |
7.000%, 06/30/352 | | | 5,179,895 | | | | 5,622,818 | |
| | |
American International Group, Inc. | | | | | | | | |
4.875%, 06/01/22 | | | 560,000 | | | | 581,015 | |
| | |
Banco Santander, S.A. (Spain) | | | | | | | | |
5.179%, 11/19/251 | | | 27,800,000 | | | | 27,662,393 | |
| | |
Bank of America Corp. | | | | | | | | |
(3 month LIBOR + 1.040%), 3.419%, 12/20/283 | | | 27,155,000 | | | | 25,366,830 | |
6.110%, 01/29/37 | | | 38,050,000 | | | | 41,818,349 | |
MTN, 4.250%, 10/22/26 | | | 2,610,000 | | | | 2,538,482 | |
| | |
Canadian Imperial Bank of Commerce (Canada) | | | | | | | | |
1.600%, 09/06/19 | | | 2,120,000 | | | | 2,100,875 | |
| | |
Citigroup, Inc. | | | | | | | | |
5.130%, 11/12/19 | | | 5,835,000 | NZD | | | 3,993,211 | |
| | |
Cooperatieve Centrale | | | | | | | | |
Raiffeisen-Boerenleenbank (Netherlands) | | | | | | | | |
3.875%, 02/08/22 | | | 9,090,000 | | | | 9,190,443 | |
3.950%, 11/09/22 | | | 2,190,000 | | | | 2,182,856 | |
| | |
Equifax, Inc. | | | | | | | | |
7.000%, 07/01/37 | | | 4,421,000 | | | | 5,059,384 | |
| | |
The Goldman Sachs Group, Inc. | | | | | | | | |
6.750%, 10/01/37 | | | 14,590,000 | | | | 16,476,251 | |
| | |
iStar, Inc. | | | | | | | | |
3.125%, 09/15/22 | | | 2,055,000 | | | | 1,851,637 | |
| | |
Jefferies Group LLC | | | | | | | | |
5.125%, 01/20/23 | | | 8,800,000 | | | | 8,997,728 | |
| | |
JPMorgan Chase & Co. | | | | | | | | |
4.125%, 12/15/26 | | | 14,350,000 | | | | 14,001,017 | |
| | |
JPMorgan Chase Bank, N.A. | | | | | | | | |
BKNT | | | | | | | | |
1.650%, 09/23/19 | | | 8,457,000 | | | | 8,379,178 | |
| | |
Lloyds Banking Group PLC (United Kingdom) | | | | | | | | |
4.500%, 11/04/24 | | | 18,500,000 | | | | 17,864,071 | |
4.582%, 12/10/25 | | | 20,972,000 | | | | 19,854,249 | |
| | |
Marsh & McLennan Cos., Inc. | | | | | | | | |
5.875%, 08/01/33 | | | 8,295,000 | | | | 9,691,756 | |
| | |
MBIA Insurance Corp. | | | | | | | | |
(3 month LIBOR + 11.260%) | | | | | | | | |
13.696%, 01/15/332,3 | | | 525,000 | | | | 320,250 | |
| | |
Morgan Stanley | | | | | | | | |
3.950%, 04/23/27 | | | 17,265,000 | | | | 16,277,345 | |
GMTN, 4.350%, 09/08/26 | | | 5,000,000 | | | | 4,859,022 | |
MTN, 4.100%, 05/22/23 | | | 12,910,000 | | | | 12,928,646 | |
MTN, 6.250%, 08/09/26 | | | 11,000,000 | | | | 12,180,517 | |
| | |
Mutual of Omaha Insurance Co. | | | | | | | | |
6.800%, 06/15/362 | | | 13,925,000 | | | | 17,334,265 | |
| | | | | | | | |
| | | Principal
Amount† | | | Value | |
| | |
National City Corp. | | | | | | | | |
6.875%, 05/15/19 | | | $1,905,000 | | | | $1,931,143 | |
| | |
National Life Insurance Co. | | | | | | | | |
10.500%, 09/15/392 | | | 5,000,000 | | | | 7,940,601 | |
| | |
Navient Corp. | | | | | | | | |
5.500%, 01/25/23 | | | 18,070,000 | | | | 15,811,250 | |
| | |
Old Republic International Corp. | | | | | | | | |
4.875%, 10/01/24 | | | 4,915,000 | | | | 5,108,881 | |
| | |
The Penn Mutual Life Insurance Co. | | | | | | | | |
7.625%, 06/15/402 | | | 8,885,000 | | | | 11,684,523 | |
| | |
Quicken Loans, Inc. | | | | | | | | |
5.250%, 01/15/282 | | | 2,080,000 | | | | 1,840,800 | |
5.750%, 05/01/252 | | | 1,815,000 | | | | 1,697,025 | |
| | |
Realty Income Corp. | | | | | | | | |
5.750%, 01/15/21 | | | 2,125,000 | | | | 2,210,945 | |
| | |
Royal Bank of Canada (Canada) | | | | | | | | |
Series GMTN | | | | | | | | |
1.625%, 04/15/19 | | | 1,348,000 | | | | 1,343,404 | |
| | |
Royal Bank of Scotland Group PLC (United Kingdom) | | | | | | | | |
6.125%, 12/15/22 | | | 4,650,000 | | | | 4,712,587 | |
| | |
Societe Generale, S.A. (France) | | | | | | | | |
4.750%, 11/24/252 | | | 11,000,000 | | | | 10,866,017 | |
5.200%, 04/15/212 | | | 7,000,000 | | | | 7,290,674 | |
| | |
Springleaf Finance Corp. | | | | | | | | |
5.250%, 12/15/19 | | | 12,890,000 | | | | 12,920,678 | |
8.250%, 10/01/23 | | | 10,865,000 | | | | 11,163,787 | |
| | |
Weyerhaeuser Co. | | | | | | | | |
6.875%, 12/15/33 | | | 12,890,000 | | | | 15,350,194 | |
7.375%, 10/01/19 | | | 3,915,000 | | | | 4,022,765 | |
7.375%, 03/15/32 | | | 1,930,000 | | | | 2,360,075 | |
| | |
Total Financials | | | | | | | 414,481,751 | |
| | |
Industrials - 35.1% | | | | | | | | |
| | |
America Movil SAB de CV (Mexico) | | | | | | | | |
6.450%, 12/05/22 | | | 169,300,000 | MXN | | | 7,602,745 | |
| | |
American Airlines 2013-1 Class A Pass | | | | | | | | |
Through Trust | | | | | | | | |
4.000%, 07/15/25 | | | 1,799,460 | | | | 1,785,694 | |
| | |
American Airlines 2016-1 Class B Pass | | | | | | | | |
Through Trust, Series B | | | | | | | | |
5.250%, 01/15/24 | | | 19,236,043 | | | | 19,801,465 | |
| | |
American Airlines 2016-2 Class B Pass | | | | | | | | |
Through Trust | | | | | | | | |
4.375%, 06/15/242 | | | 20,500,000 | | | | 20,104,350 | |
| | |
American Airlines 2016-3 Class B Pass | | | | | | | | |
Through Trust | | | | | | | | |
3.750%, 10/15/25 | | | 7,343,071 | | | | 7,048,504 | |
| | |
American Airlines 2017-1B Class B Pass | | | | | | | | |
Through Trust | | | | | | | | |
Series B | | | | | | | | |
4.950%, 02/15/25 | | | 3,558,262 | | | | 3,567,887 | |
The accompanying notes are an integral part of these financial statements.
7
| | |
| | AMG Managers Loomis Sayles Bond Fund Schedule of Portfolio Investments(continued) |
| | | | | | | | |
| | | Principal
Amount† | | Value | |
| |
Industrials - 35.1%(continued) | | | | | |
| | |
American Airlines 2017-2 Class B Pass | | | | | | | | |
Through Trust | | | | | | | | |
Series B | | | | | | | | |
3.700%, 10/15/25 | | | $2,748,649 | | | | $2,658,588 | |
| | |
APL, Ltd. | | | | | | | | |
8.000%, 01/15/24 | | | 250,000 | | | | 240,000 | |
| | |
Apple, Inc. | | | | | | | | |
1.100%, 08/02/19 | | | 485,000 | | | | 480,178 | |
1.550%, 02/07/20 | | | 2,180,000 | | | | 2,153,604 | |
1.800%, 05/11/20 | | | 18,480,000 | | | | 18,247,207 | |
| | |
ArcelorMittal (Luxembourg) | | | | | | | | |
6.750%, 03/01/414 | | | 11,065,000 | | | | 11,684,883 | |
7.000%, 10/15/394 | | | 6,604,000 | | | | 6,957,976 | |
| | |
AT&T Inc. | | | | | | | | |
4.500%, 03/09/48 | | | 2,935,000 | | | | 2,511,500 | |
4.550%, 03/09/49 | | | 3,230,000 | | | | 2,780,369 | |
| | |
AT&T, Inc. | | | | | | | | |
3.400%, 05/15/25 | | | 13,530,000 | | | | 12,740,563 | |
3.950%, 01/15/25 | | | 4,345,000 | | | | 4,248,782 | |
4.300%, 02/15/30 | | | 35,605,000 | | | | 33,646,216 | |
| | |
Booking Holdings, Inc. | | | | | | | | |
0.900%, 09/15/211,5 | | | 11,970,000 | | | | 13,209,338 | |
| | |
CenturyLink, Inc. | | | | | | | | |
Series S | | | | | | | | |
6.450%, 06/15/21 | | | 5,900,000 | | | | 5,885,250 | |
| | |
Chesapeake Energy Corp. | | | | | | | | |
6.625%, 08/15/20 | | | 55,000 | | | | 53,213 | |
6.875%, 11/15/20 | | | 85,000 | | | | 82,450 | |
| | |
Choice Hotels International, Inc. | | | | | | | | |
5.700%, 08/28/201 | | | 11,900,000 | | | | 12,108,250 | |
| | |
Continental Airlines, Inc. 2000-1 Class A-1 Pass Through Trust | | | | | | | | |
Series 00A1 | | | | | | | | |
8.048%, 11/01/20 | | | 27,698 | | | | 28,620 | |
| | |
Continental Airlines, Inc. 2007-1 Class A Pass Through Trust | | | | | | | | |
Series 071A | | | | | | | | |
5.983%, 04/19/22 | | | 12,402,012 | | | | 12,950,181 | |
| | |
Continental Airlines, Inc. 2007-1 Class B Pass Through Trust | | | | | | | | |
Series 071B | | | | | | | | |
6.903%, 04/19/22 | | | 1,210,076 | | | | 1,243,474 | |
| | |
Continental Resources, Inc. | | | | | | | | |
3.800%, 06/01/24 | | | 2,025,000 | | | | 1,917,005 | |
4.500%, 04/15/23 | | | 385,000 | | | | 378,908 | |
| | |
Corning, Inc. | | | | | | | | |
6.850%, 03/01/29 | | | 9,142,000 | | | | 10,843,223 | |
| | |
Cox Communications, Inc. | | | | | | | | |
4.800%, 02/01/352 | | | 3,369,000 | | | | 3,071,584 | |
| | |
Cummins, Inc. | | | | | | | | |
5.650%, 03/01/98 | | | 6,460,000 | | | | 7,043,164 | |
| | | | | | | | |
| | | Principal
Amount† | | Value | |
| | |
Dell International LLC / EMC Corp. | | | | | | | | |
6.020%, 06/15/262 | | | $3,270,000 | | | | $3,284,786 | |
8.100%, 07/15/362 | | | 5,470,000 | | | | 5,945,064 | |
8.350%, 07/15/462 | | | 2,990,000 | | | | 3,237,543 | |
| | |
Delta Air Lines, Inc. | | | | | | | | |
2007-1 Class B Pass Through Trust | | | | | | | | |
Series 071B | | | | | | | | |
8.021%, 08/10/22 | | | 4,767,669 | | | | 5,187,701 | |
| | |
Devon Energy Corp. | | | | | | | | |
3.250%, 05/15/22 | | | 5,256,000 | | | | 5,121,710 | |
| | |
Dillard’s, Inc. | | | | | | | | |
7.000%, 12/01/28 | | | 225,000 | | | | 231,582 | |
| | |
Embarq Corp. | | | | | | | | |
7.995%, 06/01/36 | | | 3,335,000 | | | | 3,018,175 | |
| | |
Embraer Netherlands Finance BV (Netherlands) | | | | | | | | |
5.400%, 02/01/27 | | | 2,325,000 | | | | 2,400,586 | |
| | |
Enable Midstream Partners, LP | | | | | | | | |
5.000%, 05/15/441,4 | | | 2,725,000 | | | | 2,239,674 | |
| | |
Enbridge Energy Partners, LP | | | | | | | | |
7.375%, 10/15/45 | | | 1,870,000 | | | | 2,316,165 | |
| | |
Energy Transfer Partners, LP / Regency Energy | | | | | | | | |
Finance Corp. | | | | | | | | |
4.500%, 11/01/23 | | | 700,000 | | | | 700,227 | |
| | |
EnLink Midstream Partners, LP | | | | | | | | |
4.150%, 06/01/251 | | | 6,145,000 | | | | 5,539,946 | |
| | |
Enterprise Products Operating LLC | | | | | | | | |
4.050%, 02/15/22 | | | 2,219,000 | | | | 2,253,149 | |
| | |
ERAC USA Finance LLC | | | | | | | | |
6.700%, 06/01/342 | | | 1,250,000 | | | | 1,484,745 | |
7.000%, 10/15/372 | | | 19,033,000 | | | | 23,663,202 | |
| | |
Foot Locker, Inc. | | | | | | | | |
8.500%, 01/15/22 | | | 220,000 | | | | 243,925 | |
| | |
Ford Motor Co. | | | | | | | | |
6.375%, 02/01/29 | | | 1,990,000 | | | | 1,988,569 | |
| | |
Ford Motor Credit Co. LLC, GMTN | | | | | | | | |
4.389%, 01/08/26 | | | 68,075,000 | | | | 61,370,009 | |
| | |
General Motors Co. | | | | | | | | |
5.200%, 04/01/45 | | | 2,760,000 | | | | 2,287,364 | |
| | |
General Motors Financial Co., Inc. | | | | | | | | |
5.250%, 03/01/26 | | | 9,680,000 | | | | 9,471,909 | |
| | |
Georgia-Pacific LLC | | | | | | | | |
5.400%, 11/01/202 | | | 5,175,000 | | | | 5,362,202 | |
| | |
HCA, Inc. | | | | | | | | |
4.500%, 02/15/27 | | | 3,040,000 | | | | 2,872,800 | |
7.500%, 11/06/33 | | | 75,000 | | | | 78,750 | |
| | |
Hewlett Packard Enterprise Co. | | | | | | | | |
6.350%, 10/15/454 | | | 2,243,000 | | | | 2,093,693 | |
| | |
International Business Machines Corp. | | | | | | | | |
1.625%, 05/15/20 | | | 5,980,000 | | | | 5,861,884 | |
| | |
INVISTA Finance LLC | | | | | | | | |
4.250%, 10/15/192 | | | 14,000,000 | | | | 13,896,314 | |
The accompanying notes are an integral part of these financial statements.
8
| | |
| | AMG Managers Loomis Sayles Bond Fund Schedule of Portfolio Investments(continued) |
| | | | | | | | |
| | | Principal Amount† | | Value | |
Industrials - 35.1%(continued) | | | | | |
| | |
Kinder Morgan Energy Partners, LP | | | | | | | | |
3.500%, 09/01/23 | | | $6,685,000 | | | | $6,493,617 | |
4.150%, 03/01/22 | | | 5,620,000 | | | | 5,661,439 | |
4.150%, 02/01/241 | | | 14,000,000 | | | | 13,874,955 | |
5.300%, 09/15/20 | | | 1,415,000 | | | | 1,453,257 | |
5.800%, 03/01/21 | | | 4,320,000 | | | | 4,508,941 | |
| | |
KLA-Tencor Corp. | | | | | | | | |
5.650%, 11/01/34 | | | 4,590,000 | | | | 4,679,099 | |
| | |
Macy’s Retail Holdings, Inc. | | | | | | | | |
4.500%, 12/15/34 | | | 21,000 | | | | 16,803 | |
| | |
Marks & Spencer PLC (United Kingdom) | | | | | | | | |
7.125%, 12/01/372 | | | 4,725,000 | | | | 5,004,000 | |
| | |
Masco Corp. | | | | | | | | |
6.500%, 08/15/32 | | | 254,000 | | | | 280,784 | |
7.125%, 03/15/20 | | | 357,000 | | | | 372,931 | |
7.750%, 08/01/291 | | | 499,000 | | | | 594,658 | |
| | |
Methanex Corp. (Canada) | | | | | | | | |
5.250%, 03/01/22 | | | 350,000 | | | | 352,949 | |
| | |
Microsoft Corp. | | | | | | | | |
1.100%, 08/08/19 | | | 3,819,000 | | | | 3,780,982 | |
| | |
New Albertson’s, Inc. | | | | | | | | |
7.450%, 08/01/29 | | | 3,165,000 | | | | 2,532,000 | |
7.750%, 06/15/26 | | | 915,000 | | | | 777,750 | |
MTN, Series C, 6.625%, 06/01/28 | | | 1,045,000 | | | | 773,300 | |
| | |
Newell Brands, Inc. | | | | | | | | |
4.000%, 12/01/24 | | | 3,085,000 | | | | 3,039,212 | |
| | |
Noble Energy, Inc. | | | | | | | | |
3.900%, 11/15/24 | | | 3,670,000 | | | | 3,555,051 | |
| | |
Nuance Communications, Inc. | | | | | | | | |
1.000%, 12/15/355 | | | 2,140,000 | | | | 1,853,548 | |
1.250%, 04/01/255 | | | 1,585,000 | | | | 1,396,087 | |
1.500%, 11/01/355 | | | 50,000 | | | | 46,805 | |
| | |
ONEOK Partners, LP | | | | | | | | |
4.900%, 03/15/25 | | | 28,736,000 | | | | 29,114,061 | |
6.200%, 09/15/43 | | | 245,000 | | | | 262,608 | |
| | |
Owens Corning | | | | | | | | |
7.000%, 12/01/36 | | | 2,715,000 | | | | 3,002,686 | |
| | |
Petrobras Global Finance BV (Netherlands) | | | | | | | | |
5.625%, 05/20/43 | | | 580,000 | | | | 486,046 | |
| | |
PulteGroup, Inc. | | | | | | | | |
6.000%, 02/15/35 | | | 8,860,000 | | | | 7,663,900 | |
6.375%, 05/15/331 | | | 5,135,000 | | | | 4,685,687 | |
| | |
Qwest Capital Funding, Inc. | | | | | | | | |
6.875%, 07/15/28 | | | 1,055,000 | | | | 884,755 | |
| | |
Qwest Corp. | | | | | | | | |
6.875%, 09/15/33 | | | 5,857,000 | | | | 5,232,310 | |
7.250%, 09/15/25 | | | 1,185,000 | | | | 1,220,055 | |
| | |
Reliance Holding USA, Inc. | | | | | | | | |
5.400%, 02/14/222 | | | 3,250,000 | | | | 3,365,622 | |
| | |
Samsung Electronics Co., Ltd. (South Korea) | | | | | | | | |
7.700%, 10/01/272 | | | 1,980,000 | | | | 2,197,523 | |
| | | | | | | | |
| | | Principal Amount† | | Value | |
| | |
Sealed Air Corp. | | | | | | | | |
5.500%, 09/15/251,2 | | | $1,580,000 | | | | $1,560,250 | |
| | |
Telecom Italia Capital, S.A. (Luxembourg) | | | | | | | | |
6.000%, 09/30/34 | | | 4,665,000 | | | | 4,035,225 | |
6.375%, 11/15/33 | | | 3,530,000 | | | | 3,186,284 | |
| | |
Telefonica Emisiones SAU (Spain) | | | | | | | | |
4.570%, 04/27/23 | | | 900,000 | | | | 924,449 | |
| | |
Telekom Malaysia Bhd (Malaysia) | | | | | | | | |
7.875%, 08/01/252 | | | 250,000 | | | | 304,050 | |
| | |
Time Warner Cable LLC | | | | | | | | |
5.500%, 09/01/41 | | | 805,000 | | | | 733,583 | |
| | |
The Toro Co. | | | | | | | | |
6.625%, 05/01/37 | | | 6,810,000 | | | | 7,925,787 | |
| | |
Transcontinental Gas Pipe Line Co. LLC | | | | | | | | |
7.850%, 02/01/26 | | | 15,140,000 | | | | 18,302,542 | |
| | |
UAL 2007-1 Pass Through Trust | | | | | | | | |
Series 071A | | | | | | | | |
6.636%, 07/02/22 | | | 8,814,166 | | | | 9,165,851 | |
| | |
United Airlines 2014-1 Class A Pass Through Trust | | | | | | | | |
Series A | | | | | | | | |
4.000%, 04/11/26 | | | 7,443,333 | | | | 7,416,686 | |
| | |
United Airlines 2016-2 Class B Pass Through Trust | | | | | | | | |
Series 16-2 | | | | | | | | |
3.650%, 10/07/25 | | | 2,150,556 | | | | 2,037,866 | |
| | |
United States Steel Corp. | | | | | | | | |
6.650%, 06/01/371 | | | 3,595,000 | | | | 2,705,238 | |
| | |
US Airways 2011-1 Class A Pass Through Trust | | | | | | | | |
Series A | | | | | | | | |
7.125%, 10/22/23 | | | 2,140,267 | | | | 2,335,673 | |
| | |
Vale Overseas, Ltd. (Brazil) | | | | | | | | |
6.875%, 11/21/36 | | | 1,759,000 | | | | 2,011,417 | |
| | |
Verizon Communications, Inc. | | | | | | | | |
3.500%, 11/01/24 | | | 27,900,000 | | | | 27,517,134 | |
4.862%, 08/21/46 | | | 25,890,000 | | | | 25,443,920 | |
| | |
Virgin Australia 2013-1A Trust (Australia) | | | | | | | | |
5.000%, 10/23/232 | | | 399,207 | | | | 404,317 | |
| | |
WestRock MWV LLC | | | | | | | | |
7.550%, 03/01/47 | | | 970,000 | | | | 1,184,662 | |
Total Industrials | | | | | | | 635,585,200 | |
Utilities - 1.8% | | | | | | | | |
| | |
DCP Midstream Operating, LP | | | | | | | | |
6.450%, 11/03/362 | | | 870,000 | | | | 843,900 | |
| | |
EDP Finance, B.V. (Netherlands) | | | | | | | | |
4.900%, 10/01/192 | | | 600,000 | | | | 604,554 | |
| | |
Empresa Nacional de Electricidad S.A. (Cayman Islands) | | | | | | | | |
7.875%, 02/01/27 | | | 2,900,000 | | | | 3,495,844 | |
The accompanying notes are an integral part of these financial statements.
9
| | |
| | AMG Managers Loomis Sayles Bond Fund Schedule of Portfolio Investments(continued) |
| | | | | | | | |
| | | Principal Amount† | | Value | |
| | |
Utilities - 1.8%(continued) | | | | | | | | |
| | |
Enel Finance International N.V., EMTN (Netherlands) | | | | | | | | |
5.750%, 09/14/40 | | | 210,000 | GBP | | | $315,859 | |
6.000%, 10/07/392 | | | $18,382,000 | | | | 18,222,646 | |
| | |
Enterprise Products Operating LLC | | | | | | | | |
3.900%, 02/15/24 | | | 6,400,000 | | | | 6,454,235 | |
| | |
Tenaga Nasional Bhd (Malaysia) | | | | | | | | |
7.500%, 11/01/252 | | | 2,000,000 | | | | 2,382,573 | |
| | |
Total Utilities | | | | | | | 32,319,611 | |
| | |
Total Corporate Bonds and Notes
(Cost $1,044,188,329) | | | | | | | 1,082,386,562 | |
| | |
Asset-Backed Securities - 2.2% | | | | | | | | |
| | |
FAN Engine Securitization, Ltd. | | | | | | | | |
Series 2013-1A, Class 1A | | | | | | | | |
4.625%, 10/15/432 | | | 10,459,044 | | | | 10,338,765 | |
| | |
Rise, Ltd. (Bermuda) | | | | | | | | |
Series 2014-1, Class A | | | | | | | | |
4.750%, 02/15/396,7 | | | 11,938,007 | | | | 11,579,866 | |
| | |
Shenton Aircraft Investment I, Ltd. | | | | | | | | |
Series 2015-1A, Class A | | | | | | | | |
4.750%, 10/15/422 | | | 17,277,072 | | | | 17,492,051 | |
| | |
Total Asset-Backed Securities
(Cost $39,482,225) | | | | | | | 39,410,682 | |
| | |
Mortgage-Backed Securities - 0.5% | | | | | | | | |
| | |
Commercial Mortgage Trust | | | | | | | | |
Series 2014-LC15, Class A2
2.840%, 04/10/47 | | | 3,614,394 | | | | 3,610,302 | |
Series 2014-UBS4, Class A2
2.963%, 08/10/47 | | | 2,275,531 | | | | 2,271,768 | |
| | |
JPMorgan Chase Commercial Mortgage Securities Trust | | | | | | | | |
Series 2014-C20, Class A2 | | | | | | | | |
2.872%, 07/15/47 | | | 1,550,707 | | | | 1,546,320 | |
| | |
Morgan Stanley Bank of America Merrill Lynch Trust | | | | | | | | |
Series 2014-C14, Class A2 | | | | | | | | |
2.916%, 02/15/47 | | | 264,843 | | | | 264,441 | |
| | |
WFRBS Commercial Mortgage Trust | | | | | | | | |
Series 2011-C3, Class D | | | | | | | | |
5.683%, 03/15/442,7 | | | 435,000 | | | | 395,196 | |
| | |
Total Mortgage-Backed Securities
(Cost $8,105,610) | | | | | | | 8,088,027 | |
| | |
Municipal Bonds - 0.8% | | | | | | | | |
| | |
Illinois State | | | | | | | | |
5.100%, 06/01/33 | | | 1,070,000 | | | | 1,020,170 | |
| | |
Michigan Tobacco Settlement Finance Authority | | | | | | | | |
7.309%, 06/01/34 | | | 2,055,000 | | | | 2,005,762 | |
| | |
Virginia Tobacco Settlement Financing Corp. | | | | | | | | |
6.706%, 06/01/46 | | | 11,675,000 | | | | 11,017,348 | |
| | |
Total Municipal Bonds
(Cost $14,182,183) | | | | | | | 14,043,280 | |
| | | | | | | | |
| | | Principal Amount† | | Value | |
| | |
U.S. Government and Agency Obligations - 1.8% | | | | | | | | |
| | |
Fannie Mae - 0.1% | | | | | | | | |
| | |
FNMA, | | | | | | | | |
3.000%, 07/01/27 | | | $1,437,986 | | | | $1,442,487 | |
6.000%, 07/01/29 | | | 997 | | | | 1,087 | |
| | |
Total Fannie Mae | | | | | | | 1,443,574 | |
| | |
Freddie Mac - 0.0%# | | | | | | | | |
| | |
FHLMC Gold, | | | | | | | | |
5.000%, 12/01/31 | | | 15,870 | | | | 16,656 | |
| | |
U.S. Treasury Obligations - 1.7% | | | | | | | | |
| | |
U.S. Treasury Bonds, | | | | | | | | |
3.000%, 08/15/481 | | | 31,825,000 | | | | 31,674,577 | |
| | |
Total U.S. Government and Agency Obligations
(Cost $31,014,519) | | | | | | | 33,134,807 | |
| | |
Foreign Government Obligations - 5.1% | | | | | | | | |
| | |
Brazilian Government International Bonds | | | | | | | | |
8.500%, 01/05/24 | | | 6,650,000 | BRL | | | 1,724,376 | |
10.250%, 01/10/28 | | | 5,750,000 | BRL | | | 1,645,769 | |
| | |
Canadian Government Bond | | | | | | | | |
Series 0001 | | | | | | | | |
0.750%, 09/01/20 | | | 15,225,000 | CAD | | | 10,951,919 | |
| | |
European Investment Bank Bonds | | | | | | | | |
0.000%, 03/10/218 | | | 5,000,000 | AUD | | | 3,326,790 | |
| | |
Mexican Bonos | | | | | | | | |
Series M | | | | | | | | |
8.000%, 12/07/23 | | | 122,500,000 | MXN | | | 6,083,687 | |
| | |
Mexican Bonos Bonds | | | | | | | | |
Series M 7.750%, 05/29/31 | | | 49,000,000 | MXN | | | 2,300,925 | |
Series M 20 7.500%, 06/03/27 | | | 111,000,000 | MXN | | | 5,246,020 | |
Series M 20 8.500%, 05/31/29 | | | 36,000,000 | MXN | | | 1,800,976 | |
Series M 20 10.000%, 12/05/24 | | | 761,500,000 | MXN | | | 41,156,475 | |
| | |
New Zealand Government Notes | | | | | | | | |
Series 319 | | | | | | | | |
5.000%, 03/15/19 | | | 14,845,000 | NZD | | | 10,029,280 | |
| | |
Norway Government Bonds | | | | | | | | |
Series 473 4.500%, 05/22/192 | | | 18,955,000 | NOK | | | 2,222,603 | |
Series 474 3.750%, 05/25/212 | | | 13,210,000 | NOK | | | 1,621,438 | |
| | |
Saudi Government International Bond | | | | | | | | |
3.250%, 10/26/262 | | | 5,170,000 | | | | 4,833,619 | |
| | |
Total Foreign Government Obligations
(Cost $140,277,196) | | | | | | | 92,943,877 | |
| | |
| | | Shares | | | |
Common Stocks - 1.4% | | | | | | | | |
| | |
Communication Services - 1.0% | | | | | | | | |
| | |
AT&T, Inc. | | | 614,704 | | | | 17,543,652 | |
| | |
Health Care - 0.2% | | | | | | | | |
| | |
Bristol-Myers Squibb Co. | | | 64,144 | | | | 3,334,205 | |
| | |
Industrials - 0.1% | | | | | | | | |
| | |
Arconic, Inc. | | | 154,805 | | | | 2,610,012 | |
The accompanying notes are an integral part of these financial statements.
10
| | |
| | AMG Managers Loomis Sayles Bond Fund Schedule of Portfolio Investments(continued) |
| | | | | | | | |
| | | Shares | | Value | |
| | |
Information Technology - 0.1% | | | | | | | | |
| | |
Corning, Inc. | | | 49,999 | | | | $1,510,470 | |
Total Common Stocks
(Cost $27,097,430) | | | | | | | 24,998,339 | |
| | |
Preferred Stocks - 0.6% | | | | | | | | |
| | |
Financials - 0.6% | | | | | | | | |
| | |
Bank of America Corp., 7.25%5 | | | 7,808 | | | | 9,779,520 | |
| | |
Navient Corp., 6.00%1 | | | 41,250 | | | | 680,625 | |
| | |
Total Financials | | | | | | | 10,460,145 | |
| | |
Utilities - 0.0%# | | | | | | | | |
| | |
Wisconsin Electric Power Co., 3.60% | | | 3,946 | | | | 342,907 | |
| | |
Total Preferred Stocks
(Cost $8,303,212) | | | | | | | 10,803,052 | |
| | |
| | | Principal
Amount | | | |
Short-Term Investments - 28.1% | | | | | | | | |
| | |
Joint Repurchase Agreements - 0.8%9 | | | | | | | | |
| | |
Bank of Nova Scotia, dated 12/31/18, due 01/02/19, 2.950% total to be received $746,294 (collateralized by various U.S. Treasuries, 0.000% - 8.750%, 01/08/19 - 09/09/49, totaling $761,220) | | | $746,172 | | | | 746,172 | |
| | |
Cantor Fitzgerald Securities, Inc., dated 12/31/18, due 01/02/19, 3.350% total to be received $3,560,015 (collateralized by various U.S. Government Agency Obligations and U.S. Treasuries, 0.000% - 10.000%, 01/25/19 - 10/20/68, totaling $3,630,540) | | | 3,559,353 | | | | 3,559,353 | |
| | |
Daiwa Capital Markets America, dated 12/31/18, due 01/02/19, 3.050% total to be received $3,559,956 (collateralized by various U.S. Government Agency Obligations, 2.000% - 6.500%, 01/25/19 - 02/01/49, totaling $3,630,540) | | | 3,559,353 | | | | 3,559,353 | |
| | |
RBC Dominion Securities, Inc., dated 12/31/18, due 01/02/19, 3.020% total to be received $3,559,950 (collateralized by various U.S. Government Agency Obligations, 3.000% - 7.000%, 10/01/25 - 10/20/48, totaling $3,630,540) | | | 3,559,353 | | | | 3,559,353 | |
| | | | | | | | |
| | | Principal Amount | | Value | |
| | |
State of Wisconsin Investment Board, dated 12/31/18, due 01/02/19, 3.370% total to be received $3,560,019 (collateralized by various U.S. Treasuries, 0.125% - 3.875%, 07/15/20 - 02/15/47, totaling $3,630,597) | | | $3,559,353 | | | | $3,559,353 | |
| | |
Total Joint Repurchase Agreements | | | | | | | 14,983,584 | |
| | |
U.S. Government Obligations - 25.7% | | | | | | | | |
| | |
U.S. Treasury Bill, 0.059%, 01/03/191,10 | | | 47,270,000 | | | | 47,264,329 | |
| | |
U.S. Treasury Bill, 0.764%, 04/25/191,10 | | | 20,000,000 | | | | 19,848,941 | |
| | |
U.S. Treasury Bill, 0.992%, 02/07/191,10 | | | 200,000,000 | | | | 199,526,194 | |
| | |
U.S. Treasury Bill, 1.129%, 02/14/191,10 | | | 100,000,000 | | | | 99,717,667 | |
| | |
U.S. Treasury Bill, 1.984%, 05/30/191,10 | | | 100,000,000 | | | | 99,002,542 | |
| | |
Total U.S. Government Obligations | | | | | | | 465,359,673 | |
| | |
| | | Shares | | | |
Other Investment Companies - 1.6% | | | | | | | | |
| | |
Dreyfus Government Cash Management Fund, Institutional Shares, 2.29%11 | | | 9,538,257 | | | | 9,538,257 | |
| | |
Dreyfus Institutional Preferred Government Money Market Fund, Institutional Shares, 2.40%11 | | | 9,538,257 | | | | 9,538,257 | |
| | |
JPMorgan U.S. Government Money Market Fund, IM Shares, 2.36%11 | | | 9,827,296 | | | | 9,827,296 | |
| | |
Total Other Investment Companies | | | | | | | 28,903,810 | |
| | |
Total Short-Term Investments
(Cost $509,238,717) | | | | | | | 509,247,067 | |
| | |
Total Investments - 100.3%
(Cost $1,821,889,421) | | | | | | | 1,815,055,693 | |
| | |
Other Assets, less Liabilities - (0.3)% | | | | | | | (4,767,322 | ) |
| | |
Net Assets - 100.0% | | | | | | | $1,810,288,371 | |
| † | Principal amount stated in U.S. dollars unless otherwise stated. |
| 1 | Some or all of these securities, amounting to $486,940,260 or 26.9% of net assets, were out on loan to various brokers and are collateralized by cash and various U.S. Treasury Obligations. See Note 4 of Notes to Financial Statements. |
| 2 | Security exempt from registration under Rule 144A of the Securities Act of 1933. This security may be resold in transactions exempt from registration, normally to qualified buyers. At December 31, 2018, the value of these securities amounted to $216,439,870 or 12.0% of net assets. |
| 3 | Variable rate security. The rate shown is based on the latest available information as of December 31, 2018. |
| 4 | Step Bond: A debt instrument with either deferred interest payments or an interest rate that resets at specific times during its term. |
| 5 | Convertible Security. A corporate bond or preferred stock, usually a junior debenture, that can be converted, at the option of the holder, for a specific number of shares of the company’s preferred stock or common stock. The market value of convertible bonds and convertible preferred stocks at December 31, 2018, amounted to $26,285,298 or 1.5% of net assets. |
| 6 | Security’s value was determined by using significant unobservable inputs. |
The accompanying notes are an integral part of these financial statements.
11
| | |
| | AMG Managers Loomis Sayles Bond Fund Schedule of Portfolio Investments(continued) |
| 7 | Certain variable rate securities are not based on a published reference rate and spread but are determined by the issuer or agent and are based on current market conditions. These securities do not indicate a reference rate and spread in their description above. |
| 9 | Cash collateral received from brokers for securities lending was invested in these joint repurchase agreements. |
| 10 | Represents yield to maturity at December 31, 2018. |
| 11 | Yield shown represents the December 31, 2018, seven day average yield, which refers to the sum of the previous seven days’ dividends paid, expressed as an annual percentage. |
| EMTN | European Medium Term Note |
| GMTN | Global Medium-Term Notes |
| LIBOR | London Interbank Offered Rate |
CURRENCY ABBREVIATIONS:
The accompanying notes are an integral part of these financial statements.
12
| | |
| | AMG Managers Loomis Sayles Bond Fund Schedule of Portfolio Investments(continued) |
The following table summarizes the inputs used to value the Fund’s investments by the fair value hierarchy levels as of December 31, 2018:
| | | | | | | | | | | | | | | | |
| | | Level 1 | | | Level 2 | | | Level 3 | | | Total | |
Investments in Securities | | | | | | | | | | | | | | | | |
| | | | |
Corporate Bonds and Notes† | | | — | | | | $1,082,386,562 | | | | — | | | | $1,082,386,562 | |
| | | | |
Asset-Backed Securities | | | — | | | | 27,830,816 | | | | $11,579,866 | | | | 39,410,682 | |
| | | | |
Mortgage-Backed Securities | | | — | | | | 8,088,027 | | | | — | | | | 8,088,027 | |
| | | | |
Municipal Bonds | | | — | | | | 14,043,280 | | | | — | | | | 14,043,280 | |
| | | | |
U.S. Government and Agency Obligations† | | | — | | | | 33,134,807 | | | | — | | | | 33,134,807 | |
| | | | |
Foreign Government Obligations | | | — | | | | 92,943,877 | | | | — | | | | 92,943,877 | |
| | | | |
Common Stocks†† | | | $24,998,339 | | | | — | | | | — | | | | 24,998,339 | |
| | | | |
Preferred Stocks | | | | | | | | | | | | | | | | |
| | | | |
Financials | | | 10,460,145 | | | | — | | | | — | | | | 10,460,145 | |
| | | | |
Utilities | | | — | | | | 342,907 | | | | — | | | | 342,907 | |
| | | | |
Short-Term Investments | | | | | | | | | | | | | | | | |
| | | | |
Joint Repurchase Agreements | | | — | | | | 14,983,584 | | | | — | | | | 14,983,584 | |
| | | | |
U.S. Government Obligations | | | — | | | | 465,359,673 | | | | — | | | | 465,359,673 | |
| | | | |
Other Investment Companies | | | 28,903,810 | | | | — | | | | — | | | | 28,903,810 | |
| | | | | | | | | | | | | | | | |
Total Investments in Securities | | | $64,362,294 | | | | $1,739,113,533 | | | | $11,579,866 | | | | $1,815,055,693 | |
| | | | | | | | | | | | | | | | |
| † | All corporate bonds and notes and U.S. government and agency obligations held in the Fund are Level 2 securities. For a detailed breakout of corporate bonds and notes and U.S. government and agency obligations by major industry or agency classification, please refer to the Fund’s Schedule of Portfolio Investments. |
| †† | All common stocks held in the Fund are Level 1 securities. For a detailed breakout of common stocks by major industry classification, please refer to the Fund’s Schedule of Portfolio Investments. |
For the fiscal year ended December 31, 2018, there were no transfers in or out of Level 3.
The following table below is a reconciliation of investments in which significant unobservable inputs (Level 3) were used in determining fair value at December 31, 2018:
| | | | |
| | | Asset-Backed Securities |
Balance as of December 31, 2017 | | | $13,986,585 | |
| |
Accrued discounts (premiums) | | | (5,164 | ) |
| |
Realized gain (loss) | | | (12,266 | ) |
| |
Change in unrealized appreciation/depreciation | | | (270,426 | ) |
| |
Purchases | | | — | |
| |
Sales | | | (2,118,863 | ) |
| |
Transfers in to Level 3 | | | — | |
| |
Transfers out of Level 3 | | | — | |
| |
Balance as of December 31, 2018 | | | $11,579,866 | |
| | | — | |
Net change in unrealized appreciation/depreciation on investments still held at December 31, 2018 | | | $(297,033 | ) |
The Fund’s investment that is categorized as Level 3 is valued utilizing third party pricing information without adjustment (broker quote). Such valuations are based on unobservable inputs. A significant change in third party information inputs could result in a significantly lower or higher value of such Level 3 investment.
The accompanying notes are an integral part of these financial statements.
13
| | |
| | AMG Managers Loomis Sayles Bond Fund Schedule of Portfolio Investments(continued) |
| | | | |
Country | | % of Long-Term
Investments |
Australia | | | 0.0 | # |
| | |
Bermuda | | | 0.9 | |
| |
Brazil | | | 0.4 | |
| |
Canada | | | 1.1 | |
| |
Cayman Islands | | | 1.6 | |
| |
France | | | 1.4 | |
| |
Ireland | | | 0.8 | |
| |
Luxembourg | | | 2.2 | |
| |
Malaysia | | | 0.2 | |
| |
Mexico | | | 4.9 | |
| |
Netherlands | | | 2.6 | |
| |
New Zealand | | | 0.8 | |
| |
Norway | | | 0.3 | |
| |
Saudi Arabia | | | 0.4 | |
| |
South Korea | | | 0.2 | |
| |
Spain | | | 2.2 | |
| |
United Kingdom | | | 3.6 | |
| |
United States | | | 76.4 | |
| | | | |
| | | 100.0 | |
| | | | |
The accompanying notes are an integral part of these financial statements.
14
|
AMG Managers Global Income Opportunity Fund Portfolio Manager’s Comments(unaudited) |
| | | | | | | | | | | | |
THE YEAR IN REVIEW AMG Managers Global Income Opportunity Fund (Class N) (the Fund) returned -4.18% during the year ended December 31, 2018, compared with the -1.20% return for the Bloomberg Barclays Global Aggregate Bond Index. Allocation to select corporate credit sectors and issuers, including high yield bonds, were the main detractors from performance over the past 12 months. Volatile equities stemming mostly from trade dispute concerns, slowing global growth, and Federal Reserve (“Fed”) rate hikes have been mostly to blame for the increased investor uneasiness and underperformance across credit markets. Positioning among high yield credit was also negative during the “risk-off” environment. Overweight allocation to the Banking sector was a main source of negative performance during the year. In particular, U.S., U.K., and Eurozone banking issuers weighed on performance given weakness in the sector on regional and global growth concerns. Also, selections in subordinated banks and insurance detracted value as these securities underperformed seniors amid damped risk sentiment. Security selection among Emerging Markets (“EM”) hard currency issuers from Latin America also weighed on results. Geopolitical uncertainties in several key Latin American countries—Argentina, Brazil, and Mexico—led to reduced investor risk appetite. Duration and yield curve positioning was a source of positive excess returns. Curve positioning in the 5-and 10-year part of the U.S. Dollar-pay curves proved | | | | | | most beneficial. The allocation of duration into select emerging markets such as Mexico, Indonesia, Colombia, and Brazil proved beneficial. Currency and hedging also weighed on relative returns during the year. Allocation to select EM currencies such as Brazilian Real, Indonesian Rupiah, and South African Rand proved a negative source of performance as country-specific factors and global growth concerns saw most currencies depreciate against the U.S. Dollar. Overweight to the Colombian Peso was also negative as the Peso was hampered by the drop in crude oil prices. An underweight to the strong performing Japanese Yen also weighed on performance. On the other hand, underweights to the Euro, Sterling, and overweight to the Mexican Peso were moderate contributors to relative performance. LOOKING FORWARD Consensus 2019 forecasts have been revised down throughout most of the world as downside risks appear to outweigh upside supports. Our view is that we are late in the cycle—not at the end of the cycle—and while growth and profit momentum should slow, there is still opportunity for risk sentiment to recover Growth in China is still set to slow moderately. Policy statements have called for the greater use of monetary and fiscal stimulus to stabilize growth. We don’t see a broad policy easing bias, but expect increased use of targeted policy measures to offset growing downside risks from a U.S.-China tariff war. These may be insufficient to provide a meaningful knock-on boost to global growth. | | | | | | Our inflation forecasts for the world’s major economies are slightly below consensus estimates. Given the sharp decline in oil prices over the past quarter, the risk of an oil shock severely inflating prices is less likely in the near term. At the same time, growth is seemingly converging toward levels which could have more limited upward pressure on resource and wage price levels. In a November speech, Fed Chairman Powell remarked that a major risk in the U.S. economy stems from high debt levels for businesses. We agree with this assessment at this point in the credit cycle, although corporate credit fundamentals across both Europe and the U.S. remain largely stable for now and need not deteriorate soon. We do not see a catalyst for a return to the significantly tighter global credit spread levels that prevailed a year ago, but we also do not agree with the significantly above average recession risk increasingly reflected across many asset class valuations. Persistent global trade tensions and protectionist actions would provide support for the U.S. Dollar. However, the U.S. Dollar already appears expensive under many valuation models. Therefore, we believe the Dollar is likely to remain range bound over the coming months while macro risks continue to dominate headlines and global growth stabilizes. This commentary reflects the viewpoints of the portfolio manager, Loomis, Sayles & Company, as of December 31, 2018 and is not intended as a forecast or guarantee of future results. |
15
| | |
| | AMG Managers Global Income Opportunity Fund Portfolio Manager’s Comments(continued) |
CUMULATIVE TOTAL RETURN PERFORMANCE
AMG Managers Global Income Opportunity Fund’s cumulative total return is based on the daily change in net asset value (NAV), and assumes that all dividends and distributions were reinvested. The graph compares a hypothetical $10,000 investment made in the AMG Managers Global Income Opportunity Fund’s Class N shares on December 31, 2008, to a $10,000 investment made in the Bloomberg Barclays Global Aggregate Bond Index for the same time period. The graph and table do not reflect the deduction of taxes that a shareholder would pay on a Fund distribution or redemption of shares. The listed returns for the Fund are net expenses and the returns for the index exclude expenses. Total returns would have been lower had certain expenses not been reduced.
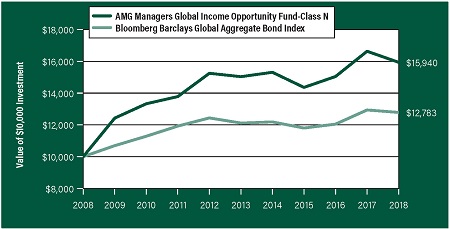
The table below shows the average annual total returns for the AMG Managers Global Income Opportunity Fund and the Bloomberg Barclays Global Aggregate Bond Index for the same time periods ended December 31, 2018.
| | | | | | | | | | | | |
Average Annual Total Returns1 | | One Year | | | Five
Years | | | Ten Years | |
AMG Managers Global Income Opportunity Fund2, 3, 4, 5, 6,7, 8, 9 | | | | | |
Class N | | | (4.18% | ) | | | 1.18% | | | | 4.77% | |
Bloomberg Barclays Global Aggregate Bond Index10 | | | (1.20% | ) | | | 1.08% | | | | 2.49% | |
The performance data shown represents past performance. Past performance is not a guarantee of future results. Current performance may be lower or higher than the performance data quoted. The investment return and principal value of an investment will fluctuate so that an investor’s shares, when redeemed, may be worth more or less than their original cost.
Investors should carefully consider the Fund’s investment objectives, risks, charges and expenses before investing. For performance information through the most recent month end, current net asset values per share for the Fund and other information, please call 800.835.3879 or visit our website at amgfunds.com for a free prospectus. Read it carefully before investing or sending money.
Distributed by AMG Distributors, Inc., member FINRA/SIPC.
| 1 | Total return equals income yield plus share price change and assumes reinvestment of all dividends and capital gain distributions. Returns are net of fees and may reflect offsets of Fund expenses as described in the prospectus. No adjustment has been made for taxes payable by shareholders on their reinvested dividends and capital gain distributions. Returns for periods greater than one year are annualized. The listed returns on the Fund are net of expenses and based on the published NAV as of December 31, 2018. All returns are in U.S. dollars($). |
| 2 | From time to time the Fund’s advisor has waived it’s fees and/or absorbed Fund expenses, which has resulted in higher returns. |
|
3 A short-term redemption fee of 1% will be charged on shares held for less than 60 days. Effective March 1, 2019, the Fund will eliminate this redemption fee. 4 The Fund is subject to currency risk resulting from fluctuations in exchange rates that may affect the total loss or gain on a non-U.S. Dollar investment when converted back to U.S. Dollars. 5 The Fund is subject to the risks associated with investments in debt securities, such as default risk and fluctuations in the perception of the debtor’s ability to pay its creditors. Changing interest rates may adversely affect the value of an investment. An increase in interest rates typically causes the value of bonds and other fixed income securities to fall. 6 To the extent that the Fund invests in asset-backed or mortgage-backed securities, its exposure to prepayment and extension risks may be greater than investments in other fixed income securities. 7 The Fund may invest in derivatives such as foreign currency contracts, options and futures; the complexity and rapidly changing structure of derivatives markets may increase the possibility of market losses. 8 High-yield bonds (also known as “junk bonds”) may be subject to greater levels of interest rate, credit, and liquidity risk than investments in higher rated securities. These securities are considered predominantly speculative with respect to the issuer’s continuing ability to make principal and interest payments. The issuers of the Fund’s holdings may be involved in bankruptcy proceedings, reorganizations, or financial restructurings, and are not as strong financially as higher-rated issuers. |
9 Investments in international securities are subject to certain risks of overseas investing including currency fluctuations and changes in political and economic conditions, which could result in significant market fluctuations. 10 The Bloomberg Barclays Global Aggregate Bond Index provides a broad-based measure of the global investment-grade fixed income markets. The three major components of this index are the U.S. Aggregate, the Pan-European Aggregate, and the Asian-Pacific Aggregate Indices. The Index also includes Eurodollar and Euro-Yen corporate bonds, Canadian government, agency and corporate securities, and USD investment grade 144A securities. Unlike the Fund, the Bloomberg Barclays Global Aggregate Bond Index is unmanaged, is not available for investment and does not incur expenses. |
| |
Not FDIC insured, nor bank guaranteed. May lose value |
16
|
AMG Managers Global Income Opportunity Fund Fund Snapshots(unaudited) December 31, 2018 |
|
PORTFOLIO BREAKDOWN
| | | | | |
Category | | % of Net Assets |
Corporate Bonds and Notes | | | | 53.9 | |
| | |
Foreign Government Obligations | | | | 42.4 | |
| | |
U.S. Government and Agency Obligations | | | | 6.1 | |
| | |
Asset-Backed Securities | | | | 0.7 | |
| | |
Short-Term Investments | | | | 0.8 | |
| | |
Other Assets Less Liabilities | | | | (3.9 | ) |
| | | | | |
Rating | | % of Market Value1 |
U.S. Government and Agency Obligations | | | | 6.0 | |
| | |
Aaa | | | | 7.5 | |
| | |
Aa | | | | 11.1 | |
| | |
A | | | | 17.5 | |
| | |
Baa | | | | 45.6 | |
| | |
Ba | | | | 8.0 | |
| | |
B | | | | 3.1 | |
| | |
N/R | | | | 1.2 | |
| 1 | Includes market value of fixed-income securities only. |
TOP TEN HOLDINGS
| | | | |
Security Name | | % of
Net Assets |
French Republic Government Bond OAT, 4.250%, 10/25/23 (France) | | | 5.9 | |
| | |
Indonesia Treasury Bonds, Series FR53, 8.250%, 07/15/21 (Indonesia) | | | 3.4 | |
| | |
South Africa Government Bond, Series R213, 7.000%, 02/28/31 (South Africa) | | | 2.9 | |
| | |
U.S. Treasury Notes, 2.875%, 08/15/28 | | | 2.8 | |
| | |
Corp. Nacional del Cobre de Chile, 4.500%, 09/16/25 (Chile) | | | 2.4 | |
| | |
New South Wales Treasury Corp., Bonds, Series 22, 6.000%, 03/01/22 (Australia) | | | 2.3 | |
| | |
Kinder Morgan Energy Partners, LP, 4.250%, 09/01/24 | | | 2.1 | |
| | |
Braskem Finance, Ltd., 5.750%, 04/15/21 (Cayman Islands) | | | 2.0 | |
| | |
Indonesia Government International Bonds, 4.750%, 01/08/26 (Indonesia) | | | 2.0 | |
| | |
Alfa, SAB de CV, 5.250%, 03/25/24 (Mexico) | | | 1.9 | |
| | | | | |
Top Ten as a Group | | | 27.7 | |
| | | | | |
Credit quality ratings shown above reflect the highest rating assigned by either Standard & Poor’s (“S&P”) or Moody’s Investors Service, Inc. (“Moody’s”). These rating agencies are independent, nationally recognized statistical rating organizations and are widely used. Investment grade ratings are credit ratings of BBB/Baa or higher. Below investment grade ratings are credit ratings of BB/Ba or lower. Investments designated N/R are not rated by either rating agency. Unrated investments do not necessarily indicate low credit quality. Credit quality ratings are subject to change.
Because a fund’s strategy may result in multiple investments in particular sectors of the economy, its performance may depend on the performance of those sectors and may fluctuate more widely than investments diversified across more sectors. For additional information on these and other risk considerations, please see the Fund’s prospectus.
Any sectors, industries, or securities discussed should not be perceived as investment recommendations. Mention of a specific security should not be considered a recommendation to buy or solicitation to sell that security. Specific securities mentioned in this report may have been sold from the Fund’s portfolio of investments by the time you receive this report.
17
| | |
| | | AMG Managers Global Income Opportunity Fund Schedule of Portfolio Investments December 31, 2018 |
| | | | | | | | |
| | | Principal
Amount† | | | Value | |
| | |
Corporate Bonds and Notes - 53.9% | | | | | | | | |
| | |
Financials - 17.4% | | | | | | | | |
| | |
Bank of America Corp. | | | | | | | | |
Series MTN | | | | | | | | |
4.200%, 08/26/24 | | | $130,000 | | | | $128,934 | |
| | |
Barclays PLC (United Kingdom) | | | | | | | | |
3.650%, 03/16/25 | | | 200,000 | | | | 184,348 | |
| | |
Citigroup, Inc. | | | | | | | | |
4.400%, 06/10/25 | | | 75,000 | | | | 73,398 | |
| | |
Commerzbank AG (Germany) Series EMTN | | | | | | | | |
4.000%, 03/23/26 | | | 40,000 | EUR | | | 47,462 | |
| | |
Credit Agricole, S.A. (France) | | | | | | | | |
(GBP Swap 5 Year + 4.535%) | | | | | | | | |
7.500%, 06/23/671,2 | | | 100,000 | GBP | | | 131,965 | |
| | |
Goodman Australia Industrial Fund Bond Issuer | | | | | | | | |
Pty, Ltd. (Australia) | | | | | | | | |
3.400%, 09/30/263 | | | 60,000 | | | | 56,658 | |
| | |
HSBC Holdings PLC (United Kingdom) | | | | | | | | |
Series EMTN | | | | | | | | |
5.750%, 12/20/27 | | | 55,000 | GBP | | | 80,324 | |
| | |
JPMorgan Chase & Co. | | | | | | | | |
3.900%, 07/15/25 | | | 50,000 | | | | 49,546 | |
3.875%, 02/01/24 | | | 25,000 | | | | 25,064 | |
Series X, (3 month LIBOR + 3.330%), 6.100%, 04/01/671,2 | | | 65,000 | | | | 64,594 | |
| | |
Lloyds Banking Group PLC (United Kingdom) | | | | | | | | |
4.500%, 11/04/24 | | | 200,000 | | | | 193,125 | |
(USD Swap 5 year + 4.760%), 7.500%, 06/27/671,2 | | | 70,000 | | | | 67,536 | |
| | |
Mid-America Apartments, LP | | | | | | | | |
4.200%, 06/15/28 | | | 95,000 | | | | 95,398 | |
| | |
Old Republic International Corp. | | | | | | | | |
4.875%, 10/01/24 | | | 100,000 | | | | 103,945 | |
| | |
Royal Bank of Scotland Group PLC (United Kingdom) | | | | | | | | |
(USD Swap 5 year + 5.800%) | | | | | | | | |
7.500%, 09/30/671,2 | | | 200,000 | | | | 198,000 | |
| | |
Santander Holdings USA, Inc. | | | | | | | | |
2.650%, 04/17/20 | | | 110,000 | | | | 108,577 | |
| | |
Societe Generale, S.A. (France) | | | | | | | | |
(EUR Swap 5 Year + 5.538%) | | | | | | | | |
6.750%, 10/07/671,2 | | | 105,000 | EUR | | | 121,770 | |
| | |
Ventas Realty, LP | | | | | | | | |
3.100%, 01/15/23 | | | 70,000 | | | | 68,257 | |
| | |
Total Financials | | | | | | | 1,798,901 | |
| | |
Industrials - 30.0% | | | | | | | | |
| | |
Air Canada 2017-1 Class AA Pass Through Trust (Canada) | | | | | | | | |
3.300%, 01/15/303 | | | 50,000 | | | | 47,715 | |
| | | | | | | | |
| | | Principal
Amount† | | | Value | |
| | |
Alfa, SAB de CV (Mexico) | | | | | | | | |
5.250%, 03/25/243 | | | $200,000 | | | | $198,752 | |
| | |
America Movil SAB de CV (Mexico) | | | | | | | | |
6.450%, 12/05/22 | | | 4,000,000 | MXN | | | 179,628 | |
| | |
Bayer US Finance II LLC | | | | | | | | |
4.375%, 12/15/283 | | | 200,000 | | | | 190,950 | |
| | |
Braskem Finance, Ltd. (Cayman Islands) | | | | | | | | |
5.750%, 04/15/213 | | | 200,000 | | | | 205,402 | |
| | |
Burlington Northern Santa Fe LLC | | | | | | | | |
4.050%, 06/15/48 | | | 65,000 | | | | 62,642 | |
| | |
Corp. Nacional del Cobre de Chile (Chile) | | | | | | | | |
4.500%, 09/16/253 | | | 245,000 | | | | 248,106 | |
| | |
Covanta Holding Corp. | | | | | | | | |
5.875%, 07/01/25 | | | 30,000 | | | | 27,600 | |
| | |
CSX Corp | | | | | | | | |
3.800%, 03/01/28 | | | 70,000 | | | | 68,678 | |
| | |
CVS Health Corp | | | | | | | | |
4.100%, 03/25/25 | | | 50,000 | | | | 49,501 | |
| | |
Delta Air Lines 2015-1 Class B Pass | | | | | | | | |
Through Trust Series 15-1 | | | | | | | | |
4.250%, 07/30/23 | | | 56,039 | | | | 56,625 | |
| | |
Embraer Netherlands Finance BV (Netherlands) | | | | | | | | |
5.050%, 06/15/25 | | | 70,000 | | | | 70,788 | |
| | |
Enbridge, Inc. (Canada) | | | | | | | | |
2.900%, 07/15/22 | | | 25,000 | | | | 24,194 | |
| | |
Energy Transfer Partners, LP | | | | | | | | |
4.050%, 03/15/25 | | | 210,000 | | | | 197,096 | |
| | |
General Motors Financial Co., Inc. | | | | | | | | |
4.000%, 01/15/25 | | | 120,000 | | | | 112,250 | |
| | |
Glencore Finance Canada, Ltd. (Canada) | | | | | | | | |
5.550%, 10/25/423,4 | | | 115,000 | | | | 103,514 | |
| | |
Hyundai Capital America | | | | | | | | |
2.750%, 09/27/263 | | | 85,000 | | | | 74,253 | |
| | |
Intel Corp. | | | | | | | | |
3.700%, 07/29/25 | | | 100,000 | | | | 100,873 | |
| | |
INVISTA Finance LLC | | | | | | | | |
4.250%, 10/15/193 | | | 130,000 | | | | 129,037 | |
| | |
Kinder Morgan Energy Partners, LP | | | | | | | | |
4.250%, 09/01/24 | | | 220,000 | | | | 218,682 | |
| | |
KT Corp. (South Korea) | | | | | | | | |
2.500%, 07/18/263 | | | 200,000 | | | | 180,982 | |
| | |
Latam Airlines 2015-1 Pass Through Trust A (Chile) | | | | | | | | |
4.200%, 11/15/27 | | | 46,278 | | | | 44,542 | |
| | |
Nissan Motor Acceptance Corp. | | | | | | | | |
3.650%, 09/21/213 | | | 60,000 | | | | 59,713 | |
| | |
Petrobras Global Finance BV (Netherlands) | | | | | | | | |
4.375%, 05/20/23 | | | 25,000 | | | | 23,847 | |
The accompanying notes are an integral part of these financial statements.
18
| | |
| | AMG Managers Global Income Opportunity Fund Schedule of Portfolio Investments(continued) |
| | | | | | | | |
| | | Principal
Amount† | | | Value | |
| | |
Industrials - 30.0%(continued) | | | | | | | | |
| | |
Petrobras Global Finance BV (Netherlands) | | | | | | | | |
5.999%, 01/27/28 | | | $15,000 | | | | $14,123 | |
| | |
Southern Copper Corp. (Peru) | | | | | | | | |
3.875%, 04/23/25 | | | 130,000 | | | | 125,422 | |
| | |
Teva Pharmaceutical Finance Co. LLC | | | | | | | | |
6.150%, 02/01/36 | | | 35,000 | | | | 31,342 | |
| | |
Walmart, Inc. | | | | | | | | |
3.700%, 06/26/28 | | | 90,000 | | | | 91,344 | |
| | |
Whiting Petroleum Corp. | | | | | | | | |
5.750%, 03/15/215 | | | 40,000 | | | | 38,000 | |
| | |
YPF, S.A. (Argentina) | | | | | | | | |
8.500%, 07/28/253 | | | 145,000 | | | | 130,138 | |
| | |
Total Industrials | | | | | | | 3,105,739 | |
| | |
Utilities - 6.5% | | | | | | | | |
| | |
CenterPoint Energy, Inc. | | | | | | | | |
3.850%, 02/01/24 | | | 30,000 | | | | 30,145 | |
| | |
Duke Energy Corp. | | | | | | | | |
3.150%, 08/15/27 | | | 70,000 | | | | 65,346 | |
| | |
Emgesa, S.A. ESP (Colombia) | | | | | | | | |
8.750%, 01/25/213 | | | 320,000,000 | COP | | | 102,646 | |
| | |
Empresas Publicas de Medellin ESP (Colombia) | | | | | | | | |
8.375%, 02/01/213 | | | 390,000,000 | COP | | | 120,695 | |
| | |
Enel Chile, S.A. (Chile) | | | | | | | | |
4.875%, 06/12/28 | | | 20,000 | | | | 19,950 | |
| | |
Enel Finance International, N.V. (Netherlands) | | | | | | | | |
1.375%, 06/01/26 | | | 100,000 | EUR | | | 110,926 | |
2.875%, 05/25/223 | | | 200,000 | | | | 188,441 | |
| | |
Virginia Electric & Power Co. | | | | | | | | |
Series A | | | | | | | | |
3.800%, 04/01/285 | | | 40,000 | | | | 40,168 | |
| | |
Total Utilities | | | | | | | 678,317 | |
| | |
Total Corporate Bonds and Notes | | | | | | | | |
(Cost $6,046,398) | | | | | | | 5,582,957 | |
| | |
Asset-Backed Security - 0.7% | | | | | | | | |
| | |
Trinity Rail Leasing 2010 LLC | | | | | | | | |
Series 2010-1A, Class A | | | | | | | | |
5.194%, 10/16/403 | | | 69,597 | | | | 74,033 | |
| | |
Total Asset-Backed Security | | | | | | | | |
(Cost $69,597) | | | | | | | 74,033 | |
| | |
U.S. Government and Agency Obligations - 6.1% | | | | | | | | |
| | |
U.S. Treasury Obligations - 6.1% | | | | | | | | |
| | |
U.S. Treasury Notes, | | | | | | | | |
2.750%, 09/30/20 | | | 50,000 | | | | 50,187 | |
2.875%, 08/15/28 | | | 290,000 | | | | 294,486 | |
0.125%, 04/15/22 | | | 119,582 | | | | 115,680 | |
0.375%, 07/15/27 | | | 186,082 | | | | 176,529 | |
| | |
Total U.S. Treasury Obligations (Cost $637,417) | | | | | | | 636,882 | |
| | | | | | | | |
| | | Principal
Amount† | | | Value | |
| | |
Foreign Government Obligations - 42.4% | | | | | | | | |
| | |
Argentine Republic Government International Bond | | | | | | | | |
7.125%, 06/28/17 | | | $95,000 | | | | $67,925 | |
7.625%, 04/22/46 | | | 150,000 | | | | 108,675 | |
| | |
Australia Government Bond | | | | | | | | |
Series 133 | | | | | | | | |
5.500%, 04/21/23 | | | 75,000 | AUD | | | 60,657 | |
| | |
Bonos de la Tesoreria de la Republica en pesos | | | | | | | | |
4.500%, 03/01/26 | | | 45,000,000 | CLP | | | 65,911 | |
| | |
Brazil Notas Do Tesouro Nacional | | | | | | | | |
Series F | | | | | | | | |
10.000%, 01/01/21 | | | 460,000 | BRL | | | 124,165 | |
| | |
Canadian When Issued Government Bond | | | | | | | | |
Series 0002 1.750%, 03/01/23 | | | 80,000 | CAD | | | 58,270 | |
Series 2 0.500%, 03/01/22 | | | 160,000 | CAD | | | 112,266 | |
| | |
Colombian TES | | | | | | | | |
Series B | | | | | | | | |
6.250%, 11/26/25 | | | 189,000,000 | COP | | | 57,493 | |
| | |
Corp. Andina de Fomento, Notes | | | | | | | | |
4.375%, 06/15/22 | | | 165,000 | | | | 170,767 | |
| | |
Dominican Republic International, Bonds | | | | | | | | |
8.625%, 04/20/273 | | | 100,000 | | | | 114,375 | |
| | |
Export Development Canada | | | | | | | | |
1.800%, 09/01/22 | | | 55,000 | CAD | | | 39,798 | |
| | |
French Republic Government Bond OAT | | | | | | | | |
4.250%, 10/25/23 | | | 440,000 | EUR | | | 610,159 | |
| | |
Indonesia Government International Bonds | | | | | | | | |
4.750%, 01/08/263 | | | 200,000 | | | | 202,619 | |
| | |
Indonesia Treasury Bonds | | | | | | | | |
Series FR53 | | | | | | | | |
8.250%, 07/15/21 | | | 4,979,000,000 | IDR | | | 351,092 | |
| | |
International Bank for Reconstruction & Development | | | | | | | | |
8.400%, 10/12/21 | | | 900,000,000 | IDR | | | 62,343 | |
| | |
Italy Buoni Poliennali Del Tesoro | | | | | | | | |
2.000%, 02/01/28 | | | 115,000 | EUR | | | 126,172 | |
5.000%, 03/01/22 | | | 90,000 | EUR | | | 115,171 | |
| | |
Korea Treasury Bond | | | | | | | | |
Series 2209 | | | | | | | | |
2.000%, 09/10/22 | | | 189,070,000 | KRW | | | 170,065 | |
| | |
Mexican Bonos | | | | | | | | |
Series M 5.750%, 03/05/26 | | | 3,630,000 | MXN | | | 156,032 | |
Series M 6.500%, 06/10/21 | | | 850,000 | MXN | | | 41,284 | |
Series M 8.000%, 12/07/23 | | | 1,600,000 | MXN | | | 79,460 | |
| | |
New South Wales Treasury Corp., Bonds | | | | | | | | |
Series 22 | | | | | | | | |
6.000%, 03/01/22 | | | 300,000 | AUD | | | 236,699 | |
| | |
Norway Government Bonds | | | | | | | | |
Series 474 | | | | | | | | |
3.750%, 05/25/213 | | | 485,000 | NOK | | | 59,530 | |
The accompanying notes are an integral part of these financial statements.
19
| | |
| | AMG Managers Global Income Opportunity Fund Schedule of Portfolio Investments(continued) |
| | | | | | | | | | |
Principal Amount† | | | | | Value | |
| | | |
Foreign Government Obligations - 42.4%(continued) | | | | | | | | | | |
| | | |
Republic of Poland Government Bond | | | | | | | | | | |
Series 0726 | | | | | | | | | | |
2.500%, 07/25/26 | | | 240,000 | | | PLN | | | $63,501 | |
| | | |
South Africa Government Bond | | | | | | | | | | |
Series R213 | | | | | | | | | | |
7.000%, 02/28/31 | | | 5,295,000 | | | ZAR | | | 301,979 | |
| | | |
Spain Government Bonds | | | | | | | | | | |
1.600%, 04/30/253 | | | 95,000 | | | EUR | | | 114,652 | |
4.400%, 10/31/233 | | | 105,000 | | | EUR | | | 143,229 | |
| | | |
Thailand Government Bonds | | | | | | | | | | |
2.125%, 12/17/26 | | | 5,000,000 | | | THB | | | 150,090 | |
| | | |
Turkey Government International Bond | | | | | | | | | | |
6.125%, 10/24/28 | | | $200,000 | | | | | | 186,235 | |
| | | |
U.K. Gilt Bonds | | | | | | | | | | |
2.000%, 09/07/25 | | | 130,000 | | | GBP | | | 176,498 | |
4.000%, 03/07/22 | | | 50,000 | | | GBP | | | 70,134 | |
| | | |
Total Foreign Government Obligations | | | | | | | | | | |
(Cost $4,654,485) | | | | | | | | | 4,397,246 | |
| | | |
| | | Principal
Amount | | | | | | |
| | | |
Short-Term Investments - 0.8% | | | | | | | | | | |
| | | |
Joint Repurchase Agreements - 0.0%#,6 | | | | | | | | | | |
| | | |
Citigroup Global Markets, Inc., dated 12/31/18, due 01/02/19, 3.000% total to be received $1,071 (collateralized by various U.S. Treasuries, 0.000% - 3.125%, 01/31/19 - 09/09/49, totaling $1,092) | | | $1,071 | | | | | | 1,071 | |
| | | | | | | | |
Shares | | | Value | |
| | |
Other Investment Companies - 0.8% | | | | | | | | |
| | |
Dreyfus Government Cash Management Fund, Institutional Shares, 2.29%7 | | | 25,105 | | | | $25,105 | |
| | |
Dreyfus Institutional Preferred Government Money Market Fund, Institutional Shares, 2.40%7 | | | 25,105 | | | | 25,105 | |
| | |
JPMorgan U.S. Government Money Market Fund, IM Shares, 2.36%7 | | | 25,866 | | | | 25,866 | |
| | |
Total Other Investment Companies | | | | | | | 76,076 | |
| | |
Total Short-Term Investments | | | | | | | | |
(Cost $77,147) | | | | | | | 77,147 | |
| | |
Total Investments - 103.9% | | | | | | | | |
(Cost $11,485,044) | | | | | | | 10,768,265 | |
| | |
Other Assets, less Liabilities - (3.9)% | | | | | | | (402,783 | ) |
| | |
Net Assets - 100.0% | | | | | | | $10,365,482 | |
| † | Principal amount stated in U.S. dollars unless otherwise stated. |
| 1 | Variable rate security. The rate shown is based on the latest available information as of December 31, 2018. |
| 2 | Perpetuity Bond. The date shown is the final call date. |
| 3 | Security exempt from registration under Rule 144A of the Securities Act of 1933. This security may be resold in transactions exempt from registration, normally to qualified buyers. At December 31, 2018, the value of these securities amounted to $2,745,440 or 26.5% of net assets. |
| 4 | Step Bond: A debt instrument with either deferred interest payments or an interest rate that resets at specific times during its term. |
| 5 | Some or all of these securities, amounting to $38,620 or 0.4% of net assets, were out on loan to various brokers and are collateralized by cash and various U.S. Treasury Obligations. See Note 4 of Notes to Financial Statements. |
| 6 | Cash collateral received from brokers for securities lending was invested in these joint repurchase agreements. |
| 7 | Yield shown represents the December 31, 2018, seven day average yield, which refers to the sum of the previous seven days’ dividends paid, expressed as an annual percentage. |
| | |
EMTN | | European Medium Term Note |
| | |
| |
LIBOR | | London Interbank Offered Rate |
| |
MTN | | Medium-Term Note |
|
| CURRENCY ABBREVIATIONS: |
| |
AUD | | Australian Dollar |
| |
BRL | | Brazilian Real |
| |
CAD | | Canadian Dollar |
| |
CLP | | Chile Peso |
| |
COP | | Colombia Peso |
| |
EUR | | Euro Dollar |
| |
GBP | | British Pound |
| |
IDR | | Indonesia Rupiah |
| |
KRW | | Korean Won |
| |
MXN | | Mexico Peso |
| |
NOK | | Norwegian Krone |
| |
PLN | | Poland Zloty |
| |
THB | | Thailand Baht |
| |
ZAR | | SouthAfrica Rand |
The accompanying notes are an integral part of these financial statements.
20
| | |
| | AMG Managers Global Income Opportunity Fund Schedule of Portfolio Investments(continued) |
Open Forward Foreign Currency Contracts at December 31, 2018
| | | | | | | | | | | | | | | | | | | | | | | | | | |
Currency Purchased | | Amount | | | | | | Currency Sold | | | Amount | | | Expiration | | Counterparty | | | Value | |
| | | | | | | |
Canadian Dollar | | | 295,000 | | | | | | | | U.S. Dollar | | | | 221,836 | | | 03/20/19 | | | UBS | | | | $(5,351 | ) |
| | | | | | | |
Euro | | | 1,208,000 | | | | | | | | U.S. Dollar | | | | 1,380,188 | | | 03/20/19 | | | MS | | | | 13,229 | |
| | | | | | | |
Japanese Yen | | | 231,875,000 | | | | | | | | U.S. Dollar | | | | 2,061,786 | | | 03/20/19 | | | CS | | | | 67,548 | |
| | | | | | | |
Sweden Krona | | | 580,000 | | | | | | | | U.S. Dollar | | | | 64,717 | | | 03/20/19 | | | UBS | | | | 1,146 | |
| | | | | | | |
U.S. Dollar | | | 157,059 | | | | | | | | Australian Dollar | | | | 217,000 | | | 03/20/19 | | | CS | | | | 4,007 | |
| | | | | | | |
U.S. Dollar | | | 131,518 | | | | | | | | Brazilian Real | | | | 515,000 | | | 03/06/19 | | | ML | | | | (701 | ) |
| | | | | | | |
U.S. Dollar | | | 110,084 | | | | | | | | Colombia Peso | | | | 352,710,000 | | | 03/20/19 | | | CS | | | | 1,888 | |
| | | | | | | |
U.S. Dollar | | | 271,820 | | | | | | | | Indonesia Rupiah | | | | 4,008,795,000 | | | 03/20/19 | | | CS | | | | (4,514 | ) |
| | | | | | | |
U.S. Dollar | | | 252,733 | | | | | | | | Mexico Peso | | | | 5,285,000 | | | 03/20/19 | | | UBS | | | | (12,864 | ) |
| | | | | | | |
U.S. Dollar | | | 147,694 | | | | | | | | Thailand Baht | | | | 4,825,000 | | | 03/20/19 | | | UBS | | | | (820 | ) |
| | | | | | | |
U.S. Dollar | | | 169,718 | | | | | | | | South Africa Rand | | | | 2,415,000 | | | 03/20/19 | | | UBS | | | | 3,466 | |
Total Forward Foreign Currency Contracts | | | | | | | | | | | | | | | | | | | | | | $67,034 | |
| | | | | | | | | | | | | | | | | | | | | | | | | | |
CS: Credit Suisse
ML: Merrill Lynch
MS: Morgan Stanley
UBS: UBS Securities LLC
The following table summarizes the inputs used to value the Fund’s investments by the fair value hierarchy levels as of December 31, 2018:
| | | | | | | | | | | | | | | | |
| | | Level 1 | | | Level 2 | | | Level 3 | | | Total | |
Investments in Securities | | | | | | | | | | | | | | | | |
| | | | |
Corporate Bonds and Notes† | | | — | | | | $5,582,957 | | | | — | | | | $5,582,957 | |
| | | | |
Asset-Backed Security | | | — | | | | 74,033 | | | | — | | | | 74,033 | |
| | | | |
U.S. Government and Agency Obligations† | | | — | | | | 636,882 | | | | — | | | | 636,882 | |
| | | | |
Foreign Government Obligations | | | — | | | | 4,397,246 | | | | — | | | | 4,397,246 | |
| | | | |
Short-Term Investments | | | | | | | | | | | | | | | | |
| | | | |
Joint Repurchase Agreements | | | — | | | | 1,071 | | | | — | | | | 1,071 | |
| | | | |
Other Investment Companies | | | $76,076 | | | | — | | | | — | | | | 76,076 | |
| | | | | | | | | | | | | | | | |
Total Investments in Securities | | | $76,076 | | | | $10,692,189 | | | | — | | | | $10,768,265 | |
| | | | | | | | | | | | | | | | |
| | | | |
Financial Derivative Instruments - Assets | | | | | | | | | | | | | | | | |
| | | | |
Foreign Currency Exchange Contracts | | | — | | | | $91,284 | | | | — | | | | $91,284 | |
| | | | |
Financial Derivative Instruments - Liabilities | | | | | | | | | | | | | | | | |
| | | | |
Foreign Currency Exchange Contracts | | | — | | | | (24,250 | ) | | | — | | | | (24,250 | ) |
| | | | | | | | | | | | | | | | |
Total Financial Derivative Instruments | | | — | | | | $67,034 | | | | — | | | | $67,034 | |
| | | | | | | | | | | | | | | | |
| † | All corporate bonds and notes and U.S. government and agency obligations held in the Fund are Level 2 securities. For a detailed breakout of corporate bonds and notes and U.S. government and agency obligations by major industry or agency classification, please refer to the Fund’s Schedule of Portfolio Investments. |
For the fiscal year ended December 31, 2018, there were no transfers in or out of Level 3.
The accompanying notes are an integral part of these financial statements.
21
| | |
| | AMG Managers Global Income Opportunity Fund Schedule of Portfolio Investments(continued) |
The following schedule shows the value of derivative instruments at December 31, 2018.
| | | | | | | | | | | | |
| | | Asset Derivatives | | | | | Liability Derivatives | |
| | | | |
Derivatives not accounted for as hedging instruments | | Statement of Assets and Liabilities Location | | | Fair Value | | | Statement of Assets and Liabilities Location | | | Fair Value | |
| | | | |
Foreign currency exchange contracts | | Unrealized appreciation on foreign currency contracts | | | $91,284 | | | Unrealized depreciation on foreign currency contracts | | | $24,250 | |
| | | | | | | | | | | | |
For the fiscal year ended December 31, 2018 the effect of derivative instruments on the Statement of Operations for the Fund and the amount of realized gain/loss and unrealized appreciation/depreciation on derivatives recognized in income was as follows:
| | | | | | | | | | | | |
| | | Realized Loss | | | | | Change in Unrealized Appreciation/Depreciation | |
| | | | |
Derivatives not accounted for as hedging instruments | | Statement of Operations
Location | |
| Realized
Loss |
| | Statement of Operations
Location | |
| Change in
Unrealized
Appreciation |
|
| | | | |
Foreign currency exchange contracts | | Net realized loss on forward contracts | | | $(108,271 | ) | | Net change in unrealized appreciation/ depreciation on forward contracts | | | $10,441 | |
| | | | | | | | | | | | |
| | |
Country | | % of Long-Term Investments |
| |
Argentina | | 2.9 |
| |
Australia | | 3.3 |
| |
Brazil | | 1.2 |
| |
Canada | | 3.6 |
| |
Cayman Islands | | 1.9 |
| |
Chile | | 3.5 |
| |
Colombia | | 2.6 |
| |
Dominican Republic | | 1.1 |
| |
France | | 8.1 |
| |
Germany | | 0.4 |
| |
Indonesia | | 5.2 |
| |
Italy | | 2.3 |
| |
Mexico | | 6.1 |
| |
Netherlands | | 3.8 |
| |
Norway | | 0.6 |
| |
Peru | | 1.2 |
| |
Poland | | 0.6 |
| |
South Africa | | 2.8 |
| |
South Korea | | 3.3 |
| |
Spain | | 2.4 |
| |
Thailand | | 1.4 |
| |
Turkey | | 1.7 |
| |
United Kingdom | | 9.1 |
| |
United States | | 29.3 |
| |
Venezuela | | 1.6 |
| | |
| | 100.0 |
| | |
The accompanying notes are an integral part of these financial statements.
22
|
AMG Managers Special Equity Fund Portfolio Manager’s Comments(unaudited) |
| | | | | | | | | | | | |
For the fiscal year ended December 31, 2018, the AMG Managers Special Equity Fund (Class I) (the Fund) returned -3.52%, compared to the -9.31% return for the Russell 2000® Growth Index. FEDERATED MDT ADVISERS 2018 was a much less happy year for the domestic market than 2017, as the fourth quarter left all of the domestic Russell equity benchmarks negative for the year. For the full year, though, our sleeve was able to outperform the benchmark and provide some downside protection. In 2018, the Federated MDT Advisors (MDT) sleeve of the Fund returned -6.7%, outperforming the benchmark Russell 2000® Growth Index which returned -9.3%. MDT has continued to follow its disciplined investment process in 2018 as before. It was a volatile market that changed directions several times based on the turbulent political environment and the uncertain economy. The MDT sleeve benefited from the stronger risk controls that have been added to the strategy over the last decade to make it more robust to changes in the market environment. Those risk controls kept the sleeve diversified all the time so the process didn’t need to change in the wake of macroeconomic events. The strategy is roughly sector-neutral to the benchmark, and it holds stocks with fundamentals that span the benchmark. Even a style-specific strategy like Small Cap Growth holds companies with different fundamental characteristics: the MDT sleeve has companies with very strong growth characteristics, and it also holds companies that are in the Russell 2000® Growth Index but look more value-oriented with characteristics like strong structural earnings (a measure of earnings repeatability) or improving earnings-to-price. While the first two quarters of the year showed roughly neutral performance versus benchmark for the MDT sleeve, in the third quarter the MDT sleeve outperformed more than 5% because of its most growth-oriented holdings (characteristics of those holdings included strong sell-side analyst conviction, high long-term earnings growth, and rising prices). In the fourth quarter, however, events such as the deepening tariff war, the killing of Jamal Khashoggi, and the lack of progress on Brexit worried investors and a market correction occurred. The MDT sleeve gave back some of its third quarter gains as there were analyst conviction/price momentum stocks that tumbled, but the loss in the quarter was limited to 1.8% versus benchmark as our more value-oriented small cap growth names did well. This performance matches MDT’s | | | | | | expectations: we want our sleeve to outperform when the market is paying attention to the fundamental and technical characteristics that we feel are important, and to lose only a little ground when the market stops paying attention to those company-specific fundamentals. Stocks that contributed significantly to the outperformance of the MDTA sleeve relative to the benchmark during the year included Medifast, Inc., Haemonetics Corporation, Five Below, Inc., The Chefs’ Warehouse, Inc., and Etsy, Inc. Specific stocks which detracted the most from relative performance included Deluxe Corporation, Denbury Resources, Inc., and Interface, Inc. At the end of the year, the MDTA sleeve’s sector exposures remained roughly neutral to the benchmark except for a small underweight in the real estate sector. The sleeve has no exposure to REITs. LORD, ABBETT & CO., LLC PERFORMANCE SUMMARY For the fiscal year ended December 31, 2018 (the “performance period”), Lord Abbett’s sleeve of the Fund (the “Sleeve”) returned 5.99%, outperforming its benchmark, the Russell 2000® Growth Index, which returned -9.31% over the same period MARKET REVIEW Domestic equity returns were negative over the past year, with large cap stocks, as represented by the S&P 500® Index, falling -4.38% during the period, while small cap stocks, as represented by the Russell 2000® Index, were down -11.01%. During the period, there were several market-moving events. Notably, Congress passed the largest rewrite of the U.S. tax code in decades, which went into effect in January 2018. The tax bill reduced the corporate tax rate from 35% to 21% and allowed for a one-time repatriation tax of 15.5%, rather than the standard repatriation tax rate of 35%. In June 2018, the White House announced its intent to impose additional tariffs on $200 billion worth of Chinese goods on top of the $50 billion previously announced. The aggressive U.S. trade posture continued into the third quarter with trade tensions mounting between the U.S. and China. In December, the White House announced a trade truce between the U.S. and China following a meeting between President Trump and President Xi Jinping at the G20 summit in December. The U.S. agreed to maintain a 10% tariff rate on $200 billion worth of Chinese imports at the start of 2019 as opposed to the originally planned 25% tariff rate. In return, China agreed to purchase a substantial | | | | | | amount of U.S. agriculture, industrial, and energy products to further reduce the trade imbalance. While the impact has yet to fully be realized, many corporations anticipate that the retaliatory tariffs will weigh on profits. Trade discussions between Mexico, Canada, and the U.S., however, took a more favorable turn as the negotiations resulted in a revised version of the North American Free Trade Agreement (NAFTA) called the U.S.-Mexico-Canada Agreement (USMCA). In March 2018, the Fed raised its target for short-term interest rates by 0.25%, to a range of 1.50%–1.75%, and followed with rate hikes of 0.25% at each of its June, September, and December meetings, raising the target range to 2.25%–2.50%. Amid rising concerns surrounding escalating trade tensions, slowing global growth, and increasing interest rates, the Nasdaq experienced the largest monthly drop since 2008 in October 2018. Following the prior month’s volatility, domestic equity markets rallied in November and partially reversed October’s losses, however the S&P 500® Index returned to negative territory in December, posting its worst month since February 2009. PORTFOLIO REVIEW The leading contributor to the Sleeve’s absolute and relative performance during the reporting period was security selection in the information technology sector. Within this sector, the Sleeve’s holdings of Twilio, Inc., a provider of a cloud based communications software platform, contributed most. Shares of Twilio benefited from the firm’s ability to capitalize on its vast and growing addressable market, through the introduction of new products like Flex, a cloud contact application, and expanding its footprint with its acquisition of SendGrid. Another contributor within this sector during the reporting period was the Sleeve’s position in Everbridge, Inc., a developer of critical event management software and applications. Shares of Everbridge appreciated as it reported successive quarters of robust revenue and earnings growth, while continuing to expand internationally and completing a key acquisition of Unified Messaging Systems. Security selection within the health care sector also positively impacted the Sleeve’s relative performance during the reporting period. Within this sector, the Sleeve’s holdings of Foundation Medicine, Inc., a molecular diagnostic company, contributed as Roche acquired the firm in an effort to expand its existing capabilities. |
23
| | |
| | AMG Managers Special Equity Fund Portfolio Manager’s Comments(continued) |
| | | | | | | | | | | | |
The leading detractors from the Sleeve’s performance relative to the benchmark during the reporting period were security selection and an underweight in the financials sector. Within this sector, the Sleeve’s position in Western Alliance Bancorp., a provider of various banking services, detracted. Shares of Western Alliance declined as investors were concerned about a possible moderation in growth due to increased competition for loans among banks and non-banks. Another detractor within the sector was the Sleeve’s position in CenterState Bank Corporation, a bank holding company. U.S. banks, like Western Alliance and CenterState, faced headwinds during the latter half of the year as investors appeared to expect commercial and industrial loan growth to decline, while the industry continued to face tougher competition from non-bank lenders and corporate clients. Security selection in the communication services (formerly telecommunication services) sector also detracted from the Sleeve’s performance relative to the benchmark during the reporting period. Within this sector, the Sleeve’s holdings of Eventbrite, Inc., an operator of a self-service online ticketing platform, detracted. Shares of Eventbrite, which conducted its IPO in September, declined during the period as investors were concerned about its valuation and pending share lockup expiration. Additionally, though it beat consensus estimates in its first public reporting, it was not of the magnitude that investors expected. RANGER INVESTMENT MANAGEMENT, L.P. Newton’s Third Law: “For every action, there is an equal and opposite reaction.” We began your 2017 year-end letter with the same quote. Not that we are prescient, but having been active market participants over the past 30 years (with half of those at Ranger), we know that anomalous market environments like 2017 (high returns with historic low levels of volatility) tend to be followed by inverse actions. While not a complete reversal of the prior years’ gains, the 29% selloff by the Russell 2000® Growth Index from the August 31 market peak to the December 24 low more than reversed the ebullient sentiment of the prior 18 months. During the fourth quarter, the markets wrestled with a host of concerning events and the resulting selloff and volatility was both severe and swift. Ranger believes the combination of high equity valuations, continued interest rate increases, escalating | | | | | | trade/tariff rhetoric and deceleration in economic data were the main culprits for the market weakness. The key question is whether the major points of uncertainty (tariffs, inflation, and geopolitical risk) change the macroeconomic environment enough to bring a halt to economic growth and a historically long bull market. Currently, the aggressive U.S. trade posture is becoming a major risk to the global economy. China and the U.S. are the most central economies in a highly integrated global trade network. Plans by the U.S. to confront China’s trade and investment policies could further ratchet up bilateral commercial tensions, thus complicating future global growth. We entered 2018 with universally strong global economic growth; however, outside of the U.S. most economies meaningfully decelerated. Slower global growth and tempered inflation stand in contrast with full employment, which should allow the Fed to pause before making a decision to move to increase rates further. Ranger also expects more elevated market volatility due to declining global economic momentum as risks to the monetary, political, and economic outlooks continue. With this increased market volatility, quality companies should outperform the overall market. This relative outperformance was validated by your portfolio performing better for both the fourth quarter and 2018, as outlined below. PORTFOLIO COMMMENTARY Ranger’s sleeve of the Fund decline of -6.9% outperformed the Russell 2000® Growth Index (“Index”) decline of -9.3% this past year. Market weakness was broad in 2018 with only the technology and consumer staples sectors advancing. The portfolio underperformed in the first quarter and benefited from sequential outperformance in the three subsequent quarters. Volatility increased significantly during the year as the VIX averaged 17 compared with the historically low average of 11 in 2017. The transition from a liquidity-powered market for risk assets to one influenced by fundamentals is not likely to be smooth. With the broad and significant market selloff, valuation levels are now more attractive. The protracted market advance from the February 2016 low through the August 2018 high provided few opportunities to invest in companies at attractive valuation levels. While broad, indiscriminate selloffs are difficult, they provide opportunity for new high quality investment ideas in the portfolio. With increasing and ongoing volatility, | | | | | | Ranger is hopeful that the differentiation between risk assets and fundamentals will present opportunities to acquire high quality businesses at attractive valuations. Factor analysis demonstrated outperformance by most low quality factors. Unprofitable companies, which represented 29% of the Index, declined 6.8%, outperforming companies with earnings which decreased -9.9%. Notably, non-earning pharmaceutical and biotech companies, which were 12.0% of the Index total and 40% of the non-earning component, underperformed meaningfully, declining -19.5%. Non-earning technology companies, which were 7.7% of the Index total and 27% of the non-earning component, gained 13.7%, continuing a trend of outperformance. Companies with negative value return on equity , which represented 28% of the index, declined only -4.6%. The three highest return on equity quintiles underperformed, declining -13.6%, -9.5%, and -15.4%, respectively. Balance sheet strength was the only high quality factor that demonstrated leadership. Companies in the three highest debt/equity quintiles underperformed the Index return, decreasing -11.7%, -16.7%, and -19.2%. Companies in the two lowest debt/equity quintiles declined -5.6% and -6.8%, respectively. High valuation factors outperformed. On both a forward and trailing twelve-month (TTM) basis, companies in the three highest P/E quintiles meaningfully outperformed the Index. The three highest price/sales quintiles outperformed with gains of 2.0%, 0.6% and a decline of -6.5%. While companies with negative price/cash flow, which represented 15.7% of the Index, declined -17.7%, the two highest price/cash flow quintiles outperformed, declining -5.3% and gaining 14.7%. Materials & processing was the largest outperforming sector in the portfolio this past year. Positions in this sector gained 4.2% compared with the -26.8% decrease by the Index component. The sector benefited from three holdings with positive gains which we trimmed/sold during the market advance and locked in performance. Healthcare was the second largest relative contributor to performance. Holdings in this sector increased 6.0% compared with the 5.6% decline by the Index component. Strong gains by four holdings helped sector performance. Underperformance by non-earning biotech and pharmaceutical companies hindered the Index return. Producer durables was the largest detractor from performance as holdings in this sector declined -23.6% compared with the -6.9% decrease by the |
24
| | |
| | AMG Managers Special Equity Fund Portfolio Manager’s Comments(continued) |
| | | | | | | | | | | | |
Index component. Three positions pressured sector performance. The financial services sector was the second largest detractor from performance. Positions in this sector declined -20.5% compared with the -10.5% decrease by the Index component. Underperformance by regional banks pressured sector performance. REITs, which represent 2.4% of the Index sector weighting, meaningfully outperformed, declining -6.1%. CONTRIBUTORS: Tabula Rasa HealthCare, a provider of cloud-based medication management software, was the largest contributor to performance this year. The strength during the year was due to strong financial results and a robust outlook for enhanced medication management. With an aging demographic, increased medication consumption, and a focus on controlling spending, the potential for adverse events due to medication interaction is a major concern and cost for the healthcare industry. Tabula Rasa HealthCare has developed a unique solution to address this issue and the potential opportunity remains large and untapped. Inter Parfums, a marketer of licensed fragrance and skin care products, was the second largest contributor to performance during the year. Throughout the year, the company reported financial results that exceeded street expectations across all metrics. A good consumer spending environment combined with the launch of new products supports the potential for continued outperformance as we enter 2019. Qualys, a software security provider, was third the largest contributor to performance for the second year in a row. The company’s strong and sticky customer base, recurring revenue and high incremental margins represent an attractive combination. The company successfully rolled out several new security products, which we think will be accretive to growth going forward. We remain excited about Qualys’s ability to garner increased wallet share at existing customers given the new product introductions DETRACTORS: WageWorks, a provider of tax-advantaged programs for consumer-directed health, commuter and other spending accounts, was the largest detractor from the performance this year. The weakness was the result of the company’s ongoing effort to file updated financial statements. During the quarter, WageWorks announced that they would be replacing their auditor KPMG with BDO in order meet their filing | | | | | | deadline. Management stated (approved by their legal team) that there are no changes to their 2017 financials and only minor changes to their 2016 financials. WageWorks is facing a final deadline of March 2019 or risk delisting. While these restatements seem minor, the risk of delisting is very concerning. We, therefore, elected to sell the position. Banc of California was the second largest detractor from performance in the financial sector for the year. In October, the stock declined after management reported weaker than expected earnings. However, most of the stock’s decline late this year was in sympathy with the broader market. The company’s new management team is one year into a three-year strategic plan. The progress in achieving its goals is slower than many investors anticipated, but we believe the goals that management established are achievable and, once met, can result in a higher stock price. We maintained your position in the stock. e.l.f. Beauty, a manufacturer and marketer of cosmetic products, was the third largest detractor from performance in 2018. As the year advanced, the company reduced financial expectations. After years of significant share gains, the company was faced with increased competitive challenges which will necessitate higher marketing spending. This shift in strategy caused us to reevaluate the position and sell it during the summer. LOOKING FORWARD A near 30% decline from peak to trough and broad, indiscriminate selling that comes with such a sharp selloff provides compelling fundamental and valuation opportunities as we enter 2019. As noted above, we purchased nine new positions during the fourth quarter. These new buys stand in sharp contrast to a year ago when valuation levels across all metrics were well above historic averages. While the economic and policy backdrop will likely dictate whether these measures stabilize, further contract or expand, the valuation backdrop is far more encouraging for the Ranger team to invest in attractively valued, sustainable growth business models. While liquidity remains ample and volatility returned to historic averages in 2018, we continue to expect that the rate normalization process will contribute to increasing volatility going forward. The cost of capital for companies is likely to increase and become more variable. Additionally, as the Fed steers us to a more normalized economic cycle, | | | | | | weaker companies should have a more challenging time and should cede market share back to good companies. Therefore, stock selectivity from both a fundamental and valuation perspective should be a more important differentiator in this market environment. Ranger’s downside capture should position our portfolios to navigate a more discerning market environment well. Our current view is that the U.S. economy is showing a mix of mid-cycle dynamics and late-cycle trends. As is typical during a late-cycle phase, tighter employment markets are pushing up wages and the Federal Reserve’s tightening of monetary policy is flattening the yield curve. While credit conditions are not yet restrictive, higher rates have tempered both consumer and corporate behavior. Despite these issues, the U.S. corporate backdrop remains healthy, and pro-business policies continue to help earnings growth. Lower tax burdens and access to offshore cash provide companies with additional spending capacity, which are being used on a wide variety of activities, including investor-friendly actions (buybacks, dividends, M&A) as well as direct boosts to the real economy (raising wages, capital expenditures). During 2018, six portfolio holdings were acquired or are in the process of being acquired. BroadSoft, Cotiviti and Sonic closed during the year, while Integrated Device Technology, WildHorse Resources and MINDBODY are pending. This high level of acquisitions is reflective of Ranger successfully identifying companies with superior sustained growth and high return profiles. As we enter the latter stages of the economic cycle with growth harder to come by and interest rates higher, we believe small capitalization companies that continue to distinguish themselves with differentiated growth should increasingly be attractive candidates for consolidation. In summary, we focus on high quality growth companies where we believe there is a valuation inefficiency in the market. We build concentrated portfolios of select companies that we believe possess the characteristics to thrive in an evolving economic landscape. After the worst market selloff since 2011, valuation levels are broadly more attractive, and we have opportunities to buy high quality franchises as we enter 2019. Obviously, the litany of concerns we outlined at the outset of the letter are the principle worries of the market and led to the sharp selloff. We take this significant decline as opportunity and currently think that the better |
25
| | |
| | AMG Managers Special Equity Fund Portfolio Manager’s Comments(continued) |
| | | | | | | | | | | | |
relative positioning of the U.S. has the prospect to particularly drive better financial performance off today’s depressed expectations. SMITH ASSET MANAGEMENT GROUP, L.P. For the fiscal year ended December 31, 2018, the Smith Group sleeve of the Fund return on a net asset value basis was -7.0%. During the same period, the Russell 2000® Growth Index posted a return of -9.3% and the Russell 2000® Index returned -11.0%. 2018 started with a marked improvement in aggregate earnings trends, especially in the U.S. Positive estimate revisions in the early months outpaced negatives by a wide margin resulting in one of the best periods for U.S. earnings revision momentum since the financial crisis. Granted, much of the initial burst in earnings expectations was due to U.S. tax reform but solid economic data across all regions of the globe also suggested the long awaited synchronized global expansion was firmly in place. By the end of the second quarter, it was becoming clear that nearly every corner of the global economy was decelerating except for the U.S. and oil rich countries (the beneficiaries of surging crude prices). Despite the specter of a multi-front trade war, domestic markets continued to march higher with more domestically oriented small-caps performing better than larger companies (which typically source more of their revenues from abroad). Exuberance in the U.S. stock market was not surprising considering the highest percentage of people since 2005 were “satisfied with the way things are going in the U.S.” according to the Gallup organization. Economic growth outside the U.S., particularly in China, continued to slow during the third quarter but within the U.S., economic strength and confidence continued to burn bright. Unemployment dipped to levels not seen since the late 1960s (and briefly in 2000) while sales growth and profit margins expanded to levels not seen since before the great recession. Strength in income and jobs led the Fed to raise rates and declare that “further gradual increases in the target range for the federal funds | | | | | | rate will likely be appropriate” to slow a booming domestic economy. The quarter closed with oil prices days away from the high of the year but only weeks away from a savage selloff. As the final quarter of the year began, it appeared trade policy would be the dominant headline for the remainder of 2018—and for most of the quarter, it was. The narrative shifted on December 19, however, following a unanimous vote by the Fed to raise interest rates and comments by the Fed Chairman stating that a slowing global economy and increased market volatility had “not fundamentally altered the outlook” for additional interest rate hikes. Fears of an interest rate policy mistake, by a Fed that might not be as independent as previously thought, coupled with a lingering trade war(s) by a “shut down” government were enough to push an already nervous market into bear territory. The quarter ended with a true “December to Remember” as the market posted its worst final month since 1931. There are plenty of issues that could further derail stocks, both domestic and around the world. But stock prices have already corrected sharply. In the U.S., 2018 saw small cap stock prices drop more than 5% for the first time since the recession, while earnings are on track to be up almost 20%. That correction has a huge impact on valuations that had been looking stretched. Both the S&P 500® and Russell 2000® Growth indices are back down to valuation levels last seen five years ago. Market timing using valuation has long been folly, but long-term investors should find a lot to like with valuations they have not seen in some time and earnings growth likely to remain positive. The strategy’s primary focus is to find companies that can sustainably grow high quality earnings faster than expectations and that also possess reasonable valuations. Stock selection was favorable vs. the Russell 2000® Growth in industrials, health care, consumer discretionary and consumer staples trailed the index in information technology, real estate and energy. An underweight to biotech companies aided relative performance. For the full year, consumer staples delivered the strongest absolute performance as strategy holdings returned 40%. | | | | | | The strategy’s top contributor was Etsy. Investors celebrated the efforts of the leader in the handmade/artisanal segment of e-commerce to reinvigorate growth which led to earnings for the last year 80% above expectations from the year ago period. Decker’s Outdoor, the casual footwear designer and distributor of brands such as Ugg, Teva, and Sanuk, shrugged off the general weakness in apparel stocks on the strength of a 50% year-over-year increase in earnings. The largest detractors in the portfolio were energy equipment company Pioneer Energy Services and gaming and racing operator Penn National Gaming. Pioneer Energy provides land-based drilling services to oil and gas exploration companies in the U.S. and Colombia. The company’s fortunes are strongly tied to crude oil prices and the stock suffered after it lowered production guidance in the third quarter and with the selloff in crude prices in the fourth quarter. Gaming company Penn National fell following reporting lower than expected earnings for the third quarter of 2018, owing to weakness in its Illinois and Mississippi properties, and was sold from the portfolio. We continue to believe that equities in general, and our investment philosophy, should be able to generate attractive returns going forward as slower but still above average economic growth will provide a solid foundation for corporate profit growth. Thank you for placing your trust in Smith Group Asset Management. As always, we appreciate the opportunity to serve your investment needs. This commentary reflects the viewpoints of the portfolio managers, Federated MDTA, LLC., Lord, Abbett & Co., LLC, Ranger Investment Management, L.P. and Smith Asset Management Group, L.P. as of December 31, 2018 and is not intended as a forecast or guarantee of future results, and is subject to change without notice. |
26
| | |
| | AMG Managers Special Equity Fund Portfolio Manager’s Comments(continued) |
CUMULATIVE TOTAL RETURN PERFORMANCE
AMG Managers Special Equity Fund’s cumulative total return is based on the daily change in net asset value (NAV), and assumes that all dividends and distributions were reinvested. The graph compares a hypothetical $10,000 investment made in the AMG Managers Special Equity Fund’s Class I Shares on December 31, 2008, to a $10,000 investment made in the Russell 2000® Growth Index for the same time period. The graph and table do not reflect the deduction of taxes that a shareholder would pay on a Fund distribution or redemption of shares. The listed returns for the Fund are net expenses and the returns for the index exclude expenses. Total returns would have been lower had certain expenses not been reduced.
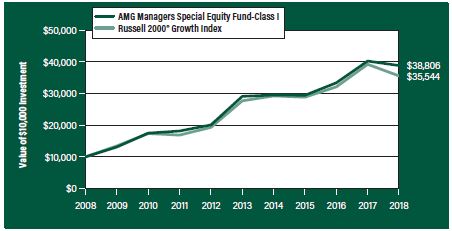
The table below shows the average annual total returns for the AMG Managers Special Equity Fund and the Russell 2000® Growth Index for the same time periods ended December 31, 2018.
| | | | | | | | | | | | |
| Average Annual Total Returns1 | | One Year | | | Five Years | | | Ten Years | |
AMG Managers Special Equity Fund2,3, 4, 5, 6 | |
| | | |
Class N | | | (3.76%) | | | | 5.67% | | | | 14.27% | |
| | | |
Class I | | | (3.52%) | | | | 5.94% | | | | 14.52% | |
| | | |
Russell 2000® Growth Index7 | | | (9.31%) | | | | 5.13% | | | | 13.52% | |
The performance data shown represents past performance. Past performance is not a guarantee of future results. Current performance may be lower or higher than the performance data quoted. The investment return and principal value of an investment will fluctuate so that an investor’s shares, when redeemed, may be worth more or less than their original cost.
Investors should carefully consider the Fund’s investment objectives, risks, charges and expenses before investing. For performance information through the most recent month end, current net asset values per share for the Fund and other information, please call 800.835.3879 or visit our website at amgfunds.com for a free prospectus. Read it carefully before investing or sending money.
Distributed by AMG Distributors, Inc., member FINRA/SIPC.
| 1 | Total return equals income yield plus share price change and assumes reinvestment of all dividends and capital gain distributions. Returns are net of fees and may reflect offsets of Fund expenses as described in the prospectus. No adjustment has been made for taxes payable by shareholders on their reinvested dividends and capital gain distributions. Returns for periods greater than one year are annualized. The listed returns on the Fund are net of expenses and based on the published NAV as of December 31, 2018. All returns are in U.S. dollars ($). |
|
2 From time to time, the Fund’s advisor has waived its fees and/or absorbed Fund expenses, which has resulted in higher returns. 3 The Fund is subject to risks associated with investments in small-capitalization companies, such as erratic earnings patterns, competitive conditions, limited earnings history and a reliance on one or a limited number of products. 4 The Fund is subject to risks associated with investments in mid-capitalization companies such as greater price volatility, lower trading volume, and less liquidity than the stocks of larger, more established companies. 5 The Fund invests in growth stocks, which may be more sensitive to market movements because their prices tend to reflect future investor expectations rather than just current profits. Growth stocks may underperform value stocks during given periods. 6 Investments in international securities are subject to certain risks of overseas investing including currency fluctuations and changes in political and economic conditions, which could result in significant market fluctuations. These risks are magnified in emerging markets. 7 The Russell 2000® Growth Index measures the performance of the Russell 2000® companies with higher price-to-book ratios and higher forecasted growth values. Unlike the Fund, the Russell 2000® Growth Index is unmanaged, is not available for investment and does not incur expenses. The Russell Indices are trademarks of the London Stock Exchange Group companies. Not FDIC insured, nor bank guaranteed. May lose value. |
27
| | |
| | AMG Managers Special Equity Fund Fund Snapshots(unaudited) December 31, 2018 |
PORTFOLIO BREAKDOWN
| | |
| Sector | | % of
Net Assets |
| | |
Health Care | | 27.4 |
| | |
Information Technology | | 24.8 |
| | |
Industrials | | 14.3 |
| | |
Consumer Discretionary | | 13.8 |
| | |
Financials | | 6.0 |
| | |
Consumer Staples | | 5.9 |
| | |
Communication Services | | 2.9 |
| | |
Energy | | 1.8 |
| | |
Materials | | 1.6 |
| | |
Real Estate | | 0.1 |
| | |
Short-Term Investments | | 4.8 |
| | |
Other Assets Less Liabilities | | (3.4) |
TOP TEN HOLDINGS
| | |
| Security Name | | % of
Net Assets |
| | |
Repligen Corp. | | 1.8 |
| | |
Pegasystems, Inc. | | 1.8 |
| | |
Qualys, Inc. | | 1.6 |
| | |
Inter Parfums, Inc. | | 1.6 |
| | |
PRA Health Sciences, Inc. | | 1.4 |
| | |
Calavo Growers, Inc. | | 1.4 |
| | |
WNS Holdings, Ltd., ADR (India) | | 1.3 |
| | |
BioTelemetry, Inc. | | 1.3 |
| | |
MAXIMUS, Inc. | | 1.2 |
| | |
Insperity, Inc. | | 1.2 |
| | | |
| | |
Top Ten as a Group | | 14.6 |
| | | |
| | | |
Because a fund’s strategy may result in multiple investments in particular sectors of the economy, its performance may depend on the performance of those sectors and may fluctuate more widely than investments diversified across more sectors. For additional information on these and other risk considerations, please see the Fund’s prospectus.
Any sectors, industries, or securities discussed should not be perceived as investment recommendations. Mention of a specific security should not be considered a recommendation to buy or solicitation to sell that security. Specific securities mentioned in this report may have been sold from the Fund’s portfolio of investments by the time you receive this report.
28
| | |
| | AMG Managers Special Equity Fund Schedule of Portfolio Investments December 31, 2018 |
| | | | | | | | |
| | | Shares | | Value | |
| | |
Common Stocks - 98.6% | | | | | | | | |
| | |
Communication Services - 2.9% | | | | | | | | |
| | |
CarGurus, Inc.*,1 | | | 14,958 | | | | $504,533 | |
| | |
Cogent Communications Holdings, Inc. | | | 43,817 | | | | 1,980,967 | |
| | |
Eventbrite, Inc., Class A*,1 | | | 18,341 | | | | 510,063 | |
| | |
Live Nation Entertainment, Inc.*,1 | | | 3,419 | | | | 168,386 | |
| | |
Nexstar Media Group, Inc., Class A1 | | | 6,904 | | | | 542,930 | |
| | |
Shenandoah Telecommunications Co. | | | 17,539 | | | | 776,101 | |
| | |
Vonage Holdings Corp.* | | | 44,932 | | | | 392,256 | |
| | |
World Wrestling Entertainment, Inc., Class A1 | | | 12,847 | | | | 959,928 | |
| | |
Total Communication Services | | | | | | | 5,835,164 | |
| | |
Consumer Discretionary - 13.8% | | | | | | | | |
| | |
American Eagle Outfitters, Inc.1 | | | 35,035 | | | | 677,227 | |
| | |
At Home Group, Inc.* | | | 21,306 | | | | 397,570 | |
| | |
Big Lots, Inc.1 | | | 3,671 | | | | 106,165 | |
| | |
BJ’s Restaurants, Inc.1 | | | 14,363 | | | | 726,337 | |
| | |
Bright Horizons Family Solutions, Inc.* | | | 7,414 | | | | 826,290 | |
| | |
Brinker International, Inc. | | | 10,800 | | | | 474,984 | |
| | |
Canada Goose Holdings, Inc. (Canada)* | | | 9,264 | | | | 405,022 | |
| | |
Cavco Industries, Inc.* | | | 5,362 | | | | 699,098 | |
| | |
Chegg, Inc.*,1 | | | 70,607 | | | | 2,006,651 | |
| | |
The Children’s Place, Inc. | | | 1,258 | | | | 113,333 | |
| | |
Churchill Downs, Inc. | | | 1,774 | | | | 432,750 | |
| | |
Cooper-Standard Holdings, Inc.* | | | 2,901 | | | | 180,210 | |
| | |
Dave & Buster’s Entertainment, Inc. | | | 9,138 | | | | 407,189 | |
| | |
Deckers Outdoor Corp.* | | | 6,228 | | | | 796,873 | |
| | |
Dine Brands Global, Inc.1 | | | 6,600 | | | | 444,444 | |
| | |
Eldorado Resorts, Inc.*,1 | | | 5,090 | | | | 184,309 | |
| | |
Etsy, Inc.*,1 | | | 40,548 | | | | 1,928,868 | |
| | |
Five Below, Inc.* | | | 5,723 | | | | 585,577 | |
| | |
Fox Factory Holding Corp.*,1 | | | 19,188 | | | | 1,129,598 | |
| | |
Grand Canyon Education, Inc.* | | | 10,199 | | | | 980,532 | |
| | |
Helen of Troy, Ltd.* | | | 3,900 | | | | 511,602 | |
| | |
iRobot Corp.* | | | 8,807 | | | | 737,498 | |
| | |
Libbey, Inc. | | | 27,957 | | | | 108,473 | |
| | |
Malibu Boats, Inc., Class A* | | | 47,220 | | | | 1,643,256 | |
| | |
MarineMax, Inc.*,1 | | | 11,200 | | | | 205,072 | |
| | |
National Vision Holdings, Inc.* | | | 11,290 | | | | 318,039 | |
| | |
Ollie’s Bargain Outlet Holdings, Inc.* | | | 9,029 | | | | 600,519 | |
| | |
Oxford Industries, Inc. | | | 16,581 | | | | 1,177,914 | |
| | |
Planet Fitness, Inc., Class A*,1 | | | 41,019 | | | | 2,199,439 | |
| | |
RH*,1 | | | 5,832 | | | | 698,790 | |
| | |
Roku, Inc.*,1 | | | 7,864 | | | | 240,953 | |
| | | | | | | | |
| | | Shares | | Value | |
| | |
Sally Beauty Holdings, Inc.*,1 | | | 23,200 | | | | $395,560 | |
| | |
SeaWorld Entertainment, Inc.* | | | 28,638 | | | | 632,613 | |
| | |
Sinclair Broadcast Group, Inc., Class A | | | 15,200 | | | | 400,368 | |
| | |
Sonos, Inc.*,1 | | | 21,461 | | | | 210,747 | |
| | |
Steven Madden, Ltd. | | | 62,354 | | | | 1,886,832 | |
| | |
Strategic Education, Inc. | | | 7,523 | | | | 853,259 | |
| | |
Tailored Brands, Inc. | | | 11,142 | | | | 151,977 | |
| | |
TopBuild Corp.* | | | 19,270 | | | | 867,150 | |
| | |
Weight Watchers International, Inc.* | | | 13,196 | | | | 508,706 | |
| | |
Total Consumer Discretionary | | | | | | | 27,851,794 | |
| | |
Consumer Staples - 5.9% | | | | | | | | |
| | |
BJ’s Wholesale Club Holdings, Inc.* | | | 26,798 | | | | 593,844 | |
| | |
The Boston Beer Co., Inc., Class A*,1 | | | 500 | | | | 120,420 | |
| | |
Calavo Growers, Inc.1 | | | 38,892 | | | | 2,837,560 | |
| | |
The Chefs’ Warehouse, Inc.*,1 | | | 17,242 | | | | 551,399 | |
| | |
Inter Parfums, Inc. | | | 50,310 | | | | 3,298,827 | |
| | |
J&J Snack Foods Corp. | | | 14,228 | | | | 2,057,226 | |
| | |
Medifast, Inc. | | | 5,845 | | | | 730,742 | |
| | |
Sprouts Farmers Market, Inc.*,1 | | | 19,033 | | | | 447,466 | |
| | |
Turning Point Brands, Inc. | | | 9,441 | | | | 256,984 | |
| | |
USANA Health Sciences, Inc.* | | | 8,090 | | | | 952,436 | |
| | |
Total Consumer Staples | | | | | | | 11,846,904 | |
| | |
Energy - 1.8% | | | | | | | | |
| | |
Cactus, Inc., Class A* | | | 17,715 | | | | 485,568 | |
| | |
Callon Petroleum Co.*,1 | | | 86,040 | | | | 558,400 | |
| | |
Carrizo Oil & Gas, Inc.*,1 | | | 11,100 | | | | 125,319 | |
| | |
Delek US Holdings, Inc.1 | | | 15,304 | | | | 497,533 | |
| | |
Denbury Resources, Inc.* | | | 123,149 | | | | 210,585 | |
| | |
Laredo Petroleum, Inc.*,1 | | | 28,300 | | | | 102,446 | |
| | |
Pioneer Energy Services Corp.* | | | 57,203 | | | | 70,360 | |
| | |
WildHorse Resource Development Corp.*,1 | | | 107,322 | | | | 1,514,313 | |
| | |
Total Energy | | | | | | | 3,564,524 | |
| | |
Financials - 6.0% | | | | | | | | |
| | |
First Financial Bankshares Inc.1 | | | 11,041 | | | | 636,955 | |
| | |
Banc of California, Inc. | | | 153,009 | | | | 2,036,550 | |
| | |
CenterState Bank Corp.1 | | | 22,859 | | | | 480,954 | |
| | |
Central Pacific Financial Corp. | | | 2,900 | | | | 70,615 | |
| | |
City Holding Co. | | | 4,100 | | | | 277,119 | |
| | |
Evercore, Inc., Class A | | | 11,197 | | | | 801,257 | |
| | |
Goosehead Insurance, Inc., Class A*,1 | | | 16,155 | | | | 424,715 | |
| | |
Green Dot Corp., Class A* | | | 13,486 | | | | 1,072,407 | |
| | |
Heritage Insurance Holdings, Inc. | | | 10,318 | | | | 151,881 | |
| | |
James River Group Holdings, Ltd. (Bermuda) | | | 2,600 | | | | 95,004 | |
The accompanying notes are an integral part of these financial statements.
29
| | |
| | AMG Managers Special Equity Fund Schedule of Portfolio Investments(continued) |
| | | | | | | | |
| | | Shares | | | Value | |
| | |
Financials - 6.0%(continued) | | | | | | | | |
| | |
Lakeland Financial Corp.1 | | | 10,400 | | | | $417,664 | |
| | |
LegacyTexas Financial Group, Inc. | | | 27,875 | | | | 894,509 | |
| | |
LendingTree, Inc.*,1 | | | 3,470 | | | | 761,908 | |
| | |
National General Holdings Corp. | | | 32,644 | | | | 790,311 | |
| | |
NMI Holdings, Inc., Class A* | | | 24,127 | | | | 430,667 | |
| | |
Primerica, Inc.1 | | | 5,600 | | | | 547,176 | |
| | |
Universal Insurance Holdings, Inc. | | | 13,047 | | | | 494,742 | |
| | |
Walker & Dunlop, Inc. | | | 8,400 | | | | 363,300 | |
| | |
Webster Financial Corp. | | | 8,258 | | | | 407,037 | |
| | |
Western Alliance Bancorp* | | | 6,933 | | | | 273,784 | |
| | |
Wintrust Financial Corp. | | | 4,535 | | | | 301,532 | |
| | |
WSFS Financial Corp. | | | 9,300 | | | | 352,563 | |
| | |
Total Financials | | | | | | | 12,082,650 | |
| | |
Health Care - 27.4% | | | | | | | | |
| | |
ACADIA Pharmaceuticals, Inc.*,1 | | | 2,700 | | | | 43,659 | |
| | |
Acceleron Pharma, Inc.* | | | 10,787 | | | | 469,774 | |
| | |
Addus HomeCare Corp.*,1 | | | 3,100 | | | | 210,428 | |
| | |
Adeptus Health, Inc.2,3 | | | 24,574 | | | | 0 | |
| | |
Agios Pharmaceuticals, Inc.*,1 | | | 4,331 | | | | 199,702 | |
| | |
Allogene Therapeutics, Inc.*,1 | | | 9,481 | | | | 255,323 | |
| | |
AMARIN Corp. PLC, ADR (Ireland)* | | | 22,548 | | | | 306,878 | |
| | |
Amedisys, Inc.* | | | 10,904 | | | | 1,276,967 | |
| | |
Amicus Therapeutics, Inc.*,1 | | | 4,700 | | | | 45,026 | |
| | |
AnaptysBio, Inc.*,1 | | | 600 | | | | 38,274 | |
| | |
ANI Pharmaceuticals, Inc.* | | | 3,500 | | | | 157,570 | |
| | |
Arena Pharmaceuticals, Inc.*,1 | | | 1,200 | | | | 46,740 | |
| | |
Argenx SE, ADR (Netherlands)* | | | 4,360 | | | | 418,865 | |
| | |
Array BioPharma, Inc.*,1 | | | 6,600 | | | | 94,050 | |
| | |
Assertio Therapeutics, Inc.*,1 | | | 38,507 | | | | 139,010 | |
| | |
Audentes Therapeutics, Inc.*,1 | | | 6,484 | | | | 138,239 | |
| | |
BioTelemetry, Inc.*,1 | | | 42,615 | | | | 2,544,968 | |
| | |
Blueprint Medicines Corp.* | | | 8,838 | | | | 476,457 | |
| | |
Cambrex Corp.*,1 | | | 47,765 | | | | 1,803,606 | |
| | |
Cantel Medical Corp. | | | 24,310 | | | | 1,809,879 | |
| | |
CareDx, Inc.* | | | 22,185 | | | | 557,731 | |
| | |
Chemed Corp. | | | 1,965 | | | | 556,645 | |
| | |
Clovis Oncology, Inc.*,1 | | | 1,200 | | | | 21,552 | |
| | |
Denali Therapeutics, Inc.*,1 | | | 19,118 | | | | 394,978 | |
| | |
Emergent BioSolutions, Inc.* | | | 8,746 | | | | 518,463 | |
| | |
Enanta Pharmaceuticals, Inc.*,1 | | | 500 | | | | 35,415 | |
| | |
Encompass Health Corp. | | | 7,300 | | | | 450,410 | |
| | |
The Ensign Group, Inc. | | | 3,800 | | | | 147,402 | |
| | | | | | | | |
| | | Shares | | Value | |
| | |
FibroGen, Inc.* | | | 5,717 | | | | $264,583 | |
| | |
Genomic Health, Inc.* | | | 11,550 | | | | 743,936 | |
| | |
Glaukos Corp.*,1 | | | 20,443 | | | | 1,148,283 | |
| | |
Global Blood Therapeutics, Inc.*,1 | | | 1,200 | | | | 49,260 | |
| | |
Globus Medical, Inc., Class A* | | | 13,956 | | | | 604,016 | |
| | |
Guardant Health, Inc.* | | | 10,751 | | | | 404,130 | |
| | |
GW Pharmaceuticals PLC, ADR (United Kingdom)* | | | 5,025 | | | | 489,385 | |
| | |
Haemonetics Corp.* | | | 16,878 | | | | 1,688,644 | |
| | |
Halozyme Therapeutics, Inc.* | | | 47,466 | | | | 694,428 | |
| | |
HealthEquity, Inc.*,1 | | | 17,343 | | | | 1,034,510 | |
| | |
Heron Therapeutics, Inc.*,1 | | | 2,200 | | | | 57,068 | |
| | |
Heska Corp.*,1 | | | 12,915 | | | | 1,111,982 | |
| | |
HMS Holdings Corp.* | | | 42,297 | | | | 1,189,815 | |
| | |
Horizon Pharma PLC* | | | 43,201 | | | | 844,148 | |
| | |
ICU Medical, Inc.* | | | 562 | | | | 129,052 | |
| | |
Immunomedics, Inc.* | | | 16,737 | | | | 238,837 | |
| | |
Innoviva, Inc.*,1 | | | 53,071 | | | | 926,089 | |
| | |
Inogen, Inc.*,1 | | | 1,920 | | | | 238,406 | |
| | |
Inspire Medical Systems, Inc.* | | | 11,679 | | | | 493,438 | |
| | |
Insulet Corp.*,1 | | | 8,535 | | | | 676,996 | |
| | |
Integer Holdings Corp.* | | | 6,447 | | | | 491,648 | |
| | |
Intercept Pharmaceuticals, Inc.*,1 | | | 2,114 | | | | 213,070 | |
| | |
iRhythm Technologies, Inc.*,1 | | | 11,438 | | | | 794,712 | |
| | |
Ironwood Pharmaceuticals, Inc.*,1 | | | 4,000 | | | | 41,440 | |
| | |
LeMaitre Vascular, Inc. | | | 39,952 | | | | 944,465 | |
| | |
Ligand Pharmaceuticals, Inc.*,1 | | | 600 | | | | 81,420 | |
| | |
Loxo Oncology, Inc.*,1 | | | 10,187 | | | | 1,426,893 | |
| | |
Masimo Corp.* | | | 7,014 | | | | 753,093 | |
| | |
Medidata Solutions, Inc.*,1 | | | 28,430 | | | | 1,916,751 | |
| | |
Medpace Holdings, Inc.*,1 | | | 33,937 | | | | 1,796,285 | |
| | |
Mirati Therapeutics, Inc.* | | | 4,481 | | | | 190,084 | |
| | |
Molina Healthcare, Inc.*,1 | | | 7,861 | | | | 913,605 | |
| | |
Momenta Pharmaceuticals Inc.* | | | 2,100 | | | | 23,184 | |
| | |
Myovant Sciences, Ltd.
(United Kingdom)*,1 | | | 22,252 | | | | 365,155 | |
| | |
Myriad Genetics, Inc.* | | | 14,640 | | | | 425,585 | |
| | |
Neogen Corp.* | | | 20,450 | | | | 1,165,650 | |
| | |
NeoGenomics, Inc.* | | | 105,576 | | | | 1,331,313 | |
| | |
Pacira Pharmaceuticals, Inc.* | | | 22,135 | | | | 952,248 | |
| | |
PDL BioPharma, Inc.* | | | 78,443 | | | | 227,485 | |
| | |
Penumbra, Inc.*,1 | | | 8,339 | | | | 1,019,026 | |
| | |
Phibro Animal Health Corp., Class A | | | 3,800 | | | | 122,208 | |
| | |
Portola Pharmaceuticals, Inc.*,1 | | | 1,900 | | | | 37,088 | |
The accompanying notes are an integral part of these financial statements.
30
| | |
| | AMG Managers Special Equity Fund Schedule of Portfolio Investments(continued) |
| | | | | | | | |
| Shares | | | Value | |
| | |
Health Care - 27.4%(continued) | | | | | | | | |
| | |
PRA Health Sciences, Inc.* | | | 31,222 | | | | $2,871,175 | |
| | |
PTC Therapeutics, Inc.* | | | 1,400 | | | | 48,048 | |
| | |
REGENXBIO, Inc.* | | | 800 | | | | 33,560 | |
| | |
Repligen Corp.* | | | 69,786 | | | | 3,680,514 | |
| | |
Sage Therapeutics, Inc.*,1 | | | 2,498 | | | | 239,283 | |
| | |
Sarepta Therapeutics, Inc.* | | | 2,314 | | | | 252,527 | |
| | |
Spark Therapeutics, Inc.*,1 | | | 900 | | | | 35,226 | |
| | |
Spectrum Pharmaceuticals, Inc.* | | | 2,900 | | | | 25,375 | |
| | |
Supernus Pharmaceuticals, Inc.*,1 | | | 28,945 | | | | 961,553 | |
| | |
Tabula Rasa HealthCare, Inc.*,1 | | | 28,410 | | | | 1,811,422 | |
| | |
Tactile Systems Technology, Inc.*,1 | | | 23,694 | | | | 1,079,262 | |
| | |
Tandem Diabetes Care, Inc.*,1 | | | 30,051 | | | | 1,141,036 | |
| | |
Teladoc Health, Inc.*,1 | | | 5,367 | | | | 266,042 | |
| | |
Tenet Healthcare Corp.* | | | 13,852 | | | | 237,423 | |
| | |
Theravance Biopharma, Inc. (Cayman Islands)*,1 | | | 12,515 | | | | 320,259 | |
| | |
Tivity Health, Inc.* | | | 8,900 | | | | 220,809 | |
| | |
Ultragenyx Pharmaceutical, Inc.*,1 | | | 6,739 | | | | 293,012 | |
| | |
Wright Medical Group, N.V. (Netherlands)* | | | 14,986 | | | | 407,919 | |
| | |
Total Health Care | | | | | | | 55,341,870 | |
| | |
Industrials - 14.3% | | | | | | | | |
| | |
Advanced Disposal Services, Inc.* | | | 37,310 | | | | 893,201 | |
| | |
Aerovironment, Inc.*,1 | | | 15,381 | | | | 1,045,139 | |
| | |
Air Lease Corp. | | | 12,035 | | | | 363,577 | |
| | |
Altra Industrial Motion Corp. | | | 6,400 | | | | 160,960 | |
| | |
Applied Industrial Technologies, Inc. | | | 5,400 | | | | 291,276 | |
| | |
ArcBest Corp.1 | | | 11,000 | | | | 376,860 | |
| | |
ASGN, Inc.* | | | 6,725 | | | | 366,512 | |
| | |
Atkore International Group, Inc.* | | | 23,200 | | | | 460,288 | |
| | |
Axon Enterprise, Inc.* | | | 30,521 | | | | 1,335,294 | |
| | |
Brady Corp., Class A | | | 3,800 | | | | 165,148 | |
| | |
Chart Industries, Inc.* | | | 17,820 | | | | 1,158,835 | |
| | |
Cimpress, N.V. (Netherlands)* | | | 4,583 | | | | 473,974 | |
| | |
Comfort Systems USA, Inc. | | | 19,185 | | | | 838,001 | |
| | |
Continental Building Products, Inc.* | | | 14,300 | | | | 363,935 | |
| | |
Curtiss-Wright Corp. | | | 6,506 | | | | 664,393 | |
| | |
Deluxe Corp. | | | 14,578 | | | | 560,378 | |
| | |
DXP Enterprises, Inc.* | | | 7,212 | | | | 200,782 | |
| | |
EMCOR Group, Inc. | | | 6,800 | | | | 405,892 | |
| | |
EnerSys | | | 5,400 | | | | 419,094 | |
| | |
Generac Holdings, Inc.* | | | 43,674 | | | | 2,170,598 | |
| | |
Harsco Corp.* | | | 41,915 | | | | 832,432 | |
| | |
Heidrick & Struggles International, Inc. | | | 12,500 | | | | 389,875 | |
| | | | | | | | |
| Shares | | | Value | |
| | |
Hub Group Inc. , Class A* | | | 3,100 | | | | $114,917 | |
| | |
Insperity, Inc. | | | 25,224 | | | | 2,354,913 | |
| | |
Insteel Industries, Inc. | | | 10,024 | | | | 243,383 | |
| | |
Interface, Inc. | | | 7,748 | | | | 110,409 | |
| | |
Kadant, Inc. | | | 3,900 | | | | 317,694 | |
| | |
Kennametal, Inc.1 | | | 12,049 | | | | 400,991 | |
| | |
Knoll, Inc. | | | 84,225 | | | | 1,388,028 | |
| | |
Korn Ferry | | | 8,200 | | | | 324,228 | |
| | |
Marten Transport, Ltd. | | | 93,690 | | | | 1,516,841 | |
| | |
Mercury Systems, Inc.* | | | 48,516 | | | | 2,294,322 | |
| | |
NV5 Global, Inc.* | | | 6,730 | | | | 407,501 | |
| | |
Proto Labs, Inc.* | | | 4,072 | | | | 459,281 | |
| | |
Quad/Graphics, Inc.1 | | | 14,318 | | | | 176,398 | |
| | |
RBC Bearings, Inc.* | | | 7,025 | | | | 920,977 | |
| | |
Rush Enterprises, Inc., Class A | | | 16,728 | | | | 576,781 | |
| | |
Saia, Inc.* | | | 27,763 | | | | 1,549,731 | |
| | |
SiteOne Landscape Supply, Inc.*,1 | | | 18,965 | | | | 1,048,195 | |
| | |
Trex Co., Inc.* | | | 13,920 | | | | 826,291 | |
| | |
Total Industrials | | | | | | | 28,967,325 | |
| | |
Information Technology - 24.8% | | | | | | | | |
| | |
Acacia Communications, Inc.* | | | 3,504 | | | | 133,152 | |
| | |
Advanced Energy Industries, Inc.* | | | 18,618 | | | | 799,271 | |
| | |
Alteryx, Inc., Class A*,1 | | | 10,319 | | | | 613,671 | |
| | |
Anaplan, Inc.* | | | 12,023 | | | | 319,090 | |
| | |
Appfolio, Inc., Class A* | | | 5,816 | | | | 344,424 | |
| | |
Appian Corp.* | | | 8,500 | | | | 227,035 | |
| | |
Box, Inc., Class A* | | | 65,280 | | | | 1,101,926 | |
| | |
Cabot Microelectronics Corp. | | | 20,115 | | | | 1,917,965 | |
| | |
Cardtronics PLC, Class A (United Kingdom)* | | | 17,200 | | | | 447,200 | |
| | |
Care.com, Inc.* | | | 21,500 | | | | 415,165 | |
| | |
Cornerstone OnDemand, Inc.* | | | 20,083 | | | | 1,012,786 | |
| | |
Coupa Software, Inc.*,1 | | | 10,969 | | | | 689,511 | |
| | |
Diodes, Inc.* | | | 15,100 | | | | 487,126 | |
| | |
Elastic, N.V.*,1 | | | 4,673 | | | | 334,026 | |
| | |
Entegris, Inc. | | | 18,841 | | | | 525,570 | |
| | |
EPAM Systems, Inc.* | | | 3,502 | | | | 406,267 | |
| | |
Everbridge, Inc.*,1 | | | 16,814 | | | | 954,363 | |
| | |
Everi Holdings, Inc.* | | | 22,629 | | | | 116,539 | |
| | |
EVERTEC, Inc. (Puerto Rico) | | | 23,000 | | | | 660,100 | |
| | |
Evo Payments, Inc., Class A* | | | 67,333 | | | | 1,661,105 | |
| | |
Five9, Inc.* | | | 34,750 | | | | 1,519,270 | |
| | |
HubSpot, Inc.* | | | 9,725 | | | | 1,222,724 | |
| | |
Inphi Corp.*,1 | | | 4,082 | | | | 131,236 | |
The accompanying notes are an integral part of these financial statements.
31
| | |
| | AMG Managers Special Equity Fund Schedule of Portfolio Investments(continued) |
| | | | | | | | |
| Shares | | | Value | |
| | |
Information Technology - 24.8%(continued) | | | | | | | | |
| | |
Insight Enterprises, Inc.* | | | 10,400 | | | | $423,800 | |
| | |
Integrated Device Technology, Inc.* | | | 18,388 | | | | 890,531 | |
| | |
j2 Global, Inc.1 | | | 17,378 | | | | 1,205,686 | |
| | |
LogMeIn, Inc.1 | | | 3,600 | | | | 293,652 | |
| | |
MAXIMUS, Inc. | | | 37,655 | | | | 2,450,964 | |
| | |
Mesa Laboratories, Inc.1 | | | 9,260 | | | | 1,929,691 | |
| | |
Mimecast, Ltd.* | | | 60,436 | | | | 2,032,463 | |
| | |
MINDBODY, Inc., Class A*,1 | | | 49,965 | | | | 1,818,726 | |
| | |
Monolithic Power Systems, Inc. | | | 5,188 | | | | 603,105 | |
| | |
Monotype Imaging Holdings Inc. | | | 25,000 | | | | 388,000 | |
| | |
New Relic, Inc.* | | | 9,171 | | | | 742,576 | |
| | |
Okta, Inc.* | | | 12,269 | | | | 782,762 | |
| | |
Paycom Software, Inc.*,1 | | | 4,370 | | | | 535,106 | |
| | |
Paylocity Holding Corp.* | | | 15,074 | | | | 907,606 | |
| | |
Pegasystems, Inc. | | | 74,865 | | | | 3,580,793 | |
| | |
Progress Software Corp. | | | 22,779 | | | | 808,427 | |
| | |
Qualys, Inc.*,1 | | | 44,175 | | | | 3,301,639 | |
| | |
RingCentral, Inc., Class A* | | | 9,807 | | | | 808,489 | |
| | |
SailPoint Technologies Holding, Inc.* | | | 11,551 | | | | 271,333 | |
| | |
Science Applications International Corp. | | | 5,500 | | | | 350,350 | |
| | |
Semtech Corp.* | | | 12,218 | | | | 560,440 | |
| | |
SendGrid, Inc.* | | | 18,427 | | | | 795,494 | |
| | |
Silicon Laboratories, Inc.* | | | 15,805 | | | | 1,245,592 | |
| | |
SPS Commerce, Inc.* | | | 15,071 | | | | 1,241,549 | |
| | |
Stamps.com, Inc.*,1 | | | 1,060 | | | | 164,978 | |
| | |
The Trade Desk, Inc., Class A*,1 | | | 7,841 | | | | 910,026 | |
| | |
Twilio, Inc., Class A*,1 | | | 6,742 | | | | 602,061 | |
| | |
Virtusa Corp.* | | | 9,900 | | | | 421,641 | |
| | |
WNS Holdings, Ltd., ADR (India)* | | | 63,095 | | | | 2,603,300 | |
| | |
Workiva, Inc.*,1 | | | 13,753 | | | | 493,595 | |
| | |
Yelp, Inc.*,1 | | | 7,060 | | | | 247,029 | |
| | |
Zendesk, Inc.* | | | 1,169 | | | | 68,235 | |
| | |
Zscaler, Inc.*,1 | | | 12,617 | | | | 494,713 | |
| | |
Total Information Technology | | | | | | | 50,013,874 | |
| | |
Materials - 1.6% | | | | | | | | |
| | |
Ingevity Corp.* | | | 3,514 | | | | 294,086 | |
| | |
Louisiana-Pacific Corp. | | | 25,077 | | | | 557,211 | |
| | |
Quaker Chemical Corp. | | | 8,180 | | | | 1,453,668 | |
| | |
Stepan Co. | | | 4,100 | | | | 303,400 | |
| | |
Trinseo, S.A. | | | 14,814 | | | | 678,185 | |
| | |
Total Materials | | | | | | | 3,286,550 | |
| | | | | | | | |
| | | Shares | | Value |
| | |
Real Estate - 0.1% | | | | | | | | |
| | |
HFF, Inc., Class A | | | 6,300 | | | $ | 208,908 | |
| | |
Marcus & Millichap, Inc.* | | | 2,500 | | | | 85,825 | |
| | |
Total Real Estate | | | | | | | 294,733 | |
| | |
Total Common Stocks (Cost $208,992,191) | | | | | | | 199,085,388 | |
| | |
| | | Principal
Amount | | |
Short-Term Investments - 4.8% | | | | | | | | |
| | |
Joint Repurchase Agreements - 3.1%4 | | | | | | | | |
| | |
Cantor Fitzgerald Securities, Inc., dated 12/31/18, due 01/02/19, 3.350% total to be received $1,516,525 (collateralized by various U.S. Government Agency Obligations and U.S. Treasuries, 0.000% - 10.000%, 01/25/19 - 10/20/68, totaling $1,546,568) | | $ | 1,516,243 | | | | 1,516,243 | |
| | |
Daiwa Capital Markets America, dated 12/31/18, due 01/02/19, 3.050% total to be received $1,516,500 (collateralized by various U.S. Government Agency Obligations, 2.000% - 6.500%, 01/25/19 - 02/01/49, totaling $1,546,568) | | | 1,516,243 | | | | 1,516,243 | |
| | |
Mizuho Securities USA, LLC, dated 12/31/18, due 01/02/19, 2.920% total to be received $317,870 (collateralized by various U.S. Treasuries, 1.875% - 2.625%, 02/29/24 - 09/09/49, totaling $324,174) | | | 317,818 | | | | 317,818 | |
| | |
Nomura Securities International, Inc., dated 12/31/18, due 01/02/19, 3.000% total to be received $1,516,496 (collateralized by various U.S. Government Agency Obligations and U.S. Treasuries, 0.000% - 7.500%, 01/03/19 - 11/20/68, totaling $1,546,568) | | | 1,516,243 | | | | 1,516,243 | |
| | |
RBC Dominion Securities, Inc., dated 12/31/18, due 01/02/19, 3.020% total to be received $1,516,497 (collateralized by various U.S. Government Agency Obligations, 3.000% - 7.000%, 10/01/25 - 10/20/48, totaling $1,546,568) | | | 1,516,243 | | | | 1,516,243 | |
| | |
Total Joint Repurchase Agreements | | | | | | | 6,382,790 | |
| | |
| | | Shares | | |
Other Investment Companies - 1.7% | | | | | | | | |
| | |
Dreyfus Government Cash Management Fund, 5 Institutional Shares, 2.29%5 | | | 3,375,630 | | | | 3,375,630 | |
| | |
Total Short-Term Investments
(Cost $9,758,420) | | | | | | | 9,758,420 | |
| | |
Total Investments - 103.4%
(Cost $218,750,611) | | | | | | | 208,843,808 | |
| | |
Other Assets, less Liabilities - (3.4)% | | | | | | | (6,846,667 | ) |
| | |
Net Assets - 100.0% | | | | | | $ | 201,997,141 | |
The accompanying notes are an integral part of these financial statements.
32
| | |
| | AMG Managers Special Equity Fund Schedule of Portfolio Investments(continued) |
| * | Non-income producing security. |
| 1 | Some or all of these securities, amounting to $48,294,998 or 23.9% of net assets, were out on loan to various brokers and are collateralized by cash and various U.S. Treasury Obligations. See Note 4 of Notes to Financial Statements. |
| 3 | Security’s value was determined by using significant unobservable inputs. |
| 4 | Cash collateral received from brokers for securities lending was invested in these joint repurchase agreements. |
| 5 | Yield shown represents the December 31, 2018, seven day average yield, which refers to the sum of the previous seven days’ dividends paid, expressed as an annual percentage. |
| ADR | American Depositary Receipt |
The following table summarizes the inputs used to value the Fund’s investments by the fair value hierarchy levels as of December 31, 2018:
| | | | | | | | | | | | | | | | |
| | | Level 1 | | | Level 2 | | | Level 3 | | | Total | |
Investments in Securities | | | | | | | | | | | | | | | | |
| | | | |
Common Stocks | | | | | | | | | | | | | | | | |
| | | | |
Health Care | | | $55,341,870 | | | | — | | | | $0 | | | | $55,341,870 | |
| | | | |
Information Technology | | | 50,013,874 | | | | — | | | | — | | | | 50,013,874 | |
| | | | |
Industrials | | | 28,967,325 | | | | — | | | | — | | | | 28,967,325 | |
| | | | |
Consumer Discretionary | | | 27,851,794 | | | | — | | | | — | | | | 27,851,794 | |
| | | | |
Financials | | | 12,082,650 | | | | — | | | | — | | | | 12,082,650 | |
| | | | |
Consumer Staples | | | 11,846,904 | | | | — | | | | — | | | | 11,846,904 | |
| | | | |
Communication Services | | | 5,835,164 | | | | — | | | | — | | | | 5,835,164 | |
| | | | |
Energy | | | 3,564,524 | | | | — | | | | — | | | | 3,564,524 | |
| | | | |
Materials | | | 3,286,550 | | | | — | | | | — | | | | 3,286,550 | |
| | | | |
Real Estate | | | 294,733 | | | | — | | | | — | | | | 294,733 | |
| | | | |
Short-Term Investments | | | | | | | | | | | | | | | | |
| | | | |
Joint Repurchase Agreements | | | — | | | | $6,382,790 | | | | — | | | | 6,382,790 | |
| | | | |
Other Investment Companies | | | 3,375,630 | | | | — | | | | — | | | | 3,375,630 | |
| | | | | | | | | | | | | | | | |
Total Investments in Securities | | | $202,461,018 | | | | $6,382,790 | | | | $0 | | | | $208,843,808 | |
| | | | | | | | | | | | | | | | |
At December 31, 2018, the Level 3 common stock was received as a result of a corporate action. The security’s value was determined by using significant unobservable inputs.
For the fiscal year ended December 31, 2018, there were no transfers in or out of Level 3.
The accompanying notes are an integral part of these financial statements.
33
| | |
| | Statement of Assets and Liabilities December 31, 2018 |
| | | | | | | | | | | | |
| | | AMG Managers
Loomis
Sayles
Bond Fund | | AMG Managers
Global Income
Opportunity Fund | | AMG Managers
Special
Equity Fund |
Assets: | | | | | | | | | | | | |
| | | |
Investments at Value1(including securities on loan valued at $486,940,260, $38,620, and $48,294,998, respectively) | | | $1,815,055,693 | | | | $10,768,265 | | | | $208,843,808 | |
| | | |
Cash | | | — | | | | — | | | | 63,667 | |
| | | |
Foreign currency2 | | | — | | | | 70,710 | | | | — | |
| | | |
Receivable for investments sold | | | 63,767 | | | | — | | | | 701,237 | |
| | | |
Dividend, interest and other receivables | | | 16,082,342 | | | | 148,486 | | | | 97,989 | |
| | | |
Receivable for Fund shares sold | | | 3,831,299 | | | | 12,403 | | | | 88,602 | |
| | | |
Receivable from affiliate | | | — | | | | 3,753 | | | | 4,688 | |
| | | |
Unrealized appreciation on foreign currency contracts | | | — | | | | 91,284 | | | | — | |
| | | |
Prepaid expenses and other assets | | | 20,239 | | | | 11,407 | | | | 16,159 | |
| | | |
Total assets | | | 1,835,053,340 | | | | 11,106,308 | | | | 209,816,150 | |
| | | |
Liabilities: | | | | | | | | | | | | |
| | | |
Payable upon return of securities loaned | | | 14,983,584 | | | | 1,071 | | | | 6,382,790 | |
| | | |
Payable for investments purchased | | | — | | | | — | | | | 404,256 | |
| | | |
Payable for Fund shares repurchased | | | 8,150,457 | | | | 650,118 | | | | 729,468 | |
| | | |
Unrealized depreciation on foreign currency contracts | | | — | | | | 24,250 | | | | — | |
| | | |
Accrued expenses: | | | | | | | | | | | | |
| | | |
Investment advisory and management fees | | | 970,115 | | | | 5,149 | | | | 163,473 | |
| | | |
Administrative fees | | | 232,827 | | | | 1,404 | | | | 27,246 | |
| | | |
Shareholder service fees | | | 143,100 | | | | — | | | | 38,513 | |
| | | |
Professional fees | | | 76,405 | | | | 41,191 | | | | 29,651 | |
| | | |
Other | | | 208,481 | | | | 17,643 | | | | 43,612 | |
| | | |
Total liabilities | | | 24,764,969 | | | | 740,826 | | | | 7,819,009 | |
| | | | | | | | | | | | |
| | | |
Net Assets | | | $1,810,288,371 | | | | $10,365,482 | | | | $201,997,141 | |
| | | |
1Investments at cost | | | $1,821,889,421 | | | | $11,485,044 | | | | $218,750,611 | |
| | | |
2Foreign currency at cost | | | — | | | | $70,526 | | | | — | |
The accompanying notes are an integral part of these financial statements.
34
| | |
| | Statement of Assets and Liabilities(continued) |
| | | | | | | | | | | | |
| | | AMG Managers
Loomis
Sayles
Bond Fund | | AMG Managers
Global Income
Opportunity Fund | | AMG Managers
Special
Equity Fund |
Net Assets Represent: | | | | | | | | | | | | |
| | | |
Paid-in capital | | | $1,815,974,193 | | | | $11,478,450 | | | | $177,161,140 | |
| | | |
Distributable earnings (loss) | | | (5,685,822 | ) | | | (1,112,968 | ) | | | 24,836,001 | |
| | | |
Net Assets | | | $1,810,288,371 | | | | $10,365,482 | | | | $201,997,141 | |
| | | |
Class N: | | | | | | | | | | | | |
| | | |
Net Assets | | | $715,467,972 | | | | $10,365,482 | | | | $170,744,243 | |
| | | |
Shares outstanding | | | 28,068,207 | | | | 517,207 | | | | 1,485,335 | |
| | | |
Net asset value, offering and redemption price per share | | | $25.49 | | | | $20.04 | | | | $114.95 | |
| | | |
Class I: | | | | | | | | | | | | |
| | | |
Net Assets | | | $1,094,820,399 | | | | — | | | | $31,252,898 | |
| | | |
Shares outstanding | | | 42,952,794 | | | | — | | | | 263,572 | |
| | | |
Net asset value, offering and redemption price per share | | | $25.49 | | | | — | | | | $118.57 | |
The accompanying notes are an integral part of these financial statements.
35
| | |
| | Statement of Operations For the fiscal year ended December 31, 2018 |
| | | | | | | | | | | | |
| | | AMG Managers
Loomis
Sayles
Bond Fund | | AMG Managers
Global Income
Opportunity Fund | | AMG Managers
Special
Equity Fund |
| | | |
Investment Income: | | | | | | | | | | | | |
| | | |
Dividend income | | | $1,349,177 | | | | $2,411 | | | | $1,191,208 | |
| | | |
Interest income | | | 78,636,837 | | | | 542,691 | | | | — | |
| | | |
Securities lending income | | | 473,217 | | | | 2,801 | | | | 163,252 | |
| | | |
Miscellaneous income | | | 61,456 | | | | 313 | | | | 129,855 | |
| | | |
Foreign withholding tax | | | (505 | ) | | | (5,044 | ) | | | — | |
| | | |
Total investment income | | | 80,520,182 | | | | 543,172 | | | | 1,484,315 | |
| | | |
Expenses: | | | | | | | | | | | | |
| | | |
Investment advisory and management fees | | | 12,085,228 | | | | 70,685 | | | | 2,019,127 | |
| | | |
Administrative fees | | | 2,900,455 | | | | 19,278 | | | | 336,521 | |
| | | |
Shareholder servicing fees - Class N | | | 968,591 | | | | — | | | | 480,217 | |
| | | |
Shareholder servicing fees - Class I | | | 254,667 | | | | — | | | | — | |
| | | |
Custodian fees | | | 177,932 | | | | 33,724 | | | | 55,770 | |
| | | |
Reports to shareholders | | | 152,904 | | | | 1,288 | | | | 12,282 | |
| | | |
Trustee fees and expenses | | | 145,670 | | | | 1,014 | | | | 15,845 | |
| | | |
Professional fees | | | 126,406 | | | | 41,485 | | | | 36,595 | |
| | | |
Registration fees | | | 78,756 | | | | 25,866 | | | | 39,313 | |
| | | |
Transfer agent fees | | | 72,182 | | | | 1,172 | | | | 23,741 | |
| | | |
Miscellaneous | | | 49,002 | | | | 1,161 | | | | 5,424 | |
| | | |
Repayment of prior reimbursements | | | 766,135 | | | | — | | | | — | |
| | | |
Total expenses before offsets | | | 17,777,928 | | | | 195,673 | | | | 3,024,835 | |
| | | |
Expense reimbursements | | | — | | | | (81,291 | ) | | | (54,349 | ) |
| | | |
Expense reductions | | | — | | | | — | | | | (11,061 | ) |
| | | |
Net expenses | | | 17,777,928 | | | | 114,382 | | | | 2,959,425 | |
| | | | | | | | | | | | |
| | | |
Net investment income (loss) | | | 62,742,254 | | | | 428,790 | | | | (1,475,110 | ) |
| | | |
Net Realized and Unrealized Loss: | | | | | | | | | | | | |
| | | |
Net realized gain (loss) on investments | | | 6,067,744 | | | | (10,766 | ) | | | 37,113,545 | |
| | | |
Net realized loss on forward contracts | | | — | | | | (108,271 | ) | | | — | |
| | | |
Net realized loss on foreign currency transactions | | | (3,147,198 | ) | | | (248,686 | ) | | | — | |
| | | |
Net change in unrealized appreciation/depreciation on investments | | | (100,852,435 | ) | | | (637,695 | ) | | | (49,499,109 | ) |
| | | |
Net change in unrealized appreciation/depreciation on forward contracts | | | — | | | | 10,441 | | | | — | |
| | | |
Net change in unrealized appreciation/depreciation on foreign currency translations | | | 6,890 | | | | (1,653 | ) | | | — | |
| | | |
Net realized and unrealized loss | | | (97,924,999 | ) | | | (996,630 | ) | | | (12,385,564 | ) |
| | | | | | | | | | | | |
| | | |
Net decrease in net assets resulting from operations | | | $(35,182,745 | ) | | | $(567,840 | ) | | | $(13,860,674 | ) |
The accompanying notes are an integral part of these financial statements.
36
| | |
| | Statements of Changes in Net Assets For the fiscal years ended December 31, |
| | | | | | | | | | | | | | | | | | | | | | | | |
| | | AMG Managers Loomis
Sayles Bond Fund | | | AMG Managers Global Income
Opportunity Fund | | AMG Managers
Special Equity Fund | |
| | | | | | |
| | | 2018 | | | 20171 | | | 2018 | | 20171 | | 2018 | | | 20171 | |
| | | | | | |
Increase (Decrease) in Net Assets Resulting From Operations: | | | | | | | | | | | | | | | | | | | | | | | | |
| | | | | | |
Net investment income (loss) | | | $62,742,254 | | | | $68,281,589 | | | | $428,790 | | | | $532,996 | | | | $(1,475,110 | ) | | | $(1,392,051 | ) |
| | | | | | |
Net realized gain (loss) on investments | | | 2,920,546 | | | | 15,239,846 | | | | (367,723 | ) | | | (267,415 | ) | | | 37,113,545 | | | | 35,304,296 | |
| | | | | | |
Net change in unrealized appreciation/depreciation on investments | | | (100,845,545 | ) | | | 47,210,554 | | | | (628,907 | ) | | | 1,194,551 | | | | (49,499,109 | ) | | | 2,472,633 | |
| | | | | | |
Net increase (decrease) in net assets resulting from operations | | | (35,182,745 | ) | | | 130,731,989 | | | | (567,840 | ) | | | 1,460,132 | | | | (13,860,674 | ) | | | 36,384,878 | |
| | | | | | |
Distributions to Shareholders:2 | | | | | | | | | | | | | | | | | | | | | | | | |
| | | | | | |
Class N | | | (29,374,441 | ) | | | (41,387,690 | ) | | | (76,366 | ) | | | — | | | | — | | | | — | |
| | | | | | |
Class I | | | (44,150,295 | ) | | | (35,283,487 | ) | | | — | | | | — | | | | — | | | | — | |
| | | | | | |
Total distributions to shareholders | | | (73,524,736 | ) | | | (76,671,177 | ) | | | (76,366 | ) | | | — | | | | — | | | | — | |
| | | | | | |
Capital Share Transactions:3 | | | | | | | | | | | | | | | | | | | | | | | | |
| | | | | | |
Net increase (decrease) from capital share transactions | | | (79,839,855 | ) | | | (61,236,003 | ) | | | (3,064,783 | ) | | | (2,819,407 | ) | | | 15,385,576 | | | | (35,567,687 | ) |
| | | | | | |
| | | | | | | | | | | | | | | | | | | | | | | | |
| | | | | | |
Total increase (decrease) in net assets | | | (188,547,336 | ) | | | (7,175,191 | ) | | | (3,708,989 | ) | | | (1,359,275 | ) | | | 1,524,902 | | | | 817,191 | |
| | | | | | |
Net Assets: | | | | | | | | | | | | | | | | | | | | | | | | |
| | | | | | |
Beginning of year | | | 1,998,835,707 | | | | 2,006,010,898 | | | | 14,074,471 | | | | 15,433,746 | | | | 200,472,239 | | | | 199,655,048 | |
| | | | | | |
End of year4 | | | $1,810,288,371 | | | | $1,998,835,707 | | | | $10,365,482 | | | | $14,074,471 | | | | $201,997,141 | | | | $200,472,239 | |
| 1 | Effective February 27, 2017, the Funds’ share classes were renamed as described in Note 1 of the Notes to the Financial Statements. |
| 2 | See Note 1(d) of the Notes to Financial Statements. |
| 3 | See Note 1(g) of the Notes to Financial Statements. |
| 4 | Net assets - End of year includes undistributed (distributions in excess of) net investment income of $1,218,065, $(98,684) and $0 for AMG Managers Loomis Sayles Bond Fund, AMG Managers Global Income Opportunities Fund and AMG Managers Special Equity Fund, respectively, in 2017. During 2018, the requirement to disclose undistributed net investment (distributions in excess of) income was eliminated. |
The accompanying notes are an integral part of these financial statements.
37
| | |
| | AMG Managers Loomis Sayles Bond Fund Financial Highlights For a share outstanding throughout each fiscal year |
| | | | | | | | | | | | | | | | | | | | |
| | | For the fiscal years ended December 31, | |
| | | | | |
Class N | | | 2018 | | | | 20171 | | | | 20162 | | | | 2015 | | | | 2014 | |
| | | | | |
Net Asset Value, Beginning of Year | | | $26.97 | | | | $26.24 | | | | $26.19 | | | | $27.88 | | | | $27.33 | |
| | | | | |
Income (loss) from Investment Operations: | | | | | | | | | | | | | | | | | | | | |
| | | | | |
Net investment income3,4 | | | 0.84 | | | | 0.91 | | | | 0.95 | | | | 0.74 | | | | 0.80 | |
| | | | | |
Net realized and unrealized gain (loss) on investments | | | (1.33 | ) | | | 0.85 | | | | 0.40 | | | | (1.34 | ) | | | 0.78 | |
| | | | | |
Total income (loss) from investment operations | | | (0.49 | ) | | | 1.76 | | | | 1.35 | | | | (0.60 | ) | | | 1.58 | |
| | | | | |
Less Distributions to Shareholders from: | | | | | | | | | | | | | | | | | | | | |
| | | | | |
Net investment income | | | (0.80 | ) | | | (0.87 | ) | | | (0.96 | ) | | | (0.71 | ) | | | (0.85 | ) |
| | | | | |
Net realized gain on investments | | | (0.19 | ) | | | (0.16 | ) | | | (0.34 | ) | | | (0.38 | ) | | | (0.18 | ) |
| | | | | |
Total distributions to shareholders | | | (0.99 | ) | | | (1.03 | ) | | | (1.30 | ) | | | (1.09 | ) | | | (1.03 | ) |
| | | | | |
Net Asset Value, End of Year | | | $25.49 | | | | $26.97 | | | | $26.24 | | | | $26.19 | | | | $27.88 | |
| | | | | |
Total Return4 | | | (1.82 | )%5 | | | 6.77 | %5 | | | 5.19 | % | | | (2.19 | )% | | | 5.81 | %5 |
| | | | | |
Ratio of net expenses to average net assets | | | 0.98 | % | | | 0.99 | % | | | 1.00 | % | | | 0.99 | % | | | 0.99 | % |
| | | | | |
Ratio of gross expenses to average net assets6 | | | 0.98 | % | | | 0.99 | % | | | 1.02 | % | | | 1.02 | % | | | 1.02 | % |
| | | | | |
Ratio of net investment income to average net assets4 | | | 3.19 | % | | | 3.38 | % | | | 3.52 | % | | | 2.69 | % | | | 2.85 | % |
| | | | | |
Portfolio turnover | | | 9 | % | | | 4 | % | | | 27 | % | | | 10 | % | | | 26 | % |
| | | | | |
Net assets end of year (000’s) omitted | | | $715,468 | | | | $971,359 | | | | $1,234,229 | | | | $1,575,246 | | | | $1,947,536 | |
| | |
38
| | |
| | | AMG Managers Loomis Sayles Bond Fund Financial Highlights For a share outstanding throughout each fiscal year |
| | | | | | | | | | | | | | | | | | | | |
| | | For the fiscal years ended December 31, |
| | | | | |
| Class I | | 2018 | | 2017 | | 20162 | | 2015 | | 2014 |
| | | | | |
Net Asset Value, Beginning of Year | | | $26.97 | | | | $26.24 | | | | $26.19 | | | | $27.87 | | | | $27.33 | |
| | | | | |
Income (loss) from Investment Operations: | | | | | | | | | | | | | | | | | | | | |
| | | | | |
Net investment income3,4 | | | 0.86 | | | | 0.94 | | | | 0.97 | | | | 0.77 | | | | 0.83 | |
| | | | | |
Net realized and unrealized gain (loss) on investments | | | (1.32 | ) | | | 0.85 | | | | 0.40 | | | | (1.33 | ) | | | 0.77 | |
Total income (loss) from investment operations | | | (0.46 | ) | | | 1.79 | | | | 1.37 | | | | (0.56 | ) | | | 1.60 | |
| | | | | |
Less Distributions to Shareholders from: | | | | | | | | | | | | | | | | | | | | |
| | | | | |
Net investment income | | | (0.83 | ) | | | (0.90 | ) | | | (0.98 | ) | | | (0.74 | ) | | | (0.88 | ) |
| | | | | |
Net realized gain on investments | | | (0.19 | ) | | | (0.16 | ) | | | (0.34 | ) | | | (0.38 | ) | | | (0.18 | ) |
| | | | | |
Total distributions to shareholders | | | (1.02 | ) | | | (1.06 | ) | | | (1.32 | ) | | | (1.12 | ) | | | (1.06 | ) |
| | | | | |
Net Asset Value, End of Year | | | $25.49 | | | | $26.97 | | | | $26.24 | | | | $26.19 | | | | $27.87 | |
| | | | | |
Total Return4,5 | | | (1.72 | )% | | | 6.87 | % | | | 5.29 | % | | | (2.05 | )% | | | 5.88 | % |
| | | | | |
Ratio of net expenses to average net assets | | | 0.88 | % | | | 0.89 | % | | | 0.90 | % | | | 0.89 | % | | | 0.89 | % |
| | | | | |
Ratio of gross expenses to average net assets6 | | | 0.88 | %7 | | | 0.89 | %7 | | | 0.93 | % | | | 0.92 | % | | | 0.92 | % |
| | | | | |
Ratio of net investment income to average net assets4 | | | 3.29 | % | | | 3.48 | % | | | 3.61 | % | | | 2.79 | % | | | 2.93 | % |
| | | | | |
Portfolio turnover | | | 9 | % | | | 4 | % | | | 27 | % | | | 10 | % | | | 26 | % |
| | | | | |
Net assets end of year (000’s) omitted | | | $1,094,820 | | | | $1,027,477 | | | | $771,782 | | | | $897,526 | | | | $1,061,280 | |
| | | | | | | | | | | | | | | | | | | | | |
| 1 | Effective February 27, 2017, Class S shares were renamed Class N shares. |
| 2 | Effective October 1, 2016, the Service Class and Institutional Class were renamed Class S and Class I, respectively. |
| 3 | Per share numbers have been calculated using average shares. |
| 4 | Total returns and net investment income would have been lower had certain expenses not been offset. |
| 5 | The total return is calculated using the published Net Asset Value as of fiscal year end. |
| 6 | Excludes the impact of expense reimbursement or fee waivers and expense reductions such as brokerage credits, but includes expense repayments and non-reimbursable expenses, if any, such as interest, taxes, and extraordinary expenses. (See Note 1(c) and 2 in the Notes to Financial Statements.) |
| 7 | Ratio includes recapture of reimbursed fees from prior years amounting to 0.04% and 0.07% for the fiscal year ended December 31, 2018 and December 31, 2017, respectively. |
39
|
AMG Managers Global Income Opportunity Fund Financial Highlights For a share outstanding throughout each fiscal year |
| | | | | | | | | | | | | | | | | | | | |
| | | For the fiscal years ended December 31, | |
| | | | | |
| Class N | | 2018 | | | 20171 | | | 20162 | | | 2015 | | | 2014 | |
| | | | | |
Net Asset Value, Beginning of Year | | | $21.06 | | | | $19.05 | | | | $18.18 | | | | $19.68 | | | | $19.69 | |
| | | | | |
Income (loss) from Investment Operations: | | | | | | | | | | | | | | | | | | | | |
| | | | | |
Net investment income3,4 | | | 0.69 | | | | 0.75 | | | | 0.72 | | | | 0.65 | | | | 0.57 | |
| | | | | |
Net realized and unrealized gain (loss) on investments | | | (1.57 | ) | | | 1.26 | | | | 0.15 | | | | (1.87 | ) | | | (0.21 | ) |
Total income (loss) from investment operations | | | (0.88 | ) | | | 2.01 | | | | 0.87 | | | | (1.22 | ) | | | 0.36 | |
| | | | | |
Less Distributions to Shareholders from: | | | | | | | | | | | | | | | | | | | | |
| | | | | |
Net investment income | | | (0.14 | ) | | | — | | | | — | | | | (0.28 | ) | | | (0.37 | ) |
| | | | | |
Net Asset Value, End of Year | | | $20.04 | | | | $21.06 | | | | $19.05 | | | | $18.18 | | | | $19.68 | |
Total Return4,5 | | | (4.18 | )% | | | 10.55 | % | | | 4.79 | % | | | (6.22 | )% | | | 1.84 | % |
| | | | | |
Ratio of net expenses to average net assets | | | 0.89 | % | | | 0.89 | % | | | 0.89 | % | | | 0.89 | % | | | 0.89 | % |
| | | | | |
Ratio of gross expenses to average net assets6 | | | 1.52 | % | | | 1.39 | % | | | 1.46 | % | | | 1.29 | % | | | 1.26 | % |
| | | | | |
Ratio of net investment income to average net assets4 | | | 3.34 | % | | | 3.71 | % | | | 3.75 | % | | | 3.36 | % | | | 2.78 | % |
| | | | | |
Portfolio turnover | | | 60 | % | | | 55 | % | | | 34 | % | | | 53 | % | | | 56 | % |
| | | | | |
Net assets end of year (000’s) omitted | | | $10,365 | | | | $14,074 | | | | $15,434 | | | | $32,141 | | | | $50,213 | |
| | | | | | | | | | | | | | | | | | | | | |
| 1 | Effective February 27, 2017, Class S was renamed Class N shares. |
| 2 | Effective October 1, 2016, the shares were reclassified and redesignated as Class S shares. |
| 3 | Per share numbers have been calculated using average shares. |
| 4 | Total returns and net investment income would have been lower had certain expenses not been offset. |
| 5 | The total return is calculated using the published Net Asset Value as of fiscal year end. |
| 6 | Excludes the impact of expense reimbursement or fee waivers and expense reductions such as brokerage credits, but includes expense repayments and non-reimbursable expenses, if any, such as interest, taxes, and extraordinary expenses. (See Note 1(c) and 2 in the Notes to Financial Statements.) |
40
| | |
| | AMG Managers Special Equity Fund Financial Highlights For a share outstanding throughout each fiscal year |
| | | | | | | | | | | | | | | | | | | | |
| | | For the fiscal years ended December 31, | |
| | | | | |
| Class N | | 2018 | | | 20171 | | | 20162 | | | 2015 | | | 2014 | |
Net Asset Value, Beginning of Year | | $ | 119.45 | | | $ | 99.33 | | | $ | 87.84 | | | $ | 88.30 | | | $ | 87.24 | |
| | | | | |
Income (loss) from Investment Operations: | | | | | | | | | | | | | | | | | | | | |
| | | | | |
Net investment loss3,4 | | | (0.91 | ) | | | (0.79 | )5 | | | (0.43 | )6 | | | (0.47 | )7 | | | (0.72 | ) |
| | | | | |
Net realized and unrealized gain (loss) on investments | | | (3.59 | ) | | | 20.91 | | | | 11.92 | | | | 0.01 | | | | 1.78 | |
Total income (loss) from investment operations | | | (4.50 | ) | | | 20.12 | | | | 11.49 | | | | (0.46 | ) | | | 1.06 | |
| | | | | |
Net Asset Value, End of Year | | $ | 114.95 | | | $ | 119.45 | | | $ | 99.33 | | | $ | 87.84 | | | $ | 88.30 | |
Total Return4 | | | (3.76 | )%8 | | | 20.25 | %8 | | | 13.08 | % | | | (0.52 | )% | | | 1.22 | %8 |
| | | | | |
Ratio of net expenses to average net assets9 | | | 1.36 | % | | | 1.36 | % | | | 1.36 | % | | | 1.35 | % | | | 1.35 | % |
| | | | | |
Ratio of gross expenses to average net assets10 | | | 1.38 | % | | | 1.41 | % | | | 1.50 | % | | | 1.51 | % | | | 1.51 | % |
| | | | | |
Ratio of net investment loss to average net assets4 | | | (0.69 | )% | | | (0.73 | )% | | | (0.49 | )% | | | (0.51 | )% | | | (0.83 | )% |
| | | | | |
Portfolio turnover | | | 113 | % | | | 81 | % | | | 120 | % | | | 116 | % | | | 121 | % |
| | | | | |
Net assets end of year (000’s) omitted | | $ | 170,744 | | | $ | 173,607 | | | $ | 180,008 | | | $ | 181,862 | | | $ | 205,362 | |
| | | | | | | | | | | | | | | | | | | | | |
41
|
AMG Managers Special Equity Fund Financial Highlights For a share outstanding throughout each fiscal year |
| | | | | | | | | | | | | | | | | | | | |
| | | For the fiscal years ended December 31, | |
| | | | | |
| Class I | | 2018 | | | 2017 | | | 20162 | | | 2015 | | | 2014 | |
| | | | | |
Net Asset Value, Beginning of Year | | $ | 122.90 | | | $ | 101.95 | | | $ | 89.92 | | | $ | 90.18 | | | $ | 88.87 | |
| | | | | |
Income (loss) from Investment Operations: | | | | | | | | | | | | | | | | | | | | |
| | | | | |
Net investment loss3,4 | | | (0.60 | ) | | | (0.54 | )5 | | | (0.22 | )6 | | | (0.26 | )7 | | | (0.51 | ) |
| | | | | |
Net realized and unrealized gain (loss) on investments | | | (3.73 | ) | | | 21.49 | | | | 12.25 | | | | 0.00 | 11 | | | 1.82 | |
Total income (loss) from investment operations | | | (4.33 | ) | | | 20.95 | | | | 12.03 | | | | (0.26 | ) | | | 1.31 | |
| | | | | |
Net Asset Value, End of Year | | $ | 118.57 | | | $ | 122.90 | | | $ | 101.95 | | | $ | 89.92 | | | $ | 90.18 | |
Total Return4 | | | (3.52 | )%8 | | | 20.55 | %8 | | | 13.38 | % | | | (0.29 | )% | | | 1.47 | %8 |
| | | | | |
Ratio of net expenses to average net assets9 | | | 1.11 | % | | | 1.11 | % | | | 1.11 | % | | | 1.10 | % | | | 1.10 | % |
| | | | | |
Ratio of gross expenses to average net assets10 | | | 1.13 | % | | | 1.16 | % | | | 1.25 | % | | | 1.26 | % | | | 1.26 | % |
| | | | | |
Ratio of net investment loss to average net assets4 | | | (0.44 | )% | | | (0.48 | )% | | | (0.24 | )% | | | (0.27 | )% | | | (0.58 | )% |
| | | | | |
Portfolio turnover | | | 113 | % | | | 81 | % | | | 120 | % | | | 116 | % | | | 121 | % |
| | | | | |
Net assets end of year (000’s) omitted | | $ | 31,253 | | | $ | 26,865 | | | $ | 19,647 | | | $ | 18,536 | | | $ | 18,917 | |
| | | | | | | | | | | | | | | | | | | | | |
| 1 | Effective February 27, 2017, Class S shares were renamed Class N shares. |
| 2 | Effective October 1, 2016, the Service Class and Institutional Class were renamed Class S and Class I, respectively. |
| 3 | Per share numbers have been calculated using average shares. |
| 4 | Total returns and net investment income would have been lower had certain expenses not been offset. |
| 5 | Includes non-recurring dividends. Without these dividends, net investment loss per share would have been $(0.84) and $(0.59) for Class N and Class I respectively. |
| 6 | Includes non-recurring dividends. Without these dividends, net investment loss per share would have been $(0.49) and $(0.28) for Class N and Class I respectively. |
| 7 | Includes non-recurring dividends. Without these dividends, net investment loss per share would have been $(0.69) and $(0.48) for Class N and Class I, respectively. |
| 8 | The total return is calculated using the published Net Asset Value as of fiscal year end. |
| 9 | Includes reduction from broker recapture amounting to less than 0.01% for the years ended 2018, 2017, 2016, 2015 and 2014, respectively. |
| 10 | Excludes the impact of expense reimbursement or fee waivers and expense reductions such as brokerage credits, but includes expense repayments and non-reimbursable expenses, if any, such as interest, taxes, and extraordinary expenses. (See Note 1(c) and 2 in the Notes to Financial Statements.) |
| 11 | Less than $0.005 per share. |
42
|
Notes to Financial Statements December 31, 2018 |
1. SUMMARY OF SIGNIFICANT ACCOUNTING POLICIES
AMG Funds III (the “Trust”) is an open-end management investment company, organized as a Massachusetts business trust, and registered under the Investment Company Act of 1940, as amended (the “1940 Act”). Currently, the Trust consists of a number of different funds, each having distinct investment management objectives, strategies, risks, and policies. Included in this report are AMG Managers Loomis Sayles Bond Fund (“Bond”), AMG Managers Global Income Opportunity Fund (“Global Income Opportunity”) and AMG Managers Special Equity Fund (“Special Equity”), each a “Fund” and collectively, the “Funds.”
Each Fund offers different classes of shares. Both Bond and Special Equity offer Class N (previously Class S) and Class I shares. Global Income Opportunity offer Class N (previously Class S) shares. Each class represents an interest in the same assets of the respective Fund. Although all share classes generally have identical voting rights, each share class votes separately when required by law. Different share classes may have different net asset values per share to the extent the share classes pay different distribution amounts and/or the expenses of such share classes differ. Each share class has its own expense structure. Please refer to a current prospectus for additional information on each share class.
The Funds’ financial statements are prepared in accordance with accounting principles generally accepted in the United States of America (“U.S. GAAP”), including accounting and reporting guidance pursuant to Accounting Standards Codification Topic 946 applicable to investment companies. U.S. GAAP requires management to make estimates and assumptions that affect the reported amounts of assets and liabilities and disclosure of contingent assets and liabilities at the date of the financial statements and the reported amounts of income and expenses during the reporting period. Actual results could differ from those estimates and such differences could be material. The following is a summary of significant accounting policies followed by the Funds in the preparation of their financial statements:
a. VALUATION OF INVESTMENTS
Equity securities traded on a national securities exchange or reported on the NASDAQ national market system (“NMS”) are valued at the last quoted sales price on the primary exchange or, if applicable, the NASDAQ official closing price or the official closing price of the relevant exchange or, lacking any sales, at the last quoted bid price or the mean between the last quoted bid and ask prices (the “exchange mean price”). Equity securities traded in the over-the-counter market (other than NMS securities) are valued at the exchange mean price. Foreign equity securities (securities principally traded in markets other than U.S. markets) are valued at the official closing price on the primary exchange or, for markets that either do not offer an official closing price or where the official closing price may not be representative of the overall market, the last quoted sale price.
Fixed income securities purchased with a remaining maturity exceeding 60 days are valued at the evaluated bid price or the mean price provided by an authorized pricing service or, if an evaluated price is not available, by reference to other securities which are considered comparable in credit rating, interest rate, due date and other features (generally referred to as “matrix pricing”) or other similar pricing methodologies. Investments in certain mortgage-backed and stripped mortgage-backed securities, preferred stocks, convertible securities, derivatives and other debt securities not traded on an organized securities market are valued on the basis of valuations provided by dealers or by a pricing service which uses information with respect to transactions in such securities and various relationships between such securities and yield to maturity in determining value.
Fixed income securities purchased with a remaining maturity of 60 days or less are valued at amortized cost, provided that the amortized cost value is approximately the same as the fair value of the security valued without the use of amortized cost. Investments in other open-end regulated investment companies are valued at their end of day net asset value per share.
The Funds’ portfolio investments are generally valued based on independent market quotations or prices or, if none, “evaluative” or other market based valuations provided by third party pricing services approved by the Board of Trustees of the Trust (the “Board”). Under certain circumstances, the value of certain Fund portfolio investments (including derivatives) may be based on an evaluation of fair value, pursuant to procedures established by and under the general supervision of the Board. The Valuation Committee, which is comprised of the Independent Trustees of the Board, and the Pricing Committee, which is comprised of representatives from AMG Funds LLC (the “Investment Manager”) are the committees appointed by the Board to make fair value determinations. Each Fund may use the fair value of a portfolio investment to calculate its net asset value (“NAV”) in the event that the market quotation, price or market based valuation for the portfolio investment is not readily available or otherwise not determinable pursuant to the Board’s valuation procedures, if the Investment Manager or the Pricing Committee believes the quotation, price or market based valuation to be unreliable, or in certain other circumstances. When determining the fair value of an investment, the Pricing Committee and, if required under the Trust’s securities valuation procedures, the Valuation Committee, seeks to determine the price that the Fund might reasonably expect to receive from current sale of that portfolio investment in an arms-length transaction. Fair value determinations shall be based upon consideration of all available facts and information, including, but not limited to (i) attributes specific to the investment; (ii) fundamental and analytical data relating to the investment; and (iii) the value of other comparable securities or relevant financial instruments, including derivative securities, traded on other markets or among dealers.
The values assigned to fair value portfolio investments are based on available information and do not necessarily represent amounts that might ultimately be realized in the future, since such amounts depend on future developments inherent in long-term investments. Because of the inherent uncertainty of valuation, those estimated values may differ significantly from the values that would have been used had a ready market for the investments existed, and the differences could be material. The Board will be presented with a quarterly report showing as of the most recent quarter end, all outstanding securities fair valued by the Funds, including a comparison with the prior quarter end and the percentage of the Funds that the security represents at each quarter end.
With respect to foreign equity securities and certain foreign fixed income securities, the Board has adopted a policy that securities held in a Fund that can be fair valued by the applicable fair value pricing service are fair valued on each business day provided that each individual price exceeds a pre-established confidence level.
U.S. GAAP defines fair value as the price that a fund would receive to sell an asset or pay to transfer a liability in an orderly transaction between market participants at the measurement date. U.S. GAAP also establishes a framework for measuring fair value, and a three level hierarchy for fair value measurements based upon the transparency of inputs to the valuation of an asset or liability. Inputs may be observable or unobservable and refer broadly to the assumptions that market participants would use in pricing the asset or liability. Observable inputs reflect the assumptions market participants would use in pricing the asset or liability based on market data obtained from sources independent of the Funds.
43
| | |
| | | Notes to Financial Statements(continued) |
Unobservable inputs reflect the Funds’ own assumptions about the assumptions that market participants would use in pricing the asset or liability developed based on the best information available in the circumstances. Each investment is assigned a level based upon the observability of the inputs which are significant to the overall valuation.
The three-tier hierarchy of inputs is summarized below:
Level 1 – inputs are quoted prices in active markets for identical investments (e.g., equity securities, open-end investment companies)
Level 2 – other observable inputs (including, but not limited to: quoted prices for similar assets or liabilities in markets that are active, quoted prices for identical or similar assets or liabilities in markets that are not active, inputs other than quoted prices that are observable for the assets or liabilities (such as interest rates, yield curves, volatilities, prepayment speeds, loss severities, credit risks and default rates) or other market corroborated inputs) (e.g., debt securities, government securities, foreign currency exchange contracts, swaps, foreign securities utilizing international fair value pricing, fair valued securities with observable inputs)
Level 3 – inputs are significant unobservable inputs (including the Fund’s own assumptions used to determine the fair value of investments) (e.g., fair valued securities with unobservable inputs)
Changes in inputs or methodologies used for valuing investments may result in a transfer in or out of levels within the fair value hierarchy. The inputs or methodologies used for valuing investments may not necessarily be an indication of the risk associated with investing in those investments.
b. SECURITY TRANSACTIONS
Security transactions are accounted for as of trade date. Realized gains and losses on securities sold are determined on the basis of identified cost.
c. INVESTMENT INCOME AND EXPENSES
Dividend income is recorded on the ex-dividend date. Dividends from foreign securities are recorded on the ex-dividend date, and if after the fact, as soon as the Funds become aware of the ex-dividend date. Interest income, which includes amortization of premium and accretion of discount on debt securities, is accrued as earned. Dividend and interest income on foreign securities is recorded gross of any withholding tax. Non-cash dividends included in dividend income, if any, are reported at the fair market value of the securities received. Other income and expenses are recorded on an accrual basis. Expenses that cannot be directly attributed to a Fund are apportioned among the funds in the Trusts and other trusts within the AMG Funds family of mutual funds (collectively the “AMG Funds
Family”) based upon their relative average net assets or number of shareholders. Investment income, realized and unrealized capital gains and losses, the common expenses of each Fund, and certain fund level expense reductions, if any, are allocated on a pro-rata basis to each class based on the relative net assets of each class to the total net assets of each Fund.
Special Equity had certain portfolio trades directed to various brokers under a brokerage recapture program. Credits received from the brokerage recapture program are earned and paid on a monthly basis, and are recorded as expense offsets, which serve to reduce the Funds’ overall expense ratio. For the fiscal year ended December 31, 2018, the impact on the expenses and expense ratios, if any, was $11,061 or less than 0.01%.
d. DIVIDENDS AND DISTRIBUTIONS
Fund distributions resulting from either net investment income or realized net capital gains, if any, will normally be declared and paid at least annually in December. Distributions to shareholders are recorded on the ex-dividend date. Distributions are determined in accordance with federal income tax regulations, which may differ from net investment income and net realized capital gains for financial statement purposes (U.S. GAAP). Differences may be permanent or temporary. Permanent differences are reclassified among capital accounts in the financial statements to reflect their tax character. Permanent book and tax basis differences, if any, relating to shareholder distributions will result in reclassifications to paid-in capital. Temporary differences arise when certain items of income, expense and gain or loss are recognized in different periods for financial statement and tax purposes; these differences will reverse at some time in the future. Permanent differences are due to currency gains/losses, capital loss carryforwards expired and current year write-off of a net operating loss. Temporary differences are due to straddles, §1256 market to market of foreign currency contracts and wash sales.
The distributions disclosed on the Statements of Changes in Net Assets for the fiscal year ended December 31, 2017 were from the following sources:
| | | | | | | | |
Fund | | Net Investment Income | | | Realized Gain on
Investments | |
| | |
Bond | | | | | | | | |
| | |
Class N | | | $35,817,018 | | | | $5,570,672 | |
| | |
Class I | | | 29,384,964 | | | | 5,898,523 | |
| | | | | | | | |
| | |
Total | | | $65,201,982 | | | | $11,469,195 | |
| | | | | | | | |
The tax character of distributions paid during the fiscal years ended December 31, 2018 and December 31, 2017 were as follows:
| | | | | | | | | | | | | | | | | | | | | | | | |
| | | Bond | | | | Global Income Opportunity | | | | Special Equity | |
Distributions paid from: | | | 2018 | | | | 2017 | | | | 2018 | | | | 2017 | | | | 2018 | | | | 2017 | |
| | | | | | |
Ordinary income | | | $60,110,954 | | | | $65,201,982 | | | | $76,366 | | | | — | | | | — | | | | — | |
| | | | | | |
Short-term capital gains | | | 21,180 | | | | 1,687,725 | | | | — | | | | — | | | | — | | | | — | |
| | | | | | |
Long-term capital gains | | | 13,392,602 | | | | 9,781,470 | | | | — | | | | — | | | | — | | | | — | |
| | | | | | | | | | | | | | | | | | | | | | | | |
| | | | | | |
| | | $73,524,736 | | | | $76,671,177 | | | | $76,366 | | | | — | | | | — | | | | — | |
| | | | | | | | | | | | | | | | | | | | | | | | |
44
| | |
| | | Notes to Financial Statements(continued) |
As of December 31, 2018, the components of distributable earnings (excluding unrealized appreciation/depreciation) on a tax basis consisted of:
| | | | | | | | | | | | |
| | | Bond | | | Global Income Opportunity | | | Special Equity | |
| | | |
Capital loss carryforward | | | — | | | | $358,632 | | | | — | |
| | | |
Undistributed ordinary income | | | $1,298,497 | | | | 29,786 | | | | — | |
| | | |
Undistributed short-term capital gains | | | 1,124 | | | | — | | | | $7,505,088 | |
| | | |
Undistributed long-term capital gains | | | — | | | | — | | | | 28,363,805 | |
| | | |
Late-year loss deferral | | | 115,416 | | | | — | | | | — | |
At December 31, 2018, the cost of investments and the aggregate gross unrealized appreciation and depreciation for federal income tax purposes were as follows:
| | | | | | | | | | | | | | | | |
Fund | | Cost | | | Appreciation | | | Depreciation | | | Net | |
| | | | |
Bond | | | $1,821,925,180 | | | | $70,581,663 | | | | $(77,451,367 | ) | | | $(6,869,704 | ) |
| | | | |
Global Income Opportunity | | | 11,485,097 | | | | 119,950 | | | | (843,412 | ) | | | (723,462 | ) |
| | | | |
Special Equity | | | 219,876,700 | | | | 14,891,540 | | | | (25,924,432 | ) | | | (11,032,892 | ) |
e. FEDERAL TAXES
Each Fund currently qualifies as an investment company and intends to comply with the requirements under Subchapter M of the Internal Revenue Code of 1986, as amended, and to distribute substantially all of its taxable income and gains to its shareholders and to meet certain diversification and income requirements with respect to investment companies. Therefore, no provision for federal income or excise tax is included in the accompanying financial statements.
Additionally, based on each Fund’s understanding of the tax rules and rates related to income, gains and transactions for the foreign jurisdictions in which it invests, each Fund will provide for foreign taxes, and where appropriate, deferred foreign taxes.
Management has analyzed the Funds’ tax positions taken on federal income tax returns as of December 31, 2018, and for all open tax years (generally, the three prior taxable years), and has concluded that no provision for federal income tax is required in the Funds’ financial statements. Additionally, Management is not aware of any tax position for which it is reasonably possible that the total amounts of unrecognized tax benefits will change materially in the next twelve months.
Net capital losses incurred may be carried forward for an unlimited time period, and retain their tax character as either short-term or long-term capital losses.
f. CAPITAL LOSS CARRYOVERS AND DEFERRALS
As of December 31, 2018, the following Fund had accumulated net realized capital loss carryovers from securities transactions for federal income tax purposes as
shown in the following chart. These amounts may be used to offset future realized capital gains, if any, for an unlimited time period.
| | | | |
| Capital Loss Carryover Amounts |
| | |
Fund | | Short-Term | | Long-Term |
| | |
Global Income Opportunity | | $358,632 | | — |
As of December 31, 2018, the Bond and Special Equity Funds had no accumulated net realized capital loss carryovers from securities transactions for federal income tax purposes. Should the Funds incur net capital losses for the fiscal year ended December 31, 2019, such amounts may be used to offset future realized capital gains, for an unlimited time period.
g. CAPITAL STOCK
The Trust’s Declaration of Trust authorizes for each Fund the issuance of an unlimited number of shares of beneficial interest, without par value. Each Fund records sales and repurchases of its capital stock on the trade date. Global Income Opportunity will deduct a 1.00% redemption fee from the proceeds of any redemption (including a redemption by exchange) of shares if the redemption occurs within 60 days of the purchase of those shares. Effective March 1, 2019, the Global Income Opportunity Fund will eliminate this redemption fee. For the fiscal year ended December 31, 2018, the Global Income Opportunity Fund had redemption fees amounting to $1,349. For the fiscal year ended December 31, 2017, the Fund had redemption fees amounting to $856. This amount is netted against the cost of shares repurchased in the Statements of Changes in Net Assets.
45
| | |
| | | Notes to Financial Statements(continued) |
For the fiscal years ended December 31, 2018 and December 31, 2017, the capital stock transactions by class for the Funds were as follows:
| | | | | | | | | | | | | | | | | | | | | | | | | | | | | | | | |
| | | Bond | | | Special Equity | |
| | | | |
| | | December 31, 2018 | | | December 31, 2017 | | | December 31, 2018 | | | December 31, 2017 | |
| | | | | | | | |
| | | Shares | | | Amount | | | Shares | | | Amount | | | Shares | | | Amount | | | Shares | | | Amount | |
| | | | | | | | |
Class N: | | | | | | | | | | | | | | | | | | | | | | | | | | | | | | | | |
| | | | | | | | |
Proceeds from sale of shares | | | 4,780,688 | | | | $126,127,019 | | | | 5,668,532 | | | | $152,614,451 | | | | 329,518 | | | | $46,939,577 | | | | 66,509 | | | | $7,066,821 | |
| | | | | | | | |
Reinvestment of distributions | | | 1,081,213 | | | | 28,139,782 | | | | 1,453,735 | | | | 39,098,655 | | | | — | | | | — | | | | — | | | | — | |
| | | | | | | | |
Cost of shares repurchased | | | (13,810,521 | ) | | | (364,150,946 | ) | | | (18,132,901 | ) | | | (489,153,758 | ) | | | (297,568 | ) | | | (38,178,984 | ) | | | (425,258 | ) | | | (45,599,506 | ) |
| | | | | | | | | | | | | | | | | | | | | | | | | | | | | | | | |
| | | | | | | | |
Net increase (decrease) | | | (7,948,620 | ) | | | $(209,884,145 | ) | | | (11,010,634 | ) | | | $(297,440,652 | ) | | | 31,950 | | | | $8,760,593 | | | | (358,749 | ) | | | $(38,532,685 | ) |
| | | | | | | | | | | | | | | | | | | | | | | | | | | | | | | | |
| | | | | | | | |
Class I: | | | | | | | | | | | | | | | | | | | | | | | | | | | | | | | | |
| | | | | | | | |
Proceeds from sale of shares | | | 14,478,048 | | | | $382,352,852 | | | | 13,507,953 | | | | $365,791,317 | | | | 88,902 | | | | $12,497,553 | | | | 80,723 | | | | $9,052,722 | |
| | | | | | | | |
Reinvestment of distributions | | | 1,652,948 | | | | 42,974,754 | | | | 1,277,804 | | | | 34,407,050 | | | | — | | | | — | | | | — | | | | — | |
| | | | | | | | |
Cost of shares repurchased | | | (11,278,671 | ) | | | (295,283,316 | ) | | | (6,093,674 | ) | | | (163,993,718 | ) | | | (43,918 | ) | | | (5,872,570 | ) | | | (54,850 | ) | | | (6,087,724 | ) |
| | | | | | | | | | | | | | | | | | | | | | | | | | | | | | | | |
| | | | | | | | |
Net increase | | | 4,852,325 | | | | $130,044,290 | | | | 8,692,083 | | | | $236,204,649 | | | | 44,984 | | | | $6,624,983 | | | | 25,873 | | | | $2,964,998 | |
| | | | | | | | | | | | | | | | | | | | | | | | | | | | | | | | |
| | | | | | | | | | | | | | | | |
| | | Global Income Opportunity | |
| | |
| | | December 31, 2018 | | | December 31, 2017 | |
| | | | |
| | | Shares | | | Amount | | | Shares | | | Amount | |
| | | | |
Class N: | | | | | | | | | | | | | | | | |
| | | | |
Proceeds from sale of shares | | | 124,370 | | | | $2,598,624 | | | | 118,276 | | | | $2,383,354 | |
| | | | |
Reinvestment of distributions | | | 3,383 | | | | 67,386 | | | | — | | | | — | |
| | | | |
Cost of shares repurchased | | | (278,715 | ) | | | (5,730,793 | ) | | | (260,356 | ) | | | (5,202,761 | ) |
| | | | | | | | | | | | | | | | |
| | | | |
Net decrease | | | (150,962 | ) | | | $(3,064,783 | ) | | | (142,080 | ) | | | $(2,819,407 | ) |
| | | | | | | | | | | | | | | | |
h. REPURCHASE AGREEMENTS AND JOINT REPURCHASE AGREEMENTS
The Funds may enter into third-party repurchase agreements for temporary cash management purposes and third-party or bilateral joint repurchase agreements for reinvestment of cash collateral on securities lending transactions under the securities lending program offered by The Bank of New York Mellon (“BNYM”) (the “Program”) (collectively, “Repurchase Agreements”). The value of the underlying collateral, including accrued interest, must equal or exceed the value of the Repurchase Agreements during the term of the agreement. For joint repurchase agreements, the Funds participate on a pro rata basis with other clients of BNYM in its share of the underlying collateral under such joint repurchase agreements and in its share of proceeds from any repurchase or other disposition of the underlying collateral. The underlying collateral for all Repurchase Agreements is held in safekeeping by the Funds’ custodian or at the Federal Reserve Bank. If the seller defaults and the value of the collateral declines, or if bankruptcy proceedings commence with respect to the seller of the security, realization of the collateral by the Funds may be delayed or limited. Pursuant to the Program, the Funds are indemnified for such losses by BNYM on joint repurchase agreements.
At December 31, 2018, the market value of Repurchase Agreements outstanding for Bond, Global Income Opportunity and Special Equity was $14,983,584, $1,071 and $6,382,790, respectively.
i. FOREIGN CURRENCY TRANSLATION
The books and records of the Funds are maintained in U.S. dollars. The value of investments, assets and liabilities denominated in currencies other than U.S. dollars are translated into U.S. dollars based upon current foreign exchange rates. Purchases and sales of foreign investments, income and expenses are converted into U.S. dollars based on currency exchange rates prevailing on the respective dates of such transactions. Net realized and unrealized gain (loss) on foreign currency transactions represent: (1) foreign exchange gains and losses from the sale and holdings of foreign currencies; (2) gains and losses between trade date and settlement date on investment securities transactions and foreign currency exchange contracts; and (3) gains and losses from the difference between amounts of interest and dividends recorded and the amounts actually received.
The Funds do not isolate the net realized and unrealized gain or loss resulting from changes in exchange rates from the fluctuations in market prices of securities held. Such fluctuations are included with the net realized and unrealized gain or loss on investments.
2. AGREEMENTS AND TRANSACTIONS WITH AFFILIATES
For each of the Funds, the Trust has entered into an investment advisory agreement under which the Investment Manager, a subsidiary and the U.S. retail distribution arm of Affiliated Managers Group, Inc. (“AMG”), serves as investment
46
| | |
| | | Notes to Financial Statements(continued) |
manager to the Funds and is responsible for the Funds’ overall administration and operations. The Investment Manager selects one or more subadvisers for the Funds (subject to Board approval) and monitors each subadviser’s investment performance, security holdings and investment strategies. Each Fund’s investment portfolio is managed by one or more portfolio managers who serve pursuant to a subadvisory agreement with the Investment Manager. Bond and Global Income Opportunity are managed by Loomis, Sayles & Company, L.P. and Special Equity is managed by Ranger Investment Management, L.P., Lord, Abbett & Co. LLC, Smith Asset Management Group, L.P. and Federated MDTA LLC.
Investment management fees are paid directly by the Funds to the Investment Manager based on average daily net assets. For the fiscal year ended December 31, 2018, the Fund’s investment management fees were paid at the following annual rate of each Fund’s respective average daily net assets:
| | | | |
| |
Bond | | | 0.625 | % |
| |
Global Income Opportunity | | | 0.550 | % |
| |
Special Equity | | | 0.900 | % |
The Investment Manager has contractually agreed, through at least May 1, 2019, to waive management fees and/or reimburse fund expenses in order to limit total annual Fund operating expenses after fee waiver and expense reimbursements (exclusive of taxes, interest (including interest incurred in connection with bank and custody overdrafts), shareholder servicing fees, brokerage commissions and other transaction costs, acquired fund fees and expenses and extraordinary expenses) of Bond and Special Equity to 0.89% and 1.11%, respectively, and waive management fees and/or reimburse Fund expenses in order to limit total annual fund operating expenses after fee waiver and expense reimbursements (exclusive of taxes, interest (including interest incurred in connection with bank and custody overdrafts), brokerage commissions and other transaction costs, acquired fund fees and expenses, and extraordinary expenses) of Global Income Opportunity to 0.89%, of each Fund’s average daily net assets subject to later reimbursement by the Funds in certain circumstances.
The contractual expense limitation may only be terminated in the event the Investment Manager or a successor ceases to be the investment manager of a Fund or a successor fund, by mutual agreement between the Investment Manager and the Board, or in the event of a Fund’s liquidation unless the Fund is reorganized or is a party to a merger in which the surviving entity is successor to the accounting and performance information of a Fund.
In general, for a period of up to 36 months, the Investment Manager may recover from each Fund fees waived and expenses paid pursuant to this contractual agreement, provided that such repayment would not cause a Fund’s total annual operating expenses after fee waiver and expense reimbursements (exclusive of the items noted in the parenthetical above) to exceed the contractual expense limitation amount.
At December 31, 2018, the Funds’ expiration of recoupment is as follows:
| | | | | | | | |
Expiration Period | | Global Income Opportunity | | | Special Equity | |
| | |
Less than 1 year | | | $122,562 | | | | $267,272 | |
| | |
Within 2 years | | | 71,340 | | | | 94,177 | |
| | |
Within 3 years | | | 81,291 | | | | 54,349 | |
| | | | | | | | |
| | |
Total Amount Subject to Recoupment | | | $275,193 | | | | $415,798 | |
| | | | | | | | |
The Trust, on behalf of the Funds, has entered into an amended and restated Administration Agreement under which the Investment Manager serves as the Funds’ administrator (the “Administrator”) and is responsible for all non-portfolio management aspects of managing the Funds’ operations, including administration and shareholder services to each Fund. Each Fund pays a fee to the Administrator at the rate of 0.15% per annum of the Fund’s average daily net assets for this service.
The Funds are distributed by AMG Distributors, Inc. (the “Distributor”), a wholly-owned subsidiary of the Investment Manager. The Distributor serves as the distributor and underwriter for each Fund and is a registered broker-dealer and member of the Financial Industry Regulatory Authority, Inc. (“FINRA”). Shares of each Fund will be continuously offered and will be sold directly to prospective purchasers and through brokers, dealers or other financial intermediaries who have executed selling agreements with the Distributor. Generally the Distributor bears all or a portion of the expenses of providing services pursuant to the distribution agreement, including the payment of the expenses relating to the distribution of prospectuses for sales purposes and any advertising or sales literature.
For Class N of Bond and Special Equity and for Class I of Bond, the Board has approved reimbursement payments to the Investment Manager for shareholder servicing expenses (“shareholder servicing fees”) incurred. Shareholder servicing fees include payments to financial intermediaries, such as broker-dealers (including fund supermarket platforms), banks, and trust companies who provide shareholder recordkeeping, account servicing and other services. Class N shares of Bond and Special Equity and Class I shares of Bond may reimburse the Investment Manager for the actual amount incurred up to a maximum annual rate of each Class’s average daily net assets as shown in the table below.
The impact on the annualized expense ratios for the fiscal year ended December 31, 2018, were as follows:
| | | | | | | | |
| Fund | | Maximum Annual Amount Approved | | | Actual Amount Incurred | |
| | |
Bond | | | | | | | | |
| | |
Class N | | | 0.15% | | | | 0.12% | |
| | |
Class I | | | 0.05% | | | | 0.02% | |
| | |
Special Equity | | | | | | | | |
| | |
Class N | | | 0.25% | | | | 0.25% | |
The Board provides supervision of the affairs of the Trust and other trusts within the AMG Funds family. The Trustees of the Trust who are not affiliated with the Investment Manager receive an annual retainer and per meeting fees for regular, special and telephonic meetings, and they are reimbursed for out-of-pocket
47
| | |
| | | Notes to Financial Statements(continued) |
expenses incurred while carrying out their duties as Board members. The Chairman of the Board and the Audit Committee Chair receive additional annual retainers. Certain Trustees and Officers of the Funds are Officers and/or Directors of the Investment Manager, AMG and/or the Distributor.
The Securities and Exchange Commission (the “SEC”) granted an exemptive order that permits the Funds to lend and borrow money for certain temporary purposes directly to and from other eligible funds in the AMG Funds family. Participation in this interfund lending program is voluntary for both the borrowing and lending funds, and an interfund loan is only made if it benefits each participating fund. The Administrator manages the program according to procedures approved by the Board, and the Board monitors the operation of the program. An interfund loan must comply with certain conditions set out in the exemptive order, which are designed to assure fairness and protect all participating funds. For the fiscal year ended December 31, 2018, Bond lent a maximum of $5,815,368, for five days earning interest of $2,275. The interest income amount is included in the Statement of Operations as interest income. Bond borrowed a maximum of $6,446,721, for two days paying interest of $770. The interest expense amount is included in the Statement of Operations as miscellaneous expense. Global income Opportunity and Special Equity Funds neither borrowed from nor lent to other funds in the AMG Funds family. At December 31, 2018, the Funds had no interfund loans outstanding.
For the year ended December 31, 2018, Special Equity executed security transactions with other funds affiliated with Lord, Abbett & Co., LLC. Each of the transactions were executed at the closing price of the security transacted and with no commissions under Rule 17a-7 procedures approved by the Board. The amounts purchased and sold during the fiscal year ended December 31, 2018, are reflected in the following chart:
| | | | | | | | | | | | | | | |
| | | Number of Transactions | | Total Quantity | | Cost/Proceeds |
| | | |
Purchases | | | | 5 | | | | | 6,956 | | | | $ | 256,112 | |
| | | |
Sales* | | | | 1 | | | | | 22 | | | | | 3,630 | |
* Realized gain was $1,762.
3. PURCHASES AND SALES OF SECURITIES
Purchases and sales of securities (excluding short-term securities and U.S. Government Obligations) for the fiscal year ended December 31, 2018, were as follows:
| | | | | | |
| | | Long Term Securities | |
| | |
| Fund | | Purchases | | Sales |
| | |
Bond | | $92,476,024 | | | $230,443,473 | |
| | |
Global Income Opportunity | | 3,575,014 | | | 5,289,619 | |
| | |
Special Equity | | 261,058,394 | | | 242,054,905 | |
Purchases and sales of U.S. Government Obligations for the fiscal year ended December 31, 2018 were as follows:
| | | | | | |
| | | U.S. Government
Obligations | |
| | |
| Fund | | Purchases | | Sales |
| | |
Bond | | $29,525,757 | | $ | 76,360,244 | |
| | |
Global Income Opportunity | | 3,947,986 | | | 4,301,713 | |
4. PORTFOLIO SECURITIES LOANED
The Funds participate in the Program providing for the lending of securities to qualified brokers. Securities lending income includes earnings of such temporary cash investments, plus or minus any rebate to a borrower. These earnings (after any rebate) are then divided between BNYM, as a fee for its services under the Program, and the Funds, according to agreed-upon rates. Collateral on all securities loaned is accepted in cash and, effective October 1, 2018, may also be accepted in U.S. Government and Agency Obligations. Collateral is maintained at a minimum level of 102% (105% in the case of certain foreign securities) of the market value, plus interest, if applicable, of investments on loan. It is the Funds’ policy to obtain additional collateral from or return excess collateral to the borrower by the end of the next business day, following the valuation date of the securities loaned. Therefore, the value of the collateral held may be temporarily less than the value of the securities on loan. Lending securities entails a risk of loss to the Funds if and to the extent that the market value of the securities loaned were to increase and the borrower did not increase the collateral accordingly, and the borrower fails to return the securities. Under the terms of the Program, the Funds are indemnified for such losses by BNYM. Cash collateral is held in separate omnibus accounts managed by BNYM, who is authorized to exclusively enter into joint repurchase agreements for that cash collateral. Securities collateral is held in separate omnibus accounts managed by BNYM that cannot be sold or pledged. BNYM bears the risk of any deficiency in the amount of the cash collateral available for return to the borrower due to any loss on the collateral invested.
The value of securities loaned on positions held, cash and securities collateral received at December 31, 2018, were as follows:
| | | | | | | | | | | | | | | | |
| Fund | | Securities Loaned | | | Cash Collateral Received | | | Securities Collateral Received | | | Total Collateral Received |
Bond | | $ | 486,940,260 | | | $ | 14,983,584 | | | $ | 481,328,575 | | | $ | 496,312,159 | |
Global Income Opportunity | | | 38,620 | | | | 1,071 | | | | 39,227 | | | | 40,298 | |
Special Equity | | | 48,294,998 | | | | 6,382,790 | | | | 42,421,482 | | | | 48,804,272 | |
The following table summarizes the securities received as collateral for securities lending:
| | | | | | |
| Fund | | Collateral Type | | Coupon Range | | Maturity Date Range |
| | | |
Bond | | U.S.
Government
Agency
Obligations | | 1.880%-11.000% | | 01/01/19-05/20/61 |
| | | |
| | U.S.
Treasury
Obligations | | 0.000%-8.750% | | 01/10/19-08/15/48 |
| | | |
Global Income Opportunity | | U.S.
Treasury
Obligations | | 0.000%-8.750% | | 01/17/19-08/15/46 |
| | | |
Special Equity | | U.S.
Treausry
Obligations | | 0.000%-8.750% | | 01/10/19-08/15/47 |
5. FOREIGN SECURITIES
Bond and Global Income Opportunity invest in securities of foreign entities and in instruments denominated in foreign currencies which involve risks not typically associated with investments in domestic securities. Non-domestic securities carry special risks, such as exposure to currency fluctuations, less developed or less efficient trading markets, political instability, a lack of company information, differing auditing and legal standards, and, potentially, less liquidity. Realized
48
| | |
| | | Notes to Financial Statements(continued) |
gains in certain countries may be subject to foreign taxes at the Fund level and the Fund would pay such foreign taxes at the appropriate rate for each jurisdiction.
6. COMMITMENTS AND CONTINGENCIES
Under the Trusts’ organizational documents, its trustees and officers are indemnified against certain liabilities arising out of the performance of their duties to the Trusts. In addition, in the normal course of business, the Funds may enter into contracts and agreements that contain a variety of representations and warranties, which provide general indemnifications. The maximum exposure to the Funds under these arrangements is unknown, as this would involve future claims that may be made against a Fund that have not yet occurred. However, based on experience, the Funds had no prior claims or losses and expect the risks of loss to be remote.
7. RISKS ASSOCIATED WITH HIGH YIELD SECURITIES
Investing in high yield securities involves greater risks and considerations not typically associated with U.S. Government and other high quality/investment grade securities. High yield securities are generally below investment grade securities and do not have an established retail secondary market. Economic downturns may disrupt the high yield market and impair the issuer’s ability to repay principal and interest. Also, an increase in interest rates would likely have an adverse impact on the value of such obligations and could cause the securities to become less liquid.
8. FORWARD COMMITMENTS
Certain transactions, such as futures and forward transactions, dollar roll agreements, or purchases of when-issued or delayed delivery securities may have a similar effect on a Fund’s net asset value as if a Fund had created a degree of leverage in its portfolio. However, if a Fund enters into such a transaction, a Fund will establish a segregated account with its custodian in which it will maintain cash, U.S. government securities or other liquid securities equal in value to its obligations in respect to such transaction. Securities and other assets held in the segregated account may not be sold while the transaction is outstanding, unless other suitable assets are substituted.
9. DERIVATIVE INSTRUMENTS
The following disclosures contain information on how and why certain Funds use derivative instruments, the credit risk and how derivative instruments affect the
Funds’ financial position, and results of operations. The location and fair value amounts of these instruments on the Statement of Assets and Liabilities, and the realized gains and losses and changes in unrealized gains and losses on the Statement of Operations, each categorized by type of derivative contract, are included in a table at the end of the applicable Fund’s Schedule of Portfolio Investments. For the fiscal year ended December 31, 2018, the average quarterly balances of derivative financial instruments outstanding were as follows:
| | | | |
| | | Global Income Opportunity | |
|
Foreign currency exchange contracts: | |
| |
Average U.S Dollar amount purchased/sold | | | $6,593,036 | |
10. FORWARD FOREIGN CURRENCY CONTRACTS
During the fiscal year ended December 31, 2018, Global Income Opportunity invested in forward foreign currency contracts to facilitate transactions in foreign securities and to hedge against foreign currency exchange rate risk on its non-U.S. dollar denominated investment securities.
A forward foreign currency contract is an agreement between a fund and another party to buy or sell a currency at a set price at a future date. The market value of the contract will fluctuate with changes in currency exchange rates. The contract is marked-to-market daily, and the change in market value is recorded as an unrealized gain or loss. Risks may arise upon entering into these contracts from the potential inability of counterparties to meet the terms of their contracts and from unanticipated movements in the value of a foreign currency relative to the U.S. dollar.
11. MASTER NETTING AGREEMENTS
The Funds may enter into master netting agreements with their counterparties for the securities lending program Repurchase Agreements and derivative instruments, which provide the right, in the event of default (including bankruptcy or insolvency) for the non-defaulting party to liquidate the collateral and calculate net exposure to the defaulting party or request additional collateral. For financial reporting purposes, the Funds do not offset financial assets and financial liabilities that are subject to master netting agreements in the Statement of Assets and Liabilities. For securities lending transactions, see Note 4.
49
| | |
| | | Notes to Financial Statements(continued) |
The following table is a summary of the Funds’ open Repurchase Agreements and derivatives that are subject to a master netting agreement as of December 31, 2018:
| | | | | | | | | | | | | | | | | | | | | | | | | |
| | | | | Gross Amount Not Offset in the
Statement of Assets and Liabilities | | | | |
| | | | | |
Fund | | Gross Amounts of Assets
Presented in the Statement
of Assets and Liabilities | | Offset Amount | | Net Asset Balance | | Collateral Received | | Net Amount |
| | | | | |
Bond | | | | | | | | | | | | | | | | | | | | | | | | | |
| | | | | |
Bank of Nova Scotia | | | | $746,172 | | | | | — | | | | | $746,172 | | | | | $746,172 | | | | | — | |
| | | | | |
Cantor Fitzgerald Securities, Inc. | | | | 3,559,353 | | | | | — | | | | | 3,559,353 | | | | | 3,559,353 | | | | | — | |
| | | | | |
Daiwa Capital Markets America | | | | 3,559,353 | | | | | — | | | | | 3,559,353 | | | | | 3,559,353 | | | | | — | |
| | | | | |
RBC Dominion Securities, Inc. | | | | 3,559,353 | | | | | — | | | | | 3,559,353 | | | | | 3,559,353 | | | | | — | |
| | | | | |
State of Wisconsin Investment Board | | | | 3,559,353 | | | | | — | | | | | 3,559,353 | | | | | 3,559,353 | | | | | — | |
| | | | | | | | | | | | | | | | | | | | | | | | | |
| | | | | |
Total | | | | $14,983,584 | | | | | — | | | | | $14,983,584 | | | | | $14,983,584 | | | | | — | |
| | | | | | | | | | | | | | | | | | | | | | | | | |
| | | | | | | | | | | | | | | | | | | | | | | | | |
| | | | | |
Global Income Opportunity Fund | | | | | | | | | | | | | | | | | | | | | | | | | |
| | | | | |
Citigroup Global Markets, Inc. | | | | $1,071 | | | | | — | | | | | $1,071 | | | | | $1,071 | | | | | — | |
| | | | | |
Credit Suisse | | | | 73,443 | | | | | (4,514 | ) | | | | 68,929 | | | | | — | | | | | $68,929 | |
| | | | | |
Morgan Stanley | | | | 13,229 | | | | | — | | | | | 13,229 | | | | | — | | | | | 13,229 | |
| | | | | |
UBS Securities LLC | | | | 4,612 | | | | | (4,612 | ) | | | | — | | | | | — | | | | | — | |
| | | | | | | | | | | | | | | | | | | | | | | | | |
| | | | | |
Total | | | | $92,355 | | | | | $(9,126 | ) | | | | $83,229 | | | | | $1,071 | | | | | $82,158 | |
| | | | | | | | | | | | | | | | | | | | | | | | | |
| | | | | |
Special Equity | | | | | | | | | | | | | | | | | | | | | | | | | |
| | | | | |
Cantor Fitzgerald Securities, Inc. | | | | $1,516,243 | | | | | — | | | | | $1,516,243 | | | | | $1,516,243 | | | | | — | |
| | | | | |
Daiwa Capital Markets America | | | | 1,516,243 | | | | | — | | | | | 1,516,243 | | | | | 1,516,243 | | | | | — | |
| | | | | |
Mizuho Securities USA, LLC | | | | 317,818 | | | | | — | | | | | 317,818 | | | | | 317,818 | | | | | — | |
| | | | | |
Nomura Securities International, Inc. | | | | 1,516,243 | | | | | — | | | | | 1,516,243 | | | | | 1,516,243 | | | | | — | |
| | | | | |
RBC Dominion Securities, Inc. | | | | 1,516,243 | | | | | — | | | | | 1,516,243 | | | | | 1,516,243 | | | | | — | |
| | | | | | | | | | | | | | | | | | | | | | | | | |
| | | | | |
Total | | | | $6,382,790 | | | | | — | | | | | $6,382,790 | | | | | $6,382,790 | | | | | — | |
| | | | | | | | | | | | | | | | | | | | | | | | | |
| | | | | |
| | | Gross Amounts of Liabilities
Presented in the Statement
of Assets and Liabilities | | Offset Amount | | Net Asset Balance | | Collateral Received | | Net Amount |
| | | | | |
Global Income Opportunity Fund | | | | | | | | | | | | | | | | | | | | | | | | | |
| | | | | |
Credit Suisse | | | | $(4,514 | ) | | | | $4,514 | | | | | — | | | | | — | | | | | — | |
| | | | | |
Merrill Lynch | | | | (701 | ) | | | | — | | | | | $(701 | ) | | | | — | | | | | $(701 | ) |
| | | | | |
UBS Securities LLC | | | | (19,035 | ) | | | | 4,612 | | | | | (14,423 | ) | | | | — | | | | | (14,423 | ) |
| | | | | | | | | | | | | | | | | | | | | | | | | |
| | | | | |
Total | | | | $(24,250 | ) | | | | $9,126 | | | | | $(15,124 | ) | | | | — | | | | | $(15,124 | ) |
| | | | | | | | | | | | | | | | | | | | | | | | | |
50
| | |
| | | Notes to Financial Statements(continued) |
12. REGULATORY UPDATES
In August 2018, the FASB issued Accounting Standards Update No. 2018-13, Fair Value Measurement (Topic 820), Disclosure Framework - Changes to the Disclosure Requirements for Fair Value Measurement (“ASU 2018-13”) which is effective for periods starting after December 15, 2019. The primary focus of the update is to improve the effectiveness of ASC 820’s disclosure in the notes to financial statements. The Funds have early adopted these changes and there was no significant impact on the financial statements and accompanying notes.
Effective November 15, 2018, the SEC amended existing rules intended to modernize reporting and disclosure of information. These amendments relate to Regulation S-X which sets forth the form and content of financial statements. The amendment requires collapsing the components of distributable earnings on the Statement of Assets and Liabilities and collapsing the distributions paid to shareholders on the Statements of Changes in Net Assets. The Funds have adopted these amendments and there was no significant impact on the financial statements and accompanying notes.
13. SUBSEQUENT EVENTS
The Funds have determined that no other material events or transactions occurred through the issuance date of the Funds’ financial statements, which require an additional disclosure in or adjustment of the Funds’ financial statements, except for effective January 1, 2019, the management fee for Bond will be reduced from 0.625% to 0.26%. Also effective on January 1, 2019, the Bond’s existing contractual expense limitation agreement with the Investment Manager will be replaced with a new contractual expense limitation agreement with the Investment Manager pursuant to which the Investment Manager has agreed, through at least May 1, 2020, to limit total annual operating expenses (exclusive of taxes, interest (including interest incurred in connection with bank and custody overdrafts, shareholder servicing fees, brokerage commissions and other transaction costs, acquired fund fees and expenses, and extraordinary expenses) of the Fund to the annual rate of 0.46% of the Fund’s average daily net assets, subject to later reimbursement by the Fund in certain circumstances. Also effective on January 1, 2019, the amount of shareholder servicing fees Class N shares of the Fund are authorized to pay to financial intermediaries will be increased from 0.15% to 0.25%. Please refer to the Fund’s prospectus for further details.
51
| | |
| | | Report of Independent Registered Public Accounting Firm |
TO THE BOARD OF TRUSTEES OF AMG FUNDS III AND SHAREHOLDERS OF AMG MANAGERS LOOMIS SAYLES BOND FUND, AMG MANAGERS GLOBAL INCOME OPPORTUNITY FUND, AND AMG MANAGERS SPECIAL EQUITY FUND
Opinions on the Financial Statements
We have audited the accompanying statements of assets and liabilities, including the schedules of portfolio investments, of AMG Managers Loomis Sayles Bond Fund, AMG Managers Global Income Opportunity Fund, and AMG Managers Special Equity Fund (three of the funds constituting AMG Funds III, hereafter collectively referred to as the “Funds”) as of December 31, 2018, the related statements of operations for the year ended December 31, 2018, the statements of changes in net assets for each of the two years in the period ended December 31, 2018, including the related notes, and the financial highlights for each of the periods indicated therein (collectively referred to as the “financial statements”). In our opinion, the financial statements present fairly, in all material respects, the financial position of each of the Funds as of December 31, 2018, the results of each of their operations for the year then ended, the changes in each of their net assets for each of the two years in the period ended December 31, 2018 and each of the financial highlights for each of the periods indicated therein in conformity with accounting principles generally accepted in the United States of America.
Basis for Opinions
These financial statements are the responsibility of the Funds’ management. Our responsibility is to express an opinion on the Funds’ financial statements based on our audits. We are a public accounting firm registered with the Public Company Accounting Oversight Board (United States) (PCAOB) and are required to be independent with respect to the Funds in accordance with the U.S. federal securities laws and the applicable rules and regulations of the Securities and Exchange Commission and the PCAOB.
We conducted our audits of these financial statements in accordance with the standards of the PCAOB. Those standards require that we plan and perform the audit to obtain reasonable assurance about whether the financial statements are free of material misstatement, whether due to error or fraud.
Our audits included performing procedures to assess the risks of material misstatement of the financial statements, whether due to error or fraud, and performing procedures that respond to those risks. Such procedures included examining, on a test basis, evidence regarding the amounts and disclosures in the financial statements. Our audits also included evaluating the accounting principles used and significant estimates made by management, as well as evaluating the overall presentation of the financial statements. Our procedures included confirmation of securities owned as of December 31, 2018 by correspondence with the custodian and brokers; when replies were not received from brokers, we performed other auditing procedures. We believe that our audits provide a reasonable basis for our opinions.
PricewaterhouseCoopers LLP
Boston, Massachusetts
February 27, 2019
We have served as the auditor of one or more investment companies in AMG Funds Family since 1993.
52
TAX INFORMATION
The AMG Managers Loomis Sayles Bond Fund, AMG Managers Global Income Opportunity Fund and AMG Managers Special Equity Fund each hereby designates the maximum amount allowable of its net taxable income as qualified dividends as provided in the Jobs and Growth Tax Relief Reconciliation Act of 2003. The 2018 Form 1099-DIV you receive for each Fund will show the tax status of all distributions paid to you during the year.
Pursuant to section 852 of the Internal Revenue Code, AMG Managers Loomis Sayles Bond Fund, AMG Managers Global Income Opportunity Fund and AMG Managers Special Equity Fund each hereby designates $13,392,602, $0, and $0 respectively, as a capital gain distribution with respect to the taxable year ended December 31, 2018, or if subsequently determined to be different, the net capital gains of such fiscal year.
53
| | |
| | | AMG Funds Trustees and Officers |
| | | | | | | | |
The Trustees and Officers of the Trust, their business addresses, principal occupations for the past five years and ages are listed below. The Trustees provide broad supervision over the affairs of the Trust and the Funds. The Trustees are experienced executives who meet periodically throughout the year to oversee the Funds’ activities, review contractual arrangements with companies that provide services to the Funds, and | | | | review the Funds’ performance. Unless otherwise noted, the address of each Trustee or Officer is the address of the Trust: 600 Steamboat Road, Suite 300, Greenwich, Connecticut 06830. There is no stated term of office for Trustees. Trustees serve until their resignation, retirement or removal in | | | | accordance with the Trust’s organizational documents and policies adopted by the Board from time to time. The Chairman of the Trustees, President, Treasurer and Secretary of the Trust are elected by the Trustees annually. Other officers hold office at the pleasure of the Trustees. |
Independent Trustees
The following Trustees are not “interested persons” of the Trust within the meaning of the 1940 Act:
| | |
Number of Funds Overseen in Fund Complex | | Name, Age, Principal Occupation(s) During Past 5 Years and Other Directorships Held by Trustee |
| |
• Trustee since 2012 • Oversees 55 Funds in Fund Complex | | Bruce B. Bingham, 70 Partner, Hamilton Partners (real estate development firm) (1987-Present); Director of The Yacktman Funds (2000-2012). |
| |
• Trustee since 1999 • Oversees 55 Funds in Fund Complex | | Edward J. Kaier, 73 Attorney at Law and Partner, Teeters Harvey Marrone & Kaier LLP (2007-Present); Attorney at Law and Partner, Hepburn Willcox Hamilton & Putnam, LLP (1977-2007); Trustee of Third Avenue Trust (3 portfolios); Trustee of Third Avenue Variable Trust (1 portfolio). |
| |
• Trustee since 2013 • Oversees 58 Funds in Fund Complex | | Kurt A. Keilhacker, 55 Managing Partner, TechFund Capital (1997-Present); Managing Partner, TechFund Europe (2000-Present); Board Member, 6wind SA, (2002-Present); Managing Partner, Elementum Ventures (2013-Present); Director, MetricStory, Inc. (2017-Present); Trustee, Wheaton College (2018-Present); Trustee, Gordon College (2001-2016). |
| |
• Trustee since 2000 • Oversees 55 Funds in Fund Complex | | Steven J. Paggioli, 68 Independent Consultant (2002-Present); Trustee, Professionally Managed Portfolios (32 portfolios); Advisory Board Member, Sustainable Growth Advisors, LP; Independent Director, Chase Investment Counsel (2008–Present); Executive Vice President, Secretary and Director, Investment Company Administration, LLC (1990-2001). |
| |
• Trustee since 2013 • Oversees 55 Funds in Fund Complex | | Richard F. Powers III, 73 Adjunct Professor, U.S. Naval War College (2016-Present); Adjunct Professor, Boston College (2010-2013); President and CEO of Van Kampen Investments Inc. (1998-2003). |
| |
• Independent Chairman • Trustee since 2000 • Oversees 58 Funds in Fund Complex | | Eric Rakowski, 60 Professor of Law, University of California at Berkeley School of Law - Boalt Hall (1990-Present); Director of Harding, Loevner Funds, Inc. (9 portfolios); Trustee of Third Avenue Trust (3 portfolios); Trustee of Third Avenue Variable Trust (1 portfolio). |
| |
• Trustee since 2013 • Oversees 58 Funds in Fund Complex | | Victoria L. Sassine, 53 Adjunct Professor, Babson College (2007–Present); Director, Board of Directors, PRG Group (2017-Present); CEO, Founder, Scale Smarter Partners, LLC (2018-Present); Chairperson, Board of Directors, Business Management Associates (2018-Present). |
| |
• Trustee since 1987 • Oversees 55 Funds in Fund Complex | | Thomas R. Schneeweis, 71 Professor Emeritus, University of Massachusetts (2013-Present); President, TRS Associates (1982-Present); Board Member, Chartered Alternative Investment Association (“CAIA”) (2002-Present); Director, Institute for GlobalAsset and Risk Management (Education) (2010-Present); Co-Owner, Quantitative Investment Technologies (2014-Present); Director of Research, Yes Wealth Management (2018-Present); Partner, S Capital Wealth Advisors (2015-2018); Partner, S Capital Management, LLC (2007-2015); President, Alternative Investment Analytics, LLC, (formerly Schneeweis Partners, LLC) (2001-2013). |
54
| | |
| | | AMG Funds |
| | | Trustees and Officers(continued) |
Interested Trustees
Each Trustee in the following table is an “interested person” of the Trust within the meaning of the 1940 Act. Ms. Carsman is an interested person of the Trust within the meaning of the 1940 Act by virtue of her position with, and interest in securities of, AMG.
| | |
Number of Funds Overseen in Fund Complex | | Name, Age, Principal Occupation(s) During Past 5 Years and Other Directorships Held by Trustee |
• Trustee since 2011 • Oversees 58 Funds in Fund Complex | | Christine C. Carsman, 66 Senior Policy Advisor, Affiliated Managers Group, Inc. (2019-Present); Director of Harding, Loevner Funds, Inc. (9 portfolios); Executive Vice President, Deputy General Counsel and Chief Regulatory Counsel, Affiliated Managers Group, Inc. (2017-2018); Director (2010-2018) and Chair of the Board of Directors (2015-2018), AMG Funds plc; Senior Vice President and Deputy General Counsel, Affiliated Managers Group, Inc.(2011-2016); Senior Vice President and Chief Regulatory Counsel, Affiliated Managers Group, Inc. (2007-2011); Vice President and Chief Regulatory Counsel, Affiliated Managers Group, Inc. (2004-2007); Secretary and Chief Legal Officer, AMG Funds, AMG Funds I, AMG Funds II and AMG Funds III (2004-2011); Senior Counsel, Vice President and Director of Operational Risk Management and Compliance, Wellington Management Company, LLP (1995-2004). |
Officers |
Position(s) Held with Fund and Length of Time Served | | Name, Age, Principal Occupation(s) During Past 5 Years |
• President since 2018 • Principal Executive Officer since 2018 • Chief Executive Officer since 2018 • Chief Operating Officer since 2007 | | Keitha L. Kinne, 60 Chief Operating Officer, AMG Funds LLC (2007-Present); Chief Investment Officer, AMG Funds LLC (2008-Present); President and Principal, AMG Distributors, Inc. (2018-Present); Chief Operating Officer, AMG Distributors, Inc. (2007-Present); President, Chief Executive Officer and Principal Executive Officer, AMG Funds, AMG Funds I, AMG Funds II, AMG Funds III and AMG Funds IV (2018-Present); Chief Operating Officer, AMG Funds, AMG Funds I, AMG Funds II, and AMG Funds III (2007-Present); Chief Operating Officer, AMG Funds IV (2016-Present); Chief Operating Officer and Chief Investment Officer, Aston Asset Management, LLC (2016); President and Principal Executive Officer, AMG Funds, AMG Funds I, AMG Funds II and AMG Funds III (2012-2014); Managing Partner, AMG Funds LLC (2007-2014); President and Principal, AMG Distributors, Inc. (2012-2014); Managing Director, Legg Mason & Co., LLC (2006-2007); Managing Director, Citigroup Asset Management (2004-2006). |
• Secretary since 2015 • Chief Legal Officer since 2015 | | Mark J. Duggan, 54 Senior Vice President and Senior Counsel, AMG Funds LLC (2015-Present); Secretary and Chief Legal Officer, AMG Funds, AMG Funds I, AMG Funds II, AMG Funds III and AMG Funds IV (2015-Present); Attorney, K&L Gates, LLP (2009-2015). |
• Chief Financial Officer since 2017 • Treasurer since 2017 • Principal Financial Officer since 2017 • Principal Accounting Officer since 2017 | | Thomas G. Disbrow, 53 Vice President, Mutual Fund Treasurer & CFO, AMG Funds, AMG Funds LLC (2017-Present); Chief Financial Officer, Principal Financial Officer, Treasurer and Principal Accounting Officer, AMG Funds, AMG Funds I, AMG Funds II, AMG Funds III and AMG Funds IV (2017-Present); Managing Director - Global Head of Traditional Funds Product Control, UBS Asset Management (Americas), Inc. (2015-2017); Managing Director - Head of North American Funds Treasury, UBS Asset Management (Americas), Inc. (2011-2015). |
• Chief Compliance Officer since 2016 | | Gerald F. Dillenburg, 52 Vice President, Chief Compliance Officer AMG Funds, AMG Funds LLC (2017-Present); Chief Compliance Officer AMG Funds, AMG Funds LLC (2016-2017); Chief Compliance Officer and Sarbanes-Oxley Code of Ethics Compliance Officer, AMG Funds, AMG Funds I, AMG Funds II and AMG Funds III (2016-Present); Chief Compliance Officer, AMG Funds IV (1996-Present); Sarbanes-Oxley Code of Ethics Compliance Officer, AMG Funds IV (2016-Present); Chief Compliance Officer, Aston Asset Management, LLC (2006-2016); Chief Operating Officer, Aston Funds (2003-2016); Secretary, Aston Funds (1996-2015); Chief Financial Officer, Aston Funds (1997-2010); Chief Financial Officer, Aston Asset Management, LLC (2006-2010); Treasurer, Aston Funds (1996-2010). |
• Deputy Treasurer since 2017 | | John A. Starace, 48 Director, Mutual Fund Accounting, AMG Funds LLC (2017-Present); Vice President, Deputy Treasurer of Mutual Funds Services, AMG Funds LLC (2014-2017); Deputy Treasurer, AMG Funds, AMG Funds I, AMG Funds II, AMG Funds III and AMG Funds IV (2017-Present); Vice President, Citi Hedge Fund Services (2010-2014); Audit Senior Manager (2005-2010) and Audit Manager (2001-2005), Deloitte & Touche LLP. |
• Anti-Money Laundering Compliance Officer since 2014 | | Patrick J. Spellman, 44 Vice President, Chief Compliance Officer, AMG Funds LLC (2017-Present); Senior Vice President, Chief Compliance Officer, AMG Funds LLC (2011-2017); Chief Compliance Officer, AMG Distributors, Inc., (2010-Present); Anti-Money Laundering Compliance Officer, AMG Funds, AMG Funds I, AMG Funds II, and AMG Funds III (2014-Present); Anti-Money Laundering Officer, AMG Funds IV, (2016-Present); Compliance Manager, Legal and Compliance, Affiliated Managers Group, Inc. (2005-2011). |
• Assistant Secretary since 2016 | | Maureen A. Meredith, 33 Vice President, Counsel, AMG Funds LLC (2019-Present); Director, Counsel, AMG Funds LLC (2017-2018); Vice President, Counsel, AMG Funds LLC (2015-2017); Assistant Secretary, AMG Funds, AMG Funds I, AMG Funds II, AMG Funds III and AMG Funds IV (2016-Present); Associate, Ropes & Gray LLP (2011-2015); Law Fellow, Massachusetts Appleseed Center for Law and Justice (2010-2011). |
55
THIS PAGE INTENTIONALLY LEFT BLANK
| | | | |
INVESTMENT MANAGER AND ADMINISTRATOR AMG Funds LLC 600 Steamboat Road, Suite 300 Greenwich, CT 06830 800.835.3879 DISTRIBUTOR AMG Distributors, Inc. 600 Steamboat Road, Suite 300 Greenwich, CT 06830 800.835.3879 CUSTODIAN The Bank of New York Mellon 111 Sanders Creek Parkway East Syracuse, NY 13057 LEGAL COUNSEL Ropes & Gray LLP Prudential Tower, 800 Boylston Street Boston, MA 02199-3600 | | TRANSFER AGENT BNY Mellon Investment Servicing (US) Inc. Attn: AMG Funds P.O. Box 9769 Providence, RI 02940 800.548.4539 | | This report is prepared for the Funds’ shareholders. It is authorized for distribution to prospective investors only when preceded or accompanied by an effective prospectus. To receive a free copy of the prospectus or Statement of Additional Information, which includes additional information about Fund Trustees, please contact us by calling 800.835.3879. Distributed by AMG Distributors, Inc., member FINRA/SIPC. Current net asset values per share for each Fund are available on the Funds’ website at amgfunds.com. A description of the policies and procedures each Fund uses to vote its proxies is available: (i) without charge, upon request, by calling 800.835.3879, or (ii) on the Securities and Exchange Commission’s (SEC) website at sec.gov. For information regarding each Fund’s proxy voting record for the 12-month period ended June 30, call 800.835.3879 or visit the SEC website at sec.gov. Each Fund files its complete schedule of portfolio holdings with the SEC for the first and third quarters of each fiscal year on Form N-Q. The Funds’ Forms N-Q are available on the SEC’s website at sec.gov. To review a complete list of the Funds’ portfolio holdings, or to view the semiannual report, or annual report, please visit amgfunds.com. |
| | |
| | | | | |
| | | | | | | | | | | | |
| | | AFFILIATE SUBADVISED FUNDS BALANCED FUNDS AMG Chicago Equity Partners Balanced Chicago Equity Partners, LLC AMG FQ Global Risk-Balanced First Quadrant, L.P. EQUITY FUNDS AMG FQ Tax-Managed U.S. Equity AMG FQ Long-Short Equity First Quadrant, L.P. AMG Frontier Small Cap Growth Frontier Capital Management Co., LLC AMG GW&K Small Cap Core AMG GW&K Small/Mid Cap AMG GW&K Trilogy Emerging Markets Equity AMG GW&K Trilogy Emerging Wealth Equity AMG GW&K U.S. Small Cap Growth GW&K Investment Management, LLC AMG Renaissance Large Cap Growth The Renaissance Group LLC AMG River Road Dividend All Cap Value AMG River Road Dividend All Cap Value II AMG River Road Focused Absolute Value AMG River Road Long-Short AMG River Road Small-Mid Cap Value AMG River Road Small Cap Value River Road Asset Management, LLC AMG SouthernSun Small Cap AMG SouthernSun U.S. Equity SouthernSun Asset Management, LLC AMG Systematic Mid Cap Value Systematic Financial Management L.P. | | | | AMG TimesSquare Emerging Markets Small Cap AMG TimesSquare Global Small Cap AMG TimesSquare International Small Cap AMG TimesSquare Mid Cap Growth AMG TimesSquare Small Cap Growth TimesSquare Capital Management, LLC AMG Yacktman AMG Yacktman Focused AMG Yacktman Focused Fund - Security Selection Only AMG Yacktman Special Opportunities Yacktman Asset Management LP FIXED INCOME FUNDS AMG GW&K Core Bond AMG GW&K Enhanced Core Bond AMG GW&K Municipal Bond AMG GW&K Municipal Enhanced Yield GW&K Investment Management, LLC OPEN-ARCHITECTURE FUNDS EQUITY FUNDS AMG Managers Brandywine AMG Managers Brandywine Advisors Mid Cap Growth AMG Managers Brandywine Blue Friess Associates, LLC AMG Managers Cadence Emerging Companies AMG Managers Cadence Mid Cap Cadence Capital Management LLC AMG Managers CenterSquare Real Estate CenterSquare Investment Management LLC AMG Managers Emerging Opportunities Lord, Abbett & Co. LLC WEDGE Capital Management L.L.P. Next Century Growth Investors LLC RBC Global Asset Management (U.S.) Inc. | | | | AMG Managers Essex Small/Micro Cap Growth Essex Investment Management Company, LLC AMG Managers Fairpointe ESG Equity AMG Managers Fairpointe Mid Cap Fairpointe Capital LLC AMG Managers LMCG Small Cap Growth LMCG Investments, LLC AMG Managers Montag & Caldwell Growth Montag & Caldwell, LLC AMG Managers Pictet International Pictet Asset Management Limited AMG Managers Silvercrest Small Cap Silvercrest Asset Management Group LLC AMG Managers Skyline Special Equities Skyline Asset Management, L.P. AMG Managers Special Equity Ranger Investment Management, L.P. Lord, Abbett & Co. LLC Smith Asset Management Group, L.P. Federated MDTA LLC AMG Managers Value Partners Asia Dividend Value Partners Hong Kong Limited FIXED INCOME FUNDS AMG Managers Amundi Intermediate Government AMG Managers Amundi Short Duration Government Amundi Pioneer Institutional Asset Management, Inc. AMG Managers Doubleline Core Plus Bond DoubleLine Capital LP AMG Managers Global Income Opportunity AMG Managers Loomis Sayles Bond Loomis, Sayles & Company, L.P. | | |
| | | | |
amgfunds.com | | | | 123118 AR078 |
Registrant has adopted a Code of Ethics. See attached Exhibit (a)(1).
| Item 3. | AUDIT COMMITTEE FINANCIAL EXPERT |
Registrant’s Board of Trustees has determined that independent Trustee Mr. Steven J. Paggioli qualifies as an Audit Committee Financial Expert. Mr. Paggioli is “independent” as such term is defined in FormN-CSR.
| Item 4. | PRINCIPAL ACCOUNTANT FEES AND SERVICES |
The aggregate fees billed by the Funds’ independent registered public accounting firm, PricewaterhouseCoopers LLP (“PwC”), to the Funds for the Funds’ two most recent fiscal years for professional services rendered for audits of annual financial statements, or services that are normally provided in connection with statutory and regulatory filings or engagements (“Audit Fees”) were as follows:
| | | | | | | | |
Fund - AMG Funds III | | Fiscal 2018 | | | Fiscal 2017 | |
AMG Managers Special Equity Fund | | $ | 20,208 | | | $ | 22,550 | |
AMG Managers Loomis Sayles Bond Fund | | $ | 48,998 | | | $ | 71,784 | |
AMG Managers Global Income Opportunity Fund | | $ | 31,648 | | | $ | 31,843 | |
There were no fees billed by PwC to the Funds in their two recent fiscal years for services rendered for assurance and related services that are reasonably related to the performance of the audit or review of the Fund’s financial statements, but are not reported as Audit Fees (“Audit-Related Fees”).
For the Funds’ two most recent fiscal years, there were no Audit-Related Fees billed by PwC for engagements related directly to the operations and financial reporting of one or more Funds by a Fund Service Provider. A Fund Service Provider is (a) any investment adviser to the Fund (not including any Subadvisor whose role is primarily portfolio management and is subcontracted with or overseen by another investment adviser) or (b) any entity that provides ongoing services to the Fund and is controlling, controlled by or under common control with a Fund investment adviser described in (a).
The aggregate fees billed by PwC to the Funds for the two most recent fiscal years for professional services rendered for tax compliance, tax advice, and tax planning (“Tax Fees”) were as follows:
| | | | | | | | |
Fund - AMG Funds III | | Fiscal 2018 | | | Fiscal 2017 | |
AMG Managers Special Equity Fund | | $ | 7,369 | | | $ | 7,369 | |
AMG Managers Loomis Sayles Bond Fund | | $ | 9,425 | | | $ | 9,425 | |
AMG Managers Global Income Opportunity Fund | | $ | 9,425 | | | $ | 9,425 | |
For the Funds’ two most recent fiscal years, Tax Fees billed by PwC for engagements by Fund Service Providers that related directly to the operations and financial reporting of the Funds were $0 for fiscal 2018 and $0 for fiscal 2017, respectively.
The services for which Tax Fees were charged comprise all services performed by professional staff in PwC’s tax division except those services related to the audit. Typically, this category would include fees for tax compliance, tax planning, and tax advice. Tax compliance, tax advice, and tax planning services include preparation of original and amended tax returns, claims for refund and tax payment-planning services, assistance with tax audits and appeals, tax advice related to mergers and acquisitions and requests for rulings or technical advice from taxing authorities.
There were no other fees billed by PwC to the Funds for all othernon-audit services (“Other Fees”) during the Funds’ two most recent fiscal years. During the same period, there were no Other Fees billed by PwC for engagements by Fund Service Providers that related directly to the operations and financial reporting of the Funds.
(e)(1) According to policies adopted by the Audit Committee, services provided by PwC to the Funds must bepre-approved by the Audit Committee. On an annual basis, the Audit Committee reviews andpre-approves various types of services that PwC may perform for the Funds without specific approval of each engagement, subject to specified budget limitations. As contemplated by the Sarbanes-Oxley Act of 2002 and related SEC rules, the Audit Committee alsopre-approvesnon-audit services provided by PwC to any Fund Service Provider for any engagement that relates directly to the operations and financial reporting of the Funds. Any engagement that is not alreadypre-approved or that will exceed apre-approved budget must be submitted to the Audit Committee forpre-approval. The Chairman of the Audit Committee is authorized on behalf of the Board of Trustees and the Audit Committee to approve the engagement of PwC to performnon-audit services subject to certain conditions, including notification to the Audit Committee of suchpre-approval not later than the next meeting of the Audit Committee following the date of suchpre-approval.
(e)(2) None.
(f) Not applicable.
(g) The aggregate fees billed by PwC in 2018 and 2017 fornon-audit services rendered to the Funds and Fund Service Providers were $75,719 and $109,919, respectively. For the fiscal year ended December 31, 2018, this amount reflects the amounts disclosed above in Item 4(b),(c),(d), plus $49,500 in fees billed to the Fund Service Providers fornon-audit services that did not relate directly to the operations and financial reporting of the Funds. For the fiscal year ended December 31, 2017, this amount reflects the amounts disclosed above in Item 4(b),(c),(d), plus $83,700 in fees billed to the Fund Service Providers fornon-audit services that did not relate directly to the operations and financial reporting of the Funds.
(h) The Trust’s Audit Committee has considered whether the provision ofnon-audit services by registrant’s independent registered public accounting firm to the registrant’s investment advisor, and any entity controlling, controlled, or under common control with the investment advisor that provided ongoing services to the registrant that were notpre-approved by the Committee (because such services did not relate directly to the operations and financial reporting of the registrant) was compatible with maintaining the independence of the independent registered public accounting firm.
| Item 5. | AUDIT COMMITTEE OF LISTED REGISTRANTS |
Not applicable.
| Item 6. | SCHEDULE OF INVESTMENTS |
The schedule of investments in unaffiliated issuers as of the close of the reporting period is included as part of the shareholder report contained in Item 1 hereof.
| Item 7. | DISCLOSURE OF PROXY VOTING POLICIES AND PROCEDURES FORCLOSED-END MANAGEMENT INVESTMENT COMPANIES |
Not applicable.
| Item 8. | PORTFOLIO MANAGERS OFCLOSED-END MANAGEMENT INVESTMENT COMPANIES |
Not applicable.
| Item 9. | PURCHASES OF EQUITY SECURITIES BYCLOSED-END MANAGEMENT INVESTMENT COMPANIES AND AFFILIATED PURCHASERS |
Not applicable.
| Item 10. | SUBMISSION OF MATTERS TO A VOTE OF SECURITY HOLDERS |
Not applicable.
| Item 11. | CONTROLS AND PROCEDURES |
(a) The Registrant’s principal executive and principal financial officers have concluded, based on their evaluation of the registrant’s disclosure controls and procedures as of a date within 90 days of the filing of this report, that the Registrant’s disclosure controls and procedures are reasonably designed to ensure that
information required to be disclosed by the Registrant on FormN-CSR is recorded, processed, summarized and reported within the required time periods and that information required to be disclosed by the registrant in the reports that it files or submits on FormN-CSR is accumulated and communicated to the Registrant’s management, including its principal executive and principal financial officers, as appropriate to allow timely decisions regarding required disclosure.
(b) There were no changes in the Registrant’s internal control over financial reporting during the Registrant’s fourth fiscal quarter of the period covered by this report that have materially affected, or are reasonably likely to affect, the internal control over financial reporting.
| Item 12. | DISCLOSURE OF SECURITIES LENDING ACTIVITIES FORCLOSED-END MANAGEMENT INVESTMENT COMPANIES |
Not applicable.
| (a)(1) | Any Code of Ethics or amendments hereto. Filed herewith. |
| (a)(2) | Certifications pursuant to Rule30a-2(a) under the Investment Company Act of 1940 - Filed herewith. |
| (b) | Certifications pursuant to Rule30a-2(b) under the Investment Company Act of 1940 - Filed herewith. |
SIGNATURES
Pursuant to the requirements of the Securities Exchange Act of 1934 and the Investment Company Act of 1940, the registrant has duly caused this report to be signed on its behalf by the undersigned, thereunto duly authorized.
AMG FUNDS III
| | |
| By: | | /s/ Keitha L. Kinne |
| | Keitha L. Kinne, Principal Executive Officer |
|
| Date: March 7, 2019 |
Pursuant to the requirements of the Securities Exchange Act of 1934 and the Investment Company Act of 1940, this report has been signed below by the following persons on behalf of the registrant and in the capacities and on the dates indicated.
| | |
| By: | | /s/ Keitha L. Kinne |
| | Keitha L. Kinne, Principal Executive Officer |
|
| Date: March 7, 2019 |
| |
| By: | | /s/ Thomas Disbrow |
| | Thomas Disbrow, Principal Financial Officer |
|
| Date: March 7, 2019 |