Exhibit 99.14
Section H
| The Québec Economy: Recent developments and outlook for 2022 and 2023 |
| Summary | H.2 | |
| 1. | Québec’s performance in 2021 was exceptional | H.6 |
| 1.1 Stronger-than-forecast economic recovery | H.6 | |
| 1.2 The Québec economy exceeded its pre-pandemic level | H.8 | |
| 1.3 Employment exceeds its pre-pandemic level | H.10 | |
| 1.4 A significant reduction in the standard of living gap with Ontario since 2019 | H.12 | |
| 2. | Québec’s economic situation in 2022 and 2023 | H.14 |
| 2.1 The Québec economy will remain dynamic | H.14 | |
| 2.2 Domestic demand remains the main driver of growth | H.15 | |
| 2.3 Job creation will continue | H.16 | |
| 2.4 Household consumption plays a central role in economic activity | H.18 | |
| 2.5 Despite a slowdown, housing market activity remains strong | H.19 | |
| 2.6 Non-residential investment back on the growth path | H.23 | |
| 2.7 Governments continue to stimulate the economy | H.25 | |
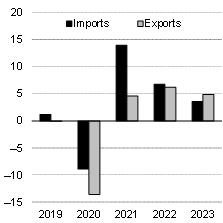
| 2.8 Strong foreign demand fuels export growth | H.26 | |
| 2.9 Inflationary pressures continue into early 2022 | H.27 | |
| 2.10 A sustained increase in nominal GDP | H.28 | |
| 2.11 Comparison with private sector forecasts | H.29 | |
| 3. | The situation of Québec’s main economic partners | H.31 |
| 3.1 The economic situation in Canada | H.31 | |
| 3.2 The economic situation in the United States | H.35 | |
| 4. | The global economic situation | H.40 |
| 5. | Developments in financial markets | H.50 |
| 6. | Main risks that may influence the forecast scenario | H.56 |
| H.1 |

Summary
The global economy rebounded significantly in 2021, supported by the easing of public health restrictions and the increase in vaccination. In addition, the unprecedented budgetary and financial measures adopted by various governments provided a favourable context for economic recovery.
For its part, the Québec economy recovered impressively in 2021.
| — | Real gross domestic product (GDP) grew 6.3%, following a 5.5% decline in 2020.1 |
| — | In 2021, growth was stronger in Québec than elsewhere in the country, allowing the economy to return to pre-pandemic levels more quickly than in Ontario and Canada. |
| — | This strength has resulted in the creation of 169 400 jobs in 2021 in Québec. As a result, employment was above pre-pandemic levels last December, and many sectors of the economy had more employees than in February 2020. |
Growth will continue over the next few years in most economies.
| — | In Québec, economic activity is expected to grow by 2.7% in 2022 and 2.0% in 2023. |
| — | In Canada, increases of 3.8% in 2022 and 2.6% in 2023 are expected, while in the United States, increases of 3.6% and 2.4% respectively are anticipated. |
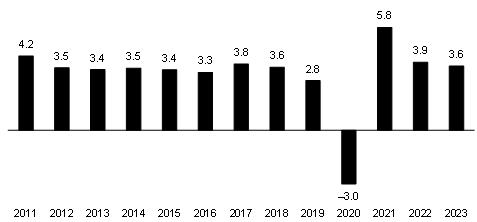
| — | Global real GDP is expected to grow by 3.9% in 2022 and 3.6% in 2023. |
| TABLE H.1 Economic growth | ||||||||||||||||
(real GDP, percentage change)
| ||||||||||||||||
| 2020 | 2021 | 2022 | 2023 | |||||||||||||
| Québec | −5.5 | 6.3 | 2.7 | 2.0 | ||||||||||||
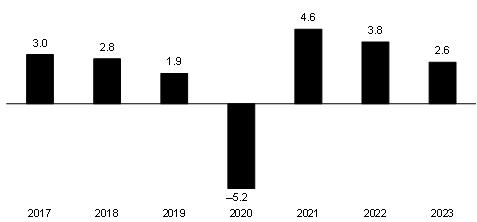
| Canada | −5.2 | 4.6 | 3.8 | 2.6 | ||||||||||||
| United States | −3.4 | 5.7 | 3.6 | 2.4 | ||||||||||||
| World | −3.0 | 5.8 | 3.9 | 3.6 | ||||||||||||
| Sources: | Institut de la statistique du Québec, Statistics Canada, International Monetary Fund, IHS Markit, Datastream, Bloomberg, Eurostat and Ministère des Finances du Québec. |
| 1 | The economic forecast was finalized on March 1, 2022. With the exception of the forecast, the information presented in this section is based on data available as at March 11, 2022. |
| Budget 2022-2023 | |
| H.2 | Budget Plan |
Moreover, the economy will have to keep dealing with the effects of supply chain disruptions. In addition, Russia’s invasion of Ukraine has already led to a significant increase in energy prices. These factors will sustain inflationary pressures in the first half of 2022.
| — | Price increases are stronger than forecast in the fall 2021 Update on Québec’s Economic and Financial Situation. They affect every household, which are facing, in particular, higher prices for gasoline, rent and food. |
| — | The measures announced since the economic and financial update will help Quebecers cope with the increase in the cost of living. |
The evolution of the war in Ukraine and that of the pandemic are significant risks to the economic forecasts. However, in the case of the latter, the high vaccination rate and the continued ability of businesses and households to adapt will ensure that the economy remains resilient.
TABLE H.2
Consumer Price Index
(percentage change)
| ||||||||||||||||
| 2020 | 2021 | 2022 | 2023 | |||||||||||||
| Québec | 0.8 | 3.8 | 4.7 | 2.3 | ||||||||||||
| – Fall 2021 | 0.8 | 3.4 | 2.9 | 2.3 | ||||||||||||
| Canada | 0.7 | 3.4 | 4.2 | 2.2 | ||||||||||||
| – Fall 2021 | 0.7 | 3.1 | 2.6 | 2.1 | ||||||||||||
Sources: Statistics Canada and Ministère des Finances du Québec.
| The Québec Economy: | |
| Recent Developments and Outlook for 2022 and 2023 | H.3 |
The effects of Russia’s invasion of Ukraine
on the economic forecasts
The invasion of Ukraine by Russia will have numerous geopolitical and economic consequences. However, it is difficult to assess the extent of these effects with certainty since the scope and duration of the conflict are unknown.
While the situation continues to evolve, the war has resulted in revisions to the economic forecast scenarios of the Ministère des Finances du Québec.
| – | Based on information available as at March 1, global economic growth has been revised downward by about 0.4 percentage point. |
| ● | The effects of this conflict on the global economy are expected to be limited, since Russia and Ukraine represent a small share of the global economy (3.5% of global GDP). |
| ● | In addition, the downward revision mainly took place in Europe. |
| – | The war in Ukraine has pushed up the prices of energy and other commodities, which will add to the inflationary pressures already present. |
| ● | Oil and natural gas prices will be at a higher level. In particular, the price of West Texas Intermediate (WTI) is expected to average US$87 a barrel in 2022 compared to the US$77 or so that was expected prior to the invasion of Ukraine.1 Oil prices, which currently carry a significant geopolitical risk premium, are expected to start falling in the second half of 2022. |
| ● | In addition, Ukraine and Russia are major exporters of grain, particularly wheat. Thus, the conflict will result in higher prices for some agricultural products. |
Canada and Québec will also be affected by the conflict fallout, but to a lesser extent. In 2021, exports to Ukraine and Russia represented only 0.3% of Québec’s total international goods exports and 0.1% of Canada’s.
| – | Gasoline prices will remain high in the coming months. Some food prices will also be affected. For example, the Consumer Price Index (CPI) for 2022 in Québec has been revised upward by 0.3 percentage point compared to the pre-invasion forecast scenario. |
| – | Québec is a net importer of oil. The rise in oil prices will therefore have a negative effect on its trade balance. Real term economic growth could also be slowed down somewhat by the additional cost of gasoline consumption and a less favourable environment for exports. Thus, the expected growth in real and nominal GDP has been revised downward by 0.2 percentage point compared to the pre-invasion forecast scenario. |
| – | High crude oil prices will benefit Canada’s economy, as the country is a net oil exporter. As a result, nominal GDP in Canada is expected to grow more than forecast, with an upward revision of 0.8 percentage point. Changes in real GDP remain similar to those expected in the pre-invasion forecast scenario. |
| 1 | This forecast is similar to the average forecast of 35 analysts surveyed by Reuters on March 4, 2022 (US$87.68 on average in 2022). |
| Budget 2022-2023 | |
| H.4 | Budget Plan |
The effects of Russia’s invasion of Ukraine
on the economic forecasts (cont.)
The government’s financial situation is based on prudent economic forecasts and a provident looking financial framework.
| – | The economic forecast for 2022 assumes an increase in economic activity in Québec (+2.7%), less than the average private sector forecast (+3.1%).1 |
| – | The financial framework includes provisions for economic risks and other contingencies of $8.5 billion, increased payments to the Generations Fund over the forecast horizon, and stable and predictable funding of the government’s chief missions. |
| – | Public finances are therefore based on solid foundations that allow Québec to cope with the uncertainties in the global economy. |
Fiscal policy will need to support households, says IMF
In a statement issued on March 5, 2022, the International Monetary Fund (IMF) provided an update on the economic effects already seen from the war in Ukraine and those potentially to come.
The effects of the war on prices will be felt worldwide, especially by poor households, as food and fuel account for a higher share of their expenses.
According to the IMF:
| – | while the situation remains highly fluid and the outlook is subject to extraordinary uncertainty, the economic consequences are already serious; |
| – | energy and commodity prices—including wheat and other grains—have surged, adding to inflationary pressures from supply chain disruptions and the rebound from the COVID-19 pandemic; |
| – | fiscal policy will need to support the most vulnerable households, to help offset rising living costs; |
| – | monetary authorities will need to carefully monitor the pass-through of rising international prices to domestic inflation, to calibrate appropriate responses; |
| – | the sanctions on Russia will also have a substantial impact on the global economy and financial markets, with significant spillovers to other countries; |
| – | countries that have very close economic links with Ukraine and Russia are at particular risk of scarcity and supply disruptions and are most affected by the increasing inflows of refugees. |
| 1 | Ministère des Finances du Québec summary as at March 8, 2022, which includes the forecasts of 11 private sector institutions. |
| The Québec Economy: | |
| Recent Developments and Outlook for 2022 and 2023 | H.5 |
| 1. | QuÉbec’s performance in 2021 was exceptional |
| 1.1 | Stronger-than-forecast economic recovery |
After a historic decline in 2020, the global economy has recovered more strongly than expected.
| — | A rebound in global real GDP of 5.8% was recorded in 2021, while growth of 5.3% was expected at the time of the Québec Budget Plan – March 2021 forecast. |
| — | Similarly, economic activity in Canada and the United States grew more than expected. |
In turn, Québec’s economic growth in 2021 was remarkable. The vaccination campaign and easing of public health restrictions provided a favourable context for growth. In addition, fiscal and financial measures adopted by governments have supported households and businesses.
| — | Real GDP grew by 6.3% in 2021. Economic activity picked up more quickly than forecast in the Québec Budget Plan – March 2021, which at the time of publication was calling for a 4.2% increase. |
In addition, the economic recovery was stronger in Québec than in Canada (+4.6%). In other words, Québec returned to pre-pandemic production levels more quickly than Ontario and Canada.
| TABLE H.3 Economic growth (real GDP, percentage change) |
| 2020 | 2021 | |||||||
| Québec | –5.5 | 6.3 | ||||||
| – March 2021 | –5.2 | 4.2 | ||||||
| Canada | –5.2 | 4.6 | ||||||
| – March 2021 | –5.4 | 4.4 | ||||||
| United States | –3.4 | 5.7 | ||||||
| – March 2021 | –3.5 | 5.0 | ||||||
| World | –3.0 | 5.8 | ||||||
| – March 2021 | –3.5 | 5.3 | ||||||
| Sources: | Institut de la statistique du Québec, Statistics Canada, International Monetary Fund, IHS Markit, Datastream, Eurostat and Ministère des Finances du Québec. |
| Budget 2022-2023 | |
| H.6 | Budget Plan |
| ☐ | Québec, a resilient economy |
The Québec economy has rebounded faster than what was expected in March 2021. At that time, Québec was faced with the emergence of a third wave of COVID-19 and had to implement very strict public health measures to curb the spread of the disease.
| — | Private-sector forecasts expected the Québec economy to grow by an average of 5.1% in 2021. |
| — | The Québec Budget Plan – March 2021 forecast a 4.2% increase in real GDP for 2021, which turned out to be 6.3%. |
The easing of pandemic uncertainties, the great capacity of Quebecers and the economy to adapt, the successful vaccination campaign and the easing of most health restrictions have led to a rapid recovery of the economy and greater-than-expected job creation.
Growth in household consumption expenditure and residential investment exceeded the March 2021 forecast.
| — | Generous government benefits have had a positive effect on household income. The strong job market has provided a stronger boost to wages and salaries than was expected. Lastly, the easing of public health measures allowed households to spend the savings accumulated during the pandemic. |
For their part, businesses experienced a more robust than expected gain in net operating surplus. The governments’ various subsidy programs and strong demand supported corporate earnings.
The remarkable performance of the Québec economy in 2021 has had a positive effect on government revenue.
| TABLE H.4 Québec economic statistics for 2021 | ||||||||
(percentage change, unless otherwise indicated)
| ||||||||
| March 2022 | March 2021 | |||||||
| Real GDP | 6.3 | 4.2 | ||||||
| – Household consumption | 5.9 | 5.0 | ||||||
| – Residential investment | 14.5 | 5.5 | ||||||
| – Exports | 5.2 | 3.1 | ||||||
| Nominal GDP | 11.3 | 6.0 | ||||||
| – Household consumption | 9.2 | 7.0 | ||||||
| – Wages and salaries | 9.6 | 6.0 | ||||||
| – Net operating surplus of corporations | 12.4 | 2.2 | ||||||
| Job creation (thousands) | 169.4 | 148.9 | ||||||
| Unemployment rate (per cent) | 6.1 | 6.4 | ||||||
Sources: Institut de la statistique du Québec, Statistics Canada and Ministère des Finances du Québec.
| The Québec Economy: | |
| Recent Developments and Outlook for 2022 and 2023 | H.7 |
| 1.2 | The Québec economy exceeded its pre-pandemic level |
Despite the various waves of COVID-19 and restrictive public health measures, the Québec economy recovered quickly.
| — | The recovery of economic activity in Québec in 2021 was more robust than that observed in Canada. |
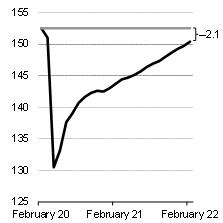
| — | The strength of the Québec economy has allowed it to return to pre-pandemic levels of production more quickly than Canada. |
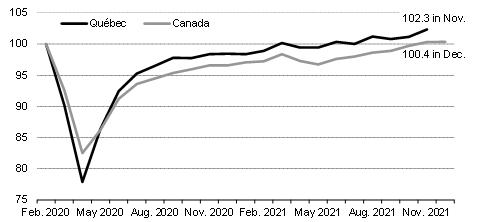
| — | Québec was 2.3% above its pre-pandemic production level in November 2021. In Canada, production was only 0.4% higher in December than in February 2020. |
The Québec economy has successfully adapted to the pandemic context.
| — | The vaccination rate of the Québec population has reached very high levels, with more than 87% of the population aged five and over having received at least two doses. Moreover, the public health measures implemented in Québec over the past few quarters have been more targeted than those applied during the first wave. |
| — | Businesses and households have adapted to the restrictions in place. |
| — | Furthermore, the generous support programs put in place since the beginning of the pandemic have fostered the recovery of economic activity in Québec. |
| CHART H.1 Change in output in Québec and Canada |
(real GDP at basic prices, index, February 2020 = 100)
|
| Sources: | Institut de la statistique du Québec, Statistics Canada and Ministère des Finances du Québec. |
| Budget 2022-2023 | |
| H.8 | Budget Plan |
| ☐ | Slower recovery for some industries |
The resilience of most industries has allowed the recovery of output for the economy as a whole.
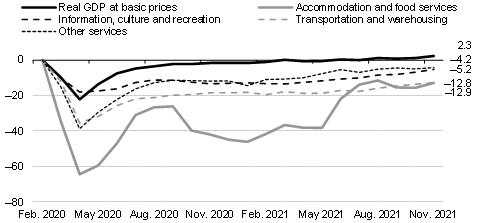
| — | Last November, the level of real GDP at basic prices was 2.3% higher than in February 2020. |
However, activity in some sectors is still slow to recover.
| — | These include the accommodation and food services industry (−12.9% between February 2020 and November 2021), as well as the transportation and warehousing (−12.8%), information, culture, and recreation (−5.2%), and other services (−4.2%) industries. |
| — | Physical distancing measures in these industries have slowed the return of production to pre-pandemic levels. |
The increase in contamination last December prompted governments to tighten public health measures. These tighter restrictions briefly slowed down activity in industries where distancing is difficult. Thereafter, the lifting of public health measures in February and March 2022 fostered the sustained recovery of activity in these industries.
| CHART H.2 Change in output for selected industries in Québec |
(real GDP at basic prices, percentage change from February 2020) |
|
| Note: | Other services include, in particular, services provided for private households by self-employed workers relating to tasks primarily concerned with the operation of the household, personal services such as hair care and esthetic services as well as funeral services, repair and maintenance—for example, for motor vehicles—and religious activities. |
| Sources: | Institut de la statistique du Québec, Statistics Canada and Ministère des Finances du Québec. |
| The Québec Economy: | |
| Recent Developments and Outlook for 2022 and 2023 | H.9 |
| 1.3 | Employment exceeds its pre-pandemic level |
The labour market was strong in Québec in 2021. In December, employment had surpassed its pre-pandemic level (100.1% of the February 2020 level). The unemployment rate fell from 6.9% in December 2020 to 4.7% in December 2021.
Then, in January 2022, the increase in contamination and the subsequent tightening of health measures led to a decline of 63 000 jobs. In turn, the unemployment rate climbed to 5.4%.
The temporary decline was more than offset by the creation of 81 500 jobs in February. This rebound followed the easing of many public health restrictions. Against this backdrop, employment rose back above its pre-pandemic level (100.5%). In February, the unemployment rate stood at 4.5%, an all-time monthly low. This is also the lowest unemployment rate among the provinces.
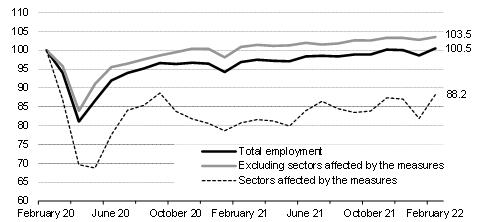
The Québec labour market is dynamic and reflects the strength of the economy. In February, excluding the sectors most affected by the public health restrictions,2 employment stood at 103.5% of the level observed in February 2020.
| — | Additional job gains may be realized over the next few months as employment in the industries sensitive to the measures is still below its February 2020 level (88.2% of February 2020). |
| CHART H.3 Change in employment in Québec |
| (index, February 2020 = 100) |
|
| Sources: | Statistics Canada and Ministère des Finances du Québec. |
| 2 | These are the accommodation and food services, transportation and warehousing, information, culture and recreation, and other services industries. Other services include, in particular, services provided for private households by self-employed workers relating to tasks primarily concerned with the operation of the household, personal services such as hair care and esthetic services as well as funeral services repair and maintenance—for example, for motor vehicles—and religious activities. |
| Budget 2022-2023 | |
| H.10 | Budget Plan |
The effects of the labour shortage
The Québec labour market must deal with the challenge of labour availability. Indeed, some industries are having difficulty hiring staff quickly.
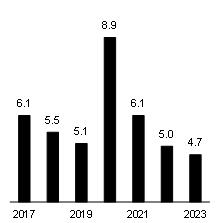
| – | In the third quarter of 2021, there were more than 238 000 unfilled positions in Québec, 100 000 more than in the third quarter of 2019. This is an increase of 73.1% in two years. |
| – | The vacancy rate, which is the number of vacant positions as a percentage of all vacant or occupied positions, is increasing. It rose to 6.1% in the third quarter of 2021, compared to 3.6% in the third quarter of 2019. |
One of the reasons for this is the aging of the population, which has resulted in a decrease in the demographic weight of the population aged 15 to 64. This group constitutes the main pool of potential workers.
As a result, Québec has fewer workers that can fill the available positions.
| – | For example, in the third quarter of 2019, when the economy was booming, Québec had 1.6 unemployed individuals per vacant job. |
| – | By the third quarter of 2021, this ratio had declined to 1.1 unemployed individuals. |
In the coming months, employers will continue to face recruitment challenges as economic activity continues to grow. Nevertheless, the effects of the labour shortage can be mitigated by an increase in the labour force participation rate, by the graduation and training of the workforce, and by productivity gains by businesses.
| Change in the number of vacancies and unemployed individuals in Québec | ||||||||||||
(number of vacancies and unemployed individuals in units, vacancy rate in per cent)
| ||||||||||||
| 3rd quarter of 2021 | 3rd quarter of 2019 | Difference | ||||||||||
| Number of vacant jobs | 238 050 | 137 530 | +100 520 | |||||||||
| Vacancy rate(1) | 6.1 | 3.6 | +2.5 | |||||||||
| Number of unemployed individuals | 265 300 | 221 900 | +43 400 | |||||||||
| NUMBER OF UNEMPLOYED INDIVIDUALS PER VACANT JOB | 1.1 | 1.6 | –0.5 | |||||||||
| Note: | Data are not seasonally adjusted. It is recommended to compare them with those of the same quarter of the previous year. However, Statistics Canada did not conduct its survey in the second and third quarters of 2020 due to the pandemic. |
| (1) | Number of vacancies as a percentage of all jobs, either occupied or vacant. |
| Sources: | Statistics Canada and Ministère des Finances du Québec. |
| The Québec Economy: | |
| Recent Developments and Outlook for 2022 and 2023 | H.11 |
| 1.4 | A significant reduction in the standard of living gap with Ontario since 2019 |
From 2015 to 2018, Québec’s average annual growth in living standards was lower than Ontario’s. This trend reversed in 2019.
| — | From 2019 to 2022, Quebecers’ standard of living is expected to grow by an average of 0.6% annually, while Ontarians’ standard of living is expected to remain stable (0.0%). |
| — | In comparison, growth in living standards averaged 1.3% annually in Québec and 1.4% in Ontario from 2015 to 2018. |
| TABLE H.5 Changes in standard of living | ||||||||||||||||||||||||
(real GDP per capita, annual percentage change and difference in percentage points)
| ||||||||||||||||||||||||
| From 2015 to 2018 | 2018 | 2019 | 2020 | From 2021 to 2022 | From 2019 to 2022 | |||||||||||||||||||
| Québec | 1.3 | 1.7 | 1.6 | –6.3 | 3.8 | 0.6 | ||||||||||||||||||
| Ontario | 1.4 | 1.7 | 0.4 | –6.4 | 3.2 | 0.0 | ||||||||||||||||||
| DIFFERENCE | — | 16.4 | 15.1 | 15.0 | 13.6 | (1) | — | |||||||||||||||||
| Note: | Ontario’s real GDP growth for 2021 and 2022 is the average of nine private sector institutions’ forecasts as at March 11, 2022. Ontario’s population growth in 2022 is the Canadian population growth rate excluding Québec, as forecast by the Ministère des Finances du Québec. |
| (1) | Gap in the standard of living in 2022. |
| Sources: | Institut de la statistique du Québec, Statistics Canada, Ontario Ministry of Finance and Ministère des Finances du Québec. |
One of the reasons for the significant gains in Québec’s standard of living since 2019 is the strong performance of its economy.
| — | In 2019, Québec’s economy was operating at full capacity. Then the pandemic hit the Québec and Ontario economies equally hard. In 2020, real GDP fell by 5.5% in Québec and 5.1% in Ontario. |
| — | However, the recovery was stronger in Québec. Real GDP increased by 6.3% in Québec in 2021 compared to 4.2% in Ontario. |
| — | Unlike Ontario, Québec has quickly caught up to its pre-pandemic level of output. |
| — | Ontario’s economy was slowed in 2021 by the global shortage of microchips, which affected the automobile industry. As a result, the recovery phase of the Ontario economy will continue into 2022. |
The strong performance of the economy has allowed Québec to make historic gains in terms of the living standard gap.
| — | The gap in favour of Ontario has fallen from 16.4% in 2018 to 13.6% in 2022, a reduction of 2.8 percentage points. |
| Budget 2022-2023 | |
| H.12 | Budget Plan |
| ☐ | Continuing efforts to increase Québec’s economic potential |
The government has set itself the objective of creating wealth and increasing Québec’s economic potential over the long term. It is by acting on the determinants of growth that this objective will be achieved.
| — | Because of its aging population, Québec cannot count on the contribution of its pool of potential workers to increase the size of its economy. |
| — | To ensure sustained growth, Québec must therefore count on the participation of all its workers. |
| — | At 60.1% on average in 2021, the employment rate is below the peak reached in 2019 (61.5%). |
| — | The job creation expected in the coming quarters should result in a significant increase in the employment rate (+1.7% on average per year in 2022 and 2023). |
| — | The increase in economic potential also depends on productivity gains, as defined by real GDP per job. |
| — | The recovery of the economy has resulted in a significant rebound in productivity of 2.1% in 2021. This growth is expected to continue in 2022 and 2023, although at a more moderate pace. |
Against a backdrop of aging demographics and labour shortage, productivity gains offer the greatest potential for improvement to support economic growth and rising living standards.
TABLE H.6
| Contribution of economic growth factors in Québec |
| (average annual percentage change and contribution in percentage points) |
| 2009- 2018 | 2019 | 2020 | 2021 | 2022- 2023 | 2024- 2025 | |||||||||||||||||||
| Real GDP | 1.5 | 2.8 | –5.5 | 6.3 | 2.4 | 1.5 | ||||||||||||||||||
| Growth factors (contribution) | ||||||||||||||||||||||||
| Potential labour pool(1) | 0.2 | 0.4 | –0.1 | –0.2 | 0.1 | 0.1 | ||||||||||||||||||
| Employment rate(2) | 0.7 | 1.6 | –4.8 | 4.4 | 1.7 | 0.4 | ||||||||||||||||||
| Productivity(3) | 0.7 | 0.7 | –0.7 | 2.1 | 0.5 | 0.9 | ||||||||||||||||||
| STANDARD OF LIVING(4) | 0.7 | 1.6 | –6.3 | 6.0 | 1.4 | 0.8 | ||||||||||||||||||
| Note: | Totals may not add due to rounding. |
| (1) | Population aged 15 to 64. |
| (2) | The employment rate corresponds to the total number of workers in proportion to the population aged 15 to 64. |
| (3) | Productivity as measured by real GDP per job. |
| (4) | Standard of living as measured by real GDP per capita. |
Sources: Institut de la statistique du Québec, Statistics Canada and Ministère des Finances du Québec.
| The Québec Economy: | |
| Recent Developments and Outlook for 2022 and 2023 | H.13 |
| 2. | QuÉbec’s economic situation in 2022 and 2023 |
| 2.1 | The Québec economy will remain dynamic |
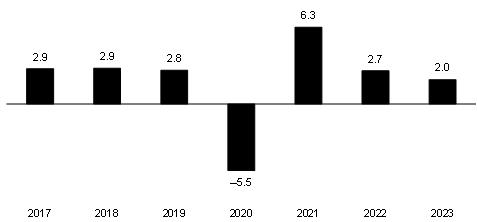
The Québec economy has made an impressive recovery in 2021. After a historic decline of 5.5% in 2020, real GDP grew by 6.3% in 2021. Growth in Québec has been more sustained than in the rest of the country.
| — | The strong recovery allowed the Québec economy to return to pre-pandemic levels by June 2021, well ahead of Ontario and Canada. |
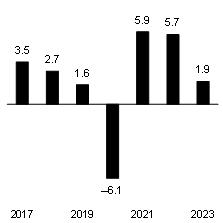
This dynamism will continue over the next few years. Real GDP increases of 2.7% in 2022 and 2.0% in 2023 are expected.
| — | With the recovery period having been completed quickly in 2021, the economy will evolve closer to its potential over the next few years. |
| — | The resurgence of contamination in early 2022 will cause a slight slowdown in economic growth in January. However, the lifting of restrictions in February and March 2022 will encourage a sustained recovery in economic activity. |
| — | The high vaccination rate and the continued ability of businesses and households to adapt will allow the economy to be resilient in the event of new waves of contamination. |
| CHART H.4 Economic growth in Québec |
| (real GDP, percentage change) |
| Sources: Institut de la statistique du Québec, Statistics Canada and Ministère des Finances du Québec. |
| Budget 2022-2023 | |
| H.14 | Budget Plan |
| 2.2 | Domestic demand remains the main driver of growth |
Domestic demand will remain a strong support for economic activity.
| — | Consumers will continue to play a key role in growth. The enviable financial position of households, the disbursement of some of their accumulated savings and the reduction of uncertainty related to the pandemic will support their spending. Moreover, wage increases and the measures announced to offset the rising cost of living will help to lessen the impact of price increases. |
| — | After peaking in 2021, activity in the residential sector will remain strong. However, rising interest rates and high housing prices will restrict housing affordability. |
| — | Non-residential business investment growth will accelerate. In particular, pressures on production capacity combined with the labour shortage will prompt businesses to implement their investment projects. These investments will help raise their productivity. |
| — | Governments will continue to support economic activity. |
Exports will benefit from sustained external demand, particularly from continued economic growth in the United States. Imports will be supported by strong domestic demand. However, disruptions in production chains will continue to weigh on the external sector in the coming quarters. In addition, Russia’s invasion of Ukraine could limit global trade.
| TABLE H.7 Real GDP and its major components in Québec | ||||||||||||||||||||||||
(percentage change and contribution in percentage points)
| ||||||||||||||||||||||||
| Change | Contribution | |||||||||||||||||||||||
| 2021 | 2022 | 2023 | 2021 | 2022 | 2023 | |||||||||||||||||||
| Domestic demand | 5.6 | 3.3 | 1.6 | 5.9 | 3.4 | 1.7 | ||||||||||||||||||
| Household consumption | 5.9 | 5.7 | 1.9 | 3.5 | 3.4 | 1.1 | ||||||||||||||||||
| Residential investment | 14.5 | –4.5 | –2.2 | 1.1 | –0.4 | –0.2 | ||||||||||||||||||
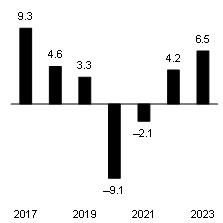
| Non-residential business investment | –2.1 | 4.2 | 6.5 | –0.2 | 0.3 | 0.5 | ||||||||||||||||||
| Government spending and investment | 5.3 | 1.1 | 1.0 | 1.5 | 0.3 | 0.3 | ||||||||||||||||||
| External sector | — | — | — | –1.1 | –1.2 | 0.2 | ||||||||||||||||||
| Exports | 5.2 | 3.9 | 4.4 | 2.4 | 1.7 | 2.0 | ||||||||||||||||||
| Imports | 7.1 | 6.0 | 3.5 | –3.4 | –3.0 | –1.8 | ||||||||||||||||||
| Inventories | — | — | — | 1.4 | 0.4 | 0.0 | ||||||||||||||||||
| REAL GDP | 6.3 | 2.7 | 2.0 | 6.3 | 2.7 | 2.0 | ||||||||||||||||||
| Note: | Totals may not add due to rounding. |
| Sources: | Institut de la statistique du Québec, Statistics Canada and Ministère des Finances du Québec. |
| The Québec Economy: | |
| Recent Developments and Outlook for 2022 and 2023 | H.15 |
| 2.3 | Job creation will continue |
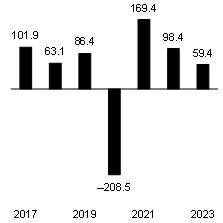
After a historic annual increase of 169 400 jobs in 2021, job creation will continue in the coming years.
| — | More specifically, 98 400 jobs will be created in 2022 and 59 400 jobs in 2023, which represents increases of 2.3% and 1.4%, respectively. |
| — | Job creation will be driven by economic growth. |
| — | In addition, the lifting of most public health restrictions will result in significant job gains in the industries that were hit the hardest by the pandemic. |
The strong demand for labour will result in a decline in the unemployment rate, which is expected to fall from an average of 6.1% in 2021 to 5.0% in 2022 and 4.7% in 2023.
Moreover, the labour shortage will slow the pace of hiring in the coming years.
| — | Despite this positive outlook, the aging of the population is limiting the growth of the labour force and increasing pressures on the labour market and production. |
| CHART H.5 Job creation in Québec | CHART H.6 Unemployment rate in Québec | |
| (average annual data in thousands) | (average annual data in per cent) | |
|
|
| Sources: | Statistics Canada and Ministère des Finances du Québec. | Sources: | Statistics Canada and Ministère des Finances du Québec. |
| Budget 2022-2023 | |
| H.16 | Budget Plan |
More than 50 000 jobs expected to be created
between December 2021 and December 2022
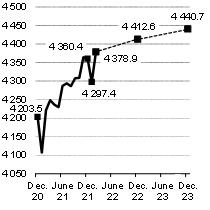
The labour market has been strong in Québec over the past year.
| – | 156 900 jobs were created between December 2020 and December 2021. |
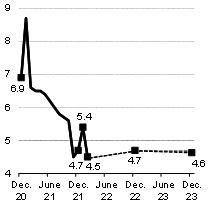
| – | At the same time, the unemployment rate decreased from 6.9% in December 2020 to 4.7% in December 2021. |
In the coming months, continued economic growth will result in strong demand for workers. However, the labour shortage will slow hiring growth.
| – | As a result, 52 200 jobs are expected to be created between December 2021 and December 2022, then 28 100 jobs between December 2022 and December 2023. |
Resumed immigration will increase the size of the labour force, which should help keep the unemployment rate near current levels.
| – | The unemployment rate is expected to remain relatively stable at 4.7% in December 2022 and 4.6% in December 2023. |
| Change in employment in Québec | Change in the unemployment rate in Québec | |
| (thousands) | (per cent) | |
|
|
| Sources: | Statistics Canada and Ministère des Finances du Québec. | Sources: | Statistics Canada and Ministère des Finances du Québec. |
| The Québec Economy: | |
| Recent Developments and Outlook for 2022 and 2023 | H.17 |
| 2.4 | Household consumption plays a central role in economic activity |
Household consumption expenditure will again be at the heart of economic growth. It will grow by 5.7% in 2022 and 1.9% in 2023 in real terms, following a solid increase in 2021 (+5.9%).
| — | Reduced uncertainty related to the pandemic and the continued recovery of the service sector will support spending. |
| — | However, changing prices, particularly for gasoline, as well as rising interest rates will put pressure on purchasing volumes. Nevertheless, the measures announced to offset the rising cost of living will mitigate the effects of inflation on Quebecers’ wallets. |
In addition, Québec households are benefiting from a favourable financial situation.
| — | Savings accumulated since the beginning of the pandemic will finance part of their new expenses. As a result, the savings rate will decline from 16.0% in 2021 to 12.1% in 2022 and 8.8% in 2023. In addition, wages and salaries will jump by 8.1% in 2022 and 3.3% in 2023, supported by a strong labour market and a shortage of labour. |
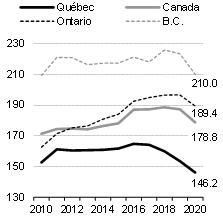
| — | Quebecers’ debt ratio (146.2% in 2020), that is, the value of household liabilities as a proportion of disposable income, is significantly lower than in Canada (178.8%) and Ontario (189.4%). Therefore, the potential effects of rising interest rates on Quebecers’ wallets will be less significant than in the rest of Canada. |
| CHART H.7 Household consumption expenditure in Québec | CHART H.8 Household indebtedness ratio | |
(percentage change, in real terms) | (total value of liabilities divided by household disposable income, in per cent) | |
|
|
| Sources: | Institut de la statistique du Québec, Statistics Canada and Ministère des Finances du Québec. | Sources: | Statistics Canada and Ministère des Finances du Québec. |
| Budget 2022-2023 | |
| H.18 | Budget Plan |
| 2.5 | Despite a slowdown, housing market activity remains strong |
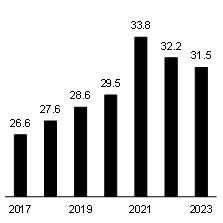
In 2021, residential investment jumped 14.5% in real terms to a record $33.8 billion.
After this record year, residential investment is expected to decline by 4.5% in 2022 and 2.2% in 2023. Despite this decline, the level of investment will remain high from a historical perspective.
| — | Households are expected to redirect some of their spending away from housing. In addition, the decline in affordability due to rising house prices, rising mortgage interest rates and stricter mortgage rules will help to moderate this market. |
| — | However, the sector should experience a soft landing. The inventory of unsold new properties is extremely low, which will support residential construction. In addition, favourable household finances, a strong labour market and a pickup in immigration will continue to support housing demand. |
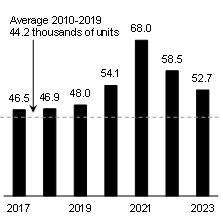
| — | Consequently, housing starts will reach 58 500 units in 2022 and 52 700 units in 2023, a level higher than the average for the 10 years prior to the pandemic, which is 44 200 units. In 2021, housing starts were up 25.7% and reached 68 000 units, the highest level since 1987. |
| CHART H.9 Residential investments in Québec | CHART H.10 Housing starts in Québec | |
| (billions of chained 2012 dollars) | (thousands of units) | |
|
|
| Sources: | Institut de la statistique du Québec, Statistics Canada and Ministère des Finances du Québec. | Sources: | Canada Mortgage and Housing Corporation and Ministère des Finances du Québec. |
| The Québec Economy: | |
| Recent Developments and Outlook for 2022 and 2023 | H.19 |
Tight conditions in the real estate market
In 2021, Québec’s housing market reached record highs
The real estate sector surprised by its strength in 2021.
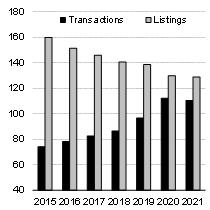
| – | Housing starts were up 25.7% to 68 000 units, the highest level since 1987 (74 200 units). The number of resale market transactions was 110 400 units, surpassing the 110 000 transactions mark for the second year in a row. |
Residential investment peaked, rising 14.5% in real terms in 2021. For this period, spending on both new residential construction and renovations peaked while homeownership transfer costs remained high after peaking in 2020.
An imbalance between supply and demand that puts pressure on prices
Since the start of the pandemic, demand for housing has risen sharply in Québec. Teleworking and the lockdown have changed the housing needs of many households. In addition, low interest rates and the accumulation of savings resulting from increased government transfers and reduced consumption have supported housing demand.
However, the supply was insufficient to absorb such a surge in demand.
| – | New listings of properties for sale fell 0.7% in 2021. This was the seventh consecutive annual decline. |
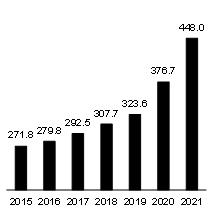
The imbalance between supply and demand has put pressure on housing costs. As a result, average prices for properties on the resale market jumped 18.9% in 2021, to $448 000. This was the highest annual increase ever recorded. Nonetheless, housing on the resale market remain much more affordable in Québec than in Ontario ($871 800 in 2021).
| Transactions and new listings on Québec’s resale market | Average home resale price in Québec | |
| (thousands of units) | (thousands of dollars) | |
|
| |
| Source: Haver Analytics. | Source: Haver Analytics. |
| Budget 2022-2023 | |
| H.20 | Budget Plan |
Tight conditions in the real estate market (cont.)
The momentum has slowed in recent months
After peaking in early 2021, housing demand has moderated in recent months.
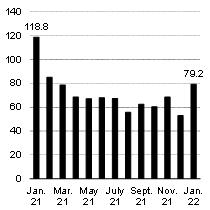
| – | In January 2021, there were the equivalent of 118 800 housing units started at an annualized rate, a record. Since then, housing starts declined to 79 200 units in January 2022. Resale market transactions are also on a downward trend. |
Several factors account for the moderation in housing demand.
| – | Properties have become less affordable and mortgage interest rates started to rise slightly. In addition, rising material prices have contributed to dampening enthusiasm for potential new homebuyers. |
| – | Moreover, as of June 1, 2021, buyers are subject to a new federal rule that limits their borrowing ability. |
| – | Lastly, the gradual recovery of activities, including recreation activities, has reduced the share of the household budget allocated to housing. |
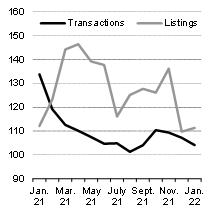
The supply of properties on the market has been slow to recover. However, the recent boom in new residential construction will increase the number of homes available on the market.
Therefore, over the next few quarters, the real estate market should gradually return to balance, which will limit price increases.
| Change in housing starts in Québec | Transactions and new listings on the resale market in Québec | |
| (thousands of units, annualized rate) | (thousands of units, annualized rate) | |
|
| |
| Source: Canada Housing and Mortgage Corporation. | Source: Haver Analytics. |
| The Québec Economy: | |
| Recent Developments and Outlook for 2022 and 2023 | H.21 |
Foreign buyers still have little presence in Québec
In 2020 and 2021, lower immigration and restrictions on international travellers to Québec have limited home purchases by foreign buyers.
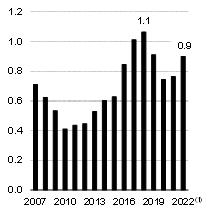
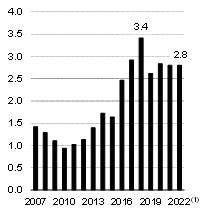
| – | The share of real estate transactions by foreign buyers1 has declined since its peak in 2018. In January 2022, it averaged 0.9% of real estate transactions in Québec and 2.8% on the island of Montréal. |
| – | In 2018, this share stood at 1.1% and 3.4% respectively. |
Moreover, the share of transactions made in Québec by buyers from the rest of Canada has continued to grow in recent quarters, but it remains low.
| – | For Québec as a whole, it rose from 2.3% in 2018 to 3.8% in January 2022. On the island of Montréal, it reached 4.1% in January 2022 compared to 3.1% in 2018. |
As a result, for both Québec as a whole and the island of Montréal, the vast majority of real estate transactions are carried out by Québec buyers.
| – | In January 2022, 95.3% of all real estate transactions in Québec and 93.1% on the island of Montréal were carried out by Québec buyers. |
Although the proportion of foreign buyers has decreased since 2018, the government will continue to keep a close watch on developments in the Québec real estate market
| Real estate transactions by foreign buyers in Québec | Real estate transactions by foreign buyers on the island of Montréal | |
| (percentage of total transactions in Québec) | (percentage of total transactions on the island of Montréal) | |
|
| |
(1) This is the average of the months available in 2022. | (1) This is the average of the months available in 2022. |
| Sources: | JLR solutions foncières and Ministère des Finances du Québec. | Sources: | JLR solutions foncières and Ministère des Finances du Québec. |
| Budget 2022-2023 | |
| H.22 | Budget Plan |
| 2.6 | Non-residential investment back on the growth path |
Non-residential business investment is expected to grow by 4.2% in 2022 and 6.5% in 2023. Several factors are currently in place to support a rebound in non-residential business investment.
| — | The tax measures implemented by the Québec government since the fall of 2018 significantly reduce the cost of investment. For example, the marginal effective tax rate (METR) for new investments in Québec has been reduced from 14.7% in 2017 to 7.4% in 2021. |
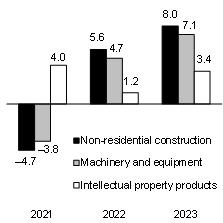
| — | Rising demand will put pressure on production capacity, which should support investment in machinery and equipment and non-residential construction. |
| — | The labour shortage could encourage entrepreneurs to invest in machinery and equipment in order to increase their productivity and automate production. |
| — | Credit conditions remain favourable despite the expected increase in interest rates. |
| — | The transition to a low-carbon economy will have a positive impact on business spending. |
| — | The digital shift in the economy will boost business spending on intellectual property products. |
| CHART H.11 Non-residential business investment in Québec | CHART H.12 Components of non-residential business investment in Québec | |
| (percentage change, in real terms) | (percentage change, in real terms) | |
|
|
| Sources: | Institut de la statistique du Québec, Statistics Canada and Ministère des Finances du Québec. | Sources: | Institut de la statistique du Québec, Statistics Canada and Ministère des Finances du Québec. |
| The Québec Economy: | |
| Recent Developments and Outlook for 2022 and 2023 | H.23 |
Québec is among the leaders in terms of investment intentions in 2022
The most recent Statistics Canada Capital and Repair Expenditures Survey (CAPEX) confirms that businesses and governments intend to increase their investments in Québec in 2022.1
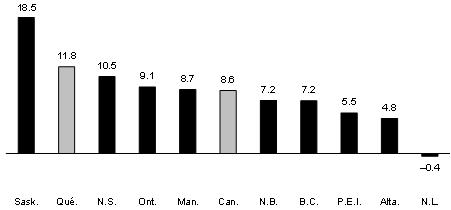
The value of total non-residential investment in Québec is expected to reach $53.1 billion in 2022, an increase of 11.8% (+10.1% in 2021).
| – | This places Québec second among Canadian provinces in terms of growth in investment intentions. |
In Canada, the value of total non-residential investment is expected to reach $298.2 billion in 2022, an increase of 8.6% (+10.4% in 2021).
Saskatchewan (+18.5%), Québec (+11.8%) and Nova Scotia (+10.5%) show the largest increases.
According to the survey, the main investment categories will be on the rise in Québec in 2022, as:
| – | investment in non-residential construction is expected to increase by 13.9% to $34.4 billion; |
| – | investment in machinery and equipment is expected to increase by 8.1% to $18.7 billion. |
| Total non-residential investment by province, outlook for 2022 |
| (percentage change, in nominal terms) |
|
| Source: Statistics Canada. |
| 1 | The statistics from the Capital and Repair Expenditures Survey for 2021 represent preliminary estimates. For 2022, they are investment intentions. |
| Budget 2022-2023 | |
| H.24 | Budget Plan |
| 2.7 | Governments continue to stimulate the economy |
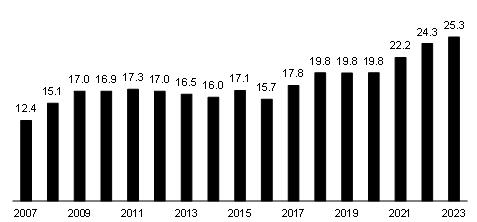
Following strong growth of 11.8% in 2021, the value of government investment is expected to increase by 9.7% in 2022 and 4.2% in 2023. It is expected to reach $25.3 billion in nominal terms in 2023.
| — | Governments are an important driver of economic growth. The value of government investment as a proportion of GDP was 4.4% in Québec in 2020, compared to 3.7% in Ontario. |
In particular, investments in the 2022-2032 Québec Infrastructure Plan (QIP) are reaching record levels. This plan makes it possible to rehabilitate infrastructure in a state of asset maintenance deficit and to add new ones.
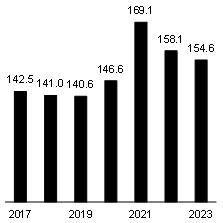
| — | The QIP amounts to $142.5 billion over a 10-year period. |
| — | These investments provide significant support to the economy. In particular, they make it possible to provide the population with modern, quality infrastructure. |
In addition, the federal government’s Investing in Canada infrastructure program and the high levels of investment planned in Québec’s major municipalities, including Montréal, Québec and Laval, will also support the growth in investments.
| CHART H.13 Government investments in Québec |
| (billions of dollars, in nominal terms) |
|
| Note: | Government investments include investments by the Québec government, the federal government, local public administrations and Aboriginal public administrations. |
| Sources: | Institut de la statistique du Québec, Statistics Canada and Ministère des Finances du Québec. |
| The Québec Economy: | |
| Recent Developments and Outlook for 2022 and 2023 | H.25 |
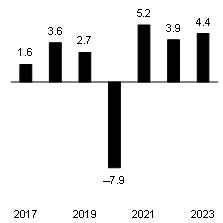
| 2.8 | Strong foreign demand fuels export growth |
Continued bottlenecks in supply chains will weigh on the external sector’s growth in the coming quarters. Despite these challenges, the outlook for the sector remains positive.
| — | Exports will increase by 3.9% in 2022 and 4.4% in 2023. |
| — | The strength of foreign demand, particularly from the United States, will contribute to the increase in exports. |
| — | Québec will also benefit from a recovery in tourism activities, which will fuel growth in international service exports. |
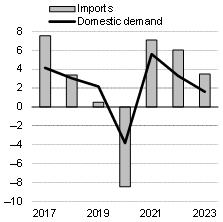
| — | Imports will grow by 6.0% in 2022 and 3.5% in 2023. |
In 2022, imports are expected to grow faster than exports for the second year in a row.
| — | This reflects strong growth in Québec’s domestic demand, particularly household consumption. In addition, imports will be stimulated by a strong rebound in travel spending by Quebecers. |
Moreover, the rise in oil prices will have a significant detrimental effect on Québec’s trade balance, as it imports all the oil it consumes.
| CHART H.14 Québec exports | CHART H.15 Québec imports and domestic demand | |
| (percentage change, in real terms) | (percentage change, in real terms) | |
|
|
| Sources: | Institut de la statistique du Québec, Statistics Canada and Ministère des Finances du Québec. | Sources: | Institut de la statistique du Québec, Statistics Canada and Ministère des Finances du Québec. |
| Budget 2022-2023 | |
| H.26 | Budget Plan |
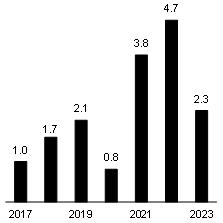
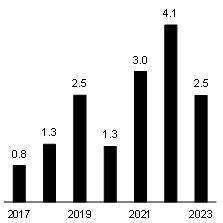
| 2.9 | Inflationary pressures continue into early 2022 |
In 2021, price pressures increased, and the CPI rose 3.8%. The Consumer Price Index (CPI) is expected to rise 4.7% in 2022 and 2.3% in 2023. Excluding food and energy, two volatile components of the index, prices are expected to rise 4.1% and 2.5% in 2022 and 2023, respectively.
Various factors will contribute to keeping prices high in the first half of 2022, including:
| — | the synchronized recovery of economic activity and the war in Ukraine, which have caused commodity prices, especially energy prices, to soar; |
| — | distortions amplified by the pandemic, which have affected supply chains, and bottlenecks in the transportation of goods, which are driving up production costs; |
| — | strong labour market performance and the labour shortage, which are driving up wages and salaries; |
| — | the imbalance between housing supply and demand, which puts pressure on housing prices. |
In the first half of 2022, CPI inflation is expected to remain above the upper end of the Bank of Canada’s 1% to 3% inflation-control range. It is expected to return closer to the 2% target during 2023 as the base effects of the reopening of the economy disappear and supply chain disruptions are resolved.
| CHART H.16 CPI in Québec | CHART H.17 CPI excluding food and energy in Québec | |
| (percentage change) | (percentage change) | |
|
|
| Sources: | Statistics Canada and Ministère des Finances du Québec. | Sources: | Statistics Canada and Ministère des Finances du Québec. |
| The Québec Economy: | |
| Recent Developments and Outlook for 2022 and 2023 | H.27 |
| 2.10 | A sustained increase in nominal GDP |
Nominal GDP will increase by 6.4% in 2022 and 3.5% in 2023, following a jump of 11.3% in 2021. These increases are due to continued economic growth in real terms and an increase in the GDP deflator, which measures changes in output prices.
The deflator is determined by two factors:
| — | domestic demand prices, of which the CPI is an important indicator; |
| — | the terms of trade, which can be measured by the ratio of export prices to import prices. |
In 2022, the change in the GDP deflator will be slowed by the change in the terms of trade.
| — | CPI growth is expected to accelerate to 4.7%. On the other hand, the rise in import prices, particularly oil prices, will lead to a deterioration in the terms of trade (−2.0%). On net, GDP prices are expected to grow by 3.6%. |
The government’s main tax bases will show increases.
| — | Growth in wages and salaries (+8.1% in 2022 and +3.3% in 2023) will be supported by a strong labour market and the labour shortage. |
| — | Nominal consumption will jump by 9.7% in 2022 and 3.9% in 2023, supported by rising consumer prices, the disbursement of some accumulated savings, and strong wage growth. |
| — | However, net operating surplus of corporations will decline in 2022 and 2023, following impressive gains of 14.5% in 2020 and 12.4% in 2021. The end of various business subsidy programs and higher oil prices and wages will limit corporate profits. |
| TABLE H.8 Nominal GDP in Québec | ||||||||||||
| (percentage change) | ||||||||||||
| 2021 | 2022 | 2023 | ||||||||||
| Real GDP | 6.3 | 2.7 | 2.0 | |||||||||
| Price – GDP deflator | 4.7 | 3.6 | 1.4 | |||||||||
| – CPI | 3.8 | 4.7 | 2.3 | |||||||||
| – Terms of trade | 1.8 | −2.0 | 0.1 | |||||||||
| NOMINAL GDP | 11.3 | 6.4 | 3.5 | |||||||||
| Note: | Totals may not add due to rounding. |
| Sources: | Institut de la statistique du Québec, Statistics Canada and Ministère des Finances du Québec. |
| Budget 2022-2023 | |
| H.28 | Budget Plan |
| 2.11 | Comparison with private sector forecasts |
In 2022, the Ministère des Finances du Québec forecasts that the increase in economic activity (+2.7%) will be lower than that anticipated on average by private sector forecasters (+3.1%).
In 2023, the Ministère des Finances du Québec estimates an increase in economic activity (+2.0%) that is lower than the average expected by private sector forecasters (+2.5%).
| CHART H.18 Economic growth in 2022 in Québec | CHART H.19 Economic growth in 2023 in Québec | |
| (real GDP, percentage change) | (real GDP, percentage change) | |
|
|
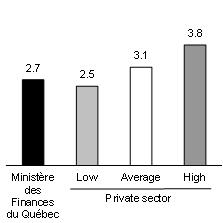
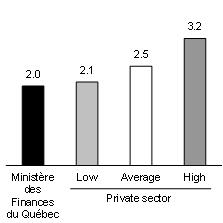
| Source: | Ministère des Finances du Québec summary as at March 8, 2022, which includes the forecasts of 11 private sector institutions. | Source: | Ministère des Finances du Québec summary as at March 8, 2022, which includes the forecasts of 11 private sector institutions. |
| TABLE H.9 Québec’s economic outlook – Comparison with the private sector | ||||||||||||||||||||||||||||
| (percentage change) | ||||||||||||||||||||||||||||
| 2021 | 2022 | 2023 | 2024 | 2025 | 2026 | Average 2022-2026 | ||||||||||||||||||||||
| Real GDP | ||||||||||||||||||||||||||||
| Ministère des Finances du Québec | 6.3 | 2.7 | 2.0 | 1.5 | 1.5 | 1.5 | 1.8 | |||||||||||||||||||||
| Private sector average | 6.2 | 3.1 | 2.5 | 1.7 | 1.5 | 1.6 | 2.1 | |||||||||||||||||||||
| Nominal GDP | ||||||||||||||||||||||||||||
| Ministère des Finances du Québec | 11.3 | 6.4 | 3.5 | 3.4 | 3.4 | 3.4 | 4.0 | |||||||||||||||||||||
| Private sector average | 11.7 | 6.2 | 4.3 | 3.7 | 3.5 | 3.5 | 4.2 | |||||||||||||||||||||
| Note: | Totals may not add due to rounding. |
| Source: | Ministère des Finances du Québec summary as at March 8, 2022, which includes the forecasts of 11 private sector institutions. |
| The Québec Economy: | |
| Recent Developments and Outlook for 2022 and 2023 | H.29 |
| TABLE H.10 Economic outlook in Québec | ||||||||||||||||||||||||||||
| (annual average, percentage change, unless otherwise indicated) | ||||||||||||||||||||||||||||
| 2020 | 2021 | 2022 | 2023 | 2024 | 2025 | 2026 | ||||||||||||||||||||||
| Output | ||||||||||||||||||||||||||||
| Real GDP | −5.5 | 6.3 | 2.7 | 2.0 | 1.5 | 1.5 | 1.5 | |||||||||||||||||||||
| Nominal GDP | −2.4 | 11.3 | 6.4 | 3.5 | 3.4 | 3.4 | 3.4 | |||||||||||||||||||||
| Nominal GDP (billions of dollars) | 449.1 | 500.0 | 532.2 | 550.7 | 569.6 | 588.8 | 608.5 | |||||||||||||||||||||
| Components of GDP (in real terms) | ||||||||||||||||||||||||||||
| Final domestic demand | −3.8 | 5.6 | 3.3 | 1.6 | 1.4 | 1.3 | 1.2 | |||||||||||||||||||||
| – Household consumption | −6.1 | 5.9 | 5.7 | 1.9 | 1.5 | 1.5 | 1.5 | |||||||||||||||||||||
| – Government spend in and investment | 0.4 | 5.3 | 1.1 | 1.0 | 1.1 | 0.9 | 0.7 | |||||||||||||||||||||
| – Residential investment | 3.1 | 14.5 | −4.5 | −2.2 | 0.1 | 0.3 | 0.2 | |||||||||||||||||||||
| – Non-residentia business investment | −9.1 | −2.1 | 4.2 | 6.5 | 2.7 | 2.5 | 2.2 | |||||||||||||||||||||
| Exports | −7.9 | 5.2 | 3.9 | 4.4 | 3.2 | 2.5 | 2.0 | |||||||||||||||||||||
| Imports | −8.5 | 7.1 | 6.0 | 3.5 | 2.8 | 2.1 | 1.5 | |||||||||||||||||||||
| Labour market | ||||||||||||||||||||||||||||
| Population (thousands) | 8 578 | 8 604 | 8 687 | 8 763 | 8 830 | 8 891 | 8 942 | |||||||||||||||||||||
| Population aged 15 and over (thousands) | 7 054 | 7 099 | 7 157 | 7 234 | 7 303 | 7 365 | 7 419 | |||||||||||||||||||||
| Jobs (thousands) | 4 100 | 4 269 | 4 367 | 4 427 | 4 453 | 4 477 | 4 498 | |||||||||||||||||||||
| Job creation (thousands) | −208.5 | 169.4 | 98.4 | 59.4 | 26.6 | 23.4 | 21.6 | |||||||||||||||||||||
| Unemployment rate (per cent) | 8.9 | 6.1 | 5.0 | 4.7 | 4.5 | 4.4 | 4.3 | |||||||||||||||||||||
| Other economic indicators (in nominal terms) | ||||||||||||||||||||||||||||
| Household consumption | −5.5 | 9.2 | 9.7 | 3.9 | 3.1 | 3.2 | 3.1 | |||||||||||||||||||||
| – Excluding food expenditures and shelter | −9.8 | 11.2 | 12.0 | 3.9 | 3.1 | 3.1 | 3.0 | |||||||||||||||||||||
| Housing starts (thousands of units) | 54.1 | 68.0 | 58.5 | 52.7 | 49.9 | 48.3 | 46.7 | |||||||||||||||||||||
| Residential investment | 9.5 | 30.0 | 0.6 | −0.1 | 2.3 | 2.5 | 2.4 | |||||||||||||||||||||
| Non-residential business investment | −7.8 | 0.7 | 8.1 | 8.9 | 4.3 | 4.3 | 4.2 | |||||||||||||||||||||
| Wages and salaries | 0.2 | 9.6 | 8.1 | 3.3 | 2.9 | 3.2 | 3.1 | |||||||||||||||||||||
| Household income | 5.8 | 6.0 | 6.0 | 1.6 | 3.1 | 3.5 | 3.3 | |||||||||||||||||||||
| Net operating surplus of corporations | 14.5 | 12.4 | −6.4 | −3.1 | 5.6 | 3.0 | 3.7 | |||||||||||||||||||||
| Consumer Price Index | 0.8 | 3.8 | 4.7 | 2.3 | 1.9 | 2.0 | 2.0 | |||||||||||||||||||||
| – Excluding food and energy | 1.3 | 3.0 | 4.1 | 2.5 | 2.0 | 1.9 | 1.8 | |||||||||||||||||||||
| Sources: | Institut de la statistique du Québec, Statistics Canada, Canada Mortgage and Housing Corporation and Ministère des Finances du Québec. |
| Budget 2022-2023 | |
| H.30 | Budget Plan |
| 3. | The situation of Québec’s main economic partners |
After a significant rebound in 2021, global economic growth will continue in 2022 and 2023, but at a more moderate pace. Most economies will lift their public health restrictions and pressures on supply chains should ease in the coming quarters. However, the war in Ukraine and the evolution of the pandemic are significant risks to the economic outlook.
| 3.1 | The economic situation in Canada |
| q | A full economic recovery |
Canada’s real GDP grew by 4.6% in 2021. However, the recovery in economic activity was less robust than in Québec (+6.3%).
| — | The rebound in real GDP in Canada has been held back by natural disasters in British Columbia. In addition, the global shortage of microchips forced the temporary closure of some automobile manufacturing plants in Ontario. |
As a result, the recovery period will continue, as real GDP is expected to grow by 3.8% in 2022 and 2.6% in 2023.
| — | The significant improvement in labour market conditions and strong consumer spending will support sustained economic growth. In addition, high oil, grain and fertilizer prices will benefit the Canadian economy, as Canada is a net exporter of these products. |
| CHART H.20 Economic growth in Canada |
| (real GDP, percentage change) |
|
| Sources: Statistics Canada and Ministère des Finances du Québec. |
| The Québec Economy: | |
| Recent Developments and Outlook for 2022 and 2023 | H.31 |
| ☐ | Increased economic activity supported by domestic demand |
In 2022 and 2023, the recovery in oil prices and continued growth in each of the provinces will support growth in economic activity in Canada.
| — | Consumer spending will continue to be the main driver of real GDP growth. The gradual lifting of public health measures, the disbursement of accumulated savings and strong employment will continue to support household consumption and residential investment. |
| — | However, the housing boom will gradually fade as affordability deteriorates and mortgage rates rise. |
| — | Non-residential business investment is expected to recover in both the energy and non-energy sectors. |
| — | Total public spending will continue to support the economy. |
| — | Improved pipeline transportation capacity, a gradual recovery in automobile production and strong foreign demand will boost export growth. |
| TABLE H.11 Real GDP and its major components in Canada |
| (percentage change and contribution in percentage points) |
| Change | Contribution | |||||||||||||||||||||||
| 2021 | 2022 | 2023 | 2021 | 2022 | 2023 | |||||||||||||||||||
| Domestic demand | 5.5 | 3.2 | 2.5 | 5.6 | 3.2 | 2.5 | ||||||||||||||||||
| Household consumption | 5.2 | 5.3 | 3.2 | 2.8 | 3.0 | 1.8 | ||||||||||||||||||
| Residential investment | 15.4 | –6.5 | –2.2 | 1.3 | –0.5 | –0.2 | ||||||||||||||||||
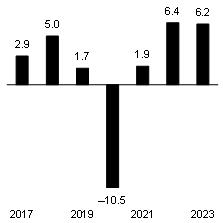
| Non-residential business investment | 1.9 | 6.4 | 6.2 | 0.2 | 0.6 | 0.6 | ||||||||||||||||||
| Government spending and investment | 4.8 | 1.2 | 1.1 | 1.3 | 0.3 | 0.3 | ||||||||||||||||||
| External sector | — | — | — | –1.8 | 0.2 | –0.2 | ||||||||||||||||||
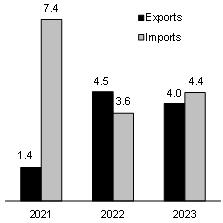
| Exports | 1.4 | 4.5 | 4.0 | 0.4 | 1.3 | 1.2 | ||||||||||||||||||
| Imports | 7.4 | 3.6 | 4.4 | –2.2 | –1.1 | –1.4 | ||||||||||||||||||
| Inventories | — | — | — | 0.7 | 0.4 | 0.2 | ||||||||||||||||||
| REAL GDP | 4.6 | 3.8 | 2.6 | 4.6 | 3.8 | 2.6 | ||||||||||||||||||
Note: Totals may not add due to rounding. Sources: Statistics Canada and Ministère des Finances du Québec. |
| Budget 2022-2023 | |
| H.32 | Budget Plan |
| n | Households are ready to spend |
Consumer spending is expected to grow by 5.3% in 2022 and 3.2% in 2023, after increasing by 5.2% in 2021.
| — | The gradual lifting of public health measures and a robust labour market will support household consumption growth. |
| — | Households will also continue to spend the savings accumulated since the beginning of the pandemic. As a result, the household savings rate will fall from an average of 10.9% in 2021 to 6.9% in 2022 and 4.9% in 2023. |
However, inflationary pressures will dampen the increase in consumer spending in real terms.
| n | Residential investment declines after a record year |
After record growth of 15.4% in 2021, residential investment is expected to decline by 6.5% in 2022 and 2.2% in 2023. Despite these declines, investment levels will remain high.
| — | Low borrowing costs, increased demand exacerbated by the pandemic, and strong growth in household disposable income have contributed to this surge in investment. |
| — | However, the expected increase in mortgage interest rates and high housing prices will dampen demand for housing in the coming years, despite the recovery in immigration. |
| CHART H.21 Household consumption expenditure in Canada | CHART H.22 Residential investment in Canada | |
| (percentage change, in real terms) | (billions of chained 2012 dollars) | |
|
| |

| Sources: | Statistics Canada and Ministère des Finances du Québec. | Sources: | Statistics Canada and Ministère des Finances du Québec. | |
| The Québec Economy: | |
| Recent Developments and Outlook for 2022 and 2023 | H.33 |
| n | Recovery in non-residential investment |
Non-residential business investment will gradually recover. It will grow by 6.4% in 2022 and 6.2% in 2023.
| — | Increasing pressure on production capacity, improved business confidence, and growing difficulty in retaining workers account for the rebound in investment in the non-energy sectors. |
| — | In the energy sectors, increased oil and gas production linked to higher energy prices will support the start of investment projects. In addition, the willingness of producers to reduce greenhouse gas emissions from their operations should support investment. |
| n | Trade flows will normalize |
Despite continued problems in supply chains in the first half of 2022, exports are expected to increase by 4.5% in 2022 and 4.0% in 2023.
| — | The rebound in exports is mainly due to strong external demand, particularly from the United States. |
| — | In addition, the opening of new oil pipelines should support the increase in exports over the next few years. |
Import growth will slow in 2022 as domestic demand moderates.
CHART H.23
Non-residential business investment in Canada | CHART H.24
Exports and imports in Canada | |
| (billions of chained 2012 dollars) | (percentage change, in real terms) | |
|
| |
| Sources: | Statistics Canada and Ministère des Finances du Québec. | Sources: | Statistics Canada and Ministère des Finances du Québec. | |
| Budget 2022-2023 | |
| H.34 | Budget Plan |
| 3.2 | The economic situation in the United States |
| ☐ | U.S. economic growth will slow down |
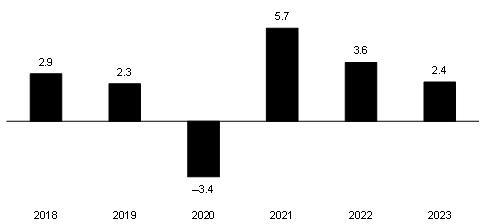
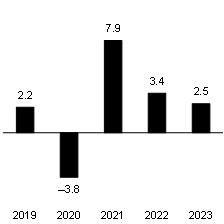
Economic growth in the United States rose to 5.7% in 2021, the highest level since 1984. As a result, the U.S. economy returned to its pre-pandemic level in the second quarter of 2021. However, economic growth is expected to slow to a more sustainable pace in the coming years, as real GDP increases of 3.6% and 2.4% are expected in 2022 and 2023, respectively.
The U.S. economy will face several headwinds over the next two years, which will limit real GDP growth. In particular:
| — | high inflation, which reached a more than 40-year high in February 2022, will prompt the Federal Reserve to move up the normalization of its policy rate in 2022, when four increases are expected; |
| — | the positive impulse of fiscal policy will fade as the income support measures adopted in the stimulus packages expired; |
| — | the Omicron outbreak is expected to cause economic growth to slow temporarily in the first quarter of 2022 as U.S. consumers exercise caution due to the high transmissibility of the variant. |
The pace of real GDP expansion will also be constrained by robust import growth, which will benefit from business restocking and easing tensions in supply lines in the coming quarters.
Moreover, the economic outlook in the United States remains uncertain. It will depend, in particular, on the evolution of the epidemiological situation and the speed at which inflationary pressures moderate.
| CHART H.25 Economic growth in the United States |
| (real GDP, percentage change) |
|
| Sources: IHS Markit and Ministère des Finances du Québec. |
| The Québec Economy: | |
| Recent Developments and Outlook for 2022 and 2023 | H.35 |
| ☐ | A moderation in consumer spending and residential investment |
Following a 7.9% increase in 2021, household consumption expenditures are expected to moderate and grow by 3.4% in 2022 and 2.5% in 2023. Spending will be limited by:
| — | the erosion of consumer purchasing power caused by high inflation, especially for food and energy, which will reduce the share of consumers’ budget available for discretionary spending; |
| — | the decline in federal government transfer revenues as the stimulus packages expired. |
However, strong wage growth, supported by a tight labour market, and significant savings accumulated during the pandemic should help mitigate these negative effects.
At the same time, residential investment is expected to stagnate in 2022 and then grow by 1.6% in 2023, following a strong year in 2021 (+9.1%).
| — | Expected increases in interest rates in the coming quarters, combined with robust growth in house prices in 2021, will further reduce affordability in the residential sector, in a context where inventories of houses for sale are at an all-time low. |
| — | However, low inventories in the resale market should support residential construction over the next two years. |
| CHART H.26 Consumption expenditure in the United States | CHART H.27 Inventory of existing houses for sale in the United States | |
| (percentage change, in real terms) | (millions of units) | |
|
| |
| Sources: | IHS Markit and Ministère des Finances du Québec. | Sources: | IHS Markit and Ministère des Finances du Québec. | |
| Budget 2022-2023 | |
| H.36 | Budget Plan |
| ☐ | Business investment and restocking will boost imports |
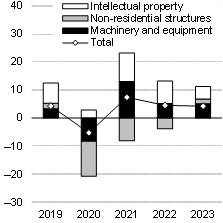
After growing by 7.4% in 2021, business investment is expected to grow by 4.5% in 2022 and 4.2% in 2023. It will be supported mainly by:
| — | investment in machinery and equipment, which will be accompanied by significant restocking by businesses as tensions on supply chains ease over the course of 2022; |
| — | energy investments, which will benefit from high oil and natural gas prices; |
| — | intellectual property investments, as the pandemic has helped drive the digital shift. |
Increased business investment and restocking should translate into robust import growth. Imports are expected to grow by 6.8% in 2022 and 3.6% in 2023, whereas exports are expected to grow by 6.2% and 4.9% over the same period.
| — | The external sector is expected to reduce real GDP growth by 0.3 percentage point in 2022. The contribution of net exports is then expected to be zero in 2023. |
| CHART H.28 Non-residential business investment in the United States | CHART H.29 Imports and exports in the United States | |
| (percentage change, in real terms) | (percentage change, in real terms) | |
|
| |
| Sources: | IHS Markit and Ministère des Finances du Québec. | Sources: | IHS Markit and Ministère des Finances du Québec. | |
| The Québec Economy: | |
| Recent Developments and Outlook for 2022 and 2023 | H.37 |
| ☐ | Labour market recovery continues |
The labour market in the United States continued to recover in 2021, as 3.9 million jobs were added on an annual average basis (+2.8%), following the 8.7-million drop in 2020 (−5.8%).
| — | In February 2022, the number of jobs remained below its pre-pandemic level by 2.1 million, or 98.6% of the level in February 2020. |
| — | The unemployment rate, meanwhile, has been steadily declining in recent months, reaching 3.8% in February 2022, a level close to that of February 2020 (3.5%). |
Despite this progress, the recovery in employment has been slower in the United States than in other advanced economies, including Canada and Québec. This is due to the fact that many individuals left the labour market prematurely in the United States.
| — | As a result, the participation rate remains well below the level of February 2020. It stood at 62.3% in February 2022, compared to 63.4% in February 2020. However, an increase in the labour force is expected over the next few years. |
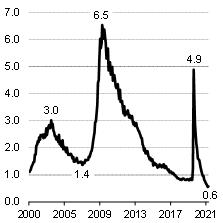
The shrinking pool of available workers has resulted in a significant tightening of the labour market in the United States. The number of unemployed persons per vacant position reached 0.6 in January 2022, a historic low.
Against this background, employment is expected to grow by 5.1 million in 2022 and 2.2 million in 2023. The unemployment rate is expected to be 3.7% in 2022 and 3.5% in 2023 (5.4% in 2021).
| CHART H.30 Number of jobs in the United States | CHART H.31 Ratio of unemployed individuals to vacant positions in the United States | |
| (millions) | (units) | |
|
| |
| Source: | IHS Markit. | Sources: | IHS Markit and Ministère des Finances du Québec. |
| Budget 2022-2023 | |
| H.38 | Budget Plan |
The recovery of the U.S. labour market limited by a shrinking labour pool
The labour force participation rate in the United States has been slowly recovering since the end of the first wave of COVID-19, in the spring of 2020, despite a strong labour market with vacancies near historic highs.
The labour force participation rate stood at 61.8% in the fourth quarter of 2021, 1.4 percentage points below the pre-pandemic level in the fourth quarter of 2019 (63.2%).
| – | This stems from the fact that several individuals left the labour force during the pandemic, resulting in a 1.5% decrease in the labour force during this period. Decreases were observed in all major age groups, with the largest decrease among individuals aged 55 and over (−2.0%). |
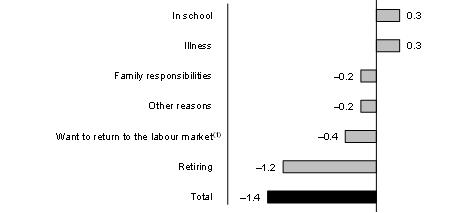
Several factors help explain the decline in the available labour pool in the United States. According to the Federal Reserve Bank of Atlanta, the main reason is the accelerating pace of retirements.
| – | The Federal Reserve Bank of Atlanta estimates that in the fourth quarter of 2021, 1.8 million individuals had retired prematurely compared to the historical trend. |
To a lesser extent, concerns about COVID-19, the fulfillment of family responsibilities, and rising household wealth are other factors that have contributed to the decline in the labour force participation rate relative to its pre-pandemic level.
| Contribution to the change in the U.S. labour force participation rate |
| (percentage points) |
|
|
Note: Contribution to the decline in the labour force participation rate between the fourth quarter of 2019 and the fourth quarter of 2021. (1) This category represents individuals who are not in the labour force, but who want to find a job. Source: Federal Reserve Bank of Atlanta. |
| The Québec Economy: | |
| Recent Developments and Outlook for 2022 and 2023 | H.39 |
| 4. | The global economic situation |
| ☐ | Global growth continues at a moderate pace |
The global economy experienced the largest post-recession recovery in 80 years in 2021, according to the World Bank. The recovery has been supported by, among other things, vaccination and the easing of public health measures, favorable financial conditions, and substantial fiscal support.
Global economic growth is expected to slow from 5.8% in 2021 to 3.9% in 2022 and 3.6% in 2023, remaining high despite some moderation.
| — | This is due to continued growth in the major advanced economies, including the United States and the euro area, as well as in emerging and developing economies, particularly China. |
| — | The easing of restrictions on the mobility of people and of supply chain pressures will support growth. |
However, some factors are expected to affect the global economic outlook.
| — | These include the withdrawal of fiscal stimulus, the tightening of monetary policy in some countries to counter the sharp rise in inflation, as well as Ukraine’s invasion by Russia. |
| — | Other factors include a possible transition from the COVID-19 pandemic to the endemic phase of the disease and the transition to a low-carbon economy. |
| CHART H.32 Global economic growth |
| (real GDP in purchasing power parity, percentage change) |
|
| Sources: International Monetary Fund, IHS Markit, Datastream, Bloomberg, Eurostat and Ministère des Finances du Québec. |
| Budget 2022-2023 | |
| H.40 | Budget Plan |
TABLE H.12 Outlook for global economic growth |
| (real GDP, percentage change) | ||||||||||||||||
| Weight(1) | 2021 | 2022 | 2023 | |||||||||||||
| World(2) | 100.0 | 5.8 | 3.9 | 3.6 | ||||||||||||
| Advanced economies(2) | 42.4 | 5.1 | 3.4 | 2.3 | ||||||||||||
| Québec | 0.3 | 6.3 | 2.7 | 2.0 | ||||||||||||
| Canada | 1.4 | 4.6 | 3.8 | 2.6 | ||||||||||||
| United States | 15.8 | 5.7 | 3.6 | 2.4 | ||||||||||||
| Euro area | 12.1 | 5.4 | 3.0 | 2.3 | ||||||||||||
| – Germany | 3.4 | 2.9 | 2.7 | 2.3 | ||||||||||||
| – France | 2.3 | 7.0 | 3.2 | 1.9 | ||||||||||||
| – Italy | 1.9 | 6.6 | 3.2 | 1.9 | ||||||||||||
| United Kingdom | 2.3 | 7.5 | 3.9 | 1.8 | ||||||||||||
| Japan | 4.0 | 1.6 | 3.0 | 1.4 | ||||||||||||
| Emerging and developing economies(2) | 57.6 | 6.3 | 4.2 | 4.6 | ||||||||||||
| China | 18.3 | 8.1 | 5.0 | 5.1 | ||||||||||||
| India(3) | 6.8 | 8.9 | 7.7 | 6.4 | ||||||||||||
| (1) | Weight in global GDP in 2020. |
| (2) | Data based on purchasing power parity. |
| (3) | For the financial year (April 1 to March 31). |
| Sources: | Institut de la statistique du Québec, Statistics Canada, International Monetary Fund, IHS Markit, Datastream Bloomberg, Eurostat and Ministère des Finances du Québec. |
| The Québec Economy: | |
| Recent Developments and Outlook for 2022 and 2023 | H.41 |
| ☐ | Russia’s invasion of Ukraine and its effect on the global economy |
Russia’s decision to invade Ukraine on February 24 and the resulting economic sanctions have led to turbulence in international financial markets, which may continue. It could also limit the outlook for global economic growth.
However, the effect of this conflict is expected to be quite limited for global economic growth due to the fact that Russia and Ukraine represent a small share of the global economy (3.5% of global GDP).
| n | An increase in inflation and commodity prices |
The world economy, and especially the European economy, will be affected by the conflict fallout, in particular through an increase in inflation. This is because:
| — | Russia is the world’s third largest producer of oil (about 12% of production) and the second largest producer of natural gas (about 17%); |
| — | Almost 40% of the European Union’s natural gas needs and 25% of its oil needs are met by Russia. |
Moreover, the combined share of Russian and Ukrainian wheat exports is nearly 30% of the world’s total wheat exports. Russia is also a major producer of fertilizers, including potash (second only to Canada, with approximatively 18% of global production).
| — | Russia also produces industrial metals, such as aluminum and nickel, which are important for the industrial sector, including the automobile industry. |
Disruptions in the supply of these products could further increase food and commodity prices.
| CHART H.33 Weight of Russia and Ukraine in world GDP and merchandise trade | CHART H.34 Russia’s share of world production of selected commodities | |
| (per cent, 2020) | (per cent, 2020) | |
|
| |
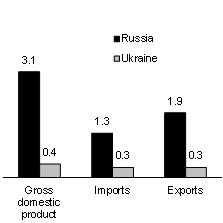
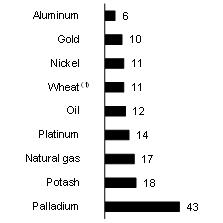
| Sources: | International Monetary Fund, World Trade Organization and Ministère des Finances du Québec. | (1) This is the period from July 2020 to June 2021. Sources: USGS, U.S. Department of Agriculture and BP. | ||
| Budget 2022-2023 | |
| H.42 | Budget Plan |
| ☐ | The pandemic remains an issue for a third year |
The pandemic is an issue for the global economy for a third consecutive year. The discovery of the Omicron variant in November 2021 was followed by a sharp increase in transmission cases of COVID-19, as this variant is more contagious than the Delta variant.
| — | By early January 2022, new weekly transmission cases reported worldwide had increased sharply from previous weeks, and the Omicron variant had quickly become dominant. |
After the discovery of Omicron, some governments tightened their public health restrictions and closed their borders again.
| — | The measures impacted economic activity as well as consumers’ and businesses’ confidence in the last quarter of 2021 and early 2022, in an environment already characterized by a sharp rise in inflation and supply chain tensions. |
| — | Among other things, in January 2022, the global composite purchasing managers’ index hit a low since July 2020, signaling moderate growth in manufacturing activity, but especially in the services sector. |
| — | In addition, the World Trade Organization’s Goods Trade Barometer of December indicates a loss of momentum in trade, following a significant rebound last year. |
However, the economic impacts have been more moderate than in 2020 and the continued lockdown lifting process that began in late January 2022 should help support economic activity.
| CHART H.35 Confirmed new weekly cases | CHART H.36 Global purchasing managers’ index | |
| (millions, as at March 10, 2022) | (index, 50+ = expansion zone) | |
|
| |
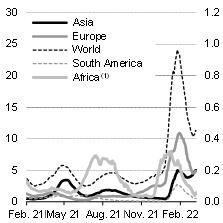
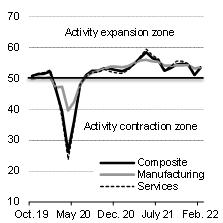
| (1) Data are shown on the right axis. | Source: | Bloomberg. | ||
| Sources: | Our World in Data and Ministère des Finances du Québec. | |||
| The Québec Economy: | |
| Recent Developments and Outlook for 2022 and 2023 | H.43 |
A movement to ease public health restrictions
The Omicron variant, being more contagious, caused a very high number of COVID-19 transmission cases in late 2021 and early 2022 and led several countries to tighten their public health measures. Nevertheless, some governments announced in early 2022 an easing of public health restrictions. For example:
| – | England and Denmark lifted most public health measures such as face masks and vaccine passports as of January 27 and February 1, respectively; |
| – | Germany, France, Belgium, Spain, Sweden and Norway, among others, announced in February the lifting of some measures; |
| – | several countries, including Australia and Japan, have recently announced relaxations in the conditions of access to their borders. |
These countries justify the lifting of measures by a high vaccination rate, a certain immunity due to a high number of COVID-19 cases in recent months, and the lesser degree of severity of the Omicron variant.
The acute phase of the pandemic could end in 2022, according to the WHO
Dr. Tedros Adhanom Ghebreyesus, Director General of the World Health Organization (WHO), said in late January that if countries work together, it will be possible to end, in 2022, the acute phase of the pandemic as a global health emergency, the WHO’s highest alert level.
| – | To achieve this, the goal of vaccinating 70% of each country’s population by mid-2022 by accelerating vaccination in low-income countries remains important. |
However, according to experts, the risk of a new variant remains very real given the wide circulation of the virus. Therefore, new public health measures may again be required at some point. However, these measures should be more targeted than at the beginning of the public health crisis.
| Containment indexes | Vaccination rate | |
(index, 0 indicating no restrictions and 100 indicating tight restrictions) | (percentage of population vaccinated according to the original vaccination protocol(1)) | |
|
| |
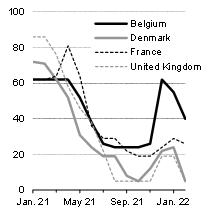
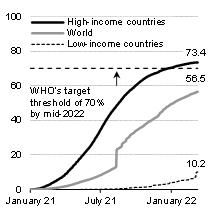
| Note: | Data cover the period January 2021 to March 2022. | (1) | This is two doses for most vaccines, and one or three doses for some manufacturers. | |
| Source: | IHS Markit. | Source: | Our World in Data. |
| Budget 2022-2023 | |
| H.44 | Budget Plan |
| ☐ | Widespread economic growth |
In advanced economies, real GDP is expected to grow by 3.4% in 2022 and 2.3% in 2023, following an increase of 5.1% in 2021. Economic growth should be supported by the improved public health situation. However, in early 2022, the impact of the pandemic and the disruptions in supply chains, as well as the labour shortage and Russia’s invasion of Ukraine, could have a dampening effect.
| — | As in the United States, growth should continue in the euro area. It will be supported, in particular, by favourable monetary conditions. |
| — | Japan is one of the few countries where growth is expected to accelerate in 2022, after having experienced weak growth in 2021. This will be supported, in particular, by favourable fiscal and monetary measures. |
In emerging and developing economies, real GDP growth is expected to slow from 6.3% in 2021 to 4.2% in 2022 and to 4.6% in 2023.
| — | High inflation, owing among other things to high energy and food prices, rising policy rates, delayed vaccination, and limited fiscal support are expected to dampen expansion in several countries. |
| — | In China, growth will be sustained by support measures, but will be constrained by the slowdown in real estate, weaker consumption due to the population’s caution in the face of the pandemic, and a moderation in exports. |
Growth is expected to move toward potential in several countries as monetary and fiscal policies are less expansionary than in 2020 and 2021 and the economic recovery period ends.
CHART H.37 Growth in advanced and emerging economies | CHART H.38 Policy rate for emerging and developing economies | |
| (real GDP, percentage change) | (per cent) | |
|
| |
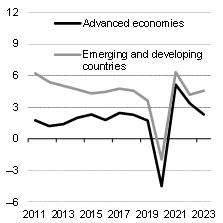
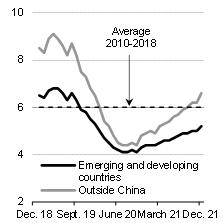
| Sources: | International Monetary Fund, IHS Markit, Datastream, Bloomberg, Eurostat and Ministère des Finances du Québec. | Note: Source: | Weighted policy rate for 22 countries. World Bank. |
| The Québec Economy: | |
| Recent Developments and Outlook for 2022 and 2023 | H.45 |
Changes in supply chain pressures
Global supply chains experienced significant disruptions in 2021. These were caused, in particular, by the effects of the pandemic on the supply of goods, including semiconductors, and by strong demand that was significantly boosted by economic stimulus packages.
The impact on the global economy caused by shortages and higher prices for imported goods was significant. The International Monetary Fund (IMF) estimates that in 2021, supply disruptions subtracted between 0.5 and 1.0 percentage point from global economic growth and raised global inflation excluding food and energy by 1.0 percentage point.
Signs of easing pressure on supply chains
Pressures on supply chains are still very high. In December, the New York Federal Reserve’s new Global Supply Chain Pressure Index remained near its all-time high, reached in October.
| – | This indicator, based on 27 variables, measures global supply chain disruptions. |
| – | Moreover, according to IHS Markit, average delivery times for manufacturing suppliers remained high for the 31st consecutive month in February, but the pace of increase has hit a low point since January 2021. |
| – | In addition, the number of containers on the Los Angeles docks was down more than 50% in mid-February compared to the end of October, and global transportation costs have been declining since peaking at the end of the third quarter of 2021. |
| Impacts of supply chain pressures | Global Supply Chain Pressure Index | |
| (percentage points, in 2021) | (percentage points, last observation in December) | |
| 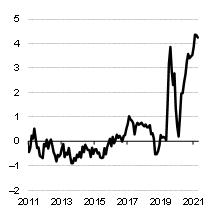
| |
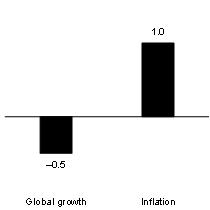
| Source: | International Monetary Fund. | Note: | Difference in standard deviations from the historical average. | |
| Source: | New York Federal Reserve. |
| Budget 2022-2023 | |
| H.46 | Budget Plan |
Changes in supply chain pressures (cont.)
| – | In Europe, delivery times have decreased from their peak in early 2021, according to the European Commission, and the problem of semiconductor availability for the automobile sector is less severe. |
Several measures have been adopted to ease pressures on supply chains. However, the effects of some of these measures may take time.
| – | In the United States, operating hours at the ports of Los Angeles and Long Beach have been extended to allow trucks to pick up and return cInflation will remain high in 2022 before moderatingontainers. This is intended to improve the movement of goods and reduce delays at the ports. |
| – | In addition, in October, U.S. businesses agreed to extend their hours of operation. Some have chartered ships for their exclusive use and sought to diversify their suppliers. |
| – | Businesses in the automobile sector are looking to keep more parts in stock to avoid production shutdowns. |
| – | In a more global effort, leaders from the European Union and 14 countries joined the United States at a summit in October to find solutions to address immediate and future supply chain issues. |
The outlook is uncertain
An easing of supply chain tensions is expected by many experts in the coming quarters.
| – | Maersk, the world’s second largest container carrier, expects the situation to normalize and transport prices to fall in the second half of 2022. The lifting of public health restrictions and the decline in cases should contribute to this situation. |
| – | In addition, the European Commission assumes that bottlenecks in the transportation and metals sectors should gradually ease during 2022 in Europe. |
| – | Also, weaker demand growth in the near term may help resolve supply bottlenecks somewhat sooner than expected. |
However, a reversal of the situation is not excluded due to Russia’s invasion of Ukraine, which could delay the reduction of tensions in the supply chains.
Also, the pandemic is still considered a significant risk to supply chain prospects.
| – | The IMF warns that the Omicron variant could further limit port efficiency, exacerbate transportation problems, and overall extend supply disruptions until 2023. |
| The Québec Economy: | |
| Recent Developments and Outlook for 2022 and 2023 | H.47 |
Inflation will remain high in 2022 before moderating
Global inflation had fallen sharply in the few decades prior to the pandemic, before showing an almost universal rebound in 2021. Many analysts expect it to remain high in 2022, but to begin to slow during the year.
Inflation at its highest in over 20 years
For 2021 as a whole, growth in the Consumer Price Index (CPI) reached 4.0% in the area of the Organisation for Economic Co-operation and Development (OECD), the highest annual inflation rate since 2000. Inflation is above the central bank target mainly in the United States, Canada and several European countries.
| – | This is also the case in large emerging economies such as Brazil, Mexico, Russia and Argentina, where central banks have raised their policy rates. |
The factors explaining this phenomenon vary according to the reality of each country. Overall, the factors identified include the rebound in global demand and economic activity, disruptions in supply chains, labour shortages, rising commodity prices and higher transportation costs.
| – | The IMF attributes more than half of the rise in inflation to high energy prices which, according to the OECD, jumped 15.4% in the OECD area in 2021, the highest since 1981. |
Gradual easing of price pressures in the coming quarters
Many forecasters expect inflation to remain high in 2022 due, in particular, to the impacts of the Omicron variant on supply chains early in the year as well as high energy prices.
| Consumer Price Index | Food and energy prices | |
| (percentage change, 2000-2021) | (annual change, in per cent, 2021) | |
|
| |
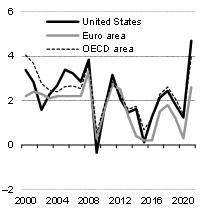
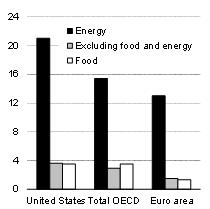
| Source: | Organisation for Economic Co-operation and Development. | Source: | Organisation for Economic Co-operation and Development. |
| Budget 2022-2023 | |
| H.48 | Budget Plan |
Inflation will remain high in 2022 before moderating (cont.)
Several forecasters expect price pressures to ease during the year and into 2023.
| – | According to IHS Markit, inflation will be limited, among other things, by rising interest rates, as well as by the slowdown in global demand and the Chinese real estate sector. |
| – | In addition, the easing of supply chain disruptions and lower energy and food prices will limit overall inflation, according to the IMF. |
However, there are several risks to the outlook for inflation, including labour shortages, which could lead to a sharp rise in wages.
| – | The IMF observes that it is possible that the persistent rise in the cost of living and the tightening of labour markets will force workers to demand higher wages, which businesses will accept. The resulting increase in labour costs would then raise prices. |
| – | In addition, Russia’s invasion of Ukraine and its effects on energy and food prices could delay the reduction of inflationary pressures. |
| The Québec Economy: | |
| Recent Developments and Outlook for 2022 and 2023 | H.49 |
| 5. | Developments in financial markets |
| ☐ | Central banks’ tone shift on inflation fuels volatility in financial markets |
Several central banks hardened their tone at the end of 2021, saying that higher interest rates would soon be needed to counter high inflation. This change from last fall has caused turbulence in global financial markets in recent months.
| — | Market participants have significantly raised their expectations about the pace of monetary policy tightening, particularly in the United States. This has resulted in a sharp rise in bond yields. |
| — | However, yields declined temporarily following the invasion of Ukraine due to increased demand for safe havens. |
| — | In addition, the prices of certain risk assets have fallen as stock markets have generally posted negative returns since the beginning of the year, after an exceptional year in 2021. |
Meanwhile, energy prices, particularly oil prices, have risen sharply in recent months, which may further fuel inflation and increase pressure on central banks, whose mandate is to keep inflation low and stable.
| CHART H.39 Number of U.S. policy rate hikes priced by markets by December 2022 | CHART H.40 Yield on 10-year federal bonds | |
| (25 basis points per increase) | (per cent) | |
|
| |
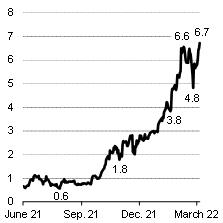
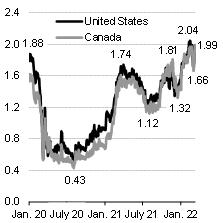
| Note: | Implied financial market expectations based on federal funds futures. Latest data as at March 11, 2022. | Note: Sources: | Latest data as at March 11, 2022. Statistics Canada and Bloomberg. | |
| Source: | Bloomberg. |
| Budget 2022-2023 | |
| H.50 | Budget Plan |
| ☐ | Bank of Canada – Numerous policy rate hikes expected in 2022 and 2023 |
In late January, the Bank of Canada said that slack in the Canadian economy had now been absorbed and that it was therefore removing exceptional forward guidance on its policy interest rate. At that time, the Bank of Canada said it expected to have to raise interest rates.
As a result, on March 2, the Bank of Canada raised its policy rate by 25 basis points for the first time since October 2018, to 0.50%. It had been at the effective lower bound of 0.25% since the start of the pandemic.
| — | Against a backdrop of strong inflationary pressures, a total of four policy rate hikes are expected in Canada in 2022. In addition, the Bank of Canada will begin to reduce the size of its balance sheet in the coming months. |
| ☐ | U.S. Federal Reserve – A major shift that should lead to multiple rate hikes |
The U.S. Federal Reserve has had to make significant adjustments to its stance since the end of 2021 in response to the sharp acceleration in inflation in the United States.
| — | The Federal Reserve therefore ended its quantitative easing program in early March. It also signaled that it will raise its policy rate several times this year. |
Continued tightness in the labour market and high inflation will result in faster monetary tightening than previously expected. As a result, four 25-basis-point increases in the policy rate are expected in 2022, in addition to the start of the Federal Reserve’s balance sheet reduction.
| CHART H.41 Policy interest rates in Canada and the United States |
| (overnight rate target and federal fund target rate,(1) per cent) |
|
(1) The federal funds target rate is the midpoint of the target range. Sources: Statistics Canada, Bloomberg and Ministère des Finances du Québec.
|
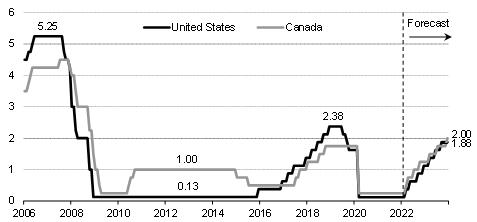
| The Québec Economy: | |
| Recent Developments and Outlook for 2022 and 2023 | H.51 |
Towards a reduction in the size of central banks’ balance sheets
|
In addition to lowering their policy rates to the lower bound in March 2020, the Bank of Canada and the U.S. Federal Reserve have implemented asset purchase programs, including government bonds (quantitative easing).
| – | The main objective of this monetary instrument is to lower long-term interest rates in order to stimulate household and business demand for credit. |
Strong growth in the size of the central banks’ balance sheets
The size of the Bank of Canada’s balance sheet has more than quadrupled since March 2020, to nearly $500 billion, largely due to purchases of federal bonds. The growth in assets is equivalent to 15% of Canadian GDP.
| – | Various programs to support the functioning of the markets ended in the spring of 2021. The size of the balance sheet has been kept relatively stable since last fall, as the Bank only purchases bonds to replace maturing ones, which is the reinvestment phase. |
In turn, the size of the U.S. Federal Reserve’s balance sheet has more than doubled since March 2020 (an increase equivalent to 20% of U.S. GDP), to nearly US$9 trillion. The Federal Reserve began slowing the pace of purchases last November and ended the bond-buying program in early March.
The impact of shrinking balance sheets will be in addition to rate hikes
The Bank of Canada and the Federal Reserve have indicated that they will begin to reduce the size of their balance sheets in the coming months. This process is expected to be gradual as they stop replacing maturing bonds.
| – | This form of monetary tightening will be in addition to the raising of policy rates and will put upward pressure on long-term interest rates. Central banks will therefore need to be cautious and properly assess the effects of tighter monetary policy on the real economy. |
| Bank of Canada and U.S. Federal Reserve balance sheet size |
| (billions of dollars and billions of U.S. dollars) |
|
| Source: Bloomberg. |
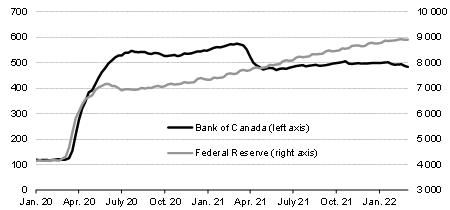
| Budget 2022-2023 | |
| H.52 | Budget Plan |
| ☐ | Bond yields will continue to rise, but at a more gradual pace |
Bond yields have seen sharp increases in most advanced economies since late 2021. In Canada, the 10-year federal bond yield reached a more than three-year high in February, at nearly 2.0%, before temporarily declining due to the war in Ukraine.
| — | The recalibration of financial market expectations regarding the pace of policy rate hikes has supported bond yields in recent months. |
Bond yields are expected to continue to rise in the coming quarters in the advanced economies, but at a more gradual pace.
| — | On the one hand, higher policy rates will support this increase. Shorter-term rates will rise more than longer-term rates, resulting in a flattening of the yield curves. |
| — | On the other hand, the beginning of the reduction in the size of the balance sheet of some central banks, including the Bank of Canada and the U.S. Federal Reserve, will also put some upward pressure on long-term rates. |
| ☐ | The Canadian dollar should continue to fluctuate near recent levels |
The Canadian dollar has generally fluctuated within a range of 78 to 80 U.S. cents since the beginning of 2022.
| — | The stimulative effect of rising commodity prices, particularly oil, has been offset by the tightening of Canadian and U.S. interest rate spreads and the general appreciation of the U.S. dollar. |
The Canadian dollar is expected to continue to move near recent levels in the coming quarters. On the one hand, the expected rebound in Canadian growth after the fifth wave of the pandemic should support the Canadian currency. On the other hand, the expected decline in oil prices should limit its advance.
| TABLE H.13 Canadian financial markets |
| (average annual percentage rate, unless otherwise indicated, end-of-year data in brackets) |
|
| 2021 | 2022 | 2023 | ||||||||||
| Overnight rate target | 0.3 (0.3 | ) | 0.8 (1.3 | ) | 1.6 (2.0 | ) | ||||||
| 3-month Treasury bill | 0.1 (0.2 | ) | 0.9 (1.4 | ) | 1.7 (1.9 | ) | ||||||
| 10-year bond | 1.4 (1.5 | ) | 2.0 (2.2 | ) | 2.3 (2.3 | ) | ||||||
| Canadian dollar (in U.S. cents) | 79.7 (78.5 | ) | 80.0 (80.3 | ) | 80.1 (80.0 | ) | ||||||
| U.S. dollar (in Canadian dollars) | 1.25 (1.27 | ) | 1.25 (1.25 | ) | 1.25 (1.25 | ) |
| Sources: Statistics Canada, Bloomberg and Ministère des Finances du Québec. |
| The Québec Economy: | |
| Recent Developments and Outlook for 2022 and 2023 | H.53 |
| ☐ | A sharp rise in energy prices |
Oil prices have risen sharply since the end of 2021, as the price of WTI rose from US$71 per barrel in December to US$112 on average in early March, an increase of nearly 60%. This rise was driven by:
| — | the easing of concerns about the effect of the Omicron variant on global oil demand and low global inventory levels; |
| — | the Organization of the Petroleum Exporting Countries (OPEC) and its partners maintaining their strategy of moderate production increases; |
| — | the invasion of Ukraine by Russia and the related tensions, with prices currently carrying a significant geopolitical risk premium. |
Despite strong global demand, oil prices are expected to begin to decline in the coming quarters, due mainly to the expected increase in non-OPEC production. This will contribute to a surplus in global oil supply this year.
| — | Stronger-than-expected growth in global demand, worsening geopolitical tensions or a stronger increase in supply are factors that could lead to a different price development. |
Also, natural gas prices have remained high in recent months, particularly in Europe, where prices reached record levels in March 2022. Prices continue to be supported by strong demand and supply concerns due to the war in Ukraine.
| CHART H.42 Change in oil prices | CHART H.43 Change in natural gas prices | |
(U.S. dollars per barrel) | (U.S. dollars per MMBtu in the United States and euros per MWh in Europe) | |
|
| |
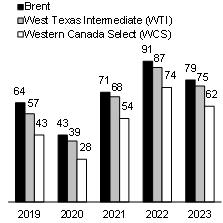
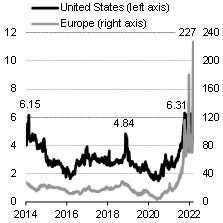
| Sources: | Bloomberg and Ministère des Finances du Québec. | Note: | The U.S. price is for delivery to the Henry Hub in Louisiana and the European price is for delivery to the Netherlands Title Transfer Facility (TTF). | |
| Source: | Bloomberg. |
| Budget 2022-2023 | |
| H.54 | Budget Plan |
A decline in investment in the oil and gas sector
|
After peaking in 2014 at US$779 billion, global upstream oil and gas investment has been on a downward trend in recent years. This decline is primarily due to lower oil and natural gas prices in the last few years, and strong growth in clean and renewable energy investments.
| – | In 2020, oil and gas investments were down 32% from 2019 levels, to US$330 billion. However, they are expected to recover slightly in 2021. |
The sharp rise in prices as well as the recent energy crisis in Europe has fueled concerns about the global supply outlook for these fuels and the supply risks for the next few years.
| – | This raises the question of the need to maintain an adequate level of investment in fossil fuel production in the coming years to support energy markets and mitigate price volatility. |
Besides, a joint report by the International Energy Forum and IHS Markit argues that upstream oil and gas investments are expected to grow in the coming years to near pre-pandemic levels. They are expected to reach approximately $525 billion in 2030 to ensure balance in the markets despite the slowdown in global demand.
| – | In addition, the Organization of the Petroleum Exporting Countries (OPEC) has estimated the cumulative investment needs for the oil sector between 2021 and 2045 at $11.8 trillion to avoid the emergence of a supply deficit and energy security risks. |
Moreover, oil and gas investment decisions will continue to be influenced in the coming years by increased uncertainty related to the outlook for global demand growth, price trends, and the speed of the energy transition.
| Global oil and gas investment |
| (billions of U.S. dollars, in nominal terms) |
|
| Source: International Energy Agency. |
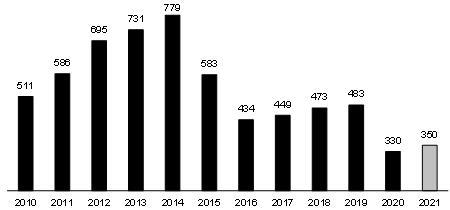
| The Québec Economy: | |
| Recent Developments and Outlook for 2022 and 2023 | H.55 |
| 6. | Main risks that may influence the forecast scenario |
The economic and financial forecasts in Québec’s Budget Plan – March 2022 are based on several assumptions. Some of them are associated with risks that could affect the global economic and financial scenario and the anticipated developments in the Québec economy.
| — | The pandemic continues to represent a big source of uncertainty for economic and financial forecasts. |
| — | Moreover, other risks have become more important and could simultaneously disrupt the evolution of the economy. |
| ☐ | The war in Ukraine |
The global context is currently characterized by the presence of geopolitical tensions. Among these, the evolution of the war in Ukraine will certainly have repercussions on the evolution of the global economy.
| — | Energy prices, financial markets, economic growth and supply chains are likely to be impacted. |
| — | However, the extent of these potential impacts remains difficult to quantify. |
The economic and financial scenario is based on the premise that the current tensions will continue but without major spillover effects.
However, should the war spread and intensify further, the global economy could be significantly affected by its consequences.
| ☐ | The evolution of the pandemic on a global scale and the progress of the vaccination campaign |
The global outlook could be revised upward or downward as the pandemic evolves and in relation to progress with the vaccination campaign.
| — | The emergence of new vaccine-resistant variants could slow economic recovery, forcing the reintroduction of restrictive public health measures both in Québec and globally. |
| — | Greater difficulty in controlling the pandemic could trigger greater caution on the part of households and businesses. They could decide to postpone their consumption and investment expenditures. |
| Budget 2022-2023 | |
| H.56 | Budget Plan |
| — | Global economic growth could also be weaker in the case of slower progress than forecast with the vaccination campaign. |
| — | According to the WHO, it will be necessary to vaccinate 70% of the population in each country worldwide to control the pandemic, a threshold that is far from being reached at present in developing countries. |
| — | On the other hand, the development of new treatments, the efficient and widespread rollout of the vaccines as well as increased confidence in the economic outlook represent positive developments for global growth. |
| ☐ | High inflation that persists longer than expected |
The rise in inflation is due, among other things, to higher energy and food prices and should gradually subside in the coming quarters.
| — | However, persistent inflationary pressures for a longer period than expected, due in part to a sharp rise in inflation expectations and wages, could weigh on the economic outlook. |
| ☐ | Monetary tightening at a different pace than expected |
More-persistent-than-expected high inflation is leading several central banks to tighten monetary policy earlier and at a faster pace than previously expected. For example, a total of seven interest rate hikes are expected in Canada and the United States by the end of 2023, with the start of balance sheet reduction during 2022.
| — | This pace of monetary tightening has not been seen in Canada for over 15 years and, in an environment of high household debt, could have significant negative effects on those sectors of the economy that are sensitive to interest rates. |
| — | As such, central banks, including the Bank of Canada, will need to be cautious in the process of tightening monetary policy, and carefully assess its effects on economic growth. |
A faster-than-expected slowdown in inflation or economic growth in 2022 could cause central banks to slow the pace of tightening.
Conversely, more persistent inflationary pressures than expected could cause central banks to accelerate the pace of interest rate hikes or balance sheet reductions, which could have a significant negative impact on economic growth globally as well as in Québec and Canada.
| The Québec Economy: | |
| Recent Developments and Outlook for 2022 and 2023 | H.57 |
| ☐ | Continued supply chain disruptions |
Increased demand in a context of limited supply due, in particular, to production stoppages has led to significant disruptions in global supply chains in 2021. Shortages have been experienced in several inputs, including semiconductors.
In addition, logistics problems in the global maritime shipping industry have caused significant delivery delays.
| — | These pressures have resulted in significant increases in material and transportation costs. |
Pressures on production lines are expected to gradually ease in the coming quarters and delivery times are expected to decrease. Continued pressure, however, could limit the pace of the global economic recovery and put upward pressure on prices.
| ☐ | Labour shortage |
Like many developed economies, Québec is faced with an aging population, which is resulting in a shrinking pool of potential workers. For some years now, the labour market has had to deal with the problem of labour availability.
The labour shortage may affect economic growth more than anticipated. In this context, the participation of all workers is needed to meet labour needs.
| ☐ | A different evolution of oil prices |
Oil prices have risen sharply since the end of 2021 against a backdrop of geopolitical tensions and a global oil supply that is insufficient to meet demand. The latter has increased with the easing of public health measures around the world.
| — | Oil prices are expected to begin to decline over the next few quarters, as the expected increase in production should gradually bring the market back into surplus. |
| — | However, there remains a high level of uncertainty regarding the outlook for global oil demand and supply growth, which could result in a different price development than previously anticipated. |
| — | In particular, oil prices could remain at higher-than-expected levels, which would have mixed effects on the Québec and Canadian economies. |
| — | Moreover, geopolitical tensions could have a positive or negative impact on the situation, depending on how they develop. These include the Iranian nuclear negotiations and the war in Ukraine. |
| Budget 2022-2023 | |
| H.58 | Budget Plan |
| ☐ | A faster and more pronounced adjustment in the real estate sector in Québec and Canada |
The real estate market boom in Québec and Canada has increased the risk of an overvaluation of housing prices in some cities.
| — | The supply of available properties has proven to be insufficient to meet the surge in demand. This imbalance has put upward pressure on prices, which are reaching record highs. |
| — | However, the deterioration in affordability in the last few months appears to have tempered demand. |
| — | There could be a correction in real estate prices in reaction to an increase in mortgage rates or a demand that is running out of steam. That could spur a faster slowdown than forecast in residential investment and curb economic growth as a result. |
| ☐ | A sharper-than-expected slowdown in the Chinese economy |
The Chinese economy may grow less than expected. China’s growth has been held back by the pandemic, power outages, supply chain disruptions and anti-pollution measures, among other factors. These factors limited industrial activity, among other things, while public health measures contributed to curbing consumer spending.
| — | In addition, activity in the real estate sector moderated as new regulations were put in place. |
Given China’s weight in the global economy, weaker-than-expected growth in 2022 or a sharper-than-expected slowdown thereafter would have significant implications for both its major trading partners and the global economy.
| The Québec Economy: | |
| Recent Developments and Outlook for 2022 and 2023 | H.59 |