Exhibit 99.15
Section I
| QuÉbec’s financial situation |
| Summary | I.2 |
| 1. Québec’s budgetary situation | I.6 |
| 1.1 Recent developments in the budgetary situation | I.8 |
| 1.2 Detailed adjustments in 2021-2022 | I.17 |
| 1.3 Sound management of public finances | I.25 |
| 2. Revenue and expenditure forecasts | I.28 |
| 2.1 Change in revenue | I.29 |
| 2.1.1 Own-source revenue excluding revenue from government enterprises | I.30 |
| 2.1.2 Revenue from government enterprises | I.35 |
| 2.1.3 Federal transfers | I.37 |
| 2.2 Change in expenditure | I.40 |
| 2.2.1 Portfolio expenditures | I.42 |
| 2.2.2 Debt service | I.51 |
| 3. Public infrastructure investments | I.53 |
| Appendix 1: Forecast expenditure by portfolio | I.58 |
| Appendix 2: Supplementary information | I.60 |
I.1

Summary
In Budget 2022-2023, the government reiterates its policy directions and presents Québec’s budgetary situation. This section reports on recent developments in Québec’s financial situation for 2021-2022 and provides a picture of the budgetary outlook up to 2026-2027.
Since the publication of Budget 2021-2022, Québec’s financial situation has significantly improved, reflecting stronger growth in economic activity and initiatives that have been implemented to help Québec control the pandemic better and return to growth.
The financial framework of Budget 2022-2023 shows favourable adjustments of $12.3 billion in 2021-2022, $9.6 billion in 2022-2023 and $9.5 billion in 2023-2024.
| — | These adjustments are mainly due to an increase in own-source revenue of $9.5 billion on average, driven by a stronger-than-expected rebound in the economy, and an increase in federal transfers of $2.7 billion on average. |
These improvements allow:
| — | funding for initiatives totalling $6.3 billion in 2022-2023,1 including $3.8 billion announced in Budget 2022-2023 for: |
| — | coping with the rising cost of living, |
| — | restoring the health care system, |
| — | investing in education and higher education, |
| — | stimulating economic growth, |
| — | continuing efforts relating to the environment, |
| — | strengthening community action and supporting communities; |
| — | stable funding for the government’s main priorities: |
| — | spending on health and social services will grow by 6.3% in 2022-2023 and 4.5% in 2023-2024, |
| — | spending on education will grow by 5.4% in 2022-2023 and 4.0% in 2023-2024, |
| — | spending on higher education will grow by 13.1% in 2022-2023 and 3.7% in 2023-2024; |
| — | a budgetary deficit of $7.4 billion in 2021-2022, an improvement of $4.9 billion in the current year compared to March 2021, as well as a deficit of $6.5 billion in 2022-2023; |
| — | a reduction of the structural deficit to $2.8 billion in 2026-2027, representing a reduction of $3.8 billion since Budget 2021-2022. |
| 1 | The initiatives include those announced in the fall 2021 update totalling $2.5 billion in 2022-2023. |
| Québec’s Financial | |
| Situation | I.2 |
| ☐ | Multi-year financial framework |
Budget 2022-2023 presents the revenue and expenditure outlook for the Québec government until 2026-2027.
Revenue amounts to $138.5 billion in 2022-2023, with growth of 2.2%. It will reach 2.9% in 2023-2024.
| — | From 2022-2023 to 2026-2027, the annual growth in revenue will reach 2.9% on average. |
Expenditure2 amounts to $136.6 billion in 2022-2023, with growth of 4.8%. It will reach 2.9% in 2023-2024.
| — | From 2022-2023 to 2026-2027, the annual growth in expenditure will be 3.2% on average. |
COVID-19 support and recovery measures total $2.4 billion in 2022-2023.
| — | The cost of these temporary pandemic measures fades as of 2023-2024. |
The financial framework includes provisions for economic risks and other support and recovery measures totalling $2.5 billion in 2022-2023 and $1.5 billion per year as of 2023-2024. These provisions are necessary to protect against risks related to the evolution of the pandemic, which could still impact the economic outlook, as well as the emergence of geopolitical tensions related to the Russian invasion of Ukraine.
The budgetary balance, within the meaning of public accounts, shows a deficit of $3.0 billion in 2022-2023 and a surplus as of 2023-2024.
Considering the requirements of the Balanced Budget Act, the budgetary balance presents a deficit of $6.5 billion in 2022-2023 and a structural deficit of $2.8 billion in 2026-2027.
| 2 | COVID-19 support and recovery measures are not included in these expenditures. |
| Budget 2022-2023 | |
| I.3 | Budget Plan |
TABLE I.1
Multi-year financial framework
(millions of dollars)
| 2021-2022 | 2022-2023 | 2023-2024 | 2024-2025 | 2025-2026 | 2026-2027 | AAGR(1) | ||||||||||||||||||||||
| Revenue | ||||||||||||||||||||||||||||
| Personal income tax | 39 094 | 41 147 | 42 197 | 43 673 | 45 332 | 46 973 | ||||||||||||||||||||||
| Contributions for health services | 7 017 | 7 299 | 7 456 | 7 649 | 7 838 | 8 029 | ||||||||||||||||||||||
| Corporate taxes(2) | 11 984 | 10 882 | 10 910 | 11 776 | 12 341 | 12 891 | ||||||||||||||||||||||
| School property tax | 1 080 | 1 178 | 1 279 | 1 360 | 1 424 | 1 472 | ||||||||||||||||||||||
| Consumption taxes | 24 536 | 26 706 | 27 441 | 28 244 | 29 060 | 29 899 | ||||||||||||||||||||||
| Duties and permits | 5 685 | 5 171 | 5 209 | 5 244 | 5 357 | 5 467 | ||||||||||||||||||||||
| Miscellaneous revenue | 11 024 | 11 680 | 12 349 | 12 936 | 13 350 | 13 904 | ||||||||||||||||||||||
| Government enterprises | 5 944 | 5 628 | 5 933 | 6 160 | 6 383 | 6 516 | ||||||||||||||||||||||
| Own-source revenue | 105 914 | 109 691 | 112 774 | 117 042 | 121 085 | 125 151 | ||||||||||||||||||||||
| % change | 15.3 | 3.6 | 2.8 | 3.8 | 3.5 | 3.4 | 3.4 | |||||||||||||||||||||
| Federal transfers | 29 547 | 28 790 | 29 748 | 29 118 | 30 968 | 31 434 | ||||||||||||||||||||||
| % change | -3.8 | -2.6 | 3.3 | -2.1 | 6.4 | 1.5 | 1.2 | |||||||||||||||||||||
| Total revenue | 135 461 | 138 481 | 142 522 | 146 160 | 152 053 | 156 585 | ||||||||||||||||||||||
| % change | 10.5 | 2.2 | 2.9 | 2.6 | 4.0 | 3.0 | 2.9 | |||||||||||||||||||||
| Expenditure | ||||||||||||||||||||||||||||
| Portfolio expenditures | −121 874 | −127 789 | −131 800 | −135 219 | −140 343 | −144 053 | ||||||||||||||||||||||
| % change | 14.8 | 4.9 | 3.1 | 2.6 | 3.8 | 2.6 | 3.4 | |||||||||||||||||||||
| Debt service | −8 441 | −8 842 | −8 725 | −8 793 | −8 588 | −8 828 | ||||||||||||||||||||||
| % change | 9.8 | 4.8 | -1.3 | 0.8 | -2.3 | 2.8 | 0.9 | |||||||||||||||||||||
| Total expenditure | −130 315 | −136 631 | −140 525 | −144 012 | −148 931 | −152 881 | ||||||||||||||||||||||
| % change | 14.5 | 4.8 | 2.9 | 2.5 | 3.4 | 2.7 | 3.2 | |||||||||||||||||||||
| COVID-19 support and recovery measures | −9 043 | −2 355 | -462 | -18 | — | — | ||||||||||||||||||||||
| Provision for economic risks and other support and recovery measures | — | −2 500 | −1 500 | −1 500 | −1 500 | −1 500 | ||||||||||||||||||||||
| SURPLUS (DEFICIT) | −3 897 | −3 005 | 35 | 630 | 1 622 | 2 204 | ||||||||||||||||||||||
Note: Totals may not add due to rounding.
| (1) | Average annual growth rate, corresponding to the geometric mean over five years, from 2022-2023 to 2026-2027. |
| (2) | Information on the change in corporate tax revenue is presented on page I.32. |
| Québec’s Financial | |
| Situation | I.4 |
| n | Requirements of the Balanced Budget Act |
Under the Balanced Budget Act, the budgetary balance corresponds essentially to the surplus or the deficit presented in the public accounts (book balance) reduced by the amount of revenues dedicated to the Generations Fund and adjusted to take certain accounting changes into consideration, if applicable.
For the purpose of calculating the attainment of fiscal balance, the balance must also take into account the use of the stabilization reserve, of which the sums available depend on the budgetary surpluses of previous years.3
For 2022-2023, dedicated revenues to the Generations Fund total $3.4 billion, resulting in a budgetary deficit of $6.5 billion.
By 2026-2027, the structural deficit will stand at $2.8 billion.
TABLE I.2
Budgetary balance within the meaning of the Balanced Budget Act
(millions of dollars)
2021-2022 | 2022-2023 | 2023-2024 | 2024-2025 | 2025-2026 | 2026-2027 | |||||||||||||||||||
| SURPLUS (DEFICIT) | −3 897 | −3 005 | 35 | 630 | 1 622 | 2 204 | ||||||||||||||||||
| Deposits of dedicated revenues in the Generations Fund | −3 457 | −3 445 | −3 935 | −4 380 | −4 622 | −4 954 | ||||||||||||||||||
| BUDGETARY BALANCE BEFORE USE OF THE STABILIZATION RESERVE | −7 354 | −6 450 | −3 900 | −3 750 | −3 000 | −2 750 | ||||||||||||||||||
| Use of the stabilization reserve | 1 221 | — | — | — | — | — | ||||||||||||||||||
| BUDGETARY BALANCE WITHIN THE MEANING OF THE BALANCED BUDGET ACT | −6 133 | −6 450 | −3 900 | −3 750 | −3 000 | −2 750 | ||||||||||||||||||
| 3 | For more information on the stabilization reserve, see page I.16. |
| Budget 2022-2023 | |
| I.5 | Budget Plan |
| 1. | QuÉbec’s budgetary situation |
In 2022-2023, the budgetary balance shows a deficit of $6.5 billion.
| — | Revenue stands at $138.5 billion. |
| — | Portfolio expenditures, or expenditures tied to the delivery of public services, stand at $127.8 billion.4 |
| — | Debt service amounts to $8.8 billion. |
| — | The support and recovery measures implemented to fight COVID-19 amount to $2.4 billion in additional spending. |
| — | A provision for economic risks and other support and recovery measures of $2.5 billion is included in the financial framework to guard against the continuing health risk and the emergence of geopolitical tensions with the Russian invasion of Ukraine. |
| — | Deposits of dedicated revenues in the Generations Fund total $3.4 billion. |
| 4 | COVID-19 support and recovery measures are not included in portfolio expenditures. |
| Québec’s Financial | |
| Situation | I.6 |
TABLE I.3
Québec’s budget – March 2022
(millions of dollars)
| 2022-2023 | ||||
| Revenue | ||||
| Own-source revenue | 109 691 | |||
| % change | 3.6 | |||
| Federal transfers | 28 790 | |||
| % change | -2.6 | |||
| Total revenue | 138 481 | |||
| % change | 2.2 | |||
| Expenditure | ||||
| Portfolio expenditures(1) | −127 789 | |||
| % change | 4.9 | |||
| Debt service | −8 842 | |||
| % change | 4.8 | |||
| Total expenditure | −136 631 | |||
| % change | 4.8 | |||
| COVID-19 support and recovery measures | −2 355 | |||
| Provision for economic risks and other support and recovery measures | −2 500 | |||
| SURPLUS (DEFICIT) | −3 005 | |||
| BALANCED BUDGET ACT | ||||
| Deposits of dedicated revenues in the Generations Fund | −3 445 | |||
| BUDGETARY BALANCE | −6 450 | |||
| (1) | COVID-19 support and recovery measures are not included in portfolio expenditures. |
| Budget 2022-2023 | |
| I.7 | Budget Plan |
| 1.1 | Recent developments in the budgetary situation |
The economic situation has improved significantly in recent months and the current outlook is brighter than the forecasts of Budget 2021-2022.
This good performance has led to upward revenue adjustments for the period covered by the financial framework, making it possible, in particular, to implement additional initiatives and to reduce the efforts necessary to restore a balanced budget in 2027-2028.
In addition, the uncertainty surrounding the pandemic and Russia’s invasion of Ukraine could influence the economic outlook and financial market developments.
| ☐ | Main adjustments from 2021-2022 to 2023-2024 |
Growth in economic activity has resulted in significant upward adjustments to the government’s financial situation, totalling $12.3 billion in 2021-2022, $9.6 billion in 2022-2023 and $9.5 billion in 2023-2024.
Over this period, the government is planning more than $3 billion in new initiatives annually, particularly for coping with the rising cost of living, restoring the health care system and stimulating economic growth.
These initiatives are in addition to those announced in the fall 2021 Update on Québec’s Economic and Financial Situation.
Overall, the government’s sound management of public finances enables it to present downward adjustments to the budgetary deficits of about $3 billion per year from 2021-2022 to 2023-2024 since Budget 2021-2022.
| Québec’s Financial | |
| Situation | I.8 |
Additional revenues of $9.4 billion reflect strong
economic recovery in Québec
Since the publication of Budget 2021-2022, the main economic indicators affecting own-source revenue1 have been adjusted favourably for 2021.
| – | Nominal GDP has been adjusted upward by 5.3 percentage points to stand at 11.3%, compared to 6.0% in March 2021. |
| – | Net operating surplus of corporations has been adjusted upward by 10.2 percentage points, rising from 2.2% to 12.4%. |
| – | Wages and salaries have been adjusted upward by 3.6 percentage points, rising from 6.0% to 9.6%. |
| – | Consumption, excluding food expenditures and shelter, has been adjusted upward by 2.9 percentage points, rising from 8.3% to 11.2%. |
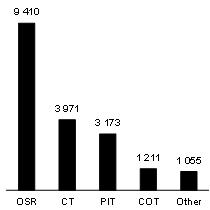
The sound economic performance in 2021 has had a positive effect on government own-source revenue, which is adjusted upward by $9.4 billion in 2021-2022. In particular:
| – | corporate taxes are adjusted upward by $4.0 billion; |
| – | personal income tax is adjusted upward by $3.2 billion; |
| – | consumption taxes are adjusted upward by $1.2 billion. |
| Nominal GDP and other economic indicators ‒ 2021 | Adjustment in 2021-2022 to own-source revenue since March 2021 | |
| (percentage change) | (millions of dollars) | |
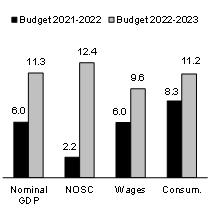 |  | |
| Notes: | Notes: | |||
| NOSC: | net operating surplus of corporations. Wages: wages and salaries. | OSR: | own-source revenue excluding revenue from government enterprises. | |
| Consum.: | household consumption excluding food expenditures and shelter. | CT: | corporate taxes. | |
| PIT: | personal income tax. | |||
| COT: | consumption taxes. |
| 1 | Own-source revenue excluding revenue from government enterprises. |
| Budget 2022-2023 | |
| I.9 | Budget Plan |
TABLE I.4
Adjustments to the financial framework since March 2021
(millions of dollars)
| 2021-2022 | 2022-2023 | 2023-2024 | ||||||||||
| BUDGETARY BALANCE(1) – MARCH 2021 | −12 250 | −8 500 | −7 000 | |||||||||
| ECONOMIC AND BUDGETARY SITUATION | ||||||||||||
| Own-source revenue excluding revenue from government enterprises | ||||||||||||
| – Tax revenue | 8 543 | 8 514 | 8 000 | |||||||||
| – Other revenue | 867 | 662 | 548 | |||||||||
| Subtotal | 9 410 | 9 176 | 8 548 | |||||||||
| Revenue from government enterprises | 836 | 227 | 170 | |||||||||
| Subtotal – Own-source revenue | 10 246 | 9 403 | 8 718 | |||||||||
| Federal transfers | 2 648 | 2 632 | 2 959 | |||||||||
| Subtotal – Revenue | 12 894 | 12 035 | 11 677 | |||||||||
| Portfolio expenditures(2) | 672 | −1 836 | −1 994 | |||||||||
| Debt service | 122 | 68 | 123 | |||||||||
| Subtotal – Expenditure | 794 | −1 768 | −1 871 | |||||||||
| COVID-19 support and recovery measures | −1 016 | -417 | -166 | |||||||||
| Deposits of dedicated revenues in the Generations Fund | -377 | -237 | -158 | |||||||||
| TOTAL ADJUSTMENTS TO THE ECONOMIC AND BUDGETARY SITUATION | 12 294 | 9 613 | 9 482 | |||||||||
| NOVEMBER 2021 INITIATIVES | −5 231 | −2 554 | −1 871 | |||||||||
| MARCH 2022 INITIATIVES | ||||||||||||
| Coping with the rising cost of living | −3 245 | -296 | -89 | |||||||||
| Restoring the health care system | — | −1 299 | −1 566 | |||||||||
| Investing in education and higher education | — | -522 | -545 | |||||||||
| Stimulating economic growth | -73 | −1 099 | −1 134 | |||||||||
| Continuing efforts relating to the environment | -3 | -63 | -84 | |||||||||
| Strengthening community action and supporting communities | -97 | -481 | -342 | |||||||||
| Subtotal | −3 418 | −3 759 | −3 760 | |||||||||
| TOTAL INITIATIVES | −8 648 | −6 313 | −5 632 | |||||||||
| Provision for economic risks and other support and recovery measures | 1 250 | −1 250 | -750 | |||||||||
| BUDGETARY BALANCE BEFORE USE OF THE STABILIZATION RESERVE | −7 354 | −6 450 | −3 900 | |||||||||
| Use of the stabilization reserve | 1 221 | — | — | |||||||||
| BUDGETARY BALANCE(1) – MARCH 2022 | −6 133 | −6 450 | −3 900 | |||||||||
| Note: | Totals may not add due to rounding. The table showing adjustments to the financial framework excludes those that can be attributed to the reclassification of the impact of the accounting standard respecting transfer payments, that were presented separately from the expenditures in Budget 2021-2022. |
| (1) | Budgetary balance within the meaning of the Balanced Budget Act, after use of the stabilization reserve. |
| (2) | COVID-19 support and recovery measures are not included in portfolio expenditures. |
| Québec’s Financial | |
| Situation | I.10 |
| n | Adjustments related to the economic and budgetary situation |
Upward adjustments of $12.3 billion in 2021-2022, $9.6 billion in 2022-2023 and $9.5 billion in 2023-2024 are provided for in the financial framework compared to March 2021. These adjustments are explained, in particular, by:
| — | an increase in own-source revenue, excluding revenue from government enterprises, of $9.4 billion in 2021-2022, $9.2 billion in 2022-2023 and $8.5 billion in 2023-2024, derived mainly from personal income tax, corporate taxes and consumption taxes; |
| — | The increase in economic activity in 2021 resulted in an upward adjustment in wages and salaries, the net operating surplus of corporations and household consumption.5 |
| — | an upward adjustment in revenue from government enterprises of $836 million in 2021-2022, $227 million in 2022-2023 and $170 million in 2023-2024, explained primarily: |
| — | for 2021-2022, by the $600-million increase in the results of Hydro-Québec and $226-million increase in the results of Investissement Québec, |
| — | for 2022-2023 and 2023-2024, by respective increases of $160 million and $157 million in Investissement Québec’s results; |
| — | an increase in revenues from federal transfers of $2.6 billion in 2021-2022 and in 2022-2023 and $3.0 billion in 2023-2024, due to: |
| — | a one-time payment of $1.1 billion in 2021-2022 to support the health care system and vaccination, |
| — | an unconditional Asymmetrical Childcare Agreement of $6.0 billion over five years, from 2021-2022 to 2025-2026, |
| — | an increase in equalization revenue starting in 2022-2023, due to an increase in the equalization envelope for Canada, which grows at the same pace as Canada’s nominal GDP, as well as an increase in the prices of oil, which drives the growth in disparities in fiscal capacity between the provinces; |
| 5 | Household consumption excluding food expenditures and shelter. |
| Budget 2022-2023 | |
| I.11 | Budget Plan |
| — | adjustments to portfolio expenditures, which are: |
| — | a $672-million decrease in 2021-2022 due to a more gradual resumption of government activities than anticipated during the pandemic, |
| — | a $1.8-billion increase in 2022-2023 due in part to an acceleration in the pace of completion of certain infrastructure projects and an upward adjustment to the forecast for municipal and housing infrastructure spending, |
| — | a $2.0-billion increase in 2023-2024 due to increased spending on health and social services and an acceleration in the pace of completion of certain infrastructure projects; |
| — | an upward adjustment in the cost of the support and recovery measures introduced to combat COVID-19 of $1.0 billion in 2021-2022, $417 million in 2022-2023, and $166 million in 2023-2024, essentially explained by the increased spending in the health and social services sector to overcome the public health crisis; |
| — | a decrease in debt service of $122 million in 2021-2022, $68 million in 2022-2023, and $123 million in 2023-2024 due to the reduction in the anticipated deficits and increase in the investment income from the Retirement Plans Sinking Fund (RPSF); |
| — | an increase in deposits in the Generations Fund of $377 million in 2021-2022, $237 million in 2022-2023 and $158 million in 2023-2024, partly due to an increase in mining revenues. |
| Québec’s Financial | |
| Situation | I.12 |
| n | Budget 2022-2023 initiatives |
In this budget, the government is providing initiatives of nearly $3.8 billion for 2022-2023, that is:
| — | $296 million for coping with the rising cost of living, to which is added the funding of $3.2 billion provided for in 2021-2022, primarily to fund the one-time cost of living amount; |
| — | $1.3 billion to restore the health care system; |
| — | $522 million to invest in education and higher education; |
| — | $1.1 billion to stimulate economic growth; |
| — | $63 million to continue efforts relating to the environment; |
| — | $481 million to strengthen community action and support communities. |
The total cost of the initiatives since Budget 2021-2022 is $8.6 billion in 2021-2022, $6.3 billion in 2022-2023 and $5.6 billion in 2023-2024.
Recap of November 2021 initiatives
In the November 2021 Update on Québec’s Economic and Financial Situation, the government announced investments of $5.2 billion in 2021-2022, $2.6 billion in 2022-2023 and $1.9 billion in 2023-2024. These investments have made it possible to introduce initiatives for:
| – | coping with the cost of living; |
| – | taking action to combat the labour shortage and stimulate economic growth; |
| – | supporting families and helping communities; |
| – | continuing efforts to strengthen the health care system. |
November 2021 initiatives
(millions of dollars)
| 2021-2022 | 2022-2023 | 2023-2024 | ||||||||||
| Coping with the cost of living | -946 | -313 | -254 | |||||||||
| Taking action to combat the labour shortage | ||||||||||||
| and stimulate economic growth | -248 | -877 | -845 | |||||||||
| Supporting families and helping communities | -444 | -749 | -589 | |||||||||
| Continuing efforts to strengthen the health care system | −3 593 | -614 | -184 | |||||||||
| TOTAL | −5 231 | −2 554 | −1 871 | |||||||||
| Budget 2022-2023 | |
| I.13 | Budget Plan |
| n | Other adjustments |
The financial framework includes a provision of $2.5 billion in 2022-2023 to mitigate potential economic risks and to fund additional support and recovery measures that may be needed. The inclusion of such a provision is necessary due to the current public health, economic and geopolitical risks.
| — | Indeed, the geopolitical tensions arising from Russia’s invasion of Ukraine represent one factor that could influence global economic developments, particularly with regard to energy prices and economic growth in Europe. |
| — | Moreover, the evolving pandemic could still impact the economic outlook and developments in the financial markets. In addition, the labour shortage and imbalances seen worldwide, such as supply chain disruptions, will exert inflationary pressures and could weigh on economic growth. |
Lastly, the use of the entire stabilization reserve in 2021-2022 reduces the budgetary deficit, within the meaning of the Balanced Budget Act, to $6.1 billion this year.
| Québec’s Financial | |
| Situation | I.14 |
| ☐ | Stabilization reserve |
Under the Balanced Budget Act, a recorded surplus, that is, a budgetary balance that is greater than zero, must be allocated to the stabilization reserve.
| — | From 2015-2016 to 2019-2020, surpluses of $12.0 billion were allocated to the stabilization reserve. In 2020-2021, part of the reserve was used to maintain budgetary balance. |
| — | In 2021-2022, the full balance of the reserve is being used to reduce the deficit. |
TABLE I.5
Stabilization reserve
(millions of dollars)
| Fiscal year | Balance, beginning of year | Allocations | Uses | Balance, end of year | ||||||||||||
| 2015-2016 | — | 2 191 | — | 2 191 | ||||||||||||
| 2016-2017 | 2 191 | 2 361 | — | 4 552 | ||||||||||||
| 2017-2018 | 4 552 | 2 622 | — | 7 174 | ||||||||||||
| 2018-2019 | 7 174 | 4 803 | — | 11 977 | ||||||||||||
| 2019-2020 | 11 977 | 4 | — | 11 981 | ||||||||||||
| 2020-2021 | 11 981 | — | −10 760 | 1 221 | ||||||||||||
| 2021-2022 | 1 221 | — | −1 221 | — | ||||||||||||
| 2022-2023 | — | — | — | — | ||||||||||||
Stabilization reserve
The stabilization reserve facilitates the government’s multi-year budget planning since it can be used if the budgetary balance is less than zero. It thus helps to keep the budget balanced under the Balanced Budget Act.
The reserve acts like a counter made up of surpluses achieved, but it does not consist of surplus cash, as generated surpluses are used to reduce the debt. In other words, the stabilization reserve is not money in the bank.
Within the meaning of the Act, the government is using the stabilization reserve in 2021-2022 to reduce the deficit.
| Budget 2022-2023 | |
| I.15 | Budget Plan |
Adjustments since November 2021
Relative to the November 2021 Update on Québec’s Economic and Financial Situation, the financial framework presents adjustments explained by:
| – | the overall improvement in the economic and budgetary situation, resulting in an adjustment of $2.9 billion in 2021-2022, $4.1 billion in 2022-2023 and $4.4 billion in 2023-2024; |
| – | the cost of the new initiatives announced, representing $3.4 billion in 2021-2022, and $3.8 billion in 2022-2023 and 2023-2024; |
| – | the increase in the provision for economic risks and other support and recovery measures, totalling $1 250 million in 2022-2023 and $500 million in 2023-2024. |
Adjustments to the financial framework since November 2021
(millions of dollars)
| 2021-2022 | 2022-2023 | 2023-2024 | ||||||||||
| BUDGETARY BALANCE(1) – NOVEMBER 2021 | −6 847 | −5 547 | −4 043 | |||||||||
| ECONOMIC AND BUDGETARY SITUATION | ||||||||||||
| Own-source revenue excluding revenue from government enterprises | 4 301 | 4 773 | 4 408 | |||||||||
| Revenue from government enterprises | 5 | 64 | 122 | |||||||||
| Federal transfers | 83 | 273 | -150 | |||||||||
| Portfolio expenditures | -128 | -120 | 370 | |||||||||
| Debt service | 102 | -72 | -126 | |||||||||
| Other | -169 | -194 | -36 | |||||||||
| Subtotal | 4 194 | 4 724 | 4 587 | |||||||||
| COVID-19 support and recovery measures | −1 283 | -618 | -184 | |||||||||
| TOTAL ADJUSTMENTS RELATED TO THE ECONOMIC AND BUDGETARY SITUATION | 2 911 | 4 106 | 4 403 | |||||||||
| INITIATIVES | ||||||||||||
| Coping with the rising cost of living | −3 245 | -296 | -89 | |||||||||
| Restoring the health care system | — | −1 299 | −1 566 | |||||||||
| Investing in education and higher education | — | -522 | -545 | |||||||||
| Stimulating economic growth | -73 | −1 099 | −1 134 | |||||||||
| Continuing efforts relating to the environment | -3 | -63 | -84 | |||||||||
| Strengthening community action and supporting communities | -97 | -481 | -342 | |||||||||
| TOTAL MARCH 2022 INITIATIVES | −3 418 | −3 759 | −3 760 | |||||||||
| Provision for economic risks and other support and recovery measures | — | −1 250 | -500 | |||||||||
| BUDGETARY BALANCE(1) – MARCH 2022 | −7 354 | −6 450 | −3 900 | |||||||||
| Note: | Totals may not add due to rounding. The table showing adjustments to the financial framework excludes those that can be attributed to the reclassification of the impact of the accounting standard respecting transfer payments, that were presented separately from the expenditures in the November 2021 Update on Québec’s Economic and Financial Situation. |
| (1) | Budgetary balance within the meaning of the Balanced Budget Act, before use of the stabilization reserve. |
| Québec’s Financial | |
| Situation | I.16 |
| 1.2 | Detailed adjustments in 2021-2022 |
Budget 2022-2023 presents detailed adjustments in revenue and expenditure for 2021-2022 since the March 2021 budget.
Overall, the budgetary adjustments result in a $4.9-billion decrease in the deficit before use of the stabilization reserve in 2021-2022, bringing it to $7.4 billion.
These adjustments are explained by:
| — | a $12.9-billion increase in revenue, including an increase of $10.2 billion in own-source revenue and of $2.6 billion from federal transfers; |
| — | a $4.1-billion increase in expenditures, primarily due to the cost of new initiatives, including the extraordinary cost of living allowance and the one-time cost of living amount; |
| — | a $4.8-billion increase in the cost of COVID-19 support and recovery measures resulting from the increase in health care costs and implementation of additional support measures; |
| — | elimination of the provision for economic risks and other support and recovery measures, which amounted to $1.3 billion. |
| Budget 2022-2023 | |
| I.17 | Budget Plan |
TABLE I.6
Adjustments to the 2021-2022 financial framework since March 2021
(millions of dollars)
| 2021-2022 | ||||||||||||||||||||
| March 2021 | Adjustments | March 2022 | ||||||||||||||||||
| Economic and budgetary situation | Initiatives and other adjustments | Total | ||||||||||||||||||
| Own-source revenue | ||||||||||||||||||||
| Tax revenue | 75 168 | 8 543 | — | 8 543 | 83 711 | |||||||||||||||
| Other revenue | 15 842 | 867 | — | 867 | 16 709 | |||||||||||||||
| Subtotal | 91 010 | 9 410 | — | 9 410 | 100 420 | |||||||||||||||
| Revenue from government enterprises | 4 658 | 836 | — | 836 | 5 494 | |||||||||||||||
| Total own-source revenue | 95 668 | 10 246 | — | 10 246 | 105 914 | |||||||||||||||
| Federal transfers | 26 899 | 2 648 | — | 2 648 | 29 547 | |||||||||||||||
| Revenue | 122 567 | 12 894 | — | 12 894 | 135 461 | |||||||||||||||
| Portfolio expenditures | −117 640 | 672 | −4 906 | −4 234 | −121 874 | |||||||||||||||
| Debt service | −8 563 | 122 | — | 122 | −8 441 | |||||||||||||||
| Expenditure | −126 203 | 794 | −4 906 | −4 112 | −130 315 | |||||||||||||||
| COVID-19 support and recovery measures | −4 284 | −1 016 | −3 743 | −4 759 | −9 043 | |||||||||||||||
| Provision for economic risks and other support and recovery measures | −1 250 | — | 1 250 | 1 250 | — | |||||||||||||||
| SURPLUS (DEFICIT) | −9 170 | 12 671 | −7 398 | 5 273 | −3 897 | |||||||||||||||
| BALANCED BUDGET ACT | ||||||||||||||||||||
| Deposits of dedicated revenues in the Generations Fund | −3 080 | -377 | — | -377 | −3 457 | |||||||||||||||
| BUDGETARY BALANCE BEFORE USE OF THE STABILIZATION RESERVE | −12 250 | 12 294 | −7 398 | 4 896 | −7 354 | |||||||||||||||
| Use of the stabilization reserve | — | — | 1 221 | 1 221 | 1 221 | |||||||||||||||
| BUDGETARY BALANCE(1) | −12 250 | 12 294 | −6 177 | 6 117 | −6 133 | |||||||||||||||
Note: Totals may not add due to rounding.
| (1) | Budgetary balance within the meaning of the Balanced Budget Act, after use of the stabilization reserve. |
| Québec’s Financial | |
| Situation | I.18 |
| ☐ | Own-source revenue excluding revenue from government enterprises |
For 2021-2022, own-source revenue excluding revenue from government enterprises shows an upward adjustment of $9.4 billion compared to the March 2021 forecast and totals $100.4 billion.
| — | Tax revenue are adjusted upward by $8.5 billion, consistent with the 5.3-percentage-point upward adjustment to nominal GDP in 2021 since last March. |
| — | Other revenue is adjusted upward by $867 million. |
TABLE I.7
Adjustments in own-source revenue excluding revenue from government enterprises
(millions of dollars)
| 2021-2022 | ||||
| OWN-SOURCE REVENUE(1) – MARCH 2021 | 91 010 | |||
| Tax revenue | ||||
| Personal income tax | 3 173 | |||
| Contributions for health services | 221 | |||
| Corporate taxes | 3 971 | |||
| School property tax | -33 | |||
| Consumption taxes | 1 211 | |||
| Subtotal | 8 543 | |||
| Other revenue | ||||
| Duties and permits | 832 | |||
| Miscellaneous revenue | 35 | |||
| Subtotal | 867 | |||
| Total adjustments | 9 410 | |||
| OWN-SOURCE REVENUE(1) – MARCH 2022 | 100 420 | |||
| (1) | Own-source revenue excluding revenue from government enterprises. |
| Budget 2022-2023 | |
| I.19 | Budget Plan |
| n | Tax revenue |
For 2021-2022, revenue from personal income tax is adjusted upward by $3.2 billion compared to the March 2021 forecast, while contributions for health services are adjusted upward by $221 million.
These favourable adjustments can be attributed to wages and salaries, whose growth was adjusted by 3.6 percentage points in 2021, rising from 6.0% to 9.6%, and by 4.6 percentage points in 2022, rising from 3.5% to 8.1%.
In 2021-2022, revenue from corporate taxes is adjusted upward by $4.0 billion compared to the March 2021 forecast.
| — | This favourable adjustment can primarily be attributed to the net operating surplus of corporations, whose growth was adjusted by 19.8 percentage points in 2020, rising from −5.3% to 14.5%, and by 10.2 percentage points in 2021, rising from 2.2% to 12.4%. |
Revenue from the school property tax is adjusted downward by $33 million in 2021-2022 compared to the March 2021 forecast.
| — | This adjustment is primarily due to a decrease in the projected student population growth and in the growth of the cost of services funded by the school property tax. |
Consumption tax revenue, which is derived mainly from the Québec sales tax, is adjusted upward by $1.2 billion in 2021-2022 compared to the March 2021 forecast.
| — | This adjustment is explained, in particular, by household consumption,6 whose growth was adjusted by 2.9 percentage points in 2021, rising from 8.3% to 11.2%, and by residential construction, whose growth was adjusted by 19.4 percentage points in 2021, rising from 10.6% to 30.0%. |
| n | Other revenue |
In 2021-2022, revenue from duties and permits is adjusted upward by $832 million compared to the March 2021 forecast.
| — | This adjustment is mainly due to the increase in mining revenues resulting from sustained market prices for metals since 20207 and an increase in revenue from the auction of GHG emission allowances. |
Miscellaneous revenue8 is adjusted upward by $35 million in 2021-2022.
| 6 | Household consumption excluding food expenditures and shelter. |
| 7 | Mining revenues are deposited in the Generations Fund. |
| 8 | Miscellaneous revenue includes interest, the sale of goods and services, as well as fines, forfeitures and recoveries. |
| Québec’s Financial | |
| Situation | I.20 |
| ☐ | Revenue from government enterprises |
For 2021-2022, revenue from government enterprises is adjusted upward by $836 million, to $5.5 billion.
This increase is mainly due to the results from:
| — | Hydro-Québec, due, in particular, to the increase in the value of exports and in the demand for electricity in Québec; |
| — | Investissement Québec, essentially due to good performance in its venture capital portfolio and the performance of its investment funds. |
TABLE I.8
Revenue from government enterprises
(millions of dollars)
| 2021-2022 | ||||
| REVENUE FROM GOVERNMENT ENTERPRISES – MARCH 2021 | 4 658 | |||
| Hydro-Québec | 600 | |||
| Loto-Québec | -32 | |||
| Société des alcools du Québec | 44 | |||
| Investissement Québec | 226 | |||
| Société québécoise du cannabis(1) | -7 | |||
| Other(2) | 5 | |||
| Total adjustments | 836 | |||
| REVENUE FROM GOVERNMENT ENTERPRISES – MARCH 2022 | 5 494 | |||
| (1) | Revenue is allocated to the Fund to Combat Addiction. |
| (2) | The other government enterprises are the Société ferroviaire et portuaire de Pointe-Noire, Capital Financière agricole and the Société du parc industriel et portuaire de Bécancour. |
| Budget 2022-2023 | |
| I.21 | Budget Plan |
| ☐ | Federal transfers |
In 2021-2022, revenues from federal transfers stand at $29.5 billion, an upward adjustment of $2.6 billion compared to Budget 2021-2022.
This upward adjustment is primarily due to:
| — | a one-time payment of $1.1 billion to support the health care system and vaccination; |
| — | an unconditional Asymmetrical Childcare Agreement of $6.0 billion over five years, including $660 million in 2021-2022. |
It is also due to the vaccines received from the federal government and changes made to the Canada Student Loans Program, for which Québec has the right to opt out with full compensation.
TABLE I.9
Adjustments to federal transfer revenues
(millions of dollars)
| 2021-2022 | ||||
| FEDERAL TRANSFERS – MARCH 2021 | 26 899 | |||
| Equalization | — | |||
| Health transfers | 1 245 | |||
| Transfers for post-secondary education and other social programs | -62 | |||
| Other programs, including: | 1 465 | |||
| – The Asymmetrical Childcare Agreement | 660 | |||
| Total adjustments | 2 648 | |||
| FEDERAL TRANSFERS – MARCH 2022 | 29 547 | |||
| Québec’s Financial | |
| Situation | I.22 |
| ☐ | Portfolio expenditures |
For 2021-2022, portfolio expenditures, before taking into account COVID-19 support and recovery measures, amount to $121.9 billion, an upward adjustment of $4.2 billion compared to the March 2021 forecast.
The adjustment is primarily due to:
| — | new initiatives in the fall 2021 update and Budget 2022-2023 not related to COVID-19, which are: |
| — | nearly $4.2 billion for measures to cope with the increase in the cost of living, including the implementation of the extraordinary cost of living allowance in November 2021 and the one-time cost of living amount provided in March 2022, |
| — | $268 million to take action to combat the labour shortage and stimulate economic growth, |
| — | $447 million to support families and help communities; |
| — | a more gradual resumption of government activities than anticipated, resulting in a $672-million downward adjustment in spending. |
With the addition of COVID-19 support and recovery measures totalling $9 billion,9 portfolio expenditures in 2021-2022 amount to $130.9 billion.
TABLE I.10
Adjustments to portfolio expenditures
(millions of dollars)
| 2021-2022 | ||||
| RESTATED PORTFOLIO EXPENDITURES – MARCH 2021(1) | 117 640 | |||
| Measures to cope with the increase in the cost of living | 4 191 | |||
| Taking action to combat the labour shortage and stimulate economic growth | 268 | |||
| Supporting families and helping communities | 447 | |||
| More-gradual-than-expected resumption of government activities(2) | -672 | |||
| Total adjustments | 4 234 | |||
| PORTFOLIO EXPENDITURES – BEFORE COVID-19 SUPPORT AND RECOVERY MEASURES | 121 874 | |||
| COVID-19 support and recovery measures | 9 043 | |||
| PORTFOLIO EXPENDITURES – MARCH 2022 | 130 917 | |||
| (1) | The March 2021 expenditure level is restated to include the change in application of the accounting standard respecting transfer payments. |
| (2) | A more gradual resumption of government activity than expected made it possible to anticipate $1.1 billion in payments for public transit projects. |
| 9 | COVID-19 support and recovery measures primarily include health funding to overcome the public health crisis. |
| Budget 2022-2023 | |
| I.23 | Budget Plan |
| ☐ | Debt service |
For 2021-2022, debt service is adjusted downward by $122 million to $8.4 billion due to:
| — | the $61-million downward adjustment in interest on the direct debt, which stems from lower budgetary deficits; |
| — | the higher return of the Retirement Plans Sinking Fund (RPSF).10 The investment income of the RPSF11 is applied against debt service. |
TABLE I.11
Adjustments to debt service
(millions of dollars)
| 2021-2022 | ||||
| DEBT SERVICE – MARCH 2021 | 8 563 | |||
| Interest on direct debt(1) | -61 | |||
| Interest on the liability for retirement plans and other employee future benefits(2) | -61 | |||
| Total adjustments | -122 | |||
| DEBT SERVICE – MARCH 2022 | 8 441 | |||
| (1) | Interest on the direct debt includes the income of the Sinking Fund for Government Borrowing. This income, which is deducted from debt service, consists of interest generated on investments as well as gains and losses on disposal. The forecast for this income may be adjusted upward or downward since it is closely tied to the change in interest rates and market behaviour. |
| (2) | This interest corresponds to the interest on obligations relating to the retirement plans and other future benefits of public and parapublic sector employees, minus mainly the investment income of the RPSF. |
| 10 | In 2020-2021, the RPSF yielded a return of 16.5%, whereas a return of 15.0% was forecast in the March 2021 budget. |
| 11 | See page J.33 of the section entitled “The Québec Government’s Debt” for further details on the net liability for retirement plans and the value of the RPSF as at March 31, 2021. |
| Québec’s Financial | |
| Situation | I.24 |
| 1.3 | Sound management of public finances |
Fiscal consolidation is essential to Québec’s prosperity. Establishing a prudent financial framework is responsible given the ongoing economic uncertainty, while sound management of public finances provides the leeway needed to:
| — | gradually reduce the structural deficit and plan a return to a balanced budget by 2027-2028; |
| — | continue debt reduction efforts. |
| ☐ | A gradual reduction in the structural deficit |
A balanced approach combining sound management of public finances with additional support and recovery measures, as well as ongoing investments in the government’s chief missions fosters a higher-than-forecast economic growth, making it possible to reduce the structural deficit by more than half in one year.
Changes in the economic and budgetary situation make it possible to reduce the structural deficit from $6.5 billion to $2.8 billion.
CHART I.1
Change in the budgetary balance
| (billions of dollars) |
|

| Budget 2022-2023 | |
| I.25 | Budget Plan |
| ☐ | Returning to a balanced budget |
The return to a balanced budget is still forecast by 2027-2028. The government is reiterating that the return to a balanced budget will continue to be based on the following principles:
| — | the government’s commitment not to increase the tax burden; |
| — | the acceleration of economic growth; |
| — | the adequate funding of the government’s chief missions; |
| — | an expenditure growth in line with revenue growth; |
| — | an increase in federal contributions for health expenditures.12 |
| 12 | The Council of the Federation is asking the federal government to increase the Canada Health Transfer to 35% of provincial and territorial health expenditures. No revenue associated with this request was built into the financial framework. |
| Québec’s Financial | |
| Situation | I.26 |
| ☐ | Ensuring a gradual reduction of the debt burden |
Despite an increase in the debt-to-GDP ratio in 2020-2021 due to the effects of the pandemic, the debt burden is decreasing again. In the coming years, the debt burden will decline gradually thanks to economic growth, an improved financial situation and deposits in the Generations Fund.
The Act to reduce the debt and establish the Generations Fund stipulates that for fiscal 2025-2026, gross debt must not exceed 45% of GDP, while the debt representing accumulated deficits must not exceed 17% of GDP.
| — | The objective regarding gross debt will be met. The gross debt burden will stand at 41.9% of GDP as at March 31, 2026. |
| — | On the other hand, the objective for the ratio of debt representing accumulated deficits to GDP will not be met. The ratio is currently expected to be 19.2% as at March 31, 2026, a gap of 2.2 percentage points or $13.2 billion compared with the 17% objective. |
The government intends to ensure a gradual reduction of the debt burden and to propose changes to the Act to reduce the debt and establish the Generations Fund in Budget 2023-2024. A new debt reduction objective covering the next 10 or 15 years will then be set.
The benefits of reducing the debt burden
Reducing the debt burden will bring substantial benefits in the form of a positive contribution to economic growth through the creation of a climate of confidence conducive to private investment and higher productivity. In addition to contributing to collective prosperity, reducing the debt burden will allow Québec to:
| – | contribute to intergenerational fairness; |
| – | ensure stable funding for the government’s main missions, including health and education; |
| – | cope with the costs associated with an aging population; |
| – | implement measures to fight climate change; |
| – | fund investment in public infrastructure; |
| – | ease the tax burden on Quebecers; |
| – | counter a potential future economic downturn; |
| – | increase | its financial autonomy within the federation. |
| Budget 2022-2023 | |
| I.27 | Budget Plan |
2. | Revenue and expenditure forecasts |
Budget 2022-2023 presents the detailed change in revenue and expenditure, that is, the three-year outlook for 2021-2022 to 2023-2024.
TABLE I.12
Change in revenue and expenditure
(millions of dollars)
| 2021-2022 | 2022-2023 | 2023-2024 | AAGR(1) | |||||||||||||
| Revenue | ||||||||||||||||
| Own-source revenue excluding revenue from government enterprises | 100 420 | 104 063 | 106 841 | |||||||||||||
| % change | 14.9 | 3.6 | 2.7 | 6.9 | ||||||||||||
| Revenue from government enterprises | 5 494 | 5 628 | 5 933 | |||||||||||||
| % change | 22.3 | 2.4 | 5.4 | 9.7 | ||||||||||||
| Federal transfers | 29 547 | 28 790 | 29 748 | |||||||||||||
| % change | -3.8 | -2.6 | 3.3 | -1.1 | ||||||||||||
| Total revenue | 135 461 | 138 481 | 142 522 | |||||||||||||
| % change | 10.5 | 2.2 | 2.9 | 5.2 | ||||||||||||
| Expenditure | ||||||||||||||||
| Portfolio expenditures | −121 874 | −127 789 | −131 800 | |||||||||||||
| % change | 14.8 | 4.9 | 3.1 | 7.5 | ||||||||||||
| Debt service | −8 441 | −8 842 | −8 725 | |||||||||||||
| % change | 9.8 | 4.8 | -1.3 | 4.3 | ||||||||||||
| Total expenditure | −130 315 | −136 631 | −140 525 | |||||||||||||
| % change | 14.5 | 4.8 | 2.9 | 7.3 | ||||||||||||
| COVID-19 support and recovery measures | −9 043 | −2 355 | -462 | |||||||||||||
| Provision for economic risks and other support and recovery measures | — | −2 500 | −1 500 | |||||||||||||
| SURPLUS (DEFICIT) | −3 897 | −3 005 | 35 | |||||||||||||
| Deposits of dedicated revenues in the Generations Fund | −3 457 | −3 445 | −3 935 | |||||||||||||
| BUDGETARY BALANCE BEFORE USE OF THE STABILIZATION RESERVE | −7 354 | −6 450 | −3 900 | |||||||||||||
| Use of the stabilization reserve | 1 221 | — | — | |||||||||||||
| BUDGETARY BALANCE(2) | −6 133 | −6 450 | −3 900 | |||||||||||||
| (1) | Average annual growth rate, corresponding to the geometric mean over three years, from 2021-2022 to 2023-2024. |
| (2) | Budgetary balance within the meaning of the Balanced Budget Act, after use of the stabilization reserve. |
| Québec’s Financial | |
| Situation | I.28 |
| 2.1 | Change in revenue |
Government revenue encompasses own-source revenue, including revenue from government enterprises, as well as federal transfers.
Government revenue totals $135.5 billion in 2021-2022, or $105.9 billion in own-source revenue and $29.5 billion from federal transfers.
Government revenue will stand at $138.5 billion in 2022-2023 and $142.5 billion in 2023-2024, representing growth of 2.2% and 2.9%, respectively.
TABLE I.13
Change in revenue
(millions of dollars)
| 2021-2022 | 2022-2023 | 2023-2024 | AAGR(1) | |||||||||||||
| Own-source revenue | ||||||||||||||||
| Own-source revenue excluding revenue from government enterprises | 100 420 | 104 063 | 106 841 | |||||||||||||
| % change | 14.9 | 3.6 | 2.7 | 6.9 | ||||||||||||
| Revenue from government enterprises | 5 494 | 5 628 | 5 933 | |||||||||||||
| % change | 22.3 | 2.4 | 5.4 | 9.7 | ||||||||||||
| Subtotal | 105 914 | 109 691 | 112 774 | |||||||||||||
| % change | 15.3 | 3.6 | 2.8 | 7.1 | ||||||||||||
| Federal transfers | 29 547 | 28 790 | 29 748 | |||||||||||||
| % change | -3.8 | -2.6 | 3.3 | -1.1 | ||||||||||||
| TOTAL | 135 461 | 138 481 | 142 522 | |||||||||||||
| % change | 10.5 | 2.2 | 2.9 | 5.2 | ||||||||||||
| (1) | Average annual growth rate, corresponding to the geometric mean over three years, from 2021-2022 to 2023-2024. |
| Budget 2022-2023 | |
| I.29 | Budget Plan |
| 2.1.1 | Own-source revenue excluding revenue from government enterprises |
Own-source revenue excluding revenue from government enterprises consists mainly of tax revenue, including personal income tax, contributions for health services, corporate taxes, school property tax and consumption taxes.
| — | How it changes generally reflects change in economic activity in Québec and changes in the tax system. |
Own-source revenue also includes other revenue sources, that is, duties and permits, in particular, revenue from the carbon market, and miscellaneous revenue, such as interest, the sale of goods and services, as well as fines, forfeitures and recoveries.
Own-source revenue stands at $100.4 billion in 2021-2022, an increase of 14.9% compared to 2020-2021. It will reach $104.1 billion in 2022-2023 and $106.8 billion in 2023-2024, representing growth of 3.6% and 2.7%, respectively.
TABLE I.14
Change in own-source revenue excluding revenue from government enterprises – Summary
(millions of dollars)
| 2021-2022 | 2022-2023 | 2023-2024 | AAGR(1) | |||||||||||||
| Tax revenue | 83 711 | 87 212 | 89 283 | |||||||||||||
| % change | 14.9 | 4.2 | 2.4 | 7.0 | ||||||||||||
| Other revenue | 16 709 | 16 851 | 17 558 | |||||||||||||
| % change | 15.3 | 0.8 | 4.2 | 6.6 | ||||||||||||
| TOTAL | 100 420 | 104 063 | 106 841 | |||||||||||||
| % change | 14.9 | 3.6 | 2.7 | 6.9 | ||||||||||||
| (1) | Average annual growth rate, corresponding to the geometric mean over three years, from 2021-2022 to 2023-2024. |
| Québec’s Financial | |
| Situation | I.30 |
| ☐ | Tax revenue |
Revenue from personal income tax, the government’s largest revenue source, stands at $39.1 billion in 2021-2022, up 11.7% compared to 2020-2021. It will reach $41.1 billion in 2022-2023 and $42.2 billion in 2023-2024, representing growth of 5.3% and 2.6%, respectively.
| — | This growth reflects such factors as the increase in household income, including wages and salaries, which, due to the recovery in employment, will grow by 9.6% in 2021, 8.1% in 2022 and 3.3% in 2023. |
| — | It also takes into account all the parameters of the personal income tax system, such as indexation and the progressive nature of the tax system. |
Contributions for health services stand at $7.0 billion in 2021-2022, which will then increase to $7.3 billion in 2022-2023 and $7.5 billion in 2023-2024, an increase of 9.7%, 4.0% and 2.2%, respectively.
| — | This change reflects the expected growth in wages and salaries. |
Corporate tax revenue will reach $12.0 billion in 2021-2022, an increase of 33.9%. It will stand at $10.9 billion in 2022-2023 and 2023-2024, representing a change of −9.2% and 0.3%, respectively.
| — | This change is influenced by the projected change in the net operating surplus of corporations, supported in part by one-off government support measures, which stands at 12.4% in 2021, −6.4% in 2022 and −3.1% in 2023. |
| — | It also reflects the measures implemented in recent years to ease the tax burden, particularly the reduced corporate tax rate for SMBs announced in Budget 2021-2022. |
Revenue from the school property tax stands at $1.1 billion in 2021-2022, down 6.6% compared to 2020-2021. It will reach $1.2 billion in 2022-2023 and $1.3 billion in 2023-2024, an increase of 9.1% and 8.6%, respectively.
| — | The decrease in 2021-2022 can be attributed to the impact of the tax rate reduction resulting from the implementation of a single school tax rate since July 1, 2020. |
| — | The change in revenue from the school property tax also takes into account the increase in the number of students and the projected increase in the cost of services funded by the school property tax. |
| Budget 2022-2023 | |
| I.31 | Budget Plan |
Consumption tax revenue totals $24.5 billion in 2021-2022, up 14.8% compared to 2020-2021. It will stand at $26.7 billion in 2022-2023 and $27.4 billion in 2023-2024, growth of 8.8% and 2.8%, respectively.
| — | This change reflects the projected growth of household consumption13 in particular, of 11.2% in 2021, 12.0% in 2022 and 3.9% in 2023. |
| — | It also reflects the projected change in residential construction of 30.0% in 2021, 0.6% in 2022 and −0.1% in 2023. |
TABLE I.15
Change in own-source revenue excluding revenue from government enterprises
(millions of dollars)
| 2021-2022 | 2022-2023 | 2023-2024 | AAGR(1) | |||||||||||||
| Tax revenue | ||||||||||||||||
| Personal income tax | 39 094 | 41 147 | 42 197 | |||||||||||||
| % change | 11.7 | 5.3 | 2.6 | 6.4 | ||||||||||||
| Contributions for health services | 7 017 | 7 299 | 7 456 | |||||||||||||
| % change | 9.7 | 4.0 | 2.2 | 5.2 | ||||||||||||
| Corporate taxes | 11 984 | 10 882 | 10 910 | |||||||||||||
| % change | 33.9 | -9.2 | 0.3 | 6.8 | ||||||||||||
| School property tax | 1 080 | 1 178 | 1 279 | |||||||||||||
| % change | -6.6 | 9.1 | 8.6 | 3.4 | ||||||||||||
| Consumption taxes | 24 536 | 26 706 | 27 441 | |||||||||||||
| % change | 14.8 | 8.8 | 2.8 | 8.7 | ||||||||||||
| Subtotal | 83 711 | 87 212 | 89 283 | |||||||||||||
| % change | 14.9 | 4.2 | 2.4 | 7.0 | ||||||||||||
| Other revenue | ||||||||||||||||
| Duties and permits | 5 685 | 5 171 | 5 209 | |||||||||||||
| % change(2) | 23.2 | -9.0 | 0.7 | 4.1 | ||||||||||||
| Miscellaneous revenue | 11 024 | 11 680 | 12 349 | |||||||||||||
| % change | 11.5 | 6.0 | 5.7 | 7.7 | ||||||||||||
| Subtotal | 16 709 | 16 851 | 17 558 | |||||||||||||
| % change | 15.3 | 0.8 | 4.2 | 6.6 | ||||||||||||
| TOTAL | 100 420 | 104 063 | 106 841 | |||||||||||||
| % change | 14.9 | 3.6 | 2.7 | 6.9 | ||||||||||||
| (1) | Average annual growth rate, corresponding to the geometric mean over three years, from 2021-2022 to 2023-2024. |
| (2) | The 9.0% decrease in revenue from duties and permits in 2022-2023 can be explained by the decrease in revenue from natural resources and the non-recurrence of revenues from the auction of GHG emission allowances, when units unsold during auctions in May and August 2020 were put back up for sale in 2021-2022. |
| 13 | Household consumption excluding food expenditures and shelter. |
| Québec’s Financial | |
| Situation | I.32 |
| ☐ | Other revenue |
Revenue from duties and permits amounts to $5.7 billion in 2021-2022, an increase of 23.2% compared to 2020-2021. It will stand at $5.2 billion in 2022-2023 and 2023-2024, changes of −9.0% and 0.7%, respectively.
| — | The 23.2% increase in revenue from duties and permits in 2021-2022 is explained primarily by an increase in revenues from the auction of GHG emission allowances,14 when units unsold in the auctions in May and August 2020 were put back up for sale in 2021. |
| — | Due to the non-recurrence of these amounts and the decrease in revenue from natural resources, as a result of lower iron prices, a 9.0% decrease in revenue from duties and permits is expected in 2022-2023. |
Miscellaneous revenue stands at $11.0 billion in 2021-2022, an increase of 11.5% compared to 2020-2021. It will reach $11.7 billion in 2022-2023 and $12.3 billion in 2023-2024, representing increases of 6.0% and 5.7%, respectively.
| — | This change stems mainly from the anticipated revenue of special funds, non-budget-funded bodies and bodies in the health and social services and education networks. |
| — | For example, the change in the revenue of the education network is influenced by, among other things, tuition fee revenues, the change in clienteles, and user revenues. |
| 14 | In 2021-2022, the average auction price is $30.92 per unit, a 38.3% increase over the average sales price observed in 2020-2021. |
| Budget 2022-2023 | |
| I.33 | Budget Plan |
A favourable adjustment of own-source revenue in Québec
and other Canadian provinces in 2021-2022
In Budget 2022-2023, own-source revenue1 is adjusted by $9.4 billion in 2021-2022, or 10.3% of revenue forecast in Budget 2021-2022.
| – | The recurrence of revenue observed in 2020-2021 and the upward adjustment of nominal GDP by 5.3 percentage points in 2021 reflect, in particular, a strong improvement in revenue from personal income tax and corporate taxes in 2021-2022. |
Like Québec, British Columbia and Ontario adjusted their own-source revenues by 18.0% and 16.1%, respectively, due to a positive trend in personal income tax and corporate taxes. Also, Alberta adjusted its revenue by 51.3%, due to an increase in revenue from natural resources.
Despite the favourable adjustments observed in Québec, several risks are currently weighing on own-source revenue forecasts. For example:
| – | the invasion of Ukraine, ongoing bottlenecks in supply chains and upward pressure on wages could reduce activity in certain sectors and affect corporate profits, posing a risk to corporate tax revenue forecasts; |
| – | interest rate hikes and the gradual withdrawal of government assistance could affect household disposable income and purchasing power, which poses a risk to consumption tax revenue forecasts. |
| Adjustment to own-source revenue – 2021-2022 | Nominal GDP growth adjustment – 2021 | |
| (percentage of revenue) | (percentage points) | |
|
|
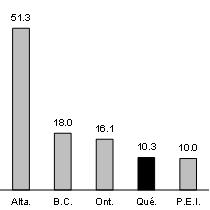
| Note: | This is the revenue adjustment, as a percentage of own-source revenue excluding revenue from government enterprises forecast in the 2021-2022 budgets.
| Sources: | 2022-2023 provincial budgets. Ontario’s data come from the financial report for the third quarter of 2021-2022. | |
| Sources: | 2022-2023 provincial budgets. Ontario’s data come from the financial report for the third quarter of 2021-2022. |
| 1 | Own-source revenue excluding revenue from government enterprises. |
| Québec’s Financial | |
| Situation | I.34 |
| 2.1.2 | Revenue from government enterprises |
Government enterprises consist of public corporations that play a commercial role, have managerial autonomy and are financially self-sufficient. The revenue from government enterprises corresponds in large part to the net earnings of these enterprises.
Revenue from government enterprises will amount to $5.5 billion in 2021-2022, an increase of 22.3%, $5.6 billion in 2022-2023, an increase of 2.4%, and $5.9 billion in 2023-2024, an increase of 5.4%.
TABLE I.16
Change in revenue from government enterprises
(millions of dollars)
| 2021-2022 | 2022-2023 | 2023-2024 | AAGR(1) | |||||||||||||
| Hydro-Québec | 2 725 | 2 525 | 2 700 | |||||||||||||
| Loto-Québec | 1 029 | 1 383 | 1 461 | |||||||||||||
| Société des alcools du Québec | 1 326 | 1 360 | 1 410 | |||||||||||||
| Investissement Québec | 318 | 256 | 246 | |||||||||||||
| Société québécoise du cannabis(2) | 81 | 94 | 105 | |||||||||||||
| Other(3) | 15 | 10 | 11 | |||||||||||||
| TOTAL | 5 494 | 5 628 | 5 933 | |||||||||||||
| % change | 22.3 | 2.4 | 5.4 | 9.7 | ||||||||||||
| (1) | Average annual growth rate, corresponding to the geometric mean over three years, from 2021-2022 to 2023-2024. |
| (2) | Revenue is allocated to the Fund to Combat Addiction. |
| (3) | The government’s other enterprises are the Société ferroviaire et portuaire de Pointe-Noire, Capital Financière agricole and the Société du parc industriel et portuaire de Bécancour. |
| Budget 2022-2023 | |
| I.35 | Budget Plan |
The 22.3% growth in 2021-2022 primarily reflects a gradual return to normal by the expected results following exceptional declines caused by COVID-19 in 2020-2021. It includes an increase in the anticipated results of:
| — | Hydro-Québec, following the increase in electricity sales in Québec and in the value of its electricity exports; |
| — | Loto-Québec, attributable to a gradual reopening of its facilities with the required physical distancing measures. |
Growth of 2.4% in 2022-2023:
| — | is mainly explained by the increase in the expected results of Loto-Québec, due to the gradual return to full operation; |
| — | is partly offset by a decrease in the expected results of Hydro-Québec, stemming particularly from the expected decrease in the value of electricity exports. |
The 5.4% growth in 2023-2024 stems in particular from the increase in the anticipated results of:
| — | Hydro-Québec, due to the increase in electricity sales in Québec; |
| — | Loto-Québec, following an increase in the profits across all its activity sectors after the return to normal of its activities due to the scheduled lifting of public health measures. |
| Québec’s Financial | |
| Situation | I.36 |
| 2.1.3 | Federal transfers |
Revenues from federal transfers consist of federal government revenues paid to Québec under the Federal-Provincial Fiscal Arrangements Act, to which are added revenues from other programs under bilateral agreements.
They include mainly equalization and revenue from the Canada Health Transfer (CHT)15 and the Canada Social Transfer (CST).
The federal transfer revenues decrease by 3.8% in 2021-2022 due to the one-time payment, the previous year, of amounts stemming from agreements concluded with the federal government in the context of the pandemic. They will decline by 2.6% in 2022-2023 for the same reason.
Revenues from federal transfers will increase by 3.3% in 2023-2024, in part because the CHT envelope will experience growth equivalent to that of Canada’s nominal GDP.16
TABLE I.17
Change in federal transfers
(millions of dollars)
| 2021-2022 | 2022-2023 | 2023-2024 | AAGR(1) | |||||||||||||
| Equalization | 13 119 | 13 666 | 14 294 | |||||||||||||
| % change | -1.0 | 4.2 | 4.6 | 2.6 | ||||||||||||
| Health transfers | 8 270 | 7 078 | 7 787 | |||||||||||||
| % change | 21.6 | -14.4 | 10.0 | 4.6 | ||||||||||||
| Transfers for post-secondary education and other social programs | 1 570 | 1 531 | 1 585 | |||||||||||||
| % change | -1.3 | -2.5 | 3.5 | -0.1 | ||||||||||||
| Other programs | 6 588 | 6 515 | 6 082 | |||||||||||||
| % change | -27.4 | -1.1 | -6.6 | -12.5 | ||||||||||||
| TOTAL | 29 547 | 28 790 | 29 748 | |||||||||||||
| % change | -3.8 | -2.6 | 3.3 | -1.1 | ||||||||||||
| (1) | Average annual growth rate, corresponding to the geometric mean over three years, from 2021-2022 to 2023-2024. |
| 15 | The Council of the Federation is asking the federal government to increase the CHT to 35% of provincial and territorial health expenditures. No revenue associated with this request was built into the financial framework. |
| 16 | In 2023-2024, the increase in the CHT envelope and the equalization envelope is based on the average annual growth in Canada’s nominal GDP for 2021 (1/3), 2022 (1/3) and 2023 (1/3). |
| Budget 2022-2023 | |
| I.37 | Budget Plan |
Ongoing decline in Québec’s share of the equalization envelope
Québec’s share of the equalization envelope has been declining since 2020-2021. This trend will continue in the years ahead due to the expected improvement in Québec’s economic situation in comparison with the rest of Canada.
Québec’s share in the equalization envelope, which was 66.2% in 2019-2020, will decline to 56.3% in 2026-2027.
| Anticipated change in Québec’s share of the equalization envelope |
| (per cent) |
|
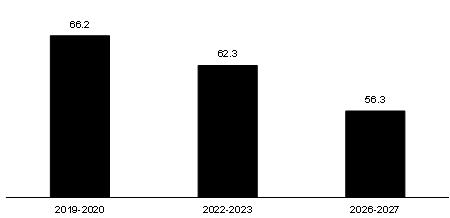
| Note: | A smoothing mechanism with lag is applied to determine equalization payments. For example, the equalization payments for the provinces for 2022-2023 are based on data for the years 2018-2019 (25%), 2019-2020 (25%) and 2020-2021 (50%). |
| Sources: | Department of Finance Canada and Ministère des Finances du Québec. |
| Québec’s Financial | |
| Situation | I.38 |
| ☐ | Québec is the equalization recipient that receives the least per capita |
The provinces do not all have the same fiscal capacity; in other words, they do not all have the same ability to generate revenue.
Provinces whose fiscal capacity, in dollars per capita, is below the average of the 10 provinces receive equalization payments. They therefore have, after equalization, a fiscal capacity equivalent to the average of the 10 provinces so that they can provide public services.17
In 2022-2023, five provinces will receive equalization payments: Manitoba, Québec, New Brunswick, Nova Scotia and Prince Edward Island.
Québec is the recipient that receives the least equalization per capita ($1 606 per capita).
CHART I.2
Provincial equalization payments – 2022-2023
| (dollars per capita) |
|
| Source: Department of Finance Canada. |
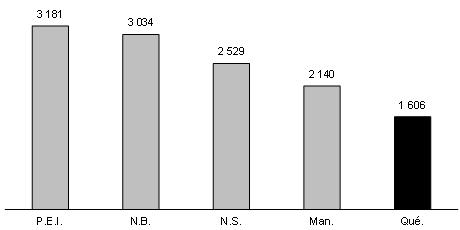
| 17 | The provinces’ fiscal capacity is assessed on the basis of five tax bases (personal income tax, corporate income tax, consumption taxes, property taxes and natural resources). |
| Budget 2022-2023 | |
| I.39 | Budget Plan |
| 2.2 | Change in expenditure |
Expenditure consists of portfolio expenditures, which are tied to the delivery of public services, and debt service.
Expenditure18 totals $130.3 billion in 2021-2022, or $121.9 billion in portfolio expenditures and $8.4 billion in debt service.
| — | Expenditure will stand at $136.6 billion in 2022-2023 and $140.5 billion in 2023-2024. |
Expenditure will grow by 14.5% in 2021-2022, 4.8% in 2022-2023 and 2.9% in 2023-2024.
| — | The 14.5% growth in 2021-2022 is due to the 14.8% increase in portfolio expenditures, which stems from the one-time cost of living amount as well as the resumption of government activities. |
| — | It can also be explained by the 9.8% increase in debt service, caused by the increase in the debt and the rise in interest rates. |
From 2021-2022 to 2023-2024, expenditure will grow by an average of 7.3% per year.
TABLE I.18
Change in expenditure
(millions of dollars)
| 2021-2022 | 2022-2023 | 2023-2024 | AAGR(1) | |||||||||||||
| Portfolio expenditures | 121 874 | 127 789 | 131 800 | |||||||||||||
| % change | 14.8 | 4.9 | 3.1 | 7.5 | ||||||||||||
| Debt service | 8 441 | 8 842 | 8 725 | |||||||||||||
| % change | 9.8 | 4.8 | -1.3 | 4.3 | ||||||||||||
| TOTAL | 130 315 | 136 631 | 140 525 | |||||||||||||
| % change | 14.5 | 4.8 | 2.9 | 7.3 | ||||||||||||
| (1) | Average annual growth rate, corresponding to the geometric mean over three years, from 2021-2022 to 2023-2024. |
| Québec’s Financial | |
| Situation | I.40 |
Increase in portfolio expenditures in 2021-2022
higher than projected in Budget 2021-2022
In Budget 2021-2022, portfolio expenditures were expected to reach $117.6 billion in 2021-2022, which represented an increase of 5.6%.
Since Budget 2021-2022, the portfolio expenditures expected for 2020-2021 and 2021-2022 have been adjusted.
| – | For 2020-2021, the recorded level of portfolio expenditures was $5.3 billion lower. |
| ▪ | This adjustment is due in particular to the slowdown in some regular government activities stemming from the pandemic, the deferral of infrastructure projects and the decrease in the allowance for doubtful accounts. |
| – | For 2021-2022, portfolio expenditures were adjusted upward by $4.2 billion, due to: |
| ▪ | new initiatives from the fall 2021 update and the March 2022 budget totalling $4.9 billion, including the impact of $3.0 billion for the one-time cost of living allowance of $500; |
| ▪ | a more gradual resumption of government activities than anticipated during the pandemic period, resulting in a $672-million downward adjustment in spending. |
It is now expected that portfolio expenditures will amount to $121.9 billion in 2021-2022, which represents an increase of 14.8%.
Portfolio expenditures
(millions of dollars)
| March 2021 | Adjustment | March 2022 | ||||||||||
| 2020-2021 | 111 453 | −5 327 | 106 126 | |||||||||
| 2021-2022 | 117 640 | 4 234 | 121 874 | |||||||||
| % change | 5.6 | 14.8 | ||||||||||
| Note: | The data exclude COVID-19 support and recovery measures. The March 2021 levels are restated to incorporate the application of the accounting standard respecting transfer payments. |
| Budget 2022-2023 | |
| I.41 | Budget Plan |
| 2.2.1 | Portfolio expenditures |
To achieve its objectives and carry out its activities, the government sets up programs that are administered by government entities, including departments and bodies. The set of entities under the responsibility of a minister constitutes a portfolio.
Before taking into account COVID-19 support and recovery measures, portfolio expenditures will amount to $121.9 billion in 2021-2022, $127.8 billion in 2022-2023 and $131.8 billion in 2023-2024.
| — | From 2021-2022 to 2023-2024, portfolio expenditures will grow by an average of 7.5% per year. |
COVID-19 support and recovery measures will amount to $9.0 billion in 2021-2022, $2.4 billion in 2022-2023 and $0.5 billion in 2023-2024.
TABLE I.19
Change in expenditure by departmental portfolio
(millions of dollars)
| 2021-2022 | 2022-2023 | 2023-2024 | AAGR(1) | |||||||||||||
| Santé et Services sociaux | 51 041 | 54 247 | 56 683 | |||||||||||||
| % change | 10.0 | 6.3 | 4.5 | 6.9 | ||||||||||||
| Éducation | 18 084 | 19 060 | 19 819 | |||||||||||||
| % change | 8.6 | 5.4 | 4.0 | 6.0 | ||||||||||||
| Enseignement supérieur | 8 903 | 10 069 | 10 447 | |||||||||||||
| % change(2) | 10.0 | 13.1 | 3.7 | 8.9 | ||||||||||||
| Other portfolios(3) | 43 847 | 44 413 | 44 851 | |||||||||||||
| % change | 25.3 | 1.3 | 1.0 | 8.6 | ||||||||||||
| Subtotal | 121 874 | 127 789 | 131 800 | |||||||||||||
| % change | 14.8 | 4.9 | 3.1 | 7.5 | ||||||||||||
| COVID-19 support and recovery measures | 9 043 | 2 355 | 462 | |||||||||||||
| TOTAL | 130 917 | 130 144 | 132 262 | |||||||||||||
| % change | 9.9 | -0.6 | 1.6 | 3.5 | ||||||||||||
Note: Totals may not add due to rounding.
| (1) | Average annual growth rate, corresponding to the geometric mean over three years, from 2021-2022 to 2023-2024. |
| (2) | Excluding the Québec Perspective scholarships that will become available in September 2022, the 2022-2023 growth rate of the Enseignement supérieur portfolio will be 8.8%. |
| (3) | Other portfolios include inter-portfolio eliminations resulting from the elimination of reciprocal transactions between entities in different portfolios. |
| Québec’s Financial | |
| Situation | I.42 |
COVID-19 support and recovery measures
Even though the majority of the support and recovery measures in response to the public health crisis were implemented in 2020-2021, the government will continue to support Quebecers and the economy in the coming years.
The support and recovery measures total $9.0 billion in 2021-2022, $2.4 billion in 2022-2023 and $0.5 billion in 2023-2024.
COVID-19 support and recovery measures
(millions of dollars)
| 2021-2022 | 2022-2023 | 2023-2024 | 2024-2025 | Total | ||||||||||||||||
| Santé et Services sociaux | ||||||||||||||||||||
| Financing of temporary actions to over come the public health crisis, taking into account postponed activities | 5 991 | 339 | — | — | 6 330 | |||||||||||||||
| New incentives to strengthen employee attendance in the face of the 5th wave | 338 | 39 | — | — | 377 | |||||||||||||||
| Antivirals against COVID-19 (including federal government contribution) | 29 | 234 | — | — | 263 | |||||||||||||||
| Added patient-care attendants and managers in CHSLDs, as well as public health resources | 750 | 750 | — | — | 1 500 | |||||||||||||||
| Non-recurring investments in mental health in the face of the pandemic | 77 | — | — | — | 77 | |||||||||||||||
| Other measures(1) | — | 232 | 368 | — | 600 | |||||||||||||||
| Subtotal | 7 185 | 1 595 | 368 | — | 9 148 | |||||||||||||||
| Éducation | ||||||||||||||||||||
| Fostering educational success | 110 | 60 | — | — | 170 | |||||||||||||||
| Helping Quebecers get back into the labour market | 65 | — | — | — | 65 | |||||||||||||||
| Supporting volunteering | 10 | — | — | — | 10 | |||||||||||||||
| Subtotal | 185 | 60 | — | — | 245 | |||||||||||||||
| Enseignement supérieur | ||||||||||||||||||||
| Easing the financial burden on students in the context of the pandemic | 155 | 72 | — | — | 227 | |||||||||||||||
| Enhancing student financial assistance and improving student support services | 50 | — | — | — | 50 | |||||||||||||||
| Helping Quebecers get back into the labour market | 26 | — | — | — | 26 | |||||||||||||||
| Subtotal | 230 | 72 | — | — | 302 | |||||||||||||||
| Other portfolios | ||||||||||||||||||||
| Supporting Quebecers(2) | 143 | 224 | — | — | 367 | |||||||||||||||
| Supporting the requalification of workers and getting them back into the labour market | 217 | 174 | 5 | — | 396 | |||||||||||||||
| Stimulating economic growth | 503 | 90 | 76 | 18 | 687 | |||||||||||||||
| Promoting economic development in all regions of Québec | 215 | 102 | 11 | — | 328 | |||||||||||||||
| Continuing to support businesses affected by the pandemic | 296 | 12 | — | — | 305 | |||||||||||||||
| Creating wealth through innovation | 69 | 26 | 2 | — | 97 | |||||||||||||||
| Subtotal | 1 443 | 628 | 94 | 18 | 2 180 | |||||||||||||||
| TOTAL | 9 043 | 2 355 | 462 | 18 | 11 874 | |||||||||||||||
Note: Totals may not add due to rounding.
| (1) | Other measures mainly include sums provided in the plan to reduce the waiting lists for surgery, which will be the subject of new planning. |
| (2) | This includes initiatives to ensure safe subsidized childcare and support for certain community organizations. |
| Budget 2022-2023 | |
| I.43 | Budget Plan |
Portfolio expenditures
including support and recovery measures
COVID-19’s arrival in Québec called for extraordinary measures to reinforce the health care system, accelerate growth, speed up the transition to the new economy and support Quebecers. In 2021-2022, there was a high level of spending due to initiatives that were implemented to deal with the public health crisis.
With the COVID-19 support and recovery measures included, portfolio expenditures will amount to $130.9 billion in 2021-2022, $130.1 billion in 2022-2023 and $132.3 billion in 2023-2024.
| – | From 2021-2022 to 2023-2024, portfolio expenditures will grow by an average of 3.5% per year. |
Detailed expenditure forecasts by portfolio are presented on page I.59.
Change in expenditure by departmental portfolio – After COVID-19 support and recovery measures
(millions of dollars)
| 2021-2022 | 2022-2023 | 2023-2024 | AAGR(1) | |||||||||||||
| Santé et Services sociaux | 58 226 | 55 842 | 57 051 | |||||||||||||
| % change | 6.4 | -4.1 | 2.2 | 1.4 | ||||||||||||
| Éducation | 18 268 | 19 120 | 19 819 | |||||||||||||
| % change | 7.9 | 4.7 | 3.7 | 5.4 | ||||||||||||
| Enseignement supérieur | 9 133 | 10 141 | 10 447 | |||||||||||||
| % change | 9.6 | 11.0 | 3.0 | 7.8 | ||||||||||||
| Other portfolios | 45 290 | 45 041 | 44 945 | |||||||||||||
| % change | 15.8 | -0.6 | -0.2 | 4.7 | ||||||||||||
| TOTAL | 130 917 | 130 144 | 132 262 | |||||||||||||
| % change | 9.9 | -0.6 | 1.6 | 3.5 | ||||||||||||
Note: Totals may not add due to rounding.
| (1) | Average annual growth rate, corresponding to the geometric mean over three years, from 2021-2022 to 2023-2024. |
| Québec’s Financial | |
| Situation | I.44 |
| ☐ | Santé et Services sociaux |
The expenditures of the Santé et Services sociaux portfolio consist primarily of the activities of the bodies in the health and social services network and programs administered by the Régie de l’assurance maladie du Québec. This portfolio also includes the expenditures of other health-related government bodies, such as Héma-Québec.
Before taking into account COVID-19 support and recovery measures, Santé et Services sociaux portfolio expenditures will amount to $51.0 billion in 2021-2022, $54.2 billion in 2022-2023 and $56.7 billion in 2023-2024. They represent roughly 42% of total portfolio expenditures.
| — | The 10.0% growth in expenditures in 2021-2022 is due in particular to the improvement in working conditions and implementation of initiatives to increase the supply of public home-support services by hiring additional resources, and strengthen care and accommodation services by adding more beds and spaces while awaiting the opening of seniors’ homes. |
| — | Expenditure will grow by 6.3% in 2022-2023 and 4.5% in 2023-2024. |
From 2021-2022 to 2023-2024, the Santé et Services sociaux portfolio will grow by an average of 6.9% per year.
Support and recovery measures for the Santé et Services sociaux portfolio will amount to $7.2 billion in 2021-2022, $1.6 billion in 2022-2023 and $368 million in 2023-2024. They consist mainly of measures to overcome the health crisis.
TABLE I.20
Expenditures of the Santé et Services sociaux portfolio
(millions of dollars)
| 2021-2022 | 2022-2023 | 2023-2024 | AAGR(1) | |||||||||||||
| Regular expenditures in Santé et Services sociaux | 51 041 | 54 247 | 56 683 | |||||||||||||
| % change | 10.0 | 6.3 | 4.5 | 6.9 | ||||||||||||
| COVID-19 support and recovery measures | 7 185 | 1 595 | 368 | |||||||||||||
| Total expenditures in Santé et services sociaux | 58 226 | 55 842 | 57 051 | |||||||||||||
| % change | 6.4 | -4.1 | 2.2 | 1.4 | ||||||||||||
| (1) | Average annual growth rate, corresponding to the geometric mean over three years, from 2021-2022 to 2023-2024. |
| Budget 2022-2023 | |
| I.45 | Budget Plan |
| ☐ | Éducation |
The expenditures of the Éducation portfolio are primarily devoted to the activities of preschool, primary and secondary education institutions. This portfolio also includes programs to promote recreation and sports, and programs associated with the status of women.
Before taking into account COVID-19 support and recovery measures, Éducation portfolio expenditures will amount to $18.1 billion in 2021-2022, $19.1 billion in 2022-2023 and $19.8 billion in 2023-2024. Spending for this portfolio represents roughly 15% of total portfolio expenditures.
| — | The 8.6% growth in expenditures in 2021-2022 is mainly due to the resumption of certain activities in school service centres and school boards that were limited or cancelled in 2020-2021, and Budget 2021-2022 investments, in particular to provide better support for the school network. |
| — | The 5.4% growth in expenditures in 2022-2023 is mainly due to the initiatives in March 2022, particularly the initiative to enhance the tutoring program. |
| — | In 2023-2024, Éducation portfolio spending will grow by 4.0%. |
From 2021-2022 to 2023-2024, average annual growth of the Éducation portfolio will reach 6.0%.
Support and recovery measures for the Éducation portfolio will total $185 million in 2021-2022 and $60 million in 2022-2023. They consist mainly of measures aimed at increasing support for students and helping get Quebecers back into the labour market.
TABLE I.21
Expenditures of the Éducation portfolio
(millions of dollars)
| 2021-2022 | 2022-2023 | 2023-2024 | AAGR(1) | |||||||||||||
| Regular expenditures in Éducation | 18 084 | 19 060 | 19 819 | |||||||||||||
| % change | 8.6 | 5.4 | 4.0 | 6.0 | ||||||||||||
| COVID-19 support and recovery measures | 185 | 60 | — | |||||||||||||
| Total expenditures in Éducation | 18 268 | 19 120 | 19 819 | |||||||||||||
| % change | 7.9 | 4.7 | 3.7 | 5.4 | ||||||||||||
| (1) | Average annual growth rate, corresponding to the geometric mean over three years, from 2021-2022 to 2023-2024. |
| Québec’s Financial | |
| Situation | I.46 |
| ☐ | Enseignement supérieur |
The expenditures of the Enseignement supérieur portfolio are primarily devoted to the activities of educational institutions at the college or university level. This portfolio also includes student financial assistance.
Before taking into account COVID-19 support and recovery measures, Enseignement supérieur portfolio expenditures will amount to $8.9 billion in 2021-2022, $10.1 billion in 2022-2023 and $10.4 billion in 2023-2024. Spending for this portfolio represents roughly 8% of total portfolio expenditures.
| — | The 10.0% growth in expenditures in 2021-2022 is mainly due to the resumption of certain activities in higher education institutions that were limited or cancelled in 2020-2021, an increase in infrastructure projects in 2021-2022, and Budget 2021-2022 investments, particularly to support student retention and graduation in higher education. |
| — | The 13.1% growth in expenditures in 2022-2023 is mainly due to the introduction of Québec Perspective scholarships, Budget 2022-2023 initiatives and the enhancement of the student financial assistance program. |
| — | In 2023-2024, Enseignement supérieur portfolio spending will grow by 3.7%. |
From 2021-2022 to 2023-2024, the Enseignement supérieur portfolio will grow by an average of 8.9% per year.
Pandemic-related support and recovery measures for the Enseignement supérieur portfolio will amount to $230 million in 2021-2022 and $72 million in 2022-2023. They mainly consist of measures aimed at alleviating the financial burden on students during the pandemic.
TABLE I.22
Expenditures of the Enseignement supérieur portfolio
(millions of dollars)
| 2021-2022 | 2022-2023 | 2023-2024 | AAGR(1) | |||||||||||||
| Regular expenditures in Enseignement supérieur | 8 903 | 10 069 | 10 447 | |||||||||||||
| % change(2) | 10.0 | 13.1 | 3.7 | 8.9 | ||||||||||||
| COVID-19 support and recovery measures | 230 | 72 | — | |||||||||||||
| Total expenditures in Enseignement supérieur | 9 133 | 10 141 | 10 447 | |||||||||||||
| % change | 9.6 | 11.0 | 3.0 | 7.8 | ||||||||||||
| (1) | Average annual growth rate, corresponding to the geometric mean over three years, from 2021-2022 to 2023-2024. |
| (2) | Excluding the Québec Perspective scholarships that will become available in September 2022, the 2022-2023 growth rate of the Enseignement supérieur portfolio will be 8.8%. |
| Budget 2022-2023 | |
| I.47 | Budget Plan |
| ☐ | Other portfolios |
The expenditures of other portfolios include the expenditures of all the portfolios other than the Santé et Services sociaux, Éducation and Enseignement supérieur portfolios. They provide government funding for, in particular, the cultural sector, the transportation and childcare services sectors, as well as support for individuals, municipalities and businesses.
Before taking into account COVID-19 support and recovery measures, other portfolio expenditures will amount to $43.8 billion in 2021-2022, $44.4 billion in 2022-2023 and $44.9 billion in 2023-2024. These expenditures represent roughly 35% of total portfolio expenditures, including more than 1% for the Culture et Communications portfolio.
| — | The strong growth in expenditures of 25.3% in 2021-2022 is mainly due to: |
| — | the gradual resumption of government activities, which were slowed in 2020-2021; |
| — | the initiatives from the fall 2021 update and Budget 2022-2023, particularly the implementation of the extraordinary cost of living allowance and one-time cost of living amount, and the development of childcare services; |
| — | the deployment of the Plan for a Green Economy and the implementation of social housing projects. |
| — | Low growth in 2022-2023 is primarily due to the non-recurrence of the extraordinary cost of living allowance and the one-time cost of living amount. |
| — | Low growth in 2023-2024 is mainly due to the end of the second agreement with the federal government on the Rapid Housing Initiative, non-recurrence of support for improving the local road network and public transit, and the end of the funding to connect all Quebecers to high-speed Internet. |
| — | Excluding the primary exceptional factors, growth in expenditures in 2023-2024 would be 2.7%.19 |
From 2021-2022 to 2023-2024, other portfolios will grow by an average of 8.6% per year.
Pandemic-related support and recovery measures for other portfolios will stand at $1.4 billion in 2021-2022, $628 million in 2022-2023 and $94 million in 2023-2024. They mainly consist of measures aimed at stimulating economic growth and supporting workers and businesses.
| 19 | Forecasts for other portfolios excluding the effect of exceptional factors are presented on page I.51. |
| Québec’s Financial | |
| Situation | I.48 |
TABLE I.23
Expenditures of other portfolios
(millions of dollars)
| 2021-2022 | 2022-2023 | 2023-2024 | AAGR(1) | |||||||||||||
| Regular expenditures of other portfolios | 43 847 | 44 413 | 44 851 | |||||||||||||
| % change | 25.3 | 1.3 | 1.0 | 8.6 | ||||||||||||
| Support and recovery measures | 1 443 | 628 | 94 | |||||||||||||
| Expenditures of other portfolios | 45 290 | 45 041 | 44 945 | |||||||||||||
| % change | 15.8 | -0.6 | -0.2 | 4.7 | ||||||||||||
| (1) | Average annual growth rate, corresponding to the geometric mean over three years, from 2021-2022 to 2023-2024. |
| Budget 2022-2023 | |
| I.49 | Budget Plan |
The effect of exceptional factors on
growth in portfolio expenditures
Growth in expenditures for other portfolios amounts to 1.3% for 2022-2023 and 1.0% for 2023-2024. This low growth is due to a variety of items generating one-time variances, including the extraordinary cost of living allowance and one-time cost of living amount in 2021-2022, as well as increased federal government funding for housing infrastructure and support for local road improvements and public transit in 2022-2023.
Excluding the primary exceptional factors in other portfolios, growth amounts to 6.3% in 2022-2023 and 2.7% in 2023-2024.
Exceptional factors in other portfolios
(millions of dollars)
| 2021-2022 | 2022-2023 | 2023-2024 | ||||||||||
| Other portfolios | 43 847 | 44 413 | 44 851 | |||||||||
| % change | 25.3 | 1.3 | 1.0 | |||||||||
| LESS: | ||||||||||||
| Change in application of the accounting standard respecting transfer payments | 372 | 1 306 | 1 409 | |||||||||
| One-time cost of living amount – Budget 2022-2023 | 2 998 | 195 | — | |||||||||
| Extraordinary cost of living allowance – November 2021 | 740 | — | — | |||||||||
| Housing infrastructure funded by the federal government(1) | 460 | 658 | 442 | |||||||||
| Municipal infrastructure funded by the federal government | 765 | 984 | 1 065 | |||||||||
| Support for local road and public transit improvements – November 2021 | — | 220 | — | |||||||||
| Investments to set up high-speed Internet in all regions | 100 | 228 | — | |||||||||
| Subtotal – Primary exceptional factors | 5 435 | 3 591 | 2 917 | |||||||||
| OTHER PORTFOLIOS AFTER SUBTRACTING THE PRIMARY EXCEPTIONAL FACTORS | 38 412 | 40 822 | 41 935 | |||||||||
| % change | 6.3 | 2.7 | ||||||||||
| (1) | Includes, in particular, the Rapid Housing Initiative. |
| Québec’s Financial | |
| Situation | I.50 |
| 2.2.2 | Debt service |
Debt service consists of interest on the direct debt as well as interest on the liability for the retirement plans and other future benefits of public and parapublic sector employees.
Debt service changes primarily according to the level of debt, interest rates and the return on the Retirement Plans Sinking Fund (RPSF).20 It will stand at $8.4 billion in 2021-2022, $8.8 billion in 2022-2023 and $8.7 billion in 2023-2024, which represents changes of 9.8%, 4.8% and −1.3%, respectively.
In 2021-2022, interest rates began to rise. Together with the increase in debt, this accounts for the 16.0% increase in interest on the direct debt. Note that interest rates had fallen to a historic low in 2020-2021.
In 2022-2023 and 2023-2024, interest on the direct debt will increase by 8.0% and 3.2%, respectively, owing in particular to the anticipated change in interest rates.
However, interest on the liability for the retirement plans and other employee future benefits is decreasing due to the increase in the investment income of the RPSF. The income of the RPSF is applied against debt service.
Over the two-year period from 2021 to 2023, Canadian long-term interest rates are expected to increase by 0.9 percentage point. The debt service forecast incorporates this increase. A greater-than-anticipated rise in interest rates of 1 percentage point over a full year would increase interest expenditure by $553 million in the first year and by more than $1.8 billion in the fifth year.21
| 20 | See page J.33 of the section entitled “The Québec Government’s Debt” for further details on the net liability for the retirement plans and the value of the RPSF as at March 31, 2021. |
| 21 | The sensitivity of debt service to a greater-than-expected increase in interest rates is presented on page J.8 of the section entitled “The Québec Government’s Debt”. |
| Budget 2022-2023 | |
| I.51 | Budget Plan |
TABLE I.24
Change in debt service
(millions of dollars)
| 2021-2022 | 2022-2023 | 2023-2024 | AAGR(1) | |||||||||||||
| Interest on the direct debt(2) | 7 895 | 8 524 | 8 795 | |||||||||||||
| % change | 16.0 | 8.0 | 3.2 | |||||||||||||
| Interest on the liability for retirement plans and other employee future benefits(3) | 546 | 318 | -70 | |||||||||||||
| TOTAL | 8 441 | 8 842 | 8 725 | |||||||||||||
| % change | 9.8 | 4.8 | -1.3 | 4.3 | ||||||||||||
| (1) | Average annual growth rate, corresponding to the geometric mean over three years, from 2021-2022 to 2023-2024. |
| (2) | Interest on the direct debt includes the income of the Sinking Fund for Government Borrowing. This income, which is applied against debt service, consists of interest generated on investments as well as gains and losses on disposal. The forecast for this income may be adjusted upward or downward since it is closely tied to the change in interest rates and market behaviour. |
| (3) | This interest corresponds to the interest on obligations relating to the retirement plans and other future benefits of public and parapublic sector employees, minus mainly the investment income of the RPSF. |
| Québec’s Financial | |
| Situation | I.52 |
| 3. | Public infrastructure investments |
Québec has significant public infrastructure needs. To meet them, the government is announcing an increase of $7.5 billion over 10 years under the 2022-2032 Québec Infrastructure Plan (QIP).
| — | The 2022-2032 QIP therefore amounts to $142.5 billion, or a little over $14 billion per year on average. |
| — | Over the past four years, the QIP has been increased each year, going from $100.4 billion in March 2018 to $142.5 billion in March 2022. |
The 2022-2032 QIP allocates considerable sums to health and social services ($22.8 billion), education and higher education ($28.3 billion), public transit ($14.7 billion)22 and road maintenance ($30.7 billion).23
CHART I.3 |
| (billions of dollars) |
|
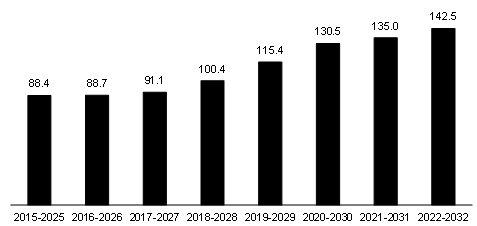
| 22 | These investments include those forecast in the central envelope. |
| 23 | The Secrétariat du Conseil du trésor’s 2022-2023 Expenditure Budget provides detailed information on planned investments by sector. |
| Québec’s Financial | |
| Situation | I.53 |
☐ | Annual investments of over $14 billion on average |
Annual investments in public infrastructure will stand at an average of a little over $14 billion per year over the next 10 years.
Investments of $80 billion are planned over the next five years, representing 56% of the 2022-2032 QIP.
These record investments will contribute to increasing Québec’s economic potential in the long term.
| CHART I.4 Annual investments in the 2022-2032 Québec Infrastructure Plan |
| (billions of dollars) |
|
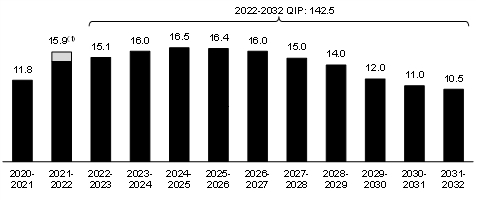
| (1) | The investments for 2021-2022 include $1.4 billion in financial assistance advance payments for infrastructure. Source: Secrétariat du Conseil du trésor. |
| Budget 2022-2023 | |
| I.54 | Budget Plan |
| ☐ | A significant share of the QIP allocated to public infrastructure maintenance |
Continued significant investments are necessary to maintain public infrastructure in good condition. Many public infrastructures are aging and require renovation.
A share of the 2022-2032 QIP investments, representing 59%,24 will be used for asset maintenance, addressing the asset maintenance deficit and asset replacement. New infrastructure will account for 41% of the investments.
CHART I.5 |
| (per cent) |
|
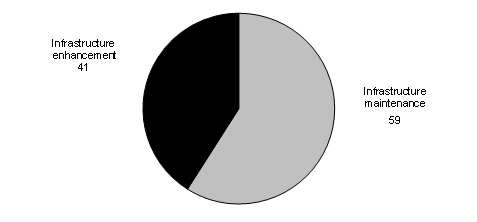
Source: Secrétariat du Conseil du trésor.
| 24 | This share excludes the central envelope. |
| Québec’s Financial | |
| Situation | I.55 |
| ☐ | Federal investments must be complementary to Québec’s investments |
The development and sustainability of public infrastructure hinges on long-term planning. In this context, the government updates the QIP on an annual basis to respond to Quebecers’ needs and specific characteristics.
To be fully effective, federal funding must be aligned with this logic and must complement Québec’s investments as provided for in the QIP. It must also be increased and be more stable and predictable. In addition, it is essential that Québec retain full control over planning and prioritizing infrastructure projects in its territory.
Québec is asking the federal government to be a true partner in terms of funding infrastructure. Therefore, Québec is requesting its fair share of federal funds and that they be transferred as a block to respect its autonomy and jurisdiction. Québec could then distribute these funds according to its priorities.
| Budget 2022-2023 | |
| I.56 | Budget Plan |
| Appendix 1: | Forecast expenditure by portfolio |
Portfolio expenditures stand at $130.9 billion in 2021-2022 and $130.1 billion in 2022-2023.
TABLE I.25
Expenditure by departmental portfolio including COVID-19 support and recovery measures
(millions of dollars)
| 2021-2022 | 2022-2023 | |||||||
| National Assembly | 144 | 167 | ||||||
| Persons appointed by the National Assembly | 123 | 238 | ||||||
| Affaires municipales et Habitation | 3 848 | 3 884 | ||||||
| Agriculture, Pêcheries et Alimentation | 1 260 | 1 358 | ||||||
| Conseil du trésor et Administration gouvernementale | 3 449 | 4 752 | ||||||
| Conseil exécutif | 785 | 953 | ||||||
| Culture et Communications | 1 705 | 1 773 | ||||||
| Cybersécurité et Numérique | 189 | 663 | ||||||
| Économie et Innovation | 3 636 | 3 617 | ||||||
| Éducation | 18 268 | 19 120 | ||||||
| Énergie et Ressources naturelles | 671 | 830 | ||||||
| Enseignement supérieur | 9 133 | 10 141 | ||||||
| Environnement et Lutte contre les changements climatiques | 1 976 | 1 935 | ||||||
| Famille | 7 430 | 7 909 | ||||||
| Finances | 6 649 | 4 415 | ||||||
| Forêts, Faune et Parcs | 1 191 | 1 115 | ||||||
| Immigration, Francisation et Intégration | 381 | 666 | ||||||
| Justice | 1 432 | 1 501 | ||||||
| Relations internationales et Francophonie | 161 | 137 | ||||||
| Santé et Services sociaux | 58 226 | 55 842 | ||||||
| Sécurité publique | 2 275 | 2 305 | ||||||
| Tourisme | 427 | 487 | ||||||
| Transports | 6 961 | 6 481 | ||||||
| Travail, Emploi et Solidarité sociale | 6 249 | 5 535 | ||||||
| Inter-portfolio eliminations | −5 652 | −5 680 | ||||||
| TOTAL | 130 917 | 130 144 | ||||||
Note: Totals may not add due to rounding.
| Québec’s Financial | |
| Situation | I.57 |
| ☐ | Expenditure by portfolio after inter-portfolio eliminations |
Starting in 2022-2023, accountability for expenditures will no longer be carried out by mission but by portfolio.
The forecasts by portfolio presented in the budget correspond to government investments in various activity sectors. The expenditure level presented also provides an additional budget management tool that helps hold public decision-makers accountable for their entire departmental portfolio.
However, in order to ensure that the presentation of budget forecasts is consistent with that of the Public Accounts, which is governed by accounting standards, the following table presents portfolio expenditures after inter-portfolio eliminations have been allocated.
| — | Inter-portfolio eliminations result from the elimination of reciprocal transactions between entities in different portfolios. |
Expenditures after the distribution of inter-portfolio eliminations will be used as a baseline when preparing the 2022-2023 and subsequent public accounts.
| Budget 2022-2023 | |
| I.58 | Budget Plan |
TABLE I.26
| Expenditures by departmental portfolio after inter-portfolio eliminations – 2022-2023 | ||||||||||||
| (millions of dollars) | ||||||||||||
| ||||||||||||
| Expenditures before distribution of inter-portfolio eliminations | Inter-portfolio eliminations | Expenditures after distribution of inter-portfolio eliminations | ||||||||||
| National Assembly | 167 | -11 | 156 | |||||||||
| Persons appointed by the National Assembly | 238 | -6 | 232 | |||||||||
| Affaires municipales et Habitation | 3 884 | -51 | 3 833 | |||||||||
| Agriculture, Pêcheries et Alimentation | 1 358 | -51 | 1 307 | |||||||||
| Conseil du trésor et Administration gouvernementale | 4 752 | -131 | 4 621 | |||||||||
| Conseil exécutif | 953 | -28 | 925 | |||||||||
| Culture et Communications | 1 773 | -57 | 1 716 | |||||||||
| Cybersécurité et Numérique | 663 | -11 | 652 | |||||||||
| Économie et Innovation | 3 617 | -233 | 3 384 | |||||||||
| Éducation | 19 120 | -676 | 18 444 | |||||||||
| Énergie et Ressources naturelles | 830 | -466 | 364 | |||||||||
| Enseignement supérieur | 10 141 | -170 | 9 971 | |||||||||
| Environnement et Lutte contre les changements climatiques | 1 935 | -324 | 1 611 | |||||||||
| Famille | 7 909 | -40 | 7 869 | |||||||||
| Finances | 4 415 | -426 | 3 989 | |||||||||
| Forêts, Faune et Parcs | 1 115 | -62 | 1 053 | |||||||||
| Immigration, Francisation et Intégration | 666 | -51 | 615 | |||||||||
| Justice | 1 501 | -187 | 1 314 | |||||||||
| Relations internationals et Francophonie | 137 | -11 | 126 | |||||||||
| Santé et Services sociaux | 55 842 | −1 710 | 54 132 | |||||||||
| Sécurité publique | 2 305 | -432 | 1 873 | |||||||||
| Tourisme | 487 | -11 | 476 | |||||||||
| Transports | 6 481 | -170 | 6 311 | |||||||||
| Travail, Emploi et Solidarité sociale | 5 535 | -364 | 5 171 | |||||||||
| Inter-portfolio eliminations | −5 680 | 5 680 | — | |||||||||
| TOTAL | 130 144 | — | 130 144 | |||||||||
Note: Totals may not add due to rounding.
| Québec’s Financial | |
| Situation | I.59 |
Appendix 2: Supplementary information
The digital dissemination of content reflects the department’s desire to improve messages addressed to the public by using electronic documents that can be viewed on a smartphone, tablet or computer.
The Ministère des Finances is promoting the transition to digital documents. Therefore, certain supplementary budgetary information is presented only on the department’s website, including:
| — | Budget by the Numbers, which presents the main budgetary and economic data in tables and interactive charts; |
| ��� | sensitivity analyses, the main risks to Québec’s financial position and prudence factors; |
| — | the government’s net financial surpluses or requirements. |
This supplementary information is available on the Ministère des Finances website. To consult it, visit the Budget 2022-2023 documents page at:
www.budget.finances.gouv.qc.ca/budget/2022-2023 |
| Budget 2022-2023 | |
| I.60 | Budget Plan |