Exhibit 99.16
Section J
The QuÉbec government’s debt
| Summary | J.2 | ||
| 1. | Québec’s debt | J.3 | |
| 1.1 | Different concepts of debt | J.3 | |
| 1.2 | Gross debt | J.4 | |
| 1.3 | Net debt | J.10 | |
| 1.4 | Debt representing accumulated deficits | J.14 | |
| 1.5 | Generations Fund | J.16 | |
| 1.6 | Debt reduction targets | J.18 | |
| 2. | Financing | J.21 | |
| 2.1 | Financing program | J.21 | |
| 2.2 | Borrowings contracted in 2021-2022 | J.23 | |
| 2.3 | Debt management strategy | J.26 | |
| 2.4 | Yield on Québec’s debt securities | J.29 | |
| 3. | Information on retirement plans and on funds deposited by the Ministère des Finances with the Caisse de dépôt et placement du Québec | J.30 | |
| 3.1 | Net liability for retirement plans | J.30 | |
| 3.2 | Returns on funds deposited with the Caisse de dépôt et placement du Québec | J.32 | |
| 4. | Credit ratings | J.35 | |
| 4.1 | Québec’s credit ratings | J.35 | |
| 4.2 | Comparison of the credit ratings of Canadian provinces | J.36 | |
J.1

Summary
As at March 31, 2022, the gross debt will stand at $215.3 billion, or 43.1% of GDP. Thanks to the strong economic recovery, the debt burden is again declining and is equivalent to its pre-pandemic level.
| — | This is a 3.7-percentage-point decrease, as against 46.8% of GDP a year previously. |
Deposits in the Generations Fund help to reduce the debt and thus to improve intergenerational fairness. Therefore, the government will maintain its deposits in the Generations Fund.
| — | In 2022-2023, deposits in the Generations Fund will stand at $3.4 billion, including nearly $800 million in investment income. |
The Act to reduce the debt and establish the Generations Fund stipulates that, for fiscal 2025-2026, gross debt must not exceed 45% of GDP, while the debt representing accumulated deficits must not exceed 17% of GDP.
| — | The objective for the gross debt-to-GDP ratio will be met. This ratio will stand at 41.9% of GDP as at March 31, 2026, which is below the 45% objective. |
| — | The objective for debt representing accumulated deficits to GDP will not be met. It is expected to stand at 19.2% as at March 31, 2026, a gap of 2.2 percentage points compared to the 17% objective. |
The government intends to propose changes to the Act to reduce the debt and establish the Generations Fund in Budget 2023-2024. A new debt reduction objective covering the next 10 or 15 years will then be set. The target will need to consider the challenges facing Québec now and those it will face in the
coming years. Like Ontario and other provinces, Québec could focus its reporting on net debt, which is also a concept used by the OECD and IMF. Reducing the debt burden remains a priority for the government.
Reducing the debt will bring substantial benefits in the form of a positive contribution to economic growth through the creation of a climate of confidence conducive to private investment and higher productivity. It will allow Québec to ensure stable funding for the government’s main missions, such as health and education.
Thus, pending the setting of a new debt target, the government intends to pursue a gradual reduction of the debt burden beyond 2025-2026.
| Budget 2022-2023 | |
| J.2 | Budget Plan |
| 1. | QuÉbec’s debt |
| 1.1 | Different concepts of debt |
A number of different concepts of debt are used to measure a government’s indebtedness.
| — | Gross debt corresponds to the debt on financial markets, plus the commitments made with regard to the retirement plans of government employees. The balance of the Generations Fund is subtracted from gross debt. |
| — | Net debt corresponds to the government’s liabilities as a whole, minus its financial assets. A number of other provinces use this concept to present the change in their debt.1 |
| — | As at March 31, 2022, Québec’s net debt will stand at $199.0 billion, or 39.8% of GDP. |
| — | Debt representing accumulated deficits corresponds to the difference between the government’s assets and liabilities. It is the debt that does not correspond to any assets. This is the concept that the federal government uses to present the change in its debt. |
TABLE J.1
Québec government debt as at March 31 according to various concepts
| (millions of dollars) | ||||||||||||
| 2021 | 2022 | 2023 | ||||||||||
| GROSS DEBT(1) | 210 072 | 215 273 | 228 319 | |||||||||
| % of GDP | 46.8 | 43.1 | 42.9 | |||||||||
| Less: Financial assets, net of other liabilities(2) | −19 827 | −16 285 | −21 647 | |||||||||
| NET DEBT | 190 245 | 198 988 | 206 672 | |||||||||
| % of GDP | 42.4 | 39.8 | 38.8 | |||||||||
| Less: Non-financial assets | −81 517 | −86 363 | −91 042 | |||||||||
| DEBT REPRESENTING ACCUMULATED DEFICITS | 108 728 | 112 625 | 115 630 | |||||||||
| % of GDP | 24.2 | 22.5 | 21.7 | |||||||||
| (1) | The gross debt excludes pre-financing and takes into account the sums accumulated in the Generations Fund. |
| (2) | Financial assets include, in particular, investments in government enterprises (e.g., Hydro-Québec) and accounts receivable, minus other liabilities (e.g., accounts payable). |
| 1 | The OECD and the IMF compare countries’ debt using, in particular, their net debt. |
| The Québec | |
| Government’s Debt | J.3 |
| 1.2 | Gross debt |
Gross debt corresponds to the amount of debt contracted on financial markets (consolidated direct debt) plus the net liability for the pension plans and other future benefits of public and parapublic sector employees, minus the balance of the Generations Fund.
The gross debt burden will stand at 43.1% of GDP as at March 31, 2022, which is below the 45% objective set out in the Act to reduce the debt and establish the Generations Fund. The gross debt-to-GDP ratio is expected to continue to decline gradually over the coming years, to 41.2% as at March 31, 2027.
Furthermore, as of 2025-2026, sums accumulated in the Retirement Plans Sinking Fund (RPSF) to cover the retirement benefits of government employees are projected to exceed the government’s liability in that regard.
| — | Thus, the government will be in a net asset position with regard to retirement plans and other employee future benefits. |
| — | In the coming years, the government will be able to use the assets of the RPSF to pay the retirement benefits of its employees, which will reduce its borrowing requirements. |
TABLE J.2
Gross debt as at March 31
| (millions of dollars) | ||||||||||||||||||||||||||||
| 2021 | 2022 | 2023 | 2024 | 2025 | 2026 | 2027 | ||||||||||||||||||||||
| Consolidated direct debt | 209 916 | 221 531 | 241 062 | 255 203 | 268 097 | 280 682 | 291 626 | |||||||||||||||||||||
| Plus: Retirement plans and other employee future benefits(1) | 12 368 | 9 411 | 6 371 | 2 755 | 167 | −2 038 | −3 619 | |||||||||||||||||||||
| Less: Generations Fund | −12 212 | −15 669 | −19 114 | −23 049 | −27 429 | −32 051 | −37 005 | |||||||||||||||||||||
| GROSS DEBT | 210 072 | 215 273 | 228 319 | 234 909 | 240 835 | 246 593 | 251 002 | |||||||||||||||||||||
| % of GDP | 46.8 | 43.1 | 42.9 | 42.7 | 42.3 | 41.9 | 41.2 | |||||||||||||||||||||
| (1) | A positive entry represents a net liability while a negative entry represents a net asset. |
| Budget 2022-2023 | |
| J.4 | Budget Plan |
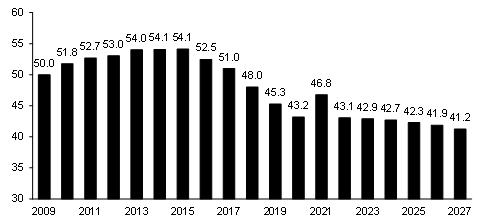
| q | A reduction in the debt burden as of 2021-2022 |
During the five years leading up to the pandemic, strong economic performance, fiscal consolidation and deposits in the Generations Fund contributed to a gradual reduction of the debt as a proportion of GDP.
Despite the substantial increase in debt in 2020-2021 due to the pandemic, the gross debt-to-GDP ratio will decrease as of 2021-2022, thanks to the strong economic recovery.
| — | As at March 31, 2022, the gross debt burden will stand at 43.1% of GDP, as against 46.8% a year previously, that is, a 3.7-percentage-point decrease. |
| — | The gross debt ratio will be equivalent to its pre-pandemic level of 43.2% of GDP as at March 31, 2020. |
In the coming years, the debt burden will decline gradually thanks to economic growth, an improved financial situation and deposits in the Generations Fund.
| — | The gross debt burden will stand at 41.2% of GDP as at March 31, 2027. |
CHART J.1
Change in gross debt as at March 31 |
| (percentage of GDP) |
 |
| The Québec | |
| Government’s Debt | J.5 |
The proportion of revenue devoted to
debt service will remain at historically low levels
The proportion of revenue devoted to debt service will remain at historically low levels. This is due to the decrease in the debt burden and the fact that the debt has been refinanced at a lower cost in recent years as a result of low interest rates. In 2022-2023, this proportion will stand at 6.4%. It will decrease in subsequent years, to 5.6% in 2026-2027. Debt service is thus growing more slowly than government revenue.
| Debt service |
| (percentage of revenue) |
 |
Sensitivity of debt service to a rise in interest rates
The high level of debt requires prudence and sound management of public finances, because a greater-than-anticipated rise in long-term interest rates would have a substantial impact on the financial framework.
A greater-than-anticipated rise in interest rates of 1 percentage point over a full year would increase interest expenditure by $553 million in the first year and by more than $1.8 billion in the fifth year.
The impact will increase, since only part of the debt needs to be refinanced every year. The average maturity of the debt is approximately 11 years.
Such a rise in interest rates as of 2022-2023 would increase the proportion of revenue devoted to debt service to 6.8% in 2026-2027, as against the currently anticipated ratio of 5.6%.
Impact on interest expenditure of a 100-basis-point-rise in interest rates
| (millions of dollars) | ||||||||||||||||||||
| 1st year | 2nd year | 3rd year | 4th year | 5th year | ||||||||||||||||
| Impact | 553 | 956 | 1 281 | 1 546 | 1 844 | |||||||||||||||
| Budget 2022-2023 | |
| J.6 | Budget Plan |
| q | Downward adjustments to gross debt compared with the March 2021 budget |
Gross debt as at March 31, 2026, has been adjusted downward by $11.8 billion compared with the March 2021 budget, falling from $258.4 billion to $246.6 billion. This downward adjustment is mainly due to lower deficits as a result of the strong economic recovery.
As a percentage of GDP, the gross debt burden as at March 31, 2026, has been adjusted downward by 5.1 percentage points, falling from 47.0% to 41.9%. This downward adjustment is mainly due to stronger-than-anticipated economic growth.
TABLE J.3
Adjustments to gross debt as at March 31 since the March 2021 budget
| (millions of dollars) | ||||||||||||||||||||||||
| 2021 | 2022 | 2023 | 2024 | 2025 | 2026 | |||||||||||||||||||
| March 2022 | 210 072 | 215 273 | 228 319 | 234 909 | 240 835 | 246 593 | ||||||||||||||||||
| % of GDP | 46.8 | 43.1 | 42.9 | 42.7 | 42.3 | 41.9 | ||||||||||||||||||
| March 2021 | 218 957 | 230 314 | 242 041 | 250 756 | 254 884 | 258 424 | ||||||||||||||||||
| % of GDP | 49.5 | 49.2 | 48.8 | 48.7 | 47.9 | 47.0 | ||||||||||||||||||
| Adjustments | −8 885 | −15 041 | −13 722 | −15 847 | −14 049 | −11 831 | ||||||||||||||||||
| % of GDP | -2.7 | -6.1 | -5.9 | -6.0 | -5.6 | -5.1 | ||||||||||||||||||
| The Québec | |
| Government’s Debt | J.7 |
TABLE J.4
Factors responsible for the change in the Québec government’s gross debt
| (millions of dollars) | ||||||||||||||||||||||||||||||||||||
| Debt, beginning of year | Budgetary deficit (surplus) | Investments, loans and advances | Net capital investments(1) | Other factors(2) | Deposits in the Generations Fund | Total change | Debt, end of year | % of GDP | ||||||||||||||||||||||||||||
| 2017-2018 | 203 490 | -721 | 431 | 2 173 | −2 009 | −2 293 | −2 419 | 201 071 | 48.0 | |||||||||||||||||||||||||||
| 2018-2019 | 201 071 | −4 413 | -250 | 3 002 | 3 165 | −3 477 | −1 973 | 199 098 | 45.3 | |||||||||||||||||||||||||||
| 2019-2020 | 199 098 | 523 | 402 | 3 737 | −2 362 | −2 606 | -306 | 198 792 | 43.2 | |||||||||||||||||||||||||||
| 2020-2021 | 198 792 | 7 539 | 6 352 | 4 351 | −3 649 | −3 313 | 11 280 | 210 072 | 46.8 | |||||||||||||||||||||||||||
| 2021-2022 | 210 072 | 7 354 | -491 | 4 846 | −3 051 | −3 457 | 5 201 | 215 273 | 43.1 | |||||||||||||||||||||||||||
| 2022-2023 | 215 273 | 6 450 | 3 721 | 4 679 | 1 641 | −3 445 | 13 046 | 228 319 | 42.9 | |||||||||||||||||||||||||||
| 2023-2024 | 228 319 | 3 900 | 2 538 | 4 878 | -791 | −3 935 | 6 590 | 234 909 | 42.7 | |||||||||||||||||||||||||||
| 2024-2025 | 234 909 | 3 750 | 2 623 | 5 229 | −1 296 | −4 380 | 5 926 | 240 835 | 42.3 | |||||||||||||||||||||||||||
| 2025-2026 | 240 835 | 3 000 | 2 002 | 5 424 | -46 | −4 622 | 5 758 | 246 593 | 41.9 | |||||||||||||||||||||||||||
| 2026-2027 | 246 593 | 2 750 | 1 345 | 4 933 | 335 | −4 954 | 4 409 | 251 002 | 41.2 | |||||||||||||||||||||||||||
| (1) | Investments made under public-private partnership agreements are included in net capital investments. |
| (2) | Other factors include, in particular, the change in other accounts, such as accounts receivable and accounts payable. |
| Budget 2022-2023 | |
| J.8 | Budget Plan |
Net capital investments
Net capital investments consist of the government’s gross investments minus depreciation expenses.
Even though gross investments have an impact on gross debt, net capital investments are presented in the factors responsible for the change in the gross debt due to the fact that depreciation expenses are included in the budgetary balance.
From 2022-2023 to 2026-2027, net capital investments will increase gross debt by $5.0 billion per year on average.
Net capital investments
| (millions of dollars) | ||||||||||||||||||
| 2021-2022 | 2022-2023 | 2023-2024 | 2024-2025 | 2025-2026 | 2026-2027 | |||||||||||||
| Gross investments(1) | 9 470 | 9 511 | 9 921 | 10 559 | 11 030 | 10 931 | ||||||||||||
| Less: Depreciation | −4 624 | −4 832 | −5 043 | −5 330 | −5 606 | −5 998 | ||||||||||||
| Net capital investments | 4 846 | 4 679 | 4 878 | 5 229 | 5 424 | 4 933 |
| (1) | These investments exclude the Québec government’s contribution to the projects of partners (e.g., municipalities), whereas this contribution is included in the annual investments of the Québec Infrastructure Plan and portfolio expenditures. |
Investments, loans and advances
Investments, loans and advances refer to investments made by the government in enterprises, mainly government enterprises.
A government enterprise may also be authorized to keep part of its net earnings.
| – | For example, every year, Hydro-Québec pays the government a dividend corresponding to 75% of its net earnings. Hydro-Québec uses the portion of net earnings not paid to the government (25%) to finance its investments, in hydroelectric dams in particular. |
| – | For the government, this constitutes an investment that creates a financial requirement and thus an increase in gross debt. |
Note that investments, loans and advances may vary from one year to another, particularly because of temporary investments made and redeemed.
| The Québec | |
| Government’s Debt | J.9 |
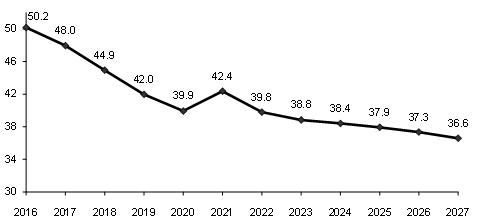
| 1.3 | Net debt |
Net debt corresponds to the government’s liabilities minus its financial assets. A number of other provinces use this concept to present the change in their debt. As at March 31, 2022, Québec’s net debt will stand at $199.0 billion, or 39.8% of GDP.
TABLE J.5
Factors responsible for the change in net debt
| (millions of dollars) | ||||||||||||||||||||||||||||
| Debt, beginning of year | Budgetary deficit (surplus) | Net capital investments | Deposits in the Generations Fund | Total change | Debt, end of year | % of GDP | ||||||||||||||||||||||
| 2021-2022 | 190 245 | 7 354 | 4 846 | −3 457 | 8 743 | 198 988 | 39.8 | |||||||||||||||||||||
| 2022-2023 | 198 988 | 6 450 | 4 679 | −3 445 | 7 684 | 206 672 | 38.8 | |||||||||||||||||||||
| 2023-2024 | 206 672 | 3 900 | 4 878 | −3 935 | 4 843 | 211 515 | 38.4 | |||||||||||||||||||||
| 2024-2025 | 211 515 | 3 750 | 5 229 | −4 380 | 4 599 | 216 114 | 37.9 | |||||||||||||||||||||
| 2025-2026 | 216 114 | 3 000 | 5 424 | −4 622 | 3 802 | 219 916 | 37.3 | |||||||||||||||||||||
| 2026-2027 | 219 916 | 2 750 | 4 933 | −4 954 | 2 729 | 222 645 | 36.6 | |||||||||||||||||||||
After declining gradually over several years, net debt rose to 42.4% of GDP as at March 31, 2021, due to the impact of the public health crisis. The net debt-to-GDP ratio will decrease as of 2021-2022 due to the strong economic recovery. This trend will continue over the coming years. Net debt as a proportion of GDP will reach 36.6% as at March 31, 2027.
CHART J.2
Net debt as at March 31 |
| (percentage of GDP) |
 |
| Budget 2022-2023 | |
| J.10 | Budget Plan |
| q | Downward adjustments to net debt compared with the March 2021 budget |
Net debt as at March 31, 2026, has been adjusted downward by $18.7 billion compared with the March 2021 budget, falling from $238.7 billion to $219.9 billion. This downward adjustment is mainly due to lower deficits as a result of the strong economic recovery.
As a percentage of GDP, the net debt burden as at March 31, 2026, has been adjusted downward by 6.1 percentage points, falling from 43.4% to 37.3%. This downward adjustment is mainly due to stronger-than-anticipated economic growth.
TABLE J.6
Adjustments to net debt as at March 31 since the March 2021 budget
| (millions of dollars) | ||||||||||||||||||||||||
| 2021 | 2022 | 2023 | 2024 | 2025 | 2026 | |||||||||||||||||||
| March 2022 | 190 245 | 198 988 | 206 672 | 211 515 | 216 114 | 219 916 | ||||||||||||||||||
| % of GDP | 42.4 | 39.8 | 38.8 | 38.4 | 37.9 | 37.3 | ||||||||||||||||||
| March 2021 | 199 060 | 213 020 | 223 583 | 230 785 | 235 428 | 238 665 | ||||||||||||||||||
| % of GDP | 45.0 | 45.5 | 45.1 | 44.9 | 44.3 | 43.4 | ||||||||||||||||||
| Adjustments | −8 815 | −14 032 | −16 911 | −19 270 | −19 314 | −18 749 | ||||||||||||||||||
| % of GDP | -2.6 | -5.7 | -6.3 | -6.5 | -6.4 | -6.1 | ||||||||||||||||||
| The Québec | |
| Government’s Debt | J.11 |
| q | Comparison of the net debt of governments in Canada |
As at March 31, 2022, Québec’s net debt burden will be 39.8% of GDP, compared with the provincial average of 33.0%.
The change in application of the accounting standard respecting transfer payments, announced in March 2021, triggered a $13.0-billion increase in net debt as at March 31, 2021.
| — | This change now makes it possible to adequately compare Québec’s net debt burden with that of other provinces. |
CHART J.3
Net debt of governments in Canada as at March 31, 2022 |
| (percentage of GDP) |
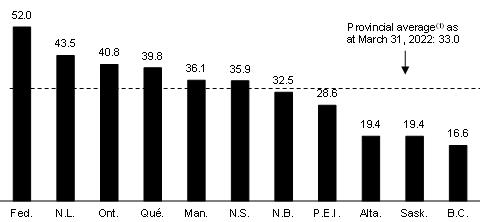 |
| (1) | Average obtained by dividing the sum of provincial debts by the sum of provincial GDPs. Sources: Statistics Canada, governments’ budgets and updates. |
| Budget 2022-2023 | |
| J.12 | Budget Plan |
| 1.4 | Debt representing accumulated deficits |
Debt representing accumulated deficits consists of accumulated deficits figuring in the government’s financial statements. It is the debt that does not correspond to any assets. The federal government uses this concept to present the change in its debt.
As at March 31, 2022, debt representing Québec’s accumulated deficits will stand at $112.6 billion, or 22.5% of GDP.
The debt burden representing accumulated deficits will resume its downward trend as of 2021-2022, reaching 18.3% of GDP as at March 31, 2027.
TABLE J.7
Factors responsible for the change in debt representing accumulated deficits
| (millions of dollars) | ||||||||||||||||||||||||
| Debt, beginning of year | Budgetary deficit (surplus) | Deposits in the Generations Fund | Total change | Debt, end of year | % of GDP | |||||||||||||||||||
| 2021-2022 | 108 728 | 7 354 | −3 457 | 3 897 | 112 625 | 22.5 | ||||||||||||||||||
| 2022-2023 | 112 625 | 6 450 | −3 445 | 3 005 | 115 630 | 21.7 | ||||||||||||||||||
| 2023-2024 | 115 630 | 3 900 | −3 935 | -35 | 115 595 | 21.0 | ||||||||||||||||||
| 2024-2025 | 115 595 | 3 750 | −4 380 | -630 | 114 965 | 20.2 | ||||||||||||||||||
| 2025-2026 | 114 965 | 3 000 | −4 622 | −1 622 | 113 343 | 19.2 | ||||||||||||||||||
| 2026-2027 | 113 343 | 2 750 | −4 954 | −2 204 | 111 139 | 18.3 | ||||||||||||||||||
| The Québec | |
| Government’s Debt | J.13 |
| q | Downward adjustments to debt representing accumulated deficits compared to the March 2021 budget |
Debt representing accumulated deficits as at March 31, 2026, has been adjusted downward by $21.8 billion compared with the March 2021 budget, falling from $135.2 billion to $113.3 billion. This downward adjustment is mainly due to lower deficits as a result of the strong economic recovery.
As a percentage of GDP, the debt burden representing accumulated deficits as at March 31, 2026, has been adjusted downward by 5.4 percentage points, falling from 24.6% to 19.2%. This downward adjustment is mainly due to stronger-than-anticipated economic growth.
TABLE J.8
Adjustments to debt representing accumulated deficits as at March 31 since the March 2021 budget
| (millions of dollars) | ||||||||||||||||||||||||
| 2021 | 2022 | 2023 | 2024 | 2025 | 2026 | |||||||||||||||||||
| March 2022 | 108 728 | 112 625 | 115 630 | 115 595 | 114 965 | 113 343 | ||||||||||||||||||
| % of GDP | 24.2 | 22.5 | 21.7 | 21.0 | 20.2 | 19.2 | ||||||||||||||||||
| March 2021 | 119 605 | 128 775 | 134 067 | 135 990 | 136 281 | 135 156 | ||||||||||||||||||
| % of GDP | 27.1 | 27.5 | 27.0 | 26.4 | 25.6 | 24.6 | ||||||||||||||||||
| Adjustments | −10 877 | −16 150 | −18 437 | −20 395 | −21 316 | −21 813 | ||||||||||||||||||
| % of GDP | -2.9 | -5.0 | -5.3 | -5.4 | -5.4 | -5.4 | ||||||||||||||||||
| Budget 2022-2023 | |
| J.14 | Budget Plan |
Québec’s public sector debt
Public sector debt includes the government’s gross debt as well as the debt of Hydro-Québec, municipalities, universities other than the Université du Québec and its constituents, and other government enterprises. This debt has served, in particular, to fund public infrastructure, such as roads, schools, hospitals, hydroelectric dams and water treatment plants.
As at March 31, 2022, Québec’s public sector debt will stand at $294.0 billion, or 58.8% of GDP. These figures must, however, be put into perspective for they do not take into account the economic value of certain assets held by the government, such as Hydro-Québec, the Société des alcools du Québec and Loto-Québec.
Public sector debt as at March 31
| (millions of dollars) | ||||||||||||||||||||
| 2018 | 2019 | 2020 | 2021 | 2022 | ||||||||||||||||
| Government’s gross debt | 201 071 | 199 098 | 198 792 | 210 072 | 215 273 | |||||||||||||||
| Hydro-Québec | 43 160 | 43 054 | 43 839 | 44 955 | 46 442 | |||||||||||||||
| Municipalities | 27 490 | 28 103 | 29 424 | 30 020 | 30 859 | |||||||||||||||
| Universities other than the Université du Québec and its constituents | 1 321 | 1 458 | 1 639 | 1 452 | 1 452 | |||||||||||||||
| Other government enterprises(1) | 218 | 210 | — | — | — | |||||||||||||||
| PUBLIC SECTOR DEBT | 273 260 | 271 923 | 273 694 | 286 499 | 294 026 | |||||||||||||||
| % of GDP | 65.3 | 61.8 | 59.5 | 63.8 | 58.8 | |||||||||||||||
| (1) | The amounts correspond to the debt of the Financing Fund to finance government enterprises and entities not included in the reporting entity. As of 2020, this debt is included in gross debt. |
| The Québec | |
| Government’s Debt | J.15 |
| 1.5 | Generations Fund |
| q | Deposits in the Generations Fund |
Deposits in the Generations Fund help to reduce the debt2 and thus to improve intergenerational fairness. Therefore, the government will maintain its deposits in the Generations Fund.
| — | In 2022-2023, dedicated revenues in the Generations Fund will stand at $3.4 billion, including nearly $800 million in investment income. |
| — | As at March 31, 2023, the Generations Fund will stand at $19.1 billion. Pursuant to the Act to reduce the debt and establish the Generations Fund, this amount can only be used to repay debt on the financial markets. |
TABLE J.9
Generations Fund
| (millions of dollars) | ||||||||||||||||||||||||
| 2021- 2022 | 2022- 2023 | 2023- 2024 | 2024- 2025 | 2025- 2026 | 2026- 2027 | |||||||||||||||||||
| Book value, beginning of year(1) | 12 212 | 15 669 | 19 114 | 23 049 | 27 429 | 32 051 | ||||||||||||||||||
| Dedicated revenues | ||||||||||||||||||||||||
| Water-power royalties | ||||||||||||||||||||||||
| Hydro-Québec | 755 | 763 | 801 | 830 | 849 | 882 | ||||||||||||||||||
| Private producers | 100 | 107 | 109 | 111 | 113 | 116 | ||||||||||||||||||
| Subtotal | 855 | 870 | 910 | 941 | 962 | 998 | ||||||||||||||||||
| Indexation of the price of heritage electricity | 488 | 535 | 775 | 970 | 1 105 | 1 215 | ||||||||||||||||||
| Additional contribution from Hydro-Québec | 215 | 215 | 215 | 215 | 215 | 215 | ||||||||||||||||||
| Mining revenues | 812 | 484 | 409 | 358 | 375 | 340 | ||||||||||||||||||
| Specific tax on alcoholic beverages | 500 | 500 | 500 | 500 | 500 | 500 | ||||||||||||||||||
| Unclaimed property | 27 | 55 | 171 | 249 | 111 | 109 | ||||||||||||||||||
| Investment income(2) | 560 | 786 | 955 | 1 147 | 1 354 | 1 577 | ||||||||||||||||||
| Total dedicated revenues | 3 457 | 3 445 | 3 935 | 4 380 | 4 622 | 4 954 | ||||||||||||||||||
| BOOK VALUE, END OF YEAR | 15 669 | 19 114 | 23 049 | 27 429 | 32 051 | 37 005 | ||||||||||||||||||
| (1) | For information purposes, as at December 31, 2021, the fair value of the Generations Fund was $16.0 billion, $1.3 billion more than its book value. |
| (2) | The investment income of the Generations Fund corresponds to realized investment income (interest income, dividends, gains on the disposal of assets, etc.). Therefore, the forecast may be adjusted upward or downward according to when the gains or losses are actually realized. An annual return of 4.8% is expected, a rate based on five historic years. |
| 2 | For example, the debt on financial markets is net of the book value of the Generations Fund. |
| Budget 2022-2023 | |
| J.16 | Budget Plan |
Returns of the Generations Fund
Since the first deposit was made in the Generations Fund in January 2007, the return has been higher than the cost of new borrowings by the government 14 years out of 15.
| – | From 2007 to 2021, the average return was 6.3%, while the average cost of new borrowings was 3.1%, which represents a difference of 3.2 percentage points. |
These returns contribute to reducing the debt burden.
Comparison of the Generations Fund’s annual return and the Québec government’s borrowing costs
| (per cent, on a calendar-year basis) | ||||||||||||
Rate of return of the | Cost of new borrowings(1) | Difference (percentage points) | ||||||||||
| 2007 | 5.6 | 4.7 | 0.9 | |||||||||
| 2008 | -22.4 | 4.5 | -26.9 | |||||||||
| 2009 | 11.3 | 4.4 | 6.9 | |||||||||
| 2010 | 12.3 | 4.1 | 8.2 | |||||||||
| 2011 | 4.0 | 3.7 | 0.3 | |||||||||
| 2012 | 8.4 | 3.0 | 5.4 | |||||||||
| 2013 | 12.0 | 3.3 | 8.7 | |||||||||
| 2014 | 11.7 | 3.2 | 8.5 | |||||||||
| 2015 | 8.1 | 2.4 | 5.7 | |||||||||
| 2016 | 7.3 | 2.2 | 5.1 | |||||||||
| 2017 | 8.5 | 2.5 | 6.0 | |||||||||
| 2018 | 4.4 | 2.9 | 1.5 | |||||||||
| 2019 | 9.5 | 2.3 | 7.2 | |||||||||
| 2020 | 7.0 | 1.5 | 5.5 | |||||||||
| 2021 | 11.4 | 1.9 | 9.5 | |||||||||
| (1) | The government’s borrowing costs correspond to the yield on 10-year maturity Québec bonds. Source: PC-Bond for the yield on 10-year maturity Québec bonds. |
| The Québec | |
| Government’s Debt | J.17 |
| 1.6 | Debt reduction targets |
The Act to reduce the debt and establish the Generations Fund was adopted in 2006. By reducing the debt burden, it aims to ensure a prosperous future for next generations.
Under the Act, for fiscal 2025-2026, the gross debt must not exceed 45% of GDP, while the debt representing accumulated deficits must not exceed 17% of GDP. These objectives were established in 2010, because the 2008 financial crisis and changes to government accounting made it impossible to reach the targets set in 2006.
Despite the increase in debt caused by the pandemic, the government expects the objective regarding gross debt to be attained. The gross debt-to-GDP ratio will stand at 41.9% as at March 31, 2026, which is below the 45% objective.
However, the objective for debt representing accumulated deficits will not be met. Currently, the accumulated deficit debt-to-GDP ratio is expected to reach 19.2% as at March 31, 2026, a gap of 2.2 percentage points of GDP or $13.2 billion over the 17% objective.
The difference is due to:
| — | budget deficits caused by the pandemic; |
| — | the government’s decision to comply with the Auditor General of Québec’s recommendation regarding application of the standard respecting transfer payments, which triggered an increase in debt representing accumulated deficits of $13.0 billion as at March 31, 2021. |
CHART J.4
Gross debt as at March 31 | CHART J.5
Debt representing accumulated deficits as at March 31 | |
| (percentage of GDP) | (percentage of GDP) | |
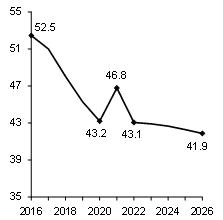 | 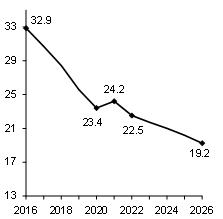 |
| Budget 2022-2023 | |
| J.18 | Budget Plan |
| q | Setting a new objective |
The government intends to propose changes to the Act to reduce the debt and establish the Generations Fund in Budget 2023-2024. A new debt reduction objective covering the next 10 or 15 years will then be set.
The target will need to consider the challenges facing Québec now and those it will face in the coming years. Among these are population aging, GHG reduction and Québec’s needs in terms of public infrastructure. When the Generations Fund was created in 2006, the government set itself the objective of catching up with the Canadian average. As at March 31, 2022, Québec’s net debt burden will be 39.8% of GDP, compared with the provincial average of 33.0%.
Like Ontario and certain other provinces, Québec could focus its reporting on the net debt, which:
| — | takes into account government borrowings arising from substantial capital investments; |
| — | subtracts financial assets that will ultimately be used to reduce the debt on financial markets; |
| — | is readily comparable from one province to another. |
TABLE J.10
Change factors that affect each debt concept
| Gross debt | Net debt | Debt representing accumulated deficits | |
| The budgetary balance (including deposits in the Generations Fund) has an impact on all three concepts of debt (a surplus reduces the debt, while a deficit increases it) | ✓ | ✓ | ✓ |
| Capital investments lead to an increase in gross debt and net debt | ✓ | ✓ | |
| The government’s investments, loans and advances affect only the gross debt (they have no impact on the net debt because the government owns financial assets in exchange; these assets will ultimately be used to reduce the debt on financial markets) | ✓ |
Reducing the debt burden remains a priority for the government. Pending the setting of a new debt target, the government intends to pursue a gradual reduction of the debt burden beyond 2025-2026.
| The Québec | |
| Government’s Debt | J.19 |
| q | The benefits of reducing the debt burden |
Reducing the debt burden contributes to economic growth by creating a climate of confidence conducive to private investment and higher productivity.
In addition to contributing to collective prosperity, reducing the debt burden will allow Québec to:
| — | contribute to intergenerational fairness; |
| — | ensure stable funding for the government’s main missions, including health and education; |
| — | cope with the costs associated with an aging population; |
| — | implement measures to fight climate change; |
| — | fund investment in public infrastructure; |
| — | ease the tax burden on Quebecers; |
| — | counter a potential future economic downturn; |
| — | increase its financial autonomy within the federation. |
The importance of setting a long-term objective
Setting a long-term debt reduction objective is an excellent way to ensure sound management of public finances. Since the government is accountable for reporting to parliamentarians and citizens year after year, it makes government action more transparent and efficient.
This long-term orientation reduces uncertainty and contributes to economic growth. Citizens and businesses can better anticipate the government’s budgetary and fiscal policies, allowing them to make better decisions.
| – | For example, thanks to debt reduction objectives, the government can plan its annual public infrastructure investments over a long period, that is, 10 years. |
It also makes it possible to work towards achieving a common objective, which, in this case, is to not leave future generations with the heavy burden of repaying the debt, thereby contributing to social cohesion.
Lastly, this orientation sends a positive signal to investors and credit rating agencies.
| Budget 2022-2023 | |
| J.20 | Budget Plan |
| 2. | Financing |
| 2.1 | Financing program |
The financing program corresponds to long-term borrowings contracted, in particular, to repay maturing borrowings and to fund the government’s capital investments and the budgetary deficit.
For 2021-2022, the program stands at $22.9 billion, which is $5.6 billion less than projected in the March 2021 budget.
The decrease is mainly due to a reduction in net financial requirements arising from a lower budgetary deficit and to an increase in the use of pre-financing, which reduces the financing program.
TABLE J.11
Government’s financing program in 2021-2022
| (millions of dollars) | ||||||||||||
| March 2021 | Adjustments | March 2022 | ||||||||||
| Net financial requirements(1) | 20 065 | −9 028 | 11 037 | |||||||||
| Repayments of borrowings | 12 688 | 429 | 13 117 | |||||||||
| Use of the Generations Fund to repay borrowings | — | — | — | |||||||||
| Withdrawal from the Accumulated Sick Leave Fund | — | —170 | —170 | |||||||||
| Use of pre-financing(2) | −4 292 | −4 260 | −8 552 | |||||||||
| Change in cash position | — | — | — | |||||||||
| Transactions under the credit policy(3) | — | 1 530 | 1 530 | |||||||||
| Pre-financing | — | 5 925 | 5 925 | |||||||||
| TOTAL | 28 461 | −5 574 | 22 887 | (4) | ||||||||
Note: A negative entry indicates a source of financing and a positive entry, a financial requirement.
| (1) | Adjustments to the net financial requirement since March 2021 are primarily due to an improvement of $4.9 billion in the budgetary balance before use of the stabilization reserve as well as the disposition of $3.1 billion of temporary investments acquired in 2020-2021. |
| (2) | The adjustment of pre-financing is mainly due to a lower-than-expected budget deficit. |
| (3) | Under the credit policy, which is designed to limit financial risk with respect to counterparties, the government disburses or receives sums following, in particular, movements in exchange rates. These sums have no effect on the debt. |
| (4) | Borrowings contracted as at March 7, 2022. |
| The Québec | |
| Government’s Debt | J.21 |
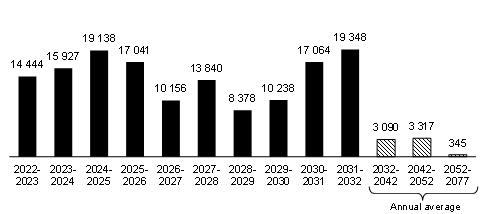
The financing program will amount to $27.6 billion in 2022-2023.
For the four subsequent years, from 2023-2024 to 2026-2027, it will average $30.4 billion per year.
TABLE J.12
Government’s financing program from 2022-2023 to 2026-2027
| (millions of dollars) | ||||||||||||||||||||
| 2022-2023 | 2023-2024 | 2024-2025 | 2025-2026 | 2026-2027 | ||||||||||||||||
| Net financial requirements | 19 096 | 14 136 | 14 698 | 15 488 | 14 868 | |||||||||||||||
| Repayments of borrowings | 14 444 | 15 927 | 19 138 | 17 041 | 10 156 | |||||||||||||||
| Use of pre-financing | −5 925 | — | — | — | — | |||||||||||||||
| Use of the Generations Fund to repay borrowings | — | — | — | — | — | |||||||||||||||
| TOTAL | 27 615 | 30 063 | 33 836 | 32 529 | 25 024 | |||||||||||||||
Note: A negative entry indicates a source of financing and a positive entry, a financial requirement.
| Budget 2022-2023 | |
| J.22 | Budget Plan |
| 2.2 | Borrowings contracted in 2021-2022 |
The government aims to borrow at the lowest possible cost. To that end, it applies a strategy for diversifying sources of funding by market, financial instrument and maturity.
Thus far in 2021-2022, the government has contracted 37% of its borrowings on foreign markets, compared to an average of 24% for the last 10 years. Québec has thus benefited from the strong demand for its securities on foreign markets. However, the government keeps no exposure of its debt to foreign currencies so as to neutralize the impact of variations in exchange rates on debt service.
In 2021-2022, conventional bonds in Canadian dollars were the main debt instrument used.
The average cost of transactions in 2021-2022 was 2.43% with an average maturity of borrowings of 18 years, while the cost of the entire debt was 3.00% with an average remaining maturity of 11 years as at March 31, 2021.
TABLE J.13
Summary of long-term borrowings contracted in 2021-2022
| Currencies | $million | % | ||||||
| CANADIAN DOLLAR | ||||||||
| Conventional bonds | 13 366 | 58.4 | ||||||
| Green bonds | 498 | 2.2 | ||||||
| Immigrant investors(1) | 297 | 1.3 | ||||||
| Savings products issued by Épargne Placements Québec | 284 | 1.2 | ||||||
| Subtotal | 14 445 | 63.1 | ||||||
| OTHER CURRENCIES | ||||||||
| Euro | 6 855 | 29.9 | ||||||
| U.S. dollar | 1 250 | 5.5 | ||||||
| Swiss franc | 337 | 1.5 | ||||||
| Subtotal | 8 442 | 36.9 | ||||||
| TOTAL | 22 887 | 100.0 | ||||||
Note: Borrowings contracted as at March 7, 2022.
| (1) | These borrowings are from sums advanced by immigrant investors. These sums are lent to the government through Investissement Québec. |
| The Québec | |
| Government’s Debt | J.23 |
Geen Bond program
In 2017, the government introduced a Green Bond program to fund projects providing tangible benefits with regard to protecting the environment, reducing greenhouse gas (GHG) emissions or adapting to climate change. Through this program, the government is contributing to, among other things, the development of a socially responsible investment market.
The program draws on the Green Bond Principles, a set of guidelines created to bring more transparency to the issuance, disclosure and reporting process.
Québec’s Green Bond framework received the highest rating possible from CICERO (Center for International Climate Research).
Six issues totalling $3.3 billion have been made since the program was launched. Given the demand for Québec’s Green Bonds and the government’s commitment to the environment, Québec has pledged to be a regular issuer of Green Bonds.
For more information, visit http://www.finances.gouv.qc.ca/en/RI_GB_Green_Bonds.asp.
| Budget 2022-2023 | |
| J.24 | Budget Plan |
Funding of public bodies
The main mission of the Financing Fund and Financement-Québec is to offer Québec’s public sector bodies financing at the lowest possible cost. The clientele of the Financing Fund consists of public bodies included in the government reporting entity. In fiscal 2021-2022, the long-term loan program of the Financing Fund is expected to amount to $11.9 billion.
| Financing Fund’s long-term loan program in 2021-2022 |
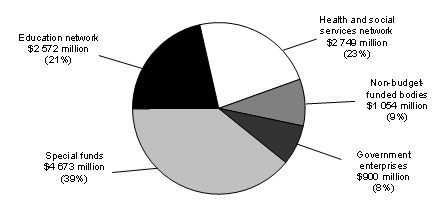 |
The clientele of Financement-Québec consists of public bodies not included in the government reporting entity. In fiscal 2021-2022, the long-term loan program of Financement-Québec is expected to amount to $1.9 billion.
| Long-term loan program of Financement-Québec in 2021-2022 |
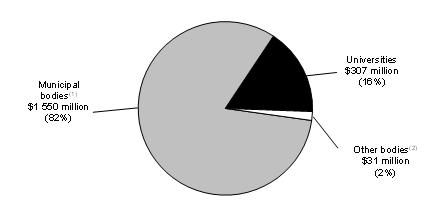 |
| (1) | Société de transport de Montréal, Autorité régionale de transport métropolitain, Réseau de transport métropolitain and Société de transport de Québec. |
| (2) | Montreal Museum of Fine Arts and Mohawk Council of Kahnawake. |
| The Québec | |
| Government’s Debt | J.25 |
| 2.3 | Debt management strategy |
The government, through its debt management strategy, aims to minimize the cost of debt while limiting the risks related to fluctuations in exchange and interest rates.
The government uses a range of financial instruments, particularly interest rate and currency swap agreements (swaps), to achieve desired debt proportions by currency and interest rate.
| q | Structure of gross debt by currency |
As at March 31, 2022, before taking swaps into account, 76% of gross debt is expected to be in Canadian dollars, 11% in euros, 10% in U.S. dollars, 1% in pounds sterling, 1% in Australian dollars, 1% in Swiss francs and less than 1% in other foreign currencies (yen, New Zealand dollars and Swedish krona).
After taking swaps into account, the entire gross debt is denominated in Canadian dollars.
Since 2012-2013, the government has maintained no exposure of its debt to foreign currencies.
Swaps allow for neutralization of the impact of variations in exchange rates on debt service.
TABLE J.14
Structure of gross debt by currency as at March 31, 2022
| (per cent) | ||||||||
| Before swaps | After swaps | |||||||
| Canadian dollar | 76 | 100 | ||||||
| Euro | 11 | 0 | ||||||
| U.S. dollar | 10 | 0 | ||||||
| Pound sterling | 1 | 0 | ||||||
| Australian dollar | 1 | 0 | ||||||
| Swiss franc | 1 | 0 | ||||||
| Other (yen, New Zealand dollar and Swedish krona) | 0 | (1) | 0 | |||||
| TOTAL | 100 | 100 | ||||||
Note: Gross debt including pre-financing.
| (1) | The proportion of debt attributable to other currencies before swaps is less than 1%. |
| Budget 2022-2023 | |
| J.26 | Budget Plan |
| q | Structure of gross debt by interest rate |
The government keeps part of its debt at fixed interest rates and part at floating interest rates.
As at March 31, 2022, after taking swaps into account, the proportion of gross debt at fixed interest rates3 is expected to be 88.1%, and the proportion at floating interest rates, 11.9%.
As at March 31, 2022, the share of gross debt subject to an interest rate change in 2022-2023 is expected to stand at 16.3%. This share includes debt at floating interest rates (11.9%) as well as debt at fixed rates to be refinanced in 2022-2023 (4.4%).
| CHART J.6 Structure of gross debt by interest rate as at March 31, 2022 |
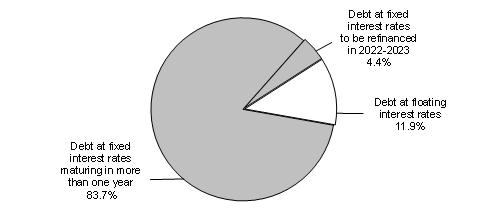 |
| Note: Gross debt including pre-financing. |
| 3 | This proportion includes debt at fixed interest rates maturing in more than one year (83.7%) as well as debt at fixed interest rates to be refinanced in 2022-2023 (4.4%). |
| The Québec | |
| Government’s Debt | J.27 |
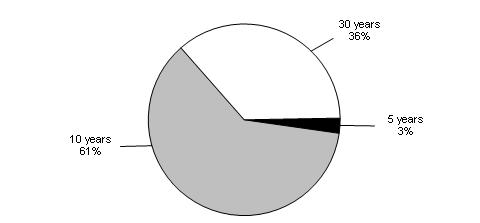
| q | Debt maturity |
Maturities of new borrowings are distributed over time so as to obtain a stable refinancing profile and ensure the government’s regular presence on capital markets. To date, approximately 97% of the borrowings contracted in 2021-2022 had a maturity of 10 years or more. The average share of issues for this term over the last 10 years represents 70%. The average maturity of borrowings is 18 years in 2021-2022.
| CHART J.7 Maturity of transactions carried out in 2021-2022 |
 |
The diversification of borrowings by term is reflected on the maturity of the debt as shown in the following chart. As at March 31, 2022, the average maturity of the debt is expected to be 11 years.
| CHART J.8 Maturity of long-term debt as at March 31, 2022 |
| (millions of dollars) |
 |
| Note: Long-term debt of the Québec government and Financement-Québec. |
| Budget 2022-2023 | |
| J.28 | Budget Plan |
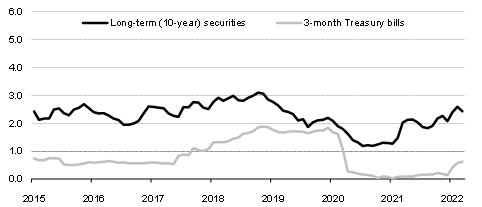
| 2.4 | Yield on Québec’s debt securities |
The recent interest rate hike brings the yield of Treasury bills to 0.6%, while the yield on 10-year Québec government securities is 2.4% after reaching a low of 1.2% in July 2020.
| CHART J.9 Yield on the Québec government’s securities |
| (per cent) |
 |
| Sources: PC-Bond and Ministère des Finances du Québec. |
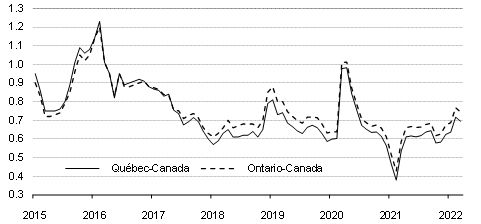
Since June 2017, a spread in favour of Québec has been observed between the yield on 10-year securities of Québec and those of Ontario. This spread now stands at about 5 basis points.
| CHART J.10 Yield spread on long-term (10-year) securities |
| (percentage points) |
|
| Source: PC-Bond. |
| The Québec | |
| Government’s Debt | J.29 |
| 3. | Information on retirement plans and on funds deposited by the Ministère des Finances with the Caisse de dépôtet placement du Québec |
| 3.1 | Net liability for retirement plans |
The Québec government covers its share of the funding of its employees’ retirement plans, which are defined-benefit plans.
In its financial statements, it discloses the pension obligation, which corresponds to the present value of the retirement benefits that it will pay to its employees. This obligation is re-evaluated annually using a method that gradually factors in differences observed relative to forecasts.4 The result is the retirement plans liability.
Sums are accumulated in the Retirement Plans Sinking Fund (RPSF) and other funds to pay retirement benefits. The value of these assets is subtracted from the liability to measure the government’s net commitment, called the net retirement plans liability. This amount is included in gross debt.
As at March 31, 2021, net liability for retirement plans and other employee future benefits stood at $12.4 billion.
| TABLE J.15 Net liability for retirement plans and other employee future benefits as at March 31, 2021 | ||||
| (millions of dollars) | ||||
| Retirement plans | ||||
| Retirement plans liability(1) | 112 861 | |||
| Less: Retirement Plans Sinking Fund (RPSF) and other funds(2) | −100 304 | |||
| Net retirement plans liability | 12 557 | |||
| Other employee future benefits | ||||
| Other employee future benefits liability | 1 445 | |||
| Less: Funds dedicated to other employee future benefits | −1 634 | |||
| Net other employee future benefits liability(3) | −189 | |||
| NET LIABILITY FOR RETIREMENT PLANS AND OTHER EMPLOYEE FUTURE BENEFITS | 12 368 | |||
| (1) | Mainly the Government and Public Employees Retirement Plan (RREGOP) and the Pension Plan of Management Personnel (PPMP). |
| (2) | The value of the RPSF is $94.1 billion. The other funds consist mainly of that of the Pension Plan of the Université du Québec. |
| (3) | A negative entry means that the value of assets is higher than the value of liabilities. |
| 4 | The value of obligations relating to accrued retirement plan benefits undergoes actuarial valuations every three years. The value is extrapolated between two valuations. |
| Budget 2022-2023 | |
| J.30 | Budget Plan |
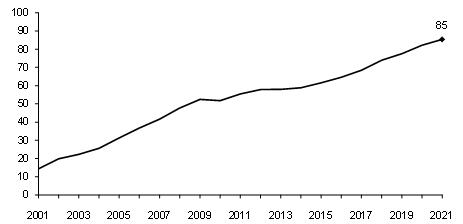
Retirement Plans Sinking Fund
The Retirement Plans Sinking Fund (RPSF) was created by the Québec government in 1993. It is an asset that was established for the payment of retirement benefits of public and parapublic sector employees.
In December 1999, as part of the agreement concluded for the renewal of its employees’ collective agreements, the government set the objective of ensuring that the book value of the sums accumulated in the RPSF would be equal, in 2020, to 70% of its actuarial obligations in respect of the retirement plans of public and parapublic sector employees.
| – | The objective was reached as at March 31, 2018, that is, two years sooner than anticipated. |
| – | As at March 31, 2021, the RPSF was equal to 85% of the actuarial obligations in respect of retirement plans. |
It is expected that the sums accumulated in the RPSF to pay the retirement benefits of government employees will exceed the government’s retirement plans liability in 2025-2026. This implies that in the coming years, the government will be able to use the assets of the RPSF to pay the retirement benefits of its employees, which will reduce its borrowing requirements.
| Book value of the RPSF in proportion to the government’s actuarial obligations in respect of the retirement plans of public and parapublic sector employees as at March 31 |
| (per cent) |
 |
| The Québec | |
| Government’s Debt | J.31 |
| 3.2 | Returns on funds deposited with the Caisse de dépôtet placement du Québec |
The main funds deposited by the Ministère des Finances with the Caisse de dépôt et placement du Québec (RPSF, Generations Fund and Accumulated Sick Leave Fund) are managed in accordance with investment policies established by the Ministère des Finances in cooperation with representatives of the Caisse.
These investment policies are established based on several factors, including 10-year return forecasts, standard deviations and correlations for various categories of assets, opportunities for investing in these assets and recommendations of the Caisse.
In 2021, the return on funds deposited by the Ministère des Finances with the Caisse was 13.9% for the RPSF, 11.4% for the Generations Fund and 13.9% for the Accumulated Sick Leave Fund.
| — | The lower return for the Generations Fund is due to differences in investment policies. The Generations Fund, by its very nature, is less exposed to less liquid investments such as private equity, which recorded exceptional performance in 2021. |
The investment policies of these three funds are presented on the next page.
TABLE J.16
| 2021 return on and market value of funds deposited by the Ministèredes Finances with the Caisse de dépôt et placement du Québec | ||||||||
| Rate of return | Market value as at December 31,2021 | |||||||
| (%) | ($billion) | |||||||
| Retirement Plans Sinking Fund (RPSF) | 13.9 | 112.9 | (1) | |||||
| Generations Fund | 11.4 | 16.0 | ||||||
| Accumulated Sick Leave Fund | 13.9 | 1.4 | ||||||
| (1) | Compared to March 31, 2021, the growth of the RPSF as at December 31, 2021, is mainly due to private equity performance during the last nine months of 2021. |
| Budget 2022-2023 | |
| J.32 | Budget Plan |
| q | Comparison of investment policies |
TABLE J.17
Investment policies as at January 1, 2022
| (per cent) | ||||||||||||
| Specialized portfolios | RPSF and ASLF | Generations Fund | Average benchmark portfolio of depositors as a whole(1) | |||||||||
| Short-Term Investments | 1.0 | 1.0 | 1.1 | |||||||||
| Rates(2) | 10.5 | 10.0 | 11.0 | |||||||||
| Credit(3) | 22.5 | 28.0 | 18.0 | |||||||||
| Long-Term Bonds | 0 | 0 | 0.9 | |||||||||
| Real Return Bonds | 0 | 0 | 0.2 | |||||||||
| Total - Fixed Income | 34.0 | 39.0 | 31.2 | |||||||||
| Infrastructure | 11.0 | 8.0 | 8.5 | |||||||||
| Real Estate | 11.5 | 8.0 | 12.5 | |||||||||
| Total - Real Assets | 22.5 | 16.0 | 21.0 | |||||||||
| Public Equity | 27.5 | 36.0 | 33.2 | |||||||||
| Private Equity | 16.0 | 9.0 | 14.6 | |||||||||
| Total - Equities | 43.5 | 45.0 | 47.8 | |||||||||
| TOTAL | 100.0 | 100.0 | 100.0 | |||||||||
RPSF: Retirement Plans Sinking Fund.
ASLF: Accumulated Sick Leave Fund.
| (1) | Data as at December 31, 2020, drawn from the 2020 Annual Report of the Caisse de dépôt et placement du Québec. |
| (2) | This portfolio consists of government bonds. |
| (3) | Broader range of instruments with fixed income securities characteristics. |
| The Québec | |
| Government’s Debt | J.33 |
Act respecting the Caisse de dépôt et placement du Québec:
Greater agility for investing in the infrastructure
and renewable energy sectors
The Act respecting the Caisse de dépôt et placement du Québec sets out holding limits of between 30% and 51% of the shares of a company, except for certain sectors, such as real estate, in which the Caisse may hold up to 100% of a company’s shares.
In the context of the fight against climate change, in particular, institutional investors such as the Caisse are placing increasing importance on infrastructure. This asset class generates attractive returns, particularly when the investor is in a controlling position, and generally offers good protection against inflation. Additional premiums may also be generated when operational value is created. However, this asset class’s environment is becoming increasingly competitive.
With the aim of making the Caisse more agile and more competitive in this investment sector, the government will propose amendments to the Act respecting the Caisse de dépôt et placement du Québec. As with the real estate sector, there will be no limit on the holding of shares of a company in the infrastructure sector. The size that an infrastructure investment can reach will, however, be subject to a proposed limit of 3.5% of the Caisse’s total assets.
The proposed changes will allow the Caisse to position itself favourably among its peers on the world stage in strongly growing investment sectors that will be crucial in the future. They will also enable it to execute its new climate strategy successfully. By 2025, the Caisse aims to hold $54 billion of green assets in order to contribute actively to a more sustainable economy1 and plans to reduce the carbon intensity of its entire portfolio by 60% by 2030. The Caisse has, moreover, announced that it will exit from oil production by the end of 2022 and is aiming for a carbon-neutral portfolio by 2050.
| 1 | In 2020, the Caisse’s low-carbon assets stood at $36 billion, and its portfolio’s carbon intensity had fallen by 38% since 2017. |
| Budget 2022-2023 | |
| J.34 | Budget Plan |
| 4. | Credit ratings |
| 4.1 | Québec’s credit ratings |
A credit rating measures the ability of a borrower, such as the Québec government, to pay interest on its debt and repay the principal at maturity.
A high credit rating means access to a broader pool of investors and advantageous borrowing costs.
Québec’s credit rating is evaluated by six credit rating agencies.
In 2021, despite the heavy turbulence caused by the pandemic, the six agencies that rate Québec confirmed its credit rating, with a stable outlook.
Overall, the credit rating agencies emphasized that Québec entered the crisis in a favourable economic and financial position. They also affirmed that Québec had a strong, diversified economy, and that the government’s commitment to returning to a balanced budget demonstrated sound management of public finances. The agencies also noted that the ongoing deposits to the Generations Fund were a positive factor.
TABLE J.18
Québec’s credit ratings
| Credit rating agency | Credit rating | Outlook | ||
| Standard & Poor’s (S&P) | AA- | Stable | ||
| Moody’s | Aa2 | Stable | ||
| Fitch Ratings | AA- | Stable | ||
| DBRS Morningstar | AA (low) | Stable | ||
| Japan Credit Rating Agency (JCR) | AA+ | Stable | ||
| China Chengxin International (CCXI)(1) | AAA | Stable |
Note: Québec’s credit ratings as at March 7, 2022.
| (1) | Credit rating for bond issues on the Chinese market. |
| The Québec | |
| Government’s Debt | J.35 |
| 4.2 | Comparison of the credit ratings of Canadian provinces |
The following charts show the credit ratings of Canadian provinces by Standard & Poor’s and Moody’s.
| CHART J.11 Credit ratings of Canadian provinces − Standard & Poor’s |
 |
Note: Credit ratings as at March 7, 2022.
| (1) | This province has a negative outlook. |
CHART J.12
Credit ratings of Canadian provinces − Moody’s
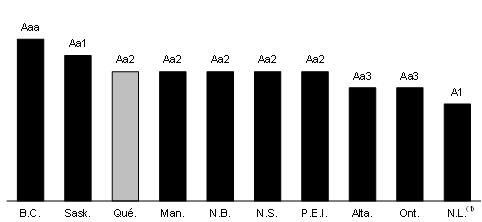
Note: Credit ratings as at March 7, 2022.
| (1) | This province has a negative outlook. |
| Budget 2022-2023 | |
| J.36 | Budget Plan |