Exhibit 99.13
Section F
THE QUÉBEC ECONOMY: RECENT DEVELOPMENTS AND OUTLOOK FOR 2024 AND 2025
| Summary | F.3 | ||
| 1. | Québec’s economic situation | F.7 | |
| 1.1 | A more favourable environment for growth is expected as of the second half of 2024 | F.7 | |
| 1.2 | The labour market is slowing, but remains resilient | F.10 | |
| 1.3 | Domestic demand will support real GDP growth | F.12 | |
| 1.4 | Interest rate cuts will ease pressure on household finances | F.15 | |
| 1.5 | The residential sector will return to growth after two difficult years | F.16 | |
| 1.6 | Several factors are in place to support the rebound in non-residential investment | F.18 | |
| 1.7 | The value of government investment reaches a peak | F.19 | |
| 1.8 | Exports will be a major contributor to economic activity | F.21 | |
| 1.9 | Price pressures are easing gradually | F.22 | |
| 1.10 | Nominal GDP growth is moderating but will remain strong | F.25 | |
| 1.11 | Forecasts comparable to those of the private sector | F.26 | |
| 2. | The situation of Québec’s main economic partners | F.29 | |
| 2.1 | The economic situation in Canada | F.29 | |
| 2.2 | The economic situation in the United States | F.34 | |
| 3. | The global economic situation | F.41 | |
| 4. | Developments in financial markets | F.47 | |
| 5. | Main risks that may influence the forecast scenario | F.51 | |
F.1

The global economy proved resilient in 2023, due in particular to the strong performance of the U.S. economy. However, difficulties are intensifying as the effects of tighter financial conditions become more pronounced. Economic activity will slow in most regions in 2024.
| — | Overall, growth in global real GDP is expected to be 2.8% in 2024 following a 3.0% increase in 2023.1 In the United States, economic activity growth will weaken, decreasing from 2.5% in 2023 to 1.5% in 2024. In Canada, real GDP growth will slow to 0.7% in 2024 (+1.1% in 2023). |
This period of economic weakness will continue to moderate price pressures. Consequently, central banks will start easing their monetary policies gradually as of the second quarter of 2024. More favourable credit conditions and controlled inflation will restore an environment conducive to sustainable growth in 2025.
The Québec economy stagnated in 2023, and real GDP growth will remain modest in 2024 (+0.6%). A more tangible improvement in economic conditions is expected in the second half of 2024 due to a gradual decline in interest rates. Real GDP growth will accelerate to 1.6% in 2025.
The effects of tighter financial conditions are becoming more pronounced in many economies. Early 2024 will therefore remain difficult. A tangible improvement in economic conditions is expected in the second half of 2024 and in 2025 due to a gradual decline in interest rates.
In Québec, real GDP growth will remain modest in 2024 (+0.6%) before accelerating to 1.6% in 2025. |
| TABLE F.1 Economic growth | ||||
| (real GDP, percentage change) | ||||
| 2022 | 2023 | 2024 | 2025 | |
| Québec | 2.5 | 0.2 | 0.6 | 1.6 |
| Canada | 3.8 | 1.1 | 0.7 | 1.9 |
| United States | 1.9 | 2.5 | 1.5 | 1.6 |
| World(1) | 3.5 | 3.0 | 2.8 | 3.0 |
(1) Global real GDP is expressed in purchasing power parity. Sources: Institut de la statistique du Québec, Statistics Canada, International Monetary Fund, S&P Global, LSEG Datastream, Bloomberg, Eurostat and Ministère des Finances du Québec. | ||||
| 1 | Unless otherwise indicated, this section reflects economic data available as at February 29, 2024. |
| The Québec Economy: Recent Developments and Outlook for 2024 and 2025 | F.3 |
Restrictive monetary policy and high inflation have had significant economic consequences in Québec in recent quarters. Real GDP stagnated in 2023. Overall, production rose by just 0.2% for the year as a whole.
| — | Economic activity contracted by 0.4% in the second quarter of 2023 and by 0.2% in the third quarter. |
| — | Furthermore, real GDP growth in the last quarter of 2023 was limited by the effect of strikes in the public and parapublic sectors. |
The relative weakness of the economy in 2023 did not spread to all industries, however. Moreover, the production declines observed are partly attributable to temporary factors. In particular:
| — | difficult weather conditions and the consequences of forest fires had repercussions on forestry and logging, paper and wood products manufacturing, utilities and agriculture; |
| — | successive interest rate hikes have affected the construction industry. |
The economy stagnated in 2023, but the labour market remained resilient. In particular, the unemployment rate, at an average of 4.5% in 2023, remains well below that for Canada as a whole (5.4%) and the lowest among the provinces.
The good labour market performance was reflected in strong growth in wages and salaries (+6.0 in 2023%). In addition, since July, Quebecers have benefited from the tax reduction granted by the government on their source deductions. These factors supported growth in household disposable income and strengthened Quebecers’ financial position.
| — | Between 2018 and 2023, household disposable income in real terms rose by 16.8% in Québec, compared to 13.1% in Canada. |
As a result, Québec’s economy is well positioned to begin a sustainable recovery in the second half of 2024, in sync with the gradual decline in interest rates and lower inflation.
| q | Price pressures are gradually easing |
Global inflationary pressures are letting up, as the effects of restrictive monetary policies are increasingly being felt. Wage growth is slowing in line with the moderation in economic growth. In addition, the imbalances between supply and demand are diminishing. Supply chain disruptions are easing, and consumers are cautious.
| F.4 | Budget 2024-2025 Budget Plan |
Although inflation has decreased considerably since peaking in 2022, it remains above central bank targets in most economies. The moderate pace of disinflation is mainly due to service prices, whose growth remains high. Housing costs have also been supported by rising interest rates, which have increased mortgage payments.
Nevertheless, the progress made so far with regard to inflation should enable central banks to start easing their monetary policies as of the second quarter of 2024. Growth in the consumer price index (CPI) is expected to continue to decrease gradually in 2024 and 2025. In Canada, the CPI should return to the central bank’s 2.0% target in the third quarter of 2025.
| TABLE F.2 Consumer price index | ||||
| (percentage change) | ||||
| 2022 | 2023 | 2024 | 2025 | |
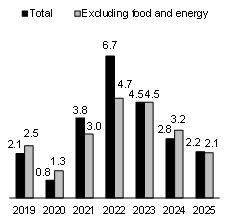
| Québec | 6.7 | 4.5 | 2.8 | 2.2 |
| Canada | 6.8 | 3.9 | 2.7 | 2.2 |
| United States | 8.0 | 4.1 | 2.6 | 2.1 |
| Euro area(1) | 8.4 | 5.4 | 2.7 | 2.2 |
| World(1) | 8.7 | 6.8 | 5.8 | 4.4 |
(1) The European Commission’s February 2024 forecast for the euro area and the International Monetary Fund’s January 2024 forecast for the world. Sources: Statistics Canada, S&P Global, International Monetary Fund, European Commission and Ministère
| ||||
| q | A forecast clouded by uncertainty over inflation |
The economic forecast scenario is based on a gradual moderation in price growth. A different trajectory could prompt central banks to reconsider their strategies, impacting global economic activity.
| — | In particular, price increases could resume or remain above the central banks’ targets. Such a situation could lead them to raise their policy rates or keep them at restrictive levels for longer than expected. This situation could push the economies of several regions, including Canada and Québec, into recession. |
| — | Conversely, inflation could slow more quickly than expected. Central banks could then begin the monetary easing cycle earlier, and even accelerate the pace of rate cuts. This situation could lead to stronger-than-expected economic growth. |
| The Québec Economy: Recent Developments and Outlook for 2024 and 2025 | F.5 |
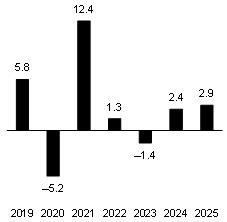
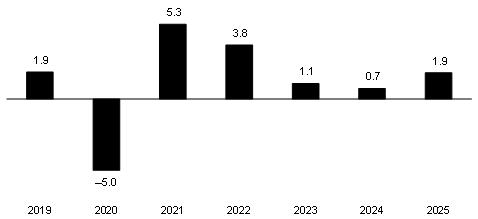
| 1. | Québec’s economic situation |
| 1.1 | A more favourable environment for growth is expected as of the second half of 2024 |
Québec’s economy stagnated in 2023.
| — | Restrictive monetary policy has limited activity in interest-rate-sensitive industries, including construction. In addition, temporary factors such as major forest fires and strikes in the public and parapublic sectors curbed production in some industries. |
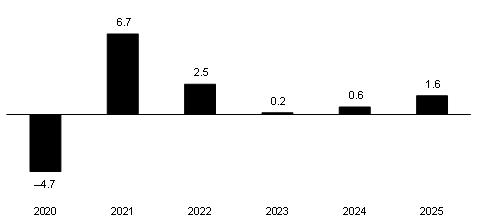
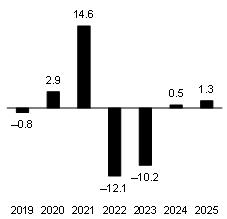
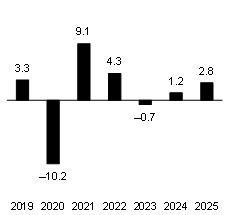
| — | After two years of strong growth in 2021 (+6.7%) and 2022 (+2.5%), real GDP rose by just 0.2% in 2023. |
Weak growth is also expected in 2024 (+0.6%).
| — | Interest rates, which will remain at levels higher than those seen before the pandemic, will continue to moderate economic activity in early 2024. |
| — | With inflation expected to slow, the Bank of Canada should begin its monetary policy easing cycle as of the second quarter of 2024. Lower interest rates will provide a more favourable environment for growth. |
A tangible improvement in economic conditions is expected in 2025. Real GDP growth will accelerate and is expected to reach 1.6%.
| CHART F.1 Economic growth in Québec |
| (real GDP, percentage change) |
 |
| Sources: Institut de la statistique du Québec, Statistics Canada and Ministère des Finances du Québec. |
| The Québec Economy: Recent Developments and Outlook for 2024 and 2025 | F.7 |
Is Québec in a recession?
Québec’s real GDP fell for two consecutive quarters in 2023
The effects of restrictive monetary policy and high inflation, as well as temporary factors such as major forest fires, led Québec into a period of economic stagnation in 2023.
| – | Québec’s real GDP fell by 0.4% in the second quarter of 2023 and by 0.2% in the third quarter. In addition, the fourth quarter is expected to see a modest rise in real GDP due to the public and parapublic sector strikes. |
The moderation in economic activity observed in 2023 in Québec does not, however, meet the generally accepted criteria for defining a recession.
| Economic growth | |||||
| (percentage change compared with the previous period) | |||||
| Québec | Canada | ||||
| Real GDP | Real GDP per capita | Real GDP | Real GDP per capita | ||
| Q1 2023 | 0.4 | 0.0 | 0.6 | 0.1 | |
| Q2 2023 | −0.4 | −0.9 | 0.2 | −0.5 | |
| Q3 2023 | −0.2 | −0.9 | −0.1 | −1.0 | |
| Q4 2023 | 0.1 | −0.7 | 0.2 | −0.8 | |
| 2022 | 2.5 | 1.3 | 3.8 | 2.0 | |
| 2023 | 0.2 | −2.1 | 1.1 | −1.9 | |
| Sources: Institut de la statistique du Québec, Statistics Canada and Ministère des Finances du Québec. | |||||
A technical recession is defined as two consecutive quarters of real GDP contraction. Yet this condition is not sufficient according to the entities responsible for declaring the existence of a recession, which examine a number of economic factors before concluding that the economy is in recession.
In the United States, recessions are determined by a committee of experts from the National Bureau of Economic Research (NBER). This committee considers three criteria to determine whether an economic slowdown qualifies as a recession: its depth, its spread throughout the economy, and its duration. The NBER examines a number of indicators to analyze business cycles, including trends in employment and consumer spending.
| – | There are many examples where two quarters of negative U.S. real GDP growth have not been considered a recession. In particular, the economic slowdown in the United States in 2022 was not considered a recession, since it was concentrated in just a few sectors. |
In Canada, economists rely on the cycles identified by the Business Cycle Council of the C.D. Howe Institute to recognize a recession. Like the NBER, it uses a three-dimensional approach in its analysis, which considers the duration, amplitude and scope of the economic slowdown. A recession is usually defined as a pronounced, persistent and pervasive decline in economic activity across multiple sectors.
These two organizations usually wait several quarters before officially announcing a period of recession. In fact, they must ensure that any revised statistics do not invalidate the preliminary interpretation of the data.
| F.8 | Budget 2024-2025 Budget Plan |
Is Québec in a recession? (cont.)
Several indicators must be analyzed to define a recession
In Québec, the moderation in economic activity observed in 2023 does not meet the generally accepted criteria for defining a recession.
In fact, declines in output were limited to a few sectors. On the other hand, most indicators showed positive changes in the third quarter despite the decline in real GDP.
| – | A weather-related drop in electricity production and demand accounts for much of the decline in real GDP. |
| – | The external sector (contribution of −0.7 percentage points to the change in real GDP) and the reduction in inventories (−0.3 percentage points) were behind the decline in real GDP in the third quarter. |
| – | By contrast, domestic demand remained robust in the third quarter (+0.8 percentage points). |
| ▪ | In particular, household expenditures in real terms rose by 0.6% over that period. |
| ▪ | Household disposable income excluding government transfers rose by 0.6% in real terms, a second consecutive quarterly increase (+1.3% in the second quarter). |
| Recent economic indicators in Québec in 2023 | ||||
| (percentage change compared with the previous period, unless otherwise indicated) | ||||
| Q1 | Q2 | Q3 | Q4(1) | |
| GDP by industry (in real terms) | 0.4 | −0.3 | −0.3 | 0.2 |
| Household disposable income less government transfers (in real terms) | 0.0 | 1.3 | 0.6 | — |
| Household consumption (in real terms) | 1.2 | −0.2 | 0.6 | — |
| Wages and salaries (in nominal terms) | 1.5 | 1.7 | 1.4 | 0.5 |
| Employment | 1.0 | 0.1 | 0.3 | 0.2 |
| Unemployment rate (per cent) | 4.1 | 4.3 | 4.4 | 5.0 |
| Retail sales (in nominal terms) | 1.4 | −0.3 | 2.0 | 0.5 |
| Wholesale sales (in nominal terms)(2) | — | −0.5 | −0.8 | 1.9 |
| Housing starts (thousands) | 36.4 | 35.2 | 45.2 | 39.4 |
| International exports of goods (customs basis, in real terms) | −1.1 | −1.0 | 4.1 | 3.6 |
| Manufacturing shipments (in nominal terms) | 0.5 | −4.0 | 2.2 | 1.6 |
Note: Shaded indicators are those considered by the NBER to determine a recession.
| (1) | Cumulative of available months compared with the previous quarter. |
| (2) | Wholesale sales excluding petroleum, petroleum products, and other hydrocarbons, as well as oilseeds and cereal grains. |
Sources: Institut de la statistique du Québec, Statistics Canada, Canada Mortgage and Housing Corporation and Ministère des Finances du Québec.
| The Québec Economy: Recent Developments and Outlook for 2024 and 2025 | F.9 |
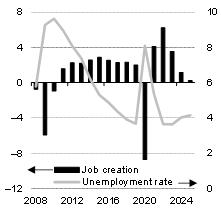
| 1.2 | The labour market is slowing, but remains resilient |
In 2023, monthly data showed that employment was fairly stable. As for the unemployment rate, it rose from 4.3% on average in 2022, a historic annual low, to 4.5% on average in 2023.
| — | This stabilization of the labour market occurred despite the exceptional population growth observed in Québec in 2023. |
The pace of hiring will continue to slow over the next few years. The number of jobs created will fall from 43 800 in 2024 to 28 000 in 2025, representing increases in the pace of hiring of 1.0% and 0.6% respectively.
| — | In the short term, the slowdown in the economy will continue to dampen labour demand. |
| — | Moreover, despite a slowdown, wage growth remains high. This trend, combined with declining corporate profits, could lead to job cuts for some businesses. |
| — | At the same time, Québec’s population is aging, which is slowing the growth of the potential labour pool. In addition, a possible cap on temporary immigration would slow the growth of the labour force. |
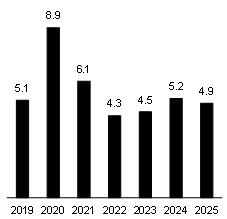
| — | Against this backdrop, the unemployment rate is set to rise briefly to 5.2% in 2024, before declining slightly to 4.9% in 2025. It will nevertheless remain at relatively low levels given the current economic slowdown. |
| CHART F.2 Jobs in Québec | CHART F.3 Unemployment rate in Québec | |
| (average annual data in thousands) | (average annual data in per cent) | |
 |
| |
| Sources: Statistics Canada and Ministère des Finances du Québec. | Sources: Statistics Canada and Ministère des Finances du Québec. |
| F.10 | Budget 2024-2025 Budget Plan |
The labour market is gradually rebalancing
Job creation slows
Despite monthly blips, the Québec labour market has been relatively stable since the start of 2023.
| – | Between January 2023 and January 2024, only 19 800 jobs were created (+0.4%). |
| – | Annual job creation in January 2024 (+0.4%) was exceeded by growth in the labour force (+0.9%). As a result, the unemployment rate rose from 4.0% in January 2023 to 4.5% in January 2024. |
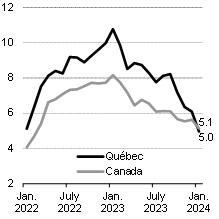
| – | Moreover, the number of vacant jobs continues to fall. After peaking in May 2022 (252 600), the number of vacant jobs gradually declined to 138 100 in December 2023, a number similar to the pre-pandemic level (143 000 in February 2020). |
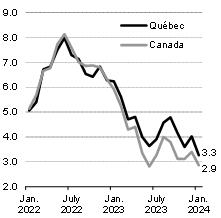
The imbalances in the Québec labour market are gradually dissipating. This trend is reflected in the annual growth in average hourly wages, which is slowing down. It fell from a peak of 7.4% in July 2022 to 3.3% in January 2024.
The labour market nevertheless remains tight
Although economic activity and job creation are moderating, tensions in the labour market persist.
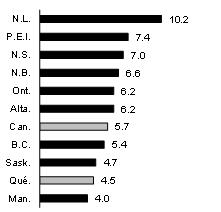
| – | Despite an upward trend, Québec’s unemployment rate remained low at 4.5% in January 2024. Only Manitoba (4.0%) had a lower unemployment rate among the provinces. |
| – | In addition, the employment rate for people aged 15 to 64 stood at 77.7% in January. In this respect, Québec ranked first among the provinces. |
| Change in employment in Québec | Unemployment rate in January 2024 | |
| (thousands, per cent) | (per cent) | |
|  | |
| Source: Statistics Canada. | Source: Statistics Canada. |
| The Québec Economy: Recent Developments and Outlook for 2024 and 2025 | F.11 |
| 1.3 | Domestic demand will support real GDP growth |
In 2024 and 2025, domestic demand will significantly support real GDP growth.
| — | Consumer spending will continue to benefit from accumulated household savings. However, consumers will remain cautious and adjust their consumption, especially discretionary spending, in response to higher interest rates. According to the Bank of Canada, 62% of all mortgages in Canada will have been renewed as at January 1, 2025 at higher interest rates than previously obtained. This proportion will increase to 83% as at January 1, 2026. The rising cost of servicing debt will influence households’ ability to spend. |
| — | The residential sector will return to growth in 2024. Population growth and the expected drop in financing rates will support demand for housing. Nevertheless, housing affordability will remain an issue for many households. |
| — | Non-residential investment will return to growth in 2024 as borrowing costs fall. However, the start-up of major projects, particularly in the mining sector and the battery industry, will support investment. |
Despite a good performance for exports, the external sector will make a modest contribution to economic activity over the next two years. In fact, relatively vigorous domestic demand will support the rise in imports.
| TABLE F.3 Real GDP and its major components in Québec | |||||||
| (percentage change and contribution in percentage points) | |||||||
| Change | Contribution | ||||||
| 2023 | 2024 | 2025 | 2023 | 2024 | 2025 | ||
| Domestic demand | −0.1 | 0.9 | 1.7 | −0.1 | 1.0 | 1.8 | |
| Household consumption | 2.3 | 0.8 | 1.8 | 1.3 | 0.5 | 1.1 | |
| Residential investment | −17.8 | 0.4 | 2.6 | −1.2 | 0.0 | 0.1 | |
| Non-residential business investment | −1.4 | 2.4 | 2.9 | −0.1 | 0.2 | 0.3 | |
| Government spending and investment | 0.2 | 0.9 | 0.9 | 0.1 | 0.3 | 0.3 | |
| External sector | — | — | — | 0.7 | 0.1 | 0.1 | |
| Exports | 2.3 | 2.0 | 2.2 | 1.0 | 0.9 | 1.0 | |
| Imports | 0.5 | 1.5 | 1.9 | −0.3 | −0.8 | −1.0 | |
| Inventories | — | — | — | −0.6 | −0.5 | −0.3 | |
| REAL GDP | 0.2 | 0.6 | 1.6 | 0.2 | 0.6 | 1.6 | |
Note: Total components may not add due to rounding. Sources: Institut de la statistique du Québec, Statistics Canada and Ministère des Finances du Québec. | |||||||
| F.12 | Budget 2024-2025 Budget Plan |
Record population growth in Québec in 2023
International migration is driving strong population growth
Québec experienced exceptional demographic growth in 2023 (+202 500 people, +2.3%), the biggest increase since 1959. This significant population growth will continue in 2024 (+2.8%).
This demographic growth is based almost entirely on net international migration.
| – | After admitting just over 62 800 permanent immigrants in 2022, Québec welcomed nearly 64 500 people in 2023, a peak partially resulting from a catch-up period after a drop in admissions due to the pandemic. |
| ▪ | Québec welcomed only 33 500 people per year on average in 2020 and 2021, when border restrictions relating to COVID-19 limited international immigration. |
| – | The number of non-permanent residents saw a record net increase of nearly 149 000 in 2023, bringing the total number to about 471 000. |
| – | Interprovincial migration losses totalled just over 6 000 people in 2023. |
| – | From July 1, 2022 to July 1, 2023, over 99.7% of population growth in Québec was due to net migration, of which around 73% stemmed from temporary immigration. |
Conversely, just under 0.3% of population growth was due to the difference between births and deaths.
| Population growth rate |
| (annual population change, per cent) |
|
Note: From 1971 onwards, population data are based on post-census estimates. Source: Statistics Canada. |

| The Québec Economy: Recent Developments and Outlook for 2024 and 2025 | F.13 |
Record population growth in Québec in 2023 (cont.)
A record rise in the number of non-permanent residents in 2023
Non-permanent residents account for an increasing share of Québec’s demographic growth.
| – | This group is mainly made up of temporary workers, foreign students and refugee protection claimants, some of whom will eventually obtain permanent immigrant status. |
After a period of moderate growth from 2000 to 2015, the number of non-permanent residents has been growing at an ever-increasing rate, until it became the main source of migratory growth in 2018.
| – | This momentum was halted in 2020 and 2021 by the pandemic and the resulting border closures. |
| – | Subsequently, the increase in non-permanent residents has risen sharply, reaching record growth of almost 149 000 people in 2023. This brings their total number to around 471 000 people as at July 1, 2023. |
Of these 149 000 additional non-permanent residents in 2023, 51.3% had a work permit, while 35.9% were refugee protection claimants. Only 3.1% of new non-permanent residents held only a study permit, and 5.0% held both a work and study permit.
In January 2024, the Government of Canada announced that it would introduce an intake cap on international student permit applications for a period of two years to limit international student admissions. This announcement will have a limited effect on demographic trends in Québec.
| Non-permanent residents in Québec | Breakdown of the balance of non-permanent residents in 2023 by type | |
| (change in thousands) | (percentage of total balance) | |
|  | |
| Source: Statistics Canada. | Note: The “other” type of non-permanent residents refers mainly to family members living with permit holders. Source: Statistics Canada. |
| F.14 | Budget 2024-2025 Budget Plan |
| 1.4 | Interest rate cuts will ease pressure on household finances |
After showing resilience in 2023 (+2.3%), household expenditures will moderate in 2024 (+0.8%). They will recover in 2025 (+1.8%), supported by falling interest rates.
| — | In 2023, the large pool of savings accumulated during the pandemic and strong population growth supported demand for goods and services. In addition, since July, Quebecers have benefited from the tax cut granted by the government on their source deductions. |
| — | These factors will continue to support consumption over the next two years. Moreover, household expenditures will be supported by continued increases in wages and salaries, which is expected to reach 5.1% in 2024 and 3.7% in 2025. In particular, public and parapublic sector workers whose collective agreements expired in April 2023 will benefit from new working conditions and salary adjustment payments. |
| — | However, in the short term, many homeowners who have to renew their mortgages will face higher payments, which will affect their ability to spend. High interest rates will have a negative impact on Quebecers’ wallets, but to a lesser extent than in the rest of Canada. In fact, the household indebtedness ratio, that is, the value of household liabilities as a proportion of disposable income, is significantly lower in Québec (148.3% in 2022) than in Canada (189.1%), making Québec households less vulnerable to high interest rates. |
| CHART F.4 Household consumption expenditure in Québec | CHART F.5 Household indebtedness ratio | |
| (percentage change, in real terms) | (total value of liabilities divided by household disposable income, in per cent) | |
|  | |
| Sources: Institut de la statistique du Québec, Statistics Canada and Ministère des Finances du Québec. | Sources: Statistics Canada and Ministère des Finances du Québec. |
| The Québec Economy: Recent Developments and Outlook for 2024 and 2025 | F.15 |
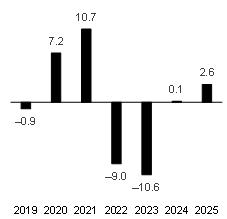
| 1.5 | The residential sector will return to growth after two difficult years |
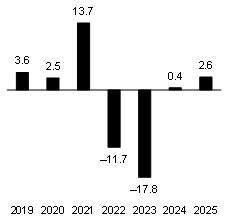
The housing sector has been shaken by successive rises in interest rates. Residential investment in real terms has thus fallen by 27.4% between 2021 and 2023. It is expected to stabilize in 2024 (+0.4%) before gaining strength in 2025 (+2.6%).
| — | This rebound will be supported by the gradual decline in interest rates, by low inventories of unsold new properties, and by the vacancy rate, which is at its lowest level since 2003. Moreover, strong population growth will support demand for housing. However, affordability will remain a challenge for many households. |
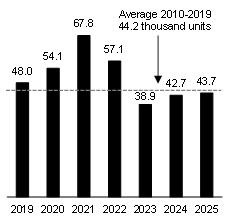
In particular, after two years of significant declines, new residential construction will return to growth.
| — | Housing starts are expected to reach 42 700 units in 2024 and 43 700 units in 2025, levels comparable to the average observed over the 10 years preceding the pandemic (44 200 units per year between 2010 and 2019). |
| — | Nevertheless, the number of units built will remain insufficient in view of the strong demand and the current housing shortage. Housing starts will be limited by still high financing rates and construction costs. |
Spending on renovations is set to decline for a third consecutive year in 2024. Mortgage renewals at higher rates will limit homeowners’ ability to spend.
| CHART F.6 Residential investment in Québec | CHART F.7 Housing starts in Québec | |
| (percentage change, in real terms) | (thousands of units) | |
|
| |
| Sources: Institut de la statistique du Québec, Statistics Canada and Ministère des Finances du Québec. | Sources: Canada Mortgage and Housing Corporation and Ministère des Finances du Québec. |
| F.16 | Budget 2024-2025 Budget Plan |
Imbalance between housing supply and demand
Strong demand in a context of limited supply
Québec’s exceptional population growth is supporting demand for housing. However, housing supply remains limited.
| – | On the one hand, rising interest rates and high input costs have slowed housing construction. On the other hand, builders have remained cautious due to the heightened uncertainty resulting from the economic slowdown. |
| ▪ | Against this backdrop, housing starts have fallen from 67 800 units in 2021 to 57 100 units in 2022 and then to 38 900 units in 2023, the lowest level since 2015. |
| ▪ | The pool of new, unoccupied housing units therefore remained well below pre-pandemic levels. |
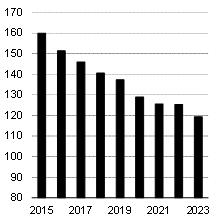
| – | The number of new listings on the resale market fell by 4.9% in 2023, the ninth consecutive annual decline. |
| – | Furthermore, the vacancy rate for rental apartments, at 1.3% in 2023 for Québec as a whole, is the lowest recorded since 2003. |
The imbalance in the real estate market is reflected in the cost of housing.
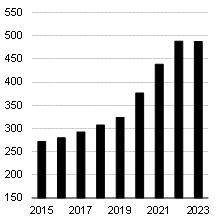
| – | The average price of a home on the resale market rose from $323 600 in 2019 to $487 400 in 2023, an increase of 50.6%. |
| – | The increase in the average rent of a two-bedroom apartment in Québec accelerated over the same period, from 5.0% in 2020 to 7.1% in 2023. |
| New listings on the Québec resale market | Average home resale price in Québec | |
| (thousands of units) | (thousands of dollars) | |
|  | |
| Source: Centris. | Source: Centris. |
| The Québec Economy: Recent Developments and Outlook for 2024 and 2025 | F.17 |
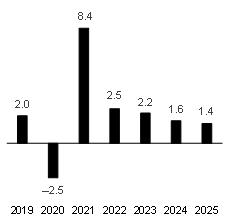
| 1.6 | Several factors are in place to support the rebound in non-residential investment |
Increased uncertainty about economic conditions, slowing demand for goods and services, the declining net operating surplus of corporations and high interest rates prompted businesses to be cautious in 2023.
After a decline of 1.4% in 2023, non-residential business investment is expected to grow by 2.4% in 2024 and 2.9% in 2025. Several factors will foster its rebound, in particular:
| — | the gradual decline in interest rates expected as of the second quarter of 2024, which will make it easier to finance construction and expansion projects, and facilitate investments in machinery and equipment; |
| — | the start-up of large projects, particularly in the mining sector and battery industry; |
| — | improved business confidence, driven by a more favourable economic climate and rising demand; |
| — | the transition to a low-carbon economy. |
In the longer term, non-residential business investment will be supported by Hydro-Québec, as described in its Action Plan 2035 – Towards a Decarbonized and Prosperous Québec.
| GRAPHIQUE F. 8 Non-residential business investment in Québec | GRAPHIQUE F. 9 Components of non-residential business investment in Québec | |
| (percentage change, in real terms) | (percentage change, in real terms) | |
| 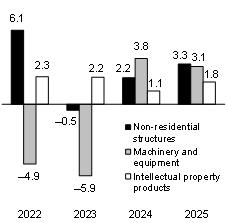 | |
| Sources: Institut de la statistique du Québec, Statistics Canada and Ministère des Finances du Québec. | Sources: Institut de la statistique du Québec, Statistics Canada and Ministère des Finances du Québec. |
| F.18 | Budget 2024-2025 Budget Plan |
| 1.7 | The value of government investment reaches a peak |
Governments are an important driver of economic activity in Québec. The value of government investment as a proportion of GDP was 4.8% in 2022, compared to 3.6% in Ontario.
This investment will increase by 1.7% in 2024 and 1.9% in 2025 to reach a peak of $28.1 billion in nominal terms.
In particular, investments under the 2024-2034 Québec Infrastructure Plan (QIP) were increased by $3.0 billion in Budget 2024-2025.
| — | The 2024-2034 QIP accordingly amounts to $153.0 billion, or over $15.0 billion per year on average. |
| — | Over the past six years, the QIP has been increased each year, going from $100.4 billion in March 2018 to $153.0 billion in March 2024. |
Moreover, the levels of investment planned in Québec’s municipalities and the federal government’s Investing in Canada Plan2 will also support growth in these investments.
| CHART F.10 Government investment in Québec |
| (billions of dollars, in nominal terms) |
|
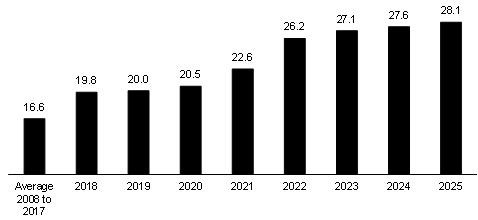
| Note: | Government investment includes investments by the Québec government, the federal government, local public administrations, and Aboriginal public administrations. |
| Sources: | Institut de la statistique du Québec, Statistics Canada and Ministère des Finances du Québec. |
| 2 | Launched in 2016, the Investing in Canada Infrastructure Program is the federal government’s long-term investment plan. The government plans to invest over $33 billion through bilateral agreements with the provinces and territories. |
| The Québec Economy: Recent Developments and Outlook for 2024 and 2025 | F.19 |
| Québec’s per capita public capital stock has caught up with that of Canada and has surpassed that of Ontario |
Public capital stock is a key determinant of productivity.1 Historically, Québec’s per capita public capital stock, in real terms, has been lower than that of Canada and Ontario. Québec caught up with Ontario in 2015, and in 2022, its per capita public capital stock was similar to that of Canada. In 2022, Québec’s per capita public capital stock stood at $16 564, virtually equivalent to that of Canada ($16 601 per capita); Ontario’s stood at $14 813 per capita. |
| Per capita public capital stock |
| (dollars per capita, in real terms) |
|
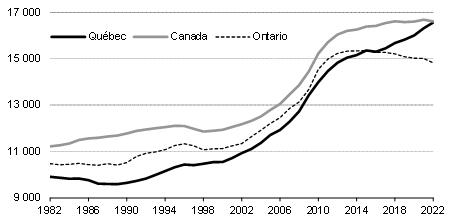
| Sources: Statistics Canada and Ministère des Finances du Québec. |
| 1 | Public capital stock represents the value of all physical assets in the public sector made up of government investments, less accumulated depreciation. It includes schools, hospitals and roads. |
| F.20 | Budget 2024-2025 Budget Plan |
| 1.8 | Exports will be a major contributor to economic activity |
Despite the global economic slowdown, exports will continue to grow in 2024 (+2.0%). This growth will benefit primarily from:
| — | a decrease in supply chain tensions; |
| — | growing demand for many export products, including aerospace products and parts, aluminum and ore; |
| — | the acceleration of the transition to clean energy; |
| — | the weakness of the Canadian dollar against the U.S. dollar, despite a slight appreciation in 2024 and 2025. |
In 2025, exports will grow by 2.2%, supported by the improved economic situation of Québec’s major trading partners.
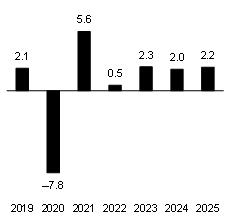
Growth in imports will strengthen in 2024 (+1.5%) and 2025 (+1.9%), following a slight increase of 0.5% in 2023. They will follow a trend similar to that of domestic demand.
Good export growth combined with a rebound in imports will see the external sector make a modest but positive contribution to economic activity over the next two years. Net exports will add 0.1 percentage points per year to the increase in economic activity in 2024 and 2025.
| CHART F.11 Exports in Québec | CHART F.12 Imports and domestic demand in Québec | |
| (percentage change, in real terms) | (percentage change, in real terms) | |
| 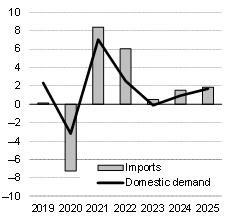 | |
| Sources: Institut de la statistique du Québec, Statistics Canada and Ministère des Finances du Québec. | Sources: Institut de la statistique du Québec, Statistics Canada and Ministère des Finances du Québec. |
| The Québec Economy: Recent Developments and Outlook for 2024 and 2025 | F.21 |
| 1.9 | Price pressures are easing gradually |
After peaking in June 2022, CPI inflation is easing. Lower energy prices and the easing of supply chain disruptions largely explain the progress observed in this area. In addition to these factors, weak economic growth and the labour market slowdown have reduced price pressures in recent months.
Although inflation is showing signs of moderation, it remains high as annual price increases in Québec were still exceeding, in January 2024, the 3% upper limit of the Bank of Canada’s target range. This is due in part to price increases in the CPI’s housing component, which are driven by rising mortgage financing costs and the imbalance between housing supply and demand.
Restrictive monetary policy, which has led Québec’s economy into a period of economic stagnation, is gradually easing excess demand. Over the coming months, inflation will continue its downward trend. CPI growth is expected to return below the 3% upper limit as of the second quarter of 2024.
| — | As for changes in prices measured by the household consumption expenditure deflator,3 it will reach the 2% target as of the third quarter of 2024. This moderation reflects households’ general capacity to adjust their consumption behaviour in the face of high prices. |
| GRAPHIQUE F. 13 CPI in Québec | GRAPHIQUE F. 14 CPI and consumption expenditure deflator in Québec | |
| (percentage change) | (annual percentage change) | |
| 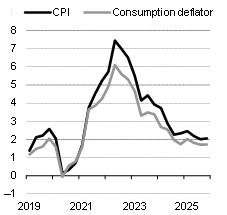 | |
| Sources: Statistics Canada and Ministère des Finances du Québec. | Sources: Institut de la statistique du Québec, Statistics Canada and Ministère des Finances du Québec. |
| 3 | The household consumption expenditure deflator measures price variations by dividing the value of household consumption expenditure by its volume. Unlike the CPI, the deflator does not assume that households consume a fixed basket of goods and services. |
| F.22 | Budget 2024-2025 Budget Plan |
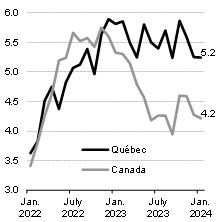
The inflation gap between Québec and Canada
is gradually closing
Since the beginning of 2023, price pressures have been stronger in Québec than in Canada.
| – | Annual growth in the CPI reached 3.3% in Québec in January 2024, against 2.9% in Canada. For the 13th consecutive month, Québec’s CPI increase exceeded that of Canada. |
| – | Nevertheless, the gap between Québec and Canada is gradually narrowing. It fell from a peak of 1.1 percentage point in October 2023 to 0.4 percentage points in January 2024. |
Service inflation still higher than in Canada
The gap in price growth between Québec and Canada is due to inflation in the service sector, while, overall, prices for goods show a similar trend.
| – | Annual growth in the CPI for services reached 5.2% in Québec in January 2024, compared with 4.2% in Canada. However, annual goods inflation in January was relatively similar (+1.4% in Québec and +1.3% in Canada). |
Service prices are based in part on labour costs. However, the labour shortage, which is more pronounced in Québec than in Canada, has put more pressure on wages. In particular, average hourly earnings rose faster in Québec (+20.4%) than in Canada (+18.5%) between 2019 and 2023.
Moreover, wage growth and transfers from all levels of government to households since the start of the pandemic have supported household disposable income and demand for goods and services.
| – | In particular, between 2018 and 2023, household disposable income rose by 35.1% in Québec, compared to 30.4% in Canada. |
The easing of tensions on the labour market is reflected in reduced pressure on wages, which should moderate inflation in services.
| Change in CPI | Change in service prices | |
| (annual percentage change) | (annual percentage change) | |
|  | |
| Source: Statistics Canada. | Source: Statistics Canada. |
| The Québec Economy: Recent Developments and Outlook for 2024 and 2025 | F.23 |
The inflation gap between Québec and Canada
is gradually closing (cont.)
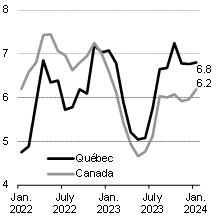
Strong housing price growth
In recent months, the inflation rate for the housing component has maintained a high growth rate. In particular, soaring mortgage rates have driven up financing costs and prices on the rental market.
| – | In January 2024 compared with January 2023, the housing price index rose by 6.8% in Québec, compared with 6.2% in Canada. |
A decrease in childcare costs across Canada
The federal government has undertaken to reduce childcare costs in all provinces. This measure slows inflation in Canada, but has no effect on price trends in Québec, since the province already benefits from affordable childcare costs.
Growth in the price of food purchased from restaurants in Canada now exceeds that in Québec
Annual increases in food prices have also diverged in recent months. In particular, the labour shortage has put further pressure on the price of food purchased from restaurants in Québec than in Canada. However, this trend reversed in January 2024.
Prices in Québec and Canada will return to a similar growth path
The factors that have kept inflation high in Québec are fading, and the gap between Québec and Canada is gradually narrowing.
| – | In particular, the moderation in the labour market is easing pressure on wages. In addition, the base effect attributable to the federal childcare program will fade. |
| CPI, housing component | CPI, food purchased from restaurants component | |
| (annual percentage change) | (annual percentage change) | |
|  |
| Source: Statistics Canada. | Source: Statistics Canada. |
| F.24 | Budget 2024-2025 Budget Plan |
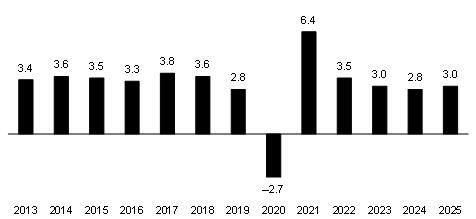
| 1.10 | Nominal GDP growth is moderating but will remain strong |
Following two sharp increases (+11.6% in 2021 and +8.4% in 2022), growth in nominal GDP, the broadest measure of the tax base, slowed to 3.9% in 2023. Economic stagnation and falling inflation dampened the increase in the value of output.
| — | Nevertheless, this increase is equivalent to the average observed over the 10 years preceding the pandemic (+3.8% from 2010 to 2019). |
Nominal GDP will keep growing over the next two years. It is expected to reach 4.0% in 2024 and 3.8% in 2025.
The main tax bases underpinning government revenues will generally show a positive trend.
| — | Wages and salaries will rise by 5.1% in 2024 and 3.7% in 2025, while tensions persist in the labour market. |
| — | They will also be buoyed by the application of new collective agreements in the public and parapublic sectors, as well as the payment of retroactive pay raises, since the previous labour agreements expired in March 2023. |
| — | After a gain of 6.1% in 2023, the value of consumer spending is expected to decelerate to 3.0% in 2024 and 3.6% in 2025 due to moderating inflation and high interest rates. These increases are comparable to those observed before the pandemic (+3.5% on average annually from 2010 to 2019). |
| — | The net operating surplus of corporations is expected to decline by 2.5% in 2024. It is expected to return to growth in 2025 (+3.0%). |
| — | Significant financing costs and the difficult economic environment will dampen corporate profits. |
| TABLE F.4 Nominal GDP in Québec | ||||
| (percentage change) | ||||
| 2022 | 2023 | 2024 | 2025 | |
| Real GDP | 2.5 | 0.2 | 0.6 | 1.6 |
| Price – GDP deflator | 5.7 | 3.8 | 3.4 | 2.2 |
| NOMINAL GDP | 8.4 | 3.9 | 4.0 | 3.8 |
| Note: | Totals may not add due to rounding. |
| Sources: | Institut de la statistique du Québec, Statistics Canada and Ministère des Finances du Québec. |
| The Québec Economy: Recent Developments and Outlook for 2024 and 2025 | F.25 |
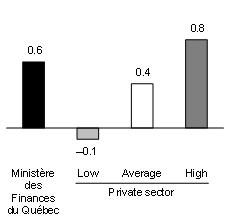
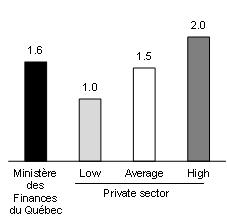
| 1.11 | Forecasts comparable to those of the private sector |
In 2024, the Ministère des Finances du Québec forecasts an increase in economic activity (+0.6%). This is a slightly higher increase than the average private sector forecast (+0.4%).
In 2025, the Ministère des Finances is forecasting 1.6% real GDP growth. This growth is comparable to the average private sector forecast (+1.5%).
The large variation between private sector forecasts reflects the uncertainty arising from the current economic situation.
CHART F.15
Economic growth in Québec in 2024 | CHART F.16
Economic growth in Québec in 2025 | |
| (real GDP, percentage change) | (real GDP, percentage change) | |
 |  |
| Sources: | Ministère des Finances du Québec summary as at February 16, 2024, which includes the forecasts of 11 private sector institutions. | Sources: | Ministère des Finances du Québec summary as at February 16, 2024, which includes the forecasts of 11 private sector institutions. |
| TABLE F.5 Economic outlook in Québec – Comparison with the private sector | |||||||
| (percentage change) | |||||||
| 2023 | 2024 | 2025 | 2026 | 2027 | 2028 | Average 2024-2028 | |
| Real GDP | |||||||
| Ministère des Finances du Québec | 0.2 | 0.6 | 1.6 | 1.7 | 1.7 | 1.7 | 1.4 |
| Private sector average | — | 0.4 | 1.5 | 1.8 | 1.8 | 1.6 | 1.4 |
| Nominal GDP | |||||||
| Ministère des Finances du Québec | 3.9 | 4.0 | 3.8 | 3.7 | 3.7 | 3.6 | 3.8 |
| Private sector average | — | 3.0 | 3.6 | 3.8 | 3.7 | 3.6 | 3.5 |
Note: Average may not add due to rounding. | |||||||
| Sources: | Ministère des Finances du Québec summary as at February 16, 2024, which includes the forecasts of 11 private sector institutions. |
| F.26 | Budget 2024-2025 Budget Plan |
| TABLE F.6 Economic outlook in Québec | |||||||
| (annual average, percentage change, unless otherwise indicated) | |||||||
| 2022 | 2023 | 2024 | 2025 | 2026 | 2027 | 2028 | |
| Output | |||||||
| Real GDP | 2.5 | 0.2 | 0.6 | 1.6 | 1.7 | 1.7 | 1.7 |
| Nominal GDP | 8.4 | 3.9 | 4.0 | 3.8 | 3.7 | 3.7 | 3.6 |
| Nominal GDP (billions of dollars) | 545.6 | 567.1 | 589.9 | 612.4 | 634.9 | 658.6 | 682.4 |
| Components of GDP (in real terms) | |||||||
| Final domestic demand | 2.5 | −0.1 | 0.9 | 1.7 | 1.5 | 1.5 | 1.5 |
| – Household consumption | 4.9 | 2.3 | 0.8 | 1.8 | 1.9 | 1.9 | 1.8 |
– Government spending and investment | 3.0 | 0.2 | 0.9 | 0.9 | 0.3 | 0.5 | 0.6 |
| – Residential investment | −11.7 | −17.8 | 0.4 | 2.6 | 1.3 | 1.2 | 0.9 |
– Non-residential business investment | 1.3 | −1.4 | 2.4 | 2.9 | 2.9 | 2.8 | 2.5 |
| Exports | 0.5 | 2.3 | 2.0 | 2.2 | 2.5 | 2.3 | 2.0 |
| Imports | 6.0 | 0.5 | 1.5 | 1.9 | 1.8 | 1.6 | 1.6 |
| Labour market | |||||||
| Population (thousands) | 8 672 | 8 875 | 9 124 | 9 185 | 9 237 | 9 283 | 9 328 |
| Population aged 15 and over (thousands) | 7 156 | 7 260 | 7 406 | 7 466 | 7 518 | 7 565 | 7 613 |
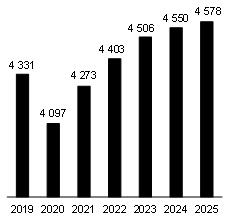
| Jobs (thousands) | 4 403 | 4 506 | 4 550 | 4 578 | 4 598 | 4 618 | 4 637 |
| Job creation (thousands) | 129.7 | 103.3 | 43.8 | 28.0 | 20.0 | 19.6 | 18.9 |
| Unemployment rate (per cent) | 4.3 | 4.5 | 5.2 | 4.9 | 4.6 | 4.2 | 4.1 |
| Other economic indicators (in nominal terms) | |||||||
| Household consumption | 10.6 | 6.1 | 3.0 | 3.6 | 3.7 | 3.7 | 3.5 |
– Excluding food expenditures and shelter | 12.3 | 5.6 | 2.5 | 3.6 | 3.6 | 3.6 | 3.4 |
| Housing starts (thousands of units) | 57.1 | 38.9 | 42.7 | 43.7 | 43.0 | 42.3 | 41.6 |
| Residential investment | −0.6 | −15.8 | 2.6 | 5.5 | 3.6 | 3.4 | 3.1 |
| Non-residential business investment | 11.3 | 3.6 | 4.3 | 4.2 | 4.4 | 4.6 | 4.5 |
| Wages and salaries | 10.4 | 6.0 | 5.1 | 3.7 | 3.3 | 3.4 | 3.2 |
| Household income | 7.9 | 6.0 | 5.2 | 3.6 | 3.3 | 3.4 | 3.3 |
| Net operating surplus of corporations | −10.2 | −11.0 | −2.5 | 3.0 | 4.0 | 4.2 | 5.4 |
| Consumer price index | 6.7 | 4.5 | 2.8 | 2.2 | 2.0 | 2.0 | 2.0 |
| – Excluding food and energy | 4.7 | 4.5 | 3.2 | 2.1 | 2.1 | 1.9 | 1.9 |
Sources: Institut de la statistique du Québec, Statistics Canada, Canada Mortgage and Housing Corporation and Ministère des Finances du Québec.
| The Québec Economy: Recent Developments and Outlook for 2024 and 2025 | F.27 |
| 2. | The situation of Québec’s main economic partners |
The trajectory of Québec’s economic activity is largely influenced by changes in its exports. In fact, the value of exports of goods and services accounted for almost 47% of nominal GDP in 2022. As a result, Québec is sensitive to changes in the global economic situation, particularly the situation of its main trading partners.
| — | In particular, the Canadian and U.S. economies proved resilient in 2023. However, the slowdown caused by restrictive monetary policies is increasingly being felt. Modest growth in their real GDP is thus forecast for 2024. |
| — | Inflation is expected to ease as economic activity slows, allowing the Bank of Canada and the U.S. Federal Reserve to ease their monetary policy. Lower interest rates will provide stimulus and result in a sustainable recovery as of 2025. |
| 2.1 | The economic situation in Canada |
| q | Canada’s economy is slowing |
The Canadian economy got off to a strong start in 2023, but the pace slowed markedly in the second half of the year. Overall, real GDP growth stood at 1.1% in 2023.
Real GDP growth is expected to decelerate to 0.7% in 2024, before resuming at a more sustained pace in 2025 (+1.9%), supported by the easing of monetary conditions.
CHART F.17 |
| (real GDP, percentage change) |
|
| Sources: Statistics Canada and Ministère des Finances du Québec. |
| The Québec Economy: Recent Developments and Outlook for 2024 and 2025 | F.29 |
| Economic growth in Canada was supported | ||
| by temporary factors in 2023 | ||
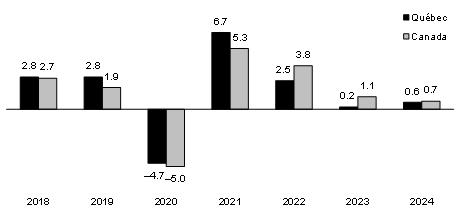
| Between 2018 and 2022, real GDP growth was more sustained in Québec (+1.7% annual average) than in Canada (+1.4%). In 2023, Canada benefited from temporary factors that supported economic growth: | ||
| – | strong production in the automobile industry. The easing of tensions in the supply chains of this industry, which has a strong presence in Ontario, led to a sharp rise in production. Following an 8.1% gain in 2022, motor vehicle manufacturing jumped by 32.6% in 2023; | |
| – | more pronounced population growth than in Québec. The Canadian population grew by 1.8% in 2022 and 3.0% in 2023, higher growth rates than in Québec (+1.2% in 2022 and +2.3% in 2023). | |
| In 2024 and 2025, production in Canada and Québec will return to similar growth rates. In particular: | ||
| – | the recovery in the automobile sector is essentially complete; | |
| – | economic activity in Canada will be less supported by households, as Canadians’ financial positions are not as strong as those of Quebecers. | |
▪ | Quebecers’ indebtedness ratio (148.3% in 2022), that is, the value of household liabilities as a proportion of disposable income, is lower than that of Canadians (189.1%). | |
| ▪ | The savings rate in Canada was 5.5% in 2023, lower than in Québec (12.0%). Households in Canada will therefore have a smaller pool of savings from which to finance their spending. | |
▪ | Increases in wages and salaries in 2024 will be greater in Québec (+5.1%) than in Canada (+4.5%) due to a tighter labour market and the renewal of collective agreements in Québec’s public and parapublic sectors. | |
| Economic growth in Québec and Canada |
| (real GDP, percentage change) |
|
| Sources: Institut de la statistique du Québec, Statistics Canada and Ministère des Finances du Québec. |
| F.30 | Budget 2024-2025 Budget Plan |
| q | Domestic demand will support economic growth |
The effects of deteriorating credit conditions are gradually being passed on to the economy. Real GDP growth is therefore expected to moderate from 1.1% in 2023 to 0.7% in 2024. Lower financing costs will allow the economy to return to stronger growth in 2025.
Over the next two years, domestic demand will continue to support economic activity.
| — | Growth in household consumption expenditure will be supported by strong demographic growth. However, the shock of interest payments, the shrinking pool of savings and the slowdown in job creation will encourage households to exercise caution in their purchases. |
| — | The easing of monetary policy and the need to increase the housing stock will promote a recovery in the residential sector. |
| — | Low oil prices and the uncertainty over economic conditions will moderate non-residential investment in 2024. The start-up of new projects in the mining sector and battery industry will, however, support this investment. |
The external sector will make a slight positive contribution, as exports will grow faster than imports.
| — | In particular, exports will benefit from increased oil and gas transport capacity. |
TABLE F.7 | |||||||
| (percentage change and contribution in percentage points) | |||||||
| Change | Contribution | ||||||
| 2023 | 2024 | 2025 | 2023 | 2024 | 2025 | ||
| Domestic demand | 0.5 | 0.9 | 1.9 | 0.5 | 0.9 | 1.9 | |
| Household consumption | 1.7 | 1.1 | 2.2 | 0.9 | 0.6 | 1.3 | |
| Residential investment | −10.2 | 0.5 | 1.3 | −0.9 | 0.0 | 0.1 | |
| Non-residential business investment | −0.7 | 1.2 | 2.8 | −0.1 | 0.1 | 0.3 | |
| Government spending and investment | 2.1 | 0.5 | 0.7 | 0.5 | 0.1 | 0.2 | |
| External sector | — | — | — | 1.6 | 0.2 | 0.2 | |
| Exports | 5.7 | 2.4 | 2.8 | 1.9 | 0.7 | 0.9 | |
| Imports | 1.0 | 1.5 | 2.1 | −0.3 | −0.5 | −0.7 | |
| Inventories | — | — | — | −1.0 | −0.5 | −0.2 | |
| REAL GDP | 1.1 | 0.7 | 1.9 | 1.1 | 0.7 | 1.9 | |
Note: Total components may not add due to rounding. Sources: Statistics Canada and Ministère des Finances du Québec. | |||||||
| The Québec Economy: Recent Developments and Outlook for 2024 and 2025 | F.31 |
| n | Household consumption growth will weaken |
Consumer spending is expected to grow by 1.1% in 2024, after rising by 1.7% in 2023.
| — | Despite the moderation in economic activity, growth in consumer spending will be supported by strong population growth. |
| — | However, financial pressures from interest rates together with the slowdown in job creation will encourage households to exercise caution. Moreover, the pool of savings accumulated by households is declining, as the savings rate has fallen from 10.5% in 2021 to 5.4% in 2022 and 5.5% in 2023. |
Household consumption will return to a more sustained growth rate as of 2025 (+2.2%), driven by rising confidence and lower financing costs.
| n | Residential investment will stabilize in 2023 |
After experiencing significant contractions in 2022 (−12.1%) and 2023 (−10.2%), real estate market activity is expected to stabilize in 2024 (+0.5%) before resuming an upward trend.
| — | Strong population growth, the gradual reduction in mortgage interest rates and the need to increase the supply of housing will be supporting factors for this sector. |
| CHART F.18 Household consumption expenditure in Canada | CHART F.19 Residential investment in Canada | |
| (percentage change, in real terms) | (percentage change, in real terms) | |
|  | |
| Sources: Statistics Canada and Ministère des Finances du Québec. | Sources: Statistics Canada and Ministère des Finances du Québec. |
| F.32 | Budget 2024-2025 Budget Plan |
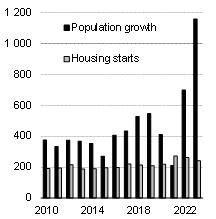
Housing demand is growing faster than supply
Over the past two years, rising interest rates, increasing commodity prices and uncertainty over the expected economic slowdown have limited the start-up of construction projects. At the same time, affordability conditions have deteriorated in Canada.
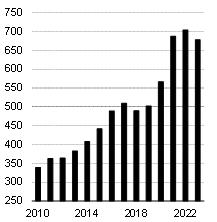
| – | In particular, the average price of a home on the resale market in Canada was $678 300 in 2023, up 35.1% compared to 2019. Moreover, high interest rates have restricted access to home ownership for many potential buyers. They must also undergo a mortgage qualification test that assesses their financial capacity to react to a rate increase. High financing costs are limiting borrowers’ leeway by reducing the amount they can borrow. This regulation does, however, protect buyers from an unexpected deterioration in their financial position. |
As a result, activity in the housing market has slowed sharply. Housing starts fell by 3.4% in 2022 and 8.2% in 2023. The number of transactions on the resale market fell by 25.1% in 2022 and 11.1% in 2023.
This decline in activity contrasts with a rapidly growing need for housing.
| – | In 2023, Canada saw record population growth (+3.0%). Immigration accounted for almost all the population growth. |
| – | At the same time, the number of new listings on the resale market fell by 7.7% in 2023, the fifth decline in the last six years. |
Housing supply is insufficient to meet demand, which is keeping up the pressure on house purchase prices and rents. As a result, real estate prices are likely to remain high.
| Population growth and housing starts in Canada | Average home resale price in Canada | |
| (change in population in thousands and housing starts in thousands of units) | (thousands of dollars) | |
|
| |
| Sources: Canada Mortgage and Housing Corporation and Statistics Canada. | Source: Haver Analytics. |
| The Québec Economy: Recent Developments and Outlook for 2024 and 2025 | F.33 |
| n | Non-residential investment will grow |
Despite the current climate of uncertainty and high financing costs, non-residential investment will grow by 1.2% in 2024, following a drop of 0.7% in 2023. Renewed confidence and lower interest rates will drive a rebound in non-residential investment in 2025 (+2.8%).
| — | Growth in this sector will also be supported by the start-up of new projects in the mining sector and the battery industry. Moreover, the digital transformation and energy transition of the economy will put upward pressure on non-residential investment. |
| — | However, investment in the energy sector will be weighed down by the weakness of oil prices and uncertainty regarding long-term demand amid the transition to a low-carbon economy. |
| n | Exports will support economic activity |
Export growth is expected to go from 5.7% in 2023 to 2.4% in 2024 and to 2.8% in 2025.
| — | Exports are expected to weaken in 2024, reflecting falling global demand. However, new oil pipelines being commissioned and improved supply chains will fuel exports. |
Imports are expected to grow by 1.5% in 2024 and 2.1% in 2025.
The external sector will make a modest positive contribution to real GDP as export growth will slightly exceed that of imports.
| GRAPHIQUE F. 20 Non-residential business investment in Canada | GRAPHIQUE F. 21 Exports and imports in Canada | |
| (percentage change, in real terms) | (percentage change, in real terms) | |
 |  | |
| Sources: Statistics Canada and Ministère des Finances du Québec. | Sources: Statistics Canada and Ministère des Finances du Québec. |
| F.34 | Budget 2024-2025 Budget Plan |
| 2.2 | The economic situation in the United States |
| q | The U.S. economy will continue to grow |
The U.S. economy performed well in 2023. Real GDP expanded by 2.5% despite the unusually rapid pace of tightening in monetary policy and a historic strike in the automobile sector. The probability of a soft landing, consisting of a drop in inflation that would not cause a sharp deterioration in the labour market, has risen in recent months.
| — | Economic activity was supported in part by a sharp rise in the budgetary deficit, which remains above its 50-year average. |
Economic growth is expected to slow over the next two years. Real GDP is expected to rise by 1.5% in 2024 and 1.6% in 2025.
| — | The economic impacts of high real interest rates will continue to be felt in 2024, while restrictive fiscal policy, the gradual elimination of excess household savings and a looser labour market will dampen domestic demand. |
| — | As a result, consumption, non-residential business investment and government spending are expected to become less dynamic, while residential investment will remain fragile. |
Despite the anticipated slowdown, a recession seems increasingly less likely, and a slight acceleration in economic growth is expected in 2025. The easing of monetary policy, due to falling inflation, will support domestic demand.
| CHART F.22 Economic growth in the United States |
| (real GDP, percentage change) |
|
| Sources: S&P Global and Ministère des Finances du Québec. |

| The Québec Economy: Recent Developments and Outlook for 2024 and 2025 | F.35 |
| q | Consumer spending will continue to grow while difficulties in the real estate sector will ease |
Consumer spending is expected to grow by 1.6% in 2024 and 1.4% in 2025, after rising by 2.2% in 2023. The slowdown is anticipated due to a decline in job creation, which should curb wage gains.
| — | In addition, the effects of accumulated savings are expected to fade, and households will allocate some income to debt repayments, as debt reached an all-time high in the fourth quarter of 2023. |
| — | Yet, consumers will remain a driving force for the U.S. economy as their confidence improves. Moreover, household financial positions are generally comfortable, due, in particular, to the strong rise in value of their assets in the past. |
Residential investment in real terms will increase. It is expected to expand by 0.1% in 2024 and 2.6% in 2025, after shrinking by an average of nearly 10% in 2022 and 2023.
| — | Residential investment, including in particular investment in new construction and existing home renovations, will remain fragile in the first half of 2024, mainly due to high mortgage rates. |
| — | An easing in credit conditions resulting from looser monetary policy, and supply chains returning to normal which leads to lower material costs should help residential investment recover as soon as the second half of the year. |
| CHART F.23 Household consumption expenditure in the United States | CHART F.24 Residential investment in the United States | |
| (percentage change, in real terms) | (percentage change, in real terms) | |
|  | |
| Sources: S&P Global and Ministère des Finances du Québec. | Sources: S&P Global and Ministère des Finances du Québec. |
| F.36 | Budget 2024-2025 Budget Plan |
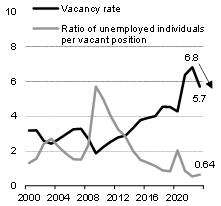
Loosening of the labour market in the United States
In the United States, job creation slipped from 6.2 million in 2022 to 3.5 million in 2023, hitting a low not seen since the start of the pandemic in 2020. Despite this pullback, the labour market has remained strong, with an average monthly creation of 255 000 jobs, well in excess of the 100 000 jobs needed to keep pace with growth in the labour force. However, the slowdown in employment is strengthening signs of a looser labour market.
| – | The vacancy rate, which expresses the number of vacant positions as a proportion of all existing jobs and unfilled positions, stood at 5.7% in 2023, after reaching an all-time high of 6.8% in 2022. |
| – | The ratio of the number of unemployed individuals to vacant positions, one of the indicators measuring the intensity of labour shortages, indicates that there were 0.64 unemployed individuals per vacant position in 2023, compared with a historic low of 0.54 in 2022. |
| – | In addition, in 2023, businesses announced layoffs representing approximately 722 000 jobs cut, the highest number since 2009, excluding 2020. These announcements came mainly from the technology sector. |
A looser labour market, attributed in particular to lower demand, economic uncertainty and a larger labour supply, may continue. Many businesses are planning to trim their production costs and therefore to continue layoffs.
However, the labour market is expected to remain relatively tight, with labour sho
| Vacancy rate and ratio of unemployed individuals to vacant positions in the United States | Labour market changes and outlook in the United States | |
| (percentage rate and ratio in units) | (millions of jobs created and unemployment rate in per cent) | |
|
| |
| Sources: S&P Global and Ministère des Finances du Québec. | Sources: S&P Global and Ministère des Finances du Québec. |
| The Québec Economy: Recent Developments and Outlook for 2024 and 2025 | F.37 |
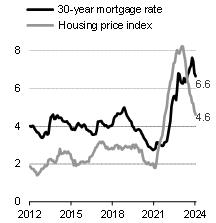
Recovery in the residential real estate sector
The U.S. housing market has faced headwinds since the start of the pandemic, which has affected both supply and demand for housing.
| – | Successive policy rate hikes by the U.S. Federal Reserve to rein in inflation have been passed on to mortgage rates, particularly the 30-year mortgage rate, which climbed from 3.0% in 2021 to 5.4% in 2022 and 6.8% in 2023. |
| – | In particular, high mortgage rates dampened supply, as homeowners were reluctant to sell, and made the housing market very tight, which boosted prices and triggered a deterioration in housing affordability. |
| – | These factors played a role in restricting existing home sales (−18.7%), building permits (−12.8%), housing starts (−8.5%) and residential investment (−10.6%), which contracted in 2023 for a second consecutive year. |
With the Federal Reserve preserving the status quo since its last rate hike in July 2023, and rate cuts expected starting in the second quarter of 2024, mortgage rates are falling. In addition, supply has improved since the beginning of the year.
| – | The number of new building permits for single-family homes rose for a 12th consecutive month in January 2024, and in February 2024, homebuilder confidence reached its highest level since August 2023. |
Some normalization is anticipated in the real estate sector as of the second half of 2024. It will be supported by both stronger demand and supply, which will benefit from monetary easing as well as favourable demographic factors, including continued household formation.
| Mortgage rates and annual change in housing prices | Residential investment | |
| (per cent) | (percentage change, in real terms) | |
|  | |
| Sources: S&P Global and Ministère des Finances du Québec. | Sources: S&P Global and Ministère des Finances du Québec. |
| F.38 | Budget 2024-2025 Budget Plan |
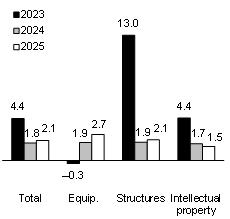
| q | Non-residential investment continues to rise |
Non-residential business investment jumped by 4.4% in 2023, driven in part by tax incentives under the CHIPS and Science Act and the Inflation Reduction Act. Its growth is expected to moderate to 1.8% in 2024, before edging up to 2.1% in 2025.
| — | This slowdown is due in part to businesses exercising caution in response to economic uncertainty and debt refinancing at higher interest rates. In addition, the effects of recent industrial policies, which have helped boost manufacturing investment, will diminish. |
| — | The three sub-components of investment–equipment, structures and intellectual property products–are expected to increase. |
| q | Neutral contribution from net exports |
After a strong positive contribution to economic growth in 2023, net exports will become neutral in 2024 and 2025.
| — | Growth in exports following depreciation in the U.S. dollar will be offset by a recovery in imports, which will be fuelled by demand for goods and services and the end of destocking. |
The outlook for foreign trade will be influenced by the significant adjustments underway. The government wishes to improve trade relations with several reliable partners, including Canada and Mexico, and strengthen the supply of certain crucial commodities.
| GRAPHIQUE F.25 Non-residential business investment in the United States | GRAPHIQUE F.26 Exports and imports in the United States | |
| (percentage change, in real terms) | (percentage change, in real terms) | |
|  | |
| Sources: S&P Global and Ministère des Finances du Québec. | Sources: S&P Global and Ministère des Finances du Québec. |
| The Québec Economy: Recent Developments and Outlook for 2024 and 2025 | F.39 |
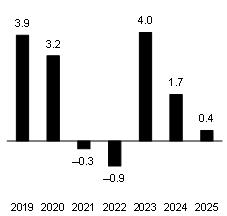
| q | Slowdown in government spending |
Government spending is expected to grow by 1.7% in 2024 and 0.4% in 2025, after rising sharply in 2023 (+4.0%).
| — | Federal government spending is expected to rise by 1.2% this year and by 0.5% next year, while growth in state and local government spending will fall from 2.1% to 0.3%. |
In particular, spending will continue to be boosted by the Infrastructure Investment and Jobs Act adopted in 2021 for a 5-year period. The moderation in government spending implies that the fiscal policy, which was strongly expansionary in 2023, will gradually become restrictive.
| — | No new economic stimulus is expected in 2024. |
��
| — | In addition, the Congressional Budget Office (CBO), a nonpartisan agency of the U.S. Congress, anticipates a reduction in the budget deficit from 6.2% of nominal GDP in fiscal 2023 to 5.6% in 2024. This temporary drop is due in particular to the resumption of tax payments, which had been delayed for taxpayers and companies based in regions affected by natural disasters. |
| — | However, according to the CBO, the deficit will remain above the average of the last 50 years, and public debt will exceed 100% of GDP from 2025 onwards. |
| — | As a result, the budgetary situation remains uncertain. |
| GRAPHIQUE F.27 Total government spending in the United States | GRAPHIQUE F.28 Spending by all levels of government in the United States | |
| (percentage change, in real terms) | (percentage change, in real terms) | |
|
| |
| Sources: S&P Global and Ministère des Finances du Québec. | Sources: S&P Global and Ministère des Finances du Québec. |
| F.40 | Budget 2024-2025 Budget Plan |
| 3. | The global economic situation |
| q | A global economic slowdown in 2024 and a rebound in 2025 |
After its resilience in 2023, driven in particular by favourable U.S. economic performance, global economic growth is expected to slow from 3.0% in 2023 to 2.8% in 2024. However, it will be a transitional year with an acceleration to 3.0% forecast for 2025.
| — | The slowdown in 2024 will be widespread. Nearly all major advanced and emerging economies are expected to post real GDP growth below or at best equal to 2023 levels. |
Inflation should experience a gradual moderation during the year, which will be decisive in determining the trajectory of global economic activity in the short and medium term.
| — | In particular, the pace of the slowdown in inflation will influence decision-making by central banks in setting monetary policy, which is currently restrictive in multiple economies. |
A gradual easing in monetary policies in many major advanced economies, expected to begin in the second quarter of 2024 and to continue in a number of emerging economies, will help restore an environment subsequently conducive to sustainable economic growth.
| — | However, international economic conditions remain uncertain due to a rise in geopolitical tensions, with economic activity remaining uneven across the various regions and economic sectors. |
| CHART F.29 Global economic growth |
| (real GDP in purchasing power parity, percentage change) |
|
| Sources: International Monetary Fund, S&P Global, LSEG Datastream, Bloomberg, Eurostat and Ministère des Finances du Québec. |
| The Québec Economy: Recent Developments and Outlook for 2024 and 2025 | F.41 |
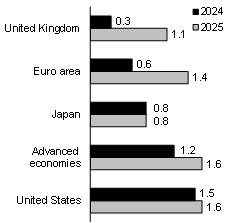
TABLE F.8 Outlook for global economic growth | ||||
| (real GDP, annual percentage change) | ||||
| Weight(1) | 2023 | 2024 | 2025 | |
| World(2) | 100.0 | 3.0 | 2.8 | 3.0 |
| Advanced economies(2) | 41.7 | 1.5 | 1.2 | 1.6 |
| Québec | 0.3 | 0.2 | 0.6 | 1.6 |
| Canada | 1.4 | 1.1 | 0.7 | 1.9 |
| United States | 15.5 | 2.5 | 1.5 | 1.6 |
| Euro area | 12.1 | 0.6 | 0.6 | 1.4 |
| – Germany | 3.3 | −0.3 | 0.3 | 1.2 |
| – France | 2.3 | 0.9 | 0.7 | 1.3 |
| – Italy | 1.9 | 0.7 | 0.5 | 1.0 |
| United Kingdom | 2.3 | 0.1 | 0.3 | 1.1 |
| Japan | 3.8 | 1.9 | 0.8 | 0.8 |
| Emerging and developing economies(2) | 58.3 | 4.0 | 3.8 | 4.0 |
| China | 18.4 | 5.2 | 4.5 | 4.3 |
| India(3) | 7.3 | 6.6 | 6.2 | 6.3 |
| (1) | Economic weight according to purchasing power parity. The weights shown are for the year 2022. | |
| (2) | GDP in purchasing power parity. | |
| (3) | Data for the fiscal year (April 1 to March 31). |
Sources: International Monetary Fund, S&P Global, Institut de la statistique du Québec, Statistics Canada, Bloomberg, LSEG Datastream, Eurostat and Ministère des Finances du Québec.
| F.42 | Budget 2024-2025 Budget Plan |
| q | Continued moderation in growth for advanced economies in 2024 |
Advanced economies are expected to see slower growth in 2024. The full effect of monetary tightening begun in 2022, restrictive fiscal policies and a slowdown in the labour markets and service sector, in particular, are expected to weigh on economic activity.
Real GDP in advanced economies is therefore set to rise slightly, that is, by 1.2% in 2024, after increasing by 1.5% in 2023.
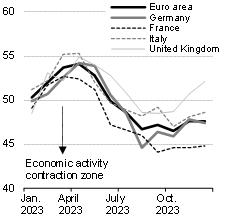
| — | Despite a slowdown, the United States will be the top-performing major advanced economy in 2024, while the euro area, the United Kingdom and Japan are expected to post real GDP growth below 1%. |
| — | The euro area economy declined slightly in the second half of 2023, according to purchasing managers’ indices. A trough in economic activity has apparently been reached but growth is expected to remain weak at the beginning of the year due to high interest rates. |
| — | For its part, the United Kingdom’s economy showed a slight decline at the end of 2023. In addition, the wave of mortgage renewals at higher interest rates expected in 2024 will continue to weigh on household consumption. |
Growth in advanced economies is expected to jump to 1.6% in 2025, due to monetary policy easing as of the second quarter of 2024 and a return to more sustainable inflation levels. Economic growth is expected to accelerate further in advanced countries in Europe and North America.
| GRAPHIQUE F.30 Real GDP growth in major advanced economies | GRAPHIQUE F.31 Composite purchasing managers’ index in Europe in 2023 | |
| (per cent) | (diffusion index; an index above 50 indicates an expansion of the economy) | |
|  | |
| Source: Ministère des Finances du Québec. | Sources: Bloomberg and S&P Global. |
| The Québec Economy: Recent Developments and Outlook for 2024 and 2025 | F.43 |
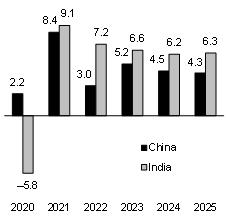
| q | Moderating growth for emerging countries in 2024 |
In the group of emerging and developing economies, the slowdown in major economies such as China, India and Brazil in 2024 will be partially offset by faster growth in the other emerging countries in Asia, as well as in Europe, Africa and the Middle East.
| — | Accordingly, growth in emerging and developing economies is expected to decline from 4.0% in 2023 to 3.8% in 2024, before accelerating to 4.0% in 2025. |
| — | Real GDP growth in these regions in 2025 will occur despite slower economic activity in China, where the economy is struggling with some structural problems. |
In particular, restrictive global financial conditions coupled with high public debt, elevated interest rates to counter inflation, geopolitical tensions and a slowdown in world trade dampened economic activity in these economies in 2023.
| — | In 2024, these difficulties stand to continue in part, despite the improvement anticipated this year. The standard of living in a number of these countries, defined by real GDP per capita, will remain below 2019 levels in 2024. |
In 2025, a number of emerging countries are expected to benefit from a gradual rise in global demand, as well as from inflation and interest rates returning to more sustainable levels.
| GRAPHIQUE F.32 Economic growth in China and India | GRAPHIQUE F.33 Growth in world trade in goods and services | |
| (real GDP, percentage change) | (average exports and imports, percentage change) | |
| 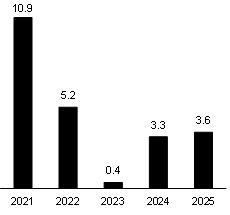 | |
| Sources: LSEG Datastream and Ministère des Finances du Québec. | Source: International Monetary Fund. |
| F.44 | Budget 2024-2025 Budget Plan |
The reduction in inflation is well underway
Global price growth slowed sharply in 2023 but remained above central bank targets in most major advanced economies, with a potentially challenging path ahead.
| – | The decline in inflation in 2023 resulted in particular from lower energy prices and a slowdown in price increases for food. |
| – | However, labour markets remained tight in a number of major advanced economies. As a result, wage growth remained high and led to a more gradual slowdown in core inflation. |
Inflation should continue losing pace in 2024. However, a sustained return to central bank targets, typically around 2%, is not expected to occur until late 2024, or even 2025, in several advanced economies.
| – | The full effect of monetary tightening and looser labour markets are expected to help reduce inflation in 2024. |
| – | The forecast moderation in wage growth will help push down core inflation, particularly in the service sector, as it has been more persistent than headline inflation. |
| – | The energy sector stands to make a smaller contribution to reducing inflation, however, due to weaker base effects than in 2023. |
| Consumer price index | Economies with above-target inflation rates | |
| (annual percentage change) | (proportion in per cent) | |
| 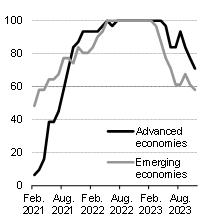 | |
| Sources: Organisation for Economic Co-operation and Development and S&P Global. | Source: World Bank. |
| The Québec Economy: Recent Developments and Outlook for 2024 and 2025 | F.45 |
The reduction in inflation is well underway (cont.)
Tensions in supply chains pose a risk to meeting central bank inflation targets
According to the Federal Reserve Bank of New York index, supply chain tensions greatly diminished in 2023 compared to previous years, and are currently hovering around their historical average.
However, the recent rise in geopolitical tensions in the Middle East and their effects on supply chains could generate upward pressure on inflation worldwide.
| – | On the one hand, the World Bank has suggested that a worsening of the Israel–Gaza conflict—which could spread to neighbouring countries—would lead to higher oil prices, as seen during previous conflicts in that region. |
| ▪ | That said, OPEC countries and their partners currently have significant excess production capacity, due to production cuts implemented to support prices. |
| – | On the other hand, container prices have risen sharply since the end of 2023. This increase is due in particular to shipping disruptions in the Red Sea. |
| ▪ | Attacks on merchant ships passing through the area, which normally handles 12% of world trade, have forced ocean carriers to take longer routes, reducing container availability in the short term. |
Furthermore, the World Trade Organization (WTO) has noted the growing vulnerability of supply chains in recent years. This is partly due to an increase in the number of products considered bottlenecks, or goods helping economies to function well that are exported by a very small number of countries.
| Geopolitical risk index | Container prices | |
| (points, historical average = 100 points) | (U.S. dollars per 40-foot container) | |
|
| |
| Source: World Bank. | Source: Drewry. |
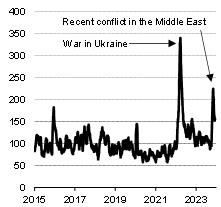
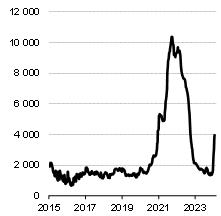
| F.46 | Budget 2024-2025 Budget Plan |
| 4. | Developments in financial markets |
| q | Investors are focused on expected interest rate cuts in 2024 |
Over the past few months, international financial markets have been focused on a specific issue, that is, anticipating when the major central banks will decide to start cutting their policy rates and the pace at which they will do so.
| — | Looking at the stock markets, the S&P 500 index established new records in January and February, due to expectations of interest rate cuts in 2024, the steady growth of the U.S. economy and better-than-anticipated financial results. |
| — | However, expectations regarding the future path of policy rates remain fairly volatile, which is reflected in bond yields. |
| — | Since the start of the year, bond yields have risen in advanced economies as investors have tempered their expectations regarding the extent of future monetary easing. |
Moreover, oil prices have dropped since fall 2023, against a backdrop of abundant global supply and weak growth prospects for world oil demand. Geopolitical risks still loom, however, and could lead to higher prices and global inflation.
| CHART F.34 North American stock market developments | CHART F.35 Yield on 10-year federal bonds | |
| (index, December 31, 2021 = 100) | (per cent) | |
| 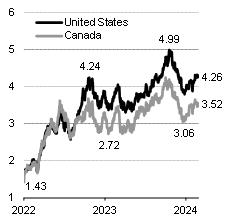 | |
Note: Most recent figure is for February 28, 2024. Sources: Bloomberg and Ministère des Finances | Note: Most recent figure is for February 28, 2024. Source: Bloomberg. |
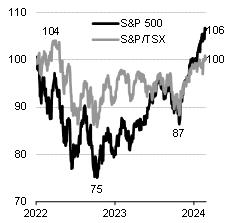
| The Québec Economy: Recent Developments and Outlook for 2024 and 2025 | F.47 |
| q | Monetary easing in the second quarter of 2024 in Canada |
In January, the Bank of Canada maintained its policy rate at 5.00% and signalled that it was done with rate hikes.
| — | Headline inflation has continued to slow in recent months, settling at 2.9% in January. That said, certain core inflation measures remain high, close to 3.5%. Wage growth also remains high, at around 4% to 5%. |
The Canadian economy has been stagnating since the third quarter of 2023 as a result of restrictive interest rates. Real GDP growth is expected to remain weak in early 2024, which would help steer inflation towards the 2% target.
| — | As a result, the Bank of Canada should be in a position to start gradually reducing its policy rate in the second quarter of 2024. |
| q | Rate cuts in the second quarter of 2024 in the United States |
In January, the U.S. Federal Reserve maintained its policy rate within the 5.25%-5.50% range. This was the fourth consecutive status quo.
| — | Given the significant slowdown in U.S. inflation in recent months, that country’s monetary policy is among the most restrictive. In addition, quantitative tightening is continuing in the United States and Canada, adding to the restrictive stance of monetary policies. |
Against this backdrop, the expected further decline in inflation should enable the Federal Reserve to start gradually cutting its policy rate in the second quarter (four cuts of 25 basis points expected in total in 2024).
| CHART F.36 Policy interest rate in Canada and the United States |
| (overnight rate target and federal funds target rate,(1) per cent) |
|
(1) The federal funds target rate is the midpoint of the target range. Sources: Statistics Canada, Bloomberg and Ministère des Finances du Québec. |

| F.48 | Budget 2024-2025 Budget Plan |
| q | Rebound in bond yields at the start of 2024 |
Bond yields fell sharply in November and December 2023 in the major advanced economies. Reacting to encouraging inflation data, investors had raised their expectations significantly for early and rapid policy rate cuts in 2024.
As a sign of the volatility prevailing on the bond market, bond yields have changed direction somewhat since the beginning of the year.
| — | The increase in yields is mainly due to a downward reassessment of financial market expectations with respect to monetary easing in 2024. |
| — | This development follows the release of data showing, in particular, that inflation could prove more persistent than expected, as well as certain comments by central bank officials seeking to moderate expectations of policy rate cuts. |
Although bond yields are expected to show high volatility again this year, the continued decline in inflation and the expected easing of monetary policies in 2024 should foster a gradual easing of yields.
| q | The Canadian dollar is expected to gradually appreciate in 2024 |
In recent months, the Canadian dollar has generally fluctuated between 72 and 75 U.S. cents, hovering around 74 U.S. cents in February. The U.S. dollar has recovered since the start of 2024, after retreating for much of fall 2023.
| — | The depreciation of the U.S. dollar is set to resume, prompted by the expected drop in interest rates in the United States and elsewhere, which would help to improve growth prospects for the global economy. |
| — | Conversely, the Canadian dollar and other currencies are expected to appreciate against the U.S. dollar over the coming quarters. |
| TABLE F.9 Canadian financial markets | |||
| (average annual percentage, unless otherwise indicated, end-of-year data in brackets) | |||
| 2023 | 2024 | 2025 | |
| Overnight rate target | 4.8 (5.0) | 4.6 (4.3) | 3.6 (3.3) |
| 3-month Treasury bill | 4.8 (4.9) | 4.6 (4.1) | 3.5 (3.0) |
| 10-year bond | 3.3 (3.1) | 3.3 (3.1) | 3.1 (3.1) |
| Canadian dollar (in U.S. cents) | 74.2 (75.7) | 75.5 (76.5) | 77.6 (78.6) |
| U.S. dollar (in Canadian dollars) | 1.35 (1.32) | 1.32 (1.31) | 1.29 (1.27) |
| Sources: Statistics Canada, Bloomberg and Ministère des Finances du Québec. | |||
| The Québec Economy: Recent Developments and Outlook for 2024 and 2025 | F.49 |
| q | Global energy markets well supplied in 2024 |
Oil prices have fallen since last fall. The price of WTI (West Texas Intermediate) has fallen by about 15% since September 2023, averaging nearly US$77 a barrel in February 2024.
As for global oil supply, the market will remain well supplied over the coming quarters due to expected production increases in non-OPEC countries, mainly the United States.
| — | Despite voluntary production cuts by OPEC and its partners, supply is expected to keep pace with the growth of global demand, which will slow this year, marking the end of its post-pandemic rebound. |
Against this backdrop, oil prices are expected to be less volatile this year, and remain at levels slightly below those seen in 2023. However, the lingering tense geopolitical situation in the Middle East remains a major risk for global oil supplies and price trends.
At the same time, U.S. natural gas prices showed limited changes in 2023. This is due to moderate demand and higher-than-normal inventory levels, the result of milder seasonal temperatures.
| — | Gas prices are expected to rise in 2024, supported by a slowdown in the pace of production in the United States and increased exports of liquefied natural gas. However, this rise in prices will likely be tempered by relatively stable demand and persistently high inventories. |
| CHART F.37 Change in oil prices | CHART F.38 Natural gas prices in the United States | |
| (U.S. dollars per barrel) | (Henry Hub, U.S. dollars per MMBtu) | |
|
| |
| Sources: Bloomberg and Ministère des Finances du Québec. | Note: Most recent figure is for February 28, 2024. Source: Bloomberg. |

| F.50 | Budget 2024-2025 Budget Plan |
| 5. | Main risks that may influence the forecast scenario |
The economic and financial forecasts in Budget 2024-2025 are based on several assumptions. Some of them are associated with risks that could affect the global economic and financial scenario as well as developments in the Québec economy.
| q | Persistently high inflation |
The economic forecast scenario is based on a gradual reduction in price pressures. A different trend in inflation could lead central banks to reconsider their strategy, impacting economic growth.
In particular, price increases could resume or remain above central banks’ targets.
| — | Such a situation could lead central banks to raise their policy rates or keep them at restrictive levels for longer than expected. Growth in economic activity would therefore be weaker than expected, which could translate into a recession in some economies. |
| — | Persistent inflation stemming from a supply-side shock, as observed in 2021 and 2022, would be especially problematic in economies where demand remains weak. This situation would further complicate the work of central banks. |
| — | In particular, this shock could come from higher shipping costs or increased geopolitical tensions, leading to heightened tensions in supply chains. |
Conversely, inflation could slow more quickly than expected.
| — | Central banks could therefore begin the monetary easing cycle earlier, and even accelerate the pace of rate cuts. This situation could lead to stronger economic growth. |
| q | Stronger-than-expected population growth |
According to Statistics Canada, Québec passed the symbolic milestone of nine million inhabitants at the end of January 2024. The province is currently experiencing unprecedented population growth. This increase is mainly due to immigration.
If population growth continues at this pace for a prolonged period, the rise in economic activity could be stronger than expected. Such a development would, however, put pressure on housing demand and prices.
| The Québec Economy: Recent Developments and Outlook for 2024 and 2025 | F.51 |
| q | A growing imbalance in the housing market |
In Canada and Québec, housing accessibility remains a key concern. Strong population growth increases demand. At the same time, heightened economic uncertainty, high interest rates and rising construction costs have slowed housing starts in recent years.
This imbalance between supply and demand has kept prices near record highs, despite the moderation in economic activity.
In 2024 and 2025, housing starts should resume their upward trend, increasing the supply of housing. In addition, slower economic growth and declining affordability should limit housing demand. These developments are expected to reduce pressure on prices.
Nevertheless, there could be an increase in the number of potential buyers on the market in anticipation of lower mortgage rates, or housing starts could remain weaker than expected. Housing prices would then rise, which could generate instability in financial markets and negatively impact household financial positions.
Conversely, a faster-than-expected recovery in real estate construction would ease imbalances between demand and supply in the residential sector, and improve housing affordability.
| q | The effects of monetary policy on households could be more pronounced |
Canadian households have seen their financial positions worsen in recent years, mainly due to elevated inflation and high interest rates.
The effects of monetary policy on households could be more pronounced than expected. Over the next few quarters, many of these households will renew their mortgages at a higher interest rate than that previously contracted. Moreover, the indebtedness of Canadian households is at a record high.
Against this backdrop, it is possible that Canadian households will be more cautious than expected and further limit their consumption expenditures.
| F.52 | Budget 2024-2025 Budget Plan |
| q | Weak non-residential business investment continues |
Increased uncertainty about economic conditions, slowing demand for goods and services, the declining net operating surplus of corporations and high interest rates prompted businesses to be cautious in 2023.
Although a rebound in non-residential investment is expected in 2024, some businesses may postpone their investment projects.
| — | In particular, January 18, 2024 marked the deadline for repaying loans from the Canada Emergency Business Account (CEBA). The payment of such a loan could place many businesses in a difficult financial position. |
| — | In addition, if the impacts of monetary policy on households are greater than expected, demand for goods and services could remain modest, driving down corporate profits. |
Against this backdrop, some businesses may be faced with difficult decisions or could even declare bankruptcy. This development would lead to negative consequences for non-residential investment.
| q | Different global economic trends than expected |
Global economic activity may differ from what is expected.
| — | In the United States, the economy could grow more than expected, particularly if unemployment remains low despite the loosening of the labour market. This different context would provide further support to consumer confidence and spending. On the other hand, persistent inflation and deteriorating credit conditions could slow the expansion of interest-rate-sensitive sectors such as household consumption, investment and exports. |
| — | In China, ongoing difficulties in the real estate sector and lacklustre consumer and business confidence could, in particular, weigh on growth forecasts. The possibility of a major economic stimulus package being announced remains fairly weak, although it would have a positive impact. |
| — | In the euro area, although natural gas supply difficulties have eased considerably, risks affecting the economic growth outlook remain on the downside. In particular, consumption could be dampened by a deterioration of the labour market or by less monetary easing than expected. |
Given the size of these economies in world GDP, a shift in their economic activity could alter the path of global growth.
| The Québec Economy: Recent Developments and Outlook for 2024 and 2025 | F.53 |
| q | Changes in geopolitical tensions |
The global economy must contend with the intensification of geopolitical tensions in the Middle East, but also with the ongoing war in Ukraine and tensions between the United States and China, in particular.
| — | A favourable geopolitical context is conducive to trade and global economic growth. |
| — | Conversely, rising geopolitical tensions are influencing trends and volatility in financial markets and energy prices. However, the extent of these effects remains difficult to quantify. |
| — | In addition, several economies have adopted strategies to secure their supply of critical and strategic metals. |
| — | The rise in the number of trade restrictions could continue, hampering world trade, increasing the volatility of commodity prices and limiting the potential for economic growth. |
The economic and financial scenario is based on the premise that the current tensions will continue without worsening significantly.
| q | A different evolution of energy prices |
Energy prices are influenced by numerous factors. A worsening of geopolitical tensions in the Middle East, one of the most important regions in terms of energy resource production, represents a major risk for the stability of global supplies.
| — | Supply disruptions could result in higher-than-expected oil and natural gas prices. |
| — | On the other hand, a possible end to voluntary production cuts by OPEC and its partners this year could substantially increase global supply on the oil market and lead to a sharp drop in oil prices. |
Furthermore, growth in the world economy that differs from what is anticipated could lead to positive or negative consequences on global demand and energy prices.
| — | A rise in oil prices has significant constraining effects on importing economies such as Québec’s. |
| F.54 | Budget 2024-2025 Budget Plan |
| q | A stock market plunge, stoked by a drop in stocks related to artificial intelligence |
Stock markets have reached record highs of late, but they remain vulnerable to a correction that could disrupt the economy as a whole.
In particular, the field of artificial intelligence is expanding rapidly, and this is helping boost stock markets, especially in the United States.
| — | In 2023, the S&P 500 U.S. stock market index posted strong growth of 24%, and the index has continued to increase since the start of 2024. |
| — | However, a handful of stocks, in particular technology companies in the field of artificial intelligence, have been responsible for a significant share of the stock market surge in recent quarters. |
The marked increase in the value of these stocks is based largely on high earnings prospects, sometimes in the distant future. Accordingly, in the event that high earnings expectations are not met, artificial intelligence stocks, and stock markets as a whole, could be vulnerable to a significant drop.
| — | Such a development would lead to negative consequences for investors and for households whose portfolios are partly invested in stock markets. |
| q | Climate events |
Climate change is having an increasingly significant economic impact. Unexpected weather events could adversely affect the activities of various sectors of the economy and push up commodity prices.
| — | Climatic disturbances can reduce production and transportation capacities. |
| — | In addition, extreme climate events generate significant costs for rebuilding basic infrastructures and force the construction of protective infrastructures. |
| The Québec Economy: Recent Developments and Outlook for 2024 and 2025 | F.55 |