Exhibit 99.15
Section H
The Québec government’s debt
| Summary | H.3 | ||
| 1. | Québec’s debt | H.5 | |
| 1.1 | Different concepts of debt | H.5 | |
| 1.2 | Net debt | H.6 | |
| 1.3 | Gross debt | H.10 | |
| 1.4 | Debt representing accumulated deficits | H.15 | |
| 1.5 | The debt reduction objective and the Generations Fund | H.17 | |
| 2. | Financing | H.23 | |
| 2.1 | Financing program | H.23 | |
| 2.2 | Borrowings contracted in 2023-2024 | H.25 | |
| 2.3 | Debt management strategy | H.28 | |
| 2.4 | Yield on Québec’s debt securities | H.31 | |
| 3. | Information on pension plans and funds deposited by the Ministère des Finances with the Caisse de dépôt et placement du Québec | H.33 | |
| 3.1 | Net liability for pension plans | H.33 | |
| 3.2 | Returns on funds deposited with the Caisse de dépôt et placement du Québec | H.35 | |
| 4. | Credit ratings | H.37 | |
| 4.1 | Québec’s credit ratings | H.37 | |
| 4.2 | Comparison of the credit ratings of Canadian provinces | H.38 | |
| Appendix: | Report on the application of the Act to reduce the debt and establish the Generations Fund | H.41 |
| H.1 |

Québec has made notable progress in reducing its debt load in recent decades, but it remains high nonetheless.
Reducing the debt burden is a priority for the government. That is why, in March 2023, it introduced new debt reduction targets, which were confirmed in the Act to reduce the debt and establish the Generations Fund in December 2023.
As at March 31, 2024, Québec’s net debt will stand at $221.1 billion, or 39.0% of GDP. This is lower than the pre-pandemic level of 40.9% of GDP as at March 31, 2020.
As a result of budgetary deficits and significant investment in public infrastructure, net debt to GDP will rise back to 41.0% by 2025-2026, and then fall again to 39.5% as at March 31, 2029. It will then continue to decline gradually until the debt reduction target is reached in 2037-2038.
As at March 31, 2024, the net debt burden will stand at 39.0% of GDP. This is a lower level than the pre-pandemic level. The government maintains its objective of reducing the net debt burden to 30% of GDP by 2037-2038.1 It will achieve this by restoring a balanced budget, continuing deposits in the Generations Fund and implementing initiatives to accelerate economic growth. |
In 2024-2025, revenues dedicated to the Generations Fund will stand at $2.2 billion. They will reach $2.7 billion in 2028-2029 and $4.2 billion in 2037-2038.
| 1 | The Act to reduce the debt and establish the Generations Fund stipulates that, for fiscal 2037-2038, the net debt presented in the government’s financial statements may not exceed 32.5% of GDP. This ratio corresponds to the maximum limit of a net debt reduction objective of 30% of GDP announced in the budget speech for fiscal 2023-2024. |
| The Québec Government’s Debt | H.3 |
The balance of the Generations Fund, which will stand at $18.5 billion as at March 31, 2024, is expected to reach $24.1 billion as at March 31, 2029, representing 8.9% of net debt. Withdrawals of $4.4 billion2 and $2.5 billion will be made in 2024-2025 and 2025-2026, respectively.
These withdrawals will serve to reduce the financing program and alleviate debt service in the current context of high interest rates. With the cost of new borrowings currently higher than the average cost of debt, debt service is coming under upward pressure.
The economic context, the evolution of interest rates and the high level of debt require prudence and the sound management of public finances, because a greater-than-anticipated rise in interest rates would have a substantial impact on the financial framework.
| q | The benefits of reducing the debt burden |
Reducing the debt burden contributes to economic growth by creating a climate of confidence conducive to private investment and higher productivity.
In addition to supporting collective prosperity, reducing the debt burden will allow Québec to:
| — | contribute to intergenerational fairness; |
| — | ensure stable funding for the government’s main missions, including health and education; |
| — | cope with the costs associated with an aging population; |
| — | implement measures to fight climate change; |
| — | fund substantial investments in public infrastructure; |
| — | ease the tax burden on Quebecers; |
| — | counter a new recession; |
| — | increase its financial autonomy within the federation. |
| 2 | These withdrawals include an amount of $400 million that will come from the Territorial Information Fund. |
| H.4 | Budget 2024-2025 Budget Plan |
| 1. | Québec’s debt |
| 1.1 | Different concepts of debt |
A number of different concepts of debt are used to measure a government’s indebtedness.
| — | Gross debt corresponds to the debt on financial markets, plus the commitments made with regard to the retirement plans of government employees. The balance of the Generations Fund is subtracted from gross debt. |
| — | As at March 31, 2024, Québec’s gross debt will stand at $235.5 billion, or 41.5% of GDP. |
| — | Net debt corresponds to the government’s liabilities as a whole, less its financial assets. |
| — | As at March 31, 2024, Québec’s net debt will stand at $221.1 billion, or 39.0% of GDP. |
| — | The government set itself the objective of reducing net debt to GDP to 30% by 2037-2038. |
| — | Debt representing accumulated deficits corresponds to the difference between the government’s assets and liabilities. It is the debt that does not correspond to any assets. This is the concept that the federal government uses to present the change in its debt. |
| — | As at March 31, 2024, Québec’s debt representing accumulated deficits will stand at $118.8 billion, or 20.9% of GDP. |
TABLE H.1
Québec government debt as at March 31 according to different concepts
| (millions of dollars) | |||
| 2023 | 2024 | 2025 | |
| GROSS DEBT(1) | 226 065 | 235 504 | 257 781 |
| % of GDP | 41.4 | 41.5 | 43.7 |
| Less: Financial assets, net of other liabilities(2) | −17 353 | −14 376 | −20 010 |
| NET DEBT | 208 712 | 221 128 | 237 771 |
| % of GDP | 38.3 | 39.0 | 40.3 |
| Less: Non-financial assets | −93 833 | −102 369 | −110 577 |
| DEBT REPRESENTING ACCUMULATED DEFICITS | 114 879 | 118 759 | 127 194 |
| % of GDP | 21.1 | 20.9 | 21.6 |
| (1) | Gross debt excludes pre-financing and takes into account amounts accumulated in the Generations Fund. |
| (2) | Financial assets include, in particular, investments in government enterprises (e.g. Hydro-Québec) and accounts receivable, minus other liabilities (e.g. accounts payable). |
| The Québec Government’s Debt | H.5 |
| 1.2 | Net debt |
Net debt corresponds to the government’s liabilities minus its financial assets.
As at March 31, 2024, Québec’s net debt will stand at $221.1 billion, or 39.0% of GDP. Net debt to GDP will rise back to 41.0% by 2025-2026, due to deficits and significant investments in public infrastructure. It will then fall again to stand at 39.5% as at March 31, 2029.
| — | Before the contingency reserve, this ratio is expected to stand at 38.4% of GDP as at March 31, 2029. |
TABLE H.2
Factors responsible for the change in net debt
| (millions of dollars) |
| Debt, beginning of year | Budgetary deficit (surplus) | Net capital investments | Accoun- ting adjust- ments(1) | Revenues dedicated to the Generations Fund | Total change | Debt, end of year | % of GDP | |
| 2022-2023 | 196 800 | 6 084 | 6 500 | 2 410 | −3 082 | 11 912 | 208 712 | 38.3 |
| 2023-2024 | 208 712 | 6 302 | 8 536 | −341 | −2 081 | 12 416 | 221 128 | 39.0 |
| 2024-2025 | 221 128 | 10 998 | 8 208 | −341 | −2 222 | 16 643 | 237 771 | 40.3 |
| 2025-2026 | 237 771 | 8 486 | 7 196 | −341 | −2 219 | 13 122 | 250 893 | 41.0 |
| 2026-2027 | 250 893 | 4 209 | 5 173 | −341 | −2 419 | 6 622 | 257 515 | 40.6 |
| 2027-2028 | 257 515 | 3 944 | 4 891 | −341 | −2 554 | 5 940 | 263 455 | 40.0 |
| 2028-2029 | 263 455 | 3 940 | 5 013 | −341 | −2 671 | 5 941 | 269 396 | 39.5(2) |
| (1) | Accounting adjustments notably include the impact on debt of measuring derivative financial instruments at their fair value. This valuation results in temporary changes in the debt. For forecasting purposes, it is estimated that this impact will be amortized over the average maturity of the debt as at March 31, 2023, which is 12 years. |
| (2) | Before the contingency reserve ($7.5 billion over 5 years, that is, from 2024-2025 to 2028-2029), net debt to GDP is expected to stand at 38.4% as at March 31, 2029. |
| H.6 | Budget 2024-2025 Budget Plan |
Net capital investments
Net capital investments consist of the government’s gross investments minus depreciation expenses.
Even though gross investments have an impact on debt, net capital investments are presented in the factors responsible for the change in the debt due to the fact that depreciation expenses are included in the budgetary balance.
From 2024-2025 to 2028-2029, net capital investments will increase gross debt by $6.1 billion per year on average.
Net capital investments
(millions of dollars)
2023- 2024- | 2024- 2025- | 2025- 2026- | 2026- 2027- | 2027- 2028- | 2028- 2029- | |
| Gross investments(1) | 13 543 | 13 708 | 12 995 | 11 199 | 11 036 | 11 526 |
| Less: Depreciation | −5 007 | −5 500 | −5 799 | −6 026 | −6 145 | −6 513 |
| TOTAL | 8 536 | 8 208 | 7 196 | 5 173 | 4 891 | 5 013 |
| (1) | These investments exclude the Québec government’s contribution to the projects of partners (e.g. municipalities), whereas this contribution is included in the annual investments of the Québec Infrastructure Plan and portfolio expenditures. |
| The Québec Government’s Debt | H.7 |
| q | Net debt is lower than it was before the pandemic |
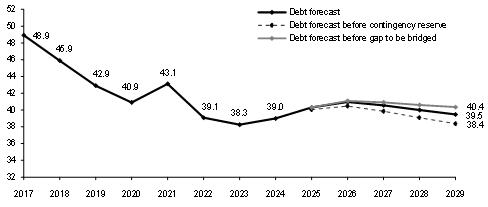
The net debt burden will stand at 39.0% of GDP as at March 31, 2024. This is lower than the pre-pandemic level of 40.9% of GDP as at March 31, 2020.
Net debt to GDP will rise by 2025-2026, due to deficits and significant investments in public infrastructure. It will then fall again, to 39.5% of GDP as at March 31, 2029.
| — | Before the gap to be bridged, net debt to GDP is estimated at 40.4% as at March 31, 2029. |
| — | Before the contingency reserve of $7.5 billion over five years, from 2024-2025 to 2028-2029, net debt to GDP is estimated at 38.4% as at March 31, 2029. |
| CHART H.1 Net debt as at March 31 |
| (percentage of GDP) |
|
| H.8 | Budget 2024-2025 Budget Plan |
Accounting changes that led to an increase in net debt
In 2021, to comply with the recommendation of the Auditor General of Québec who, since 2012-2013 had issued a recommendation with reservations in the audit of the financial statements, the government changed the application of the accounting standard respecting transfer payments. In particular, it wanted its financial information, including the net debt indicator, to be fully comparable with that of the federal government and other provinces. This change resulted in an increase in net debt of $13.0 billion, or 2.8 percentage points of GDP, as at March 31, 2021.
Moreover, a new accounting standard with retroactive application respecting asset retirement obligations came into effect in 2022-2023 for all governments in Canada. For Québec, the main obligation in this respect concerns asbestos in buildings and roads. This new standard has resulted in an increase in net debt of $4.4 billion, or 1.0 percentage point of GDP, as at March 31, 2021.
Overall, these accounting changes resulted in an increase in net debt of $17.4 billion or 3.8 percentage points of GDP as at March 31, 2021. Without these changes, net debt to GDP would have been 39.3% as at March 31, 2021, instead of 43.1%.
| q | Comparison of the net debt of governments in Canada |
As at March 31, 2024, Québec’s net debt burden will stand at 39.0% of GDP, compared with the provincial average of 29.9%.3
Québec is one of the most indebted governments in Canada.
CHART H.2
Net debt of governments in Canada as at March 31, 2024
| (percentage of GDP) |
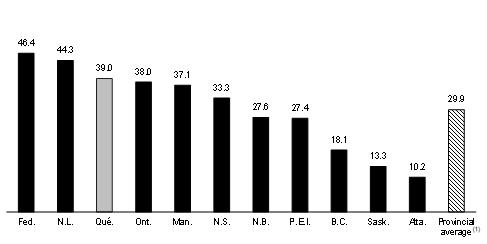 |
| (1) | This average is obtained by dividing the sum of provincial debts by the sum of provincial GDP. |
Sources: Governments’ budget documents.
| 3 | Provincial average as at March 31, 2023 was 29.1%. |
| The Québec Government’s Debt | H.9 |
| 1.3 | Gross debt |
Gross debt corresponds to the amount of debt contracted on financial markets (direct debt) plus the net liability for the pension plans and other future benefits of public and parapublic sector employees, minus the balance of the Generations Fund.
The gross debt burden will stand at 41.5% of GDP as at March 31, 2024. Due to deficits and significant investments in public infrastructure, an increase in gross debt to GDP is expected by 2026-2027. Gross debt to GDP will then fall to 44.4% as at March 31, 2029.
A decrease in net liability for pension plans and other employee future benefits is also forecast by 2028-2029.
TABLE H.3
Gross debt as at March 31
(millions of dollars)
| 2023 | 2024 | 2025 | 2026 | 2027 | 2028 | 2029 | |
| Direct debt | 238 191 | 250 361 | 271 284 | 288 092 | 301 273 | 314 110 | 325 671 |
| Plus: Pension plans and other employee future benefits | 6 785 | 3 635 | 3 211 | 2 091 | 1 741 | 1 712 | 1 310 |
| Less: Generations Fund | −18 911 | −18 492 | −16 714 | −16 433 | −18 852 | −21 406 | −24 077 |
| GROSS DEBT | 226 065 | 235 504 | 257 781 | 273 750 | 284 162 | 294 416 | 302 904 |
| % of GDP | 41.4 | 41.5 | 43.7 | 44.7 | 44.8 | 44.7 | 44.4 |
| H.10 | Budget 2024-2025 Budget Plan |
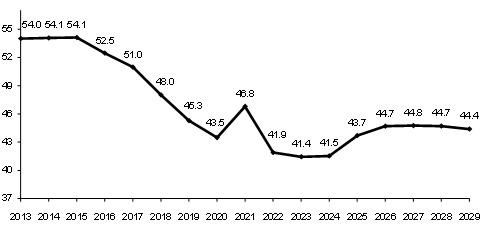
| q | A significant reduction in the gross debt burden since the mid-2010s |
The gross debt burden is expected to stand at 44.4% of GDP as at March 31, 2029. This will be much lower than the peak reached in the mid-2010s.
CHART H.3
Gross debt as at March 31
| (percentage of GDP) |
|
| The Québec Government’s Debt | H.11 |
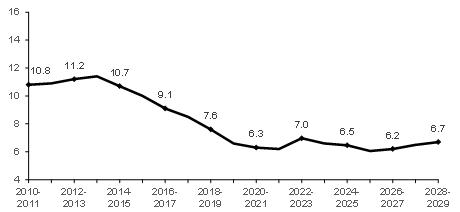
The proportion of revenue dedicated to debt service will remain
at historically low levels
Debt service as a proportion of revenue, which will stand at 6.5% in 2024-2025, is expected to increase slightly in future years. Debt service as a proportion of revenue stood at over 10% during the early 2010s.
Debt service
| (percentage of revenue) |
|
Sensitivity of debt service to a rise in interest rates
The economic context, the evolution of interest rates and the high level of debt require prudence and sound management of public finances, because a greater-than-anticipated rise in long-term interest rates would have a substantial impact on the financial framework.
A greater-than-anticipated rise in interest rates of 1 percentage point over a full year would increase interest expenditure by $434 million in the first year, by nearly $1.7 billion in the fifth year and by approximately $3 billion in the tenth year.
The impact is increasing, as only a portion of the debt is refinanced each year. The average maturity of the debt was 12 years as at March 31, 2023.
Such a rise in interest rates starting in 2024-2025 would put the proportion of revenue dedicated to debt service at 7.7% in 2028-2029, compared to the currently anticipated ratio of 6.7%.
Impact on interest expenditure of a 1-percentage-point rise in interest rates
| (millions of dollars) | |||||
| 1st year | 2nd year | 3rd year | 4th year | 5th year | |
| Impact | 434 | 771 | 1 080 | 1 373 | 1 665 |
| H.12 | Budget 2024-2025 Budget Plan |
TABLE H.4
Factors responsible for the change in the Québec government’s gross debt
(millions of dollars)
| Debt, beginning of year | Budgetary deficit (surplus) | Investments, loans and advances | Net capital investments | Other factors(1) | Deposits in the Generations Fund | Total change | Debt, end of year | % of GDP | |
| 2022-2023 | 210 952 | 6 084 | −1 193 | 6 500 | 6 804 | −3 082 | 15 113 | 226 065 | 41.4 |
| 2023-2024 | 226 065 | 6 302 | 1 145 | 8 536 | −4 463 | −2 081 | 9 439 | 235 504 | 41.5 |
| 2024-2025 | 235 504 | 10 998 | 4 689 | 8 208 | 1 004 | −2 622(2) | 22 277 | 257 781 | 43.7 |
| 2025-2026 | 257 781 | 8 486 | 2 605 | 7 196 | −99 | −2 219 | 15 969 | 273 750 | 44.7 |
| 2026-2027 | 273 750 | 4 209 | 3 201 | 5 173 | 248 | −2 419 | 10 412 | 284 162 | 44.8 |
| 2027-2028 | 284 162 | 3 944 | 2 453 | 4 891 | 1 520 | −2 554 | 10 254 | 294 416 | 44.7 |
| 2028-2029 | 294 416 | 3 940 | 2 176 | 5 013 | 30 | −2 671 | 8 488 | 302 904 | 44.4 |
| (1) | Other factors notably include the change in other accounts, such as accounts receivable and accounts payable. They also include the impact on debt of measuring derivative financial instruments at their fair value. This valuation results in temporary changes in the debt. For forecasting purposes, it is estimated that this impact will be amortized over the average maturity of the debt as at March 31, 2023, which is 12 years. The increase in debt in 2022-2023 is due in particular to the one-time cost of living amount of $500 per adult, announced in the March 2022 budget. This measure resulted in an expenditure in 2021-2022, but in a cash outflow at the beginning of 2022-2023. The decrease in debt in 2023-2024 is due to expenditures recognized in 2023-2024, but not disbursed in 2023-2024, such as those relating to collective agreement renewal, disbursed in 2024-2025. |
| (2) | Deposits in the Generations Fund in 2024-2025 include an amount of $400 million from the Territorial Information Fund. |
| The Québec Government’s Debt | H.13 |
Investments, loans and advances
The government makes investments, in the form of investments, loans and advances, in private businesses, through the Economic Development Fund (EDF)1 as well as in state-owned corporations.
A state-owned corporation may be authorized to keep part of its net earnings.
| – | For example, every year, Hydro-Québec pays the government a dividend corresponding to 75% of its net earnings. Hydro-Québec uses the portion of net earnings not paid to the government (25%) to finance its requirements. |
| – | For the government, this constitutes an investment that creates a financial requirement and thus an increase in gross debt. |
Note that investments, loans and advances may vary from one year to another, particularly because of temporary investments made and redeemed.
| 1 | From 2023-2024 to 2028-2029, the EDF’s net acquisitions of investments and loans average close to $900 million annually. |
| H.14 | Budget 2024-2025 Budget Plan |
| 1.4 | Debt representing accumulated deficits |
Debt representing accumulated deficits consists of accumulated deficits figuring in the government’s financial statements. It is the debt that does not correspond to any assets. The federal government uses this concept to present the change in its debt.
As at March 31, 2024, the debt representing Québec’s accumulated deficits will stand at $118.8 billion, or 20.9% of GDP.
The burden of the debt representing accumulated deficits is expected to decline as of 2026-2027, to stand at 20.0% of GDP as at March 31, 2029.
TABLE H.5
Factors responsible for the change in debt representing accumulated deficits
(millions of dollars)
| Debt, beginning of year | Budgetary deficit (surplus) | Accounting adjustments(1) | Revenues dedicated to the Generations Fund | Total change | Debt, end of year | % of GDP | |
| 2022-2023 | 108 969 | 6 084 | 2 908 | −3 082 | 5 910 | 114 879 | 21.1 |
| 2023-2024 | 114 879 | 6 302 | −341 | −2 081 | 3 880 | 118 759 | 20.9 |
| 2024-2025 | 118 759 | 10 998 | −341 | −2 222 | 8 435 | 127 194 | 21.6 |
| 2025-2026 | 127 194 | 8 486 | −341 | −2 219 | 5 926 | 133 120 | 21.7 |
| 2026-2027 | 133 120 | 4 209 | −341 | −2 419 | 1 449 | 134 569 | 21.2 |
| 2027-2028 | 134 569 | 3 944 | −341 | −2 554 | 1 049 | 135 618 | 20.6 |
| 2028-2029 | 135 618 | 3 940 | −341 | −2 671 | 928 | 136 546 | 20.0 |
| (1) | Accounting adjustments notably include the impact on debt of measuring derivative financial instruments at their fair value. This valuation results in temporary changes in the debt. For forecasting purposes, it is estimated that this impact will be amortized over the average maturity of the debt as at March 31, 2023, which is 12 years. |
| The Québec Government’s Debt | H.15 |
Québec’s public sector debt
The public sector debt includes the government’s gross debt, the debt of Hydro-Québec, the debt of municipalities as well as the debt of universities other than the Université du Québec and its constituents. This debt has served, in particular, to fund public infrastructure, such as roads, schools, hospitals, hydroelectric dams and water treatment plants.
As at March 31, 2024, Québec’s public sector debt will stand at $321.9 billion, or 56.8% of GDP. These figures must, however, be seen in perspective, for they do not take into account the economic value of certain assets held by the government, such as Hydro-Québec, the Société des alcools du Québec and Loto-Québec.
Public sector debt as at March 31
| (millions of dollars) | |||||
| 2020 | 2021 | 2022 | 2023 | 2024 | |
| Government’s gross debt | 199 930 | 211 228 | 210 952 | 226 065 | 235 504 |
| Hydro-Québec | 43 839 | 44 831 | 46 225 | 49 438 | 53 006 |
| Municipalities | 29 424 | 30 020 | 31 263 | 30 952 | 32 017 |
| Universities other than the Université du Québec and its constituents | 1 639 | 1 452 | 1 379 | 1 395 | 1 395 |
| PUBLIC SECTOR DEBT | 274 832 | 287 531 | 289 819 | 307 850 | 321 922 |
| % of GDP | 59.8 | 63.7 | 57.6 | 56.4 | 56.8 |
| H.16 | Budget 2024-2025 Budget Plan |
| 1.5 | The debt reduction objective and the Generations Fund |
| q | Debt reduction objectives |
Québec has made notable progress in reducing its debt load in recent decades, but it remains high nonetheless.
The Act to reduce the debt and establish the Generations Fund was adopted in 2006. By reducing the debt burden, it aims to ensure the long-term financing of the government’s main missions as well as a prosperous tomorrow for future generations.
As at March 31, 2024, net debt will stand at 39.0% of GDP. The government intends to reduce the debt to 30% of GDP by 2037-2038.
| — | The government also aims for the net debt burden to be 33% of GDP by 2032-2033. This is an intermediate target. |
At a time when it is difficult to forecast how the economy will change over the long term, the government has provided an interval for these two targets. These two targets were incorporated in the Act to reduce the debt and establish the Generations Fund in December 2023.
TABLE H.6
The debt reduction targets
| Net debt by 2032-2033 (intermediate target) | 33% of GDP (±2.5% of GDP) |
| Net debt by 2037-2038 | 30% of GDP (±2.5% of GDP) |
| The Québec Government’s Debt | H.17 |
The government intends to achieve these targets by restoring a balanced budget, continuing to make payments to the Generations Fund and implementing measures to accelerate economic growth.
It will ensure that these targets can be achieved under the plan to restore fiscal balance, which will be presented in the 2025-2026 budget.
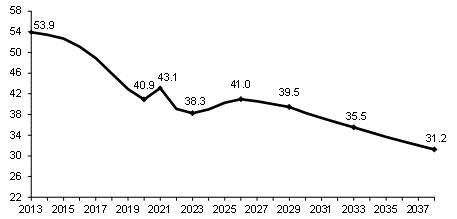
The Ministère des Finances conducts detailed five-year debt forecasts. For information purposes, a projection of the net debt-to-GDP ratio has been made up to 2037-2038.
Based on this projection, it is expected that the targets will be met:
| — | net debt to GDP would stand at 35.5% as at March 31, 2033, the maximum limit; |
| — | net debt to GDP would stand at 31.2% as at March 31, 2038, below the maximum limit of 32.5% of GDP. |
Net debt to GDP had peaked in 2012-2013 at 53.9%.
| CHART H.4 Net debt projection as at March 31 |
| (percentage of GDP) |
|
| H.18 | Budget 2024-2025 Budget Plan |
| q | Deposits in the Generations Fund |
Since 2006, the Generations Fund is an important pillar of the debt reduction strategy.
In accordance with the changes made to the Act to reduce the debt and establish the Generations Fund in December 2023, three sources of revenue are now dedicated to the Generations Fund:
| — | water-power royalties, which are paid by Hydro-Québec and private hydroelectricity producers;4 |
| — | an additional contribution from Hydro-Québec, set at $650 million per year, taken from the dividend paid by Hydro-Québec to the government; |
| — | income generated by the investment of the sums making up the Generations Fund. |
In 2023-2024, revenues dedicated to the Generations Fund will stand at $2.1 billion. They will reach $2.7 billion in 2028-2029 and $4.2 billion in 2037-2038.
As at March 31, 2024, the balance of the Generations Fund will stand at $18.5 billion, which is 8.4% of net debt.
This budget provides for an additional deposit of $400 million to the Generations Fund in 2024-2025, drawn from a portion of the accumulated surplus of the Territorial Information Fund of the Ministère des Ressources naturelles et des Forêts.
This deposit, which reduces the gross debt by an equivalent amount, will be withdrawn in 2024-2025, in order to directly repay maturing borrowings.
Withdrawals from the Generations Fund to repay borrowings will stand at $4.4 billion in 2024-2025 and $2.5 billion in 2025-2026. These withdrawals stood at $2.5 billion in 2023-2024.
Withdrawals serve to reduce the financing program and alleviate debt service in the current context of high interest rates.
With the cost of new borrowings currently higher than the average cost of debt, debt service is coming under upward pressure.
| 4 | Under the Watercourses Act (CQLR, chapter R-13), every holder of hydraulic powers in Québec is required to pay royalties, based in part on the amount of electricity generated. |
| The Québec Government’s Debt | H.19 |
TABLE H.7
Generations Fund
| (millions of dollars) | |||||||
| 2023- 2024- | 2024- 2025- | 2025- 2026- | 2026- 2027- | 2027- 2028- | 2028- 2029- | ||
| Book value, beginning of year(1) | 18 911 | 18 492 | 16 714 | 16 433 | 18 852 | 21 406 | |
| Dedicated revenues | |||||||
| Water-power royalties | |||||||
| Hydro-Québec | 730 | 750 | 789 | 884 | 907 | 906 | |
| Private producers | 111 | 117 | 120 | 123 | 125 | 128 | |
| Subtotal | 841 | 867 | 909 | 1 007 | 1 032 | 1 034 | |
| Additional contribution from Hydro-Québec | 650 | 650 | 650 | 650 | 650 | 650 | |
| Investment income(2) | 590 | 705 | 660 | 762 | 872 | 987 | |
| Total dedicated revenues | 2 081 | 2 222 | 2 219 | (3) | 2 419 | 2 554 | 2 671 |
| Deposit from the Territorial Information Fund | — | 400 | — | — | — | — | |
| Total deposits | 2 081 | 2 622 | 2 219 | 2 419 | 2 554 | 2 671 | |
| Use of the Generations Fund to repay borrowings | −2 500 | −4 400 | −2 500 | — | — | — | |
| Book value, end of year | 18 492 | 16 714 | 16 433 | 18 852 | 21 406 | 24 077 | |
| % of net debt | 8.4 | 7.0 | 6.5 | 7.3 | 8.1 | 8.9 | |
| % of GDP | 3.3 | 2.8 | 2.7 | 3.0 | 3.3 | 3.5 | |
| (1) | For information purposes, as at December 31, 2023, the fair value of the Generations Fund was $19.9 billion, $2.1 billion more than its book value. Like the book value, the fair value includes accounts receivable ($0.5 billion as at December 31, 2023). |
| (2) | The investment income of the Generations Fund corresponds to realized investment income (interest income, dividends, gains on the disposal of assets, etc.). Therefore, the forecast may be adjusted upward or downward according to when the gains or losses are actually realized. An annual return of 4.5% is expected, corresponding to the historical average. |
| (3) | The slight drop in revenues dedicated to the Generations Fund in 2025-2026 is explained by the expected withdrawals in 2024-2025, which will result in lower investment income in 2025-2026. |
| H.20 | Budget 2024-2025 Budget Plan |
Returns of the Generations Fund
The sums dedicated annually to the Generations Fund are deposited with the Caisse de dépôt et placement du Québec.
Since the first deposit was made in the Generations Fund in January 2007, the return has been higher than the cost of new borrowings by the government 15 years out of 17.
| – | From 2007 to 2023, the average return was 5.6%, while the average cost of new borrowings was 3.2%, which represents a difference of 2.4 percentage points. |
These returns contribute to reducing the debt burden.
Comparison of the Generations Fund’s annual return and the Québec
government’s borrowing costs
| (per cent, on a calendar year basis) | |||
| Rate of return of the Generations Fund | Cost of new borrowings(1) | Difference (percentage points) | |
| 2007 | 5.6 | 4.7 | 0.9 |
| 2008 | −22.4 | 4.5 | −26.9 |
| 2009 | 11.3 | 4.4 | 6.9 |
| 2010 | 12.3 | 4.1 | 8.2 |
| 2011 | 4.0 | 3.7 | 0.3 |
| 2012 | 8.4 | 3.0 | 5.4 |
| 2013 | 12.0 | 3.3 | 8.7 |
| 2014 | 11.7 | 3.2 | 8.5 |
| 2015 | 8.1 | 2.4 | 5.7 |
| 2016 | 7.3 | 2.2 | 5.1 |
| 2017 | 8.5 | 2.5 | 6.0 |
| 2018 | 4.4 | 2.9 | 1.5 |
| 2019 | 9.5 | 2.3 | 7.2 |
| 2020 | 7.0 | 1.5 | 5.5 |
| 2021 | 11.4 | 1.9 | 9.5 |
| 2022 | −7.9 | 3.5 | −11.4 |
| 2023 | 9.3 | 4.1 | 5.2 |
| (1) | The government’s borrowing costs correspond to the yield on 10-year maturity Québec bonds. |
Source: PC-Bond for the yield on 10-year maturity Québec bonds.
| The Québec Government’s Debt | H.21 |
| 2. | Financing |
| 2.1 | Financing program |
The financing program consists of long-term borrowings contracted during the fiscal year. The program is used to, among other things, repay maturing borrowings and meet net financial requirements. The latter include the budgetary deficit as well as the government’s capital investments.
For 2023-2024, the program stands at $21.5 billion, which is $8.1 billion less than projected in the March 2023 budget.
The decrease is mainly due to a reduction in net financial requirements, use of pre-financing and an increase in the outstanding amount of Québec Treasury bills.
As at February 23, 2024, borrowings contracted in 2023-2024 amount to $21.4 billion, or 100% of the scheduled program.
TABLE H.8
Government’s financing program in 2023-2024
| (millions of dollars) | |||
| March 2023 | Adjustments | March 2024 | |
| Net financial requirements(1) | 18 647 | −3 880 | 14 767 |
| Repayments of borrowings | 13 396 | 267 | 13 663 |
| Use of the Generations Fund to repay borrowings | −2 500 | — | −2 500 |
| Withdrawal from the Accumulated Sick Leave Fund | — | −160 | −160 |
| Use of pre-financing | — | −2 233 | −2 233 |
| Change in cash position | — | 295 | 295 |
| Transactions under the credit policy(2) | — | −372 | −372 |
| Pre-financing | — | — | — |
| Increase in the outstanding amount of Québec Treasury bills | — | −2 000 | −2 000 |
| TOTAL | 29 543 | −8 083 | 21 460 |
Note: A negative entry indicates a source of financing and a positive entry, a financial requirement.
| (1) | The downward revision of net financial requirements is mainly due to the postponement to 2024-2025 of the disbursement related to expenses recorded in 2023-2024 arising from the renewal of the collective agreements. |
| (2) | Under the credit policy, which is designed to limit financial risk with respect to counterparties, the government disburses or receives sums that fluctuate with the market value of the contracts. The amounts exchanged do not affect the debt. |
| The Québec Government’s Debt | H.23 |
The financing program will stand at $36.5 billion in 2024-2025.
For the four subsequent years, from 2025-2026 to 2028-2029, it will average $28.4 billion per year.
TABLE H.9
Government’s financing program from 2024-2025 to 2028-2029
| (millions of dollars) | |||||
| 2024-2025 | 2025-2026 | 2026-2027 | 2027-2028 | 2028-2029 | |
| Net financial requirements(1) | 28 472 | 22 591 | 17 540 | 17 409 | 16 208 |
| Repayments of borrowings | 16 904 | 17 155 | 14 025 | 13 086 | 14 254 |
| Use of pre-financing | — | — | — | — | — |
| Use of the Generations Fund to repay borrowings | −4 400 | −2 500 | — | — | — |
| Retirement Plans Sinking Fund withdrawal | −2 500 | −2 500 | −3 500 | −4 000 | −4 000 |
| Increase in the outstanding amount of Québec Treasury bills | −2 000 | −2 000 | — | — | — |
| TOTAL | 36 476 | 32 746 | 28 065 | 26 495 | 26 462 |
Note: A negative entry indicates a source of financing and a positive entry, a financial requirement.
| (1) | The high level of net financial requirements in 2024-2025 is mainly due to the cash outflow in 2024-2025 of expenses related to the renewal of collective agreements recorded in 2023-2024, as well as to the budgetary deficit and higher net capital investments than in subsequent years. |
| H.24 | Budget 2024-2025 Budget Plan |
| 2.2 | Borrowings contracted in 2023-2024 |
The government aims to achieve stable financing at the lowest possible cost. To that end, it applies a strategy of diversifying sources of funding by market, financial instrument and maturity.
Thus far in 2023-2024, the government has contracted 34% of its borrowings on foreign markets, compared to an average of 27% over the last 10 years. However, the government keeps no exposure of its debt to foreign currencies in order to neutralize the effects of their fluctuations on debt service.
In 2023-2024, conventional bonds in Canadian dollars are the main debt instrument used.
The average cost of transactions in 2023-2024 was 3.99% with an average maturity of borrowings of 14 years, while the cost of the entire debt was 3.73% with an average remaining maturity of 12 years as at March 31, 2023.
TABLE H.10
Summary of long-term borrowings contracted in 2023-2024
| Currencies | $million | % |
| CANADIAN DOLLAR | ||
| Conventional bonds | 12 034 | 56.3 |
| Savings products issued by Épargne Placements Québec | 1 256 | 5.9 |
| Green bonds | 591 | 2.8 |
| Immigrant investors(1) | 190 | 0.9 |
| Subtotal | 14 071 | 65.9 |
| OTHER CURRENCIES | ||
| U.S. dollar | 6 702 | 31.4 |
| Swiss franc | 586 | 2.7 |
| Subtotal | 7 288 | 34.1 |
| TOTAL | 21 359 | 100.0 |
Note: Borrowings contracted as at February 23, 2024.
| (1) | These borrowings are from sums advanced by immigrant investors. These sums are lent to the government through Investissement Québec. |
| The Québec Government’s Debt | H.25 |
Green Bond program
In 2017, the government introduced a Green Bond program to fund projects providing tangible benefits with regard to protecting the environment, reducing greenhouse gas (GHG) emissions or adapting to climate change. Through this program, the government is contributing to, among other things, the development of a socially responsible investment market.
The program draws on the Green Bond Principles, a set of guidelines created to bring more transparency to the issuance, disclosure and reporting process.
The Québec Green Bond program’s framework, which was updated in July 2022, received the highest rating possible from Shades of Green (formerly part of CICERO).
Nine issues totalling $5.7 billion have been made since the program was launched, including an issue of $600 million made in June 2023. Given the demand for Québec’s Green Bonds and the government’s commitment to the environment, Québec has pledged to be a regular issuer of Green Bonds.
For more information, visit
https://www.finances.gouv.qc.ca/department/financing/green_bonds.
| H.26 | Budget 2024-2025 Budget Plan |
Funding of public bodies
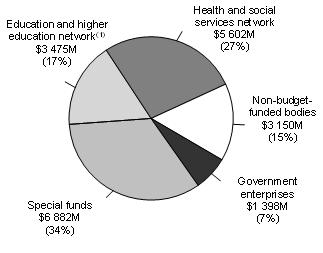
The main mission of the Financing Fund and Financement-Québec is to offer Québec’s public sector bodies financing at the lowest possible cost.
The clientele of the Financing Fund consists of public bodies included in the government reporting entity, whereas the clientele of Financement-Québec consists of public bodies not included in the government reporting entity.
In fiscal year 2023-2024, the Financing Fund and Financement-Québec loan programs stand at $20.5 billion and nearly $2.6 billion, respectively. These amounts are included in the government’s net financial requirements.
Financing Fund’s loan program in 2023-2024 | Financement-Québec’s loan program in 2023-2024 | |
| 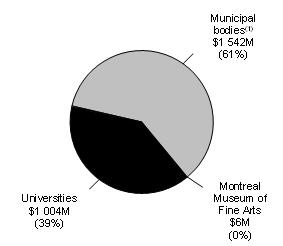
| |
| (1) This category includes school service centres, school boards, CEGEPs and the Université du Québec and its constituents. | (1) This category includes municipal transit authorities, the Réseau de transport métropolitain and the Autorité régionale de transport métropolitain. |
As a result of the change in the application of the accounting standard respecting transfer payments, the government has modified the terms and conditions for the payment of grants related to infrastructure projects. Grants related to investments are now paid in cash rather than as repayment of debt service on long-term loans contracted with the Financing Fund or Financement-Québec.
This change in payment terms was implemented gradually. The Ministère de la Santé et des Services sociaux notably started making cash payments in 2022-2023, followed, in 2023-2024, by the Ministère de l’Éducation. As such, no new long-term loans are made in connection with these grants. Conversely, temporary financing for all subsidized infrastructure projects is now provided by the Financing Fund or Financement-Québec.
The government continues to finance its infrastructure through long-term borrowing on the financial markets regardless of whether it chooses to finance the grant recipient entity on a long-term basis or to pay cash for its grants.
| The Québec Government’s Debt | H.27 |
| 2.3 | Debt management strategy |
The government’s debt management strategy aims to minimize the cost of debt while limiting the risks related to fluctuations in foreign exchange and interest rates.
The government uses a range of financial instruments, particularly interest rate and currency swap agreements (swaps), to achieve desired debt proportions by currency and interest rate.
| q | Structure of debt by currency |
As at March 31, 2024, before taking swaps into account, 77% of the debt is expected to be in Canadian dollars, 10% in U.S. dollars, 10% in euros, 1% in pounds sterling, 1% in Swiss francs, 1% in Australian dollars and less than 1% in other foreign currencies (yen, New Zealand dollars and Swedish krona).
After taking swaps into account, the entire debt is denominated in Canadian dollars.
The government maintains no exposure of its debt issued on financial markets to foreign currencies. As part of the management of its sinking fund investments, the government invests in financial instruments denominated in foreign currencies. As a result, the government may be exposed to fluctuations in foreign exchange on a portion of its assets.
TABLE H.11
Structure of debt by currency as at March 31, 2024
| (per cent) | |||
| Before swaps | After swaps | ||
| Canadian dollar | 77 | 100 | |
| U.S. dollar | 10 | 0 | |
| Euro | 10 | 0 | |
| Pound sterling | 1 | 0 | |
| Swiss franc | 1 | 0 | |
| Australian dollar | 1 | 0 | |
| Other (yen, New Zealand dollar and Swedish krona) | 0 | (1) | 0 |
| TOTAL | 100 | 100 | |
Note: This is the debt issued on financial markets by the government and Financement-Québec.
(1) The proportion of debt attributable to other currencies before swaps is less than 1%.
| H.28 | Budget 2024-2025 Budget Plan |
| q | Structure of debt by type of interest rate |
The government keeps part of its debt at fixed interest rates and part at floating interest rates.
As at March 31, 2024, after taking swaps into account, the proportion of debt at fixed interest rates5 is expected to be 89.4%, and the proportion at floating interest rates is expected to be 10.6%.
Moreover, as at March 31, 2024, the share of debt subject to an interest rate change in 2024-2025 is expected to stand at 16.0%. This share includes debt at floating interest rates (10.6%) as well as debt at fixed rates to be refinanced in 2024-2025 (5.4%).
CHART H.5
Structure of debt by type of interest rate as at March 31, 2024 |
|
| Note: This is the debt issued on financial markets by the government and Financement-Québec. |
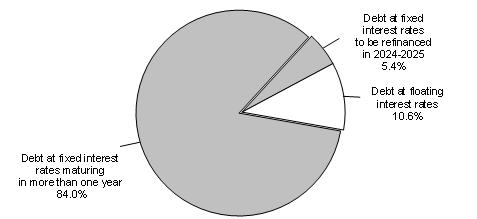
| 5 | This proportion includes debt at fixed interest rates maturing in more than one year (84.0%) as well as debt at fixed interest rates to be refinanced in 2024-2025 (5.4%). |
| The Québec Government’s Debt | H.29 |
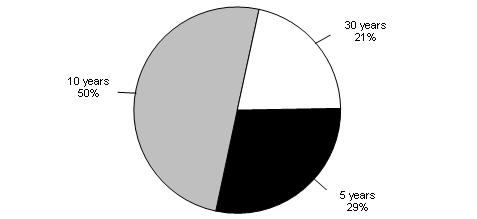
| q | Debt maturity |
Maturities of new borrowings are distributed over time so as to stabilize the refinancing profile and ensure the government’s regular presence on capital markets. To date, approximately 71% of the borrowings contracted in 2023-2024 had a maturity of 10 years or more. The average share of issues for this term over the last 10 years represents 77%. The average maturity of borrowings is 14 years in 2023-2024.
CHART H.6
Maturity of transactions carried out in 2023-2024 |
|
Note: Borrowings contracted as at February 23, 2024. |
The diversification of borrowings by term is reflected on the debt maturity profile as shown in the following chart. As at March 31, 2024, the average maturity of the debt is expected to be 11 years.
CHART H.7
Maturity of long-term debt as at March 31, 2024 |
| (millions of dollars) |
|
| Note: This is the long-term debt of the Québec government and Financement-Québec, minus the balance of the Sinking Fund for Government Borrowing. |

| H.30 | Budget 2024-2025 Budget Plan |
| 2.4 | Yield on Québec’s debt securities |
The recent rise in interest rates brings the yield of 3-month Québec Treasury bills to 5.0%, which is 0.2% less than its highest level since January 2001. Following a low of 1.2% in July 2020, the yield on 10-year Québec government securities stands at 4.2% after peaking at 4.8% in October 2023. An increase in the yield of Québec securities translates into an increase in Québec’s debt cost since these securities are used to fulfill the financing program.
CHART H.8
Yield on the Québec government’s securities |
| (per cent) |
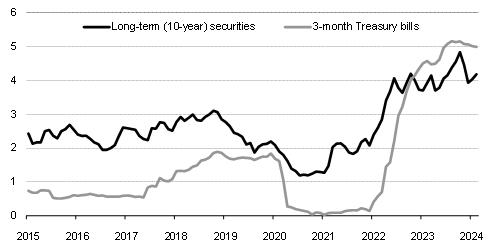
|
| Sources: PC-Bond and Ministère des Finances du Québec. |
| The Québec Government’s Debt | H.31 |
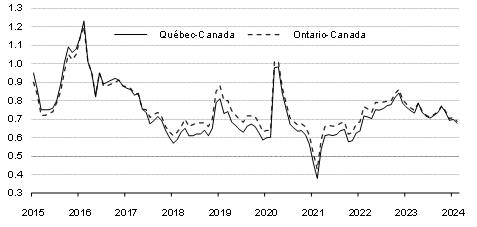
Yields on 10-year securities in Québec and Ontario are currently very similar. At present, the spread is slightly in Québec’s favour, at around 1 basis point.
CHART H.9
Yield spread on long-term (10-year) securities |
| (percentage points) |
|
| Source: PC-Bond. |
| H.32 | Budget 2024-2025 Budget Plan |
| 3. | Information on pension plans and funds deposited by the Ministère des Finances with the Caisse de dépôt et placement du Québec |
| 3.1 | Net liability for pension plans |
The Québec government covers its share of the funding of its employees’ pension plans, which are defined-benefit plans.
In its financial statements, it discloses the pension obligation, which corresponds to the present value of the retirement benefits that it will pay to its employees. This obligation is re-evaluated annually using a method that gradually factors in differences observed relative to forecasts.6 The result is the liability for pension plans.
Sums are accumulated in the Retirement Plans Sinking Fund (RPSF) and other funds to pay retirement benefits. The value of these assets is subtracted from the liability to measure the government’s net commitment, called the net pension plans liability. This amount is included in the government’s debt.
As at March 31, 2023, net liability for pension plans and other employee future benefits stood at $6.8 billion, down $2.7 billion from data as at March 31, 2022.
TABLE H.12
Net liability for pension plans and other employee future benefits as at March 31, 2023
| (millions of dollars) | |
| Liabilities | |
| Pension plans liability(1) | 120 845 |
| Other employee future benefits liability | 1 344 |
| Liability for pension plans and other employee future benefits | 122 189 |
| Assets | |
| Retirement Plans Sinking Fund (RPSF) and other funds(2) | −113 903 |
| Funds dedicated to other employee future benefits | −1 501 |
| Asset for pension plans and other employee future benefits | −115 404 |
| NET LIABILITY FOR PENSION PLANS AND OTHER EMPLOYEE FUTURE BENEFITS | 6 785 |
(1) Mainly the Government and Public Employees Retirement Plan (RREGOP) and the Pension Plan of Management Personnel (PPMP). (2) The value of the RPSF stands at $107.1 billion. The other funds consist mainly of that of the Pension Plan of the Université du Québec. For the RPSF, this is the book value. For information purposes, as at December 31, 2023, the market value of the RPSF was $115.0 billion. | |
| 6 | The value of obligations relating to accrued retirement plan benefits undergoes actuarial valuations every three years. The value is extrapolated between two valuations. |
| The Québec Government’s Debt | H.33 |
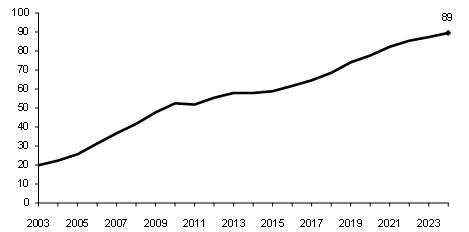
The Retirement Plans Sinking Fund
in proportion to actuarial obligations
The Retirement Plans Sinking Fund (RPSF) was created by the Québec government in 1993. It is an asset that was established for the payment of retirement benefits of public and parapublic sector employees. In December 1999, as part of the agreement concluded for the renewal of its employees’ collective agreements, the government set the objective of ensuring that the book value of the sums accumulated in the RPSF would be equal, in 2020, to 70% of its actuarial obligations in respect of the pension plans of public and parapublic sector employees.
| – | The objective was reached as at March 31, 2018, that is, two years sooner than anticipated. |
| – | As at March 31, 2023, the RPSF was equal to 89% of the actuarial obligations in respect of pension plans. |
In order to provide for the payment of pension benefits to government employees, withdrawals from the RPSF will begin as of 2024-2025. Annual withdrawals of $2.5 billion will take place in 2024-2025 and 2025-2026. These withdrawals, which will help reduce the funding program, will then gradually increase to reach $4.0 billion in 2028-2029.
| Book value of the RPSF in proportion to the government’s actuarial obligations in respect of the pension plans of public and parapublic sector employees as at March 31 |
| (per cent) |
|
| H.34 | Budget 2024-2025 Budget Plan |
| 3.2 | Returns on funds deposited with the Caisse de dépôt et placement du Québec |
The main funds deposited by the Ministère des Finances with the Caisse de dépôt et placement du Québec (RPSF, Generations Fund and Accumulated Sick Leave Fund) are managed in accordance with investment policies established by the Ministère des Finances in cooperation with representatives of the Caisse.
These investment policies are established based on several factors, including 10-year return forecasts, standard deviations and correlations for various categories of assets, opportunities for investing in these assets and recommendations of the Caisse.
In 2023, the return on funds deposited by the Ministère des Finances with the Caisse was 7.2% for the RPSF, 9.3% for the Generations Fund and 7.2% for the Accumulated Sick Leave Fund (ASLF).
| — | Good returns on investments in equity markets and high current income from fixed-income securities are the main contributors to the results achieved by the Caisse at the end of 2023. |
| — | The superior return for the Generations Fund can also be explained by differences in investment policies. The Generations Fund, by its very nature, holds more liquid investments such as stocks and bonds. |
The investment policies of these three funds are presented on the next page.
TABLE H.13
2023 return on and market value of funds deposited by the Ministère des Finances with the Caisse de dépôt et placement du Québec
| Rate of return in 2023 | Market value, as at December 31, 2023 | |
| (%) | ($billion) | |
| Retirement Plans Sinking Fund (RPSF) | 7.2 | 115.0 |
| Generations Fund | 9.3 | 19.4 |
| Accumulated Sick Leave Fund (ASLF) | 7.2 | 1.1 |
| The Québec Government’s Debt | H.35 |
| q | Comparison of investment policies |
TABLE H.14
Investment policies as at January 1, 2024
| (per cent) | |||
| Specialized portfolio | RPSF and ASLF | Generations Fund | Average benchmark portfolio of depositors as a whole(1) |
| Short-term investments | 1.00 | 1.00 | 1.2 |
| Rates(2) | 9.50 | 10.00 | 10.2 |
| Credit(3) | 23.50 | 30.00 | 20.3 |
| Total – Fixed income | 34.00 | 41.00 | 31.7 |
| Infrastructure | 12.75 | 9.00 | 11.0 |
| Real estate | 10.75 | 7.00 | 11.9 |
| Total – Real assets | 23.50 | 16.00 | 22.9 |
| Equity markets | 26.50 | 34.00 | 30.0 |
| Private equity | 16.00 | 9.00 | 16.2 |
| Total – Equities | 42.50 | 43.00 | 46.2 |
| Leverage product | — | — | −0.8 |
| TOTAL | 100.00 | 100.00 | 100.0 |
RPSF: Retirement Plans Sinking Fund.
ASLF: Accumulated Sick Leave Fund.
| (1) | Data as at December 31, 2022, drawn from the 2022 Annual Report of the Caisse de dépôt et placement du Québec. |
| (2) | This portfolio consists of government bonds. |
| (3) | Broader range of instruments with fixed income securities characteristics. |
| H.36 | Budget 2024-2025 Budget Plan |
| 4. | Credit ratings |
| 4.1 | Québec’s credit ratings |
A credit rating helps measure the ability of a borrower, such as the Québec government, to pay interest on its debt and repay the principal at maturity.
A high credit rating means access to a broader pool of investors and advantageous borrowing costs.
Québec’s credit rating is evaluated by six credit rating agencies.
In 2023, all agencies have confirmed Québec’s credit rating with a stable outlook.
TABLE H.15
Québec’s credit ratings
| Credit rating agency | Credit rating | Outlook |
| Standard & Poor’s (S&P) | AA− | Stable |
| Moody’s | Aa2 | Stable |
| Fitch Ratings | AA− | Stable |
| Morningstar DBRS | AA (low) | Stable |
| Japan Credit Rating Agency (JCR) | AAA | Stable |
| China Chengxin International (CCXI) | AAA | Stable |
Note: Québec’s credit ratings as at February 23, 2024.
| The Québec Government’s Debt | H.37 |
| 4.2 | Comparison of the credit ratings of Canadian provinces |
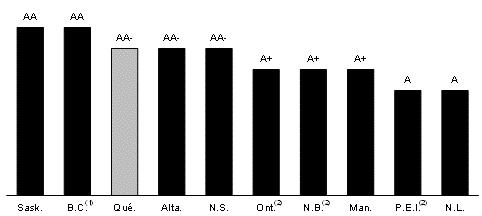
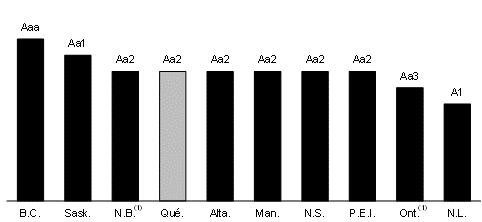
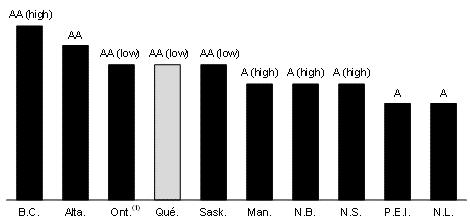
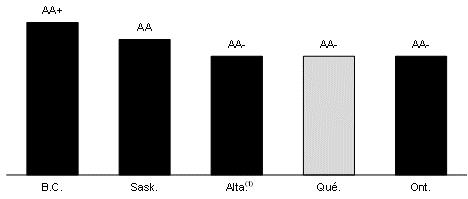
The following charts show the credit ratings of Canadian provinces assigned by Standard & Poor’s, Moody’s, Morningstar DBRS and Fitch Ratings.
| CHART H.10 Credit rating of Canadian provinces – Standard & Poor’s | |
| |
Note: Credit ratings as at February 23, 2024. (1) This province has a negative outlook. (2) These provinces have a positive outlook.
| |
| CHART H.11 Credit rating of Canadian provinces – Moody’s | |
| |
Note: Credit ratings as at February 23, 2024. (1) These provinces have a positive outlook. | |
| H.38 | Budget 2024-2025 Budget Plan |
| CHART H.12 Credit rating of Canadian provinces – Morningstar DBRS |
|
Note: Credit ratings as at February 23, 2024. (1) This province has a positive outlook. |
| CHART H.13 Credit rating of Canadian provinces – Fitch Ratings |
|
Note: Five provinces receive a credit rating from Fitch Ratings. Credit ratings as at February 23, 2024. (1) This province has a positive outlook. |
| The Québec Government’s Debt | H.39 |
| Appendix: | Report on the application of the act to reduce the debt and establish the Generations Fund |
| q | Debt reduction objective |
The Act to reduce the debt and establish the Generations Fund, amended on December 7, 2023, stipulates that, for fiscal years 2032-2033 and 2037-2038, the net debt presented in the government’s financial statements may not exceed 35.5% and 32.5% of GDP, respectively.7
| — | These ratios correspond to the upper limit of the respective targets of 33% and 30% of GDP that were announced by the government in the budget speech for fiscal 2023-2024. |
TABLE H. 16
Debt reduction targets
| Net debt by 2032-2033 (intermediate target) | 33% of GDP (±2.5% of GDP) |
| Net debt by 2037-2038 | 30% of GDP (±2.5% of GDP) |
As at March 31, 2024, Québec’s net debt will stand at $221.1 billion, or 39.0% of GDP.
Net debt to GDP is expected to stand at 39.5% as at March 31, 2029.
| q | Deposits in the Generations Fund and use of the latter to repay maturing borrowings |
In accordance with the changes made to the Act in December 2023, three sources of revenue are now dedicated to the Generations Fund:
| — | water-power royalties, which are paid by Hydro-Québec and private hydroelectricity producers; |
| — | an additional contribution from Hydro-Québec, set at $650 million per year, taken from the dividend paid by Hydro-Québec to the government; |
| — | income generated by the investment of the sums making up the Generations Fund. |
| 7 | Changes have been made to the Act to reduce the debt and establish the Generations Fund under An Act respecting the implementation of certain provisions of the Budget Speech of 21 March 2023 and amending other provisions (S.Q. 2023, c. 30), which was assented to on December 7, 2023. |
| The Québec Government’s Debt | H.41 |
In 2023-2024 and 2024-2025, revenues dedicated to the Generations Fund will amount to $2.1 billion and $2.2 billion, respectively.
In accordance with the Act, the Generations Fund is allocated exclusively to debt repayment.
| ■ | Additional deposit of $400 million in 2024-2025 from the Territorial Information Fund |
This budget provides for an additional deposit of $400 million to the Generations Fund in 2024-2025, drawn from a portion of the accumulated surplus of the Territorial Information Fund of the Ministère des Ressources naturelles et des Forêts.
Legislative amendments to this effect will be proposed to enable the government to make this deposit in the Generations Fund.
This deposit, which reduces the gross debt by an equivalent amount, will be withdrawn in 2024-2025, in order to directly repay maturing borrowings.
Withdrawals from the Generations Fund to repay borrowings will amount to $4.4 billion in 2024-2025 and $2.5 billion in 2025-2026. These withdrawals amounted to $2.5 billion in 2023-2024.
These withdrawals serve to reduce the financing program and alleviate debt service in the current context of high interest rates. With the cost of new borrowings currently higher than the average cost of debt, debt service is coming under upward pressure.
As at March 31, 2025, the balance of the Generations Fund will stand at $16.7 billion, which corresponds to 7.0% of net debt.
| H.42 | Budget 2024-2025 Budget Plan |
TABLE H.17
Generations Fund
| (millions of dollars) | ||||||
| 2023- 2024- | 2024- 2025- | 2025- 2026- | 2026- 2027- | 2027- 2028- | 2028- 2029- | |
| Book value, beginning of year(1) | 18 911 | 18 492 | 16 714 | 16 433 | 18 852 | 21 406 |
| Dedicated revenues | ||||||
| Water-power royalties | ||||||
| Hydro-Québec | 730 | 750 | 789 | 884 | 907 | 906 |
| Private producers | 111 | 117 | 120 | 123 | 125 | 128 |
| Subtotal | 841 | 867 | 909 | 1 007 | 1 032 | 1 034 |
| Additional contribution from Hydro-Québec | 650 | 650 | 650 | 650 | 650 | 650 |
| Investment income(2) | 590 | 705 | 660 | 762 | 872 | 987 |
| Total dedicated revenues | 2 081 | 2 222 | 2 219(3) | 2 419 | 2 554 | 2 671 |
| Deposit from the Territorial Information Fund | — | 400 | — | — | — | — |
| Total deposits | 2 081 | 2 622 | 2 219 | 2 419 | 2 554 | 2 671 |
| Use of the Generations Fund to repay borrowings | −2 500 | −4 400 | −2 500 | — | — | — |
| Book value, end of year | 18 492 | 16 714 | 16 433 | 18 852 | 21 406 | 24 077 |
| % of net debt | 8.4 | 7.0 | 6.5 | 7.3 | 8.1 | 8.9 |
| % of GDP | 3.3 | 2.8 | 2.7 | 3.0 | 3.3 | 3.5 |
| (1) | For information purposes, as at December 31, 2023, the fair value of the Generations Fund was $19.9 billion, $2.1 billion more than its book value. Like the book value, the fair value includes accounts receivable ($0.5 billion as at December 31, 2023). |
| (2) | The investment income of the Generations Fund corresponds to realized investment income (interest income, dividends, gains on the disposal of assets, etc.). Therefore, the forecast may be adjusted upward or downward according to when the gains or losses are actually realized. An annual return of 4.5% is expected, corresponding to the historical average. |
| (3) | The slight drop in revenues dedicated to the Generations Fund in 2025-2026 is explained by the expected withdrawals in 2024-2025, which will result in lower investment income in 2025-2026. |
| The Québec Government’s Debt | H.43 |