OMB APPROVAL OMB Number: 3235-0570 Expires: August 31, 2020 Estimated average burden hours per response...20.6
UNITED STATES SECURITIES AND EXCHANGE COMMISSION Washington, DC 20549
FORM N-CSR
CERTIFIED SHAREHOLDER REPORT OF REGISTERED MANAGEMENT INVESTMENT COMPANIES
Investment Company Act file number 811-4815
Ultra Series Fund (Exact name of registrant as specified in charter)
550 Science Drive, Madison, WI 53711 (Address of principal executive offices)(Zip code)
Kevin S. Thompson Madison Funds Legal and Compliance Department 550 Science Drive Madison, WI 53711 (Name and address of agent for service)
Registrant’s telephone number, including area code: 608-274-0300
Date of fiscal year end: December 31
Date of reporting period: December 31, 2017
Form N-CSR is to be used by management investment companies to file reports with the Commission not later than 10 days after the transmission to stockholders of any report that is required to be transmitted to stockholders under Rule 30e-1 under the Investment Company Act of 1940 (17 CFR 270.30e-1). The Commission may use the information provided on Form N-CSR in its regulatory, disclosure review, inspection, and policymaking roles.
A registrant is required to disclose the information specified by Form N-CSR, and the Commission will make this information public. A registrant is not required to respond to the collection of information contained in Form N-CSR unless the Form displays a currently valid Office of Management and Budget (“OMB”) control number. Please direct comments concerning the accuracy of the information collection burden estimate and any suggestions for reducing the burden to Secretary, Securities and Exchange Commission, 100 F Street, NE, Washington, DC 20549-0609. The OMB has reviewed this collection of information under the clearance requirements of 44 U.S.C. s 3507.
Item 1. Certified Financial Statement
Ultra Series Fund | December 31, 2017
Table of Contents
Page
Management’s Discussion of Fund Performance
Period in Review
2
Allocation Funds
3
Conservative Allocation Fund
3
Moderate Allocation Fund
4
Aggressive Allocation Fund
6
Core Bond Fund
7
High Income Fund
9
Diversified Income Fund
10
Large Cap Value Fund
11
Large Cap Growth Fund
12
Mid Cap Fund
13
International Stock Fund
14
Notes to Management’s Discussion of Fund Performance
17
Portfolios of Investments
Conservative Allocation Fund
19
Moderate Allocation Fund
20
Aggressive Allocation Fund
21
Core Bond Fund
22
High Income Fund
26
Diversified Income Fund
28
Large Cap Value Fund
33
Large Cap Growth Fund
34
Mid Cap Fund
35
International Stock Fund
36
Financial Statements
Statements of Assets and Liabilities
38
Statements of Operations
40
Statements of Changes in Net Assets
42
Financial Highlights for a Share of Beneficial Interest Outstanding
46
Notes to Financial Statements
56
Report of Independent Registered Public Accounting Firm
72
Other Information
73
Trustees and Officers
81
Nondeposit investment products are not federally insured, involve investment risk, may lose value and are not obligations of or guaranteed by any financial institution. For more complete information about Ultra Series Fund, including charges and expenses, request a prospectus from your financial advisor or from CMFG Life Insurance Company, 2000 Heritage Way, Waverly, IA 50677. Consider the investment objectives, risks, and charges and expenses of any fund carefully before investing. The prospectus contains this and other information about the investment company. For more current Ultra Series Fund performance information, please call 1-800-670-3600. Current performance may be lower or higher than the performance data quoted within. Past performance does not guarantee future results. Nothing in this report represents a recommendation of a security by the investment adviser. Portfolio holdings may have changed since the date of this report.
1
Ultra Series Fund | December 31, 2017
Management’s Discussion of Fund Performance (unaudited)
PERIOD IN REVIEW
The fourth quarter capped a perfect year for stock investors as the S&P 500® Index delivered positive returns every month in 2017, a first based on data going back to 1928. Although bond returns were mixed during the quarter, results were positive for the year despite the Federal Reserve (Fed) increasing short-term interest rates three times over the last twelve months. During the fourth quarter, the S&P 500® gained 6.64%, the Russell Midcap® Index rose 6.07% and the MSCI EAFE® (net) Index advanced 4.23% (3.66% excluding currency effect). The Bloomberg Barclays Intermediate Government/Credit Index declined 0.20% while the Bloomberg Barclays Aggregate Index gained 0.39% during the quarter. Equity market returns for 2017 were outstanding as the S&P 500® Index returned 21.83%, the Russell Midcap® Index advanced 18.52% and the MSCI EAFE® (net) Index gained 25.03% (15.23% excluding currency effect). Bond performance was also positive during 2017 as the Bloomberg Barclays Intermediate Government/ Credit Index gained 2.14% and the Bloomberg Barclays Aggregate Index advanced 3.54% for the year.
A year ago we opined that, with asset values stretched, economic and earnings growth would likely be necessary to support continued gains in the equity markets. This occurred during 2017 as both global economic activity and company earnings not only grew but accelerated into year-end. All 35 OECD (Organization for Economic Cooperation and Development) countries reported positive economic growth during 2017 for the first time since 2007. S&P 500® company earnings reached all-time highs and, with the recent tax cut, expectations are that earnings will grow another 16% in 2018.
Concerns over an unpredictable government administration caused little concern for the markets as the administration’s business-friendly reduction in regulations and tax cuts spawned optimism that long-missing business spending may soon materialize. The resilience of the equity market was impressive as it surged in the face of geopolitical turmoil, dysfunction in Washington and natural disasters. In fact, the largest pull-back in the market during the year was just 3%.
During the fourth quarter, real U.S. Gross Domestic Product (GDP) growth for the third quarter was revised to 3.2%, marking the second consecutive quarter of 3%+ growth. The unemployment rate fell again in the fourth quarter to 4.1%, the lowest rate since December of 2000, and manufacturing continued to grow, driven by renewed strength in the global economy and a weak U.S. dollar. The United States has now added jobs for 86 straight months, the longest streak on record. While wage increases have been modest, household income – which includes not only hourly wages but also hours worked – has shown strong gains. Companies are now reveling in the best opportunities they have seen in years. Strong profit growth was reported in all sectors, although Energy, Materials and Technology companies recorded the strongest gains. Overall earnings growth of the S&P 500® companies was near 10% for the year, with top-line sales growth of over 6%. Although 10% earnings growth was impressive, it didn’t keep pace with the 20% advance of the S&P 500® Index, implying that rich stock valuations got even richer during the period.
As the second longest bull market on record continues to push ahead, it’s likely that a few factors may change in 2018 – inflation, interest rates and monetary policy. In December, the Fed boosted its target Federal Funds rate range by 0.25% (up to 1.25% to 1.5%) and projected three additional hikes in 2018. While rising short-term rates didn’t deter the stock market in 2017, it’s likely that some level of interest rates may entice investors back to a “guaranteed” rate of return. With the S&P 500® trading at approximately 20 times earnings, the earnings yield is 5% (the inverse of P/E or 1/20) and we suspect that the closer to this level interest rates rise, the closer we may be to a “tipping point” for investors favoring bonds over stocks. As we’ve highlighted in previous letters, timing the market is nearly impossible to do with any degree of accuracy, as a slight mistiming can wreak havoc on investor returns. With this in mind, we continue to believe that stocks of lower-risk, higher-quality companies, along with shorter-duration, higher-quality bonds, will allow investors to participate in the market and provide some shelter should volatility return to more typical levels.
2
Ultra Series Fund | Management’s Discussion of Fund Performance (unaudited) - continued | December 31, 2017
ALLOCATION FUNDS
The Ultra Series Conservative Allocation, Moderate Allocation and Aggressive Allocation Funds (the “Funds”) invest primarily in shares of registered investment companies (the “Underlying Funds”). The Funds will be diversified among a number of asset classes and their allocation among Underlying Funds will be based on an asset allocation model developed by Madison Asset Management, LLC (“Madison”), the Funds’ investment adviser. The team may use multiple analytical approaches to determine the appropriate asset allocation, including:
•
Asset allocation optimization analysis – considers the degree to which returns in different asset classes do or do not move together, and the Funds’ aim to achieve a favorable overall risk profile for any targeted portfolio return.
•
Scenario analysis – historical and expected return data is analyzed to model how individual asset classes and combinations of asset classes would affect the Funds under different economic and market conditions.
•
Fundamental analysis – draws upon Madison’s investment teams to judge each asset class against current and forecasted market conditions. Economic, industry and security analysis is used to develop return and risk expectations that may influence asset class selection. In addition, Madison has a flexible mandate which permits the Funds, at the sole discretion of Madison, to materially reduce equity risk exposures when and if conditions are deemed to warrant such an action.
CONSERVATIVE ALLOCATION FUND
INVESTMENT STRATEGY HIGHLIGHTS
Under normal circumstances, the Ultra Series Conservative Allocation Fund’s total net assets will be allocated among various asset classes and Underlying Funds, including those whose shares trade on a stock exchange (exchange traded funds or “ETFs”), with target allocations over time of approximately 35% equity investments and 65% fixed income investments. Underlying Funds in which the Fund invests may include funds advised by Madison and/or its affiliates, including the Madison Funds (the “Affiliated Underlying Funds”). Generally, Madison will not invest more than 75% of the Fund’s net assets, at the time of purchase, in Affiliated Underlying Funds. Although actual allocations may vary, as of December 31, 2017, the Fund’s asset allocation was:
PORTFOLIO ALLOCATION AS A PERCENTAGE OF NET ASSETS
AS OF 12/31/17
Alternative Funds
2.0%
Money Market Funds
2.3%
Bond Funds
57.9%
Stock Funds
24.1%
Foreign Stock Funds
13.5%
Net Other Assets and Liabilities
0.2%
PERFORMANCE
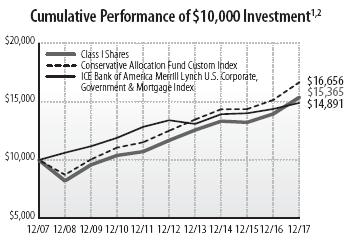
The Ultra Series Conservative Allocation Fund (Class I) returned 10.17% over the 12-month period, slightly outperforming the Conservative Allocation Fund Custom Index return of 10.00%. The Fund lagged the Morningstar Conservative Allocation Category peer group, which returned 10.86%.
For the first time in history, the S&P 500® Index produced a positive return in all 12 calendar months for 2017. Overall, the streak stands at 14 consecutive positive months as of 12/31/2017. Just as noteworthy, if not more so, has been the vanishing of market volatility. The trailing one-year standard deviation of the Index stood at 4% versus the long-term average of roughly 14.5%. Given our conservative DNA, we are quite pleased with how well the Fund kept pace over what has been a remarkable run in the global equity markets. Overall, the Fund captured 102% of the benchmark’s return for the year. A timely move toward international equities late in 2016 was the most notable contributor to 2017 performance as foreign stocks outperformed. Other positives included relative overweight allocations to U.S. growth stocks, European equities, corporate bonds and long-term Treasuries. A modest
3
Ultra Series Fund | Management’s Discussion of Fund Performance (unaudited) - continued | December 31, 2017
underweight to equities overall, and overweight allocations to U.S. mid cap stocks and hedged Japanese equities were the largest detractors from performance.
Years of consistently low U.S. inflation have provided our U.S. central bank the Fed with the justification and conviction to provide massive levels of monetary stimulus. Importantly, this has been true in terms of both scale and longevity. The Fed’s primary goal since the 2007-09 global financial crisis has been to “reflate” and stimulate the real economy. In reality, the Fed has instead been more successful at “inflating” the value of virtually all investment asset classes. The median U.S. stock, for example, is now trading near all-time record high valuation levels relative to both current and (normalized) long-term earnings. In our view, this level of valuation extreme is not justified given the elevated levels of uncertainty that both global economies (unprecedented debt levels) and established companies (pervasive disruption risk) are facing. Our perspective, then, is that today’s “concocted” increase in asset class valuations is not primarily based on prospects for improving economic fundamentals but rather the cumulative influence of pervasive liquidity and historically low interest rates on investor confidence and financial leverage.
It may sound like a broken record, but our portfolio strategies remain primarily focused on capital preservation. Incremental allocations continue to focus on international equities. In our view, the best investment values continue to be found in high quality U.S. and international large-cap equities, equities with links to commodities (especially oil) and high quality bonds. We believe that lower-quality, higher-risk asset classes are overpriced; our expectation is that the gradual removal of global central bank accommodation, currently scheduled to accelerate in 2018 (led by the Fed), could very well begin to normalize at least some of these extraordinary valuations.
Finally, global debt levels remain elevated and are also near record amounts relative to GDP. Inflationary pressures are slowly building, which could put some modest upward pressure on interest rates. Accordingly, we are making greater use of Treasury Inflation-Protected Securities (TIPS).
However, we believe that any upward trajectory in interest rates will be constrained due to the extraordinary levels of global debt.
We are confident the Fund remains well-positioned for a growth-challenged global economy. We also understand and embrace our ongoing responsibility to insightfully differentiate between attractive and less attractive asset classes as we strive to deliver superior risk-adjusted returns. As always, we sincerely appreciate your support.
Average Annual Total Return (%) through December 31, 20171,2
1 Year
3 Years
5 Years
10 Years
Since 5/1/09 Inception
Ultra Series Conservative Allocation, Class I
10.17
4.87
5.64
4.39
-
Ultra Series Conservative Allocation, Class II
9.90
4.60
5.38
-
7.05
Conservative Allocation Fund Custom Index
10.00
5.10
5.90
5.23
7.66
ICE BofAML US Corp, Govt & Mortg Index
3.63
2.27
2.13
4.06
3.95
See accompanying Notes to Management’s Discussion of Fund Performance.
MODERATE ALLOCATION FUND
INVESTMENT STRATEGY HIGHLIGHTS
Under normal circumstances, the Ultra Series Moderate Allocation Fund’s total net assets will be allocated among various asset classes and Underlying Funds, including ETFs, with target allocations over time of approximately 60% equity investments and 40% fixed income investments. Underlying Funds in which the Fund invests may include Affiliated Underlying Funds. Generally, Madison will not invest more than 75% of the Fund’s net assets, at the time of purchase, in Affiliated Underlying Funds. Although actual allocations may vary, as of December 31, 2017, the Fund’s asset allocation was:
PORTFOLIO ALLOCATION AS A PERCENTAGE OF NET ASSETS
AS OF 12/31/17
Alternative Funds
2.0%
Money Market Funds
1.2%
Bond Funds
33.7%
Stock Funds
39.7%
Foreign Stock Funds
23.3%
Net Other Assets and Liabilities
0.1%
4
Ultra Series Fund | Management’s Discussion of Fund Performance (unaudited) - continued | December 31, 2017
PERFORMANCE
The Ultra Series Moderate Allocation Fund (Class I) returned 14.80% over the 12-month period, roughly matching the Moderate Allocation Fund Custom Index return of 14.84%. The Fund slightly outperformed the Morningstar Moderate Allocation Category peer group, which returned 14.76%.
For the first time in history, the S&P 500® Index produced a positive return in all 12 calendar months for 2017. Overall, the streak stands at 14 consecutive positive months as of 12/31/2017. Just as noteworthy, if not more so, has been the vanishing of market volatility. The trailing one-year standard deviation of the Index stood at 4% versus the long-term average of roughly 14.5%. Given our conservative DNA, we are quite pleased with how well the Fund kept pace over what has been a remarkable run in the global equity markets. Overall, the Fund captured 100% of the benchmark’s return for the year. A timely move toward international equities late in 2016 was the most notable contributor to 2017 performance as foreign stocks outperformed. Other positives included relative overweight allocations to U.S. growth stocks, European equities, corporate bonds and long-term Treasuries. A modest underweight to equities overall, and overweight allocations to U.S. mid cap stocks and hedged Japanese equities were the largest detractors from performance.
Years of consistently low U.S. inflation have provided our U.S. central bank the Fed with the justification and conviction to provide massive levels of monetary stimulus. Importantly, this has been true in terms of both scale and longevity. The Fed’s primary goal since the 2007-09 global financial crisis has been to “reflate” and stimulate the real economy. In reality, the Fed has instead been more successful at “inflating” the value of virtually all investment asset classes. The median U.S. stock, for example, is now trading near all-time record high valuation levels relative to both current and (normalized) long-term earnings. In our view, this level of valuation extreme is not justified given the elevated levels of uncertainty that both global economies (unprecedented debt levels) and established companies (pervasive disruption risk) are facing. Our perspective, then, is that today’s “concocted” increase in asset class valuations is not primarily based on prospects for improving economic fundamentals but rather the cumulative influence of pervasive liquidity and historically low interest rates on investor confidence and financial leverage.
It may sound like a broken record, but our portfolio strategies remain primarily focused on capital preservation. Incremental allocations continue to focus on international equities. In our view, the best investment values continue to be found in high quality U.S. and international large-cap equities, equities with links to commodities (especially oil) and high quality bonds. We believe that lower-quality, higher-risk asset classes are overpriced; our expectation is that the gradual removal of global central bank accommodation, currently scheduled to accelerate in 2018 (led by the Fed), could very well begin to normalize at least some of these extraordinary valuations.
Finally, global debt levels remain elevated and are also near record amounts relative to GDP. Inflationary pressures are slowly building, which could put some modest upward pressure on interest rates. Accordingly, we are making greater use of TIPS. However, we believe that any upward trajectory in interest rates will be constrained due to the extraordinary levels of global debt.
We are confident the Fund remains well-positioned for a growth-challenged global economy. We also understand and embrace our ongoing responsibility to insightfully differentiate between attractive and less attractive asset classes as we strive to deliver superior risk-adjusted returns. As always, we sincerely appreciate your support.
5
Ultra Series Fund | Management’s Discussion of Fund Performance (unaudited) - continued | December 31, 2017
Average Annual Total Return (%) through December 31, 20171,2
1 Year
3 Years
5 Years
10 Years
Since 5/1/09 Inception
Ultra Series Moderate Allocation, Class I
14.80
6.89
8.58
4.67
–
Ultra Series Moderate Allocation, Class II
14.52
6.62
8.31
–
9.44
Moderate Allocation Fund Custom Index
14.84
7.09
8.61
5.91
10.22
S&P 500® Index
21.83
11.41
15.79
8.50
16.15
See accompanying Notes to Management’s Discussion of Fund Performance.
AGGRESSIVE ALLOCATION FUND
INVESTMENT STRATEGY HIGHLIGHTS
Under normal circumstances, the Ultra Series Aggressive Allocation Fund’s total net assets will be allocated among various asset classes and Underlying Funds, including ETFs, with target allocations over time of approximately 80% equity investments and 20% fixed income investments. Underlying Funds in which the Fund invests may include Affiliated Underlying Funds. Generally, Madison will not invest more than 75% of Fund’s net assets, at the time of purchase, in Affiliated Underlying Funds. Although actual allocations may vary, as of December 31, 2017, the Fund’s asset allocation was:
PORTFOLIO ALLOCATION AS A PERCENTAGE OF NET ASSETS
AS OF 12/31/17
Alternative Funds
2.0%
Money Market Funds
1.4%
Bond Funds
13.7%
Stock Funds
51.5%
Foreign Stock Funds
31.2%
Net Other Assets and Liabilities
0.2%
PERFORMANCE
The Ultra Series Aggressive Allocation Fund (Class I) returned 18.52% over the 12-month period, modestly underperforming the Aggressive Allocation Fund Custom Index return of 18.83%. The Fund outperformed the Morningstar Aggressive Allocation Category peer group, which returned 17.44%.
For the first time in history, the S&P 500® Index produced a positive return in all 12 calendar months for 2017. Overall, the streak stands at 14 consecutive positive months as of 12/31/2017. Just as noteworthy, if not more so, has been the vanishing of market volatility. The trailing one-year standard deviation of the Index stood at 4% versus the long-term average of roughly 14.5%. Given our conservative DNA, we are quite pleased with how well the Fund kept pace over what has been a remarkable run in the global equity markets. Overall, the Fund captured 98% of the benchmark’s return for the year. A timely move toward international equities late in 2016 was the most notable contributor to 2017 performance as foreign stocks outperformed. Other positives included relative overweight allocations to U.S. growth stocks, European equities and long-term Treasuries. A modest underweight to equities overall, and overweight allocations to U.S. mid cap stocks and hedged Japanese equities were the largest detractors from performance.
Years of consistently low U.S. inflation have provided our U.S. central bank the Fed with the justification and conviction to provide massive levels of monetary stimulus. Importantly, this has been true in terms of both scale and longevity. The Fed’s primary goal since the 2007-09 global financial crisis has been to “reflate” and stimulate the real economy. In reality, the Fed has instead been more successful at “inflating” the value of virtually all investment asset classes. The median U.S. stock, for example, is now trading near all-time record high valuation levels relative to both current and (normalized) long-term earnings. In our view, this level of valuation extreme is not justified given the elevated levels of uncertainty that both global economies (unprecedented debt levels) and established companies (pervasive disruption risk) are facing. Our perspective, then, is that today’s “concocted” increase in asset class valuations is not primarily based on prospects for improving economic fundamentals but rather the cumulative influence of pervasive liquidity and historically low interest rates on investor confidence and financial leverage.
6
Ultra Series Fund | Management’s Discussion of Fund Performance (unaudited) - continued | December 31, 2017
It may sound like a broken record, but our portfolio strategies remain primarily focused on capital preservation. Incremental allocations continue to focus on international equities. In our view, the best investment values continue to be found in high quality U.S. and international large-cap equities, equities with links to commodities (especially oil) and high quality bonds. We believe that lower-quality, higher-risk asset classes are overpriced; our expectation is that the gradual removal of global central bank accommodation, currently scheduled to accelerate in 2018 (led by the Fed), could very well begin to normalize at least some of these extraordinary valuations.
Finally, global debt levels remain elevated and are also near record amounts relative to GDP. Inflationary pressures are slowly building, which could put some modest upward pressure on interest rates. Accordingly, we are making greater use of TIPS. However, we believe that any upward trajectory in interest rates will be constrained due to the extraordinary levels of global debt.
We are confident the Fund remains well-positioned for a growth-challenged global economy. We also understand and embrace our ongoing responsibility to insightfully differentiate between attractive and less attractive asset classes as we strive to deliver superior risk-adjusted returns. As always, we sincerely appreciate your support.
Average Annual Total Return (%) through December 31, 20171,2
1 Year
3 Years
5 Years
10 Years
Since 5/1/09 Inception
Ultra Series Aggressive Allocation, Class I
18.52
8.45
10.90
4.62
-
Ultra Series Aggressive Allocation, Class II
18.22
8.18
10.62
-
11.44
Aggressive Allocation Fund Custom Index
18.83
8.65
10.78
6.32
12.23
S&P 500® Index
21.83
11.41
15.79
8.50
16.15
See accompanying Notes to Management’s Discussion of Fund Performance.
CORE BOND FUND
INVESTMENT STRATEGY HIGHLIGHTS
Under normal circumstances, the Ultra Series Core Bond Fund invests at least 80% of its net assets in bonds. To keep current income relatively stable and to limit share price volatility, the Fund emphasizes investment grade securities and maintains an intermediate (typically 3-7 year) average portfolio duration, with the goal of being between 85- 115% of the market benchmark duration. The Fund also strives to add incremental return in the portfolio by making strategic decisions relating to credit risk, sector exposure and yield curve positioning. The Fund may invest in corporate debt securities, U.S. Government debt securities, foreign government debt securities, non-rated debt securities, and asset-backed, mortgage-backed and commercial mortgage-backed securities.
PERFORMANCE
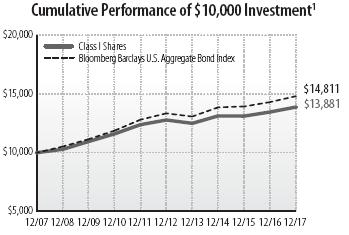
The Ultra Series Core Bond Fund (Class I) returned 3.11% over the 12-month period, underperforming the Fund’s benchmark, the Bloomberg Barclays U.S. Aggregate® Bond Index, which returned 3.54%. The Morningstar Intermediate-Term Bond peer group returned 3.88% for the period.
An old adage states “may you live in interesting times.” There is debate about where the saying originated and whether it is a curse or blessing. However, if you view this adage through the market’s lens, the financial markets are acting as if nothing interesting at all will happen in comings years. Equity valuations are at elevated levels and risk premiums (“spreads”) on investment grade and high yield corporate bonds are at or near historical lows. Movements in nearly all asset classes, be they currencies, fixed income or equities, exhibited very subdued levels of volatility throughout 2017.
7
Ultra Series Fund | Management’s Discussion of Fund Performance (unaudited) - continued | December 31, 2017
The probability of 2018 experiencing as little volatility as 2017 is very low when looking at the markets from a historical perspective. Few things hold true in financial markets, but one that does is that they are mean reverting and another is that trends last until they don’t. If the markets do become more “interesting” in 2018, investors will have to decide if the old adage is a blessing or a curse.
A theme that persisted all year was the flattening of the Treasury yield curve. The yield on the 10-year U.S. Treasury Bond less the 2-year U.S. Treasury Bond ended the year at 52 basis points (bps) after starting the year at 125 bps. The flattening of the yield curve was mostly a function of the Fed raising interest rates three times during the year while longer maturity bond yields didn’t move much due to low inflation. The two-year U.S. Treasury Bond ended the year near the high for the year at 1.88% versus starting 2017 at 1.20%. The curve shifts drove large differences among performance across the yield curve. During the year the Bloomberg Barclay’s U.S. Intermediate Treasury® Index returned 1.14% versus the Bloomberg Barclay’s U.S. Long Treasury Index® gaining 8.53%.
Market participants are currently pricing only two increases in Fed Funds rate while the Fed has stated an expectation of three rate hikes. If market expectations move towards the Fed’s, there is a real possibility of a flat or inverted yield curve by year-end unless inflation expectations move meaningfully higher. We expect that inflation will pick-up and that there will be a term premium in the Treasury market by next year-end. This should steepen the yield curve and provide opportunities to extend duration in the Fund.
Another theme throughout 2017 was the strong performance of corporate bonds. The Bloomberg Barclay’s U.S. Corporate Bond® Index had an excess return of 3.46% in 2017. Similar to Treasuries, there was a bifurcation in performance between intermediate corporate bonds, which returned 2.56% more than Treasuries, and long corporates, which had an excess return of 5.54%.
As mentioned above, spreads are at or near historically tight levels across the corporate bond market. With very low interest rates and narrow spreads, corporations are likely to issue a substantial amount of debt in 2018. Much of this debt will be from mergers and acquisitions activity and many market strategists believe this will be a near-record year for that type of activity. This type of behavior is classic late credit cycle activity and provides a source of risk going into 2018.
Positioning
As we enter 2018, the Fund will still be positioned in an overweight of spread product (non-Treasury issues) while having a more conservative duration (interest rate risk) position. If longer-term interest rates were to rise by a further 15 to 20 bps, we would look to become more neutral versus the benchmark within the 20- and 30-year bond segment. We still believe that the credit sectors remain expensive and, even though the Fund is currently overweight corporate bonds, we are actively looking to take advantage of swap opportunities to move up in quality.
Average Annual Total Return (%) through December 31, 20171
Since
5/1/09
1 Year
3 Years
5 Years
10 Years
Inception
Ultra Series Core Bond,
Class I
3.11
1.87
1.66
3.33
–
Ultra Series Core Bond,
Class II
2.85
1.61
1.41
–
3.17
Bloomberg Barclays U.S.
Aggregate Bond Index
3.54
2.24
2.10
4.01
3.96
See accompanying Notes to Management’s Discussion of Fund Performance.
SECTOR ALLOCATION AS A PERCENTAGE OF NET ASSETS
AS OF 12/31/17
Asset Backed Securities
2.2
%
Collateralized Mortgage Obligations
2.1
%
Commercial Mortgage-Backed Securities
2.0
%
Corporate Notes and Bonds
34.0
%
Long Term Municipal Bonds
4.3
%
Mortgage Backed Securities
26.5
%
U.S. Government and Agency Obligations
26.2
%
Money Market Funds
1.5
%
Net Other Assets and Liabilities
1.2
%
8
Ultra Series Fund | Management’s Discussion of Fund Performance (unaudited) - continued | December 31, 2017
HIGH INCOME FUND
INVESTMENT STRATEGY HIGHLIGHTS
The Ultra Series High Income Fund invests primarily in lower-rated, higher-yielding income bearing securities, such as “junk” bonds. Because the performance of these securities has historically been strongly influenced by economic conditions, the Fund may rotate securities selection by business sector according to the economic outlook. Under normal market conditions, the Fund invests at least 80% of its net assets in bonds rated lower than investment grade (BBB/Baa) and their unrated equivalents or other high-yielding securities.
PERFORMANCE
The Ultra Series High Income Fund (Class I) returned 6.32% during the period, lagging the ICE Bank of America Merrill Lynch U.S. High Yield Constrained® Index’s 7.48% return. The Fund also trailed its Morningstar High Yield Bond Category peer group, which returned 7.07%.
Overall, the high yield market experienced its second consecutive full-year of positive total returns. We believe the gains have been supported by positive fundamental and economic data, along with a favorable political backdrop. For the full-year 2017, high yield corporate bonds returned 7.47%, or about 181 bps below the average annual total return since 1987.
Within the high yield rating categories, CCC-rated bonds had the best annual total return at +10.59%, while BB-rated bonds trailed at +7.15% and B-rated bonds experienced a +6.74% total return. The outperformance by the CCC category had a negative impact on the Fund, as we were underweight lower quality bonds and more volatile sectors. We intend to maintain our bias towards higher quality credit and a relatively higher cash position, particularly given the current valuations of high yield bonds.
On a sector level, the Fund had underexposure to Healthcare (+8.52%), Metals & Mining (+9.85%) and Steel (+10.09%), all of which outpaced the overall market return. The Fund also underperformed in its bond selection within the Telecom and Media sectors. Partially offsetting these negatives, the Fund had a positive contribution to performance from an overweight in the Services (+9.00%) and Utilities (+11.59%) sectors, both of which outperformed the overall market. The Fund also benefited from bond selection in Consumer-related sectors. The largest single factor related to the Fund’s underperformance relative to the benchmark was a high-single-digit cash balance. As of December 29, 2017, the yield-to-worst of the Fund was 4.83% and the average rating within the Fund was Ba3.
For 2018, the Fund will continue to emphasize BB-rated and B-rated corporate bonds. Given unattractive high yield bond valuations, we believe conservative positioning is prudent. We highlight that, as of December 29, 2017, the average spread-over-Treasuries in the high yield bond market is just modestly above the current cycle’s lowest level, which likely leaves little room for further spread tightening. Thus, we anticipate the high yield market’s total return to be relatively flat in 2018 with the positive return generated by the bond’s coupons offset by the potential decline in the market prices of the underlying bonds.
Average Annual Total Return (%) through December 31, 20171
Since
5/1/09
1 Year
3 Years
5 Years
10 Years
Inception
Ultra Series High Income,
Class I
6.32
5.16
4.53
6.43
–
Ultra Series High Income,
Class II
6.06
4.90
4.27
–
7.53
ICE BofAmerica Merrill
Lynch US High Yield
Constrained Index
7.48
6.40
5.81
7.96
10.99
See accompanying Notes to Management’s Discussion of Fund Performance.
9
Ultra Series Fund | Management’s Discussion of Fund Performance (unaudited) - continued | December 31, 2017
SECTOR ALLOCATION AS A PERCENTAGE OF NET ASSETS
AS OF 12/31/17
Consumer Discretionary
22.6
%
Consumer Staples
7.8
%
Energy
7.6
%
Financials
10.6
%
Health Care
7.9
%
Industrials
15.7
%
Information Technology
4.3
%
Materials
4.7
%
Money Market Funds
7.8
%
Real Estate
1.5
%
Telecommunication Services
3.2
%
Utilities
5.1
%
Net Other Assets and Liabilities
1.2
%
DIVERSIFIED INCOME FUND
INVESTMENT STRATEGY HIGHLIGHTS
The Ultra Series Diversified Income Fund seeks income by investing in a broadly diversified array of securities including bonds, common stocks, real estate securities, foreign market bonds and stocks and money market instruments. Bonds, stock and cash components will vary, reflecting the portfolio managers’ judgments of the relative availability of attractively yielding and priced stocks and bonds; however, under normal market conditions, the Fund’s portfolio managers generally attempt to target a 40% bond and 60% stock investment allocation. Nevertheless, bonds (including investment grade, high yield and mortgage- or asset-backed) may constitute up to 80% of the Fund’s assets, stocks (including common stocks, preferred stocks and convertible bonds) may constitute up to 70% of the Fund’s assets, real estate securities may constitute up to 25% of the Fund’s assets, foreign (including American Depositary Receipts (“ADRs”) and emerging market) stocks and bonds may constitute up to 25% of the Fund’s assets, and money market instruments may constitute up to 25% of the Fund’s assets. Although the Fund is permitted to invest up to 80% of its assets in lower credit quality bonds, under normal circumstances, the Fund intends to limit the investment in lower credit quality bonds to less than 50% of the Fund’s assets. The balance between the two strategies of the Fund (fixed income and equity investing) is determined after reviewing the risks associated with each type of investment, with the goal of meaningful risk reduction as market conditions demand.
PERFORMANCE
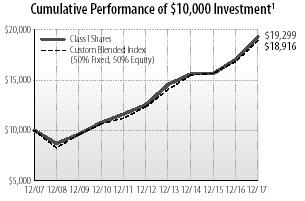
For the twelve month period, the Ultra Series Diversified Income Fund (Class I) returned 13.31% compared to its Custom Blended Index (50% S&P 500® Index and 50% ICE Bank of America Merrill Lynch U.S. Corporate Government and Mortgage Index) return of 12.42%. The Fund’s Morningstar peer group, the Moderate Allocation Category, returned 14.76% over the same period.
Equity returns in the Fund compared favorably to the S&P 500® for the year. Sector allocation was negative versus the Index while stock selection was positive. For sector allocation, an overweight position in Energy along with an underweight position in Technology negatively impacted results. In terms of stock selection, there were favorable results in Industrials, Consumer Discretionary, Utilities, Consumer Staples and Materials, partially offset by weakness in Financials, Technology, and Health Care.
The fixed income portion of the Fund modestly outperformed its benchmark for the year before fees and expenses. In the final quarter of 2017, the Fund benefited from an overall move higher in interest rates but lost performance due to the flattening yield curve as the Fund is underweight 20- and 30-year bonds. The Fund’s mortgage positions outperformed the Index as did corporate and municipal bond positions. The Fund’s corporate bond performance was driven by an overweight in triple-B rated corporate bonds and an allocation to high yield while the mortgage positions benefited from owning less 30-year mortgages than the Index.
10
Ultra Series Fund | Management’s Discussion of Fund Performance (unaudited) - continued | December 31, 2017
We continue to favor stocks of lower-risk, higher-quality companies, along with shorter-duration, higher-quality bonds in the Fund given the environment of rising interest rates, rising volatility and stretched equity valuations that we see ahead.
Average Annual Total Return (%) through December 31, 20171
Since
5/1/09
1 Year
3 Years
5 Years
10 Years
Inception
Ultra Series Diversified
Income, Class I
13.31
7.33
8.98
6.80
–
Ultra Series Diversified
Income, Class II
13.03
7.06
8.71
–
9.82
Custom Blended Index
(50% Fixed, 50% Equity)
12.42
6.91
8.90
6.58
10.11
ICE BofAML US Corp, Govt
& Mortgage Index
3.63
2.27
2.13
4.06
3.95
S&P 500® Index
21.83
11.41
15.79
8.50
16.15
See accompanying Notes to Management’s Discussion of Fund Performance.
SECTOR ALLOCATION AS A PERCENTAGE OF NET ASSETS
AS OF 12/31/17
Asset Backed Securities
0.3
%
Collateralized Mortgage Obligations
1.2
%
Commercial Mortgage-Backed Securities
0.6
%
Common Stocks
62.4
%
Corporate Notes and Bonds
13.1
%
Long Term Municipal Bonds
2.5
%
Mortgage Backed Securities
9.1
%
U.S. Government and Agency Obligations
8.9
%
Money Market Funds
1.6
%
Net Other Assets and Liabilities
0.3
%
LARGE CAP VALUE FUND
INVESTMENT STRATEGY HIGHLIGHTS
The Ultra Series Large Cap Value Fund will, under normal market conditions, maintain at least 80% of its net assets in large cap stocks. The Fund follows a “value” approach, meaning the portfolio managers seek to invest in stocks at prices below their perceived intrinsic value as estimated based on fundamental analysis of the issuing company and its prospects. By investing in value stocks, the Fund attempts to limit the downside risk over time but may also produce smaller gains than other stock funds if their intrinsic values are not realized by the market or if growth-oriented investments are favored by investors. The Fund will diversify its holdings among various industries and among companies within those industries.
PERFORMANCE
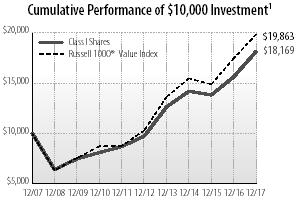
For the full year, the Ultra Series Large Cap Value Fund (Class I) returned 16.23%, outperforming the Russell 1000® Value Index return of 13.66%. The Fund also outperformed its Morningstar peer group, the Morningstar Large Value Category, which returned 15.51% for the period.
Sector allocation detracted from performance, but stock selection was strong. In terms of sector allocation, underweight positions in Health Care and Technology, along with an overweight position in Industrials negatively impacted results. For stock selection, there were positive contributions from Utilities, Industrials, Health Care, Real Estate, and Technology, while there were negative results in Financials, Consumer Discretionary, and Materials. In Utilities, NRG Energy (NRG) was the best performing stock in the portfolio, while FedEx Corp. (FDX) was significantly additive to results within Industrials. In Health Care, medical device manufacturer Baxter (BAX) contributed nicely to performance as it had solid sales and earnings growth due to new product launches. Within Real Estate, data center real estate investment trust (REIT) Digital Realty (DLR) was a top performer as there was strong demand for its data center solutions. The Fund sold the stock as it reached what we believe was a full valuation. Another notable outperforming stock was mobile phone operator T-Mobile (TMUS) within Telecom. It continues to take subscriber market share with its innovative pricing plans and improved cellular network. On the negative side, within Financials, insurance conglomerate American International Group (AIG) hurt results as it reported weak underwriting profits on business it wrote as recently as 2016, which we believe impaired the thesis and the stock was sold. Within Consumer Discretionary, home furnishing retailer Lowe’s Companies (LOW) negatively impacted the portfolio. It had
11
Ultra Series Fund | Management’s Discussion of Fund Performance (unaudited) - continued | December 31, 2017
a disappointing earnings report with weaker than expected same-store sales and the stock was sold we believe its thesis was impaired. In Materials, Nucor (NUE) was detractive to results and was sold. In Energy, exploration and production company Apache (APA) was the worst performing stock in the portfolio as it was hurt by low oil and natural gas prices. APA was sold to move the proceeds into other stocks where we have higher conviction levels. The Fund continues to hold all stocks mentioned above except for APA, AIG, DLR, LOW and NUE.
Average Annual Total Return (%) through December 31, 20171
Since
5/1/09
1 Year
3 Years
5 Years
10 Years
Inception
Ultra Series Large Cap
Value, Class I
16.23
8.53
13.32
6.15
–
Ultra Series Large Cap
Value, Class II
15.94
8.26
13.04
–
13.53
Russell 1000® Value Index
13.66
8.65
14.04
7.10
15.15
See accompanying Notes to Management’s Discussion of Fund Performance.
SECTOR ALLOCATION AS A PERCENTAGE OF NET ASSETS
AS OF 12/31/17
Consumer Discretionary
3.3
%
Consumer Staples
2.2
%
Energy
15.4
%
Financials†
27.6
%
Health Care
6.7
%
Industrials
12.1
%
Information Technology
6.9
%
Materials
12.4
%
Money Market Funds
1.1
%
Real Estate
4.1
%
Telecommunication Services
4.1
%
Utilities
3.9
%
Net Other Assets and Liabilities
0.2
%
†Financials includes securities in the following industries: Capital Markets; Commercial Banks; Diversified Financial Services; and Insurance.
LARGE CAP GROWTH FUND
INVESTMENT STRATEGY HIGHLIGHTS
The Ultra Series Large Cap Growth Fund invests primarily in common stocks of larger companies and will, under normal market conditions, maintain at least 80% of its net assets in large cap stocks. Stocks selected for the Fund will represent primarily well-established companies that have a demonstrated pattern of consistent growth. To a lesser extent, the Fund may invest in less established companies that may offer more rapid growth potential. The Fund has an active trading strategy which will lead to more portfolio turnover than a more passively-managed Fund.
PERFORMANCE
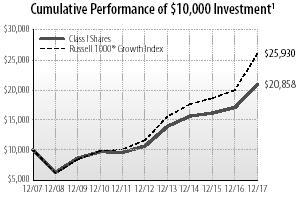
The Ultra Series Large Cap Growth Fund (Class I) returned 22.28% for the period, underperforming its benchmark, the Russell 1000® Growth Index, which returned 30.21%. The Fund underperformed its peer group, the Morningstar Large Growth category, which averaged a return of 30.01% over the same period.
The stock market, as measured by the Russell 1000 Growth® Index (RLG), produced a very strong year in 2017. During the year, market leadership was somewhat narrow as the Information Technology sector was dominant and accounted for nearly half of the total return of the RLG for the period. The next best sector, Consumer Discretionary (which includes Amazon), accounted for just 17% of the RLG’s return. The top ten individual company contributors to the RLG accounted for over 40% of the total return during the year. Our underweighting to these top ten performers resulted in approximately a 1.7% drag (before fees) on relative performance.
This current environment has favored high growth companies regardless of their valuation levels, which has created a near-term headwind for portfolio managers such as us that follow a discipline where valuation metrics are an integral part of their process (sometimes called GARP or Growth At a Reasonable Price). To demonstrate this challenge, just compare the 2017 return of 30.2% for the RLG versus a total return of just 13.6% for the Russell 1000® Value Index (RLV). Fortunately, this trend was showing signs of reversing itself late in the year.
12
Ultra Series Fund | Management’s Discussion of Fund Performance (unaudited) - continued | December 31, 2017
During the year, our sector allocation decisions were slightly negative. For example, our under-weighting in Technology companies hampered our relative returns. In addition, although we held less than 3% cash on average during the year, it was still a slight drag on relative results given the strong market. We did benefit from a less than market weighting in Materials, Telecom and Utilities.
Our stock selection in the Technology, Health Care and Consumer Discretionary sectors negatively impacted our relative performance. While we did benefit from our significant Technology holdings, our underweighting of the select few high growth, mega-cap companies that led the market higher hindered results. In addition, our exposure to certain biotechnology companies in the Health Care sector and to media companies in the Consumer Discretionary sector also held back our relative performance. We did selectively cut back on our holdings in these areas, but many of these companies appear to be very inexpensive such that we have maintained ample exposure.
The basic backdrop for the stock market remains favorable. Interest rates and inflation remain low, the global economy is growing at a very solid pace and consumer confidence is very high. The passage of the business friendly income tax bill also added to this favorable setting. However, we do anticipate a more subdued market in 2018, given relatively high stock valuations and the likelihood of the Federal Reserve continuing to raise interest rates. As such, we remain optimistic but are cognizant of rising market risks and continued investor complacency. We believe investors will be well served by focusing on lower-risk, higher-quality companies for the foreseeable future. We remain diligent and committed to investing in high quality growth companies that can deliver consistent results in a variety of economic environments and also offer a margin of safety from a valuation perspective.
Average Annual Total Return (%) through December 31, 20171
Since
5/1/09
1 Year
3 Years
5 Years
10 Years
Inception
Ultra Series Large Cap
Growth, Class I
22.28
10.11
14.33
7.63
–
Ultra Series Large Cap
Growth, Class II
21.98
9.84
14.05
–
13.42
Russell 1000® Growth
Index
30.21
13.79
17.33
10.00
17.30
See accompanying Notes to Management’s Discussion of Fund Performance.
SECTOR ALLOCATION AS A PERCENTAGE OF NET ASSETS
AS OF 12/31/17
Consumer Discretionary
18.8
%
Consumer Staples
9.9
%
Energy
3.8
%
Financials
8.2
%
Health Care
20.1
%
Industrials
4.5
%
Information Technology†
28.6
%
Materials
1.7
%
Money Market Funds
2.6
%
Real Estate
1.8
%
Net Other Assets and Liabilities
0.0
%
†Information Technology includes securities in the following industries: Computers and Peripherals; Electronic Equipment, Instruments & Components; Internet Software & Services; IT Services and Software.
MID CAP FUND
INVESTMENT STRATEGY HIGHLIGHTS
The Ultra Series Mid Cap Fund generally invests in common stocks of midsize companies and will, under normal market conditions, maintain at least 80% of its net assets in mid cap securities. The Fund seeks attractive long-term returns through bottom-up security selection based on fundamental analysis in a diversified portfolio of high-quality growth companies with attractive valuations. These will typically be industry leading companies in niches with strong growth prospects. The Fund’s portfolio managers believe in selecting stocks for the Fund that show steady, sustainable growth and reasonable valuations. As a result, stocks of issuers that are believed to have a blend of both value and growth potential will be selected for investment.
13
Ultra Series Fund | Management’s Discussion of Fund Performance (unaudited) - continued | December 31, 2017
PERFORMANCE
The Ultra Series Mid Cap Fund (Class I) returned 15.74% for the annual period, trailing its benchmark Russell Midcap® Index’s 18.52% return. The Fund lagged its peer group, the Morningstar Mid-Cap Growth category, which returned 25.81%.
Both sector allocation and stock selection were unfavorable over the past 12 months. We were underweight the three weakest sectors of the Index – Telecommunications Services, Energy, and Real Estate – but we were also heavily underweight Information Technology, the best performing sector. The Fund was materially overweight Consumer Discretionary, which lagged the broader market. Our top three individual contributors were Copart, CDW, and Brookfield Asset Management. Our bottom three contributors were Sally Beauty, World Fuel, and Omnicom.
Copart is an auctioneer of salvaged cars. The more expensive components used in cars today and the skyrocketing usage of mobile phones while driving have increased the supply of totaled cars that flow through Copart’s lots. CDW is a value-added distributor selling hardware, software and services from thousands of vendors. The company is benefitting from growth in overall Information Technology spending. Brookfield Asset Management is an alternative asset manager that possesses the global scope, financial wherewithal, and operating acumen needed to invest in hard assets like real estate and infrastructure. Brookfield is currently in a high-growth phase that is benefitting from investors increasing allocations to hard assets.
Sally Beauty and World Fuel Services reported disappointing results for an extended period of time, and both stocks are no longer held in the Fund. Omnicom is an advertising agency that is experiencing a slowdown in ad spending from global consumer firms that have historically been bedrocks of agency business. The valuation of the stock more than reflects the slowdown.
Average Annual Total Return (%) through December 31, 20171
Since
5/1/09
1 Year
3 Years
5 Years
10 Years
Inception
Ultra Series Mid Cap,
Class I
15.74
9.68
13.38
7.89
–
Ultra Series Mid Cap,
Class II
15.45
9.41
13.09
–
15.08
Russell Midcap® Index
18.52
9.58
14.96
9.11
16.95
See accompanying Notes to Management’s Discussion of Fund Performance.
SECTOR ALLOCATION AS A PERCENTAGE OF NET ASSETS
AS OF 12/31/17
Consumer Discretionary
23.4
%
Consumer Staples
1.6
%
Energy
0.9
%
Financials
21.7
%
Health Care
13.5
%
Industrials
16.1
%
Information Technology
6.4
%
Materials
6.6
%
Money Market Funds
5.1
%
Real Estate
4.7
%
Net Other Assets and Liabilities
0.0
%
INTERNATIONAL STOCK FUND
INVESTMENT STRATEGY HIGHLIGHTS
The Ultra Series International Stock Fund will invest, under normal market conditions, at least 80% of its net assets in the stock of foreign companies. Typically, a majority of the Fund’s assets are invested in relatively large cap stocks of companies located or operating in developed countries. The Fund may also invest up to 30% of its assets in securities of companies whose principal business activities are located in emerging market countries. The portfolio managers typically maintain this segment of the Fund’s portfolio in such stocks which it believes have a low market price relative to their perceived value based on fundamental analysis of the issuing company and its prospects. The Fund may also invest in foreign debt and other income bearing securities at times when it believes that income bearing securities have greater capital appreciation potential than equity securities.
14
Ultra Series Fund | Management’s Discussion of Fund Performance (unaudited) - continued | December 31, 2017
PERFORMANCE
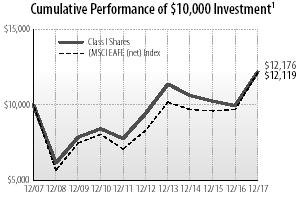
The Ultra Series International Stock Fund (Class I) returned 22.54% for the year, trailing the MSCI EAFE (net) Index’s 25.03% return. The Fund lagged its peer group, the Morningstar Foreign Large Blend Category, which returned 25.53%.
The strength of the global economy over the past year exceeded expectations, with positive growth occurring in all major regions, albeit off low levels. Outside the United States, earnings growth of over 20% drove stock returns higher in 2017. Sector leadership was dominated by cyclicals, and more specifically by Information Technology (+39% during 2017). More defensive, and some higher quality sectors such as Consumer Staples, Healthcare and Telecommunications, lagged in this market. As with sectors, regions with higher exposure to the global economy outperformed, driven by rising global growth prospects, a weaker U.S. dollar, and the improvement of industrial commodities prices. These factors especially benefited emerging markets, which generated extraordinary returns of 37.3% in 2017. Emerging markets Technology companies were especially favored by investors seeking companies with higher revenue and earnings growth – as well as higher valuations. Among developed markets, Japan generated significant returns in the fourth quarter, nearly matching the EAFE benchmark for the year after lagging in the first three quarters. Continental European equities outperformed the MSCI EAFE Index in U.S. dollar terms in 2017, boosted by stronger currencies. UK equities generated solid absolute returns of 22% in the year but modestly lagged the broader EAFE market amidst a challenging political backdrop and Brexit negotiations, which pushed valuation multiples lower.
Portfolio Review
Stock selection in the Healthcare sector detracted from performance in both the quarter and the year, as our holding in Shire underperformed. While having fallen nearly 10% in 2017 and being one of the largest relative detractors, Shire’s stock appears to be improving, rising in line with the benchmark during the fourth quarter. At 9.5x earnings with a 14% ROE, we expect the fundamentals of this company will drive earnings and cash flows in 2018, which we believe should ultimately rerate its valuation higher.
Our holding in Assa Abloy underperformed. This global leader in locks produces high, stable financial productivity in an industry with high barriers to entry (such as building codes and regulations that differ globally). Despite rising 13% during the year, the stock underperformed during the fourth quarter, falling nearly 9%, the result of a company specific, transitory issues in China, rising materials costs, and the CEO’s retirement announcement. However, we believe the stock will resume strong performance in 2018 due to a bottoming in their China operations coupled with strength in EMEA and North America.
Cash also continued to be a significant drag on relative performance in the quarter and the year. As equity markets continued to rise during the quarter and valuations remain elevated in historical terms, we have trimmed or sold some investments that have reached our target valuations faster than we have been able to replace them. Our cash exposure – which historically averages less than 5% of assets – is a byproduct of our process and is not a managed allocation. Our intention, as always, is to remain fully invested.
In contrast, stock selection in the consumer discretionary sector was additive to relative returns. Shares of Japanese retailer Don Quijote rose after reporting strong results driven by better sales and cost control, leading to operating profit margin expansion, while also increasing guidance. In the Industrials sector, Dutch software company Wolters Kluwer was a strong performer, both during the quarter and throughout the year, rising 13% and 47% respectively. Stock selection in the Real Estate sector was also beneficial to relative returns. Daiwa House was a
15
Ultra Series Fund | Management’s Discussion of Fund Performance (unaudited) - concluded | December 31, 2017
strong performer as it rose 11% during the quarter and 44% for the year. The Japanese diversified real estate company operates in the construction of residential housing (both single family and rental condominiums) as well as commercial facilities, including logistics and medical facilities as well as convenience stores. Positive stock selection in the Telecommunications sector was driven by Nordic telecommunications provider Telenor, which owns additional assets in emerging markets Malaysia and Thailand. Telenor stock rallied nearly 28% in the quarter, mostly because management reported earnings in July that beat expectations.
Average Annual Total Return through December 31, 20171
Since
5/1/09
1 Year
3 Years
5 Years
10 Years
Inception
Ultra Series International
Stock, Class I
22.54
4.73
5.28
1.99
–
Ultra Series International
Stock, Class II
22.24
4.47
5.02
–
8.40
MSCI EAFE Index (net)
25.03
7.80
7.90
1.94
9.54
See accompanying Notes to Management’s Discussion of Fund Performance.
SECTOR ALLOCATION AS A PERCENTAGE OF NET ASSETS
AS OF 12/31/17
Consumer Discretionary
16.6
%
Consumer Staples
10.5
%
Energy
7.6
%
Financials
17.4
%
Health Care
7.3
%
Industrials
15.9
%
Information Technology
7.2
%
Materials
5.5
%
Money Market Funds
1.6
%
Real Estate
2.6
%
Telecommunication Services
6.1
%
Utilities
1.5
%
Net Other Assets and Liabilities
0.2
%
GEOGRAPHICAL ALLOCATION AS A PERCENTAGE OF NET ASSETS
AS OF 12/31/17
Japan
18.5
%
United Kingdom
16.6
%
France
10.6
%
Netherlands
6.8
%
Switzerland
6.5
%
Canada
4.4
%
Germany
4.2
%
Sweden
3.4
%
Ireland
3.3
%
Australia
3.2
%
Norway
2.9
%
Belgium
2.5
%
Denmark
2.5
%
Singapore
2.5
%
United States
2.3
%
Spain
1.7
%
Finland
1.5
%
Taiwan
1.5
%
Turkey
1.1
%
Brazil
0.9
%
Italy
0.7
%
Luxembourg
0.6
%
Net Other Assets and Liabilities
0.2
%
16
Ultra Series Fund | December 31, 2017
Notes to Management’s Discussion of Fund Performance (unaudited)
1
Fund returns are calculated after fund level expenses have been subtracted, but do not include any separate account fees, charges or expenses imposed by the variable annuity and variable life insurance contracts that invest in the Fund, as described in the Prospectus. If these fees, charges, or expenses were included, fund returns would have been lower. Fund returns also assume that dividends and capital gains are reinvested in additional shares of the Fund. Investment return and principal value will fluctuate, so an investor’s shares, when redeemed, may be worth more or less than when purchased. Further information relating to the Fund’s performance is contained in the Prospectus and elsewhere in this report. The Fund’s past performance is not indicative of future performance. Current performance may be lower or higher than the performance data cited. For Ultra Series Fund performance data current to the most recent month-end, please call 1-800-670-3600 or visit www.ultraseriesfund.com. Indices are unmanaged and investors cannot invest in them directly. Index returns do not reflect fees or expenses.
2
Effective July 1, 2014 the Investment Adviser contractually agreed to waive a portion of the management fee for the Conservative, Moderate and Aggressive Allocation Funds until at least June 30, 2015. This waiver was renewed through April 30, 2018. If these waivers were not in place, returns would have been lower.
Morningstar Percentile rankings note: 1st percentile is top, 99th percentile is bottom.
BENCHMARK DESCRIPTIONS
Allocation Fund Indexes*
The Conservative Allocation Fund Custom Index consists of 65% Bloomberg Barclays US Aggregate Bond Index, 24.5% Russell 3000® Index and 10.5% MSCI ACWI ex-USA Index (net). See market index descriptions below.
The Moderate Allocation Fund Custom Index consists of 40% Bloomberg Barclays US Aggregate Bond Index, 42% Russell 3000® Index and 18% MSCI ACWI ex-USA Index (net). See market index descriptions below.
The Aggressive Allocation Fund Custom Index consists of 20% Bloomberg Barclays US Aggregate Bond Index, 56% Russell 3000® Index and 24% MSCI ACWI ex-USA Index (net). See market index descriptions below.
Hybrid Fund Custom Indexes*
The Custom Blended Index consists of 50% S&P 500 Index and 50% Bank of America Merrill Lynch U.S. Corporate, Government & Mortgage Index. See market indexes descriptions below.
*The Custom Indexes are calculated using a monthly re-balancing frequency (i.e., rebalanced back to original constituent weight every calendar month-end).
Market Indexes
The ICE Bank of America Merrill Lynch U.S. Corporate, Government & Mortgage Index is a broad-based measure of the total rate of return performance of the U.S. investment-grade bond markets. The index is a capitalization-weighted aggregation of outstanding U.S. treasury, agency and supranational mortgage pass-through, and investment-grade corporate bonds meeting specified selection criteria.
17
Ultra Series Fund | Notes to Management’s Discussion of Fund Performance (unaudited) - concluded | December 31, 2017
The ICE Bank of America Merrill Lynch U.S. High Yield Constrained Index tracks the performance of below investment grade U.S. dollar denominated corporate bonds publicly issued in the U.S. domestic market, but limits any individual issuer to a maximum weighting of 2%.
The Bloomberg Barclays Intermediate Government Credit Index measures the investment grade, U.S. dollar-denominated, fixed-rate, taxable corporate and government related bond markets. It is composed of the U.S. corporate index and a non-corporate component that includes foreign agencies, sovereigns, supranationals and local authorities.
The Bloomberg Barclays U.S. Aggregate Bond Index is a broad-based flagship benchmark that measures the investment grade, U.S. dollar-denominated, fixed-rate taxable bond market. The index includes Treasuries, government-related and corporate securities, mortgage backed securities, asset backed securities and commercial mortgage-backed securities.
The MSCI EAFE (Europe, Australasia & Far East) Index (net) is a free float-adjusted market capitalization index that is designed to measure developed market equity performance, excluding the U.S. and Canada. The MSCI EAFE Index (net) is calculated on a total return basis with dividends reinvested after the deduction of withholding taxes.
The MSCI ACWI ex USA Index is a free float-adjusted market capitalization weighted index that is designed to measure the equity market performance of developed and emerging markets. The MSCI ACWI ex USA (net) is calculated on a total return basis with dividends reinvested after the deduction of withholding taxes.
The Russell 1000® Growth Index is a large-cap market index which measures the performance of those Russell 1000 companies with higher price-to-book ratios and higher forecasted growth values.
The Russell 1000® Value Index is a large-cap market index which measures the performance of those Russell 1000 companies with lower price-to-book ratios and lower forecasted growth values.
The Russell 3000® Index measures the performance of the 3,000 largest U.S. companies based on total market capitalization, which represents 98% of the investable U.S. equity market.
The Russell Midcap® Index is a mid-cap market index which measures the performance of the mid-cap segment of the U.S. equity universe.
The S&P 500® Index is a large-cap market index which measures the performance of a representative sample of 500 leading companies in leading industries in the U.S.
Past performance is no guarantee of future results.
Russell Investment Group is the source and owner of the trademarks, service marks and copyrights related to the Russell Indexes. Russell® is a trademark of Russell Investment Group.
18
Ultra Series Fund | December 31, 2017
Conservative Allocation Fund Portfolio of Investments
Shares
Value (Note 2)
INVESTMENT COMPANIES - 99.8%
Alternative Funds - 2.0%
SPDR Gold Shares*
24,457
$
3,024,108
Bond Funds - 57.9%
Baird Aggregate Bond Fund Institutional Shares
825,819
8,976,647
iShares 20+ Year Treasury Bond ETF
36,340
4,610,092
iShares 7-10 Year Treasury Bond ETF
39,456
4,165,370
iShares TIPS Bond Fund ETF
98,952
11,288,444
Madison Core Bond Fund Class Y (A)
3,370,781
33,640,397
Madison Corporate Bond Fund Class Y (A)
886,851
10,260,871
Vanguard Short-Term Corporate Bond ETF
84,465
6,698,075
Virtus Seix Floating Rate High Income Fund, Class R6
862,511
7,512,473
87,152,369
Foreign Stock Funds - 13.5%
iShares MSCI Eurozone ETF
62,615
2,716,239
iShares MSCI Japan ETF
18,859
1,130,220
Vanguard FTSE All-World ex-U.S. ETF
202,475
11,079,432
Vanguard FTSE Emerging Markets ETF
41,201
1,891,538
Vanguard FTSE Europe ETF
46,631
2,758,223
WisdomTree Japan Hedged Equity Fund
12,782
758,356
20,334,008
Money Market Funds - 2.3%
State Street Institutional U.S. Government
Money Market Fund, 1.21%, Premier Class
3,388,009
3,388,009
Stock Funds - 24.1%
Energy Select Sector SPDR Fund
17,443
1,260,431
iShares Core S&P Mid-Cap ETF
16,403
3,112,961
Madison Dividend Income Fund Class Y (A)
400,874
10,703,348
Madison Investors Fund Class Y (A)
466,612
10,662,079
Madison Mid Cap Fund Class Y (A)
239,672
2,365,565
PowerShares Optimum Yield Diversified
Commodity Strategy No. K-1 Portfolio
209,196
3,650,470
Vanguard Financials ETF
10,612
743,265
Vanguard Growth ETF
23,860
3,355,909
Vanguard Information Technology ETF
2,980
490,895
36,344,923
TOTAL INVESTMENTS - 99.8%
(Cost $139,532,351**)
150,243,417
NET OTHER ASSETS AND LIABILITIES - 0.2%
231,204
TOTAL NET ASSETS - 100.0%
$
150,474,621
*
Non-income producing.
**
Aggregate cost for Federal tax purposes was $139,788,001.
(A)
Affiliated Company (see Note 11).
ETF
Exchange Traded Fund.
See accompanying Notes to Financial Statements.
19
Ultra Series Fund | December 31, 2017
Moderate Allocation Fund Portfolio of Investments
Shares
Value (Note 2)
INVESTMENT COMPANIES - 99.9%
Alternative Funds - 2.0%
SPDR Gold Shares*
39,873
$
4,930,296
Bond Funds - 33.7%
Baird Aggregate Bond Fund Institutional Shares
252,273
2,742,207
iShares 20+ Year Treasury Bond ETF
59,179
7,507,448
iShares 7-10 Year Treasury Bond ETF
45,880
4,843,551
iShares TIPS Bond Fund ETF
107,434
12,256,071
Madison Core Bond Fund Class Y (A)
4,268,407
42,598,706
Madison Corporate Bond Fund Class Y (A)
437,539
5,062,324
Virtus Seix Floating Rate High Income Fund, Class R6
835,576
7,277,868
82,288,175
Foreign Stock Funds - 23.3%
iShares MSCI Eurozone ETF
178,102
7,726,065
iShares MSCI Japan ETF
61,118
3,662,801
Vanguard FTSE All-World ex-U.S. ETF
530,814
29,046,142
Vanguard FTSE Emerging Markets ETF
134,180
6,160,204
Vanguard FTSE Europe ETF
133,472
7,894,869
WisdomTree Japan Hedged Equity Fund
37,064
2,199,007
56,689,088
Money Market Funds - 1.2%
State Street Institutional U.S. Government
Money Market Fund, 1.21%, Premier Class
2,970,572
2,970,572
Stock Funds - 39.7%
Energy Select Sector SPDR Fund
40,991
2,962,010
iShares Core S&P Mid-Cap ETF
42,379
8,042,687
Madison Dividend Income Fund Class Y (A)
1,081,152
28,866,751
Madison Investors Fund Class Y (A)
1,258,199
28,749,850
Madison Large Cap Value Fund Class Y (A)
530,228
7,757,239
Madison Mid Cap Fund Class Y (A)
491,383
4,849,948
PowerShares Optimum Yield Diversified
Commodity Strategy No. K-1 Portfolio
341,225
5,954,376
Vanguard Financials ETF
17,280
1,210,291
Vanguard Growth ETF
51,671
7,267,526
Vanguard Information Technology ETF
7,352
1,211,095
96,871,773
TOTAL INVESTMENTS - 99.9%
(Cost $211,969,758**)
243,749,904
NET OTHER ASSETS AND LIABILITIES - 0.1%
315,029
TOTAL NET ASSETS - 100.0%
$
244,064,933
*
Non-income producing.
**
Aggregate cost for Federal tax purposes was $212,727,572.
(A)
Affiliated Company (see Note 11).
ETF
Exchange Traded Fund.
See accompanying Notes to Financial Statements.
20
Ultra Series Fund | December 31, 2017
Aggressive Allocation Fund Portfolio of Investments
Shares
Value (Note 2)
INVESTMENT COMPANIES - 99.8%
Alternative Funds - 2.0%
SPDR Gold Shares*
13,920
$
1,721,208
Bond Funds - 13.7%
iShares 20+ Year Treasury Bond ETF
12,077
1,532,088
iShares 7-10 Year Treasury Bond ETF
18,205
1,921,902
Madison Core Bond Fund Class Y (A)
841,003
8,393,210
11,847,200
Foreign Stock Funds - 31.2%
iShares MSCI Eurozone ETF
90,342
3,919,036
iShares MSCI Japan ETF
28,738
1,722,268
Vanguard FTSE All-World ex-U.S. ETF
235,650
12,894,768
Vanguard FTSE Emerging Markets ETF
71,574
3,285,962
Vanguard FTSE Europe ETF
67,703
4,004,633
WisdomTree Japan Hedged Equity Fund
20,332
1,206,298
27,032,965
Money Market Funds - 1.4%
State Street Institutional U.S. Government
Money Market Fund, 1.21%, Premier Class
1,215,283
1,215,283
Stock Funds - 51.5%
Energy Select Sector SPDR Fund
20,074
1,450,547
iShares Core S&P Mid-Cap ETF
23,100
4,383,918
Madison Dividend Income Fund Class Y (A)
432,730
11,553,878
Madison Investors Fund Class Y (A)
502,853
11,490,182
Madison Large Cap Value Fund Class Y (A)
291,130
4,259,230
Madison Mid Cap Fund Class Y (A)
428,588
4,230,159
PowerShares Optimum Yield Diversified
Commodity Strategy No. K-1 Portfolio
101,742
1,775,398
Vanguard Financials ETF
9,218
645,629
Vanguard Growth ETF
27,562
3,876,596
Vanguard Information Technology ETF
5,203
857,090
44,522,627
TOTAL INVESTMENTS - 99.8%
(Cost $71,603,748**)
86,339,283
NET OTHER ASSETS AND LIABILITIES - 0.2%
145,177
TOTAL NET ASSETS - 100.0%
$
86,484,460
*
Non-income producing.
**
Aggregate cost for Federal tax purposes was $71,793,660.
(A)
Affiliated Company (see Note 11).
ETF
Exchange Traded Fund.
See accompanying Notes to Financial Statements.
21
Ultra Series Fund | December 31, 2017
Core Bond Fund Portfolio of Investments
Par Value
Value (Note 2)
ASSET BACKED SECURITIES - 2.2%
CarMax Auto Owner Trust, Series 2014-1, Class B, 1.69%, 8/15/19
$
510,000
$
509,788
CarMax Auto Owner Trust, Series 2017-1, Class A2, 1.54%, 2/18/20
673,133
672,244
Chase Issuance Trust, Series 2017-A1, Class A, (1M LIBOR + 0.300%) (A), 1.777%, 1/18/22
500,000
501,780
Chesapeake Funding II LLC, Series 2017 4A, Class A1 (B), 2.12%, 11/15/29
400,000
398,325
Enterprise Fleet Financing LLC, Series 2015-2, Class A3 (B), 2.09%, 2/22/21
200,000
199,929
Enterprise Fleet Financing LLC, Series 2017-3, Class A2 (B), 2.13%, 5/22/23
500,000
499,113
Santander Drive Auto Receivables Trust, Series 2013-5, Class D, 2.73%, 10/15/19
523,438
524,867
Santander Drive Auto Receivables Trust, Series 2014-5, Class C, 2.46%, 6/15/20
231,799
232,192
Total Asset Backed Securities
(Cost $3,544,159)
3,538,238
COLLATERALIZED MORTGAGE OBLIGATIONS - 2.1%
Fannie Mae REMICS, Series 2015-12, Class NI, IO, 3.5%, 3/25/30
2,375,558
270,566
Fannie Mae REMICS, Series 2011-31, Class DB, 3.5%, 4/25/31
375,000
387,462
Fannie Mae REMICS, Series 2011-36, Class QB, 4%, 5/25/31
500,000
529,321
Fannie Mae REMICS, Series 2005-79, Class LT, 5.5%, 9/25/35
526,920
581,665
Fannie Mae REMICS, Series 2011-101, Class NC, 2.5%, 4/25/40
355,597
355,646
Fannie Mae REMICS, Series 2016-21, Class BA, 3%, 3/25/42
745,484
750,699
Freddie Mac REMICS, Series 4066, Class DI, IO, 3%, 6/15/27
3,016,133
258,509
Government National Mortgage Association, Series 2015-53, Class IL, IO, 3%, 9/20/44
2,200,442
387,195
Total Collateralized Mortgage
Obligations (Cost $3,560,417)
3,521,063
COMMERCIAL MORTGAGE-BACKED SECURITIES - 2.0%
Fannie Mae-Aces, Series 2016-M2, Class X2, IO (A) (C), 1.094%, 1/25/23
10,502,835
450,475
FHLMC Multifamily Structured Pass Through Certificates, Series K718, Class X1, IO (A) (C), 0.642%, 1/25/22
23,965,040
532,741
FHLMC Multifamily Structured Pass Through Certificates, Series K066, Class A2, 3.117%, 6/25/27
500,000
510,212
FREMF Mortgage Trust, Series 2011-K702, Class B (A) (B) (C), 4.793%, 4/25/44
750,000
750,190
FREMF Mortgage Trust, Series 2012-K708, Class B (A) (B) (C), 3.75%, 2/25/45
1,000,000
1,011,211
Total Commercial Mortgage-Backed
Securities (Cost $3,354,854)
3,254,829
CORPORATE NOTES AND BONDS - 34.0%
Consumer Discretionary - 7.2%
Advance Auto Parts Inc., 4.5%, 12/1/23
1,000,000
1,051,371
Amazon.com Inc. (B), 2.8%, 8/22/24
125,000
124,620
Charter Communications Operating LLC / Charter Communications Operating Capital Corp., 4.464%, 7/23/22
800,000
834,679
D.R. Horton Inc., 2.55%, 12/1/20
400,000
399,402
Discovery Communications LLC, 5%, 9/20/37
500,000
518,047
ERAC USA Finance LLC (B), 6.7%, 6/1/34
500,000
631,105
Ford Motor Credit Co. LLC, MTN, 2.943%, 1/8/19
1,000,000
1,006,244
GameStop Corp. (B), 6.75%, 3/15/21
200,000
209,000
General Motors Financial Co. Inc., 3.2%, 7/6/21
750,000
757,321
GLP Capital L.P. / GLP Financing II Inc., 4.875%, 11/1/20
253,000
262,488
Harman International Industries Inc., 4.15%, 5/15/25
400,000
413,578
Lennar Corp., 4.75%, 4/1/21
500,000
520,000
Lowe’s Cos. Inc., 2.5%, 4/15/26
500,000
480,658
Marriott International Inc., 3.125%, 6/15/26
400,000
393,460
McDonald’s Corp., MTN, 4.875%, 12/9/45
400,000
463,379
Newell Brands Inc., 4.2%, 4/1/26
800,000
835,527
Omnicom Group Inc., 3.6%, 4/15/26
750,000
758,759
Priceline Group Inc./The, 3.6%, 6/1/26
500,000
502,141
Sirius XM Radio Inc. (B), 6%, 7/15/24
350,000
370,125
Toll Brothers Finance Corp., 4%, 12/31/18
500,000
508,125
Walgreens Boots Alliance Inc., 3.45%, 6/1/26
850,000
840,527
11,880,556
Consumer Staples - 3.0%
Anheuser-Busch InBev Finance Inc., 4.9%, 2/1/46
1,000,000
1,158,989
Bunge Ltd. Finance Corp., 3.25%, 8/15/26
850,000
812,319
CVS Health Corp., 4.75%, 12/1/22
1,060,000
1,135,396
CVS Health Corp., 5.125%, 7/20/45
1,000,000
1,146,094
Molson Coors Brewing Co., 2.1%, 7/15/21
400,000
392,053
Tyson Foods Inc., 3.55%, 6/2/27
300,000
307,188
4,952,039
See accompanying Notes to Financial Statements.
22
Ultra Series Fund | December 31, 2017
Core Bond Fund Portfolio of Investments - continued
Par Value
Value (Note 2)
CORPORATE NOTES AND BONDS - continued
Energy - 2.0%
Antero Resources Corp., 5.625%, 6/1/23
$
300,000
$
312,000
EnLink Midstream Partners L.P., 5.45%, 6/1/47
550,000
581,180
Enterprise Products Operating LLC, 3.75%, 2/15/25
750,000
773,322
Helmerich & Payne International Drilling Co., 4.65%, 3/15/25
400,000
421,060
Marathon Oil Corp., 2.7%, 6/1/20
750,000
750,104
Marathon Petroleum Corp., 2.7%, 12/14/18
400,000
401,437
3,239,103
Financials - 10.7%
AerCap Ireland Capital DAC / AerCap Global
Aviation Trust (D), 3.75%, 5/15/19
400,000
406,331
Affiliated Managers Group Inc., 4.25%, 2/15/24
1,000,000
1,054,395
Air Lease Corp., 3.875%, 4/1/21
500,000
517,888
Air Lease Corp., 3.75%, 2/1/22
700,000
723,261
American Express Co., 2.5%, 8/1/22
500,000
493,965
Bank of America Corp., MTN, 2.503%, 10/21/22
400,000
395,745
Bank of America Corp., MTN, (3M USD LIBOR + 0.930%) (A), 2.816%, 7/21/23
New York City Transitional Finance Authority Future Tax Secured Revenue, 6.267%, 8/1/39
500,000
532,385
Palomar Community College District, General Obligation, 7.194%, 8/1/45
1,000,000
1,131,980
Washington County School District #1 West Union, General Obligation, 4.355%, 6/30/34
800,000
866,848
7,093,113
Total Long Term Municipal Bonds
(Cost $6,994,778)
7,093,113
MORTGAGE BACKED SECURITIES - 26.5%
Fannie Mae - 17.0%
1.125%, 10/19/18 Pool # IE MAE
500,000
497,490
3.5%, 5/1/28 Pool # AL3678
174,800
181,483
3.5%, 8/1/29 Pool # MA2003
975,558
1,007,771
3%, 9/1/30 Pool # 890696
1,367,102
1,395,446
3%, 12/1/30 Pool # AL8924
569,642
581,435
7%, 11/1/31 Pool # 607515
23,970
26,240
3.5%, 12/1/31 Pool # MA0919
144,235
149,990
3%, 2/1/32 Pool # AL9867
542,959
553,550
6.5%, 3/1/32 Pool # 631377
32,954
36,528
7%, 5/1/32 Pool # 644591
9,618
10,382
6.5%, 6/1/32 Pool # 545691
305,447
347,096
3.5%, 8/1/32 Pool # MA3098
238,864
247,015
5.5%, 11/1/33 Pool # 555880
390,996
433,566
7%, 7/1/34 Pool # 792636
37,421
38,524
4%, 2/1/35 Pool # MA2177
1,517,869
1,602,270
5%, 8/1/35 Pool # 829670
438,193
475,661
5%, 9/1/35 Pool # 820347
614,615
676,409
5%, 9/1/35 Pool # 835699
493,531
542,905
3.5%, 12/1/35 Pool # MA2473
1,076,930
1,120,567
5%, 12/1/35 Pool # 850561
168,973
183,298
5.5%, 10/1/36 Pool # 901723
499,545
552,328
6.5%, 10/1/36 Pool # 894118
331,017
366,929
6%, 11/1/36 Pool # 902510
388,290
435,654
6%, 10/1/37 Pool # 947563
513,697
588,521
6.5%, 8/1/38 Pool # 987711
815,564
930,098
4%, 1/1/41 Pool # AB2080
1,501,650
1,585,683
4.5%, 7/1/41 Pool # AB3274
614,704
662,048
5.5%, 7/1/41 Pool # AL6588
1,247,834
1,385,846
4%, 9/1/41 Pool # AJ1406
1,075,085
1,128,839
3.5%, 6/1/42 Pool # AO4136
1,640,481
1,693,992
4%, 6/1/42 Pool # MA1087
410,133
430,469
3.5%, 8/1/42 Pool # AP2133
737,827
761,817
3.5%, 9/1/42 Pool # AB6228
1,312,402
1,354,663
4%, 10/1/42 Pool # AP7363
998,882
1,049,080
3.5%, 3/1/43 Pool # AT0310
782,490
807,712
4%, 1/1/45 Pool # AS4257
265,647
279,660
4.5%, 2/1/45 Pool # MA2193
1,058,031
1,127,243
3.5%, 8/1/45 Pool # AS5645
769,280
790,257
3.5%, 11/1/45 Pool # BA4907
607,636
624,205
3.5%, 12/1/45 Pool # AS6309
353,685
363,330
4.5%, 10/1/46 Pool # MA2783
142,322
151,538
4%, 12/1/46 Pool # BD2379
450,210
471,114
3%, 1/1/47 Pool # BE0108
469,610
471,176
28,119,828
Freddie Mac - 9.4%
4.5%, 2/1/25 Pool # J11722
207,720
217,850
4.5%, 5/1/25 Pool # J12247
382,657
401,366
8%, 6/1/30 Pool # C01005
13,572
15,653
7%, 3/1/31 Pool # C48129
53,112
54,106
5.5%, 11/1/34 Pool # A28282
804,908
900,446
5.5%, 1/1/37 Pool # G04593
227,919
252,942
5%, 10/1/39 Pool # G60465
1,826,569
1,980,799
See accompanying Notes to Financial Statements.
24
Ultra Series Fund | December 31, 2017
Core Bond Fund Portfolio of Investments - continued
Par Value
Value (Note 2)
MORTGAGE BACKED SECURITIES - continued
Freddie Mac - continued
4%, 10/1/41 Pool # Q04092
$
713,981
$
753,878
3%, 9/1/42 Pool # C04233
2,198,775
2,210,894
3%, 4/1/43 Pool # V80025
1,987,983
1,999,443
3%, 4/1/43 Pool # V80026
1,969,430
1,980,794
3.5%, 8/1/44 Pool # Q27927
654,636
675,207
3%, 7/1/45 Pool # G08653
994,423
995,567
3.5%, 8/1/45 Pool # Q35614
1,170,125
1,205,172
3%, 10/1/46 Pool # G60722
846,065
847,728
4%, 3/1/47 Pool # Q46801
928,248
972,360
15,464,205
Ginnie Mae - 0.1%
6.5%, 2/20/29 Pool # 2714
55,799
64,180
6.5%, 4/20/31 Pool # 3068
38,599
44,723
108,903
Total Mortgage Backed Securities
(Cost $43,385,349)
43,692,936
U.S. GOVERNMENT AND AGENCY OBLIGATIONS - 26.2%
U.S. Treasury Bonds - 9.6%
6.625%, 2/15/27
5,000,000
6,740,820
4.500%, 5/15/38
4,000,000
5,198,750
3.000%, 5/15/45
750,000
787,646
2.500%, 5/15/46
500,000
475,625
2.250%, 8/15/46
2,000,000
1,804,141
3.000%, 5/15/47
750,000
788,525
15,795,507
U.S. Treasury Notes - 16.6%
2.750%, 2/15/19
3,500,000
3,534,863
3.375%, 11/15/19
5,500,000
5,651,250
2.625%, 11/15/20
6,500,000
6,617,305
2.000%, 11/15/21
5,000,000
4,985,156
2.750%, 11/15/23
3,500,000
3,594,746
2.125%, 3/31/24
1,500,000
1,484,707
2.250%, 11/15/25
1,500,000
1,486,817
27,354,844
Total U.S. Government and Agency
Obligations (Cost $40,713,127)
43,150,351
Shares
SHORT-TERM INVESTMENTS - 1.5%
State Street Institutional U.S. Government
Money Market Fund, 1.21%, Premier Class
2,471,814
2,471,814
Total Short-Term Investments
(Cost $2,471,814)
2,471,814
TOTAL INVESTMENTS - 98.8%
(Cost $158,132,796**)
162,779,324
NET OTHER ASSETS AND LIABILITIES - 1.2%
1,902,347
TOTAL NET ASSETS - 100.0%
$
164,681,671
**
Aggregate cost for Federal tax purposes was $158,132,796.
(A)
Floating rate or variable rate note. Rate shown is as of December 31, 2017.
(B)
Security sold within terms of a private placement memorandum exempt from registration under section 144A of the Securities Act of 1933, as amended, and may be sold only to dealers in that program or other “qualified institutional buyers.”
(C)
Coupon rate may change based on changes of the underlying collateral or prepayments of principal. The coupon rate shown represents the rate at period end.
(D)
Notes and bonds, issued by foreign entities, denominated in U.S. dollars. The aggregate of these securities is 1.8% of total net assets.
Aggregate cost for Federal tax purposes was $25,152,537.
(A)
Security sold within terms of a private placement memorandum exempt from registration under section 144A of the Securities Act of 1933, as amended, and may be sold only to dealers in that program or other “qualified institutional buyers.”
(B)
Notes and bonds, issued by foreign entities, denominated in U.S. dollars. The aggregate of these securities is 10.2% of total net assets.
PIK
Payment in Kind.
PLC
Public Limited Company.
See accompanying Notes to Financial Statements.
27
Ultra Series Fund | December 31, 2017
Diversified Income Fund Portfolio of Investments
Shares
Value (Note 2)
COMMON STOCKS - 62.4%
Consumer Discretionary - 3.9%
Carnival Corp.
52,000
$
3,451,240
Home Depot Inc./The
24,000
4,548,720
McDonald’s Corp.
17,000
2,926,040
10,926,000
Consumer Staples - 5.8%
Diageo PLC, ADR
29,000
4,234,870
Nestle S.A., ADR
52,500
4,513,425
PepsiCo Inc.
32,500
3,897,400
Procter & Gamble Co./The
39,500
3,629,260
16,274,955
Energy - 4.4%
Chevron Corp.
28,500
3,567,915
Exxon Mobil Corp.
55,000
4,600,200
Schlumberger Ltd.
60,000
4,043,400
12,211,515
Financials - 10.7%
BB&T Corp.
51,000
2,535,720
Chubb Ltd.
18,000
2,630,340
CME Group Inc.
34,000
4,965,700
Northern Trust Corp.
23,000
2,297,470
PNC Financial Services Group Inc./The
35,500
5,122,295
Travelers Cos. Inc./The
27,500
3,730,100
US Bancorp
103,000
5,518,740
Wells Fargo & Co.
53,000
3,215,510
30,015,875
Health Care - 8.4%
Amgen Inc.
17,000
2,956,300
Johnson & Johnson
40,000
5,588,800
Medtronic PLC
46,500
3,754,875
Merck & Co. Inc.
52,000
2,926,040
Novartis AG, ADR
48,500
4,072,060
Pfizer Inc.
115,000
4,165,300
23,463,375
Industrials - 10.9%
3M Co.
9,000
2,118,330
Boeing Co./The
13,500
3,981,285
Caterpillar Inc.
21,500
3,387,970
Emerson Electric Co.
53,000
3,693,570
Fastenal Co.
81,000
4,429,890
Union Pacific Corp.
21,500
2,883,150
United Parcel Service Inc., Class B
42,500
5,063,875
United Technologies Corp.
38,500
4,911,445
30,469,515
Information Technology - 11.2%
Accenture PLC, Class A
24,500
3,750,705
Analog Devices Inc.
25,000
2,225,750
Apple Inc.
16,500
2,792,295
Automatic Data Processing Inc.
16,500
1,933,635
Cisco Systems Inc.
141,000
5,400,300
Microsoft Corp.
68,500
5,859,490
TE Connectivity Ltd.
37,500
3,564,000
Texas Instruments Inc.
26,500
2,767,660
Xilinx Inc.
44,500
3,000,190
31,294,025
Materials - 2.8%
Monsanto Co.
16,000
1,868,480
Praxair Inc.
39,500
6,109,860
7,978,340
Telecommunication Service - 1.6%
Verizon Communications Inc.
84,000
4,446,120
Utilities - 2.7%
Dominion Energy Inc.
26,500
2,148,090
Duke Energy Corp.
25,545
2,148,590
NextEra Energy Inc.
21,000
3,279,990
7,576,670
Total Common Stocks
(Cost $111,820,077)
174,656,390
Par Value
ASSET BACKED SECURITIES - 0.3%
CarMax Auto Owner Trust, Series 2017-1, Class A2, 1.54%, 2/18/20
$
269,253
268,898
Santander Drive Auto Receivables Trust, Series 2013-5, Class D, 2.73%, 10/15/19
174,479
174,956
Santander Drive Auto Receivables Trust, Series 2014-5, Class C, 2.46%, 6/15/20
331,141
331,703
Total Asset Backed Securities
(Cost $777,472)
775,557
COLLATERALIZED MORTGAGE OBLIGATIONS - 1.2%
Fannie Mae REMICS, Series 2011-31, Class DB, 3.5%, 4/25/31
350,000
361,631
Fannie Mae REMICS, Series 2011-36, Class QB, 4%, 5/25/31
481,000
509,207
Fannie Mae REMICS, Series 2005-79, Class LT, 5.5%, 9/25/35
480,815
530,769
Fannie Mae REMICS, Series 2011-101, Class NC, 2.5%, 4/25/40
609,595
609,679
See accompanying Notes to Financial Statements.
28
Ultra Series Fund | December 31, 2017
Diversified Income Fund Portfolio of Investments - continued
Par Value
Value (Note 2)
COLLATERALIZED MORTGAGE OBLIGATIONS - continued
Fannie Mae REMICS, Series 2016-21, Class BA, 3%, 3/25/42
$
447,290
$
450,420
Freddie Mac REMICS, Series 3825, Class CB, 3.5%, 3/15/26
400,000
415,248
Freddie Mac REMICS, Series 4037, Class B, 3%, 4/15/27
450,000
449,688
Total Collateralized Mortgage
Obligations ( Cost $3,408,848 )
3,326,642
COMMERCIAL MORTGAGE-BACKED SECURITIES - 0.6%
Fannie Mae-Aces, Series 2016-M2, Class X2, IO (A) (B), 1.094%, 1/25/23
7,638,426
327,618
FHLMC Multifamily Structured Pass Through Certificates, Series K066, Class A2, 3.117%, 6/25/27
225,000
229,595
FREMF Mortgage Trust, Series 2011-K702, Class B (A) (B) (C), 4.793%, 4/25/44
500,000
500,127
FREMF Mortgage Trust, Series 2012-K708, Class B (A) (B) (C), 3.75%, 2/25/45
700,000
707,848
Total Commercial Mortgage-Backed
Securities (Cost $1,819,021)
1,765,188
CORPORATE NOTES AND BONDS - 13.1%
Consumer Discretionary - 2.6%
Amazon.com Inc. (C), 2.8%, 8/22/24
200,000
199,392
Charter Communications Operating LLC / Charter Communications Operating Capital Corp., 4.464%, 7/23/22
600,000
626,010
Discovery Communications LLC, 5%, 9/20/37
300,000
310,828
ERAC USA Finance LLC (C), 6.7%, 6/1/34
875,000
1,104,434
Ford Motor Credit Co. LLC, MTN, 2.943%, 1/8/19
500,000
503,122
GameStop Corp. (C), 6.75%, 3/15/21
200,000
209,000
General Motors Financial Co. Inc., 3.2%, 7/6/21
650,000
656,345
GLP Capital L.P. / GLP Financing II Inc., 4.875%, 11/1/20
450,000
466,875
Lennar Corp., 4.75%, 4/1/21
350,000
364,000
Lowe’s Cos. Inc., 2.5%, 4/15/26
400,000
384,526
Marriott International Inc., 3.125%, 6/15/26
400,000
393,460
Newell Brands Inc., 5.5%, 4/1/46
450,000
536,524
Omnicom Group Inc., 3.6%, 4/15/26
650,000
657,591
Priceline Group Inc./The, 3.6%, 6/1/26
500,000
502,141
Walgreens Boots Alliance Inc., 3.45%, 6/1/26
350,000
346,099
7,260,347
Consumer Staples - 0.7%
Anheuser-Busch InBev Finance Inc., 4.9%, 2/1/46
500,000
579,494
Bunge Ltd. Finance Corp., 3.25%, 8/15/26
600,000
573,402
CVS Health Corp., 5.125%, 7/20/45
400,000
458,438
Tyson Foods Inc., 3.55%, 6/2/27
300,000
307,188
1,918,522
Energy - 1.2%
Antero Resources Corp., 5.625%, 6/1/23
200,000
208,000
Enterprise Products Operating LLC, 3.75%, 2/15/25
400,000
412,438
Exxon Mobil Corp., 4.114%, 3/1/46
500,000
559,618
Marathon Oil Corp., 2.7%, 6/1/20
500,000
500,070
Phillips 66, 4.65%, 11/15/34
500,000
547,825
Schlumberger Holdings Corp. (C), 4%, 12/21/25
400,000
420,336
Valero Energy Corp., 6.625%, 6/15/37
500,000
658,957
3,307,244
Financials - 3.7%
Air Lease Corp., 3.75%, 2/1/22
500,000
516,615
Air Lease Corp., 3.625%, 4/1/27
500,000
499,604
American Express Co., 2.5%, 8/1/22
400,000
395,172
Bank of America Corp., MTN, 2.503%, 10/21/22
400,000
395,745
Bank of America Corp., MTN, (3M USD LIBOR + 0.930%) (B), 2.816%, 7/21/23
250,000
249,512
Bank of America Corp., MTN, (3M USD LIBOR + 1.090%) (B), 3.093%, 10/1/25
New York City Transitional Finance Authority Future Tax Secured Revenue, 6.267%, 8/1/39
500,000
532,385
Northside Independent School District, General Obligation, Series B, (PSF-GTD), 5.741%, 8/15/35
850,000
899,954
Rancho Water District Financing Authority Revenue, (Prerefunded 8/1/20 @ $100), 6.337%, 8/1/40
5,000
5,504
Rancho Water District Financing Authority Revenue, 6.337%, 8/1/40
795,000
868,617
University of Massachusetts Building Authority Revenue, 6.573%, 5/1/39
1,000,000
1,059,620
6,855,660
Total Long Term Municipal Bonds
(Cost $6,774,344)
6,855,660
MORTGAGE BACKED SECURITIES - 9.1%
Fannie Mae - 6.1%
3%, 5/1/27 Pool # AL1715
498,175
508,805
3.5%, 5/1/28 Pool # AL3678
174,800
181,483
3.5%, 8/1/29 Pool # MA2003
391,939
404,881
3%, 9/1/30 Pool # 890696
647,575
661,001
3%, 12/1/30 Pool # AL8924
455,713
465,148
7%, 11/1/31 Pool # 607515
23,970
26,240
3.5%, 12/1/31 Pool # MA0919
180,294
187,488
3%, 2/1/32 Pool # AL9867
769,192
784,196
7%, 5/1/32 Pool # 644591
5,288
5,708
3.5%, 8/1/32 Pool # MA3098
238,864
247,015
5.5%, 10/1/33 Pool # 254904
154,249
171,137
5.5%, 11/1/33 Pool # 555880
390,996
433,565
5%, 5/1/34 Pool # 780890
516,210
560,812
7%, 7/1/34 Pool # 792636
17,911
18,439
4%, 2/1/35 Pool # MA2177
729,744
770,322
5%, 9/1/35 Pool # 820347
251,196
276,452
See accompanying Notes to Financial Statements.
30
Ultra Series Fund | December 31, 2017
Diversified Income Fund Portfolio of Investments - continued
Par Value
Value (Note 2)
MORTGAGE BACKED SECURITIES - continued
Fannie Mae - continued
5%, 9/1/35 Pool # 835699
$
206,586
$
227,253
5%, 12/1/35 Pool # 850561
70,686
76,679
5.5%, 9/1/36 Pool # 831820
395,265
439,901
6%, 9/1/36 Pool # 831741
300,046
335,190
5.5%, 10/1/36 Pool # 901723
187,329
207,123
5.5%, 12/1/36 Pool # 903059
327,604
362,113
4%, 1/1/41 Pool # AB2080
667,400
704,748
4.5%, 7/1/41 Pool # AB3274
193,765
208,689
5.5%, 7/1/41 Pool # AL6588
719,904
799,527
4%, 9/1/41 Pool # AJ1406
477,816
501,706
4%, 10/1/41 Pool # AJ4046
610,782
645,956
3.5%, 6/1/42 Pool # AO4134
494,344
510,337
3.5%, 6/1/42 Pool # AO4136
615,180
635,247
3.5%, 8/1/42 Pool # AP2133
614,856
634,848
4%, 10/1/42 Pool # AP7363
525,727
552,147
3%, 2/1/43 Pool # AB8486
982,746
988,057
3%, 2/1/43 Pool # AL3072
754,069
758,852
3.5%, 3/1/43 Pool # AT0310
497,948
513,998
4%, 1/1/45 Pool # AS4257
191,856
201,976
4.5%, 2/1/45 Pool # MA2193
597,484
636,569
3.5%, 4/1/45 Pool # MA2229
503,848
517,587
3.5%, 11/1/45 Pool # BA4907
607,636
624,205
3.5%, 12/1/45 Pool # AS6309
132,632
136,249
16,921,649
Freddie Mac - 3.0%
4.5%, 2/1/25 Pool # J11722
124,632
130,710
4.5%, 5/1/25 Pool # J12247
107,622
112,884
8%, 6/1/30 Pool # C01005
10,857
12,523
6.5%, 1/1/32 Pool # C62333
79,485
88,042
5%, 10/1/39 Pool # G60465
1,153,605
1,251,012
3.5%, 11/1/40 Pool # G06168
313,297
323,310
4.5%, 9/1/41 Pool # Q03516
503,925
537,652
4%, 10/1/41 Pool # Q04092
713,981
753,878
3%, 9/1/42 Pool # C04233
1,130,798
1,137,031
3%, 4/1/43 Pool # V80025
795,193
799,777
3%, 4/1/43 Pool # V80026
787,772
792,318
3%, 7/1/45 Pool # G08653
238,661
238,936
3.5%, 8/1/45 Pool # Q35614
780,083
803,448
3%, 10/1/46 Pool # G60722
594,532
595,701
4%, 3/1/47 Pool # Q46801
742,598
777,888
8,355,110
Ginnie Mae - 0.0%
6.5%, 4/20/31 Pool # 3068
31,787
36,830
Total Mortgage Backed Securities
(Cost $25,176,147)
25,313,589
U.S. GOVERNMENT AND AGENCY OBLIGATIONS - 8.9%
Federal Home Loan Bank - 0.1%
1.750%, 12/21/23 (E)
350,000
349,117
U.S. Treasury Bonds - 2.7%
6.625%, 2/15/27
2,270,000
3,060,333
3.000%, 5/15/42
1,000,000
1,052,539
2.500%, 2/15/45
1,250,000
1,191,650
2.500%, 5/15/46
1,000,000
951,250
2.250%, 8/15/46
1,000,000
902,070
3.000%, 5/15/47
400,000
420,547
7,578,389
U.S. Treasury Notes - 6.1%
2.750%, 2/15/19
500,000
504,980
3.125%, 5/15/19
2,000,000
2,034,219
3.625%, 8/15/19
2,250,000
2,312,578
3.375%, 11/15/19
1,000,000
1,027,500
2.000%, 7/31/20
1,000,000
1,001,641
2.625%, 11/15/20
6,200,000
6,311,891
2.000%, 2/15/22
1,250,000
1,244,043
1.750%, 5/15/22
1,750,000
1,721,836
2.125%, 3/31/24
800,000
791,844
16,950,532
Total U.S. Government and Agency
Obligations (Cost $24,228,296)
24,878,038
Shares
SHORT-TERM INVESTMENTS - 1.6%
State Street Institutional U.S. Government
Money Market Fund, 1.21%, Premier Class
4,589,005
4,589,005
Total Short-Term Investments
(Cost $4,589,005)
4,589,005
TOTAL INVESTMENTS - 99.7%
(Cost $213,642,669**)
278,811,138
NET OTHER ASSETS AND LIABILITIES - 0.3%
927,721
TOTAL NET ASSETS - 100.0%
$
279,738,859
See accompanying Notes to Financial Statements.
31
Ultra Series Fund | December 31, 2017
Diversified Income Fund Portfolio of Investments - continued
**
Aggregate cost for Federal tax purposes was $214,331,628.
(A)
Coupon rate may change based on changes of the underlying collateral or prepayments of principal. The coupon rate shown represents the rate at period end.
(B)
Floating rate or variable rate note. Rate shown is as of December 31, 2017.
(C)
Security sold within terms of a private placement memorandum exempt from registration under section 144A of the Securities Act of 1933, as amended, and may be sold only to dealers in that program or other “qualified institutional investors.”
(D)
Notes and bonds, issued by foreign entities, denominated in U.S. dollars. The aggregate of these securities is 0.9% of total net assets.
(E)
Stepped rate security. Rate shown is as of December 31, 2017.
ADR
American Depositary Receipt.
LIBOR
London Interbank Offered Rate.
MTN
Medium Term Note.
PLC
Public Limited Company.
PSF-
GTD
Permanent School Fund Guaranteed.
See accompanying Notes to Financial Statements.
32
Ultra Series Fund | December 31, 2017
Large Cap Value Fund Portfolio of Investments
Shares
Value (Note 2)
COMMON STOCKS - 98.7%
Consumer Discretionary - 3.3%
General Motors Co.
281,000
$
11,518,190
Consumer Staples - 2.2%
Nestle S.A., ADR
86,500
7,436,405
Energy - 15.4%
Canadian Natural Resources Ltd.
294,000
10,501,680
Chevron Corp.
57,000
7,135,830
EOG Resources Inc.
161,000
17,373,510
Halliburton Co.
78,000
3,811,860
Marathon Petroleum Corp.
223,000
14,713,540
53,536,420
Financials - 27.6%
Capital Markets - 4.5%
Bank of New York Mellon Corp./The
287,000
15,457,820
Commercial Banks - 16.0%
Bank of America Corp.
605,000
17,859,600
JPMorgan Chase & Co.
169,000
18,072,860
Regions Financial Corp.
290,000
5,011,200
US Bancorp
273,000
14,627,340
55,571,000
Diversified Financial Services - 2.3%
Berkshire Hathaway Inc., Class B*
41,000
8,127,020
Insurance - 4.8%
Hartford Financial Services Group Inc./The
293,000
16,490,040
95,645,880
Health Care - 6.7%
Baxter International Inc.
214,000
13,832,960
Humana Inc.
38,500
9,550,695
23,383,655
Industrials - 12.1%
Delta Air Lines Inc.
179,000
10,024,000
FedEx Corp.
58,000
14,473,320
General Dynamics Corp.
20,500
4,170,725
Textron Inc.
237,000
13,411,830
42,079,875
Information Technology - 6.9%
Seagate Technology PLC
264,000
11,045,760
TE Connectivity Ltd.
135,500
12,877,920
23,923,680
Materials - 12.4%
DowDuPont Inc.
244,000
17,377,680
Freeport-McMoRan Inc.*
650,000
12,324,000
Rio Tinto PLC, ADR
252,500
13,364,825
43,066,505
Real Estate - 4.1%
Weyerhaeuser Co.
403,000
14,209,780
Telecommunication Service - 4.1%
T-Mobile U.S. Inc.*
221,000
14,035,710
Utilities - 3.9%
NRG Energy Inc.
471,000
13,414,080
Total Common Stocks
(Cost $268,573,041)
342,250,180
SHORT-TERM INVESTMENTS - 1.1%
State Street Institutional U.S. Government
Money Market Fund, 1.21%, Premier Class
3,927,817
3,927,817
Total Short-Term Investments
(Cost $3,927,817)
3,927,817
TOTAL INVESTMENTS - 99.8%
(Cost $272,500,858**)
346,177,997
NET OTHER ASSETS AND LIABILITIES - 0.2%
573,914
TOTAL NET ASSETS - 100.0%
$
346,751,911
*
Non-income producing.
**
Aggregate cost for Federal tax purposes was $272,500,858.
Aggregate cost for Federal tax purposes was $153,886,124.
ADR
American Depositary Receipt.
PLC
Public Limited Company.
See accompanying Notes to Financial Statements.
34
Ultra Series Fund | December 31, 2017
Mid Cap Fund Portfolio of Investments
Shares
Value (Note 2)
COMMON STOCKS - 94.9%
Consumer Discretionary - 23.4%
CarMax Inc.*
119,095
$
7,637,562
Liberty Broadband Corp., Class C*
94,783
8,071,720
Liberty Global PLC, Series C*
221,035
7,479,825
O’Reilly Automotive Inc.*
26,404
6,351,218
Omnicom Group Inc.
96,456
7,024,891
Ross Stores Inc.
81,501
6,540,455
TJX Cos. Inc./The
56,836
4,345,681
47,451,352
Consumer Staples - 1.6%
Brown-Forman Corp., Class B
48,136
3,305,499
Energy - 0.9%
Oceaneering International Inc.
83,556
1,766,374
Financials - 21.7%
Arch Capital Group Ltd.*
65,921
5,983,649
Brookfield Asset Management Inc., Class A
196,774
8,567,540
Brown & Brown Inc.
154,201
7,935,183
Glacier Bancorp Inc.
119,962
4,725,303
Markel Corp.*
9,182
10,459,492
WR Berkley Corp.
89,558
6,416,831
44,087,998
Health Care - 13.5%
DaVita Inc.*
100,043
7,228,107
Henry Schein Inc.*
102,146
7,137,962
Laboratory Corp. of America Holdings*
45,174
7,205,705
Zoetis Inc.
79,931
5,758,229
27,330,003
Industrials - 16.1%
Copart Inc.*
244,076
10,541,642
Expeditors International of Washington Inc.
121,582
7,865,140
Fastenal Co.
99,555
5,444,663
IHS Markit Ltd.*
146,140
6,598,221
Wabtec Corp.
26,040
2,120,437
32,570,103
Information Technology - 6.4%
Amphenol Corp., Class A
47,296
4,152,589
CDW Corp.
126,620
8,798,824
12,951,413
Materials - 6.6%
Axalta Coating Systems Ltd.*
236,061
7,638,934
Crown Holdings Inc.*
101,326
5,699,588
13,338,522
Real Estate - 4.7%
American Tower Corp.
32,408
4,623,649
Crown Castle International Corp.
44,196
4,906,198
9,529,847
Total Common Stocks
(Cost $110,498,985)
192,331,111
SHORT-TERM INVESTMENTS - 5.1%
State Street Institutional U.S. Government
Money Market Fund, 1.21%, Premier Class
10,334,355
10,334,355
Total Short-Term Investments
(Cost $10,334,355)
10,334,355
TOTAL INVESTMENTS - 100.0%
(Cost $120,833,340**)
202,665,466
NET OTHER ASSETS AND LIABILITIES - 0.0%
(16,426
)
TOTAL NET ASSETS - 100.0%
$
202,649,040
*
Non-income producing.
**
Aggregate cost for Federal tax purposes was $120,995,415.
PLC
Public Limited Company.
See accompanying Notes to Financial Statements.
35
Ultra Series Fund | December 31, 2017
International Stock Fund Portfolio of Investments
Shares
Value (Note 2)
COMMON STOCKS - 98.2%
Australia - 3.2%
BHP Billiton PLC (A)
49,383
$
1,010,806
Caltex Australia Ltd. (A)
10,706
283,951
1,294,757
Belgium - 2.5%
Anheuser-Busch InBev S.A. (A)
6,218
693,573
KBC Group N.V. (A)
3,808
324,437
1,018,010
Brazil - 0.9%
Cielo S.A. (A)
50,300
355,177
Canada - 4.4%
Canadian National Railway Co.
4,800
395,800
National Bank of Canada
12,500
623,707
Suncor Energy Inc.
21,200
778,345
1,797,852
Denmark - 2.5%
AP Moeller - Maersk AS, Class B (A)
294
512,336
Carlsberg AS, Class B (A)
4,395
526,417
1,038,753
Finland - 1.5%
Sampo Oyj, Class A (A)
10,963
602,257
France - 10.6%
Air Liquide S.A. (A)
5,982
752,363
Capgemini SE (A)
7,849
928,869
Cie Generale des Etablissements Michelin (A)
5,180
742,006
Safran S.A. (A)
4,471
459,750
Valeo S.A. (A)
5,533
412,330
Vinci S.A. (A)
10,165
1,037,104
4,332,422
Germany - 4.2%
Deutsche Post AG (A)
14,057
667,776
SAP SE (A)
9,456
1,060,300
1,728,076
Ireland - 5.6%
Medtronic PLC
9,990
806,692
Ryanair Holdings PLC, ADR*
5,020
523,034
Shire PLC (A)
18,070
937,261
2,266,987
Italy - 0.7%
UniCredit SpA* (A)
15,043
280,240
Japan - 18.5%
Bridgestone Corp. (A)
8,700
404,602
Daiwa House Industry Co. Ltd. (A)
27,435
1,053,970
Don Quijote Holdings Co. Ltd. (A)
21,300
1,113,506
Hoshizaki Corp. (A)
2,300
203,063
Isuzu Motors Ltd. (A)
44,500
744,171
Kao Corp. (A)
6,630
448,439
KDDI Corp. (A)
18,300
455,621
Makita Corp. (A)
16,900
707,571
Shin-Etsu Chemical Co. Ltd. (A)
4,800
486,839
Sony Corp. (A)
13,800
619,882
Sumitomo Mitsui Financial Group Inc. (A)
16,100
695,359
United Arrows Ltd. (A)
7,700
312,704
Yamaha Corp. (A)
7,800
286,092
7,531,819
Luxembourg - 0.6%
Tenaris S.A. (A)
16,916
267,024
Netherlands - 6.8%
ABN AMRO Group N.V. (A) (B)
9,560
307,623
Koninklijke KPN N.V. (A)
95,229
332,228
Royal Dutch Shell PLC, Class A (A)
37,650
1,260,401
Wolters Kluwer N.V. (A)
16,970
883,691
2,783,943
Norway - 2.9%
Statoil ASA (A)
23,881
510,864
Telenor ASA (A)
30,793
659,607
1,170,471
Singapore - 2.5%
DBS Group Holdings Ltd. (A)
38,300
709,154
NetLink NBN Trust* (A)
468,000
292,153
1,001,307
Spain - 1.7%
Bankia S.A. (A)
18,948
90,440
Red Electrica Corp. S.A. (A)
26,627
597,061
687,501
Sweden - 3.4%
Assa Abloy AB, Class B (A)
35,722
741,246
Nordea Bank AB (A)
54,446
658,935
1,400,181
Switzerland - 6.5%
Ferguson PLC (A)
12,581
900,205
Julius Baer Group Ltd. * (A)
8,318
508,538
Novartis AG (A)
14,803
1,251,471
2,660,214
Taiwan - 1.5%
Taiwan Semiconductor Manufacturing Co. Ltd., ADR
15,100
598,715
Turkey - 1.1%
Turkcell Iletisim Hizmetleri AS (A)
108,854
444,524
See accompanying Notes to Financial Statements.
36
Ultra Series Fund | December 31, 2017
International Stock Fund Portfolio of Investments - continued
Shares
Value (Note 2)
COMMON STOCKS - continued
United Kingdom - 16.6%
Aon PLC
6,300
$
844,200
British American Tobacco PLC (A)
16,990
1,146,663
BT Group PLC (A)
82,510
302,105
Diageo PLC (A)
18,827
689,037
Howden Joinery Group PLC (A)
50,419
317,556
Informa PLC (A)
43,976
427,788
Prudential PLC (A)
55,831
1,435,424
RELX PLC (A)
35,753
837,612
Unilever PLC (A)
14,186
785,898
6,786,283
Total Common Stocks
(Cost $33,405,653)
40,046,513
SHORT-TERM INVESTMENTS – 1.6%
United States – 1.6%
State Street Institutional U.S. Government
Money Market Fund, 1.21%, Premier Class
636,257
636,257
Total Short-Term Investments
(Cost $636,257)
636,257
TOTAL INVESTMENTS - 99.8%
(Cost $34,041,910)
40,682,770
NET OTHER ASSETS AND LIABILITIES - 0.2%
90,672
TOTAL NET ASSETS - 100.0%
$
40,773,442
*
Non-income producing.
**
Aggregate cost for Federal tax purposes was $35,448,221.
(A)
Due to events that occurred between the close of the exchange on which this security is traded and that of the New York Stock Exchange, fair value was determined for this security using methods determined in good faith by or at the discretion of the Board of Trustees (see Note 3).
(B)
Security sold within terms of a private placement memorandum exempt from registration under section 144A of the Securities Act of 1933, as amended, and may be sold only to dealers in that program or other “qualified institutional investors.” The securities have been determined to be liquid under guidelines established by the Board of Trustees.
ADR
American Depositary Receipt.
PLC
Public Limited Company.
OTHER INFORMATION:
Sector Allocation
% of Net Assets
Consumer Discretionary
16.6
%
Consumer Staples
10.5
%
Energy
7.6
%
Financials
17.4
%
Health Care
7.3
%
Industrials
15.9
%
Information Technology
7.2
%
Materials
5.5
%
Real Estate
2.6
%
Telecommunication Services
6.1
%
Utilities
1.5
%
Money Market Funds
1.6
%
Net Other Assets and Liabilities
0.2
%
See accompanying Notes to Financial Statements.
37
Ultra Series Fund | December 31, 2017
Statements of Assets and Liabilities as of December 31, 2017
Conservative Allocation Fund
Moderate Allocation Fund
Aggressive Allocation Fund
Core Bond Fund
Assets:
Investments in securities, at cost
Unaffiliated issuers
$
78,047,618
$
112,504,661
$
39,798,947
$
158,132,796
Affiliated issuers1
61,484,733
99,465,097
31,804,801
–
Net unrealized appreciation
Unaffiliated issuers
4,563,539
13,360,425
6,613,677
4,646,528
Affiliated issuers1
6,147,527
18,419,721
8,121,858
–
Total investments at value
150,243,417
243,749,904
86,339,283
162,779,324
Cash
–
–
–
866,758
Foreign currency (cost of $1,380) (Note 2)
–
–
–
–
Receivables:
Investments sold
–
–
–
–
Fund shares sold
69,969
204,084
145,091
22,742
Dividends and Interest
895,430
2,745,185
1,240,773
1,189,459
Due from Adviser
12,740
20,681
7,331
–
Total assets
151,221,556
246,719,854
87,732,478
164,858,283
Liabilities:
Payables:
Investments purchased
677,062
2,561,230
1,220,575
–
Fund shares repurchased
17,101
11,943
–
82,966
Management fees
38,221
62,042
21,993
76,220
Audit and trustees fees
8,252
14,040
4,973
9,950
Distribution fees - Class II
6,299
5,666
477
7,476
Total liabilities
746,935
2,654,921
1,248,018
176,612
Net assets applicable to outstanding capital stock
$
150,474,621
$
244,064,933
$
86,484,460
$
164,681,671
Net assets consist of:
Paid-in capital in excess of par
$
139,872,892
$
212,388,824
$
71,672,310
$
160,328,973
Accumulated undistributed net investment income
121,915
71,563
28,779
89,394
Accumulated net realized gain (loss) on investments sold and foreign currency related transactions
(231,252
)
(175,600
)
47,836
(383,224
)
Net unrealized appreciation of investments (including appreciation (depreciation)
of foreign currency related transactions)
10,711,066
31,780,146
14,735,535
4,646,528
Net Assets
$
150,474,621
$
244,064,933
$
86,484,460
$
164,681,671
Class I Shares:
Net Assets
$
120,703,086
$
217,300,822
$
84,217,415
$
129,429,435
Shares of beneficial interest outstanding
11,809,428
20,034,679
8,320,390
13,262,500
Net Asset Value and redemption price per share
$
10.22
$
10.85
$
10.12
$
9.76
Class II Shares:
Net Assets
$
29,771,535
$
26,764,111
$
2,267,045
$
35,252,236
Shares of beneficial interest outstanding
2,912,987
2,470,592
224,677
3,623,701
Net Asset Value and redemption price per share
$
10.22
$
10.83
$
10.09
$
9.73
1 See Note 11 for information on affiliated issuers.
See accompanying Notes to Financial Statements.
38
Ultra Series Fund | December 31, 2017
Statements of Assets and Liabilities as of December 31, 2017
High Income Fund
Diversified Income Fund
Large Cap Value Fund
Large Cap Growth Fund
Mid Cap Fund
International Stock Fund
$
25,152,537
$
213,642,669
$
272,500,858
$
153,708,868
$
120,833,340
$
34,041,910
–
–
–
–
–
–
699,337
65,168,469
73,677,139
102,016,743
81,832,126
6,640,860
–
–
–
–
–
–
25,851,874
278,811,138
346,177,997
255,725,611
202,665,466
40,682,770
–
–
–
16,528
24,528
–
–
–
–
–
–
1,380
–
–
214,793
–
–
19
1,111
31,963
61,909
67,167
55,562
881
331,374
1,091,352
505,984
270,891
99,052
166,943
–
–
–
–
–
–
26,184,359
279,934,453
346,960,683
256,080,197
202,844,608
40,851,993
–
–
–
–
–
14,416
2,022
6,213
15,301
82,321
29,093
19,570
16,647
165,108
173,174
171,535
152,955
39,649
1,494
15,687
19,144
14,079
11,315
2,105
1,177
8,586
1,153
4,946
2,205
2,811
21,340
195,594
208,772
272,881
195,568
78,551
$
26,163,019
$
279,738,859
$
346,751,911
$
255,807,316
$
202,649,040
$
40,773,442
$
27,105,194
$
214,185,047
$
271,616,677
$
151,280,068
$
120,593,458
$
41,670,943
24,534
127,318
106,683
30,930
–
13,461
(1,666,046
)
258,025
1,350,429
2,479,575
223,456
(7,546,191
)
699,337
65,168,469
73,678,122
102,016,743
81,832,126
6,635,229
$
26,163,019
$
279,738,859
$
346,751,911
$
255,807,316
$
202,649,040
$
40,773,442
$
20,601,123
$
239,212,388
$
341,212,823
$
232,362,007
$
192,140,452
$
27,516,177
2,379,627
12,238,907
11,980,038
8,755,757
10,129,581
2,345,878
$
8.66
$
19.55
$
28.48
$
26.54
$
18.97
$
11.73
$
5,561,896
$
40,526,471
$
5,539,088
$
23,445,309
$
10,508,588
$
13,257,265
641,865
2,087,475
196,632
894,199
565,152
1,135,732
$
8.67
$
19.41
$
28.17
$
26.22
$
18.59
$
11.67
See accompanying Notes to Financial Statements.
39
Ultra Series Fund | December 31, 2017
Statements of Operations for the Year Ended December 31, 2017
Conservative Allocation Fund
Moderate Allocation Fund
Aggressive Allocation Fund
Core Bond Fund
Investment Income:
Interest
$
28,892
$
53,125
$
19,417
$
5,442,344
Dividends
Unaffiliated issuers
1,916,895
3,008,388
1,008,516
–
Affiliated issuers1
1,404,566
1,992,121
542,726
–
Less: Foreign taxes withheld/reclaimed
–
–
–
–
Total investment income
3,350,353
5,053,634
1,570,659
5,442,344
Expenses:2
Management fees
440,768
749,698
261,835
961,233
Audit and trustee fees
28,158
48,501
16,898
34,144
Distribution fees - Class II
75,130
69,119
5,197
94,038
Other expenses
5,225
8,495
3,023
5,740
Total expenses before reimbursement/waiver
549,281
875,813
286,953
1,095,155
Less reimbursement/waiver2
(146,923
)
(249,899
)
(87,278
)
–
Total expenses net of waiver
402,358
625,914
199,675
1,095,155
Net Investment Income (Loss)
2,947,995
4,427,720
1,370,984
4,347,189
Net Realized and Unrealized Gain (Loss) on Investments
Net realized gain on investments (including net realized gain (loss) on foreign
currency related transactions)
Options
–
–
–
6,710
Unaffiliated issuers
2,792,810
9,393,956
4,283,313
383,672
Affiliated issuers1
651,438
1,675,501
562,446
–
Capital gain distributions received from underlying funds
Affiliated issuers1
961,571
2,980,281
1,346,946
–
Net change in unrealized appreciation on investments (including net unrealized
appreciation (depreciation) on foreign currency related transactions)
Unaffiliated issuers
3,713,537
7,940,807
3,786,977
591,067
Affiliated issuers1
3,124,268
8,058,902
3,480,329
–
Net Realized and Unrealized Gain on Investments
11,243,624
30,049,447
13,460,011
981,449
Net Increase in Net Assets from Operations
$
14,191,619
$
34,477,167
$
14,830,995
$
5,328,638
1
See Note 11 for information on affiliated issuers.
2
See Note 3 for information on expenses.
See accompanying Notes to Financial Statements.
40
Ultra Series Fund | December 31, 2017
Statements of Operations for the Year Ended December 31, 2017
High Income Fund
Diversified Income Fund
Large Cap Value Fund
Large Cap Growth Fund
Mid Cap Fund
International Stock Fund
$
1,476,293
$
3,408,884
$
52,719
$
46,707
$
104,239
$
10,092
19,964
4,590,206
9,903,284
3,945,395
1,670,851
1,097,424
–
–
–
–
–
–
–
(3,343
)
(7,735
)
(11,667
)
(18,247
)
(110,608
)
1,496,257
7,995,747
9,948,268
3,980,435
1,756,843
996,908
204,275
1,962,453
2,052,192
2,024,430
1,847,068
469,461
5,296
54,232
66,137
48,913
39,903
7,881
14,047
102,350
13,182
60,138
26,759
33,468
917
9,704
11,889
8,878
7,041
1,524
224,535
2,128,739
2,143,400
2,142,359
1,920,771
512,334
–
–
–
–
–
–
224,535
2,128,739
2,143,400
2,142,359
1,920,771
512,334
1,271,722
5,867,008
7,804,868
1,838,076
(163,928
)
484,574
–
–
–
–
–
–
208,730
12,354,557
19,175,375
31,958,000
19,610,591
228,731
–
–
–
–
–
–
–
–
–
–
–
–
189,436
16,682,463
24,364,107
17,042,657
10,329,405
7,552,307
–
–
–
–
–
–
398,166
29,037,020
43,539,482
49,000,657
29,939,996
7,781,038
$
1,669,888
$
34,904,028
$
51,344,350
$
50,838,733
$
29,776,068
$
8,265,612
See accompanying Notes to Financial Statements.
41
Ultra Series Fund | December 31, 2017
Statements of Changes in Net Assets
Conservative Allocation Fund
Moderate Allocation Fund
Year Ended December 31,
2017
2016
2017
2016
Net Assets at beginning of period
$
152,466,453
$
158,711,931
$
263,051,727
$
276,569,223
Increase (decrease) in net assets from operations:
Net investment income
2,947,995
2,613,189
4,427,720
3,912,883
Net realized gain (loss)
4,405,819
2,897,381
14,049,738
8,470,937
Net change in unrealized appreciation (depreciation)
6,837,805
2,917,316
15,999,709
6,640,494
Net increase in net assets from operations
14,191,619
8,427,886
34,477,167
19,024,314
Distributions to shareholders from:
Net investment income
Class I
(2,500,202
)
(2,388,145
)
(4,216,851
)
(4,504,299
)
Class II
(529,648
)
(523,620
)
(442,525
)
(452,980
)
Net realized gains
Class I
(3,187,066
)
(1,850,936
)
(11,344,314
)
(5,953,436
)
Class II
(789,844
)
(480,832
)
(1,405,372
)
(708,013
)
Total distributions
(7,006,760
)
(5,243,533
)
(17,409,062
)
(11,618,728
)
Capital Stock transactions:
Class I Shares
Shares sold
21,249,852
19,759,339
22,851,026
17,890,365
Issued to shareholders in reinvestment of distributions
5,687,269
4,239,082
15,561,165
10,457,735
Shares redeemed
(33,248,239
)
(30,111,987
)
(71,458,848
)
(45,491,293
)
Net decrease from capital stock transactions
(6,311,118
)
(6,113,566
)
(33,046,657
)
(17,143,193
)
Class II Shares
Shares sold
1,905,666
3,991,826
1,476,470
1,829,876
Issued to shareholders in reinvestment of distributions
1,319,492
1,004,452
1,847,897
1,160,992
Shares redeemed
(6,090,731
)
(8,312,543
)
(6,332,609
)
(6,770,757
)
Net increase (decrease) from capital stock transactions
(2,865,573
)
(3,316,265
)
(3,008,242
)
(3,779,889
)
Total decrease from capital stock transactions
(9,176,691
)
(9,429,831
)
(36,054,899
)
(20,923,082
)
Total decrease in net assets
(1,991,832
)
(6,245,478
)
(18,986,794
)
(13,517,496
)
Net Assets at end of period
$
150,474,621
$
152,466,453
$
244,064,933
$
263,051,727
Undistributed net investment income included in net assets
$
21,915
$
58,163
$
71,563
$
99,180
Capital Share transactions:
Class I Shares
Shares sold
2,071,023
2,010,412
2,143,826
1,757,311
Issued to shareholders in reinvestment of distributions
556,409
435,118
1,434,551
1,027,532
Shares redeemed
(3,281,672
)
(3,051,187
)
(6,654,961
)
(4,461,513
)
Net decrease from capital share transactions
(654,240
)
(605,657
)
(3,076,584
)
(1,676,670
)
Class II Shares
Shares sold
189,218
402,139
138,824
180,318
Issued to shareholders in reinvestment of distributions
129,103
103,182
170,566
114,261
Shares redeemed
(602,979
)
(835,176
)
(581,871
)
(659,694
)
Net increase (decrease) from capital share transactions
(284,658
)
(329,855
)
(272,481
)
(365,115
)
See accompanying Notes to Financial Statements.
42
Ultra Series Fund | December 31, 2017
Statements of Changes in Net Assets
Aggressive Allocation Fund
Core Bond Fund
High Income Fund
Diversified Income Fund
2017
2016
2017
2016
2017
2016
2017
2016
$
90,949,828
$
91,926,453
$
184,945,243
$
218,078,096
$
27,407,016
$
29,917,586
$
286,037,793
$
306,895,571
1,370,984
1,203,221
4,347,189
5,025,878
1,271,722
1,384,743
5,867,008
6,556,029
6,192,705
2,348,675
390,382
4,163,122
208,730
(11,004
)
12,354,557
20,236,756
7,267,306
4,084,782
591,067
(3,289,334
)
189,436
1,869,070
16,682,463
(1,371,240
)
14,830,995
7,636,678
5,328,638
5,899,666
1,669,888
3,242,809
34,904,028
25,421,545
(1,410,274
)
(1,586,515
)
(3,839,704
)
(4,453,508
)
(1,016,210
)
(1,126,799
)
(5,154,317
)
(5,934,220
)
(31,646
)
(30,723
)
(969,657
)
(1,081,808
)
(260,404
)
(258,378
)
(826,409
)
(908,715
)
(5,435,153
)
(1,501,291
)
–
–
–
–
(9,857,953
)
(17,344,094
)
(147,158
)
(33,795
)
–
–
–
–
(1,683,155
)
(2,881,475
)
(7,024,231
)
(3,152,324
)
(4,809,361
)
(5,535,316
)
(1,276,614
)
(1,385,177
)
(17,521,834
)
(27,068,504
)
14,299,948
11,721,462
6,624,555
10,793,608
528,995
429,079
10,710,442
11,019,757
6,845,426
3,087,806
3,839,704
4,453,508
1,016,210
1,126,799
15,012,270
23,278,313
(33,484,730
)
(20,539,902
)
(28,233,982
)
(42,725,712
)
(3,361,108
)
(4,925,428
)
(46,853,243
)
(54,514,970
)
(12,339,356
)
(5,730,634
)
(17,769,723
)
(27,478,596
)
(1,815,903
)
(3,369,550
)
(21,130,531
)
(20,216,900
)
213,038
297,021
2,264,909
882,591
783,472
75,212
2,884,175
5,616,780
178,804
64,517
969,657
1,081,808
260,404
258,378
2,509,564
3,790,190
(324,618
)
(91,883
)
(6,247,692
)
(7,983,006
)
(865,244
)
(1,332,242
)
(7,944,336
)
(8,400,889
)
67,224
269,655
(3,013,126
)
(6,018,607
)
178,632
(998,652
)
(2,550,597
)
1,006,081
(12,272,132
)
(5,460,979
)
(20,782,849
)
(33,497,203
)
(1,637,271
)
(4,368,202
)
(23,681,128
)
(19,210,819
)
(4,465,368
)
(976,625
)
(20,263,572
)
(33,132,853
)
(1,243,997
)
(2,510,570
)
(6,298,934
)
(20,857,778
)
$
86,484,460
$
90,949,828
$
164,681,671
$
184,945,243
$
26,163,019
$
27,407,016
$
279,738,859
$
286,037,793
$
28,779
$
32,397
$
89,394
$
124,269
$
24,534
$
29,426
$
127,318
$
–
1,455,389
1,290,372
670,205
1,066,963
60,086
50,044
562,948
567,693
676,304
332,834
394,821
458,874
117,485
131,928
769,261
1,260,652
(3,375,439
)
(2,260,176
)
(2,850,687
)
(4,227,861
)
(377,920
)
(581,998
)
(2,434,037
)
(2,811,124
)
(1,243,746
)
(636,970
)
(1,785,661
)
(2,702,024
)
(200,349
)
(400,026
)
(1,101,828
)
(982,779
)
20,096
31,638
229,954
87,675
89,047
8,962
153,418
293,949
17,720
6,975
100,101
111,930
30,099
30,216
129,455
206,386
(32,466
)
(9,983
)
(629,907
)
(792,397
)
(97,240
)
(157,240
)
(410,213
)
(434,410
)
5,350
28,630
(299,852
)
(592,792
)
21,906
(118,062
)
(127,340
)
65,925
See accompanying Notes to Financial Statements.
43
Ultra Series Fund | December 31, 2017
Statements of Changes in Net Assets
Large Cap Value Fund
Large Cap Growth Fund
Year Ended December 31,
2017
2016
2017
2016
Net Assets at beginning of period
$
352,701,915
$
370,893,722
$
247,224,084
$
279,273,794
Increase (decrease) in net assets from operations:
Net investment income (loss)
7,804,868
5,280,820
1,838,076
2,012,255
Net realized gain (loss)
19,175,375
40,921,164
31,958,000
12,229,493
Net change in unrealized appreciation (depreciation)
24,364,107
(3,697,009
)
17,042,657
9,549
Net increase (decrease) in net assets from operations
51,344,350
42,504,975
50,838,733
14,251,297
Distributions to shareholders from:
Net investment income
Class I
(7,698,319
)
(5,080,540
)
(1,700,965
)
(1,878,529
)
Class II
(117,237
)
(62,071
)
(139,953
)
(162,347
)
Net realized gains
Class I
(18,774,779
)
(41,626,496
)
(28,091,073
)
(13,050,600
)
Class II
(308,724
)
(570,234
)
(2,888,346
)
(1,406,329
)
Total distributions
(26,899,059
)
(47,339,341
)
(32,820,337
)
(16,497,805
)
Capital Stock transactions:
Class I Shares
Shares sold
10,247,248
12,137,375
9,778,133
11,322,134
Issued to shareholders in reinvestment of distributions
26,473,098
46,707,036
29,792,038
14,929,129
Shares redeemed
(67,580,492
)
(71,501,833
)
(46,921,100
)
(52,331,252
)
Net decrease from capital stock transactions
(30,860,146
)
(12,657,422
)
(7,350,929
)
(26,079,989
)
Class II Shares
Shares sold
1,255,348
395,080
275,075
285,853
Issued to shareholders in reinvestment of distributions
425,960
632,305
3,028,299
1,568,676
Shares redeemed
(1,216,457
)
(1,727,404
)
(5,387,609
)
(5,577,742
)
Net increase (decrease) from capital stock transactions
464,851
(700,019
)
(2,084,235
)
(3,723,213
)
Total decrease from capital stock transactions
(30,395,295
)
(13,357,441
)
(9,435,164
)
(29,803,202
)
Total increase (decrease) in net assets
(5,950,004
)
(18,191,807
)
8,583,232
(32,049,710
)
Net Assets at end of period
$
346,751,911
$
352,701,915
$
255,807,316
$
247,224,084
Undistributed net investment income included in net assets
$
106,683
$
124,969
$
30,930
$
33,772
Capital Share transactions:
Class I Shares
Shares sold
375,647
432,829
368,199
445,528
Issued to shareholders in reinvestment of distributions
933,148
1,731,636
1,113,799
597,910
Shares redeemed
(2,429,088
)
(2,567,010
)
(1,721,641
)
(2,061,576
)
Net decrease from capital share transactions
(1,120,293
)
(402,545
)
(239,643
)
(1,018,138
)
Class II Shares
Shares sold
46,300
13,732
10,349
11,205
Issued to shareholders in reinvestment of distributions
15,178
23,662
114,571
63,421
Shares redeemed
(43,767
)
(63,535
)
(196,943
)
(222,064
)
Net increase (decrease) from capital share transactions
17,711
(26,141
)
(72,023
)
(147,438
)
See accompanying Notes to Financial Statements.
44
Ultra Series Fund | December 31, 2017
Statements of Changes in Net Assets
Mid Cap Fund
International Stock Fund
2017
2016
2017
2016
$
214,217,873
$
233,688,172
$
39,604,139
$
47,200,403
(163,928
)
61,054
484,574
737,458
19,610,591
15,300,014
228,731
(6,335,993
)
10,329,405
10,146,964
7,552,307
4,137,319
29,776,068
25,508,032
8,265,612
(1,461,216
)
–
(42,012
)
(333,652
)
(483,029
)
–
–
(140,056
)
(214,129
)
(18,232,719
)
(18,807,488
)
–
–
(1,015,996
)
(1,063,286
)
–
–
(19,248,715
)
(19,912,786
)
(473,708
)
(697,158
)
8,585,574
8,998,407
620,534
1,221,810
18,232,719
18,849,500
333,652
483,029
(47,769,566
)
(51,064,902
)
(5,488,645
)
(5,973,627
)
(20,951,273
)
(23,216,995
)
(4,534,459
)
(4,268,788
)
296,716
175,753
425,059
798,715
1,015,996
1,063,286
140,056
214,129
(2,457,625
)
(3,087,589
)
(2,653,257
)
(2,181,946
)
(1,144,913
)
(1,848,550
)
(2,088,142
)
(1,169,102
)
(22,096,186
)
(25,065,545
)
(6,622,601
)
(5,437,890
)
(11,568,833
)
(19,470,299
)
1,169,303
(7,596,264
)
$
202,649,040
$
214,217,873
$
40,773,442
$
39,604,139
$
–
$
–
$
13,461
$
10,452
461,805
494,649
58,835
125,031
964,367
1,040,777
28,685
50,032
(2,512,866
)
(2,840,633
)
(508,360
)
(611,788
)
(1,086,694
)
(1,305,207
)
(420,840
)
(436,725
)
15,984
9,520
40,942
81,288
54,813
59,602
12,069
22,266
(130,651
)
(172,868
)
(243,062
)
(222,167
)
(59,854
)
(103,746
)
(190,051
)
(118,613
)
See accompanying Notes to Financial Statements.
45
Ultra Series Fund | December 31, 2017
Financial Highlights for a Share of Beneficial Interest Outstanding
CONSERVATIVE ALLOCATION FUND
Year Ended December 31,
2017
2016
2015
2014
2013
CLASS I
Net Asset Value at beginning of period
$
9.74
$
9.56
$
10.22
$
10.70
$
10.45
Income from Investment Operations:
Net investment income
0.21
0.17
1
0.16
1
0.19
1
0.25
1
Net realized and unrealized gain (loss)on investments
0.77
0.36
(0.24
)
0.46
0.55
Total from investment operations
0.98
0.53
(0.08
)
0.65
0.80
Less Distributions From:
Net investment income
(0.22
)
(0.20
)
(0.20
)
(0.25
)
(0.27
)
Capital gains
(0.28
)
(0.15
)
(0.38
)
(0.88
)
(0.28
)
Total distributions
(0.50
)
(0.35
)
(0.58
)
(1.13
)
(0.55
)
Net increase (decrease) in net asset value
0.48
0.18
(0.66
)
(0.48
)
0.25
Net Asset Value at end of period
$
10.22
$
9.74
$
9.56
$
10.22
$
10.70
Total Return (%)2
10.17
5.48
(0.76
)
6.03
7.61
Ratios/Supplemental Data:
Net Assets at end of period (in 000’s)
$
120,703
$
121,351
$
125,007
$
156,054
$
181,427
Ratios of expenses to average net assets:
Before waiver of expenses by Adviser (%)
0.32
0.32
0.32
0.31
0.31
After waiver of expenses by Adviser (%)
0.22
0.22
0.22
0.27
0.31
Ratio of net investment income to average net assets (%)
2.06
1.71
1.53
1.71
2.27
Portfolio turnover (%)3
49
83
54
73
70
CLASS II
2017
2016
2015
2014
2013
Net Asset Value at beginning of period
$
9.73
$
9.55
$
10.20
$
10.68
$
10.43
Income from Investment Operations:
Net investment income
0.18
0.14
1
0.15
1
0.18
1
0.22
1
Net realized and unrealized gain (loss) on investments
0.78
0.36
(0.25
)
0.43
0.55
Total from investment operations
0.96
0.50
(0.10
)
0.61
0.77
Less Distributions From:
Net investment income
(0.19
)
(0.17
)
(0.17
)
(0.21
)
(0.24
)
Capital gains
(0.28
)
(0.15
)
(0.38
)
(0.88
)
(0.28
)
Total distributions
(0.47
)
(0.32
)
(0.55
)
(1.09
)
(0.52
)
Net increase (decrease) in net asset value
0.49
0.18
(0.65
)
(0.48
)
0.25
Net Asset Value at end of period
$
10.22
$
9.73
$
9.55
$
10.20
$
10.68
Total Return (%)2
9.90
5.21
(1.01
)
5.77
7.34
Ratios/Supplemental Data:
Net Assets at end of period (in 000’s)
$
29,772
$
31,116
$
33,705
$
37,837
$
40,069
Ratios of expenses to average net assets:
Before waiver of expenses by Adviser (%)
0.57
0.57
0.57
0.56
0.56
After waiver of expenses by Adviser (%)
0.47
0.47
0.47
0.51
0.56
Ratio of net investment income to average net assets (%)
��
1.78
1.42
1.46
1.65
2.04
Portfolio turnover (%)3
49
83
54
73
70
1
Based on average shares outstanding during the year.
2
These returns are after all charges at the mutual fund level have been subtracted. These returns are higher than the returns at the separate account level because charges made at the separate account level have not been subtracted. Total returns are not annualized for periods less than one year.
3
Portfolio turnover is calculated at the fund level and represents the entire fiscal year or period.
See accompanying Notes to Financial Statements.
46
Ultra Series Fund | December 31, 2017
Financial Highlights for a Share of Beneficial Interest Outstanding
MODERATE ALLOCATION FUND
Year Ended December 31,
2017
2016
2015
2014
2013
CLASS I
Net Asset Value at beginning of period
$
10.18
$
9.92
$
10.92
$
11.48
$
10.11
Income from Investment Operations:
Net investment income
0.22
0.15
1
0.14
1
0.16
1
0.19
1
Net realized and unrealized gain (loss) on investments
1.29
0.58
(0.24
)
0.62
1.39
Total from investment operations
1.51
0.73
(0.10
)
0.78
1.58
Less Distributions From:
Net investment income
(0.23
)
(0.20
)
(0.19
)
(0.25
)
(0.21
)
Capital gains
(0.61
)
(0.27
)
(0.71
)
(1.09
)
–
Total distributions
(0.84
)
(0.47
)
(0.90
)
(1.34
)
(0.21
)
Net increase (decrease) in net asset value
0.67
0.26
(1.00
)
(0.56
)
1.37
Net Asset Value at end of period
$
10.85
$
10.18
$
9.92
$
10.92
$
11.48
Total Return (%)2
14.80
7.39
(0.93
)
6.85
15.66
Ratios/Supplemental Data:
Net Assets at end of period (in 000’s)
$
217,301
$
235,182
$
245,807
$
315,568
$
370,954
Ratios of expenses to average net assets:
Before waiver of expenses by Adviser (%)
0.32
0.32
0.32
0.31
0.31
After waiver of expenses by Adviser (%)
0.22
0.22
0.22
0.27
0.31
Ratio of net investment income to average net assets (%)
1.80
1.49
1.30
1.37
1.75
Portfolio turnover (%)3
39
91
52
73
66
CLASS II
2017
2016
2015
2014
2013
Net Asset Value at beginning of period
$
10.16
$
9.90
$
10.89
$
11.45
$
10.08
Income from Investment Operations:
Net investment income
0.16
0.12
1
0.15
1
0.18
1
0.16
1
Net realized and unrealized gain (loss) on investments
1.31
0.58
(0.27
)
0.57
1.39
Total from investment operations
1.47
0.70
(0.12
)
0.75
1.55
Less Distributions From:
Net investment income
(0.19
)
(0.17
)
(0.16
)
(0.22
)
(0.18
)
Capital gains
(0.61
)
(0.27
)
(0.71
)
(1.09
)
–
Total distributions
(0.80
)
(0.44
)
(0.87
)
(1.31
)
(0.18
)
Net increase (decrease) in net asset value
0.67
0.26
(0.99
)
(0.56
)
1.37
Net Asset Value at end of period
$
10.83
$
10.16
$
9.90
$
10.89
$
11.45
Total Return (%)2
14.52
7.12
(1.18
)
6.58
15.37
Ratios/Supplemental Data:
Net Assets at end of period (in 000’s)
$
26,764
$
27,870
$
30,763
$
34,134
$
34,965
Ratios of expenses to average net assets:
Before waiver of expenses by Adviser (%)
0.57
0.57
0.57
0.56
0.56
After waiver of expenses by Adviser (%)
0.47
0.47
0.47
0.51
0.56
Ratio of net investment income to average net assets (%)
1.54
1.18
1.36
1.49
1.49
Portfolio turnover (%)3
39
91
52
73
66
1
Based on average shares outstanding during the year.
2
These returns are after all charges at the mutual fund level have been subtracted. These returns are higher than the returns at the separate account level because charges made at the separate account level have not been subtracted. Total returns are not annualized for periods less than one year.
3
Portfolio turnover is calculated at the fund level and represents the entire fiscal year or period.
See accompanying Notes to Financial Statements.
47
Ultra Series Fund | December 31, 2017
Financial Highlights for a Share of Beneficial Interest Outstanding
AGGRESSIVE ALLOCATION FUND
Year Ended December 31,
2017
2016
2015
2014
2013
CLASS I
Net Asset Value at beginning of period
$
9.30
$
8.85
$
10.25
$
11.66
$
9.75
Income from Investment Operations:
Net investment income
0.17
0.12
1
0.11
1
0.14
1
0.12
1
Net realized and unrealized gain (loss) on investments
1.54
0.66
(0.22
)
0.72
2.07
Total from investment operations
1.71
0.78
(0.11
)
0.86
2.19
Less Distributions From:
Net investment income
(0.18
)
(0.17
)
(0.16
)
(0.24
)
(0.13
)
Capital gains
(0.71
)
(0.16
)
(1.13
)
(2.03
)
(0.15
)
Total distributions
(0.89
)
(0.33
)
(1.29
)
(2.27
)
(0.28
)
Net increase (decrease) in net asset value
0.82
0.45
(1.40
)
(1.41
)
1.91
Net Asset Value at end of period
$
10.12
$
9.30
$
8.85
$
10.25
$
11.66
Total Return (%)2
18.52
8.87
(1.14
)
7.46
22.35
Ratios/Supplemental Data:
Net Assets at end of period (in 000’s)
$
84,217
$
88,917
$
90,245
$
124,838
$
149,514
Ratios of expenses to average net assets:
Before waiver of expenses by Adviser (%)
0.32
0.32
0.32
0.31
0.31
After waiver of expenses by Adviser (%)
0.22
0.22
0.22
0.27
0.31
Ratio of net investment income to average net assets (%)
1.57
1.34
1.08
1.13
1.07
Portfolio turnover (%)3
36
89
53
70
70
CLASS II
2017
2016
2015
2014
2013
Net Asset Value at beginning of period
$
9.27
$
8.82
$
10.21
$
11.62
$
9.72
Income from Investment Operations:
Net investment income
0.15
0.13
1
0.17
1
0.17
1
0.09
1
Net realized and unrealized gain (loss) on investments
1.53
0.62
(0.30
)
0.66
2.06
Total from investment operations
1.68
0.75
(0.13
)
0.83
2.15
Less Distributions From:
Net investment income
(0.15
)
(0.14
)
(0.13
)
(0.21
)
(0.10
)
Capital gains
(0.71
)
(0.16
)
(1.13
)
(2.03
)
(0.15
)
Total distributions
(0.86
)
(0.30
)
(1.26
)
(2.24
)
(0.25
)
Net increase (decrease) in net asset value
0.82
0.45
(1.39
)
(1.41
)
1.90
Net Asset Value at end of period
$
10.09
$
9.27
$
8.82
$
10.21
$
11.62
Total Return (%)2
18.22
8.60
(1.39
)
7.19
22.05
Ratios/Supplemental Data:
Net Assets at end of period (in 000’s)
$
2,267
$
2,032
$
1,681
$
1,809
$
1,911
Ratios of expenses to average net assets:
Before waiver of expenses by Adviser (%)
0.57
0.57
0.57
0.56
0.56
After waiver of expenses by Adviser (%)
0.47
0.47
0.47
0.51
0.56
Ratio of net investment income to average net assets (%)
1.53
1.42
1.64
1.45
0.81
Portfolio turnover (%)3
36
89
53
70
70
1
Based on average shares outstanding during the year.
2
These returns are after all charges at the mutual fund level have been subtracted. These returns are higher than the returns at the separate account level because charges made at the separate account level have not been subtracted. Total returns are not annualized for periods less than one year.
3
Portfolio turnover is calculated at the fund level and represents the entire fiscal year or period.
See accompanying Notes to Financial Statements.
48
Ultra Series Fund | December 31, 2017
Financial Highlights for a Share of Beneficial Interest Outstanding
CORE BOND FUND
Year Ended December 31,
2017
2016
2015
2014
2013
CLASS I
Net Asset Value at beginning of period
$
9.75
$
9.80
$
10.14
$
9.97
$
10.55
Income from Investment Operations:
Net investment income
0.29
0.26
1
0.28
1
0.30
1
0.31
1
Net realized and unrealized gain (loss) on investments
0.02
(0.01
)
(0.29
)
0.20
(0.54
)
Total from investment operations
0.31
0.25
(0.01
)
0.50
(0.23
)
Less Distributions From:
Net investment income
(0.30
)
(0.30
)
(0.33
)
(0.33
)
(0.35
)
Net increase (decrease) in net asset value
0.01
(0.05
)
(0.34
)
0.17
(0.58
)
Net Asset Value at end of period
$
9.76
$
9.75
$
9.80
$
10.14
$
9.97
Total Return (%)2
3.11
2.67
(0.15
)
5.09
(2.24
)
Ratios/Supplemental Data:
Net Assets at end of period (in 000’s)
$
129,429
$
146,780
$
173,927
$
224,976
$
270,289
Ratios of expenses to average net assets (%)
0.57
0.57
0.57
0.56
0.56
Ratio of net investment income to average net assets (%)
2.54
2.53
2.73
2.88
3.02
Portfolio turnover (%)3
16
39
25
17
14
CLASS II
2017
2016
2015
2014
2013
Net Asset Value at beginning of period
$
9.73
$
9.78
$
10.12
$
9.95
$
10.54
Income from Investment Operations:
Net investment income
0.22
0.23
1
0.25
1
0.27
1
0.29
1
Net realized and unrealized gain (loss) on investments
0.06
–
(0.29
)
0.21
(0.56
)
Total from investment operations
0.28
0.23
(0.04
)
0.48
(0.27
)
Less Distributions From:
Net investment income
(0.28
)
(0.28
)
(0.30
)
(0.31
)
(0.32
)
Net increase (decrease) in net asset value
–
(0.05
)
(0.34
)
0.17
(0.59
)
Net Asset Value at end of period
$
9.73
$
9.73
$
9.78
$
10.12
$
9.95
Total Return (%)2
2.85
2.41
(0.40
)
4.83
(2.49
)
Ratios/Supplemental Data:
Net Assets at end of period (in 000’s)
$
35,252
$
38,165
$
44,151
$
47,162
$
46,991
Ratios of expenses to average net assets (%)
0.82
0.82
0.82
0.81
0.81
Ratio of net investment income to average net assets (%)
2.29
2.28
2.48
2.62
2.77
Portfolio turnover (%)3
16
39
25
17
14
1
Based on average shares outstanding during the year.
2
These returns are after all charges at the mutual fund level have been subtracted. These returns are higher than the returns at the separate account level because charges made at the separate account level have not been subtracted. Total returns are not annualized for periods less than one year.
3
Portfolio turnover is calculated at the fund level and represents the entire fiscal year or period.
See accompanying Notes to Financial Statements.
49
Ultra Series Fund | December 31, 2017
Financial Highlights for a Share of Beneficial Interest Outstanding
HIGH INCOME FUND
Year Ended December 31,
2017
2016
2015
2014
2013
CLASS I
Net Asset Value at beginning of period
$
8.56
$
8.05
$
8.78
$
9.22
$
9.37
Income from Investment Operations:
Net investment income
0.47
0.42
1
0.47
1
0.49
1
0.52
1
Net realized and unrealized gain (loss) on investments
0.08
0.55
(0.68
)
(0.33
)
(0.01
)
Total from investment operations
0.55
0.97
(0.21
)
0.16
0.51
Less Distributions From:
Net investment income
(0.45
)
(0.46
)
(0.52
)
(0.60
)
(0.66
)
Net increase (decrease) in net asset value
0.10
0.51
(0.73
)
(0.44
)
(0.15
)
Net Asset Value at end of period
$
8.66
$
8.56
$
8.05
$
8.78
$
9.22
Total Return (%)2
6.32
12.15
(2.47
)
1.74
5.49
Ratios/Supplemental Data:
Net Assets at end of period (in 000’s)
$
20,601
$
22,093
$
23,975
$
30,455
$
43,622
Ratios of expenses to average net assets (%)
0.77
0.77
0.77
0.76
0.76
Ratio of net investment income to average net assets (%)
4.72
4.91
5.23
5.12
5.42
Portfolio turnover (%)3
39
58
27
53
32
CLASS II
2017
2016
2015
2014
2013
Net Asset Value at beginning of period
$
8.57
$
8.05
$
8.79
$
9.23
$
9.37
Income from Investment Operations:
Net investment income
0.43
0.40
1
0.44
1
0.46
1
0.50
1
Net realized and unrealized gain (loss) on investments
0.09
0.56
(0.68
)
(0.33
)
–
Total from investment operations
0.52
0.96
(0.24
)
0.13
0.50
Less Distributions From:
Net investment income
(0.42
)
(0.44
)
(0.50
)
(0.57
)
(0.64
)
Net increase (decrease) in net asset value
0.10
0.52
(0.74
)
(0.44
)
(0.14
)
Net Asset Value at end of period
$
8.67
$
8.57
$
8.05
$
8.79
$
9.23
Total Return (%)2
6.06
11.87
(2.71
)
1.48
5.23
Ratios/Supplemental Data:
Net Assets at end of period (in 000’s)
$
5,562
$
5,314
$
5,943
$
6,685
$
6,906
Ratios of expenses to average net assets (%)
1.02
1.02
1.02
1.01
1.01
Ratio of net investment income to average net assets (%)
4.47
4.66
4.98
4.88
5.17
Portfolio turnover (%)3
39
58
27
53
32
1
Based on average shares outstanding during the year.
2
These returns are after all charges at the mutual fund level have been subtracted. These returns are higher than the returns at the separate account level because charges made at the separate account level have not been subtracted. Total returns are not annualized for periods less than one year.
3
Portfolio turnover is calculated at the fund level and represents the entire fiscal year or period.
See accompanying Notes to Financial Statements.
50
Ultra Series Fund | December 31, 2017
Financial Highlights for a Share of Beneficial Interest Outstanding
DIVERSIFIED INCOME FUND
Year Ended December 31,
2017
2016
2015
2014
2013
CLASS I
Net Asset Value at beginning of period
$
18.40
$
18.64
$
20.30
$
20.76
$
18.29
Income from Investment Operations:
Net investment income
0.45
0.44
1
0.46
1
0.47
1
0.46
1
Net realized and unrealized gain (loss) on investments
2.00
1.24
(0.43
)
1.02
2.48
Total from investment operations
2.45
1.68
0.03
1.49
2.94
Less Distributions From:
Net investment income
(0.45
)
(0.49
)
(0.52
)
(0.52
)
(0.47
)
Capital gains
(0.85
)
(1.43
)
(1.17
)
(1.43
)
–
Total distributions
(1.30
)
(1.92
)
(1.69
)
(1.95
)
(0.47
)
Net increase (decrease) in net asset value
1.15
(0.24
)
(1.66
)
(0.46
)
2.47
Net Asset Value at end of period
$
19.55
$
18.40
$
18.64
$
20.30
$
20.76
Total Return (%)2
13.31
8.99
0.11
7.12
16.07
Ratios/Supplemental Data:
Net Assets at end of period (in 000’s)
$
239,212
$
245,490
$
267,001
$
327,951
$
378,807
Ratios of expenses to average net assets (%)
0.72
0.72
0.72
0.71
0.71
Ratio of net investment income to average net assets (%)
2.13
2.25
2.27
2.20
2.31
Portfolio turnover (%)3
16
34
21
24
17
CLASS II
2017
2016
2015
2014
2013
Net Asset Value at beginning of period
$
18.31
$
18.57
$
20.23
$
20.71
$
18.26
Income from Investment Operations:
Net investment income
0.37
0.39
1
0.41
1
0.41
1
0.41
1
Net realized and unrealized gain (loss) on investments
2.00
1.23
(0.42
)
1.02
2.47
Total from investment operations
2.37
1.62
(0.01
)
1.43
2.88
Less Distributions From:
Net investment income
(0.42
)
(0.45
)
(0.48
)
(0.48
)
(0.43
)
Capital gains
(0.85
)
(1.43
)
(1.17
)
(1.43
)
–
Total distributions
(1.27
)
(1.88
)
(1.65
)
(1.91
)
(0.43
)
Net increase (decrease) in net asset value
1.10
(0.26
)
(1.66
)
(0.48
)
2.45
Net Asset Value at end of period
$
19.41
$
18.31
$
18.57
$
20.23
$
20.71
Total Return (%)2
13.03
8.72
(0.14
)
6.85
15.78
Ratios/Supplemental Data:
Net Assets at end of period (in 000’s)
$
40,526
$
40,548
$
39,894
$
44,772
$
43,601
Ratios of expenses to average net assets (%)
0.97
0.97
0.97
0.96
0.96
Ratio of net investment income to average net assets (%)
1.88
1.99
2.02
1.95
2.05
Portfolio turnover (%)3
16
34
21
24
17
1
Based on average shares outstanding during the year.
2
These returns are after all charges at the mutual fund level have been subtracted. These returns are higher than the returns at the separate account level because charges made at the separate account level have not been subtracted. Total returns are not annualized for periods less than one year.
3
Portfolio turnover is calculated at the fund level and represents the entire fiscal year or period.
See accompanying Notes to Financial Statements.
51
Ultra Series Fund | December 31, 2017
Financial Highlights for a Share of Beneficial Interest Outstanding
LARGE CAP VALUE FUND
Year Ended December 31,
2017
2016
2015
2014
2013
CLASS I
Net Asset Value at beginning of period
$
26.56
$
27.06
$
33.10
$
34.76
$
27.12
Income from Investment Operations:
Net investment income
0.69
0.42
1
0.35
1
0.43
1
0.48
1
Net realized and unrealized gain (loss) on investments
3.60
3.13
(1.18
)
3.97
7.67
Total from investment operations
4.29
3.55
(0.83
)
4.40
8.15
Less Distributions From:
Net investment income
(0.69
)
(0.44
)
(0.40
)
(0.51
)
(0.51
)
Capital gains
(1.68
)
(3.61
)
(4.81
)
(5.55
)
–
Total distributions
(2.37
)
(4.05
)
(5.21
)
(6.06
)
(0.51
)
Net increase (decrease) in net asset value
1.92
(0.50
)
(6.04
)
(1.66
)
7.64
Net Asset Value at end of period
$
28.48
$
26.56
$
27.06
$
33.10
$
34.76
Total Return (%)2
16.23
13.01
(2.68
)
12.41
30.07
Ratios/Supplemental Data:
Net Assets at end of period (in 000’s)
$
341,213
$
347,993
$
365,385
$
491,416
$
576,731
Ratios of expenses to average net assets (%)
0.62
0.62
0.62
0.61
0.61
Ratio of net investment income to average net assets (%)
2.28
1.50
1.09
1.18
1.53
Portfolio turnover (%)3
77
93
90
82
32
CLASS II
2017
2016
2015
2014
2013
Net Asset Value at beginning of period
$
26.32
$
26.87
$
32.93
$
34.64
$
27.05
Income from Investment Operations:
Net investment income
0.65
0.34
1
0.27
1
0.34
1
0.40
1
Net realized and unrealized gain (loss) on investments
3.52
3.11
(1.17
)
3.94
7.64
Total from investment operations
4.17
3.45
(0.90
)
4.28
8.04
Less Distributions From:
Net investment income
(0.64
)
(0.39
)
(0.35
)
(0.44
)
(0.45
)
Capital gains
(1.68
)
(3.61
)
(4.81
)
(5.55
)
–
Total distributions
(2.32
)
(4.00
)
(5.16
)
(5.99
)
(0.45
)
Net increase (decrease) in net asset value
1.85
(0.55
)
(6.06
)
(1.71
)
7.59
Net Asset Value at end of period
$
28.17
$
26.32
$
26.87
$
32.93
$
34.64
Total Return (%)2
15.94
12.73
(2.92
)
12.13
29.74
Ratios/Supplemental Data:
Net Assets at end of period (in 000’s)
$
5,539
$
4,709
$
5,509
$
6,700
$
6,875
Ratios of expenses to average net assets (%)
0.87
0.87
0.87
0.86
0.86
Ratio of net investment income to average net assets (%)
2.08
1.24
0.84
0.93
1.28
Portfolio turnover (%)3
77
93
90
82
32
1
Based on average shares outstanding during the year.
2
These returns are after all charges at the mutual fund level have been subtracted. These returns are higher than the returns at the separate account level because charges made at the separate account level have not been subtracted. Total returns are not annualized for periods less than one year.
3
Portfolio turnover is calculated at the fund level and represents the entire fiscal year or period.
See accompanying Notes to Financial Statements.
52
Ultra Series Fund | December 31, 2017
Financial Highlights for a Share of Beneficial Interest Outstanding
LARGE CAP GROWTH FUND
Year Ended December 31,
2017
2016
2015
2014
2013
CLASS I
Net Asset Value at beginning of period
$
24.84
$
25.12
$
27.27
$
28.76
$
24.09
Income from Investment Operations:
Net investment income
0.22
0.20
1
0.28
1
0.19
1
0.17
1
Net realized and unrealized gain on investments
5.32
1.23
0.64
3.32
7.17
Total from investment operations
5.54
1.43
0.92
3.51
7.34
Less Distributions From:
Net investment income
(0.22
)
(0.22
)
(0.32
)
(0.20
)
(0.18
)
Capital gains
(3.62
)
(1.49
)
(2.75
)
(4.80
)
(2.49
)
Total distributions
(3.84
)
(1.71
)
(3.07
)
(5.00
)
(2.67
)
Net increase (decrease) in net asset value
1.70
(0.28
)
(2.15
)
(1.49
)
4.67
Net Asset Value at end of period
$
26.54
$
24.84
$
25.12
$
27.27
$
28.76
Total Return (%)2
22.28
5.74
3.26
12.13
30.51
Ratios/Supplemental Data:
Net Assets at end of period (in 000’s)
$
232,362
$
223,450
$
251,524
$
305,800
$
359,959
Ratios of expenses to average net assets (%)
0.82
0.82
0.82
0.81
0.81
Ratio of net investment income to average net assets (%)
0.75
0.80
1.02
0.63
0.62
Portfolio turnover (%)3
22
13
19
33
50
CLASS II
2017
2016
2015
2014
2013
Net Asset Value at beginning of period
$
24.60
$
24.92
$
27.10
$
28.63
$
24.02
Income from Investment Operations:
Net investment income
0.14
0.14
1
0.21
1
0.11
1
0.10
1
Net realized and unrealized gain on investments
5.28
1.21
0.63
3.32
7.13
Total from investment operations
5.42
1.35
0.84
3.43
7.23
Less Distributions From:
Net investment income
(0.18
)
(0.18
)
(0.27
)
(0.16
)
(0.13
)
Capital gains
(3.62
)
(1.49
)
(2.75
)
(4.80
)
(2.49
)
Total distributions
(3.80
)
(1.67
)
(3.02
)
(4.96
)
(2.62
)
Net increase (decrease) in net asset value
1.62
(0.32
)
(2.18
)
(1.53
)
4.61
Net Asset Value at end of period
$
26.22
$
24.60
$
24.92
$
27.10
$
28.63
Total Return (%)2
21.98
5.47
3.00
11.85
30.18
Ratios/Supplemental Data:
Net Assets at end of period (in 000’s)
$
23,445
$
23,774
$
27,749
$
32,168
$
33,983
Ratios of expenses to average net assets (%)
1.07
1.07
1.07
1.06
1.06
Ratio of net investment income to average net assets (%)
0.50
0.55
0.77
0.38
0.37
Portfolio turnover (%)3
22
13
19
33
50
1
Based on average shares outstanding during the year.
2
These returns are after all charges at the mutual fund level have been subtracted. These returns are higher than the returns at the separate account level because charges made at the separate account level have not been subtracted. Total returns are not annualized for periods less than one year.
3
Portfolio turnover is calculated at the fund level and represents the entire fiscal year or period.
See accompanying Notes to Financial Statements.
53
Ultra Series Fund | December 31, 2017
Financial Highlights for a Share of Beneficial Interest Outstanding
MID CAP FUND
Year Ended December 31,
2017
2016
2015
2014
2013
CLASS I
Net Asset Value at beginning of period
$
18.11
$
17.65
$
19.30
$
21.76
$
17.09
Income from Investment Operations:
Net investment income (loss)
(0.01
)
0.01
1
(0.05
)1
0.02
1
0.00
1,4
Net realized and unrealized gain on investments
2.85
2.22
0.27
2.13
5.00
Total from investment operations
2.84
2.23
0.22
2.15
5.00
Less Distributions From:
Net investment income
–
(0.00
)4
(0.01
)
(0.01
)
(0.00
)4
Capital gains
(1.98
)
(1.77
)
(1.86
)
(4.60
)
(0.33
)
Total distributions
(1.98
)
(1.77
)
(1.87
)
(4.61
)
(0.33
)
Net increase (decrease) in net asset value
0.86
0.46
(1.65
)
(2.46
)
4.67
Net Asset Value at end of period
$
18.97
$
18.11
$
17.65
$
19.30
$
21.76
Total Return (%)2
15.74
12.84
1.04
9.82
29.28
Ratios/Supplemental Data:
Net Assets at end of period (in 000’s)
$
192,140
$
203,076
$
220,979
$
286,704
$
381,703
Ratios of expenses to average net assets (%)
0.92
0.92
0.92
0.91
0.91
Ratio of net investment income (loss) to average net assets (%)
(0.07
)
0.04
(0.24
)
0.10
(0.01
)
Portfolio turnover (%)3
22
21
28
35
28
CLASS II
2017
2016
2015
2014
2013
Net Asset Value at beginning of period
$
17.83
$
17.44
$
19.13
$
21.65
$
17.05
Income from Investment Operations:
Net investment income (loss)
(0.08
)
(0.04
)1
(0.09
)1
(0.03
)1
(0.05
)1
Net realized and unrealized gain on investments
2.82
2.20
0.26
2.11
4.98
Total from investment operations
2.74
2.16
0.17
2.08
4.93
Less Distributions From:
Capital gains
(1.98
)
(1.77
)
(1.86
)
(4.60
)
(0.33
)
Total distributions
(1.98
)
(1.77
)
(1.86
)
(4.60
)
(0.33
)
Net increase (decrease) in net asset value
0.76
0.39
(1.69
)
(2.52
)
4.60
Net Asset Value at end of period
$
18.59
$
17.83
$
17.44
$
19.13
$
21.65
Total Return (%)2
15.45
12.55
0.79
9.55
28.95
Ratios/Supplemental Data:
Net Assets at end of period (in 000’s)
$
10,509
$
11,142
$
12,710
$
15,067
$
15,762
Ratios of expenses to average net assets (%)
1.17
1.17
1.17
–
1.16
Ratio of net investment income to average net assets (%)
(0.32
)
(0.21
)
(0.49
)
(0.15
)
(0.26
)
Portfolio turnover (%)3
22
21
28
35
28
1
Based on average shares outstanding during the year.
2
These returns are after all charges at the mutual fund level have been subtracted. These returns are higher than the returns at the separate account level because charges made at the separate account level have not been subtracted. Total returns are not annualized for periods less than one year.
3
Portfolio turnover is calculated at the fund level and represents the entire fiscal year or period.
4
Amounts represent less than $0.005 per share.
See accompanying Notes to Financial Statements.
54
Ultra Series Fund | December 31, 2017
Financial Highlights for a Share of Beneficial Interest Outstanding
INTERNATIONAL STOCK FUND
Year Ended December 31,
2017
2016
2015
2014
2013
CLASS I
Net Asset Value at beginning of period
$
9.69
$
10.16
$
10.77
$
12.99
$
10.78
Income from Investment Operations:
Net investment income
0.17
0.18
1
0.19
1
0.27
1
0.16
1
Net realized and unrealized gain (loss) on investments
2.01
(0.47
)
(0.56
)
(1.10
)
2.07
Total from investment operations
2.18
(0.29
)
(0.37
)
(0.83
)
2.23
Less Distributions From:
Net investment income
(0.14
)
(0.18
)
(0.22
)
(0.47
)
(0.02
)
Capital gains
–
–
(0.02
)
(0.92
)
–
Total distributions
(0.14
)
(0.18
)
(0.24
)
(1.39
)
(0.02
)
Net increase (decrease) in net asset value
2.04
(0.47
)
(0.61
)
(2.22
)
2.21
Net Asset Value at end of period
$
11.73
$
9.69
$
10.16
$
10.77
$
12.99
Total Return (%)2
22.54
(2.91
)
(3.45
)
(6.76
)
20.76
Ratios/Supplemental Data:
Net Assets at end of period (in 000’s)
$
27,516
$
26,809
$
32,560
$
38,826
$
75,808
Ratios of expenses to average net assets (%)
1.17
1.17
1.17
1.17
1.21
Ratio of net investment income to average net assets (%)
1.27
1.84
1.70
2.09
1.37
Portfolio turnover (%)3
28
98
23
103
39
CLASS II
2017
2016
2015
2014
2013
Net Asset Value at beginning of period
$
9.65
$
10.14
$
10.74
$
12.96
$
10.76
Income from Investment Operations:
Net investment income
0.08
0.16
1
0.16
1
0.22
1
0.13
1
Net realized and unrealized gain (loss) on investments
2.06
(0.49
)
(0.55
)
(1.08
)
2.07
Total from investment operations
2.14
(0.33
)
(0.39
)
(0.86
)
2.20
Less Distributions From:
Net investment income
(0.12
)
(0.16
)
(0.19
)
(0.44
)
(0.00
)4
Capital gains
–
–
(0.02
)
(0.92
)
–
Total distributions
(0.12
)
(0.16
)
(0.21
)
(1.36
)
(0.00
)4
Net increase (decrease) in net asset value
2.02
(0.49
)
(0.60
)
(2.22
)
2.20
Net Asset Value at end of period
$
11.67
$
9.65
$
10.14
$
10.74
$
12.96
Total Return (%)2
22.24
(3.16
)
(3.69
)
(6.99
)
20.45
Ratios/Supplemental Data:
Net Assets at end of period (in 000’s)
$
13,257
$
12,796
$
14,641
$
16,174
$
19,134
Ratios of expenses to average net assets (%)
1.42
1.42
1.42
1.42
1.46
Ratio of net investment income to average net assets (%)
1.02
1.58
1.43
1.72
1.10
Portfolio turnover (%)3
28
98
23
103
39
1
Based on average shares outstanding during the year.
2
These returns are after all charges at the mutual fund level have been subtracted. These returns are higher than the returns at the separate account level because charges made at the separate account level have not been subtracted. Total returns are not annualized for periods less than one year.
3
Portfolio turnover is calculated at the fund level and represents the entire fiscal year or period.
4
Amounts represent less than $(0.005) per share.
See accompanying Notes to Financial Statements.
55
Ultra Series Fund | December 31, 2017
Notes to Financial Statements
1. ORGANIZATION
The Ultra Series Fund (the “Trust”), a Massachusetts business trust, is registered under the Investment Company Act of 1940 (the “1940 Act”), as amended, as a diversified, open-end management investment company. The Trust is a series trust with, at the end of the period covered by this report, 14 investment portfolios (individually, a “fund,” and collectively, the “funds”), each with different investment objectives and policies. The funds reported within this book at the end of the period were the Core Bond Fund, High Income Fund, Diversified Income Fund, Large Cap Value Fund, Large Cap Growth Fund, Mid Cap Fund and International Stock Fund (collectively, the “Core Funds”), and the Conservative Allocation Fund, Moderate Allocation Fund and Aggressive Allocation Fund (collectively, the “Target Allocation Funds”).
The Declaration of Trust permits the Board of Trustees to issue an unlimited number of full and fractional shares of the Trust without par value. All funds offer Class I and II shares. Each class of shares represents an interest in the assets of the respective fund and has identical voting, dividend, liquidation and other rights, except that each class of shares bears its own distribution fee, if any, and its proportional share of fund level expenses, and has exclusive voting rights on matters pertaining to Rule 12b-1 under the 1940 Act as it relates to that class and other class specific matters. Shares are offered to separate accounts (the “Accounts”) of CMFG Life Insurance Company and to qualified pension and retirement plans of CMFG Life Insurance Company or its affiliates (“CUNA Mutual Group”). The Trust may, in the future, offer other share classes to separate accounts of insurance companies and to qualified pension and retirement plans that are not affiliated with CUNA Mutual Group. The Trust does not offer shares directly to the general public.
The Trust has entered into a Management Agreement with Madison Asset Management, LLC (the “Investment Adviser” or “Madison”). The Investment Adviser, in turn, has entered into a subadvisory agreement with a subadviser (“Subadviser”) for the management of the investments of the International Stock Fund.
2. SIGNIFICANT ACCOUNTING POLICIES
The funds are investment companies that apply the accounting and reporting guidance in the Financial Accounting Standards Board (FASB) Accounting Standards Codification Topic 946, Financial Services-Investment Companies (ASC 946). The following is a summary of significant accounting policies consistently followed by each fund in the preparation of its financial statements.
Portfolio Valuation: The Trust and each series of the Trust referred to individually as a fund values securities and other investments as follows: Equity securities, including American Depositary Receipts (“ADRs”),Global Depositary Receipts (“GDRs”) and exchange-traded funds (“ETFs”) listed on any U.S. or foreign stock exchange or quoted on the National Association of Securities Dealers Automated Quotation System (“NASDAQ’’) are valued at the last quoted sale price or official closing price on that exchange or NASDAQ on the valuation day (provided that, for securities traded on NASDAQ, the funds utilize the NASDAQ Official Closing Price (“NOCP”)). If no sale occurs, equities traded on a U.S. exchange, foreign exchange or on NASDAQ are valued at the bid price. Debt securities (other than short-term obligations) purchased with a remaining maturity of 61 days or more are valued on the basis of last available bid prices or current market quotations provided by dealers or pricing services approved by the Trust. In determining the value of a particular investment, pricing services may use certain information with respect to transactions in such investments, quotations from dealers, pricing matrixes, market transactions in comparable investments, various relationships observed in the market between investments and calculated yield measures based on valuation technology commonly employed in the market for such investments.
56
Ultra Series Fund | December 31, 2017
Notes to Financial Statements
Municipal debt securities are traded via a network among dealers and brokers that connect buyers and sellers. Liquidity in the tax-exempt market is influenced by economic conditions, issuer financial strength, bond structure, trade size, supply and demand, tax code and regulatory environment. There may be little trading in the secondary market for the particular bonds and other debt securities, making them more difficult to value or sell. Asset-backed and mortgage-backed securities are valued by independent pricing services using models that consider estimated cash flows of each tranche of the security, establish a benchmark yield and develop an estimated tranche specific spread to the benchmark yield based on the unique attributes of the tranche.
Investments in shares of open-end mutual funds, including money market funds, are valued at their daily net asset value (“NAV”) which is calculated as of the close of regular trading on the New York Stock Exchange (the “NYSE”) usually 4:00 p.m. Eastern Standard Time on each day on which the NYSE is open for business. NAV per share is determined by dividing each fund’s total net assets by the number of shares of such fund outstanding at the time of calculation. Because the assets of each Target Allocation Fund consist primarily of shares of other registered investment companies (the “Underlying Funds”), the NAV of each fund is determined based on the NAVs of the Underlying Funds. Total net assets are determined by adding the total current value of portfolio securities, cash, receivables, and other assets and subtracting liabilities. Short-term instruments having maturities of 60 days or less are valued on an amortized cost basis, which approximates market value.
Over-the-counter securities not listed or traded on NASDAQ are valued at the last sale price on the valuation day. If no sale occurs on the valuation day, an over-the-counter security is valued at the last bid price. Exchange-traded options are valued at the mean of the best bid and ask prices across all option exchanges. Financial futures contracts generally are valued at the settlement price established by the exchange(s) on which the contracts are primarily traded. Spot and forward foreign currency exchange contracts are valued based on quotations supplied by dealers in such contracts. Overnight repurchase agreements are valued at cost, and term repurchase agreements (i.e., those whose maturity exceeds seven days), swaps, caps, collars and floors, if any, are valued at the average of the closing bids obtained daily from at least one dealer.
Through the end of this reporting period, the value of all assets and liabilities expressed in foreign currencies was converted into U.S. dollar values using the then-current exchange rate at the close of regular trading on the NYSE.
All other securities for which either quotations are not readily available, no other sales have occurred, or in the Investment Adviser’s opinion, do not reflect the current market value, are appraised at their fair values as determined in good faith by the Pricing Committee (the “Committee”) and under the general supervision of the Board of Trustees. When fair value pricing of securities is employed, the prices of securities used by the funds to calculate NAV may differ from market quotations or NOCP. Because the Target Allocation Funds primarily invest in Underlying Funds, government securities and short-term paper, it is not anticipated that the Investment Adviser will need to “fair value” any of the investments of these funds. However, an Underlying Fund may need to “fair value” one or more of its investments, which may, in turn, require a Target Allocation Fund to do the same because of delays in obtaining the Underlying Fund’s NAV.
A fund’s investments (or Underlying Fund) will be valued at fair value if, in the judgment of the Committee, an event impacting the value of an investment occurred between the closing time of a security’s primary market or exchange (for example, a foreign exchange or market) and the time the fund’s share price is calculated as of the close of regular trading on the NYSE. Significant events may include, but are not limited to, the following: (1) significant fluctuations in domestic markets, foreign markets or foreign currencies; (2) occurrences not directly tied to the securities markets such as natural disasters, armed conflicts or significant government actions; and (3) major announcements affecting a single issuer or an entire market or market sector. In responding to a significant event, the Committee would determine the fair value of affected securities considering factors including, but not limited to: fundamental analytical data relating to the investment; the nature
57
Ultra Series Fund | December 31, 2017
Notes to Financial Statements
and duration of any restrictions on the disposition of the investment; and the forces influencing the market(s) in which the investment is purchased or sold.
In addition to independent fair value decisions made by the Committee noted above, the Committee also engages an independent fair valuation service to adjust the valuations of foreign equity securities based on specific market-movement parameters established by the Committee and approved by the Trust. Such adjustments to the valuation of foreign securities are applied automatically upon market close if the parameters established are exceeded. A foreign security is also automatically fair valued if the exchange it is traded on is on holiday.
Security Transactions and Investment Income: Security transactions are accounted for on a trade date basis. Net realized gains or losses on sales are determined by the identified cost method. Interest income is recorded on an accrual basis. Dividend income is recorded on ex-dividend date, except that certain dividends from foreign securities may be recorded after the ex-dividend date based on when the fund is informed of the dividend. Interest income is recorded on an accrual basis and is increased by the accretion of discount and decreased by the amortization of premium. Amortization and accretion are recorded on the effective yield method.
Expenses: Expenses that are directly related to one fund are charged directly to that fund. Other operating expenses are prorated to the funds on the basis of relative net assets. Class-specific expenses are borne by that class.
Classes: Income and realized and unrealized gains/losses are allocated to the respective classes on the basis of relative net assets.
Repurchase Agreements: Each fund may engage in repurchase agreements. In a repurchase agreement, a security is purchased for a relatively short period (usually not more than seven days) subject to the obligation to sell it back to the issuer at a fixed time and price plus accrued interest. The funds will enter into repurchase agreements only with members of the Federal Reserve System and with “primary dealers” in U.S. Government securities.
The Trust has established a procedure providing that the securities serving as collateral for each repurchase agreement must be delivered to the Trust’s custodian either physically or in book-entry form and that the collateral must be marked to market daily to ensure that each repurchase agreement is fully collateralized at all times. In the event of bankruptcy or other default by a seller of a repurchase agreement, a fund could experience one of the following: delays in liquidating the underlying securities during the period in which the fund seeks to enforce its rights thereto, possible decreased levels of income, declines in value of the underlying securities, or lack of access to income during this period and the expense of enforcing its rights. As of December 31, 2017, none of the funds held open repurchase agreements.
Foreign Currency Transactions: The Trust’s books and records are maintained in U.S. dollars. Foreign currency denominated transactions (i.e., market value of investment securities, assets and liabilities, purchases and sales of investment securities, and income and expenses) are translated into U.S. dollars at the current rate of exchange. The funds enter into contracts on the trade date to settle any securities transactions denominated in foreign currencies on behalf of the funds at the spot rate at settlement.
Each fund reports certain foreign currency-related transactions as components of realized gains or losses for financial reporting purposes, whereas such components are treated as ordinary income for federal income tax purposes. Realized gains or losses associated with currency transactions are included in the Statements of Operations under the heading “Net realized gain (loss) on investments.” Only the International Stock Fund had net realized gains from foreign currency transactions.
58
Ultra Series Fund | December 31, 2017
Notes to Financial Statements
The funds do not isolate the portion of gains and losses on investments in securities that is due to changes in the foreign exchange rates from that which is due to change in market prices of securities. Such amounts are categorized as gain or loss on investments for financial reporting purposes.
Forward Foreign Currency Exchange Contracts: Each fund may purchase and sell forward foreign currency exchange contracts for defensive or hedging purposes. When entering into forward foreign currency exchange contracts, the funds agree to receive or deliver a fixed quantity of foreign currency for an agreed-upon price on an agreed future date. These contracts are valued daily. The funds’ net assets reflect unrealized gains or losses on the contracts as measured by the difference between the forward foreign currency exchange rates at the dates of entry into the contracts and the forward rates at the reporting date. The funds realize a gain or a loss at the time the forward foreign currency exchange contracts are settled or closed out with an offsetting contract. Contracts are traded over-the-counter directly with a counterparty. Realized and unrealized gains and losses are included in the Statements of Operations. As of December 31, 2017, none of the funds had open forward foreign currency exchange contracts.
If a fund enters into a forward foreign currency exchange contract to buy foreign currency for any purpose, the fund will be required to place cash or other liquid assets in a segregated account with the fund’s custodian in an amount equal to the value of the fund’s total assets committed to the consummation of the forward contract. If the value of the securities in the segregated account declines, additional cash or securities will be placed in the segregated account so that the value of the account will equal the amount of the fund’s commitment with respect to the contract.
Cash Concentration: At times, the funds maintain cash balances at financial institutions in excess of federally insured limits. The funds monitor this credit risk and have not experienced any losses related to this risk.
Illiquid Securities: Each fund currently limits investments in illiquid securities to 15% of net assets at the time of purchase. An illiquid security is generally defined as any investment that may be difficult to sell within seven days for the price at which the fund values it. At December 31, 2017, there were no illiquid securities held in the funds. Pursuant to guidelines adopted by the Board of Trustees, certain unregistered securities are determined to be liquid and are not included within the percent limitations specified above.
Delayed Delivery Securities: Each fund may purchase securities on a when-issued or delayed delivery basis. “When-issued” refers to securities whose terms are available and for which a market exists, but that have not been issued. For when-issued or delayed delivery transactions, no payment is made until delivery date, which is typically longer than the normal course of settlement. When a fund enters into an agreement to purchase securities on a when-issued or delayed delivery basis, the fund segregates cash or other liquid securities, of any type or maturity, equal in value to the fund’s commitment. Losses may arise due to changes in the market value of the underlying securities, if the counterparty does not perform under the contract, or if the issuer does not issue the securities due to political, economic or other factors. As of December 31, 2017, none of the funds had entered into such transactions.
Indemnifications: Under the funds’ organizational documents, the funds’ officers and Trustees are indemnified against certain liabilities arising out of the performance of their duties to the funds. In the normal course of business, the funds enter into contracts that contain a variety of representations and provide general indemnifications. The funds’ maximum liability exposure under these arrangements is unknown, as future claims that have not yet occurred may be made against the funds. However, based on experience, management expects the risk of loss to be remote.
59
Ultra Series Fund | December 31, 2017
Notes to Financial Statements
Fair Value Measurements: Each fund has adopted Financial Accounting Standards Board (the “FASB”) guidance on fair value measurements. Fair value is defined as the price that each fund would receive upon selling an investment in a timely transaction to an independent buyer in the principal or most advantageous market of the investment. A three-tier hierarchy is used to maximize the use of observable market data “inputs” and minimize the use of unobservable “inputs” and to establish classification of fair value measurements for disclosure purposes. Inputs refer broadly to the assumptions that market participants would use in pricing the asset or liability, including assumptions about risk (for example, the risk inherent in a particular valuation technique used to measure fair value including such a pricing model and/or the risk inherent in the inputs used in the valuation technique). Inputs may be observable or unobservable.
Observable inputs are inputs that reflect the assumptions market participants would use in pricing the asset or liability developed based on market data obtained from sources independent of the reporting entity. Unobservable inputs are inputs that reflect the reporting entity’s own assumptions about the assumptions market participants would use in pricing the asset or liability developed based on the best information available in the circumstances. The three-tier hierarchy of inputs is summarized in the three broad Levels listed below:
•
Level 1 – unadjusted quoted prices in active markets for identical investments
•
Level 2 – other significant observable inputs (including quoted prices for similar investments, interest rate volatilities, prepayment speeds, credit risk, benchmark yields, transactions, bids, offers, new issues, spreads and other relationships observed in the markets among comparable securities, underlying equity of the issuer; and proprietary pricing models such as yield measures calculated using factors such as cash flows, financial or collateral performance and other reference data, etc.)
•
Level 3 – significant unobservable inputs (including the fund’s own assumptions in determining the fair value of investments)
The valuation techniques used by the funds to measure fair value for the year ended December 31, 2017 maximized the use of observable inputs and minimized the use of unobservable inputs. The funds utilized the following fair value techniques: multi-dimensional relational pricing model and option adjusted spread pricing; the funds estimated the price that would have prevailed in a liquid market for an international equity security given information available at the time of valuation. As of December 31, 2017, none of the funds held securities deemed as a Level 3, and there were no transfers between classification levels.
The following is a summary of the inputs used as of December 31, 2017, in valuing the funds’ investments carried at fair value:
60
Ultra Series Fund | December 31, 2017
Notes to Financial Statements
Quoted Prices in
Significant Other
Active Markets for
Observable
Significant Unobservable
Identical Investments
Inputs
Inputs
Value at
Fund 1
(Level 1)
(Level 2)
(Level 3)
12/31/17
Conservative Allocation
$
150,243,417
$
–
$
–
$
150,243,417
Moderate Allocation
243,749,904
–
–
243,749,904
Aggressive Allocation
86,339,283
–
–
86,339,283
Core Bond
Asset Backed Securities
–
3,538,238
–
3,538,238
Collateralized Mortgage Obligations
–
3,521,063
–
3,521,063
Commercial Mortgage-Backed Securities
–
3,254,829
–
3,254,829
Corporate Notes and Bonds
–
56,056,980
–
56,056,980
Long Term Municipal Bonds
–
7,093,113
–
7,093,113
Mortgage Backed Securities
–
43,692,936
–
43,692,936
U.S. Government and Agency Obligations
–
43,150,351
–
43,150,351
Short-Term Investments
2,471,814
–
–
2,471,814
2,471,814
160,307,510
–
162,779,324
High Income
Corporate Notes and Bonds
–
23,805,355
–
23,805,355
Short-Term Investments
2,046,519
–
–
2,046,519
2,046,519
23,805,355
–
25,851,874
Diversified Income
Common Stocks
174,656,390
–
–
174,656,390
Asset Backed Securities
–
775,557
–
775,557
Collateralized Mortgage Obligations
–
3,326,642
–
3,326,642
Commercial Mortgage-Backed Securities
–
1,765,188
–
1,765,188
Corporate Notes and Bonds
–
36,651,069
–
36,651,069
Long Term Municipal Bonds
–
6,855,660
–
6,855,660
Mortgage Backed Securities
–
25,313,589
–
25,313,589
U.S. Government and Agency Obligations
–
24,878,038
–
24,878,038
Short-Term Investments
4,589,005
–
–
4,589,005
179,245,395
99,565,743
–
278,811,138
Large Cap Value
Common Stocks
342,250,180
–
–
342,250,180
Short-Term Investments
3,927,817
–
–
3,927,817
346,177,997
–
–
346,177,997
Large Cap Growth
Common Stocks
249,072,826
–
–
249,072,826
Short-Term Investments
6,652,785
–
–
6,652,785
255,725,611
–
–
255,725,611
Mid Cap
Common Stocks
192,331,111
–
–
192,331,111
Short-Term Investments
10,334,355
–
–
10,334,355
202,665,466
–
–
202,665,466
1 See respective portfolio of investments for underlying holdings in each fund. For additional information on the Underlying Funds held in the Conservative, Moderate and Aggressive Allocation Funds, including shareholder prospectuses and financial reports, please visit each Underlying Funds’ website or visit the Securities and Exchange Commission’s website at http://www.sec.gov.
61
Ultra Series Fund | December 31, 2017
Notes to Financial Statements
Quoted Prices in
Significant Other
Active Markets for
Observable
Significant Unobservable
Identical Investments
Inputs
Inputs
Value at
Fund1
(Level 1)
(Level 2)
(Level 3)
12/31/17
International Stock
Common Stocks
Australia
$
–
$
1,294,757
$
–
$
1,294,757
Belgium
–
1,018,010
–
1,018,010
Brazil
–
355,177
–
355,177
Canada
–
1,797,852
–
1,797,852
Denmark
–
1,038,753
–
1,038,753
Finland
–
602,257
–
602,257
France
–
4,332,422
–
4,332,422
Germany
–
1,728,076
–
1,728,076
Ireland
1,329,726
937,261
–
2,266,987
Italy
–
280,240
–
280,240
Japan
–
7,531,819
–
7,531,819
Luxembourg
–
267,024
–
267,024
Netherland
–
2,783,943
–
2,783,943
Norway
–
1,170,471
–
1,170,471
Singapore
–
1,001,307
–
1,001,307
Spain
–
687,501
–
687,501
Sweden
–
1,400,181
–
1,400,181
Switzerland
–
2,660,214
–
2,660,214
Taiwan
598,715
–
–
598,715
Turkey
–
444,524
–
444,524
United Kingdom
844,200
5,942,083
–
6,786,283
Short-Term Investments
636,257
–
–
636,257
3,408,898
37,273,872
–
40,682,770
1 See respective portfolio of investments for underlying holdings in each fund. For additional information on the Underlying Funds held in the Conservative, Moderate and Aggressive Allocation Funds, including shareholder prospectuses and financial reports, please visit each Underlying Funds’ website or visit the Securities and Exchange Commission’s website at http://www.sec.gov.
Derivatives: The FASB issued guidance intended to enhance financial statement disclosure for derivative instruments and hedging activities and enable investors to understand: a) how and why a fund uses derivative investments, b) how derivative instruments and related hedge fund items are accounted for, and c) how derivative instruments and related hedge items affect a fund’s financial position, results of operations and cash flows.
The following table presents the effect of derivative instruments on the Statement of Operations for the year ended December 31, 2017:
Derivatives not accounted
Change in Unrealized
Fund
for as hedging Instruments
Realized Gain (Loss) on Derivatives:
Depreciation on Derivatives
Core Bond
Equity contracts, Options purchased
$ 46,949
$ –
Equity contracts, Options written
(40,239)
–
Management has determined that there is no impact on the financial statements of the other funds held in the Trust as they currently do not hold derivative financial instruments.
62
Ultra Series Fund | December 31, 2017
Notes to Financial Statements
Recently Issued Accounting Pronouncements: In October 2016, the U.S. Securities and Exchange Commission (“SEC”) adopted new rules and forms, and amendments to certain current rules and forms, to modernize reporting and disclosure of information by registered investment companies. The amendments to Regulation S-X require standardized, enhanced disclosure about derivatives in investment company financial statements, and also change the rules governing the form and content of such financial statements. The amendments to Regulation S-X took effect on August 1, 2017 and the financial statements have been updated, as applicable.
In March 2017, the FASB issued Accounting Standards Update (ASU) 2017-08 which changes the amortization period for a callable debt security from the maturity date to the earliest call date. The ASU is effective for annual periods beginning after December 15, 2018, and interim periods within those annual periods. At this time, management is still evaluating the impacts this ASU will have on the financial statements.
3. MANAGEMENT, DISTRIBUTION AGREEMENTS AND OTHER EXPENSES
Management Agreement: For services under the Management Agreement, the Investment Adviser is entitle to receive a management fee, which is calculated daily and paid monthly, at an annual rate based upon the following percentages of average daily net assets of each fund as follows as of December 31, 2017:
Fund
Management Fee
Fund
Management Fee
Conservative Allocation
0.30%
Diversified Income
0.70%
Moderate Allocation
0.30%
Large Cap Value
0.60%
Aggressive Allocation
0.30%
Large Cap Growth
0.80%
Core Bond
0.55%
Mid Cap
0.90%
High Income
0.75%
International Stock
1.15%
The Management Agreement requires the Investment Adviser to provide or arrange to provide overall management of the funds, including but not limited to, investment advisory services, custody, transfer agency, dividend disbursing, legal, accounting and administrative services.
The Investment Adviser is solely responsible for the payment of all fees to the Subadviser. Lazard Asset Management LLC served as the subadviser for the International Stock Fund. The Investment Adviser manages the Core Bond Fund, High Income Fund, Diversified Income Fund, Large Cap Value Fund, Large Cap Growth Fund, Mid Cap Fund and the Target Allocation Funds.
The Investment Adviser may from time to time contractually or voluntarily agree to waive a portion of its fees or expenses related to the funds. Effective July 1, 2014, the Investment Adviser contractually agreed to waive a portion (0.10%) of its management fee of the Target Allocation Funds, which waiver is in effect until at least April 30, 2018. For the year ended December 31, 2017, the waivers were as follows:
Waived Fees or Expenses*
Fund
Class I
Class II
Total Waivers
Conservative Allocation
$
116,876
$
30,047
$
146,923
Moderate Allocation
222,248
27,651
249,899
Aggressive Allocation
85,198
2,080
87,278
*The Investment Adviser does not have the right to recoup these waived fees.
63
Ultra Series Fund | December 31, 2017
Notes to Financial Statements
Distribution Agreement: MFD Distributor, LLC (“MFD”) serves as distributor of the funds. The Trust adopted a distribution and service plan with respect to the Trust’s Class II shares pursuant to Rule 12b-1 under the 1940 Act. Under the plan, the Trust will pay a service fee with regard to Class II shares at an annual rate of 0.25% each fund’s daily net assets.
MFD may from time to time voluntarily agree to waive a portion of its fees or expenses related to the funds. MFD does not have the right to recoup these waived fees.
Other Expenses: In addition to the management fee noted above, the Trust is responsible to pay the following expenses: expenses for independent audits; fees and expenses of the independent trustees and their independent counsel; brokerage commissions and other expenses incurred in the acquisition or disposition of any securities or other investments; costs of borrowing money, overdrafts (if any) and any potential taxes owed; and extraordinary expenses (including litigation and/or and consulting expenses) as approved by a majority of the independent trustees.
Audit and trustees fees are broken out separately from “other expenses” on the Statement of Operations.
Certain officers and trustees of the Trust are also officers of the Investment Adviser. The funds do not compensate their officers or affiliated trustees. The Nominating and Governance Committee of the Board may change trustee fees paid at any time.
4. DIVIDENDS FROM NET INCOME AND DISTRIBUTIONS OF CAPITAL GAINS
The funds declare dividends from net investment income and net realized gains from investment transactions, if any, annually, which are reinvested in additional full and fractional shares of the respective funds.
Income and capital gain distributions, if any, are determined in accordance with federal income tax regulations, which may differ from accounting principles generally accepted in the United States of America. Taxable distributions from income and realized capital gains of the funds may differ from book amounts earned during the period due to differences in the timing of capital gains recognition, and due to the reclassification of certain gains or losses from capital to income.
5. SECURITIES TRANSACTIONS
For the year ended December 31, 2017, aggregate cost of purchases and proceeds from sales of securities, other than short-term investment, were as follows:
U.S. Government Securities
Other Investment Securities
Fund
Purchases
Sales
Purchases
Sales
Conservative Allocation
$
–
$
–
$
69,896,634
$
83,972,514
Moderate Allocation
–
–
95,742,391
139,981,278
Aggressive Allocation
–
–
30,674,173
45,816,832
Core Bond
12,117,126
22,887,872
15,146,611
21,101,598
High Income
–
–
9,450,057
10,217,476
Diversified Income
7,213,054
18,603,760
38,044,168
58,392,581
Large Cap Value
–
–
259,785,255
305,006,156
Large Cap Growth
–
–
54,704,843
91,321,039
Mid Cap
–
–
42,047,936
77,801,249
International Stock
–
–
11,045,431
16,448,605
6. FUTURES CONTRACTS AND OPTIONS ON FUTURES CONTRACTS
The Core Bond Fund may purchase and sell futures contracts and purchase and write options on futures contracts on a limited basis. The fund may purchase and sell futures contracts based on various securities (such as U.S. Government securities), securities indices, foreign currencies and other financial instruments and indices. The fund will engage in futures or related
64
Ultra Series Fund | December 31, 2017
Notes to Financial Statements
options transactions on a limited basis only for bona fide hedging purposes or for purposes of seeking to increase total returns to the extent permitted by regulations of the Commodity Futures Trading Commission.
Futures Contracts. The Core Bond Fund may use futures contracts to manage its exposure to the securities markets or to movements in interest rates and currency values. The primary risks associated with the use of futures contracts are the imperfect correlation between the change in market value of the securities held by the fund and the prices of futures contracts and the possibility of an illiquid market. Futures contracts are valued based upon their quoted daily settlement prices. Upon entering into a futures contract, the fund is required to deposit with its futures broker an amount of cash, U.S. Government and Agency Obligations, or other assets, in accordance with the initial margin requirements of the broker or exchange. Futures contracts are marked to market daily and based on such movements in the price of the contracts, an appropriate payable or receivable for the change in value may be posted or collected by the fund (“variation margin”). Gains or losses are recognized but not considered realized until the contracts expire or close. Futures contracts involve, to varying degrees, risk of loss in excess of the variation margin disclosed within exchange traded or centrally cleared financial derivative instruments on the Statement of Assets and Liabilities.
Options on Futures Contracts. The acquisition of put and call options on futures contracts will give the Core Bond Fund the right (but not the obligation) for a specified price, to sell or to purchase, respectively, the underlying futures contract at any time during the option period. As the purchaser of an option on a futures contract, the fund obtains the benefit of the futures position if prices move in a favorable direction but limits its risk of loss in the event of an unfavorable price movement to the loss of the premium and transaction costs.
The writing of a call option on a futures contract generates a premium which may partially offset a decline in the value of the fund’s assets. By writing a call option, the fund becomes obligated, in exchange for the premium, to sell a futures contract which may have a value higher than the exercise price. Conversely, the writing of a put option on a futures contract generates a premium, which may partially offset an increase in the price of securities that the fund intends to purchase. However, the fund becomes obligated to purchase a futures contract, which may have a value lower than the exercise price. Thus, the loss incurred by the fund in writing options on futures is potentially unlimited and may exceed the amount of the premium received.
7. FOREIGN SECURITIES
Each fund may invest in foreign securities. Foreign securities are defined as securities that are: (i) issued by companies organized outside the U.S. or whose principal operations are outside the U.S., or issued by foreign governments or their agencies or instrumentalities (“foreign issuers”); (ii) principally traded outside of the U.S.; and/or (iii) quoted or denominated in a foreign currency (“non-dollar securities”). Foreign securities include American Depositary Receipts (“ADRs”), European Depositary Receipts (“EDRs”), Global Depositary Receipts (“GDRs”), Swedish Depositary Receipts (“SDRs”) and foreign money market securities. U.S. dollar-denominated securities that are part of the Merrill Lynch U.S. Domestic Master Index are not considered a foreign security.
Certain of the funds have reclaimed receivable balances, in which the funds are due a reclaim on the taxes that have been paid to some foreign jurisdictions. The values of all reclaims are not significant for any of the funds and are reflected in Other Assets on the Statements of Assets and Liabilities. These receivables are reviewed to ensure the current receivable balance is reflective of the amount deemed to be collectable.
65
Ultra Series Fund | December 31, 2017
Notes to Financial Statements
8. SECURITIES LENDING
Several Ultra Funds had been previously authorized to engage in securities lending, although they have not done so since the financial crisis. The Ultra Funds’ board has recently re-authorized the funds to engage in securities lending with State Street Bank and Trust Company as securities lending agent pursuant to a Securities Lending Authorization Agreement (the “Agreement”) and subject to certain securities lending policies and procedures. Under the terms of the Agreement, and subject to the policies and procedures, the authorized funds may lend portfolio securities to qualified borrowers in order to generate additional income, while managing risk associated with the securities lending program. The Agreement requires that loans are collateralized at all times by cash or U.S. government securities, initially equal to at least 102% of the value of the securities. The loaned securities and collateral are marked to market daily to maintain collateral at 102% of the total loaned portfolio. Amounts earned as interest on investments of cash collateral, net of rebates and fees, if any, are included in the Statement of Operations. The primary risk associated with securities lending is if the borrower defaults on its obligation to return the securities loaned because of insolvency or other reasons, the fund could experience delays and costs in recovering securities loaned or in gaining access to the collateral. Under the Agreement, the securities lending agent has provided a limited indemnification in the event of a borrower default.
The funds did not engage in any securities lending activities during the year ended December 31, 2017. It is expected that the funds, other than Target Retirement Funds, whose information is presented in a different book, may re-engage in securities lending activity in the fiscal first quarter of 2018.
9. FEDERAL INCOME TAX INFORMATION
It is each fund’s policy to comply with the requirements of Subchapter M of the Internal Revenue Code of 1986, as amended, applicable to regulated investment companies and to distribute all its taxable income to its shareholders. Accordingly, no provisions for federal income taxes are recorded in the accompanying statements.
The funds have not recorded any liabilities for material unrecognized tax benefits as of December 31, 2017. It is each fund’s policy to recognize accrued interest and penalties related to uncertain tax benefits in income taxes, as appropriate. Tax years that remain open to examination by major tax jurisdictions include tax years ended December 31, 2014 through December 31, 2017.
The tax character of distributions paid during the years ended December 31, 2017 and 2016 was as follows:
Ordinary Income
Long-Term Capital Gain
Fund
2017
2016
2017
2016
Conservative Allocation
$4,546,610
$2,911,765
$2,460,150
$2,331,768
Moderate Allocation
7,709,142
4,957,279
9,699,920
6,661,449
Aggressive Allocation
2,844,088
1,617,238
4,180,143
1,535,086
Core Bond
4,809,361
5,535,316
–
–
High Income
1,276,614
1,385,177
–
–
Diversified Income
6,253,492
8,407,075
11,268,342
18,661,429
Large Cap Value
8,346,432
15,107,501
18,552,627
32,231,840
Large Cap Growth
2,512,025
2,743,783
30,308,312
13,754,022
Mid Cap
295,753
537,825
18,952,962
19,374,961
International Stock
473,708
697,158
–
–
As of December 31, 2017, the components of distributable earnings on a tax basis were as follows:
66
Ultra Series Fund | December 31, 2017
Notes to Financial Statements
Long-Term
Long-Term
Fund
Ordinary Income
Capital Gain
Fund
Ordinary Income
Capital Gain
Conservative Allocation
$146,313
$
–
Diversified Income
$
141,614
$
932,688
Moderate Allocation
133,803
519,974
Large Cap Value
106,683
1,350,427
Aggressive Allocation
57,394
209,133
Large Cap Growth
43,238
2,644,523
Core Bond
89,395
–
Mid Cap
2,604
382,927
High Income
24,534
–
International Stock
13,447
–
For federal income tax purposes, the funds listed below have capital loss carryforwards as of December 31, 2017, which are available to offset future capital gains, if any, realized through the fiscal year listed:
No Expiration
No Expiration
Date
Date
Fund
2018
Short-Term
Long-Term
Core Bond
$
346,309
$
36,915
$
–
International Stock
1,312,565
865,856
5,274,010
The capital loss carryovers for the International Stock Fund is subject to certain limitations upon availability, to offset future gains, pursuant to Section 382 of the Internal Revenue Code.
The Core Bond, High Income and International Stock Funds had capital loss carryovers expire unused in the current year in the amounts of $2,357,684, $4,592,774 and $1,312,565, respectively.
Certain losses incurred after October 31 and within the taxable year are deemed to arise on the first day of the funds’ next taxable year, if the funds so elect. For 2017, the High Income Fund had a post-October net capital loss of $1,666,046, which is being deferred for tax purposes. No other funds are deferring post-October losses.
For the year ended December 31, 2017, the High Income and International Stock Funds utilized $283,944 and $227,718, respectively, in prior year capital losses. No other fund utilized losses.
At December 31, 2017, the aggregate gross unrealized appreciation (depreciation) and net unrealized appreciation (depreciation) for all securities as computed on a federal income tax basis for each fund were as follows:
Fund
Appreciation
Depreciation
Net
Conservative Allocation
$
10,605,881
$
150,465
$
10,455,416
Moderate Allocation
31,076,263
53,931
31,022,332
Aggressive Allocation
14,674,615
128,992
14,545,623
Core Bond
5,634,758
988,231
4,646,527
High Income
817,334
117,997
699,337
Diversified Income
65,974,482
1,494,972
64,479,510
Large Cap Value
73,845,255
168,114
73,677,141
Large Cap Growth
103,557,857
1,718,370
101,839,487
Mid Cap
83,987,745
2,317,694
81,670,051
International Stock
5,830,827
596,292
5,234,535
Reclassification Adjustments: Paid-in capital, undistributed net investment income, and accumulated net realized gain (loss) have been adjusted in the Statements of Assets and Liabilities for permanent book-tax differences for all funds.
67
Ultra Series Fund | December 31, 2017
Notes to Financial Statements
Differences primarily relate to the tax treatment of net operating losses, paydown gains and losses, foreign currency gains and losses, return of capital and other distributions from real estate investment trusts and non-REITs, securities adjustments related to Treasury Inflation Protected securities (TIPS), distribution re-designations from investments in other regulated investment companies and unusable capital carry loss carryforwards.
To the extent these book and tax differences are permanent in nature, such amounts are reclassified at the end of the fiscal year among paid-in capital in excess of par value, accumulated undistributed net investment income (loss) and accumulated net realized gain (loss) on investments and foreign currency translations. Accordingly, at December 31, 2017, reclassifications were recorded as follows:
Accumulated Undistributed Net
Accumulated Net
Fund
Paid-in Capital
Investment Income (Loss)
Realized Gain (Loss)
Conservative Allocation
$
–
$
145,607
$
(145,607
)
Moderate Allocation
–
204,039
(204,039
)
Aggressive Allocation
–
67,318
(67,318
)
Core Bond
(2,357,684
)
427,297
1,930,387
High Income
(4,592,774
)
4,592,774
–
Diversified Income
–
241,036
(241,036
)
Large Cap Value
–
(7,598
)
7,598
Large Cap Growth
–
–
–
Mid Cap
–
163,928
(163,928
)
International Stock
(1,312,565
)
(7,857
)
1,320,422
10. CONCENTRATION OF RISKS
Investing in certain financial instruments, including forward foreign currency contracts, involves certain risks. Risks associated with these instruments include potential for an illiquid secondary market for the instruments or inability of counterparties to perform under the terms of the contracts, changes in the value of foreign currency relative to the U.S. dollar and volatility resulting from an imperfect correlation between the movements in the prices of the instruments and the prices of the underlying securities and interest rates being hedged. The International Stock Fund may enter into these contracts primarily to protect the fund from adverse currency movements.
Investing in foreign securities involves certain risks not necessarily found in U.S. markets. These include risks associated with adverse changes in economic, political, regulatory and other conditions, changes in currency exchange rates, exchange control regulations, expropriation of assets or nationalization, imposition of withholding taxes on dividend or interest payments or capital gains, and possible difficulty in obtaining and enforcing judgments against foreign entities. Further, issuers of foreign securities are subject to different, and often less comprehensive, accounting, reporting and disclosure requirements than domestic issuers.
The Core Bond Fund is subject to derivatives risk. The risk that loss may result from investments in options, forwards, futures, swaps and other derivatives instruments. These instruments may be illiquid, difficult to price and leveraged so that small changes in the value of the underlying instruments may produce disproportionate losses to the fund. Derivatives are also subject to counterparty risk, which is the risk that the other party to the transaction will not fulfill its contractual obligations.
68
Ultra Series Fund | December 31, 2017
Notes to Financial Statements
The High Income Fund invests in securities offering high current income which generally will include bonds in the below investment grade categories of recognized rating agencies (so-called “junk bonds”). These securities generally involve more credit risk than securities in the higher rating categories. In addition, the trading market for high yield securities may be relatively less liquid than the market for higher-rated securities. The fund generally invests at least 80% of its net assets in high yield securities.
The Target Allocation Funds are fund of funds, meaning that each invests primarily in Underlying Funds, including ETFs. Thus, each fund’s investment performance and its ability to achieve its investment goal are directly related to the performance of the Underlying Funds in which it invests; and the Underlying Fund’s performance, in turn, depends on the particular securities in which that Underlying Fund invests and the expenses of that fund. Accordingly, the Allocation Funds are subject to the risks of the Underlying Funds in direct proportion to the allocation of their respective assets among the Underlying Funds.
Additionally, the Target Allocation Funds are subject to asset allocation risk and manager risk. Manager risk (i.e., fund selection risk) is the risk that the Underlying Fund(s) selected to fulfill a particular asset class underperforms their peers. Asset allocation risk is the risk that the allocation of the fund’s assets among the various asset classes and market segments will cause the fund to underperform other funds with a similar investment objective.
The funds may be subject to interest rate risk which is the risk that the value of your investment will fluctuate with changes in interest rates. Typically, a rise in interest rates causes a decline in the market value of income-bearing securities. When interest rates rise, bond prices fall; generally the longer a bond’s maturity, the more sensitive it is to risk. Federal Reserve policy changes may expose fixed-income and related markets to heightened volatility and may reduce liquidity for certain fund investments, which could cause the value of a fund’s investments and share price to decline. The Core Bond may invest in derivatives tied to fixed-income markets and may be more substantially exposed to these risks than a fund that does not invest in derivatives.
The funds are also subject to cybersecurity risk, which include the risks associated with computer systems, networks and devices to carry out routine business operations. These systems, networks and devices employ a variety of protections that are designed to prevent cyberattacks. Despite the various cyber protections utilized by the funds, the Investment Adviser, and other service providers, their systems, networks, or devices could potentially be breached. The funds, their shareholders, and the Investment Adviser could be negatively impacted as a result of a cybersecurity breach. The funds cannot control the cybersecurity plans and systems put in place by service providers or any other third parties whose operations may affect the funds. The funds do monitor this risk closely.
In addition to the other risks described above and in the prospectus, you should understand what we refer to as “unknown market risks.” While investments in securities have been keystones in wealth building and management, at times these investments have produced surprises. Those who enjoyed growth and income of their investments generally were rewarded for the risks they took by investing in the markets. Although the Investment Adviser seeks to appropriately address and manage the risks identified and disclosed to you in connection with the management of the securities in the funds, you should understand that the very nature of the securities markets includes the possibility that there may be additional risks of which we are not aware. We certainly seek to identify all applicable risks and then appropriately address them, take appropriate action to reasonably manage them and to make you aware of them so you can determine if they exceed your risk tolerance. Nevertheless, the often volatile nature of the securities markets and the global economy in which we work suggests that the risk of the unknown is something to consider in connection with an investment in securities. Unforeseen events could under certain circumstances produce a material loss of the value of some or all of the securities we manage for you in the funds.
69
Ultra Series Fund | December 31, 2017
Notes to Financial Statements
11. CAPITAL SHARES AND AFFILIATED OWNERSHIP
All capital shares outstanding at December 31, 2017, are owned by separate investment accounts and/or pension plans of CMFG Life Insurance Company.
The Target Allocation Funds invest in Underlying Funds, such as the Madison Funds, which may be deemed to be under common control because of the same or affiliated investment adviser and membership in a common family of investment companies (the “Affiliated Underlying Funds”). Madison Funds’ historical financial information is available to you at no cost on the Securities and Exchange Commission’s website at www.sec.gov, by calling 1-800-877-6089 or by visiting the Madison Funds’ website at www.madisonfunds.com. A summary of the transactions with each Affiliated Underlying Fund during the year ended December 31, 2017 follows:
Change in
Beginning
Realized
Unrealized
Capital Gains
Value as of
Gross
Gross
Gain
Appreciation
Value at
Dividend
Distributions
Fund/Underlying Fund
12/31/16
Additions
Sales
(Loss)
(depreciation)
12/31/17
Shares
Income
Received
Conservative Allocation Fund
Madison Core Bond
Fund Class Y
$
36,828,176
$
–
$
(3,450,841
)
$
(67,444
)
$
330,506
$
33,640,397
3,370,781
$
872,048
$
10,790
Madison Corporate
Bond Fund Class Y
11,583,199
–
(1,505,240
)
37,991
144,921
10,260,871
886,851
310,724
83,473
Madison Dividend
Income Fund Class Y
12,333,613
412,039
(3,534,825
)
283,135
1,209,386
10,703,348
400,874
179,972
232,067
Madison Investors
Fund Class Y
10,129,559
595,349
(1,551,020
)
100,309
1,387,882
10,662,079
466,612
41,822
553,527
Madison Large Cap
Value Fund Class Y
671,060
–
(681,454
)
(488
)
10,882
–
–
–
–
Madison Mid Cap
Fund Class Y
4,139,040
81,714
(2,193,815
)
297,935
40,691
2,365,565
239,672
–
81,714
Totals
$
75,684,647
$
1,089,102
$
(12,917,195
)
$
651,438
$
3,124,268
$
67,632,260
$
1,404,566
$
961,571
Moderate Allocation Fund
Madison Core Bond
Fund Class Y
$
45,087,981
$
–
$
(2,798,247
)
$
(72,728
)
$
381,700
$
42,598,706
4,268,407
$
1,089,118
$
13,664
Madison Corporate Bond
Fund Class Y
5,476,135
–
(501,747
)
(3,453
)
91,389
5,062,324
437,539
151,489
41,183
Madison Dividend
Income Fund Class Y
28,295,800
1,115,719
(4,478,895
)
344,661
3,589,466
28,866,751
1,081,152
489,839
625,879
Madison Investors Fund
Class Y
28,811,272
1,605,332
(5,753,914
)
416,720
3,670,440
28,749,850
1,258,199
112,770
1,492,562
Madison Large Cap Value
Fund Class Y
10,782,276
788,366
(4,247,170
)
(23,357
)
457,124
7,757,239
530,228
148,905
639,461
Madison Mid Cap Fund
Class Y
10,663,405
167,532
(6,863,430
)
1,013,658
(131,217
)
4,849,948
491,383
–
167,532
Totals
$
129,116,869
$
3,676,949
$
(24,643,403
)
$
1,675,501
$
8,058,902
$
117,884,818
$
1,992,121
$
2,980,281
70
Ultra Series Fund | December 31, 2017
Notes to Financial Statements
Change in
Beginning
Realized
Unrealized
Capital Gains
Value as of
Gross
Gross
Gain
Appreciation
Value at
Dividend
Distributions
Fund/Underlying Fund
12/31/16
Additions
Sales
(Loss)
(depreciation)
12/31/17
Shares
Income
Received
Aggressive Allocation Fund
Madison Core Bond
Fund Class Y
$
8,731,473
$
550,000
$
(949,749
)
$
(26,690
)
$
88,176
$
8,393,210
841,003
$
215,742
$
2,692
Madison Dividend
Income Fund Class Y
11,654,618
450,663
(2,153,314
)
182,190
1,419,721
11,553,878
432,730
200,156
250,507
Madison Investors Fund
Class Y
11,533,445
641,588
(2,351,233
)
172,099
1,494,283
11,490,182
502,853
45,070
596,518
Madison Large Cap Value
Fund Class Y
4,671,810
432,864
(1,052,144
)
13,421
193,279
4,259,230
291,130
81,758
351,106
Madison Mid Cap Fund
Class Y
5,230,517
146,123
(1,652,777
)
221,426
284,870
4,230,159
428,588
–
146,123
Totals
$
41,821,863
$
2,221,238
$
(8,159,217
)
$
562,446
$
3,480,329
$
39,926,659
$
542,726
$
1,346,946
12. SUBSEQUENT EVENTS
All Matters
Management has evaluated the impact of all subsequent events on the funds through the date the financial statements were available for issue. No other events have taken place that meet the definition of subsequent event that require adjustment to, or disclosure, in the financial statements.
71
Ultra Series Fund | December 31, 2017
Report of Independent Registered Public Accounting Firm
To the Shareholders and Board of Trustees of Ultra Series Fund:
Opinion on the Financial Statements and Financial Highlights
We have audited the accompanying statements of assets and liabilities including the portfolios of investments of Conservative Allocation Fund, Moderate Allocation Fund, Aggressive Allocation Fund, Core Bond Fund, High Income Fund, Diversified Income Fund, Large Cap Value Fund, Large Cap Growth Fund, Mid Cap Fund, and International Stock Fund, (collectively, the “funds”), ten of fourteen portfolios constituting Ultra Series Fund (the “Trust”), as of December 31, 2017, the related statements of operations for the year then ended, the statements of changes in net assets for each of the two years in the period then ended, the financial highlights for each of the five years in the period then ended, and the related notes. In our opinion, the financial statements and financial highlights present fairly, in all material respects, the financial position of each of the respective portfolios of the Trust as of December 31, 2017, and the results of their operations for the year then ended, the changes in their net assets for each of the two years in the period then ended, and the financial highlights for each of the five years in the period then ended, in conformity with accounting principles generally accepted in the United States of America.
Basis for Opinion
These financial statements and financial highlights are the responsibility of the Trust’s management. Our responsibility is to express an opinion on the Trust’s financial statements and financial highlights based on our audits. We are a public accounting firm registered with the Public Company Accounting Oversight Board (United States) (PCAOB) and are required to be independent with respect to the Trust in accordance with the U.S. federal securities laws and the applicable rules and regulations of the Securities and Exchange Commission and the PCAOB.
We conducted our audits in accordance with the standards of the PCAOB. Those standards require that we plan and perform the audit to obtain reasonable assurance about whether the financial statements and financial highlights are free of material misstatement, whether due to error or fraud. The Trust is not required to have, nor were we engaged to perform, an audit of their internal control over financial reporting. As part of our audits we are required to obtain an understanding of internal control over financial reporting but not for the purpose of expressing an opinion on the effectiveness of the Trust’s internal control over financial reporting. Accordingly, we express no such opinion.
Our audits included performing procedures to assess the risks of material misstatement of the financial statements and financial highlights, whether due to error or fraud, and performing procedures that respond to those risks. Such procedures included examining, on a test basis, evidence regarding the amounts and disclosures in the financial statements and financial highlights. Our audits also included evaluating the accounting principles used and significant estimates made by management, as well as evaluating the overall presentation of the financial statements and financial highlights. Our procedures included confirmation of securities owned as of December 31, 2017, by correspondence with the custodian and brokers; when replies were not received from brokers, we performed other auditing procedures. We believe that our audits provide a reasonable basis for our opinion.
/s/ Deloitte & Touche, LLP
Chicago, IL February 22, 2018
We have served as the auditor of one or more affiliated investment companies of Ultra Series Fund since 2009.
72
Ultra Series Fund | December 31, 2017
Other Information (unaudited)
DISCUSSION OF CONTRACT RENEWAL PROCESS AND CONSIDERATIONS
At an in-person meeting of the Board held in July 2017, the Board of Trustees (the “Board” or “Trustees”) of Ultra Series Fund (the “Trust”), and by a separate vote, the Independent Trustees of the Trust, approved the continuance of the Investment Advisory Agreement (the “Agreement”) between the Trust and Madison Asset Management, LLC (the “Adviser”) with respect to the individual series of the Trust (each a “fund” and together, the “funds”) and the continuance of the Investment Sub-Advisory Agreement between the Adviser and Lazard Asset Management LLC (the “Subadviser”) with respect to International Stock Fund.
In determining whether to approve the continuation of the Investment Advisory Agreement and the Investment Sub-Advisory Agreement, the Adviser and Subadviser furnished information necessary for a majority of the Independent Trustees to make the determination that the continuance of the Agreements was in the best interests of the respective funds and their shareholders. The information provided to the Board included: (1) data comparing advisory fees and expense ratios of comparable investment companies; (2) comparative performance information; (3) the Adviser’s and its affiliates’ revenues and costs of providing services to the funds; and (4) information about the Adviser’s and Subadviser’s personnel. Prior to voting, the Independent Trustees reviewed the proposed continuance of the Investment Advisory Agreement and the Investment Sub-Advisory Agreement with management and independent legal counsel to the Independent Trustees and received materials from such counsel discussing the legal standards for their consideration of the proposed continuation of the Agreements. The Independent Trustees also reviewed the proposed continuation of the Investment Advisory Agreement and Investment Sub-Advisory Agreement with independent legal counsel in a private session at which no representatives of management were present. The Independent Trustees made a variety of additional inquiries regarding the written materials provided by the Adviser and the Subadviser, and representatives of the Adviser discussed with the Independent Trustees each of those additional inquiries at the July 2017 meeting.
In approving the continuance of the Investment Advisory Agreement and the Investment Sub-Advisory Agreement, the Board considered various factors, among them: (1) the nature, extent and quality of services provided by the Adviser and Subadviser to the funds, including the personnel providing such services; (2) the Adviser’s and Subadviser’s compensation and profitability; (3) a comparison of fees and performance with comparable funds and accounts; (4) economies of scale; and (5) the terms of the Investment Advisory Agreement and the Investment Sub-Advisory Agreement. The Board’s analysis of these factors is set forth below. The Independent Trustees were advised by independent legal counsel throughout the process.
Nature, Extent and Quality of Services. The Board reviewed a variety of materials provided by the Adviser and Subadviser in connection with the Board’s consideration of the renewal of the Trust’s Investment Advisory Agreement with the Adviser and the Investment Sub-Advisory Agreement with the Subadviser. The Board reviewed and considered a variety of fund specific information for each fund.
The Board reviewed the biographies and tenure of the personnel involved in Trust management and the experience of the Adviser (and Subadviser) and its affiliates as investment manager to other investment companies with similar investment strategies or to individual clients or institutions with similar investment strategies. They recognized the wide array of investment professionals employed by the respective firm or firms. Representatives of the Adviser and each Subadviser discussed or otherwise presented their respective firms’ ongoing investment philosophies and strategies intended to provide investment performance consistent with each fund’s investment objectives in a variety of market environments.
The Board also discussed the various administrative services provided by the Adviser. The Board took into account that these services included arranging for third-party service providers to provide all necessary fund administration as well as ongoing
73
Ultra Series Fund | December 31, 2017
Other Information (unaudited)
monitoring of the Subadviser. Based on their review of the information provided, the Independent Trustees determined with respect to each fund that the nature, extent and quality of services provided by the Adviser (and Subadviser) to the fund were satisfactory.
Fund Investment Performance. With regard to the investment performance of each fund, the Board reviewed current performance information provided in the written Board materials. They discussed the reasons for both outperformance and underperformance relative to the applicable peer groups, indices and benchmarks. They recognized that the usefulness of comparative performance data as a frame of reference to measure a fund’s performance may be limited because the performance peer group, among other things, may not precisely reflect the objectives and strategies of the fund, may have a different investable universe, or the composition of the peer group may be limited in size or number as well as other factors. They discussed the unique aspects of the securities markets applicable to particular funds so that the performance of any such funds could be reviewed in context.
The Trustees reviewed with the Adviser both long-term and short-term performance of each fund and considered the effect on long-term performance that may have been attributable to any previous portfolio managers to any fund or to a different investment strategy. They recognized that the performance data reflects a snapshot in time, in this case as of the end of the most recent calendar year or quarter. They took into account that a different performance period, however, could generate significantly different results. Further, they noted that long-term performance can be adversely affected by even one period of significant underperformance so that a single investment decision or theme has the ability to disproportionately affect long-term performance. The Board also noted that it reviews on a quarterly basis detailed information for each fund, including investment performance results, portfolio composition and investment philosophies, processes and strategies. They also considered whether any relative underperformance was appropriate in view of the Adviser’s conservative investment philosophy. The Board discussed the conservative investment philosophy implemented across certain funds and recognized the challenges to achieving relative outperformance given the unprecedented bull market. The Board noted the type of market environments that favor the funds’ strategies and discussed the funds’ performance in such market environments. The Board performed this review in connection with the Adviser and Subadviser. In connection with the review of the funds’ investment performance, the Board also engaged in a comprehensive discussion of market conditions and discussed the reasons for fund performance under such conditions. The equity funds participated reasonably well in a generally strong market environment, especially during the three and five year time periods, and captured less downside during market corrections. The equity funds generally employ strategies that assume lower risk than that of the aggregate market. Regarding the allocation funds, the Board noted the risk adjusted performance of all three allocation funds. With regard to fixed-income funds, the Board considered each fund’s relatively conservative investment philosophy and high-quality bias during a period of historically low interest rates and the relative risks to fixed-income funds in the current environment. The Board noted the USF Target Date Funds’ three and five year annualized returns and Sharpe ratio rankings. Representatives of the Adviser discussed with the Board the methodology for arriving at peer groups and indices used for performance comparisons. The Board also considered that sometimes the Morningstar categories the funds fall into do not precisely match a fund’s investment strategy and philosophy. Based on their review, the Independent Trustees determined that, given the totality of the above factors and considerations, each fund’s overall investment performance had been satisfactory.
Costs and Profitability. With regard to the costs of the services to be provided and the profits to be realized by the Adviser and its affiliates from the relationship with the Trust, the Board reviewed the expense ratios for comparable funds in each fund’s peer group. The Board reviewed these matters with respect to the Adviser and the Subadviser.
The Board noted that the Adviser or its affiliates, and, as applicable, Subadviser, provided investment management services to other investment company and/or non-investment company clients and considered the fees charged by the Adviser (and
74
Ultra Series Fund | December 31, 2017
Other Information (unaudited)
Subadviser) to such funds and clients for purposes of determining whether the given advisory fee was disproportionately large under the legal standard traditionally used by investment company boards in connection with contract renewal considerations. The Board took those fees into account and considered the differences in services and time required by the various types of funds and clients to which the Adviser (or Subadviser, if applicable) provided services. The Board recognized that significant differences may exist between the services provided to one type of fund or client and those provided to others, such as those resulting from a greater frequency of shareholder redemptions in a mutual fund and the higher portfolio turnover rates typically experienced by mutual funds. The Board gave such comparisons the weight that they merit in light of the similarities and differences between the services that the various funds require. They considered that, if the services rendered by the Adviser (or Subadviser, if applicable) to one type of fund or client differed significantly from others, then the comparison should be given less weight. In the case of non-investment company clients for which the Adviser (or Subadviser, if applicable) may act as either investment adviser or Subadviser, the Board noted that the fee may be lower than the fee charged to the Trust. The Board also noted the various administrative, operational, compliance, legal and corporate communication services required to be handled by the Adviser (or Subadviser, if applicable) which are performed for investment company clients but are not typically performed for non-investment company clients.
The Trustees compared each fund’s total expense ratio and advisory fee to those of comparable funds with similar investment objectives and strategies. The Board noted the simple expense structure maintained by the Trust: (1) an advisory fee and a capped administrative “services” expense for the USF Target Retirement Date Funds, and (2) for the remaining series of the Trust, a unitary fee with limited independent expenses for Trustee compensation and audit fees not covered by the unitary fee (“Unitary Fee”). The Board noted that so long as substantially all of the assets of a USF Target Retirement Date Fund are invested in a corresponding Goldman Sachs Target Retirement Portfolio, no Advisory or Service fee would be payable directly by such fund. The Board reviewed total expense ratios paid by other funds with similar investment strategies, recognizing that such a comparison, while not dispositive, was an important consideration.
The Trustees sought to ensure that fees paid by the funds were appropriate. The Board reviewed materials demonstrating that although the Adviser is compensated for a variety of the administrative services it provides or arranges to provide to the funds pursuant to its administrative services agreement with the Trust (“Services Agreement”), such compensation does not always cover all costs because the Services Agreement effectively acts as a cap on administrative expenses. Therefore, the Board recognized that any administrative, operational, regulatory or compliance fees or costs in excess of the Services Agreement fees, in the case of the USF Target Date Funds, or in excess of the Unitary Fee, in the case of the remaining series, are paid by the Adviser from investment advisory fees earned. In this regard, the Trustees noted that examination of each fund portfolio’s total expense ratio compared to those of other investment companies was more meaningful than a simple comparison of basic “investment management only” fee schedules.
The Board recognized that to the extent a fund invests in other mutual funds managed by the Adviser (or its affiliates), the Adviser (or an affiliate) receives investment advisory fees from both the fund and the underlying mutual fund. The Board was satisfied in this regard that the Adviser (or an affiliate) provides separate services to the Trust’s “fund of funds” portfolios and the underlying mutual funds in which each such fund invests in exchange for the fees received from them (except as noted above with respect to the USF Target Retirement Date Funds which do not pay any advisory or service fees directly so long as invested in corresponding Goldman Sachs Target Retirement Portfolio).
The Board noted that for some smaller funds, the salaries of all portfolio management personnel, trading desk personnel, corporate accounting personnel and employees of the Adviser who serve as Trust officers, as well as facility costs (e.g., rent, etc.), could not be supported by fees received from such funds alone. However, the Board recognized that the Trust is profitable to the Adviser because such salaries and fixed costs are already paid in whole or in part from revenue generated by
75
Ultra Series Fund | December 31, 2017
Other Information (unaudited)
management of other client assets managed by the Adviser, including the Trust as one of a consolidated family of investment companies. The Trustees noted that total assets managed by the Adviser and its affiliates of approximately $16 billion at the time of the meeting. As a result, although the fees paid by an individual fund at its present size might not be sufficient to profitably support a stand-alone fund, the Trust is reasonably profitable to the Adviser as part of its larger, diversified organization. In sum, the Trustees recognized that the Trust is important to the Adviser and is managed with the attention given to the Adviser’s other clients.
Based on the foregoing, the Independent Trustees concluded that the level of profitability to the Adviser and its affiliates was reasonable in light of the services provided. In considering the profitability of the Subadviser, the Board noted that the Sub-advisory fees payable under the Investment Sub-Advisory Agreement were paid by the Adviser out of the fees that it receives under the Investment Advisory Agreement and were negotiated by the Adviser at arm’s length. As a consequence, the profitability to each Subadviser of its relationship with the applicable fund was not a substantial factor in the Board’s deliberations.
Economies of Scale. With regard to the extent to which economies of scale would be realized as each fund’s assets increase, the Trustees recognized that at their current asset levels, it was premature to discuss any economies of scale not already factored into the compensation payable under Investment Advisory (Agreement) and Services Agreement. In addition, the Trustees recognized that the Adviser was currently waiving fees (pursuant to its Investment Advisory Agreement, with respect to the Conservative, Moderate and Aggressive Allocation Funds). Further, as noted above with respect to the USF Target Retirement Date Funds, so long as such funds invest substantially all of their assets in the corresponding Goldman Sachs Target Retirement Portfolio, no advisory or service fee shall be payable directly by those funds. Based on their review, the Independent Trustees concluded that the fee arrangements and waivers (as applicable) were acceptable. Because the Adviser pays the Subadviser’s sub-advisory fees and those fees are negotiated at arm’s length by the Adviser, the Board did not consider the potential economies of scale in the Subadviser’s management of the International Stock Fund to be a material factor in its consideration.
The Board recognized that another method to help ensure the shareholders share in any economies of scale is to include breakpoints in the advisory fee schedules. Based on their review, the Independent Trustees concluded that the current advisory fee schedules and fee arrangements and waivers (as applicable) were appropriate and reflect economies of scale to be shared with shareholders when assets under management increase. In considering the economies of scale experienced by the Subadviser, the Board noted that the sub-advisory fees payable under the Investment Sub-Advisory Agreement were paid by the Adviser out of the fees that it receives under the Investment Advisory Agreement and were negotiated by the Adviser at arm’s length. As a consequence, the Board did not consider the potential economies of scale in the Subadviser’s management of the International Stock Fund to be a substantial factor in its deliberations, although the Board noted that the sub-advisory fee schedule for the fund managed by Lazard Asset Management contained a breakpoint that would reduce the sub-advisory fee rate on assets above specified levels as the fund’s assets increased.
In the course of their review of the contract renewal materials, the Board also reviewed and discussed with counsel the “Rule 12b-1” plans adopted by certain funds. Advisory personnel directed the Board to the written materials regarding these matters during the course of the Board’s consideration of the Rule 12b-1 plans. Finally, the Board also reviewed the Trust’s distribution agreements and the information provided in the written materials regarding the distributor.
Conclusions. In considering the renewal of the funds’ Investment Advisory Agreement with the Adviser, the Board, including the Independent Trustees, did not identify any single factor as controlling, and each Trustee may have attributed different weights to the various factors. The Trustees evaluated all information available to them on a fund-by-fund basis, and their
76
Ultra Series Fund | December 31, 2017
Other Information (unaudited)
determinations were made separately with respect to each fund. The Board reached the following conclusions regarding each fund’s Investment Advisory Agreement, among others: (a) the Adviser demonstrated that it possesses the capability and resources to perform the duties required of it under the Investment Advisory Agreement; (b) the Adviser is qualified to manage the fund’s assets in accordance with the fund’s investment objective and strategies; (c) the overall investment performance of the fund is satisfactory relative to the performance of funds with similar investment objectives and relevant indices and benchmarks; (d) the fund’s advisory fee is reasonable in light of the services received by the fund from the Adviser and other factors considered; and (e) the Adviser’s investment strategies are appropriate for pursuing the investment objectives of the fund. Based on the foregoing conclusions, the Trustees determined with respect to each fund that continuation of the Investment Advisory Agreement with the Adviser was in the best interests of the fund and its shareholders.
In considering the renewal of the Investment Sub-Advisory Agreement with respect to the Subadviser, the Board, including the Independent Trustees, did not identify any single factor as controlling, and each Trustee may have attributed different weights to the various factors. The Board reached the following conclusions regarding the International Stock Fund’s Investment Sub-Advisory Agreement, among others: (a) the Subadviser demonstrated that it possesses the capability and resources to perform the duties required of it under the Agreement; (b) the Subadviser is qualified to manage the fund’s assets in accordance with the fund’s investment objectives and policies; (c) the overall investment performance of the fund is satisfactory relative to the performance of funds with similar investment objectives and relevant indices and benchmarks; (d) the fund’s sub-advisory fee is reasonable in light of the services received by the fund from the Subadviser; and (e) the Subadviser’s investment strategies are appropriate for pursuing the investment objectives of the fund. Based on the foregoing conclusions, the Board determined that approval of the International Stock Fund’s Investment Sub-Advisory Agreement with the Subadviser was in the best interests of the fund and its shareholders.
77
Ultra Series Fund | December 31, 2017
Other Information (unaudited)
FUND EXPENSES PAID BY SHAREHOLDERS
As a shareholder of the funds, you pay no transaction costs, but do incur ongoing costs which include management fees; 12b-1 fees (Class II only); disinterested trustee fees and expenses; brokerage commissions and other expenses incurred in connection with the acquisition or disposition of investments; costs of borrowing money; expenses for independent audits, taxes, and extraordinary expenses as approved by a majority of the disinterested trustees. The examples in the table that follows are intended to help you understand your ongoing costs (in dollars) of investing in the funds and to compare these costs with the ongoing costs of investing in other mutual funds.
The examples below are based on an investment of $1,000 invested for the six-month period ended December 31, 2017. Expenses paid during the period in the table below are equal to each fund’s annualized expense ratio, multiplied by the average account value over the period, multiplied by 184/365 (to reflect the one-half fiscal year period).
Actual Expenses
The table below provides information about actual account values using actual expenses and actual returns for the funds. You may use the information in this table, together with the amount you invested, to estimate the expenses that you paid over the period. Simply divide your account value by $1,000 (for example, an $8,600 account value divided by $1,000 = 8.6), then multiply the result by the number in the table for the fund you own under the heading entitled “Expenses Paid During Period” to estimate the expenses you paid on your account during this period.
CLASS I
CLASS II
Fund
Beginning Account Value
Ending Account Value
Annual Expense Ratio
Expenses Paid During Period
Ending Account Value
Annual Expense Ratio
Expenses Paid During Period
Conservative Allocation*
$1,000
$1,047.30
0.22%
$1.19
$1,046.00
0.47%
$2.48
Moderate Allocation*
1,000
1070.70
0.22%
1.20
1069.40
0.47%
2.50
Aggressive Allocation*
1,000
1089.10
0.22%
1.21
1087.70
0.47%
2.53
Core Bond
1,000
1010.30
0.57%
2.94
1009.00
0.82%
4.20
High Income
1,000
1019.50
0.77%
3.97
1018.20
1.02%
5.24
Diversified Income
1,000
1077.70
0.72%
3.82
1076.30
0.97%
5.13
Large Cap Value
1,000
1111.10
0.62%
3.35
1109.70
0.87%
4.68
Large Cap Growth
1,000
1101.80
0.82%
4.40
1100.40
1.07%
5.66
Mid Cap
1,000
1097.60
0.92%
4.92
1096.20
1.17%
6.18
International Stock
1,000
1095.90
1.17%
6.23
1094.50
1.42%
7.55
Hypothetical Example for Comparison Purposes
The table below provides information about hypothetical account values and hypothetical expenses based on the funds’ actual expense ratios and an assumed rate of return of 5% per year before expenses, which are not the funds’ actual returns. The hypothetical account values and expenses may not be used to estimate the actual ending account balance or expenses you paid for the period. You may use this information to compare the ongoing costs of investing in the funds and other funds. To do so, compare the 5% hypothetical example of the funds you own with the 5% hypothetical examples that appear in the shareholder reports of other similar funds.
78
Ultra Series Fund | December 31, 2017
Other Information (unaudited)
CLASS I
CLASS II
Fund
Beginning Account Value
Ending Account Value
Annual Expense Ratio
Expenses Paid During Period
Ending Account Value
Annual Expense Ratio
Expenses Paid During Period
Conservative Allocation*
$1,000
$1,024.05
0.22%
$1.17
$1,022.79
0.47%
$2.45
Moderate Allocation*
1,000
1024.05
0.22%
1.17
1022.79
0.47%
2.45
Aggressive Allocation*
1,000
1024.05
0.22%
1.17
1022.79
0.47%
2.45
Core Bond
1,000
1022.28
0.57%
2.96
1021.02
0.82%
4.23
High Income
1,000
1021.27
0.77%
3.97
1020.01
1.02%
5.24
Diversified Income
1,000
1021.53
0.72%
3.72
1020.27
0.97%
4.99
Large Cap Value
1,000
1022.03
0.62%
3.21
1020.77
0.87%
4.48
Large Cap Growth
1,000
1021.02
0.82%
4.23
1019.81
1.07%
5.45
Mid Cap
1,000
1020.52
0.92%
4.74
1019.31
1.17%
5.96
International Stock
1,000
1019.26
1.17%
6.01
1018.00
1.42%
7.27
*The annual expense ratio does not include the expenses of the Underlying Funds.
Please note that the expenses shown in the table are meant to highlight your ongoing costs only and do not reflect any separate account fees, charges, or expenses imposed by the variable annuity or variable life insurance contracts, or retirement and pension plans that use the funds. The information provided in the hypothetical example table is useful in comparing ongoing fund costs only, and will not help you determine the relative total costs of owning different funds. In addition, if these fees, charges or expenses were included, your costs would have been higher.
AVAILABILITY OF QUARTERLY PORTFOLIO SCHEDULES
The Trust files its complete schedule of portfolio holdings with the SEC for the first and third quarters of each fiscal year on Form N-Q. Form N-Q is available to shareholders at no cost by calling 1-800-877-6089, or on the SEC’s website at www. sec.gov. Form N-Q may also be reviewed and copied at the Commission’s Public Reference Room in Washington, DC. More information on the operation of the Public Reference Room may be obtained by calling 1-800-SEC-0330. Form N-Q and other information about the Trust are available on the EDGAR database on the SEC’s Internet site at www.sec.gov. Copies of this information may also be obtained, upon payment of a duplicating fee, by electronic request at the following email address: publicinfo@sec.gov, or by writing the SEC’s Public Reference Section, Washington, DC 20549-0102.
PROXY VOTING POLICIES, PROCEDURES AND RECORDS
A description of the policies and procedures used by the Trust to vote proxies related to portfolio securities is available to shareholders at no cost by calling 1-800-877-6089, or on the SEC’s website at www.sec.gov and is also located in the funds’ Statement of Additional Information. The proxy voting records for the Trust for the most recent twelve-month period ended June 30 are available to shareholders at no cost on the SEC’s website at www.sec.gov.
FORWARD-LOOKING STATEMENT DISCLOSURE
One of our most important responsibilities as investment company managers is to communicate with shareholders in an open and direct manner. Some of our comments in the Period in Review are based on current management expectations and are considered “forward-looking statements.” Actual future results, however, may prove to be different from our expectations. You can identify forward-looking statements by words such as “estimate,” “may,” “will,” “expect,” “believe,” “plan” and other similar terms. We cannot promise future returns. Our opinions are a reflection of our best judgment at the time this report is compiled, and we disclaim any obligation to update or after forward-looking statements as a result of new information, future events, or otherwise.
79
Ultra Series Fund | December 31, 2017
Other Information (unaudited)
TAX INFORMATION
Foreign Tax Credit: The International Stock Fund expects to make an election under Internal Revenue Code Section 853 to pass through foreign taxes paid by the funds to their shareholders. For the year ended December 31, 2017 the total amount of foreign taxes that is expected to pass through to shareholders and foreign source income for reporting purposes will be $95,364(all of which represent taxes withheld) and $1,097,424, respectively
Corporate Dividends Received Deduction: For the taxable year ended December 31, 2017, the following percentage of income dividends paid by the fund qualify for the dividends received deduction available to corporations:
Fund
Percentage
Conservative Allocation
6.17
%
Moderate Allocation
11.12
%
Aggressive Allocation
13.28
%
Diversified Income
60.42
%
Large Cap Value
95.62
%
Large Cap Growth
100.00
%
Mid Cap
100.00
%
80
Ultra Series Fund | December 31, 2017
Ultra Series Fund’s Trustees and Officers
The address of each Trustee and officer is 550 Science Drive, Madison, Wisconsin 53711. The Statement of Additional Information, which includes additional information about the Trustees and officers, is available upon request at no cost on the SEC’s website at www.sec.gov or by calling CMFG Life Insurance Company at 1-800-798-5500.
Interested Trustees and Officers
Name and Year of Birth
Position(s) and Length of Time Served
Principal Occupation(s) During Past Five Years
Portfolios Overseen in Fund Complex by Director/Trustee1
Other Directorships Held by Director/ Trustee
Katherine L. Frank2 1960
Trustee and President, 2009 - Present
Madison Investment Holdings, Inc. (“MIH”) (affiliated investment advisory firm of Madison), Executive Committee Member and Chief Operating Officer, 2010 - Present; Managing Director and Vice President, 1986 - 2010
Madison Asset Management, LLC (“Madison”), Executive Committee Member and Chief Operating Officer, 2010 - Present; Vice President, 2004 - 2010
Madison Investment Advisors, LLC (“MIA”) (affiliated investment advisory firm of Madison), Executive Committee Member and Chief Operating Officer, 2010 - Present; President, 1996 - 2010
Madison Funds (18) (mutual funds), President, 2009 - Present
Madison Strategic Sector Premium Fund (closed end fund), President, 2005 - Present; Madison Covered Call & Equity Strategy Fund (closed end fund), President, 2012 - Present
32
Madison Funds (18), 2009 - Present
Madison Strategic Sector Premium Fund, 2005 - 2017
Jay R. Sekelsky 1959
Vice President, 2009 - December 2017*
MIH, Executive Committee Member and Chief Investment Officer, 2010 - Present; Managing Director and Vice President, 1990 - 2010
Madison, Executive Committee Member and Chief Investment Officer, 2010 - Present
MIA, Executive Committee Member and Chief Investment Officer, 2010 - Present; Vice President, 1996 - 2010
Madison Strategic Sector Premium Fund, Vice President, 2005 - December 2017; Madison Covered Call & Equity Strategy Fund, Vice President, 2012 - December 2017; Madison Funds (18), Vice President, 2009 - December 2017
N/A
N/A
1
As of the date of this report, the fund complex consists of Madison Funds with 18 portfolios, the Ultra Series Fund with 14 portfolios, the Madison Strategic Sector Premium Fund (a closed-end fund) and the Madison Covered Call & Equity Strategy Fund (closed end fund), for a grand total of 34 separate portfolios in the fund complex. Not every Trustee is a member of the Board of Trustees of every fund in the fund complex, as noted above. References to the “Fund Complex” in the following tables have the meaning disclosed in this paragraph.
2
“Interested person” as defined in the 1940 Act. Considered an interested Trustee because of the position held with the investment adviser of Madison Funds.
*
Effective as of December 31, 2017, Mr. Sekeleky resigned as an officer of the fund.
81
Ultra Series Fund | December 31, 2017
Ultra Series Fund’s Trustees and Officers
Name and Year of Birth
Position(s) and Length of Time Served
Principal Occupation(s) During Past Five Years
Portfolios Overseen in Fund Complex by Director/Trustee1
Other Directorships Held by Director/ Trustee
Paul A. Lefurgey 1964
Vice President, 2009 - Present
MIH, Madison and MIA, CEO, 2017 - Present; Chairman - Executive Committee, 2015 - 2017; Director of Fixed Income Investments, 2016 - Present; Executive Director and Head of Fixed Income Investments, 2013 - 2016; Managing Director and Head of Fixed Income Investments, 2005 - 2013
Madison Strategic Sector Premium Fund, Vice President, 2010 - Present; Madison Covered Call & Equity Strategy Fund, Vice President, 2012 - Present; Madison Funds (18), Vice President, 2009 - Present
Madison Strategic Sector Premium Fund, Secretary and Assistant Treasurer, 2010 - Present; Madison Covered Call & Equity Strategy Fund, Secretary and Assistant Treasurer, 2012 - Present; Madison Funds (18), Secretary, 1999-Present and Treasurer, 2008-2009 and Assistant Treasurer, 1997-2007 and 2009 - Present
N/A
N/A
1
As of the date of this report, the fund complex consists of Madison Funds with 18 portfolios, the Ultra Series Fund with 14 portfolios, the Madison Strategic Sector Premium Fund (a closed-end fund) and the Madison Covered Call & Equity Strategy Fund (closed end fund), for a grand total of 34 separate portfolios in the fund complex. Not every Trustee is a member of the Board of Trustees of every fund in the fund complex, as noted above. References to the “Fund Complex” in the following tables have the meaning disclosed in this paragraph.
82
Ultra Series Fund | December 31, 2017
Ultra Series Fund’s Trustees and Officers
Name and Year of Birth
Position(s) and Length of Time Served
Principal Occupation(s) During Past Five Years
Portfolios Overseen in Fund Complex by Director/Trustee1
Other Directorships Held by Director/ Trustee
Kevin S. Thompson 1966
Chief Legal Officer and Assistant Secretary, 2017 - Present
Chief Compliance Officer, January 2018 - Present
MIH, MIA and Madison, Chief Legal Officer and Chief Administrative Officer, 2017 - Present; Chief Compliance Officer, January 2018 - Present
Madison Funds (18), Madison Strategic Sector Premium Fund and Madison Covered Call & Equity Strategy Fund, Chief Legal Officer and Assistant Secretary, 2017 - Present; Chief Compliance Officer, January 2018 - Present
CFMG Life Insurance Company, Associate General Counsel, 2012 - 2015; Vice President Wealth Management, 2015 - 2017; President of CBSI 2016 - 2017
N/A
N/A
Lisa R. Lange 1969
Chief Compliance Officer and Assistant Secretary, 2015 - January 2018*
MIH, MIA and Madison, Chief Compliance Officer, 2015 - January 2018 and Chief Legal Officer, 2015 - 2017
NorthRoad Capital Management LLC (“NorthRoad”) (former affiliated investment advisory firm of Madison), Chief Compliance Officer and Chief Legal Officer April 2015 - September 2016
Madison Funds (18), Madison Strategic Sector Premium Fund and Madison Covered Call & Equity Strategy Fund, Chief Compliance
Officer and Assistant Secretary, 2015 - Present and Chief Legal Officer 2015 - 2017
As of the date of this report, the fund complex consists of Madison Funds with 18 portfolios, the Ultra Series Fund with 14 portfolios, the Madison Strategic Sector Premium Fund (a closed-end fund) and the Madison Covered Call & Equity Strategy Fund (closed end fund), for a grand total of 34 separate portfolios in the fund complex. Not every Trustee is a member of the Board of Trustees of every fund in the fund complex, as noted above. References to the “Fund Complex” in the following tables have the meaning disclosed in this paragraph.
*
Effective as of January 19, 2018, Ms. Lange resigned as Chief Compliance Officer of the fund.
83
Ultra Series Fund | December 31, 2017
Ultra Series Fund’s Trustees and Officers
Independent Trustees
Name and Year of Birth
Position(s) and Length of Time Served1
Principal Occupation(s) During Past Five Years
Portfolios Overseen in Fund Complex by Director/ Trustee2
Other Directorships Held by Director/Trustee
James R. Imhoff, Jr. 1944
Trustee, 2009 - Present
First Weber, Inc. (real estate brokers), Madison, WI, Chief Executive Officer, 1996 - July 2017 and Chairman July 2017 - Present
34
Park Bank, 1978 - Present
First Weber, Inc., 2017 - Present
Madison Funds (18), 2009 - Present; Madison Strategic Sector Premium Fund, 2005 - Present; Madison Covered Call & Equity Strategy Fund, 2005 - Present
Independent Trustees serve in such capacity until the age of 76, unless retirement is waived by unanimous vote of the remaining Trustees on an annual basis.
2
As of the date of this report, the fund complex consists of Madison Funds with 18 portfolios, the Ultra Series Fund with 14 portfolios, the Madison Strategic Sector Premium Fund (a closed-end fund) and the Madison Covered Call & Equity Strategy Fund (closed end fund), for a grand total of 34 separate portfolios in the fund complex. Not every Trustee is a member of the Board of Trustees of every fund in the fund complex, as noted above. References to the “Fund Complex” in the preceding tables have the meaning disclosed in this paragraph.
SEC File Number: 811-04815
84
a123.htm - Generated by SEC Publisher for SEC Filing
Annual Report
December 31, 2017
Ultra Series Madison Target Retirement 2020 Fund
Ultra Series Madison Target Retirement 2030 Fund
Ultra Series Madison Target Retirement 2040 Fund
Ultra Series Madison Target Retirement 2050 Fund
Ultra Series Fund | December 31, 2017
Table of Contents
Page
Management’s Discussion of Fund Performance
2
Period in Review
2
Madison Target Retirement 2020 Fund
3
Madison Target Retirement 2030 Fund
3
Madison Target Retirement 2040 Fund
4
Madison Target Retirement 2050 Fund
5
Notes to Management’s Discussion of Fund Performance
6
Portfolios of Investments
Madison Target Retirement 2020 Fund
7
Madison Target Retirement 2030 Fund
7
Madison Target Retirement 2040 Fund
7
Madison Target Retirement 2050 Fund
7
Financial Statements
Statements of Assets and Liabilities
8
Statements of Operations
9
Statements of Changes in Net Assets
10
Financial Highlights for a Share of Beneficial Interest Outstanding
11
Notes to Financial Statements
12
Report of Independent Registered
Public Accounting Firm
17
Other Information
18
Trustees and Officers
25
Nondeposit investment products are not federally insured, involve investment risk, may lose value and are not obligations of or guaranteed by any financial institution. For more complete information about Ultra Series Fund, including charges and expenses, request a prospectus from your plan administrator or call CUNA Mutual Retirement Solutions at 1-800-999-8786. Consider the investment objectives, risks, and charges and expenses of any fund carefully before investing. The prospectus contains this and other information about the investment company. For more current Ultra Series Fund performance information, please call 1-800-670-3600. Current performance may be lower or higher than the performance data quoted within. Past performance does not guarantee future results. Nothing in this report represents a recommendation of a security by the investment adviser. Portfolio holdings may have changed since the date of this report.
1
Ultra Series Fund | December 31, 2017
Management’s Discussion of Fund Performance (unaudited)
Period in Review
The fourth quarter capped a perfect year for stock investors as the S&P 500® Index delivered positive returns every month in 2017, a first based on data going back to 1928. Although bond returns were mixed during the quarter, results were positive for the year despite the Federal Reserve (Fed) increasing short-term interest rates three times over the last twelve months. During the fourth quarter, the S&P 500® gained 6.64%, the Russell Midcap® Index rose 6.07% and the MSCI EAFE® (net) Index advanced 4.23% (3.66% excluding currency effect). The Bloomberg Barclays Intermediate Government/Credit Index declined 0.20% while the Bloomberg Barclays Aggregate Index gained 0.39% during the quarter. Equity market returns for 2017 were outstanding as the S&P 500® Index returned 21.83%, the Russell Midcap® Index advanced 18.52% and the MSCI EAFE® (net) Index gained 25.03% (15.23% excluding currency effect). Bond performance was also positive during 2017 as the Bloomberg Barclays Intermediate Government/Credit Index gained 2.14% and the Bloomberg Barclays Aggregate Index advanced 3.54% for the year.
A year ago we opined that, with asset values stretched, economic and earnings growth would likely be necessary to support continued gains in the equity markets. This occurred during 2017 as both global economic activity and company earnings not only grew but accelerated into year-end. All 35 OECD (Organization for Economic Cooperation and Development) countries reported positive economic growth during 2017 for the first time since 2007. S&P 500® company earnings reached all-time highs and, with the recent tax cut, expectations are that earnings will grow another 16% in 2018.
Concerns over an unpredictable government administration caused little concern for the markets as the administration’s business-friendly reduction in regulations and tax cuts spawned optimism that long-missing business spending may soon materialize. The resilience of the equity market was impressive as it surged in the face of geopolitical turmoil, dysfunction in Washington and natural disasters. In fact, the largest pull-back in the market during the year was just 3%.
During the fourth quarter, real U.S. Gross Domestic Product (GDP) growth for the third quarter was revised to 3.2%, marking the second consecutive quarter of 3%+ growth. The unemployment rate fell again in the fourth quarter to 4.1%, the lowest rate since December of 2000, and manufacturing continued to grow, driven by renewed strength in the global economy and a weak U.S. dollar. The United States has now added jobs for 86 straight months, the longest streak on record. While wage increases have been modest, household income – which includes not only hourly wages but also hours worked – has shown strong gains. Companies are now reveling in the best opportunities they have seen in years. Strong profit growth was reported in all sectors, although Energy, Materials and Technology companies recorded the strongest gains. Overall earnings growth of the S&P 500® companies was near 10% for the year, with top-line sales growth of over 6%. Although 10% earnings growth was impressive, it didn’t keep pace with the 20% advance of the S&P 500® Index, implying that rich stock valuations got even richer during the period.
As the second longest bull market on record continues to push ahead, it’s likely that a few factors may change in 2018 – inflation, interest rates and monetary policy. In December, the Fed boosted its target Federal Funds rate range by 0.25% (up to 1.25% to 1.5%) and projected three additional hikes in 2018. While rising short-term rates didn’t deter the stock market in 2017, it’s likely that some level of interest rates may entice investors back to a “guaranteed” rate of return. With the S&P 500® trading at approximately 20 times earnings, the earnings yield is 5% (the inverse of P/E or 1/20) and we suspect that the closer to this level interest rates rise, the closer we may be to a “tipping point” for investors favoring bonds over stocks. As we’ve highlighted in previous letters, timing the market is nearly impossible to do with any degree of accuracy, as a slight mistiming can wreak havoc on investor returns. With this in mind, we continue to believe that stocks of lower-risk, higher-quality companies, along with shorter-duration, higher-quality bonds, will allow investors to participate in the market and provide some shelter should volatility return to more typical levels.
2
Ultra Series Fund | Management’s Discussion of Fund Performance (unaudited) - continued | December 31, 2017
MADISON TARGET RETIREMENT 2020 FUND
INVESTMENT STRATEGY HIGHLIGHTS
The Ultra Series Madison Target Retirement 2020 Fund invests primarily in shares of registered investment companies according to an asset allocation strategy developed by the Fund’s investment adviser for investors planning to retire in or within a few years of 2020. Over time, the Fund’s asset allocation will gradually shift until it reaches the more conservative allocation target of approximately 10-30% in stock funds and 70-90% in bond funds. The asset allocation strategy is designed to reduce the volatility of investment returns in the later years while still providing the potential for higher total returns over the target period.
PERFORMANCE
The Ultra Series Madison Target Retirement 2020 Fund returned 8.34% in the 12-month period, underperforming the S&P Target Date® To 2020 Index which returned 11.16%, and the Morningstar Target Date 2020 Category peer group which returned 12.39%.
For the first time in history, the S&P 500® Index produced a positive return in all 12 calendar months for 2017. Overall, the streak stands at 14 consecutive positive months as of 12/31/2017. Just as noteworthy, if not more so, has been the vanishing of market volatility. The trailing one-year standard deviation of the Index stood at 4% versus the long-term average of roughly 14.5%. Given our conservative DNA, we are quite pleased with how well the Fund kept pace over what has been a remarkable run in the global equity markets. Overall, the Fund captured 91% of the benchmark’s return for the year. A timely move toward international equities late in 2016 was the most notable contributor to 2017 performance as foreign stocks outperformed. Other positives included relative overweight allocations to U.S. growth stocks, European equities and long-term Treasuries. A modest underweight to equities overall, and overweight allocations to U.S. mid cap stocks, hedged Japanese equities and intermediate-term treasuries were the largest detractors from performance.
Years of consistently low U.S. inflation have provided the Fed with the justification and conviction to provide massive levels of monetary stimulus. Importantly, this has been true in terms of both scale and longevity. The Fed’s primary goal since the 2007-09 global financial crisis has been to “reflate” and stimulate the real economy. In reality, the Fed has instead been more successful at “inflating” the value of virtually all investment asset classes. The median U.S. stock, for example, is now trading near all-time record high valuation levels relative to both current and (normalized) long-term earnings. In our view, this level of valuation extreme is not justified given the elevated levels of uncertainty that both global economies (unprecedented debt levels) and established companies (pervasive disruption risk) are facing. Our perspective, then, is that today’s “concocted” increase in asset class valuations is not primarily based on prospects for improving economic fundamentals but rather the cumulative influence of pervasive liquidity and historically low interest rates on investor confidence and financial leverage.
It may sound like a broken record, but our portfolio strategies remain primarily focused on capital preservation. Incremental allocations continue to focus on international equities. In our view, the best investment values continue to be found in high quality U.S. and international large-cap equities, equities with links to commodities (especially oil) and high quality bonds. We believe that lower-quality, higher-risk asset classes are overpriced; our expectation is that the gradual removal of global central bank accommodation, currently scheduled to accelerate in 2018 (led by the Fed), could very well begin to normalize at least some of these extraordinary valuations.
Finally, global debt levels remain elevated and are also near record amounts relative to GDP. Inflationary pressures are slowly building, which could put some modest upward pressure on interest rates. Accordingly, we are making greater use of Treasury Inflation-Protected Securities (TIPS). However, we believe that any upward trajectory in interest rates will be constrained due to the extraordinary levels of global debt.
We are confident the Fund remains well-positioned for a growth-challenged global economy. We also understand and embrace our ongoing responsibility to insightfully differentiate between attractive and less attractive asset classes as we strive to deliver superior risk-adjusted returns. As always, we sincerely appreciate your support.
Average Annual Total Return (%) through December 31, 20171,2
1 Year
3 Years
5 Years
10 Years
Ultra Series Madison Target Retirement 2020
8.34
4.49
6.28
3.31
S&P Target Date® To 2020 Index
11.16
5.74
6.70
4.73
See accompanying Notes to Management’s Discussion of Fund Performance.
MADISON TARGET RETIREMENT 2030 FUND
INVESTMENT STRATEGY HIGHLIGHTS
The Ultra Series Madison Target Retirement 2030 Fund invests primarily in shares of registered investment companies according to an asset allocation strategy developed by the Fund’s investment adviser for investors planning to retire in or within a few years of 2030. Over time, the Fund’s asset allocation will gradually shift until it reaches the more conservative allocation target of approximately 10-30% in stock funds and 70-90% in bond funds. The asset allocation strategy is designed to reduce the volatility of investment returns in the later years while still providing the potential for higher total returns over the target period.
PERFORMANCE
The Ultra Series Madison Target Retirement 2030 Fund returned 13.18% in the 12-month period, underperforming the S&P Target Date® To 2030 Index, which returned 14.76%, and the Morningstar Target Date 2030 Category peer group, which returned 16.17%.
For the first time in history, the S&P 500® Index produced a positive return in all 12 calendar months for 2017. Overall, the streak stands at 14 consecutive positive months as of 12/31/2017. Just as noteworthy, if not more so, has been the vanishing
3
Ultra Series Fund | Management’s Discussion of Fund Performance (unaudited) - continued | December 31, 2017
of market volatility. The trailing one-year standard deviation of the Index stood at 4% versus the long-term average of roughly 14.5%. Given our conservative DNA, we are quite pleased with how well the Fund kept pace over what has been a remarkable run in the global equity markets. Overall, the Fund captured 91% of the benchmark’s return for the year. A timely move toward international equities late in 2016 was the most notable contributor to 2017 performance as foreign stocks outperformed. Other positives included relative overweight allocations to U.S. growth stocks, European equities and long-term Treasuries. A modest underweight to equities overall, and overweight allocations to U.S. mid cap stocks, hedged Japanese equities and intermediate-term treasuries were the largest detractors from performance.
Years of consistently low U.S. inflation have provided the Fed with the justification and conviction to provide massive levels of monetary stimulus. Importantly, this has been true in terms of both scale and longevity. The Fed’s primary goal since the 2007-09 global financial crisis has been to “reflate” and stimulate the real economy. In reality, the Fed has instead been more successful at “inflating” the value of virtually all investment asset classes. The median U.S. stock, for example, is now trading near all-time record high valuation levels relative to both current and (normalized) long-term earnings. In our view, this level of valuation extreme is not justified given the elevated levels of uncertainty that both global economies (unprecedented debt levels) and established companies (pervasive disruption risk) are facing. Our perspective, then, is that today’s “concocted” increase in asset class valuations is not primarily based on prospects for improving economic fundamentals but rather the cumulative influence of pervasive liquidity and historically low interest rates on investor confidence and financial leverage.
It may sound like a broken record, but our portfolio strategies remain primarily focused on capital preservation. Incremental allocations continue to focus on international equities. In our view, the best investment values continue to be found in high quality U.S. and international large-cap equities, equities with links to commodities (especially oil) and high quality bonds. We believe that lower-quality, higher-risk asset classes are overpriced; our expectation is that the gradual removal of global central bank accommodation, currently scheduled to accelerate in 2018 (led by the Fed), could very well begin to normalize at least some of these extraordinary valuations.
Finally, global debt levels remain elevated and are also near record amounts relative to GDP. Inflationary pressures are slowly building, which could put some modest upward pressure on interest rates. Accordingly, we are making greater use of TIPS. However, we believe that any upward trajectory in interest rates will be constrained due to the extraordinary levels of global debt.
We are confident the Fund remains well-positioned for a growth-challenged global economy. We also understand and embrace our ongoing responsibility to insightfully differentiate between attractive and less attractive asset classes as we strive to deliver superior risk-adjusted returns. As always, we sincerely appreciate your support.
Average Annual Total Return (%) through December 31, 20171,2
1 Year
3 Years
5 Years
10 Years
Ultra Series Madison Target Retirement 2030
13.18
6.40
8.69
4.19
S&P Target Date® To 2030 Index
14.76
7.24
8.44
5.14
See accompanying Notes to Management’s Discussion of Fund Performance.
MADISON TARGET RETIREMENT 2040 FUND
INVESTMENT STRATEGY HIGHLIGHTS
The Ultra Series Madison Target Retirement 2040 Fund invests primarily in shares of registered investment companies according to an asset allocation strategy developed by the Fund’s investment adviser for investors planning to retire in or within a few years of 2040. Over time, the Fund’s asset allocation will gradually shift until it reaches the more conservative allocation target of approximately 10-30% in stock funds and 70-90% in bond funds. The asset allocation strategy is designed to reduce the volatility of investment returns in the later years while still providing the potential for higher total returns over the target period.
PERFORMANCE
The Ultra Series Madison Target Retirement 2040 Fund returned 15.16% in the 12-month period, underperforming the S&P Target Date® To 2040 Index which returned 17.72%, and the Morningstar Target Date 2040 Category peer group, which returned 17.69%.
For the first time in history, the S&P 500® Index produced a positive return in all 12 calendar months for 2017. Overall, the streak stands at 14 consecutive positive months as of 12/31/2017. Just as noteworthy, if not more so, has been the vanishing of market volatility. The trailing one-year standard deviation of the Index stood at 4% versus the long-term average of roughly 14.5%. Given our conservative DNA, we are quite pleased with how well the Fund kept pace over what has been a remarkable run in the global equity markets. Overall, the Fund captured 92% of the benchmark’s return for the year. A timely move toward international equities late in 2016 was the most notable contributor to 2017 performance as foreign stocks outperformed. Other positives included relative overweight allocations to U.S. growth stocks, European equities and long-term Treasuries. A modest underweight to equities overall, and overweight allocations to U.S. mid cap stocks, hedged Japanese equities and intermediate-term treasuries were the largest detractors from performance.
Years of consistently low U.S. inflation have provided the Fed with the justification and conviction to provide massive levels of monetary stimulus. Importantly, this has been true in terms of both scale and longevity. The Fed’s primary goal since the 2007-09 global financial crisis has been to “reflate” and stimulate the real economy. In reality, the Fed has instead been more successful at “inflating” the value of virtually all investment asset classes. The median U.S. stock, for example, is now trading near all-time record high valuation levels relative to both current and (normalized) long-term earnings. In our view, this level of valuation extreme is not justified given the elevated levels of uncertainty that both global economies (unprecedented debt levels) and established companies (pervasive disruption risk) are facing. Our perspective, then, is that today’s “concocted” increase in asset class valuations is not primarily based on prospects for improving economic fundamentals but rather the cumulative influence of pervasive liquidity and historically low interest rates on investor confidence and financial leverage.
4
Ultra Series Fund | Management’s Discussion of Fund Performance (unaudited) - concluded | December 31, 2017
It may sound like a broken record, but our portfolio strategies remain primarily focused on capital preservation. Incremental allocations continue to focus on international equities. In our view, the best investment values continue to be found in high quality U.S. and international large-cap equities, equities with links to commodities (especially oil) and high quality bonds. We believe that lower-quality, higher-risk asset classes are overpriced; our expectation is that the gradual removal of global central bank accommodation, currently scheduled to accelerate in 2018 (led by the Fed), could very well begin to normalize at least some of these extraordinary valuations.
Finally, global debt levels remain elevated and are also near record amounts relative to GDP. Inflationary pressures are slowly building, which could put some modest upward pressure on interest rates. Accordingly, we are making greater use of TIPS. However, we believe that any upward trajectory in interest rates will be constrained due to the extraordinary levels of global debt.
We are confident the Fund remains well-positioned for a growth-challenged global economy. We also understand and embrace our ongoing responsibility to insightfully differentiate between attractive and less attractive asset classes as we strive to deliver superior risk-adjusted returns. As always, we sincerely appreciate your support.
Average Annual Total Return (%) through December 31, 20171,2
1 Year
3 Years
5 Years
10 Years
Ultra Series Madison Target Retirement 2040
15.16
7.28
9.84
4.22
S&P Target Date® To 2040 Index
17.72
8.40
9.81
5.51
See accompanying Notes to Management’s Discussion of Fund Performance.
MADISON TARGET RETIREMENT 2050 FUND
INVESTMENT STRATEGY HIGHLIGHTS
The Ultra Series Madison Target Retirement 2050 Fund invests primarily in shares of registered investment companies according to an asset allocation strategy developed by the Fund’s investment adviser for investors planning to retire in or within a few years of 2050. Over time, the Fund’s asset allocation will gradually shift until it reaches the more conservative allocation target of approximately 10-30% in stock funds and 70-90% in bond funds. The asset allocation strategy is designed to reduce the volatility of investment returns in the later years while still providing the potential for higher total returns over the target period.
PERFORMANCE
The Ultra Series Madison Target Retirement 2050 Fund returned 16.99% in the 12-month period, underperforming the S&P Target Date® To 2050 Index which returned 19.06%, and the Morningstar Target Date 2050 Category peer group, which returned 19.54%.
For the first time in history, the S&P 500® Index produced a positive return in all 12 calendar months for 2017. Overall, the streak stands at 14 consecutive positive months as of 12/31/2017. Just as noteworthy, if not more so, has been the vanishing of market volatility. The trailing one-year standard deviation of the Index stood at 4% versus the long-term average of roughly 14.5%. Given our conservative DNA, we are quite pleased with how well the Fund kept pace over what has been a remarkable run in the global equity markets. Overall, the Fund captured 92% of the benchmark’s return for the year. A timely move toward international equities late in 2016 was the most notable contributor to 2017 performance as foreign stocks outperformed. Other positives included relative overweight allocations to U.S. growth stocks, European equities and long-term Treasuries. A modest underweight to equities overall, and overweight allocations to U.S. mid cap stocks, hedged Japanese equities and intermediate-term treasuries were the largest detractors from performance.
Years of consistently low U.S. inflation have provided the Fed with the justification and conviction to provide massive levels of monetary stimulus. Importantly, this has been true in terms of both scale and longevity. The Fed’s primary goal since the 2007-09 global financial crisis has been to “reflate” and stimulate the real economy. In reality, the Fed has instead been more successful at “inflating” the value of virtually all investment asset classes. The median U.S. stock, for example, is now trading near all-time record high valuation levels relative to both current and (normalized) long-term earnings. In our view, this level of valuation extreme is not justified given the elevated levels of uncertainty that both global economies (unprecedented debt levels) and established companies (pervasive disruption risk) are facing. Our perspective, then, is that today’s “concocted” increase in asset class valuations is not primarily based on prospects for improving economic fundamentals but rather the cumulative influence of pervasive liquidity and historically low interest rates on investor confidence and financial leverage.
It may sound like a broken record, but our portfolio strategies remain primarily focused on capital preservation. Incremental allocations continue to focus on international equities. In our view, the best investment values continue to be found in high quality U.S. and international large-cap equities, equities with links to commodities (especially oil) and high quality bonds. We believe that lower-quality, higher-risk asset classes are overpriced; our expectation is that the gradual removal of global central bank accommodation, currently scheduled to accelerate in 2018 (led by the Fed), could very well begin to normalize at least some of these extraordinary valuations.
Finally, global debt levels remain elevated and are also near record amounts relative to GDP. Inflationary pressures are slowly building, which could put some modest upward pressure on interest rates. Accordingly, we are making greater use of TIPS. However, we believe that any upward trajectory in interest rates will be constrained due to the extraordinary levels of global debt.
We are confident the Fund remains well-positioned for a growth-challenged global economy. We also understand and embrace our ongoing responsibility to insightfully differentiate between attractive and less attractive asset classes as we strive to deliver superior risk-adjusted returns. As always, we sincerely appreciate your support.
Average Annual Total Return (%) through December 31, 20171,2
Since
1/3/11
1 Year
3 Years
5 Years
Inception
Ultra Series Madison Target Retirement 2050
16.99
8.10
10.97
9.34
S&P Target Date® To 2050 Index
19.06
9.01
10.69
9.12
See accompanying Notes to Management’s Discussion of Fund Performance.
5
Ultra Series Fund | December 31, 2017
Notes to Management’s Discussion of Fund Performance (unaudited)
1
Fund returns are calculated after fund level expenses have been subtracted, but do not include any separate account fees, charges or expenses imposed by the group variable annuity contracts that invest in the Fund, as described in the Prospectus. If these fees, charges, or expenses were included, fund returns would have been lower. Fund returns also assume that dividends and capital gains are reinvested in additional shares of the Fund. Investment return and principal value will fluctuate, so an investor’s shares, when redeemed, may be worth more or less than when purchased. Further information relating to the Fund’s performance is contained in the Prospectus and elsewhere in this report. The Fund’s past performance is not indicative of future performance. Current performance may be lower or higher than the performance data cited. For Ultra Series Fund performance data current to the most recent month-end, please call 1-800-670-3600 or visit www.ultraseriesfund.com. Indices are unmanaged and investors cannot invest in them directly. Index returns do not reflect fees or expenses.
2
Effective October 1, 2009, Madison Asset Management LLC (Madison) contractually agreed to waive a portion of the management fee of the Ultra Series Madison Target Retirement 2020, 2030, 2040 and 2050 Funds (USF Target Date Funds) from 0.40% to 0.20%. Effective February 17, 2011, the fee was permanently reduced to 0.20%. On September 1, 2011, shareholders of the USF Target Date Funds approved a new fee arrangement which includes an investment advisory fee of 0.25% annualized and a services agreement fee of 0.05% annualized. From August 30, 2014 to August 21, 2016, each USF Target Date Fund invested substantially all of its assets in a corresponding Madison Target Retirement Fund. In order to avoid duplicate fees, from August 30 through December 31, 2014, all direct fees and expenses (0.25% management and 0.05% services) of each USF Target Date Fund were waived; and effective January 1, 2015, the USF Target Date Funds did not charge management or services fees, only the acquired fees from the Madison Target Retirement Funds. Effective August 22, 2016, the Madison Target Retirement Funds were reorganized (the “Reorganization”) into the Goldman Sachs Trust II Target Date Portfolios (GS Target Date Portfolios) managed by Goldman Sachs Asset Management, L.P. and subadvised by Madison. Following the Reorganization, so long as Madison is the sub-adviser of the GS Target Date Portfolios, the USF Target Date Funds will not charge management or service fees, only the acquired fees from the GS Target Date Portfolios. If these fees had not been reduced, returns would have been lower.
Morningstar Percentile rankings note: 1st percentile is top, 99th percentile is bottom.
(c)Morningstar, Inc. All Rights Reserved. The Morningstar related information contained herein: (1) is proprietary to Morningstar and/or its content providers; (2) may not be copied or distributed; and (3) is not warranted to be accurate, complete or timely. Neither Morningstar nor its content providers are responsible for any damages or losses arising from any use of this information.
BENCHMARK DESCRIPTIONS
The S&P Target Date® To Index Series
The S&P Target Date® “To” Index Series consists of multi-asset class indices, and corresponds to specific target retirement dates. The series reflects the consensus asset allocation and glide path of a subset of target date funds that generally pursue investment policies characterized by static total equity exposure after retirement and a relatively conservative total equity exposure near retirement. As the overall universe becomes more conservative with the approach of each target date year, so will the index. The asset allocation is based on market observations through an annual survey of “to” target date fund managers, and is categorized by S&P Dow Jones Indices.
•
The S&P Target Date® To 2020 Index is a benchmark for multi-class asset portfolios that corresponds to the target retirement date 2020.
•
The S&P Target Date® To 2030 Index is a benchmark for multi-class asset portfolios that corresponds to the target retirement date 2030.
•
The S&P Target Date® To 2040 Index is a benchmark for multi-class asset portfolios that corresponds to the target retirement date 2040.
•
The S&P Target Date® To 2050 Index is a benchmark for multi-class asset portfolios that corresponds to the target retirement date 2050.
MARKET INDEXES
The Bloomberg Barclays Intermediate Government Credit Index measures the investment grade, U.S. dollar-denominated, fixed-rate, taxable corporate and government related bond markets. It is composed of the U.S. corporate index and a non-corporate component that includes foreign agencies, sovereigns, supranationals and local authorities.
The Bloomberg Barclays U.S. Aggregate Bond Index is a broad-based flagship benchmark that measures the investment grade, U.S. dollar-denominated, fixed-rate taxable bond market. The index includes Treasuries, government-related and corporate securities, mortgage backed securities, asset backed securities and commercial mortgage-backed securities.
The MSCI EAFE (Europe, Australasia & Far East) Index (net) is a free float-adjusted market capitalization index that is designed to measure developed market equity performance, excluding the U.S. and Canada. The MSCI EAFE Index (net) is calculated on a total return basis with dividends reinvested after the deduction of withholding taxes.
The Russell Midcap® Index is a mid-cap market index which measures the performance of the mid-cap segment of the U.S. equity universe.
The S&P 500® Index is a large-cap market index which measures the performance of a representative sample of 500 leading companies in leading industries in the U.S.
Past performance is no guarantee of future results.
Russell Investment Group is the source and owner of the trademarks, service marks and copyrights related to the Russell Indexes. Russell® is a trademark of Russell Investment Group.
6
Ultra Series Fund | December 31, 2017
Madison Target Retirement 2020 Fund Portfolio of Investments
Shares
Value (Note 2)
INVESTMENT COMPANIES - 98.1%
Target Date Fund - 98.1%*
Goldman Sachs Target Date 2020 Portfolio,
Class R6
4,993,435
$
46,588,748
TOTAL INVESTMENTS - 98.1% (Cost $45,398,294**)
$
46,588,748
NET OTHER ASSETS AND LIABILITIES - 1.9%
921,351
TOTAL NET ASSETS - 100.0%
$
47,510,099
*
See Appendix A for a complete listing of holdings of the
underlying Target Date Fund.
**
Aggregate cost for Federal tax purposes was $45,398,294.
Madison Target Retirement 2030 Fund Portfolio of Investments
Shares
Value (Note 2)
INVESTMENT COMPANIES - 98.3%
Target Date Fund - 98.3%*
Goldman Sachs Target Date 2030 Portfolio,
Class R6
7,735,146
$
73,174,478
TOTAL INVESTMENTS - 98.3% (Cost $67,399,854**)
$
73,174,478
NET OTHER ASSETS AND LIABILITIES - 1.7%
1,240,934
TOTAL NET ASSETS - 100.0%
$
74,415,412
*
See Appendix A for a complete listing of holdings of the
underlying Target Date Fund.
**
Aggregate cost for Federal tax purposes was $67,399,854.
Madison Target Retirement 2040 Fund Portfolio of Investments
Shares
Value (Note 2)
INVESTMENT COMPANIES - 98.3%
Target Date Fund - 98.3%*
Goldman Sachs Target Date 2040 Portfolio,
Class R6
5,309,475
$
49,059,545
TOTAL INVESTMENTS - 98.3% (Cost $44,844,107**)
$
49,059,545
NET OTHER ASSETS AND LIABILITIES - 1.7%
849,760
TOTAL NET ASSETS - 100.0%
$
49,909,305
*
See Appendix A for a complete listing of holdings of the
underlying Target Date Fund.
**
Aggregate cost for Federal tax purposes was $44,844,107.
Madison Target Retirement 2050 Fund Portfolio of Investments
Shares
Value (Note 2)
INVESTMENT COMPANIES - 97.6%
Target Date Fund - 97.6%*
Goldman Sachs Target Date 2050 Portfolio,
Class R6
2,660,715
$
27,565,006
TOTAL INVESTMENTS - 97.6% (Cost $23,623,386**)
$
27,565,006
NET OTHER ASSETS AND LIABILITIES - 2.4%
666,056
TOTAL NET ASSETS - 100.0%
$
28,231,062
*
See Appendix A for a complete listing of holdings of the underlying Target Date Fund.
**
Aggregate cost for Federal tax purposes was $23,623,570.
See accompanying Notes to Financial Statements.
7
Ultra Series Fund | December 31, 2017
Statements of Assets and Liabilities as of December 31, 2017
Madison Target Retirement 2020 Fund
Madison Target Retirement 2030 Fund
Madison Target Retirement 2040 Fund
Madison Target Retirement 2050 Fund
Assets:
Investments in securities, at cost
Unaffiliated issuers
$
45,398,294
$
67,399,854
$
44,844,107
$
23,623,386
Net unrealized appreciation
Unaffiliated issuers
1,190,454
5,774,624
4,215,438
3,941,620
Total investments at value
46,588,748
73,174,478
49,059,545
27,565,006
Cash
838,323
1,076,450
646,242
514,945
Receivables:
Fund shares sold
83,028
164,484
203,518
151,111
Total assets
47,510,099
74,415,412
49,909,305
28,231,062
Liabilities:
Total liabilities
–
–
–
–
Net Assets applicable to outstanding capital stock
$
47,510,099
$
74,415,412
$
49,909,305
$
28,231,062
Net Assets consist of:
Paid-in capital in excess of par
$
46,232,199
$
68,449,671
$
45,548,491
$
24,246,996
Accumulated undistributed net investment income
40,702
61,709
43,427
20,690
Accumulated net realized gain on investments sold
46,744
129,408
101,949
21,756
Net unrealized appreciation of investments
1,190,454
5,774,624
4,215,438
3,941,620
Net Assets
$
47,510,099
$
74,415,412
$
49,909,305
$
28,231,062
Net Assets
$
47,510,099
$
74,415,412
$
49,909,305
$
28,231,062
Shares of beneficial interest outstanding
5,990,932
9,119,312
6,608,233
2,076,441
Net Asset Value and redemption price per share
$
7.93
$
8.16
$
7.55
$
13.60
See accompanying Notes to Financial Statements.
8
Ultra Series Fund | December 31, 2017
Statements of Operations for the Year Ended December 31, 2017
Madison Target Retirement 2020 Fund
Madison Target Retirement 2030 Fund
Madison Target Retirement 2040 Fund
Madison Target Retirement 2050 Fund
Investment Income:
Dividends
Unaffiliated issuers
$
919,244
$
1,318,624
$
881,184
$
464,321
Total investment income
919,244
1,318,624
881,184
464,321
Expenses1
–
–
–
–
Net Investment Income
919,244
1,318,624
881,184
464,321
Net Realized and Unrealized Gain (Loss) on Investments
Net realized gain on investments
Unaffiliated issuers
378,227
914,432
705,816
18,168
Capital gain distributions received from underlying funds
Unaffiliated issuers
3,074,880
7,322,874
5,681,906
1,648,843
Net change in unrealized appreciation (depreciation) on investments
Unaffiliated issuers
(460,954
)
(360,994
)
(199,904
)
1,914,989
Net Realized and Unrealized Gain on Investments
2,992,153
7,876,312
6,187,818
3,582,000
Net Increase in Net Assets from Operations
$
3,911,397
$
9,194,936
$
7,069,002
$
4,046,321
1 See Note 3 for information on expenses.
See accompanying Notes to Financial Statements.
9
Ultra Series Fund | December 31, 2017
Statements of Changes in Net Assets
Madison Target Retirement 2020 Fund
Madison Target Retirement 2030 Fund
Madison Target Retirement 2040 Fund
Madison Target Retirement 2050 Fund
Year Ended December 31,
2017
2016
2017
2016
2017
2016
2017
2016
Net Assets at beginning of period
$
51,485,211
$
52,858,479
$
75,564,099
$
74,258,209
$
49,514,964
$
49,576,290
$
23,441,816
$
21,173,170
Increase in net assets from operations:
Net investment income
919,244
931,717
1,318,624
1,467,504
881,184
1,009,845
464,321
462,710
Net realized gain
3,453,107
2,126,576
8,237,306
2,710,502
6,387,722
2,438,131
1,667,011
902,167
Net change in unrealized appreciation (depreciation)
(460,954
)
(158,228
)
(360,994
)
1,253,403
(199,904
)
562,321
1,914,989
598,267
Net increase in net assets from operations
3,911,397
2,900,065
9,194,936
5,431,409
7,069,002
4,010,297
4,046,321
1,963,144
Distributions to shareholders from:
Net investment income
(2,015,556
)
(1,061,413
)
(3,054,046
)
(1,511,801
)
(2,151,191
)
(1,162,210
)
(1,024,758
)
(545,783
)
Net realized gains
(2,322,168
)
(1,599,588
)
(6,383,202
)
(2,146,522
)
(5,032,525
)
(1,867,444
)
(1,089,381
)
(713,406
)
Total distributions
(4,337,724
)
(2,661,001
)
(9,437,248
)
(3,658,323
)
(7,183,716
)
(3,029,654
)
(2,114,139
)
(1,259,189
)
Capital Stock transactions:
Shares sold
9,256,576
18,107,940
16,154,343
20,505,495
11,720,477
13,688,202
8,936,678
10,091,461
Issued to shareholders in reinvestment of distributions
4,337,724
2,661,001
9,437,248
3,658,323
7,183,716
3,029,655
2,114,139
1,259,189
Shares redeemed
(17,143,085
)
(22,381,273
)
(26,497,966
)
(24,631,014
)
(18,395,138
)
(17,759,826
)
(8,193,753
)
(9,785,959
)
Total increase (decrease) from capital stock transactions
(3,548,785
)
(1,612,332
)
(906,375
)
(467,196
)
509,055
(1,041,969
)
2,857,064
1,564,691
Total increase (decrease) in net assets
(3,975,112
)
(1,373,268
)
(1,148,687
)
1,305,890
394,341
(61,326
)
4,789,246
2,268,646
Net Assets at end of period
$
47,510,099
$
51,485,211
$
74,415,412
$
75,564,099
$
49,909,305
$
49,514,964
$
28,231,062
$
23,441,816
Undistributed net investment income included in net assets
$
40,702
$
21,163
$
61,709
$
30,271
$
43,427
$
23,264
$
20,690
$
10,950
Capital Share transactions:
Shares sold
1,111,956
2,186,104
1,865,076
2,477,424
1,450,582
1,771,037
665,071
808,845
Issued to shareholders in reinvestment of distributions
546,600
330,038
1,155,850
442,869
950,506
395,172
155,502
100,210
Shares redeemed
(2,058,707
)
(2,699,257
)
(3,051,129
)
(2,957,998
)
(2,252,898
)
(2,285,451
)
(609,415
)
(781,090
)
Net increase (decrease) from capital share transactions
(400,151
)
(183,115
)
(30,203
)
(37,705
)
148,190
(119,242
)
211,158
127,965
See accompanying Notes to Financial Statements.
10
Ultra Series Fund | December 31, 2017
Financial Highlights for a Share of Beneficial Interest Outstanding
MADISON TARGET RETIREMENT 2020 FUND
MADISON TARGET RETIREMENT 2030 FUND
Year Ended December 31,
Year Ended December 31,
2017
2016
2015
2014
2013
2017
2016
2015
2014
2013
Net Asset Value at beginning of period
$
8.06
$
8.04
$
8.67
$
8.76
$
8.31
$
8.26
$
8.08
$
8.77
$
8.92
$
8.04
Income from Investment Operations:
Net investment income
0.19
0.15
1
0.13
1
0.19
1
0.21
1
0.19
0.16
1
0.13
1
0.18
1
0.19
1
Net realized and unrealized gain (loss) on investments
0.48
0.32
(0.15
)
0.42
0.70
0.89
0.44
(0.21
)
0.54
1.13
Total from investment operations
0.67
0.47
(0.02
)
0.61
0.91
1.08
0.60
(0.08
)
0.72
1.32
Less Distributions From:
Net investment income
(0.37
)
(0.18
)
(0.20
)
(0.24
)
(0.22
)
(0.38
)
(0.17
)
(0.18
)
(0.22
)
(0.18
)
Capital gains
(0.43
)
(0.27
)
(0.41
)
(0.46
)
(0.24
)
(0.80
)
(0.25
)
(0.43
)
(0.65
)
(0.26
)
Total distributions
(0.80
)
(0.45
)
(0.61
)
(0.70
)
(0.46
)
(1.18
)
(0.42
)
(0.61
)
(0.87
)
(0.44
)
Net increase (decrease) in net asset value
(0.13
)
0.02
(0.63
)
(0.09
)
0.45
(0.10
)
0.18
(0.69
)
(0.15
)
0.88
Net Asset Value at end of period
$
7.93
$
8.06
$
8.04
$
8.67
$
8.76
$
8.16
$
8.26
$
8.08
$
8.77
$
8.92
Total Return (%)2
8.34
5.68
(0.34
)
7.11
10.94
13.18
7.35
(0.86
)
8.06
16.56
Ratios/Supplemental Data:
Net Assets at end of period (in 000’s)
$
47,510
$
51,485
$
52,858
$
62,087
$
70,472
$
74,415
$
75,564
$
74,258
$
84,935
$
93,187
Ratios of expenses to average net assets:
Before reimbursement of expenses by Adviser (%)
0.00
4
0.00
4
0.00
3,4
0.30
0.30
0.00
4
0.00
4
0.00
3,4
0.30
0.30
After reimbursement of expenses by Adviser (%)
0.00
4
0.00
4
0.00
3,4
0.21
5
0.30
0.00
4
0.00
4
0.00
3,4
0.21
5
0.30
Ratio of net investment income to average net assets (%)
1.89
4
1.80
4
1.51
4
2.08
2.37
1.78
4
1.95
4
1.51
4
1.98
2.16
Portfolio turnover (%)6
9
7
7
142
167
13
6
7
103
136
MADISON TARGET RETIREMENT 2040 FUND
MADISON TARGET RETIREMENT 2050 FUND
Year Ended December 31,
Year Ended December 31,
2017
2016
2015
2014
2013
2017
2016
2015
2014
2013
Net Asset Value at beginning of period
$
7.66
$
7.54
$
8.37
$
8.68
$
7.61
$
12.57
$
12.19
$
12.97
$
12.78
$
10.69
Income from Investment Operations:
Net investment income
0.19
0.16
1
0.13
1
0.17
1
0.17
1
0.27
0.26
1
0.21
1
0.27
1
0.24
1
Net realized and unrealized gain (loss) on investments
0.97
0.46
(0.20
)
0.55
1.32
1.87
0.84
(0.33
)
0.82
2.19
Total from investment operations
1.16
0.62
(0.07
)
0.72
1.49
2.14
1.10
(0.12
)
1.09
2.43
Less Distributions From:
Net investment income
(0.38
)
(0.19
)
(0.19
)
(0.22
)
(0.16
)
(0.54
)
(0.31
)
(0.28
)
(0.27
)
(0.18
)
Capital gains
(0.89
)
(0.31
)
(0.57
)
(0.81
)
(0.26
)
(0.57
)
(0.41
)
(0.38
)
(0.63
)
(0.16
)
Total distributions
(1.27
)
(0.50
)
(0.76
)
(1.03
)
(0.42
)
(1.11
)
(0.72
)
(0.66
)
(0.90
)
(0.34
)
Net increase (decrease) in net asset value
(0.11
)
0.12
(0.83
)
(0.31
)
1.07
1.03
0.38
(0.78
)
0.19
2.09
Net Asset Value at end of period
$
7.55
$
7.66
$
7.54
$
8.37
$
8.68
$
13.60
$
12.57
$
12.19
$
12.97
$
12.78
Total Return (%)2
15.16
8.31
(1.01
)
8.27
19.63
16.99
8.97
(0.91
)
8.51
22.78
Ratios/Supplemental Data:
Net Assets at end of period (in 000’s)
$
49,909
$
49,515
$
49,576
$
59,499
$
68,917
$
28,231
$
23,442
$
21,173
$
22,799
$
18,123
Ratios of expenses to average net assets:
Before reimbursement of expenses by Adviser (%)
0.00
4
0.00
4
0.00
3,4
0.30
0.30
0.00
4
0.00
4
0.00
3,4
0.30
0.30
After reimbursement of expenses by Adviser (%)
0.00
4
0.00
4
0.00
3,4
0.21
5
0.30
0.00
4
0.00
4
0.00
3,4
0.20
5
0.30
Ratio of net investment income to average net assets (%)
1.76
4
2.01
4
1.52
4
1.95
2.01
1.79
4
2.08
4
1.57
4
2.02
1.98
Portfolio turnover (%)6
16
7
8
108
151
8
6
13
133
215
1
Based on average shares outstanding during the year.
2
These returns are after all charges at the mutual fund level have been subtracted. These returns are higher than the returns at the separate account level because charges made at the separate account level have not been subtracted. Total returns are not annualized for periods less than one year.
3
Amounts represent less than 0.01%.
4
Amount does not include income or expenses of the underlying GS Target Date Portfolio, nor the underlying expenses of the funds held by the GS Target Date Portfolio. See Note 1 for an explanation of the Fund organizational structure and current prospectus for more complete information regarding the charges and expenses of the Fund.
5
Amount includes fees waived by the adviser (see Note 3).
6
Portfolio turnover is calculated at the fund level and represents the entire fiscal year.
See accompanying Notes to Financial Statements.
11
Ultra Series Fund | December 31, 2017
Notes to Financial Statements
1. ORGANIZATION
The Ultra Series Fund (the “Trust”), a Massachusetts business trust, is registered under the investment company Act of 1940 (the “1940 Act”), as amended, as a diversified, open-end management investment company. The Trust is a series trust with, at the end of the period covered by this report, 14 investment portfolios (individually, a “fund,” and collectively, the “funds”), each with different investment objectives and policies. The funds currently reporting within this book at the end of the period were the Madison Target Retirement 2020 Fund, Madison Target Retirement 2030 Fund, Madison Target Retirement 2040 Fund, and Madison Target Retirement 2050 Fund, (collectively, the “Target Date Funds” or “Ultra Series Madison Target Retirement Funds” or “USF Target Date Funds”).
The Declaration of Trust permits the Board of Trustees to issue an unlimited number of full and fractional shares of the Trust without par value. The Target Date Funds only offer a single class of shares, Class I shares. The shares represent an interest in the assets of the respective fund with identical voting, dividend, liquidation and other rights, and its proportional share of fund level expenses. Shares are offered to the Group Variable Annuity Separate Accounts (“GVA Separate Accounts”) of CMFG Life Insurance Company (“CMFG Life”).The purchase of shares of the USF Target Date Funds is limited to separate accounts of insurance companies that exclusively support variable contracts that qualify as pension plan contracts under section 818(a) of the Internal Revenue Code (the “Code”). The Trust does not offer shares directly to the general public.
The Trust has entered into a Management Agreement with Madison Asset Management, LLC (the “Investment Adviser” or “Madison”).
Previously, the Ultra Series Madison Target Retirement Funds aimed to achieve their investment objectives by investing in the shares of the corresponding Madison Funds Target Retirement Fund series, other than cash required to process shareholder transactions. As of August 22, 2016, the Madison Funds Target Retirement Fund series were reorganized into the Goldman Sachs Target Date 2020 Portfolio, the Goldman Sachs Target Date 2030 Portfolio, the Goldman Sachs Target Date 2040 Portfolio and the Goldman Sachs Target Date 2050 Portfolio, respectively (collectively, the “GS Target Date Portfolios”), each which was a newly formed “shell” series of the Goldman Sachs Trust II.
The GS Target Date Portfolios’ principal investment objectives and strategies are substantially similar to those of the corresponding predecessor Madison Funds Target Retirement Fund. Goldman Sachs Asset Management, L.P. serves as the investment adviser of the GS Target Date Portfolios, and Madison, serves as the subadviser of the GS Target Date Portfolios. The predecessor Madison Funds Target Retirement Funds’ portfolio managers continue to manage the GS Target Date Portfolios.
As of December 31, 2017, the Ultra Series Madison Target Retirement 2020 Fund owned approximately 96.31% of the Goldman Sachs Target Date 2020 Portfolio, the Ultra Series Madison Target Retirement 2030 Fund owned approximately 94.31% of the Goldman Sachs Target Date 2030 Portfolio, the Ultra Series Madison Target Retirement 2040 Fund owned approximately 97.69% of the Goldman Sachs Target Date 2040 Portfolio, and the Ultra Series Madison Target Retirement 2050 Fund owned approximately 94.51% of the Goldman Sachs Target Date 2050 Portfolio. See also Appendix A, page 22 for the Portfolio of Investments, and Appendix B, page 24 for the Statements of Assets and Liabilities for the respective GS Target Date Portfolios.
2. SIGNIFICANT ACCOUNTING POLICIES
The funds are investment companies that apply the accounting and reporting guidance in the Financial Accounting Standards Board (FASB) Accounting Standards Codification Topic 946, Financial Services-Investment Companies (ASC 946). The following is a summary of significant accounting policies consistently followed by each fund in the preparation of its financial statements.
Portfolio Valuation: Equity securities, including exchange-traded funds (“ETFs”) listed on any U.S. or foreign stock exchange or quoted on the National Association of Securities Dealers Automated Quotation System (“NASDAQ’’) are valued at the last quoted sale price or official closing price on that exchange or NASDAQ on the valuation day (provided that, for securities traded on NASDAQ, the funds utilize the NASDAQ Official Closing Price (“NOCP”)). If no sale occurs, equities traded on a U.S. exchange, foreign exchange or on NASDAQ are valued at the bid price.
Investments in shares of open-end mutual funds are valued at their daily net asset value (“NAV”) which is calculated as of the close of regular trading on the New York Stock Exchange ((the “NYSE”), usually 4:00 p.m. Eastern Standard Time), on each day on which the NYSE is open for business. NAV per share is determined by dividing each fund’s total net assets by the number of shares of such fund outstanding at the time of calculation. Because the assets of each Target Date Fund consist primarily of shares of other registered investment companies (the “Underlying funds”), the NAV of each fund is determined based on the NAVs of the Underlying funds. Total net assets are determined by adding the total current value of portfolio securities, cash, receivables, and other assets and subtracting liabilities.
Over-the-counter securities not listed or traded on NASDAQ are valued at the last sale price on the valuation day. If no sale occurs on the valuation day, an over-the-counter security is valued at the last bid price. Exchange traded options are valued at the mean of the best bid and ask prices across all option exchanges. Financial futures contracts generally are valued at the settlement price established by the exchange(s) on which the contracts are primarily traded. Overnight repurchase agreements are valued at cost, and term repurchase agreements (i.e., those whose maturity exceeds seven days), swaps, caps, collars and floors, if any, are valued at the average of the closing bids obtained daily from at least one dealer.
Through the end of this reporting period, the value of all assets and liabilities expressed in foreign currencies was converted into U.S. dollar values using the then-current exchange rate at the close of regular trading on the NYSE.
All other securities for which either quotations are not readily available, no other sales have occurred, or in the Investment Adviser’s opinion, do not reflect the current market value, are appraised at their fair values as determined in good faith by the Pricing Committee (the “Committee”) and under the general supervision of the Board of Trustees. When fair value pricing of securities is employed, the prices of securities used by the funds to calculate NAV may differ from market quotations or NOCP. Because the Target Date Funds primarily invest in Underlying Funds, it is not anticipated that the Investment Adviser will need to “fair value” any of the investments of these funds. However, an Underlying Fund may need to “fair value” one or more of its investments, which may, in turn, require a Target Date Fund to do the same because of delays in obtaining the Underlying Fund’s NAV.
A fund’s investments (or Underlying Fund) will be valued at fair value if, in the judgment of the Committee, an event impacting the value of an investment occurred between the closing time of a security’s primary market or exchange (for example, a foreign exchange or market) and the time the fund’s share price is calculated as of the close of regular trading on the NYSE. Significant events may include, but are not limited to, the following: (1) significant fluctuations in domestic markets, foreign markets or foreign currencies; (2) occurrences not directly tied to the securities markets such as natural disasters, armed conflicts or significant government actions; and (3) major announcements affecting a single issuer or an entire market or market sector. In responding to a significant event, the Committee would determine the fair value of affected securities considering factors including, but not limited to: fundamental analytical data relating to the investment; the
12
Ultra Series Fund | Notes to the Financial Statements - continued | December 31, 2017
nature and duration of any restrictions on the disposition of the investment; and the forces influencing the market(s) in which the investment is purchased or sold.
In addition to independent fair value decisions made by the Committee noted above, the Committee also engages an independent fair valuation service to adjust the valuations of foreign equity securities based on specific market-movement parameters established by the Committee and approved by the Trust. Such adjustments to the valuation of foreign securities are applied automatically upon market close if the parameters established are exceeded. A foreign security is also automatically fair valued if the exchange it is traded in is on holiday.
Security Transactions and Investment Income: Security transactions are accounted for on a trade date basis. Net realized gains or losses on sales are determined by the identified cost method. Interest income is recorded on an accrual basis. Dividend income is recorded on ex-dividend date, except that certain dividends from foreign securities may be recorded after the ex-dividend date based on when the fund is informed of the dividend. Interest income is recorded on an accrual basis and is increased by the accretion of discount and decreased by the amortization of premium. Amortization and accretion are recorded on the effective yield method.
Expenses: Expenses that are directly related to one fund are charged directly to that fund. Other operating expenses are prorated to the funds on the basis of relative net assets.
Repurchase Agreements: Each fund may engage in repurchase agreements. In a repurchase agreement, a security is purchased for a relatively short period (usually not more than seven days) subject to the obligation to sell it back to the issuer at a fixed time and price plus accrued interest. The funds will enter into repurchase agreements only with members of the Federal Reserve System and with “primary dealers” in U.S. Government securities.
The Trust has established a procedure providing that the securities serving as collateral for each repurchase agreement must be delivered to the Trust’s custodian either physically or in book-entry form and that the collateral must be marked to market daily to ensure that each repurchase agreement is fully collateralized at all times. In the event of bankruptcy or other default by a seller of a repurchase agreement, a fund could experience one of the following: delays in liquidating the underlying securities during the period in which the fund seeks to enforce its rights thereto, possible decreased levels of income, declines in value of the underlying securities, or lack of access to income during this period and the expense of enforcing its rights. As of December 31, 2017, none of the funds held open repurchase agreements.
Foreign Currency Transactions: The Trust’s books and records are maintained in U.S. dollars. Foreign currency denominated transactions (i.e., market value of investment securities, assets and liabilities, purchases and sales of investment securities, and income and expenses) are translated into U.S. dollars at the current rate of exchange. The funds enter into contracts on the trade date to settle any securities transactions denominated in foreign currencies on behalf of the funds at the spot rate at settlement.
Each fund reports certain foreign currency-related transactions as components of realized gains or losses for financial reporting purposes, whereas such components are treated as ordinary income for federal income tax purposes.
The funds do not isolate the portion of gains and losses on investments in securities that is due to changes in the foreign exchange rates from that which is due to changes in market prices of securities. Such amounts are categorized as gain or loss on investments for financial reporting purposes.
Cash Concentration: At times, the funds maintain cash balances at financial institutions in excess of federally insured limits. The funds monitor this credit risk and have not experienced any losses related to this risk.
Indemnifications: Under the funds’ organizational documents, the funds’ officers and Trustees are indemnified against certain liabilities arising out of the performance of their duties to the funds. In the normal course of business, the funds enter into contracts that contain a variety of representations and provide general indemnifications. The funds’ maximum liability exposure under these arrangements is unknown, as future claims that have not yet occurred may be made against the funds. However, based on experience, management expects the risk of loss to be remote.
Fair Value Measurements: Each fund has adopted Financial Accounting Standards Board (the “FASB”) guidance on fair value measurements. Fair value is defined as the price that each fund would receive upon selling an investment in a timely transaction to an independent buyer in the principal or most advantageous market of the investment. A three-tier hierarchy is used to maximize the use of observable market data “inputs” and minimize the use of unobservable “inputs” and to establish classification of fair value measurements for disclosure purposes. Inputs refer broadly to the assumptions that market participants would use in pricing the asset or liability, including assumptions about risk (for example, the risk inherent in a particular valuation technique used to measure fair value including such a pricing model and/or the risk inherent in the inputs used in the valuation technique). Inputs may be observable or unobservable.
Observable inputs are inputs that reflect the assumptions market participants would use in pricing the asset or liability developed based on market data obtained from sources independent of the reporting entity. Unobservable inputs are inputs that reflect the reporting entity’s own assumptions about the assumptions market participants would use in pricing the asset or liability developed based on the best information available in the circumstances. The three-tier hierarchy of inputs is summarized in the three broad Levels listed below:
•
Level 1 – unadjusted quoted prices in active markets for identical investments
•
Level 2 – other significant observable inputs (including quoted prices for similar investments, interest rate volatilities, prepayment speeds, credit risk, benchmark yields, transactions, bids, offers, new issues, spreads and other relationships observed in the markets among comparable securities, underlying equity of the issuer; and proprietary pricing models such as yield measures calculated using factors such as cash flows, financial or collateral performance and other reference data, etc.)
•
Level 3 – significant unobservable inputs (including the fund’s own assumptions in determining the fair value of investments)
The valuation techniques used by the funds to measure fair value for the year ended December 31, 2017 maximized the use of observable inputs and minimized the use of unobservable inputs. The funds utilized the following fair value techniques: multidimensional relational pricing model and option adjusted spread pricing; the funds estimated the price that would have prevailed in a liquid market for an international equity security given information available at the time of valuation. As of December 31, 2017, none of the funds held securities deemed as a Level 3, and there were no transfers between classification levels.
13
Ultra Series Fund | Notes to the Financial Statements - continued | December 31, 2017
The following is a summary of the inputs used as of December 31, 2017 in valuing the funds’ investments carried at fair value (please see the Portfolio of Investments for each fund for a listing of all securities within each category):
Quoted Prices in
Significant
Active Markets
Other
Significant
for Identical
Observable
Unobservable
Investments
Inputs
Inputs
Value at
Fund
(Level 1)
(Level 2)
(Level 3)
12/31/17
Ultra Series Madison Target
Retirement 2020: Goldman Sachs
Target Retirement 20201
$
46,588,748
$
–
$
–
$
46,588,748
Ultra Series Madison Target
Retirement 2030: Goldman Sachs
Target Retirement 20301
$
73,174,478
$
–
$
–
$
73,174,478
Ultra Series Madison Target
Retirement 2040: Goldman Sachs
Target Retirement 20401
$
49,059,545
$
–
$
–
$
49,059,545
Ultra Series Madison Target
Retirement 2050: Goldman Sachs
Target Retirement 20501
$
27,565,006
$
–
$
–
$
27,565,006
1
Please refer to Appendix A of this report (page 21) for a list of underlying holdings of the GS Target Date Portfolio held by each respective Ultra Series Target Date Fund. For additional information on the Underlying Funds held by each respective GS Target Date Fund, including shareholder prospectuses and financial reports, please visit the GSAM website at www.GSAMFUNDS.com or visit the Securities and Exchange Commission’s website at http://www.sec.gov.
Recently Issued Accounting Pronouncements: In October 2016, the U.S. Securities and Exchange Commission (“SEC”) adopted new rules and forms, and amendments to certain current rules and forms, to modernize reporting and disclosure of information by registered investment companies. The amendments to Regulation S-X require standardized, enhanced disclosure about derivatives in investment company financial statements, and also change the rules governing the form and content of such financial statements. The amendments to Regulation S-X took effect on August 1, 2017 and the financial statements have been updated, as applicable.
In March 2017, the Financial Accounting Standards Board (FASB) issued Accounting Standards Update (ASU) 2017-08 which changes the amortization period for a callable debt security from the maturity date to the earliest call date. The ASU is effective for annual periods beginning after December 15, 2018, and interim periods within those annual periods. At this time, there will be no changes on the financial statements.
3. MANAGEMENT AND SERVICES AGREEMENTS AND OTHER EXPENSES
Management Agreement: For services under the Management Agreement, the Investment Adviser is entitled to receive a management fee, which is calculated daily and paid monthly, at an annual rate of 0.25% of each fund’s average daily net assets. Effective with the launch of the Madison Funds Madison Target Date Funds (see Note 1), the funds invested substantially all of their assets in these Madison Funds. In order to avoid charging duplicate fees, from August 30, 2014 through December 31, 2014, these fees were waived by the Investment Adviser. The Investment Adviser does not have the right to recoup any of these waived fees. In that same regard, effective January 1, 2015 through August 21, 2016, while each USF Target Date Fund invested substantially all of its assets in the underlying Madison Target Date Fund discussed above, the USF Target Date Funds did not pay any management fees to the Investment Adviser in recognition of the fees paid to the Investment Adviser by the corresponding Madison Funds Madison Target Date Funds to avoid charging duplicate fees. Effective August 22, 2016, Goldman Sachs Asset Management L.P.(“GSAM”), the Investment Adviser of the GS Target Date Portfolios, charges 0.25% of each GS Target Date Portfolio’s average daily net assets. In order to avoid charging duplicate fees to USF Target Date Fund, for as long as the USF Target Date Fund invests substantially all of its assets in the corresponding GS Target Date Portfolio, no management fees will be paid by USF Target Date Fund. This arrangement will remain in effect through at least August 22, 2018, and prior to such date, GSAM may not terminate the arrangements without the approval of the Board of Trustees of the GS Target Date Portfolios.
Services Agreement: The Investment Adviser provides or arranges for each fund to have all of the necessary operational and support services it needs for a fee, which is calculated daily and paid monthly, at an annual rate of 0.05% of each fund’s average daily net assets. Effective with the launch of the GS Target Date Portfolios (See Note 1), the funds invested substantially all of their assets in these GS Target Date Portfolios. Prior to August 21, 2016, the funds invested substantially all their assets in the Madison Funds Madison Target Date Funds. In order to avoid charging duplicate fees, from August 30, 2014 through December 31, 2014, these fees were waived by the Investment Adviser. The Investment Adviser does not have the right to recoup any of these waived fees. In that same regard, effective January 1, 2015 through August 21, 2016, while each USF Target Date Fund invested substantially all of its assets in the underlying Madison Target Date Fund discussed above, the USF Target Date Funds did not pay any service fees to the Investment Adviser in recognition of the fees paid to the Investment Adviser by the corresponding Madison Funds Madison Target Date Funds to avoid charging duplicate fees. GSAM has agreed to limit its fees and expenses (excluding acquired (underlying) fund fees and expenses, transfer agency fees and expenses, taxes, interest, brokerage fees, shareholder meeting, litigation, indemnification and extraordinary expenses) to 0.024% of each GS Target Date Portfolio’s average daily net assets until February 28, 2018.
Other Expenses: In addition to the fees described above, the Trust is responsible for brokerage commissions and other expenses incurred in connection with the acquisition or disposition of investments, overdrafts, any potential taxes owed and extraordinary expenses as approved by a majority of independent trustees.
Certain officers and trustees of the Trust are also officers of the Investment Adviser. The funds do not compensate their officers or affiliated trustees. The Nominating and Governance Committee of the Board may change trustee fees paid at any time.
4. DIVIDENDS FROM NET INCOME AND DISTRIBUTIONS OF CAPITAL GAINS
The funds declare dividends from net investment income and net realized gains from investment transactions, if any, annually, which are reinvested in additional full and fractional shares of the respective funds.
Income and capital gain distributions, if any, are determined in accordance with federal income tax regulations, which may differ from accounting principles generally accepted in the United States of America. Taxable distributions from income and realized capital gains of the funds may differ from book amounts earned during the period due to differences in the timing of capital gains recognition, and due to the reclassification of certain gains or losses from capital to income.
5. SECURITIES TRANSACTIONS
For the year ended December 31, 2017, aggregate cost of purchases and proceeds from sales of securities, other than short-term investment, were as follows:
Fund
Purchases
Sales
Ultra Series Madison Target Retirement 2020
$4,401,624
$8,278,135
Ultra Series Madison Target Retirement 2030
9,787,360
11,002,477
Ultra Series Madison Target Retirement 2040
8,497,525
7,946,944
Ultra Series Madison Target Retirement 2050
5,207,145
1,900,163
6. FEDERAL INCOME TAX INFORMATION
It is each fund’s policy to comply with the requirements of Subchapter M of the Code applicable to regulated investment companies and to distribute all its taxable income to its shareholders. Accordingly, no provisions for federal income taxes are recorded in the accompanying statements.
14
Ultra Series Fund | Notes to the Financial Statements - continued | December 31, 2017
The funds have not recorded any liabilities for material unrecognized tax benefits as of December 31, 2017. It is each fund’s policy to recognize accrued interest and penalties related to uncertain tax benefits in income taxes, as appropriate. Tax years that remain open to examination by major tax jurisdictions include tax years ended December 31, 2014 through December 31, 2017.
The tax character of distributions paid during the years ended December 31, 2017 and 2016 was as follows:
Ordinary Income
Long-Term Capital Gain
Fund
2017
2016
2017
2016
Ultra Series Madison Target Retirement 2020
$2,044,512
$1,063,482
$2,293,212
$1,597,519
Ultra Series Madison Target Retirement 2030
3,157,660
1,511,801
6,279,588
2,146,522
Ultra Series Madison Target Retirement 2040
2,306,823
1,168,014
4,876,893
1,861,640
Ultra Series Madison Target Retirement 2050
1,042,743
547,497
1,071,396
711,692
As of December 31, 2017, the components of distributable earnings on a tax basis were as follows:
Fund
Ordinary Income
Long-Term Capital Gain
Ultra Series Madison Target Retirement 2020
$41,293
$46,153
Ultra Series Madison Target Retirement 2030
63,824
127,293
Ultra Series Madison Target Retirement 2040
46,603
98,773
Ultra Series Madison Target Retirement 2050
21,057
21,573
For federal income tax purposes, the Target Date Funds did not have capital loss carryforwards as of December 31, 2017.
Certain specified losses incurred after October 31 and within the taxable year are deemed to arise on the first day of the Funds’ next taxable year, if the Funds so elect. For the year ended December 31, 2017, none of the funds elected to defer late-year losses.
For the year ended December 31, 2017, there were no capital losses utilized for the Target Date Funds.
At December 31, 2017, the aggregate gross unrealized appreciation (depreciation) and net unrealized appreciation (depreciation) for all securities as computed on a federal income tax basis for each fund were as follows:
Fund
Appreciation
Depreciation
Net
Ultra Series Madison Target Retirement 2020
$
1,190,454
$
–
$1,190,454
Ultra Series Madison Target Retirement 2030
5,774,624
–
5,774,624
Ultra Series Madison Target Retirement 2040
4,215,438
–
4,215,438
Ultra Series Madison Target Retirement 2050
3,941,436
–
3,941,436
Reclassification Adjustments: Paid-in capital, undistributed net investment income (loss), and accumulated net realized gain (loss) have been adjusted in the Statements of Assets and Liabilities for permanent book-tax differences for all funds.
Differences primarily relate to distribution re-designations from investments in other regulated investment companies.
To the extent these book and tax differences are permanent in nature, such amounts are reclassified at the end of the fiscal year among undistributed net investment income (loss) and undistributed net realized gain (loss) on investments and foreign currency translations. Accordingly, at December 31, 2017, reclassifications were recorded as follows:
Undistributed
Accumulated
Net Investment
Net Realized
Fund
Income (Loss)
Gain (Loss)
Ultra Series Madison Target Retirement 2020
$
1,115,851
$
(1,115,851
)
Ultra Series Madison Target Retirement 2030
1,766,860
(1,766,860
)
Ultra Series Madison Target Retirement 2040
1,290,170
(1,290,170
)
Ultra Series Madison Target Retirement 2050
570,177
(570,177
)
7. INVESTMENT RISKS
Investing in certain financial instruments, including forward foreign currency contracts, involves certain risks. Risks associated with these instruments include potential for an illiquid secondary market for the instruments or inability of counterparties to perform under the terms of the contracts, changes in the value of foreign currency relative to the U.S. dollar and volatility resulting from an imperfect correlation between the movements in the prices of the instruments and the prices of the underlying securities and interest rates being hedged.
Investing in foreign securities involves certain risks not necessarily found in U.S. markets. These include risks associated with adverse changes in economic, political, regulatory and other conditions, changes in currency exchange rates, exchange control regulations, expropriation of assets or nationalization, imposition of withholding taxes on dividend or interest payments or capital gains, and possible difficulty in obtaining and enforcing judgments against foreign entities. Further, issuers of foreign securities are subject to different, and often less comprehensive, accounting, reporting and disclosure requirements than domestic issuers.
The Target Date Funds are fund of funds, meaning that they invest primarily in the shares of the GS Target Date Portfolios, including exchange traded funds (“ETFs”). Thus, each fund’s investment performance and its ability to achieve its investment goal are directly related to the performance of the GS Target Date Portfolios in which it invests; and the GS Target Date Portfolio’s performance, in turn, depends on the particular securities in which that GS Target Date Portfolio invests and the expenses of that GS Target Date Portfolio. Accordingly, these funds are subject to the risks of the GS Target Date Portfolios in direct proportion to the allocation of their respective assets among the GS Target Date Portfolio.
Additionally, the Target Date Funds are subject to asset allocation risk and manager risk. Manager risk (i.e., fund selection risk) is the risk that the underlying fund selected to fulfill a particular asset class underperforms its peers. Asset allocation risk is the risk that the allocation of the fund’s assets among the various asset classes and market segments will cause the fund to underperform other funds with a similar investment objective.
The funds are also subject to cybersecurity risk, which include the risks associated with computer systems, networks and devices to carry out routine business operations. These system, networks and devices employ a variety of protections that are designed to prevent cyberattacks. Despite the various cyber protections utilized by the funds, the Investment Adviser, and other service providers, their systems, networks, or devices could potentially be breached. The funds, their shareholders, and the Investment Adviser could be negatively impacted as a result of a cyber security breach. The funds cannot control the cybersecurity plans and systems put in place by service providers or any other third parties whose operations may affect the funds. The funds do monitor this risk closely.
In addition to the other risks described above and in the prospectus, you should understand what we refer to as “unknown market risks.” While investments in securities have been keystones in wealth building and management, at times these investments have produced surprises. Those who enjoyed growth and income of their investments generally were rewarded for the risks they took by investing in the markets. Although the Investment Adviser seeks to appropriately address and manage the risks identified and disclosed to you in connection with the management of the securities in the funds, you should understand that the very nature of the securities markets includes the possibility that there may be additional risks of which we are not aware. We certainly seek to identify all applicable risks and then appropriately address them, take appropriate action to reasonably manage them and to make you aware of them so you can determine if they exceed your risk tolerance. Nevertheless, the often volatile nature of the securities markets and the global economy in which we work suggests that the risk of the unknown is
15
Ultra Series Fund | Notes to the Financial Statements - concluded | December 31, 2017
something to consider in connection with an investment in securities. Unforeseen events could under certain circumstances produce a material loss of the value of some or all of the securities we manage for you in the funds.
8. CAPITAL SHARES AND AFFILIATED OWNERSHIP
All capital shares outstanding at December 31, 2017 are owned by separate investment accounts and/or pension plans of CMFG Life Insurance Company. There were no affiliate’s investment for the year ended December 31, 2017.
9. SUBSEQUENT EVENTS
Management has evaluated the impact of all subsequent events on the funds through the date the financial statements were available for issue. No other events have taken place that meet the definition of subsequent event that require adjustment to, or disclosure in the financial statements.
16
Ultra Series Fund | December 31, 2017
Report of Independent Registered Public Accounting Firm
To the Shareholders and Board of Trustees of Ultra Series Fund:
Opinion on the Financial Statements and Financial Highlights
We have audited the accompanying statements of assets and liabilities including the portfolios of investments of Madison Target Retirement 2020 Fund, Madison Target Retirement 2030 Fund, Madison Target Retirement 2040 Fund, and Madison Target Retirement 2050 Fund, four of fourteen portfolios constituting Ultra Series Fund (collectively the “Trust”), as of December 31, 2017, the related statements of operations for the year then ended, the statements of changes in net assets for each of the two years in the period then ended, the financial highlights for each of the five years in the period then ended, and the related notes. In our opinion, the financial statements and financial highlights present fairly, in all material respects, the financial position of each of the respective portfolios of the Trust as of December 31, 2017, and the results of their operations for the year then ended, the changes in their net assets for each of the two years in the period then ended, and the financial highlights for each of the five years in the period then ended, in conformity with accounting principles generally accepted in the United States of America.
Basis for Opinion
These financial statements and financial highlights are the responsibility of the Trust’s management. Our responsibility is to express an opinion on the Trust’s financial statements and financial highlights based on our audits. We are a public accounting firm registered with the Public Company Accounting Oversight Board (United States) (PCAOB) and are required to be independent with respect to the Trust in accordance with the U.S. federal securities laws and the applicable rules and regulations of the Securities and Exchange Commission and the PCAOB.
We conducted our audits in accordance with the standards of the PCAOB. Those standards require that we plan and perform the audit to obtain reasonable assurance about whether the financial statements and financial highlights are free of material misstatement, whether due to error or fraud. The Trust is not required to have, nor were we engaged to perform, an audit of their internal control over financial reporting. As part of our audits we are required to obtain an understanding of internal control over financial reporting but not for the purpose of expressing an opinion on the effectiveness of the Trust’s internal control over financial reporting. Accordingly, we express no such opinion.
Our audits included performing procedures to assess the risks of material misstatement of the financial statements and financial highlights, whether due to error or fraud, and performing procedures that respond to those risks. Such procedures included examining, on a test basis, evidence regarding the amounts and disclosures in the financial statements and financial highlights. Our audits also included evaluating the accounting principles used and significant estimates made by management, as well as evaluating the overall presentation of the financial statements and financial highlights. Our procedures included confirmation of securities owned as of December 31, 2017, by correspondence with the custodian, transfer agents, and brokers; when replies were not received from brokers, we performed other auditing procedures. We believe that our audits provide a reasonable basis for our opinion.
/s/ Deloitte & Touche, LLP
Chicago, IL February 22, 2018
We have served as the auditor of one or more affiliated investment companies of Ultra Series Fund since 2009.
17
Ultra Series Fund | December 31, 2017
Other Information (unaudited)
DISCUSSION OF CONTRACT RENEWAL PROCESS AND CONSIDERATIONS
At an in-person meeting of the Board held in July 2017, the Board of Trustees (the “Board” or “Trustees”) of Ultra Series Fund (the “Trust”), and by a separate vote, the Independent Trustees of the Trust, approved the continuance of the Investment Advisory Agreement (the “Agreement”) between the Trust and Madison Asset Management, LLC (the “Adviser”) with respect to the individual series of the Trust (each a “fund” and together, the “funds”) and the continuance of the Investment Sub-Advisory Agreement between the Adviser and Lazard Asset Management LLC (the “Subadviser”) with respect to International Stock Fund.
In determining whether to approve the continuation of the Investment Advisory Agreement and the Investment Sub-Advisory Agreement, the Adviser and Subadviser furnished information necessary for a majority of the Independent Trustees to make the determination that the continuance of the Agreements was in the best interests of the respective funds and their shareholders. The information provided to the Board included: (1) data comparing advisory fees and expense ratios of comparable investment companies; (2) comparative performance information; (3) the Adviser’s and its affiliates’ revenues and costs of providing services to the funds; and (4) information about the Adviser’s and Subadviser’s personnel. Prior to voting, the Independent Trustees reviewed the proposed continuance of the Investment Advisory Agreement and the Investment Sub-Advisory Agreement with management and independent legal counsel to the Independent Trustees and received materials from such counsel discussing the legal standards for their consideration of the proposed continuation of the Agreements. The Independent Trustees also reviewed the proposed continuation of the Investment Advisory Agreement and Investment Sub-Advisory Agreement with independent legal counsel in a private session at which no representatives of management were present. The Independent Trustees made a variety of additional inquiries regarding the written materials provided by the Adviser and the Subadviser, and representatives of the Adviser discussed with the Independent Trustees each of those additional inquiries at the July 2017 meeting.
In approving the continuance of the Investment Advisory Agreement and the Investment Sub-Advisory Agreement, the Board considered various factors, among them: (1) the nature, extent and quality of services provided by the Adviser and Subadviser to the funds, including the personnel providing such services; (2) the Adviser’s and Subadviser’s compensation and profitability; (3) a comparison of fees and performance with comparable funds and accounts; (4) economies of scale; and (5) the terms of the Investment Advisory Agreement and the Investment Sub- Advisory Agreement. The Board’s analysis of these factors is set forth below. The Independent Trustees were advised by independent legal counsel throughout the process.
Nature, Extent and Quality of Services. The Board reviewed a variety of materials provided by the Adviser and Subadviser in connection with the Board’s consideration of the renewal of the Trust’s Investment Advisory Agreement with the Adviser and the Investment Sub-Advisory Agreement with the Subadviser. The Board reviewed and considered a variety of fund specific information for each fund.
The Board reviewed the biographies and tenure of the personnel involved in Trust management and the experience of the Adviser (and Subadviser) and its affiliates as investment manager to other investment companies with similar investment strategies or to individual clients or institutions with similar investment strategies. They recognized the wide array of investment professionals employed by the respective firm or firms. Representatives of the Adviser and each Subadviser discussed or otherwise presented their respective firms’ ongoing investment philosophies and strategies intended to provide investment performance consistent with each fund’s investment objectives in a variety of market environments.
The Board also discussed the various administrative services provided by the Adviser. The Board took into account that these services included arranging for third-party service providers to provide all necessary fund administration as well as ongoing monitoring of the Subadviser. Based on their review of the information provided, the Independent Trustees determined with respect to each fund that the nature, extent and quality of services provided by the Adviser (and Subadviser) to the fund were satisfactory.
Fund Investment Performance. With regard to the investment performance of each fund, the Board reviewed current performance information provided in the written Board materials. They discussed the reasons for both outperformance and underperformance relative to the applicable peer groups, indices and benchmarks. They recognized that the usefulness of comparative performance data as a frame of reference to measure a fund’s performance may be limited because the performance peer group, among other things, may not precisely reflect the objectives and strategies of the fund, may have a different investable universe, or the composition of the peer group may be limited in size or number as well as other factors. They discussed the unique aspects of the securities markets applicable to particular funds so that the performance of any such funds could be reviewed in context.
The Trustees reviewed with the Adviser both long-term and short-term performance of each fund and considered the effect on long-term performance that may have been attributable to any previous portfolio managers to any fund or to a different investment strategy. They recognized that the performance data reflects a snapshot in time, in this case as of the end of the most recent calendar year or quarter. They took into account that a different performance period, however, could generate significantly different results. Further, they noted that long-term performance can be adversely affected by even one period of significant underperformance so that a single investment decision or theme has the ability to disproportionately affect long-term performance. The Board also noted that it reviews on a quarterly basis detailed information for each fund, including investment performance results, portfolio composition and investment philosophies, processes and strategies. They also considered whether any relative underperformance was appropriate in view of the Adviser’s conservative investment philosophy. The Board discussed the conservative investment philosophy implemented across certain funds and recognized the challenges to achieving relative outperformance given the unprecedented bull market. The Board noted the type of market environments that favor the funds’ strategies and discussed the funds’ performance in such market environments. The Board performed this review in connection with the Adviser and Subadviser. In connection with the review of the funds’ investment performance, the Board also engaged in a comprehensive discussion of market conditions and discussed the reasons for fund performance under such conditions. The equity funds participated reasonably well in a generally strong market environment, especially during the three and five year time periods, and captured less downside during market corrections. The equity funds generally employ strategies that assume lower risk than that of the aggregate market. Regarding the allocation funds, the Board noted the risk adjusted performance of all three allocation funds. With regard to fixed-income funds, the Board considered each fund’s relatively conservative investment philosophy and high-quality bias during a period of historically low interest rates and the relative risks to fixed-income funds in the current environment. The Board noted the USF Target Date Funds’ three and five year annualized returns and Sharpe ratio rankings. Representatives of the Adviser discussed with the Board the methodology for arriving at peer groups and indices used for performance comparisons. The Board also considered that sometimes the Morningstar categories the funds fall into do not precisely match a fund’s investment strategy and philosophy. Based on their review, the Independent Trustees determined that, given the totality of the above factors and considerations, each fund’s overall investment performance had been satisfactory.
18
Ultra Series Funds | Other Information (unaudited) - continued | December 31, 2017
Costs and Profitability. With regard to the costs of the services to be provided and the profits to be realized by the Adviser and its affiliates from the relationship with the Trust, the Board reviewed the expense ratios for comparable funds in each fund’s peer group. The Board reviewed these matters with respect to the Adviser and the Subadviser.
The Board noted that the Adviser or its affiliates, and, as applicable, Subadviser, provided investment management services to other investment company and/or non-investment company clients and considered the fees charged by the Adviser (and Subadviser) to such funds and clients for purposes of determining whether the given advisory fee was disproportionately large under the legal standard traditionally used by investment company boards in connection with contract renewal considerations. The Board took those fees into account and considered the differences in services and time required by the various types of funds and clients to which the Adviser (or Subadviser, if applicable) provided services. The Board recognized that significant differences may exist between the services provided to one type of fund or client and those provided to others, such as those resulting from a greater frequency of shareholder redemptions in a mutual fund and the higher portfolio turnover rates typically experienced by mutual funds. The Board gave such comparisons the weight that they merit in light of the similarities and differences between the services that the various funds require. They considered that, if the services rendered by the Adviser (or Subadviser, if applicable) to one type of fund or client differed significantly from others, then the comparison should be given less weight. In the case of non-investment company clients for which the Adviser (or Subadviser, if applicable) may act as either investment adviser or Subadviser, the Board noted that the fee may be lower than the fee charged to the Trust. The Board also noted the various administrative, operational, compliance, legal and corporate communication services required to be handled by the Adviser (or Subadviser, if applicable) which are performed for investment company clients but are not typically performed for non-investment company clients.
The Trustees compared each fund’s total expense ratio and advisory fee to those of comparable funds with similar investment objectives and strategies. The Board noted the simple expense structure maintained by the Trust: (1) an advisory fee and a capped administrative “services” expense for the USF Target Retirement Date Funds, and (2) for the remaining series of the Trust, a unitary fee with limited independent expenses for Trustee compensation and audit fees not covered by the unitary fee (“Unitary Fee”). The Board noted that so long as substantially all of the assets of a USF Target Retirement Date Fund are invested in a corresponding Goldman Sachs Target Retirement Portfolio, no Advisory or Service fee would be payable directly by such fund. The Board reviewed total expense ratios paid by other funds with similar investment strategies, recognizing that such a comparison, while not dispositive, was an important consideration.
The Trustees sought to ensure that fees paid by the funds were appropriate. The Board reviewed materials demonstrating that although the Adviser is compensated for a variety of the administrative services it provides or arranges to provide to the funds pursuant to its administrative services agreement with the Trust (“Services Agreement”), such compensation does not always cover all costs because the Services Agreement effectively acts as a cap on administrative expenses. Therefore, the Board recognized that any administrative, operational, regulatory or compliance fees or costs in excess of the Services Agreement fees, in the case of the USF Target Date Funds, or in excess of the Unitary Fee, in the case of the remaining series, are paid by the Adviser from investment advisory fees earned. In this regard, the Trustees noted that examination of each fund portfolio’s total expense ratio compared to those of other investment companies was more meaningful than a simple comparison of basic “investment management only” fee schedules.
The Board recognized that to the extent a fund invests in other mutual funds managed by the Adviser (or its affiliates), the Adviser (or an affiliate) receives investment advisory fees from both the fund and the underlying mutual fund. The Board was satisfied in this regard that the Adviser (or an affiliate) provides separate services to the Trust’s “fund of funds” portfolios and the underlying mutual funds in which each such fund invests in exchange for the fees received from them (except as noted above with respect to the USF Target Retirement Date Funds which do not pay any advisory or service fees directly so long as invested in corresponding Goldman Sachs Target Retirement Portfolio).
The Board noted that for some smaller funds, the salaries of all portfolio management personnel, trading desk personnel, corporate accounting personnel and employees of the Adviser who serve as Trust officers, as well as facility costs (e.g., rent, etc.), could not be supported by fees received from such funds alone. However, the Board recognized that the Trust is profitable to the Adviser because such salaries and fixed costs are already paid in whole or in part from revenue generated by management of other client assets managed by the Adviser, including the Trust as one of a consolidated family of investment companies. The Trustees noted that total assets managed by the Adviser and its affiliates of approximately $16 billion at the time of the meeting. As a result, although the fees paid by an individual fund at its present size might not be sufficient to profitably support a stand-alone fund, the Trust is reasonably profitable to the Adviser as part of its larger, diversified organization. In sum, the Trustees recognized that the Trust is important to the Adviser and is managed with the attention given to the Adviser’s other clients.
Based on the foregoing, the Independent Trustees concluded that the level of profitability to the Adviser and its affiliates was reasonable in light of the services provided. In considering the profitability of the Subadviser, the Board noted that the Sub-advisory fees payable under the Investment Sub-Advisory Agreement were paid by the Adviser out of the fees that it receives under the Investment Advisory Agreement and were negotiated by the Adviser at arm’s length. As a consequence, the profitability to each Subadviser of its relationship with the applicable fund was not a substantial factor in the Board’s deliberations.
Economies of Scale. With regard to the extent to which economies of scale would be realized as each fund’s assets increase, the Trustees recognized that at their current asset levels, it was premature to discuss any economies of scale not already factored into the compensation payable under Investment Advisory (Agreement) and Services Agreement. In addition, the Trustees recognized that the Adviser was currently waiving fees (pursuant to its Investment Advisory Agreement, with respect to the Conservative, Moderate and Aggressive Allocation Funds). Further, as noted above with respect to the USF Target Retirement Date Funds, so long as such funds invest substantially all of their assets in the corresponding Goldman Sachs Target Retirement Portfolio, no advisory or service fee shall be payable directly by those funds. Based on their review, the Independent Trustees concluded that the fee arrangements and waivers (as applicable) were acceptable. Because the Adviser pays the Subadviser’s sub-advisory fees and those fees are negotiated at arm’s length by the Adviser, the Board did not consider the potential economies of scale in the Subadviser’s management of the International Stock Fund to be a material factor in its consideration.
The Board recognized that another method to help ensure the shareholders share in any economies of scale is to include breakpoints in the advisory fee schedules. Based on their review, the Independent Trustees concluded that the current advisory fee schedules and fee arrangements and waivers (as applicable) were appropriate and reflect economies of scale to be shared with shareholders when assets under management increase. In considering the economies of scale experienced by the Subadviser, the Board noted that the sub-advisory fees payable under the Investment Sub-Advisory Agreement were paid by the Adviser out of the fees that it receives under the Investment Advisory Agreement and were negotiated by the Adviser at arm’s length. As a consequence, the Board did not consider the potential economies of scale in the Subadviser’s management of the International Stock Fund to be a substantial factor in its deliberations, although the Board noted that the sub-
19
Ultra Series Funds | Other Information (unaudited) - continued | December 31, 2017
advisory fee schedule for the fund managed by Lazard Asset Management contained a breakpoint that would reduce the sub-advisory fee rate on assets above specified levels as the fund’s assets increased.
In the course of their review of the contract renewal materials, the Board also reviewed and discussed with counsel the “Rule 12b-1” plans adopted by certain funds. Advisory personnel directed the Board to the written materials regarding these matters during the course of the Board’s consideration of the Rule 12b-1 plans. Finally, the Board also reviewed the Trust’s distribution agreements and the information provided in the written materials regarding the distributor.
Conclusions. In considering the renewal of the funds’ Investment Advisory Agreement with the Adviser, the Board, including the Independent Trustees, did not identify any single factor as controlling, and each Trustee may have attributed different weights to the various factors. The Trustees evaluated all information available to them on a fund-by-fund basis, and their determinations were made separately with respect to each fund. The Board reached the following conclusions regarding each fund’s Investment Advisory Agreement, among others: (a) the Adviser demonstrated that it possesses the capability and resources to perform the duties required of it under the Investment Advisory Agreement; (b) the Adviser is qualified to manage the fund’s assets in accordance with the fund’s investment objective and strategies; (c) the overall investment performance of the fund is satisfactory relative to the performance of funds with similar investment objectives and relevant indices and benchmarks; (d) the fund’s advisory fee is reasonable in light of the services received by the fund from the Adviser and other factors considered; and (e) the Adviser’s investment strategies are appropriate for pursuing the investment objectives of the fund. Based on the foregoing conclusions, the Trustees determined with respect to each fund that continuation of the Investment Advisory Agreement with the Adviser was in the best interests of the fund and its shareholders.
In considering the renewal of the Investment Sub-Advisory Agreement with respect to the Subadviser, the Board, including the Independent Trustees, did not identify any single factor as controlling, and each Trustee may have attributed different weights to the various factors. The Board reached the following conclusions regarding the International Stock Fund’s Investment Sub-Advisory Agreement, among others: (a) the Subadviser demonstrated that it possesses the capability and resources to perform the duties required of it under the Agreement; (b) the Subadviser is qualified to manage the fund’s assets in accordance with the fund’s investment objectives and policies; (c) the overall investment performance of the fund is satisfactory relative to the performance of funds with similar investment objectives and relevant indices and benchmarks; (d) the fund’s sub-advisory fee is reasonable in light of the services received by the fund from the Subadviser; and (e) the Subadviser’s investment strategies are appropriate for pursuing the investment objectives of the fund. Based on the foregoing conclusions, the Board determined that approval of the International Stock Fund’s Investment Sub-Advisory Agreement with the Subadviser was in the best interests of the fund and its shareholders.
FUND EXPENSES PAID BY SHAREHOLDERS
As a shareholder of the funds, you pay no transaction costs, but may indirectly (see Note 3 to the Financial Statements) incur ongoing costs which include management fees; disinterested trustee fees; brokerage commissions and other expenses incurred in connection with the acquisition or disposition of investments; costs of borrowing money; expenses for independent audits, taxes, and extraordinary expenses as approved by a majority of the disinterested trustees. The examples in the table that follows are intended to help you understand your ongoing costs (in dollars) of investing in the funds and to compare these costs with the ongoing costs of investing in other mutual funds.
The examples below are based on an investment of $1,000 invested for the six-month period ended December 31, 2017. Expenses paid during the period in the table below are equal to each fund’s annualized expense ratio, multiplied by the average account value over the period, multiplied by 184/365 (to reflect the one-half fiscal year period).
Actual Expenses
The table below provides information about actual account values using actual expenses and actual returns for the funds. You may use the information in this table, together with the amount you invested, to estimate the expenses that you paid over the period. Simply divide your account value by $1,000 (for example, an $8,600 account value divided by $1,000 = 8.6), then multiply the result by the number in the table for the fund you own under the heading entitled “Expenses Paid During Period” to estimate the expenses you paid on your account during this period.
Beginning
Ending
Annual
Expenses Paid
Fund
Account Value
Account Value
Expense Ratio1
During Period1
Ultra Series Target Retirement 2020 Fund
$1,000
$1,038.50
0.30%
$1.49
Ultra Series Target Retirement 2030 Fund
1,000
1,061.90
0.30%
1.50
Ultra Series Target Retirement 2040 Fund
1,000
1,071.90
0.30%
1.50
Ultra Series Target Retirement 2050 Fund
1,000
1,082.10
0.30%
1.51
Hypothetical Example for Comparison Purposes
The table below provides information about hypothetical account values and hypothetical expenses based on the funds’ actual expense ratios and an assumed rate of return of 5% per year before expenses, which are not the funds’ actual returns. The hypothetical account values and expenses may not be used to estimate the actual ending account balance or expenses you paid for the period. You may use this information to compare the ongoing costs of investing in the funds and other funds. To do so, compare the 5% hypothetical example of the funds you own with the 5% hypothetical examples that appear in the shareholder reports of other similar funds.
Beginning
Ending
Annual
Expenses Paid
Fund
Account Value
Account Value
Expense Ratio1
During Period1
Ultra Series Target Retirement 2020 Fund
$1,000
$1,025.21
0.30%
$1.48
Ultra Series Target Retirement 2030 Fund
1,000
1,025.21
0.30%
1.48
Ultra Series Target Retirement 2040 Fund
1,000
1,025.21
0.30%
1.48
Ultra Series Target Retirement 2050 Fund
1,000
1,025.21
0.30%
1.48
1
Amounts include expenses of the underlying GS Target Date Portfolio, and the underlying expense of the funds held by the GS Target Date Protfolio. See Note 1 to the Financial Statements for an explanation of the fund organizational structure, Note 3 to the Financial Statements for a description of the expense structure, and the current prospectus for more complete information regarding the charges and expenses of the GS Target Date Portfolios.
Please note that the expenses shown in the tables are meant to highlight your ongoing costs only and do not reflect any separate account fees, charges, or expenses imposed by the group variable annuity contracts, or retirement and pension plans that use the funds. The information provided in the hypothetical example table is useful in comparing ongoing Target Date Fund costs only, and will not help you determine the relative total costs of owning different funds. In addition, if these fees, charges or expenses were included, your costs would have been higher.
20
Ultra Series Funds | Other Information (unaudited) - continued | December 31, 2017
AVAILABILITY OF QUARTERLY PORTFOLIO SCHEDULES
The Trust files its complete schedule of portfolio holdings with the SEC for the first and third quarters of each fiscal year on Form N-Q. Form N-Q is available to shareholders at no cost by calling 1-800-877-6089, or on the SEC’s website at www. sec.gov. Form N-Q may also be reviewed and copied at the Commission’s Public Reference Room in Washington, DC. More information on the operation of the Public Reference Room may be obtained by calling 1-800-SEC-0330. Form N-Q and other information about the Trust are available on the EDGAR database on the SEC’s Internet site at www.sec.gov. Copies of this information may also be obtained, upon payment of a duplicating fee, by electronic request at the following email address: publicinfo@sec.gov, or by writing the SEC’s Public Reference Section, Washington, DC 20549-0102.
PROXY VOTING POLICIES, PROCEDURES AND RECORDS
A description of the policies and procedures used by the Trust to vote proxies related to portfolio securities is available to shareholders at no cost by calling 1-800-877- 6089, or on the SEC’s website at www.sec.gov and is also located in the funds’ Statement of Additional Information. The proxy voting records for the Trust for the most recent twelve-month period ended June 30 are available to shareholders at no cost on the SEC’s website at www.sec.gov.
FORWARD-LOOKING STATEMENT DISCLOSURE
One of our most important responsibilities as investment company managers is to communicate with shareholders in an open and direct manner. Some of our comments in the Management’s Discussion of Fund Performance - Period in Review are based on current management expectations and are considered “forward-looking statements.” Actual future results, however, may prove to be different from our expectations. You can identify forward-looking statements by words such as “estimate,” “may,” “will,” “expect,” “believe,” “plan” and other similar terms. We cannot promise future returns. Our opinions are a reflection of our best judgment at the time this report is compiled, and we disclaim any obligation to update or alter forward-looking statements as a result of new information, future events, or otherwise.
TAX INFORMATION
Corporate Dividends Received Deduction: For the taxable year ended December 31, 2017, the following percentage of income dividends paid by the fund qualify for the dividends received deduction available to corporations:
Fund
Percentage
Ultra Series Madison Target Retirement 2020 Fund
7.20
%
Ultra Series Madison Target Retirement 2030 Fund
13.86
%
Ultra Series Madison Target Retirement 2040 Fund
14.12
%
Ultra Series Madison Target Retirement 2050 Fund
17.30
%
See accompanying Notes to Financial Statements.
21
Ultra Series Funds | Other Information (unaudited) - continued | December 31, 2017
APPENDIX A: GOLDMAN SACHS FUNDS: GOLDMAN SACHS TARGET DATE PORTFOLIOS SCHEDULES OF INVESTMENTS - Target Date Funds (unaudited) - December 31, 2017
Goldman Sachs Target Date 2020 Portfolio Schedule of Investments1
The percentage shown for each investment category reflects the value of investments in that category as a percentage of net assets.
1
Reported on a cash basis and therefore may not include unsettled shareholder trades from the feeder fund. For additional information on the underlying funds, including shareholder prospectuses and financial reports, please visit each underlying fund’s website or visit the Securities and Exchange Commission’s website at http://www.sec.gov.
(a)
Represents an Affiliated Issuer.
Investment Abbreviations: ETF - Exchange Traded Fund
TIPs - Treasury Inflation Protected Securities
Goldman Sachs Target Date 2030 Portfolio Schedule of Investments1
The percentage shown for each investment category reflects the value of investments in that category as a percentage of net assets.
1
Reported on a cash basis and therefore may not include unsettled shareholder trades from the feeder fund. For additional information on the underlying funds, including shareholder prospectuses and financial reports, please visit each underlying fund’s website or visit the Securities and Exchange Commission’s website at http://www.sec.gov.
(a)
Represents an Affiliated Issuer.
Investment Abbreviations: ETF - Exchange Traded Fund
TIPs - Treasury Inflation Protected Securities
See accompanying Notes to Financial Statements.
22
Ultra Series Funds | Other Information (unaudited) - continued | December 31, 2017
APPENDIX A: GOLDMAN SACHS FUNDS: GOLDMAN SACHS TARGET DATE PORTFOLIOS SCHEDULES OF INVESTMENTS - Target Date Funds (unaudited) - December 31, 2017 - continued
Goldman Sachs Target Date 2040 Portfolio Schedule of Investments1
The percentage shown for each investment category reflects the value of investments in that category as a percentage of net assets.
1
Reported on a cash basis and therefore may not include unsettled shareholder trades from the feeder fund. For additional information on the underlying funds, including shareholder prospectuses and financial reports, please visit each underlying fund’s website or visit the Securities and Exchange Commission’s website at http://www.sec.gov.
(a)
Represents an Affiliated Issuer.
Investment Abbreviations: ETF - Exchange Traded Fund
TIPs - Treasury Inflation Protected Securities
Goldman Sachs Target Date 2050 Portfolio Schedule of Investments 1
The percentage shown for each investment category reflects the value of investments in that category as a percentage of net assets.
1
Reported on a cash basis and therefore may not include unsettled shareholder trades from the feeder fund. For additional information on the underlying funds, including shareholder prospectuses and financial reports, please visit each underlying fund’s website or visit the Securities and Exchange Commission’s website at http://www.sec.gov.
(a)
Represents an Affiliated Issuer.
Investment Abbreviations: ETF - Exchange Traded Fund
TIPs - Treasury Inflation Protected Securities
See accompanying Notes to Financial Statements.
23
Ultra Series Funds | Other Information (unaudited) - concluded | December 31, 2017
APPENDIX B: GOLDMAN SACHS FUNDS: GOLDMAN SACHS TARGET DATE FUNDS STATEMENTS OF ASSETS AND LIABILITIES (unaudited) - December 31, 2017
Target Date 2020 Portfolio
Target Date 2030 Portfolio
Target Date 2040 Portfolio
Target Date 2050 Portfolio
Assets:
Investments of unaffiliated issuers, at value (Cost $45,310,722, $68,413,808, $43,362,545
and $24,861,878)
$
47,780,219
$
76,460,604
$
49,604,262
$
28,872,303
Investments of affiliated issuers, at value (Cost $117, $4,451, $197 and $98)
117
4,451
198
98
Cash
835,255
1,351,978
888,982
524,641
Investments sold
2,425,837
976,306
759,651
368,992
Dividends and interest
36,216
29,194
12,245
4,961
Receivables:
Reimbursement from investment adviser
22,142
21,810
22,040
20,939
Fund shares sold
1,814
117,592
14,488
4,831
Total assets
51,101,600
78,961,935
51,301,866
29,796,765
Liabilities:
Payables:
Investments purchased
2,539,594
1,172,325
893,783
454,798
Management fees
10,195
16,316
10,573
6,120
Distribution and Service fees and Transfer Agency fees
1,905
3,112
1,953
1,194
Accrued expenses
177,951
181,613
176,104
168,370
Total liabilities
2,729,645
1,373,366
1,082,413
630,482
Net Assets:
Paid-in capital
45,897,626
69,824,746
43,985,310
25,182,402
Distributions in excess of net investment income
(31,660
)
(20,242
)
(10,212
)
(16,593
)
Accumulated net realized gain (loss)
36,492
(262,731
)
2,638
(9,951
)
Net unrealized gain
2,469,497
8,046,796
6,241,717
4,010,425
NET ASSETS
$
48,371,955
$
77,588,569
$
50,219,453
$
29,166,283
Net Assets:
Class A
$
17,164
$
318,115
$
20,718
$
97,629
Institutional
10,735
11,374
11,649
11,927
Service
10,662
11,296
11,569
11,846
Class IR
859,319
1,426,972
528,726
832,466
Class R
10,641
25,518
27,984
11,849
Class R6
47,463,434
75,795,294
49,618,807
28,200,566
Total Net Assets
$
48,371,955
$
77,588,569
$
50,219,453
$
29,166,283
Shares Outstanding $0.001 par value (unlimited number of shares authorized):
Class A
1,843
33,688
2,247
9,449
Institutional
1,151
1,202
1,261
1,151
Service
1,144
1,195
1,254
1,144
Class IR
92,252
151,068
57,321
80,458
Class R
1,142
2,702
3,038
1,145
Class R6
5,088,355
8,012,282
5,368,076
2,721,997
Net asset value, offering and redemption price per share:(a)
Class A
$
9.31
$
9.44
$
9.22
$
10.33
Institutional
9.33
9.47
(b)
9.24
10.36
Service
9.32
9.46
(b)
9.23
10.35
Class IR
9.31
9.45
9.22
10.35
Class R
9.32
9.44
9.21
10.35
Class R6
9.33
9.46
9.24
10.36
(a)
Maximum public offering price per share for Class A Shares of the Target Date 2020, Target Date 2030, Target Date 2040, and Target Date 2050 Portfolios is $9.85, $9.99, $9.76 and $10.93, respectively.
(B)
Net asset value may not recalculate due to rounding of fractional shares.
24
Ultra Series Fund | December 31, 2017
Trustees and Officers
The address of each Trustee and officer is 550 Science Drive, Madison, Wisconsin 53711. The Statement of Additional Information, which includes additional information about the trustees of the fund and is available at no cost on the SEC’s website at www.sec.gov or by calling 1-800-798-5500.
Interested Trustees and Officers
Name and Year of Birth
Position(s) and Length of Time Served
Principal Occupation(s) During Past Five Years
Portfolios Overseen in Fund Complex by Director/Trustee1
Other Directorships Held by Director/ Trustee
Katherine L. Frank2 1960
Trustee and President, 2009 - Present
Madison Investment Holdings, Inc. (“MIH”) (affiliated investment advisory firm of Madison), Executive Committee Member and Chief Operating Officer, 2010 - Present; Managing Director and Vice President, 1986 - 2010
Madison Asset Management, LLC (“Madison”), Executive Committee Member and Chief Operating Officer, 2010 - Present; Vice President, 2004 - 2010
Madison Investment Advisors, LLC (“MIA”) (affiliated investment advisory firm of Madison), Executive Committee Member and Chief Operating Officer, 2010 - Present; President, 1996 - 2010
Madison Funds (18) (mutual funds), President, 2009 - Present; Madison Strategic Sector Premium Fund (closed end fund), President, 2005 - Present; Madison Covered Call & Equity Strategy Fund (closed end fund), President, 2012 - Present;
32
Madison Funds (18), 2009 - Present
Madison Strategic Sector Premium Fund, 2005 -2017
Jay R. Sekelsky 1959
Vice President, 2009 - December 2017*
MIH, Executive Committee Member and Chief Investment Officer, 2010 - Present; Managing Director and Vice President, 1990 - 2010
Madison, Executive Committee Member and Chief Investment Officer, 2010 – Present
MIA, Executive Committee Member and Chief Investment Officer, 2010 - Present; Vice President, 1996 - 2010
Madison Strategic Sector Premium Fund, Vice President, 2005 - Present; Madison Covered Call & Equity Strategy Fund, Vice President, 2012 - December 2017; Madison Funds (18), Vice President, 2009 - December 2017
N/A
N/A
Paul A. Lefurgey 1964
Vice President, 2009 - Present
MIH, Madison and MIA, CEO, 2017 – Present; Chairman - Executive Committee, 2015 - 2017; Director of Fixed Income Investments, 2016 - Present; Executive Director and Head of Fixed Income Investments, 2013 - 2016; Managing Director and Head of Fixed Income Investments, 2005 - 2013
Madison Strategic Sector Premium Fund, Vice President, 2010 - Present; Madison Covered Call & Equity Strategy Fund, Vice President, 2012 - Present; Madison Funds (18), Vice President, 2009 - Present
Madison Strategic Sector Premium Fund, Secretary and Assistant Treasurer, 2010 - Present; Madison Covered Call & Equity Strategy Fund, Secretary and Assistant Treasurer, 2012 - Present; Madison Funds (18), Secretary, 1999 - Present and Treasurer, 2008-2009 and Assistant Treasurer, 1997 - 2007 and 2009 - Present
N/A
N/A
1
As of the date of this report, the fund complex consists of Madison Funds with 18 portfolios, the Ultra Series Fund with 14 portfolios, the Madison Strategic Sector Premium Fund (a closed-end fund) and the Madison Covered Call & Equity Strategy Fund (closed end fund), for a grand total of 34 separate portfolios in the fund complex. Not every Trustee is a member of the Board of Trustees of every fund in the fund complex, as noted above. References to the “Fund Complex” in the following tables have the meaning disclosed in this paragraph.
2
“Interested person” as defined in the 1940 Act. Considered an interested Trustee because of the position held with the investment adviser of Madison Funds.
*
Effective as of December 31, 2017, Mr. Sekeleky resigned as an officer of the fund.
25
Ultra Series Funds | Trustees and Officers - concluded | December 31, 2017
Name and Year of Birth
Position(s) and Length of Time Served
Principal Occupation(s) During Past Five Years
Portfolios Overseen in Fund Complex by Director/Trustee1
Other Directorships Held by Director/Trustee
Kevin S. Thompson 1966
Chief Legal Officer and Assistant Secretary, 2017 - Present
Chief Compliance Officer, January 2018 - Present
MIH, MIA and Madison, Chief Legal Officer and Chief Administrative Officer, 2017 - Present; Chief Compliance Officer, January 2018 - Present
Madison Funds (18), Madison Strategic Sector Premium Fund and Madison Covered Call & Equity Strategy Fund, Chief Legal Officer and Assistant Secretary, 2017 - Present; Chief Compliance Officer, January 2018 - Present
CFMG Life Insurance Company, Associate General Counsel, 2012 - 2015; Vice President Wealth Management, 2015 - 2017; President of CBSI 2016 - 2017
N/A
N/A
Lisa R. Lange 1969
Chief Compliance Officer and Assistant Secretary, 2015 - January 2018*
MIH, MIA and Madison, Chief Compliance Officer, 2015 - January 2018 and Chief Legal Officer, 2015 - 2017
NorthRoad Capital Management LLC (“NorthRoad”) (former affiliated investment advisory firm of Madison), Chief Compliance Officer and Chief Legal Officer April 2015 - September 2016
Madison Funds (18), Madison Strategic Sector Premium Fund and Madison Covered Call & Equity Strategy Fund, Chief Compliance Officer and Assistant Secretary, 2015 - Present and Chief Legal Officer 2015 - 2017
As of the date of this report, the fund complex consists of Madison Funds with 18 portfolios, the Ultra Series Fund with 14 portfolios, the Madison Strategic Sector Premium Fund (a closed-end fund) and the Madison Covered Call & Equity Strategy Fund (closed end fund), for a grand total of 34 separate portfolios in the fund complex. Not every Trustee is a member of the Board of Trustees of every fund in the fund complex, as noted above. References to the “Fund Complex” in the following tables have the meaning disclosed in this paragraph.
*
Effective as of January 19, 2018, Ms. Lange resigned as Chief Compliance Officer of the Fund.
Independent Trustees
Name and Year of Birth
Position(s) and Length of Time Served1
Principal Occupation(s) During Past Five Years
Portfolios Overseen in Fund Complex2
Other Directorships Held by Director/ Trustee
James R. Imhoff, Jr. 1944
Trustee, 2009 - Present
First Weber, Inc. (real estate brokers), Madison, WI, Chief Executive Officer, 1996 - July 2017 and Chairman July 2017 -Present
34
Park Bank, 1978 - Present First Weber, Inc., 2017 - Present Madison Funds (18), 2009 - Present; Madison Strategic Sector Premium Fund, 2005 - Present; Madison Covered Call & Equity Strategy Fund, 2005 - Present
Independent Trustees serve in such capacity until the age of 76, unless retirement is waived by unanimous vote of the remaining Trustees on an annual basis.
2
As of the date of this report, the fund complex consists of Madison Funds with 18 portfolios, the Ultra Series Fund with 14 portfolios, the Madison Strategic Sector Premium Fund (a closed-end fund) and the Madison Covered Call & Equity Strategy Fund (closed end fund), for a grand total of 34 separate portfolios in the fund complex. Not every Trustee is a member of the Board of Trustees of every fund in the fund complex, as noted above. References to the “Fund Complex” in the preceding tables have the meaning disclosed in this paragraph.
SEC File Number: 811-04815
26
Goldman Sachs Funds
Annual Report August 31, 2017
Target Date Portfolios
Target Date 2020 Target Date 2025 Target Date 2030 Target Date 2035 Target Date 2040 Target Date 2045 Target Date 2050 Target Date 2055
Goldman Sachs Target Date Portfolios
n TARGET DATE 2020
n TARGET DATE 2025
n TARGET DATE 2030
n TARGET DATE 2035
n TARGET DATE 2040
n TARGET DATE 2045
n TARGET DATE 2050
n TARGET DATE 2055
TABLE OF CONTENTS
Market Review
1
Portfolio Management Discussions and
Performance Summaries
7
Schedules of Investments
38
Financial Statements
46
Financial Highlights
58
Notes to Financial Statements
74
Report of Independent Registered Public
Accounting Firm
92
Other Information
93
NOT FDIC-INSURED
May Lose Value
No Bank Guarantee
MARKET REVIEW
Target Date Portfolios
Market Review
During the period between November 1, 2016 and August 31, 2017 (the “Reporting Period”), U.S., international and emerging markets equities rallied despite unexpected geopolitical events and shifting global central bank monetary policy. Within the broad U.S. fixed income market, spread, or non-government bond, sectors generally produced positive returns as interest rates rose and investors’ risk appetite increased.
U.S. Equities
When the Reporting Period began in November 2016, U.S. equities sold off ahead of the presidential elections but surged higher after the surprise result on anticipation of a potentially pro-growth effect from the incoming Administration’s fiscal stimulus plan. In December 2016, the Federal Reserve (“Fed”) raised interest rates 25 basis points as had largely been anticipated, and set a more hawkish hike path for 2017, causing equities to decline, albeit modestly, following the announcement. (A basis point is 1/100th of a percentage point. Hawkish implies higher interest rates; opposite of dovish.)
U.S. equities rallied significantly in the first two months of 2017 before declining in March. In January 2017, U.S. equities advanced on the prospect of deregulation following presidential executive orders on oil pipelines and on optimism around infrastructure spending after a $1 trillion proposal from Senate Democrats made headlines. Despite political uncertainty and concerns about protectionism, U.S. equities continued to advance in February 2017 amid “risk on” sentiment, or increased risk appetite, due to potential U.S. tax reform and deregulation as well as on stronger economic data. In March 2017, the Fed raised interest rates another 25 basis points, while maintaining its projections for three rate hikes in 2017. However, a seemingly cautious stance on the future path of monetary tightening from Fed Chair Janet Yellen and the presence of a dissenter on the Fed’s policy-making committee led to a dovish market reaction. Political risks subsequently drove U.S. equities lower as Republicans in the House of Representatives struggled to schedule a vote on health care legislation.
U.S. equities declined in April 2017 as Fed minutes suggested stocks were overvalued, but then rebounded on strong first quarter 2017 earnings reports and receding European political risk following the French presidential election. Although the labor market remained strong, economic activity and inflation data appeared to be moderating during the second quarter of 2017. The core consumer price index (“CPI”) softened to 1.7% year-over-year in May 2017, marking a third consecutive month of weakness, while core personal consumption expenditure (“PCE”) remained below the Fed’s 2% target at just 1.4% year over year. In addition, market expectations for pro-growth U.S. fiscal policy were dampened by domestic political developments. Nonetheless, the Fed proceeded to raise the federal funds rate by 25 basis points in June 2017, citing ongoing strength in the labor market and a pickup in household spending and business fixed investment. The results of the Fed’s 2017 Comprehensive Capital Analysis and Review (“CCAR”) stress test for banks were encouraging, with improving payout ratios.
U.S. equities gained in July 2017. At the beginning of the month, the Institute for Supply Management (“ISM”) reported its manufacturing index had risen to 57.8% during June 2017, the highest level in nearly three years. However, inflation dynamics remained weak. Core CPI stayed soft in June 2017, rising 1.7% year over year and 0.1% month over month. Fed Chair Yellen’s assessment during her Congressional testimony that the federal funds rate was close to its neutral policy rate was interpreted dovishly by markets. The Fed kept its monetary policy unchanged in July 2017, as had been widely expected. The Fed’s statement included an upgrade to its assessment of job growth as well as an acknowledgment that inflation was “below” target.
1
MARKET REVIEW
This compares with its prior view, which noted inflation was “somewhat below” its 2% target, a shift that resulted in a mildly dovish market reaction. The Fed also stated it expected its balance sheet normalization to begin “relatively soon.” (Balance sheet normalization refers to the steps the Fed will take to reverse quantitative easing and remove the substantial monetary accommodation it has provided to the economy since the financial crisis began in 2007.)
U.S. equities were roughly flat in August 2017. U.S. economic activity continued to be strong, with several surveys on consumer sentiment and manufacturing surprising positively. This was in contrast to subdued inflation. Minutes from the Fed’s July policy meeting suggested increased concerns on inflation, highlighting that “many participants” saw “some likelihood that inflation may remain below 2 percent for longer than expected.” Hurricane Harvey caused extensive flooding and damage in Texas and Louisiana and significantly impacted refinery operations, resulting in a surge in gasoline prices.
International Equities
Soon after the Reporting Period began in early November 2016, international equities rallied on the unexpected outcome of the U.S. presidential elections. Investors appeared optimistic about the potential pro-growth effect of the incoming Administration’s fiscal stimulus plan. However, U.S. dollar appreciation against local currencies detracted from their U.S. dollar performance. International equities then saw a strong advance during an eventful December 2016, with the resignation of Italy’s prime minister after voters’ rejection of its constitutional referendum, the Fed’s interest rate hike, and the European Central Bank’s (“ECB”) decision to slow its monthly pace of quantitative easing while extending its program to the end of 2017.
International equities continued their rally in early January 2017 on the prospect of U.S. deregulation following presidential executive orders on oil pipelines and optimism around infrastructure spending. However, international equity markets subsequently retreated on political uncertainty and protectionism concerns. In February 2017, international equities were buoyed by “risk on” sentiment owing to potential U.S. tax reform and deregulation as well as on strong economic data. In March 2017, Fed Chair Yellen’s seemingly cautious stance on the future path of tightening and the presence of a dissenter on the Fed’s policy-making committee led to a dovish market reaction and the appreciation of the Japanese yen, despite the Bank of Japan (“BoJ”) maintaining its policy rate. Meanwhile, the ECB kept its monetary policy unchanged at its March 2017 meeting but revised its economic growth and inflation forecasts upward. Equity markets interpreted the positive economic assessment as hawkish, sparking concerns around the sequencing of the ECB’s policy steps — namely, whether interest rates might rise before quantitative easing ends.
During the second quarter of 2017, international equities were bolstered by receding political risk, as the centrist candidate defeated the nationalist candidate in the French election and successfully secured a parliamentary majority. Political risk also declined in Italy, as the antiestablishment Five Star Movement saw a setback in local elections, and expectations for parliamentary elections this year declined. However, market optimism for pro-growth U.S. fiscal policy was dampened by political developments. Strong first quarter 2017 corporate earnings results, with double-digit growth across virtually all major developed market regions, were supportive for international equity markets. In June 2017, European markets reacted hawkishly to ECB President Mario Draghi’s optimistic outlook for recovering inflation and his cautious reference to tapering of asset purchases. Japanese equities saw a temporary pull-back in June 2017, as market sentiment deteriorated and as the Japanese yen strengthened immediately after the Fed’s June rate hike.
2
MARKET REVIEW
International equities gained in July 2017. However, a dovish market reaction to the Fed’s decision to leave interest rates unchanged at its July policy meeting, combined with political turmoil in Washington, D.C., added to U.S. dollar weakness. Meanwhile, market expectations of asset purchase tapering by the ECB continued to support the euro, despite ECB President Draghi’s cautious and mildly dovish tone at the ECB’s July 2017 policy meeting. The BoJ maintained its monetary policy during the month, pushing back the timeframe for achieving its 2% inflation target from 2018 to 2019, as slow wage growth continued to cloud the inflation outlook.
In August 2017, international equities were generally flat. Eurozone economic growth picked up to an annualized rate of 2.1% in the second calendar quarter from 1.9% in the first calendar quarter. However, economic activity indicators appeared to be moderating, though still at relatively robust levels. The Japanese yen strengthened as risk sentiment deteriorated amid escalating geopolitical tensions between U.S. and North Korea, creating headwinds for Japanese equities. Contrary to the expectations of some market participants, the Fed’s Jackson Hole Economic Policy Symposium toward the end of the month provided no indication of the monetary policy outlooks of either Fed Chair Yellen or ECB President Draghi. This buoyed Japanese equities, as did moderating geopolitical risks and encouraging U.S. economic data.
Emerging Markets Equities
In early November 2016, soon after the Reporting Period started, emerging markets equities fell sharply following the unexpected outcome of the U.S. presidential elections due to headwinds from the resulting rise in U.S. Treasury yields and appreciation of the U.S. dollar. Concerns about protectionist U.S. trade and immigration policies also weighed on emerging markets equities. In December 2016, emerging markets equities remained weak, as the Fed raised interest rates 25 basis points and set a more hawkish tone for its 2017 rate hike path.
Despite the political uncertainty and protectionism concerns arising from the new U.S. Administration in January 2017, emerging markets equities were buoyed by optimism about economic growth, owing to strong economic data and rising metal and soft commodity prices. February 2017 was another month of positive performance for emerging markets equities, as investors continued to assess the outlook for potential tax reform, deregulation and other fiscal policies out of the new U.S. Administration. Indian equities were a standout performer, as a pragmatic Union Budget and a strong third quarter 2016 Gross Domestic Product (“GDP”) number were supportive of risk sentiment, particularly following India’s November 2016 demonetization move. (On November 8, 2016, India’s prime minister announced that 86% of the country’s currency would be rendered null and void in 50 days. It was posited as a move to crackdown on corruption and the country’s booming under-regulated and virtually untaxed grassroots economy, but was also being used as a driver to get millions of Indians onto the country’s official economic grid—many for the first time. The crackdown saw all 500 and 1,000 rupee notes—the country’s most popular currency denominations—removed from circulation, while a new 2,000 rupee note was added. Five hundred rupees is roughly the equivalent of $7.50.)
In March 2017, the Fed raised interest rates by another 25 basis points. However, the market reacted dovishly on a seemingly cautious stance on the future path of monetary tightening from the Fed chair and the presence of a dissenter on the Fed’s policy-making committee. Mexico was the best performing country within emerging markets equities in March 2017, boosted by peso appreciation following a fourth consecutive rate hike by its central bank, Banxico.
Receding political risk in Europe was supportive for emerging markets equities during the second quarter of 2017. Chinese equities, which largely shrugged off a May 2017 sovereign credit rating downgrade by Moody’s Investors Service, rallied on easing market concerns after
3
MARKET REVIEW
the People’s Bank of China made a distinction between ongoing financial deleveraging and monetary policy tightening and also as the Chinese renminbi appreciated. In India, continued progress on the Goods and Services Tax (“GST”) implementation and a better outlook for the monsoon season were positive for Indian equities during May 2017, offsetting softer economic data. However, Indian equities sold off in June 2017 on concerns about the impact on growth of the GST rollout as well as elevated valuations, despite supportive domestic monetary and fiscal policy developments. Qatar was the worst performing emerging markets country for the second calendar quarter overall, as several key Gulf states cut off diplomatic ties and closed borders with the country, citing security concerns.
Emerging markets equities continued to enjoy strong returns in July 2017. The market’s dovish reaction to the Fed’s decision to leave interest rates unchanged at its July policy meeting, combined with continuing political gridlock in Washington, D.C., increased U.S. dollar weakness against emerging markets currencies. Latin American equities advanced during the month, with standout Brazilian equity performance driven by a 100 basis point rate cut by the Central Bank of Brazil and the appreciation of the Brazilian real. Elsewhere in Latin America, the central banks of Peru and Colombia both lowered their policy interest rates by 25 basis points. In Asia, China outperformed on strong June 2017 economic activity data, with second calendar quarter GDP coming in at an annualized rate of 6.9%. Chinese corporate sector balance sheets also showed signs of improvement. Indian equities experienced a strong rebound, driven by tailwinds that included a successful GST rollout, a good monsoon season and higher market expectations of central bank rate cuts due to moderating inflation.
Emerging markets equities rallied further in August 2017, outperforming developed markets equities overall. Persistently low U.S. inflation led the markets to price in a more dovish pace of Fed rate hikes. This, along with U.S. dollar weakness and solid earnings forecasts, supported emerging markets equities. Asian equities underperformed on escalating geopolitical tensions between the U.S. and North Korea. China outperformed broader Asia on solid earnings results for the first half of 2017 and robust investment flows from mainland China to Hong Kong. However, despite a 25 basis point rate cut by the Reserve Bank of India, Indian equities underperformed on meaningful 2017 earnings downgrades. India’s economic data was also disappointing, due to the lagging effects of demonetization and spillover from GST implementation. South Korean equities were weak on the country’s outsized exposure to geopolitical tensions with North Korea following missile launches as well as on domestic concerns about government policy. Latin American equities outperformed, with Peru and Chile benefiting from surging copper prices and Brazil gaining on strong economic data and the dismissal of corruption accusations against the country’s president.
Fixed Income Markets
During November 2016, when the Reporting Period began, spread sectors were volatile. Investor sentiment was dominated by the results of the U.S. presidential elections, which appeared to change expectations for future fiscal and regulatory policy. More specifically, investors appeared to anticipate fiscal stimulus, a looser regulatory agenda and a faster pace of Fed monetary policy tightening. Global interest rates rose, and the U.S. dollar appreciated versus other developed markets and emerging markets currencies. Meanwhile, the U.S. economy continued to strengthen, with strong jobs growth and increased consumer spending reported. In December 2016, spread sectors advanced, outpacing U.S. Treasury securities. Mid-month, the Fed hiked short-term interest rates, which resulted in a further rise in U.S. Treasury yields, with a notable increase in shorter-term yields and additional appreciation in the U.S. dollar. In Europe, the ECB announced it would reduce its monthly pace of asset
4
MARKET REVIEW
purchases starting in April 2017 but stated it would extend its quantitative easing program to the end of 2017. On the political front, Italy voted to reject its constitutional reforms, while the outcome of Austria’s election defied the populist tide that had claimed victories in the U.K. and U.S. during 2016. Crude oil prices rose following an agreement by the Organization of the Petroleum Exporting Countries (“OPEC”) and non-OPEC producers to cut production, which provided support for energy issuers within the corporate credit market as well as for oil-exporting emerging economies.
During the first quarter of 2017, spread sectors provided mixed results versus U.S. Treasuries but posted gains overall. Investors focused on the prospect of pro-growth policies from the new U.S. Administration, which we believe helped boost business and consumer sentiment to near record levels. Investors also evaluated the positive impact of earlier fiscal stimulus in China. Global purchasing managers’ indices pointed to solid and synchronized global expansion, led by developed markets, most notably the U.S. In Europe, economic data strengthened and political risk remained contained, as markets weathered the official start of Brexit negotiations. (Brexit refers to the U.K.’s efforts to exit the European Union.) The far right lost to centrists in the Netherlands’ election. In France, polls reflected a relatively low chance of victory for the far-right candidate in the country’s then-upcoming presidential vote. Monetary policy presented few surprises during the first calendar quarter, as the ECB, BoJ and Bank of England (“BoE”) kept their respective monetary policies unchanged. In March 2017, the ECB raised its economic growth and inflation forecast, while the Fed raised its target range for the federal funds rate by 25 basis points. Minutes from the meeting raised expectations that Fed balance sheet normalization would begin in 2017. Despite the Fed’s monetary policy tightening, U.S. financial conditions eased and the U.S. dollar weakened versus both developed and emerging markets currencies during the first calendar quarter.
In the second quarter of 2017, spread sectors generally recorded positive returns, though with mixed results relative to U.S. Treasuries. Political developments led to temporary bouts of volatility early in the quarter, driving weakness in Brazilian, U.S. and U.K. fixed income assets as well as a credit rating downgrade of South Africa’s sovereign debt. Political risks receded in May 2017 on the centrist candidate’s victory in the French presidential election, which was supportive of French and European peripheral bonds broadly. On the economic front, U.S. core inflation weakened for the third consecutive month in May 2017, casting uncertainty over the pace of Fed monetary tightening. Nonetheless, comments included in minutes from the Fed’s May and June 2017 policy meetings suggested an announcement about how and when the Fed would begin reducing the size of its balance sheet would be made sooner than the markets had previously anticipated. In Europe, economic data continued to surprise to the upside. At its June 2017 policy meeting, the ECB provided an optimistic assessment of the risks to growth, but revised downward its medium-term inflation forecasts. The ECB, BoJ and BoE left their respective monetary policies unchanged during the second calendar quarter, while the Fed raised interest rates for the second time in 2017 and the fourth time in a decade at its June 2017 policy meeting. As the quarter came to an end, a string of comments from global central bankers triggered a hawkish market reaction. Global interest rates rose as the market anticipated a faster than expected pace of monetary policy tightening by the BoE, ECB and Bank of Canada. During the second quarter of 2017, the U.S. dollar continued to weaken versus many global currencies.
In July 2017, spread sectors broadly advanced, outperforming U.S. Treasury securities. The Fed kept its monetary policy unchanged, though policymakers noted that balance sheet normalization would begin “relatively soon.” U.S. financial conditions continued to ease despite previous Fed
5
MARKET REVIEW
rate hikes, while European financial conditions tightened on raised expectations for the potential withdrawal of the ECB’s accommodative monetary policy. In the U.S., second quarter 2017 GDP increased at an annualized rate of 2.6%, contrasting with inflation, which was subdued. In Europe, economic data continued to strengthen, but inflation remained below the ECB’s target and forecast. The U.S. dollar weakened relative to many global currencies.
During August 2017, spread sectors generally lagged U.S. Treasuries due to bouts of “risk off” sentiment, or increased risk aversion, amid rising geopolitical risks. In the U.S., limited progress on the Administration’s pro-growth fiscal policy measures, concerns about September 2017 debt limit and spending bill deadlines, and geopolitical uncertainty pushed down U.S. government bond yields. Second quarter 2017 U.S. GDP was revised up to an annualized rate 3.0% and the ISM’s manufacturing index rose to a six-year high in August 2017. In Europe, economic data was generally positive, driving appreciation of the euro against the U.S. dollar. In Japan, second calendar quarter GDP was revised down sharply from a preliminary annualized reading of 4% to 2.8%.
Looking Ahead
At the end of the Reporting Period, we believed global economic growth was in the midst of a synchronized upswing, led by developed markets with support from recovery in emerging economies. In the U.S., the labor market continued to tighten and financial conditions remained easy. Regarding Europe, economic growth surprises have driven our growth outlook for 2017 higher. In 2018, we expect to see modest slowing in several world economies, but we do not think such slowing will end the global expansion cycle, and we expect growth to remain above trend overall.
Inflation generally remained soft at the end of the Reporting Period, despite tight labor markets in some economies, most notably the U.S. We think global factors such as labor mobility are subduing inflationary pressures. In the U.S., we think recent soft economic data have interrupted, not derailed, the gradual rising trend in core inflation and wages. In Europe and Japan, we think structural challenges will continue to constrain wages and core inflation.
Regarding central bank policy, we believe the agenda is increasingly dominated by quantitative tightening, with the U.S. leading the way. In September 2017, we expect the Fed to formally unveil its plan for scaling down the size of its balance sheet and think implementation could begin in October 2017, with balance sheet normalization likely to span multiple years, in our view. In Europe, we think the ECB will increase communication about its strategy for tapering asset purchases starting in 2018. That said, we see the possibility that purchases could continue into 2019 due to recent currency strength weighing on an already-subdued inflation outlook. As for interest-rate policy, we expect one further rate hike by the Fed in 2017, provided inflation data improves and financial conditions do not tighten materially. We do not see rate hikes in Europe or Japan in the near term.
On the political front, market reaction to heighted geopolitical risk on the Korean Peninsula was relatively contained during the Reporting Period. In the U.S., we believe low expectations regarding the Administration’s ability to implement its pro-growth agenda creates potential for positive market surprises. We think there is a chance the Administration will press ahead with fiscal proposals during the fall of 2017. In Europe, we believe political risk could increase ahead of several upcoming events, including the Catalan Independence Referendum in Spain and elections in Austria and Italy. We expect continued uncertainty around the eventual Brexit outcome.
6
PORTFOLIO R E S U L T S
Goldman Sachs Target Date 2020 Portfolio,
Goldman Sachs Target Date 2025 Portfolio,
Goldman Sachs Target Date 2030 Portfolio,
Goldman Sachs Target Date 2035 Portfolio,
Goldman Sachs Target Date 2040 Portfolio,
Goldman Sachs Target Date 2045 Portfolio,
Goldman Sachs Target Date 2050 Portfolio and
Goldman Sachs Target Date 2055 Portfolio
Investment Process and Principal Strategies
The Goldman Sachs Target Date 2020 Portfolio, the Goldman Sachs Target Date 2025 Portfolio, the Goldman Sachs Target Date 2030 Portfolio, the Goldman Sachs Target Date 2035 Portfolio, the Goldman Sachs Target Date 2040 Portfolio, the Goldman Sachs Target Date 2045 Portfolio, the Goldman Sachs Target Date 2050 Portfolio and the Goldman Sachs Target Date 2055 Portfolio (collectively, the “Portfolios”) seek to provide capital appreciation and current income consistent with each respective Portfolio’s current asset allocation. The Portfolios employ asset allocation strategies designed for investors who plan to retire and to begin gradually withdrawing their investment beginning in or around 2020, 2025, 2030, 2035, 2040, 2045, 2050 and 2055 (respectively, the “Target Dates”). The Portfolios generally seek to achieve their investment objective by investing in shares of exchange-traded funds (“ETFs”) and other registered investment companies (collectively, the “Underlying Funds”), according to an asset allocation strategy developed by Madison Asset Management, LLC, the sub-adviser, which is unaffiliated with Goldman Sachs Asset Management, L.P., the investment adviser for the Portfolios.
Portfolio Management Discussion and Analysis
The Board of Trustees of Goldman Sachs Trust II (the “Board”) has approved a change to the fiscal year end of the Goldman Sachs Target Date Portfolios (the “Portfolios”). Effective August 1, 2017, the Portfolios’ fiscal year end changed from October 31 to August 31. Below, the Madison Asset Management, LLC portfolio management team, the Portfolios’ sub-adviser, discusses the Portfolios’ performance and positioning for the period from November 1, 2016 through August 31, 2017 (the “Reporting Period”).
Q
How did the Portfolios perform during the Reporting Period?
A
Goldman Sachs Target Date 2020 Portfolio — During the Reporting Period, the Target Date 2020 Portfolio’s Class A, Institutional, Service, IR, R and R6 Shares generated cumulative total returns of 6.06%, 6.42%, 6.02%, 6.26%, 5.86% and 6.42%, respectively. These returns compare to the 8.86% cumulative total return of the Portfolio’s benchmark, the S&P Target Date To 2020 Index (Total Return, Unhedged, USD) during the same period.
Goldman Sachs Target Date 2025 Portfolio — During the Reporting Period, the Target Date 2025 Portfolio’s Class A, Institutional, Service, IR, R and R6 Shares generated cumulative total returns of 8.77%, 9.22%, 8.83%, 9.06%, 8.67% and 9.22%, respectively. These returns compare to the 10.27% cumulative total return of the Portfolio’s benchmark, the S&P Target Date To 2025 Index (Total Return, Unhedged, USD) during the same period.
Goldman Sachs Target Date 2030 Portfolio — During the Reporting Period, the Target Date 2030 Portfolio’s Class A, Institutional, Service, IR, R and R6 Shares generated cumulative total returns of 10.47%, 10.87%, 10.47%, 10.71%, 10.30% and 10.88%, respectively. These returns compare to the 11.61% cumulative total return of the Portfolio’s benchmark, the S&P Target Date To 2030 Index (Total Return, Unhedged, USD) during the same period.
Goldman Sachs Target Date 2035 Portfolio — During the Reporting Period, the Target Date 2035 Portfolio’s Class A,
7
PORTFOLIO R E S U L T S
Institutional, Service, IR, R and R6 Shares generated cumulative total returns of 11.39%, 11.75%, 11.36%, 11.59%, 11.20% and 11.75%, respectively. These returns compare to the 12.65% cumulative total return of the Portfolio’s benchmark, the S&P Target Date To 2035 Index (Total Return, Unhedged, USD) during the same period.
Goldman Sachs Target Date 2040 Portfolio — During the Reporting Period, the Target Date 2040 Portfolio’s Class A, Institutional, Service, IR, R and R6 Shares generated cumulative total returns of 12.37%, 12.85%, 12.21%, 12.68%, 12.16% and 12.73%, respectively. These returns compare to the 13.88% cumulative total return of the Portfolio’s benchmark, the S&P Target Date To 2040 Index (Total Return, Unhedged, USD) during the same period.
Goldman Sachs Target Date 2045 Portfolio — During the Reporting Period, the Target Date 2045 Portfolio’s Class A, Institutional, Service, IR, R and R6 Shares generated cumulative total returns of 13.17%, 13.52%, 13.03%, 13.48%, 12.98% and 13.64%, respectively. These returns compare to the 14.63% cumulative total return of the Portfolio’s benchmark, the S&P Target Date To 2045 Index (Total Return, Unhedged, USD) during the same period.
Goldman Sachs Target Date 2050 Portfolio — During the Reporting Period, the Target Date 2050 Portfolio’s Class A, Institutional, Service, IR, R and R6 Shares generated cumulative total returns of 14.21%, 14.58%, 14.18%, 14.42%, 14.02% and 14.59%, respectively. These returns compare to the 15.33% cumulative total return of the Portfolio’s benchmark, the S&P Target Date To 2050 Index (Total Return, Unhedged, USD) during the same period.
Goldman Sachs Target Date 2055 Portfolio — During the Reporting Period, the Target Date 2055 Portfolio’s Class A, Institutional, Service, IR, R and R6 Shares generated cumulative total returns of 14.90%, 15.32%, 14.83%, 15.16%, 14.66% and 15.32%, respectively. These returns compare to the 15.80% cumulative total return of the Portfolio’s benchmark, the S&P Target Date To 2055 Index (Total Return, Unhedged, USD) during the same period.
Q
What key factors affected the Portfolios’ performance during the Reporting Period?
A
During the Reporting Period, the Portfolios benefited from our asset allocation decisions to favor certain asset classes through the Underlying Funds. Security selection was a slight drag on performance during the Reporting Period.
Q
How did the Portfolios’ asset allocations affect performance during the Reporting Period?
A
Within the Portfolios’ strategic allocations, our slight preference for equities over fixed income produced positive results. Within equities, the Portfolios benefited from their strategic allocations to non-U.S. stocks, which outpaced U.S. stocks during the Reporting Period, especially between January 1, 2017 and August 31, 2017. The Portfolios were also helped by their small tactical overweights in European stocks. Conversely, the Portfolios’ were hurt by our preference for higher quality companies (i.e., those with higher returns on equity and assets), which was expressed through tactical allocations to exchange-traded funds (“ETFs”) that emphasize lower volatility.
Within U.S. equities, our decision to modestly increase tactical exposure to U.S. mid-cap stocks detracted from the Portfolios’ performance, as large-cap and small-cap stocks outpaced mid-cap stocks during the Reporting Period. In addition, the Portfolios’ slight bias toward value stocks, which generally lagged growth stocks, dampened results. On the positive side, tactical overweights in regional banks and technology stocks bolstered returns.
Within fixed income, tactical exposure to intermediate-term U.S. Treasuries and their cash holdings detracted from the Portfolios’ performance. This was offset by the Portfolios’ tactical allocations to high yield loans and longer-duration U.S. Treasury securities, which added to results.
Within commodities, the Portfolios were hampered by their tactical allocations to gold, through which we sought to mitigate potential risks from fixed income and U.S. equity exposure. However, gold trailed both these asset classes in the wake of the U.S. elections. This was partially offset in the latter part of the Reporting Period by the positive effect of the Portfolios’ tactical allocations to commodities broadly, positioning that we established after eliminating the Portfolios’ tactical allocations to gold.
Q
Did the Underlying Funds help or hurt the Portfolios’ performance during the Reporting Period?
A
During the Reporting Period, the Portfolios’ Underlying Funds generated mixed results.
Within the Portfolios’ equity-related Underlying Funds, tactical overweights in certain sectors added to overall performance. The SPDR® S&P® Regional Banking ETF made the largest positive contribution, with much of the
8
PORTFOLIO R E S U L T S
outperformance occurring during November and December 2016 when interest rates rose on expectations of potential pro-growth policies from the newly elected Administration.
Conversely, the Portfolios’ tactical exposure to mid-cap companies through the iShares Core® S&P Mid-Cap ETF detracted from returns. Small-cap stocks outperformed early in the Reporting Period on anticipation of possible tax reform by a Republican-led Congress, while large-cap stocks gained later in the Reporting Period as investors’ preferences shifted toward the perceived stability of large, growth-oriented companies. Within international equities, the Vanguard FTSE Europe ETF advanced as economic growth expectations and manufacturing activity picked up throughout the Eurozone; this was in contrast to the longer- term underperformance of European equities relative to U.S. equities moving into the start of 2017. Some of these gains were offset by our tactical decision to tilt the Portfolios’ international exposures by using low volatility ETFs, which lagged international equities broadly. With global growth appearing to be on more solid footing, higher quality companies tended to lag. ETFs that emphasized lower volatility were iShares® Edge MSCI Min Vol EAFE ETF and iShares® Edge MSCI Min Vol Emerging Markets ETF.
Of the Portfolios’ fixed income-related Underlying Funds, the PowerShares Senior Loan ETF, which provides tactical exposure to high yield loans, added most significantly to returns. However, the Portfolios’ cash positions detracted from their relative results.
Of the Portfolios’ commodities-related Underlying Funds, the PowerShares Optimum Yield Diversified Commodity Strategy ETF contributed positively to performance, as market-implied inflation expectations and crude oil prices moved higher. However, the Portfolios’ exposure to gold during the last two months of 2016 had a negative impact on performance as interest rates rose sharply following the U.S. presidential elections on market expectations of faster economic growth.
Q
How did the Portfolios use derivatives and similar instruments during the Reporting Period?
A
The Portfolios do not directly invest in derivatives. However, some of the Underlying Funds may have used derivatives to allow them to track their respective benchmark indices with more precision. These may have included options, forwards, futures, swaps, structured securities and other derivative instruments.
Q
What changes did you make to the Portfolios’ strategic allocations during the Reporting Period?
A
During the Reporting Period, we increased the Portfolios’ strategic allocations to international equities and reduced their strategic allocations to U.S. equities. In our view, the performance differential between U.S. and non-U.S. equities at the end of 2016 provided an opportunity to shift the Portfolios’ strategic allocations, as we believed the prospects for non-U.S. equities were more attractive.
Q
What is the Portfolios’ tactical view and strategy for the months ahead?
A
In the near term, we expect to see low returns from virtually all asset classes. Therefore, we believe managing risk is likely to be of greater importance going forward. We plan to maintain a modestly defensive posture in the Portfolios, with a continued emphasis on seeking to generate strong risk- adjusted returns.
9
FUND BASICS
Target Date 2020 Portfolio as of August 31, 2017
PERFORMANCE REVIEW
S&P Target Date To
Portfolio Total Return
2020 (Total Return,
November 1, 2016–August 31, 2017
(based on NAV)1
Unhedged, USD)2
Class A
6.06
%
8.86
%
Institutional
6.42
8.86
Service
6.02
8.86
Class IR
6.26
8.86
Class R
5.86
8.86
Class R6
6.42
8.86
1
The net asset value (“NAV”) represents the net assets of the class of the Portfolio (ex-dividend) divided by the total number of shares of the class outstanding. The Portfolio’s performance assumes the reinvestment of dividends and other distributions. The Portfolio’s performance does not reflect the deduction of any applicable sales charges.
2
The S&P Target Date Index Series is a component of the S&P Target Allocation Index Family, and is related to the S&P Target Risk Index Series. Both series are broadly representative of the investment opportunity available to investors in target date and target risk funds, respectively. The index series reflects the market consensus for asset allocations for different target date horizons. In particular, each index is representative of the investment opportunity available to investors for the corresponding target date horizon, with asset class exposures driven by a survey of available target date funds for that horizon.
The returns set forth in the table above represent past performance. Past performance does not guarantee future results. The Portfolio’s investment return and principal value will fluctuate so that an investor’s shares, when redeemed, may be worth more or less than their original cost. Current performance may be lower or higher than the performance quoted above. Please visit our web site at www.GSAMFUNDS.com to obtain the most recent month-end returns.
Performance reflects fee waivers and/or expense limitations in effect. In their absence, performance would be reduced. Returns do not reflect the deduction of taxes that a shareholder would pay on Portfolio distributions or the redemption of Portfolio shares. Returns less than 12 months are cumulative, not annualized.
10
FUND BASICS
STANDARDIZED TOTAL RETURNS3
For the period ended 6/30/17
One Year
Five Years
Since Inception
Inception Date
Class A
N/A
N/A
-2.62
%
8/22/16
Institutional
N/A
N/A
3.36
8/22/16
Service
N/A
N/A
2.97
8/22/16
Class IR
N/A
N/A
3.20
8/22/16
Class R
N/A
N/A
2.81
8/22/16
Class R6
5.35%
6.61%
2.77
10/01/07
3
The Standardized Total Returns are average annual total returns or cumulative total returns (only if the performance period is one year or less) as of the most recent calendar quarter-end. They assume reinvestment of all distributions at NAV. These returns reflect a maximum initial sales charge of 5.5% for Class A Shares. Because Institutional, Service, Class IR, Class R and Class R6 Shares do not involve a sales charge, such a charge is not applied to their Standardized Total Returns.
Effective August 22, 2016, the Madison Target Retirement 2020 Fund (the “Predecessor Fund”) was reorganized into the Portfolio. The Portfolio has assumed the Predecessor Fund’s historical performance. The returns for the Predecessor Fund for periods prior to August 29, 2014 reflect the performance of the Madison Target Retirement 2020 Fund’s Class I Shares, a series of Ultra Series Fund (the “Ultra Predecessor Fund”). As of August 29, 2014, the inception date of the Predecessor Fund, the Ultra Predecessor Fund exchanged in kind substantially all of its portfolio holdings for Class R6 shares of the Predecessor Fund. As a result, the Predecessor Fund assumed the performance of the Ultra Predecessor Fund. Performance reflects applicable fee waivers and/or expense limitations in effect during the periods shown. Past performance does not guarantee future results, which may vary. The value of investments and the income derived from investments will fluctuate and can go down as well as up. A loss of principal may occur.
The returns set forth in the table above represent past performance. Past performance does not guarantee future results. The Portfolio’s investment return and principal value will fluctuate so that an investor’s shares, when redeemed, may be worth more or less than their original cost. Current performance may be lower or higher than the performance quoted above. Please visit our web site at www.GSAMFUNDS.com to obtain the most recent month-end returns. Performance reflects applicable fee waivers and/or expense limitations in effect during the periods shown. In their absence, performance would be reduced. Returns do not reflect the deduction of taxes that a shareholder would pay on Portfolio distributions or the redemption of Portfolio shares. Returns less than 12 months are cumulative, not annualized.
EXPENSE RATIOS4
Net Expense Ratio (Current)
Gross Expense Ratio (Before Waivers)
Class A
0.91
%
1.43
%
Institutional
0.51
1.03
Service
1.01
1.53
Class IR
0.66
1.18
Class R
1.16
1.68
Class R6
0.49
0.97
4
The expense ratios of the Portfolio, both current (net of applicable fee waivers and/or expense limitations) and before waivers (gross of applicable fee waivers and/or expense limitations) are as set forth above according to the most recent publicly available Prospectus for the Portfolio and will differ from the expense ratios disclosed in the Financial Highlights in this report due to the inclusion of Underlying Fund fees and expenses, which are not included in the operating expenses of the Portfolio reflected in the Financial Highlights. Pursuant to a contractual arrangement, the Portfolio’s waivers and/or expense limitations will remain in place through at least February 28, 2018, and prior to such date, the Investment Adviser may not terminate the arrangements without the approval of the Portfolio’s Board of Trustees. If these arrangements are discontinued in the future, the expense ratios may change without shareholder approval.
11
FUND BASICS
TOP TEN HOLDINGS AS OF 8/31/175
Holding
% of Net Assets
Line of Business
Schwab Intermediate-Term U.S. Treasury ETF
20.0
%
Exchange Traded Funds
Vanguard Short-Term Corporate Bond ETF
17.0
Exchange Traded Funds
iShares 7-10 Year Treasury Bond ETF
10.0
Exchange Traded Funds
iShares Core S&P 500 ETF
9.5
Exchange Traded Funds
iShares 20+ Year Treasury Bond ETF
4.5
Exchange Traded Funds
Vanguard Long-Term Corporate Bond ETF
4.0
Exchange Traded Funds
Schwab U.S. TIPs ETF
4.0
Exchange Traded Funds
Vanguard Short-Term Inflation-Protected
3.5
Exchange Traded Funds
Securities ETF
iShares Core S&P Mid-Cap ETF
3.5
Exchange Traded Funds
PowerShares Optimum Yield Diversified
3.0
Exchange Traded Funds
Commodity Strategy No. K-1 Portfolio
5
The top 10 holdings may not be representative of the Portfolio’s future investments. The top 10 holdings exclude investments in money market funds.
PORTFOLIO COMPOSITION6
Holding
As of August 31, 2017
As of October 31, 2016
Bond Funds
65.1
%
59.6
%
Stock Funds
20.3
25.5
Foreign Stock Funds
7.8
8.5
Investment Companies
3.2
0.0
Alternative Funds
3.0
2.5
6
The Portfolio is actively managed and, as such, its composition may differ over time. The percentage shown for each fund type reflects the value of that fund type as a percentage of the Portfolio’s net assets. Figures above may not sum to 100% due to rounding and/or exclusion of other assets and liabilities.
12
GOLDMAN SACHS TARGET DATE 2020 PORTFOLIO
Performance Summary August 31, 2017
The following graph shows the value, as of August 31, 2017, of a $10,000 investment made on October 1, 2007 (commencement of operations of the Ultra Predecessor Fund) in Class R6 Shares. For comparative purposes, the performance of the Portfolio’s benchmark, the S&P Target Date to 2020 Index (Total Return, Unhedged, USD), is shown. This performance data represents past performance and should not be considered indicative of future performance, which will fluctuate with changes in market conditions. These performance fluctuations may cause an investor’s shares, when redeemed, to be worth more or less than their original cost. Performance reflects applicable fee waivers and/or expense limitations currently in effect during the periods shown and in their absence, performance would be reduced. Returns do not reflect the deduction of taxes that a shareholder would pay on Portfolio distributions or the redemption of Portfolio shares. Performance of Class A, Institutional, Service, Class IR and Class R Shares will vary from Class R6 Shares due to differences in class specific fees and any applicable sales charges. In addition to the Sub-Adviser’s decisions regarding underlying fund selection and allocations among them, other factors may affect Portfolio performance. These factors include, but are not limited to, portfolio operating fees and expenses, portfolio turnover and subscription and redemption cash flows affecting the Portfolio.
Target Date 2020 Portfolio’s Lifetime Performance
Average Annual Total Return through August 31, 2017
One Year
Five Years
Since Inception
Class A (Commenced August 22, 2016)
Excluding sales charges
4.79
%
N/A
4.35
%
Including sales charges
-0.95
%
N/A
-1.20
%
Institutional (Commenced August 22, 2016)
5.25
%
N/A
4.80
%
Service (Commenced August 22, 2016)
4.86
%
N/A
4.32
%
Class IR (Commenced August 22, 2016)
5.09
%
N/A
4.65
%
Class R (Commenced August 22, 2016)
4.70
%
N/A
4.16
%
Class R6 (Commenced October 1, 2007)
5.25
%
6.35
%
2.87
%
13
FUND BASICS
Target Date 2025 Portfolio as of August 31, 2017
PERFORMANCE REVIEW
S&P Target Date To
Portfolio Total Return
2025 (Total Return,
November 1, 2016–August 31, 2017
(based on NAV)1
Unhedged, USD)2
Class A
8.77
%
10.27
%
Institutional
9.22
10.27
Service
8.83
10.27
Class IR
9.06
10.27
Class R
8.67
10.27
Class R6
9.22
10.27
1
The net asset value (“NAV”) represents the net assets of the class of the Portfolio (ex-dividend) divided by the total number of shares of the class outstanding. The Portfolio’s performance assumes the reinvestment of dividends and other distributions. The Portfolio’s performance does not reflect the deduction of any applicable sales charges.
2
The S&P Target Date Index Series is a component of the S&P Target Allocation Index Family, and is related to the S&P Target Risk Index Series. Both series are broadly representative of the investment opportunity available to investors in target date and target risk funds, respectively. The index series reflects the market consensus for asset allocations for different target date horizons. In particular, each index is representative of the investment opportunity available to investors for the corresponding target date horizon, with asset class exposures driven by a survey of available target date funds for that horizon.
STANDARDIZED TOTAL RETURNS3
For the period ended 6/30/17
Since Inception
Inception Date
Class A
-0.56
%
8/22/16
Institutional
5.65
8/22/16
Service
5.16
8/22/16
Class IR
5.49
8/22/16
Class R
5.00
8/22/16
Class R6
5.65
8/22/16
3
The Standardized Total Returns are average annual total returns or cumulative total returns (only if the performance period is one year or less) as of the most recent calendar quarter-end. They assume reinvestment of all distributions at NAV. These returns reflect a maximum initial sales charge of 5.5% for Class A Shares. Because Institutional, Service, Class IR, Class R and Class R6 Shares do not involve a sales charge, such a charge is not applied to their Standardized Total Returns.
The returns set forth in the tables above represent past performance. Past performance does not guarantee future results. The Portfolio’s investment return and principal value will fluctuate so that an investor’s shares, when redeemed, may be worth more or less than their original cost. Current performance may be lower or higher than the performance quoted above. Please visit our web site at www.GSAMFUNDS.com to obtain the most recent month-end returns.
Performance reflects applicable fee waivers and/or expense limitations in effect during the periods shown. In their absence, performance would be reduced. Returns do not reflect the deduction of taxes that a shareholder would pay on Portfolio distributions or the redemption of Portfolio shares. Returns less than 12 months are cumulative, not annualized.
14
FUND BASICS
EXPENSE RATIOS4
Net Expense Ratio (Current)
Gross Expense Ratio (Before Waivers)
Class A
0.91
%
3.20
%
Institutional
0.51
2.80
Service
1.01
3.30
Class IR
0.66
2.95
Class R
1.16
3.45
Class R6
0.49
2.80
4
The expense ratios of the Portfolio, both current (net of applicable fee waivers and/or expense limitations) and before waivers (gross of applicable fee waivers and/or expense limitations) are as set forth above according to the most recent publicly available Prospectus for the Portfolio and will differ from the expense ratios disclosed in the Financial Highlights in this report due to the inclusion of Underlying Fund fees and expenses, which are not included in the operating expenses of the Portfolio reflected in the Financial Highlights. Pursuant to a contractual arrangement, the Portfolio’s waivers and/or expense limitations will remain in place through at least February 28, 2018, and prior to such date, the Investment Adviser may not terminate the arrangements without the approval of the Portfolio’s Board of Trustees. If these arrangements are discontinued in the future, the expense ratios may change without shareholder approval.
TOP TEN HOLDINGS AS OF 8/31/175
Holding
% of Net Assets
Line of Business
iShares Core S&P 500 ETF
17.0
%
Exchange Traded Funds
Schwab Intermediate-Term U.S. Treasury ETF
16.0
Exchange Traded Funds
Vanguard Short-Term Corporate Bond ETF
13.0
Exchange Traded Funds
iShares 7-10 Year Treasury Bond ETF
7.0
Exchange Traded Funds
iShares Core S&P Mid-Cap ETF
6.0
Exchange Traded Funds
Vanguard FTSE All-World ex-U.S. ETF
5.0
Exchange Traded Funds
iShares 20+ Year Treasury Bond ETF
4.5
Exchange Traded Funds
Vanguard FTSE Europe ETF
3.5
Exchange Traded Funds
PowerShares Optimum Yield Diversified
3.0
Exchange Traded Funds
Commodity Strategy No. K-1 Portfolio
Schwab U.S. TIPs ETF
2.5
Exchange Traded Funds
5
The top 10 holdings may not be representative of the Portfolio’s future investments. The top 10 holdings exclude investments in money market funds.
PORTFOLIO COMPOSITION6
Holding
As of August 31, 2017
As of October 31, 2016
Bond Funds
48.5
%
35.0
%
Stock Funds
31.5
43.5
Foreign Stock Funds
13.1
14.3
Investment Companies
3.5
0.8
Alternative Funds
3.0
2.5
6
The Portfolio is actively managed and, as such, its composition may differ over time. The percentage shown for each fund type reflects the value of that fund type as a percentage of the Portfolio’s net assets. Figures above may not sum to 100% due to rounding and/or exclusion of other assets and liabilities.
15
GOLDMAN SACHS TARGET DATE 2025 PORT FOLIO
Performance Summary August 31, 2017
The following graph shows the value, as of August 31, 2017, of a $1,000,000 investment made on August 22, 2016 (commencement of operations) in Institutional Shares. For comparative purposes, the performance of the Portfolio’s benchmark, the S&P Target Date to 2025 Index (Total Return, Unhedged, USD), is shown. This performance data represents past performance and should not be considered indicative of future performance, which will fluctuate with changes in market conditions. These performance fluctuations may cause an investor’s shares, when redeemed, to be worth more or less than their original cost. Performance reflects applicable fee waivers and/or expense limitations currently in effect during the periods shown and in their absence, performance would be reduced. Returns do not reflect the deduction of taxes that a shareholder would pay on Portfolio distributions or the redemption of Portfolio shares. Performance of Class A, Service, Class IR, Class R and Class R6 Shares will vary from Institutional Shares due to differences in class specific fees and any applicable sales charges. In addition to the Sub-Adviser’s decisions regarding underlying fund selection and allocations among them, other factors may affect Portfolio performance. These factors include, but are not limited to, portfolio operating fees and expenses, portfolio turnover and subscription and redemption cash flows affecting the Portfolio.
Target Date 2025 Portfolio’s Lifetime Performance
Average Annual Total Return through August 31, 2017
One Year
Since Inception
Class A (Commenced August 22, 2016)
Excluding sales charges
7.35
%
6.73
%
Including sales charges
1.44
%
1.03
%
Institutional (Commenced August 22, 2016)
7.79
%
7.16
%
Service (Commenced August 22, 2016)
7.30
%
6.68
%
Class IR (Commenced August 22, 2016)
7.64
%
7.01
%
Class R (Commenced August 22, 2016)
7.14
%
6.53
%
Class R6 (Commenced August 22, 2016)
7.79
%
7.16
%
16
FUND BASICS
Target Date 2030 Portfolio as of August 31, 2017
PERFORMANCE REVIEW
S&P Target Date To
Portfolio Total Return
2030 (Total Return,
November 1, 2016–August 31, 2017
(based on NAV)1
Unhedged, USD)2
Class A
10.47
%
11.61
%
Institutional
10.87
11.61
Service
10.47
11.61
Class IR
10.71
11.61
Class R
10.30
11.61
Class R6
10.88
11.61
1
The net asset value (“NAV”) represents the net assets of the class of the Portfolio (ex-dividend) divided by the total number of shares of the class outstanding. The Portfolio’s performance assumes the reinvestment of dividends and other distributions. The Portfolio’s performance does not reflect the deduction of any applicable sales charges.
2
The S&P Target Date Index Series is a component of the S&P Target Allocation Index Family, and is related to the S&P Target Risk Index Series. Both series are broadly representative of the investment opportunity available to investors in target date and target risk funds, respectively. The index series reflects the market consensus for asset allocations for different target date horizons. In particular, each index is representative of the investment opportunity available to investors for the corresponding target date horizon, with asset class exposures driven by a survey of available target date funds for that horizon.
The returns set forth in the table above represent past performance. Past performance does not guarantee future results. The Portfolio’s investment return and principal value will fluctuate so that an investor’s shares, when redeemed, may be worth more or less than their original cost. Current performance may be lower or higher than the performance quoted above. Please visit our web site at www.GSAMFUNDS.com to obtain the most recent month-end returns.
Performance reflects fee waivers and/or expense limitations in effect. In their absence, performance would be reduced. Returns do not reflect the deduction of taxes that a shareholder would pay on Portfolio distributions or the redemption of Portfolio shares. Returns less than 12 months are cumulative, not annualized.
17
FUND BASICS
STANDARDIZED TOTAL RETURNS3
For the period ended 6/30/17
One Year
Five Years
Since Inception
Inception Date
Class A
N/A
N/A
0.67
%
8/22/16
Institutional
N/A
N/A
6.95
8/22/16
Service
N/A
N/A
6.56
8/22/16
Class IR
N/A
N/A
6.79
8/22/16
Class R
N/A
N/A
6.39
8/22/16
Class R6
10.06
%
8.72%
3.41
10/01/07
3
The Standardized Total Returns are average annual total returns or cumulative total returns (only if the performance period is one year or less) as of the most recent calendar quarter-end. They assume reinvestment of all distributions at NAV. These returns reflect a maximum initial sales charge of 5.5% for Class A Shares. Because Institutional, Service, Class IR, Class R and Class R6 Shares do not involve a sales charge, such a charge is not applied to their Standardized Total Returns.
Effective August 22, 2016, the Madison Target Retirement 2030 Fund (the “Predecessor Fund”) was reorganized into the Portfolio. The Portfolio has assumed the Predecessor Fund’s historical performance. The returns for the Predecessor Fund for periods prior to August 29, 2014 reflect the performance of the Madison Target Retirement 2030 Fund’s Class I Shares, a series of Ultra Series Fund (the “Ultra Predecessor Fund”). As of August 29, 2014, the inception date of the Predecessor Fund, the Ultra Predecessor Fund exchanged in kind substantially all of its portfolio holdings for Class R6 shares of the Predecessor Fund. As a result, the Predecessor Fund assumed the performance of the Ultra Predecessor Fund. Performance reflects applicable fee waivers and/or expense limitations in effect during the periods shown. Past performance does not guarantee future results, which may vary. The value of investments and the income derived from investments will fluctuate and can go down as well as up. A loss of principal may occur.
The returns set forth in the table above represent past performance. Past performance does not guarantee future results. The Portfolio’s investment return and principal value will fluctuate so that an investor’s shares, when redeemed, may be worth more or less than their original cost. Current performance may be lower or higher than the performance quoted above. Please visit our web site at www.GSAMFUNDS.com to obtain the most recent month-end returns. Performance reflects applicable fee waivers and/or expense limitations in effect during the periods shown. In their absence, performance would be reduced. Returns do not reflect the deduction of taxes that a shareholder would pay on Portfolio distributions or the redemption of Portfolio shares. Returns less than 12 months are cumulative, not annualized.
EXPENSE RATIOS4
Net Expense Ratio (Current)
Gross Expense Ratio (Before Waivers)
Class A
0.91
%
1.16
%
Institutional
0.51
0.76
Service
1.01
1.26
Class IR
0.66
0.91
Class R
1.16
1.41
Class R6
0.49
0.83
4
The expense ratios of the Portfolio, both current (net of applicable fee waivers and/or expense limitations) and before waivers (gross of applicable fee waivers and/or expense limitations) are as set forth above according to the most recent publicly available Prospectus for the Portfolio and will differ from the expense ratios disclosed in the Financial Highlights in this report due to the inclusion of Underlying Fund fees and expenses, which are not included in the operating expenses of the Portfolio reflected in the Financial Highlights. Pursuant to a contractual arrangement, the Portfolio’s waivers and/or expense limitations will remain in place through at least February 28, 2018, and prior to such date, the Investment Adviser may not terminate the arrangements without the approval of the Portfolio’s Board of Trustees. If these arrangements are discontinued in the future, the expense ratios may change without shareholder approval.
18
FUND BASICS
TOP TEN HOLDINGS AS OF 8/31/175
Holding
% of Net Assets
Line of Business
iShares Core S&P 500 ETF
19.9
%
Exchange Traded Funds
Schwab Intermediate-Term U.S. Treasury ETF
13.4
Exchange Traded Funds
Vanguard Short-Term Corporate Bond ETF
10.9
Exchange Traded Funds
Vanguard FTSE All-World ex-U.S. ETF
7.2
Exchange Traded Funds
iShares Core S&P Mid-Cap ETF
7.0
Exchange Traded Funds
iShares 7-10 Year Treasury Bond ETF
5.5
Exchange Traded Funds
iShares 20+ Year Treasury Bond ETF
4.0
Exchange Traded Funds
Vanguard FTSE Europe ETF
4.0
Exchange Traded Funds
PowerShares Optimum Yield Diversified
3.0
Exchange Traded Funds
Commodity Strategy No. K-1 Portfolio
Vanguard Financials ETF
2.0
Exchange Traded Funds
5
The top 10 holdings may not be representative of the Portfolio’s future investments. The top 10 holdings exclude investments in money market funds.
PORTFOLIO COMPOSITION6
Holding
As of August 31, 2017
As of October 31, 2016
Bond Funds
39.3
%
35.0
%
Stock Funds
36.3
43.5
Foreign Stock Funds
16.4
14.3
Alternative Funds
3.0
2.5
Investment Companies
2.0
0.8
6
The Portfolio is actively managed and, as such, its composition may differ over time. The percentage shown for each fund type reflects the value of that fund type as a percentage of the Portfolio’s net assets. Figures above may not sum to 100% due to rounding and/or exclusion of other assets and liabilities.
19
GOLDMAN SACHS TARGET DATE 2030 PORTFOLIO
Performance Summary August 31, 2017
The following graph shows the value, as of August 31, 2017, of a $10,000 investment made on October 1, 2007 (commencement of operations of the Ultra Predecessor Fund) in Class R6 Shares. For comparative purposes, the performance of the Portfolio’s benchmark, the S&P Target Date to 2030 Index (Total Return, Unhedged, USD), is shown. This performance data represents past performance and should not be considered indicative of future performance, which will fluctuate with changes in market conditions. These performance fluctuations may cause an investor’s shares, when redeemed, to be worth more or less than their original cost. Performance reflects applicable fee waivers and/or expense limitations currently in effect during the periods shown and in their absence, performance would be reduced. Returns do not reflect the deduction of taxes that a shareholder would pay on Portfolio distributions or the redemption of Portfolio shares. Performance of Class A, Institutional, Service, Class IR and Class R Shares will vary from Class R6 Shares due to differences in class specific fees and any applicable sales charges. In addition to the Sub-Adviser’s decisions regarding underlying fund selection and allocations among them, other factors may affect Portfolio performance. These factors include, but are not limited to, portfolio operating fees and expenses, portfolio turnover and subscription and redemption cash flows affecting the Portfolio.
Target Date 2030 Portfolio’s Lifetime Performance
Average Annual Total Return through August 31, 2017
One Year
Five Years
Since Inception
Class A (Commenced August 22, 2016)
Excluding sales charges
8.79
%
N/A
8.12
%
Including sales charges
2.76
%
N/A
2.31
%
Institutional (Commenced August 22, 2016)
9.30
%
N/A
8.61
%
Service (Commenced August 22, 2016)
8.79
%
N/A
8.12
%
Class IR (Commenced August 22, 2016)
9.14
%
N/A
8.46
%
Class R (Commenced August 22, 2016)
8.63
%
N/A
7.97
%
Class R6 (Commenced October 1, 2007)
9.31
%
8.46
%
3.53
%
20
FUND BASICS
Target Date 2035 Portfolio as of August 31, 2017
PERFORMANCE REVIEW
S&P Target Date To
Portfolio Total Return
2035 (Total Return,
November 1, 2016–August 31, 2017
(based on NAV)1
Unhedged, USD)2
Class A
11.39
%
12.65
%
Institutional
11.75
12.65
Service
11.36
12.65
Class IR
11.59
12.65
Class R
11.20
12.65
Class R6
11.75
12.65
1
The net asset value (“NAV”) represents the net assets of the class of the Portfolio (ex-dividend) divided by the total number of shares of the class outstanding. The Portfolio’s performance assumes the reinvestment of dividends and other distributions. The Portfolio’s performance does not reflect the deduction of any applicable sales charges.
2
The S&P Target Date Index Series is a component of the S&P Target Allocation Index Family, and is related to the S&P Target Risk Index Series. Both series are broadly representative of the investment opportunity available to investors in target date and target risk funds, respectively. The index series reflects the market consensus for asset allocations for different target date horizons. In particular, each index is representative of the investment opportunity available to investors for the corresponding target date horizon, with asset class exposures driven by a survey of available target date funds for that horizon.
STANDARDIZED TOTAL RETURNS3
For the period ended 6/30/17
Since Inception
Inception Date
Class A
1.38
%
8/22/16
Institutional
7.61
8/22/16
Service
7.22
8/22/16
Class IR
7.45
8/22/16
Class R
7.06
8/22/16
Class R6
7.61
8/22/16
3
The Standardized Total Returns are average annual total returns or cumulative total returns (only if the performance period is one year or less) as of the most recent calendar quarter-end. They assume reinvestment of all distributions at NAV. These returns reflect a maximum initial sales charge of 5.5% for Class A Shares. Because Institutional, Service, Class IR, Class R and Class R6 Shares do not involve a sales charge, such a charge is not applied to their Standardized Total Returns.
The returns set forth in the tables above represent past performance. Past performance does not guarantee future results. The Portfolio’s investment return and principal value will fluctuate so that an investor’s shares, when redeemed, may be worth more or less than their original cost. Current performance may be lower or higher than the performance quoted above. Please visit our web site at www.GSAMFUNDS.com to obtain the most recent month-end returns.
Performance reflects applicable fee waivers and/or expense limitations in effect during the periods shown. In their absence, performance would be reduced. Returns do not reflect the deduction of taxes that a shareholder would pay on Portfolio distributions or the redemption of Portfolio shares. Returns less than 12 months are cumulative, not annualized.
21
FUND BASICS
EXPENSE RATIOS4
Net Expense Ratio (Current)
Gross Expense Ratio (Before Waivers)
Class A
0.91
%
3.20
%
Institutional
0.51
2.81
Service
1.01
3.30
Class IR
0.66
2.95
Class R
1.16
3.45
Class R6
0.49
2.80
4
The expense ratios of the Portfolio, both current (net of applicable fee waivers and/or expense limitations) and before waivers (gross of applicable fee waivers and/or expense limitations) are as set forth above according to the most recent publicly available Prospectus for the Portfolio and will differ from the expense ratios disclosed in the Financial Highlights in this report due to the inclusion of Underlying Fund fees and expenses, which are not included in the operating expenses of the Portfolio reflected in the Financial Highlights. Pursuant to a contractual arrangement, the Portfolio’s waivers and/or expense limitations will remain in place through at least February 28, 2018, and prior to such date, the Investment Adviser may not terminate the arrangements without the approval of the Portfolio’s Board of Trustees. If these arrangements are discontinued in the future, the expense ratios may change without shareholder approval.
TOP TEN HOLDINGS AS OF 8/31/175
Holding
% of Net Assets
Line of Business
iShares Core S&P 500 ETF
21.5
%
Exchange Traded Funds
Schwab Intermediate-Term U.S. Treasury ETF
12.5
Exchange Traded Funds
Vanguard Short-Term Corporate Bond ETF
9.0
Exchange Traded Funds
Vanguard FTSE All-World ex-U.S. ETF
8.0
Exchange Traded Funds
iShares Core S&P Mid-Cap ETF
7.5
Exchange Traded Funds
iShares 7-10 Year Treasury Bond ETF
5.0
Exchange Traded Funds
Vanguard FTSE Europe ETF
4.5
Exchange Traded Funds
iShares 20+ Year Treasury Bond ETF
4.0
Exchange Traded Funds
PowerShares Optimum Yield Diversified
3.0
Exchange Traded Funds
Commodity Strategy No. K-1 Portfolio
iShares Edge MSCI Minimum Volatility
2.5
Exchange Traded Funds
EAFE ETF
5
The top 10 holdings may not be representative of the Portfolio’s future investments. The top 10 holdings exclude investments in money market funds.
PORTFOLIO COMPOSITION6
Holding
As of August 31, 2017
As of October 31, 2016
Stock Funds
39.6
%
46.7
%
Bond Funds
34.5
29.8
Foreign Stock Funds
18.5
15.4
Investment Companies
3.5
1.0
Alternative Funds
3.0
2.5
6
The Portfolio is actively managed and, as such, its composition may differ over time. The percentage shown for each fund type reflects the value of that fund type as a percentage of the Portfolio’s net assets. Figures above may not sum to 100% due to rounding and/or exclusion of other assets and liabilities.
22
GOLDMAN SACHS TARGET DATE 2035 PORTFOLIO
Performance Summary August 31, 2017
The following graph shows the value, as of August 31, 2017, of a $1,000,000 investment made on August 22, 2016 (commencement of operations) in Institutional Shares. For comparative purposes, the performance of the Portfolio’s benchmark, the S&P Target Date to 2035 Index (Total Return, Unhedged, USD), is shown. This performance data represents past performance and should not be considered indicative of future performance, which will fluctuate with changes in market conditions. These performance fluctuations may cause an investor’s shares, when redeemed, to be worth more or less than their original cost. Performance reflects applicable fee waivers and/or expense limitations currently in effect during the periods shown and in their absence, performance would be reduced. Returns do not reflect the deduction of taxes that a shareholder would pay on Portfolio distributions or the redemption of Portfolio shares. Performance of Class A, Service, Class IR, Class R and Class R6 Shares will vary from Institutional Shares due to differences in class specific fees and any applicable sales charges. In addition to the Sub-Adviser’s decisions regarding underlying fund selection and allocations among them, other factors may affect Portfolio performance. These factors include, but are not limited to, portfolio operating fees and expenses, portfolio turnover and subscription and redemption cash flows affecting the Portfolio.
Target Date 2035 Portfolio’s Lifetime Performance
Average Annual Total Return through August 31, 2017
One Year
Since Inception
Class A (Commenced August 22, 2016)
Excluding sales charges
9.71
%
9.01
%
Including sales charges
3.67
%
3.19
%
Institutional (Commenced August 22, 2016)
10.07
%
9.36
%
Service (Commenced August 22, 2016)
9.57
%
8.88
%
Class IR (Commenced August 22, 2016)
9.91
%
9.21
%
Class R (Commenced August 22, 2016)
9.41
%
8.73
%
Class R6 (Commenced August 22, 2016)
10.07
%
9.36
%
23
FUND BASICS
Target Date 2040 Portfolio as of August 31, 2017
PERFORMANCE REVIEW
S&P Target Date To
Portfolio Total Return
2040 (Total Return,
November 1, 2016–August 31, 2017
(based on NAV)1
Unhedged, USD)2
Class A
12.37
%
13.88
%
Institutional
12.85
13.88
Service
12.21
13.88
Class IR
12.68
13.88
Class R
12.16
13.88
Class R6
12.73
13.88
1
The net asset value (“NAV”) represents the net assets of the class of the Portfolio (ex-dividend) divided by the total number of shares of the class outstanding. The Portfolio’s performance assumes the reinvestment of dividends and other distributions. The Portfolio’s performance does not reflect the deduction of any applicable sales charges.
2
The S&P Target Date Index Series is a component of the S&P Target Allocation Index Family, and is related to the S&P Target Risk Index Series. Both series are broadly representative of the investment opportunity available to investors in target date and target risk funds, respectively. The index series reflects the market consensus for asset allocations for different target date horizons. In particular, each index is representative of the investment opportunity available to investors for the corresponding target date horizon, with asset class exposures driven by a survey of available target date funds for that horizon.
The returns set forth in the table above represent past performance. Past performance does not guarantee future results. The Portfolio’s investment return and principal value will fluctuate so that an investor’s shares, when redeemed, may be worth more or less than their original cost. Current performance may be lower or higher than the performance quoted above. Please visit our web site at www.GSAMFUNDS.com to obtain the most recent month-end returns. Performance reflects fee waivers and/or expense limitations in effect. In their absence, performance would be reduced. Returns do not reflect the deduction of taxes that a shareholder would pay on Portfolio distributions or the redemption of Portfolio shares. Returns less than 12 months are cumulative, not annualized.
24
FUND BASICS
STANDARDIZED TOTAL RETURNS3
For the period ended 6/30/17
One Year
Five Years
Since Inception
Inception Date
Class A
N/A
N/A
2.15
%
8/22/16
Institutional
N/A
N/A
8.47
8/22/16
Service
N/A
N/A
8.06
8/22/16
Class IR
N/A
N/A
8.41
8/22/16
Class R
N/A
N/A
7.90
8/22/16
Class R6
12.25
%
9.72
%
3.31
10/01/07
3
The Standardized Total Returns are average annual total returns or cumulative total returns (only if the performance period is one year or less) as of the most recent calendar quarter-end. They assume reinvestment of all distributions at NAV. These returns reflect a maximum initial sales charge of 5.5% for Class A Shares. Because Institutional, Service, Class IR, Class R and Class R6 Shares do not involve a sales charge, such a charge is not applied to their Standardized Total Returns.
Effective August 22, 2016, the Madison Target Retirement 2040 Fund (the “Predecessor Fund”) was reorganized into the Portfolio. The Portfolio has assumed the Predecessor Fund’s historical performance. The returns for the Predecessor Fund for periods prior to August 29, 2014 reflect the performance of the Madison Target Retirement 2040 Fund’s Class I Shares, a series of Ultra Series Fund (the “Ultra Predecessor Fund”). As of August 29, 2014, the inception date of the Predecessor Fund, the Ultra Predecessor Fund exchanged in kind substantially all of its portfolio holdings for Class R6 shares of the Predecessor Fund. As a result, the Predecessor Fund assumed the performance of the Ultra Predecessor Fund. Performance reflects applicable fee waivers and/or expense limitations in effect during the periods shown. Past performance does not guarantee future results, which may vary. The value of investments and the income derived from investments will fluctuate and can go down as well as up. A loss of principal may occur.
The returns set forth in the table above represent past performance. Past performance does not guarantee future results. The Portfolio’s investment return and principal value will fluctuate so that an investor’s shares, when redeemed, may be worth more or less than their original cost. Current performance may be lower or higher than the performance quoted above. Please visit our web site at www.GSAMFUNDS.com to obtain the most recent month-end returns.
Performance reflects applicable fee waivers and/or expense limitations in effect during the periods shown. In their absence, performance would be reduced. Returns do not reflect the deduction of taxes that a shareholder would pay on Portfolio distributions or the redemption of Portfolio shares. Returns less than 12 months are cumulative, not annualized.
EXPENSE RATIOS4
Net Expense Ratio (Current)
Gross Expense Ratio (Before Waivers)
Class A
0.91
%
1.49
%
Institutional
0.51
1.01
Service
1.01
1.51
Class IR
0.66
1.16
Class R
1.16
1.66
Class R6
0.49
1.01
4
The expense ratios of the Portfolio, both current (net of applicable fee waivers and/or expense limitations) and before waivers (gross of applicable fee waivers and/or expense limitations) are as set forth above according to the most recent publicly available Prospectus for the Portfolio and will differ from the expense ratios disclosed in the Financial Highlights in this report due to the inclusion of Underlying Fund fees and expenses, which are not included in the operating expenses of the Portfolio reflected in the Financial Highlights. Pursuant to a contractual arrangement, the Portfolio’s waivers and/or expense limitations will remain in place through at least February 28, 2018, and prior to such date, the Investment Adviser may not terminate the arrangements without the approval of the Portfolio’s Board of Trustees. If these arrangements are discontinued in the future, the expense ratios may change without shareholder approval.
25
FUND BASICS
TOP TEN HOLDINGS AS OF 8/31/175
Holding
% of Net Assets
Line of Business
iShares Core S&P 500 ETF
23.1
%
Exchange Traded Funds
Schwab Intermediate-Term U.S. Treasury ETF
11.6
Exchange Traded Funds
Vanguard FTSE All-World ex-U.S. ETF
8.5
Exchange Traded Funds
iShares Core S&P Mid-Cap ETF
8.0
Exchange Traded Funds
Vanguard Short-Term Corporate Bond ETF
7.0
Exchange Traded Funds
Vanguard FTSE Europe ETF
5.0
Exchange Traded Funds
iShares 7-10 Year Treasury Bond ETF
4.5
Exchange Traded Funds
iShares 20+ Year Treasury Bond ETF
4.0
Exchange Traded Funds
PowerShares Optimum Yield Diversified
3.0
Exchange Traded Funds
Commodity Strategy No. K-1 Portfolio
iShares Edge MSCI Minimum Volatility EAFE ETF
2.5
Exchange Traded Funds
5
The top 10 holdings may not be representative of the Portfolio’s future investments.
PORTFOLIO COMPOSITION6
Holding
As of August 31, 2017
As of October 31, 2016
Stock Funds
43.1
%
50.5
%
Bond Funds
29.6
25.0
Foreign Stock Funds
20.0
16.8
Alternative Funds
3.0
2.5
Investment Companies
2.3
1.3
6
The Portfolio is actively managed and, as such, its composition may differ over time. The percentage shown for each fund type reflects the value of that fund type as a percentage of the Portfolio’s net assets. Figures above may not sum to 100% due to rounding and/or exclusion of other assets and liabilities.
26
GOLDMAN SACHS TARGET DATE 2040 PORTFOLIO
Performance Summary August 31, 2017
The following graph shows the value, as of August 31, 2017, of a $10,000 investment made on October 1, 2007 (commencement of operations of the Ultra Predecessor Fund) in Class R6 Shares. For comparative purposes, the performance of the Portfolio’s benchmark, the S&P Target Date to 2040 Index (Total Return, Unhedged, USD), is shown. This performance data represents past performance and should not be considered indicative of future performance, which will fluctuate with changes in market conditions. These performance fluctuations may cause an investor’s shares, when redeemed, to be worth more or less than their original cost. Performance reflects applicable fee waivers and/or expense limitations currently in effect during the periods shown and in their absence, performance would be reduced. Returns do not reflect the deduction of taxes that a shareholder would pay on Portfolio distributions or the redemption of Portfolio shares. Performance of Class A, Institutional, Service, Class IR and Class R Shares will vary from Class R6 Shares due to differences in class specific fees and any applicable sales charges. In addition to the Sub-Adviser’s decisions regarding underlying fund selection and allocations among them, other factors may affect Portfolio performance. These factors include, but are not limited to, portfolio operating fees and expenses, portfolio turnover and subscription and redemption cash flows affecting the Portfolio.
Target Date 2040 Portfolio’s Lifetime Performance
Average Annual Total Return through August 31, 2017
One Year
Five Years
Since Inception
Class A (Commenced August 22, 2016)
Excluding sales charges
10.64
%
N/A
9.90
%
Including sales charges
4.52
%
N/A
4.00
%
Institutional (Commenced August 22, 2016)
10.99
%
N/A
10.35
%
Service (Commenced August 22, 2016)
10.48
%
N/A
9.74
%
Class IR (Commenced August 22, 2016)
10.94
%
N/A
10.19
%
Class R (Commenced August 22, 2016)
10.31
%
N/A
9.59
%
Class R6 (Commenced October 1, 2007)
10.99
%
9.45
%
3.45
%
27
FUND BASICS
Target Date 2045 Portfolio as of August 31, 2017
PERFORMANCE REVIEW
S&P Target Date To
Portfolio Total Return
2045 (Total Return,
November 1, 2016–August 31, 2017
(based on NAV)1
Unhedged, USD)2
Class A
13.17
%
14.63
%
Institutional
13.52
14.63
Service
13.03
14.63
Class IR
13.48
14.63
Class R
12.98
14.63
Class R6
13.64
14.63
1
The net asset value (“NAV”) represents the net assets of the class of the Portfolio (ex-dividend) divided by the total number of shares of the class outstanding. The Portfolio’s performance assumes the reinvestment of dividends and other distributions. The Portfolio’s performance does not reflect the deduction of any applicable sales charges.
2
The S&P Target Date Index Series is a component of the S&P Target Allocation Index Family, and is related to the S&P Target Risk Index Series. Both series are broadly representative of the investment opportunity available to investors in target date and target risk funds, respectively. The index series reflects the market consensus for asset allocations for different target date horizons. In particular, each index is representative of the investment opportunity available to investors for the corresponding target date horizon, with asset class exposures driven by a survey of available target date funds for that horizon.
STANDARDIZED TOTAL RETURNS3
For the period ended 6/30/17
Since Inception
Inception Date
Class A
2.83
%
8/22/16
Institutional
9.15
8/22/16
Service
8.65
8/22/16
Class IR
9.09
8/22/16
Class R
8.59
8/22/16
Class R6
9.15
8/22/16
3The Standardized Total Returns are average annual total returns or cumulative total returns (only if the performance period is one year or less) as of the most recent calendar quarter-end. They assume reinvestment of all distributions at NAV. These returns reflect a maximum initial sales charge of 5.5% for Class A Shares. Because Institutional, Service, Class IR, Class R and Class R6 Shares do not involve a sales charge, such a charge is not applied to their Standardized Total Returns.
The returns set forth in the tables above represent past performance. Past performance does not guarantee future results. The Portfolio’s investment return and principal value will fluctuate so that an investor’s shares, when redeemed, may be worth more or less than their original cost. Current performance may be lower or higher than the performance quoted above. Please visit our web site at www.GSAMFUNDS.com to obtain the most recent month-end returns.
Performance reflects applicable fee waivers and/or expense limitations in effect during the periods shown. In their absence, performance would be reduced. Returns do not reflect the deduction of taxes that a shareholder would pay on Portfolio distributions or the redemption of Portfolio shares. Returns less than 12 months are cumulative, not annualized.
28
FUND BASICS
EXPENSE RATIOS4
Net Expense Ratio (Current)
Gross Expense Ratio (Before Waivers)
Class A
0.91
%
3.21
%
Institutional
0.51
2.81
Service
1.01
3.31
Class IR
0.66
2.95
Class R
1.16
3.46
Class R6
0.49
2.80
4
The expense ratios of the Portfolio, both current (net of applicable fee waivers and/or expense limitations) and before waivers (gross of applicable fee waivers and/or expense limitations) are as set forth above according to the most recent publicly available Prospectus for the Portfolio and will differ from the expense ratios disclosed in the Financial Highlights in this report due to the inclusion of Underlying Fund fees and expenses, which are not included in the operating expenses of the Portfolio reflected in the Financial Highlights. Pursuant to a contractual arrangement, the Portfolio’s waivers and/or expense limitations will remain in place through at least February 28, 2018, and prior to such date, the Investment Adviser may not terminate the arrangements without the approval of the Portfolio’s Board of Trustees. If these arrangements are discontinued in the future, the expense ratios may change without shareholder approval.
TOP TEN HOLDINGS AS OF 8/31/175
Holding
% of Net Assets
Line of Business
iShares Core S&P 500 ETF
23.5
%
Exchange Traded Funds
Schwab Intermediate-Term U.S. Treasury ETF
10.5
Exchange Traded Funds
Vanguard FTSE All-World ex-U.S. ETF
9.0
Exchange Traded Funds
iShares Core S&P Mid-Cap ETF
8.5
Exchange Traded Funds
Vanguard Short-Term Corporate Bond ETF
6.0
Exchange Traded Funds
Vanguard FTSE Europe ETF
5.5
Exchange Traded Funds
iShares 20+ Year Treasury Bond ETF
4.0
Exchange Traded Funds
iShares 7-10 Year Treasury Bond ETF
3.5
Exchange Traded Funds
PowerShares Optimum Yield Diversified
3.0
Exchange Traded Funds
Commodity Strategy No. K-1 Portfolio
iShares Edge MSCI Minimum Volatility
3.0
Exchange Traded Funds
EAFE ETF
5
The top 10 holdings may not be representative of the Portfolio’s future investments. The top 10 holdings exclude investments in money market funds.
PORTFOLIO COMPOSITION6
Holding
As of August 31, 2017
As of October 31, 2016
Stock Funds
45.3
%
53.9
%
Bond Funds
25.5
19.9
Foreign Stock Funds
21.7
17.8
Investment Companies
3.5
1.3
Alternative Funds
3.0
2.5
6
The Portfolio is actively managed and, as such, its composition may differ over time. The percentage shown for each fund type reflects the value of that fund type as a percentage of the Portfolio’s net assets. Figures above may not sum to 100% due to rounding and/or exclusion of other assets and liabilities.
29
GOLDMAN SACHS TARGET DATE 2045 PORTFOLIO
Performance Summary August 31, 2017
The following graph shows the value, as of August 31, 2017, of a $1,000,000 investment made on August 22, 2016 (commencement of operations) in Institutional Shares. For comparative purposes, the performance of the the S&P Target Date to 2045 Index (Total Return, Unhedged, USD), is shown. This performance data represents past performance and should not be considered indicative of future performance, which will fluctuate with changes in market conditions. These performance fluctuations may cause an investor’s shares, when redeemed, to be worth more or less than their original cost. Performance reflects applicable fee waivers and/or expense limitations currently in effect during the periods shown and in their absence, performance would be reduced. Returns do not reflect the deduction of taxes that a shareholder would pay on Portfolio distributions or the redemption of Portfolio shares. Performance of Class A, Service, Class IR, Class R and Class R6 Shares will vary from Institutional Shares due to differences in class specific fees and any applicable sales charges. In addition to the Sub-Adviser’s decisions regarding underlying fund selection and allocations among them, other factors may affect Portfolio performance. These factors include, but are not limited to, portfolio operating fees and expenses, portfolio turnover and subscription and redemption cash flows affecting the Portfolio.
Target Date 2045 Portfolio’s Lifetime Performance
Average Annual Total Return through August 31, 2017
One Year
Since Inception
Class A (Commenced August 22, 2016)
Excluding sales charges
11.35
%
10.60
%
Including sales charges
5.22
%
4.69
%
Institutional (Commenced August 22, 2016)
11.81
%
11.05
%
Service (Commenced August 22, 2016)
11.21
%
10.46
%
Class IR (Commenced August 22, 2016)
11.65
%
10.89
%
Class R (Commenced August 22, 2016)
11.05
%
10.31
%
Class R6 (Commenced August 22, 2016)
11.81
%
11.05
%
30
FUND BASICS
Target Date 2050 Portfolio as of August 31, 2017
PERFORMANCE REVIEW
S&P Target Date To
Portfolio Total Return
2050 (Total Return,
November 1, 2016–August 31, 2017
(based on NAV)1
Unhedged, USD)2
Class A
14.21
%
15.33
%
Institutional
14.58
15.33
Service
14.18
15.33
Class IR
14.42
15.33
Class R
14.02
15.33
Class R6
14.59
15.33
1
The net asset value (“NAV”) represents the net assets of the class of the Portfolio (ex-dividend) divided by the total number of shares of the class outstanding. The Portfolio’s performance assumes the reinvestment of dividends and other distributions. The Portfolio’s performance does not reflect the deduction of any applicable sales charges.
2
The S&P Target Date Index Series is a component of the S&P Target Allocation Index Family, and is related to the S&P Target Risk Index Series. Both series are broadly representative of the investment opportunity available to investors in target date and target risk funds, respectively. The index series reflects the market consensus for asset allocations for different target date horizons. In particular, each index is representative of the investment opportunity available to investors for the corresponding target date horizon, with asset class exposures driven by a survey of available target date funds for that horizon.
The returns set forth in the table above represent past performance. Past performance does not guarantee future results. The Portfolio’s investment return and principal value will fluctuate so that an investor’s shares, when redeemed, may be worth more or less than their original cost. Current performance may be lower or higher than the performance quoted above. Please visit our web site at www.GSAMFUNDS.com to obtain the most recent month-end returns.
Performance reflects fee waivers and/or expense limitations in effect. In their absence, performance would be reduced. Returns do not reflect the deduction of taxes that a shareholder would pay on Portfolio distributions or the redemption of Portfolio shares. Returns less than 12 months are cumulative, not annualized.
31
FUND BASICS
STANDARDIZED TOTAL RETURNS3
For the period ended 6/30/17
One Year
Five Years
Since Inception
Inception Date
Class A
N/A
N/A
3.68
%
8/22/16
Institutional
N/A
N/A
10.06
8/22/16
Service
N/A
N/A
9.56
8/22/16
Class IR
N/A
N/A
9.90
8/22/16
Class R
N/A
N/A
9.39
8/22/16
Class R6
14.29
%
10.76
%
8.84
1/3/11
3
The Standardized Total Returns are average annual total returns or cumulative total returns (only if the performance period is one year or less) as of the most recent calendar quarter-end. They assume reinvestment of all distributions at NAV. These returns reflect a maximum initial sales charge of 5.5% for Class A Shares. Because Institutional, Service, Class IR, Class R and Class R6 Shares do not involve a sales charge, such a charge is not applied to their Standardized Total Returns.
Effective August 22, 2016, the Madison Target Retirement 2050 Fund (the “Predecessor Fund”) was reorganized into the Portfolio. The Portfolio has assumed the Predecessor Fund’s historical performance. The returns for the Predecessor Fund for periods prior to August 29, 2014 reflect the performance of the Madison Target Retirement 2050 Fund’s Class I Shares, a series of Ultra Series Fund (the “Ultra Predecessor Fund”). As of August 29, 2014, the inception date of the Predecessor Fund, the Ultra Predecessor Fund exchanged in kind substantially all of its portfolio holdings for Class R6 shares of the Predecessor Fund. As a result, the Predecessor Fund assumed the performance of the Ultra Predecessor Fund. Performance reflects applicable fee waivers and/or expense limitations in effect during the periods shown. Past performance does not guarantee future results, which may vary. The value of investments and the income derived from investments will fluctuate and can go down as well as up. A loss of principal may occur.
The returns set forth in the table above represent past performance. Past performance does not guarantee future results. The Portfolio’s investment return and principal value will fluctuate so that an investor’s shares, when redeemed, may be worth more or less than their original cost. Current performance may be lower or higher than the performance quoted above. Please visit our web site at www.GSAMFUNDS.com to obtain the most recent month-end returns.
Performance reflects applicable fee waivers and/or expense limitations in effect during the periods shown. In their absence, performance would be reduced. Returns do not reflect the deduction of taxes that a shareholder would pay on Portfolio distributions or the redemption of Portfolio shares. Returns less than 12 months are cumulative, not annualized.
EXPENSE RATIOS4
Net Expense Ratio (Current)
Gross Expense Ratio (Before Waivers)
Class A
0.91
%
2.19
%
Institutional
0.51
1.79
Service
1.01
2.29
Class IR
0.66
1.94
Class R
1.16
2.44
Class R6
0.49
1.65
4
The expense ratios of the Portfolio, both current (net of applicable fee waivers and/or expense limitations) and before waivers (gross of applicable fee waivers and/or expense limitations) are as set forth above according to the most recent publicly available Prospectus for the Portfolio and will differ from the expense ratios disclosed in the Financial Highlights in this report due to the inclusion of Underlying Fund fees and expenses, which are not included in the operating expenses of the Portfolio reflected in the Financial Highlights. Pursuant to a contractual arrangement, the Portfolio’s waivers and/or expense limitations will remain in place through at least February 28, 2018, and prior to such date, the Investment Adviser may not terminate the arrangements without the approval of the Portfolio’s Board of Trustees. If these arrangements are discontinued in the future, the expense ratios may change without shareholder approval.
32
FUND BASICS
TOP TEN HOLDINGS AS OF 8/31/17
5
Holding
% of Net Assets
Line of Business
iShares Core S&P 500 ETF
24.6
%
Exchange Traded Funds
Schwab Intermediate-Term U.S. Treasury ETF
10.0
Exchange Traded Funds
Vanguard FTSE All-World ex-U.S. ETF
9.5
Exchange Traded Funds
iShares Core S&P Mid-Cap ETF
9.0
Exchange Traded Funds
Vanguard FTSE Europe ETF
6.5
Exchange Traded Funds
Vanguard Short-Term Corporate Bond ETF
4.0
Exchange Traded Funds
iShares 20+ Year Treasury Bond ETF
3.5
Exchange Traded Funds
PowerShares Optimum Yield Diversified
3.0
Exchange Traded Funds
Commodity Strategy No. K-1 Portfolio
iShares Edge MSCI Minimum Volatility EAFE ETF
3.0
Exchange Traded Funds
Vanguard Financials ETF
2.3
Exchange Traded Funds
5
The top 10 holdings may not be representative of the Portfolio’s future investments. The top 10 holdings exclude investments in money market funds.
PORTFOLIO COMPOSITION6
Holding
As of August 31, 2017
As of October 31, 2016
Stock Funds
48.4
%
58.0
%
Foreign Stock Funds
23.8
19.3
Bond Funds
20.5
15.0
Investment Companies
3.5
2.5
Alternative Funds
3.0
1.3
6
The Portfolio is actively managed and, as such, its composition may differ over time. The percentage shown for each fund type reflects the value of that fund type as a percentage of the Portfolio’s net assets. Figures above may not sum to 100% due to rounding and/or exclusion of other assets and liabilities.
33
GOLDMAN SACHS TARGET DATE 2050 PORTFOLIO
Performance Summary August 31, 2017
The following graph shows the value, as of August 31, 2017, of a $10,000 investment made on January 3, 2011 (commencement of operations of the Ultra Predecessor Fund) in Class R6 Shares. For comparative purposes, the performance of the Portfolio’s benchmark, the S&P Target Date to 2050 Index (Total Return, Unhedged, USD), is shown. This performance data represents past performance and should not be considered indicative of future performance, which will fluctuate with changes in market conditions. These performance fluctuations may cause an investor’s shares, when redeemed, to be worth more or less than their original cost. Performance reflects applicable fee waivers and/or expense limitations currently in effect during the periods shown and in their absence, performance would be reduced. Returns do not reflect the deduction of taxes that a shareholder would pay on Portfolio distributions or the redemption of Portfolio shares. Performance of Class A, Institutional, Service, Class IR and Class R Shares will vary from Class R6 Shares due to differences in class specific fees and any applicable sales charges. In addition to the Sub-Adviser’s decisions regarding underlying fund selection and allocations among them, other factors may affect Portfolio performance. These factors include, but are not limited to, portfolio operating fees and expenses, portfolio turnover and subscription and redemption cash flows affecting the Portfolio.
Target Date 2050 Portfolio’s Lifetime Performance
Average Annual Total Return through August 31, 2017
One Year
Five Years
Since Inception
Class A (Commenced August 22, 2016)
Excluding sales charges
12.37
%
N/A
11.59
%
Including sales charges
6.19
%
N/A
5.63
%
Institutional (Commenced August 22, 2016)
12.74
%
N/A
11.95
%
Service (Commenced August 22, 2016)
12.24
%
N/A
11.45
%
Class IR (Commenced August 22, 2016)
12.58
%
N/A
11.79
%
Class R (Commenced August 22, 2016)
12.07
%
N/A
11.30
%
Class R6 (Commenced January 3, 2011)
12.75
%
10.48
%
8.93
%
34
FUND BASICS
Target Date 2055 Portfolio as of August 31, 2017
PERFORMANCE REVIEW
S&P Target Date To
Portfolio Total Return
2055 (Total Return,
November 1, 2016–August 31, 2017
(based on NAV)1
Unhedged, USD)2
Class A
14.90
%
15.80
%
Institutional
15.32
15.80
Service
14.83
15.80
Class IR
15.16
15.80
Class R
14.66
15.80
Class R6
15.32
15.80
1
The net asset value (“NAV”) represents the net assets of the class of the Portfolio (ex-dividend) divided by the total number of shares of the class outstanding. The Portfolio’s performance assumes the reinvestment of dividends and other distributions. The Portfolio’s performance does not reflect the deduction of any applicable sales charges.
2
The S&P Target Date Index Series is a component of the S&P Target Allocation Index Family, and is related to the S&P Target Risk Index Series. Both series are broadly representative of the investment opportunity available to investors in target date and target risk funds, respectively. The index series reflects the market consensus for asset allocations for different target date horizons. In particular, each index is representative of the investment opportunity available to investors for the corresponding target date horizon, with asset class exposures driven by a survey of available target date funds for that horizon.
STANDARDIZED TOTAL RETURNS3
For the period ended 6/30/17
Since Inception
Inception Date
Class A
4.22
%
8/22/16
Institutional
10.69
8/22/16
Service
10.20
8/22/16
Class IR
10.54
8/22/16
Class R
10.04
8/22/16
Class R6
10.60
8/22/16
3
The Standardized Total Returns are average annual total returns or cumulative total returns (only if the performance period is one year or less) as of the most recent calendar quarter-end. They assume reinvestment of all distributions at NAV. These returns reflect a maximum initial sales charge of 5.5% for Class A Shares. Because Institutional, Service, Class IR, Class R and Class R6 Shares do not involve a sales charge, such a charge is not applied to their Standardized Total Returns.
The returns set forth in the tables above represent past performance. Past performance does not guarantee future results. The Portfolio’s investment return and principal value will fluctuate so that an investor’s shares, when redeemed, may be worth more or less than their original cost. Current performance may be lower or higher than the performance quoted above. Please visit our web site at www.GSAMFUNDS.com to obtain the most recent month-end returns.
Performance reflects applicable fee waivers and/or expense limitations in effect during the periods shown. In their absence, performance would be reduced. Returns do not reflect the deduction of taxes that a shareholder would pay on Portfolio distributions or the redemption of Portfolio shares. Returns less than 12 months are cumulative, not annualized.
35
FUND BASICS
EXPENSE RATIOS4
Net Expense Ratio (Current)
Gross Expense Ratio (Before Waivers)
Class A
0.91
%
3.21
%
Institutional
0.51
2.81
Service
1.01
3.31
Class IR
0.66
2.96
Class R
1.16
3.46
Class R6
0.49
2.81
4
The expense ratios of the Portfolio, both current (net of applicable fee waivers and/or expense limitations) and before waivers (gross of applicable fee waivers and/or expense limitations) are as set forth above according to the most recent publicly available Prospectus for the Portfolio and will differ from the expense ratios disclosed in the Financial Highlights in this report due to the inclusion of Underlying Fund fees and expenses, which are not included in the operating expenses of the Portfolio reflected in the Financial Highlights. Pursuant to a contractual arrangement, the Portfolio’s waivers and/or expense limitations will remain in place through at least February 28, 2018, and prior to such date, the Investment Adviser may not terminate the arrangements without the approval of the Portfolio’s Board of Trustees. If these arrangements are discontinued in the future, the expense ratios may change without shareholder approval.
TOP TEN HOLDINGS AS OF 8/31/175
Holding
% of Net Assets
Line of Business
iShares Core S&P 500 ETF
25.5
%
Exchange Traded Funds
Vanguard FTSE All-World ex-U.S. ETF
10.0
Exchange Traded Funds
iShares Core S&P Mid-Cap ETF
9.5
Exchange Traded Funds
Schwab Intermediate-Term U.S. Treasury ETF
9.5
Exchange Traded Funds
Vanguard FTSE Europe ETF
7.5
Exchange Traded Funds
iShares 20+ Year Treasury Bond ETF
3.5
Exchange Traded Funds
iShares Edge MSCI Minimum Volatility EAFE
3.0
Exchange Traded Funds
ETF
PowerShares Optimum Yield Diversified
3.0
Exchange Traded Funds
Commodity Strategy No. K-1 Portfolio
Vanguard Financials ETF
2.5
Exchange Traded Funds
Vanguard Growth ETF
2.5
Exchange Traded Funds
5
The top 10 holdings may not be representative of the Portfolio’s future investments. The top 10 holdings exclude investments in money market funds.
PORTFOLIO COMPOSITION6
Holding
As of August 31, 2017
As of October 31, 2016
Stock Funds
51.5
%
61.4
%
Foreign Stock Funds
25.5
20.3
Bond Funds
15.5
9.9
Investment Companies
3.5
2.5
Alternative Funds
3.0
1.3
6
The Portfolio is actively managed and, as such, its composition may differ over time. The percentage shown for each fund type reflects the value of that fund type as a percentage of the Portfolio’s net assets. Figures above may not sum to 100% due to rounding and/or exclusion of other assets and liabilities.
36
GOLDMAN SACHS TARGET DATE 2055 PORTFOLIO
Performance Summary August 31, 2017
The following graph shows the value, as of August 31, 2017, of a $1,000,000 investment made on August 22, 2016 (commencement of operations) in Institutional Shares. For comparative purposes, the performance of the Portfolio’s benchmark, the S&P Target Date to 2055 Index (Total Return, Unhedged, USD), is shown. This performance data represents past performance and should not be considered indicative of future performance, which will fluctuate with changes in market conditions. These performance fluctuations may cause an investor’s shares, when redeemed, to be worth more or less than their original cost. Performance reflects applicable fee waivers and/or expense limitations currently in effect during the periods shown and in their absence, performance would be reduced. Returns do not reflect the deduction of taxes that a shareholder would pay on Portfolio distributions or the redemption of Portfolio shares. Performance of Class A, Service, Class IR, Class R and Class R6 Shares will vary from Institutional Shares due to differences in class specific fees and any applicable sales charges. In addition to the Sub-Adviser’s decisions regarding underlying fund selection and allocations among them, other factors may affect Portfolio performance. These factors include, but are not limited to, portfolio operating fees and expenses, portfolio turnover and subscription and redemption cash flows affecting the Portfolio.
Target Date 2055 Portfolio’s Lifetime Performance
Average Annual Total Return through August 31, 2017
One Year
Since Inception
Class A (Commenced August 22, 2016)
Excluding sales charges
12.94
%
12.13
%
Including sales charges
6.72
%
6.15
%
Institutional (Commenced August 22, 2016)
13.47
%
12.65
%
Service (Commenced August 22, 2016)
12.87
%
12.06
%
Class IR (Commenced August 22, 2016)
13.31
%
12.49
%
Class R (Commenced August 22, 2016)
12.71
%
11.91
%
Class R6 (Commenced August 22, 2016)
13.47
%
12.65
%
37
GOLDMAN SACHS TARGET DATE 2020 PORTFOLIO
Schedule of Investments
August 31, 2017
Shares
Description
Value
Exchange Traded Funds – 96.2%
Alternative Funds – 3.0%
87,567
PowerShares Optimum Yield Diversified
Commodity Strategy No. K-1 Portfolio
$
1,443,104
Bond Funds – 65.1%
16,909
iShares 20+ Year Treasury Bond ETF
2,164,183
44,378
iShares 7-10 Year Treasury Bond ETF
4,803,475
176,201
Schwab Intermediate-Term U.S.
Treasury ETF
9,601,192
34,461
Schwab U.S. TIPS ETF
1,920,856
20,346
Vanguard Long-Term Corporate
Bond ETF
1,922,290
101,557
Vanguard Short-Term Corporate
Bond ETF
8,162,136
33,947
Vanguard Short-Term Inflation-Protected
Securities ETF
1,680,377
110,083
Virtus Seix Floating Rate High
Income Fund
959,925
31,214,434
Foreign Stock Funds – 7.8%
6,785
iShares Edge MSCI Minimum Volatility
EAFE ETF
482,482
8,240
iShares Edge MSCI Minimum Volatility
Emerging Markets ETF
479,074
18,446
Vanguard FTSE All-World ex-U.S. ETF
960,114
5,421
Vanguard FTSE Emerging Markets ETF
240,150
21,150
Vanguard FTSE Europe ETF
1,200,051
6,936
WisdomTree Japan Hedged Equity Fund
361,088
3,722,959
Stock Funds – 20.3%
18,326
iShares Core S&P 500 ETF
4,565,740
9,670
iShares Core S&P Mid-Cap ETF
1,671,073
8,344
iShares Currency Hedged MSCI
Eurozone ETF
240,474
6,624
iShares MSCI Japan ETF
362,399
17,057
PowerShares S&P 500 Quality Portfolio
480,325
10,476
Schwab U.S. Dividend Equity ETF
480,220
11,586
Vanguard Financials ETF
721,344
3,644
Vanguard Growth ETF
480,279
1,594
Vanguard Health Care ETF
240,790
1,598
Vanguard Information Technology ETF
241,649
1,943
Vanguard Materials ETF
241,321
9,725,614
TOTAL EXCHANGE TRADED FUNDS
(Cost $43,471,784)
$
46,106,111
Distribution
Shares
Rate
Value
Investment Company(a)– 3.2%
Goldman Sachs Financial Square Government Fund –
Institutional Shares
1,542,601
0.927%
$
1,542,601
(Cost $1,542,601)
TOTAL INVESTMENTS – 99.4%
(Cost $45,014,385)
$
47,648,712
OTHER ASSETS IN EXCESS OF
LIABILITIES – 0.6%
311,149
NET ASSETS – 100.0%
$
47,959,861
The percentage shown for each investment category reflects the value of investments in that category as a percentage of net assets.
(a) Represents an Affiliated fund.
Investment Abbreviations:
ETF —Exchange Traded Fund
TIPS—Treasury Inflation Protected Securities
38
The accompanying notes are an integral part of these financial statements.
GOLDMAN SACHS TARGET DATE 2025 PORTFOLIO
Schedule of Investments
August 31, 2017
Shares
Description
Value
Exchange Traded Funds – 96.1%
Alternative Funds – 3.0%
19,754
PowerShares Optimum Yield Diversified
Commodity Strategy No. K-1 Portfolio
$
325,546
Bond Funds – 48.5%
3,814
iShares 20+ Year Treasury Bond ETF
488,154
7,008
iShares 7-10 Year Treasury Bond ETF
758,546
31,799
Schwab Intermediate-Term U.S.
Treasury ETF
1,732,728
4,850
Schwab U.S. TIPS ETF
270,339
2,303
Vanguard Long-Term Corporate
Bond ETF
217,587
17,520
Vanguard Short-Term Corporate
Bond ETF
1,408,082
5,453
Vanguard Short-Term Inflation-Protected
Securities ETF
269,924
12,313
Virtus Seix Floating Rate High
Income Fund
107,368
5,252,728
Foreign Stock Funds – 13.1%
2,284
iShares Edge MSCI Minimum Volatility
EAFE ETF
162,415
2,792
iShares Edge MSCI Minimum Volatility
Emerging Markets ETF
162,327
10,406
Vanguard FTSE All-World ex-U.S. ETF
541,632
1,252
Vanguard FTSE Emerging Markets ETF
55,464
6,686
Vanguard FTSE Europe ETF
379,364
2,092
WisdomTree Japan Hedged Equity Fund
108,909
1,410,111
Stock Funds – 31.5%
7,402
iShares Core S&P 500 ETF
1,844,134
3,730
iShares Core S&P Mid-Cap ETF
644,581
1,840
iShares Currency Hedged MSCI
Eurozone ETF
53,029
1,983
iShares MSCI Japan ETF
108,490
4,815
PowerShares S&P 500 Quality Portfolio
135,590
3,541
Schwab U.S. Dividend Equity ETF
162,319
3,049
Vanguard Financials ETF
189,831
832
Vanguard Growth ETF
109,658
367
Vanguard Health Care ETF
55,439
366
Vanguard Information Technology ETF
55,346
439
Vanguard Materials ETF
54,524
3,412,941
TOTAL EXCHANGE TRADED FUNDS
(Cost $9,831,539)
$
10,401,326
Distribution
Shares
Rate
Value
Investment Company(a)– 3.5%
Goldman Sachs Financial Square Government Fund –
Institutional Shares
381,305
0.927%
$
381,305
(Cost $381,305)
TOTAL INVESTMENTS – 99.6%
(Cost $10,212,844)
$
10,782,631
OTHER ASSETS IN EXCESS OF
LIABILITIES – 0.4%
45,578
NET ASSETS – 100.0%
$
10,828,209
The percentage shown for each investment category reflects the value of investments in that category as a percentage of net assets.
(a) Represents an Affiliated fund.
Investment Abbreviations:
ETF —Exchange Traded Fund
TIPS—Treasury Inflation Protected Securities
The accompanying notes are an integral part of these financial statements.
39
GOLDMAN SACHS TARGET DATE 2030 PORTFOLIO
Schedule of Investments
August 31, 2017
Shares
Description
Value
Exchange Traded Funds – 95.0%
Alternative Funds – 3.0%
137,729
PowerShares Optimum Yield Diversified
Commodity Strategy No. K-1 Portfolio
$
2,269,774
Bond Funds – 39.3%
23,613
iShares 20+ Year Treasury Bond ETF
3,022,228
38,390
iShares 7-10 Year Treasury Bond ETF
4,155,334
187,066
Schwab Intermediate-Term U.S. Treasury
ETF
10,193,226
27,070
Schwab U.S. TIPS ETF
1,508,882
11,986
Vanguard Long-Term Corporate Bond
ETF
1,132,437
103,357
Vanguard Short-Term Corporate Bond
ETF
8,306,802
30,511
Vanguard Short-Term Inflation-Protected
Securities ETF
1,510,294
29,829,203
Foreign Stock Funds – 16.4%
21,255
iShares Edge MSCI Minimum Volatility
EAFE ETF
1,511,443
22,720
iShares Edge MSCI Minimum Volatility
Emerging Markets ETF
1,320,941
105,170
Vanguard FTSE All-World ex-U.S. ETF
5,474,098
8,516
Vanguard FTSE Emerging Markets ETF
377,259
53,226
Vanguard FTSE Europe ETF
3,020,043
14,528
WisdomTree Japan Hedged Equity Fund
756,328
12,460,112
Stock Funds – 36.3%
60,681
iShares Core S&P 500 ETF
15,118,064
30,549
iShares Core S&P Mid-Cap ETF
5,279,173
13,147
iShares Currency Hedged MSCI
Eurozone ETF
378,897
13,876
iShares MSCI Japan ETF
759,156
40,196
PowerShares S&P 500 Quality Portfolio
1,131,919
24,686
Schwab U.S. Dividend Equity ETF
1,131,606
24,297
Vanguard Financials ETF
1,512,731
7,165
Vanguard Growth ETF
944,347
2,531
Vanguard Health Care ETF
382,333
3,765
Vanguard Information Technology ETF
569,343
3,052
Vanguard Materials ETF
379,059
27,586,628
TOTAL EXCHANGE TRADED FUNDS
(Cost $65,749,557)
$
72,145,717
Distribution
Shares
Rate
Value
Investment Companies – 2.0%
Goldman Sachs Financial Square Government Fund –
Institutional Shares(a)
1,170,153
0.927%
$
1,170,153
Schwab Fundamental U.S. Large Company Index Fund
Institutional Shares
23,469
0.000%
378,788
TOTAL INVESTMENT COMPANIES
(Cost $1,486,015)
$
1,548,941
TOTAL INVESTMENTS – 97.0%
(Cost $67,235,572)
$
73,694,658
OTHER ASSETS IN EXCESS OF
LIABILITIES – 3.0%
2,241,429
NET ASSETS – 100.0%
$
75,936,087
The percentage shown for each investment category reflects the value of investments in that category as a percentage of net assets.
(a) Represents an Affiliated fund.
Investment Abbreviations:
ETF—Exchange Traded Fund
TIPS—Treasury Inflation Protected Securities
40
The accompanying notes are an integral part of these financial statements.
GOLDMAN SACHS TARGET DATE 2035 PORTFOLIO
Schedule of Investments
August 31, 2017
Shares
Description
Value
Exchange Traded Funds – 95.6%
Alternative Funds – 3.0%
20,337
PowerShares Optimum Yield Diversified
Commodity Strategy No. K-1 Portfolio
$
335,154
Bond Funds – 34.5%
3,486
iShares 20+ Year Treasury Bond ETF
446,173
5,153
iShares 7-10 Year Treasury Bond ETF
557,761
25,577
Schwab Intermediate-Term U.S.
Treasury ETF
1,393,691
1,990
Schwab U.S. TIPS ETF
110,922
1,187
Vanguard Long-Term Corporate
Bond ETF
112,148
12,487
Vanguard Short-Term Corporate
Bond ETF
1,003,580
4,490
Vanguard Short-Term Inflation-Protected
Securities ETF
222,255
3,846,530
Foreign Stock Funds – 18.5%
3,925
iShares Edge MSCI Minimum Volatility
EAFE ETF
279,107
3,831
iShares Edge MSCI Minimum Volatility
Emerging Markets ETF
222,734
17,134
Vanguard FTSE All-World ex-U.S. ETF
891,825
1,286
Vanguard FTSE Emerging Markets ETF
56,970
8,842
Vanguard FTSE Europe ETF
501,695
2,159
WisdomTree Japan Hedged Equity Fund
112,397
2,064,728
Stock Funds – 39.6%
9,632
iShares Core S&P 500 ETF
2,399,716
4,834
iShares Core S&P Mid-Cap ETF
835,364
1,911
iShares Currency Hedged MSCI
Eurozone ETF
55,075
2,040
iShares MSCI Japan ETF
111,608
6,916
PowerShares S&P 500 Quality Portfolio
194,755
4,266
Schwab U.S. Dividend Equity ETF
195,553
3,588
Vanguard Financials ETF
223,389
1,270
Vanguard Growth ETF
167,386
378
Vanguard Health Care ETF
57,101
738
Vanguard Information Technology ETF
111,600
449
Vanguard Materials ETF
55,766
4,407,313
TOTAL EXCHANGE TRADED FUNDS
(Cost $9,925,442)
$
10,653,725
Distribution
Shares
Rate
Value
Investment Companies – 3.5%
Goldman Sachs Financial Square Government Fund –
Institutional Shares(a)
333,517
0.927%
$
333,517
Schwab Fundamental U.S. Large Company Index Fund
Institutional Shares
3,425
0.000%
55,274
TOTAL INVESTMENT COMPANIES
(Cost $386,173)
$
388,791
TOTAL INVESTMENTS – 99.1%
(Cost $10,311,615)
$
11,042,516
OTHER ASSETS IN EXCESS OF
LIABILITIES – 0.9%
105,741
NET ASSETS – 100.0%
$
11,148,257
The percentage shown for each investment category reflects the value of investments in that category as a percentage of net assets.
(a) Represents an Affiliated fund.
Investment Abbreviations:
ETF —Exchange Traded Fund
TIPS—Treasury Inflation Protected Securities
The accompanying notes are an integral part of these financial statements.
41
GOLDMAN SACHS TARGET DATE 2040 PORTFOLIO
Schedule of Investments
August 31, 2017
Shares
Description
Value
Exchange Traded Funds – 95.7%
Alternative Funds – 3.0%
89,734
PowerShares Optimum Yield Diversified
Commodity Strategy No. K-1 Portfolio
$
1,478,816
Bond Funds – 29.6%
15,376
iShares 20+ Year Treasury Bond ETF
1,967,974
20,464
iShares 7-10 Year Treasury Bond ETF
2,215,023
103,823
Schwab Intermediate-Term U.S. Treasury
ETF
5,657,315
2,602
Vanguard Long-Term Corporate Bond
ETF
245,837
42,853
Vanguard Short-Term Corporate Bond
ETF
3,444,096
19,878
Vanguard Short-Term Inflation-Protected
Securities ETF
983,961
14,514,206
Foreign Stock Funds – 20.0%
17,310
iShares Edge MSCI Minimum Volatility
EAFE ETF
1,230,914
16,918
iShares Edge MSCI Minimum Volatility
Emerging Markets ETF
983,613
80,335
Vanguard FTSE All-World ex-U.S. ETF
4,181,437
8,318
Vanguard FTSE Emerging Markets ETF
368,487
43,348
Vanguard FTSE Europe ETF
2,459,565
11,826
WisdomTree Japan Hedged Equity Fund
615,662
9,839,678
Stock Funds – 43.1%
45,470
iShares Core S&P 500 ETF
11,328,396
22,779
iShares Core S&P Mid-Cap ETF
3,936,439
12,805
iShares Currency Hedged MSCI
Eurozone ETF
369,040
11,295
iShares MSCI Japan ETF
617,949
30,538
PowerShares S&P 500 Quality Portfolio
859,950
21,434
Schwab U.S. Dividend Equity ETF
982,535
15,830
Vanguard Financials ETF
985,576
6,535
Vanguard Growth ETF
861,313
2,450
Vanguard Health Care ETF
370,097
4,069
Vanguard Information Technology ETF
615,314
1,988
Vanguard Materials ETF
246,910
21,173,519
TOTAL EXCHANGE TRADED FUNDS
(Cost $42,105,202)
$
47,006,219
Distribution
Shares
Rate
Value
Investment Companies – 2.3%
Goldman Sachs Financial Square Government Fund –
Institutional Shares(a)
882,582
0.927%
$
882,582
Schwab Fundamental U.S. Large Company Index Fund
Institutional Shares
15,283
0.000%
246,661
TOTAL INVESTMENT COMPANIES
(Cost $1,022,958)
$
1,129,243
TOTAL INVESTMENTS – 98.0%
(Cost $43,128,160)
$
48,135,462
OTHER ASSETS IN EXCESS OF
LIABILITIES – 2.0%
959,702
NET ASSETS – 100.0%
$
49,095,164
The percentage shown for each investment category reflects the value of investments in that category as a percentage of net assets.
(a) Represents an Affiliated fund.
Investment Abbreviations:
ETF—Exchange Traded Fund
42
The accompanying notes are an integral part of these financial statements.
GOLDMAN SACHS TARGET DATE 2045 PORTFOLIO
Schedule of Investments
August 31, 2017
Shares
Description
Value
Exchange Traded Funds – 95.5%
Alternative Funds – 3.0%
20,637
PowerShares Optimum Yield Diversified
Commodity Strategy No. K-1 Portfolio
$
340,098
Bond Funds – 25.5%
3,544
iShares 20+ Year Treasury Bond ETF
453,597
3,662
iShares 7-10 Year Treasury Bond ETF
396,375
21,801
Schwab Intermediate-Term U.S.
Treasury ETF
1,187,936
8,447
Vanguard Short-Term Corporate
Bond ETF
678,885
3,416
Vanguard Short-Term Inflation-Protected
Securities ETF
169,092
2,885,885
Foreign Stock Funds – 21.7%
4,774
iShares Edge MSCI Minimum Volatility
EAFE ETF
339,479
3,891
iShares Edge MSCI Minimum Volatility
Emerging Markets ETF
226,223
19,551
Vanguard FTSE All-World ex-U.S. ETF
1,017,629
2,548
Vanguard FTSE Emerging Markets ETF
112,876
10,940
Vanguard FTSE Europe ETF
620,736
2,713
WisdomTree Japan Hedged Equity Fund
141,239
2,458,182
Stock Funds – 45.3%
10,683
iShares Core S&P 500 ETF
2,661,563
5,566
iShares Core S&P Mid-Cap ETF
961,861
3,923
iShares Currency Hedged MSCI Eurozone
ETF
113,061
2,607
iShares MSCI Japan ETF
142,629
6,984
PowerShares S&P 500 Quality Portfolio
196,669
5,550
Schwab U.S. Dividend Equity ETF
254,412
3,641
Vanguard Financials ETF
226,689
1,718
Vanguard Growth ETF
226,432
751
Vanguard Health Care ETF
113,446
1,132
Vanguard Information Technology ETF
171,181
465
Vanguard Materials ETF
57,753
5,125,696
TOTAL EXCHANGE TRADED FUNDS
(Cost $9,971,085)
$
10,809,861
Distribution
Shares
Rate
Value
Investment Companies – 3.5%
Goldman Sachs Financial Square Government Fund –
Institutional Shares(a)
336,673
0.927%
$
336,673
Schwab Fundamental U.S. Large Company Index Fund
Institutional Shares
3,507
0.000%
56,606
TOTAL INVESTMENT COMPANIES
(Cost $390,336)
$
393,279
TOTAL INVESTMENTS – 99.0%
(Cost $10,361,421)
$
11,203,140
OTHER ASSETS IN EXCESS OF
LIABILITIES – 1.0%
109,129
NET ASSETS – 100.0%
$
11,312,269
The percentage shown for each investment category reflects the value of investments in that category as a percentage of net assets.
(a) Represents an Affiliated fund.
Investment Abbreviations:
ETF—Exchange Traded Fund
The accompanying notes are an integral part of these financial statements.
43
GOLDMAN SACHS TARGET DATE 2050 PORTFOLIO
Schedule of Investments
August 31, 2017
Shares
Description
Value
Exchange Traded Funds – 95.7%
Alternative Funds – 3.0%
48,226
PowerShares Optimum Yield Diversified
Commodity Strategy No. K-1 Portfolio
$
794,764
Bond Funds – 20.5%
7,238
iShares 20+ Year Treasury Bond ETF
926,392
4,888
iShares 7-10 Year Treasury Bond ETF
529,077
48,519
Schwab Intermediate-Term U.S.
Treasury ETF
2,643,800
13,160
Vanguard Short-Term Corporate
Bond ETF
1,057,669
5,320
Vanguard Short-Term Inflation-Protected
Securities ETF
263,340
5,420,278
Foreign Stock Funds – 23.8%
11,164
iShares Edge MSCI Minimum Volatility
EAFE ETF
793,872
9,092
iShares Edge MSCI Minimum Volatility
Emerging Markets ETF
528,609
48,253
Vanguard FTSE All-World ex-U.S. ETF
2,511,569
7,439
Vanguard FTSE Emerging Markets ETF
329,548
30,285
Vanguard FTSE Europe ETF
1,718,371
7,622
WisdomTree Japan Hedged Equity Fund
396,801
6,278,770
Stock Funds – 48.4%
26,028
iShares Core S&P 500 ETF
6,484,616
13,772
iShares Core S&P Mid-Cap ETF
2,379,939
9,170
iShares Currency Hedged MSCI Eurozone
ETF
264,279
6,048
iShares MSCI Japan ETF
330,886
18,768
PowerShares S&P 500 Quality Portfolio
528,507
12,952
Schwab U.S. Dividend Equity ETF
593,720
9,571
Vanguard Financials ETF
595,891
4,516
Vanguard Growth ETF
595,209
2,195
Vanguard Health Care ETF
331,577
3,061
Vanguard Information Technology ETF
462,884
1,607
Vanguard Materials ETF
199,589
12,767,097
TOTAL EXCHANGE TRADED FUNDS
(Cost $22,329,792)
$
25,260,909
Distribution
Shares
Rate
Value
Investment Companies – 3.5%
Goldman Sachs Financial Square Government Fund –
Institutional Shares(a)
791,555
0.927%
$
791,555
Schwab Fundamental U.S. Large Company Index Fund
Institutional Shares
8,252
0.000%
133,189
TOTAL INVESTMENT COMPANIES
(Cost $870,896)
$
924,744
TOTAL INVESTMENTS – 99.2%
(Cost $23,200,688)
$
26,185,653
OTHER ASSETS IN EXCESS OF
LIABILITIES – 0.8%
207,332
NET ASSETS – 100.0%
$
26,392,985
The percentage shown for each investment category reflects the value of investments in that category as a percentage of net assets.
(a) Represents an Affiliated fund.
Investment Abbreviations:
ETF—Exchange Traded Fund
44
The accompanying notes are an integral part of these financial statements.
GOLDMAN SACHS TARGET DATE 2055 PORTFOLIO
Schedule of Investments
August 31, 2017
Shares
Description
Value
Exchange Traded Funds – 95.5%
Alternative Funds – 3.0%
20,942
PowerShares Optimum Yield Diversified
Commodity Strategy No. K-1 Portfolio
$
345,124
Bond Funds – 15.5%
3,146
iShares 20+ Year Treasury Bond ETF
402,656
20,016
Schwab Intermediate-Term U.S.
Treasury ETF
1,090,672
2,857
Vanguard Short-Term Corporate
Bond ETF
229,617
1,154
Vanguard Short-Term Inflation-Protected
Securities ETF
57,123
1,780,068
Foreign Stock Funds – 25.5%
4,856
iShares Edge MSCI Minimum Volatility
EAFE ETF
345,310
3,948
iShares Edge MSCI Minimum Volatility
Emerging Markets ETF
229,537
22,034
Vanguard FTSE All-World ex-U.S. ETF
1,146,869
3,874
Vanguard FTSE Emerging Markets ETF
171,618
15,174
Vanguard FTSE Europe ETF
860,973
3,329
WisdomTree Japan Hedged Equity Fund
173,308
2,927,615
Stock Funds – 51.5%
11,764
iShares Core S&P 500 ETF
2,930,883
6,313
iShares Core S&P Mid-Cap ETF
1,090,950
3,999
iShares Currency Hedged MSCI
Eurozone ETF
115,251
3,147
iShares MSCI Japan ETF
172,172
8,108
PowerShares S&P 500 Quality Portfolio
228,321
6,252
Schwab U.S. Dividend Equity ETF
286,592
4,618
Vanguard Financials ETF
287,517
2,179
Vanguard Growth ETF
287,192
1,144
Vanguard Health Care ETF
172,813
1,519
Vanguard Information Technology ETF
229,703
935
Vanguard Materials ETF
116,127
5,917,521
TOTAL EXCHANGE TRADED FUNDS
(Cost $10,008,658)
$
10,970,328
Distribution
Shares
Rate
Value
Investment Companies – 3.5%
Goldman Sachs Financial Square Government Fund –
Institutional Shares(a)
342,191
0.927%
$
342,191
Schwab Fundamental U.S. Large Company Index Fund
Institutional Shares
3,542
0.000%
57,172
TOTAL INVESTMENT COMPANIES
(Cost $396,404)
$
399,363
TOTAL INVESTMENTS – 99.0%
(Cost $10,405,062)
$
11,369,691
OTHER ASSETS IN EXCESS OF
LIABILITIES – 1.0%
110,523
NET ASSETS – 100.0%
$
11,480,214
The percentage shown for each investment category reflects the value of investments in that category as a percentage of net assets.
(a) Represents an Affiliated fund.
Investment Abbreviations:
ETF—Exchange Traded Fund
The accompanying notes are an integral part of these financial statements.
45
GOLDMAN SACHS TARGET DATE 2055 PORTFOLIOS
Statements of Assets and Liabilities
August 31, 2017
Target Date 2020
Portfolio
Assets:
Investments of unaffiliated issuers, at value (Cost $43,471,784, $9,831,539, $66,065,419, $9,978,098, $42,245,578,
$10,024,748, $22,409,133 and $10,062,871)
$
46,106,111
Investments of affiliated issuers, at value (Cost $1,542,601, $381,305, $1,170,153, $333,517, $882,582, $336,673, $791,555 and
$342,191)
1,542,601
Cash
—
Receivables:
Investments sold
3,206,199
Portfolio shares sold
115,475
Reimbursement from investment adviser
17,743
Dividends and interest
4,949
Other assets
2,379
Total assets
50,995,457
Liabilities:
Due to custodian
2,533,250
Payables:
Investments purchased
296,242
Management fees
10,697
Distribution and Service fees and Transfer Agency fees
916
Offering expense
—
Accrued expenses
194,491
Total liabilities
3,035,596
Net Assets:
Paid-in capital
42,430,851
Undistributed net investment income
488,324
Accumulated net realized gain
2,406,359
Net unrealized gain
2,634,327
NET ASSETS
$
47,959,861
Net Assets:
Class A
$
16,125
Institutional
10,496
Service
10,441
Class IR
323,170
Class R
10,425
Class R6
47,589,204
Total Net Assets
$
47,959,861
Shares Outstanding $0.001 par value (unlimited number of shares authorized):
Class A
1,623
Institutional
1,054
Service
1,052
Class IR
32,474
Class R
1,051
Class R6
4,776,265
Net asset value, offering and redemption price per share:(a)
Class A
$
9.93
(b)
Institutional
9.96
Service
9.93
(b)
Class IR
9.95
Class R
9.92
Class R6
9.96
(a)
Maximum public offering price per share for Class A Shares of the Target Date 2020, Target Date 2025, Target Date 2030, Target Date 2035, Target Date 2040, Target Date 2045, Target Date 2050, and Target Date 2055 Portfolios is $10.51, $11.23, $10.81, $11.48, $10.68, $11.65, $11.15 and $11.81, respectively.
(b)
Net asset value may not recalculate due to rounding of fractional shares.
46
The accompanying notes are an integral part of these financial statements.
GOLDMAN SACHS TARGET DATE PORTFOLIOS
Target Date 2025
Target Date 2030
Target Date 2035
Target Date 2040
Target Date 2045
Target Date 2050
Target Date 2055
Portfolio
Portfolio
Portfolio
Portfolio
Portfolio
Portfolio
Portfolio
$
10,401,326
$
72,524,505
$
10,708,999
$
47,252,880
$
10,866,467
$
25,394,098
$
11,027,500
381,305
1,170,153
333,517
882,582
336,673
791,555
342,191
215,538
1,500,042
221,833
975,533
224,999
522,295
228,203
29,929
1,274,634
14,909
737,717
52,017
302,248
74,740
—
574,832
—
58,162
—
123,580
—
97,840
31,554
97,880
18,772
97,446
5,040
96,673
638
1,421
235
929
235
521
245
526
3,317
528
2,158
530
1,050
532
11,127,102
77,080,458
11,377,901
49,928,733
11,578,367
27,140,387
11,770,084
—
—
—
—
—
—
—
193,518
926,122
124,227
629,455
160,757
558,344
185,947
2,243
15,955
2,306
10,344
2,338
5,444
2,374
404
1,397
415
875
438
477
439
37,870
—
37,871
—
37,871
—
36,473
64,858
200,897
64,825
192,895
64,694
183,137
64,637
298,893
1,144,371
229,644
833,569
266,098
747,402
289,870
10,163,453
62,383,549
10,263,578
38,756,926
10,262,344
21,851,759
10,266,906
93,676
673,115
91,530
436,364
90,473
214,585
88,669
1,293
6,420,337
62,248
4,894,572
117,733
1,341,676
160,010
569,787
6,459,086
730,901
5,007,302
841,719
2,984,965
964,629
$
10,828,209
$
75,936,087
$
11,148,257
$
49,095,164
$
11,312,269
$
26,392,985
$
11,480,214
$
74,621
$
204,871
$
28,769
$
13,293
$
83,874
$
49,279
$
87,106
10,686,940
10,891
10,910,695
11,061
11,077,455
11,234
11,242,030
10,686
10,833
10,910
11,003
11,077
11,176
11,241
34,551
625,137
151,944
130,406
96,871
156,151
101,170
10,670
22,880
10,963
24,138
29,110
11,184
11,223
10,741
75,061,475
34,976
48,905,263
13,882
26,153,961
27,444
$
10,828,209
$
75,936,087
$
11,148,257
$
49,095,164
$
11,312,269
$
26,392,985
$
11,480,214
7,030
20,040
2,652
1,318
7,617
4,676
7,805
1,003,051
1,061
1,003,493
1,094
1,003,690
1,063
1,004,014
1,006
1,059
1,007
1,092
1,007
1,062
1,007
3,246
60,988
13,992
12,902
8,786
14,801
9,043
1,006
2,239
1,013
2,397
2,649
1,064
1,007
1,008
7,316,887
3,216
4,832,132
1,258
2,475,794
2,451
$10.61
$10.22
$10.85
$10.09
$11.01
$10.54
$
11.16
10.65
10.26
10.87
10.12
(b)
11.04
10.56
(b)
11.20
10.62
10.23
10.84
(b)
10.08
11.00
10.53
(b)
11.16
10.64
10.25
10.86
10.11
11.03
10.55
11.19
10.61
10.22
10.83
(b)
10.07
10.99
10.52
(b)
11.15
(b)
10.65
(b)
10.26
10.87
(b)
10.12
11.04
(b)
10.56
11.20
The accompanying notes are an integral part of these financial statements.
47
GOLDMAN SACHS TARGET DATE PORTFOLIOS
Statements of Operations
For the Period Ended August 31, 2017
Target Date 2020 Portfolio
For the Period
For the Fiscal
November 1, 2016 –
Year Ended
August 31, 2017*
October 31, 2016
Investment income:
Dividends — unaffiliated issuers
$
883,598
$
1,133,681
Dividends — affiliated issuers
1,011
—
Interest
—
2,967
Total investment income
884,609
1,136,648
Expenses:
Registration fees
190,250
103,913
Management fees
110,711
159,742
Professional fees
12,674
98,339
Custody, accounting and administrative services
34,364
8,073
Printing and mailing costs
22,010
26,841
Trustee fees
28,808
10,142
Transfer Agency fees(b)
8,932
2,172
Distribution and Service fees(b)
111
25
Organization costs
—
—
Amortization of offering costs
—
—
Other
8,672
4,243
Total expenses
416,532
413,490
Less — expense reductions
(281,773
)
(246,152
)
Net expenses
134,759
167,338
NET INVESTMENT INCOME
749,850
969,310
Realized and unrealized gain (loss):
Capital gain distributions from unaffiliated Underlying Funds
—
135,945
Net realized gain (loss) from investments
2,911,207
2,168,805
Net change in unrealized gain (loss) on investments
(350,687
)
(1,317,333
)
Net realized and unrealized gain (loss)
2,560,520
987,417
NET INCREASE (DECREASE) IN NET ASSETS RESULTING FROM OPERATIONS
$
3,310,370
$
1,956,727
*
The Portfolios changed their fiscal year end from October 31 to August 31.
(a)
Commenced operations on August 22, 2016.
(b)
Class specific Distribution and Service and Transfer Agency fees were as follows:
Distribution and Service Fees
Transfer Agency Fees
Portfolio
Class A
Service
Class R
Class A
Institutional
Service
Class IR
Class R
Class R6
Target Date 2020 Portfolio
$
27
$
42
$
42
$
19
$
3
$
3
$
47
$
15
$
8,845
Target Date 2025 Portfolio
105
43
42
79
3,417
3
21
16
3
Target Date 2030 Portfolio
330
43
68
250
3
3
30
25
12,727
Target Date 2035 Portfolio
48
44
44
37
3,464
3
44
17
4
Target Date 2040 Portfolio
27
44
71
21
3
3
30
27
8,291
Target Date 2045 Portfolio
57
44
80
43
3,501
3
37
30
3
Target Date 2050 Portfolio
49
44
44
37
3
3
23
17
4,089
Target Date 2055 Portfolio
102
44
44
77
3,537
3
32
17
3
48
The accompanying notes are an integral part of these financial statements.
GOLDMAN SACHS TARGET DATE PORTFOLIOS
Target Date 2025 Portfolio
Target Date 2030 Portfolio
Target Date 2035 Portfolio
For the Period November 1, 2016 – August 31, 2017*
For the Fiscal Period Ended October 31, 2016(a)
For the Period November 1, 2016 – August 31, 2017*
For the Fiscal Year Ended October 31, 2016
For the Period November 1, 2016 – August 31, 2017*
For the Fiscal Period Ended October 31, 2016(a)
$
172,864
$
33,312
$
1,288,068
$
1,694,381
$
175,306
$
33,763
231
—
1,479
—
243
—
—
—
—
4,079
—
—
173,095
33,312
1,289,547
1,698,460
175,549
33,763
81,957
4,373
190,243
103,913
81,966
4,373
21,553
4,744
159,526
226,031
21,844
4,741
48,987
21,969
12,674
98,339
48,987
21,969
40,289
5,789
34,439
8,124
39,899
5,789
7,366
7,500
33,046
26,839
7,156
7,500
26,574
9,877
30,064
10,209
26,580
9,877
3,539
769
13,038
3,019
3,569
769
190
25
441
25
136
25
—
12,000
—
—
—
12,000
123,521
32,282
—
—
123,521
32,282
5,459
750
10,001
4,243
5,462
747
359,435
100,078
483,472
480,742
359,120
100,072
(331,806
)
(93,591
)
(288,907
)
(244,151
)
(331,206
)
(93,592
)
27,629
6,487
194,565
236,591
27,914
6,480
145,466
26,825
1,094,982
1,461,869
147,635
27,283
4,000
—
34,942
242,271
5,746
—
55,137
(57,510
)
7,553,509
2,494,888
113,083
(56,337
)
706,788
(137,001
)
(771,447
)
(1,710,529
)
888,166
(157,265
)
765,925
(194,511
)
6,817,004
1,026,630
1,006,995
(213,602
)
$
911,391
$
(167,686
)
$
7,911,986
$
2,488,499
$
1,154,630
$
(186,319
)
The accompanying notes are an integral part of these financial statements.
49
GOLDMAN SACHS TARGET DATE PORTFOLIOS
Statements of Operations (continued)
For the Period Ended August 31, 2017
Target Date 2040 Portfolio
For the Period
For the Fiscal
November 1, 2016 –
Year Ended
August 31, 2017*
October 31, 2016
Investment income:
Dividends — unaffiliated issuers
$
843,892
$
1,134,608
Dividends — affiliated issuers
961
—
Interest
—
2,660
Total investment income
844,853
1,137,268
Expenses:
Registration fees
190,236
103,913
Management fees
103,785
147,269
Professional fees
12,674
98,339
Custody, accounting and administrative services
33,309
7,413
Printing and mailing costs
19,942
26,839
Trustee fees
28,620
10,138
Transfer Agency fees(b)
8,375
1,992
Distribution and Service fees(b)
142
25
Organization costs
—
—
Amortization of offering costs
—
—
Other
8,215
4,242
Total expenses
405,298
400,170
Less — expense reductions
(279,039
)
(245,937
)
Net expenses
126,259
154,233
NET INVESTMENT INCOME
718,594
983,035
Realized and unrealized gain (loss):
Capital gain distributions from unaffiliated Underlying Funds
28,049
192,305
Net realized gain (loss) from investments
5,820,894
2,008,437
Net change in unrealized gain (loss) on investments
(625,537
)
(1,495,190
)
Net realized and unrealized gain (loss)
5,223,406
705,552
NET INCREASE (DECREASE) IN NET ASSETS RESULTING FROM OPERATIONS
$
5,942,000
$
1,688,587
*
The Portfolios changed their fiscal year end from October 31 to August 31.
(a)
Commenced operations on August 22, 2016.
(b)
Class specific Distribution and Service and Transfer Agency fees were as follows:
50
The accompanying notes are an integral part of these financial statements.
GOLDMAN SACHS TARGET DATE PORTFOLIOS
Target Date 2045 Portfolio
Target Date 2050 Portfolio
Target Date 2055 Portfolio
For the Period November 1, 2016 – August 31, 2017*
For the Fiscal Period Ended October 31, 2016(a)
For the Period November 1, 2016 – August 31, 2017*
For the Fiscal Year Ended October 31, 2016
For the Period November 1, 2016 – August 31, 2017*
For the Fiscal Period Ended October 31, 2016(a)
$
177,147
$
33,575
$
412,352
$
512,196
$
179,535
$
33,456
244
—
536
—
253
—
—
—
—
1,168
—
—
177,391
33,575
412,888
513,364
179,788
33,456
81,977
4,373
190,259
103,913
82,284
4,373
22,069
4,740
51,258
63,738
22,330
4,740
48,987
21,969
12,674
98,339
48,987
21,969
39,511
5,789
24,886
5,901
39,993
5,789
7,160
7,500
6,194
27,369
7,332
7,500
26,585
9,877
27,194
10,057
26,590
9,877
3,617
769
4,172
895
3,669
769
181
25
137
25
190
25
—
12,000
—
—
—
12,000
123,521
32,282
—
—
122,397
32,281
5,467
746
6,495
4,242
5,470
747
359,075
100,070
323,269
314,479
359,242
100,070
(330,823
)
(93,592
)
(260,922
)
(247,616
)
(330,649
)
(93,591
)
28,252
6,478
62,347
66,863
28,593
6,479
149,139
27,097
350,541
446,501
151,195
26,977
5,796
—
12,983
95,186
5,840
—
169,625
(57,327
)
1,832,990
749,735
219,057
(64,343
)
1,006,023
(164,304
)
1,087,414
(529,507
)
1,129,809
(165,180
)
1,181,444
(221,631
)
2,933,387
315,414
1,354,706
(229,523
)
$
1,330,583
$
(194,534
)
$
3,283,928
$
761,915
$
1,505,901
$
(202,546
)
The accompanying notes are an integral part of these financial statements.
51
GOLDMAN SACHS TARGET DATE PORTFOLIOS
Statements of Changes in Net Assets
Target Date 2020 Portfolio
For the Period
For the Fiscal
For the Fiscal
November 1, 2016 –
Year Ended
Year Ended
August 31, 2017*
October 31, 2016
October 31, 2015
From operations:
Net investment income
$
749,850
$
969,310
$
872,479
Net realized gain (loss)
2,911,207
2,304,750
1,693,559
Net change in unrealized gain (loss)
(350,687
)
(1,317,333
)
(984,069
)
Net increase (decrease) in net assets resulting from operations
3,310,370
1,956,727
1,581,969
Distributions to shareholders:
From net investment income
Class A Shares(a)
(167
)
—
—
Institutional Shares(a)
(182
)
—
—
Service Shares(a)
(164
)
—
—
Class IR Shares(a)
(177
)
—
—
Class R Shares(a)
(159
)
—
—
Class R6 Shares
(1,005,896
)
(899,589
)
(537,568
)
From net realized gains
Class A Shares(a)
(373
)
—
—
Institutional Shares(a)
(373
)
—
—
Service Shares(a)
(373
)
—
—
Class IR Shares(a)
(373
)
—
—
Class R Shares(a)
(373
)
—
—
Class R6 Shares
(2,022,264
)
(1,764,331
)
(604,745
)
Total distributions to shareholders
(3,030,874
)
(2,663,920
)
(1,142,313
)
From share transactions:
Proceeds from sales of shares
1,740,467
5,445,589
1,965,286
Reinvestment of distributions
3,030,874
2,663,920
1,142,314
Cost of shares redeemed
(10,811,559
)
(7,300,343
)
(11,892,996
)
Net increase (decrease) in net assets resulting from share transactions
(6,040,218
)
809,166
(8,785,396
)
TOTAL INCREASE (DECREASE)
(5,760,722
)
101,973
(8,345,740
)
Net assets:
Beginning of year
53,720,583
53,618,610
61,964,350
End of year
$
47,959,861
$
53,720,583
$
53,618,610
Undistributed net investment income
$
488,324
$
747,818
$
624,905
*
The Portfolios changed their fiscal year end from October 31 to August 31.
(a)
Commenced operations on August 22, 2016.
52
The accompanying notes are an integral part of these financial statements.
GOLDMAN SACHS TARGET DATE PORTFOLIOS
Target Date 2025 Portfolio
Target Date 2030 Portfolio
For the Period November 1, 2016 – August 31, 2017*
For the Period Ended October 31, 2016(a)
For the Period November 1, 2016 – August 31, 2017*
For the Fiscal Year Ended October 31, 2016
For the Fiscal Year Ended October 31, 2015
$
145,466
$
26,825
$
1,094,982
$
1,461,869
$
1,234,059
59,137
(57,510
)
7,588,451
2,737,159
2,099,659
706,788
(137,001
)
(771,447
)
(1,710,529
)
(1,065,611
)
911,391
(167,686
)
7,911,986
2,488,499
2,268,107
(375
)
—
(306
)
—
—
(79,700
)
—
(198
)
—
—
(62
)
—
(181
)
—
—
(75
)
—
(193
)
—
—
(57
)
—
(175
)
—
—
(80
)
—
(1,529,883
)
(1,258,551
)
(781,023
)
—
—
(317
)
—
—
—
—
(317
)
—
—
—
—
(317
)
—
—
—
—
(317
)
—
—
—
—
(317
)
—
—
—
—
(2,407,010
)
(2,672,152
)
(1,632,546
)
(80,349
)
—
(3,939,531
)
(3,930,703
)
(2,413,569
)
84,579
10,000,066
3,528,594
2,761,285
2,827,154
80,349
—
3,939,531
3,930,703
2,413,569
(76
)
(65
)
(9,777,634
)
(9,983,568
)
(8,940,513
)
164,852
10,000,001
(2,309,509
)
(3,291,580
)
(3,699,790
)
995,894
9,832,315
1,662,946
(4,733,784
)
(3,845,252
)
9,832,315
—
74,273,141
79,006,925
82,852,177
$
10,828,209
$
9,832,315
$
75,936,087
$
74,273,141
$
79,006,925
$
93,676
$
27,333
$
673,115
$
1,109,790
$
815,924
The accompanying notes are an integral part of these financial statements.
53
GOLDMAN SACHS TARGET DATE PORTFOLIOS
Statements of Changes in Net Assets (continued)
Target Date 2035 Portfolio
For the Period November 1, 2016 – August 31, 2017*
For the Period Ended October 31, 2016(a)
From operations:
Net investment income
$
147,635
$
27,283
Net realized gain (loss)
118,829
(56,337
)
Net change in unrealized gain (loss)
888,166
(157,265
)
Net increase (decrease) in net assets resulting from operations
1,154,630
(186,319
)
Distributions to shareholders:
From net investment income
Class A Shares(a)
(71
)
—
Institutional Shares(a)
(84,675
)
—
Service Shares(a)
(67
)
—
Class IR Shares(a)
(80
)
—
Class R Shares(a)
(62
)
—
Class R6 Shares
(85
)
—
From net realized gains
Class A Shares(a)
—
—
Institutional Shares(a)
—
—
Service Shares(a)
—
—
Class IR Shares(a)
—
—
Class R Shares(a)
—
—
Class R6 Shares
—
—
Total distributions to shareholders
(85,040
)
—
From share transactions:
Proceeds from sales of shares
180,035
10,000,066
Reinvestment of distributions
85,040
—
Cost of shares redeemed
(90
)
(65
)
Net increase (decrease) in net assets resulting from share transactions
264,985
10,000,001
TOTAL INCREASE (DECREASE)
1,334,575
9,813,682
Net assets:
Beginning of year
9,813,682
—
End of year
$
11,148,257
$
9,813,682
Undistributed net investment income
$
91,530
$
27,791
*
The Portfolios changed their fiscal year end from October 31 to August 31.
(a)
Commenced operations on August 22, 2016.
54
The accompanying notes are an integral part of these financial statements.
GOLDMAN SACHS TARGET DATE PORTFOLIOS
Target Date 2040 Portfolio
Target Date 2045 Portfolio
For the Period November 1, 2016 – August 31, 2017*
For the Fiscal Year Ended October 31, 2016
For the Fiscal Year Ended October 31, 2015
For the Period November 1, 2016 – August 31, 2017*
For the Period Ended October 31, 2016(a)
$
718,594
$
983,035
$
839,055
$
149,139
$
27,097
5,848,943
2,200,742
1,997,182
175,421
(57,327
)
(625,537
)
(1,495,190
)
(1,252,918
)
1,006,023
(164,304
)
5,942,000
1,688,587
1,583,319
1,330,583
(194,534
)
(256
)
—
—
(73
)
—
(211
)
—
—
(87,162
)
—
(193
)
—
—
(70
)
—
(206
)
—
—
(82
)
—
(188
)
—
—
(65
)
—
(1,022,650
)
(839,070
)
(588,549
)
(88
)
—
(571
)
—
—
—
—
(442
)
—
—
—
—
(443
)
—
—
—
—
(442
)
—
—
—
—
(442
)
—
—
—
—
(2,134,309
)
(2,209,026
)
(1,513,221
)
—
(3,160,353
)
(3,048,096
)
(2,101,770
)
(87,540
)
—
2,044,481
1,187,738
1,322,699
251,712
10,000,066
3,160,353
3,048,096
2,101,769
87,540
—
(6,283,037
)
(5,514,019
)
(11,779,177
)
(75,493
)
(65
)
(1,078,203
)
(1,278,185
)
(8,354,709
)
263,759
10,000,001
1,703,444
(2,637,694
)
(8,873,160
)
1,506,802
9,805,467
47,391,720
50,029,414
58,902,574
9,805,467
—
$
49,095,164
$
47,391,720
$
50,029,414
$
11,312,269
$
9,805,467
$
436,364
$
738,785
$
522,865
$
90,473
$
27,605
The accompanying notes are an integral part of these financial statements.
55
GOLDMAN SACHS TARGET DATE PORTFOLIOS
Statements of Changes in Net Assets (continued)
Target Date 2050 Portfolio
For the Period November 1, 2016 – August 31, 2017*
For the Fiscal Year Ended October 31, 2016
For the Fiscal Year Ended October 31, 2015
From operations:
Net investment income
$
350,541
$
446,501
$
326,330
Net realized gain (loss)
1,845,973
844,921
416,075
Net change in unrealized gain (loss)
1,087,414
(529,507
)
(90,904
)
Net increase (decrease) in net assets resulting from operations
3,283,928
761,915
651,501
Distributions to shareholders:
From net investment income
Class A Shares(a)
(196
)
—
—
Institutional Shares(a)
(210
)
—
—
Service Shares(a)
(192
)
—
—
Class IR Shares(a)
(205
)
—
—
Class R Shares(a)
(187
)
—
—
Class R6 Shares
(470,084
)
(348,249
)
(227,101
)
From net realized gains
Class A Shares(a)
(404
)
—
—
Institutional Shares(a)
(404
)
—
—
Service Shares(a)
(404
)
—
—
Class IR Shares(a)
(404
)
—
—
Class R Shares(a)
(404
)
—
—
Class R6 Shares
(892,169
)
(629,298
)
(463,433
)
Total distributions to shareholders
(1,365,263
)
(977,547
)
(690,534
)
From share transactions:
Proceeds from sales of shares
3,007,855
1,728,932
2,060,597
Reinvestment of distributions
1,365,263
977,547
690,534
Cost of shares redeemed
(1,604,503
)
(1,267,315
)
(3,495,489
)
Net increase (decrease) in net assets resulting from share transactions
2,768,615
1,439,164
(744,358
)
TOTAL INCREASE (DECREASE)
4,687,280
1,223,532
(783,391
)
Net assets:
Beginning of year
21,705,705
20,482,173
21,265,564
End of year
$
26,392,985
$
21,705,705
$
20,482,173
Undistributed net investment income
$
214,585
$
333,260
$
199,102
*
The Portfolios changed their fiscal year end from October 31 to August 31.
(a)
Commenced operations on August 22, 2016.
56
The accompanying notes are an integral part of these financial statements.
GOLDMAN SACHS TARGET DATE PORTFOLIOS
Target Date 2055 Portfolio
For the Period November 1, 2016 – August 31, 2017*
For the Period Ended October 31, 2016(a)
$
151,195
$
26,977
224,897
(64,343
)
1,129,809
(165,180
)
1,505,901
(202,546
)
(98
)
—
(91,043
)
—
(74
)
—
(86
)
—
(69
)
—
(92
)
—
—
—
—
—
—
—
—
—
—
—
—
—
(91,462
)
—
176,911
10,000,066
91,462
—
(53
)
(65
)
268,320
10,000,001
1,682,759
9,797,455
9,797,455
—
$
11,480,214
$
9,797,455
$
88,669
$
27,485
The accompanying notes are an integral part of these financial statements.
57
GOLDMAN SACHS TARGET DATE 2020 PORTFOLIO
Financial Highlights
Selected Data for a Share Outstanding Throughout Each Year
From Investment operations
Distributions to shareholders
Year - Share Class
Net asset value, beginning of year
Net investment income(a)
Net and unrealized gain (loss)
Total from investment operations
From net investment income
From net realized gains
Total distributions
FOR THE PERIOD NOVEMBER 1, 2016 – AUGUST 31,*
2017 - A
$
9.90
$
0.10
$
0.47
$
0.57
$
(0.16
)
$
(0.38
)
$
(0.54
)
2017 - Institutional
9.91
0.13
0.48
0.61
(0.18
)
(0.38
)
(0.56
)
2017 - Service
9.90
0.09
0.48
0.57
(0.16
)
(0.38
)
(0.54
)
2017 - IR
9.91
0.09
0.50
0.59
(0.17
)
(0.38
)
(0.55
)
2017 - R
9.90
0.08
0.47
0.55
(0.15
)
(0.38
)
(0.53
)
2017 - R6
9.91
0.14
0.47
0.61
(0.18
)
(0.38
)
(0.56
)
FOR THE FISCAL YEARS ENDED OCTOBER 31,
2016 - A (Commenced August 22, 2016)
10.05
0.02
(0.17
)
(0.15
)
—
—
—
2016 - Institutional (Commenced August 22, 2016)
10.05
0.03
(0.17
)
(0.14
)
—
—
—
2016 - Service (Commenced August 22, 2016)
10.05
0.02
(0.17
)
(0.15
)
—
—
—
2016 - IR (Commenced August 22, 2016)
10.05
0.02
(0.16
)
(0.14
)
—
—
—
2016 - R (Commenced August 22, 2016)
10.05
0.01
(0.16
)
(0.15
)
—
—
—
2016 - R6
10.07
0.18
0.16
0.34
(0.17
)
(0.33
)
(0.50
)
2015 - R6
10.00
0.16
0.10
0.26
(0.09
)
(0.10
)
(0.19
)
FOR THE PERIOD ENDED OCTOBER 31,
2014 - R6 (Commenced August 29, 2014)
10.00
0.03
(0.03
)
—
—
—
—
*
The Portfolio changed its fiscal year end from October 31 to August 31.
(a)
Calculated based on the average shares outstanding methodology.
(b)
Assumes investment at the NAV at the beginning of the period, reinvestment of all dividends and distributions, a complete redemption of the investment at the NAV at the end of the period and no sales or redemption charges. Total returns would be reduced if a sales or redemption charge was taken into account. Returns do not reflect the impact of taxes to shareholders relating to Portfolio distributions or the redemption of Portfolio shares. Total returns for periods less than one full year are not annualized. The Goldman Sachs Target Date 2020 Portfolio’s predecessor was the Madison Target Retirement 2020 Fund (the “Predecessor Fund”,). On August 22, 2016, the Predecessor Fund was reorganized as a new series of Goldman Sachs Trust II. Performance prior to August 22, 2016 is that of the Predecessor Fund. Total return information of the Predecessor Fund is included in the above table because the Predecessor Fund is considered the accounting survivor of the reorganization.
(c)
The Portfolio’s turnover rate is calculated in accordance with regulatory requirements, without regard to transactions involving short term investments. If such transactions were included, the Portfolio’s turnover rate may be higher.
(d)
Annualized.
58
The accompanying notes are an integral part of these financial statements.
GOLDMAN SACHS TARGET DATE 2020 PORTFOLIO
Net asset value, end of year
Total return(b)
Net assets, end of year (in 000s)
Ratio of net expenses to average net assets
Ratio of total expenses to average net assets
Ratio of net investment income to average net assets
Portfolio turnover rate(c)
$
9.93
6.06
%
$
16
0.72
%(d)
1.26
%(d)
1.21
%(d)
189
%
9.96
6.42
10
0.32
(d)
0.96
(d)
1.66
(d)
189
9.93
6.02
10
0.82
(d)
1.46
(d)
1.16
(d)
189
9.95
6.26
323
0.46
(d)
1.07
(d)
1.08
(d)
189
9.92
5.86
10
0.97
(d)
1.61
(d)
1.01
(d)
189
9.96
6.42
47,589
0.30
(d)
0.94
(d)
1.69
(d)
189
9.90
(1.49
)
10
0.74
(d)
3.01
(d)
0.94
(d)
204
9.91
(1.39
)
10
0.34
(d)
2.61
(d)
1.34
(d)
204
9.90
(1.49
)
10
0.84
(d)
3.11
(d)
0.84
(d)
204
9.91
(1.39
)
10
0.48
(d)
2.75
(d)
1.19
(d)
204
9.90
(1.49
)
10
0.98
(d)
3.25
(d)
0.69
(d)
204
9.91
3.65
53,671
0.31
0.76
1.79
204
10.07
2.61
53,619
0.30
0.30
1.46
207
10.00
—
61,964
0.32
(d)
0.32
(d)
1.82
(d)
48
The accompanying notes are an integral part of these financial statements.
59
GOLDMAN SACHS TARGET DATE 2025 PORTFOLIO
Financial Highlights
Selected Data for a Share Outstanding Throughout Each Year
From Investment operations
Year - Share Class
Net asset value, beginning of year
Net investment income(a)
Net realized and unrealized gain (loss)
Total from investment operations
Distributions to shareholders from net investment income
FOR THE PERIOD NOVEMBER 1, 2016 - AUGUST 31,*
2017 - A
$
9.82
$
0.12
$
0.75
$
0.87
$
(0.08
)
2017 - Institutional
9.83
0.14
0.76
0.90
(0.08
)
2017 - Service
9.82
0.10
0.76
0.86
(0.06
)
2017 - IR
9.83
0.12
0.76
0.88
(0.07
)
2017 - R
9.82
0.09
0.76
0.85
(0.06
)
2017 - R6
9.83
0.14
0.76
0.90
(0.08
)
FOR THE PERIOD ENDED OCTOBER 31 ,
2016 - A (Commenced August 22, 2016)
10.00
0.02
(0.20
)
(0.18
)
—
2016 - Institutional (Commenced August 22, 2016)
10.00
0.03
(0.20
)
(0.17
)
—
2016 - Service (Commenced August 22, 2016)
10.00
0.02
(0.20
)
(0.18
)
—
2016 - IR (Commenced August 22, 2016)
10.00
0.02
(0.19
)
(0.17
)
—
2016 - R (Commenced August 22, 2016)
10.00
0.01
(0.19
)
(0.18
)
—
2016 - R6 (Commenced August 22, 2016)
10.00
0.03
(0.20
)
(0.17
)
—
*
The Portfolio changed its fiscal year end from October 31 to August 31.
(a)
Calculated based on the average shares outstanding methodology.
(b)
Assumes investment at the NAV at the beginning of the year, reinvestment of all dividends and distributions, a complete redemption of the investment at the NAV at the end of the year and no sales or redemption charges. Total returns would be reduced if a sales or redemption charge was taken into account. Returns do not reflect the impact of taxes to shareholders relating to Portfolio distributions or the redemption of Portfolio shares. Total returns for periods less than one full year are not annualized.
(c)
Annualized.
(d)
The Portfolio’s turnover rate is calculated in accordance with regulatory requirements, without regard to transactions involving short term investments. If such transactions were included, the Portfolio’s turnover rate may be higher.
60
The accompanying notes are an integral part of these financial statements.
GOLDMAN SACHS TARGET DATE 2025 PORTFOLIO
Net asset value, end of year
Total return(b)
Net assets, end of year (in 000s)
Ratio of net expenses to average net assets(c)
Ratio of total expenses to average net assets(c)
Ratio of net investment income to average net assets(c)
Portfolio turnover rate(d)
$
10.61
8.77
%
$
75
0.71
%
4.54
%
1.39
%
167
%
10.65
9.22
10,687
0.32
3.92
1.69
167
10.62
8.83
11
0.81
4.40
1.20
167
10.64
9.06
35
0.46
5.20
1.37
167
10.61
8.67
11
0.95
4.54
1.06
167
10.65
9.22
11
0.31
3.95
1.69
167
9.82
(1.70
)
10
0.75
4.23
1.01
33
9.83
(1.70
)
9,783
0.34
3.85
1.42
33
9.82
(1.80
)
10
0.84
4.32
0.91
33
9.83
(1.70
)
10
0.49
3.97
1.27
33
9.82
(1.80
)
10
0.99
4.47
0.77
33
9.83
(1.70
)
10
0.33
3.92
1.43
33
The accompanying notes are an integral part of these financial statements.
61
GOLDMAN SACHS TARGET DATE 2030 PORTFOLIO
Financial Highlights
Selected Data for a Share Outstanding Throughout Each Year
From Investment operations
Distributions to shareholders
Year - Share Class
Net asset value, beginning of year
Net investment income(a)
Net realized and unrealized gain (loss)
Total from investment operations
From net investment income
From net realized gains
Total distributions
FOR THE PERIOD NOVEMBER 1, 2016 – AUGUST 31,*
2017 - A
$
9.74
$
0.08
$
0.90
$
0.98
$
(0.18
)
$
(0.32
)
$
(0.50
)
2017 - Institutional
9.75
0.14
0.88
1.02
(0.19
)
(0.32
)
(0.51
)
2017 - Service
9.74
0.10
0.88
0.98
(0.17
)
(0.32
)
(0.49
)
2017 - IR
9.75
0.11
0.90
1.01
(0.19
)
(0.32
)
(0.51
)
2017 - R
9.74
0.09
0.88
0.97
(0.17
)
(0.32
)
(0.49
)
2017 - R6
9.75
0.14
0.88
1.02
(0.19
)
(0.32
)
(0.51
)
FOR THE FISCAL YEARS ENDED OCTOBER 31,
2016 - A (Commenced August 22, 2016)
9.93
0.02
(0.21
)
(0.19
)
—
—
—
2016 - Institutional (Commenced August 22, 2016)
9.93
0.03
(0.21
)
(0.18
)
—
—
—
2016 - Service (Commenced August 22, 2016)
9.93
0.02
(0.21
)
(0.19
)
—
—
—
2016 - IR (Commenced August 22, 2016)
9.93
0.02
(0.20
)
(0.18
)
—
—
—
2016 - R (Commenced August 22, 2016)
9.93
0.02
(0.21
)
(0.19
)
—
—
—
2016 - R6
9.97
0.19
0.11
0.30
(0.17
)
(0.35
)
(0.52
)
2015 - R6
9.99
0.15
0.12
0.27
(0.09
)
(0.20
)
(0.29
)
FOR THE PERIOD ENDED OCTOBER 31,
2014 - R6 (Commenced August 29, 2014)
10.00
0.03
(0.04
)
(0.01
)
—
—
—
*
The Portfolio changed its fiscal year end from October 31 to August 31.
(a)
Calculated based on the average shares outstanding methodology.
(b)
Assumes investment at the net asset value at the beginning of the year, reinvestment of all dividends and distributions, a complete redemption of the investment at the net asset value at the end of the year and no sales or redemption charges. Total returns would be reduced if a sales or redemption charge was taken into account. Returns do not reflect the impact of taxes to shareholders relating to Portfolio distributions or the redemption of Portfolio shares. Total returns for periods less than one full year are not annualized. The Goldman Sachs Target Date 2030 Portfolio’s predecessor was the Madison Target Retirement 2030 Fund (the “Predecessor Fund”). On August 22, 2016, the Predecessor Fund was reorganized as a new series of Goldman Sachs Trust II. Performance prior to August 22, 2016 is that of the Predecessor Fund. Total return information of the Predecessor Fund is included in the above table because the Predecessor Fund is considered the accounting survivor of the reorganization.
(c)
The Portfolio’s turnover rate is calculated in accordance with regulatory requirements, without regard to transactions involving short term investments. If such transactions were included, the Portfolio’s turnover rate may be higher.
(d)
Annualized.
62
The accompanying notes are an integral part of these financial statements.
GOLDMAN SACHS TARGET DATE 2030 PORTFOLIO
Net asset value, end of year
Total return(b)
Net assets, end of year (in 000s)
Ratio of net expenses to average net assets
Ratio of total expenses to average net assets
Ratio of net investment income to average net assets
Portfolio turnover rate(c)
$
10.22
10.47
%
$
205
0.72
%(d)
0.99
%(d)
0.99
%(d)
143
%
10.26
10.87
11
0.31
(d)
0.75
(d)
1.69
(d)
143
10.23
10.47
11
0.82
(d)
1.26
(d)
1.19
(d)
143
10.25
10.71
625
0.46
(d)
0.82
(d)
1.30
(d)
143
10.22
10.30
23
0.97
(d)
1.28
(d)
1.04
(d)
143
10.26
10.88
75,061
0.30
(d)
0.76
(d)
1.72
(d)
143
9.74
(1.91
)
10
0.74
(d)
2.33
(d)
1.01
(d)
176
9.75
(1.81
)
10
0.34
(d)
1.93
(d)
1.41
(d)
176
9.74
(1.91
)
10
0.83
(d)
2.43
(d)
0.92
(d)
176
9.75
(1.81
)
10
0.48
(d)
2.08
(d)
1.27
(d)
176
9.74
(1.91
)
10
0.98
(d)
2.57
(d)
0.77
(d)
176
9.75
3.23
74,224
0.31
0.62
1.91
176
9.97
2.76
79,007
0.30
0.30
1.49
156
9.99
(0.10
)
82,852
0.32
(d)
0.32
(d)
1.87
(d)
44
The accompanying notes are an integral part of these financial statements.
63
GOLDMAN SACHS TARGET DATE 2035 PORTFOLIO
Financial Highlights
Selected Data for a Share Outstanding Throughout Each Year
From
Investment operations
Distributions
Net asset
to shareholders
value,
Net
Net realized
Total from
from net
beginning
investment
and unrealized
investment
investment
Year - Share Class
of year
income(a)
gain (loss)
operations
income
FOR THE PERIOD NOVEMBER 1, 2016 – AUGUST 31,*
2017 - A
$
9.81
$
0.10
$
1.01
$
1.11
$
(0.07
)
2017 - Institutional
9.81
0.15
1.00
1.15
(0.09
)
2017 - Service
9.80
0.10
1.01
1.11
(0.07
)
2017 - IR
9.81
0.08
1.05
1.13
(0.08
)
2017 - R
9.80
0.09
1.00
1.09
(0.06
)
2017 - R6
9.81
0.14
1.01
1.15
(0.09
)
FOR THE PERIOD ENDED OCTOBER 31,
2016 - A (Commenced August 22, 2016)
10.00
0.02
(0.21
)
(0.19
)
—
2016 - Institutional (Commenced August 22, 2016)
10.00
0.03
(0.22
)
(0.19
)
—
2016 - Service (Commenced August 22, 2016)
10.00
0.02
(0.22
)
(0.20
)
—
2016 - IR (Commenced August 22, 2016)
10.00
0.02
(0.21
)
(0.19
)
—
2016 - R (Commenced August 22, 2016)
10.00
0.02
(0.22
)
(0.20
)
—
2016 - R6 (Commenced August 22, 2016)
10.00
0.03
(0.22
)
(0.19
)
—
*
The Portfolio changed its fiscal year end from October 31 to August 31.
(a)
Calculated based on the average shares outstanding methodology.
(b)
Assumes investment at the NAV at the beginning of the year, reinvestment of all dividends and distributions, a complete redemption of the investment at the NAV at the end of the year and no sales or redemption charges. Total returns would be reduced if a sales or redemption charge was taken into account. Returns do not reflect the impact of taxes to shareholders relating to Portfolio distributions or the redemption of Portfolio shares. Total returns for periods less than one full year are not annualized.
(c)
Annualized.
(d)
The Portfolio’s turnover rate is calculated in accordance with regulatory requirements, without regard to transactions involving short term investments. If such transactions were included, the Portfolio’s turnover rate may be higher.
64
The accompanying notes are an integral part of these financial statements.
GOLDMAN SACHS TARGET DATE 2035 PORTFOLIO
Ratio of
Net assets,
Ratio of
Ratio of
net investment
Net asset
end of
net expenses
total expenses
income
Portfolio
value, end
Total
year
to average
to average
to average
turnover
of year
return(b)
(in 000s)
net assets(c)
net assets(c)
net assets(c)
rate(d)
$
10.85
11.39
%
$
29
0.71
%
4.28
%
1.11
%
137
%
10.87
11.75
10,911
0.32
3.86
1.69
137
10.84
11.36
11
0.81
4.34
1.20
137
10.86
11.59
152
0.45
7.23
0.89
137
10.83
11.20
11
0.98
4.50
1.04
137
10.87
11.75
35
0.30
4.22
1.64
137
9.81
(1.90
)
10
0.75
4.23
1.03
29
9.81
(1.90
)
9,765
0.34
3.85
1.44
29
9.80
(2.00
)
10
0.84
4.33
0.94
29
9.81
(1.90
)
10
0.49
3.97
1.29
29
9.80
(2.00
)
10
0.99
4.47
0.79
29
9.81
(1.90
)
10
0.32
3.93
1.46
29
The accompanying notes are an integral part of these financial statements.
65
GOLDMAN SACHS TARGET DATE 2040 PORTFOLIO
Financial Highlights
Selected Data for a Share Outstanding Throughout Each Year
From
Distributions
Investment operations
to shareholders
Net asset
value,
Net
Net realized
Total from
From net
From net
beginning
investment
and unrealized
investment
investment
realized
Total
Year - Share Class
of year
income(a)
gain (loss)
operations
income
gains
distributions
FOR THE PERIOD NOVEMBER 1, 2016 – AUGUST 31,*
2017 - A
$
9.58
$
0.10
$
1.03
$
1.13
$
(0.19
)
$
(0.43
)
$
(0.62
)
2017 - Institutional
9.58
0.14
1.03
1.17
(0.20
)
(0.43
)
(0.63
)
2017 - Service
9.58
0.10
1.01
1.11
(0.18
)
(0.43
)
(0.61
)
2017 - IR
9.58
0.09
1.06
1.15
(0.19
)
(0.43
)
(0.62
)
2017 - R
9.57
0.09
1.02
1.11
(0.18
)
(0.43
)
(0.61
)
2017 - R6
9.59
0.14
1.02
1.16
(0.20
)
(0.43
)
(0.63
)
FOR THE FISCAL YEARS ENDED OCTOBER 31,
2016 - A (Commenced August 22, 2016)
9.77
0.02
(0.21
)
(0.19
)
—
—
—
2016 - Institutional (Commenced August 22, 2016)
9.77
0.03
(0.22
)
(0.19
)
—
—
—
2016 - Service (Commenced August 22, 2016)
9.77
0.02
(0.21
)
(0.19
)
—
—
—
2016 - IR (Commenced August 22, 2016)
9.77
0.02
(0.21
)
(0.19
)
—
—
—
2016 - R (Commenced August 22, 2016)
9.77
0.01
(0.21
)
(0.20
)
—
—
—
2016 - R6
9.90
0.19
0.11
0.30
(0.17
)
(0.44
)
(0.61
)
2015 - R6
9.98
0.15
0.13
0.28
(0.10
)
(0.26
)
(0.36
)
FOR THE PERIOD ENDED OCTOBER 31,
2014 - R6 (Commenced August 29, 2014)
10.00
0.03
(0.05
)
(0.02
)
—
—
—
*
The Portfolio changed its fiscal year end from October 31 to August 31.
(a)
Calculated based on the average shares outstanding methodology.
(b)
Assumes investment at the net asset value at the beginning of the year, reinvestment of all dividends and distributions, a complete redemption of the investment at the net asset value at the end of the year and no sales or redemption charges. Total returns would be reduced if a sales or redemption charge was taken into account. Returns do not reflect the impact of taxes to shareholders relating to Portfolio distributions or the redemption of Portfolio shares. Total returns for periods less than one full year are not annualized. The Goldman Sachs Target Date 2040 Portfolio’s predecessor was the Madison Target Retirement 2040 Fund (the “Predecessor Fund”). On August 22, 2016, the Predecessor Fund was reorganized as a new series of Goldman Sachs Trust II. Performance prior to August 22, 2016 is that of the Predecessor Fund. Total return information of the Predecessor Fund is included in the above table because the Predecessor Fund is considered the accounting survivor of the reorganization.
(c)
The Portfolio’s turnover rate is calculated in accordance with regulatory requirements, without regard to transactions involving short term investments. If such transactions were included, the Portfolio’s turnover rate may be higher.
(d)
Annualized.
66
The accompanying notes are an integral part of these financial statements.
GOLDMAN SACHS TARGET DATE 2040 PORTFOLIO
Ratio of
Net assets,
Ratio of
Ratio of
net investment
Net asset
end of
net expenses
total expenses
income
Portfolio
value, end
Total
year
to average
to average
to average
turnover
of year
return(b)
(in 000s)
net assets
net assets
net assets
rate(c)
$
10.09
12.37
%
$
13
0.73
%(d)
1.41
%(d)
1.27
%(d)
142
%
10.12
12.85
11
0.32
(d)
0.98
(d)
1.70
(d)
142
10.08
12.21
11
0.82
(d)
1.48
(d)
1.20
(d)
142
10.11
12.68
130
0.46
(d)
0.98
(d)
1.11
(d)
142
10.07
12.16
24
0.97
(d)
1.42
(d)
1.05
(d)
142
10.12
12.73
48,905
0.30
(d)
0.98
(d)
1.73
(d)
142
9.58
(1.94
)
13
0.74
(d)
3.23
(d)
0.98
(d)
174
9.58
(1.94
)
10
0.34
(d)
2.82
(d)
1.41
(d)
174
9.58
(1.94
)
10
0.83
(d)
3.31
(d)
0.92
(d)
174
9.58
(1.94
)
10
0.48
(d)
2.96
(d)
1.27
(d)
174
9.57
(2.05
)
10
0.98
(d)
3.46
(d)
0.77
(d)
174
9.59
3.33
47,340
0.31
0.80
1.97
174
9.90
2.86
50,029
0.30
0.30
1.50
160
9.98
(0.20
)
58,903
0.32
(d)
0.32
(d)
1.84
(d)
46
The accompanying notes are an integral part of these financial statements.
67
GOLDMAN SACHS TARGET DATE 2045 PORTFOLIO
Financial Highlights
Selected Data for a Share Outstanding Throughout Each Year
From
Investment operations
Distributions
Net asset
to shareholders
value,
Net
Net realized
Total from
from net
beginning
investment
and unrealized
investment
investment
Year - Share Class
of year
income(a)
gain (loss)
operations
income
FOR THE PERIOD NOVEMBER 1, 2016 – AUGUST 31,*
2017 - A
$
9.80
$
0.08
$
1.20
$
1.28
$
(0.07
)
2017 - Institutional
9.81
0.15
1.17
1.32
(0.09
)
2017 - Service
9.80
0.10
1.17
1.27
(0.07
)
2017 - IR
9.80
0.10
1.21
1.31
(0.08
)
2017 - R
9.79
0.09
1.17
1.26
(0.06
)
2017 - R6
9.81
0.15
1.17
1.32
(0.09
)
FOR THE PERIOD ENDED OCTOBER 31,
2016 - A (Commenced August 22, 2016)
10.00
0.02
(0.22
)
(0.20
)
—
2016 - Institutional (Commenced August 22, 2016)
10.00
0.03
(0.22
)
(0.19
)
—
2016 - Service (Commenced August 22, 2016)
10.00
0.02
(0.22
)
(0.20
)
—
2016 - IR (Commenced August 22, 2016)
10.00
0.02
(0.22
)
(0.20
)
—
2016 - R (Commenced August 22, 2016)
10.00
0.01
(0.22
)
(0.21
)
—
2016 - R6 (Commenced August 22, 2016)
10.00
0.03
(0.22
)
(0.19
)
—
*
The Portfolio changed its fiscal year end from October 31 to August 31.
(a)
Calculated based on the average shares outstanding methodology.
(b)
Assumes investment at the NAV at the beginning of the year, reinvestment of all dividends and distributions, a complete redemption of the investment at the NAV at the end of the year and no sales or redemption charges. Total returns would be reduced if a sales or redemption charge was taken into account. Returns do not reflect the impact of taxes to shareholders relating to Portfolio distributions or the redemption of Portfolio shares. Total returns for periods less than one full year are not annualized.
(c)
Annualized.
(d)
The Portfolio’s turnover rate is calculated in accordance with regulatory requirements, without regard to transactions involving short term investments. If such transactions were included, the Portfolio’s turnover rate may be higher.
68
The accompanying notes are an integral part of these financial statements.
GOLDMAN SACHS TARGET DATE 2045 PORTFOLIO
Ratio of
Net assets,
Ratio of
Ratio of
net investment
Net asset
end of
net expenses
total expenses
income
Portfolio
value, end
Total
year
to average
to average
to average
turnover
of year
return(b)
(in 000s)
net assets(c)
net assets(c)
net assets(c)
rate(d)
$
11.01
13.17
%
$
84
0.71
%
5.43
%
0.90
%
143
%
11.04
13.52
11,077
0.32
3.82
1.69
143
11.00
13.03
11
0.81
4.30
1.20
143
11.03
13.48
97
0.46
6.16
1.13
143
10.99
12.98
29
0.95
4.63
1.07
143
11.04
13.64
14
0.31
4.00
1.68
143
9.80
(2.00
)
10
0.75
4.23
1.02
29
9.81
(1.90
)
9,756
0.34
3.85
1.43
29
9.80
(2.00
)
10
0.84
4.33
0.93
29
9.80
(2.00
)
10
0.49
3.97
1.28
29
9.79
(2.10
)
10
0.99
4.48
0.78
29
9.81
(2.00
)
10
0.32
3.93
1.45
29
The accompanying notes are an integral part of these financial statements.
69
GOLDMAN SACHS TARGET DATE 2050 PORTFOLIO
Financial Highlights
Selected Data for a Share Outstanding Throughout Each Year
From
Distributions
Investment operations
to shareholders
Net asset
value,
Net
Net realized
Total from
From net
From net
beginning
investment
and unrealized
investment
investment
realized
Total
Year - Share Class
of year
income(a)
gain (loss)
operations
income
gains
distributions
FOR THE PERIOD NOVEMBER 1, 2016 – AUGUST 31,*
2017 - A
$
9.80
$
0.12
$
1.21
$
1.33
$
(0.19
)
$
(0.40
)
$
(0.59
)
2017 - Institutional
9.80
0.14
1.22
1.36
(0.20
)
(0.40
)
(0.60
)
2017 - Service
9.79
0.10
1.22
1.32
(0.18
)
(0.40
)
(0.58
)
2017 - IR
9.80
0.11
1.24
1.35
(0.20
)
(0.40
)
(0.60
)
2017 - R
9.79
0.09
1.22
1.31
(0.18
)
(0.40
)
(0.58
)
2017 - R6
9.80
0.14
1.22
1.36
(0.20
)
(0.40
)
(0.60
)
FOR THE FISCAL YEARS ENDED OCTOBER 31,
2016 - A (Commenced August 22, 2016)
10.00
0.02
(0.22
)
(0.20
)
—
—
—
2016 - Institutional (Commenced August 22, 2016)
10.00
0.03
(0.23
)
(0.20
)
—
—
—
2016 - Service (Commenced August 22, 2016)
10.00
0.02
(0.23
)
(0.21
)
—
—
—
2016 - IR (Commenced August 22, 2016)
10.00
0.02
(0.22
)
(0.20
)
—
—
—
2016 - R (Commenced August 22, 2016)
10.00
0.02
(0.23
)
(0.21
)
—
—
—
2016 - R6
9.95
0.20
0.11
0.31
(0.16
)
(0.30
)
(0.46
)
2015 - R6
9.98
0.15
0.13
0.28
(0.10
)
(0.21
)
(0.31
)
FOR THE PERIOD ENDED OCTOBER 31,
2014 - R6 (Commenced August 29, 2014)
10.00
0.03
(0.05
)
(0.02
)
—
—
—
*
The Portfolio changed its fiscal year end from October 31 to August 31.
(a)
Calculated based on the average shares outstanding methodology.
(b)
Assumes investment at the net asset value at the beginning of the year, reinvestment of all dividends and distributions, a complete redemption of the investment at the net asset value at the end of the year and no sales or redemption charges. Total returns would be reduced if a sales or redemption charge was taken into account. Returns do not reflect the impact of taxes to shareholders relating to Portfolio distributions or the redemption of Portfolio shares. Total returns for periods less than one full year are not annualized. The Goldman Sachs Target Date 2050 Portfolio’s predecessor was the Madison Target Retirement 2050 Fund (the “Predecessor Fund”). On August 22, 2016, the Predecessor Fund was reorganized as a new series of Goldman Sachs Trust II. Performance prior to August 22, 2016 is that of the Predecessor Fund. Total return information of the Predecessor Fund is included in the above table because the Predecessor Fund is considered the accounting survivor of the reorganization.
(c)
The Portfolio’s turnover rate is calculated in accordance with regulatory requirements, without regard to transactions involving short term investments. If such transactions were included, the Portfolio’s turnover rate may be higher.
(d)
Annualized.
70
The accompanying notes are an integral part of these financial statements.
GOLDMAN SACHS TARGET DATE 2050 PORTFOLIO
Ratio of
Net assets,
Ratio of
Ratio of
net investment
Net asset
end of
net expenses
total expenses
income
Portfolio
value, end
Total
year
to average
to average
to average
turnover
of year
return(b)
(in 000s)
net assets
net assets
net assets
rate(c)
$
10.54
14.21
%
$
49
0.71
%(d)
1.34
%(d)
1.38
%(d)
139
%
10.56
14.58
11
0.32
(d)
1.63
(d)
1.71
(d)
139
10.53
14.18
11
0.82
(d)
2.13
(d)
1.21
(d)
139
10.55
14.42
156
0.47
(d)
1.45
(d)
1.31
(d)
139
10.52
14.02
11
0.98
(d)
2.29
(d)
1.05
(d)
139
10.56
14.59
26,154
0.30
(d)
1.58
(d)
1.71
(d)
139
9.80
(2.00
)
10
0.74
(d)
6.30
(d)
1.04
(d)
191
9.80
(2.00
)
10
0.34
(d)
5.90
(d)
1.44
(d)
191
9.79
(2.10
)
10
0.83
(d)
6.40
(d)
0.95
(d)
191
9.80
(2.00
)
10
0.48
(d)
6.04
(d)
1.30
(d)
191
9.79
(2.10
)
10
0.98
(d)
6.54
(d)
0.80
(d)
191
9.80
3.37
21,657
0.31
1.45
2.07
191
9.95
2.87
20,482
0.30
0.30
1.51
204
9.98
(0.20
)
21,266
0.32
(d)
0.32
(d)
1.72
(d)
52
The accompanying notes are an integral part of these financial statements.
71
GOLDMAN SACHS TARGET DATE 2055 PORTFOLIO
Financial Highlights
Selected Data for a Share Outstanding Throughout Each Year
From
Investment operations
Distributions
Net asset
to shareholders
value,
Net
Net realized
Total from
from net
beginning
investment
and unrealized
investment
investment
Year - Share Class
of year
income(a)
gain (loss)
operations
income
FOR THE PERIOD NOVEMBER 1, 2016 – AUGUST 31,*
2017 - A
$
9.79
$
0.09
$
1.36
$
1.45
$
(0.08
)
2017 - Institutional
9.80
0.15
1.34
1.49
(0.09
)
2017 - Service
9.79
0.11
1.33
1.44
(0.07
)
2017 - IR
9.79
0.07
1.42
1.49
(0.09
)
2017 - R
9.79
0.09
1.34
1.43
(0.07
)
2017 - R6
9.80
0.15
1.34
1.49
(0.09
)
FOR THE PERIOD ENDED OCTOBER 31,
2016 - A (Commenced August 22, 2016)
10.00
0.02
(0.23
)
(0.21
)
—
2016 - Institutional (Commenced August 22, 2016)
10.00
0.03
(0.23
)
(0.20
)
—
2016 - Service (Commenced August 22, 2016)
10.00
0.02
(0.23
)
(0.21
)
—
2016 - IR (Commenced August 22, 2016)
10.00
0.02
(0.23
)
(0.21
)
—
2016 - R (Commenced August 22, 2016)
10.00
0.01
(0.22
)
(0.21
)
—
2016 - R6 (Commenced August 22, 2016)
10.00
0.03
(0.23
)
(0.20
)
—
*
The Portfolio changed its fiscal year end from October 31 to August 31.
(a)
Calculated based on the average shares outstanding methodology.
(b)
Assumes investment at the NAV at the beginning of the year, reinvestment of all dividends and distributions, a complete redemption of the investment at the NAV at the end of the year and no sales or redemption charges. Total returns would be reduced if a sales or redemption charge was taken into account. Returns do not reflect the impact of taxes to shareholders relating to Portfolio distributions or the redemption of Portfolio shares. Total returns for periods less than one full year are not annualized.
(c)
Annualized.
(d)
The Portfolio’s turnover rate is calculated in accordance with regulatory requirements, without regard to transactions involving short term investments. If such transactions were included, the Portfolio’s turnover rate may be higher.
72
The accompanying notes are an integral part of these financial statements.
GOLDMAN SACHS TARGET DATE 2055 PORTFOLIO
Ratio of
Net assets,
Ratio of
Ratio of
net investment
Net asset
end of
net expenses
total expenses
income
Portfolio
value, end
Total
year
to average
to average
to average
turnover
of year
return(b)
(in 000s)
net assets(c)
net assets(c)
net assets(c)
rate(d)
$
11.16
14.90
%
$
87
0.71
%
4.43
%
1.01
%
182
%
11.20
15.32
11,242
0.32
3.78
1.70
182
11.16
14.83
11
0.81
4.26
1.20
182
11.19
15.16
101
0.46
6.85
0.77
182
11.15
14.66
11
0.97
4.42
1.05
182
11.20
15.32
27
0.29
3.99
1.68
182
9.79
(2.10
)
10
0.75
4.23
1.02
34
9.80
(2.00
)
9,748
0.34
3.85
1.43
34
9.79
(2.10
)
10
0.84
4.33
0.92
34
9.79
(2.00
)
10
0.49
3.97
1.28
34
9.79
(2.10
)
10
0.99
4.48
0.77
34
9.80
(2.00
)
10
0.32
3.92
1.45
34
The accompanying notes are an integral part of these financial statements.
73
GOLDMAN SACHS TARGET DATE PORTFOLIOS
Notes to Financial Statements
August 31, 2017
1. ORGANIZATION
Goldman Sachs Trust II (the “Trust”) is a Delaware statutory trust registered under the Investment Company Act of 1940, as amended (the “Act”), as an open-end management investment company. The following table lists those series of the Trust that are included in this report (collectively, the “Portfolios” or individually a “Portfolio”), along with their corresponding share classes and respective diversification status under the Act. Effective August 1, the Portfolios’ fiscal year end changed from October 31 to August 31.
Diversified/
Portfolio
Share Classes Offered
Non-diversified
All Portfolios
A, Institutional, Service, IR*, R, R6
Diversified
* Effective October 10, 2017, Class IR Shares were designated as Investor Shares.
Class A Shares are sold with a front-end sales charge of up to 5.50%. Institutional, Service, Class IR, Class R and Class R6 Shares are not subject to a sales charge.
Goldman Sachs Asset Management, L.P. (“GSAM”), an affiliate of Goldman Sachs & Co. LLC (formerly, Goldman, Sachs & Co.) (“Goldman Sachs”), serves as investment adviser to the Portfolios pursuant to a management agreement (the “Agreement”) with the Trust. Madison Asset Management, LLC, (the “Sub-Adviser”) serves as the subadviser to the Portfolios.
GSAM compensates the Sub-Adviser directly in accordance with the terms of the Sub-Advisory Agreement. The Portfolios are not charged any separate or additional investment advisory fees by the Sub-Adviser.
2. SIGNIFICANT ACCOUNTING POLICIES
The financial statements have been prepared in accordance with accounting principles generally accepted in the United States of America (“GAAP”) and require management to make estimates and assumptions that may affect the reported amounts and disclosures. Actual results may differ from those estimates and assumptions.
A. Investment Valuation — The Portfolios’ valuation policy is to value investments at fair value.
B. Investment Income and Investments — Investment income includes interest income, dividend income, and securities lending income. Interest income is accrued daily and adjusted for amortization of premiums and accretion of discounts. Dividend income is recognized on ex-dividend date or, for certain foreign securities, as soon as such information is obtained subsequent to the ex-dividend date. Investment transactions are reflected on trade date. Realized gains and losses are calculated using identified cost. Investment transactions are recorded on the following business day for daily net asset value (“NAV”) calculations. Investment income is recorded net of any foreign withholding taxes, less any amounts reclaimable. The Portfolios may file withholding tax reclaims in certain jurisdictions to recover a portion of amounts previously withheld. Any foreign capital gains tax is accrued daily based upon net unrealized gains, and is payable upon sale of such investments. Income distributions are recognized as capital gains or income in the financial statements in accordance with the character that is distributed.
C. Class Allocations and Expenses — Investment income, realized and unrealized gain (loss), if any, and non-class specific expenses of each Portfolio are allocated daily based upon the proportion of net assets of each class. Non-class specific expenses directly incurred by a Portfolio are charged to that Portfolio, while such expenses incurred by the Trust are allocated across the applicable Portfolios on a straight-line and/or pro-rata basis depending upon the nature of the expenses. Class specific expenses, where applicable, are borne by the respective share classes and include Distribution and Service, Transfer Agency and Service and Shareholder Administration fees.
Expenses included in the accompanying financial statements reflect the expenses of each Portfolio and do not include any expenses associated with the Underlying Funds (“Underlying Funds”). Because the Underlying Funds have varied expense and fee levels and the Portfolios may own different proportions of the Underlying Funds at different times, the amount of fees and expenses incurred indirectly by each Portfolio will vary.
D. Offering Costs — Offering costs paid in connection with the initial offering of shares of Target Date 2025, Target Date 2035, Target Date 2045 and Target Date 2055 were amortized on a straight-line basis over 12 months from the date of commencement of operations.
74
GOLDMAN SACHS TARGET DATE PORTFOLIOS
2. SIGNIFICANT ACCOUNTING POLICIES (continued)
E. Federal Taxes and Distributions to Shareholders — It is each Portfolio’s policy to comply with the requirements of the Internal Revenue Code of 1986, as amended (the “Code”), applicable to regulated investment companies (mutual funds) and to distribute each year substantially all of its investment company taxable income and capital gains to its shareholders. Accordingly, the Portfolios are not required to make any provisions for the payment of federal income tax. Distributions to shareholders are recorded on the ex-dividend date. Income and capital gains distributions, if any, are declared and paid annually.
Net capital losses, if any, are carried forward to future fiscal years and may be used to the extent allowed by the Code to offset any future capital gains. Losses that are carried forward will retain their character as either short-term or long-term capital losses. Utilization of capital loss carryforwards will reduce the requirement of future capital gains distributions.
The characterization of distributions to shareholders for financial reporting purposes is determined in accordance with federal income tax rules, which may differ from GAAP. The source of each Portfolio’s distributions may be shown in the accompanying financial statements as either from net investment income, net realized gain or capital. Certain components of the Portfolios’ net assets on the Statements of Assets and Liabilities reflect permanent GAAP/tax differences based on the appropriate tax character.
3. INVESTMENTS AND FAIR VALUE MEASUREMENTS
U.S. GAAP defines the fair value of a financial instrument as the amount that would be received to sell an asset or paid to transfer a liability in an orderly transaction between market participants at the measurement date (i.e., the exit price); the Portfolios’ policy is to use the market approach. GAAP establishes a fair value hierarchy that prioritizes the inputs to valuation techniques used to measure fair value. The hierarchy gives the highest priority to unadjusted quoted prices in active markets for identical assets or liabilities (Level 1 measurements) and the lowest priority to unobservable inputs (Level 3 measurements). The levels used for classifying investments are not necessarily an indication of the risk associated with investing in these investments. The three levels of the fair value hierarchy are described below:
Level 1 — Unadjusted quoted prices in active markets that are accessible at the measurement date for identical, unrestricted assets or liabilities;
Level 2 — Quoted prices in markets that are not active or financial instruments for which significant inputs are observable (including, but not limited to, quoted prices for similar investments, interest rates, foreign exchange rates, volatility and credit spreads), either directly or indirectly;
Level 3 — Prices or valuations that require significant unobservable inputs (including GSAM’s assumptions in determining fair value measurement).
Changes in valuation techniques may result in transfers into or out of an assigned level within the hierarchy. In accordance with the Portfolios’ policy, transfers between different levels of the fair value hierarchy resulting from such changes are deemed to have occurred as of the beginning of the reporting period.
The Board of Trustees (“Trustees”) has approved Valuation Procedures that govern the valuation of the portfolio investments held by the Portfolios, including investments for which market quotations are not readily available. The Trustees have delegated to GSAM day-to-day responsibility for implementing and maintaining internal controls and procedures related to the valuation of the Portfolios’ investments. To assess the continuing appropriateness of pricing sources and methodologies, GSAM regularly performs price verification procedures and issues challenges as necessary to third party pricing vendors or brokers, and any differences are reviewed in accordance with the Valuation Procedures.
A. Level 1 and Level 2 Fair Value Investments — The valuation techniques and significant inputs used in determining the fair values for investments classified as Level 1 and Level 2 are as follows:
Underlying Funds — Underlying Funds include other investment companies and exchange-traded funds (“ETFs”). Investments in the Underlying Funds (except ETFs) are valued at the NAV per share of the Institutional Share class on the day of valuation. ETFs are valued daily at the last sale price or official closing price on the principal exchange or system on which the investment is traded. Because the Portfolios invest in Underlying Funds that fluctuate in value, the Portfolios’ shares will correspondingly fluctuate in value. To the extent these investments are actively traded, they are classified as Level 1 of the fair value hierarchy,
75
GOLDMAN SACHS TARGET DATE PORTFOLIOS
Notes to Financial Statements (continued)
August 31, 2017
3. INVESTMENTS AND FAIR VALUE MEASUREMENTS (continued)
otherwise they are generally classified as Level 2. For information regarding an Underlying Fund’s accounting policies and investment holdings, please see the Underlying Fund’s shareholder report.
B. Level 3 Fair Value Investments — To the extent that significant inputs to valuation models and other alternative pricing sources are unobservable, or if quotations are not readily available, or if GSAM believes that such quotations do not accurately reflect fair value, the fair value of a Portfolio’s investments may be determined under Valuation Procedures approved by the Trustees. GSAM, consistent with its procedures and applicable regulatory guidance, may make an adjustment to the most recent valuation prices of either domestic or foreign securities in light of significant events to reflect what it believes to be the fair value of the securities at the time of determining a Portfolio’s NAV. Significant events which could affect a large number of securities in a particular market may include, but are not limited to: significant fluctuations in U.S. or foreign markets; market dislocations; market disruptions; or unscheduled market closings. Significant events which could also affect a single issuer may include, but are not limited to: corporate actions such as reorganizations, mergers and buy-outs; ratings downgrades; and bankruptcies.
C. Fair Value Hierarchy — The following is a summary of the Portfolios’ investments classified in the fair value hierarchy as of August 31, 2017:
TARGET DATE 2020 PORTFOLIO
Investment Type
Level 1
Level 2
Level 3
Assets
Exchange Traded Funds
$
46,106,111
$
—
$
—
Investment Company
1,542,601
—
—
Total
$
47,648,712
$
—
$
—
TARGET DATE 2025 PORTFOLIO
Investment Type
Level 1
Level 2
Level 3
Assets
Exchange Traded Funds
$
10,401,326
$
—
$
—
Investment Company
381,305
—
—
Total
$
10,782,631
$
—
$
—
TARGET DATE 2030 PORTFOLIO
Investment Type
Level 1
Level 2
Level 3
Assets
Exchange Traded Funds
$
72,145,717
$
—
$
—
Investment Companies
1,548,941
—
—
Total
$
73,694,658
$
—
$
—
TARGET DATE 2035 PORTFOLIO
Investment Type
Level 1
Level 2
Level 3
Assets
Exchange Traded Funds
$
10,653,725
$
—
$
—
Investment Companies
388,791
—
—
Total
$
11,042,516
$
—
$
—
76
GOLDMAN SACHS TARGET DATE PORTFOLIOS
3. INVESTMENTS AND FAIR VALUE MEASUREMENTS (continued)
TARGET DATE 2040 PORTFOLIO
Investment Type
Level 1
Level 2
Level 3
Assets
Exchange Traded Funds
$
47,006,219
$
—
$
—
Investment Companies
1,129,243
—
—
Total
$
48,135,462
$
—
$
—
TARGET DATE 2045 PORTFOLIO
Investment Type
Level 1
Level 2
Level 3
Assets
Exchange Traded Funds
$
10,809,861
$
—
$
—
Investment Companies
393,279
—
—
Total
$
11,203,140
$
—
$
—
TARGET DATE 2050 PORTFOLIO
Investment Type
Level 1
Level 2
Level 3
Assets
Exchange Traded Funds
$
25,260,909
$
—
$
—
Investment Companies
924,744
—
—
Total
$
26,185,653
$
—
$
—
TARGET DATE 2055 PORTFOLIO
Investment Type
Level 1
Level 2
Level 3
Assets
Exchange Traded Funds
$
10,970,328
$
—
$
—
Investment Companies
399,363
—
—
Total
$
11,369,691
$
—
$
—
For further information regarding security characteristics, see the Schedules of Investments.
4. AGREEMENTS AND AFFILIATED TRANSACTIONS
A. Management Agreement — Under the Agreement, GSAM manages the Portfolios, subject to the general supervision of the Trustees.
As compensation for the services rendered pursuant to the Agreement, the assumption of the expenses related thereto and administration of the Portfolios’ business affairs, including providing facilities, GSAM is entitled to a management fee, accrued daily and paid monthly, equal to an annual percentage rate of each Portfolio’s average daily net assets.
77
GOLDMAN SACHS TARGET DATE PORTFOLIOS
Notes to Financial Statements (continued)
August 31, 2017
4. AGREEMENTS AND AFFILIATED TRANSACTIONS (continued)
For the period ended August 31, 2017, contractual and effective net management fees with GSAM were at the following rates:
Contractual Management Rate
Contractual
First
Next
Over
Management Fee
$2 billion
$3 billion
$5 billion
Annual Rate
0.25%
0.23%
0.21%
0.25%
The Portfolios invest in Institutional Shares of the Goldman Sachs Financial Square Government Fund (“Government Money Market Fund”), which is an affiliated Underlying Fund. GSAM has agreed to waive a portion of its management fee payable by the Portfolios in an amount equal to the management fee it earns as an investment adviser to the affiliated Underlying Fund in which the Portfolios invest, except those management fees it earns from the Portfolio’s investment of cash collateral received in connection with securities lending transactions in the Government Money Market Fund. For the period ended August 31, 2017, the management fee waived by GSAM for each Portfolio was as follows:
Management
Fund
Fee Waived
Target Date 2020
$190
Target Date 2025
40
Target Date 2030
262
Target Date 2035
43
Target Date 2040
173
Target Date 2045
44
Target Date 2050
95
Target Date 2055
45
B. Distribution and/or Service (12b-1) Plans — The Trust, on behalf of Class A and Class R Shares of each applicable Portfolio, has adopted Distribution Plans subject to Rule 12b-1 under the Act. Under the Distribution Plans, Goldman Sachs, which serves as distributor (the “Distributor”), is entitled to a fee accrued daily and paid monthly for distribution services and personal and account maintenance services, which may then be paid by Goldman Sachs to authorized dealers. These fees are equal to an annual percentage rate of the average daily net assets attributable to Class A or Class R Shares of the Portfolios, as applicable, as set forth below.
The Trust, on behalf of Services Shares of each applicable Portfolio, has adopted a Service Plan subject to Rule 12b-1 under the Act to allow Service Shares to compensate service organizations (including Goldman Sachs) for providing personal account maintenance to their customers who are beneficial owners of such shares. The Service Plan provides for compensation to the service organizations equal to an annual percentage rate of the average daily net assets attributable to the Service Shares of the Portfolios, as set forth below.
Distribution and Service Plan Rates
Class A*
Class R*
Service
Distribution Plan
0.25%
0.50%
—
Service Plan
—
—
0.25%
*
With respect to Class A and Class R Shares, the Distributor at its discretion may use compensation for distribution services paid under the Distribution Plan to compensate service organizations for personal and account maintenance services and expenses as long as such total compensation does not exceed the maximum cap on “service fees” imposed by the Financial Industry Regulatory Authority.
78
GOLDMAN SACHS TARGET DATE PORTFOLIOS
4. AGREEMENTS AND AFFILIATED TRANSACTIONS (continued)
C. Distribution Agreement — Goldman Sachs, as Distributor of the shares of the Portfolios pursuant to a Distribution Agreement, may retain a portion of the Class A Shares’ front end sales charge. During the period ended August 31, 2017, Goldman Sachs did not retain any of the Class A Shares’ front end sales charge.
D. Shareholder Administration Plan — The Trust, on behalf of the Portfolios, has adopted a Shareholder Administration Plan to allow Service Shares to compensate service organizations (including Goldman Sachs) for providing varying levels of shareholder administration services to their customers who are beneficial owners of such shares. The Shareholder Administration Plan provides for compensation to the service organizations equal to an annual percentage rate of 0.25% of the average daily net assets attributable to Service Shares of the Portfolios.
E. Transfer Agency Agreement — Goldman Sachs also serves as the transfer agent of the Portfolios for a fee pursuant to the Transfer Agency Agreement. The fees charged for such transfer agency services are accrued daily and paid monthly at annual rates as follows: 0.19% of the average daily net assets of Class A, Class IR and Class R Shares; 0.02% of the average daily net assets of Class R6 Shares; and 0.04% of the average daily net assets of Institutional and Service Shares. Effective October 8, 2017, the annual rates will be as follows: 0.18% of the average daily net assets of Class A, Class IR and Class R Shares and 0.03% of the average daily net assets of Class R6 Shares.
F. Other Expense Agreements and Affiliated Transactions — GSAM has agreed to limit certain “Other Expenses” of the Portfolios (excluding acquired (underlying) fund fees and expenses, transfer agency fees and expenses, service fees, shareholder administration fees, taxes, interest, brokerage fees, expenses of shareholder meetings, litigation and indemnification, and extraordinary expenses) to the extent such expenses exceed, on an annual basis, a percentage rate of the average daily net assets of each Portfolio. Such Other Expense reimbursements, if any, are accrued daily and paid monthly. In addition, the Portfolios are not obligated to reimburse GSAM for prior fiscal year expense reimbursements, if any. The Other Expense limitations as an annual percentage rate of average daily net assets for Target Date 2020, Target Date 2030, Target Date 2040 and Target Date 2050 are each 0.024%, and Target Date 2025, Target Date 2035, Target Date 2045 and Target Date 2055 are each 0.014%. Prior to February 28, 2017, the Other Expense limitations as an annual percentage rate of average daily net assets for each Portfolio were 0.05%. These Other Expense limitations will remain in place through at least February 28, 2018, and prior to such date, GSAM may not terminate the arrangements without the approval of the Trustees. In addition, the Portfolios have entered into certain offset arrangements with the transfer agent, which may result in a reduction of the Portfolios’ expenses and are received irrespective of the application of the “Other Expense” limitations described above.
For the period ended August 31, 2017, these expense reductions, including any fee waivers and Other Expense reimbursements, were as follows:
Other
Total
Management
Expense
Expense
Portfolio
Fee Waiver
Reimbursements
Reductions
Target Date 2020
$
190
$
281,583
$
281,773
Target Date 2025
40
331,766
331,806
Target Date 2030
262
288,645
288,907
Target Date 2035
43
331,163
331,206
Target Date 2040
173
278,866
279,039
Target Date 2045
44
330,779
330,823
Target Date 2050
95
260,827
260,922
Target Date 2055
45
330,604
330,649
79
GOLDMAN SACHS TARGET DATE PORTFOLIOS
Notes to Financial Statements (continued)
August 31, 2017
4. AGREEMENTS AND AFFILIATED TRANSACTIONS (continued)
G. Line of Credit Facility — As of August 31, 2017, the Portfolios participated in a $1,100,000,000 committed, unsecured revolving line of credit facility (the “facility”) together with other funds of the Trust and certain registered investment companies having management agreements with GSAM or its affiliates. This facility is to be used for temporary emergency purposes, or to allow for an orderly liquidation of securities to meet redemption requests. The interest rate on borrowings is based on the federal funds rate. The facility also requires a fee to be paid by the Portfolios based on the amount of the commitment that has not been utilized. For the period ended August 31, 2017, the Portfolios did not have any borrowings under the facility.
H. Other Transactions with Affiliates — For the period ended August 31, 2017, Goldman Sachs did not earn any brokerage commissions from portfolio transactions, on behalf of the Portfolios.
The table below shows the transactions in and earnings from investments in the Goldman Sachs Financial Square Government Fund for the period ended August 31, 2017:
Net Realized
Gain (Loss)
Market
on Sales of
Net Change in
Market
Value as of
Affiliated
Unrealized
Value as of
Shares as of
October 31,
Purchases
Proceeds
Investment
Appreciation/
August 31,
August 31,
Dividend
Affiliated Investment Companies
2016
at Cost
from Sales
Companies
Depreciation
2017
2017
Income
Target Date 2020 Portfolio
$
—
$
4,077,229
$
2,534,628
$
—
$
—
$
1,542,601
1,542,601
$
1,011
Target Date 2025 Portfolio
—
644,668
263,363
—
—
381,305
381,305
231
Target Date 2030 Portfolio
—
5,083,160
3,913,007
—
—
1,170,153
1,170,153
1,479
Target Date 2035 Portfolio
—
693,621
360,104
—
—
333,517
333,517
243
Target Date 2040 Portfolio
—
3,450,587
2,568,005
—
—
882,582
882,582
961
Target Date 2045 Portfolio
—
847,534
510,861
—
—
336,673
336,673
244
Target Date 2050 Portfolio
—
1,655,246
863,691
—
—
791,555
791,555
536
Target Date 2055 Portfolio
—
624,879
282,688
—
—
342,191
342,191
253
As of August 31, 2017, The Goldman Sachs Group, Inc. was the beneficial owner of 5% or more of total outstanding shares of the following Portfolios:
Class A
Institutional
Service
Class IR
Class R
Class R6
Target Date 2020
65
%
100
%
100
%
—
%
100
%
—
%
Target Date 2025
14
100
100
31
100
100
Target Date 2030
5
100
100
—
47
—
Target Date 2035
38
100
100
7
99
31
Target Date 2040
83
100
100
8
46
—
Target Date 2045
13
100
100
11
38
80
Target Date 2050
23
100
100
7
100
—
Target Date 2055
13
100
100
11
100
41
80
GOLDMAN SACHS TARGET DATE PORTFOLIOS
5. PORTFOLIO SECURITIES TRANSACTIONS
The cost of purchases and proceeds from sales and maturities of long-term securities for the period ended August 31, 2017, were:
Fund
Purchases
Sales and Maturities
Target Date 2020
$
96,391,143
$
104,449,335
Target Date 2025
16,832,393
16,571,485
Target Date 2030
105,140,845
110,741,468
Target Date 2035
14,046,188
13,698,516
Target Date 2040
68,131,921
71,598,996
Target Date 2045
14,819,340
14,480,296
Target Date 2050
34,640,323
33,021,762
Target Date 2055
18,995,394
18,660,910
6. TAX INFORMATION
The tax character of distributions paid during the period ended August 31, 2017 was as follows:
Target Date
Target Date
Target Date
Target Date
Target Date
Target Date
Target Date
Target Date
2020
2025
2030
2035
2040
2045
2050
2055
Distribution paid from:
Ordinary income
$
1,143,779
$
80,349
$
1,579,091
$
85,040
$
1,179,834
$
87,540
$
557,709
$
91,462
Net long-term capital gains
1,887,095
—
2,360,440
—
1,980,519
—
807,554
—
Total taxable distributions
$
3,030,874
$
80,349
$
3,939,531
$
85,040
$
3,160,353
$
87,540
$
1,365,263
$
91,462
The tax character of distributions paid during the fiscal year ended October 31, 2016 was as follows:
Target Date
Target Date
Target Date
Target Date
Target Date
Target Date
Target Date
Target Date
2020
2025
2030
2035
2040
2045
2050
2055
Distribution paid from:
Ordinary income
$
1,207,803
$
—
$
1,551,992
$
—
$
1,118,464
$
—
$
469,675
$
—
Net long-term capital gains
1,456,117
—
2,378,711
—
1,929,632
—
507,872
—
Total taxable distributions
$
2,663,920
$
—
$
3,930,703
$
—
$
3,048,096
$
—
$
977,547
$
—
The tax character of distributions paid during the fiscal year ended October 31, 2015 was as follows:
Target Date
Target Date
Target Date
Target Date
Target Date
Target Date
Target Date
Target Date
2020
2025
2030
2035
2040
2045
2050
2055
Distribution paid from:
Ordinary income
$
745,004
$
—
$
939,469
$
—
$
687,796
$
—
$
240,391
$
—
Net long-term capital gains
397,309
—
1,474,100
—
1,413,974
—
450,143
—
Total taxable distributions
$
1,142,313
$
—
$
2,413,569
$
—
$
2,101,770
$
—
$
690,534
$
—
81
GOLDMAN SACHS TARGET DATE PORTFOLIOS
Notes to Financial Statements (continued)
August 31, 2017
6. TAX INFORMATION (continued)
As of August 31, 2017, the components of accumulated earnings (losses) on a tax basis were as follows:
Target Date
Target Date
Target Date
Target Date
Target Date
Target Date
Target Date
Target Date
2020
2025
2030
2035
2040
2045
2050
2055
Undistributed ordinary income — net
$
1,452,556
$
167,638
$
2,056,248
$
213,990
$
1,471,211
$
274,639
$
699,531
$
326,467
Undistributed long-term capital gains
1,855,140
—
5,750,409
—
4,445,691
—
1,111,571
—
Total undistributed earnings
$
3,307,696
$
167,638
$
7,806,657
$
213,990
$
5,916,902
$
274,639
$
1,811,102
$
326,467
Unrealized gains (losses) — net
2,221,314
497,118
5,745,881
670,689
4,421,336
775,286
2,730,124
886,841
Total accumulated earnings (losses) net
$
5,529,010
$
664,756
$
13,552,538
$
884,679
$
10,338,238
$
1,049,925
$
4,541,226
$
1,213,308
The Target Date 2025, Target Date 2035, Target Date 2045 and Target Date 2055 Portfolios utilized $41,920, $43,449, $42,638 and $41,912, respectively, of capital losses in the current fiscal period.
As of August 31, 2017, the Portfolios’ aggregate security unrealized gains and losses based on cost for U.S. federal income tax purposes were as follows:
Target Date
Target Date
Target Date
Target Date
Target Date
Target Date
Target Date
Target Date
2020
2025
2030
2035
2040
2045
2050
2055
Tax Cost
$
45,427,398
$
10,285,513
$
67,948,777
$
10,371,827
$
43,714,126
$
10,427,854
$
23,455,529
$
10,482,850
Gross unrealized gain
2,641,338
571,099
6,466,899
731,262
5,009,574
842,448
2,986,617
965,361
Gross unrealized loss
(420,024
)
(73,981
)
(721,018
)
(60,573
)
(588,238
)
(67,162
)
(256,493
)
(78,520
)
Net unrealized gains (losses)
$
2,221,314
$
497,118
$
5,745,881
$
670,689
$
4,421,336
$
775,286
$
2,730,124
$
886,841
The difference between GAAP-basis and tax-basis unrealized gains (losses) is attributable primarily to wash sales.
In order to present certain components of the Portfolios’ capital accounts on a tax-basis, certain reclassifications have been recorded to the Portfolios’ accounts. These reclassifications have no impact on the net asset value of the Portfolios and result primarily from dividend redesignations, non-deductible expenses, and differences in the tax treatment of underlying fund investments and partnership investments.
Accumulated
Undistributed
Paid in
Net Realized
Net Investment
Capital
Gain (Loss)
Income (Loss)
Target Date 2020
$
—
$
2,599
$
(2,599
)
Target Date 2025
(892
)
(334
)
1,226
Target Date 2030
—
721
(721
)
Target Date 2035
(900
)
(244
)
1,144
Target Date 2040
—
(2,689
)
2,689
Target Date 2045
(908
)
(361
)
1,269
Target Date 2050
—
(1,858
)
1,858
Target Date 2055
(907
)
(544
)
1,451
82
GOLDMAN SACHS TARGET DATE PORTFOLIOS
6. TAX INFORMATION (continued)
GSAM has reviewed the Portfolios’ tax positions for all open tax years (the current and prior three years, as applicable) and has concluded that no provision for income tax is required in the Portfolios’ financial statements. Such open tax years remain subject to examination and adjustment by tax authorities.
7. OTHER RISKS
The Portfolios’ risks include, but are not limited to, the following:
Investments in Other Investment Companies Risk — As a shareholder of another investment company, including an ETF, a Portfolio will indirectly bear its proportionate share of any net management fees and other expenses paid by such other investment companies, in addition to the fees and expenses regularly borne by the Portfolio. ETFs are subject to risks that do not apply to conventional mutual funds, including but not limited to the following: (i) the market price of the ETF’s shares may trade at a premium or a discount to their NAV; and (ii) an active trading market for an ETF’s shares may not develop or be maintained.
The Portfolios may be indirectly exposed to the following risks through their investments in the Underlying Funds. For more information regarding the risks of an Underlying Fund, please see the Underlying Fund’s shareholder report.
Liquidity Risk — A Portfolio may make investments that are illiquid or that may become less liquid in response to market developments or adverse investor perceptions. Illiquid investments may be more difficult to value. Liquidity risk may also refer to the risk that a Portfolio will not be able to pay redemption proceeds within the allowable time period because of unusual market conditions, an unusually high volume of redemption requests, or other reasons. To meet redemption requests, a Portfolio may be forced to sell investments at an unfavorable time and/or under unfavorable conditions.
Market and Credit Risks — In the normal course of business, a Portfolio trades financial instruments and enters into financial transactions where risk of potential loss exists due to changes in the market (market risk). Additionally, a Portfolio may also be exposed to credit risk in the event that an issuer or guarantor fails to perform or that an institution or entity with which the Portfolio has unsettled or open transactions defaults.
8. INDEMNIFICATIONS
Under the Trust’s organizational documents, its Trustees, officers, employees and agents are indemnified, to the extent permitted by the Act and state law, against certain liabilities that may arise out of performance of their duties to the Portfolios. Additionally, in the course of business, the Portfolios enter into contracts that contain a variety of indemnification clauses. The Portfolios’ maximum exposure under these arrangements is unknown, as this would involve future claims that may be made against the Portfolios that have not yet occurred. However, GSAM believes the risk of loss under these arrangements to be remote.
9. SUBSEQUENT EVENTS
Subsequent events after the Statements of Assets and Liabilities date have been evaluated, and GSAM has concluded that there is no impact requiring adjustment or disclosure in the financial statements.
83
GOLDMAN SACHS TARGET DATE PORTFOLIOS
Notes to Financial Statements (continued)
August 31, 2017
10. SUMMARY OF SHARE TRANSACTIONS
Share activity is as follows:
Target Date 2020 Portfolio
For the Period
November 1, 2016 —
For the Fiscal Year Ended
For the Fiscal Year Ended
August 31, 2017(a)
October 31, 2016
October 31, 2015
Shares
Dollars
Shares
Dollars
Shares
Dollars
Class A Shares(b)
Shares sold
571
$
5,508
$
996
$
10,010
$
—
$
—
Reinvestment of distributions
57
540
—
—
—
—
Shares redeemed
—
—
(1
)
(11
)
—
—
628
6,048
995
9,999
—
—
Institutional Shares(b)
Shares sold
1
5
996
10,010
—
—
Reinvestment of distributions
59
555
—
—
—
—
Shares redeemed
(1
)
(5
)
(1
)
(10
)
—
—
59
555
995
10,000
—
—
Service Shares(b)
Shares sold
—
—
996
10,010
—
—
Reinvestment of distributions
57
537
—
—
—
—
Shares redeemed
—
—
(1
)
(11
)
—
—
57
537
995
9,999
—
—
Class IR Shares(b)
Shares sold
31,422
311,469
996
10,010
—
—
Reinvestment of distributions
58
550
—
—
—
—
Shares redeemed
(1
)
(10
)
(1
)
(11
)
—
—
31,479
312,009
995
9,999
—
—
Class R Shares(b)
Shares sold
—
—
996
10,010
—
—
Reinvestment of distributions
56
532
—
—
—
—
Shares redeemed
—
—
(1
)
(11
)
—
—
56
532
995
9,999
—
—
Class R6 Shares
Shares sold
148,501
1,423,485
556,157
5,395,539
194,179
1,965,286
Reinvestment of distributions
319,101
3,028,160
282,195
2,663,920
114,460
1,142,314
Shares redeemed
(1,106,730
)
(10,811,544
)
(745,292
)
(7,300,289
)
(1,184,264
)
(11,892,996
)
(639,128
)
(6,359,899
)
93,060
759,170
(875,625
)
(8,785,396
)
NET INCREASE (DECREASE)
(606,849
)
$
(6,040,218
)
98,035
$
809,166
(875,625
)
$
(8,785,396
)
(a) The Portfolios changed their fiscal year end from October 31 to August 31.
(b) Commenced operations on August 22, 2016.
84
GOLDMAN SACHS TARGET DATE PORTFOLIOS
10. SUMMARY OF SHARE TRANSACTIONS (continued)
Share activity is as follows:
Target Date 2025 Portfolio
For the Period
November 1, 2016 —
For the Period Ended
August 31, 2017(a)
October 31, 2016(b)
Shares
Dollars
Shares
Dollars
Class A Shares
Shares sold
5,992
$
60,856
1,001
$
10,011
Reinvestment of distributions
38
375
—
—
Shares redeemed
—
—
(1
)
(11
)
6,030
61,231
1,000
10,000
Institutional Shares
Shares sold
1
5
995,001
9,950,011
Reinvestment of distributions
8,051
79,700
—
—
Shares redeemed
(1
)
(5
)
(1
)
(10
)
8,051
79,700
995,000
9,950,001
Service Shares
Shares sold
—
—
1,001
10,011
Reinvestment of distributions
6
62
—
—
Shares redeemed
—
—
(1
)
(11
)
6
62
1,000
10,000
Class IR Shares
Shares sold
2,241
23,671
1,001
10,011
Reinvestment of distributions
8
75
—
—
Shares redeemed
(3
)
(25
)
(1
)
(11
)
2,246
23,721
1,000
10,000
Class R Shares
Shares sold
3
36
1,001
10,011
Reinvestment of distributions
6
57
—
—
Shares redeemed
(3
)
(36
)
(1
)
(11
)
6
57
1,000
10,000
Class R6 Shares
Shares sold
1
11
1,001
10,011
Reinvestment of distributions
8
80
—
—
Shares redeemed
(1
)
(10
)
(1
)
(11
)
8
81
1,000
10,000
NET INCREASE
16,347
$
164,852
1,000,000
$
10,000,001
(a) The Portfolios changed their fiscal year end from October 31 to August 31.
(b) Commenced operations on August 22, 2016.
85
GOLDMAN SACHS TARGET DATE PORTFOLIOS
Notes to Financial Statements (continued)
August 31, 2017
10. SUMMARY OF SHARE TRANSACTIONS (continued)
Share activity is as follows:
Target Date 2030 Portfolio
For the Period
November 1, 2016 —
For the Fiscal Year Ended
For the Fiscal Year Ended
August 31, 2017(a)
October 31, 2016
October 31, 2015
Shares
Dollars
Shares
Dollars
Shares
Dollars
Class A Shares(b)
Shares sold
19,953
$
189,739
1,008
$
10,010
—
$
—
Reinvestment of distributions
65
623
—
—
—
—
Shares redeemed
(985
)
(9,998
)
(1
)
(11
)
—
—
19,033
180,364
1,007
9,999
—
—
Institutional Shares(b)
Shares sold
1
5
1,008
10,010
—
—
Reinvestment of distributions
54
515
—
—
—
—
Shares redeemed
(1
)
(5
)
(1
)
(10
)
—
—
54
515
1,007
10,000
—
—
Service Shares(b)
Shares sold
—
—
1,008
10,010
—
—
Reinvestment of distributions
52
498
—
—
—
—
Shares redeemed
—
—
(1
)
(11
)
—
—
52
498
1,007
9,999
—
—
Class IR Shares(b)
Shares sold
59,937
613,794
1,008
10,010
—
—
Reinvestment of distributions
53
510
—
—
—
—
Shares redeemed
(9
)
(90
)
(1
)
(11
)
—
—
59,981
614,214
1,007
9,999
—
—
Class R Shares(b)
Shares sold
1,182
11,639
1,008
10,010
—
—
Reinvestment of distributions
52
492
—
—
—
—
Shares redeemed
(2
)
(16
)
(1
)
(11
)
—
—
1,232
12,115
1,007
9,999
—
—
Class R6 Shares
Shares sold
276,954
2,713,417
284,587
2,711,235
279,805
2,827,154
Reinvestment of distributions
412,273
3,936,893
422,202
3,930,703
243,549
2,413,569
Shares redeemed
(988,092
)
(9,767,525
)
(1,015,250
)
(9,983,514
)
(894,665
)
(8,940,513
)
(298,865
)
(3,117,215
)
(308,461
)
(3,341,576
)
(371,311
)
(3,699,790
)
NET DECREASE
(218,513
)
$
(2,309,509
)
(303,426
)
$
(3,291,580
)
(371,311
)
$
(3,699,790
)
(a) The Portfolios changed their fiscal year end from October 31 to August 31.
(b) Commenced operations on August 22, 2016.
86
GOLDMAN SACHS TARGET DATE PORTFOLIOS
10. SUMMARY OF SHARE TRANSACTIONS (continued)
Share activity is as follows:
Target Date 2035 Portfolio
For the Period
November 1, 2016 —
For the Period Ended
August 31, 2017(a)
October 31, 2016(b)
Shares
Dollars
Shares
Dollars
Class A Shares
Shares sold
1,645
$
16,616
1,001
$
10,011
Reinvestment of distributions
7
71
—
—
Shares redeemed
—
—
(1
)
(11
)
1,652
16,687
1,000
10,000
Institutional Shares
Shares sold
—
5
995,001
9,950,011
Reinvestment of distributions
8,493
84,675
—
—
Shares redeemed
—
(5
)
(1
)
(10
)
8,493
84,675
995,000
9,950,001
Service Shares
Shares sold
—
—
1,001
10,011
Reinvestment of distributions
7
67
—
—
Shares redeemed
—
—
(1
)
(11
)
7
67
1,000
10,000
Class IR Shares
Shares sold
12,990
140,121
1,001
10,011
Reinvestment of distributions
8
80
—
—
Shares redeemed
(6
)
(69
)
(1
)
(11
)
12,992
140,132
1,000
10,000
Class R Shares
Shares sold
7
67
1,001
10,011
Reinvestment of distributions
6
62
—
—
Shares redeemed
—
—
(1
)
(11
)
13
129
1,000
10,000
Class R6 Shares
Shares sold
2,209
23,226
1,001
10,011
Reinvestment of distributions
9
85
—
—
Shares redeemed
(2
)
(16
)
(1
)
(11
)
2,216
23,295
1,000
10,000
NET INCREASE
25,373
$
264,985
1,000,000
$
10,000,001
(a) The Portfolios changed their fiscal year end from October 31 to August 31.
(b) Commenced operations on August 22, 2016.
87
GOLDMAN SACHS TARGET DATE PORTFOLIOS
Notes to Financial Statements (continued)
August 31, 2017
10. SUMMARY OF SHARE TRANSACTIONS (continued)
Share activity is as follows:
Target Date 2040 Portfolio
For the Period
November 1, 2016 —
For the Fiscal Year Ended
For the Fiscal Year Ended
August 31, 2017(a)
October 31, 2016
October 31, 2015
Shares
Dollars
Shares
Dollars
Shares
Dollars
Class A Shares(b)
Shares sold
227
$
2,223
1,323
$
12,879
—
$
—
Reinvestment of distributions
88
827
—
—
—
—
Shares redeemed
(319
)
(3,121
)
(1
)
(11
)
—
—
(4
)
(71
)
1,322
12,868
—
—
Institutional Shares(b)
Shares sold
1
5
1,025
10,010
—
—
Reinvestment of distributions
70
654
—
—
—
—
Shares redeemed
(1
)
(5
)
(1
)
(10
)
—
—
70
654
1,024
10,000
—
—
Service Shares(b)
Shares sold
—
—
1,025
10,010
—
—
Reinvestment of distributions
68
636
—
—
—
—
Shares redeemed
—
—
(1
)
(11
)
—
—
68
636
1,024
9,999
—
—
Class IR Shares(b)
Shares sold
11,815
118,889
1,025
10,010
—
—
Reinvestment of distributions
69
648
—
—
—
—
Shares redeemed
(6
)
(55
)
(1
)
(11
)
—
—
11,878
119,482
1,024
9,999
—
—
Class R Shares(b)
Shares sold
1,308
12,647
1,025
10,010
—
—
Reinvestment of distributions
67
630
—
—
—
—
Shares redeemed
(2
)
(16
)
(1
)
(11
)
—
—
1,373
13,261
1,024
9,999
—
—
Class R6 Shares
Shares sold
200,436
1,910,717
121,810
1,134,819
132,290
1,322,699
Reinvestment of distributions
337,128
3,156,958
333,125
3,048,096
213,378
2,101,769
Shares redeemed
(642,379
)
(6,279,840
)
(572,414
)
(5,513,965
)
(1,191,593
)
(11,779,177
)
(104,815
)
(1,212,165
)
(117,479
)
(1,331,050
)
(845,925
)
(8,354,709
)
NET DECREASE
(91,430
)
$
(1,078,203
)
(112,061
)
$
(1,278,185
)
(845,925
)
$
(8,354,709
)
(a) The Portfolios changed their fiscal year end from October 31 to August 31.
(b) Commenced operations on August 22, 2016.
88
GOLDMAN SACHS TARGET DATE PORTFOLIOS
10. SUMMARY OF SHARE TRANSACTIONS (continued)
Share activity is as follows:
Target Date 2045 Portfolio
For the Period
November 1, 2016 —
For the Period Ended
August 31, 2017(a)
October 31, 2016(b)
Shares
Dollars
Shares
Dollars
Class A Shares
Shares sold
6,611
$
71,383
1,001
$
10,011
Reinvestment of distributions
7
73
—
—
Shares redeemed
(1
)
(10
)
(1
)
(11
)
6,617
71,446
1,000
10,000
Institutional Shares
Shares sold
—
5
995,001
9,950,011
Reinvestment of distributions
8,690
87,162
—
—
Shares redeemed
—
(5
)
(1
)
(10
)
8,690
87,162
995,000
9,950,001
Service Shares
Shares sold
—
—
1,001
10,011
Reinvestment of distributions
7
70
—
—
Shares redeemed
—
—
(1
)
(11
)
7
70
1,000
10,000
Class IR Shares
Shares sold
14,630
160,250
1,001
10,011
Reinvestment of distributions
8
82
—
—
Shares redeemed
(6,852
)
(75,444
)
(1
)
(11
)
7,786
84,888
1,000
10,000
Class R Shares
Shares sold
1,645
17,338
1,001
10,011
Reinvestment of distributions
6
65
—
—
Shares redeemed
(2
)
(23
)
(1
)
(11
)
1,649
17,380
1,000
10,000
Class R6 Shares
Shares sold
250
2,736
1,001
10,011
Reinvestment of distributions
9
88
—
—
Shares redeemed
(1
)
(11
)
(1
)
(11
)
258
2,813
1,000
10,000
NET INCREASE
25,007
$
263,759
1,000,000
$
10,000,001
(a) The Portfolios changed their fiscal year end from October 31 to August 31.
(b) Commenced operations on August 22, 2016.
89
GOLDMAN SACHS TARGET DATE PORTFOLIOS
Notes to Financial Statements (continued)
August 31, 2017
10. SUMMARY OF SHARE TRANSACTIONS (continued)
Share activity is as follows:
Target Date 2050 Portfolio
For the Period
November 1, 2016 —
For the Fiscal Year Ended
For the Fiscal Year Ended
August 31, 2017(a)
October 31, 2016
October 31, 2015
Shares
Dollars
Shares
Dollars
Shares
Dollars
Class A Shares(b)
Shares sold
3,615
$
37,062
1,001
$
10,010
—
$
—
Reinvestment of distributions
62
600
—
—
—
—
Shares redeemed
(1
)
(12
)
(1
)
(11
)
—
—
3,676
37,650
1,000
9,999
—
—
Institutional Shares(b)
Shares sold
1
5
1,001
10,010
—
—
Reinvestment of distributions
63
614
—
—
—
—
Shares redeemed
(1
)
(5
)
(1
)
(10
)
—
—
63
614
1,000
10,000
—
—
Service Shares(b)
Shares sold
—
—
1,001
10,010
—
—
Reinvestment of distributions
62
596
—
—
—
—
Shares redeemed
—
—
(1
)
(11
)
—
—
62
596
1,000
9,999
—
—
Class IR Shares(b)
Shares sold
14,233
149,919
1,001
10,010
—
—
Reinvestment of distributions
63
609
—
—
—
—
Shares redeemed
(495
)
(5,184
)
(1
)
(11
)
—
—
13,801
145,344
1,000
9,999
—
—
Class R Shares(b)
Shares sold
3
25
1,001
10,010
—
—
Reinvestment of distributions
61
591
—
—
—
—
Shares redeemed
—
—
(1
)
(11
)
—
—
64
616
1,000
9,999
—
—
Class R6 Shares
Shares sold
284,037
2,820,844
175,129
1,678,882
204,401
2,060,597
Reinvestment of distributions
140,583
1,362,253
104,550
977,547
69,681
690,534
Shares redeemed
(157,962
)
(1,599,302
)
(128,796
)
(1,267,261
)
(346,869
)
(3,495,489
)
266,658
2,583,795
150,883
1,389,168
(72,787
)
(744,358
)
NET INCREASE (DECREASE)
284,324
$
2,768,615
155,883
$
1,439,164
(72,787
)
$
(744,358
)
(a) The Portfolios changed their fiscal year end from October 31 to August 31.
(b) Commenced operations on August 22, 2016.
90
GOLDMAN SACHS TARGET DATE PORTFOLIOS
10. SUMMARY OF SHARE TRANSACTIONS (continued)
Share activity is as follows:
Target Date 2055 Portfolio
For the Period
November 1, 2016 —
For the Period Ended
August 31, 2017(a)
October 31, 2016(b)
Shares
Dollars
Shares
Dollars
Class A Shares
Shares sold
6,796
$
71,928
1,001
$
10,011
Reinvestment of distributions
10
98
—
—
Shares redeemed
(1
)
(10
)
(1
)
(11
)
6,805
72,016
1,000
10,000
Institutional Shares
Shares sold
—
5
995,001
9,950,011
Reinvestment of distributions
9,014
91,043
—
—
Shares redeemed
—
(5
)
(1
)
(10
)
9,014
91,043
995,000
9,950,001
Service Shares
Shares sold
—
—
1,001
10,011
Reinvestment of distributions
7
74
—
—
Shares redeemed
—
—
(1
)
(11
)
7
74
1,000
10,000
Class IR Shares
Shares sold
8,035
89,578
1,001
10,011
Reinvestment of distributions
9
86
—
—
Shares redeemed
(1
)
(13
)
(1
)
(11
)
8,043
89,651
1,000
10,000
Class R Shares
Shares sold
—
—
1,001
10,011
Reinvestment of distributions
7
69
—
—
Shares redeemed
—
—
(1
)
(11
)
7
69
1,000
10,000
Class R6 Shares
Shares sold
1,444
15,400
1,001
10,011
Reinvestment of distributions
9
92
—
—
Shares redeemed
(2
)
(25
)
(1
)
(11
)
1,451
15,467
1,000
10,000
NET INCREASE
25,327
$
268,320
1,000,000
$
10,000,001
(a) The Portfolios changed their fiscal year end from October 31 to August 31.
(b) Commenced operations on August 22, 2016.
91
Report of Independent Registered Public Accounting Firm
To the Board of Trustees of Goldman Sachs Trust II and Shareholders of Goldman Sachs Target Date 2020 Portfolio, Goldman Sachs Target Date 2025 Portfolio, Goldman Sachs Target Date 2030 Portfolio, Goldman Sachs Target Date 2035 Portfolio, Goldman Sachs Target Date 2040 Portfolio, Goldman Sachs Target Date 2045 Portfolio, Goldman Sachs Target Date 2050 Portfolio, and Goldman Sachs Target Date 2055 Portfolio:
In our opinion, the accompanying statements of assets and liabilities, including the schedules of investments, and the related statements of operations and of changes in net assets and the financial highlights present fairly, in all material respects, the financial position of the Goldman Sachs Target Date 2020 Portfolio, Goldman Sachs Target Date 2025 Portfolio, Goldman Sachs Target Date 2030 Portfolio, Goldman Sachs Target Date 2035 Portfolio, Goldman Sachs Target Date 2040 Portfolio, Goldman Sachs Target Date 2045 Portfolio, Goldman Sachs Target Date 2050 Portfolio, and Goldman Sachs Target Date 2055 Portfolio (each a “Portfolio” of the Goldman Sachs Trust II, hereafter collectively referred to as the “Portfolios”), as of August 31, 2017, and the results of each of their operations for the periods November 1, 2016 through August 31, 2017 and for period November 1, 2015 through October 31, 2016 and changes in each of their net assets for the periods November 1, 2016 through August 31, 2017 and November 1, 2015 through October 31, 2016 (or for Target Date 2025 Portfolio, Target Date 2035 Portfolio, Target Date 2045 Portfolio, and Target Date 2055 Portfolio, the periods from November 1, 2016 through August 31, 2017 and August 22, 2016 (commencement of operations) through October 31, 2016), and the financial highlights for each of the periods presented therein, in conformity with accounting principles generally accepted in the United States of America. These financial statements and financial highlights (hereafter referred to as “financial statements”) are the responsibility of the Portfolios’ management. Our responsibility is to express an opinion on these financial statements based on our audits. We conducted our audits of these financial statements in accordance with the standards of the Public Company Accounting Oversight Board (United States). Those standards require that we plan and perform the audit to obtain reasonable assurance about whether the financial statements are free of material misstatement. An audit includes examining, on a test basis, evidence supporting the amounts and disclosures in the financial statements, assessing the accounting principles used and significant estimates made by management, and evaluating the overall financial statement presentation. We believe that our audits, which included confirmation of securities as of August 31, 2017 by correspondence with the custodian, brokers, transfer agent of the underlying funds and the application of alternative auditing procedures where securities purchased confirmations had not been received, provide a reasonable basis for our opinions. With respect to Goldman Sachs Target Date 2020 Portfolio, Goldman Sachs Target Date 2030 Portfolio, Goldman Sachs Target Date 2040 Portfolio, and Goldman Sachs Target Date 2050 Portfolio, the financial statements as of October 31, 2015 and for the year ended October 31, 2015 and the financial highlights for each of the periods ended on or prior to October 31, 2015 (not presented herein, other than the statements of changes in net assets and the financial highlights) were audited by other auditors whose report dated December 18, 2015 expressed unqualified opinions on those financial statements and financial highlights.
PricewaterhouseCoopers LLP
Boston, Massachusetts October 24, 2017
92
GOLDMAN SACHS TARGET DATE PORTFOLIOS
Fund Expenses — Period Ended August 31, 2017 (Unaudited)
As a shareholder of Class A, Institutional, Service, Class IR, Class R, and Class R6 Shares of the Portfolios, you incur two types of costs: (1) transaction costs, including sales charges on purchase payments (with respect to Class A Shares), and (2) ongoing costs, including management fees; distribution and/or service (12b-1) fees (with respect to Class A, Service and Class R Shares); and other Portfolio expenses. This Example is intended to help you understand your ongoing costs (in dollars) of investing in Class A, Institutional, Service, Class IR, Class R or Class R6 Shares of the Portfolios and to compare these costs with the ongoing costs of investing in other mutual funds.
The Example is based on an investment of $1,000 invested at the beginning of the period and held for the entire period from March 1, 2017 through August 31, 2017 (which represents a period of 184 Days).
Actual Expenses — The first line under each share class in the table below provides information about actual account values and actual expenses. You may use the information in this line, together with the amount you invested, to estimate the expenses that you paid over the period. Simply divide your account value by $1,000 (for example, an $8,600 account value divided by $1,000=8.6), then multiply the result by the number in the first line under the heading entitled “Expenses Paid” to estimate the expenses you paid on your account during this period.
Hypothetical Example for Comparison Purposes — The second line under each share class in the table below provides information about hypothetical account values and hypothetical expenses based on the Portfolios’ actual net expense ratios and an assumed rate of return of 5% per year before expenses, which is not the Portfolios’ actual return. The hypothetical account values and expenses may not be used to estimate the actual ending account balance or expenses you paid for the period. You may use this information to compare the ongoing costs of investing in the Portfolios and other funds. To do so, compare this 5% hypothetical example with the 5% hypothetical examples that appear in the shareholder reports of the other funds.
Please note that the expenses shown in the table are meant to highlight your ongoing costs only and do not reflect any transactional costs, such as sales charges, redemption fees, or exchange fees and do not include expenses of Underlying Funds in which the Portfolios invest. Therefore, the second line of the table is useful in comparing ongoing costs only, and will not help you determine the relative total costs of owning different funds. In addition, if these transactional costs were included, your costs would have been higher.
Target Date 2020 Portfolio
Target Date 2025 Portfolio
Target Date 2030 Portfolio
Target Date 2035 Portfolio
Share Class
Beginning Account Value 3/1/17
Ending Account Value 8/31/17
Expenses Paid for the 6 months ended 8/31/17*
Beginning Account Value 3/1/17
Ending Account Value 8/31/17
Expenses Paid for the 6 months ended 8/31/17*
Beginning Account Value 3/1/17
Ending Account Value 8/31/17
Expenses Paid for the 6 months ended 8/31/17*
Beginning Account Value 3/1/17
Ending Account Value 8/31/17
Expenses Paid for the 6 months ended 8/31/17*
Class A Actual Hypothetical 5% return
$1,000.00 1,000.00
$1,033.30 1,021.68+
$3.59 3.57
$1,000.00 1,000.00
$1,041.20 1,021.68+
$3.60 3.57
$1,000.00 1,000.00
$1,047.10 1,021.63+
$3.66 3.62
$1,000.00 1,000.00
$1,050.30 1,021.68+
$3.62 3.57
Institutional Actual Hypothetical 5% return
1,000.00 1,000.00
1,036.40 1,023.69+
1.54 1.53
1,000.00 1,000.00
1,043.10 1,023.69+
1.54 1.53
1,000.00 1,000.00
1,049.10 1,023.69+
1.55 1.53
1,000.00 1,000.00
1,052.30 1,023.69+
1.55 1.53
Service Actual Hypothetical 5% return
1,000.00 1,000.00
1,033.30 1,021.22+
4.05 4.02
1,000.00 1,000.00
1,041.20 1,021.17+
4.12 4.08
1,000.00 1,000.00
1,047.10 1,021.17+
4.13 4.08
1,000.00 1,000.00
1,049.40 1,021.17+
4.13 4.08
Class IR Actual Hypothetical 5% return
1,000.00 1,000.00
1,035.40 1,022.89+
2.36 2.35
1,000.00 1,000.00
1,043.10 1,022.89+
2.37 2.35
1,000.00 1,000.00
1,048.10 1,022.89+
2.37 2.35
1,000.00 1,000.00
1,051.30 1,022.94+
2.33 2.29
Class R Actual Hypothetical 5% return
1,000.00 1,000.00
1,033.30 1,020.47+
4.82 4.79
1,000.00 1,000.00
1,041.20 1,020.57+
4.73 4.69
1,000.00 1,000.00
1,046.10 1,020.32+
5.00 4.94
1,000.00 1,000.00
1,049.40 1,020.26+
5.06 4.99
Class R6 Actual Hypothetical 5% return
1,000.00 1,000.00
1,035.30 1,023.74+
1.49 1.48
1,000.00 1,000.00
1,044.10 1,023.84+
1.39 1.38
1,000.00 1,000.00
1,049.10 1,023.74+
1.50 1.48
1,000.00 1,000.00
1,052.30 1,023.84+
1.40 1.38
93
GOLDMAN SACHS TARGET DATE PORTFOLIOS
Fund Expenses — Period Ended August 31, 2017 (Unaudited) (continued)
Target Date 2040 Portfolio
Target Date 2045 Portfolio
Target Date 2050 Portfolio
Target Date 2055 Portfolio
Share Class
Beginning Account Value 3/1/17
Ending Account Value 8/31/17
Expenses Paid for the 6 months ended 8/31/17*
Beginning Account Value 3/1/17
Ending Account Value 8/31/17
Expenses Paid for the 6 months ended 8/31/17*
Beginning Account Value 3/1/17
Ending Account Value 8/31/17
Expenses Paid for the 6 months ended 8/31/17*
Beginning Account Value 3/1/17
Ending Account Value 8/31/17
Expenses Paid for the 6 months ended 8/31/17*
Class A Actual Hypothetical 5% return
$1,000.00 1,000.00
$1,053.20 1,021.58+
$3.73 3.67
$1,000.00 1,000.00
$1,055.60 1,021.63+
$3.68 3.62
$1,000.00 1,000.00
$1,059.30 1,021.63+
$3.69 3.62
$1,000.00 1,000.00
$1,059.80 1,021.68+
$3.63 3.57
Institutional Actual Hypothetical 5% return
1,000.00 1,000.00
1,055.30 1,023.64+
1.61 1.58
1,000.00 1,000.00
1,057.50 1,023.69+
1.56 1.53
1,000.00 1,000.00
1,060.20 1,023.69+
1.56 1.53
1,000.00 1,000.00
1,062.60 1,023.69+
1.56 1.53
Service Actual Hypothetical 5% return
1,000.00 1,000.00
1,052.20 1,021.12+
4.19 4.13
1,000.00 1,000.00
1,054.70 1,021.17+
4.14 4.08
1,000.00 1,000.00
1,058.30 1,021.17+
4.15 4.08
1,000.00 1,000.00
1,059.80 1,021.12+
4.21 4.13
Class IR Actual Hypothetical 5% return
1,000.00 1,000.00
1,054.20 1,022.89+
2.38 2.35
1,000.00 1,000.00
1,056.50 1,022.89+
2.38 2.35
1,000.00 1,000.00
1,059.20 1,022.89+
2.39 2.35
1,000.00 1,000.00
1,061.70 1,022.89+
2.39 2.35
Class R Actual Hypothetical 5% return
1,000.00 1,000.00
1,051.10 1,020.32+
5.01 4.94
1,000.00 1,000.00
1,053.70 1,020.42+
4.92 4.84
1,000.00 1,000.00
1,057.30 1,020.32+
5.03 4.94
1,000.00 1,000.00
1,058.90 1,020.32+
5.03 4.94
Class R6 Actual Hypothetical 5% return
1,000.00 1,000.00
1,055.30 1,023.74+
1.50 1.48
1,000.00 1,000.00
1,057.50 1,023.89+
1.35 1.33
1,000.00 1,000.00
1,060.20 1,023.74+
1.51 1.48
1,000.00 1,000.00
1,062.60 1,023.89+
1.35 1.33
*
Expenses for each share class are calculated using each Portfolio’s annualized net expense ratio for each class, which represents the ongoing expenses as a percentage of net assets for the six months ended August 31, 2017. Expenses are calculated by multiplying the annualized net expense ratio by the average account value for the period; then multiplying the result by the number of days in the most recent fiscal half year; and then dividing that result by the number of days in the fiscal year. The annualized net expense ratios for the period were as follows:
Portfolio
Class A
Institutional
Service
Class IR
Class R
Class R6
Target Date 2020
0.70
%
0.30
%
0.79
%
0.46
%
0.94
%
0.29
%
Target Date 2025
0.70
0.30
0.80
0.46
0.92
0.27
Target Date 2030
0.71
0.30
0.80
0.46
0.97
0.29
Target Date 2035
0.70
0.30
0.80
0.45
0.98
0.27
Target Date 2040
0.72
0.31
0.81
0.46
0.97
0.29
Target Date 2045
0.71
0.30
0.80
0.46
0.95
0.26
Target Date 2050
0.71
0.30
0.80
0.46
0.97
0.29
Target Date 2055
0.70
0.30
0.81
0.46
0.97
0.26
+ Hypothetical expenses are based on each Portfolio’s actual annualized net expense ratios and an assumed rate of return of 5% per year before expenses.
94
GOLDMAN SACHS TARGET DATE PORTFOLIOS
Statement Regarding Basis for Approval of Management Agreement and Sub-Advisory Agreement (Unaudited)
Background The Goldman Sachs Target Date 2020 Portfolio, Goldman Sachs Target Date 2025 Portfolio, Goldman Sachs Target Date 2030 Portfolio, Goldman Sachs Target Date 2035 Portfolio, Goldman Sachs Target Date 2040 Portfolio, Goldman Sachs Target Date 2045 Portfolio, Goldman Sachs Target Date 2050 Portfolio, and Goldman Sachs Target Date 2055 Portfolio (the “Portfolios”) are investment portfolios of Goldman Sachs Trust II (the “Trust”). Each of the Goldman Sachs Target Date 2020, 2030, 2040, and 2050 Portfolios were successors to corresponding series of the Madison Target Retirement Funds (collectively, the “Predecessor Funds”). Each Predecessor Fund was managed by the Sub-Adviser (as defined below) and had an investment objective and strategy similar to that of the applicable Goldman Sachs Target Date Portfolio, and was reorganized into the applicable Goldman Sachs Target Date Portfolio on August 22, 2016. The Board of Trustees oversees the management of the Trust and reviews the investment performance and expenses of the Portfolios at regularly scheduled meetings held throughout the year. In addition, the Board of Trustees determines annually whether to approve the continuance of the Trust’s investment management agreement (the “Management Agreement”) with Goldman Sachs Asset Management, L.P. (the “Investment Adviser”) on behalf of the Portfolios. The Management Agreement was most recently approved for continuation until August 31, 2018 by the Board of Trustees, including those Trustees who are not parties to the Management Agreement or “interested persons” (as defined in the Investment Company Act of 1940, as amended) of any party thereto (the “Independent Trustees”), at a meeting held on August 8, 2017 (the “Annual Meeting”). At the Annual Meeting, the Board also considered the sub-advisory agreement (the “Sub-Advisory Agreement” and, together with the Management Agreement, the “Agreements”) between the Investment Adviser and Madison Asset Management, LLC (the “Sub-Adviser”). The review process undertaken by the Trustees spans the course of the year and culminates with the Annual Meeting. To assist the Trustees in their deliberations, the Trustees have established a Contract Review Committee (the “Committee”), comprised of the Independent Trustees. The Committee held five meetings over the course of the year since the Management Agreement was last approved. At those Committee meetings, regularly scheduled Board or other committee meetings, and/or the Annual Meeting, matters relevant to the renewal of the Management Agreement and the Sub-Advisory Agreement were considered by the Board, or the Independent Trustees, as applicable. With respect to each Portfolio, such matters included:
(a)
the nature and quality of the advisory, administrative, and other services provided to the Portfolio by the Investment Adviser and its affiliates and the Sub-Adviser, including, as applicable, information about:
95
GOLDMAN SACHS TARGET DATE PORTFOLIOS
Statement Regarding Basis for Approval of Management Agreement and Sub-Advisory Agreement (Unaudited) (continued)
(i)
the structure, staff, and capabilities of the Investment Adviser and the Sub-Adviser and Sub-Adviser’s portfolio management team;
(ii)
the groups within the Investment Adviser and its affiliates that support the Portfolio or provide other types of necessary services, including fund services groups (e.g., accounting and financial reporting, tax, shareholder services, and operations); controls and risk management groups (e.g., legal, compliance, valuation oversight, credit risk management, internal audit, compliance testing, market risk analysis, finance, and central funding); sales and distribution support groups, and others (e.g., information technology and training);
(iii)
trends in employee headcount;
(iv)
the Investment Adviser’s financial resources and ability to hire and retain talented personnel and strengthen its operations; and
(v)
the parent company’s support of the Investment Adviser and its mutual fund business, as expressed by the firm’s senior management;
(b)
information on the investment performance of the Portfolio, including comparisons to the performance of similar mutual funds, as provided by a third-party mutual fund data provider engaged as part of the contract review process (the “Outside Data Provider”), and a benchmark performance index, and information on general investment outlooks in the markets in which the Portfolio invests;
(c)
information provided by the Investment Adviser indicating the Investment Adviser’s views on whether the Portfolio’s peer group and/or benchmark index had high, medium, or low relevance given the Portfolio’s particular investment strategy;
(d)
the terms of the Agreements and other agreements with affiliated service providers entered into by the Trust on behalf of the Portfolio;
(e)
fee and expense information for the Portfolio, including the relative management fee and expense levels of the Portfolio as compared to those of comparable funds managed by other advisers, as provided by the Outside Data Provider;
(f)
with respect to the extensive investment performance and expense comparison data provided by the Outside Data Provider, its processes in producing that data for the Portfolio;
(g)
the undertakings of the Investment Adviser and its affiliates to implement fee waivers and/or expense limitations;
(h)
information relating to the profitability of the Management Agreement and the transfer agency and distribution and service arrangements of the Portfolio to the Investment Adviser and its affiliates;
(i)
whether the Portfolio’s existing management fee schedule adequately addressed any economies of scale;
(j)
a summary of the “fall-out” benefits derived by the Investment Adviser and its affiliates from their relationships with the Portfolio, including the fees received by the Investment Adviser’s affiliates from the Portfolio for transfer agency, portfolio trading, distribution and other services;
96
GOLDMAN SACHS TARGET DATE PORTFOLIOS
Statement Regarding Basis for Approval of Management Agreement and Sub-Advisory Agreement (Unaudited) (continued)
(k)
a summary of potential benefits derived by the Portfolio as a result of its relationship with the Investment Adviser;
(l)
portfolio manager ownership of Portfolio shares; the manner in which portfolio manager compensation is determined; information on the Sub-Adviser’s compensation arrangements; and the number and types of accounts managed by the portfolio managers;
(m)
the nature and quality of the services provided to the Portfolio by its unaffiliated service providers (including the Sub-Adviser), and the Investment Adviser’s general oversight and evaluation (including reports on due diligence) of those service providers as part of the administrative services provided under the Management Agreement; and
(n)
the Investment Adviser’s processes and policies addressing various types of potential conflicts of interest; its approach to risk management; the annual review of the effectiveness of the Portfolio’s compliance program; and periodic compliance reports.
The Trustees also received an overview of the Portfolios’ distribution arrangements. They received information regarding the Portfolios’ assets, share purchase and redemption activity, and payment of distribution, service, and shareholder administration fees, as applicable. Information was also provided to the Trustees relating to revenue sharing payments made by and services provided by the Investment Adviser and its affiliates to intermediaries that promote the sale, distribution, and/or servicing of Portfolio shares. The Independent Trustees also discussed the broad range of other investment choices that are available to Portfolio investors, including the availability of comparable funds managed by other advisers. The presentations made at the Board and Committee meetings and at the Annual Meeting encompassed the Portfolios and other mutual funds for which the Board of Trustees has responsibility. In evaluating the Agreements at the Annual Meeting, the Trustees relied upon their knowledge, resulting from their meetings and other interactions throughout the year, of the Portfolios and the respective services of the Investment Adviser and its affiliates and the Sub-Adviser. In conjunction with these meetings, the Trustees received written materials and oral presentations on the topics covered, and the Investment Adviser addressed the questions and concerns of the Trustees, including concerns regarding the investment performance of certain of the funds they oversee. In addition, the Independent Trustees periodically received written materials and oral presentations from the funds’ various sub-advisers, including the Sub-Adviser. The Independent Trustees were advised by their independent legal counsel regarding their responsibilities and other regulatory requirements related to the approval and continuation of mutual fund investment management agreements under applicable law. In addition, the Investment Adviser and its affiliates provided the Independent Trustees with a written response to a formal request for information sent on behalf of the Independent Trustees by their independent legal counsel. The Independent Trustees reviewed a written response prepared by the Sub-Adviser to a similar request for information submitted to the Sub-Adviser by the Investment Adviser. During the course of their deliberations, the Independent Trustees met in executive sessions with their independent legal counsel, without representatives of the Investment Adviser or its affiliates present.
97
GOLDMAN SACHS TARGET DATE PORTFOLIOS
Statement Regarding Basis for Approval of Management Agreement and Sub-Advisory Agreement (Unaudited) (continued)
Nature, Extent, and Quality of the Services Provided Under the Management Agreement As part of their review, the Trustees considered the nature, extent, and quality of the services provided to the Portfolios by the Investment Adviser. In this regard, the Trustees considered both the investment advisory services and non-advisory services (including oversight of the Sub-Adviser’s day-to-day management of the Portfolios) that are provided by the Investment Adviser and its affiliates. The Trustees noted the ongoing recruitment efforts aimed at bringing high quality investment talent to the Investment Adviser. They also noted the Investment Adviser’s commitment to maintaining high quality systems and expending substantial resources to respond to ongoing changes to the regulatory and control environment in which the Portfolios and their service providers operate, as well as the efforts of the Investment Adviser and its affiliates to combat cyber security risks. The Trustees concluded that the Investment Adviser continued to commit substantial financial and operational resources to the Portfolios and expressed confidence that the Investment Adviser would continue to do so in the future. The Trustees also recognized that the Investment Adviser had made significant commitments to address regulatory compliance requirements applicable to the Portfolios and the Investment Adviser and its affiliates.
Investment Performance In considering the investment performance of the Portfolios, the Trustees considered the investment performance of each Portfolio relative to its benchmark, the performance of other comparable registered funds, the Portfolios’ rankings and ratings based on information prepared by the Outside Data Provider, and updated performance information prepared by the Investment Adviser using data provided by the Outside Data Provider. As part of this review, they considered the investment performance trends of the Portfolios over time, and reviewed the investment performance of each Portfolio in light of its investment objective and policies and market conditions. The Trustees considered the performance record of each of the Goldman Sachs Target Date 2020, 2030, 2040, and 2050 Portfolios, which included the performance of its corresponding Predecessor Fund. The Trustees noted that the Goldman Sachs Target Date 2020 Portfolio’s Class R6 Shares had placed in the second quartile of the Portfolio’s performance peer group for the three-year period, the third quartile for the five-year period, and the fourth quartile for the one-year period ended June 30, 2017, and had outperformed the Portfolio’s primary benchmark index for the three-year period and underperformed for the one- and five-year periods ended June 30, 2017. They noted that each of the Goldman Sachs Target Date 2030 and 2040 Portfolios’ Class R6 Shares had placed in the first quartile of the Portfolios’ performance peer group for the three-year period, the third quartile for the five-year period, and the fourth quartile for the one-year period ended June 30, 2017, and had outperformed the Portfolios’ primary benchmark index for the three- and five-year periods and underperformed for the one-year period ended June 30, 2017. They noted that the Goldman Sachs Target Date 2050 Portfolio’s Class R6 Shares had placed in the top half of the Portfolio’s performance peer group and had outperformed the Portfolio’s primary benchmark index for the three- and five-year periods ended June 30, 2017, and had placed in the fourth quartile and underperformed the Portfolio’s primary benchmark index for the one-year period ended June 30, 2017. The Trustees concluded that the Goldman Sachs Target Date 2025, 2035, 2045, and 2055 Portfolios did not yet have a meaningful performance history.
98
GOLDMAN SACHS TARGET DATE PORTFOLIOS
Statement Regarding Basis for Approval of Management Agreement and Sub-Advisory Agreement (Unaudited) (continued)
Management Fees and Expense Ratios The Trustees considered the contractual terms of the Management Agreement, the fee rates payable by each Portfolio thereunder, and the net amount retained by the Investment Adviser after payment of sub-advisory fees. In this regard, the Trustees considered information on the services rendered by the Investment Adviser to the Portfolios, which include both advisory and administrative services that were directed to the needs and operations of the Portfolios as registered mutual funds. In particular, the Trustees reviewed analyses prepared by the Outside Data Provider regarding the expense rankings of the Portfolios. The analyses provided an expense analysis which compared each Portfolio’s overall net and gross expenses to a peer group and a category universe. The analyses also compared the Portfolios’ transfer agency, custody, distribution fees, other expenses, and fee waivers/reimbursements to those of the peer group and category medians. The Trustees concluded that the comparisons prepared by the Outside Data Provider and the Investment Adviser were useful in evaluating the reasonableness of the management fees and total expenses paid by the Portfolios. The Trustees considered the Investment Adviser’s undertaking to limit each Portfolio’s “other expenses” ratios (excluding certain expenses) to a specified level. In addition, the Trustees noted that shareholders are able to redeem their Portfolio shares at any time if shareholders believe that the Portfolio fees and expenses are too high or if they are dissatisfied with the performance of the Portfolio.
The Investment Adviser’s Profitability. The Trustees reviewed each Portfolio’s contribution to the Investment Adviser’s revenues and pre-tax profit margins. In this regard the Trustees noted that they had received, among other things, profitability analyses and summaries, revenue and expense schedules by Portfolio and by function (i.e., investment management, transfer agency, and distribution and service), and information on the Investment Adviser’s expense allocation methodology. They observed that the profitability and expense figures are substantially similar to those used by the Investment Adviser for many internal purposes, including compensation decisions among various business groups, and are thus subject to a vigorous internal debate about how certain revenue and expenses should be allocated. The Trustees also noted that the internal audit group within the Goldman Sachs organization had audited the expense allocation methodology and that the internal audit group was satisfied with the reasonableness, consistency, and accuracy of the Investment Adviser’s expense allocation methodology and profitability analysis calculations. Profitability data for each Portfolio was provided for 2016, and the Trustees considered this information in relation to the Investment Adviser’s overall profitability.
Economies of Scale The Trustees considered the information that had been provided regarding the Investment Adviser’s profitability. The Trustees also considered the breakpoints in the fee rate payable under the Management Agreement for each of the Portfolios at the following annual percentage rates of the average daily net assets of the Portfolios:
Average Daily Net Assets
Management Fee Annual Rate
First $2 billion
0.25
%
Next $3 billion
0.23
Over $5 billion
0.21
99
GOLDMAN SACHS TARGET DATE PORTFOLIOS
Statement Regarding Basis for Approval of Management Agreement and Sub-Advisory Agreement (Unaudited) (continued)
The Trustees noted that the breakpoints were designed to share potential economies of scale, if any, with each Portfolio and its shareholders as assets under management reach those asset levels. The Trustees considered the amounts of assets in the Portfolios; the Portfolios’ recent share purchase and redemption activity; the information provided by the Investment Adviser relating to the costs of the services provided by the Investment Adviser and its affiliates and their realized profits; information comparing fee rates charged by the Investment Adviser with fee rates charged to other funds in the peer group, as well as the Investment Adviser’s undertaking to limit certain expenses of each Portfolio that exceed specified levels. The Independent Trustees also considered the relationship between the advisory and sub-advisory fee rate schedules, including the terms of the minimum sub-advisory fee arrangement (described below). Upon reviewing these matters, the Trustees concluded that the fee breakpoints represented a means of assuring that benefits of scalability, if any, would be passed along to shareholders at the specified asset levels.
Other Benefits to the Investment Adviser and Its Affiliates The Trustees also considered the other benefits derived by the Investment Adviser and its affiliates from their relationships with the Portfolios, including: (a) transfer agency fees received by Goldman Sachs; (b) brokerage and futures commissions earned by Goldman Sachs for executing securities and futures transactions on behalf of the Portfolios; (c) the Investment Adviser’s ability to leverage the infrastructure designed to service the Portfolios on behalf of the Investment Adviser’s other clients; (d) the Investment Adviser’s ability to cross-market other products and services to Portfolio shareholders; (e) Goldman Sachs’ retention of certain fees as Distributor; (f) the Investment Adviser’s ability to negotiate better pricing with custodians on behalf of its other clients, as a result of the relationship with the Portfolios; and (g) the possibility that the working relationship between the Investment Adviser and the Portfolios’ third party service providers (including the Sub-Adviser) may cause those service providers to be more likely to do business with other areas of Goldman Sachs.
Other Benefits to the Portfolios and Their Shareholders The Trustees also noted that the Portfolios receive certain potential benefits as a result of their relationship with the Investment Adviser, including: (a) enhanced servicing from vendors because of the volume of business generated by the Investment Adviser and its affiliates; (b) the advantages received from the Investment Adviser’s knowledge and experience gained from managing other accounts and products; (c) the Investment Adviser’s ability to hire and retain qualified personnel, including the Sub-Adviser, to provide services to the Portfolios because of the reputation of the Goldman Sachs organization; (d) the Portfolios’ access, through the Investment Adviser, to certain firm-wide resources (e.g., proprietary risk management systems and databases), subject to certain restrictions; and (e) the Portfolios’ access to certain affiliated distribution channels.
100
GOLDMAN SACHS TARGET DATE PORTFOLIOS
Statement Regarding Basis for Approval of Management Agreement and Sub-Advisory Agreement (Unaudited) (continued)
Conclusion In connection with their consideration of the Management Agreement, the Trustees gave weight to each of the factors described above, but did not identify any particular factor as controlling their decision. After deliberation and consideration of the information provided, including the factors described above, the Trustees, including the Independent Trustees, unanimously concluded, in the exercise of their business judgment, that the investment management fees paid by each Portfolio were reasonable in light of the services provided to it by the Investment Adviser, the Investment Adviser’s costs and each Portfolio’s current and reasonably foreseeable asset levels. The Trustees unanimously concluded that the Management Agreement should be approved and continued with respect to each Portfolio until August 31, 2018.
Sub-Advisory Agreement with Madison Asset Management, LLC Nature, Extent, and Quality of the Services Provided Under the Sub-Advisory Agreement In evaluating the Sub-Advisory Agreement, the Trustees relied upon materials furnished and presentations made by the Investment Adviser and Sub-Adviser. In evaluating the nature, extent, and quality of services provided by the Sub-Adviser, the Trustees considered information on the services provided to each Portfolio by the Sub-Adviser, including information about the Sub-Adviser’s (a) personnel and compensation structure; (b) track record in managing the Portfolio and, with respect to certain Portfolios, the Predecessor Funds; (c) policies and procedures in place to address potential conflicts of interest; and (d) compliance program and code of ethics. In this regard, they also considered assessments provided by the Investment Adviser of the Sub-Adviser, the Sub-Adviser’s investment strategies and personnel, and its compliance program.
Costs of Services Provided The Trustees reviewed the terms of the Sub-Advisory Agreement and the fee schedule, including breakpoints, as well as the Investment Adviser’s agreement to pay the Sub-Adviser a minimum sub-advisory fee with respect to the Sub-Adviser’s first three years of service. They noted that the compensation paid to the Sub-Adviser is paid by the Investment Adviser, not by the Portfolios, and that the retention of the Sub-Adviser does not directly increase the fees incurred by the Portfolio for advisory services. They considered the Investment Adviser’s belief that the relationship between the management fees paid by each Portfolio and the sub-advisory fees paid by the Investment Adviser is appropriate given the level of services the Investment Adviser provides to each Portfolio and significant differences in cost drivers and risks associated with the respective services offered by the Investment Adviser and the Sub-Adviser.
Conclusion In connection with their consideration of the Sub-Advisory Agreement, the Trustees gave weight to various factors, but did not identify any particular factor as controlling their decision. After deliberation and consideration of the information provided, including the factors described above, the Trustees, including the Independent Trustees, unanimously concluded that the sub-advisory fees to be paid by the Investment Adviser to the Sub-Adviser are reasonable in light of the services provided by the Sub-Adviser and each Portfolio’s current and reasonably foreseeable asset levels, and that the Sub-Advisory Agreement should be approved and continued until August 31, 2018.
101
GOLDMAN SACHS TARGET DATE PORTFOLIOS
Trustees and Officers (Unaudited) Independent Trustees
Name, Address and Age1
Position(s) Held with the Trust
Term of Office and Length of Time Served2
Principal Occupation(s) During Past 5 Years
Number of Portfolios in Fund Complex Overseen by Trustee3
Other Directorships Held by Trustee4
Cheryl K. Beebe Age: 61
Chair of the Board of Trustees
Since 2017 (Trustee since 2015)
Ms. Beebe is retired. She is Director, Convergys Corporation (2015-Present); Director, Packaging Corporation of America (2008-Present); and was formerly Executive Vice President, (2010-2014); and Chief Financial Officer, Ingredion, Inc. (a leading global ingredient solutions company) (2004-2014). Chair of the Board of Trustees — Goldman Sachs Trust II.
17
Convergys Corporation (a global leader in customer experience outsourcing); Packaging Corporation of America (producer of container board)
Lawrence Hughes Age: 59
Trustee
Since 2016
Mr. Hughes is retired. Formerly, he held senior management positions with BNY Mellon Wealth Management, a division of The Bank of New York Mellon Corporation (a financial services company) (1991-2015), most recently as Chief Executive Officer (2010-2015). He serves as Chairman of the Board of Directors, Ellis Memorial and Eldredge House (a not-for-profit organization) (2012-Present). Previously, Mr. Hughes served as an Advisory Board Member of Goldman Sachs Trust II (February 2016-April 2016). Trustee — Goldman Sachs Trust II.
17
None
John F. Killian Age: 62
Trustee
Since 2015
Mr. Killian is retired. He is Director, Consolidated Edison, Inc. (2007-Present); Director, Houghton Mifflin Harcourt Publishing Company (2011-Present); and formerly held senior management positions with Verizon Communications, Inc., including Executive Vice President and Chief Financial Officer (2009- 2010); and President, Verizon Business, Verizon Communications, Inc. (2005-2009). Trustee — Goldman Sachs Trust II.
17
Consolidated Edison, Inc. (a utility holding company); Houghton Mifflin Harcourt Publishing Company
102
GOLDMAN SACHS TARGET DATE PORTFOLIOS
Trustees and Officers (Unaudited) (continued) Interested Trustee*
Name, Address and Age1
Position(s) Held with the Trust
Term of Office and Length of Time Served2
Principal Occupation(s) During Past 5 Years
Number of Portfolios in Fund Complex Overseen by Trustee3
Other Directorships Held by Trustee4
James A. McNamara Age: 54
President and Trustee
Since 2012
Managing Director, Goldman Sachs (December 1998-Present); Director of Institutional Fund Sales, GSAM (April 1998-December 2000); and Senior Vice President and Manager, Dreyfus Institutional Service Corporation (January 1993- April 1998).
142
None
President and Trustee — Goldman Sachs Trust II; Goldman Sachs Trust; Goldman Sachs Variable Insurance Trust; Goldman Sachs MLP Income Opportunities Fund; Goldman Sachs MLP and Energy Renaissance Fund; and Goldman Sachs ETF Trust.
*
Mr. McNamara is considered to be an “Interested Trustee” because he holds a position with Goldman Sachs and owns securities issued by The Goldman SachsGroup, Inc. He holds comparable positions with certain other companies of which Goldman Sachs, GSAM or an affiliate thereof is the investment adviser,administrator and/or distributor.
1
Each Trustee may be contacted by writing to the Trustee, c/o Goldman Sachs, 200 West Street, New York, New York, 10282, Attn: Caroline Kraus. Information isprovided as of August 31, 2017.
2
Subject to such policies as may be adopted by the Board from time-to-time, each Trustee holds office for an indefinite term, until the earliest of: (a) the election of hisor her successor; (b) the date the Trustee resigns or is removed by the Board or shareholders, in accordance with the Trust’s Declaration of Trust; or (c) thetermination of the Trust. The Board has adopted policies which provide that (a) no Trustee shall hold office for more than 15 years and (b) a Trustee shall retire as ofDecember 31st of the calendar year in which he or she reaches his or her 74th birthday, unless a waiver of such requirement shall have been adopted by a majority ofthe other Trustees. These policies may be changed by the Trustees without shareholder vote.
3
The Goldman Sachs Fund Complex includes certain other companies listed above for each respective Trustee. As of August 31, 2017, Goldman Sachs Trust IIconsisted of 17 portfolios (16 of which offered shares to the public); Goldman Sachs Trust consisted of 90 portfolios (88 of which offered shares to the public);Goldman Sachs Variable Insurance Trust consisted of 14 portfolios; Goldman Sachs MLP Income Opportunities Fund and Goldman Sachs MLP and EnergyRenaissance Fund each consisted of one portfolio; and Goldman Sachs ETF Trust consisted of 19 portfolios (eight of which offered shares to the public).
4
This column includes only directorships of companies required to report to the Securities and Exchange Commission under the Securities Exchange Act of 1934(i.e., “public companies”) or other investment companies registered under the Act.
Additional information about the Trustees is available in the Portfolios’ Statement of Additional Information, which can be obtained from Goldman Sachs free of charge by calling this toll-free number (in the United States of America): 1-800-526-7384.
103
GOLDMAN SACHS TARGET DATE PORTFOLIOS
Trustees and Officers (Unaudited) (continued) Officers of the Trust*
Name, Address and Age1
Position(s) Held with the Trust
Term of Office and Length of Time Served2
Principal Occupation(s) During Past 5 Years
James A. McNamara 200 West Street New York, NY 10282 Age: 54
Trustee and President
Since 2012
Managing Director, Goldman Sachs (December 1998-Present); Director of Institutional Fund Sales, GSAM (April 1998-December 2000); and Senior Vice President and Manager, Dreyfus Institutional Service Corporation (January 1993-April 1998). President and Trustee — Goldman Sachs Trust II; Goldman Sachs Trust; Goldman Sachs Variable Insurance Trust; Goldman Sachs MLP Income Opportunities Fund; Goldman Sachs MLP and Energy Renaissance Fund; and Goldman Sachs ETF Trust.
Caroline L. Kraus 200 West Street New York, NY 10282 Age: 40
Scott M. McHugh 200 West Street New York, NY 10282 Age: 45
Treasurer, Senior Vice President and Principal Financial Officer
Since 2012 (Principal Financial Officer since 2013)
Managing Director, Goldman Sachs (January 2016-Present); Vice President, Goldman Sachs (February 2007-December 2015); Assistant Treasurer of certain mutual funds administered by DWS Scudder (2005-2007); and Director (2005-2007), Vice President (2000-2005), and Assistant Vice President (1998-2000), Deutsche Asset Management or its predecessor (1998-2007). Treasurer, Senior Vice President and Principal Financial Officer — Goldman Sachs Trust II; Goldman Sachs Trust; Goldman Sachs Variable Insurance Trust; Goldman Sachs MLP Income Opportunities Fund; Goldman Sachs MLP and Energy Renaissance Fund; and Goldman Sachs ETF Trust.
Joseph F. DiMaria 30 Hudson Street Jersey City, NJ 07302 Age: 49
Assistant Treasurer and Principal Accounting Officer
Since 2017
Managing Director, Goldman Sachs (November 2015-Present) and Vice President — Mutual Fund Administration, Columbia Management Investment Advisers, LLC (May 2010-October 2015). Assistant Treasurer and Principal Accounting Officer — Goldman Sachs Trust II; Goldman Sachs Trust; Goldman Sachs Variable Insurance Trust; Goldman Sachs MLP Income Opportunities Fund; Goldman Sachs MLP and Energy Renaissance Fund; and Goldman Sachs ETF Trust.
*
Represents a partial list of officers of the Trust. Additional information about all the officers is available in the Portfolios’ Statement of Additional Information, whichcan be obtained from Goldman Sachs free of charge by calling this toll-free number (in the United States): 1-800-526-7384.
1
Information is provided as of August 31, 2017.
2
Officers hold office at the pleasure of the Board of Trustees or until their successors are duly elected and qualified. Each officer holds comparable positions withcertain other companies of which Goldman Sachs, GSAM or an affiliate thereof is the investment adviser, administrator and/or distributor.
Goldman Sachs Trust II — Goldman Sachs Target Date Portfolios — Tax Information (Unaudited)
For the fiscal year ended August 31, 2017, 15.04%, 27.41%, 26.35%, 30.04%, 25.78%, 30.84%, 26.88% and 33.78% of the dividends paid from net investment company taxable income by the Target Date 2020, Target Date 2025, Target Date 2030, Target Date 2035, Target Date 2040, Target Date 2045, Target Date 2050 and Target Date 2055 Portfolios, respectively, qualify for the dividends received deduction available to corporations.
From distributions paid during the fiscal year ended August 31, 2017, the total amount of income received by the Target Date 2020, Target Date 2025, Target Date 2030, Target Date 2035, Target Date 2040, Target Date 2045, Target Date 2050 and Target Date 2055 Portfolios from sources within foreign countries and possessions of the United States was $0.0187, $0.0153, $0.0357, $0.0199, $0.0397, $0.0232, $0.0469 and $0.0269 per share, respectively, all of which is attributable to qualified passive income. The percentage of net investment income dividends paid from foreign sources by the Target Date 2020, Target Date 2025, Target Date 2030, Target Date 2035, Target Date 2040, Target Date 2045, Target Date 2050 and Target Date 2055 Portfolios was 5.47%, 16.57%, 17.82%, 20.26%, 17.65%, 22.90%, 20.21% and 25.51%, respectively. The total amount of taxes paid by the Target Date 2020, Target Date 2025, Target Date 2030, Target Date 2035, Target Date 2040, Target Date 2045, Target Date 2050 and Target Date 2055 Portfolios to such countries was $0.0020, $0.0017, $0.0037, $0.0021, $0.0041, $0.0025, $0.0049 and $0.0029 per share, respectively.
For the fiscal year ended August 31, 2017, the Target Date 2020, Target Date 2025, Target Date 2030, Target Date 2035, Target Date 2040, Target Date 2045, Target Date 2050 and Target Date 2055 Portfolios designate 11.76%, 43.27%, 23.24%, 56.55%, 24.23%, 61.49%, 29.19% and 62.55%, respectively, of the dividends paid from net investment company taxable income as qualifying for the reduced tax rate under the Jobs and Growth Tax Relief and Reconciliation Act of 2003.
Pursuant to Section 852 of the Internal Revenue Code, the Target Date 2020, Target Date 2030, Target Date 2040 and Target Date 2050 Portfolios designate $1,887,095, $2,360,440, $1,980,519 and $807,554, respectively, or, if different, the maximum amount allowable, as capital gain dividends paid during the fiscal year ended August 31, 2017.
During the fiscal year ended August 31, 2017, the Target Date 2020, Target Date 2030, Target Date 2040 and Target Date 2050 Portfolios designate $141,846, $54,404, $159,108 and $87,982, respectively, as short-term capital gain dividends pursuant to Section 871(k) of the Internal Revenue Code.
104
FUNDS PROFILE
Goldman Sachs Funds
Goldman Sachs is a premier financial services firm, known since 1869 for creating thoughtful and customized investment solutions in complex global markets.
Today, the Investment Management Division of Goldman Sachs serves a diverse set of clients worldwide, including private institutions, public entities and individuals. With approximately $1.21 trillion in assets under supervision as of June 30, 2017, Goldman Sachs Asset Management (“GSAM”) has portfolio management teams located around the world and our investment professionals bring firsthand knowledge of local markets to every investment decision. Assets under supervision includes assets under management and other client assets for which Goldman Sachs does not have full discretion. GSAM leverages the resources of Goldman Sachs & Co. LLC subject to legal, internal and regulatory restrictions.
Money Market Financial Square FundsSM • Financial Square Treasury Solutions Fund1 • Financial Square Government Fund1 • Financial Square Money Market Fund2 • Financial Square Prime Obligations Fund2 • Financial Square Treasury Instruments Fund1 • Financial Square Treasury Obligations Fund1 • Financial Square Federal Instruments Fund1 • Financial Square Tax-Exempt Money Market Fund2 Investor FundsSM • Investor Money Market Fund3 • Investor Tax-Exempt Money Market Fund3 Fixed Income Short Duration and Government • Enhanced Income Fund • High Quality Floating Rate Fund • Short-Term Conservative Income Fund • Short Duration Government Fund • Short Duration Income Fund • Government Income Fund • Inflation Protected Securities Fund Multi-Sector • Bond Fund • Core Fixed Income Fund • Global Income Fund • Strategic Income Fund Municipal and Tax-Free • High Yield Municipal Fund • Dynamic Municipal Income Fund • Short Duration Tax-Free Fund
Single Sector • Investment Grade Credit Fund • U.S. Mortgages Fund • High Yield Fund • High Yield Floating Rate Fund • Emerging Markets Debt Fund • Local Emerging Markets Debt Fund • Dynamic Emerging Markets Debt Fund Fixed Income Alternatives • Long Short Credit Strategies Fund • Strategic Macro Fund4 Fundamental Equity • Equity Income Fund5 • Small Cap Value Fund • Small/Mid Cap Value Fund • Mid Cap Value Fund • Large Cap Value Fund • Focused Value Fund • Capital Growth Fund • Strategic Growth Fund • Small/Mid Cap Growth Fund • Flexible Cap Fund6 • Concentrated Growth Fund7 • Technology Opportunities Fund • Growth Opportunities Fund • Rising Dividend Growth Fund • Blue Chip Fund8 • Income Builder Fund Tax-Advantaged Equity • U.S. Tax-Managed Equity Fund • International Tax-Managed Equity Fund • U.S. Equity Dividend and Premium Fund • International Equity Dividend and Premium Fund
Equity Insights • Small Cap Equity Insights Fund • U.S. Equity Insights Fund • Small Cap Growth Insights Fund • Large Cap Growth Insights Fund • Large Cap Value Insights Fund • Small Cap Value Insights Fund • International Small Cap Insights Fund • International Equity Insights Fund • Emerging Markets Equity Insights Fund Fundamental Equity International • Strategic International Equity Fund • Focused International Equity Fund • Asia Equity Fund • Emerging Markets Equity Fund • N-11 Equity Fund Select Satellite • Real Estate Securities Fund • International Real Estate Securities Fund • Commodity Strategy Fund • Global Real Estate Securities Fund • Alternative Premia Fund9 • Absolute Return Tracker Fund • Long Short Fund • Managed Futures Strategy Fund • MLP Energy Infrastructure Fund • Multi-Manager Alternatives Fund • Absolute Return Multi-Asset Fund • Global Infrastructure Fund Total Portfolio Solutions • Global Managed Beta Fund • Multi-Manager Non-Core Fixed Income Fund
• Multi-Manager U.S. Dynamic Equity Fund • Multi-Manager Global Equity Fund • Multi-Manager International Equity Fund • Tactical Tilt Overlay Fund • Balanced Strategy Portfolio • Multi-Manager U.S. Small Cap Equity Fund • Multi-Manager Real Assets Strategy Fund • Growth and Income Strategy Portfolio • Growth Strategy Portfolio • Equity Growth Strategy Portfolio • Satellite Strategies Portfolio • Enhanced Dividend Global Equity Portfolio • Tax-Advantaged Global Equity Portfolio • Strategic Factor Allocation Fund • Target Date 2020 Portfolio • Target Date 2025 Portfolio • Target Date 2030 Portfolio • Target Date 2035 Portfolio • Target Date 2040 Portfolio • Target Date 2045 Portfolio • Target Date 2050 Portfolio • Target Date 2055 Portfolio • GQG Partners International Opportunities Fund • Tactical Exposure Fund
1
You could lose money by investing in the Fund. Although the Fund seeks to preserve the value of your investment at $1.00 per share, it cannot guarantee it will do so. An investment in the Fund is not a deposit of a bank and is not insured or guaranteed by the Federal Deposit Insurance Corporation or any other government agency. The Fund’s sponsor has no legal obligation to provide financial support to the Fund, and you should not expect that the sponsor will provide financial support to the Fund at any time.
2
You could lose money by investing in the Fund. Because the share price of the Fund will fluctuate, when you sell your shares they may be worth more or less than what you originally paid for them. The Fund may impose a fee upon sale of your shares or may temporarily suspend your ability to sell shares if the Fund’s liquidity falls below required minimums because of market conditions or other factors. An investment in the Fund is not a deposit of a bank and is not insured or guaranteed by the Federal Deposit Insurance Corporation or any other government agency. The Fund’s sponsor has no legal obligation to provide financial support to the Fund, and you should not expect that the sponsor will provide financial support to the Fund at any time.
3
You could lose money by investing in the Fund. Although the Fund seeks to preserve the value of your investment at $1.00 per share, it cannot guarantee it will do so. The Fund may impose a fee upon sale of your shares or may temporarily suspend your ability to sell shares if the Fund’s liquidity falls below required minimums because of market conditions or other factors. An investment in the Fund is not a deposit of a bank and is not insured or guaranteed by the Federal Deposit Insurance Corporation or any other government agency. The Fund’s sponsor has no legal obligation to provide financial support to the Fund, and you should not expect that the sponsor will provide financial support to the Fund at any time.
4
Effective on June 20, 2017, the Goldman Sachs Fixed Income Macro Strategies Fund was renamed the Goldman Sachs Strategic Macro Fund.
5
Effective on June 20, 2017, the Goldman Sachs Growth and Income Fund was renamed the Goldman Sachs Equity Income Fund.
6
Effective after the close of business on August 31, 2017, the Goldman Sachs Flexible Cap Growth Fund was renamed the Goldman Sachs Flexible Cap Fund.
7
Effective on July 28, 2017, the Goldman Sachs Focused Growth Fund was reorganized with and into the Goldman Sachs Concentrated Growth Fund.
8
Effective after the close of business on October 31, 2017, the Goldman Sachs Dynamic U.S. Equity Fund was renamed the Goldman Sachs Blue Chip Fund.
9
Effective after the close of business on October 30, 2017, the Goldman Sachs Dynamic Allocation Fund was renamed the Goldman Sachs Alternative Premia Fund.
Financial Square FundsSM and Investor FundsSM are registered service marks of Goldman Sachs & Co. LLC.
*
This list covers open-end funds only. Please visit our website at www.GSAMFUNDS.com to learn about our closed-end funds and exchange-traded funds.
TRUSTEES
OFFICERS
Cheryl K. Beebe, Chair
James A. McNamara, President
Lawrence Hughes
Scott M. McHugh, Treasurer, Senior Vice President, and
John F. Killian
Principal Financial Officer
James A. McNamara
Joseph F. DiMaria, Assistant Treasurer and Principal
Accounting Officer
Caroline L. Kraus, Secretary
GOLDMAN SACHS & CO. LLC
GOLDMAN SACHS ASSET MANAGEMENT, L.P.
Distributor and Transfer Agent
Investment Adviser
Visit our Web site at www.GSAMFUNDS.com to obtain the most recent month-end returns.
Goldman Sachs Asset Management, L.P. 200 West Street, New York, New York 10282
The portfolio risk management process includes an effort to monitor and manage risk, but does not imply low risk.
The reports concerning the Portfolios included in this shareholder report may contain certain forward-looking statements about the factors that may affect the performance of the Portfolios in the future. These statements are based on Portfolio management’s predictions and expectations concerning certain future events and their expected impact on the Portfolios, such as performance of the economy as a whole and of specific industry sectors, changes in the levels of interest rates, the impact of developing world events, and other factors that may influence the future performance of the Portfolios. Management believes these forward-looking statements to be reasonable, although they are inherently uncertain and difficult to predict. Actual events may cause adjustments in portfolio management strategies from those currently expected to be employed.
Views and opinions expressed are for informational purposes only and do not constitute a recommendation by GSAM to buy, sell, or hold any security. Views and opinions are current as of the date of this presentation and may be subject to change, they should not be construed as investment advice.
A description of the policies and procedures that the Portfolios use to determine how to vote proxies relating to portfolio securities and information regarding how a Portfolio voted proxies relating to portfolio securities during the most recent 12-month period ended June 30 is available (i) without charge, upon request by calling 1-800-526-7384 (for Retail Shareholders) or 1-800-621-2550 (for Institutional Shareholders); and (ii) on the Securities and Exchange Commission (“SEC”) web site at http://www.sec.gov.
References to indices, benchmarks or other measures of relative market performance over a specified period of time are provided for your information only and do not imply that the portfolio will achieve similar results. The index composition may not reflect the manner in which a portfolio is constructed. While an adviser seeks to design a portfolio which reflects appropriate risk and return features, portfolio characteristics may deviate from those of the benchmark.
The Portfolios file their complete schedule of portfolio holdings with the SEC for the first and third quarters of each fiscal year on Form N-Qs. The Portfolios’ Form N-Qs are available on the SEC’s website at http://www.sec.gov within 60 days after the Portfolios’ first and third fiscal quarters. The Portfolios’ Form N-Qs may be reviewed and copied at the SEC’s Public Reference Room in Washington, D.C. and information on the operation of the Public Reference Room may also be obtained by calling 1-800-SEC-0330. When available, Form N-Qs may be obtained upon request and without charge by calling 1-800-526-7384 (for Retail Shareholders) or 1-800-621-2550 (for Institutional Shareholders).
Economic and market forecasts presented herein reflect a series of assumptions and judgments as of the date of this presentation and are subject to change without notice. These forecasts do not take into account the specific investment objectives, restrictions, tax and financial situation or other needs of any specific client. Actual data will vary and may not be reflected here. These forecasts are subject to high levels of uncertainty that may affect actual performance. Accordingly, these forecasts should be viewed as merely representative of a broad range of possible outcomes. These forecasts are estimated, based on assumptions, land are subject to significant revision and may change materially as economic and market conditions change. Goldman Sachs has no obligation to provide updates or changes to these forecasts. Case studies and examples are for illustrative purposes only.
Portfolio holdings and allocations shown are as of August 31, 2017 and may not be representative of future investments. Portfolio holdings should not be relied on in making investment decisions and should not be construed as research or investment advice regarding particular securities. Current and future holdings are subject to risk.
THIS MATERIAL IS FOR INFORMATIONAL PURPOSES ONLY AND IS PROVIDED SOLELY ON THE BASIS THAT IT WILL NOT CONSTITUTE INVESTMENT OR OTHER ADVICE OR A RECOMMENDATION RELATING TO ANY PERSON’S OR PLAN’S INVESTMENT OR OTHER DECISIONS, AND GOLDMAN SACHS IS NOT A FIDUCIARY OR ADVISOR WITH RESPECT TO ANY PERSON OR PLAN BY REASON OF PROVIDING THE MATERIAL OR CONTENT HEREIN INCLUDING UNDER THE EMPLOYEE RETIREMENT INCOME SECURITY ACT OF 1974 OR DEPARTMENT OF LABOR REGULATIONS. PLAN SPONSORS AND OTHER FIDUCIARIES SHOULD CONSIDER THEIR OWN CIRCUMSTANCES IN ASSESSING ANY POTENTIAL COURSE OF ACTION.
This material is not authorized for distribution to prospective investors unless preceded or accompanied by a current Prospectus or summary prospectus, if applicable. Investors should consider a Portfolio’s objective, risks, and charges and expenses, and read the summary prospectus, if available, and/or the Prospectus carefully before investing or sending money. The summary prospectus, if available, and the Prospectus contain this and other information about a Portfolio and may be obtained from your authorized dealer or from Goldman Sachs & Co. LLC by calling (retail – 1-800-526-7384) (institutional – 1-800-621-2550).
(a) The Trust has adopted a code of ethics that applies to the Trust’s principal executive officer, principal financial officer, principal accounting officer or controller or persons performing similar functions, regardless of whether these individuals are employed by the Trust or a third party.
(c) During the period covered by the report, registrant did not make any substantive amendments to the Code.
(d) The Trust granted no waivers from the code during the period covered by this report.
(f) Any person may obtain a complete copy of the code without charge by calling the Adviser at 800-767-0300 and requesting a copy of “the Ultra Series Fund Sarbanes Oxley Code of Ethics.”
Item 3. Audit Committee Financial Expert.
In July 2017, Richard Struthers, an “independent” Trustee and a member of the Trust’s audit committee, was appointed to serve as the Trust’s audit committee financial expert among the four independent Trustees who so qualify to serve in that capacity.
Item 4. Principal Accountant Fees and Services.
(a) Audit Fees. Total audit fees paid (or to be paid) to the registrant’s principal accountant for the fiscal years ended December 31, 2017 and 2016, respectively were $227,000 ($450,000 including the Madison Fund, the Madison Strategic Sector Premium Fund and the Madison Covered Call & Equity Strategy Fund, all affiliated investment companies together, the “Affiliated Funds”) and $223,000 ($446,800 including the Affiliated Funds).
(b) Audit-Related Fees. Not applicable.
(c - e) Tax-Fees. The Audit Committee has pre-approved, as required by Rule 2-01(c)(7)(i)(C) of Regulation S-X, 100% of the services described in this Item 4(b) through (e).
For the fiscal years ended December 31, 2017 and December 31, 2016, the aggregate fees for professional services rendered to Deloitte & Touche for tax compliance, tax advice and tax planning for such fiscal years totaled $30,285 (budgeted) and $29,702, respectively.
In the scope of services comprising the fees disclosed under this Item 4(c) were the following services:
-Review and sign as signature preparer for U.S. Income Tax Return for Regulated Investment Companies, Form 1120-RIC.
(f) Not applicable.
(g) Not applicable.
(h) Not applicable.
Item 5. Audit Committee of Listed Registrants.
Not applicable.
Item 6. Schedule of Investments
(a) Schedule included as part of the report to shareholders filed under Item 1 of this Form.
(b) Not applicable.
Item 7. Disclosure of Proxy Voting Policies and Procedures for Closed-End Management Investment Companies.
Not applicable.
Item 8. Portfolio Managers of Closed-End Management Investment Companies.
Not applicable.
Item 9. Purchases of Equity Securities by Closed-End Management Investment Company and Affiliated Purchasers.
Not applicable.
Item 10. Submission of Matters to a Vote of Security Holders.
The Trust does not normally hold shareholder meetings. There have been no changes to the Trust’s procedures during the period covered by this report.
Item 11. Controls and Procedures.
(a) The Trust’s principal executive officer and principal financial officer determined that the Trust’s disclosure controls and procedures (as defined in Rule 30a-3(c) under the Investment Company Act of 1940 (the “Act”)) are effective, based on their evaluation of these controls and procedures required by Rule 30a-3(b) under the Act and Rules 13a-15(b) or 15d-15(b) under the Securities Exchange Act of 1934 within 90 days of the date of this report. There were no significant changes in the Trust’s internal controls or in other factors that could significantly affect these controls subsequent to the date of their evaluation. The officers identified no significant deficiencies or material weaknesses.
(b) There were no changes in the Trust’s internal control over financial reporting (as defined in Rule 30a-3(d) under the Act) that occurred during the second fiscal quarter of the period covered by this report that has materially affected, or is reasonably likely to materially affect, the Trust’s internal control over financial reporting.
Item 12. Disclosure of Securities Lending Activities for Closed-End Management Investment Companies.
Not applicable.
Item 13. Exhibits.
(a)
(1) Code of ethics - See Item 2.
(2) Certifications of principal executive and principal financial officers pursuant to Section 302 of the Sarbanes-Oxley Act of 2002 – Filed herewith.
(3) Not applicable.
(4) There was no change in the registrant’s independent public accountant for the period covered by this report.
(b) Certifications pursuant to Section 906 of the Sarbanes – Oxley Act of 2002. Furnished herewith.
SIGNATURES
Pursuant to the requirements of the Securities Exchange Act of 1934 and the Investment Company Act of 1940, the Registrant has duly caused this Report to be signed on its behalf by the undersigned, thereunto duly authorized.
Ultra Series Fund
/s/ Kevin S. Thompson Kevin S. Thompson, Chief Legal Officer and Chief Compliance Officer
Date: March 5, 2018
Pursuant to the requirements of the Securities Exchange Act of 1934 and the Investment Company Act of 1940, this Report has been signed below by the following persons on behalf of the Registrant and in the capacities and on the dates indicated.
/s/ Katherine L. Frank Katherine L. Frank, President and Principal Executive Officer
Date: March 5, 2018
/s/ Greg Hoppe Greg Hoppe, Principal Financial Officer
Date: March 5, 2018
We use cookies on this site to provide a more responsive and personalized service. Continuing to browse, clicking I Agree, or closing this banner indicates agreement. See our Cookie Policy for more information.