The address of each Trustee and officer is 550 Science Drive, Madison, Wisconsin 53711. The Statement of Additional Information, which includes additional information about the trustees and officers, is available at no cost on the SEC’s website at www.sec.gov or by calling CMFG Life Insurance Company at 1-800-798-5500.
Ultra Series Fund | December 31, 2015
| |
| Ultra Series Fund’s Trustees and Officers |
| | | | |
Name and
Year of Birth | Position(s)
and Length of
Time Served | Principal Occupation(s) During Past Five Years | Portfolios
Overseen in
Fund Complex by
Director/Trustee1 | Other Directorships
Held by Director/
TrusteeDuring Past
Five Years |
| Paul A. Lefurgey | Vice President, | MIH, Chairman - Executive Committee, 2015-Present, | N/A | N/A |
| 1964 | 2009 - Present | Executive Director and Head of Fixed Income | | |
| | | Investments, 2013 - Present; Managing Director and | | |
| | | Head of Fixed Income Investments, | | |
| | | 2005 - 2013; Madison and MIA, Executive Director and | | |
| | | Head of Fixed Income Investments, 2013 - Present; | | |
| | | Managing Director and Head of Fixed Income | | |
| | | Investments, 2010 - 2013 | | |
| | |
MEMBERS Capital Advisors, Inc. (“MCA”) (investment | | |
| | | advisory firm), Madison, WI, Vice President, 2003 - 2005 | | |
| | |
Madison Strategic Sector Premium Fund, Vice President, | | |
| | | 2010 - Present; Madison Funds (25), Vice President, | | |
| | | 2009 - Present; Madison Covered Call & Equity Strategy | | |
| | | Fund, Vice President, December 2012 - Present | | |
| Greg D. Hoppe | Treasurer, | MIH and MIA, Vice President, 1999 - Present; Madison, | N/A | N/A |
| 1969 | 2009 - Present | Vice President, 2009 - Present | | |
| | | Madison Strategic Sector Premium Fund, Treasurer, | | |
| | | 2009 - Present; Chief Financial Officer, 2005 - 2009; | | |
| | | Madison Funds (25), Treasurer, | | |
| | | 2009 - Present; Madison Covered Call & Equity Strategy | | |
| | | Fund, Treasurer, December 2012 - Present | | |
| Holly S. Baggot | Secretary, | MIH and MIA, Vice President, 2010 - Present; Madison, | N/A | N/A |
| 1960 | 1999 - Present | Vice President, 2009 - Present; MFD Distributor, LLC | | |
| | Assistant | (“MFD”) (an affiliated brokerage firm of Madison), Vice | | |
| | Treasurer, | President, 2012 - Present | | |
| | 1999 - 2007; |
MCA, Director-Mutual Funds, 2008-2009; Director- | | |
| | 2009 - Present | Mutual Fund Operations, 2006-2008; Operations | | |
| | | Officer-Mutual Funds, 2005-2006 | | |
| | | Madison Strategic Sector Premium Fund, Secretary | | |
| | | and Assistant Treasurer, 2010 - Present; Madison Funds | | |
| | | (25), Secretary, 1999-Present and Treasurer, 2008-2009 | | |
| | | and Assistant Treasurer, 1997-2007 and 2009-Present; | | |
| | | Madison Covered Call & Equity Strategy Fund, Secretary | | |
| | | and Assistant Treasurer, December 2012 - Present | | |
| 1 | As of the date of this report, the fund complex consists of Madison Funds with 25 portfolios, the Ultra Series Fund with 16 portfolios, the Madison Strategic Sector Premium Fund (a closed-end fund) and the Madison Covered Call & Equity Strategy Fund (closed end fund) (“MCN”), for a grand total of 43 separate portfolios in the fund complex. Not every Trustee is a member of the Board of Trustees of every fund in the fund complex, as noted above. |
82
Ultra Series Fund | December 31, 2015
| |
| Ultra Series Fund’s Trustees and Officers |
| | | | | |
Name and
Year of Birth | Position(s)
and Length of
Time Served | Principal Occupation(s) During Past Five Years | | Portfolios
Overseen in
Fund Complex by
Director/Trustee1 | Other Directorships
Held by Director/
TrusteeDuring Past
Five Years |
| Lisa R. Lange | Chief Compliance | MIH, MIA, and Madison, Chief Compliance Officer and | N/A | N/A |
| 1969 | Officer, | Chief Legal Officer, April 2015-Present | | | |
| | Chief Legal | NorthRoad Capital Management LLC (“NorthRoad”) | | |
| | Officer and | (an affiliated investment advisory firm of Madison), | | | |
| | Assistant Secretary, | Chief Compliance Officer and Chief Legal Officer April 2015-Present | | | |
| | April 2015 - | | | | |
| | Present | | | | |
| | | Madison Strategic Sector Premium Fund, Chief | | |
| | | Compliance Officer, Chief Legal Officer and | | |
| | | Assistant Secretary April 2015-Present | | | |
| | |
Madison Covered Call & Equity Strategy Fund, Chief | | |
| | | Compliance Officer, Chief Legal Officer and Assistant | | |
| | |
Secretary April 2015-Present, | | | |
| | | Madison Funds (25), Chief Compliance Officer, Chief | | |
| | | Legal Officer and Assistant Secretary, | | | |
| | | April 2015 -Present | | | |
| |
| |
| Independent Trustees | | | | |
Name and
Year of Birth | Position(s)
and Length of
Time Served2 | Principal Occupation(s)
During Past Five Years | | Portfolios
Overseen in
Fund Complex
by Director/
Trustee1 | Other Directorships Held by Director/
TrusteeDuring Past Five Years |
| | | | | |
Philip E. Blake
1944 | Trustee, 2009 - Present | Retired Investor | | 43 | Edgewood College, 2003 - Present; Chairman of the Board, 2010 - 2012 |
| | | Lee Enterprises, Inc (news and | | | |
| | | advertising publisher), Madison, WI, Vice President, 1998 - 2001 | | | Nerites Corporation (technology company), 2004 - 2013 |
| | |
Madison Newspapers, Inc., Madison, WI, President and Chief Executive Officer, 1993 - 2000 | | |
Madison Strategic Sector Premium Fund, 2005 - Present; Madison Funds (25), 2009 - Present; Madison Covered Call & Equity Strategy Fund, 2005-Aug 2009, and December 2012 - Present |
| | | | | | |
| | | | | | |
| | | | | | |
| | | | | | |
| 1 | As of the date of this report, the fund complex consists of Madison Funds with 25 portfolios, the Ultra Series Fund with 16 portfolios, the Madison Strategic Sector Premium Fund (a closed-end fund) and the Madison Covered Call & Equity Strategy Fund (closed end fund) (“MCN”), for a grand total of 43 separate portfolios in the fund complex. Not every Trustee is a member of the Board of Trustees of every fund in the fund complex, as noted above. |
| 2 | Independent Trustees serve in such capacity until reaching the age of 76, unless retirement is waived by unanimous vote of the remaining Trustees on an annual basis. |
83
Ultra Series Fund | December 31, 2015
| |
| Ultra Series Fund’s Trustees and Officers |
| | | | |
Name and
Year of Birth | Position(s)
and Length of
Time Served1 | Principal Occupation(s)
During Past Five Years | Portfolios
Overseen in
Fund Complex
by Director/
Trustee2 | Other Directorships Held by Director/
TrusteeDuring Past Five Years |
| James R. | Trustee, | First Weber Group (real estate | 43 | Park Bank, 1978 - Present |
| Imhoff, Jr. | 2009 - Present | brokers), Madison, WI, Chief | | Madison Strategic Sector Premium Fund, |
| 1944 | | Executive Officer, 1996 - Present | | 2005 - Present; Madison Covered Call |
| | | | | & Equity Strategy Fund, 2005 - Present; |
| | | | | Madison Funds (25), 2009 - Present |
| Steven P. Riege | Trustee, | Ovation Leadership (management | 43 | Forward Service Corporation (employment |
| 1954 | 2005 - Present | consulting), Milwaukee, WI, Owner/ | | training non-profit), 2010 - Present |
| | | President, 2001 - Present | | Stanek Tool Corp., 1990 - Present |
| | | Robert W. Baird & Company | | Madison Funds (25), 2005 - Present |
| | | (financial services), Milwaukee, WI, | | |
| | | Senior Vice President-Marketing and | | Madison Strategic Sector Premium Fund, |
| | | Vice President-Human Resources, | | 2014 - Present |
| | | 1986 - 2001 | | Madison Covered Call & Equity Strategy Fund, |
| | | | | 2015-Present |
| Richard E. | Trustee, 2004 - | Clearwater Capital Management | 41 | Park Nicolet Health Services, 2001 - 2012 |
| Struthers | Present | (investment advisory firm), | | HealthPartners, 2013 - Present |
| 1952 | | Minneapolis, MN, Chair and Chief | | |
| | | Executive Officer, 1998 - Present | | Madison Funds (25), 2004 - Present |
| | | Park Nicollet Health Services, Minneapolis, MN, Chairman, Finance and Investment Committee, 2006 - 2012 | | |
| | | IAI Mutual Funds, Minneapolis, MN, President and Director, 1992-1997 | | |
| 1 | Independent Trustees serve in such capacity until reaching the age of 76, unless retirement is waived by unanimous vote of the remaining Trustees on an annual basis. |
| 2 | As of the date of this report, the fund complex consists of Madison Funds with 25 portfolios, the Ultra Series Fund with 16 portfolios, the Madison Strategic Sector Premium Fund (a closed-end fund) and the Madison Covered Call & Equity Strategy Fund (closed end fund) (“MCN”), for a grand total of 43 separate portfolios in the fund complex. Not every Trustee is a member of the Board of Trustees of every fund in the fund complex, as noted above. |
SEC File Number: 811-04815
84
 | | Presorted Standard
U.S. POSTAGE
PAID
Louisville, KY
Permit No. 1051 | |
Madison Funds
Post Office Box 8390
Boston, MA 02266-8390
1 (800) 877-6089
www.madisonfunds.com
SEC File Number: 811-08261 | | | |
4460-P1053
Rev. 1015
| Annual Report |
| December 31, 2015 |
| Ultra Series Madison Target Retirement 2020 Fund |
| | Ultra Series Madison Target Retirement 2030 Fund |
| | Ultra Series Madison Target Retirement 2040 Fund |
| | Ultra Series Madison Target Retirement 2050 Fund |
Ultra Series Fund | December 31, 2015
| | | Page |
| | | |
| Management’s Discussion of Fund Performance | | 2 |
| | | |
Period in Review | | 2 |
Outlook | | 2 |
Target Retirement Date Funds | | 2 |
Target Retirement 2020 Fund | | 3 |
Target Retirement 2030 Fund | | 3 |
Target Retirement 2040 Fund | | 4 |
Target Retirement 2050 Fund | | 4 |
Notes to Management’s Discussion of Fund Performance | | 5 |
| | | |
| Portfolios of Investments | | |
| | | |
Target Retirement 2020 Fund | | 6 |
Target Retirement 2030 Fund | | 6 |
Target Retirement 2040 Fund | | 6 |
Target Retirement 2050 Fund | | 6 |
| | | |
| Financial Statements | | |
| | | |
Statements of Assets and Liabilities | | 7 |
Statements of Operations | | 8 |
Statements of Changes in Net Assets | | 9 |
Financial Highlights for a Share of Beneficial Interest Outstanding | | 10 |
| | | |
| Notes to Financial Statements | | 12 |
| | | |
| Report of Independent Registered | | |
| Public Accounting Firm | | 17 |
| | | |
| Other Information | | 18 |
| | | |
| Trustees and Officers | | 24 |
Nondeposit investment products are not federally insured, involve investment risk, may lose value and are not obligations of or guaranteed by any financial institution. For more complete information about Ultra Series Fund, including charges and expenses, request a prospectus from your plan administrator or call CUNA Mutual Retirement Solutions at 1-800-999-8786. Consider the investment objectives, risks, and charges and expenses of any fund carefully before investing. The prospectus contains this and other information about the investment company. For more current Ultra Series Fund performance information, please call 1-800-670-3600. Current performance may be lower or higher than the performance data quoted within. Past performance does not guarantee future results. Nothing in this report represents a recommendation of a security by the investment adviser. Portfolio holdings may have changed since the date of this report.
Ultra Series Fund | December 31, 2015
Management’s Discussion of Fund Performance (unaudited)
Period in Review
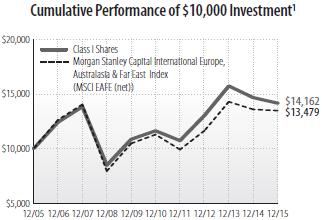
The fiscal year that ended December 31, 2015 reintroduced volatility into U.S. stock markets. After a slow upward march for the first seven months of the year, domestic stocks re-trenched in August. Through the highs of July 2015, the S&P 500® Index price advanced 3.37% for the calendar year-to-date. But the market fell in August as continued weakness in Chinese economic growth, devaluation of the Chinese currency and fears of a U.S. Federal Reserve monetary tightening triggered market declines throughout Asia which carried over to stock exchanges around the globe. U.S. markets quickly declined over 12% from July highs, creating the first “correction” (decline >10%) in stock prices since 2011. Materials and energy stocks were particularly hard hit. After an ensuing month of volatile share prices, the market stabilized and, by the beginning of November, the S&P 500® had recovered almost 13% from its August lows. Despite this volatility, the S&P 500® returned 1.38% for the calendar year. Small and mid-cap stocks returned -4.41% and -2.44% respectively, as measured by the Russell 2000® Index and Russell MidCap® Index. Foreign markets, as measured by the MSCI EAFE Index, returned -0.81%.
The sharp recovery in share prices from the August and late September lows point up the fickle nature of market psychology and the perils of trying to time major market moves. The fears over Chinese growth sustainability, which had in many ways been the catalyst for the market’s retreat, were replaced by a recognition that the impact of Chinese economic growth on the U.S. economy really is not that great. Oil prices, which have fallen by 65% since the end of last year, temporarily stabilized before heading lower. In short, what was bad news suddenly became not so bad, and in some cases even good. This was aided by a realization that central banks around the world were concerned about the swoon in asset prices and ready to lend a helping monetary hand.
Against the backdrop of volatility and market uncertainty, the U.S. economy continued to perform modestly. Domestic GDP growth recovered from a weather-induced weak first quarter of 2015 to a relatively robust 3.9% annualized rate in the second quarter before easing to an annualized 2.0% rate of growth in the third quarter. Early indications of fourth quarter growth suggest a continued tepid pace, driven by volatility in stock prices and continued softness in Energy sector investment (due to weak oil prices). Inflation remains well contained, with consumer prices through the end of November +0.5% compared to the same time last year. The decline in energy prices continues to keep overall inflation under control, but even without energy prices figured into inflation, the year-over-year change in non-energy, non-food prices remains under the Fed’s stated goal of 2%. Employment trends are favorable as well, with the unemployment rate falling from 5.6% to 5.0% in the last year.
Long-term interest rates experienced their share of volatility during the year, ranging from a low of 1.64% on ten year Treasury Notes in January to a high of 2.49% in mid-June. By the end of December, yields had fallen back to 2.27% as stock market turmoil, softer domestic economic growth and uncertainty over the future path of Federal Reserve Board (“Fed”) monetary policy took pressure off of the interest rate markets. The Fed began the process of normalizing short-term interest rates at its December meeting by raising its target for the benchmark Federal Funds Rate marginally above the zero level in place for the last seven years. Accompanying the increase was a statement that the pace of additional interest rate increases would be gradual and highly dependent on the path of future economic growth and inflation developments. For the calendar year period, the broad-based Barclays U.S. Aggregate Bond Index returned 0.55%. Shorter-maturity bond indices returned generally better results than very long maturity. Tax-exempt municipal funds were among the best performers during the year, while the high yield sector of the bond market suffered negative returns.
Outlook
With the previously weakest performing market sectors performing better, and bad news now good news, we are concerned about the fundamental underpinnings and sentiment of the stock market. Earnings are under pressure, valuations remain full and the market’s short memory seems to have quickly forgotten the turmoil of August and September. The Fed has begun the process of raising short-term interest rates and is expected to continue on this path, albeit at a gradual pace, over the coming year. The economy remains on solid footing and employment trends remain favorable. With the unemployment rate at 5.0%, we are beginning to see upward pressure on labor costs due to tightening employment market conditions. This trend bears watching, and while good for the American consumer, rising wage costs could pressure corporate profits. As a result, we continue to counsel caution and seek companies whose competitive position, strong management and solid balance sheet inspire confidence in future profitability.
Similarly, we remain defensive in our interest rate outlook as the Fed embarks on a tighter monetary policy regime. While we do not think the Fed will raise short-term interest rates too far or too quickly and run the risk of derailing the current expansion, the specter of higher short-term yields usually signals trouble for longer-term interest rates as well. This could have a cooling effect on interest rate sensitive sectors of the economy such as housing and automobile sales, which have been among the more solid performing sectors this past year.
Finally, 2016 is a Presidential election year, and we anticipate much talk of health care reform, tax reform, and energy policy. The U.S. regulatory environment is likely to draw increased attention as the consequences of the Dodd-Frank legislation are felt in the financial markets. We expect the political discussion of the year ahead to contribute to an environment of uncertainty and enhanced volatility.
Our goal is to seek investment opportunities that provide attractive return potential without undue risk. In the current environment of fully valued stock prices, very low short and long-term interest rates, and heightened market volatility, we are paying particularly close attention to the risk side of this tradeoff.
Target Retirement Date Funds
Positive contributors to the Funds’ performance for 2015 included an overweight allocation to U.S. Treasuries, overweight allocations to Japanese and European equities on a hedged basis, an underweight allocation to U.S. small cap stocks and an underweight allocation to emerging market equities. Our U.S. Treasury positions returned north of +1.5% for the year, outperforming the Barclays U.S. Aggregate Bond Index by roughly 1%. Our hedged Japanese and European equity positions returned +7.7% and +5.8% respectively, outperforming the MSCI ACWI ex-US Index return of -5.7% by a wide margin. U.S. small cap stocks underperformed U.S. large cap stocks -4.4% to +1.4%, while the MSCI Emerging Markets Index lost -14.9% against the developed markets MSCI EAFE Index return of -0.8%. Detractors from performance included an overweight to U.S. mid cap stocks and an allocation to gold. U.S. mid cap stocks underperformed U.S. large cap stocks -2.4% to +1.4%, while gold was down nearly 11%.
Ultra Series Fund | Management’s Discussion of Fund Performance (unaudited) - continued | December 31, 2015
| MADISON TARGET RETIREMENT 2020 FUND |
| |
| INVESTMENT STRATEGY HIGHLIGHTS |
The Ultra Series Madison Target Retirement 2020 Fund invests primarily in shares of registered investment companies according to an asset allocation strategy developed by the Fund’s investment adviser for investors planning to retire in or within a few years of 2020. Over time, the Fund’s asset allocation will gradually shift until it reaches the more conservative allocation target of approximately 15-30% in stock funds and 70-85% in bond funds. The asset allocation strategy is designed to reduce the volatility of investment returns in the later years while still providing the potential for higher total returns over the target period.
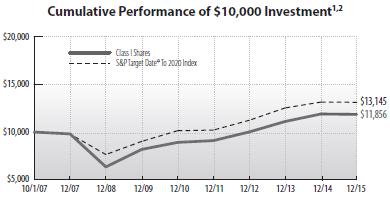
The Ultra Series Madison Target Retirement 2020 Fund returned -0.34% in the 12-month period, underperforming the S&P Target Date® To 2020 Index which returned -0.15%, but outperforming the Morningstar Target Date 2016-2020 category which returned -1.57%.
| |
| Average Annual Total Return (%) through December 31, 20151,2 |
| | | | | | | | | Since |
| | | | | | | | | 10/1/07 |
| | | 1 Year | | 3 Years | | 5 Years | | Inception |
| |
| Ultra Series Target Retirement 2020, Class I | | -0.34 | | 5.80 | | 5.87 | | 2.08 |
| |
| S&P Target Date® To 2020 Index | | -0.15 | | 5.31 | | 5.29 | | 3.35 |
| |
See accompanying Notes to Management’s Discussion of Fund Performance.
| |
| MADISON FUNDS: MADISON TARGET RETIREMENT 2020 FUND | | | |
| SECTOR ALLOCATION AS A PERCENTAGE OF NET ASSETS AS OF 12/31/15 | | | |
| |
| Bond Funds | | 58.9 | % |
| Stock Funds | | 27.7 | % |
| Foreign Stock Funds | | 6.0 | % |
| Alternative Funds | | 2.0 | % |
| Money Market Funds and Other Net Assets | | 5.4 | % |
| |
| MADISON TARGET RETIREMENT 2030 FUND |
| |
| INVESTMENT STRATEGY HIGHLIGHTS |
The Ultra Series Madison Target Retirement 2030 Fund invests primarily in shares of registered investment companies according to an asset allocation strategy developed by the Fund’s investment adviser for investors planning to retire in or within a few years of 2030. Over time, the Fund’s asset allocation will gradually shift until it reaches the more conservative allocation target of approximately 15-30% in stock funds and 70-85% in bond funds. The asset allocation strategy is designed to reduce the volatility of investment returns in the later years while still providing the potential for higher total returns over the target period.
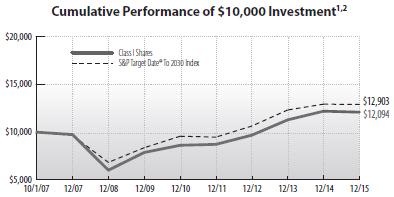
The Ultra Series Madison Target Retirement 2030 Fund returned -0.86% in the 12-month period, underperforming the S&P Target Date® To 2030 Index which returned -0.26%, but outperforming the Morningstar Target Date 2026-2030 category which returned -1.79%.
| |
| Average Annual Total Return (%) through December 31, 20151,2 |
| | | | | | | | | Since |
| | | | | | | | | 10/1/07 |
| | | 1 Year | | 3 Years | | 5 Years | | Inception |
| |
| Ultra Series Target Retirement 2030, Class I | | -0.86 | | 7.68 | | 7.00 | | 2.33 |
| |
| S&P Target Date® To 2030 Index | | -0.26 | | 6.64 | | 6.15 | | 3.14 |
| |
See accompanying Notes to Management’s Discussion of Fund Performance.
| |
| MADISON FUNDS: MADISON TARGET RETIREMENT 2030 FUND | | | |
| SECTOR ALLOCATION AS A PERCENTAGE OF NET ASSETS AS OF 12/31/15 | | | |
| |
| Stock Funds | | 46.5 | % |
| Bond Funds | | 37.1 | % |
| Foreign Stock Funds | | 10.8 | % |
| Alternative Funds | | 2.0 | % |
| Money Market Funds and Other Net Assets | | 3.6 | % |
| |
Ultra Series Fund | Management’s Discussion of Fund Performance (unaudited) - concluded | December 31, 2015
| MADISON TARGET RETIREMENT 2040 FUND |
| |
| INVESTMENT STRATEGY HIGHLIGHTS |
The Ultra Series Madison Target Retirement 2040 Fund invests primarily in shares of registered investment companies according to an asset allocation strategy developed by the Fund’s investment adviser for investors planning to retire in or within a few years of 2040. Over time, the Fund’s asset allocation will gradually shift until it reaches the more conservative allocation target of approximately 15-30% in stock funds and 70-85% in bond funds. The asset allocation strategy is designed to reduce the volatility of investment returns in the later years while still providing the potential for higher total returns over the target period.
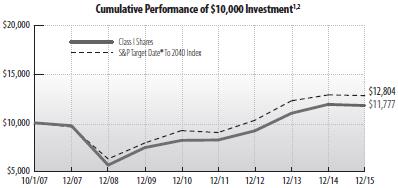
The Ultra Series Madison Target Retirement 2040 Fund returned -1.01% in the 12-month period, underperforming the S&P Target Date® To 2040 Index which returned -0.52%, but outperforming the Morningstar Target Date 2036-2040 category which returned -1.99%.
| |
| Average Annual Total Return (%) through December 31, 20151,2 | | | | | | | | |
| | | | | | | | | Since |
| | | | | | | | | 10/1/07 |
| | | 1 Year | | 3 Years | | 5 Years | | Inception |
| |
| Ultra Series Target Retirement 2040, Class I | | -1.01 | | 8.64 | | 7.49 | | 2.00 |
| |
| S&P Target Date® To 2040 Index | | -0.52 | | 7.64 | | 6.81 | | 3.04 |
| |
| | | | | | | | | |
| See accompanying Notes to Management’s Discussion of Fund Performance. | | | | | | | | |
| |
| MADISON FUNDS: MADISON TARGET RETIREMENT 2040 FUND | | | |
| SECTOR ALLOCATION AS A PERCENTAGE OF NET ASSETS AS OF 12/31/15 | | | |
| |
| Stock Funds | | 53.4 | % |
| Bond Funds | | 27.1 | % |
| Foreign Stock Funds | | 13.4 | % |
| Alternative Funds | | 2.5 | % |
| Money Market Funds and Other Net Assets | | 3.6 | % |
| |
| MADISON TARGET RETIREMENT 2050 FUND |
| |
| INVESTMENT STRATEGY HIGHLIGHTS |
The Ultra Series Madison Target Retirement 2050 Fund invests primarily in shares of registered investment companies according to an asset allocation strategy developed by the Fund’s investment adviser for investors planning to retire in or within a few years of 2050. Over time, the Fund’s asset allocation will gradually shift until it reaches the more conservative allocation target of approximately 15-30% in stock funds and 70-85% in bond funds. The asset allocation strategy is designed to reduce the volatility of investment returns in the later years while still providing the potential for higher total returns over the target period.
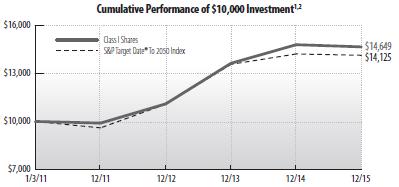
The Ultra Series Madison Target Retirement 2050 Fund returned -0.91% in the 12-month period, underperforming the S&P Target Date® To 2050 Index which returned -0.58%, but outperforming the Morningstar Target Date 2046-2050 category which returned -2.01%.
| |
| Average Annual Total Return (%) through December 31, 20151,2 | | | | | | |
| | | | | | | Since |
| | | | | | | 1/3/11 |
| | | 1 Year | | 3 Years | | Inception |
| |
| Ultra Series Target Retirement 2050, Class I | | -0.91 | | 9.70 | | 7.94 |
| |
| S&P Target Date® To 2050 Index | | -0.58 | | 8.44 | | – |
| |
See accompanying Notes to Management’s Discussion of Fund Performance.
| |
| MADISON FUNDS: MADISON TARGET RETIREMENT 2050 FUND | | | |
| SECTOR ALLOCATION AS A PERCENTAGE OF NET ASSETS AS OF 12/31/15 | | | |
| |
| Stock Funds | | 60.3 | % |
| Bond Funds | | 17.1 | % |
| Foreign Stock Funds | | 15.9 | % |
| Alternative Funds | | 3.0 | % |
| Money Market Funds and Other Net Assets | | 3.7 | % |
| |
Ultra Series Fund | December 31, 2015
| |
| Notes to Management’s Discussion of Fund Performance (unaudited) |
| 1 | Fund returns are calculated after fund level expenses have been subtracted, but do not include any separate account fees, charges or expenses imposed by the group variable annuity contracts that invest in the fund, as described in the Prospectus. If these fees, charges, or expenses were included, fund returns would have been lower. Fund returns also assume that dividends and capital gains are reinvested in additional shares of the fund. Investment return and principal value will fluctuate, so an investor’s shares, when redeemed, may be worth more or less than when purchased. Further information relating to the fund’s performance is contained in the Prospectus and elsewhere in this report. The fund’s past performance is not indicative of future performance. Current performance may be lower or higher than the performance data cited. For Ultra Series Fund performance data current to the most recent month-end, please call 1-800-670-3600 or visit www.ultraseriesfund.com. Indices are unmanaged and investors cannot invest in them directly. Index returns do not reflect fees or expenses. |
| | |
| 2 | Effective October 1, 2009, Madison contractually agreed to waive a portion of the management fee of the Target Retirement Date 2020, 2030, 2040 and 2050 Funds from 0.40% to 0.20%. Effective February 17, 2011, the fee was permanently reduced to 0.20%. On September 1, 2011, shareholders of the Target Retirement Date Funds approved a new fee arrangement which includes an investment advisory fee of 0.25% annualized and a services agreement fee of 0.05% annualized. Effective August 30, 2014, each Ultra Series Target Retirement Date Fund (USF Target Date Fund) invests substantially all of its assets in a corresponding Madison Target Retirement Date Fund. In order to avoid duplicate fees, from August 30 through December 31, 2014, all direct fees and expenses (0.25% management and 0.05% services) of each USF Target Date Fund were waived; and effective January 1, 2015, the USF Target Date Funds will not charge Management or Services Fees, only the acquired fees from the Madison Target Date Funds. If these fees had not been reduced, returns would have been lower. |
Morningstar Percentile rankings note: 1st percentile is top, 99th percentile is bottom.
©Morningstar, Inc. All Rights Reserved. The Morningstar related information contained herein: (1) is proprietary to Morningstar and/or its content providers; (2) may not be copied or distributed; and (3) is not warranted to be accurate, complete or timely. Neither Morningstar nor its content providers are responsible for any damages or losses arising from any use of this information.
BENCHMARK DESCRIPTIONS
The S&P Target Date® To Index Series
The S&P Target Date® “To” Index Series consists of multi-asset class indices, and corresponds to specific target retirement dates. The series reflects the consensus asset allocation and glide path of a subset of target date funds that generally pursue investment policies characterized by static total equity exposure after retirement and a relatively conservative total equity exposure near retirement. As the overall universe becomes more conservative with the approach of each target date year, so will the index. The asset allocation is based on market observations through an annual survey of “to” target date fund managers, and is categorized by S&P Dow Jones Indices.
| • | | The S&P Target Date® To 2020 Index is a benchmark for multi-class asset portfolios that corresponds to the target retirement date 2020. |
| • | | The S&P Target Date® To 2030 Index is a benchmark for multi-class asset portfolios that corresponds to the target retirement date 2030. |
| • | | The S&P Target Date® To 2040 Index is a benchmark for multi-class asset portfolios that corresponds to the target retirement date 2040. |
| • | | The S&P Target Date® To 2050 Index is a benchmark for multi-class asset portfolios that corresponds to the target retirement date 2050. |
Past performance is no guarantee of future results.
Ultra Series Fund | December 31, 2015
| |
| Madison Target Retirement 2020 Fund Portfolio of Investments |
| | | Shares | | Value (Note 2) | |
| INVESTMENT COMPANIES - 99.8% | | | | | | |
| | | | | | | |
| Master Fund - 97.4%* | | | | | | |
| Madison Funds: Madison Target | | | | | | |
| Retirement 2020 Fund Class R6 (A) | | 5,469,874 | | $ | 51,471,517 | |
| | | | | | | |
| Money Market Funds - 2.4% | | | | | | |
| State Street Institutional U.S. Government | | | | | | |
| Money Market Fund, 0.16%, Premier Class | | 1,261,128 | | | 1,261,128 | |
| | | | | | |
| TOTAL INVESTMENTS - 99.8% (Cost $50,923,009**) | | | | $ | 52,732,645 | |
| NET OTHER ASSETS AND LIABILITIES - 0.2% | | | | | 125,834 | |
| | | | | | |
| TOTAL NET ASSETS - 100.0% | | | | $ | 52,858,479 | |
| | | | | | |
| * | See Appendix A for a complete listing of holdings of the Master Fund. |
| ** | Aggregate cost for Federal tax purposes was $51,338,284. |
| (A) | Affiliated Company (see Note 8). |
| |
| Madison Target Retirement 2030 Fund Portfolio of Investments |
| | | Shares | | Value (Note 2) | |
| INVESTMENT COMPANIES - 99.8% | | | | | | |
| | | | | | | |
| Master Fund - 98.2%* | | | | | | |
| Madison Funds: Madison Target | | | | | | |
| Retirement 2030 Fund Class R6 (A) | | 7,882,221 | | $ | 72,989,363 | |
| | | | | | | |
| Money Market Funds - 1.6% | | | | | | |
| State Street Institutional U.S. Government | | | | | | |
| Money Market Fund, 0.16%, Premier Class | | 1,151,228 | | | 1,151,228 | |
| | | | | | |
| TOTAL INVESTMENTS - 99.8% (Cost $69,258,376**) | | | | $ | 74,140,591 | |
| NET OTHER ASSETS AND LIABILITIES - 0.2% | | | | | 117,618 | |
| | | | | | |
| TOTAL NET ASSETS - 100.0% | | | | $ | 74,258,209 | |
| | | | | | |
| * | See Appendix A for a complete listing of holdings of the Master Fund. |
| ** | Aggregate cost for Federal tax purposes was $69,810,838. |
| (A) | Affiliated Company (see Note 8). |
| |
| Madison Target Retirement 2040 Fund Portfolio of Investments |
| | | Shares | | Value (Note 2) | |
| INVESTMENT COMPANIES - 99.8% | | | | | | |
| | | | | | | |
| Master Fund - 97.6%* | | | | | | |
| Madison Funds: Madison Target | | | | | | |
| Retirement 2040 Fund Class R6 (A) | | 5,322,370 | | $ | 48,380,343 | |
| | | | | | | |
| Money Market Funds - 2.2% | | | | | | |
| State Street Institutional U.S. Government | | | | | | |
| Money Market Fund, 0.16%, Premier Class | | 1,097,244 | | | 1,097,244 | |
| | | | | | |
| TOTAL INVESTMENTS - 99.8% (Cost $45,624,566**) | | | | $ | 49,477,587 | |
| NET OTHER ASSETS AND LIABILITIES - 0.2% | | | | | 98,703 | |
| | | | | | |
| TOTAL NET ASSETS - 100.0% | | | | $ | 49,576,290 | |
| | | | | | |
| * | See Appendix A for a complete listing of holdings of the Master Fund. |
| ** | Aggregate cost for Federal tax purposes was $46,061,925. |
| (A) | Affiliated Company (see Note 8). |
| |
| Madison Target Retirement 2050 Fund Portfolio of Investments |
| | | Shares | | Value (Note 2) | |
| INVESTMENT COMPANIES - 99.6% | | | | | | |
| |
| Master Fund - 95.9%* | | | | | | |
| Madison Funds: Madison Target | | | | | | |
| Retirement 2050 Fund Class R6 (A) | | 2,188,418 | | $ | 20,308,516 | |
| | | | | | | |
| Money Market Funds - 3.7% | | | | | | |
| State Street Institutional U.S. Government | | | | | | |
| Money Market Fund, 0.16%, Premier Class | | 781,565 | | | 781,565 | |
| | | | | | |
| TOTAL INVESTMENTS - 99.6% (Cost $19,661,717**) | | | | $ | 21,090,081 | |
| NET OTHER ASSETS AND LIABILITIES - 0.4% | | | | | 83,089 | |
| | | | | | |
| TOTAL NET ASSETS - 100.0% | | | | $ | 21,173,170 | |
| | | | | | |
| * | See Appendix A for a complete listing of holdings of the Master Fund. |
| ** | Aggregate cost for Federal tax purposes was $19,763,815. |
| (A) | Affiliated Company (see Note 8). |
| See accompanying Notes to Financial Statements. |
| | |
| 6 |
Ultra Series Fund | December 31, 2015
| |
| Statements of Assets and Liabilities as of December 31, 2015 |
| | | | Madison | | | | Madison | | | | Madison | | | | Madison | |
| | | | Target | | | | Target | | | | Target | | | | Target | |
| | | | Retirement | | | | Retirement | | | | Retirement | | | | Retirement | |
| | | | 2020 Fund | | | | 2030 Fund | | | | 2040 Fund | | | | 2050 Fund | |
| | | | | | | | | | | | | |
| Assets: | | | | | | | | | | | | | | | | |
| Investments in securities, at cost | | | | | | | | | | | | | | | | |
Unaffiliated issuers | | $ | 1,261,128 | | | $ | 1,151,228 | | | $ | 1,097,244 | | | $ | 781,565 | |
Master Fund1 | | | 49,661,881 | | | | 68,107,148 | | | | 44,527,322 | | | | 18,880,152 | |
| Net unrealized appreciation | | | | | | | | | | | | | | | | |
Master Fund1 | | | 1,809,636 | | | | 4,882,215 | | | | 3,853,021 | | | | 1,428,364 | |
| | | | | | | | | | | | | |
Total investments at value | | | 52,732,645 | | | | 74,140,591 | | | | 49,477,587 | | | | 21,090,081 | |
| Receivables: | | | | | | | | | | | | | | | | |
Fund shares sold | | | 153,645 | | | | 117,634 | | | | 98,718 | | | | 83,096 | |
| | | | | | | | | | | | | |
Total assets | | | 52,886,290 | | | | 74,258,225 | | | | 49,576,305 | | | | 21,173,177 | |
| | | | | | | | | | | | | |
| Liabilities: | | | | | | | | | | | | | | | | |
| Payables: | | | | | | | | | | | | | | | | |
Fund shares repurchased | | | 27,811 | | | | 16 | | | | 15 | | | | 7 | |
| | | | | | | | | | | | | |
Total liabilities | | | 27,811 | | | | 16 | | | | 15 | | | | 7 | |
| | | | | | | | | | | | | |
| Net assets applicable to outstanding capital stock | | $ | 52,858,479 | | | $ | 74,258,209 | | | $ | 49,576,290 | | | $ | 21,173,170 | |
| | | | | | | | | | | | | |
| Net assets consist of: | | | | | | | | | | | | | | | | |
Paid-in capital | | $ | 51,393,316 | | | $ | 69,823,242 | | | $ | 46,081,405 | | | $ | 19,825,241 | |
Accumulated undistributed net investment income | | | 24,470 | | | | 28,485 | | | | 22,292 | | | | 9,234 | |
Accumulated net realized loss on investments sold | | | (368,943 | ) | | | (475,733 | ) | | | (380,428 | ) | | | (89,669 | ) |
Net unrealized appreciation of investments | | | 1,809,636 | | | | 4,882,215 | | | | 3,853,021 | | | | 1,428,364 | |
| | | | | | | | | | | | | |
| Net Assets | | $ | 52,858,479 | | | $ | 74,258,209 | | | $ | 49,576,290 | | | $ | 21,173,170 | |
| | | | | | | | | | | | | |
| Class I Shares: | | | | | | | | | | | | | | | | |
Net Assets | | $ | 52,858,479 | | | $ | 74,258,209 | | | $ | 49,576,290 | | | $ | 21,173,170 | |
Shares of beneficial interest outstanding | | | 6,574,198 | | | | 9,187,220 | | | | 6,579,285 | | | | 1,737,318 | |
Net Asset Value and redemption price per share | | $ | 8.04 | | | $ | 8.08 | | | $ | 7.54 | | | $ | 12.19 | |
| | | | | | | | | | | | | |
1 See Note 8 for information on affiliated issuers.
| See accompanying Notes to Financial Statements. |
| | |
| 7 |
Ultra Series Fund | December 31, 2015
| |
| Statements of Operations for the Year Ended December 31, 2015 |
| | | | Madison | | | | Madison | | | | Madison | | | | Madison | |
| | | | Target | | | | Target | | | | Target | | | | Target | |
| | | | Retirement | | | | Retirement | | | | Retirement | | | | Retirement | |
| | | | 2020 Fund | | | | 2030 Fund | | | | 2040 Fund | | | | 2050 Fund | |
| | | | | | | | | | | | | |
| Investment Income: | | | | | | | | | | | | | | | | |
Master Fund1 | | $ | 888,831 | | | $ | 1,241,035 | | | $ | 836,551 | | | $ | 342,649 | |
| | | | | | | | | | | | | |
Total investment income | | | 888,831 | | | | 1,241,035 | | | | 836,551 | | | | 342,649 | |
| | | | | | | | | | | | | |
| Expenses:2 | | | | | | | | | | | | | | | | |
Other expenses | | | 77 | | | | 53 | | | | 559 | | | | 395 | |
| | | | | | | | | | | | | |
Total expenses | | | 77 | | | | 53 | | | | 559 | | | | 395 | |
| | | | | | | | | | | | | |
| Net Investment Income | | | 888,754 | | | | 1,240,982 | | | | 835,992 | | | | 342,254 | |
| Net Realized and Unrealized Gain (Loss) on Investments | | | | | | | | | | | | | | | | |
Net realized gain (loss) on investments | | | | | | | | | | | | | | | | |
Unaffiliated issuers | | | (406,768 | ) | | | (524,765 | ) | | | (335,127 | ) | | | (2,162 | ) |
Master Fund1 | | | 1,214,724 | | | | 1,457,349 | | | | 1,552,803 | | | | 118,000 | |
| Capital gain distributions received from underlying funds | | | | | | | | | | | | | | | | |
Master Fund1 | | | 1,743,230 | | | | 2,634,963 | | | | 2,202,395 | | | | 619,178 | |
| Net change in unrealized appreciation (depreciation) on investments | | | | | | | | | | | | | | | | |
Master Fund1 | | | (3,559,651 | ) | | | (5,368,467 | ) | | | (4,671,217 | ) | | | (1,250,237 | ) |
| | | | | | | | | | | | | |
| Net Realized and Unrealized Loss on Investments | | | (1,008,465 | ) | | | (1,800,920 | ) | | | (1,251,146 | ) | | | (515,221 | ) |
| | | | | | | | | | | | | |
| Net Decrease in Net Assets from Operations | | $ | (119,711 | ) | | $ | (559,938 | ) | | $ | (415,154 | ) | | $ | (172,967 | ) |
| | | | | | | | | | | | | |
| 1 See Note 8 for information on affiliated issuers. |
| 2 See Note 3 for information on expenses. |
| See accompanying Notes to Financial Statements. |
| | |
| 8 |
Ultra Series Fund | December 31, 2015
| |
| Statements of Changes in Net Assets |
| | | Madison Target | | | Madison Target | | | Madison Target | | | Madison Target | |
| | | Retirement 2020 Fund | | | Retirement 2030 Fund | | | Retirement 2040 Fund | | | Retirement 2050 Fund | |
| | | | | | | | | | | | | |
| Year Ended December 31, | | | 2015 | | | | 2014 | | | | 2015 | | | | 2014 | | | | 2015 | | | | 2014 | | | | 2015 | | | | 2014 | |
| | | | | | | | | | | | | | | | | | | | | | | | | |
| Net Assets at beginning of period | | $ | 62,086,994 | | | $ | 70,472,021 | | | $ | 84,935,455 | | | $ | 93,187,497 | | | $ | 59,498,853 | | | $ | 68,917,211 | | | $ | 22,798,839 | | | $ | 18,122,573 | |
| | | | | | | | | | | | | | | | | | | | | | | | | |
| Increase (decrease) in net assets from operations: | | | | | | | | | | | | | | | | | | | | | | | | | | | | | | | | |
Net investment income | | | 888,754 | | | | 1,445,899 | | | | 1,240,982 | | | | 1,815,148 | | | | 835,992 | | | | 1,302,838 | | | | 342,254 | | | | 425,053 | |
Net realized gain | | | 2,551,186 | | | | 3,778,434 | | | | 3,567,547 | | | | 6,459,366 | | | | 3,420,071 | | | | 5,681,727 | | | | 735,016 | | | | 1,065,684 | |
Net change in unrealized appreciation (depreciation) | | | (3,559,651 | ) | | | (377,301 | ) | | | (5,368,467 | ) | | | (1,014,709 | ) | | | (4,671,217 | ) | | | (1,511,357 | ) | | | (1,250,237 | ) | | | 303,312 | |
| | | | | | | | | | | | | | | | | | | | | | | | | |
Net increase (decrease) in net assets from operations | | | (119,711 | ) | | | 4,847,032 | | | | (559,938 | ) | | | 7,259,805 | | | | (415,154 | ) | | | 5,473,208 | | | | (172,967 | ) | | | 1,794,049 | |
| Distributions to shareholders from: | | | | | | | | | | | | | | | | | | | | | | | | | | | | | | | | |
Net investment income | | | | | | | | | | | | | | | | | | | | | | | | | | | | | | | | |
Class I | | | (1,232,070 | ) | | | (1,620,265 | ) | | | (1,539,158 | ) | | | (1,934,962 | ) | | | (1,120,298 | ) | | | (1,401,615 | ) | | | (461,247 | ) | | | (435,257 | ) |
Net realized gains | | | | | | | | | | | | | | | | | | | | | | | | | | | | | | | | |
Class I | | | (2,535,543 | ) | | | (3,040,240 | ) | | | (3,763,105 | ) | | | (5,778,868 | ) | | | (3,435,249 | ) | | | (5,125,812 | ) | | | (623,257 | ) | | | (1,035,732 | ) |
| | | | | | | | | | | | | | | | | | | | | | | | | |
Total distributions | | | (3,767,613 | ) | | | (4,660,505 | ) | | | (5,302,263 | ) | | | (7,713,830 | ) | | | (4,555,547 | ) | | | (6,527,427 | ) | | | (1,084,504 | ) | | | (1,470,989 | ) |
| | | | | | | | | | | | | | | | | | | | | | | | | |
| Capital Stock transactions: | | | | | | | | | | | | | | | | | | | | | | | | | | | | | | | | |
Class I Shares | | | | | | | | | | | | | | | | | | | | | | | | | | | | | | | | |
Shares sold | | | 17,955,487 | | | | 30,353,864 | | | | 24,673,115 | | | | 36,962,168 | | | | 15,715,878 | | | | 30,530,746 | | | | 11,556,097 | | | | 15,844,030 | |
Issued to shareholders in reinvestment of distributions | | | 3,767,612 | | | | 4,660,505 | | | | 5,302,263 | | | | 7,713,830 | | | | 4,555,546 | | | | 6,527,427 | | | | 1,084,504 | | | | 1,470,989 | |
Shares redeemed | | | (27,064,290 | ) | | | (43,585,923 | ) | | | (34,790,423 | ) | | | (52,474,015 | ) | | | (25,223,286 | ) | | | (45,422,312 | ) | | | (13,008,799 | ) | | | (12,961,813 | ) |
| | | | | | | | | | | | | | | | | | | | | | | | | |
| Total increase (decrease) from capital stock transactions | | | (5,341,191 | ) | | | (8,571,554 | ) | | | (4,815,045 | ) | | | (7,798,017 | ) | | | (4,951,862 | ) | | | (8,364,139 | ) | | | (368,198 | ) | | | 4,353,206 | |
| | | | | | | | | | | | | | | | | | | | | | | | | |
| Total increase (decrease) in net assets | | | (9,228,515 | ) | | | (8,385,027 | ) | | | (10,677,246 | ) | | | (8,252,042 | ) | | | (9,922,563 | ) | | | (9,418,358 | ) | | | (1,625,669 | ) | | | 4,676,266 | |
| | | | | | | | | | | | | | | | | | | | | | | | | |
| Net Assets at end of period | | $ | 52,858,479 | | | $ | 62,086,994 | | | $ | 74,258,209 | | | $ | 84,935,455 | | | $ | 49,576,290 | | | $ | 59,498,853 | | | $ | 21,173,170 | | | $ | 22,798,839 | |
| | | | | | | | | | | | | | | | | | | | | | | | | |
Undistributed net investment income (loss) included in net assets | | $ | 24,470 | | | $ | 33,067 | | | $ | 28,485 | | | $ | 39,470 | | | $ | 22,292 | | | $ | 28,042 | | | $ | 9,234 | | | $ | 8,767 | |
| Capital Share transactions: | | | | | | | | | | | | | | | | | | | | | | | | | | | | | | | | |
Class I Shares | | | | | | | | | | | | | | | | | | | | | | | | | | | | | | | | |
Shares sold | | | 2,057,092 | | | | 3,356,026 | | | | 2,781,632 | | | | 4,006,031 | | | | 1,862,045 | | | | 3,401,029 | | | | 880,973 | | | | 1,196,333 | |
Issued to shareholders in reinvestment of distributions | | | 463,651 | | | | 536,783 | | | | 648,077 | | | | 878,019 | | | | 597,134 | | | | 778,089 | | | | 88,680 | | | | 113,369 | |
Shares redeemed | | | (3,103,891 | ) | | | (4,784,545 | ) | | | (3,929,355 | ) | | | (5,641,542 | ) | | | (2,987,668 | ) | | | (5,008,307 | ) | | | (990,668 | ) | | | (969,318 | ) |
| | | | | | | | | | | | | | | | | | | | | | | | | |
Net increase (decrease) from capital share transactions | | | (583,148 | ) | | | (891,736 | ) | | | (499,646 | ) | | | (757,492 | ) | | | (528,489 | ) | | | (829,189 | ) | | | (21,015 | ) | | | 340,384 | |
| | | | | | | | | | | | | | | | | | | | | | | | | |
| See accompanying Notes to Financial Statements. |
| | |
| 9 |
Ultra Series Fund | December 31, 2015
| |
| Financial Highlights for a Share of Beneficial Interest Outstanding |
| MADISON TARGET RETIREMENT 2020 FUND |
| | | Year Ended December 31, |
| | | |
| | | 2015 | | 2014 | | 2013 | | 2012 | | 2011 |
| | | | | | | | | | | |
| CLASS I | | | | | | | | | | | | | | | | | | | | |
| Net Asset Value at beginning of period | | $ | 8.67 | | | $ | 8.76 | | | $ | 8.31 | | | $ | 7.82 | | | $ | 8.06 | |
Income from Investment Operations: | | | | | | | | | | | | | | | | | | | | |
Net investment income1 | | | 0.13 | | | | 0.19 | | | | 0.21 | | | | 0.24 | | | | 0.22 | |
Net realized and unrealized gain (loss) on investments | | | (0.15 | ) | | | 0.42 | | | | 0.70 | | | | 0.53 | | | | (0.04 | ) |
Total from investment operations | | | (0.02 | ) | | | 0.61 | | | | 0.91 | | | | 0.77 | | | | 0.18 | |
Less Distributions From: | | | | | | | | | | | | | | | | | | | | |
Net investment income | | | (0.20 | ) | | | (0.24 | ) | | | (0.22 | ) | | | (0.25 | ) | | | (0.23 | ) |
Capital gains | | | (0.41 | ) | | | (0.46 | ) | | | (0.24 | ) | | | (0.03 | ) | | | (0.19 | ) |
Total distributions | | | (0.61 | ) | | | (0.70 | ) | | | (0.46 | ) | | | (0.28 | ) | | | (0.42 | ) |
| Net increase (decrease) in net asset value | | | (0.63 | ) | | | (0.09 | ) | | | 0.45 | | | | 0.49 | | | | (0.24 | ) |
| Net Asset Value at end of period | | $ | 8.04 | | | $ | 8.67 | | | $ | 8.76 | | | $ | 8.31 | | | $ | 7.82 | |
| Total Return (%)2 | | | (0.34 | ) | | | 7.11 | | | | 10.94 | | | | 9.98 | | | | 2.11 | |
| Ratios/Supplemental Data: | | | | | | | | | | | | | | | | | | | | |
| Net Assets at end of period (in 000’s) | | $ | 52,858 | | | $ | 62,087 | | | $ | 70,472 | | | $ | 56,607 | | | $ | 39,580 | |
| Ratios of expenses to average net assets: | | | | | | | | | | | | | | | | | | | | |
Before reimbursement of expenses by Adviser (%) | | | 0.00 | 4,7 | | | 0.30 | | | | 0.30 | | | | 0.30 | | | | 0.26 | |
After reimbursement of expenses by Adviser (%) | | | 0.00 | 4,7 | | | 0.21 | 5 | | | 0.30 | | | | 0.30 | | | | 0.24 | 3 |
| Ratio of net investment income to average net assets (%) | | | 1.51 | 7 | | | 2.08 | | | | 2.37 | | | | 2.96 | | | | 2.70 | |
| Portfolio turnover (%)6 | | | 7 | | | | 142 | | | | 167 | | | | 90 | | | | 114 | |
| MADISON TARGET RETIREMENT 2030 FUND |
| | | | Year Ended December 31, |
| | | |
| | | 2015 | | 2014 | | 2013 | | 2012 | | 2011 |
| | | | | | | | | | | |
| CLASS I | | | | | | | | | | | | | | | | | | | | |
| Net Asset Value at beginning of period | | $ | 8.77 | | | $ | 8.92 | | | $ | 8.04 | | | $ | 7.49 | | | $ | 7.90 | |
Income from Investment Operations: | | | | | | | | | | | | | | | | | | | | |
Net investment income1 | | | 0.13 | | | | 0.18 | | | | 0.19 | | | | 0.23 | | | | 0.19 | |
Net realized and unrealized gain (loss) on investments | | | (0.21 | ) | | | 0.54 | | | | 1.13 | | | | 0.60 | | | | (0.09 | ) |
Total from investment operations | | | (0.08 | ) | | | 0.72 | | | | 1.32 | | | | 0.83 | | | | 0.10 | |
Less Distributions From: | | | | | | | | | | | | | | | | | | | | |
Net investment income | | | (0.18 | ) | | | (0.22 | ) | | | (0.18 | ) | | | (0.22 | ) | | | (0.20 | ) |
Capital gains | | | (0.43 | ) | | | (0.65 | ) | | | (0.26 | ) | | | (0.06 | ) | | | (0.31 | ) |
Total distributions | | | (0.61 | ) | | | (0.87 | ) | | | (0.44 | ) | | | (0.28 | ) | | | (0.51 | ) |
| Net increase (decrease) in net asset value | | | (0.69 | ) | | | (0.15 | ) | | | 0.88 | | | | 0.55 | | | | (0.41 | ) |
| Net Asset Value at end of period | | $ | 8.08 | | | $ | 8.77 | | | $ | 8.92 | | | $ | 8.04 | | | $ | 7.49 | |
| Total Return (%)2 | | | (0.86 | ) | | | 8.06 | | | | 16.56 | | | | 11.05 | | | | 1.16 | |
| Ratios/Supplemental Data: | | | | | | | | | | | | | | | | | | | | |
| Net Assets at end of period (in 000’s) | | $ | 74,258 | | | $ | 84,935 | | | $ | 93,187 | | | $ | 68,009 | | | $ | 45,404 | |
| Ratios of expenses to average net assets: | | | | | | | | | | | | | | | | | | | | |
Before reimbursement of expenses by Adviser (%) | | | 0.00 | 4,7 | | | 0.30 | | | | 0.30 | | | | 0.30 | | | | 0.26 | |
After reimbursement of expenses by Adviser (%) | | | 0.00 | 4,7 | | | 0.21 | 5 | | | 0.30 | | | | 0.30 | | | | 0.24 | 3 |
| Ratio of net investment income to average net assets (%) | | | 1.51 | 7 | | | 1.98 | | | | 2.16 | | | | 2.84 | | | | 2.43 | |
| Portfolio turnover (%)6 | | | 7 | | | | 103 | | | | 136 | | | | 86 | | | | 108 | |
| 1 | Based on average shares outstanding during the year. |
| 2 | These returns are after all charges at the mutual fund level have been subtracted. These returns are higher than the returns at the separate account level because charges made at the separate account level have not been subtracted. Total returns are not annualized for periods less than one year. |
| 3 | Amount includes fees waived by the adviser through a contractual management fee reduction from 0.40% to 0.20% effective October 1, 2009 to February 16, 2011. Effective February 17, 2011 to August 31, 2011, the fee was permanently reduced to 0.20% Effective September 1, 2011, shareholders approved a new fee arrangement which includes an advisory fee of 0.25% and services agreement fee of 0.05%. |
| 4 | Amounts represent less than 0.01%. |
| 5 | Amount includes fees waived by the adviser (see Note 3). |
| 6 | Portfolio turnover is calculated at the fund level and represents the entire fiscal year or period. |
| 7 | Amount does not include income or expenses of the underlying Master Fund, nor the underlying expenses of the funds held by the Master Fund. See Note 1 for an explanation of the Fund organizational structure. |
| See accompanying Notes to Financial Statements. |
| | |
| 10 |
Ultra Series Fund | December 31, 2015
| |
| Financial Highlights for a Share of Beneficial Interest Outstanding |
| MADISON TARGET RETIREMENT 2040 FUND |
| | | Year Ended December 31, |
| | | |
| | | 2015 | | 2014 | | 2013 | | 2012 | | 2011 |
| | | | | | | | | | | |
| CLASS I | | | | | | | | | | | | | | | | | | | | |
| Net Asset Value at beginning of period | | $ | 8.37 | | | $ | 8.68 | | | $ | 7.61 | | | $ | 7.06 | | | $ | 7.60 | |
Income from Investment Operations: | | | | | | | | | | | | | | | | | | | | |
Net investment income1 | | | 0.13 | | | | 0.17 | | | | 0.17 | | | | 0.20 | | | | 0.16 | |
Net realized and unrealized gain (loss) on investments | | | (0.20 | ) | | | 0.55 | | | | 1.32 | | | | 0.61 | | | | (0.12 | ) |
Total from investment operations | | | (0.07 | ) | | | 0.72 | | | | 1.49 | | | | 0.81 | | | | 0.04 | |
Less Distributions From: | | | | | | | | | | | | | | | | | | | | |
Net investment income | | | (0.19 | ) | | | (0.22 | ) | | | (0.16 | ) | | | (0.19 | ) | | | (0.17 | ) |
Capital gains | | | (0.57 | ) | | | (0.81 | ) | | | (0.26 | ) | | | (0.07 | ) | | | (0.41 | ) |
Total distributions | | | (0.76 | ) | | | (1.03 | ) | | | (0.42 | ) | | | (0.26 | ) | | | (0.58 | ) |
| Net increase (decrease) in net asset value | | | (0.83 | ) | | | (0.31 | ) | | | 1.07 | | | | 0.55 | | | | (0.54 | ) |
| Net Asset Value at end of period | | $ | 7.54 | | | $ | 8.37 | | | $ | 8.68 | | | $ | 7.61 | | | $ | 7.06 | |
| Total Return (%)2 | | | (1.01 | ) | | | 8.27 | | | | 19.63 | | | | 11.42 | | | | 0.47 | |
| Ratios/Supplemental Data: | | | | | | | | | | | | | | | | | | | | |
| Net Assets at end of period (in 000’s) | | $ | 49,576 | | | $ | 59,499 | | | $ | 68,917 | | | $ | 49,269 | | | $ | 35,182 | |
| Ratios of expenses to average net assets: | | | | | | | | | | | | | | | | | | | | |
Before reimbursement of expenses by Adviser (%) | | | 0.00 | 4,7 | | | 0.30 | | | | 0.30 | | | | 0.30 | | | | 0.26 | |
After reimbursement of expenses by Adviser (%) | | | 0.00 | 4,7 | | | 0.21 | 5 | | | 0.30 | | | | 0.30 | | | | 0.24 | 3 |
| Ratio of net investment income to average net assets (%) | | | 1.52 | 7 | | | 1.95 | | | | 2.01 | | | | 2.65 | | | | 2.11 | |
| Portfolio turnover (%)6 | | | 8 | | | | 108 | | | | 151 | | | | 101 | | | | 115 | |
| 1 | Based on average shares outstanding during the year. |
| 2 | These returns are after all charges at the mutual fund level have been subtracted. These returns are higher than the returns at the separate account level because charges made at the separate account level have not been subtracted. Total returns are not annualized for periods less than one year. |
| 3 | Amount includes fees waived by the adviser through a contractual management fee reduction from 0.40% to 0.20% effective October 1, 2009 to February 16, 2011. Effective February 17, 2011 to August 31, 2011, the fee was permanently reduced to 020%. Effective September 1, 2011, shareholders approved a new fee arrangement which includes an advisory fee of 0.25% and services agreement fee of 0.05%. |
| 4 | Amounts represent less than 0.01%. |
| 5 | Amount includes fees waived by the adviser (see Note 3). |
| 6 | Portfolio turnover is calculated at the fund level and represents the entire fiscal year or period. |
| 7 | Amount does not include income or expenses of the underlying Master Fund, nor the underlying expenses of the funds held by the Master Fund. See Note 1 for an explanation of the Fund organizational structure. |
| MADISON TARGET RETIREMENT 2050 FUND |
| | | Year Ended December 31, | | | Inception to |
| | | | | | | |
| | | 2015 | | 2014 | | 2013 | | 2012 | | 12/31/111 |
| | | | | | | | | | | |
| CLASS I | | | | | | | | | | | | | | | | | | | | |
| Net Asset Value at beginning of period | | $ | 12.97 | | | $ | 12.78 | | | $ | 10.69 | | | $ | 9.75 | | | $ | 10.00 | |
Income from Investment Operations: | | | | | | | | | | | | | | | | | | | | |
Net investment income2 | | | 0.21 | | | | 0.27 | | | | 0.24 | | | | 0.30 | | | | 0.26 | |
Net realized and unrealized gain (loss) on investments | | | (0.33 | ) | | | 0.82 | | | | 2.19 | | | | 0.89 | | | | (0.36 | ) |
Total from investment operations | | | (0.12 | ) | | | 1.09 | | | | 2.43 | | | | 1.19 | | | | (0.10 | ) |
Less Distributions From: | | | | | | | | | | | | | | | | | | | | |
Net investment income | | | (0.28 | ) | | | (0.27 | ) | | | (0.18 | ) | | | (0.21 | ) | | | (0.14 | ) |
Capital gains | | | (0.38 | ) | | | (0.63 | ) | | | (0.16 | ) | | | (0.04 | ) | | | – | |
Return of capital | | | – | | | | – | | | | – | | | | – | | | | (0.01 | ) |
Total distributions | | | (0.66 | ) | | | (0.90 | ) | | | (0.34 | ) | | | (0.25 | ) | | | (0.15 | ) |
| Net increase (decrease) in net asset value | | | (0.78 | ) | | | 0.19 | | | | 2.09 | | | | 0.94 | | | | (0.25 | ) |
| Net Asset Value at end of period | | $ | 12.19 | | | $ | 12.97 | | | $ | 12.78 | | | $ | 10.69 | | | $ | 9.75 | |
| Total Return (%)3 | | | (0.91 | ) | | | 8.51 | | | | 22.78 | | | | 12.12 | | | | (1.03 | )4 |
| Ratios/Supplemental Data: | | | | | | | | | | | | | | | | | | | | |
| Net Assets at end of period (in 000’s) | | $ | 21,173 | | | $ | 22,799 | | | $ | 18,123 | | | $ | 7,160 | | | $ | 2,236 | |
| Ratios of expenses to average net assets: | | | | | | | | | | | | | | | | | | | | |
Before reimbursement of expenses by Adviser (%) | | | 0.00 | 7,10 | | | 0.30 | | | | 0.30 | | | | 0.30 | | | | 0.26 | 5 |
After reimbursement of expenses by Adviser (%) | | | 0.00 | 7,10 | | | 0.20 | 8 | | | 0.30 | | | | 0.30 | | | | 0.26 | 5,6 |
| Ratio of net investment income to average net assets (%) | | | 1.57 | 10 | | | 2.02 | | | | 1.98 | | | | 2.90 | | | | 2.61 | 5 |
| Portfolio turnover (%)9 | | | 13 | | | | 133 | | | | 215 | | | | 86 | | | | 75 | 4 |
| 1 | Commenced investment operations on January 3, 2011. |
| 2 | Based on average shares outstanding during the year. |
| 3 | These returns are after all charges at the mutual fund level have been subtracted. These returns are higher than the returns at the separate account level because charges made at the separate account level have not been subtracted. Total returns are not annualized for periods less than one year. |
| 4 | Not annualized. |
| 5 | Annualized. |
| 6 | Amount includes fees waived by the adviser through a contractual management fee reduction from 0.40% to 0.20% effective October 1, 2009 to February 16, 2011. Effective February 17, 2011 to August 31, 2011, the fee was permanently reduced to 0.20%. Effective September 1, 2011, shareholders approved a new fee arrangement which includes an advisory fee of 0.25% and services agreement fee of 0.05%. |
| 7 | Amounts represent less than 0.01%. |
| 8 | Amount includes fees waived by the adviser (see Note 3). |
| 9 | Portfolio turnover is calculated at the fund level and represents the entire fiscal year or period. |
| 10 | Amount does not include income or expenses of the underlying Master Fund, nor the underlying expenses of the funds held by the Master Fund. See Note 1 for an explanation of the Fund organizational structure. |
| See accompanying Notes to Financial Statements. |
| | |
| 11 |
Ultra Series Fund | December 31, 2015
Notes to Financial Statements
1. ORGANIZATION
The Ultra Series Fund (the “Trust”), a Massachusetts business trust, is registered under the investment company Act of 1940 (the “1940 Act”), as amended, as a diversified, open-end management investment company. The Trust is a series trust with, at the end of the period covered by this report, 16 investment portfolios (individually, a “Fund,” and collectively, the “Funds”), each with different investment objectives and policies. The Funds currently reporting within this book at the end of the period were the Madison Target Retirement 2020 Fund, Madison Target Retirement 2030 Fund, Madison Target Retirement 2040 Fund, and Madison Target Retirement 2050 Fund, (collectively, the “Target Date Funds” or “Ultra Series Madison Target Retirement Funds” or “USF Target Date Funds”).
The Declaration of Trust permits the Board of Trustees to issue an unlimited number of full and fractional shares of the Trust without par value. The Target Date Funds only offer a single class of shares, Class I shares. The shares represent an interest in the assets of the respective Fund and identical voting, dividend, liquidation and other rights, except the class of shares bears its own distribution fees, if any, and its proportional share of Fund level expenses, and has exclusive voting rights on matters pertaining to Rule 12b-1 under the 1940 Act as it relates to that class and other class specific matters. Shares are offered to qualified pension and retirement plans of CMFG Life Insurance Company or its affiliates (“CUNA Mutual Group”). The Trust may, in the future, offer other share classes to qualified pension and retirement plans that are not affiliated with CUNA Mutual Group. The Trust does not offer shares directly to the general public.
The Trust has entered into a Management Agreement with Madison Asset Management, LLC (the “Investment Adviser” or “Madison”).
Each Target Date Fund, each a feeder fund, seeks to achieve its investment objective by investing all of its investable assets in a respective master fund (the “Master Fund”), each Master Fund a series of the Madison Funds. Madison Funds is an open-end diversified investment management company advised by the Investment Adviser. The financial statements of each of the respective Master Funds should be read in conjunction with the Ultra Series Madison Target Retirement Funds’ financial statements. The valuation policies of the Master Funds can be found within the above referenced financial statements. As of December 31, 2015, the Ultra Series Madison Target Retirement 2020 Fund owned approximately 99.09% of the respective Madison Funds Master Fund, the Ultra Series Madison Target Retirement 2030 Fund owned approximately 99.36% of the respective Madison Funds Master Fund, the Ultra Series Madison Target Retirement 2040 Fund owned approximately 99.99% of the respective Madison Funds Master Fund, and the Ultra Series Madison Target Retirement 2050 Fund owned approximately 97.91% of the respective Madison Funds Master Fund. See also Appendix A, page 21 for the Portfolio of Investments, and Appendix B, page 23 for the Statements of Assets and Liabilities for the respective Master Funds.
2. SIGNIFICANT ACCOUNTING POLICIES
The Funds are investment companies that apply the accounting and reporting guidance in the Financial Accounting Standards Board (FASB) Accounting Standards Codification Topic 946, Financial Services – Investment Companies (ASC 946). The following is a summary of significant accounting policies consistently followed by each Fund in the preparation of its financial statements.
Portfolio Valuation: Equity securities, including exchange-traded funds (“ETFs”) listed on any U.S. or foreign stock exchange or quoted on the National Association of Securities Dealers Automated Quotation System (“NASDAQ’’) are valued at the last quoted sale price or official closing price on that exchange or NASDAQ on the valuation day (provided that, for securities traded on NASDAQ, the Funds utilize the NASDAQ Official Closing Price (“NOCP”)). If no sale occurs, equities traded on a U.S. exchange, foreign exchange or on NASDAQ are valued at the bid price.
Investments in shares of open-end mutual funds are valued at their daily net asset value (“NAV”) which is calculated as of the close of regular trading on the New York Stock Exchange ((the “NYSE”), usually 4:00 p.m. Eastern Standard Time) on each day on which the NYSE is open for business. NAV per share is determined by dividing each Fund’s total net assets by the number of shares of such Fund outstanding at the time of calculation. Because the assets of each Target Date Fund consist primarily of shares of other registered investment companies (the “Underlying Funds”), the NAV of each Fund is determined based on the NAV’s of the Underlying Funds. Total net assets are determined by adding the total current value of portfolio securities, cash, receivables, and other assets and subtracting liabilities.
Over-the-counter securities not listed or traded on NASDAQ are valued at the last sale price on the valuation day. If no sale occurs on the valuation day, an over-the-counter security is valued at the last bid price. Exchange traded options are valued at the mean of the best bid and ask prices across all option exchanges. Financial futures contracts generally are valued at the settlement price established by the exchange(s) on which the contracts are primarily traded. Overnight repurchase agreements are valued at cost, and term repurchase agreements (i.e., those whose maturity exceeds seven days), swaps, caps, collars and floors, if any, are valued at the average of the closing bids obtained daily from at least one dealer.
Through the end of this reporting period, the value of all assets and liabilities expressed in foreign currencies was converted into U.S. dollar values using the then-current exchange rate at the close of regular trading on the NYSE.
All other securities for which either quotations are not readily available, no other sales have occurred, or in the Investment Adviser’s opinion, do not reflect the current market value, are appraised at their fair values as determined in good faith by the Pricing Committee (the “Committee”) and under the general supervision of the Board of Trustees. When fair value pricing of securities is employed, the prices of securities used by the Funds to calculate NAV may differ from market quotations or NOCP. Because the Target Date Funds primarily invest in Underlying Funds it is not anticipated that the Investment Adviser will need to “fair value” any of the investments of these Funds. However, an Underlying Fund may need to “fair value” one or more of its investments, which may, in turn, require a Target Date Fund to do the same because of delays in obtaining the Underlying Fund’s NAV.
A Fund’s investments (or Underlying Fund) will be valued at fair value if, in the judgment of the Committee, an event impacting the value of an investment occurred between the closing time of a security’s primary market or exchange (for example, a foreign exchange or market) and the time the Fund’s share price is calculated as of the close of regular trading on the NYSE. Significant events may include, but are not limited to, the following: (1) significant fluctuations in domestic markets, foreign markets or foreign currencies; (2) occurrences not directly tied to the securities markets such as natural disasters, armed conflicts or significant government actions; and (3) major announcements affecting a single issuer or an entire market or market sector. In responding to a significant event, the Committee would determine the fair value of affected securities considering factors including, but not limited to: fundamental analytical data relating to the investment; the nature and duration of any restrictions on the disposition of the investment; and the forces influencing the market(s) in which the investment is purchased or sold.
In addition to independent fair value decisions made by the Committee noted above, the Committee also engages an independent fair valuation service to adjust the valuations of foreign equity securities based on specific market-movement parameters established by the Committee and approved by the Trust. Such adjustments to the valuation of foreign securities are applied automatically upon market close if the parameters established are exceeded. A foreign security is also automatically fair valued if the exchange it is traded in is on holiday.
Ultra Series Fund | Notes to the Financial Statements - continued | December 31, 2015
Security Transactions and Investment Income: Security transactions are accounted for on a trade date basis. Net realized gains or losses on sales are determined by the identified cost method. Interest income is recorded on an accrual basis. Dividend income is recorded on ex-dividend date, except that certain dividends from foreign securities may be recorded after the ex-dividend date based on when the Fund is informed of the dividend. Interest income is recorded on an accrual basis and is increased by the accretion of discount and decreased by the amortization of premium. Amortization and accretion are recorded on the effective yield method.
Expenses: Expenses that are directly related to one Fund are charged directly to that Fund. Other operating expenses are prorated to the Funds on the basis of relative net assets.
Repurchase Agreements: Each Fund may engage in repurchase agreements. In a repurchase agreement, a security is purchased for a relatively short period (usually not more than seven days) subject to the obligation to sell it back to the issuer at a fixed time and price plus accrued interest. The Funds will enter into repurchase agreements only with members of the Federal Reserve System and with “primary dealers” in U.S. Government securities.
The Trust has established a procedure providing that the securities serving as collateral for each repurchase agreement must be delivered to the Trust’s custodian either physically or in book-entry form and that the collateral must be marked to market daily to ensure that each repurchase agreement is fully collateralized at all times. In the event of bankruptcy or other default by a seller of a repurchase agreement, a Fund could experience one of the following: delays in liquidating the underlying securities during the period in which the Fund seeks to enforce its rights thereto, possible decreased levels of income, declines in value of the underlying securities, or lack of access to income during this period and the expense of enforcing its rights. As of December 31, 2015, none of the Funds held open repurchase agreements.
Foreign Currency Transactions: The Trust’s books and records are maintained in U.S. dollars. Foreign currency denominated transactions (i.e., market value of investment securities, assets and liabilities, purchases and sales of investment securities, and income and expenses) are translated into U.S. dollars at the current rate of exchange. The Funds enter into contracts on the trade date to settle any securities transactions denominated in foreign currencies on behalf of the Funds at the spot rate at settlement.
Each Fund, reports certain foreign currency-related transactions as components of realized gains or losses for financial reporting purposes, whereas such components are treated as ordinary income for federal income tax purposes.
The Funds do not isolate the portion of gains and losses on investments in securities that is due to changes in the foreign exchange rates from that which is due to changes in market prices of securities. Such amounts are categorized as gain or loss on investments for financial reporting purposes.
Cash Concentration: At times, the Funds maintain cash balances at financial institutions in excess of federally insured limits. The Funds monitor this credit risk and have not experienced any losses related to this risk.
Indemnifications: Under the Funds’ organizational documents, the Funds’ officers and Trustees are indemnified against certain liabilities arising out of the performance of their duties to the Funds. In the normal course of business, the Funds enter into contracts that contain a variety of representations and provide general indemnifications. The Funds’ maximum liability exposure under these arrangements is unknown, as future claims that have not yet occurred may be made against the Funds. However, based on experience, management expects the risk of loss to be remote.
Fair Value Measurements: Each Fund has adopted Financial Accounting Standards Board (the “FASB”) guidance on fair value measurements. Fair value is defined as the price that each Fund would receive upon selling an investment in a timely transaction to an independent buyer in the principal or most advantageous market of the investment. A three-tier hierarchy is used to maximize the use of observable market data “inputs” and minimize the use of unobservable “inputs” and to establish classification of fair value measurements for disclosure purposes. Inputs refer broadly to the assumptions that market participants would use in pricing the asset or liability, including assumptions about risk (for example, the risk inherent in a particular valuation technique used to measure fair value including such a pricing model and/or the risk inherent in the inputs used in the valuation technique). Inputs may be observable or unobservable.
Observable inputs are inputs that reflect the assumptions market participants would use in pricing the asset or liability developed based on market data obtained from sources independent of the reporting entity. Unobservable inputs are inputs that reflect the reporting entity’s own assumptions about the assumptions market participants would use in pricing the asset or liability developed based on the best information available in the circumstances. The three-tier hierarchy of inputs is summarized in the three broad Levels listed below:
| • | Level 1 – unadjusted quoted prices in active markets for identical investments |
| | |
| • | Level 2 – other significant observable inputs (including quoted prices for similar investments, interest rate volatilities, prepayment speeds, credit risk, benchmark yields, transactions, bids, offers, new issues, spreads and other relationships observed in the markets among comparable securities, underlying equity of the issuer; and proprietary pricing models such as yield measures calculated using factors such as cash flows, financial or collateral performance and other reference data, etc.) |
| | |
| • | Level 3 – significant unobservable inputs (including the Fund’s own assumptions in determining the fair value of investments) |
The valuation techniques used by the Funds to measure fair value for the year ended December 31, 2015, maximized the use of observable inputs and minimized the use of unobservable inputs. The Funds utilized the following fair value techniques: multi-dimensional relational pricing model and option adjusted spread pricing; the Funds estimated the price that would have prevailed in a liquid market for an international equity security given information available at the time of valuation. As of December 31, 2015, none of the Funds held securities deemed as a Level 3, and there were no transfers between classification levels.
The following is a summary of the inputs used as of December 31, 2015, in valuing the Funds’ investments carried at fair value (please see the Portfolio of Investments for each Fund for a listing of all securities within each category):
| | | Quoted Prices in | | Significant | | | | | | | |
| | | Active Markets | | Other | | Significant | | | |
| | | for Identical | | Observable | | Unobservable | | | |
| | | Investments | | Inputs | | Inputs | | Value at |
| Fund | | (Level 1) | | (Level 2) | | (Level 3) | | 12/31/15 |
| | | | | | | | | | | | | | | | |
| Madison Target Retirement 20201 | | $ | 51,471,517 | | | $ | – | | | $ | – | | | $ | 51,471,517 |
| State Street Institutional U.S. | | | | | | | | | | | | | | | |
| Government Money Market Fund | | | 1,261,128 | | | | – | | | | – | | | | 1,261,128 |
| | | | | | | | | | | | |
| Ultra Series Madison Target | | | | | | | | | | | | | | | |
| Retirement 2020 | | | 52,732,645 | | | | – | | | | – | | | | 52,732,645 |
| | | | | | | | | | | | | | | | |
| Madison Target Retirement 20301 | | | 72,989,363 | | | | – | | | | – | | | | 72,989,363 |
| State Street Institutional U.S. | | | | | | | | | | | | | | | |
| Government Money Market Fund | | | 1,151,228 | | | | – | | | | – | | | | 1,151,228 |
| | | | | | | | | | | | |
| Ultra Series Madison Target | | | | | | | | | | | | | | | |
| Retirement 2030 | | | 74,140,591 | | | | – | | | | – | | | | 74,140,591 |
1Please refer to Appendix A of this report (page 21) for a list of underlying holdings of the Master Fund held by each respective Ultra Series Target Date Fund. For additional information on the underlying funds held by each respective Master Fund, including shareholder prospectuses and financial reports, please visit each underlying fund’s website or visit the Securities and Exchange Commission’s website at http://www.sec.gov.
Ultra Series Fund | Notes to the Financial Statements - continued | December 31, 2015
| | | Quoted Prices in | | Significant | | | | | | | | |
| | | Active Markets | | Other | | Significant | | | | |
| | | for Identical | | Observable | | Unobservable | | | | |
| | | Investments | | Inputs | | Inputs | | Value at |
| Fund | | (Level 1) | | (Level 2) | | (Level 3) | | 12/31/15 |
| | | | | | | | | | | | | | | | | |
| Madison Target Retirement 20401 | | $ | 48,380,343 | | | $ | – | | | $ | – | | | $ | 48,380,343 | |
| State Street Institutional U.S. | | | | | | | | | | | | | | | | |
| Government Money Market Fund | | | 1,097,244 | | | | – | | | | – | | | | 1,097,244 | |
| | | | | | | | | | | | | |
| Ultra Series Madison Target | | | | | | | | | | | | | | | | |
| Retirement 2040 | | | 49,477,587 | | | | – | | | | – | | | | 49,477,587 | |
| Madison Target Retirement 20501 | | | 20,308,516 | | | | – | | | | – | | | | 20,308,516 | |
| State Street Institutional U.S. | | | | | | | | | | | | | | | | |
| Government Money Market Fund | | | 781,565 | | | | – | | | | – | | | | 781,565 | |
| | | | | | | | | | | | | |
| Ultra Series Madison Target | | | | | | | | | | | | | | | | |
| Retirement 2050 | | | 21,090,081 | | | | – | | | | – | | | | 21,090,081 | |
| 1Please refer to Appendix A of this report (page 21) for a list of underlying holdings of the Master Fund held by each respective Ultra Series Target Date Fund. For additional information on the underlying funds held by each respective Master Fund, including shareholder prospectuses and financial reports, please visit each underlying fund’s website or visit the Securities and Exchange Commission’s website at http://www.sec.gov. |
3. MANAGEMENT AND SERVICES AGREEMENTS AND OTHER EXPENSES
Management Agreement: For services under the Management Agreement, the Investment Adviser is entitled to receive a management fee, which is calculated daily and paid monthly, at an annual rate of 0.25% of each Fund’s average daily net assets. Effective with the launch of the Madison Funds Madison Target Date Funds or Master Funds (see Note 1), the Funds invested substantially all of their assets in these Master Funds. In order to avoid charging duplicate fees, from August 30, 2014 through December 31, 2014, these fees were waived by the Investment Adviser. The Investment Adviser does not have the right to recoup any of these waived fees. In that same regard, effective January 1, 2015, and as long as each USF Target Date Fund invests substantially all of its assets in the underlying Madison Target Date Fund discussed above, the USF Target Date Funds shall not pay any management fees to the Investment Adviser in recognition of the fees paid to the Adviser by the corresponding Madison Funds Madison Target Retirement Date Funds to avoid charging duplicate fees.
Services Agreement: The Investment Adviser provides or arranges for each Fund to have all of the necessary operational and support services it needs for a fee, which is calculated daily and paid monthly, at an annual rate of 0.05% of each Fund’s average daily net assets. Effective with the launch of the Madison Funds Madison Target Date Funds or Master Funds (See Note 1), the Funds invested substantially all of their asset in these Master Funds. In order to avoid charging duplicate fees, from August 30, 2014 through December 31, 2014, these fees were waived by the Investment Adviser. The Investment Adviser does not have the right to recoup any of these waived fees. In that same regard, effective January 1, 2015, and as long as each USF Target Date Fund invests substantially all of its assets in the underlying Madison Target Date Fund discussed above, the USF Target Date Funds shall not pay any service fees to the Investment Adviser in recognition of the fees paid to the Adviser by the corresponding Madison Funds Madison Target Retirement Date Funds to avoid charging duplicate fees.
Other Expenses: In addition to the fees described above, the Trust is responsible for brokerage commissions and other expenses incurred in connection with the acquisition or disposition of investments, overdrafts, any potential taxes owed and extraordinary expenses as approved by a majority of independent trustees.
Certain officers and trustees of the Trust are also officers of the Investment Adviser. The Funds do not compensate their officers or affiliated trustees. The Nominating and Governance Committee of the Board may change trustee fees paid at any time.
4. DIVIDENDS FROM NET INCOME AND DISTRIBUTIONS OF CAPITAL GAINS
The Funds declare dividends from net investment income and net realized gains from investment transactions, if any, annually, which are reinvested in additional full and fractional shares of the respective Funds.
Income and capital gain distributions, if any, are determined in accordance with federal income tax regulations, which may differ from accounting principles generally accepted in the United States of America. Taxable distributions from income and realized capital gains of the Funds may differ from book amounts earned during the period due to differences in the timing of capital gains recognition, and due to the reclassification of certain gains or losses from capital to income.
5. SECURITIES TRANSACTIONS
For the year ended December 31, 2015, aggregate cost of purchases and proceeds from sales of securities, other than short-term investment, were as follows:
| Fund | | Purchases | | Sales |
| Ultra Series Madison Target Retirement 2020 | | | $3,971,906 | | $ | 10,938,650 |
| Ultra Series Madison Target Retirement 2030 | | | 5,257,957 | | | 11,138,296 |
| Ultra Series Madison Target Retirement 2040 | | | 4,237,370 | | | 11,112,843 |
| Ultra Series Madison Target Retirement 2050 | | | 2,673,222 | | | 3,495,490 |
6. FEDERAL INCOME TAX INFORMATION
It is each Fund’s policy to comply with the requirements of Subchapter M of the Internal Revenue Code of 1986 applicable to regulated investment companies and to distribute all its taxable income to its shareholders. Accordingly, no provisions for federal income taxes are recorded in the accompanying statements.
The Funds have not recorded any liabilities for material unrecognized tax benefits as of December 31, 2015. It is each Fund’s policy to recognize accrued interest and penalties related to uncertain tax benefits in income taxes, as appropriate. Tax years that remain open to examination by major tax jurisdictions include tax years ended December 31, 2012 through December 31, 2015.
The tax character of distributions paid during the years ended December 31, 2015 and 2014 was as follows:
| | | | Ordinary Income | | | Long-Term Capital Gain |
| Fund | | | 2015 | | | 2014 | | | 2015 | | 2014 |
| Ultra Series Madison Target Retirement 2020 | | | $1,795,008 | | | | $2,178,516 | | | | $1,972,605 | | | $ | 2,481,989 |
| Ultra Series Madison Target Retirement 2030 | | | 1,972,507 | | | | 2,788,948 | | | | 3,329,756 | | | | 4,924,882 |
| Ultra Series Madison Target Retirement 2040 | | | 1,717,851 | | | | 2,327,916 | | | | 2,837,696 | | | | 4,199,511 |
| Ultra Series Madison Target Retirement 2050 | | | 542,952 | | | | 699,116 | | | | 541,552 | | | | 771,873 |
As of December 31, 2015, the components of distributable earnings on a tax basis were as follows:
| Fund | | Ordinary Income | | Long-Term Capital Gain |
| Ultra Series Madison Target Retirement 2020 | | | $26,491 | | | | $44,311 | |
| Ultra Series Madison Target Retirement 2030 | | | 28,486 | | | | 76,728 | |
| Ultra Series Madison Target Retirement 2040 | | | 28,078 | | | | 51,145 | |
| Ultra Series Madison Target Retirement 2050 | | | 10,936 | | | | 10,727 | |
For federal income tax purposes, the Target Date Funds did not have capital loss carryforwards as of December 31, 2015.
Certain specified losses incurred after October 31 and within the taxable year are deemed to arise on the first day of the Funds’ next taxable year, if the Funds so elect. For the year ended December 31, 2015, none of the Funds elected to defer late-year losses.
For the year ended December 31, 2015, there were no capital losses utilized for the Target Date Funds.
Ultra Series Fund | Notes to the Financial Statements - continued | December 31, 2015
At December 31, 2015, the aggregate gross unrealized appreciation/depreciation and net unrealized appreciation (depreciation) for all securities as computed on a federal income tax basis for each Fund were as follows:
| Fund | | Appreciation | | Depreciation | | Net |
| Ultra Series Madison Target Retirement 2020 | | | $1,394,361 | | | $ | – | | | | $1,394,361 | |
| Ultra Series Madison Target Retirement 2030 | | | 4,329,753 | | | | – | | | | 4,329,753 | |
| Ultra Series Madison Target Retirement 2040 | | | 3,415,662 | | | | – | | | | 3,415,662 | |
| Ultra Series Madison Target Retirement 2050 | | | 1,326,266 | | | | – | | | | 1,326,266 | |
The differences between book unrealized amounts reflected in the Statement of Assets and Liabilities and tax unrealized amounts (shown above) are due to the tax deferral of losses on wash sales.
Reclassification Adjustments: Paid-in capital, undistributed net investment income (loss), and accumulated net realized gain (loss) have been adjusted in the Statements of Assets and Liabilities for permanent book-tax differences for all Funds.
Differences primarily relate to distribution re-designations from investments in other regulated Investment companies.
To the extent these book and tax differences are permanent in nature, such amounts are reclassified at the end of the fiscal year among undistributed net investment income (loss) and undistributed net realized gain (loss) on investments and foreign currency translations. Accordingly, at December 31, 2015, reclassifications were recorded as follows:
| | | Undistributed | | Accumulated |
| | | Net Investment | | Net Realized |
| Fund | | Income (Loss) | | Gain (Loss) |
| Ultra Series Madison Target Retirement 2020 | | | $334,719 | | | | $(334,719) | |
| Ultra Series Madison Target Retirement 2030 | | | 287,191 | | | | (287,191) | |
| Ultra Series Madison Target Retirement 2040 | | | 278,556 | | | | (278,556) | |
| Ultra Series Madison Target Retirement 2050 | | | 119,460 | | | | (119,460) | |
7. INVESTMENT RISKS
Investing in certain financial instruments, including forward foreign currency contracts, involves certain risks. Risks associated with these instruments include potential for an illiquid secondary market for the instruments or inability of counterparties to perform under the terms of the contracts, changes in the value of foreign currency relative to the U.S. dollar and volatility resulting from an imperfect correlation between the movements in the prices of the instruments and the prices of the underlying securities and interest rates being hedged.
Investing in foreign securities involves certain risks not necessarily found in U.S. markets. These include risks associated with adverse changes in economic, political, regulatory and other conditions, changes in currency exchange rates, exchange control regulations, expropriation of assets or nationalization, imposition of withholding taxes on dividend or interest payments or capital gains, and possible difficulty in obtaining and enforcing judgments against foreign entities. Further, issuers of foreign securities are subject to different, and often less comprehensive, accounting, reporting and disclosure requirements than domestic issuers.
The Target Date Funds are fund of funds, meaning that they invest primarily in the shares of the Master Funds, including exchange traded funds (“ETFs”). Thus, each Fund’s investment performance and its ability to achieve its investment goal are directly related to the performance of the Master Funds in which it invests; and the Master Fund’s performance, in turn, depends on the particular securities in which that Master Fund invests and the expenses of that Fund. Accordingly, these Funds are subject to the risks of the Master Funds in direct proportion to the allocation of their respective assets among the Master Funds.
Additionally, the Target Date Funds are subject to asset allocation risk and manager risk. Manager risk (i.e., fund selection risk) is the risk that the Master Fund(s) selected to fulfill a particular asset class underperforms their peers. Asset allocation risk is the risk that the allocation of the Fund’s assets among the various asset classes and market segments will cause the Fund to underperform other funds with a similar investment objective.
The Funds are also subject to cybersecurity risk, which include the risks associated with computer systems, networks and devices to carry out routine business operations. These system, networks and devices employ a variety of protections that are designed to prevent cyberattacks. Despite the various cyber protections utilized by the Funds, the Investment Adviser, and other service providers, their systems, networks, or devices could potentially be breached. The Funds, their shareholders, and the Investment Adviser could be negatively impacted as a result of a cybersecurity breach. The Funds cannot control the cybersecurity plans and systems put in place by service providers or any other third parties whose operations may affect the Funds. The Funds do monitor this risk closely.
In addition to the other risks described above in the prospectus, you should understand what we refer to as “unknown market risks.” While investments in securities have been keystones in wealth building and management, at times these investments have produced surprises. Those who enjoyed growth and income of their investments generally were rewarded for the risks they took by investing in the markets. Although the Investment Adviser seeks to appropriately address and manage the risks identified and disclosed to you in connection with the management of the securities in the Funds, you should understand that the very nature of the securities markets includes the possibility that there may be additional risks of which we are not aware. We certainly seek to identify all applicable risks and then appropriately address them, take appropriate action to reasonably manage them and to make you aware of them so you can determine if they exceed your risk tolerance. Nevertheless, the often volatile nature of the securities markets and the global economy in which we work suggests that the risk of the unknown is something to consider in connection with an investment in securities. Unforeseen events could under certain circumstances produce a material loss of the value of some or all of the securities we manage for you in the Funds.
Ultra Series Funds | Notes to the Financial Statements - concluded | December 31, 2015
8. CAPITAL SHARES AND AFFILIATED OWNERSHIP
All capital shares outstanding at December 31, 2015 are owned by separate investment accounts and/or pension plans of CMFG Life Insurance Company. A summary of the transactions with each affiliated underlying fund as of December 31, 2015, follows:
| | | Balance of | | | | | | | | | | Balance of | | | | | | | | | | | |
| | | Shares | | | | | | | | | | Shares | | | | | | | | | | | |
| | | Held at | | Gross | | Gross | | Held at | | Value at | | Realized | | Distributions |
| Fund/Master Fund | | 12/31/14 | | Additions | | Sales | | 12/31/15 | | 12/31/15 | | Gain (Loss) | | Received1 |
| | | | | | | | | | | | | | | | | | | | | | | | | | | | |
| Ultra Series Madison Target Retirement 2020 Fund | | | | | | | | | | | | | | | | | | | | | | | | | | | |
| Madison Funds: Madison Target Retirement 2020 Fund Class R6 | | | 6,149,744 | | | | 411,281 | | | | (1,091,151 | ) | | | 5,469,874 | | | $ | 51,471,517 | | | $ | 1,214,724 | | | $ | 2,632,061 |
| | | | | | | | | | | | | | | | | | | | | | | | | |
| Totals | | | | | | | | | | | | | | | | | | $ | 51,471,517 | | | $ | 1,214,724 | | | $ | 2,632,061 |
| | | | | | | | | | | | | | | | | | | | | | | | | | | | |
| Ultra Series Madison Target Retirement 2030 Fund | | | | | | | | | | | | | | | | | | | | | | | | | | | |
| Madison Funds: Madison Target Retirement 2030 Fund Class R6 | | | 8,448,842 | | | | 553,254 | | | | (1,119,875 | ) | | | 7,882,221 | | | $ | 72,989,363 | | | $ | 1,457,349 | | | $ | 3,875,998 |
| | | | | | | | | | | | | | | | | | | | | | | | | |
| Totals | | | | | | | | | | | | | | | | | | $ | 72,989,363 | | | $ | 1,457,349 | | | $ | 3,875,998 |
| | | | | | | | | | | | | | | | | | | | | | | | | | | | |
| Ultra Series Madison Target Retirement 2040 Fund | | | | | | | | | | | | | | | | | | | | | | | | | | | |
| Madison Funds: Madison Target Retirement 2040 Fund Class R6 | | | 5,996,870 | | | | 451,885 | | | | (1,126,385 | ) | | | 5,322,370 | | | $ | 48,380,343 | | | $ | 1,552,803 | | | $ | 3,038,946 |
| | | | | | | | | | | | | | | | | | | | | | | | | |
| Totals | | | | | | | | | | | | | | | | | | $ | 48,380,343 | | | $ | 1,552,803 | | | $ | 3,038,946 |
| | | | | | | | | | | | | | | | | | | | | | | | | | | | |
| Ultra Series Madison Target Retirement 2050 Fund | | | | | | | | | | | | | | | | | | | | | | | | | | | |
| Madison Funds: Madison Target Retirement 2050 Fund Class R6 | | | 2,262,722 | | | | 272,564 | | | | (346,868 | ) | | | 2,188,418 | | | $ | 20,308,516 | | | $ | 118,000 | | | $ | 961,827 |
| | | | | | | | | | | | | | | | | | | | | | | | | |
| Totals | | | | | | | | | | | | | | | | | | $ | 20,308,516 | | | $ | 118,000 | | | $ | 961,827 |
1Distributions received include distributions from net investment income and from capital gains from the underlying funds.
9. SUBSEQUENT EVENTS
Management has evaluated the impact of all subsequent events on the Funds through the date the financial statements were available for issue. No other events have taken place that meet the definition of subsequent event that require adjustment to, or disclosure, in the financial statements.
Ultra Series Fund | December 31, 2015
Report of Independent Registered Public Accounting Firm
To the Shareholders and Board of Trustees of Ultra Series Fund:
We have audited the accompanying statements of assets and liabilities, including the portfolios of investments, of Madison Target Retirement 2020 Fund, Madison Target Retirement 2030 Fund, Madison Target Retirement 2040 Fund, and Madison Target Retirement 2050 Fund each a portfolio constituting Ultra Series Fund (collectively, the “Funds”) as of December 31, 2015, and the related statements of operations for the year then ended, and the statements of changes in net assets and the financial highlights for each of the periods presented. These financial statements and financial highlights are the responsibility of the Funds’ management. Our responsibility is to express an opinion on these financial statements and financial highlights based on our audits.
We conducted our audits in accordance with the standards of the Public Company Accounting Oversight Board (United States). Those standards require that we plan and perform the audit to obtain reasonable assurance about whether the financial statements and financial highlights are free of material misstatement. The Funds are not required to have, nor were we engaged to perform, an audit of their internal control over financial reporting. Our audits included consideration of internal control over financial reporting as a basis for designing audit procedures that are appropriate in the circumstances, but not for the purpose of expressing an opinion on the effectiveness of the Funds’ internal control over financial reporting. Accordingly, we express no such opinion. An audit also includes examining, on a test basis, evidence supporting the amounts and disclosures in the financial statements, assessing the accounting principles used and significant estimates made by management, as well as evaluating the overall financial statement presentation. Our procedures included confirmation of securities owned as of December 31, 2015, by correspondence with the custodian and brokers. We believe that our audits provide a reasonable basis for our opinion.
In our opinion, the financial statements and financial highlights referred to above present fairly, in all material respects, the financial position of each of the Funds constituting the Ultra Series Fund as of December 31, 2015, the results of their operations for the year then ended, and the changes in their net assets and the financial highlights for each of the periods presented, in conformity with accounting principles generally accepted in the United States of America.
/s/ Deloitte & Touche, LLP
Milwaukee, WI
February 24, 2016
Ultra Series Fund | December 31, 2015
Other Information (unaudited)
SUMMARY OF BOARD’S ANNUAL APPROVAL PROCESS AND CONSIDERATIONS
The Board of Trustees reviewed a variety of matters in connection with the renewal of the Trust’s Investment Advisory Agreement with the Adviser and the Sub-Advisory Agreements with the applicable Subadvisers at an in-person meeting of the Board held in July 2015. The following summarizes the Board’s process and considerations in connection with those renewals.
In evaluating the Investment Advisory Agreement and Sub-Advisory Agreements, the Board considered a variety of information relating to each Fund, the Adviser and the applicable Subadvisers. The information provided to the Board included: (1) industry data comparing advisory fees and expense ratios of comparable investment companies; (2) comparative performance information; (3) the Adviser’s and its affiliates’ revenues and costs of providing services to the Funds; and (4) information about the Adviser’s and applicable Subadviser’s personnel.
The Independent Trustees were separately represented by independent legal counsel with respect to their consideration of the renewal of the Investment Advisory Agreement and Sub-Advisory Agreements and received materials from such counsel discussing the legal standards for their consideration of the proposed renewal of the Investment Advisory Agreement and Sub-Advisory Agreements with respect to the Funds. Prior to voting, the Independent Trustees reviewed the proposed renewal of the Investment Advisory Agreement and Sub-Advisory Agreements with management and also met in a private session with their counsel at which no representatives of management were present.
In the course of its deliberations regarding the Investment Advisory Agreement and Sub-Advisory Agreements, the Board considered the following factors, among others: the nature, extent and quality of the services provided by the Adviser and, as applicable, the Subadviser, including the personnel providing such services; comparative performance, fee and expense information for each Fund; the profitability of each Fund to the Adviser and its affiliates; the direct and indirect benefits, if any, derived by the Adviser, Subadviser and their affiliates from their relationship with a Fund; economies of scale; and the Adviser’s and, as applicable, the Subadviser’s performance of substantially similar duties for other clients with similar investment strategies.
With regard to the nature, extent and quality of the services provided by the Adviser and, as applicable, each Subadviser, the Board reviewed the biographies and tenure of the personnel involved in Trust management and the experience of the Adviser (and applicable Subadviser) and its affiliates as investment manager to other investment companies with similar investment strategies or to individual clients or institutions with similar investment strategies. They recognized the wide array of investment professionals employed by the respective firm or firms. Representatives of the Adviser and, as applicable, each Subadviser discussed or otherwise presented their respective firms’ ongoing investment philosophies and strategies intended to provide investment performance consistent with each Fund’s investment objectives under various market scenarios.
The Board discussed the various administrative services provided directly by the Adviser. Such services included arranging for third party service providers to provide all necessary Fund administration as well as supervising any Subadvisers to the Funds.
Based on their review of the information provided, the Independent Trustees determined that the nature, extent and quality of services provided by the Adviser and, as applicable, the Subadviser to each Fund were satisfactory.
With regard to the investment performance of the Funds, the Board reviewed current performance information provided in the written Board materials. They discussed the reasons for both outperformance and underperformance compared with peer groups and applicable indices and benchmarks. They recognized that the usefulness of comparative performance data as a frame of reference to measure a Fund’s performance may be limited because the performance peer group, among other things, may not adequately reflect the objectives and strategies of the Fund, may have a different investable universe, or the composition of the peer group may be limited in size or number as well as other factors. They discussed the unique aspects of the securities markets applicable to particular Funds so that the performance of any such Funds could be reviewed in context. They reviewed both long-term and short-term performance and considered the effect on long-term performance that may have been attributable to a Fund’s previous portfolio managers or investment strategies. They recognized that the performance data reflects a snapshot in time, in this case as of the end of the most recent calendar year or quarter. A different performance period, however, could generate significantly different results. Further, they noted that long-term performance can be adversely affected by even one period of significant underperformance so that a single investment decision or theme has the ability to disproportionately affect long-term performance. The Board and the portfolio managers discussed the Funds that adhere to the Adviser’s “participate and protect” investment philosophy and, recognizing that this is a conservative investment philosophy, the portfolio managers explained that individual Fund performance indicative of the strategy may be reflected in relative underperformance during periods of high risk market environments, such as the recent market environment. The Board performed this review in connection with the Adviser and each Subadviser that manages a sub-advised Fund. In connection with the review of performance, the Board engaged in a comprehensive discussion of market conditions and discussed the reasons for Fund performance under such conditions. The Board noted the relative strong risk-adjusted returns of the Target Retirement Date Funds for the period ended May 31, 2015. In addition, the Board recognized that the Mid Cap Fund and the Small Cap Fund, each outperformed its benchmark and peer group for the one-year period ended May 31, 2015, which was largely due to individual stock selection in the Funds. With regard to fixed-income Funds, the Board considered each Fund’s relatively conservative investment philosophy and high-quality bias during a period of historically low interest rates and the relative risks to fixed-income Funds in the current environment. For example, the Core Bond Fund held more conservative shorter duration exposure than their benchmarks for the period resulting in relative underperformance. Representatives of the Adviser discussed with the Board the methodology for arriving at peer groups and indices used for performance comparisons. The Board also considered that sometimes the Morningstar categories the Funds fall into do not reflect the Funds’ investment strategy and philosophy. Based on their review, the Independent Trustees determined that, given the totality of the above factors and considerations, each Fund’s investment performance had been satisfactory.
With regard to the costs of the services provided and the profits realized by the Adviser and its affiliates (including the affiliated Subadviser to the International Stock Fund) from their relationship with the Trust, the Board reviewed the expense ratios for a variety of other funds in each Fund’s peer group with similar investment strategies. Again, the Board reviewed these matters in connection with the Adviser and each Subadviser that manages a sub-advised Fund. Based on their review, the Independent Trustees concluded that the Adviser’s and its affiliates’ level of profitability from their relationship with each Fund was reasonable. Because the Adviser pays the unaffiliated Subadvisers’ sub-advisory fees and those fees are negotiated at arm’s length by the Adviser, the cost of services to be provided and the profits to be realized by the unaffiliated Subadvisers were not material factors in the Board’s deliberations.
The Board noted that the Adviser or its affiliates, and, as applicable, each Subadviser, provided investment management services to other investment company and/or non-investment company clients and considered the fees charged by the Adviser
Ultra Series Funds | Other Information (unaudited) - continued | December 31, 2015
(and respective Subadviser) to such Funds and clients for purposes of determining whether the given advisory fee was disproportionately large under the so-called Gartenberg standard traditionally used by investment company boards in connection with contract renewal considerations. The Board took those fees into account and considered the differences in services and time required by the various types of funds and clients to which the Adviser (or Subadviser, if applicable) provided services. The Board recognized that significant differences may exist between the services provided to one type of fund or client and those provided to others, such as those resulting from a greater frequency of shareholder redemptions in a mutual fund and the higher turnover of mutual fund assets. The Board gave such comparisons the weight that they merit in light of the similarities and differences between the services that the various Funds require. They considered that, if the services rendered by the Adviser (or Subadviser, if applicable) to one type of fund or client differed significantly from others, then the comparison should be given less weight. In the case of non-investment company clients for which the Adviser (or Subadviser, if applicable) may act as either investment adviser or Subadviser, the Board noted that the fee may be lower than the fee charged to the Trust. The Board noted too the various administrative, operational, compliance, legal and corporate communication services required to be handled by the Adviser (or Subadviser, if applicable) which are performed for investment company clients but are not typically performed for non-investment company clients.
The Trustees reviewed each Fund’s fee structure based on the total Fund expense ratio as well as by comparing advisory fees to other advisory fees. The Board noted the simple expense structure maintained by the Trust: (1) an advisory fee and a capped administrative “services” expense for the Target Retirement Date Funds, and (2) for the remaining series of the Trust, a unitary fee with limited independent expenses for Trustee compensation and audit fees not covered by the unitary fee (“Unitary Fee”). The Board reviewed total expense ratios paid by other funds with similar investment strategies, recognizing that such a comparison, while not dispositive, was an important consideration.
The Trustees sought to ensure that fees paid by the Funds were appropriate. The Board reviewed materials demonstrating that although the Adviser is compensated for a variety of the administrative services it provides or arranges to provide to the Funds pursuant to its administrative services agreement with the Trust (“Services Agreement”), such compensation does not always cover all costs because the Services Agreement effectively acts as a cap on administrative expenses. Therefore, the Board recognized that any administrative, operational, regulatory or compliance fees or costs in excess of the Services Agreement fees, in the case of the Target Retirement Date Funds, or in excess of the Unitary Fee, in the case of the remaining series, are paid by the Adviser from investment advisory fees earned. In this regard, the Trustees noted that examination of each Fund portfolio’s total expense ratio compared to those of other investment companies was more meaningful than a simple comparison of basic “investment management only” fee schedules.
The Board recognized that to the extent a Fund invests in other mutual funds also managed by the Adviser (or its affiliates), the Adviser (or an affiliate) receives investment advisory fees from both the Fund and the underlying mutual fund. The Board was satisfied in this regard that the Adviser (or an affiliate) provides services to the Trust’s “Fund-of-Funds” that are in addition to, rather than duplicative of, the services the Adviser (or its affiliates) provides to the underlying mutual funds in which each such Fund-of-Funds invests.
In reviewing costs and profits, the Board noted that for some smaller Funds, the salaries of all portfolio management personnel, trading desk personnel, corporate accounting personnel and employees of the Adviser who serve as Trust officers, as well as facility costs (e.g., rent, etc.), could not be supported by fees received from such Funds alone. However, the Board recognized that the Trust is profitable to the Adviser because such salaries and fixed costs are already paid in whole or in part from revenue generated by management of other client assets managed by the Adviser, including the Trust as one of a consolidated family of investment companies. The Trustees noted that total assets managed by the Adviser and its affiliates of approximately $15 billion at the time of the meeting. As a result, although the fees paid by an individual Fund at its present size might not be sufficient to profitably support a stand-alone fund, the Trust is reasonably profitable to the Adviser as part of its larger, diversified organization. In sum, the Trustees recognized that the Trust is important to the Adviser and is managed with the attention given to the Adviser’s other clients.
With regard to the extent to which economies of scale would be realized as each Fund’s assets increase, the Trustees recognized that at their current asset levels, it was premature to discuss any economies of scale not already factored into the compensation payable under Investment Advisory (Unitary Fee) and Services Agreements. In addition, the Trustees recognized that the Adviser was currently waiving fees (pursuant to its investment management agreement, with respect to the Money Market Fund and the Conservative, Moderate and Aggressive Allocation Funds). The Board also recognized that the Adviser had arranged for the fees to be capped for the Target Retirement Date Funds. Based on their review, the Independent Trustees concluded that the fee arrangements and waivers (as applicable) were acceptable. Because the Adviser pays the unaffiliated Subadvisers’ sub-advisory fees and those fees are negotiated at arm’s length by the Adviser, the Board did not consider the potential economies of scale in the unaffiliated Subadvisers’ management of the sub-advised Funds to be a material factor in its consideration.
Counsel to the Independent Trustees confirmed that the Trust’s Independent Trustees had met previously and reviewed the written contract renewal materials provided by the Adviser and applicable Subadvisers. He noted that the Independent Trustees had considered such materials in light of the Gartenberg standard as well as criteria either set forth or discussed in the Supreme Court decision in Jones v. Harris regarding the investment company contract renewal process under Section 15(c) of the Investment Company Act of 1940, as amended. The Independent Trustees made a variety of additional inquiries regarding such written materials to the Adviser and the Subadvisers and representatives of the Adviser and Subadvisers, respectively, and discussed each matter raised.
After further discussion, analysis and review of the totality of the information presented, including the information set forth above and the other information considered by the Board, the Trustees, including the Independent Trustees, concluded that each Fund’s advisory fees (including applicable sub-advisory fees) are reasonable for such Fund and that the renewal of the Investment Advisory Agreement (including Unitary Fee) and, as applicable, the Sub-Advisory Agreement with respect to such Fund are in the best interests of such Fund and its shareholders.
In the course of their review of the contract renewal materials, the Board also reviewed and discussed with counsel the “Rule 12b-1” plans adopted by certain Funds. Advisory personnel directed the Board to the written materials regarding these matters during the course of the Board’s consideration of the Rule 12b-1 plans. Finally, the Board also reviewed the Trust’s distribution agreements and the information provided in the written materials regarding the distributor.
FUND EXPENSES PAID BY SHAREHOLDERS
As a shareholder of the Funds, you pay no transaction costs, but may indirectly (see Note 3) incur ongoing costs which include management fees; disinterested trustee fees; brokerage commissions and other expenses incurred in connection with the acquisition or disposition of investments; costs of borrowing money; expenses for independent audits, taxes, and extraordinary expenses as approved by a majority of the disinterested trustees. The examples in the table that follows are intended to help you understand your ongoing costs (in dollars) of investing in the Funds and to compare these costs with the ongoing costs of investing in other mutual funds.
Ultra Series Funds | Other Information (unaudited) - continued | December 31, 2015
The examples below are based on an investment of $1,000 invested for the six-month period ended December 31, 2015. Expenses paid during the period in the table below are equal to each Fund’s annualized expense ratio, multiplied by the average account value over the period, multiplied by 184/365 (to reflect the one-half fiscal year period).
Actual Expenses
The table below provides information about actual account values using actual expenses and actual returns for the Funds. You may use the information in this table, together with the amount you invested, to estimate the expenses that you paid over the period. Simply divide your account value by $1,000 (for example, an $8,600 account value divided by $1,000 = 8.6), then multiply the result by the number in the table for the Fund you own under the heading entitled “Actual” to estimate the expenses you paid on your account during this period.
| | | | | CLASS I | | |
| | | Beginning | | Ending | | Annual | | Expenses Paid |
| Fund | | Account Value | | Account Value | | Expense Ratio1,2 | | During Period3 |
| Ultra Series Target Retirement 2020 Fund | | $1,000 | | $986.80 | | 0.00% | | $0.00 |
| Ultra Series Target Retirement 2030 Fund | | 1,000 | | 976.80 | | 0.00% | | 0.00 |
| Ultra Series Target Retirement 2040 Fund | | 1,000 | | 973.60 | | 0.00% | | 0.00 |
| Ultra Series Target Retirement 2050 Fund | | 1,000 | | 971.50 | | 0.00% | | 0.00 |
| 1 Amounts represent less than 0.01%. |
| 2 Amounts does not include expenses of the underlying Master Fund, nor the underlying expense of the funds held by the Master Fund. See Note 1 for an explanation of the Fund organizational structure, Note 3 for a description of the expense structure, and the current prospectus for more complete information regarding the charges and expenses of the Target Date Funds. |
| 3 Amounts represent less than $0.01. |
Hypothetical Example for Comparison Purposes
The table below provides information about hypothetical account values and hypothetical expenses based on the Funds’ actual expense ratios and an assumed rate of return of 5% per year before expenses, which are not the Funds’ actual returns. The hypothetical account values and expenses may not be used to estimate the actual ending account balance or expenses you paid for the period. You may use this information to compare the ongoing costs of investing in the Funds and other funds. To do so, compare the 5% hypothetical example of the Funds you own with the 5% hypothetical examples that appear in the shareholder reports of other similar funds.
| | | | | CLASS I | | |
| | | Beginning | | Ending | | Annual | | Expenses Paid |
| Fund | | Account Value | | Account Value | | Expense Ratio1,2 | | During Period3 |
| Ultra Series Target Retirement 2020 Fund | | $1,000 | | $1,025.21 | | 0.00% | | $0.00 |
| Ultra Series Target Retirement 2030 Fund | | 1,000 | | 1,025.21 | | 0.00% | | 0.00 |
| Ultra Series Target Retirement 2040 Fund | | 1,000 | | 1,025.21 | | 0.00% | | 0.00 |
| Ultra Series Target Retirement 2050 Fund | | 1,000 | | 1,025.21 | | 0.00% | | 0.00 |
| 1 Amounts represent less than 0.01%. |
| 2 Amounts does not include expenses of the underlying Master Fund, nor the underlying expense of the funds held by the Master Fund. See Note 1 for an explanation of the Fund organizational structure, Note 3 for a description of the expense structure, and the current prospectus for more complete information regarding the charges and expenses of the Target Date Funds. |
| 3 Amounts represent less than $0.01. |
Please note that the expenses shown in the tables are meant to highlight your ongoing costs only and do not reflect any separate account fees, charges, or expenses imposed by the group variable annuity contracts, or retirement and pension plans that use the Funds. The information provided in the hypothetical example table is useful in comparing ongoing Fund costs only, and will not help you determine the relative total costs of owning different funds. In addition, if these fees, charges or expenses were included, your costs would have been higher.
AVAILABILITY OF QUARTERLY PORTFOLIO SCHEDULES
The Trust files its complete schedule of portfolio holdings with the SEC for the first and third quarters of each fiscal year on Form N-Q. Form N-Q is available to shareholders at no cost on the SEC’s website at www.sec.gov. Form N-Q may also be reviewed and copied at the Commission’s Public Reference Room in Washington, DC. More information on the operation of the Public Reference Room may be obtained by calling 1-202-551-8090. Form N-Q and other information about the Trust are available on the EDGAR database on the SEC’s Internet site at www.sec.gov. Copies of this information may also be obtained, upon payment of a duplicating fee, by electronic request at the following email address: publicinfo@sec.gov, or by writing the SEC’s Public Reference Section, Washington, DC 20549-0102.
PROXY VOTING POLICIES, PROCEDURES AND RECORDS
A description of the policies and procedures used by the Trust to vote proxies related to portfolio securities is available to shareholders at no cost on the SEC’s website at www.sec.gov and is also located in the Funds’ Statement of Additional Information. The proxy voting records for the Trust for the most recent twelve-month period ended June 30 are available to shareholders at no cost on the SEC’s website at www.sec.gov.
FORWARD-LOOKING STATEMENT DISCLOSURE
One of our most important responsibilities as investment company managers is to communicate with shareholders in an open and direct manner. Some of our comments in the Management’s Discussion of Fund Performance are based on current management expectations and are considered “forward-looking statements.” Actual future results, however, may prove to be different from our expectations. You can identify forward-looking statements by words such as “estimate,” “may,” “will,” “expect,” “believe,” “plan” and other similar terms. We cannot promise future returns. Our opinions are a reflection of our best judgment at the time this report is compiled, and we disclaim any obligation to update or alter forward-looking statements as a result of new information, future events, or otherwise.
TAX INFORMATION
Corporate Dividends Received Deduction: For the taxable year ended December 31, 2015, the following percentage of income dividends paid by the Fund qualify for the dividends received deduction available to corporations:
| Fund | | Percentage |
| Ultra Series Madison Target Retirement 2020 Fund | | 13.38% |
| Ultra Series Madison Target Retirement 2030 Fund | | 27.12% |
| Ultra Series Madison Target Retirement 2040 Fund | | 22.16% |
| Ultra Series Madison Target Retirement 2050 Fund | | 28.58% |
Ultra Series Funds | Other Information (unaudited) - continued | December 31, 2015
APPENDIX A: MADISON FUNDS: MADISON TARGET DATE FUNDS PORTFOLIOS OF INVESTMENTS - Master Funds (unaudited)
| Madison Funds: Madison Target Retirement 2020 Fund Portfolio of Investments1 | | | | | | |
| | | | | | | |
| INVESTMENT COMPANIES - 97.5% | | Shares | | | Value (Note 2) | |
| | | | | | | |
| Alternative Funds - 2.0% | | | | | | |
| SPDR Gold Shares* | | 10,289 | | $ | 1,043,922 | |
| | | | | | |
| | | | | | | |
| Bond Funds - 58.9% | | | | | | |
| Baird Aggregate Bond Fund Institutional Shares | | 73,768 | | | 782,681 | |
| iShares 20+ Year Treasury Bond ETF | | 10,818 | | | 1,304,867 | |
| iShares 3-7 Year Treasury Bond ETF † | | 149,009 | | | 18,269,994 | |
| iShares 7-10 Year Treasury Bond ETF | | 39,529 | | | 4,173,867 | |
| iShares TIPS Bond Fund ETF | | 38,065 | | | 4,174,969 | |
| Metropolitan West Total Return Bond Fund Class I | | 73,907 | | | 784,894 | |
| PowerShares Fundamental High Yield Corporate Bond Portfolio | | 14,507 | | | 253,002 | |
| Vanguard Intermediate-Term Corporate Bond ETF | | 12,443 | | | 1,046,332 | |
| | | | | | |
| | | | | | 30,790,606 | |
| Foreign Stock Funds - 6.0% | | | | | | |
| iShares MSCI EAFE Minimum Volatility ETF | | 8,148 | | | 528,561 | |
| iShares MSCI United Kingdom ETF | | 16,011 | | | 258,417 | |
| Vanguard FTSE All-World ex-U.S. ETF | | 12,102 | | | 525,348 | |
| WisdomTree Europe Hedged Equity Fund | | 19,319 | | | 1,039,555 | |
| WisdomTree Japan Hedged Equity Fund | | 15,459 | | | 774,187 | |
| | | | | | |
| | | | | | 3,126,068 | |
| Money Market Funds - 2.9% | | | | | | |
| State Street Institutional U.S. Government Money Market Fund, 0.16%, | | | | | | |
| Premier Class | | 1,530,192 | | | 1,530,192 | |
| | | | | | |
| | | | | | | |
| Stock Funds - 27.7% | | | | | | |
| Energy Select Sector SPDR Fund | | 4,317 | | | 261,394 | |
| iShares Core S&P Mid-Cap ETF | | 7,317 | | | 1,019,844 | |
| Market Vectors Agribusiness ETF | | 6,833 | | | 317,666 | |
| PowerShares Buyback Achievers Portfolio ETF | | 46,116 | | | 2,096,433 | |
| Schwab Fundamental U.S. Large Company Index Fund Institutional Shares | | 37,348 | | | 523,991 | |
| Schwab U.S. Dividend Equity ETF | | 13,430 | | | 517,861 | |
| SPDR S&P 500 ETF Trust | | 35,475 | | | 7,232,998 | |
| SPDR S&P Homebuilders ETF | | 7,694 | | | 262,981 | |
| Vanguard Financials ETF | | 10,667 | | | 516,816 | |
| Vanguard Growth ETF | | 4,451 | | | 473,542 | |
| Vanguard Health Care ETF | | 1,959 | | | 260,312 | |
| Vanguard Information Technology ETF | | 9,485 | | | 1,027,131 | |
| | | | | | |
| | | | | | 14,510,969 | |
| | | | | | |
| TOTAL INVESTMENTS - 97.5% (Cost $47,737,922**) | | | | | 51,001,757 | |
| NET OTHER ASSETS AND LIABILITIES - 2.5% | | | | | 1,303,307 | |
| | | | | | |
| TOTAL NET ASSETS - 100.0% | | | | $ | 52,305,064 | |
| | | | | | |
| 1 | | Calculated on a cash basis. |
| * | | Non-income producing. |
| ** | | Aggregate cost for Federal tax purposes was $47,737,922. |
| † | | The annual report and prospectus for the iShare 3-7 Year Treasury Bond ETF can be found at: |
| | | http://www.ishares.com/us/library/financial-legal-tax. |
| ETF | | Exchange Traded Fund. |
| Madison Funds: Madison Target Retirement 2030 Fund Portfolio of Investments1 | | | | | | |
| | | Shares | | | Value (Note 2) | |
| INVESTMENT COMPANIES - 99.5% | | | | | | |
| | | | | | | |
| Alternative Funds - 2.0% | | | | | | |
| SPDR Gold Shares* | | 14,647 | | $ | 1,486,084 | |
| | | | | | |
| | | | | | | |
| Bond Funds - 37.1% | | | | | | |
| iShares 20+ Year Treasury Bond ETF | | 15,391 | | | 1,856,462 | |
| iShares 3-7 Year Treasury Bond ETF | | 127,950 | | | 15,687,950 | |
| iShares 7-10 Year Treasury Bond ETF | | 42,012 | | | 4,436,047 | |
| iShares TIPS Bond Fund ETF | | 44,682 | | | 4,900,722 | |
| Vanguard Intermediate-Term Corporate Bond ETF | | 7,064 | | | 594,012 | |
| | | | | | |
| | | | | | 27,475,193 | |
| Foreign Stock Funds - 10.8% | | | | | | |
| iShares MSCI EAFE Minimum Volatility ETF | | 32,263 | | | 2,092,901 | |
| iShares MSCI United Kingdom ETF | | 45,440 | | | 733,402 | |
| Vanguard FTSE All-World ex-U.S. ETF | | 33,835 | | | 1,468,777 | |
| WisdomTree Europe Hedged Equity Fund | | 41,160 | | | 2,214,819 | |
| WisdomTree Japan Hedged Equity Fund | | 29,249 | | | 1,464,790 | |
| | | | | | |
| | | | | | 7,974,689 | |
| Money Market Funds - 3.1% | | | | | | |
| State Street Institutional U.S. Government Money Market Fund, 0.16%, | | | | | | |
| Premier Class | | 2,286,224 | | | 2,286,224 | |
| | | | | | |
| | | | | | | |
| Stock Funds - 46.5% | | | | | | |
| Energy Select Sector SPDR Fund | | 6,148 | | | 372,261 | |
| iShares Core S&P Mid-Cap ETF | | 15,148 | | | 2,111,328 | |
| Market Vectors Agribusiness ETF | | 16,084 | | | 747,745 | |
| PowerShares Buyback Achievers Portfolio ETF | | 104,438 | | | 4,747,752 | |
| Schwab Fundamental U.S. Large Company Index Fund Institutional Shares | | 52,992 | | | 743,473 | |
| Schwab U.S. Dividend Equity ETF | | 31,499 | | | 1,214,601 | |
| SPDR S&P 500 ETF Trust † | | 93,809 | | | 19,126,717 | |
| SPDR S&P Homebuilders ETF | | 21,597 | | | 738,186 | |
| Vanguard Financials ETF | | 19,737 | | | 956,258 | |
| Vanguard Growth ETF | | 6,944 | | | 738,772 | |
| Vanguard Health Care ETF | | 5,559 | | | 738,680 | |
| Vanguard Information Technology ETF | | 20,427 | | | 2,212,040 | |
| | | | | | |
| | | | | | 34,447,813 | |
| | | | | | |
| TOTAL INVESTMENTS - 99.5% (Cost $66,561,875**) | | | | | 73,670,003 | |
| NET OTHER ASSETS AND LIABILITIES - 0.5% | | | | | 407,308 | |
| | | | | | |
| TOTAL NET ASSETS - 100.0% | | | | $ | 74,077,311 | |
| | | | | | |
| 1 | | Calculated on a cash basis. |
| * | | Non-income producing. |
| ** | | Aggregate cost for Federal tax purposes was $66,561,875. |
| † | | The annual report and prospectus for the SPDR S&P 500 ETF Trust can be found at: |
| | | http://www.spdrs.com/product/fund.seam?ticker=SPY. |
| ETF | | Exchange Traded Fund. |
| See accompanying Notes to Financial Statements. |
| |
| |
| 21 |
Ultra Series Funds | Other Information (unaudited) - continued | December 31, 2015
| Madison Funds: Madison Target Retirement 2040 Fund Portfolio of Investments1 |
| | | Shares | | | Value (Note 2) | |
| INVESTMENT COMPANIES - 99.9% | | | | | | |
| | | | | | | |
| Alternative Funds - 2.5% | | | | | | |
| SPDR Gold Shares * | | 12,037 | | $ | 1,221,274 | |
| | | | | | |
| | | | | | | |
| Bond Funds - 27.1% | | | | | | |
| iShares 20+ Year Treasury Bond ETF | | 10,093 | | | 1,217,418 | |
| iShares 3-7 Year Treasury Bond ETF | | 55,611 | | | 6,818,465 | |
| iShares 7-10 Year Treasury Bond ETF | | 18,441 | | | 1,947,185 | |
| iShares TIPS Bond Fund ETF | | 26,636 | | | 2,921,436 | |
| Vanguard Intermediate-Term Corporate Bond ETF | | 2,914 | | | 245,038 | |
| | | | | | |
| | | | | | 13,149,542 | |
| Foreign Stock Funds - 13.4% | | | | | | |
| iShares MSCI EAFE Minimum Volatility ETF | | 29,735 | | | 1,928,910 | |
| iShares MSCI United Kingdom ETF | | 29,981 | | | 483,893 | |
| Vanguard FTSE All-World ex-U.S. ETF | | 27,855 | | | 1,209,186 | |
| WisdomTree Europe Hedged Equity Fund | | 31,362 | | | 1,687,589 | |
| WisdomTree Japan Hedged Equity Fund | | 24,055 | | | 1,204,674 | |
| | | | | | |
| | | | | | 6,514,252 | |
| Money Market Funds - 3.5% | | | | | | |
| State Street Institutional U.S. Government Money Market Fund, 0.16%, | | | | | | |
| Premier Class | | 1,710,667 | | | 1,710,667 | |
| | | | | | |
| | | | | | | |
| Stock Funds - 53.4% | | | | | | |
| Energy Select Sector SPDR Fund | | 4,056 | | | 245,591 | |
| iShares Core S&P Mid-Cap ETF | | 12,104 | | | 1,687,055 | |
| Market Vectors Agribusiness ETF | | 15,593 | | | 724,919 | |
| PowerShares Buyback Achievers Portfolio ETF | | 74,286 | | | 3,377,041 | |
| Schwab Fundamental U.S. Large Company Index Fund Institutional Shares | | 51,417 | | | 721,378 | |
| Schwab U.S. Dividend Equity ETF | | 37,467 | | | 1,444,727 | |
| SPDR S&P 500 ETF Trust † | | 63,829 | | | 13,014,095 | |
| SPDR S&P Homebuilders ETF | | 14,148 | | | 483,579 | |
| Vanguard Financials ETF | | 18,518 | | | 897,197 | |
| Vanguard Growth ETF | | 6,796 | | | 723,026 | |
| Vanguard Health Care ETF | | 4,953 | | | 658,155 | |
| Vanguard Information Technology ETF | | 17,723 | | | 1,919,224 | |
| | | | | | |
| | | | | | 25,895,987 | |
| | | | | | |
| TOTAL INVESTMENTS - 99.9% (Cost $42,628,777**) | | | | | 48,491,722 | |
| NET OTHER ASSETS AND LIABILITIES - 0.1% | | | | | 60,199 | |
| | | | | | |
| TOTAL NET ASSETS - 100.0% | | | | $ | 48,551,921 | |
| | | | | | |
| 1 | | Calculated on a cash basis. |
| * | | Non-income producing. |
| ** | | Aggregate cost for Federal tax purposes was $42,628,777. |
| † | | The annual report and prospectus for the SPDR S&P 500 ETF Trust can be found at: |
| | | http://www.spdrs.com/product/fund.seam?ticker=SPY. |
| ETF | | Exchange Traded Fund. |
| Madison Funds: Madison Target Retirement 2050 Fund Portfolio of Investments1 | | | | | | |
| | | Shares | | | Value (Note 2) | |
| INVESTMENT COMPANIES - 100.0% | | | | | | |
| | | | | | | |
| Alternative Funds - 3.0% | | | | | | |
| SPDR Gold Shares * | | 6,151 | | $ | 624,080 | |
| | | | | | |
| | | | | | | |
| Bond Funds - 17.1% | | | | | | |
| iShares 20+ Year Treasury Bond ETF | | 4,320 | | | 521,079 | |
| iShares 3-7 Year Treasury Bond ETF | | 11,828 | | | 1,450,231 | |
| iShares 7-10 Year Treasury Bond ETF | | 3,895 | | | 411,273 | |
| iShares TIPS Bond Fund ETF | | 9,443 | | | 1,035,708 | |
| Vanguard Intermediate-Term Corporate Bond ETF | | 1,231 | | | 103,515 | |
| | | | | | |
| | | | | | 3,521,806 | |
| Foreign Stock Funds - 15.9% | | | | | | |
| iShares MSCI EAFE Minimum Volatility ETF | | 15,835 | | | 1,027,217 | |
| iShares MSCI United Kingdom ETF | | 12,630 | | | 203,848 | |
| Vanguard FTSE All-World ex-U.S. ETF | | 14,223 | | | 617,420 | |
| WisdomTree Europe Hedged Equity Fund | | 15,264 | | | 821,356 | |
| WisdomTree Japan Hedged Equity Fund | | 12,293 | | | 615,633 | |
| | | | | | |
| | | | | | 3,285,474 | |
| Money Market Funds - 3.7% | | | | | | |
| State Street Institutional U.S. Government Money Market Fund, 0.16%, | | | | | | |
| Premier Class | | 757,286 | | | 757,286 | |
| | | | | | |
| | | | | | | |
| Stock Funds - 60.3% | | | | | | |
| Energy Select Sector SPDR Fund | | 3,454 | | | 209,140 | |
| iShares Core S&P Mid-Cap ETF | | 5,891 | | | 821,088 | |
| Market Vectors Agribusiness ETF | | 8,854 | | | 411,622 | |
| PowerShares Buyback Achievers Portfolio ETF | | 36,177 | | | 1,644,606 | |
| Schwab Fundamental U.S. Large Company Index Fund Institutional Shares | | 29,192 | | | 409,571 | |
| Schwab U.S. Dividend Equity ETF | | 21,275 | | | 820,364 | |
| SPDR S&P 500 ETF Trust † | | 28,190 | | | 5,747,659 | |
| SPDR S&P Homebuilders ETF | | 6,025 | | | 205,935 | |
| Vanguard Financials ETF | | 9,953 | | | 482,223 | |
| Vanguard Growth ETF | | 3,860 | | | 410,665 | |
| Vanguard Health Care ETF | | 2,080 | | | 276,390 | |
| Vanguard Information Technology ETF | | 9,451 | | | 1,023,449 | |
| | | | | | |
| | | | | | 12,462,712 | |
| | | | | | |
| TOTAL INVESTMENTS - 100.0% (Cost $18,797,683**) | | | | | 20,651,358 | |
| NET OTHER ASSETS AND LIABILITIES - 0.0% | | | | | (2,388 | ) |
| | | | | | |
| TOTAL NET ASSETS - 100.0% | | | | $ | 20,648,970 | |
| | | | | | |
| 1 | | Calculated on a cash basis. |
| * | | Non-income producing. |
| ** | | Aggregate cost for Federal tax purposes was $18,797,683. |
| † | | The annual report and prospectus for the SPDR S&P 500 ETF Trust can be found at: |
| | | http://www.spdrs.com/product/fund.seam?ticker=SPY. |
| ETF | | Exchange Traded Fund. |
| See accompanying Notes to Financial Statements. |
| |
| |
| 22 |
Ultra Series Funds | Other Information (unaudited) - concluded | December 31, 2015
APPENDIX B: MADISON FUNDS: MADISON TARGET DATE FUNDS STATEMENTS OF ASSETS AND LIABILITIES (unaudited)
| | | Madison Target | | Madison Target | | Madison Target | | Madison Target |
| | | Retirement | | Retirement | | Retirement | | Retirement |
| | | 2020 Fund | | 2030 Fund | | 2040 Fund | | 2050 Fund |
| Assets: | | | | | | | | | | | | | | | | |
| Investments in securities, at cost | | | | | | | | | | | | | | | | |
Unaffiliated issuers | | $ | 47,737,922 | | | $ | 66,561,875 | | | $ | 42,628,777 | | | $ | 18,797,683 | |
| Net unrealized appreciation | | | | | | | | | | | | | | | | |
Unaffiliated issuers | | | 3,263,835 | | | | 7,108,128 | | | | 5,862,945 | | | | 1,853,675 | |
| | | | | | | | | | | | | |
Total investments at value | | | 51,001,757 | | | | 73,670,003 | | | | 48,491,722 | | | | 20,651,358 | |
| Receivables: | | | | | | | | | | | | | | | | |
Investments sold | | | 2,447,654 | | | | 2,030,178 | | | | 1,814,693 | | | | 719,892 | |
Fund shares sold | | | 195,099 | | | | – | | | | – | | | | – | |
Dividends | | | 47,189 | | | | 117,310 | | | | 79,832 | | | | 34,838 | |
| | | | | | | | | | | | | |
Total assets | | | 53,691,699 | | | | 75,817,491 | | | | 50,386,247 | | | | 21,406,088 | |
| | | | | | | | | | | | | |
| Liabilities: | | | | | | | | | | | | | | | | |
| Payables: | | | | | | | | | | | | | | | | |
Investments purchased | | | 1,373,199 | | | | 1,721,082 | | | | 1,821,821 | | | | 751,842 | |
Advisory agreement fees | | | 11,197 | | | | 15,915 | | | | 10,421 | | | | 4,397 | |
Service agreement fees | | | 2,239 | | | | 3,183 | | | | 2,084 | | | | 879 | |
| | | | | | | | | | | | | |
Total liabilities | | | 1,386,635 | | | | 1,740,180 | | | | 1,834,326 | | | | 757,118 | |
| | | | | | | | | | | | | |
| Net assets | | $ | 52,305,064 | | | $ | 74,077,311 | | | $ | 48,551,921 | | | $ | 20,648,970 | |
| | | | | | | | | | | | | |
| Net assets consist of: | | | | | | | | | | | | | | | | |
Paid-in capital | | | 49,858,954 | | | | 68,447,251 | | | | 43,691,680 | | | | 19,237,878 | |
Accumulated undistributed net investment income | | | 81,446 | | | | 147,845 | | | | 117,372 | | | | 58,090 | |
Accumulated net realized loss on investments sold | | | (899,171 | ) | | | (1,625,913 | ) | | | (1,120,076 | ) | | | (500,673 | ) |
Net unrealized appreciation of investments | | | 3,263,835 | | | | 7,108,128 | | | | 5,862,945 | | | | 1,853,675 | |
| | | | | | | | | | | | | |
| Net Assets | | $ | 52,305,064 | | | $ | 74,077,311 | | | $ | 48,551,921 | | | $ | 20,648,970 | |
| | | | | | | | | | | | | |
| Class R6 Shares: | | | | | | | | | | | | | | | | |
Net Assets | | $ | 52,305,064 | | | $ | 74,077,311 | | | $ | 48,551,921 | | | $ | 20,648,970 | |
Shares of beneficial interest outstanding | | | 5,557,234 | | | | 7,995,458 | | | | 5,339,580 | | | | 2,224,695 | |
Net Asset Value and redemption price per share | | $ | 9.41 | | | $ | 9.26 | | | $ | 9.09 | | | $ | 9.28 | |
| | | | | | | | | | | | | |
| See accompanying Notes to Financial Statements. |
| |
| |
| 23 |
Ultra Series Fund | December 31, 2015
Trustees and Officers
The address of each Trustee and officer is 550 Science Drive, Madison, Wisconsin 53711. The Statement of Additional Information, which includes additional information about the trustees and officers, is available at no cost on the SEC’s website at www.sec.gov or by calling CMFG Life Insurance Company at 1-800-798-5500.
Interested Trustees and Officers
| |
Name and
Year of Birth | Position(s) and Length
of Time Served | Principal Occupation(s)
During Past Five Years | Portfolios Overseen
in Fund Complex by
Director/Trustee1 | Other Directorships Held
by Director/ Trustee
During Past Five Years |
| |
Katherine L. Frank2
1960 | Trustee and President,
2009 - Present | Madison Investment Holdings, Inc. (“MIH”) (affiliated investment advisory firm of Madison), Executive Director and Chief Operating Officer, 2010 - Present; Managing Director and Vice President, 1986 - 2010 | 42 | Madison Strategic Sector Premium Fund, 2005 -Present;
Madison Funds (25), 2009 - Present |
| |
| | | Madison Asset Management, LLC (“Madison”), Executive Director and Chief Operating Officer, 2010 - Present; Vice President, 2004 - 2010 | | |
| |
| | | Madison Investment Advisors, LLC (“MIA”) (affiliated investment advisory firm of Madison), Executive Director and Chief Operating Officer, 2010 - Present; President, 1996 - 2010 | | |
| |
| | | Madison Strategic Sector Premium Fund (closed end fund), President, 2005 - Present; Madison Funds (25) (mutual funds), President, 2009 - Present; Madison Covered Call & Equity Strategy Fund (closed end fund), President, December 2012 - Present | | |
| |
Jay R. Sekelsky
1959 | Vice President,
2009 - Present | MIH, Executive Director and Chief Investment Officer, 2010 - Present; Managing Director and Vice President, 1990 - 2010 | N/A | N/A |
| |
| | | Madison, Executive Director and Chief Investment Officer, 2010 - Present | | |
| |
| | | MIA, Executive Director and Chief Investment Officer, 2010 - Present; Vice President, 1996 - 2010 | | |
| |
| | | Madison Strategic Sector Premium Fund, Vice President, 2005 - Present; Madison Funds (25), Vice President, 2009 - Present; Madison Covered Call & Equity Strategy Fund, Vice President, December 2012 - Present | | |
| |
Paul A. Lefurgey
1964 | Vice President,
2009 - Present | MIH, Chairman - Executive Committee, 2015-Present, Executive Director and Head of Fixed Income Investments, 2013 - Present; Managing Director and Head of Fixed Income Investments, 2005 - 2013; Madison and MIA, Executive Director and Head of Fixed Income Investments, 2013 - Present; Managing Director and Head of Fixed Income Investments, 2010 - 2013 | N/A | N/A |
| |
| | | MEMBERS Capital Advisors, Inc. (“MCA”) (investment advisory firm), Madison, WI, Vice President, 2003 - 2005 | | |
| |
| | | Madison Strategic Sector Premium Fund, Vice President, 2010 - Present; Madison Funds (25), Vice President, 2009 - Present; Madison Covered Call & Equity Strategy Fund, Vice President, December 2012 - Present | | |
| |
Greg D. Hoppe
1969 | Treasurer,
2009 - Present | MIH and MIA, Vice President, 1999 - Present; Madison, Vice President, 2009 - Present Madison Strategic Sector Premium Fund, Treasurer, 2009 - Present; Chief Financial Officer, 2005 - 2009; Madison Funds (25), Treasurer, 2009 - Present; Madison Covered Call & Equity Strategy Fund, Treasurer, December 2012 - Present | N/A | N/A |
| |
Holly S. Baggot
1960 | Secretary,
1999 - Present
Assistant Treasurer,
1999 - 2007;
2009 - Present | MIH and MIA, Vice President, 2010 - Present; Madison, Vice President, 2009 - Present; MFD Distributor, LLC (“MFD”) (an affiliated brokerage firm of Madison), Vice President, 2012 - Present
MCA, Director-Mutual Funds, 2008-2009; Director-Mutual Fund Operations, 2006 - 2008; Operations Officer-Mutual Funds, 2005 - 2006 | N/A | N/A |
| | | | | |
| |
| | | Madison Strategic Sector Premium Fund, Secretary and Assistant Treasurer, 2010 - Present; Madison Funds (25), Secretary, 1999-Present and Treasurer, 2008 - 2009 and Assistant Treasurer, 1997 - 2007 and 2009 - Present; Madison Covered Call & Equity Strategy Fund, Secretary and Assistant Treasurer, December 2012 - Present | | |
| |
Lisa R. Lange
1969 | Chief Compliance Officer,
Chief Legal Officer and
Assistant Secretary,
April 2015 - Present | MIH, MIA, and Madison, Chief Compliance Officer and Chief Legal Officer, April 2015 - Present
NorthRoad Capital Management LLC (“NorthRoad”) (an affiliated investment advisory firm of Madison), Chief Compliance Officer and Chief Legal Officer April 2015 - Present | N/A | N/A |
| |
| | | Madison Strategic Sector Premium Fund, Chief Compliance Officer, Chief Legal Officer and Assistant Secretary April 2015 - Present | | |
| |
| | | Madison Covered Call & Equity Strategy Fund, Chief Compliance Officer, Chief Legal Officer and Assistant Secretary April 2015 - Present, | | |
| |
| | | Madison Funds (25), Chief Compliance Officer, Chief Legal Officer and Assistant Secretary, April 2015 - Present | | |
| |
| 1 | As of the date of this report, the fund complex consists of Madison Funds with 25 portfolios, the Ultra Series Fund with 16 portfolios, the Madison Strategic Sector Premium Fund (a closed-end fund) and the Madison Covered Call & Equity Strategy Fund (closed end fund) (“MCN”), for a grand total of 43 separate portfolios in the fund complex. Not every Trustee is a member of the Board of Trustees of every fund in the fund complex, as noted above. |
| 2 | “Interested person” as defined in the 1940 Act. Considered an interested Trustee because of the position held with the investment adviser of the Ultra Series Fund. |
Ultra Series Funds | Trustees and Officers - concluded | December 31, 2015
| Independent Trustees |
| |
Name and
Year of Birth | Position(s) and Length
of Time Served1 | Principal Occupation(s)
During Past Five Years | Portfolios Overseen
in Fund Complex2 | Other Directorships Held
by Director/ Trustee
During Past Five Years |
Philip E. Blake
1944 | Trustee,
2009 - Present | Retired Investor | 43 | Edgewood College, 2003 - Present; Chairman of the Board, 2010 - 2012 |
| | | Lee Enterprises, Inc (news and advertising publisher), Madison, WI, Vice President, 1998 - 2001 | | Nerites Corporation (technology company), 2004 - 2013 |
| |
| | | Madison Newspapers, Inc., Madison, WI, President and Chief Executive Officer, 1993 - 2000 | | Madison Strategic Sector Premium Fund, 2005 - Present; |
| | | | | Madison Funds (25), 2009 - Present; Madison Covered Call & Equity Strategy Fund, 2005-Aug 2009, and December 2012 - Present |
| |
James R.
Imhoff, Jr.
1944 | Trustee,
2009 - Present | First Weber Group (real estate brokers), Madison, WI, Chief Executive Officer, 1996 - Present | 43 | Park Bank, 1978 - Present
Madison Strategic Sector Premium Fund, 2005 - Present; Madison Covered Call & Equity Strategy Fund, 2005 - Present; Madison Funds (25), 2009 - Present |
| |
Steven P. Riege
1954 | Trustee,
2005 - Present | Ovation Leadership (management consulting), Milwaukee, WI, Owner/President, 2001 - Present | 43 | Forward Service Corporation (employment training non-profit), 2010 - Present |
| |
| | | Robert W. Baird & Company (financial services), Milwaukee, WI, Senior Vice President-Marketing and Vice President-Human Resources, 1986 - 2001 | | Stanek Tool Corp., 1990 - Present
Madison Funds (25), 2005 - Present
Madison Strategic Sector Premium Fund, 2014 - Present
Madison Covered Call & Equity Strategy Fund, 2015-Present |
| |
Richard E. Struthers
1952 | Trustee, 2004 - Present | Clearwater Capital Management (investment advisory firm), Minneapolis, MN, Chair and Chief Executive Officer, 1998 - Present | 41 | Park Nicolet Health Services, 2001 - 2012 |
| |
| | | Park Nicollet Health Services, Minneapolis, MN, Chairman, Finance and Investment Committee, 2006 - 2012 | | HealthPartners, 2013 - Present |
| |
| | | IAI Mutual Funds, Minneapolis, MN, President and Director, 1992-1997 | | Madison Funds (25), 2004 - Present |
|
| |
| 1 | Independent Trustees serve in such capacity until reaching the age of 76, unless retirement is waived by unanimous vote of the remaining Trustees on an annual basis. |
| | |
| 2 | As of the date of this report, the fund complex consists of Madison Funds with 25 portfolios, the Ultra Series Fund with 16 portfolios, the Madison Strategic Sector Premium Fund (a closed-end fund) and the Madison Covered Call & Equity Strategy Fund (closed end fund) (“MCN”), for a grand total of 43 separate portfolios in the fund complex. Not every Trustee is a member of the Board of Trustees of every fund in the fund complex, as noted above. |
SEC File Number: 811-04815
Annual Report
October 31, 2015

Madison Conservative Allocation Fund
Madison Moderate Allocation Fund
Madison Aggressive Allocation
Madison Cash Reserves Fund
Madison Tax-Free Virginia Fund
Madison Tax-Free National Fund
Madison High Quality Bond Fund
Madison Core Bond Fund
Madison Corporate Bond Fund
Madison High Income Fund
Madison Diversified Income Fund
Madison Covered Call & Equity Income Fund
Madison Dividend Income Fund
Madison Large Cap Value Fund
Madison Investors Fund
Madison Large Cap Growth Fund
Madison Mid Cap Fund
Madison Small Cap Fund
Madison NorthRoad International Fund
Madison International Stock Fund
Madison Hansberger International Growth Fund
Madison Target Retirement 2020 Fund
Madison Target Retirement 2030 Fund
Madison Target Retirement 2040 Fund
Madison Target Retirement 2050 Fund
| Madison Funds | October 31, 2015 |
| |
| |
| Table of Contents |
| | | Page |
| Management’s Discussion of Fund Performance | | 2 |
Review of Period | | 2 |
Outlook | | 2 |
Allocation Funds Summary | | 3 |
Conservative Allocation Fund | | 3 |
Moderate Allocation Fund | | 4 |
Aggressive Allocation Fund | | 5 |
Cash Reserves Fund | | 5 |
Tax-Free Virginia Fund | | 6 |
Tax-Free National Fund | | 6 |
High Quality Bond Fund | | 8 |
Core Bond Fund | | 8 |
Corporate Bond Fund | | 9 |
High Income Fund | | 10 |
Diversified Income Fund | | 10 |
Covered Call & Equity Income Fund | | 11 |
Dividend Income Fund | | 12 |
Large Cap Value Fund | | 13 |
Investors Fund | | 13 |
Large Cap Growth Fund | | 14 |
Mid Cap Fund | | 15 |
Small Cap Fund | | 16 |
NorthRoad International Fund | | 16 |
International Stock Fund | | 17 |
Hansberger International Growth Fund | | 18 |
Target Retirement Date Funds | | 18 |
Target Retirement 2020 Fund | | 19 |
Target Retirement 2030 Fund | | 19 |
Target Retirement 2040 Fund | | 20 |
Target Retirement 2050 Fund | | 20 |
Notes to Management’s Discussion of Fund Performance | | 21 |
| Portfolios of Investments | | |
Conservative Allocation Fund | | 24 |
Moderate Allocation Fund | | 24 |
Aggressive Allocation Fund | | 24 |
Cash Reserves Fund | | 25 |
Tax-Free Virginia Fund | | 25 |
Tax-Free National Fund | | 26 |
High Quality Bond Fund | | 28 |
Core Bond Fund | | 29 |
Corporate Bond Fund | | 31 |
High Income Fund | | 32 |
Diversified Income Fund | | 34 |
Covered Call & Equity Income Fund | | 36 |
Dividend Income Fund | | 37 |
Large Cap Value Fund | | 38 |
Investors Fund | | 38 |
Large Cap Growth Fund | | 39 |
Mid Cap Fund | | 39 |
Small Cap Fund | | 40 |
NorthRoad International Fund | | 41 |
International Stock Fund | | 42 |
Hansberger International Growth Fund | | 43 |
Target Retirement 2020 Fund | | 43 |
Target Retirement 2030 Fund | | 44 |
Target Retirement 2040 Fund | | 44 |
Target Retirement 2050 Fund | | 44 |
| Financial Statements | | |
Statements of Assets and Liabilities | | 45 |
Statements of Operations | | 48 |
Statements of Changes in Net Assets | | 51 |
Financial Highlights | | 58 |
| Notes to Financial Statements | | 69 |
| Report of Independent Registered Public Accounting Firm | | 80 |
| Other Information | | 82 |
| Trustees and Officers | | 87 |
| | *Although each Fund’s name begins with the word “Madison,” the word “Madison” may be omitted in this report for simplicity when referring to any particular Fund, group of Funds or list of Funds. |
| | |
| | Nondeposit investment products are not federally insured, involve investment risk, may lose value and are not obligations of or guaranteed by any financial institution. |
| | |
| | For more complete information about Madison Funds, including charges and expenses, request a prospectus from your financial advisor or from Madison Funds, P.O. Box 8390, Boston, MA 02266-8390. Consider the investment objectives, risks, and charges and expenses of any fund carefully before investing. |
| | The prospectus contains this and other information about the investment company. |
| | |
| | For more current performance information, please call 1-800-877-6089 or visit our website at www.madisonfunds.com. Current performance may be lower or higher than the performance data quoted within. Past performance does not guarantee future results. |
| | |
| | Nothing in this report represents a recommendation of a security by the investment adviser. Portfolio holdings may have changed since the date of this report. |
Madison Funds | October 31, 2015
Management’s Discussion of Fund Performance (unaudited)
Period in Review
The fiscal year that ended October 31, 2015 reintroduced volatility into U.S. stock markets. After a grudgingly upward march for the first nine months, domestic stocks re-trenched in August. Through the highs of July 2015, the S&P 500® Index price advanced 5.46% for the fiscal year-to-date. But the market came unglued in August as continued weakness in Chinese economic growth, devaluation of the Chinese currency and fears of a U.S. Federal Reserve monetary tightening triggered market declines throughout Asia which carried over to stock exchanges around the globe. U.S. markets quickly declined over 12% from July highs, creating the first “correction” (decline >10%) in stock prices since 2011. Materials and energy stocks were particularly hard hit. After an ensuing month of volatile share prices, the market regained its legs and, by the end of October, the S&P 500 had recovered over 11% from its August lows. Despite this volatility, the S&P 500 returned 5.20% for the entire fiscal year. Small and mid-cap stocks as measured by the Russell 2000® Index and Russell Midcap® Index, returned 0.34% and 2.77% respectively, and foreign markets, as measured by the MSCI EAFE Index, returned -0.07%.
The sharp recovery in share prices from the August and late September lows point up the fickle nature of market psychology and the perils of trying to time major market moves. Since the lows in August, major market sectors which had previously underperformed suddenly led the way higher (i.e., Energy and Materials). The fears over Chinese growth sustainability, which had in many ways been the catalyst for the market’s retreat, were replaced by a recognition that the impact of Chinese economic growth on the U.S. economy really isn’t that great. Oil prices, which have fallen by 50% since last October, could be putting in a bottom and have firmed in the last two months. In short, what was bad news suddenly became not so bad, and in some cases even good. This was aided by a realization that central banks around the world were concerned about the swoon in asset prices and ready to lend a helping monetary hand.
Against the backdrop of volatility and market uncertainty, the U.S. economy continued to perform in a Goldilocks fashion – not too hot, not too cold. Domestic GDP growth recovered from a weather-induced weak first quarter of 2015 to a relatively robust 3.9% annualized rate in the second quarter. Early indications of third quarter growth suggest a bit of a cooling, driven by volatility in stock prices and continued softness in Energy sector investment (due to weak oil prices). Inflation remains well contained, with consumer prices through the end of September flat compared to the same time last year. The decline in energy prices continues to keep overall inflation under control, but even without energy prices figured into inflation, the year-over-year change in non-energy, non-food prices remains under the Fed’s stated goal of 2%. Employment trends are favorable as well, with the unemployment rate falling from 5.7% to 5.0% in the last year.
Long-term interest rates experienced their share of volatility during the fiscal year, ranging from a low of 1.64% on ten-year Treasury Notes in January to a high of 2.49% in mid-June. By the end of October, yields had fallen back to 2.14% as stock market turmoil, softer domestic economic growth and uncertainty over the future path of Federal Reserve Board (“Fed”) monetary policy took pressure off of the interest rate markets. The Fed continued to send mixed signals about the timing of interest rate “lift off.” Expectations had been for a sooner-rather-than-later increase in the benchmark Federal Funds Rate based on decent economic growth and improving labor markets. Global stock market unrest in August and September, and continued monetary accommodation by foreign central banks, gave the Fed cause to push back monetary tightening. As of the end of October, U.S. interest rate markets were about evenly split in their expectations of the timing of the Fed’s first increase. For the fiscal year, the broad-based Barclays U.S. Aggregate Bond Index returned 1.96%, aided by the point-to-point decline in longer-term interest rates over the last twelve months. Shorter maturity bond funds also yielded positive results, although not to the extent experienced by longer-maturity funds which benefited the most from lower interest rates during the period. Tax-exempt municipal funds were among the best performers during the year, while the high yield sector of the bond market suffered negative returns.
Outlook
With the previously weakest performing market sectors now among the strongest, and bad news now good news, we are concerned about the fundamental underpinnings and sentiment of the stock market. Earnings are under pressure, valuations remain full and the market’s short memory seems to have quickly forgotten the turmoil of August and September. We believe the Fed will raise short-term interest rates soon, if not before the end of the year then likely in the first quarter of 2016. The economy remains on solid footing and employment trends are encouraging. With the unemployment rate at 5.0%, many argue that we are near a point where continued gains in jobs will be accompanied by faster growth in wages – good for the American consumer but not good for corporate profits. As a result, we continue to counsel caution and seek companies whose competitive position, strong management and solid balance sheet inspire confidence in future profitability.
Similarly, we remain defensive in our interest rate outlook as the Fed embarks on a tighter monetary policy regime. While we don’t think the Fed will raise short-term interest rates too far or too quickly and run the risk of derailing the current expansion, the specter of higher short-term yields usually portends trouble for longer-term interest rates as well. This could have a cooling effect on interest rate sensitive sectors of the economy such as housing and automobile sales, which have been among the more solid performing sectors this year.
Our goal is to seek investment opportunities that provide attractive return potential without undue risk. In the current environment of fully valued stock prices, very low short- and long-term interest rates, and heightened market volatility, we are paying particularly close attention to the risk side of this tradeoff.
Madison Funds | October 31, 2015
The Madison Conservative Allocation, Moderate Allocation and Aggressive Allocation Funds (the “Funds”) invest primarily in shares of registered investment companies (the “Underlying Funds”). The Funds will be diversified among a number of asset classes and their allocation among Underlying Funds will be based on an asset allocation model developed by Madison Asset Management, LLC (“Madison”), the Funds’ investment adviser. The team may use multiple analytical approaches to determine the appropriate asset allocation, including:
| • | | Asset allocation optimization analysis – considers the degree to which returns in different asset classes do or do not move together, and the Funds’ aim to achieve a favorable overall risk profile for any targeted portfolio return. |
| • | | Scenario analysis – historical and expected return data is analyzed to model how individual asset classes and combinations of asset classes would affect the Funds under different economic and market conditions. |
| • | | Fundamental analysis – draws upon Madison’s investment teams to judge each asset class against current and forecasted market conditions. Economic, industry and security analysis is used to develop return and risk expectations that may influence asset class selection. In addition, Madison has a flexible mandate which permits the Funds, at the sole discretion of Madison, to materially reduce equity risk exposures when and if conditions are deemed to warrant such an action. |
| MADISON CONSERVATIVE ALLOCATION FUND |
| |
| INVESTMENT STRATEGY HIGHLIGHTS |
Under normal circumstances, the Madison Conservative Allocation Fund’s total net assets will be allocated among various asset classes and Underlying Funds, including those whose shares trade on a stock exchange (exchange traded funds or “ETFs”), with target allocations over time of approximately 35% equity investments and 65% fixed income investments. Underlying Funds in which the Fund invests may include funds advised by Madison and/or its affiliates, including other Madison Funds (the “Affiliated Underlying Funds”). Generally, Madison will not invest more than 75% of the Fund’s net assets, at the time of purchase, in Affiliated Underlying Funds. Although actual allocations may vary, the Fund’s asset allocation among asset classes and Underlying Funds is expected to be approximately:
| • | | 0-20% money market funds; |
| • | | 20-80% debt securities (e.g., bond funds and convertible bond funds); |
| • | | 0-20% below-investment grade (“junk”) debt securities (e.g., high income funds); |
| • | | 10-50% equity securities (e.g., U.S. stock funds); |
| • | | 0-40% foreign securities (e.g., international stock and bond funds, including emerging market securities); and |
| • | | 0-20% alternative asset classes (e.g., real estate investment trust funds, natural resources funds, precious metal funds and long/short funds). |
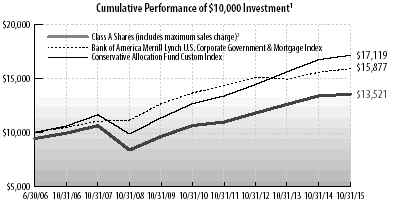
| Average Annual Total Return through October 31, 20151 |
| | | | | % Return Without Sales Charge | | | | % Return After Sales Charge5 |
| | | | | | | | | |
| | | | | | | | | | | | | | | | | | | | Since | | Since | | | | | | | | | | | | | | | | | | Since | | Since |
| | | | 1
Year | | 3
Years | | 5
Years | | 10
Years | | 6/30/06
Inception | | 2/29/08
Inception | | 1
Year | | 3
Years | | 5
Years | | 10
Years | | 6/30/06
Inception | | 2/29/08
Inception |
| |
| Class A Shares2 | | | | 1.17 | | | | 4.70 | | | | 4.93 | | | | – | | | | 3.94 | | | | – | | | | -4.65 | | | | 2.64 | | | | 3.70 | | | | – | | | | 3.28 | | | | – | |
| |
| Class B Shares3 | | | | 0.44 | | | | 3.94 | | | | 4.14 | | | | – | | | | 3.29 | | | | – | | | | -3.86 | | | | 2.85 | | | | 3.80 | | | | – | | | | 3.29 | | | | – | |
| |
| Class C Shares4 | | | | 0.34 | | | | 3.90 | | | | 4.12 | | | | – | | | | – | | | | 2.88 | | | | -0.61 | | | | 3.90 | | | | 4.12 | | | | – | | | | – | | | | 2.88 | |
| |
| Bank of America | | | | | | | | | | | | | | | | | | | | | | | | | | | | | | | | | | | | | | | | | | | | | | | | | |
| Merrill Lynch | | | | | | | | | | | | | | | | | | | | | | | | | | | | | | | | | | | | | | | | | | | | | | | | | |
| US Corp, Govt & | | | | | | | | | | | | | | | | | | | | | | | | | | | | | | | | | | | | | | | | | | | | | | | | | |
| Mortgage Index | | | | 2.07 | | | | 1.70 | | | | 3.08 | | | | 4.79 | | | | 5.08 | | | | 4.27 | | | | NA | | | | NA | | | | NA | | | | NA | | | | NA | | | | NA | |
| |
| Conservative | | | | | | | | | | | | | | | | | | | | | | | | | | | | | | | | | | | | | | | | | | | | | | | | | |
| Allocation Fund | | | | | | | | | | | | | | | | | | | | | | | | | | | | | | | | | | | | | | | | | | | | | | | | | |
| Custom Index | | | | 2.41 | | | | 5.88 | | | | 6.23 | | | | 5.91 | | | | 5.93 | | | | 5.52 | | | | NA | | | | NA | | | | NA | | | | NA | | | | NA | | | | NA | |
See accompanying Notes to Management’s Discussion of Fund Performance.
The Madison Conservative Allocation Fund (Class A load waived) returned 1.17% for the one-year period, compared to its custom blended benchmark’s return of 2.41%. The Fund outperformed its peers as measured by the Morningstar Conservative Allocation category, which returned -0.77% for the year. Contributing positively to the Fund’s return were overweight allocations to hedged European and Japanese stocks, U.S. growth stocks and U.S. Treasuries. The Fund also benefited from an underweight allocation to emerging markets stocks, which sustained double digit losses over the trailing 12 months. A final benefit came from the Fund’s overall defensive posturing, which helped mitigate losses during the steep equity market decline experienced in August/September. Detracting from performance was the Fund’s overweight allocation to U.S. mid-cap stocks, a modest stake in gold and the underperformance of a few key actively managed equity and fixed income holdings. The Fund was also held back by a below benchmark interest rate risk posture as interest rates fell over the period.
| PORTFOLIO ALLOCATION AS A PERCENTAGE OF NET ASSETS AS OF 10/31/15 | | | |
| |
| Bond Funds | | 61.4 | % |
| Stock Funds | | 24.2 | % |
| Foreign Stock Funds | | 7.8 | % |
| Alternative Funds | | 2.7 | % |
| Money Market Funds and Other Net Assets | | 3.9 | % |
| |
| | | | |
| TOP TEN HOLDINGS AS A PERCENTAGE OF NET ASSETS AS OF 10/31/15 | | | |
| |
| Madison Core Bond Fund Class Y | | 20.9 | % |
| Metropolitan West Total Return Bond Fund Class I | | 8.8 | % |
| iShares 3-7 Year Treasury Bond ETF | | 8.5 | % |
| iShares 7-10 Year Treasury Bond ETF | | 6.9 | % |
| Madison Corporate Bond Fund Class Y | | 6.7 | % |
| Baird Aggregate Bond Fund Institutional Shares | | 6.6 | % |
| Madison Large Cap Growth Fund Class Y | | 6.2 | % |
| Madison Large Cap Value Fund Class Y | | 5.1 | % |
| iShares Russell Mid-Cap ETF | | 4.5 | % |
| Vanguard Value ETF | | 4.1 | % |
| |
Madison Funds | Management’s Discussion of Fund Performance - continued | October 31, 2015
| MADISON MODERATE ALLOCATION FUND |
| |
| INVESTMENT STRATEGY HIGHLIGHTS |
Under normal circumstances, the Madison Moderate Allocation Fund’s total net assets will be allocated among various asset classes and Underlying Funds, including those whose shares trade on a stock exchange (exchange traded funds or “ETFs”), with target allocations over time of approximately 60% equity investments and 40% fixed income investments. Underlying Funds in which the Fund invests may include Affiliated Underlying Funds. Generally, Madison will not invest more than 75% of the Fund’s net assets, at the time of purchase, in Affiliated Underlying Funds. Although actual allocations may vary, the Fund’s asset allocation among asset classes and Underlying Funds is expected to be approximately:
| • | | 0-15% money market funds; |
| • | | 10-60% debt securities (e.g., bond funds and convertible bond funds); |
| • | | 0-20% below-investment grade (“junk”) debt securities (e.g., high income funds); |
| • | | 20-80% equity securities (e.g., U.S. stock funds); |
| • | | 0-50% foreign securities (e.g., international stock and bond funds, including emerging market securities); and |
| • | | 0-20% alternative asset classes (e.g., real estate investment trust funds, natural resources funds, precious metal funds and long/short funds). |
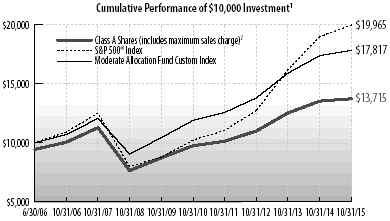
| Average Annual Total Return through October 31, 20151 |
| | | | | % Return Without Sales Charge | | | | % Return After Sales Charge5 |
| | | | | | | | | |
| | | | | | | | | | | | | | | | | | | | Since | | Since | | | | | | | | | | | | | | | | | | Since | | Since |
| | | | 1
Year | | 3
Years | | 5
Years | | 10
Years | | 6/30/06
Inception | | 2/29/08
Inception | | 1
Year | | 3
Years | | 5
Years | | 10
Years | | 6/30/06
Inception | | 2/29/08
Inception |
| |
| Class A Shares2 | | | | 1.44 | | | | 7.66 | | | | 7.09 | | | | – | | | | 4.10 | | | | – | | | | -4.41 | | | | 5.56 | | | | 5.82 | | | | – | | | | 3.44 | | | | – | |
| |
| Class B Shares3 | | | | 0.72 | | | | 6.84 | | | | 6.29 | | | | – | | | | 3.44 | | | | – | | | | -3.53 | | | | 5.81 | | | | 5.97 | | | | – | | | | 3.44 | | | | – | |
| |
| Class C Shares4 | | | | 0.72 | | | | 6.84 | | | | 6.28 | | | | – | | | | – | | | | 2.97 | | | | -0.23 | | | | 6.84 | | | | 6.28 | | | | – | | | | – | | | | 2.97 | |
| |
| S&P 500® Index | | | | 5.20 | | | | 16.20 | | | | 14.33 | | | | 7.85 | | | | 7.69 | | | | 8.32 | | | | NA | | | | NA | | | | NA | | | | NA | | | | NA | | | | NA | |
| |
| Moderate | | | | | | | | | | | | | | | | | | | | | | | | | | | | | | | | | | | | | | | | | | | | | | | | | |
| Allocation Fund | | | | | | | | | | | | | | | | | | | | | | | | | | | | | | | | | | | | | | | | | | | | | | | | | |
| Custom Index | | | | 2.59 | | | | 8.92 | | | | 8.43 | | | | 6.56 | | | | 6.38 | | | | 6.18 | | | | NA | | | | NA | | | | NA | | | | NA | | | | NA | | | | NA | |
See accompanying Notes to Management’s Discussion of Fund Performance.
The Madison Moderate Allocation Fund (Class A load waived) returned 1.44% for the one-year period, compared to its custom blended benchmark’s return of 2.59%. The Fund outperformed its peers as measured by the Morningstar Moderate Allocation category, which advanced 0.61% for the period. Contributing positively to the Fund’s return were overweight allocations to hedged European and Japanese stocks, U.S. growth stocks and U.S. Treasuries. The Fund also benefited from an underweight allocation to emerging markets stocks, which sustained double digit losses over the trailing 12 months. A final benefit came from the Fund’s overall defensive posturing, which helped mitigate losses during the steep equity market decline experienced in August/September. Detracting from performance was the Fund’s overweight allocation to U.S. mid-cap stocks, a modest stake in gold and the underperformance of a few key actively managed equity and fixed income holdings. The Fund was also held back by a below benchmark interest rate risk posture as interest rates fell over the period.
| PORTFOLIO ALLOCATION AS A PERCENTAGE OF NET ASSETS AS OF 10/31/15 | | | |
| |
| Stock Funds | | 43.3 | % |
| Bond Funds | | 36.9 | % |
| Foreign Stock Funds | | 13.7 | % |
| Alternative Funds | | 2.6 | % |
| Money Market Funds and Other Net Assets | | 3.5 | % |
| |
| | | | |
| TOP TEN HOLDINGS AS A PERCENTAGE OF NET ASSETS AS OF 10/31/15 | | | |
| |
| Madison Core Bond Fund Class Y | | 14.5 | % |
| Madison Large Cap Growth Fund Class Y | | 11.7 | % |
| Madison Large Cap Value Fund Class Y | | 11.1 | % |
| Metropolitan West Total Return Bond Fund Class I | | 8.1 | % |
| iShares 7-10 Year Treasury Bond ETF | | 6.9 | % |
| iShares Core S&P Mid-Cap ETF | | 6.6 | % |
| iShares 3-7 Year Treasury Bond ETF | | 5.9 | % |
| Vanguard Growth ETF | | 5.9 | % |
| iShares Core MSCI EAFE ETF | | 5.7 | % |
| Vanguard Value ETF | | 5.2 | % |
| |
Madison Funds | Management’s Discussion of Fund Performance - continued | October 31, 2015
| MADISON AGGRESSIVE ALLOCATION FUND |
| |
| INVESTMENT STRATEGY HIGHLIGHTS |
Under normal circumstances, the Aggressive Allocation Fund’s total net assets will be allocated among various asset classes and Underlying Funds, including those whose shares trade on a stock exchange (exchange traded funds or “ETFs”), with target allocations over time of approximately 85% equity investments and 15% fixed income investments. Underlying Funds in which the Fund invests may include Affiliated Underlying Funds. Generally, Madison will not invest more than 75% of Fund’s net assets, at the time of purchase, in Affiliated Underlying Funds. Although actual allocations may vary, the Fund’s asset allocation among asset classes and Underlying Funds is expected to be approximately:
| • | | 0-10% money market funds; |
| • | | 0-30% debt securities, all of which could be in below investment grade (“junk”) debt securities (e.g., bond funds, convertible bond funds and high income funds); |
| • | | 30-90% equity securities (e.g., U.S. stock funds); |
| • | | 0-60% foreign securities (e.g., international stock and bond funds, including emerging market securities); and |
| • | | 0-20% alternative asset classes (e.g., real estate investment trust funds, natural resources funds, precious metal funds and long/short funds). |
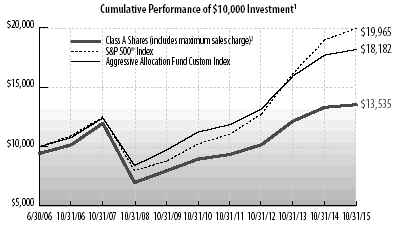
| Average Annual Total Return through October 31, 20151 |
| |
| | | | % Return Without Sales Charge | | | | % Return After Sales Charge5 |
| | | | | | | | | |
| | | | | | | | | | | | | | | | | | | | Since | | Since | | | | | | | | | | | | | | | | | | Since | | Since |
| | | | 1
Year | | 3
Years | | 5
Years | | 10
Years | | 6/30/06
Inception | | 2/29/08
Inception | | 1
Year | | 3
Years | | 5
Years | | 10
Years | | 6/30/06
Inception | | 2/29/08
Inception |
| |
| Class A Shares2 | | | | 1.66 | | | | 10.06 | | | | 8.64 | | | | – | | | | 3.95 | | | | – | | | | -4.17 | | | | 7.91 | | | | 7.37 | | | | – | | | | 3.29 | | | | – | |
| |
| Class B Shares3 | | | | 0.91 | | | | 9.26 | | | | 7.84 | | | | – | | | | 3.29 | | | | – | | | | -3.25 | | | | 8.27 | | | | 7.54 | | | | – | | | | 3.29 | | | | – | |
| |
| Class C Shares4 | | | | 0.91 | | | | 9.25 | | | | 7.83 | | | | – | | | | – | | | | 2.69 | | | | -0.01 | | | | 9.25 | | | | 7.83 | | | | – | | | | – | | | | 2.69 | |
| |
| S&P 500 Index | | | | 5.20 | | | | 16.20 | | | | 14.33 | | | | 7.85 | | | | 7.69 | | | | 8.32 | | | | NA | | | | NA | | | | NA | | | | NA | | | | NA | | | | NA | |
| |
| Aggressive | | | | | | | | | | | | | | | | | | | | | | | | | | | | | | | | | | | | | | | | | | | | | | | | | |
| Allocation Fund | | | | | | | | | | | | | | | | | | | | | | | | | | | | | | | | | | | | | | | | | | | | | | | | | |
| Custom Index | | | | 2.66 | | | | 11.95 | | | | 10.56 | | | | 7.04 | | | | 6.65 | | | | 6.64 | | | | NA | | | | NA | | | | NA | | | | NA | | | | NA | | | | NA | |
See accompanying Notes to Management’s Discussion of Fund Performance.
The Madison Aggressive Allocation Fund (Class A load waived) returned 1.66% for the one-year period, compared to its custom blended benchmark’s return of 2.66%. The Fund outperformed its peers as measured by the Morningstar Aggressive Allocation category, which returned -0.21% for the period. Contributing positively to the Fund’s return were overweight allocations to hedged European and Japanese stocks, U.S. growth stocks and U.S. Treasuries. The Fund also benefited from an underweight allocation to emerging markets stocks, which sustained double digit losses over the trailing 12 months. A final benefit came from the Fund’s overall defensive posturing, which helped mitigate losses during the steep equity market decline experienced in August/September. Detracting from performance was the Fund’s overweight allocation to U.S. mid-cap stocks, a modest stake in gold and the underperformance of a few key actively managed equity and fixed income holdings. The Fund was also held back by a below benchmark interest rate risk posture as interest rates fell over the period.
| PORTFOLIO ALLOCATION AS A PERCENTAGE OF NET ASSETS AS OF 10/31/15 | | | |
| |
| Stock Funds | | 58.9 | % |
| Foreign Stock Funds | | 18.8 | % |
| Bond Funds | | 16.9 | % |
| Alternative Funds | | 2.6 | % |
| Money Market Funds and Other Net Assets | | 2.8 | % |
| |
| | | | |
| TOP TEN HOLDINGS AS A PERCENTAGE OF NET ASSETS AS OF 10/31/15 | | | |
| |
| Madison Large Cap Growth Fund Class Y | | 14.6 | % |
| Madison Large Cap Value Fund Class Y | | 14.0 | % |
| iShares Core S&P Mid-Cap ETF | | 9.5 | % |
| Vanguard Growth ETF | | 8.2 | % |
| iShares Core MSCI EAFE ETF | | 8.2 | % |
| Madison Core Bond Fund Class Y | | 8.1 | % |
| Vanguard Value ETF | | 6.4 | % |
| iShares 7-10 Year Treasury Bond ETF | | 5.9 | % |
| Madison NorthRoad International Fund Class Y | | 3.8 | % |
| WisdomTree Europe Hedged Equity Fund | | 3.6 | % |
| |
| MADISON CASH RESERVES FUND |
| |
| INVESTMENT STRATEGY HIGHLIGHTS |
The Madison Cash Reserves Fund invests exclusively in U.S. dollar-denominated money market securities maturing in thirteen months or less from the date of purchase. These securities will be obligations of the U.S. Government and its agencies and instrumentalities, but may also include securities issued by U.S. and foreign financial institutions, corporations, municipalities, foreign governments, and multi-national organizations, such as the World Bank.
The Fund may invest in mortgage-backed and asset-backed securities, including those representing pools of mortgage, commercial, or consumer loans originated by financial institutions.
The Madison Cash Reserves Fund (Class A) returned 0.00% for the prior twelve months, compared to a 0.02% return on the Fund’s 90 day Treasury Bill benchmark. With the Federal Reserve maintaining a “Zero Interest Rate Policy” (ZIRP) throughout this past fiscal year, the Fund was unable to pay dividends to shareholders despite continuing to waive its fees in order to preserve capital. With changes to Fed policy likely coming in the next fiscal year, we are hopeful that the Fund will be able to once again begin paying a dividend.
| SECTOR ALLOCATION AS A PERCENTAGE OF NET ASSETS AS OF 10/31/15 | | | |
| |
| Federal Home Loan Bank | | 26.0 | % |
| Fannie Mae | | 24.7 | % |
| Freddie Mac | | 20.8 | % |
| U.S. Treasury Notes | | 10.9 | % |
| Federal Farm Credit Bank | | 10.4 | % |
| Cash and Other Net Assets | | 7.2 | % |
| |
Madison Funds | Management’s Discussion of Fund Performance - continued | October 31, 2015
MADISON TAX-FREE VIRGINIA FUND
INVESTMENT STRATEGY HIGHLIGHTS
The Madison Tax-Free Virginia Fund seeks to achieve its investment objective by investing at least 80% of its net assets in municipal bonds that are exempt from federal and state income tax for residents of Virginia. These securities may be issued by state governments, their political subdivisions (for example, cities and counties) and public authorities (for example, school districts and housing authorities). The Fund may also invest in bonds that, under federal law, are exempt from federal and state income taxation, such as bonds issued by the District of Columbia, Puerto Rico, the Virgin Islands and Guam. The Fund invests in intermediate and long-term bonds having average, aggregate maturities (at the portfolio level) of 7 to 15 years.
PERFORMANCE DISCUSSION
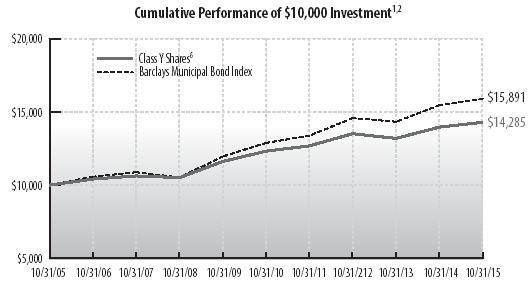
| | | | | |
| Average Annual Total Return through October 31, 20152 | | | | |
| | % Return Without Sales Charge |
| | 1 Year | | 3 Years | 5 Years | 10 Years |
| Class Y Shares6 | 2.36 | | 1.88 | 3.01 | 3.63 |
| Barclays Municipal Bond Index | 2.87 | | 2.91 | 4.28 | 4.74 |
| See accompanying Notes to Management’s Discussion of Fund Performance. | | |
The Madison Tax-Free Virginia Fund (Class Y) returned 2.36% for the one-year period, underperforming its benchmark, the Barclays Municipal Bond Index, which returned 2.87%. The Morningstar Muni Single State Long peer group gained 2.25% for the period. The underperformance of the Fund versus its benchmark was primarily attributable to a significant underweight in the longest sector of the yield curve which posted the best performance during the 12-month period. Specifically, bonds with final maturities of 22 years and longer returned 3.89% with a 19.73% weighting in the benchmark compared to only an 11.32% weighting for the Fund. The overall duration (a measure of interest rate risk) of the Virginia Fund was 5.8 years versus 6.7 years for the benchmark. This underweighting in interest rate risk in a falling rate environment detracted from the Fund’s performance.
| |
| SECTOR ALLOCATION AS A PERCENTAGE OF NET ASSETS AS OF 10/31/15 |
| Development | 8.2% |
| Education | 13.5% |
| Facilities | 6.8% |
| General | 9.6% |
| General Obligation | 21.2% |
| Medical | 7.3% |
| Multifamily Housing | 9.2% |
| Power | 4.3% |
| Transportation | 5.4% |
| Utilities | 1.5% |
| Water | 10.8% |
| Net Other Assets and Liabilities | 2.2% |
| | |
| TOP TEN HOLDINGS AS A PERCENTAGE OF NET ASSETS AS OF 10/31/15 | | |
| Northern Virginia Transportation Authority, 5.0%, 6/1/30 | 4.0% |
| Fairfax County Redevelopment & Housing Authority, 4.75%, 10/1/36 | 3.4% |
| Newport News Economic Development Authority, 5.0%, 7/1/25 | 3.4% |
| City of Portsmouth VA, 5.0%, 2/1/31 | 3.2% |
| Suffolk Redevelopment & Housing Authority, 5.6%, 2/1/33 | 3.2% |
| Prince William County Industrial Development Authority, 5.25%, 2/1/18 | 3.2% |
| Virginia Commonwealth Transportation Board, 5.0%, 3/15/25 | 2.8% |
| Chesterfield County Economic Development Authority, 5.0%, 5/1/23 | 2.8% |
| Commonwealth of Virginia, 5.0%, 6/1/23 | 2.7% |
| Virginia College Building Authority, 5.0%, 2/1/23 | 2.7% |
MADISON TAX-FREE NATIONAL FUND
INVESTMENT STRATEGY HIGHLIGHTS
The Madison Tax-Free National Fund seeks to achieve its investment objective by investing at least 80% of its net assets in municipal bonds that are exempt from federal income taxes. These securities may be issued by state governments, their political subdivisions (for example, cities and counties) and public authorities (for example, school districts and housing authorities). The Fund may also invest in bonds that, under federal law, are exempt from federal and state income taxation, such as bonds issued by the District of Columbia, Puerto Rico, the Virgin Islands and Guam. The Fund invests in intermediate and long-term bonds having average, aggregate maturities (at the portfolio level) of seven to 15 years. The primary difference between this Fund and the Madison Tax-Free Virginia Fund is that the Madison Tax-Free Virginia Fund will invest in bonds that are exempt from federal and state income tax for residents of Virginia, while this Fund will invest in bonds that are exempt from federal income tax.
PERFORMANCE DISCUSSION
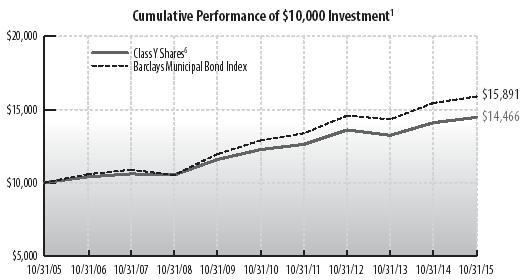
| | | | | |
| Average Annual Total Return through October 31, 20151 | | | | |
| | % Return Without Sales Charge |
| | 1 Year | | 3 Years | 5 Years | 10 Years |
| Class Y Shares6 | 2.61 | | 2.08 | 3.37 | 3.76 |
| Barclays Municipal Bond Index | 2.87 | | 2.91 | 4.28 | 4.74 |
| See accompanying Notes to Management’s Discussion of Fund Performance. | | |
The Madison Tax-Free National Fund (Class Y) returned 2.61% for the one-year period, modestly underperforming its benchmark, the Barclays Municipal Bond Index, which returned 2.87%. The Morningstar Muni National Long peer group gained 2.57%. The underperformance of the Fund versus its benchmark was primarily attributable to a significant underweight in the longest sector of the yield curve which posted the best performance during the 12 month period. Specifically, bonds with final maturities of 22 years and longer returned 3.89% with a 19.73% weighting in the benchmark compared to only a 4.36% weighting for the Fund. The overall duration (a measure of interest rate risk) of the National Fund was 6.1 years versus 6.7 years for the benchmark. This underweighting in interest rate risk in a falling rate environment detracted from the Fund’s performance.
6
Madison Funds | Management’s Discussion of Fund Performance - Madison Tax-Free National Fund - continued | October 31, 2015
| | | | | |
| STATE ALLOCATION AS A PERCENTAGE OF NET ASSETS AS OF 10/31/15 | | |
| Alabama | 2.4% |
| Arkansas | 0.7% |
| Colorado | 1.7% |
| Delaware | 1.5% |
| Florida | 13.8% |
| Georgia | 4.1% |
| Illinois | 0.8% |
| Indiana | 3.6% |
| Iowa | 2.8% |
| Kansas | 2.3% |
| Maryland | 5.6% |
| Michigan | 3.4% |
| Missouri | 6.8% |
| New Jersey | 4.0% |
| New Mexico | 1.7% |
| New York | 3.2% |
| North Carolina | 6.6% |
| Ohio | 2.1% |
| Pennsylvania | 0.6% |
| South Carolina | 8.9% |
| Tennessee | 1.7% |
| Texas | 9.8% |
| Virginia | 3.4% |
| Washington | 2.9% |
| Wisconsin | 3.6% |
| Net Other Assets and Liabilities | 2.0% |
| |
| TOP TEN HOLDINGS AS A PERCENTAGE OF NET ASSETS AS OF 10/31/15 | | |
| Anderson County School District No. 1, General Obligation, 5.0%, 3/1/25 | 3.2% |
| Maple School District, General Obligation, 5.0%, 4/1/24 | | | 2.8% |
| City of Rockville MD, General Obligation, 5.0%, 6/1/24 | | | 2.7% |
| City of Port St. Lucie FL Utility System Revenue, 5.0%, 9/1/27 | 2.5% |
| Montgomery County Revenue Authority, 5.0%, 5/1/31 | | | 2.5% |
| Orlando Utilities Commission, 5.0%, 10/1/22 | | | | 2.3% |
| City of Wichita KS, General Obligation, 5.0%, 12/1/24 | | | 2.3% |
| County of Miami-Dade FL, 5.0%, 3/1/25 | | | | 2.2% |
| Town of Cary NC Combined Utility Systems Revenue, 5.0%, 12/1/23 | 2.2% |
| Cleveland-Cuyahoga County Port Authority, 5.0%, 7/1/24 | | | 2.1% |
MADISON HIGH QUALITY BOND FUND
INVESTMENT STRATEGY HIGHLIGHTS
The Madison High Quality Bond Fund seeks to achieve its investment objectives through diversified investments in a broad range of corporate debt securities, obligations of the U.S. Government and its agencies, and money market instruments. In seeking to achieve the Fund’s goals, the Fund’s management will (1) shorten or lengthen the dollar weighted average maturity of the Fund based on its anticipation of the movement of interest rates (the dollar weighted average maturity is expected to be ten years or less), and (2) monitor the yields of the various bonds that satisfy the Fund’s investment guidelines to determine the best combination of yield, credit risk and diversification for the Fund. Under normal market conditions, the Fund will invest at least 80% of its net assets in higher quality bond issues and, therefore, intends to maintain an overall portfolio quality rating of A by Standard & Poor’s and/or A2 by Moody’s or equivalent.
PERFORMANCE DISCUSSION
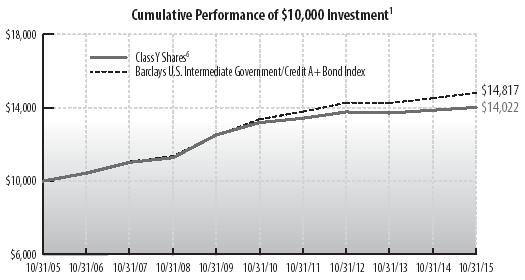
| | | | | |
| Average Annual Total Return through October 31, 20151 | | | | |
| | % Return Without Sales Charge |
| | 1 Year | | 3 Years | 5 Years | 10 Years |
| Class Y Shares6 | 1.11 | | 0.60 | 1.22 | 3.44 |
| Barclays U.S. Intermediate Govt/Credit A+ | | | | | |
| Bond Index | 2.05 | | 1.25 | 2.07 | 4.01 |
See accompanying Notes to Management’s Discussion of Fund Performance.
The Madison High Quality Bond Fund (Class Y) returned 1.11% for the one-year period, lagging the benchmark Barclays U.S. Intermediate Government Credit A+ Index which returned 2.05%. The Fund outperformed the Morningstar Short-Term Bond category peer group’s return of 0.46% over the same period. Underperformance during the trailing 12 months compared to the market benchmark was due largely to conservative maturity positioning. As interest rates declined over the period, the Fund’s underweight in longer maturities detracted from total return. The Fund’s conservative maturity profile also produced a yield difference that was detractive to total return. Some of the yield shortfall was mitigated by the Fund’s sector overweight in corporate bonds. Security selection and credit sector selection were additive to returns over the period as the Fund participated in positive individual bond performance and avoided some volatile credit sectors. Looking forward, we view recent positive relative performance as a sign of opportunities ahead. The recent uptick in volatility has provided opportunities to add credit and attractive yields to the portfolio and we feel this will continue.
| | |
| SECTOR ALLOCATION AS A PERCENTAGE OF NET ASSETS AS OF 10/31/15 | | |
| Consumer Discretionary | 6.7 | % |
| Consumer Staples | 1.5 | % |
| Energy | 1.5 | % |
| Fannie Mae | 14.7 | % |
| Financials | 14.0 | % |
| Freddie Mac | 5.9 | % |
| Health Care | 3.0 | % |
| Industrials | 1.6 | % |
| Information Technology | 8.7 | % |
| Materials | 0.0 | % |
| Telecommunication Services | 0.0 | % |
| U.S. Treasury Notes | 39.2 | % |
| Short-Term Investments and Other Net Assets and Liabilities | 3.2 | % |
| |
| TOP TEN HOLDINGS AS A PERCENTAGE OF NET ASSETS AS OF 10/31/15 | | |
| Freddie Mac, 2.5%, 5/27/16 | 4.9 | % |
| U.S. Treasury Note, 3.875%, 5/15/18 | 4.7 | % |
| U.S. Treasury Note, 3.0%, 2/28/17 | 4.0 | % |
| U.S. Treasury Note, 1.5%, 12/31/18 | 3.9 | % |
| Fannie Mae, 1.25%, 1/30/17 | 3.9 | % |
| Fannie Mae, 1.25%, 9/28/16 | 3.9 | % |
| U.S. Treasury Note, 1.0%, 8/31/16 | 3.9 | % |
| U.S. Treasury Note, 0.875%, 1/31/17 | 3.9 | % |
| Fannie Mae, 0.875%, 2/8/18 | 3.9 | % |
| U.S. Treasury Note, 1.25%, 1/31/19 | 3.7 | % |
7
Madison Funds | Management’s Discussion of Fund Performance - continued | October 31, 2015
MADISON CORE BOND FUND
INVESTMENT STRATEGY HIGHLIGHTS Under normal market conditions, the Madison Core Bond Fund invests at least 80% of its net assets in bonds. To keep current income relatively stable and to limit share price volatility, the Fund emphasizes investment grade securities and maintains an intermediate (typically 3-7 year) average portfolio duration, with the goal of being between 85-115% of the market benchmark duration. The Fund strives to add incremental return in the portfolio by making strategic decisions related to credit risk, sector exposure and yield curve positioning. The Fund may invest in corporate debt securities, U.S. Government debt securities, foreign government debt securities, non-rated debt securities, and asset-backed, mortgage-backed and commercial mortgage-backed securities.
PERFORMANCE DISCUSSION

| | | | | | | | | | | |
| Average Annual Total Return through October 31, 20151 | | | | | | |
| | | % Return Without Sales Charge | | | % Return After Sales Charge5 |
| | 1 Year | 3 Years | 5 Years | 10 Years | Since
6/30/06
Inception | Since
4/19/13
Inception | | 1 Year | 3 Years | 5 Years | 10 Years |
| Class A Shares2 | 1.34 | 0.80 | 1.85 | 3.38 | – | – | | -3.19 | -0.73 | 0.93 | 2.91 |
| Class B Shares3 | 0.69 | 0.05 | 1.11 | 2.77 | – | – | | -3.75 | -1.06 | 0.74 | 2.77 |
| Class Y Shares6 | 1.71 | 1.08 | 2.11 | – | 3.85 | – | | – | – | – | – |
| Class R6 Shares7 | 1.71 | – | – | – | – | 1.22 | | – | – | – | – |
| Bank of America Merrill | | | | | | | | | | | |
| Lynch US Corp, Govt & | | | | | | | | | | | |
| Mortgage Index | 2.07 | 1.70 | 3.08 | 4.79 | 5.08 | 4.37 | | NA | NA | NA | NA |
| Barclays U.S. Aggregate | | | | | | | | | | | |
| Bond Index | 1.96 | 1.65 | 3.03 | 4.72 | 4.99 | 4.27 | | NA | NA | NA | NA |
See accompanying Notes to Management’s Discussion of Fund Performance.
The Madison Core Bond Fund (Class Y) returned 1.71% for the one-year period, trailing the Fund’s benchmark, the Barclays U.S. Aggregate Bond Index, which advanced 1.96%. The Fund outperformed the Morningstar Intermediate-Term Bond peer group, which gained 0.98% for the period. The majority of the Fund’s underperformance relative to its benchmark resulted from the Fund’s short duration exposure (90% of benchmark) in an environment of five-year and longer interest rates falling by 10-20 basis points. The strongest sector performance came from the Fund’s corporate and municipal bond holdings, which provided weighted returns of 2.54% for the period versus the Barclays Credit Index return of 0.90%.
| | |
| PORTFOLIO ALLOCATION AS A PERCENTAGE OF NET ASSETS AS OF 10/31/15 | | |
| Corporate Notes and Bonds | 32.0 | % |
| U.S. Government and Agency Obligations | 26.6 | % |
| Mortgage-Backed Securities | 20.6 | % |
| Municipal Bonds | 9.5 | % |
| Asset-Backed Securities | 4.0 | % |
| Commercial Mortgage Backed Securities | 2.0 | % |
| Collateralized Mortgage Obligations | 1.1 | % |
| Short-Term Investments, Options, Futures and Other Net Assets and Liabilities | 4.2 | % |
| | |
| TOP TEN HOLDINGS AS A PERCENTAGE OF NET ASSETS AS OF 10/31/15 | | |
| U.S. Treasury Note, 3.125%, 5/15/21 | 1.8 | % |
| U.S. Treasury Note, 3.125%, 1/31/17 | 1.8 | % |
| U.S. Treasury Note, 0.75%, 3/15/17 | 1.6 | % |
| U.S. Treasury Bond, 4.5%, 5/15/38 | 1.6 | % |
| U.S. Treasury Note, 2.75%, 2/28/18 | 1.4 | % |
| U.S. Treasury Note, 2.625%, 1/31/18 | 1.4 | % |
| U.S. Treasury Note, 1.875%, 10/31/17 | 1.4 | % |
| U.S. Treasury Note, 1.375%, 2/28/19 | 1.3 | % |
| U.S. Treasury Note, 3.875%, 5/15/18 | 1.3 | % |
| U.S. Treasury Bond, 6.625%, 2/15/27 | 1.3 | % |
MADISON CORPORATE BOND FUND
INVESTMENT STRATEGY HIGHLIGHTS
The Madison Corporate Bond Fund seeks to achieve its investment objective through diversified investment in a broad range of corporate debt securities. Under normal market conditions, the Fund will invest at least 80% of its net assets in income-producing corporate bonds, and at least 80% of its assets in investment grade bonds. Up to 20% of the Fund’s assets may be invested in non-investment grade fixed-income securities commonly referred to as “high yield” or “junk” bonds. The Fund expects to maintain an average overall portfolio quality of A- or better, an overall portfolio dollar weighted average maturity of 15 years or less, and an overall portfolio duration within 25% of the Barclays U.S. Credit Bond Index benchmark (with the flexibility to occasionally vary from the benchmark by up to 50% when the investment adviser believes interest rates are likely to materially change).
PERFORMANCE DISCUSSION
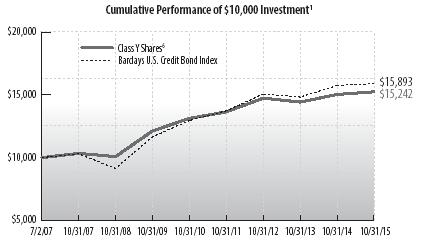
| | | | | | |
| Average Annual Total Return through October 31, 20151 | | | |
| | | | % Return Without Sales Charge | |
| | 1 Year | | 3 Years | 5 Years | 10 Years | Since
7/2/07
Inception |
| Class Y Shares6 | 1.40 | | 1.13 | 3.03 | – | 5.19 |
| Barclays U.S. Credit Bond Index | 0.90 | | 1.80 | 4.17 | 5.45 | 5.72 |
| See accompanying Notes to Management’s Discussion of Fund Performance. | | |
The Madison Corporate Bond Fund (Class Y) gained 1.40% for the period, while its benchmark, the Barclays U.S. Credit Bond Index gained 0.90%. The Fund outperformed its peer group, the Morningstar Corporate Bond category, which posted a 0.25% gain. The Fund benefited from being overweight Oil Refiners within the Energy sector and Financials, both of which have generated favorable excess returns over the past year. The Fund also benefited from its underweight of the Metals/Mining within the Materials sector, which has performed poorly due to significantly lower commodity prices. The Fund focused heavily on the new issue market where yield premiums are more attractive. Some of the bonds purchased on the new issue market during the past year that have performed well include CVS, Frontier, and UnitedHealth. In addition, the Fund purchased Omnicare bonds before the company was purchased by CVS and its bond spreads tightened significantly.
8
Madison Funds | Management’s Discussion of Fund Performance - Madison Corporate Bond Fund - continued | October 31, 2015
On a duration basis, the Fund’s overall duration remains lower than its benchmark’s duration and it continues to have an underweight in the long-maturity end of the yield curve (30-year bonds). Longer-term investment grade corporate bonds have performed poorly in 2015 and have, as a class, generated negative total returns.
| | |
| SECTOR ALLOCATION AS A PERCENTAGE OF NET ASSETS AS OF 10/31/15 | | |
| Consumer Discretionary | 10.3 | % |
| Consumer Staples | 6.0 | % |
| Energy | 11.3 | % |
| Financials† | 36.5 | % |
| Health Care | 6.3 | % |
| Industrials | 7.3 | % |
| Information Technology | 4.6 | % |
| Materials | 3.2 | % |
| Telecommunication Services | 3.8 | % |
| Utilities | 0.0 | % |
| Municipal Bonds | 7.6 | % |
| Short-Term Investments and Other Net Assets and Liabilities | 3.1 | % |
| †Financials includes securities in the following industries: Banks; Diversified Financial Services; Insurance; Iron/Steel; Machinery-Construction & Mining; Mining and Real Estate | |
| | |
| TOP TEN HOLDINGS AS A PERCENTAGE OF NET ASSETS AS OF 10/31/15 | | |
| General Electric Capital Corp., 6.75%, 3/15/32 | 2.4 | % |
| Wells Fargo & Co., 5.625%, 12/11/17 | 1.9 | % |
| Berkshire Hathaway Finance Corp., 5.4%, 5/15/18 | 1.9 | % |
| Simon Property Group L.P., 4.125%, 12/1/21 | 1.8 | % |
| US Bancorp, 2.2%, 11/15/16 | 1.7 | % |
| Valero Energy Corp., 6.625%, 6/15/37 | 1.6 | % |
| Comcast Corp., 6.45%, 3/15/37 | 1.6 | % |
| Oracle Corp., 5.75%, 4/15/18 | 1.4 | % |
| DIRECTV Holdings LLC / DIRECTV Financing Co. Inc., 5.0%, 3/1/21 | 1.4 | % |
| American Express Co., 6.15%, 8/28/17 | 1.4 | % |
MADISON HIGH INCOME FUND
INVESTMENT STRATEGY HIGHLIGHTS
The Madison High Income Fund invests primarily in lower-rated, higher-yielding income bearing securities, such as “junk��� bonds. Because the performance of these securities has historically been strongly influenced by economic conditions, the Fund may rotate securities selection by business sector according to economic outlook. Under normal market conditions, the Fund invests at least 80% of its net assets in bonds rated lower than investment grade (BBB/Baa) and their unrated equivalents or other high-yielding securities.
PERFORMANCE DISCUSSION
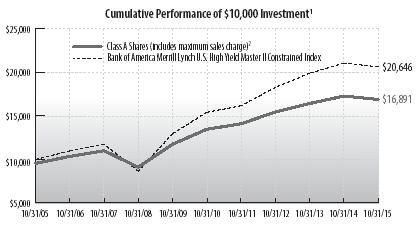
| | | | | | | | | | | | |
| Average Annual Total Return through October 31, 20151 | | | | | | |
| | | | % Return Without Sales Charge | | | % Return Without Sales Charge5 |
| | 1 Year | | 3 Years | 5 Years | 10 Years | Since
6/30/06
Inception | | 1 Year | | 3 Years | 5 Years | 10 Years |
| Class A Shares2 | -2.29 | | 2.99 | 4.62 | 5.86 | – | | -6.69 | | 1.41 | 3.68 | 5.38 |
| Class B Shares3 | -3.11 | | 2.24 | 3.84 | 5.24 | – | | -7.05 | | 1.30 | 3.55 | 5.24 |
| Class Y Shares6 | -2.00 | | 3.35 | 4.93 | – | 6.18 | | – | | – | – | – |
| Bank of America Merrill | | | | | | | | | | | | |
| Lynch U.S. High Yield | | | | | | | | | | | | |
| Master II Constrained | -2.03 | | 4.11 | 6.01 | 7.52 | 7.60 | | NA | | NA | NA | NA |
| See accompanying Notes to Management’s Discussion of Fund Performance. | | | | | |
Madison High Income Fund (Class Y) returned -2.00% over the twelve-month period, slightly outperforming the Bank of America Merrill Lynch High Yield Constrained Index benchmark return of -2.03%. The Fund also modestly outperformed the Morningstar High Yield Bond category peer group, which returned -2.09% over the same period. From a ratings perspective, the biggest contribution came from positive security selection and underweight within credit groups rated triple-C and below. From an industry perspective, the key driver of the Fund’s outperformance was the portfolio’s positive selection and overweight in Support – Services and underweight in Metals/Mining Excluding Steel. Negative selection in Oil and Gas, as well as negative selection in B-rated credits, detracted from performance. During the period, we reduced our exposure to Chemicals and Oil and Gas. We slightly increased our exposure to Support-Services, Telecom: Wireline/Wireless, and Media - Cable. We also slightly reduced our weighting to pure CCC credits. Some important portfolio metrics included a 6.45% yield-to-worst, a current yield of 6.73%, and weighted average credit ratings of B+/B1, respectively. Looking forward, although the Federal Reserve may now have the green light to institute the first rate increase in nearly ten years, future rate hikes should be slow, deliberate, and well-telegraphed, and we believe that high yield credit markets are unlikely to react adversely to the slight increase.
| | |
| SECTOR ALLOCATION AS A PERCENTAGE OF NET ASSETS AS OF 10/31/15 | | |
| Consumer Discretionary | 22.9 | % |
| Consumer Staples | 2.8 | % |
| Energy | 8.2 | % |
| Financials | 7.1 | % |
| Health Care | 9.1 | % |
| Industrials | 10.9 | % |
| Information Technology | 9.6 | % |
| Materials | 6.8 | % |
| Telecommunication Services | 7.1 | % |
| Utilities | 9.4 | % |
| Short-Term Investments and Other Net Assets and Liabilities | 6.1 | % |
| |
| TOP TEN HOLDINGS AS A PERCENTAGE OF NET ASSETS AS OF 10/31/15 | | |
| Univision Communications Inc., 6.75%, 9/15/22 | 2.1 | % |
| Outfront Media Capital LLC / Outfront Media Capital Corp., 5.625%, 2/15/24 | 2.0 | % |
| Endo Finance LLC / Endo Finco Inc., 7.25%, 12/15/20 | 2.0 | % |
| Dole Food Co. Inc., 7.25%, 5/1/19 | 2.0 | % |
| Belden Inc., 5.5%, 9/1/22 | 1.9 | % |
| AmeriGas Finance LLC / AmeriGas Finance Corp., 7.0%, 5/20/22 | 1.7 | % |
| CCO Holdings LLC / CCO Holdings Capital Corp., 6.5%, 4/30/21 | 1.6 | % |
| Reynolds Group Issuer Inc. / Reynolds Group Issuer LLC / Reynolds Group Issuer Lu, 5.75%, 10/15/20 | 1.6 | % |
| Alliance Data Systems Corp., 6.375%, 4/1/20 | 1.6 | % |
| Sinclair Television Group Inc., 6.375%, 11/1/21 | 1.6 | % |
9
Madison Funds | Management’s Discussion of Fund Performance - continued | October 31, 2015
MADISON DIVERSIFIED INCOME FUND
INVESTMENT STRATEGY HIGHLIGHTS
The Madison Diversified Income Fund seeks income by investing in a broadly diversified array of securities including bonds, common stocks, real estate securities, foreign market bonds and stocks and money market instruments. Bonds, stock and cash components will vary, reflecting the portfolio managers’ judgments of the relative availability of attractively yielding and priced stocks and bonds. Generally, however, bonds will constitute up to 80% of the Fund’s assets, stocks will constitute up to 70% of the Fund’s assets, real estate securities will constitute up to 25% of the Fund’s assets, foreign stocks and bonds will constitute up to 25% of the Fund’s assets and money market instruments may constitute up to 25% of the Fund’s assets. The Fund intends to limit the investment in lower credit quality bonds to less than 50% of the Fund’s assets.
PERFORMANCE DISCUSSION

| | | | | | | | | | | | |
| Average Annual Total Return through October 31, 20151 | | | | | | |
| | % Return Without Sales Charge | | % Return After Sales Charge5 |
| | 1 Year | | 3 Years | 5 Years | 10 Years | Since
7/31/12
Inception | | 1 Year | 3 Years | 5 Years | 10 Years | Since
7/31/12
Inception |
| Class A Shares2 | 1.39 | | 7.35 | 7.81 | 5.69 | – | | -4.42 | 5.24 | 6.54 | 5.07 | – |
| Class B Shares3 | 0.58 | | 6.54 | 6.99 | 5.06 | – | | -3.91 | 5.50 | 6.69 | 5.06 | – |
| Class C Shares4 | 0.64 | | 6.54 | – | – | 6.32 | | -0.35 | 6.54 | – | – | 6.32 |
Bank of
America Merrill
Lynch US
Corp, Govt &
Mortgage Index | 2.07 | | 1.70 | 3.08 | 4.79 | 1.69 | | NA | NA | NA | NA | NA |
S&P 500®
Index | 5.20 | | 16.20 | 14.33 | 7.85 | 15.90 | | NA | NA | NA | NA | NA |
Custom
Blended Index
(50% Fixed
50% Equity) | 3.88 | | 8.89 | 8.79 | 6.64 | 8.73 | | NA | NA | NA | NA | NA |
| See accompanying Notes to Management’s Discussion of Fund Performance. | | | |
The Madison Diversified Income Fund (A Class load waived) returned 1.39% for the one-year period, trailing its custom blended benchmark index (50% Bank of America Merrill Lynch U.S. Corporate, Government and Mortgage Index and 50% S&P 500® Index) which returned 3.88%. The Fund outperformed its Morningstar Moderate Allocation category peer group, which advanced 0.61% over the last year.
For much of the period, the Fund maintained an allocation of 54% equities / 46% fixed income, with a lower credit risk and duration profile in the bond portion of the portfolio than both its peers and the market. Fixed income performance has improved meaningfully in recent months as credit spreads have widened and interest rates have begun to migrate higher. Importantly, the Fund’s lower risk profile, from both duration and credit perspectives, helped it to perform well relative to its peers.
Relative to the S&P 500 Index, Equity sector allocation and stock selection were both negatives for performance. In terms of sectors, underweight positions in the Consumer Discretionary and Technology sectors detracted from performance. Stock selection results were positive in the Industrial, Financial, and Energy sectors, while Consumer Staples, Health Care and Consumer Discretionary stocks negatively impacted the portfolio. Within Industrials, aerospace manufacturer Boeing (BA) contributed nicely to results as it benefited from strength in the aerospace cycle. In Financials, property and casualty insurer Travelers (TRV) was additive to returns as it continued to grow book value, while Technology consulting firm Accenture (ACN) was the best performing stock in the portfolio due to a strong earnings report and outlook. On the negative side, Consumer Staples holdings Procter & Gamble (PG) and Walmart (WMT) were notable underperformers as sales fell short of expectations. In Health Care, pharmaceutical firm Johnson & Johnson (JNJ) and medical device maker Baxter (BAX) trailed the index. In general, there was wide performance discrepancy between high dividend paying stocks and non-dividend paying stocks in the period. The stocks with the highest dividend yields tended to perform the worst, while those stocks that didn’t pay dividends generally performed much better.
| | |
| PORTFOLIO ALLOCATION AS A PERCENTAGE OF NET ASSETS AS OF 10/31/15 | | |
| Common Stocks | 54.1 | % |
| Corporate Notes and Bonds | 15.6 | % |
| U.S. Government and Agency Obligations | 13.8 | % |
| Mortgage-Backed Securities | 9.0 | % |
| Municipal Bonds | 1.6 | % |
| Asset-Backed Securities | 1.2 | % |
| Commercial Mortgage-Backed Securities | 0.7 | % |
| Short-Term Investments and Other Net Assets and Liabilities | 4.0 | % |
| |
| TOP TEN HOLDINGS AS A PERCENTAGE OF NET ASSETS AS OF 10/31/15 | | |
| McDonald’s Corp. | 2.5 | % |
| Travelers Cos. Inc./The | 2.4 | % |
| Pfizer Inc. | 2.1 | % |
| General Electric Co. | 2.0 | % |
| Accenture PLC, Class A | 2.0 | % |
| Procter & Gamble Co./The | 1.9 | % |
| Johnson & Johnson | 1.9 | % |
| Boeing Co./The | 1.8 | % |
| Microsoft Corp. | 1.8 | % |
| United Parcel Service Inc., Class B | 1.8 | % |
10
Madison Funds | Management’s Discussion of Fund Performance - continued | October 31, 2015
MADISON COVERED CALL & EQUITY INCOME FUND
INVESTMENT STRATEGY HIGHLIGHTS
The Madison Covered Call & Equity Income Fund (formerly the Madison Equity Income Fund) invests, under normal market conditions, primarily in common stocks of large-and mid-capitalization companies that are, in the view of the Fund’s investment adviser, selling at a reasonable price in relation to their long-term earnings growth rates. The portfolio managers will allocate the Fund’s assets among stocks in sectors of the economy based upon their views on forward earnings growth rates, adjusted to reflect their views on economic and market conditions and sector risk factors.
The Fund will seek to generate current earnings from option premiums by writing (selling) covered call options on a substantial portion of its portfolio securities. The extent of option writing activity will depend upon market conditions and the portfolio manager’s ongoing assessment of the attractiveness of writing call options on the Fund’s stock holdings. In addition to providing income, covered call writing helps to reduce the volatility (and risk profile) of the Fund by providing downside protection.
PERFORMANCE DISCUSSION
| | | | | | | | | | | |
| Average Annual Total Return through October 31, 20151 |
| | % Return Without Sales Charge | | % Return After Sales Charge5 |
| | 1 Year | 3 Years | 5 Years | Since
10/30/09
Inception | Since
7/31/12
Inception | | 1 Year | 3 Years | 5 Years | Since
10/30/09
Inception | Since
7/31/12
Inception |
| Class A Shares2 | -0.18 | 6.87 | 6.88 | 6.90 | – | | -5.96 | 4.77 | 5.62 | 5.85 | – |
| Class C Shares4 | -0.83 | 6.08 | – | – | 6.52 | | -1.74 | 6.08 | – | – | 6.52 |
| Class Y Shares6 | 0.13 | 7.14 | 7.13 | 7.14 | – | | – | – | – | – | – |
| Class R6 Shares7 | 0.23 | 7.29 | – | – | 7.70 | | – | – | – | – | – |
| S&P 500® Index | 5.20 | 16.20 | 14.33 | 14.33 | 15.90 | | – | – | – | – | – |
| CBOE S&P 500 | | | | | | | | | | | |
| BuyWrite Index | 6.47 | 7.43 | 7.95 | 7.95 | 7.18 | | – | – | – | – | – |
| See accompanying Notes to Management’s Discussion of Fund Performance. | | | | |
Madison Covered Call & Equity Income Fund (Class Y) returned 0.13% for the one-year period, lagging the broad market as measured by the S&P 500® Index which advanced 5.20% during the year. The Fund lagged the passive strategy of its covered call benchmark, the CBOE S&P 500 Buy/Write Index (BXM), which returned 6.47% over the twelve months. The Fund outperformed its Morningstar Long/Short Equity category peer group, which returned -0.14%. Given the length of the bull market and deteriorating company fundamentals, the Fund has been consistently more hedged than the BXM Index. As a result, the Fund underperformed the benchmark as the market rose for much of the year, but outperformed during the market decline in August. The largest relative performance impact occurred in July as markets aggressively rallied following the perceived Greek bankruptcy resolution. The BXM Index, being essentially unhedged at the time, rallied in lock-step with the markets while the Fund remained more conservatively positioned. Stock selection within the Fund was quite strong relative to the overall market, led by companies involved in takeover activity including Cameron International, Altera and Catamaran. Additionally, strong performers such as Amazon, Lululemon, Progressive, Google (now Alphabet) and Microsoft were additive to performance. Somewhat offsetting these were underperformers such as CBS, Discovery Communications, Jacobs Engineering and Qualcomm. The Fund’s sector position was slightly additive as minimal exposure to the underperforming Utilities and Materials sectors was offset by underweighting in the strong Health Care sector. The most significant drag on this year’s performance came from the Fund’s normal conservative positioning through the use of covered call options and also through the use of put protection (which only added value in the short-lived August decline). The Fund continues to maintain a conservative posture.
| | | | | | | | | | |
| SECTOR ALLOCATION AS A PERCENTAGE OF TOTAL INVESTMENTS AS OF 10/31/15 | | | | | |
| | Fund | S&P 500®
Index |
| Consumer Discretionary | 9.2 | % | 13.1 | % |
| Consumer Staples | 6.6 | % | 9.7 | % |
| Energy | 8.6 | % | 7.1 | % |
| Financials | 8.6 | % | 16.2 | % |
| Health Care | 13.4 | % | 14.6 | % |
| Industrials | 11.1 | % | 10.2 | % |
| Information Technology | 14.3 | % | 20.8 | % |
| Materials | – | | 3.0 | % |
| Telecommunication Services | 2.4 | % | 2.4 | % |
| Utilities | – | | 2.9 | % |
| Exchange-Traded Funds | 9.2 | % | – | |
| Put Options Purchased | 0.2 | % | – | |
| U.S. Government and Agency Obligations | 6.5 | % | – | |
| Short-Term Investments | 9.9 | % | – | |
| |
| TOP TEN HOLDINGS AS A PERCENTAGE OF NET ASSETS AS OF 10/31/15 | | | | | |
| Apple Inc. | | | | | | | | | 3.3 | % |
| SPDR Gold Shares | | | | | | | | | 3.1 | % |
| Powershares QQQ Trust Series 1 | | | | | | | | | 3.1 | % |
| SPDR S&P 500 ETF Trust | | | | | | | | | 3.1 | % |
| United Technologies Corp. | | | | | | | | | 3.0 | % |
| Verizon Communications Inc. | | | | | | | | | 2.5 | % |
| T. Rowe Price Group Inc. | | | | | | | | | 2.5 | % |
| Occidental Petroleum Corp. | | | | | | | | | 2.4 | % |
| Biogen Inc. | | | | | | | | | 2.4 | % |
| Microsoft Corp. | | | | | | | | | 2.3 | % |
MADISON DIVIDEND INCOME FUND
INVESTMENT STRATEGY HIGHLIGHTS
The Madison Dividend Income Fund invests in equity securities of companies with a market capitalization of over $1 billion and a history of paying dividends, with the ability to increase dividends over time. Under normal market conditions, at least 80% of the Fund’s net assets will be invested in dividend paying equity securities. The Fund typically owns 40-55 securities which are chosen for having a current yield exceeding the S&P 500’s average yield, strong fundamentals including an attractive balance sheet and reasonable valuations at the time of purchase. A key attraction for management is a company with a history of increasing dividend payments and a business model that supports the possibility of continuing these increases in the future.
PERFORMANCE DISCUSSION
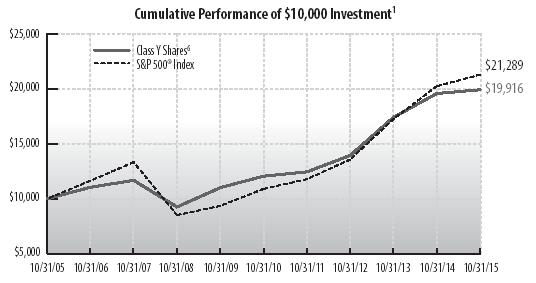
11
Madison Funds | Management’s Discussion of Fund Performance - Madison Dividend Income Fund - continued | October 31, 2015
| | | | | |
| Average Annual Total Return through October 31, 20151 | | | | |
| | % Return Without Sales Charge |
| | 1 Year | | 3 Years | 5 Years | 10 Years |
| Class Y Shares6 | 1.76 | | 12.62 | 10.56 | 7.13 |
| S&P 500® Index | 5.20 | | 16.20 | 14.33 | 7.85 |
| See accompanying Notes to Management’s Discussion of Fund Performance. | | |
Madison Dividend Income Fund (Class Y) returned 1.76% for the annual period, trailing its benchmark S&P 500® Index, which advanced 5.20%. The Fund outperformed its Morningstar Large Value category peer group, which returned 0.37% over the same period. Relative to the S&P 500 Index, sector allocation and stock selection were both negatives for performance. In terms of sectors, underweight positions in the Consumer Discretionary and Technology sectors detracted from performance. Stock selection results were positive in the Industrial, Financial, and Energy sectors, while Consumer Staples, Health Care and Consumer Discretionary stocks negatively impacted the portfolio. Within Industrials, aerospace manufacturer Boeing (BA) contributed nicely to results as it benefited from strength in the aerospace cycle. In Financials, property and casualty insurer Travelers (TRV) was additive to returns as it continued to grow book value, while Technology consulting firm Accenture (ACN) was the best performing stock in the portfolio due to a strong earnings report and outlook. On the negative side, Consumer Staples holdings Procter & Gamble (PG) and Walmart (WMT) were notable underperformers as sales fell short of expectations. In Health Care, pharmaceutical firm Johnson & Johnson (JNJ) and medical device maker Baxter (BAX) trailed the index. In general, there was wide performance discrepancy between high dividend paying stocks and non-dividend paying stocks in the period. The stocks with the highest dividend yields tended to perform the worst, while those stocks that didn’t pay dividends generally performed much better.
| | | | | |
| SECTOR ALLOCATION AS A PERCENTAGE OF NET ASSETS AS OF 10/31/15 | | | | | |
| | Fund | | S&P 500®
Index |
| Consumer Discretionary | 9.1 | % | | 13.1 | % |
| Consumer Staples | 17.3 | % | | 9.7 | % |
| Energy | 8.2 | % | | 7.1 | % |
| Financials | 14.3 | % | | 16.2 | % |
| Health Care | 13.2 | % | | 14.6 | % |
| Industrials | 15.0 | % | | 10.2 | % |
| Information Technology | 12.9 | % | | 20.8 | % |
| Materials | 1.9 | % | | 3.0 | % |
| Telecommunication Services | 3.1 | % | | 2.4 | % |
| Utilities | 2.3 | % | | 2.9 | % |
| Short-Term Investments and Other Net Assets and Liabilities | 2.7 | % | | – | |
| |
| TOP TEN HOLDINGS AS A PERCENTAGE OF NET ASSETS AS OF 10/31/15 | | | | | |
| McDonald’s Corp. | | | | 4.5 | % |
| Travelers Cos. Inc./The | | | | 4.4 | % |
| Pfizer Inc. | | | | 3.8 | % |
| Accenture PLC, Class A | | | | 3.6 | % |
| General Electric Co. | | | | 3.5 | % |
| Procter & Gamble Co./The | | | | 3.4 | % |
| Boeing Co./The | | | | 3.4 | % |
| Johnson & Johnson | | | | 3.4 | % |
| Microsoft Corp. | | | | 3.2 | % |
| United Parcel Service Inc., Class B | | | | 3.1 | % |
MADISON LARGE CAP VALUE FUND
INVESTMENT STRATEGY HIGHLIGHTS
The Madison Large Cap Value Fund will, under normal market conditions, invest primarily in large cap stocks. The Fund follows a “value” approach, meaning the portfolio managers seek to invest in stocks at prices below their perceived intrinsic value as estimated based on fundamental analysis of the issuing company and its prospects. By investing in value stocks, the Fund attempts to limit the downside risk over time but may also produce smaller gains than other stock funds if their intrinsic values are not realized by the market or if growth-oriented investments are favored by investors. The Fund will diversify its holdings among various industries and among companies within those industries. The Fund typically sells a stock when the fundamental expectations for buying it no longer apply, the price exceeds its intrinsic value or other stocks appear more attractively priced relative to their intrinsic values.
PERFORMANCE DISCUSSION
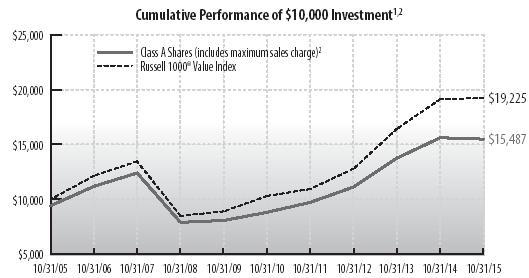
| | | | | | | | | | | |
| Average Annual Total Return through October 31, 20151 | | | | | |
| | % Return Without Sales Charge | | % Return After Sales Charge5 |
| | 1 Year | | 3 Years | 5 Years | 10 Years | Since
6/30/06
Inception | | 1 Year | 3 Years | 5 Years | 10 Years |
| Class A Shares2 | -0.80 | | 11.63 | 11.90 | 5.10 | – | | -6.50 | 9.46 | 10.57 | 4.47 |
| Class B Shares3 | -1.49 | | 10.82 | 11.07 | 4.47 | – | | -5.32 | 9.86 | 10.80 | 4.47 |
| Class Y Shares6 | -0.51 | | 11.91 | 12.17 | – | 4.87 | | – | – | – | – |
| Russell 1000® Value Index | 0.53 | | 14.52 | 13.26 | 6.75 | 6.09 | | NA | NA | NA | NA |
| See accompanying Notes to Management’s Discussion of Fund Performance. | | | | |
Madison Large Cap Value Fund (Class Y) returned -0.51% for the twelve-month period, trailing its benchmark, the Russell 1000 Value® Index, which advanced 0.53%. The Fund’s Morningstar Large Value category peer group returned 0.37% for the same period. Relative to the index, sector allocation was modestly negative and accounted for all of the performance difference between the Fund and the Index. An overweight position in the Consumer Staples sector detracted from the Fund’s results, as did an underweight position in the Technology sector. Stock selection results were positive in the Industrials, Financials, Consumer Staples and Energy sectors, while Technology, Consumer Discretionary, and Health Care stocks negatively impacted the portfolio. Within Industrials, aerospace companies Boeing (BA) and Rockwell Collins (COL) contributed nicely to results as both stocks benefited from an aerospace upcycle. In Financials, specialty insurance company Markel (MKL) was the best performing stock in the portfolio, and strong performance came from another specialty insurance firm, Arch Capital Group (ACGL). On the negative side, two Consumer Discretionary holdings were notable underperformers. Media conglomerate Twenty-First Century Fox (FOXA) was the biggest Fund detractor. Time Warner (TWX) was another media stock with negative returns. Both stocks are facing headwinds from lower pay TV subscribers in the U.S. along with weak advertising revenues. Within Technology, software maker Microsoft, router and switches provider Cisco Systems (CSCO) and data storage company EMC Corp. (EMC) all lagged behind the index. The Fund continues to hold CSCO and MSFT but sold out of FOXA, TWX and EMC during the period.
12
Madison Funds | Management’s Discussion of Fund Performance - Madison Large Cap Value Fund - continued | October 31, 2015
| | | | | |
| SECTOR ALLOCATION AS A PERCENTAGE OF NET ASSETS AS OF 10/31/15 | | | | | |
| | Fund | | Russell
1000 ® Value
Index |
| Consumer Discretionary | 4.5 | % | | 5.4 | % |
| Consumer Staples | 13.2 | % | | 6.7 | % |
| Energy | 7.9 | % | | 13.2 | % |
| Financials | 27.4 | % | | 29.7 | % |
| Health Care | 7.2 | % | | 11.6 | % |
| Industrials | 15.9 | % | | 10.3 | % |
| Information Technology | 7.5 | % | | 11.5 | % |
| Materials | – | | | 2.9 | % |
| Telecommunication Services | 3.5 | % | | 2.5 | % |
| Utilities | 2.6 | % | | 6.2 | % |
| Short-Term Investments and Other Net Assets and Liabilities | 10.3 | % | | – | |
| |
| TOP TEN HOLDINGS AS A PERCENTAGE OF NET ASSETS AS OF 10/31/15 | | | | | |
| American International Group Inc. | | | | 5.0 | % |
| General Electric Co. | | | | 4.9 | % |
| Wells Fargo & Co. | | | | 4.6 | % |
| McDonald’s Corp. | | | | 4.6 | % |
| Pfizer Inc. | | | | 4.5 | % |
| JM Smucker Co./The | | | | 4.2 | % |
| Markel Corp. | | | | 4.1 | % |
| Republic Services Inc. | | | | 3.6 | % |
| T-Mobile U.S. Inc. | | | | 3.5 | % |
| Exxon Mobil Corp. | | | | 3.5 | % |
MADISON INVESTORS FUND
INVESTMENT STRATEGY HIGHLIGHTSThe Madison Investors Fund invests primarily in the common stocks of established, high-quality growth companies. The Fund typically owns 25-40 securities which are selected using our long-held investment discipline of seeking the highest-quality, proven companies and purchasing them when valuations appear advantageous. A rigorous three-step process is followed when evaluating companies. The business model, the management team and the valuation of each potential investment are considered. Management strives to purchase securities trading at a discount to their intrinsic value as determined by discounted cash flows. Management corroborates this valuation work with additional valuation methodologies. The Fund typically sells a stock when the valuation target the portfolio managers have set for the stock has been achieved, the fundamental business prospects for the company have materially changed, or the portfolio managers find a more attractive alternative.
PERFORMANCE DISCUSSION

| | | | | | | | | | | |
| Average Annual Total Return through October 31, 20151 | | | | | | |
| | % Return Without Sales Charge | | | % Return After Sales Charge5 |
| | 1 Year | 3 Years | 5 Years | 10 Years | Since
9/23/13
Inception | | 1 Year | 3 Years | 5 Years | 10 Years | Since
9/23/13
Inception |
| Class A Shares2 | 4.78 | – | – | – | 10.01 | | -1.26 | – | – | – | 6.97 |
| Class Y Shares6 | 5.07 | 14.39 | 12.08 | 6.81 | – | | – | – | – | – | – |
| Class R6 Shares7 | 5.25 | – | – | – | 10.54 | | – | – | – | – | – |
| S&P 500® Index | 5.20 | 16.20 | 14.33 | 7.85 | 26.95 | | NA | NA | NA | NA | NA |
| See accompanying Notes to Management’s Discussion of Fund Performance. | | | |
The Madison Investors Fund (Class Y) returned 5.07% for the year ending 10/31/2015. The S&P 500® Index advanced 5.20% for the same period. The Fund’s performance during the fiscal year lagged its Morningstar Large Growth peer group, which averaged 6.59%. The S&P 500 Index’s performance was driven by the Consumer Discretionary sector, which returned over 20% in total, and the Information Technology sector, which returned 11%. These sectors were offset by weak performance from the Energy sector, which was down over 19%. The Madison Investors Fund’s performance was supported by its underweight in the Energy sector and strong returns from the stocks of Progressive Corporation, Markel Corporation, Accenture Plc and Alphabet Inc. Progressive benefited from strong underwriting results as U.S. consumers increased their miles driven over the past year. Likewise, insurance holding Markel benefited from strong underwriting results and appreciation in its investment portfolio. Information technology consultant Accenture saw strong results from an increase in global information technology spending by corporate customers and strong competitive positioning. Alphabet Inc. benefited from strong advertising results at search engine Google. The Fund’s three most detractive stocks included Discovery Communications, PACCAR Inc. and Jacobs Engineering Group. Discovery Communications is a media content company, and the media industry witnessed some diminution in the number of pay TV subscribers over the past year at the same time that TV ratings were also weak. The weak ratings reduced advertising revenue growth, causing stocks in the industry to decline over the last twelve months. PACCAR and Jacobs Engineering shares were pressured by weak global growth that caused investors to sell stocks with heavy industrial exposure.
| | | | | |
| SECTOR ALLOCATION AS A PERCENTAGE OF NET ASSETS AS OF 10/31/15 | | | | | |
| | Fund | | S&P 500®
Index |
| Consumer Discretionary | 15.1 | % | | 13.1 | % |
| Consumer Staples | 14.8 | % | | 9.7 | % |
| Energy | 1.4 | % | | 7.1 | % |
| Financials | 21.3 | % | | 16.2 | % |
| Health Care | 9.9 | % | | 14.6 | % |
| Industrials | 14.3 | % | | 10.2 | % |
| Information Technology | 16.5 | % | | 20.8 | % |
| Materials | – | | | 3.0 | % |
| Telecommunication Services | – | | | 2.4 | % |
| Utilities | – | | | 2.9 | % |
| Short-Term Investments and Other Net Assets and Liabilities | 6.7 | % | | – | |
| |
| TOP TEN HOLDINGS AS A PERCENTAGE OF NET ASSETS AS OF 10/31/15 | | | | | |
| Diageo PLC | | | | 5.2 | % |
| Johnson & Johnson | | | | 4.5 | % |
| Accenture PLC, Class A | | | | 4.3 | % |
| Discovery Communications Inc., Class C | | | | 4.2 | % |
| Progressive Corp./The | | | | 4.0 | % |
| Alphabet Inc., Class C | | | | 3.8 | % |
| Berkshire Hathaway Inc., Class B | | | | 3.8 | % |
| American Tower Corp. | | | | 3.7 | % |
| JM Smucker Co./The | | | | 3.7 | % |
| TJX Cos. Inc./The | | | | 3.7 | % |
13
Madison Funds | Management’s Discussion of Fund Performance - continued | October 31, 2015
MADISON LARGE CAP GROWTH FUND
INVESTMENT STRATEGY HIGHLIGHTS
The Madison Large Cap Growth Fund invests primarily in common stocks of larger companies and will, under normal market conditions, maintain at least 80% of its net assets in large cap stocks. Stocks selected for the Fund will represent primarily well-established companies that have a demonstrated pattern of consistent growth. To a lesser extent, the Fund may invest in less-established companies that may offer more rapid growth potential. The Fund has an active trading strategy which will lead to higher portfolio turnover than a more passively-managed fund.
PERFORMANCE DISCUSSION
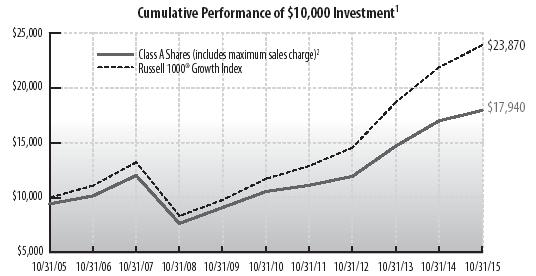
| | | | | | | | | | | |
| Average Annual Total Return through October 31, 20151 | | | | | |
| | | | % Return Without Sales Charge | | % Return After Sales Charge5 |
| | | 1 Year | 3 Years | 5 Years | 10 Years | Since
6/30/06
Inception | | 1 Year | 3 Years | 5 Years | 10 Years |
| Class A Shares2 | | 5.65 | 14.55 | 11.21 | 6.65 | – | | -0.41 | 12.31 | 9.90 | 6.02 |
| Class B Shares3 | | 4.85 | 13.67 | 10.39 | 6.01 | – | | 0.53 | 12.76 | 10.12 | 6.01 |
| Class Y Shares6 | | 5.88 | 14.82 | 11.49 | – | 7.36 | | – | – | – | – |
Russell 1000®
Growth Index | | 9.18 | 17.94 | 15.30 | 9.09 | 9.42 | | NA | NA | NA | NA |
| See accompanying Notes to Management’s Discussion of Fund Performance. | | | | |
The Madison Large Cap Growth Fund (Class Y) returned 5.88% for the annual period. This compares to 6.59% for the Morningstar Large Growth peer group and 9.18% for the Russell 1000 Growth® Index (RLG). Narrow market leadership has made it difficult for investors to keep pace with the Index over the last year as strong performance by a few large companies has masked the underlying weakness in the rest of the market. For example, just three companies combined to produce 32% of the RLG’s total return, while the top ten accounted for nearly 60%. One reason for this narrowness is that value holdings were relatively shunned, while high growth companies were favored. This led to a wide discrepancy in sector performance as well, with four sectors producing negative returns over the past year, while just three sectors – Consumer Discretionary, Consumer Staples and Information Technology – managed to beat the 9.18% return of the RLG. Our focus on high quality growth companies, trading at reasonable valuations, proved to be a headwind in a market environment that favored “growth at any price.”
During the past year, the Madison Large Cap Growth Fund’s performance was supported by our overweight to the Consumer Discretionary sector as well as strong results from Accenture Plc, Alphabet Inc. and Starbucks Corp. Information technology consultant Accenture saw strong results from an increase in global information technology spending by corporate customers and strong competitive positioning. Alphabet Inc. benefited from strong advertising results at search engine Google. Our overweight in Energy was a drag on performance, as was QUALCOMM Inc. and media holdings Discovery Communications and CBS Corp. Media companies were hurt by changing TV viewership habits which negatively impacted advertising revenues, and content viewership appears to be moving to other non-TV devices at an increasing rate. Chip maker QUALCOMM has been negatively impacted by business trends in China, including their difficulty in collecting royalty payments in that country.
| | | | |
| SECTOR ALLOCATION AS A PERCENTAGE OF NET ASSETS AS OF 10/31/15 | | | | |
| | Fund | Russell 1000®
Growth Index |
| Consumer Discretionary | 20.2 | % | 21.5 | % |
| Consumer Staples | 8.6 | % | 11.0 | % |
| Energy | 1.7 | % | 0.7 | % |
| Financials | 3.9 | % | 5.6 | % |
| Health Care | 20.9 | % | 16.4 | % |
| Industrials | 9.2 | % | 11.0 | % |
| Information Technology† | 29.6 | % | 28.0 | % |
| Materials | – | | 3.6 | % |
| Telecommunication Services | 1.0 | % | 2.1 | % |
| Utilities | – | | 0.1 | % |
| Short-Term Investments and Other Net Assets and Liabilities | 4.9 | % | – | |
| †Information Technology includes securities in the following industries: Communications Equipment; Computers & Peripherals; Electronic Equipment, Instruments & Components; Internet Software & Services; IT Services; Semiconductors & Semiconductor Equipment; and Software. |
| |
| TOP TEN HOLDINGS AS A PERCENTAGE OF NET ASSETS AS OF 10/31/15 | | | | |
| Alphabet Inc., Class C | | | 5.2 | % |
| Apple Inc. | | | 5.0 | % |
| Microsoft Corp. | | | 4.7 | % |
| Oracle Corp. | | | 3.5 | % |
| Gilead Sciences Inc. | | | 3.0 | % |
| McDonald’s Corp. | | | 2.8 | % |
| Amgen Inc. | | | 2.5 | % |
| Accenture PLC, Class A | | | 2.4 | % |
| United Parcel Service Inc., Class B | | | 2.2 | % |
| Visa Inc., Class A | | | 2.2 | % |
MADISON MID CAP FUND
INVESTMENT STRATEGY HIGHLIGHTS
The Madison Mid Cap Fund invests generally in common stocks, securities convertible into common stocks and related equity securities of midsize companies and will, under normal market conditions, maintain at least 80% of its net assets in such mid-cap securities. The Fund seeks attractive long-term returns through bottom-up security selection based on fundamental analysis in a diversified portfolio of high-quality growth companies with attractive valuations. These will typically be industry leading companies in niches with strong growth prospects. The Fund’s portfolio managers believe in selecting stocks for the Fund that show steady, sustainable growth and reasonable valuation. As a result, stocks of issuers that are believed to have a blend of both value and growth potential will be selected for investment. Stocks are generally sold when target prices are reached, company fundamentals deteriorate or more attractive stocks are identified.
PERFORMANCE DISCUSSION
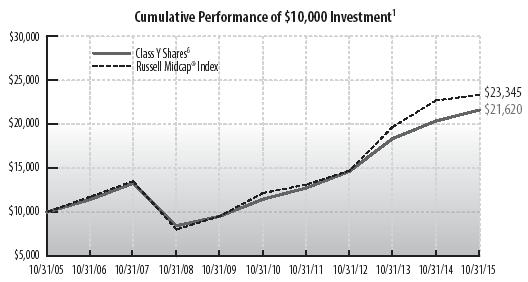
14
Madison Funds | Management’s Discussion of Fund Performance - Madison Mid Cap Fund - continued | October 31, 2015
| | | | | | | | | | |
| Average Annual Total Return through October 31, 20151 |
| | % Return Without Sales Charge | | % Return After Sales Charge5 |
| | 1 Year | 3 Years | 5 Years | 10 Years | Since
2/29/12
Inception | Since
4/19/13
Inception | | 1 Year | | Since
4/19/13
Inception |
| Class A Shares2 | 5.80 | – | – | – | – | 11.55 | | -0.31 | | 8.99 |
| Class B Shares3 | 5.06 | – | – | – | – | 10.74 | | 1.24 | | 9.59 |
| Class Y Shares6 | 6.13 | 13.87 | 13.53 | 8.02 | – | – | | – | | – |
| Class R6 Shares7 | 6.55 | 0.14 | – | – | 12.99 | – | | – | | – |
| Russell Midcap® Index | 2.77 | 16.61 | 13.91 | 8.85 | 14.06 | 13.91 | | NA | | NA |
| See accompanying Notes to Management’s Discussion of Fund Performance. | | | |
The Madison Mid Cap Fund (Class Y) returned 6.13% for the annual period, ahead of its benchmark Russell MidCap® Index return of 2.77%. The Fund outperformed its peer group, the Morningstar Mid-Cap Growth category, which returned 3.00% for the same period. Individual stock-picking accounted for the majority of the outperformance, while sector allocation was mildly favorable. The biggest positive individual contributors to returns were CDW, Markel, and Advance Auto Parts. The biggest negative contributors were Colfax, Discovery Communications, and Generac. Within the Russell MidCap® Index, Health Care led the way once again as the top performing sector. We were slightly underweighted in the sector, but two of our Health Care holdings received buyout offers, boosting the sector’s contribution to the Fund. Energy was by far the worst performing sector in the Russell MidCap® Index. We couldn’t avoid the entire downdraft, but materially outperformed in this sector due to our focus on companies with solid balance sheets and secular growth profiles. Aside from the two buyout offers in the Health Care sector, the Fund had one other holding receive an acquisition offer: Precision Castparts, a new investment made during the year, agreed to be purchased by Berkshire Hathaway. Historically, our style of investing has not lent itself to a lot of buyouts, so this may be an indication of the general level of merger and acquisition activity in the capital markets.
| | | | | |
| SECTOR ALLOCATION AS A PERCENTAGE OF NET ASSETS AS OF 10/31/15 | | | | |
| | Fund | | Russell Midcap®
Index |
| Consumer Discretionary† | 26.0 | % | | 16.8 | % |
| Consumer Staples | 1.1 | % | | 5.9 | % |
| Energy | 4.5 | % | | 4.8 | % |
| Financials± | 27.9 | % | | 22.7 | % |
| Health Care | 6.1 | % | | 9.3 | % |
| Industrials | 14.5 | % | | 12.8 | % |
| Information Technology | 9.5 | % | | 14.6 | % |
| Materials | 3.4 | % | | 5.9 | % |
| Telecommunication Services | – | | | 1.1 | % |
| Utilities | – | | | 6.1 | % |
| Short-Term Investments and Other Net Assets and Liabilities | 7.0 | % | | – | |
| †Consumer Discretionary includes securities in the Media and Specialty Retail Industries. | |
| ±Financials includes securities in the following industries: Commercial Banks; Insurance: Real Estate Investment Trusts and Real Estate Management & Development. |
| |
| TOP TEN HOLDINGS AS A PERCENTAGE OF NET ASSETS AS OF 10/31/15 | | | | |
| Markel Corp. | | | | 6.5 | % |
| Ross Stores Inc. | | | | 5.1 | % |
| Brown & Brown Inc. | | | | 5.0 | % |
| Brookfield Asset Management Inc., Class A | | | | 4.4 | % |
| CDW Corp. | | | | 4.4 | % |
| Expeditors International of Washington Inc. | | | | 3.9 | % |
| Copart Inc. | | | | 3.9 | % |
| Sally Beauty Holdings Inc. | | | | 3.7 | % |
| Crown Holdings Inc. | | | | 3.4 | % |
| Laboratory Corp. of America Holdings | | | | 3.3 | % |
MADISON SMALL CAP FUND
INVESTMENT STRATEGY HIGHLIGHTS
The Madison Small Cap Fund invests primarily in a diversified mix of common stocks of small cap U.S. companies that are believed to be undervalued by various measures and offer sound prospects for capital appreciation. Under normal market conditions, the Fund will maintain at least 80% of its net assets in such small cap securities. The portfolio managers employ a value-oriented investment approach in selecting stocks, using proprietary fundamental research to identify securities of companies they believe have attractive valuations. The portfolio managers focus on companies with a record of above average rates of profitability that sell at a discount relative to the overall small cap market. Through fundamental research, the portfolio managers seek to identify those companies which possess one or more of the following characteristics: sustainable competitive advantages within a market niche; strong profitability and free cash flows; strong market share positions and trends; quality of and share ownership by management; and financial structures that are more conservative than the relevant industry average.
PERFORMANCE DISCUSSION
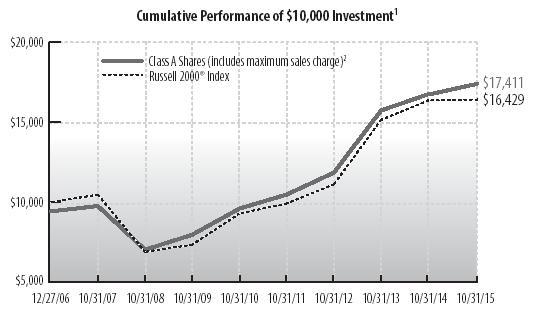
| | | | | | | | | | | | |
| Average Annual Total Return through October 31, 20151 |
| | % Return Without Sales Charge | | % Return After Sales Charge5 |
| | 1 Year | 3 Years | 5 Years | 10 Years | Since
12/27/06
Inception | Since
1/9/07
Inception | | 1 Year | 3 Years | 5 Years | 10 Years | Since
12/27/06
Inception |
| Class B Shares3 | 3.10 | 12.85 | 11.78 | – | 6.51 | – | | -1.29 | 11.93 | 11.52 | – | 6.51 |
| Class Y Shares6 | 4.16 | 13.97 | 12.90 | – | 7.70 | | | – | – | – | – | – |
| Russell 2000® Index | 0.34 | 13.90 | 12.06 | 7.47 | 5.77 | 6.09 | | – | – | – | – | – |
| Russell 2000® Value Index | -2.88 | 11.65 | 10.53 | 6.19 | 3.98 | 4.30 | | NA | – | – | – | NA |
| |
| See accompanying Notes to Management’s Discussion of Fund Performance. | | | | | |
The Madison Small Cap Fund (Class Y) returned 4.16% for the twelve-month period, beating the returns of both the Russell 2000® Index (0.34%) and the Russell 2000 Value® Index (-2.88%). The Fund also outperformed its Morningstar Small Cap Blend category peer group, which returned -0.45% over the period. Security selection was the source of relative outperformance during the period as strong selection in the Energy, Health Care and Consumer Staples sectors offset weak stock selection within Information Technology. Sector allocation, a residual of the bottom-up stock selection process, detracted from relative results during the period, driven by overweights to the Energy and Industrials and underweights to the Information Technology and Financial sectors. A frictional cash balance was also a drag on performance during this period of positive absolute returns.
The Fund’s top contributors to relative returns during the period included developer and distributor of branded consumer products in personal care and housewares, Helen of Troy; consumer packaged goods company focused on branded and private label cereals, nutrition, and snack products, Post Holdings; and ICU Medical, a manufacturer of consumable medical products. The Fund’s top detractors from
15
Madison Funds | Management’s Discussion of Fund Performance - Madison Small Cap Fund - continued | October 31, 2015
relative performance during the period included Koppers, a global coal tar distiller and producer of carbon compounds and treated wood products; GATX, a leasing provider specializing in transportation equipment; and Stage Stores, a regional department store operator.
The Fund’s investment approach emphasizes individual stock selection; sector weights are a residual of our bottom-up investment process. The manager does, however, carefully consider diversification across economic sectors to limit risk. Based on bottom-up stock decisions, overweight exposure to the Industrials, Energy, and Consumer Staples sectors increased during the period, while underweight exposure to the Information Technology, Consumer Discretionary, and Health Care sectors grew. We initiated positions in industrial companies TriMas, Tyman, and Primoris Services, as well as Great Western Bancorp within financials. We eliminated our positions in ICON (Health Care), Maximus (Information Technology), UTI Worldwide (Industrials), Koppers Holdings (Materials), Verint Systems (Information Technology), and Zebra Technologies (Information Technology) during the period. As of the end of the period, the Fund was most overweight the Industrial and Energy sectors relative to the Russell 2000® Index, and most underweight Information Technology and Consumer Discretionary. Based on our two- to three-year time horizon we continue to find opportunities created by the inefficiencies frequently found among small cap companies.
| | | | | |
| SECTOR ALLOCATION AS A PERCENTAGE OF NET ASSETS AS OF 10/31/15 | | | | | |
| | Fund | | Russell 2000®
Value Index |
| Consumer Discretionary | 7.0 | % | | 10.3 | % |
| Consumer Staples | 5.4 | % | | 3.3 | % |
| Energy | 6.2 | % | | 4.9 | % |
| Financials | 20.8 | % | | 43.6 | % |
| Health Care | 10.8 | % | | 4.2 | % |
| Industrials† | 29.3 | % | | 11.6 | % |
| Information Technology | 8.7 | % | | 10.5 | % |
| Materials | 4.8 | % | | 3.3 | % |
| Telecommunication Services | – | | | 0.9 | % |
| Utilities | 3.4 | % | | 7.4 | % |
| Short-Term Investments and Other Net Assets and Liabilities | 3.6 | % | | – | |
| †Industrials includes securities in the following industries: Aerospace & Defense; Building Products; Commercial Services & Supplies; Construction & Engineering; Electrical Equipment; Machinery; Professional Services and Trading Companies & Distributors. |
| |
| TOP TEN HOLDINGS AS A PERCENTAGE OF NET ASSETS AS OF 10/31/15 | | | | | |
| Mueller Industries Inc. | | | | 2.7 | % |
| Webster Financial Corp. | | | | 2.5 | % |
| Belden Inc. | | | | 2.5 | % |
| G&K Services Inc. | | | | 2.4 | % |
| International Bancshares Corp. | | | | 2.1 | % |
| Cubic Corp. | | | | 1.9 | % |
| Albany International Corp. | | | | 1.9 | % |
| Sensient Technologies Corp. | | | | 1.9 | % |
| Helen of Troy Ltd. | | | | 1.9 | % |
| STERIS Corp. | | | | 1.9 | % |
MADISON NORTHROAD INTERNATIONAL FUND
INVESTMENT STRATEGY HIGHLIGHTS
The Madison NorthRoad International Fund seeks to achieve its investment objective by investing, under normal market conditions, at least 80% of its net assets in the stock of foreign companies, with an emphasis on companies with a market capitalization of approximately $3 billion or greater. The Fund expects to have a relatively focused portfolio of between 25-50 holdings.
PERFORMANCE DISCUSSION
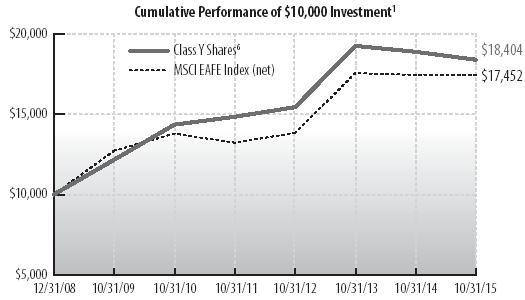
| | | | | | |
| Average Annual Total Return through October 31, 20151,8 | | | |
| | | | % Return Without Sales Charge | |
| | 1 Year | | 3 Years | 5 Years | Since
12/31/08
Inception | Since
2/29/12
Inception |
| Class Y Shares6 | -2.63 | | 6.01 | 5.09 | 9.33 | – |
| Class R6 Shares7 | -2.25 | | 0.06 | – | – | 5.38 |
| MSCI EAFE Index (net) | -0.07 | | 8.02 | | | 6.41 |
| See accompanying Notes to Management’s Discussion of Fund Performance. | | | |
The Madison NorthRoad International Stock Fund (Class Y) returned -2.63% for the twelve-month period, lagging the -0.07% return of its benchmark MSCI EAFE Index (net). The Fund’s Morningstar Foreign Large Blend category peer group returned -1.58% over the same span.
However, the Fund outperformed both the MSCI EAFE Value Index and the MSCI ACWI ex US Index, which declined by 4.2% and 4.7%, respectively. During the year, the hardest hit sectors were those most exposed to a slowdown in emerging market economies, and more broadly the global economy, including the Energy and Materials sectors. Energy stocks fell by more than 20%. As valuations became more attractive, the portfolio increased its exposure to high quality, but cyclically-exposed, businesses. This weighed on performance. However, strong stock selection in both Energy and Materials helped offset the portfolio’s overweightings compared to the MSCI EAFE Index. Examples of where the Fund added capital include Total, a French-based integrated oil company, BHP, an Australian-based metals and mining company, and TE Connectivity, a manufacturer of connectors and sensors. Our valuation discipline also led us to reduce exposure to holdings that had seen their valuation multiples expand significantly prior to the most recent correction. One example was our sale earlier in the year of RELX group, an Anglo-Dutch information solutions provider. Its share price had appreciated sharply and surpassed our fundamental value target, trading at over 20x earnings. We redeployed that capital into lower multiple stocks that offered a better tradeoff between the price we paid and their long-term financial productivity.
| | |
| GEOGRAPHICAL ALLOCATION AS A PERCENTAGE OF NET ASSETS AS OF 10/31/15 | | |
| Europe (excluding United Kingdom) | 50.2 | % |
| United Kingdom | 26.1 | % |
| Japan | 9.2 | % |
| Pacific Basin (excluding Japan) | 5.8 | % |
| Middle East | 1.8 | % |
| Latin America | 1.7 | % |
| Short-Term Investments and Other Net Assets and Liabilities | 5.2 | % |
16
Madison Funds | Management’s Discussion of Fund Performance - Madison NorthRoad International Fund - continued | October 31, 2015
| | |
| TOP TEN HOLDINGS AS A PERCENTAGE OF NET ASSETS AS OF 10/31/15 | | |
| Diageo PLC | 3.7 | % |
| SAP SE | 2.9 | % |
| Total S.A. | 2.8 | % |
| BG Group PLC | 2.8 | % |
| Novartis AG | 2.7 | % |
| Sanofi | 2.7 | % |
| TE Connectivity Ltd. | 2.7 | % |
| Mitsubishi UFJ Financial Group Inc. | 2.7 | % |
| Nestle S.A. | 2.5 | % |
| Telefonaktiebolaget LM Ericsson | 2.5 | % |
MADISON INTERNATIONAL STOCK FUND
INVESTMENT STRATEGY HIGHLIGHTS
The Madison International Stock Fund will invest, under normal market conditions, at least 80% of its net assets in the stock of foreign companies. Typically, a majority of the Fund’s assets are invested in relatively large capitalization stocks of companies located or operating in developed countries. The Fund may also invest up to 30% of its assets in securities of companies whose principal business activities are located in emerging market countries. The portfolio managers typically maintain this segment of the Fund’s portfolio in such stocks which it believes have a low market price relative to their perceived value based on fundamental analysis of the issuing company and its prospects. The Fund may also invest in foreign debt and other income bearing securities at times when it believes that income bearing securities have greater capital appreciation potential than equity securities.
PERFORMANCE DISCUSSION
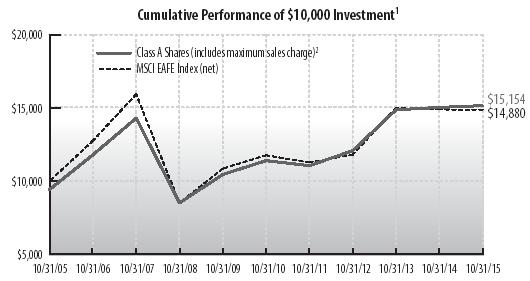
| | | | | | | | | | | | |
| Average Annual Total Return through October 31, 20151 |
| | % Return Without Sales Charge | | % Return After Sales Charge5 |
| | 1 Year | | 3 Years | 5 Years | 10 Years | Since
6/30/06
Inception | | 1 Year | | 3 Years | 5 Years | 10 Years |
| Class A Shares2 | 0.83 | | 7.86 | 5.86 | 4.86 | – | | -5.00 | | 5.75 | 4.61 | 4.24 |
| Class B Shares3 | 0.06 | | 7.06 | 5.06 | 4.23 | – | | -4.37 | | 6.03 | 4.73 | 4.23 |
| Class Y Shares6 | 1.09 | | 8.12 | 6.12 | – | 3.78 | | – | | – | – | – |
| MSCI EAFE Index (net) | -0.07 | | 8.02 | 4.81 | 4.05 | 2.51 | | NA | | NA | NA | NA |
| See accompanying Notes to Management’s Discussion of Fund Performance. | | | | |
The Madison International Stock Fund (Class Y) returned 1.09% for the twelve-month period, beating the -0.07% return of its benchmark MSCI EAFE Index (net). The Fund also outperformed the Morningstar Foreign Large Blend category peer group’s return of -1.58% over the same span.
Stock selection in the Financial sector was additive to relative returns, as shares of Japanese real estate construction company Daiwa House rose in a negative market on better-than-expected results, while British credit card company Provident Financial offered a strong outlook, highlighting a rise and improvement in credit quality amid a stronger UK economy. In the Industrials sector, the continued European economic recovery and lower oil prices were favorable for both domestic and international air travel, which benefited British airline International Consolidated and Ireland’s discount airline Ryanair.
In contrast, stock selection in Telecom Services detracted from relative returns as shares of Japanese conglomerate SoftBank fell on concerns about slowing growth at its Chinese e-commerce holding, Alibaba. The stock recovered somewhat in the most recent month as Alibaba reported encouraging results. Also in the sector, a holding in Turkcell hurt returns, exacerbated by a weak Turkish lira and political uncertainty despite strong company fundamentals. Additionally, the portfolio suffered from exposure to emerging markets, as holdings in Brazil such as BB Seguridade and Estacio were hurt by adverse economic conditions and by the decline in the real. In Greece, shares of Piraeus Bank and Hellenic Telecom declined due to the uncertainty of the country leaving the euro. The positions in Piraeus Bank and Hellenic Telecom were sold prior to the implementation of capital controls that closed the banking system for three weeks.
During the prior 12 months, interesting stock-specific opportunities led to changes in our exposures. In the Financial sector, the portfolio’s underweight exposure was neutralized following the purchases of Aon (UK), Azimut (Italy), BB Seguridade (Brazil), Credit Suisse (Switzerland), KBC (Belgium), and National Bank of Canada, even as positions in AEON Financial (Japan), GAM (Switzerland), and Piraeus Bank (Greece) were sold. Purchases of Iliad (France), KPN (Netherlands), Telenor (Norway), and Turkcell (Turkey), increased the portfolio’s overweight exposure to the Telecom Services sector, despite a sale of Rogers Communications (Canada). Within the Energy sector, despite the overall exposure to the sector decreasing, the portfolio went from slightly underweight to slightly overweight as we initiated positions in BG (UK), Encana (Canada), and Total (France), and exited positions in Eni (Italy) and Petroleum Geo-Services (Norway). In the Industrials sector, sales of Airbus (France), Daikin (Japan), and Rolls-Royce (UK), resulted in an overweight exposure becoming an underweight exposure despite new purchases in Vinci (France) and Wolseley (UK). An overweight exposure to the Consumer Discretionary sector narrowed on sales of Asics (Japan), BMW (Germany), Estacio (Brazil), Mediaset Espana (Spain), Swatch (Switzerland), Taylor Wimpey (UK), and William Hill (UK), which were only slightly offset by purchases of ABC Mart (Japan), Isuzu (Japan), Sony (Japan), and Wolters Kluwer (Netherlands). In the Health Care sector, the portfolio’s overweight exposure declined on the sale of Sanofi (France), while the underweight exposure in Information Technology was largely unchanged, despite a sale of NXP Semiconductors (Netherlands) as the stock approached its fair value within a relatively short timeframe. Elsewhere, the underweight to Materials persists, as a purchase of BHP (UK) was offset by sales of Anglo American (UK) and Glencore (UK). In the Consumer Discretionary sector, relative exposure remained slightly underweight. On a regional basis, an overweight to the United Kingdom decreased, while the underweight to Continental Europe lessened. Meanwhile, exposure to Japan and emerging markets decreased during the period.
| | |
| GEOGRAPHICAL ALLOCATION AS A PERCENTAGE OF NET ASSETS AS OF 10/31/15 | | |
| Europe (excluding United Kingdom) | 42.8 | % |
| United Kingdom | 21.4 | % |
| Japan | 19.0 | % |
| Emerging Markets | 4.8 | % |
| Canada | 2.9 | % |
| Middle East | 2.1 | % |
| Pacific Basin (excluding Japan) | 2.1 | % |
| Short-Term Investments and Other Net Assets and Liabilities | 4.9 | % |
17
Madison Funds | Management’s Discussion of Fund Performance - Madison International Stock Fund - continued | October 31, 2015
| | |
| TOP TEN HOLDINGS AS A PERCENTAGE OF NET ASSETS AS OF 10/31/15 | | |
| Novartis AG | 4.4 | % |
| Anheuser-Busch InBev N.V. | 3.0 | % |
| Daiwa House Industry Co. Ltd. | 2.9 | % |
| Prudential PLC | 2.9 | % |
| Bayer AG | 2.8 | % |
| British American Tobacco PLC | 2.8 | % |
| Sumitomo Mitsui Financial Group Inc. | 2.3 | % |
| Shire PLC | 2.3 | % |
| Don Quijote Holdings Co. Ltd. | 2.2 | % |
| Teva Pharmaceutical Industries Ltd. | 2.1 | % |
MADISON HANSBERGER INTERNATIONAL GROWTH FUND
INVESTMENT STRATEGY HIGHLIGHTS
The Hansberger International Growth Fund seeks to achieve its investment objective by investing at least 80% of total assets in the equity securities (including common stock, preferred stock and convertible securities) of companies organized or located outside of the U.S. Even though these companies are based outside of the U.S., their securities may be traded on U.S. securities markets. The Fund will invest in at least three different countries and generally expects to be invested in more than three countries, including countries considered to be emerging market countries. The Fund anticipates that it will invest primarily in common stock, though the balance of its equity holdings may vary.
PERFORMANCE DISCUSSION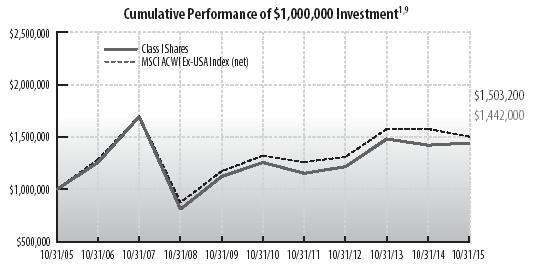
| | | | | |
| Average Annual Total Return through October 31, 20151 | | | | | |
| | | % Return Without Sales Charge | |
| | 1 Year | 3 Years | 5 Years | 10 Years | Since
9/13/05
Inception |
| Class Y Shares6,9 | 1.27 | 5.62 | 2.58 | 3.51 | 3.18 |
| Class I Shares8 | 1.41 | 5.83 | 2.79 | 3.73 | – |
| MSCI ACWI ex-USA (net) | -4.68 | 4.69 | 2.60 | 4.16 | 3.96 |
| See accompanying Notes to Management’s Discussion of Fund Performance. | | |
The Madison Hansberger International Growth Fund (Class Y) returned 1.27% for the twelve-month period, beating the -4.68% return of its benchmark MSCI ACWI ex USA Index (net). The Fund also outperformed its Morningstar Foreign Large Growth category peer group which returned 0.96% over the same timeframe. The Fund was structured to target exposure to companies that, on average, tend to be more profitable and which are capable of growing their earnings at a faster rate over the long-term. These types of companies typically reinvest in their own business opportunities rather than pay out high dividends. Geographically, Europe is the Fund’s largest regional weight and was the second largest contributor to performance as companies such as Carnival, NICE Systems, Fresenius and Kingspan all posted positive returns. The Fund’s holdings in emerging markets were the largest contributor to outperformance versus the Index with Ping An Insurance, LG Household & Health and Dr. Reddy’s Laboratories all posting strong returns during the period. Eight out of ten sectors contributed positively to performance led by the Financial, Consumer Discretionary and Information Technology sectors. The Materials and Telecommunication Services sectors were the only detractors from performance during the period.
| | |
| GEOGRAPHICAL ALLOCATION AS A PERCENTAGE OF NET ASSETS AS OF 10/31/15 | | |
| Europe (excluding United Kingdom) | 37.2 | % |
| Japan | 20.8 | % |
| Emerging Markets | 20.1 | % |
| United Kingdom | 14.6 | % |
| Pacific Basin (excluding Japan) | 10.4 | % |
| Canada | 5.7 | % |
| Latin America | 3.2 | % |
| Short-Term Investments and Other Net Assets and Liabilities* | -12.0 | % |
| *Primarily represents a large shareholder redemption October 31. Trades processed November 1 after fiscal year end to raise cash. | | |
| |
| TOP TEN HOLDINGS AS A PERCENTAGE OF NET ASSETS AS OF 10/31/15 | | |
| Tencent Holdings Ltd. | 4.1 | % |
| Toyota Motor Corp. | 4.0 | % |
| Nidec Corp. | 3.7 | % |
| Keyence Corp. | 3.0 | % |
| SoftBank Group Corp. | 2.9 | % |
| Nomura Holdings Inc. | 2.9 | % |
| AIA Group Ltd. | 2.8 | % |
| Alibaba Group Holding Ltd. | 2.8 | % |
| Ping An Insurance Group Co. of China Ltd. | 2.8 | % |
| LG Household & Health Care Ltd. | 2.6 | % |
TARGET RETIREMENT DATE FUNDS
PERFORMANCE SUMMARY
The Madison Target Retirement 2020, 2030, 2040 and 2050 Funds’ strong performance for the year was enhanced by our very consistent and deliberate approach to comprehensive risk management. For example, as the year progressed, we became increasingly concerned with stretched equity valuations, slowing global growth and increasingly unpredictable Federal Reserve policy. In addition, growing weakness in the U.S. credit markets (widening risk spreads) and poor market breadth (narrow sector leadership) corroborated our view that the risk/reward climate for stocks was turning increasingly unfavorable. Accordingly, we came to view these factors as actionable catalysts, prompting our shift to a decidedly defensive posture by mid-August (2015). This timely reduction in risk exposures proved beneficial as risk assets were subjected to a historically significant increase in volatility in late August.
18
Madison Funds | Management’s Discussion of Fund Performance - continued | October 31, 2015
MADISON TARGET RETIREMENT 2020 FUND
INVESTMENT STRATEGY HIGHLIGHTS
The Madison Target Retirement 2020 Fund invests primarily in shares of registered investment companies according to an asset allocation strategy developed by the Fund’s investment adviser for investors planning to retire in or within a few years of 2020. Over time, the Fund’s asset allocation will gradually shift until it reaches the more conservative allocation target of approximately 15-30% in stock funds and 70-85% in bond funds. The asset allocation strategy is designed to reduce the volatility of investment returns in the later years while still providing the potential for higher total returns over the target period.
PERFORMANCE DISCUSSION
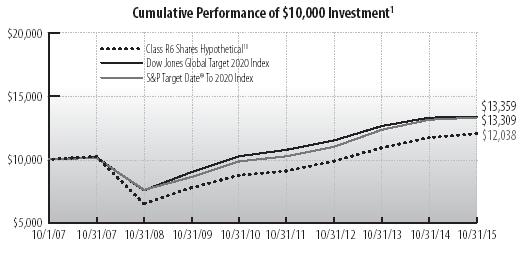
| | | | | |
| Average Annual Total Return through October 31, 20151 | | | | | |
| | | % Return Without Sales Charge | |
| | 1 Year | 3 Years | 5 Years | Since
10/1/07
Inception | Since
10/1/07
Inception |
| Class R6 Shares Actual7 | 2.61 | – | – | – | 2.22 |
| Class R6 SharesHypothetical10 | – | 6.85 | 6.61 | 2.32 | – |
| S&P Target Date® To 2020 Index | 1.33 | 6.57 | 6.24 | 3.60 | 0.78 |
| Dow Jones Global Target 2020 Index | 0.40 | 5.13 | 5.45 | 3.65 | -0.94 |
| See accompanying Notes to Management’s Discussion of Fund Performance. | | | | | |
The Madison Target Retirement 2020 Fund (Class R6) returned 2.61% for the one-year period, bettering its S&P Target Date® To 2020 benchmark return of 1.33%. The Fund also outperformed its peers as measured by Morningstar’s Target Date 2016-2020 category, which advanced 0.21% for the year.
| | |
| PORTFOLIO ALLOCATION AS A PERCENTAGE OF NET ASSETS AS OF 10/31/15 | | |
| Bond Funds | 60.6 | % |
| Stock Funds | 27.4 | % |
| Foreign Stock Funds | 7.5 | % |
| Alternative Funds | 2.5 | % |
| Money Market Funds and Other Net Assets | 2.0 | % |
| |
| TOP TEN HOLDINGS AS A PERCENTAGE OF NET ASSETS AS OF 10/31/15 | | |
| iShares 3-7 Year Treasury Bond ETF | 30.1 | % |
| SPDR S&P 500 ETF Trust | 13.9 | % |
| iShares 7-10 Year Treasury Bond ETF | 12.5 | % |
| iShares TIPS Bond Fund ETF | 6.0 | % |
| Metropolitan West High Yield Bond Fund Class I | 5.0 | % |
| PowerShares Buyback Achievers Portfolio ETF | 4.0 | % |
| Baird Aggregate Bond Fund Institutional Shares | 2.5 | % |
| SPDR Gold Shares | 2.5 | % |
| Metropolitan West Total Return Bond Fund Class I | 2.5 | % |
| iShares Core S&P Mid-Cap ETF | 2.0 | % |
MADISON TARGET RETIREMENT 2030 FUND
INVESTMENT STRATEGY HIGHLIGHTS
The Madison Target Retirement 2030 Fund invests primarily in shares of registered investment companies according to an asset allocation strategy developed by the Fund’s investment adviser for investors planning to retire in or within a few years of 2030. Over time, the Fund’s asset allocation will gradually shift until it reaches the more conservative allocation target of approximately 15-30% in stock funds and 70-85% in bond funds. The asset allocation strategy is designed to reduce the volatility of investment returns in the later years while still providing the potential for higher total returns over the target period.
PERFORMANCE DISCUSSION
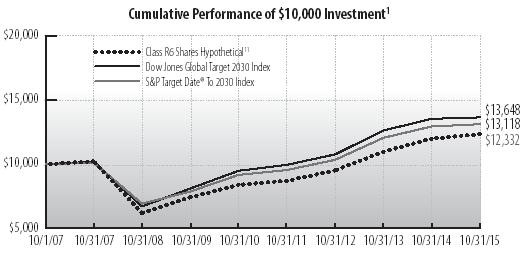
| | | | | |
| Average Annual Total Return through October 31, 20151 | | | | | |
| | % Return Without Sales Charge |
| | 1 Year | 3 Years | 5 Years | Since
10/1/07
Inception | Since
8/29/14
Inception |
| Class R6 Shares Actual7 | 2.76 | – | – | – | 2.26 |
| Class R6 SharesHypothetical11 | – | 9.02 | 8.01 | 2.63 | – |
| S&P Target Date® To 2030 Index | 1.35 | 8.25 | 7.43 | 3.42 | 0.55 |
| Dow Jones Global Target 2030 Index | 0.80 | 8.23 | 7.54 | 3.92 | -0.71 |
| |
| See accompanying Notes to Management’s Discussion of Fund Performance. | | | | | |
The Madison Target Retirement 2030 Fund (Class R6) returned 2.76% for the one-year period, bettering its S&P Target Date® To 2030 benchmark return of 1.35%. The Fund also outperformed its peers as measured by Morningstar’s Target Date 2026-2030 category, which advanced 0.30% for the year.
| | |
| PORTFOLIO ALLOCATION AS A PERCENTAGE OF NET ASSETS AS OF 10/31/15 | | |
| Stock Funds | 43.8 | % |
| Bond Funds | 39.1 | % |
| Foreign Stock Funds | 12.0 | % |
| Alternative Funds | 3.1 | % |
| Money Market Funds and Other Net Assets | 2.0 | % |
| |
| TOP TEN HOLDINGS AS A PERCENTAGE OF NET ASSETS AS OF 10/31/15 | | |
| SPDR S&P 500 ETF Trust | 23.6 | % |
| iShares 3-7 Year Treasury Bond ETF | 21.0 | % |
| iShares 7-10 Year Treasury Bond ETF | 7.5 | % |
| PowerShares Buyback Achievers Portfolio ETF | 7.1 | % |
| iShares TIPS Bond Fund ETF | 5.1 | % |
| SPDR Gold Shares | 3.1 | % |
| iShares Core S&P Mid-Cap ETF | 3.0 | % |
| iShares MSCI EAFE Minimum Volatility ETF | 3.0 | % |
| WisdomTree Europe Hedged Equity Fund | 2.9 | % |
| Vanguard Information Technology ETF | 2.5 | % |
19
Madison Funds | Management’s Discussion of Fund Performance - continued | October 31, 2015
MADISON TARGET RETIREMENT 2040 FUND
INVESTMENT STRATEGY HIGHLIGHTS
The Madison Target Retirement 2040 Fund invests primarily in shares of registered investment companies according to an asset allocation strategy developed by the Fund’s investment adviser for investors planning to retire in or within a few years of 2040. Over time, the Fund’s asset allocation will gradually shift until it reaches the more conservative allocation target of approximately 15-30% in stock funds and 70-85% in bond funds. The asset allocation strategy is designed to reduce the volatility of investment returns in the later years while still providing the potential for higher total returns over the target period.
PERFORMANCE DISCUSSION
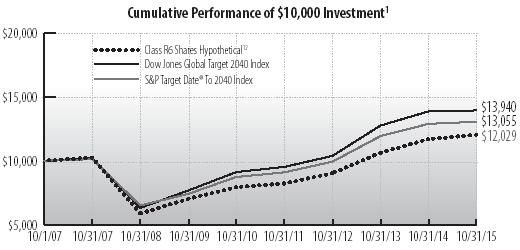
| | | | | | |
| Average Annual Total Return through October 31, 20151 | | | | | | |
| | | | % Return Without Sales Charge | |
| | 1 Year | | 3 Years | 5 Years | Since
10/1/07
Inception | Since
8/29/14
Inception |
| Class R6 Shares Actual7 | 2.86 | | – | – | – | 2.26 |
| Class R6 SharesHypothetical12 | – | | 10.07 | 8.70 | 2.31 | – |
| S&P Target Date® To 2040 Index | 1.27 | | 9.56 | 8.38 | 3.25 | 0.24 |
| Dow Jones Global Target 2040 Index | 0.54 | | 10.33 | 8.86 | 4.20 | -1.09 |
| See accompanying Notes to Management’s Discussion of Fund Performance. | | | | | | |
The Madison Target Retirement 2040 Fund (Class R6) returned 2.86% for the one-year period, bettering its S&P Target Date® To 2040 benchmark return of 1.27%. The Fund also outperformed its peers as measured by Morningstar’s Target Date 2036-2040 category, which advanced 0.27% for the year.
| | |
| PORTFOLIO ALLOCATION AS A PERCENTAGE OF NET ASSETS AS OF 10/31/15 | | |
| Stock Funds | 51.4 | % |
| Bond Funds | 29.1 | % |
| Foreign Stock Funds | 14.5 | % |
| Alternative Funds | 3.0 | % |
| Money Market Funds and Other Net Assets | 2.0 | % |
| |
| TOP TEN HOLDINGS AS A PERCENTAGE OF NET ASSETS AS OF 10/31/15 | | |
| SPDR S&P 500 ETF Trust | 25.9 | % |
| iShares 3-7 Year Treasury Bond ETF | 15.1 | % |
| PowerShares Buyback Achievers Portfolio ETF | 8.0 | % |
| iShares 7-10 Year Treasury Bond ETF | 5.0 | % |
| iShares TIPS Bond Fund ETF | 4.5 | % |
| iShares MSCI EAFE Minimum Volatility ETF | 4.0 | % |
| WisdomTree Europe Hedged Equity Fund | 3.5 | % |
| iShares Core S&P Mid-Cap ETF | 3.5 | % |
| Vanguard Information Technology ETF | 3.5 | % |
| SPDR Gold Shares | 3.0 | % |
MADISON TARGET RETIREMENT 2050 FUND
INVESTMENT STRATEGY HIGHLIGHTS
The Madison Target Retirement 2050 Fund invests primarily in shares of registered investment companies according to an asset allocation strategy developed by the Fund’s investment adviser for investors planning to retire in or within a few years of 2050. Over time, the Fund’s asset allocation will gradually shift until it reaches the more conservative allocation target of approximately 15-30% in stock funds and 70-85% in bond funds. The asset allocation strategy is designed to reduce the volatility of investment returns in the later years while still providing the potential for higher total returns over the target period.
PERFORMANCE DISCUSSION
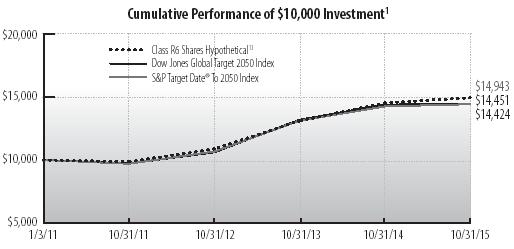
| | | | |
| Average Annual Total Return through October 31, 20151 | | | | |
| | % Return Without Sales Charge |
| | 1 Year | 3 Years | Since
1/3/11
Inception | Since
8/29/14
Inception |
| Class R6 Shares Actual7 | 2.87 | – | – | 2.27 |
| Class R6 SharesHypothetical13 | – | 11.17 | 8.68 | – |
| S&P Target Date® To 2050 Index | 1.23 | 10.57 | 6.66 | 0.00 |
| Dow Jones Global Target 2050 Index | 0.43 | 10.85 | 4.38 | -1.24 |
| See accompanying Notes to Management’s Discussion of Fund Performance. | | | |
The Madison Target Retirement 2050 Fund (Class R6) returned 2.87% for the one-year period, bettering its S&P Target Date® To 2050 benchmark return of 1.23%. The Fund also outperformed its peers as measured by Morningstar’s Target Date 2046-2050 category, which advanced 0.36% for the year.
| | |
| PORTFOLIO ALLOCATION AS A PERCENTAGE OF NET ASSETS AS OF 10/31/15 | | |
| Stock Funds | 58.9 | % |
| Bond Funds | 19.1 | % |
| Foreign Stock Funds | 17.0 | % |
| Alternative Funds | 3.0 | % |
| Money Market Funds and Other Net Assets | 2.0 | % |
| |
| TOP TEN HOLDINGS AS A PERCENTAGE OF NET ASSETS AS OF 10/31/15 | | |
| SPDR S&P 500 ETF Trust | 27.9 | % |
| iShares 3-7 Year Treasury Bond ETF | 9.0 | % |
| PowerShares Buyback Achievers Portfolio ETF | 8.0 | % |
| iShares MSCI EAFE Minimum Volatility ETF | 5.0 | % |
| Vanguard Information Technology ETF | 4.5 | % |
| iShares TIPS Bond Fund ETF | 4.0 | % |
| WisdomTree Europe Hedged Equity Fund | 4.0 | % |
| iShares Core S&P Mid-Cap ETF | 4.0 | % |
| Schwab U.S. Dividend Equity ETF | 4.0 | % |
| SPDR Gold Shares | 3.0 | % |
20
Madison Funds | October 31, 2015
| |
| Notes to Management’s Discussion of Fund Performance |
| NA Not Applicable. Index returns do not reflect sales charges, fees or expenses. |
| 1 | | Fund returns are calculated after fund expenses have been subtracted and assume that dividends and capital gains are reinvested in additional shares of the fund. Returns do not reflect the deduction of taxes that a shareholder would pay on fund distributions or the redemption of fund shares. Investment return and principal value will fluctuate, so an investor’s shares, when redeemed, may be worth more or less than original cost. Further information relating to the fund’s performance is contained in the prospectus and elsewhere in this report. The fund’s past performance is not indicative of future performance. Current performance may be lower or higher than the performance data cited. For fund performance data current to the most recent month-end, please call 1-800-877-6089 or visit www.madisonfunds.com. Indices are unmanaged and investors cannot invest in them directly. Index returns do not reflect fees or expenses. |
| 2 | | Maximum sales charge is 5.75% for class A shares for the Conservative, Moderate and Aggressive Allocation Funds and the Diversified Income, Equity Income, Large Cap Value, Investors, Large Cap Growth, Mid Cap, Small Cap and International Stock Funds. The maximum sales charge is 4.50% for the Core Bond and High Income Fund class A shares. |
| 3 | | Maximum contingent deferred sales charge (CDSC) is 4.50% for class B shares, which is reduced after 12 months and eliminated after six years. |
| 4 | | Maximum contingent deferred sales charge (CDSC) is 1% for class C shares, which is eliminated after one year. |
| 5 | | Assumes maximum applicable sales charge. |
| 6 | | Class Y Shares are only available for purchase by Madison Funds and other affiliated asset allocation funds, in managed account programs, and to certain other investors as described in the current prospectus. |
| 7 | | Class R6 shares are generally only available for purchase by retirement plan investors and certain other institutional investors. |
| 8 | | Prior to June 30, 2011, the NorthRoad International Fund was known as the Madison Mosaic Small/Mid-Cap Fund and had different investment objectives and strategies. Its portfolio holdings were liquidated on June 29, 2011, and the fund began implementing its new investment objectives and strategies thereafter. Because the fund had different objectives and strategies prior to June 30, 2011, comparison to the MSCI EAFE index for period before June 30, 2011 is not provided. |
| 9 | | After market close on July 31, 2014, Madison Asset Management assumed the investment management of the Hansberger International Growth Fund. See Note 1 of the Notes to Financial Statements for further information. |
| 10 | | The performance data presented here are returns calculated using historical performance prior to 8/29/14 from the Class I shares of the Ultra Series Madison Target Retirement 2020 Fund (the “Predecessor Fund”), and therefore are hypothetical. As of 8/29/14, the inception date of the Madison Target Retirement 2020 Fund, the Predecessor Fund exchanged (in kind) substantially all of its portfolio holdings for Class R6 shares of the Madison Target Retirement 2020 Fund. Both the Madison Target Retirement 2020 Fund and Predecessor Fund are managed by the same investment adviser and portfolio managers. |
| 11 | | The performance data presented here are returns calculated using historical performance prior to 8/29/14 from the Class I shares of the Ultra Series Madison Target Retirement 2040 Fund (the “Predecessor Fund”), and therefore are hypothetical. As of 8/29/14, the inception date of the Madison Target Retirement 2030 Fund, the Predecessor Fund exchanged (in kind) substantially all of its portfolio holdings for Class R6 shares of the Madison Target Retirement 2040 Fund. Both the Madison Target Retirement 2030 Fund and Predecessor Fund are managed by the same investment adviser and portfolio managers. |
| 12 | | The performance data presented here are returns calculated using historical performance prior to 8/29/14 from the Class I shares of the Ultra Series Madison Target Retirement 2040 Fund (the “Predecessor Fund”), and therefore are hypothetical. As of 8/29/14, the inception date of the Madison Target Retirement 2040 Fund, the Predecessor Fund exchanged (in kind) substantially all of its portfolio holdings for Class R6 shares of the Madison Target Retirement 2040 Fund. Both the Madison Target Retirement 2040 Fund and Predecessor Fund are managed by the same investment adviser and portfolio managers. |
| 13 | | The performance data presented here are returns calculated using historical performance prior to 8/29/14 from the Class I shares of the Ultra Series Madison Target Retirement 2050 Fund (the “Predecessor Fund”), and therefore are hypothetical. As of 8/29/14, the inception date of the Madison Target Retirement 2050 Fund, the Predecessor Fund exchanged (in kind) substantially all of its portfolio holdings for Class R6 shares of the Madison Target Retirement 2050 Fund. Both the Madison Target Retirement 2050 Fund and Predecessor Fund are managed by the same investment adviser and portfolio managers. |
21
Madison Funds | Notes to Management’s Discussion of Fund Performance - continued | October 31, 2015
BENCHMARK DESCRIPTIONS
Allocation Fund Indexes* |
The Conservative Allocation Fund Custom Index consists of 28% Russell 3000 Index, 7% MSCI ACWI ex-US Index and 65% Barclays US Aggregate Bond Index. See market index descriptions below.
The Moderate Allocation Fund Custom Index consists of 48% Russell 3000 Index, 12% MSCI ACWI ex-US Index and 40% Barclays US Aggregate Bond Index. See market index descriptions below.
The Aggressive Allocation Fund Custom Index consists of 64% Russell 3000 Index, 16% MSCI ACWI ex-US Index and 20% Barclays US Aggregate Bond Index. In 2014, the Aggressive Allocation Fund Custom Index consisted of 68% Russell 3000 Index, 17% MSCI AWCI ex-USA Index and 15% Barclays U.S. Aggregate Bond Index. See market index descriptions below.
Target Date Fund Indexes
Effective February 28, 2015 the Target Date Fund Indexes were changed from the Dow Jones Global Target Indexes to the S&P Target Date® To Index Series. See below.
Dow Jones Global Target Indexes
| • | The Dow Jones Global Target 2020 Index is a benchmark for multi-asset class portfolios with risk profiles that become more conservative as the year 2020 approaches. The index is a composite of other indexes that represent stocks, bonds and cash. |
| | |
| • | The Dow Jones Global Target 2030 Index is a benchmark for multi-asset class portfolios with risk profiles that become more conservative as the year 2030 approaches. The index is a composite of other indexes that represent stocks, bonds and cash. |
| | |
| • | The Dow Jones Global Target 2040 Index is a benchmark for multi-asset class portfolios with risk profiles that become more conservative as the year 2040 approaches. The index is a composite of other indexes that represent stocks, bonds and cash. |
| | |
| • | The Dow Jones Global Target 2050 Index is a benchmark for multi-asset class portfolios with risk profiles that become more conservative as the year 2050 approaches. The index is a composite of other indexes that represent stocks, bonds and cash. |
The S&P Target Date® To Index Series
The S&P Target Date® To Index Series consists of multi-asset class indices, and corresponds to specific target retirement dates. The series reflects the consensus asset allocation and glide path of a subset of target date funds that generally pursue investment policies characterized by static total equity exposure after retirement and a relatively conservative total equity exposure near retirement. As the overall universe becomes more conservative with the approach of each target date year, so will the index. The asset allocation is based on market observations through an annual survey of “to” target date fund managers, and is categorized by S&P Dow Jones Indices.
| • | The S&P Target Date® To 2020 is a benchmark for multi-class asset portfolios that corresponds to the target retirement date 2020. |
| | |
| • | The S&P Target Date® To 2030 is a benchmark for multi-class asset portfolios that corresponds to the target retirement date 2030. |
| | |
| • | The S&P Target Date® To 2040 is a benchmark for multi-class asset portfolios that corresponds to the target retirement date 2040. |
| | |
| • | The S&P Target Date® To 2050 is a benchmark for multi-class asset portfolios that corresponds to the target retirement date 2050. |
Hybrid Fund Indexes*
The Custom Blended Index consists of 50% S&P 500® Index and 50% Bank of America Merrill Lynch U.S. Corporate, Government & Mortgage Index. See market index descriptions below.
Market Indexes
The CBOE S&P 500 BuyWrite IndexSM (BXM) is a benchmark index designed to track the performance of a hypothetical buy-write strategy (i.e. holding a long position in and selling covered call options on that position) on the S&P 500® Index.
The Bank of America Merrill Lynch U.S. Corporate, Government & Mortgage Index is a broad-based measure of the total rate of return performance of the U.S. investment-grade bond markets. The index is a capitalization-weighted aggregation of outstanding U.S. treasury, agency and supranational mortgage pass-through, and investment-grade corporate bonds meeting specified selection criteria.
The Bank of America Merrill Lynch U.S. High Yield Master II Constrained Index tracks the performance of below investment grade U.S. dollar denominated corporate bonds publicly issued in the U.S. domestic market, but limits any individual issuer to a maximum weighting of 2%.
The Barclays U.S. Credit Bond Index is an unmanaged, market capitalization weighted index that covers the U.S. dollar denominated fixed-rate, taxable bond market, with maturities of one year or more.
The Barclays U.S. Aggregate Bond Index is a broad-based flagship benchmark that measures the investment grade, U.S. dollar- denominated, fixed-rate taxable bond market. The index includes Treasuries, government-related and corporate securities, mortgage backed-securities, asset-backed securities and corporate securities, with maturities greater than one year.
The Barclays U.S. Intermediate Government Credit Bond Index measures the performance of U.S. dollar denominated U.S. Treasuries, government related and investment grade U.S. corporate securities with maturities between one and 10 years.
The Barclays U.S. Intermediate Government Credit A+ Bond Index measures the performance of U.S. dollar denominated U.S. Treasuries, government related and investment grade U.S. corporate securities with quality ratings of A3/A- or better and maturities between one and 10 years.
The Barclays Municipal Bond Index measures the performance of the U.S. dollar denominated long-term tax exempt bond market.
THE MSCI ACWI ex-U.S. Index is a market-capitalization-weighted index maintained by Morgan Stanley Capital International (MSCI) and designed to provide a broad measure of stock performance throughout the world, with the exception of U.S.-based companies. The Index includes both developed and emerging markets.
The MSCI EAFE (Europe, Australasia & Far East) Index is a free-float adjusted market capitalization index that is designed to measure developed market equity performance, excluding the U.S. and Canada. The MSCI EAFE Index (net) is calculated on a total return basis with dividends reinvested after the deduction of withholding taxes.
22
Madison Funds | Notes to Management’s Discussion of Fund Performance - concluded | October 31, 2015
The Russell 1000® Growth Index is a large-cap market index which measures the performance of those Russell 1000 companies with higher price-to-book ratios and higher forecasted growth values.
The Russell 1000® Value Index is a large-cap market index which measures the performance of those Russell 1000 companies with lower price-to-book ratios and lower forecasted growth values.
The Russell 2000® Index is a small-cap market index which measures the performance of the smallest 2,000 companies in the Russell 3000® Index.
The Russell 2000® Value Index measures the performance of small-cap value segment of the U.S. equity universe. It includes those Russell 2000® Index companies with lower price-to-book ratios and lower forecasted growth values.
The Russell Midcap® Index is a mid-cap market index which measures the performance of the mid-cap segment of the U.S. equity universe.
The S&P 500® Index is a large-cap market index which measures the performance of a representative sample of 500 leading companies in leading industries in the U.S.
*The Custom Indexes are calculated using a monthly re-balancing frequency (i.e. rebalanced back to original constituent weight every calendar month-end).
© 2015 Morningstar, Inc. All rights reserved. The information contained herein: (1) is proprietary to Morningstar and/or its content providers; (2) may not be copied or distributed; and (3) is not warranted to be accurate, complete, or timely. Neither Morningstar nor its content providers are responsible for any damages or losses arising from any use of this information.
Russell Investment Group is the source and owner of the trademarks, service marks and copyrights related to the Russell Indexes. Russell® is a trademark of Russell Investment Group.
Past performance is no guarantee of future results.
23
| Madison Funds | October 31, 2015 |
| |
| Madison Conservative Allocation Fund Portfolio of Investments |
| | | | Shares | | | Value (Note 2) | |
| | | | | | | | |
| INVESTMENT COMPANIES - 99.9% | | | | | | | |
| |
| Alternative Funds - 2.7% | | | | | | | |
| SPDR Gold Shares* | | | 18,268 | | $ | 1,996,692 | |
| | | | | | | |
| | | | | | | | |
| Bond Funds - 61.4% | | | | | | | |
| Baird Aggregate Bond Fund Institutional Shares | | | 465,531 | | | 4,999,805 | |
| iShares 3-7 Year Treasury Bond ETF | | | 51,921 | | | 6,433,531 | |
| iShares 7-10 Year Treasury Bond ETF | | | 48,841 | | | 5,226,964 | |
| iShares TIPS Bond Fund ETF | | | 6,966 | | | 772,947 | |
| Madison Core Bond Fund Class Y (A) | | | 1,574,009 | | | 15,850,270 | |
| Madison Corporate Bond Fund Class Y (A) | | | 446,801 | | | 5,066,719 | |
| Metropolitan West Total Return Bond Fund Class I | | | 618,369 | | | 6,690,751 | |
| SPDR Barclays Short-Term High Yield Bond ETF | | | 55,714 | | | 1,520,992 | |
| | | | | | | |
| | | | | | | 46,561,979 | |
| Foreign Stock Funds - 7.8% | | | | | | | |
| iShares Core MSCI EAFE ETF | | | 37,227 | | | 2,091,413 | |
| Madison NorthRoad International Fund Class Y (A) | | | 158,257 | | | 1,672,775 | |
| SPDR S&P Emerging Asia Pacific ETF | | | 7,117 | | | 556,407 | |
| WisdomTree Europe Hedged Equity Fund | | | 19,966 | | | 1,213,534 | |
| WisdomTree Japan Hedged Equity Fund | | | 7,422 | | | 395,518 | |
| | | | | | | 5,929,647 | |
| | | | | | | |
| Money Market Funds - 3.8% | | | | | | | |
| State Street Institutional U.S. Government | | | | | | | |
| Money Market Fund, Premier Class | | | 2,892,940 | | | 2,892,940 | |
| | | | | | | |
| | | | | | | | |
| Stock Funds - 24.2% | | | | | | | |
| iShares Russell Mid-Cap ETF | | | 20,886 | | | 3,448,487 | |
| Madison Large Cap Growth Fund Class Y (A) | | | 204,750 | | | 4,731,773 | |
| Madison Large Cap Value Fund Class Y (A) | | | 235,565 | | | 3,851,484 | |
| Schwab Fundamental U.S. Large Company Index Fund Institutional Shares | | | 12,364 | | | 187,186 | |
| Vanguard Growth ETF | | | 20,644 | | | 2,256,183 | |
| Vanguard Information Technology ETF | | | 7,240 | | | 799,730 | |
| Vanguard Value ETF | | | 37,325 | | | 3,083,792 | |
| | | | | | | |
| | | | | | | 18,358,635 | |
| | | | | | | |
TOTAL INVESTMENTS - 99.9%
(Cost $74,258,339**) | | | | | | 75,739,893 | |
| NET OTHER ASSETS AND LIABILITIES - 0.1% | | | | | | 57,077 | |
| | | | | | | |
| TOTAL NET ASSETS - 100.0% | | | | | $ | 75,796,970 | |
| | | | | | | |
| * | | Non-income producing. |
| ** | | Aggregate cost for Federal tax purposes was $74,707,957. |
| (A) | | Affiliated Company (see Note 12). |
| ETF | | Exchange Traded Fund. |
| |
| Madison Moderate Allocation Fund Portfolio of Investments |
| | | | Shares | | | Value (Note 2) | |
| | | | | | | | |
| INVESTMENT COMPANIES - 100.0% | | | | | | | |
| |
| Alternative Funds - 2.6% | | | | | | | |
| SPDR Gold Shares* | | | 35,104 | | $ | 3,836,867 | |
| | | | | | | |
| | | | | | | | |
| Bond Funds - 36.9% | | | | | | | |
| iShares 3-7 Year Treasury Bond ETF | | | 69,707 | | | 8,637,394 | |
| iShares 7-10 Year Treasury Bond ETF | | | 93,952 | | | 10,054,743 | |
| iShares TIPS Bond Fund ETF | | | 6,730 | | | 746,761 | |
| Madison Core Bond Fund Class Y (A) | | | 2,097,384 | | | 21,120,655 | |
| Metropolitan West Total Return Bond Fund Class I | | | 1,098,309 | | | 11,883,706 | |
| SPDR Barclays Short-Term High Yield Bond ETF | | | 53,006 | | | 1,447,064 | |
| | | | | | | |
| | | | | | | 53,890,323 | |
| Foreign Stock Funds - 13.7% | | | | | | | |
| iShares Core MSCI EAFE ETF | | | 149,193 | | | 8,381,663 | |
| Madison NorthRoad International Fund Class Y (A) | | | 430,751 | | | 4,553,033 | |
| SPDR S&P Emerging Asia Pacific ETF | | | 23,715 | | | 1,854,039 | |
| WisdomTree Europe Hedged Equity Fund | | | 60,450 | | | 3,674,151 | |
| WisdomTree Japan Hedged Equity Fund | | | 28,330 | | | 1,509,706 | |
| | | | | | | |
| | | | | | | 19,972,592 | |
| Money Market Funds - 3.5% | | | | | | | |
| State Street Institutional U.S. Government Money Market Fund, Premier Class | | | 5,139,779 | | | 5,139,779 | |
| | | | | | | |
| | | | | | | | |
| Stock Funds - 43.3% | | | | | | | |
| iShares Core S&P Mid-Cap ETF | | | 66,436 | | | 9,580,736 | |
| Madison Large Cap Growth Fund Class Y (A) | | | 740,132 | | | 17,104,447 | |
| Madison Large Cap Value Fund Class Y (A) | | | 991,432 | | | 16,209,905 | |
| Schwab Fundamental U.S. Large Company Index Fund Institutional Shares | | | 120,977 | | | 1,831,593 | |
| Vanguard Growth ETF | | | 78,762 | | | 8,607,899 | |
| Vanguard Information Technology ETF | | | 20,788 | | | 2,296,242 | |
| Vanguard Value ETF | | | 91,059 | | | 7,523,295 | |
| | | | | | | |
| | | | | | | 63,154,117 | |
| | | | | | | |
| TOTAL INVESTMENTS - 100.0% | | | | | | | |
| (Cost $138,150,070**) | | | | | | 145,993,678 | |
| NET OTHER ASSETS AND LIABILITIES - 0.0% | | | | | | 6,112 | |
| | | | | | | |
| TOTAL NET ASSETS - 100.0% | | | | | $ | 145,999,790 | |
| | | | | | | |
| * | | Non-income producing. |
| ** | | Aggregate cost for Federal tax purposes was $139,447,340. |
| (A) | | Affiliated Company (see Note 12). |
| ETF | | Exchange Traded Fund. |
| |
| Madison Aggressive Allocation Fund Portfolio of Investments |
| | | | Shares | | | Value (Note 2) | |
| | | | | | | | |
| INVESTMENT COMPANIES - 100.1% | | | | | | | |
| Alternative Funds - 2.6% | | | | | | | |
| SPDR Gold Shares* | | | 14,740 | | $ | 1,611,082 | |
| | | | | | | |
| | | | | | | | |
| Bond Funds - 16.9% | | | | | | | |
| iShares 7-10 Year Treasury Bond ETF | | | 33,996 | | | 3,638,252 | |
| Madison Core Bond Fund Class Y (A) | | | 499,599 | | | 5,030,963 | |
| Metropolitan West Total Return Bond Fund Class I | | | 164,110 | | | 1,775,671 | |
| | | | | | | |
| | | | | | | 10,444,886 | |
| Foreign Stock Funds - 18.8% | | | | | | | |
| iShares Core MSCI EAFE ETF | | | 90,022 | | | 5,057,436 | |
| Madison NorthRoad International Fund Class Y (A) | | | 222,260 | | | 2,349,290 | |
| SPDR S&P Emerging Asia Pacific ETF | | | 15,463 | | | 1,208,897 | |
| WisdomTree Europe Hedged Equity Fund | | | 36,415 | | | 2,213,304 | |
| WisdomTree Japan Hedged Equity Fund | | | 14,548 | | | 775,263 | |
| | | | | | | |
| | | | | | | 11,604,190 | |
| Money Market Funds - 2.9% | | | | | | | |
| State Street Institutional U.S. Government Money Market Fund, Premier Class | | | 1,799,849 | | | 1,799,849 | |
| | | | | | | |
| | | | | | | | |
| Stock Funds - 58.9% | | | | | | | |
| iShares Core S&P Mid-Cap ETF | | | 40,800 | | | 5,883,768 | |
| Madison Large Cap Growth Fund Class Y (A) | | | 390,860 | | | 9,032,776 | |
| Madison Large Cap Value Fund Class Y (A) | | | 530,122 | | | 8,667,492 | |
| Schwab Fundamental U.S. Large Company Index Fund Institutional Shares | | | 144,042 | | | 2,180,799 | |
| Vanguard Growth ETF | | | 46,399 | | | 5,070,947 | |
| Vanguard Information Technology ETF | | | 14,536 | | | 1,605,647 | |
| Vanguard Value ETF | | | 47,889 | | | 3,956,589 | |
| | | | | | | |
| | | | | | | 36,398,018 | |
| | | | | | | |
| TOTAL INVESTMENTS - 100.1% | | | | | | | |
| (Cost $57,796,345**) | | | | | | 61,858,025 | |
| NET OTHER ASSETS AND LIABILITIES - (0.1%) | | | | | | (41,396 | ) |
| | | | | | | |
| TOTAL NET ASSETS - 100.0% | | | | | $ | 61,816,629 | |
| | | | | | | |
| * | | Non-income producing. |
| ** | | Aggregate cost for Federal tax purposes was $58,400,983. |
| (A) | | Affiliated Company (see Note 12). |
| ETF | | Exchange Traded Fund. |
See accompanying Notes to Financial Statements.
24
| Madison Funds | October 31, 2015 |
| |
| Madison Cash Reserves Fund Portfolio of Investments |
| | | Par Value | | | Value (Note 2) | |
| | | | | | | |
| U.S. GOVERNMENT AND AGENCY OBLIGATIONS - 92.8% | | | | | | | |
| | | | | | | | |
| Fannie Mae - 24.7% | | $ | 1,100,000 | | $ | 1,099,997 | |
| 0.031%, 11/4/15 (A) | | | 300,000 | | | 299,977 | |
| 0.162%, 11/18/15 (A) | | | 500,000 | | | 505,426 | |
| 10.350%, 12/10/15 | | | 600,000 | | | 599,893 | |
| 0.125%, 12/23/15 (A) | | | 750,000 | | | 749,854 | |
| 0.096%, 1/14/16 (A) | | | 1,511,000 | | | 1,510,487 | |
| | | | | | | |
| 0.133%, 2/2/16 (A) | | | | | | 4,765,634 | |
| | | | | | | | |
| Federal Farm Credit Bank - 10.4% | | | | | | | |
| 0.430%, 11/16/15 | | | 500,000 | | | 500,062 | |
| 1.500%, 11/16/15 | | | 245,000 | | | 245,129 | |
| 0.030%, 11/19/15 (A) | | | 500,000 | | | 499,993 | |
| 4.875%, 12/16/15 | | | 760,000 | | | 764,414 | |
| | | | | | | |
| | | | | | | 2,009,598 | |
| Federal Home Loan Bank - 26.0% | | | | | | | |
| 0.203%, 11/2/15 (A) | | | 200,000 | | | 199,999 | |
| 0.203%, 11/3/15 (A) | | | 800,000 | | | 799,991 | |
| 0.167%, 11/10/15 (A) | | | 600,000 | | | 599,975 | |
| 0.180%, 11/12/15 | | | 625,000 | | | 625,009 | |
| 0.061%, 11/30/15 (A) | | | 900,000 | | | 899,957 | |
| 0.066%, 12/8/15 (A) | | | 300,000 | | | 299,980 | |
| 0.152%, 12/11/15 (A) | | | 900,000 | | | 899,850 | |
| 0.183%, 1/4/16 (A) | | | 300,000 | | | 299,904 | |
| 0.167%, 1/8/16 (A) | | | 400,000 | | | 399,875 | |
| | | | | | | |
| | | | | | | 5,024,540 | |
| Freddie Mac - 20.8% | | | | | | | |
| 4.750%, 11/17/15 | | | 1,050,000 | | | 1,052,110 | |
| 0.450%, 11/24/15 | | | 965,000 | | | 965,222 | |
| 0.101%, 12/8/15 (A) | | | 200,000 | | | 199,979 | |
| 0.101%, 12/14/15 (A) | | | 200,000 | | | 199,976 | |
| 0.086%, 1/8/16 (A) | | | 500,000 | | | 499,920 | |
| 0.178%, 1/21/16 (A) | | | 379,000 | | | 378,851 | |
| 0.132%, 2/10/16 (A) | | | 725,000 | | | 724,736 | |
| | | | | | | |
| | | | | | | 4,020,794 | |
| U.S. Treasury Notes - 10.9% | | | | | | | |
| 1.375%, 11/30/15 | | | 500,000 | | | 500,507 | |
| 0.250%, 12/31/15 | | | 700,000 | | | 700,269 | |
| 4.500%, 2/15/16 | | | 900,000 | | | 911,455 | |
| | | | | | | |
| | | | | | | 2,112,231 | |
| | | | | | | |
Total U.S. Government and Agency Obligations (Cost $17,932,797) | | | | | | 17,932,797 | |
| INVESTMENT COMPANIES - 4.2% | | | | | | | |
| State Street Institutional U.S. Government | | | | | | | |
| | | | | | | | |
| Money Market Fund, Premier Class | | | 803,124 | | | 803,124 | |
| | | | | | | |
Total Investment Companies | | | | | | | |
(Cost $803,124) | | | | | | 803,124 | |
| | | | | | | |
| TOTAL INVESTMENTS - 97.0% (Cost $18,735,921**) | | | | | | 18,735,921 | |
| NET OTHER ASSETS AND LIABILITIES - 3.0% | | | | | | 573,883 | |
| | | | | | | |
| TOTAL NET ASSETS - 100.0% | | | | | $ | 19,309,804 | |
| | | | | | | |
| ** | | Aggregate cost for Federal tax purposes was $18,735,921. |
| (A) | | Rate noted represents annualized yield at time of purchase. |
| |
| Madison Tax-Free Virginia Fund Portfolio of Investments |
| | | | Par Value | | | Value (Note 2) | |
| | | | | | | | |
| MUNICIPAL BONDS - 97.8% | | | | | | | |
| Development - 8.2% | | | | | | | |
| Fairfax County Economic Development Authority, Series A, 5%, 10/1/26 | | $ | 150,000 | | $ | 181,645 | |
| Norfolk Economic Development Authority, 5%, 11/1/29 | | | 480,000 | | | 537,893 | |
| Powhatan County Economic Development Authority, 3%, 9/15/28 | | | 200,000 | | | 200,506 | |
| Prince William County Industrial Development Authority, 5.25%, 2/1/18 | | | 675,000 | | | 724,221 | |
| Virginia Housing Development Authority, 1.5%, 4/1/19 | | | 200,000 | | | 202,602 | |
| | | | | | | |
| | | | | | | 1,846,867 | |
| Education - 13.5% | | | | | | | |
| Henrico County Economic Development Authority, 4%, 4/15/42 | | | 220,000 | | | 221,863 | |
| University of Virginia, 5%, 6/1/40 | | | 255,000 | | | 278,746 | |
| Virginia College Building Authority, (ST APPROP), 5%, 2/1/23 | | | 500,000 | | | 605,140 | |
| Virginia College Building Authority, (ST APPROP), 5%, 9/1/26 | | | 140,000 | | | 155,765 | |
| Virginia College Building Authority, (ST APPROP), 5%, 2/1/29 | | | 375,000 | | | 418,264 | |
| Virginia Commonwealth University, Series A, 5%, 5/1/26 | | | 385,000 | | | 450,385 | |
| Virginia Public School Authority, 5%, 12/1/18 | | | 100,000 | | | 111,727 | |
| Virginia Public School Authority, (ST APPROP), 5%, 8/1/27 | | | 350,000 | | | 390,492 | |
| Virginia Public School Authority, (ST AID WITHHLDG), 3%, 8/1/33 | | | 450,000 | | | 430,213 | |
| | | | | | | |
| | | | | | | 3,062,595 | |
| Facilities - 6.8% | | | | | | | |
| Newport News Economic Development Authority, (Prerefunded 7/1/16 @ $100), 5%, 7/1/25 | | | 745,000 | | | 768,363 | |
| Stafford County & Staunton Industrial Development Authority, (NATL-RE), 4.5%, 8/1/25 | | | 50,000 | | | 50,046 | |
| Virginia Public Building Authority, 5.25%, 8/1/23 | | | 200,000 | | | 224,492 | |
| Western Regional Jail Authority, 3.125%, 12/1/29 | | | 500,000 | | | 500,635 | |
| | | | | | | |
| | | | | | | 1,543,536 | |
| General - 9.6% | | | | | | | |
| Fairfax County Economic Development Authority, 4.25%, 8/1/29 | | | 340,000 | | | 360,648 | |
| Northern Virginia Transportation Authority, 5%, 6/1/30 | | | 780,000 | | | 914,535 | |
| Puerto Rico Public Finance Corp, (Escrowed To Maturity) (AMBAC)*, 5.5%, 8/1/27 | | | 100,000 | | | 129,295 | |
| Territory of Guam, 5%, 1/1/26 | | | 150,000 | | | 166,416 | |
| Virgin Islands Public Finance Authority, (NATL-RE), 5%, 10/1/23 | | | 100,000 | | | 103,602 | |
| Virginia Beach Development Authority, Series A, 3.5%, 5/1/30 | | | 250,000 | | | 254,420 | |
| Virginia Resources Authority, (MORAL OBLG), 5%, 11/1/23 | | | 200,000 | | | 237,070 | |
| | | | | | | |
| | | | | | | 2,165,986 | |
| General Obligation - 21.2% | | | | | | | |
| City of Danville VA, Series A, (ST AID WITHHLDG), 5%, 8/1/23 | | | 190,000 | | | 229,476 | |
| City of Fredericksburg VA, Series A, 3.625%, 7/15/30 | | | 400,000 | | | 411,928 | |
| City of Hampton VA, 5%, 1/15/21 | | | 250,000 | | | 280,377 | |
| City of Norfolk VA, Series A (Prerefunded 11/1/19 @ $100), 4.125%, 11/1/27 | | | 75,000 | | | 84,243 | |
| City of Portsmouth VA, Series A, (ST AID WITHHLDG), 5%, 2/1/31 | | | 635,000 | | | 730,009 | |
| City of Richmond VA, (ST AID WITHHLDG), 5%, 7/15/22 | | | 100,000 | | | 116,556 | |
| City of Roanoke VA, (ST AID WITHHLDG), 5%, 2/1/25 | | | 230,000 | | | 267,485 | |
| City of Virginia Beach VA, Series A, 4%, 8/1/22 | | | 300,000 | | | 342,948 | |
| Commonwealth of Virginia, Series B, 5%, 6/1/21 | | | 175,000 | | | 193,790 | |
| Commonwealth of Virginia, Series A, 5%, 6/1/23 | | | 500,000 | | | 614,810 | |
| Commonwealth of Virginia, 5%, 6/1/27 | | | 150,000 | | | 170,961 | |
| County of Arlington VA, (Prerefunded 1/15/17 @ $100), 5%, 1/15/25 | | | 175,000 | | | 184,713 | |
| County of Fairfax VA, (ST AID WITHHLDG), 4%, 10/1/22 | | | 250,000 | | | 286,800 | |
| County of Henrico VA, (Prerefunded 12/1/18 @ $100), 5%, 12/1/24 | | | 200,000 | | | 225,334 | |
| County of Henrico VA, 5%, 7/15/25 | | | 150,000 | | | 174,909 | |
| County of Prince William VA, (ST AID WITHHLDG), 5%, 8/1/21 | | | 105,000 | | | 126,039 | |
| County of Stafford VA, (ST AID WITHHLDG), 4%, 7/1/33 | | | 100,000 | | | 106,935 | |
| Town of Leesburg VA, (ST AID WITHHLDG), 5%, 1/15/25 | | | 90,000 | | | 111,638 | |
| Town of Leesburg VA, 5%, 1/15/41 | | | 135,000 | | | 149,198 | |
| | | | | | | |
| | | | | | | 4,808,149 | |
| Medical - 7.3% | | | | | | | |
| Fredericksburg Economic Development Authority, 5.25%, 6/15/18 | | | 250,000 | | | 271,387 | |
| Harrisonburg Industrial Development Authority, (AMBAC)*, 5%, 8/15/46 | | | 180,000 | | | 181,829 | |
| Henrico County Economic Development Authority, (NATL-RE), 6%, 8/15/16 | | | 60,000 | | | 62,456 | |
| Norfolk Economic Development Authority, 5%, 11/1/36 | | | 480,000 | | | 535,651 | |
| Roanoke Economic Development Authority, (Escrowed To Maturity) (NATL-RE), 6.125%, 7/1/17 | | | 265,000 | | | 280,982 | |
| Virginia Small Business Financing Authority, 5%, 11/1/40 | | | 300,000 | | | 328,071 | |
| | | | | | | |
| | | | | | | 1,660,376 | |
See accompanying Notes to Financial Statements.
25
| Madison Funds | October 31, 2015 |
| |
| Madison Tax-Free Virginia Fund Portfolio of Investments - continued |
| | | | Par Value | | | Value (Note 2) | |
| | | | | | | | |
| MUNICIPAL BONDS - continued | | | | | | | |
| | | | | | | | |
| Multifamily Housing - 9.2% | | | | | | | |
| Fairfax County Redevelopment & Housing Authority, 4.75%, 10/1/36 | | $ | 725,000 | | $ | 777,258 | |
| Fairfax County Redevelopment & Housing Authority, 5%, 10/1/39 | | | 300,000 | | | 325,887 | |
| Suffolk Redevelopment & Housing Authority, 5.6%, 2/1/33 | | | 725,000 | | | 727,639 | |
| Virginia Housing Development Authority, 4.8%, 10/1/39 | | | 250,000 | | | 257,672 | |
| | | | | | | |
| | | | | | | 2,088,456 | |
| Power - 4.3% | | | | | | | |
| Chesterfield County Economic Development Authority, 5%, 5/1/23 | | | 565,000 | | | 633,665 | |
| Puerto Rico Electric Power Authority, (BHAC-CR MBIA-RE FGIC), 5.25%, 7/1/24 | | | 290,000 | | | 336,771 | |
| | | | | | | |
| | | | | | | 970,436 | |
| Transportation - 5.4% | | | | | | | |
| Puerto Rico Highways & Transportation Authority, (ASSURED GTY), 5.25%, 7/1/34 | | | 100,000 | | | 96,577 | |
| Richmond Metropolitan Authority, (Escrowed To Maturity) (NATL-RE), 5.25%, 7/15/22 | | | 60,000 | | | 69,645 | |
| Richmond Metropolitan Authority, (NATL-RE), 5.25%, 7/15/22 | | | 140,000 | | | 158,652 | |
| Virginia Commonwealth Transportation Board, Series A, 5%, 9/15/24 | | | 225,000 | | | 265,583 | |
| Virginia Commonwealth Transportation Board, 5%, 3/15/25 | | | 535,000 | | | 636,313 | |
| | | | | | | |
| | | | | | | 1,226,770 | |
| Utilities - 1.5% | | | | | | | |
| | | | | | | | |
| City of Richmond VA, Series A, 5%, 1/15/38 | | | 300,000 | | | 337,122 | |
| | | | | | | |
|
| | | | | | | | |
Water - 10.8% | | | | | | | | | Fairfax County Water Authority, 5.25%, 4/1/23 | | | 180,000 | | | 222,746 | |
| Fairfax County Water Authority, 5%, 4/1/27 | | | 150,000 | | | 177,234 | |
| Hampton Roads Sanitation District, 5%, 4/1/33 | | | 160,000 | | | 173,155 | |
| Hampton Roads Sanitation District, (Prerefunded 4/1/18 @ $100), 5%, 4/1/33 | | | 90,000 | | | 99,180 | |
| Prince William County Service Authority, 5%, 7/1/22 | | | 250,000 | | | 300,503 | |
| Upper Occoquan Sewage Authority, (NATL-RE), 5.15%, 7/1/20 | | | 500,000 | | | 555,440 | |
| Virginia Resources Authority, (ST AID WITHHLDG), 5%, 10/1/23 | | | 500,000 | | | 578,135 | |
| Virginia Resources Authority, (ST AID WITHHLDG), 4.5%, 10/1/28 | | | 160,000 | | | 181,939 | |
| Virginia Resources Authority, (Prerefunded 11/1/16 @ $100), 5%, 11/1/31 | | | 140,000 | | | 146,397 | |
| Virginia Resources Authority, 5%, 11/1/31 | | | 20,000 | | | 20,830 | |
| | | | | | | |
| | | | | | | 2,455,559 | |
| | | | | | | |
TOTAL INVESTMENTS - 97.8%
(Cost $21,394,098**) | | | | | | 22,165,852 | |
| NET OTHER ASSETS AND LIABILITIES - 2.2% | | | | | | 493,520 | |
| | | | | | | |
| TOTAL NET ASSETS - 100.0% | | | | | $ | 22,659,372 | |
| | | | | | | |
| * | | This bond is covered by insurance issued by Ambac Assurance Corporation (“AMBAC”). On November 8, 2010, Ambac Financial Group, Inc., the holding company of AMBAC, announced that it had filed for Chapter 11 bankruptcy protection. The impact that this event may have on the ability of AMBAC to guarantee timely payment of principal and interest on these bonds, should they default, is not known at this time. |
| ** | | Aggregate cost for Federal tax purposes was $21,394,098. |
| AMBAC | | AMBAC Indemnity Corp. |
| ASSURED GTY | | Assured Guaranty. |
| BHAC-CR | | Berkshire Hathaway Assurance Corp. |
| FGIC | | Financial Guaranty Insurance Co. |
| MORAL OBLG | | Moral Obligation. |
| NATL-RE | | National Public Finance Guarantee Corp. |
| ST AID WITHHLDG | | State Aid Withholding. |
| ST APPROP | | State Appropriations. |
| |
| Madison Tax-Free National Fund Portfolio of Investments |
| | | | Par Value | | | Value (Note 2) | |
| | | | | | | | |
| MUNICIPAL BONDS - 98.0% | | | | | | | |
| Alabama - 2.4% | | | | | | | |
| Alabama Incentives Financing Authority Revenue, Series A, 5%, 9/1/29 | | $ | 300,000 | | $ | 338,766 | |
| Tuscaloosa Public Educational Building Authority, (ASSURED GTY), 6.375%, 7/1/28 | | | 295,000 | | | 334,902 | |
| | | | | | | |
| | | | | | | 673,668 | |
| Arkansas - 0.7% | | | | | | | |
| City of Fort Smith AR Water & Sewer Revenue, (AGM), 5%, 10/1/21 | | | 175,000 | | | 194,747 | |
| | | | | | | |
| | | | | | | | |
| Colorado - 1.7% | | | | | | | |
| El Paso County Facilities Corp., Certificate Participation, 5%, 12/1/27 | | | 400,000 | | | 472,516 | |
| | | | | | | |
| | | | | | | | |
| Delaware - 1.5% | | | | | | | |
| State of Delaware, General Obligation, Series A, 5%, 8/1/25 | | | 345,000 | | | 422,484 | |
| | | | | | | |
| | | | | | | | |
| Florida - 13.8% | | | | | | | |
| City of Port St. Lucie FL Utility System Revenue, 5%, 9/1/27 | | | 600,000 | | | 696,420 | |
| County of Miami-Dade FL, Series B, 5%, 3/1/25 | | | 525,000 | | | 618,103 | |
| Highlands County Health Facilities Authority, 5%, 11/15/20 | | | 455,000 | | | 455,742 | |
| Hillsborough County Industrial Development Authority, 5%, 10/1/34 | | | 450,000 | | | 489,780 | |
| Lee County Industrial Development Authority, 5%, 11/1/28 | | | 500,000 | | | 581,245 | |
| Orlando Utilities Commission, Series C, 5%, 10/1/22 | | | 525,000 | | | 634,048 | |
| Palm Beach County Solid Waste Authority, 5%, 10/1/24 | | | 300,000 | | | 360,846 | |
| | | | | | | |
| | | | | | | 3,836,184 | |
| Georgia - 4.1% | | | | | | | |
| City of Atlanta GA Water & Wastewater Revenue, (AGM), 5.75%, 11/1/30 | | | 300,000 | | | 396,024 | |
| City of Columbus GA Water & Sewerage Revenue, Series A, 5%, 5/1/31 | | | 430,000 | | | 499,995 | |
| Georgia State Road & Tollway Authority, 5%, 6/1/21 | | | 90,000 | | | 101,932 | |
| Private Colleges & Universities Authority, 5%, 9/1/38 | | | 130,000 | | | 142,765 | |
| | | | | | | |
| | | | | | | 1,140,716 | |
| Illinois - 0.8% | | | | | | | |
| Regional Transportation Authority, (AMBAC GO of AUTH)*, 7.2%, 11/1/20 | | | 190,000 | | | 217,727 | |
| | | | | | | |
| | | | | | | | |
| Indiana - 3.6% | | | | | | | |
| Indiana Finance Authority, 5%, 2/1/21 | | | 400,000 | | | 463,028 | |
| Indianapolis Local Public Improvement | | | | | | | |
| Bond Bank, (ASSURED GTY), 5.5%, 1/1/38 | | | 475,000 | | | 536,056 | |
| | | | | | | |
| | | | | | | 999,084 | |
| Iowa - 2.8% | | | | | | | |
| City of Bettendorf IA, General Obligation, 5%, 6/1/28 | | | 475,000 | | | 546,872 | |
| City of Bettendorf IA, General Obligation, 5%, 6/1/30 | | | 210,000 | | | 240,776 | |
| | | | | | | |
| | | | | | | 787,648 | |
| Kansas - 2.3% | | | | | | | |
| City of Wichita KS, General Obligation, 5%, 12/1/24 | | | 510,000 | | | 633,048 | |
| | | | | | | |
| | | | | | | | |
| Maryland - 5.6% | | | | | | | |
| City of Rockville MD, General Obligation, Series A, 5%, 6/1/24 | | | 600,000 | | | 745,992 | |
| Maryland State Transportation Authority, Series A, 5%, 7/1/18 | | | 100,000 | | | 110,912 | |
| Montgomery County Revenue Authority, 5%, 5/1/31 | | | 600,000 | | | 683,790 | |
| | | | | | | |
| | | | | | | 1,540,694 | |
| Michigan - 3.4% | | | | | | | |
| Detroit City School District, General Obligation, (FGIC Q-SBLF), 6%, 5/1/20 | | | 400,000 | | | 472,748 | |
| Redford Unified School District No. 1, General Obligation, (AMBAC Q-SBLF)*, 5%, 5/1/22 | | | 410,000 | | | 469,347 | |
| | | | | | | |
| | | | | | | 942,095 | |
| Missouri - 6.8% | | | | | | | |
| County of St Louis MO, (Escrowed To Maturity), 5.65%, 2/1/20 | | | 500,000 | | | 589,240 | |
| Missouri State Board of Public Buildings, Series B, 4%, 4/1/25 | | | 525,000 | | | 592,872 | |
| Springfield School District No. R-12, General Obligation, Series B, (ST AID DIR DEP), 5%, 3/1/25 | | | 400,000 | | | 494,328 | |
| St. Louis Industrial Development Authority, 6.65%, 5/1/16 | | | 200,000 | | | 205,942 | |
| | | | | | | |
| | | | | | | 1,882,382 | |
| New Jersey - 4.0% | | | | | | | |
| City of Elizabeth NJ, General Obligation, (AGM), 3%, 4/1/24 | | | 300,000 | | | 312,465 | |
| New Jersey State Turnpike Authority, (BHAC-CR FSA), 5.25%, 1/1/28 | | | 250,000 | | | 308,667 | |
| New Jersey State Turnpike Authority, Series A, (BHAC-CR FSA), 5.25%, 1/1/29 | | | 250,000 | | | 308,927 | |
| Union County Improvement Authority, Series A, 4%, 2/1/25 | | | 150,000 | | | 168,323 | |
| | | | | | | |
| | | | | | | 1,098,382 | |
See accompanying Notes to Financial Statements.
26
| Madison Funds | October 31, 2015 |
| |
| Madison Tax-Free National Fund Portfolio of Investments - continued |
| | | | Par Value | | | Value (Note 2) | |
| | | | | | | | |
| MUNICIPAL BONDS - continued | | | | | | | |
| | | | | | | | |
| New Mexico - 1.7% | | | | | | | |
| Farmington Municipal School District No. 5, General Obligation, Series A, (ST AID WITHHLDG), 3%, 9/1/23 | | $ | 450,000 | | $ | 482,135 | |
| | | | | | | |
| | | | | | | | |
| New York - 3.2% | | | | | | | |
| New York State Dormitory Authority, (BHAC-CR AMBAC)*, 5.5%, 7/1/31 | | | 250,000 | | | 318,820 | |
| Port Authority of New York & New Jersey, (GO of AUTH), 5.375%, 3/1/28 | | | 455,000 | | | 553,025 | |
| | | | | | | |
| | | | | | | 871,845 | |
| North Carolina - 6.6% | | | | | | | |
| County of New Hanover NC, General Obligation, 3%, 2/1/29 | | | 385,000 | | | 387,780 | |
| North Carolina Medical Care Commission, (HUD SECT 8), 5.5%, 10/1/24 | | | 500,000 | | | 501,540 | |
| State of North Carolina, 4.5%, 5/1/27 | | | 200,000 | | | 219,762 | |
| State of North Carolina, General Obligation, Series D, 4%, 6/1/21 | | | 100,000 | | | 114,300 | |
| Town of Cary NC Combined Utility Systems Revenue, 5%, 12/1/23 | | | 500,000 | | | 609,545 | |
| | | | | | | |
| | | | | | | 1,832,927 | |
| Ohio - 2.1% | | | | | | | |
| Cleveland-Cuyahoga County Port Authority, 5%, 7/1/24 | | | 500,000 | | | 592,910 | |
| | | | | | | |
| | | | | | | | |
| Pennsylvania - 0.6% | | | | | | | |
| Lehigh County General Purpose Authority, (NATL-RE GO of HOSP), 7%, 7/1/16 | | | 170,000 | | | 177,415 | |
| | | | | | | |
| | | | | | | | |
| South Carolina - 8.9% | | | | | | | |
| Anderson County School District No. 1, General Obligation, Series A, (SCSDE), 5%, 3/1/25 | | | 720,000 | | | 897,350 | |
| City of Bennettsville SC Combined Utility System Revenue, (BAM), 3.5%, 2/1/24 | | | 465,000 | | | 505,771 | |
| County of Richland SC, General Obligation, Series A, (ST AID WITHHLDG), 4%, 3/1/27 | | | 495,000 | | | 554,826 | |
| York County School District No. 1, General Obligation, (SCSDE), 5%, 3/1/27 | | | 440,000 | | | 496,949 | |
| | | | | | | |
| | | | | | | 2,454,896 | |
| Tennessee - 1.7% | | | | | | | |
| Gibson County Special School District, (BAM), 5%, 4/1/26 | | | 300,000 | | | 359,319 | |
| Jackson Energy Authority, 4.75%, 6/1/25 | | | 100,000 | | | 115,001 | |
| | | | | | | |
| | | | | | | 474,320 | |
| Texas - 9.8% | | | | | | | |
| Beaumont Independent School District, General Obligation, (PSF-GTD), 4.75%, 2/15/38 | | | 300,000 | | | 321,510 | |
| City of San Antonio TX, Water System Revenue, 5.125%, 5/15/29 | | | 500,000 | | | 557,440 | |
| Liberty Hill Independent School District, General Obligation, (PSF-GTD), 5%, 8/1/26 | | | 410,000 | | | 464,415 | |
| Mueller Local Government Corp, 5%, 9/1/25 | | | 500,000 | | | 518,625 | |
| San Jacinto College District Revenue, 3.625%, 2/15/30 | | | 250,000 | | | 252,648 | |
| San Jacinto River Authority, (BAM), 4%, 10/1/23 | | | 200,000 | | | 222,312 | |
| State of Texas, General Obligation, 5%, 8/1/27 | | | 330,000 | | | 376,655 | |
| | | | | | | |
| | | | | | | 2,713,605 | |
| Virginia - 3.4% | | | | | | | |
| County of Stafford VA, General Obligation, (ST AID WITHHLDG), 4%, 7/1/33 | | | 150,000 | | | 160,403 | |
| Fairfax County Redevelopment & Housing Authority, 5%, 10/1/39 | | | 265,000 | | | 287,867 | |
| Virginia Commonwealth Transportation Board, 5%, 3/15/23 | | | 200,000 | | | 237,654 | |
| Virginia Housing Development Authority, 4.8%, 10/1/39 | | | 250,000 | | | 257,672 | |
| | | | | | | |
| | | | | | | 943,596 | |
| Washington - 2.9% | | | | | | | |
| State of Washington, General Obligation, Series E, 5%, 2/1/29 | | | 205,000 | | | 239,789 | |
| University of Washington, 5%, 7/1/32 | | | 500,000 | | | 576,550 | |
| | | | | | | |
| | | | | | | 816,339 | |
| Wisconsin - 3.6% | | | | | | | |
| Maple School District, General Obligation, Series A, 5%, 4/1/24 | | | 650,000 | | | 776,880 | |
| Wisconsin Health & Educational Facilities Authority, 5.25%, 10/1/21 | | | 200,000 | | | 206,370 | |
| | | | | | | |
| | | | | | | 983,250 | |
| | | | | | | |
| TOTAL INVESTMENTS - 98.0% | | | | | | | |
| (Cost $25,832,587**) | | | | | | 27,184,613 | |
| NET OTHER ASSETS AND LIABILITIES - 2.0% | | | | | | 559,496 | |
| | | | | | | |
| TOTAL NET ASSETS - 100.0% | | | | | $ | 27,744,109 | |
| | | | | | | |
| * | | This bond is covered by insurance issued by Ambac Assurance Corporation (“AMBAC”). On November 8, 2010, Ambac Financial Group, Inc., the holding company of AMBAC, announced that it had filed for Chapter 11 bankruptcy protection. The impact that this event may have on the ability of AMBAC to guarantee timely payment of principal and interest on these bonds, should they default, is not known at this time. |
| ** | | Aggregate cost for Federal tax purposes was $25,832,587. |
| AGM | | Assured Guaranty Municipal Corp. |
| AMBAC | | AMBAC Indemnity Corp. |
| ASSURED GTY | | Assured Guaranty. |
| BAM | | Build America Mutual Assurance Co. |
| BHAC-CR | | Berkshire Hathaway Assurance Corp. |
| FGIC | | Financial Guaranty Insurance Co. |
| FSA | | Financial Security Assurance. |
| GO of AUTH | | General Obligation of the Authority. |
| GO of HOSP | | General Obligation of the Hospital District. |
| HUD SECT 8 | | HUD Insured Multifamily Housing. |
| NATL-RE | | National Public Finance Guarantee Corp. |
| PSF-GTD | | Permanent School Fund Guaranteed. |
| Q-SBLF | | Qualified School Board Loan Fund. |
| SCSDE | | South Carolina School District-Enhanced (State of SC’s Intercept program). |
| ST AID DIR DEP | | State Aid Direct Deposit. |
| ST AID WITHHLDG | | State Aid Withholding. |
| |
| Madison High Quality Bond Fund Portfolio of Investments |
| | | | Par Value | | | Value (Note 2) | |
| | | | | | | | |
| CORPORATE NOTES AND BONDS - 37.0% | | | | | | | |
| Consumer Discretionary - 6.7% | | | | | | | |
| Comcast Corp., 3.125%, 7/15/22 | | $ | 2,000,000 | | $ | 2,051,546 | |
| Home Depot Inc./The, 2%, 6/15/19 | | | 2,000,000 | | | 2,031,204 | |
| Target Corp., 2.9%, 1/15/22 | | | 2,000,000 | | | 2,047,164 | |
| Walt Disney Co./The, MTN, 1.1%, 12/1/17 | | | 750,000 | | | 748,684 | |
| | | | | | | |
| | | | | | | 6,878,598 | |
| Consumer Staples - 1.5% | | | | | | | |
| Coca-Cola Co./The, 2.45%, 11/1/20 | | | 1,500,000 | | | 1,526,447 | |
| | | | | | | |
| | | | | | | | |
| Energy - 1.5% | | | | | | | |
| Chevron Corp., 2.427%, 6/24/20 | | | 1,500,000 | | | 1,527,331 | |
| | | | | | | |
| | | | | | | | |
| Financials - 14.0% | | | | | | | |
| American Express Credit Corp., 2.125%, 7/27/18 | | | 1,000,000 | | | 1,009,642 | |
| Bank of New York Mellon Corp./The, MTN, 1.35%, 3/6/18 | | | 500,000 | | | 499,218 | |
| General Electric Capital Corp., MTN, 5.625%, 9/15/17 | | | 2,000,000 | | | 2,158,740 | |
| Goldman Sachs Group Inc./The, 2.625%, 1/31/19 | | | 1,360,000 | | | 1,382,757 | |
| John Deere Capital Corp., MTN, 1.4%, 3/15/17 | | | 2,000,000 | | | 2,010,892 | |
| JPMorgan Chase & Co., 2.25%, 1/23/20 | | | 2,000,000 | | | 1,984,192 | |
| Morgan Stanley, 2.8%, 6/16/20 | | | 500,000 | | | 504,200 | |
| Simon Property Group L.P., 4.125%, 12/1/21 | | | 1,750,000 | | | 1,877,627 | |
| US Bancorp, MTN, 1.95%, 11/15/18 | | | 750,000 | | | 757,641 | |
| Wells Fargo & Co., 5.625%, 12/11/17 | | | 2,000,000 | | | 2,170,918 | |
| | | | | | | |
| | | | | | | 14,355,827 | |
| Health Care - 3.0% | | | | | | | |
| Merck & Co. Inc., 3.875%, 1/15/21 | | | 1,500,000 | | | 1,617,259 | |
| UnitedHealth Group Inc., 2.875%, 3/15/23 | | | 1,500,000 | | | 1,497,098 | |
| | | | | | | |
| | | | | | | 3,114,357 | |
| Industrials - 1.6% | | | | | | | |
| United Parcel Service Inc., 5.5%, 1/15/18 | | | 1,500,000 | | | 1,641,492 | |
| | | | | | | |
| | | | | | | | |
| Information Technology - 8.7% | | | | | | | |
| Apple Inc., 2.4%, 5/3/23 | | | 1,000,000 | | | 978,351 | |
| Cisco Systems Inc., 5.5%, 2/22/16 | | | 2,000,000 | | | 2,031,366 | |
| EMC Corp., 2.65%, 6/1/20 | | | 260,000 | | | 236,772 | |
| Intel Corp., 1.95%, 10/1/16 | | | 2,000,000 | | | 2,025,082 | |
| Microsoft Corp., 3%, 10/1/20 | | | 1,500,000 | | | 1,588,785 | |
| Texas Instruments Inc., 2.375%, 5/16/16 | | | 2,000,000 | | | 2,020,224 | |
| | | | | | | |
| | | | | | | 8,880,580 | |
| | | | | | | |
| | | | | | | | |
Total Corporate Notes and Bonds | | | | | | | |
(Cost $37,460,231) | | | | | | 37,924,632 | |
| | | | | | | | |
| U.S. GOVERNMENT AND AGENCY | | | | | | | |
| OBLIGATIONS - 59.8% | | | | | | | |
| | | | | | | | |
| Fannie Mae - 14.7% | | | | | | | |
| 1.250%, 9/28/16 | | | 4,000,000 | | | 4,027,616 | |
| 1.375%, 11/15/16 | | | 3,000,000 | | | 3,027,162 | |
| 1.250%, 1/30/17 | | | 4,000,000 | | | 4,033,276 | |
| 0.875%, 2/8/18 | | | 4,000,000 | | | 3,999,348 | |
| | | | | | | |
| | | | | | | 15,087,402 | |
See accompanying Notes to Financial Statements.
27
| Madison Funds | October 31, 2015 |
| |
| Madison High Quality Bond Fund Portfolio of Investments - continued |
| | | | Par Value | | | Value (Note 2) | |
| | | | | | | | |
| U.S. GOVERNMENT AND AGENCY OBLIGATIONS - continued | | | | | | | |
| | | | | | | | |
| Freddie Mac - 5.9% | | | | | | | |
| 2.500%, 5/27/16 | | $ | 5,000,000 | | $ | 5,060,380 | |
| 2.375%, 1/13/22 | | | 1,000,000 | | | 1,023,607 | |
| | | | | | | |
| | | | | | | 6,083,987 | |
| U.S. Treasury Notes - 39.2% | | | | | | | |
| 0.375%, 3/31/16 | | | 2,500,000 | | | 2,501,368 | |
| 1.000%, 8/31/16 | | | 4,000,000 | | | 4,018,804 | |
| 0.875%, 1/31/17 | | | 4,000,000 | | | 4,017,760 | |
| 3.000%, 2/28/17 | | | 4,000,000 | | | 4,129,012 | |
| 3.875%, 5/15/18 | | | 4,500,000 | | | 4,835,389 | |
| 1.500%, 12/31/18 | | | 4,000,000 | | | 4,047,604 | |
| 1.250%, 1/31/19 | | | 3,750,000 | | | 3,762,499 | |
| 1.500%, 3/31/19 | | | 2,750,000 | | | 2,778,861 | |
| 3.125%, 5/15/19 | | | 3,000,000 | | | 3,194,844 | |
| 3.625%, 2/15/20 | | | 2,000,000 | | | 2,182,292 | |
| 2.625%, 11/15/20 | | | 2,000,000 | | | 2,100,364 | |
| 2.500%, 8/15/23 | | | 2,500,000 | | | 2,594,205 | |
| | | | | | | |
| | | | | | | 40,163,002 | |
| | | | | | | |
| | | | | | | | |
Total U.S. Government and Agency Obligations | | | | | | | |
(Cost $60,841,395) | | | | | | 61,334,391 | |
| | | | Shares | | | | |
| | | | | | | | |
| SHORT-TERM INVESTMENTS - 2.3% | | | | | | | |
| State Street Institutional U.S. Government | | | | | | | |
| Money Market Fund, Premier Class | | | 2,326,519 | | | 2,326,519 | |
| | | | | | | |
| | | | | | | | |
Total Short-Term Investments | | | | | | | |
(Cost $2,326,519) | | | | | | 2,326,519 | |
| | | | | | | |
| | | | | | | | |
| TOTAL INVESTMENTS - 99.1% | | | | | | | |
| (Cost $100,628,145**) | | | | | | 101,585,542 | |
| NET OTHER ASSETS AND LIABILITIES - 0.9% | | | | | | 965,967 | |
| | | | | | | |
| TOTAL NET ASSETS - 100.0% | | | | | $ | 102,551,509 | |
| | | | | | | |
| ** | | Aggregate cost for Federal tax purposes was $100,628,145. |
| MTN | | Medium Term Note. |
| |
| Madison Core Bond Fund Portfolio of Investments |
| | | | Par Value | | | Value (Note 2) | |
| | | | | | | | |
| ASSET BACKED SECURITIES - 4.0% | | | | | | | |
| ABSC Long Beach Home Equity Loan Trust, Series 2000-LB1, Class AF5 (A), 8.55%, 9/21/30 | | $ | 64,040 | | $ | 66,713 | |
| Ally Master Owner Trust, Series 2014-4, Class A2, 1.43%, 6/17/19 | | | 750,000 | | | 749,106 | |
| CarMax Auto Owner Trust, Series 2015-1, Class A2, 0.88%, 3/15/18 | | | 890,041 | | | 890,434 | |
| CNH Equipment Trust, Series 2014-A, Class A3, 0.84%, 5/15/19 | | | 750,000 | | | 748,504 | |
| Ford Credit Auto Owner Trust, Series 2014-A, Class A3, 0.79%, 5/15/18 | | | 619,718 | | | 619,401 | |
| GreatAmerica Leasing Receivables, Series 2015-1, Class A2 (B), 1.12%, 6/20/17 | | | 500,000 | | | 499,665 | |
| Hyundai Auto Receivables Trust, Series 2014-A, Class A3, 0.79%, 7/16/18 | | | 262,206 | | | 262,078 | |
| John Deere Owner Trust, Series 2014-B, Class A2A, 0.54%, 7/17/17 | | | 336,611 | | | 336,424 | |
| Mercedes-Benz Auto Lease Trust, Series 2014-A, Class A4, 0.9%, 12/16/19 | | | 1,125,000 | | | 1,124,979 | |
| Santander Drive Auto Receivables Trust, Series 2013-3 Class B, 1.19%, 5/15/18 | | | 607,467 | | | 607,387 | |
| Santander Drive Auto Receivables Trust, Series 2014-2, Class B, 1.62%, 2/15/19 | | | 1,000,000 | | | 1,001,100 | |
| Santander Drive Auto Receivables Trust, Series 2013-5, Class C, 2.25%, 6/17/19 | | | 1,000,000 | | | 1,005,546 | |
| Volkswagen Auto Lease Trust, Series 2014-A, Class A3, 0.8%, 4/20/17 | | | 625,000 | | | 624,976 | |
| Volvo Financial Equipment LLC, Series 2014-1A, Class A3 (B), 0.82%, 4/16/18 | | | 500,000 | | | 499,281 | |
| | | | | | | |
| | | | | | | | |
Total Asset Backed Securities | | | | | | | |
(Cost $9,048,624) | | | | | | 9,035,594 | |
| | | | | | | | |
| COLLATERALIZED MORTGAGE OBLIGATIONS - 1.1% | | | | | | | |
| Fannie Mae REMICS, Series 2015-12, Class NI, IO, 3.5%, 3/25/30 | | | 3,423,005 | | | 427,136 | |
| Fannie Mae REMICS, Series 2001-73, Class GZ, 6%, 12/25/31 | | | 468,625 | | | 530,905 | |
| Fannie Mae REMICS, Series 2005-79, Class LT, 5.5%, 9/25/35 | | | 327,612 | | | 369,883 | |
| Fannie Mae REMICS, Series 2015-44, Class GI, IO, 3%, 11/25/40 | | | 1,219,285 | | | 129,634 | |
| Freddie Mac REMICS, Series 4066, Class DI, IO, 3%, 6/15/27 | | | 4,704,439 | | | 476,036 | |
| Government National Mortgage Association, Series 2015-53, Class IL, IO, 3%, 9/20/44 | | | 3,184,661 | | | 486,262 | |
| | | | | | | |
| | | | | | | | |
Total Collateralized Mortgage Obligations | | | | | | | |
(Cost $2,531,284) | | | | | | 2,419,856 | |
| | | | | | | | |
| COMMERCIAL MORTGAGE-BACKED SECURITIES - 2.0% | | | | | | | |
| Bear Stearns Commercial Mortgage Securities Trust, Series 2007-PW17, Class A1A (A), 5.65%, 6/11/50 | | | 1,135,906 | | | 1,206,352 | |
| FREMF Mortgage Trust, Series 2012-K708, Class B (A) (B), 3.754%, 2/25/45 | | | 1,250,000 | | | 1,297,605 | |
| FREMF Mortgage Trust, Series 2011-K701, Class C (A) (B), 4.286%, 7/25/48 | | | 1,250,000 | | | 1,297,682 | |
| Merrill Lynch Mortgage Trust, Series 2006- C1, Class A4 (A), 5.674%, 5/12/39 | | | 600,000 | | | 604,446 | |
| | | | | | | |
| | | | | | | | |
Total Commercial Mortgage-Backed Securities | | | | | | | |
(Cost $4,478,167) | | | | | | 4,406,085 | |
| | | | | | | | |
| CORPORATE NOTES AND BONDS - 32.0% | | | | | | | |
| | | | | | | | |
| Consumer Discretionary - 5.0% | | | | | | | |
| AARP Inc. (B) (C), 7.5%, 5/1/31 | | | 750,000 | | | 1,013,933 | |
| AutoZone Inc., 1.3%, 1/13/17 | | | 1,400,000 | | | 1,399,489 | |
| CCO Safari II LLC (B), 4.464%, 7/23/22 | | | 1,000,000 | | | 1,014,498 | |
| DR Horton Inc., 3.75%, 3/1/19 | | | 475,000 | | | 488,063 | |
| ERAC USA Finance LLC (B), 6.7%, 6/1/34 | | | 575,000 | | | 681,581 | |
| Georgia-Pacific LLC (B), 3.163%, 11/15/21 | | | 1,000,000 | | | 1,003,917 | |
| GLP Capital L.P. / GLP Financing II Inc., 4.875%, 11/1/20 | | | 275,000 | | | 283,250 | |
| Harman International Industries Inc., 4.15%, 5/15/25 | | | 1,000,000 | | | 976,790 | |
| Nissan Motor Acceptance Corp. (B), 2.65%, 9/26/18 | | | 500,000 | | | 510,143 | |
| Priceline Group Inc./The, 3.65%, 3/15/25 | | | 1,000,000 | | | 996,056 | |
| QVC Inc., 3.125%, 4/1/19 | | | 800,000 | | | 794,280 | |
| Sirius XM Radio Inc. (B), 6%, 7/15/24 | | | 525,000 | | | 554,295 | |
| Toll Brothers Finance Corp., 4%, 12/31/18 | | | 450,000 | | | 468,000 | |
| Walgreens Boots Alliance Inc., 4.5%, 11/18/34 | | | 1,000,000 | | | 926,880 | |
| | | | | | | |
| | | | | | | 11,111,175 | |
| Consumer Staples - 3.0% | | | | | | | |
| CVS Health Corp. (B), 4.75%, 12/1/22 | | | 1,000,000 | | | 1,089,973 | |
| CVS Health Corp., 5.125%, 7/20/45 | | | 1,000,000 | | | 1,072,085 | |
| JM Smucker Co./The, 3.5%, 3/15/25 | | | 1,000,000 | | | 1,003,131 | |
| Kraft Foods Group Inc., 3.5%, 6/6/22 | | | 1,000,000 | | | 1,019,801 | |
| Kraft Heinz Foods Co. (B), 3.95%, 7/15/25 | | | 1,000,000 | | | 1,023,900 | |
| Kroger Co./The, 2.95%, 11/1/21 | | | 1,000,000 | | | 1,001,180 | |
| Mead Johnson Nutrition Co., 3%, 11/15/20 | | | 500,000 | | | 502,729 | |
| | | | | | | |
| | | | | | | 6,712,799 | |
| Energy - 4.8% | | | | | | | |
| Antero Resources Corp. (B), 5.625%, 6/1/23 | | | 300,000 | | | 276,000 | |
| Energy Transfer Partners L.P., 5.2%, 2/1/22 | | | 1,000,000 | | | 994,960 | |
| Enterprise Products Operating LLC, 3.75%, 2/15/25 | | | 1,000,000 | | | 963,048 | |
| Freeport-McMoran Oil & Gas LLC / FCX Oil & Gas Inc., 6.75%, 2/1/22 | | | 600,000 | | | 528,750 | |
| Helmerich & Payne International Drilling Co., 4.65%, 3/15/25 | | | 1,000,000 | | | 1,014,745 | |
| Hess Corp., 7.875%, 10/1/29 | | | 240,000 | | | 286,532 | |
| Kinder Morgan Inc. (B), 5%, 2/15/21 | | | 1,000,000 | | | 1,012,000 | |
| Marathon Oil Corp., 2.7%, 6/1/20 | | | 1,000,000 | | | 970,734 | |
| Phillips 66, 4.65%, 11/15/34 | | | 1,000,000 | | | 997,817 | |
| Phillips 66 Partners L.P., 3.605%, 2/15/25 | | | 1,300,000 | | | 1,196,775 | |
| Transocean Inc. (D), 6%, 3/15/18 | | | 850,000 | | | 797,300 | |
| Valero Energy Corp., 6.625%, 6/15/37 | | | 1,000,000 | | | 1,106,162 | |
| Williams Partners L.P. / ACMP Finance Corp., 4.875%, 5/15/23 | | | 750,000 | | | 676,949 | |
| | | | | | | |
| | | | | | | 10,821,772 | |
| Financials - 5.7% | | | | | | | |
| AerCap Ireland Captial Ltd. / AerCap Global Aviation Trust (D), 3.75%, 5/15/19 | | | 450,000 | | | 455,400 | |
| Air Lease Corp., 3.875%, 4/1/21 | | | 450,000 | | | 459,000 | |
| Air Lease Corp., 3.75%, 2/1/22 | | | 1,000,000 | | | 989,747 | |
| American International Group Inc., 3.875%, 1/15/35 | | | 1,000,000 | | | 936,924 | |
| Apollo Management Holdings L.P. (B), 4%, 5/30/24 | | | 1,000,000 | | | 1,005,245 | |
| Bank of America Corp., 2.65%, 4/1/19 | | | 1,000,000 | | | 1,011,631 | |
| Glencore Funding LLC (B), 3.125%, 4/29/19 | | | 825,000 | | | 707,438 | |
| Goldman Sachs Group Inc./The, 5.75%, 1/24/22 | | | 1,000,000 | | | 1,145,908 | |
| Goldman Sachs Group Inc./The, 4.75%, 10/21/45 | | | 1,000,000 | | | 1,014,319 | |
| JPMorgan Chase & Co., 3.125%, 1/23/25 | | | 1,000,000 | | | 971,494 | |
See accompanying Notes to Financial Statements.
28
| Madison Funds | October 31, 2015 |
| |
| Madison Core Bond Fund Portfolio of Investments - continued |
| | | | Par Value | | | Value (Note 2) | |
| | | | | | | | |
| CORPORATE NOTES AND BONDS - continued | | | | | | | |
| | | | | | | | |
| Financials - continued | | | | | | | |
| Liberty Mutual Group Inc. (B), 4.25%, 6/15/23 | | $ | 1,250,000 | | $ | 1,281,149 | |
| Morgan Stanley, 2.8%, 6/16/20 | | | 1,000,000 | | | 1,008,400 | |
| Regions Bank, 2.25%, 9/14/18 | | | 1,000,000 | | | 1,003,574 | |
| Synchrony Financial, 3.75%, 8/15/21 | | | 700,000 | | | 705,960 | |
| UBS AG/Stamford CT (D), 5.75%, 4/25/18 | | | 122,000 | | | 133,133 | |
| | | | | | | |
| | | | | | | 12,829,322 | |
| Health Care - 3.7% | | | | | | | |
| AbbVie Inc., 2%, 11/6/18 | | | 1,100,000 | | | 1,100,536 | |
| AbbVie Inc., 4.7%, 5/14/45 | | | 1,000,000 | | | 957,232 | |
| Actavis Funding SCS (D), 4.75%, 3/15/45 | | | 1,565,000 | | | 1,496,628 | |
| Cardinal Health Inc., 1.95%, 6/15/18 | | | 1,000,000 | | | 1,004,707 | |
| Forest Laboratories Inc. (B), 5%, 12/15/21 | | | 200,000 | | | 216,151 | |
| Gilead Sciences Inc., 4.75%, 3/1/46 | | | 450,000 | | | 455,210 | |
| HCA Inc., 3.75%, 3/15/19 | | | 800,000 | | | 814,000 | |
| Laboratory Corp. of America Holdings, 3.6%, 2/1/25 | | | 1,000,000 | | | 973,315 | |
| UnitedHealth Group Inc., 4.75%, 7/15/45 | | | 1,000,000 | | | 1,062,993 | |
| Wyeth LLC, 6.5%, 2/1/34 | | | 230,000 | | | 289,121 | |
| | | | | | | |
| | | | | | | 8,369,893 | |
| Industrials - 2.8% | | | | | | | |
| ADT Corp./The, 4.125%, 4/15/19 | | | 475,000 | | | 485,687 | |
| Boeing Co./The, 8.625%, 11/15/31 | | | 240,000 | | | 354,309 | |
| Burlington Northern Santa Fe LLC, 8.125%, 4/15/20 | | | 285,000 | | | 345,873 | |
| CRH America Inc. (B), 3.875%, 5/18/25 | | | 1,000,000 | | | 1,003,535 | |
| FedEx Corp., 4.75%, 11/15/45 | | | 1,000,000 | | | 986,514 | |
| Hertz Corp./The, 7.5%, 10/15/18 | | | 500,000 | | | 511,250 | |
| International Lease Finance Corp., 8.875%, 9/1/17 | | | 500,000 | | | 555,000 | |
| Norfolk Southern Corp., 7.05%, 5/1/37 | | | 390,000 | | | 512,522 | |
| United Rentals North America Inc., 6.125%, 6/15/23 | | | 400,000 | | | 417,400 | |
| Verisk Analytics Inc., 4%, 6/15/25 | | | 1,000,000 | | | 972,958 | |
| | | | | | | |
| | | | | | | 6,145,048 | |
| Information Technology - 2.5% | | | | | | | |
| Autodesk Inc., 4.375%, 6/15/25 | | | 1,000,000 | | | 1,001,250 | |
| CDW LLC / CDW Finance Corp., 5%, 9/1/23 | | | 200,000 | | | 207,500 | |
| First Data Corp. (B), 6.75%, 11/1/20 | | | 500,000 | | | 526,875 | |
| Fiserv Inc., 2.7%, 6/1/20 | | | 1,000,000 | | | 1,001,069 | |
| Hewlett-Packard Enterprise Co. (B), 6.35%, 10/15/45 | | | 350,000 | | | 339,050 | |
| Intuit Inc., 5.75%, 3/15/17 | | | 1,100,000 | | | 1,161,927 | |
| Microsoft Corp., 3.5%, 2/12/35 | | | 1,000,000 | | | 925,255 | |
| Xilinx Inc., 3%, 3/15/21 | | | 500,000 | | | 505,392 | |
| | | | | | | |
| | | | | | | 5,668,318 | |
| Materials - 0.8% | | | | | | | |
| Alcoa Inc., 5.125%, 10/1/24 | | | 200,000 | | | 198,250 | |
| Packaging Corp. of America, 3.65%, 9/15/24 | | | 1,000,000 | | | 998,659 | |
| Weyerhaeuser Co., 7.375%, 3/15/32 | | | 500,000 | | | 624,389 | |
| | | | | | | |
| | | | | | | 1,821,298 | |
| Telecommunication Services - 2.5% | | | | | | | |
| AT&T Inc., 4.75%, 5/15/46 | | | 1,000,000 | | | 918,157 | |
| Frontier Communications Corp. (B), 11%, 9/15/25 | | | 1,100,000 | | | 1,152,932 | |
| Harris Corp., 5.054%, 4/27/45 | | | 1,000,000 | | | 979,656 | |
| Verizon Communications Inc., 3.45%, 3/15/21 | | | 1,500,000 | | | 1,546,836 | |
| Verizon Communications Inc., 4.4%, 11/1/34 | | | 1,000,000 | | | 939,932 | |
| | | | | | | |
| | | | | | | 5,537,513 | |
| Utilities - 1.2% | | | | | | | |
| Black Hills Corp., 4.25%, 11/30/23 | | | 1,000,000 | | | 1,045,727 | |
| Sierra Pacific Power Co., Series M, 6%, 5/15/16 | | | 650,000 | | | 668,093 | |
| Wisconsin Electric Power Co., 6.5%, 6/1/28 | | | 750,000 | | | 949,477 | |
| | | | | | | |
| | | | | | | 2,663,297 | |
| | | | | | | |
Total Corporate Notes and Bonds | | | | | | | |
(Cost $71,435,404) | | | | | | 71,680,435 | |
| | | | | | | | |
| LONG TERM MUNICIPAL BONDS - 9.5% | | | | | | | |
| City of Laredo TX, General Obligation, 6.566%, 2/15/39 | | | 1,500,000 | | | 1,668,330 | |
| City of Reading PA, General Obligation, (AGM), 5.3%, 11/1/33 | | | 1,500,000 | | | 1,541,085 | |
| County of Bexar TX, General Obligation, Series C, 6.628%, 6/15/39 | | | 1,800,000 | | | 2,043,594 | |
| County of Palm Beach FL Revenue, 5%, 11/1/33 | | | 1,880,000 | | | 1,998,064 | |
| East Baton Rouge Sewerage Commission Revenue, 6.087%, 2/1/45 | | | 2,000,000 | | | 2,223,280 | |
| Las Vegas Valley Water District, General Obligation, Series A, 7.1%, 6/1/39 | | | 1,000,000 | | | 1,151,760 | |
| Metropolitan Water District of Southern California Revenue, Series D, 6.538%, 7/1/39 | | | 420,000 | | | 474,000 | |
| New York City Water & Sewer System Revenue, 6.491%, 6/15/42 | | | 1,025,000 | | | 1,169,453 | |
| Northside Independent School District, General Obligation, Series B, (PSF-GTD), 5.741%, 8/15/35 | | | 1,600,000 | | | 1,762,064 | |
| Rancho Water District Financing Authority Revenue, Series A, 6.337%, 8/1/40 | | | 1,000,000 | | | 1,131,890 | |
| South Dakota State Building Authority Revenue, Series F, 4.7%, 6/1/32 | | | 1,250,000 | | | 1,324,750 | |
| State of Iowa Revenue, 6.75%, 6/1/34 | | | 2,000,000 | | | 2,285,600 | |
| West Contra Costa Unified School District, General Obligation, 8.46%, 8/1/34 | | | 2,000,000 | | | 2,387,920 | |
| | | | | | | |
| | | | | | | |
Total Long Term Municipal Bonds | | | | | | | |
(Cost $21,029,865) | | | | | | 21,161,790 | |
| | | | | | | | |
| MORTGAGE BACKED SECURITIES - 20.6% | | | | | | | |
| | | | | | | | |
| Fannie Mae - 12.7% | | | | | | | |
| 5.5%, 4/1/16 Pool # 745444 | | | 3,621 | | | 3,634 | |
| 6%, 5/1/16 Pool # 582558 | | | 689 | | | 693 | |
| 5.5%, 2/1/18 Pool # 673194 | | | 39,115 | | | 40,305 | |
| 5%, 2/1/19 Pool # 725341 | | | 5,432 | | | 5,643 | |
| 5%, 5/1/20 Pool # 813965 | | | 78,943 | | | 83,812 | |
| 4.5%, 9/1/20 Pool # 835465 | | | 75,289 | | | 79,091 | |
| 5.5%, 3/1/21 Pool # 837199 | | | 12,909 | | | 13,863 | |
| 6%, 3/1/21 Pool # 745406 | | | 10,277 | | | 11,018 | |
| 6%, 5/1/21 Pool # 253847 | | | 10,282 | | | 11,642 | |
| 4.5%, 4/1/23 Pool # 974401 | | | 172,130 | | | 182,948 | |
| 4.5%, 6/1/23 Pool # 984075 | | | 71,073 | | | 75,100 | |
| 3%, 12/1/26 Pool # AB4086 | | | 727,830 | | | 759,748 | |
| 3%, 3/1/27 Pool # AK6784 | | | 1,434,728 | | | 1,497,656 | |
| 3%, 5/1/27 Pool # AL1715 | | | 1,081,818 | | | 1,129,261 | |
| 3.5%, 5/1/29 Pool # AW3740 | | | 1,438,050 | | | 1,522,697 | |
| 3.5%, 8/1/29 Pool # MA2003 | | | 1,269,291 | | | 1,341,132 | |
| 3.5%, 10/1/29 Pool # AX3155 | | | 623,272 | | | 658,290 | |
| 7%, 12/1/29 Pool # 762813 | | | 12,957 | | | 13,670 | |
| 7%, 11/1/31 Pool # 607515 | | | 11,639 | | | 12,862 | |
| 6.5%, 3/1/32 Pool # 631377 | | | 55,364 | | | 63,279 | |
| 6.5%, 5/1/32 Pool # 636758 | | | 2,435 | | | 2,783 | |
| 7%, 5/1/32 Pool # 644591 | | | 1,746 | | | 1,955 | |
| 6.5%, 6/1/32 Pool # 545691 | | | 117,355 | | | 134,529 | |
| 5%, 10/1/33 Pool # 254903 | | | 117,439 | | | 130,012 | |
| 5.5%, 11/1/33 Pool # 555880 | | | 140,742 | | | 158,411 | |
| 5%, 5/1/34 Pool # 775604 | | | 15,637 | | | 17,311 | |
| 5%, 5/1/34 Pool # 780890 | | | 63,220 | | | 69,981 | |
| 5%, 6/1/34 Pool # 255230 | | | 26,678 | | | 29,529 | |
| 7%, 7/1/34 Pool # 792636 | | | 8,217 | | | 8,604 | |
| 4%, 2/1/35 Pool # MA2177 | | | 1,365,639 | | | 1,467,449 | |
| 5%, 8/1/35 Pool # 829670 | | | 127,863 | | | 140,840 | |
| 5%, 9/1/35 Pool # 820347 | | | 168,762 | | | 190,115 | |
| 5%, 9/1/35 Pool # 835699 | | | 141,065 | | | 156,044 | |
| 5%, 11/1/35 Pool # 844809 | | | 51,613 | | | 56,863 | |
| 4.5%, 12/1/35 Pool # 745147 | | | 24,809 | | | 26,974 | |
| 5%, 12/1/35 Pool # 850561 | | | 61,010 | | | 67,225 | |
| 5%, 2/1/36 Pool # 745275 | | | 24,246 | | | 26,722 | |
| 5%, 3/1/36 Pool # 745355 | | | 32,017 | | | 35,277 | |
| 6%, 11/1/36 Pool # 902510 | | | 117,250 | | | 134,582 | |
| 5.5%, 5/1/37 Pool # 928292 | | | 177,690 | | | 198,383 | |
| 6%, 10/1/37 Pool # 947563 | | | 150,659 | | | 173,235 | |
| 6.5%, 12/1/37 Pool # 889072 | | | 143,091 | | | 163,935 | |
| 5%, 4/1/38 Pool # 889260 | | | 29,344 | | | 32,302 | |
| 6.5%, 8/1/38 Pool # 987711 | | | 275,929 | | | 332,926 | |
| 4.5%, 8/1/40 Pool # AD8243 | | | 139,909 | | | 152,012 | |
| 4%, 9/1/40 Pool # AE3039 | | | 1,243,063 | | | 1,336,885 | |
| 4%, 1/1/41 Pool # AB2080 | | | 1,002,944 | | | 1,073,837 | |
| 5.5%, 7/1/41 Pool # AL6588 | | | 1,032,788 | | | 1,157,819 | |
| 4%, 9/1/41 Pool # AJ1406 | | | 876,334 | | | 935,023 | |
| 4%, 10/1/41 Pool # AJ4046 | | | 1,220,501 | | | 1,312,911 | |
| 3.5%, 11/1/41 Pool # AB3867 | | | 526,697 | | | 549,735 | |
| 4%, 3/1/42 Pool # AL1998 | | | 1,897,837 | | | 2,041,617 | |
| 3.5%, 6/1/42 Pool # AO4134 | | | 1,784,118 | | | 1,861,939 | |
| 3.5%, 8/1/42 Pool # AP2133 | | | 1,036,162 | | | 1,080,857 | |
| 3%, 9/1/42 Pool # AP6568 | | | 162,633 | | | 164,998 | |
| 3.5%, 9/1/42 Pool # AB6228 | | | 565,527 | | | 589,931 | |
| 3.5%, 12/1/42 Pool # AQ8892 | | | 175,507 | | | 183,043 | |
| 3.5%, 1/1/43 Pool # AQ9326 | | | 837,316 | | | 878,850 | |
| 3%, 2/1/43 Pool # AL3072 | | | 1,330,299 | | | 1,349,390 | |
| 3.5%, 4/1/43 Pool # AR9902 | | | 551,193 | | | 578,865 | |
| 3.5%, 4/1/43 Pool # AT2887 | | | 486,026 | | | 507,537 | |
| 4.5%, 2/1/45 Pool # MA2193 | | | 1,362,528 | | | 1,484,992 | |
| | | | | | | |
| | | | | | | 28,502,572 | |
| Freddie Mac - 7.9% | | | | | | | |
| 5%, 5/1/18 Pool # E96322 | | | 30,010 | | | 31,120 | |
| 5%, 2/1/21 Pool # G11911 | | | 11,838 | | | 12,567 | |
| 4.5%, 4/1/23 Pool # J07302 | | | 24,616 | | | 26,379 | |
| 4.5%, 11/1/23 Pool # G13342 | | | 13,845 | | | 14,974 | |
| 3%, 12/1/26 Pool # J17506 | | | 109,648 | | | 114,227 | |
| 3%, 1/1/27 Pool # G18420 | | | 56,620 | | | 58,938 | |
| 3%, 8/1/27 Pool # J19899 | | | 1,086,826 | | | 1,135,022 | |
| 8%, 6/1/30 Pool # C01005 | | | 1,021 | | | 1,156 | |
| 7%, 3/1/31 Pool # C48133 | | | 6,943 | | | 6,967 | |
| 6.5%, 1/1/32 Pool # C62333 | | | 29,724 | | | 33,970 | |
| 3.5%, 8/1/32 Pool # C91485 | | | 233,517 | | | 245,566 | |
| 5%, 7/1/33 Pool # A11325 | | | 306,926 | | | 341,180 | |
| 4.5%, 6/1/34 Pool # C01856 | | | 826,785 | | | 897,475 | |
| 5%, 4/1/35 Pool # A32315 | | | 49,226 | | | 54,231 | |
| 5%, 4/1/35 Pool # A32316 | | | 50,333 | | | 55,069 | |
| 6.5%, 11/1/36 Pool # C02660 | | | 17,055 | | | 19,544 | |
| 5.5%, 11/1/37 Pool # A68787 | | | 275,905 | | | 311,799 | |
| 5%, 9/1/38 Pool # G04815 | | | 13,236 | | | 14,487 | |
| 5.5%, 12/1/38 Pool # G05267 | | | 968,505 | | | 1,077,833 | |
| 5%, 2/1/39 Pool # G05572 | | | 420,895 | | | 464,064 | |
| 5%, 10/1/39 Pool # A89335 | | | 1,227,909 | | | 1,361,526 | |
| 3.5%, 11/1/40 Pool # G06168 | | | 867,553 | | | 902,933 | |
| 4%, 10/1/41 Pool # Q04092 | | | 1,500,891 | | | 1,604,197 | |
| 4.5%, 3/1/42 Pool # G07491 | | | 1,091,325 | | | 1,185,635 | |
See accompanying Notes to Financial Statements.
29
| Madison Funds | October 31, 2015 |
| |
| Madison Core Bond Fund Portfolio of Investments - continued |
| | | | Par Value | | | Value (Note 2) | |
| | | | | | | | |
| MORTGAGE BACKED SECURITIES - continued | | | | | | | |
| Freddie Mac - continued | | | | | | | |
| 3%, 9/1/42 Pool # C04233 | | $ | 897,112 | | $ | 907,374 | |
| 3%, 2/1/43 Pool # Q15767 | | | 163,613 | | | 165,123 | |
| 3%, 4/1/43 Pool # V80025 | | | 632,893 | | | 640,043 | |
| 3%, 4/1/43 Pool # V80026 | | | 632,111 | | | 639,264 | |
| 3.5%, 8/1/44 Pool # Q27927 | | | 877,026 | | | 913,269 | |
| 4%, 5/1/45 Pool # G08642 | | | 1,941,715 | | | 2,065,883 | |
| 3%, 7/1/45 Pool # G08653 | | | 990,418 | | | 998,856 | |
| 3.5%, 9/1/45 Pool # G08667 | | | 1,246,524 | | | 1,295,361 | |
| | | | | | | |
| | | | | | | 17,596,032 | |
| Ginnie Mae - 0.0% | | | | | | | |
| 6.5%, 2/20/29 Pool # 2714 | | | 15,527 | | | 18,202 | |
| 6.5%, 4/20/31 Pool # 3068 | | | 7,467 | | | 8,823 | |
| 4%, 4/15/39 Pool # 698089 | | | 77,390 | | | 82,468 | |
| | | | | | | |
| | | | | | | 109,493 | |
| | | | | | | |
Total Mortgage Backed Securities
(Cost $45,320,370) | | | | | | 46,208,097 | |
| | | | Contracts | | | | |
| | | | | | | | |
| PUT OPTIONS PURCHASED - 0.0% | | | | | | | |
| 10 Year U.S. Treasury Note, Put, Dec | | | | | | | |
| 2015, $125 | | | 25 | | | 5,468 | |
| 10 Year U.S. Treasury Note, Put, Dec | | | | | | | |
| 2015, $127 | | | 25 | | | 23,047 | |
| | | | | | | |
Total Put Options Purchased (Cost $14,213) | | | | | | 28,515 | |
| | | | Par Value | | | | |
| | | | | | | | |
| U.S. GOVERNMENT AND AGENCY OBLIGATIONS - 26.6% | | | | | | | |
| | | | | | | | |
| Fannie Mae - 0.6% | | | | | | | |
| 3.000%, 5/24/32 (E) | | $ | 1,250,000 | | | 1,228,754 | |
| | | | | | | |
| | | | | | | | |
| Federal Farm Credit Bank - 0.2% | | | | | | | |
| 5.875%, 10/3/16 | | | 500,000 | | | 525,493 | |
| | | | | | | |
| | | | | | | | |
| Freddie Mac - 0.2% | | | | | | | |
| 5.000%, 2/16/17 | | | 450,000 | | | 475,398 | |
| | | | | | | |
| | | | | | | | |
| U.S. Treasury Bonds - 4.5% | | | | | | | |
| 6.625%, 2/15/27 | | | 2,000,000 | | | 2,877,604 | |
| 5.375%, 2/15/31 | | | 1,250,000 | | | 1,717,090 | |
| 4.500%, 5/15/38 | | | 2,750,000 | | | 3,578,616 | |
| 3.750%, 8/15/41 | | | 250,000 | | | 291,201 | |
| 3.000%, 5/15/45 | | | 1,650,000 | | | 1,669,487 | |
| | | | | | | |
| | | | | | | 10,133,998 | |
| U.S. Treasury Notes - 21.1% | | | | | | | |
| 0.375%, 10/31/16 | | | 1,000,000 | | | 999,206 | |
| 0.875%, 1/31/17 | | | 2,500,000 | | | 2,511,100 | |
| 3.125%, 1/31/17 | | | 3,800,000 | | | 3,922,162 | |
| 0.750%, 3/15/17 | | | 3,600,000 | | | 3,608,298 | |
| 2.375%, 7/31/17 | | | 2,200,000 | | | 2,264,139 | |
| 1.875%, 10/31/17 | | | 3,000,000 | | | 3,066,015 | |
| 4.250%, 11/15/17 | | | 2,550,000 | | | 2,727,602 | |
| 2.625%, 1/31/18 | | | 3,000,000 | | | 3,117,969 | |
| 2.750%, 2/28/18 | | | 3,000,000 | | | 3,129,063 | |
| 3.875%, 5/15/18 | | | 2,750,000 | | | 2,954,960 | |
| 1.375%, 2/28/19 | | | 3,000,000 | | | 3,020,235 | |
| 3.625%, 8/15/19 | | | 1,750,000 | | | 1,899,480 | |
| 2.625%, 11/15/20 | | | 1,350,000 | | | 1,417,746 | |
| 3.125%, 5/15/21 | | | 3,750,000 | | | 4,036,132 | |
| 2.125%, 8/15/21 | | | 1,900,000 | | | 1,941,563 | |
| 2.000%, 10/31/21 | | | 2,500,000 | | | 2,533,267 | |
| 1.750%, 9/30/22 | | | 2,500,000 | | | 2,477,735 | |
| 2.750%, 2/15/24 | | | 1,500,000 | | | 1,581,524 | |
| | | | | | | |
| | | | | | | 47,208,196 | |
| | | | | | | |
Total U.S. Government and Agency Obligations
(Cost $57,088,504) | | | | | | 59,571,839 | |
| | | | Shares | | | | |
| | | | | | | | |
| SHORT-TERM INVESTMENTS - 2.9% | | | | | | | |
| State Street Institutional U.S. Government | | | | | | | |
| Money Market Fund, Premier Class | | | 6,554,356 | | | 6,554,356 | |
| | | | | | | |
| | | | | | | | |
Total Short-Term Investments
(Cost $6,554,356) | | | | | | 6,554,356 | |
| | | | | | | |
| | | | | | | | |
| TOTAL INVESTMENTS - 98.7% (Cost $217,500,787**) | | | | | | 221,066,567 | |
| NET OTHER ASSETS AND LIABILITIES - 1.3% | | | | | | 2,812,313 | |
| | | | | | | |
| TOTAL CALL & PUT OPTIONS WRITTEN - (0.0)% | | | | | | (20,313 | ) |
| | | | | | | |
| TOTAL NET ASSETS - 100.0% | | | | | $ | 223,858,567 | |
| | | | | | | |
| ** | | Aggregate cost for Federal tax purposes was $217,500,787. |
| (A) | | Floating rate or variable rate note. Rate shown is as of October 31, 2015. |
| (B) | | Security sold within terms of a private placement memorandum exempt from registration under section 144A of the Securities Act of 1933, as amended, and may be sold only to dealers in that program or other “qualified institutional buyers.” |
| (C) | | Illiquid security (See Note 2). |
| (D) | | Notes and bonds, issued by foreign entities, denominated in U.S. dollars. The aggregate of these securities is 1.3% of total net assets. |
| (E) | | Stepped rate security. Rate shown is as of October 31, 2015. |
| | | |
| AGM Assured Guaranty Municipal Corp. |
| PSF-GTD Permanent School Fund Guaranteed. |
| Put Options Written | | | Contracts
(100 Shares Per Contract) | | | Expiration Date | | | Strike Price | | Value (Note 2) |
| 10 Year U.S. Treasury Note | | | 50 | | | December 2015 | | | $125.50 | | | $20,313 | |
| |
Total Put Options Written (Premiums received $9,225) | | | $20,313 | |
| | | | | | | | | | | | | | |
| |
Total Options Written, at Value (Premiums received $9,225) | | | $20,313 | |
| | | | | | | | | | | | | | |
| | | | | | | | | | | | | | |
| Holdings of Open Futures Contracts | | | | |
| Type | | | Expiration | | | Number of
Contracts | | | Position Type | | UnrealizedAppreciation/
(Depreciation) |
| 90 Day Euro Futures | | | March 2016 | | | 1 | | | Long | | | $610 | |
| | | | | | | | | | | | | $610 | |
See accompanying Notes to Financial Statements.
30
| Madison Funds | October 31, 2015 |
| |
| Madison Corporate Bond Fund Portfolio of Investments |
| | | | Par Value | | | Value (Note 2) | |
| | | | | | | | |
| CORPORATE NOTES AND BONDS - 89.3% | | | | | | | |
| | | | | | | | |
| Consumer Discretionary - 10.3% | | | | | | | |
| Amazon.com Inc., 3.8%, 12/5/24 | | $ | 200,000 | | $ | 208,699 | |
| CCO Safari II LLC (A), 4.464%, 7/23/22 | | | 200,000 | | | 202,900 | |
| Comcast Corp., 6.45%, 3/15/37 | | | 300,000 | | | 376,269 | |
| DIRECTV Holdings LLC / DIRECTV Financing Co. Inc., 5%, 3/1/21 | | | 300,000 | | | 327,957 | |
| DR Horton Inc., 3.75%, 3/1/19 | | | 50,000 | | | 51,375 | |
| Georgia-Pacific LLC (A), 3.163%, 11/15/21 | | | 100,000 | | | 100,392 | |
| GLP Capital L.P. / GLP Financing II Inc., 4.875%, 11/1/20 | | | 25,000 | | | 25,750 | |
| Harman International Industries Inc., 4.15%, 5/15/25 | | | 100,000 | | | 97,679 | |
| Nissan Motor Acceptance Corp. (A), 2.65%, 9/26/18 | | | 50,000 | | | 51,014 | |
| Priceline Group Inc./The, 3.65%, 3/15/25 | | | 200,000 | | | 199,211 | |
| QVC Inc., 3.125%, 4/1/19 | | | 200,000 | | | 198,570 | |
| Sirius XM Radio Inc. (A), 6%, 7/15/24 | | | 125,000 | | | 131,975 | |
| Time Warner Inc., 6.25%, 3/29/41 | | | 150,000 | | | 171,178 | |
| Toll Brothers Finance Corp., 4%, 12/31/18 | | | 50,000 | | | 52,000 | |
| Viacom Inc., 3.25%, 3/15/23 | | | 100,000 | | | 92,599 | |
| Walgreens Boots Alliance Inc., 4.5%, 11/18/34 | | | 150,000 | | | 139,032 | |
| | | | | | | |
| | | | | | | 2,426,600 | |
| Consumer Staples - 6.0% | | | | | | | |
| CVS Health Corp. (A), 4.75%, 12/1/22 | | | 200,000 | | | 217,995 | |
| CVS Health Corp., 5.125%, 7/20/45 | | | 200,000 | | | 214,417 | |
| General Mills Inc., 5.65%, 2/15/19 | | | 200,000 | | | 222,649 | |
| JM Smucker Co/The, 3.5%, 3/15/25 | | | 200,000 | | | 200,626 | |
| Kraft Foods Group Inc., 3.5%, 6/6/22 | | | 200,000 | | | 203,960 | |
| Kraft Heinz Foods Co. (A), 3.95%, 7/15/25 | | | 150,000 | | | 153,585 | |
| Wal-Mart Stores Inc., 3.25%, 10/25/20 | | | 200,000 | | | 211,748 | |
| | | | | | | |
| | | | | | | 1,424,980 | |
| Energy - 11.3% | | | | | | | |
| Antero Resources Corp. (A), 5.625%, 6/1/23 | | | 50,000 | | | 46,000 | |
| Calumet Specialty Products Partners L.P. / Calumet Finance Corp., 6.5%, 4/15/21 | | | 100,000 | | | 93,000 | |
| Chevron Corp., 3.191%, 6/24/23 | | | 200,000 | | | 204,467 | |
| ConocoPhillips Co., 4.15%, 11/15/34 | | | 200,000 | | | 192,183 | |
| Devon Energy Corp., 5.6%, 7/15/41 | | | 100,000 | | | 96,819 | |
| Energy Transfer Partners L.P., 5.2%, 2/1/22 | | | 300,000 | | | 298,488 | |
| Enterprise Products Operating LLC, 4.45%, 2/15/43 | | | 200,000 | | | 171,902 | |
| Freeport-McMoran Oil & Gas LLC / FCX Oil & Gas Inc., 6.75%, 2/1/22 | | | 150,000 | | | 132,187 | |
| Helmerich & Payne International Drilling Co., 4.65%, 3/15/25 | | | 100,000 | | | 101,475 | |
| Kinder Morgan Energy Partners L.P., 2.65%, 2/1/19 | | | 50,000 | | | 48,873 | |
| Kinder Morgan Inc. (A), 5%, 2/15/21 | | | 50,000 | | | 50,600 | |
| Marathon Oil Corp., 2.7%, 6/1/20 | | | 200,000 | | | 194,147 | |
| Marathon Petroleum Corp., 5.125%, 3/1/21 | | | 250,000 | | | 272,737 | |
| Phillips 66, 4.65%, 11/15/34 | | | 100,000 | | | 99,782 | |
| Phillips 66 Partners L.P., 3.605%, 2/15/25 | | | 200,000 | | | 184,119 | |
| Valero Energy Corp., 6.625%, 6/15/37 | | | 350,000 | | | 387,157 | |
| Williams Partners L.P. / ACMP Finance Corp., 4.875%, 5/15/23 | | | 100,000 | | | 90,260 | |
| | | | | | | |
| | | | | | | 2,664,196 | |
| Financials - 36.5% | | | | | | | |
| | | | | | | | |
| Banks - 16.6% | | | | | | | |
| Bank of America Corp., 2.6%, 1/15/19 | | | 100,000 | | | 101,180 | |
| Bank of America Corp., MTN, 3.3%, 1/11/23 | | | 200,000 | | | 199,421 | |
| BB&T Corp., MTN, 2.25%, 2/1/19 | | | 200,000 | | | 202,084 | |
| Capital One Financial Corp., 2.45%, 4/24/19 | | | 300,000 | | | 300,277 | |
| Fifth Third Bancorp, 2.3%, 3/1/19 | | | 300,000 | | | 300,658 | |
| Goldman Sachs Group Inc./The, 5.75%, 1/24/22 | | | 100,000 | | | 114,591 | |
| Goldman Sachs Group Inc./The, 3.625%, 1/22/23 | | | 200,000 | | | 204,217 | |
| Huntington National Bank/The, 2.2%, 4/1/19 | | | 300,000 | | | 299,173 | |
| JPMorgan Chase & Co., 4.25%, 10/15/20 | | | 100,000 | | | 107,103 | |
| JPMorgan Chase & Co., 3.125%, 1/23/25 | | | 200,000 | | | 194,299 | |
| KeyCorp, MTN, 5.1%, 3/24/21 | | | 250,000 | | | 278,312 | |
| Morgan Stanley, 2.8%, 6/16/20 | | | 200,000 | | | 201,680 | |
| Morgan Stanley, MTN, 3.7%, 10/23/24 | | | 200,000 | | | 202,545 | |
| PNC Funding Corp., 3.3%, 3/8/22 | | | 100,000 | | | 103,032 | |
| Regions Bank, 2.25%, 9/14/18 | | | 250,000 | | | 250,893 | |
| US Bancorp, MTN, 2.2%, 11/15/16 | | | 400,000 | | | 405,609 | |
| Wells Fargo & Co., 5.625%, 12/11/17 | | | 410,000 | | | 445,038 | |
| | | | | | | |
| | | | | | | 3,910,112 | |
| Diversified Financial Services - 8.2% | | | | | | | |
| AerCap Ireland Captial Ltd. / AerCap Global Aviation Trust (B), 3.75%, 5/15/19 | | | 150,000 | | | 151,800 | |
| Affiliated Managers Group Inc., 4.25%, 2/15/24 | | | 300,000 | | | 306,696 | |
| Air Lease Corp., 3.875%, 4/1/21 | | | 50,000 | | | 51,000 | |
| Air Lease Corp., 3.75%, 2/1/22 | | | 200,000 | | | 197,950 | |
| American Express Co., 6.15%, 8/28/17 | | | 300,000 | | | 324,277 | |
| Apollo Management Holdings L.P. (A), 4%, 5/30/24 | | | 250,000 | | | 251,311 | |
| General Electric Capital Corp., MTN, 6.75%, 3/15/32 | | | 425,000 | | | 557,361 | |
| Synchrony Financial, 3.75%, 8/15/21 | | | 100,000 | | | 100,851 | |
| | | | | | | |
| | | | | | | 1,941,246 | |
| Insurance - 7.6% | | | | | | | |
| Aflac Inc., 3.625%, 11/15/24 | | | 200,000 | | | 203,353 | |
| American International Group Inc., 3.875%, 1/15/35 | | | 200,000 | | | 187,385 | |
| Berkshire Hathaway Finance Corp., 5.4%, 5/15/18 | | | 400,000 | | | 439,483 | |
| Liberty Mutual Group Inc. (A), 4.25%, 6/15/23 | | | 100,000 | | | 102,492 | |
| MetLife Inc., 3.6%, 4/10/24 | | | 300,000 | | | 308,417 | |
| New York Life Global Funding (A), 1.95%, 2/11/20 | | | 200,000 | | | 198,060 | |
| ProAssurance Corp., 5.3%, 11/15/23 | | | 50,000 | | | 53,502 | |
| Prudential Financial Inc., MTN, 3.5%, 5/15/24 | | | 300,000 | | | 304,825 | |
| | | | | | | |
| | | | | | | 1,797,517 | |
| Machinery-Constr&Mining - 0.9% | | | | | | | |
| Caterpillar Financial Services Corp., Series G, 2.45%, 9/6/18 | | | 200,000 | | | 205,180 | |
| | | | | | | |
| | | | | | | | |
| Mining - 0.5% | | | | | | | |
| Glencore Funding LLC (A), 3.125%, 4/29/19 | | | 125,000 | | | 107,188 | |
| | | | | | | |
| |
| Real Estate - 2.7% | | | | | | | |
| Simon Property Group L.P., 4.125%, 12/1/21 | | | 400,000 | | | 429,172 | |
| WP Carey Inc., 4.6%, 4/1/24 | | | 200,000 | | | 201,973 | |
| | | | | | | |
| | | | | | | 631,145 | |
| | | | | | | |
| | | | | | | 8,592,388 | |
| Health Care - 6.3% | | | | | | | |
| AbbVie Inc., 4.7%, 5/14/45 | | | 100,000 | | | 95,723 | |
| Actavis Funding SCS (B), 4.55%, 3/15/35 | | | 130,000 | | | 123,901 | |
| Cardinal Health Inc., 1.95%, 6/15/18 | | | 200,000 | | | 200,942 | |
| Express Scripts Holding Co., 4.75%, 11/15/21 | | | 200,000 | | | 216,532 | |
| Forest Laboratories Inc. (A), 5%, 12/15/21 | | | 50,000 | | | 54,038 | |
| Gilead Sciences Inc., 4.75%, 3/1/46 | | | 100,000 | | | 101,158 | |
| HCA Inc., 3.75%, 3/15/19 | | | 100,000 | | | 101,750 | |
| Laboratory Corp. of America Holdings, 3.6%, 2/1/25 | | | 200,000 | | | 194,663 | |
| Stryker Corp., 1.3%, 4/1/18 | | | 100,000 | | | 99,683 | |
| UnitedHealth Group Inc., 2.875%, 3/15/23 | | | 200,000 | | | 199,613 | |
| UnitedHealth Group Inc., 4.75%, 7/15/45 | | | 100,000 | | | 106,299 | |
| | | | | | | |
| | | | | | | 1,494,302 | |
| Industrials - 7.3% | | | | | | | |
| Burlington Northern Santa Fe LLC, 4.45%, 3/15/43 | | | 200,000 | | | 196,492 | |
| Caterpillar Inc., 5.2%, 5/27/41 | | | 20,000 | | | 22,136 | |
| CRH America Inc. (A), 3.875%, 5/18/25 | | | 200,000 | | | 200,707 | |
| FedEx Corp., 4.75%, 11/15/45 | | | 200,000 | | | 197,303 | |
| Hertz Corp/The, 7.5%, 10/15/18 | | | 100,000 | | | 102,250 | |
| International Lease Finance Corp., 8.875%, 9/1/17 | | | 100,000 | | | 111,000 | |
| Lockheed Martin Corp., 2.9%, 3/1/25 | | | 200,000 | | | 192,983 | |
| Norfolk Southern Corp., 3.25%, 12/1/21 | | | 200,000 | | | 202,779 | |
| Textron Inc., 3.875%, 3/1/25 | | | 200,000 | | | 198,127 | |
| United Rentals North America Inc., 6.125%, 6/15/23 | | | 100,000 | | | 104,350 | |
| Verisk Analytics Inc., 4%, 6/15/25 | | | 200,000 | | | 194,592 | |
| | | | | | | |
| | | | | | | 1,722,719 | |
| Information Technology - 4.6% | | | | | | | |
| Autodesk Inc., 4.375%, 6/15/25 | | | 200,000 | | | 200,250 | |
| CDW LLC / CDW Finance Corp., 5%, 9/1/23 | | | 50,000 | | | 51,875 | |
| First Data Corp. (A), 6.75%, 11/1/20 | | | 100,000 | | | 105,375 | |
| Fiserv Inc., 2.7%, 6/1/20 | | | 200,000 | | | 200,214 | |
| Intel Corp., 4.9%, 7/29/45 | | | 100,000 | | | 103,997 | |
| Microsoft Corp., 3.5%, 2/12/35 | | | 100,000 | | | 92,526 | |
| Oracle Corp., 5.75%, 4/15/18 | | | 300,000 | | | 331,217 | |
| | | | | | | |
| | | | | | | 1,085,454 | |
| Materials - 3.2% | | | | | | | |
| Agrium Inc. (B), 3.375%, 3/15/25 | | | 200,000 | | | 186,865 | |
| Alcoa Inc., 5.125%, 10/1/24 | | | 50,000 | | | 49,562 | |
| Dow Chemical Co./The, 4.125%, 11/15/21 | | | 200,000 | | | 211,377 | |
| Packaging Corp. of America, 3.65%, 9/15/24 | | | 300,000 | | | 299,598 | |
| | | | | | | |
| | | | | | | 747,402 | |
| Telecommunication Services - 3.8% | | | | | | | |
| AT&T Inc., 4.75%, 5/15/46 | | | 75,000 | | | 68,862 | |
| Frontier Communications Corp. (A), 11%, 9/15/25 | | | 200,000 | | | 209,624 | |
| Harris Corp., 5.054%, 4/27/45 | | | 200,000 | | | 195,931 | |
| Verizon Communications Inc., 5.15%, 9/15/23 | | | 200,000 | | | 222,921 | |
| Verizon Communications Inc., 4.4%, 11/1/34 | | | 200,000 | | | 187,986 | |
| | | | | | | |
| | | | | | | 885,324 | |
| | | | | | | |
Total Corporate Notes and Bonds
(Cost $20,889,465) | | | | | | 21,043,365 | |
See accompanying Notes to Financial Statements.
31
| Madison Funds | October 31, 2015 |
| |
| Madison Corporate Bond Fund Portfolio of Investments - Continued |
| | | | Par Value | | | Value (Note 2) | |
| | | | | | | | |
| LONG TERM MUNICIPAL BONDS - 7.6% | | | | | | | |
| Alabama Incentives Financing Authority Revenue, Series A, 5%, 9/1/29 | | $ | 200,000 | | $ | 225,844 | |
| City of Oklahoma City OK Tax Allocation, Series B, 5%, 3/1/32 | | | 200,000 | | | 227,046 | |
| County of Bexar TX, General Obligation, Series C, 6.628%, 6/15/39 | | | 200,000 | | | 227,066 | |
| County of Palm Beach FL Revenue, 5%, 11/1/33 | | | 200,000 | | | 212,560 | |
| Dallas/Fort Worth International Airport Revenue, Series G, 5%, 11/1/29 | | | 200,000 | | | 229,392 | |
| Desert Community College District CA, General Obligation, Series B, (AGM), 5%, 8/1/32 | | | 200,000 | | | 213,236 | |
| Las Vegas Valley Water District, General Obligation, Series A, 7.1%, 6/1/39 | | | 200,000 | | | 230,352 | |
| Orange County Health Facilities Authority Revenue, 5%, 1/1/29 | | | 200,000 | | | 219,106 | |
| | | | | | | |
| | | | | | | | |
Total Long Term Municipal Bonds
(Cost $1,755,743) | | | | | | 1,784,602 | |
| | | | Shares | | | | |
| | | | | | | | |
| SHORT-TERM INVESTMENTS - 2.5% | | | | | | | |
| State Street Institutional U.S. Government Money Market Fund, Premier Class | | | 585,487 | | | 585,487 | |
| | | | | | | |
| | | | | | | | |
Total Short-Term Investments
(Cost $585,487) | | | | | | 585,487 | |
| | | | | | | |
| | | | | | | | |
| TOTAL INVESTMENTS - 99.4% (Cost $23,230,695**) | | | | | | 23,413,454 | |
| NET OTHER ASSETS AND LIABILITIES - 0.6% | | | | | | 131,661 | |
| | | | | | | |
| TOTAL NET ASSETS - 100.0% | | | | | $ | 23,545,115 | |
| | | | | | | |
| ** | | Aggregate cost for Federal tax purposes was $23,230,695. |
| (A) | | Security sold within terms of a private placement memorandum exempt from registration under Rule 144A of the Securities Act of 1933, as amended, and may be sold only to dealers in that program or other “qualified institutional buyers.” |
| (B) | | Notes and bonds, issued by foreign entities, denominated in U.S. dollars. The aggregate of these securities is 2.0% of total net assets. |
| AGM | | Assured Guaranty Municipal Corp. |
| MTN | | Medium Term Note. |
| |
| Madison High Income Fund Portfolio of Investments |
| | | | Par Value | | | Value (Note 2) | |
| | | | | | | | |
| CORPORATE NOTES AND BONDS - 93.9% | | | | | | | |
| Consumer Discretionary - 22.9% | | | | | | | |
| Cablevision Systems Corp., 5.875%, 9/15/22 | | $ | 100,000 | | $ | 83,000 | |
| CCO Holdings LLC / CCO Holdings Capital Corp., 6.5%, 4/30/21 | | | 400,000 | | | 419,750 | |
| Cequel Communications Holdings I LLC / Cequel Capital Corp. (A), 5.125%, 12/15/21 | | | 250,000 | | | 240,185 | |
| Cumulus Media Holdings Inc., 7.75%, 5/1/19 | | | 75,000 | | | 49,875 | |
| DISH DBS Corp., 6.75%, 6/1/21 | | | 200,000 | | | 206,500 | |
| DISH DBS Corp., 5.875%, 11/15/24 | | | 100,000 | | | 95,650 | |
| Group 1 Automotive Inc., 5%, 6/1/22 | | | 300,000 | | | 303,000 | |
| Mediacom LLC / Mediacom Capital Corp., 7.25%, 2/15/22 | | | 100,000 | | | 101,250 | |
| MGM Resorts International, 6%, 3/15/23 | | | 150,000 | | | 152,250 | |
| New Red Finance Inc. (A) (B), 6%, 4/1/22 | | | 300,000 | | | 313,875 | |
| Nexteer Automotive Group Ltd. (A) (B), 5.875%, 11/15/21 | | | 250,000 | | | 252,500 | |
| Outfront Media Capital LLC / Outfront | | | | | | | |
| Media Capital Corp., 5.625%, 2/15/24 | | | 500,000 | | | 520,315 | |
| Penske Automotive Group Inc., 5.75%, 10/1/22 | | | 250,000 | | | 258,125 | |
| Pinnacle Entertainment Inc., 8.75%, 5/15/20 | | | 200,000 | | | 208,250 | |
| Scientific Games International Inc., 6.25%, 9/1/20 | | | 350,000 | | | 243,250 | |
| Sinclair Television Group Inc., 6.375%, 11/1/21 | | | 400,000 | | | 412,000 | |
| Sirius XM Radio Inc. (A), 5.875%, 10/1/20 | | | 250,000 | | | 265,750 | |
| Sirius XM Radio Inc. (A), 4.625%, 5/15/23 | | | 250,000 | | | 246,875 | |
| Univision Communications Inc. (A), 6.75%, 9/15/22 | | | 497,000 | | | 524,956 | |
| UPCB Finance VI Ltd. (A) (B), 6.875%, 1/15/22 | | | 225,000 | | | 237,938 | |
| Viking Cruises Ltd. (A) (B), 8.5%, 10/15/22 | | | 300,000 | | | 326,250 | |
| WMG Acquisition Corp. (A), 6.75%, 4/15/22 | | | 400,000 | | | 370,252 | |
| | | | | | | |
| | | | | | | 5,831,796 | |
| Consumer Staples - 2.8% | | | | | | | |
| Dean Foods Co. (A), 6.5%, 3/15/23 | | | 200,000 | | | 211,000 | |
| Dole Food Co. Inc. (A), 7.25%, 5/1/19 | | | 500,000 | | | 501,750 | |
| | | | | | | |
| | | | | | | 712,750 | |
| Energy - 8.2% | | | | | | | |
| Berry Petroleum Co. LLC, 6.75%, 11/1/20 | | | 200,000 | | | 78,000 | |
| Chaparral Energy Inc., 8.25%, 9/1/21 | | | 500,000 | | | 170,000 | |
| Exterran Partners L.P. / EXLP Finance Corp. (C), 6%, 10/1/22 | | | 250,000 | | | 211,250 | |
| Jupiter Resources Inc. (A) (B), 8.5%, 10/1/22 | | | 150,000 | | | 78,000 | |
| Linn Energy LLC / Linn Energy Finance Corp., 6.5%, 9/15/21 | | | 200,000 | | | 44,000 | |
| Memorial Production Partners L.P. / Memorial Production Finance Corp., 7.625%, 5/1/21 | | | 300,000 | | | 201,000 | |
| Memorial Production Partners L.P. / Memorial Production Finance Corp., 6.875%, 8/1/22 | | | 150,000 | | | 94,500 | |
| Paramount Resources Ltd. (A) (B), 6.875%, 6/30/23 | | | 100,000 | | | 88,000 | |
| QEP Resources Inc., 5.375%, 10/1/22 | | | 250,000 | | | 225,000 | |
| QEP Resources Inc., 5.25%, 5/1/23 | | | 250,000 | | | 221,875 | |
| Sanchez Energy Corp., 6.125%, 1/15/23 | | | 100,000 | | | 72,500 | |
| Southern Star Central Corp. (A), 5.125%, 7/15/22 | | | 300,000 | | | 291,000 | |
| Tesoro Logistics L.P. / Tesoro Logistics Finance Corp. (A), 6.25%, 10/15/22 | | | 100,000 | | | 104,000 | |
| Unit Corp., 6.625%, 5/15/21 | | | 250,000 | | | 200,000 | |
| | | | | | | |
| | | | | | | 2,079,125 | |
| Financials - 7.1% | | | | | | | |
| Ally Financial Inc., 3.75%, 11/18/19 | | | 300,000 | | | 303,900 | |
| Geo Group Inc./The, 5.875%, 10/15/24 | | | 150,000 | | | 151,500 | |
| Iron Mountain Inc., 6%, 8/15/23 | | | 150,000 | | | 157,313 | |
| Iron Mountain Inc., 5.75%, 8/15/24 | | | 350,000 | | | 351,750 | |
| MPT Operating Partnership L.P. / MPT Finance Corp., 6.875%, 5/1/21 | | | 350,000 | | | 366,187 | |
| Nationstar Mortgage LLC / Nationstar Capital Corp., 6.5%, 7/1/21 | | | 300,000 | | | 274,500 | |
| Quicken Loans Inc. (A), 5.75%, 5/1/25 | | | 200,000 | | | 198,500 | |
| | | | | | | |
| | | | | | | 1,803,650 | |
| Health Care - 9.1% | | | | | | | |
| Acadia Healthcare Co. Inc., 5.125%, 7/1/22 | | | 250,000 | | | 246,875 | |
| Alere Inc. (A), 6.375%, 7/1/23 | | | 200,000 | | | 208,000 | |
| CHS/Community Health Systems Inc., 6.875%, 2/1/22 | | | 300,000 | | | 302,250 | |
| Endo Finance LLC / Endo Finco Inc. (A), 7.25%, 12/15/20 | | | 500,000 | | | 516,875 | |
| Grifols Worldwide Operations Ltd. (B), 5.25%, 4/1/22 | | | 250,000 | | | 258,750 | |
| Jaguar Holding Co. II / Pharmaceutical | | | | | | | |
| Product Development LLC (A), 6.375%, 8/1/23 | | | 100,000 | | | 100,125 | |
| Mallinckrodt International Finance S.A. (B), 4.75%, 4/15/23 | | | 300,000 | | | 261,000 | |
| MPH Acquisition Holdings LLC (A), 6.625%, 4/1/22 | | | 250,000 | | | 255,000 | |
| Valeant Pharmaceuticals International Inc. (A) (B), 5.625%, 12/1/21 | | | 200,000 | | | 173,500 | |
| | | | | | | |
| | | | | | | 2,322,375 | |
| Industrials - 10.9% | | | | | | | |
| ACCO Brands Corp., 6.75%, 4/30/20 | | | 200,000 | | | 213,000 | |
| Ashtead Capital Inc. (A), 6.5%, 7/15/22 | | | 250,000 | | | 268,125 | |
| Avis Budget Car Rental LLC / Avis Budget Finance Inc. (A), 5.25%, 3/15/25 | | | 250,000 | | | 249,062 | |
| Bombardier Inc. (A) (B), 6.125%, 1/15/23 | | | 200,000 | | | 155,000 | |
| Brand Energy & Infrastructure Services Inc. (A) (C), 8.5%, 12/1/21 | | | 250,000 | | | 226,250 | |
| Building Materials Corp. of America (A), 5.375%, 11/15/24 | | | 250,000 | | | 257,187 | |
| Casella Waste Systems Inc. (C), 7.75%, 2/15/19 | | | 200,000 | | | 203,000 | |
| Clean Harbors Inc., 5.125%, 6/1/21 | | | 150,000 | | | 153,975 | |
| Gates Global LLC / Gates Global Co. (A), 6%, 7/15/22 | | | 175,000 | | | 140,438 | |
| Hertz Corp./The, 6.75%, 4/15/19 | | | 250,000 | | | 256,562 | |
| Hertz Corp./The, 5.875%, 10/15/20 | | | 100,000 | | | 103,500 | |
| Nortek Inc., 8.5%, 4/15/21 | | | 250,000 | | | 265,000 | |
| Spirit AeroSystems Inc., 5.25%, 3/15/22 | | | 200,000 | | | 206,750 | |
| United Rentals North America Inc., 8.25%, 2/1/21 | | | 69,000 | | | 72,623 | |
| | | | | | | |
| | | | | | | 2,770,472 | |
| Information Technology - 9.6% | | | | | | | |
| Alliance Data Systems Corp. (A), 6.375%, 4/1/20 | | | 400,000 | | | 413,000 | |
| Audatex North America Inc. (A), 6%, 6/15/21 | | | 200,000 | | | 201,402 | |
| Belden Inc. (A), 5.5%, 9/1/22 | | | 500,000 | | | 495,000 | |
| CommScope Holding Co. Inc. (A), 6.625%, 6/1/20 | | | 200,000 | | | 208,000 | |
| Hughes Satellite Systems Corp., 7.625%, 6/15/21 | | | 150,000 | | | 163,500 | |
See accompanying Notes to Financial Statements.
32
Madison Funds | October 31, 2015
| |
| Madison High Income Fund Portfolio of Investments - continued |
| | | Par Value | | Value (Note 2) | |
| | | | | |
| CORPORATE NOTES AND BONDS - continued | | | | | | |
| | | | | | | | |
| Information Technology - continued | | | | | | |
| Micron Technology Inc. (A), 5.25%, 1/15/24 | $ | 125,000 | | $ | 119,688 | |
| Plantronics Inc. (A), 5.5%, 5/31/23 | | 200,000 | | | 203,500 | |
| SunGard Data Systems Inc., 7.375%, 11/15/18 | | 246,000 | | | 251,842 | |
| ViaSat Inc., 6.875%, 6/15/20 | | 370,000 | | | 387,575 | |
| | | | | | |
| | | | | | 2,443,507 | |
| Materials - 6.8% | | | | | | |
| Berry Plastics Corp., 5.5%, 5/15/22 | | 275,000 | | | 283,250 | |
| Greif Inc., 6.75%, 2/1/17 | | 250,000 | | | 260,620 | |
| Murray Energy Corp. (A), 11.25%, 4/15/21 | | 100,000 | | | 26,750 | |
| Rayonier AM Products Inc. (A), 5.5%, 6/1/24 | | 450,000 | | | 355,500 | |
| Reynolds Group Issuer Inc. / Reynolds | | | | | | |
| Group Issuer LLC / Reynolds Group Issuer Lu, 5.75%, 10/15/20 | | 400,000 | | | 416,000 | |
| Steel Dynamics Inc., 5.5%, 10/1/24 | | 250,000 | | | 246,875 | |
| Tronox Finance LLC, 6.375%, 8/15/20 | | 200,000 | | | 142,440 | |
| | | | | | |
| | | | | | 1,731,435 | |
| Telecommunication Services - 7.1% | | | | | | |
| Altice S.A. (A) (B), 7.625%, 2/15/25 | | 250,000 | | | 229,875 | |
| CenturyLink Inc., 5.625%, 4/1/20 | | 250,000 | | | 250,285 | |
| Frontier Communications Corp. (A), 10.5%, 9/15/22 | | 100,000 | | | 103,750 | |
| GCI Inc., 6.875%, 4/15/25 | | 150,000 | | | 154,500 | |
| Intelsat Jackson Holding SA (B), 5.5%, 8/1/23 | | 200,000 | | | 164,875 | |
| SBA Telecommunications Inc., 5.75%, 7/15/20 | | 300,000 | | | 313,125 | |
| Sprint Corp., 7.125%, 6/15/24 | | 300,000 | | | 263,438 | |
| Sprint Corp., 7.625%, 2/15/25 | | 150,000 | | | 133,125 | |
| T-Mobile USA Inc., 6.633%, 4/28/21 | | 200,000 | | | 207,000 | |
| | | | | | |
| | | | | | 1,819,973 | |
| Utilities - 9.4% | | | | | | |
| AES Corp./VA, 5.5%, 3/15/24 | | 400,000 | | | 378,000 | |
| AmeriGas Finance LLC / AmeriGas Finance | | | | | | |
| Corp., 7%, 5/20/22 | | 400,000 | | | 422,000 | |
| Calpine Corp., 5.5%, 2/1/24 | | 250,000 | | | 237,500 | |
| Dynegy Inc., 7.625%, 11/1/24 | | 150,000 | | | 150,375 | |
| Ferrellgas L.P. / Ferrellgas Finance Corp., 6.75%, 1/15/22 | | 400,000 | | | 371,064 | |
| NRG Energy Inc., 8.25%, 9/1/20 | | 200,000 | | | 205,000 | |
| NRG Energy Inc., 6.25%, 5/1/24 | | 200,000 | | | 179,000 | |
| Suburban Propane Partners L.P. / Suburban | | | | | | |
| Energy Finance Corp., 7.375%, 8/1/21 | | 227,000 | | | 238,350 | |
| Talen Energy Supply LLC (A), 4.625%, 7/15/19 | | 250,000 | | | 228,700 | |
| | | | | | |
| | | | | | 2,409,989 | |
| | | | | | |
Total Corporate Notes and Bonds | | | | | | |
(Cost $25,203,764) | | | | | 23,925,072 | |
| | | | | | | |
| SHORT-TERM INVESTMENTS - 3.8% | | | | | | |
| State Street Institutional U.S. Government | | | | | | |
| Money Market Fund, Premier Class | | 981,190 | | | 981,190 | |
| | | | | | |
| | | | | | | | |
Total Short-Term Investments | | | | | | |
(Cost $981,190) | | | | | 981,190 | |
| | | | | | |
| | | | | | | | |
| TOTAL INVESTMENTS - 97.7% (Cost $26,184,954** ) | | | | | 24,906,262 | |
| NET OTHER ASSETS AND LIABILITIES - 2.3% | | | | | 597,694 | |
| | | | | | |
| TOTAL NET ASSETS - 100.0% | | | | $ | 25,503,956 | |
| | | | | | |
| ** | | Aggregate cost for Federal tax purposes was $26,184,954. |
| (A) | | Security sold within terms of a private placement memorandum exempt from registration under Rule 144A of the Securities Act of 1933, as amended, and may be sold only to dealers in that program or other “qualified institutional buyers.” |
| (B) | | Notes and bonds, issued by foreign entities, denominated in U.S. dollars. The aggregate of these securities is 10.0% of total net assets. |
| (C) | | Illiquid security (See Note 2). |
| |
| Madison Diversified Income Fund Portfolio of Investments |
| | | Shares | | Value (Note 2) | |
| | | | | |
| COMMON STOCKS - 54.1% | | | | | | |
| Consumer Discretionary - 5.1% | | | | | | |
| Home Depot Inc./The | | 20,800 | | $ | 2,571,712 | |
| McDonald’s Corp. | | 33,000 | | | 3,704,250 | |
| Omnicom Group Inc. | | 17,000 | | | 1,273,640 | |
| | | | | | |
| | | | | | 7,549,602 | |
| Consumer Staples - 9.6% | | | | | | |
| Coca-Cola Co./The | | 45,000 | | | 1,905,750 | |
| General Mills Inc. | | 33,500 | | | 1,946,685 | |
| JM Smucker Co./The | | 20,000 | | | 2,347,800 | |
| Mondelez International Inc., Class A | | 33,500 | | | 1,546,360 | |
| Nestle S.A., ADR | | 26,700 | | | 2,035,074 | |
| PepsiCo Inc. | | 15,000 | | | 1,532,850 | |
| Procter & Gamble Co./The | | 37,500 | | | 2,864,250 | |
| | | | | | |
| | | | | | 14,178,769 | |
| Energy - 4.5% | | | | | | |
| Chevron Corp. | | 17,700 | | | 1,608,576 | |
| Exxon Mobil Corp. | | 27,500 | | | 2,275,350 | |
| Marathon Petroleum Corp. | | 17,000 | | | 880,600 | |
| Occidental Petroleum Corp. | | 8,500 | | | 633,590 | |
| Schlumberger Ltd. | | 16,000 | | | 1,250,560 | |
| | | | | | |
| | | | | | 6,648,676 | |
| Financials - 8.1% | | | | | | |
| BB&T Corp. | | 33,500 | | | 1,244,525 | |
| MetLife Inc. | | 24,500 | | | 1,234,310 | |
| Northern Trust Corp. | | 16,000 | | | 1,126,240 | |
| Travelers Cos. Inc./The | | 31,500 | | | 3,556,035 | |
| US Bancorp | | 51,500 | | | 2,172,270 | |
| Wells Fargo & Co. | | 47,000 | | | 2,544,580 | |
| | | | | | |
| | | | | | 11,877,960 | |
| Health Care - 7.2% | | | | | | |
| Amgen Inc. | | 7,500 | | | 1,186,350 | |
| Johnson & Johnson | | 27,500 | | | 2,778,325 | |
| Medtronic PLC | | 22,100 | | | 1,633,632 | |
| Merck & Co. Inc. | | 35,000 | | | 1,913,100 | |
| Pfizer Inc. | | 90,000 | | | 3,043,800 | |
| | | | | | |
| | | | | | 10,555,207 | |
| Industrials - 8.4% | | | | | | |
| 3M Co. | | 5,500 | | | 864,655 | |
| Boeing Co./The | | 18,200 | | | 2,694,874 | |
| General Electric Co. | | 101,500 | | | 2,935,380 | |
| United Parcel Service Inc., Class B | | 25,300 | | | 2,606,406 | |
| United Technologies Corp. | | 18,500 | | | 1,820,585 | |
| Waste Management Inc. | | 28,000 | | | 1,505,280 | |
| | | | | | |
| | | | | | 12,427,180 | |
| Information Technology - 7.2% | | | | | | |
| Accenture PLC, Class A | | 27,000 | | | 2,894,400 | |
| Automatic Data Processing Inc. | | 10,000 | | | 869,900 | |
| Cisco Systems Inc. | | 32,000 | | | 923,200 | |
| Linear Technology Corp. | | 33,000 | | | 1,465,860 | |
| Microsoft Corp. | | 50,500 | | | 2,658,320 | |
| Texas Instruments Inc. | | 31,000 | | | 1,758,320 | |
| | | | | | |
| | | | | | 10,570,000 | |
| Materials - 1.1% | | | | | | |
| Praxair Inc. | | 14,000 | | | 1,555,260 | |
| | | | | | |
| | | | | | | |
| Telecommunication Service - 1.6% | | | | | | |
| Verizon Communications Inc. | | 52,000 | | | 2,437,760 | |
| | | | | | |
| | | | | | | |
| Utilities - 1.3% | | | | | | |
| Duke Energy Corp. | | 26,500 | | | 1,893,955 | |
| | | | | | |
| | | | | | | | |
Total Common Stocks | | | | | | |
(Cost $62,068,568) | | | | | 79,694,369 | |
| | | Par Value | | | | |
| | | | | | |
| ASSET BACKED SECURITIES - 1.2% | | | | | | |
| ABSC Long Beach Home Equity Loan Trust, Series 2000-LB1, Class AF5 (A), 8.55%, 9/21/30 | $ | 98,971 | | | 103,101 | |
| Ally Master Owner Trust, Series 2014-4, Class A2, 1.43%, 6/17/19 | | 225,000 | | | 224,732 | |
| CNH Equipment Trust, Series 2014-A, Class A3, 0.84%, 5/15/19 | | 175,000 | | | 174,651 | |
| Ford Credit Auto Owner Trust, Series 2014-A, Class A3, 0.79%, 5/15/18 | | 179,918 | | | 179,826 | |
| Hyundai Auto Receivables Trust, Series 2014-A, Class A3, 0.79%, 7/16/18 | | 95,347 | | | 95,301 | |
| Mercedes-Benz Auto Lease Trust, Series 2014-A, Class A4, 0.9%, 12/16/19 | | 325,000 | | | 324,994 | |
| Santander Drive Auto Receivables Trust, Series 2013-3 Class B, 1.19%, 5/15/18 | | 121,493 | | | 121,477 | |
| Santander Drive Auto Receivables Trust, Series 2013-5, Class C, 2.25%, 6/17/19 | | 250,000 | | | 251,387 | |
| Volkswagen Auto Lease Trust, Series 2014-A, Class A3, 0.8%, 4/20/17 | | 150,000 | | | 149,994 | |
| Volvo Financial Equipment LLC, Series 2014-1A, Class A3 (B), 0.82%, 4/16/18 | | 125,000 | | | 124,820 | |
| | | | | | |
| | | | | | | | |
Total Asset Backed Securities | | | | | | |
(Cost $1,750,519) | | | | | 1,750,283 | |
| | | | | | | |
| COMMERCIAL MORTGAGE-BACKED | | | | | | |
| SECURITIES - 0.7% | | | | | | |
| Bear Stearns Commercial Mortgage | | | | | | |
| Securities Trust, Series 2007-PW17, Class A1A (A), 5.65%, 6/11/50 | | 324,545 | | | 344,672 | |
| Fannie Mae-Aces, Series 2013-M12, Class APT (A), 2.387%, 3/25/23 | | 310,276 | | | 315,235 | |
| FREMF Mortgage Trust, Series 2012-K708, Class B (A) (B), 3.754%, 2/25/45 | | 300,000 | | | 311,425 | |
| | | | | | |
| | | | | | | | |
Total Commercial Mortgage-Backed | | | | | | |
Securities (Cost $967,431) | | | | | 971,332 | |
| See accompanying Notes to Financial Statements. |
| | | |
| |
| | | 33 |
Madison Funds | October 31, 2015
| |
| Madison Diversified Income Fund Portfolio of Investments - continued |
| | | Par Value | | Value (Note 2) | |
| | | | | |
| CORPORATE NOTES AND BONDS - 15.6% | | | | | | |
| Consumer Discretionary - 2.5% | | | | | | |
| AARP Inc. (B) (C), 7.5%, 5/1/31 | $ | 750,000 | | $ | 1,013,933 | |
| Advance Auto Parts Inc., 4.5%, 12/1/23 | | 500,000 | | | 519,694 | |
| Amazon.com Inc., 3.3%, 12/5/21 | | 200,000 | | | 207,745 | |
| CCO Safari II LLC (B), 4.464%, 7/23/22 | | 400,000 | | | 405,799 | |
| ERAC USA Finance LLC (B), 6.7%, 6/1/34 | | 325,000 | | | 385,241 | |
| GLP Capital L.P. / GLP Financing II Inc., 4.875%, 11/1/20 | | 125,000 | | | 128,750 | |
| Royal Caribbean Cruises Ltd. (D), 7.25%, 6/15/16 | | 400,000 | | | 412,112 | |
| Time Warner Inc., 4.75%, 3/29/21 | | 400,000 | | | 437,819 | |
| Walgreens Boots Alliance Inc., 4.5%, 11/18/34 | | 155,000 | | | 143,666 | |
| | | | | | |
| | | | | | 3,654,759 | |
| Consumer Staples - 0.8% | | | | | | |
| Coca-Cola Co./The, 2.45%, 11/1/20 | | 500,000 | | | 508,816 | |
| CVS Health Corp., 5.125%, 7/20/45 | | 250,000 | | | 268,021 | |
| Mead Johnson Nutrition Co., 3%, 11/15/20 | | 125,000 | | | 125,682 | |
| Sysco Corp., 2.6%, 10/1/20 | | 250,000 | | | 252,560 | |
| | | | | | |
| | | | | | 1,155,079 | |
| Energy - 2.2% | | | | | | |
| Antero Resources Corp. (B), 5.625%, 6/1/23 | | 150,000 | | | 138,000 | |
| ConocoPhillips Co., 4.15%, 11/15/34 | | 500,000 | | | 480,459 | |
| Energy Transfer Partners L.P., 5.2%, 2/1/22 | | 200,000 | | | 198,992 | |
| Enterprise Products Operating LLC, 5.2%, 9/1/20 | | 450,000 | | | 494,719 | |
| Enterprise Products Operating LLC, 3.75%, 2/15/25 | | 300,000 | | | 288,914 | |
| Freeport-McMoran Oil & Gas LLC / FCX Oil & Gas Inc., 6.75%, 2/1/22 | | 250,000 | | | 220,313 | |
| Hess Corp., 7.875%, 10/1/29 | | 150,000 | | | 179,082 | |
| Marathon Oil Corp., 6%, 10/1/17 | | 300,000 | | | 320,733 | |
| Phillips 66, 4.65%, 11/15/34 | | 500,000 | | | 498,908 | |
| Transocean Inc. (D), 7.5%, 4/15/31 | | 280,000 | | | 189,000 | |
| Williams Partners L.P. / ACMP Finance Corp., 4.875%, 5/15/23 | | 250,000 | | | 225,650 | |
| | | | | | |
| | | | | | 3,234,770 | |
| Financials - 2.1% | | | | | | |
| Air Lease Corp., 3.75%, 2/1/22 | | 300,000 | | | 296,924 | |
| American Express Credit Corp., MTN, 2.375%, 3/24/17 | | 90,000 | | | 91,394 | |
| Capital One Financial Corp., 2.45%, 4/24/19 | | 200,000 | | | 200,185 | |
| Fifth Third Bancorp, 2.3%, 3/1/19 | | 275,000 | | | 275,603 | |
| Glencore Funding LLC (B), 3.125%, 4/29/19 | | 265,000 | | | 227,238 | |
| Goldman Sachs Group Inc./The, 5.75%, 1/24/22 | | 500,000 | | | 572,954 | |
| Huntington National Bank/The, 2.2%, 4/1/19 | | 400,000 | | | 398,897 | |
| Morgan Stanley, 2.8%, 6/16/20 | | 225,000 | | | 226,890 | |
| New York Life Global Funding (B), 1.95%, 2/11/20 | | 300,000 | | | 297,089 | |
| Synchrony Financial, 3.75%, 8/15/21 | | 250,000 | | | 252,128 | |
| Welltower Inc., 4.5%, 1/15/24 | | 200,000 | | | 207,772 | |
| | | | | | |
| | | | | | 3,047,074 | |
| Health Care - 1.7% | | | | | | |
| AbbVie Inc., 2%, 11/6/18 | | 300,000 | | | 300,146 | |
| Actavis Funding SCS (D), 4.75%, 3/15/45 | | 150,000 | | | 143,447 | |
| Amgen Inc., 5.85%, 6/1/17 | | 1,050,000 | | | 1,122,238 | |
| HCA Inc., 3.75%, 3/15/19 | | 150,000 | | | 152,625 | |
| Merck Sharp & Dohme Corp., 5.75%, 11/15/36 | | 220,000 | | | 267,796 | |
| UnitedHealth Group Inc., 2.875%, 3/15/23 | | 400,000 | | | 399,226 | |
| Wyeth LLC, 6.5%, 2/1/34 | | 150,000 | | | 188,557 | |
| | | | | | |
| | | | | | 2,574,035 | |
| Industrials - 1.7% | | | | | | |
| Boeing Co./The, 8.625%, 11/15/31 | | 150,000 | | | 221,443 | |
| Burlington Northern Santa Fe LLC, 8.125%, 4/15/20 | | 175,000 | | | 212,378 | |
| Caterpillar Inc., 3.9%, 5/27/21 | | 450,000 | | | 479,100 | |
| Danaher Corp., 3.9%, 6/23/21 | | 450,000 | | | 481,325 | |
| FedEx Corp., 4.75%, 11/15/45 | | 250,000 | | | 246,628 | |
| International Lease Finance Corp., 8.875%, 9/1/17 | | 150,000 | | | 166,500 | |
| Norfolk Southern Corp., 5.59%, 5/17/25 | | 239,000 | | | 272,345 | |
| Norfolk Southern Corp., 7.05%, 5/1/37 | | 260,000 | | | 341,681 | |
| United Rentals North America Inc., 4.625%, 7/15/23 | | 150,000 | | | 150,656 | |
| | | | | | |
| | | | | | 2,572,056 | |
| Information Technology - 1.7% | | | | | | |
| Apple Inc., 2.4%, 5/3/23 | | 450,000 | | | 440,258 | |
| Broadridge Financial Solutions Inc., 3.95%, 9/1/20 | | 450,000 | | | 470,556 | |
| Cisco Systems Inc., 5.5%, 2/22/16 | | 240,000 | | | 243,764 | |
| EMC Corp., 2.65%, 6/1/20 | | 70,000 | | | 63,746 | |
| Fiserv Inc., 2.7%, 6/1/20 | | 250,000 | | | 250,267 | |
| Hewlett-Packard Enterprise Co. (B), 6.35%, 10/15/45 | | 175,000 | | | 169,525 | |
| Intel Corp., 4.9%, 7/29/45 | | 250,000 | | | 259,993 | |
| International Business Machines Corp., 1.875%, 8/1/22 | | 400,000 | | | 379,121 | |
| Thomson Reuters Corp. (D), 4.3%, 11/23/23 | | 225,000 | | | 233,906 | |
| | | | | | |
| | | | | | 2,511,136 | |
| Materials - 0.2% | | | | | | |
| Westvaco Corp., 8.2%, 1/15/30 | | 175,000 | | | 231,569 | |
| | | | | | |
| | | | | | | |
| Telecommunication Services - 1.1% | | | | | | |
| AT&T Inc., 4.75%, 5/15/46 | | 200,000 | | | 183,631 | |
| Comcast Cable Communications Holdings Inc., 9.455%, 11/15/22 | | 415,000 | | | 576,900 | |
| Frontier Communications Corp. (B), 11%, 9/15/25 | | 200,000 | | | 209,624 | |
| Harris Corp., 5.054%, 4/27/45 | | 250,000 | | | 244,914 | |
| Verizon Communications Inc., 5.15%, 9/15/23 | | 400,000 | | | 445,843 | |
| | | | | | |
| | | | | | 1,660,912 | |
| Utilities - 1.6% | | | | | | |
| Interstate Power & Light Co., 6.25%, 7/15/39 | | 175,000 | | | 226,579 | |
| Nevada Power Co., Series R, 6.75%, 7/1/37 | | 400,000 | | | 521,579 | |
| Sierra Pacific Power Co., Series M, 6%, 5/15/16 | | 126,000 | | | 129,507 | |
| Southwestern Electric Power Co., Series E, 5.55%, 1/15/17 | | 500,000 | | | 521,738 | |
| Wisconsin Electric Power Co., 6.5%, 6/1/28 | | 750,000 | | | 949,477 | |
| | | | | | |
| | | | | | 2,348,880 | |
| | | | | | |
Total Corporate Notes and Bonds | | | | | | |
(Cost $22,025,867 ) | | | | | 22,990,270 | |
| | | | | | | |
| LONG TERM MUNICIPAL BONDS - 1.6% | | | | | | |
| Dallas/Fort Worth International Airport Revenue, Series G, 5%, 11/1/29 | | 300,000 | | | 344,088 | |
| District of Columbia Water & Sewer Authority Revenue, Series A, (ASSURED GTY), 5%, 10/1/34 | | 300,000 | | | 328,419 | |
| Jacksonville FL Sales Tax Revenue, Series A, 5%, 10/1/29 | | 300,000 | | | 342,402 | |
| Metropolitan Water District of Southern California Revenue, Series D, 6.538%, 7/1/39 | | 300,000 | | | 338,571 | |
| Northside Independent School District, General Obligation, Series B, (PSF-GTD), 5.741%, 8/15/35 | | 325,000 | | | 357,919 | |
| Rancho Water District Financing Authority Revenue, Series A, 6.337%, 8/1/40 | | 350,000 | | | 396,162 | |
| State of Iowa Revenue, 6.75%, 6/1/34 | | 250,000 | | | 285,700 | |
| | | | | | |
| | | | | | | | |
Total Long Term Municipal Bonds | | | | | | |
(Cost $2,338,080) | | | | | 2,393,261 | |
| | | | | | | |
| MORTGAGE BACKED SECURITIES - 9.0% | | | | | | |
| | | | | | | | |
| Fannie Mae - 5.6% | | | | | | |
| 5.5%, 4/1/16 Pool # 745444 | | 2,309 | | | 2,317 | |
| 6%, 5/1/16 Pool # 582558 | | 1,033 | | | 1,040 | |
| 5%, 12/1/17 Pool # 672243 | | 27,287 | | | 28,340 | |
| 5%, 5/1/20 Pool # 813965 | | 64,590 | | | 68,573 | |
| 4.5%, 9/1/20 Pool # 835465 | | 75,289 | | | 79,091 | |
| 6%, 5/1/21 Pool # 253847 | | 14,395 | | | 16,299 | |
| 3.5%, 8/1/26 Pool # AL0787 | | 291,123 | | | 307,853 | |
| 3%, 5/1/27 Pool # AL1715 | | 351,591 | | | 367,010 | |
| 3.5%, 8/1/29 Pool # MA2003 | | 317,323 | | | 335,283 | |
| 7%, 12/1/29 Pool # 762813 | | 8,245 | | | 8,699 | |
| 7%, 11/1/31 Pool # 607515 | | 11,639 | | | 12,862 | |
| 3.5%, 12/1/31 Pool # MA0919 | | 546,331 | | | 575,903 | |
| 7%, 5/1/32 Pool # 644591 | | 2,794 | | | 3,128 | |
| 5.5%, 10/1/33 Pool # 254904 | | 85,241 | | | 96,084 | |
| 5%, 6/1/34 Pool # 255230 | | 65,283 | | | 72,259 | |
| 7%, 7/1/34 Pool # 792636 | | 5,165 | | | 5,408 | |
| 4%, 2/1/35 Pool # MA2177 | | 591,777 | | | 635,895 | |
| 5%, 8/1/35 Pool # 829670 | | 74,339 | | | 81,884 | |
| 5%, 9/1/35 Pool # 820347 | | 100,665 | | | 113,402 | |
| 5%, 9/1/35 Pool # 835699 | | 87,806 | | | 97,129 | |
| 5%, 11/1/35 Pool # 844809 | | 32,844 | | | 36,185 | |
| 5%, 12/1/35 Pool # 850561 | | 37,136 | | | 40,919 | |
| 5.5%, 9/1/36 Pool # 831820 | | 158,154 | | | 180,471 | |
| 6%, 9/1/36 Pool # 831741 | | 149,786 | | | 169,604 | |
| 5.5%, 10/1/36 Pool # 901723 | | 80,317 | | | 90,048 | |
| 5.5%, 12/1/36 Pool # 903059 | | 121,177 | | | 137,689 | |
| 5.5%, 7/1/41 Pool # AL6588 | | 309,836 | | | 347,346 | |
| 3.5%, 6/1/42 Pool # AO4134 | | 418,153 | | | 436,392 | |
| 4%, 6/1/42 Pool # MA1087 | | 338,788 | | | 361,632 | |
| 3.5%, 8/1/42 Pool # AO8100 | | 298,908 | | | 311,767 | |
| 3.5%, 8/1/42 Pool # AP2133 | | 310,849 | | | 324,257 | |
| 3%, 2/1/43 Pool # AB8486 | | 418,698 | | | 424,404 | |
| 3%, 2/1/43 Pool # AB8563 | | 248,683 | | | 252,059 | |
| 3%, 2/1/43 Pool # AL3072 | | 406,132 | | | 411,961 | |
| 3%, 3/1/43 Pool # AB8818 | | 419,022 | | | 424,728 | |
| 4%, 1/1/45 Pool # MA2145 | | 621,522 | | | 661,972 | |
| 4.5%, 2/1/45 Pool # MA2193 | | 454,176 | | | 494,997 | |
| 5.5%, 9/25/35 Series 2005-79, Class LT | | 153,568 | | | 173,383 | |
| | | | | | |
| | | | | | 8,188,273 | |
| Freddie Mac - 3.4% | | | | | | |
| 3%, 8/1/27 Pool # J19899 | | 323,110 | | | 337,439 | |
| 8%, 6/1/30 Pool # C01005 | | 1,888 | | | 2,138 | |
| 6.5%, 1/1/32 Pool # C62333 | | 44,586 | | | 50,955 | |
| 5%, 7/1/33 Pool # A11325 | | 219,233 | | | 243,700 | |
| 5%, 4/1/35 Pool # A32315 | | 32,489 | | | 35,792 | |
| 5%, 4/1/35 Pool # A32316 | | 28,490 | | | 31,171 | |
| 5%, 2/1/39 Pool # G05572 | | 420,895 | | | 464,064 | |
| 3.5%, 11/1/40 Pool # G06168 | | 460,196 | | | 478,963 | |
| 4.5%, 9/1/41 Pool # Q03516 | | 282,360 | | | 306,241 | |
| 4%, 10/1/41 Pool # Q04092 | | 354,756 | | | 379,174 | |
| 3%, 8/1/42 Pool # G08502 | | 370,334 | | | 374,593 | |
| 3%, 9/1/42 Pool # C04233 | | 371,625 | | | 375,876 | |
| See accompanying Notes to Financial Statements. |
| | | |
| |
| 34 | | |
Madison Funds | October 31, 2015
| |
| Madison Diversified Income Fund Portfolio of Investments - continued |
| | | Par Value | | Value (Note 2) | |
| | | | | |
| MORTGAGE BACKED SECURITIES - continued | | | | | | |
| | | | | | | |
| Freddie Mac - continued | | | | | | |
| 3%, 4/1/43 Pool # V80025 | $ | 421,928 | | $ | 426,695 | |
| 3%, 4/1/43 Pool # V80026 | | 421,408 | | | 426,176 | |
| 3.5%, 8/1/44 Pool # Q27927 | | 679,695 | | | 707,784 | |
| 4%, 5/1/45 Pool # G08642 | | 388,343 | | | 413,177 | |
| | | | | | |
| | | | | | 5,053,938 | |
| Ginnie Mae - 0.0% | | | | | | |
| 6.5%, 2/20/29 Pool # 2714 | | 21,738 | | | 25,483 | |
| 6.5%, 4/20/31 Pool # 3068 | | 12,445 | | | 14,705 | |
| | | | | | |
| | | | | | 40,188 | |
| | | | | | |
Total Mortgage Backed Securities | | | | | | |
(Cost $13,104,746) | | | | | 13,282,399 | |
| | | | | | | |
| U.S. GOVERNMENT AND AGENCY OBLIGATIONS - 13.8% | | | | | | |
| | | | | | | |
| U.S. Treasury Bonds - 1.3% | | | | | | |
| 6.625%, 2/15/27 | | 860,000 | | | 1,237,370 | |
| 3.000%, 5/15/42 | | 500,000 | | | 509,896 | |
| 2.500%, 2/15/45 | | 250,000 | | | 227,692 | |
| | | | | | |
| | | | | | 1,974,958 | |
| U.S. Treasury Notes - 12.5% | | | | | | |
| 1.375%, 11/30/15 | | 1,500,000 | | | 1,501,407 | |
| 3.125%, 1/31/17 | | 1,750,000 | | | 1,806,259 | |
| 2.375%, 7/31/17 | | 700,000 | | | 720,408 | |
| 4.250%, 11/15/17 | | 2,100,000 | | | 2,246,261 | |
| 3.875%, 5/15/18 | | 750,000 | | | 805,898 | |
| 1.500%, 12/31/18 | | 750,000 | | | 758,926 | |
| 3.125%, 5/15/19 | | 1,000,000 | | | 1,064,948 | |
| 1.625%, 8/31/19 | | 2,000,000 | | | 2,023,282 | |
| 3.375%, 11/15/19 | | 2,000,000 | | | 2,157,656 | |
| 2.000%, 7/31/20 | | 750,000 | | | 766,582 | |
| 2.625%, 11/15/20 | | 2,000,000 | | | 2,100,364 | |
| 1.750%, 5/15/22 | | 1,600,000 | | | 1,589,584 | |
| 2.500%, 8/15/23 | | 750,000 | | | 778,261 | |
| | | | | | |
| | | | | | 18,319,836 | |
| | | | | | |
Total U.S. Government and Agency Obligations
(Cost $19,857,445) | | | | | 20,294,794 | |
| | Shares | | | | |
| | | | | | |
| SHORT-TERM INVESTMENTS - 3.5% | | | | | | |
| State Street Institutional U.S. Government Money Market Fund, Premier Class | | 5,091,894 | | | 5,091,894 | |
| | | | | | |
| | | | | | | |
Total Short-Term Investments | | | | | | |
(Cost $5,091,894) | | | | | 5,091,894 | |
| | | | | | |
| | | | | | | |
| TOTAL INVESTMENTS - 99.5% | | | | | | |
| (Cost $127,204,550**) | | | | | 146,468,602 | |
| NET OTHER ASSETS AND LIABILITIES - 0.5% | | | | | 765,041 | |
| | | | | | |
| TOTAL NET ASSETS - 100.0% | | | | $ | 147,233,643 | |
| | | | | | |
| ** | | Aggregate cost for Federal tax purposes was $127,377,279. |
| (A) | | Floating rate or variable rate note. Rate shown is as of October 31, 2015. |
| (B) | | Security sold within terms of a private placement memorandum exempt from registration under Rule 144A of the Securities Act of 1933, as amended, and may be sold only to dealers in that program or other “qualified institutional buyers.” |
| (C) | | Illiquid security (See Note 2). |
| (D) | | Notes and bonds, issued by foreign entities, denominated in U.S. dollars. The aggregate of these securities is 0.7% of total net assets. |
| ADR | | American Depositary Receipt. |
| ASSURED | | GTY Assured Guaranty. |
| MTN | | Medium Term Note. |
| PLC | | Public Limited Company. |
| PSF-GTD | | Permanent School Fund Guaranteed. |
| |
| Madison Covered Call & Equity Income Fund Portfolio of Investments |
| | Shares | | Value (Note 2) | |
| | | | | |
| COMMON STOCKS - 76.9% | | | | | | |
| | | | | | | |
| Consumer Discretionary - 9.5% | | | | | | |
| CarMax Inc.* (A) | | 22,700 | | $ | 1,339,527 | |
| CBS Corp., Class B (A) | | 38,700 | | | 1,800,324 | |
| Discovery Communications Inc., | | | | | | |
| Class A* (A) | | 33,800 | | | 995,072 | |
| Discovery Communications Inc., Class C* | | 31,500 | | | 866,880 | |
| Johnson Controls Inc. (A) | | 37,800 | | | 1,707,804 | |
| Nordstrom Inc. (A) | | 26,500 | | | 1,728,065 | |
| | | | | | |
| | | | | | 8,437,672 | |
| Consumer Staples - 6.8% | | | | | | |
| Costco Wholesale Corp. (A) | | 8,500 | | | 1,344,020 | |
| Diageo PLC, ADR (A) | | 11,700 | | | 1,346,436 | |
| JM Smucker Co./The (A) | | 12,000 | | | 1,408,680 | |
| Tyson Foods Inc., Class A (A) | | 44,300 | | | 1,965,148 | |
| | | | | | |
| | | | | | 6,064,284 | |
| Energy - 8.9% | | | | | | |
| Apache Corp. (A) | | 19,700 | | | 928,461 | |
| Baker Hughes Inc. (A) | | 36,300 | | | 1,912,284 | |
| EOG Resources Inc. (A) | | 18,600 | | | 1,596,810 | |
| Occidental Petroleum Corp. (A) | | 28,700 | | | 2,139,298 | |
| Schlumberger Ltd. (A) | | 17,300 | | | 1,352,168 | |
| | | | | | |
| | | | | | 7,929,021 | |
| Financials - 9.1% | | | | | | |
| American Tower Corp. (A) | | 13,800 | | | 1,410,774 | |
| PNC Financial Services Group Inc./The (A) | | 21,700 | | | 1,958,642 | |
| Progressive Corp./The (A) | | 23,600 | | | 781,868 | |
| State Street Corp. (A) | | 25,600 | | | 1,766,400 | |
| T. Rowe Price Group Inc. (A) | | 29,000 | | | 2,192,980 | |
| | | | | | |
| | | | | | 8,110,664 | |
| Health Care - 13.8% | | | | | | |
| Agilent Technologies Inc. (A) | | 35,700 | | | 1,348,032 | |
| Biogen Inc.* (A) | | 7,300 | | | 2,120,723 | |
| Cerner Corp.* (A) | | 29,200 | | | 1,935,668 | |
| Express Scripts Holding Co.* (A) | | 20,800 | | | 1,796,704 | |
| Gilead Sciences Inc. (A) | | 10,200 | | | 1,102,926 | |
| HCA Holdings Inc.* | | 18,000 | | | 1,238,220 | |
| McKesson Corp. (A) | | 6,000 | | | 1,072,800 | |
| Varian Medical Systems Inc.* (A) | | 21,500 | | | 1,688,395 | |
| | | | | | |
| | | | | | 12,303,468 | |
| Industrials - 11.4% | | | | | | |
| Danaher Corp. (A) | | 19,200 | | | 1,791,552 | |
| Jacobs Engineering Group Inc.* (A) | | 35,300 | | | 1,416,942 | |
| PACCAR Inc. (A) | | 21,000 | | | 1,105,650 | |
| United Parcel Service Inc., Class B (A) | | 18,300 | | | 1,885,266 | |
| United Technologies Corp. (A) | | 27,100 | | | 2,666,911 | |
| W.W. Grainger Inc. (A) | | 6,200 | | | 1,302,000 | |
| | | | | | |
| | | | | | 10,168,321 | |
| Information Technology - 14.8% | | | | | | |
| Apple Inc. (A) | | 24,600 | | | 2,939,700 | |
| EMC Corp. (A) | | 60,900 | | | 1,596,798 | |
| Linear Technology Corp. (A) | | 44,100 | | | 1,958,922 | |
| Microsoft Corp. (A) | | 38,400 | | | 2,021,376 | |
| Nuance Communications Inc.* (A) | | 63,600 | | | 1,079,292 | |
| Oracle Corp. (A) | | 44,700 | | | 1,736,148 | |
| QUALCOMM Inc. (A) | | 31,100 | | | 1,847,962 | |
| | | | | | |
| | | | | | 13,180,198 | |
| Telecommunication Service - 2.6% | | | | | | |
| Verizon Communications Inc. (A) | | 48,000 | | | 2,250,240 | |
| | | | | | |
| | | | | | | |
Total Common Stocks | | | | | | |
(Cost $73,974,197) | | | | | 68,443,868 | |
| | | | | | | |
| EXCHANGE TRADED FUNDS - 9.3% | | | | | | |
| Powershares QQQ Trust Series 1 (A) | | 24,500 | | | 2,776,585 | |
| SPDR Gold Shares* (A) | | 25,600 | | | 2,798,080 | |
| SPDR S&P 500 ETF Trust (A) | | 13,100 | | | 2,723,883 | |
| | | | | | |
| | | | | | | |
Total Exchange Traded Funds | | | | | | |
(Cost $8,454,329) | | | | | 8,298,548 | |
| | | | | | | |
| PUT OPTIONS PURCHASED - 0.3% | | | | | | |
| S&P 500 Index, Put, Nov 2015, $1,900 | | 130 | | | 25,675 | |
| S&P 500 Index, Put, Jan 2016, $1,950 | | 78 | | | 183,300 | |
| | | | | | |
| | | | | | | |
Total Put Options Purchased | | | | | | |
(Cost $1,009,788) | | | | | 208,975 | |
| | | Par Value | | | | |
| | | | | | |
| U.S. GOVERNMENT AND AGENCY OBLIGATIONS - 6.7% | | | | | | |
| U.S. Treasury Bill (B) (C), 0.002%, 2/25/16 | $ | 6,000,000 | | | 5,998,512 | |
| | | | | | |
| | | | | | | |
Total U.S. Government and Agency | | | | | | |
Obligations (Cost $5,999,961) | | | | | 5,998,512 | |
| | | Shares | | | | |
| | | | | | |
| SHORT-TERM INVESTMENTS - 10.2% | | | | | | |
| State Street Institutional U.S. Government Money Market Fund, Premier Class | | 9,112,595 | | | 9,112,595 | |
| | | | | | |
| | | | | | | |
Total Short-Term Investments | | | | | | |
(Cost $9,112,595) | | | | | 9,112,595 | |
| | | | | | |
| | | | | | | |
| TOTAL INVESTMENTS - 103.4% (Cost $98,550,870**) | | | | | 92,062,498 | |
| | | | | | | |
| NET OTHER ASSETS AND LIABILITIES - 0.2% | | | | | 222,542 | |
| TOTAL CALL & PUT OPTIONS WRITTEN - (3.6%) | | | | | (3,213,647 | ) |
| | | | | | |
| TOTAL NET ASSETS - 100.0% | | | | $ | 89,071,393 | |
| | | | | | |
| * | | Non-income producing. |
| ** | | Aggregate cost for Federal tax purposes was $95,877,113. |
| (A) | | All or a portion of these securities’ positions represent covers (directly or through conversion rights) for outstanding options written. |
| (B) | | Rate noted represents annualized yield at time of purchase. |
| (C) | | All or a portion of these securities are segregated as collateral for put options written. As of October 31, 2015, the total amount segregated was $5,998,512. |
| ADR | | American Depositary Receipt. |
| ETF | | Exchange Traded Fund. |
| PLC | | Public Limited Company. |
| See accompanying Notes to Financial Statements. |
| | | |
| |
| | | 35 |
Madison Funds | October 31, 2015
| |
| Madison Covered Call & Equity Income Fund Portfolio of Investments - continued |
| | | Contracts | | | | | | | | | | |
| | | (100 Shares | | | Expiration | | | Strike | | | Value | |
| Call Options Written | | Per Contract) | | | Date | | | Price | | | (Note 2) | |
| Agilent Technologies Inc. | | 180 | | | December 2015 | | $ | 37.50 | | $ | 32,220 | |
| American Tower Corp. | | 85 | | | November 2015 | | | 92.50 | | | 82,450 | |
| American Tower Corp. | | 53 | | | November 2015 | | | 98.00 | | | 25,705 | |
| Apache Corp. | | 197 | | | January 2016 | | | 47.50 | | | 65,010 | |
| Apple Inc. | | 130 | | | December 2015 | | | 115.00 | | | 85,800 | |
| Apple Inc. | | 116 | | | January 2016 | | | 117.86 | | | 70,180 | |
| Baker Hughes Inc. | | 180 | | | January 2016 | | | 55.00 | | | 63,900 | |
| Biogen Inc. | | 19 | | | December 2015 | | | 280.00 | | | 37,810 | |
| Biogen Inc. | | 20 | | | December 2015 | | | 300.00 | | | 19,200 | |
| Biogen Inc. | | 34 | | | January 2016 | | | 300.00 | | | 44,370 | |
| CarMax Inc. | | 227 | | | December 2015 | | | 60.00 | | | 52,778 | |
| CBS Corp., Class B | | 195 | | | December 2015 | | | 45.00 | | | 60,450 | |
| CBS Corp., Class B | | 192 | | | January 2016 | | | 45.00 | | | 64,800 | |
| Cerner Corp. | | 107 | | | November 2015 | | | 65.00 | | | 30,495 | |
| Cerner Corp. | | 119 | | | December 2015 | | | 65.00 | | | 42,245 | |
| Cerner Corp. | | 23 | | | January 2016 | | | 65.00 | | | 8,970 | |
| Cerner Corp. | | 43 | | | January 2016 | | | 70.00 | | | 7,202 | |
| Costco Wholesale Corp. | | 85 | | | December 2015 | | | 160.00 | | | 24,650 | |
| Danaher Corp. | | 79 | | | December 2015 | | | 87.50 | | | 55,695 | |
| Danaher Corp. | | 113 | | | January 2016 | | | 95.00 | | | 27,685 | |
| Diageo PLC | | 117 | | | November 2015 | | | 115.00 | | | 22,815 | |
| Discovery Communications Inc. | | 183 | | | January 2016 | | | 30.00 | | | 26,535 | |
| EMC Corp. | | 230 | | | November 2015 | | | 25.00 | | | 35,305 | |
| EOG Resources Inc. | | 120 | | | January 2016 | | | 77.50 | | | 123,900 | |
| EOG Resources Inc. | | 66 | | | January 2016 | | | 82.50 | | | 44,880 | |
| Express Scripts Holding Co. | | 88 | | | November 2015 | | | 87.50 | | | 16,368 | |
| Express Scripts Holding Co. | | 120 | | | November 2015 | | | 88.50 | | | 17,640 | |
| Gilead Sciences Inc. | | 102 | | | November 2015 | | | 106.00 | | | 41,565 | |
| Jacobs Engineering Group Inc. | | 175 | | | December 2015 | | | 40.00 | | | 30,625 | |
| JM Smucker Co./The | | 50 | | | December 2015 | | | 115.00 | | | 23,500 | |
| JM Smucker Co./The | | 70 | | | January 2016 | | | 120.00 | | | 17,850 | |
| Johnson Controls Inc. | | 189 | | | January 2016 | | | 43.00 | | | 58,590 | |
| Johnson Controls Inc. | | 189 | | | January 2016 | | | 45.00 | | | 34,020 | |
| Linear Technology Corp. | | 48 | | | November 2015 | | | 41.00 | | | 17,520 | |
| Linear Technology Corp. | | 113 | | | November 2015 | | | 42.00 | | | 30,510 | |
| Linear Technology Corp. | | 160 | | | December 2015 | | | 45.00 | | | 24,000 | |
| McKesson Corp. | | 60 | | | January 2016 | | | 210.00 | | | 4,650 | |
| Microsoft Corp. | | 187 | | | November 2015 | | | 44.00 | | | 162,223 | |
| Microsoft Corp. | | 120 | | | January 2016 | | | 45.00 | | | 93,300 | |
| Microsoft Corp. | | 77 | | | January 2016 | | | 52.50 | | | 14,206 | |
| Nordstrom Inc. | | 110 | | | January 2016 | | | 67.65 | | | 19,360 | |
| Nuance Communications Inc. | | 227 | | | November 2015 | | | 18.00 | | | 6,810 | |
| Nuance Communications Inc. | | 215 | | | January 2016 | | | 18.00 | | | 12,362 | |
| Occidental Petroleum Corp. | | 287 | | | December 2015 | | | 72.50 | | | 106,190 | |
| Oracle Corp. | | 199 | | | January 2016 | | | 38.00 | | | 40,298 | |
| Oracle Corp. | | 104 | | | January 2016 | | | 39.00 | | | 15,028 | |
| PACCAR Inc. | | 85 | | | November 2015 | | | 57.50 | | | 637 | |
| PACCAR Inc. | | 125 | | | February 2016 | | | 55.00 | | | 22,187 | |
| PNC Financial Services Group Inc./The | | 117 | | | November 2015 | | | 87.50 | | | 42,413 | |
| PNC Financial Services Group Inc./The | | 100 | | | December 2015 | | | 90.00 | | | 27,750 | |
| Powershares QQQ Trust Series 1 | | 245 | | | November 2015 | | | 105.00 | | | 210,333 | |
| Progressive Corp./The | | 236 | | | November 2015 | | | 28.00 | | | 126,260 | |
| QUALCOMM Inc. | | 311 | | | January 2016 | | | 57.50 | | | 111,183 | |
| Schlumberger Ltd. | | 93 | | | December 2015 | | | 77.50 | | | 28,086 | |
| Schlumberger Ltd. | | 80 | | | December 2015 | | | 80.00 | | | 14,320 | |
| SPDR Gold Shares | | 130 | | | December 2015 | | | 114.00 | | | 9,815 | |
| SPDR S&P 500 ETF Trust | | 131 | | | November 2015 | | | 200.00 | | | 115,346 | |
| State Street Corp. | | 87 | | | December 2015 | | | 67.50 | | | 27,405 | |
| State Street Corp. | | 169 | | | January 2016 | | | 70.00 | | | 37,518 | |
| T. Rowe Price Group Inc. | | 135 | | | November 2015 | | | 70.00 | | | 77,625 | |
| T. Rowe Price Group Inc. | | 155 | | | January 2016 | | | 75.00 | | | 40,300 | |
| Tyson Foods Inc., Class A | | 123 | | | November 2015 | | | 44.00 | | | 15,682 | |
| Tyson Foods Inc., Class A | | 106 | | | November 2015 | | | 45.00 | | | 8,480 | |
| Tyson Foods Inc., Class A | | 214 | | | December 2015 | | | 46.00 | | | 25,680 | |
| United Parcel Service Inc., Class B | | 58 | | | November 2015 | | | 100.00 | | | 20,155 | |
| United Parcel Service Inc., Class B | | 125 | | | December 2015 | | | 105.00 | | | 15,062 | |
| United Technologies Corp. | | 131 | | | January 2016 | | | 95.00 | | | 67,138 | |
| United Technologies Corp. | | 140 | | | January 2016 | | | 100.00 | | | 31,500 | |
| Varian Medical Systems Inc. | | 215 | | | December 2015 | | | 80.00 | | | 36,012 | |
| Verizon Communications Inc. | | 240 | | | November 2015 | | | 44.00 | | | 72,480 | |
| Verizon Communications Inc. | | 240 | | | January 2016 | | | 45.00 | | | 58,080 | |
| W.W. Grainger Inc. | | 31 | | | December 2015 | | | 210.00 | | | 18,910 | |
| W.W. Grainger Inc. | | 31 | | | January 2016 | | | 220.00 | | | 11,625 | |
| | | | | | | | | | | | |
| | | | | | | | | | | | | |
Total Call Options Written (Premiums received $1,916,685) | | | | | | | | | | $ | 3,213,647 | |
| | | | | | | | | | | | |
Total Options Written, at Value (Premiums received $1,916,685) | | | | | | | | | | $ | 3,213,647 | |
| | | | | | | | | | | | |
| See accompanying Notes to Financial Statements. |
| | | |
| |
| 36 | | |
Madison Funds | October 31, 2015
| |
| Madison Dividend Income Fund Portfolio of Investments |
| | | Shares | | Value (Note 2) | |
| | | | | |
| COMMON STOCKS - 97.3% | | | | | | |
| | | | | | | |
| Consumer Discretionary - 9.1% | | | | | | |
| Home Depot Inc./The | | 5,200 | | $ | 642,928 | |
| McDonald’s Corp. | | 8,350 | | | 937,288 | |
| Omnicom Group Inc. | | 4,300 | | | 322,156 | |
| | | | | | |
| | | | | | 1,902,372 | |
| | | | | | | |
| Consumer Staples - 17.3% | | | | | | |
| Coca-Cola Co./The | | 11,400 | | | 482,790 | |
| General Mills Inc. | | 9,000 | | | 522,990 | |
| JM Smucker Co./The | | 5,000 | | | 586,950 | |
| Mondelez International Inc., Class A | | 8,800 | | | 406,208 | |
| Nestle S.A., ADR | | 6,700 | | | 510,674 | |
| PepsiCo Inc. | | 3,800 | | | 388,322 | |
| Procter & Gamble Co./The | | 9,400 | | | 717,972 | |
| | | | | | |
| | | | | | 3,615,906 | |
| | | | | | | |
| Energy - 8.2% | | | | | | |
| Chevron Corp. | | 4,450 | | | 404,416 | |
| Exxon Mobil Corp. | | 6,900 | | | 570,906 | |
| Marathon Petroleum Corp. | | 4,300 | | | 222,740 | |
| Occidental Petroleum Corp. | | 2,300 | | | 171,442 | |
| Schlumberger Ltd. | | 4,400 | | | 343,904 | |
| | | | | | |
| | | | | | 1,713,408 | |
| | | | | | | |
| Financials - 14.3% | | | | | | |
| BB&T Corp. | | 8,400 | | | 312,060 | |
| MetLife Inc. | | 6,000 | | | 302,280 | |
| Northern Trust Corp. | | 4,000 | | | 281,560 | |
| Travelers Cos. Inc./The | | 8,100 | | | 914,409 | |
| US Bancorp | | 12,600 | | | 531,468 | |
| Wells Fargo & Co. | | 11,900 | | | 644,266 | |
| | | | | | |
| | | | | | 2,986,043 | |
| | | | | | | |
| Health Care - 13.2% | | | | | | |
| Amgen Inc. | | 2,200 | | | 347,996 | |
| Johnson & Johnson | | 7,000 | | | 707,210 | |
| Medtronic PLC | | 5,600 | | | 413,952 | |
| Merck & Co. Inc. | | 9,000 | | | 491,940 | |
| Pfizer Inc. | | 23,700 | | | 801,534 | |
| | | | | | |
| | | | | | 2,762,632 | |
| | | | | | | |
| Industrials - 15.0% | | | | | | |
| 3M Co. | | 1,350 | | | 212,234 | |
| Boeing Co./The | | 4,800 | | | 710,736 | |
| General Electric Co. | | 25,200 | | | 728,784 | |
| United Parcel Service Inc., Class B | | 6,375 | | | 656,752 | |
| United Technologies Corp. | | 4,700 | | | 462,527 | |
| Waste Management Inc. | | 7,000 | | | 376,320 | |
| | | | | | |
| | | | | | 3,147,353 | |
| | | | | | | |
| Information Technology - 12.9% | | | | | | |
| Accenture PLC, Class A | | 7,100 | | | 761,120 | |
| Automatic Data Processing Inc. | | 2,600 | | | 226,174 | |
| Cisco Systems Inc. | | 8,000 | | | 230,800 | |
| Linear Technology Corp. | | 8,400 | | | 373,128 | |
| Microsoft Corp. | | 12,700 | | | 668,528 | |
| Texas Instruments Inc. | | 8,000 | | | 453,760 | |
| | | | | | |
| | | | | | 2,713,510 | |
| | | | | | | |
| Materials - 1.9% | | | | | | |
| Praxair Inc. | | 3,600 | | | 399,924 | |
| | | | | | |
| | | | | | | |
| Telecommunication Service - 3.1% | | | | | | |
| Verizon Communications Inc. | | 13,800 | | | 646,944 | |
| | | | | | |
| | | | | | | |
| Utilities - 2.3% | | | | | | |
| Duke Energy Corp. | | 6,700 | | | 478,849 | |
| | | | | | |
Total Common Stocks | | | | | | |
(Cost $16,560,486) | | | | | 20,366,941 | |
| | | | | | | |
| SHORT-TERM INVESTMENTS - 2.6% | | | | | | |
| State Street Institutional U.S. Government | | | | | | |
| Money Market Fund, Premier Class | | 540,277 | | | 540,277 | |
| | | | | | |
| | | | | | | |
Total Short-Term Investments | | | | | | |
(Cost $540,277) | | | | | 540,277 | |
| | | | | | |
| | | | | | | |
| TOTAL INVESTMENTS - 99.9% (Cost $17,100,763**) | | | | | 20,907,218 | |
| NET OTHER ASSETS AND LIABILITIES - 0.1% | | | | | 17,340 | |
| | | | | | |
| TOTAL NET ASSETS - 100.0% | | | | $ | 20,924,558 | |
| | | | | | |
| ** | | Aggregate cost for Federal tax purposes was $17,106,991. |
| ADR | | American Depositary Receipt. |
| PLC | | Public Limited Company. |
| |
| Madison Large Cap Value Fund Portfolio of Investments |
| | | Shares | | Value (Note 2) | |
| | | | | |
| COMMON STOCKS - 89.7% | | | | | | |
| | | | | | | |
| Consumer Discretionary - 4.5% | | | | | | |
| McDonald’s Corp. | | 72,000 | | $ | 8,082,000 | |
| | | | | | |
| | | | | | | |
| Consumer Staples - 13.2% | | | | | | |
| General Mills Inc. | | 73,000 | | | 4,242,030 | |
| JM Smucker Co./The | | 63,000 | | | 7,395,570 | |
| Mondelez International Inc., Class A | | 125,000 | | | 5,770,000 | |
| Tyson Foods Inc., Class A | | 134,000 | | | 5,944,240 | |
| | | | | | |
| | | | | | 23,351,840 | |
| | | | | | | |
| Energy - 7.9% | | | | | | |
| Exxon Mobil Corp. | | 74,000 | | | 6,122,760 | |
| Marathon Petroleum Corp. | | 47,000 | | | 2,434,600 | |
| Occidental Petroleum Corp. | | 74,000 | | | 5,515,960 | |
| | | | | | |
| | | | | | 14,073,320 | |
| | | | | | | |
| Financials - 27.4% | | | | | | |
| | | | | | | |
| Capital Markets - 1.6% | | | | | | |
| Bank of New York Mellon Corp./The | | 67,000 | | | 2,790,550 | |
| | | | | | |
| | | | | | | |
| Commercial Banks - 9.9% | | | | | | |
| Citigroup Inc. | | 84,000 | | | 4,466,280 | |
| US Bancorp | | 114,000 | | | 4,808,520 | |
| Wells Fargo & Co. | | 152,000 | | | 8,229,280 | |
| | | | | | |
| | | | | | 17,504,080 | |
| | | | | | | |
| Diversified Financial Services - 1.7% | | | | | | |
| Berkshire Hathaway Inc., Class B * | | 22,500 | | | 3,060,450 | |
| | | | | | |
| | | | | | | |
| Insurance - 14.2% | | | | | | |
| American International Group Inc. | | 141,000 | | | 8,891,460 | |
| Arch Capital Group Ltd.* | | 55,000 | | | 4,118,950 | |
| Hartford Financial Services Group Inc./ | | | | | | |
| The | | 107,000 | | | 4,949,820 | |
| Markel Corp.* | | 8,300 | | | 7,204,400 | |
| | | | | | |
| | | | | | 25,164,630 | |
| | | | | | |
| | | | | | 48,519,710 | |
| | | | | | | |
| Health Care - 7.2% | | | | | | |
| Medtronic PLC | | 26,000 | | | 1,921,920 | |
| Pifizer Inc. | | 234,000 | | | 7,913,880 | |
| Thermo Fisher Scientific Inc. | | 22,000 | | | 2,877,160 | |
| | | | | | |
| | | | | | 12,712,960 | |
| | | | | | | |
| Industrials - 15.9% | | | | | | |
| Boeing Co./The | | 21,500 | | | 3,183,505 | |
| Danaher Corp. | | 58,000 | | | 5,411,980 | |
| Expeditors International of Washington | | | | | | |
| Inc. | | 34,500 | | | 1,717,755 | |
| General Electric Co. | | 301,000 | | | 8,704,920 | |
| Republic Services Inc. | | 145,500 | | | 6,364,170 | |
| Rockwell Collins Inc. | | 33,000 | | | 2,861,760 | |
| | | | | | |
| | | | | | 28,244,090 | |
| | | | | | | |
| Information Technology - 7.5% | | | | | | |
| Cisco Systems Inc. | | 200,000 | | | 5,770,000 | |
| Microsoft Corp. | | 81,000 | | | 4,263,840 | |
| Oracle Corp. | | 84,000 | | | 3,262,560 | |
| | | | | | |
| | | | | | 13,296,400 | |
| Telecommunication Service - 3.5% | | | | | | |
| T-Mobile U.S. Inc.* | | 162,000 | | | 6,138,180 | |
| | | | | | |
| | | | | | | |
| Utilities - 2.6% | | | | | | |
| Duke Energy Corp. | | 64,500 | | | 4,609,815 | |
| | | | | | |
| | | | | | | |
Total Common Stocks | | | | | | |
(Cost $141,657,411) | | | | | 159,028,315 | |
| | | | | | | |
| | | | | | | |
| SHORT-TERM INVESTMENTS - 10.3% | | | | | | |
| State Street Institutional U.S. | | | | | | |
| Government Money Market Fund, | | | | | | |
| Premier Class | | 18,244,271 | | | 18,244,271 | |
| | | | | | |
| | | | | | | |
Total Short-Term Investments | | | | | | |
(Cost $18,244,271) | | | | | 18,244,271 | |
| | | | | | |
| | | | | | | |
| TOTAL INVESTMENTS - 100.0% | | | | | | |
| (Cost $159,901,682**) | | | | | 177,272,586 | |
| | | | | | |
| NET OTHER ASSETS AND LIABILITIES - 0.0% | | | | | (64,200 | ) |
| | | | | | |
| TOTAL NET ASSETS - 100.0% | | | | $ | 177,208,386 | |
| | | | | | |
| * | | Non-income producing. |
| ** | | Aggregate cost for Federal tax purposes was $159,991,135. |
| PLC | | Public Limited Company. |
| See accompanying Notes to Financial Statements. |
| | | |
| |
| | | 37 |
Madison Funds | October 31, 2015
| |
| Madison Investors Fund Portfolio of Investments |
| | | Shares | | Value (Note 2) | |
| | | | | |
| COMMON STOCKS - 93.3% | | | | | | |
| | | | | | | |
| Consumer Discretionary - 15.1% | | | | | | |
| CarMax Inc.* | | 29,445 | | $ | 1,737,550 | |
| Discovery Communications Inc., Class C* | | 181,010 | | | 4,981,395 | |
| McDonald’s Corp. | | 29,493 | | | 3,310,589 | |
| Nordstrom Inc. | | 52,795 | | | 3,442,762 | |
| TJX Cos. Inc./The | | 59,370 | | | 4,345,290 | |
| | | | | | |
| | | | | | 17,817,586 | |
| | | | | | | |
| Consumer Staples - 14.8% | | | | | | |
| Costco Wholesale Corp. | | 17,183 | | | 2,716,976 | |
| Diageo PLC, ADR | | 53,499 | | | 6,156,665 | |
| JM Smucker Co./The | | 37,070 | | | 4,351,647 | |
| Nestle S.A., ADR | | 56,234 | | | 4,286,156 | |
| | | | | | |
| | | | | | 17,511,444 | |
| | | | | | | |
| Energy - 1.4% | | | | | | |
| Schlumberger Ltd. | | 21,315 | | | 1,665,980 | |
| | | | | | |
| | | | | | | |
| Financials - 21.3% | | | | | | |
| American Tower Corp. | | 43,100 | | | 4,406,113 | |
| Berkshire Hathaway Inc., Class B* | | 32,663 | | | 4,442,821 | |
| Brookfield Asset Management Inc., Class A | | 118,382 | | | 4,139,819 | |
| Markel Corp.* | | 4,689 | | | 4,070,052 | |
| Progressive Corp./The | | 141,075 | | | 4,673,815 | |
| US Bancorp | | 80,674 | | | 3,402,829 | |
| | | | | | |
| | | | | | 25,135,449 | |
| | | | | | | |
| Health Care - 9.9% | | | | | | |
| Baxter International Inc. | | 47,710 | | | 1,783,877 | |
| HCA Holdings Inc.* | | 18,105 | | | 1,245,443 | |
| Johnson & Johnson | | 52,348 | | | 5,288,719 | |
| Varian Medical Systems Inc.* | | 43,812 | | | 3,440,556 | |
| | | | | | |
| | | | | | 11,758,595 | |
| | | | | | | |
| Industrials - 14.3% | | | | | | |
| Copart Inc.* | | 99,105 | | | 3,588,592 | |
| Danaher Corp. | | 33,944 | | | 3,167,315 | |
| Jacobs Engineering Group Inc.* | | 96,475 | | | 3,872,506 | |
| PACCAR Inc. | | 54,795 | | | 2,884,957 | |
| Rockwell Collins Inc. | | 39,299 | | | 3,408,009 | |
| | | | | | |
| | | | | | 16,921,379 | |
| | | | | | | |
| Information Technology - 16.5% | | | | | | |
| Accenture PLC, Class A | | 47,207 | | | 5,060,590 | |
| Alphabet Inc., Class C* | | 6,299 | | | 4,477,392 | |
| Oracle Corp. | | 99,900 | | | 3,880,116 | |
| TE Connectivity Ltd. | | 44,240 | | | 2,850,826 | |
| Visa Inc., Class A | | 42,479 | | | 3,295,521 | |
| | | | | | |
| | | | | | 19,564,445 | |
| | | | | | |
Total Common Stocks | | | | | | |
(Cost $90,828,348) | | | | | 110,374,878 | |
| | | | | | | |
| SHORT-TERM INVESTMENTS - 6.9% | | | | | | |
| State Street Institutional U.S. Government | | | | | | |
| Money Market Fund, Premier Class | | 8,136,685 | | | 8,136,685 | |
| | | | | | |
| | | | | | | |
Total Short-Term Investments | | | | | | |
(Cost $8,136,685) | | | | | 8,136,685 | |
| | | | | | |
| | | | | | | |
| TOTAL INVESTMENTS - 100.2% | | | | | | |
| (Cost $98,965,033**) | | | | | 118,511,563 | |
| NET OTHER ASSETS AND LIABILITIES - (0.2%) | | | | | (227,359 | ) |
| | | | | | |
| TOTAL NET ASSETS - 100.0% | | | | $ | 118,284,204 | |
| | | | | | |
| * | | Non-income producing. |
| ** | | Aggregate cost for Federal tax purposes was $99,302,760. |
| ADR | | American Depositary Receipt. |
| PLC | | Public Limited Company. |
| |
| Madison Large Cap Growth Fund Portfolio of Investments |
| | Shares | | Value (Note 2) |
| | | | | |
| COMMON STOCKS - 95.1% | | | | | | |
| | | | | | | |
| Consumer Discretionary - 20.2% | | | | | | |
| Amazon.com Inc.* | | 4,730 | | $ | 2,960,507 | |
| CBS Corp., Class B | | 76,890 | | | 3,576,923 | |
| Discovery Communications Inc., Class C* | | 79,869 | | | 2,197,995 | |
| Home Depot Inc./The | | 25,000 | | | 3,091,000 | |
| Liberty Global PLC* | | 61,345 | | | 2,615,751 | |
| McDonald’s Corp. | | 44,215 | | | 4,963,134 | |
| Nordstrom Inc. | | 38,545 | | | 2,513,519 | |
| Omnicom Group Inc. | | 47,947 | | | 3,592,189 | |
| Ross Stores Inc. | | 36,620 | | | 1,852,240 | |
| Starbucks Corp. | | 30,000 | | | 1,877,100 | |
| TJX Cos. Inc./The | | 35,665 | | | 2,610,321 | |
| Walt Disney Co./The | | 30,515 | | | 3,470,776 | |
| | | | | | |
| | | | | | 35,321,455 | |
| | | | | | | |
| Consumer Staples - 8.6% | | | | | | |
| Costco Wholesale Corp. | | 22,582 | | | 3,570,666 | |
| CVS Health Corp. | | 33,066 | | | 3,266,259 | |
| Diageo PLC, ADR | | 21,410 | | | 2,463,863 | |
| JM Smucker Co./The | | 25,620 | | | 3,007,532 | |
| PepsiCo Inc. | | 26,800 | | | 2,738,692 | |
| | | | | | |
| | | | | | 15,047,012 | |
| | | | | | | |
| Energy - 1.7% | | | | | | |
| Schlumberger Ltd. | | 38,980 | | | 3,046,677 | |
| | | | | | |
| | | | | | | |
| Financials - 3.9% | | | | | | |
| Brookfield Asset Management Inc., Class A | | 70,342 | | | 2,459,859 | |
| McGraw Hill Financial Inc. | | 17,531 | | | 1,624,072 | |
| T. Rowe Price Group Inc. | | 35,355 | | | 2,673,545 | |
| | | | | | |
| | | | | | 6,757,476 | |
| | | | | | | |
| Health Care - 20.9% | | | | | | |
| Amgen Inc. | | 27,555 | | | 4,358,650 | |
| Baxalta Inc. | | 51,450 | | | 1,772,967 | |
| Baxter International Inc. | | 51,450 | | | 1,923,716 | |
| Biogen Inc.* | | 11,445 | | | 3,324,887 | |
| Celgene Corp.* | | 15,675 | | | 1,923,479 | |
| Express Scripts Holding Co.* | | 38,475 | | | 3,323,470 | |
| Gilead Sciences Inc. | | 49,275 | | | 5,328,106 | |
| HCA Holdings Inc.* | | 40,440 | | | 2,781,868 | |
| Johnson & Johnson | | 37,375 | | | 3,775,996 | |
| McKesson Corp. | | 16,583 | | | 2,965,040 | |
| Thermo Fisher Scientific Inc. | | 20,493 | | | 2,680,075 | |
| Varian Medical Systems Inc.* | | 29,425 | | | 2,310,745 | |
| | | | | | |
| | | | | | 36,468,999 | |
| | | | | | | |
| Industrials - 9.2% | | | | | | |
| 3M Co. | | 13,315 | | | 2,093,251 | |
| Danaher Corp. | | 22,170 | | | 2,068,683 | |
| PACCAR Inc. | | 38,575 | | | 2,030,974 | |
| Rockwell Collins Inc. | | 32,955 | | | 2,857,857 | |
| United Parcel Service Inc., Class B | | 37,938 | | | 3,908,373 | |
| W.W. Grainger Inc. | | 15,000 | | | 3,150,000 | |
| | | | | | |
| | | | | | 16,109,138 | |
| | | | | | | |
| Information Technology - 29.6% | | | | | | |
| Communications Equipment - 1.5% | | | | | | |
| QUALCOMM Inc. | | 45,845 | | | 2,724,110 | |
| | | | | | |
| | | | | | | |
| Computers & Peripherals - 5.0% | | | | | | |
| Apple Inc. | | 72,678 | | | 8,685,021 | |
| | | | | | |
| | | | | | | |
| Electronic Equipment, Instruments & | | | | | | |
| Components - 1.4% | | | | | | |
| TE Connectivity Ltd. | | 39,340 | | | 2,535,070 | |
| | | | | | |
| | | | | | | |
| Internet Software & Services - 5.2% | | | | | | |
| Alphabet Inc., Class C* | | 12,890 | | | 9,162,341 | |
| | | | | | |
| | | | | | | |
| Services - 6.5% | | | | | | |
| Accenture PLC, Class A | | 39,300 | | | 4,212,960 | |
| PayPal Holdings Inc.* | | 90,287 | | | 3,251,235 | |
| Visa Inc., Class A | | 49,380 | | | 3,830,900 | |
| | | | | | |
| | | | | | 11,295,095 | |
| Semiconductors & Semiconductor | | | | | | |
| Equipment - 1.8% | | | | | | |
| Linear Technology Corp. | | 69,805 | | | 3,100,738 | |
| | | | | | |
| | | | | | | |
| Software - 8.2% | | | | | | |
| Microsoft Corp. | | 155,585 | | | 8,189,994 | |
| Oracle Corp. | | 158,120 | | | 6,141,381 | |
| | | | | | |
| | | | | | 14,331,375 | |
| | | | | | |
| | | | | | 51,833,750 | |
| | | | | | | |
| Telecommunication Service - 1.0% | | | | | | |
| Verizon Communications Inc. | | 38,135 | | | 1,787,769 | |
| | | | | | |
Total Common Stocks | | | | | | |
(Cost $143,579,613) | | | | | 166,372,276 | |
| SHORT-TERM INVESTMENTS - 3.9% | | | | | | |
| State Street Institutional U.S. Government | | | | | | |
| Money Market Fund, Premier Class | | 6,775,655 | | | 6,775,655 | |
| | | | | | |
Total Short-Term Investments | | | | | | |
(Cost $6,775,655) | | | | | 6,775,655 | |
| | | | | | |
| | | | | | | |
| TOTAL INVESTMENTS - 99.0% | | | | | | |
| (Cost $150,355,268**) | | | | | 173,147,931 | |
| NET OTHER ASSETS AND LIABILITIES - 1.0% | | | | | 1,690,453 | |
| | | | | | |
| TOTAL NET ASSETS - 100.0% | | | | $ | 174,838,384 | |
| | | | | | |
| * | | Non-income producing. |
| ** | | Aggregate cost for Federal tax purposes was $150,551,425. |
| ADR | | American Depositary Receipt. |
| PLC | | Public Limited Company. |
| See accompanying Notes to Financial Statements. |
| | | |
| |
| 38 | |
Madison Funds | October 31, 2015
| |
| Madison Mid Cap Fund Portfolio of Investments |
| | Shares | | Value (Note 2) |
| | | | | |
| COMMON STOCKS - 93.0% | | | | | | |
| | | | | | | |
| Consumer Discretionary - 26.0% | | | | | | |
| Media - 12.3% | | | | | | |
| Discovery Communications Inc., Class C* | | 274,654 | | $ | 7,558,478 | |
| Liberty Global PLC* | | 201,999 | | | 8,613,238 | |
| Liberty Ventures* | | 195,097 | | | 8,500,376 | |
| Omnicom Group Inc. | | 107,352 | | | 8,042,812 | |
| | | | | | |
| | | | | | 32,714,904 | |
| Specialty Retail - 13.7% | | | | | | |
| Advance Auto Parts Inc. | | 39,998 | | | 7,936,803 | |
| CarMax Inc.* | | 81,678 | | | 4,819,819 | |
| Ross Stores Inc. | | 269,252 | | | 13,618,766 | |
| Sally Beauty Holdings Inc.* | | 423,914 | | | 9,966,218 | |
| | | | | | |
| | | | | | 36,341,606 | |
| | | | | | |
| | | | | | 69,056,510 | |
| | | | | | | |
| Consumer Staples - 1.1% | | | | | | |
| Brown-Forman Corp., Class B | | 26,555 | | | 2,819,610 | |
| | | | | | |
| | | | | | | |
| Energy - 4.5% | | | | | | |
| Oceaneering International Inc. | | 78,530 | | | 3,299,830 | |
| World Fuel Services Corp. | | 196,947 | | | 8,756,264 | |
| | | | | | |
| | | | | | 12,056,094 | |
| | | | | | | |
| Financials - 27.9% | | | | | | |
| Commercial Banks - 4.3% | | | | | | |
| Glacier Bancorp Inc. | | 214,174 | | | 5,859,801 | |
| M&T Bank Corp. | | 45,587 | | | 5,463,602 | |
| | | | | | |
| | | | | | 11,323,403 | |
| Insurance - 17.1% | | | | | | |
| Arch Capital Group Ltd.* | | 89,605 | | | 6,710,518 | |
| Brown & Brown Inc. | | 410,006 | | | 13,230,894 | |
| Markel Corp.* | | 20,029 | | | 17,385,172 | |
| WR Berkley Corp. | | 144,252 | | | 8,053,589 | |
| | | | | | |
| | | | | | 45,380,173 | |
| Real Estate Investment Trusts (REITs) - 2.1% | | | | | | |
| American Tower Corp. | | 28,303 | | | 2,893,416 | |
| Crown Castle International Corp. | | 32,548 | | | 2,781,552 | |
| | | | | | |
| | | | | | 5,674,968 | |
| Real Estate Management & Development - 4.4% | | | | | | |
| Brookfield Asset Management Inc., | | | | | | |
| Class A | | 334,863 | | | 11,710,159 | |
| | | | | | |
| | | | | | 74,088,703 | |
| | | | | | | |
| Health Care - 6.1% | | | | | | |
| DaVita HealthCare Partners Inc.* | | 95,130 | | | 7,373,526 | |
| Laboratory Corp. of America Holdings* | | 71,984 | | | 8,835,316 | |
| | | | | | |
| | | | | | 16,208,842 | |
| | | | | | | |
| Industrials - 14.5% | | | | | | |
| Copart Inc.* | | 283,282 | | | 10,257,641 | |
| Expeditors International of Washington | | | | | | |
| Inc. | | 207,082 | | | 10,310,613 | |
| Fastenal Co. | | 119,721 | | | 4,688,274 | |
| IHS Inc., Class A* | | 60,648 | | | 7,249,862 | |
| Precision Castparts Corp. | | 26,866 | | | 6,200,942 | |
| | | | | | |
| | | | | | 38,707,332 | |
| | | | | | | |
| Information Technology - 9.5% | | | | | | |
| Amphenol Corp., Class A | | 107,413 | | | 5,823,933 | |
| CDW Corp. | | 261,594 | | | 11,690,636 | |
| Motorola Solutions Inc. | | 111,635 | | | 7,811,101 | |
| | | | | | |
| | | | | | 25,325,670 | |
| | | | | | | |
| Materials - 3.4% | | | | | | |
| Crown Holdings Inc.* | | 169,802 | | | 9,006,298 | |
| | | | | | |
Total Common Stocks | | | | | | |
(Cost $166,625,811) | | | | | 247,269,059 | |
| | | | | | | |
| SHORT-TERM INVESTMENTS - 7.1% | | | | | | |
| State Street Institutional U.S. | | | | | | |
| Government Money Market Fund, | | | | | | |
| Premier Class | | 18,829,399 | | | 18,829,399 | |
| | | | | | |
| | | | | | | |
Total Short-Term Investments | | | | | | |
(Cost $18,829,399) | | | | | 18,829,399 | |
| | | | | | |
| | | | | | | |
| TOTAL INVESTMENTS - 100.1% | | | | | | |
| (Cost $185,455,210**) | | | | | 266,098,458 | |
| NET OTHER ASSETS AND LIABILITIES - (0.1%) | | | | | (218,274 | ) |
| | | | | | |
| TOTAL NET ASSETS - 100.0% | | | | $ | 265,880,184 | |
| | | | | | |
| * | | Non-income producing. |
| ** | | Aggregate cost for Federal tax purposes was $185,562,615. |
| PLC | | Public Limited Company. |
| |
| Madison Small Cap Fund Portfolio of Investments |
| | Shares | | Value (Note 2) |
| | | | | |
| COMMON STOCKS - 96.4% | | | | | | |
| | | | | | | |
| Consumer Discretionary - 7.0% | | | | | | |
| Ascena Retail Group Inc.* | | 102,980 | | $ | 1,371,694 | |
| Cato Corp./The, Class A | | 30,519 | | | 1,152,397 | |
| Fred’s Inc., Class A | | 81,560 | | | 1,127,975 | |
| Helen of Troy Ltd.* | | 16,510 | | | 1,637,957 | |
| Horizon Global Corp.* | | 13,220 | | | 116,204 | |
| International Speedway Corp., Class A | | 2,800 | | | 97,132 | |
| Stage Stores Inc. | | 63,030 | | | 613,282 | |
| | | | | | |
| | | | | | 6,116,641 | |
| | | | | | | |
| Consumer Staples - 5.4% | | | | | | |
| C&C Group PLC (A) | | 271,683 | | | 1,083,782 | |
| Casey’s General Stores Inc. | | 10,000 | | | 1,062,200 | |
| Cranswick PLC (A) | | 45,411 | | | 1,199,435 | |
| Post Holdings Inc.* | | 21,200 | | | 1,362,524 | |
| | | | | | |
| | | | | | 4,707,941 | |
| | | | | | | |
| Energy - 6.2% | | | | | | |
| Dorian LPG Ltd.* | | 58,850 | | | 693,253 | |
| Era Group Inc.* | | 34,510 | | | 480,034 | |
| RSP Permian Inc.* | | 48,344 | | | 1,325,592 | |
| Scorpio Tankers Inc. | | 173,260 | | | 1,580,131 | |
| SEACOR Holdings Inc.* | | 17,740 | | | 1,036,371 | |
| Tesco Corp. | | 43,305 | | | 346,440 | |
| | | | | | |
| | | | | | 5,461,821 | |
| | | | | | | |
| Financials - 20.8% | | | | | | |
| AMERISAFE Inc. | | 10,590 | | | 579,591 | |
| DiamondRock Hospitality Co., REIT | | 71,884 | | | 839,605 | |
| Education Realty Trust Inc., REIT | | 28,563 | | | 1,025,697 | |
| First Busey Corp. | | 39,797 | | | 830,563 | |
| First Midwest Bancorp Inc. | | 89,210 | | | 1,589,722 | |
| First Niagara Financial Group Inc. | | 96,320 | | | 996,912 | |
| Flushing Financial Corp. | | 39,470 | | | 830,449 | |
| Great Western Bancorp Inc. | | 38,848 | | | 1,097,844 | |
| Hancock Holding Co. | | 32,110 | | | 886,236 | |
| International Bancshares Corp. | | 67,790 | | | 1,826,941 | |
| MB Financial Inc. | | 38,440 | | | 1,239,306 | |
| Northwest Bancshares Inc. | | 106,950 | | | 1,439,547 | |
| Primerica Inc. | | 27,970 | | | 1,332,211 | |
| Solar Capital Ltd. | | 41,065 | | | 710,835 | |
| Summit Hotel Properties Inc., REIT | | 64,160 | | | 839,213 | |
| Webster Financial Corp. | | 59,390 | | | 2,203,369 | |
| | | | | | |
| | | | | | 18,268,041 | |
| | | | | | | |
| Health Care - 10.8% | | | | | | |
| Allscripts Healthcare Solutions Inc.* | | 98,740 | | | 1,388,284 | |
| Amsurg Corp.* | | 10,540 | | | 738,749 | |
| Charles River Laboratories International | | | | | | |
| Inc.* | | 20,330 | | | 1,326,329 | |
| Corvel Corp.* | | 16,930 | | | 562,076 | |
| Haemonetics Corp.* | | 33,680 | | | 1,137,710 | |
| ICU Medical Inc.* | | 7,420 | | | 815,977 | |
| MedAssets Inc.* | | 47,560 | | | 1,126,221 | |
| Phibro Animal Health Corp., Class A | | 22,060 | | | 735,922 | |
| STERIS Corp. | | 21,670 | | | 1,624,167 | |
| | | | | | |
| | | | | | 9,455,435 | |
| | | | | | | |
| Industrials - 29.3% | | | | | | |
| Aerospace & Defense - 1.9% | | | | | | |
| Cubic Corp. | | 37,550 | | | 1,684,118 | |
| | | | | | |
| | | | | | | |
| Building Products - 0.9% | | | | | | |
| Tyman PLC (A) | | 201,289 | | | 796,682 | |
| | | | | | |
| | | | | | | |
| Commercial Services & Supplies - 10.0% | | | | | | |
| ACCO Brands Corp.* | | 143,430 | | | 1,157,480 | |
| Essendant Inc. | | 45,960 | | | 1,588,837 | |
| G&K Services Inc., Class A | | 31,650 | | | 2,083,203 | |
| Matthews International Corp., Class A | | 26,850 | | | 1,550,051 | |
| SP Plus Corp.* | | 59,700 | | | 1,522,350 | |
| Steelcase Inc., Class A | | 44,420 | | | 862,192 | |
| | | | | | |
| | | | | | 8,764,113 | |
| | | | | | | |
| Construction & Engineering - 1.0% | | | | | | |
| Primoris Services Corp. | | 45,780 | | | 911,938 | |
| | | | | | |
| | | | | | | |
| Electrical Equipment - 1.7% | | | | | | |
| Babcock & Wilcox Enterprises Inc.* | | 47,300 | | | 803,154 | |
| Thermon Group Holdings Inc.* | | 33,110 | | | 665,842 | |
| | | | | | |
| | | | | | 1,468,996 | |
| | | | | | | |
| Machinery - 9.3% | | | | | | |
| Albany International Corp., Class A | | 44,510 | | | 1,672,240 | |
| CIRCOR International Inc. | | 16,110 | | | 739,771 | |
| ESCO Technologies Inc. | | 33,030 | | | 1,225,083 | |
| Luxfer Holdings PLC, ADR | | 52,541 | | | 569,019 | |
| Mueller Industries Inc. | | 74,450 | | | 2,346,664 | |
| TriMas Corp.* | | 77,580 | | | 1,552,376 | |
| | | | | | |
| | | | | | 8,105,153 | |
| | | | | | | |
| Professional Services - 2.9% | | | | | | |
| FTI Consulting Inc.* | | 39,100 | | | 1,329,791 | |
| Huron Consulting Group Inc.* | | 5,800 | | | 280,140 | |
| Mistras Group Inc.* | | 51,110 | | | 967,001 | |
| | | | | | |
| | | | | | 2,576,932 | |
| | | | | | | |
| Trading Companies & Distributors - 1.6% | | | | | | |
| GATX Corp. | | 29,370 | | | 1,371,579 | |
| | | | | | |
| | | | | | 25,679,511 | |
| See accompanying Notes to Financial Statements. |
| | | |
| |
| | 39 |
Madison Funds | October 31, 2015
| |
| Madison Small Cap Fund Portfolio of Investments - continued |
| | Shares | | Value (Note 2) |
| | | | | |
| COMMON STOCKS - continued | | | | | | |
| | | | | | | |
| Information Technology - 8.7% | | | | | | |
| Belden Inc. | | 33,882 | | $ | 2,169,464 | |
| Coherent Inc.* | | 15,220 | | | 824,924 | |
| CTS Corp. | | 38,210 | | | 694,658 | |
| Diebold Inc. | | 41,410 | | | 1,526,787 | |
| Forrester Research Inc. | | 35,140 | | | 1,133,968 | |
| ScanSource Inc.* | | 37,100 | | | 1,280,321 | |
| | | | | | |
| | | | | | 7,630,122 | |
| | | | | | | |
| Materials - 4.8% | | | | | | |
| Deltic Timber Corp. | | 18,620 | | | 1,153,695 | |
| Greif Inc., Class A | | 24,150 | | | 791,637 | |
| Innospec Inc. | | 11,010 | | | 608,192 | |
| Sensient Technologies Corp. | | 25,170 | | | 1,642,846 | |
| | | | | | |
| | | | | | 4,196,370 | |
| | | | | | | |
| Utilities - 3.4% | | | | | | |
| Laclede Group Inc./The | | 20,170 | | | 1,181,357 | |
| New Jersey Resources Corp. | | 21,360 | | | 676,685 | |
| WGL Holdings Inc. | | 18,150 | | | 1,129,474 | |
| | | | | | |
| | | | | | 2,987,516 | |
| | | | | | |
| | | | | | | |
Total Common Stocks | | | | | | |
(Cost $74,791,494) | | | | | 84,503,398 | |
| | | | | | | |
| SHORT-TERM INVESTMENTS - 2.5% | | | | | | |
| State Street Institutional U.S. Government | | | | | | |
| Money Market Fund, Premier Class | | 2,153,223 | | | 2,153,223 | |
| | | | | | |
| | | | | | | |
Total Short-Term Investments | | | | | | |
(Cost $2,153,223) | | | | | 2,153,223 | |
| | | | | | |
| | | | | | | |
| TOTAL INVESTMENTS - 98.9% (Cost $76,944,717**) | | | | | 86,656,621 | |
| NET OTHER ASSETS AND LIABILITIES - 1.1% | | | | | 943,625 | |
| | | | | | |
| TOTAL NET ASSETS - 100.0% | | | | $ | 87,600,246 | |
| | | | | | |
| * | | Non-income producing. |
| ** | | Aggregate cost for Federal tax purposes was $77,091,261. |
| (A) | | Due to events that occurred between the close of the exchange on which this security is traded and that of the New York Stock Exchange, fair value was determined for this security using methods determined in good faith by or at the discretion of the Board of Trustees (see Note 2). |
| ADR | | American Depositary Receipt. |
| PLC | | Public Limited Company. |
| REIT | | Real Estate Investment Trust. |
| |
| Madison NorthRoad International Fund Portfolio of Investments |
| | Shares | | Value (Note 2) |
| | | | | |
| COMMON STOCKS - 94.8% | | | | | | |
| | | | | | | |
| Australia - 1.8% | | | | | | |
| BHP Billiton Ltd., ADR | | 24,330 | | $ | 800,214 | |
| | | | | | |
| | | | | | | |
| Brazil - 1.7% | | | | | | |
| Estacio Participacoes S.A. | | 105,952 | | | 424,736 | |
| Kroton Educacional S.A. | | 136,990 | | | 350,241 | |
| | | | | | |
| | | | | | 774,977 | |
| Denmark - 4.3% | | | | | | |
| Carlsberg AS, Class B (A) | | 11,945 | | | 977,288 | |
| ISS AS (A) | | 28,295 | | | 993,976 | |
| | | | | | |
| | | | | | 1,971,264 | |
| France - 16.0% | | | | | | |
| AXA S.A., ADR | | 39,437 | | | 1,052,968 | |
| BNP Paribas S.A. (A) | | 13,850 | | | 840,065 | |
| LVMH Moet Hennessy Louis Vuitton SE (A) | | 4,768 | | | 887,079 | |
| Sanofi, ADR | | 24,390 | | | 1,227,793 | |
| Schneider Electric SE, ADR | | 83,545 | | | 1,003,375 | |
| Technip S.A. (A) | | 18,735 | | | 977,156 | |
| Total S.A., ADR | | 26,276 | | | 1,267,291 | |
| | | | | | |
| | | | | | 7,255,727 | |
| Germany - 2.9% | | | | | | |
| SAP SE, ADR | | 16,979 | | | 1,336,417 | |
| | | | | | |
| | | | | | | |
| Ireland - 2.1% | | | | | | |
| CRH PLC, ADR | | 34,316 | | | 938,886 | |
| | | | | | |
| | | | | | | |
| Israel - 1.8% | | | | | | |
| Teva Pharmaceutical Industries Ltd., ADR | | 14,099 | | | 834,520 | |
| | | | | | |
| | | | | | | |
| Japan - 9.2% | | | | | | |
| Hitachi Ltd. (A) | | 157,273 | | | 903,453 | |
| Mitsubishi UFJ Financial Group Inc., ADR | | 186,866 | | | 1,209,023 | |
| Secom Co. Ltd., ADR | | 68,280 | | | 1,134,131 | |
| Seven & I Holdings Co. Ltd. (A) | | 20,595 | | | 930,644 | |
| | | | | | |
| | | | | | 4,177,251 | |
| Netherlands - 6.5% | | | | | | |
| Akzo Nobel N.V., ADR | | 39,031 | | | 917,228 | |
| ING Groep N.V. (A) | | 75,230 | | | 1,091,015 | |
| Royal Dutch Shell PLC, Class A, ADR | | 18,528 | | | 971,979 | |
| | | | | | |
| | | | | | 2,980,222 | |
| Singapore - 1.7% | | | | | | |
| DBS Group Holdings Ltd. (A) | | 61,680 | | | 759,447 | |
| | | | | | |
| | | | | | | |
| South Korea - 2.3% | | | | | | |
| Samsung Electronics Co. Ltd. (A) | | 861 | | | 1,031,390 | |
| | | | | | |
| | | | | | | |
| Sweden - 2.5% | | | | | | |
| Telefonaktiebolaget LM Ericsson, ADR | | 116,473 | | | 1,134,447 | |
| | | | | | |
| | | | | | | |
| Switzerland - 15.9% | | | | | | |
| ABB Ltd., ADR * | | 45,080 | | | 851,110 | |
| Credit Suisse Group AG, ADR * | | 32,693 | | | 817,325 | |
| Nestle S.A., ADR | | 14,939 | | | 1,138,651 | |
| Novartis AG, ADR | | 13,809 | | | 1,248,748 | |
| Roche Holding AG, ADR | | 29,540 | | | 1,001,701 | |
| Syngenta AG, ADR | | 14,010 | | | 942,733 | |
| TE Connectivity Ltd. | | 18,860 | | | 1,215,339 | |
| | | | | | |
| | | | | | 7,215,607 | |
| United Kingdom - 26.1% | | | | | | |
| Babcock International Group PLC (A) | | 68,825 | | | 1,021,356 | |
| Barclays PLC (A) | | 276,995 | | | 985,820 | |
| Berendsen PLC (A) | | 55,545 | | | 876,246 | |
| BG Group PLC (A) | | 79,360 | | | 1,250,048 | |
| Compass Group PLC, ADR | | 60,516 | | | 1,044,506 | |
| Diageo PLC, ADR | | 14,412 | | | 1,658,533 | |
| GlaxoSmithKline PLC, ADR | | 19,809 | | | 852,976 | |
| HSBC Holdings PLC, ADR | | 18,053 | | | 705,331 | |
| Rolls-Royce Holdings PLC * (A) | | 59,435 | | | 628,786 | |
| Standard Chartered PLC (A) | | 65,313 | | | 724,876 | |
| Tesco PLC, ADR | | 124,131 | | | 1,038,976 | |
| WPP PLC, ADR | | 9,549 | | | 1,070,061 | |
| | | | | | |
| | | | | | 11,857,515 | |
| | | | | | |
Total Common Stocks | | | | | | |
(Cost $44,297,949) | | | | | 43,067,884 | |
| | | | | | | |
| PREFERRED STOCK - 0.0% | | | | | | |
| | | | | | | |
| United Kingdom - 0.0% | | | | | | |
| Rolls-Royce Holdings PLC* | | 5,612,058 | | | 8,652 | |
| | | | | | |
Total Preferred Stocks | | | | | | |
(Cost $8,653) | | | | | 8,652 | |
| | | | | | | |
| SHORT-TERM INVESTMENTS - 2.7% | | | | | | |
| | | | | | | |
| United States - 2.7% | | | | | | |
| State Street Institutional U.S. Government | | | | | | |
| Money Market Fund, Premier Class | | 1,232,870 | | $ | 1,232,870 | |
| | | | | | |
| | | | | | | |
Total Short-Term Investments | | | | | | |
(Cost $1,232,870) | | | | | 1,232,870 | |
| | | | | | |
| | | | | | | |
| TOTAL INVESTMENTS - 97.5% (Cost $45,539,472**) | | | | | 44,309,406 | |
| NET OTHER ASSETS AND LIABILITIES - 2.5% | | | | | 1,119,855 | |
| | | | | | |
| TOTAL NET ASSETS - 100.0% | | | | $ | 45,429,261 | |
| | | | | | |
| * | | Non-income producing. |
| ** | | Aggregate cost for Federal tax purposes was $45,829,660. |
| (A) | | Due to events that occurred between the close of the exchange on which this security is traded and that of the New York Stock Exchange, fair value was determined for this security using methods determined in good faith by or at the discretion of the Board of Trustees (see Note 2). |
| ADR | | American Depositary Receipt. |
| PLC | | Public Limited Company. |
| SECTOR ALLOCATION AS A PERCENTAGE OF NET ASSETS AS OF 10/31/15 | |
| Consumer Discretionary | 8.3% |
| Consumer Staples | 12.6% |
| Energy | 9.8% |
| Financials | 18.0% |
| Health Care | 11.4% |
| Industrials | 14.4% |
| Information Technology | 12.4% |
| Materials | 7.9% |
| Money Market Funds | 2.7% |
| Net Other Assets and Liabilities | 2.5% |
| See accompanying Notes to Financial Statements. |
| | | |
| |
| 40 | |
Madison Funds | October 31, 2015
| |
| Madison International Stock Fund Portfolio of Investments |
| | | | Shares | | Value (Note 2) | |
| | | | | | |
| COMMON STOCKS - 95.1% | | | | | | | |
| | | | | | | | |
| Australia - 2.1% | | | | | | | |
| Ansell Ltd. (A) | | | 18,714 | | $ | 266,088 | |
| Caltex Australia Ltd. (A) | | | 24,828 | | | 554,138 | |
| | | | | | | |
| | | | | | | 820,226 | |
| Austria - 0.7% | | | | | | | |
| UNIQA Insurance Group AG (A) | | | 28,003 | | | 260,051 | |
| | | | | | | |
| | | | | | | | |
| Belgium - 4.0% | | | | | | | |
| Anheuser-Busch InBev N.V. (A) | | | 9,517 | | | 1,135,039 | |
| KBC Groep N.V. (A) | | | 6,442 | | | 391,506 | |
| | | | | | | |
| | | | | | | 1,526,545 | |
| Brazil - 0.7% | | | | | | | |
| BB Seguridade Participacoes S.A. | | | 41,000 | | | 282,792 | |
| | | | | | | |
| | | | | | | | |
| Canada - 2.9% | | | | | | | |
| Encana Corp. | | | 32,100 | | | 244,260 | |
| MacDonald Dettwiler & Associates Ltd. | | | 6,500 | | | 387,435 | |
| National Bank of Canada | | | 14,300 | | | 473,641 | |
| | | | | | | |
| | | | | | | 1,105,336 | |
| Denmark - 1.0% | | | | | | | |
| Carlsberg AS, Class B (A) | | | 4,667 | | | 381,834 | |
| | | | | | | |
| | | | | | | | |
| Finland - 1.9% | | | | | | | |
| Sampo Oyj, Class A (A) | | | 15,134 | | | 738,339 | |
| | | | | | | |
| | | | | | | | |
| France - 9.0% | | | | | | | |
| BNP Paribas S.A. (A) | | | 9,998 | | | 606,424 | |
| Cap Gemini S.A. (A) | | | 8,332 | | | 741,013 | |
| Iliad S.A. (A) | | | 1,320 | | | 277,343 | |
| Total S.A. (A) | | | 8,038 | | | 389,517 | |
| Valeo S.A. (A) | | | 4,958 | | | 765,561 | |
| Vinci S.A. (A) | | | 9,931 | | | 669,357 | |
| | | | | | | |
| | | | | | | 3,449,215 | |
| Germany - 2.8% | | | | | | | |
| Bayer AG (A) | | | 8,132 | | | 1,085,460 | |
| | | | | | | |
| | | | | | | | |
| Ireland - 4.2% | | | | | | | |
| James Hardie Industries PLC (A) | | | 29,658 | | | 387,196 | |
| Ryanair Holdings PLC, ADR | | | 4,368 | | | 341,534 | |
| Shire PLC (A) | | | 11,539 | | | 873,769 | |
| | | | | | | |
| | | | | | | 1,602,499 | |
| Israel - 2.1% | | | | | | | |
| Teva Pharmaceutical Industries Ltd., ADR | | | 13,755 | | | 814,158 | |
| | | | | | | |
| | | | | | | | |
| Italy - 2.1% | | | | | | | |
| Atlantia SpA (A) | | | 14,204 | | | 393,814 | |
| Azimut Holding SpA (A) | | | 16,843 | | | 404,431 | |
| | | | | | | |
| | | | | | | 798,245 | |
| Japan - 19.0% | | | | | | | |
| ABC-Mart Inc. (A) | | | 4,300 | | | 239,534 | |
| Daiwa House Industry Co. Ltd. (A) | | | 42,900 | | | 1,120,119 | |
| Don Quijote Holdings Co. Ltd. (A) | | | 22,600 | | | 828,644 | |
| Isuzu Motors Ltd. (A) | | | 30,200 | | | 350,974 | |
| Japan Tobacco Inc. (A) | | | 14,700 | | | 507,842 | |
| KDDI Corp. (A) | | | 28,900 | | | 698,104 | |
| Makita Corp. (A) | | | 6,100 | | | 332,669 | |
| Seven & I Holdings Co. Ltd. (A) | | | 15,500 | | | 700,412 | |
| SoftBank Group Corp. (A) | | | 10,700 | | | 595,564 | |
| Sony Corp. (A) | | | 22,100 | | | 626,770 | |
| Sumitomo Mitsui Financial Group Inc. (A) | | | 22,100 | | | 878,625 | |
| United Arrows Ltd. (A) | | | 9,100 | | | 391,709 | |
| | | | | | | |
| | | | | | | 7,270,966 | |
| Luxembourg - 0.7% | | | | | | | |
| RTL Group S.A.* (A) | | | 3,297 | | | 285,066 | |
| | | | | | | |
| | | | | | | | |
| Netherlands - 2.9% | | | | | | | |
| Koninklijke KPN N.V. (A) | | | 101,075 | | | 370,147 | |
| Wolters Kluwer N.V. (A) | | | 21,469 | | | 725,148 | |
| | | | | | | |
| | | | | | | 1,095,295 | |
| Norway - 1.4% | | | | | | | |
| Telenor ASA (A) | | | 27,946 | | | 526,004 | |
| | | | | | | |
| | | | | | | | |
| Philippines - 0.9% | | | | | | | |
| Alliance Global Group Inc. (A) | | | 868,600 | | | 337,297 | |
| | | | | | | |
| | | | | | | | |
| Spain - 1.1% | | | | | | | |
| Red Electrica Corp. S.A. (A) | | | 4,568 | | | 402,549 | |
| | | | | | | |
| | | | | | | | |
| Sweden - 3.9% | | | | | | | |
| Assa Abloy AB, Class B (A) | | | 37,914 | | | 751,928 | |
| Swedbank AB, Class A (A) | | | 32,427 | | | 743,906 | |
| | | | | | | |
| | | | | | | 1,495,834 | |
| Switzerland - 7.1% | | | | | | | |
| Credit Suisse Group AG* (A) | | | 17,375 | | | 432,667 | |
| Novartis AG (A) | | | 18,791 | | | 1,703,705 | |
| Wolseley PLC (A) | | | 10,207 | | | 599,031 | |
| | | | | | | |
| | | | | | | 2,735,403 | |
| Taiwan - 1.6% | | | | | | | |
| Taiwan Semiconductor Manufacturing Co. Ltd., ADR | | | 28,500 | | | 625,860 | |
| | | | | | | |
| | | | | | | | |
| Thailand - 0.6% | | | | | | | |
| Krung Thai Bank PCL | | | 447,500 | | | 215,147 | |
| | | | | | | |
| | | | | | | | |
| Turkey - 1.0% | | | | | | | |
| Turkcell Iletisim Hizmetleri AS (A) | | | 92,098 | | | 366,314 | |
| | | | | | | |
| | | | | | | | |
| United Kingdom - 21.4% | | | | | | | |
| Aon PLC | | | 5,845 | | | 545,397 | |
| BG Group PLC (A) | | | 27,724 | | | 436,698 | |
| BHP Billiton PLC (A) | | | 20,588 | | | 329,266 | |
| British American Tobacco PLC (A) | | | 18,033 | | | 1,070,354 | |
| Direct Line Insurance Group PLC (A) | | | 57,006 | | | 346,133 | |
| Informa PLC (A) | | | 62,246 | | | 543,826 | |
| International Consolidated Airlines Group S.A.* (A) | | | 21,741 | | | 194,724 | |
| Lloyds Banking Group PLC (A) | | | 616,823 | | | 699,891 | |
| Provident Financial PLC (A) | | | 10,330 | | | 551,761 | |
| Prudential PLC (A) | | | 47,223 | | | 1,102,230 | |
| RELX PLC (A) | | | 37,948 | | | 678,324 | |
| Rexam PLC (A) | | | 69,101 | | | 574,604 | |
| Royal Dutch Shell PLC, Class A (A) | | | 24,146 | | | 627,031 | |
| Unilever PLC (A) | | | 11,684 | | | 518,880 | |
| | | | | | | |
| | | | | | | 8,219,119 | |
| | | | | | | |
Total Common Stocks | | | | | | | |
(Cost $31,753,705) | | | | | | 36,439,554 | |
| | | | | | | | |
| SHORT-TERM INVESTMENTS - 4.0% | | | | | | | |
| | | | | | | | |
| United States - 4.0% | | | | | | | |
| State Street Institutional U.S. Government | | | | | | | |
| Money Market Fund, Premier Class | | | 1,543,236 | | | 1,543,236 | |
| | | | | | | |
| | | | | | | | |
Total Short-Term Investments | | | | | | | |
(Cost $1,543,236 ) | | | | | | 1,543,236 | |
| | | | | | | |
| | | | | | | | |
| TOTAL INVESTMENTS - 99.1% (Cost $33,296,941**) | | | | | | 37,982,790 | |
| NET OTHER ASSETS AND LIABILITIES - 0.9% | | | | | | 346,854 | |
| | | | | | | |
| TOTAL NET ASSETS - 100.0% | | | | | $ | 38,329,644 | |
| | | | | | | |
| * | | Non-income producing. |
| ** | | Aggregate cost for Federal tax purposes was $33,654,270. |
| (A) | | Due to events that occurred between the close of the exchange on which this security is traded and that of the New York Stock Exchange, fair value was determined for this security using methods determined in good faith by or at the discretion of the Board of Trustees (see Note 2). |
| ADR | | American Depositary Receipt. |
| PCL | | Public Company Limited. |
| PLC | | Public Limited Company. |
| SECTOR ALLOCATION AS A PERCENTAGE OF NET ASSETS AS OF 10/31/15 |
| Consumer Discretionary | | 14.2% |
| Consumer Staples | | 11.2% |
| Energy | | 5.9% |
| Financials | | 25.5% |
| Health Care | | 12.4% |
| Industrials | | 10.5% |
| Information Technology | | 3.6% |
| Materials | | 3.4% |
| Money Market Funds | | 4.0% |
| Telecommunication Services | | 7.4% |
| Utilities | | 1.0% |
| Net Other Assets and Liabilities | | 0.9% |
| See accompanying Notes to Financial Statements. |
| | | |
| |
| 41 |
| Madison Funds | October 31, 2015 |
| |
| Madison Hansberger International Growth Fund Portfolio of Investments |
| | | | Shares | | Value (Note 2) | |
| | | | | | |
| COMMON STOCKS - 112.0% | | | | | | | |
| | | | | | | | |
| Canada - 5.7% | | | | | | | |
| Cameco Corp. | | | 39,300 | | $ | 556,881 | |
| Canadian Pacific Railway Ltd. | | | 4,500 | | | 632,250 | |
| Manulife Financial Corp. | | | 43,200 | | | 716,688 | |
| | | | | | | |
| | | | | | | 1,905,819 | |
| | | | | | | | |
| China - 14.5% | | | | | | | |
| Alibaba Group Holding Ltd., ADR * | | | 11,000 | | | 922,130 | |
| China Longyuan Power Group Corp., Class H (A) | | | 504,000 | | | 460,349 | |
| CITIC Securities Co. Ltd., Class H (A) | | | 310,500 | | | 668,466 | |
| Hengan International Group Co. Ltd. (A) | | | 46,510 | | | 499,574 | |
| Ping An Insurance Group Co. of China Ltd., Class H (A) | | | 164,442 | | | 920,868 | |
| Tencent Holdings Ltd. (A) | | | 73,833 | | | 1,381,856 | |
| | | | | | | |
| | | | | | | 4,853,243 | |
| | | | | | | | |
| Denmark - 1.5% | | | | | | | |
| Novo Nordisk AS, Class B (A) | | | 9,425 | | | 499,277 | |
| | | | | | | |
| | | | | | | | |
| France - 7.5% | | | | | | | |
| Christian Dior SE (A) | | | 1,782 | | | 350,270 | |
| Hermes International (A) | | | 935 | | | 359,699 | |
| Iliad S.A. (A) | | | 1,642 | | | 344,998 | |
| Pernod Ricard S.A. (A) | | | 3,141 | | | 369,722 | |
| Safran S.A. (A) | | | 5,041 | | | 382,553 | |
| Zodiac Aerospace (A) | | | 27,368 | | | 692,048 | |
| | | | | | | |
| | | | | | | 2,499,290 | |
| | | | | | | | |
| Germany - 7.2% | | | | | | | |
| Bayer AG (A) | | | 2,862 | | | 382,020 | |
| Continental AG (A) | | | 2,124 | | | 510,660 | |
| Fresenius SE & Co. KGaA (A) | | | 11,873 | | | 871,123 | |
| KUKA AG (A) | | | 7,588 | | | 641,144 | |
| | | | | | | |
| | | | | | | 2,404,947 | |
| | | | | | | | |
| Hong Kong - 2.8% | | | | | | | |
| AIA Group Ltd. (A) | | | 161,800 | | | 943,764 | |
| | | | | | | |
| | | | | | | | |
| India - 5.6% | | | | | | | |
| Dr Reddy’s Laboratories Ltd., ADR | | | 11,400 | | | 738,606 | |
| HDFC Bank Ltd., ADR | | | 11,800 | | | 721,452 | |
| Larsen & Toubro Ltd., GDR (A) | | | 19,904 | | | 425,123 | |
| | | | | | | |
| | | | | | | 1,885,181 | |
| | | | | | | | |
| Indonesia - 1.4% | | | | | | | |
| Bank Mandiri Persero Tbk PT (A) | | | 714,000 | | | 451,507 | |
| | | | | | | |
| | | | | | | | |
| Ireland - 2.3% | | | | | | | |
| Kerry Group PLC, Class A (A) | | | 5,082 | | | 412,740 | |
| Kingspan Group PLC (A) | | | 14,977 | | | 362,486 | |
| | | | | | | |
| | | | | | | 775,226 | |
| Japan - 20.8% | | | | | | | |
| CyberAgent Inc. (A) | | | 20,900 | | | 856,942 | |
| Keyence Corp. (A) | | | 1,960 | | | 1,017,281 | |
| Nidec Corp. (A) | | | 16,301 | | | 1,224,800 | |
| Nomura Holdings Inc. (A) | | | 154,090 | | | 965,383 | |
| Seven & I Holdings Co. Ltd. (A) | | | 12,953 | | | 585,319 | |
| SoftBank Group Corp. (A) | | | 17,492 | | | 973,608 | |
| Toyota Motor Corp. (A) | | | 21,583 | | | 1,321,540 | |
| | | | | | | |
| | | | | | | 6,944,873 | |
| | | | | | | | |
| Mexico - 3.2% | | | | | | | |
| Grupo Financiero Banorte S.A.B. de C.V., | | | | | | | |
| Class O | | | 97,400 | | | 521,443 | |
| Grupo Mexico S.A.B. de C.V. | | | 228,100 | | | 555,964 | |
| | | | | | | |
| | | | | | | 1,077,407 | |
| | | | | | | | |
| Netherlands - 4.2% | | | | | | | |
| ASML Holding N.V. | | | 7,523 | | | 698,059 | |
| NXP Semiconductors N.V. * | | | 8,909 | | | 698,020 | |
| | | | | | | |
| | | | | | | 1,396,079 | |
| | | | | | | | |
| Norway - 1.0% | | | | | | | |
| Telenor ASA (A) | | | 18,072 | | | 340,154 | |
| | | | | | | |
| | | | | | | | |
| Singapore - 2.0% | | | | | | | |
| DBS Group Holdings Ltd. (A) | | | 54,395 | | | 669,749 | |
| | | | | | | |
| | | | | | | | |
| South Korea - 4.2% | | | | | | | |
| Amorepacific Corp. (A) | | | 1,642 | | | 540,521 | |
| LG Household & Health Care Ltd. (A) | | | 1,063 | | | 879,573 | |
| | | | | | | |
| | | | | | | 1,420,094 | |
| | | | | | | | |
| Spain - 1.2% | | | | | | | |
| Grifols S.A. (A) | | | 8,314 | | | 385,316 | |
| | | | | | | |
| | | | | | | | |
| Sweden - 1.9% | | | | | | | |
| Hexagon AB, Class B shares (A) | | | 17,994 | | | 622,909 | |
| | | | | | | |
| | | | | | | | |
| Switzerland - 10.4% | | | | | | | |
| Cie Financiere Richemont S.A. (A) | | | 5,624 | | | 481,031 | |
| Credit Suisse Group AG * (A) | | | 27,351 | | | 681,087 | |
| LafargeHolcim Ltd. * (A) | | | 6,840 | | | 384,683 | |
| Nestle S.A. (A) | | | 4,701 | | | 358,889 | |
| Partners Group Holding AG (A) | | | 1,900 | | | 686,881 | |
| Roche Holding AG (A) | | | 1,246 | | | 337,494 | |
| UBS Group AG (A) | | | 27,337 | | | 545,588 | |
| | | | | | | |
| | | | | | | 3,475,653 | |
| | | | | | | | |
| United Kingdom - 14.6% | | | | | | | |
| Amec Foster Wheeler PLC (A) | | | 49,426 | | | 540,002 | |
| ARM Holdings PLC (A) | | | 37,512 | | | 592,923 | |
| Ashtead Group PLC (A) | | | 42,992 | | | 661,491 | |
| BG Group PLC (A) | | | 29,377 | | | 462,735 | |
| Carnival PLC (A) | | | 14,650 | | | 814,461 | |
| London Stock Exchange Group PLC (A) | | | 13,784 | | | 539,218 | |
| Michael Page International PLC (A) | | | 72,977 | | | 555,362 | |
| Prudential PLC (A) | | | 30,498 | | | 711,852 | |
| | | | | | | |
| | | | | | | 4,878,044 | |
Total Common Stocks | | | | | | | |
(Cost $33,644,477) | | | | | | 37,428,532 | |
| | | | | | | | |
| SHORT-TERM INVESTMENTS - 1.2% | | | | | | | |
| United States - 1.2% | | | | | | | |
| State Street Institutional U.S. Government | | | | | | | |
| Money Market Fund, Premier Class 388,902 | | | 388,902 | | $ | 388,902 | |
| | | | | | | |
| | | | | | | | |
Total Short-Term Investments | | | | | | | |
(Cost $388,902) | | | | | | 388,902 | |
| | | | | | | |
| | | | | | | | |
| TOTAL INVESTMENTS - 113.2% | | | | | | | |
| (Cost $34,033,379**) | | | | | | 37,817,434 | |
| NET OTHER ASSETS AND LIABILITIES - (13.2%) | | | | | | (4,412,412 | ) |
| | | | | | | |
| TOTAL NET ASSETS - 100.0% | | | | | $ | 33,405,022 | |
| | | | | | | |
| * | | Non-income producing. |
| ** | | Aggregate cost for Federal tax purposes was $34,929,061. |
| (A) | | Due to events that occurred between the close of the exchange on which this security is traded and that of the New York Stock Exchange, fair value was determined for this security using methods determined in good faith by or at the discretion of the Board of Trustees (see Note 2). |
| ADR | | American Depositary Receipt. |
| GDR | | Global Depositary Receipt. |
| PLC | | Public Limited Company. |
| See accompanying Notes to Financial Statements. |
| |
| |
| 42 |
| Madison Funds | October 31, 2015 |
| |
| Madison Target Retirement 2020 Fund Portfolio of Investments |
| | | | Shares | | Value (Note 2) | |
| | | | | | |
| INVESTMENT COMPANIES - 100.1% | | | | | | | |
| | | | | | | | |
| Alternative Funds - 2.5% | | | | | | | |
| SPDR Gold Shares* | | | 12,293 | | $ | 1,343,625 | |
| | | | | | | |
| | | | | | | | |
| Bond Funds - 60.6% | | | | | | | |
| Baird Aggregate Bond Fund Institutional Shares | | | 125,308 | | | 1,345,806 | |
| iShares 20+ Year Treasury Bond ETF | | | 6,571 | | | 806,787 | |
| iShares 3-7 Year Treasury Bond ETF † | | | 130,112 | | | 16,122,178 | |
| iShares 7-10 Year Treasury Bond ETF | | | 62,748 | | | 6,715,291 | |
| iShares TIPS Bond Fund ETF | | | 29,054 | | | 3,223,832 | |
| Metropolitan West High Yield Bond Fund Class I | | | 286,110 | | | 2,689,437 | |
| Metropolitan West Total Return Bond Fund Class I | | | 124,151 | | | 1,343,318 | |
| Vanguard Short-Term Corporate Bond ETF | | | 3,354 | | | 267,247 | |
| | | | | | | |
| | | | | | | 32,513,896 | |
| | | | | | | | |
| Foreign Stock Funds - 7.5% | | | | | | | |
| iShares Global Energy ETF | | | 8,385 | | | 266,559 | |
| iShares MSCI EAFE Minimum Volatility ETF | | | 16,231 | | | 1,068,325 | |
| iShares MSCI United Kingdom ETF | | | 30,783 | | | 537,779 | |
| Vanguard FTSE All-World ex-U.S. ETF | | | 11,755 | | | 534,617 | |
| WisdomTree Europe Hedged Equity Fund | | | 17,535 | | | 1,065,777 | |
| WisdomTree Japan Hedged Equity Fund | | | 10,038 | | | 534,925 | |
| | | | | | | |
| | | | | | | 4,007,982 | |
| | | | | | | | |
| Money Market Funds - 2.1% | | | | | | | |
| State Street Institutional U.S. Government | | | | | | | |
| Money Market Fund, Premier Class | | | 1,099,884 | | | 1,099,884 | |
| | | | | | | |
| | | | | | | | |
| Stock Funds - 27.4% | | | | | | | |
| Financial Select Sector SPDR Fund | | | 11,088 | | | 266,999 | |
| iShares Core S&P Mid-Cap ETF | | | 7,416 | | | 1,069,461 | |
| PowerShares Buyback Achievers | | | | | | | |
| Portfolio ETF | | | 45,230 | | | 2,135,308 | |
| Schwab Fundamental U.S. Large Company | | | | | | | |
| Index Fund Institutional Shares | | | 35,374 | | | 535,559 | |
| Schwab U.S. Dividend Equity ETF | | | 27,304 | | | 1,067,586 | |
| SPDR S&P 500 ETF Trust | | | 35,936 | | | 7,472,173 | |
| SPDR S&P Homebuilders ETF | | | 14,892 | | | 532,240 | |
| Vanguard Growth ETF | | | 4,889 | | | 534,319 | |
| Vanguard Health Care ETF | | | 2,034 | | | 266,312 | |
| Vanguard Information Technology ETF | | | 7,255 | | | 801,387 | |
| | | | | | | |
| | | | | | | 14,681,344 | |
| | | | | | | |
| | | | | | | | |
| TOTAL INVESTMENTS - 100.1% | | | | | | | |
| (Cost $49,344,384** ) | | | | | | 53,646,731 | |
| | | | | | | | |
| NET OTHER ASSETS AND LIABILITIES - (0.1%) | | | | | | (28,121 | ) |
| | | | | | | |
| TOTAL NET ASSETS - 100.0% | | | | | $ | 53,618,610 | |
| | | | | | | |
| * | | Non-income producing. |
| † | | The annual report and prospectus for the iShare 3-7 Year Treasury Bond ETF can be found at: http://www.ishares.com/us/library/ financial-legal-tax. |
| ** | | Aggregate cost for Federal tax purposes was $50,079,193. |
| ETF | | Exchange Traded Fund. |
| |
| Madison Target Retirement 2030 Fund Portfolio of Investments |
| | | | Shares | | Value (Note 2) | |
| | | | | | |
| INVESTMENT COMPANIES - 100.1% | | | | | | | |
| | | | | | | | |
| Alternative Funds - 3.1% | | | | | | | |
| SPDR Gold Shares* | | | 22,047 | | $ | 2,409,736 | |
| | | | | | | |
| | | | | | | | |
| Bond Funds - 39.1% | | | | | | | |
| Baird Aggregate Bond Fund Institutional Shares | | | 74,094 | | | 795,773 | |
| iShares 20+ Year Treasury Bond ETF | | | 9,607 | | | 1,179,547 | |
| iShares 3-7 Year Treasury Bond ETF | | | 134,108 | | | 16,617,322 | |
| iShares 7-10 Year Treasury Bond ETF | | | 55,333 | | | 5,921,738 | |
| iShares TIPS Bond Fund ETF | | | 36,104 | | | 4,006,100 | |
| Metropolitan West High Yield Bond Fund Class I | | | 170,656 | | | 1,604,165 | |
| Metropolitan West Total Return Bond Fund Class I | | | 73,684 | | | 797,265 | |
| | | | | | | |
| | | | | | | 30,921,910 | |
| | | | | | | | |
| Foreign Stock Funds - 12.0% | | | | | | | |
| iShares Global Energy ETF | | | 25,048 | | | 796,276 | |
| iShares MSCI EAFE Minimum Volatility ETF | | | 36,295 | | | 2,388,937 | |
| iShares MSCI United Kingdom ETF | | | 45,760 | | | 799,427 | |
| Vanguard FTSE All-World ex-U.S. ETF | | | 34,949 | | | 1,589,481 | |
| WisdomTree Europe Hedged Equity Fund | | | 38,047 | | | 2,312,497 | |
| WisdomTree India Earnings Fund | | | 19,185 | | | 385,618 | |
| WisdomTree Japan Hedged Equity Fund | | | 22,383 | | | 1,192,790 | |
| | | | | | | |
| | | | | | | 9,465,026 | |
| | | | | | | | |
| Money Market Funds - 2.1% | | | | | | | |
| State Street Institutional U.S. Government | | | | | | | |
| Money Market Fund, Premier Class | | | 1,678,588 | | | 1,678,588 | |
| | | | | | | |
| | | | | | | | |
| Stock Funds - 43.8% | | | | | | | |
| iShares Core S&P Mid-Cap ETF | | | 16,621 | | | 2,396,914 | |
| PowerShares Buyback Achievers Portfolio ETF | | | 118,290 | | | 5,584,471 | |
| Schwab Fundamental U.S. Large Company | | | | | | | |
| Index Fund Institutional Shares | | | 52,761 | | | 798,809 | |
| Schwab U.S. Dividend Equity ETF | | | 40,810 | | | 1,595,671 | |
| SPDR S&P 500 ETF Trust | | | 89,783 | | | 18,668,579 | |
| SPDR S&P Homebuilders ETF | | | 44,412 | | | 1,587,285 | |
| Vanguard Financials ETF | | | 8,175 | | | 400,820 | |
| Vanguard Growth ETF | | | 7,307 | | | 798,582 | |
| Vanguard Health Care ETF | | | 6,079 | | | 795,924 | |
| Vanguard Information Technology ETF | | | 18,071 | | | 1,996,123 | |
| | | | | | | |
| | | | | | | 34,623,178 | |
| | | | | | | |
| | | | | | | | |
| TOTAL INVESTMENTS - 100.1% | | | | | | | |
| (Cost $70,157,376**) | | | | | | 79,098,438 | |
| | | | | | | | |
| NET OTHER ASSETS AND LIABILITIES - (0.1%) | | | | | | (91,513 | ) |
| | | | | | | |
| TOTAL NET ASSETS - 100.0% | | | | | $ | 79,006,925 | |
| | | | | | | |
| * | | Non-income producing. |
| ** | | Aggregate cost for Federal tax purposes was $71,564,106. |
| ETF | | Exchange Traded Fund. |
| See accompanying Notes to Financial Statements. |
| |
| |
| 43 |
| Madison Funds | October 31, 2015 |
| |
| Madison Target Retirement 2040 Fund Portfolio of Investments |
| | | | Shares | | Value (Note 2) | |
| | | | | | |
| | | | | | | | |
| INVESTMENT COMPANIES - 100.4% | | | | | | | |
| | | | | | | | |
| Alternative Funds - 3.0% | | | | | | | |
| SPDR Gold Shares* | | | 13,794 | | $ | 1,507,684 | |
| | | | | | | |
| | | | | | | | |
| Bond Funds - 29.1% | | | | | | | |
| Baird Aggregate Bond Fund Institutional Shares | | | 23,434 | | | 251,679 | |
| iShares 20+ Year Treasury Bond ETF | | | 6,144 | | | 754,360 | |
| iShares 3-7 Year Treasury Bond ETF | | | 60,839 | | | 7,538,560 | |
| iShares 7-10 Year Treasury Bond ETF | | | 23,469 | | | 2,511,652 | |
| iShares TIPS Bond Fund ETF | | | 20,385 | | | 2,261,920 | |
| Metropolitan West High Yield Bond Fund Class I | | | 106,680 | | | 1,002,794 | |
| Metropolitan West Total Return Bond Fund Class I | | | 23,218 | | | 251,217 | |
| | | | | | | |
| | | | | | | 14,572,182 | |
| | | | | | | | |
| Foreign Stock Funds - 14.5% | | | | | | | |
| iShares Global Energy ETF | | | 15,682 | | | 498,531 | |
| iShares MSCI EAFE Minimum Volatility ETF | | | 30,354 | | | 1,997,900 | |
| iShares MSCI United Kingdom ETF | | | 28,569 | | | 499,101 | |
| Vanguard FTSE All-World ex-U.S. ETF | | | 27,476 | | | 1,249,609 | |
| WisdomTree Europe Hedged Equity Fund | | | 28,795 | | | 1,750,160 | |
| WisdomTree India Earnings Fund | | | 12,452 | | | 250,285 | |
| WisdomTree Japan Hedged Equity Fund | | | 18,777 | | | 1,000,626 | |
| | | | | | | |
| | | | | | | 7,246,212 | |
| | | | | | | | |
| Money Market Funds - 2.4% | | | | | | | |
| State Street Institutional U.S. Government | | | | | | | |
| Money Market Fund, Premier Class | | | 1,181,736 | | | 1,181,736 | |
| | | | | | | |
| | | | | | | | |
| Stock Funds - 51.4% | | | | | | | |
| iShares Core S&P Mid-Cap ETF | | | 12,134 | | | 1,749,844 | |
| PowerShares Buyback Achievers Portfolio ETF | | | 84,585 | | | 3,993,258 | |
| Schwab Fundamental U.S. Large Company | | | | | | | |
| Index Fund Institutional Shares | | | 49,616 | | | 751,183 | |
| Schwab U.S. Dividend Equity ETF | | | 38,296 | | | 1,497,374 | |
| SPDR S&P 500 ETF Trust † | | | 62,411 | | | 12,977,119 | |
| SPDR S&P Homebuilders ETF | | | 27,890 | | | 996,789 | |
| Vanguard Financials ETF | | | 10,173 | | | 498,782 | |
| Vanguard Growth ETF | | | 6,857 | | | 749,401 | |
| Vanguard Health Care ETF | | | 5,706 | | | 747,087 | |
| Vanguard Information Technology ETF | | | 15,823 | | | 1,747,809 | |
| | | | | | | |
| | | | | | | 25,708,646 | |
| | | | | | | |
| TOTAL INVESTMENTS - 100.4% | | | | | | | |
| (Cost $43,088,431**) | | | | | | 50,216,460 | |
| | | | | | | | |
| NET OTHER ASSETS AND LIABILITIES - (0.4%) | | | | | | (187,046 | ) |
| | | | | | | |
| TOTAL NET ASSETS - 100.0% | | | | | $ | 50,029,414 | |
| | | | | | | |
| * | | Non-income producing. |
| † | | The annual report and prospectus for the SPDR S&P 500 ETF Trust can be found at: http://www.spdrs.com/product/fund.seam?ticker=spy. |
| ** | | Aggregate cost for Federal tax purposes was $44,032,210. |
| ETF | | Exchange Traded Fund. |
| |
| Madison Target Retirement 2050 Fund Portfolio of Investments |
| | | | Shares | | Value (Note 2) |
| | | | | | |
| INVESTMENT COMPANIES - 101.6% | | | | | | | |
| | | | | | | | |
| Alternative Funds - 3.0% | | | | | | | |
| SPDR Gold Shares* | | | 5,650 | | $ | 617,545 | |
| | | | | | | |
| | | | | | | | |
| Bond Funds - 19.1% | | | | | | | |
| iShares 20+ Year Treasury Bond ETF | | | 2,517 | | | 309,037 | |
| iShares 3-7 Year Treasury Bond ETF | | | 14,950 | | | 1,852,455 | |
| iShares 7-10 Year Treasury Bond ETF | | | 4,807 | | | 514,445 | |
| iShares TIPS Bond Fund ETF | | | 7,417 | | | 822,990 | |
| Metropolitan West High Yield Bond Fund Class I | | | 43,842 | | | 412,116 | |
| | | | | | | |
| | | | | | | 3,911,043 | |
| Foreign Stock Funds - 17.0% | | | | | | | |
| iShares Global Energy ETF | | | 6,424 | | | 204,219 | |
| iShares MSCI EAFE Minimum Volatility ETF | | | 15,542 | | | 1,022,975 | |
| iShares MSCI United Kingdom ETF | | | 17,525 | | | 306,162 | |
| Vanguard FTSE All-World ex-U.S. ETF | | | 13,506 | | | 614,253 | |
| WisdomTree Europe Hedged Equity Fund | | | 13,480 | | | 819,314 | |
| WisdomTree India Earnings Fund | | | 5,100 | | | 102,510 | |
| WisdomTree Japan Hedged Equity Fund | | | 7,691 | | | 409,853 | |
| | | | | | | |
| | | | | | | 3,479,286 | |
| | | | | | | | |
| Money Market Funds - 3.6% | | | | | | | |
| State Street Institutional U.S. Government | | | | | | | |
| Money Market Fund, Premier Class | | | 737,677 | | | 737,677 | |
| | | | | | | |
| | | | | | | | |
| Stock Funds - 58.9% | | | | | | | |
| iShares Core S&P Mid-Cap ETF | | | 5,680 | | | 819,113 | |
| Market Vectors Agribusiness ETF | | | 4,223 | | | 204,731 | |
| PowerShares Buyback Achievers Portfolio ETF | | | 34,647 | | | 1,635,685 | |
| Schwab Fundamental U.S. Large Company Index Fund Institutional Shares | | | 27,098 | | | 410,265 | |
| Schwab U.S. Dividend Equity ETF | | | 20,916 | | | 817,816 | |
| SPDR S&P 500 ETF Trust † | | | 27,528 | | | 5,723,897 | |
| SPDR S&P Homebuilders ETF | | | 11,424 | | | 408,294 | |
| Vanguard Financials ETF | | | 6,250 | | | 306,437 | |
| Vanguard Growth ETF | | | 3,745 | | | 409,291 | |
| Vanguard Health Care ETF | | | 3,117 | | | 408,109 | |
| Vanguard Information Technology ETF | | | 8,336 | | | 920,794 | |
| | | | | | | |
| | | | | | | 12,064,432 | |
| | | | | | | |
| | | | | | | | |
| TOTAL INVESTMENTS - 101.6% | | | | | | | |
| (Cost $18,382,925**) | | | | | | 20,809,983 | |
| NET OTHER ASSETS AND LIABILITIES - (1.6%) | | | | | | (327,810 | ) |
| | | | | | | |
| TOTAL NET ASSETS - 100.0% | | | | | $ | 20,482,173 | |
| | | | | | | |
| * | | Non-income producing. |
| † | | The annual report and prospectus for the SPDR S&P 500 ETF Trust can be found at: http://www.spdrs.com/product/fund. seam?ticker=spy. |
| ** | | Aggregate cost for Federal tax purposes was $18,800,081. |
| ETF | | Exchange Traded Fund. |
| See accompanying Notes to Financial Statements. |
| |
| |
| 44 |
Madison Funds | October 31, 2015
| |
| Statements of Assets and Liabilities as of October 31, 2015 |
| | | | | | | | | | | | | | | | | |
| | | Conservative
Allocation
Fund | | Moderate
Allocation
Fund | | Aggressive
Allocation
Fund | | Cash
Reserves
Fund | | | Tax-Free
Virginia
Fund | | Tax-Free
National
Fund | | High Quality
Bond
Fund | | Core
Bond
Fund |
| Assets: | | | | | | | | | | | | | | | | | |
| Investments in securities, at cost: | | | | | | | | | | | | | | | | | |
| Unaffiliated issuers | | $ 44,305,696 | | $ 86,030,921 | | $36,232,574 | | $18,735,921 | | | $21,394,098 | | $25,832,587 | | $100,628,145 | | $217,500,787 |
| Affiliated issuers1 | | 29,952,643 | | 52,119,149 | | 21,563,771 | | – | | | – | | – | | – | | – |
| Net unrealized appreciation | | | | | | | | | | | | | | | | | |
| Unaffiliated issuers | | 261,176 | | 974,717 | | 544,930 | | – | | | 771,754 | | 1,352,026 | | 957,397 | | 3,565,780 |
| Affiliated issuers1 | | 1,220,378 | | 6,868,891 | | 3,516,750 | | – | | | – | | – | | – | | – |
| Total investments, at value | | 75,739,893 | | 145,993,678 | | 61,858,025 | | 18,735,921 | | | 22,165,852 | | 27,184,613 | | 101,585,542 | | 221,066,567 |
| Cash | | – | | – | | – | | 500,000 | | | 232,337 | | 266,865 | | – | | 893,028 |
| Receivables: | | | | | | | | | | | | | | | | | |
| Investments sold | | – | | – | | – | | – | | | – | | – | | 452,026 | | 1,008,091 |
| Fund shares sold | | 72,884 | | 80,991 | | 16,683 | | 1,799 | | | 50 | | 8,242 | | 23,378 | | 3,304 |
| Dividends and interest | | 53,778 | | 58,975 | | 12,502 | | 76,885 | | | 279,995 | | 319,423 | | 682,571 | | 1,958,774 |
| Due from Adviser | | – | | – | | – | | 7,511 | | | – | | – | | – | | – |
| Variation margin receivable | | – | | – | | – | | – | | | – | | – | | – | | 615 |
| Total assets | | 75,866,555 | | 146,133,644 | | 61,887,210 | | 19,322,116 | | | 22,678,234 | | 27,779,143 | | 102,743,517 | | 224,930,379 |
| Liabilities: | | | | | | | | | | | | | | | | | |
| Payables: | | | | | | | | | | | | | | | | | |
| Investments purchased | | – | | – | | – | | – | | | – | | – | | – | | 499,510 |
| Fund shares repurchased | | 5,969 | | 23,360 | | 24,984 | | 2,810 | | | 1,245 | | 9,079 | | 149,005 | | 141,401 |
| Advisory agreement fees | | 12,807 | | 24,570 | | 10,339 | | 6,579 | | | 9,618 | | 11,784 | | 26,328 | | 95,058 |
| Service agreement fees | | 16,009 | | 30,712 | | 12,924 | | 2,774 | | | 6,732 | | 8,249 | | 16,675 | | 28,366 |
| Distribution fees - Class B | | 6,419 | | 18,576 | | 7,783 | | 149 | | | – | | – | | – | | 1,921 |
| Distribution fees - Class C | | 12,382 | | 5,943 | | 1,629 | | – | | | – | | – | | – | | – |
| Shareholder servicing fees | | 15,999 | | 30,693 | | 12,922 | | – | | | – | | – | | – | | 7,636 |
| Dividends | | – | | – | | – | | – | | | 1,267 | | 5,922 | | – | | 277,607 |
| Options written, at value (premium received $9,225) (Note 6) | | – | | – | | – | | – | | | – | | – | | – | | 20,313 |
| Total liabilities | | 69,585 | | 133,854 | | 70,581 | | 12,312 | | | 18,862 | | 35,034 | | 192,008 | | 1,071,812 |
| Net Assets | | $ 75,796,970 | | $145,999,790 | | $61,816,629 | | $19,309,804 | | | $22,659,372 | | $27,744,109 | | $102,551,509 | | $223,858,567 |
| Net Assets consist of: | | | | | | | | | | | | | | | | | |
| Paid-in capital | | $ 72,435,723 | | $131,262,857 | | $53,526,705 | | $19,309,826 | | | $21,814,121 | | $26,225,365 | | $101,151,344 | | $218,404,747 |
| Accumulated undistributed net investment income (loss) | | 56,082 | | 393,328 | | 15,070 | | – | | | 3,700 | | 4,472 | | 96,596 | | 44,769 |
Accumulated net realized gain (loss) on investments sold and foreign currency related transactions | | 1,823,611 | | 6,499,997 | | 4,213,174 | | (22 | ) | | 69,797 | | 162,246 | | 346,172 | | 1,853,749 |
Net unrealized appreciation of investments (including appreciation (depreciation) of foreign currency related transactions) | | 1,481,554 | | 7,843,608 | | 4,061,680 | | – | | | 771,754 | | 1,352,026 | | 957,397 | | 3,555,302 |
| Net Assets | | $ 75,796,970 | | $145,999,790 | | $61,816,629 | | $19,309,804 | | | $22,659,372 | | $27,744,109 | | $102,551,509 | | $223,858,567 |
| Class A Shares: | | | | | | | | | | | | | | | | | |
| Net Assets | | $ 46,039,076 | | $107,042,875 | | $46,834,314 | | $19,075,910 | | | | | | | | | $ 32,822,558 |
| Shares of beneficial interest outstanding | | 4,331,112 | | 9,210,173 | | 3,944,472 | | 19,075,922 | | | | | | | | | 3,251,376 |
| Net Asset Value and redemption price per share | | $ 10.63 | | $ 11.62 | | $ 11.87 | | $ 1.00 | | | | | | | | | $ 10.09 |
| Sales charge of offering price2 | | 0.65 | | 0.71 | | 0.72 | | – | | | | | | | | | 0.48 |
| Maximum offering price per share | | $ 11.28 | | $ 12.33 | | $ 12.59 | | $ 1.00 | | | | | | | | | $ 10.57 |
| Class B Shares: | | | | | | | | | | | | | | | | | |
| Net Assets | | $ 10,064,020 | | $ 29,450,533 | | $12,382,566 | | $ 233,894 | | | | | | | | | $ 2,929,318 |
| Shares of beneficial interest outstanding | | 941,688 | | 2,555,421 | | 1,062,570 | | 233,882 | | | | | | | | | 290,024 |
| Net Asset Value and redemption price per share3 | | $ 10.69 | | $ 11.52 | | $ 11.65 | | $ 1.00 | | | | | | | | | $ 10.10 |
| Class C Shares: | | | | | | | | | | | | | | | | | |
| Net Assets | | $ 19,693,874 | | $ 9,506,382 | | $ 2,599,749 | | | | | | | | | | | |
| Shares of beneficial interest outstanding | | 1,841,617 | | 824,377 | | 222,950 | | | | | | | | | | | |
| Net Asset Value and redemption price per share3 | | $ 10.69 | | $ 11.53 | | $ 11.66 | | | | | | | | | | | |
| Class Y Shares: | | | | | | | | | | | | | | | | | |
| Net Assets | | | | | | | | | | | $22,659,372 | | $27,744,109 | | $102,551,509 | | $186,414,012 |
| Shares of beneficial interest outstanding | | | | | | | | | | | 1,952,237 | | 2,518,994 | | 9,286,871 | | 18,519,348 |
| Net Asset Value and redemption price per share3 | | | | | | | | | | | $ 11.61 | | $ 11.01 | | $ 11.04 | | $ 10.07 |
| Class R6 Shares: | | | | | | | | | | | | | | | | | |
| Net Assets | | | | | | | | | | | | | | | | | $ 1,692,679 |
| Shares of beneficial interest outstanding | | | | | | | | | | | | | | | | | 167,753 |
| Net Asset Value and redemption price per share3 | | | | | | | | | | | | | | | | | $ 10.09 |
| |
| 1 | See Note 12 for information on affiliated issuers. |
| 2 | Sales charge of offering price is 5.75% for the Conservative Allocation, Moderate Allocation, and Aggressive Allocation Funds and 4.50% for the Core Bond Fund. |
| 3 | If applicable, redemption price per share may be reduced by a contingent deferred sales charge. |
See accompanying Notes to Financial Statements.
45
Madison Funds | October 31, 2015
| |
| Statements of Assets and Liabilities as of October 31, 2015 |
| | | | | | | | | | | | | | | | | | | |
| | | Corporate
Bond
Fund | | High
Income
Fund | | | Diversified
Income
Fund | | Covered Call &
Equity
Income
Fund | | | Dividend
Income
Fund | | Large Cap
Value
Fund | | Investors
Fund | | | Large Cap
Growth
Fund |
| Assets: | | | | | | | | | | | | | | | | | | | |
| Investments in securities, at cost: | | | | | | | | | | | | | | | | | | | |
| Unaffiliated issuers | | $ 23,230,695 | | $26,184,954 | | | $127,204,550 | | $ 98,550,870 | | | $17,100,763 | | $159,901,682 | | $ 98,965,033 | | | $150,355,268 |
| Net unrealized appreciation (depreciation) | | | | | | | | | | | | | | | | | | | |
| Unaffiliated issuers | | 182,759 | | (1,278,692 | ) | | 19,264,052 | | (6,488,372 | ) | | 3,806,455 | | 17,370,904 | | 19,546,530 | | | 22,792,663 |
| Total investments at value | | 23,413,454 | | 24,906,262 | | | 146,468,602 | | 92,062,498 | | | 20,907,218 | | 177,272,586 | | 118,511,563 | | | 173,147,931 |
Foreign currency (cost of $15,682, $4, and $44, respectively) (Note 2) | | – | | – | | | – | | – | | | – | | – | | – | | | – |
| Receivables: | | | | | | | | | | | | | | | | | | | |
| Investments sold | | – | | 217,581 | | | 160,667 | | – | | | – | | – | | 260,995 | | | 1,656,150 |
| Fund shares sold | | 30 | | 539 | | | 275,424 | | 299,380 | | | 10,569 | | 113,550 | | 17,852 | | | 100,070 |
| Dividends and interest | | 249,270 | | 426,026 | | | 716,562 | | 52,968 | | | 28,242 | | 47,710 | | 95,964 | | | 96,689 |
| Due from Adviser | | – | | – | | | – | | – | | | 2,592 | | – | | 12,028 | | | – |
| Other assets | | – | | – | | | – | | – | | | – | | 212 | | – | | | 131 |
| Total assets | | 23,662,754 | | 25,550,408 | | | 147,621,255 | | 92,414,846 | | | 20,948,621 | | 177,434,058 | | 118,898,402 | | | 175,000,971 |
| Liabilities: | | | | | | | | | | | | | | | | | | | |
| Payables: | | | | | | | | | | | | | | | | | | | |
| Investments purchased | | – | | – | | | 124,878 | | – | | | – | | – | | 433,365 | | | – |
| Fund shares repurchased | | 49,185 | | 20,567 | | | 106,592 | | 44,934 | | | 5,058 | | 73,480 | | 75,620 | | | 9,767 |
| Advisory agreement fees | | 8,340 | | 11,842 | | | 80,160 | | 63,296 | | | 12,958 | | 81,824 | | 72,000 | | | 107,536 |
| Service agreement fees | | 5,212 | | 4,306 | | | 24,665 | | 10,869 | | | 6,047 | | 53,558 | | 32,755 | | | 28,676 |
| Distribution fees - Class B | | – | | 1,014 | | | 8,456 | | 5,750 | | | – | | 2,575 | | – | | | 2,810 |
| Distribution fees - Class C | | – | | – | | | 7,892 | | – | | | – | | – | | – | | | – |
| Shareholder servicing fees | | – | | 5,234 | | | 33,907 | | 4,957 | | | – | | 14,235 | | 458 | | | 13,798 |
| Dividends | | 54,902 | | 3,489 | | | 1,062 | | – | | | – | | – | | – | | | – |
| Accrued expenses and other payables | | – | | – | | | – | | – | | | – | | – | | – | | | – |
Options written, at value (premium received $1,916,685) ) (Note 6) | | – | | – | | | – | | 3,213,647 | | | – | | – | | – | | | – |
| Total liabilities | | 117,639 | | 46,452 | | | 387,612 | | 3,343,453 | | | 24,063 | | 225,672 | | 614,198 | | | 162,587 |
| Net Assets | | $ 23,545,115 | | $25,503,956 | | | $147,233,643 | | $ 89,071,393 | | | $20,924,558 | | $177,208,386 | | $118,284,204 | | | $174,838,384 |
| Net Assets consist of: | | | | | | | | | | | | | | | | | | | |
| Paid-in capital | | $ 23,279,768 | | $27,086,788 | | | $124,804,637 | | $ 94,544,431 | | | $16,277,527 | | $139,570,037 | | $ 83,492,641 | | | $120,760,534 |
Accumulated undistributed net investment income (loss) | | 4,848 | | 9,492 | | | – | | – | | | 8,506 | | 860,234 | | 795,675 | | | 1,048,456 |
Accumulated net realized gain (loss) on investments sold and foreign currency related transactions | | 77,740 | | (313,632 | ) | | 3,164,954 | | 2,312,296 | | | 832,070 | | 19,407,211 | | 14,449,358 | | | 30,236,731 |
Net unrealized appreciation (depreciation) of investments (including appreciation (depreciation) of foreign currency related transactions) | | 182,759 | | (1,278,692 | ) | | 19,264,052 | | (7,785,334 | ) | | 3,806,455 | | 17,370,904 | | 19,546,530 | | | 22,792,663 |
| Net Assets | | $ 23,545,115 | | $25,503,956 | | | $147,233,643 | | $ 89,071,393 | | | $20,924,558 | | $177,208,386 | | $118,284,204 | | | $174,838,384 |
| Class A Shares: | | | | | | | | | | | | | | | | | | | |
| Net Assets | | | | $23,154,654 | | | $121,026,153 | | $ 16,041,761 | | | | | $ 63,565,910 | | $ 2,188,553 | | | $ 62,266,241 |
| Shares of beneficial interest outstanding | | | | 3,905,139 | | | 8,207,286 | | 1,755,488 | | | | | 3,891,683 | | 102,743 | | | 2,720,664 |
| Net Asset Value and redemption price per share | | | | $ 5.93 | | | $ 14.75 | | $ 9.14 | | | | | $ 16.33 | | $ 21.30 | | | $ 22.89 |
| Sales charge of offering price1 | | | | 0.28 | | | 0.90 | | 0.56 | | | | | 1.00 | | 1.30 | | | 1.40 |
| Maximum offering price per share | | | | $ 6.21 | | | $ 15.65 | | $ 9.70 | | | | | $ 17.33 | | $ 22.60 | | | $ 24.29 |
| Class B Shares: | | | | | | | | | | | | | | | | | | | |
| Net Assets | | | | $ 1,685,584 | | | $ 13,441,561 | | | | | | | $ 4,095,839 | | | | | $ 4,554,235 |
| Shares of beneficial interest outstanding | | | | 277,192 | | | 906,220 | | | | | | | 255,879 | | | | | 226,211 |
| Net Asset Value and redemption price per share2 | | | | $ 6.08 | | | $ 14.83 | | | | | | | $ 16.01 | | | | | $ 20.13 |
| Class C Shares: | | | | | | | | | | | | | | | | | | | |
| Net Assets | | | | | | | $ 12,765,929 | | $ 9,287,323 | | | | | | | | | | |
| Shares of beneficial interest outstanding | | | | | | | 861,009 | | 1,045,195 | | | | | | | | | | |
| Net Asset Value and redemption price per share2 | | | | | | | $ 14.83 | | $ 8.89 | | | | | | | | | | |
| Class Y Shares: | | | | | | | | | | | | | | | | | | | |
| Net Assets | | $ 23,545,115 | | $ 663,718 | | | | | $ 60,915,817 | | | $20,924,558 | | $109,546,637 | | $109,506,333 | | | $108,017,908 |
| Shares of beneficial interest outstanding | | 2,076,267 | | 113,260 | | | | | 6,570,277 | | | 939,235 | | 6,700,196 | | 5,127,762 | | | 4,674,145 |
| Net Asset Value and redemption price per share2 | | $ 11.34 | | $ 5.86 | | | | | $ 9.27 | | | $ 22.28 | | $ 16.35 | | $ 21.36 | | | $ 23.11 |
| Class R6 Shares: | | | | | | | | | | | | | | | | | | | |
| Net Assets | | | | | | | | | $ 2,826,492 | | | | | | | $ 6,589,318 | | | |
| Shares of beneficial interest outstanding | | | | | | | | | 303,620 | | | | | | | 306,911 | | | |
| Net Asset Value and redemption price per share2 | | | | | | | | | $ 9.31 | | | | | | | $ 21.47 | | | |
| Class I Shares: | | | | | | | | | | | | | | | | | | | |
| Net Assets | | | | | | | | | | | | | | | | | | | |
| Shares of beneficial interest outstanding | | | | | | | | | | | | | | | | | | | |
| Net Asset Value and redemption price per share | | | | | | | | | | | | | | | | | | | |
| 1 | Sales charge of offering price is 4.50% for the High Income Fund and 5.75% for the Diversified Income, Covered Call & Equity Income, Large Cap Value, Investors, Large Cap Growth, Mid Cap, Small Cap and International Stock Funds. |
| 2 | If applicable, redemption price per share may be reduced by a contingent deferred sales charge. |
See accompanying Notes to Financial Statements.
46
Madison Funds | October 31, 2015
| |
| Statements of Assets and Liabilities as of October 31, 2015 |
| | | | | | | | | | | | | | | | | | | | | | | | | |
| | Mid Cap
Fund | | | Small Cap
Fund | | NorthRoad
International
Fund | | | International
Stock
Fund | | | Hansberger
International
Growth
Fund | | | Madison
Target
Retirement
2020 Fund | | | Madison
Target
Retirement
2030 Fund | | | Madison
Target
Retirement
2040 Fund | | | Madison
Target
Retirement
2050 Fund | |
| |
| |
| $ | 185,455,210 | | $ | 76,944,717 | | $ 45,539,472 | | $ | 33,296,941 | | $ | 34,033,379 | | $ | 49,344,384 | | $ | 70,157,376 | | $ | 43,088,431 | | $ | 18,382,925 | |
| |
| | 80,643,248 | | | 9,711,904 | | (1,230,066 | ) | | 4,685,849 | | | 3,784,055 | | | 4,302,347 | | | 8,941,062 | | | 7,128,029 | | | 2,427,058 | |
| | 266,098,458 | | | 86,656,621 | | 44,309,406 | | | 37,982,790 | | | 37,817,434 | | | 53,646,731 | | | 79,098,438 | | | 50,216,460 | | | 20,809,983 | |
| | – | | | – | | 15,654 | | | 4 | | | 44 | | | – | | | – | | | – | | | – | |
| |
| | – | | | 1,156,158 | | 289,025 | | | 317,714 | | | 8,631,769 | | | 526,314 | | | 1,348,223 | | | 550,371 | | | 216,706 | |
| | 98,726 | | | 25,610 | | 954,339 | | | 2,660 | | | 56 | | | 1,090 | | | 188 | | | 658 | | | 1,466 | |
| | 65,433 | | | 31,606 | | 113,714 | | | 169,528 | | | 149,089 | | | 11,877 | | | 7,599 | | | 4,326 | | | 1,547 | |
| | – | | | – | | – | | | – | | | – | | | – | | | – | | | – | | | – | |
| | 135 | | | – | | – | | | – | | | – | | | – | | | – | | | – | | | – | |
| | 266,262,752 | | | 87,869,995 | | 45,682,138 | | | 38,472,696 | | | 46,598,392 | | | 54,186,012 | | | 80,454,448 | | | 50,771,815 | | | 21,029,702 | |
| |
| |
| | – | | | 176,663 | | 209,558 | | | 40,496 | | | 126,755 | | | 553,747 | | | 428,345 | | | 729,830 | | | 542,429 | |
| | 117,802 | | | – | | 2,646 | | | 53,623 | | | 12,810,318 | | | – | | | 998,998 | | | – | | | – | |
| | 165,277 | | | 73,584 | | 30,080 | | | 33,441 | | | 29,020 | | | 11,379 | | | 16,817 | | | 10,476 | | | 4,250 | |
| | 85,296 | | | 18,396 | | 10,593 | | | 9,554 | | | 17,113 | | | 2,276 | | | 3,363 | | | 2,095 | | | 850 | |
| | 2,125 | | | 275 | | – | | | 1,073 | | | – | | | – | | | – | | | – | | | – | |
| | – | | | – | | – | | | – | | | – | | | – | | | – | | | – | | | – | |
| | 12,068 | | | 831 | | – | | | 4,865 | | | – | | | – | | | – | | | – | | | – | |
| | – | | | – | | – | | | – | | | – | | | – | | | – | | | – | | | – | |
| | – | | | – | | – | | | – | | | 210,164 | | | – | | | – | | | – | | | – | |
| | – | | | – | | – | | | – | | | – | | | – | | | – | | | – | | | – | |
| | 382,568 | | | 269,749 | | 252,877 | | | 143,052 | | | 13,193,370 | | | 567,402 | | | 1,447,523 | | | 742,401 | | | 547,529 | |
| $ | 265,880,184 | | $ | 87,600,246 | | $ 45,429,261 | | $ | 38,329,644 | | $ | 33,405,022 | | $ | 53,618,610 | | $ | 79,006,925 | | $ | 50,029,414 | | $ | 20,482,173 | |
| |
| $ | 173,999,949 | | $ | 75,521,878 | | $ 45,876,077 | | $ | 34,370,856 | | $ | 37,965,617 | | $ | 47,661,903 | | $ | 67,984,638 | | $ | 41,113,314 | | $ | 17,643,980 | |
| | (2,336,832 | ) | | 112,311 | | 691,903 | | | 351,817 | | | 129,997 | | | 624,905 | | | 815,924 | | | 522,865 | | | 199,012 | |
| |
| | 13,573,819 | | | 2,254,168 | | 93,134 | | | (1,068,200 | ) | | (8,456,199 | ) | | 1,029,455 | | | 1,265,301 | | | 1,265,206 | | | 212,123 | |
| |
| | 80,643,248 | | | 9,711,889 | | (1,231,853 | ) | | 4,675,171 | | | 3,765,607 | | | 4,302,347 | | | 8,941,062 | | | 7,128,029 | | | 2,427,058 | |
| $ | 265,880,184 | | $ | 87,600,246 | | $ 45,429,261 | | $ | 38,329,644 | | $ | 33,405,022 | | $ | 53,618,610 | | $ | 79,006,925 | | $ | 50,029,414 | | $ | 20,482,173 | |
| |
| $ | 53,999,941 | | $ | 3,434,921 | | | | $ | 21,071,888 | | | | | | | | | | | | | | | | |
| | 6,283,528 | | | 229,256 | | | | | 1,622,655 | | | | | | | | | | | | | | | | |
| $ | 8.59 | | $ | 14.98 | | | | $ | 12.99 | | | | | | | | | | | | | | | | |
| | 0.52 | | | 0.91 | | | | | 0.79 | | | | | | | | | | | | | | | | |
| $ | 9.11 | | $ | 15.89 | | | | $ | 13.78 | | | | | | | | | | | | | | | | |
| |
| $ | 3,401,603 | | $ | 436,706 | | | | $ | 1,691,784 | | | | | | | | | | | | | | | | |
| | 461,073 | | | 30,641 | | | | | 133,453 | | | | | | | | | | | | | | | | |
| $ | 7.38 | | $ | 14.25 | | | | $ | 12.68 | | | | | | | | | | | | | | | | |
| |
| |
| |
| |
| $ | 198,604,620 | | $ | 83,728,619 | | $ 36,216,591 | | $ | 15,565,972 | | $ | 2,510,355 | | | | | | | | | | | | | |
| | 22,434,722 | | | 5,570,336 | | 3,424,971 | | | 1,196,951 | | | 156,047 | | | | | | | | | | | | | |
| $ | 8.85 | | $ | 15.03 | | $ 10.57 | | $ | 13.00 | | $ | 16.09 | | | | | | | | | | | | | |
| |
| $ | 9,874,020 | | | | | $ 9,212,670 | | | | | | | | $ | 53,618,610 | | $ | 79,006,925 | | $ | 50,029,414 | | $ | 20,482,173 | |
| | 1,102,965 | | | | | 863,351 | | | | | | | | | 5,322,333 | | | 7,924,213 | | | 5,054,426 | | | 2,058,253 | |
| $ | 8.95 | | | | | $ 10.67 | | | | | | | | $ | 10.07 | | $ | 9.97 | | $ | 9.90 | | $ | 9.95 | |
| |
| | | | | | | | | | | | $ | 30,894,667 | | | | | | | | | | | | | |
| | | | | | | | | | | | | 1,918,185 | | | | | | | | | | | | | |
| | | | | | | | | | | | $ | 16.11 | | | | | | | | | | | | | |
See accompanying Notes to Financial Statements.
47
Madison Funds | October 31, 2015
| |
| Statements of Operations for the Year Ended October 31, 2015 |
| | | | | | | | | | | | | | | | | | | | | | | | |
| | Conservative
Allocation
Fund | | Moderate
Allocation
Fund | | Aggressive
Allocation
Fund | | Cash
Reserves
Fund | | Tax-Free
Virginia
Fund | | Tax-Free
National
Fund | | High Quality
Bond
Fund | | Core
Bond
Fund | |
| Investment Income: | | | | | | | | | | | | | | | | | | | | | | | | |
| Interest | $ | – | | $ | – | | $ | – | | $ | 17,324 | | $ | 750,967 | | $ | 919,327 | | $ | 1,595,824 | | $ | 6,206,575 | |
| Dividends | | | | | | | | | | | | | | | | | | | | | | | | |
| Unaffiliated issuers | | 920,045 | | | 1,788,641 | | | 679,671 | | | – | | | – | | | – | | | – | | | – | |
| Affiliated issuers1 | | 584,966 | | | 829,556 | | | 280,886 | | | – | | | – | | | – | | | – | | | – | |
| Less: Foreign taxes withheld/reclaimed | | – | | | – | | | – | | | – | | | – | | | – | | | – | | | – | |
| Total investment income | | 1,505,011 | | | 2,618,197 | | | 960,557 | | | 17,324 | | | 750,967 | | | 919,327 | | | 1,595,824 | | | 6,206,575 | |
| Expenses:2 | | | | | | | | | | | | | | | | | | | | | | | | |
| Advisory agreement fees | | 154,756 | | | 301,667 | | | 124,776 | | | 81,491 | | | 113,775 | | | 139,803 | | | 322,301 | | | 1,127,993 | |
| Service agreement fees | | 193,445 | | | 377,084 | | | 155,970 | | | 30,559 | | | 79,643 | | | 97,862 | | | 204,123 | | | 337,622 | |
| Distribution fees - Class B | | 81,775 | | | 238,373 | | | 96,713 | | | 2,154 | | | – | | | – | | | – | | | 23,726 | |
| Distribution fees - Class C | | 147,601 | | | 67,497 | | | 19,513 | | | – | | | – | | | – | | | – | | | – | |
| Shareholder servicing fees - Class A | | 116,944 | | | 275,080 | | | 117,222 | | | – | | | – | | | – | | | – | | | 84,044 | |
| Shareholder servicing fees - Class B | | 27,258 | | | 79,443 | | | 32,237 | | | – | | | – | | | – | | | – | | | 7,906 | |
| Shareholder servicing fees - Class C | | 49,200 | | | 22,499 | | | 6,505 | | | – | | | – | | | – | | | – | | | – | |
| Other expenses | | – | | | – | | | 14 | | | – | | | – | | | 4 | | | 569 | | | 75 | |
| Total expenses before reimbursement/waiver | | 770,979 | | | 1,361,643 | | | 552,950 | | | 114,204 | | | 193,418 | | | 237,669 | | | 526,993 | | | 1,581,366 | |
| Less reimbursement/waiver3 | | – | | | – | | | – | | | (96,880 | ) | | – | | | – | | | – | | | – | |
| Total expenses net of reimbursement/waiver | | 770,979 | | | 1,361,643 | | | 552,950 | | | 17,324 | | | 193,418 | | | 237,669 | | | 526,993 | | | 1,581,366 | |
| Net Investment Income (Loss) | | 734,032 | | | 1,256,554 | | | 407,607 | | | – | | | 557,549 | | | 681,658 | | | 1,068,831 | | | 4,625,209 | |
| Net Realized and Unrealized Gain (Loss) on Investments | | | | | | | | | | | | | | | | | | | | | | | | |
Net realized gain (loss) on investments (including net realized gain (loss) on foreign currency related transactions) | | | | | | | | | | | | | | | | | | | | | | | | |
| Options | | – | | | – | | | – | | | – | | | – | | | – | | | – | | | 148,353 | |
| Futures | | – | | | – | | | – | | | – | | | – | | | – | | | – | | | (332 | ) |
| Unaffiliated issuers | | 831,348 | | | 2,441,060 | | | 1,638,180 | | | – | | | 69,799 | | | 162,253 | | | 346,179 | | | 2,204,062 | |
| Affiliated issuers1 | | 139,646 | | | 852,867 | | | 893,389 | | | – | | | – | | | – | | | – | | | – | |
| Capital gain distributions received from underlying funds | | | | | | | | | | | | | | | | | | | | | | | | |
| Unaffiliated issuers | | 301,709 | | | 845,405 | | | 405,216 | | | – | | | – | | | – | | | – | | | – | |
| Affiliated issuers1 | | 1,211,722 | | | 4,492,837 | | | 2,247,127 | | | – | | | – | | | – | | | – | | | – | |
Net change in unrealized appreciation (depreciation) on investments (including net | | | | | | | | | | | | | | | | | | | | | | | | |
unrealized appreciation (depreciation) on foreign currency related transactions) | | | | | | | | | | | | | | | | | | | | | | | | |
| Options | | – | | | – | | | – | | | – | | | – | | | – | | | – | | | (11,088 | ) |
| Futures | | – | | | – | | | – | | | – | | | – | | | – | | | – | | | 610 | |
| Unaffiliated issuers | | (1,171,630 | ) | | (2,845,335 | ) | | (1,724,088 | ) | | – | | | (110,858 | ) | | (115,237 | ) | | (278,909 | ) | | (3,383,786 | ) |
| Affiliated issuers1 | | (1,472,504 | ) | | (5,185,886 | ) | | (2,939,229 | ) | | – | | | – | | | – | | | – | | | – | |
Net Realized and Unrealized Gain (Loss) on Investments and Option Transactions | | (159,709 | ) | | 600,948 | | | 520,595 | | | – | | | (41,059 | ) | | 47,016 | | | 67,270 | | | (1,042,181 | ) |
| Net Increase (Decrease) in Net Assets from Operations | $ | 574,323 | | $ | 1,857,502 | | $ | 928,202 | | $ | – | | $ | 516,490 | | $ | 728,674 | | $ | 1,136,101 | | $ | 3,583,028 | |
| |
| 1 See Note 12 for information on affiliated issuers. |
| 2 See Note 3 for information on expenses. |
| 3 See Note 3 for more information on these waivers. |
See accompanying Notes to Financial Statements.
48
Madison Funds | October 31, 2015
| |
| Statements of Operations for the Year Ended October 31, 2015 |
| | | | | | | | | | | | | | | | | | | | | | | | | | | | | | | | | | |
| | Corporate
Bond
Fund | | | High
Income
Bond Fund | | Diversified
Income
Bond Fund | | Covered Call &
Equity Income
Fund1 | | Dividend
Income
Fund | | Large Cap
Value
Fund | | Investors
Fund | | Large Cap
Growth
Fund | | Mid
Cap
Fund | | Small
Cap
Fund | | NorthRoad
International
Fund | | International
Stock
Fund | | Hansberger
International
Growth Fund | |
| |
| $ | 854,002 | | $ | 1,741,615 | | $ | 1,758,062 | | $ | 886 | | $ – | | $ | – | | $ – | | $ | – | | $ | – | | $ | – | | $ | – | | $ 1 | | $ – | |
| |
| | – | | | – | | | 2,232,719 | | | 982,119 | | 574,676 | | | 3,222,647 | | 2,105,822 | | | 3,239,380 | | | 1,883,496 | | | 1,264,232 | | | 1,416,296 | | 1,040,412 | | 1,193,624 | |
| | – | | | – | | | – | | | – | | – | | | – | | – | | | – | | | – | | | – | | | – | | – | | – | |
| | – | | | – | | | (13,172 | ) | | – | | (3,291 | ) | | (14,208 | ) | 12,900 | | | (12,776 | ) | | (24,322 | ) | | (1,077 | ) | | (109,649 | ) | (100,584 | ) | (75,226 | ) |
| | 854,002 | | | 1,741,615 | | | 3,977,609 | | | 983,005 | | 571,385 | | | 3,208,439 | | 2,118,722 | | | 3,226,604 | | | 1,859,174 | | | 1,263,155 | | | 1,306,647 | | 939,829 | | 1,118,398 | |
| |
| | 106,900 | | | 156,661 | | | 961,087 | | | 597,983 | | 158,793 | | | 1,079,438 | | 970,407 | | | 1,387,733 | | | 2,044,034 | | | 801,963 | | | 362,381 | | 390,834 | | 453,053 | |
| | 66,813 | | | 56,968 | | | 295,719 | | | 104,123 | | 74,103 | | | 706,541 | | 456,268 | | | 370,062 | | | 1,064,865 | | | 200,490 | | | 127,045 | | 111,667 | | 155,154 | |
| | – | | | 14,117 | | | 106,004 | | | 51,055 | | – | | | 34,068 | | – | | | 35,134 | | | 29,261 | | | 3,688 | | | – | | 13,961 | | – | |
| | – | | | – | | | 91,994 | | | – | | – | | | – | | – | | | – | | | – | | | – | | | – | | – | | – | |
| | – | | | 65,585 | | | 303,439 | | | 36,059 | | – | | | 174,553 | | 4,714 | | | 162,033 | | | 144,410 | | | 9,342 | | | – | | 56,988 | | – | |
| | – | | | 4,706 | | | 35,300 | | | 16,737 | | – | | | 11,319 | | – | | | 11,693 | | | 9,754 | | | 1,229 | | | – | | 4,654 | | – | |
| | – | | | – | | | 30,366 | | | – | | – | | | – | | – | | | – | | | – | | | – | | | – | | – | | – | |
| | – | | | 12 | | | 2 | | | 189 | | – | | | – | | – | | | – | | | – | | | – | | | 813 | | 533 | | 1,397 | |
| | 173,713 | | | 298,049 | | | 1,823,911 | | | 806,146 | | 232,896 | | | 2,005,919 | | 1,431,389 | | | 1,966,655 | | | 3,292,324 | | | 1,016,712 | | | 490,239 | | 578,637 | | 609,604 | |
| | – | | | – | | | – | | | – | | (31,759 | ) | | – | | (163,638 | ) | | – | | | – | | | – | | | – | | – | | – | |
| | 173,713 | | | 298,049 | | | 1,823,911 | | | 806,146 | | 201,137 | | | 2,005,919 | | 1,267,751 | | | 1,966,655 | | | 3,292,324 | | | 1,016,712 | | | 490,239 | | 578,637 | | 609,604 | |
| | 680,289 | | | 1,443,566 | | | 2,153,698 | | | 176,859 | | 370,248 | | | 1,202,520 | | 850,971 | | | 1,259,949 | | | (1,433,150 | ) | | 246,443 | | | 816,408 | | 361,192 | | 508,794 | |
| |
| |
| |
| | – | | | – | | | – | | | 3,475,627 | | – | | | – | | – | | | – | | | – | | | – | | | – | | – | | – | |
| | – | | | – | | | – | | | – | | – | | | – | | – | | | – | | | – | | | – | | | – | | – | | – | |
| | 77,740 | | | (313,632 | ) | | 3,893,229 | | | 2,367,116 | | 830,164 | | | 19,715,065 | | 14,548,492 | | | 30,298,105 | | | 15,183,881 | | | 3,744,598 | | | 141,024 | | 365,802 | | 8,360,702 | |
| | – | | | – | | | – | | | – | | – | | | – | | – | | | – | | | – | | | – | | | – | | – | | – | |
| |
| | – | | | – | | | – | | | – | | – | | | – | | – | | | – | | | – | | | – | | | – | | – | | – | |
| | – | | | – | | | – | | | – | | – | | | – | | – | | | – | | | – | | | – | | | – | | – | | – | |
| |
| |
| | – | | | – | | | – | | | (1,188,546 | ) | – | | | – | | – | | | – | | | – | | | – | | | – | | – | | – | |
| | – | | | – | | | – | | | – | | – | | | – | | – | | | – | | | – | | | – | | | – | | – | | – | |
| | (395,306 | ) | | (1,854,987 | ) | | (4,362,658 | ) | | (5,521,015 | ) | (863,192 | ) | | (22,072,941 | ) | (7,809,747 | ) | | (21,418,198 | ) | | 2,822,289 | | | (991,275 | ) | | (2,600,056 | ) | (805,075 | ) | (6,988,840 | ) |
| | – | | | – | | | – | | | – | | – | | | – | | – | | | – | | | – | | | – | | | – | | – | | – | |
| | (317,566 | ) | | (2,168,619 | ) | | (469,429 | ) | | (866,818 | ) | (33,028 | ) | | (2,357,876 | ) | 6,738,745 | | | 8,879,907 | | | 18,006,170 | | | 2,753,323 | | | (2,459,032 | ) | (439,273 | ) | 1,371,862 | |
| $ | 362,723 | | $ | (725,053 | ) | | $1,684,269 | | $ | (689,959 | ) | $ 337,220 | | $ | (1,155,356 | ) | $ 7,589,716 | | $ | 10,139,856 | | $ | 16,573,020 | | $ | 2,999,766 | | $ | (78,081 | ) | $ (1,642,624 | ) | $ 1,880,656 | |
See accompanying Notes to Financial Statements.
49
Madison Funds | October 31, 2015
| |
| Statements of Operations for the Year Ended October 31, 2015 |
| | | | | | | | | | | | |
| | | Madison
Target
Retirement 2020 Fund | | Madison
Target
Retirement
2030 Fund | | Madison
Target
Retirement
2040 Fund | | Madison
Target
Retirement
2050 Fund | |
| Investment Income: | | | | | | | | | | | | |
| Interest | $ | – | | $ | – | | $ | – | | $ | – | |
| Dividends | | | | | | | | | | | | |
| Unaffiliated issuers | | 1,051,917 | | | 1,482,859 | | | 1,007,040 | | | 391,132 | |
| Less: Foreign taxes withheld | | – | | | – | | | – | | | – | |
| Total investment income | | 1,051,917 | | | 1,482,859 | | | 1,007,040 | | | 391,132 | |
| Expenses: | | | | | | | | | | | | |
| Advisory agreement fees | | 149,527 | | | 207,327 | | | 139,947 | | | 53,995 | |
| Service agreement fees | | 29,905 | | | 41,465 | | | 27,990 | | | 10,799 | |
| Other expenses | | 6 | | | 8 | | | 48 | | | 8 | |
| Total expenses before reimbursement/waiver | | 179,438 | | | 248,800 | | | 167,985 | | | 64,802 | |
| Less reimbursement/waiver | | – | | | – | | | – | | | – | |
| Total expenses net of reimbursement/waiver | | 179,438 | | | 248,800 | | | 167,985 | | | 64,802 | |
| Net Investment Income | | 872,479 | | | 1,234,059 | | | 839,055 | | | 326,330 | |
| Net Realized and Unrealized Gain (Loss) on Investments | | | | | | | | | | | | |
Net realized gain on investments (including net realized gain on foreign currency related transactions) | | | | | | | | | | | | |
| Unaffiliated issuers | | 1,516,062 | | | 1,835,634 | | | 1,766,144 | | | 316,705 | |
| Capital gain distributions received from underlying funds | | | | | | | | | | | | |
| Unaffiliated issuers | | 177,497 | | | 264,025 | | | 231,038 | | | 99,370 | |
Net change in unrealized depreciation on investments (including net unrealized appreciation
(depreciation) on foreign currency related transactions)
Unaffiliated issuers | | (984,069 | ) | | (1,065,611 | ) | | (1,252,918 | ) | | (90,904 | ) |
| Net Realized and Unrealized Gain on Investments and Option Transactions | | 709,490 | | | 1,034,048 | | | 744,264 | | | 325,171 | |
| Net Increase in Net Assets from Operations | $ | 1,581,969 | | $ | 2,268,107 | | $ | 1,583,319 | | $ | 651,501 | |
See accompanying Notes to Financial Statements.
50
Madison Funds | October 31, 2015
| |
| Statements of Changes in Net Assets |
| | | | | | | | | | | | | | | | | | | | | | | | |
| | | Conservative Allocation Fund | | | Moderate Allocation Fund | | | Aggressive Allocation Fund | | | Cash Reserves Fund | |
| | | Year Ended
October 31,
2015 | | | Year Ended
October 31,
2014 | | | Year Ended
October 31,
2015 | | | Year Ended
October 31,
2014 | | | Year Ended
October 31,
2015 | | | Year Ended
October 31,
2014 | | | Year Ended
October 31,
2015 | | | Year Ended
October 31,
2014 | |
| Net Assets at beginning of period | $ | 74,779,327 | | $ | 70,709,344 | | $ | 150,621,084 | | $ | 145,265,676 | | $ | 61,306,975 | | $ | 56,007,317 | | $ | 21,031,337 | | $ | 25,076,196 | |
| Increase (decrease) in net assets from operations: | | | | | | | | | | | | | | | | | | | | | | | | |
| Net investment income | | 734,032 | | | 754,993 | | | 1,256,554 | | | 1,181,514 | | | 407,607 | | | 319,360 | | | – | | | – | |
| Net realized gain. | | 2,484,425 | | | 3,857,014 | | | 8,632,169 | | | 13,932,757 | | | 5,183,912 | | | 5,925,247 | | | – | | | – | |
| Net change in unrealized appreciation (depreciation) | | (2,644,134 | ) | | (439,981 | ) | | (8,031,221 | ) | | (4,002,919 | ) | | (4,663,317 | ) | | (917,293 | ) | | – | | | – | |
| Net increase in net assets from operations | | 574,323 | | | 4,172,026 | | | 1,857,502 | | | 11,111,352 | | | 928,202 | | | 5,327,314 | | | – | | | – | |
| Distributions to shareholders from: | | | | | | | | | | | | | | | | | | | | | | | | |
| Net investment income | | | | | | | | | | | | | | | | | | | | | | | | |
| Class A | | (735,977 | ) | | (545,505 | ) | | (1,515,732 | ) | | (1,325,591 | ) | | (712,370 | ) | | (146,020 | ) | | – | | | – | |
| Class B | | (73,931 | ) | | (56,958 | ) | | (288,639 | ) | | (167,155 | ) | | (131,546 | ) | | – | | | – | | | – | |
| Class C | | (132,294 | ) | | (89,391 | ) | | (73,012 | ) | | (37,587 | ) | | (25,700 | ) | | – | | | – | | | – | |
| Net realized gains | | | | | | | | | | | | | | | | | | | | | | | | |
| Class A | | (1,947,168 | ) | | (170,950 | ) | | (5,792,027 | ) | | – | | | (3,391,541 | ) | | – | | | – | | | – | |
| Class B | | (477,033 | ) | | (45,469 | ) | | (1,751,819 | ) | | – | | | (974,688 | ) | | – | | | – | | | – | |
| Class C | | (819,430 | ) | | (68,404 | ) | | (443,063 | ) | | – | | | (190,426 | ) | | – | | | – | | | – | |
| Total distributions | | (4,185,833 | ) | | (976,677 | ) | | (9,864,292 | ) | | (1,530,333 | ) | | (5,426,271 | ) | | (146,020 | ) | | – | | | – | |
| Capital Stock transactions: | | | | | | | | | | | | | | | | | | | | | | | | |
| Class A Shares | | | | | | | | | | | | | | | | | | | | | | | | |
| Shares sold | | 9,812,568 | | | 7,253,706 | | | 12,938,988 | | | 10,239,076 | | | 5,699,130 | | | 5,059,417 | | | 6,879,831 | | | 3,566,314 | |
| Issued to shareholders in reinvestment of distributions | | 2,669,691 | | | 710,504 | | | 7,261,935 | | | 1,315,643 | | | 4,090,813 | | | 145,468 | | | – | | | – | |
| Shares redeemed | | (8,667,176 | ) | | (7,780,575 | ) | | (16,565,032 | ) | | (14,186,325 | ) | | (5,323,214 | ) | | (4,926,145 | ) | | (8,374,021 | ) | | (7,548,377 | ) |
| Net increase (decrease) from capital stock transactions | | 3,815,083 | | | 183,635 | | | 3,635,891 | | | (2,631,606 | ) | | 4,466,729 | | | 278,740 | | | (1,494,190 | ) | | (3,982,063 | ) |
| Class B Shares | | | | | | | | | | | | | | | | | | | | | | | | |
| Shares sold | | 1,167,306 | | | 1,340,049 | | | 3,501,055 | | | 3,345,756 | | | 1,937,168 | | | 1,282,352 | | | 345,729 | | | 387,839 | |
| Issued to shareholders in reinvestment of distributions | | 549,584 | | | 101,955 | | | 2,033,723 | | | 166,921 | | | 1,103,670 | | | – | | | – | | | – | |
| Shares redeemed | | (2,544,524 | ) | | (2,124,420 | ) | | (7,540,929 | ) | | (5,492,795 | ) | | (2,748,286 | ) | | (1,672,008 | ) | | (573,072 | ) | | (450,635 | ) |
| Net increase (decrease) from capital stock transactions | | (827,634 | ) | | (682,416 | ) | | (2,006,151 | ) | | (1,980,118 | ) | | 292,552 | | | (389,656 | ) | | (227,343 | ) | | (62,796 | ) |
| Class C Shares | | | | | | | | | | | | | | | | | | | | | | | | |
| Shares sold | | 3,766,571 | | | 3,563,170 | | | 2,193,521 | | | 1,389,856 | | | 432,354 | | | 442,054 | | | | | | | |
| Issued to shareholders in reinvestment of distributions | | 942,456 | | | 156,682 | | | 488,581 | | | 35,303 | | | 211,144 | | | – | | | | | | | |
| Shares redeemed | | (3,067,323 | ) | | (2,346,437 | ) | | (926,346 | ) | | (1,039,046 | ) | | (395,056 | ) | | (212,774 | ) | | | | | | |
| Net increase from capital stock transactions | | 1,641,704 | | | 1,373,415 | | | 1,755,756 | | | 386,113 | | | 248,442 | | | 229,280 | | | | | | | |
Total net increase (decrease) from capital stock transactions | | 4,629,153 | | | 874,634 | | | 3,385,496 | | | (4,225,611 | ) | | 5,007,723 | | | 118,364 | | | (1,721,533 | ) | | (4,044,859 | ) |
| Total increase (decrease) in net assets | | 1,017,643 | | | 4,069,983 | | | (4,621,294 | ) | | 5,355,408 | | | 509,654 | | | 5,299,658 | | | (1,721,533 | ) | | (4,044,859 | ) |
| Net Assets at end of period | $ | 75,796,970 | | $ | 74,779,327 | | $ | 145,999,790 | | $ | 150,621,084 | | $ | 61,816,629 | | $ | 61,306,975 | | $ | 19,309,804 | | $ | 21,031,337 | |
Undistributed net investment income included in net assets | $ | 56,082 | | $ | 67,553 | | $ | 393,328 | | $ | 422,762 | | $ | 15,070 | | $ | 196,252 | | $ | – | | $ | – | |
| Capital Share transactions: | | | | | | | | | | | | | | | | | | | | | | | | |
| Class A Shares | | | | | | | | | | | | | | | | | | | | | | | | |
| Shares sold | | 903,657 | | | 662,930 | | | 1,093,950 | | | 863,775 | | | 470,864 | | | 412,704 | | | 6,879,831 | | | 3,566,314 | |
| Issued to shareholders in reinvestment of distributions | | 249,386 | | | 65,219 | | | 627,110 | | | 112,641 | | | 345,800 | | | 11,983 | | | – | | | – | |
| Shares redeemed | | (805,705 | ) | | (711,202 | ) | | (1,408,144 | ) | | (1,193,833 | ) | | (439,396 | ) | | (399,549 | ) | | (8,374,021 | ) | | (7,548,377 | ) |
| Net increase (decrease) in shares outstanding | | 347,338 | | | 16,947 | | | 312,916 | | | (217,417 | ) | | 377,268 | | | 25,138 | | | (1,494,190 | ) | | (3,982,063 | ) |
| Class B Shares | | | | | | | | | | | | | | | | | | | | | | | | |
| Shares sold | | 107,196 | | | 122,280 | | | 298,149 | | | 282,906 | | | 164,052 | | | 105,674 | | | 345,729 | | | 387,839 | |
| Issued to shareholders in reinvestment of distributions | | 50,974 | | | 9,354 | | | 175,928 | | | 14,291 | | | 94,492 | | | – | | | – | | | – | |
| Shares redeemed | | (234,224 | ) | | (193,708 | ) | | (644,105 | ) | | (463,855 | ) | | (231,728 | ) | | (136,891 | ) | | (573,072 | ) | | (450,635 | ) |
| Net increase (decrease) in shares outstanding | | (76,054 | ) | | (62,074 | ) | | (170,028 | ) | | (166,658 | ) | | 26,816 | | | (31,217 | ) | | (227,343 | ) | | (62,796 | ) |
| Class C Shares | | | | | | | | | | | | | | | | | | | | | | | | |
| Shares sold | | 345,850 | | | 325,243 | | | 186,779 | | | 117,752 | | | 36,088 | | | 36,637 | | | | | | | |
| Issued to shareholders in reinvestment of distributions | | 87,338 | | | 14,369 | | | 42,228 | | | 3,020 | | | 18,062 | | | – | | | | | | | |
| Shares redeemed | | (283,227 | ) | | (213,865 | ) | | (79,781 | ) | | (87,784 | ) | | (33,075 | ) | | (17,247 | ) | | | | | | |
| Net increase in shares outstanding | | 149,961 | | | 125,747 | | | 149,226 | | | 32,988 | | | 21,075 | | | 19,390 | | | | | | | |
See accompanying Notes to Financial Statements.
51
Madison Funds | October 31, 2015
| |
| Statements of Changes in Net Assets |
| | | | | | | | | | | | | | | | | | | | | | | | |
| | | Tax-Free Virginia Fund | | | Tax-Free National Fund | | | High Quality Bond Fund | | | Core Bond Fund | |
| | | Year Ended
October 31,
2015 | | | Year Ended
October 31,
2014 | | | Year Ended
October 31,
2015 | | | Year Ended
October 31,
2014 | | | Year Ended
October 31,
2015 | | | Year Ended
October 31,
2014 | | | Year Ended
October 31,
2015 | | | Year Ended
October 31,
2014 | |
| Net Assets at beginning of period | $ | 23,100,256 | | $ | 23,407,619 | | $ | 28,414,758 | | $ | 27,805,398 | | $ | 118,082,335 | | $ | 132,687,696 | | $ | 225,218,208 | | $ | 153,794,099 | |
| Increase (decrease) in net assets from operations: | | | | | | | | | | | | | | | | | | | | | | | | |
| Net investment income | | 557,549 | | | 611,384 | | | 681,658 | | | 742,096 | | | 1,068,831 | | | 1,258,319 | | | 4,625,209 | | | 4,204,375 | |
| Net realized gain . | | 69,799 | | | 150,594 | | | 162,253 | | | 224,828 | | | 346,179 | | | 118,611 | | | 2,352,083 | | | 2,118,236 | |
| Net change in unrealized appreciation (depreciation) | | (110,858 | ) | | 550,339 | | | (115,237 | ) | | 801,303 | | | (278,909 | ) | | (29,887 | ) | | (3,394,264 | ) | | (181,307 | ) |
| Net increase in net assets from operations | | 516,490 | | | 1,312,317 | | | 728,674 | | | 1,768,227 | | | 1,136,101 | | | 1,347,043 | | | 3,583,028 | | | 6,141,304 | |
| Distributions to shareholders from: | | | | | | | | | | | | | | | | | | | | | | | | |
| Net investment income | | | | | | | | | | | | | | | | | | | | | | | | |
| Class A | | – | | | – | | | – | | | – | | | – | | | – | | | (686,660 | ) | | (768,317 | ) |
| Class B | | – | | | – | | | – | | | – | | | – | | | – | | | (40,569 | ) | | (52,861 | ) |
| Class Y | | (556,364 | ) | | (611,560 | ) | | (680,303 | ) | | (742,302 | ) | | (1,074,047 | ) | | (1,276,087 | ) | | (4,356,627 | ) | | (3,578,402 | ) |
| Class R6 | | – | | | – | | | – | | | – | | | – | | | – | | | (15,797 | ) | | (245 | ) |
| Net realized gains | | | | | | | | | | | | | | | | | | | | | | | | |
| Class A | | – | | | – | | | – | | | – | | | – | | | – | | | (288,322 | ) | | (183,135 | ) |
| Class B | | – | | | – | | | – | | | – | | | – | | | – | | | (28,595 | ) | | (20,191 | ) |
| Class Y | | (150,588 | ) | | (375,715 | ) | | (217,904 | ) | | (127,150 | ) | | (118,544 | ) | | (484,991 | ) | | (1,598,223 | ) | | (577,721 | ) |
| Class R6 | | – | | | – | | | – | | | – | | | – | | | – | | | (3,894 | ) | | (48 | ) |
| Total distributions | | (706,952 | ) | | (987,275 | ) | | (898,207 | ) | | (869,452 | ) | | (1,192,591 | ) | | (1,761,078 | ) | | (7,018,687 | ) | | (5,180,920 | ) |
| Capital Stock transactions: | | | | | | | | | | | | | | | | | | | | | | | | |
| Class A Shares | | | | | | | | | | | | | | | | | | | | | | | | |
| Shares sold | | | | | | | | | | | | | | | | | | | | 4,601,495 | | | 2,647,156 | |
| Issued to shareholders in reinvestment of distributions | | | | | | | | | | | | | | | | | | | | 933,423 | | | 891,515 | |
| Shares redeemed | | | | | | | | | | | | | | | | | | | | (6,179,365 | ) | | (9,743,095 | ) |
| Net decrease from capital stock transactions | | | | | | | | | | | | | | | | | | | | (644,447 | ) | | (6,204,424 | ) |
| Class B Shares | | | | | | | | | | | | | | | | | | | | | | | | |
| Shares sold | | | | | | | | | | | | | | | | | | | | 256,153 | | | 154,398 | |
| Issued to shareholders in reinvestment of distributions | | | | | | | | | | | | | | | | | | | | 68,295 | | | 72,102 | |
| Shares redeemed | | | | | | | | | | | | | | | | | | | | (795,720 | ) | | (1,221,097 | ) |
| Net decrease from capital stock transactions | | | | | | | | | | | | | | | | | | | | (471,272 | ) | | (994,597 | ) |
| Class Y Shares | | | | | | | | | | | | | | | | | | | | | | | | |
| Shares sold | | 259,157 | | | 393,632 | | | 775,540 | | | 1,143,659 | | | 40,394,343 | | | 57,687,784 | | | 16,119,764 | | | 92,417,586 | |
| Issued to shareholders in reinvestment of distributions | | 682,954 | | | 944,525 | | | 709,457 | | | 629,479 | | | 760,886 | | | 640,280 | | | 1,482,771 | | | 1,122,533 | |
| Shares redeemed | | (1,192,533 | ) | | (1,970,562 | ) | | (1,986,113 | ) | | (2,062,553 | ) | | (56,629,565 | ) | | (72,519,390 | ) | | (16,101,865 | ) | | (15,877,666 | ) |
| Net increase (decrease) from capital stock transactions | | (250,422 | ) | | (632,405 | ) | | (501,116 | ) | | (289,415 | ) | | (15,474,336 | ) | | (14,191,326 | ) | | 1,500,670 | | | 77,662,453 | |
| Class R6 Shares | | | | | | | | | | | | | | | | | | | | | | | | |
| Shares sold | | | | | | | | | | | | | | | | | | | | 1,686,691 | | | – | |
| Issued to shareholders in reinvestment of distributions | | | | | | | | | | | | | | | | | | | | 19,691 | | | 293 | |
| Shares redeemed | | | | | | | | | | | | | | | | | | | | (15,315 | ) | | – | |
| Net increase from capital stock transactions | | | | | | | | | | | | | | | | | | | | 1,691,067 | | | 293 | |
Total net increase (decrease) from capital stock transactions | | (250,422 | ) | | (632,405 | ) | | (501,116 | ) | | (289,415 | ) | | (15,474,336 | ) | | (14,191,326 | ) | | 2,076,018 | | | 70,463,725 | |
| Total increase (decrease) in net assets | | (440,884 | ) | | (307,363 | ) | | (670,649 | ) | | 609,360 | | | (15,530,826 | ) | | (14,605,361 | ) | | (1,359,641 | ) | | 71,424,109 | |
| Net Assets at end of period | $ | 22,659,372 | | $ | 23,100,256 | | $ | 27,744,109 | | $ | 28,414,758 | | $ | 102,551,509 | | $ | 118,082,335 | | $ | 223,858,567 | | $ | 225,218,208 | |
Undistributed net investment income included in net assets | $ | 3,700 | | $ | 2,515 | | $ | 4,472 | | $ | 3,117 | | $ | 96,596 | | $ | 101,812 | | $ | 44,769 | | $ | 20,861 | |
| Capital Share transactions: | | | | | | | | | | | | | | | | | | | | | | | | |
| Class A Shares | | | | | | | | | | | | | | | | | | | | | | | | |
| Shares sold | | | | | | | | | | | | | | | | | | | | 452,158 | | | 259,612 | |
| Issued to shareholders in reinvestment of distributions | | | | | | | | | | | | | | | | | | | | 91,746 | | | 87,908 | |
| Shares redeemed | | | | | | | | | | | | | | | | | | | | (607,067 | ) | | (959,431 | ) |
| Net decrease in shares outstanding | | | | | | | | | | | | | | | | | | | | (63,163 | ) | | (611,911 | ) |
| Class B Shares | | | | | | | | | | | | | | | | | | | | | | | | |
| Shares sold | | | | | | | | | | | | | | | | | | | | 25,161 | | | 15,174 | |
| Issued to shareholders in reinvestment of distributions | | | | | | | | | | | | | | | | | | | | 6,712 | | | 7,120 | |
| Shares redeemed | | | | | | | | | | | | | | | | | | | | (77,826 | ) | | (120,166 | ) |
| Net decrease in shares outstanding | | | | | | | | | | | | | | | | | | | | (45,953 | ) | | (97,872 | ) |
| Class Y Shares | | | | | | | | | | | | | | | | | | | | | | | | |
| Shares sold | | 22,359 | | | 34,165 | | | 70,523 | | | 105,412 | | | 3,649,801 | | | 5,229,733 | | | 1,583,787 | | | 9,103,829 | |
| Issued to shareholders in reinvestment of distributions | | 58,764 | | | 82,623 | | | 64,491 | | | 58,172 | | | 69,007 | | | 58,387 | | | 146,113 | | | 110,849 | |
| Shares redeemed | | (102,600 | ) | | (170,870 | ) | | (180,352 | ) | | (189,820 | ) | | (5,126,122 | ) | | (6,575,967 | ) | | (1,581,126 | ) | | (1,565,428 | ) |
| Net increase (decrease) in shares outstanding | | (21,477 | ) | | (54,082 | ) | | (45,338 | ) | | (26,236 | ) | | (1,407,314 | ) | | (1,287,847 | ) | | 148,774 | | | 7,649,250 | |
| Class R6 Shares | | | | | | | | | | | | | | | | | | | | | | | | |
| Shares sold | | | | | | | | | | | | | | | | | | | | 166,291 | | | – | |
| Issued to shareholders in reinvestment of distributions | | | | | | | | | | | | | | | | | | | | 1,941 | | | 29 | |
| Shares redeemed | | | | | | | | | | | | | | | | | | | | (1,497 | ) | | – | |
| Net increase in shares outstanding | | | | | | | | | | | | | | | | | | | | 166,735 | | | 29 | |
See accompanying Notes to Financial Statements.
52
Madison Funds | October 31, 2015
| |
| Statements of Changes in Net Assets |
| | | | | | | | | | | | | | | | | | | | | | | | |
| | | | | | | | | | | | | | | | | | | | | | |
| | | Corporate Bond Fund | | | High Income Fund | | | Diversified Income Fund | | | Covered Call &
Equity Income Fund | |
| | | Year Ended
October 31,
2015 | | | Year Ended
October 31,
2014 | | | Year Ended
October 31,
2015 | | | Year Ended
October 31,
2014 | | | Year Ended
October 31,
2015 | | | Year Ended
October 31,
2014 | | | Year Ended
October 31,
2015 | | | Year Ended
October 31,
2014 | |
| |
| Net Assets at beginning of period | $ | 27,010,078 | | $ | 19,742,741 | | $ | 31,251,076 | | $ | 48,544,980 | | $ | 145,286,852 | | $ | 126,549,734 | | $ | 60,220,920 | | $ | 39,239,210 | |
| Increase (decrease) in net assets from operations: | | | | | | | | | | | | | | | | | | | | | | | | |
| Net investment income | | 680,289 | | | 527,351 | | | 1,443,566 | | | 2,102,819 | | | 2,153,698 | | | 2,013,684 | | | 176,859 | | | (73,068 | ) |
| Net realized gain (loss) | | 77,740 | | | 65,662 | | | (313,632 | ) | | 1,708,404 | | | 3,893,229 | | | 5,595,030 | | | 5,842,743 | | | 4,391,243 | |
| Net change in unrealized appreciation (depreciation) | | (395,306 | ) | | 371,880 | | | (1,854,987 | ) | | (1,532,500 | ) | | (4,362,658 | ) | | 2,951,218 | | | (6,709,561 | ) | | (815,479 | ) |
| Net increase (decrease) in net assets from operations | | 362,723 | | | 964,893 | | | (725,053 | ) | | 2,278,723 | | | 1,684,269 | | | 10,559,932 | | | (689,959 | ) | | 3,502,696 | |
| Distributions to shareholders from: | | | | | | | | | | | | | | | | | | | | | | | | |
| Net investment income | | | | | | | | | | | | | | | | | | | | | | | | |
| Class A | | – | | | – | | | (1,339,819 | ) | | (1,532,619 | ) | | (2,006,159 | ) | | (1,833,076 | ) | | (803,931 | ) | | (575,155 | ) |
| Class B | | – | | | – | | | (79,813 | ) | | (99,991 | ) | | (128,802 | ) | | (126,493 | ) | | – | | | – | |
| Class C | | – | | | – | | | – | | | – | | | (111,519 | ) | | (82,200 | ) | | (383,709 | ) | | (238,449 | ) |
| Class Y | | (678,077 | ) | | (526,572 | ) | | (21,057 | ) | | (474,514 | ) | | – | | | – | | | (2,484,145 | ) | | (1,729,015 | ) |
| Class R6 | | – | | | – | | | – | | | – | | | – | | | – | | | (75,556 | ) | | (7,480 | ) |
| Net realized gains | | | | | | | | | | | | | | | | | | | | | | | | |
| Class A | | – | | | – | | | (1,576,185 | ) | | (1,402,074 | ) | | – | | | – | | | (346,247 | ) | | (244,921 | ) |
| Class B | | – | | | – | | | (120,683 | ) | | (114,583 | ) | | – | | | – | | | – | | | – | |
| Class C | | – | | | – | | | – | | | – | | | – | | | – | | | (157,719 | ) | | (81,744 | ) |
| Class Y | | (40,614 | ) | | – | | | (11,512 | ) | | (865,371 | ) | | – | | | – | | | (1,233,836 | ) | | (829,777 | ) |
| Class R6 | | – | | | – | | | – | | | – | | | – | | | – | | | (10,324 | ) | | (3,628 | ) |
| Total distributions | | (718,691 | ) | | (526,572 | ) | | (3,149,069 | ) | | (4,489,152 | ) | | (2,246,480 | ) | | (2,041,769 | ) | | (5,495,467 | ) | | (3,710,169 | ) |
| Capital Stock transactions: | | | | | | | | | | | | | | | | | | | | | | | | |
| Class A Shares | | | | | | | | | | | | | | | | | | | | | | | | |
| Shares sold | | | | | | | | 1,674,886 | | | 4,650,169 | | | 14,869,686 | | | 18,548,756 | | | 7,299,764 | | | 4,129,974 | |
| Issued to shareholders in reinvestment of distributions | | | | | | | | 2,568,863 | | | 2,501,528 | | | 1,978,421 | | | 1,795,214 | | | 1,038,831 | | | 788,884 | |
| Shares redeemed | | | | | | | | (6,104,245 | ) | | (5,646,298 | ) | | (14,726,381 | ) | | (13,553,386 | ) | | (2,453,398 | ) | | (1,031,688 | ) |
| Net increase (decrease) from capital stock transactions | | | | | | | | (1,860,496 | ) | | 1,505,399 | | | 2,121,726 | | | 6,790,584 | | | 5,885,197 | | | 3,887,170 | |
| Class B Shares | | | | | | | | | | | | | | | | | | | | | | | | |
| Shares sold | | | | | | | | 160,043 | | | 321,030 | | | 1,577,854 | | | 2,215,483 | | | | | | | |
| Issued to shareholders in reinvestment of distributions | | | | | | | | 162,119 | | | 181,701 | | | 128,547 | | | 126,014 | | | | | | | |
| Shares redeemed | | | | | | | | (647,318 | ) | | (685,506 | ) | | (2,585,540 | ) | | (3,154,179 | ) | | | | | | |
| Net decrease from capital stock transactions | | | | | | | | (325,156 | ) | | (182,775 | ) | | (879,139 | ) | | (812,682 | ) | | | | | | |
| Class C Shares | | | | | | | | | | | | | | | | | | | | | | | | |
| Shares sold | | | | | | | | | | | | | | 3,290,899 | | | 5,377,576 | | | 5,704,108 | | | 2,482,092 | |
| Issued to shareholders in reinvestment of distributions | | | | | | | | | | | | | | 110,743 | | | 80,942 | | | 438,189 | | | 256,128 | |
| Shares redeemed | | | | | | | | | | | | | | (2,135,227 | ) | | (1,217,465 | ) | | (1,013,937 | ) | | (120,714 | ) |
| Net increase from capital stock transactions | | | | | | | | | | | | | | 1,266,415 | | | 4,241,053 | | | 5,128,360 | | | 2,617,506 | |
| Class Y Shares | | | | | | | | | | | | | | | | | | | | | | | | |
| Shares sold | | 81,139 | | | 7,198,487 | | | 1,733,581 | | | 1,311,977 | | | | | | | | | 51,075,935 | | | 29,632,400 | |
| Issued to shareholders in reinvestment of distributions | | 26,796 | | | 23,415 | | | 31,473 | | | 35,460 | | | | | | | | | 2,791,002 | | | 993,428 | |
| Shares redeemed | | (3,216,930 | ) | | (392,886 | ) | | (1,452,400 | ) | | (17,753,536 | ) | | | | | | | | (32,641,444 | ) | | (15,977,429 | ) |
| Net increase (decrease) from capital stock transactions | | (3,108,995 | ) | | 6,829,016 | | | 312,654 | | | (16,406,099 | ) | | | | | | | | 21,225,493 | | | 14,648,399 | |
| Class R6 Shares | | | | | | | | | | | | | | | | | | | | | | | | |
| Shares sold | | | | | | | | | | | | | | | | | | | | 2,861,624 | | | 25,000 | |
| Issued to shareholders in reinvestment of distributions | | | | | | | | | | | | | | | | | | | | 51,333 | | | 11,108 | |
| Shares redeemed | | | | | | | | | | | | | | | | | | | | (116,108 | ) | | – | |
| Net increase from capital stock transactions | | | | | | | | | | | | | | | | | | | | 2,796,849 | | | 36,108 | |
Total net increase (decrease) from capital stock transactions | | (3,108,995 | ) | | 6,829,016 | | | (1,872,998 | ) | | (15,083,475 | ) | | 2,509,002 | | | 10,218,955 | | | 35,035,899 | | | 21,189,183 | |
| Total increase (decrease) in net assets | | (3,464,963 | ) | | 7,267,337 | | | (5,747,120 | ) | | (17,293,904 | ) | | 1,946,791 | | | 18,737,118 | | | 28,850,473 | | | 20,981,710 | |
| Net Assets at end of period | $ | 23,545,115 | | $ | 27,010,078 | | $ | 25,503,956 | | $ | 31,251,076 | | $ | 147,233,643 | | $ | 145,286,852 | | $ | 89,071,393 | | $ | 60,220,920 | |
Undistributed net investment income included in net assets | $ | 4,848 | | $ | 2,635 | | $ | 9,492 | | $ | 6,596 | | $ | – | | $ | 1,901 | | $ | – | | $ | – | |
| Capital Share transactions: | | | | | | | | | | | | | | | | | | | | | | | | |
| Class A Shares | | | | | | | | | | | | | | | | | | | | | | | | |
| Shares sold | | | | | | | | 265,723 | | | 677,461 | | | 1,003,726 | | | 1,291,377 | | | 759,705 | | | 413,192 | |
| Issued to shareholders in reinvestment of distributions | | | | | | | | 416,152 | | | 366,432 | | | 134,264 | | | 124,380 | | | 110,180 | | | 79,490 | |
| Shares redeemed | | | | | | | | (988,266 | ) | | (822,021 | ) | | (999,059 | ) | | (942,377 | ) | | (260,367 | ) | | (103,163 | ) |
| Net increase (decrease) in shares outstanding | | | | | | | | (306,391 | ) | | 221,872 | | | 138,931 | | | 473,380 | | | 609,518 | | | 389,519 | |
| Class B Shares | | | | | | | | | | | | | | | | | | | | | | | | |
| Shares sold | | | | | | | | 25,728 | | | 45,511 | | | 105,641 | | | 153,724 | | | | | | | |
| Issued to shareholders in reinvestment of distributions | | | | | | | | 25,617 | | | 26,046 | | | 8,671 | | | 8,689 | | | | | | | |
| Shares redeemed | | | | | | | | (100,582 | ) | | (96,615 | ) | | (174,264 | ) | | (219,143 | ) | | | | | | |
| Net decrease in shares outstanding | | | | | | | | (49,237 | ) | | (25,058 | ) | | (59,952 | ) | | (56,730 | ) | | | | | | |
| Class C Shares | | | | | | | | | | | | | | | | | | | | | | | | |
| Shares sold | | | | | | | | | | | | | | 221,556 | | | 372,703 | | | 612,689 | | | 251,128 | |
| Issued to shareholders in reinvestment of distributions | | | | | | | | | | | | | | 7,477 | | | 5,571 | | | 47,722 | | | 26,186 | |
| Shares redeemed | | | | | | | | | | | | | | (144,085 | ) | | (84,099 | ) | | (108,461 | ) | | (12,321 | ) |
| Net increase from capital stock transactions | | | | | | | | | | | | | | 84,948 | | | 294,175 | | | 551,950 | | | 264,993 | |
| Class Y Shares | | | | | | | | | | | | | | | | | | | | | | | | |
| Shares sold | | 7,034 | | | 631,195 | | | 287,679 | | | 192,649 | | | | | | | | | 5,296,137 | | | 2,943,413 | |
| Issued to shareholders in reinvestment of distributions | �� | 2,338 | | | 2,053 | | | 5,194 | | | 5,245 | | | | | | | | | 294,148 | | | 99,219 | |
| Shares redeemed | | (282,934 | ) | | (34,705 | ) | | (237,196 | ) | | (2,602,446 | ) | | | | | | | | (3,394,084 | ) | | (1,574,659 | ) |
| Net increase (decrease) in shares outstanding | | (273,562 | ) | | 598,543 | | | 55,677 | | | (2,404,552 | ) | | | | | | | | 2,196,201 | | | 1,467,973 | |
| Class R6 Shares | | | | | | | | | | | | | | | | | | | | | | | | |
| Shares sold | | | | | | | | | | | | | | | | | | | | 295,083 | | | 2,512 | |
| Issued to shareholders in reinvestment of distributions | | | | | | | | | | | | | | | | | | | | 5,516 | | | 1,107 | |
| Shares redeemed | | | | | | | | | | | | | | | | | | | | (12,115 | ) | | – | |
| Net increase in shares outstanding | | | | | | | | | | | | | | | | | | | | 288,484 | | | 3,619 | |
See accompanying Notes to Financial Statements.
53
Madison Funds | October 31, 2015
| |
| Statements of Changes in Net Assets |
| | | | | | | | | | | | | | | | | | | | | | | | |
| | | Dividend Income Fund | | | Large Cap Value Fund | | | Investors Fund | | | Large Cap Growth Fund | |
| | | Year Ended
October 31,
2015 | | | Year Ended
October 31,
2014 | | | Year Ended
October 31,
2015 | | | Year Ended
October 31,
2014 | | | Year Ended
October 31,
2015 | | | Year Ended
October 31,
2014 | | | Year Ended
October 31,
2015 | | | Year Ended
October 31,
2014 | |
| Net Assets at beginning of period | $ | 21,518,235 | | $ | 18,657,813 | | $ | 203,817,722 | | $ | 204,476,151 | | $ | 173,358,800 | | $ | 203,678,461 | | $ | 187,202,550 | | $ | 156,356,448 | |
Increase (decrease) in net assets from operations: | | | | | | | | | | | | | | | | | | | | | | | | |
| Net investment income | | 370,248 | | | 338,908 | | | 1,202,520 | | | 1,780,823 | | | 850,971 | | | 888,734 | | | 1,259,949 | | | 517,060 | |
| Net realized gain . | | 830,164 | | | 1,215,981 | | | 19,715,065 | | | 33,719,665 | | | 14,548,492 | | | 31,504,261 | | | 30,298,105 | | | 14,683,779 | |
Net change in unrealized appreciation (depreciation) | | (863,192 | ) | | 784,431 | | | (22,072,941 | ) | | (9,008,042 | ) | | (7,809,747 | ) | | (4,278,949 | ) | | (21,418,198 | ) | | 8,479,224 | |
Net increase (decrease) in net assets from operations | | 337,220 | | | 2,339,320 | | | (1,155,356 | ) | | 26,492,446 | | | 7,589,716 | | | 28,114,046 | | | 10,139,856 | | | 23,680,063 | |
| Distributions to shareholders from: | | | | | | | | | | | | | | | | | | | | | | | | |
| Net investment income | | | | | | | | | | | | | | | | | | | | | | | | |
| Class A | | – | | | – | | | (530,834 | ) | | (558,942 | ) | | (3,124 | ) | | (256 | ) | | (153,577 | ) | | (1 | ) |
| Class B | | – | | | – | | | (982 | ) | | (2,969 | ) | | – | | | – | | | – | | | – | |
| Class Y | | (355,808 | ) | | (338,908 | ) | | (1,222,110 | ) | | (1,439,649 | ) | | (722,755 | ) | | (205,696 | ) | | (574,923 | ) | | (199,656 | ) |
| Class R6 | | – | | | – | | | – | | | – | | | (31,748 | ) | | (6,296 | ) | | – | | | – | |
| Net realized gains | | | | | | | | | | | | | | | | | | | | | | | | |
| Class A | | – | | | – | | | (9,855,995 | ) | | – | | | (282,552 | ) | | (16,415 | ) | | (5,000,863 | ) | | (2,167,745 | ) |
| Class B | | – | | | – | | | (680,861 | ) | | – | | | – | | | – | | | (405,694 | ) | | (204,606 | ) |
| Class Y | | (1,219,689 | ) | | (554,711 | ) | | (16,853,584 | ) | | – | | | (29,941,971 | ) | | (5,995,694 | ) | | (8,983,417 | ) | | (3,413,769 | ) |
| Class R6 | | – | | | – | | | – | | | – | | | (1,315,235 | ) | | (183,523 | ) | | – | | | – | |
| Total distributions | | (1,575,497 | ) | | (893,619 | ) | | (29,144,366 | ) | | (2,001,560 | ) | | (32,297,385 | ) | | (6,407,880 | ) | | (15,118,474 | ) | | (5,985,777 | ) |
| Capital Stock transactions: | | | | | | | | | | | | | | | | | | | | | | | | |
| Class A Shares | | | | | | | | | | | | | | | | | | | | | | | | |
| Shares sold | | | | | | | | 4,423,301 | | | 5,087,856 | | | 1,008,592 | | | 1,035,158 | | | 3,375,075 | | | 5,417,757 | |
Issued to shareholders in reinvestment of distributions | | | | | | | | 10,243,270 | | | 551,494 | | | 279,828 | | | 16,672 | | | 5,091,132 | | | 2,142,366 | |
| Shares redeemed | | | | | | | | (10,600,838 | ) | | (10,428,959 | ) | | (231,323 | ) | | (81,568 | ) | | (8,944,227 | ) | | (9,129,847 | ) |
Net increase (decrease) from capital stock transactions | | | | | | | | 4,065,733 | | | (4,789,609 | ) | | 1,057,097 | | | 970,262 | | | (478,020 | ) | | (1,569,724 | ) |
| Class B Shares | | | | | | | | | | | | | | | | | | | | | | | | |
| Shares sold | | | | | | | | 427,559 | | | 730,039 | | | | | | | | | 598,887 | | | 465,516 | |
Issued to shareholders in reinvestment of distributions | | | | | | | | 678,940 | | | 2,952 | | | | | | | | | 404,362 | | | 203,976 | |
| Shares redeemed | | | | | | | | (1,141,251 | ) | | (1,691,990 | ) | | | | | | | | (990,037 | ) | | (1,515,416 | ) |
Net increase (decrease) from capital stock transactions | | | | | | | | (34,752 | ) | | (958,999 | ) | | | | | | | | 13,212 | | | (845,924 | ) |
| Class Y Shares | | | | | | | | | | | | | | | | | | | | | | | | |
| Shares sold | | 1,989,210 | | | 4,344,388 | | | 12,963,807 | | | 32,136,613 | | | 11,006,964 | | | 35,887,369 | | | 12,537,110 | | | 40,766,887 | |
Issued to shareholders in reinvestment of distributions | | 1,511,616 | | | 861,540 | | | 18,074,172 | | | 1,439,649 | | | 17,846,708 | | | 4,069,483 | | | 9,558,340 | | | 3,613,425 | |
| Shares redeemed | | (2,856,226 | ) | | (3,791,207 | ) | | (31,378,574 | ) | | (52,976,969 | ) | | (62,675,960 | ) | | (90,388,771 | ) | | (29,016,190 | ) | | (28,812,848 | ) |
Net increase (decrease) from capital stock transactions | | 644,600 | | | 1,414,721 | | | (340,595 | ) | | (19,400,707 | ) | | (33,822,288 | ) | | (50,431,919 | ) | | (6,920,740 | ) | | 15,567,464 | |
| Class R6 Shares | | | | | | | | | | | | | | | | | | | | | | | | |
| Shares sold | | | | | | | | | | | | | | 2,128,479 | | | 322,986 | | | | | | | |
Issued to shareholders in reinvestment of distributions | | | | | | | | | | | | | | 1,346,983 | | | 189,820 | | | | | | | |
| Shares redeemed | | | | | | | | | | | | | | (1,077,198 | ) | | (3,076,976 | ) | | | | | | |
Net increase (decrease) from capital stock transactions | | | | | | | | | | | | | | 2,398,264 | | | (2,564,170 | ) | | | | | | |
Total net increase (decrease) from capital stock transactions | | 644,600 | | | 1,414,721 | | | 3,690,386 | | | (25,149,315 | ) | | (30,366,927 | ) | | (52,025,827 | ) | | (7,385,548 | ) | | 13,151,816 | |
| Total increase (decrease) in net assets | | (593,677 | ) | | 2,860,422 | | | (26,609,336 | ) | | (658,429 | ) | | (55,074,596 | ) | | (30,319,661 | ) | | (12,364,166 | ) | | 30,846,102 | |
| Net Assets at end of period | $ | 20,924,558 | | $ | 21,518,235 | | $ | 177,208,386 | | $ | 203,817,722 | | $ | 118,284,204 | | $ | 173,358,800 | | $ | 174,838,384 | | $ | 187,202,550 | |
Undistributed net investment income included in net assets | $ | 8,506 | | $ | 2,201 | | $ | 860,234 | | $ | 1,412,067 | | $ | 795,675 | | $ | 702,331 | | $ | 1,048,456 | | $ | 517,059 | |
| Capital Share transactions: | | | | | | | | | | | | | | | | | | | | | | | | |
| Class A Shares | | | | | | | | | | | | | | | | | | | | | | | | |
| Shares sold | | | | | | | | 255,629 | | | 278,846 | | | 47,076 | | | 43,777 | | | 148,335 | | | 245,967 | |
Issued to shareholders in reinvestment of distributions | | | | | | | | 596,927 | | | 31,264 | | | 13,268 | | | 724 | | | 228,200 | | | 100,064 | |
| Shares redeemed | | | | | | | | (636,857 | ) | | (568,779 | ) | | (11,159 | ) | | (3,400 | ) | | (398,879 | ) | | (412,845 | ) |
| Net increase (decrease) in shares outstanding | | | | | | | | 215,699 | | | (258,669 | ) | | 49,185 | | | 41,101 | | | (22,344 | ) | | (66,814 | ) |
| Class B Shares | | | | | | | | | | | | | | | | | | | | | | | | |
| Shares sold | | | | | | | | 25,274 | | | 40,704 | | | | | | | | | 29,797 | | | 23,799 | |
Issued to shareholders in reinvestment of distributions | | | | | | | | 40,127 | | | 169 | | | | | | | | | 20,474 | | | 10,602 | |
| Shares redeemed | | | | | | | | (67,859 | ) | | (94,460 | ) | | | | | | | | (49,271 | ) | | (77,390 | ) |
| Net increase (decrease) in shares outstanding | | | | | | | | (2,458 | ) | | (53,587 | ) | | | | | | | | 1,000 | | | (42,989 | ) |
| Class Y Shares | | | | | | | | | | | | | | | | | | | | | | | | |
| Shares sold | | 87,166 | | | 193,006 | | | 777,399 | | | 1,774,354 | | | 521,213 | | | 1,539,785 | | | 547,441 | | | 1,808,577 | |
Issued to shareholders in reinvestment of distributions | | 66,708 | | | 38,403 | | | 1,054,503 | | | 81,705 | | | 845,815 | | | 176,780 | | | 425,193 | | | 167,599 | |
| Shares redeemed | | (126,660 | ) | | (169,660 | ) | | (1,822,188 | ) | | (2,914,791 | ) | | (2,892,859 | ) | | (3,780,734 | ) | | (1,274,290 | ) | | (1,334,746 | ) |
| Net increase (decrease) in shares outstanding | | 27,214 | | | 61,749 | | | 9,714 | | | (1,058,732 | ) | | (1,525,831 | ) | | (2,064,169 | ) | | (301,656 | ) | | 641,430 | |
| Class R6 Shares | | | | | | | | | | | | | | | | | | | | | | | | |
| Shares sold | | | | | | | | | | | | | | 87,423 | | | 13,602 | | | | | | | |
Issued to shareholders in reinvestment of distributions | | | | | | | | | | | | | | 63,627 | | | 8,239 | | | | | | | |
| Shares redeemed | | | | | | | | | | | | | | (50,991 | ) | | (136,434 | ) | | | | | | |
| Net increase (decrease) in shares outstanding | | | | | | | | | | | | | | 100,059 | | | (114,593 | ) | | | | | | |
See accompanying Notes to Financial Statements.
54
Madison Funds | October 31, 2015
| |
| Statements of Changes in Net Assets |
| | | | | | | | | | | | | | | | | | | | | | | | |
| | | Mid Cap Fund | | | Small Cap Fund | | | NorthRoad International Fund | | | International Stock Fund | |
| | | Year Ended
October 31,
2015 | | | Year Ended
October 31,
2014 | | | Year Ended
October 31,
2015 | | | Year Ended
October 31,
2014 | | | Year Ended
October 31,
2015 | | | Year Ended
October 31,
2014 | | | Year Ended
October 31,
2015 | | | Year Ended
October 31,
2014 | |
| Net Assets at beginning of period | $ | 290,650,610 | | $ | 323,586,628 | | $ | 64,439,940 | | $ | 50,280,101 | | $ | 45,425,305 | | $ | 32,628,399 | | $ | 33,010,915 | | $ | 62,150,969 | |
| Increase (decrease) in net assets from operations: | | | | | | | | | | | | | | | | | | | | | | | | |
| Net investment income (loss) | | (1,433,150 | ) | | (711,103 | ) | | 246,443 | | | 309,327 | | | 816,408 | | | 783,752 | | | 361,192 | | | 780,376 | |
| Net realized gain. | | 15,183,881 | | | 51,687,953 | | | 3,744,598 | | | 4,258,634 | | | 141,024 | | | 1,651,193 | | | 365,802 | | | 10,955,287 | |
| Net change in unrealized appreciation (depreciation) | | 2,822,289 | | | (19,200,340 | ) | | (991,275 | ) | | (656,750 | ) | | (2,600,056 | ) | | (4,183,840 | ) | | (805,075 | ) | | (9,847,171 | ) |
| Net increase (decrease) in net assets from operations | | 16,573,020 | | | 31,776,510 | | | 2,999,766 | | | 3,911,211 | | | (1,642,624 | ) | | (1,748,895 | ) | | (78,081 | ) | | 1,888,492 | |
| Distributions to shareholders from: | | | | | | | | | | | | | | | | | | | | | | | | |
| Net investment income | | | | | | | | | | | | | | | | | | | | | | | | |
| Class A | | – | | | – | | | (8,622 | ) | | – | | | – | | | – | | | (533,657 | ) | | (196,126 | ) |
| Class B | | – | | | – | | | – | | | – | | | – | | | – | | | (31,860 | ) | | (4,534 | ) |
| Class Y | | – | | | – | | | (334,294 | ) | | – | | | (674,182 | ) | | (526,648 | ) | | (210,332 | ) | | (341,577 | ) |
| Class R6 | | – | | | – | | | – | | | (2,317 | ) | | (180,437 | ) | | (204 | ) | | – | | | – | |
| Net realized gains | | | | | | | | | | | | | | | | | | | | | | | | |
| Class A | | (10,096,248 | ) | | (3,967,132 | ) | | (191,090 | ) | | (187,370 | ) | | – | | | – | | | – | | | – | |
| Class B | | (827,997 | ) | | (411,064 | ) | | (25,961 | ) | | (20,771 | ) | | – | | | – | | | – | | | – | |
| Class Y | | (36,856,357 | ) | | (17,376,994 | ) | | (3,500,200 | ) | | (1,945,021 | ) | | (1,361,399 | ) | | (781,796 | ) | | – | | | – | |
| Class R6 | | (1,049,409 | ) | | (320,452 | ) | | – | | | – | | | (364,362 | ) | | (302 | ) | | – | | | – | |
| Total distributions | | (48,830,011 | ) | | (22,075,642 | ) | | (4,060,167 | ) | | (2,155,479 | ) | | (2,580,380 | ) | | (1,308,950 | ) | | (775,849 | ) | | (542,237 | ) |
| Capital Stock transactions: | | | | | | | | | | | | | | | | | | | | | | | | |
| Class A Shares | | | | | | | | | | | | | | | | | | | | | | | | |
| Shares sold | | 3,292,194 | | | 4,513,570 | | | 773,600 | | | 724,712 | | | | | | | | | 2,379,285 | | | 3,237,394 | |
| Issued to shareholders in reinvestment of distributions | | 10,025,872 | | | 3,933,648 | | | 199,707 | | | 187,260 | | | | | | | | | 527,393 | | | 193,731 | |
| Shares redeemed | | (9,476,158 | ) | | (9,757,434 | ) | | (1,112,553 | ) | | (1,874,511 | ) | | | | | | | | (4,455,302 | ) | | (5,088,253 | ) |
| Net increase (decrease) from capital stock transactions | | 3,841,908 | | | (1,310,216 | ) | | (139,246 | ) | | (962,539 | ) | | | | | | | | (1,548,624 | ) | | (1,657,128 | ) |
| Class B Shares | | | | | | | | | | | | | | | | | | | | | | | | |
| Shares sold | | 320,087 | | | 462,609 | | | 84,462 | | | 111,058 | | | | | | | | | 279,135 | | | 223,658 | |
| Issued to shareholders in reinvestment of distributions | | 827,123 | | | 410,354 | | | 25,961 | | | 20,588 | | | | | | | | | 31,860 | | | 4,518 | |
| Shares redeemed | | (1,358,274 | ) | | (2,141,980 | ) | | (184,776 | ) | | (111,768 | ) | | | | | | | | (651,975 | ) | | (1,135,578 | ) |
| Net increase (decrease) from capital stock transactions | | (211,064 | ) | | (1,269,017 | ) | | (74,353 | ) | | 19,878 | | | | | | | | | (340,980 | ) | | (907,402 | ) |
| Class Y Shares | | | | | | | | | | | | | | | | | | | | | | | | |
| Shares sold | | 27,769,283 | | | 27,738,092 | | | 26,907,349 | | | 27,454,584 | | | 9,402,829 | | | 15,883,967 | | | 12,453,021 | | | 14,862,886 | |
| Issued to shareholders in reinvestment of distributions | | 25,946,268 | | | 12,242,989 | | | 3,544,488 | | | 1,418,926 | | | 525,272 | | | 319,523 | | | 210,332 | | | 61,110 | |
| Shares redeemed | | (55,123,047 | ) | | (78,676,105 | ) | | (6,017,531 | ) | | (15,526,742 | ) | | (6,991,005 | ) | | (9,240,235 | ) | | (4,601,090 | ) | | (42,845,775 | ) |
| Net increase (decrease) from capital stock transactions | | (1,407,496 | ) | | (38,695,024 | ) | | 24,434,306 | | | 13,346,768 | | | 2,937,096 | | | 6,963,255 | | | 8,062,263 | | | (27,921,779 | ) |
| Class R6 Shares | | | | | | | | | | | | | | | | | | | | | | | | |
| Shares sold | | 4,515,567 | | | 644,684 | | | | | | | | | 864,300 | | | 8,890,990 | | | | | | | |
| Issued to shareholders in reinvestment of distributions | | 1,049,409 | | | 320,452 | | | | | | | | | 544,800 | | | 506 | | | | | | | |
| Shares redeemed | | (301,759 | ) | | (2,327,765 | ) | | | | | | | | (119,236 | ) | | – | | | | | | | |
| Net increase (decrease) from capital stock transactions | | 5,263,217 | | | (1,362,629 | ) | | | | | | | | 1,289,864 | | | 8,891,496 | | | | | | | |
Total net increase (decrease) from capital stock transactions | | 7,486,565 | | | (42,636,886 | ) | | 24,220,707 | | | 12,404,107 | | | 4,226,960 | | | 15,854,751 | | | 6,172,659 | | | (30,486,309 | ) |
| Total increase (decrease) in net assets | | (24,770,426 | ) | | (32,936,018 | ) | | 23,160,306 | | | 14,159,839 | | | 3,956 | | | 12,796,906 | | | 5,318,729 | | | (29,140,054 | ) |
| Net Assets at end of period | $ | 265,880,184 | | $ | 290,650,610 | | $ | 87,600,246 | | $ | 64,439,940 | | $ | 45,429,261 | | $ | 45,425,305 | | $ | 38,329,644 | | $ | 33,010,915 | |
Undistributed net investment income included in net assets | $ | – | | $ | – | | $ | 112,311 | | $ | 274,955 | | $ | 691,903 | | $ | 748,357 | | $ | 351,817 | | $ | 781,469 | |
| Capital Share transactions: | | | | | | | | | | | | | | | | | | | | | | | | |
| Class A Shares | | | | | | | | | | | | | | | | | | | | | | | | |
| Shares sold | | 378,026 | | | 485,015 | | | 51,618 | | | 49,333 | | | | | | | | | 178,791 | | | 241,599 | |
| Issued to shareholders in reinvestment of distributions | | 1,182,296 | | | 427,106 | | | 13,261 | | | 12,602 | | | | | | | | | 41,790 | | | 14,425 | |
| Shares redeemed | | (1,116,448 | ) | | (1,041,231 | ) | | (74,908 | ) | | (129,652 | ) | | | | | | | | (341,596 | ) | | (379,025 | ) |
| Net increase (decrease) in shares outstanding | | 443,874 | | | (129,110 | ) | | (10,029 | ) | | (67,717 | ) | | | | | | | | (121,015 | ) | | (123,001 | ) |
| Class B Shares | | | | | | | | | | | | | | | | | | | | | | | | |
| Shares sold | | 42,643 | | | 55,249 | | | 5,872 | | | 7,756 | | | | | | | | | 21,503 | | | 16,837 | |
| Issued to shareholders in reinvestment of distributions | | 112,995 | | | 49,861 | | | 1,802 | | | 1,436 | | | | | | | | | 2,569 | | | 342 | |
| Shares redeemed | | (182,024 | ) | | (258,038 | ) | | (12,831 | ) | | (7,981 | ) | | | | | | | | (50,526 | ) | | (86,152 | ) |
| Net increase (decrease) in shares outstanding | | (26,386 | ) | | (152,928 | ) | | (5,157 | ) | | 1,211 | | | | | | | | | (26,454 | ) | | (68,973 | ) |
| Class Y Shares | | | | | | | | | | | | | | | | | | | | | | | | |
| Shares sold | | 3,149,762 | | | 2,917,626 | | | 1,782,129 | | | 1,873,671 | | | 833,074 | | | 1,274,876 | | | 938,710 | | | 1,118,323 | |
| Issued to shareholders in reinvestment of distributions | | 2,978,906 | | | 1,302,445 | | | 235,202 | | | 95,358 | | | 49,789 | | | 26,738 | | | 16,680 | | | 4,550 | |
| Shares redeemed | | (6,101,904 | ) | | (8,241,261 | ) | | (397,954 | ) | | (1,056,199 | ) | | (642,543 | ) | | (779,518 | ) | | (358,949 | ) | | (3,150,181 | ) |
| Net increase (decrease) in shares outstanding | | 26,764 | | | (4,021,190 | ) | | 1,619,377 | | | 912,830 | | | 240,320 | | | 522,096 | | | 596,441 | | | (2,027,308 | ) |
| Class R6 Shares | | | | | | | | | | | | | | | | | | | | | | | | |
| Shares sold | | 508,499 | | | 67,209 | | | | | | | | | 75,185 | | | 746,515 | | | | | | | |
| Issued to shareholders in reinvestment of distributions | | 119,523 | | | 33,982 | | | | | | | | | 51,299 | | | 42 | | | | | | | |
| Shares redeemed | | (33,600 | ) | | (240,479 | ) | | | | | | | | (10,717 | ) | | – | | | | | | | |
| Net increase (decrease) in shares outstanding | | 594,422 | | | (139,288 | ) | | | | | | | | 115,767 | | | 746,557 | | | | | | | |
See accompanying Notes to Financial Statements.
55
Madison Funds | October 31, 2015
| |
| Statements of Changes in Net Assets |
| | | | | | | | | | | | | | | | | | | | | |
| | | Hansberger International Growth Fund* | | Target Retirement 2020 Fund | | Target Retirement 2030 Fund | |
| | Year Ended
October 31,
2015 | | Year Ended
October 31,
20141 | | Year Ended
December 31,
2013 | | Year Ended
October 31,
2015 | | Period from
August 29,
2014 to
October 31,
20142 | | Year Ended
October 31,
2015 | |
Period from
August 29,
2014 to
October 31,
20142 | |
| Net Assets at beginning of period | $ | 156,780,547 | | $ | 266,555,325 | | $ | 522,595,541 | | $ | 61,964,350 | | $ | – | | $ | 82,852,177 | | $ | – | |
| Increase (decrease) in net assets from operations: | | | | | | | | | | | | | | | | | | | | | |
| Net investment income . | | 508,794 | | | 2,555,878 | | | 3,708,991 | | | 872,479 | | | 185,951 | | | 1,234,059 | | | 252,295 | |
| Net realized gain. | | 8,360,702 | | | 19,367,136 | | | 43,393,169 | | | 1,693,559 | | | 561,840 | | | 2,099,659 | | | 1,522,964 | |
| Net change in unrealized appreciation (depreciation) | | (6,988,840 | ) | | (38,589,621 | ) | | 6,406,886 | | | (984,069 | ) | | (791,797 | ) | | (1,065,611 | ) | | (1,906,515 | ) |
| Net increase (decrease) in net assets from operations | | 1,880,656 | | | (16,666,607 | ) | | 53,509,046 | | | 1,581,969 | | | (44,006 | ) | | 2,268,107 | | | (131,256 | ) |
| Distributions to shareholders from: | | | | | | | | | | | | | | | | | | | | | |
| Net investment income | | | | | | | | | | | | | | | | | | | | | |
| Class Y | | (130,885 | ) | | – | | | (40,911 | ) | | | | | | | | | | | | |
| Class R6 | | – | | | – | | | – | | | (537,568 | ) | | | | | (781,023 | ) | | | |
| Class I | | (2,365,747 | ) | | – | | | (3,315,218 | ) | | | | | | | | | | | | |
| Net realized gains | | | | | | | | | | | | | | | | | | | | | |
| Class R6 | | – | | | – | | | – | | | (604,745 | ) | | | | | (1,632,546 | ) | | | |
| Total distributions | | (2,496,632 | ) | | – | | | (3,356,129 | ) | | (1,142,313 | ) | | | | | (2,413,569 | ) | | | |
| Capital Stock transactions: | | | | | | | | | | | | | | | | | | | | | |
| Class Y Shares | | | | | | | | | | | | | | | | | | | | | |
| Shares sold | | 15,399 | | | 47,615 | | | 311,359 | | | | | | | | | | | | | |
| Issued to shareholders in reinvestment of distributions | | 128,025 | | | – | | | 40,272 | | | | | | | | | | | | | |
| Shares redeemed | | (484,040 | ) | | (802,844 | ) | | (1,435,511 | ) | | | | | | | | | | | | |
| Net decrease from capital stock transactions | | (340,616 | ) | | (755,229 | ) | | (1,083,880 | ) | | | | | | | | | | | | |
| Class R6 Shares | | | | | | | | | | | | | | | | | | | | | |
| Shares sold | | | | | | | | | | | 1,965,286 | | | 65,040,867 | | | 2,827,154 | | | 86,549,653 | |
| Issued to shareholders in reinvestment of distributions | | | | | | | | | | | 1,142,314 | | | – | | | 2,413,569 | | | – | |
| Shares redeemed | | | | | | | | | | | (11,892,996 | ) | | (3,032,511 | ) | | (8,940,513 | ) | | (3,566,220 | ) |
| Net increase (decrease) from capital stock transactions | | | | | | | | | | | (8,785,396 | ) | | 62,008,356 | | | (3,699,790 | ) | | 82,983,433 | |
| Class I Shares | | | | | | | | | | | | | | | | | | | | | |
| Shares sold | | 819,009 | | | 927,144 | | | 10,861,909 | | | | | | | | | | | | | |
| Issued to shareholders in reinvestment of distributions | | 2,365,747 | | | – | | | 2,748,605 | | | | | | | | | | | | | |
| Shares redeemed | | (125,603,689 | ) | | (93,280,086 | ) | | (318,719,767 | ) | | | | | | | | | | | | |
| Net decrease from capital stock transactions | | (122,418,933 | ) | | (92,352,942 | ) | | (305,109,253 | ) | | | | | | | | | | | | |
Total net increase (decrease) from capital stock transactions | | (122,759,549 | ) | | (93,108,171 | ) | | (306,193,133 | ) | | (8,785,396 | ) | | 62,008,356 | | | (3,699,790 | ) | | 82,983,433 | |
| Total increase (decrease) in net assets | | (123,375,525 | ) | | (109,774,778 | ) | | (256,040,216 | ) | | (8,345,740 | ) | | 61,964,350 | | | (3,845,252 | ) | | 82,852,177 | |
| Net Assets at end of period | $ | 33,405,022 | | $ | 156,780,547 | | $ | 266,555,325 | | $ | 53,618,610 | | $ | 61,964,350 | | $ | 79,006,925 | | $ | 82,852,177 | |
Undistributed net investment income (loss) included in net assets | $ | 129,997 | | $ | 2,240,888 | | $ | (268,082 | ) | $ | 624,905 | | $ | 185,951 | | $ | 815,924 | | $ | 252,295 | |
| Capital Share transactions: | | | | | | | | | | | | | | | | | | | | | |
| Class Y Shares | | | | | | | | | | | | | | | | | | | | | |
| Shares sold | | 905 | | | 2,674 | | | 19,024 | | | | | | | | | | | | | |
| Issued to shareholders in reinvestment of distributions | | 8,270 | | | – | | | 2,293 | | | | | | | | | | | | | |
| Shares redeemed | | (29,533 | ) | | (45,877 | ) | | (87,609 | ) | | | | | | | | | | | | |
| Net decrease in shares outstanding | | (20,358 | ) | | (43,203 | ) | | (66,292 | ) | | | | | | | | | | | | |
| Class R6 Shares | | | | | | | | | | | | | | | | | | | | | |
| Shares sold | | | | | | | | | | | 194,179 | | | 6,504,391 | | | 279,805 | | | 8,656,906 | |
| Issued to shareholders in reinvestment of distributions | | | | | | | | | | | 114,460 | | | – | | | 243,549 | | | – | |
| Shares redeemed | | | | | | | | | | | (1,184,264 | ) | | (306,433 | ) | | (894,665 | ) | | (361,382 | ) |
| Net increase (decrease) in shares outstanding | | | | | | | | | | | (875,625 | ) | | 6,197,958 | | | (371,311 | ) | | 8,295,524 | |
| Class I Shares | | | | | | | | | | | | | | | | | | | | | |
| Shares sold | | 48,884 | | | 54,325 | | | 623,674 | | | | | | | | | | | | | |
| Issued to shareholders in reinvestment of distributions | | 152,826 | | | – | | | 156,616 | | | | | | | | | | | | | |
| Shares redeemed | | (7,498,009 | ) | | (5,530,183 | ) | | (19,699,473 | ) | | | | | | | | | | | | |
| Net decrease in shares outstanding | | (7,296,299 | ) | | (5,475,858 | ) | | (18,919,183 | ) | | | | | | | | | | | | |
| |
| *The Statements of Changes in Net Assets presented herein include the operating results of the Hansberger International Series International Growth Fund through July 31, 2014. See Note 1 for a discussion of the Fund’s reorganization. |
| 1 Effective at the close of business on July 31, 2014, the fiscal year end of the Fund changed to October 31. Disclosure represents 10 months of information. |
| 2 Commenced investment operations August 29, 2014. See Note 1 for further information. |
See accompanying Notes to Financial Statements.
56
Madison Funds | October 31, 2015
| |
| Statements of Changes in Net Assets |
| | | | | | | | | | | | |
| | | Target Retirement 2040 Fund | | | Target Retirement 2050 Fund | |
| | | Year Ended
October 31,
2015 | | | Period from
August 29,
2014 to
October 31,
20141 | | | Year Ended
October 31,
2015 | | | Period from
August 29,
2014 to
October 31,
20141 | |
| Net Assets at beginning of period | $ | 58,902,574 | | $ | – | | $ | 21,265,564 | | $ | – | |
| Increase (decrease) in net assets from operations: | | | | | | | | | | | | |
| Net investment income . | | 839,055 | | | 176,278 | | | 326,330 | | | 58,479 | |
| Net realized gain. | | 1,997,182 | | | 1,401,274 | | | 416,075 | | | 408,755 | |
| Net change in unrealized appreciation (depreciation) | | (1,252,918 | ) | | (1,699,031 | ) | | (90,904 | ) | | (509,226 | ) |
| Net increase (decrease) in net assets from operations | | 1,583,319 | | | (121,479 | ) | | 651,501 | | | (41,992 | ) |
| Distributions to shareholders from: | | | | | | | | | | | | |
| Net investment income | | | | | | | | | | | | |
| Class R6 | | (588,549 | ) | | | | | (227,101 | ) | | | |
| Net realized gains | | | | | | | | | | | | |
| Class R6 | | (1,513,221 | ) | | | | | (463,433 | ) | | | |
| Total distributions | | (2,101,770 | ) | | | | | (690,534 | ) | | | |
| Capital Stock transactions: | | | | | | | | | | | | |
| Class R6 Shares | | | | | | | | | | | | |
| Shares sold | | 1,322,699 | | | 60,698,322 | | | 2,060,597 | | | 22,015,358 | |
| Issued to shareholders in reinvestment of distributions | | 2,101,769 | | | – | | | 690,534 | | | – | |
| Shares redeemed | | (11,779,177 | ) | | (1,674,269 | ) | | (3,495,489 | ) | | (707,802 | ) |
| Net increase (decrease) from capital stock transactions | | (8,354,709 | ) | | 59,024,053 | | | (744,358 | ) | | 21,307,556 | |
| Total net increase (decrease) from capital stock transactions | | (8,354,709 | ) | | 59,024,053 | | | (744,358 | ) | | 21,307,556 | |
| Total increase (decrease) in net assets | | (8,873,160 | ) | | 58,902,574 | | | (783,391 | ) | | 21,265,564 | |
| Net Assets at end of period | $ | 50,029,414 | | $ | 58,902,574 | | $ | 20,482,173 | | $ | 21,265,564 | |
| Undistributed net investment income included in net assets | $ | 522,865 | | $ | 176,278 | | $ | 199,012 | | | $ 58,479 | |
| Capital Share transactions: | | | | | | | | | | | | |
| Class R6 Shares | | | | | | | | | | | | |
| Shares sold | | 132,290 | | | 6,070,505 | | | 204,401 | | | 2,202,492 | |
| Issued to shareholders in reinvestment of distributions | | 213,378 | | | | | | 69,681 | | | | |
| Shares redeemed | | (1,191,593 | ) | | (170,154 | ) | | (346,869 | ) | | (71,452 | ) |
| Net increase (decrease) in shares outstanding | | (845,925 | ) | | 5,900,351 | | | (72,787 | ) | | 2,131,040 | |
| |
| 1 Commenced investment operations August 29, 2014 |
See accompanying Notes to Financial Statements.
57
Madison Funds | October 31, 2015
| |
| Financial Highlights for a Share of Beneficial Interest Outstanding |
| | | | | | | | | | | | | | | | | | | | | | | | | | | | | | | | | | | | | | | | | | | | | |
| | | | | | | | | | | | | | | | | | CONSERVATIVE ALLOCATION FUND | | | | | | | | | | | | | | | | |
| | | | | | | | CLASS A | | | | | | | | | | | | | CLASS B | | | | | | | | | | | | | CLASS C | | | | | | |
| | | | | | Year Ended October 31, | | | | | | | | | Year Ended October 31, | | | | | | | | | Year Ended October 31, | | | | |
| | | 2015 | | | 2014 | | | 2013 | | | 2012 | | | 2011 | | | 2015 | | | 2014 | | | 2013 | | | 2012 | | | 2011 | | | 2015 | | | 2014 | | | 2013 | | | 2012 | | | 2011 | |
Net Asset Value at beginning of period | $ | 11.15 | | $ | 10.68 | | $ | 10.43 | | $ | 9.94 | | $ | 10.02 | | $ | 11.19 | | $ | 10.71 | | $ | 10.42 | | $ | 9.94 | | $ | 10.03 | | $ | 11.20 | | $ | 10.72 | | $ | 10.43 | | $ | 9.95 | | $ | 10.04 | |
Income from Investment Operations: | | | | | | | | | | | | | | | | | | | | | | | | | | | | | | | | | | | | | | | | | | | | | |
| Net investment income1 | | 0.13 | | | 0.15 | | | 0.22 | | | 0.24 | | | 0.25 | | | 0.06 | | | 0.06 | | | 0.15 | | | 0.16 | | | 0.17 | | | 0.05 | | | 0.06 | | | 0.16 | | | 0.16 | | | 0.19 | |
Net realized and unrealized gain (loss) on investments | | – | | | 0.50 | | | 0.48 | | | 0.50 | | | 0.04 | | | (0.01 | ) | | 0.51 | | | 0.47 | | | 0.50 | | | 0.05 | | | (0.01 | ) | | 0.51 | | | 0.46 | | | 0.50 | | | 0.03 | |
Total from investment operations | | 0.13 | | | 0.65 | | | 0.70 | | | 0.74 | | | 0.29 | | | 0.05 | | | 0.57 | | | 0.62 | | | 0.66 | | | 0.22 | | | 0.04 | | | 0.57 | | | 0.62 | | | 0.66 | | | 0.22 | |
| Less Distributions: | | | | | | | | | | | | | | | | | | | | | | | | | | | | | | | | | | | | | | | | | | | | | |
Distributions from net investment income | | (0.17 | ) | | (0.14 | ) | | (0.45 | ) | | (0.25 | ) | | (0.37 | ) | | (0.07 | ) | | (0.05 | ) | | (0.33 | ) | | (0.18 | ) | | (0.31 | ) | | (0.07 | ) | | (0.05 | ) | | (0.33 | ) | | (0.18 | ) | | (0.31 | ) |
Distributions from capital gains | | (0.48 | ) | | (0.04 | ) | | – | | | – | | | – | | | (0.48 | ) | | (0.04 | ) | | – | | | – | | | – | | | (0.48 | ) | | (0.04 | ) | | – | | | – | | | – | |
Total distributions | | (0.65 | ) | | (0.18 | ) | | (0.45 | ) | | (0.25 | ) | | (0.37 | ) | | (0.55 | ) | | (0.09 | ) | | (0.33 | ) | | (0.18 | ) | | (0.31 | ) | | (0.55 | ) | | (0.09 | ) | | (0.33 | ) | | (0.18 | ) | | (0.31 | ) |
Net increase (decrease) in net asset value | | (0.52 | ) | | 0.47 | | | 0.25 | | | 0.49 | | | (0.08 | ) | | (0.50 | ) | | 0.48 | | | 0.29 | | | 0.48 | | | (0.09 | ) | | (0.51 | ) | | 0.48 | | | 0.29 | | | 0.48 | | | (0.09 | ) |
Net Asset Value at end of period | $ | 10.63 | | $ | 11.15 | | $ | 10.68 | | $ | 10.43 | | $ | 9.94 | | $ | 10.69 | | $ | 11.19 | | $ | 10.71 | | $ | 10.42 | | $ | 9.94 | | $ | 10.69 | | $ | 11.20 | | $ | 10.72 | | $ | 10.43 | | $ | 9.95 | |
| Total Return (%)2 | | 1.17 | | | 6.13 | | | 6.90 | | | 7.60 | | | 3.00 | | | 0.44 | | | 5.41 | | | 6.05 | | | 6.75 | | | 2.19 | | | 0.34 | | | 5.41 | | | 6.05 | | | 6.75 | | | 2.19 | |
| Ratios/Supplemental Data: | | | | | | | | | | | | | | | | | | | | | | | | | | | | | | | | | | | | | | | | | | | | | |
Net Assets at end of period (in 000’s) | $ | 46,039 | | $ | 44,438 | | $ | 42,353 | | $ | 41,905 | | $ | 35,293 | | $ | 10,064 | | $ | 11,393 | | $ | 11,569 | | $ | 9,521 | | $ | 8,203 | | $ | 19,694 | | $ | 18,948 | | $ | 16,787 | | $ | 10,813 | | $ | 5,846 | |
Ratios of expenses to average net assets: | | | | | | | | | | | | | | | | | | | | | | | | | | | | | | | | | | | | | | | | | | | | | |
Before reimbursement of expenses by Adviser (%) | | 0.70 | | | 0.70 | | | 0.70 | | | 0.70 | | | 0.70 | | | 1.45 | | | 1.45 | | | 1.45 | | | 1.45 | | | 1.45 | | | 1.45 | | | 1.45 | | | 1.45 | | | 1.45 | | | 1.45 | |
After reimbursement of expenses by Adviser (%) | | 0.70 | | | 0.70 | | | 0.70 | | | 0.70 | | | 0.70 | | | 1.45 | | | 1.45 | | | 1.45 | | | 1.45 | | | 1.45 | | | 1.45 | | | 1.45 | | | 1.45 | | | 1.45 | | | 1.45 | |
Ratio of net investment income to average net assets | | | | | | | | | | | | | | | | | | | | | | | | | | | | | | | | | | | | | | | | | | | | | |
After reimbursement of expenses by Adviser (%) | | 1.23 | | | 1.35 | | | 2.09 | | | 2.34 | | | 2.40 | | | 0.59 | | | 0.59 | | | 1.29 | | | 1.61 | | | 1.67 | | | 0.49 | | | 0.57 | | | 1.22 | | | 1.49 | | | 1.76 | |
| Portfolio turnover (%)3 | | 83 | | | 96 | | | 69 | | | 40 | | | 26 | | | 83 | | | 96 | | | 69 | | | 40 | | | 26 | | | 83 | | | 96 | | | 69 | | | 40 | | | 26 | |
| | | | | | | | | | | | | | | | | | | | | | | | | | | | | | | | | | | | | | | | | | | | | |
| | | | | | | | | | | | | | | | | | MODERATE ALLOCATION FUND | | | | | | | | | | | | | | | | | | | |
| | | | | | | | CLASS A | | | | | | | | | | | | | CLASS B | | | | | | | | | | | | | CLASS C | | | | | | |
| | | | | | Year Ended October 31, | | | | | | | | | Year Ended October 31, | | | | | | | | | Year Ended October 31, | | | | |
| | | 2015 | | | 2014 | | | 2013 | | | 2012 | | | 2011 | | | 2015 | | | 2014 | | | 2013 | | | 2012 | | | 2011 | | | 2015 | | | 2014 | | | 2013 | | | 2012 | | | 2011 | |
Net Asset Value at beginning of period | $ | 12.27 | | $ | 11.50 | | $ | 10.35 | | $ | 9.76 | | $ | 9.63 | | $ | 12.19 | | $ | 11.43 | | $ | 10.29 | | $ | 9.70 | | $ | 9.58 | | $ | 12.20 | | $ | 11.44 | | $ | 10.30 | | $ | 9.71 | | $ | 9.58 | |
Income from Investment Operations: | | | | | | | | | | | | | | | | | | | | | | | | | | | | | | | | | | | | | | | | | | | | | |
Net investment income1 | | 0.13 | | | 0.12 | | | 0.17 | | | 0.19 | | | 0.16 | | | 0.05 | | | 0.04 | | | 0.09 | | | 0.11 | | | 0.08 | | | 0.02 | | | 0.03 | | | 0.10 | | | 0.10 | | | 0.08 | |
Net realized and unrealized gain on investments | | 0.04 | | | 0.80 | | | 1.23 | | | 0.63 | | | 0.22 | | | 0.04 | | | 0.78 | | | 1.23 | | | 0.63 | | | 0.21 | | | 0.07 | | | 0.79 | | | 1.22 | | | 0.64 | | | 0.22 | |
Total from investment operations | | 0.17 | | | 0.92 | | | 1.40 | | | 0.82 | | | 0.38 | | | 0.09 | | | 0.82 | | | 1.32 | | | 0.74 | | | 0.29 | | | 0.09 | | | 0.82 | | | 1.32 | | | 0.74 | | | 0.30 | |
Less Distributions: | | | | | | | | | | | | | | | | | | | | | | | | | | | | | | | | | | | | | | | | | | | | | |
Distributions from net investment income | | (0.17 | ) | | (0.15 | ) | | (0.25 | ) | | (0.23 | ) | | (0.25 | ) | | (0.11 | ) | | (0.06 | ) | | (0.18 | ) | | (0.15 | ) | | (0.17 | ) | | (0.11 | ) | | (0.06 | ) | | (0.18 | ) | | (0.15 | ) | | (0.17 | ) |
Distributions from capital gains | | (0.65 | ) | | – | | | – | | | – | | | – | | | (0.65 | ) | | – | | | – | | | – | | | – | | | (0.65 | ) | | – | | | – | | | – | | | – | |
Total distributions | | (0.82 | ) | | (0.15 | ) | | (0.25 | ) | | (0.23 | ) | | (0.25 | ) | | (0.76 | ) | | (0.06 | ) | | (0.18 | ) | | (0.15 | ) | | (0.17 | ) | | (0.76 | ) | | (0.06 | ) | | (0.18 | ) | | (0.15 | ) | | (0.17 | ) |
Net increase (decrease) in net asset value | | (0.65 | ) | | 0.77 | | | 1.15 | | | 0.59 | | | 0.13 | | | (0.67 | ) | | 0.76 | | | 1.14 | | | 0.59 | | | 0.12 | | | (0.67 | ) | | 0.76 | | | 1.14 | | | 0.59 | | | 0.13 | |
Net Asset Value at end of period | $ | 11.62 | | $ | 12.27 | | $ | 11.50 | | $ | 10.35 | | $ | 9.76 | | $ | 11.52 | | $ | 12.19 | | $ | 11.43 | | $ | 10.29 | | $ | 9.70 | | $ | 11.53 | | $ | 12.20 | | $ | 11.44 | | $ | 10.30 | | $ | 9.71 | |
| Total Return (%)2 | | 1.44 | | | 8.03 | | | 13.87 | | | 8.55 | | | 3.97 | | | 0.72 | | | 7.18 | | | 12.98 | | | 7.77 | | | 3.19 | | | 0.72 | | | 7.17 | | | 12.97 | | | 7.77 | | | 3.19 | |
Ratios/Supplemental Data: | | | | | | | | | | | | | | | | | | | | | | | | | | | | | | | | | | | | | | | | | | | | | |
Net Assets at end of period (in 000’s) | $ | 107,043 | | $ | 109,148 | | $ | 104,849 | | | 92,954 | | $ | 84,321 | | $ | 29,451 | | $ | 33,235 | | $ | 33,070 | | $ | 29,821 | | $ | 26,928 | | $ | 9,506 | | $ | 8,238 | | $ | 7,347 | | $ | 5,253 | | $ | 3,939 | |
Ratios of expenses to average net assets: | | | | | | | | | | | | | | | | | | | | | | | | | | | | | | | | | | | | | | | | | | | | | |
Before reimbursement of expenses by Adviser (%) | | 0.70 | | | 0.70 | | | 0.70 | | | 0.70 | | | 0.70 | | | 1.45 | | | 1.45 | | | 1.45 | | | 1.45 | | | 1.45 | | | 1.45 | | | 1.45 | | | 1.45 | | | 1.45 | | | 1.45 | |
After reimbursement of expenses by Adviser (%) | | 0.70 | | | 0.70 | | | 0.70 | | | 0.70 | | | 0.70 | | | 1.45 | | | 1.45 | | | 1.45 | | | 1.45 | | | 1.45 | | | 1.45 | | | 1.45 | | | 1.45 | | | 1.45 | | | 1.45 | |
Ratio of net investment income to average net assets | | | | | | | | | | | | | | | | | | | | | | | | | | | | | | | | | | | | | | | | | | | | | |
After reimbursement of expenses by Adviser (%) | | 1.02 | | | 1.00 | | | 1.55 | | | 1.86 | | | 1.64 | | | 0.41 | | | 0.27 | | | 0.82 | | | 1.11 | | | 0.88 | | | 0.01 | | | 0.21 | | | 0.82 | | | 1.02 | | | 0.90 | |
| Portfolio turnover (%)3 | | 81 | | | 89 | | | 69 | | | 50 | | | 20 | | | 81 | | | 89 | | | 69 | | | 50 | | | 20 | | | 81 | | | 89 | | | 69 | | | 50 | | | 20 | |
| |
| 1 Net investment income calculated excluding permanent tax adjustments to undistributed net investment income. |
| 2 Total return without applicable sales charge. |
| 3 Portfolio turnover is calculated at the fund level and represents the entire fiscal year or period. |
See accompanying Notes to Financial Statements.
58
Madison Funds | October 31, 2015
| |
| Financial Highlights for a Share of Beneficial Interest Outstanding |
| | | | | | | | | | | | | | | | | | | | | | | | | | | | | | | | | | | | | | | | | | | | | |
| | | | | | | | | | | | | | | | | | AGGRESSIVE ALLOCATION FUND | | | | | | | | | | | | | | | | |
| | | | | | | | CLASS A | | | | | | | | | | | | | CLASS B | | | | | | | | | | | | | CLASS C | | | | | | |
| | | | | | Year Ended October 31, | | | | | | | | | Year Ended October 31, | | | | | | | | | Year Ended October 31, | | | | |
| | | 2015 | | | 2014 | | | 2013 | | | 2012 | | | 2011 | | | 2015 | | | 2014 | | | 2013 | | | 2012 | | | 2011 | | | 2015 | | | 2014 | | | 2013 | | | 2012 | | | 2011 | |
Net Asset Value at beginning of period | $ | 12.81 | | $ | 11.72 | | $ | 10.01 | | $ | 9.32 | | $ | 9.04 | | $ | 12.61 | | $ | 11.59 | | $ | 9.89 | | $ | 9.23 | | $ | 8.96 | | $ | 12.62 | | $ | 11.60 | | $ | 9.90 | | $ | 9.24 | | $ | 8.97 | |
Income from Investment Operations: | | | | | | | | | | | | | | | | | | | | | | | | | | | | | | | | | | | | | | | | | | | | | |
Net investment income (loss)1 | | 0.11 | | | 0.09 | | | 0.12 | | | 0.12 | | | 0.07 | | | 0.03 | | | 0.00 | 4 | | 0.04 | | | 0.05 | | | 0.00 | 4 | | 0.02 | | | (0.01 | ) | | 0.05 | | | 0.03 | | | (0.02 | ) |
Net realized and unrealized gain on investments | | 0.10 | | | 1.04 | | | 1.80 | | | 0.70 | | | 0.32 | | | 0.09 | | | 1.02 | | | 1.80 | | | 0.68 | | | 0.32 | | | 0.10 | | | 1.03 | | | 1.79 | | | 0.70 | | | 0.34 | |
Total from investment operations | | 0.21 | | | 1.13 | | | 1.92 | | | 0.82 | | | 0.39 | | | 0.12 | | | 1.02 | | | 1.84 | | | 0.73 | | | 0.32 | | | 0.12 | | | 1.02 | | | 1.84 | | | 0.73 | | | 0.32 | |
| Less Distributions: | | | | | | | | | | | | | | | | | | | | | | | | | | | | | | | | | | | | | | | | | | | | | |
Distributions from net investment income | | (0.20 | ) | | (0.04 | ) | | (0.21 | ) | | (0.13 | ) | | (0.11 | ) | | (0.13 | ) | | – | | | (0.14 | ) | | (0.07 | ) | | (0.05 | ) | | (0.13 | ) | | – | | | (0.14 | ) | | (0.07 | ) | | (0.05 | ) |
Distributions from capital gains | | (0.95 | ) | | – | | | – | | | – | | | – | | | (0.95 | ) | | – | | | – | | | – | | | – | | | (0.95 | ) | | – | | | – | | | – | | | – | |
Total distributions | | (1.15 | ) | | (0.04 | ) | | (0.21 | ) | | (0.13 | ) | | (0.11 | ) | | (1.08 | ) | | – | | | (0.14 | ) | | (0.07 | ) | | (0.05 | ) | | (1.08 | ) | | – | | | (0.14 | ) | | (0.07 | ) | | (0.05 | ) |
Net increase (decrease) in net asset value | | (0.94 | ) | | 1.09 | | | 1.71 | | | 0.69 | | | 0.28 | | | (0.96 | ) | | 1.02 | | | 1.70 | | | 0.66 | | | 0.27 | | | (0.96 | ) | | 1.02 | | | 1.70 | | | 0.66 | | | 0.27 | |
Net Asset Value at end of period | $ | 11.87 | | $ | 12.81 | | $ | 11.72 | | $ | 10.01 | | $ | 9.32 | | $ | 11.65 | | $ | 12.61 | | $ | 11.59 | | $ | 9.89 | | $ | 9.23 | | $ | 11.66 | | $ | 12.62 | | $ | 11.60 | | $ | 9.90 | | $ | 9.24 | |
| Total Return (%)2 | | 1.66 | | | 9.67 | | | 19.56 | | | 8.87 | | | 4.29 | | | 0.91 | | | 8.80 | | | 18.79 | | | 7.99 | | | 3.54 | | | 0.91 | | | 8.79 | | | 18.78 | | | 7.98 | | | 3.54 | |
| Ratios/Supplemental Data: | | | | | | | | | | | | | | | | | | | | | | | | | | | | | | | | | | | | | | | | | | | | | |
Net Assets at end of period (in 000’s) | $ | 46,834 | | $ | 45,697 | | $ | 41,526 | | $ | 33,282 | | $ | 30,190 | | $ | 12,383 | | $ | 13,063 | | $ | 12,365 | | $ | 10,787 | | $ | 9,975 | | $ | 2,600 | | $ | 2,547 | | $ | 2,116 | | $ | 1,099 | | $ | 828 | |
Ratios of expenses to average net assets: | | | | | | | | | | | | | | | | | | | | | | | | | | | | | | | | | | | | | | | | | | | | | |
Before reimbursement of expenses by Adviser (%) | | 0.70 | | | 0.70 | | | 0.70 | | | 0.70 | | | 0.70 | | | 1.45 | | | 1.45 | | | 1.45 | | | 1.45 | | | 1.45 | | | 1.45 | | | 1.45 | | | 1.45 | | | 1.45 | | | 1.45 | |
After reimbursement of expenses by Adviser (%) | | 0.70 | | | 0.70 | | | 0.70 | | | 0.70 | | | 0.70 | | | 1.45 | | | 1.45 | | | 1.45 | | | 1.45 | | | 1.45 | | | 1.45 | | | 1.45 | | | 1.45 | | | 1.45 | | | 1.45 | |
Ratio of net investment income (loss) to average net assets | | | | | | | | | | | | | | | | | | | | | | | | | | | | | | | | | | | | | | | | | | | | | |
After reimbursement of expenses by Adviser (%) | | 0.81 | | | 0.73 | | | 1.02 | | | 1.22 | | | 0.74 | | | 0.21 | | | (0.01 | ) | | 0.34 | | | 0.48 | | | (0.00 | )4 | | 0.05 | | | (0.09 | ) | | 0.10 | | | 0.32 | | | (0.32 | ) |
| Portfolio turnover (%)3 | | 72 | | | 78 | | | 67 | | | 67 | | | 29 | | | 72 | | | 78 | | | 67 | | | 67 | | | 29 | | | 72 | | | 78 | | | 67 | | | 67 | | | 29 | |
| | | | | | | | | | | | | | | | | | | | | |
| | | | | | | | | | | | CASH RESERVES FUND | | | | | | | | |
| | | | | | CLASS A | | | | | | | | | CLASS B | | | |
| | | | | Year Ended October 31, | | | | | | Year Ended October 31, | | |
| | | 2015 | | 2014 | | 2013 | | | 2012 | | 2011 | | 2015 | | 2014 | | 2013 | | 2012 | | 2011 |
| Net Asset Value at beginning of period | $ | 1.00 | | $ 1.00 | | $ 1.00 | | $ | 1.00 | | $ 1.00 | | $ 1.00 | | $ 1.00 | | $ 1.00 | | $ 1.00 | | $ 1.00 |
| Income from Investment Operations: | | | | | | | | | | | | | | | | | | | | | |
| Net investment income (loss)1 | | 0.00 | 4 | 0.00 | 4 | 0.00 | 4 | | 0.00 | 4 | 0.00 | 4 | 0.00 | 4 | 0.00 | 4 | 0.00 | 4 | 0.00 | 4 | 0.004 |
| Total from investment operations | | 0.00 | 4 | 0.00 | 4 | 0.00 | 4 | | 0.00 | 4 | 0.00 | 4 | 0.00 | 4 | 0.00 | 4 | 0.00 | 4 | 0.00 | 4 | 0.004 |
| Net increase (decrease) in net asset value | | 0.00 | 4 | 0.00 | | 0.00 | 4 | | 0.00 | 4 | 0.00 | 4 | 0.00 | 4 | 0.00 | 4 | 0.00 | 4 | 0.00 | 4 | 0.004 |
| Net Asset Value at end of period | $ | 1.00 | | $ 1.00 | | $ 1.00 | | $ | 1.00 | | $ 1.00 | | $ 1.00 | | $ 1.00 | | $ 1.00 | | $ 1.00 | | $ 1.00 |
| Total Return (%)2 | | 0.00 | | 0.00 | | 0.00 | | | 0.00 | | 0.00 | | 0.00 | | 0.00 | | 0.00 | | 0.00 | | 0.00 |
| Ratios/Supplemental Data: | | | | | | | | | | | | | | | | | | | | | |
| Net Assets at end of period (in 000’s) | $ | 19,076 | | $ 20,570 | | $ 24,552 | | $ | 11,654 | | $ 12,298 | | $ 234 | | $ 461 | | $ 524 | | $ 826 | | $ 1,601 |
| Ratios of expenses to average net assets: | | | | | | | | | | | | | | | | | | | | | |
| Before reimbursement of expenses by Adviser (%) | | 0.55 | | 0.55 | | 0.55 | | | 0.55 | | 0.55 | | 1.30 | | 1.30 | | 1.30 | | 1.30 | | 1.30 |
| After reimbursement of expenses by Adviser (%) | | 0.07 | 5 | 0.07 | 5 | 0.09 | 5 | | 0.08 | 5 | 0.10 | 5 | 0.08 | 5 | 0.07 | 5 | 0.10 | 5 | 0.07 | 5 | 0.105 |
| Ratio of net investment income (loss) to average net assets | | | | | | | | | | | | | | | | | | | | | |
| After reimbursement and waiver of expenses by Adviser (%) | | 0.00 | 5 | 0.00 | 5 | (0.00 | )5 | | 0.00 | 5 | 0.00 | 5 | 0.00 | 5 | 0.00 | 5 | 0.00 | 5 | 0.00 | 5 | 0.005 |
| |
| 1 Net investment income (loss) calculated excluding permanent tax adjustments to undistributed net investment income. |
| 2 Total return without applicable sales charge. |
| 3 Portfolio turnover is calculated at the fund level and represents the entire fiscal year or period. |
| 4 Amounts represent less than $0.005 per share. |
| 5 Ratio is net of fees waived by the adviser and distributor (See Note 3). |
See accompanying Notes to Financial Statements.
59
Madison Funds | October 31, 2015
| |
| Financial Highlights for a Share of Beneficial Interest Outstanding |
| | | | | | | | | | | | | | | | | | | | | | | | | | | | | | | | | | | | |
| | | | | | TAX-FREE VIRGINIA FUND* | | | | | | | | | TAX-FREE NATIONAL FUND* | | | | |
| | | | | | | | | CLASS Y | | | | | | | | | | | | | | | CLASS Y | | | | | | | |
| | | Year Ended October 31, | | | Year Ended September 30, | | | Year Ended October 31, | | | Year Ended September 30, | |
| | | 2015 | | | 2014 | | | 20136 | | | 2013 | | | 2012 | | | 2011 | | | 2015 | | | 2014 | | | 20136 | | | 2013 | | | 2012 | | | 2011 | |
| Net Asset Value at beginning of period | $ | 11.70 | | $ | 11.54 | | $ | 11.50 | | $ | 12.24 | | $ | 11.92 | | $ | 11.98 | | $ | 11.08 | | $ | 10.73 | | $ | 10.70 | | $ | 11.44 | | $ | 11.05 | | $ | 11.16 | |
| Income from Investment Operations: | | | | | | | | | | | | | | | | | | | | | | | | | | | | | | | | | | | | |
| Net investment income1 | | 0.28 | | | 0.30 | | | 0.03 | | | 0.32 | | | 0.35 | | | 0.35 | | | 0.27 | | | 0.29 | | | 0.03 | | | 0.32 | | | 0.33 | | | 0.34 | |
Net realized and unrealized gain (loss) on investments | | (0.01 | ) | | 0.35 | | | 0.04 | | | (0.65 | ) | | 0.33 | | | – | | | 0.01 | | | 0.40 | | | 0.03 | | | (0.66 | ) | | 0.43 | | | (0.02 | ) |
| Total from investment operations | | 0.27 | | | 0.65 | | | 0.07 | | | (0.33 | ) | | 0.68 | | | 0.35 | | | 0.28 | | | 0.69 | | | 0.06 | | | (0.34 | ) | | 0.76 | | | 0.32 | |
| Less Distributions: | | | | | | | | | | | | | | | | | | | | | | | | | | | | | | | | | | | | |
| Distributions from net investment income | | (0.28 | ) | | (0.30 | ) | | (0.03 | ) | | (0.32 | ) | | (0.35 | ) | | (0.35 | ) | | (0.27 | ) | | (0.29 | ) | | (0.03 | ) | | (0.32 | ) | | (0.33 | ) | | (0.34 | ) |
| Distributions from capital gains | | (0.08 | ) | | (0.19 | ) | | – | | | (0.09 | ) | | (0.01 | ) | | (0.06 | ) | | (0.08 | ) | | (0.05 | ) | | – | | | (0.08 | ) | | (0.04 | ) | | (0.09 | ) |
Total distributions | | (0.36 | ) | | (0.49 | ) | | (0.03 | ) | | (0.41 | ) | | (0.36 | ) | | (0.41 | ) | | (0.35 | ) | | (0.34 | ) | | (0.03 | ) | | (0.40 | ) | | (0.37 | ) | | (0.43 | ) |
| Net increase (decrease) in net asset value | | (0.09 | ) | | 0.16 | | | 0.04 | | | (0.74 | ) | | 0.32 | | | (0.06 | ) | | (0.07 | ) | | 0.35 | | | 0.03 | | | (0.74 | ) | | 0.39 | | | (0.11 | ) |
| Net Asset Value at end of period | $ | 11.61 | | $ | 11.70 | | $ | 11.54 | | $ | 11.50 | | $ | 12.24 | | $ | 11.92 | | $ | 11.01 | | $ | 11.08 | | $ | 10.73 | | $ | 10.70 | | $ | 11.44 | | $ | 11.05 | |
| Total Return (%)2 | | 2.36 | | | 5.82 | | | 0.57 | 4 | | (2.77 | ) | | 5.75 | | | 3.10 | | | 2.61 | | | 6.52 | | | 0.52 | 4 | | (3.03 | ) | | 7.02 | | | 3.02 | |
| Ratios/Supplemental Data: | | | | | | | | | | | | | | | | | | | | | | | | | | | | | | | | | | | | |
| Net Assets at end of period (in 000’s) | $ | 22,659 | | $ | 23,100 | | $ | 23,408 | | $ | 23,215 | | $ | 26,117 | | $ | 25,009 | | $ | 27,744 | | $ | 28,415 | | $ | 27,805 | | $ | 28,328 | | $ | 31,526 | | $ | 31,319 | |
| Ratios of expenses to average net assets: | | | | | | | | | | | | | | | | | | | | | | | | | | | | | | | | | | | | |
Before reimbursement of expenses by Adviser (%) | | 0.85 | | | 0.85 | | | 0.85 | 5 | | 0.85 | | | 0.98 | | | 1.03 | | | 0.85 | | | 0.85 | | | 0.85 | 5 | | 0.85 | | | 1.00 | | | 1.06 | |
After reimbursement of expenses by Adviser (%) | | 0.85 | | | 0.85 | | | 0.85 | 5 | | 0.85 | | | – | | | – | | | 0.85 | | | 0.85 | | | 0.85 | 5 | | 0.85 | | | – | | | – | |
Ratio of net investment income to average net assets | | | | | | | | | | | | | | | | | | | | | | | | | | | | | | | | | | | | |
After reimbursement of expenses by Adviser (%) | | 2.45 | | | 2.63 | | | 2.58 | 5 | | 2.71 | | | 2.88 | | | 3.03 | | | 2.44 | | | 2.65 | | | 2.79 | 5 | | 2.92 | | | 2.97 | | | 3.11 | |
| Portfolio turnover (%)3 | | 12 | | | 16 | | | – | 4 | | 14 | | | 12 | | | 7 | | | 15 | | | 30 | | | 6 | 4 | | 24 | | | 13 | | | 13 | |
| | | | | | | | | | | | | | | | | | |
| | | | | | HIGH QUALITY BOND FUND* | | | | |
| | | | | | CLASS Y | | | | |
| | | Year Ended October 31, | | | Year Ended December 31, | |
| | | 2015 | | | 2014 | | | 20137 | | | 2012 | | | 2011 | | | 2010 | |
| Net Asset Value at beginning of period | $ | 11.04 | | $ | 11.07 | | $ | 11.21 | | $ | 11.15 | | $ | 10.94 | | $ | 10.68 | |
| Income from Investment Operations: | | | | | | | | | | | | | | | | | | |
| Net investment income1 | | 0.11 | | | 0.11 | | | 0.09 | | | 0.13 | | | 0.16 | | | 0.19 | |
Net realized and unrealized gain (loss) on investments | | 0.01 | | | 0.01 | | | (0.13 | ) | | 0.10 | | | 0.22 | | | 0.27 | |
| Total from investment operations | | 0.12 | | | 0.12 | | | 0.04 | | | 0.23 | | | 0.38 | | | 0.46 | |
| Less Distributions: | | | | | | | | | | | | | | | | | | |
| Distributions from net investment income | | (0.11 | ) | | (0.11 | ) | | (0.08 | ) | | (0.13 | ) | | (0.16 | ) | | (0.19 | ) |
| Distributions from capital gains | | (0.01 | ) | | (0.04 | ) | | (0.02 | ) | | (0.04 | ) | | (0.01 | ) | | (0.01 | ) |
Total distributions | | (0.12 | ) | | (0.15 | ) | | (0.10 | ) | | (0.17 | ) | | (0.17 | ) | | (0.20 | ) |
| Net increase (decrease) in net asset value | | – | | | (0.03 | ) | | (0.14 | ) | | 0.06 | | | 0.21 | | | 0.26 | |
| Net Asset Value at end of period | $ | 11.04 | | $ | 11.04 | | $ | 11.07 | | $ | 11.21 | | $ | 11.15 | | $ | 10.94 | |
| Total Return (%)2 | | 1.11 | | | 1.12 | | | (0.35 | )4 | | 2.04 | | | 3.53 | | | 4.35 | |
| Ratios/Supplemental Data: | | | | | | | | | | | | | | | | | | |
| Net Assets at end of period (in 000’s) | $ | 102,552 | | $ | 118,082 | | $ | 132,688 | | $ | 109,694 | | $ | 104,849 | | $ | 52,388 | |
| Ratios of expenses to average net assets: | | | | | | | | | | | | | | | | | | |
Before reimbursement of expenses by Adviser (%) | | 0.49 | | | 0.49 | | | 0.495 | | | 0.49 | | | 0.49 | | | 0.49 | |
| After reimbursement of expenses by Adviser (%) | | 0.49 | | | 0.49 | | | 0.495 | | | – | | | – | | | – | |
Ratio of net investment income to average net assets | | | | | | | | | | | | | | | | | | |
| After reimbursement of expenses by Adviser (%) | | 1.00 | | | 1.00 | | | 0.995 | | | 1.15 | | | 1.48 | | | 1.76 | |
| Portfolio turnover (%)3 | | 35 | | | 20 | | | 304 | | | 29 | | | 9 | | | 21 | |
| * The Financial Statements presented herein include the historical operating results of the Madison Mosaic Funds through April 19, 2013. Effective after market close on this date, the Madison Mosaic Funds reorganized into the Madison Funds. |
| 1 Net investment income (loss) calculated excluding permanent tax adjustments to undistributed net investment income. |
| 2 Total return without applicable sales charge. |
| 3 Portfolio turnover is calculated at the fund level and represents the entire fiscal year or period. |
| 4 Not annualized. |
| 5 Annualized. |
| 6 Effective at the close of business on April 19, 2013, the fiscal year end of the fund changed to October 31. Disclosure represents 1 month of information. |
| 7 Effective at the close of business on April 19, 2013, the fiscal year end of the fund changed to October 31. Disclosure represents 10 months of information. |
See accompanying Notes to Financial Statements.
60
Madison Funds | October 31, 2015
| |
| Financial Highlights for a Share of Beneficial Interest Outstanding |
| | | | | | | | | | | | | | | | | | | | | | | | | | | | | | | | | | | | | | | | | | | | | |
| | | | | | | | | | | | | | | | | | | | | CORE BOND FUND | | | | | | | | | | | | | | | | | | | |
| | | | | | | | CLASS A | | | | | | | | | | | | | CLASS B | | | | | | | | | | | | | CLASS Y | | | | | | |
| | | | | | Year Ended October 31, | | | | | | | | | Year Ended October 31, | | | | | | | | | Year Ended October 31, | | | | |
| | | 2015 | | | 2014 | | | 2013 | | | 2012 | | | 2011 | | | 2015 | | | 2014 | | | 2013 | | | 2012 | | | 2011 | | | 2015 | | | 2014 | | | 2013 | | | 2012 | | | 2011 | |
Net Asset Value at beginning of period | $ | 10.25 | | $ | 10.21 | | $ | 10.66 | | $ | 10.59 | | $ | 10.46 | | $ | 10.25 | | $ | 10.22 | | $ | 10.67 | | $ | 10.59 | | $ | 10.46 | | $ | 10.22 | | $ | 10.19 | | $ | 10.64 | | $ | 10.58 | | $ | 10.46 | |
Income from Investment Operations: | | | | | | | | | | | | | | | | | | | | | | | | | | | | | | | | | | | | | | | | | | | | | |
Net investment income1 | | 0.19 | | | 0.22 | | | 0.26 | | | 0.26 | | | 0.26 | | | 0.11 | | | 0.14 | | | 0.18 | | | 0.18 | | | 0.19 | | | 0.21 | | | 0.23 | | | 0.28 | | | 0.29 | | | 0.29 | |
Net realized and unrealized gain (loss) on investments | | (0.05 | ) | | 0.09 | | | (0.46 | ) | | 0.07 | | | 0.13 | | | (0.04 | ) | | 0.08 | | | (0.46 | ) | | 0.08 | | | 0.12 | | | (0.04 | ) | | 0.09 | | | (0.45 | ) | | 0.06 | | | 0.12 | |
Total from investment operations | | 0.14 | | | 0.31 | | | (0.20 | ) | | 0.33 | | | 0.39 | | | 0.07 | | | 0.22 | | | (0.28 | ) | | 0.26 | | | 0.31 | | | 0.17 | | | 0.32 | | | (0.17 | ) | | 0.35 | | | 0.41 | |
| Less Distributions: | | | | | | | | | | | | | | | | | | | | | | | | | | | | | | | | | | | | | | | | | | | | | |
Distributions from net investment income | | (0.21 | ) | | (0.22 | ) | | (0.25 | ) | | (0.26 | ) | | (0.26 | ) | | (0.13 | ) | | (0.14 | ) | | (0.17 | ) | | (0.18 | ) | | (0.18 | ) | | (0.23 | ) | | (0.24 | ) | | (0.28 | ) | | (0.29 | ) | | (0.29 | ) |
Distributions from capital gains | | (0.09 | ) | | (0.05 | ) | | – | | | – | | | – | | | (0.09 | ) | | (0.05 | ) | | – | | | – | | | – | | | (0.09 | ) | | (0.05 | ) | | – | | | – | | | – | |
Total distributions | | (0.30 | ) | | (0.27 | ) | | (0.25 | ) | | (0.26 | ) | | (0.26 | ) | | (0.22 | ) | | (0.19 | ) | | (0.17 | ) | | (0.18 | ) | | (0.18 | ) | | (0.32 | ) | | (0.29 | ) | | (0.28 | ) | | (0.29 | ) | | (0.29 | ) |
Net increase (decrease) in net asset value | | (0.16 | ) | | 0.04 | | | (0.45 | ) | | 0.07 | | | 0.13 | | | (0.15 | ) | | 0.03 | | | (0.45 | ) | | 0.08 | | | 0.13 | | | (0.15 | ) | | 0.03 | | | (0.45 | ) | | 0.06 | | | 0.12 | |
Net Asset Value at end of period | $ | 10.09 | | $ | 10.25 | | $ | 10.21 | | $ | 10.66 | | $ | 10.59 | | $ | 10.10 | | $ | 10.25 | | $ | 10.22 | | $ | 10.67 | | $ | 10.59 | | $ | 10.07 | | $ | 10.22 | | $ | 10.19 | | $ | 10.64 | | $ | 10.58 | |
| Total Return (%)2 | | 1.34 | | | 3.04 | | | (1.92 | ) | | 3.11 | | | 3.81 | | | 0.69 | | | 2.18 | | | (2.65 | ) | | 2.43 | | | 3.04 | | | 1.71 | | | 3.23 | | | (1.65 | ) | | 3.36 | | | 4.03 | |
Ratios/Supplemental Data: | | | | | | | | | | | | | | | | | | | | | | | | | | | | | | | | | | | | | | | | | | | | | |
Net Assets at end of period (in 000’s) | $ | 32,823 | | $ | 33,973 | | $ | 40,104 | | $ | 45,671 | | $ | 43,775 | | $ | 2,929 | | $ | 3,445 | | $ | 4,433 | | $ | 6,088 | | $ | 5,678 | | $ | 186,414 | | $ | 187,790 | | $ | 109,247 | | $ | 74,486 | | $ | 145,125 | |
Ratios of expenses to average net assets: | | | | | | | | | | | | | | | | | | | | | | | | | | | | | | | | | | | | | | | | | | | | | |
Before reimbursement of expenses by Adviser (%) | | 0.90 | | | 0.90 | | | 0.90 | | | 0.90 | | | 0.90 | | | 1.65 | | | 1.65 | | | 1.65 | | | 1.65 | | | 1.65 | | | 0.65 | | | 0.65 | | | 0.65 | | | 0.65 | | | 0.65 | |
After reimbursement of expenses by Adviser (%) | | 0.90 | | | 0.90 | | | 0.90 | | | 0.90 | | | 0.90 | | | 1.65 | | | 1.65 | | | 1.65 | | | 1.65 | | | 1.65 | | | 0.65 | | | 0.65 | | | 0.65 | | | 0.65 | | | 0.65 | |
Ratio of net investment income to average net assets | | | | | | | | | | | | | | | | | | | | | | | | | | | | | | | | | | | | | | | | | | | | | |
After reimbursement of expenses by Adviser (%) | | 1.85 | | | 2.10 | | | 2.42 | | | 2.41 | | | 2.54 | | | 1.10 | | | 1.36 | | | 1.68 | | | 1.66 | | | 1.78 | | | 2.10 | | | 2.30 | | | 2.64 | | | 2.64 | | | 2.79 | |
| Portfolio turnover (%)3 | | 57 | | | 41 | | | 24 | | | 6 | | | 12 | | | 57 | | | 41 | | | 24 | | | 6 | | | 12 | | | 57 | | | 41 | | | 24 | | | 6 | | | 12 | |
| | | | | | | | | | | | | | | | | | | | | | | | | | | |
| | | CORE BOND FUND | | | | | | CORPORATE BOND FUND* | | | | |
| | | CLASS R6 | | | | | | | | | CLASS Y | | | | | | | |
| | Year Ended
October 31, | | | Inception
to | | | | | Year Ended
October 31, | | | | | Year Ended December 31, | |
| | | 2015 | | | 2014 | | | 10/31/136 | | | 2015 | | | 2014 | | | 20138 | | | 2012 | | | 2011 | | | 2010 | |
| Net Asset Value at beginning of period | $ | 10.24 | | $ | 10.20 | | $ | 10.53 | | $ | 11.49 | | $ | 11.27 | | $ | 11.67 | | $ | 11.27 | | $ | 10.81 | | $ | 10.68 | |
| Income from Investment Operations: | | | | | | | | | | | | | | | | | | | | | | | | | | | |
| Net investment income1 | | 0.23 | | | 0.20 | | | 0.14 | | | 0.29 | | | 0.25 | | | 0.19 | | | 0.24 | | | 0.22 | | | 0.48 | |
Net realized and unrealized gain (loss) on investments | | (0.06 | ) | | 0.13 | | | (0.34 | ) | | (0.13 | ) | | 0.22 | | | (0.38 | ) | | 0.39 | | | 0.61 | | | 0.13 | |
| Total from investment operations | | 0.17 | | | 0.33 | | | (0.20 | ) | | 0.16 | | | 0.47 | | | (0.19 | ) | | 0.63 | | | 0.83 | | | 0.61 | |
| Less Distributions: | | | | | | | | | | | | | | | | | | | | | | | | | | | |
| Distributions from net investment income | | (0.23 | ) | | (0.24 | ) | | (0.13 | ) | | (0.29 | ) | | (0.25 | ) | | (0.19 | ) | | (0.23 | ) | | (0.36 | ) | | (0.48 | ) |
| Distributions from capital gains | | (0.09 | ) | | (0.05 | ) | | – | | | (0.02 | ) | | – | | | (0.02 | ) | | (0.00 | )7 | | (0.01 | ) | | – | |
Total distributions | | (0.32 | ) | | (0.29 | ) | | (0.13 | ) | | (0.31 | ) | | (0.25 | ) | | (0.21 | ) | | (0.23 | ) | | (0.37 | ) | | (0.48 | ) |
| Net increase (decrease) in net asset value | | (0.15 | ) | | 0.04 | | | (0.33 | ) | | (0.15 | ) | | 0.22 | | | (0.40 | ) | | 0.40 | | | 0.46 | | | 0.13 | |
| Net Asset Value at end of period | $ | 10.09 | | $ | 10.24 | | $ | 10.20 | | $ | 11.34 | | $ | 11.49 | | $ | 11.27 | | $ | 11.67 | | $ | 11.27 | | $ | 10.81 | |
| Total Return (%)2 | | 1.71 | | | 3.32 | | | (1.86 | )4 | | 1.40 | | | 4.21 | | | (1.58 | )4 | | 5.72 | | | 7.83 | | | 5.81 | |
| Ratios/Supplemental Data: | | | | | | | | | | | | | | | | | | | | | | | | | | | |
| Net Assets at end of period (in 000’s) | $ | 1,693 | | $ | 10 | | $ | 10 | | $ | 23,545 | | $ | 27,010 | | $ | 19,743 | | $ | 19,813 | | $ | 17,550 | | $ | 1,069 | |
| Ratios of expenses to average net assets: | | | | | | | | | | | | | | | | | | | | | | | | | | | |
Before reimbursement of expenses by Adviser (%) | | 0.52 | | | 0.54 | | | 0.53 | 5 | | 0.65 | | | 0.65 | | | 0.65 | 5 | | 0.67 | | | 0.69 | | | 0.06 | |
After reimbursement of expenses by Adviser (%) | | 0.52 | | | 0.54 | | | 0.53 | 5 | | 0.65 | | | 0.65 | | | 0.65 | 5 | | – | | | – | | | – | |
Ratio of net investment income to average net assets | | | | | | | | | | | | | | | | | | | | | | | | | | | |
After reimbursement of expenses by Adviser (%) | | 2.24 | | | 1.99 | | | 2.71 | 5 | | 2.55 | | | 2.22 | | | 2.05 | 5 | | 2.04 | | | 1.98 | | | 4.44 | |
| Portfolio turnover (%)3 | | 57 | | | 41 | | | 24 | 4 | | 37 | | | 31 | | | 10 | 4 | | 11 | | | 10 | | | 14 | |
| |
| * The Financial Statements presented herein include the historical operating results of the Madison Mosaic Funds through April 19, 2013. Effective after market close on this date, the Madison Mosaic Funds reorganized into the Madison Funds. | |
| 1 Net investment income calculated excluding permanent tax adjustments to undistributed net investment income. |
| 2 Total return without applicable sales charge. |
| 3 Portfolio turnover is calculated at the fund level and represents the entire fiscal year or period. |
| 4 Not annualized. |
| 5 Annualized. |
| 6 Commenced investment operations at the close of business on April 22, 2013. |
| 7 Amounts represent less than $0.005 per share. |
| 8 Effective at the close of business on April 19, 2013, the fiscal year end of the fund changed to October 31. Disclosure represents 10 months of information. |
See accompanying Notes to Financial Statements.
61
Madison Funds | October 31, 2015
| |
| Financial Highlights for a Share of Beneficial Interest Outstanding |
| | | | | | | | | | | | | | | | | | | | | | | | | | | | | | | | | | | | | | | | | | | | | |
| | | | | | | | | | | | | | | | | | | | | HIGH INCOME FUND | | | | | | | | | | | | | | | | | | | |
| | | | | | | | CLASS A | | | | | | | | | | | | | CLASS B | | | | | | | | | | | | | CLASS Y | | | | | | |
| | | | | | Year Ended October 31, | | | | | | | | | Year Ended October 31, | | | | | | | | | Year Ended October 31, | | | | |
| | | 2015 | | | 2014 | | | 2013 | | | 2012 | | | 2011 | | | 2015 | | | 2014 | | | 2013 | | | 2012 | | | 2011 | | | 2015 | | | 2014 | | | 2013 | | | 2012 | | | 2011 | |
Net Asset Value at beginning of period | $ | 6.79 | | $ | 7.15 | | $ | 7.15 | | $ | 6.95 | | $ | 7.10 | | $ | 6.95 | | $ | 7.30 | | $ | 7.26 | | $ | 7.05 | | $ | 7.19 | | $ | 6.73 | | $ | 7.09 | | $ | 7.10 | | $ | 6.92 | | $ | 7.09 | |
Income from Investment Operations: | | | | | | | | | | | | | | | | | | | | | | | | | | | | | | | | | | | | | | | | | | | | | |
| Net investment income1 | | 0.32 | | | 0.35 | | | 0.41 | | | 0.45 | | | 0.48 | | | 0.29 | | | 0.30 | | | 0.37 | | | 0.40 | | | 0.44 | | | 0.01 | | | 1.02 | | | 0.45 | | | 0.47 | | | 0.49 | |
Net realized and unrealized gain (loss) on investments | | (0.47 | ) | | – | | | 0.03 | | | 0.20 | | | (0.16 | ) | | (0.50 | ) | | – | | | 0.03 | | | 0.20 | | | (0.17 | ) | | (0.14 | ) | | (0.65 | ) | | 0.01 | | | 0.19 | | | (0.16 | ) |
Total from investment operations | | (0.15 | ) | | 0.35 | | | 0.44 | | | 0.65 | | | 0.32 | | | (0.21 | ) | | 0.30 | | | 0.40 | | | 0.60 | | | 0.27 | | | (0.13 | ) | | 0.37 | | | 0.46 | | | 0.66 | | | 0.33 | |
| Less Distributions: | | | | | | | | | | | | | | | | | | | | | | | | | | | | | | | | | | | | | | | | | | | | | |
Distributions from net investment income | | (0.32 | ) | | (0.36 | ) | | (0.44 | ) | | (0.45 | ) | | (0.47 | ) | | (0.27 | ) | | (0.30 | ) | | (0.36 | ) | | (0.39 | ) | | (0.41 | ) | | (0.35 | ) | | (0.38 | ) | | (0.47 | ) | | (0.48 | ) | | (0.50 | ) |
Distributions from capital gains | | (0.39 | ) | | (0.35 | ) | | – | | | – | | | – | | | (0.39 | ) | | (0.35 | ) | | – | | | – | | | – | | | (0.39 | ) | | (0.35 | ) | | – | | | – | | | – | |
| Total distributions | | (0.71 | ) | | (0.71 | ) | | (0.44 | ) | | (0.45 | ) | | (0.47 | ) | | (0.66 | ) | | (0.65 | ) | | (0.36 | ) | | (0.39 | ) | | (0.41 | ) | | (0.74 | ) | | (0.73 | ) | | (0.47 | ) | | (0.48 | ) | | (0.50 | ) |
Net increase (decrease) in net asset value | | (0.86 | ) | | (0.36 | ) | | (0.00 | )7 | | 0.20 | | | (0.15 | ) | | (0.87 | ) | | (0.35 | ) | | 0.04 | | | 0.21 | | | (0.14 | ) | | (0.87 | ) | | (0.36 | ) | | (0.01 | ) | | 0.18 | | | (0.17 | ) |
Net Asset Value at end of period | $ | 5.93 | | $ | 6.79 | | $ | 7.15 | | $ | 7.15 | | $ | 6.95 | | $ | 6.08 | | $ | 6.95 | | $ | 7.30 | | $ | 7.26 | | $ | 7.05 | | $ | 5.86 | | $ | 6.73 | | $ | 7.09 | | $ | 7.10 | | $ | 6.92 | |
| Total Return (%)2 | | (2.29 | ) | | 5.20 | | | 6.29 | | | 9.67 | | | 4.61 | | | (3.11 | ) | | 4.47 | | | 5.60 | | | 8.74 | | | 3.89 | | | (2.00 | ) | | 5.59 | | | 6.68 | | | 9.92 | | | 4.81 | |
| Ratios/Supplemental Data: | | | | | | | | | | | | | | | | | | | | | | | | | | | | | | | | | | | | | | | | | | | | | |
Net Assets at end of period (in 000’s) | $ | 23,155 | | $ | 28,596 | | $ | 28,530 | | $ | 27,061 | | $ | 25,299 | | $ | 1,685 | | $ | 2,267 | | $ | 2,566 | | $ | 2,983 | | $ | 3,023 | | $ | 664 | | $ | 388 | | $ | 17,449 | | $ | 53,121 | | $ | 81,572 | |
Ratios of expenses to average net assets: | | | | | | | | | | | | | | | | | | | | | | | | | | | | | | | | | | | | | | | | | | | | | |
Before reimbursement of expenses by Adviser (%) | | 1.00 | | | 1.00 | | | 1.00 | | | 1.00 | | | 1.00 | | | 1.75 | | | 1.75 | | | 1.75 | | | 1.75 | | | 1.75 | | | 0.75 | | | 0.75 | | | 0.75 | | | 0.75 | | | 0.75 | |
After reimbursement of expenses by Adviser (%) | | 1.00 | | | 1.00 | | | 1.00 | | | 1.00 | | | 1.00 | | | 1.75 | | | 1.75 | | | 1.75 | | | 1.75 | | | 1.75 | | | 0.75 | | | 0.75 | | | 0.75 | | | 0.75 | | | 0.75 | |
Ratio of net investment income to average net assets | | | | | | | | | | | | | | | | | | | | | | | | | | | | | | | | | | | | | | | | | | | | | |
After reimbursement of expenses by Adviser (%) | | 5.12 | | | 5.05 | | | 5.63 | | | 6.35 | | | 6.73 | | | 4.36 | | | 4.30 | | | 4.89 | | | 5.60 | | | 6.01 | | | 5.39 | | | 5.36 | | | 5.95 | | | 6.61 | | | 7.00 | |
| Portfolio turnover (%)3 | | 28 | | | 52 | | | 28 | | | 36 | | | 55 | | | 28 | | | 52 | | | 28 | | | 36 | | | 55 | | | 28 | | | 52 | | | 28 | | | 36 | | | 55 | |
| | | | | | | | | | | | | | | | | | | | | | | | | | | | | | | | | | | | | | | | | | |
| | | | | | | | | | | | | | | | | | DIVERSIFIED INCOME FUND | | | | | | | | | | | | | | | | |
| | | | | | | | CLASS A | | | | | | | | | | | | | CLASS B | | | | | | | | | | | CLASS C | | | | |
| | | | | | Year Ended October 31, | | | | | | | | | Year Ended October 31, | | | | | | Year Ended October 31, | | | Inception
to | |
| | | 2015 | | | 2014 | | | 2013 | | | 2012 | | | 2011 | | | 2015 | | | 2014 | | | 2013 | | | 2012 | | | 2011 | | | 2015 | | | 2014 | | | 2013 | | | 10/31/124 | |
Net Asset Value at beginning of period | $ | 14.79 | | $ | 13.89 | | $ | 12.54 | | $ | 11.68 | | $ | 11.16 | | $ | 14.88 | | $ | 13.98 | | $ | 12.61 | | $ | 11.74 | | $ | 11.22 | | $ | 14.88 | | $ | 13.97 | | $ | 12.61 | | $ | 12.53 | |
Income from Investment Operations: | | | | | | | | | | | | | | | | | | | | | | | | | | | | | | | | | | | | | | | | | | |
Net investment income1 | | 0.23 | | | 0.23 | | | 0.24 | | | 0.26 | | | 0.29 | | | 0.13 | | | 0.13 | | | 0.13 | | | 0.18 | | | 0.20 | | | 0.13 | | | 0.13 | | | 0.13 | | | 0.04 | |
Net realized and unrealized gain (loss) on investments | | (0.03 | ) | | 0.90 | | | 1.35 | | | 0.86 | | | 0.52 | | | (0.04 | ) | | 0.90 | | | 1.37 | | | 0.86 | | | 0.52 | | | (0.04 | ) | | 0.91 | | | 1.36 | | | 0.08 | |
Total from investment operations | | 0.20 | | | 1.13 | | | 1.59 | | | 1.12 | | | 0.81 | | | 0.09 | | | 1.03 | | | 1.50 | | | 1.04 | | | 0.72 | | | 0.09 | | | 1.04 | | | 1.49 | | | 0.12 | |
| Less Distributions: | | | | | | | | | | | | | | | | | | | | | | | | | | | | | | | | | | | | | | | | | | |
Distributions from net investment income | | (0.24 | ) | | (0.23 | ) | | (0.24 | ) | | (0.26 | ) | | (0.29 | ) | | (0.14 | ) | | (0.13 | ) | | (0.13 | ) | | (0.17 | ) | | (0.20 | ) | | (0.14 | ) | | (0.13 | ) | | (0.13 | ) | | (0.04 | ) |
Total distributions | | (0.24 | ) | | (0.23 | ) | | (0.24 | ) | | (0.26 | ) | | (0.29 | ) | | (0.14 | ) | | (0.13 | ) | | (0.13 | ) | | (0.17 | ) | | (0.20 | ) | | (0.14 | ) | | (0.13 | ) | | (0.13 | ) | | (0.04 | ) |
Net increase (decrease) in net asset value | | (0.04 | ) | | 0.90 | | | 1.35 | | | 0.86 | | | 0.52 | | | (0.05 | ) | | 0.90 | | | 1.37 | | | 0.87 | | | 0.52 | | | (0.05 | ) | | 0.91 | | | 1.36 | | | 0.08 | |
Net Asset Value at end of period | $ | 14.75 | | $ | 14.79 | | $ | 13.89 | | $ | 12.54 | | $ | 11.68 | | $ | 14.83 | | $ | 14.88 | | $ | 13.98 | | $ | 12.61 | | $ | 11.74 | | $ | 14.83 | | $ | 14.88 | | $ | 13.97 | | $ | 12.61 | |
| Total Return (%)2 | | 1.39 | | | 8.22 | | | 12.76 | | | 9.69 | | | 7.32 | | | 0.58 | | | 7.37 | | | 11.99 | | | 8.89 | | | 6.47 | | | 0.64 | | | 7.38 | | | 11.91 | | | 0.94 | 5 |
| Ratios/Supplemental Data: | | | | | | | | | | | | | | | | | | | | | | | | | | | | | | | | | | | | | | | | | | |
Net Assets at end of period (in 000’s) | $ | 121,026 | | $ | 119,364 | | $ | 105,521 | | $ | 86,952 | | $ | 72,913 | | $ | 13,442 | | $ | 14,378 | | $ | 14,297 | | $ | 14,387 | | $ | 15,906 | | $ | 12,766 | | $ | 11,545 | | $ | 6,732 | | $ | 924 | |
Ratios of expenses to average net assets: | | | | | | | | | | | | | | | | | | | | | | | | | | | | | | | | | | | | | | | | | | |
Before reimbursement of expenses by Adviser (%) | | 1.10 | | | 1.10 | | | 1.10 | | | 1.10 | | | 1.10 | | | 1.85 | | | 1.85 | | | 1.85 | | | 1.85 | | | 1.85 | | | 1.85 | | | 1.85 | | | 1.84 | | | 1.83 | 6 |
After reimbursement of expenses by Adviser (%) | | 1.10 | | | 1.10 | | | 1.10 | | | 1.10 | | | 1.10 | | | 1.85 | | | 1.85 | | | 1.85 | | | 1.85 | | | 1.85 | | | 1.85 | | | 1.85 | | | 1.84 | | | 1.83 | 6 |
Ratio of net investment income to average net assets | | | | | | | | | | | | | | | | | | | | | | | | | | | | | | | | | | | | | | | | | | |
After reimbursement of expenses by Adviser (%) | | 1.59 | | | 1.61 | | | 1.75 | | | 2.14 | | | 2.51 | | | 0.84 | | | 0.86 | | | 1.01 | | | 1.42 | | | 1.77 | | | 0.84 | | | 0.83 | | | 0.88 | | | 0.83 | 6 |
| Portfolio turnover (%)3 | | 25 | | | 23 | | | 18 | | | 21 | | | 17 | | | 25 | | | 23 | | | 18 | | | 21 | | | 17 | | | 25 | | | 23 | | | 18 | | | 21 | 5 |
| |
| 1 Net investment income calculated excluding permanent tax adjustments to undistributed net investment income. |
| 2 Total return without applicable sales charge. |
| 3 Portfolio turnover is calculated at the fund level and represents the entire fiscal year or period. |
| 4 Commenced investment operations July 31, 2012. |
| 5 Not annualized. |
| 6 Annualized. | ||||||||||||||||||||||||||||||||||||||||||
| 7 Amounts represent less than $0.005 per share. |
See accompanying Notes to Financial Statements.
62
Madison Funds | October 31, 2015
| |
| Financial Highlights for a Share of Beneficial Interest Outstanding |
| | | | | | | | | | | | | | | | | | | | | | | | | | | | | | | | | | | | | | | | | | |
| | | | | | | | | | | | | | | | | | COVERED CALL & EQUITY INCOME FUND1 | | | | | | | | | | | | | | | | |
| | | | | | | | CLASS A | | | | | | | | CLASS C | | | | | | | | CLASS Y | | | | | | |
| | | | | | Year Ended October 31, | | | | | | Year Ended October 31, | | | Inception
to | | | | | | Year Ended October 31, | | | | |
| | | 2015 | | | 2014 | | | 2013 | | | 2012 | | | 2011 | | | 2015 | | | 2014 | | | 2013 | | | 10/31/128 | | | 2015 | | | 2014 | | | 2013 | | | 2012 | | | 2011 | |
Net Asset Value at beginning of period | $ | 9.92 | | $ | 9.99 | | $ | 9.76 | | $ | 9.76 | | $ | 10.27 | | $ | 9.74 | | $ | 9.89 | | $ | 9.74 | | $ | 9.66 | | $ | 10.03 | | $ | 10.08 | | $ | 9.82 | | $ | 9.81 | | $ | 10.29 | |
Income from Investment Operations: | | | | | | | | | | | | | | | | | | | | | | | | | | | | | | | | | | | | | | | | | | |
Net investment income (loss)3 | | 0.06 | | | 0.08 | | | 0.02 | | | 0.00 | 2 | | 0.00 | 2 | | 0.16 | | | 0.08 | | | 0.20 | | | 0.00 | 2 | | 0.14 | | | 0.22 | | | (0.28 | ) | | 0.00 | 2 | | 0.03 | |
Net realized and unrealized gain (loss) on investments | | (0.06 | ) | | 0.77 | | | 1.12 | | | 0.82 | | | 0.50 | | | (0.23 | ) | | 0.69 | | | 0.86 | | | 0.28 | | | (0.12 | ) | | 0.67 | | | 1.45 | | | 0.84 | | | 0.50 | |
Total from investment operations | | – | | | 0.85 | | | 1.14 | | | 0.82 | | | 0.50 | | | (0.07 | ) | | 0.77 | | | 1.06 | | | 0.28 | | | 0.02 | | | 0.89 | | | 1.17 | | | 0.84 | | | 0.53 | |
| Less Distributions: | | | | | | | | | | | | | | | | | | | | | | | | | | | | | | | | | | | | | | | | | | |
Distributions from net investment income | | (0.50 | ) | | (0.60 | ) | | (0.60 | ) | | – | | | – | | | (0.50 | ) | | (0.60 | ) | | (0.60 | ) | | – | | | (0.50 | ) | | (0.62 | ) | | (0.60 | ) | | (0.02 | ) | | – | |
Distributions from capital gains | | (0.28 | ) | | (0.32 | ) | | (0.31 | ) | | (0.82 | ) | | (1.01 | ) | | (0.28 | ) | | (0.32 | ) | | (0.31 | ) | | (0.20 | ) | | (0.28 | ) | | (0.32 | ) | | (0.31 | ) | | (0.81 | ) | | (1.01 | ) |
Total distributions | | (0.78 | ) | | (0.92 | ) | | (0.91 | ) | | (0.82 | ) | | (1.01 | ) | | (0.78 | ) | | (0.92 | ) | | (0.91 | ) | | (0.20 | ) | | (0.78 | ) | | (0.94 | ) | | (0.91 | ) | | (0.83 | ) | | (1.01 | ) |
Net increase (decrease) in net asset value | | (0.78 | ) | | (0.07 | ) | | 0.23 | | | – | | | (0.51 | ) | | (0.85 | ) | | (0.15 | ) | | 0.15 | | | 0.08 | | | (0.76 | ) | | (0.05 | ) | | 0.26 | | | 0.01 | | | (0.48 | ) |
| Net Asset Value at end of period | $ | 9.14 | | $ | 9.92 | | $ | 9.99 | | $ | 9.76 | | $ | 9.76 | | $ | 8.89 | | $ | 9.74 | | $ | 9.89 | | $ | 9.74 | | $ | 9.27 | | $ | 10.03 | | $ | 10.08 | | $ | 9.82 | | $ | 9.81 | |
| Total Return (%)4 | | (0.18 | ) | | 8.90 | | | 12.29 | | | 8.61 | | | 5.22 | | | (0.83 | ) | | 8.01 | | | 11.44 | | | 2.88 | 5 | | 0.13 | | | 9.08 | | | 12.60 | | | 8.73 | | | 5.51 | |
| Ratios/Supplemental Data: | | | | | | | | | | | | | | | | | | | | | | | | | | | | | | | | | | | | | | | | | | |
Net Assets at end of period (in 000’s) | $ | 16,042 | | $ | 11,373 | | $ | 7,559 | | $ | 6,297 | | $ | 4,072 | | $ | 9,287 | | $ | 4,805 | | $ | 2,258 | | $ | 527 | | $ | 60,916 | | $ | 43,891 | | $ | 29,307 | | $ | 81,779 | | $ | 63,395 | |
Ratios of expenses to average net assets: | | | | | | | | | | | | | | | | | | | | | | | | | | | | | | | | | | | | | | | | | | |
Before reimbursement of expenses by Adviser (%) | | 1.25 | | | 1.25 | | | 1.25 | | | 1.24 | | | 1.25 | | | 1.99 | | | 2.00 | | | 2.00 | | | 1.96 | 6 | | 1.00 | | | 1.00 | | | 1.00 | | | 1.00 | | | 1.00 | |
After reimbursement of expenses by Adviser (%) | | 1.25 | | | 1.25 | | | 1.25 | | | 1.24 | | | 1.25 | | | 1.99 | | | 2.00 | | | 2.00 | | | 1.96 | 6 | | 1.00 | | | 1.00 | | | 1.00 | | | 1.00 | | | 1.00 | |
Ratio of net investment income (loss) to average net assets | | | | | | | | | | | | | | | | | | | | | | | | | | | | | | | | | | | | | | | | | | |
After reimbursement of expenses by Adviser (%) | | 0.13 | | | (0.30 | ) | | (0.12 | ) | | (0.15 | ) | | (0.44 | ) | | (0.59 | ) | | (1.07 | ) | | (0.91 | ) | | (0.89 | )6 | | 0.40 | | | (0.03 | ) | | 0.14 | | | 0.09 | | | (0.15 | ) |
| Portfolio turnover (%)7 | | 107 | | | 139 | | | 100 | | | 84 | | | 107 | | | 107 | | | 139 | | | 100 | | | 84 | 5 | | 107 | | | 139 | | | 100 | | | 84 | | | 107 | |
| | | | | | | | | | | | | | | | | | | | | | | | | | | | | | |
| | | COVERED CALL &
EQUITY INCOME FUND1 | | | | | | DIVIDEND INCOME FUND* | | | | |
| | | | | | CLASS R6 | | | | | | | | | | | | CLASS Y | | | | | | | |
| | | Year Ended October 31, | | | Inception
to | | | Year Ended October 31, | | | Year Ended December 31, | |
| | | 2015 | | | 2014 | | | 2013 | | | 10/31/128 | | | 2015 | | | 2014 | | | 20139 | | | 2012 | | | 2011 | | | 2010 | |
Net Asset Value at beginning of period | $ | 10.06 | | $ | 10.09 | | $ | 9.82 | | $ | 9.72 | | $ | 23.59 | | $ | 21.94 | | $ | 17.90 | | $ | 17.17 | | $ | 17.50 | | $ | 16.39 | |
Income from Investment Operations: | | | | | | | | | | | | | | | | | | | | | | | | | | | | | | |
Net investment income3 | | 0.24 | | | 0.13 | | | 0.04 | | | 0.00 | 2 | | 0.40 | | | 0.38 | | | 0.28 | | | 0.36 | | | 0.20 | | | 0.19 | |
Net realized and unrealized gain (loss) on investments | | (0.21 | ) | | 0.78 | | | 1.14 | | | 0.30 | | | 0.01 | | | 2.29 | | | 4.03 | | | 1.50 | | | 0.10 | | | 1.11 | |
Total from investment operations | | 0.03 | | | 0.91 | | | 1.18 | | | 0.30 | | | 0.41 | | | 2.67 | | | 4.31 | | | 1.86 | | | 0.30 | | | 1.30 | |
Less Distributions: | | | | | | | | | | | | | | | | | | | | | | | | | | | | | | |
Distributions from net investment income | | (0.50 | ) | | (0.62 | ) | | (0.60 | ) | | – | | | (0.38 | ) | | (0.38 | ) | | (0.27 | ) | | (0.35 | ) | | (0.20 | ) | | (0.19 | ) |
Distributions from capital gains | | (0.28 | ) | | (0.32 | ) | | (0.31 | ) | | (0.20 | ) | | (1.34 | ) | | (0.64 | ) | | – | | | (0.78 | ) | | (0.43 | ) | | – | |
Total distributions | | (0.78 | ) | | (0.94 | ) | | (0.91 | ) | | (0.20 | ) | | (1.72 | ) | | (1.02 | ) | | (0.27 | ) | | (1.13 | ) | | (0.63 | ) | | (0.19 | ) |
Net increase (decrease) in net asset value | | (0.75 | ) | | (0.03 | ) | | 0.27 | | | 0.10 | | | (1.31 | ) | | 1.65 | | | 4.04 | | | 0.73 | | | (0.33 | ) | | 1.11 | |
| Net Asset Value at end of period | $ | 9.31 | | $ | 10.06 | | $ | 10.09 | | $ | 9.82 | | $ | 22.28 | | $ | 23.59 | | $ | 21.94 | | $ | 17.90 | | $ | 17.17 | | $ | 17.50 | |
| Total Return (%)4 | | 0.23 | | | 9.29 | | | 12.75 | | | 3.07 | 5 | | 1.76 | | | 12.42 | | | 24.18 | 5 | | 10.86 | | | 1.73 | | | 8.02 | |
| Ratios/Supplemental Data: | | | | | | | | | | | | | | | | | | | | | | | | | | | | | | |
| Net Assets at end of period (in 000’s) | $ | 2,826 | | $ | 152 | | $ | 116 | | | 103 | | $ | 20,925 | | $ | 21,518 | | $ | 18,658 | | $ | 13,263 | | $ | 11,189 | | $ | 12,256 | |
Ratios of expenses to average net assets: | | | | | | | | | | | | | | | | | | | | | | | | | | | | | | |
Before reimbursement of expenses by Adviser (%) | | 0.87 | | | 0.87 | | | 0.87 | | | 0.86 | 6 | | 1.10 | | | 1.10 | | | 1.10 | 6 | | 1.17 | | | 1.25 | | | 1.24 | |
After reimbursement of expenses by Adviser (%) | | 0.87 | | | 0.87 | | | 0.87 | | | 0.86 | 6 | | 0.95 | | | 0.95 | | | 0.95 | 6 | | 1.09 | | | – | | | – | |
Ratio of net investment income to average net assets | | | | | | | | | | | | | | | | | | | | | | | | | | | | | | |
After reimbursement of expenses by Adviser (%) | | 0.70 | | | 0.10 | | | 0.21 | | | 0.17 | 6 | | 1.75 | | | 1.66 | | | 1.66 | 6 | | 1.95 | | | – | | | – | |
| Portfolio turnover (%)7 | | 107 | | | 139 | | | 100 | | | 84 | 5 | | 24 | | | 29 | | | 16 | 5 | | 61 | | | 56 | | | 39 | |
| * The Financial Statements presented herein include the historical operating results of the Madison Mosaic Funds through April 19, 2013. Effective after market close on this date, the Madison Mosaic Funds reorganized into the Madison Funds. |
| 1 Prior to close of business on February 28, 2014, the Fund was known as the Equity Income Fund. See Note 1. |
| 2 Amounts represent less than $0.005 per share. |
| 3 Net investment income (loss) calculated excluding permanent tax adjustments to undistributed net investment income. |
| 4 Total return without applicable sales charge. |
| 5 Not annualized. |
| 6 Annualized. |
| 7 Portfolio turnover is calculated at the fund level and represents the entire fiscal year or period. |
| 8 Class was launched on July 31, 2012. |
| 9 Effective at the close of business on April 19, 2013, the fiscal year end of the fund changed to October 31. Disclosure represents 10 months of information. |
See accompanying Notes to Financial Statements.
63
Madison Funds | October 31, 2015
| |
| Financial Highlights for a Share of Beneficial Interest Outstanding |
| | | | | | | | | | | | | | | | | | | | | | | | | | | | | | | | | | | | | | | | | | | | | |
| | | | | | | | | | | | | | | | | | | | | LARGE CAP VALUE FUND | | | | | | | | | | | | | | | | | | | |
| | | | | | | | CLASS A | | | | | | | | | | | | | CLASS B | | | | | | | | | | | | | CLASS Y | | | | | | |
| | | | | | Year Ended October 31, | | | | | | | | | Year Ended October 31, | | | | | | | | | Year Ended October 31, | | | | |
| | | 2015 | | | 2014 | | | 2013 | | | 2012 | | | 2011 | | | 2015 | | | 2014 | | | 2013 | | | 2012 | | | 2011 | | | 2015 | | | 2014 | | | 2013 | | | 2012 | | | 2011 | |
Net Asset Value at beginning of period | $ | 19.18 | | $ | 17.04 | | $ | 13.99 | | $ | 12.42 | | $ | 11.40 | | $ | 18.84 | | $ | 16.74 | | $ | 13.74 | | $ | 12.21 | | $ | 11.20 | | $ | 19.20 | | $ | 17.06 | | $ | 14.01 | | $ | 12.44 | | $ | 11.42 | |
Income from Investment Operations: | | | | | | | | | | | | | | | | | | | | | | | | | | | | | | | | | | | | | | | | | | | | | |
Net investment income (loss)1 | | 0.08 | | | 0.13 | | | 0.18 | | | 0.21 | | | 0.18 | | | (0.05 | ) | | 0.04 | | | 0.12 | | | 0.16 | | | 0.12 | | | 0.14 | | | 0.19 | | | 0.19 | | | 0.22 | | | 0.23 | |
Net realized and unrealized gain (loss) on investments | | (0.10 | ) | | 2.15 | | | 3.07 | | | 1.55 | | | 0.98 | | | (0.09 | ) | | 2.07 | | | 2.98 | | | 1.47 | | | 0.94 | | | (0.11 | ) | | 2.14 | | | 3.10 | | | 1.57 | | | 0.97 | |
Total from investment operations | | (0.02 | ) | | 2.28 | | | 3.25 | | | 1.76 | | | 1.16 | | | (0.14 | ) | | 2.11 | | | 3.10 | | | 1.63 | | | 1.06 | | | 0.03 | | | 2.33 | | | 3.29 | | | 1.79 | | | 1.20 | |
| Less Distributions: | | | | | | | | | | | | | | | | | | | | | | | | | | | | | | | | | | | | | | | | | | | | | |
Distributions from net investment income | | (0.14 | ) | | (0.14 | ) | | (0.20 | ) | | (0.19 | ) | | (0.14 | ) | | (0.00 | )6 | | (0.01 | ) | | (0.10 | ) | | (0.10 | ) | | (0.05 | ) | | (0.19 | ) | | (0.19 | ) | | (0.24 | ) | | (0.22 | ) | | (0.18 | ) |
Distributions from capital gains | | (2.69 | ) | | – | | | – | | | – | | | – | | | (2.69 | ) | | – | | | – | | | – | | | – | | | (2.69 | ) | | – | | | – | | | – | | | – | |
Total distributions | | (2.83 | ) | | (0.14 | ) | | (0.20 | ) | | (0.19 | ) | | (0.14 | ) | | (2.69 | ) | | (0.01 | ) | | (0.10 | ) | | (0.10 | ) | | (0.05 | ) | | (2.88 | ) | | (0.19 | ) | | (0.24 | ) | | (0.22 | ) | | (0.18 | ) |
Net increase (decrease) in net asset value | | (2.85 | ) | | 2.14 | | | 3.05 | | | 1.57 | | | 1.02 | | | (2.83 | ) | | 2.10 | | | 3.00 | | | 1.53 | | | 1.01 | | | (2.85 | ) | | 2.14 | | | 3.05 | | | 1.57 | | | 1.02 | |
Net Asset Value at end of period | $ | 16.33 | | $ | 19.18 | | $ | 17.04 | | $ | 13.99 | | $ | 12.42 | | $ | 16.01 | | $ | 18.84 | | $ | 16.74 | | $ | 13.74 | | $ | 12.21 | | $ | 16.35 | | $ | 19.20 | | $ | 17.06 | | $ | 14.01 | | $ | 12.44 | |
| Total Return (%)2 | | (0.80 | ) | | 13.47 | | | 23.58 | | | 14.37 | | | 10.27 | | | (1.49 | ) | | 12.61 | | | 22.69 | | | 13.41 | | | 9.52 | | | (0.51 | ) | | 13.74 | | | 23.86 | | | 14.64 | | | 10.53 | |
| Ratios/Supplemental Data: | | | | | | | | | | | | | | | | | | | | | | | | | | | | | | | | | | | | | | | | | | | | | |
Net Assets at end of period (in 000’s) | $ | 63,566 | | $ | 70,495 | | $ | 67,048 | | $ | 58,537 | | $ | 54,271 | | $ | 4,096 | | $ | 4,867 | | $ | 5,222 | | $ | 5,768 | | $ | 7,199 | | $ | 109,546 | | $ | 128,456 | | $ | 132,206 | | $ | 84,545 | | $ | 78,344 | |
Ratios of expenses to average net assets: | | | | | | | | | | | | | | | | | | | | | | | | | | | | | | | | | | | | | | | | | | | | | |
Before reimbursement of expenses by Adviser (%) | | 1.16 | | | 1.16 | | | 1.16 | | | 1.16 | | | 1.16 | | | 1.91 | | | 1.91 | | | 1.91 | | | 1.91 | | | 1.91 | | | 0.91 | | | 0.91 | | | 0.91 | | | 0.91 | | | 0.91 | |
After reimbursement of expenses by Adviser (%) | | 1.16 | | | 1.16 | | | 1.16 | | | 1.16 | | | 1.16 | | | 1.91 | | | 1.91 | | | 1.91 | | | 1.91 | | | 1.91 | | | 0.91 | | | 0.91 | | | 0.91 | | | 0.91 | | | 0.91 | |
Ratio of net investment income to average net assets | | | | | | | | | | | | | | | | | | | | | | | | | | | | | | | | | | | | | | | | | | | | | |
After reimbursement of expenses by Adviser (%) | | 0.47 | | | 0.69 | | | 1.12 | | | 1.51 | | | 1.44 | | | (0.27 | ) | | (0.06 | ) | | 0.40 | | | 0.79 | | | 0.70 | | | 0.73 | | | 0.92 | | | 1.33 | | | 1.76 | | | 1.69 | |
| Portfolio turnover (%)3 | | 97 | | | 85 | | | 33 | | | 25 | | | 39 | | | 97 | | | 85 | | | 33 | | | 25 | | | 39 | | | 97 | | | 85 | | | 33 | | | 25 | | | 39 | |
| | | | | | | | | | | | | | | | | | | | | | | | | | | | | | | | | | | |
| | | | | | | | | | | | | | | | | | INVESTORS FUND* | | | | | | | | | | | | | | | |
| | CLASS A | | | | | | | | | CLASS Y | | | | | | | | | CLASS R6 |
| | | Year Ended
October 31 | | | Inception
to | | | Year Ended October 31, | | | Year Ended December 31, | | | Year Ended
October 31 | | | Inception
to |
| | | 2015 | | | 2014 | | | 10/31/137 | | | 2015 | | | 2014 | | | 20138 | | | 2012 | | | 2011 | | | 2010 | | | 2015 | | | 2014 | | | 10/31/137 |
Net Asset Value at beginning of period | $ | 25.01 | | $ | 22.49 | | $ | 22.06 | | $ | 25.07 | | $ | 22.50 | | $ | 18.56 | | $ | 16.40 | | $ | 16.55 | | $ | 15.07 | | $ | 25.14 | | $ | 22.51 | | $ | 22.06 |
| Income from Investment Operations: | | | | | | | | | | | | | | | | | | | | | | | | | | | | | | | | | | | |
| Net investment income1 | | 0.09 | | | 0.03 | | | – | | | 0.16 | | | 0.12 | | | 0.10 | | | 0.13 | | | 0.15 | | | 0.09 | | | 0.15 | | | 0.17 | | | – |
Net realized and unrealized gain (loss) on investments | | 1.06 | | | 3.18 | | | 0.43 | | | 1.05 | | | 3.15 | | | 3.94 | | | 2.17 | | | (0.15 | ) | | 1.48 | | | 1.10 | | | 3.16 | | | 0.45 |
| Total from investment operations | | 1.15 | | | 3.21 | | | 0.43 | | | 1.21 | | | 3.27 | | | 4.04 | | | 2.30 | | | – | | | 1.57 | | | 1.25 | | | 3.33 | | | 0.45 |
| Less Distributions: | | | | | | | | | | | | | | | | | | | | | | | | | | | | | | | | | | | |
Distributions from net investment income | | (0.06 | ) | | (0.01 | ) | | – | | | (0.12 | ) | | (0.02 | ) | | (0.10 | ) | | (0.14 | ) | | (0.15 | ) | | (0.09 | ) | | (0.12 | ) | | (0.02 | ) | | – |
| Distributions from capital gains | | (4.80 | ) | | (0.68 | ) | | – | | | (4.80 | ) | | (0.68 | ) | | – | | | – | | | – | | | – | | | (4.80 | ) | | (0.68 | ) | | – |
Total distributions | | (4.86 | ) | | (0.69 | ) | | – | | | (4.92 | ) | | (0.70 | ) | | (0.10 | ) | | (0.14 | ) | | (0.15 | ) | | (0.09 | ) | | (4.92 | ) | | (0.70 | ) | | – |
| Net increase (decrease) in net asset value | | (3.71 | ) | | 2.52 | | | 0.43 | | | (3.71 | ) | | 2.57 | | | 3.94 | | | 2.16 | | | (0.15 | ) | | 1.48 | | | (3.67 | ) | | 2.63 | | | 0.45 |
| Net Asset Value at end of period | $ | 21.30 | | $ | 25.01 | | $ | 22.49 | | $ | 21.36 | | $ | 25.07 | | $ | 22.50 | | $ | 18.56 | | $ | 16.40 | | $ | 16.55 | | $ | 21.47 | | $ | 25.14 | | $ | 22.51 |
| Total Return (%)2 | | 4.78 | | | 14.55 | | | 1.95 | 4 | | 5.07 | | | 14.84 | | | 21.78 | 4 | | 14.05 | | | – | | | 10.44 | | | 5.25 | | | 15.10 | | | 2.044 |
| Ratios/Supplemental Data: | | | | | | | | | | | | | | | | | | | | | | | | | | | | | | | | | | | |
| Net Assets at end of period (in 000’s) | $ | 2,189 | | $ | 1,340 | | $ | 280 | | $ | 109,506 | | $ | 166,819 | | $ | 196,164 | | $ | 35,176 | | $ | 36,339 | | $ | 42,882 | | $ | 6,589 | | $ | 5,200 | | $ | 7,234 |
| Ratios of expenses to average net assets: | | | | | | | | | | | | | | | | | | | | | | | | | | | | | | | | | | | |
Before reimbursement of expenses by Adviser (%) | | 1.31 | | | 1.28 | | | 1.20 | 5 | | 1.06 | | | 1.02 | | | 1.04 | 5 | | 1.05 | | | 0.99 | | | 0.99 | | | 0.73 | | | 0.69 | | | 0.655 |
After reimbursement of expenses by Adviser (%) | | 1.19 | | | 1.13 | | | 1.06 | 5 | | 0.94 | | | 0.87 | | | 0.89 | 5 | | 0.97 | | | 0.99 | | | 0.99 | | | 0.73 | | | 0.64 | | | 0.565 |
Ratio of net investment income to average net assets | | | | | | | | | | | | | | | | | | | | | | | | | | | | | | | | | | | |
After reimbursement of expenses by Adviser (%) | | 0.38 | | | 0.15 | | | (0.22 | )5 | | 0.62 | | | 0.43 | | | 0.41 | 5 | | 0.75 | | | 0.82 | | | 0.60 | | | 0.83 | | | 0.65 | | | 0.235 |
| Portfolio turnover (%)3 | | 33 | | | 52 | | | 34 | 4 | | 33 | | | 52 | | | 34 | 4 | | 47 | | | 36 | | | 41 | | | 33 | | | 52 | | | 344 |
| *The Financial Statements presented herein include the historical operating results of the Madison Mosaic Funds through April 19, 2013. Effective after market close on this date, the Madison Mosaic Funds reorganized into the Madison Funds. |
| 1 Net investment income calculated excluding permanent tax adjustments to undistributed net investment income. |
| 2 Total return without applicable sales charge. |
| 3 Portfolio turnover is calculated at the fund level and represents the entire fiscal year or period. |
| 4 Not annualized. |
| 5 Annualized. |
| 6 Amounts represent less than $0.005 per share. |
| 7 Class was launched on September 20, 2013. |
| 8 Effective at the close of business on April 19, 2013, the fiscal year end of the fund changed to October 31. Disclosure represents 10 months of information. |
See accompanying Notes to Financial Statements.
64
Madison Funds | October 31, 2015
| |
| Financial Highlights for a Share of Beneficial Interest Outstanding |
| | | | | | | | | | | | | | | | | | | | | | | | | | | | | | | | | | | | | | | | | | | | |
| | | | | | | | | | | | | | | | | | | | LARGE CAP GROWTH FUND | | | | | | | | | | | | | | | | | | | |
| | | | | | | | CLASS A | | | | | | | | | | | | CLASS B | | | | | | | | | | | | | CLASS Y | | | | | | |
| | | | | | Year Ended October 31, | | | | | | | | Year Ended October 31, | | | | | | | | | Year Ended October 31, | | | | |
| | | 2015 | | | 2014 | | | 2013 | | | 2012 | | 2011 | | | 2015 | | | 2014 | | | 2013 | | | 2012 | | | 2011 | | | 2015 | | | 2014 | | | 2013 | | | 2012 | | | 2011 | |
Net Asset Value at beginning of period | $ | 23.50 | | $ | 21.06 | | $ | 17.18 | | $ | 16.00 | | $ 15.20 | | $ | 20.99 | | $ | 19.02 | | $ | 15.61 | | $ | 14.64 | | $ | 13.99 | | $ | 23.72 | | $ | 21.24 | | $ | 17.33 | | $ | 16.11 | | $ | 15.30 | |
Income from Investment Operations: | | | | | | | | | | | | | | | | | | | | | | | | | | | | | | | | | | | | | | | | | | | | |
Net investment income (loss)2 | | 0.13 | | | 0.05 | | | 0.07 | | | 0.01 | | (0.01 | ) | | (0.04 | ) | | (0.17 | ) | | (0.12 | ) | | (0.12 | ) | | (0.13 | ) | | 0.20 | | | 0.09 | | | 0.11 | | | 0.06 | | | 0.04 | |
Net realized and unrealized gain on investments | | 1.15 | | | 3.17 | | | 3.88 | | | 1.17 | | 0.83 | | | 1.01 | | | 2.92 | | | 3.56 | | | 1.09 | | | 0.78 | | | 1.14 | | | 3.22 | | | 3.91 | | | 1.18 | | | 0.82 | |
Total from investment operations | | 1.28 | | | 3.22 | | | 3.95 | | | 1.18 | | 0.82 | | | 0.97 | | | 2.75 | | | 3.44 | | | 0.97 | | | 0.65 | | | 1.34 | | | 3.31 | | | 4.02 | | | 1.24 | | | 0.86 | |
| Less Distributions: | | | | | | | | | | | | | | | | | | | | | | | | | | | | | | | | | | | | | | | | | | | | |
Distributions from net investment income | | (0.06 | ) | | – | | | (0.07 | ) | | – | | (0.02 | ) | | – | | | – | | | (0.03 | ) | | – | | | – | | | (0.12 | ) | | (0.05 | ) | | (0.11 | ) | | (0.02 | ) | | (0.05 | ) |
Distributions from capital gains | | (1.83 | ) | | (0.78 | ) | | – | | | – | | – | | | (1.83 | ) | | (0.78 | ) | | – | | | – | | | – | | | (1.83 | ) | | (0.78 | ) | | – | | | – | | | – | |
Total distributions | | (1.89 | ) | | (0.78 | ) | | (0.07 | ) | | – | | (0.02 | ) | | (1.83 | ) | | (0.78 | ) | | (0.03 | ) | | – | | | – | | | (1.95 | ) | | (0.83 | ) | | (0.11 | ) | | (0.02 | ) | | (0.05 | ) |
Net increase (decrease) in net asset value | | (0.61 | ) | | 2.44 | | | 3.88 | | | 1.18 | | 0.80 | | | (0.86 | ) | | 1.97 | | | 3.41 | | | 0.97 | | | 0.65 | | | (0.61 | ) | | 2.48 | | | 3.91 | | | 1.22 | | | 0.81 | |
Net Asset Value at end of period | $ | 22.89 | | $ | 23.50 | | $ | 21.06 | | $ | 17.18 | | $ 16.00 | | $ | 20.13 | | $ | 20.99 | | $ | 19.02 | | $ | 15.61 | | $ | 14.64 | | $ | 23.11 | | $ | 23.72 | | $ | 21.24 | | $ | 17.33 | | $ | 16.11 | |
| Total Return (%)3 | | 5.65 | | | 15.63 | | | 23.05 | | | 7.38 | | 5.39 | | | 4.85 | | | 14.76 | | | 22.08 | | | 6.63 | | | 4.65 | | | 5.88 | | | 15.94 | | | 23.33 | | | 7.72 | | | 5.63 | |
| Ratios/Supplemental Data: | | | | | | | | | | | | | | | | | | | | | | | | | | | | | | | | | | | | | | | | | | | | |
Net Assets at end of period (in 000’s) | $ | 62,266 | | $ | 64,468 | | $ | 59,187 | | $ | 49,824 | | $ 48,068 | | $ | 4,554 | | $ | 4,726 | | $ | 5,102 | | $ | 5,731 | | $ | 7,581 | | $ | 108,018 | | $ | 118,009 | | $ | 92,067 | | $ | 63,956 | | $ | 61,122 | |
Ratios of expenses to average net assets: | | | | | | | | | | | | | | | | | | | | | | | | | | | | | | | | | | | | | | | | | | | | |
Before reimbursement of expenses by Adviser (%) | | 1.20 | | | 1.20 | | | 1.20 | | | 1.20 | | 1.20 | | | 1.95 | | | 1.95 | | | 1.95 | | | 1.95 | | | 1.95 | | | 0.95 | | | 0.95 | | | 0.95 | | | 0.95 | | | 0.95 | |
After reimbursement of expenses by Adviser (%) | | 1.20 | | | 1.20 | | | 1.20 | | | 1.20 | | 1.20 | | | 1.95 | | | 1.95 | | | 1.95 | | | 1.95 | | | 1.95 | | | 0.95 | | | 0.95 | | | 0.95 | | | 0.95 | | | 0.95 | |
Ratio of net investment income (loss) to average net assets | | | | | | | | | | | | | | | | | | | | | | | | | | | | | | | | | | | | | | | | | | | | |
After reimbursement of expenses by Adviser (%) | | 0.55 | | | 0.20 | | | 0.34 | | | 0.08 | | (0.05 | ) | | (0.21 | ) | | (0.54 | ) | | (0.37 | ) | | (0.68 | ) | | (0.79 | ) | | 0.79 | | | 0.44 | | | 0.57 | | | 0.33 | | | 0.22 | |
| Portfolio turnover (%)6 | | 50 | | | 40 | | | 58 | | | 71 | | 77 | | | 50 | | | 40 | | | 58 | | | 71 | | | 77 | | | 50 | | | 40 | | | 58 | | | 71 | | | 77 | |
| | | | | | | | | | | | | | | | | | | | | | | | | | | | | | | | | | | | |
| | | | | | | | | | | | | | | | | | MID CAP FUND* | | | | | | | | | | | | | | | | |
| | | | | CLASS A | | | | | | | CLASS B | | | | | | | | | | | CLASS Y | | | | | | | |
| | | Year Ended
October 31, | | | Inception
to | | | Year Ended
October 31, | | | Inception
to | | | Year Ended October 31, | | | Year Ended December 31, | |
| | | 2015 | | | 2014 | | | 10/31/131 | | | 2015 | | | 2014 | | | 10/31/131 | | | 2015 | | | 2014 | | | 20138 | | | 20127 | | | 20117 | | | 20107 | |
| Net Asset Value at beginning of period | $ | 9.78 | | $ | 9.48 | | $ | 8.41 | | $ | 8.69 | | $ | 8.55 | | $ | 7.62 | | $ | 10.00 | | $ | 9.66 | | $ | 8.31 | | $ | 7.45 | | $ | 7.40 | | $ | 6.11 | |
| Income from Investment Operations: | | | | | | | | | | | | | | | | | | | | | | | | | | | | | | | | | | | | |
Net investment income (loss)2 | | (0.06 | ) | | (0.04 | ) | | (0.03 | ) | | (0.13 | ) | | (0.14 | ) | | (0.06 | ) | | (0.04 | ) | | (0.02 | ) | | (0.02 | ) | | – | | | (0.01 | ) | | (0.02 | ) |
Net realized and unrealized gain on investments | | 0.61 | | | 1.01 | | | 1.10 | | | 0.56 | | | 0.95 | | | 0.99 | | | 0.63 | | | 1.03 | | | 2.11 | | | 1.17 | | | 0.39 | | | 1.31 | |
Total from investment operations | | 0.55 | | | 0.97 | | | 1.07 | | | 0.43 | | | 0.81 | | | 0.93 | | | 0.59 | | | 1.01 | | | 2.09 | | | 1.17 | | | 0.38 | | | 1.29 | |
| Less Distributions: | | | | | | | | | | | | | | | | | | | | | | | | | | | | | | | | | | | | |
Distributions from capital gains | | (1.74 | ) | | (0.67 | ) | | – | | | (1.74 | ) | | (0.67 | ) | | – | | | (1.74 | ) | | (0.67 | ) | | (0.74 | ) | | (0.31 | ) | | (0.33 | ) | | – | |
Total distributions | | (1.74 | ) | | (0.67 | ) | | – | | | (1.74 | ) | | (0.67 | ) | | – | | | (1.74 | ) | | (0.67 | ) | | (0.74 | ) | | (0.31 | ) | | (0.33 | ) | | – | |
Net increase (decrease) in net asset value | | (1.19 | ) | | 0.30 | | | 1.07 | | | (1.31 | ) | | 0.14 | | | 0.93 | | | (1.15 | ) | | 0.34 | | | 1.35 | | | 0.86 | | | 0.05 | | | 1.29 | |
| Net Asset Value at end of period | $ | 8.59 | | $ | 9.78 | | $ | 9.48 | | $ | 7.38 | | $ | 8.69 | | $ | 8.55 | | $ | 8.85 | | $ | 10.00 | | $ | 9.66 | | $ | 8.31 | | $ | 7.45 | | $ | 7.40 | |
| Total Return (%)3 | | 5.80 | | | 10.65 | | | 12.72 | 4 | | 5.06 | | | 9.89 | | | 12.20 | 4 | | 6.13 | | | 10.88 | | | 22.68 | 4 | | 15.69 | | | 5.10 | | | 21.15 | |
| Ratios/Supplemental Data: | | | | | | | | | | | | | | | | | | | | | | | | | | | | | | | | | | | | |
| Net Assets at end of period (in 000’s) | $ | 54,000 | | $ | 57,117 | | $ | 56,578 | | $ | 3,401 | | $ | 4,235 | | $ | 5,476 | | $ | 198,605 | | $ | 224,181 | | $ | 255,263 | | $ | 168,428 | | $ | 160,328 | | $ | 159,413 | |
| Ratios of expenses to average net assets: | | | | | | | | | | | | | | | | | | | | | | | | | | | | | | | | | | | | |
Before reimbursement of expenses by Adviser (%) | | 1.40 | | | 1.40 | | | 1.40 | 5 | | 2.15 | | | 2.15 | | | 2.15 | 5 | | 1.15 | | | 1.15 | | | 1.15 | 5 | | 1.20 | | | 1.25 | | | 1.25 | |
After reimbursement of expenses by Adviser (%) | | 1.40 | | | 1.40 | | | 1.40 | 5 | | 2.15 | | | 2.15 | | | 2.15 | 5 | | 1.15 | | | 1.15 | | | 1.15 | 5 | | 1.20 | | | 1.25 | | | 1.25 | |
Ratio of net investment income (loss) to average net assets | | | | | | | | | | | | | | | | | | | | | | | | | | | | | | | | | | | | |
After reimbursement of expenses by Adviser (%) | | (0.72 | ) | | (0.42 | ) | | (0.64 | )5 | | (1.47 | ) | | (1.19 | ) | | (1.39 | )5 | | (0.47 | ) | | (0.17 | ) | | (0.29 | )5 | | 0.00 | | | (0.20 | ) | | (0.26 | ) |
| Portfolio turnover (%)6 | | 28 | | | 33 | | | 21 | 4 | | 28 | | | 33 | | | 21 | 4 | | 28 | | | 33 | | | 21 | 4 | | 28 | | | 32 | | | 57 | |
* The Financial Statements presented herein include the historical operating results of the Madison Mosaic Funds through April 19, 2013. Effective after market close on this date, the Madison Mosaic Funds reorganized into the Madison Funds.
1 For accounting purposes, the Mid-Cap Fund Class A & B are treated as having commenced investment operations at the close of business on April 19, 2013.
2 Net investment income calculated excluding permanent tax adjustments to undistributed net investment income.
3 Total return without applicable sales charge.
4 Not annualized.
5 Annualized.
6 Portfolio turnover is calculated at the fund level and represents the entire fiscal year or period.
7 The financial highlights prior to April 22, 2013 are those of the Madison Mosaic Mid Cap Fund, the accounting survivor of the reorganization of the Madison Mid Cap and Madison Mosaic Mid Cap Funds. The net asset values and other per share information of the Madison Mosaic Mid Cap Fund have been restated by the conversion ratio of 1.5634 for Class Y shares to reflect those of the legal survivor of the reorganization, the Madison Mosaic Mid Cap Fund, which was renamed the Madison Mid Cap Fund after reorganization.
8 Effective at the close of business on April 19, 2013, the fiscal year end of the fund changed to October 31. Disclosure represents 10 months of information.
See accompanying Notes to Financial Statements.
65
Madison Funds | October 31, 2015
| |
| Financial Highlights for a Share of Beneficial Interest Outstanding |
| | | | | | | | | | | | |
| | | MID CAP FUND* - continued | |
| | | | | | CLASS R6 | | | | |
| | | Year Ended October 31, | | | Year
Ended | |
| | | 2015 | | | 2014 | | | 20131 | | | 12/31/127,8 | |
| Net Asset Value at beginning of period | $ | 10.06 | | $ | 9.68 | | $ | 8.30 | | $ | 7.42 | |
| Income from Investment Operations: | | | | | | | | | | | | |
| Net investment income (loss)2 | | (0.05 | ) | | 0.02 | | | 0.01 | | | 0.08 | |
Net realized and unrealized gain on investments | | 0.68 | | | 1.03 | | | 2.11 | | | 1.12 | |
| Total from investment operations | | 0.63 | | | 1.05 | | | 2.12 | | | 1.20 | |
| Less Distributions: | | | | | | | | | | | | |
| Distributions from net investment income | | – | | | – | | | – | | | (0.01 | ) |
| Distributions from capital gains | | (1.74 | ) | | (0.67 | ) | | (0.74 | ) | | (0.31 | ) |
Total distributions | | (1.74 | ) | | (0.67 | ) | | (0.74 | ) | | (0.32 | ) |
| Net increase (decrease) in net asset value | | (1.11 | ) | | 0.38 | | | 1.38 | | | 0.88 | |
| Net Asset Value at end of period | $ | 8.95 | | $ | 10.06 | | $ | 9.68 | | $ | 8.30 | |
| Total Return (%)3 | | 6.55 | | | 11.29 | | | 23.05 | 4 | | 7.34 | 4 |
| Ratios/Supplemental Data: | | | | | | | | | | | | |
| Net Assets at end of period (in 000’s) | $ | 9,874 | | $ | 5,118 | | $ | 6,270 | | $ | 4,856 | |
| Ratios of expenses to average net assets: | | | | | | | | | | | | |
Before reimbursement of expenses by Adviser (%) | | 0.77 | | | 0.77 | | | 0.77 | 5 | | 0.76 | 5 |
| After reimbursement of expenses by Adviser (%) | | 0.77 | | | 0.77 | | | 0.77 | 5 | | 0.76 | 5 |
Ratio of net investment income (loss) to average net assets | | | | | | | | | | | | |
| After reimbursement of expenses by Adviser (%) | | (0.09 | ) | | 0.20 | | | 0.11 | 5 | | 1.19 | 5 |
| Portfolio turnover (%)6 | | 28 | | | 33 | | | 21 | 4 | | 28 | 4 |
| | | | | | | | | | | | | | | | | | | | | | | | | | | | | | | | | | | | | | | | | | | | | |
| | | | | | | | | | | | | | | | | | | | | SMALL CAP FUND | | | | | | | | | | | | | | | | | | | |
| | | | | | | | CLASS A | | | | | | | | | | | | | CLASS B | | | | | | | | | | | | | CLASS Y | | | | | | |
| | | | | | Year Ended October 31, | | | | | | | | | Year Ended October 31, | | | | | | | | | Year Ended October 31, | | | | |
| | | 2015 | | | 2014 | | | 2013 | | | 2012 | | | 2011 | | | 2015 | | | 2014 | | | 2013 | | | 2012 | | | 2011 | | | 2015 | | | 2014 | | | 2013 | | | 2012 | | | 2011 | |
Net Asset Value at beginning of period | $ | 15.21 | | $ | 14.87 | | $ | 11.81 | | $ | 10.79 | | $ | 9.93 | | $ | 14.58 | | $ | 14.38 | | $ | 11.45 | | $ | 10.55 | | $ | 9.78 | | $ | 15.26 | | $ | 14.88 | | $ | 11.82 | | $ | 10.77 | | $ | 9.91 | |
Income from Investment Operations: | | | | | | | | | | | | | | | | | | | | | | | | | | | | | | | | | | | | | | | | | | | | | |
Net investment income (loss)2 | | 0.02 | | | 0.06 | | | 0.02 | | | 0.06 | | | 0.04 | | | (0.14 | ) | | (0.05 | ) | | (0.06 | ) | | (0.02 | ) | | (0.06 | ) | | 0.04 | | | 0.07 | | | 0.02 | | | 0.10 | | | 0.07 | |
Net realized and unrealized gain on investments | | 0.58 | | | 0.88 | | | 3.68 | | | 1.31 | | | 0.86 | | | 0.60 | | | 0.85 | | | 3.56 | | | 1.27 | | | 0.86 | | | 0.60 | | | 0.91 | | | 3.71 | | | 1.30 | | | 0.85 | |
Total from investment operations | | 0.60 | | | 0.94 | | | 3.70 | | | 1.37 | | | 0.90 | | | 0.46 | | | 0.80 | | | 3.50 | | | 1.25 | | | 0.80 | | | 0.64 | | | 0.98 | | | 3.73 | | | 1.40 | | | 0.92 | |
| Redemption Fees | | – | | | – | | | – | | | – | | | 0.01 | | | – | | | – | | | – | | | – | | | – | | | – | | | – | | | – | | | – | | | – | |
| Less Distributions: | | | | | | | | | | | | | | | | | | | | | | | | | | | | | | | | | | | | | | | | | | | | | |
Distributions from net investment income | | (0.04 | ) | | – | | | (0.09 | ) | | – | | | (0.05 | ) | | – | | | – | | | (0.02 | ) | | – | | | (0.03 | ) | | (0.08 | ) | | (0.00 | )9 | | (0.12 | ) | | – | | | (0.06 | ) |
Distributions from capital gains | | (0.79 | ) | | (0.60 | ) | | (0.55 | ) | | (0.35 | ) | | – | | | (0.79 | ) | | (0.60 | ) | | (0.55 | ) | | (0.35 | ) | | – | | | (0.79 | ) | | (0.60 | ) | | (0.55 | ) | | (0.35 | ) | | – | |
Total distributions | | (0.83 | ) | | (0.60 | ) | | (0.64 | ) | | (0.35 | ) | | (0.05 | ) | | (0.79 | ) | | (0.60 | ) | | (0.57 | ) | | (0.35 | ) | | (0.03 | ) | | (0.87 | ) | | (0.60 | ) | | (0.67 | ) | | (0.35 | ) | | (0.06 | ) |
Net increase (decrease) in net asset value | | (0.23 | ) | | 0.34 | | | 3.06 | | | 1.02 | | | 0.86 | | | (0.33 | ) | | 0.20 | | | 2.93 | | | 0.90 | | | 0.77 | | | (0.23 | ) | | 0.38 | | | 3.06 | | | 1.05 | | | 0.86 | |
Net Asset Value at end of period | $ | 14.98 | | $ | 15.21 | | $ | 14.87 | | $ | 11.81 | | $ | 10.79 | | $ | 14.25 | | $ | 14.58 | | $ | 14.38 | | $ | 11.45 | | $ | 10.55 | | $ | 15.03 | | $ | 15.26 | | $ | 14.88 | | $ | 11.82 | | $ | 10.77 | |
| Total Return (%)3 | | 3.90 | | | 6.45 | | | 32.85 | | | 13.08 | | | 9.12 | | | 3.10 | | | 5.66 | | | 31.92 | | | 12.21 | | | 8.20 | | | 4.16 | | | 6.72 | | | 33.17 | | | 13.39 | | | 9.29 | |
| Ratios/Supplemental Data: | | | | | | | | | | | | | | | | | | | | | | | | | | | | | | | | | | | | | | | | | | | | | |
Net Assets at end of period (in 000’s) | $ | 3,435 | | $ | 3,639 | | $ | 4,566 | | $ | 3,941 | | $ | 3,201 | | $ | 437 | | $ | 522 | | $ | 497 | | $ | 318 | | $ | 266 | | $ | 83,728 | | $ | 60,279 | | $ | 45,217 | | $ | 13,808 | | $ | 17,039 | |
Ratios of expenses to average net assets: | | | | | | | | | | | | | | | | | | | | | | | | | | | | | | | | | | | | | | | | | | | | | |
Before reimbursement of expenses by Adviser (%) | | 1.50 | | | 1.50 | | | 1.50 | | | 1.50 | | | 1.50 | | | 2.25 | | | 2.25 | | | 2.25 | | | 2.25 | | | 2.25 | | | 1.25 | | | 1.25 | | | 1.25 | | | 1.25 | | | 1.25 | |
After reimbursement of expenses by Adviser (%) | | 1.50 | | | 1.50 | | | 1.50 | | | 1.50 | | | 1.50 | | | 2.25 | | | 2.25 | | | 2.25 | | | 2.25 | | | 2.25 | | | 1.25 | | | 1.25 | | | 1.25 | | | 1.25 | | | 1.25 | |
Ratio of net investment income (loss) to average net assets | | | | | | | | | | | | | | | | | | | | | | | | | | | | | | | | | | | | | | | | | | | | | |
After reimbursement of expenses by Adviser (%) | | 0.09 | | | 0.35 | | | 0.14 | | | 0.53 | | | 0.33 | | | (0.66 | ) | | (0.40 | ) | | (0.62 | ) | | (0.22 | ) | | (0.42 | ) | | 0.32 | | | 0.59 | | | 0.28 | | | 0.77 | | | 0.69 | |
| Portfolio turnover (%)6 | | 19 | | | 29 | | | 22 | | | 15 | | | 15 | | | 19 | | | 29 | | | 22 | | | 15 | | | 15 | | | 19 | | | 29 | | | 22 | | | 15 | | | 15 | |
| |
| *The Financial Statements presented herein include the historical operating results of the Madison Mosaic Funds through April 19, 2013. Effective after market close on this date, the Madison Mosaic Funds reorganized into the Madison Funds. |
| 1 Effective at the close of business on April 19, 2013, the fiscal year end of the fund changed to October 31. Disclosure represents 10 months of information. |
| 2 Net investment income calculated excluding permanent tax adjustments to undistributed net investment income. |
| 3 Total return without applicable sales charge. |
| 4 Not annualized. |
| 5 Annualized. |
| 6 Portfolio turnover is calculated at the fund level and represents the entire fiscal year or period. |
| 7 The financial highlights prior to April 22, 2013 are those of the Madison Mosaic Mid Cap Fund, the accounting survivor of the reorganization of the Madison Mid Cap and Madison Mosaic Mid Cap Funds. The net asset values and other per share information of the Madison Mosaic Mid Cap Fund have been restated by the conversion ratio of 1.5696 for Class R6 shares to reflect those of the legal survivor of the reorganization, the Madison Mosaic Mid Cap Fund, which was renamed the Madison Mid Cap Fund after reorganization. |
| 8 Class was launched on February 29, 2012. |
| 9 Amounts represent less than $0.005 per share. |
See accompanying Notes to Financial Statements.
66
Madison Funds | October 31, 2015
| |
| Financial Highlights for a Share of Beneficial Interest Outstanding |
| | | | | | | | | | | | | | | | | | | | | | | | | | | | |
| | | | | | | | | | | NORTHROAD INTERNATIONAL FUND* | | | | | | | | | |
| | | | | | | | | CLASS Y | | | | | | | | | | | | CLASS R6 | | | |
| | | Year Ended October 31, | | Year Ended December 31, | | | Year Ended October 31, | | Inception
to | |
| | | 2015 | | | 2014 | | | 20138 | | 2012 | | | 2011 | | | 20109 | | | 2015 | | | 2014 | | | 20/138 | | 12/31/121 | |
| Net Asset Value at beginning of period | $ | 11.54 | | $ | 12.25 | | $ | 10.39 | | $ 9.28 | | $ | 13.30 | | $ | 11.92 | | $ | 11.60 | | $ | 12.28 | | $ | 10.39 | | $ 9.28 | |
| Income from Investment Operations: | | | | | | | | | | | | | | | | | | | | | | | | | | | | |
| Net investment income2 | | 0.19 | | | 0.19 | | | 0.19 | | 0.19 | | | 0.04 | | | 0.007 | | | 0.21 | | | 0.24 | | | 0.22 | | 0.19 | |
Net realized and unrealized gain (loss) on investments | | (0.49 | ) | | (0.41 | ) | | 1.67 | | 1.09 | | | (1.03 | ) | | 2.20 | | | (0.47 | ) | | (0.43 | ) | | 1.67 | | 1.11 | |
| Total from investment operations | | (0.30 | ) | | (0.22 | ) | | 1.86 | | 1.28 | | | (0.99 | ) | | 2.20 | | | (0.26 | ) | | (0.19 | ) | | 1.89 | | 1.30 | |
| Less Distributions: | | | | | | | | | | | | | | | | | | | | | | | | | | | | |
| Distributions from net investment income | | (0.22 | ) | | (0.20 | ) | | – | | (0.17 | ) | | (0.04 | ) | | (0.00 | )7 | | (0.22 | ) | | (0.20 | ) | | – | | (0.19 | ) |
| Distributions from capital gains | | (0.45 | ) | | (0.29 | ) | | – | | – | | | (2.99 | ) | | (0.82 | ) | | (0.45 | ) | | (0.29 | ) | | – | | – | |
Total distributions | | (0.67 | ) | | (0.49 | ) | | – | | (0.17 | ) | | (3.03 | ) | | (0.82 | ) | | (0.67 | ) | | (0.49 | ) | | – | | (0.19 | ) |
| Net increase (decrease) in net asset value | | (0.97 | ) | | (0.71 | ) | | 1.86 | | 1.11 | | | (4.02 | ) | | 1.38 | | | (0.93 | ) | | (0.68 | ) | | 1.89 | | 1.11 | |
| Net Asset Value at end of period | $ | 10.57 | | $ | 11.54 | | $ | 12.25 | | $ 10.39 | | $ | 9.28 | | $ | 13.30 | | $ | 10.67 | | $ | 11.60 | | $ | 12.28 | | $ 10.39 | |
| Total Return (%)3 | | (2.63 | ) | | (1.91 | ) | | 17.90 | 4 | 13.76 | | | (6.43 | ) | | 18.42 | | | (2.25 | ) | | (1.66 | ) | | 18.19 | 4 | 6.70 | 4 |
| Ratios/Supplemental Data: | | | | | | | | | | | | | | | | | | | | | | | | | | | | |
| Net Assets at end of period (in 000’s) | $ | 36,216 | | $ | 36,751 | | $ | 32,616 | | $ 28,856 | | $ | 1,621 | | $ | 1,763 | | $ | 9,213 | | $ | 8,674 | | $ | 12 | | $ 11 | |
| Ratios of expenses to average net assets: | | | | | | | | | | | | | | | | | | | | | | | | | | | | |
Before reimbursement of expenses by Adviser (%) | | 1.15 | | | 1.15 | | | 1.15 | 5 | 1.15 | | | 1.20 | | | 1.25 | | | 0.82 | | | 0.83 | | | 0.83 | 5 | 0.83 | 5 |
After reimbursement of expenses by Adviser (%) | | 1.15 | | | 1.15 | | | 1.15 | 5 | 1.15 | | | 1.20 | | | 1.25 | | | 0.82 | | | 0.83 | | | 0.83 | 5 | 0.83 | 5 |
Ratio of net investment income (loss) to average net assets | | | | | | | | | | | | | | | | | | | | | | | | | | | | |
After reimbursement of expenses by Adviser (%) | | 1.73 | | | 1.68 | | | 2.01 | 5 | 1.94 | | | 0.43 | | | 0.02 | | | 2.08 | | | 2.67 | | | 2.33 | 5 | 2.33 | 5 |
| Portfolio turnover (%)6 | | 29 | | | 30 | | | 15 | 4 | 12 | | | 129 | | | 61 | | | 29 | | | 30 | | | 154 | | 124 | |
| | | | | | | | | | | | | | | | | | | | | | | | | | | | | | | | | | | | | | | | | | | | | |
| | | | | | | | | | | | | | | | | | INTERNATIONAL STOCK FUND | | | | | | | | | | | | | | | | | | | |
| | | | | | | | CLASS A | | | | | | | | | | | | | CLASS B | | | | | | | | | | | | | CLASS Y | | | | | | |
| | | | | | Year Ended October 31, | | | | | | | | | Year Ended October 31, | | | | | | | | | Year Ended October 31, | | | | |
| | | 2015 | | | 2014 | | | 2013 | | | 2012 | | | 2011 | | | 2015 | | | 2014 | | | 2013 | | | 2012 | | | 2011 | | | 2015 | | | 2014 | | | 2013 | | | 2012 | | | 2011 | |
Net Asset Value at beginning of period | $ | 13.20 | | $ | 13.16 | | $ | 10.81 | | $ | 10.12 | | $ | 10.58 | | $ | 12.89 | | $ | 12.87 | | $ | 10.58 | | $ | 9.92 | | $ | 10.39 | | $ | 13.22 | | $ | 13.18 | | $ | 10.82 | | $ | 10.13 | | $ | 10.59 | |
Income from Investment Operations: | | | | | | | | | | | | | | | | | | | | | | | | | | | | | | | | | | | | | | | | | | | | | |
Net investment income2 | | 0.12 | | | 0.16 | | | 0.13 | | | 0.14 | | | 0.16 | | | 0.03 | | | 0.10 | | | 0.07 | | | 0.09 | | | 0.08 | | | (0.05 | ) | | 0.73 | | | 0.13 | | | 0.18 | | | 0.21 | |
Net realized and unrealized gain (loss) on investments | | (0.02 | ) | | (0.02 | ) | | 2.35 | | | 0.76 | | | (0.47 | ) | | (0.03 | ) | | (0.06 | ) | | 2.28 | | | 0.72 | | | (0.47 | ) | | 0.17 | | | (0.56 | ) | | 2.38 | | | 0.75 | | | (0.49 | ) |
Total from investment operations | | 0.10 | | | 0.14 | | | 2.48 | | | 0.90 | | | (0.31 | ) | | – | | | 0.04 | | | 2.35 | | | 0.81 | | | (0.39 | ) | | 0.12 | | | 0.17 | | | 2.51 | | | 0.93 | | | (0.28 | ) |
Less Distributions: | | | | | | | | | | | | | | | | | | | | | | | | | | | | | | | | | | | | | | | | | | | | | |
Distributions from net investment income | | (0.31 | ) | | (0.10 | ) | | (0.13 | ) | | (0.21 | ) | | (0.15 | ) | | (0.21 | ) | | (0.02 | ) | | (0.06 | ) | | (0.15 | ) | | (0.08 | ) | | (0.34 | ) | | (0.13 | ) | | (0.15 | ) | | (0.24 | ) | | (0.18 | ) |
Total distributions | | (0.31 | ) | | (0.10 | ) | | (0.13 | ) | | (0.21 | ) | | (0.15 | ) | | (0.21 | ) | | (0.02 | ) | | (0.06 | ) | | (0.15 | ) | | (0.08 | ) | | (0.34 | ) | | (0.13 | ) | | (0.15 | ) | | (0.24 | ) | | (0.18 | ) |
Net increase (decrease) in net asset value | | (0.21 | ) | | 0.04 | | | 2.35 | | | 0.69 | | | (0.46 | ) | | (0.21 | ) | | 0.02 | | | 2.29 | | | 0.66 | | | (0.47 | ) | | (0.22 | ) | | 0.04 | | | 2.36 | | | 0.69 | | | (0.46 | ) |
Net Asset Value at end of period | $ | 12.99 | | $ | 13.20 | | $ | 13.16 | | $ | 10.81 | | $ | 10.12 | | $ | 12.68 | | $ | 12.89 | | $ | 12.87 | | $ | 10.58 | | $ | 9.92 | | $ | 13.00 | | $ | 13.22 | | $ | 13.18 | | $ | 10.82 | | $ | 10.13 | |
| Total Return (%)3 | | 0.83 | | | 1.09 | | | 23.11 | | | 9.23 | | | (3.00 | ) | | 0.06 | | | 0.31 | | | 22.26 | | | 8.39 | | | (3.77 | ) | | 1.09 | | | 1.29 | | | 23.44 | | | 9.61 | | | (2.85 | ) |
| Ratios/Supplemental Data: | | | | | | | | | | | | | | | | | | | | | | | | | | | | | | | | | | | | | | | | | | | | | |
Net Assets at end of period (in 000’s) | $ | 21,072 | | $ | 23,012 | | $ | 24,571 | | $ | 21,002 | | $ | 20,763 | | $ | 1,692 | | $ | 2,061 | | $ | 2,946 | | $ | 3,206 | | $ | 3,872 | | $ | 15,566 | | $ | 7,938 | | $ | 34,634 | | $ | 23,294 | | $ | 44,358 | |
Ratios of expenses to average net assets: | | | | | | | | | | | | | | | | | | | | | | | | | | | | | | | | | | | | | | | | | | | | | |
Before reimbursement of expenses by Adviser (%) | | 1.60 | | | 1.60 | | | 1.60 | | | 1.60 | | | 1.60 | | | 2.35 | | | 2.35 | | | 2.35 | | | 2.35 | | | 2.35 | | | 1.35 | | | 1.35 | | | 1.35 | | | 1.35 | | | 1.35 | |
After reimbursement of expenses by Adviser (%) | | 1.60 | | | 1.60 | | | 1.60 | | | 1.60 | | | 1.60 | | | 2.35 | | | 2.35 | | | 2.35 | | | 2.35 | | | 2.35 | | | 1.35 | | | 1.35 | | | 1.35 | | | 1.35 | | | 1.35 | |
Ratio of net investment income to average net assets | | | | | | | | | | | | | | | | | | | | | | | | | | | | | | | | | | | | | | | | | | | | | |
After reimbursement of expenses by Adviser (%) | | 0.88 | | | 1.13 | | | 1.02 | | | 1.35 | | | 1.45 | | | 0.10 | | | 0.29 | | | 0.28 | | | 0.59 | | | 0.72 | | | 1.27 | | | 1.65 | | | 1.26 | | | 1.36 | | | 1.70 | |
| Portfolio turnover (%)6 | | 45 | | | 44 | | | 53 | | | 41 | | | 44 | | | 45 | | | 44 | | | 53 | | | 41 | | | 44 | | | 45 | | | 44 | | | 53 | | | 41 | | | 44 | |
| |
| * The Financial Statements presented herein include the historical operating results of the Madison Mosaic Funds through April 19, 2013. Effective after market close on this date, the Madison Mosaic Funds reorganized into the Madison Funds. |
| 1 Class was launched on February 29, 2012. |
| 2 Net investment income (loss) calculated excluding permanent tax adjustments to undistributed net investment income. |
| 3 Total return without applicable sales charge. |
| 4 Not annualized. |
| 5 Annualized. |
| 6 Portfolio turnover is calculated at the fund level and represents the entire fiscal year or period. |
| 7 Amounts represent less than $0.005 per share. |
| 8 Effective at the close of business on April 19, 2013, the fiscal year end of the fund changed to October 31. Disclosure represents 10 months of information. |
| 9 Prior to June 30, 2011, the NorthRoad International Fund was known as the Small/Mid-Cap Fund. Inception of the fund was December 31, 2008. |
See accompanying Notes to Financial Statements.
67
Madison Funds | October 31, 2015
| |
| Financial Highlights for a Share of Beneficial Interest Outstanding |
| | | | | | | | | | | | | | | | | | | | | | | | | | | | | | | | | | | | |
| | | | | | | | | | | | | | | HANSBERGER INTERNATIONAL GROWTH FUND* | | | | | | | | | | |
| | | | | | | | | CLASS I | | | | | | | | | | | | | | | CLASS Y | | | | | | | |
| | | Year Ended
October 31, | | | Year Ended December 31, | | | Year Ended
October 31, | | | Year Ended December 31, |
| | | 2015 | | | 20141 | | | 2013 | | | 2012 | | | 2011 | | | 2010 | | | 2015 | | | 20141 | | | 2013 | | | 2012 | | | 2011 | | | 2010 | |
Net Asset Value at beginning of period | $ | 16.70 | | $ | 17.88 | | $ | 15.42 | | $ | 13.11 | | $ | 16.16 | | $ | 15.02 | | $ | 16.68 | | $ | 17.89 | | $ | 15.42 | | $ | 13.11 | | $ | 16.16 | | $ | 15.01 | |
Income from Investment Operations: | | | | | | | | | | | | | | | | | | | | | | | | | | | | | | | | | | | | |
Net investment income2 | | 0.73 | | | 0.26 | | | 0.17 | 3 | | 0.21 | 3 | | 0.21 | 3 | | 0.15 | 3 | | 0.05 | | | 0.14 | | | 0.13 | 3 | | 0.17 | 3 | | 0.19 | 3 | | 0.12 | 3 |
Net realized and unrealized gain (loss) on investments | | (0.54 | ) | | (1.44 | ) | | 2.52 | | | 2.33 | | | (3.06 | ) | | 1.14 | | | 0.12 | | | (1.35 | ) | | 2.53 | | | 2.32 | | | (3.07 | ) | | 1.15 | |
Total from investment operations | | 0.19 | | | (1.18 | ) | | 2.69 | | | 2.54 | | | (2.85 | ) | | 1.29 | | | 0.17 | | | (1.21 | ) | | 2.66 | | | 2.49 | | | (2.88 | ) | | 1.27 | |
Less Distributions: | | | | | | | | | | | | | | | | | | | | | | | | | | | | | | | | | | | | |
Distributions from net investment income | | (0.78 | ) | | – | | | (0.23 | ) | | (0.23 | ) | | (0.20 | ) | | (0.15 | ) | | (0.76 | ) | | – | | | (0.19 | ) | | (0.18 | ) | | (0.17 | ) | | (0.12 | ) |
Total distributions | | (0.78 | ) | | – | | | (0.23 | ) | | (0.23 | ) | | (0.20 | ) | | (0.15 | ) | | (0.76 | ) | | – | | | (0.19 | ) | | (0.18 | ) | | (0.17 | ) | | (0.12 | ) |
Net increase (decrease) in net asset value | | (0.59 | ) | | (1.18 | ) | | 2.46 | | | 2.31 | | | (3.05 | ) | | 1.14 | | | (0.59 | ) | | (1.21 | ) | | 2.47 | | | 2.31 | | | (3.05 | ) | | 1.15 | |
| Net Asset Value at end of period | $ | 16.11 | | $ | 16.70 | | $ | 17.88 | | $ | 15.42 | | $ | 13.11 | | $ | 16.16 | | $ | 16.09 | | $ | 16.68 | | $ | 17.89 | | $ | 15.42 | | $ | 13.11 | | $ | 16.16 | |
| Total Return (%)4 | | 1.41 | | | (6.60 | )5 | | 17.46 | | | 19.37 | | | (17.61 | ) | | 8.63 | | | 1.27 | | | (6.76 | )5 | | 17.26 | | | 19.01 | | | (17.82 | ) | | 8.44 | |
| Ratios/Supplemental Data: | | | | | | | | | | | | | | | | | | | | | | | | | | | | | | | | | | | | |
| Net Assets at end of period (in 000’s) | $ | 30,895 | | $ | 153,839 | | $ | 262,627 | | $ | 518,186 | | $ | 548,110 | | $ | 608,571 | | $ | 2,510 | | $ | 2,942 | | $ | 3,928 | | $ | 4,410 | | $ | 5,907 | | $ | 9,398 | |
| Ratios of expenses to average net assets: | | | | | | | | | | | | | | | | | | | | | | | | | | | | | | | | | | | | |
Before reimbursement of expenses by Adviser (%) | | 1.01 | | | 0.95 | 6 | | 0.94 | | | 0.89 | | | 0.86 | | | 0.87 | | | 1.16 | | | 1.85 | 6 | | 1.67 | | | 1.45 | | | 1.05 | | | 1.10 | |
After reimbursement of expenses by Adviser (%) | | 1.01 | | | 0.95 | 6 | | 0.94 | 7 | | 0.89 | 8 | | 0.86 | | | 0.87 | | | 1.16 | | | 1.16 | 6 | | 1.17 | 7 | | 1.15 | 10 | | 1.05 | | | 1.10 | |
Ratio of net investment income to average net assets | | | | | | | | | | | | | | | | | | | | | | | | | | | | | | | | | | | | |
After reimbursement of expenses by Adviser (%) | | 0.85 | | | 1.40 | 6 | | 1.05 | | | 1.44 | | | 1.39 | | | 1.05 | | | 0.80 | | | 1.22 | 6 | | 0.78 | | | 1.15 | | | 1.22 | | | 0.83 | |
| Portfolio turnover (%)9 | | 61 | | | 34 | 5 | | 48 | | | 47 | | | 62 | | | 52 | | | 61 | | | 34 | 5 | | 48 | | | 47 | | | 62 | | | 52 | |
| | | | | | | | | | | | | | | | | | | | | | | | |
| | | TARGET RETIREMENT | | | TARGET RETIREMENT | | | TARGET RETIREMENT | | | TARGET RETIREMENT | |
| | | 2020 FUND | | | 2030 FUND | | | 2040 FUND | | | 2050 FUND | |
| | | CLASS R6 | | | CLASS R6 | | | CLASS R6 | | | CLASS R6 | |
| | | Year Ended
10/31/15 | | | Inception to
10/31/1411 | | | Year Ended
10/31/15 | | | Inception to
10/31/1411 | | | Year Ended
10/31/15 | | | Inception to
10/31/1411 | | | Year Ended
10/31/15 | | | Inception to
10/31/1411 | |
| Net Asset Value at beginning of period | $ | 10.00 | | $ | 10.00 | | $ | 9.99 | | $ | 10.00 | | $ | 9.98 | | $ | 10.00 | | $ | 9.98 | | $ | 10.00 | |
| Income from Investment Operations: | | | | | | | | | | | | | | | | | | | | | | | | |
| Net investment income2 | | 0.16 | | | 0.03 | | | 0.15 | | | 0.03 | | | 0.15 | | | 0.03 | | | 0.15 | | | 0.03 | |
| Net realized and unrealized gain (loss) on investments | | 0.10 | | | (0.03 | ) | | 0.12 | | | (0.04 | ) | | 0.13 | | | (0.05 | ) | | 0.13 | | | (0.05 | ) |
Total from investment operations | | 0.26 | | | – | | | 0.27 | | | (0.01 | ) | | 0.28 | | | (0.02 | ) | | 0.28 | | | (0.02 | ) |
| Less Distributions: | | | | | | | | | | | | | | | | | | | | | | | | |
| Distributions from net investment income | | (0.09 | ) | | – | | | (0.09 | ) | | – | | | (0.10 | ) | | – | | | (0.10 | ) | | – | |
| Distributions from capital gains | | (0.10 | ) | | – | | | (0.20 | ) | | – | | | (0.26 | ) | | – | | | (0.21 | ) | | – | |
Total from investment operations | | (0.19 | ) | | – | | | (0.29 | ) | | – | | | (0.36 | ) | | – | | | (0.31 | ) | | – | |
| Net increase (decrease) in net asset value | | 0.07 | | | – | | | (0.02 | ) | | (0.01 | ) | | (0.08 | ) | | (0.02 | ) | | (0.03 | ) | | (0.02 | ) |
| Net Asset Value at end of period | $ | 10.07 | | $ | 10.00 | | $ | 9.97 | | $ | 9.99 | | $ | 9.90 | | $ | 9.98 | | $ | 9.95 | | $ | 9.98 | |
| Total Return (%)4 | | 2.61 | | | 0.00 | 5 | | 2.76 | | | (0.10 | )5 | | 2.86 | | | (0.20 | )5 | | 2.87 | | | (0.20 | )5 |
| Ratios/Supplemental Data: | | | | | | | | | | | | | | | | | | | | | | | | |
| Net Assets at end of period (in 000’s) | $ | 53,619 | | $ | 61,964 | | $ | 79,007 | | $ | 82,852 | | $ | 50,029 | | $ | 58,903 | | $ | 20,482 | | $ | 21,266 | |
| Ratios of expenses to average net assets: | | | | | | | | | | | | | | | | | | | | | | | | |
| Before reimbursement of expenses by Adviser (%) | | 0.30 | | | 0.32 | 6 | | 0.30 | | | 0.32 | 6 | | 0.30 | | | 0.32 | 6 | | 0.30 | | | 0.32 | 6 |
| After reimbursement of expenses by Adviser (%) | | 0.30 | | | 0.32 | 6 | | 0.30 | | | 0.32 | 6 | | 0.30 | | | 0.32 | 6 | | 0.30 | | | 0.32 | 6 |
| Ratio of net investment income to average net assets | | | | | | | | | | | | | | | | | | | | | | | | |
| After reimbursement of expenses by Adviser (%) | | 1.46 | | | 1.82 | 6 | | 1.49 | | | 1.87 | 6 | | 1.50 | | | 1.84 | 6 | | 1.51 | | | 1.72 | 6 |
| Portfolio turnover (%)9 | | 207 | | | 48 | 5 | | 156 | | | 44 | 5 | | 160 | | | 46 | 5 | | 204 | | | 52 | 5 |
| |
| * The Financial Statements presented herein include the historical operating results of the Hansberger International Series International Growth Fund through July 31, 2014. See Note 1 for a discussion of the Fund’s reorganization. |
| 1 Effective at the close of business on July 31, 2014, the fiscal year end of the fund changed to October 31. Disclosure represents 10 months of information. |
| 2 Net investment income calculated excluding permanent tax adjustments to undistributed net investment income. |
| 3 Per share net investment income has been calculated using the average shares outstanding during the period. |
| 4 Total return without applicable sales charge. |
| 5 Not annualized. |
| 6 Annualized. |
| 7 Includes interest expense of 0.02%. Without this expense the ratio of net expenses would have been 0.92%. |
| 8 Includes interest expense of 0.01%. Without this expense the ratio of net expenses would have been 0.88%. |
| 9 Portfolio turnover is calculated at the fund level and represents the entire fiscal year or period. |
| 10 Includes interest expense of less than 0.01%. |
| 11 Commenced investment operations August 29, 2014. See Note 1. |
See accompanying Notes to Financial Statements.
68
Madison Funds | October 31, 2015
Notes to the Financial Statements
1. ORGANIZATION
Madison Funds, a Delaware business trust (the “Trust”), is registered under the Investment Company Act of 1940, as amended (the “1940 Act”), as a diversified, open-end, management investment company. As of the date of this report, the Trust offers twenty-five funds (individually, a “Fund,” collectively, the “Funds”). The Government Bond Fund liquidated as of October 15, 2015.
The Declaration of Trust permits the Trustees to issue an unlimited number of shares of beneficial interest of the Trust without par value. The Trust has entered into an Investment Advisory Agreement with Madison Asset Management, LLC (the “Investment Adviser” or “Madison”). The Investment Adviser, in turn, has entered into subadvisory agreements with certain subadvisers (“Subadvisers”) for the management of the investments of the High Income Fund, Small Cap Fund, NorthRoad International Fund, International Stock Fund and Hansberger International Growth Fund.
After approval at a special meeting of shareholders of the Hansberger International Growth Fund (the “Hansberger Fund”) which was held on July 21, 2014, Madison assumed the investment management of the Hansberger Fund and reorganized it into the Madison Funds® after market close July 31, 2014. In a one-to-one exchange, existing Advisor Class shareholders of the Hansberger Fund became shareholders of Madison Hansberger International Growth Fund (“Acquiring Fund”) Class Y shares, and existing Hansberger Fund Institutional Class shareholders became shareholders of the Acquiring Fund Class I shares. While the Acquiring Fund was the legal survivor of the transaction, the predecessor Hansberger Fund was the accounting survivor of the transaction and therefore the historical performance of the predecessor Hansberger Fund was retained by the Acquiring Fund.
On August 29, 2014, Madison launched four new series of the Trust, the Madison Target Retirement 2020, 2030, 2040 and 2050 Funds, respectively (collectively, the “Target Date Funds”). In exchange for Class R6 shares of each new series of the Trust, substantially all portfolio holdings were received in-kind from the Ultra Series Madison Target Retirement 2020, 2030, 2040 and 2050 Funds. Both the Ultra Series Target Date Funds and the Madison Target Date Funds are managed by Madison under the same portfolio management team.
The accompanying financial statements include the Cash Reserves, Tax-Free Virginia, Tax-Free National, High Quality Bond, Core Bond, Corporate Bond, High Income, Diversified Income, Covered Call & Equity Income, Dividend Income, Large Cap Value, Investors, Large Cap Growth, Mid Cap, Small Cap, NorthRoad International, International Stock and Hansberger International Growth Funds (collectively, the “Core Funds”), the Conservative Allocation, Moderate Allocation, and Aggressive Allocation Funds (collectively, the “Allocation Funds”) and the Madison Target Retirement 2020 Fund, Madison Target Retirement 2030 Fund, Madison Target Retirement 2040 Fund, and Madison Target Retirement 2050 Fund. The Tax-Free Virginia Fund invests solely in securities exempt from both federal and Virginia state income taxes, while the Tax-Free National Fund invests in securities exempt from federal taxes ( together, the “Tax-Free Funds”).
The Cash Reserves Fund offers two classes of shares: Class A and B. The High Income, Large Cap Value, Large Cap Growth, Small Cap and International Stock Funds offer three classes of shares: Class A, B and Y. The Diversified Income Fund and Allocation Funds offer three classes of shares: Class A, B and C. The Investors Fund offers three classes of shares: Class A, Y and R6. The Core Bond Fund and Mid Cap Fund offer four classes of shares: Class A, B, Y and R6. The Covered Call & Equity Income Fund offers four classes of shares: Class A, C, Y and R6. The NorthRoad International Fund offers two classes of shares: Class Y and R6. The Tax-Free Virginia, Tax-Free National, High Quality Bond, Corporate Bond and Dividend Income offer one class of shares: Class Y. The Hansberger International Growth Fund offers two classes of shares: Class I and Y.
The Target Date Funds offer one class of shares, Class R6 shares. Each class of shares represents an interest in the assets of the respective Fund and has identical voting, dividend, liquidation and other rights, except that each class of shares bears its own distribution fees and servicing fees, if any, and its proportional share of Fund level expenses, is subject to its own sales charges, if any, and has exclusive voting rights on matters pertaining to Rule 12b-1 of the 1940 Act as it relates to that class and other class-specific matters.
2. SIGNIFICANT ACCOUNTING POLICIES
The preparation of financial statements requires management to make estimates and assumptions that affect the reported amounts of assets and liabilities and disclosure of contingent assets and liabilities at the date of the financial statements and the reported amounts of income and expenses during the reported period. Actual results could differ from those estimates.
The following is a summary of significant accounting policies consistently followed by each Fund in the preparation of its financial statements.
Portfolio Valuation. Equity securities, including American Depository Receipts (“ADRs”), Global Depositary Receipts (“GDRs”) and exchange-traded funds (“ETFs”) listed on any U.S. or foreign stock exchange or quoted on the National Association of Securities Dealers Automated Quotation System (“NASDAQ”) are valued at the last quoted sale price or official closing price on that exchange or NASDAQ on the valuation day (provided that, for securities traded on NASDAQ, the Funds utilize the NASDAQ Official Closing Price (“NOCP”). If no sale occurs, equities traded on a U.S. exchange, foreign exchange or on NASDAQ are valued at the bid price. Debt securities purchased (other than short-term obligations) with a remaining maturity of 61 days or more are valued on the basis of last available bid prices or current market quotations provided by dealers or pricing services approved by the Trust. In determining the value of a particular investment, pricing services may use certain information with respect to transactions in such investments, quotations from dealers, pricing matrixes, market transactions in comparable investments, various relationships observed in the market between investments and calculated yield measurements based on valuation technology commonly employed in the market for such investments.
Municipal debt securities are traded via a network of dealers and brokers that connects buyers and sellers. Liquidity in the tax-exempt market has been reduced as a result of overall economic conditions and credit tightening. There may be little trading in the secondary market for particular bonds and other debt securities, making them more difficult to value or sell. Asset-backed and mortgage-backed securities are valued by independent pricing services using models that consider estimated cash flows of each tranche of the security, establish a benchmark yield and develop an estimated tranche specific spread to the benchmark yield based on the unique attributes of the tranche.
Investments in shares of open-end mutual funds, including money market funds, are valued at their daily net asset value (“NAV”) which is calculated as of the close of regular trading on the New York Stock Exchange (the “NYSE”) usually 4:00 p.m. Eastern Standard Time) on each day on which the NYSE is open for business. NAV per share is determined by dividing each Fund’s total net assets by the number of shares of such Fund outstanding at the time of calculation. Because the assets of each Allocation and Target Date Fund consist primarily of shares of other registered investment companies (the “Underlying Funds”), the NAV of each Fund is determined based on the NAV’s of the Underlying Funds. Total net assets are determined by adding the total current value of portfolio securities, cash, receivables, and other assets and subtracting liabilities. Short-term instruments having maturities of 60 days or less and all securities in the Cash Reserves Fund are valued on an amortized cost basis, which approximates market value.
69
Madison Funds | Notes to the Financial Statements - continued | October 31, 2015
Over-the-counter securities not listed or traded on NASDAQ are valued at the last sale price on the valuation day. If no sale occurs on the valuation day, an over-the-counter security is valued at the last bid price. Exchange-traded options are valued at the mean of the best bid and ask prices across all option exchanges. Financial futures contracts generally are valued at the settlement price established by the exchange(s) on which the contracts are primarily traded. Spot and forward foreign currency exchange contracts are valued based on quotations supplied by dealers in such contracts. Overnight repurchase agreements are valued at cost, and term repurchase agreements (i.e., those whose maturity exceeds seven days), swaps, caps, collars and floors, if any, are valued at the average of the closing bids obtained daily from at least one dealer.
Through the end of this reporting period, the value of all assets and liabilities expressed in foreign currencies was converted into U.S. dollar values using the then-current exchange rate at the close of regular trading on the NYSE.
All other securities for which either quotations are not readily available, no other sales have occurred, or in the Investment Adviser’s opinion, do not reflect the current market value, are appraised at their fair values as determined in good faith by the Committee and under the general supervision of the Board of Trustees. When fair value pricing of securities is employed, the prices of securities used by the Funds to calculate NAV may differ from market quotations or NOCP. Because the Allocation and Target Date Funds primarily invest in Underlying Funds, government securities and short-term paper, it is not anticipated that the Investment Adviser will need to “fair value” any of the investments of these Funds. However, an Underlying Fund may need to “fair value” one or more of its investments, which may, in turn, require an Allocation or Target Date Fund to do the same because of delays in obtaining the Underlying Fund’s NAV.
A Fund’s investments (or Underlying Fund) will be valued at fair value if, in the judgment of the Committee, an event impacting the value of an investment occurred between the closing time of a security’s primary market or exchange (for example, a foreign exchange or market) and the time the Fund’s share price is calculated as of the close of regular trading on the NYSE. Significant events may include, but are not limited to, the following: (1) significant fluctuations in domestic markets, foreign markets or foreign currencies; (2) occurrences not directly tied to the securities markets such as natural disasters, armed conflicts or significant government actions; and (3) major announcements affecting a single issuer or an entire market or market sector. In responding to a significant event, the Committee would determine the fair value of affected securities considering factors including, but not limited to: fundamental analytical data relating to the investment; the nature and duration of any restrictions on the disposition of the investment; and the forces influencing the market(s) in which the investment is purchased or sold. The Committee may rely on an independent fair valuation service to adjust the valuations of foreign equity securities based on specific market-movement parameters established by the Committee and approved by the Trust.
Security Transactions and Investment Income. Security transactions are accounted for on a trade date basis. Net realized gains or losses on sales are determined by the identified cost method. Interest income is recorded on an accrual basis. Dividend income is recorded on ex-dividend date, except that certain dividends from foreign securities may be recorded after the ex-dividend date based on when the Fund is informed of the dividend. Interest income is recorded on an accrual basis and is increased by the accretion of discount and decreased by the amortization of premium, unless collection of the income is unlikely to occur. Amortization and accretion are recorded on the effective yield method.
Expenses. Expenses that are directly related to one Fund are charged directly to that Fund. Other operating expenses are prorated to the Funds on the basis of relative net assets. Class-specific expenses are borne by that class.
Classes. Income and realized and unrealized gains/losses are allocated to the respective classes on the basis of relative net assets.
Repurchase Agreements. Each Fund may engage in repurchase agreements. In a repurchase agreement, a security is purchased for a relatively short period (usually not more than seven days) subject to the obligation to sell it back to the issuer at a fixed time and price plus accrued interest. The Funds will enter into repurchase agreements only with members of the Federal Reserve System and with “primary dealers” in U.S. Government securities. As of October 31, 2015, none of the Funds held open repurchase agreements.
The Trust has established a procedure providing that the securities serving as collateral for each repurchase agreement must be delivered to the Funds’ custodian either physically or in book-entry form and that the collateral must be marked to market daily to ensure that each repurchase agreement is fully collateralized at all times. In the event of bankruptcy or other default by a seller of a repurchase agreement, a Fund could experience one of the following: delays in liquidating the underlying securities during the period in which the Fund seeks to enforce its rights thereto, possible decreased levels of income, declines in value of the underlying securities, or lack of access to income during this period and the expense of enforcing its rights.
Foreign Currency Transactions. The Trust’s books and records are maintained in U.S. dollars. Foreign currency-denominated transactions (i.e., market value of investment securities, assets and liabilities, purchases and sales of investment securities, and income and expenses) are translated into U.S. dollars at the current rate of exchange. The Funds enter into contracts on the trade date to settle any securities transactions denominated in foreign currencies on behalf of the Funds at the spot rate at settlement.
Each Fund, except the Cash Reserves Fund and the Tax-Free Funds, which can only invest in U.S. dollar-denominated foreign money market securities, reports certain foreign currency-related transactions as components of realized gains or losses for financial reporting purposes, whereas such components are treated as ordinary income for federal income tax purposes. Realized gains or losses associated with currency transactions are included in the Statements of Operations under the heading “Net realized gain (loss) on investments.” The NorthRoad International, Small Cap, International Stock and Hansberger International Growth Funds had net realized losses of $17,521, $846, $13,366 and $121,213, related to foreign currency transactions, respectively.
The Funds do not isolate the portion of gains and losses on investments in securities that is due to changes in the foreign exchange rates from that which is due to change in market prices of securities. Such amounts are categorized as gain or loss on investments for financial reporting purposes.
Forward Foreign Currency Exchange Contracts. Each Fund, except the Cash Reserves Fund and the Tax-Free Funds, may purchase and sell forward foreign currency exchange contracts for defensive or hedging purposes. When entering into forward foreign currency exchange contracts, the Funds agree to receive or deliver a fixed quantity of foreign currency for an agreed-upon price on an agreed future date. These contracts are valued daily. The Funds’ net assets reflect unrealized gains or losses on the contracts as measured by the difference between the forward foreign currency exchange rates at the dates of entry into the contracts and the forward rates at the reporting date. The Funds realize a gain or a loss at the time the forward foreign currency exchange contracts are settled or closed out with an offsetting contract. Contracts are traded over-the-counter directly with a counterparty. Realized and unrealized gains and losses are included in the Statements of Operations. As of October 31, 2015, none of the Funds had open forward foreign currency exchange contracts.
70
Madison Funds | Notes to the Financial Statements - continued | October 31, 2015
If a Fund enters into a forward foreign currency exchange contract to buy foreign currency for any purpose, the Fund will be required to place cash or other liquid assets in a segregated account with the Fund’s custodian in an amount equal to the value of the Fund’s total assets committed to the consummation of the forward contract. If the value of the securities in the segregated account declines, additional cash or securities will be placed in the segregated account so that the value of the account will equal the amount of the Fund’s commitment with respect to the contract.
Cash Concentration. At times, the Funds maintain cash balances at financial institutions in excess of federally insured limits. The Funds monitor this credit risk and have not experienced any losses related to this risk.
Illiquid Securities. Each Fund currently limits investments in illiquid securities to 15% of net assets at the time of purchase, except for Cash Reserves Fund, which limits the investment in illiquid securities to 5% of net assets. An illiquid security is generally defined as any investment that may be difficult to sell within seven days for the price at which the Fund values it. At October 31, 2015, investments in securities of the Core Bond, High Income and Diversified Income Funds included issues that are illiquid. As of that date, the aggregate values of illiquid securities held by the Core Bond, High Income and Diversified Income Funds were $1,013,933, $640,500 and $1,013,933, respectively, which represent 0.45%, 2.51% and 0.69% of net assets, respectively. Pursuant to guidelines adopted by the Board of Trustees, certain unregistered securities are determined to be liquid and are not included within the percent limitations specified above. Information concerning the illiquid securities held at October 31, 2015, which includes cost and acquisition date, is as follows:
| | | | | |
| Security | Acquisition Date | | Acquisition Cost |
| Core Bond Fund | | | | | |
| AARP, Inc. | 5/16/02 | | | $782,994 | |
| | | | | $782,994 | |
| High Income Fund | | | | | |
| Brand Energy & Infrastructure Services Inc. | 11/22/13 | | | $250,000 | |
| Casella Waste Systems Inc | 9/12/14 | | | 202,214 | |
| Exterran Partners L.P. / EXLP Finance Corp. | 3/31/14 | | | 246,531 | |
| | | | | $698,745 | |
| Diversified Income Fund | | | | | |
| AARP, Inc. | 5/16/02 | | | $782,994 | |
| | | | | $782,994 | |
Delayed Delivery Securities. Each Fund may purchase securities on a when-issued or delayed delivery basis. “When-issued” refers to securities whose terms are available and for which a market exists, but that have not been issued. For when-issued or delayed delivery transactions, no payment is made until delivery date, which is typically longer than the normal course of settlement. When a Fund enters into an agreement to purchase securities on a when-issued or delayed delivery basis, the Fund segregates cash or other liquid securities, of any type or maturity, equal in value to the Fund’s commitment. Losses may arise due to changes in the market value of the underlying securities, if the counterparty does not perform under the contract, or if the issuer does not issue the securities due to political, economic or other factors. As of October 31, 2015, none of the Funds had entered into such transactions.
Indemnifications. Under the Funds’ organizational documents, the Funds’ officers and Trustees are indemnified against certain liabilities arising out of the performance of their duties to the Funds. In the normal course of business, the Funds enter into contracts that contain a variety of representations and provide general indemnifications. The Funds’ maximum liability exposure under these arrangements is unknown, as future claims that have not yet occurred may be made against the Funds. However, based on experience, management expects the risk of loss to be remote.
Fair Value Measurements. Each Fund has adopted Financial Accounting Standards Board (the “FASB”) guidance on fair value measurements. Fair value is defined as the price that each fund would receive upon selling an investment in a timely transaction to an independent buyer in the principal or most advantageous market of the investment. A three-tier hierarchy is used to maximize the use of observable market data “inputs” and minimize the use of unobservable “inputs” and to establish classification of fair value measurements for disclosure purposes. Inputs refer broadly to the assumptions that market participants would use in pricing the asset or liability, including assumptions about risk (for example, the risk inherent in a particular valuation technique used to measure fair value including such a pricing model and/or the risk inherent in the inputs used in the valuation technique). Inputs may be observable or unobservable.
Observable inputs are inputs that reflect the assumptions market participants would use in pricing the asset or liability developed based on market data obtained from sources independent of the reporting entity. Unobservable inputs are inputs that reflect the reporting entity’s own assumptions about the assumptions market participants would use in pricing the asset or liability developed based on the best information available in the circumstances. The three-tier hierarchy of inputs is summarized in the three broad Levels listed below:
Level 1 - unadjusted quoted prices in active markets for identical investments
Level 2 - other significant observable inputs (including quoted prices for similar investments, interest rate volatilities, prepayment speeds, credit risk, benchmark yields, transactions, bids, offers, new issues, spreads, and other relationships observed in the markets among comparable securities, underlying equity of the issuer; and proprietary pricing models such as yield measures calculated using factors such as cash flows, financial or collateral performance, and other reference data, etc.)
Level 3 - significant unobservable inputs (including the Fund’s own assumptions in determining the fair value of investments)
The valuation techniques used by the Funds to measure fair value for the year ended October 31, 2015, maximized the use of observable inputs and minimized the use of unobservable inputs. The Funds utilized the following fair value techniques: multi-dimensional relational pricing model and option adjusted spread pricing; the Funds estimated the price that would have prevailed in a liquid market for an international equity security given information available at the time of valuation. As of October 31, 2015, none of the Funds held securities deemed as a Level 3, and there were no transfers between classification levels.
The following is a summary of the inputs used as of October 31, 2015, in valuing the Funds’ investments carried at fair value (please see the Portfolio of Investments for each Fund for a listing of all securities within each category):
| | | | | | |
| | | Quoted Prices In | Significant | | | |
| | | Active Markets | Other | Significant | | |
| | | for Identical | Observable | Unobservable | | |
| | | Investments | Inputs | Inputs | | Value at |
| Fund1 | | (Level 1) | (Level 2) | (Level 3) | | 10/31/15 |
| Conservative Allocation | | $ 75,739,893 | $ – | $ – | | $ 75,739,893 |
| Moderate Allocation | | 145,993,678 | – | – | | 145,993,678 |
| Aggressive Allocation | | 61,858,025 | – | – | | 61,858,025 |
| Cash Reserves2 | | 803,124 | 17,932,797 | – | | 18,735,921 |
| Tax-Free Virginia | | | | | | |
| Municipal Bonds | | – | 22,165,852 | – | | 22,165,852 |
| Tax-Free National | | | | | | |
| Municipal Bonds | | – | 27,184,613 | – | | 27,184,613 |
| High Quality Bond | | | | | | |
| Corporate Notes and Bonds | | – | 37,924,632 | – | | 37,924,632 |
| U.S. Government and Agency | | | | | | |
| Obligations | | – | 61,334,391 | – | | 61,334,391 |
| Short-Term Investments | | 2,326,519 | – | – | | 2,326,519 |
| | | 2,326,519 | 99,259,023 | – | | 101,585,542 |
71
Madison Funds | Notes to the Financial Statements - continued | October 31, 2015
| | | | | | | |
| | Quoted Prices In | | Significant | | | |
| | Active Markets | | Other | | Significant | | |
| | for Identical | | Observable | | Unobservable | | |
| | Investments | | Inputs | | Inputs | | Value at |
| Fund1 | (Level 1) | | (Level 2) | | (Level 3) | | 10/31/15 |
| Core Bond | | | | | | |
| Asset Backed Securities | $ – | $ | 9,035,594 | | $ – | $ | 9,035,594 |
| Collateralized Mortgage | | | | | | | |
| Obligations | – | | 2,419,856 | | – | | 2,419,856 |
| Commercial Mortgage-Backed | | | | | | | |
| Securities | – | | 4,406,085 | | – | | 4,406,085 |
| Corporate Notes and Bonds | – | | 71,680,435 | | – | | 71,680,435 |
| Long Term Municipal Bonds | – | | 21,161,790 | | – | | 21,161,790 |
| Mortgage Backed Securities | – | | 46,208,097 | | – | | 46,208,097 |
| Put Options Purchased | 28,515 | | – | | – | | 28,515 |
| U.S. Government and Agency | | | | | | | |
| Obligations | – | | 59,571,839 | | – | | 59,571,839 |
| Short-Term Investments | 6,554,356 | | – | | – | | 6,554,356 |
| | 6,582,871 | | 214,483,696 | | – | | 221,066,567 |
| Liabilities: | | | | | | | |
| Options Written | 20,313 | | – | | – | | 20,313 |
| |
| Corporate Bond | | | | | | | |
| Corporate Notes and Bonds | – | | 21,043,365 | | – | | 21,043,365 |
| Long Term Municipal Bonds | – | | 1,784,602 | | – | | 1,784,602 |
| Short-Term Investments | 585,487 | | – | | – | | 585,487 |
| | 585,487 | | 22,827,967 | | – | | 23,413,454 |
| High Income | | | | | | | |
| Corporate Notes and Bonds | – | | 23,925,072 | | – | | 23,925,072 |
| Short-Term Investments | 981,190 | | – | | – | | 981,190 |
| | 981,190 | | 23,925,072 | | – | | 24,906,262 |
| Diversified Income | | | | | | |
| Common Stocks | 79,694,369 | | – | | – | | 79,694,369 |
| Asset Backed Securities | – | | 1,750,283 | | – | | 1,750,283 |
| Commercial Mortgage-Backed | | | | | | | |
| Securities | – | | 971,332 | | – | | 971,332 |
| Corporate Notes and Bonds | – | | 22,990,270 | | – | | 22,990,270 |
| Long Term Municipal Bonds | – | | 2,393,261 | | – | | 2,393,261 |
| Mortgage Backed Securities | – | | 13,282,399 | | – | | 13,282,399 |
| U.S. Government and Agency | | | | | | | |
| Obligations | – | | 20,294,794 | | – | | 20,294,794 |
| Short-Term Investments | 5,091,894 | | – | | – | | 5,091,894 |
| | 84,786,263 | | 61,682,339 | | – | | 146,468,602 |
| Covered Call & Equity Income | | | | | | | |
| Assets: | | | | | – | | |
| Common Stocks | 68,443,868 | | – | | – | | 68,443,868 |
| Exchange Traded Funds | 8,298,548 | | – | | – | | 8,298,548 |
| Put Options Purchased | 208,975 | | – | | – | | 208,975 |
| U.S. Government and Agency | | | | | | |
| Obligations | – | | 5,998,512 | | – | | 5,998,512 |
| Short-Term Investments | 9,112,595 | | – | | – | | 9,112,595 |
| | 86,063,986 | | 5,998,512 | | – | | 92,062,498 |
| Liabilities: | | | | | | | |
| Options Written | 3,213,647 | | – | | – | | 3,213,647 |
| |
| Dividend Income | | | | | | | |
| Common Stocks | 20,366,941 | | – | | – | | 20,366,941 |
| Short-Term Investments | 540,277 | | – | | – | | 540,277 |
| | 20,907,218 | | – | | – | | 20,907,218 |
| Large Cap Value | | | | | | | |
| Common Stocks | 159,028,315 | | – | | – | | 159,028,315 |
| Short-Term Investments | 18,244,271 | | – | | – | | 18,244,271 |
| | 177,272,586 | | – | | – | | 177,272,586 |
| Investors | | | | | | |
| Common Stocks | 110,374,878 | | – | | – | | 110,374,878 |
| Short-Term Investments | 8,136,685 | | – | | – | | 8,136,685 |
| | 118,511,563 | | – | | – | | 118,511,563 |
| | | | | | | | |
| Large Cap Growth | | | | | | |
| Common Stocks | | 166,372,276 | | – | | – | | 166,372,276 |
| Short-Term Investments | | 6,775,655 | | – | | – | | 6,775,655 |
| | | 173,147,931 | | – | | – | | 173,147,931 |
| Mid Cap | | | | | | |
| Common Stocks | | 247,269,059 | | – | | – | | 247,269,059 |
| Short-Term Investments | | 18,829,399 | | – | | – | | 18,829,399 |
| | | 266,098,458 | | – | | – | | 266,098,458 |
| Small Cap | | | | | | |
| Common Stocks | | 81,423,499 | | 3,079,899 | | – | | 84,503,398 |
| Short-Term Investments | | 2,153,223 | | – | | – | | 2,153,223 |
| | | 83,576,722 | | 3,079,899 | | – | | 86,656,621 |
| NorthRoad International | | | | | | |
| Common Stocks | | | | | | |
| Australia | | 800,214 | | – | | – | | 800,214 |
| Brazil | | – | | 774,977 | | – | | 774,977 |
| Denmark | | – | | 1,971,264 | | – | | 1,971,264 |
| France | | 4,551,427 | | 2,704,300 | | – | | 7,255,727 |
| Germany | | 1,336,417 | | – | | – | | 1,336,417 |
| Ireland | | 938,886 | | – | | – | | 938,886 |
| Israel | | 834,520 | | – | | – | | 834,520 |
| Japan | | 2,343,154 | | 1,834,097 | | – | | 4,177,251 |
| Netherlands | | 1,889,207 | | 1,091,015 | | – | | 2,980,222 |
| Singapore | | – | | 759,447 | | – | | 759,447 |
| South Korea | | – | | 1,031,390 | | – | | 1,031,390 |
| Sweden | | 1,134,447 | | – | | – | | 1,134,447 |
| Switzerland | | 7,215,607 | | – | | – | | 7,215,607 |
| United Kingdom | | 6,370,383 | | 5,487,132 | | – | | 11,857,515 |
| Preferred Stocks | | – | | 8,652 | | – | | 8,652 |
| Short-Term Investments | | 1,232,870 | | – | | – | | 1,232,870 |
| | | 28,647,132 | | 15,662,274 | | – | | 44,309,406 |
| International Stock | | | | | | |
| Common Stocks | | | | | | |
| Australia | | – | | 820,226 | | – | | 820,226 |
| Austria | | – | | 260,051 | | – | | 260,051 |
| Belgium | | – | | 1,526,545 | | – | | 1,526,545 |
| Brazil | | – | | 282,792 | | – | | 282,792 |
| Canada | | – | | 1,105,336 | | – | | 1,105,336 |
| Denmark | | – | | 381,834 | | – | | 381,834 |
| Finland | | – | | 738,339 | | – | | 738,339 |
| France | | – | | 3,449,215 | | – | | 3,449,215 |
| Germany | | – | | 1,085,460 | | – | | 1,085,460 |
| Ireland | | 341,534 | | 1,260,965 | | – | | 1,602,499 |
| Israel | | 814,158 | | – | | – | | 814,158 |
| Italy | | – | | 798,245 | | – | | 798,245 |
| Japan | | – | | 7,270,966 | | – | | 7,270,966 |
| Luxembourg | | – | | 285,066 | | – | | 285,066 |
| Netherlands | | – | | 1,095,295 | | – | | 1,095,295 |
| Norway | | – | | 526,004 | | – | | 526,004 |
| Philippines | | – | | 337,297 | | – | | 337,297 |
| Spain | | – | | 402,549 | | – | | 402,549 |
| Sweden | | – | | 1,495,834 | | – | | 1,495,834 |
| Switzerland | | – | | 2,735,403 | | – | | 2,735,403 |
| Taiwan | | 625,860 | | – | | – | | 625,860 |
| Thailand | | – | | 215,147 | | – | | 215,147 |
| Turkey | | – | | 366,314 | | – | | 366,314 |
| United Kingdom | | 545,397 | | 7,673,722 | | – | | 8,219,119 |
| Short-Term Investments | | 1,543,236 | | – | | – | | 1,543,236 |
| | | 3,870,185 | | 34,112,605 | | – | | 37,982,790 |
72
Madison Funds | Notes to the Financial Statements - continued | October 31, 2015
| | | | | | | |
| | Quoted Prices In | | Significant | | | | |
| | Active Markets | | Other | | Significant | | |
| | for Identical | | Observable | | Unobservable | | |
| | Investments | | Inputs | | Inputs | | Value at |
| Fund1 | (Level 1) | | (Level 2) | | (Level 3) | | 10/31/15 |
| Hansberger International | | | | | | |
| Growth | | | | | | |
| Common Stocks | | | | | | |
| Canada | $ – | | $ 1,905,819 | | $ – | | $ 1,905,819 |
| China | 922,130 | | 3,931,113 | | – | | 4,853,243 |
| Denmark | – | | 499,277 | | – | | 499,277 |
| France | – | | 2,499,290 | | – | | 2,499,290 |
| Germany | – | | 2,404,947 | | – | | 2,404,947 |
| Hong Kong | – | | 943,764 | | – | | 943,764 |
| India | 1,460,058 | | 425,123 | | – | | 1,885,181 |
| Indonesia | – | | 451,507 | | | | 451,507 |
| Ireland | – | | 775,226 | | – | | 775,226 |
| Japan | – | | 6,944,873 | | – | | 6,944,873 |
| Mexico | – | | 1,077,407 | | – | | 1,077,407 |
| Netherlands | 1,396,079 | | – | | – | | 1,396,079 |
| Norway | – | | 340,154 | | – | | 340,154 |
| Singapore | – | | 669,749 | | – | | 669,749 |
| South Korea | – | | 1,420,094 | | – | | 1,420,094 |
| Spain | – | | 385,316 | | – | | 385,316 |
| Sweden | – | | 622,909 | | – | | 622,909 |
| Switzerland | – | | 3,475,653 | | – | | 3,475,653 |
| United Kingdom | – | | 4,878,044 | | – | | 4,878,044 |
| Short-Term Investments | 388,902 | | – | | – | | 388,902 |
| | 4,167,169 | | 33,650,265 | | – | | 37,817,434 |
| Target Retirement 2020 | 53,646,731 | | – | | – | | 53,646,731 |
| Target Retirement 2030 | 79,098,438 | | – | | – | | 79,098,438 |
| Target Retirement 2040 | 50,216,460 | | – | | – | | 50,216,460 |
| Target Retirement 2050 | 20,809,983 | | – | | – | | 20,809,983 |
1See respective portfolio of investments for underlying holdings in each Fund. For additional information on the underlying funds held in the Allocation and Target Date Funds, including shareholder prospectuses and financial reports, please visit each underlying fund’s website or visit the Securities and Exchange Commission’s website at http://www.sec.gov.
2At October 31, 2015, all Level 2 securities held are U.S. Government and Agency Obligations. See respective Portfolio of Investments.
Derivatives: The FASB issued guidance intended to enhance financial statement disclosure for derivative instruments and hedging activities and enable investors to understand: a) how and why a Fund uses derivative investments, b) how derivative instruments and related hedge fund items are accounted for, and c) how derivative instruments and related hedge fund items affect a Fund’s financial position, results of operations and cash flows.
The following table presents the types of derivatives in the Core Bond and Covered Call & Equity Income Fund by location as presented on the Statement of Assets and Liabilities as of October 31, 2015.
| | | | | |
| Statement of Asset & Liability Presentation of Fair Values of Derivative Instruments |
| | | Asset Derivatives | Liability Derivatives |
| | Derivatives | Statement of | | Statement of | |
| | accounted | Assets and | | Assets and | |
| | for as hedging | Liabilities | | Liabilities | |
| Fund | instruments | Location | Fair Value | Location | Fair Value |
| Core Bond | Equity contracts | Options purchased | $ 28,515 | Options written | $ 20,313 |
| | Interest rate | | | | |
| | contracts, | Variation margin | | | |
| | Futures | receivable | 615 | | |
| Covered Call & | | | | | |
| Equity Income | Equity contracts | Options purchased | 208,975 | Options written | 3,213,647 |
The following table presents the effect of Derivative Instruments on the Statement of Operations for the year ended October 31, 2015:
| | | | | | | |
| | Derivatives not accounted | | Realized Gain | | Change in Unrealized |
| Fund | for as hedging Instruments | | on Derivatives: | | Depreciation on Derivatives |
| Core Bond | Equity contracts | | $ 148,353 | | | $ (11,088 | ) |
| | Interest rate contracts, Futures | | (332 | ) | | 610 | |
| Covered Call & | | | | | | | |
| Equity Income | Equity contracts | | 3,475,627 | | | (1,930,590 | ) |
Management has determined that there is no impact on the financial statements of the other Funds held in the Trust as they currently do not hold derivative financial instruments.
3. ADVISORY, ADMINISTRATION AND DISTRIBUTION AGREEMENTS
Advisory Agreement. For its investment advisory services to the Funds, the Investment Adviser is entitled to receive a fee, which is computed daily and paid monthly, at an annualized percentage rate of the average daily value of the net assets of each Fund as follows as of October 31, 2015:
| | |
| Fund | Advisory Fee |
| Conservative Allocation | 0.20 | % |
| Moderate Allocation | 0.20 | % |
| Aggressive Allocation | 0.20 | % |
| Cash Reserves | 0.40 | % |
| Tax-Free Virginia | 0.50 | % |
| Tax-Free National | 0.50 | % |
| High Quality Bond | 0.30 | % |
| Core Bond | 0.50 | % |
| Corporate Bond | 0.40 | % |
| High Income | 0.55 | % |
| Diversified Income | 0.65 | % |
| Covered Call & Equity Income | 0.85 | % |
| Dividend Income | 0.75 | % |
| Large Cap Value | 0.55 | % |
| Investors | 0.75 | % |
| Large Cap Growth | 0.75 | % |
| Mid Cap | 0.75 | % |
| Small Cap | 1.00 | % |
| NorthRoad International | 0.80 | % |
| International Stock | 1.05 | % |
| Hansberger International Growth | 0.75 | % |
| Madison Target Retirement 2020 | 0.25 | % |
| Madison Target Retirement 2030 | 0.25 | % |
| Madison Target Retirement 2040 | 0.25 | % |
| Madison Target Retirement 2050 | 0.25 | % |
The Cash Reserves, Core Bond, High Income, Diversified Income, Large Cap Value, Large Cap Growth, Mid Cap, Small Cap and International Stock Funds’ advisory fee will be reduced by 0.05% on assets exceeding $500 million, and by another 0.05% on assets exceeding $1 billion. The Investors Fund advisory fee is 0.75% on the first $100 million of assets, and 0.60% on assets in excess of $100 million. The Investment Adviser is solely responsible for the payment of all fees to the Subadvisers. The Subadvisers for the Funds at October 31, 2015, are Shenkman Capital Management, Inc. for the High Income Fund, Wellington Management Company, LLP for the Small Cap Fund, NorthRoad Capital Management, LLC for the NorthRoad International Fund, Lazard Asset Management LLC for the International Stock Fund and Hansberger Growth Investors, LP for the Hansberger International Growth Fund.
The Investment Adviser may, from time to time, contractually or voluntarily agree to waive a portion of its fees or expenses related to the Funds. In that regard, the Investment Adviser has contractually agreed to waive a portion of advisory fees on the Cash Reserves Fund Class A Shares and Class B Shares until February 28, 2016, for the purpose of maintaining a one-day yield of zero. The amount of the daily waiver was equal to the amount required to maintain a minimum daily distribution rate of zero. For the year ended October 31, 2015, the waivers totaled $80,445 for Class A Shares and $986 for Class B Shares and are reflected as fees waived in the accompanying Statement of Operations. A portion of the Dividend Income Fund’s advisory fee, 0.10%, is being waived by the Investment Adviser until February 28, 2016. For the year ended October 31, 2015, the waiver totaled $21,173 for Divided Income and is reflected as fees waived in the accompanying Statement of Operations. The Investment Adviser does not have the right to recoup these waived fees.
73
Madison Funds | Notes to the Financial Statements - continued | October 31, 2015
Administrative Services Agreement. The Investment Adviser provides or arranges for each Fund to have all of the necessary operational and support services it needs for a fee. These fees are computed daily and paid monthly, at an annualized percentage rate of the average daily value of the net assets of each Fund as follows:
| | | | | | | | | | |
| Fund | Class A | Class B | Class C | Class Y | Class R6 | Class I |
| Conservative Allocation | 0.25% | | 0.25% | | 0.25% | N/A | | N/A | | N/A |
| Moderate Allocation | 0.25% | | 0.25% | | 0.25% | N/A | | N/A | | N/A |
| Aggressive Allocation | 0.25% | | 0.25% | | 0.25% | N/A | | N/A | | N/A |
| Cash Reserves | 0.15% | | 0.15% | | N/A | N/A | | N/A | | N/A |
| Tax-Free Virginia | N/A | | N/A | | N/A | 0.35% | | N/A | | N/A |
| Tax-Free National | N/A | | N/A | | N/A | 0.35% | | N/A | | N/A |
| High Quality Bond | N/A | | N/A | | N/A | 0.19% | | N/A | | N/A |
| Core Bond | 0.15% | | 0.15% | | N/A | 0.15% | | 0.02% | | N/A |
| Corporate Bond | N/A | | N/A | | N/A | 0.25% | | N/A | | N/A |
| High Income | 0.20% | | 0.20% | | N/A | 0.20% | | N/A | | N/A |
| Diversified Income | 0.20% | | 0.20% | | 0.20% | N/A | | N/A | | N/A |
| Covered Call & Equity Income | 0.15% | | N/A | | 0.15% | 0.15% | | 0.02% | | N/A |
| Dividend Income | N/A | | N/A | | N/A | 0.35% | | N/A | | N/A |
| Large Cap Value | 0.36% | | 0.36% | | N/A | 0.36% | | N/A | | N/A |
| Investors | 0.35% | | N/A | | N/A | 0.35% | | 0.02% | | N/A |
| Large Cap Growth | 0.20% | | 0.20% | | N/A | 0.20% | | N/A | | N/A |
| Mid Cap | 0.40% | | 0.40% | | N/A | 0.40% | | 0.02% | | N/A |
| Small Cap | 0.25% | | 0.25% | | N/A | 0.25% | | N/A | | N/A |
| NorthRoad International | N/A | | N/A | | N/A | 0.35% | | 0.02% | | N/A |
| International Stock | 0.30% | | 0.30% | | N/A | 0.30% | | N/A | | N/A |
| Hansberger International Growth | N/A | | N/A | | N/A | 0.40% | | N/A | | 0.25% |
| Target Retirement 2020 | N/A | | N/A | | N/A | N/A | | 0.05% | | N/A |
| Target Retirement 2030 | N/A | | N/A | | N/A | N/A | | 0.05% | | N/A |
| Target Retirement 2040 | N/A | | N/A | | N/A | N/A | | 0.05% | | N/A |
| Target Retirement 2050 | N/A | | N/A | | N/A | N/A | | 0.05% | | N/A |
The direct expenses of the Funds’ Independent Trustees and independent auditors are paid out of this fee on behalf of the Funds.
The Investment Adviser may from time to time contractually or voluntarily agree to waive a portion of its fees or expenses related to the Funds. In that regard, the Investment Adviser waived a portion of service agreement fees on the Cash Reserves Fund Class A Shares and Class B Shares until at least February 28, 2016, for the purpose of maintaining a one-day yield of zero. The amount of the daily waiver is equal to the amount required to maintain a minimum daily distribution rate of zero. A portion of the Dividend Income and Investors Funds’ annual service fee, 0.05% and up to 0.15%, respectively, is being waived by the Investment Adviser until February 28, 2016. The waived amounts for the Cash Reserves, Dividend Income and Investors Funds are reflected as fees waived in the accompanying Statement of Operations. For the year ended October 31, 2015, the waivers were as follows:
| | | | | | | | |
| Waived Fees or Expenses* |
| Fund | | Class A | | Class B | Class Y | | Total Waivers |
Cash Reserves | | $12,944 | | $351 | $ – | | $ 13,295 | |
| Dividend Income | | – | | – | 10,586 | | 10,586 | |
| Investors | | 2,365 | | – | 161,273 | | 163,638 | |
* The Investment Adviser does not have the right to recoup any of these waived fees.
Shareholder Servicing and Distribution (Rule 12b-1). Madison Funds has adopted, on behalf of certain funds and share classes, distribution and/or service plans pursuant to Rule 12b-1 under the Investment Company Act of 1940, as amended (the “1940 Act”). These plans permit the funds to pay for distribution of their shares and servicing of their shareholders out of fund assets; therefore, the cost of these plans is indirectly borne by all shareholders who own shares of the affected funds and share classes. These plans are described below.
Shareholder Servicing Fees (Class A, B and C shares). Service plans have been adopted pursuant to Rule 12b-1 under the 1940 Act for Class A, B and C shares of each of the funds, other than the Cash Reserves Fund. Under the terms of these plans, each fund pays MFD Distributor, LLC (“MFD”) a service fee equal to 0.25% of the average daily net assets attributable to each class of shares of that fund. The service fee is used by MFD to offset costs of servicing shareholder accounts or to compensate other qualified broker/dealers who sell shares of the funds pursuant to agreements with MFD for their costs of servicing shareholder accounts. MFD may retain any portion of the service fee for which there is no broker/dealer of record as partial consideration for its services with respect to shareholder accounts.
Distribution Fees (Class B and C shares only). Distribution plans have been adopted pursuant to Rule 12b-1 under 1940 Act for Class B and C shares of each of the funds. Under the terms of each plan, each fund pays its principal distributor, MFD, a fee equal to 0.75% of the average daily net assets attributable to Class B and C shares of that fund. MFD may use this fee to cover its distribution-related expenses (including commissions paid to broker/dealers for selling Class B and C shares) or distribution-related expenses of dealers. This fee increases the cost of investment in the Class B and C shares of a fund and, over time, may cost more than paying the initial sales charge for Class A shares.
The Shareholder Servicing & Distribution Fees are computed daily and paid monthly, at an annualized percentage rate of the average daily value of the net assets of each Fund as follows:
| | | | | | | | | | | | | | | | |
| | | | | | | | | | | | Total Shareholder Servicing |
| | | | | | | | | | | | and Distribution Fees |
| | Shareholder Servicing Fee | | Distribution Fee | (Rule 12b-1) |
| |
| Fund | Class A | Class B | Class C | Class B | Class C | Class A | Class B | Class C |
| Conservative Allocation | 0.25% | | 0.25% | | 0.25% | | 0.75% | | 0.75% | | 0.25% | | 1.00% | | 1.00% | |
Moderate Allocation | 0.25% | | 0.25% | | 0.25% | | 0.75% | | 0.75% | | 0.25% | | 1.00% | | 1.00% | |
| Aggressive Allocation | 0.25% | | 0.25% | | 0.25% | | 0.75% | | 0.75% | | 0.25% | | 1.00% | | 1.00% | |
| Cash Reserves | N/A | | N/A | | N/A | | 0.75% | | N/A | | N/A | | 0.75% | | N/A | |
| Tax-Free Virginia | N/A | | N/A | | N/A | | N/A | | N/A | | N/A | | N/A | | N/A | |
| Tax-Free National | N/A | | N/A | | N/A | | N/A | | N/A | | N/A | | N/A | | N/A | |
| High Quality Bond | N/A | | N/A | | N/A | | N/A | | N/A | | N/A | | N/A | | N/A | |
| Core Bond | 0.25% | | 0.25% | | N/A | | 0.75% | | N/A | | 0.25% | | 1.00% | | N/A | |
| Corporate Bond | N/A | | N/A | | N/A | | N/A | | N/A | | N/A | | N/A | | N/A | |
| High Income | 0.25% | | 0.25% | | N/A | | 0.75% | | N/A | | 0.25% | | 1.00% | | N/A | |
Diversified Income | 0.25% | | 0.25% | | 0.25% | | 0.75% | | 0.75% | | 0.25% | | 1.00% | | 1.00% | |
| Covered Call & | | | | | | | | | | | | | | | | |
| Equity Income | 0.25% | | N/A | | 0.25% | | N/A | | 0.75% | | 0.25% | | N/A | | 1.00% | |
| Dividend Income | N/A | | N/A | | N/A | | N/A | | N/A | | N/A | | N/A | | N/A | |
| Large Cap Value | 0.25% | | 0.25% | | N/A | | 0.75% | | N/A | | 0.25% | | 1.00% | | N/A | |
| Investors | 0.25% | | N/A | | N/A | | N/A | | N/A | | 0.25% | | N/A | | N/A | |
| Large Cap Growth | 0.25% | | 0.25% | | N/A | | 0.75% | | N/A | | 0.25% | | 1.00% | | N/A | |
| Mid Cap | 0.25% | | 0.25% | | N/A | | 0.75% | | N/A | | 0.25% | | 1.00% | | N/A | |
| Small Cap | 0.25% | | 0.25% | | N/A | | 0.75% | | N/A | | 0.25% | | 1.00% | | N/A | |
| NorthRoad International | N/A | | N/A | | N/A | | N/A | | N/A | | N/A | | N/A | | N/A | |
| International Stock | 0.25% | | 0.25% | | N/A | | 0.75% | | N/A | | 0.25% | | 1.00% | | N/A | |
| Hansberger International | | | | | | | | | | | | | | | | |
| Growth | N/A | | N/A | | N/A | | N/A | | N/A | | N/A | | N/A | | N/A | |
| Target Retirement 2020 | N/A | | N/A | | N/A | | N/A | | N/A | | N/A | | N/A | | N/A | |
| Target Retirement 2030 | N/A | | N/A | | N/A | | N/A | | N/A | | N/A | | N/A | | N/A | |
| Target Retirement 2040 | N/A | | N/A | | N/A | | N/A | | N/A | | N/A | | N/A | | N/A | |
| Target Retirement 2050 | N/A | | N/A | | N/A | | N/A | | N/A | | N/A | | N/A | | N/A | |
MFD may from time to time voluntarily agree to waive a portion of its fees or expenses related to the Funds. In that regard, MFD waived a portion of 12b-1 fees on the Cash Reserves Fund Class B Shares for the purpose of maintaining a one-day yield of zero. The amount of the daily waiver is equal to the amount required to maintain a minimum daily distribution rate of zero. For the year ended October 31, 2015, the waivers totaled $2,154 and are reflected as fees waived in the accompanying Statement of Operations. MFD does not have the right to recoup these waived fees.
Front-end sales charges and contingent deferred sales charges (“CDSC”) do not represent expenses of the Funds. Rather, they are deducted from the proceeds of sales of Fund shares prior to investment (Class A shares) or from redemption proceeds prior to remittance (Class A, B and C shares), as applicable. MFD, in turn,
74
Madison Funds | Notes to the Financial Statements - continued | October 31, 2015
uses a portion of these fees to pay financial advisors who sell Fund shares, as disclosed in the prospectus. The sales charges and CDSC collected and retained for the period November 1, 2014 through October 31, 2015, were as follows:
| | | | | | | | | | | | |
| | | Amount Collected | | Amount Retained |
| Fund | | Class A | | Class B | | Class C | | Class A | | Class B | | Class C |
| Conservative Allocation | $ | 192,924 | $ | 21,514 | $ | 3,076 | $ | 25,483 | $ | 21,514 | $ | 3,076 |
| Moderate Allocation | | 244,523 | | 36,356 | | 531 | | 30,253 | | 36,356 | | 531 |
| Aggressive Allocation | | 110,153 | | 9,011 | | 240 | | 12,321 | | 9,011 | | 240 |
| Cash Reserves | | – | | 3,748 | | – | | – | | 3,748 | | – |
| Core Bond | | 64,318 | | 3,940 | | – | | 9,327 | | 3,940 | | – |
| High Income | | 25,099 | | 4,110 | | – | | 3,479 | | 4,110 | | – |
| Diversified Income | | 422,136 | | 17,498 | | 2,829 | | 58,984 | | 17,498 | | 2,829 |
| Covered Call & | | | | | | | | | | | | |
| Equity Income | | 168,189 | | – | | 2,090 | | 22,849 | | – | | 2,090 |
| Large Cap Value | | 67,975 | | 4,157 | | – | | 8,754 | | 4,157 | | – |
| Investors | | 21,538 | | – | | – | | 3,082 | | – | | – |
| Large Cap Growth | | 51,015 | | 2,117 | | – | | 6,234 | | 2,117 | | – |
| Mid Cap | | 42,024 | | 3,448 | | – | | 4,919 | | 3,448 | | – |
| Small Cap | | 5,652 | | 474 | | – | | 427 | | 474 | | – |
| International Stock | | 34,311 | | 1,277 | | – | | 4,491 | | 1,277 | | – |
Other Expenses. In addition to the fees described above, the Trust is responsible for brokerage commissions and other expenses incurred in connection with the acquisition or disposition of investments, costs of borrowing money, overdrafts and any potential taxes owed and extraordinary expenses as approved by a majority of independent trustees.
Officers and Trustees. Certain officers and trustees of the Funds are also officers of the Investment Adviser. The Funds do not compensate their officers or affiliated trustees. Independent Trustees are compensated. Fees paid to the Trustees reduce the fees paid to the Investment Adviser pursuant to the Administrative Services Agreement as described above.
4. DIVIDENDS FROM NET INCOME AND DISTRIBUTIONS OF CAPITAL GAINS
With respect to dividends from net investment income, the Cash Reserves Fund declares dividends, if any, daily and reinvests monthly. The Tax-Free, Core Bond, Corporate Bond, High Income and Diversified Income Funds declare and reinvest dividends, if any, monthly. The Conservative Allocation, High Quality, Dividend Income and Covered Call & Equity Income Funds declare and reinvest dividends, if any, quarterly. The Moderate Allocation, Aggressive Allocation, Large Cap Value, Investors, Large Cap Growth, Mid Cap, Small Cap, NorthRoad International, International Stock, Hansberger International Growth and the Target Date Funds declare and reinvest dividends, if any, annually. The Funds distribute net realized gains from investment transactions, if any, to shareholders annually.
Income and capital gain distributions, if any, are determined in accordance with federal income tax regulations, which may differ from accounting principles generally accepted in the United States of America. Taxable distributions from income and realized capital gains in the Funds differ from book amounts earned during the period due to differences in the timing of capital gains recognition, and due to the reclassification of certain gains or losses from capital to income. Dividends from net investment income are determined on a class level. Capital gains are determined on a fund level.
5. SECURITIES TRANSACTIONS
For the year ended October 31, 2015, aggregate cost of purchases and proceeds from sales of securities, other than short-term investment, were as follows:
| | | | | | |
| | U.S. Government Securities | | Other Investment Securities |
| Fund | Purchases | Sales | | Purchases | | Sales |
| Conservative Allocation | $ – | $ – | $ | 64,178,267 | $ | 62,791,308 |
| Moderate Allocation | – | – | | 120,703,704 | | 123,494,266 |
| Aggressive Allocation | – | – | | 45,736,817 | | 43,862,038 |
Tax-Free Virginia | – | – | | 2,599,646 | | 2,753,251 |
| Tax-Free National | – | – | | 4,210,541 | | 4,861,767 |
| High Quality Bond | 21,992,684 | 28,397,449 | | 13,133,042 | | 16,434,195 |
| Core Bond | 37,710,306 | 56,017,113 | | 87,424,866 | | 68,591,488 |
| Corporate Bond | – | – | | 9,646,776 | | 12,577,970 |
| High Income | – | – | | 7,481,826 | | 10,825,720 |
| Diversified Income | 9,202,236 | 9,547,967 | | 27,988,548 | | 24,945,274 |
| Covered Call & Equity Income | – | – | | 94,929,988 | | 61,538,867 |
| Dividend Income | – | – | | 4,924,985 | | 5,436,251 |
| Large Cap Value | – | – | | 181,599,740 | | 219,454,159 |
| Investors | – | – | | 42,458,575 | | 96,949,654 |
| Large Cap Growth | – | – | | 86,745,179 | | 102,105,928 |
| Mid Cap | – | – | | 70,744,148 | | 106,125,536 |
| Small Cap | – | – | | 34,639,527 | | 14,460,955 |
| NorthRoad International | – | – | | 13,337,131 | | 12,427,335 |
| International Stock | – | – | | 21,177,137 | | 16,065,354 |
| Hansberger International Growth | – | – | | 39,400,113 | | 158,247,484 |
| Target Retirement 2020 | – | – | | 121,365,099 | | 130,022,164 |
| Target Retirement 2030 | – | – | | 126,549,237 | | 131,003,962 |
| Target Retirement 2040 | – | – | | 87,634,307 | | 96,772,064 |
| Target Retirement 2050 | – | – | | 42,906,005 | | 43,876,596 |
6. COVERED CALL AND PUT OPTIONS
An option on a security is a contract that gives the holder of the option, in return for a premium, the right to buy from (in the case of a call) or sell to (in the case of a put) the writer of the option the security underlying the option at a specified exercise or “strike” price. The writer of an option on a security has an obligation upon exercise of the option to deliver the underlying security upon payment of the exercise price (in the case of a call) or pay the exercise price upon delivery of the underlying security (in the case of a put).
The Covered Call & Equity Income Fund will pursue its primary objective by employing an option strategy of writing (selling) covered call options on common stocks. The number of call options the Fund can write (sell) is limited by the amount of equity securities the Fund holds in its portfolio. The Fund will not write (sell) “naked” or uncovered call options. The Fund seeks to produce a high level of current income and gains generated from option writing premiums and, to a lesser extent, from dividends. Covered call writing also helps to reduce volatility (and risk profile) of the Fund by providing protection from declining stock prices.
When an option is written, the premium received is recorded as an asset with an equal liability and is subsequently marked to market to reflect the current market value of the option written. These liabilities are reflected as options written in the Statement of Assets and Liabilities. Premiums received from writing options, which expire unexercised, are recorded on the expiration date as a realized gain. The difference between the premium received and the amount paid on effecting a closing purchase transaction, including brokerage commissions, is also treated as a realized gain, or if the premium is less than the amount paid for the closing purchase transactions, as a realized loss. If a call option is exercised, the premium is added to the proceeds from the sale of the underlying security in determining whether there has been a realized gain or loss.
Transactions in option contracts in the Core Bond Fund and Covered Call & Equity Income Fund during the year ended October 31, 2015 were as follows:
| | | | | |
| Core Bond Fund | Number of Contracts | | Premiums Received |
| Options outstanding, beginning of period | - | | | $ – | |
| Options written during the period | 240 | | | 185,530 | |
| Options closed during the period | (120 | ) | | (110,265 | ) |
| Options expired during the period | (70 | ) | | (66,040 | ) |
| Options outstanding, end of period | 50 | | | $ 9,225 | |
75
Madison Funds | Notes to the Financial Statements - continued | October 31, 2015
| | | | | |
| Covered Call & Equity Income Fund | Number of Contracts | | Premiums Received |
| Options outstanding, beginning of period | 5,643 | | | $ 1,197,123 | |
| Options written during the period | 36,913 | | | 7,959,701 | |
| Options closed during the period | (12,251 | ) | | (2,879,424 | ) |
| Options exercised during the period | (7,749 | ) | | (1,830,959 | ) |
| Options expired during the period | (12,900 | ) | | (2,529,756 | ) |
| Options outstanding, end of period | 9,656 | | | $ 1,916,685 | |
7. FUTURES CONTRACTS AND OPTIONS ON FUTURES CONTRACTS
Effective May 1, 2015, the Core Bond Fund may purchase and sell futures contracts and purchase and write options on futures contracts on a limited basis. The Fund may purchase and sell futures contracts based on various securities (such as U.S. Government securities), securities indices, foreign currencies and other financial instruments and indices. The Fund will engage in futures or related options transactions on a limited basis only for bona fide hedging purposes or for purposes of seeking to increase total returns to the extent permitted by regulations of the Commodity Futures Trading Commission.
Futures Contracts. The Core Bond Fund may use futures contracts to manage its exposure to the securities markets or to movements in interest rates and currency values. The primary risks associated with the use of futures contracts are the imperfect correlation between the change in market value of the securities held by the Fund and the prices of futures contracts and the possibility of an illiquid market. Futures contracts are valued based upon their quoted daily settlement prices. Upon entering into a futures contract, the Fund is required to deposit with its futures broker an amount of cash, U.S. Government and Agency Obligations, or other assets, in accordance with the initial margin requirements of the broker or exchange. Futures contracts are marked to market daily and based on such movements in the price of the contracts, an appropriate payable or receivable for the change in value may be posted or collected by the Fund (“variation margin”). Gains or losses are recognized but not considered realized until the contracts expire or close. Futures contracts involve, to varying degrees, risk of loss in excess of the variation margin disclosed within exchange traded or centrally cleared financial derivative instruments on the Statement of Assets and Liabilities.
Options on Futures Contracts. The acquisition of put and call options on futures contracts will give the fund the right (but not the obligation) for a specified price, to sell or to purchase, respectively, the underlying futures contract at any time during the option period. As the purchaser of an option on a futures contract, the Fund obtains the benefit of the futures position if prices move in a favorable direction but limits its risk of loss in the event of an unfavorable price movement to the loss of the premium and transaction costs.
The writing of a call option on a futures contract generates a premium which may partially offset a decline in the value of the Fund’s assets. By writing a call option, the Fund becomes obligated, in exchange for the premium, to sell a futures contract which may have a value higher than the exercise price. Conversely, the writing of a put option on a futures contract generates a premium, which may partially offset an increase in the price of securities that the Fund intends to purchase. However, the Fund becomes obligated to purchase a futures contract, which may have a value lower than the exercise price. Thus, the loss incurred by the Fund in writing options on futures is potentially unlimited and may exceed the amount of the premium received.
8. FOREIGN SECURITIES
Each Fund, other than the Tax-Free Funds, may invest in foreign securities; however, the Cash Reserves Fund is limited to U.S. dollar-denominated foreign money market securities. Foreign securities are defined as securities that are: (i) issued by companies organized outside the U.S. or whose principal operations are outside the U.S., or issued by foreign governments or their agencies or instrumentalities (“foreign issuers”); (ii) principally traded outside of the U.S.; and (iii) quoted or denominated in a foreign currency (“non-dollar securities”). Foreign securities include ADRs, European Depositary Receipts (“EDRs”), GDRs, Swedish Depositary Receipts (“SDRs”) and foreign money market securities.
Certain of the Funds have reclaim receivable balances, in which the Funds are due a reclaim on the taxes that have been paid to some foreign jurisdictions. The values of all reclaims are not significant for any of the Funds and are reflected in Other Assets on the Statement of Assets and Liabilities. These receivables are reviewed to ensure the current receivable balance is reflective of the amount deemed to be collectible.
9. SECURITIES LENDING
The Core Bond, High Income, Diversified Income, Large Cap Value, Large Cap Growth, Mid Cap and International Stock Funds have entered into a Securities Lending Agreement (the “Agreement”) with State Street Bank and Trust Company (“State Street”). Under the terms of the Agreement, the Funds may lend portfolio securities to qualified borrowers in order to earn additional income. The Agreement requires that loans are collateralized at all times by cash or other liquid assets at least equal to 102% of the value of securities, which is determined on a daily basis. Amounts earned as interest on investments of cash collateral, net of rebates and fees, if any, are included in the Statement of Operations. The primary risk associated with securities lending is if the borrower defaults on its obligation to return the securities loaned because of insolvency or other reasons, the Funds could experience delays and costs in recovering securities loaned or in gaining access to the collateral.
The Funds did not engage in any securities lending activity during the year ended October 31, 2015.
10. FEDERAL AND FOREIGN INCOME TAX INFORMATION
It is each Fund’s policy to comply with the requirements of Subchapter M of the Internal Revenue Code of 1986 applicable to regulated investment companies and to distribute all its taxable income to its shareholders and any net realized capital gains at least annually. Accordingly, no provisions for federal income taxes are recorded in the accompanying statements.
The Funds have not recorded any liabilities for material unrecognized tax benefits as of October 31, 2015. It is each Fund’s policy to recognize accrued interest and penalties related to uncertain tax benefits in income taxes, as appropriate. Tax years that remain open to examination by major tax jurisdictions include tax years ended 2012 through 2015. The prior years of 2012 and 2013 represent the legacy MEMBERS Mutual Funds and the legacy Madison Mosaic Funds. Effective as of the market close of April 19, 2013, the Mosaic Funds reorganized into the Madison Funds (formerly known as the MEMBERS Mutual Funds).
The tax character of distributions paid during the years ended October 31, 2014 and 2015 was as follows:
| | | | | | | | |
| | | Ordinary Income | | Capital Gain |
| Fund | | 2015 | | 2014 | | 2015 | | 2014 |
| Conservative Allocation | | $1,359,702 | | $ 691,854 | | $ 2,826,131 | | $ 284,823 |
| Moderate Allocation | | 1,877,315 | | 1,530,333 | | 7,986,977 | | – |
| Aggressive Allocation | | 869,616 | | 146,020 | | 4,556,655 | | – |
| Cash Reserves | | – | | – | | – | | – |
| High Quality Bond | | 1,074,047 | | 1,311,861 | | 118,544 | | 449,217 |
| Core Bond | | 5,345,069 | | 4,399,825 | | 1,673,616 | | 781,095 |
| Corporate Bond | | 698,396 | | 526,572 | | 20,295 | | – |
| High Income | | 1,772,903 | | 2,107,124 | | 1,376,166 | | 2,382,028 |
| Diversified Income | | 2,224,686 | | 2,041,769 | | 21,794 | | – |
| Covered Call & Equity Income | | 5,333,810 | | 3,710,169 | | 161,657 | | – |
| Dividend Income | | 355,808 | | 399,321 | | 1,219,689 | | 494,298 |
| Large Cap Value | | 1,753,926 | | 2,001,560 | | 27,390,440 | | – |
| Investors | | 6,779,021 | | 212,248 | | 25,518,364 | | 6,195,632 |
| Large Cap Growth | | 1,299,470 | | 199,657 | | 13,819,004 | | 5,786,120 |
| Mid Cap | | 6,182,447 | | – | | 42,647,564 | | 22,075,642 |
| Small Cap | | 342,916 | | 2,317 | | 3,717,251 | | 2,153,162 |
76
Madison Funds | Notes to the Financial Statements - continued | October 31, 2015
| | | | | | | | | | | |
| | | | | Ordinary Income | | | Capital Gain |
| Fund | | | | 2015 | | 2014 | | | 2015 | | 2014 |
| NorthRoad International | | | | $ 854,619 | | $1,192,782 | | | $ 1,725,761 | | $ 116,168 |
| International Stock | | | | 775,849 | | 542,237 | | | – | | – |
| Hansberger International Growth | | | | 2,496,632 | | – | | | – | | – |
| Target Retirement 2020 | | | | 745,004 | | – | | | 397,309 | | – |
| Target Retirement 2030 | | | | 939,469 | | – | | | 1,474,100 | | – |
| Target Retirement 2040 | | | | 687,796 | | – | | | 1,413,974 | | – |
| Target Retirement 2050 | | | | 240,391 | | – | | | 450,143 | | – |
| | | Tax Exempt Income | | Ordinary Income | | Capital Gain |
| Fund | | 2015 | | 2014 | | 2015 | 2014 | | 2015 | | 2014 |
| Tax-Free Virginia | | $ 557,020 | | $ 611,995 | | $ 10,501 | $ – | | $ 140,087 | | $ 375,715 |
| Tax-Free National | | 691,135 | | 744,624 | | – | – | | 217,904 | | 127,150 |
As of October 31, 2015, the components of distributable earnings on a tax basis were as follows:
| | | | | |
| Fund | | Ordinary Income | Tax Exempt Income | | Capital Gain |
| Conservative Allocation | | $ 56,082 | $ – | | $ 2,273,229 |
| Moderate Allocation | | 393,328 | – | | 7,797,267 |
| Aggressive Allocation | | 15,070 | – | | 4,817,813 |
| Cash Reserves | | – | – | | – |
| Tax-Free Virginia | | – | 4,967 | | 69,797 |
| Tax-Free National | | 1,906 | 10,394 | | 160,340 |
| High Quality Bond | | 152,659 | – | | 290,109 |
| Core Bond | | 405,978 | – | | 1,493,150 |
| Corporate Bond | | 15,143 | – | | 67,445 |
| High Income | | 12,981 | – | | – |
| Diversified Income | | – | – | | 3,337,683 |
| Covered Call & Equity Income | | 1,555,224 | – | | – |
| Dividend Income | | 8,506 | – | | 838,298 |
| Large Cap Value | | 860,234 | – | | 19,496,664 |
| Investors | | 1,910,650 | – | | 13,672,109 |
| Large Cap Growth | | 1,048,456 | – | | 30,432,888 |
| Mid Cap | | – | – | | 14,925,916 |
| Small Cap | | 112,311 | – | | 3,076,610 |
| NorthRoad International | | 691,531 | – | | 383,322 |
| International Stock | | 351,712 | – | | – |
| Hansberger International Growth | | 338,984 | – | | 276,193 |
| Target Retirement 2020 | | 963,641 | – | | 1,425,528 |
| Target Retirement 2030 | | 1,109,244 | – | | 2,378,711 |
| Target Retirement 2040 | | 802,243 | – | | 1,929,607 |
| Target Retirement 2050 | | 320,419 | – | | 507,872 |
For federal income tax purposes, the Funds listed below have capital loss carryovers as of October 31, 2015, which are available to offset future capital gains, if any, realized through the fiscal year listed:
| | | | | | | | | |
| | | | | | | | No Expiration Date |
| Fund | 2016 | | 2017 | | 2018 | | Short Term | | Long Term |
| Cash Reserves | $ – | | $ 16 | | $ 5 | | $ 1 | | $ – |
| High Income | – | | – | | – | | 82,006 | | 231,626 |
| Mid Cap | 1,244,692 | | – | | – | | – | | – |
| Small Cap | 675,894 | | – | | – | | – | | – |
| International Stock | – | | – | | – | | 710,871 | | – |
| Hansberger International | | | | | | | | | |
| Growth | – | | 7,836,710 | | – | | – | | – |
The capital loss carryovers for the Mid Cap Fund, Small Cap Fund, and Hansberger International are subject to certain limitations upon availability, to offset future gains, pursuant to Section 382 of the Internal Revenue Code.
The Madison Hansberger International Growth Fund experienced a greater than 50% change in ownership by one or more 5% shareholders on 12/1/2014. Pursuant to the capital loss usage limitations provided under Section 382 of the Internal Revenue Code, a significant portion of the capital loss carryforwards for the Fund coming in to fiscal year 2015 are now unavailable. The Fund wrote down $37,529,572 in unusable capital loss carryforwards, which is part of the Reclassification Adjustments discussed below.
Certain ordinary losses incurred after December 31 and within the taxable year are deemed to arise on the first day of the Funds’ next taxable year, if the Funds so elect.
For the year ended October 31, 2015, Mid Cap Fund elected to defer $2,336,832 in late-year ordinary losses.
For the year-ended October 31, 2015, capital losses utilized for each Fund were as follows:
| | |
| Fund | | Amount Utilized |
| Diversified Income | | $ 464,665 |
| Mid Cap | | 1,244,694 |
| Small Cap | | 675,894 |
| International Stock | | 396,023 |
| Hansberger International Growth | | 3,939,931 |
At October 31, 2015, the aggregate gross unrealized appreciation (depreciation) and net unrealized appreciation (depreciation) for all securities, excluding options, as computed on a federal income tax basis for each Fund were as follows:
| | | | | | | |
| Fund | | Appreciation | | Depreciation | | Net | |
| Conservative Allocation | | $ 1,585,492 | | $ 553,556 | | $ 1,031,936 | |
| Moderate Allocation | | 7,533,299 | | 986,961 | | 6,546,338 | |
| Aggressive Allocation | | 3,879,753 | | 422,711 | | 3,457,042 | |
| Cash Reserves | | – | | – | | – | |
| Tax-Free Virginia | | 821,648 | | 49,894 | | 771,754 | |
| Tax-Free National | | 1,356,430 | | 4,404 | | 1,352,026 | |
| High Quality Bond | | 1,054,271 | | 96,874 | | 957,397 | |
| Core Bond | | 5,270,569 | | 1,704,789 | | 3,565,780 | |
| Corporate Bond | | 462,559 | | 279,800 | | 182,759 | |
| High Income | | 458,356 | | 1,737,048 | | (1,278,692 | ) |
| Diversified Income | | 20,540,942 | | 1,449,619 | | 19,091,323 | |
| Covered Call & Equity Income | | 699,935 | | 6,326,448 | | (5,626,513 | ) |
| Dividend Income | | 4,057,339 | | 257,112 | | 3,800,227 | |
| Large Cap Value | | 19,659,590 | | 2,378,139 | | 17,281,451 | |
| Investors | | 21,467,615 | | 2,258,812 | | 19,208,803 | |
| Large Cap Growth | | 24,586,036 | | 1,989,530 | | 22,596,506 | |
| Mid Cap | | 82,850,890 | | 2,315,047 | | 80,535,843 | |
| Small Cap | | 12,919,768 | | 3,354,408 | | 9,565,360 | |
| NorthRoad International | | 3,302,913 | | 4,823,167 | | (1,520,254 | ) |
| International Stock | | 5,979,831 | | 1,651,311 | | 4,328,520 | |
| Hansberger International Growth | | 4,092,098 | | 1,203,725 | | 2,888,373 | |
| Target Retirement 2020 | | 3,619,313 | | 51,775 | | 3,567,538 | |
| Target Retirement 2030 | | 7,582,274 | | 47,942 | | 7,534,332 | |
| Target Retirement 2040 | | 6,195,480 | | 11,230 | | 6,184,250 | |
| Target Retirement 2050 | | 2,018,752 | | 8,850 | | 2,009,902 | |
The differences between cost amounts for book purposes and tax purposes are primarily due to the tax deferral of wash sales.
Reclassification Adjustments. Paid-in capital, undistributed net investment income, and accumulated net realized gain (loss) have been adjusted in the Statements of Assets and Liabilities for permanent book-tax differences for all Funds.
Differences relate to the tax treatment of net operating losses, paydown gains and losses, foreign currency gains and losses, distributions from real estate investment trusts, distribution re-designations from investments in other regulated investment companies, and unusable capital loss carryforwards.
To the extent these book and tax differences are permanent in nature, such amounts are reclassified at the end of the fiscal year among paid-in capital in excess of par value, undistributed net investment income (loss) and undistributed net realized gain (loss) on investments and foreign currency translations. Accordingly, at October 31, 2015, reclassifications were recorded as follows:
77
Madison Funds | Notes to the Financial Statements - continued | October 31, 2015
| | | | | | | | | |
| | | | | | Undistributed | | Accumulated |
| | | Paid-in | | Net Investment | | Net Realized |
| Fund | | Capital | | Income (Loss) | | Gain (Loss) |
| Conservative Allocation | | $ – | | | $ 196,699 | | | $ (196,699 | ) |
| Moderate Allocation | | – | | | 591,395 | | | (591,395 | ) |
| Aggressive Allocation | | – | | | 280,827 | | | (280,827 | ) |
| Cash Reserves | | – | | | – | | | – | |
| Tax-Free Virginia | | – | | | – | | | – | |
| Tax-Free National | | – | | | – | | | – | |
| High Quality Bond | | – | | | – | | | – | |
| Core Bond | | – | | | 498,351 | | | (498,351 | ) |
| Corporate Bond | | – | | | 1 | | | (1 | ) |
| High Income | | – | | | 19 | | | (19 | ) |
| Diversified Income | | – | | | 90,881 | | | (90,881 | ) |
| Covered Call & Equity Income | | – | | | 3,570,482 | | | (3,570,482 | ) |
| Dividend Income | | – | | | (8,135 | ) | | 8,135 | |
| Large Cap Value | | – | | | (427 | ) | | 427 | |
| Investors Fund | | – | | | – | | | – | |
| Large Cap Growth | | 1 | | | (52 | ) | | 51 | |
| Mid Cap | | (87,849 | ) | | (903,682 | ) | | 991,531 | |
| Small Cap | | – | | | (66,171 | ) | | 66,171 | |
| NorthRoad International | | – | | | (18,243 | ) | | 18,243 | |
| International Stock | | – | | | (14,995 | ) | | 14,995 | |
| Hansberger International Growth | | (37,529,572 | ) | | (123,053 | ) | | 37,652,625 | |
| Target Retirement 2020 | | – | | | 104,043 | | | (104,043 | ) |
| Target Retirement 2030 | | 1 | | | 110,593 | | | (110,594 | ) |
| Target Retirement 2040 | | – | | | 96,081 | | | (96,081 | ) |
| Target Retirement 2050 | | – | | | 41,304 | | | (41,304 | ) |
11. CONCENTRATION OF RISK
Investing in certain financial instruments, including forward foreign currency contracts, involves certain risks. Risks associated with these instruments include potential for an illiquid secondary market for the instruments or inability of counterparties to perform under the terms of the contracts, changes in the value of foreign currency relative to the U.S. dollar and financial statements’ volatility resulting from an imperfect correlation between the movements in the prices of the instruments and the prices of the underlying securities and interest rates being hedged. The International Stock Fund may enter into these contracts primarily to protect the Fund from adverse currency movements.
Investing in foreign securities involves certain risks not necessarily found in U.S. markets. These include risks associated with adverse changes in economic, political, regulatory and other conditions, changes in currency exchange rates, exchange control regulations, expropriation of assets or nationalization, imposition of withholding taxes on dividend or interest payments or capital gains, and possible difficulty in obtaining and enforcing judgments against foreign entities. Further, issuers of foreign securities are subject to different, and often less comprehensive, accounting, reporting and disclosure requirements than domestic issuers.
The Funds may be subject to interest rate policy risk, which are the risks associated with the Federal Reserve System’s program to stabilize the economy (the “quantitative easing program”) in the wake of the financial crisis that began in 2007. As a result of the quantitative easing program, the United States is experiencing historically low interest rate levels. A low interest rate environment can pose risks to a Fund, because low yields on the Fund’s portfolio holdings may have an adverse impact on the Fund’s ability to provide a positive yield to its shareholders and pay expenses out of Fund assets. However, continued economic recovery and the cessation of the quantitative easing program increase the risk that interest rates will rise in the near future and that the Funds will face a heightened level of interest rate risk. Federal Reserve policy changes may expose fixed-income and related markets to heightened volatility and may reduce liquidity for certain Fund investments, which could cause the value of a Fund’s investments and share price to decline. The Core Bond may invest in derivatives tied to fixed-income markets and may be more substantially exposed to these risks than a fund that does not invest in derivatives.
The Cash Reserves Fund is not insured or guaranteed by the Federal Deposit Insurance Corporation (“FDIC”) or any other government agency. Although the Fund seeks to preserve the value of your investment at $1.00 per share, it is possible to lose money by investing in the Fund. Additionally, while the Fund has maintained a constant share price since inception, and will continue to try to do so, neither the Investment Adviser nor its affiliates are required to make a capital infusion, enter into a capital support agreement or take other actions to prevent the Fund’s share price from falling below $1.00.
The Tax-Free Funds invest in municipal securities. Municipal securities generally are subject to possible default, bankruptcy or insolvency of the issuer. Principal and interest repayment may be affected by federal, state and local legislation, referendums, judicial decisions and executive acts. The tax-exempt status of municipal securities may be affected by future changes in the tax laws, litigation involving the tax status of the securities and errors and omissions by issuers and their counsel. Madison will not attempt to make an independent determination of the present or future tax-exempt status of municipal securities acquired for the Funds. While most municipal securities have a readily available market, a variety of factors, including the scarcity of issues and the fact that tax-free investments are inappropriate for significant numbers of investors, limit the depth of the market for these securities. Accordingly, it may be more difficult for the Funds to sell large blocks of municipal securities advantageously than would be the case with comparable taxable securities.
The High Income Fund invests in securities offering high current income which generally will include bonds in the below investment grade categories of recognized rating agencies (so-called “junk bonds”). These securities generally involve more credit risk than securities in the higher rating categories. In addition, the trading market for high yield securities may be relatively less liquid than the market for higher-rated securities. The Fund generally invests at least 80% of its net assets in high yield securities.
The Covered Call & Equity Income Fund invests in options on securities. As the writer of a covered call option, the Fund forgoes, during the option’s life, the opportunity to profit from increases in the market value of the security covering the call option above the sum of the premium and the strike price of the call but has retained the risk of loss should the price of the underlying security decline. A writer of a put option is exposed to the risk of loss if fair value of the underlying securities declines, but profits only to the extent of the premium received if the underlying security increases in value. The writer of an option has no control over the time when it may be required to fulfill its obligation as writer of the option. Once an option writer has received an exercise notice, it cannot effect a closing purchase transaction in order to terminate its obligation under the option and must deliver the underlying security at the exercise price.
The Core Bond Fund may invest in futures contracts or options on futures contracts. Investing in futures contracts and options on futures entail certain other risks: such as unanticipated changes in interest rates, securities prices or currency exchange rates, and may result in a poorer overall performance for the Fund than if it had not entered into any futures contracts or options transactions. In the event of an imperfect correlation between a futures position and portfolio position, which is intended to be protected, the desired protection may not be obtained and the Fund may be exposed to risk of loss. Perfect correlation between the fund’s futures positions and portfolio positions may be difficult to achieve.
The Allocation and Target Date Funds are fund of funds, meaning that each invests primarily in Underlying Funds, including ETFs. Thus, each Fund’s investment performance and its ability to achieve its investment goal are directly related to the performance of the Underlying Funds in which it invests; and the Underlying Fund’s performance, in turn, depends on the particular securities in which that Underlying Fund invests and the expenses of that Fund. Accordingly, the Allocation Funds are
78
Madison Funds | Notes to the Financial Statements - concluded | October 31, 2015
subject to the risks of the Underlying Funds in direct proportion to the allocation of their respective assets among the Underlying Funds.
Additionally, the Allocation and Target Date Funds are subject to asset allocation risk and manager risk. Manager risk (i.e., fund selection risk) is the risk that the Underlying Fund(s) selected to fulfill a particular asset class underperforms their peers. Asset allocation risk is the risk that the allocation of the Fund’s assets among the various asset classes and market segments will cause the Fund to underperform other funds with a similar investment objective.
The Funds are also subject to cybersecurity risk, which include the risks associated with computer systems, networks and devices to carry out routine business operations. These systems, networks and devices employ a variety of protections that are designed to prevent cyberattacks. Despite the various cyber protections utilized by the Funds, the Investment Adviser, and other service providers, their systems, networks, or devices could potentially be breached. The Funds, their shareholders and the Investment Adviser could be negatively impacted as a result of a cybersecurity breach. The Funds cannot control the cybersecurity plans and systems put in place by service providers or any other third parties whose operations may affect the Funds. The Funds do monitor this risk closely.
In addition to the other risks described above in the prospectus, you should understand what we refer to as “unknown market risks.” While investments in securities have been keystones in wealth building and management, at times these investments have produced surprises. Those who enjoyed growth and income of their investments generally were rewarded for the risks they took by investing in the markets. Although the Investment Adviser seeks to appropriately address and manage the risks identified and disclosed to you in connection with the management of the securities in the Funds, you should understand that the very nature of the securities markets includes the possibility that there may be additional risks of which we are not aware. We certainly seek to identify all applicable risks and then appropriately address them, take appropriate action to reasonably manage them and, of course, to make you aware of them so you can determine if they exceed your risk tolerance. Nevertheless, the often volatile nature of the securities markets and the global economy in which we work suggests that the risk of the unknown is something to consider in connection with an investment in securities. Unforeseen events could under certain circumstances produce a material loss of the value of some or all of the securities we manage for you in the Funds.
12. CAPITAL SHARES AND AFFILIATED OWNERSHIP
The Allocation Funds invest in Underlying Funds, certain of which may be deemed to be under common control because of the same or affiliated investment adviser and membership in a common family of investment companies (the “Affiliated Underlying Funds”). A summary of the transactions with each Affiliated Underlying Fund during the year ended October 31, 2015 follows:
| | | | | | | | | | | | |
| | Balance of | | | | Balance of | | | | Realized | | | |
| | Shares Held at | Gross | Gross | | Shares Held at | | Value at | | Gain | | | Distributions |
| Fund/Underlying Fund | 10/31/2014 | Additions | Sales | | 10/31/2015 | | 10/31/2015 | | (Loss) | | | Received1 |
| Conservative Allocation Fund | | | | | | | | | | | | |
| Madison Core Bond Fund Class Y | 1,447,996 | 192,607 | (66,594 | ) | 1,574,009 | | $ 15,850,270 | | $ (7,526 | ) | | $ 496,903 |
| Madison Corporate Bond Fund Class Y | 446,801 | — | — | | 446,801 | | 5,066,719 | | — | | | 138,803 |
| Madison High Quality Bond Fund Class Y | 167,473 | — | (167,473 | ) | — | | — | | 51,237 | | | — |
| Madison Investors Fund Class Y | 30,494 | 3,417 | (33,911 | ) | — | | — | | 17,535 | | | 72,103 |
| Madison Large Cap Growth Fund Class Y | 205,969 | 34,071 | (35,290 | ) | 204,750 | | 4,731,773 | | 67,815 | | | 368,518 |
| Madison Large Cap Value Fund Class Y | 254,379 | 58,505 | (77,319 | ) | 235,565 | | 3,851,484 | | 58,323 | | | 666,239 |
| Madison NorthRoad International Fund Class Y | 98,687 | 90,923 | (31,353 | ) | 158,257 | | 1,672,775 | | (47,738 | ) | | 54,122 |
| Totals | | | | | | | $ 31,173,021 | | $ 139,646 | | | $ 1,796,688 |
| |
| Moderate Allocation Fund | | | | | | | | | | | | |
| Madison Core Bond Fund Class Y | 2,036,565 | 149,352 | (88,533 | ) | 2,097,384 | | $ 21,120,655 | | $ (9,561 | ) | | $ 667,436 |
| Madison High Quality Bond Fund Class Y | 209,235 | — | (209,235 | ) | — | | — | | 50,539 | | | — |
| Madison Investors Fund Class Y | 183,738 | 28,059 | (211,797 | ) | — | | — | | 219,389 | | | 592,031 |
| Madison Large Cap Growth Fund Class Y | 708,200 | 124,592 | (92,660 | ) | 740,132 | | 17,104,447 | | 34,479 | | | 1,363,798 |
| Madison Large Cap Value Fund Class Y | 918,441 | 262,689 | (189,698 | ) | 991,432 | | 16,209,905 | | 19,312 | | | 2,476,465 |
| Madison Mid Cap Fund Class Y | 154,715 | — | (154,715 | ) | — | | — | | 648,527 | | | — |
| Madison NorthRoad International Fund Class Y | 334,586 | 186,963 | (90,798 | ) | 430,751 | | 4,553,033 | | (109,818 | ) | | 222,663 |
| Totals | | | | | | | $ 58,988,040 | | $ 852,867 | | | $ 5,322,393 |
| |
| Aggressive Allocation Fund | | | | | | | | | | | | |
| Madison Core Bond Fund Class Y | 409,381 | 114,970 | (24,752 | ) | 499,599 | | $ 5,030,963 | | $ (2,228 | ) | | $ 145,851 |
| Madison Investors Fund Class Y | 99,732 | 14,211 | (113,943 | ) | — | | — | | 204,047 | | | 299,856 |
| Madison Large Cap Growth Fund Class Y | 376,302 | 55,882 | (41,324 | ) | 390,860 | | 9,032,776 | | 94,087 | | | 694,624 |
| Madison Large Cap Value Fund Class Y | 464,517 | 123,598 | (57,993 | ) | 530,122 | | 8,667,492 | | 11,564 | | | 1,280,380 |
| Madison Mid Cap Fund Class Y | 126,198 | — | (126,198 | ) | — | | — | | 584,465 | | | — |
| Madison NorthRoad International Fund Class Y | 161,237 | 74,472 | (13,449 | ) | 222,260 | | 2,349,290 | | 1,454 | | | 107,302 |
| Totals | | | | | | | $ 25,080,521 | | $ 893,389 | | | $ 2,528,013 |
| |
| 1 Distributions received include distributions from net investment income and from capital gains from the underlying funds. |
13. SUBSEQUENT EVENTS
Management has evaluated the impact of all subsequent events on the Funds through the date the financial statements were available for issue. Effective December 31, 2015, Madison Asset Management, LLC will take over management of the High Income Fund. Aside from this change, no other events have taken place that meet the definition of subsequent event that require adjustment to, or disclosure in the financial statements.
79
Madison Funds | October 31, 2015
Report of Independent Registered Public Accounting Firm
To the Shareholders and Board of Trustees of Madison Funds:
We have audited the accompanying statements of assets and liabilities, including the portfolios of investments, of Madison Funds, comprising the Madison Conservative Allocation Fund, Madison Moderate Allocation Fund, Madison Aggressive Allocation Fund, Madison Cash Reserves Fund, Madison Tax-Free Virginia Fund, Madison Tax-Free National Fund, Madison High Quality Bond Fund, Madison Core Bond Fund, Madison Corporate Bond Fund, Madison High Income Fund, Madison Diversified Income Fund, Madison Covered Call & Equity Income Fund (formerly the Madison Equity Income Fund), Madison Dividend Income Fund, Madison Large Cap Value Fund, Madison Investors Fund, Madison Large Cap Growth Fund, Madison Mid Cap Fund, Madison Small Cap Fund, Madison NorthRoad International Fund, Madison International Stock Fund, Madison Hansberger International Growth Fund, Madison Target Retirement 2020 Fund, Madison Target Retirement 2030 Fund, Madison Target Retirement 2040 Fund, and Madison Target Retirement 2050 Fund (collectively, the “Funds”) as of October 31, 2015, the related statements of operations for the year then ended, the statements of changes in net assets of Madison Conservative Allocation Fund, Madison Moderate Allocation Fund, Madison Aggressive Allocation Fund, Madison Cash Reserves Fund, Madison Tax-Free Virginia Fund, Madison Tax-Free National Fund, Madison High Quality Bond Fund, Madison Core Bond Fund, Madison Corporate Bond Fund, Madison High Income Fund, Madison Diversified Income Fund, Madison Covered Call & Equity Income Fund (formerly the Madison Equity Income Fund), Madison Dividend Income Fund, Madison Large Cap Value Fund, Madison Investors Fund, Madison Large Cap Growth Fund, Madison Mid Cap Fund, Madison Small Cap Fund, Madison NorthRoad International Fund, Madison International Stock Fund, Madison Target Retirement 2020 Fund, Madison Target Retirement 2030 Fund, Madison Target Retirement 2040 Fund, and Madison Target Retirement 2050 Fund for all periods presented, the statements of changes in nets assets of Madison Hansberger International Growth Fund for the year ended October 31, 2015 and period ended October 31, 2014, the financial highlights of Madison Conservative Allocation Fund, Madison Moderate Allocation Fund, Madison Aggressive Allocation Fund, Madison Cash Reserves Fund, Madison Core Bond Fund, Madison High Income Fund, Madison Diversified Income Fund, Madison Covered Call & Equity Income Fund, Madison Large Cap Value Fund, Madison Large Cap Growth Fund, Madison Small Cap Fund, Madison International Stock Fund, Madison Target Retirement 2020 Fund, Madison Target Retirement 2030 Fund, Madison Target Retirement 2040 Fund, and Madison Target Retirement 2050 for each of the periods presented, the financial highlights of Madison Tax-Free Virginia Fund and Madison Tax-Free National Fund for the years ended October 31, 2015 and 2014, and each of the two periods in the period ended October 31, 2013, the financial highlights of Madison High Quality Bond Fund, Madison Corporate Bond Fund, Madison Dividend Income Fund, Madison Investors Fund, Madison Mid Cap Fund, and Madison NorthRoad International Fund for the years ended October 31, 2015 and 2014 and the period ended October 31, 2014, and the financial highlights of Madison Hansberger International Growth Fund for the year ended October 31, 2015 and the period ended October 31, 2014. Our responsibility is to express an opinion on these financial statements and financial highlights based on our audits. The financial highlights of Madison Tax-Free Virginia Fund and Madison Tax-Free National Fund for the periods ended prior to October 1, 2012 were audited by other auditors, whose report, dated November 14, 2012, expressed an unqualified opinion on those financial highlights. The financial highlights of Madison High Quality Bond Fund, Madison Corporate Bond Fund, Madison Dividend Income Fund, Madison Investors Fund, and Madison NorthRoad International Fund for the periods ended prior to January 1, 2013 were audited by other auditors, whose report, dated February 26, 2013, expressed an unqualified opinion on those financial highlights. The financial highlights of the Madison Mid Cap Fund for the periods ended prior to January 1, 2013, before the effects of adjustments to retrospectively adjust the financial highlights to give effect to the reorganization as discussed in footnote 7 to the financial highlights, were audited by other auditors, whose report, dated February 26, 2013 expressed an unqualified opinion on those financial highlights and the statement of changes in net assets. The financial highlights of Madison Hansberger International Growth Funds for the periods ended prior to January 1, 2014 were audited by other auditors, whose report, dated February 24, 2014, expressed an unqualified opinion on those financial highlights.
We conducted our audits in accordance with the standards of the Public Company Accounting Oversight Board (United States). Those standards require that we plan and perform the audit to obtain reasonable assurance about whether the financial statements and financial highlights are free of material misstatement. The Funds are not required to have, nor were we engaged to perform, an audit of their internal control over financial reporting. Our audits included consideration of internal control over financial reporting as a basis for designing audit procedures that are appropriate in the circumstances, but not for the purpose of expressing an opinion on the effectiveness of the Funds’ internal control over financial reporting. Accordingly, we express no such opinion. An audit also includes examining, on a test basis, evidence supporting the amounts and disclosures in the financial statements, assessing the accounting principles used and significant estimates made by management, as well as evaluating the overall financial statement presentation. Our procedures included confirmation of securities owned as of October 31, 2015, by correspondence with the custodian and brokers; where replies were not received from brokers, we performed other auditing procedures. We believe that our audits provide a reasonable basis for our opinion.
In our opinion, the financial statements and financial highlights referred to above present fairly, in all material respects, the financial position of each of the Funds as of October 31, 2015, the results of their operations for the year then ended, the statements of changes in net assets of Madison Conservative Allocation Fund, Madison Moderate Allocation Fund, Madison Aggressive Allocation Fund, Madison Cash Reserves Fund, Madison Tax-Free Virginia Fund, Madison Tax-Free National Fund, Madison High Quality Bond Fund, Madison Core Bond Fund, Madison Corporate Bond Fund, Madison High Income Fund, Madison Diversified Income Fund, Madison Covered Call & Equity Income Fund (formerly the Madison Equity Income Fund), Madison Dividend Income Fund, Madison Large Cap Value Fund, Madison Investors Fund, Madison Large Cap Growth Fund, Madison Mid Cap Fund, Madison Small Cap Fund, Madison NorthRoad International Fund, Madison International Stock Fund, Madison Target Retirement 2020 Fund, Madison Target Retirement 2030 Fund, Madison Target Retirement 2040 Fund, and Madison Target Retirement 2050 Fund for all periods presented, the statements of changes in nets assets of Madison Hansberger International Growth Fund for the year ended October 31, 2015 and period ended October 31, 2014, the financial highlights of Madison Conservative Allocation Fund, Madison Moderate Allocation Fund, Madison Aggressive Allocation Fund, Madison Cash Reserves Fund, Madison Core Bond Fund, Madison High Income Fund, Madison Diversified Income Fund, Madison Covered Call & Equity Income Fund, Madison Large Cap Value Fund, Madison Large Cap Growth Fund, Madison Small Cap Fund, Madison International Stock Fund, Madison Target Retirement 2020 Fund, Madison Target Retirement 2030 Fund, Madison Target Retirement 2040 Fund, and Madison Target Retirement 2050 for each of the periods presented, the financial highlights of Madison Tax-Free Virginia Fund and Madison Tax-Free National Fund for the years ended October 31, 2015 and 2014, and each of the two periods in the period ended October 31, 2013, the financial highlights of Madison High Quality Bond Fund, Madison Corporate Bond Fund, Madison Dividend Income Fund, Madison
80
Madison Funds | Report of Independent Registered Public Accounting Firm - concluded | October 31, 2015
Investors Fund, Madison Mid Cap Fund, and Madison NorthRoad International Fund for the years ended October 31, 2015 and 2014 and the period ended October 31, 2013, and the financial highlights of Madison Hansberger International Growth Fund for the year ended October 31, 2015 and the period ended October 31, 2014, in conformity with accounting principles generally accepted in the United States of America.
We have also audited the adjustments to the financial highlights of the Madison Mid Cap Fund for each of the periods ended prior to January 1, 2013, to retrospectively adjust the financial highlights to give effect to the reorganization as discussed in footnote 7 to the financial highlights. Our procedures included recalculating the conversion factor discussed in that footnote. In our opinion, such retrospective adjustments are appropriate and have been appropriately applied. However, we were not engaged to audit, review, or perform any procedures to the financial statements and financial highlights of the Madison Mid Cap Fund for periods prior to January 1, 2013 other than with respect to the retrospective adjustment described herein, and accordingly, we do not express an opinion or any other form of assurance on the financial statements and financial highlights of Madison Mid Cap Fund for periods prior to January 1, 2013.
/s/ Deloitte & Touche, LLP
Chicago, IL
December 18, 2015
81
Madison Funds | October 31, 2015
Other Information (unaudited)
DISCUSSION OF CONTRACT RENEWAL PROCESS AND CONSIDERATIONS
The Board of Trustees reviewed a variety of matters in connection with the Trust’s investment advisory contract with the Investment Adviser and the subadvisory contracts with the applicable Subadvisers at an in-person meeting of the Board held in July 2015. The following summarizes the Board’s process and considerations during that meeting.
With regard to the nature, extent and quality of the services to be provided by the Adviser and each sub-adviser, the Board reviewed the biographies and tenure of the personnel involved in Trust management and the experience of the Adviser (and applicable sub-adviser) and its affiliates as investment manager to other investment companies with similar investment strategies or to individual clients or institutions with similar investment strategies. They recognized the wide array of investment professionals employed by the respective firm or firms. Representatives of the Adviser and each sub-adviser discussed or otherwise presented their respective firms’ ongoing investment philosophies and strategies intended to provide investment performance consistent with each Fund’s investment objectives under various market scenarios.
The Board discussed the various administrative services provided directly by the Adviser. Such services included arranging for third party service providers to provide all necessary Fund administration as well as supervising any sub-advisers to Fund portfolios.
Based on their review of the information provided, the Independent Trustees determined that the nature, extent and quality of services provided to the Fund were satisfactory.
With regard to the investment performance of the Trust and the investment adviser, the Board reviewed current performance information provided in the written Board materials. They discussed the reasons for both outperformance and underperformance compared with peer groups and applicable indices and benchmarks. They recognized that the usefulness of comparative performance data as a frame of reference to measure a fund’s performance may be limited because the performance peer group, among other things, does not adequately reflect the objectives and strategies of the fund, has a different investable universe, or the composition of the peer set may be limited in size or number as well as other factors. They discussed the unique aspects of the securities markets applicable to particular Funds so that the performance of any such Funds could be reviewed in context. They reviewed both long-term and short-term performance and considered the effect on long-term performance that may have been attributable to any previous portfolio managers to any Fund. They recognized that the performance data reflects a snapshot in time, in this case as of the end of the most recent calendar year or quarter. A different performance period, however, could generate significantly different results. Further, they noted that long-term performance can be adversely affected by even one period of significant underperformance so that a single investment decision or theme has the ability to disproportionately affect long-term performance. The Board and the portfolio managers discussed the Funds that adhere to the Adviser’s “participate and protect” investment philosophy and, recognizing that this is a conservative investment philosophy, the portfolio managers explained that individual Fund performance indicative of the strategy may be reflected in relative underperformance during periods of high risk market environments, such as the recent market environment. The Board performed this review in connection with the Adviser and each sub-adviser that manages a sub-advised Fund portfolio. In connection with the review of performance, the Board engaged in a comprehensive discussion of market conditions and discussed the reasons for Fund performance under such conditions. The Board noted the relative strong performance of the Target Retirement Date Funds for the period. In addition, the Board recognized that the Mid Cap Fund, the Small Cap Fund, the Madison International Fund and the Hansberger International Growth Fund, each outperformed its benchmark and peer group for the period, which was largely due to individual stock selection in the Funds. With regard to fixed-income Funds, the Board considered each Fund’s relatively conservative investment philosophy and high-quality bias during a period of historically low interest rates and the relative risks to fixed-income Funds in the current environment. For example, the High Quality Bond Fund, the Core Bond Fund and the Tax-Free Funds held more conservative shorter duration exposure than their benchmarks for the period resulting in relative underperformance. Representatives of the Adviser discussed with the Board the methodology for arriving at peer groups and indices used for performance comparisons. The Board also considered that sometimes the Morningstar categories the Funds fall into do not completely match up with the Funds’ investment strategy and philosophy. Based on their review, the Independent Trustees determined that, given the totality of the above factors and considerations, each Fund’s investment performance had been satisfactory.
With regard to the costs of the services to be provided and the profits to be realized by the investment adviser and its affiliates from the relationship with the Trust, the Board reviewed the expense ratios for a variety of other funds in each Fund portfolio’s peer group with similar investment objectives. Again, the Board reviewed these matters in connection with the Adviser and each sub-adviser that manages a sub-advised Fund portfolio. Based on their review, the Independent Trustees concluded that the Adviser’s level of profitability for its advisory activities was reasonable in light of the services provided.
The Board noted that the Adviser or its affiliates, and, as applicable, each sub-adviser, provided investment management services to other investment company and/or non-investment company clients and considered the fees charged by the Adviser (and respective sub-adviser) to such Funds and clients for purposes of determining whether the given advisory fee was disproportionately large under the so-called Gartenberg standard traditionally used by investment company boards in connection with contract renewal considerations. The Board took those fees into account and considered the differences in services and time required by the various types of funds and clients to which the Adviser (or sub-adviser, if applicable) provided services. The Board recognized that significant differences may exist between the services provided to one type of fund or client and those provided to others, such as those resulting from a greater frequency of shareholder redemptions in a mutual fund and the higher turnover of mutual fund assets. The Board gave such comparisons the weight that they merit in light of the similarities and differences between the services that the various Funds require. They considered that, if the services rendered by the Adviser (or sub-adviser, if applicable) to one type of fund or client differed significantly from others, then the comparison should be given less weight. In the case of non-investment company clients for which the Adviser (or sub-adviser, if applicable) may act as either investment adviser or sub-adviser, the Board noted that the fee may be lower than the fee charged to the Trust. The Board noted too the various administrative, operational, compliance, legal and corporate communication services required to be handled by the Adviser (or sub-adviser, if applicable) which are performed for investment company clients but are not typically performed for non-investment company clients.
The Trustees reviewed each Fund’s fee structure based on the total Fund expense ratio as well as by comparing advisory fees to other advisory fees. The Board noted the simple expense structure maintained by the Trust: an advisory fee and a capped administrative “services” expense. The Board reviewed total expense ratios paid by other funds with similar investment objectives, recognizing that such a comparison, while not dispositive, was an important consideration.
The Trustees sought to ensure that fees paid by the Trust were appropriate. The Board reviewed materials demonstrating that although the Adviser is compensated for a variety of the administrative services it provides or arranges to provide to the
82
Madison Funds | Other Information (unaudited) - continued | October 31, 2015
Funds pursuant to its administrative services agreements with the Trust (“Services Agreement”), such compensation does not always cover all costs because the Services Agreement effectively acts as a cap on administrative expenses. Therefore, the Board recognized that any administrative, operational, regulatory or compliance fees or costs in excess of the Services Agreement fees are paid by the Adviser from investment advisory fees earned. In this regard, the Trustees noted that examination of each Fund portfolio’s total expense ratio compared to those of other investment companies was more meaningful than a simple comparison of basic “investment management only” fee schedules.
The Board recognized that to the extent a Fund portfolio invests in other mutual funds also managed by the Adviser (or its affiliates), the Adviser (or an affiliate) receives investment advisory fees from both the Fund portfolio and the underlying mutual fund. The Board was satisfied in this regard that the Adviser (or an affiliate) provides separate services to the Trust’s “Fund of funds” portfolios and the underlying mutual funds in which each such Fund invests in exchange for the fees received from them.
In reviewing costs and profits, the Board noted that for some smaller Fund portfolios, the salaries of all portfolio management personnel, trading desk personnel, corporate accounting personnel and employees of the Adviser who serve as Trust officers, as well as facility costs (e.g., rent, etc.), could not be supported by fees received from such portfolios alone. However, the Board recognized that the Trust is profitable to the Adviser because such salaries and fixed costs are already paid in whole or in part from revenue generated by management of other client assets managed by the Adviser, including the Trust as one of a consolidated family of investment companies. The Trustees noted that total assets managed by the Adviser and its affiliates of approximately $15 billion at the time of the meeting. As a result, although the fees paid by an individual Fund at its present size might not be sufficient to profitably support a stand-alone fund, the Trust is reasonably profitable to the Adviser as part of its larger, diversified organization. In sum, the Trustees recognized that the Trust is important to the Adviser and is managed with the attention given to the Adviser’s other clients.
With regard to the extent to which economies of scale would be realized as each Fund’s assets increase, the Trustees recognized that at their current asset levels, it was premature to discuss any economies of scale not already factored into the compensation payable under existing Advisory and Services Agreements. In addition, the Trustees recognized that the Adviser was currently waiving certain fees (pursuant to its investment management agreement or pursuant to the applicable Services Agreement, as the case may be) with regard to: the Dividend Income, Cash Reserves and certain classes of the Investors Fund. The Board also recognized that the Adviser had arranged for the fees to be capped for certain classes of the Investors Fund. Another method to help ensure the shareholders share in these benefits is to include breakpoints in the advisory fee schedule. Based on their review, the Independent Trustees concluded that the breakpoint schedules and fee arrangement and waivers (as applicable) were acceptable and reflect economies of scale to be shared with shareholders when assets under management increase.
Counsel to the Independent Trustees confirmed that the Trust’s Independent Trustees had met previously and reviewed the written contract renewal materials provided by the Adviser and applicable sub-advisers. He noted that the Independent Trustees had considered such materials in light of the Gartenberg standard as well as criteria either set forth or discussed in the Supreme Court decision in Jones v. Harris regarding the investment company contract renewal process under Section 15(c) of the Investment Company Act of 1940, as amended. The Independent Trustees made a variety of additional inquiries regarding such written materials to the Adviser and the sub-advisers and representatives of the Adviser and sub-advisers, respectively, and discussed each matter raised as summarized herein.
After further discussion, analysis and review of the totality of the information presented, including the information set forth above and the other information considered by the Board, the Trustees, including the Independent Trustees, concluded that the Trust’s advisory fees (including applicable sub-advisory fees) are fair and reasonable for each respective Fund portfolio and that renewal of their respective Advisory, Sub-Advisory and Services Agreements are in the best interests of each respective Fund and its shareholders.
FUND EXPENSES PAID BY SHAREHOLDERS
As a shareholder of the Funds, you incur two types of costs: (1) transaction costs, including sales charges (loads) on purchase payments, and redemption fees; and (2) ongoing costs, including management fees; distribution and/or service (12b-1) fees; and other fund expenses. The examples below are intended to help you understand your ongoing costs (in dollars) of investing in the Funds and to compare these costs with the ongoing costs of investing in other mutual funds.
The examples below are based on an investment of $1,000 invested at the beginning of the period and held for the entire six-month period ended October 31, 2015. Expenses paid during the period in the tables below are equal to the Fund’s annualized expense ratio, multiplied by the average account value over the period, multiplied by 184/365 (to reflect the one-half fiscal year period).
Actual Expenses
The table below provides information about actual account values using actual expenses and actual returns for the funds. You may use the information in this table, together with the amount you invested, to estimate the expenses that you paid over the period. Simply divide your account value by $1,000 (for example, an $8,600 account value divided by $1,000 = 8.6), then multiply the result by the number in the table for the fund you own under the heading entitled “Expenses Paid During Period” to estimate the expenses you paid on your account during this period.
83
Madison Funds | Other Information (unaudited) - continued | October 31, 2015
| | | | | | | | | | | | | | | | | | |
| | | | | CLASS A | | | | | | CLASS B | | | |
| | Beginning | | Ending | Annual | Expenses Paid | | Ending | Annual | | Expenses Paid |
| Fund | Account Value | | Account Value | Expense Ratio | During Period | | Account Value | Expense Ratio | | During Period |
| Conservative Allocation* | $ | 1,000 | | $ 983.60 | | 0.70 | % | | $ 3.50 | | $ 980.00 | | 1.45 | % | | $ 7.24 | |
| Moderate Allocation* | | 1,000 | | 979.80 | | 0.70 | % | | 3.49 | | 976.30 | | 1.45 | % | | 7.22 | |
| Aggressive Allocation* | | 1,000 | | 976.20 | | 0.70 | % | | 3.49 | | 972.50 | | 1.45 | % | | 7.21 | |
| Cash Reserves | | 1,000 | | 1,000.00 | | 0.09 | % | | 0.45 | | 1,000.00 | | 0.09 | % | | 0.45 | |
| Core Bond | | 1,000 | | 996.80 | | 0.90 | % | | 4.53 | | 994.00 | | 1.65 | % | | 8.29 | |
| High Income | | 1,000 | | 963.10 | | 1.00 | % | | 4.95 | | 959.00 | | 1.75 | % | | 8.64 | |
| Diversified Income | | 1,000 | | 999.00 | | 1.10 | % | | 5.54 | | 994.70 | | 1.85 | % | | 9.30 | |
| Covered Call & Equity Income | | 1,000 | | 975.20 | | 1.25 | % | | 6.22 | | N/A | | N/A | | | N/A | |
| Large Cap Value | | 1,000 | | 973.80 | | 1.16 | % | | 5.77 | | 970.90 | | 1.91 | % | | 9.49 | |
| Investors | | 1,000 | | 1,017.20 | | 1.20 | % | | 6.10 | | N/A | | N/A | | | N/A | |
| Large Cap Growth | | 1,000 | | 1,001.80 | | 1.20 | % | | 6.05 | | 998.00 | | 1.95 | % | | 9.82 | |
| Mid Cap | | 1,000 | | 998.80 | | 1.40 | % | | 7.05 | | 996.00 | | 2.15 | % | | 10.82 | |
| Small Cap | | 1,000 | | 990.70 | | 1.50 | % | | 7.53 | | 986.80 | | 2.25 | % | | 11.27 | |
| International Stock | | 1,000 | | 951.00 | | 1.60 | % | | 7.87 | | 947.00 | | 2.35 | % | | 11.53 | |
| | |
| | | | | | | | | | CLASS C | | | | | | | | |
| Fund | Beginning Account Value | Ending Account Value | | | | Annual Expense Ratio | Expenses Paid During Period |
| Conservative Allocation* | | $1,000 | | | | $ 980.00 | | | | | 1.45 | % | | | | $ 7.24 | |
| Moderate Allocation* | | 1,000 | | | | 976.30 | | | | | 1.45 | % | | | | 7.22 | |
| Aggressive Allocation* | | 1,000 | | | | 972.50 | | | | | 1.45 | % | | | | 7.21 | |
| Diversified Income | | 1,000 | | | | 995.30 | | | | | 1.85 | % | | | | 9.30 | |
| Covered Call & Equity Income | | 1,000 | | | | 971.40 | | | | | 1.99 | % | | | | 9.89 | |
| | |
| | | | | | | | | | CLASS Y | | | | | | | | |
| Fund | Beginning Account Value | Ending Account Value | | | | Annual Expense Ratio | Expenses Paid During Period |
| Tax-Free Virginia | | $1,000 | | | | $ 1,012.90 | | | | | 0.85 | % | | | | $ 4.31 | |
| Tax-Free National | | 1,000 | | | | 1,014.80 | | | | | 0.85 | % | | | | 4.32 | |
| High Quality Bond | | 1,000 | | | | 1,002.40 | | | | | 0.49 | % | | | | 2.47 | |
| Core Bond | | 1,000 | | | | 999.00 | | | | | 0.65 | % | | | | 3.28 | |
| Corporate Bond | | 1,000 | | | | 991.90 | | | | | 0.65 | % | | | | 3.26 | |
| High Income | | 1,000 | | | | 964.00 | | | | | 0.75 | % | | | | 3.71 | |
| Covered Call & Equity Income | | 1,000 | | | | 975.50 | | | | | 1.00 | % | | | | 4.98 | |
| Dividend Income | | 1,000 | | | | 1,001.90 | | | | | 0.95 | % | | | | 4.79 | |
| Large Cap Value | | 1,000 | | | | 975.50 | | | | | 0.91 | % | | | | 4.53 | |
| Investors | | 1,000 | | | | 1,018.60 | | | | | 0.95 | % | | | | 4.83 | |
| Large Cap Growth | | 1,000 | | | | 1,003.00 | | | | | 0.95 | % | | | | 4.80 | |
| Mid Cap | | 1,000 | | | | 1,001.10 | | | | | 1.15 | % | | | | 5.80 | |
| Small Cap | | 1,000 | | | | 992.10 | | | | | 1.25 | % | | | | 6.28 | |
| NorthRoad International | | 1,000 | | | | 921.50 | | | | | 1.15 | % | | | | 5.57 | |
| International Stock | | 1,000 | | | | 952.40 | | | | | 1.35 | % | | | | 6.64 | |
| Hansberger International Growth | | 1,000 | | | | 926.40 | | | | | 1.16 | % | | | | 5.63 | |
| | |
| | | | | | | | | | CLASS R6 | | | | | | | | |
| Fund | Beginning Account Value | Ending Account Value | | | | Annual Expense Ratio | Expenses Paid During Period |
| Core Bond | | $1,000 | | | | $ 999.00 | | | | | 0.52 | % | | | | $ 2.62 | |
| Covered Call & Equity Income | | 1,000 | | | | 976.60 | | | | | 0.87 | % | | | | 4.33 | |
| Investors | | 1,000 | | | | 1,019.50 | | | | | 0.74 | % | | | | 3.77 | |
| Mid Cap | | 1,000 | | | | 1,002.20 | | | | | 0.77 | % | | | | 3.89 | |
| NorthRoad International | | 1,000 | | | | 923.00 | | | | | 0.82 | % | | | | 3.97 | |
| Target Retirement 2020* | | 1,000 | | | | 992.10 | | | | | 0.30 | % | | | | 1.51 | |
| Target Retirement 2030* | | 1,000 | | | | 986.20 | | | | | 0.30 | % | | | | 1.50 | |
| Target Retirement 2040* | | 1,000 | | | | 984.10 | | | | | 0.30 | % | | | | 1.50 | |
| Target Retirement 2050* | | 1,000 | | | | 982.20 | | | | | 0.30 | % | | | | 1.50 | |
| | |
| | | | | | | | | | CLASS I | | | | | | | | |
| Fund | Beginning Account Value | Ending Account Value | | | | Annual Expense Ratio | Expenses Paid During Period |
| Hansberger International Growth | | $1,000 | | | | $ 927.00 | | | | | 1.01 | % | | | | $ 4.91 | |
| | |
| *The annual expense ratio does not include the expenses of the underlying funds. | | | | | | | | | | | | | |
84
Madison Funds | Other Information (unaudited) - continued | October 31, 2015
Hypothetical Example for Comparison Purposes
The table below provides information about hypothetical account values and hypothetical expenses based on the Funds’ actual expense ratios and an assumed rate of return of 5% per year before expenses, which are not the Funds’ actual returns. The hypothetical account values and expenses may not be used to estimate the actual ending account balance or expenses you paid for the period. You may use this information to compare the ongoing costs of investing in the Funds and other funds. To do so, compare the 5% hypothetical example of the funds you own with the 5% hypothetical examples that appear in the shareholder reports of other similar funds.
| | | | | | | | | | | | | | | | | | |
| | | | | CLASS A | | | | | | | CLASS B | | | |
| | Beginning | | Ending | Annual | Expenses Paid | | Ending | Annual | | Expenses Paid |
| Fund | Account Value | | Account Value | Expense Ratio | During Period | | Account Value | Expense Ratio | | During Period |
| Conservative Allocation* | $ | 1,000 | | $ 1,021.68 | | 0.70 | % | | $ 3.57 | | $ 1,017.90 | | 1.45 | % | | $ 7.38 | |
| Moderate Allocation* | | 1,000 | | 1,021.68 | | 0.70 | % | | 3.57 | | 1,017.90 | | 1.45 | % | | 7.38 | |
| Aggressive Allocation* | | 1,000 | | 1,021.68 | | 0.70 | % | | 3.57 | | 1,017.90 | | 1.45 | % | | 7.38 | |
| Cash Reserves | | 1,000 | | 1,024.75 | | 0.09 | % | | 0.46 | | 1,024.75 | | 0.09 | % | | 0.46 | |
| Core Bond | | 1,000 | | 1,020.67 | | 0.90 | % | | 4.58 | | 1,016.89 | | 1.65 | % | | 8.39 | |
| High Income | | 1,000 | | 1,020.16 | | 1.00 | % | | 5.09 | | 1,016.38 | | 1.75 | % | | 8.89 | |
| Diversified Income | | 1,000 | | 1,019.66 | | 1.10 | % | | 5.60 | | 1,015.88 | | 1.85 | % | | 9.40 | |
| Covered Call & Equity Income | | 1,000 | | 1,018.90 | | 1.25 | % | | 6.36 | | N/A | | N/A | | | N/A | |
| Large Cap Value | | 1,000 | | 1,019.36 | | 1.16 | % | | 5.90 | | 1,015.58 | | 1.91 | % | | 9.70 | |
| Investors | | 1,000 | | 1,019.16 | | 1.20 | % | | 6.11 | | 1,000.00 | | N/A | | | N/A | |
| Large Cap Growth | | 1,000 | | 1,019.16 | | 1.20 | % | | 6.11 | | 1,015.38 | | 1.95 | % | | 9.91 | |
| Mid Cap | | 1,000 | | 1,018.15 | | 1.40 | % | | 7.12 | | 1,014.37 | | 2.15 | % | | 10.92 | |
| Small Cap | | 1,000 | | 1,017.64 | | 1.50 | % | | 7.63 | | 1,013.86 | | 2.25 | % | | 11.42 | |
| International Stock | | 1,000 | | 1,017.14 | | 1.60 | % | | 8.13 | | 1,013.36 | | 2.35 | % | | 11.93 | |
| | |
| | | | | | | | | | CLASS C | | | | | | | | |
| Fund | Beginning Account Value | Ending Account Value | | | | Annual Expense Ratio | Expenses Paid During Period |
| Conservative Allocation* | | $ 1,000 | | | | $ 1,017.90 | | | | | 1.45 | % | | | | $ 7.38 | |
| Moderate Allocation* | | 1,000 | | | | 1,017.90 | | | | | 1.45 | % | | | | 7.38 | |
| Aggressive Allocation* | | 1,000 | | | | 1,017.90 | | | | | 1.45 | % | | | | 7.38 | |
| Diversified Income | | 1,000 | | | | 1,015.88 | | | | | 1.85 | % | | | | 9.40 | |
| Covered Call & Equity Income | | 1,000 | | | | 1,015.17 | | | | | 1.99 | % | | | | 10.11 | |
| | |
| | | | | | | | | | CLASS Y | | | | | | | | |
| Fund | Beginning Account Value | Ending Account Value | | | | Annual Expense Ratio | Expenses Paid During Period |
| Tax-Free Virginia | | $ 1,000 | | | | $ 1,020.92 | | | | | 0.85 | % | | | | $ 4.33 | |
| Tax-Free National | | 1,000 | | | | 1,020.92 | | | | | 0.85 | % | | | | 4.33 | |
| High Quality Bond | | 1,000 | | | | 1,022.74 | | | | | 0.49 | % | | | | 2.50 | |
| Core Bond | | 1,000 | | | | 1,021.93 | | | | | 0.65 | % | | | | 3.31 | |
| Corporate Bond | | 1,000 | | | | 1,021.93 | | | | | 0.65 | % | | | | 3.31 | |
| High Income | | 1,000 | | | | 1,021.42 | | | | | 0.75 | % | | | | 3.82 | |
| Covered Call & Equity Income | | 1,000 | | | | 1,020.16 | | | | | 1.00 | % | | | | 5.09 | |
| Dividend Income | | 1,000 | | | | 1,020.42 | | | | | 0.95 | % | | | | 4.84 | |
| Large Cap Value | | 1,000 | | | | 1,020.62 | | | | | 0.91 | % | | | | 4.63 | |
| Investors | | 1,000 | | | | 1,020.42 | | | | | 0.95 | % | | | | 4.84 | |
| Large Cap Growth | | 1,000 | | | | 1,020.42 | | | | | 0.95 | % | | | | 4.84 | |
| Mid Cap | | 1,000 | | | | 1,019.41 | | | | | 1.15 | % | | | | 5.85 | |
| Small Cap | | 1,000 | | | | 1,018.90 | | | | | 1.25 | % | | | | 6.36 | |
| NorthRoad International | | 1,000 | | | | 1,019.41 | | | | | 1.15 | % | | | | 5.85 | |
| International Stock | | 1,000 | | | | 1,018.40 | | | | | 1.35 | % | | | | 6.87 | |
| Hansberger International Growth | | 1,000 | | | | 1,019.36 | | | | | 1.16 | % | | | | 5.90 | |
| | |
| | | | | | | | | | CLASS R6 | | | | | | | | |
| Fund | Beginning Account Value | Ending Account Value | | | | Annual Expense Ratio | Expenses Paid During Period |
| Core Bond | | $ 1,000 | | | | $ 1,022.58 | | | | | 0.52 | % | | | | $ 2.65 | |
| Covered Call & Equity Income | | 1,000 | | | | 1,020.82 | | | | | 0.87 | % | | | | 4.43 | |
| Investors | | 1,000 | | | | 1,021.48 | | | | | 0.74 | % | | | | 3.77 | |
| Mid Cap | | 1,000 | | | | 1,021.32 | | | | | 0.77 | % | | | | 3.92 | |
| NorthRoad International | | 1,000 | | | | 1,021.07 | | | | | 0.82 | % | | | | 4.18 | |
| Target Retirement 2020* | | 1,000 | | | | 1,023.69 | | | | | 0.30 | % | | | | 1.53 | |
| Target Retirement 2030* | | 1,000 | | | | 1,023.69 | | | | | 0.30 | % | | | | 1.53 | |
| Target Retirement 2040* | | 1,000 | | | | 1,023.69 | | | | | 0.30 | % | | | | 1.53 | |
| Target Retirement 2050* | | 1,000 | | | | 1,023.69 | | | | | 0.30 | % | | | | 1.53 | |
| | |
| | | | | | | | | | CLASS I | | | | | | | | |
| Fund | Beginning Account Value | Ending Account Value | | | | Annual Expense Ratio | Expenses Paid During Period |
| Hansberger International Growth | | $ 1,000 | | | | $ 1,020.11 | | | | | 1.01 | % | | | | $ 5.14 | |
| | |
| *The annual expense ratio does not include the expenses of the underlying funds. | | | | | | | | | | | | | |
85
Madison Funds | Other Information (unaudited) - concluded | October 31, 2015
Please note that the expenses shown in both tables are meant to highlight your ongoing costs only and do not reflect any transactional costs, such as sales charges (loads), or redemption fees. The information provided in the hypothetical example table is useful in comparing ongoing costs only, and will not help you determine the relative total costs of owning different funds. In addition, if these transactional costs were included, your costs would have been higher.
AVAILABILITY OF QUARTERLY PORTFOLIO SCHEDULES
The funds file their complete schedule of portfolio holdings with the SEC for the first and third quarters of each fiscal year on Form N-Q. Form N-Q is available to shareholders at no cost by calling 1-800-877-6089 or on the SEC’s website at www. sec.gov. Form N-Q may also be reviewed and copied at the SEC’s Public Reference Room in Washington, DC. More information on the operation of the Public Reference Room may be obtained by calling 1-202-551-8090.
PROXY VOTING POLICIES, PROCEDURES AND RECORDS
A description of the policies and procedures used by the Funds to vote proxies related to portfolio securities is available to shareholders at no cost on the Funds’ website at www.membersfunds.com or by calling 1-800-877-6089. The proxy voting records for the Funds for the most recent twelve-month period ended June 30 are available to shareholders at no cost on the SEC’s website at www.sec.gov.
FORWARD-LOOKING STATEMENT DISCLOSURE
One of our most important responsibilities as investment company managers is to communicate with shareholders in an open and direct manner. Some of our comments in our letters to shareholders are based on current management expectations and are considered “forward-looking statements.” Actual future results, however, may prove to be different from our expectations. You can identify forward-looking statements by words such as “estimate,” “may,” “will,” “expect,” “believe,” “plan” and other similar terms. We cannot promise future returns. Our opinions are a reflection of our best judgment at the time this report is compiled, and we disclaim any obligation to update or alter forward-looking statements as a result of new information, future events, or otherwise.
TAX INFORMATION
Foreign Tax Credits: The Funds expect to make an election under Internal Revenue Code Section 853 to pass through foreign taxes paid by the Funds to their shareholders. For the year ended October 31, 2015, the following Funds intend to pass through foreign tax credits and have derived gross income from foreign countries amounting to:
| | | | |
| Fund | | Foreign Tax Credit Pass-Through | | Foreign Source Income |
| NorthRoad International | | $ 58,209 | | $ 1,416,296 |
| International Stock | | 92,933 | | 1,040,474 |
| Hansberger International Growth | | 71,222 | | 1,193,869 |
Complete information regarding the Funds’ foreign tax credit pass through to shareholders for 2015 will be reported in conjunction with Form 1099-DIV.
Corporate Dividends Received Deduction: For the taxable year ended October 31, 2015, the following percentage of income dividends paid by the Funds qualify for the dividends received deduction available to corporations:
| Fund | Percentage |
| Conservative Allocation | 14.02 | % |
| Moderate Allocation | 25.37 | % |
| Aggressive Allocation | 38.40 | % |
| Diversified Income | 92.87 | % |
| Covered Call Equity Income | 14.02 | % |
| Dividend Income | 100.00 | % |
| Large Cap Value | 100.00 | % |
| Investors | 38.36 | % |
| Large Cap Growth | 100.00 | % |
| Small Cap | 100.00 | % |
| Target Retirement 2020 | 18.23 | % |
| Target Retirement 2320 | 33.08 | % |
| Target Retirement 2040 | 32.55 | % |
| Target Retirement 2050 | 33.73 | % |
Qualified Dividend Income: For the taxable year ended October 31, 2015, the Funds hereby designate the maximum amount of dividends allowable pursuant to the Internal Revenue Code, as qualified dividend income (“QDI”) eligible for reduced tax rates (the rates range from 5% to 15% depending upon individual’s tax bracket). Complete information regarding each Fund’s income distributions paid during the calendar year 2015, including the portion, if any, which qualify as QDI, will be reported in conjunction with Form 1099-DIV.
| | |
| Fund | | Amount |
| Conservative Allocation | | $ 334,975 |
| Moderate Allocation | | 669,435 |
| Aggressive Allocation | | 391,415 |
| Diversified Income | | 2,172,807 |
| Covered Call & Equity Income | | 925,546 |
| Dividend Income | | 362,113 |
| Large Cap Value | | 1,202,093 |
| Investors | | 1,965,594 |
| Large Cap Growth | | 1,259,949 |
Small Cap | | 180,272 |
| NorthRoad International | | 856,002 |
| International Stock | | 444,646 |
| Hansberger International Growth | | 416,026 |
| Madison Target Retirement 2020 | | 343,022 |
| Madison Target Retirement 2030 | | 762,516 |
| Madison Target Retirement 2040 | | 601,617 |
| Madison Target Retirement 2050 | | 263,763 |
86
Madison Funds | October 31, 2015
Trustees and Officers
The address of each Trustee and officer is 550 Science Drive, Madison, Wisconsin 3711, except for Mr. Mason for whom it is 8777 N. Gainey Center Drive, #220, Scottsdale, Arizona 85258. The Statement of Additional Information, which includes additional information about the trustees and officers, is available at no cost on the Funds’ website at www.madisonfunds.com or by calling 1-800-877-6089.
| | | | | | |
| Interested Trustees and Officers | | | | |
Name and
Year of Birth | Position(s) and Length
of Time Served | Principal Occupation(s) During Past Five Years | | Portfolios Overseen
in Fund Complex by
Director/Trustee1 | Other Directorships Held by Director/ Trustee
During Past Five Years |
| | | | | | |
Katherine L. Frank2
1960 | Trustee and President,
2009 - Present | Madison Investment Holdings, Inc. (“MIH”) (affiliated investment advisory firm of the Adviser), Executive Director and Chief Operating Officer, 2010 - Present; Managing Director and Vice President, 1986 - 2010 | | 42 | Madison Strategic Sector Premium Fund,
2005 - Present;
Ultra Series Fund (16), 2009 - Present |
| | | | | | |
| | | Madison Asset Management, LLC (“Madison”), Executive Director and Chief Operating Officer, 2010 - Present; Vice President, 2004 - 2010 | | | |
| | | | | | |
| | | Madison Investment Advisors, LLC (“MIA”) (affiliated investment advisory firm of the Adviser), Executive Director and Chief Operating Officer, 2010 - Present; President, 1996 - 2010 | | | |
| | | | | | |
| | | Madison Strategic Sector Premium Fund (closed-end fund), President, 2005 - Present; Ultra Series Fund (16) (mutual funds), President, 2009 - Present; Madison Covered Call & Equity Strategy Fund (closed end fund), President, December 2012 - Present | | | |
| | | | | | |
Jay R. Sekelsky
1959 | Vice President,
2009 - Present | MIH, Executive Director and Chief Investment Officer, 2010 - Present; Managing Director and Vice President, 1990 - 2010 | | N/A | N/A |
| | | | | | |
| | | Madison, Executive Director and Chief Investment Officer, 2010 - Present | | | |
| | | | | | |
| | | MIA, Executive Director and Chief Investment Officer, 2010 - Present; Vice President, 1996 - 2010 | | | |
| | | | | | |
| | | Madison Strategic Sector Premium Fund, Vice President, 2005 - Present; Ultra Series Fund (16), Vice President, 2009 - Present; Madison Covered Call & Equity Strategy Fund, Vice President, December 2012 - Present | | | |
| | | | | | |
Paul Lefurgey
1964 | Vice President,
2009 - Present | MIH, Managing Director and Head of Fixed Income Investments, 2005 - Present; Madison and MIA, Managing Director and Head of Fixed Income Investments, 2010 - Present | | N/A | N/A |
| | | | | | |
| | | MEMBERS Capital Advisors, Inc. (“MCA”) (investment advisory firm), Madison, WI, Vice President, 2003 - 2005 | | | |
| | | | | | |
| | | Madison Strategic Sector Premium Fund, Vice President, 2010 - Present; Ultra Series Fund (16), Vice President, 2009 - Present; Madison Covered Call & Equity Strategy Fund, Vice President, December 2012 - Present | | | |
| | | | | | |
Greg D. Hoppe
1969 | Treasurer, 2009 - Present | MIH, MIA and Madison, Vice President, 1999 - Present; Madison, Vice President, 2009 - Present | | N/A | N/A |
| | | | | | |
| | | Madison Strategic Sector Premium Fund, Treasurer, 2009 - Present; Chief Financial Officer, 2005 - 2009; Ultra Series Fund (16), Treasurer, 2009 - Present; Madison Covered Call & Equity Strategy Fund, Treasurer, December 2012 - Present | | | |
| | | | | | |
Holly S. Baggot
1960 | Secretary, 1999 - Present
Assistant Treasurer,
1999 - 2007;
2009 - Present | MIH, MIA and Madison, Vice President, 2010 - Present; Madison, Vice President, 2009 - Present; MFD Distributor, LLC (“MFD”) (an affiliated brokerage firm of Madison), Vice President, 2012 - Present | | N/A | N/A |
| | | | | | |
| | | MCA, Director-Mutual Funds, 2008-2009; Director-Mutual Fund Operations, 2006- 2008; Operations Officer-Mutual Funds, 2005-2006; Senior Manager-Product & Fund Operations, 2001-2005 | | | |
| | | | | | |
| | | Madison Strategic Sector Premium Fund, Secretary and Assistant Treasurer, 2010 - Present; Ultra Series Fund (16), Secretary, 1999 - Present and Treasurer, 2008-2009 and Assistant Treasurer, 1997-2007 and 2009 - Present; Madison Covered Call & Equity Strategy Fund, Secretary and Assistant Treasurer, December 2012 - Present | | | |
| | | | | | |
Lisa R. Lange
1969 | Chief Compliance
Officer, Chief
Legal Officer
and Assistant
Secretary, April
2015 - Present | MIH, MIA and Madison, Chief Compliance Officer and Chief Legal Officer, April 2015-Present | | N/A | N/A |
| | | | | |
| | NorthRoad Capital Management LLC (“NorthRoad”) (an affiliated investment advisory firm of Madison), Chief Compliance Officer and Chief Legal Officer April 2015 – Present | | | |
| | | | | |
| | | Madison Strategic Sector Premium Fund, Chief Compliance Officer, Chief Legal Officer and Assistant Secretary, April 2015 - Present | | | |
| | | | | | |
| | | Madison Covered Call & Equity Strategy Fund, Chief Compliance Officer, Chief Legal Officer and Assistant Secretary April 2015 - Present | | | |
| | | | | | |
| | | Ultra Series Fund (16), Chief Compliance Officer, Chief Legal Officer and Assistant Secretary, April 2015 - Present | | | |
| | | | | | |
| | | Whyte Hirschboeck Dudek S.C. (law firm), Shareholder, 2003-2015 | | | |
|
| 1 As of the date of this report, the fund complex consists of Madison Funds with 25 portfolios, the Ultra Series Fund with 16 portfolios, the Madison Strategic Sector Premium Fund (a closed-end fund) and the Madison Covered Call & Equity Strategy Fund (closed end fund) (“MCN”), for a grand total of 43 separate portfolios in the fund complex. Not every Trustee is a member of the Board of Trustees of every fund in the fund complex, as noted above. References to the “Fund Complex” in the following tables have the meaning disclosed in this paragraph. |
| 2 “Interested person” as defined in the 1940 Act. Considered an interested Trustee because of the position held with the investment adviser of Madison Funds. |
87
Madison Funds | Trustees and Officers - concluded | October 31, 2015
| | | | |
| Independent Trustees | | | |
| | | | | |
Name and
Year of Birth | Position(s) and Length
of Time Served1 | Principal Occupation(s) During Past Five Years | Portfolios Overseen
in Fund Complex2 | Other Directorships Held by Director/ Trustee
During Past Five Years |
| | | | | |
Philip E. Blake
1944 | Trustee, 2009 - Present | Retired Investor | 43 | Edgewood College, 2003 - Present; Chairman of the Board, 2010 - 2012 |
| | Lee Enterprises, Inc. (news and advertising publisher), Madison, WI, Vice President, 1998 - 2001 | | |
| | | | Nerites Corporation (technology company), 2004 - Dec. 2013 |
| | | Madison Newspapers, Inc., Madison, WI, President and Chief Executive Officer, 1993 - 2000 | | Madison Strategic Sector Premium Fund, 2005 - Present; Ultra Series Fund (16), 2009 - Present; Madison Covered Call & Equity Strategy Fund, December 2012 - Present |
| | | | | |
James R. Imhoff, Jr.
1944 | Trustee, 2009 - Present | First Weber Group (real estate brokers), Madison, WI, Chief Executive Officer, 1996 - Present | 43 | Park Bank, 1978 - Present |
| | | | Madison Strategic Sector Premium Fund, 2005 - Present; Madison Covered Call & Equity Strategy Fund, 2005 - Present; Ultra Series Fund (16), 2009 - Present |
| | | | | |
Steven P. Riege
1954 | Trustee, 2005 - Present | Ovation Leadership (management consulting), Milwaukee, WI, Owner/President, 2001 - Present | 43 | Forward Service Corporation (employment training non-profit), 2010- Present Stanek Tool Corp., 1990 – Present |
| | | | | |
| | | Robert W. Baird & Company (financial services), Milwaukee, WI, Senior Vice President-Marketing and Vice President-Human Resources, 1986 - 2001 | | Ultra Series Fund (16), 2005 - Present
Madison Strategic Sector Premium Fund, 2014 - Present
Madison Covered Call & Equity Strategy Fund, 2015 - Present |
| | | | | |
Richard E. Struthers
1952 | Trustee, 2004 - Present | Clearwater Capital Management (investment advisory firm), Minneapolis, MN, Chair and Chief Executive Officer, 1998 - Present | 41 | Park Nicolet Health Services, 2001 - 2012
HealthPartners, 2013 - Present
Ultra Series Fund (16), 2004 - Present |
| | | | | |
| | | Park Nicollet Health Services, Minneapolis, MN, Chairman, Finance and Investment Committee, 2006 - 2012
IAI Mutual Funds, Minneapolis, MN, President and Director, 1992-1997 | | |
|
| 1 Independent Trustees serve in such capacity until reaching the age of 76, unless retirement is waived by unanimous vote of the remaining Trustees on an annual basis. |
| 2 As of the date of this report, the fund complex consists of Madison Funds with 25 portfolios, the Ultra Series Fund with 16 portfolios, the Madison Strategic Sector Premium Fund (a closed-end fund) and the Madison Covered Call & Equity Strategy Fund (closed end fund) (“MCN”), for a grand total of 43 separate portfolios in the fund complex. Not every Trustee is a member of the Board of Trustees of every fund in the fund complex, as noted above. References to the “Fund Complex” in the preceding tables have the meaning disclosed in this paragraph. |
88
| | Presorted Standard
U.S. POSTAGE
PAID
Louisville, KY
Permit No. 1051 | |
Madison Funds
Post Office Box 8390
Boston, MA 02266-8390
1 (800) 877-6089
www.madisonfunds.com
SEC File Number: 811-08261 | | | |
4460-P1053
Rev. 1015
Item 2. Code of Ethics.
(a) The Trust has adopted a code of ethics that applies to the Trust’s principal executive officer, principal financial officer, principal accounting officer or controller or persons performing similar functions, regardless of whether these individuals are employed by the Trust or a third party.
(c) The code was amended during the year covered by this report, however, none of the changes are material to the Trust. The amendments do apply to the Trust’s principal executive officer and principal financial officer, as employees of the Adviser’s parent company. Such amendments include the addition of an excessive trading policy, certain clarifications to the private placement preclearance and ETF policies, the implementation of a de minimis exception for personal investment activity of employees and several non-substantive updates and corrections.
(d) The Trust granted no waivers from the code during the period covered by this report.
(f) Any person may obtain a complete copy of the code without charge by calling the Adviser at 800-767-0300 and requesting a copy of “the Ultra Series Fund Sarbanes Oxley Code of Ethics.”
Item 3. Audit Committee Financial Expert.
In July 2015, James Imhoff, an “independent” Trustee and a member of the Trust’s audit committee, was appointed to continue to serve as the Trust’s audit committee financial expert among the four independent Trustees who so qualify to serve in that capacity.
Item 4. Principal Accountant Fees and Services.
(a) Audit Fees. Total audit fees paid (or to be paid) to the registrant’s principal accountant for the fiscal years ended December 31, 2015 and 2014, respectively were $276,000 ($512,000 including the Madison Funds , the Madison Strategic Sector Premium Fund and the Madison Covered Call & Equity Strategy Fund, all affiliated investment companies “together, the “Affiliated Funds”) and $266,500 ($502,000 including the Madison Funds).
(b) Audit-Related Fees. Not applicable.
(c) Tax-Fees. The Audit Committee has pre-approved, as required by Rule 2-01(c)(7)(i)(C) of Regulation S-X, 100% of the services described in this Item 4(b) through (d).
For the fiscal years ended December 31, 2015 and December 31, 2014, the aggregate fees for professional services rendered to Deloitte & Touche for tax compliance, tax advice and tax planning for such fiscal years totaled $33,280 (budgeted) and $32,032 (actual), respectively.
In the scope of services comprising the fees disclosed under this Item 4(c) were the following services:
-Review and sign as signature preparer for U.S. Income Tax Return for Regulated Investment Companies, Form 1120-RIC.
(d) All Other Fees. Not applicable.
(e) (1) Before any accountant is engaged by the registrant to render audit or non-audit services, the engagement must be approved by the audit committee as contemplated by paragraph (c)(7)(i)(A) of Rule 2-01of Regulation S-X.
(2) The Audit Committee has waived pre-approval, as required by Rule 2-01(c)(7)(i)(C) of Regulation S-X, for 0% (none) of the services described in this Item 4(b) through (d), which such services are described above.
(f) Not applicable.
(g) Not applicable.
(h) Not applicable.
Item 5. Audit Committee of Listed Registrants.
Not applicable.
Item 6. Schedule of Investments
Schedule included as part of the report to shareholders filed under Item 1 of this Form.
Item 7. Disclosure of Proxy Voting Policies and Procedures for Closed-End Management Investment Companies.
Not applicable.
Item 8. Portfolio Managers of Closed-End Management Investment Companies.
Not applicable.
Item 9. Purchases of Equity Securities by Closed-End Management Investment Company and Affiliated Purchasers.
Not applicable.
Item 10. Submission of Matters to a Vote of Security Holders.
The Trust does not normally hold shareholder meetings. There have been no changes to the Trust’s procedures during the period covered by this report.
Item 11. Controls and Procedures.
(a) The Trust’s principal executive officer and principal financial officer determined that the Trust’s disclosure controls and procedures (as defined in Rule 30a-3(c) under the Investment Company Act of 1940 (the “Act”)) are effective, based on their evaluation of these controls and procedures required by Rule 30a-3(b) under the Act and Rules 13a-15(b) or 15d-15(b) under the Securities Exchange Act of 1934 within 90 days of the date of this report. There were no significant changes in the Trust’s internal controls or in other factors that could significantly affect these controls subsequent to the date of their evaluation. The officers identified no significant deficiencies or material weaknesses.
(b) There were no changes in the Trust’s internal control over financial reporting (as defined in Rule 30a-3(d) under the Act) that occurred during the second fiscal quarter of the period covered by this report that has materially affected, or is reasonably likely to materially affect, the Trust’s internal control over financial reporting.
Item 12. Exhibits.
(a)(1) Code of ethics - See Item 2.
(a)(2) Certifications of principal executive and principal financial officers as required by Rule 30a-2(a) under the Act.
(b) Certification of principal executive and principal financial officers as required by Rule 30a-2(b) under the Act.
SIGNATURES
Pursuant to the requirements of the Securities Exchange Act of 1934 and the Investment Company Act of 1940, the Registrant has duly caused this Report to be signed on its behalf by the undersigned, thereunto duly authorized.
Ultra Series Fund
/s/ Lisa R. Lange
Lisa R. Lange, Chief Legal Officer and Chief Compliance Officer
Date: March 2, 2016
Pursuant to the requirements of the Securities Exchange Act of 1934 and the Investment Company Act of 1940, this Report has been signed below by the following persons on behalf of the Registrant and in the capacities and on the dates indicated.
/s/ Katherine L. Frank
Katherine L. Frank, President and Principal Executive Officer
Date: March 2, 2016
/s/ Greg Hoppe
Greg Hoppe, Principal Financial Officer
Date: March 2, 2016