OMB APPROVAL
OMB Number: 3235-0570
Expires: January 31, 2014
Estimated average burden hours per response...20.6
UNITED STATES SECURITIES AND EXCHANGE COMMISSION
Washington, DC 20549
FORM N-CSR
CERTIFIED SHAREHOLDER REPORT OF REGISTERED
MANAGEMENT INVESTMENT COMPANIES
Investment Company Act file number 811-4815
Ultra Series Fund
(Exact name of registrant as specified in charter)
550 Science Drive, Madison, WI 53711
(Address of principal executive offices)(Zip code)
Pamela M. Krill
Madison Funds Legal and Compliance Department
550 Science Drive
Madison, WI 53711
(Name and address of agent for service)
Registrant's telephone number, including area code: 608-274-0300
Date of fiscal year end: December 31
Date of reporting period: December 31, 2013
Form N-CSR is to be used by management investment companies to file reports with the Commission not later than 10 days after the transmission to stockholders of any report that is required to be transmitted to stockholders under Rule 30e-1 under the Investment Company Act of 1940 (17 CFR 270.30e-1). The Commission may use the information provided on Form N-CSR in its regulatory, disclosure review, inspection, and policymaking roles.
A registrant is required to disclose the information specified by Form N-CSR, and the Commission will make this information public. A registrant is not required to respond to the collection of information contained in Form N-CSR unless the Form displays a currently valid Office of Management and Budget ("OMB") control number. Please direct comments concerning the accuracy of the information collection burden estimate and any suggestions for reducing the burden to Secretary, Securities and Exchange Commission, 100 F Street, NE, Washington, DC 20549-0609. The OMB has reviewed this collection of information under the clearance requirements of 44 U.S.C. s 3507.
Ultra Series Fund | Management’s Discussion of Fund Performance | December 31, 2013
Table of Contents
|
| |
| | Page |
| Management’s Discussion of Fund Performance | |
| Period in Review | |
| Outlook | |
| Conservative Allocation Fund | |
| Moderate Allocation Fund | |
| Aggressive Allocation Fund | |
| Money Market Fund | |
| Core Bond Fund | |
| High Income Fund | |
| Diversified Income Fund | |
| Large Cap Value Fund | |
| Large Cap Growth Fund | |
| Mid Cap Fund | |
| Small Cap Fund | |
| International Stock Fund | |
| Madison Target Retirement 2020 Fund | |
| Madison Target Retirement 2030 Fund | |
| Madison Target Retirement 2040 Fund | |
| Madison Target Retirement 2050 Fund | |
| Notes to Management’s Discussion of Fund Performance | |
| Portfolios of Investments | |
| Conservative Allocation Fund | |
| Moderate Allocation Fund | |
| Aggressive Allocation Fund | |
| Money Market Fund | |
| Core Bond Fund | |
| High Income Fund | |
|
| |
| Diversified Income Fund | |
| Large Cap Value Fund | |
| Large Cap Growth Fund | |
| Mid Cap Fund | |
| Small Cap Fund | |
| International Stock Fund | |
| Madison Target Retirement 2020 Fund | |
| Madison Target Retirement 2030 Fund | |
| Madison Target Retirement 2040 Fund | |
| Madison Target Retirement 2050 Fund | |
| Financial Statements | |
| Statements of Assets and Liabilities | |
| Statements of Operations | |
| Statements of Changes in Net Assets | |
| Financial Highlights | |
Notes to Financial Statements | |
Report of Independent Registered Public Accounting Firm | |
Other Information | |
Trustees and Officers | |
Nondeposit investment products are not federally insured, involve investment risk, may lose value and are not obligations of or guaranteed by any financial institution. For more complete information about Ultra Series Fund, including charges and expenses, request a prospectus from your financial advisor or from CMFG Life Insurance Company, 2000 Heritage Way, Waverly, IA 50677. Consider the investment objectives, risks, and charges and expenses of any fund carefully before investing. The prospectus contains this and other information about the investment company. For more current Ultra Series Fund performance information, please call 1-800-670-3600. Current performance may be lower or higher than the performance data quoted within. Past performance does not guarantee future results. Nothing in this report represents a recommendation of a security by the investment adviser. Portfolio holdings may have changed since the date of this report.
Management’s Discussion of Fund Performance
PERIOD IN REVIEW
Despite modest economic growth, U.S. equities had one of the best years in history and led the world’s stock markets, as the S&P 500 Index advanced 32.39% in 2013. Domestic mid-cap and small-cap indices showed even stronger returns, with the Russell Midcap® Index up 34.76% and the Russell 2000® Index of small-cap stocks up 38.82%. Developed international markets were also robust, as the broad MSCI EAFE Net Index advanced 22.78%. Emerging markets, on the other hand, lagged the developed world badly, with the Russell Emerging Market Index barely positive with a 0.29% return.
Despite an array of challenges, the resilient U.S. economy grew by nearly 2% in 2013, with the rate of this growth appearing to accelerate through the final quarters. Europe seemed to be working through the worst of its problems, while emerging markets showed signs of slowing growth, putting selling pressure on what had been an investor favorite for much of the past decade.
Returns for bond investors were not as satisfying, as the broad Barclays U.S. Aggregate Bond Index dropped -2.02%. During the final quarter of 2013, fixed income investors continued to focus on the timing of a much awaited shift in monetary policy from the Federal Reserve. Throughout 2013 strengthening economic fundamentals and hints from the Federal Reserve Board created expectations for a tapering in Fed open-market bond purchasing. These expectations for what was widely viewed as the first stage towards monetary tightening put steady pressure on interest rates. The yield on the bellwether 10-year Treasury note began the year below 2% and climbed close to 3% in early September before drifting back to 2.6% at the end of the third quarter. At year’s end the 10-year yield was just over 3%, marking its highest level for 2013.
OUTLOOK
In our view, this encouraging display of economic persistence bodes well for 2014. Our cautiously upbeat outlook is largely based on an improving fiscal backdrop, with 2013’s federal government headwind expected to recede in 2014. We are impressed by the improvement in the U.S. economy. Relative to other countries, the U.S. enjoys favorable demographics, has strong energy and agricultural resources, and a robust consumer base. In addition, the U.S. federal budget deficit has declined from 10% to near 4% of GDP over the past four years. We remain watchful regarding still-high debt levels with governmental entities and consumers, lower labor force participation, unclear long-
Ultra Series Fund | Management’s Discussion of Fund Performance | December 31, 2013
term fiscal and monetary policies, and lower levels of capital investments by businesses. On balance, though, the U.S. looks strong compared to the rest of the world.
Ultra Series Fund | Management’s Discussion of Fund Performance | December 31, 2013
This page was intentionally left blank.
Ultra Series Fund | Management’s Discussion of Fund Performance | December 31, 2013
CONSERVATIVE ALLOCATION FUND
INVESTMENT STRATEGY HIGHLIGHTS
The Ultra Series Conservative Allocation Fund invests primarily in shares of registered investment companies (the “underlying funds”). The fund will be diversified among a number of asset classes and its allocation among underlying funds will be based on an asset allocation model developed by Madison Asset Management, LLC (“Madison”), the fund’s investment adviser.
The team may use multiple analytical approaches to determine the appropriate asset allocation, including:
| |
| • | Asset allocation optimization analysis – considers the degree to which returns in different asset classes do or do not move together, and the fund’s aim to achieve a favorable overall risk profile for any targeted portfolio return. |
| |
| • | Scenario analysis – historical and expected return data is analyzed to model how individual asset classes and combinations of asset classes would affect the fund under different economic and market conditions. |
| |
| • | Fundamental analysis – draws upon Madison’s investment teams to judge each asset class against current and forecasted market condi-tions. Economic, industry and security analysis is used to develop return and risk expectations that may influence asset class selection. |
In addition, Madison has a flexible mandate which permits the fund, at the sole discretion of Madison, to materially reduce equity risk exposures when and if conditions are deemed to warrant such an action.
PERFORMANCE HISTORY
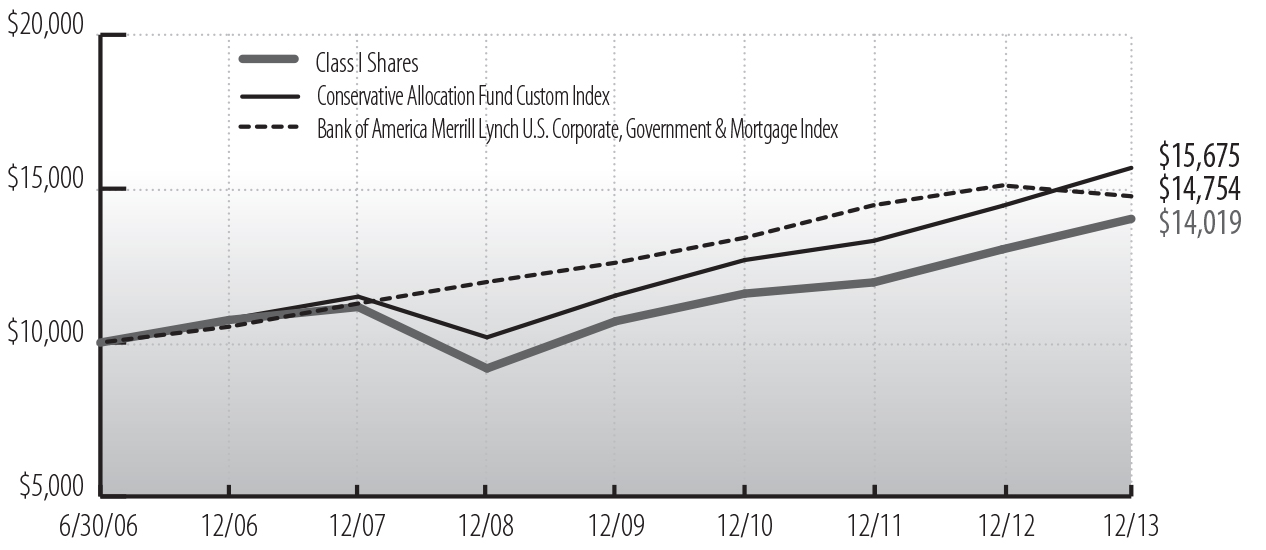
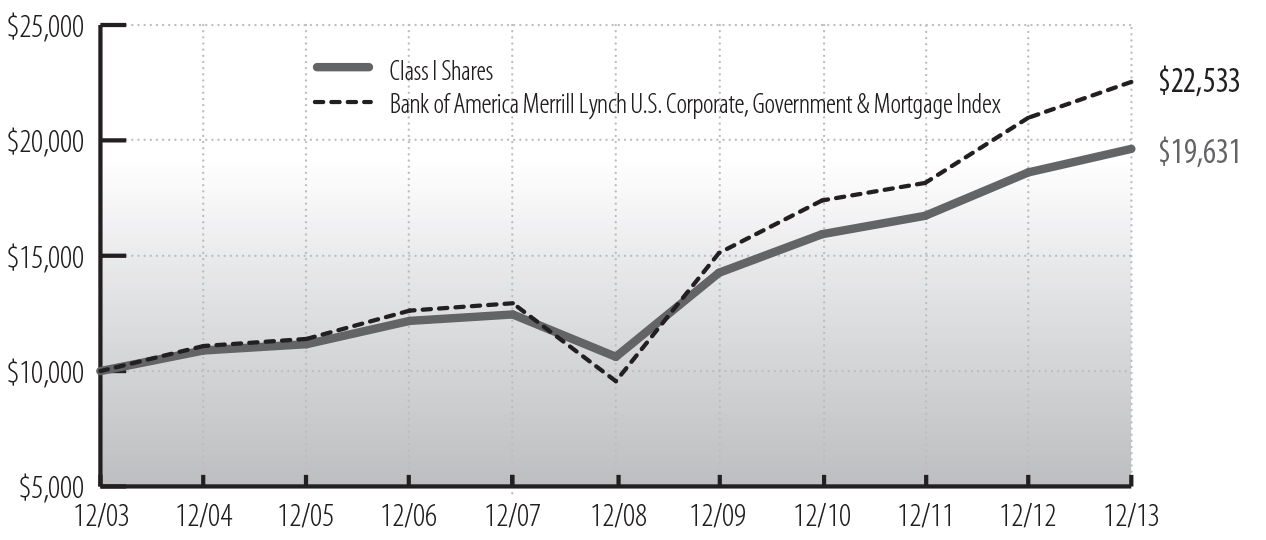
Cumulative Performance of $10,000 Investment Since Inception1,2
Ultra Series Fund | Management’s Discussion of Fund Performance | December 31, 2013
|
| | | | | | | | | | |
Average Annual Total Return through December 31, 20131,2 |
| | 1 Year |
| 3 Years |
| 5 Years |
| Since
6/30/06
Inception |
| Since
5/1/09
Inception |
|
| Ultra Series Conservative Allocation, Class I | 7.61 | % | 6.55 | % | 8.89 | % | 4.60 | % | — |
|
| Ultra Series Conservative Allocation, Class II | 7.34 |
| 6.28 |
| — |
| — |
| 8.93 | % |
| Conservative Allocation Fund Custom Index | 8.54 |
| 7.32 |
| 9.04 |
| 6.18 |
| 9.71 |
|
| Bank of America Merrill Lynch US Corp, Govt & Mortg Index | -2.34 |
| 3.24 |
| 4.27 |
| 5.32 |
| 4.53 |
|
See accompanying Notes to Management’s Discussion of Fund Performance.
|
| | |
PORTFOLIO ALLOCATION AS A PERCENTAGE OF NET ASSETS
AS OF 12/31/13 |
| Bond Funds | 56.7 | % |
| Foreign Bond Funds | 3.8 | % |
| Stock Funds | 34.4 | % |
| Foreign Stock Funds | 4.5 | % |
| Money Market Funds and Other Net Assets | 0.6 | % |
PERFORMANCE DISCUSSION
The Ultra Series Conservative Allocation Fund (Class I) returned 7.61% over the 12-month period, underperforming the Conservative Allocation Fund Custom Index return of 8.54%, but slightly outperforming the Morningstar Conservative Allocation category average return of 7.23%. The two greatest positive contributors to performance were the fund’s relative overweight to U.S. stocks within the equity allocation, and a below-benchmark duration within the fixed income portion of the portfolio. The broad U.S. stock market (Russell 3000® Index) outperformed the international market (MSCI EAFE Index) by approximately 10% over the period. Bonds were hurt by a significant rise in interest rates since the end of 2012. The yield on the bellwether 10-year Treasury note began the year below 2% and climbed to just over 3% by year’s end. The fund’s modest duration and floating rate holdings served to mitigate the losses within the fixed income portion of the fund. The two most negative detractors from performance were the fund’s underweighting to small-cap stocks and weak selection among core U.S. equity positions where Madison’s preference for managers holding more proven, high-quality companies was out of favor with a speculative market. These negative factors outweighed the positive factors and resulted in underperformance compared to the benchmark, but not the peer category for the year.
Ultra Series Fund | Management’s Discussion of Fund Performance | December 31, 2013
MODERATE ALLOCATION FUND
INVESTMENT STRATEGY HIGHLIGHTS
The Ultra Series Moderate Allocation Fund invests primarily in shares of registered investment companies (the “underlying funds”). The fund will be diversified among a number of asset classes and its allocation among underlying funds will be based on an asset allocation model developed by Madison Asset Management, LLC (“Madison”), the fund’s investment adviser.
The team may use multiple analytical approaches to determine the appropriate asset allocation, including:
| |
| • | Asset allocation optimization analysis – considers the degree to which returns in different asset classes do or do not move together, and the fund’s aim to achieve a favorable overall risk profile for any targeted portfolio return. |
| |
| • | Scenario analysis – historical and expected return data is analyzed to model how individual asset classes and combinations of asset classes would affect the fund under different economic and market conditions. |
| |
| • | Fundamental analysis – draws upon Madison’s investment teams to judge each asset class against current and forecasted market conditions. Economic, industry and security analysis is used to develop return and risk expectations that may influence asset class selection. |
In addition, Madison has a flexible mandate which permits the fund, at the sole discretion of Madison, to materially reduce equity risk exposures when and if conditions are deemed to warrant such an action.
PERFORMANCE HISTORY
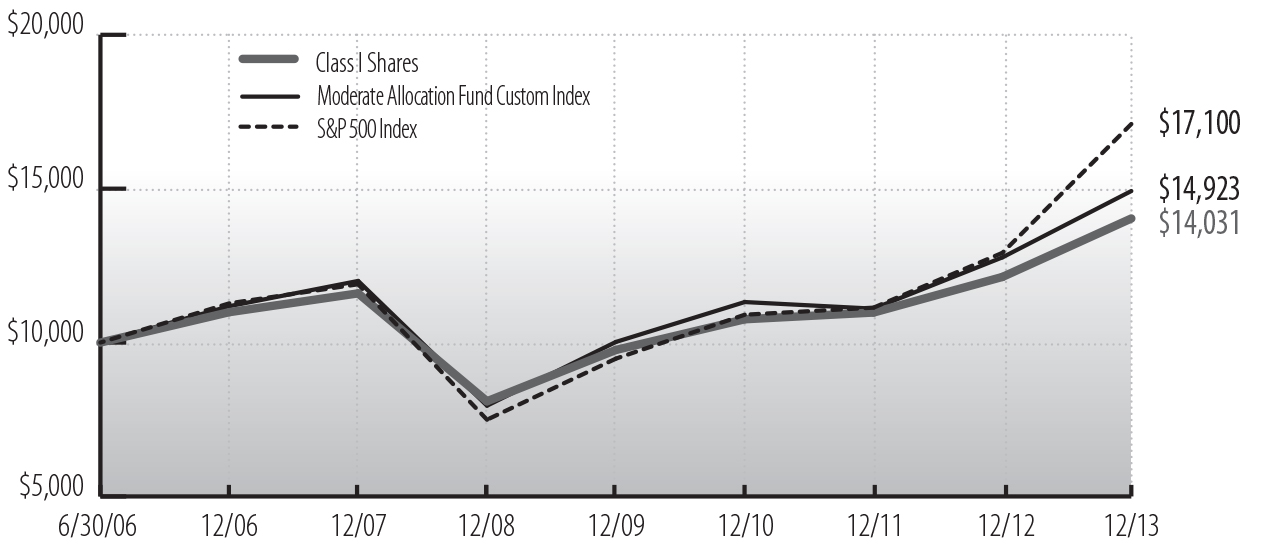
Cumulative Performance of $10,000 Investment Since Inception1,2
Ultra Series Fund | Management’s Discussion of Fund Performance | December 31, 2013
|
| | | | | | | | | | |
Average Annual Total Return through December 31, 20131,2 |
| | 1 Year |
| 3 Years |
| 5 Years |
| Since
6/30/06
Inception |
| Since
5/1/09
Inception |
|
| Ultra Series Moderate Allocation, Class I | 15.66 | % | 9.27 | % | 11.64 | % | 4.62 | % | — |
|
| Ultra Series Moderate Allocation, Class II | 15.37 |
| 8.99 |
| — |
| — |
| 11.91 | % |
| Moderate Allocation Fund Custom Index | 16.10 |
| 9.48 |
| 11.75 |
| 6.11 |
| 12.78 |
|
| S&P 500 Index | 32.39 |
| 16.18 |
| 17.94 |
| 7.41 |
| 19.84 |
|
See accompanying Notes to Management’s Discussion of Fund Performance.
|
| | |
PORTFOLIO ALLOCATION AS A PERCENTAGE OF NET ASSETS
AS OF 12/31/13 |
| Bond Funds | 34.6 | % |
| Stock Funds | 54.1 | % |
| Foreign Stock Funds | 10.3 | % |
| Money Market Funds and Other Net Assets | 1.0 | % |
PERFORMANCE DISCUSSION
The Ultra Series Moderate Allocation Fund (Class I) returned 15.66% over the 12-month period, slightly underperforming the Moderate Allocation Fund Custom Index return of 16.10% and the Morningstar Moderate Allocation category average return of 16.48%. The two greatest positive contributors to performance were the fund’s relative overweight to U.S. stocks within the equity allocation, and a below-benchmark duration within the fixed income portion of the portfolio. The broad U.S. stock market (Russell 3000® Index) outperformed the international market (MSCI EAFE Index) by approximately 10% over the period. Bonds were hurt by a significant rise in interest rates since the end of 2012. The yield on the bellwether 10-year Treasury note began the year below 2% and climbed to just over 3% by year’s end. The fund’s modest duration and floating rate holdings served to mitigate the losses within the fixed income portion of the fund. The two most negative detractors from performance were the fund’s underweighting to small-cap stocks and weak selection among core U.S. equity positions where Madison‘s preference for managers holding more proven, high-quality companies was out of favor with a speculative market. These negative factors outweighed the positive factors and resulted in underperformance against the bench-mark and peer category for the year.
Ultra Series Fund | Management’s Discussion of Fund Performance | December 31, 2013
AGGRESSIVE ALLOCATION FUND
INVESTMENT STRATEGY HIGHLIGHTS
The Ultra Series Aggressive Allocation Fund invests primarily in shares of registered investment companies (the “underlying funds”). The fund will be diversified among a number of asset classes and its allocation among underlying funds will be based on an asset allocation model developed by Madison Asset Management, LLC (“Madison”), the fund’s investment adviser. The team may use multiple analytical approaches to determine the appropriate asset allocation, including:
| |
| • | Asset allocation optimization analysis – considers the degree to which returns in different asset classes do or do not move together, and the fund’s aim to achieve a favorable overall risk profile for any targeted portfolio return. |
| |
| • | Scenario analysis – historical and expected return data is analyzed to model how individual asset classes and combinations of asset classes would affect the fund under different economic and market conditions. |
| |
| • | Fundamental analysis – draws upon Madison’s investment teams to judge each asset class against current and forecasted market conditions. Economic, industry and security analysis is used to develop return and risk expectations that may influence asset class selection. |
In addition, Madison has a flexible mandate which permits the fund, at the sole discretion of Madison, to materially reduce equity risk exposures when and if conditions are deemed to warrant such an action.
PERFORMANCE HISTORY
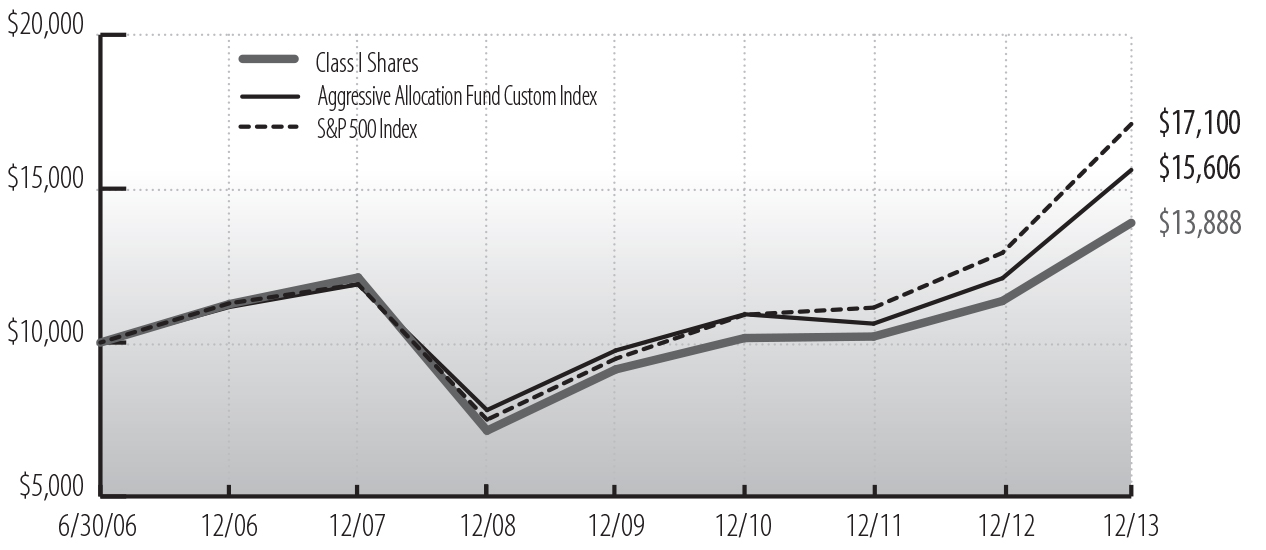
Cumulative Performance of $10,000 Investment Since Inception1,2
Ultra Series Fund | Management’s Discussion of Fund Performance | December 31, 2013
|
| | | | | | | | | | |
Average Annual Total Return through December 31, 20131,2 |
| | 1 Year |
| 3 Years |
| 5 Years |
| Since
6/30/06
Inception |
| Since
5/1/09
Inception |
|
| Ultra Series Aggressive Allocation, Class I | 22.35 | % | 11.03 | % | 14.24 | % | 4.47 | % | — |
|
| Ultra Series Aggressive Allocation, Class II | 22.05 |
| 10.76 |
| — |
| — |
| 14.53 | % |
| Aggressive Allocation Fund Custom Index | 23.41 |
| 10.97 |
| 13.84 |
| 5.48 |
| 15.27 |
|
| S&P 500 Index | 32.39 |
| 16.18 |
| 17.94 |
| 7.41 |
| 19.84 |
|
See accompanying Notes to Management’s Discussion of Fund Performance.
|
| | |
PORTFOLIO ALLOCATION AS A PERCENTAGE OF NET ASSETS
AS OF 12/31/13 |
| Bond Funds | 12.8 | % |
| Stock Funds | 70.0 | % |
| Foreign Stock Funds | 15.6 | % |
| Money Market Funds and Other Net Assets | 1.6 | % |
PERFORMANCE DISCUSSION
The Ultra Series Aggressive Allocation Fund (Class I) returned 22.35% over the 12-month period, slightly underperforming the Aggressive Allocation Fund Custom Index return of 23.41%, but outperforming the Morningstar Aggressive Allocation category average return of 21.31%. The two greatest positive contributors to performance were the fund’s relative overweight to U.S. stocks within the equity allocation, and a below-benchmark duration within the fixed income portion of the portfolio. The broad U.S. stock market (Russell 3000® Index) outperformed the international market (MSCI EAFE Index) by approximately 10% over the period. Bonds were hurt by a significant rise in interest rates since the end of 2012. The yield on the bellwether 10-year Treasury note began the year below 2% and climbed to just over 3% by year’s end. The fund’s modest duration served to mitigate the losses within the fixed income portion of the fund. The two most negative detractors from performance were the fund’s underweighting to small-cap stocks and weak selection among core U.S. equity positions where Madison’s preference for managers holding more proven, high-quality companies was out of favor with a speculative market. The negative factors slightly outweighed the positive, resulting in underperformance against the benchmark, but the opposite is true compared to the fund’s peers.
Ultra Series Fund | Management’s Discussion of Fund Performance | December 31, 2013
MONEY MARKET FUND
INVESTMENT STRATEGY HIGHLIGHTS
The Ultra Series Money Market Fund invests exclusively in U.S. dollar-denominated money market securities maturing in thirteen months or less from the date of purchase. These securities will be obligations of the U.S. Government and its agencies and instrumentalities, but may also include securities issued by U.S. and foreign financial institutions, corporations, municipalities, foreign governments, and multi-national organizations, such as the World Bank. The fund may invest in mortgage-backed and asset-backed securities, including those representing pools of mortgage, commercial, or consumer loans originated by financial institutions.
|
| | |
PORTFOLIO ALLOCATION AS A PERCENTAGE OF NET ASSETS
AS OF 12/31/13 |
| Fannie Mae | 19.9 | % |
| Federal Home Loan Bank | 15.9 | % |
| Freddie Mac | 33.6 | % |
| U.S. Treasury Notes | 9.6 | % |
| Commercial Paper | 16.3 | % |
| Cash and Other Net Assets | 4.7 | % |
Ultra Series Fund | Management’s Discussion of Fund Performance | December 31, 2013
This page was intentionally left blank.
Ultra Series Fund | Management’s Discussion of Fund Performance | December 31, 2013
CORE BOND FUND
INVESTMENT STRATEGY HIGHLIGHTS
Under normal circumstances, the Ultra Series Core Bond Fund invests at least 80% of its net assets in bonds. To keep current income relatively stable and to limit share price volatility, the fund emphasizes investment grade securities and maintains an intermediate (typically 3-7 year) average portfolio duration, with the goal of being between 85-115% of the market benchmark duration. The fund also strives to add incremental return in the portfolio by making strategic decisions relating to credit risk, sector exposure and yield curve positioning. The fund may invest in corporate debt securities, U.S. Government debt securities, foreign government debt securities, non-rated debt securities, and asset-backed, mortgage-backed and commercial mortgage-backed securities.
PERFORMANCE HISTORY
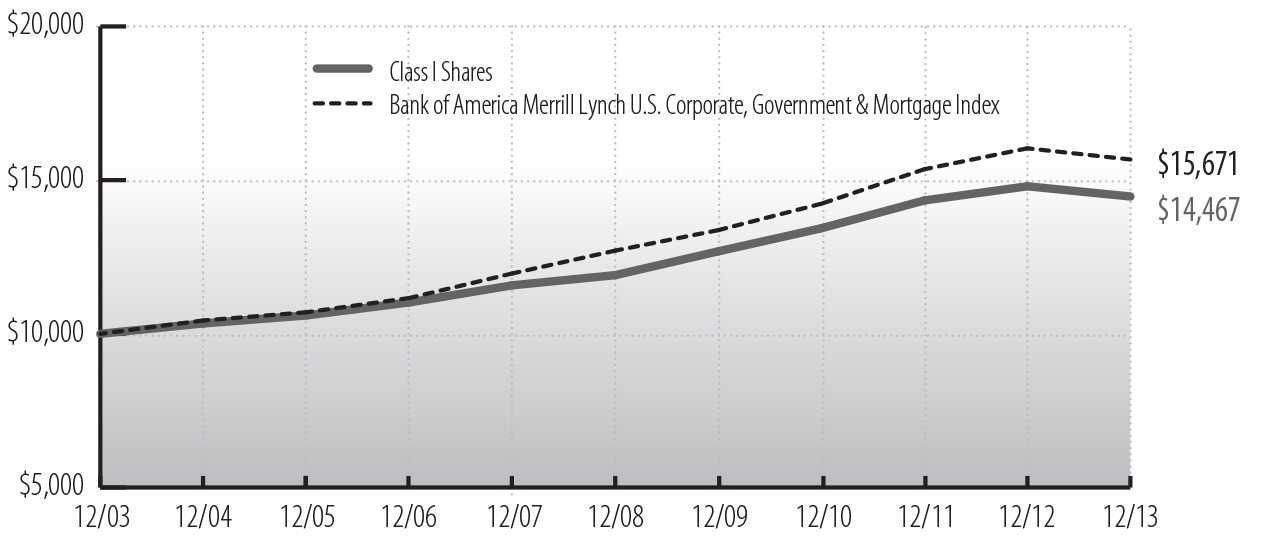
Cumulative Performance of $10,000 Investment Since Inception1
|
| | | | | | | | | | |
Average Annual Total Return through December 31, 20131 |
| | 1 Year |
| 3 Years |
| 5 Years |
| 10 Years |
| Since
5/1/09
Inception |
|
| Ultra Series Core Bond, Class I | -2.24 | % | 2.50 | % | 3.97 | % | 3.76 | % | — |
|
| Ultra Series Core Bond, Class II | -2.49 |
| 2.24 |
| — |
| — |
| 3.83 | % |
| Bank of America Merrill Lynch US Corp, Govt & Mortg Index | -2.34 |
| 3.24 |
| 4.27 |
| 4.59 |
| 4.53 |
|
See accompanying Notes to Management’s Discussion of Fund Performance.
Ultra Series Fund | Management’s Discussion of Fund Performance | December 31, 2013
|
| | |
PORTFOLIO ALLOCATION AS A PERCENTAGE OF NET ASSETS
AS OF 12/31/13 |
| Asset Backed | 0.3 | % |
| Corporate Notes and Bonds | 28.9 | % |
| Municipal Bonds | 0.7 | % |
| Mortgage Backed | 18.5 | % |
| U.S. Government and Agency Obligations | 49.5 | % |
| Short-Term Investments and Other Net Assets and Liabilities | 2.1 | % |
PERFORMANCE DISCUSSION
The Ultra Series Core Bond Fund (Class I) outperformed its benchmark, but had a negative return of -2.24% for the 12-month period, in which bonds suffered broadly in the face of rising interest rates. The yield on the bellwether 10-year Treasury note began the year below 2% and climbed to just over 3% by year’s end. Rising rates depress the value of existing, lower-yielding bonds. The fund’s benchmark index, the Bank of America Merrill Lynch U.S. Corporate, Government and Mortgage Index produced a loss of -2.34% for the period. The fund had the advantage of a shorter relative duration than its benchmark, with less exposure to the long-end of the yield curve where losses were most pronounced. On the other hand, the short duration stance meant less yield than the index, which has a negative impact on total return. An underexposure to low-quality, high-yield bonds was a detriment as CAA rated junk bonds were the bond market leaders. Overall, the shorter duration resulted in fund outperformance relative to its benchmark for the year.
Ultra Series Fund | Management’s Discussion of Fund Performance | December 31, 2013
HIGH INCOME FUND
INVESTMENT STRATEGY HIGHLIGHTS
The Ultra Series High Income Fund invests primarily in lower-rated, higher-yielding income bearing securities, such as “junk” bonds. Because the performance of these securities has historically been strongly influenced by economic conditions, the fund may rotate securities selection by business sector according to the economic outlook. Under normal market conditions, the fund invests at least 80% of its net assets in bonds rated lower than investment grade (BBB/Baa) and their unrated equivalents or other high-yielding securities.
PERFORMANCE HISTORY
Cumulative Performance of $10,000 Investment Since Inception1
|
| | | | | | | | | | |
Average Annual Total Return through December 31, 20131 |
| | 1 Year |
| 3 Years |
| 5 Years |
| 10 Years |
| Since
5/1/09
Inception |
|
| Ultra Series High Income, Class I | 5.49 | % | 7.21 | % | 13.08 | % | 6.98 | % | — |
|
| Ultra Series High Income, Class II | 5.23 |
| 6.94 |
| — |
| — |
| 10.61 | % |
| Bank of America Merrill Lynch US High Yield Master II, Constrained | 7.41 |
| 9.01 |
| 18.70 |
| 8.46 |
| 15.99 |
|
See accompanying Notes to Management’s Discussion of Fund Performance.
Ultra Series Fund | Management’s Discussion of Fund Performance | December 31, 2013
|
| | |
SECTOR ALLOCATION AS A PERCENTAGE OF NET ASSETS AS OF 12/31/13 |
| Consumer Discretionary† | 32.5 | % |
| Consumer Staples | 6.2 | % |
| Energy | 14.8 | % |
| Financials | 2.6 | % |
| Health Care | 6.4 | % |
| Industrials | 12.4 | % |
| Information Technology | 5.5 | % |
| Materials | 6.7 | % |
| Telecommunication Services | 4.7 | % |
| Utilities | 3.3 | % |
| Short-Term Investments and Other Net Assets and Liabilities | 4.9 | % |
| †Consumer Discretionary includes securities in the following industries: Auto Components; Automobiles; Hotels, Restaurants & Leisure, Media; Specialty Retail; and Textiles, Apparel & Luxury Goods. |
PERFORMANCE DISCUSSION
The Ultra Series High Income Fund (Class I) had strong absolute returns for the 12-month period, with a gain of 5.49%. This trailed its benchmark, the Bank of America Merrill Lynch U.S. High Yield Master II Constrained Index, which advanced 7.41%. While most bond sectors showed negative returns in 2013 in the wake of rising interest rates, high yield bonds were the exception. Investors continued to be attracted to their excess yield, while an improving U.S. economy buoyed confidence in corporate prospects. Based on Barclays Capital Bond Indices, intermediate corporate bonds rated in the top AAA to A classes all had small losses in 2013, while BA-rated bonds rose 5.1%, B-rated 7.5%, and CAA-rated led the market with a 13.4% gain. The fund’s returns were somewhat constrained by management’s relative quality bias and preference for bonds from more conservative industry sectors, especially Health Care, resulting in the overall underperformance against the benchmark for the year.
Ultra Series Fund | Management’s Discussion of Fund Performance | December 31, 2013
DIVERSIFIED INCOME FUND
INVESTMENT STRATEGY HIGHLIGHTS
The Ultra Series Diversified Income Fund seeks income by investing in a broadly diversified array of securities including bonds, common stocks, real estate securities, foreign market bonds and stocks and money market instruments. Bonds, stock and cash components will vary, reflecting the portfolio managers’ judgments of the relative availability of attractively yielding and priced stocks and bonds. Generally, however, bonds will constitute up to 80% of the fund’s assets, stocks will constitute up to 60% of the fund’s assets, real estate securities will constitute up to 25% of the fund’s assets, foreign stocks and bonds will constitute up to 25% of the fund’s assets and money market instruments will constitute up to 25% of the fund’s assets. Under normal market conditions, the fund intends to limit the investment in lower credit quality bonds to less than 50% of the fund’s assets. The balance between the two strategies of the fund (fixed income and equity investing) is determined after reviewing the risks associated with each type of investment, with the goal of meaningful risk reduction as market conditions demand.
PERFORMANCE HISTORY
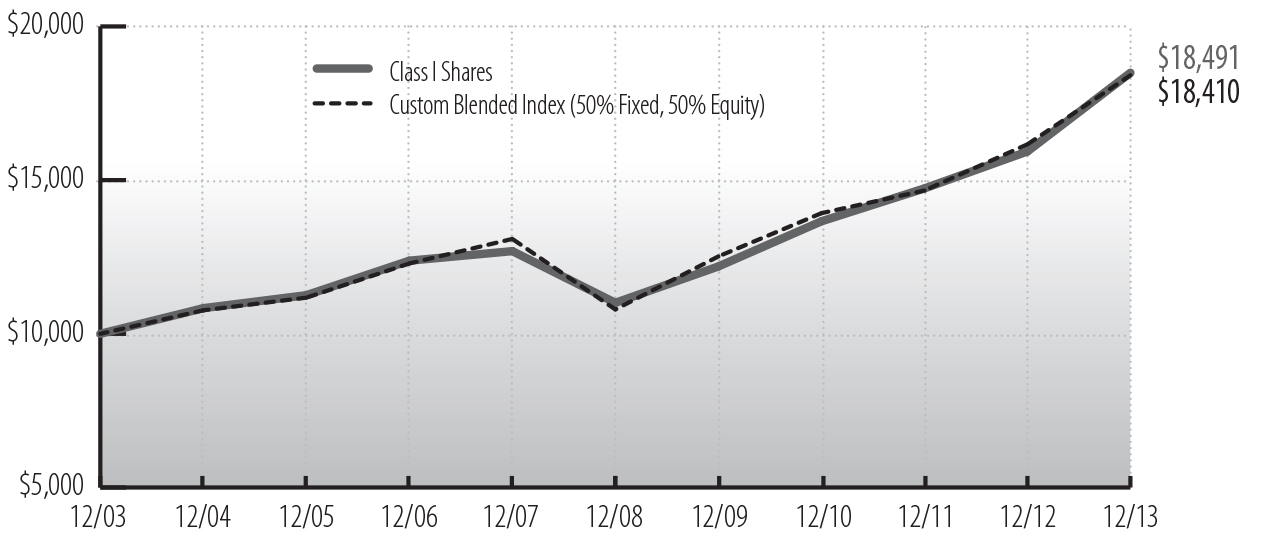
Cumulative Performance of $10,000 Investment Since Inception1
Ultra Series Fund | Management’s Discussion of Fund Performance | December 31, 2013
|
| | | | | | | | | | |
Average Annual Total Return through December 31, 20131 |
| | 1 Year |
| 3 Years |
| 5 Years |
| 10 Years |
| Since
5/1/09
Inception |
|
| Ultra Series Diversified Income, Class I | 16.07 | % | 10.62 | % | 10.93 | % | 6.34 | % | — |
|
| Ultra Series Diversified Income, Class II | 15.78 |
| 10.35 |
| — |
| — |
| 12.29 | % |
| Custom Blended Index (50% Fixed, 50% Equity) | 13.90 |
| 9.76 |
| 11.27 |
| 6.29 |
| 12.24 |
|
| Bank of America Merrill Lynch US Corp, Govt & Mortg Index | -2.34 |
| 3.24 |
| 4.27 |
| 4.59 |
| 4.53 |
|
| S&P 500 Index | 32.39 |
| 16.18 |
| 17.94 |
| 7.41 |
| 19.84 |
|
See accompanying Notes to Management’s Discussion of Fund Performance.
|
| | |
PORTFOLIO ALLOCATION AS A PERCENTAGE OF NET ASSETS
AS OF 12/31/13 |
| Asset Backed | 0.1 | % |
| Common Stocks | 57.5 | % |
| Corporate Notes and Bonds | 14.4 | % |
| Municipal Bonds | 0.2 | % |
| Mortgage Backed | 7.0 | % |
| U.S. Government and Agency Obligations | 16.5 | % |
| Short-Term Investments and Other Net Assets and Liabilities | 4.3 | % |
PERFORMANCE DISCUSSION
The Ultra Series Diversified Income Fund (Class I) outperformed its blended benchmark with a return of 16.07% for the 12-month period. This 50% stock, 50% bond benchmark had a return of 13.90%, combining the Bank of America Merrill Lynch U.S. Corporate Government and Mortgage Index’s -2.34% return with S&P 500 Index’s 32.39% return. The equity portion of the portfolio was in line with the broader index, as value stocks trailed growth stocks only slightly over the period. The stock portfolio had its best relative returns in the Industrials sector, where an overweighting to an index-beating sector was supported by strong returns by 3M, Boeing, UPS and United Technologies. On the other hand, the rapidly rising market left many of the more defensive positions behind, and this was particularly true in Consumer Staples, where an above-index exposure and holdings in Philip Morris, Sysco and Coca-Cola trailed the market. The bond allocation suffered a negative return in face of broad bond market losses over the year but outperformed its benchmark due to a shorter, more conservative duration stance and a lighter exposure to financial and mortgage-based bonds, which had sharper declines than the overall market.
Ultra Series Fund | Management’s Discussion of Fund Performance | December 31, 2013
LARGE CAP VALUE FUND
INVESTMENT STRATEGY HIGHLIGHTS
The Ultra Series Large Cap Value Fund will, under normal market conditions, maintain at least 80% of its net assets in large cap stocks. The fund follows a “value” approach, meaning the portfolio managers seek to invest in stocks at prices below their perceived intrinsic value as estimated based on fundamental analysis of the issuing company and its prospects. By investing in value stocks, the fund attempts to limit the downside risk over time but may also produce smaller gains than other stock funds if their intrinsic values are not realized by the market or if growth-oriented investments are favored by investors. The fund will diversify its holdings among various industries and among companies within those industries.
PERFORMANCE HISTORY
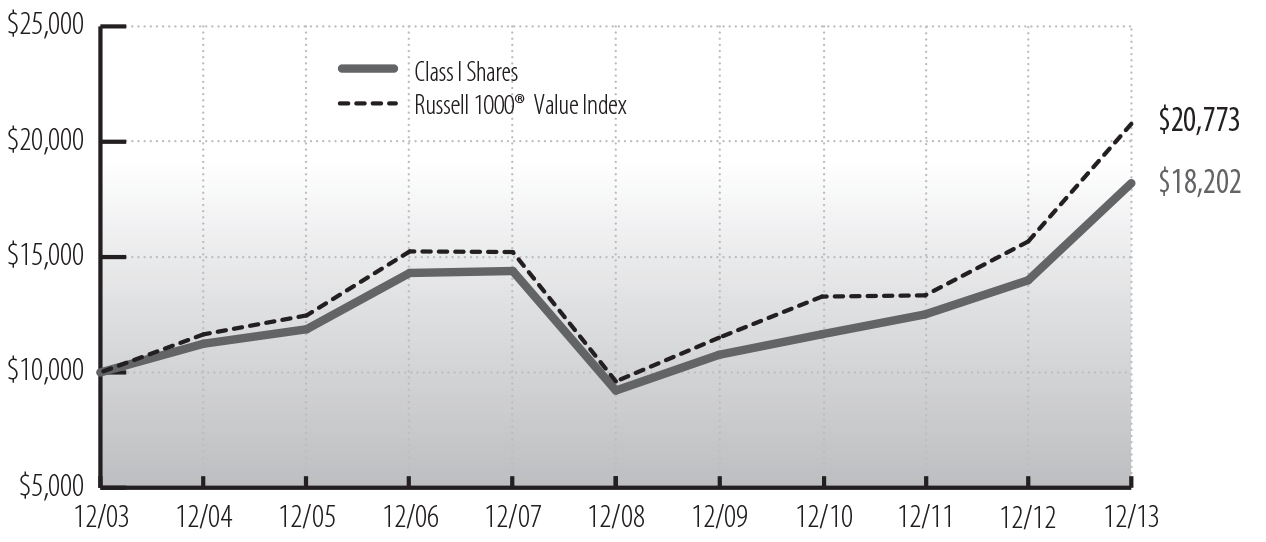
Cumulative Performance of $10,000 Investment Since Inception1
|
| | | | | | | | | | |
Average Annual Total Return through December 31, 20131 |
| | 1 Year |
| 3 Years |
| 5 Years |
| 10 Years |
| Since
5/1/09
Inception |
|
| Ultra Series Large Cap Value, Class I | 30.07 | % | 16.02 | % | 14.58 | % | 6.17 | % | — |
|
| Ultra Series Large Cap Value, Class II | 29.74 |
| 15.73 |
| — |
| — |
| 17.35 | % |
| Russell 1000 Value Index | 32.53 |
| 16.06 |
| 16.67 |
| 7.58 |
| 19.91 |
|
See accompanying Notes to Management’s Discussion of Fund Performance.
Ultra Series Fund | Management’s Discussion of Fund Performance | December 31, 2013
|
| | | | |
SECTOR ALLOCATION AS A PERCENTAGE OF NET ASSETS AS OF 12/31/13 |
| | Fund | Russell 1000® Value Index |
| Consumer Discretionary | 11.8 | % | 6.7 | % |
| Consumer Staples | 8.1 | % | 5.9 | % |
| Energy | 14.3 | % | 15.0 | % |
| Financials† | 25.2 | % | 29.0 | % |
| Health Care | 14.2 | % | 12.9 | % |
| Industrials | 14.3 | % | 10.4 | % |
| Information Technology | 6.3 | % | 8.9 | % |
| Materials | 1.2 | % | 3.0 | % |
| Telecommunication Services | 1.2 | % | 2.5 | % |
| Utilities | — |
| 5.7 | % |
| Short-Term Investments and Other Net Assets and Liabilities | 3.4 | % | — |
|
| †Financials includes securities in the following industries: Capital Markets; Commercial Banks; Insurance; and Real Estate Management & Development. |
PERFORMANCE DISCUSSION
The Ultra Series Large Cap Value Fund (Class I) returned 30.07% for the twelve-month period, underperforming the Russell 1000® Value Index, which advanced 32.53%. The largest lag in terms of sector performance was in Materials, where the fund experienced a negative return against the Index’s positive results, as Newmont Mining was punished when the price of gold plummeted, and The Mosaic Company was hit by unexpected price cuts from foreign competitors. Other drags on performance included the fund’s three Materials Sector stocks, which had negative results for the period. The fund‘s holdings in cash, which is necessary for fund operations, was also a detriment in a rapidly rising market. IBM was the largest detractor in Technology. The fund had particularly strong results in the index-beating Industrials Sector, where a higher exposure and excellent results from 3M, Boeing, UPS and United Technologies. The fund also had excellent results in Consumer Discretionary, led by communications stocks Viacom, Time Warner and Omnicom. Overall, the burden on performance outweighed the strongly performing positives, which resulted in underperformance against the benchmark.
Ultra Series Fund | Management’s Discussion of Fund Performance | December 31, 2013
LARGE CAP GROWTH FUND
INVESTMENT STRATEGY HIGHLIGHTS
The Ultra Series Large Cap Growth Fund invests primarily in common stocks of larger companies and will, under normal market conditions, maintain at least 80% of its net assets in large cap stocks. Stocks selected for the fund will represent primarily well-established companies that have a demonstrated pattern of consistent growth. To a lesser extent, the fund may invest in less established companies that may offer more rapid growth potential. The fund has an active trading strategy which will lead to more portfolio turnover than a more passively-managed fund.
PERFORMANCE HISTORY
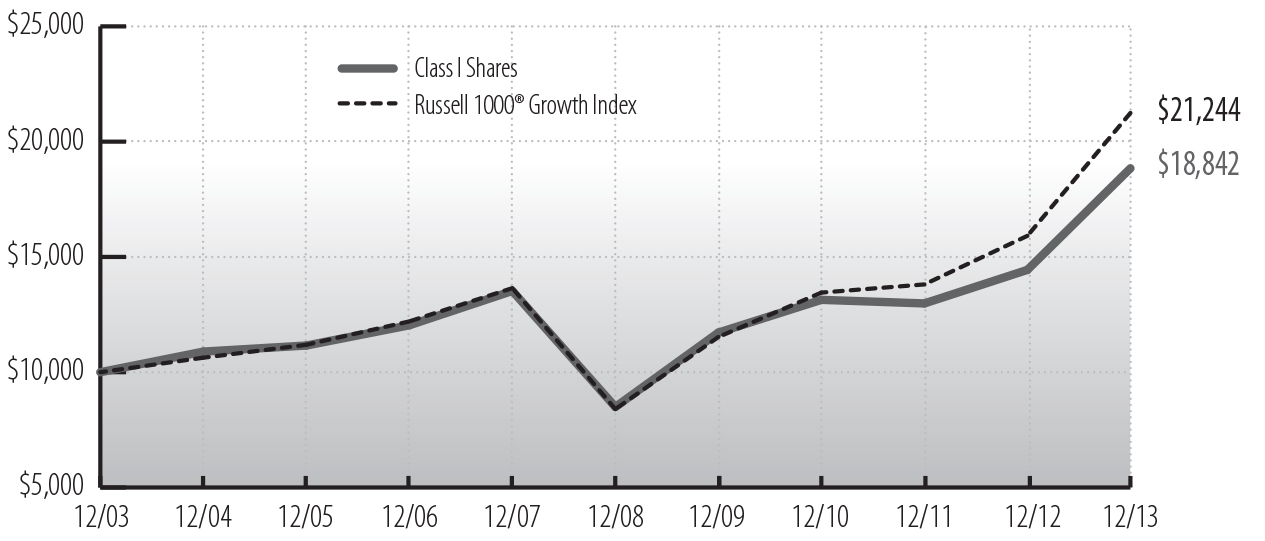
Cumulative Performance of $10,000 Investment Since Inception1
|
| | | | | | | | | | |
Average Annual Total Return through December 31, 20131 |
| | 1 Year |
| 3 Years |
| 5 Years |
| 10 Years |
| Since
5/1/09
Inception |
|
| Ultra Series Large Cap Growth, Class I | 30.51 | % | 12.77 | % | 17.28 | % | 6.54 | % | — |
|
| Ultra Series Large Cap Growth, Class II | 30.18 |
| 12.49 |
| — |
| — |
| 16.11 | % |
| Russell 1000® Growth Index | 33.48 |
| 16.45 |
| 20.39 |
| 7.83 |
| 20.56 |
|
See accompanying Notes to Management’s Discussion of Fund Performance.
Ultra Series Fund | Management’s Discussion of Fund Performance | December 31, 2013
|
| | | | |
SECTOR ALLOCATION AS A PERCENTAGE OF NET ASSETS AS OF 12/31/13 |
| | Fund | Russell 1000® Growth Index |
| Consumer Discretionary | 19.8 | % | 19.9 | % |
| Consumer Staples | 8.3 | % | 12.0 | % |
| Energy | 4.3 | % | 4.3 | % |
| Financials | 2.8 | % | 5.5 | % |
| Health Care | 12.1 | % | 12.2 | % |
| Industrials | 15.4 | % | 12.3 | % |
| Information Technology† | 28.5 | % | 27.0 | % |
| Materials | 3.6 | % | 4.5 | % |
| Telecommunication Services | – |
| 2.0 | % |
| Utilities | – |
| 0.3 | % |
| Short-Term Investments and Other Net Assets and Liabilities | 5.2 | % | – |
|
†Information Technology includes securities in the following industries: Communications Equipment; Computers and Peripherals; Internet Software & Services; IT services; Semiconductors & Semiconductor Equipment; and Software. |
PERFORMANCE DISCUSSION
The Ultra Series Large Cap Growth Fund (Class I) returned 30.51% for the 12-month period, underperforming the Russell 1000® Growth Index, which advanced 33.48%. This was a period in which lower-quality, more financially leveraged companies showed better returns than higher-quality companies with strong balance sheets, which we as fund manager, favor. Another related headwind for the fund was sector allocation, as the fund was underweight one of the S&P 500’s best-performing sectors, Health Care. However, stock picking made up the difference, led by biotechs Biogen Idec and Celgene. The main detriment for the period was not stock picking or sector allocation, but the holding of cash in such a strong market, which contributed more than three-fourths of the fund’s underperformance. While holding some cash is generally part of prudent management of liquidity in a mutual fund, rapidly rising valuations during this period made it increasingly difficult for us to find attractive entry points for investing. In such circumstances we typically are pa-tient, waiting for more opportune times to invest, and cash positions can rise. The fund had its worst relative performance in Con-sumer Discretionary and Technology. Con-sumer stocks which disappointed included Lululemon Athletica and JCPenney. Tech-nology was hampered by an overweight in Apple and disappointing returns from IBM and Nuance Communications. In addition to the stellar returns of the fund’s biotechnology holdings, top contributors included Amazon, Google and Microsoft.
Ultra Series Fund | Management’s Discussion of Fund Performance | December 31, 2013
MID CAP FUND
INVESTMENT STRATEGY HIGHLIGHTS
The Ultra Series Mid Cap Fund generally invests in common stocks of midsize companies and will, under normal market conditions, maintain at least 80% of its net assets in mid cap securities. The fund seeks attractive long-term returns through bottom-up security selection based on fundamental analysis in a diversified portfolio of high-quality growth companies with attractive valuations. These will typically be industry leading companies in niches with strong growth prospects. The fund’s portfolio managers believe in selecting stocks for the fund that show steady, sustainable growth and reasonable valuations. As a result, stocks of issuers that are believed to have a blend of both value and growth potential will be selected for investment.
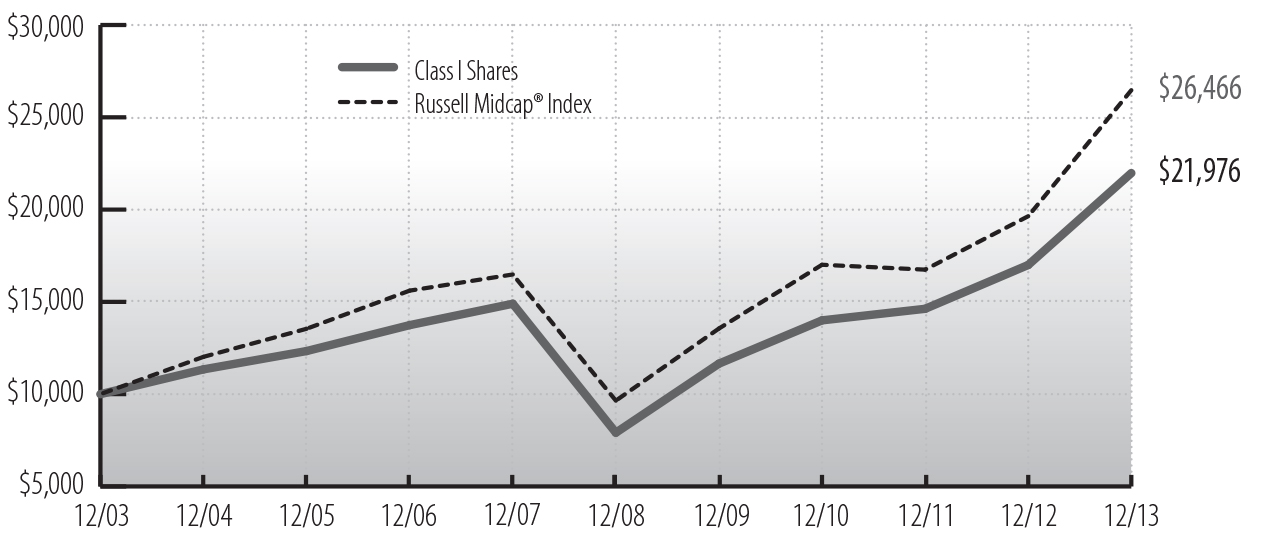
PERFORMANCE HISTORY
Cumulative Performance of $10,000 Investment Since Inception1
|
| | | | | | | | | | |
Average Annual Total Return through December 31, 20131 |
| | 1 Year |
| 3 Years |
| 5 Years |
| 10 Years |
| Since
5/1/09
Inception |
|
| Ultra Series Mid Cap, Class I | 29.28 | % | 16.22 | % | 22.67 | % | 8.19 | % | — |
|
| Ultra Series Mid Cap, Class II | 28.95 |
| 15.94 |
| — |
| — |
| 20.12 | % |
| Russell Midcap Index | 34.76 |
| 15.88 |
| 22.36 |
| 10.22 |
| 22.79 |
|
See accompanying Notes to Management’s Discussion of Fund Performance.
Ultra Series Fund | Management’s Discussion of Fund Performance | December 31, 2013
|
| | | | |
SECTOR ALLOCATION AS A PERCENTAGE OF NET ASSETS AS OF 12/31/13 |
| | Fund | Russell Midcap® Index |
| Consumer Discretionary† | 30.3 | % | 17.7 | % |
| Consumer Staples | 0.8 | % | 5.7 | % |
| Energy | 4.2 | % | 6.3 | % |
| Financials | 22.8 | % | 19.9 | % |
| Health Care | 10.9 | % | 11.0 | % |
| Industrials | 17.5 | % | 13.1 | % |
| Information Technology | 4.9 | % | 13.5 | % |
| Materials | 3.3 | % | 5.7 | % |
| Telecommunication Services | – |
| 1.1 | % |
| Utilities | – |
| 6.0 | % |
| Short-Term Investments and Other Net Assets and Liabilities | 5.3 | % | – |
|
| †Consumer Discretionary includes securities in the following industries: Media and Specialty Retail. |
PERFORMANCE DISCUSSION
The Ultra Series Mid Cap Fund (Class I) rose 29.28%, against the strong returns of the Russell Midcap® Index, which was up 34.76% during the twelve-month period. The fund was focused on high-quality companies with strong fundamentals, but lower quality, riskier assets performed better during the period. Most of the underperformance came from three sources. Holding cash in such a strong market is always a detriment, and over the year it amounted to some 40% of the fund’s performance gap against the Index. While holding some cash is generally part of prudent management of liquidity in a mutual fund, rapidly rising valuations during this period made it increasingly difficult for us to find attractive entry points for investing. In such circumstances we typically are patient, waiting for more opportune times to invest, and cash positions can rise. Most of the remaining lag came from the Heath Care and Industrial Sectors, as both sectors outperformed the overall market. Not holding the hottest biotech stocks made it hard to keep up in Heath Care, as the fund’s largest holding in the sector, Laboratory Corporation of America produced only single-digit gains. In the Industrials Sector the fund held some strong stocks, but results were hampered by holdings in C.H. Robinson and Ritchie Brothers Auctioneers. The fund had strong results in the year’s best performing sector, Consumer Discretionary where we had significant exposure to a number of index-beating stocks including Advance Auto Parts, advertiser Omnicom Group and retailers TJX and Tiffany.
Ultra Series Fund | Management’s Discussion of Fund Performance | December 31, 2013
SMALL CAP FUND
INVESTMENT STRATEGY HIGHLIGHTS
The Ultra Series Small Cap Fund invests primarily in a diversified mix of common stocks of small cap U.S. companies that are believed to be undervalued by various measures and offer sound prospects for capital appreciation. Under normal market conditions, the fund will maintain at least 80% of its net assets in small cap securities. The portfolio managers employ a value-oriented investment approach in selecting stocks, using proprietary fundamental research to identify securities of companies they believe have attractive valuations. The portfolio managers focus on companies with a record of above average rates of profitability that sell at a discount relative to the overall small cap market. Through fundamental research, the portfolio managers seek to identify those companies that possess one or more of the following characteristics: sustainable competitive advantages within a market niche; strong profitability and free cash flows; strong market share positions and trends; quality of and share ownership by management; and financial structures that are more conservative than the relevant industry average.
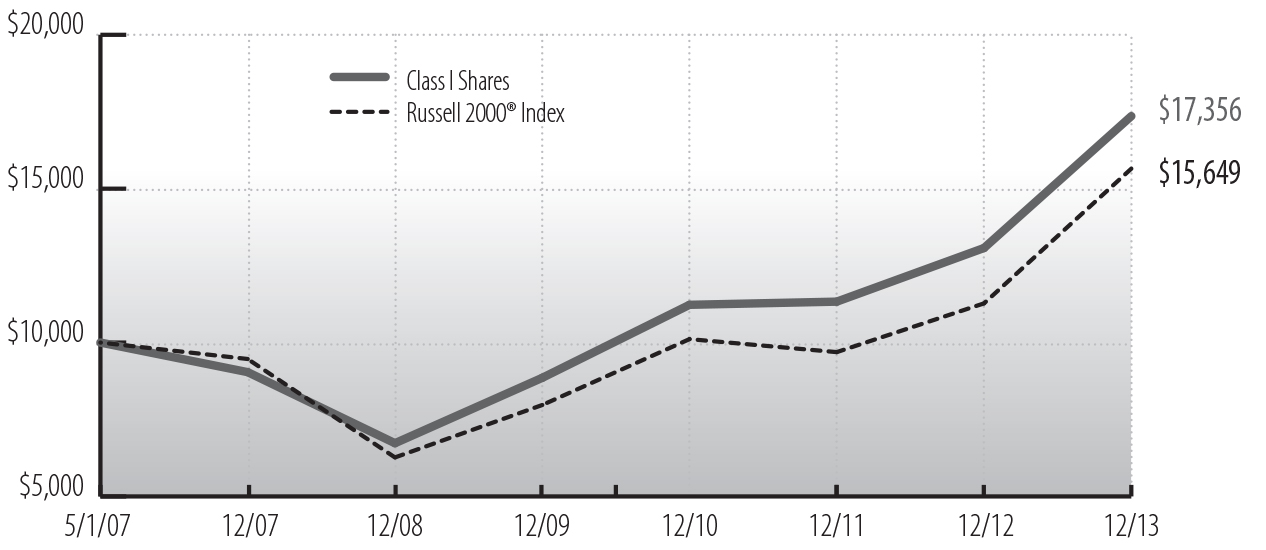
PERFORMANCE HISTORY
Cumulative Performance of $10,000 Investment Since Inception1
Ultra Series Fund | Management’s Discussion of Fund Performance | December 31, 2013
|
| | | | | | | | | | |
Average Annual Total Return through December 31, 20131 |
| | 1 Year |
| 3 Years |
| 5 Years |
| Since
5/1/07
Inception |
| Since
5/1/09
Inception |
|
| Ultra Series Small Cap Class I Shares | 32.77 | % | 15.63 | % | 20.86 | % | 8.62 | % | — |
|
| Ultra Series Small Cap Class II Shares | 32.44 |
| 15.34 |
| — |
| — |
| 22.23 | % |
| Russell 2000® Index | 38.82 |
| 15.67 |
| 20.08 |
| 6.94 |
| 22.16 |
|
See accompanying Notes to Management’s Discussion of Fund Performance.
|
| | | | |
SECTOR ALLOCATION AS A PERCENTAGE OF NET ASSETS
AS OF 12/31/13 |
| | Fund | Russell 2000® Index |
| Consumer Discretionary | 13.0 | % | 13.7 | % |
| Consumer Staples | 2.1 | % | 3.8 | % |
| Energy | 5.7 | % | 5.5 | % |
| Financials | 21.4 | % | 22.8 | % |
| Health Care | 10.8 | % | 13.2 | % |
| Industrials | 18.6 | % | 14.5 | % |
| Information Technology | 14.2 | % | 17.8 | % |
| Materials | 6.9 | % | 4.9 | % |
| Telecommunication Services | – |
| 0.8 | % |
| Utilities | 4.2 | % | 3.0 | % |
| Short-Term Investments and Other Net Assets and Liabilities | 3.1 | % | – |
|
PERFORMANCE DISCUSSION
The Ultra Series Small Cap Fund (Class I) returned 32.77% for the 12-month period, underperforming the Russell 2000® Index, which advanced 38.82%. Sector allocation, which is a residual of the bottom-up stock selection process, was a detractor from relative results during the period, as our overweight exposure to the Materials and Utilities Sectors weighed on returns. A cash balance within the fund, which is necessary for fund operations but not a component of the fund’s benchmark index, was also a drag on performance in a rising market. On the positive side, an underweight allocation to the weak-performing Financials Sector and an overweight to the strong-performing Industrials Sector contributed to relative performance. Security selection also detracted from relative returns during the period as weak selection in the Consumer Discretionary, Industrials, and Health Care sectors was only partially offset by strong stock selection within Energy, Financials, and Utilities. The fund’s most significant detractors from
Ultra Series Fund | Management’s Discussion of Fund Performance | December 31, 2013
relative performance during the period included real estate investment trust Campus Crest Communities, industrial products and systems producer ESCO Technologies, and designer and manufacturer of school and office products ACCO Brands. Independent energy company Halcon Resources was also among top detractors from absolute performance. The fund’s top contributors to relative returns during the period included provider of branded uniform and facility services programs, G&K Services, oil and natural gas exploration company, Diamondback Energy, and health care management services and solutions provider, CorVel. Positions in Belden, designer, manufacturer, and marketer of electronic cables and connectivity products for the specialty electronics and data-networking markets, and manufacturer, Albany International, were also among the largest contributors to absolute returns during the period.
INTERNATIONAL STOCK FUND
INVESTMENT STRATEGY HIGHLIGHTS
The Ultra Series International Stock Fund will invest, under normal market conditions, at least 80% of its net assets in the stock of foreign companies. Typically, a majority of the fund’s assets are invested in relatively large cap stocks of companies located or operating in developed countries. The fund may also invest up to 30% of its assets in securities of companies whose principal business activities are located in emerging market countries. The portfolio managers typically maintain this segment of the fund’s portfolio in such stocks which it believes have a low market price relative to their perceived value based on fundamental analysis of the issuing company and its prospects. The fund may also invest in foreign debt and other income bearing securities at times when it believes that income bearing securities have greater capital appreciation potential than equity securities.
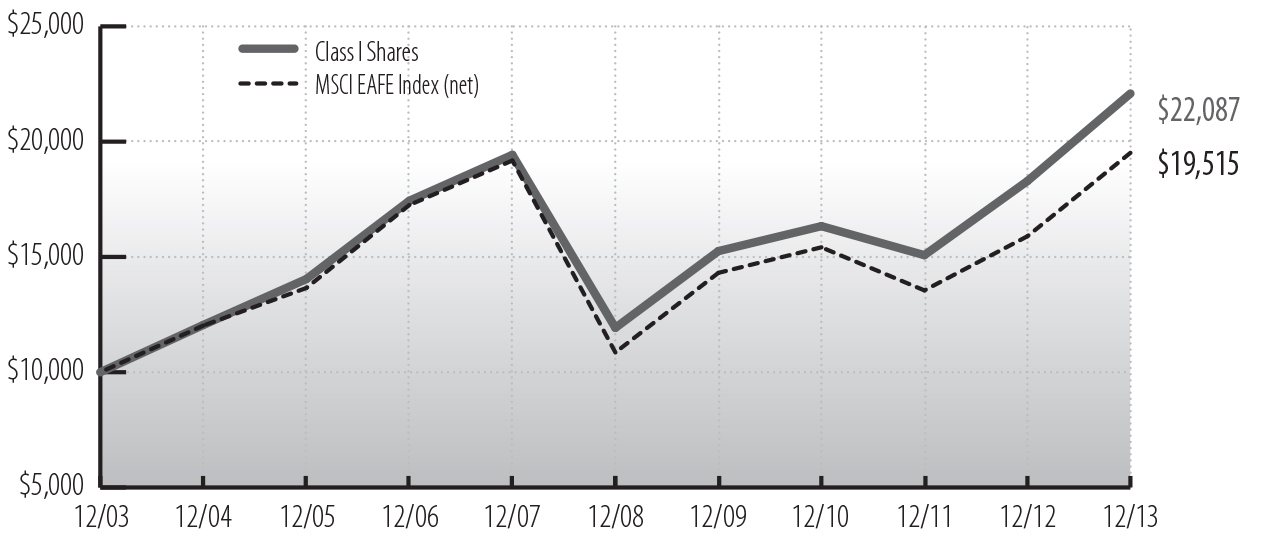
PERFORMANCE HISTORY
Cumulative Performance of $10,000 Investment Since Inception1
|
| | | | | | | | | | |
Average Annual Total Return through December 31, 20131 |
| | 1 Year |
| 3 Years |
| 5 Years |
| 10 Years |
| Since
5/1/09
Inception |
|
| Ultra Series International Stock, Class I | 20.76 | % | 10.58 | % | 13.12 | % | 8.25 | % | — |
|
| Ultra Series International Stock, Class II | 20.45 |
| 10.31 |
| — |
| — |
| 14.69 | % |
| MSCI EAFE Index (net) | 22.78 |
| 8.17 |
| 12.44 |
| 6.91 |
| 14.08 |
|
See accompanying Notes to Management’s Discussion of Fund Performance.
|
| | |
GEOGRAPHICAL ALLOCATION AS A PERCENTAGE OF NET ASSETS AS OF 12/31/13 |
| Europe (excluding United Kingdom) | 47.6 | % |
| Japan | 19.3 | % |
| Latin America | 2.0 | % |
| Pacific Basin | 5.5 | % |
| United Kingdom | 20.3 | % |
| Other Countries | 3.1 | % |
| Short-Term Investments and Other Net Assets and Liabilities | 2.2 | % |
PERFORMANCE DISCUSSION
The Ultra Series International Equity Fund (Class I) returned 20.76% for the 12-month period, underperforming the MSCI EAFE (net) Index’s 22.78%. Exposure to emerging markets was a detriment, since developed markets were the leaders over the year. The fund also faced headwinds from a slight underweight in Japan, where the Nikkei Index rose 57%, buoyed by economic reforms from Prime Minister Abe and aggressive central bank stimulus. In the consumer discretionary sector, French auto parts supplier Valeo performed well on increased car sales. In financials, British insurer Prudential added to returns amid continued strong growth in its Asian unit. A below-benchmark weight and stock selection in the outperforming telecom services industry hurt the fund, as did the Energy Sector as French seismic surveyors CGG and Petroleum Geo-Services declined on disappointing results.
MADISON TARGET RETIREMENT 2020 FUND
INVESTMENT STRATEGY HIGHLIGHTS
The Madison Target Retirement 2020 Fund invests primarily in shares of registered investment companies according to an asset allocation strategy developed by the fund’s investment adviser for investors planning to retire in or within a few years of 2020. Over time, the fund’s asset allocation will gradually shift from the sector allocation shown below (see sector allocation in the grey box) until it reaches the more conservative allocation target of approximately 15-30% in stock funds and 70-85% in bond funds. The asset allocation strategy is designed to reduce the volatility of investment returns in the later years while still providing the potential for higher total returns over the target period.
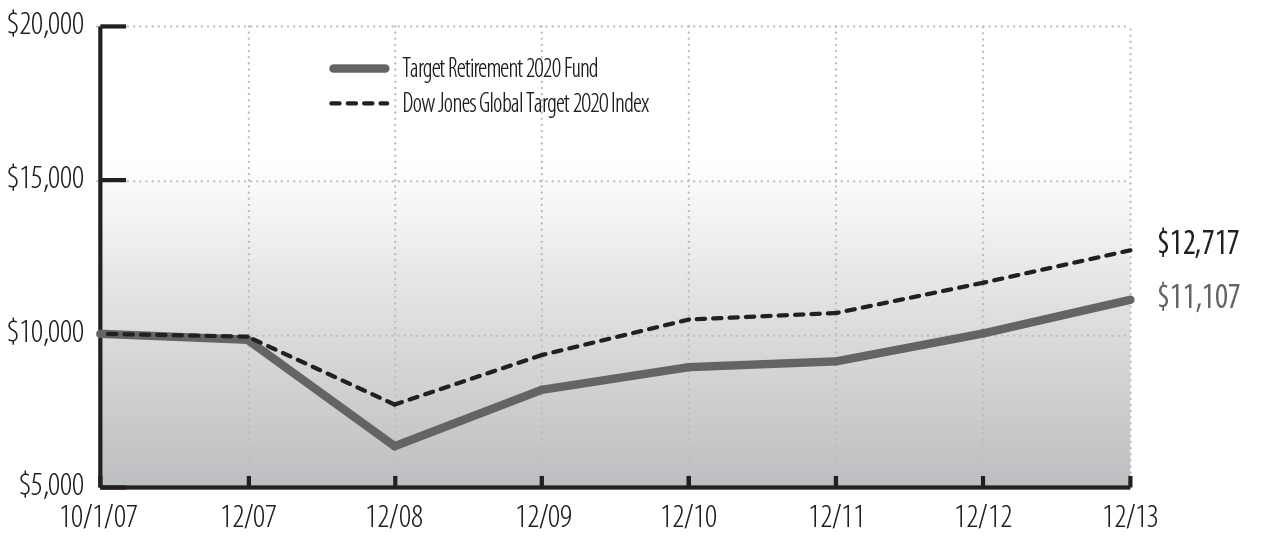
PERFORMANCE HISTORY
Cumulative Performance of $10,000 Investment Since Inception1,2
|
| | | | | | | | |
Average Annual Total Return through December 31, 20131,2 |
| | 1 Year |
| 3 Years |
| 5 Years |
| Since
10/1/07
Inception |
|
| Ultra Series Target Retirement 2020, Class I | 10.94 | % | 7.61 | % | 11.86 | % | 1.69 | % |
| Dow Jones Global Target 2020 Index | 9.05 |
| 6.71 |
| 10.56 |
| 3.92 |
|
See accompanying Notes to Management’s Discussion of Fund Performance.
|
| | |
PORTFOLIO ALLOCATION AS A PERCENTAGE OF NET ASSETS AS OF 12/31/13 |
| Bond Funds | 60.8 | % |
| Stock Funds | 33.1 | % |
| Foreign Stock Funds | 4.8 | % |
| Money Market Funds and Other Net Assets | 1.3 | % |
PERFORMANCE DISCUSSION
The Ultra Series Madison Target Retirement 2020 Fund (Class I) returned 10.94% for the 12-month period, outperforming the Dow Jones Global Target 2020 Index return of 9.05%, while trailing the Morningstar Target Date 2016-2020 fund category average return of 11.57%. Our prejudice for capital preservation in this shorter-to-target fund was a detriment against more aggressive peers in the sort of rapidly ascending stock market we experienced in 2013. The two greatest positive contributors to performance were the fund’s relative overweight to U.S. stocks within the equity allocation, and a below-benchmark duration within the fixed income portion of the portfolio. The broad U.S. stock market (Russell 3000® Index) outperformed the international market (MSCI EAFE Index) by approximately 10% over the period. Bonds were hurt by a significant rise in interest rates since the end of 2012. The yield on the bellwether 10-year Treasury note began the year below 2% and climbed to just over 3% by year’s end. The fund‘s modest duration and floating rate holdings served to mitigate the losses within the fixed income portion of the fund. The two most negative detractors from performance were the fund’s underweighting to smaller cap stocks and the fund’s exposure to emerging markets debt. Emerging markets debt was dually impacted by the sharp rise in interest rates and a strengthening U.S. Dollar.
Ultra Series Fund | Management’s Discussion of Fund Performance | December 31, 2013
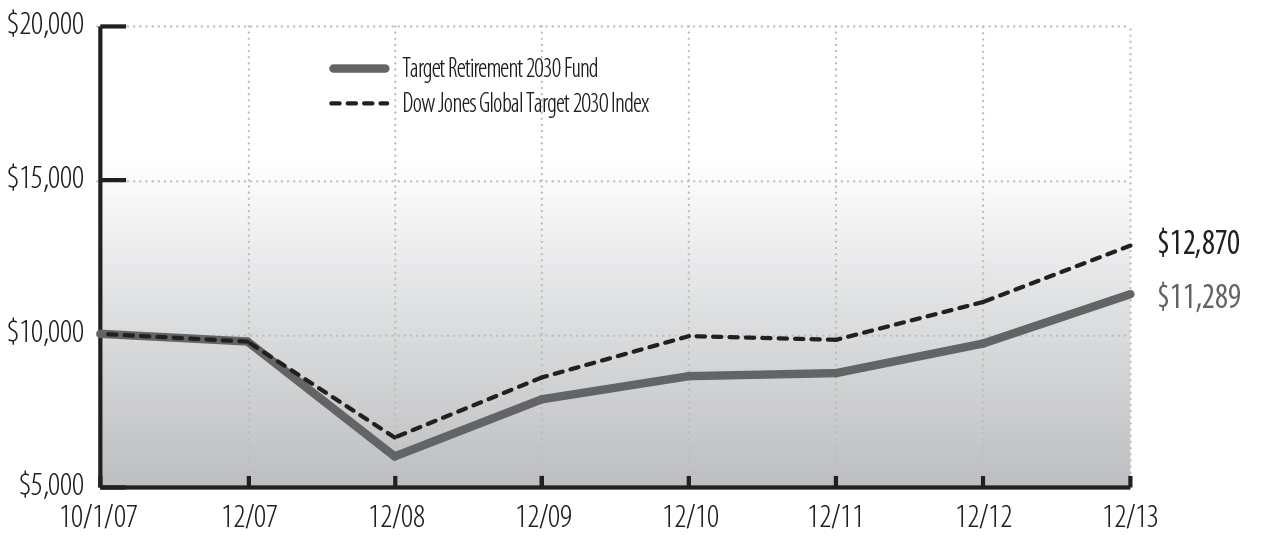
MADISON TARGET RETIREMENT 2030 FUND
INVESTMENT STRATEGY HIGHLIGHTS
The Madison Target Retirement 2030 Fund invests primarily in shares of registered investment companies according to an asset allocation strategy developed by the fund’s investment adviser for investors planning to retire in or within a few years of 2030. Over time, the fund’s asset allocation will gradually shift from the sector allocation shown below (see sector allocation in the grey box) until it reaches the more conservative allocation target of approximately 15-30% in stock funds and 70-85% in bond funds. The asset allocation strategy is designed to reduce the volatility of investment returns in the later years while still providing the potential for higher total returns over the target period.
PERFORMANCE HISTORY
Cumulative Performance of $10,000 Investment Since Inception1,2
|
| | | | | | | | |
Average Annual Total Return through December 31, 20131,2 |
| | 1 Year |
| 3 Years |
| 5 Years |
| Since
10/1/07
Inception |
|
| Ultra Series Target Retirement 2030, Class I | 16.56 | % | 9.40 | % | 13.44 | % | 1.96 | % |
| Dow Jones Global Target 2030 Index | 16.59 |
| 9.04 |
| 14.20 |
| 4.12 |
|
See accompanying Notes to Management’s Discussion of Fund Performance.
Ultra Series Fund | Management’s Discussion of Fund Performance | December 31, 2013
|
| | |
PORTFOLIO ALLOCATION AS A PERCENTAGE OF NET ASSETS AS OF 12/31/13 |
| Bond Funds | 39.4 | % |
| Stock Funds | 50.4 | % |
| Foreign Stock Funds | 8.9 | % |
| Money Market Funds and Other Net Assets | 1.3 | % |
PERFORMANCE DISCUSSION
The Ultra Series Madison Target Retirement 2030 Fund (Class I) returned 16.56% for the 12-month period, almost identical to the Dow Jones Global Target 2030 Index return of 16.59%, and just behind the Morningstar Target Date 2026-2030 fund category average return of 16.65%. Our conservative positioning of asset allocation (59% equity compared to the Index’s 65%) was a relative detriment in 2013, with the rapid rise of the U.S. and overseas stock markets. On the other hand, the two greatest positive contributors to performance were the fund’s relative overweight to U.S. stocks within the equity allocation, and a below-benchmark duration within the fixed income portion of the portfolio. The broad U.S. stock market (Russell 3000® Index) outperformed the international market (MSCI EAFE Index) by approximately 10% over the period. Bonds were hurt by a significant rise in interest rates since the end of 2012. The yield on the bellwether 10-year Treasury note began the year below 2% and climbed to just over 3% by year’s end. The fund’s more modest duration and floating rate holdings served to mitigate the losses within the fixed income portion of the fund. The two most negative detractors from performance were the fund’s underweighting to smaller cap stocks and the fund’s exposure to emerging markets debt. Emerging markets debt was dually impacted by the sharp rise in interest rates and a strengthening U.S. Dollar.
Ultra Series Fund | Management’s Discussion of Fund Performance | December 31, 2013
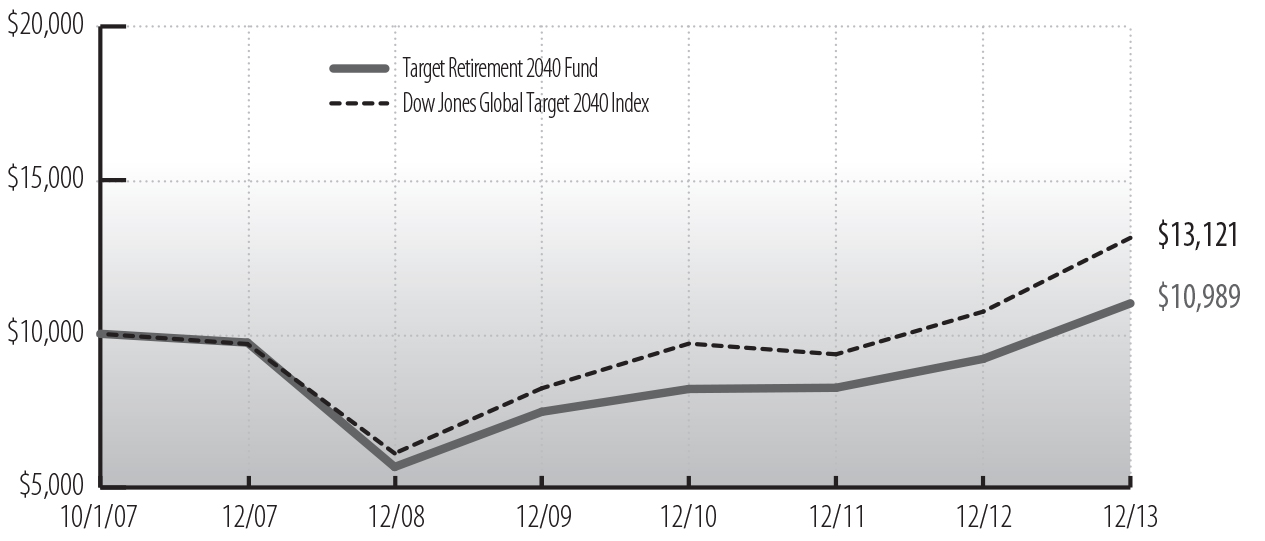
MADISON TARGET RETIREMENT 2040 FUND
INVESTMENT STRATEGY HIGHLIGHTS
The Madison Target Retirement 2040 Fund invests primarily in shares of registered investment companies according to an asset allocation strategy developed by the fund’s investment adviser for investors planning to retire in or within a few years of 2040. Over time, the fund’s asset allocation will gradually shift from the sector allocation shown below (see sector allocation in the grey box) until it reaches the more conservative allocation target of approximately 15-30% in stock funds and 70-85% in bond funds. The asset allocation strategy is designed to reduce the volatility of investment returns in the later years while still providing the potential for higher total returns over the target period.
PERFORMANCE HISTORY
Cumulative Performance of $10,000 Investment Since Inception1,2
|
| | | | | | | | |
Average Annual Total Return through December 31, 20131,2 |
| | 1 Year |
| 3 Years |
| 5 Years |
| Since
10/1/07
Inception |
|
| Ultra Series Target Retirement 2040, Class I | 19.63 | % | 10.23 | % | 14.16 | % | 1.52 | % |
| Dow Jones Global Target 2040 Index | 22.38 |
| 10.67 |
| 16.51 |
| 4.44 |
|
See accompanying Notes to Management’s Discussion of Fund Performance.
Ultra Series Fund | Management’s Discussion of Fund Performance | December 31, 2013
|
| | |
PORTFOLIO ALLOCATION AS A PERCENTAGE OF NET ASSETS AS OF 12/31/13 |
| Bond Funds | 28.3 | % |
| Stock Funds | 58.8 | % |
| Foreign Stock Funds | 11.5 | % |
| Money Market Funds and Other Net Assets | 1.4 | % |
PERFORMANCE DISCUSSION
The Ultra Series Madison Target Retirement 2040 Fund (Class I) returned 19.63% over the 12-month period, underperforming the Dow Jones Global Target 2040 Index return of 22.38%, and to a lesser extent, the Morningstar Target Date 2036-2040 fund category average return of 19.97%. With stock markets making major advances both domestically and overseas, the biggest driver of performance was stock allocation, where we tend to be on the conservative side (70% equity to the Index’s 85%). On the other hand, the two greatest positive contributors to performance were the fund’s relative overweight to U.S. stocks within the equity allocation, and a below-benchmark duration within the fixed income portion of the portfolio. The broad U.S. stock market (Russell 3000® Index) outperformed the international market (MSCI EAFE Index) by approximately 10% over the period. Bonds were hurt by a significant rise in interest rates since the end of 2012. The yield on the bellwether 10-year Treasury note began the year below 2% and climbed to just over 3% by year’s end. The fund’s modest duration and floating rate holdings served to mitigate the losses within the fixed income portion of the fund. The two most negative detractors from performance were the fund’s underweighting to smaller cap stocks and weak selection among core U.S. large cap stock positions.
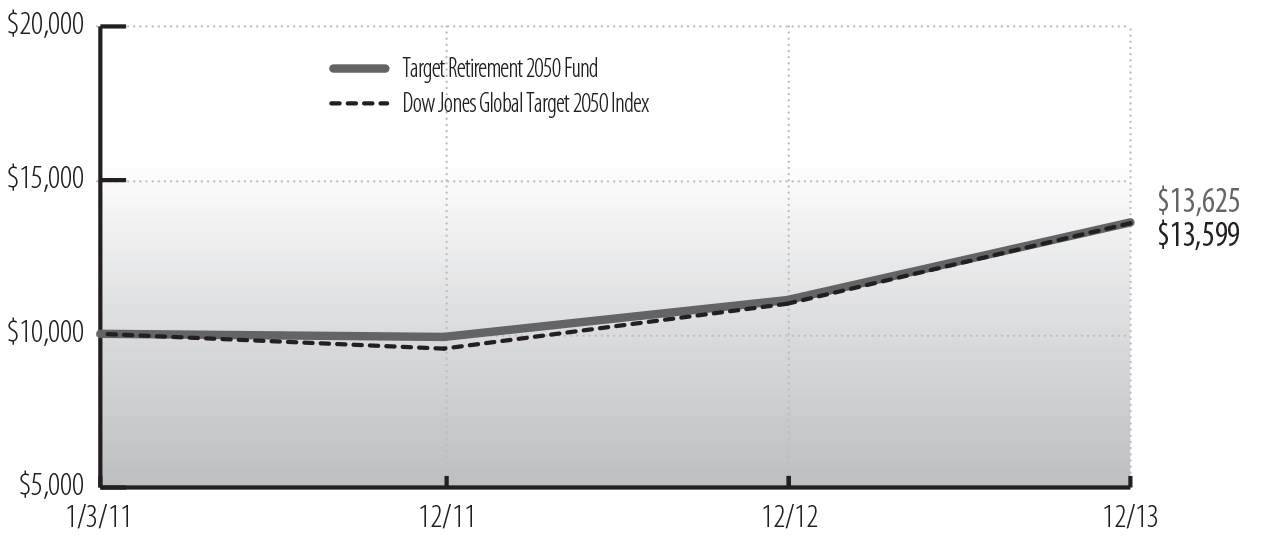
MADISON TARGET RETIREMENT 2050 FUND
INVESTMENT STRATEGY HIGHLIGHTS
The Madison Target Retirement 2050 Fund invests primarily in shares of registered investment companies according to an asset allocation strategy developed by the fund’s investment adviser for investors planning to retire in or within a few years of 2050. Over time, the fund’s asset allocation will gradually shift from the sector allocation shown below (see sector allocation in the grey box) until it reaches the more conservative allocation target of approximately 15-30% in stock funds and 70-85% in bond funds. The asset allocation strategy is designed to reduce the volatility of investment returns in the later years while still providing the potential for higher total returns over the target period.
PERFORMANCE HISTORY
Cumulative Performance of $10,000 Investment Since Inception1,2
|
| | | | |
Average Annual Total Return through December 31, 20131,2 | |
| | 1 Year |
| Since
1/3/11
Inception |
|
| Ultra Series Target Retirement 2050, Class I | 22.78 | % | 10.88 | % |
| Dow Jones Global Target 2050 Index | 23.89 |
| 10.82 |
|
See accompanying Notes to Management’s Discussion of Fund Performance.
|
| | |
| PORTFOLIO ALLOCATION AS A PERCENTAGE OF NET ASSETS |
| AS OF 12/31/13 |
| Bond Funds | 17.1 | % |
| Stock Funds | 66.6 | % |
| Foreign Stock Funds | 14.8 | % |
| Money Market Funds and Other Net Assets | 1.5 | % |
PERFORMANCE DISCUSSION
The Ultra Series Madison Target Retirement 2050 Fund (Class I) returned 22.78% over the 12-month period, underperforming the Dow Jones Global Target 2050 Index return of 23.89% while beating the Morningstar Target Date 2046-2050 fund category average return of 21.02%. Our more conservative asset allocation was a detriment in the rampant bull markets of 2013, with an average exposure of 82% against the Index’s target of 90%. The two greatest positive contributors to performance were the fund’s relative overweight to U.S. stocks within the equity allocation, and a below-benchmark duration within the fixed income portion of the portfolio. The broad U.S. stock market (Russell 3000® Index) outperformed the international market (MSCI EAFE Index) by approximately 10% over the period. Bonds were hurt by a significant rise in interest rates since the end of 2012. The yield on the bellwether 10-year Treasury note began the year below 2% and climbed to just over 3% by year’s end. The fund’s more modest duration and floating rate holdings served to mitigate the losses within the fixed income portion of the fund. The two most negative detractors from performance were the fund’s underweighting to smaller cap stocks and weak selection among core U.S. large cap stock positions.
Ultra Series Fund | December 31, 2013
Notes to Management’s Discussion of Fund Performance
| |
1 | Fund returns are calculated after fund level expenses have been subtracted, but do not include any separate account fees, charges or expenses imposed by the variable annuity and variable life insurance contracts that invest in the fund, as |
described in the Prospectus. If these fees, charges, or expenses were included, fund returns would have been lower. Fund returns also assume that dividends and capital gains are reinvested in additional shares of the fund. Investment return and principal value will fluctuate, so an investor’s shares, when redeemed, may be worth more or less than when purchased. Further information relating to the fund’s performance is contained in the Prospectus and elsewhere in this report. The fund’s past performance is not indicative of future performance. Current performance may be lower or higher than the performance data cited. For Ultra Series Fund performance data current to the most recent month-end, please call 1-800-670-3600 or visit www.ultraseriesfund.com. Indices are unmanaged and investors cannot invest in them directly. Index returns do not reflect fees or expenses.
| |
2 | The management fee for the Conservative, Moderate, and Aggressive Allocation Funds was reduced from June 30, 2006-April 30, 2008. Effective October 1, 2009, Madison contractually agreed to waive a portion of the management fee of the Target Retirement Date 2020, 2030 and 2040 Funds from 0.40% to 0.20%. Effective February 17, 2011, the fee was permanently reduced to 0.20%. On September 1, 2011, shareholders of the Target Retirement Date Funds approved a new fee arrangement which includes an investment advisory fee of 0.25% annualized and a services agreement fee of 0.05% annualized. If the management fees had not been reduced, returns would have been lower. |
Morningstar Percentile rankings note: 1st percentile is top, 99th percentile is bottom.
©Morningstar, Inc. All Rights Reserved. The Morningstar related information contained herein: (1) is proprietary to Morningstar and/or its content providers; (2) may not be copied or distributed; and (3) is not warranted to be accurate, complete or timely. Neither Morningstar nor its content providers are responsible for any damages or losses arising from any use of this information.
BENCHMARK DESCRIPTIONS
Allocation Fund Indexes
The Conservative Allocation Fund Custom Index consists of 65% Bank of America Merrill Lynch U.S. Corporate, Government and Mortgage Index, 30% Russell 3000® Index and 5% MSCI EAFE Index. See market indexes descriptions below.
Ultra Series Fund | December 31, 2013
The Moderate Allocation Fund Custom Index consists of 40% Bank of America Merrill Lynch U.S. Corporate, Government and Mortgage Index, 45% Russell 3000® Index and 15% MSCI EAFE Index. See market indexes descriptions below.
The Aggressive Allocation Fund Custom Index consists of 15% Bank of America Merrill Lynch U.S. Corporate, Government and Mortgage Index, 55% Russell 3000® Index and 30% MSCI EAFE Index. See market indexes descriptions below.
Hybrid Fund Indexes
The Custom Blended Index consists of 50% S&P 500 Index and 50% Bank of America Merrill Lynch U.S. Corporate, Government & Mortgage Index. See market indexes descriptions below.
Market Indexes
The Bank of America Merrill Lynch U.S. Corporate, Government & Mortgage Index is a broad-based measure of the total rate of return performance of the U.S. investment-grade bond markets. The index is a capitalization-weighted aggregation of outstanding U.S. treasury, agency and supranational mortgage pass-through, and investment-grade corporate bonds meeting specified selection criteria.
The Bank of America Merrill Lynch U.S. High Yield Master II Constrained Index tracks the performance of below investment grade U.S. dollar denominated corporate bonds publicly issued in the U.S. domestic market, but limits any individual issuer to a maximum weighting of 2%.
The Dow Jones Global Target 2020 Index is a benchmark for multi-asset class portfolios with risk profiles that become more conservative as the year 2020 approaches. The index is a composite of other indexes that represent stocks, bonds and cash.
The Dow Jones Global Target 2030 Index is a benchmark for multi-asset class portfolios with risk profiles that become more conservative as the year 2030 approaches. The index is a composite of other indexes that represent stocks, bonds and cash.
The Dow Jones Global Target 2040 Index is a benchmark for multi-asset class portfolios with risk profiles that become more conservative as the year 2040 approaches. The index is a composite of other indexes that represent stocks, bonds and cash.
The Dow Jones Global Target 2050 Index is a benchmark for multi-asset class portfolios with risk profiles that become more conservative as the year 2050 approaches. The index is a composite of other indexes that represent stocks, bonds and cash.
Ultra Series Fund | December 31, 2013
The MSCI EAFE (Europe, Australasia & Far East) Index is a free float-adjusted market capitalization index that is designed to measure developed market equity performance, excluding the U.S. and Canada. The MSCI EAFE Index (net) is calculated on a total return basis with dividends reinvested after the deduction of withholding taxes.
The Russell 1000® Index is a large-cap market index which measures the performance of the 1,000 largest companies in the Russell 3000® Index (see definition below).
The Russell 1000® Growth Index is a large-cap market index which measures the performance of those Russell 1000 companies with higher price-to-book ratios and higher forecasted growth values.
The Russell 1000® Value Index is a large-cap market index which measures the performance of those Russell 1000 companies with lower price-to-book ratios and lower forecasted growth values.
The Russell 2000® Index is a small-cap market index which measures the performance of the smallest 2,000 companies in the Russell 3000® Index (see definition below.)
The Russell 3000® Index measures the performance of the 3,000 largest U.S. companies based on total market capitalization, which represents 98% of the investable U.S. equity market.
The Russell Midcap® Index is a mid-cap market index which measures the performance of the mid-cap segment of the U.S. equity universe.
The S&P 500 Index is a large-cap market index which measures the performance of a representative sample of 500 leading companies in leading industries in the U.S.
Ultra Series Fund | December 31, 2013
Conservative Allocation Fund Portfolio of Investments
|
| | | | |
| | Shares | Value (Note 2) |
|
| INVESTMENT COMPANIES - 100.3% | | |
| Bond Funds - 56.7% | | |
| Franklin Floating Rate Daily Access Fund Advisor Class | 1,883,422 | $ 17,346,314 |
|
| iShares 7-10 Year Treasury Bond ETF | 77,453 | 7,686,436 |
|
| iShares iBoxx $ High Yield Corporate Bond ETF | 23,735 | 2,204,507 |
|
| Madison Core Bond Fund Class Y (A) | 2,922,623 | 29,197,006 |
|
| Madison Corporate Bond Fund Class Y (A) | 1,242,125 | 13,899,373 |
|
| Madison High Income Fund Class Y (A) | 644,273 | 4,335,960 |
|
| Madison High Quality Bond Fund Class Y (A) | 1,311,499 | 14,334,688 |
|
| Metropolitan West Total Return Bond Fund Class I | 2,834,614 | 29,905,177 |
|
| Vanguard Short-Term Corporate Bond ETF | 82,998 | 6,621,580 |
|
| | | 125,531,041 |
|
| Foreign Bond Funds - 3.8% | | |
| Templeton Global Bond Fund Advisor Class | 633,364 | 8,290,734 |
|
| Foreign Stock Funds - 4.5% | | |
| iShares MSCI All Country Asia ex Japan ETF | 18,138 | 1,093,903 |
|
| Madison International Stock Fund Class Y (A) | 619,931 | 8,362,869 |
|
| Vanguard FTSE Europe ETF | 9,965 | 585,942 |
|
| | | 10,042,714 |
|
| | Shares | Value (Note 2) |
|
| Money Market Funds - 0.9% | | |
| State Street Institutional U.S. Government Money Market Fund | 2,074,901 | $ 2,074,901 |
|
| Stock Funds - 34.4% | | |
| iShares Core MSCI EAFE ETF | 57,089 | 3,469,299 |
|
| iShares Russell Mid-Cap ETF | 85,771 | 12,863,935 |
|
| Madison Investors Fund Class Y (A) | 482,787 | 11,171,688 |
|
| Madison Large Cap Growth Fund Class Y (A) | 529,589 | 11,470,901 |
|
| Madison Large Cap Value Fund Class Y (A) | 1,154,703 | 20,438,246 |
|
| Schwab Fundamental U.S. Large Company Index Fund Institutional Shares | 1,100,919 | 15,633,045 |
|
| Vanguard Dividend Appreciation ETF | 14,684 | 1,104,824 |
|
| | | 76,151,938 |
|
| TOTAL INVESTMENTS - 100.3% ( Cost $202,850,391** ) | 222,091,328 |
|
| NET OTHER ASSETS AND LIABILITIES - (0.3%) | (595,494) |
|
| TOTAL NET ASSETS - 100.0% |
| $221,495,834 |
|
|
| |
| ** | Aggregate cost for Federal tax purposes was $204,833,994. |
| (A) | Affiliated Company (see Note 10). |
| ETF | Exchange Traded Fund. |
See accompanying Notes to Financial Statements.
Ultra Series Fund | December 31, 2013
Moderate Allocation Fund Portfolio of Investments
|
| | | | |
| | Shares | Value (Note 2) |
|
| INVESTMENT COMPANIES - 100.7% | | |
| Bond Funds - 34.6% | | |
| Franklin Floating Rate Daily Access Fund Advisor Class | 2,177,299 | $ 20,052,923 |
|
| iShares 7-10 Year Treasury Bond ETF | 80,471 | 7,985,942 |
|
| iShares iBoxx $ High Yield Corporate Bond ETF | 21,451 | 1,992,369 |
|
| Madison Core Bond Fund Class Y (A) | 3,502,719 | 34,992,164 |
|
| Madison High Income Fund Class Y (A) | 997,754 | 6,714,883 |
|
| Madison High Quality Bond Fund Class Y (A) | 1,410,475 | 15,416,491 |
|
| Metropolitan West Total Return Bond Fund Class I | 4,205,615 | 44,369,236 |
|
| Vanguard Intermediate-Term Corporate Bond ETF | 71,587 | 5,920,245 |
|
| Vanguard Short-Term Corporate Bond ETF | 37,727 | 3,009,860 |
|
| | | 140,454,113 |
|
| Foreign Stock Funds - 10.3% | | |
| iShares MSCI All Country Asia ex Japan ETF | 100,010 | 6,031,603 |
|
| Madison International Stock Fund Class Y (A) | 617,093 | 8,324,585 |
|
| Madison NorthRoad International Fund Class Y (A) | 1,094,129 | 13,151,436 |
|
| Vanguard FTSE All-World ex-U.S. ETF | 162,121 | 8,224,398 |
|
| Vanguard FTSE Europe ETF | 106,653 | 6,271,197 |
|
| | | 42,003,219 |
|
| Money Market Funds - 1.7% | | |
| State Street Institutional U.S. Government Money Market Fund | 6,844,603 | 6,844,603 |
|
| | Shares | Value (Note 2) |
|
| Stock Funds - 54.1% | | |
| iShares Core S&P Mid-Cap ETF | 155,466 | $ 20,807,569 |
|
| Madison Investors Fund Class Y (A) | 1,408,146 | 32,584,493 |
|
| Madison Large Cap Growth Fund Class Y (A) | 1,726,206 | 37,389,622 |
|
| Madison Large Cap Value Fund Class Y (A) | 2,603,004 | 46,073,164 |
|
| Madison Mid Cap Fund Class Y (A) | 1,557,029 | 14,760,632 |
|
| Madison Small Cap Fund Class Y (A) | 339,648 | 5,043,773 |
|
| Schwab Fundamental U.S. Large Company Index Fund Institutional Shares | 4,008,434 | 56,919,767 |
|
| Vanguard Dividend Appreciation ETF | 80,774 | 6,077,436 |
|
| | | 219,656,456 |
|
| TOTAL INVESTMENTS - 100.7% ( Cost $343,808,804** ) | 408,958,391 |
|
| NET OTHER ASSETS AND LIABILITIES - (0.7%) | (3,039,183) |
|
| TOTAL NET ASSETS - 100.0% |
| $405,919,208 |
|
|
| |
| ** | Aggregate cost for Federal tax purposes was $347,873,769. |
| (A) | Affiliated Company (see Note 10). |
| ETF | Exchange Traded Fund. |
See accompanying Notes to Financial Statements.
Ultra Series Fund | December 31, 2013
Aggressive Allocation Fund Portfolio of Investments
|
| | | | |
| | Shares | Value (Note 2) |
|
| INVESTMENT COMPANIES - 100.2% | | |
| Bond Funds - 12.8% | | |
| iShares iBoxx $ High Yield Corporate Bond ETF | 15,995 | $ 1,485,615 |
|
| Madison High Income Fund Class Y (A) | 110,764 | 745,445 |
|
| Metropolitan West Total Return Bond Fund Class I | 1,623,914 | 17,132,290 |
|
| | | 19,363,350 |
|
| Foreign Stock Funds - 15.6% | | |
| iShares MSCI All Country Asia ex Japan ETF | 51,050 | 3,078,826 |
|
| Madison International Stock Fund Class Y (A) | 302,943 | 4,086,699 |
|
| Madison NorthRoad International Fund Class Y (A) | 406,344 | 4,884,259 |
|
| Vanguard FTSE All-World ex-U.S. ETF | 143,116 | 7,260,275 |
|
| Vanguard FTSE Europe ETF | 72,709 | 4,275,289 |
|
| | | 23,585,348 |
|
| Money Market Funds - 1.8% | | |
| State Street Institutional U.S. Government Money Market Fund | 2,680,346 | 2,680,346 |
|
| | Shares | Value (Note 2) |
|
| Stock Funds - 70.0% | | |
| iShares Core S&P Mid-Cap ETF | 73,528 | $ 9,840,987 |
|
| Madison Investors Fund Class Y (A) | 658,131 | 15,229,151 |
|
| Madison Large Cap Growth Fund Class Y (A) | 813,620 | 17,623,014 |
|
| Madison Large Cap Value Fund Class Y (A) | 1,197,778 | 21,200,665 |
|
| Madison Mid Cap Fund Class Y (A) | 1,166,027 | 11,053,937 |
|
| Madison Small Cap Fund Class Y (A) | 146,980 | 2,182,651 |
|
| Schwab Fundamental U.S. Large Company Index Fund Institutional Shares | 1,842,393 | 26,161,976 |
|
| Vanguard Dividend Appreciation ETF | 36,453 | 2,742,724 |
|
| | | 106,035,105 |
|
| TOTAL INVESTMENTS - 100.2% ( Cost $121,421,020** ) | 151,664,149 |
|
| NET OTHER ASSETS AND LIABILITIES - (0.2%) | (239,244) |
|
| TOTAL NET ASSETS - 100.0% |
| $151,424,905 |
|
|
| |
| ** | Aggregate cost for Federal tax purposes was $123,533,526. |
| (A) | Affiliated Company (see Note 10). |
| ETF | Exchange Traded Fund. |
See accompanying Notes to Financial Statements.
Ultra Series Fund | December 31, 2013
Money Market Fund Portfolio of Investments
|
| | |
| | Par Value | Value (Note 2) |
| U.S. GOVERNMENT AND AGENCY OBLIGATIONS - 79.0% | | |
| Fannie Mae - 19.9% | | |
| 0.304%, 1/21/14 (A) | $ 225,000 | $ 224,963 |
| 0.142%, 1/27/14 (A) | 630,000 | 629,936 |
| 0.072%, 2/19/14 (A) | 2,450,000 | 2,449,763 |
| 0.096%, 2/24/14 (A) | 290,000 | 289,959 |
| 1.250%, 2/27/14 | 500,000 | 500,892 |
| 0.095%, 3/12/14 (A) | 1,492,000 | 1,491,729 |
| 1.250%, 3/14/14 | 2,100,000 | 2,104,738 |
| | | 7,691,980 |
| Federal Home Loan Bank - 15.9% | | |
| 0.076%, 1/2/14 (A) | 415,000 | 414,999 |
| 0.264%, 1/3/14 (A) | 600,000 | 599,991 |
| 0.122%, 1/8/14 (A) | 415,000 | 414,990 |
| 0.071%, 1/17/14 (A) | 250,000 | 249,992 |
| 0.375%, 1/29/14 | 1,000,000 | 1,000,223 |
| 0.091%, 2/14/14 (A) | 100,000 | 99,989 |
| 0.112%, 2/18/14 (A) | 200,000 | 199,971 |
| 0.091%, 2/21/14 (A) | 600,000 | 599,924 |
| 0.066%, 3/4/14 (A) | 500,000 | 499,944 |
| 0.106%, 3/6/14 (A) | 400,000 | 399,925 |
| 0.112%, 3/19/14 (A) | 1,000,000 | 999,765 |
| 0.112%, 4/2/14 (A) | 150,000 | 149,958 |
| 0.125%, 4/11/14 | 500,000 | 500,000 |
| | | 6,129,671 |
| Freddie Mac - 33.6% | | |
| 2.500%, 1/7/14 | 230,000 | 230,092 |
| 0.041%, 1/14/14 (A) | 510,000 | 509,993 |
| 0.071%, 1/15/14 (A) | 200,000 | 199,995 |
| 4.500%, 1/15/14 | 1,615,000 | 1,617,708 |
| 0.061%, 1/23/14 (A) | 177,000 | 176,993 |
| 0.071%, 2/3/14 (A) | 800,000 | 799,949 |
| 0.091%, 2/4/14 (A) | 200,000 | 199,983 |
| 0.076%, 2/5/14 (A) | 1,300,000 | 1,299,905 |
| 0.084%, 2/10/14 (A) | 959,000 | 958,912 |
| 0.066%, 2/11/14 (A) | 285,000 | 284,979 |
| 0.081%, 2/19/14 (A) | 800,000 | 799,913 |
| 0.096%, 2/24/14 (A) | 1,500,000 | 1,499,786 |
| 1.375%, 2/25/14 | 500,000 | 500,957 |
| 0.100%, 3/3/14 (A) | 900,000 | 899,850 |
Ultra Series Fund | December 31, 2013
|
| | | | |
| | Par Value |
| Value (Note 2) |
| 0.101%, 3/10/14 (A) |
| $2,000,000 |
| $ 1,999,622 |
| 0.101%, 3/13/14 (A) | 600,000 |
| 599,882 |
| 0.300%, 3/21/14 | 400,000 |
| 400,166 |
| | | 12,978,685 |
| U.S. Treasury Notes - 9.6% | | |
| 1.250%, 2/15/14 | 1,200,000 |
| 1,201,671 |
| 1.250%, 3/15/14 | 2,500,000 |
| 2,505,768 |
| | | 3,707,439 |
| Total U.S. Government and Agency Obligations ( Cost $30,507,775 ) | | 30,507,775 |
| SHORT-TERM INVESTMENTS - 16.3% | | |
| Energy - 4.6% | | |
| ConocoPhillips, 4.75%, 2/1/14 | 1,772,000 |
| 1,778,278 |
| Financials - 7.6% | | |
| Berkshire Hathaway Finance Corp., 1.5%, 1/10/14 | 300,000 |
| 300,091 |
| Caterpillar Financial Services Corp., Series F, MTN, 4.6%, 1/15/14 | 100,000 |
| 100,164 |
| General Electric Capital Corp., 2.1%, 1/7/14 | 1,000,000 |
| 1,000,302 |
| JPMorgan Chase & Co., MTN, 2.05%, 1/24/14 | 1,539,000 |
| 1,540,863 |
| | | 2,941,420 |
| Health Care - 4.1% | | |
| Eli Lilly & Co., 4.2%, 3/6/14 | 1,588,000 |
| 1,598,936 |
Total Short-Term Investments
( Cost $6,318,634 ) | | 6,318,634 |
| | Shares | |
| INVESTMENT COMPANIES - 4.3% | | |
| State Street Institutional U.S. Government Money Market Fund | 1,678,512 |
| 1,678,512 |
Total Investment Companies
( Cost $1,678,512 ) | | 1,678,512 |
| TOTAL INVESTMENTS - 99.6% ( Cost $38,504,921** ) | 38,504,921 |
| NET OTHER ASSETS AND LIABILITIES - 0.4% | 146,430 |
| TOTAL NET ASSETS – 100.0% | $ 38,651,351 |
|
| |
| ** | Aggregate cost for Federal tax purposes was $38,504,921. |
| (A) | Rate noted represents annualized yield at time of purchase. |
See accompanying Notes to Financial Statements.
Ultra Series Fund | December 31, 2013
Core Bond Fund Portfolio of Investments
|
| | | | | | |
| | Par Value |
| Value (Note 2) |
|
| ASSET BACKED SECURITIES - 0.3% | | |
| ABSC Long Beach Home Equity Loan Trust, Series 2000-LB1, Class AF5 (A), 8.55%, 9/21/30 | $ | 652,045 |
| $ | 659,980 |
|
| New Century Home Equity Loan Trust, Series 2003-5, Class AI5 (B), 5.5%, 11/25/33 | 370,990 |
| 370,147 |
|
| Total Asset Backed Securities ( Cost $1,042,114 ) | 1,030,127 |
|
| CORPORATE NOTES AND BONDS - 28.9% | | |
| Consumer Discretionary - 2.7% | | |
| Advance Auto Parts Inc., 4.5%, 12/1/23 | 1,000,000 |
| 999,512 |
|
| American Association of Retired Persons (C) (D), 7.5%, 5/1/31 | 2,500,000 |
| 3,186,343 |
|
| DR Horton Inc., 5.25%, 2/15/15 | 1,140,000 |
| 1,182,750 |
|
| ERAC USA Finance LLC (C) (D), 6.7%, 6/1/34 | 2,400,000 |
| 2,664,024 |
|
| Toll Brothers Finance Corp., 4%, 12/31/18 | 500,000 |
| 508,750 |
|
| | | 8,541,379 |
|
| Energy - 3.0% | | |
| Energy Transfer Partners L.P., 4.15%, 10/1/20 | 1,500,000 |
| 1,521,872 |
|
| Hess Corp., 7.875%, 10/1/29 | 1,960,000 |
| 2,497,804 |
|
| Transocean Inc. (E), 7.5%, 4/15/31 | 2,310,000 |
| 2,640,129 |
|
| Valero Energy Corp., 7.5%, 4/15/32 | 2,275,000 |
| 2,766,912 |
|
| | | 9,426,717 |
|
| Financials - 4.1% | | |
| American Express Credit Corp., 2.375%, 3/24/17 | 1,080,000 |
| 1,110,108 |
|
| CBL & Associates L.P., 5.25%, 12/1/23 | 500,000 |
| 499,335 |
|
| General Electric Capital Corp., 3.35%, 10/17/16 | 3,200,000 |
| 3,399,501 |
|
| HCP Inc., 6.7%, 1/30/18 | 2,000,000 |
| 2,324,642 |
|
| Health Care REIT Inc., 4.5%, 1/15/24 | 1,000,000 |
| 987,348 |
|
| Lehman Brothers Holdings Inc.* (F), 5.75%, 1/3/17 | 3,135,000 |
| 314 |
|
| Liberty Mutual Group Inc. (C) (D), 4.25%, 6/15/23 | 1,000,000 |
| 965,531 |
|
| Simon Property Group L.P., 5.875%, 3/1/17 | 1,060,000 |
| 1,188,840 |
|
| UBS AG (E), 5.75%, 4/25/18 | 366,000 |
| 420,186 |
|
| US Bank NA, 6.3%, 2/4/14 | 2,000,000 |
| 2,009,814 |
|
| | | 12,905,619 |
|
| Health Care - 4.3% | | |
| Eli Lilly & Co., 6.57%, 1/1/16 | 1,000,000 |
| 1,115,327 |
|
| Forest Laboratories Inc. (C) (D), 5%, 12/15/21 | 250,000 |
| 250,938 |
|
| Genentech Inc., 5.25%, 7/15/35 | 1,740,000 |
| 1,833,562 |
|
| Merck Sharp & Dohme Corp., 5.75%, 11/15/36 | 2,960,000 |
| 3,327,730 |
|
| Quest Diagnostics Inc., 5.45%, 11/1/15 | 3,500,000 |
| 3,772,450 |
|
| Thermo Fisher Scientific Inc., 2.4%, 2/1/19 | 500,000 |
| 495,345 |
|
| Wyeth LLC, 6.5%, 2/1/34 | 2,370,000 |
| 2,901,119 |
|
| | | 13,696,471 |
|
| Industrials - 4.7% | | |
| Boeing Co./The, 8.625%, 11/15/31 | 760,000 |
| 1,050,011 |
|
Ultra Series Fund | December 31, 2013
|
| | | | | | |
| | Par Value |
| Value (Note 2) |
|
| Boeing Co./The, 6.875%, 10/15/43 | $ | 1,380,000 |
| $ | 1,692,799 |
|
| Burlington Northern Santa Fe LLC, 8.125%, 4/15/20 | 2,000,000 |
| 2,498,858 |
|
| Crane Co., 2.75%, 12/15/18 | 500,000 |
| 497,562 |
|
| Lockheed Martin Corp., 7.65%, 5/1/16 | 1,450,000 |
| 1,672,579 |
|
| Norfolk Southern Corp., 5.59%, 5/17/25 | 1,268,000 |
| 1,385,676 |
|
| Norfolk Southern Corp., 7.05%, 5/1/37 | 1,400,000 |
| 1,722,462 |
|
| Northrop Grumman Corp., 1.75%, 6/1/18 | 1,500,000 |
| 1,463,342 |
|
| Waste Management Inc., 7.125%, 12/15/17 | 2,465,000 |
| 2,867,396 |
|
| | | 14,850,685 |
|
| Information Technology - 2.3% | | |
| Apple Inc., 2.4%, 5/3/23 | 3,000,000 |
| 2,697,633 |
|
| Broadridge Financial Solutions Inc., 3.95%, 9/1/20 | 1,000,000 |
| 1,006,027 |
|
| EMC Corp., 2.65%, 6/1/20 | 3,000,000 |
| 2,938,140 |
|
| Thomson Reuters Corp. (E), 4.3%, 11/23/23 | 650,000 |
| 652,795 |
|
| | | 7,294,595 |
|
| Materials - 1.2% | | |
| Westvaco Corp., 8.2%, 1/15/30 | 2,250,000 |
| 2,666,115 |
|
| Weyerhaeuser Co., 7.375%, 3/15/32 | 1,000,000 |
| 1,223,655 |
|
| | | 3,889,770 |
|
| Telecommunication Services - 1.7% | | |
| Comcast Cable Communications Holdings Inc., 9.455%, 11/15/22 | 2,300,000 |
| 3,185,675 |
|
| Rogers Communications Inc. (E), 4.1%, 10/1/23 | 1,500,000 |
| 1,502,824 |
|
| Verizon Communications Inc., 5.15%, 9/15/23 | 626,000 |
| 672,131 |
|
| | | 5,360,630 |
|
| Utilities - 4.9% | | |
| Indianapolis Power & Light Co. (C) (D), 6.05%, 10/1/36 | 3,445,000 |
| 3,835,115 |
|
| Interstate Power & Light Co., 6.25%, 7/15/39 | 2,925,000 |
| 3,451,377 |
|
| Sierra Pacific Power Co., Series M, 6%, 5/15/16 | 3,250,000 |
| 3,627,907 |
|
| Southwestern Electric Power Co., Series E, 5.55%, 1/15/17 | 1,165,000 |
| 1,279,764 |
|
| Wisconsin Electric Power Co., 6.5%, 6/1/28 | 3,000,000 |
| 3,523,986 |
|
| | | 15,718,149 |
|
Total Corporate Notes and Bonds
( Cost $88,551,389 ) | | 91,684,015 |
|
| LONG TERM MUNICIPAL BONDS - 0.7% | | |
| General - 0.7% | | |
| Jacksonville FL Sales Tax Revenue, 5%, 10/1/29 | 1,000,000 |
| 1,034,990 |
|
| McHenry & Kane Cntys Community Consolidated School Dist No 158 Huntley, 5.375%, 1/15/30 | 1,000,000 |
| 1,057,740 |
|
Total Long Term Municipal Bonds
( Cost $2,072,750 ) | | 2,092,730 |
|
See accompanying Notes to Financial Statements.
Ultra Series Fund | December 31, 2013
Core Bond Fund Portfolio of Investments
|
| | | | | | |
| | Par Value |
| Value (Note 2) |
|
| MORTGAGE BACKED SECURITIES - 18.5% | | |
| Fannie Mae - 12.2% | | |
| 4%, 4/1/15 Pool # 255719 | $ | 149,408 |
| $ | 158,215 |
|
| 5.5%, 4/1/16 Pool # 745444 | 369,738 |
| 392,424 |
|
| 6%, 5/1/16 Pool # 582558 | 22,231 |
| 22,957 |
|
| 5.5%, 9/1/17 Pool # 657335 | 64,444 |
| 68,477 |
|
| 5.5%, 2/1/18 Pool # 673194 | 211,650 |
| 224,910 |
|
| 5%, 5/1/20 Pool # 813965 | 807,307 |
| 867,720 |
|
| 4.5%, 9/1/20 Pool # 835465 | 599,907 |
| 639,361 |
|
| 6%, 5/1/21 Pool # 253847 | 105,340 |
| 117,241 |
|
| 7%, 12/1/29 Pool # 762813 | 93,139 |
| 103,355 |
|
| 7%, 11/1/31 Pool # 607515 | 59,481 |
| 67,431 |
|
| 6.5%, 3/1/32 Pool # 631377 | 122,897 |
| 136,646 |
|
| 7%, 5/1/32 Pool # 644591 | 36,701 |
| 41,227 |
|
| 6.5%, 6/1/32 Pool # 545691 | 761,959 |
| 856,869 |
|
| 5.5%, 4/1/33 Pool # 690206 | 953,417 |
| 1,050,440 |
|
| 5%, 10/1/33 Pool # 254903 | 1,287,943 |
| 1,402,239 |
|
| 5.5%, 11/1/33 Pool # 555880 | 1,057,793 |
| 1,166,099 |
|
| 5%, 6/1/34 Pool # 778891 | 320,996 |
| 349,297 |
|
| 7%, 7/1/34 Pool # 792636 | 41,419 |
| 43,538 |
|
| 5.5%, 8/1/34 Pool # 793647 | 185,481 |
| 204,240 |
|
| 5.5%, 3/1/35 Pool # 810075 | 659,701 |
| 725,545 |
|
| 5.5%, 3/1/35 Pool # 815976 | 810,826 |
| 890,847 |
|
| 5%, 8/1/35 Pool # 829670 | 1,020,755 |
| 1,107,906 |
|
| 5.5%, 8/1/35 Pool # 826872 | 420,968 |
| 462,578 |
|
| 5%, 9/1/35 Pool # 820347 | 1,258,627 |
| 1,388,765 |
|
| 5%, 9/1/35 Pool # 835699 | 1,130,940 |
| 1,236,788 |
|
| 5%, 10/1/35 Pool # 797669 | 1,361,344 |
| 1,491,118 |
|
| 5.5%, 10/1/35 Pool # 836912 | 31,697 |
| 34,791 |
|
| 5%, 11/1/35 Pool # 844809 | 523,447 |
| 567,952 |
|
| 5%, 12/1/35 Pool # 850561 | 596,162 |
| 646,948 |
|
| 5.5%, 10/1/36 Pool # 896340 | 180,878 |
| 198,621 |
|
| 5.5%, 10/1/36 Pool # 901723 | 1,224,478 |
| 1,344,778 |
|
| 6.5%, 10/1/36 Pool # 894118 | 636,618 |
| 707,344 |
|
| 6%, 11/1/36 Pool # 902510 | 1,361,436 |
| 1,530,812 |
|
| 5.5%, 2/1/37 Pool # 905140 | 1,024,585 |
| 1,140,504 |
|
| 5.5%, 5/1/37 Pool # 928292 | 705,607 |
| 785,246 |
|
| 6%, 10/1/37 Pool # 947563 | 1,220,676 |
| 1,371,830 |
|
| 5.5%, 7/1/38 Pool # 986973 | 670,651 |
| 736,471 |
|
| 6.5%, 8/1/38 Pool # 987711 | 1,921,859 |
| 2,194,423 |
|
| 4.5%, 8/1/40 Pool # AD8243 | 816,436 |
| 865,057 |
|
| 4%, 1/1/41 Pool # AB2080 | 2,869,628 |
| 2,957,397 |
|
| 4%, 9/1/41 Pool # AJ1406 | 3,010,998 |
| 3,101,622 |
|
| 3.5%, 6/1/42 Pool # AO4136 | 3,188,291 |
| 3,170,438 |
|
| 3.5%, 9/1/42 Pool # AB6228 | 2,014,342 |
| 2,003,054 |
|
| | | 38,573,521 |
|
Ultra Series Fund | December 31, 2013
|
| | | | | | |
| | Par Value |
| Value (Note 2) |
|
| Freddie Mac - 6.2% | | |
| 5%, 5/1/18 Pool # E96322 | $ | 449,729 |
| $ | 476,130 |
|
| 3%, 8/1/27 Pool # J19899 | 2,848,186 |
| 2,906,057 |
|
| 8%, 6/1/30 Pool # C01005 | 38,342 |
| 44,622 |
|
| 7%, 3/1/31 Pool # C48129 | 118,242 |
| 127,956 |
|
| 5%, 7/1/33 Pool # A11325 | 866,365 |
| 950,440 |
|
| 6%, 10/1/34 Pool # A28439 | 269,554 |
| 297,730 |
|
| 6%, 10/1/34 Pool # A28598 | 98,368 |
| 108,758 |
|
| 5.5%, 11/1/34 Pool # A28282 | 1,921,506 |
| 2,147,985 |
|
| 5%, 4/1/35 Pool # A32314 | 248,821 |
| 268,175 |
|
| 5%, 4/1/35 Pool # A32315 | 407,597 |
| 449,020 |
|
| 5%, 4/1/35 Pool # A32316 | 569,112 |
| 626,831 |
|
| 5%, 4/1/35 Pool # A32509 | 193,129 |
| 212,857 |
|
| 5%, 1/1/37 Pool # A56371 | 989,698 |
| 1,065,459 |
|
| 4%, 10/1/41 Pool # Q04092 | 1,448,358 |
| 1,490,847 |
|
| 3%, 9/1/42 Pool # C04233 | 3,283,820 |
| 3,114,901 |
|
| 3%, 4/1/43 Pool # V80025 | 2,894,397 |
| 2,745,510 |
|
| 3%, 4/1/43 Pool # V80026 | 2,913,028 |
| 2,763,183 |
|
| | | 19,796,461 |
|
| Ginnie Mae - 0.1% | | |
| 8%, 10/20/15 Pool # 2995 | 13,041 |
| 13,167 |
|
| 6.5%, 2/20/29 Pool # 2714 | 106,317 |
| 121,604 |
|
| 6.5%, 4/20/31 Pool # 3068 | 79,945 |
| 91,339 |
|
| | | 226,110 |
|
Total Mortgage Backed Securities
( Cost $56,527,700 ) | | 58,596,092 |
|
| U.S. GOVERNMENT AND AGENCY OBLIGATIONS - 49.5% | | |
| Fannie Mae - 1.3% | | |
| 4.625%, 10/15/14 | 3,905,000 |
| 4,041,452 |
|
| Federal Farm Credit Bank - 1.4% | | |
| 5.875%, 10/3/16 | 4,000,000 |
| 4,551,800 |
|
| Freddie Mac - 1.7% | | |
| 4.500%, 1/15/14 | 5,500,000 |
| 5,508,635 |
|
| U.S. Treasury Bonds - 4.2% | | |
| 6.625%, 2/15/27 | 6,600,000 |
| 8,918,250 |
|
| 4.500%, 5/15/38 | 4,000,000 |
| 4,435,000 |
|
| | | 13,353,250 |
|
See accompanying Notes to Financial Statements.
Ultra Series Fund | December 31, 2013
Core Bond Fund Portfolio of Investments
|
| | | | | | |
| | Par Value |
| Value (Note 2) |
|
| U.S. GOVERNMENT AND AGENCY OBLIGATIONS (continued) | | |
| U.S. Treasury Notes - 40.9% | | |
| 4.000%, 2/15/14 | $ | 4,000,000 |
| $ | 4,018,592 |
|
| 4.250%, 8/15/14 | 10,200,000 |
| 10,459,784 |
|
| 2.375%, 9/30/14 | 3,600,000 |
| 3,659,767 |
|
| 2.625%, 12/31/14 | 26,000,000 |
| 26,631,722 |
|
| 2.500%, 3/31/15 | 1,750,000 |
| 1,799,697 |
|
| 4.250%, 8/15/15 | 8,900,000 |
| 9,468,416 |
|
| 3.250%, 12/31/16 | 8,000,000 |
| 8,580,624 |
|
| 3.125%, 1/31/17 | 4,000,000 |
| 4,276,248 |
|
| 2.375%, 7/31/17 | 5,250,000 |
| 5,485,841 |
|
| 0.750%, 10/31/17 | 8,000,000 |
| 7,855,000 |
|
| 4.250%, 11/15/17 | 9,100,000 |
| 10,132,286 |
|
| 2.750%, 2/15/19 | 8,250,000 |
| 8,644,449 |
|
| 3.375%, 11/15/19 | 13,000,000 |
| 13,983,125 |
|
| 2.625%, 11/15/20 | 6,500,000 |
| 6,605,625 |
|
| 2.000%, 11/15/21 | 7,500,000 |
| 7,158,397 |
|
| 2.750%, 11/15/23 | 1,000,000 |
| 978,281 |
|
| | | 129,737,854 |
|
| Total U.S. Government and Agency Obligations ( Cost $151,691,366 ) | | 157,192,991 |
|
| | Shares | |
| SHORT-TERM INVESTMENTS - 1.4% | | |
| State Street Institutional U.S. Government Money Market Fund | 4,378,761 |
| 4,378,761 |
|
| Total Short-Term Investments ( Cost $4,378,761 ) | | 4,378,761 |
|
| TOTAL INVESTMENTS - 99.3% ( Cost $304,264,080** ) | 314,974,716 |
|
| NET OTHER ASSETS AND LIABILITIES - 0.7% | 2,305,260 |
|
| TOTAL NET ASSETS - 100.0% | $ | 317,279,976 |
|
|
| |
| * | Non-income producing. |
| ** | Aggregate cost for Federal tax purposes was $304,301,134. |
| (A) | Stepped rate security. Rate shown is as of December 31, 2013. |
| (B) | Floating rate or variable rate note. Rate shown is as of December 31, 2013. |
| (C) | Security sold within terms of a private placement memorandum exempt from registration under section 144A of the Securities Act of 1933, as amended, and may be sold only to dealers in that program or other “qualified institutional investors.” |
| (D) | Illiquid security (See Note 2). |
| (E) | Notes and bonds, issued by foreign entities, denominated in U.S. dollars. The aggregate of these securities is 1.6% of total net assets. |
| (F) | In default. Issuer is bankrupt. |
| REIT | Real Estate Investment Trust. |
See accompanying Notes to Financial Statements.
Ultra Series Fund | December 31, 2013
High Income Fund Portfolio of Investments
|
| | | | | | |
| | Par Value |
| Value (Note 2) |
|
| CORPORATE NOTES AND BONDS - 95.1% | | |
| Consumer Discretionary - 32.5% | | |
| Auto Components - 3.6% | | |
| Allison Transmission Inc. (A), 7.125%, 5/15/19 | $ | 300,000 |
| $ | 323,250 |
|
| Dana Holding Corp., 6.5%, 2/15/19 | 350,000 |
| 371,875 |
|
| Goodyear Tire & Rubber Co., 7%, 5/15/22 | 500,000 |
| 538,125 |
|
| Tenneco Inc., 6.875%, 12/15/20 | 525,000 |
| 573,563 |
|
| | | 1,806,813 |
|
| Automobiles - 0.5% | | |
| Cooper Standard Automotive Inc., 8.5%, 5/1/18 | 250,000 |
| 265,000 |
|
| Hotels, Restaurants & Leisure - 4.9% | | |
| Boyd Gaming Corp., 9.125%, 12/1/18 | 300,000 |
| 326,250 |
|
| Felcor Lodging L.P., 6.75%, 6/1/19 | 450,000 |
| 479,250 |
|
| GLP Capital L.P./GLP Financing II Inc. (A), 4.875%, 11/1/20 | 300,000 |
| 300,000 |
|
| Isle of Capri Casinos Inc., 5.875%, 3/15/21 | 300,000 |
| 294,750 |
|
| Peninsula Gaming LLC/Peninsula Gaming Corp. (A), 8.375%, 2/15/18 | 200,000 |
| 218,000 |
|
| Pinnacle Entertainment Inc., 8.75%, 5/15/20 | 300,000 |
| 330,750 |
|
| Pinnacle Entertainment Inc., 7.5%, 4/15/21 | 200,000 |
| 217,000 |
|
| Scientific Games International Inc., 6.25%, 9/1/20 | 300,000 |
| 307,500 |
|
| | | 2,473,500 |
|
| Media - 17.2% | | |
| AMC Networks Inc., 4.75%, 12/15/22 | 400,000 |
| 381,000 |
|
| Cablevision Systems Corp., 7.75%, 4/15/18 | 250,000 |
| 279,062 |
|
| Cablevision Systems Corp., 5.875%, 9/15/22 | 100,000 |
| 95,750 |
|
| CCO Holdings LLC/CCO Holdings Capital Corp., 6.5%, 4/30/21 | 750,000 |
| 770,625 |
|
| Cequel Communications Holdings I LLC/Cequel Capital Corp. (A), 6.375%, 9/15/20 | 200,000 |
| 205,000 |
|
| Cumulus Media Holdings Inc., 7.75%, 5/1/19 | 900,000 |
| 949,500 |
|
| DISH DBS Corp., 5.125%, 5/1/20 | 500,000 |
| 501,250 |
|
| DISH DBS Corp., 5.875%, 7/15/22 | 100,000 |
| 100,000 |
|
| Gray Television Inc., 7.5%, 10/1/20 | 400,000 |
| 425,000 |
|
| Hughes Satellite Systems Corp., 6.5%, 6/15/19 | 500,000 |
| 541,250 |
|
| Intelsat Jackson Holdings S.A. (B), 7.25%, 10/15/20 | 525,000 |
| 574,219 |
|
| Intelsat Luxembourg S.A. (A) (B), 6.75%, 6/1/18 | 250,000 |
| 265,625 |
|
| Lamar Media Corp., 5.875%, 2/1/22 | 500,000 |
| 512,500 |
|
| Mediacom Broadband LLC/Mediacom Broadband Corp., 6.375%, 4/1/23 | 800,000 |
| 818,000 |
|
| Sinclair Television Group Inc., 6.125%, 10/1/22 | 250,000 |
| 252,500 |
|
| Sirius XM Holdings, Inc. (A), 5.875%, 10/1/20 | 250,000 |
| 255,000 |
|
| Telesat Canada/Telesat LLC (A) (B), 6%, 5/15/17 | 500,000 |
| 520,000 |
|
Ultra Series Fund | December 31, 2013
|
| | | | | | |
| | Par Value |
| Value (Note 2) |
|
| Univision Communications Inc. (A), 6.75%, 9/15/22 | $ | 500,000 |
| $ | 547,500 |
|
| UPCB Finance V Ltd. (A) (B), 6.875%, 1/15/22 | 350,000 |
| 371,875 |
|
| ViaSat Inc., 6.875%, 6/15/20 | 300,000 |
| 317,250 |
|
| | | 8,682,906 |
|
| Specialty Retail - 4.7% | | |
| Chinos Intermediate Holdings A Inc., PIK (A), 7.75%, 5/1/19 | 400,000 |
| 409,000 |
|
| Jo-Ann Stores Inc. (A), 8.125%, 3/15/19 | 600,000 |
| 627,750 |
|
| Michaels FinCo Holdings LLC/Michaels FinCo Inc., PIK (A), 7.5%, 8/1/18 | 300,000 |
| 312,000 |
|
| Penske Automotive Group Inc., 5.75%, 10/1/22 | 500,000 |
| 511,250 |
|
| Sally Holdings LLC/Sally Capital Inc., 5.75%, 6/1/22 | 500,000 |
| 520,000 |
|
| | | 2,380,000 |
|
| Textiles, Apparel & Luxury Goods - 1.6% | | |
| Hanesbrands Inc., 6.375%, 12/15/20 | 250,000 |
| 273,125 |
|
| Levi Strauss & Co., 7.625%, 5/15/20 | 500,000 |
| 548,750 |
|
| | | 821,875 |
|
| | | 16,430,094 |
|
| Consumer Staples - 6.2% | | |
| ACCO Brands Corp., 6.75%, 4/30/20 | 400,000 |
| 395,000 |
|
| Alphabet Holding Co. Inc., PIK, 7.75%, 11/1/17 | 600,000 |
| 618,750 |
|
| Central Garden and Pet Co., 8.25%, 3/1/18 | 500,000 |
| 486,250 |
|
| Del Monte Corp., 7.625%, 2/15/19 | 600,000 |
| 623,250 |
|
| Dole Food Co. Inc. (A), 7.25%, 5/1/19 | 500,000 |
| 498,750 |
|
| Stater Brothers Holdings Inc., 7.75%, 4/15/15 | 500,000 |
| 501,260 |
|
| | | 3,123,260 |
|
| Energy - 14.8% | | |
| AmeriGas Finance LLC/AmeriGas Finance Corp., 7%, 5/20/22 | 250,000 |
| 271,250 |
|
| AmeriGas Partners L.P./AmeriGas Finance Corp., 6.25%, 8/20/19 | 500,000 |
| 537,500 |
|
| Berry Petroleum Co., 6.375%, 9/15/22 | 250,000 |
| 254,375 |
|
| Cie Generale de Geophysique – Veritas (B), 6.5%, 6/1/21 | 300,000 |
| 307,500 |
|
| Chaparral Energy Inc., 8.25%, 9/1/21 | 500,000 |
| 542,500 |
|
| Chesapeake Energy Corp., 6.875%, 11/15/20 | 300,000 |
| 339,000 |
|
| Continental Resources Inc., 8.25%, 10/1/19 | 250,000 |
| 273,125 |
|
| Exterran Holdings Inc., 7.25%, 12/1/18 | 500,000 |
| 528,125 |
|
| Ferrellgas L.P./Ferrellgas Finance Corp. (A), 6.75%, 1/15/22 | 400,000 |
| 406,000 |
|
| Hornbeck Offshore Services Inc., 5.875%, 4/1/20 | 400,000 |
| 413,000 |
|
| Key Energy Services Inc., 6.75%, 3/1/21 | 500,000 |
| 512,500 |
|
| Lightstream Resources Ltd. (A) (B), 8.625%, 2/1/20 | 300,000 |
| 303,000 |
|
See accompanying Notes to Financial Statements.
Ultra Series Fund | December 31, 2013
High Income Fund Portfolio of Investments
|
| | | | | | |
| | Par Value |
| Value (Note 2) |
|
| CORPORATE NOTES AND BONDS (continued) | |
| Energy (continued) | | |
| MarkWest Energy Partners L.P./MarkWest Energy Finance Corp., 6.75%, 11/1/20 | $ | 400,000 |
| $ | 434,000 |
|
| Penn Virginia Resource Partners L.P./Penn Virginia Resource Finance Corp., 8.25%, 4/15/18 | 400,000 | 424,000 |
| Precision Drilling Corp. (B), 6.5%, 12/15/21 | 350,000 | 372,750 |
| QEP Resources Inc., 5.375%, 10/1/22 | 150,000 | 144,375 |
| QEP Resources Inc., 5.25%, 5/1/23 | 500,000 | 468,750 |
| Regency Energy Partners L.P./Regency Energy Finance Corp., 6.875%, 12/1/18 | 400,000 | 429,000 |
| Suburban Propane Partners L.P./Suburban Energy Finance Corp., 7.375%, 8/1/21 | 227,000 | 247,430 |
| Unit Corp., 6.625%, 5/15/21 | 250,000 | 263,750 |
| | | 7,471,930 |
| Financials - 2.6% | | |
| MPT Operating Partnership L.P./MPT Finance Corp., 6.875%, 5/1/21 | 250,000 | 267,500 |
| Nationstar Mortgage LLC/Nationstar Capital Corp., 6.5%, 7/1/21 | 450,000 | 428,625 |
| Omega Healthcare Investors Inc., 5.875%, 3/15/24 | 250,000 | 252,500 |
| Springleaf Finance Corp., MTN, 6.9%, 12/15/17 | 350,000 | 382,550 |
| | | 1,331,175 |
| Health Care - 6.4% | | |
| Air Medical Group Holdings Inc., 9.25%, 11/1/18 | 300,000 | 324,000 |
| Biomet Inc., 6.5%, 8/1/20 | 250,000 | 262,500 |
| Biomet Inc., 6.5%, 10/1/20 | 400,000 | 412,000 |
| Endo Health Solutions Inc., 7%, 7/15/19 | 100,000 | 107,000 |
| Endo Health Solutions Inc., 7%, 12/15/20 | 500,000 | 535,000 |
| Fresenius Medical Care US Finance II Inc. (A), 5.625%, 7/31/19 | 200,000 | 216,000 |
| Fresenius Medical Care US Finance II Inc. (A), 5.875%, 1/31/22 | 200,000 | 211,000 |
| Multiplan Inc. (A), 9.875%, 9/1/18 | 250,000 | 275,000 |
| Tenet Healthcare Corp., 8%, 8/1/20 | 350,000 | 380,187 |
| Tenet Healthcare Corp. (A), 6%, 10/1/20 | 100,000 | 104,375 |
| Valeant Pharmaceuticals International Inc. (A) (B), 5.625%, 12/1/21 | 400,000 | 402,000 |
| | | 3,229,062 |
| Industrials - 12.4% | | |
| Ashtead Capital Inc. (A), 6.5%, 7/15/22 | 500,000 | 533,125 |
| Avis Budget Car Rental LLC/Avis Budget Finance Inc., 8.25%, 1/15/19 | 500,000 | 545,000 |
Ultra Series Fund | December 31, 2013
|
| | | | | | |
| | Par Value |
| Value (Note 2) |
|
| Belden Inc. (A), 5.5%, 9/1/22 | $ | 500,000 |
| $ | 490,000 |
|
| Bombardier Inc. (A) (B), 6.125%, 1/15/23 | 350,000 |
| 347,375 |
|
| Clean Harbors Inc., 5.125%, 6/1/21 | 150,000 |
| 151,500 |
|
| FTI Consulting Inc., 6%, 11/15/22 | 500,000 |
| 506,250 |
|
| Griffon Corp., 7.125%, 4/1/18 | 500,000 |
| 530,000 |
|
| HD Supply Inc., 7.5%, 7/15/20 | 550,000 |
| 592,625 |
|
| Iron Mountain Inc., 6%, 8/15/23 | 200,000 |
| 205,000 |
|
| Iron Mountain Inc., 5.75%, 8/15/24 | 150,000 |
| 139,125 |
|
| Nortek Inc., 8.5%, 4/15/21 | 250,000 |
| 276,875 |
|
| RR Donnelley & Sons Co., 7.875%, 3/15/21 | 200,000 |
| 222,000 |
|
| Tomkins LLC/Tomkins Inc., 9%, 10/1/18 | 127,000 |
| 139,065 |
|
| TransDigm Inc., 5.5%, 10/15/20 | 200,000 |
| 195,500 |
|
| United Rentals North America Inc., 8.25%, 2/1/21 | 175,000 |
| 197,312 |
|
| United Rentals North America Inc., 7.625%, 4/15/22 | 500,000 |
| 555,625 |
|
| West Corp., 8.625%, 10/1/18 | 100,000 |
| 108,750 |
|
| West Corp., 7.875%, 1/15/19 | 500,000 |
| 540,000 |
|
| | | 6,275,127 |
|
| Information Technology - 5.5% | | |
| Alliance Data Systems Corp. (A), 5.25%, 12/1/17 | 50,000 |
| 51,875 |
|
| Alliance Data Systems Corp. (A), 6.375%, 4/1/20 | 400,000 |
| 419,000 |
|
| CommScope Holding Co. Inc., PIK (A), 6.625%, 6/1/20 | 250,000 |
| 260,000 |
|
| CommScope Inc. (A), 8.25%, 1/15/19 | 367,000 |
| 402,324 |
|
| Level 3 Financing Inc., 8.125%, 7/1/19 | 600,000 |
| 657,000 |
|
| Syniverse Holdings Inc., 9.125%, 1/15/19 | 400,000 |
| 437,000 |
|
| T-Mobile USA Inc., 6.633%, 4/28/21 | 500,000 |
| 526,250 |
|
| | | 2,753,449 |
|
| Materials - 6.7% | | |
| ArcelorMittal (B), 5.75%, 8/5/20 | 300,000 |
| 318,750 |
|
| Ardagh Packaging Finance PLC/Ardagh MP Holdings USA Inc. (A) (B), 9.125%, 10/15/20 | 300,000 |
| 327,000 |
|
| Boise Cascade Co. (C), 6.375%, 11/1/20 | 600,000 |
| 631,500 |
|
| FMG Resources August 2006 Pty Ltd. (A) (B), 7%, 11/1/15 | 103,000 |
| 106,862 |
|
| Huntsman International LLC, 4.875%, 11/15/20 | 400,000 |
| 394,000 |
|
| Polymer Group Inc., 7.75%, 2/1/19 | 500,000 |
| 533,125 |
|
| Reynolds Group Issuer Inc./Reynolds Group Issuer LLC, 8.5%, 5/15/18 | 250,000 |
| 263,750 |
|
| Reynolds Group Issuer Inc./Reynolds Group Issuer LLC, 9%, 4/15/19 | 250,000 |
| 268,125 |
|
| Tronox Finance LLC, 6.375%, 8/15/20 | 500,000 |
| 510,000 |
|
| | | 3,353,112 |
|
Ultra Series Fund | December 31, 2013
High Income Fund Portfolio of Investments
|
| | | | | | |
| | Par Value |
| Value (Note 2) |
|
| CORPORATE NOTES AND BONDS (continued) | |
| Telecommunication Services - 4.7% | | |
| CenturyLink Inc., 5.625%, 4/1/20 | $ | 200,000 |
| $ | 203,500 |
|
| CenturyLink Inc., 5.8%, 3/15/22 | 500,000 |
| 493,750 |
|
| SBA Telecommunications Inc., 5.75%, 7/15/20 | 300,000 |
| 312,000 |
|
| Softbank Corp. (A) (B), 4.5%, 4/15/20 | 250,000 |
| 243,750 |
|
| Sprint Communications Inc., 7%, 8/15/20 | 325,000 |
| 351,813 |
|
| Sprint Corp. (A), 7.875%, 9/15/23 | 500,000 |
| 537,500 |
|
| Windstream Corp., 6.375%, 8/1/23 | 250,000 |
| 233,750 |
|
| | | 2,376,063 |
|
| Utilities - 3.3% | | |
| Calpine Corp. (A), 6%, 1/15/22 | 500,000 |
| 512,500 |
|
| GenOn Energy Inc., 7.875%, 6/15/17 | 300,000 |
| 330,000 |
|
| Mirant Americas Generation LLC, 8.5%, 10/1/21 | 300,000 |
| 315,750 |
|
| NRG Energy Inc., 8.25%, 9/1/20 | 475,000 |
| 526,063 |
|
| | | 1,684,313 |
|
Total Corporate Notes and Bonds
( Cost $46,381,454 ) | | 48,027,585 |
|
| | Shares | |
| SHORT-TERM INVESTMENTS - 3.4% | | |
| State Street Institutional U.S. Government Money Market Fund | 1,737,761 |
| 1,737,761 |
|
Total Short-Term Investments
( Cost $1,737,761 ) | | 1,737,761 |
|
| TOTAL INVESTMENTS - 98.5% ( Cost $48,119,215** ) | 49,765,346 |
|
| NET OTHER ASSETS AND LIABILITIES - 1.5% | 762,425 |
|
| TOTAL NET ASSETS - 100.0% | $ | 50,527,771 |
|
|
| |
| ** | Aggregate cost for Federal tax purposes was $48,119,215. |
| (A) | Security sold within terms of a private placement memorandum exempt from registration under section 144A of the Securities Act of 1933, as amended, and may be sold only to dealers in that program or other “qualified institutional investors.” |
| (B) | Notes and bonds, issued by foreign entities, denominated in U.S. dollars. The aggregate of these securities is 8.8% of total net assets. |
| (C) | Illiquid security (See Note 2). |
| PIK | Payment in Kind Security. Pays interest in additional bonds rather than in cash. |
| PLC | Public Limited Company. |
See accompanying Notes to Financial Statements.
Ultra Series Fund | December 31, 2013
Diversified Income Fund Portfolio of Investments
|
| | | | |
| | Shares | Value (Note 2) |
|
| COMMON STOCKS - 57.5% | | |
| Consumer Discretionary - 5.7% | | |
| McDonald’s Corp. | 63,500 | $ | 6,161,405 |
|
| Omnicom Group Inc. | 59,000 | 4,387,830 |
|
| Target Corp. | 65,000 | 4,112,550 |
|
| Time Warner Inc. | 76,000 | 5,298,720 |
|
| Viacom Inc., Class B | 45,500 | 3,973,970 |
|
| | | 23,934,475 |
|
| Consumer Staples - 7.3% | | |
| Coca-Cola Co./The | 86,000 | 3,552,660 |
|
| Diageo PLC, ADR | 35,000 | 4,634,700 |
|
| Nestle S.A., ADR | 59,000 | 4,341,810 |
|
| PepsiCo Inc. | 64,000 | 5,308,160 |
|
| Philip Morris International Inc. | 58,500 | 5,097,105 |
|
| Procter & Gamble Co./The | 64,000 | 5,210,240 |
|
| Wal-Mart Stores Inc. | 34,000 | 2,675,460 |
|
| | | 30,820,135 |
|
| Energy - 7.5% | | |
| Chevron Corp. | 87,000 | 10,867,170 |
|
| ConocoPhillips | 74,000 | 5,228,100 |
|
| Ensco PLC, Class A | 44,000 | 2,515,920 |
|
| Exxon Mobil Corp. | 93,000 | 9,411,600 |
|
| Occidental Petroleum Corp. | 39,500 | 3,756,450 |
|
| | | 31,779,240 |
|
| Financials - 10.0% | | |
| Bank of New York Mellon Corp./The | 89,500 | 3,127,130 |
|
| BB&T Corp. | 110,000 | 4,105,200 |
|
| M&T Bank Corp. | 30,000 | 3,492,600 |
|
| Northern Trust Corp. | 49,000 | 3,032,610 |
|
| PartnerRe Ltd. | 44,500 | 4,691,635 |
|
| Travelers Cos. Inc./The | 113,000 | 10,231,020 |
|
| US Bancorp | 167,000 | 6,746,800 |
|
| Wells Fargo & Co. | 149,000 | 6,764,600 |
|
| | | 42,191,595 |
|
| Health Care - 9.5% | | |
| Baxter International Inc. | 59,000 | 4,103,450 |
|
| Becton, Dickinson and Co. | 26,000 | 2,872,740 |
|
| Johnson & Johnson | 90,000 | 8,243,100 |
|
| Medtronic Inc. | 82,000 | 4,705,980 |
|
| Merck & Co. Inc. | 161,000 | 8,058,050 |
|
| Novartis AG, ADR | 34,000 | 2,732,920 |
|
| Pfizer Inc. | 304,000 | 9,311,520 |
|
| | | 40,027,760 |
|
| Industrials - 8.4% | | |
| 3M Co. | 54,500 | 7,643,625 |
|
| Boeing Co./The | 34,000 | 4,640,660 |
|
Ultra Series Fund | December 31, 2013
|
| | | | | | |
| | Shares |
| Value (Note 2) |
|
| Emerson Electric Co. | 38,500 |
| $ | 2,701,930 |
|
| General Dynamics Corp. | 33,000 |
| 3,153,150 |
|
| United Parcel Service Inc., Class B | 69,000 |
| 7,250,520 |
|
| United Technologies Corp. | 65,000 |
| 7,397,000 |
|
| Waste Management Inc. | 61,000 |
| 2,737,070 |
|
| | | 35,523,955 |
|
| Information Technology - 7.9% | | |
| Accenture PLC, Class A | 70,000 |
| 5,755,400 |
|
| Automatic Data Processing Inc. | 52,000 |
| 4,202,120 |
|
| Intel Corp. | 111,000 |
| 2,881,560 |
|
| Linear Technology Corp. | 77,000 |
| 3,507,350 |
|
| Microchip Technology Inc. | 72,500 |
| 3,244,375 |
|
| Microsoft Corp. | 101,500 |
| 3,799,145 |
|
| Oracle Corp. | 75,000 |
| 2,869,500 |
|
| QUALCOMM Inc. | 97,000 |
| 7,202,250 |
|
| | | 33,461,700 |
|
| Telecommunication Service - 1.2% | | |
| AT&T Inc. | 144,000 |
| 5,063,040 |
|
| Total Common Stocks ( Cost $159,971,779 ) | | 242,801,900 |
|
| | Par Value |
| |
| ASSET BACKED SECURITIES - 0.1% | | |
| ABSC Long Beach Home Equity Loan Trust, Series 2000-LB1, Class AF5 (A), 8.55%, 9/21/30 | $ | 599,648 |
| 606,946 |
Total Asset Backed Securities
( Cost $617,240 ) | | 606,946 |
| CORPORATE NOTES AND BONDS - 14.4% | | |
| Consumer Discretionary - 1.9% | | |
| American Association of Retired Persons (B) (C), 7.5%, 5/1/31 | 2,000,000 | 2,549,074 |
| DR Horton Inc., 5.25%, 2/15/15 | 515,000 | 534,313 |
| ERAC USA Finance LLC (B) (C), 6.7%, 6/1/34 | 1,850,000 | 2,053,518 |
| Royal Caribbean Cruises Ltd. (D), 7.25%, 6/15/16 | 1,600,000 | 1,796,000 |
| Time Warner Inc., 4.75%, 3/29/21 | 1,000,000 | 1,066,372 |
| | | 7,999,277 |
| Consumer Staples - 0.6% | | |
| Mondelez International Inc., 6.5%, 11/1/31 | 2,025,000 | 2,304,157 |
| Energy - 1.4% | | |
| ConocoPhillips, 6.65%, 7/15/18 | 1,500,000 | 1,784,622 |
| Energy Transfer Partners L.P., 4.15%, 10/1/20 | 600,000 | 608,749 |
| Hess Corp., 7.875%, 10/1/29 | 1,150,000 | 1,465,548 |
| Transocean Inc. (D), 6%, 3/15/18 | 750,000 | 841,085 |
| Transocean Inc. (D), 7.5%, 4/15/31 | 1,030,000 | 1,177,200 |
| | | 5,877,204 |
See accompanying Notes to Financial Statements.
Ultra Series Fund | December 31, 2013
Diversified Income Fund Portfolio of Investments
|
| | | | | | |
| | Par Value |
| Value (Note 2) |
|
| CORPORATE NOTES AND BONDS (continued) | |
| Financials - 1.3% | | |
| American Express Credit Corp., 2.375%, 3/24/17 | $ | 450,000 |
| $ | 462,545 |
|
| HCP Inc., 6.7%, 1/30/18 | 1,450,000 | 1,685,365 |
| Health Care REIT Inc., 4.5%, 1/15/24 | 725,000 | 715,827 |
| Lehman Brothers Holdings Inc. * (E), 5.75%, 1/3/17 | 1,735,000 | 174 |
| Simon Property Group L.P., 5.875%, 3/1/17 | 530,000 | 594,420 |
| US Bank NA, 6.3%, 2/4/14 | 2,000,000 | 2,009,814 |
| | | 5,468,145 |
| Health Care - 3.1% | | |
| AbbVie Inc., 2%, 11/6/18 | 1,200,000 | 1,187,052 |
| Amgen Inc., 5.85%, 6/1/17 | 3,950,000 | 4,481,662 |
| Eli Lilly & Co., 6.57%, 1/1/16 | 1,200,000 | 1,338,392 |
| Genentech Inc., 5.25%, 7/15/35 | 740,000 | 779,791 |
| Merck Sharp & Dohme Corp., 5.75%, 11/15/36 | 1,320,000 | 1,483,988 |
| Quest Diagnostics Inc., 5.45%, 11/1/15 | 1,500,000 | 1,616,764 |
| UnitedHealth Group Inc., 2.875%, 3/15/23 | 1,000,000 | 930,506 |
| Wyeth LLC, 6.5%, 2/1/34 | 1,100,000 | 1,346,511 |
| | | 13,164,666 |
| Industrials - 1.8% | | |
| Boeing Co./The, 8.625%, 11/15/31 | 350,000 | 483,558 |
| Boeing Co./The, 6.875%, 10/15/43 | 620,000 | 760,533 |
| Burlington Northern Santa Fe LLC, 8.125%, 4/15/20 | 1,365,000 | 1,705,471 |
| Lockheed Martin Corp., 7.65%, 5/1/16 | 780,000 | 899,732 |
| Norfolk Southern Corp., 5.59%, 5/17/25 | 957,000 | 1,045,813 |
| Norfolk Southern Corp., 7.05%, 5/1/37 | 1,050,000 | 1,291,846 |
| Waste Management Inc., 7.125%, 12/15/17 | 1,150,000 | 1,337,731 |
| | | 7,524,684 |
| Information Technology - 0.8% | | |
| Apple Inc., 2.4%, 5/3/23 | 500,000 | 449,605 |
| Cisco Systems Inc., 5.5%, 2/22/16 | 960,000 | 1,056,129 |
| International Business Machines Corp., 1.875%, 8/1/22 | 1,600,000 | 1,398,309 |
| Thomson Reuters Corp. (D), 4.3%, 11/23/23 | 600,000 | 602,580 |
| | | 3,506,623 |
| Materials - 0.4% | | |
| Ball Corp., 4%, 11/15/23 | 250,000 | 223,750 |
| Rio Tinto Finance USA PLC (D), 2.25%, 12/14/18 | 400,000 | 398,026 |
| Westvaco Corp., 8.2%, 1/15/30 | 1,025,000 | 1,214,564 |
| | | 1,836,340 |
Ultra Series Fund | December 31, 2013
|
| | | | | | |
| | Par Value |
| Value (Note 2) |
|
| Telecommunication Services - 0.9% | | |
| Comcast Cable Communications Holdings Inc., 9.455%, 11/15/22 | $ | 1,780,000 |
| $ | 2,465,435 |
|
| Verizon Communications Inc., 5.15%, 9/15/23 | 1,260,000 |
| 1,352,852 |
|
| | | 3,818,287 |
|
| Utilities - 2.2% | | |
| Indianapolis Power & Light Co. (B) (C), 6.05%, 10/1/36 | 1,555,000 |
| 1,731,090 |
|
| Interstate Power & Light Co., 6.25%, 7/15/39 | 1,365,000 |
| 1,610,643 |
|
| Nevada Power Co., Series R, 6.75%, 7/1/37 | 1,600,000 |
| 1,985,803 |
|
| Sierra Pacific Power Co., Series M, 6%, 5/15/16 | 474,000 |
| 529,116 |
|
| Southwestern Electric Power Co., Series E, 5.55%, 1/15/17 | 835,000 |
| 917,256 |
|
| Westar Energy Inc., 6%, 7/1/14 | 2,400,000 |
| 2,466,017 |
|
| | | 9,239,925 |
|
| Total Corporate Notes and Bonds ( Cost $57,872,668 ) | | 60,739,308 |
|
| LONG TERM MUNICIPAL BONDS - 0.2% | | |
| General - 0.2% | | |
| Jacksonville FL Sales Tax Revenue, 5%, 10/1/29 | 950,000 |
| 983,241 |
|
| Total Long Term Municipal Bonds ( Cost $981,190 ) | | 983,241 |
|
| MORTGAGE BACKED SECURITIES - 7.0% | | |
| Fannie Mae - 4.8% | | |
| 4%, 4/1/15 Pool # 255719 | 70,145 |
| 74,279 |
|
| 5.5%, 4/1/16 Pool # 745444 | 142,888 |
| 151,655 |
|
| 6%, 5/1/16 Pool # 582558 | 40,756 |
| 42,088 |
|
| 5%, 12/1/17 Pool # 672243 | 366,664 |
| 390,577 |
|
| 4.5%, 9/1/20 Pool # 835465 | 368,795 |
| 393,050 |
|
| 6%, 5/1/21 Pool # 253847 | 89,617 |
| 99,743 |
|
| 3%, 5/1/27 Pool # AL1715 | 1,064,199 |
| 1,087,245 |
|
| 7%, 12/1/29 Pool # 762813 | 43,618 |
| 48,402 |
|
| 7%, 11/1/31 Pool # 607515 | 59,481 |
| 67,431 |
|
| 7%, 5/1/32 Pool # 644591 | 20,177 |
| 22,665 |
|
| 5.5%, 10/1/33 Pool # 254904 | 367,678 |
| 404,833 |
|
| 5.5%, 11/1/33 Pool # 555880 | 1,057,793 |
| 1,166,099 |
|
| 5%, 5/1/34 Pool # 780890 | 1,414,410 |
| 1,537,321 |
|
| 7%, 7/1/34 Pool # 792636 | 19,825 |
| 20,839 |
|
| 5.5%, 8/1/34 Pool # 793647 | 179,194 |
| 197,316 |
|
| 5.5%, 3/1/35 Pool # 815976 | 786,681 |
| 864,320 |
|
| 5.5%, 8/1/35 Pool # 826872 | 184,728 |
| 202,987 |
|
| 5%, 9/1/35 Pool # 820347 | 514,407 |
| 567,595 |
|
| 5%, 9/1/35 Pool # 835699 | 473,398 |
| 517,704 |
|
See accompanying Notes to Financial Statements.
Ultra Series Fund | December 31, 2013
Diversified Income Fund Portfolio of Investments
|
| | | | | | |
| | Par Value |
| Value (Note 2) |
|
| MORTGAGE BACKED SECURITIES (continued) | |
| Fannie Mae (continued) | | |
| 5%, 10/1/35 Pool # 797669 | $ | 426,445 |
| $ | 467,097 |
|
| 5.5%, 10/1/35 Pool # 836912 | 69,264 |
| 76,027 |
|
| 5%, 12/1/35 Pool # 850561 | 249,390 |
| 270,636 |
|
| 5.5%, 12/1/35 Pool # 844583 | 861,625 |
| 950,313 |
|
| 5.5%, 9/1/36 Pool # 831820 | 964,937 |
| 1,079,162 |
|
| 6%, 9/1/36 Pool # 831741 | 622,782 |
| 689,122 |
|
| 5.5%, 10/1/36 Pool # 896340 | 81,382 |
| 89,366 |
|
| 5.5%, 10/1/36 Pool # 901723 | 459,179 |
| 504,292 |
|
| 5.5%, 12/1/36 Pool # 902853 | 915,308 |
| 1,013,286 |
|
| 5.5%, 12/1/36 Pool # 903059 | 759,339 |
| 836,974 |
|
| 4%, 1/1/41 Pool # AB2080 | 1,275,390 |
| 1,314,399 |
|
| 4%, 9/1/41 Pool # AJ1406 | 1,338,221 |
| 1,378,499 |
|
| 4%, 10/1/41 Pool # AJ4046 | 1,157,504 |
| 1,194,179 |
|
| 3.5%, 6/1/42 Pool # AO4136 | 1,195,609 |
| 1,188,914 |
|
| 3%, 2/1/43 Pool # AB8486 | 1,441,729 |
| 1,370,273 |
|
| | | 20,278,688 |
|
| Freddie Mac - 2.2% | | |
| 3%, 8/1/27 Pool # J19899 | 1,264,358 |
| 1,290,048 |
|
| 8%, 6/1/30 Pool # C01005 | 30,673 |
| 35,698 |
|
| 6.5%, 1/1/32 Pool # C62333 | 110,331 |
| 122,875 |
|
| 5%, 7/1/33 Pool # A11325 | 866,365 |
| 950,440 |
|
| 6%, 10/1/34 Pool # A28439 | 125,011 |
| 138,078 |
|
| 6%, 10/1/34 Pool # A28598 | 45,620 |
| 50,438 |
|
| 5%, 4/1/35 Pool # A32314 | 134,554 |
| 145,020 |
|
| 5%, 4/1/35 Pool # A32315 | 182,010 |
| 200,507 |
|
| 5%, 4/1/35 Pool # A32316 | 195,631 |
| 215,472 |
|
| 5%, 4/1/35 Pool # A32509 | 128,266 |
| 141,368 |
|
| 5%, 1/1/37 Pool # A56371 | 494,849 |
| 532,729 |
|
| 4%, 10/1/41 Pool # Q04092 | 1,448,358 |
| 1,490,846 |
|
| 3%, 9/1/42 Pool # C04233 | 1,688,822 |
| 1,601,949 |
|
| 3%, 4/1/43 Pool # V80025 | 1,157,759 |
| 1,098,204 |
|
| 3%, 4/1/43 Pool # V80026 | 1,165,211 |
| 1,105,273 |
|
| | | 9,118,945 |
|
| Ginnie Mae - 0.0% | | |
| 6.5%, 4/20/31 Pool # 3068 | 65,837 |
| 75,220 |
|
| Total Mortgage Backed Securities ( Cost $28,649,117 ) | | 29,472,853 |
|
| U.S. GOVERNMENT AND AGENCY OBLIGATIONS - 16.5% | | |
| U.S. Treasury Bond - 1.1% | | |
| 6.625%, 2/15/27 | 3,270,000 |
| 4,418,587 |
|
Ultra Series Fund | December 31, 2013
|
| | | | | | |
| | Par Value |
| Value (Note 2) |
|
| U.S. Treasury Notes - 15.4% | | |
| 4.000%, 2/15/14 | $ | 4,810,000 |
| $ | 4,832,357 |
|
| 4.250%, 8/15/14 | 4,965,000 |
| 5,091,454 |
|
| 2.375%, 9/30/14 | 1,400,000 |
| 1,423,243 |
|
| 0.500%, 10/15/14 | 5,000,000 |
| 5,014,060 |
|
| 2.500%, 3/31/15 | 795,000 |
| 817,576 |
|
| 2.500%, 4/30/15 | 3,750,000 |
| 3,863,231 |
|
| 4.500%, 2/15/16 | 5,550,000 |
| 6,029,986 |
|
| 3.250%, 12/31/16 | 2,500,000 |
| 2,681,445 |
|
| 3.125%, 1/31/17 | 2,000,000 |
| 2,138,124 |
|
| 0.500%, 7/31/17 | 4,000,000 |
| 3,915,936 |
|
| 2.375%, 7/31/17 | 2,000,000 |
| 2,089,844 |
|
| 4.250%, 11/15/17 | 12,100,000 |
| 13,472,600 |
|
| 2.750%, 2/15/19 | 1,300,000 |
| 1,362,156 |
|
| 3.125%, 5/15/19 | 2,000,000 |
| 2,131,250 |
|
| 3.375%, 11/15/19 | 1,000,000 |
| 1,075,625 |
|
| 2.625%, 11/15/20 | 7,400,000 |
| 7,520,250 |
|
| 1.750%, 5/15/22 | 1,750,000 |
| 1,618,204 |
|
| | | 65,077,341 |
|
| Total U.S. Government and Agency Obligations ( Cost $67,794,412 ) | | 69,495,928 |
|
| | Shares |
| |
| SHORT-TERM INVESTMENTS - 3.9% | | |
| State Street Institutional U.S. Government Money Market Fund | 16,613,277 |
| 16,613,277 |
|
| Total Short-Term Investments ( Cost $16,613,277 ) | | 16,613,277 |
|
| TOTAL INVESTMENTS - 99.6% ( Cost $332,499,683** ) | 420,713,453 |
|
| NET OTHER ASSETS AND LIABILITIES - 0.4% | 1,694,836 |
|
| TOTAL NET ASSETS - 100.0% | $ | 422,408,289 |
|
|
| |
| * | Non-income producing. |
| ** | Aggregate cost for Federal tax purposes was $333,349,372. |
| (A) | Stepped rate security. Rate shown is as of December 31, 2013. |
| (B) | Security sold within terms of a private placement memorandum exempt from registration under section 144A of the Securities Act of 1933, as amended, and may be sold only to dealers in that program or other “qualified institutional investors.” |
| (C) | Illiquid security (See Note 2). |
| (D) | Notes and bonds, issued by foreign entities, denominated in U.S. dollars. The aggregate of these securities is 1.1% of total net assets. |
| (E) | In default. Issuer is bankrupt. |
| ADR | American Depositary Receipt. |
| PLC | Public Limited Company. |
| REIT | Real Estate Investment Trust. |
See accompanying Notes to Financial Statements.
Ultra Series Fund | December 31, 2013
Large Cap Value Fund Portfolio of Investments
|
| | | | |
| | Shares | Value (Note 2) |
|
| COMMON STOCKS - 96.6% | | |
| Consumer Discretionary - 11.8% | | |
| Advance Auto Parts Inc. | 92,000 | $ | 10,182,560 |
|
| DIRECTV* | 318,000 | 21,970,620 |
|
| McDonald’s Corp. | 86,000 | 8,344,580 |
|
| Target Corp. | 90,000 | 5,694,300 |
|
| Time Warner Inc. | 180,000 | 12,549,600 |
|
| Viacom Inc., Class B | 115,000 | 10,044,100 |
|
| | | 68,785,760 |
|
| Consumer Staples - 8.1% | | |
| CVS Caremark Corp. | 149,000 | 10,663,930 |
|
| Diageo PLC, ADR | 45,000 | 5,958,900 |
|
| Nestle S.A., ADR | 96,000 | 7,064,640 |
|
| Philip Morris International Inc. | 96,000 | 8,364,480 |
|
| Procter & Gamble Co./The | 72,000 | 5,861,520 |
|
| Wal-Mart Stores Inc. | 117,000 | 9,206,730 |
|
| | | 47,120,200 |
|
| Energy - 14.3% | | |
| Baker Hughes Inc. | 160,000 | 8,841,600 |
|
| Chevron Corp. | 132,500 | 16,550,575 |
|
| ConocoPhillips | 122,000 | 8,619,300 |
|
| Ensco PLC, Class A | 161,000 | 9,205,980 |
|
| Exxon Mobil Corp. | 87,000 | 8,804,400 |
|
| National Oilwell Varco Inc. | 132,000 | 10,497,960 |
|
| Occidental Petroleum Corp. | 93,000 | 8,844,300 |
|
| Schlumberger Ltd. | 132,500 | 11,939,575 |
|
| | | 83,303,690 |
|
| Financials - 25.2% | | |
| Capital Markets - 1.8% | | |
| Bank of New York Mellon Corp./The | 304,000 | 10,621,760 |
|
| Commercial Banks - 7.7% | | |
| BB&T Corp. | 254,000 | 9,479,280 |
|
| M&T Bank Corp. | 52,000 | 6,053,840 |
|
| US Bancorp | 322,000 | 13,008,800 |
|
| Wells Fargo & Co. | 357,000 | 16,207,800 |
|
| | | 44,749,720 |
|
| Insurance - 14.3% | | |
| American International Group Inc. | 329,000 | 16,795,450 |
|
| Arch Capital Group Ltd.* | 170,000 | 10,147,300 |
|
| Berkshire Hathaway Inc., Class B* | 142,000 | 16,835,520 |
|
| Markel Corp.* | 32,500 | 18,861,375 |
|
| Travelers Cos. Inc./The | 157,000 | 14,214,780 |
|
| WR Berkley Corp. | 151,000 | 6,551,890 |
|
| | | 83,406,315 |
|
| Real Estate Management & Development - 1.4% | |
| Brookfield Asset Management Inc., Class A | 212,000 | 8,231,960 |
|
| | | 147,009,755 |
|
Ultra Series Fund | December 31, 2013
|
| | | | |
| | Shares | Value (Note 2) |
|
| Health Care - 14.2% | | |
| Johnson & Johnson | 158,000 | $ | 14,471,220 |
|
| Medtronic Inc. | 187,000 | 10,731,930 |
|
| Merck & Co. Inc. | 437,000 | 21,871,850 |
|
| Novartis AG, ADR | 74,000 | 5,948,120 |
|
| Pfizer Inc. | 722,000 | 22,114,860 |
|
| UnitedHealth Group Inc. | 104,000 | 7,831,200 |
|
| | | 82,969,180 |
|
| Industrials - 14.3% | | |
| 3M Co. | 82,000 | 11,500,500 |
|
| Boeing Co./The | 71,500 | 9,759,035 |
|
| Danaher Corp. | 144,000 | 11,116,800 |
|
| FedEx Corp. | 124,000 | 17,827,480 |
|
| General Dynamics Corp. | 76,000 | 7,261,800 |
|
| Rockwell Collins Inc. | 117,000 | 8,648,640 |
|
| United Parcel Service Inc., Class B | 61,000 | 6,409,880 |
|
| United Technologies Corp. | 94,000 | 10,697,200 |
|
| | | 83,221,335 |
|
| Information Technology - 6.3% | | |
| Accenture PLC, Class A | 78,000 | 6,413,160 |
|
| Oracle Corp. | 270,000 | 10,330,200 |
|
| QUALCOMM Inc. | 117,000 | 8,687,250 |
|
| Seagate Technology PLC | 197,000 | 11,063,520 |
|
| | | 36,494,130 |
|
| Materials - 1.2% | | |
| Mosaic Co./The | 154,000 | 7,279,580 |
|
| Telecommunication Service - 1.2% | | |
| AT&T Inc. | 202,000 | 7,102,320 |
|
Total Common Stocks ( Cost $391,232,820 ) | | 563,285,950 |
|
| SHORT-TERM INVESTMENTS - 3.4% | | |
| State Street Institutional U.S. Government Money Market Fund | 20,079,258 | 20,079,258 |
|
| Total Short-Term Investments ( Cost $20,079,258 ) | | 20,079,258 |
|
| TOTAL INVESTMENTS - 100.0% ( Cost $411,312,078** ) | 583,365,208 |
|
| NET OTHER ASSETS AND LIABILITIES - 0.0% | 240,540 |
|
| TOTAL NET ASSETS - 100.0% | $ | 583,605,748 |
|
|
| |
| * | Non-income producing. |
| ** | Aggregate cost for Federal tax purposes was $411,684,308. |
| ADR | American Depositary Receipt. |
| PLC | Public Limited Company. |
See accompanying Notes to Financial Statements.
Ultra Series Fund | December 31, 2013
Large Cap Growth Fund Portfolio of Investments
|
| | | | |
| | Shares | Value (Note 2) |
|
| COMMON STOCKS - 94.8% | | |
| Consumer Discretionary - 19.8% | | |
| Amazon.com Inc.* | 21,497 | $ | 8,572,789 |
|
| CBS Corp., Class B | 86,500 | 5,513,510 |
|
| DIRECTV* | 90,465 | 6,250,227 |
|
| Discovery Communications Inc., Class C* | 77,523 | 6,501,079 |
|
| Home Depot Inc./The | 110,040 | 9,060,693 |
|
| Lululemon Athletica Inc.* | 86,062 | 5,080,240 |
|
| McDonald’s Corp. | 58,720 | 5,697,602 |
|
| Omnicom Group Inc. | 79,720 | 5,928,776 |
|
| Panera Bread Co., Class A* | 31,966 | 5,648,072 |
|
| priceline.com Inc.* | 6,235 | 7,247,564 |
|
| Starbucks Corp. | 56,378 | 4,419,471 |
|
| TJX Cos. Inc. | 85,975 | 5,479,187 |
|
| Walt Disney Co./The | 32,840 | 2,508,976 |
|
| | | 77,908,186 |
|
| Consumer Staples - 8.3% | | |
| Costco Wholesale Corp. | 52,804 | 6,284,204 |
|
| CVS Caremark Corp. | 85,957 | 6,151,943 |
|
| Nestle S.A., ADR | 108,155 | 7,959,126 |
|
| PepsiCo Inc. | 39,725 | 3,294,792 |
|
| Philip Morris International Inc. | 105,955 | 9,231,859 |
|
| | | 32,921,924 |
|
| Energy - 4.3% | | |
| Apache Corp. | 55,000 | 4,726,700 |
|
| Schlumberger Ltd. | 134,765 | 12,143,674 |
|
| | | 16,870,374 |
|
| Financials - 2.8% | | |
| Brookfield Asset Management Inc., Class A | 124,706 | 4,842,334 |
|
| T. Rowe Price Group Inc. | 76,629 | 6,419,211 |
|
| | | 11,261,545 |
|
| Health Care - 12.1% | | |
| Allergan Inc. | 65,428 | 7,267,742 |
|
| Baxter International Inc. | 81,245 | 5,650,590 |
|
| Biogen Idec Inc.* | 17,640 | 4,934,790 |
|
| Celgene Corp.* | 28,065 | 4,741,862 |
|
| Cerner Corp.* | 86,258 | 4,808,021 |
|
| Gilead Sciences Inc.* | 73,090 | 5,492,713 |
|
| Johnson & Johnson | 61,450 | 5,628,205 |
|
| UnitedHealth Group Inc. | 68,535 | 5,160,686 |
|
| Varian Medical Systems Inc.* | 51,550 | 4,004,920 |
|
| | | 47,689,529 |
|
Ultra Series Fund | December 31, 2013
|
| | | | |
| | Shares | Value (Note 2) |
|
| Industrials - 15.4% | | |
| 3M Co. | 40,137 | $ | 5,629,214 |
|
| Boeing Co./The | 47,142 | 6,434,412 |
|
| Danaher Corp. | 78,166 | 6,034,415 |
|
| Expeditors International of Washington Inc. | 98,300 | 4,349,775 |
|
| FedEx Corp. | 33,155 | 4,766,694 |
|
| Jacobs Engineering Group Inc.* | 60,890 | 3,835,461 |
|
| Rockwell Collins Inc. | 69,615 | 5,145,941 |
|
| Roper Industries Inc. | 28,093 | 3,895,937 |
|
| United Parcel Service Inc., Class B | 67,000 | 7,040,360 |
|
| United Technologies Corp. | 75,928 | 8,640,607 |
|
| W.W. Grainger Inc. | 18,800 | 4,801,896 |
|
| | | 60,574,712 |
|
| Information Technology - 28.5% | | |
| Communications Equipment - 3.3% | | |
| QUALCOMM Inc. | 175,618 | 13,039,637 |
|
| Computers & Peripherals - 5.5% | | |
| Apple Inc. | 38,624 | 21,672,313 |
|
| Internet Software & Services - 5.6% | | |
| eBay Inc.* | 146,342 | 8,032,712 |
|
| Google Inc., Class A* | 12,378 | 13,872,149 |
|
| | | 21,904,861 |
|
| IT Services - 4.9% | | |
| Accenture PLC, Class A | 101,572 | 8,351,250 |
|
| International Business Machines Corp. | 31,790 | 5,962,850 |
|
| Visa Inc., Class A | 22,821 | 5,081,780 |
|
| | | 19,395,880 |
|
| Semiconductors & Semiconductor Equipment - 1.6% | | |
| Linear Technology Corp. | 140,000 | 6,377,000 |
|
| Software - 7.6% | | |
| MICROS Systems Inc.* | 76,753 | 4,403,320 |
|
| Microsoft Corp. | 316,745 | 11,855,765 |
|
| Oracle Corp. | 352,632 | 13,491,700 |
|
| | | 29,750,785 |
|
| | | 112,140,476 |
|
| Materials - 3.6% | | |
| Monsanto Co. | 79,825 | 9,303,604 |
|
| Mosaic Co./The | 100,000 | 4,727,000 |
|
| | | 14,030,604 |
|
| Total Common Stocks ( Cost $252,675,200 ) | | 373,397,350 |
|
See accompanying Notes to Financial Statements.
Ultra Series Fund | December 31, 2013
Large Cap Growth Fund Portfolio of Investments
|
| | | | |
| | Shares | Value (Note 2) |
|
| SHORT-TERM INVESTMENTS - 5.2% | | |
| State Street Institutional U.S. Government Money Market Fund | 20,536,155 | $ | 20,536,155 |
|
Total Short-Term Investments
( Cost $20,536,155 ) | | 20,536,155 |
|
| TOTAL INVESTMENTS - 100.0% ( Cost $273,211,355** ) | 393,933,505 |
|
| NET OTHER ASSETS AND LIABILITIES - 0.0% | 8,053 |
|
| TOTAL NET ASSETS - 100.0% | | $ | 393,941,558 |
|
|
| |
| * | Non-income producing. |
| ** | Aggregate cost for Federal tax purposes was $274,792,813. |
| ADR | American Depositary Receipt. |
| PLC | Public Limited Company. |
See accompanying Notes to Financial Statements.
Ultra Series Fund | December 31, 2013
Mid Cap Fund Portfolio of Investments
|
| | | | |
| | Shares | Value (Note 2) |
|
| COMMON STOCKS - 94.7% | | |
| Consumer Discretionary - 30.3% | | |
| Media - 11.3% | | |
| DIRECTV* | 150,475 | $ | 10,396,318 |
|
| Discovery Communications Inc., Class C* | 105,081 | 8,812,093 |
|
| Liberty Global PLC* | 136,980 | 11,550,154 |
|
| Omnicom Group Inc. | 189,488 | 14,092,222 |
|
| | | 44,850,787 |
|
| Specialty Retail - 19.0% | | |
| Advance Auto Parts Inc. | 170,339 | 18,853,120 |
|
| Bed Bath & Beyond Inc.* | 114,689 | 9,209,527 |
|
| CarMax Inc.* | 203,482 | 9,567,724 |
|
| Ross Stores Inc. | 137,725 | 10,319,734 |
|
| Sally Beauty Holdings Inc.* | 287,890 | 8,702,915 |
|
| Tiffany & Co. | 101,662 | 9,432,200 |
|
| TJX Cos. Inc. | 149,852 | 9,550,068 |
|
| | | 75,635,288 |
|
| | | 120,486,075 |
|
| Consumer Staples - 0.8% | | |
| Brown-Forman Corp., Class B | 44,273 | 3,345,710 |
|
| Energy - 4.2% | | |
| Ensco PLC, Class A | 130,107 | 7,439,518 |
|
| World Fuel Services Corp. | 212,809 | 9,184,837 |
|
| | | 16,624,355 |
|
| Financials - 22.8% | | |
| Arch Capital Group Ltd.* | 185,914 | 11,097,207 |
|
| Brookfield Asset Management Inc., Class A | 340,118 | 13,206,782 |
|
| Brown & Brown Inc. | 318,438 | 9,995,769 |
|
| Glacier Bancorp Inc. | 203,637 | 6,066,346 |
|
| Leucadia National Corp. | 302,128 | 8,562,307 |
|
| M&T Bank Corp. | 82,480 | 9,602,322 |
|
| Markel Corp.* | 34,354 | 19,937,344 |
|
| WR Berkley Corp. | 280,737 | 12,181,178 |
|
| | | 90,649,255 |
|
| Health Care - 10.9% | | |
| DENTSPLY International Inc. | 279,027 | 13,527,229 |
|
| Laboratory Corp. of America Holdings* | 113,352 | 10,356,972 |
|
| Perrigo Co. PLC | 73,122 | 11,221,302 |
|
| Techne Corp. | 85,044 | 8,051,116 |
|
| | | 43,156,619 |
|
Ultra Series Fund | December 31, 2013
|
| | | | |
| | Shares | Value (Note 2) |
|
| Industrials - 17.5% | | |
| C.H. Robinson Worldwide Inc. | 172,235 | $ | 10,048,190 |
|
| Colfax Corp.* | 133,375 | 8,494,654 |
|
| Copart Inc.* | 408,981 | 14,989,154 |
|
| Expeditors International of Washington Inc. | 240,165 | 10,627,301 |
|
| Jacobs Engineering Group Inc.* | 111,049 | 6,994,976 |
|
| TransDigm Group Inc. | 60,909 | 9,807,567 |
|
| Wabtec Corp. | 113,165 | 8,404,765 |
|
| | | 69,366,607 |
|
| Information Technology - 4.9% | | |
| Amphenol Corp., Class A | 89,537 | 7,984,910 |
|
| MICROS Systems Inc.* | 199,907 | 11,468,664 |
|
| | | 19,453,574 |
|
| Materials - 3.3% | | |
| Crown Holdings Inc.* | 297,994 | 13,281,592 |
|
| Total Common Stocks ( Cost $249,591,424 ) | | 376,363,787 |
|
| SHORT-TERM INVESTMENTS - 5.4% | | |
| State Street Institutional U.S. Government Money Market Fund | 21,317,843 | 21,317,843 |
|
| Total Short-Term Investments ( Cost $21,317,843 ) | | 21,317,843 |
|
| TOTAL INVESTMENTS - 100.1% ( Cost $270,909,267** ) | 397,681,630 |
|
| NET OTHER ASSETS AND LIABILITIES - (0.1%) | (216,972) |
|
| TOTAL NET ASSETS - 100.0% | $ | 397,464,658 |
|
|
| |
| * | Non-income producing. |
| ** | Aggregate cost for Federal tax purposes was $271,142,147. |
| PLC | Public Limited Company. |
See accompanying Notes to Financial Statements.
Ultra Series Fund | December 31, 2013
Small Cap Fund Portfolio of Investments
|
| | | | |
| | Shares | Value (Note 2) |
|
| COMMON STOCKS - 96.9% | | |
| Consumer Discretionary - 13.0% | | |
| Ascena Retail Group Inc.* | 7,320 | $ | 154,891 |
|
| Cato Corp./The, Class A | 5,080 | 161,544 |
|
| CEC Entertainment Inc. | 3,420 | 151,438 |
|
| Choice Hotels International Inc. | 470 | 23,082 |
|
| Fred’s Inc., Class A | 7,000 | 129,640 |
|
| Helen of Troy Ltd.* | 3,510 | 173,780 |
|
| Matthews International Corp., Class A | 2,940 | 125,273 |
|
| Stage Stores Inc. | 4,610 | 102,434 |
|
| | | 1,022,082 |
|
| Consumer Staples - 2.1% | | |
| Casey’s General Stores Inc. | 1,480 | 103,970 |
|
| Post Holdings Inc.* | 1,300 | 64,051 |
|
| | | 168,021 |
|
| Energy - 5.7% | | |
| Diamondback Energy Inc.* | 1,700 | 89,862 |
|
| Era Group Inc.* | 2,590 | 79,927 |
|
| Scorpio Tankers Inc. | 15,400 | 181,566 |
|
| SEACOR Holdings Inc.* | 1,090 | 99,408 |
|
| | | 450,763 |
|
| Financials - 21.4% | | |
| AMERISAFE Inc. | 1,710 | 72,230 |
|
| Assured Guaranty Ltd. | 3,600 | 84,924 |
|
| Campus Crest Communities Inc., REIT | 8,000 | 75,280 |
|
| DiamondRock Hospitality Co., REIT | 6,229 | 71,945 |
|
| Education Realty Trust Inc., REIT | 7,500 | 66,150 |
|
| First Busey Corp. | 10,107 | 58,621 |
|
| First Midwest Bancorp Inc. | 7,830 | 137,260 |
|
| First Niagara Financial Group Inc. | 7,507 | 79,724 |
|
| Flushing Financial Corp. | 3,881 | 80,337 |
|
| Hancock Holding Co. | 2,100 | 77,028 |
|
| International Bancshares Corp. | 5,450 | 143,826 |
|
| MB Financial Inc. | 3,030 | 97,233 |
|
| Northwest Bancshares Inc. | 8,380 | 123,856 |
|
| Platinum Underwriters Holdings Ltd. | 1,260 | 77,213 |
|
| Primerica Inc. | 3,000 | 128,730 |
|
| Solar Capital Ltd. | 2,200 | 49,610 |
|
| Summit Hotel Properties Inc., REIT | 7,100 | 63,900 |
|
| Webster Financial Corp. | 5,480 | 170,866 |
|
| Westamerica Bancorporation | 570 | 32,182 |
|
| | | 1,690,915 |
|
| Health Care - 10.8% | | |
| Allscripts Healthcare Solutions Inc.* | 5,200 | 80,392 |
|
| Amsurg Corp.* | 3,490 | 160,261 |
|
| Charles River Laboratories International Inc.* | 4,100 | 217,464 |
|
| Corvel Corp.* | 1,460 | 68,182 |
|
| Haemonetics Corp.* | 400 | 16,852 |
|
Ultra Series Fund | December 31, 2013
|
| | | | |
| | Shares | Value (Note 2) |
|
| ICON PLC* | 2,530 | $ | 102,237 |
|
| ICU Medical Inc.* | 1,770 | 112,767 |
|
| STERIS Corp. | 2,000 | 96,100 |
|
| | | 854,255 |
|
| Industrials - 18.6% | | |
| ACCO Brands Corp.* | 12,940 | 86,957 |
|
| Albany International Corp., Class A | 4,250 | 152,702 |
|
| Atlas Air Worldwide Holdings Inc.* | 2,400 | 98,760 |
|
| Cubic Corp. | 2,100 | 110,586 |
|
| ESCO Technologies Inc. | 2,790 | 95,585 |
|
| G&K Services Inc., Class A | 2,800 | 174,244 |
|
| GATX Corp. | 2,570 | 134,077 |
|
| Luxfer Holdings PLC, ADR | 1,300 | 27,118 |
|
| Mueller Industries Inc. | 3,000 | 189,030 |
|
| SP Plus Corp.* | 5,190 | 135,148 |
|
| United Stationers Inc. | 3,900 | 178,971 |
|
| UTi Worldwide Inc. | 4,600 | 80,776 |
|
| | | 1,463,954 |
|
| Information Technology - 14.2% | | |
| Belden Inc. | 4,070 | 286,732 |
|
| Coherent Inc.* | 1,070 | 79,597 |
|
| Diebold Inc. | 3,670 | 121,147 |
|
| Forrester Research Inc. | 3,200 | 122,432 |
|
| MAXIMUS Inc. | 1,760 | 77,422 |
|
| Micrel Inc. | 6,200 | 61,194 |
|
| MTS Systems Corp. | 1,030 | 73,388 |
|
| ScanSource Inc.* | 2,600 | 110,318 |
|
| Verint Systems Inc.* | 1,900 | 81,586 |
|
| Zebra Technologies Corp., Class A* | 2,000 | 108,160 |
|
| | | 1,121,976 |
|
| Materials - 6.9% | | |
| Deltic Timber Corp. | 1,520 | 103,269 |
|
| Greif Inc., Class A | 1,300 | 68,120 |
|
| Innospec Inc. | 2,200 | 101,684 |
|
| Koppers Holdings Inc. | 1,800 | 82,350 |
|
| Sensient Technologies Corp. | 1,700 | 82,484 |
|
| Zep Inc. | 5,840 | 106,054 |
|
| | | 543,961 |
|
| Utilities - 4.2% | | |
| Atmos Energy Corp. | 2,050 | 93,111 |
|
| Laclede Group Inc./The | 1,200 | 54,648 |
|
| New Jersey Resources Corp. | 670 | 30,981 |
|
| UNS Energy Corp. | 1,540 | 92,169 |
|
| WGL Holdings Inc. | 1,460 | 58,487 |
|
| | | 329,396 |
|
| Total Common Stocks ( Cost $4,205,004 ) | | 7,645,323 |
|
Ultra Series Fund | December 31, 2013
Small Cap Fund Portfolio of Investments
|
| | | | |
| | Shares | Value (Note 2) |
|
| SHORT-TERM INVESTMENTS - 3.3% | | |
| State Street Institutional U.S. Government Money Market Fund | 263,581 | $ | 263,581 |
|
Total Short-Term Investments
( Cost $263,581 ) | | 263,581 |
|
| TOTAL INVESTMENTS - 100.2% ( Cost $4,468,585** ) | 7,908,904 |
|
| NET OTHER ASSETS AND LIABILITIES - (0.2%) | (13,005) |
|
| TOTAL NET ASSETS - 100.0% | | $ | 7,895,899 |
|
|
| |
| * | Non-income producing. |
| ** | Aggregate cost for Federal tax purposes was $4,516,289. |
| ADR | American Depository Receipt. |
| PLC | Public Limited Company. |
| REIT | Real Estate Investment Trust. |
See accompanying Notes to Financial Statements.
Ultra Series Fund | December 31, 2013
International Stock Fund Portfolio of Investments
|
| | | | |
| | Shares | Value (Note 2) |
|
| COMMON STOCKS - 97.8% | | |
| Australia - 2.0% | | |
| Ansell Ltd. | 44,785 | $ | 826,563 |
|
| James Hardie Industries Plc | 88,531 | 1,022,899 |
|
| | | 1,849,462 |
|
| Austria - 0.9% | | |
| UNIQA Insurance Group AG | 69,995 | 893,494 |
|
| Belgium - 2.5% | | |
| Anheuser-Busch InBev N.V. | 22,655 | 2,407,921 |
|
| Bermuda - 0.9% | | |
| Signet Jewelers Ltd. | 10,717 | 846,434 |
|
| Brazil - 1.1% | | |
| Estacio Participacoes S.A. | 115,500 | 999,197 |
|
| Canada - 2.7% | | |
| MacDonald Dettwiler & Associates Ltd. | 14,500 | 1,123,417 |
|
| Rogers Communications Inc. | 32,600 | 1,475,248 |
|
| | | 2,598,665 |
|
| Denmark - 1.0% | | |
| Carlsberg AS | 8,639 | 955,862 |
|
| Finland - 1.9% | | |
| Sampo | 36,121 | 1,774,985 |
|
| France - 9.0% | | |
| BNP Paribas S.A. | 34,264 | 2,670,309 |
|
| Cap Gemini S.A. | 17,155 | 1,159,474 |
|
| Sanofi | 24,249 | 2,572,672 |
|
| Valeo S.A. | 19,768 | 2,187,280 |
|
| | | 8,589,735 |
|
| Germany - 6.6% | | |
| Bayer AG | 19,377 | 2,717,674 |
|
| Bayerische Motoren Werke AG | 15,052 | 1,764,653 |
|
| Merck KGaA | 9,912 | 1,776,080 |
|
| | | 6,258,407 |
|
| Greece - 0.7% | | |
| Piraeus Bank S.A. * | 296,397 | 623,862 |
|
| Ireland - 0.9% | | |
| Ryanair Holdings PLC, ADR * | 18,600 | 872,898 |
|
| Italy - 2.7% | | |
| Atlantia SpA | 57,039 | 1,279,822 |
|
| Eni SpA | 54,639 | 1,314,668 |
|
| | | 2,594,490 |
|
| Japan - 19.3% | | |
| AEON Financial Service Co. Ltd. | 26,000 | 696,230 |
|
| Asahi Group Holdings Ltd. | 66,800 | 1,880,118 |
|
Ultra Series Fund | December 31, 2013
|
| | | | |
| | Shares | Value (Note 2) |
|
| Asics Corp. | 73,990 | $ | 1,261,153 |
|
| Daikin Industries Ltd. | 18,600 | 1,156,870 |
| Daiwa House Industry Co. Ltd. | 67,000 | 1,294,701 |
| Don Quijote Co. Ltd. | 28,700 | 1,736,008 |
| Japan Tobacco Inc. | 42,400 | 1,376,963 |
| KDDI Corp. | 20,800 | 1,277,903 |
| LIXIL Group Corp. | 56,200 | 1,538,549 |
| Makita Corp. | 14,600 | 765,284 |
| Seven & I Holdings Co. Ltd. | 37,100 | 1,472,586 |
| Sumitomo Mitsui Financial Group Inc. | 51,900 | 2,671,142 |
| Yahoo Japan Corp. | 214,300 | 1,190,443 |
| | | 18,317,950 |
| Luxembourg - 1.4% | | |
| RTL Group * | 10,519 | 1,359,259 |
| Netherlands - 1.7% | | |
| European Aeronautic Defence and Space Co. N.V. | 21,133 | 1,622,545 |
| Norway - 0.7% | | |
| Petroleum Geo-Services ASA | 55,981 | 659,463 |
| Philippines - 1.8% | | |
| Alliance Global Group Inc. | 2,622,100 | 1,524,253 |
| LT Group Inc. | 428,100 | 148,930 |
| | | 1,673,183 |
| South Korea - 1.1% | | |
| Samsung Electronics Co. Ltd., GDR | 1,658 | 1,082,674 |
| Spain - 4.4% | | |
| International Consolidated Airlines Group S.A. * | 200,317 | 1,331,504 |
| Mediaset Espana Comunicacion S.A. * | 81,215 | 937,281 |
| Red Electrica Corp. S.A. | 27,963 | 1,865,731 |
| | | 4,134,516 |
| Sweden - 2.9% | | |
| Assa Abloy AB | 24,846 | 1,312,635 |
| Swedbank AB | 50,788 | 1,429,235 |
| | | 2,741,870 |
| Switzerland - 10.3% | | |
| GAM Holding AG * | 66,996 | 1,303,044 |
| Glencore Xstrata PLC * | 286,850 | 1,485,354 |
| Informa PLC | 226,026 | 2,146,540 |
| Novartis AG | 44,550 | 3,555,810 |
| Swatch Group AG/The | 2,001 | 1,322,336 |
| | | 9,813,084 |
| Thailand - 0.6% | | |
| Krung Thai Bank PCL | 1,064,100 | 534,317 |
See accompanying Notes to Financial Statements.
Ultra Series Fund | December 31, 2013
International Stock Fund Portfolio of Investments
|
| | | | |
| | Shares | Value (Note 2) |
|
| COMMON STOCKS (continued) | | |
| Turkey - 0.4% | | |
| KOC Holding AS | 97,133 | $ | 397,753 |
|
| United Kingdom - 20.3% | | |
| BG Group PLC | 40,225 | 864,272 |
|
| British American Tobacco PLC | 31,472 | 1,687,518 |
|
| Direct Line Insurance Group PLC | 324,948 | 1,343,092 |
|
| Ladbrokes PLC | 162,379 | 481,047 |
|
| Lloyds Banking Group PLC * | 1,712,160 | 2,236,446 |
|
| Prudential PLC | 113,071 | 2,509,015 |
|
| Reed Elsevier PLC | 103,140 | 1,535,444 |
|
| Rexam PLC | 240,616 | 2,113,767 |
|
| Royal Dutch Shell PLC | 72,903 | 2,611,254 |
|
| Standard Chartered PLC | 55,075 | 1,240,339 |
|
| Taylor Wimpey PLC | 588,338 | 1,086,298 |
|
| Unilever PLC | 37,741 | 1,551,181 |
|
| | | 19,259,673 |
|
| Total Common Stocks ( Cost $64,632,485 ) | | 92,861,699 |
|
| SHORT-TERM INVESTMENTS - 2.1% | | |
| United States - 2.1% | | |
| State Street Institutional U.S. Government Money Market Fund | 2,012,515 | 2,012,515 |
|
| Total Short-Term Investments ( Cost $2,012,515 ) | | 2,012,515 |
|
| TOTAL INVESTMENTS - 99.9% ( Cost $66,645,000** ) | 94,874,214 |
|
| NET OTHER ASSETS AND LIABILITIES - 0.1% | 67,721 |
|
| TOTAL NET ASSETS - 100.0% | | $ | 94,941,935 |
|
|
| |
| * | Non-income producing. |
| ** | Aggregate cost for Federal tax purposes was $67,017,978. |
| ADR | American Depositary Receipt. |
| GDR | Global Depositary Receipt. |
| PLC | Public Limited Company. |
Ultra Series Fund | December 31, 2013
|
| | |
OTHER INFORMATION: Sector Concentration | % of Net Assets |
|
| Consumer Discretionary | 19 | % |
| Consumer Staples | 12 | % |
| Energy | 7 | % |
| Financials | 22 | % |
| Health Care | 12 | % |
| Industrials | 14 | % |
| Information Technology | 4 | % |
| Materials | 3 | % |
| Money Market Funds | 2 | % |
| Telecommunication Services | 3 | % |
| Utilities | 2 | % |
| Net Other Assets and Liabilities | –* |
|
| | 100 | % |
| *Amount represents less than 0.5% of net assets. |
See accompanying Notes to Financial Statements.
Ultra Series Fund | December 31, 2013
Madison Target Retirement 2020 Fund Portfolio of Investments
|
| | | | |
| | Shares | Value (Note 2) |
|
| INVESTMENT COMPANIES - 99.9% | | |
| Bond Funds - 60.8% | | |
| Baird Aggregate Bond Fund Institutional Shares | 674,247 | $ | 7,018,908 |
|
| Franklin Floating Rate Daily Access Fund Advisor Class | 953,577 | 8,782,447 |
|
| iShares 20+ Year Treasury Bond Fund ETF | 2,756 | 280,726 |
|
| iShares 7-10 Year Treasury Bond ETF | 14,850 | 1,473,714 |
|
| iShares Barclays TIPS Bond Fund ETF | 9,597 | 1,054,710 |
|
| Metropolitan West High Yield Bond Fund Class I | 136,963 | 1,405,241 |
|
| Metropolitan West Total Return Bond Fund Class I | 532,761 | 5,620,633 |
|
| PIMCO Investment Grade Corporate Bond Fund Institutional Class | 273,678 | 2,802,462 |
|
| Vanguard Intermediate-Term Corporate Bond ETF | 67,925 | 5,617,397 |
|
| Vanguard Short-Term Bond ETF | 43,950 | 3,512,924 |
|
| Vanguard Short-Term Corporate Bond ETF | 17,619 | 1,405,644 |
|
| Vanguard Total Bond Market ETF | 48,294 | 3,863,037 |
|
| | | 42,837,843 |
|
| Foreign Stock Funds - 4.8% | | |
| iShares MSCI EAFE ETF | 20,905 | 1,401,889 |
|
| iShares MSCI United Kingdom ETF | 26,836 | 560,336 |
|
| Vanguard FTSE All-World ex-US ETF | 13,849 | 702,560 |
|
| WisdomTree Japan Hedged Equity Fund ETF | 13,876 | 705,456 |
|
| | | 3,370,241 |
|
| Money Market Funds - 1.2% | | |
| State Street Institutional U.S. Government Money Market Fund | 814,355 | 814,355 |
|
Ultra Series Fund | December 31, 2013
|
| | | | | |
| | Shares |
| Value (Note 2) |
|
| Stock Funds - 33.1% | | |
| iShares Core S&P Mid-Cap ETF | 7,863 |
| $ | 1,052,384 |
|
| iShares S&P 100 ETF | 34,142 |
| 2,811,594 |
|
| iShares S&P Mid-Cap 400 Value ETF | 4,827 |
| 561,042 |
|
| PowerShares Buyback Achievers Portfolio ETF | 26,102 |
| 1,124,474 |
|
| Schwab Fundamental U.S. Large Company Index Fund Institutional Shares | 347,577 |
| 4,935,589 |
|
| SPDR S&P 500 ETF Trust | 53,311 |
| 9,844,942 |
|
| Vanguard Dividend Appreciation ETF | 18,655 |
| 1,403,602 |
|
| Vanguard Information Technology ETF | 12,563 |
| 1,124,640 |
|
| Vanguard Value ETF | 6,441 |
| 492,028 |
|
| | | 23,350,295 |
|
| TOTAL INVESTMENTS - 99.9% ( Cost $64,626,146** ) | 70,372,734 |
|
| NET OTHER ASSETS AND LIABILITIES - 0.1% | 99,287 |
|
| TOTAL NET ASSETS - 100.0% | $ | 70,472,021 |
|
|
| |
| ** | Aggregate cost for Federal tax purposes was $65,286,212. |
| ETF | Exchange Traded Fund. |
See accompanying Notes to Financial Statements.
Ultra Series Fund | December 31, 2013
Madison Target Retirement 2030 Fund Portfolio of Investments
|
| | | | |
| | Shares | Value (Note 2) |
|
| INVESTMENT COMPANIES - 99.7% | | |
| Bond Funds - 39.4% | | |
| Baird Aggregate Bond Fund Institutional Shares | 445,706 | $ | 4,639,797 |
|
| Franklin Floating Rate Daily Access Fund Advisor Class | 806,820 | 7,430,809 |
|
| iShares 20+ Year Treasury Bond Fund ETF | 3,643 | 371,076 |
|
| iShares 7-10 Year Treasury Bond ETF | 19,632 | 1,948,280 |
|
| iShares Barclays TIPS Bond Fund ETF | 10,150 | 1,115,485 |
|
| Metropolitan West High Yield Bond Fund Class I | 181,087 | 1,857,952 |
|
| Metropolitan West Total Return Bond Fund Class I | 440,202 | 4,644,131 |
|
| PIMCO Investment Grade Corporate Bond Fund Institutional Class | 180,853 | 1,851,935 |
|
| Vanguard Intermediate-Term Corporate Bond ETF | 56,124 | 4,641,455 |
|
| Vanguard Short-Term Bond ETF | 34,862 | 2,786,520 |
|
| Vanguard Short-Term Corporate Bond ETF | 17,469 | 1,393,677 |
|
| Vanguard Total Bond Market ETF | 51,076 | 4,085,569 |
|
| | | 36,766,686 |
|
| Foreign Stock Funds - 8.9% | | |
| iShares Global Energy ETF | 4,311 | 186,321 |
|
| iShares MSCI All Country Asia ex Japan ETF | 6,183 | 372,897 |
|
| iShares MSCI EAFE ETF | 41,454 | 2,779,905 |
|
| iShares MSCI United Kingdom ETF | 70,955 | 1,481,540 |
|
| Vanguard FTSE All-World ex-US ETF | 27,463 | 1,393,198 |
|
| Vanguard FTSE Europe ETF | 6,310 | 371,028 |
|
| WisdomTree Europe Hedged Equity Fund ETF | 6,613 | 371,056 |
|
| WisdomTree Japan Hedged Equity Fund ETF | 25,682 | 1,305,673 |
|
| | | 8,261,618 |
|
Ultra Series Fund | December 31, 2013
|
| | | | |
| | Shares | Value (Note 2) |
|
| Money Market Funds - 1.0% | | |
| State Street Institutional U.S. Government Money Market Fund | 940,700 | $ | 940,700 |
|
| Stock Funds - 50.4% | | |
| iShares Core S&P Mid-Cap ETF | 20,789 | 2,782,400 |
|
| iShares S&P 100 ETF | 56,421 | 4,646,269 |
|
| iShares S&P Mid-Cap 400 Value ETF | 9,573 | 1,112,670 |
|
| Market Vectors Agribusiness ETF | 3,420 | 186,356 |
|
| PowerShares Buyback Achievers Portfolio ETF | 86,270 | 3,716,512 |
|
| Schwab Fundamental U.S. Large Company Index Fund Institutional Shares | 656,371 | 9,320,464 |
|
| SPDR S&P 500 ETF Trust | 100,683 | 18,593,130 |
|
| Vanguard Dividend Appreciation ETF | 36,994 | 2,783,428 |
|
| Vanguard Information Technology ETF | 24,912 | 2,230,122 |
|
| Vanguard Value ETF | 20,678 | 1,579,592 |
|
| | | 46,950,943 |
|
| TOTAL INVESTMENTS - 99.7% ( Cost $81,654,556** ) | 92,919,947 |
|
| NET OTHER ASSETS AND LIABILITIES - 0.3% | 267,550 |
|
| TOTAL NET ASSETS - 100.0% | $ | 93,187,497 |
|
|
| |
| ** | Aggregate cost for Federal tax purposes was $82,399,225. |
| ETF | Exchange Traded Fund. |
See accompanying Notes to Financial Statements.
Ultra Series Fund | December 31, 2013
Madison Target Retirement 2040 Fund Portfolio of Investments
|
| | | | |
| | Shares | Value (Note 2) |
|
| INVESTMENT COMPANIES - 99.8% | | |
| Bond Funds - 28.3% | | |
| Baird Aggregate Bond Fund Institutional Shares | 197,483 | $ | 2,055,795 |
|
| Franklin Floating Rate Daily Access Fund Advisor Class | 521,349 | 4,801,626 |
|
| iShares 20+ Year Treasury Bond Fund ETF | 4,036 | 411,107 |
|
| iShares 7-10 Year Treasury Bond ETF | 16,572 | 1,644,605 |
|
| iShares Barclays TIPS Bond Fund ETF | 7,496 | 823,810 |
|
| Metropolitan West High Yield Bond Fund Class I | 66,851 | 685,893 |
|
| Metropolitan West Total Return Bond Fund Class I | 195,044 | 2,057,714 |
|
| PIMCO Investment Grade Corporate Bond Fund Institutional Class | 66,791 | 683,941 |
|
| Vanguard Intermediate-Term Corporate Bond ETF | 24,871 | 2,056,832 |
|
| Vanguard Short-Term Bond ETF | 8,583 | 686,039 |
|
| Vanguard Short-Term Corporate Bond ETF | 8,602 | 686,268 |
|
| Vanguard Total Bond Market ETF | 36,009 | 2,880,360 |
|
| | | 19,473,990 |
|
| Foreign Stock Funds - 11.5% | | |
| iShares Global Energy ETF | 6,366 | 275,139 |
|
| iShares MSCI All Country Asia ex Japan ETF | 6,847 | 412,943 |
|
| iShares MSCI EAFE ETF | 35,721 | 2,395,450 |
|
| iShares MSCI United Kingdom ETF | 65,507 | 1,367,786 |
|
| Vanguard FTSE All-World ex-U.S. ETF | 33,806 | 1,714,978 |
|
| Vanguard FTSE Europe ETF | 6,988 | 410,894 |
|
| WisdomTree Europe Hedged Equity Fund ETF | 4,884 | 274,041 |
|
| WisdomTree Japan Hedged Equity Fund ETF | 21,678 | 1,102,110 |
|
| | | 7,953,341 |
|
Ultra Series Fund | December 31, 2013
|
| | | | |
| | Shares | Value (Note 2) |
|
| Money Market Funds - 1.2% | | |
| State Street Institutional U.S. Government Money Market Fund | 846,589 | $ | 846,589 |
|
| Stock Funds - 58.8% | | |
| iShares Core S&P Mid-Cap ETF | 20,472 | 2,739,973 |
|
| iShares S&P 100 ETF | 41,671 | 3,431,607 |
|
| iShares S&P Mid-Cap 400 Value ETF | 9,427 | 1,095,700 |
|
| Market Vectors Agribusiness ETF | 5,051 | 275,229 |
|
| PowerShares Buyback Achievers Portfolio ETF | 79,646 | 3,431,150 |
|
| Schwab Fundamental U.S. Large Company Index Fund Institutional Shares | 581,750 | 8,260,845 |
|
| SPDR S&P 500 ETF Trust | 81,799 | 15,105,821 |
|
| Vanguard Dividend Appreciation ETF | 36,431 | 2,741,069 |
|
| Vanguard Information Technology ETF | 21,466 | 1,921,636 |
|
| Vanguard Value ETF | 19,765 | 1,509,848 |
|
| | | 40,512,878 |
|
| TOTAL INVESTMENTS - 99.8% ( Cost $58,751,203** ) | 68,786,798 |
|
| NET OTHER ASSETS AND LIABILITIES - 0.2% | 130,413 |
|
| TOTAL NET ASSETS - 100.0% | $ | 68,917,211 |
|
|
| |
| ** | Aggregate cost for Federal tax purposes was $59,421,886. |
| ETF | Exchange Traded Fund. |
See accompanying Notes to Financial Statements.
Ultra Series Fund | December 31, 2013
Madison Target Retirement 2050 Fund Portfolio of Investments
|
| | | | |
| | Shares | Value (Note 2) |
|
| INVESTMENT COMPANIES - 101.5% | | |
| Bond Funds - 17.1% | | |
| Franklin Floating Rate Daily Access Fund Advisor Class | 117,442 | $ | 1,081,638 |
|
| iShares 20+ Year Treasury Bond Fund ETF | 2,121 | 216,045 |
|
| iShares 7-10 Year Treasury Bond ETF | 4,899 | 486,177 |
|
| iShares Barclays TIPS Bond Fund ETF | 1,970 | 216,503 |
|
| Metropolitan West Total Return Bond Fund Class I | 17,089 | 180,284 |
|
| PIMCO Investment Grade Corporate Bond Fund Institutional Class | 17,550 | 179,713 |
|
| Vanguard Intermediate-Term Corporate Bond ETF | 2,179 | 180,203 |
|
| Vanguard Short-Term Bond ETF | 2,255 | 180,242 |
|
| Vanguard Short-Term Corporate Bond ETF | 2,260 | 180,303 |
|
| Vanguard Total Bond Market ETF | 2,478 | 198,215 |
|
| | | 3,099,323 |
|
| Foreign Stock Funds - 14.8% | | |
| iShares Global Energy ETF | 1,674 | 72,350 |
|
| iShares MSCI All Country Asia ex Japan ETF | 3,599 | 217,056 |
|
| iShares MSCI EAFE ETF | 10,728 | 719,420 |
|
| iShares MSCI United Kingdom ETF | 20,657 | 431,318 |
|
| Vanguard FTSE All-World ex-U.S. ETF | 12,437 | 630,929 |
|
| Vanguard FTSE Europe ETF | 3,670 | 215,796 |
|
| WisdomTree Europe Hedged Equity Fund ETF | 1,282 | 71,933 |
|
| WisdomTree Japan Hedged Equity Fund ETF | 6,409 | 325,834 |
|
| | | 2,684,636 |
|
| Money Market Funds - 3.0% | | |
| State Street Institutional U.S. Government Money Market Fund | 538,842 | 538,842 |
|
Ultra Series Fund | December 31, 2013
|
| | | | | |
| | Shares |
| Value (Note 2) |
|
| Stock Funds - 66.6% | | |
| iShares Core S&P Mid-Cap ETF | 6,725 |
| $ | 900,074 |
|
| iShares Core S&P Small-Cap ETF | 989 |
| 108,009 |
|
| iShares S&P 100 ETF | 10,950 |
| 901,733 |
|
| iShares S&P Mid-Cap 400 Value ETF | 3,096 |
| 359,848 |
|
| Market Vectors Agribusiness ETF | 1,327 |
| 72,308 |
|
| PowerShares Buyback Achievers Portfolio ETF | 20,930 |
| 901,664 |
|
| Schwab Fundamental U.S. Large Company Index Fund Institutional Shares | 178,354 |
| 2,532,624 |
|
| SPDR S&P 500 ETF Trust | 23,449 |
| 4,330,327 |
|
| Vanguard Dividend Appreciation ETF | 11,967 |
| 900,397 |
|
| Vanguard Information Technology ETF | 6,447 |
| 577,135 |
|
| Vanguard Value ETF | 6,374 |
| 486,910 |
|
| | | 12,071,029 |
|
| TOTAL INVESTMENTS - 101.5% ( Cost $16,018,541** ) | 18,393,830 |
|
| NET OTHER ASSETS AND LIABILITIES - (1.5%) | (271,257 | ) |
| TOTAL NET ASSETS - 100.0% | $ | 18,122,573 |
|
|
| |
| ** | Aggregate cost for Federal tax purposes was $16,131,197. |
| ETF | Exchange Traded Fund. |
See accompanying Notes to Financial Statements.
Ultra Series Fund | December 31, 2013
Statements of Assets and Liabilities as of December 31, 2013
|
| | | | | | | | | | | | |
| | Conservative Allocation
Fund | Moderate Allocation
Fund | Aggressive Allocation
Fund | Money
Market
Fund |
| Assets: | | | | |
| Investments in securities, at cost | | | | |
| Unaffiliated issuers |
| $104,891,443 |
|
| $179,120,412 |
| $ 67,300,756 |
| $ 38,504,921 |
|
Affiliated issuers1 | 97,958,948 |
| 164,688,392 |
| 54,120,264 |
| – |
|
| Net unrealized appreciation | | | | |
| Unaffiliated issuers | 3,989,154 |
| 15,386,736 |
| 7,357,572 |
| – |
|
Affiliated issuers1 | 15,251,783 |
| 49,762,851 |
| 22,885,557 |
| – |
|
| Total investments at value | 222,091,328 |
| 408,958,391 |
| 151,664,149 |
| 38,504,921 |
|
| Receivables: | | | | |
| Investments sold | 2,130,414 |
| – |
| 290,432 |
| – |
|
| Fund shares sold | 39,352 |
| 202,944 |
| 104,206 |
| 3,261 |
|
| Dividends and interest | 225,134 |
| 1,026,622 |
| 361,868 |
| 150,240 |
|
| Due from Adviser | – |
| – |
| – |
| 11,667 |
|
| Total assets | 224,486,228 |
| 410,187,957 |
| 152,420,655 |
| 38,670,089 |
|
| Liabilities: | | | | |
| Payables: | | | | |
| Investments purchased | 2,713,508 |
| 4,061,205 |
| 812,023 |
| – |
|
| Fund shares repurchased | 201,242 |
| 80,277 |
| 138,625 |
| 1,459 |
|
| Management fees | 56,455 |
| 102,039 |
| 37,959 |
| 14,930 |
|
| Distribution fees - Class II | 8,618 |
| 7,355 |
| 407 |
| 375 |
|
| Audit and trustee fees | 10,571 |
| 17,873 |
| 6,736 |
| 1,974 |
|
| Total liabilities | 2,990,394 |
| 4,268,749 |
| 995,750 |
| 18,738 |
|
Net assets applicable to outstanding capital stock |
| $221,495,834 |
|
| $405,919,208 |
|
| $151,424,905 |
| $ 38,651,351 |
|
| Net assets consist of: | | | | |
| Paid-in capital |
| $204,208,399 |
|
| $360,037,608 |
|
| $123,215,206 |
| $ 38,651,750 |
|
| Accumulated undistributed net investment income | 118,861 |
| 163,666 |
| 38,320 |
| – |
|
| Accumulated net realized loss on investments sold and foreign currency related transactions | (2,072,363) |
| (19,431,653) |
| (2,071,750) |
| (399) |
|
| Net unrealized appreciation of investments (including appreciation of foreign currency related transactions) | 19,240,937 |
| 65,149,587 |
| 30,243,129 |
| – |
|
| Net Assets |
| $221,495,834 |
|
| $405,919,208 |
|
| $151,424,905 |
|
| $38,651,351 |
|
| Class I Shares: | | | | |
| Net Assets |
| $181,426,577 |
|
| $370,954,299 |
|
| $149,513,618 |
| $ 36,921,834 |
|
| Shares of beneficial interest outstanding | 16,955,414 |
| 32,316,526 |
| 12,828,245 |
| 36,922,217 |
|
| Net Asset Value and redemption price per share |
| $10.70 |
|
| $11.48 |
|
| $11.66 |
|
| $1.00 |
|
| Class II Shares: | | | | |
Ultra Series Fund | December 31, 2013
|
| | | | | | | | | | | | |
| Net Assets | $ 40,069,257 |
| $ 34,964,909 |
| $ 1,911,287 |
| $ 1,729,517 |
|
| Shares of beneficial interest outstanding | 3,752,742 |
| 3,053,803 |
| 164,513 |
| 1,729,533 |
|
Net Asset Value and redemption price per share |
| $10.68 |
|
| $11.45 |
|
| $11.62 |
|
| $1.00 |
|
|
| |
1 | See Note 10 for information on affiliated issuers. |
See accompanying Notes to Financial Statements.
Ultra Series Fund | December 31, 2013
Statements of Assets and Liabilities as of December 31, 2013
|
| | | | | | | | | | | | |
| | Core
Bond
Fund | High
Income
Fund | Diversified
Income
Fund | Large Cap
Value
Fund |
| Assets: | | | | |
| Investments in securities, at cost | | | | |
| Unaffiliated issuers |
| $304,264,080 |
| $ 48,119,215 |
|
| $332,499,683 |
|
| $411,312,078 |
|
| Net unrealized appreciation | | | | |
| Unaffiliated issuers | 10,710,636 |
| 1,646,131 |
| 88,213,770 |
| 172,053,130 |
|
| Total investments at value | 314,974,716 |
| 49,765,346 |
| 420,713,453 |
| 583,365,208 |
|
| Foreign currency (cost of $21,456) (Note 2) | – |
| – |
| – |
| – |
|
| Receivables: | | | | |
| Investments sold | – |
| – |
| – |
| – |
|
| Fund shares sold | 127,270 |
| 17,539 |
| 225,120 |
| 55,479 |
|
| Dividends and interest | 2,488,118 |
| 783,867 |
| 1,851,236 |
| 595,293 |
|
| Other assets | 4,548 |
| – |
| – |
| – |
|
| Total assets | 317,594,652 |
| 50,566,752 |
| 422,789,809 |
| 584,015,980 |
|
| Liabilities: | | | | |
| Payables: | | | | |
| Investments purchased | – |
| – |
| – |
| – |
|
| Fund shares repurchased | 138,700 |
| 2,691 |
| 106,254 |
| 93,018 |
|
| Management fees | 149,915 |
| 32,163 |
| 248,163 |
| 291,766 |
|
| Distribution fees - Class II | 9,994 |
| 1,455 |
| 9,136 |
| 1,427 |
|
| Audit and trustee fees | 16,067 |
| 2,672 |
| 17,967 |
| 24,021 |
|
| Service agreement fees | – |
| – |
| – |
| – |
|
| Total liabilities | 314,676 |
| 38,981 |
| 381,520 |
| 410,232 |
|
Net assets applicable to outstanding capital stock |
| $317,279,976 |
| $ 50,527,771 |
|
| $422,408,289 |
|
| $583,605,748 |
|
| Net assets consist of: | | | | |
| Paid-in capital |
| $315,336,264 |
| $ 56,104,599 |
|
| $341,276,765 |
|
| $440,555,472 |
|
| Accumulated undistributed net investment income | 173,004 |
| 71,584 |
| 187,487 |
| 128,277 |
|
| Accumulated net realized gain (loss) on investments sold and foreign currency related transactions | (8,939,928) |
| (7,294,543) |
| (7,269,733) |
| (29,131,131) |
|
| Net unrealized appreciation of investments (including appreciation of foreign currency related transactions) | 10,710,636 |
| 1,646,131 |
| 88,213,770 |
| 172,053,130 |
|
| Net Assets |
| $317,279,976 |
| $ 50,527,771 |
|
| $422,408,289 |
|
| $583,605,748 |
|
Ultra Series Fund | December 31, 2013
|
| | | | | | | | | | | | |
| Class I Shares: | | | | |
| Net Assets |
| $270,288,813 |
| $ 43,622,257 |
|
| $378,806,892 |
|
| $576,730,982 |
|
| Shares of beneficial interest outstanding | 27,113,255 |
| 4,731,888 |
| 18,248,210 |
| 16,590,835 |
|
| Net Asset Value and redemption price per share |
| $9.97 |
|
| $9.22 |
|
| $20.76 |
|
| $34.76 |
|
| Class II Shares: | | | | |
| Net Assets | $ 46,991,163 |
| $ 6,905,514 |
| $ 43,601,397 |
| $ 6,874,766 |
|
| Shares of beneficial interest outstanding | 4,721,074 |
| 748,483 |
| 2,105,119 |
| 198,451 |
|
Net Asset Value and redemption price per share |
| $9.95 |
|
| $9.23 |
|
| $20.71 |
|
| $34.64 |
|
See accompanying Notes to Financial Statements.
Ultra Series Fund | December 31, 2013
Statements of Assets and Liabilities as of December 31, 2013
|
| | | | | | | | | | | | | | | | | | | | | | | |
Large Cap
Growth
Fund | Mid Cap
Fund | Small Cap
Fund | International
Stock Fund | Madison
Target
Retirement
2020 Fund | Madison
Target
Retirement
2030 Fund | Madison
Target
Retirement
2040 Fund | Madison
Target
Retirement
2050 Fund |
| | | | | | | | |
| | | | | | | | |
| $273,211,355 |
|
| $270,909,267 |
| $ 4,468,585 |
| $ 66,645,000 |
| $ 64,626,146 |
| $ 81,654,556 |
| $ 58,751,203 |
| $ 16,018,541 |
|
| | | | | | | | |
| 120,722,150 |
| 126,772,363 |
| 3,440,319 |
| 28,229,214 |
| 5,746,588 |
| 11,265,391 |
| 10,035,595 |
| 2,375,289 |
|
| 393,933,505 |
| 397,681,630 |
| 7,908,904 |
| 94,874,214 |
| 70,372,734 |
| 92,919,947 |
| 68,786,798 |
| 18,393,830 |
|
| – |
| – |
| – |
| 21,528 |
| – |
| – |
| – |
| – |
|
| | | | | | | | |
| – |
| – |
| – |
| 3,287 |
| 2,789,275 |
| 1,818,070 |
| 1,788,342 |
| 777,257 |
|
| 77,576 |
| 61,142 |
| 272 |
| 8,019 |
| 123,573 |
| 176,285 |
| 225,948 |
| 64,628 |
|
| 284,341 |
| 163,908 |
| 7,347 |
| 52,286 |
| 168,150 |
| 194,511 |
| 105,632 |
| 28,394 |
|
| – |
| 84 |
| – |
| 156,149 |
| – |
| – |
| – |
| – |
|
| 394,295,422 |
| 397,906,764 |
| 7,916,523 |
| 95,115,483 |
| 73,453,732 |
| 95,108,813 |
| 70,906,720 |
| 19,264,109 |
|
| | | | | | | | |
| | | | | | | | |
| – |
| – |
| – |
| 22,635 |
| 2,963,987 |
| 1,892,554 |
| 1,950,506 |
| 1,135,864 |
|
| 68,172 |
| 122,110 |
| 12,448 |
| 48,529 |
| 50 |
| 5,500 |
| 21,908 |
| 1,275 |
|
| 262,496 |
| 299,417 |
| 7,160 |
| 94,263 |
| 14,728 |
| 19,385 |
| 14,246 |
| 3,664 |
|
| 7,080 |
| 3,287 |
| 365 |
| 3,951 |
| – |
| – |
| – |
| – |
|
| 16,116 |
| 17,292 |
| 651 |
| 4,170 |
| – |
| – |
| – |
| – |
|
| – |
| – |
| – |
| – |
| 2,946 |
| 3,877 |
| 2,849 |
| 733 |
|
| 353,864 |
| 442,106 |
| 20,624 |
| 173,548 |
| 2,981,711 |
| 1,921,316 |
| 1,989,509 |
| 1,141,536 |
|
| $393,941,558 |
|
| $397,464,658 |
| $ 7,895,899 |
| $ 94,941,935 |
| $ 70,472,021 |
| $ 93,187,497 |
| $ 68,917,211 |
| $ 18,122,573 |
|
| | | | | | | | |
| $271,353,359 |
|
| $282,779,335 |
| $ 5,032,435 |
| $ 92,050,090 |
| $ 65,306,061 |
| $ 82,436,304 |
| $ 59,397,406 |
| $ 15,840,233 |
|
| 46,176 |
| – |
| – |
| 1,067,539 |
| – |
| 840 |
| 27,574 |
| 5,681 |
|
1,819,873 |
| (12,087,040) |
| (576,855) |
| (26,419,124) |
| (580,628) |
| (515,038) |
| (543,364) |
| (98,630) |
|
120,722,150 |
| 126,772,363 |
| 3,440,319 |
| 28,243,430 |
| 5,746,588 |
| 11,265,391 |
| 10,035,595 |
| 2,375,289 |
|
| $393,941,558 |
|
| $397,464,658 |
| $ 7,895,899 |
| $ 94,941,935 |
| $ 70,472,021 |
| $ 93,187,497 |
| $ 68,917,211 |
| $ 18,122,573 |
|
| | | | | | | | |
Ultra Series Fund | December 31, 2013
|
| | | | | | | | | | | | | | | | | | | | | | | |
| $359,958,731 |
|
| $381,703,019 |
| $ 6,120,680 |
| $ 75,807,873 |
| $ 70,472,021 |
| $ 93,187,497 |
| $ 68,917,211 |
| $ 18,122,573 |
|
| 12,517,028 |
| 17,542,401 |
| 672,600 |
| 5,835,498 |
| 8,049,082 |
| 10,444,358 |
| 7,936,963 |
| 1,417,949 |
|
| $28.76 |
|
| $21.76 |
|
| $9.10 |
|
| $12.99 |
|
| $8.76 |
|
| $8.92 |
|
| $8.68 |
|
| $12.78 |
|
| | | | | | | | |
| $ 33,982,827 |
| $ 15,761,639 |
| $ 1,775,219 |
| $ 19,134,062 |
| | | | |
| 1,186,963 |
| 728,109 |
| 196,206 |
| 1,476,391 |
| | | | |
| $28.63 |
|
| $21.65 |
|
| $9.05 |
|
| $12.96 |
| | | | |
See accompanying Notes to Financial Statements.
Ultra Series Fund | December 31, 2013
Statements of Operations for the Period Ended December 31, 2013 |
| | | | | | | | | | | | |
| | Conservative Allocation
Fund | Moderate Allocation
Fund | Aggressive Allocation
Fund | Money
Market
Fund |
| Investment Income: | | | | |
| Interest | $ | 125 |
| $ | 235 |
| $ | 125 |
| $ | 53,380 |
|
| Dividends | | | | |
| Unaffiliated issuers | 3,907,610 |
| 5,588,567 |
| 1,535,883 |
| – |
|
Affiliated issuers1 | 2,182,667 |
| 2,764,358 |
| 578,276 |
| – |
|
| Less: Foreign taxes withheld | – |
| – |
| – |
| – |
|
| Total investment income | 6,090,402 |
| 8,353,160 |
| 2,114,284 |
| 53,380 |
|
| Expenses: | | | | |
| Management fees | 706,785 |
| 1,213,697 |
| 458,998 |
| 204,783 |
|
| Audit and trustee fees | 31,727 |
| 54,498 |
| 20,673 |
| 5,992 |
|
| Distribution fees - Class II | 105,288 |
| 86,284 |
| 4,698 |
| 3,975 |
|
| Other expenses | 169 |
| 335 |
| 2 |
| – |
|
| Total expenses before reimbursement/waiver | 843,969 |
| 1,354,814 |
| 484,371 |
| 214,750 |
|
Less reimbursement/waiver2 | – |
| – |
| – |
| (161,370 | ) |
| Total expenses net of reimbursement/waiver | 843,969 |
| 1,354,814 |
| 484,371 |
| 53,380 |
|
| Net Investment Income | 5,246,433 |
| 6,998,346 |
| 1,629,913 |
| – |
|
| Net Realized and Unrealized Gain (Loss) on Investments | | | | |
Net realized gain (loss) on investments (including net realized gain (loss) on foreign currency related transactions)3 | | | | |
| Unaffiliated issuers | 723,012 |
| 7,636,227 |
| 5,645,813 |
| (399 | ) |
Affiliated issuers1 | 3,788,418 |
| 8,164,223 |
| 5,060,640 |
| – |
|
| Capital gain distributions received from underlying funds | | | | |
| Unaffiliated issuers | 219,904 |
| 286,969 |
| 89,990 |
| – |
|
Affiliated issuers1 | 3,178,413 |
| 8,901,976 |
| 4,175,243 |
| – |
|
Net change in unrealized appreciation (depreciation) on investments (including net unrealized appreciation (depreciation) on foreign currency related transactions)3 | | | | |
| Unaffiliated issuers | 1,225,845 |
| 9,515,091 |
| 5,006,320 |
| – |
|
Affiliated issuers1 | 2,425,003 |
| 16,663,898 |
| 8,496,360 |
| – |
|
| Net Realized and Unrealized Gain (Loss) on Investments | 11,560,595 |
| 51,168,384 |
| 28,474,366 |
| (399 | ) |
| Net Increase (Decrease) in Net Assets from Operations | $ | 16,807,028 |
| $ | 58,166,730 |
| $ | 30,104,279 |
| $ | (399 | ) |
Ultra Series Fund | December 31, 2013
|
| |
1 | See Note 10 for information on affiliated issuers. |
2 | Waiver includes management fees of $157,395, and distribution fees of $3,975, for the Money Market Fund. |
3 | Includes foreign capital gains taxes paid of $9,624 for the International Stock Fund. |
See accompanying Notes to Financial Statements.
Ultra Series Fund | December 31, 2013
Statements of Operations for the Period Ended December 31, 2013
|
| | | | | | | | | | | | | | | | | | | | | | | |
Core
Bond
Fund | High
Income
Fund | Diversified
Income
Fund | Large Cap
Value
Fund | Large Cap
Growth
Fund | Mid Cap
Fund | Small Cap
Fund | Inter-national Stock Fund |
| | | | | | | | |
| $ | 12,799,677 |
| $ | 3,763,843 |
| $ | 5,785,070 |
| $ | 1,063 |
| $ | 573 |
| $ | 1,386 |
| $ | 27 |
| $ | 720 |
|
| | | | | | | | |
| – |
| – |
| 6,550,172 |
| 11,866,202 |
| 5,299,740 |
| 3,662,420 |
| 177,238 |
| 2,701,897 |
|
| – |
| – |
| – |
| – |
| – |
| – |
| – |
| – |
|
| – |
| – |
| (41,749 | ) | (139,441 | ) | (29,345 | ) | (130,806 | ) | – |
| (249,950 | ) |
| 12,799,677 |
| 3,763,843 |
| 12,293,493 |
| 11,727,824 |
| 5,270,968 |
| 3,533,000 |
| 177,265 |
| 2,452,667 |
|
| | | | | | | | |
| 1,967,690 |
| 456,562 |
| 2,848,294 |
| 3,280,922 |
| 2,934,134 |
| 3,516,475 |
| 150,669 |
| 1,140,621 |
|
| 48,215 |
| 8,120 |
| 54,608 |
| 73,524 |
| 49,258 |
| 52,678 |
| 1,993 |
| 12,703 |
|
| 120,062 |
| 16,942 |
| 95,615 |
| 16,308 |
| 79,382 |
| 37,625 |
| 4,219 |
| 46,225 |
|
| – |
| 38 |
| 46 |
| – |
| 2,050 |
| – |
| – |
| 45 |
|
| 2,135,967 |
| 481,662 |
| 2,998,563 |
| 3,370,754 |
| 3,064,824 |
| 3,606,778 |
| 156,881 |
| 1,199,594 |
|
| – |
| – |
| – |
| – |
| – |
| – |
| – |
| – |
|
| 2,135,967 |
| 481,662 |
| 2,998,563 |
| 3,370,754 |
| 3,064,824 |
| 3,606,778 |
| 156,881 |
| 1,199,594 |
|
| 10,663,710 |
| 3,282,181 |
| 9,294,930 |
| 8,357,070 |
| 2,206,144 |
| (73,778 | ) | 20,384 |
| 1,253,073 |
|
| | | | | | | | |
|
| | | | | | | |
| 3,400,369 |
| 1,218,435 |
| 18,482,747 |
| 44,008,819 |
| 46,315,578 |
| 55,507,561 |
| 3,932,916 |
| 6,547,704 |
|
| – |
| – |
| – |
| – |
| – |
| – |
| – |
| – |
|
| | | | | | | | |
| – |
| – |
| – |
| – |
| – |
| – |
| – |
| – |
|
| – |
| – |
| – |
| – |
| – |
| – |
| – |
| – |
|
|
| | | | | | | |
| (22,572,865 | ) | (1,457,653 | ) | 32,667,224 |
| 90,180,559 |
| 49,418,057 |
| 44,349,667 |
| 152,394 |
| 9,957,513 |
|
| – |
| – |
| – |
| – |
| – |
| – |
| – |
| – |
|
| (19,172,496 | ) | (239,218 | ) | 51,149,971 |
| 134,189,378 |
| 95,733,635 |
| 99,857,228 |
| 4,085,310 |
| 16,505,217 |
|
| $ | (8,508,786 | ) | $ | 3,042,963 |
| $ | 60,444,901 |
| $ | 142,546,448 |
| $ | 97,939,779 |
| $ | 99,783,450 |
| $ | 4,105,694 |
| $ | 17,758,290 |
|
See accompanying Notes to Financial Statements.
Ultra Series Fund | December 31, 2013
Statements of Operations for the Period Ended December 31, 2013
|
| | | | | | | | | | | | |
| | Madison
Target
Retirement
2020 Fund | Madison
Target
Retirement
2030 Fund | Madison
Target
Retirement
2040 Fund | Madison
Target
Retirement
2050 Fund |
| Investment Income: | | | | |
| Interest | $ | 36 |
| $ | 44 |
| $ | 30 |
| $ | 8 |
|
| Dividends | | | | |
| Unaffiliated issuers | 1,729,296 |
| 2,021,267 |
| 1,384,611 |
| 282,827 |
|
| Total investment income | 1,729,332 |
| 2,021,311 |
| 1,384,641 |
| 282,835 |
|
| Expenses: | | | | |
| Management fees | 161,522 |
| 205,449 |
| 149,250 |
| 30,946 |
|
| Service agreement fees | 32,304 |
| 41,090 |
| 29,850 |
| 6,189 |
|
| Other expenses | 153 |
| – |
| 155 |
| 2 |
|
| Total expenses | 193,979 |
| 246,539 |
| 179,255 |
| 37,137 |
|
| Net Investment Income | 1,535,353 |
| 1,774,772 |
| 1,205,386 |
| 245,698 |
|
| Net Realized and Unrealized Gain on Investments | | | | |
| Net realized gain on investments (including net realized gain on foreign currency related transactions) | | | | |
| Unaffiliated issuers | 1,589,635 |
| 2,522,257 |
| 1,794,582 |
| 167,871 |
|
| Capital gain distributions received from underlying funds | | | | |
| Unaffiliated issuers | 218,267 |
| 192,459 |
| 100,408 |
| 20,375 |
|
| Net change in unrealized appreciation on investments (including net unrealized appreciation on foreign currency related transactions) | | | | |
| Unaffiliated issuers | 3,247,598 |
| 7,898,230 |
| 7,472,509 |
| 2,058,896 |
|
| Net Realized and Unrealized Gain on Investments | 5,055,500 |
| 10,612,946 |
| 9,367,499 |
| 2,247,142 |
|
| Net Increase in Net Assets from Operations | $ 6,590,853 |
| $ 12,387,718 |
| $ 10,572,885 |
| $ 2,492,840 |
|
See accompanying Notes to Financial Statements.
Statements of Changes in Net Assets
|
| | | | | | | | | | | | |
| | Conservative Allocation Fund | Moderate Allocation Fund |
| Year Ended December 31, | 2013 | 2012 | 2013 | 2012 |
| Net Assets at beginning of period |
| $238,216,607 |
|
| $227,634,129 |
|
| $393,058,473 |
|
| $382,606,027 |
|
| Increase in net assets from operations: | | | | |
| Net investment income | 5,246,433 |
| 6,404,623 |
| 6,998,346 |
| 9,024,664 |
|
| Net realized gain on investment transactions | 7,909,747 |
| 5,954,390 |
| 24,989,395 |
| 10,957,642 |
|
| Net change in unrealized appreciation on investments transactions | 3,650,848 |
| 7,620,015 |
| 26,178,989 |
| 19,170,279 |
|
| Net increase in net assets from operations | 16,807,028 |
| 19,979,028 |
| 58,166,730 |
| 39,152,585 |
|
| Distributions to shareholders from: | | | | |
| Net investment income | | | | |
| Class I | (4,298,542) |
| (7,226,155) |
| (6,612,939) |
| (10,646,775) |
|
| Class II | (857,521) |
| (1,526,152) |
| (539,130) |
| (985,020) |
|
| Net realized gains | | | | |
| Class I | (4,535,392) |
| – |
| – |
| – |
|
| Class II | (1,011,220) |
| – |
| – |
| – |
|
| Total distributions | (10,702,675) |
| (8,752,307) |
| (7,152,069) |
| (11,631,795) |
|
| Capital Stock transactions: | | | | |
| Class I Shares | | | | |
| Shares sold | 32,461,650 |
| 36,406,472 |
| 62,076,217 |
| 45,709,365 |
|
| Issued to shareholders in reinvestment of distributions | 8,833,950 |
| 7,226,139 |
| 6,612,941 |
| 10,646,773 |
|
| Shares redeemed | (60,422,702) |
| (41,688,374) |
| (102,805,402) |
| (69,665,565) |
|
| Net increase (decrease) in net assets from capital stock transactions | (19,127,102) |
| 1,944,237 |
| (34,116,244) |
| (13,309,427) |
|
| Class II Shares | | | | |
| Shares sold | 2,216,880 |
| 1,950,081 |
| 1,773,730 |
| 1,099,583 |
|
| Issued to shareholders in reinvestment of distributions | 1,868,741 |
| 1,526,152 |
| 539,130 |
| 985,020 |
|
| Shares redeemed | (7,783,645) |
| (6,064,713) |
| (6,350,542) |
| (5,843,520) |
|
| Net decrease in net assets from capital stock transactions | (3,698,024) |
| (2,588,480) |
| (4,037,682) |
| (3,758,917) |
|
| Total decrease from capital stock transactions | (22,825,126) |
| (644,243) |
| (38,153,926) |
| (17,068,344) |
|
| Total increase (decrease) in net assets | (16,720,773) |
| 10,582,478 |
| 12,860,735 |
| 10,452,446 |
|
| Net Assets at end of period |
| $221,495,834 |
|
| $238,216,607 |
|
| $405,919,208 |
|
| $393,058,473 |
|
| Undistributed net investment income included in net assets | $ 118,861 |
| $ – |
| $ 163,666 |
| $ – |
|
|
| | | | | | | | | | | | |
| Capital Share transactions: | | | | |
| Class I Shares | | | | |
| Shares sold | 3,012,062 |
| 3,483,197 |
| 5,699,276 |
| 4,586,565 |
|
| Issued to shareholders in reinvestment of distributions | 825,610 |
| 691,344 |
| 576,115 |
| 1,053,646 |
|
| Shares redeemed | (5,587,565) |
| (3,985,882) |
| (9,434,643) |
| (6,964,923) |
|
| Net increase (decrease) from capital share transactions | (1,749,893) |
| 188,659 |
| (3,159,252) |
| (1,324,712) |
|
| Class II Shares | | | | |
| Shares sold | 206,264 |
| 187,427 |
| 163,298 |
| 112,305 |
|
| Issued to shareholders in reinvestment of distributions | 175,025 |
| 146,308 |
| 47,088 |
| 97,726 |
|
| Shares redeemed | (720,986) |
| (582,367) |
| (586,492) |
| (592,373) |
|
| Net decrease from capital share transactions | (339,697) |
| (248,632) |
| (376,106) |
| (382,342) |
|
See accompanying Notes to Financial Statements.
Statements of Changes in Net Assets
|
| | | | | | | | | | | | |
| | Aggressive Allocation Fund | Money Market Fund |
| Year Ended December 31, | 2013 | 2012 | 2013 | 2012 |
| Net Assets at beginning of period |
| $144,675,419 |
|
| $134,360,528 |
| $ 50,323,677 |
| $ 62,660,366 |
|
| Increase (decrease) in net assets from operations: | | | | |
| Net investment income | 1,629,913 |
| 2,537,833 |
| – |
| – |
|
| Net realized gain (loss) on investment transactions | 14,971,686 |
| 5,179,817 |
| (399) |
| – |
|
| Net change in unrealized appreciation (depreciation) on investments transactions | 13,502,680 |
| 7,348,417 |
| – |
| – |
|
| Net increase (decrease) in net assets from operations | 30,104,279 |
| 15,066,067 |
| (399) |
| – |
|
| Distributions to shareholders from: | | | | |
| Net investment income | | | | |
| Class I | (1,688,840) |
| (3,193,957) |
| – |
| – |
|
| Class II | (16,918) |
| (39,884) |
| – |
| – |
|
| Net realized gains | | | | |
| Class I | (1,820,249) |
| – |
| – |
| – |
|
| Class II | (23,396) |
| – |
| – |
| – |
|
| Total distributions | (3,549,403) |
| (3,233,841) |
| – |
| – |
|
| Capital Stock transactions: | | | | |
| Class I Shares | | | | |
| Shares sold | 39,997,814 |
| 30,425,398 |
| 22,429,011 |
| 15,456,536 |
|
| Issued to shareholders in reinvestment of distributions | 3,509,089 |
| 3,193,957 |
| – |
| – |
|
| Shares redeemed | (62,966,271) |
| (35,113,393) |
| (34,154,734) |
| (28,490,349) |
|
| Net decrease in net assets from capital stock transactions | (19,459,368) |
| (1,494,038) |
| (11,725,723) |
| (13,033,813) |
|
| Class II Shares | | | | |
| Shares sold | 153,811 |
| 103,181 |
| 1,372,932 |
| 2,213,981 |
|
| Issued to shareholders in reinvestment of distributions | 40,313 |
| 39,884 |
| – |
| – |
|
| Shares redeemed | (540,146) |
| (166,362) |
| (1,319,136) |
| (1,516,857) |
|
| Net increase (decrease) in net assets from capital stock transactions | (346,022) |
| (23,297) |
| 53,796 |
| 697,124 |
|
| Total decrease from capital stock transactions | (19,805,390) |
| (1,517,335) |
| (11,671,927) |
| (12,336,689) |
|
| Total increase (decrease) in net assets | 6,749,486 |
| 10,314,891 |
| (11,672,326) |
| (12,336,689) |
|
| Net Assets at end of period |
| $151,424,905 |
|
| $144,675,419 |
| $ 38,651,351 |
| $ 50,323,677 |
|
|
| | | | | | | | | | | | |
| Undistributed net investment income included in net assets | $ | 38,320 |
| $ | — |
| $ | — |
| $ | — |
|
| Capital Share transactions: | | | | |
| Class I Shares | | | | |
| Shares sold | 3,695,513 |
| 3,188,342 |
| 22,429,011 |
| 15,456,536 |
|
| Issued to shareholders in reinvestment of distributions | 301,083 |
| 327,438 |
| — |
| — |
|
| Shares redeemed | (5,802,894 | ) | (3,674,003 | ) | (34,154,735 | ) | (28,490,349 | ) |
| Net decrease from capital share transactions | (1,806,298 | ) | (158,223 | ) | (11,725,724 | ) | (13,033,813 | ) |
| Class II Shares | | | | |
| Shares sold | 14,545 |
| 10,752 |
| 1,372,932 |
| 2,213,981 |
|
| Issued to shareholders in reinvestment of distributions | 3,470 |
| 4,102 |
| – |
| – |
|
| Shares redeemed | (51,023 | ) | (16,989 | ) | (1,319,136 | ) | (1,516,857 | ) |
| Net increase (decrease) from capital share transactions | (33,008 | ) | (2,135 | ) | 53,796 |
| 697,124 |
|
See accompanying Notes to Financial Statements.
Statements of Changes in Net Assets
|
| | | | | | | | | | | | | | | | | | | | | | | |
| Core Bond Fund | High Income Fund | Diversified Income Fund | Large Cap Value Fund |
| 2013 | 2012 | 2013 | 2012 | 2013 | 2012 | 2013 | 2012 |
| 389,790,924 |
| 425,099,202 |
| 67,099,601 |
| 92,675,282 |
| 393,930,489 |
| 403,211,434 |
| 500,469,127 |
| 491,674,493 |
|
| | | | | | | | |
| 10,663,710 |
| 12,849,590 |
| 3,282,181 |
| 5,479,561 |
| 9,294,930 |
| 10,757,484 |
| 8,357,070 |
| 10,488,964 |
|
| 3,400,369 |
| 255,801 |
| 1,218,435 |
| 3,222,281 |
| 18,482,747 |
| 6,819,611 |
| 44,008,819 |
| 22,534,576 |
|
| (22,572,865 | ) | (41,918 | ) | (1,457,653 | ) | 860,384 |
| 32,667,224 |
| 14,057,412 |
| 90,180,559 |
| 24,248,240 |
|
| (8,508,786 | ) | 13,063,473 |
| 3,042,963 |
| 9,562,226 |
| 60,444,901 |
| 31,634,507 |
| 142,546,448 |
| 57,271,780 |
|
| | | | | | | | |
| | | | | | | | |
| (9,139,256 | ) | (11,250,243 | ) | (2,970,731 | ) | (5,116,320 | ) | (8,436,925 | ) | (9,820,039 | ) | (8,350,987 | ) | (10,356,142 | ) |
| (1,485,806 | ) | (1,526,409 | ) | (445,909 | ) | (542,703 | ) | (890,524 | ) | (889,234 | ) | (88,154 | ) | (112,931 | ) |
| | | | | | | | |
| – |
| – |
| – |
| – |
| – |
| – |
| – |
| – |
|
| – |
| – |
| – |
| – |
| – |
| – |
| – |
| – |
|
| (10,625,062 | ) | (12,776,652 | ) | (3,416,640 | ) | (5,659,023 | ) | (9,327,449 | ) | (10,709,273 | ) | (8,439,141 | ) | (10,469,073 | ) |
| | | | | | | | |
| | | | | | | | |
| 42,430,910 |
| 80,281,951 |
| 6,738,454 |
| 6,340,313 |
| 40,709,576 |
| 33,291,125 |
| 67,449,447 |
| 69,507,711 |
|
| 9,139,256 |
| 11,250,243 |
| 2,970,732 |
| 5,116,320 |
| 8,436,925 |
| 9,820,039 |
| 8,350,987 |
| 10,356,143 |
|
| (105,194,348 | ) | (126,901,735 | ) | (26,176,976 | ) | (41,331,439 | ) | (75,771,244 | ) | (76,259,090 | ) | (126,175,216 | ) | (117,526,447 | ) |
| (53,624,182 | ) | (35,369,541 | ) | (16,467,790 | ) | (29,874,806 | ) | (26,624,743 | ) | (33,147,926 | ) | (50,374,782 | ) | (37,662,593 | ) |
| | | | | | | | |
| 2,747,459 |
| 3,009,622 |
| 500,612 |
| 356,009 |
| 6,938,994 |
| 5,148,640 |
| 386,693 |
| 224,114 |
|
| 1,485,805 |
| 1,526,409 |
| 445,909 |
| 542,703 |
| 890,524 |
| 889,234 |
| 88,154 |
| 112,931 |
|
| (3,986,182 | ) | (4,761,589 | ) | (676,884 | ) | (502,790 | ) | (3,844,427 | ) | (3,096,127 | ) | (1,070,751 | ) | (682,525 | ) |
| 247,082 |
| (225,558 | ) | 269,637 |
| 395,922 |
| 3,985,091 |
| 2,941,747 |
| (595,904 | ) | (345,480 | ) |
| (53,377,100 | ) | (35,595,099 | ) | (16,198,153 | ) | (29,478,884 | ) | (22,639,652 | ) | (30,206,179 | ) | (50,970,686 | ) | (38,008,073 | ) |
| (72,510,948 | ) | (35,308,278 | ) | (16,571,830 | ) | (25,575,681 | ) | 28,477,800 |
| (9,280,945 | ) | 83,136,621 |
| 8,794,634 |
|
| 317,279,976 |
| 389,790,924 |
| $ 50,527,771 |
| $ 67,099,601 |
| 422,408,289 |
| 393,930,489 |
| 583,605,748 |
| 500,469,127 |
|
| $ | 173,004 |
| $ | 215,795 |
| $ | 71,584 |
| $ | 206,043 |
| $ | 187,487 |
| $ | 215,755 |
| $ | 128,277 |
| $ | 210,348 |
|
| | | | | | | | |
| | | | | | | | |
| 4,072,473 |
| 7,495,349 |
| 708,112 |
| 651,888 |
| 2,022,975 |
| 1,813,514 |
| 2,132,804 |
| 2,587,667 |
|
| 914,607 |
| 1,064,171 |
| 321,930 |
| 545,827 |
| 407,420 |
| 539,704 |
| 241,843 |
| 386,381 |
|
| (10,125,461 | ) | (11,809,745 | ) | (2,742,911 | ) | (4,170,438 | ) | (3,808,727 | ) | (4,167,601 | ) | (4,019,796 | ) | (4,353,429 | ) |
|
| | | | | | | | | | | | | | | | | | | | | | | |
| (5,138,381 | ) | (3,250,225 | ) | (1,712,869 | ) | (2,972,723 | ) | (1,378,332 | ) | (1,814,383 | ) | (1,645,149 | ) | (1,379,381 | ) |
| | | | | | | | |
| 264,053 |
| 279,678 |
| 52,231 |
| 36,572 |
| 344,108 |
| 284,063 |
| 12,441 |
| 8,317 |
|
| 149,108 |
| 144,622 |
| 48,322 |
| 57,879 |
| 43,055 |
| 48,943 |
| 2,555 |
| 4,222 |
|
| (384,042 | ) | (444,157 | ) | (70,876 | ) | (51,896 | ) | (193,496 | ) | (169,225 | ) | (33,991 | ) | (25,462 | ) |
| 29,119 |
| (19,857 | ) | 29,677 |
| 42,555 |
| 193,667 |
| 163,781 |
| (18,995 | ) | (12,923 | ) |
See accompanying Notes to Financial Statements.
Statements of Changes in Net Assets
|
| | | | | | | | | | | | |
| | Large Cap Growth Fund | Mid Cap Fund |
| Year Ended December 31, | 2013 | 2012 | 2013 | 2012 |
| Net Assets at beginning of period | $ | 347,125,853 |
| $ | 358,620,849 |
| $ | 370,461,007 |
| $ | 365,102,889 |
|
| Increase (decrease) in net assets from operations: | | | | |
| Net investment income (loss) | 2,206,144 |
| 2,733,613 |
| (73,778 | ) | 1,096,782 |
|
| Net realized gain on investments transactions | 46,315,578 |
| 5,568,234 |
| 55,507,561 |
| 12,645,399 |
|
| Net change in unrealized appreciation on investments transactions | 49,418,057 |
| 31,642,311 |
| 44,349,667 |
| 42,480,016 |
|
| Net increase in net assets from operations | 97,939,779 |
| 39,944,158 |
| 99,783,450 |
| 56,222,197 |
|
| Distributions to shareholders from: | | | | |
| Net investment income | | | | |
| Class I | (2,066,477 | ) | (2,515,455 | ) | (22,765 | ) | (1,067,719 | ) |
| Class II | (145,243 | ) | (189,383 | ) | – |
| (22,229 | ) |
| Net realized gains | | | | |
| Class I | (28,523,067 | ) | – |
| (5,736,762 | ) | – |
|
| Class II | (2,713,918 | ) | – |
| (238,428 | ) | – |
|
| Total distributions | (33,448,705 | ) | (2,704,838 | ) | (5,997,955 | ) | (1,089,948 | ) |
| Capital Stock transactions: | | | | |
| Class I Shares | | | | |
| Shares sold | 39,961,700 |
| 51,759,146 |
| 61,138,417 |
| 46,160,581 |
|
| Issued to shareholders in reinvestment of distributions | 30,589,544 |
| 2,515,455 |
| 5,759,527 |
| 1,067,719 |
|
| Shares redeemed | (87,579,290 | ) | (101,706,126 | ) | (131,946,552 | ) | (95,640,480 | ) |
| Net decrease in net assets from capital stock transactions | (17,028,046 | ) | (47,431,525 | ) | (65,048,608 | ) | (48,412,180 | ) |
| Class II Shares | | | | |
| Shares sold | 671,676 |
| 1,039,287 |
| 234,178 |
| 205,290 |
|
| Issued to shareholders in reinvestment of distributions | 2,859,161 |
| 189,383 |
| 238,428 |
| 22,229 |
|
| Shares redeemed | (4,178,160 | ) | (2,531,461 | ) | (2,205,842 | ) | (1,589,470 | ) |
| Net increase (decrease) in net assets from capital stock transactions | (647,323 | ) | (1,302,791 | ) | (1,733,236 | ) | (1,361,951 | ) |
| Total net decrease from capital stock transactions | (17,675,369 | ) | (48,734,316 | ) | (66,781,844 | ) | (49,774,131 | ) |
| Total increase (decrease) in net assets | 46,815,705 |
| (11,494,996 | ) | 27,003,651 |
| 5,358,118 |
|
| Net Assets at end of period | $ | 393,941,558 |
| $ | 347,125,853 |
| $ | 397,464,658 |
| $ | 370,461,007 |
|
| Undistributed net investment income included in net assets | $ | 46,176 |
| $ | 51,752 |
| $ | — |
| $ | 22,758 |
|
| Capital Share transactions: | | | | |
| Class I Shares | | | | |
|
| | | | | | | | | | | | |
| Shares sold | 1,449,675 |
| 2,172,455 |
| 3,070,158 |
| 2,819,510 |
|
| Issued to shareholders in reinvestment of distributions | 1,068,979 |
| 106,135 |
| 266,189 |
| 63,373 |
|
| Shares redeemed | (3,201,630 | ) | (4,235,335 | ) | (6,655,480 | ) | (5,878,665 | ) |
| Net decrease from capital share transactions | (682,976 | ) | (1,956,745 | ) | (3,319,133 | ) | (2,995,782 | ) |
| Class II Shares | | | | |
| Shares sold | 25,934 |
| 44,301 |
| 12,289 |
| 12,749 |
|
| Issued to shareholders in reinvestment of distributions | 100,350 |
| 8,013 |
| 11,071 |
| 1,321 |
|
| Shares redeemed | (150,958 | ) | (106,446 | ) | (112,274 | ) | (98,269 | ) |
| Net increase (decrease) from capital share transactions | (24,674 | ) | (54,132 | ) | (88,914 | ) | (84,199 | ) |
See accompanying Notes to Financial Statements.
Statements of Changes in Net Assets
|
| | | | | | | | | | | |
| Small Cap Fund | International Stock Fund |
| 2013 | 2012 | 2013 | 2012 |
| $ | 13,422,398 |
| $ | 12,661,690 |
| $ | 95,182,105 |
| $ | 88,163,466 |
|
| | | | |
| 20,384 |
| 157,422 |
| 1,253,073 |
| 1,552,102 |
|
| 3,932,916 |
| 585,925 |
| 6,547,704 |
| 2,784,165 |
|
| 152,394 |
| 1,117,532 |
| 9,957,513 |
| 13,554,327 |
|
| 4,105,694 |
| 1,860,879 |
| 17,758,290 |
| 17,890,594 |
|
| | | | |
| | | | |
| (18,220 | ) | (139,045 | ) | (148,073 | ) | (1,223,367 | ) |
| (839 | ) | (15,378 | ) | (757 | ) | (263,629 | ) |
| | | | |
| (2,705,545 | ) | – |
| – |
| – |
|
| (787,820 | ) | – |
| – |
| – |
|
| (3,512,424 | ) | (154,423 | ) | (148,830 | ) | (1,486,996 | ) |
| | | | |
| | | | |
| 1,521,960 |
| 567,964 |
| 10,556,562 |
| 6,139,330 |
|
| 2,723,766 |
| 139,045 |
| 148,073 |
| 1,223,367 |
|
| (10,973,144 | ) | (1,550,153 | ) | (25,973,317 | ) | (16,609,228 | ) |
| (6,727,418 | ) | (843,144 | ) | (15,268,682 | ) | (9,246,531 | ) |
| | | | |
| 146,352 |
| 28,404 |
| 216,807 |
| 867,658 |
|
| 788,658 |
| 15,378 |
| 758 |
| 263,629 |
|
| (327,361 | ) | (146,386 | ) | (2,798,513 | ) | (1,269,715 | ) |
| 607,649 |
| (102,604 | ) | (2,580,948 | ) | (138,428 | ) |
| (6,119,769 | ) | (945,748 | ) | (17,849,630 | ) | (9,384,959 | ) |
| (5,526,499 | ) | 760,708 |
| (240,170 | ) | 7,018,639 |
|
| $ | 7,895,899 |
| $ | 13,422,398 |
| $ | 94,941,935 |
| $ | 95,182,105 |
|
| — |
| — |
| 1,067,539 |
| 14,030 |
|
| | | | |
| | | | |
| 103,824 |
| 49,083 |
| 902,307 |
| 624,736 |
|
| 299,177 |
| 11,463 |
| 11,881 |
| 114,510 |
|
| (698,899 | ) | (133,951 | ) | (2,214,685 | ) | (1,660,974 | ) |
| (295,898 | ) | (73,405 | ) | (1,300,497 | ) | (921,728 | ) |
| | | | |
| 10,715 |
| 2,393 |
| 19,055 |
| 91,269 |
|
| 87,126 |
| 1,272 |
| 58 |
| 24,683 |
|
| (22,588 | ) | (12,565 | ) | (240,076 | ) | (126,337 | ) |
| 75,253 |
| (8,900 | ) | (220,963 | ) | (10,385 | ) |
See accompanying Notes to Financial Statements.
Statements of Changes in Net Assets
|
| | | | | | | | | | | | |
| | Madison Target
Retirement 2020 Fund | Madison Target
Retirement 2030 Fund |
| Year Ended December 31, | 2013 | 2012 | 2013 | 2012 |
| Net Assets at beginning of period | $ 56,607,290 |
| $ 39,580,036 |
| $ 68,009,467 |
| $ 45,404,453 |
|
| Increase in net assets from operations: | | | | |
| Net investment income | 1,535,353 |
| 1,434,560 |
| 1,774,772 |
| 1,619,329 |
|
| Net realized gain on investments | 1,807,902 |
| 165,174 |
| 2,714,716 |
| 202,955 |
|
| Net change in unrealized appreciation on investments | 3,247,598 |
| 2,879,364 |
| 7,898,230 |
| 3,982,918 |
|
| Net increase in net assets from operations | 6,590,853 |
| 4,479,098 |
| 12,387,718 |
| 5,805,202 |
|
| Distributions to shareholders from: | | | | |
| Net investment income | | | | |
| Class I | (1,662,495 | ) | (1,667,275 | ) | (1,824,367 | ) | (1,812,454 | ) |
| Net realized gains | | | | |
| Class I | (1,885,461 | ) | (178,482 | ) | (2,582,083 | ) | (440,797 | ) |
| Total distributions | (3,547,956 | ) | (1,845,757 | ) | (4,406,450 | ) | (2,253,251 | ) |
| Capital Stock transactions: | | | | |
| Class I Shares | | | | |
| Shares sold | 32,237,785 |
| 26,778,150 |
| 40,496,358 |
| 29,952,292 |
|
| Issued to shareholders in reinvestment of distributions | 3,547,957 |
| 1,845,756 |
| 4,406,452 |
| 2,253,248 |
|
| Shares redeemed | (24,963,908 | ) | (14,229,993 | ) | (27,706,048 | ) | (13,152,477 | ) |
| Net increase from capital stock transactions | 10,821,834 |
| 14,393,913 |
| 17,196,762 |
| 19,053,063 |
|
| Total net increase from capital stock transactions | 10,821,834 |
| 14,393,913 |
| 17,196,762 |
| 19,053,063 |
|
| Total increase in net assets | 13,864,731 |
| 17,027,254 |
| 25,178,030 |
| 22,605,014 |
|
| Net Assets at end of period | $ 70,472,021 |
| $ 56,607,290 |
| $ 93,187,497 |
| $ 68,009,467 |
|
| Undistributed net investment income included in net assets | $ | — |
| $ | — |
| $ | 840 |
| $ | — |
|
| Capital Share transactions: | | | | |
| Class I Shares | | | | |
| Shares sold | 3,671,120 |
| 3,249,949 |
| 4,643,938 |
| 3,774,920 |
|
| Issued to shareholders in reinvestment of distributions | 405,309 |
| 222,629 |
| 494,188 |
| 281,135 |
|
| Shares redeemed | (2,838,209 | ) | (1,725,495 | ) | (3,156,563 | ) | (1,656,361 | ) |
| Net increase from capital share transactions | 1,238,220 |
| 1,747,083 |
| 1,981,563 |
| 2,399,694 |
|
See accompanying Notes to Financial Statements.
Statements of Changes in Net Assets
|
| | | | | | | | | | | |
Madison Target
Retirement 2040 Fund | Madison Target
Retirement 2050 Fund |
| 2013 | 2012 | 2013 | 2012 |
| $ | 49,268,630 |
| $ | 35,182,268 |
| $ | 7,160,082 |
| $ | 2,236,241 |
|
| | | | |
| 1,205,386 |
| 1,111,481 |
| 245,698 |
| 128,525 |
|
| 1,894,990 |
| 140,879 |
| 188,246 |
| 1,533 |
|
| 7,472,509 |
| 3,160,888 |
| 2,058,896 |
| 333,215 |
|
| 10,572,885 |
| 4,413,248 |
| 2,492,840 |
| 463,273 |
|
| | | | |
| | | | |
| (1,211,502 | ) | (1,199,277 | ) | (249,891 | ) | (134,118 | ) |
| | | | |
| (1,929,708 | ) | (401,247 | ) | (211,851 | ) | (27,128 | ) |
| (3,141,210 | ) | (1,600,524 | ) | (461,742 | ) | (161,246 | ) |
| | | | |
| | | | |
| 31,957,596 |
| 21,643,373 |
| 12,784,911 |
| 5,538,045 |
|
| 3,141,212 |
| 1,600,523 |
| 461,742 |
| 161,246 |
|
| (22,881,902 | ) | (11,970,258 | ) | (4,315,260 | ) | (1,077,477 | ) |
| 12,216,906 |
| 11,273,638 |
| 8,931,393 |
| 4,621,814 |
|
| 12,216,906 |
| 11,273,638 |
| 8,931,393 |
| 4,621,814 |
|
| 19,648,581 |
| 14,086,362 |
| 10,962,491 |
| 4,923,841 |
|
| $ | 68,917,211 |
| $ | 49,268,630 |
| $ | 18,122,573 |
| $ | 7,160,082 |
|
| $ | 27,574 |
| $ | — |
| $ | 5,681 |
| $ | — |
|
| | | | |
| | | | |
| 3,820,959 |
| 2,875,883 |
| 1,071,415 |
| 528,566 |
|
| 362,172 |
| 210,569 |
| 36,179 |
| 15,091 |
|
| (2,722,907 | ) | (1,594,072 | ) | (359,726 | ) | (102,883 | ) |
| 1,460,224 |
| 1,492,380 |
| 747,868 |
| 440,774 |
|
See accompanying Notes to Financial Statements.
Ultra Series Fund | December 31, 2013
Financial Highlights for a Share of Beneficial Interest Outstanding
|
| | | | | | | | | | | | | | | |
| CONSERVATIVE ALLOCATION FUND |
| | Year Ended December 31, |
| | 2013 | 2012 | 2011 | 2010 | 2009 |
| CLASS I | | | | | |
Net Asset Value at beginning of period | $ | 10.45 |
| $ | 9.96 |
| $ | 10.01 |
| $ | 9.61 |
| $ | 8.48 |
|
| Income from Investment Operations: | | | | | |
Net investment income2 | 0.25 |
| 0.29 |
| 0.28 |
| 0.29 |
| 0.29 |
|
| Net realized and unrealized gain on investments | 0.55 |
| 0.60 |
| 0.03 |
| 0.52 |
| 1.12 |
|
| Total from investment operations | 0.80 |
| 0.89 |
| 0.31 |
| 0.81 |
| 1.41 |
|
| Less Distributions: | | | | | |
| Distributions from net investment income | (0.27 | ) | (0.40 | ) | (0.35 | ) | (0.41 | ) | (0.28 | ) |
| Distributions from capital gains | (0.28 | ) | – |
| – |
| – |
| – |
|
| Distributions from return of capital | – |
| – |
| (0.01 | ) | – |
| – |
|
| Total distributions | (0.55 | ) | (0.40 | ) | (0.36 | ) | (0.41 | ) | (0.28 | ) |
| Net increase (decrease) in net asset value | 0.25 |
| 0.49 |
| (0.05 | ) | 0.40 |
| 1.13 |
|
Net Asset Value at end of period | $ | 10.70 |
| $ | 10.45 |
| $ | 9.96 |
| $ | 10.01 |
| $ | 9.61 |
|
Total Return (%)3 | 7.61 |
| 8.98 |
| 3.14 |
| 8.37 |
| 16.76 |
|
| Ratios/Supplemental Data: | | | | | |
| Net Assets at end of period (in 000’s) | $ | 181,427 |
| $ | 195,526 |
| $ | 184,431 |
| $ | 195,657 |
| $ | 176,322 |
|
| Ratios of expenses to average net assets (%) | 0.31 |
| 0.31 |
| 0.31 |
| 0.31 |
| 0.31 |
|
| Ratio of net investment income to average net assets (%) | 2.27 |
| 2.79 |
| 2.76 |
| 2.90 |
| 3.23 |
|
Portfolio turnover (%)6 | 70 |
| 44 |
| 36 |
| 36 |
| 47 |
|
Ultra Series Fund | December 31, 2013
Financial Highlights for a Share of Beneficial Interest Outstanding
|
| | | | | | | | | | | | | | | |
| CLASS II | 2013 |
| 2012 |
| 2011 |
| 2010 |
| Inception to
12/31/091 |
|
Net Asset Value at beginning of period | $ | 10.43 |
| $ | 9.95 |
| $ | 10.00 |
| $ | 9.61 |
| $ | 8.51 |
|
| Income from Investment Operations: | | | | | |
Net investment income2 | 0.22 |
| 0.26 |
| 0.27 |
| 0.35 |
| 0.28 |
|
| Net realized and unrealized gain on investments | 0.55 |
| 0.61 |
| 0.02 |
| 0.43 |
| 0.99 |
|
| Total from investment operations | 0.77 |
| 0.87 |
| 0.29 |
| 0.78 |
| 1.27 |
|
| Less Distributions: | | | | | |
| Distributions from net investment income | (0.24 | ) | (0.39 | ) | (0.33 | ) | (0.39 | ) | (0.17 | ) |
| Distributions from capital gains | (0.28 | ) | – |
| – |
| – |
| – |
|
| Distributions from return of capital | – |
| – |
| (0.01 | ) | – |
| – |
|
| Total distributions | (0.52 | ) | (0.39 | ) | (0.34 | ) | (0.39 | ) | (0.17 | ) |
| Net increase (decrease) in net asset value | 0.25 |
| 0.48 |
| (0.05 | ) | 0.39 |
| 1.10 |
|
Net Asset Value at end of period | $ | 10.68 |
| $ | 10.43 |
| $ | 9.95 |
| $ | 10.00 |
| $ | 9.61 |
|
Total Return (%)3 | 7.34 |
| 8.71 |
| 2.89 |
| 8.10 |
| 14.91 4 |
|
| Ratios/Supplemental Data: | | | | | |
| Net Assets at end of period (in 000’s) | $ | 40,069 |
| $ | 42,691 |
| $ | 43,203 |
| $ | 35,425 |
| $ | 12,829 |
|
| Ratios of expenses to average net assets (%) | 0.56 |
| 0.56 |
| 0.56 |
| 0.55 |
| 0.56 5 |
|
| Ratio of net investment income to average net assets (%) | 2.04 |
| 2.49 |
| 2.67 |
| 3.47 |
| 4.38 5 |
|
Portfolio turnover (%)6 | 70 |
| 44 |
| 36 |
| 36 |
| 47 4 |
|
|
| |
1 | Commenced investment operations May 1, 2009. |
2 | Based on average shares outstanding during the year. |
3 | These returns are after all charges at the mutual fund level have been subtracted. These returns are higher than the returns at the separate account level because charges made at the separate account level have not been subtracted. Total returns are not annualized for periods less than one year. |
4 | Not annualized. |
5 | Annualized. |
6 | Portfolio turnover is calculated at the fund level and represents the entire fiscal year or period. |
See accompanying Notes to Financial Statements.
Ultra Series Fund | December 31, 2013
Financial Highlights for a Share of Beneficial Interest Outstanding
|
| | | | | | | | | | | | | | | |
| MODERATE ALLOCATION FUND |
| | Year Ended December 31, |
| | 2013 | 2012 | 2011 | 2010 | 2009 |
| CLASS I | | | | | |
| Net Asset Value at beginning of period | $ | 10.11 |
| $ | 9.42 |
| $ | 9.49 |
| $ | 8.87 |
| $ | 7.51 |
|
| Income from Investment Operations: | | | | | |
Net investment income2 | 0.19 |
| 0.23 |
| 0.20 |
| 0.20 |
| 0.18 |
|
| Net realized and unrealized gain (loss) on investments | 1.39 |
| 0.77 |
| (0.01 | ) | 0.71 |
| 1.37 |
|
| Total from investment operations | 1.58 |
| 1.00 |
| 0.19 |
| 0.91 |
| 1.55 |
|
| Less Distributions: | | | | | |
| Distributions from net investment income | (0.21 | ) | (0.31 | ) | (0.26 | ) | (0.29 | ) | (0.19 | ) |
| Net increase (decrease) in net asset value | 1.37 |
| 0.69 |
| (0.07 | ) | 0.62 |
| 1.36 |
|
| Net Asset Value at end of period | 11.48 |
| 10.11 |
| $ 9.42 |
| $ 9.49 |
| $ 8.87 |
|
Total Return (%)3 | 15.66 |
| 10.54 |
| 2.03 |
| 10.22 |
| 20.61 |
|
| Ratios/Supplemental Data: | | | | | |
| Net Assets at end of period (in 000’s) | 370,954 |
| 358,486 |
| 346,733 |
| 352,545 |
| 332,428 |
|
| Ratios of expenses to average net assets (%) | 0.31 |
| 0.31 |
| 0.31 |
| 0.31 |
| 0.31 |
|
| Ratio of net investment income to average net assets (%) | 1.75 |
| 2.32 |
| 2.07 |
| 2.24 |
| 2.29 |
|
Portfolio turnover (%)6 | 66 |
| 49 |
| 25 |
| 34 |
| 52 |
|
Ultra Series Fund | December 31, 2013
Financial Highlights for a Share of Beneficial Interest Outstanding
|
| | | | | | | | | | | | | | | |
| CLASS II | 2013 | 2012 | 2011 | 2010 | Inception to
12/31/091 |
| Net Asset Value at beginning of period |
| $10.08 |
| $ 9.41 |
| $ 9.48 |
| $ 8.87 |
| $ 7.56 |
|
| Income from Investment Operations: | | | | | |
Net investment income2 | 0.16 |
| 0.20 |
| 0.18 |
| 0.25 |
| 0.19 |
|
| Net realized and unrealized gain (loss) on investments | 1.39 |
| 0.77 |
| (0.01) |
| 0.63 |
| 1.24 |
|
| Total from investment operations | 1.55 |
| 0.97 |
| 0.17 |
| 0.88 |
| 1.43 |
|
| Less Distributions: | | | | | |
| Distributions from net investment income | (0.18) |
| (0.30) |
| (0.24) |
| (0.27) |
| (0.12) |
|
| Net increase (decrease) in net asset value | 1.37 |
| 0.67 |
| (0.07) |
| 0.61 |
| 1.31 |
|
| Net Asset Value at end of period |
| $11.45 |
|
| $10.08 |
| $ 9.41 |
| $ 9.48 |
| $ 8.87 |
|
Total Return (%)3 | 15.37 |
| 10.26 |
| 1.78 |
| 9.94 |
| 18.82 4 |
|
| Ratios/Supplemental Data: | | | | | |
| Net Assets at end of period (in 000’s) |
| $34,965 |
|
| $34,573 |
|
| $35,873 |
|
| $31,715 |
|
| $12,162 |
|
| Ratios of expenses to average net assets (%) | 0.56 |
| 0.56 |
| 0.56 |
| 0.56 |
| 0.56 5 |
|
| Ratio of net investment income to average net assets (%) | 1.49 |
| 2.01 |
| 1.86 |
| 2.76 |
| 3.33 5 |
|
Portfolio turnover (%)6 | 66 |
| 49 |
| 25 |
| 34 |
| 52 4 |
|
|
| |
1 | Commenced investment operations May 1, 2009. |
2 | Based on average shares outstanding during the year. |
3 | These returns are after all charges at the mutual fund level have been subtracted. These returns are higher than the returns at the separate account level because charges made at the separate account level have not been subtracted. Total returns are not annualized for periods less than one year. |
4 | Not annualized. |
5 | Annualized. |
6 | Portfolio turnover is calculated at the fund level and represents the entire fiscal year or period. |
See accompanying Notes to Financial Statements.
Ultra Series Fund | December 31, 2013
Financial Highlights for a Share of Beneficial Interest Outstanding
|
| | | | | | | | | | | | | | | |
| AGGRESSIVE ALLOCATION FUND |
| | Year Ended December 31, |
| | 2013 | 2012 | 2011 | 2010 | 2009 |
| CLASS I | | | | | |
| Net Asset Value at beginning of period | $ 9.75 |
| $ 8.96 |
| $ 9.08 |
| $ 8.30 |
| $ 6.57 |
|
| Income from Investment Operations: | | | | | |
Net investment income2 | 0.12 |
| 0.17 |
| 0.12 |
| 0.11 |
| 0.10 |
|
| Net realized and unrealized gain (loss) on investments | 2.07 |
| 0.84 |
| (0.08) |
| 0.81 |
| 1.74 |
|
| Total from investment operations | 2.19 |
| 1.01 |
| 0.04 |
| 0.92 |
| 1.84 |
|
| Less Distributions: | | | | | |
| Distributions from net investment income | (0.13) |
| (0.22) |
| (0.16) |
| (0.14) |
| (0.11) |
|
| Distributions from capital gains | (0.15) |
| – |
| – |
| – |
| – |
|
| Total distributions | (0.28) |
| (0.22) |
| (0.16) |
| (0.14) |
| (0.11) |
|
| Net increase (decrease) in net asset value | 1.91 |
| 0.79 |
| (0.12) |
| 0.78 |
| 1.73 |
|
| Net Asset Value at end of period |
| $11.66 |
| $ 9.75 |
| $ 8.96 |
| $ 9.08 |
| $ 8.30 |
|
Total Return (%)3 | 22.35 |
| 11.34 |
| 0.48 |
| 11.15 |
| 27.91 |
|
| Ratios/Supplemental Data: | | | | | |
| Net Assets at end of period (in 000’s) |
| $149,514 |
|
| $142,755 |
|
| $132,575 |
|
| $126,270 |
|
| $114,492 |
|
| Ratios of expenses to average net assets: (%) | 0.31 |
| 0.31 |
| 0.31 |
| 0.31 |
| 0.31 |
|
| Ratio of net investment income to average net assets (%) | 1.07 |
| 1.80 |
| 1.26 |
| 1.27 |
| 1.44 |
|
Portfolio turnover (%)6 | 70 |
| 69 |
| 32 |
| 33 |
| 58 |
|
| CLASS II | 2013 |
| 2012 |
| 2011 |
| 2010 |
| Inception to
12/31/091 |
|
| Net Asset Value at beginning of period | $ 9.72 |
| $ 8.95 |
| $ 9.07 |
| $ 8.30 |
| $ 6.69 |
|
| Income from Investment Operations: | | | | | |
Net investment income2 | 0.09 |
| 0.15 |
| 0.10 |
| 0.17 |
| 0.15 |
|
| Net realized and unrealized gain (loss) on investments | 2.06 |
| 0.83 |
| (0.08) |
| 0.73 |
| 1.54 |
|
| Total from investment operations | 2.15 |
| 0.98 |
| 0.02 |
| 0.90 |
| 1.69 |
|
| Less Distributions: | | | | | |
| Distributions from net investment income | (0.10) |
| (0.21) |
| (0.14) |
| (0.13) |
| (0.08) |
|
| Distributions from capital gains | (0.15) |
| – |
| – |
| – |
| – |
|
| Total distributions | (0.25) |
| (0.21) |
| (0.14) |
| (0.13) |
| (0.08) |
|
| Net increase (decrease) in net asset value | 1.90 |
| 0.77 |
| (0.12) |
| 0.77 |
| 1.61 |
|
| Net Asset Value at end of period |
| $11.62 |
| $ 9.72 |
| $ 8.95 |
| $ 9.07 |
| $ 8.30 |
|
Total Return (%)3 | 22.05 |
| 11.06 |
| 0.23 |
| 10.87 |
| 25.09 4 |
|
Ultra Series Fund | December 31, 2013
Financial Highlights for a Share of Beneficial Interest Outstanding
|
| | | | | | | | | | | | | | | |
| Ratios/Supplemental Data: | | | | | |
| Net Assets at end of period (in 000’s) |
| $1,911 |
|
| $1,921 |
|
| $1,786 |
|
| $1,424 |
|
| $514 |
|
| Ratios of expenses to average net assets (%) | 0.56 |
| 0.56 |
| 0.56 |
| 0.56 |
| 0.56 5 |
|
| Ratio of net investment income to average net assets (%) | 0.81 |
| 1.55 |
| 1.05 |
| 1.99 |
| 2.86 5 |
|
Portfolio turnover (%)6 | 70 |
| 69 |
| 32 |
| 33 |
| 58 4 |
|
|
| |
1 | Commenced investment operations May 1, 2009. |
2 | Based on average shares outstanding during the year. |
3 | These returns are after all charges at the mutual fund level have been subtracted. These returns are higher than the returns at the separate account level because charges made at the separate account level have not been subtracted. Total returns are not annualized for periods less than one year. |
4 | Not annualized. |
5 | Annualized. |
6 | Portfolio turnover is calculated at the fund level and represents the entire fiscal year or period. |
See accompanying Notes to Financial Statements.
Ultra Series Fund | December 31, 2013
Financial Highlights for a Share of Beneficial Interest Outstanding
|
| | | | | | | | | | | | | | | |
| MONEY MARKET FUND |
| | Year Ended December 31, |
| | 2013 | 2012 | 2011 | 2010 | 2009 |
| CLASS I | | | | | |
| Net Asset Value at beginning of period |
| $1.00 |
|
| $1.00 |
|
| $1.00 |
|
| $1.00 |
|
| $1.00 |
|
| Income from Investment Operations: | | | | | |
Net investment income2 | – |
| – |
| – |
| – |
| 0.00 4 |
|
| Total from investment operations | – |
| – |
| – |
| – |
| – |
|
| Less Distributions: | | | | | |
| Distributions from net investment income | – |
| – |
| – |
| – |
| (0.00)4 |
|
| Net increase in net asset value | – |
| – |
| – |
| – |
| – |
|
| Net Asset Value at end of period |
| $1.00 |
|
| $1.00 |
|
| $1.00 |
|
| $1.00 |
|
| $1.00 |
|
Total Return (%)3 | 0.00 |
| 0.00 |
| 0.00 |
| 0.00 |
| 0.00 |
|
| Ratios/Supplemental Data: | | | | | |
| Net Assets at end of period (in 000’s) |
| $36,922 |
|
| $48,648 |
|
| $61,682 |
|
| $69,634 |
|
| $92,463 |
|
| Ratios of expenses to average net assets: | | | | | |
| Before waiver of expenses by Adviser (%) | 0.46 |
| 0.46 |
| 0.47 |
| 0.47 |
| 0.47 |
|
| After waiver of expenses by Adviser (%) | 0.12 7 |
| 0.11 7 |
| 0.08 7 |
| 0.14 7 |
| 0.28 7 |
|
| Ratio of net investment income to average net assets (%) | 0.00 |
| 0.00 |
| 0.00 |
| 0.00 |
| 0.00 |
|
Ultra Series Fund | December 31, 2013
Financial Highlights for a Share of Beneficial Interest Outstanding
|
| | | | | | | | | | | | | | | |
| CLASS II | 2013 | 2012 | 2011 | 2010 | Inception
to
12/31/091 |
| Net Asset Value at beginning of period |
| $1.00 |
|
| $1.00 |
|
| $1.00 |
|
| $1.00 |
|
| $1.00 |
|
| Income from Investment Operations: | | | | | |
Net investment income2 | – |
| – |
| – |
| – |
| – |
|
| Total from investment operations | – |
| – |
| – |
| – |
| – |
|
| Less Distributions: | | | | | |
| Distributions from net investment income | – |
| – |
| – |
| – |
| – |
|
| Net increase in net asset value | – |
| – |
| – |
| – |
| – |
|
| Net Asset Value at end of period |
| $1.00 |
|
| $1.00 |
|
| $1.00 |
|
| $1.00 |
|
| $1.00 |
|
Total Return (%)3 | 0.00 |
| 0.00 |
| 0.00 |
| 0.00 |
| 0.00 5 |
|
| Ratios/Supplemental Data: | | | | | |
| Net Assets at end of period (in 000’s) |
| $1,730 |
|
| $1,676 |
|
| $979 |
|
| $577 |
|
| $185 |
|
| Ratios of expenses to average net assets: | | | | | |
| Before waiver of expenses by Adviser (%) | 0.71 |
| 0.71 |
| 0.72 |
| 0.73 |
| 0.73 6 |
|
| After waiver of expenses by Adviser (%) | 0.12 7 |
| 0.12 7 |
| 0.07 7 |
| 0.16 7 |
| 0.20 6,7 |
|
| Ratio of net investment income to average net assets (%) | 0.00 |
| 0.00 |
| 0.00 |
| 0.00 |
| 0.00 6 |
|
|
| |
1 | Commenced investment operations May 1, 2009. |
2 | Based on average shares outstanding during the year. |
3 | These returns are after all charges at the mutual fund level have been subtracted. These returns are higher than the returns at the separate account level because charges made at the separate account level have not been subtracted. Total returns are not annualized for periods less than one year. |
4 | Amounts represent less than $0.005 per share. |
5 | Not annualized. |
6 | Annualized. |
7 | Amount includes fees waived by the adviser (see Note 3). |
See accompanying Notes to Financial Statements.
Ultra Series Fund | December 31, 2013
Financial Highlights for a Share of Beneficial Interest Outstanding
|
| | | | | | | | | | | | | | | |
| CORE BOND FUND |
| | Year Ended December 31, |
| | 2013 | 2012 | 2011 | 2010 | 2009 |
| CLASS I | | | | | |
| Net Asset Value at beginning of period |
| $10.55 |
|
| $10.57 |
|
| $10.29 |
|
| $10.14 |
| $ 9.94 |
|
| Income from Investment Operations: | | | | | |
Net investment income2 | 0.31 |
| 0.34 |
| 0.38 |
| 0.40 |
| 0.43 |
|
| Net realized and unrealized gain (loss) on investments | (0.54) |
| 0.00 |
| 0.31 |
| 0.20 |
| 0.21 |
|
| Total from investment operations | (0.23) |
| 0.34 |
| 0.69 |
| 0.60 |
| 0.64 |
|
| Less Distributions: | | | | | |
| Distributions from net investment income | (0.35) |
| (0.36) |
| (0.41) |
| (0.45) |
| (0.44) |
|
| Net increase (decrease) in net asset value | (0.58) |
| (0.02) |
| 0.28 |
| 0.15 |
| 0.20 |
|
| Net Asset Value at end of period | $ 9.97 |
|
| $10.55 |
|
| $10.57 |
|
| $10.29 |
|
| $10.14 |
|
Total Return (%)3 | (2.24) |
| 3.21 |
| 6.73 |
| 5.92 |
| 6.50 |
|
| Ratios/Supplemental Data: | | | | | |
| Net Assets at end of period (in 000’s) |
| $270,289 |
|
| $340,335 |
|
| $375,325 |
|
| $429,499 |
|
| $541,789 |
|
| Ratios of expenses to average net assets (%) | 0.56 |
| 0.56 |
| 0.57 |
| 0.56 |
| 0.57 |
|
| Ratio of net investment income to average net assets (%) | 3.02 |
| 3.13 |
| 3.62 |
| 3.76 |
| 4.28 |
|
Portfolio turnover (%)6 | 14 |
| 11 |
| 6 |
| 2 |
| 25 |
|
Ultra Series Fund | December 31, 2013
Financial Highlights for a Share of Beneficial Interest Outstanding
|
| | | | | | | | | | | | | | | |
| CLASS II | 2013 | 2012 | 2011 | 2010 | Inception
to
12/31/091 |
| Net Asset Value at beginning of period |
| $10.54 |
|
| $10.56 |
|
| $10.28 |
|
| $10.14 |
| $ 9.85 |
|
| Income from Investment Operations: | | | | | |
Net investment income2 | 0.29 |
| 0.31 |
| 0.36 |
| 0.37 |
| 0.27 |
|
| Net realized and unrealized gain (loss) on investments | (0.56) |
| 0.01 |
| 0.31 |
| 0.20 |
| 0.28 |
|
| Total from investment operations | (0.27) |
| 0.32 |
| 0.67 |
| 0.57 |
| 0.55 |
|
| Less Distributions: | | | | | |
| Distributions from net investment income | (0.32) |
| (0.34) |
| (0.39) |
| (0.43) |
| (0.26) |
|
| Net increase (decrease) in net asset value | (0.59) |
| (0.02) |
| 0.28 |
| 0.14 |
| 0.29 |
|
| Net Asset Value at end of period | $ 9.95 |
|
| $10.54 |
|
| $10.56 |
|
| $10.28 |
|
| $10.14 |
|
Total Return (%)3 | (2.49) |
| 2.96 |
| 6.47 |
| 5.66 |
| 5.55 4 |
|
| Ratios/Supplemental Data: | | | | | |
| Net Assets at end of period (in 000’s) |
| $46,991 |
|
| $49,456 |
|
| $49,774 |
|
| $35,750 |
|
| $9,719 |
|
| Ratios of expenses to average net assets (%) | 0.81 |
| 0.81 |
| 0.82 |
| 0.81 |
| 0.82 5 |
|
| Ratio of net investment income to average net assets (%) | 2.77 |
| 2.88 |
| 3.36 |
| 3.49 |
| 3.86 5 |
|
Portfolio turnover (%)6 | 14 |
| 11 |
| 6 |
| 2 |
| 25 4 |
|
|
| |
1 | Commenced investment operations May 1, 2009. |
2 | Based on average shares outstanding during the year. |
3 | These returns are after all charges at the mutual fund level have been subtracted. These returns are higher than the returns at the separate account level because charges made at the separate account level have not been subtracted. Total returns are not annualized for periods less than one year. |
4 | Not annualized. |
5 | Annualized. |
6 | Portfolio turnover is calculated at the fund level and represents the entire fiscal year or period. |
See accompanying Notes to Financial Statements.
Ultra Series Fund | December 31, 2013
Financial Highlights for a Share of Beneficial Interest Outstanding
|
| | | | | | | | | | | | | | | |
| HIGH INCOME FUND |
| | Year Ended December 31, |
| | 2013 | 2012 | 2011 | 2010 | 2009 |
| CLASS I | | | | | |
| Net Asset Value at beginning of period | $ 9.37 |
| $ 9.18 |
| $ 9.42 |
| $ 9.11 |
| $ 7.34 |
|
| Income from Investment Operations: | | | | | |
Net investment income2 | 0.52 |
| 0.61 |
| 0.65 |
| 0.72 |
| 0.68 |
|
| Net realized and unrealized gain (loss) on investments | (0.01) |
| 0.42 |
| (0.18) |
| 0.35 |
| 1.80 |
|
| Total from investment operations | 0.51 |
| 1.03 |
| 0.47 |
| 1.07 |
| 2.48 |
|
| Less Distributions: | | | | | |
| Distributions from net investment income | (0.66) |
| (0.84) |
| (0.71) |
| (0.76) |
| (0.71) |
|
| Net increase (decrease) in net asset value | (0.15) |
| 0.19 |
| (0.24) |
| 0.31 |
| 1.77 |
|
| Net Asset Value at end of period | $ 9.22 |
| $ 9.37 |
| $ 9.18 |
| $ 9.42 |
| $ 9.11 |
|
Total Return (%)3 | 5.49 |
| 11.23 |
| 5.01 |
| 11.73 |
| 34.29 |
|
| Ratios/Supplemental Data: | | | | | |
| Net Assets at end of period (in 000’s) |
| $43,622 |
|
| $60,362 |
|
| $86,462 |
|
| $95,552 |
|
| $107,722 |
|
| Ratios of expenses to average net assets (%) | 0.76 |
| 0.77 |
| 0.77 |
| 0.77 |
| 0.77 |
|
| Ratio of net investment income to average net assets (%) | 5.42 |
| 6.31 |
| 6.76 |
| 7.54 |
| 7.94 |
|
Portfolio turnover (%)6 | 32 |
| 55 |
| 54 |
| 53 |
| 73 |
|
Ultra Series Fund | December 31, 2013
Financial Highlights for a Share of Beneficial Interest Outstanding
|
| | | | | | | | | | | | | |
| CLASS II | 2013 | 2012 | 2011 | 2010 | Inception
to
12/31/091 |
| Net Asset Value at beginning of period |
| $9.37 |
| $ 9.19 | $ 9.42 |
| $ 9.11 |
| $ 8.14 |
|
| Income from Investment Operations: | | | | | |
Net investment income2 | 0.50 |
| 0.58 | 0.63 |
| 0.70 |
| 0.47 |
|
| Net realized and unrealized gain (loss) on investments | – |
| 0.42 | (0.18) |
| 0.34 |
| 0.96 |
|
| Total from investment operations | 0.50 |
| 1.00 | 0.45 |
| 1.04 |
| 1.43 |
|
| Less Distributions: | | | | | |
| Distributions from net investment income | (0.64) |
| (0.82) | (0.68) |
| (0.73) |
| (0.46) |
|
| Net increase (decrease) in net asset value | (0.14) |
| 0.18 | (0.23) |
| 0.31 |
| 0.97 |
|
| Net Asset Value at end of period |
| $9.23 |
| $ 9.37 | $ 9.19 |
| $ 9.42 |
| $ 9.11 |
|
Total Return (%)3 | 5.23 |
| 10.95 | 4.75 |
| 11.45 |
| 17.49 4 |
|
| Ratios/Supplemental Data: | | | | | |
| Net Assets at end of period (in 000’s) |
| $6,906 |
| $ 6,737 |
| $6,213 |
|
| $4,286 |
|
| $1,148 |
|
| Ratios of expenses to average net assets (%) | 1.01 |
| 1.02 | 1.02 |
| 1.01 |
| 1.01 5 |
|
| Ratio of net investment income to average net assets (%) | 5.17 |
| 6.02 | 6.52 |
| 7.20 |
| 7.65 5 |
|
Portfolio turnover (%)6 | 32 |
| 55 | 54 |
| 53 |
| 73 4 |
|
|
| |
1 | Commenced investment operations May 1, 2009. |
2 | Based on average shares outstanding during the year. |
3 | These returns are after all charges at the mutual fund level have been subtracted. These returns are higher than the returns at the separate account level because charges made at the separate account level have not been subtracted. Total returns are not annualized for periods less than one year. |
4 | Not annualized. |
5 | Annualized. |
6 | Portfolio turnover is calculated at the fund level and represents the entire fiscal year or period. |
See accompanying Notes to Financial Statements.
Ultra Series Fund | December 31, 2013
Financial Highlights for a Share of Beneficial Interest Outstanding
|
| | | | | | | | | | | | | | | |
| DIVERSIFIED INCOME FUND |
| | Year Ended December 31, |
| | 2013 | 2012 | 2011 | 2010 | 2009 |
| CLASS I | | | | | |
| Net Asset Value at beginning of period |
| $18.29 |
|
| $17.39 |
|
| $16.62 |
|
| $15.37 |
|
| $14.46 |
|
| Income from Investment Operations: | | | | | |
Net investment income2 | 0.46 |
| 0.49 |
| 0.51 |
| 0.56 |
| 0.60 |
|
| Net realized and unrealized gain on investments | 2.48 |
| 0.92 |
| 0.79 |
| 1.29 |
| 0.92 |
|
| Total from investment operations | 2.94 |
| 1.41 |
| 1.30 |
| 1.85 |
| 1.52 |
|
| Less Distributions: | | | | | |
| Distributions from net investment income | (0.47) |
| (0.51) |
| (0.53) |
| (0.60) |
| (0.61) |
|
| Net increase in net asset value | 2.47 |
| 0.90 |
| 0.77 |
| 1.25 |
| 0.91 |
|
| Net Asset Value at end of period |
| $20.76 |
|
| $18.29 |
|
| $17.39 |
|
| $16.62 |
|
| $15.37 |
|
Total Return (%)3 | 16.07 |
| 8.16 |
| 7.84 |
| 12.04 |
| 10.74 |
|
| Ratios/Supplemental Data: | | | | | |
| Net Assets at end of period (in 000’s) |
| $378,807 |
|
| $359,022 |
|
| $372,852 |
|
| $384,709 |
|
| $418,381 |
|
| Ratios of expenses to average net assets (%) | 0.71 |
| 0.71 |
| 0.72 |
| 0.72 |
| 0.72 |
|
| Ratio of net investment income to average net assets (%) | 2.31 |
| 2.69 |
| 2.94 |
| 3.50 |
| 4.12 |
|
Portfolio turnover (%)6 | 17 |
| 17 |
| 19 |
| 23 |
| 26 |
|
Ultra Series Fund | December 31, 2013
Financial Highlights for a Share of Beneficial Interest Outstanding
|
| | | | | | | | | | | | | | | |
| CLASS II | 2013 | 2012 | 2011 | 2010 | Inception
to
12/31/091 |
| Net Asset Value at beginning of period |
| $18.26 |
|
| $17.37 |
|
| $16.61 |
|
| $15.37 |
|
| $13.74 |
|
| Income from Investment Operations: | | | | | |
Net investment income2 | 0.41 |
| 0.44 |
| 0.46 |
| 0.52 |
| 0.35 |
|
| Net realized and unrealized gain on investments | 2.47 |
| 0.93 |
| 0.79 |
| 1.29 |
| 1.64 |
|
| Total from investment operations | 2.88 |
| 1.37 |
| 1.25 |
| 1.81 |
| 1.99 |
|
| Less Distributions: | | | | | |
| Distributions from net investment income | (0.43) |
| (0.48) |
| (0.49) |
| (0.57) |
| (0.36) |
|
| Net increase in net asset value | 2.45 |
| 0.89 |
| 0.76 |
| 1.24 |
| 1.63 |
|
| Net Asset Value at end of period |
| $20.71 |
|
| $18.26 |
|
| $17.37 |
|
| $16.61 |
|
| $15.37 |
|
Total Return (%)3 | 15.78 |
| 7.89 |
| 7.57 |
| 11.77 |
| 14.43 4 |
|
| Ratios/Supplemental Data: | | | | | |
| Net Assets at end of period (in 000’s) |
| $43,601 |
|
| $34,908 |
|
| $30,360 |
|
| $22,309 |
|
| $6,261 |
|
| Ratios of expenses to average net assets (%) | 0.96 |
| 0.96 |
| 0.97 |
| 0.97 |
| 0.97 5 |
|
| Ratio of net investment income to average net assets (%) | 2.05 |
| 2.43 |
| 2.69 |
| 3.20 |
| 3.44 5 |
|
Portfolio turnover (%)6 | 17 |
| 17 |
| 19 |
| 23 |
| 26 4 |
|
|
| |
1 | Commenced investment operations May 1, 2009. |
2 | Based on average shares outstanding during the year. |
3 | These returns are after all charges at the mutual fund level have been subtracted. These returns are higher than the returns at the separate account level because charges made at the separate account level have not been subtracted. Total returns are not annualized for periods less than one year. |
4 | Not annualized. |
5 | Annualized. |
6 | Portfolio turnover is calculated at the fund level and represents the entire fiscal year or period. |
See accompanying Notes to Financial Statements.
82
Ultra Series Fund | December 31, 2013
Financial Highlights for a Share of Beneficial Interest Outstanding
|
| | | | | | | | | | | | | | | |
| LARGE CAP VALUE FUND |
| | Year Ended December 31, |
| | 2013 | 2012 | 2011 | 2010 | 2009 |
| CLASS I | | | | | |
| Net Asset Value at beginning of period |
| $27.12 |
|
| $24.78 |
|
| $23.56 |
|
| $22.17 |
|
| $19.42 |
|
| Income from Investment Operations: | | | | | |
Net investment income2 | 0.48 |
| 0.55 |
| 0.50 |
| 0.38 |
| 0.43 |
|
| Net realized and unrealized gain on investments | 7.67 |
| 2.37 |
| 1.24 |
| 1.46 |
| 2.76 |
|
| Total from investment operations | 8.15 |
| 2.92 |
| 1.74 |
| 1.84 |
| 3.19 |
|
| Less Distributions: | | | | | |
| Distributions from net investment income | (0.51) |
| (0.58) |
| (0.52) |
| (0.45) |
| (0.44) |
|
| Net increase in net asset value | 7.64 |
| 2.34 |
| 1.22 |
| 1.39 |
| 2.75 |
|
| Net Asset Value at end of period |
| $34.76 |
|
| $27.12 |
|
| $24.78 |
| $ | 23.56 |
|
| $22.17 |
|
Total Return (%)3 | 30.07 |
| 11.82 |
| 7.38 |
| 8.29 |
| 16.79 |
|
| Ratios/Supplemental Data: | | | | | |
| Net Assets at end of period (in 000’s) |
| $576,731 |
|
| $494,587 |
|
| $485,978 |
|
| $524,894 |
|
| $630,764 |
|
| Ratios of expenses to average net assets (%) | 0.61 |
| 0.61 |
| 0.62 |
| 0.62 |
| 0.62 |
|
| Ratio of net investment income to average net assets (%) | 1.53 |
| 2.05 |
| 2.03 |
| 1.72 |
| 2.23 |
|
Portfolio turnover (%)6 | 32 |
| 27 |
| 29 |
| 63 |
| 81 |
|
Ultra Series Fund | December 31, 2013
Financial Highlights for a Share of Beneficial Interest Outstanding
|
| | | | | | | | | | | | | | | |
| CLASS II | 2013 | 2012 | 2011 | 2010 | Inception
to
12/31/091 |
| Net Asset Value at beginning of period |
| $27.05 |
|
| $24.73 |
|
| $23.54 |
|
| $22.17 |
|
| $17.74 |
|
| Income from Investment Operations: | | | | | |
Net investment income2 | 0.40 | 0.48 | 0.43 | 0.34 | 0.18 |
| Net realized and unrealized gain on investments | 7.64 | 2.37 | 1.25 | 1.44 | 4.45 |
| Total from investment operations | 8.04 | 2.85 | 1.68 | 1.78 | 4.63 |
| Less Distributions: | | | | | |
| Distributions from net investment income | (0.45) | (0.53) | (0.49) | (0.41) | (0.20) |
| Net increase in net asset value | 7.59 | 2.32 | 1.19 | 1.37 | 4.43 |
| Net Asset Value at end of period |
| $34.64 |
|
| $27.05 |
|
| $24.73 |
|
| $23.54 |
|
| $22.17 |
|
Total Return (%)3 | 29.74 | 11.55 | 7.11 | 8.02 | 26.09 4 |
|
| Ratios/Supplemental Data: | | | | | |
| Net Assets at end of period (in 000’s) |
| $6,875 |
|
| $5,882 |
|
| $5,697 |
|
| $5,354 |
|
| $2,552 |
|
| Ratios of expenses to average net assets (%) | 0.86 |
| 0.86 |
| 0.87 |
| 0.87 |
| 0.87 5 |
|
| Ratio of net investment income to average net assets (%) | 1.28 |
| 1.80 |
| 1.78 |
| 1.51 |
| 1.28 5 |
|
Portfolio turnover (%)6 | 32 | 27 | 29 | 63 | 81 4 |
|
|
| |
1 | Commenced investment operations May 1, 2009. |
2 | Based on average shares outstanding during the year. |
3 | These returns are after all charges at the mutual fund level have been subtracted. These returns are higher than the returns at the separate account level because charges made at the separate account level have not been subtracted. Total returns are not annualized for periods less than one year. |
4 | Not annualized. |
5 | Annualized. |
6 | Portfolio turnover is calculated at the fund level and represents the entire fiscal year or period. |
See accompanying Notes to Financial Statements.
Ultra Series Fund | December 31, 2013
Financial Highlights for a Share of Beneficial Interest Outstanding
|
| | | | | | | | | | | | | | | |
| LARGE CAP GROWTH FUND |
| | Year Ended December 31, |
| | 2013 | 2012 | 2011 | 2010 | 2009 |
| CLASS I | | | | | |
| Net Asset Value at beginning of period |
| $24.09 |
|
| $21.84 |
|
| $22.16 |
|
| $19.87 |
|
| $14.50 |
|
| Income from Investment Operations: | | | | | |
Net investment income2 | 0.17 | 0.18 | 0.05 | 0.10 | 0.12 |
| Net realized and unrealized gain (loss) on investments | 7.17 | 2.26 | (0.31) | 2.31 | 5.37 |
| Total from investment operations | 7.34 | 2.44 | (0.26) | 2.41 | 5.49 |
| Less Distributions: | | | | | |
| Distributions from net investment income | (0.18) | (0.19) | (0.06) | (0.12) | (0.12) |
| Distributions from capital gains | (2.49) | – | – | – | – |
| Total distributions | (2.67) | (0.19) | (0.06) | (0.12) | (0.12) |
| Net increase (decrease) in net asset value | 4.67 | 2.25 | (0.32) | 2.29 | 5.37 |
| Net Asset Value at end of period |
| $28.76 |
|
| $24.09 |
|
| $21.84 |
|
| $22.16 |
|
| $19.87 |
|
Total Return (%)3 | 30.51 | 11.20 | (1.19) | 12.13 | 37.98 |
| Ratios/Supplemental Data: | | | | | |
| Net Assets at end of period (in 000’s) |
| $359,959 |
|
| $318,024 |
|
| $331,032 |
|
| $374,644 |
|
| $433,483 |
|
| Ratios of expenses to average net assets (%) | 0.81 | 0.82 | 0.82 | 0.82 | 0.82 |
| Ratio of net investment income to average net assets (%) | 0.62 | 0.76 | 0.24 | 0.51 | 0.72 |
Portfolio turnover (%)8 | 50 | 64 | 85 | 78 | 89 |
Ultra Series Fund | December 31, 2013
Financial Highlights for a Share of Beneficial Interest Outstanding
|
| | | | | | | | | | | | | | | |
| CLASS II | 2013 | 2012 | 2011 | 2010 | Inception
to
12/31/091 |
| Net Asset Value at beginning of period |
| $24.02 |
|
| $21.80 |
|
| $22.14 |
|
| $19.87 |
|
| $15.78 |
|
| Income from Investment Operations: | | | | | |
Net investment income2 | 0.10 |
| 0.12 |
| (0.00)7 |
| 0.06 |
| 0.05 |
|
| Net realized and unrealized gain (loss) on investments | 7.13 |
| 2.26 |
| (0.32) |
| 2.30 |
| 4.09 |
|
| Total from investment operations | 7.23 |
| 2.38 |
| (0.32) |
| 2.36 |
| 4.14 |
|
| Less Distributions: | | | | | |
| Distributions from net investment income | (0.13) |
| (0.16) |
| (0.02) |
| (0.09) |
| (0.05) |
|
| Distributions from capital gains | (2.49) |
| – |
| – |
| – |
| – |
|
| Total distributions | (2.62) |
| (0.16) |
| (0.02) |
| (0.09) |
| (0.05) |
|
| Net increase (decrease) in net asset value | 4.61 |
| 2.22 |
| (0.34) |
| 2.27 |
| 4.09 |
|
| Net Asset Value at end of period |
| $28.63 |
|
| $24.02 |
|
| $21.80 |
|
| $22.14 |
|
| $19.87 |
|
Total Return (%)3 | 30.18 |
| 10.93 |
| (1.43) |
| 11.85 |
| 26.21 4 |
|
| Ratios/Supplemental Data: | | | | | |
| Net Assets at end of period (in 000’s) |
| $33,983 |
|
| $29,101 |
|
| $27,589 |
|
| $20,802 |
|
| $6,003 |
|
| Ratios of expenses to average net assets (%) | 1.06 |
| 1.07 |
| 1.07 |
| 1.07 |
| 1.07 5 |
|
| Ratio of net investment income to average net assets (%) | 0.37 |
| 0.51 |
| 0.01 |
| 0.29 |
| 0.36 5 |
|
Portfolio turnover (%)8 | 50 |
| 64 |
| 85 |
| 78 |
| 89 4 |
|
|
| |
1 | Commenced investment operations May 1, 2009. |
2 | Based on average shares outstanding during the year. |
3 | These returns are after all charges at the mutual fund level have been subtracted. These returns are higher than the returns at the separate account level because charges made at the separate account level have not been subtracted. Total returns are not annualized for periods less than one year. |
4 | Not annualized. |
5 | Annualized. |
6 | Amount represents less than 0.01%. |
7 | Amount represents less than $(0.005) per share. |
8 | Portfolio turnover is calculated at the fund level and represents the entire fiscal year or period. |
See accompanying Notes to Financial Statements.
Ultra Series Fund | December 31, 2013
Financial Highlights for a Share of Beneficial Interest Outstanding
|
| | | | | | | | | | | | | | | |
| MID CAP FUND |
| | Year Ended December 31, |
| | 2013 | 2012 | 2011 | 20,103 | 20,093 |
| CLASS I | | | | | |
| Net Asset Value at beginning of period |
| $17.09 |
|
| $14.75 |
|
| $14.14 |
|
| $11.82 |
| $ 8.01 |
|
| Income from Investment Operations: | | | | | |
Net investment income2 | 0.00 5 |
| 0.05 |
| 0.02 |
| 0.04 |
| 0.00 5 |
|
| Net realized and unrealized gain on investments | 5.00 |
| 2.34 |
| 0.62 |
| 2.33 |
| 3.81 |
|
| Total from investment operations | 5.00 |
| 2.39 |
| 0.64 |
| 2.37 |
| 3.81 |
|
| Less Distributions: | | | | | |
| Distributions from net investment income | (0.00)5 |
| (0.05) |
| (0.03) |
| (0.05) |
| (0.00)5 |
|
| Distributions from capital gains | (0.33) |
| – |
| – |
| – |
| – |
|
| Total distributions | (0.33) |
| (0.05) |
| (0.03) |
| (0.05) |
| – |
|
| Net increase in net asset value | 4.67 |
| 2.34 |
| 0.61 |
| 2.32 |
| 3.81 |
|
| Net Asset Value at end of period |
| $21.76 |
|
| $17.09 |
|
| $14.75 |
|
| $14.14 |
|
| $11.82 |
|
Total Return (%)4 | 29.28 |
| 16.24 |
| 4.47 |
| 20.12 |
| 47.28 |
|
| Ratios/Supplemental Data: | | | | | |
| Net Assets at end of period (in 000’s) |
| $381,703 |
|
| $356,534 |
|
| $351,833 |
|
| $385,219 |
|
| $229,395 |
|
| Ratios of expenses to average net assets (%) | 0.91 |
| 0.91 |
| 0.91 |
| 0.90 |
| 0.87 |
|
| Ratio of net investment income to average net assets (%) | (0.01) |
| 0.30 |
| 0.16 |
| 0.42 |
| (0.05) |
|
Portfolio turnover (%)8 | 28 |
| 25 |
| 52 |
| 46 |
| 186 |
|
Ultra Series Fund | December 31, 2013
Financial Highlights for a Share of Beneficial Interest Outstanding
|
| | | | | | | | | | | | | | | |
| CLASS II | 2013 | 2012 | 2011 | 20,103 | Inception
to
12/31/091,3 |
| Net Asset Value at beginning of period |
| $17.05 |
|
| $14.72 |
|
| $14.13 |
|
| $11.82 |
| $ 9.36 |
|
| Income from Investment Operations: | | | | | |
Net investment income (loss)2 | (0.05) |
| 0.01 |
| (0.01) |
| 0.04 |
| (0.00)5 |
|
| Net realized and unrealized gain on investments | 4.98 |
| 2.35 |
| 0.60 |
| 2.30 |
| 2.45 |
|
| Total from investment operations | 4.93 |
| 2.36 |
| 0.59 |
| 2.34 |
| 2.45 |
|
| Less Distributions: | | | | | |
| Distributions from net investment income | – |
| (0.03) |
| – |
| (0.03) |
| – |
|
| Distributions from capital gains | (0.33) |
| – |
| – |
| – |
| – |
|
| Total distributions | (0.33) |
| (0.03) |
| – |
| (0.03) |
| – |
|
| Net increase in net asset value | 4.60 |
| 2.33 |
| 0.59 |
| 2.31 |
| 2.45 |
|
| Net Asset Value at end of period |
| $21.65 |
|
| $17.05 |
|
| $14.72 |
|
| $14.13 |
|
| $11.82 |
|
Total Return (%)4 | 28.95 |
| 15.95 |
| 4.22 |
| 19.82 |
| 26.13 6 |
|
| Ratios/Supplemental Data: | | | | | |
| Net Assets at end of period (in 000’s) |
| $15,762 |
|
| $13,927 |
|
| $13,270 |
|
| $11,951 |
|
| $1,745 |
|
| Ratios of expenses to average net assets (%) | 1.16 |
| 1.16 |
| 1.17 |
| 1.16 |
| 1.12 7 |
|
| Ratio of net investment income to average net assets (%) | (0.26) |
| 0.05 |
| (0.07) |
| 0.38 |
| (0.14)7 |
|
Portfolio turnover (%)8 | 28 |
| 25 |
| 52 |
| 46 |
| 186 6 |
|
|
| |
1 | Commenced investment operations May 1, 2009. |
2 | Based on average shares outstanding during the year. |
3 | The financial highlights prior to May 1, 2010 are those of the Mid Cap Growth Fund, the accounting survivor of the reorganization of the Mid Cap Value and Mid Cap Growth Funds. The net asset values and other per share information of the Mid Cap Growth Fund have been restated by the conversion ration of 2.6623 for Class I shares and 2.6678 for Class II shares to reflect those of the legal survivor of the reorganization the Mid Cap Value Fund, which was renamed the Mid Cap Fund after the reorganization. |
4 | These returns are after all charges at the mutual fund level have been subtracted. These returns are higher than the returns at the separate account level because charges made at the separate account level have not been subtracted. Total returns are not annualized for periods less than one year. |
5 | Amounts represents less than $0.005 per share. |
6 | Not annualized. |
7 | Annualized. |
8 | Portfolio turnover is calculated at the fund level and represents the entire fiscal year or period. |
See accompanying Notes to Financial Statements.
Ultra Series Fund | December 31, 2013
Financial Highlights for a Share of Beneficial Interest Outstanding
|
| | | | | | | | | | | | | | | |
| SMALL CAP FUND |
| | Year Ended December 31, |
| | 2013 | 2012 | 2011 | 2010 | 2009 |
| CLASS I | | | | | |
| Net Asset Value at beginning of period |
| $12.32 |
|
| $10.81 |
|
| $10.75 |
| $ 8.54 |
| $ 6.53 |
|
| Income from Investment Operations: | | | | | |
Net investment income2 | 0.02 |
| 0.14 |
| 0.04 |
| 0.08 |
| 0.05 |
|
| Net realized and unrealized gain (loss) on investments | 4.03 |
| 1.52 |
| 0.06 |
| 2.20 |
| 2.00 |
|
| Total from investment operations | 4.05 |
| 1.66 |
| 0.10 |
| 2.28 |
| 2.05 |
|
| Less Distributions: | | | | | |
| Distributions from net investment income | (0.05) |
| (0.15) |
| (0.04) |
| (0.07) |
| (0.04) |
|
| Distributions from capital gains | (7.22) |
| – |
| – |
| – |
| – |
|
| Total distributions | (7.27) |
| (0.15) |
| (0.04) |
| (0.07) |
| (0.04) |
|
| Net increase (decrease) in net asset value | (3.22) |
| 1.51 |
| 0.06 |
| 2.21 |
| 2.01 |
|
| Net Asset Value at end of period | $ 9.10 |
|
| $12.32 |
|
| $10.81 |
|
| $10.75 |
| $ 8.54 |
|
Total Return (%)3 | 32.77 |
| 15.39 |
| 0.91 |
| 26.80 |
| 31.56 |
|
| Ratios/Supplemental Data: | | | | | |
| Net Assets at end of period (in 000’s) |
| $6,121 |
|
| $11,936 |
|
| $11,261 |
|
| $11,710 |
|
| $7,989 |
|
| Ratios of expenses to average net assets (%) | 1.11 |
| 1.11 |
| 1.11 |
| 1.11 |
| 1.11 |
|
| Ratio of net investment income to average net assets (%) | 0.17 |
| 1.24 |
| 0.41 |
| 0.85 |
| 0.77 |
|
Portfolio turnover (%)6 | 19 |
| 15 |
| 22 |
| 33 |
| 21 |
|
| | | | | | |
| CLASS II | 2013 |
| 2012 |
| 2011 |
| 2010 |
| Inception to
12/31/091 |
|
| Net Asset Value at beginning of period |
| $12.29 |
|
| $10.79 |
|
| $10.74 |
| $ 8.54 |
| $ 6.50 |
|
| Income from Investment Operations: | | | | | |
Net investment income2 | – |
| 0.11 |
| 0.02 |
| 0.06 |
| 0.02 |
|
| Net realized and unrealized gain (loss) on investments | 3.99 |
| 1.52 |
| 0.06 |
| 2.20 |
| 2.03 |
|
| Total from investment operations | 3.99 |
| 1.63 |
| 0.08 |
| 2.26 |
| 2.05 |
|
| Less Distributions: | | | | | |
| Distributions from net investment income | (0.01) |
| (0.13) |
| (0.03) |
| (0.06) |
| (0.01) |
|
| Distributions from capital gains | (7.22) |
| – |
| – |
| – |
| – |
|
| Total distributions | (7.23) |
| (0.13) |
| (0.03) |
| (0.06) |
| (0.01) |
|
| Net increase (decrease) in net asset value | (3.24) |
| 1.50 |
| 0.05 |
| 2.20 |
| 2.04 |
|
| Net Asset Value at end of period |
| $9.05 |
|
| $12.29 |
|
| $10.79 |
|
| $10.74 |
| $ 8.54 |
|
Total Return (%)3 | 32.44 |
| 15.10 |
| 0.66 |
| 26.48 |
| 31.57 4 |
|
| Ratios/Supplemental Data: | | | | | |
Ultra Series Fund | December 31, 2013
Financial Highlights for a Share of Beneficial Interest Outstanding
|
| | | | | | | | | | | | | | | |
| Net Assets at end of period (in 000’s) |
| $1,775 |
|
| $1,486 |
|
| $1,401 |
|
| $1,387 |
|
| $616 |
|
| Ratios of expenses to average net assets (%) | 1.37 |
| 1.36 |
| 1.36 |
| 1.36 |
| 1.36 5 |
|
| Ratio of net investment income to average net assets (%) | (0.02) |
| 0.99 |
| 0.16 |
| 0.67 |
| 0.44 5 |
|
Portfolio turnover (%)6 | 19 |
| 15 |
| 22 |
| 33 |
| 21 4 |
|
|
| |
1 | Commenced investment operations May 1, 2009. |
2 | Based on average shares outstanding during the year. |
3 | These returns are after all charges at the mutual fund level have been subtracted. These returns are higher than the returns at the separate account level because charges made at the separate account level have not been subtracted. Total returns are not annualized for periods less than one year. |
4 | Not annualized. |
5 | Annualized. |
6 | Portfolio turnover is calculated at the fund level and represents the entire fiscal year or period. |
See accompanying Notes to Financial Statements.
Ultra Series Fund | December 31, 2013
Financial Highlights for a Share of Beneficial Interest Outstanding
|
| | | | | | | | | | | | | | | |
| INTERNATIONAL STOCK FUND |
| | Year Ended December 31, |
| | 2013 | 2012 | 2011 | 2010 | 2009 |
| CLASS I | | | | | |
| Net Asset Value at beginning of period |
| $10.78 |
| $ 9.03 |
| $ 9.99 |
| $ 9.53 |
| $ 7.59 |
|
| Income from Investment Operations: | | | | | |
Net investment income2 | 0.16 |
| 0.17 |
| 0.19 |
| 0.14 |
| 0.17 |
|
| Net realized and unrealized gain (loss) on investments | 2.07 |
| 1.75 |
| (0.96) |
| 0.53 |
| 1.95 |
|
| Total from investment operations | 2.23 |
| 1.92 |
| (0.77) |
| 0.67 |
| 2.12 |
|
| Less Distributions: | | | | | |
| Distributions from net investment income | (0.02) |
| (0.17) |
| (0.19) |
| (0.21) |
| (0.18) |
|
| Net increase (decrease) in net asset value | 2.21 |
| 1.75 |
| (0.96) |
| 0.46 |
| 1.94 |
|
| Net Asset Value at end of period |
| $12.99 |
|
| $10.78 |
| $ 9.03 |
| $ 9.99 |
| $ 9.53 |
|
Total Return (%)4 | 20.76 |
| 21.31 |
| (7.70) |
| 7.09 |
| 27.90 |
|
| Ratios/Supplemental Data: | | | | | |
| Net Assets at end of period (in 000’s) |
| $75,808 |
|
| $76,919 |
|
| $72,756 |
|
| $92,063 |
|
| $77,997 |
|
| Ratios of expenses to average net assets (%) | 1.21 |
| 1.21 |
| 1.22 |
| 1.22 |
| 1.22 |
|
| Ratio of net investment income to average net assets (%) | 1.37 |
| 1.74 |
| 1.90 |
| 1.48 |
| 2.08 |
|
Portfolio turnover (%)7 | 39 |
| 42 |
| 38 |
| 79 |
| 87 |
|
Ultra Series Fund | December 31, 2013
Financial Highlights for a Share of Beneficial Interest Outstanding
|
| | | | | | | | | | | | | | | |
| CLASS II | 2013 | 2012 | 2011 | 2010 | Inception
to
12/31/091 |
| Net Asset Value at beginning of period |
| $10.76 |
|
| $9.02 |
| $ 9.99 |
| $ 9.53 |
| $ 7.32 |
|
| Income from Investment Operations: | | | | | |
Net investment income2 | 0.13 |
| 0.14 |
| 0.16 |
| 0.09 |
| 0.04 |
|
| Net realized and unrealized gain (loss) on investments | 2.07 |
| 1.76 |
| (0.96) |
| 0.56 |
| 2.33 |
|
| Total from investment operations | 2.20 |
| 1.90 |
| (0.80) |
| 0.65 |
| 2.37 |
|
| Less Distributions: | | | | | |
| Distributions from net investment income | (0.00)3 |
| (0.16) |
| (0.17) |
| (0.19) |
| (0.16) |
|
| Net increase (decrease) in net asset value | 2.20 |
| 1.74 |
| (0.97) |
| 0.46 |
| 2.21 |
|
| Net Asset Value at end of period |
| $12.96 |
|
| $10.76 |
| $ 9.02 |
| $ 9.99 |
| $ 9.53 |
|
Total Return (%)4 | 20.45 |
| 21.01 |
| (7.91) |
| 6.83 |
| 32.30 5 |
|
| Ratios/Supplemental Data: | | | | | |
| Net Assets at end of period (in 000’s) |
| $19,134 |
|
| $18,263 |
|
| $15,407 |
|
| $13,241 |
|
| $3,962 |
|
| Ratios of expenses to average net assets (%) | 1.46 |
| 1.46 |
| 1.47 |
| 1.47 |
| 1.48 6 |
|
| Ratio of net investment income to average net assets (%) | 1.10 |
| 1.45 |
| 1.58 |
| 1.00 |
| 0.57 6 |
|
Portfolio turnover (%)7 | 39 |
| 42 |
| 38 |
| 79 |
| 87 5 |
|
|
| |
1 | Commenced investment operations May 1, 2009. |
2 | Based on average shares outstanding during the year. |
3 | Amounts represents less than $0.005 per share. |
4 | These returns are after all charges at the mutual fund level have been subtracted. These returns are higher than the returns at the separate account level because charges made at the separate account level have not been subtracted. Total returns are not annualized for periods less than one year. |
5 | Not annualized. |
6 | Annualized. |
7 | Portfolio turnover is calculated at the fund level and represents the entire fiscal year or period. |
See accompanying Notes to Financial Statements.
Ultra Series Fund | December 31, 2013
Financial Highlights for a Share of Beneficial Interest Outstanding
|
| | | | | | | | | | | | | | | |
| MADISON TARGET RETIREMENT 2020 FUND |
| | Year Ended December 31, |
| | 2013 | 2012 | 2011 |
| 2010 |
| 2009 |
|
| CLASS I | | | | | |
| Net Asset Value at beginning of period | $ 8.31 |
| $ 7.82 |
| $ 8.06 |
| $ 7.64 |
| $ 6.04 |
|
| Income from Investment Operations: | | | | | |
Net investment income1 | 0.21 |
| 0.24 |
| 0.22 |
| 0.20 |
| 0.15 |
|
| Net realized and unrealized gain (loss) on investments | 0.70 |
| 0.53 |
| (0.04) |
| 0.49 |
| 1.59 |
|
| Total from investment operations | 0.91 |
| 0.77 |
| 0.18 |
| 0.69 |
| 1.74 |
|
| Less Distributions: | | | | | |
| Distributions from net investment income | (0.22) |
| (0.25) |
| (0.23) |
| (0.27) |
| (0.14) |
|
| Distributions from capital gains | (0.24) |
| (0.03) |
| (0.19) |
| – |
| – |
|
| Total distributions | (0.46) |
| (0.28) |
| (0.42) |
| (0.27) |
| (0.14) |
|
| Net increase (decrease) in net asset value | 0.45 |
| 0.49 |
| (0.24) |
| 0.42 |
| 1.60 |
|
| Net Asset Value at end of period | $ 8.76 |
| $ 8.31 |
| $ 7.82 |
| $ 8.06 |
| $ 7.64 |
|
Total Return (%)2 | 10.94 |
| 9.98 |
| 2.11 |
| 9.01 |
| 28.93 |
|
| Ratios/Supplemental Data: | | | | | |
| Net Assets at end of period (in 000’s) |
| $70,472 |
|
| $56,607 |
|
| $39,580 |
|
| $27,648 |
|
| $19,300 |
|
| Ratios of expenses to average net assets | | | | | |
| Before reimbursement of expenses by Adviser (%) | 0.30 |
| 0.30 |
| 0.26 |
| 0.40 |
| 0.41 |
|
| After reimbursement of expenses by Adviser (%) | 0.30 |
| 0.30 |
| 0.24 3 |
| 0.20 3 |
| 0.34 3 |
|
| Ratio of net investment income to average net assets (%) | 2.37 |
| 2.96 |
| 2.70 |
| 2.61 |
| 2.24 |
|
Portfolio turnover (%)4 | 167 |
| 90 |
| 114 |
| 51 |
| 78 |
|
|
| |
1 | Based on average shares outstanding during the year. |
2 | These returns are after all charges at the mutual fund level have been subtracted. These returns are higher than the returns at the separate account level because charges made at the separate account level have not been subtracted. Total returns are not annualized for periods less than one year. |
3 | Amount includes fees waived by the adviser through a contractual management fee reduction from 0.40% to 0.20% effective October 1, 2009 to February 16, 2011. Effective February 17, 2011 to August 31, 2011, the fee was permanently reduced to 0.20%. Effective September 1, 2011, shareholders approved a new fee arrangement which includes an advisory fee of 0.25% and services agreement fee of 0.05%. |
4 | Portfolio turnover is calculated at the fund level and represents the entire fiscal year or period. |
See accompanying Notes to Financial Statements.
Ultra Series Fund | December 31, 2013
Financial Highlights for a Share of Beneficial Interest Outstanding
|
| | | | | | | | | | | | | | | |
| MADISON TARGET RETIREMENT 2030 FUND |
| | Year Ended December 31, |
| | 2013 | 2012 | 2011 | 2010 | 2009 |
| CLASS I | | | | | |
| Net Asset Value at beginning of period | $ 8.04 |
| $ 7.49 |
| $ 7.90 |
| $ 7.41 |
| $ 5.75 |
|
| Income from Investment Operations: | | | | | |
Net investment income1 | 0.19 |
| 0.23 |
| 0.19 |
| 0.18 |
| 0.12 |
|
| Net realized and unrealized gain (loss) on investments | 1.13 |
| 0.60 |
| (0.09) |
| 0.52 |
| 1.65 |
|
| Total from investment operations | 1.32 |
| 0.83 |
| 0.10 |
| 0.70 |
| 1.77 |
|
| Less Distributions: | | | | | |
| Distributions from net investment income | (0.18) |
| (0.22) |
| (0.20) |
| (0.21) |
| (0.11) |
|
| Distributions from capital gains | (0.26) |
| (0.06) |
| (0.31) |
| – |
| – |
|
| Total distributions | (0.44) |
| (0.28) |
| (0.51) |
| (0.21) |
| (0.11) |
|
| Net increase (decrease) in net asset value | 0.88 |
| 0.55 |
| (0.41) |
| 0.49 |
| 1.66 |
|
| Net Asset Value at end of period | $ 8.92 |
| $ 8.04 |
| $ 7.49 |
| $ 7.90 |
| $ 7.41 |
|
Total Return (%)2 | 16.56 |
| 11.05 |
| 1.16 |
| 9.56 |
| 30.94 |
|
| Ratios/Supplemental Data: | | | | | |
| Net Assets at end of period (in 000’s) |
| $93,187 |
|
| $68,009 |
|
| $45,404 |
|
| $31,279 |
|
| $19,330 |
|
| Ratios of expenses to average net assets | | | | | |
| Before reimbursement of expenses by Adviser (%) | 0.30 |
| 0.30 |
| 0.26 |
| 0.40 |
| 0.41 |
|
| After reimbursement of expenses by Adviser (%) | 0.30 |
| 0.30 |
| 0.24 3 |
| 0.20 3 |
| 0.34 3 |
|
| Ratio of net investment income to average net assets (%) | 2.16 |
| 2.84 |
| 2.43 |
| 2.42 |
| 1.87 |
|
Portfolio turnover (%)4 | 136 |
| 86 |
| 108 |
| 43 |
| 78 |
|
|
| |
1 | Based on average shares outstanding during the year. |
2 | These returns are after all charges at the mutual fund level have been subtracted. These returns are higher than the returns at the separate account level because charges made at the separate account level have not been subtracted. Total returns are not annualized for periods less than one year. |
3 | Amount includes fees waived by the adviser through a contractual management fee reduction from 0.40% to 0.20% effective October 1, 2009 to February 16, 2011. Effective February 17, 2011 to August 31, 2011, the fee was permanently reduced to 0.20%. Effective September 1, 2011, shareholders approved a new fee arrangement which includes an advisory fee of 0.25% and services agreement fee of 0.05%. |
4 | Portfolio turnover is calculated at the fund level and represents the entire fiscal year or period. |
See accompanying Notes to Financial Statements.
Ultra Series Fund | December 31, 2013
Financial Highlights for a Share of Beneficial Interest Outstanding
|
| | | | | | | | | | | | | | | |
| MADISON TARGET RETIREMENT 2040 FUND |
| | Year Ended December 31, |
| | 2013 | 2012 | 2011 | 2010 | 2009 |
| CLASS I | | | | | |
| Net Asset Value at beginning of period | $ 7.61 |
| $ 7.06 |
| $ 7.60 |
| $ 7.07 |
| $ 5.43 |
|
| Income from Investment Operations: | | | | | |
Net investment income1 | 0.17 |
| 0.20 |
| 0.16 |
| 0.15 |
| 0.08 |
|
| Net realized and unrealized gain (loss) on investments | 1.32 |
| 0.61 |
| (0.12) |
| 0.55 |
| 1.63 |
|
| Total from investment operations | 1.49 |
| 0.81 |
| 0.04 |
| 0.70 |
| 1.71 |
|
| Less Distributions: | | | | | |
| Distributions from net investment income | (0.16) |
| (0.19) |
| (0.17) |
| (0.17) |
| (0.07) |
|
| Distributions from capital gains | (0.26) |
| (0.07) |
| (0.41) |
| – |
| – |
|
| Total distributions | (0.42) |
| (0.26) |
| (0.58) |
| (0.17) |
| (0.07) |
|
| Net increase (decrease) in net asset value | 1.07 |
| 0.55 |
| (0.54) |
| 0.53 |
| 1.64 |
|
| Net Asset Value at end of period | $ 8.68 |
| $ 7.61 |
| $ 7.06 |
| $ 7.60 |
| $ 7.07 |
|
Total Return (%)2 | 19.63 |
| 11.42 |
| 0.47 |
| 9.97 |
| 31.64 |
|
| Ratios/Supplemental Data: | | | | | |
| Net Assets at end of period (in 000’s) |
| $68,917 |
|
| $49,269 |
|
| $35,182 |
|
| $26,147 |
|
| $16,656 |
|
| Ratios of expenses to average net assets | | | | | |
| Before reimbursement of expenses by Adviser (%) | 0.30 |
| 0.30 |
| 0.26 |
| 0.40 |
| 0.41 |
|
| After reimbursement of expenses by Adviser (%) | 0.30 |
| 0.30 |
| 0.24 3 |
| 0.20 |
| 0.34 3 |
|
| Ratio of net investment income to average net assets (%) | 2.01 |
| 2.65 |
| 2.11 |
| 2.14 |
| 1.22 |
|
Portfolio turnover (%)4 | 151 |
| 101 |
| 115 |
| 40 |
| 86 |
|
|
| |
1 | Based on average shares outstanding during the year. |
2 | These returns are after all charges at the mutual fund level have been subtracted. These returns are higher than the returns at the separate account level because charges made at the separate account level have not been subtracted. Total returns are not annualized for periods less than one year. |
3 | Amount includes fees waived by the adviser through a contractual management fee reduction from 0.40% to 0.20% effective October 1, 2009 to February 16, 2011. Effective February 17, 2011 to August 31, 2011, the fee was permanently reduced to 0.20%. Effective September 1, 2011, shareholders approved a new fee arrangement which includes an advisory fee of 0.25% and services agreement fee of 0.05%. |
4 | Portfolio turnover is calculated at the fund level and represents the entire fiscal year or period. |
See accompanying Notes to Financial Statements.
Ultra Series Fund | December 31, 2013
Financial Highlights for a Share of Beneficial Interest Outstanding
|
| | | | | | | | | |
| MADISON TARGET RETIREMENT 2050 FUND |
| | Year Ended December 31, | Inception to
12/31/111 |
| | 2013 | 2012 |
| CLASS I | | | |
| Net Asset Value at beginning of period |
| $10.69 |
| $ 9.75 |
|
| $10.00 |
|
| Income from Investment Operations: | | | |
Net investment income2 | 0.24 |
| 0.30 |
| 0.26 |
|
| Net realized and unrealized gain (loss) on investments | 2.19 |
| 0.89 |
| (0.36) |
|
| Total from investment operations | 2.43 |
| 1.19 |
| (0.10) |
|
| Less Distributions: | | | |
| Distributions from net investment income | (0.18) |
| (0.21) |
| (0.14) |
|
| Distributions from capital gains | (0.16) |
| (0.04) |
| – |
|
| Distributions from return of capital | – |
| – |
| (0.01) |
|
| Total distributions | (0.34) |
| (0.25) |
| (0.15) |
|
| Net increase (decrease) in net asset value | 2.09 |
| 0.94 |
| (0.25) |
|
| Net Asset Value at end of period |
| $12.78 |
|
| $10.69 |
| $ 9.75 |
|
Total Return (%)3 | 22.78 |
| 12.12 |
| (1.03) 4 |
|
| Ratios/Supplemental Data: | | | |
| Net Assets at end of period (in 000’s) |
| $18,123 |
|
| $7,160 |
|
| $2,236 |
|
| Ratios of expenses to average net assets | | | |
| Before reimbursement of expenses by Adviser (%) | 0.30 |
| 0.30 |
| 0.26 5 |
|
| After reimbursement of expenses by Adviser (%) | 0.30 |
| 0.30 |
| 0.26 5,6 |
|
| Ratio of net investment income to average net assets (%) | 1.98 |
| 2.90 |
| 2.61 5 |
|
Portfolio turnover (%)7 | 215 |
| 86 |
| 75 4 |
|
|
| |
1 | Commenced investment operations on January 3, 2011. |
2 | Based on average shares outstanding during the year. |
3 | These returns are after all charges at the mutual fund level have been subtracted. These returns are higher than the returns at the separate account level because charges made at the separate account level have not been subtracted. Total returns are not annualized for periods less than one year. |
4 | Not annualized. |
5 | Annualized. |
6 | Amount includes fees waived by the adviser through a contractual management fee reduction from 0.40% to 0.20% effective October 1, 2009 to February 16, 2011. Effective February 17, 2011 to August 31, 2011, the fee was permanently reduced to 0.20%. Effective September 1, 2011, shareholders approved a new fee arrangement which includes an advisory fee of 0.25% and services agreement fee of 0.05%. |
7 | Portfolio turnover is calculated at the fund level and represents the entire fiscal year or period. |
See accompanying Notes to Financial Statements.
Ultra Series Fund | December 31, 2013
Notes to Financial Statements
1. ORGANIZATION
The Ultra Series Fund (the “Trust’’), a Massachusetts business trust, is registered under the Investment Company Act of 1940 (the “1940 Act’’), as amended, as a diversified, open-end management investment company. The Trust is a series fund with, at the end of the period covered by this report, 16 investment portfolios (individually, a “Fund,” and collectively, the “Funds’’), each with different investment objectives and policies. The Funds currently available at the end of the period were the Money Market Fund, Core Bond Fund (formerly Bond Fund), High Income Fund, Diversified Income Fund, Large Cap Value Fund, Large Cap Growth Fund, Mid Cap Fund, Small Cap Fund and International Stock Fund (collectively, the “Core Funds’’), the Conservative Allocation Fund, Moderate Allocation Fund and Aggressive Allocation Fund (collectively, the “Target Allocation Funds’’), and the Madison Target Retirement 2020 Fund, Madison Target Retirement 2030 Fund, Madison Target Retirement 2040 Fund, and Madison Target Retirement 2050 Fund, (collectively, the “Target Date Funds”).
The Declaration of Trust permits the Board of Trustees to issue an unlimited number of full and fractional shares of the Trust without par value. All Funds, except for the Target Date Funds, offer Class I and II shares. The Target Date Funds only offer a single class of shares, Class I shares. Each class of shares represents an interest in the assets of the respective Fund and has identical voting, dividend, liquidation and other rights, except that each class of shares bears its own distribution fees, if any, and its proportional share of Fund level expenses, and has exclusive voting rights on matters pertaining to Rule 12b-1 under the 1940 Act as it relates to that class and other class specific matters. Shares are offered to separate accounts (the “Accounts’’) of CMFG Life Insurance Company and to qualified pension and retirement plans of CMFG Life Insurance Company or its affiliates (“CUNA Mutual Group’’). The Trust may, in the future, offer other share classes to separate accounts of insurance companies and to qualified pension and retirement plans that are not affiliated with CUNA Mutual Group. The Trust does not offer shares directly to the general public.
The Trust has entered into a Management Agreement with Madison Asset Management, LLC. (the “Investment Adviser” or “Madison”). The Investment Adviser, in turn, has entered into subadvisory agreements with certain subadvisers (“Subadvisers”) for the management of the investments of the High Income, Small Cap and International Stock Funds.
Ultra Series Fund | December 31, 2013
Notes to Financial Statements
2. SIGNIFICANT ACCOUNTING POLICIES
The following is a summary of significant accounting policies consistently followed by each Fund in the preparation of its financial statements.
Portfolio Valuation: Securities and other investments are valued as follows: Equity securities, including American Depositary Receipts (“ADRs”), Global Depositary Receipts (“GDRs”) and exchange-traded funds (“ETFs”) listed on any U.S. or foreign stock exchange or quoted on the National Association of Securities Dealers Automated Quotation System (“NASDAQ’’) are valued at the last quoted sale price or official closing price on that exchange or NASDAQ on the valuation day (provided that, for securities traded on NASDAQ, the Funds utilize the NASDAQ Official Closing Price). If no sale occurs, equities traded on a U.S. exchange, foreign exchange or on NASDAQ are valued at the bid price. Debt securities purchased with a remaining maturity of 61 days or more are valued on the basis of last available bid prices or current market quotations provided by dealers or pricing services approved by the Trust. In determining the value of a particular investment, pricing services may use certain information with respect to transactions in such investments, quotations from dealers, pricing matrixes, market transactions in comparable investments, various relationships observed in the market between investments and calculated yield measures based on valuation technology commonly employed in the market for such for such investments. Municipal debt securities are traded via a network among dealers and brokers that connect buyers and sellers. Liquidity in the tax-exempt market has been reduced as a result of overall economic conditions and credit tightening. There may be little trading in the secondary market for the particular bonds and other debt securities, making them more difficult to value or sell. Asset-backed and mortgage-backed securities are valued by independent pricing services using models that consider estimated cash flows of each tranche of the security, establish a benchmark yield and develop an estimated tranche specific spread to the benchmark yield based on the unique attributes of the tranche.
Investments in shares of open-end mutual funds, including money market funds, are valued at their daily net asset value (“NAV”) which is calculated as of the close of regular trading on the New York Stock Exchange (usually 4:00 p.m. Eastern Standard Time) on each day on which the New York Stock Exchange is open for business. NAV per share is determined by dividing each Fund’s total net assets by the number of shares of such Fund outstanding at the time of calculation. Because the assets of each Target Allocation and each Target Date Fund consist primarily of
Ultra Series Fund | December 31, 2013
Notes to Financial Statements
shares of underlying funds, the NAV of each Fund is determined based on the NAV’s of the underlying funds. Total net assets are determined by adding the total current value of portfolio securities, cash, receivables, and other assets and subtracting liabilities. Short-term instruments having maturities of 60 days or less and all securities in the Money Market Fund are valued on an amortized cost basis, which approximates market value.
Over-the-counter securities not listed or traded on NASDAQ are valued at the last sale price on the valuation day. If no sale occurs on the valuation day, an over-the-counter security is valued at the last bid price. Exchange traded options are valued at the mean of the best bid and ask prices across all option exchanges. Financial futures contracts generally are valued at the settlement price established by the exchange(s) on which the contracts are primarily traded. The Trust’s Pricing Committee (the “Committee”) shall estimate the fair value of futures positions affected by the daily limit by using its valuation procedures for determining fair value, when necessary. Spot and forward foreign currency exchange contracts are valued based on quotations supplied by dealers in such contracts. Overnight repurchase agreements are valued at cost, and term repurchase agreements (i.e., those whose maturity exceeds seven days), swaps, caps, collars and floors, if any, are valued at the average of the closing bids obtained daily from at least one dealer.
Through the end of this reporting period, the value of all assets and liabilities expressed in foreign currencies was converted into U.S. dollar values using the then-current exchange rate at the close of regular trading on the New York Stock Exchange (usually 4:00 p.m. Eastern Standard Time).
All other securities for which either quotations are not readily available, no other sales have occurred, or in the Investment Adviser’s opinion, do not reflect the current market value, are appraised at their fair values as determined in good faith by the Trust’s Pricing Committee (the “Committee’’) and under the general supervision of the Board of Trustees. When fair value pricing of securities is employed, the prices of securities used by the Funds to calculate NAV may differ from market quotations or official closing prices. Because the Target Allocation and Target Date Funds primarily invest in underlying funds, government securities and short-term paper, it is not anticipated that the Investment Adviser will need to “fair value” any of the investments of these Funds. However, an underlying fund may need to “fair value” one or more of its investments, which may, in turn, require a Target Allocation or
Ultra Series Fund | December 31, 2013
Notes to Financial Statements
Target Date Fund to do the same because of delays in obtaining the underlying fund’s NAV.
A Fund’s investments (or underlying fund) will be valued at fair value if, in the judgment of the Committee, an event impacting the value of an investment occurred between the closing time of a security’s primary market or exchange (for example, a foreign exchange or market) and the time the Fund’s share price is calculated as of the close of regular trading on the New York Stock Exchange (usually 4:00 p.m. Eastern Standard Time). Significant events may include, but are not limited to, the following: (1) significant fluctuations in domestic markets, foreign markets or foreign currencies; (2) occurrences not directly tied to the securities markets such as natural disasters, armed conflicts or significant government actions; and (3) major announcements affecting a single issuer or an entire market or market sector. In responding to a significant event, the Committee would determine the fair value of affected securities considering factors including, but not limited to: fundamental analytical data relating to the investment; the nature and duration of any restrictions on the disposition of the investment; and the forces influencing the market(s) in which the investment is purchased or sold. The Committee may engage an independent fair valuation service to adjust the valuations of foreign equity securities based on specific market-movement parameters established by the Committee and approved by the Trust.
Security Transactions and Investment Income: Security transactions are accounted for on a trade date basis. Net realized gains or losses on sales are determined by the identified cost method. Interest income is recorded on an accrual basis. Dividend income is recorded on ex-dividend date, except that certain dividends from foreign securities may be recorded after the ex-dividend date based on when the Fund is informed of the dividend. Amortization and accretion are recorded on the effective yield method.
Expenses: Expenses that are directly related to one Fund are charged directly to that Fund. Other operating expenses are prorated to the Funds on the basis of relative net assets. Class-specific expenses are borne by that class.
Classes: Income and realized and unrealized gains/losses are allocated to the respective classes on the basis of relative net assets. Repurchase Agreements: Each Fund may engage in repurchase agreements. In a repurchase agreement, a security is purchased for a relatively short period (usually not more than 7 days) subject to the
Ultra Series Fund | December 31, 2013
Notes to Financial Statements
obligation to sell it back to the issuer at a fixed time and price plus accrued interest. The Funds will enter into repurchase agreements only with member banks of the Federal Reserve System and with “primary dealers’’ in U.S. Government securities. As of December 31, 2013, none of the Funds held open repurchase agreements.
The Trust has established a procedure providing that the securities serving as collateral for each repurchase agreement must be delivered to the Trust’s custodian either physically or in book-entry form and that the collateral must be marked to market daily to ensure that the repurchase agreement is fully collateralized at all times. In the event of bankruptcy or other default by a seller of a repurchase agreement, a Fund could experience one of the following: delays in liquidating the underlying securities during the period in which the Fund seeks to enforce its rights thereto, possible subnormal levels of income, declines in value of the underlying securities, or lack of access to income during this period and the expense of enforcing its rights.
Foreign Currency Transactions: The Trust’s books and records are maintained in U.S. dollars. Foreign currency denominated transactions (i.e., market value of investment securities, assets and liabilities, purchases and sales of investment securities, and income and expenses) are translated into U.S. dollars at the current rate of exchange. The Funds enter into contracts on the trade date to settle any securities transactions denominated in foreign currencies on behalf of the Funds at the spot rate at settlement.
Each Fund, except the Money Market Fund, which can only invest in U.S. dollar-denominated foreign money market securities, reports certain foreign currency-related transactions as components of realized gains or losses for financial reporting purposes, whereas such components are treated as ordinary income for federal income tax purposes. Only the International Stock Fund had net realized gains from foreign currency transactions, and that amount is included in the Statements of Operations under the heading “Net realized gain (loss) on investments” for that Fund.
The Funds do not isolate the portion of gains and losses on investments in securities that is due to changes in the foreign exchange rates from that which is due to changes in market prices of securities. Such amounts are categorized as gain or loss on investments for financial reporting purposes.
Ultra Series Fund | December 31, 2013
Notes to Financial Statements
Forward Foreign Currency Exchange Contracts: Each Fund, except the Money Market Fund, may purchase and sell forward foreign currency exchange contracts for defensive or hedging purposes. When entering into forward foreign currency exchange contracts, the Funds agree to receive or deliver a fixed quantity of foreign currency for an agreed-upon price on an agreed future date. These contracts are valued daily. The Funds’ net assets reflect unrealized gains or losses on the contracts as measured by the difference between the forward foreign currency exchange rates at the dates of entry into the contracts and the forward rates at the reporting date. The Funds realize a gain or a loss at the time the forward foreign currency exchange contracts are settled or closed out with an offsetting contract. Realized and unrealized gains and losses are included in the Statements of Operations. As of December 31, 2013, none of the Funds had open forward foreign currency exchange contracts.
If a Fund enters into a forward foreign currency exchange contract to buy foreign currency for any purpose, the Fund will be required to place cash or other liquid assets in a segregated account with the Fund’s custodian in an amount equal to the value of the Fund’s total assets committed to the consummation of the forward contract. If the value of the securities in the segregated account declines, additional cash or securities will be placed in the segregated account so that the value of the account will equal the amount of the Fund’s commitment with respect to the contract.
Cash Concentration: At times, the Funds maintain cash balances at financial institutions in excess of federally insured limits. The Funds monitor this credit risk and have not experienced any losses related to this risk.
Illiquid Securities: Each Fund currently limits investments in illiquid securities to 15% of net assets at the time of purchase, except for Money Market which limits the investment in illiquid securities to 5% of net assets. An illiquid security is generally defined as any investment that may be difficult to sell within seven days for the price at which the Fund values it. At December 31, 2013, investments in securities of the Core Bond, High Income and Diversified Income Funds include issues that are illiquid. As of that date, the aggregate values of illiquid securities held by Core Bond, High Income and Diversified Income Funds were $10,901,951, $631,500, and $6,333,682, respectively, which represent 3.4%, 1.2% and 1.5% of net assets, respectively. Pursuant to guidelines adopted by the Board of Trustees, certain
Ultra Series Fund | December 31, 2013
Notes to Financial Statements
unregistered securities are determined to be liquid and are not included within the percent limitations specified above. Information concerning the illiquid securities held at December 31, 2013, which includes cost and acquisition date, is as follows:
|
| | |
| Security | Acquisition Date | Acquisition Cost |
| Core Bond Fund | | |
| American Association of Retired Persons | 5/16/02 | $ 2,616,788 |
| ERAC USA Finance LLC | 12/16/04 | 2,592,874 |
| Forest Laboratories Inc | 12/5/13 | 250,000 |
| Indianapolis Power & Light Co. | 10/2/06 | 3,425,267 |
| Liberty Mutual Group Inc. | 6/13/13 | 993,928 |
| | | $ 9,878,857 |
| High Income Fund | | |
| Boise Cascade Co. | 10/17/12 | $ 600,000 |
Ultra Series Fund | December 31, 2013
Notes to Financial Statements
|
| | | | |
| Security | Acquisition Date | Acquisition Cost |
| Diversified Income Fund | | |
| American Association of Retired Persons | 5/16/02 | $ | 2,093,431 |
|
| ERAC USA Finance LLC | 12/16/04 | 1,998,674 |
|
| Indianapolis Power & Light Co. | 10/2/06 | 1,546,093 |
|
| | | $ | 5,638,198 |
|
Delayed Delivery Securities: Each Fund may purchase securities on a when-issued or delayed delivery basis. “When-issued’’ refers to securities whose terms are available and for which a market exists, but that have not been issued. For when-issued or delayed delivery transactions, no payment is made until delivery date, which is typically longer than the normal course of settlement, and often a month or more after the purchase. When a Fund enters into an agreement to purchase securities on a when-issued or delayed delivery basis, the Fund segregates cash or other liquid securities, of any type or maturity, equal in value to the Fund’s commitment. Losses may arise due to changes in the market value of the underlying securities, if the counterparty does not perform under the contract, or if the issuer does not issue the securities due to political, economic or other factors. As of December 31, 2013, none of the Funds had entered into such transactions.
Use of Estimates: The preparation of the financial statements in conformity with accounting principles generally accepted in the United States of America requires management to make estimates and assumptions. Such estimates affect the reported amounts of assets and liabilities and reported amounts of increases and decreases in net assets from operations during the reporting period. Actual results could differ from those estimates.
Indemnifications: Under the Funds’ organizational documents, the Funds’ officers and Trustees are indemnified against certain liabilities arising out of the performance of their duties to the Funds. In the normal course of business, the Funds enter into contracts that contain a variety of representations and provide general indemnifications. The Funds’ maximum liability exposure under these arrangements is unknown, as future claims that have not yet occurred may be made against the Funds. However, based on experience, management expects the risk of loss to be remote.
Fair Value Measurements: Each Fund has adopted the FASB guidance on fair value measurements. Fair value is defined as the price that each Fund would receive upon
Ultra Series Fund | December 31, 2013
Notes to Financial Statements
selling an investment in a timely transaction to an independent buyer in the principal or most advantageous market of the investment. A three-tier hierarchy is used to maximize the use of observable market data “inputs” and minimize the use of unobservable “inputs” and to establish classification of fair value measurements for disclosure purposes. Inputs refer broadly to the assumptions that market participants would use in pricing the asset or liability, including assumptions about risk (for example, the risk inherent in a particular valuation technique used to measure fair value including such a pricing model and/or the risk inherent in the inputs used in the valuation technique). Inputs may be observable or unobservable.
Observable inputs are inputs that reflect the assumptions market participants would use in pricing the asset or liability developed based on market data obtained from sources independent of the reporting entity. Unobservable inputs are inputs that reflect the reporting entity’s own assumptions about the assumptions market participants would use in pricing the asset or liability developed based on the best information available in the circumstances. The three-tier hierarchy of inputs is summarized in the three broad Levels listed below:
• Level 1 – unadjusted quoted prices in active markets for identical investments
• Level 2 – other significant observable inputs (including quoted prices for similar investments, interest rate volatilities, prepayment speeds, credit risk, benchmark yields, transactions, bids, offers, new issues, spreads and other relationships observed in the markets among comparable securities, underlying equity of the issuer; and proprietary pricing models such as yield measures calculated using factors such as cash flows, financial or collateral performance and other reference data, etc.)
• Level 3 – significant unobservable inputs (including the Fund’s own assumptions in determining the fair value of investments)
The valuation techniques used by the Funds to measure fair value for the year ended December 31, 2013 maximized the use of observable inputs and minimized the use of unobservable inputs. The Funds utilized the following fair value techniques: multi-dimensional relational pricing model and option adjusted spread pricing; the Funds estimated the price that would have prevailed in a liquid market for an international equity security given information available at the time of evaluation. Through the year ended December 31, 2013, none of the Funds held securities
Ultra Series Fund | December 31, 2013
Notes to Financial Statements
deemed as a Level 3 and there were no transfers between classification levels during the year.
The following is a summary of the inputs used as of December 31, 2013 in valuing the Funds’ investments carried at fair value (please see the Portfolio of Investments for each Fund for a listing of all securities within each category):
|
| | | | | | | | | | | | |
| Fund | Quoted Prices in
Active Markets for Identical Investments (Level 1) | Significant Other
Observable
Inputs
(Level 2) | Significant Unobservable
Inputs
(Level 3) | Value at
12/31/13 |
| Conservative Allocation | $ | 222,091,328 |
| $ | — |
| $ | — |
| $ | 222,091,328 |
|
| Moderate Allocation | 408,958,391 |
| — |
| — |
| 408,958,391 |
|
| Aggressive Allocation | 151,664,149 |
| — |
| — |
| 151,664,149 |
|
Money Market1 | 1,678,512 |
| 36,826,409 |
| — |
| 38,504,921 |
|
| Core Bond | | | | |
| Asset Backed | — |
| 1,030,127 |
| — |
| 1,030,127 |
|
| Corporate Notes and Bonds | — |
| 91,684,015 |
| — |
| 91,684,015 |
|
| Long Term Municipal Bonds | — |
| 2,092,730 |
| — |
| 2,092,730 |
|
| Mortgage Backed | — |
| 58,596,092 |
| — |
| 58,596,092 |
|
| U.S. Government and Agency Obligations | — |
| 157,192,991 |
| — |
| 157,192,991 |
|
| Short-Term Investments | 4,378,761 |
| — |
| — |
| 4,378,761 |
|
| | 4,378,761 |
| 310,595,955 |
| — |
| 314,974,716 |
|
| High Income | | | — |
| |
| Corporate Notes and Bonds | — |
| 48,027,585 |
| — |
| 48,027,585 |
|
| Short-Term Investments | 1,737,761 |
| — |
| — |
| 1,737,761 |
|
| | 1,737,761 |
| 48,027,585 |
| — |
| 49,765,346 |
|
| Diversified Income | | | | |
| Common Stocks | 242,801,900 |
| — |
| — |
| 242,801,900 |
|
| Asset Backed | — |
| 606,946 |
| — |
| 606,946 |
|
| Corporate Notes and Bonds | — |
| 60,739,308 |
| — |
| 60,739,308 |
|
| Long Term Municipal Bonds | — |
| 983,241 |
| — |
| 983,241 |
|
| Mortgage Backed | — |
| 29,472,853 |
| — |
| 29,472,853 |
|
| U.S. Government and Agency Obligations | — |
| 69,495,928 |
| — |
| 69,495,928 |
|
| Short-Term Investments | 16,613,277 |
| — |
| — |
| 16,613,277 |
|
| | 259,415,177 |
| 161,298,276 |
| — |
| 420,713,453 |
|
Ultra Series Fund | December 31, 2013
Notes to Financial Statements
|
| | | | | | | | |
| Fund | Quoted Prices in
Active Markets for Identical Investments (Level 1) | Significant Other
Observable
Inputs
(Level 2) | Significant Unobservable
Inputs
(Level 3) | Value at
12/31/13 |
| Large Cap Value | | | | |
| Common Stocks | 563,285,950 |
| — |
| — |
| 563,285,950 |
|
| Short-Term Investments | 20,079,258 |
| — |
| — |
| 20,079,258 |
|
| | 583,365,208 |
| — |
| — |
| 583,365,208 |
|
| Large Cap Growth | | | | |
| Common Stocks | 373,397,350 |
| — |
| — |
| 373,397,350 |
|
| Short-Term Investments | 20,536,155 |
| — |
| — |
| 20,536,155 |
|
| | 393,933,505 |
| — |
| — |
| 393,933,505 |
|
| Mid Cap | | | | |
| Common Stocks | 376,363,787 |
| — |
| — |
| 376,363,787 |
|
| Short-Term Investments | 21,317,843 |
| — |
| — |
| 21,317,843 |
|
| | 397,681,630 |
| — |
| — |
| 397,681,630 |
|
| Small Cap | | | | |
| Common Stocks | 7,645,323 |
| — |
| — |
| 7,645,323 |
|
| Short-Term Investments | 263,581 |
| — |
| — |
| 263,581 |
|
| | 7,908,904 |
| | | 7,908,904 |
|
| International Stock | | | | |
| Common Stocks | | | | |
| Australia | — |
| 1,849,462 |
| — |
| 1,849,462 |
|
| Austria | — |
| 893,494 |
| — |
| 893,494 |
|
| Belgium | — |
| 2,407,921 |
| — |
| 2,407,921 |
|
| Bermuda | — |
| 846,434 |
| — |
| 846,434 |
|
| Brazil | — |
| 999,197 |
| — |
| 999,197 |
|
| Canada | — |
| 2,598,665 |
| — |
| 2,598,665 |
|
| Denmark | — |
| 955,862 |
| — |
| 955,862 |
|
| Finland | — |
| 1,774,985 |
| — |
| 1,774,985 |
|
| France | — |
| 8,589,735 |
| — |
| 8,589,735 |
|
| Germany | — |
| 6,258,407 |
| — |
| 6,258,407 |
|
| Greece | — |
| 623,862 |
| — |
| 623,862 |
|
| Ireland | 872,898 |
| – |
| — |
| 872,898 |
|
| Italy | — |
| 2,594,490 |
| — |
| 2,594,490 |
|
| Japan | — |
| 18,317,950 |
| — |
| 18,317,950 |
|
| Luxembourg | — |
| 1,359,259 |
| — |
| 1,359,259 |
|
| Netherlands | — |
| 1,622,545 |
| — |
| 1,622,545 |
|
| Norway | — |
| 659,463 |
| — |
| 659,463 |
|
| Philippines | — |
| 1,673,183 |
| — |
| 1,673,183 |
|
| South Korea | — |
| 1,082,674 |
| — |
| 1,082,674 |
|
| Spain | — |
| 4,134,516 |
| — |
| 4,134,516 |
|
| Sweden | — |
| 2,741,870 |
| — |
| 2,741,870 |
|
| Switzerland | — |
| 9,813,084 |
| — |
| 9,813,084 |
|
| Thailand | — |
| 534,317 |
| — |
| 534,317 |
|
| Turkey | — |
| 397,753 |
| — |
| 397,753 |
|
Ultra Series Fund | December 31, 2013
Notes to Financial Statements
|
| | | | | | | | |
| United Kingdom | — |
| 19,259,673 |
| — |
| 19,259,673 |
|
| Short-Term Investments | 2,012,515 |
| — |
| — |
| 2,012,515 |
|
| | 2,885,413 |
| 91,988,801 |
| — |
| 94,874,214 |
|
|
| | | | | | | | | | | | |
| Fund | Quoted Prices in
Active Markets for Identical Investments (Level 1) | Significant Other
Observable
Inputs
(Level 2) | Significant Unobservable
Inputs
(Level 3) | Value at
12/31/13 |
| Madison Target Retirement 2020 | $ | 70,372,734 |
| $ | — |
| $ | — |
| $ | 70,372,734 |
|
| Madison Target Retirement 2030 | 92,919,947 |
| — |
| — |
| 92,919,947 |
|
| Madison Target Retirement 2040 | 68,786,798 |
| — |
| — |
| 68,786,798 |
|
| Madison Target Retirement 2050 | 18,393,830 |
| — |
| — |
| 18,393,830 |
|
3. MANAGEMENT, SERVICES AND DISTRIBUTION AGREEMENTS
Management Agreement: For services under the Management Agreement, the Investment Adviser is entitled to receive a management fee, which is calculated daily and paid monthly, at an annual rate based upon the following percentages of average daily net assets:
|
| | | | |
| Fund | Management Fee | | Fund | Management Fee |
| Conservative Allocation | 0.30% | | Large Cap Growth | 0.80% |
| Moderate Allocation | 0.30% | | Mid Cap | 0.90% |
| Aggressive Allocation | 0.30% | | Small Cap | 1.10% |
| Money Market | 0.45% | | International Stock* | 1.15% |
| Core Bond | 0.55% | | Madison Target Retirement 2020 | 0.25% |
| High Income | 0.75% | | Madison Target Retirement 2030 | 0.25% |
| Diversified Income | 0.70% | | Madison Target Retirement 2040 | 0.25% |
| Large Cap Value | 0.60% | | Madison Target Retirement 2050 | 0.25% |
| *Effective December 31, 2013, the management fee for the International Stock Fund was reduced from 1.20% to 1.15%. |
For all but the Target Date Funds, the Management Agreement requires the Investment Adviser to provide or arrange to provide overall management of the Funds, including but not limited to, investment advisory services, custody, transfer
Ultra Series Fund | December 31, 2013
Notes to Financial Statements
agency, dividend disbursing, legal, accounting and administrative services. Neither Management Agreement includes Trustee compensation or the fees paid to the Trust’s independent Registered Public Accountant. For the Target Date Funds, the Management Agreement requires the Investment Adviser to provide investment management services to the Funds. Other services performed by the Investment Adviser for these Funds are covered under a separate Services Agreement (discussed below).
The Investment Adviser is solely responsible for the payment of all fees to the Subadvisers. The Subadvisers for the Funds are Shenkman Capital Management, Inc. for the High Income Fund, Wellington Management Company, LLP for the Small Cap Fund and effective December 31, 2013, NorthRoad Capital Management LLC, an affiliate of Madison, replaced Lazard Asset Management, LLC as the subadviser for the International Stock Fund. The Investment Adviser manages the Money Market Fund, Core Bond Fund, Diversified Income Fund, Large Cap Growth Fund, Large Cap Value Fund, Mid Cap Fund, Target Allocation Funds and the Target Date Funds.
The Investment Adviser may from time to time voluntarily agree to waive a portion of its fees or expenses related to the Funds. In that regard, the Investment Adviser waived a portion of management fees on the Money Market Class I Shares and Class II Shares. The amount of the daily waiver is equal to the amount required to maintain a minimum daily distribution rate of zero. For the year ended December 31, 2013, the waivers totaled $151,868 for Class I Shares and $5,527 for Class II Shares and are reflected as fees waived by the Investment Adviser in the accompanying Statements of Operations. The Investment Adviser does not have the right to recoup these waived fees.
Services Agreement: Effective September 1, 2011, the Investment Adviser entered into a services agreement (“Services Agreement”) for the Target Date Funds. Under the Services Agreement, Madison provides either directly or through outsourced arrangements all operational and support services of the Target Date Funds not provided under the Management Agreement discussed above. Under this Services Agreement, Madison receives a fee of 0.05% (annualized) of the average daily net assets of each Target Date Fund. In exchange for the aforementioned fee, Madison is responsible for paying all of the Funds’ fees and expenses, other than (i) the
Ultra Series Fund | December 31, 2013
Notes to Financial Statements
management fee (described above), (ii) fees related to the Funds’ portfolio holdings (such as brokerage commissions, interest on loans, etc.), (iii) acquired Fund fees, and (iv) extraordinary or non-recurring fees (such as fees and costs relating to any temporary line of credit the Funds may maintain for emergency or extraordinary purposes). The direct expenses of the Funds’ independent trustees and independent auditors are paid out of this fee by the Target Date Funds. Pursuant to the Services Agreement, Madison has also agreed, until April 30, 2014, to waive and/or reimburse investment advisory fees and/or its services fee to the extent necessary to limit each Target Date Fund’s total operating expenses and underlying fees and expenses to 0.65% of average daily net assets. In applying this waiver, Madison must utilize good faith estimates of the fees and expenses of the underlying funds. For the year ended December 31, 2013, no fees were waived. The Investment Adviser does not have the right to recoup these waived fees, if any.
Distribution Agreement: MFD Distributor, LLC (“MFD”) serves as distributor of the Funds. The Trust adopted a distribution and service plan with respect to the Trust’s Class II shares pursuant to Rule 12b-1 under the 1940 Act. Under the plan, the Trust will pay a service fee with regard to Class II shares at an annual rate of 0.25% of each Fund’s daily net assets. MFD arranges to provide compensation to others that provide distribution and shareholder servicing services to the Funds and their shareholders. Fees incurred by the Funds under the plan are detailed in the Statements of Operations.
MFD may from time to time voluntarily agree to waive a portion of its fees or expenses related to the Funds. In this regard, the distributor waived all of the 12b-1 fees on the Money Market Class II shares for the purpose of maintaining a one-day yield of zero. For the year ended December 31, 2013, the waivers totaled $3,975 and are reflected as fees waived in the Statements of Operations. Neither MFD nor the Investment Adviser has the right to recoup these waived fees.
MFD changed its name from Mosaic Funds Distributor, LLC on February 1, 2013.
Other Expenses: Except as provided below, in addition to the management fee, the Trust is responsible for fees of the independent trustees, brokerage commissions and other expenses incurred in connection with the acquisition or disposition of investments, costs of borrowing money, expenses for independent audits, any potential taxes owed and extraordinary expenses as approved by a majority of independent trustees. Effective September 1, 2011, the fees for the independent
Ultra Series Fund | December 31, 2013
Notes to Financial Statements
trustees and independent audits are paid out of the Services Agreement fee (noted above) for the Target Date Funds.
Certain officers and trustees of the Trust are also officers of the Investment Adviser. The Funds do not compensate their officers or affiliated trustees. Unaffiliated trustees receive from the Trust an attendance fee for each Committee meeting attended. The nominating and Governance Committee of the Board may change these fees at any time.
4. DIVIDENDS FROM NET INCOME AND DISTRIBUTIONS OF CAPITAL GAINS
The Money Market Fund declares dividends from net investment income and net realized gains from investment transactions, if any, daily, and net realized gains from investment transactions, if any, annually, which are reinvested in additional full and fractional shares of the Fund. The Funds declare dividends from net investment income and net realized gains from investment transactions, if any, annually, which are reinvested in additional full and fractional shares of the respective Funds.
Income and capital gain distributions, if any, are determined in accordance with federal income tax regulations, which may differ from accounting principles generally accepted in the United States of America. Taxable distributions from income and realized capital gains of the Funds may differ from book amounts earned during the period due to differences in the timing of capital gains recognition, and due to the reclassification of certain gains or losses from capital to income.
5. SECURITIES TRANSACTIONS
For the year ended December 31, 2013, aggregate cost of purchases and proceeds from sales of securities, other than short-term investments, were as follows:
Ultra Series Fund | December 31, 2013
Notes to Financial Statements
|
| | | | | | | | | | | | |
| | U.S. Government Securities | Other Investment Securities |
| Fund | Purchases | Sales | Purchases | Sales |
| Conservative Allocation | $ | — |
| $ | — |
| $ | 162,504,606 |
| $ | 184,865,100 |
|
| Moderate Allocation | — |
| — |
| 262,862,743 |
| 288,602,543 |
|
| Aggressive Allocation | — |
| — |
| 104,902,005 |
| 122,173,836 |
|
| Core Bond | 26,714,786 |
| 60,606,484 |
| 22,798,516 |
| 31,505,118 |
|
| High Income | — |
| — |
| 18,308,179 |
| 34,350,908 |
|
| Diversified Income | 22,138,926 |
| 17,064,716 |
| 44,988,591 |
| 74,959,624 |
|
| Large Cap Value | — |
| — |
| 167,098,795 |
| 219,364,344 |
|
| Large Cap Growth | — |
| — |
| 171,637,683 |
| 224,878,409 |
|
| Mid Cap | — |
| — |
| 99,635,319 |
| 168,896,790 |
|
| Small Cap | — |
| — |
| 2,358,685 |
| 11,813,239 |
|
| International Stock | — |
| — |
| 35,774,965 |
| 52,889,071 |
|
| Madison Target Retirement 2020 | — |
| — |
| 116,401,852 |
| 106,636,649 |
|
| Madison Target Retirement 2030 | — |
| — |
| 124,839,715 |
| 110,327,788 |
|
| Madison Target Retirement 2040 | — |
| — |
| 98,876,690 |
| 88,705,873 |
|
| Madison Target Retirement 2050 | — |
| — |
| 34,831,826 |
| 26,219,844 |
|
6. FOREIGN SECURITIES
Each Fund may invest in foreign securities; however, the Money Market Fund is limited to U.S. dollar-denominated foreign money market securities. Foreign securities include American Depositary Receipts (“ADRs’’), European Depositary Receipts (“EDRs’’), Global Depositary Receipts (“GDRs’’), Swedish Depositary Receipts (“SDRs’’) and foreign money market securities. U.S. dollar-denominated securities that are part of the Merrill Lynch U.S.Domestic Master Index are not considered a foreign security.
Certain Funds have reclaim receivable balances, in which the Funds are due a reclaim on the taxes that have been paid to some foreign jurisdictions. The values of all reclaims are not significant for any of the Funds and are reflected in Other Assets on the Statements of Assets and Liabilities. These receivables are reviewed to ensure the current receivable balance is reflective of the amount deemed to be collectable.
7. SECURITIES LENDING
Ultra Series Fund | December 31, 2013
Notes to Financial Statements
Each Fund, except the Target Allocation, Money Market, Small Cap and Target Retirement Funds, entered into a Securities Lending Agreement (the “Agreement”) with State Street Bank and Trust Company (“State Street”). Under the terms of the Agreement, the Funds may lend portfolio securities to qualified borrowers in order to earn additional income. The Agreement requires that loans are collateralized at all times by cash or other liquid assets at least equal to 102% of the value of the securities, which is determined on a daily basis. Amounts earned as interest on investments of cash collateral, net of rebates and fees, if any, are included in the Statements of Operations. The primary risk associated with securities lending is if the borrower defaults on its obligation to return the securities loaned because of insolvency or other reasons, the Funds could experience delays and costs in recovering securities loaned or in gaining access to the collateral.
At December 31, 2013, none of the Funds had securities out on loan.
8. FEDERAL INCOME TAX INFORMATION
It is each Fund’s policy to comply with the requirements of Subchapter M of the Internal Revenue Code of 1986 applicable to regulated investment companies and to distribute all its taxable income to its shareholders. Accordingly, no provisions for federal income taxes are recorded in the accompanying statements.
The Funds have not recorded any liabilities for material unrecognized tax benefits as of December 31, 2013. It is each Fund’s policy to recognize accrued interest and penalties related to uncertain tax benefits in income taxes, as appropriate. Tax years that remain open to examination by major tax jurisdictions include tax years ended December 31, 2010 through December 31, 2013.
The tax character of distributions paid during the years ended December 31, 2013 and 2012 was as follows:
Ultra Series Fund | December 31, 2013
Notes to Financial Statements
|
| | | | | | | | | | |
| Fund | Ordinary Income | | Long-Term Capital Gain |
| 2013 | 2012 | | 2013 | 2012 |
| Conservative Allocation | $ 5,156,063 |
| $ 8,752,307 |
| | $ 5,546,612 |
| $ | — |
|
| Moderate Allocation | 7,152,069 |
| 11,631,795 |
| | — |
| — |
|
| Aggressive Allocation | 1,705,758 |
| 3,233,841 |
| | 1,843,645 |
| — |
|
| Money Market | — |
| — |
| | — |
| — |
|
| Core Bond | 10,625,062 |
| 12,776,652 |
| | — |
| — |
|
| High Income | 3,416,640 |
| 5,659,023 |
| | — |
| — |
|
| Diversified Income | 9,327,449 |
| 10,709,273 |
| | — |
| — |
|
| Large Cap Value | 8,439,141 |
| 10,469,073 |
| | — |
| — |
|
| Large Cap Growth | 5,389,701 |
| 2,704,838 |
| | 28,059,003 |
| — |
|
| Mid Cap | 22,758 |
| 1,089,948 |
| | 5,975,197 |
| — |
|
| Small Cap | 58,672 |
| 154,423 |
| | 3,453,752 |
| — |
|
| International Stock | 148,830 |
| 1,486,996 |
| | — |
| — |
|
| Madison Target Retirement 2020 | 2,180,470 |
| 1,701,151 |
| | 1,367,486 |
| 144,606 |
|
| Madison Target Retirement 2030 | 2,700,413 |
| 2,082,265 |
| | 1,706,037 |
| 170,986 |
|
| Madison Target Retirement 2040 | 1,992,163 |
| 1,497,374 |
| | 1,149,047 |
| 103,150 |
|
| Madison Target Retirement 2050 | 367,015 |
| 146,274 |
| | 94,727 |
| 14,972 |
|
As of December 31, 2013, the components of distributable earnings on a tax basis were as follows.
|
| | | | | | | | | | | | | | |
| Fund | Ordinary Income | Long-Term
Capital Gain | | Fund | Ordinary Income | Long-Term
Capital Gain |
| Conservative Allocation | $ | 118,861 |
| $ | — |
| | Large Cap Growth | $ | 481,328 |
| $ | 2,966,180 |
|
| Moderate Allocation | 163,666 |
| — |
| | Mid Cap | — |
| 3,338,338 |
|
| Aggressive Allocation | 38,320 |
| 40,756 |
| | Small Cap | — |
| 78,393 |
|
| Money Market | — |
| — |
| | International Stock | 1,067,517 |
| — |
|
| Core Bond | 210,058 |
| — |
| | Madison Target Retirement 2020 | — |
| 79,438 |
|
| High Income | 71,584 |
| — |
| | Madison Target Retirement 2030 | 840 |
| 229,631 |
|
| Diversified Income | 187,487 |
| — |
| | Madison Target Retirement 2040 | 69,512 |
| 85,381 |
|
| Large Cap Value | 128,277 |
| — |
| | Madison Target Retirement 2050 | 19,475 |
| 232 |
|
Ultra Series Fund | December 31, 2013
Notes to Financial Statements
For federal income tax purposes, the Funds listed below have capital loss carryovers as of December 31, 2013, which are available to offset future capital gains, if any, realized through the fiscal year listed:
|
| | | | | | | | | | | | | | | | | | | | | |
| Fund | 2014 | 2015 | 2016 | 2017 | 2018 | 2019 | No Expiration- Short Term |
| Conservative Allocation | $ | — |
| $ | — |
| $ | — |
| $ | — |
| $ | — |
| $ | — |
| $ | — |
|
| Moderate Allocation | — |
| — |
| — |
| 5,429,580 |
| 9,937,108 |
| — |
| — |
|
| Aggressive Allocation | — |
| — |
| — |
| — |
| — |
| — |
| — |
|
| Money Market | — |
| — |
| — |
| — |
| — |
| — |
| 399 |
|
| Core Bond | — |
| — |
| — |
| 8,593,619 |
| 346,309 |
| — |
| — |
|
| High Income | — |
| — |
| 2,652,908 |
| 4,641,635 |
| — |
| — |
| — |
|
| Diversified Income | — |
| — |
| — |
| 6,420,044 |
| — |
| — |
| — |
|
| Large Cap Value | — |
| — |
| — |
| 28,758,901 |
| — |
| — |
| — |
|
| Large Cap Growth | — |
| — |
| — |
| — |
| — |
| — |
| — |
|
| Mid Cap | — |
| — |
| 15,192,498 |
| — |
| — |
| — |
| — |
|
| Small Cap | — |
| — |
| 607,545 |
| — |
| — |
| — |
| — |
|
| International Stock | — |
| — |
| 3,937,695 |
| 20,286,292 |
| 1,822,160 |
| — |
| — |
|
| Madison Target Retirement 2020 | — |
| — |
| — |
| — |
| — |
| — |
| — |
|
| Madison Target Retirement 2030 | — |
| — |
| — |
| — |
| — |
| — |
| — |
|
| Madison Target Retirement 2040 | — |
| — |
| — |
| — |
| — |
| — |
| — |
|
| Madison Target Retirement 2050 | — |
| — |
| — |
| — |
| — |
| — |
| — |
|
Included in the net capital loss carryforwards for Mid Cap Fund, Small Cap Fund and International Stock Fund is $15,192,498, $607,545 and $6,562,825, respectively, of capital loss carryforwards subject to certain limitations upon availability, to offset future gains, if any, as the successor of a merger. These acquired losses are included in the total losses available noted above.
Certain specified losses incurred after October 31 and within the taxable year are deemed to arise on the first day of the Funds’ next taxable year, if the Funds so elect. For the year ended December 31, 2013, none of the Funds elected to defer late-year ordinary losses.
Ultra Series Fund | December 31, 2013
Notes to Financial Statements
For the year ended December 31, 2013, capital losses utilized for each Fund were as follows:
|
| | | | | | | | |
| Fund | Amount Utilized | | Fund | Amount Utilized |
| Conservative Allocation | $ | 2,386,143 |
| | Large Cap Growth | $ | 11,561,675 |
|
| Moderate Allocation | 24,584,406 |
| | Mid Cap | 46,183,745 |
|
| Aggressive Allocation | 13,048,340 |
| | Small Cap | 308,677 |
|
| Money Market | — |
| | International Stock | 6,535,625 |
|
| Core Bond | 3,481,808 |
| | Madison Target Retirement 2020 | — |
|
| High Income | 1,218,435 |
| | Madison Target Retirement 2030 | — |
|
| Diversified Income | 18,478,496 |
| | Madison Target Retirement 2040 | — |
|
| Large Cap Value | 43,993,519 |
| | Madison Target Retirement 2050 | — |
|
After October 31, 2013, only the Conservative Allocation Fund had Short-Term post-October capital losses of $88,760, which is being deferred for tax purposes.
Ultra Series Fund | December 31, 2013
Notes to Financial Statements
At December 31, 2013, the aggregate gross unrealized appreciation/depreciation and net unrealized appreciation for all securities as computed on a federal income tax basis for each Fund were as follows:
|
| | | | | | | | | |
| Fund | Appreciation | Depreciation | Net |
| Conservative Allocation | $ | 17,393,973 |
| $ | 136,639 |
| $ | 17,257,334 |
|
| Moderate Allocation | 61,253,563 |
| 168,941 |
| 61,084,622 |
|
| Aggressive Allocation | 28,346,418 |
| 215,795 |
| 28,130,623 |
|
| Core Bond | 16,195,997 |
| 5,522,415 |
| 10,673,582 |
|
| High Income | 1,861,648 |
| 215,517 |
| 1,646,131 |
|
| Diversified Income | 90,378,473 |
| 3,014,392 |
| 87,364,081 |
|
| Large Cap Value | 173,283,192 |
| 1,602,292 |
| 171,680,900 |
|
| Large Cap Growth | 122,006,775 |
| 2,866,083 |
| 119,140,692 |
|
| Mid Cap | 126,692,308 |
| 152,825 |
| 126,539,483 |
|
| Small Cap | 3,403,892 |
| 11,277 |
| 3,392,615 |
|
| International Stock | 28,535,717 |
| 679,481 |
| 27,856,236 |
|
| Madison Target Retirement 2020 | 5,368,187 |
| 281,665 |
| 5,086,522 |
|
| Madison Target Retirement 2030 | 10,800,254 |
| 279,532 |
| 10,520,722 |
|
| Madison Target Retirement 2040 | 9,495,732 |
| 130,820 |
| 9,364,912 |
|
| Madison Target Retirement 2050 | 2,283,992 |
| 21,359 |
| 2,262,633 |
|
The differences between the book unrealized amounts reflected in the Statement of Assets and Liabilities and tax unrealized amounts (shown above) are due to the tax deferral of losses on wash sales.
Reclassification Adjustments: Paid-in capital, undistributed net investment income, and accumulated net realized gain (loss) have been adjusted in the Statements of Assets and Liabilities for permanent book-tax differences for all funds.
Differences primarily relate to the tax treatment of net operating losses, paydown gains and losses, foreign currency gains and losses, and distributions from real estate investment trusts and passive foreign investment companies.
To the extent these book and tax differences are permanent in nature, such amounts are reclassified at the end of the fiscal year among paid-in capital in excess of par value, undistributed net investment income (loss) and undistributed net realized gain
Ultra Series Fund | December 31, 2013
Notes to Financial Statements
(loss) on investments and foreign currency translations. Accordingly, at December 31, 2013 reclassifications were recorded as follows:
|
| | | | | | | | | |
| Fund | Paid-in Capital | Undistributed Net
Investment Income (Loss) | Accumulated Net
Realized Gain (Loss) |
| Conservative Allocation | $ | — |
| $ | 28,491 |
| $ | (28,491 | ) |
| Moderate Allocation | — |
| 317,389 |
| (317,389 | ) |
| Aggressive Allocation | — |
| 114,165 |
| (114,165 | ) |
| Money Market | — |
| — |
| — |
|
| Core Bond | — |
| (81,439 | ) | 81,439 |
|
| High Income | — |
| — |
| — |
|
| Diversified Income | — |
| 4,251 |
| (4,251 | ) |
| Large Cap Value | — |
| — |
| — |
|
| Large Cap Growth | — |
| — |
| — |
|
| Mid Cap | (73,778 | ) | 73,785 |
| (7 | ) |
| Small Cap | — |
| (1,325 | ) | 1,325 |
|
| International Stock | (1,926,937 | ) | (50,734 | ) | 1,977,671 |
|
| Madison Target Retirement 2020 | — |
| 127,142 |
| (127,142 | ) |
| Madison Target Retirement 2030 | — |
| 50,435 |
| (50,435 | ) |
| Madison Target Retirement 2040 | — |
| 33,690 |
| (33,690 | ) |
| Madison Target Retirement 2050 | — |
| 9,874 |
| (9,874 | ) |
9. INVESTMENT RISKS
Investing in certain financial instruments, including forward foreign currency contracts, involves certain risks. Risks associated with these instruments include potential for an illiquid secondary market for the instruments or inability of counterparties to perform under the terms of the contracts, changes in the value of foreign currency relative to the U.S. dollar and financial statement volatility resulting from an imperfect correlation between the movements in the prices of the instruments and the prices of the underlying securities and interest rates being
Ultra Series Fund | December 31, 2013
Notes to Financial Statements
hedged. The International Stock Fund may enter into these contracts primarily to protect these Funds from adverse currency movements.
Investing in foreign securities involves certain risks not necessarily found in U.S. markets. These include, but are not limited to, risks associated with adverse changes in economic, political, regulatory and other conditions, changes in currency exchange rates, exchange control regulations, expropriation of assets or nationalization, imposition of withholding taxes on dividend or interest payments or capital gains, and possible difficulty in obtaining and enforcing judgments against foreign entities. Further, issuers of foreign securities are subject to different, and often less comprehensive, accounting, reporting and disclosure requirements than domestic issuers.
The High Income Fund invests in securities offering high current income which generally will include bonds in the below investment grade categories of recognized ratings agencies (so-called “junk bonds’’). These securities generally involve more credit risk than securities in the higher rating categories. In addition, the trading market for high yield securities may be relatively less liquid than the market for higher-rated securities. The High Income Fund generally invests at least 80% of its net assets in high yield securities.
The Target Allocation Funds and Target Date Funds are fund of funds, meaning that they invest primarily in the shares of other registered investment companies (the “underlying funds’’), including exchange traded funds (“ETFs”). Thus, each Fund’s investment performance and its ability to achieve its investment goal are directly related to the performance of the underlying funds in which it invests; and the underlying fund’s performance, in turn, depends on the particular securities in which that underlying fund invests and the expenses of that fund. Accordingly, these Funds are subject to the risks of the underlying funds in direct proportion to the allocation of their respective assets among the underlying funds.
Additionally, the Target Allocation Funds and Target Date Funds are subject to asset allocation risk and manager risk. Manager risk (i.e., fund selection risk) is the risk that the fund(s) selected to fulfill a particular asset class underperforms its peers. Asset allocation risk is the risk that the allocation of the Fund’s assets among the various asset classes and market segments will cause the Fund to underperform other funds with a similar investment objective.
Ultra Series Fund | December 31, 2013
Notes to Financial Statements
Please see the most current version of a Fund’s prospectus(es) for a more detailed discussion of risks associated with investing in the Funds.
10. CAPITAL SHARES AND AFFILIATED OWNERSHIP
All capital shares outstanding at December 31, 2013, are owned by separate investment accounts and/or pension plans of CMFG Life Insurance Company.
The Target Allocation Funds invest in underlying funds, of which certain underlying funds (the “affiliated underlying funds’’), may be deemed to be under common control because of the same Board of Trustees. Madison Funds’ historical financial information is available to you at no cost on the Securities and Exchange Commission’s website at www.sec.gov, by calling 1-800-877-6089 or by visiting the Madison Funds’ website at www.madisonfunds.com. A summary of the transactions with each affiliated underlying fund as of December 31, 2013 follows:
|
| | | | | | | | | | | | | | | | | |
| Fund/Underlying Fund | Balance of
Shares
Held at
12/31/12 | Gross
Additions | Gross
Sales | Balance of
Shares
Held at
12/31/13 | Value at
12/31/13 | Realized
Gain (Loss) | Distributions
Received1 |
| Conservative Allocation Fund | | | | | | | |
| Madison High Quality Bond Fund Class Y | 1,641,621 |
| 120,189 |
| 450,311 |
| 1,311,499 |
| $ | 14,334,688 |
| $ | 95,331 |
| $ | 262,628 |
|
| Madison Core Bond Fund Class Y | 1,904,243 |
| 1,257,235 |
| 238,855 |
| 2,922,623 |
| 29,197,006 |
| (45,072 | ) | 754,793 |
|
| Madison Corporate Bond Fund Class Y | 1,277,935 |
| – |
| 35,810 |
| 1,242,125 |
| 13,899,373 |
| (15,007 | ) | 310,807 |
|
| Madison High Income Fund Class Y | 1,737,052 |
| 34,532 |
| 1,127,311 |
| 644,273 |
| 4,335,960 |
| 961,670 |
| 675,537 |
|
| Madison Equity Income Fund Class Y | 958,772 |
| – |
| 958,772 |
| – |
| – |
| 250,163 |
| 251,552 |
|
| Madison Large Cap Value Fund Class Y | 1,076,398 |
| 196,041 |
| 117,736 |
| 1,154,703 |
| 20,438,246 |
| 363,817 |
| 214,137 |
|
| Madison Disciplined Equity Fund Class Y | 980,883 |
| 444,254 |
| 1,425,137 |
| – |
| – |
| 1,239,774 |
| 2,059,431 |
|
| Madison Investors Fund Class Y | – |
| 674,905 |
| 192,118 |
| 482,787 |
| 11,171,688 |
| 392,547 |
| 330,544 |
|
| Madison Large Cap Growth Fund Class Y | 407,511 |
| 182,691 |
| 60,613 |
| 529,589 |
| 11,470,901 |
| 383,863 |
| 419,464 |
|
| Madison International Stock Fund Class Y | 592,560 |
| 122,826 |
| 95,455 |
| 619,931 |
| 8,362,869 |
| 161,332 |
| 82,187 |
|
| Totals | | | | | $ | 113,210,731 |
| $ | 3,788,418 |
| $ | 5,361,080 |
|
| Moderate Allocation Fund | | | | | | | |
Ultra Series Fund | December 31, 2013
Notes to Financial Statements
|
| | | | | | | | | | | | | | | | | |
| Madison High Quality Bond Fund Class Y | 1,393,750 |
| 188,556 |
| 171,831 |
| 1,410,475 |
| $ | 15,416,491 |
| $ | 28,137 |
| $ | 242,746 |
|
| Madison Core Bond Fund Class Y | 2,405,616 |
| 1,390,971 |
| 293,868 |
| 3,502,719 |
| 34,992,164 |
| 169,252 |
| 876,925 |
|
| Madison High Income Fund Class Y | 2,455,877 |
| 23,545 |
| 1,481,668 |
| 997,754 |
| 6,714,883 |
| 1,828,475 |
| 901,871 |
|
| Madison Equity Income Fund Class Y | 1,319,334 |
| - |
| 1,319,334 |
| - |
| - |
| (17,339 | ) | 255,191 |
|
| Madison Large Cap Value Fund Class Y | 2,356,806 |
| 411,103 |
| 164,905 |
| 2,603,004 |
| 46,073,164 |
| 500,245 |
| 482,722 |
|
| Madison Disciplined Equity Fund Class Y | 2,220,189 |
| 425,799 |
| 2,645,988 |
| - |
| - |
| 562,119 |
| 4,778,185 |
|
| Madison Investors Fund Class Y | - |
| 1,600,051 |
| 191,905 |
| 1,408,146 |
| 32,584,493 |
| 789,034 |
| 964,099 |
|
| Madison Large Cap Growth Fund Class Y | 1,513,868 |
| 396,129 |
| 183,791 |
| 1,726,206 |
| 37,389,622 |
| 653,396 |
| 1,367,251 |
|
| Madison Mid Cap Fund Class Y | 2,263,279 |
| 121,281 |
| 827,531 |
| 1,557,029 |
| 14,760,632 |
| 1,409,849 |
| 971,290 |
|
| Madison Small Cap Fund Class Y | 619,710 |
| 30,628 |
| 310,690 |
| 339,648 |
| 5,043,773 |
| 1,396,855 |
| 205,511 |
|
| Madison Northroad International Fund Class Y | 1,378,003 |
| - |
| 283,874 |
| 1,094,129 |
| 13,151,436 |
| 440,259 |
| 538,733 |
|
| Madison International Stock Fund Class Y | 708,463 |
| - |
| 91,370 |
| 617,093 |
| 8,324,585 |
| 403,941 |
| 81,810 |
|
| Totals | | | | | $ | 214,451,243 |
| $ | 8,164,223 |
| $ | 11,666,334 |
|
| Aggressive Allocation Fund | | | | | | | |
| Madison High Income Fund Class Y | 429,563 |
| 256,511 |
| 575,310 |
| 110,764 |
| 745,445 |
| 607,184 |
| 114,180 |
|
| Madison Equity Income Fund Class Y | 333,863 |
| - | 333,863 |
| - | - | (50,114 | ) | 15,115 |
|
| Madison Large Cap Value Fund Class Y | 1,180,844 |
| 173,589 |
| 156,655 |
| 1,197,778 |
| 21,200,665 |
| 406,519 |
| 222,126 |
|
| Madison Disciplined Equity Fund Class Y | 1,236,305 |
| 235,664 |
| 1,471,969 |
| — |
| — |
| 1,155,007 |
| 2,250,519 |
|
| Madison Investors Fund Class Y | | 744,156 |
| 86,025 |
| 658,131 |
| 15,229,151 |
| 251,476 |
| 450,595 |
|
| Madison Large Cap Growth Fund Class Y | 618,663 |
| 306,129 |
| 111,172 |
| 813,620 |
| 17,623,014 |
| 248,315 |
| 644,432 |
|
| Madison Mid Cap Fund Class Y | 1,544,805 |
| 193,332 |
| 572,110 |
| 1,166,027 |
| 11,053,937 |
| 991,633 |
| 727,379 |
|
| Madison Small Cap Fund Class Y | 255,585 |
| 38,285 |
| 146,890 |
| 146,980 |
| 2,182,651 |
| 945,133 |
| 88,933 |
|
Ultra Series Fund | December 31, 2013
Notes to Financial Statements
|
| | | | | | | | | | | | | | | | | |
| Madison Northroad International Fund Class Y | 492,632 |
| 35,779 |
| 122,067 |
| 406,344 |
| 4,884,259 |
| 196,567 |
| 200,078 |
|
| Madison International Stock Fund Class Y | 321,305 |
| 61,823 |
| 80,185 |
| 302,943 |
| 4,086,699 |
| 308,920 |
| 40,162 |
|
| Totals | | | | | $ | 77,005,821 |
| $ | 5,060,640 |
| $ | 4,753,519 |
|
|
|
1 Distributions received include distributions from net investment income and from capital gains from the underlying funds. |
11. SUBSEQUENT EVENTS
Clawback Litigation
The Trust is aware of litigation relating to attempts by certain fixed income security-holders of Lyondell Chemical company (LYO) to retrieve proceeds from the sale by equity security-holders of LYO shares occurring pursuant to its acquisition by merger in December 2007. The Mid Cap Fund received proceeds of approximately $1,574,400 from the sale of its LYO equity securities in December 2007. The Trust has not been named as a defendant in this litigation as of the date of this report.
All Other Matters
Other than what is noted above, management has evaluated the impact of all other subsequent events on the Funds through the date the financial statements were available for issue. No other events have taken place that meet the definition of subsequent event that require adjustment to, or disclosure in the financial statements.
Ultra Series Fund | December 31, 2013
Notes to Financial Statements
Report of Independent Registered Public Accounting Firm
To the Shareholders and Board of Trustees of Ultra Series Fund:
We have audited the accompanying statements of assets and liabilities, including the portfolios of investments, of Ultra Series Fund, comprising the Conservative Allocation Fund, Moderate Allocation Fund, Aggressive Allocation Fund, Money Market Fund, Core Bond Fund (formerly Bond Fund), High Income Fund, Diversified Income Fund, Large Cap Value Fund, Large Cap Growth Fund, Mid Cap Fund, Small Cap Fund, International Stock Fund, Madison Target Retirement 2020 Fund, Madison Target Retirement 2030 Fund, Madison Target Retirement 2040 Fund, and Madison Target Retirement 2050 Fund (collectively, the “Funds”) as of December 31, 2013, and the related statements of operations for the year then ended, and the statements of changes in net assets and the financial highlights for each of the periods presented. These financial statements and financial highlights are the responsibility of the Funds’ management. Our responsibility is to express an opinion on these financial statements and financial highlights based on our audits.
We conducted our audits in accordance with the standards of the Public Company Accounting Oversight Board (United States). Those standards require that we plan and perform the audit to obtain reasonable assurance about whether the financial statements and financial highlights are free of material misstatement. The Funds are not required to have, nor were we engaged to perform, an audit of their internal control over financial reporting. Our audits included consideration of internal control over financial reporting as a basis for designing audit procedures that are appropriate in the circumstances, but not for the purpose of expressing an opinion on the effectiveness of the Funds’ internal control over financial reporting. Accordingly, we express no such opinion. An audit also includes examining, on a test basis, evidence supporting the amounts and disclosures in the financial statements, assessing the accounting principles used and significant estimates made by management, as well as evaluating the overall financial statement presentation. Our procedures included confirmation of securities owned as of December 31, 2013, by correspondence with the custodian and brokers; where replies were not received from brokers, we performed other auditing procedures. We believe that our audits provide a reasonable basis for our opinion.
In our opinion, the financial statements and financial highlights referred to above present fairly, in all material respects, the financial position of each of the Funds as of December 31, 2013, the results of their operations for the year then ended, and the
Ultra Series Fund | December 31, 2013
Notes to Financial Statements
changes in their net assets and the financial highlights for each of the periods presented, in conformity with accounting principles generally accepted in the United States of America.
Deloitte & Touche, LLP
(signature)
Milwaukee, WI
February 21, 2014
Ultra Series Fund | December 31, 2013
Other Information (unaudited)
BOARD APPROVAL OF ADVISORY AND SUBADVISORY CONTRACTS
The Board of Trustees reviewed a variety of matters in connection with the Trust’s investment advisory contract with the Investment Adviser and the subadvisory contracts with the applicable Subadvisers at an in-person meeting of the Board held in July 2013. The following summarizes the Board’s process and considerations during that meeting.
With regard to the nature, extent and quality of the services to be provided by the Investment Adviser and each Subadviser, the Board reviewed the biographies and tenure of the personnel involved in Trust management and the experience of the Investment Adviser (and applicable Subadviser) and its affiliates as investment manager to other investment companies with similar investment strategies or to individual clients or institutions with similar investment strategies. They recognized the wide array of investment professionals employed by the respective firm or firms. Representatives of the Investment Adviser and each Subadviser discussed their firms’ ongoing investment philosophies and strategies intended to provide performance consistent with each Fund’s investment objectives under various market scenarios. The Trustees also noted their familiarity with the Investment Adviser and its affiliates due to the Investment Advisers’ history of providing advisory services to its proprietary investment company clients.
The Board also discussed the quality of services provided to the Trust by its applicable transfer agent, fund administrator and custodian as well as the various administrative services provided directly by the Investment Adviser. Such services included arranging for third party service providers to provide all necessary administration as well as supervising any Subadvisers to Fund portfolios.
With regard to the investment performance of the Trust and the Investment Adviser, the Board reviewed current performance information provided in the written Board materials. They discussed the reasons for both outperformance and underperformance compared with peer groups and applicable indices and benchmarks. They reviewed both long-term and short-term performance and considered the effect on long-term performance that may have been attributable to any previous investment advisers to any Fund. They also considered whether any relative underperformance was appropriate in view of the Investment Adviser’s conservative investment philosophy. The Board performed this review in connection with the Investment Adviser and each Subadviser that manages a subadvised Fund portfolio. In connection with the review of performance, the Board engaged in a
Ultra Series Fund | December 31, 2013
Other Information (unaudited)
comprehensive discussion of market conditions and discussed the reasons for Fund performance under such conditions. With regard to fixed-income Funds, the Board considered the relatively conservative investment philosophy followed by the Funds during a period of historically low interest rates and the relative risks to fixed-income Funds in the current environment. Representatives of the Investment Adviser and each Subadviser discussed with the Board the methodology for arriving at peer groups and indices used for performance comparisons.
With regard to the costs of the services to be provided and the profits to be realized by the Investment Adviser and its affiliates from the relationship with the Trusts, the Board reviewed the expense ratios for a variety of other funds in each Fund portfolio’s peer group with similar investment objectives. Again, the Board reviewed these matters in connection with the Investment Adviser and each Subadviser that manages a subadvised Fund portfolio.
The Board noted that the Investment Adviser or its affiliates, and, as applicable, each Subadviser, provided investment management services to other investment company and/or non-investment company clients and considered the fees charged by the Investment Adviser (and respective Subadviser) to such Funds and clients for purposes of determining whether the given advisory fee was disproportionately large under the so-called Gartenberg standard traditionally used by investment company boards in connection with contract renewal considerations. The Board took those fees into account and considered the differences in services and time required by the various types of funds and clients to which the Investment Adviser (or Subadviser, if applicable) provided services. The Board recognized that significant differences may exist between the services provided to one type of fund or client and those provided to others, such as those resulting from a greater frequency of shareholder redemptions in a mutual fund and the higher turnover of mutual fund assets. The Board gave such comparisons the weight that they merit in light of the similarities and differences between the services that the various Funds require and were wary of “inapt comparisons.” They considered that, if the services rendered by the Investment Adviser (or Subadviser, if applicable) to one type of fund or client differed significantly from others, then the comparison should not be used. In the case of non-investment company clients for which the Investment Adviser (or Subadviser, if applicable) may act as either investment adviser or subadviser, the Board noted that the fee may be lower than the fee charged to the Trust. The Board noted too the various administrative, operational, compliance, legal and corporate
Ultra Series Fund | December 31, 2013
Other Information (unaudited)
communication services required to be handled by the Investment Adviser (or Subadviser, if applicable) which are performed for investment company clients but are not performed for other institutional clients.
TThe Trustees reviewed each Fund’s fee structure based on total Fund expense ratio as well as by comparing advisory fees to other advisory fees. The Board noted the simple expense structure maintained by the Trust: (1) an advisory fee and a capped administrative “services” expense for its Target Retirement Date Funds; and (2) for the remaining series, a unitary fee with limited independent expenses for Trustee compensation and audit fees not covered by the unitary fee. The Board reviewed total expense ratios paid by other funds with similar investment objectives, recognizing that such a comparison, while not dispositive, was an important consideration.
The Trustees sought to ensure that fees paid by the Trusts were appropriate. The Board reviewed materials demonstrating that although the Investment Adviser is compensated for a variety of the administrative services it provides or arranges to provide to the Target Retirement Date Funds of the Trust pursuant to its administrative services agreements with those series, such compensation does not always cover all costs due to the cap on administrative expenses. Administrative, operational, regulatory and compliance fees and costs in excess of the Services Agreement fees, in the case of the Target Retirement Date series, or in excess of the unitary fee, in the case of the remaining series of the Trust, are paid by the Investment Adviser from the investment advisory fees earned. In this regard, the Trustees noted that examination of each Fund portfolio’s total expense ratio compared to those of other investment companies was more meaningful than a simple comparison of basic “investment management only” fee schedules.
The Board recognized that to the extent a Fund portfolio invests in other mutual funds also managed by the Investment Adviser (or its affiliates), the Investment Adviser (or an affiliate) receives investment advisory fees from both the Fund portfolio and the underlying mutual fund. The Board was satisfied in this regard that the Investment Adviser (or an affiliate) provides separate services to each “Fund of funds” portfolios and the underlying mutual funds in which each such Fund invests in exchange for the fees received from them.
In reviewing costs and profits, the Board noted that for some smaller Fund portfolios, the salaries of all portfolio management personnel, trading desk personnel, corporate
Ultra Series Fund | December 31, 2013
Other Information (unaudited)
accounting personnel and employees of the Investment Adviser who serve as Trust officers, as well as facility costs (rent), could not be supported by fees received from such portfolios alone. However, the Board recognized that the Trust is profitable to the Investment Adviser because such salaries and fixed costs are already paid in whole or in part from revenue generated by management of other client assets managed by the Investment Adviser including the Trust as a consolidated Fund family. The Trustees noted that total assets managed by the Investment Adviser and its affiliates were in excess of $15 billion at the time of the meeting. As a result, although the fees paid by each Fund portfolio at its present size might not be sufficient to profitably support a stand-alone fund, the Trust is reasonably profitable to the Investment Adviser as part of its larger, diversified organization. In sum, the Trustees recognized that the Trust is important to the Investment Adviser and is managed with the attention given to the Investment Adviser’s other clients.
With regard to the extent to which economies of scale would be realized as each Fund portfolio grows, the Trustees recognized that at their current sizes, it was premature to discuss any economies of scale not already factored into existing advisory and services agreements. In addition, the Trustees recognized that the Investment Adviser was currently waiving fees with with regard to the Money Market Fund.
Counsel to the Trust’s Independent Trustees confirmed that the Trust’s Independent Trustees met previously and reviewed the written contract renewal materials provided by the Investment Adviser. He noted that the Independent Trustees had considered such materials in light of the aforementioned Gartenberg standards as well as criteria either set forth or discussed in the more recent Supreme Court decision in Jones v. Harris regarding the investment company contract renewal process under Section 15(c) of the Investment Company Act of 1940, as amended. The Independent Trustees made a variety of additional inquiries regarding such written materials to the Investment Adviser and the Subadvisers and representatives of the Investment Adviser and Subadvisers, respectively, discussed each matter raised.
After further discussion, analysis and review of the totality of the information presented, including the information set forth above and the other information considered by the Board of Trustees, the Trustees, including the Independent Trustees, concluded that the Trust’s advisory fees (including applicable subadvisory fees) are fair and reasonable for each respective Fund portfolio and that renewal of
Ultra Series Fund | December 31, 2013
Other Information (unaudited)
its respective Advisory, Subadvisory and Services Agreements are in the best interests of each respective Fund portfolio and its shareholders.
In the course of their review of the contract renewal materials, the Board also reviewed and discussed with counsel the “Rule 12b-1” plans adopted by some of the Funds. Representatives of the Investment Adviser directed the Board to the written materials regarding these matters during the course of the Board’s consideration of the Rule 12b-1 plans. Finally, the Board also reviewed the Trust’s distribution agreements and the information provided in the written materials regarding the distributor as well as applicable Codes of Ethics.
FUND EXPENSES PAID BY SHAREHOLDERS
As a shareholder of the Funds, you pay no transaction costs, but do incur ongoing costs which include management fees; disinterested trustee fees; brokerage commissions and other expenses incurred in connection with the acquisition or disposition of investments; costs of borrowing money; expenses for independent audits, taxes, and extraordinary expenses as approved by a majority of the disinterested trustees. The examples in the table that follows are intended to help you understand your ongoing costs (in dollars) of investing in the Funds and to compare these costs with the ongoing costs of investing in other mutual funds.
The examples below are based on an investment of $1,000 invested for the six-month period ended December 31, 2013. Expenses paid during the period in the table below are equal to each Fund’s annualized expense ratio, multiplied by the average account value over the period, multiplied by 184/365 (to reflect the one-half fiscal year period).
Actual Expenses
The table below provides information about actual account values using actual expenses and actual returns for the Funds. You may use the information in this table, together with the amount you invested, to estimate the expenses that you paid over the period. Simply divide your account value by $1,000 (for example, an $8,600 account value divided by $1,000 = 8.6), then multiply the result by the number in the table for the Fund you own under the heading entitled “Actual” to estimate the expenses you paid on your account during this period.
Ultra Series Fund | December 31, 2013
Other Information (unaudited)
|
| | | | | | | | | | | | | | | | | | | | |
| | CLASS I | | CLASS II |
| Fund | Beginning
Account
Value | Ending
Account
Value | Annual
Expense
Ratio | Expenses
Paid
During
Period | | Ending
Account
Value | Annual
Expense
Ratio | Expenses
Paid
During
Period |
| Conservative Allocation |
| $1,000 |
|
| $1,059.40 |
| 0.31 | % |
| $1.61 |
| �� |
| $1,058.00 |
| 0.56 | % |
| $2.90 |
|
| Moderate Allocation | 1,000 | 1,097.00 | 0.31 | % | 1.64 | | 1,095.60 | 0.56 | % | 2.96 |
| Aggressive Allocation | 1,000 | 1,131.10 | 0.31 | % | 1.67 | | 1,129.70 | 0.56 | % | 3.01 |
| Money Market | 1,000 | 1,000.00 | 0.11 | % | 0.55 | | 1,000.00 | 0.11 | % | 0.55 |
| Core Bond | 1,000 | 1000.30 | 0.56 | % | 2.82 | | 999.00 | 0.81 | % | 4.08 |
| High Income | 1,000 | 1,054.70 | 0.76 | % | 3.94 | | 1053.40 | 1.01 | % | 5.23 |
| Diversified Income | 1,000 | 1,077.20 | 0.71 | % | 3.72 | | 1,075.80 | 0.96 | % | 5.02 |
| Large Cap Value | 1,000 | 1,144.10 | 0.61 | % | 3.30 | | 1,142.60 | 0.86 | % | 4.64 |
| Large Cap Growth | 1,000 | 1,186.70 | 0.81 | % | 4.46 | | 1,183.90 | 1.06 | % | 5.83 |
| Mid Cap | 1,000 | 1,149.90 | 0.91 | % | 4.93 | | 1,148.40 | 1.16 | % | 6.28 |
| Small Cap | 1,000 | 1,165.40 | 1.12 | % | 6.11 | | 1,163.90 | 1.37 | % | 7.47 |
| International Stock | 1,000 | 1,175.80 | 1.21 | % | 6.64 | | 1,174.40 | 1.46 | % | 8.00 |
| Madison Target Retirement 2020 | 1,000 | 1,070.20 | 0.30 | % | 1.57 | | | | |
| Madison Target Retirement 2030 | 1,000 | 1,099.10 | 0.30 | % | 1.59 | | | | |
| Madison Target Retirement 2040 | 1,000 | 1,114.70 | 0.30 | % | 1.60 | | | | |
| Madison Target Retirement 2050 | 1,000 | 1,129.40 | 0.30 | % | 1.61 | | | | |
Hypothetical Example for Comparison Purposes
The table also provides information about hypothetical account values and hypothetical expenses based on the Funds’ actual expense ratios and an assumed rate of return of 5% per year before expenses, which are not the Funds’ actual returns. The hypothetical account values and expenses may not be used to estimate the actual ending account balance or expenses you paid for the period. You may use this information to compare the ongoing costs of investing in the Funds and other funds. To do so, compare the 5% hypothetical example of the Funds you own with the 5% hypothetical examples that appear in the shareholder reports of other similar funds.
Ultra Series Fund | December 31, 2013
Other Information (unaudited)
|
| | | | | | | | | | | | | | | | | | | | |
| | CLASS I | | CLASS II |
| Fund | Beginning
Account
Value | Ending
Account
Value | Annual
Expense
Ratio | Expenses
Paid
During
Period | | Ending
Account
Value | Annual
Expense
Ratio | Expenses
Paid
During
Period |
| Conservative Allocation |
| $1,000 |
|
| $1,023.64 |
| 0.31 | % |
| $1.58 |
| |
| $1,022.38 |
| 0.56 | % |
| $2.85 |
|
| Moderate Allocation | 1,000 | 1,023.64 | 0.31 | % | 1.58 | | 1,022.38 | 0.56 | % | 2.85 |
| Aggressive Allocation | 1,000 | 1,023.64 | 0.31 | % | 1.58 | | 1,022.38 | 0.56 | % | 2.85 |
| Money Market | 1,000 | 1,024.65 | 0.11 | % | 0.56 | | 1,024.65 | 0.11 | % | 0.56 |
| Core Bond | 1,000 | 1,022.38 | 0.56 | % | 2.85 | | 1,021.12 | 0.81 | % | 4.13 |
| High Income | 1,000 | 1,021.37 | 0.76 | % | 3.87 | | 1,020.11 | 1.01 | % | 5.14 |
| Diversified Income | 1,000 | 1,021.63 | 0.71 | % | 3.62 | | 1,020.37 | 0.96 | % | 4.89 |
| Large Cap Value | 1,000 | 1,022.13 | 0.61 | % | 3.11 | | 1,020.87 | 0.86 | % | 4.38 |
| Large Cap Growth | 1,000 | 1,021.12 | 0.81 | % | 4.13 | | 1,019.86 | 1.06 | % | 5.40 |
| Mid Cap | 1,000 | 1,020.62 | 0.91 | % | 4.63 | | 1,019.36 | 1.16 | % | 5.90 |
| Small Cap | 1,000 | 1,019.56 | 1.12 | % | 5.70 | | 1,018.30 | 1.37 | % | 6.97 |
| International Stock | 1,000 | 1,019.11 | 1.21 | % | 6.16 | | 1,017.85 | 1.46 | % | 7.43 |
| Madison Target Retirement 2020 | 1,000 | 1,023.69 | 0.30 | % | 1.53 | | | | |
| Madison Target Retirement 2030 | 1,000 | 1,023.69 | 0.30 | % | 1.53 | | | | |
| Madison Target Retirement 2040 | 1,000 | 1,023.69 | 0.30 | % | 1.53 | | | | |
| Madison Target Retirement 2050 | 1,000 | 1,023.69 | 0.30 | % | 1.53 | | | | |
Please note that the expenses shown in the table are meant to highlight your ongoing costs only and do not reflect any separate account fees, charges, or expenses imposed by the variable annuity or variable life insurance contracts, or retirement and pension plans that use the Funds. The information provided in the hypothetical example table is useful in comparing ongoing Fund costs only, and will not help you determine the relative total costs of owning different funds. In addition, if these fees, charges or expenses were included, your costs would have been higher.
AVAILABILITY OF QUARTERLY PORTFOLIO SCHEDULES
The Trust files its complete schedule of portfolio holdings with the SEC for the first and third quarters of each fiscal year on Form N-Q. Form N-Q is available to shareholders at no cost on the SEC’s website at www.sec.gov. Form N-Q may also be reviewed and copied at the Commission’s Public Reference Room in Washington,
Ultra Series Fund | December 31, 2013
Other Information (unaudited)
DC. More information on the operation of the Public Reference Room may be obtained by calling 1-202-551-8090. Form N-Q and other information about the Trust are available on the EDGAR database on the SEC’s Internet site at www.sec.gov. Copies of this information may also be obtained, upon payment of a duplicating fee, by electronic request at the following email address: publicinfo@sec.gov, or by writing the SEC’s Public Reference Section, Washington, DC 20549-0102.
PROXY VOTING POLICIES, PROCEDURES AND RECORDS
A description of the policies and procedures used by the Trust to vote proxies related to portfolio securities is available to shareholders at no cost on the SEC’s website at www.sec.gov and is also located in the Funds’ Statement of Additional Information. The proxy voting records for the Trust for the most recent twelve-month period ended June 30 are available to shareholders at no cost on the SEC’s website at www.sec.gov.
PROXY VOTING RESULTS
A special meeting of the Ultra Series International Stock Fund shareholders was held on December 27, 2013, at which time, shareholders approved changing the Fund’s subadviser. Accordingly, NorthRoad Capital Management LLC became subadviser for the International Stock Fund effective December 31, 2013, replacing Lazard Asset Management, LLC. The voting results are described below:
|
| | |
| FOR: 91.426% | AGAINST: 3.292% | ABSTAIN: 5.282% |
OTHER CONSIDERATIONS
While investments in securities have been keystones in wealth building and management, at times these investments have produced surprises. Those who enjoyed growth and income of their investments generally were rewarded for the risks they took by investing in the markets. Although the Investment Adviser seeks to appropriately address and manage the risks identified and disclosed to you in connection with the management of the securities in the Funds, you should understand that the very nature of the securities markets includes the possibility that there may be additional risks of which we are not aware. We certainly seek to identify all applicable risks and then appropriately address the, take appropriate action to reasonably manage them and, of course, to make you aware of them so you can determine if they exceed your risk tolerance. Nevertheless, the often volatile
Ultra Series Fund | December 31, 2013
Other Information (unaudited)
nature of the securities markets and the global economy in which we work suggests that the risk of the unknown is something to consider in connection with an investment in securities. Unforeseen events could under certain circumstances produce a material loss of the value of some or all of the securities we manage for you in the Funds.
One of our most important responsibilities as investment company managers is to communicate with shareholders in an open and direct manner. Some of our comments in our letters to shareholders are based on current management expectations and are considered “forward-looking statements.” Actual future results, however, may prove to be different from our expectations. You can identify forward-looking statements by words such as “estimate,” ”may,” ”will,” ”expect,””believe,” ”plan” and other similar terms. We cannot promise future returns. Our opinions are a reflection of our best judgment at the time this report is compiled, and we disclaim any obligation to update or after forward-looking statements as a result of new information, future events, or otherwise.
TAX INFORMATION
Foreign Tax Credit: The International Stock Fund expects to make an election under Internal Revenue Code Section 853 to pass through foreign taxes paid by the Fund to its shareholders. For the year ended December 31, 2013, the total amount of foreign taxes that is expected to pass through to shareholders and foreign source income for information reporting purposes will be $225,957 (all of which represents taxes withheld) and $2,701,897, respectively.
Corporate Dividends Received Deduction: For the taxable year ended December 31, 2013, the following percentage of income dividends paid by the Fund qualify for the dividends received deduction available to corporations:
|
| | | | |
| Fund | Percentage | | Fund | Percentage |
| Large Cap Value Fund | 100.00% | | Aggressive Allocation Fund | 28.22% |
| Diversified Income Fund | 63.30% | | Small Cap Fund | 100.00% |
| Large Cap Growth Fund | 81.75% | | Madison Target Retirement 2020 Fund | 3.77% |
| Mid Cap Fund | 100.00% | | Madison Target Retirement 2030 Fund | 6.43% |
| Conservative Allocation Fund | 9.51% | | Madison Target Retirement 2040 Fund | 7.25% |
| Moderate Allocation Fund | 14.72% | | Madison Target Retirement 2050 Fund | 8.90% |
Ultra Series Fund | December 31, 2013
Ultra Series Fund’s Trustees and Officers
The address of each Trustee and officer is 550 Science Drive, Madison, Wisconsin 53711, except for Mr. Mason for which it is 8777 N. Gainey Center Drive, #220, Scottsdale, Arizona 85258. The Statement of Additional Information, which includes additional information about the trustees and officers, is available at no cost on the SEC’s website at www.sec.gov or by calling CMFG Life Insurance Company at 1-800-798-5500.
Interested Trustees and Officers
|
| | | | |
Name and
Year of Birth | Position(s) and Length of Time Served | Principal Occupation(s) During Past Five Years | Portfolios
Overseen in
Fund Complex by Director/Trustee1 | Other Directorships Held by Director/Trustee During Past Five Years |
Katherine L. Frank2
1960 | Trustee and President,
2009 - Present | Madison Investment Holdings, Inc. (“MIH”) (affiliated investment advisory firm of Madison), Executive Director and Chief Operating Officer, 2010 - Present; Managing Director and Vice President, 1986 - 2010 Madison Asset Management, LLC (“Madison”), Executive Director and Chief Operating Officer, 2010 - Present; Vice President, 2004 - 2010 Madison Investment Advisors, LLC (“MIA”) (affiliated investment advisory firm of Madison), Executive Director and Chief Operating Officer, 2010 - Present; President, 1996 - 2010 Madison Strategic Sector Premium Fund (closed end fund), President, 2005 - Present; Madison Funds (21) (mutual funds), President, 2009 - Present; Madison Covered Call & Equity Strategy Fund (closed end fund), President, December 2012 - Present | 38 | Madison Strategic Sector Premium Fund, 2005 - Present; Madison Funds (21), 2009 - Present |
Ultra Series Fund | December 31, 2013
Ultra Series Fund’s Trustees and Officers
|
| | | | |
Jay R. Sekelsky
1959 | Vice President, 2009 - Present | MIH, Executive Director and Chief Investment Officer, 2010 - Present; Managing Director and Vice President, 1990 - 2010 Madison, Executive Director and Chief Investment Officer, 2010 - Present MIA, Executive Director and Chief Investment Officer, 2010 - Present; Vice President, 1996 - 2010 Madison Strategic Sector Premium Fund, Vice President, 2005 - Present; Madison Funds (21), Vice President, 2009 - Present; Madison Covered Call & Equity Strategy Fund, Vice President, December 2012 - Present | N/A | N/A |
Ultra Series Fund | December 31, 2013
Ultra Series Fund’s Trustees and Officers
|
| | | | |
Name and
Year of Birth | Position(s) and Length of Time Served | Principal Occupation(s) During Past Five Years | Portfolios
Overseen in
Fund Complex by Director/Trustee1 | Other Directorships Held by Director/Trustee During Past Five Years |
Paul Lefurgey
1964 | Vice President, 2009 - Present | MIH, Executive Director and Head of Fixed Income Investments, 2013 - Present; Managing Director and Head of Fixed Income Investments,
2005 - 2013; Madison and MIA, Executive Director and Head of Fixed Income Investments, 2013 - Present; Managing Director and Head of Fixed Income Investments, 2010 - 2013 MEMBERS Capital Advisors, Inc. (“MCA”) (investment advisory firm), Madison, WI, Vice President, 2003 - 2005 Madison Strategic Sector Premium Fund, Vice President, 2010 - Present; Madison Funds (21), Vice President, 2009 - Present; Madison Covered Call & Equity Strategy Fund, Vice President, December 2012 - Present | N/A | N/A |
Greg D. Hoppe
1969 | Treasurer,
2009 - Present | MIH and MIA, Vice President, 1999 - Present; Madison, Vice President, 2009 - Present Madison Strategic Sector Premium Fund, Treasurer, 2009 - Present; Chief Financial Officer, 2005 - 2009; Madison Funds (21), Treasurer,
2009 - Present; Madison Covered Call & Equity Strategy Fund, Treasurer, December 2012 - Present | N/A | N/A |
Ultra Series Fund | December 31, 2013
Ultra Series Fund’s Trustees and Officers
|
| | | | |
Holly S. Baggot
1960 | Secretary,
1999 - Present Assistant Treasurer,
1999 - 2007; 2009 - Present
| MIH and MIA, Vice President, 2010 - Present; Madison, Vice President, 2009 - Present; MFD Distributor, LLC (“MFD”) (an affiliated brokerage firm of Madison), Vice President, 2012 - Present MCA, Director-Mutual Funds, 2008-2009; Director-Mutual Fund Operations, 2006-2008; Operations Officer-Mutual Funds, 2005-2006; Senior Manager-Product & Fund Operations, 2001-2005 Madison Strategic Sector Premium Fund, Secretary and Assistant Treasurer, 2010 - Present; Madison Funds (21), Secretary, 1999-Present and Treasurer, 2008-2009 and Assistant Treasurer, 1997-2007 and 2009-Present; Madison Covered Call & Equity Strategy Fund, Secretary and Assistant Treasurer, December 2012 - Present | N/A | N/A |
Ultra Series Fund | December 31, 2013
Ultra Series Fund’s Trustees and Officers
|
| | | | |
Name and
Year of Birth | Position(s) and Length of Time Served | Principal Occupation(s) During Past Five Years | Portfolios
Overseen in
Fund Complex by Director/Trustee1 | Other Directorships Held by Director/Trustee During Past Five Years |
W. Richard Mason
1960 | Chief
Compliance Officer,
Corporate Counsel and Assistant Secretary,
2009 - Present | MIH, MIA, Madison and Madison Scottsdale, LC (an affiliated investment advisory firm of Madison), Chief Compliance Officer and Corporate Counsel, 2009 - Present; General Counsel and Chief Compliance Officer, 1996 - 2009 MFD, Principal, 1998 - Present; Concord Asset Management, LLC (“Concord”) (an affiliated investment advisory firm of Madison), General Counsel, 1996 - 2009; NorthRoad Capital Management LLC (“NorthRoad”) (an affiliated investment advisory firm of Madison), Chief Compliance Officer and Corporate Counsel,
2011 - Present Madison Strategic Sector Premium Fund, Chief Compliance Officer, Corporate Counsel and Assistant Secretary, 2009 - Present; Secretary, General Counsel and Chief Compliance Officer, 2005 - 2009; Madison Covered Call & Equity Strategy Fund, Chief Compliance Officer, Corporate Counsel and Assistant Secretary, December
2012 - Present Madison Funds (21), Chief Compliance Officer, Corporate Counsel and Assistant Secretary,
2009 - Present | N/A | N/A |
Ultra Series Fund | December 31, 2013
Ultra Series Fund’s Trustees and Officers
|
| | | | |
Name and
Year of Birth | Position(s) and Length of Time Served | Principal Occupation(s) During Past Five Years | Portfolios
Overseen in
Fund Complex by Director/Trustee1 | Other Directorships Held by Director/Trustee During Past Five Years |
Pamela M. Krill
1966 | General Counsel, Chief Legal Officer and Assistant Secretary,
2009 - Present | MIH, MIA, Madison, Madison Scottsdale, LC, MFD, and Concord, General Counsel and Chief Legal Officer, 2009 - Present NorthRoad, General Counsel & Chief Legal Officer, 2011 - Present Madison Strategic Sector Premium Fund, General Counsel, Chief Legal Officer and Assistant Secretary, 2010 - Present; Madison Funds (21), General Counsel, Chief Legal Officer and Assistant Secretary, 2009 - Present; Madison Covered Call & Equity Strategy Fund, General Counsel, Chief Legal Officer and Assistant Secretary, December 2012 - Present CUNA Mutual Insurance Society (insurance company with affiliated investment advisory, brokerage and mutual fund operations), Madison, WI, Managing Associate General Counsel-Securities & Investments, 2007 - 2009 Godfrey & Kahn, S.C. (law firm), Madison and Milwaukee, WI, Partner/Shareholder, Securities Practice Group, 1994-2007 | N/A | N/A |
Ultra Series Fund | December 31, 2013
Ultra Series Fund’s Trustees and Officers
|
| |
| 1 | As of the date of this report, the fund complex consists of Madison Funds with 21 portfolios, the Ultra Series Fund with 16 portfolios, the Madison Strategic Sector Premium Fund (a closed-end fund) and the Madison Covered Call & Equity Strategy Fund (closed end fund) (“MCN”), for a grand total of 39 separate portfolios in the fund complex. Not every Trustee is a member of the Board of Trustees of every fund in the fund complex, as noted above. |
| 2 | “Interested person” as defined in the 1940 Act. Considered an interested Trustee because of the position held with the investment adviser of Madison Funds. |
Independent Trustees
|
| | | | |
Name and
Year of Birth | Position(s) and Length of Time Served1 | Principal Occupation(s) During Past Five Years | Portfolios
Overseen in
Fund Complex by Director/ Trustee2 | Other Directorships Held by Director/Trustee During Past Five Years |
Philip E. Blake
1944 | Trustee,
2009 - Present | Retired Investor Lee Enterprises, Inc (news and advertising publisher), Madison, WI, Vice President, 1998 - 2001 Madison Newspapers, Inc., Madison, WI, President and Chief Executive Officer,
1993 - 2000 | 39 | Edgewood College, 2003 - Present; Chairman of the Board, 2010 - 2012 Nerites Corporation (technology company), 2004 - 2013 Madison Strategic Sector Premium Fund, 2005 - Present; Madison Funds (21), 2009 - Present; Madison Covered Call & Equity Strategy Fund, 2005-Aug 2009, and December 2012 - Present |
James R.
Imhoff, Jr.
1944 | Trustee,
2009 - Present | First Weber Group (real estate brokers), Madison, WI, Chief Executive Officer, 1996 - Present | 39 | Park Bank, 1978 - Present Madison Strategic Sector Premium Fund, 2005 - Present; Madison Covered Call & Equity Strategy Fund, 2005 - Present; Madison Funds (21), 2009 - Present |
Ultra Series Fund | December 31, 2013
Ultra Series Fund’s Trustees and Officers
|
| | | | |
Steven P. Riege
1954 | Trustee,
2005 - Present | Ovation Leadership (management consulting), Milwaukee, WI, Owner/President, 2001 - Present Robert W. Baird & Company (financial services), Milwaukee, WI, Senior Vice President-Marketing and Vice President-Human Resources, 1986 - 2001 | 37 | Forward Service Corporation (employment training non-profit),
2010 - Present Stanek Tool Corp., 1990 - Present Madison Funds (21), 2005 - Present |
Richard E.
Struthers
1952 | Trustee, 2004 - Present | Clearwater Capital Management (investment advisory firm), Minneapolis, MN, Chair and Chief Executive Officer, 1998 - Present Park Nicollet Health Services, Minneapolis, MN, Chairman, Finance and Investment Committee, 2006 - 2012 IAI Mutual Funds, Minneapolis, MN, President and Director, 1992-1997 | 37 | Park Nicolet Health Services, 2001 - 2012 HealthPartners, 2013 - Present Madison Funds (21), 2004 - Present |
Ultra Series Fund | December 31, 2013
Ultra Series Fund’s Trustees and Officers
|
| | | | |
Name and
Year of Birth | Position(s) and Length of Time Served1 | Principal Occupation(s) During Past Five Years | Portfolios
Overseen in
Fund Complex by Director/ Trustee2 | Other Directorships Held by Director/Trustee During Past Five Years |
Lorence D. Wheeler
1938 | Trustee, 2009 - Present | Retired investor Credit Union Benefits Services, Inc. (a provider of retirement plans and related services for credit union employees nationwide), Madison, WI, President, 1986 - 1997 | 39 | Grand Mountain Bank FSB and Grand Mountain Bancshares, Inc. 2003 - Present Madison Strategic Sector Premium Fund, 2005 - Present; Madison Covered Call & Equity Strategy Fund, 2005 - Present; Madison Funds (21), 2009 - Present |
|
| |
| 1 | Independent Trustees serve in such capacity until reaching the age of 76, unless retirement is waived by unanimous vote of the remaining Trustees on an annual basis. |
| 2 | As of the date of this report, the fund complex consists of Madison Funds with 21 portfolios, the Ultra Series Fund with 16 portfolios, the Madison Strategic Sector Premium Fund (a closed-end fund) and the Madison Covered Call & Equity Strategy Fund (closed end fund) (“MCN”), for a grand total of 39 separate portfolios in the fund complex. Not every Trustee is a member of the Board of Trustees of every fund in the fund complex, as noted above. |
SEC File Number: 811-04815
Item 2. Code of Ethics.
(a) The Trust has adopted a code of ethics that applies to the Trust’s principal executive officer, principal financial officer, principal accounting officer or controller or persons performing similar functions, regardless of whether these individuals are employed by the Trust or a third party.
(c) The code was not amended during the year covered by this report.
(d) The Trust granted no waivers from the code during the period covered by this report.
(f) Any person may obtain a complete copy of the code without charge by calling the Adviser at 800-767-0300 and requesting a copy of "the Ultra Series Fund Sarbanes Oxley Code of Ethics."
Item 3. Audit Committee Financial Expert.
Philip Blake, an “independent” Trustee and a member of the Trust’s audit committee, serves as the Trust’s audit committee financial expert among the five independent Trustees who so qualify to serve in that capacity was elected to serve in such capacity at the Trust’s July 24, 2013 meeting, replacing James Imhoff who had previously serviced in such capacity.
Item 4. Principal Accountant Fees and Services.
(a) Audit Fees. Total audit fees paid (or to be paid) to the registrant's principal accountant for the fiscal years ended December 31, 2013 and 2012, respectively were $275,500 ($468,500 including the Madison Funds (formerly known as MEMBERS Mutual Funds, an affiliated registered investment company ("MMF")), the Madison Strategic Sector Premium Fund and the Madison Covered Call & Equity Strategy Fund, all affiliated investment companies “together, the “Affiliated Funds”) and $298,000 ($405,500 including the Madison Funds).
(b) Audit-Related Fees. Not applicable.
(c) Tax-Fees. The Audit Committee has pre-approved, as required by Rule 2-01(c)(7)(i)(C) of Regulation S-X, 100% of the services described in this Item 4(b) through (d).
For the fiscal years ended December 31, 2013 and December 31, 2012, the aggregate fees for professional services rendered by Deloitte & Touche for tax compliance, tax advice and tax planning for such fiscal years totaled $30,800 (budgeted) and $38,460 (budgeted), respectively.
In the scope of services comprising the fees disclosed under this Item 4(c) were the following services:
-Review and sign as signature preparer for U.S. Income Tax Return for Regulated Investment Companies, Form 1120-RIC and the Return of Excise Tax on Undistributed Income of Regulated Investment Companies, Form 8613.
(d) All Other Fees. Not applicable.
(e) (1) Before any accountant is engaged by the registrant to render audit or non-audit services, the engagement must be approved by the audit committee as contemplated by paragraph (c)(7)(i)(A) of Rule 2-01of Regulation S-X.
(2) The Audit Committee has pre-approved, as required by Rule 2-01(c)(7)(i)(C) of Regulation S-X, 100% of the services described in this Item 4(b) through (d), which such services are described above.
(f) Not applicable.
(g) Not applicable.
(h) Not applicable.
Item 5. Audit Committee of Listed Registrants.
Not applicable.
Item 6. Schedule of Investments
Schedule included as part of the report to shareholders filed under Item 1 of this Form.
Item 7. Disclosure of Proxy Voting Policies and Procedures for Closed-End Management Investment Companies.
Not applicable.
Item 8. Portfolio Managers of Closed-End Management Investment Companies.
Not applicable.
Item 9. Purchases of Equity Securities by Closed-End Management Investment Company and Affiliated Purchasers.
Not applicable.
Item 10. Submission of Matters to a Vote of Security Holders.
The Trust does not normally hold shareholder meetings. There have been no changes to the Trust's procedures during the period covered by this report.
Item 11. Controls and Procedures.
(a) The Trust’s principal executive officer and principal financial officer determined that the Trust’s disclosure controls and procedures (as defined in Rule 30a-3(c) under the Investment Company Act of 1940 (the "Act")) are effective, based on their evaluation of these controls and procedures required by Rule 30a-3(b) under the Act and Rules 13a-15(b) or 15d-15(b) under the Securities Exchange Act of 1934 within 90 days of the date of this report. There were no significant changes in the Trust’s internal controls or in other factors that could significantly affect these controls subsequent to the date of their evaluation. The officers identified no significant deficiencies or material weaknesses.
(b) There were no changes in the Trust's internal control over financial reporting (as defined in Rule 30a-3(d) under the Act) that occurred during the second fiscal quarter of the period covered by this report that has materially affected, or is reasonably likely to materially affect, the Trust's internal control over financial reporting.
Item 12. Exhibits.
(a)(1) Code of ethics referred to in Item 2.
(a)(2) Certifications of principal executive and principal financial officers as required by Rule 30a-2(a) under the Act.
(b) Certification of principal executive and principal financial officers as required by Rule 30a-2(b) under the Act.
SIGNATURES
Pursuant to the requirements of the Securities Exchange Act of 1934 and the Investment Company Act of 1940, the Registrant has duly caused this Report to be signed on its behalf by the undersigned, thereunto duly authorized.
Ultra Series Fund
By: (signature)
W. Richard Mason, Chief Compliance Officer
Date: February 26, 2014
Pursuant to the requirements of the Securities Exchange Act of 1934 and the Investment Company Act of 1940, this Report has been signed below by the following persons on behalf of the Registrant and in the capacities and on the dates indicated.
By: (signature)
Katherine L. Frank, President and Principal Executive Officer
Date: February 26, 2014
By: (signature)
Greg Hoppe, Principal Financial Officer
Date: February 26, 2014